UNITED STATES
SECURITIES AND EXCHANGE COMMISSION
Washington, D.C. 20549
Form 6-K
REPORT OF FOREIGN PRIVATE ISSUER PURSUANT TO
RULE
13a-16 OR 15d-16 UNDER
THE SECURITIES EXCHANGE ACT OF 1934
For the month of August 2023
Commission File Number 001-38752
Qifu Technology, Inc.
(Translation of registrant’s name into English)
7/F Lujiazui Finance Plaza
No. 1217 Dongfang Road
Pudong New Area, Shanghai 200122
People’s Republic of China
(Address of principal executive office)
Indicate by check mark whether the registrant files or will file annual reports under cover of Form 20-F or Form 40-F. Form 20-F x Form 40-F ¨
EXPLANATORY NOTE
On August 22, 2023, Hong Kong Time, we published an announcement of the second quarter and interim 2023 financial results and semi-annual dividend (the “HK Announcement”) pursuant to the Rules Governing the Listing of Securities on The Stock Exchange of Hong Kong Limited (the “Hong Kong Listing Rules”) on the website of The Stock Exchange of Hong Kong Limited. Pursuant to the Hong Kong Listing Rules, the HK Announcement contains supplemental disclosure of reconciliation of the material differences between the consolidated financial statements of the Company prepared under the U.S. GAAP and International Financial Reporting Standards, which supplemental disclosure has been attached hereto as exhibit 99.2.
Exhibit Index
SIGNATURES
Pursuant to the requirements of the Securities Exchange Act of 1934, the registrant has duly caused this report to be signed on its behalf by the undersigned, thereunto duly authorized.
| Qifu Technology, Inc. | ||
| By: | /s/ Alex Xu | |
| Name: | Alex Xu | |
| Title: | Director and Chief Financial Officer | |
| Date: August 21, 2023 | ||
Exhibit 99.1
Qifu Technology Announces Second Quarter and Interim 2023 Unaudited Financial Results
and Declares Semi-Annual Dividend
Shanghai, China, August 21, 2023, Qifu Technology, Inc. (NASDAQ: QFIN; HKEx: 3660) (“Qifu Technology” or the “Company”), a leading Credit-Tech platform in China, today announced its unaudited financial results for the second quarter and six months ended June 30, 2023, and declared semi-annual dividend.
Second Quarter 2023 Business Highlights
| • | As of June 30, 2023, our platform has connected 153 financial institutional partners and 220.6 million consumers*1 with potential credit needs, cumulatively, an increase of 11.5% from 197.9 million a year ago. |
| • | Cumulative users with approved credit lines*2 were 47.4 million as of June 30, 2023, an increase of 14.9% from 41.3 million as of June 30, 2022. |
| • | Cumulative borrowers with successful drawdown, including repeat borrowers was 28.5 million as of June 30, 2023, an increase of 11.3% from 25.6 million as of June 30, 2022. |
| • | In the second quarter of 2023, financial institutional partners originated 16,702,579 loans*3 through our platform. Total facilitation and origination loan volume reached RMB124,225 million*4, an increase of 26.4% from RMB98,281 million in the same period of 2022. |
| • | Out of those loans originated by financial institutions, RMB71,860 million was under capital-light model, Intelligence Credit Engine (“ICE”) and other technology solutions*5, representing 57.8% of the total, an increase of 31.2% from RMB54,784 million in the same period of 2022. |
| • | Total outstanding loan balance*6 was RMB184,459 million as of June 30, 2023, an increase of 22.6% from RMB150,490 million as of June 30, 2022. |
| • | RMB114,835 million of such loan balance was under capital-light model, “ICE” and other technology solutions*7, an increase of 39.1% from RMB82,580 million as of June 30, 2022. |
| • | The weighted average contractual tenor of loans originated by financial institutions across our platform in the second quarter of 2023 was approximately 11.00 months, compared with 12.06 months in the same period of 2022. |
| • | 90 day+ delinquency rate*8 of loans originated by financial institutions across our platform was 1.84% as of June 30, 2023. |
| • | Repeat borrower contribution*9 of loans originated by financial institutions across our platform for the second quarter of 2023 was 92.3%. |
1 Refers to cumulative registered users across our platform.
2 “Users with approved credit lines” refers to the total number of users who had submitted their credit applications and were approved with a credit line at the end of each period.
3 Including 6,054,571 loans across “V-pocket”, and 10,648,008 loans across other products.
4 Refers to the total principal amount of loans facilitated and originated during the given period, including loan volume facilitated through Intelligence Credit Engine (“ICE”) and other technology solutions.
5 “ICE” is an open platform on our “360 Jietiao” APP, we match borrowers and financial institutions through big data and cloud computing technology on “ICE”, and provide pre-loan investigation report of borrowers. For loans facilitated through “ICE”, the Company does not bear principal risk. Loan facilitation volume through “ICE” was RMB6,912 million in the second quarter of 2023.
Under other technology solutions, we offer financial institutions on-premise deployed, modular risk management SaaS, which helps financial institution partners improve credit assessment results. Loan facilitation volume through other technology solutions was RMB 28,260 million in the second quarter of 2023.
6 “Total outstanding loan balance” refers to the total amount of principal outstanding for loans facilitated and originated at the end of each period, including loan balance for “ICE” and other technology solutions, excluding loans delinquent for more than 180 days.
7 Outstanding loan balance for “ICE” and other technology solutions were RMB9,365 million and RMB43,760 million, respectively, as of June 30, 2023.
8 “90 day+ delinquency rate” refers to the outstanding principal balance of on- and off-balance sheet loans that were 91 to 180 calendar days past due as a percentage of the total outstanding principal balance of on- and off-balance sheet loans across our platform as of a specific date. Loans that are charged-off and loans under “ICE” and other technology solutions are not included in the delinquency rate calculation.
9 “Repeat borrower contribution” for a given period refers to (i) the principal amount of loans borrowed during that period by borrowers who had historically made at least one successful drawdown, divided by (ii) the total loan facilitation and origination volume through our platform during that period.
Second Quarter 2023 Financial Highlights
| • | Total net revenue was RMB3,914.3 million (US$539.8 million), compared to RMB4,183.2 million in the same period of 2022. |
| • | Income from operations was RMB1,181.5 million (US$162.9 million), compared to RMB1,010.8 million in the same period of 2022. |
| • | Non-GAAP*10 income from operations was RMB1,234.7 million (US$170.3 million), compared to RMB1,057.5 million in the same period of 2022. |
| • | Operating margin was 30.2%. Non-GAAP operating margin was 31.5%. |
| • | Net income was RMB1,093.4 million (US$150.8 million), compared to RMB975.0 million in the same period of 2022. |
| • | Non-GAAP net income was RMB1,146.6 million (US$158.1 million), compared to RMB1,021.7 million in the same period of 2022. |
| • | Net income attributed to the Company was RMB1,097.4 million (US$151.3 million), compared to RMB979.8 million in the same period of 2022. |
| • | Net income margin was 27.9%. Non-GAAP net income margin was 29.3%. |
10 Non-GAAP income from operations (Adjusted Income from operations), Non-GAAP net income (Adjusted net income), Non-GAAP operating margin and Non-GAAP net income margin are non-GAAP financial measures. For more information on these non-GAAP financial measures, please see the section of “Use of Non-GAAP Financial Measures Statement” and the table captioned “Unaudited Reconciliations of GAAP and Non-GAAP Results” set forth at the end of this press release.
Mr. Haisheng Wu, Chief Executive Officer and Director of Qifu Technology, commented, “While macro-economic recovery appeared moderating, along with consumers’ demand for credit, we managed to generate accelerated growth in loan volume in the second quarter, exceeding our internal targets. For the second quarter, total loan facilitation and origination volume was RMB124.2 billion, up approximately 26.4% year-on-year and 13.5% sequentially. Through optimizing customer acquisition channels and enriching product offerings, we achieved better customer engagement and activity levels, which are expected to continue to support sustainable growth. Approximately 58% of the loan volume was facilitated under the capital-light model, ICE and other technology solutions, which is slightly above the level in recent quarters.
With an optimized user base, we continued to offer more attractive products in a stable pricing environment to achieve higher retention rates. Overall risk metrics were stable in the second quarter despite somewhat weakening consumer sentiment. In addition, we continued to strengthen our partnership with financial institutions to secure better funding terms. During the quarter we issued record amount of ABS, which helped us further reduce our overall funding costs to record low levels.
We note that recent public statements by government agencies suggest further policy support to re-energize the economy. While the pace of macro-economic recovery is still uncertain, we will continue to drive for consistent executions and optimal balance between healthy growth and manageable risks. Some of the operational initiatives we launched recently are expected to make positive contributions in the second half of this year and the next year. In the long run, we are confident to maintain our leadership position in the industry through continued enhancement of business model and technology innovation.”
“We are pleased to report another quarter of solid financial results amidst a moderately recovering macro environment. Total revenue was RMB3.91 billion and non-GAAP net income was RMB1,147 million for the second quarter,” Mr. Alex Xu, Chief Financial Officer, commented. “During the quarter, despite the macro uncertainty, we continued to deploy additional resources to drive business growth while maintaining a prudent approach to manage risks and cash flow. At the end of the second quarter, our total cash and cash equivalent*11 was approximately RMB8.5 billion, and we generated approximately RMB1.8 billion cash from operations. During the quarter, we announced a 12-month, US$150 million share repurchase program, which is still being gradually executed. Our strong financial positions not only enable us to drive additional growth, but also allow us to maintain decent shareholder returns through dividend payout and share repurchase.”
Mr. Yan Zheng, Chief Risk Officer, added, “We see relatively stable overall risk metrics of our loan book in the second quarter as we continued to take a prudent approach in managing risks. While we observed some regain of confidence among our users, the pace and scope of such improvement remained uncertain. Among key leading indicators, Day-1 delinquency rate*12 was 4.2%, and 30-day collection rate*13 was approximately 87%. Both metrics were still close to the best levels in recent quarters. As the economic conditions change, we will continue to seek optimal balance between risk exposure and business growth.”
11 Including “Cash and cash equivalents”, “Restricted cash”, and “Security deposit prepaid to third-party guarantee companies”.
12 “Day-1 delinquency rate” is defined as (i) the total amount of principal that became overdue as of a specified date, divided by (ii) the total amount of principal that was due for repayment as of such specified date.
13 “30 day collection rate” is defined as (i) the amount of principal that was repaid in one month among the total amount of principal that became overdue as of a specified date, divided by (ii) the total amount of principal that became overdue as of such specified date.
Second Quarter 2023 Financial Results
Total net revenue was RMB3,914.3 million (US$539.8 million), compared to RMB4,183.2 million in the same period of 2022, and RMB3,599.2 million in the prior quarter.
Net revenue from Credit Driven Services was RMB2,788.7 million (US$384.6 million), compared to RMB2,947.8 million in the same period of 2022, and RMB2,630.6 million in the prior quarter.
Loan facilitation and servicing fees-capital heavy were RMB395.5 million (US$54.5 million), compared to RMB580.4 million in the same period of 2022 and RMB311.2 million in the prior quarter. The year-over-year decrease was primarily due to a decline in capital-heavy loan facilitation volume and shorter average duration of the loans. The sequential increase was primarily due to higher capital-heavy loan volume and relatively stable effective duration of the loans.
Financing income*14 was RMB1,188.7 million (US$163.9 million), compared to RMB819.6 million in the same period of 2022 and RMB1,065.9 million in the prior quarter. The year-over-year and sequential increases were primarily due to the growth in average outstanding balance of the on-balance-sheet loans.
Revenue from releasing of guarantee liabilities was RMB1,158.6 million (US$159.8 million), compared to RMB1,524.5 million in the same period of 2022, and RMB1,209.8 million in the prior quarter. The year-over-year and sequential decreases were mainly due to decreases in average outstanding balance of off-balance-sheet capital-heavy loans during the period.
Other services fees were RMB45.9 million (US$6.3 million), compared to RMB23.3 million in the same period of 2022, and RMB43.8 million in the prior quarter. The year-over-year and sequential increases were mainly due to the increases in late payment fees under the capital-heavy model.
Net revenue from Platform Services was RMB1,125.6 million (US$155.2 million), compared to RMB1,235.4 million in the same period of 2022 and RMB968.6 million in the prior quarter.
Loan facilitation and servicing fees-capital light were RMB887.8 million (US$122.4 million), compared to RMB1,030.0 million in the same period of 2022 and RMB765.3 million in the prior quarter. The year-over-year decrease was mainly due to a decline in the fees received from financial institutions as a result of reduced interest rates. The sequential increase was primarily due to higher capital-light loan volume and relatively stable effective duration of the loans.
Referral services fees were RMB160.9 million (US$22.2 million), compared to RMB135.4 million in the same period of 2022 and RMB108.5 million in the prior quarter. The year-over-year and sequential increases were mainly due to the increase in the loan facilitation volume through ICE.
Other services fees were RMB76.9 million (US$10.6 million), compared to RMB70.1 million in the same period of 2022 and RMB94.8 million in the prior quarter. The year-over-year and sequential changes were mainly due to changes in late payment fees.
Total operating costs and expenses were RMB2,732.8 million (US$376.9 million), compared to RMB3,172.4 million in the same period of 2022 and RMB2,592.1 million in the prior quarter.
Facilitation, origination and servicing expenses were RMB648.0 million (US$89.4 million), compared to RMB555.6 million in the same period of 2022 and RMB640.3 million in the prior quarter. The year-over-year increase was primarily due to higher credit search fees and collection fees.
Funding costs were RMB165.2 million (US$22.8 million), compared to RMB123.9 million in the same period of 2022 and RMB159.0 million in the prior quarter. The year-over-year and sequential increases were mainly due to increases in funding from ABS, as a result of continued growth in on-balance-sheet loan balance, partially offset by the lower average cost of ABS.
Sales and marketing expenses were RMB436.5 million (US$60.2 million), compared to RMB615.1 million in the same period of 2022 and RMB422.2 million in the prior quarter. The year-over-year and sequential changes were mainly due to changes in unit customer acquisition cost in the second quarter.
General and administrative expenses were RMB112.8 million (US$15.6 million), compared to RMB93.9 million in the same period of 2022 and RMB104.9 million in the prior quarter. The year-over-year and sequential increases were mainly due to increases in professional service fees.
Provision for loans receivable was RMB483.3 million (US$66.7 million), compared to RMB416.1 million in the same period of 2022 and RMB518.9 million in the prior quarter. The year-over-year increase was mainly due to the growth in loan origination volume of on-balance-sheet loans, partially offset by the better overall performance of loans facilitated in previous quarters. The sequential decrease was mainly due to a reversal of prior quarters’ provision in this quarter as on-balance-sheet loans facilitated in previous quarters performed better than expected.
Provision for financial assets receivable was RMB82.3 million (US$11.3 million), compared to RMB103.7 million in the same period of 2022 and RMB68.8 million in the prior quarter. The year-over-year and sequential changes mainly reflected changes in loan facilitation volume of off-balance-sheet loans, and the Company’s consistent approach in assessing provisions commensurate with its underlying loan profile.
Provision for accounts receivable and contract assets was RMB47.2 million (US$6.5 million), compared to RMB63.4 million in the same period of 2022 and RMB-2.2 million in the prior quarter. The year-over-year and sequential changes reflected the Company’s consistent approach in assessing provisions commensurate with its underlying loan profile.
Provision for contingent liability was RMB757.6 million (US$104.5 million), compared to RMB1,200.7 million in the same period of 2022 and RMB680.3 million in the prior quarter. The year-over-year and sequential changes reflected the Company’s consistent approach in assessing provisions commensurate with its underlying loan profile. In addition, the year-over-year decrease was also partially due to the decrease in loan facilitation volume of off-balance-sheet loans.
Income from operations was RMB1,181.5 million (US$162.9 million), compared to RMB1,010.8 million in the same period of 2022 and RMB1,007.0 million in the prior quarter.
Non-GAAP income from operations was RMB1,234.7 million (US$170.3 million), compared to RMB1,057.5 million in the same period of 2022 and RMB1,053.5 million in the prior quarter.
Operating margin was 30.2%. Non-GAAP operating margin was 31.5%.
Income before income tax expense was RMB1,366.3 million (US$188.4 million), compared to RMB1,155.3 million in the same period of 2022 and RMB1,102.1 million in the prior quarter.
Net income was RMB1,093.4 million (US$150.8 million), compared to RMB975.0 million in the same period of 2022 and RMB929.8 million in the prior quarter.
Non-GAAP net income was RMB1,146.6 million (US$158.1 million), compared to RMB1,021.7 million in the same period of 2022 and RMB976.3 million in the prior quarter.
Net income margin was 27.9%. Non-GAAP net income margin was 29.3%.
Net income attributed to the Company was RMB1,097.4 million (US$151.3 million), compared to RMB979.8 million in the same period of 2022 and RMB934.1 million in the prior quarter.
Non-GAAP net income attributed to the Company was RMB1,150.7 million (US$158.7 million), compared to RMB1,026.6 million in the same period of 2022 and RMB980.6 million in the prior quarter.
Net income per fully diluted ADS was RMB6.64 (US$0.92).
Non-GAAP net income per fully diluted ADS was RMB6.95 (US$0.96).
Weighted average basic ADS used in calculating GAAP and non-GAAP net income per ADS was 161.55 million.
Weighted average diluted ADS used in calculating GAAP and non-GAAP net income per ADS was 165.46 million.
14 “Financing income” is generated from loans facilitated through the Company’s platform funded by the consolidated trusts and Fuzhou Microcredit, which charge fees and interests from borrowers.
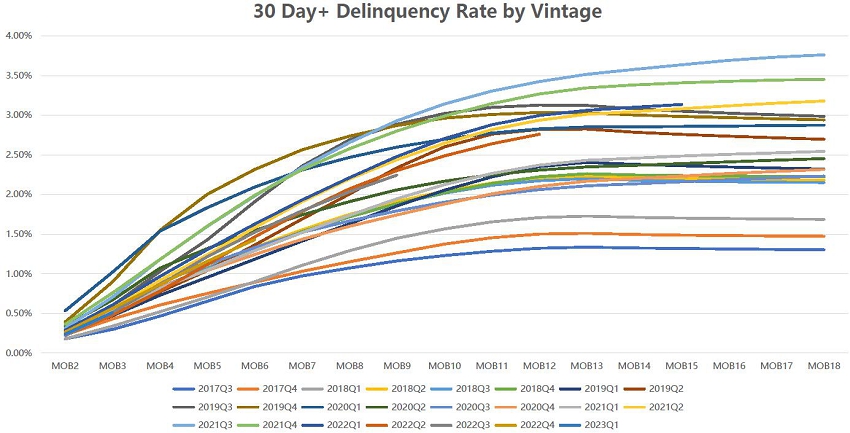
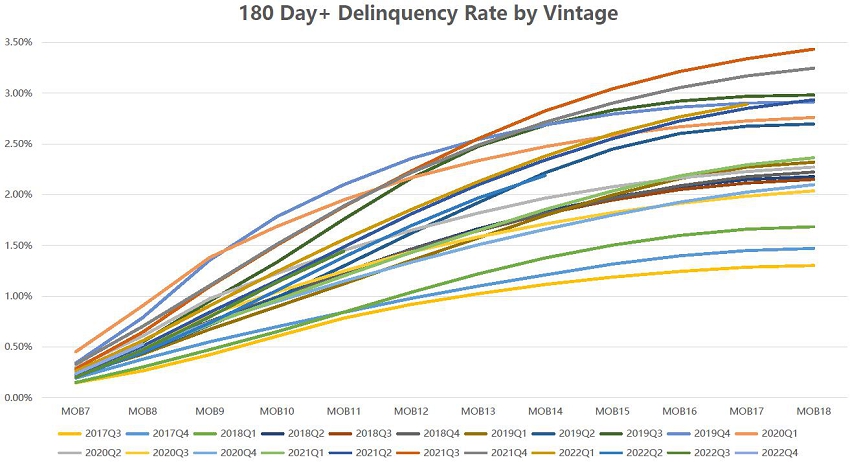
30 Day+ Delinquency Rate by Vintage and 180 Day+ Delinquency Rate by Vintage
The following charts and tables display the historical cumulative 30 day+ delinquency rates by loan facilitation and origination vintage and 180 day+ delinquency rates by loan facilitation and origination vintage for all loans facilitated and originated through the Company’s platform. Loans under “ICE” and other technology solutions are not included in the 30 day+ charts and the 180 day+ charts:
Semi-Annual Dividend
The board of directors of the Company has approved a dividend of US$0.25 per Class A ordinary share, or US$0.50 per ADS for the first half of 2023 to holders of record of Class A ordinary shares and ADSs as of the close of business on September 22, 2023 Hong Kong Time and New York Time, respectively, in accordance with the Company’s dividend policy. For holder of Class A ordinary shares, in order to qualify for the dividend, all valid documents for the transfers of shares accompanied by the relevant share certificates must be lodged for registration with the Company’s Hong Kong branch share registrar, Computershare Hong Kong Investor Services Limited, at Shops 1712-1716, 17th Floor, Hopewell Centre, 183 Queen’s Road East, Hong Kong no later than 4:30 p.m. on September 22, 2023 (Hong Kong Time). The payment date is expected to be on October 27, 2023 for holders of Class A ordinary shares and around November 1, 2023 for holders of ADSs.
Update on Share Repurchase
On June 20, 2023, the Company announced a share repurchase plan whereby the Company is authorized to repurchase its American depositary shares (“ADSs”) or Class A ordinary shares with an aggregate value of up to US$150 million during the 12-month period from June 20, 2023. From the launch of the share repurchase plan to August 18, 2023, the Company in aggregate purchased approximately 1.6 million ADSs in the open market for a total cost of approximately US$28.3 million (inclusive of commissions) at an average price of $18.03 per ADS pursuant to the share repurchase plan.
Business Outlook
While the year-on-year growth in loan volume in the second quarter of 2023 accelerated, which is in part due to a relatively lower loan volume in the same period of 2022, macro-economic uncertainties remained. At this junction, the Company continues to expect a slow recovery in consumer credit demand, with growth rates depending on macro conditions for the rest of the year to some extent. As such, the Company would like to adjust its outlook of loan volume for 2023 to be between RMB470 billion and RMB485 billion, representing a year-on-year growth of 14% to 18%, compared to the previous outlook of RMB455 billion to RMB495 billion. This outlook reflects the Company’s current and preliminary views, which is subject to material changes.
Conference Call Preregistration
Qifu Technology’s management team will host an earnings conference call at 8:00 PM U.S. Eastern Time on Monday, August 21, 2023 (8:00 AM Beijing Time on Tuesday, August 22).
All participants wishing to join the conference call must pre-register online using the link provided below.
Registration Link: https://register.vevent.com/register/BI814a184451444f5ab9d0166af26fe116
Upon registration, each participant will receive details for the conference call, including dial-in numbers and a unique access PIN. Please dial in 10 minutes before the call is scheduled to begin.
Additionally, a live and archived webcast of the conference call will be available on the Investor Relations section of the Company's website at http://ir.qifu.tech.
About Qifu Technology
Qifu Technology is a Credit-Tech platform in China that provides a comprehensive suite of technology services to assist financial institutions and consumers and SMEs in the loan lifecycle, ranging from borrower acquisition, preliminary credit assessment, fund matching and post-facilitation services. The Company is dedicated to making credit services more accessible and personalized to consumers and SMEs through Credit-Tech services to financial institutions.
For more information, please visit: https://ir.qifu.tech.
Use of Non-GAAP Financial Measures Statement
To supplement our financial results presented in accordance with U.S. GAAP, we use Non-GAAP financial measure, which is adjusted from results based on U.S. GAAP to exclude share-based compensation expenses. Reconciliations of our Non-GAAP financial measures to our U.S. GAAP financial measures are set forth in tables at the end of this earnings release, which provide more details on the Non-GAAP financial measures.
We use Non-GAAP income from operation, Non-GAAP operating margin, Non-GAAP net income, Non-GAAP net income margin, Non-GAAP net income attributed to the Company and Non-GAAP net income per fully diluted ADS in evaluating our operating results and for financial and operational decision-making purposes. Non-GAAP income from operation represents income from operation excluding share-based compensation expenses. Non-GAAP operating margin is equal to Non-GAAP income from operation divided by total net revenue. Non-GAAP net income represents net income excluding share-based compensation expenses. Non-GAAP net income margin is equal to Non-GAAP net income divided by total net revenue. Non-GAAP net income attributed to the Company represents net income attributed to the Company excluding share-based compensation expenses. Non-GAAP net income per fully diluted ADS represents net income per fully diluted ADS excluding share-based compensation expenses. Such adjustments have no impact on income tax. We believe that Non-GAAP income from operation and Non-GAAP net income help identify underlying trends in our business that could otherwise be distorted by the effect of certain expenses that we include in results based on U.S. GAAP. We believe that Non-GAAP income from operation and Non-GAAP net income provide useful information about our operating results, enhance the overall understanding of our past performance and future prospects and allow for greater visibility with respect to key metrics used by our management in its financial and operational decision-making. Our Non-GAAP financial information should be considered in addition to results prepared in accordance with U.S. GAAP, but should not be considered a substitute for or superior to U.S. GAAP results. In addition, our calculation of Non-GAAP financial information may be different from the calculation used by other companies, and therefore comparability may be limited.
Exchange Rate Information
This announcement contains translations of certain RMB amounts into U.S. dollars at specified rates solely for the convenience of the reader. Unless otherwise noted, all translations from RMB to U.S. dollars are made at a rate of RMB7.2513 to US$1.00, the exchange rate set forth in the H.10 statistical release of the Board of Governors of the Federal Reserve System as of June 30, 2023.
Safe Harbor Statement
Any forward-looking statements contained in this announcement are made under the “safe harbor” provisions of the U.S. Private Securities Litigation Reform Act of 1995. Forward-looking statements can be identified by terminology such as “will,” “expects,” “anticipates,” “future,” “intends,” “plans,” “believes,” “estimates” and similar statements. Among other things, the business outlook and quotations from management in this announcement, as well as the Company’s strategic and operational plans, contain forward-looking statements. Qifu Technology may also make written or oral forward-looking statements in its periodic reports to the U.S. Securities and Exchange Commission (“SEC”), in announcements made on the website of The Stock Exchange of Hong Kong Limited (the “Hong Kong Stock Exchange”), in its annual report to shareholders, in press releases and other written materials and in oral statements made by its officers, directors or employees to third parties. Statements that are not historical facts, including the Company’s business outlook, beliefs and expectations, are forward-looking statements. Forward-looking statements involve inherent risks and uncertainties. A number of factors could cause actual results to differ materially from those contained in any forward-looking statement, which factors include but not limited to the following: the Company’s growth strategies, the Company’s cooperation with 360 Group, changes in laws, rules and regulatory environments, the recognition of the Company’s brand, market acceptance of the Company’s products and services, trends and developments in the credit-tech industry, governmental policies relating to the credit-tech industry, general economic conditions in China and around the globe, and assumptions underlying or related to any of the foregoing. Further information regarding these and other risks and uncertainties is included in Qifu Technology’s filings with the SEC and announcements on the website of the Hong Kong Stock Exchange. All information provided in this press release is as of the date of this press release, and Qifu Technology does not undertake any obligation to update any forward-looking statement, except as required under applicable law.
For more information, please contact:
Qifu Technology
E-mail: ir@360shuke.com
Unaudited Condensed Consolidated Balance Sheets
(Amounts in thousands of Renminbi (“RMB”) and U.S. dollars (“USD”)
except for number of shares and per share data, or otherwise noted)
| December 31, | June 30, | June 30, | ||||||||||
| 2022 | 2023 | 2023 | ||||||||||
| RMB | RMB | USD | ||||||||||
| ASSETS | ||||||||||||
| Current assets: | ||||||||||||
| Cash and cash equivalents | 7,165,584 | 5,256,375 | 724,887 | |||||||||
| Restricted cash | 3,346,779 | 3,058,166 | 421,740 | |||||||||
| Short term investments | 57,000 | 247,539 | 34,137 | |||||||||
| Security deposit prepaid to third-party guarantee companies | 396,699 | 210,362 | 29,010 | |||||||||
| Funds receivable from third party payment service providers | 1,158,781 | 1,183,720 | 163,242 | |||||||||
| Accounts receivable and contract assets, net | 2,868,625 | 2,808,531 | 387,314 | |||||||||
| Financial assets receivable, net | 2,982,076 | 2,746,010 | 378,692 | |||||||||
| Amounts due from related parties | 394,872 | 187,938 | 25,918 | |||||||||
| Loans receivable, net | 15,347,662 | 21,430,147 | 2,955,352 | |||||||||
| Prepaid expenses and other assets | 379,388 | 428,973 | 59,158 | |||||||||
| Total current assets | 34,097,466 | 37,557,761 | 5,179,450 | |||||||||
| Non-current assets: | ||||||||||||
| Accounts receivable and contract assets, net-non current | 261,319 | 172,413 | 23,777 | |||||||||
| Financial assets receivable, net-non current | 688,843 | 522,451 | 72,049 | |||||||||
| Amounts due from related parties | 33,236 | 12,407 | 1,711 | |||||||||
| Loans receivable, net-non current | 3,136,994 | 2,881,248 | 397,342 | |||||||||
| Property and equipment, net | 47,602 | 106,719 | 14,717 | |||||||||
| Land use rights,net | 998,185 | 987,823 | 136,227 | |||||||||
| Intangible assets | 4,696 | 4,718 | 651 | |||||||||
| Deferred tax assets | 1,019,171 | 1,097,504 | 151,353 | |||||||||
| Other non-current assets | 55,658 | 59,069 | 8,146 | |||||||||
| Total non-current assets | 6,245,704 | 5,844,352 | 805,973 | |||||||||
| TOTAL ASSETS | 40,343,170 | 43,402,113 | 5,985,423 | |||||||||
| LIABILITIES AND EQUITY | ||||||||||||
| Current liabilities: | ||||||||||||
| Payable to investors of the consolidated trusts-current | 6,099,520 | 5,965,297 | 822,652 | |||||||||
| Accrued expenses and other current liabilities | 2,004,551 | 1,755,914 | 242,152 | |||||||||
| Amounts due to related parties | 113,697 | 105,383 | 14,533 | |||||||||
| Short term loans | 150,000 | 260,000 | 35,856 | |||||||||
| Guarantee liabilities-stand ready | 4,120,346 | 3,851,692 | 531,173 | |||||||||
| Guarantee liabilities-contingent | 3,418,391 | 3,306,712 | 456,016 | |||||||||
| Income tax payable | 661,015 | 796,928 | 109,901 | |||||||||
| Other tax payable | 182,398 | 144,361 | 19,908 | |||||||||
| Total current liabilities | 16,749,918 | 16,186,287 | 2,232,191 | |||||||||
| Non-current liabilities: | ||||||||||||
| Deferred tax liabilities | 100,835 | 122,347 | 16,872 | |||||||||
| Payable to investors of the consolidated trusts-noncurrent | 4,521,600 | 6,146,000 | 847,572 | |||||||||
| Other long-term liabilities | 39,520 | 61,912 | 8,538 | |||||||||
| Total non-current liabilities | 4,661,955 | 6,330,259 | 872,982 | |||||||||
| TOTAL LIABILITIES | 21,411,873 | 22,516,546 | 3,105,173 | |||||||||
| TOTAL QIFU TECHNOLOGY INC EQUITY | 18,847,156 | 20,809,775 | 2,869,798 | |||||||||
| Noncontroling interests | 84,141 | 75,792 | 10,452 | |||||||||
| TOTAL EQUITY | 18,931,297 | 20,885,567 | 2,880,250 | |||||||||
| TOTAL LIABILITIES AND EQUITY | 40,343,170 | 43,402,113 | 5,985,423 | |||||||||
Unaudited Condensed Consolidated Statements of Operations
(Amounts in thousands of Renminbi (“RMB”) and U.S. dollars (“USD”)
except for number of shares and per share data, or otherwise noted)
| Three months ended June 30, | Six months ended June 30, | |||||||||||||||||||||||
| 2022 | 2023 | 2023 | 2022 | 2023 | 2023 | |||||||||||||||||||
| RMB | RMB | USD | RMB | RMB | USD | |||||||||||||||||||
| Credit driven services | 2,947,767 | 2,788,707 | 384,580 | 5,868,397 | 5,419,328 | 747,359 | ||||||||||||||||||
| Loan facilitation and servicing fees-capital heavy | 580,360 | 395,512 | 54,544 | 1,141,771 | 706,676 | 97,455 | ||||||||||||||||||
| Financing income | 819,572 | 1,188,738 | 163,934 | 1,608,820 | 2,254,620 | 310,926 | ||||||||||||||||||
| Revenue from releasing of guarantee liabilities | 1,524,547 | 1,158,554 | 159,772 | 3,074,515 | 2,368,374 | 326,614 | ||||||||||||||||||
| Other services fees | 23,288 | 45,903 | 6,330 | 43,291 | 89,658 | 12,364 | ||||||||||||||||||
| Platform services | 1,235,432 | 1,125,617 | 155,229 | 2,634,849 | 2,094,170 | 288,799 | ||||||||||||||||||
| Loan facilitation and servicing fees-capital light | 1,030,024 | 887,830 | 122,437 | 2,128,955 | 1,653,110 | 227,974 | ||||||||||||||||||
| Referral services fees | 135,352 | 160,864 | 22,184 | 382,650 | 269,340 | 37,144 | ||||||||||||||||||
| Other services fees | 70,056 | 76,923 | 10,608 | 123,244 | 171,720 | 23,681 | ||||||||||||||||||
| Total net revenue | 4,183,199 | 3,914,324 | 539,809 | 8,503,246 | 7,513,498 | 1,036,158 | ||||||||||||||||||
| Facilitation, origination and servicing | 555,631 | 647,989 | 89,362 | 1,170,561 | 1,288,330 | 177,669 | ||||||||||||||||||
| Funding costs | 123,862 | 165,225 | 22,786 | 227,630 | 324,248 | 44,716 | ||||||||||||||||||
| Sales and marketing | 615,080 | 436,486 | 60,194 | 1,167,657 | 858,663 | 118,415 | ||||||||||||||||||
| General and administrative | 93,890 | 112,757 | 15,550 | 216,148 | 217,646 | 30,015 | ||||||||||||||||||
| Provision for loans receivable | 416,090 | 483,306 | 66,651 | 907,317 | 1,002,170 | 138,206 | ||||||||||||||||||
| Provision for financial assets receivable | 103,703 | 82,265 | 11,345 | 164,217 | 151,017 | 20,826 | ||||||||||||||||||
| Provision for accounts receivable and contract assets | 63,417 | 47,206 | 6,510 | 117,025 | 44,970 | 6,202 | ||||||||||||||||||
| Provision for contingent liabilities | 1,200,742 | 757,590 | 104,476 | 2,162,638 | 1,437,924 | 198,299 | ||||||||||||||||||
| Total operating costs and expenses | 3,172,415 | 2,732,824 | 376,874 | 6,133,193 | 5,324,968 | 734,348 | ||||||||||||||||||
| Income from operations | 1,010,784 | 1,181,500 | 162,935 | 2,370,053 | 2,188,530 | 301,810 | ||||||||||||||||||
| Interest income, net | 43,771 | 55,854 | 7,703 | 68,188 | 120,624 | 16,635 | ||||||||||||||||||
| Foreign exchange (loss) gain | (91,610 | ) | (2,319 | ) | (320 | ) | (86,658 | ) | 3,830 | 528 | ||||||||||||||
| Other income, net | 196,410 | 161,388 | 22,256 | 203,458 | 185,552 | 25,589 | ||||||||||||||||||
| Investment loss | (4,096 | ) | (30,112 | ) | (4,153 | ) | (8,996 | ) | (30,112 | ) | (4,153 | ) | ||||||||||||
| Income before income tax expense | 1,155,259 | 1,366,311 | 188,421 | 2,546,045 | 2,468,424 | 340,409 | ||||||||||||||||||
| Income taxes expense | (180,303 | ) | (272,934 | ) | (37,639 | ) | (396,732 | ) | (445,225 | ) | (61,399 | ) | ||||||||||||
| Net income | 974,956 | 1,093,377 | 150,782 | 2,149,313 | 2,023,199 | 279,010 | ||||||||||||||||||
| Net loss attributable to noncontrolling interests | 4,883 | 4,063 | 560 | 10,024 | 8,350 | 1,152 | ||||||||||||||||||
| Net income attributable to ordinary shareholders of the Company | 979,839 | 1,097,440 | 151,342 | 2,159,337 | 2,031,549 | 280,162 | ||||||||||||||||||
| Net income per ordinary share attributable to ordinary shareholders of Qifu Technology, Inc. | ||||||||||||||||||||||||
| Basic | 3.14 | 3.40 | 0.47 | 6.94 | 6.29 | 0.87 | ||||||||||||||||||
| Diluted | 3.06 | 3.32 | 0.46 | 6.74 | 6.14 | 0.85 | ||||||||||||||||||
| Net income per ADS attributable to ordinary shareholders of Qifu Technology, Inc. | ||||||||||||||||||||||||
| Basic | 6.28 | 6.80 | 0.94 | 13.88 | 12.58 | 1.74 | ||||||||||||||||||
| Diluted | 6.12 | 6.64 | 0.92 | 13.48 | 12.28 | 1.70 | ||||||||||||||||||
| Weighted average shares used in calculating net income per ordinary share | ||||||||||||||||||||||||
| Basic | 311,615,233 | 323,095,877 | 323,095,877 | 311,109,257 | 322,978,323 | 322,978,323 | ||||||||||||||||||
| Diluted | 319,874,351 | 330,918,585 | 330,918,585 | 320,251,194 | 331,118,889 | 331,118,889 | ||||||||||||||||||
Unaudited Condensed Consolidated Statements of Cash Flows
(Amounts in thousands of Renminbi (“RMB”) and U.S. dollars (“USD”)
except for number of shares and per share data, or otherwise noted)
| Three months ended June 30, | Six months ended June 30, | |||||||||||||||||||||||
| 2022 | 2023 | 2023 | 2022 | 2023 | 2023 | |||||||||||||||||||
| RMB | RMB | USD | RMB | RMB | USD | |||||||||||||||||||
| Net cash provided by operating activities | 1,118,314 | 1,761,575 | 242,932 | 2,537,911 | 3,522,666 | 485,798 | ||||||||||||||||||
| Net cash used in investing activities | (252,787 | ) | (3,436,966 | ) | (473,979 | ) | (2,694,432 | ) | (7,001,173 | ) | (965,506 | ) | ||||||||||||
| Net cash provided by financing activities | 1,052,143 | 1,236,187 | 170,478 | 2,129,177 | 1,275,127 | 175,848 | ||||||||||||||||||
| Effect of foreign exchange rate changes | 1,443 | 8,401 | 1,158 | (2,377 | ) | 5,558 | 766 | |||||||||||||||||
| Net increase (decrease) in cash and cash equivalents | 1,919,113 | (430,803 | ) | (59,411 | ) | 1,970,279 | (2,197,822 | ) | (303,094 | ) | ||||||||||||||
| Cash, cash equivalents, and restricted cash, beginning of period | 8,811,113 | 8,745,344 | 1,206,038 | 8,759,947 | 10,512,363 | 1,449,721 | ||||||||||||||||||
| Cash, cash equivalents, and restricted cash, end of period | 10,730,226 | 8,314,541 | 1,146,627 | 10,730,226 | 8,314,541 | 1,146,627 | ||||||||||||||||||
Unaudited Condensed Consolidated Statements of Comprehensive Income
(Amounts in thousands of Renminbi (“RMB”) and U.S. dollars (“USD”)
except for number of shares and per share data, or otherwise noted)
| Three months ended June 30, | ||||||||||||
| 2022 | 2023 | 2023 | ||||||||||
| RMB | RMB | USD | ||||||||||
| Net income | 974,956 | 1,093,377 | 150,782 | |||||||||
| Other comprehensive income, net of tax of nil: | ||||||||||||
| Foreign currency translation adjustment | 49,579 | 19,482 | 2,687 | |||||||||
| Other comprehensive income | 49,579 | 19,482 | 2,687 | |||||||||
| Total comprehensive income | 1,024,535 | 1,112,859 | 153,469 | |||||||||
| Comprehensive loss attributable to noncontrolling interests | 4,883 | 4,063 | 560 | |||||||||
| Comprehensive income attributable to ordinary shareholders | 1,029,418 | 1,116,922 | 154,029 | |||||||||
| Six months ended June 30, | ||||||||||||
| 2022 | 2023 | 2023 | ||||||||||
| RMB | RMB | USD | ||||||||||
| Net income | 2,149,313 | 2,023,199 | 279,010 | |||||||||
| Other comprehensive income, net of tax of nil: | ||||||||||||
| Foreign currency translation adjustment | 43,320 | 16,673 | 2,299 | |||||||||
| Other comprehensive income | 43,320 | 16,673 | 2,299 | |||||||||
| Total comprehensive income | 2,192,633 | 2,039,872 | 281,309 | |||||||||
| Comprehensive loss attributable to noncontrolling interests | 10,024 | 8,350 | 1,152 | |||||||||
| Comprehensive income attributable to ordinary shareholders | 2,202,657 | 2,048,222 | 282,461 | |||||||||
Unaudited Reconciliations of GAAP and Non-GAAP Results
(Amounts in thousands of Renminbi (“RMB”) and U.S. dollars (“USD”)
except for number of shares and per share data, or otherwise noted)
| Three months ended June 30, | ||||||||||||
| 2022 | 2023 | 2023 | ||||||||||
| RMB | RMB | USD | ||||||||||
| Reconciliation of Non-GAAP Net Income to Net Income | ||||||||||||
| Net income | 974,956 | 1,093,377 | 150,782 | |||||||||
| Add: Share-based compensation expenses | 46,759 | 53,247 | 7,343 | |||||||||
| Non-GAAP net income | 1,021,715 | 1,146,624 | 158,125 | |||||||||
| GAAP net income margin | 23.3 | % | 27.9 | % | ||||||||
| Non-GAAP net income margin | 24.4 | % | 29.3 | % | ||||||||
| Net income attributable to shareholders of Qifu Technology, Inc. | 979,839 | 1,097,440 | 151,342 | |||||||||
| Add: Share-based compensation expenses | 46,759 | 53,247 | 7,343 | |||||||||
| Non-GAAP net income attributable to shareholders of Qifu Technology, Inc. | 1,026,598 | 1,150,687 | 158,685 | |||||||||
| Weighted average ADS used in calculating net income per ordinary share for both GAAP and non-GAAP EPS -diluted | 159,937,176 | 165,459,293 | 165,459,293 | |||||||||
| Net income per ADS attributable to ordinary shareholders of Qifu Technology, Inc. -diluted | 6.12 | 6.64 | 0.92 | |||||||||
| Non-GAAP net income per ADS attributable to ordinary shareholders of Qifu Technology, Inc. -diluted | 6.42 | 6.95 | 0.96 | |||||||||
| Reconciliation of Non-GAAP Income from operations to Income from operations | ||||||||||||
| Income from operations | 1,010,784 | 1,181,500 | 162,935 | |||||||||
| Add: Share-based compensation expenses | 46,759 | 53,247 | 7,343 | |||||||||
| Non-GAAP Income from operations | 1,057,543 | 1,234,747 | 170,278 | |||||||||
| GAAP operating margin | 24.2 | % | 30.2 | % | ||||||||
| Non-GAAP operating margin | 25.3 | % | 31.5 | % | ||||||||
| Six months ended June 30, | ||||||||||||
| 2022 | 2023 | 2023 | ||||||||||
| RMB | RMB | USD | ||||||||||
| Reconciliation of Non-GAAP Net Income to Net Income | ||||||||||||
| Net income | 2,149,313 | 2,023,199 | 279,010 | |||||||||
| Add: Share-based compensation expenses | 98,833 | 99,743 | 13,755 | |||||||||
| Non-GAAP net income | 2,248,146 | 2,122,942 | 292,765 | |||||||||
| GAAP net income margin | 25.3 | % | 26.9 | % | ||||||||
| Non-GAAP net income margin | 26.4 | % | 28.3 | % | ||||||||
| Net income attributable to shareholders of Qifu Technology, Inc. | 2,159,337 | 2,031,549 | 280,162 | |||||||||
| Add: Share-based compensation expenses | 98,833 | 99,743 | 13,755 | |||||||||
| Non-GAAP net income attributable to shareholders of Qifu Technology, Inc. | 2,258,170 | 2,131,292 | 293,917 | |||||||||
| Weighted average ADS used in calculating net income per ordinary share for both GAAP and non-GAAP EPS -diluted | 160,125,597 | 165,559,445 | 165,559,445 | |||||||||
| Net income per ADS attributable to ordinary shareholders of Qifu Technology, Inc. -diluted | 13.48 | 12.28 | 1.70 | |||||||||
| Non-GAAP net income per ADS attributable to ordinary shareholders of Qifu Technology, Inc. -diluted | 14.10 | 12.87 | 1.78 | |||||||||
| Reconciliation of Non-GAAP Income from operations to Income from operations | ||||||||||||
| Income from operations | 2,370,053 | 2,188,530 | 301,810 | |||||||||
| Add: Share-based compensation expenses | 98,833 | 99,743 | 13,755 | |||||||||
| Non-GAAP Income from operations | 2,468,886 | 2,288,273 | 315,565 | |||||||||
| GAAP operating margin | 27.9 | % | 29.1 | % | ||||||||
| Non-GAAP operating margin | 29.0 | % | 30.5 | % | ||||||||
Exhibit 99.2
DIFFERENCES BETWEEN U.S. GAAP AND IFRSs
The interim financial statements for the six months ended June 30, 2023 is prepared by Directors of the Company under the accounting principles generally accepted in the United States of America (the "U.S. GAAP") , and the differences between U.S. GAAP and the International Financial Reporting Standards (the "IFRSs") issued by the International Accounting Standards Board (together, the "Reconciliation") have been disclosed in the Appendix – Reconciliation Statement attached herein.
Basis of Preparation
The directors of the Company are responsible for the preparation of the Reconciliation based on the notes to Reconciliation as set out in the Appendix, in accordance with paragraph 19.25A of the Hong Kong Listing Rules and the guidance letter HKEX-GL111-22 updated by The Stock Exchange of Hong Kong Limited in August 2022. This responsibility includes designing, implementing and maintaining internal control relevant to the preparation of the Reconciliation to enable the preparation of such information that is free from material misstatement, whether due to fraud or error.
Reconciliation Process
The Reconciliation has been prepared by the Directors by comparing the differences between the "Amounts as reported under U.S. GAAP" for each of the six months ended June 30, 2023 and 2022 on the one hand, and the "Amounts as reported under IFRSs" on the other hand in respect of each of the six months ended June 30, 2023 and 2022, as appropriate, and quantifying the relevant financial effects of such differences, if any. Attention is drawn to the fact that as the GAAP Difference Reconciliation has not been subject to an independent audit and accordingly, no opinion is expressed by an auditor on whether the financial information in the GAAP Difference Reconciliation presents a true and fair view or not.
Limited Assurance Engagement and Results
| Deloitte Touche Tohmatsu was engaged by the Company to conduct limited assurance engagement in accordance with Hong Kong Standard on Assurance Engagements 3000 (Revised) "Assurance Engagements Other Than Audits or Reviews of Historical Financial Information" ("HKSAE 3000 (Revised)") issued by the Hong Kong Institute of Certified Public Accountants (the "HKICPA") on the Reconciliation. The limited assurance engagement consisted primarily of: |
| (i) | Comparing the "Amounts as reported under U.S. GAAP" for the six months ended June 30, 2023 in the Reconciliation as set out in the Appendix with the published unaudited financial results of the Group for the six months ended June 30, 2023 prepared in accordance with the U.S. GAAP; |
| (ii) | Evaluating the assessment made by the Directors in identifying the differences between the accounting policies in accordance with the U.S. GAAP and the IFRSs, and the evidence supporting the adjustments and reclassifications made in the Reconciliation in arriving at the "Amounts as reported under IFRSs" in the Reconciliation as set out in the Appendix; and |
-
Limited Assurance Engagement and Results - continued
| (iii) | Checking the arithmetic accuracy of the computation of the Reconciliation as set out in the Appendix. |
The procedures performed by Deloitte Touche Tohmatsu in this limited assurance engagement vary in nature and timing from, and are less in extent than for, a reasonable assurance engagement. Consequently, the level of assurance obtained in a limited assurance engagement is substantially lower than the assurance that would have been obtained had a reasonable assurance engagement been performed. Accordingly, Deloitte Touche Tohmatsu do not express a reasonable assurance opinion.
Based on the procedures performed and evidence obtained, Deloitte Touche Tohmatsu have concluded that nothing has come to their attention that causes them to believe that:
| (i) | The "Amounts as reported under U.S. GAAP" for the six months ended June 30, 2023 in the Reconciliation as set out in the Appendix is not in agreement with the published unaudited financial results of the Group for the six months ended June 30, 2023 prepared in accordance with the U.S. GAAP; |
| (ii) | The adjustments and reclassifications made in the Reconciliation in arriving at the "Amounts as reported under IFRSs" in the Reconciliation as set out in the Appendix, do not reflect, in all material respects, the different accounting treatments according to the Group's accounting policies in accordance with the U.S. GAAP and the IFRSs of the relevant period; and |
| (iii) | The computation of the Reconciliation as set out in the Appendix is not arithmetically accurate. |
-
Appendix – Reconciliation statement
The unaudited condensed consolidated financial statements are prepared in accordance with U.S. GAAP, which differ in certain respects from International Financial Reporting Standards ("IFRSs") issued by the International Accounting Standards Board. The effects of material differences between the financial statements of the Group prepared under U.S. GAAP and IFRSs are as follows:
| Six months ended June 30, 2022 | ||||||||||||||||||||||||
| IFRSs adjustments | ||||||||||||||||||||||||
| Consolidated Statement of Operations | Amounts as reported under U.S. GAAP |
Expected credit Losses, net of tax |
Effective interest rate on loans receivable, net of tax |
Share-based
compensation |
Financial Guarantee, net of tax |
Amounts
as reported under IFRSs |
||||||||||||||||||
| (In thousands of Renminbi (“RMB”)) | ||||||||||||||||||||||||
| (Note i) | (Note ii) | (Note iii) | (Note iv) | |||||||||||||||||||||
| RMB | RMB | RMB | RMB | RMB | RMB | |||||||||||||||||||
| Revenue, net of value-added tax and related surcharges: | ||||||||||||||||||||||||
| Credit driven services | 5,868,397 | — | (14,945 | ) | — | — | 5,853,452 | |||||||||||||||||
| Financing income | 1,608,820 | — | (14,945 | ) | — | — | 1,593,875 | |||||||||||||||||
| Total net revenue | 8,503,246 | — | (14,945 | ) | — | — | 8,488,301 | |||||||||||||||||
| Operating costs and expenses: | ||||||||||||||||||||||||
| Facilitation, origination and servicing | 1,170,561 | — | — | 11,670 | — | 1,182,231 | ||||||||||||||||||
| Sales and marketing | 1,167,657 | — | — | (1,225 | ) | — | 1,166,432 | |||||||||||||||||
| General and administrative | 216,148 | — | — | 2,695 | — | 218,843 | ||||||||||||||||||
| Provision for loans receivable | 907,317 | (20,456 | ) | — | — | — | 886,861 | |||||||||||||||||
| Provision for financial assets receivable | 164,217 | — | — | — | 132,194 | 296,411 | ||||||||||||||||||
| Provision for contingent liabilities | 2,162,638 | (223,702 | ) | — | — | — | 1,938,936 | |||||||||||||||||
| Total operating costs and expenses | 6,133,193 | (244,158 | ) | — | 13,140 | 132,194 | 6,034,369 | |||||||||||||||||
| Income from operations | 2,370,053 | 244,158 | (14,945 | ) | (13,140 | ) | (132,194 | ) | 2,453,932 | |||||||||||||||
| Income before income tax expense | 2,546,045 | 244,158 | (14,945 | ) | (13,140 | ) | (132,194 | ) | 2,629,924 | |||||||||||||||
| Income tax expense | (396,732 | ) | (36,623 | ) | 2,243 | — | 19,830 | (411,282 | ) | |||||||||||||||
| Net income | 2,149,313 | 207,535 | (12,702 | ) | (13,140 | ) | (112,364 | ) | 2,218,642 | |||||||||||||||
| Net income attributable to ordinary shareholders of the Company | 2,159,337 | 207,535 | (12,702 | ) | (13,140 | ) | (112,364 | ) | 2,228,666 | |||||||||||||||
-
Appendix – Reconciliation statement - continued
| Six months ended June 30, 2023 | ||||||||||||||||||||||||
| IFRSs adjustments | ||||||||||||||||||||||||
| Consolidated Statement of Operations | Amounts
as reported under U.S. GAAP |
Expected credit Losses, net of tax |
Effective interest rate on loans receivable, net of tax |
Share-based compensation |
Financial Guarantee, net of tax |
Amounts
as reported under IFRSs |
||||||||||||||||||
| (In thousands of Renminbi (“RMB”)) | ||||||||||||||||||||||||
| (Note i) | (Note ii) | (Note iii) | (Note iv) | |||||||||||||||||||||
| RMB | RMB | RMB | RMB | RMB | RMB | |||||||||||||||||||
| Revenue, net of value-added tax and related surcharges: | ||||||||||||||||||||||||
| Credit driven services | 5,419,328 | — | (253,007 | ) | — | — | 5,166,321 | |||||||||||||||||
| Financing income | 2,254,620 | — | (253,007 | ) | — | — | 2,001,613 | |||||||||||||||||
| Total net revenue | 7,513,498 | — | (253,007 | ) | — | — | 7,260,491 | |||||||||||||||||
| Operating costs and expenses: | ||||||||||||||||||||||||
| Facilitation, origination and servicing | 1,288,330 | — | — | (14,561 | ) | — | 1,273,769 | |||||||||||||||||
| Sales and marketing | 858,663 | — | — | (2,114 | ) | — | 856,549 | |||||||||||||||||
| General and administrative | 217,646 | — | — | (32,662 | ) | — | 184,984 | |||||||||||||||||
| Provision for loans receivable | 1,002,170 | (116,729 | ) | — | — | — | 885,441 | |||||||||||||||||
| Provision for financial assets receivable | 151,017 | — | — | — | 159,778 | 310,795 | ||||||||||||||||||
| Provision for contingent liabilities | 1,437,924 | 87,062 | — | — | — | 1,524,986 | ||||||||||||||||||
| Total operating costs and expenses | 5,324,968 | (29,667 | ) | — | (49,337 | ) | 159,778 | 5,405,742 | ||||||||||||||||
| Income from operations | 2,188,530 | 29,667 | (253,007 | ) | 49,337 | (159,778 | ) | 1,854,749 | ||||||||||||||||
| Income before income tax expense | 2,468,424 | 29,667 | (253,007 | ) | 49,337 | (159,778 | ) | 2,134,643 | ||||||||||||||||
| Income tax expense | (445,225 | ) | (4,450 | ) | 37,952 | — | 23,967 | (387,756 | ) | |||||||||||||||
| Net income | 2,023,199 | 25,217 | (215,055 | ) | 49,337 | (135,811 | ) | 1,746,887 | ||||||||||||||||
| Net income attributable to ordinary shareholders of the Company | 2,031,549 | 25,217 | (215,055 | ) | 49,337 | (135,811 | ) | 1,755,237 | ||||||||||||||||
-
Appendix – Reconciliation statement - continued
| As of December 31, 2022 | ||||||||||||||||||||||||
| IFRSs adjustments | ||||||||||||||||||||||||
| Consolidated Balance Sheet | Amounts
as reported under U.S. GAAP |
Expected
credit losses, net of tax |
Effective
interest rate on loans receivable, net of tax |
Share-based
compensation |
Financial
guarantee, net of tax |
Amounts
as reported under IFRSs |
||||||||||||||||||
| (In thousands of Renminbi (“RMB”)) | ||||||||||||||||||||||||
| (Note i) | (Note ii) | (Note iii) | (Note iv) | |||||||||||||||||||||
| RMB | RMB | RMB | RMB | RMB | RMB | |||||||||||||||||||
| ASSETS | ||||||||||||||||||||||||
| Current assets: | ||||||||||||||||||||||||
| Financial assets receivable, net | 2,982,076 | — | — | — | (2,966,528 | ) | 15,548 | |||||||||||||||||
| Amounts due from related parties | 394,872 | — | — | — | (33,296 | ) | 361,576 | |||||||||||||||||
| Loans receivable, net | 15,347,662 | — | (88,430 | ) | — | — | 15,259,232 | |||||||||||||||||
| Total current assets | 34,097,466 | — | (88,430 | ) | — | (2,999,824 | ) | 31,009,212 | ||||||||||||||||
| Non-current assets: | ||||||||||||||||||||||||
| Financial assets receivable, net-noncurrent | 688,843 | — | — | — | (688,843 | ) | — | |||||||||||||||||
| Amounts due from related parties | 33,236 | — | — | — | (6,720 | ) | 26,516 | |||||||||||||||||
| Loans receivable, net-noncurrent | 3,136,994 | 137,155 | (44,120 | ) | — | — | 3,230,029 | |||||||||||||||||
| Deferred tax assets | 1,019,171 | 72,932 | — | — | (132,927 | ) | 959,176 | |||||||||||||||||
| Total non-current assets | 6,245,704 | 210,087 | (44,120 | ) | — | (828,490 | ) | 5,583,181 | ||||||||||||||||
| TOTAL ASSETS | 40,343,170 | 210,087 | (132,550 | ) | — | (3,828,314 | ) | 36,592,393 | ||||||||||||||||
| LIABILITIES AND EQUITY | ||||||||||||||||||||||||
| LIABILITIES | ||||||||||||||||||||||||
| Current liabilities: | ||||||||||||||||||||||||
| Guarantee liabilities-stand ready | 4,120,346 | — | — | — | (4,120,346 | ) | — | |||||||||||||||||
| Guarantee liabilities-contingent | 3,418,391 | (790,950 | ) | — | — | — | 2,627,441 | |||||||||||||||||
| Other tax payable | 182,398 | — | (7,502 | ) | — | — | 174,896 | |||||||||||||||||
| Total current liabilities | 16,749,918 | (790,950 | ) | (7,502 | ) | — | (4,120,346 | ) | 11,831,120 | |||||||||||||||
| Non-current liabilities: | ||||||||||||||||||||||||
| Deferred tax liabilities | 100,835 | — | (19,744 | ) | — | — | 81,091 | |||||||||||||||||
| Total non-current liabilities | 4,661,955 | — | (19,744 | ) | — | — | 4,642,211 | |||||||||||||||||
| TOTAL LIABILITIES | 21,411,873 | (790,950 | ) | (27,246 | ) | — | (4,120,346 | ) | 16,473,331 | |||||||||||||||
| SHAREHOLDERS' EQUITY | ||||||||||||||||||||||||
| Additional paid-in capital | 6,095,225 | — | — | 71,032 | — | 6,166,257 | ||||||||||||||||||
| Retained earnings | 12,803,684 | 1,001,037 | (105,304 | ) | (71,032 | ) | 292,032 | 13,920,417 | ||||||||||||||||
| TOTAL QIFU TECHNOLOGY INC. EQUITY | 18,847,156 | 1,001,037 | (105,304 | ) | — | 292,032 | 20,034,921 | |||||||||||||||||
| TOTAL EQUITY | 18,931,297 | 1,001,037 | (105,304 | ) | — | 292,032 | 20,119,062 | |||||||||||||||||
| TOTAL LIABILITIES AND EQUITY | 40,343,170 | 210,087 | (132,550 | ) | — | (3,828,314 | ) | 36,592,393 | ||||||||||||||||
-
Appendix – Reconciliation statement - continued
| As of June 30, 2023 | ||||||||||||||||||||||||
| IFRSs adjustments | ||||||||||||||||||||||||
| Consolidated Balance Sheet | Amounts as reported under U.S. GAAP |
Expected credit losses, net of tax |
Effective interest rate on loans receivable, net of tax |
Share-based compensation |
Financial guarantee, net of tax |
Amounts as reported under IFRSs |
||||||||||||||||||
| (In thousands of Renminbi (“RMB”)) | ||||||||||||||||||||||||
| (Note i) | (Note ii) | (Note iii) | (Note iv) | |||||||||||||||||||||
| RMB | RMB | RMB | RMB | RMB | RMB | |||||||||||||||||||
| ASSETS | ||||||||||||||||||||||||
| Current assets: | ||||||||||||||||||||||||
| Financial assets receivable, net | 2,746,010 | — | — | — | (2,697,754 | ) | 48,256 | |||||||||||||||||
| Amounts due from related parties | 187,938 | — | — | — | (40,794 | ) | 147,144 | |||||||||||||||||
| Loans receivable, net | 21,430,147 | — | (341,505 | ) | — | — | 21,088,642 | |||||||||||||||||
| Total current assets | 37,557,761 | — | (341,505 | ) | — | (2,738,548 | ) | 34,477,708 | ||||||||||||||||
| Non-current assets: | ||||||||||||||||||||||||
| Financial assets receivable, net-noncurrent | 522,451 | — | — | — | (522,451 | ) | — | |||||||||||||||||
| Amounts due from related parties | 12,407 | — | — | — | (4,667 | ) | 7,740 | |||||||||||||||||
| Loans receivable, net-noncurrent | 2,881,248 | 253,884 | (59,232 | ) | — | — | 3,075,900 | |||||||||||||||||
| Deferred tax assets | 1,097,504 | 68,481 | — | — | (108,960 | ) | 1,057,025 | |||||||||||||||||
| Total non-current assets | 5,844,352 | 322,365 | (59,232 | ) | — | (636,078 | ) | 5,471,407 | ||||||||||||||||
| TOTAL ASSETS | 43,402,113 | 322,365 | (400,737 | ) | — | (3,374,626 | ) | 39,949,115 | ||||||||||||||||
| LIABILITIES AND EQUITY | ||||||||||||||||||||||||
| LIABILITIES | ||||||||||||||||||||||||
| Current liabilities: | ||||||||||||||||||||||||
| Contract liabilities | — | — | — | — | 320,845 | 320,845 | ||||||||||||||||||
| Guarantee liabilities-stand ready | 3,851,692 | — | — | — | (3,851,692 | ) | — | |||||||||||||||||
| Guarantee liabilities-contingent | 3,306,712 | (703,889 | ) | — | — | — | 2,602,823 | |||||||||||||||||
| Other tax payable | 144,361 | — | (22,682 | ) | — | — | 121,679 | |||||||||||||||||
| Total current liabilities | 16,186,287 | (703,889 | ) | (22,682 | ) | — | (3,530,847 | ) | 11,928,869 | |||||||||||||||
| Non-current liabilities: | ||||||||||||||||||||||||
| Deferred tax liabilities | 122,347 | — | (57,696 | ) | — | — | 64,651 | |||||||||||||||||
| Total non-current liabilities | 6,330,259 | — | (57,696 | ) | — | — | 6,272,563 | |||||||||||||||||
| TOTAL LIABILITIES | 22,516,546 | (703,889 | ) | (80,378 | ) | — | (3,530,847 | ) | 18,201,432 | |||||||||||||||
| SHAREHOLDERS' EQUITY | ||||||||||||||||||||||||
| Additional paid-in capital | 6,194,968 | — | — | 21,695 | — | 6,216,663 | ||||||||||||||||||
| Retained earnings | 14,657,756 | 1,026,254 | (320,359 | ) | (21,695 | ) | 156,221 | 15,498,177 | ||||||||||||||||
| TOTAL QIFU TECHNOLOGY INC. EQUITY | 20,809,775 | 1,026,254 | (320,359 | ) | — | 156,221 | 21,671,891 | |||||||||||||||||
| TOTAL EQUITY | 20,885,567 | 1,026,254 | (320,359 | ) | — | 156,221 | 21,747,683 | |||||||||||||||||
| TOTAL LIABILITIES AND EQUITY | 43,402,113 | 322,365 | (400,737 | ) | — | (3,374,626 | ) | 39,949,115 | ||||||||||||||||
-
Appendix – Reconciliation statement - continued
Notes:
| (i) | Expected credit losses, net of tax |
Under U.S. GAAP, ASC 326 requires recognition of allowances upon origination or acquisition of financial assets at an estimate to reflect expected credit losses over the contractual term of the financial assets (the current expected credit loss or the "CECL" model) and adjusted as of each subsequent reporting period. Under IFRSs, in accordance with IFRS 9, only the portion of lifetime expected credit loss ("ECL") that results from default events that are possible within 12 months after the reporting date is recorded ("stage 1") upon initial recognition. Lifetime expected credit losses are subsequently recorded only if there is a significant increase in the credit risk of the asset ("stage 2"). Once there is objective evidence of impairment ("stage 3"), lifetime ECL continues to be recognized, but interest revenue is calculated on the net carrying amount (that is, amortized cost net of the credit allowance). Accordingly, the reconciliation includes a difference in the credit losses for loans receivable and guarantee liabilities to reflect the difference between IFRS 9 and ASC 326.
| (ii) | Effective interest rate on loans receivable, net of tax |
The Group recognizes revenue fees and interests charged to the borrowers over the lifetime of the loans using the effective interest method under "financing income" in the consolidated statement of operations. Under U.S. GAAP, the effective interest rate is computed on the basis of the contractual cash flows over the contractual term of the loan. Under IFRSs, the effective interest rate is computed on the basis of the estimated cash flows that are expected to be received over the expected life of a loan by considering all of the loan's contractual terms (e.g., prepayment and similar options). Accordingly, the reconciliation includes a difference in financing income and loans receivable as a result.
| (iii) | Share-based compensation |
The Group granted options and restricted shares with service condition only to employees and the share-based compensation expenses were recognized over the vesting period using straight-line method under U.S. GAAP. The Company is allowed to make an accounting policy election to account for awards forfeitures as they occur or by estimating expected forfeitures as compensation cost is recognized. The Company elects to account for forfeitures in the period they occur as a deduction to expense. While under IFRSs, the graded vesting method must be applied and in regard of forfeitures of the awards, the Group is required to estimate the forfeitures. Accordingly, the reconciliation includes an expense recognition difference in the consolidated statements of comprehensive loss of RMB13,140 for the six months ended June 30, 2022, and comprehensive gain of RMB49,337 for the six months ended June 30, 2023, respectively.
| (iv) | Financial guarantee, net of tax |
Under U.S. GAAP, the Group adopted ASC 326, Financial Instruments – Credit Losses, which requires gross accounting for guarantee liability. As a result, at inception of the guarantee, the Group will recognize both a stand-ready guarantee liability under ASC 460 with an associated financial assets receivable, and a contingent guarantee liability with an allowance under CECL model. Subsequent to the initial recognition, the ASC 460 stand-ready guarantee liability is released into guarantee revenue on a straight-line basis over the term of the guarantee, while the contingent guarantee is reduced by the payouts made by the Group to compensate the investors upon borrowers' default. Under IFRSs, according to IFRS 9 and IFRS 15, the Group chose to apply the accounting policy that guarantee premium receivable is accrued and the corresponding revenue recognized on a monthly basis as the service fees are due and collected by installment rather than upfront. After initial recognition, the Group subsequently measure the financial guarantees at the higher of (1) the amount of the loss allowance and (2) the amount initially recognized less, when appropriate, the cumulative amount of income recognized in accordance with the principles of IFRS 15. Accordingly, the reconciliation includes a difference in financial guarantee to reduce the liabilities recorded.
Tax impacts for each difference have been reflected in respective columns.
-