UNITED STATES
SECURITIES AND EXCHANGE COMMISSION
Washington, D.C. 20549
FORM 6-K
REPORT OF FOREIGN PRIVATE ISSUER
PURSUANT TO RULE 13a-16 OR 15d-16 OF
THE SECURITIES EXCHANGE ACT OF 1934
August 1st, 2023
Commission File Number 001-10888
TotalEnergies SE
(Translation of registrant’s name into English)
2, place Jean Millier
La Défense 6
92400 Courbevoie
France
(Address of principal executive offices)
Indicate by check mark whether the registrant files or will file annual reports under cover of Form 20-F or Form 40-F.
Form 20-F x Form 40-F ¨
Indicate by check mark if the registrant is submitting the Form 6-K in paper as permitted by Regulation S-T Rule 101(b)(1): ¨
Note: Regulation S-T Rule 101(b)(1) only permits the submission in paper of a Form 6-K if submitted solely to provide an attached annual report to security holders.
Indicate by check mark if the registrant is submitting the Form 6-K in paper as permitted by Regulation S-T Rule 101(b)(7): ¨
Note: Regulation S-T Rule 101(b)(7) only permits the submission in paper of a Form 6-K if submitted to furnish a report or other document that the registrant foreign private issuer must furnish and make public under the laws of the jurisdiction in which the registrant is incorporated, domiciled or legally organized (the registrant’s “home country”), or under the rules of the home country exchange on which the registrant’s securities are traded, as long as the report or other document is not a press release, is not required to be and has not been distributed to the registrant’s security holders, and, if discussing a material event, has already been the subject of a Form 6-K submission or other Commission filing on EDGAR.
TotalEnergies SE is providing on this Form 6-K a description of certain recent developments relating to its business.
EXHIBIT INDEX
SIGNATURES
Pursuant to the requirements of the Securities Exchange Act of 1934, the registrant has duly caused this report to be signed on its behalf by the undersigned, thereunto duly authorized.
| TotalEnergies SE | |||
| Date: August 1st, 2023 | By: | /s/ GWENOLA JAN | |
| Name: | Gwenola Jan | ||
| Title: | Company Treasurer | ||
Exhibit 99.1

Disclosure of Transactions in Own Shares
Paris, July 3, 2023 – In accordance with the authorization given by the ordinary shareholders’ general meeting on May 26, 2023 to trade on its shares and pursuant to applicable law on share repurchase, TotalEnergies SE (LEI: 529900S21EQ1BO4ESM68) declares the following purchases of its own shares (FR0000120271) on June 26, 2023:
| Transaction Date | Total
daily volume (number of shares) |
Daily
weighted average purchase price of shares (EUR/share) |
Amount
of transactions (EUR) |
Market (MIC Code) |
| 26/06/2023 | 305,853 | 52.343827 | 16,009,516.60 | XPAR |
| 26/06/2023 | 145,000 | 52.337450 | 7,588,930.32 | CEUX |
| 26/06/2023 | 40,000 | 52.341089 | 2,093,643.56 | TQEX |
| 26/06/2023 | 25,000 | 52.314921 | 1,307,873.02 | AQEU |
| Total | 515,853 | 52.340422 | 26,999,963.50 |
Transaction details
In accordance with Article 5(1)(b) of Regulation (EU) No 596/2014 (the Market Abuse Regulation) a full breakdown of the individual trades are disclosed on the TotalEnergies website: https://totalenergies.com/investors/shares-and-dividends/total-shares/info/company-share-transactions
About TotalEnergies
TotalEnergies is a global multi-energy company that produces and markets energies: oil and biofuels, natural gas and green gases, renewables and electricity. Our more than 100,000 employees are committed to energy that is ever more affordable, cleaner, more reliable and accessible to as many people as possible. Active in nearly 130 countries, TotalEnergies puts sustainable development in all its dimensions at the heart of its projects and operations to contribute to the well-being of people.
TotalEnergies Contacts
Media Relations:+33 (0)1 47 44 46 99l presse@totalenergies.com l @TotalEnergiesPR
Investor Relations:+33 (0)1 47 44 46 46 l ir@totalenergies.com
 |
@TotalEnergies |  |
TotalEnergies |  |
TotalEnergies |  |
TotalEnergies |
Cautionary Note
The terms “TotalEnergies”, “TotalEnergies company” or “Company” in this document are used to designate TotalEnergies SE and the consolidated entities that are directly or indirectly controlled by TotalEnergies SE. Likewise, the words “we”, “us” and “our” may also be used to refer to these entities or to their employees. The entities in which TotalEnergies SE directly or indirectly owns a shareholding are separate legal entities. This document may contain forward-looking information and statements that are based on a number of economic data and assumptions made in a given economic, competitive and regulatory environment. They may prove to be inaccurate in the future and are subject to a number of risk factors. Neither TotalEnergies SE nor any of its subsidiaries assumes any obligation to update publicly any forward-looking information or statement, objectives or trends contained in this document whether as a result of new information, future events or otherwise. Information concerning risk factors, that may affect TotalEnergies’ financial results or activities is provided in the most recent Universal Registration Document, the French-language version of which is filed by TotalEnergies SE with the French securities regulator Autorité des Marchés Financiers (AMF), and in the Form 20-F filed with the United States Securities and Exchange Commission (SEC).
Exhibit 99.2
|
PRESS RELEASE |
INEOS and TotalEnergies Further Integrate
their Petrochemical Assets in Eastern France
Paris, July 5, 2023 – TotalEnergies and INEOS have signed agreements to realign their respective stakes in their production assets and logistics infrastructure to better reflect the balance between their production and internal use of ethylene in eastern France. For TotalEnergies, this exchange of interests supports the integration between its petrochemical sites at Feyzin, near Lyon, and Carling in eastern France, while INEOS strengthens its operations at the Lavéra site on the Mediterranean coast.
Realigning the two companies’ interests to improve integration
The companies’ sites that produce and use ethylene in eastern France are connected by a pipelines and storage network that begins at Lavéra in south-eastern France and passes through Feyzin to Carling in the north-east.
However, TotalEnergies does not itself use its share of production from the Lavéra steam cracker, which is equally (50/50) owned with INEOS, and sells it mainly to INEOS.
In order to realign the companies’ production and internal use of ethylene, TotalEnergies will therefore sell its stake in the Lavéra assets to INEOS, in addition to part of its interests in the Eastern France ethylene pipeline and storage network, which TotalEnergies will continue to operate.
TotalEnergies reaffirms the key role of the Feyzin petrochemical platform
Within TotalEnergies, the Company is thus consolidating the key role of the Feyzin petrochemical platform as the integrated supplier of ethylene to the Carling platform.
The agreement will have no operational impact on TotalEnergies’ refining and petrochemical sites.
"This operation allows us to strengthen the links between our Feyzin and Carling petrochemical sites, with Feyzin becoming Carling’s integrated ethylene supplier, in line with our strategy to focus on our integrated platforms," said Jean-Marc Durand, Senior Vice President, TotalEnergies Refining Base Chemicals Europe.
The implementation of this project is subject to the prior consultation process of employee representatives and the approval from the relevant authorities.

***
About TotalEnergies
TotalEnergies is a global multi-energy company that produces and markets energies: oil and biofuels, natural gas and green gases, renewables and electricity. Our more than 100,000 employees are committed to energy that is ever more affordable, cleaner, more reliable and accessible to as many people as possible. Active in nearly 130 countries, TotalEnergies puts sustainable development in all its dimensions at the heart of its projects and operations to contribute to the well-being of people.
TotalEnergies Contacts
Media Relations: +33 (0)1 47 44 46 99 l presse@totalenergies.com l @TotalEnergiesPR
Investor Relations: +33 (0)1 47 44 46 46 l ir@totalenergies.com
|
@TotalEnergies | |
TotalEnergies | |
TotalEnergies | |
TotalEnergies |
Cautionary Note
The terms “TotalEnergies”, “TotalEnergies company” or “Company” in this document are used to designate TotalEnergies SE and the consolidated entities that are directly or indirectly controlled by TotalEnergies SE. Likewise, the words “we”, “us” and “our” may also be used to refer to these entities or to their employees. The entities in which TotalEnergies SE directly or
indirectly owns a shareholding are separate legal entities. This document may contain forward-looking information and statements that are based on a number of economic data and assumptions made in a given economic, competitive and regulatory environment. They may prove to be inaccurate in the future and are subject to a number of risk factors. Neither TotalEnergies SE nor any of its subsidiaries assumes any obligation to update publicly any forward-looking information or statement, objectives or trends contained in this document whether as a result of new information, future events or otherwise. Information concerning risk factors, that may affect TotalEnergies’ financial results or activities is provided in the most recent Universal Registration Document, the French-language version of which is filed by TotalEnergies SE with the French securities regulator Autorité des Marchés Financiers (AMF), and in the Form 20-F filed with the United States Securities and Exchange Commission (SEC).
Exhibit 99.3
 |
COMMUNIQUÉ DE PRESSE |
Algeria: TotalEnergies Strengthens its Gas Partnership
with
Sonatrach and Extends it to Renewables
Algiers, July 10, 2023 - During a meeting held today in Algiers between Patrick Pouyanné, Chairman and CEO of TotalEnergies, and Toufik Hakkar, Chief Executive Officer of Sonatrach, a series of agreements were signed to strengthen the cooperation between the two companies in the production of natural gas, the delivery of liquefied natural gas (LNG) to Europe, and the development of renewables in Algeria.
| 1. | Natural gas: increased production at the Tin Fouyé Tabankort fields |
Under a first agreement, which remains subject to the approval of the Algerian authorities, Sonatrach and TotalEnergies have agreed to convert the production contracts for the Tin Fouyé Tabankort II (TFTII) and Tin Fouyé Tabankort Sud (TFT sud) fields in southern Algeria (Sonatrach 51%, TotalEnergies 49%) to the framework established by the new Algerian Petroleum Law enacted on December 11, 2019. These are the first conversions of contracts in Algeria under the regime of the new Petroleum Law.
In this context, Sonatrach and TotalEnergies will pursue the investment program already launched to increase the gas production of TFTII and TFT South, which includes the upgrade of existing facilities and the drilling of additional wells. The combined production of the two fields is expected to exceed 100,000 boe per day by 2026, versus a level of around 60,000 boe per day in 2022, thus increasing the potential export of Algerian gas to the European market.
| 2. | European energy security: additional LNG deliveries |
Under a second agreement, Sonatrach and TotalEnergies have extended for the year 2024 deliveries of 2 million tons per year of LNG to TotalEnergies at the port of Fos-Cavaou, near Marseille, France. These deliveries of Algerian natural gas by sea contribute directly to energy security in France and Europe.
| 3. | Energy transition: developing renewables in Algeria |
TotalEnergies and Sonatrach have also signed a third deal to examine the development of projects to produce renewable energy in Algeria, specifically:
| · | Renewables projects to solarize exploration and production sites for oil and gas, and to power seawater desalination plants; |
| · | A project to produce renewable, low carbon hydrogen for the export market; |
| · | An R&D program in low carbon energies and the energy transition. |
"I am delighted to sign these new agreements with our strategic partner Sonatrach. They testify to TotalEnergies’ close ties to Algeria, whose resources contribute directly to Europe’s energy supply and security. We are also happy to support Algeria in the energy transition, by examining and developing its huge potential for renewables production," said Patrick Pouyanné, Chairman and CEO of TotalEnergies.
***
|
@TotalEnergies | |
TotalEnergies | |
TotalEnergies | |
TotalEnergies |
About TotalEnergies in Algeria
TotalEnergies is a long-standing player in the Algerian energy sector. Present in the country through its various subsidiaries. The Company is active in oil and gas exploration and production through its interests in the Tin Fouyé Tabankort and Timimoun gas fields, the Berkine Basin oil fields (Blocks 404a and 208) and liquefied natural gas via supply contracts with Sonatrach. In 2022, the Company produced 62 kboe/d (group share) in Algeria through its interests in the TFT II and Timimoun gas fields and in the Berkine Basin oil fields (blocks 404a and 208). Downstream, TotalEnergies Lubrifiants Algérie SPA and
Contacts TotalEnergies
Media Relations: +33 (0)1 47 44 46 99 l presse@totalenergies.com l @TotalEnergiesPR
Investor Relations: +33 (0)1 47 44 46 46 l ir@totalenergies.com
Cautionary Note
The terms “TotalEnergies”, “TotalEnergies company” or “Company” in this document are used to designate TotalEnergies SE and the consolidated entities that are directly or indirectly controlled by TotalEnergies SE. Likewise, the words “we”, “us” and “our” may also be used to refer to these entities or to their employees. The entities in which TotalEnergies SE directly or indirectly owns a shareholding are separate legal entities. This document may contain forward-looking information and statements that are based on a number of economic data and assumptions made in a given economic, competitive and regulatory environment. They may prove to be inaccurate in the future and are subject to a number of risk factors. Neither TotalEnergies SE nor any of its subsidiaries assumes any obligation to update publicly any forward-looking information or statement, objectives or trends contained in this document whether as a result of new information, future events or otherwise. Information concerning risk factors, that may affect TotalEnergies’ financial results or activities is provided in the most recent Universal Registration Document, the French-language version of which is filed by TotalEnergies SE with the French securities regulator Autorité des Marchés Financiers (AMF), and in the Form 20-F filed with the United States Securities and Exchange Commission (SEC).
Exhibit 99.4
 |
PRESS RELEASE |
TotalEnergies Announces Start of Production
in the Absheron Gas Field in Azerbaijan
Paris, July 10, 2023 – TotalEnergies and its partner SOCAR (State Oil Company of the Republic of Azerbaijan) announce the start of production of the first phase of development of the Absheron gas and condensate field in the Caspian Sea, around 100 km south-east of Baku.
This first phase connects a subsea production well to a new gas processing platform, itself linked to SOCAR’s existing facilities in Oil Rocks. It has production capacity of 4 million cubic meters of gas per day and 12,000 barrels a day of condensate. The gas will be sold on the domestic market in Azerbaijan.
The development of the Absheron field provides an additional gas supply to meet growing demand, at a competitive technical cost and low greenhouse gas emissions intensity, in line with TotalEnergies’ strategy.
TotalEnergies and SOCAR both hold a 50% interest in the project, which is operated by the joint company JOCAP (Joint Operating Company of Absheron Petroleum).
"We are very pleased to announce the start-up of the Absheron gas field, the result of our exploration team’s success. This project is in line with the Company's strategy of meeting the growing demand for gas and reinforces our partnership with the national company SOCAR” said Nicolas Terraz, President, Exploration & Production at TotalEnergies.
***
About TotalEnergies in Azerbaijan
TotalEnergies has been present in Azerbaijan since 1996, where it is a 50% partner of SOCAR in the Absheron gas and condensate field and holds a 5% stake in the Baku-Tbilisi-Ceyhan (BTC) pipeline.
About TotalEnergies
TotalEnergies is a global multi-energy company that produces and markets energies: oil and biofuels, natural gas and green gases, renewables and electricity. Our 100,000 employees are committed to energy that is ever more affordable, cleaner, more reliable and accessible to as many people as possible. Active in nearly 130 countries, TotalEnergies puts sustainable development in all its dimensions at the heart of its projects and operations to contribute to the well-being of people.
TotalEnergies Contacts
Media Relations: +33 (0)1 47 44 46 99 l presse@totalenergies.com l @TotalEnergiesPR
Investor Relations: +33 (0)1 47 44 46 46 l ir@totalenergies.com
|
@TotalEnergies | |
TotalEnergies | |
TotalEnergies | |
TotalEnergies |
Cautionary Note
The terms “TotalEnergies”, “TotalEnergies company” or “Company” in this document are used to designate TotalEnergies SE and the consolidated entities that are directly or indirectly controlled by TotalEnergies SE. Likewise, the words “we”, “us” and “our” may also be used to refer to these entities or to their employees. The entities in which TotalEnergies SE directly or indirectly owns a shareholding
are separate legal entities. This document may contain forward-looking information and statements that are based on a number of economic data and assumptions made in a given economic, competitive and regulatory environment. They may prove to be inaccurate in the future and are subject to a number of risk factors. Neither TotalEnergies SE nor any of its subsidiaries assumes any obligation to update publicly any forward-looking information or statement, objectives or trends contained in this document whether as a result of new information, future events or otherwise. Information concerning risk factors, that may affect TotalEnergies’ financial results or activities is provided in the most recent Universal Registration Document, the French-language version of which is filed by TotalEnergies SE with the French securities regulator Autorité des Marchés Financiers (AMF), and in the Form 20-F filed with the United States Securities and Exchange Commission (SEC).
 |
Exhibit 99.5 |
Disclosure of Transactions in Own Shares
Paris, July 10, 2023 – In accordance with the authorization given by the ordinary shareholders’ general meeting on May 26, 2023, to trade on its shares and pursuant to applicable law on share repurchase, TotalEnergies SE (LEI: 529900S21EQ1BO4ESM68) declares the following purchases of its own shares (FR0000120271) from July 3rd to July 7th, 2023:
| Transaction Date | Total
daily volume (number of shares) |
Daily
weighted average purchase price of shares (EUR/share) |
Amount
of transactions (EUR) |
Market (MIC Code) | |
| 03/07/2023 | 351,885 | 53.681874 | 18,889,846.23 | XPAR | |
| 03/07/2023 | 110,000 | 53.640875 | 5,900,496.25 | CEUX | |
| 03/07/2023 | 40,000 | 53.637431 | 2,145,497.24 | TQEX | |
| 03/07/2023 | 38,000 | 53.640129 | 2,038,324.90 | AQEU | |
| 04/07/2023 | 353,306 | 53.750249 | 18,990,285.47 | XPAR | |
| 04/07/2023 | 120,000 | 53.750401 | 6,450,048.12 | CEUX | |
| 04/07/2023 | 32,000 | 53.750803 | 1,720,025.70 | TQEX | |
| 04/07/2023 | 33,943 | 53.749801 | 1,824,429.50 | AQEU | |
| 05/07/2023 | 326,796 | 53.109749 | 17,356,053.53 | XPAR | |
| 05/07/2023 | 150,000 | 53.040557 | 7,956,083.55 | CEUX | |
| 05/07/2023 | 35,000 | 53.082309 | 1,857,880.82 | TQEX | |
| 05/07/2023 | 35,000 | 53.068334 | 1,857,391.69 | AQEU | |
| 06/07/2023 | 312,442 | 51.633656 | 16,132,522.75 | XPAR | |
| 06/07/2023 | 160,000 | 51.540855 | 8,246,536.80 | CEUX | |
| 06/07/2023 | 50,000 | 51.568150 | 2,578,407.50 | TQEX | |
| 06/07/2023 | 39,000 | 51.709570 | 2,016,673.23 | AQEU | |
| 07/07/2023 | 389,832 | 51.013703 | 19,886,773.87 | XPAR | |
| 07/07/2023 | 105,000 | 50.924177 | 5,347,038.59 | CEUX | |
| 07/07/2023 | 39,000 | 50.948173 | 1,986,978.75 | TQEX | |
| 07/07/2023 | 35,000 | 50.931881 | 1,782,615.84 | AQEU | |
| Total | 2,756,204 | 52.595494 | 144,963,910.31 | ||
Transaction details
In accordance with Article 5(1)(b) of Regulation (EU) No 596/2014 (the Market Abuse Regulation) a full breakdown of the individual trades are disclosed on the TotalEnergies website:
https://totalenergies.com/investors/shares-and-dividends/total-shares/info/company-share-transactions
About TotalEnergies
TotalEnergies is a global multi-energy company that produces and markets energies: oil and biofuels, natural gas and green gases, renewables and electricity. Our more than 100,000 employees are committed to energy that is ever more affordable, cleaner, more reliable and accessible to as many people as possible. Active in nearly 130 countries, TotalEnergies puts sustainable development in all its dimensions at the heart of its projects and operations to contribute to the well-being of people.
TotalEnergies Contacts
Media Relations:+33 (0)1 47 44 46 99l presse@totalenergies.com l @TotalEnergiesPR
Investor Relations:+33 (0)1 47 44 46 46 l ir@totalenergies.com
 |
@TotalEnergies |  |
TotalEnergies |  |
TotalEnergies |  |
TotalEnergies |
Cautionary Note
The terms “TotalEnergies”, “TotalEnergies company” or “Company” in this document are used to designate TotalEnergies SE and the consolidated entities that are directly or indirectly controlled by TotalEnergies SE. Likewise, the words “we”, “us” and “our” may also be used to refer to these entities or to their employees. The entities in which TotalEnergies SE directly or indirectly owns a shareholding are separate legal entities. This document may contain forward-looking information and statements that are based on a number of economic data and assumptions made in a given economic, competitive and regulatory environment. They may prove to be inaccurate in the future and are subject to a number of risk factors. Neither TotalEnergies SE nor any of its subsidiaries assumes any obligation to update publicly any forward-looking information or statement, objectives or trends contained in this document whether as a result of new information, future events or otherwise. Information concerning risk factors, that may affect TotalEnergies’ financial results or activities is provided in the most recent Universal Registration Document, the French-language version of which is filed by TotalEnergies SE with the French securities regulator Autorité des Marchés Financiers (AMF), and in the Form 20-F filed with the United States Securities and Exchange Commission (SEC).
Exhibit 99.6
 |
PRESS RELEASE |
TotalEnergies Wins Two Maritime Leases to Develop
two
Giga Offshore Wind Farms in Germany
Paris, July 12, 2023 – TotalEnergies has been awarded by the Bundesnetzagentur (German Federal Network Agency) two marine concessions, N-12.1 and O-2.2, at the end of the auction held in Germany.
Located in the North Sea, 170 kilometers off the coast, concession N-12.1 covers an area of around 200 square kilometers. Located in the Baltic Sea 40 kilometers from the coast, concession O-2.2 has a surface area of around 100 square kilometers.
Green electricity for over 3 million households
The concessions will run for a term of 25 years, extendable to 35 years. With capacities of 2 GW and 1 GW respectively, these two wind farms will provide a volume of electricity equivalent to the consumption of over 3,000,000 homes. Following these awards, TotalEnergies will pay the German Federal government 582 million euros, which will be allocated to the conservation of the marine environment and the promotion of environmentally friendly fishing. An annual contribution will also be paid to the electricity transmission system operators in charge of connecting the projects for 20 years from commissioning of the sites.
The production generated by these sites will be marketed by TotalEnergies, either by selling it directly on the electricity market, or by entering into Power Purchase Agreements (PPAs) with end-buyers, enabling them to reduce their carbon footprint. These projects, which are cost-competitive given the quality of the sites, are in line with the Company's strategy of becoming an integrated player in the electricity markets, taking advantage of price volatility. They will contribute to the Integrated Power Business Unit’s objective of reaching a two-digit profitability.
Commissioning by 2030
These major projects are in line with the German government's objective of deploying 30 GW of offshore wind power in Germany by 2030. The next step for TotalEnergies will be to carry out the studies required to obtain the environmental permits, as well as the technical analyses on these sites, leading to investment decisions in 2027 and commissioning by 2030.
“TotalEnergies is proud to leverage its expertise in offshore and large-scale projects to build these giant wind farms, which will make a significant contribution to the development of renewable electricity in Europe by 2030. Our entry into offshore wind power in Germany, Europe's largest electricity market, is a key step in the implementation of our strategy to become an integrated profitable player in the electricity markets. After the commissioning of a floating LNG regasification unit at the Lubmin terminal in January 2023, this is a further commitment by TotalEnergies to deploy our multi-energy strategy in Germany and contribute to the country's and Europe's energy security.,” said Patrick Pouyanné, chairman and CEO of TotalEnergies.
***
TotalEnergies and offshore wind
TotalEnergies is already developing a portfolio of offshore wind projects with a total capacity of more than 13 GW, the majority of which are bottom-fixed. These projects are located in the United Kingdom (Seagreen project, Outer Dowsing, Erebus, ScotWind), South Korea (Bada project), Taiwan (Yunlin project), France (Eolmed project), the United States (New York Bight project, North Carolina project) and Germany. The Company has also been qualified to participate in competitive tenders in the US, UK and France, and will also participate in tenders in Norway and Poland.
TotalEnergies and renewables electricity
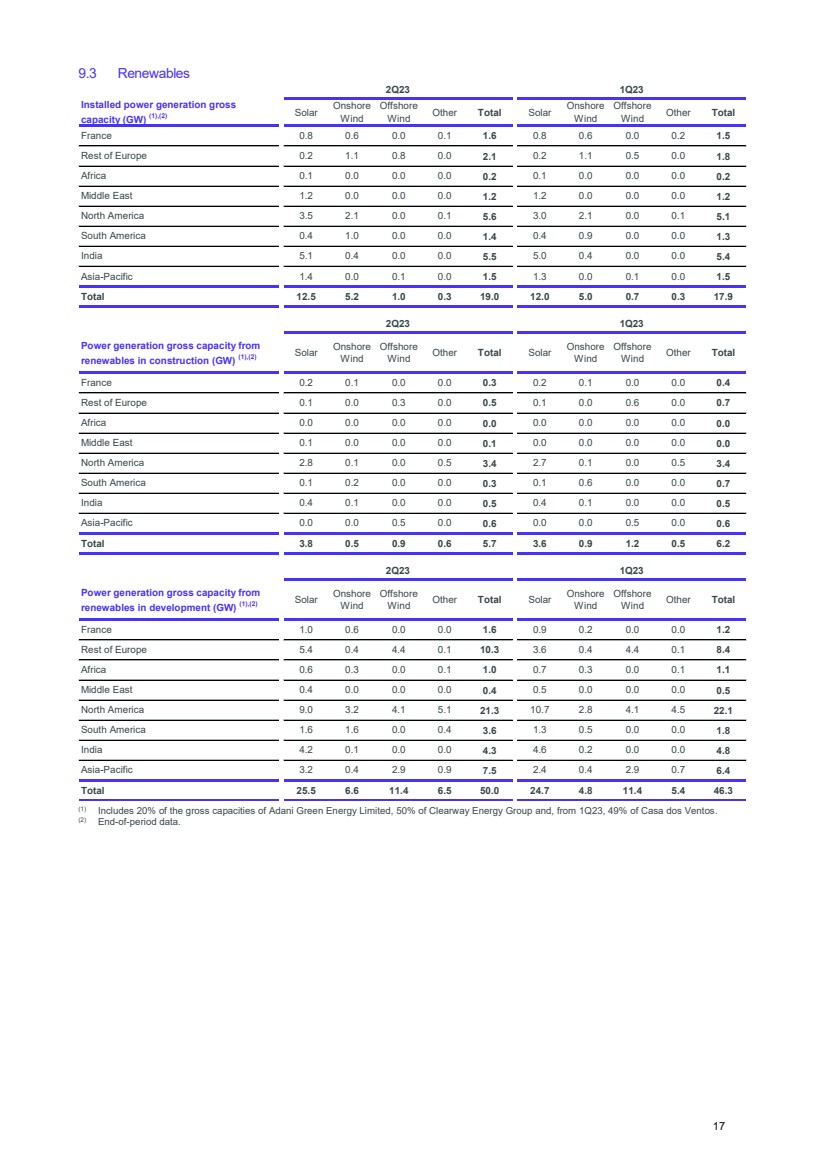
As part of its ambition to get to net zero by 2050, TotalEnergies is building a portfolio of activities in electricity and renewables. By the first half of 2023, TotalEnergies' gross renewable electricity generation installed capacity was 18 GW. TotalEnergies will continue to expand this business to reach 35 GW of gross production capacity from renewable sources and storage by 2025, and then 100 GW by 2030 with the objective of being among the world's top 5 producers of electricity from wind and solar energy.
About TotalEnergies
TotalEnergies is a global multi-energy company that produces and markets energies: oil and biofuels, natural gas and green gases, renewables and electricity. Our more than 100,000 employees are committed to energy that is ever more affordable, cleaner, more reliable and accessible to as many people as possible. Active in nearly 130 countries, TotalEnergies puts sustainable development in all its dimensions at the heart of its projects and operations to contribute to the well-being of people.
TotalEnergies Contacts
Media Relations: +33 (0)1 47 44 46 99 l presse@totalenergies.com l @TotalEnergiesPR
Investor Relations: +33 (0)1 47 44 46 46 l ir@totalenergies.com
Total Eren Contacts
Media Relations: +33 (0)6 18 23 76 99 l presse@total-eren.com
Brunswick: + 33 (0)7 88 72 28 94 l EREN@brunswickgroup.com
 |
@TotalEnergies |  |
TotalEnergies |  |
TotalEnergies |  |
TotalEnergies |
Cautionary Note
The terms “TotalEnergies”, “TotalEnergies company” or “Company” in this document are used to designate TotalEnergies SE and the consolidated entities that are directly or indirectly controlled by TotalEnergies SE. Likewise, the words “we”, “us” and “our” may also be used to refer to these entities or to their employees. The entities in which TotalEnergies SE directly or indirectly owns a shareholding are separate legal entities. This document may contain forward-looking information and statements that are based on a number of economic data and assumptions made in a given economic, competitive and regulatory environment. They may prove to be inaccurate in the future and are subject to a number of risk factors. Neither TotalEnergies SE nor any of its subsidiaries assumes any obligation to update publicly any forward-looking information or statement, objectives or trends contained in this document whether as a result of new information, future events or otherwise. Information concerning risk factors, that may affect TotalEnergies’ financial results or activities is provided in the most recent Universal Registration Document, the French-language version of which is filed by TotalEnergies SE with the French securities regulator Autorité des Marchés Financiers (AMF), and in the Form 20-F filed with the United States Securities and Exchange Commission (SEC).
Exhibit 99.7
|
PRESS RELEASE |
United States: TotalEnergies and its Partners
Make the Final
Investment Decision of the RGLNG Project in Texas
Paris, July 13, 2023 – TotalEnergies, Global Infrastructure Partners (GIP) NextDecade Corporation, and their partners, GIC and Mubadala, made the final investment decision (FID) to develop phase 1 of Rio Grande LNG (RGLNG), a natural gas liquefaction (LNG) project in South Texas.
This first phase comprises 3 liquefaction trains with a total capacity of 17.5 million tons per annum (Mtpa) and CAPEX of $14.8 billion. The Engineering, procurement, and construction (EPC) contract has been awarded to Bechtel, and commissioning of the plant is scheduled for 2027. The project will be financed by equity contributions from the partners and by a debt contribution concluded today with an international banks’ consortium.
As a result of this decision, and according to the terms of the agreement signed in June, TotalEnergies:
| · | acquires a 16.67% stake in the joint-venture in charge of this first phase, and will participate in its equity contributions, for a total amount of $1.1 billion. |
| · | will hold a total 17.5% stake in NextDecade for a total amount of $219 million. A first tranche of 5.06% was acquired last June, and a second tranche will be acquired in the next few days to increase this stake to 12.47% and a third tranche of 5.03 % shall be acquired before the end of the year. |
| · | TotalEnergies will also offtake 5.4 Mtpa of LNG from the production of this phase for 20 years. |
“We are delighted with this final investment decision that enable us to launch the construction of this new LNG liquefaction plant in the Unites States, to which TotalEnergies will contribute its expertise in the development of major LNG projects,” said Patrick Pouyanné, Chairman and CEO of TotalEnergies. “This project gives TotalEnergies access to competitive LNG thanks to its low production costs. LNG from this first phase will boost TotalEnergies U.S. LNG export capacity to over 15 Mtpa by 2030, and thus our ability to contribute to European gas security, and to provide customers in Asia with an alternative form of energy that is half as emissive as coal.”
“Having TotalEnergies as a key partner in the Rio Grande LNG project is an honor. Their long-standing reputation as a leader in the LNG and energy industry makes this a great partnership,” said Matt Schatzman, Chairman and Chief Executive Officer of NextDecade. “Working together with TotalEnergies, we will be able to fulfill our mission to deliver lower carbon-intensive LNG to customers around the globe and we look forward to working together as construction on Phase 1 of Rio Grande LNG begins.”
***
TotalEnergies, the world’s third largest LNG player
TotalEnergies is the world’s third largest LNG player with a market share of around 12% and a global portfolio of about 50 Mt/y thanks to its interests in liquefaction plants in all geographies. The Company benefits from an integrated position across the LNG value chain, including production, transportation, access to more than 20 Mt/y of regasification capacity in Europe, trading, and LNG bunkering. TotalEnergies’ ambition is to increase the share of natural gas in its sales mix to close to 50% by 2030, to reduce carbon emissions and eliminate methane emissions associated with the gas value chain, and to work with local partners to promote the transition from coal to natural gas.
About TotalEnergies
TotalEnergies is a global multi-energy company that produces and markets energies: oil and biofuels, natural gas and green gases, renewables and electricity. Our more than 100,000 employees are committed to energy that is ever more affordable, cleaner, more reliable and accessible to as many people as possible. Active in nearly 130 countries, TotalEnergies puts sustainable development in all its dimensions at the heart of its projects and operations to contribute to the well-being of people.
TotalEnergies Contacts
Media Relations:+33 (0)1 47 44 46 99l presse@totalenergies.com l @TotalEnergiesPR
Investor Relations:+33 (0)1 47 44 46 46 l ir@totalenergies.com
|
@TotalEnergies | |
TotalEnergies | |
TotalEnergies | |
TotalEnergies |
Cautionary Note
The terms “TotalEnergies”, “TotalEnergies company” or “Company” in this document are used to designate TotalEnergies SE and the consolidated entities that are directly or indirectly controlled by TotalEnergies SE. Likewise, the words “we”, “us” and “our” may also be used to refer to these entities or to their employees. The entities in which TotalEnergies SE directly or indirectly owns a shareholding are separate legal entities. This document may contain forward-looking information and statements that are based on a number of economic data and assumptions made in a given economic, competitive and regulatory environment. They may prove to be inaccurate in the future and are subject to a number of risk factors. Neither TotalEnergies SE nor any of its subsidiaries assumes any obligation to update publicly any forward-looking information or statement, objectives or trends contained in this document whether as a result of new information, future events or otherwise. Information concerning risk factors, that may affect TotalEnergies’ financial results or activities is provided in the most recent Universal Registration Document, the French-language version of which is filed by TotalEnergies SE with the French securities regulator Autorité des Marchés Financiers (AMF), and in the Form 20-F filed with the United States Securities and Exchange Commission (SEC).
Exhibit 99.8

PRESS RELEASE
TotalEnergies, Aramco and SABIC complete MENA
region’s
first processing of oil from plastic waste at scale to make
certified circular polymers
Dhahran, Saudi Arabia, July 17th, 2023 – TotalEnergies, Aramco and SABIC have for the first time in the Middle East and North Africa successfully converted oil derived from plastic waste into ISCC+ certified circular polymers. The plastic pyrolysis oil, also called plastic waste derived oil (PDO), was processed at the SATORP refinery jointly owned by Aramco and TotalEnergies, in Jubail, Saudi Arabia. It was then used as a feedstock by Petrokemya, a SABIC affiliate, to produce certified circular polymers.
The project aims to pave the way for the creation of a domestic value chain for the advanced recycling of plastics to circular polymers in the Kingdom of Saudi Arabia. The process allows the use of non-sorted plastics, which can be difficult to recycle mechanically, and consequently contributes to solving the challenge of end-of-life plastics.
A first milestone for the project was obtaining ISCC+ certification to assure transparency and traceability of the recycled origin of feedstock and products. Three industrial plants were involved in the process: SATORP refinery, Aramco’s Ju'aymah NGL Fractionation Plant and Petrokemya. All successfully obtained the ISCC+ certification, enabling the production of circular materials.
Mohammed Y. Al Qahtani, Aramco’s President of Downstream, said: “This achievement illustrates the importance of the petrochemical sector in creating more sustainable products and solutions. Our aim is to create circular solutions for plastic waste, while also making progress on our ambition to achieve net-zero Scope 1 and Scope 2 greenhouse gas emissions across our wholly-owned operated assets by 2050. By leveraging spare capacity of existing infrastructure, we aim to produce circular products that could be scaled up at low cost. Aramco is considering multiple ways of tapping into new technologies and leveraging existing assets to support the deployment of circular, more sustainable and lower-carbon products.”
Bernard Pinatel, President, Refining & Chemicals, TotalEnergies, said: “This advanced plastic recycling initiative reflects TotalEnergies’ ambition to concretely contribute to addressing the challenge of end-of-life of plastics. Several other circular economy projects are being studied, leveraging the partners’ technical expertise and experience to further contribute to plastics recycling. It is a major pathway towards TotalEnergies’ target to produce 30% of recycled plastics by 2030, and its strategy to build a multi-energy company with the ambition to get to net zero by 2050, together with society.”
Sami Al-Osaimi, SABIC EVP Petrochemicals (A), said: “SABIC is a national champion in chemicals that supports Saudi Vision 2030, ensuring sustainable future growth by focusing on environment, energy and climate. This project is aligned with SABIC’s commitment to avoid landfill and incineration through its innovation competencies and advanced technology. This project shows collaboration across the petrochemical value chain to overcome upstream and downstream challenges in circular plastics. To this end, SABIC recently announced its target of one million metric tons of TRUCIRCLE TM solutions by 2030, which intends to help provide our customers with more sustainable solutions.”
SABIC and TotalEnergies are founding members of the non-profit organization Alliance to End Plastic Waste (AEPW), which aims to bring collective knowledge, resources and experience to address current waste management challenges.
***
About TotalEnergies
TotalEnergies is a global multi-energy company that produces and markets energies: oil and biofuels, natural gas and green gases, renewables and electricity. Our more than 100,000 employees are committed to energy that is ever more affordable, cleaner, more reliable and accessible to as many people as possible. Active in close to 130 countries, TotalEnergies puts sustainable development in all its dimensions at the heart of its projects and operations to contribute to the well-being of people.
About Aramco:
Aramco is a global integrated energy and chemicals company. We are driven by the core belief that energy is opportunity. From producing approximately one in every eight barrels of the world’s oil supply to developing new energy technologies, our global team is dedicated to creating impact in all that we do. We focus on making our resources more dependable, more sustainable and more useful. This helps promote stability and long-term growth around the world. www.aramco.com
About SABIC:
SABIC is a global diversified chemicals company, headquartered in Riyadh, Saudi Arabia. It manufactures on a global scale in the Americas, Europe, Middle East and Asia Pacific, making distinctly different kinds of products: chemicals, commodity and high performance plastics, agri-nutrients and metals. SABIC supports its customers by identifying and developing opportunities in key end-use applications such as construction, medical devices, packaging, agri-nutrients, electrical and electronics, transportation and clean energy.
|
@TotalEnergies | |
TotalEnergies | |
TotalEnergies | |
TotalEnergies |
TotalEnergies Contacts
Media Relations: +33 (0)1 47 44 46 99 l presse@totalenergies.com l @TotalEnergiesPR
Investor Relations: +33 (0)1 47 44 46 46 l ir@totalenergies.com
Contact Aramco
|
|
International Media Relations: international.media@aramco.com
@Aramco
Cautionary Note |
The terms “TotalEnergies”, “TotalEnergies company” or “Company” in this document are used to designate TotalEnergies SE and the consolidated entities that are directly or indirectly controlled by TotalEnergies SE. Likewise, the words “we”, “us” and “our” may also be used to refer to these entities or to their employees. The entities in which TotalEnergies SE directly or indirectly owns a shareholding are separate legal entities. This document may contain forward-looking information and statements that are based on a number of economic data and assumptions made in a given economic, competitive and regulatory environment. They may prove to be inaccurate in the future and are subject to a number of risk factors. Neither TotalEnergies SE nor any of its subsidiaries assumes any obligation to update publicly any forward-looking information or statement, objectives or trends contained in this document whether as a result of new information, future events or otherwise. Information concerning risk factors, that may affect TotalEnergies’ financial results or activities is provided in the most recent Registration Document, the French-language version of which is filed by TotalEnergies SE with the French securities regulator Autorité des Marchés Financiers (AMF), and in the Form 20-F filed with the United States Securities and Exchange Commission (SEC).
Exhibit 99.9
Disclosure of Transactions in Own Shares
Paris, July 17, 2023 – In accordance with the authorization given by the ordinary shareholders’ general meeting on May 26, 2023, to trade on its shares and pursuant to applicable law on share repurchase, TotalEnergies SE (LEI: 529900S21EQ1BO4ESM68) declares the following purchases of its own shares (FR0000120271) from July 10 to 14, 2023:
| Transaction Date | Total
daily volume (number of shares) |
Daily
weighted average purchase price of shares (EUR/share) |
Amount
of transactions (EUR) |
Market (MIC Code) | |
| 10/07/2023 | 350,717 | 51.613755 | 18,101,821.31 | XPAR | |
| 10/07/2023 | 149,153 | 51.497746 | 7,681,043.31 | CEUX | |
| 10/07/2023 | 40,000 | 51.509070 | 2,060,362.80 | TQEX | |
| 10/07/2023 | 19,000 | 51.589325 | 980,197.18 | AQEU | |
| 11/07/2023 | 354,898 | 51.785816 | 18,378,682.53 | XPAR | |
| 11/07/2023 | 155,000 | 51.794360 | 8,028,125.80 | CEUX | |
| 11/07/2023 | 20,000 | 51.753848 | 1,035,076.96 | TQEX | |
| 11/07/2023 | 25,000 | 51.798748 | 1,294,968.70 | AQEU | |
| 12/07/2023 | 344,763 | 52.581227 | 18,128,061.56 | XPAR | |
| 12/07/2023 | 150,000 | 52.617852 | 7,892,677.80 | CEUX | |
| 12/07/2023 | 25,000 | 52.598370 | 1,314,959.25 | TQEX | |
| 12/07/2023 | 25,000 | 52.604040 | 1,315,101.00 | AQEU | |
| 13/07/2023 | 324,252 | 52.861901 | 17,140,577.12 | XPAR | |
| 13/07/2023 | 150,000 | 52.860158 | 7,929,023.70 | CEUX | |
| 13/07/2023 | 30,000 | 52.853064 | 1,585,591.92 | TQEX | |
| 13/07/2023 | 30,000 | 52.855283 | 1,585,658.49 | AQEU | |
| 14/07/2023 | 382,130 | 51.914628 | 19,838,136.80 | XPAR | |
| 14/07/2023 | 100,000 | 51.925952 | 5,192,595.20 | CEUX | |
| 14/07/2023 | 30,000 | 51.931321 | 1,557,939.63 | TQEX | |
| 14/07/2023 | 30,000 | 51.800704 | 1,554,021.12 | AQEU | |
| Total | 2,734,913 | 52.138632 | 142,594,622.18 | ||
Transaction details
In accordance with Article 5(1)(b) of Regulation (EU) No 596/2014 (the Market Abuse Regulation) a full breakdown of the individual trades are disclosed on the TotalEnergies website:
https://totalenergies.com/investors/shares-and-dividends/total-shares/info/company-share-transactions
About TotalEnergies
TotalEnergies is a global multi-energy company that produces and markets energies: oil and biofuels, natural gas and green gases, renewables and electricity. Our more than 100,000 employees are committed to energy that is ever more affordable, cleaner, more reliable and accessible to as many people as possible. Active in nearly 130 countries, TotalEnergies puts sustainable development in all its dimensions at the heart of its projects and operations to contribute to the well-being of people.
TotalEnergies Contacts
Media Relations:+33 (0)1 47 44 46 99l presse@totalenergies.com l @TotalEnergiesPR
Investor Relations:+33 (0)1 47 44 46 46 l ir@totalenergies.com
|
@TotalEnergies | |
TotalEnergies | |
TotalEnergies | |
TotalEnergies |
Cautionary Note
The terms “TotalEnergies”, “TotalEnergies company” or “Company” in this document are used to designate TotalEnergies SE and the consolidated entities that are directly or indirectly controlled by TotalEnergies SE. Likewise, the words “we”, “us” and “our” may also be used to refer to these entities or to their employees. The entities in which TotalEnergies SE directly or indirectly owns a shareholding are separate legal entities. This document may contain forward-looking information and statements that are based on a number of economic data and assumptions made in a given economic, competitive and regulatory environment. They may prove to be inaccurate in the future and are subject to a number of risk factors. Neither TotalEnergies SE nor any of its subsidiaries assumes any obligation to update publicly any forward-looking information or statement, objectives or trends contained in this document whether as a result of new information, future events or otherwise. Information concerning risk factors, that may affect TotalEnergies’ financial results or activities is provided in the most recent Universal Registration Document, the French-language version of which is filed by TotalEnergies SE with the French securities regulator Autorité des Marchés Financiers (AMF), and in the Form 20-F filed with the United States Securities and Exchange Commission (SEC).
Exhibit 99.10
|
 |
PRESS RELEASE
Turkey: TotalEnergies partners with Rönesans
Holding to
develop renewable energy in the country
Paris, July 24, 2023 – TotalEnergies has signed an agreement with Rönesans Holding to acquire a 50% stake in Rönesans Enerji and jointly develop, through this joint-venture, renewable projects in Turkey, which is a liberalized growing electricity market.
Rönesans Enerji is currently operating a portfolio of 166 MW hydro assets. The company has as well secured a pipeline of more than 700 MW of wind, photovoltaic, and battery storage assets.
Leveraging TotalEnergies knowhow in onshore wind and solar development and in electricity trading and Rönesans deep knowledge of the local electricity market, Rönesans Enerji’s ambition is to produce 2 GW of renewable energy by 2028.
The production generated by these sites will be marketed, notably by selling it directly on the electricity market or by entering into power purchase agreements (PPAs) with end-buyers. These projects, which are cost-competitive given the quality of Turkey's renewable potential, are in line with the Company's strategy of becoming an integrated player in the electricity markets, taking advantage of price volatility, and will contribute to achieving the Integrated Power Business Unit's double-digit profitability targets.
“We are delighted to join forces with Rönesans, which has developed a diversified portfolio of assets including wind, hydro and solar power. Given the outlook for the Turkish market and the quality of the renewable sites in the country, we are convinced that this new partnership will be a further step towards our goal of developing our Integrated Power activity profitably. I'm delighted that it will also help boost Turkey's renewable energy sector”, said Stéphane Michel, President Gas, Renewables & Power for TotalEnergies.
“We deeply value investments in renewable energy both in Turkey and worldwide. With a goal of playing an active part in Turkey’s green energy transition, it was crucial that we work with a reputable and impactful global player. We’re excited to collaborate with TotalEnergies to jointly invest in green projects. While adding a new partner to our global shareholders, we are always excited to invest in our country”, said Erman Ilicak, Rönesans Holding’s President.
The transaction is subject to regulatory and administrative approvals.

***
TotalEnergies and renewables electricity
As part of its ambition to get to net zero by 2050, TotalEnergies is building a profitable portfolio of activities in electricity and renewables. At the end of March 2023, TotalEnergies' gross renewable electricity generation installed capacity was 18 GW. TotalEnergies will continue to expand this business to reach 35 GW of gross production capacity from renewable sources and storage by 2025, and then 100 GW by 2030 with the objective of being among the world's top 5 producers of electricity from wind and solar energy.
About TotalEnergies
TotalEnergies is a global multi-energy company that produces and markets energies: oil and biofuels, natural gas and green gases, renewables and electricity. Our more than 100,000 employees are committed to energy that is ever more affordable, cleaner, more reliable and accessible to as many people as possible. Active in nearly 130 countries, TotalEnergies puts sustainable development in all its dimensions at the heart of its projects and operations to contribute to the well-being of people.
TotalEnergies Contacts
Media Relations: +33 (0)1 47 44 46 99 l presse@totalenergies.com l @TotalEnergiesPR
Investor Relations: +33 (0)1 47 44 46 46 l ir@totalenergies.com
|
@TotalEnergies | |
TotalEnergies | |
TotalEnergies | |
TotalEnergies |
About
Rönesans Holding
Rönesans Holding, headquartered in Ankara, is the 24th largest international contracting company globally and the 8th in Europe* with international operation in 30 countries across Europe, Central Asia, the Middle East and Africa - including Ballast Nedam in the Netherlands and Heitkamp in Germany, Rönesans has been operating as the main contractor and investor successfully for 30 years across construction, real estate development, energy, healthcare and industrial facilities. Putting resilience and growth through innovation at the core of the company, with a priority on sustainability and social development, Rönesans has developed projects supporting students with scholarships, academic platforms and initiatives; been a signatory of the UN Global Compact since 2015; and a signatory of the UN Women’s Empowerment Principles since 2016.
Along with its partners IFC, GIC, Meridiam Infrastructure, Sojitz, Samsung [and Total Energies], Rönesans has invested more than EUR7 billion into pioneering projects in Türkiye. *According to Engineering News Record 2022, World’s Top 250 International Contractors.
Cautionary Note
The terms “TotalEnergies”, “TotalEnergies company” or “Company” in this document are used to designate TotalEnergies SE and the consolidated entities that are directly or indirectly controlled by TotalEnergies SE. Likewise, the words “we”, “us” and “our” may also be used to refer to these entities or to their employees. The entities in which TotalEnergies SE directly or indirectly owns a shareholding are separate legal entities. This document may contain forward-looking information and statements that are based on a number of economic data and assumptions made in a given economic, competitive and regulatory environment. They may prove to be inaccurate in the future and are subject to a number of risk factors. Neither TotalEnergies SE nor any of its subsidiaries assumes any obligation to update publicly any forward-looking information or statement, objectives or trends contained in this document whether as a result of new information, future events or otherwise. Information concerning risk factors, that may affect TotalEnergies’ financial results or activities is provided in the most recent Universal Registration Document, the French-language version of which is filed by TotalEnergies SE with the French securities regulator Autorité des Marchés Financiers (AMF), and in the Form 20-F filed with the United States Securities and Exchange Commission (SEC).
Exhibit 99.11
|
PRESS RELEASE |
Electricity: TotalEnergies Fully Acquires Total
Eren After a
Successful Strategic Alliance of Five Years
Paris, July 25, 2023 – TotalEnergies is pursuing its profitable growth in the renewable energy sector with today’s announcement that it is buying out Total Eren’s other shareholders, increasing its stake from close to 30% to 100%. The Total Eren teams will be fully integrated within TotalEnergies’ Renewables business unit. The deal follows the strategic agreement signed between TotalEnergies and Total Eren in 2017, which granted TotalEnergies the right to acquire all of Total Eren (formerly EREN RE) after a five-year period.
As part of this transaction, Total Eren is valued at an Enterprise Value of €3.8 billion based on an attractive EBITDA multiple negotiated in the initial strategic agreement signed in 2017. The acquisition of 70,8%1 represents a net investment of around €1.5 billion for TotalEnergies.
Total Eren’s integration should result in an increase in TotalEnergies’ Integrated Power Net Operating Income of around €160 million and CFFO of around €400 million in 2024.
A global player with a 3.5 GW renewables production and a 10 GW pipeline
Total Eren has 3.5 GW of renewable capacity in operation worldwide and a solar, wind, hydroelectric and storage projects pipeline of over 10 GW in 30 countries, of which 1.2 GW are in construction or late-stage development. TotalEnergies will leverage Total Eren’s 2 GW assets in operation in merchant countries (notably Portugal, Greece, Australia, and Brazil) to build up its integrated power strategy. TotalEnergies will also benefit from Total Eren’s footprint and ability to develop projects in other countries such as India, Argentina, Kazakhstan, or Uzbekistan.
A complementary fit with TotalEnergies’ footprint and workforce
Total Eren will not only contribute high-quality operated assets, but also the expertise and skills of nearly 500 people based in more than 20 countries. Total Eren’s successful organic growth testifies to the expertise that its teams have built up internally and in connection with partners and suppliers since its creation in 2012. The teams and the quality of Total Eren’s portfolio will strengthen TotalEnergies’ ability to deliver production growth while optimizing its operating costs and capex by leveraging its size and purchasing bargaining power.
A pioneer in green hydrogen
Further to its activities as a renewable energy producer, Total Eren has launched pioneering green hydrogen projects in recent years, located in various regions, such as North Africa, Latin America, and Australia. These green hydrogen activities will be pursued through a new partnership in an entity named "TEH2” (80% owned by TotalEnergies and 20% owned by EREN Group).
“Our partnership with Total Eren has been very successful, as shown by the size and quality of the renewables portfolio. With the acquisition and integration of Total Eren. we are now opening a new chapter of our development as the expertise of its team and its complementary

1 On a fully-diluted basis
geographical footprint will strengthen our renewable activities and our ability to build a profitable integrated power player,” said Patrick Pouyanné, Chairman & CEO of TotalEnergies. “I want to thank Total Eren’s founders, Pâris Mouratoglou and David Corchia, as well as their teams, for their incredible development work, which led to this successful achievement. Today, we are welcoming Total Eren’s experienced teams, who will continue their remarkable work with the added resources of a bigger company.”
Pâris Mouratoglou, Chairmanof Total Eren, stated: “With Total Eren, we have successfully created a best-in-class renewable energy player. I want to thank BPI France, Tikehau Capital, NextWorld and Peugeot Invest, for their constant support since 2015. I also want to thank Patrick Pouyanné for his trust and for the spirit of partnership that has led to such achievements with TotalEnergies over the last five years.”
David Corchia, CEO of Total Eren, added: “This success belongs first to Total Eren’s teams around the globe. They will undoubtedly make a huge contribution to TotalEnergies’ highly ambitious plan in the renewable sector. Together with Pâris Mouratoglou, we will continue creating and developing new companies for the energy transition and the planet’s decarbonization, as well as, within our new promising partnership with TotalEnergies, the development of giant green hydrogen production projects worldwide.”
***
TotalEnergies and renewables electricity
As part of its ambition to get to net zero by 2050, TotalEnergies is building a portfolio of activities in electricity and renewables. At the end of March 2023, TotalEnergies' gross renewable electricity generation installed capacity was 18 GW. TotalEnergies will continue to expand this business to reach 35 GW of gross production capacity from renewable sources and storage by 2025, and then 100 GW by 2030 with the objective of being among the world's top 5 producers of electricity from wind and solar energy.
About TotalEnergies
TotalEnergies is a global multi-energy company that produces and markets energies: oil and biofuels, natural gas and green gases, renewables and electricity. Our more than 100,000 employees are committed to energy that is ever more affordable, cleaner, more reliable and accessible to as many people as possible. Active in nearly 130 countries, TotalEnergies puts sustainable development in all its dimensions at the heart of its projects and operations to contribute to the well-being of people.
TotalEnergies Contacts
Media Relations: +33 (0)1 47 44 46 99 l presse@totalenergies.com l @TotalEnergiesPR
Investor Relations: +33 (0)1 47 44 46 46 l ir@totalenergies.com
|
@TotalEnergies | |
TotalEnergies | |
TotalEnergies | |
TotalEnergies |
Cautionary Note
The terms “TotalEnergies”, “TotalEnergies company” or “Company” in this document are used to designate TotalEnergies SE and the consolidated entities that are directly or indirectly controlled by TotalEnergies SE. Likewise, the words “we”, “us” and “our” may also be used to refer to these entities or to their employees. The entities in which TotalEnergies SE directly or indirectly owns a shareholding are separate legal entities. This document may contain forward-looking information and statements that are based on a number of economic data and assumptions made in a given economic, competitive and regulatory environment. They may prove to be inaccurate in the future and are subject to a number of risk factors. Neither TotalEnergies SE nor any of its subsidiaries assumes any obligation to update publicly any forward-looking information or statement, objectives or trends contained in this document whether as a result of new information, future events or otherwise. Information concerning risk factors, that may affect TotalEnergies’ financial results or activities is provided in the most recent Universal Registration Document, the French-language version of which is filed by TotalEnergies SE with the French securities regulator Autorité des Marchés Financiers (AMF), and in the Form 20-F filed with the United States Securities and Exchange Commission (SEC).
|
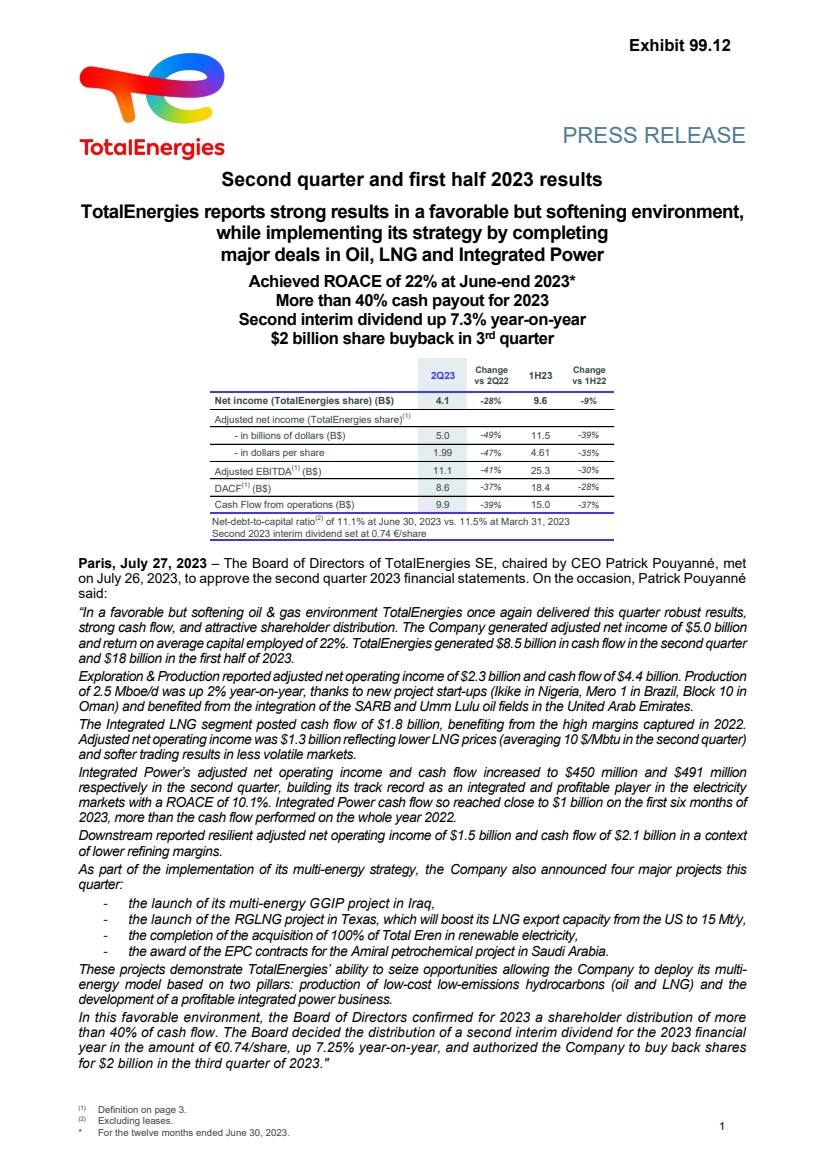
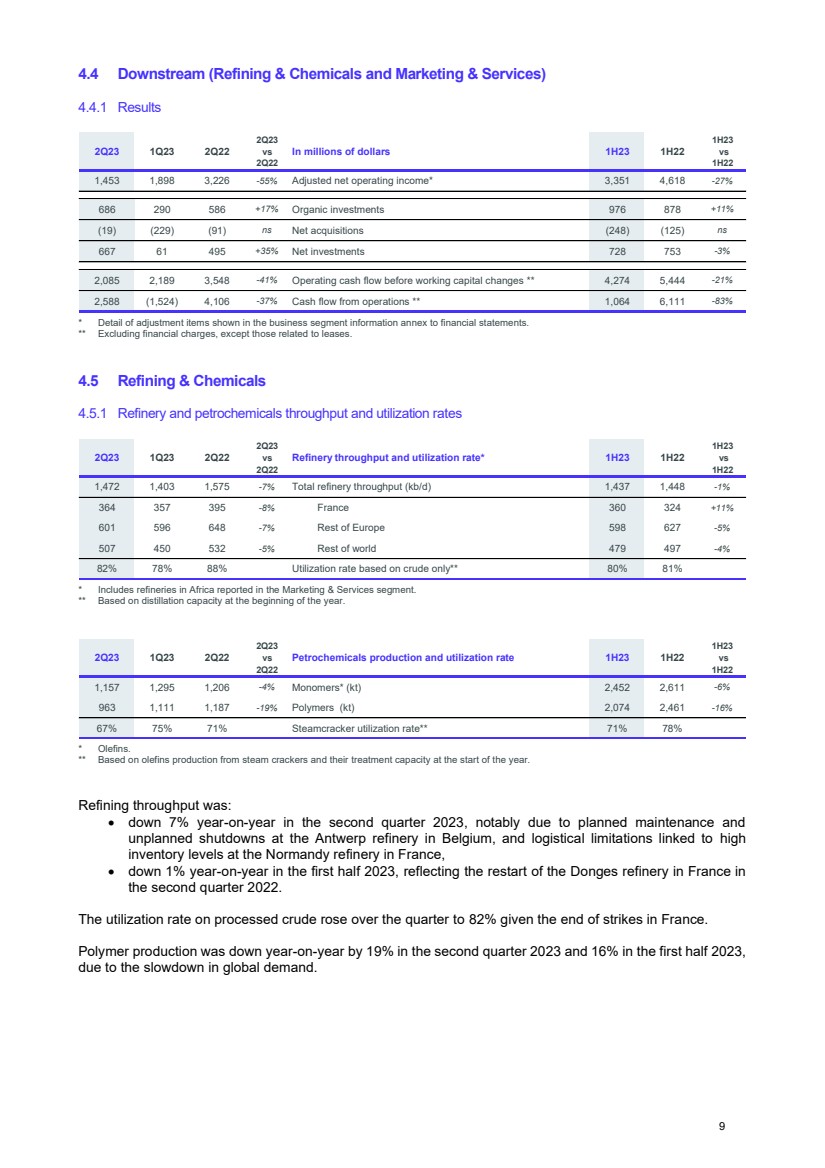
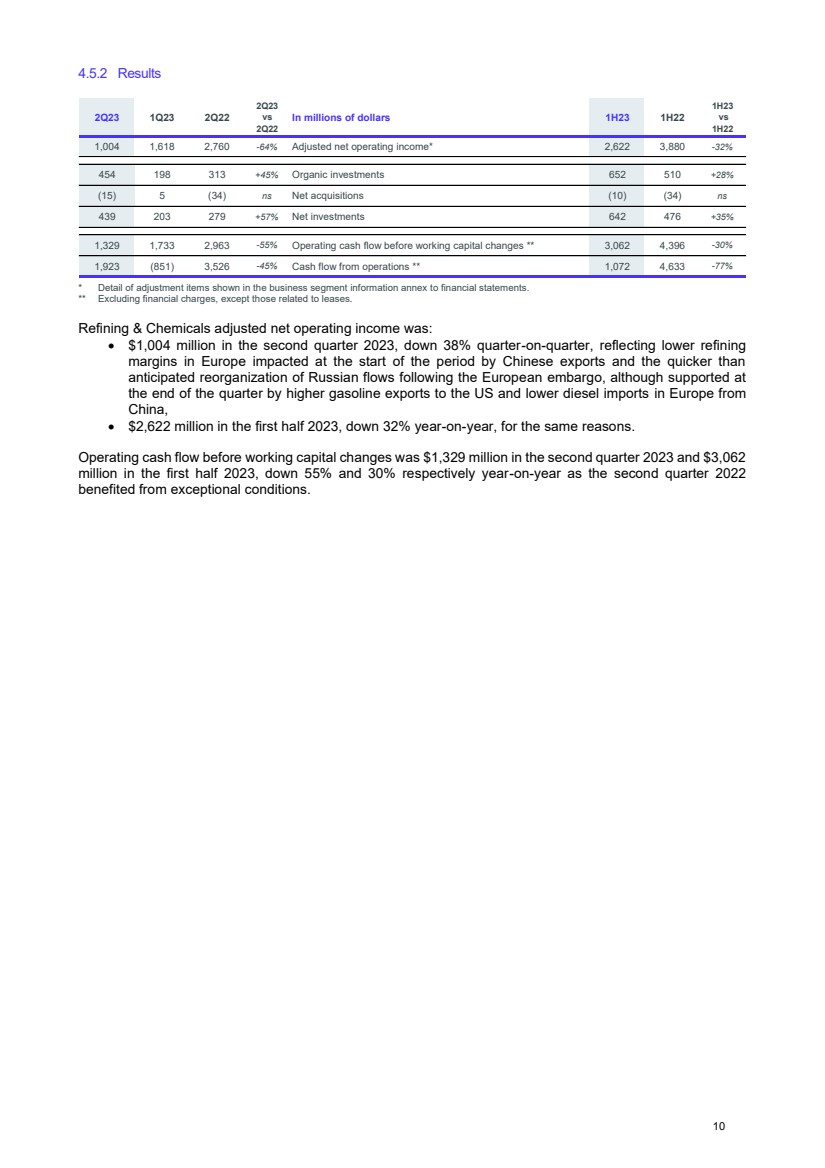
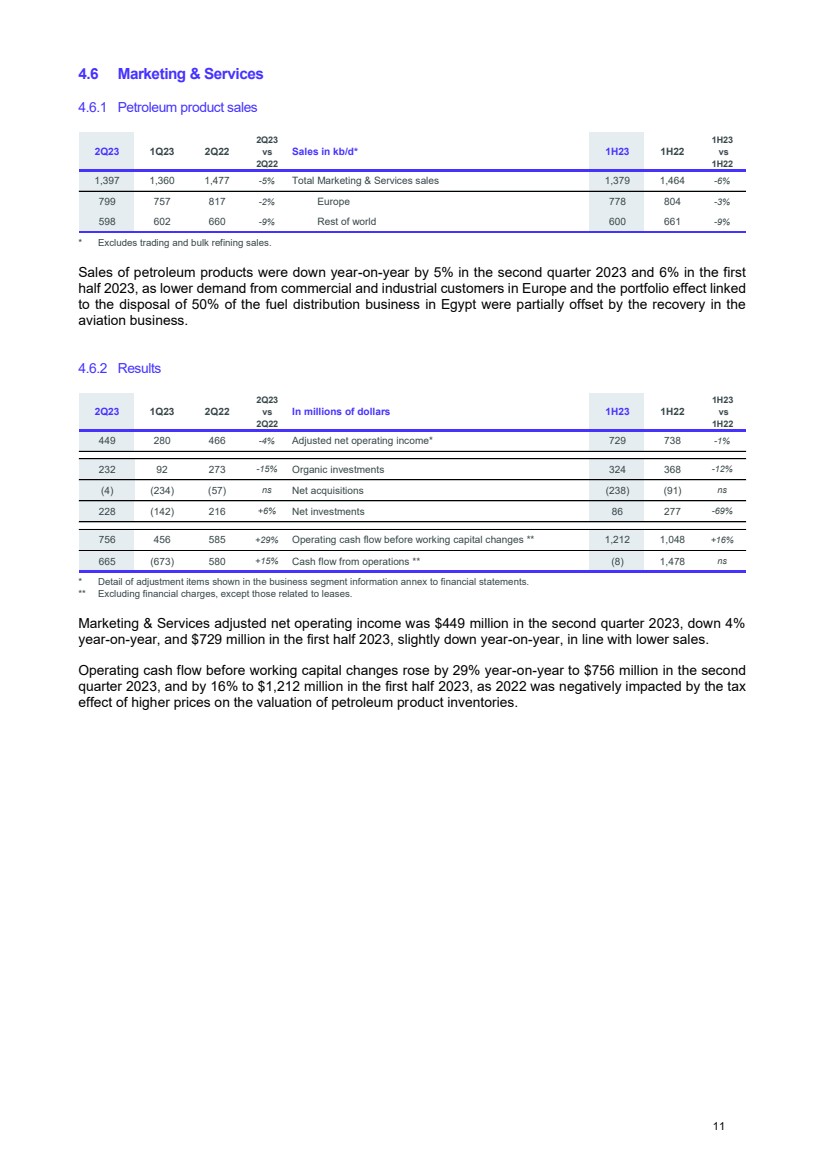
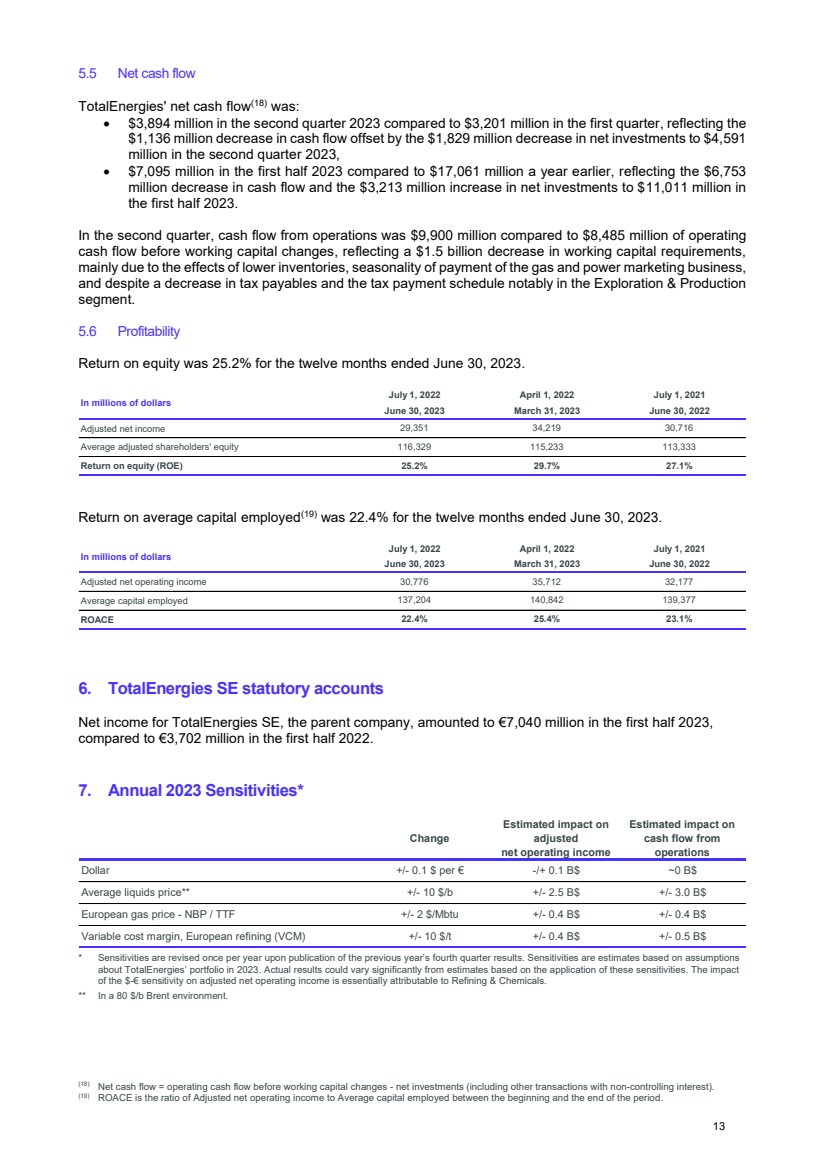
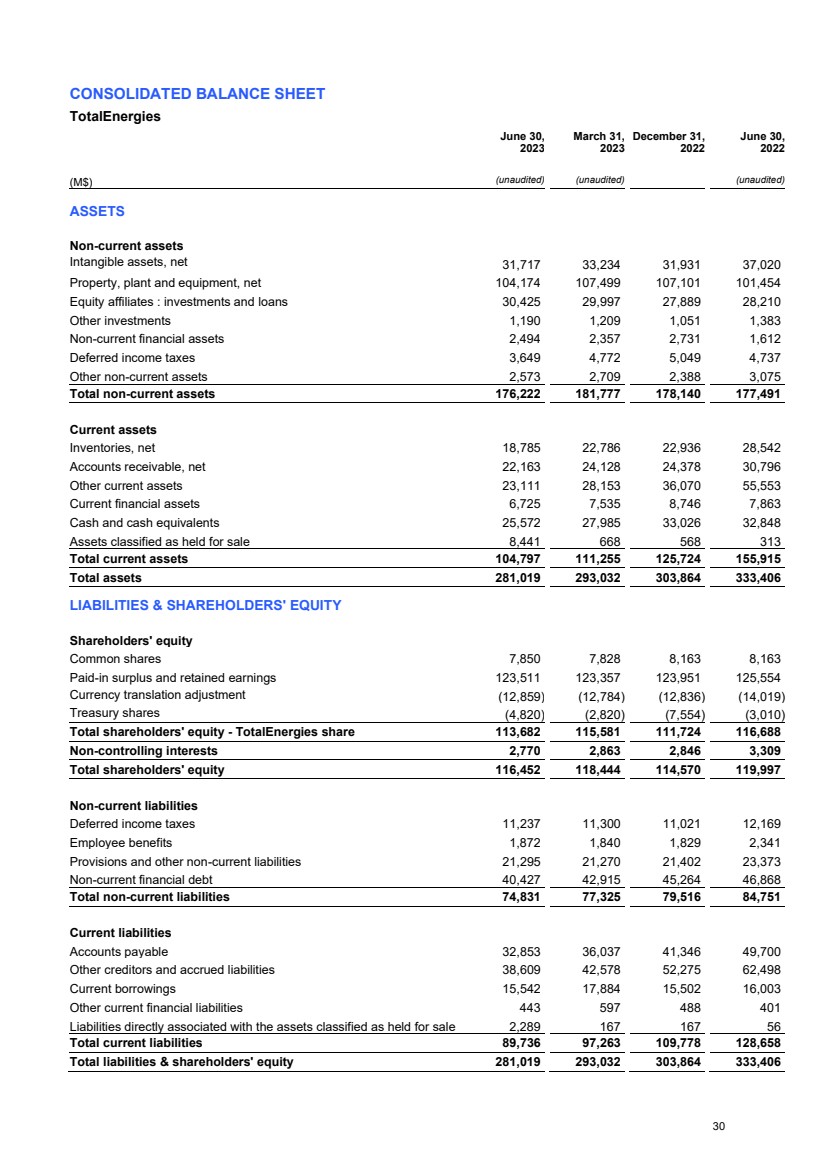
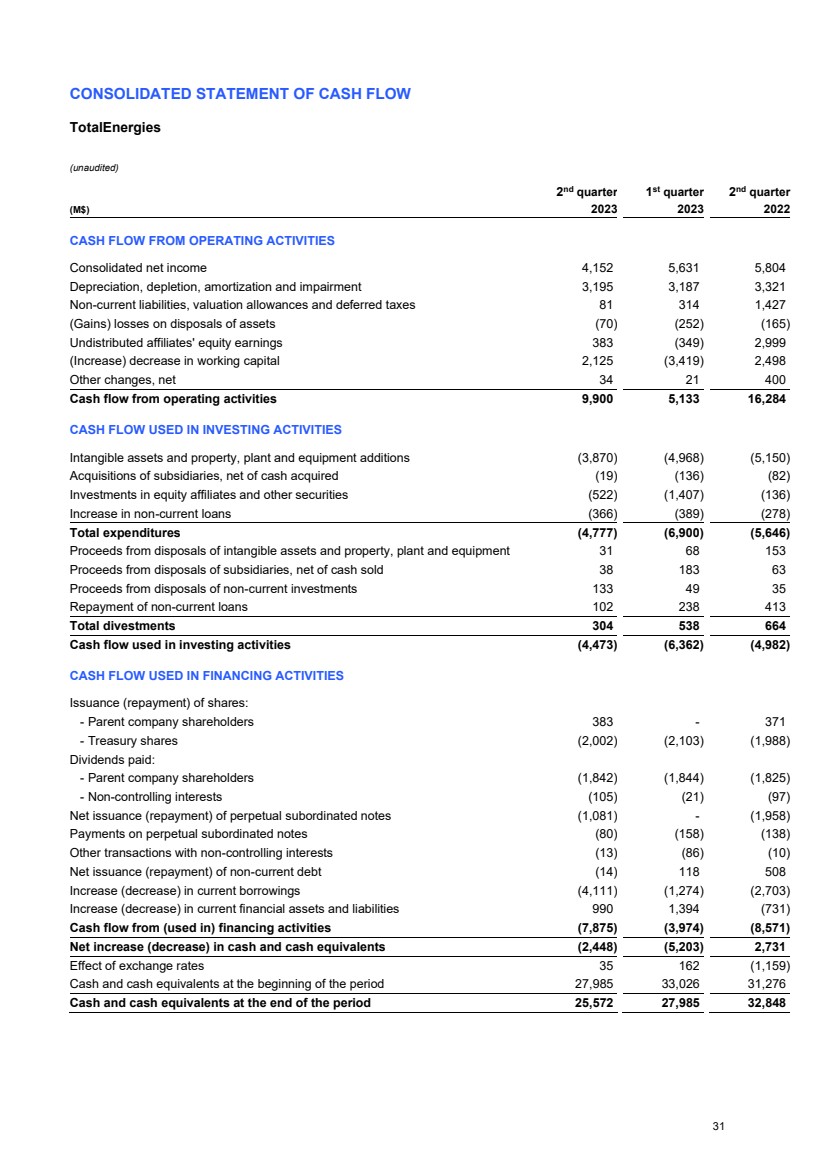
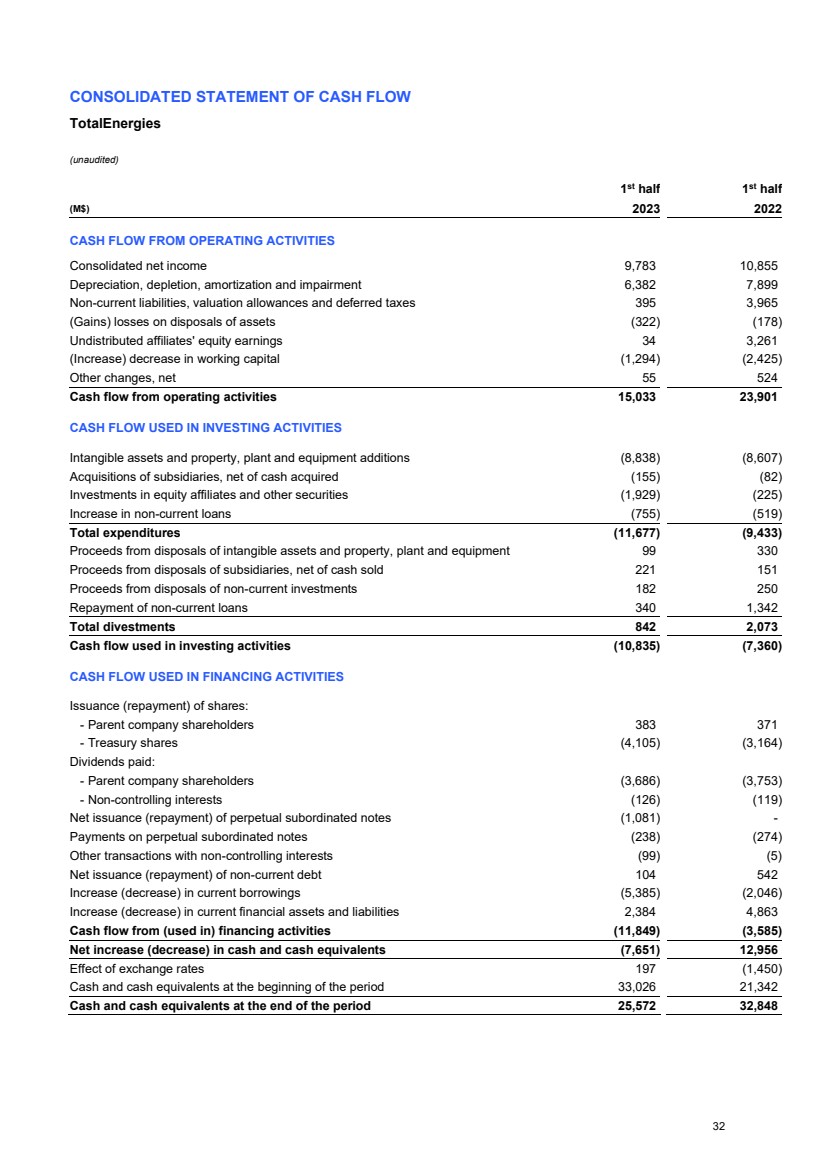
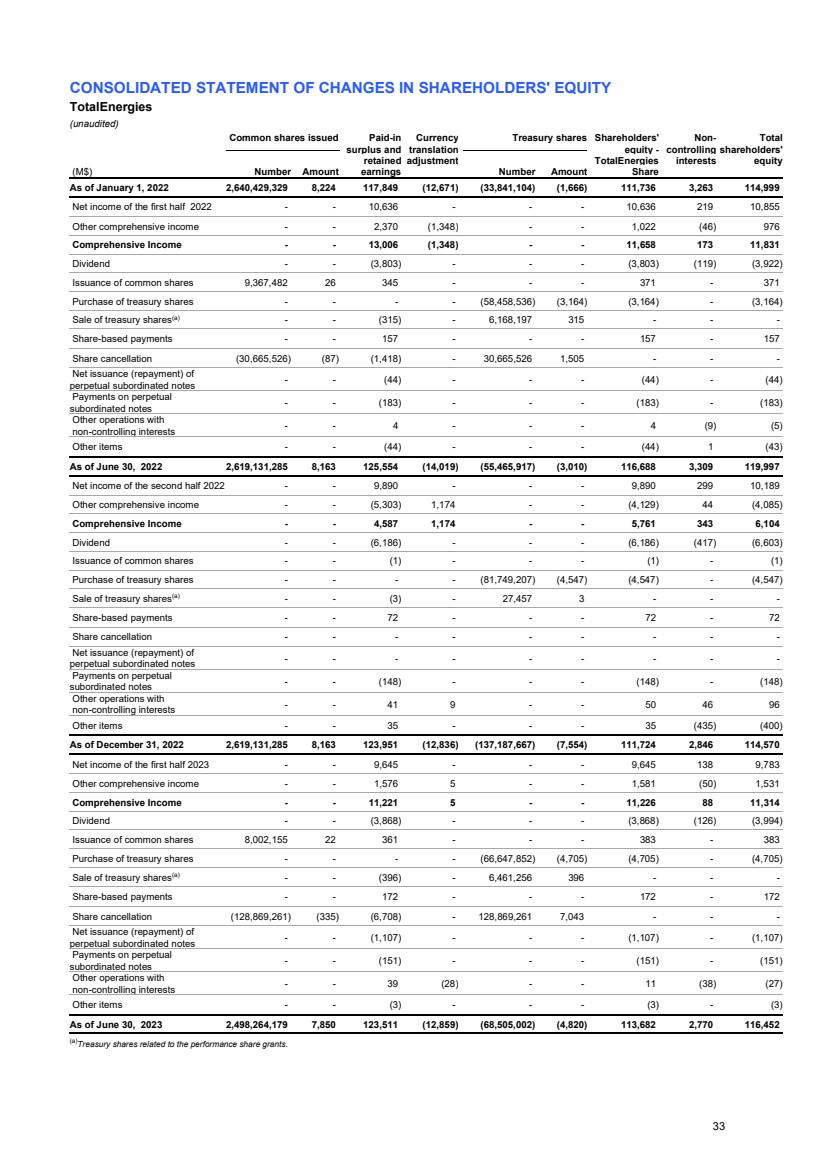
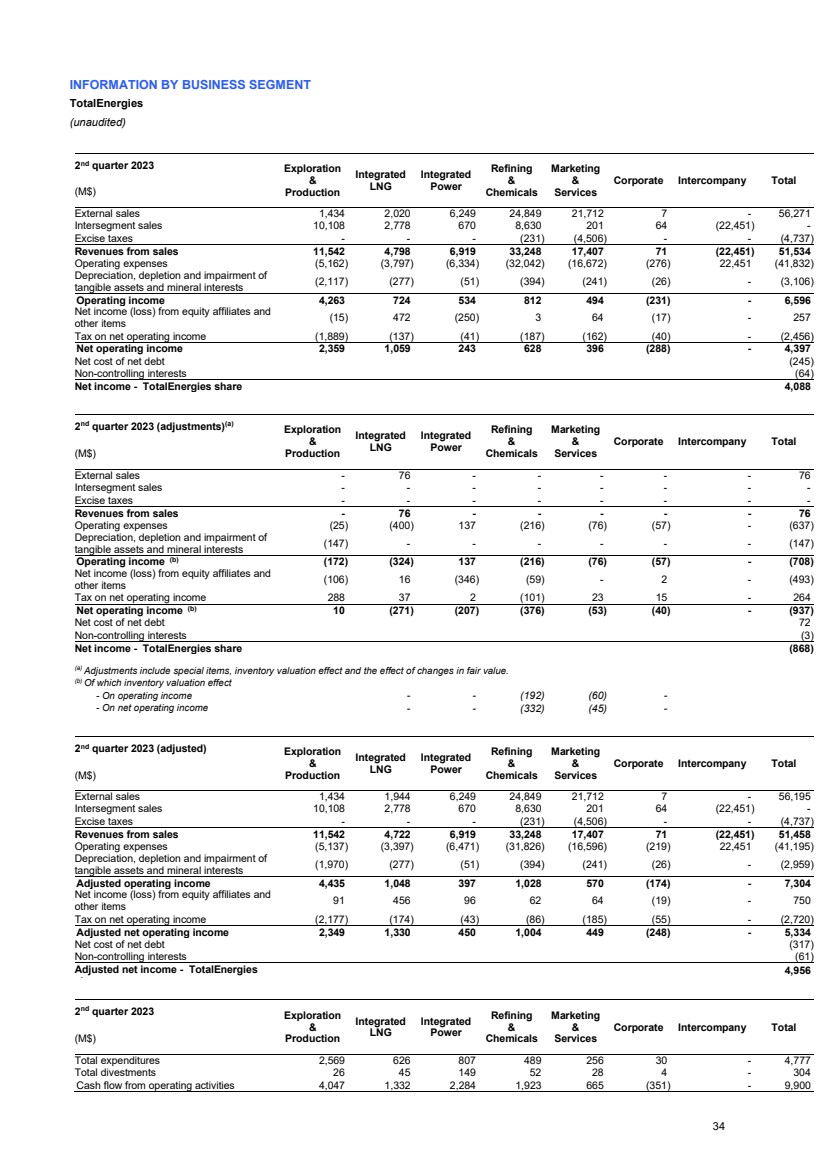
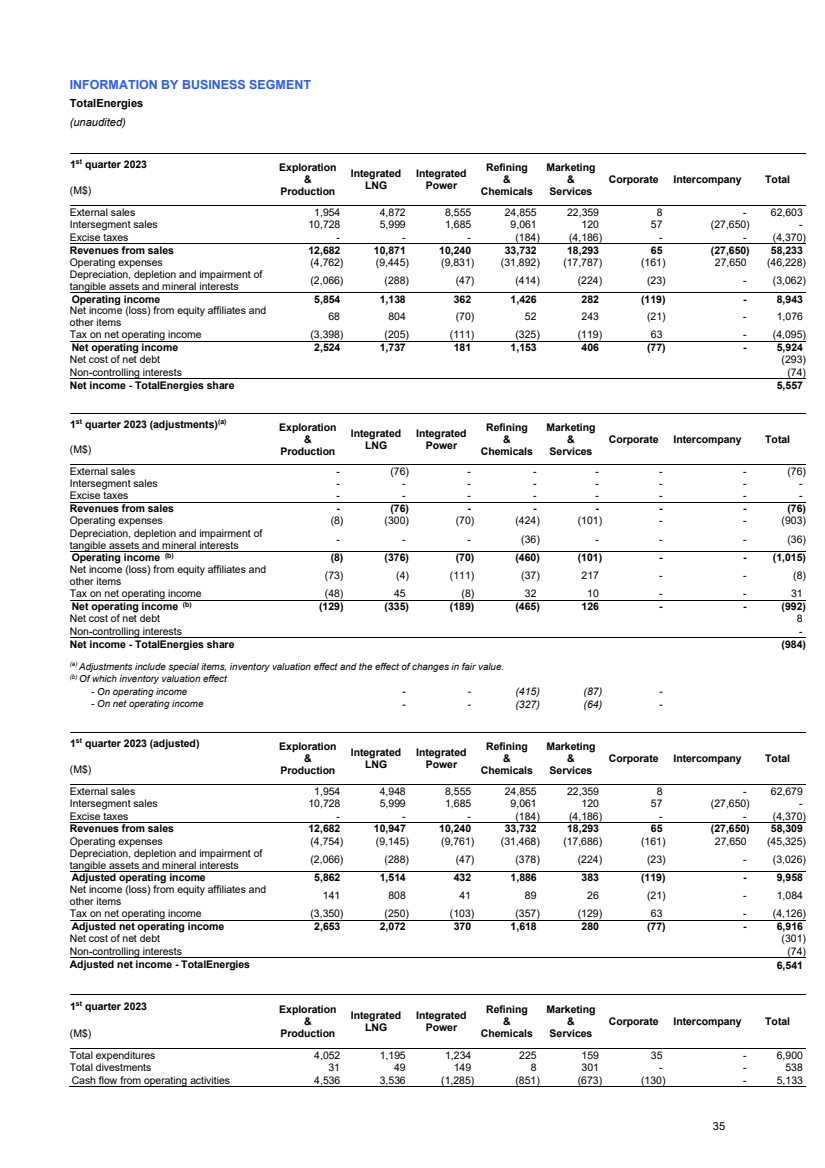
PRESS RELEASE Second quarter and first half 2023 results TotalEnergies reports strong results in a favorable but softening environment, while implementing its strategy by completing major deals in Oil, LNG and Integrated Power Achieved ROACE of 22% at June-end 2023* More than 40% cash payout for 2023 Second interim dividend up 7.3% year-on-year $2 billion share buyback in 3rd quarter 12 Paris, July 27, 2023 – The Board of Directors of TotalEnergies SE, chaired by CEO Patrick Pouyanné, met on July 26, 2023, to approve the second quarter 2023 financial statements. On the occasion, Patrick Pouyanné said: “In a favorable but softening oil & gas environment TotalEnergies once again delivered this quarter robust results, strong cash flow, and attractive shareholder distribution. The Company generated adjusted net income of $5.0 billion and return on average capital employed of 22%. TotalEnergies generated $8.5 billion in cash flow in the second quarter and $18 billion in the first half of 2023. Exploration & Production reported adjusted net operating income of $2.3 billion and cash flow of $4.4 billion. Production of 2.5 Mboe/d was up 2% year-on-year, thanks to new project start-ups (Ikike in Nigeria, Mero 1 in Brazil, Block 10 in Oman) and benefited from the integration of the SARB and Umm Lulu oil fields in the United Arab Emirates. The Integrated LNG segment posted cash flow of $1.8 billion, benefiting from the high margins captured in 2022. Adjusted net operating income was $1.3 billion reflecting lower LNG prices (averaging 10 $/Mbtu in the second quarter) and softer trading results in less volatile markets. Integrated Power’s adjusted net operating income and cash flow increased to $450 million and $491 million respectively in the second quarter, building its track record as an integrated and profitable player in the electricity markets with a ROACE of 10.1%. Integrated Power cash flow so reached close to $1 billion on the first six months of 2023, more than the cash flow performed on the whole year 2022. Downstream reported resilient adjusted net operating income of $1.5 billion and cash flow of $2.1 billion in a context of lower refining margins. As part of the implementation of its multi-energy strategy, the Company also announced four major projects this quarter: - the launch of its multi-energy GGIP project in Iraq, - the launch of the RGLNG project in Texas, which will boost its LNG export capacity from the US to 15 Mt/y, - the completion of the acquisition of 100% of Total Eren in renewable electricity, - the award of the EPC contracts for the Amiral petrochemical project in Saudi Arabia. These projects demonstrate TotalEnergies’ ability to seize opportunities allowing the Company to deploy its multi-energy model based on two pillars: production of low-cost low-emissions hydrocarbons (oil and LNG) and the development of a profitable integrated power business. In this favorable environment, the Board of Directors confirmed for 2023 a shareholder distribution of more than 40% of cash flow. The Board decided the distribution of a second interim dividend for the 2023 financial year in the amount of €0.74/share, up 7.25% year-on-year, and authorized the Company to buy back shares for $2 billion in the third quarter of 2023." (1) Definition on page 3. (2) Excluding leases. * For the twelve months ended June 30, 2023. 2Q23 Change vs 2Q22 1H23 Change vs 1H22 Net income (TotalEnergies share) (B$) 4.1 -28% 9.6 -9% Adjusted net income (TotalEnergies share)(1) - in billions of dollars (B$) 5.0 -49% 11.5 -39% - in dollars per share 1.99 -47% 4.61 -35% Adjusted EBITDA(1) (B$) 11.1 -41% 25.3 -30% DACF(1) (B$) 8.6 -37% 18.4 -28% Cash Flow from operations (B$) 9.9 -39% 15.0 -37% Net-debt-to-capital ratio(2) of 11.1% at June 30, 2023 vs. 11.5% at March 31, 2023 Second 2023 interim dividend set at 0.74 €/share 1 Exhibit 99.12 |
|
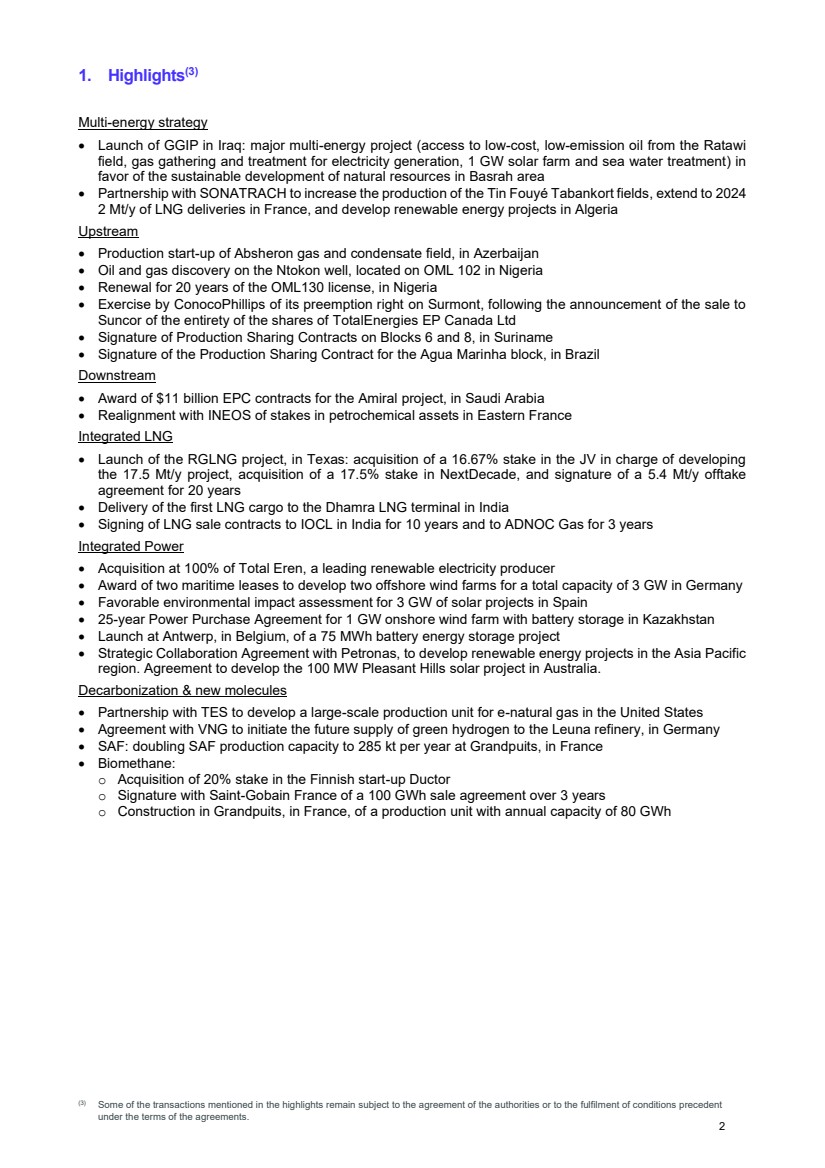
1. Highlights (3) Multi-energy strategy • Launch of GGIP in Iraq: major multi-energy project (access to low-cost, low-emission oil from the Ratawi field, gas gathering and treatment for electricity generation, 1 GW solar farm and sea water treatment) in favor of the sustainable development of natural resources in Basrah area • Partnership with SONATRACH to increase the production of the Tin Fouyé Tabankort fields, extend to 2024 2 Mt/y of LNG deliveries in France, and develop renewable energy projects in Algeria Upstream • Production start-up of Absheron gas and condensate field, in Azerbaijan • Oil and gas discovery on the Ntokon well, located on OML 102 in Nigeria • Renewal for 20 years of the OML130 license, in Nigeria • Exercise by ConocoPhillips of its preemption right on Surmont, following the announcement of the sale to Suncor of the entirety of the shares of TotalEnergies EP Canada Ltd • Signature of Production Sharing Contracts on Blocks 6 and 8, in Suriname • Signature of the Production Sharing Contract for the Agua Marinha block, in Brazil Downstream • Award of $11 billion EPC contracts for the Amiral project, in Saudi Arabia • Realignment with INEOS of stakes in petrochemical assets in Eastern France Integrated LNG • Launch of the RGLNG project, in Texas: acquisition of a 16.67% stake in the JV in charge of developing the 17.5 Mt/y project, acquisition of a 17.5% stake in NextDecade, and signature of a 5.4 Mt/y offtake agreement for 20 years • Delivery of the first LNG cargo to the Dhamra LNG terminal in India • Signing of LNG sale contracts to IOCL in India for 10 years and to ADNOC Gas for 3 years Integrated Power • Acquisition at 100% of Total Eren, a leading renewable electricity producer • Award of two maritime leases to develop two offshore wind farms for a total capacity of 3 GW in Germany • Favorable environmental impact assessment for 3 GW of solar projects in Spain • 25-year Power Purchase Agreement for 1 GW onshore wind farm with battery storage in Kazakhstan • Launch at Antwerp, in Belgium, of a 75 MWh battery energy storage project • Strategic Collaboration Agreement with Petronas, to develop renewable energy projects in the Asia Pacific region. Agreement to develop the 100 MW Pleasant Hills solar project in Australia. Decarbonization & new molecules • Partnership with TES to develop a large-scale production unit for e-natural gas in the United States • Agreement with VNG to initiate the future supply of green hydrogen to the Leuna refinery, in Germany • SAF: doubling SAF production capacity to 285 kt per year at Grandpuits, in France • Biomethane: o Acquisition of 20% stake in the Finnish start-up Ductor o Signature with Saint-Gobain France of a 100 GWh sale agreement over 3 years o Construction in Grandpuits, in France, of a production unit with annual capacity of 80 GWh (3) Some of the transactions mentioned in the highlights remain subject to the agreement of the authorities or to the fulfilment of conditions precedent under the terms of the agreements. 2 |
|
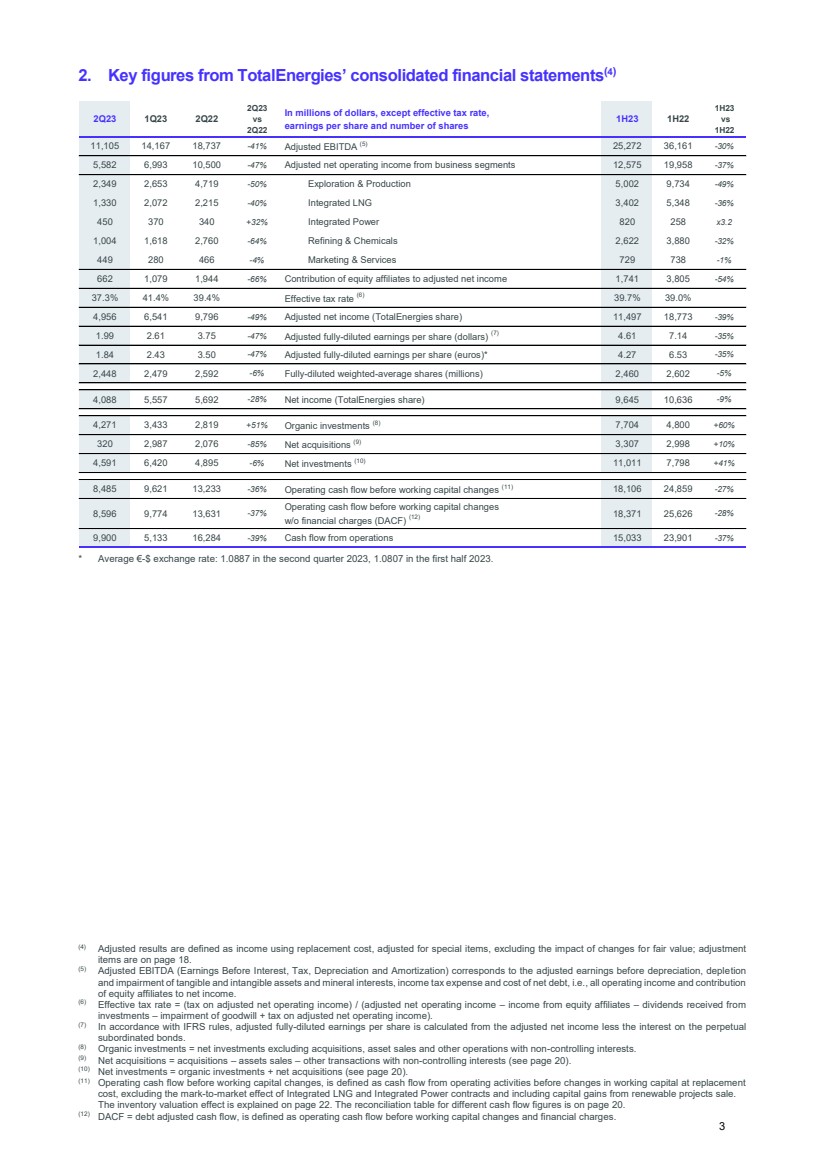
2. Key figures from TotalEnergies’ consolidated financial statements(4) * Average €-$ exchange rate: 1.0887 in the second quarter 2023, 1.0807 in the first half 2023. (4) Adjusted results are defined as income using replacement cost, adjusted for special items, excluding the impact of changes for fair value; adjustment items are on page 18. (5) Adjusted EBITDA (Earnings Before Interest, Tax, Depreciation and Amortization) corresponds to the adjusted earnings before depreciation, depletion and impairment of tangible and intangible assets and mineral interests, income tax expense and cost of net debt, i.e., all operating income and contribution of equity affiliates to net income. (6) Effective tax rate = (tax on adjusted net operating income) / (adjusted net operating income – income from equity affiliates – dividends received from investments – impairment of goodwill + tax on adjusted net operating income). (7) In accordance with IFRS rules, adjusted fully-diluted earnings per share is calculated from the adjusted net income less the interest on the perpetual subordinated bonds. (8) Organic investments = net investments excluding acquisitions, asset sales and other operations with non-controlling interests. (9) Net acquisitions = acquisitions – assets sales – other transactions with non-controlling interests (see page 20). (10) Net investments = organic investments + net acquisitions (see page 20). (11) Operating cash flow before working capital changes, is defined as cash flow from operating activities before changes in working capital at replacement cost, excluding the mark-to-market effect of Integrated LNG and Integrated Power contracts and including capital gains from renewable projects sale. The inventory valuation effect is explained on page 22. The reconciliation table for different cash flow figures is on page 20. (12) DACF = debt adjusted cash flow, is defined as operating cash flow before working capital changes and financial charges. 2Q23 1Q23 2Q22 2Q23 vs 2Q22 In millions of dollars, except effective tax rate, earnings per share and number of shares 1H23 1H22 1H23 vs 1H22 11,105 14,167 18,737 -41% Adjusted EBITDA (5) 25,272 36,161 -30% 5,582 6,993 10,500 -47% Adjusted net operating income from business segments 12,575 19,958 -37% 2,349 2,653 4,719 -50% Exploration & Production 5,002 9,734 -49% 1,330 2,072 2,215 -40% Integrated LNG 3,402 5,348 -36% 450 370 340 +32% Integrated Power 820 258 x3.2 1,004 1,618 2,760 -64% Refining & Chemicals 2,622 3,880 -32% 449 280 466 -4% Marketing & Services 729 738 -1% 662 1,079 1,944 -66% Contribution of equity affiliates to adjusted net income 1,741 3,805 -54% 37.3% 41.4% 39.4% Effective tax rate (6) 39.7% 39.0% 4,956 6,541 9,796 -49% Adjusted net income (TotalEnergies share) 11,497 18,773 -39% 1.99 2.61 3.75 -47% Adjusted fully-diluted earnings per share (dollars) (7) 4.61 7.14 -35% 1.84 2.43 3.50 -47% Adjusted fully-diluted earnings per share (euros)* 4.27 6.53 -35% 2,448 2,479 2,592 -6% Fully-diluted weighted-average shares (millions) 2,460 2,602 -5% 4,088 5,557 5,692 -28% Net income (TotalEnergies share) 9,645 10,636 -9% 4,271 3,433 2,819 +51% Organic investments (8) 7,704 4,800 +60% 320 2,987 2,076 -85% Net acquisitions (9) 3,307 2,998 +10% 4,591 6,420 4,895 -6% Net investments (10) 11,011 7,798 +41% 8,485 9,621 13,233 -36% Operating cash flow before working capital changes (11) 18,106 24,859 -27% 8,596 9,774 13,631 -37% Operating cash flow before working capital changes w/o financial charges (DACF) (12) 18,371 25,626 -28% 9,900 5,133 16,284 -39% Cash flow from operations 15,033 23,901 -37% 3 |
|
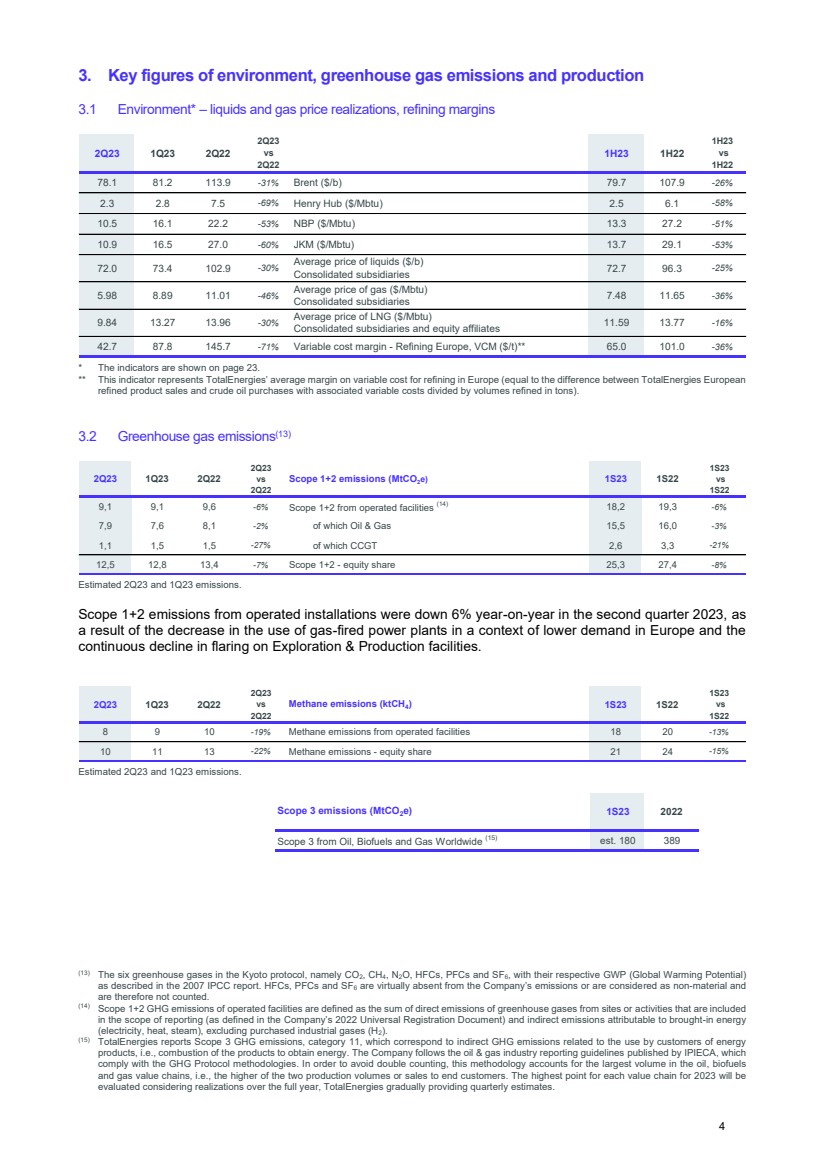
3. Key figures of environment, greenhouse gas emissions and production 3.1 Environment* – liquids and gas price realizations, refining margins * The indicators are shown on page 23. ** This indicator represents TotalEnergies’ average margin on variable cost for refining in Europe (equal to the difference between TotalEnergies European refined product sales and crude oil purchases with associated variable costs divided by volumes refined in tons). 3.2 Greenhouse gas emissions(13) Estimated 2Q23 and 1Q23 emissions. Scope 1+2 emissions from operated installations were down 6% year-on-year in the second quarter 2023, as a result of the decrease in the use of gas-fired power plants in a context of lower demand in Europe and the continuous decline in flaring on Exploration & Production facilities. Estimated 2Q23 and 1Q23 emissions. (13) The six greenhouse gases in the Kyoto protocol, namely CO2, CH4, N2O, HFCs, PFCs and SF6, with their respective GWP (Global Warming Potential) as described in the 2007 IPCC report. HFCs, PFCs and SF6 are virtually absent from the Company’s emissions or are considered as non-material and are therefore not counted. (14) Scope 1+2 GHG emissions of operated facilities are defined as the sum of direct emissions of greenhouse gases from sites or activities that are included in the scope of reporting (as defined in the Company’s 2022 Universal Registration Document) and indirect emissions attributable to brought-in energy (electricity, heat, steam), excluding purchased industrial gases (H2). (15) TotalEnergies reports Scope 3 GHG emissions, category 11, which correspond to indirect GHG emissions related to the use by customers of energy products, i.e., combustion of the products to obtain energy. The Company follows the oil & gas industry reporting guidelines published by IPIECA, which comply with the GHG Protocol methodologies. In order to avoid double counting, this methodology accounts for the largest volume in the oil, biofuels and gas value chains, i.e., the higher of the two production volumes or sales to end customers. The highest point for each value chain for 2023 will be evaluated considering realizations over the full year, TotalEnergies gradually providing quarterly estimates. 2Q23 1Q23 2Q22 2Q23 vs 2Q22 1H23 1H22 1H23 vs 1H22 78.1 81.2 113.9 -31% Brent ($/b) 79.7 107.9 -26% 2.3 2.8 7.5 -69% Henry Hub ($/Mbtu) 2.5 6.1 -58% 10.5 16.1 22.2 -53% NBP ($/Mbtu) 13.3 27.2 -51% 10.9 16.5 27.0 -60% JKM ($/Mbtu) 13.7 29.1 -53% 72.0 73.4 102.9 -30% Average price of liquids ($/b) Consolidated subsidiaries 72.7 96.3 -25% 5.98 8.89 11.01 -46% Average price of gas ($/Mbtu) Consolidated subsidiaries 7.48 11.65 -36% 9.84 13.27 13.96 -30% Average price of LNG ($/Mbtu) Consolidated subsidiaries and equity affiliates 11.59 13.77 -16% 42.7 87.8 145.7 -71% Variable cost margin - Refining Europe, VCM ($/t)** 65.0 101.0 -36% 2Q23 1Q23 2Q22 2Q23 vs 2Q22 Scope 1+2 emissions (MtCO2e) 1S23 1S22 1S23 vs 1S22 9,1 9,1 9,6 -6% Scope 1+2 from operated facilities (14) 18,2 19,3 -6% 7,9 7,6 8,1 -2% of which Oil & Gas 15,5 16,0 -3% 1,1 1,5 1,5 -27% of which CCGT 2,6 3,3 -21% 12,5 12,8 13,4 -7% Scope 1+2 - equity share 25,3 27,4 -8% 2Q23 1Q23 2Q22 2Q23 vs 2Q22 Methane emissions (ktCH4 ) 1S23 1S22 1S23 vs 1S22 8 9 10 -19% Methane emissions from operated facilities 18 20 -13% 10 11 13 -22% Methane emissions - equity share 21 24 -15% Scope 3 emissions (MtCO2e) 1S23 2022 Scope 3 from Oil, Biofuels and Gas Worldwide (15) est. 180 389 4 |
|
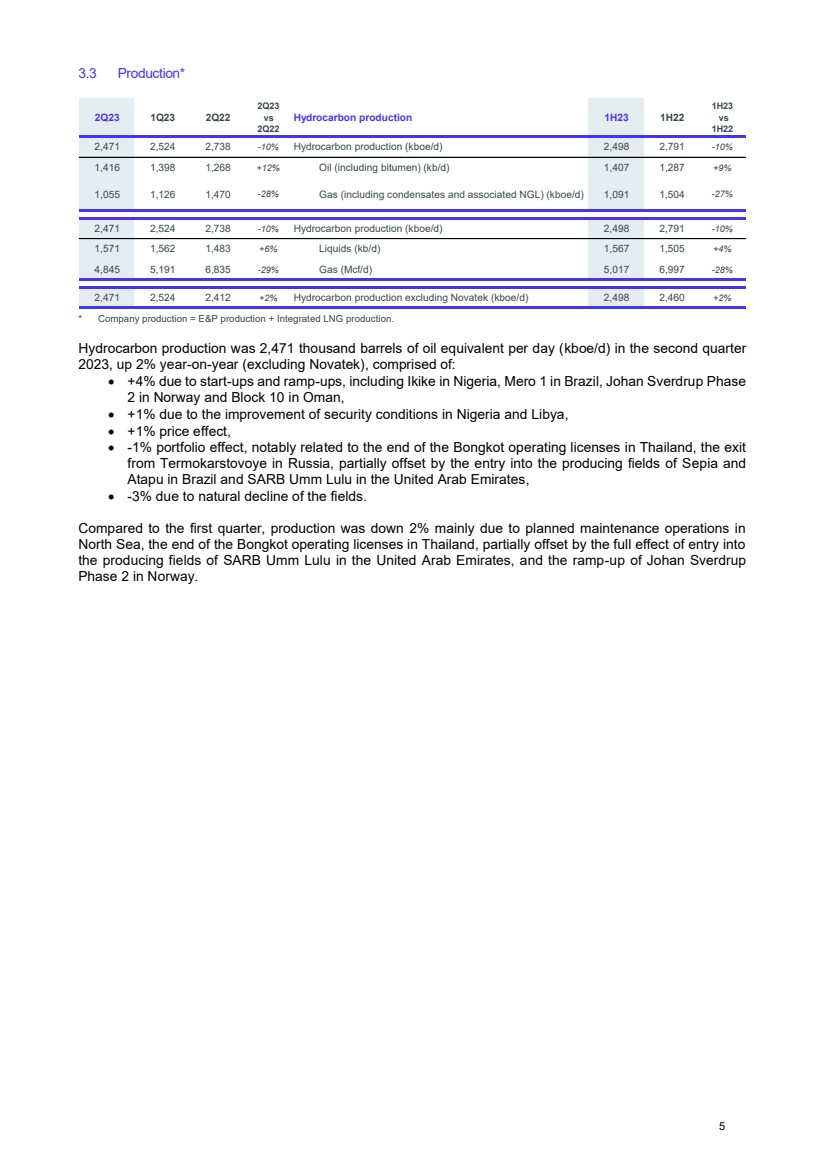
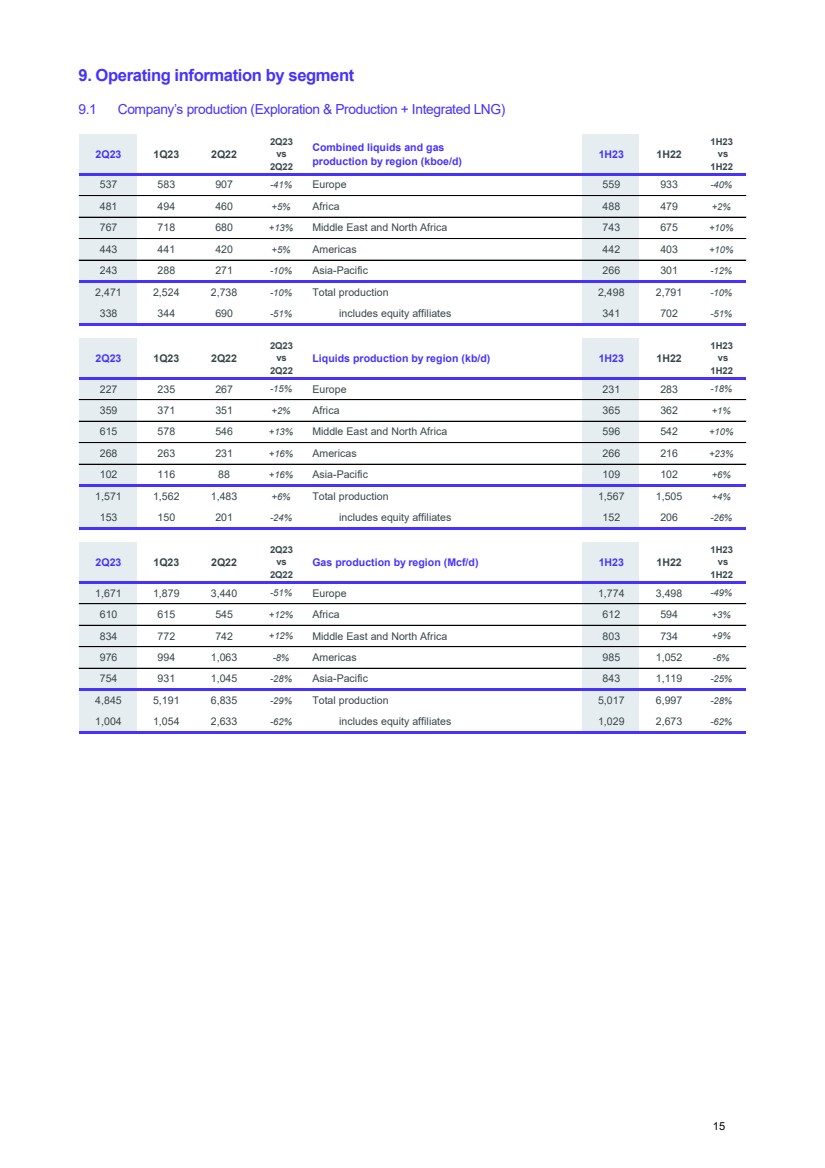
3.3 Production* * Company production = E&P production + Integrated LNG production. Hydrocarbon production was 2,471 thousand barrels of oil equivalent per day (kboe/d) in the second quarter 2023, up 2% year-on-year (excluding Novatek), comprised of: • +4% due to start-ups and ramp-ups, including Ikike in Nigeria, Mero 1 in Brazil, Johan Sverdrup Phase 2 in Norway and Block 10 in Oman, • +1% due to the improvement of security conditions in Nigeria and Libya, • +1% price effect, • -1% portfolio effect, notably related to the end of the Bongkot operating licenses in Thailand, the exit from Termokarstovoye in Russia, partially offset by the entry into the producing fields of Sepia and Atapu in Brazil and SARB Umm Lulu in the United Arab Emirates, • -3% due to natural decline of the fields. Compared to the first quarter, production was down 2% mainly due to planned maintenance operations in North Sea, the end of the Bongkot operating licenses in Thailand, partially offset by the full effect of entry into the producing fields of SARB Umm Lulu in the United Arab Emirates, and the ramp-up of Johan Sverdrup Phase 2 in Norway. 2Q23 1Q23 2Q22 2Q23 vs 2Q22 Hydrocarbon production 1H23 1H22 1H23 vs 1H22 2,471 2,524 2,738 -10% Hydrocarbon production (kboe/d) 2,498 2,791 -10% 1,416 1,398 1,268 +12% Oil (including bitumen) (kb/d) 1,407 1,287 +9% 1,055 1,126 1,470 -28% Gas (including condensates and associated NGL) (kboe/d) 1,091 1,504 -27% 2,471 2,524 2,738 -10% Hydrocarbon production (kboe/d) 2,498 2,791 -10% 1,571 1,562 1,483 +6% Liquids (kb/d) 1,567 1,505 +4% 4,845 5,191 6,835 -29% Gas (Mcf/d) 5,017 6,997 -28% 2,471 2,524 2,412 +2% Hydrocarbon production excluding Novatek (kboe/d) 2,498 2,460 +2% 5 |
|
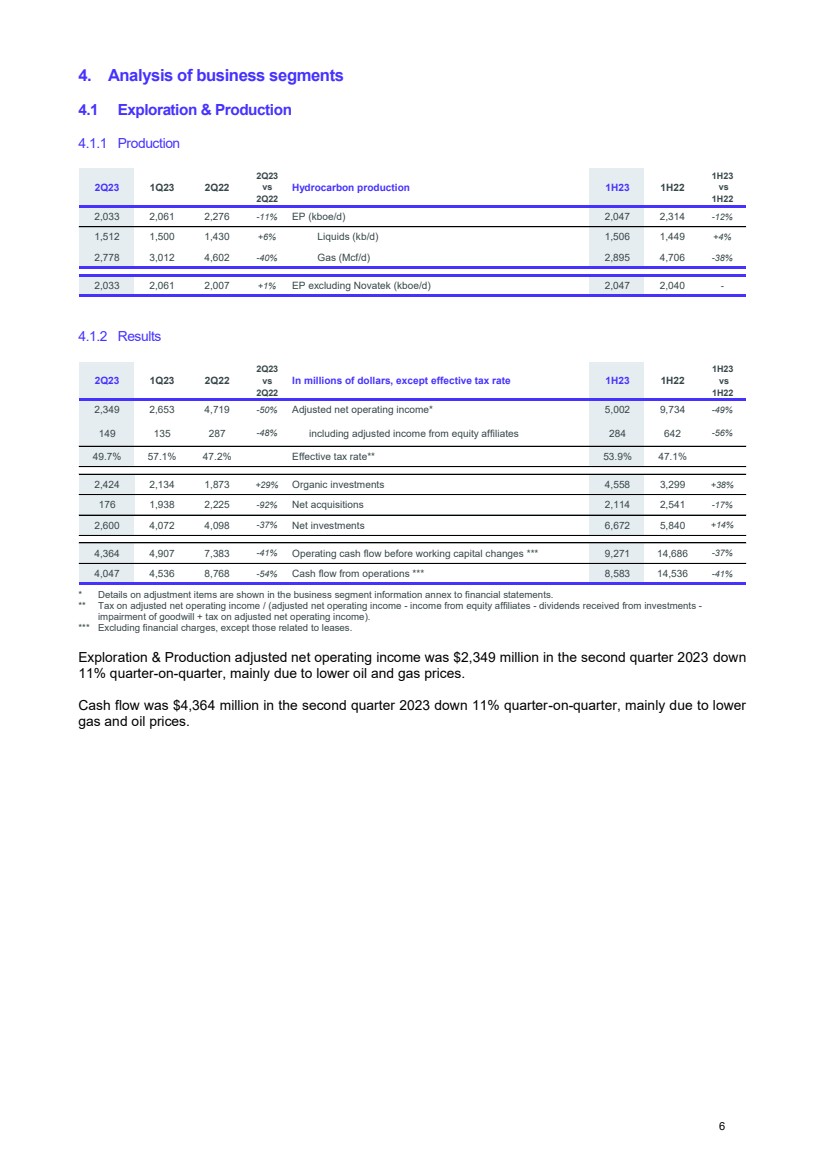
4. Analysis of business segments 4.1 Exploration & Production 4.1.1 Production 4.1.2 Results * Details on adjustment items are shown in the business segment information annex to financial statements. ** Tax on adjusted net operating income / (adjusted net operating income - income from equity affiliates - dividends received from investments - impairment of goodwill + tax on adjusted net operating income). *** Excluding financial charges, except those related to leases. Exploration & Production adjusted net operating income was $2,349 million in the second quarter 2023 down 11% quarter-on-quarter, mainly due to lower oil and gas prices. Cash flow was $4,364 million in the second quarter 2023 down 11% quarter-on-quarter, mainly due to lower gas and oil prices. 2Q23 1Q23 2Q22 2Q23 vs 2Q22 Hydrocarbon production 1H23 1H22 1H23 vs 1H22 2,033 2,061 2,276 -11% EP (kboe/d) 2,047 2,314 -12% 1,512 1,500 1,430 +6% Liquids (kb/d) 1,506 1,449 +4% 2,778 3,012 4,602 -40% Gas (Mcf/d) 2,895 4,706 -38% 2,033 2,061 2,007 +1% EP excluding Novatek (kboe/d) 2,047 2,040 - 2Q23 1Q23 2Q22 2Q23 vs 2Q22 In millions of dollars, except effective tax rate 1H23 1H22 1H23 vs 1H22 2,349 2,653 4,719 -50% Adjusted net operating income* 5,002 9,734 -49% 149 135 287 -48% including adjusted income from equity affiliates 284 642 -56% 49.7% 57.1% 47.2% Effective tax rate** 53.9% 47.1% 2,424 2,134 1,873 +29% Organic investments 4,558 3,299 +38% 176 1,938 2,225 -92% Net acquisitions 2,114 2,541 -17% 2,600 4,072 4,098 -37% Net investments 6,672 5,840 +14% 4,364 4,907 7,383 -41% Operating cash flow before working capital changes *** 9,271 14,686 -37% 4,047 4,536 8,768 -54% Cash flow from operations *** 8,583 14,536 -41% 6 |
|
4.2 Integrated LNG 4.2.1 Production * The Company’s equity production may be sold by TotalEnergies or by the joint ventures. Hydrocarbon production for LNG was up 8% year-on-year in the second quarter 2023 and first half 2023, due to the increased supply of NLNG following improved security conditions in Nigeria and the restart of Snøhvit in Norway during the second quarter 2022. LNG sales decreased year-on-year due to lower demand in Europe and are stable quarter-on-quarter, beneficiating from the restart of Freeport LNG. 4.2.2 Results * Detail of adjustment items shown in the business segment information annex to financial statements. ** Excluding financial charges, except those related to lease contracts, excluding the impact of contracts recognized at fair value. *** Excluding financial charges, except those related to leases. Integrated LNG adjusted net operating income was: • $1,330 million in the second quarter 2023, down 28% year-on-year (excluding Novatek) and 36% quarter-on-quarter, mainly due to lower spot and forward LNG prices, • $3,402 million in the first half 2023, down 26% year-on-year (excluding Novatek), due to lower prices and LNG sales, as well as exceptional trading results in the first quarter 2022. Operating cash flow before working capital changes for Integrated LNG was: • $1,801 million in the second quarter 2023, down 15% year-on-year (excluding Novatek), and 13% quarter-on-quarter due to lower LNG prices, partially offset by higher margins secured in 2022 on LNG cargoes to be delivered in 2023, • $3,882 million in the first half 2023, down 16% year-on-year (excluding Novatek), for the same reasons. 2Q23 1Q23 2Q22 2Q23 vs 2Q22 Hydrocarbon production for LNG 1H23 1H22 1H23 vs 1H22 438 463 462 -5% Integrated LNG (kboe/d) 451 477 -6% 59 62 53 +11% Liquids (kb/d) 61 56 +7% 2,067 2,179 2,233 -7% Gas (Mcf/d) 2,122 2,291 -7% 438 463 405 +8% Integrated LNG excluding Novatek (kboe/d) 451 419 +8% 2Q23 1Q23 2Q22 2Q23 vs 2Q22 Liquefied Natural Gas in Mt 1H23 1H22 1H23 vs 1H22 11.0 11.0 11.7 -6% Overall LNG sales 22.0 24.9 -12% 3.6 4.0 4.1 -12% incl. Sales from equity production* 7.6 8.6 -12% 10.0 9.9 10.2 -2% incl. Sales by TotalEnergies from equity production and third party purchases 19.9 22.2 -10% 2Q23 1Q23 2Q22 2Q23 vs 2Q22 In millions of dollars 1H23 1H22 1H23 vs 1H22 1,330 2,072 2,215 -40% Adjusted net operating income* 3,402 5,348 -36% 432 786 1,192 -64% including adjusted income from equity affiliates 1,218 2,596 -53% 382 396 171 x2.2 Organic investments 779 110 x7.1 205 759 (36) ns Net acquisitions 964 (56) ns 587 1,155 135 x4.3 Net investments 1,743 54 x32.3 1,801 2,081 2,112 -15% Operating cash flow before working capital changes ** 3,882 4,604 -16% 1,332 3,536 3,802 -65% Cash flow from operations *** 4,868 6,021 -19% 7 |
|
4.3 Integrated Power 4.3.1 Capacities, productions, clients and sales (1) Includes 20% of Adani Green Energy Ltd’s gross capacity effective first quarter 2021, 50% of Clearway Energy Group’s gross capacity effective third quarter 2022 and 49% of Casa dos Ventos’ gross capacity effective first quarter 2023. (2) End of period data. (3) Solar, wind, hydroelectric and combined-cycle gas turbine (CCGT) plants. Net power production was: • 8.2 TWh in the second quarter 2023, up 8% year-on-year, as growing electricity generation from renewables is partially offset by lower generation from flexible capacity in a context of lower demand, • 16.6 TWh in the first half 2023, up 9% year-on-year, for the same reasons. Gross installed renewable power generation capacity was 19 GW at the end of the second quarter 2023, up by more than 1 GW quarter-on-quarter, including 0.5 GW installed in the USA and the connection of 0.3 GW from the Seagreen offshore wind project in the UK. 4.3.2 Results * Detail of adjustment items shown in the business segment information annex to financial statements. ** Excluding financial charges, except those related to lease contracts, excluding the impact of contracts recognized at fair value for the sector and including capital gains on the sale of renewable projects. *** Excluding financial charges, except those related to leases. Excluding margin calls, reported in the Integrated LNG segment since the implementation in 2022 of its centralized management. Integrated Power adjusted net operating income was $450 million and operating cash flow before working capital changes was $491 million in the second quarter 2023, up 22% and 12% respectively quarter-on-quarter, due to the performance of its integrated electricity portfolio. 2Q23 1Q23 2Q22 2Q23 vs 2Q22 Integrated Power 1H23 1H22 1H23 vs 1H22 74.7 70.4 50.7 +47% Portfolio of renewable power generation gross capacity (GW) (1),(2) 74.7 50.7 +47% 19.0 17.9 11.6 +63% o/w installed capacity 19.0 11.6 +63% 5.7 6.2 5.2 +11% o/w capacity in construction 5.7 5.2 +11% 50.0 46.3 33.9 +47% o/w capacity in development 50.0 33.9 +47% 46.9 44.4 38.4 +22% Portfolio of renewable power generation net capacity (GW) (2) 46.9 38.4 +22% 8.9 8.4 5.8 +53% o/w installed capacity 8.9 5.8 +53% 3.9 4.0 3.7 +7% o/w capacity in construction 3.9 3.7 +7% 34.1 32.0 28.9 +18% o/w capacity in development 34.1 28.9 +18% 5.8 5.8 5.8 - Gas-fired power generation gross installed capacity (GW) (2) 5.8 5.8 - 4.3 4.3 4.3 - Gas-fired power generation net installed capacity (GW) (2) 4.3 4.3 - 8.2 8.4 7.7 +8% Net power production (TWh) (3) 16.6 15.2 +9% 4.2 3.8 2.5 +69% incl. power production from renewables 8.1 4.7 +70% 6.0 6.0 6.2 -3% Clients power - BtB and BtC (Million) (2) 6.0 6.2 -3% 2.8 2.8 2.7 +1% Clients gas - BtB and BtC (Million) (2) 2.8 2.7 +1% 11.5 15.5 12.3 -7% Sales power - BtB and BtC (TWh) 27.0 28.6 -6% 19.2 37.3 19.1 - Sales gas - BtB and BtC (TWh) 56.4 54.1 +4% 2Q23 1Q23 2Q22 2Q23 vs 2Q22 In millions of dollars 1H23 1H22 1H23 vs 1H22 450 370 340 +32% Adjusted net operating income* 820 258 x3.2 23 56 27 -15% including adjusted income from equity affiliates 79 53 +49% 753 577 170 x4.4 Organic investments 1,330 489 x2.7 (42) 519 (22) ns Net acquisitions 477 639 -25% 711 1,096 148 x4.8 Net investments 1,807 1,128 +60% 491 440 248 +98% Operating cash flow before working capital changes ** 931 341 x2.7 2,284 (1,285) 168 x13.6 Cash flow from operations *** 999 (1,736) ns 8 |
|
4.4 Downstream (Refining & Chemicals and Marketing & Services) 4.4.1 Results * Detail of adjustment items shown in the business segment information annex to financial statements. ** Excluding financial charges, except those related to leases. 4.5 Refining & Chemicals 4.5.1 Refinery and petrochemicals throughput and utilization rates * Includes refineries in Africa reported in the Marketing & Services segment. ** Based on distillation capacity at the beginning of the year. * Olefins. ** Based on olefins production from steam crackers and their treatment capacity at the start of the year. Refining throughput was: • down 7% year-on-year in the second quarter 2023, notably due to planned maintenance and unplanned shutdowns at the Antwerp refinery in Belgium, and logistical limitations linked to high inventory levels at the Normandy refinery in France, • down 1% year-on-year in the first half 2023, reflecting the restart of the Donges refinery in France in the second quarter 2022. The utilization rate on processed crude rose over the quarter to 82% given the end of strikes in France. Polymer production was down year-on-year by 19% in the second quarter 2023 and 16% in the first half 2023, due to the slowdown in global demand. 2Q23 1Q23 2Q22 2Q23 vs 2Q22 In millions of dollars 1H23 1H22 1H23 vs 1H22 1,453 1,898 3,226 -55% Adjusted net operating income* 3,351 4,618 -27% 686 290 586 +17% Organic investments 976 878 +11% (19) (229) (91) ns Net acquisitions (248) (125) ns 667 61 495 +35% Net investments 728 753 -3% 2,085 2,189 3,548 -41% Operating cash flow before working capital changes ** 4,274 5,444 -21% 2,588 (1,524) 4,106 -37% Cash flow from operations ** 1,064 6,111 -83% 2Q23 1Q23 2Q22 2Q23 vs 2Q22 Refinery throughput and utilization rate* 1H23 1H22 1H23 vs 1H22 1,472 1,403 1,575 -7% Total refinery throughput (kb/d) 1,437 1,448 -1% 364 357 395 -8% France 360 324 +11% 601 596 648 -7% Rest of Europe 598 627 -5% 507 450 532 -5% Rest of world 479 497 -4% 82% 78% 88% Utilization rate based on crude only** 80% 81% 2Q23 1Q23 2Q22 2Q23 vs 2Q22 Petrochemicals production and utilization rate 1H23 1H22 1H23 vs 1H22 1,157 1,295 1,206 -4% Monomers* (kt) 2,452 2,611 -6% 963 1,111 1,187 -19% Polymers (kt) 2,074 2,461 -16% 67% 75% 71% Steamcracker utilization rate** 71% 78% 9 |
|
4.5.2 Results * Detail of adjustment items shown in the business segment information annex to financial statements. ** Excluding financial charges, except those related to leases. Refining & Chemicals adjusted net operating income was: • $1,004 million in the second quarter 2023, down 38% quarter-on-quarter, reflecting lower refining margins in Europe impacted at the start of the period by Chinese exports and the quicker than anticipated reorganization of Russian flows following the European embargo, although supported at the end of the quarter by higher gasoline exports to the US and lower diesel imports in Europe from China, • $2,622 million in the first half 2023, down 32% year-on-year, for the same reasons. Operating cash flow before working capital changes was $1,329 million in the second quarter 2023 and $3,062 million in the first half 2023, down 55% and 30% respectively year-on-year as the second quarter 2022 benefited from exceptional conditions. 2Q23 1Q23 2Q22 2Q23 vs 2Q22 In millions of dollars 1H23 1H22 1H23 vs 1H22 1,004 1,618 2,760 -64% Adjusted net operating income* 2,622 3,880 -32% 454 198 313 +45% Organic investments 652 510 +28% (15) 5 (34) ns Net acquisitions (10) (34) ns 439 203 279 +57% Net investments 642 476 +35% 1,329 1,733 2,963 -55% Operating cash flow before working capital changes ** 3,062 4,396 -30% 1,923 (851) 3,526 -45% Cash flow from operations ** 1,072 4,633 -77% 10 |
|
4.6 Marketing & Services 4.6.1 Petroleum product sales * Excludes trading and bulk refining sales. Sales of petroleum products were down year-on-year by 5% in the second quarter 2023 and 6% in the first half 2023, as lower demand from commercial and industrial customers in Europe and the portfolio effect linked to the disposal of 50% of the fuel distribution business in Egypt were partially offset by the recovery in the aviation business. 4.6.2 Results * Detail of adjustment items shown in the business segment information annex to financial statements. ** Excluding financial charges, except those related to leases. Marketing & Services adjusted net operating income was $449 million in the second quarter 2023, down 4% year-on-year, and $729 million in the first half 2023, slightly down year-on-year, in line with lower sales. Operating cash flow before working capital changes rose by 29% year-on-year to $756 million in the second quarter 2023, and by 16% to $1,212 million in the first half 2023, as 2022 was negatively impacted by the tax effect of higher prices on the valuation of petroleum product inventories. 2Q23 1Q23 2Q22 2Q23 vs 2Q22 Sales in kb/d* 1H23 1H22 1H23 vs 1H22 1,397 1,360 1,477 -5% Total Marketing & Services sales 1,379 1,464 -6% 799 757 817 -2% Europe 778 804 -3% 598 602 660 -9% Rest of world 600 661 -9% 2Q23 1Q23 2Q22 2Q23 vs 2Q22 In millions of dollars 1H23 1H22 1H23 vs 1H22 449 280 466 -4% Adjusted net operating income* 729 738 -1% 232 92 273 -15% Organic investments 324 368 -12% (4) (234) (57) ns Net acquisitions (238) (91) ns 228 (142) 216 +6% Net investments 86 277 -69% 756 456 585 +29% Operating cash flow before working capital changes ** 1,212 1,048 +16% 665 (673) 580 +15% Cash flow from operations ** (8) 1,478 ns 11 |
|
5. TotalEnergies results 5.1 Adjusted net operating income from business segments Adjusted net operating income from business segments was: • $5,582 million in the second quarter 2023, compared to $6,993 million in the first quarter 2023, due to lower gas prices and refining margins, • $12,575 million in the first half 2023, compared to $19,958 million in the first half 2022, due to lower oil and gas prices and refining margins. 5.2 Adjusted net income (TotalEnergies share) TotalEnergies adjusted net income was $4,956 million in the second quarter 2023 versus $6,541 million in the first quarter 2023, mainly due to lower gas prices and refining margins. Adjusted net income excludes the after-tax inventory effect, special items and the impact of changes in fair value(16) . Adjustments to net income(17) were ($868) million in the second quarter 2023, consisting mainly of: • ($0.5) billion related to impairments, notably on upstream assets in Kenya and the Yunlin offshore wind project in Taiwan, • ($0.4) billion of inventory effect. TotalEnergies’ average tax rate was: • 37.3% in the second quarter 2023 versus 41.4% in the first quarter 2023, mainly as a result of the lower tax rate for Exploration & Production related to lower oil and gas prices, • 39.7% in the first half 2023 versus 39.0% in the first half 2022, mainly as a result of the higher tax rate for Exploration & Production related notably to the Energy Profits Levy in the UK. 5.3 Adjusted earnings per share Adjusted diluted net earnings per share were: • $1.99 in the second quarter 2023, based on 2,448 million weighted average diluted shares, compared to $2.61 in the first quarter 2023, • $4.61 in the first half 2023, based on 2,460 million weighted average diluted shares, compared to $7.14 a year earlier. As of June 30, 2023, the number of diluted shares was 2,443 million. As part of its shareholder return policy, TotalEnergies repurchased: • 32.8 million shares for cancellation in the second quarter 2023 for $2 billion, • 65.0 million shares for cancellation in the first half 2023 for $4 billion. 5.4 Acquisitions - asset sales Acquisitions were: • $482 million in the second quarter 2023, mainly related to the acquisition of a 9.375% stake in the NFS LNG project in Qatar, the renewal of the license OML 130 in Nigeria, and the acquisition of a 5.06% stake in NextDecade in line with the launch of RGLNG project in the US, • $3,738 million in the first half 2023, mainly related to the above items, as well as the acquisition of a 20% interest in the SARB and Umm Lulu concession in the United Arab Emirates, the acquisition of a 6.25% stake in the NFE LNG project in Qatar, and a 34% stake in a joint venture with Casa dos Ventos in Brazil. Divestments were: • $162 million in the second quarter 2023, notably for the sale of shares in Maxeon, • $431 million in the first half 2023, notably for the above item as well as the sale of 50% of the Marketing & Services subsidiary in Egypt. (16) These adjustment elements are explained page 22. (17) Total net income adjustment items are detailed page 18 as well as in the annexes to the accounts. 12 |
|
5.5 Net cash flow TotalEnergies' net cash flow(18) was: • $3,894 million in the second quarter 2023 compared to $3,201 million in the first quarter, reflecting the $1,136 million decrease in cash flow offset by the $1,829 million decrease in net investments to $4,591 million in the second quarter 2023, • $7,095 million in the first half 2023 compared to $17,061 million a year earlier, reflecting the $6,753 million decrease in cash flow and the $3,213 million increase in net investments to $11,011 million in the first half 2023. In the second quarter, cash flow from operations was $9,900 million compared to $8,485 million of operating cash flow before working capital changes, reflecting a $1.5 billion decrease in working capital requirements, mainly due to the effects of lower inventories, seasonality of payment of the gas and power marketing business, and despite a decrease in tax payables and the tax payment schedule notably in the Exploration & Production segment. 5.6 Profitability Return on equity was 25.2% for the twelve months ended June 30, 2023. Return on average capital employed(19) was 22.4% for the twelve months ended June 30, 2023. 6. TotalEnergies SE statutory accounts Net income for TotalEnergies SE, the parent company, amounted to €7,040 million in the first half 2023, compared to €3,702 million in the first half 2022. 7. Annual 2023 Sensitivities* * Sensitivities are revised once per year upon publication of the previous year’s fourth quarter results. Sensitivities are estimates based on assumptions about TotalEnergies’ portfolio in 2023. Actual results could vary significantly from estimates based on the application of these sensitivities. The impact of the $-€ sensitivity on adjusted net operating income is essentially attributable to Refining & Chemicals. ** In a 80 $/b Brent environment. (18) Net cash flow = operating cash flow before working capital changes - net investments (including other transactions with non-controlling interest). (19) ROACE is the ratio of Adjusted net operating income to Average capital employed between the beginning and the end of the period. Adjusted net income Average adjusted shareholders' equity Return on equity (ROE) 25.2% 29.7% 27.1% In millions of dollars July 1, 2022 April 1, 2022 July 1, 2021 June 30, 2023 March 31, 2023 June 30, 2022 30,716 113,333 29,351 34,219 116,329 115,233 Adjusted net operating income Average capital employed ROACE 137,204 140,842 139,377 22.4% 25.4% 23.1% 30,776 35,712 32,177 In millions of dollars July 1, 2022 April 1, 2022 July 1, 2021 June 30, 2023 March 31, 2023 June 30, 2022 Change Estimated impact on adjusted net operating income Estimated impact on cash flow from operations Dollar +/- 0.1 $ per € -/+ 0.1 B$ ~0 B$ Average liquids price** +/- 10 $/b +/- 2.5 B$ +/- 3.0 B$ European gas price - NBP / TTF +/- 2 $/Mbtu +/- 0.4 B$ +/- 0.4 B$ Variable cost margin, European refining (VCM) +/- 10 $/t +/- 0.4 B$ +/- 0.5 B$ 13 |
|
8. Outlook Oil prices have remained buoyant at around $75/b for several months now, supported by OPEC+ actions. Demand for petroleum products should be supported as the summer driving season is ongoing and the global recovery for air travel continues. European natural gas prices are currently around $10/Mbtu due to high inventories in Europe. Demand recovery in Asia and tension on supply capacities in Europe support forward prices above $15/Mbtu for the winter of 2023/2024. Given the evolution of oil and gas prices in recent months and the lag effect on price formulas, TotalEnergies anticipates that its average LNG selling price should be between $9 and $10/Mbtu in the third quarter 2023. For the third quarter 2023, TotalEnergies anticipates hydrocarbon production of around 2.5 Mboe/d, notably supported by the start-up of Absheron field in Azerbaijan. The utilization rate in refineries should remain above 80%. The Company confirms 2023 guidance of net investments between $16 and $18 billion, including $5 billion in low-carbon energies. * * * * To listen to the conference call with CEO Patrick Pouyanné and CFO Jean-Pierre Sbraire today at 12:00 (Paris time), please log on to totalenergies.com or dial +44 (0) 121 281 8004 or +1 (718) 705-8796. The conference replay will be available on the Company's website totalenergies.com after the event. * * * * TotalEnergies contacts Media Relations: +33 (0)1 47 44 46 99 l presse@totalenergies.com l @TotalEnergiesPR Investor Relations: +33 (0)1 47 44 46 46 l ir@totalenergies.com 14 |
|
9. Operating information by segment 9.1 Company’s production (Exploration & Production + Integrated LNG) 2Q23 1Q23 2Q22 2Q23 vs 2Q22 Combined liquids and gas production by region (kboe/d) 1H23 1H22 1H23 vs 1H22 537 583 907 -41% Europe 559 933 -40% 481 494 460 +5% Africa 488 479 +2% 767 718 680 +13% Middle East and North Africa 743 675 +10% 443 441 420 +5% Americas 442 403 +10% 243 288 271 -10% Asia-Pacific 266 301 -12% 2,471 2,524 2,738 -10% Total production 2,498 2,791 -10% 338 344 690 -51% includes equity affiliates 341 702 -51% 2Q23 1Q23 2Q22 2Q23 vs 2Q22 Liquids production by region (kb/d) 1H23 1H22 1H23 vs 1H22 227 235 267 -15% Europe 231 283 -18% 359 371 351 +2% Africa 365 362 +1% 615 578 546 +13% Middle East and North Africa 596 542 +10% 268 263 231 +16% Americas 266 216 +23% 102 116 88 +16% Asia-Pacific 109 102 +6% 1,571 1,562 1,483 +6% Total production 1,567 1,505 +4% 153 150 201 -24% includes equity affiliates 152 206 -26% 2Q23 1Q23 2Q22 2Q23 vs 2Q22 Gas production by region (Mcf/d) 1H23 1H22 1H23 vs 1H22 1,671 1,879 3,440 -51% Europe 1,774 3,498 -49% 610 615 545 +12% Africa 612 594 +3% 834 772 742 +12% Middle East and North Africa 803 734 +9% 976 994 1,063 -8% Americas 985 1,052 -6% 754 931 1,045 -28% Asia-Pacific 843 1,119 -25% 4,845 5,191 6,835 -29% Total production 5,017 6,997 -28% 1,004 1,054 2,633 -62% includes equity affiliates 1,029 2,673 -62% 15 |
|
9.2 Downstream (Refining & Chemicals and Marketing & Services) * 1Q23 data restated * Olefins, polymers. 2Q23 1Q23 2Q22 2Q23 vs 2Q22 Petroleum product sales by region (kb/d) 1H23 1H22 1H23 vs 1H22 1,709 1,600 1,814 -6% Europe* 1,655 1,724 -4% 599 667 734 -18% Africa 633 747 -15% 918 849 922 - Americas 883 849 +4% 665 623 705 -6% Rest of world 644 618 +4% 3,892 3,739 4,176 -7% Total consolidated sales* 3,815 3,939 -3% 424 387 409 +4% Includes bulk sales 405 409 -1% 2,070 1,992 2,290 -10% Includes trading* 2,031 2,065 -2% 2Q23 1Q23 2Q22 2Q23 vs 2Q22 Petrochemicals production* (kt) 1H23 1H22 1H23 vs 1H22 1,026 1,047 1,023 - Europe 2,073 2,282 -9% 619 607 603 +3% Americas 1,226 1,240 -1% 475 753 768 -38% Middle East and Asia 1,228 1,549 -21% 16 |
|
9.3 Renewables (1) Includes 20% of the gross capacities of Adani Green Energy Limited, 50% of Clearway Energy Group and, from 1Q23, 49% of Casa dos Ventos. (2) End-of-period data. Installed power generation gross capacity (GW) (1),(2) Solar Onshore Wind Offshore Wind Other Total Solar Onshore Wind Offshore Wind Other Total France 0.8 0.6 0.0 0.1 1.6 0.8 0.6 0.0 0.2 1.5 Rest of Europe 0.2 1.1 0.8 0.0 2.1 0.2 1.1 0.5 0.0 1.8 Africa 0.1 0.0 0.0 0.0 0.2 0.1 0.0 0.0 0.0 0.2 Middle East 1.2 0.0 0.0 0.0 1.2 1.2 0.0 0.0 0.0 1.2 North America 3.5 2.1 0.0 0.1 5.6 3.0 2.1 0.0 0.1 5.1 South America 0.4 1.0 0.0 0.0 1.4 0.4 0.9 0.0 0.0 1.3 India 5.1 0.4 0.0 0.0 5.5 5.0 0.4 0.0 0.0 5.4 Asia-Pacific 1.4 0.0 0.1 0.0 1.5 1.3 0.0 0.1 0.0 1.5 Total 12.5 5.2 1.0 0.3 19.0 12.0 5.0 0.7 0.3 17.9 Power generation gross capacity from renewables in construction (GW) (1),(2) Solar Onshore Wind Offshore Wind Other Total Solar Onshore Wind Offshore Wind Other Total France 0.2 0.1 0.0 0.0 0.3 0.2 0.1 0.0 0.0 0.4 Rest of Europe 0.1 0.0 0.3 0.0 0.5 0.1 0.0 0.6 0.0 0.7 Africa 0.0 0.0 0.0 0.0 0.0 0.0 0.0 0.0 0.0 0.0 Middle East 0.1 0.0 0.0 0.0 0.1 0.0 0.0 0.0 0.0 0.0 North America 2.8 0.1 0.0 0.5 3.4 2.7 0.1 0.0 0.5 3.4 South America 0.1 0.2 0.0 0.0 0.3 0.1 0.6 0.0 0.0 0.7 India 0.4 0.1 0.0 0.0 0.5 0.4 0.1 0.0 0.0 0.5 Asia-Pacific 0.0 0.0 0.5 0.0 0.6 0.0 0.0 0.5 0.0 0.6 Total 3.8 0.5 0.9 0.6 5.7 3.6 0.9 1.2 0.5 6.2 Power generation gross capacity from renewables in development (GW) (1),(2) Solar Onshore Wind Offshore Wind Other Total Solar Onshore Wind Offshore Wind Other Total France 1.0 0.6 0.0 0.0 1.6 0.9 0.2 0.0 0.0 1.2 Rest of Europe 5.4 0.4 4.4 0.1 10.3 3.6 0.4 4.4 0.1 8.4 Africa 0.6 0.3 0.0 0.1 1.0 0.7 0.3 0.0 0.1 1.1 Middle East 0.4 0.0 0.0 0.0 0.4 0.5 0.0 0.0 0.0 0.5 North America 9.0 3.2 4.1 5.1 21.3 10.7 2.8 4.1 4.5 22.1 South America 1.6 1.6 0.0 0.4 3.6 1.3 0.5 0.0 0.0 1.8 India 4.2 0.1 0.0 0.0 4.3 4.6 0.2 0.0 0.0 4.8 Asia-Pacific 3.2 0.4 2.9 0.9 7.5 2.4 0.4 2.9 0.7 6.4 Total 25.5 6.6 11.4 6.5 50.0 24.7 4.8 11.4 5.4 46.3 2Q23 1Q23 2Q23 1Q23 2Q23 1Q23 17 |
|
10. Adjustment items to net income (TotalEnergies share) 2Q23 1Q23 2Q22 In millions of dollars 1H23 1H22 (377) (159) (4,546) Special items affecting net income (TotalEnergies share) (536) (9,539) - 203 - Gain (loss) on asset sales 203 - (5) - (8) Restructuring charges (5) (11) (469) (60) (3,719) Impairments (529) (8,780) 97 (302) (819) Other (205) (748) (380) (391) 993 After-tax inventory effect : FIFO vs. replacement cost (771) 2,033 (111) (434) (551) Effect of changes in fair value (545) (631) (868) (984) (4,104) Total adjustments affecting net income (1,852) (8,137) 18 |
|
11. Reconciliation of adjusted EBITDA with consolidated financial statements 11.1 Reconciliation of net income (TotalEnergies share) to adjusted EBITDA 11.2 Reconciliation of revenues from sales to adjusted EBITDA and net income (TotalEnergies share) 2Q23 1Q23 2Q22 2Q23 vs 2Q22 In millions of dollars 1H23 1H22 1H23 vs 1H22 4,088 5,557 5,692 -28% Net income - TotalEnergies share 9,645 10,636 -9% 868 984 4,104 -79% Less: adjustment items to net income (TotalEnergies share) 1,852 8,137 -77% 4,956 6,541 9,796 -49% Adjusted net income - TotalEnergies share 11,497 18,773 -39% Adjusted items 61 74 89 -31% Add: non-controlling interests 135 165 -18% 2,715 4,090 5,274 -49% Add: income taxes 6,805 9,998 -32% 2,959 3,026 3,038 -3% Add: depreciation, depletion and impairment of tangible assets and mineral interests 5,985 6,186 -3% 92 99 98 -6% Add: amortization and impairment of intangible assets 191 194 -2% 724 710 572 +27% Add: financial interest on debt 1,434 1,034 +39% (402) (373) (130) ns Less: financial income and expense from cash & cash equivalents (775) (189) ns 11,105 14,167 18,737 -41% Adjusted EBITDA 25,272 36,161 -30% 2Q23 1Q23 2Q22 2Q23 vs 2Q22 In millions of dollars 1H23 1H22 1H23 vs 1H22 Adjusted items 51,458 58,309 70,460 -27% Revenues from sales 109,767 134,398 -18% (33,379) (37,479) (46,023) ns Purchases, net of inventory variation (70,858) (86,785) ns (7,754) (7,752) (7,620) ns Other operating expenses (15,506) (15,029) ns (62) (94) (117) ns Exploration costs (156) (253) ns 116 77 429 -73% Other income 193 550 -65% (164) (38) (431) ns Other expense, excluding amortization and impairment of intangible assets (202) (604) ns 401 248 231 +74% Other financial income 649 350 +85% (173) (183) (136) ns Other financial expense (356) (271) ns 662 1,079 1,944 -66% Net income (loss) from equity affiliates 1,741 3,805 -54% 11,105 14,167 18,737 -41% Adjusted EBITDA 25,272 36,161 -30% Adjusted items (2,959) (3,026) (3,038) ns Less: depreciation, depletion and impairment of tangible assets and mineral interests (5,985) (6,186) ns (92) (99) (98) ns Less: amortization of intangible assets (191) (194) ns (724) (710) (572) ns Less: financial interest on debt (1,434) (1,034) ns 402 373 130 x3.1 Add: financial income and expense from cash & cash equivalents 775 189 x4.1 (2,715) (4,090) (5,274) ns Less: income taxes (6,805) (9,998) ns (61) (74) (89) ns Less: non-controlling interests (135) (165) ns (868) (984) (4,104) ns Add: adjustment - TotalEnergies share (1,852) (8,137) ns 4,088 5,557 5,692 -28% Net income - TotalEnergies share 9,645 10,636 -9% 19 |
|
12. Investments - Divestments * Change in debt from renewable projects (TotalEnergies share and partner share). 13. Cash flow * Operating cash flow before working capital changes, is defined as cash flow from operating activities before changes in working capital at replacement cost, excluding the mark-to-market effect of Integrated LNG and Integrated Power sectors’ contracts and including capital gain from renewable projects sale. Historical data have been restated to cancel the impact of fair valuation of Integrated LNG and Integrated Power sectors’ contracts. ** Changes in working capital are presented excluding the mark-to-market effect of Integrated LNG and Integrated Power sectors’ contracts. 2Q23 1Q23 2Q22 2Q23 vs 2Q22 In millions of dollars 1H23 1H22 1H23 vs 1H22 4,271 3,433 2,819 +51% Organic investments ( a ) 7,704 4,800 +60% 328 205 98 x3.3 Capitalized exploration 533 212 x2.5 366 374 277 +32% Increase in non-current loans 740 511 +45% (84) (229) (174) ns Repayment of non-current loans, excluding organic loan repayment from equity affiliates (313) (609) ns - - (190) -100% Change in debt from renewable projects (TotalEnergies share) - (190) -100% 482 3,256 2,464 -80% Acquisitions ( b ) 3,738 3,864 -3% 162 269 388 -58% Asset sales ( c ) 431 866 -50% (35) (3) 176 ns Change in debt from renewable projects (partner share) (38) 174 ns 320 2,987 2,076 -85% Net acquisitions 3,307 2,998 +10% 4,591 6,420 4,895 -6% Net investments ( a + b - c ) 11,011 7,798 +41% - - - ns Other transactions with non-controlling interests ( d ) - - ns (18) 6 (238) ns Organic loan repayment from equity affiliates ( e ) (12) (725) ns (35) (3) 366 ns Change in debt from renewable projects financing * ( f ) (38) 364 ns 64 60 37 +73% Capex linked to capitalized leasing contracts ( g ) 124 73 +70% 1 1 4 -75% Expenditures related to carbon credits ( h ) 2 4 -50% 4,473 6,362 4,982 -10% Cash flow used in investing activities ( a + b - c + d + e + f - g - h ) 10,835 7,360 +47% 2Q23 1Q23 2Q22 2Q23 vs 2Q22 In millions of dollars 1H23 1H22 1H23 vs 1H22 9 900 5 133 16 284 -39% Cash flow from operations 15 033 23 901 -37% 1 720 (3 989) 2 161 -20% Less (Increase) decrease in working capital ** (2 269) (2 614) ns (252) (502) 1 151 ns Less Inventory effect (754) 2 406 ns (35) (3) (23) ns Less Capital gain from renewable project sales (38) (25) ns (18) 6 (238) ns Less Organic loan repayments from equity affiliates (12) (725) ns 8 485 9 621 13 233 -36% = Operating cash flow before working capital changes ( a ) * 18 106 24 859 -27% (112) (153) (399) ns Financial charges (265) (767) ns 8 596 9 774 13 631 -37% Operating cash flow before working capital changes w/o financial charges (DACF) 18 371 25 626 -28% 4 271 3 433 2 819 +51% Organic investments ( b ) 7 704 4 800 +60% 4 214 6 188 10 414 -60% Free cash flow after organic investments, w/o net asset sales ( a - b ) 10 402 20 059 -48% 4 591 6 420 4 895 -6% Net investments ( c ) 11 011 7 798 +41% 3 894 3 201 8 338 -53% Net cash flow ( a - c ) 7 095 17 061 -58% 20 |
|
14. Gearing ratio (1) Excludes leases receivables and leases debts. (2) Including initial margins held as part of the Company's activities on organized markets. 15. Return on average capital employed(20) Twelve months ended June 30, 2023 Twelve months ended March 31, 2023 * At replacement cost (excluding after-tax inventory effect). (20) ROACE is the ratio of Adjusted net operating income to Average capital employed between the beginning and the end of the period. In millions of dollars 06/30/2023 03/31/2023 06/30/2022 Current borrowings (1) 13,980 16,280 14,589 Other current financial liabilities 443 597 401 Current financial assets (1),(2) (6,397) (7,223) (7,697) Net financial assets classified as held for sale (1) (41) (38) (14) Non-current financial debt (1) 33,387 34,820 39,233 Non-current financial assets (1) (1,264) (1,101) (692) Cash and cash equivalents (25,572) (27,985) (32,848) Net debt (a) 14,536 15,350 12,972 Shareholders’ equity - TotalEnergies share 113,682 115,581 116,688 Non-controlling interests 2,770 2,863 3,309 Shareholders' equity (b) 116,452 118,444 119,997 Net-debt-to-capital ratio = a / (a+b) 11.1% 11.5% 9.8% Leases (c) 8,090 8,131 7,963 Net-debt-to-capital ratio including leases (a+c) / (a+b+c) 16.3% 16.5% 14.9% In millions of dollars Exploration & Production Integrated LNG Integrated Power Refining & Chemicals Marketing & Services Company Adjusted net operating income 12,747 9,223 1,537 6,044 1,541 30,776 Capital employed at 06/30/2022* 70,248 41,606 12,568 7,958 7,475 137,035 Capital employed at 06/30/2023* 68,530 34,598 17,804 9,698 8,796 137,372 ROACE 18.4% 24.2% 10.1% 68.5% 18.9% 22.4% In millions of dollars Exploration & Production Integrated LNG Integrated Power Refining & Chemicals Marketing & Services Company Adjusted net operating income 15,117 10,108 1,427 7,800 1,558 35,712 Capital employed at 03/31/2022* 71,518 44,803 9,937 8,847 7,751 141,853 Capital employed at 03/31/2023* 67,658 34,183 18,982 10,115 8,811 139,830 ROACE 21.7% 25.6% 9.9% 82.3% 18.8% 25.4% 21 |
|
Disclaimer: The terms “TotalEnergies”, “TotalEnergies company” and “Company” in this document are used to designate TotalEnergies SE and the consolidated entities directly or indirectly controlled by TotalEnergies SE. Likewise, the words “we”, “us” and “our” may also be used to refer to these entities or their employees. The entities in which TotalEnergies SE directly or indirectly owns a shareholding are separate and independent legal entities. This document does not constitute the half-year financial report, which will be separately published in accordance with article L. 451-1-2-III of the French Code monétaire et financier and applicable UK law, and available on the website totalenergies.com. This press release presents the results for the second quarter 2023 and half-year 2023 from the consolidated financial statements of TotalEnergies SE as of June 30, 2023 (unaudited). The limited review procedures by the Statutory Auditors are underway. The notes to the consolidated financial statements (unaudited) are available on the website totalenergies.com. This document may contain forward-looking statements (including forward-looking statements within the meaning of the Private Securities Litigation Reform Act of 1995), notably with respect to the financial condition, results of operations, business activities and industrial strategy of TotalEnergies. This document may also contain statements regarding the perspectives, objectives, areas of improvement and goals of TotalEnergies, including with respect to climate change and carbon neutrality (net zero emissions). An ambition expresses an outcome desired by TotalEnergies, it being specified that the means to be deployed do not depend solely on TotalEnergies. These forward-looking statements may generally be identified by the use of the future or conditional tense or forward-looking words such as “envisions”, “intends”, “anticipates”, “believes”, “considers”, “plans”, “expects”, “thinks”, “targets”, “aims” or similar terminology. Such forward-looking statements included in this document are based on economic data, estimates and assumptions prepared in a given economic, competitive and regulatory environment and considered to be reasonable by TotalEnergies as of the date of this document. These forward-looking statements are not historical data and should not be interpreted as assurances that the perspectives, objectives or goals announced will be achieved. They may prove to be inaccurate in the future, and may evolve or be modified with a significant difference between the actual results and those initially estimated, due to the uncertainties notably related to the economic, financial, competitive and regulatory environment, or due to the occurrence of risk factors, such as, notably, the price fluctuations in crude oil and natural gas, the evolution of the demand and price of petroleum products, the changes in production results and reserves estimates, the ability to achieve cost reductions and operating efficiencies without unduly disrupting business operations, changes in laws and regulations including those related to the environment and climate, currency fluctuations, as well as economic and political developments, changes in market conditions, loss of market share and changes in consumer preferences, or pandemics such as the COVID-19 pandemic. Additionally, certain financial information is based on estimates particularly in the assessment of the recoverable value of assets and potential impairments of assets relating thereto. Neither TotalEnergies SE nor any of its subsidiaries assumes any obligation to update publicly any forward-looking information or statement, objectives or trends contained in this document whether as a result of new information, future events or otherwise. The information on risk factors that could have a significant adverse effect on TotalEnergies’ business, financial condition, including its operating income and cash flow, reputation, outlook or the value of financial instruments issued by TotalEnergies is provided in the most recent version of the Universal Registration Document which is filed by TotalEnergies SE with the French Autorité des Marchés Financiers and the annual report on Form 20-F filed with the United States Securities and Exchange Commission (“SEC”). Financial information by business segment is reported in accordance with the internal reporting system and shows internal segment information that is used to manage and measure the performance of TotalEnergies. In addition to IFRS measures, certain alternative performance indicators are presented, such as performance indicators excluding the adjustment items described below (adjusted operating income, adjusted net operating income, adjusted net income), return on equity (ROE), return on average capital employed (ROACE), gearing ratio, operating cash flow before working capital changes, the shareholder rate of return. These indicators are meant to facilitate the analysis of the financial performance of TotalEnergies and the comparison of income between periods. They allow investors to track the measures used internally to manage and measure the performance of TotalEnergies. These adjustment items include: (i) Special items Due to their unusual nature or particular significance, certain transactions qualified as "special items" are excluded from the business segment figures. In general, special items relate to transactions that are significant, infrequent or unusual. However, in certain instances, transactions such as restructuring costs or asset disposals, which are not considered to be representative of the normal course of business, may be qualified as special items although they may have occurred within prior years or are likely to occur again within the coming years. (ii) Inventory valuation effect The adjusted results of the Refining & Chemicals and Marketing & Services segments are presented according to the replacement cost method. This method is used to assess the segments’ performance and facilitate the comparability of the segments’ performance with those of TotalEnergies’ principal competitors. In the replacement cost method, which approximates the LIFO (Last-In, First-Out) method, the variation of inventory values in the statement of income is, depending on the nature of the inventory, determined using either the month-end price differentials between one period and another or the average prices of the period rather than the historical value. The inventory valuation effect is the difference between the results according to the FIFO (First-In, First-Out) and the replacement cost. (iii) Effect of changes in fair value The effect of changes in fair value presented as an adjustment item reflects, for some transactions, differences between internal measures of performance used by TotalEnergies’ management and the accounting for these transactions under IFRS. IFRS requires that trading inventories be recorded at their fair value using period-end spot prices. In order to best reflect the management of economic exposure through derivative transactions, internal indicators used to measure performance include valuations of trading inventories based on forward prices. TotalEnergies, in its trading activities, enters into storage contracts, whose future effects are recorded at fair value in TotalEnergies’ internal economic performance. IFRS precludes recognition of this fair value effect. Furthermore, TotalEnergies enters into derivative instruments to risk manage certain operational contracts or assets. Under IFRS, these derivatives are recorded at fair value while the underlying operational transactions are recorded as they occur. Internal indicators defer the fair value on derivatives to match with the transaction occurrence. The adjusted results (adjusted operating income, adjusted net operating income, adjusted net income) are defined as replacement cost results, adjusted for special items, excluding the effect of changes in fair value. Euro amounts presented for the fully adjusted-diluted earnings per share represent dollar amounts converted at the average euro-dollar (€-$) exchange rate for the applicable period and are not the result of financial statements prepared in euros. Cautionary Note to U.S. Investors – The SEC permits oil and gas companies, in their filings with the SEC, to separately disclose proved, probable and possible reserves that a company has determined in accordance with SEC rules. We may use certain terms in this press release, such as “potential reserves” or “resources”, that the SEC’s guidelines strictly prohibit us from including in filings with the SEC. U.S. investors are urged to consider closely the disclosure in the Form 20-F of TotalEnergies SE, File N° 1-10888, available from us at 2, place Jean Millier – Arche Nord Coupole/Regnault - 92078 Paris-La Défense Cedex, France, or at our website totalenergies.com. You can also obtain this form from the SEC by calling 1-800-SEC-0330 or on the SEC’s website sec.gov. 22 |
|
Second Quarter 2023: Main Indicators Paris, July 18, 2023 – The main indicators, estimated financial information and key elements impacting TotalEnergies’ second quarter 2023 aggregates are shown below: * Sales in $ / Sales in volume for consolidated affiliates. ** Sales in $ / Sales in volume for consolidated and equity affiliates. *** This indicator represents the average margin on variable costs realized by TotalEnergies’ European refining business (equal to the difference between the sales of refined products realized by TotalEnergies’ European refining and the crude purchases as well as associated variable costs, divided by refinery throughput in tons). (1) Does not take include oil, gas and LNG trading activities, respectively. Main elements impacting the quarter aggregates • Hydrocarbon production is expected at nearly 2.5 Mboe/d this quarter, down about 50 kboe/d compared to the previous quarter mainly due to planned maintenance in the North Sea. Exploration & Production results are expected to be in line with the evolution of the environment. • Despite the expected significant impact of a less favorable environment on results from the Integrated LNG segment, illustrated by an average LNG price near 10 $/Mbtu, cash flow should remain high thanks to high margins captured in 2022 for 2023 deliveries. • Integrated Power results are expected to be above $400 million, higher than previous quarter. • Downstream results are expected to be in line with the decrease in refining margins. • A working capital release is expected, which should provide a tailwind to cash flow. 2023 Sensitivities* * Sensitivities are revised once per year upon publication of the previous year’s fourth quarter results. Sensitivities are estimates based on assumptions about TotalEnergies’ portfolio in 2023. Actual results could vary significantly from estimates based on the application of these sensitivities. The impact of the $-€ sensitivity on adjusted net operating income is essentially attributable to Refining & Chemicals. ** In a 80 $/b Brent environment. Main indicators 2Q23 1Q23 4Q22 3Q22 2Q22 €/$ 1.09 1.07 1.02 1.01 1.06 Brent ($/b) 78.1 81.2 88.8 100.8 113.9 Average liquids price * (1) ($/b) 72.0 73.4 80.6 93.6 102.9 Average gas price * (1) ($/Mbtu) 5.98 8.89 12.74 16.83 11.01 Average LNG price ** (1) ($/Mbtu) 9.84 13.27 14.83 21.51 13.96 Variable Cost Margin, European refining *** ($/t) 42.7 87.8 73.6 99.2 145.7 Change Estimated impact on adjusted net operating income Estimated impact on cash flow from operations Dollar +/- 0.1 $ per € -/+ 0.1 B$ ~0 B$ Average liquids price** +/- 10 $/b +/- 2.5 B$ +/- 3.0 B$ European gas price - NBP / TTF +/- 2 $/Mbtu +/- 0.4 B$ +/- 0.4 B$ Variable cost margin, European refining (VCM) +/- 10 $/t +/- 0.4 B$ +/- 0.5 B$ 23 |
|
Disclaimer The terms “TotalEnergies”, “TotalEnergies company” and “Company” in this document are used to designate TotalEnergies SE and the consolidated entities directly or indirectly controlled by TotalEnergies SE. Likewise, the words “we”, “us” and “our” may also be used to refer to these entities or their employees. The entities in which TotalEnergies SE directly or indirectly owns a shareholding are separate and independent legal entities. The data presented in this document is based on TotalEnergies’ internal preliminary reporting and is not audited. This data is not intended to be a comprehensive summary of all items that will affect TotalEnergies SE’s results or to provide an estimate of the first quarter 2023 results. Actual results may vary. To the extent permitted by law, TotalEnergies SE disclaims all liability from the use of this data. This document may contain forward-looking statements within the meaning of the Private Securities Litigation Reform Act of 1995, notably with respect to the financial condition, results of operations, business activities and industrial strategy of TotalEnergies. This document may also contain statements regarding the perspectives, objectives, areas of improvement and goals of TotalEnergies, including with respect to climate change and carbon neutrality (net zero emissions). An ambition expresses an outcome desired by TotalEnergies, it being specified that the means to be deployed do not depend solely on TotalEnergies. These forward-looking statements may generally be identified by the use of the future or conditional tense or forward-looking words such as “envisions”, “intends”, “anticipates”, “believes”, “considers”, “plans”, “expects”, “thinks”, “targets”, “aims” or similar terminology. Such forward-looking statements included in this document are based on economic data, estimates and assumptions prepared in a given economic, competitive and regulatory environment and considered to be reasonable by TotalEnergies as of the date of this document. These forward-looking statements are not historical data and should not be interpreted as assurances that the perspectives, objectives or goals announced will be achieved. They may prove to be inaccurate in the future, and may evolve or be modified with a significant difference between the actual results and those initially estimated, due to the uncertainties notably related to the economic, financial, competitive and regulatory environment, or due to the occurrence of risk factors, such as, notably, the price fluctuations in crude oil and natural gas, the evolution of the demand and price of petroleum products, the changes in production results and reserves estimates, the ability to achieve cost reductions and operating efficiencies without unduly disrupting business operations, changes in laws and regulations including those related to the environment and climate, currency fluctuations, as well as economic and political developments, changes in market conditions, loss of market share and changes in consumer preferences, or pandemics such as the COVID-19 pandemic. Additionally, certain financial information is based on estimates particularly in the assessment of the recoverable value of assets and potential impairments of assets relating thereto. Neither TotalEnergies SE nor any of its subsidiaries assumes any obligation to update publicly any forward-looking information or statement, objectives or trends contained in this document whether as a result of new information, future events or otherwise. The information on risk factors that could have a significant adverse effect on TotalEnergies’ business, financial condition, including its operating income and cash flow, reputation, outlook or the value of financial instruments issued by TotalEnergies is provided in the most recent version of the Universal Registration Document which is filed by TotalEnergies SE with the French Autorité des Marchés Financiers and the annual report on Form 20-F filed with the United States Securities and Exchange Commission (“SEC”). Financial information by business segment is reported in accordance with the internal reporting system and shows internal segment information that is used to manage and measure the performance of TotalEnergies. In addition to IFRS measures, certain alternative performance indicators are presented, such as performance indicators excluding certain adjustment items (i.e., special items, inventory valuation effect and effect of changes in fair value) -adjusted net operating income, adjusted net income). These indicators are meant to facilitate the analysis of the financial performance of TotalEnergies and the comparison of income between periods. They allow investors to track the measures used internally to manage and measure the performance of TotalEnergies. The adjusted results (adjusted net operating income, adjusted net income) are defined as replacement cost results, adjusted for special items, excluding the effect of changes in fair value. For further details on the adjustment items, please refer to the last published earnings statement and notes to the consolidated financial statements. 24 |
|
TotalEnergies financial statements Second quarter and first half 2023 consolidated accounts, IFRS 25 |
|
CONSOLIDATED STATEMENT OF INCOME TotalEnergies (unaudited) 2 nd quarter 1 st quarter 2 nd quarter (M$)(a) 2023 2023 2022 Sales 56,271 62,603 74,774 Excise taxes (4,737) (4,370) (4,329) Revenues from sales 51,534 58,233 70,445 Purchases, net of inventory variation (33,864) (38,351) (45,443) Other operating expenses (7,906) (7,785) (8,041) Exploration costs (62) (92) (117) Depreciation, depletion and impairment of tangible assets and mineral interests (3,106) (3,062) (3,102) Other income 116 341 429 Other expense (366) (300) (1,305) Financial interest on debt (724) (710) (572) Financial income and expense from cash & cash equivalents 510 393 245 Cost of net debt (214) (317) (327) Other financial income 413 258 231 Other financial expense (173) (183) (136) Net income (loss) from equity affiliates 267 960 (1,546) Income taxes (2,487) (4,071) (5,284) Consolidated net income 4,152 5,631 5,804 TotalEnergies share 4,088 5,557 5,692 Non-controlling interests 64 74 112 Earnings per share ($) 1.65 2.23 2.18 Fully-diluted earnings per share ($) 1.64 2.21 2.16 (a) Except for per share amounts. 26 |
|
CONSOLIDATED STATEMENT OF COMPREHENSIVE INCOME TotalEnergies (unaudited) 2 nd quarter 1 st quarter 2 nd quarter (M$) 2023 2023 2022 Consolidated net income 4,152 5,631 5,804 Other comprehensive income Actuarial gains and losses 135 3 204 Change in fair value of investments in equity instruments (1) 4 (20) Tax effect (43) (8) (53) Currency translation adjustment generated by the parent company (57) 1,466 (5,387) Items not potentially reclassifiable to profit and loss 34 1,465 (5,256) Currency translation adjustment (49) (1,250) 2,523 Cash flow hedge 689 1,202 3,222 Variation of foreign currency basis spread 11 (3) 21 share of other comprehensive income of equity affiliates, net amount 3 (98) 2,548 Other (4) 3 (1) Tax effect (136) (336) (1,112) Items potentially reclassifiable to profit and loss 514 (482) 7,201 Total other comprehensive income (net amount) 548 983 1,945 Comprehensive income 4,700 6,614 7,749 TotalEnergies share 4,676 6,550 7,705 Non-controlling interests 24 64 44 27 |
|
CONSOLIDATED STATEMENT OF INCOME TotalEnergies (unaudited) 1 st half 1 st half (M$)(a) 2023 2022 Sales 118,874 143,380 Excise taxes (9,107) (8,985) Revenues from sales 109,767 134,395 Purchases, net of inventory variation (72,215) (85,091) Other operating expenses (15,691) (15,664) Exploration costs (154) (978) Depreciation, depletion and impairment of tangible assets and mineral interests (6,168) (6,781) Other income 457 572 Other expense (666) (3,595) Financial interest on debt (1,434) (1,034) Financial income and expense from cash & cash equivalents 903 459 Cost of net debt (531) (575) Other financial income 671 434 Other financial expense (356) (271) Net income (loss) from equity affiliates 1,227 (1,503) Income taxes (6,558) (10,088) Consolidated net income 9,783 10,855 TotalEnergies share 9,645 10,636 Non-controlling interests 138 219 Earnings per share ($) 3.88 4.04 Fully-diluted earnings per share ($) 3.86 4.02 (a) Except for per share amounts. 28 |
|
CONSOLIDATED STATEMENT OF COMPREHENSIVE INCOME TotalEnergies (unaudited) 1 st half 1 st half (M$) 2023 2022 Consolidated net income 9,783 10,855 Other comprehensive income Actuarial gains and losses 138 204 Change in fair value of investments in equity instruments 3 (17) Tax effect (51) (42) Currency translation adjustment generated by the parent company 1,409 (7,137) Items not potentially reclassifiable to profit and loss 1,499 (6,992) Currency translation adjustment (1,299) 3,535 Cash flow hedge 1,891 2,959 Variation of foreign currency basis spread 8 70 share of other comprehensive income of equity affiliates, net amount (95) 2,464 Other (1) (1) Tax effect (472) (1,059) Items potentially reclassifiable to profit and loss 32 7,968 Total other comprehensive income (net amount) 1,531 976 Comprehensive income 11,314 11,831 TotalEnergies share 11,226 11,658 Non-controlling interests 88 173 29 |
|
CONSOLIDATED BALANCE SHEET TotalEnergies June 30, 2023 March 31, 2023 December 31, 2022 June 30, 2022 (M$) (unaudited) (unaudited) (unaudited) ASSETS Non-current assets Intangible assets, net 31,717 33,234 31,931 37,020 Property, plant and equipment, net 104,174 107,499 107,101 101,454 Equity affiliates : investments and loans 30,425 29,997 27,889 28,210 Other investments 1,190 1,209 1,051 1,383 Non-current financial assets 2,494 2,357 2,731 1,612 Deferred income taxes 3,649 4,772 5,049 4,737 Other non-current assets 2,573 2,709 2,388 3,075 Total non-current assets 176,222 181,777 178,140 177,491 Current assets Inventories, net 18,785 22,786 22,936 28,542 Accounts receivable, net 22,163 24,128 24,378 30,796 Other current assets 23,111 28,153 36,070 55,553 Current financial assets 6,725 7,535 8,746 7,863 Cash and cash equivalents 25,572 27,985 33,026 32,848 Assets classified as held for sale 8,441 668 568 313 Total current assets 104,797 111,255 125,724 155,915 Total assets 281,019 293,032 303,864 333,406 LIABILITIES & SHAREHOLDERS' EQUITY Shareholders' equity Common shares 7,850 7,828 8,163 8,163 Paid-in surplus and retained earnings 123,511 123,357 123,951 125,554 Currency translation adjustment (12,859) (12,784) (12,836) (14,019) Treasury shares (4,820) (2,820) (7,554) (3,010) Total shareholders' equity - TotalEnergies share 113,682 115,581 111,724 116,688 Non-controlling interests 2,770 2,863 2,846 3,309 Total shareholders' equity 116,452 118,444 114,570 119,997 Non-current liabilities Deferred income taxes 11,237 11,300 11,021 12,169 Employee benefits 1,872 1,840 1,829 2,341 Provisions and other non-current liabilities 21,295 21,270 21,402 23,373 Non-current financial debt 40,427 42,915 45,264 46,868 Total non-current liabilities 74,831 77,325 79,516 84,751 Current liabilities Accounts payable 32,853 36,037 41,346 49,700 Other creditors and accrued liabilities 38,609 42,578 52,275 62,498 Current borrowings 15,542 17,884 15,502 16,003 Other current financial liabilities 443 597 488 401 Liabilities directly associated with the assets classified as held for sale 2,289 167 167 56 Total current liabilities 89,736 97,263 109,778 128,658 Total liabilities & shareholders' equity 281,019 293,032 303,864 333,406 30 |
|
CONSOLIDATED STATEMENT OF CASH FLOW TotalEnergies (unaudited) 2 nd quarter 1 st quarter 2 nd quarter (M$) 2023 2023 2022 CASH FLOW FROM OPERATING ACTIVITIES Consolidated net income 4,152 5,631 5,804 Depreciation, depletion, amortization and impairment 3,195 3,187 3,321 Non-current liabilities, valuation allowances and deferred taxes 81 314 1,427 (Gains) losses on disposals of assets (70) (252) (165) Undistributed affiliates' equity earnings 383 (349) 2,999 (Increase) decrease in working capital 2,125 (3,419) 2,498 Other changes, net 34 21 400 Cash flow from operating activities 9,900 5,133 16,284 CASH FLOW USED IN INVESTING ACTIVITIES Intangible assets and property, plant and equipment additions (3,870) (4,968) (5,150) Acquisitions of subsidiaries, net of cash acquired (19) (136) (82) Investments in equity affiliates and other securities (522) (1,407) (136) Increase in non-current loans (366) (389) (278) Total expenditures (4,777) (6,900) (5,646) Proceeds from disposals of intangible assets and property, plant and equipment 31 68 153 Proceeds from disposals of subsidiaries, net of cash sold 38 183 63 Proceeds from disposals of non-current investments 133 49 35 Repayment of non-current loans 102 238 413 Total divestments 304 538 664 Cash flow used in investing activities (4,473) (6,362) (4,982) CASH FLOW USED IN FINANCING ACTIVITIES Issuance (repayment) of shares: - Parent company shareholders 383 - 371 - Treasury shares (2,002) (2,103) (1,988) Dividends paid: - Parent company shareholders (1,842) (1,844) (1,825) - Non-controlling interests (105) (21) (97) Net issuance (repayment) of perpetual subordinated notes (1,081) - (1,958) Payments on perpetual subordinated notes (80) (158) (138) Other transactions with non-controlling interests (13) (86) (10) Net issuance (repayment) of non-current debt (14) 118 508 Increase (decrease) in current borrowings (4,111) (1,274) (2,703) Increase (decrease) in current financial assets and liabilities 990 1,394 (731) Cash flow from (used in) financing activities (7,875) (3,974) (8,571) Net increase (decrease) in cash and cash equivalents (2,448) (5,203) 2,731 Effect of exchange rates 35 162 (1,159) Cash and cash equivalents at the beginning of the period 27,985 33,026 31,276 Cash and cash equivalents at the end of the period 25,572 27,985 32,848 31 |
|
CONSOLIDATED STATEMENT OF CASH FLOW TotalEnergies (unaudited) 1 st half 1 st half (M$) 2023 2022 CASH FLOW FROM OPERATING ACTIVITIES Consolidated net income 9,783 10,855 Depreciation, depletion, amortization and impairment 6,382 7,899 Non-current liabilities, valuation allowances and deferred taxes 395 3,965 (Gains) losses on disposals of assets (322) (178) Undistributed affiliates' equity earnings 34 3,261 (Increase) decrease in working capital (1,294) (2,425) Other changes, net 55 524 Cash flow from operating activities 15,033 23,901 CASH FLOW USED IN INVESTING ACTIVITIES Intangible assets and property, plant and equipment additions (8,838) (8,607) Acquisitions of subsidiaries, net of cash acquired (155) (82) Investments in equity affiliates and other securities (1,929) (225) Increase in non-current loans (755) (519) Total expenditures (11,677) (9,433) Proceeds from disposals of intangible assets and property, plant and equipment 99 330 Proceeds from disposals of subsidiaries, net of cash sold 221 151 Proceeds from disposals of non-current investments 182 250 Repayment of non-current loans 340 1,342 Total divestments 842 2,073 Cash flow used in investing activities (10,835) (7,360) CASH FLOW USED IN FINANCING ACTIVITIES Issuance (repayment) of shares: - Parent company shareholders 383 371 - Treasury shares (4,105) (3,164) Dividends paid: - Parent company shareholders (3,686) (3,753) - Non-controlling interests (126) (119) Net issuance (repayment) of perpetual subordinated notes (1,081) - Payments on perpetual subordinated notes (238) (274) Other transactions with non-controlling interests (99) (5) Net issuance (repayment) of non-current debt 104 542 Increase (decrease) in current borrowings (5,385) (2,046) Increase (decrease) in current financial assets and liabilities 2,384 4,863 Cash flow from (used in) financing activities (11,849) (3,585) Net increase (decrease) in cash and cash equivalents (7,651) 12,956 Effect of exchange rates 197 (1,450) Cash and cash equivalents at the beginning of the period 33,026 21,342 Cash and cash equivalents at the end of the period 25,572 32,848 32 |
|
CONSOLIDATED STATEMENT OF CHANGES IN SHAREHOLDERS' EQUITY TotalEnergies (unaudited) Common shares issued Paid-in surplus and retained earnings Currency translation adjustment Treasury shares Shareholders' equity - TotalEnergies Share Non-controlling interests Total shareholders' equity (M$) Number Amount Number Amount As of January 1, 2022 2,640,429,329 8,224 117,849 (12,671) (33,841,104) (1,666) 111,736 3,263 114,999 Net income of the first half 2022 - - 10,636 - - - 10,636 219 10,855 Other comprehensive income - - 2,370 (1,348) - - 1,022 (46) 976 Comprehensive Income - - 13,006 (1,348) - - 11,658 173 11,831 Dividend - - (3,803) - - - (3,803) (119) (3,922) Issuance of common shares 9,367,482 26 345 - - - 371 - 371 Purchase of treasury shares - - - - (58,458,536) (3,164) (3,164) - (3,164) Sale of treasury shares(a) - - (315) - 6,168,197 315 - - - Share-based payments - - 157 - - - 157 - 157 Share cancellation (30,665,526) (87) (1,418) - 30,665,526 1,505 - - - Net issuance (repayment) of perpetual subordinated notes - - (44) - - - (44) - (44) Payments on perpetual subordinated notes - - (183) - - - (183) - (183) Other operations with non-controlling interests - - 4 - - - 4 (9) (5) Other items - - (44) - - - (44) 1 (43) As of June 30, 2022 2,619,131,285 8,163 125,554 (14,019) (55,465,917) (3,010) 116,688 3,309 119,997 Net income of the second half 2022 - - 9,890 - - - 9,890 299 10,189 Other comprehensive income - - (5,303) 1,174 - - (4,129) 44 (4,085) Comprehensive Income - - 4,587 1,174 - - 5,761 343 6,104 Dividend - - (6,186) - - - (6,186) (417) (6,603) Issuance of common shares - - (1) - - - (1) - (1) Purchase of treasury shares - - - - (81,749,207) (4,547) (4,547) - (4,547) Sale of treasury shares(a) - - (3) - 27,457 3 - - - Share-based payments - - 72 - - - 72 - 72 Share cancellation - - - - - - - - - Net issuance (repayment) of perpetual subordinated notes - - - - - - - - - Payments on perpetual subordinated notes - - (148) - - - (148) - (148) Other operations with non-controlling interests - - 41 9 - - 50 46 96 Other items - - 35 - - - 35 (435) (400) As of December 31, 2022 2,619,131,285 8,163 123,951 (12,836) (137,187,667) (7,554) 111,724 2,846 114,570 Net income of the first half 2023 - - 9,645 - - - 9,645 138 9,783 Other comprehensive income - - 1,576 5 - - 1,581 (50) 1,531 Comprehensive Income - - 11,221 5 - - 11,226 88 11,314 Dividend - - (3,868) - - - (3,868) (126) (3,994) Issuance of common shares 8,002,155 22 361 - - - 383 - 383 Purchase of treasury shares - - - - (66,647,852) (4,705) (4,705) - (4,705) Sale of treasury shares(a) - - (396) - 6,461,256 396 - - - Share-based payments - - 172 - - - 172 - 172 Share cancellation (128,869,261) (335) (6,708) - 128,869,261 7,043 - - - Net issuance (repayment) of perpetual subordinated notes - - (1,107) - - - (1,107) - (1,107) Payments on perpetual subordinated notes - - (151) - - - (151) - (151) Other operations with non-controlling interests - - 39 (28) - - 11 (38) (27) Other items - - (3) - - - (3) - (3) As of June 30, 2023 2,498,264,179 7,850 123,511 (12,859) (68,505,002) (4,820) 113,682 2,770 116,452 (a)Treasury shares related to the performance share grants. 33 |
|
INFORMATION BY BUSINESS SEGMENT TotalEnergies (unaudited) 2 nd quarter 2023 Exploration & Production Integrated LNG Integrated Power Refining & Chemicals Marketing & Services Corporate Intercompany Total (M$) External sales 1,434 2,020 6,249 24,849 21,712 7 - 56,271 Intersegment sales 10,108 2,778 670 8,630 201 64 (22,451) - Excise taxes - - - (231) (4,506) - - (4,737) Revenues from sales 11,542 4,798 6,919 33,248 17,407 71 (22,451) 51,534 Operating expenses (5,162) (3,797) (6,334) (32,042) (16,672) (276) 22,451 (41,832) Depreciation, depletion and impairment of tangible assets and mineral interests (2,117) (277) (51) (394) (241) (26) - (3,106) Operating income 4,263 724 534 812 494 (231) - 6,596 Net income (loss) from equity affiliates and other items (15) 472 (250) 3 64 (17) - 257 Tax on net operating income (1,889) (137) (41) (187) (162) (40) - (2,456) Net operating income 2,359 1,059 243 628 396 (288) - 4,397 Net cost of net debt (245) Non-controlling interests (64) Net income - TotalEnergies share 4,088 2 nd quarter 2023 (adjustments)(a) Exploration & Production Integrated LNG Integrated Power Refining & Chemicals Marketing & Services Corporate Intercompany Total (M$) External sales - 76 - - - - - 76 Intersegment sales - - - - - - - - Excise taxes - - - - - - - - Revenues from sales - 76 - - - - - 76 Operating expenses (25) (400) 137 (216) (76) (57) - (637) Depreciation, depletion and impairment of tangible assets and mineral interests (147) - - - - - - (147) Operating income (b) (172) (324) 137 (216) (76) (57) - (708) Net income (loss) from equity affiliates and other items (106) 16 (346) (59) - 2 - (493) Tax on net operating income 288 37 2 (101) 23 15 - 264 Net operating income (b) 10 (271) (207) (376) (53) (40) - (937) Net cost of net debt 72 Non-controlling interests (3) Net income - TotalEnergies share (868) (a) Adjustments include special items, inventory valuation effect and the effect of changes in fair value. (b) Of which inventory valuation effect - On operating income - - (192) (60) - - On net operating income - - (332) (45) - 2 nd quarter 2023 (adjusted) Exploration & Production Integrated LNG Integrated Power Refining & Chemicals Marketing & Services Corporate Intercompany Total (M$) External sales 1,434 1,944 6,249 24,849 21,712 7 - 56,195 Intersegment sales 10,108 2,778 670 8,630 201 64 (22,451) - Excise taxes - - - (231) (4,506) - - (4,737) Revenues from sales 11,542 4,722 6,919 33,248 17,407 71 (22,451) 51,458 Operating expenses (5,137) (3,397) (6,471) (31,826) (16,596) (219) 22,451 (41,195) Depreciation, depletion and impairment of tangible assets and mineral interests (1,970) (277) (51) (394) (241) (26) - (2,959) Adjusted operating income 4,435 1,048 397 1,028 570 (174) - 7,304 Net income (loss) from equity affiliates and other items 91 456 96 62 64 (19) - 750 Tax on net operating income (2,177) (174) (43) (86) (185) (55) - (2,720) Adjusted net operating income 2,349 1,330 450 1,004 449 (248) - 5,334 Net cost of net debt (317) Non-controlling interests (61) Adjusted net income - TotalEnergies share 4,956 2 nd quarter 2023 Exploration & Production Integrated LNG Integrated Power Refining & Chemicals Marketing & Services Corporate Intercompany Total (M$) Total expenditures 2,569 626 807 489 256 30 - 4,777 Total divestments 26 45 149 52 28 4 - 304 Cash flow from operating activities 4,047 1,332 2,284 1,923 665 (351) - 9,900 34 |
|
INFORMATION BY BUSINESS SEGMENT TotalEnergies (unaudited) 1 st quarter 2023 Exploration & Production Integrated LNG Integrated Power Refining & Chemicals Marketing & Services Corporate Intercompany Total (M$) External sales 1,954 4,872 8,555 24,855 22,359 8 - 62,603 Intersegment sales 10,728 5,999 1,685 9,061 120 57 (27,650) - Excise taxes - - - (184) (4,186) - - (4,370) Revenues from sales 12,682 10,871 10,240 33,732 18,293 65 (27,650) 58,233 Operating expenses (4,762) (9,445) (9,831) (31,892) (17,787) (161) 27,650 (46,228) Depreciation, depletion and impairment of tangible assets and mineral interests (2,066) (288) (47) (414) (224) (23) - (3,062) Operating income 5,854 1,138 362 1,426 282 (119) - 8,943 Net income (loss) from equity affiliates and other items 68 804 (70) 52 243 (21) - 1,076 Tax on net operating income (3,398) (205) (111) (325) (119) 63 - (4,095) Net operating income 2,524 1,737 181 1,153 406 (77) - 5,924 Net cost of net debt (293) Non-controlling interests (74) Net income - TotalEnergies share 5,557 1 st quarter 2023 (adjustments)(a) Exploration & Production Integrated LNG Integrated Power Refining & Chemicals Marketing & Services Corporate Intercompany Total (M$) External sales - (76) - - - - - (76) Intersegment sales - - - - - - - - Excise taxes - - - - - - - - Revenues from sales - (76) - - - - - (76) Operating expenses (8) (300) (70) (424) (101) - - (903) Depreciation, depletion and impairment of tangible assets and mineral interests - - - (36) - - - (36) Operating income (b) (8) (376) (70) (460) (101) - - (1,015) Net income (loss) from equity affiliates and other items (73) (4) (111) (37) 217 - - (8) Tax on net operating income (48) 45 (8) 32 10 - - 31 Net operating income (b) (129) (335) (189) (465) 126 - - (992) Net cost of net debt 8 Non-controlling interests - Net income - TotalEnergies share (984) (a) Adjustments include special items, inventory valuation effect and the effect of changes in fair value. (b) Of which inventory valuation effect - On operating income - - (415) (87) - - On net operating income - - (327) (64) - 1 st quarter 2023 (adjusted) Exploration & Production Integrated LNG Integrated Power Refining & Chemicals Marketing & Services Corporate Intercompany Total (M$) External sales 1,954 4,948 8,555 24,855 22,359 8 - 62,679 Intersegment sales 10,728 5,999 1,685 9,061 120 57 (27,650) - Excise taxes - - - (184) (4,186) - - (4,370) Revenues from sales 12,682 10,947 10,240 33,732 18,293 65 (27,650) 58,309 Operating expenses (4,754) (9,145) (9,761) (31,468) (17,686) (161) 27,650 (45,325) Depreciation, depletion and impairment of tangible assets and mineral interests (2,066) (288) (47) (378) (224) (23) - (3,026) Adjusted operating income 5,862 1,514 432 1,886 383 (119) - 9,958 Net income (loss) from equity affiliates and other items 141 808 41 89 26 (21) - 1,084 Tax on net operating income (3,350) (250) (103) (357) (129) 63 - (4,126) Adjusted net operating income 2,653 2,072 370 1,618 280 (77) - 6,916 Net cost of net debt (301) Non-controlling interests (74) Adjusted net income - TotalEnergies share 6,541 1 st quarter 2023 Exploration & Production Integrated LNG Integrated Power Refining & Chemicals Marketing & Services Corporate Intercompany Total (M$) Total expenditures 4,052 1,195 1,234 225 159 35 - 6,900 Total divestments 31 49 149 8 301 - - 538 Cash flow from operating activities 4,536 3,536 (1,285) (851) (673) (130) - 5,133 35 |
|
INFORMATION BY BUSINESS SEGMENT TotalEnergies (unaudited) 2 nd quarter 2022 Exploration & Production Integrated LNG Integrated Power Refining & Chemicals Marketing & Services Corporate Intercompany Total (M$) External sales 2,521 3,901 6,380 35,061 26,907 4 - 74,774 Intersegment sales 13,805 3,940 488 12,785 716 70 (31,804) - Excise taxes - - - (186) (4,143) - - (4,329) Revenues from sales 16,326 7,841 6,868 47,660 23,480 74 (31,804) 70,445 Operating expenses (5,760) (6,144) (7,392) (43,242) (22,310) (557) 31,804 (53,601) Depreciation, depletion and impairment of tangible assets and mineral interests (2,112) (276) (51) (389) (241) (33) - (3,102) Operating income 8,454 1,421 (575) 4,029 929 (516) - 13,742 Net income (loss) from equity affiliates and other items (3,668) 626 197 349 98 71 - (2,327) Tax on net operating income (3,876) (292) 32 (866) (296) (8) - (5,306) Net operating income 910 1,755 (346) 3,512 731 (453) - 6,109 Net cost of net debt (305) Non-controlling interests (112) Net income - TotalEnergies share 5,692 2 nd quarter 2022 (adjustments)(a) Exploration & Production Integrated LNG Integrated Power Refining & Chemicals Marketing & Services Corporate Intercompany Total (M$) External sales - (15) - - - - - (15) Intersegment sales - - - - - - - - Excise taxes - - - - - - - - Revenues from sales - (15) - - - - - (15) Operating expenses (82) 152 (758) 775 373 (301) - 159 Depreciation, depletion and impairment of tangible assets and mineral interests (46) (14) - - (4) - - (64) Operating income (b) (128) 123 (758) 775 369 (301) - 80 Net income (loss) from equity affiliates and other items (3,756) (560) 2 52 (4) - - (4,266) Tax on net operating income 75 (23) 70 (75) (100) 78 - 25 Net operating income (b) (3,809) (460) (686) 752 265 (223) - (4,161) Net cost of net debt 80 Non-controlling interests (23) Net income - TotalEnergies share (4,104) (a) Adjustments include special items, inventory valuation effect and the effect of changes in fair value. (b) Of which inventory valuation effect - On operating income - - 775 376 - - On net operating income - - 752 275 - 2 nd quarter 2022 (adjusted) Exploration & Production Integrated LNG Integrated Power Refining & Chemicals Marketing & Services Corporate Intercompany Total (M$) External sales 2,521 3,916 6,380 35,061 26,907 4 - 74,789 Intersegment sales 13,805 3,940 488 12,785 716 70 (31,804) - Excise taxes - - - (186) (4,143) - - (4,329) Revenues from sales 16,326 7,856 6,868 47,660 23,480 74 (31,804) 70,460 Operating expenses (5,678) (6,296) (6,634) (44,017) (22,683) (256) 31,804 (53,760) Depreciation, depletion and impairment of tangible assets and mineral interests (2,066) (262) (51) (389) (237) (33) - (3,038) Adjusted operating income 8,582 1,298 183 3,254 560 (215) - 13,662 Net income (loss) from equity affiliates and other items 88 1,186 195 297 102 71 - 1,939 Tax on net operating income (3,951) (269) (38) (791) (196) (86) - (5,331) Adjusted net operating income 4,719 2,215 340 2,760 466 (230) - 10,270 Net cost of net debt (385) Non-controlling interests (89) Adjusted net income - TotalEnergies share 9,796 2 nd quarter 2022 Exploration & Production Integrated LNG Integrated Power Refining & Chemicals Marketing & Services Corporate Intercompany Total (M$) Total expenditures 4,128 285 587 333 288 25 - 5,646 Total divestments 63 393 73 56 72 7 - 664 Cash flow from operating activities 8,768 3,802 168 3,526 580 (560) - 16,284 36 |
|
INFORMATION BY BUSINESS SEGMENT TotalEnergies (unaudited) 1 sthalf 2023 Exploration & Production Integrated LNG Integrated Power Refining & Chemicals Marketing & Services Corporate Intercompany Total (M$) External sales 3,388 6,892 14,804 49,704 44,071 15 - 118,874 Intersegment sales 20,836 8,777 2,355 17,691 321 121 (50,101) - Excise taxes - - - (415) (8,692) - - (9,107) Revenues from sales 24,224 15,669 17,159 66,980 35,700 136 (50,101) 109,767 Operating expenses (9,924) (13,242) (16,165) (63,934) (34,459) (437) 50,101 (88,060) Depreciation, depletion and impairment of tangible assets and mineral interests (4,183) (565) (98) (808) (465) (49) - (6,168) Operating income 10,117 1,862 896 2,238 776 (350) - 15,539 Net income (loss) from equity affiliates and other items 53 1,276 (320) 55 307 (38) - 1,333 Tax on net operating income (5,287) (342) (152) (512) (281) 23 - (6,551) Net operating income 4,883 2,796 424 1,781 802 (365) - 10,321 Net cost of net debt (538) Non-controlling interests (138) Net income - TotalEnergies share 9,645 1 sthalf 2023 (adjustments)(a) Exploration & Production Integrated LNG Integrated Power Refining & Chemicals Marketing & Services Corporate Intercompany Total (M$) External sales - - - - - - - - Intersegment sales - - - - - - - - Excise taxes - - - - - - - - Revenues from sales - - - - - - - - Operating expenses (33) (700) 67 (640) (177) (57) - (1,540) Depreciation, depletion and impairment of tangible assets and mineral interests (147) - - (36) - - - (183) Operating income (b) (180) (700) 67 (676) (177) (57) - (1,723) Net income (loss) from equity affiliates and other items (179) 12 (457) (96) 217 2 - (501) Tax on net operating income 240 82 (6) (69) 33 15 - 295 Net operating income (b) (119) (606) (396) (841) 73 (40) - (1,929) Net cost of net debt 80 Non-controlling interests (3) Net income - TotalEnergies share (1,852) (a) Adjustments include special items, inventory valuation effect and the effect of changes in fair value. (b) Of which inventory valuation effect - On operating income - - (607) (147) - - On net operating income - - (659) (109) - 1 sthalf 2023 (adjusted) Exploration & Production Integrated LNG Integrated Power Refining & Chemicals Marketing & Services Corporate Intercompany Total (M$) External sales 3,388 6,892 14,804 49,704 44,071 15 - 118,874 Intersegment sales 20,836 8,777 2,355 17,691 321 121 (50,101) - Excise taxes - - - (415) (8,692) - - (9,107) Revenues from sales 24,224 15,669 17,159 66,980 35,700 136 (50,101) 109,767 Operating expenses (9,891) (12,542) (16,232) (63,294) (34,282) (380) 50,101 (86,520) Depreciation, depletion and impairment of tangible assets and mineral interests (4,036) (565) (98) (772) (465) (49) - (5,985) Adjusted operating income 10,297 2,562 829 2,914 953 (293) - 17,262 Net income (loss) from equity affiliates and other items 232 1,264 137 151 90 (40) - 1,834 Tax on net operating income (5,527) (424) (146) (443) (314) 8 - (6,846) Adjusted net operating income 5,002 3,402 820 2,622 729 (325) - 12,250 Net cost of net debt (618) Non-controlling interests (135) Adjusted net income - TotalEnergies share 11,497 1 sthalf 2023 Exploration & Production Integrated LNG Integrated Power Refining & Chemicals Marketing & Services Corporate Intercompany Total (M$) Total expenditures 6,621 1,821 2,041 714 415 65 - 11,677 Total divestments 57 94 298 60 329 4 - 842 Cash flow from operating activities 8,583 4,868 999 1,072 (8) (481) - 15,033 37 |
|
INFORMATION BY BUSINESS SEGMENT TotalEnergies (unaudited) 1 sthalf 2022 Exploration & Production Integrated LNG Integrated Power Refining & Chemicals Marketing & Services Corporate Intercompany Total (M$) External sales 4,672 9,408 13,167 66,069 50,056 8 - 143,380 Intersegment sales 27,623 7,438 1,009 22,062 983 133 (59,248) - Excise taxes - - - (378) (8,607) - - (8,985) Revenues from sales 32,295 16,846 14,176 87,753 42,432 141 (59,248) 134,395 Operating expenses (11,468) (13,030) (14,686) (80,653) (40,294) (850) 59,248 (101,733) Depreciation, depletion and impairment of tangible assets and mineral interests (4,773) (554) (94) (769) (514) (77) - (6,781) Operating income 16,054 3,262 (604) 6,331 1,624 (786) - 25,881 Net income (loss) from equity affiliates and other items (3,426) (1,869) 192 505 56 179 - (4,363) Tax on net operating income (7,739) (553) (1) (1,391) (521) 97 - (10,108) Net operating income 4,889 840 (413) 5,445 1,159 (510) - 11,410 Net cost of net debt (555) Non-controlling interests (219) Net income - TotalEnergies share 10,636 1 sthalf 2022 (adjustments)(a) Exploration & Production Integrated LNG Integrated Power Refining & Chemicals Marketing & Services Corporate Intercompany Total (M$) External sales - (18) 15 - - - - (3) Intersegment sales - - - - - - - - Excise taxes - - - - - - - - Revenues from sales - (18) 15 - - - - (3) Operating expenses (873) 45 (768) 1,722 641 (433) - 334 Depreciation, depletion and impairment of tangible assets and mineral interests (539) (14) - - (33) (9) - (595) Operating income (b) (1,412) 13 (753) 1,722 608 (442) - (264) Net income (loss) from equity affiliates and other items (3,770) (4,508) 11 169 (7) 106 - (7,999) Tax on net operating income 337 (13) 71 (326) (180) 98 - (13) Net operating income (b) (4,845) (4,508) (671) 1,565 421 (238) - (8,276) Net cost of net debt 193 Non-controlling interests (54) Net income - TotalEnergies share (8,137) (a) Adjustments include special items, inventory valuation effect and the effect of changes in fair value. (b) Of which inventory valuation effect - On operating income - - 1,722 684 - - On net operating income - - 1,597 503 - 1 sthalf 2022 (adjusted) Exploration & Production Integrated LNG Integrated Power Refining & Chemicals Marketing & Services Corporate Intercompany Total (M$) External sales 4,672 9,426 13,152 66,069 50,056 8 - 143,383 Intersegment sales 27,623 7,438 1,009 22,062 983 133 (59,248) - Excise taxes - - - (378) (8,607) - - (8,985) Revenues from sales 32,295 16,864 14,161 87,753 42,432 141 (59,248) 134,398 Operating expenses (10,595) (13,075) (13,918) (82,375) (40,935) (417) 59,248 (102,067) Depreciation, depletion and impairment of tangible assets and mineral interests (4,234) (540) (94) (769) (481) (68) - (6,186) Adjusted operating income 17,466 3,249 149 4,609 1,016 (344) - 26,145 Net income (loss) from equity affiliates and other items 344 2,639 181 336 63 73 - 3,636 Tax on net operating income (8,076) (540) (72) (1,065) (341) (1) - (10,095) Adjusted net operating income 9,734 5,348 258 3,880 738 (272) - 19,686 Net cost of net debt (748) Non-controlling interests (165) Adjusted net income - TotalEnergies share 18,773 1 sthalf 2022 Exploration & Production Integrated LNG Integrated Power Refining & Chemicals Marketing & Services Corporate Intercompany Total (M$) Total expenditures 6,099 575 1,736 561 428 34 - 9,433 Total divestments 346 1,237 244 83 151 12 - 2,073 Cash flow from operating activities 14,536 6,021 (1,736) 4,633 1,478 (1,031) - 23,901 38 |
|
Reconciliation of the information by business segment with Consolidated Financial Statements TotalEnergies (unaudited) Consolidated 2 nd quarter 2023 statement (M$) Adjusted Adjustments(a) of income Sales 56,195 76 56,271 Excise taxes (4,737) - (4,737) Revenues from sales 51,458 76 51,534 Purchases net of inventory variation (33,379) (485) (33,864) Other operating expenses (7,754) (152) (7,906) Exploration costs (62) - (62) Depreciation, depletion and impairment of tangible assets and mineral interests (2,959) (147) (3,106) Other income 116 - 116 Other expense (256) (110) (366) Financial interest on debt (724) - (724) Financial income and expense from cash & cash equivalents 402 108 510 Cost of net debt (322) 108 (214) Other financial income 401 12 413 Other financial expense (173) - (173) Net income (loss) from equity affiliates 662 (395) 267 Income taxes (2,715) 228 (2,487) Consolidated net income 5,017 (865) 4,152 TotalEnergies share 4,956 (868) 4,088 Non-controlling interests 61 3 64 (a) Adjustments include special items, inventory valuation effect and the effect of changes in fair value. Consolidated 2 nd quarter 2022 statement (M$) Adjusted Adjustments(a) of income Sales 74,789 (15) 74,774 Excise taxes (4,329) - (4,329) Revenues from sales 70,460 (15) 70,445 Purchases net of inventory variation (46,023) 580 (45,443) Other operating expenses (7,620) (421) (8,041) Exploration costs (117) - (117) Depreciation, depletion and impairment of tangible assets and mineral interests (3,038) (64) (3,102) Other income 429 - 429 Other expense (529) (776) (1,305) Financial interest on debt (572) - (572) Financial income and expense from cash & cash equivalents 130 115 245 Cost of net debt (442) 115 (327) Other financial income 231 - 231 Other financial expense (136) - (136) Net income (loss) from equity affiliates 1,944 (3,490) (1,546) Income taxes (5,274) (10) (5,284) Consolidated net income 9,885 (4,081) 5,804 TotalEnergies share 9,796 (4,104) 5,692 Non-controlling interests 89 23 112 (a) Adjustments include special items, inventory valuation effect and the effect of changes in fair value. 39 |
|
Reconciliation of the information by business segment with Consolidated Financial Statements TotalEnergies (unaudited) Consolidated 1 sthalf 2023 statement of (M$) Adjusted Adjustments(a) income Sales 118,874 - 118,874 Excise taxes (9,107) - (9,107) Revenues from sales 109,767 - 109,767 Purchases net of inventory variation (70,858) (1,357) (72,215) Other operating expenses (15,506) (185) (15,691) Exploration costs (156) 2 (154) Depreciation, depletion and impairment of tangible assets and mineral interests (5,985) (183) (6,168) Other income 193 264 457 Other expense (393) (273) (666) Financial interest on debt (1,434) - (1,434) Financial income and expense from cash & cash equivalents 775 128 903 Cost of net debt (659) 128 (531) Other financial income 649 22 671 Other financial expense (356) - (356) Net income (loss) from equity affiliates 1,741 (514) 1,227 Income taxes (6,805) 247 (6,558) Consolidated net income 11,632 (1,849) 9,783 TotalEnergies share 11,497 (1,852) 9,645 Non-controlling interests 135 3 138 (a) Adjustments include special items, inventory valuation effect and the effect of changes in fair value. Consolidated 1 sthalf 2022 statement of (M$) Adjusted Adjustments(a) income Sales 143,383 (3) 143,380 Excise taxes (8,985) - (8,985) Revenues from sales 134,398 (3) 134,395 Purchases net of inventory variation (86,785) 1,694 (85,091) Other operating expenses (15,029) (635) (15,664) Exploration costs (253) (725) (978) Depreciation, depletion and impairment of tangible assets and mineral interests (6,186) (595) (6,781) Other income 550 22 572 Other expense (798) (2,797) (3,595) Financial interest on debt (1,034) - (1,034) Financial income and expense from cash & cash equivalents 189 270 459 Cost of net debt (845) 270 (575) Other financial income 350 84 434 Other financial expense (271) - (271) Net income (loss) from equity affiliates 3,805 (5,308) (1,503) Income taxes (9,998) (90) (10,088) Consolidated net income 18,938 (8,083) 10,855 TotalEnergies share 18,773 (8,137) 10,636 Non-controlling interests 165 54 219 (a) Adjustments include special items, inventory valuation effect and the effect of changes in fair value. 40 |
Exhibit 99.13
|
PRESS RELEASE |
TotalEnergies announces the second interim dividend of
€0.74/share for fiscal year 2023,
an increase of 7.25% compared to 2022
Paris, 27th July 2023 - The Board of Directors meeting on July 26, 2023 under the chairmanship of Mr. Patrick Pouyanné, Chairman and Chief Executive Officer, decided the distribution of the second 2023 interim dividend of 0.74 €/share, an increase of 7.25% compared to the three interim dividends paid for fiscal year 2022 and identical to the final ordinary dividend for fiscal year 2022 and to the first 2023 interim. This increase is in line with the shareholder return policy confirmed by the Board of Directors in February 2023 and reiterated at the Annual General Meeting of May 26, 2023.
This interim dividend will be paid in cash exclusively, according to the following timetable:
| Shareholders | ADS holders | |||||
| Ex-dividend date | January 2, 2024 | 28 December 2023 | ||||
| Payment date | January 12, 2024 | 25 January 2024 |
____
About TotalEnergies
TotalEnergies is a global multi-energy company that produces and markets energies: oil and biofuels, natural gas and green gases, renewables and electricity. Our more than 100,000 employees are committed to energy that is ever more affordable, cleaner, more reliable and accessible to as many people as possible. Active in nearly 130 countries, TotalEnergies puts sustainable development in all its dimensions at the heart of its projects and operations to contribute to the well-being of people.
Contacts TotalEnergies
Media Relations : +33 (0)1 47 44 46 99 l presse@totalenergies.com l
@TotalEnergiesPR Investor Relations : +33 (0)1 47 44 46 46 l ir@totalenergies.com
|
@TotalEnergies | |
TotalEnergies | |
TotalEnergies | |
TotalEnergies |
Cautionary Note
The terms “TotalEnergies”, “TotalEnergies company” or “Company” in this document are used to designate TotalEnergies SE and the consolidated entities that are directly or indirectly controlled by TotalEnergies SE. Likewise, the words “we”, “us” and “our” may also be used to refer to these entities or to their employees. The entities in which TotalEnergies SE directly or indirectly owns a shareholding are separate legal entities. TotalEnergies SE has no liability for the acts or omissions of these entities. This document may contain forward-looking information and statements that are based on a number of economic data and assumptions made in a given economic, competitive and regulatory environment. They may prove to be inaccurate in the future and are subject to a number of risk factors. Neither TotalEnergies SE nor any of its subsidiaries assumes any obligation to update publicly any forward-looking information or statement, objectives or trends contained in this document whether as a result of new information, future events or otherwise. Information concerning risk factors, that may affect TotalEnergies’ financial results or activities is provided in the most recent Registration Document, the French-language version of which is filed by TotalEnergies SE with the French securities regulator Autorité des Marchés Financiers (AMF), and in the Form 20-F filed with the United States Securities and Exchange Commission (SEC).
Exhibit 99.14
|
PRESS RELEASE |
Financial Report – 1st half 2023
Paris, 28 July, 2023 – The financial report of TotalEnergies SE for the first half 2023 was filed with the French Financial Markets Authority (Autorité des marchés financiers) on July 28, 2023. It can be consulted and downloaded from the website totalenergies.com, under the heading Investors / Results and Investor presentations / Results.
***
About TotalEnergies
TotalEnergies is a global multi-energy company that produces and markets energies: oil and biofuels, natural gas and green gases, renewables and electricity. Our more than 100,000 employees are committed to energy that is ever more affordable, cleaner, more reliable and accessible to as many people as possible. Active in more than 130 countries, TotalEnergies puts sustainable development in all its dimensions at the heart of its projects and operations to contribute to the well-being of people.
|
@TotalEnergies | |
TotalEnergies | |
TotalEnergies | |
TotalEnergies |
TotalEnergies Contacts
Media Relations: +33 (0)1 47 44 46 99 l presse@totalenergies.com l @TotalEnergiesPR
Investor Relations: +33 (0)1 47 44 46 46 l ir@totalenergies.com
Cautionary note
The terms “TotalEnergies”, “TotalEnergies company” or “Company” in this document are used to designate TotalEnergies SE and the consolidated entities that are directly or indirectly controlled by TotalEnergies SE. Likewise, the words “we”, “us” and “our” may also be used to refer to these entities or to their employees. The entities in which TotalEnergies SE directly or indirectly owns a shareholding are separate legal entities. This document may contain forward-looking information and statements that are based on a number of economic data and assumptions made in a given economic, competitive and regulatory environment. They may prove to be inaccurate in the future and are subject to a number of risk factors. Neither TotalEnergies SE nor any of its subsidiaries assumes any obligation to update publicly any forward-looking information or statement, objectives or trends contained in this document whether as a result of new information, future events or otherwise. Information concerning risk factors, that may affect TotalEnergies’ financial results or activities is provided in the most recent Universal Registration Document, the French-language version of which is filed by TotalEnergies SE with the French securities regulator Autorité des Marchés Financiers (AMF), and in the Form 20-F filed with the United States Securities and Exchange Commission (SEC).
Exhibit 99.15
Disclosure of Transactions in Own Shares
Paris, July 31, 2023 – In accordance with the authorization given by the ordinary shareholders’ general meeting on May 26, 2023, to trade on its shares and pursuant to applicable law on share repurchase, TotalEnergies SE (LEI: 529900S21EQ1BO4ESM68) declares the following purchases of its own shares (FR0000120271) from July 24 to July 28, 2023:
| Transaction Date | Total
daily volume (number of shares) |
Daily
weighted average purchase price of shares (EUR/share) |
Amount
of transactions (EUR) |
Market (MIC Code) | |
| 24/07/2023 | 377,374 | 54.479493 | 20,559,144.19 | XPAR | |
| 24/07/2023 | 95,000 | 54.485694 | 5,176,140.93 | CEUX | |
| 24/07/2023 | 25,000 | 54.485290 | 1,362,132.25 | TQEX | |
| 24/07/2023 | 25,000 | 54.494638 | 1,362,365.95 | AQEU | |
| 25/07/2023 | 383,944 | 54.537202 | 20,939,231.48 | XPAR | |
| 25/07/2023 | 95,000 | 54.539942 | 5,181,294.49 | CEUX | |
| 25/07/2023 | 20,000 | 54.566549 | 1,091,330.98 | TQEX | |
| 25/07/2023 | 25,000 | 54.551590 | 1,363,789.75 | AQEU | |
| 26/07/2023 | 386,939 | 53.843686 | 20,834,222.02 | XPAR | |
| 26/07/2023 | 93,863 | 53.844886 | 5,054,042.53 | CEUX | |
| 26/07/2023 | 24,914 | 53.821377 | 1,340,905.79 | TQEX | |
| 26/07/2023 | 24,640 | 53.809863 | 1,325,875.02 | AQEU | |
| 27/07/2023 | 384,076 | 54.162508 | 20,802,519.42 | XPAR | |
| 27/07/2023 | 100,000 | 54.164613 | 5,416,461.30 | CEUX | |
| 27/07/2023 | 20,000 | 54.166293 | 1,083,325.86 | TQEX | |
| 27/07/2023 | 20,000 | 54.167086 | 1,083,341.72 | AQEU | |
| 28/07/2023 | 403,062 | 54.243592 | 21,863,530.68 | XPAR | |
| 28/07/2023 | 100,000 | 54.240821 | 5,424,082.10 | CEUX | |
| 28/07/2023 | 25,000 | 54.242068 | 1,356,051.70 | TQEX | |
| 28/07/2023 | 25,000 | 54.251782 | 1,356,294.55 | AQEU | |
| Total | 2,653,812 | 54.252555 | 143,976,082.72 | ||
Transaction details
In accordance with Article 5(1)(b) of Regulation (EU) No 596/2014 (the Market Abuse Regulation) a full breakdown of the individual trades are disclosed on the TotalEnergies website:
https://totalenergies.com/investors/shares-and-dividends/total-shares/info/company-share-transactions
About TotalEnergies
TotalEnergies is a global multi-energy company that produces and markets energies: oil and biofuels, natural gas and green gases, renewables and electricity. Our more than 100,000 employees are committed to energy that is ever more affordable, cleaner, more reliable and accessible to as many people as possible. Active in nearly 130 countries, TotalEnergies puts sustainable development in all its dimensions at the heart of its projects and operations to contribute to the well-being of people.
TotalEnergies Contacts
Media Relations:+33 (0)1 47 44 46 99l presse@totalenergies.com l @TotalEnergiesPR
Investor Relations:+33 (0)1 47 44 46 46 l ir@totalenergies.com
|
@TotalEnergies | |
TotalEnergies | |
TotalEnergies | |
TotalEnergies |
Cautionary Note
The terms “TotalEnergies”, “TotalEnergies company” or “Company” in this document are used to designate TotalEnergies SE and the consolidated entities that are directly or indirectly controlled by TotalEnergies SE. Likewise, the words “we”, “us” and “our” may also be used to refer to these entities or to their employees. The entities in which TotalEnergies SE directly or indirectly owns a shareholding are separate legal entities. This document may contain forward-looking information and statements that are based on a number of economic data and assumptions made in a given economic, competitive and regulatory environment. They may prove to be inaccurate in the future and are subject to a number of risk factors. Neither TotalEnergies SE nor any of its subsidiaries assumes any obligation to update publicly any forward-looking information or statement, objectives or trends contained in this document whether as a result of new information, future events or otherwise. Information concerning risk factors, that may affect TotalEnergies’ financial results or activities is provided in the most recent Universal Registration Document, the French-language version of which is filed by TotalEnergies SE with the French securities regulator Autorité des Marchés Financiers (AMF), and in the Form 20-F filed with the United States Securities and Exchange Commission (SEC).