UNITED STATES
SECURITIES AND EXCHANGE COMMISSION
WASHINGTON, D.C. 20549
FORM 6-K
REPORT OF FOREIGN ISSUER
PURSUANT TO RULE 13a-16 OR 15b-16 OF
THE SECURITIES EXCHANGE ACT OF 1934
July 2023
Date of Report (Date of Earliest Event Reported)
Embotelladora Andina S.A.
(Exact name of registrant as specified in its charter)
Andina Bottling Company, Inc.
(Translation of Registrant´s name into English)
Avda. Miraflores 9153
Renca
Santiago, Chile
(Address of principal executive office)
Indicate by check mark whether the registrant files or will file annual reports under cover Form 20-F or Form 40-F.
Form 20-F x Form 40-F ¨
Indicate by check mark if the Registrant is submitting this Form 6-K in paper as permitted by Regulation S-T Rule 101(b)(1):
Yes ¨ No x
Indicate by check mark if the Registrant is submitting this Form 6-K in paper as permitted by Regulation S-T Rule 101(b)(7):
Yes ¨ No x
Indicate by check mark whether the registrant by furnishing the information contained in this Form 6-K is also thereby furnishing the information to the Commission pursuant to Rule 12g3-2(b) under the Securities Exchange Act of 1934
Yes ¨ No x

EXECUTIVE SUMMARY
 |
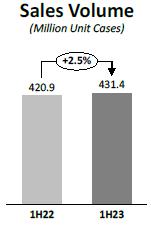
The quarter closed with a consolidated Sales Volume of 196.4 million unit cases*, increasing 1.8% regarding the same quarter of the previous year. Accumulated consolidated Sales Volume reached 431.4 million unit cases, representing a 2.5% increase regarding the previous year. |
|
|
Company figures reported are the following: |
| • | Consolidated Net Sales reached CLP 614,428 million in the quarter, increasing by 3.8% over the same quarter of the previous year. Accumulated consolidated Net Sales reached CLP 1,325,983 million, representing a 5.7% increase regarding the previous year. |
| • | Consolidated Operating Income* reached CLP 69,682 million in the quarter, representing a 9.1% increase over the same quarter of the previous year. Accumulated consolidated Operating Income reached CLP 169,868 million, an increase of 1.9% regarding the previous year. |
| • | Consolidated Adjusted EBITDA* increased by 6.3% over the same quarter of the previous year, reaching CLP 99,770 million in the quarter. Adjusted EBITDA Margin reached 16.2%, an expansion of 37 basis points regarding the same quarter of the previous year. Accumulated consolidated Adjusted EBITDA reached CLP 229,486 million, which represents an increase of 2.2% regarding the previous year. Adjusted EBITDA Margin for the period reached 17.3%, a contraction of 58 basis points regarding the previous year. |
| • | Net Income attributable to the owners of the controller for the quarter was CLP 12,192 million, representing a 52.3% decrease regarding the same quarter of the previous year. Accumulated Net Income attributable to the owners of the controller was CLP 52,931 million, which represents a 10.8% decrease regarding the previous year. |
SUMMARY OF RESULTS – SECOND QUARTER 2023 AND ACCUMULATED FOR THE FIRST HALF 2023
| (Figures in million CLP) | 2Q22 | 2Q23 | Var % | 1H22 | 1H23 | Var % | |||||||||||||||||||
| Sales Volume (Million Unit Cases) |
193.0 | 196.4 | 1.8 | % | 420.9 | 431.4 | 2.5 | % | |||||||||||||||||
| Net Sales | 591,716 | 614,428 | 3.8 | % | 1,254,914 | 1,325,983 | 5.7 | % | |||||||||||||||||
| Operating Income* | 63,896 | 69,682 | 9.1 | % | 166,774 | 169,868 | 1.9 | % | |||||||||||||||||
| Adjusted EBITDA* | 93,879 | 99,770 | 6.3 | % | 224,511 | 229,486 | 2.2 | % | |||||||||||||||||
| Net income attributable to the owners of the controller | 25,537 | 12,192 | -52.3 | % | 59,328 | 52,931 | -10.8 | % | |||||||||||||||||
Comment of the Chief Executive Officer. Mr. Miguel Ángel Peirano
"Our Brazilian and Paraguayan operations ended the second quarter with volume growth, while our Chilean operation ended with flat volume, and our Argentine operation's volume declined due in part to the economic situation in that country as well as an 8-day strike that affected production and sales in May.
On the other hand, our operations in Brazil, Paraguay, and Chile had a very strong financial performance, whereas Argentina's adjusted EBITDA decreased in real terms, primarily due to a decline in volume. In consolidated terms, although adjusted EBITDA increased by 6.3%, on a currency neutral basis* the increase was 11.7%, a difference largely attributable to the revaluation of the Chilean peso against the currencies of the other countries in which the Company operates.
In Argentina, our beer distribution agreement with CCU expired in June, and we are currently in negotiations to sign a possible new agreement that would include some of the brands covered by the expired agreement. It is also important to mention that in Argentina, we began a pilot program in the Cuyo region to distribute wines from Grupo Peñaflor and Diageo.
*The definitions used can be found in the Glossary on page 16 of this document.
COCA-COLA ANDINA
2Q23 EARNINGS RELEASE
www.koandina.com
-
On the other hand, our Ribeirão Preto plant in Brazil began producing Jack & Coke for the entire Coca-Cola system in Brazil during the month of June. In addition, we are in the process of expanding and adapting the infrastructure in Duque de Caxias for the production and storage of new products, such as beer and alcoholic and nonalcoholic beverages, a project that will be operational by the beginning of 2025. This project will require an investment of approximately USD 80 million, which is included in our Capex guidance for 2023 and 2024 of USD 250 million.
In Chile, approximately 10,000 liters of water and sparkling beverages were donated in the context of the floods that hit the country, and in Paraguay we were recognized for the eleventh consecutive year with the Top of Mind Award for the Coca-Cola brand, and the Employer of the Year Award for the sixth consecutive year.
Finally, during these last months, we have focused on defining and communicating our purpose: "reach together every corner, to refresh moments and open opportunities". This phrase, which combines several attributes, recognizes what we have built throughout our history, reflects who we are and also drives us to face the challenges of the future. The identity we seek with our purpose is based on the origin of Coca-Cola Andina, through its different milestones and learning, as well as reflecting the actions that make this commitment a reality and the challenge it means for each person who is part of our Company, which has allowed us to become one of the most important bottlers of the Coca-Cola System in Latin America".
BASIS OF PRESENTATION
Figures in the following analysis are expressed in accordance with IFRS, in nominal Chilean pesos, both for consolidated results and for the results of each of our operations. All variations with respect to 2022 are nominal.
Since Argentina has been classified as a Hyperinflationary economy, pursuant to IAS 29, translation of figures from local to reporting currency was performed using the closing exchange rate for the translation to Chilean pesos. Local currency figures for both 2023 and 2022 referred to in the Argentina sections are expressed in June 2023 currency.
Finally, a devaluation of local currencies regarding the U.S. dollar has a negative impact on our dollarized costs and a devaluation of local currencies regarding the Chilean peso has a negative impact upon consolidating figures.
When we refer to "Argentina", we mean our subsidiaries Embotelladora del Atlántico S.A. and Empaques Argentina S.A. When we refer to "Chile", we mean our subsidiaries Embotelladora Andina S.A., VJ S.A., Vital Aguas S.A., Envases Central S.A. and Re-Ciclar S.A.
CONSOLIDATED RESULTS: 2nd Quarter 2023 vs. 2nd Quarter 2022

| (Figures in million CLP) | 2Q22 | 2Q23 | Var % | |||||||||
| Net Sales | 591,716 | 614,428 | 3.8 | % | ||||||||
| Operating Income | 63,896 | 69,682 | 9.1 | % | ||||||||
| Adjusted EBITDA | 93,879 | 99,770 | 6.3 | % | ||||||||
| Net income attributable to the owners of the controller | 25,537 | 12,192 | -52.3 | % | ||||||||
During the quarter, consolidated Sales Volume was 196.4 million unit cases, which represented an increase of 1.8% compared to the same period of 2022, mainly explained by the volume increase of the operations in Paraguay and Brazil, partially offset by the volume decrease in the operation in Argentina. The Non-Alcoholic Beverages Segment represented 94.8% of consolidated Sales Volume and grew 1.9%, mainly explained by the growth of the Segment in Paraguay and Brazil, partially offset by the decrease in Argentina. The Alcoholic Beverages Segment represented 5.2% of total volume and did not change with respect to the same quarter of the previous year. Transactions reached 1,086.5 million during the quarter, an increase of 2.6% compared to the same quarter of the previous year.
Consolidated Net Sales reached CLP 614,428 million, an increase of 3.8%, explained by the revenue growth in Chile, Paraguay and Brazil, which was partially offset by the reduction in revenues in Argentina, as well as the effect of translating figures from the local currencies of Argentina, Brazil and Paraguay to the reporting currency.
Consolidated Cost of Sales increased 3.7%, which is mainly explained by (i) higher sales volumes in Brazil and Paraguay, (ii) a higher cost of concentrate due to price increases, mainly in Brazil, Chile and Paraguay, (iii) the effect of the shift in the mix towards higher unit cost products in Brazil, Chile and Paraguay, and (iv) higher labor costs in Argentina. This was partially offset by (i) the effect of translating figures from the local currencies of Argentina, Brazil and Paraguay to the reporting currency, and (ii) a lower cost of Pet in Argentina, Brazil and Chile.
Consolidated Distribution Costs and Administrative Expenses increased 2.1%, which is mainly explained by (i) higher labor expenses, (ii) higher distribution expenses in Brazil, Chile and Paraguay, and (iii) higher marketing expenses in Chile and Paraguay. This was partially offset by (i) lower freight and marketing expenses in Argentina, and (ii) the effect of translating figures from the local currencies of Argentina, Brazil and Paraguay to the reporting currency.
The aforementioned effects led to a consolidated Operating Income of CLP 69,682 million, an increase of 9.1%. Operating Margin was 11.3%.
COCA-COLA ANDINA
2Q23 EARNINGS RELEASE
www.koandina.com
-
Consolidated Adjusted EBITDA reached CLP 99,770 million, increasing by 6.3%. Adjusted EBITDA margin was 16.2%, an expansion of 37 basis points.
Net income attributable to the owners of the controller for the quarter was CLP 12,192 million, a decrease of 52.3%, and Net Margin reached 2.0%, a contraction of 233 basis points.
ARGENTINA: 2nd Quarter 2023 vs. 2nd Quarter 2022
| 2Q22 | 2Q23 | Var % | 2Q22 | 2Q23 | Var % | |||||||||||||||||||
| (Figures in million CLP) | (Figures in million ARS of June 2023) | |||||||||||||||||||||||
| Net Sales | 158,125 | 138,928 | -12.1 | % | 47,322 | 44,486 | -6.0 | % | ||||||||||||||||
| Operating Income | 18,137 | 15,781 | -13.0 | % | 5,428 | 5,053 | -6.9 | % | ||||||||||||||||
| Adjusted EBITDA | 26,931 | 24,081 | -10.6 | % | 8,060 | 7,711 | -4.3 | % | ||||||||||||||||
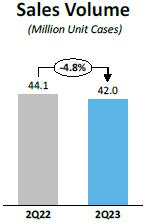
Sales volume in the quarter decreased 4.8%, reaching 42.0 million unit cases, explained by the volume decrease in the Soft Drinks and Juices and other non-alcoholic beverages categories, partially offset by the increase in the Water category. Transactions reached 200.4 million, representing a decrease of 1.9%, as a result of the recovery of immediate consumption packaging.
Net Sales amounted to CLP 138,928 million, a decrease of 12.1%. In local currency, they decreased by 6.0%, which was mainly explained by the aforementioned volume decrease and by the decrease in the average revenue per unit case sold, as a result of price increases slightly below local inflation during the quarter.
Cost of Sales decreased 15.2%, while in local currency it decreased 9.2%, which is mainly explained by (i) lower sales volume, (ii) a lower cost of Pet resin, and (iii) a lower cost of sugar. This was offset by higher labor costs.
Distribution Costs and Administrative Expenses decreased 7.1% in the reporting currency, while in local currency they decreased 0.5%, which is mainly explained by (i) lower freight expenses due to lower volumes sold, and (ii) lower marketing expenses. This was offset by higher labor expenses.
The aforementioned effects led to an Operating Income of CLP 15,781 million, a decrease of 13.0% compared to the same period of the previous year. Operating Margin was 11.4%. In local currency, Operating Income decreased 6.9%.
Adjusted EBITDA amounted to CLP 24,081 million, a decrease of 10.6%. Adjusted EBITDA margin was 17.3%, an expansion of 30 basis points. Adjusted EBITDA in local currency decreased 4.3%.
BRAZIL: 2nd Quarter 2023 vs. 2nd Quarter 2022
| 2Q22 | 2Q23 | Var % | 2Q22 | 2Q23 | Var % | |||||||||||||||||||
| (Figures in million CLP) | (Figures in million BRL) | |||||||||||||||||||||||
| Net Sales | 153,221 | 159,181 | 3.9 | % | 894 | 984 | 10.1 | % | ||||||||||||||||
| Operating Income | 17,863 | 22,078 | 23.6 | % | 104 | 137 | 31.2 | % | ||||||||||||||||
| Adjusted EBITDA | 26,555 | 29,929 | 12.7 | % | 155 | 185 | 19.5 | % | ||||||||||||||||
COCA-COLA ANDINA
2Q23 EARNINGS RELEASE
www.koandina.com
-
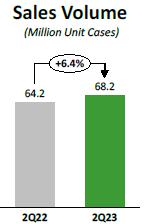
Sales volume for the quarter reached 68.2 million unit cases, an increase of 6.4%, explained by the increase in the Soft Drinks, Waters and Beer and other alcoholic beverages categories, partially offset by the decrease in the Juices and other non-alcoholic beverages category. The Non-Alcoholic Beverages Segment represented 98.1% of total sales volume, and grew 6.2%, which was explained by the growth of the Soft Drinks and Waters categories, partially offset by the decrease in the Juices and other non-alcoholic beverages category. The Alcoholic Beverages segment represented 1.9% of total volume and grew 14.6%. Transactions amounted to 371.2 million, an increase of 6.5%.
Net Sales amounted to CLP 159,181 million, an increase of 3.9%. In local currency, Net Sales increased 10.1%, which was mainly explained by the aforementioned volume increase and the increase in the average revenue per unit case sold. Net Sales of the Non-Alcoholic Beverages segment increased 8.7% in local currency, representing 94.1% of total sales. Net Sales of the Alcoholic Beverages Segment increased 36.6% in local currency, representing 5.9% of total sales.
Cost of sales increased 0.9%, while in local currency it increased 6.9%, which is mainly explained by (i) the higher sales volume, (ii) a higher cost of concentrate due to price increases, and (iii) a shift in the mix towards higher unit cost products. This was partially offset by a lower cost of raw materials, especially Pet resin.
Distribution Costs and Administrative Expenses increased 2.3% in the reporting currency. In local currency, they increased 8.3%, which is mainly explained by (i) higher labor expenses, (ii) higher depreciation, and (iii) higher distribution expenses, due to both higher volumes and higher tariffs. This was partially offset by lower marketing expenses.
The aforementioned effects led to an Operating Income of CLP 22,078 million, an increase of 23.6%. Operating Margin was 13.9%. In local currency, Operating Income increased 31.2%.
Adjusted EBITDA reached CLP 29,929 million, an increase of 12.7% over the previous year. Adjusted EBITDA margin was 18.8%, an expansion of 147 basis points. In local currency Adjusted EBITDA increased 19.5%.
CHILE: 2nd Quarter 2023 vs. 2nd Quarter 2022
| 2Q22 | 2Q23 | Var % | ||||||||||
| (Figures in million CLP) | ||||||||||||
| Net Sales | 238,106 | 270,196 | 13.5 | % | ||||||||
| Operating Income | 20,427 | 23,226 | 13.7 | % | ||||||||
| Adjusted EBITDA | 29,920 | 34,196 | 14.3 | % | ||||||||
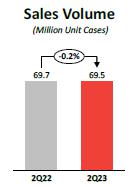
During the quarter, Sales Volume reached 69.5 million unit cases, a variation of -0.2% compared to the same quarter of the previous year. Transactions reached 410.6 million, a decrease of 0.8%. The volume of the Non-Alcoholic Beverages Segment represented 87.4% of total sales volume, unchanged from the same quarter of the previous year. The volume of the Alcoholic Beverages Segment represented 12.6% of total Sales Volume, and decreased 2.5%, explained by the Beer and Other Alcoholic Beverages categories.
Net Sales reached CLP 270,196 million, a 13.5% growth, which is mainly explained by the increase in the average revenue per unit case sold, as a result of price increases. Net Sales of the Non-Alcoholic Beverages segment increased 12.7%, representing 76.1% of total sales. Net Sales of the Alcoholic Beverages Segment increased 15.9%, representing 23.9% of total sales.
COCA-COLA ANDINA
2Q23 EARNINGS RELEASE
www.koandina.com
-
Cost of sales increased 14.7%, which is mainly explained by (i) a higher cost of concentrate due to price increases, and (ii) a shift in the mix towards higher unit cost products. This was partially offset by a lower cost of raw materials, especially Pet.
Distribution Costs and Administrative Expenses increased 10.1%, which is mainly explained by (i) a higher cost of labor and services provided by third parties, (ii) higher distribution and haulage expenses due to higher tariffs, and (iii) higher marketing expenses.
The aforementioned effects led to an Operating Income of CLP 23,226 million, 13.7% higher when compared to the previous year. Operating Margin was 8.6%.
Adjusted EBITDA reached CLP 34,196 million, an increase of 14.3%. Adjusted EBITDA margin was 12.7%, an expansion of 9 basis points.
PARAGUAY: 2nd Quarter 2023 vs. 2nd Quarter 2022

| 2Q22 | 2Q23 | Var % | 2Q22 | 2Q23 | Var % | |||||||||||||||||||
| (Figures in million CLP) | (Figures in million PGY) | |||||||||||||||||||||||
| Net Sales | 43,220 | 46,622 | 7.9 | % | 352,250 | 419,879 | 19.2 | % | ||||||||||||||||
| Operating Income | 9,077 | 10,210 | 12.5 | % | 74,123 | 91,955 | 24.1 | % | ||||||||||||||||
| Adjusted EBITDA | 12,082 | 13,342 | 10.4 | % | 98,570 | 120,166 | 21.9 | % | ||||||||||||||||
During the quarter, Sales Volume reached 16.7 million unit cases, an increase of 10.2%, explained by the increase in volume of all categories. Transactions reached 104.2 million, an increase of 12.8%.
Net sales amounted to CLP 46,622 million, an increase of 7.9%. In local currency, Net Sales increased 19.2%, which was mainly explained by the aforementioned increase in volume and a higher average revenue per unit case sold.
Cost of Sales in the reporting currency increased 8.7%. In local currency, it increased 20.1%, which is mainly explained by (i) the higher volume sold, (ii) a higher cost of concentrate due to price increases, (iii) a higher cost of sugar and fructose, and (iv) the shift in the mix towards higher unit cost products.
Distribution Costs and Administrative Expenses increased 1.8%, and in local currency they increased 12.6%. This is mainly explained by (i) higher labor costs and services provided by third parties, (ii) higher distribution expenses, due to higher volume sold and higher tariffs, and (iii) higher depreciation charges.
The aforementioned effects led to an Operating Income of CLP 10,210 million, 12.5% higher when compared to the previous year. Operating Margin reached 21.9%. In local currency, Operating Income increased 24.1%.
Adjusted EBITDA reached CLP 13,342 million, an increase of 10.4%, and Adjusted EBITDA Margin was 28.6%, an expansion of 66 basis points. In local currency Adjusted EBITDA increased 21.9%.
COCA-COLA ANDINA
2Q23 EARNINGS RELEASE
www.koandina.com
-
ACCUMULATED RESULTS: 1st Half 2023 vs. 1st Half 2022
Consolidated Results
| (Figures in million CLP) | 1H22 | 1H23 | Var % | |||||||||
| Net Sales | 1,254,914 | 1,325,983 | 5.7 | % | ||||||||
| Operating Income | 166,774 | 169,868 | 1.9 | % | ||||||||
| Adjusted EBITDA | 224,511 | 229,486 | 2.2 | % | ||||||||
| Net income attributable to the owners of the controller | 59,328 | 52,931 | -10.8 | % | ||||||||
Consolidated Sales Volume was 431.4 million unit cases, which represented an increase of 2.5% compared to the same period of 2022, mainly explained by the volume increase in the Brazilian and Paraguayan operations, partially offset by the volume decrease in the Argentine operation. The Non-Alcoholic Beverages Segment represented 95.0% of consolidated Sales Volume and grew 2.9%, explained by the growth of the Segment in Brazil, Paraguay and Chile, partially offset by the decrease in Argentina. The Alcoholic Beverages Segment represented 5.0% of total volume and decreased 4.5%, which was mainly explained by the reduction of the Segment's volume in the Chilean operation, partially offset by the growth of the Segment in the Brazilian operation. Transactions amounted to 2,370.2 million, representing an increase of 3.0%. Consolidated Net Sales reached CLP 1,325,983 million, an increase of 5.7%.
Consolidated Cost of Sales increased 6.0%, which is mainly explained by (i) the higher cost of concentrate due to price increases in Brazil, Chile and Paraguay, (ii) the shift in the mix towards higher unit cost products in Brazil, Chile and Paraguay, and (iii) a higher cost of sugar in Paraguay. This was partially offset by (i) a lower cost of sugar and Pet in Argentina, and (ii) the effect of translating figures from the local currencies of Argentina, Brazil and Paraguay to the reporting currency.
Consolidated Distribution Costs and Administrative Expenses increased 6.9%, which is mainly explained by (i) higher distribution expenses in Brazil, Chile and Paraguay, and (ii) higher labor costs. This was partially offset by (i) a lower freight expense in Argentina, and (ii) the effect of translating figures from the local currencies of Argentina, Brazil and Paraguay to the reporting currency.
The aforementioned effects led to a consolidated Operating Income of CLP 169,868 million, an increase of 1.9%. Operating Margin was 12.8%.
Consolidated Adjusted EBITDA reached CLP 229,486 million, increasing by 2.2%. Adjusted EBITDA Margin was 17.3%, a decrease of 58 basis points.
Net income attributable to the owners of the controller was CLP 52,931 million, a decrease of 10.8%, and net margin reached 4.0%.
Argentina
| 1H22 | 1H23 | Var % | 1H22 | 1H23 | Var % | |||||||||||||||||||
| (Figures in million CLP) | (Figures in million ARS of June 2023) | |||||||||||||||||||||||
| Net Sales | 349,640 | 323,541 | -7.5 | % | 104,638 | 103,601 | -1.0 | % | ||||||||||||||||
| Operating Income | 54,148 | 50,205 | -7.3 | % | 16,205 | 16,076 | -0.8 | % | ||||||||||||||||
| Adjusted EBITDA | 71,718 | 66,641 | -7.1 | % | 21,463 | 21,339 | -0.6 | % | ||||||||||||||||
COCA-COLA ANDINA
2Q23 EARNINGS RELEASE
www.koandina.com
-
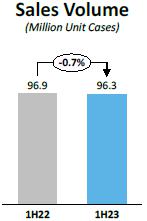
Sales volume decreased 0.7%, reaching 96.3 million unit cases, explained by the decrease in the volume of the Soft Drinks category, partially offset by the increase in the volume of the Water and Juice and other non-alcoholic beverages categories. Transactions amounted to 461.5 million, an increase of 2.8%, explained by a higher immediate consumption mix.
Net Sales amounted to CLP 323,541 million, a decrease of 7.5%, while in local currency, Net Sales decreased 1.0%, which was mainly explained by the aforementioned decrease in volume and the decrease in the average revenue per unit case sold.
Cost of Sales decreased 10.7%. In local currency, it decreased 4.5%, which is mainly explained by (i) the reduction in volume sold, (ii) a lower cost of sugar, and (iii) a lower cost of Pet resin. This was partially offset by higher labor costs.
Distribution Costs and Administrative Expenses decreased 2.2% in the reporting currency. In local currency, these increased 4.7%, which is mainly explained by (i) higher advertising expenses, and (ii) higher labor expenses. This was partially offset by lower distribution costs due to lower sales volume.
The aforementioned effects led to an Operating Income of CLP 50,205 million, a decrease of 7.3%. Operating Margin was 15.5%. In local currency, Operating Income decreased 0.8%.
Adjusted EBITDA amounted to CLP 66,641 million, a decrease of 7.1%. Adjusted EBITDA margin was 20.6%, an expansion of 9 basis points. Adjusted EBITDA in local currency decreased 0.6%.
Brazil
| 1H22 | 1H23 | Var % | 1H22 | 1H23 | Var % | |||||||||||||||||||
| (Figures in million CLP) | (Figures in million BRL) | |||||||||||||||||||||||
| Net Sales | 281,732 | 320,506 | 13.8 | % | 1,722 | 2,019 | 17.3 | % | ||||||||||||||||
| Operating Income | 33,659 | 41,848 | 24.3 | % | 205 | 264 | 28.5 | % | ||||||||||||||||
| Adjusted EBITDA | 48,657 | 57,168 | 17.5 | % | 297 | 360 | 21.3 | % | ||||||||||||||||
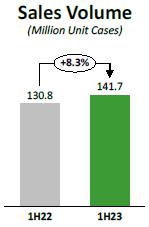
Sales volume increased 8.3%, reaching 141.7 million unit cases, explained by the increase in volume of all categories. The Non-Alcoholic Beverages Segment represented 98.1% of total sales volume, and grew 8.2%, which was explained by the growth of all the Segment's categories. The Alcoholic Beverages Segment represented 1.9% of total volume and grew 13.5%. Transactions amounted to 775.5 million, an increase of 8.7%.
Net Sales reached CLP 320,506 million, an increase of 13.8%, affected by the negative effect of the translation of figures into Chilean pesos. In local currency, Net Sales increased 17.3%, due to a higher average price as a result of the price increases we have implemented and the aforementioned volume increase. Net Sales of the Non-Alcoholic Beverages segment increased 16.6% in local currency, representing 94.2% of total sales. Net Sales of the Alcoholic Beverages Segment increased 28.6% in local currency, representing 5.8% of total sales.
Cost of Sales increased 11.7%, while in local currency it increased 15.1%, which is mainly explained by (i) the higher sales volume, (ii) a higher cost of concentrate due to price increases, and (iii) a shift in the mix towards higher unit cost products.
Distribution Costs and Administrative Expenses increased 14.0% in the reporting currency, and in local currency they increased 17.2%, which is mainly explained by (i) higher labor costs, (ii) higher distribution and hauling expenses, and (iii) higher depreciation charges.
The aforementioned effects led to an Operating Income of CLP 41,848 million, an increase of 24.3%. Operating Margin was 13.1%. In local currency, Operating Income increased 28.5%.
Adjusted EBITDA reached CLP 57,168 million, an increase of 17.5% regarding the previous year. Adjusted EBITDA margin was 17.8%, an expansion of 57 basis points. In local currency Adjusted EBITDA increased 21.3%.
COCA-COLA ANDINA
2Q23 EARNINGS RELEASE
www.koandina.com
-
Chile
| 1H22 | 1H23 | Var % | ||||||||||
| (Figures in million CLP) | ||||||||||||
| Net Sales | 529,102 | 582,729 | 10.1 | % | ||||||||
| Operating Income | 58,420 | 57,280 | -2.0 | % | ||||||||
| Adjusted EBITDA | 77,676 | 78,933 | 1.6 | % | ||||||||
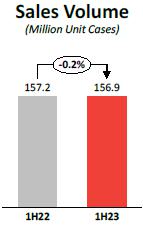
Sales volume reached 156.9 million unit cases, a variation of -0.2% with respect to the same period of the previous year. Transactions totaled 910.0 million, a decrease of 1.9%. The Non-Alcoholic Beverages Segment represented 88.0% of total sales volume, and grew by 0.8%, which was explained by the growth of the Water category, partially offset by the decrease in the Juices and other non-alcoholic beverages category. The Alcoholic Beverages Segment represented 12.0% of total Sales Volume and decreased 7.1%, explained by the decrease in the Beer and Other alcoholic beverages categories.
Net Sales amounted to CLP 582,729 million, an increase of 10.1%, which is explained by a higher average price in the period, due to price increases. Net Sales of the Non-Alcoholic Beverages segment increased 11.6%, representing 77.3% of total sales. Net Sales of the Alcoholic Beverages Segment increased 5.5%, representing 22.7% of total sales.
Cost of Sales increased 11.6%, which is mainly explained by (i) a higher cost of concentrate due to price increases, and (ii) a shift in the mix towards higher unit cost products.
Distribution Costs and Administrative Expenses increased 11.6%, which is mainly explained by (i) higher distribution and hauling expenses, resulting from higher tariffs, (ii) higher cost of labor and services provided by third parties, and (iii) higher marketing expenses.
The aforementioned effects led to an Operating Income of CLP 57,280 million, 2.0% lower when compared to the previous year. Operating Margin was 9.8%.
Adjusted EBITDA reached CLP 78,933 million, an increase of 1.6%. Adjusted EBITDA margin was 13.5%, a contraction of 114 basis points.
Paraguay
| 1H22 | 1H23 | Var % | 1H22 | 1H23 | Var % | |||||||||||||||||||
| (Figures in million CLP) | (Figures in million PGY) | |||||||||||||||||||||||
| Net Sales | 96,347 | 100,464 | 4.3 | % | 810,773 | 903,865 | 11.5 | % | ||||||||||||||||
| Operating Income | 23,695 | 23,826 | 0.6 | % | 200,329 | 214,284 | 7.0 | % | ||||||||||||||||
| Adjusted EBITDA | 29,608 | 30,200 | 2.0 | % | 249,866 | 271,647 | 8.7 | % | ||||||||||||||||
COCA-COLA ANDINA
2Q23 EARNINGS RELEASE
www.koandina.com
-
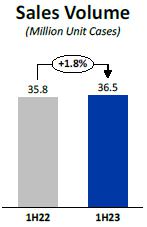
Sales volume reached 36.5 million unit cases, an increase of 1.8%, explained by the increase in volume in all categories. Transactions totaled 223.2 million, an increase of 5.6%.
Net sales amounted to CLP 100,464 million, an increase of 4.3%. In local currency, Net Sales increased 11.5%, which is explained by a higher average price, and to a lesser extent by the aforementioned increase in Sales Volume.
Cost of Sales increased 6.5% and in local currency it increased 13.9%, which is mainly explained by (i) a higher cost of concentrate due to price increases, (ii) a shift in the mix towards higher unit cost products, and (iii) a higher cost of sweeteners.
Distribution Costs and Administrative Expenses increased 3.0% in the reporting currency. In local currency, they increased 10.6%, which is mainly explained by (i) higher distribution expenses, mainly due to higher tariffs, (ii) higher labor costs and services provided by third parties, and (iii) higher depreciation charges.
The aforementioned effects led to an Operating Income of CLP 23,826 million, 0.6% higher when compared to the previous year. Operating Margin reached 23.7%. In local currency, Operating Income increased 7.0%.
Adjusted EBITDA reached CLP 30,200 million, 2.0% higher when compared to the previous year, and Adjusted EBITDA Margin was 30.1%, a contraction of 67 basis points. In local currency Adjusted EBITDA increased 8.7%.
NON-OPERATING RESULTS FOR THE QUARTER
Net Financial Income and Expenses account recorded an expense of CLP 7,192 million, compared with an expense of CLP 1,464 million in the same quarter of the previous year, mainly as a result of lower financial income from investments held in AGFs (mutual and investment fund management companies).
Share of Profit or Loss from Investments Accounted for by the Equity Method went from a profit of CLP 546 million to a loss of CLP 230 million, which is mainly explained by lower results of subsidiaries in Chile, and partially offset by higher results of subsidiaries in Brazil.
Other Income and Expenses account recorded a loss of CLP 28,890 million, compared to a loss of CLP 15,922 million in the same quarter of the previous year, a difference that is mainly explained by a reversal of a provision in Brazil that occurred in the same quarter of the previous year and did not occur this year.
Results by Adjustment Units and Exchange Rate Differences account went from a loss of CLP 15,424 million to a loss of CLP 4,764 million. This lower loss is mainly explained by the effect of lower inflation in Chile (1.44% in 2Q23 and 4.28% in 2Q22), which had a lower impact than in the previous year on the Company's debt in UF. This effect was partially offset by losses in Argentina due to net liabilities in U.S. dollars.
Income Tax went from -CLP 6,483 million to -CLP 16,611 million, a variation that is mainly explained by the negative tax effect of the exchange rate difference, compared to the previous year and by higher operating income.
COCA-COLA ANDINA
2Q23 EARNINGS RELEASE
www.koandina.com
-
CONSOLIDATED BALANCE
The following are the balances of Assets and Liabilities as of the closing date of these financial statements:
| 12.31.2022 | 06.30.2023 | Variation | ||||||||||
| Assets | million CLP | million CLP | million CLP | |||||||||
| Current assets | 1,161,729 | 941,799 | -219,931 | |||||||||
| Non-current assets | 1,848,971 | 1,856,114 | 7,143 | |||||||||
| Total Assets | 3,010,701 | 2,797,913 | -212,788 | |||||||||
| 12.31.2022 | 06.30.2023 | Variation | ||||||||||
| Liabilities | million CLP | million CLP | million CLP | |||||||||
| Current liabilities | 949,245 | 778,607 | -170,639 | |||||||||
| Non-current liabilities | 1,178,053 | 1,133,488 | -44,565 | |||||||||
| Total Liabilities | 2,127,298 | 1,912,094 | -215,204 | |||||||||
| 12.31.2022 | 06.30.2023 | Variation | ||||||||||
| Equity | million CLP | million CLP | million CLP | |||||||||
| Non-controlling interests | 28,143 | 31,242 | 3,100 | |||||||||
| Equity attributable to the owners of the controller | 855,260 | 854,576 | -684 | |||||||||
| Total Equity | 883,403 | 885,818 | 2,416 | |||||||||
At the closing of June 2023, with respect to the closing of 2022, the Argentine peso and the Paraguayan guarani depreciated with respect to the Chilean peso by 54.7% and 5.6%, respectively, which generated a decrease in assets, liabilities and equity accounts, due to the effect of translation of figures to the reporting currency. On the other hand, the Brazilian real appreciated against the Chilean peso by 1.4%, which generated an increase in the assets, liabilities and equity account, due to the effect of translation of figures to the reporting currency. Additionally, the figures for Argentina, in accordance with IAS 29, prior to the translation of figures, are adjusted for accumulated inflation as of the closing of 2022, until the closing currency of this report (June 2023), increasing the figures in local currency by 50.7%.
Assets
Total assets decreased by CLP 212,788 million, 7.1% compared to December 2022.
Current assets decreased by CLP 219,931 million, 18.9% compared to December 2022, which is mainly explained by the decrease in Other current financial assets (-CLP 86,233 million) and by the decrease in Trade and other current accounts receivable (-CLP 75,955 million), due to seasonal factors, since we compare it to December, the month of highest sales of the year and, as a result, of high accounts receivable with respect to an average month. In addition to the above decreases, there was a decrease in Cash and cash equivalents (-CLP 42,692 million) due to the payment of dividends.
Non-current assets increased by CLP 7,143 million, 0.4% compared to December 2022, mainly due to the increase in Property, plant and equipment (CLP 20,496 million) due to investments made (CLP 85,339 million) which were partially offset by the Depreciation account. This increase was partially offset by the decrease in Intangible assets other than goodwill (-CLP 6,981 million) due to the negative effect of translating figures of our foreign subsidiaries to the reporting currency, and by the decrease in Other non-current financial assets (-CLP 5,638 million).
Liabilities and Equity
Total liabilities decreased by CLP 215,204 million, 10.1% compared to December 2022.
Current liabilities decreased by CLP 170,639 million, 18.0% with respect to December 2022, mainly due to the decrease in Trade and other current accounts payable (-CLP 113,797 million), due to seasonal factors considering that December is the month with the highest sales of the year, and therefore, a month with high accounts payable to suppliers. In addition to the above decrease, there was a decrease in Other current non-financial liabilities (-CLP 29,225 million) due to the payment of the interim dividend in January of this year, which was a liability in December 2022, and a decrease in Current accounts payable to related entities (-CLP 22,750 million), mainly due to accounts payable to The Coca-Cola Company.
On the other hand, non-current liabilities decreased by CLP 44,565 million, 3.8% compared to December 2022, mainly due to the decrease in Other non-current financial liabilities (-CLP 51,207 million), which is mainly explained by the change in the valuation of the mark to market liabilities of the cross currency swaps of the bond placed in the U.S. market in 2020.
Equity increased by CLP 2,416 million, 0.3% compared to December 2022, explained by the increase in Accumulated Earnings as a result of the profits obtained in the period, the restatement of equity balances in our subsidiary in Argentina, in accordance with IAS 29 (CLP 75,469 million) and by the distribution of dividends (-CLP 78,518 million). The increase in Accumulated earnings was partially offset by the decrease in Other reserves (-CLP 50,567 million), mainly explained by the negative effect of translation of figures of our foreign subsidiaries.
COCA-COLA ANDINA
2Q23 EARNINGS RELEASE
www.koandina.com
-
FINANCIAL ASSETS AND LIABILITIES
| CONSOLIDATED NET FINANCIAL DEBT | (million USD) | |||
| Total Financial Assets | 528 | |||
| Cash and Cash Equivalent (1) | 311 | |||
| Other current financial assets (1) | 38 | |||
| Net valuation of Hedge Derivatives (2) | 179 | |||
| Financial Debt | 1,429 | |||
| Bonds on the international market | 672 | |||
| Bonds on the local market (Chile) | 670 | |||
| Bank Debt and Others | 88 | |||
| Net Financial Debt | 901 | |||
(1) Financial Assets corresponding to Cash and Cash Equivalents and Other current financial assets are held invested in low-risk instruments such as time deposits, short-term fixed-income mutual funds and others.
(2) Considers the net effect of valuations in favor of and against hedge derivatives.
CURRENCY EXPOSURE (%)
| Financial
Assets (1) |
Financial
Debt (3) |
|||||||
| CLP (Chile) | 33 | % | 27 | % | ||||
|
Unidad de Fomento (CLP indexed to inflation) |
9 | % | 53 | % | ||||
| BRL (Brazil) | 32 | % | 16 | % | ||||
| PGY (Paraguay) | 5 | % | 0 | % | ||||
| ARS (Argentina) | 1 | % | 3 | % | ||||
| USD (United States) | 20 | % | 1 | % | ||||
| Total | 100 | % | 100 | % | ||||
(3) Includes valuation of hedge derivatives.
RISK RATING
| Local rating agencies | Rating | |||
| ICR | AA+ | |||
| Fitch Chile | AA+ | |||
| International rating agencies | Rating | |||
| Standard & Poors | BBB | |||
| Fitch Ratings, Inc. | BBB+ | |||
DEBT AMORTIZATION PROFILE

CASH FLOW
| 06.30.2022 | 06.30.2023 | Variation | ||||||||||||||
| Cash flow | million CLP | million CLP | million CLP | % | ||||||||||||
| Operating | 162,272 | 127,008 | -35,264 | -21.7 | % | |||||||||||
| Investment | 38,643 | -55,992 | -94,634 | -244.9 | % | |||||||||||
| Financing | -222,957 | -75,856 | 147,101 | -66.0 | % | |||||||||||
| Net Cash Flow for the period | -22,042 | -4,839 | 17,203 | -78.0 | % | |||||||||||
COCA-COLA ANDINA
2Q23 EARNINGS RELEASE
www.koandina.com
-
During the period, the Company generated a negative net cash flow of CLP 4,839 million, which is explained as follows:
Operating activities generated a positive net cash flow of CLP 127,008 million, lower than the CLP 162,272 million recorded in the same period of 2022, mainly due to higher operating payments and payments to suppliers, partially offset by higher collections from sale of goods.
Investing activities generated a negative cash flow of CLP 55,992 million, with a negative variation of CLP 94,634 million with respect to the previous period, which is mainly explained by lower redemptions of financial instruments for CLP 51,539 million, increasing cash and cash equivalents, added to a higher investment in Capex for CLP 46,164 million.
Financing activities generated a negative cash flow of CLP 75,856 million, with a positive variation of CLP 147,101 million with respect to the previous period, which is mainly explained by a lower dividend payment in 2023, in addition to obtaining short-term financing in Argentina.
MAIN INDICATORS
| INDICATOR | Definition | Unit | Jun 23 | Dec 22 | Jun 22 | Jun 23 vs Dec 22 |
Jun 23 vs Jun 22 |
| LIQUIDITY | |||||||
| Current liquidity | Current Asset | Times | 1.2 | 1.2 | 1.8 | -1.2% | -32.2% |
| Current Liability | |||||||
| Acid ratio | Current Asset – Inventory | Times | 0.9 | 1.0 | 1.3 | -7.3% | -32.0% |
| Current Liability | |||||||
| ACTIVITY | |||||||
| Investment | Million CLP | 85,339 | 173,675 | 60,150 | -50.9% | 41.9% | |
| Inventory turnover | Cost of Sales | Times | 3.3 | 7.4 | 3.6 | -55.9% | -8.9% |
| Average Inventory | |||||||
| INDEBTEDNESS | |||||||
| Indebtedness ratio | Net Financial Debt* | Times | 0.8 | 0.7 | 0.5 | 15.2% | 51.1% |
| Total Equity* | |||||||
| Financial exp. coverage | Adjusted EBITDA (12M) | Times | 17.2 | 19.9 | 14.1 | -13.7% | 22.1% |
| Financial Expenses* (12M) – Financial Income* (12M) | |||||||
| Net financial debt / | Net Financial Debt | Times | 1.5 | 1.3 | 1.3 | 14.3% | 20.5% |
| Adjusted EBITDA | Adjusted EBITDA (12M) | ||||||
| PROFITABILITY | |||||||
| On Equity | Net Income Fiscal Year (12M) | % | 13.9% | 13.0% | 16.2% | 0.9 pp | (2.3 pp) |
| Average Equity | |||||||
| On Total Assets | Net Income Fiscal Year (12M) | % | 4.1% | 4.2% | 5.8% | (0.1 pp) | (1.7 pp) |
| Average Equity |
Liquidity
Current Liquidity showed a negative variation of 1.2% compared to December 2022, explained by the 18.9% decrease in current assets, which was greater than the decrease in current liabilities (18.0%).
The Acid Ratio showed a decrease of 7.3% compared to December 2022, for the reasons explained above, in addition to the decrease in inventories (0.2%) in the period. Current assets excluding inventories showed a decrease of 24.0% compared to December 2022.
Activity
At the closing of June 2023, investments reached CLP 85,339 million, which corresponds to an increase of 41.9% compared to the same period of 2022, mainly explained by higher investments in cold equipment and containers.
Inventory turnover reached 3.3 times, showing a decrease of 8.9% compared to the same period of 2022, mainly explained by the increase in average inventory of 16.3% compared to the same period of 2022, which was higher than the increase in the cost of sales (6.0%).
Indebtedness
Indebtedness ratio reached 0.8 times at the closing of June 2023, which corresponds to an increase of 15.2% compared to the closing of December 2022. This is mainly due to the 15.5% increase in net debt, together with a 0.3% increase in equity.
The Financial Expense Coverage indicator shows a decrease of 13.7% when compared to December 2022, reaching 17.2 times. This is explained by the 17.1% increase in net financial expenses (12 rolling months), and the 1.1% increase in Adjusted EBITDA (12 rolling months) for the period.
Net financial debt/Adjusted EBITDA reached 1.5 times, which represents an increase of 14.3% compared to December 2022. This is due to the 15.5% increase in Net Financial Debt, together with a 1.1.% increase in Adjusted EBITDA for the period.
*Definitions used are contained in the Glossary on page 16 of this document.
COCA-COLA ANDINA
2Q23 EARNINGS RELEASE
www.koandina.com
-
Profitability
Return on Equity reached 13.9%, 0.9 percentage points higher than the indicator measured in December 2022. This result is due to the decrease in Average Equity (11.5%), which was higher than the decrease in Net Income for the 12 rolling months (5.1%).
Return on Total Assets was 4.1%, 0.1 percentage points lower than the indicator measured in December 2022, explained by the decrease in Net Income for the 12 rolling months (5.1%), which was higher than the decrease in Average Assets (2.5%).
MACROECONOMIC INFORMATION
INFLATION
| Accumulated 1H23 |
LTM | |||||||
| Argentina* | 50.74 | % | 115.60 | % | ||||
| Brazil | 2.87 | % | 3.16 | % | ||||
| Chile | 2.01 | % | 7.60 | % | ||||
| Paraguay | 2.16 | % | 4.24 | % | ||||
*Official inflation reported by the National Institute of Statistics and Censuses of Argentina (INDEC). It should be mentioned that the inflation used to restate Argentina's figures in accordance with IAS 29 corresponds to inflation estimated by the Central Bank of the Argentine Republic (in its Survey of Market Expectations report), which is also adjusted for the difference between the estimate (by the Central Bank) and the actual inflation of the previous month (INDEC).
| Local currency/USD | CLP/local currency | |||||||||||||||
| EXCHANGE | (Average exchange rate*) | (Average exchange rate*) | ||||||||||||||
| RATES USED | 2Q22 | 2Q23 | 2Q22 | 2Q23 | ||||||||||||
| Argentina | 125.2 | 256.7 | 7.4 | 3.1 | ||||||||||||
| Brazil | 4.92 | 4.95 | 171.36 | 161.77 | ||||||||||||
| Chile | 843 | 801 | N.A | N.A | ||||||||||||
| Paraguay | 6,857 | 7,216 | 0.12 | 0.11 | ||||||||||||
*Except Argentina, where the closing exchange rate is used, in accordance with IAS 29.
| Local currency/USD | CLP/local currency | |||||||||||||||
| EXCHANGE | (Average exchange rate*) | (Average exchange rate*) | ||||||||||||||
| RATES USED | 1H22 | 1H23 | 1H22 | 1H23 | ||||||||||||
| Argentina | 125.2 | 256.7 | 7.4 | 3.1 | ||||||||||||
| Brazil | 5.08 | 5.07 | 162.67 | 158.82 | ||||||||||||
| Chile | 826 | 806 | N.A | N.A | ||||||||||||
| Paraguay | 6,917 | 7,252 | 0.12 | 0.11 | ||||||||||||
*Except Argentina, where the closing exchange rate is used, in accordance with IAS 29.
MARKET RISK ANALYSIS
The Company’s risk management is the responsibility of the office of the Chief Executive Officer, (through the areas of Corporate Management Control, Sustainability and Risks, which depends on the office of the Chief Financial Officer), as well as each of the management areas of Coca-Cola Andina. The main risks that the Company has identified and that could possibly affect the business are as follows:
Relationship with The Coca-Cola Company
A large part of the Company’s sales derives from the sale of products whose trademarks are owned by The Coca-Cola Company, which has the ability to exert an important influence on the business through its rights under the Licensing or Bottling Agreements. In addition, we depend on The Coca-Cola Company to renew these Bottling Agreements.
Non-alcoholic beverage business environment
Consumers, public health officials, and government officials in our markets are increasingly concerned about the public health consequences associated with obesity, which can affect demand for our products, especially those containing sugar.
The Company has developed a large portfolio of sugar-free products and has also made reformulations to some of its sugary products, significantly reducing sugar contents of its products.
COCA-COLA ANDINA
2Q23 EARNINGS RELEASE
www.koandina.com
-
Raw material prices and exchange rate
Many raw materials are used in the production of beverages and packaging, including sugar and PET resin, the prices of which may present great volatility. In the case of sugar, the Company sets the price of a part of the volume that it consumes with some anticipation, in order to avoid having large fluctuations of cost that cannot be anticipated.
In addition, these raw materials are traded in dollars; the Company has a policy of hedging in the futures market a portion of the dollars it uses to buy raw materials.
Instability in the supply of utilities and raw materials
In the countries in which we operate, our operations depend on a stable supply of utilities, fuel and raw materials. Power outages or water shut offs as well as the lack of raw materials may result in interruptions of our production. The Company has mitigation plans to reduce the effects of eventual interruptions in the supply of utilities and raw materials.
Economic conditions of the countries where we operate
The Company maintains operations in Argentina, Brazil, Chile and Paraguay. The demand for our products largely depends on the economic situation of these countries. Moreover, economic instability can cause depreciation of the currencies of these countries, as well as inflation, which may eventually affect the Company’s financial situation.
New tax laws or modifications to tax incentives
We cannot ensure that any government authority in any of the countries in which we operate will not impose new taxes or increase existing taxes on our raw materials, products or containers. Likewise, we cannot assure that these authorities are going to uphold and/or renew tax incentives that currently benefit some of our operations.
A devaluation of the currencies of the countries where we have our operations, regarding the Chilean peso, can negatively affect the results reported by the Company in Chilean pesos
The Company reports its results in Chilean pesos, while a large part of its revenues and Adjusted EBITDA comes from countries that use other currencies. Should currencies devaluate regarding the Chilean peso, this would have a negative effect on the results of the Company, upon the translation of results into Chilean pesos.
The imposition of exchange controls could restrict the entry and exit of funds to and from the countries in which we operate, which could significantly limit our financial capacity
The imposition of exchange controls in the countries in which we operate could affect our ability to repatriate profits, which could significantly limit our ability to pay dividends to our shareholders. Additionally, it may limit the ability of our foreign subsidiaries to finance payments of U.S. dollar denominated liabilities required by foreign creditors.
Price control policies in Argentina may be accentuated, which may have a material and adverse effect on the results of our Argentine operations
The Argentine government has from time to time established price controls on consumer products. To the extent that the price of our products in Argentina are restricted by government imposed price controls the results of our Argentine operations may be materially affected. We cannot assure that price controls in Argentina will not continue or be expected to include additional consumer products. Nor can we assure you the effect to which government imposed price controls will affect the profitability of our Argentina operations.
Civil unrest in Chile could have a material adverse effect on general economic conditions in Chile and our business and financial condition
Since October 18, 2019, there have been protests and demonstrations in Chile, seeking to reduce inequality, including claims about better pensions, improvement in health plans and reduced health care costs, reduction in the cost of public transportation, better wages, among others. Sometimes demonstrations have been violent, causing damage to public and private property.
We cannot predict the extent to which the Chilean economy will be affected by the civil unrest, nor can we predict if government policies enacted as a response to the civil unrest will have a negative impact on the Chilean economy and our business. Neither can we assure that demonstrations and vandalism will not cause damage to our logistics and production infrastructure. So far, the Company has not been affected in any material respect.
Our business is subject to risks arising from the COVID-19 pandemic
The COVID-19 pandemic has resulted in the countries where we operate taking extraordinary measures to contain the spread of COVID-19, including travel restrictions, closing borders, restrictions or bans on social gathering events, instructions to citizens to practice social distancing, non-essential business closure, quarantine implementation, and other similar actions. The impact of this pandemic has substantially increased uncertainty regarding the development of economies and is most likely to cause a global recession. We cannot predict how long this pandemic will last, or how long the restrictions imposed by the countries where we operate will last.
COCA-COLA ANDINA
2Q23 EARNINGS RELEASE
www.koandina.com
-
Since the impact of COVID-19 is very uncertain, we cannot accurately predict the extent of impact this pandemic will have on our business and our operations. There is a risk that our collaborators, contractors and suppliers may be restricted or prevented from carrying out their activities for an indefinite period of time, due to shutdowns mandated by the authorities. Although our operations have not been materially disrupted to date, eventually the pandemic and the measures taken by governments to contain the virus could affect the continuity of our operations. In addition, some measures taken by governments have negatively affected some of our sales channels, especially the closing of restaurants and bars, as well as the prohibition of social gathering events, which affects our sales volumes to these channels. We cannot predict the effect that the pandemic and these measures will have on our sales to these channels, nor whether these channels will recover once the pandemic is over. Nor can we predict how long our consumers will change their consumer spending pattern as a result of the pandemic.
Additionally, a possible outbreak of other epidemics in the future, such as SARS, Zika or the Ebola virus, could also result in a similar impact on our business than COVID-19.
A more detailed analysis of business risks is available in the Company’s 20-F and Annual Report, available on our website.
RECENT EVENTS
Additional Dividend 225
On May 9, 2023, the Company paid Additional Dividend 225: CLP 29.0 per Series A share; and CLP 31.9 per Series B share.
Final Eventual Dividend 226
On May 26, 2023, the Company paid Final Eventual Dividend 226: CLP 50.0 per Series A share; and CLP 55.0 per Series B share.
Resignation of Director Marco Antonio Araujo
On May 30, 2023, the Company's Board of Directors was notified of the resignation as director of Mr. Marco Antonio Araujo, which was accepted. In his stead, Mr. Luis Felipe Coelho Duprat Avellar has been appointed until the next General Shareholders' Meeting.
Termination of Beer Distribution Agreement with CCU Argentina
In Argentina, our beer distribution agreement with CCU expired in June, and we are currently in negotiations for a possible new agreement that would only include some of the brands covered by the expired agreement.
GLOSSARY
Adjusted EBITDA: includes Revenue, Costs of Sales, Distribution Costs and Administrative Expenses, included in the Financial Statements submitted to Chile’s Financial Market Commission and determined in accordance with IFRS, plus Depreciation.
Currency-neutral: of a quarter q for a Q year is calculated using the same ratio of local currencies to the Chilean peso as the q quarter of the Q-1 year. In the case of Argentina, given that it is a hyperinflationary economy, the result of the q quarter is also deflated by inflation of the last 12 months.
Financial Expenses: correspond to interest generated by the Company’s financial debt.
Financial Income: corresponds to the interest generated by the Company's cash.
Net Financial Debt: considers the consolidated financial liability that accrues interest, i.e.: (i) other current financial liabilities, plus (ii) other non-current financial liabilities, less (iii) the sum of cash and cash equivalent; plus other current financial assets; plus other non-current financial assets (to the extent that they correspond to the balances of assets for derivative financial instruments, taken to cover exchange rate risk and/or interest rate of financial liabilities).
Operating Income: includes Revenue, Costs of Sales, Distribution Costs and Administrative Expenses, included in the Financial Statements submitted to Chile Financial Market Commission and determined in accordance with IFRS.
Total Equity: corresponds to the equity attributable to the owners of the controller plus non-controlling interests.
Transactions: refers to the number of units sold, regardless of size.
Volume: expressed in Unit Cases (UCs), which is the conventional measurement used to measure sales volume in the Coca-Cola System worldwide.
COCA-COLA ANDINA
2Q23 EARNINGS RELEASE
www.koandina.com
-
ADDITIONAL INFORMATION
| STOCK EXCHANGES ON WHICH WE TRADE | |||
|
ANDINA-A ANDINA-B
|
AKO/A AKO/B
|
||
| ESG INDICES IN WHICH WE PARTICIPATE | |||
|
Dow Jones Sustainability Index Chile Dow Jones Sustainability MILA Pacific Alliance Index. |
|
|
|
| NUMBER OF SHARES | |||
| TOTAL: 946,570,604 | SERIES A: 473,289,301 | SERIES B: 473,281,303 | SHARES PER ADR: 6 |
ABOUT COCA-COLA ANDINA
Coca-Cola Andina is among the three largest Coca-Cola bottlers in Latin America, servicing franchised territories with almost 55.7 million people, delivering 873.6 million unit cases or 4,960 million liters of soft drinks, juices, bottled water, beer and other alcoholic beverages during 2022. Coca-Cola Andina has the franchise to produce and commercialize Coca-Cola products in certain territories in Argentina (through Embotelladora del Atlántico), in Brazil (through Rio de Janeiro Refrescos), in Chile, (through Embotelladora Andina) and in all of Paraguay (through Paraguay Refrescos). The Chadwick Claro, Garcés Silva, Said Handal and Said Somavía families control Coca-Cola Andina in equal parts. The Company's value generation proposal is to become a Total Beverage Company, using existing resources efficiently and sustainably, developing a relationship of excellence with consumers of its products, as well as with its collaborators, customers, suppliers, the community in which it operates and with its strategic partner The Coca-Cola Company, in order to increase ROIC for shareholders in the long term. For more company information visit www.koandina.com.
This document may contain projections reflecting Coca-Cola Andina’s good faith expectations and are based on currently available information. However, the results that are finally obtained are subject to diverse variables, many of which are beyond the Company's control, and which could materially impact the current performance. Among the factors that could change the performance are the political and economic conditions on mass consumption, pricing pressures resulting from competitive discounts of other bottlers, weather conditions in the Southern Cone and other risk factors that would be applicable from time to time, and which are periodically informed in reports filed before the appropriate regulatory authorities, and which are available on our website.
COCA-COLA ANDINA
2Q23 EARNINGS RELEASE
www.koandina.com
-
Embotelladora Andina S.A.
Second Quarter Results for the period ended June 30, 2023. Reported figures, IFRS GAAP.
(In nominal million Chilean pesos, except per share)
| April-June 2023 | April-June 2022 | |||||||||||||||||||||||||||||||||||||||||||
| Chilean Operations |
Brazilian Operations |
Argentine Operations |
Paraguay Operations |
Total (1) | Chilean Operations |
Brazilian Operations | Argentine Operations |
Paraguay Operations |
Total (1) | % Ch. | ||||||||||||||||||||||||||||||||||
| Volume total beverages (Million UC) | 69.5 | 68.2 | 42.0 | 16.7 | 196.4 | 69.7 | 64.2 | 44.1 | 15.1 | 193.0 | 1.8 | % | ||||||||||||||||||||||||||||||||
| Transactions (Million) | 410.6 | 371.2 | 200.4 | 104.2 | 1,086.5 | 413.9 | 348.5 | 204.3 | 92.4 | 1,059.1 | 2.6 | % | ||||||||||||||||||||||||||||||||
| Net sales | 270,196 | 159,181 | 138,928 | 46,622 | 614,428 | 238,106 | 153,221 | 158,125 | 43,220 | 591,716 | 3.8 | % | ||||||||||||||||||||||||||||||||
| Cost of sales | (181,862 | ) | (97,634 | ) | (72,876 | ) | (26,101 | ) | (377,809 | ) | (158,568 | ) | (96,783 | ) | (85,902 | ) | (24,013 | ) | (364,310 | ) | 3.7 | % | ||||||||||||||||||||||
| Gross profit | 88,334 | 61,547 | 66,052 | 20,521 | 236,619 | 79,537 | 56,439 | 72,222 | 19,208 | 227,406 | 4.1 | % | ||||||||||||||||||||||||||||||||
| Gross margin | 32.7 | % | 38.7 | % | 47.5 | % | 44.0 | % | 38.5 | % | 33.4 | % | 36.8 | % | 45.7 | % | 44.4 | % | 38.4 | % | ||||||||||||||||||||||||
| Distribution and administrative expenses | (65,108 | ) | (39,469 | ) | (50,271 | ) | (10,311 | ) | (165,159 | ) | (59,110 | ) | (38,576 | ) | (54,085 | ) | (10,131 | ) | (161,902 | ) | 2.0 | % | ||||||||||||||||||||||
| Corporate expenses (2) | (1,778 | ) | (1,608 | ) | 10.6 | % | ||||||||||||||||||||||||||||||||||||||
| Operating income (3) | 23,226 | 22,078 | 15,781 | 10,210 | 69,682 | 20,427 | 17,863 | 18,137 | 9,077 | 63,896 | 9.1 | % | ||||||||||||||||||||||||||||||||
| Operating margin | 8.6 | % | 13.9 | % | 11.4 | % | 21.9 | % | 11.3 | % | 8.6 | % | 11.7 | % | 11.5 | % | 21.0 | % | 10.8 | % | ||||||||||||||||||||||||
| Adjusted EBITDA (4) | 34,196 | 29,929 | 24,081 | 13,342 | 99,770 | 29,920 | 26,555 | 26,931 | 12,082 | 93,879 | 6.3 | % | ||||||||||||||||||||||||||||||||
| Adjusted EBITDA margin | 12.7 | % | 18.8 | % | 17.3 | % | 28.6 | % | 16.2 | % | 12.6 | % | 17.3 | % | 17.0 | % | 28.0 | % | 15.9 | % | ||||||||||||||||||||||||
| Financial (expenses) income (net) | (7,192 | ) | (1,464 | ) | 391.3 | % | ||||||||||||||||||||||||||||||||||||||
| Share of (loss) profit of investments accounted for using the equity method | (230 | ) | 546 | -142.1 | % | |||||||||||||||||||||||||||||||||||||||
| Other income (expenses) (5) | (28,890 | ) | (15,922 | ) | 81.4 | % | ||||||||||||||||||||||||||||||||||||||
| Results by readjustement unit and exchange rate difference | (4,764 | ) | (15,424 | ) | -69.1 | % | ||||||||||||||||||||||||||||||||||||||
| Net income before income taxes | 28,607 | 31,633 | -9.6 | % | ||||||||||||||||||||||||||||||||||||||||
| Income tax expense | (16,611 | ) | (6,483 | ) | 156.2 | % | ||||||||||||||||||||||||||||||||||||||
| Net income | 11,995 | 25,150 | -52.3 | % | ||||||||||||||||||||||||||||||||||||||||
| Net income attributable to non-controlling interests | 196 | 387 | -49.2 | % | ||||||||||||||||||||||||||||||||||||||||
| Net income attributable to equity holders of the parent | 12,192 | 25,537 | -52.3 | % | ||||||||||||||||||||||||||||||||||||||||
| Net margin | 2.0 | % | 4.3 | % | ||||||||||||||||||||||||||||||||||||||||
| WEIGHTED AVERAGE SHARES OUTSTANDING | 946.6 | 946.6 | ||||||||||||||||||||||||||||||||||||||||||
| EARNINGS PER SHARE | 12.9 | 27.0 | ||||||||||||||||||||||||||||||||||||||||||
| EARNINGS PER ADS | 77.3 | 161.9 | -52.3 | % | ||||||||||||||||||||||||||||||||||||||||
(1) Total may be different from the addition of the four countries because of intercountry eliminations.
(2) Corporate expenses partially reclassified to the operations.
(3) Operating Income considers Net Sales, Cost of Sales, Distribution Costs, and Administrative Expenses included in the Financial Statements filed with the Chilean Financial Market Comission and determined in accordance to IFRS.
(4) Adjusted EBITDA considers Net Sales, Cost of Sales, Distribution Costs, and Administrative Expenses included in the Financial Statements filed with the Chilean Financial Market Comission and determined in accordance to IFRS, plus Depreciation.
(5) Other income (expenses) includes the following lines of the income statement by function included in the published financial statements in the Financial Market Comission: "Other income", "Other expenses" and "Other (loss) gains".
Embotelladora Andina S.A.
Six Months Results for the period ended June 30, 2023. Reported figures, IFRS GAAP.
(In nominal million Chilean pesos, except per share)
| January-June 2023 | January-June 2022 | |||||||||||||||||||||||||||||||||||||||||||
| Chilean Operations |
Brazilian Operations |
Argentine Operations |
Paraguay Operations |
Total (1) | Chilean Operations |
Brazilian Operations |
Argentine Operations |
Paraguay Operations |
Total (1) | % Ch. | ||||||||||||||||||||||||||||||||||
| Volume total beverages (Million UC) | 156.9 | 141.7 | 96.3 | 36.5 | 431.4 | 157.2 | 130.8 | 96.9 | 35.8 | 420.9 | 2.5 | % | ||||||||||||||||||||||||||||||||
| Transactions (Million) | 910.0 | 775.5 | 461.5 | 223.2 | 2,370.2 | 927.8 | 713.2 | 449.1 | 211.4 | 2,301.5 | 3.0 | % | ||||||||||||||||||||||||||||||||
| Net sales | 582,729 | 320,506 | 323,541 | 100,464 | 1,325,983 | 529,102 | 281,732 | 349,640 | 96,347 | 1,254,914 | 5.7 | % | ||||||||||||||||||||||||||||||||
| Cost of sales | (389,548 | ) | (199,508 | ) | (164,591 | ) | (55,647 | ) | (807,872 | ) | (348,920 | ) | (178,634 | ) | (184,349 | ) | (52,272 | ) | (762,267 | ) | 6.0 | % | ||||||||||||||||||||||
| Gross profit | 193,182 | 120,998 | 158,950 | 44,817 | 518,111 | 180,182 | 103,098 | 165,291 | 44,075 | 492,647 | 5.2 | % | ||||||||||||||||||||||||||||||||
| Gross margin | 33.2 | % | 37.8 | % | 49.1 | % | 44.6 | % | 39.1 | % | 34.1 | % | 36.6 | % | 47.3 | % | 45.7 | % | 39.3 | % | ||||||||||||||||||||||||
| Distribution and administrative expenses | (135,902 | ) | (79,149 | ) | (108,745 | ) | (20,991 | ) | (344,788 | ) | (121,762 | ) | (69,440 | ) | (111,143 | ) | (20,381 | ) | (322,725 | ) | 6.8 | % | ||||||||||||||||||||||
| Corporate expenses (2) | (3,455 | ) | (3,147 | ) | 9.8 | % | ||||||||||||||||||||||||||||||||||||||
| Operating income (3) | 57,280 | 41,848 | 50,205 | 23,826 | 169,868 | 58,420 | 33,659 | 54,148 | 23,695 | 166,774 | 1.9 | % | ||||||||||||||||||||||||||||||||
| Operating margin | 9.8 | % | 13.1 | % | 15.5 | % | 23.7 | % | 12.8 | % | 11.0 | % | 11.9 | % | 15.5 | % | 24.6 | % | 13.3 | % | ||||||||||||||||||||||||
| Adjusted EBITDA (4) | 78,933 | 57,168 | 66,641 | 30,200 | 229,486 | 77,676 | 48,657 | 71,718 | 29,608 | 224,511 | 2.2 | % | ||||||||||||||||||||||||||||||||
| Adjusted EBITDA margin | 13.5 | % | 17.8 | % | 20.6 | % | 30.1 | % | 17.3 | % | 14.7 | % | 17.3 | % | 20.5 | % | 30.7 | % | 17.9 | % | ||||||||||||||||||||||||
| Financial (expenses) income (net) | (9,236 | ) | (3,065 | ) | 201.4 | % | ||||||||||||||||||||||||||||||||||||||
| Share of (loss) profit of investments accounted for using the equity method | 840 | 33 | 2416.1 | % | ||||||||||||||||||||||||||||||||||||||||
| Other income (expenses) (5) | (33,371 | ) | (20,184 | ) | 65.3 | % | ||||||||||||||||||||||||||||||||||||||
| Results by readjustement unit and exchange rate difference | (20,140 | ) | (33,525 | ) | -39.9 | % | ||||||||||||||||||||||||||||||||||||||
| Net income before income taxes | 107,961 | 110,033 | -1.9 | % | ||||||||||||||||||||||||||||||||||||||||
| Income tax expense | (53,468 | ) | (49,877 | ) | 7.2 | % | ||||||||||||||||||||||||||||||||||||||
| Net income | 54,493 | 60,157 | -9.4 | % | ||||||||||||||||||||||||||||||||||||||||
| Net income attributable to non-controlling interests | (1,562 | ) | (829 | ) | 88.4 | % | ||||||||||||||||||||||||||||||||||||||
| Net income attributable to equity holders of the parent | 52,931 | 59,328 | -10.8 | % | ||||||||||||||||||||||||||||||||||||||||
| Net margin | 4.0 | % | 4.7 | % | ||||||||||||||||||||||||||||||||||||||||
| WEIGHTED AVERAGE SHARES OUTSTANDING | 946.6 | 946.6 | ||||||||||||||||||||||||||||||||||||||||||
| EARNINGS PER SHARE | 55.9 | 62.7 | ||||||||||||||||||||||||||||||||||||||||||
| EARNINGS PER ADS | 335.5 | 376.1 | -10.8 | % | ||||||||||||||||||||||||||||||||||||||||
(1) Total may be different from the addition of the four countries because of intercountry eliminations.
(2) Corporate expenses partially reclassified to the operations.
(3) Operating Income considers Net Sales, Cost of Sales, Distribution Costs, and Administrative Expenses included in the Financial Statements filed with the Chilean Financial Market Comission and determined in accordance to IFRS.
(4) Adjusted EBITDA considers Net Sales, Cost of Sales, Distribution Costs, and Administrative Expenses included in the Financial Statements filed with the Chilean Financial Market Comission and determined in accordance to IFRS, plus Depreciation.
(5) Other income (expenses) includes the following lines of the income statement by function included in the published financial statements in the Financial Market Comission: "Other income", "Other expenses" and "Other (loss) gains".
Embotelladora Andina S.A.
Second Quarter Results for the period ended June 30, 2023.
(In local nominal currency of each period, except Argentina (3))
| April-June 2023 | April-June 2022 | |||||||||||||||||||||||||||||||
| Chile Million Ch$ |
Brazil Million R$ |
Argentina
(3) Million AR$ |
Paraguay Million G$ |
Chile Million Ch$ |
Brazil Million R$ |
Argentina
(3) Million AR$ |
Paraguay Million G$ |
|||||||||||||||||||||||||
| Nominal | Nominal | IAS29 | Nominal | Nominal | Nominal | IAS 29 | Nominal | |||||||||||||||||||||||||
| Total beverages volume (Million UC) | 69.5 | 68.2 | 42.0 | 16.7 | 69.7 | 64.2 | 44.1 | 15.1 | ||||||||||||||||||||||||
| Transactions (Million) | 410.6 | 371.2 | 200.4 | 104.2 | 413.9 | 348.5 | 204.3 | 92.4 | ||||||||||||||||||||||||
| Net sales | 270,196 | 983.9 | 44,486.3 | 419,879 | 238,106 | 894.0 | 47,322.5 | 352,250 | ||||||||||||||||||||||||
| Cost of sales | (181,862 | ) | (603.4 | ) | (23,335.7 | ) | (235,046 | ) | (158,568 | ) | (564.7 | ) | (25,708.3 | ) | (195,665 | ) | ||||||||||||||||
| Gross profit | 88,334 | 380.5 | 21,150.6 | 184,833 | 79,537 | 329.3 | 21,614.2 | 156,585 | ||||||||||||||||||||||||
| Gross margin | 32.7 | % | 38.7 | % | 47.5 | % | 44.0 | % | 33.4 | % | 36.8 | % | 45.7 | % | 44.5 | % | ||||||||||||||||
| Distribution and administrative expenses | (65,108 | ) | (243.9 | ) | (16,097.3 | ) | (92,878 | ) | (59,110 | ) | (225.1 | ) | (16,186.2 | ) | (82,462 | ) | ||||||||||||||||
| Operating income (1) | 23,226 | 136.6 | 5,053.3 | 91,955 | 20,427 | 104.2 | 5,428.0 | 74,123 | ||||||||||||||||||||||||
| Operating margin | 8.6 | % | 13.9 | % | 11.4 | % | 21.9 | % | 8.6 | % | 11.7 | % | 11.5 | % | 21.0 | % | ||||||||||||||||
| Adjusted EBITDA (2) | 34,196 | 185.1 | 7,711.0 | 120,166 | 29,920 | 154.9 | 8,059.8 | 98,570 | ||||||||||||||||||||||||
| Adjusted EBITDA margin | 12.7 | % | 18.8 | % | 17.3 | % | 28.6 | % | 12.6 | % | 17.3 | % | 17.0 | % | 28.0 | % | ||||||||||||||||
(1) Operating Income considers Net Sales, Cost of Sales, Distribution Costs, and Administrative Expenses included in the Financial Statements filed with the Chilean Financial Market Comission and determined in accordance to IFRS.
(2) Adjusted EBITDA considers Net Sales, Cost of Sales, Distribution Costs, and Administrative Expenses included in the Financial Statements filed with the Chilean Financial Market Comission and determined in accordance to IFRS, plus Depreciation.
(3) Argentina 2023 figures are presented in accordance to IAS 29, in June 2023 currency. 2022 figures are also presented in accordance to IAS 29, in June 2023 currency.
Embotelladora Andina S.A.
Six Months Results for the period ended June 30, 2023.
(In local nominal currency of each period, except Argentina (3))
| January-June 2023 | January-June 2022 | |||||||||||||||||||||||||||||||
| Chile Million Ch$ |
Brazil Million R$ |
Argentina
(3) Million AR$ |
Paraguay Million G$ |
Chile Million Ch$ |
Brazil Million R$ |
Argentina
(3) Million AR$ |
Paraguay Million G$ |
|||||||||||||||||||||||||
| Nominal | Nominal | IAS29 | Nominal | Nominal | Nominal | IAS 29 | Nominal | |||||||||||||||||||||||||
| Total beverages volume (Million UC) | 156.9 | 141.7 | 96.3 | 36.5 | 157.2 | 130.8 | 96.9 | 35.8 | ||||||||||||||||||||||||
| Transactions (Million) | 910.0 | 775.5 | 461.5 | 223.2 | 927.8 | 713.2 | 449.1 | 211.4 | ||||||||||||||||||||||||
| Net sales | 582,729 | 2,018.7 | 103,601.3 | 903,865 | 529,102 | 1,721.7 | 104,637.9 | 810,773 | ||||||||||||||||||||||||
| Cost of sales | (389,548 | ) | (1,257.0 | ) | (52,703.7 | ) | (500,632 | ) | (348,920 | ) | (1,091.7 | ) | (55,170.7 | ) | (439,551 | ) | ||||||||||||||||
| Gross profit | 193,182 | 761.7 | 50,897.6 | 403,233 | 180,182 | 630.0 | 49,467.3 | 371,222 | ||||||||||||||||||||||||
| Gross margin | 33.2 | % | 37.7 | % | 49.1 | % | 44.6 | % | 34.1 | % | 36.6 | % | 47.3 | % | 45.8 | % | ||||||||||||||||
| Distribution and administrative expenses | (135,902 | ) | (498.1 | ) | (34,821.3 | ) | (188,949 | ) | (121,762 | ) | (424.9 | ) | (33,262.1 | ) | (170,893 | ) | ||||||||||||||||
| Operating income (1) | 57,280 | 263.6 | 16,076.2 | 214,284 | 58,420 | 205.2 | 16,205.1 | 200,329 | ||||||||||||||||||||||||
| Operating margin | 9.8 | % | 13.1 | % | 15.5 | % | 23.7 | % | 11.0 | % | 11.9 | % | 15.5 | % | 24.7 | % | ||||||||||||||||
| Adjusted EBITDA (2) | 78,933 | 360.0 | 21,339.1 | 271,647 | 77,676 | 296.7 | 21,463.1 | 249,866 | ||||||||||||||||||||||||
| Adjusted EBITDA margin | 13.5 | % | 17.8 | % | 20.6 | % | 30.1 | % | 14.7 | % | 17.2 | % | 20.5 | % | 30.8 | % | ||||||||||||||||
(1) Operating Income considers Net Sales, Cost of Sales, Distribution Costs, and Administrative Expenses included in the Financial Statements filed with the Chilean Financial Market Comission and determined in accordance to IFRS.
(2) Adjusted EBITDA considers Net Sales, Cost of Sales, Distribution Costs, and Administrative Expenses included in the Financial Statements filed with the Chilean Financial Market Comission and determined in accordance to IFRS, plus Depreciation.
(3) Argentina 2023 figures are presented in accordance to IAS 29, in June 2023 currency. 2022 figures are also presented in accordance to IAS 29, in June 2023 currency.
Embotelladora Andina S.A.
Consolidated Balance Sheet
(In million Chilean pesos)
| Variation % | ||||||||||||||||||||
| ASSETS | 06-30-2023 | 12-31-2022 | 06-30-2022 | 12-31-2022 | 06-30-2022 | |||||||||||||||
| Cash + Time deposits + market. Securit. | 425,801 | 554,727 | 342,998 | -23.2 | % | 24.1 | % | |||||||||||||
| Account receivables (net) | 214,033 | 294,832 | 245,838 | -27.4 | % | -12.9 | % | |||||||||||||
| Inventories | 245,474 | 245,887 | 231,015 | -0.2 | % | 6.3 | % | |||||||||||||
| Other current assets | 56,491 | 66,283 | 60,550 | -14.8 | % | -6.7 | % | |||||||||||||
| Total Current Assets | 941,799 | 1,161,729 | 880,401 | -18.9 | % | 7.0 | % | |||||||||||||
| Property, plant and equipment | 1,952,503 | 1,888,340 | 1,915,112 | 3.4 | % | 2.0 | % | |||||||||||||
| Depreciation | (1,133,786 | ) | (1,090,118 | ) | (1,112,948 | ) | 4.0 | % | 1.9 | % | ||||||||||
| Total Property, Plant, and Equipment | 818,718 | 798,221 | 802,164 | 2.6 | % | 2.1 | % | |||||||||||||
| Investment in related companies | 89,902 | 92,345 | 98,547 | -2.6 | % | -8.8 | % | |||||||||||||
| Goodwill | 129,222 | 129,024 | 138,716 | 0.2 | % | -6.8 | % | |||||||||||||
| Other long term assets | 818,272 | 829,381 | 1,062,288 | -1.3 | % | -23.0 | % | |||||||||||||
| Total Other Assets | 1,037,396 | 1,050,750 | 1,299,551 | -1.3 | % | -20.2 | % | |||||||||||||
| TOTAL ASSETS | 2,797,913 | 3,010,701 | 2,982,116 | -7.1 | % | -6.2 | % | |||||||||||||
| Variation % | ||||||||||||||||||||
| LIABILITIES & SHAREHOLDERS' EQUITY | 06-30-2023 | 12-31-2022 | 06-30-2022 | 12-31-2022 | 06-30-2022 | |||||||||||||||
| Short term bank liabilities | 32,238 | 689 | 5,886 | 4580.3 | % | 447.7 | % | |||||||||||||
| Current portion of bonds payable | 321,543 | 340,768 | 27,523 | -5.6 | % | 1068.3 | % | |||||||||||||
| Other financial liabilities | 25,520 | 25,845 | 22,790 | -1.3 | % | 12.0 | % | |||||||||||||
| Trade accounts payable and notes payable | 338,503 | 475,050 | 369,361 | -28.7 | % | -8.4 | % | |||||||||||||
| Other liabilities | 60,803 | 106,893 | 68,189 | -43.1 | % | -10.8 | % | |||||||||||||
| Total Current Liabilities | 778,607 | 949,245 | 493,749 | -18.0 | % | 57.7 | % | |||||||||||||
| Long term bank liabilities | 13,310 | 13,366 | 4,000 | -0.4 | % | 232.8 | % | |||||||||||||
| Bonds payable | 753,898 | 763,368 | 1,103,084 | -1.2 | % | -31.7 | % | |||||||||||||
| Other financial liabilities | 86,387 | 128,068 | 33,534 | -32.5 | % | 157.6 | % | |||||||||||||
| Other long term liabilities | 279,893 | 273,251 | 286,911 | 2.4 | % | -2.4 | % | |||||||||||||
| Total Long Term Liabilities | 1,133,488 | 1,178,053 | 1,427,529 | -3.8 | % | -20.6 | % | |||||||||||||
| Minority interest | 31,242 | 28,143 | 28,058 | 11.0 | % | 11.3 | % | |||||||||||||
| Stockholders' Equity | 854,576 | 855,260 | 1,032,780 | -0.1 | % | -17.3 | % | |||||||||||||
| TOTAL LIABILITIES & SHAREHOLDERS' EQUITY | 2,797,913 | 3,010,701 | 2,982,116 | -7.1 | % | -6.2 | % | |||||||||||||
Financial Highlights
(In million Chilean pesos)
| Accumulated | ||||||||||||
| ADDITIONS TO FIXED ASSETS | 06-30-2023 | 12-31-2022 | 06-30-2022 | |||||||||
| Chile | 41,559 | 70,395 | 20,891 | |||||||||
| Brazil | 14,418 | 44,611 | 15,990 | |||||||||
| Argentina | 23,720 | 37,757 | 17,409 | |||||||||
| Paraguay | 5,643 | 20,912 | 5,860 | |||||||||
| Total | 85,339 | 173,675 | 60,150 | |||||||||
SIGNATURES
Pursuant to the requirements of the Securities Exchange Act of 1934, the registrant has duly caused this report to be signed on its behalf by the undersigned, thereunto duly authorized, in the city of Santiago, Chile.
| EMBOTELLADORA ANDINA S.A. | ||
| By: | /s/ Andrés Wainer | |
| Name: | Andrés Wainer | |
| Title: | Chief Financial Officer | |
Santiago, July 25, 2023


