UNITED STATES
SECURITIES AND EXCHANGE COMMISSION
Washington, D.C. 20549
FORM 8-K
CURRENT REPORT
Pursuant to Section 13 OR 15(d) of The Securities Exchange Act of 1934
Date of Report (Date of earliest event reported): July 20, 2023
AAR CORP.
(Exact name of registrant as specified in its charter)
| Delaware | 1-6263 | 36-2334820 | ||
| (State or other jurisdiction of incorporation) |
(Commission File Number) | (IRS Employer Identification No.) |
| One AAR Place | |
| 1100 N. Wood Dale Road | |
| Wood Dale, Illinois | 60191 |
| (Address of principal executive offices) | (Zip Code) |
Registrant’s telephone number, including area code: (630) 227-2000
Not Applicable
(Former name or former address, if changed since last report)
Check the appropriate box below if the Form 8-K filing is intended to simultaneously satisfy the filing obligation of the registrant under any of the following provisions:
¨ Written communications pursuant to Rule 425 under the Securities Act (17 CFR 230.425)
¨ Soliciting material pursuant to Rule 14a-12 under the Exchange Act (17 CFR 240.14a-12)
¨ Pre-commencement communications pursuant to Rule 14d-2(b) under the Exchange Act (17 CFR 240.14d-2(b))
¨ Pre-commencement communications pursuant to Rule 13e-4(c) under the Exchange Act (17 CFR 240.13e-4(c))
Securities registered pursuant to Section 12(b) of the Act:
| Title of Each Class | Trading Symbol(s) | Name of Each Exchange on Which Registered | ||
| Common Stock, $1.00 par value | AIR | New York Stock Exchange | ||
| Chicago Stock Exchange |
Indicate by check mark whether the registrant is an emerging growth company as defined in Rule 405 of the Securities Act of 1933 (§ 230.405 of this chapter) or Rule 12b-2 of the Securities Exchange Act of 1934 (§ 240.12b-2 of this chapter).
Emerging growth company ¨
If an emerging growth company, indicate by check mark if the registrant has elected not to use the extended transition period for complying with any new or revised financial accounting standards provided pursuant to Section 13(a) of the Exchange Act. ¨
| Item 7.01. | Regulation FD Disclosure. |
On July 20, 2023, AAR CORP. (the “Company”) hosted an Investor Day event at 9:00 a.m. ET in New York City. During the event, which was held in person and via live webcast, the Company’s senior leadership team provided an overview of the Company’s strategy, markets, operations, and key growth opportunities. A copy of the presentation shown during the event and available on the Company’s website is furnished as Exhibit 99.1 to this Current Report on Form 8-K.
The information in this Form 8-K, including Exhibit 99.1, is being furnished and shall not be deemed to be “filed” for purposes of Section 18 of the Securities Exchange Act of 1934, as amended (the “Exchange Act”), or otherwise subject to the liabilities of that section, nor shall it be deemed to be incorporated by reference in any registration statement or other document filed under the Securities Act of 1933, as amended, or the Exchange Act, except as otherwise stated in such filing.
| Item 9.01. | Financial Statements and Exhibits. |
(d) Exhibits
| Exhibit No. | Description | |
| 99.1 | AAR CORP. Investor Day Presentation dated July 20, 2023 | |
| 104 | Cover Page Interactive Data File (the cover page XBRL tags are embedded in the Inline XBRL document) |
SIGNATURES
Pursuant to the requirements of the Securities Exchange Act of 1934, the registrant has duly caused this report to be signed on its behalf by the undersigned hereunto duly authorized.
Date: July 20, 2023
| AAR CORP. | ||
| By: | /s/ Jessica A. Garascia | |
| Jessica A. Garascia | ||
|
Senior Vice President, General Counsel, Chief Administrative Officer and Secretary |
||
Exhibit 99.1

© 2023 AAR CORP. All rights reserved worldwide. 1 aarcorp.com Investor Day July 20, 2023

© 2023 AAR CORP. All rights reserved worldwide. 2 Forward - looking statements Note: All results and expectations in the presentation reflect continuing operations unless otherwise noted. This presentation contains certain statements relating to future results, which are forward - looking statements as that term is d efined in the Private Securities Litigation Reform Act of 1995, which reflect management’s expectations about future conditions. Forward - looking statements often address our expected future operating and financial perfo rmance and financial condition, or targets, goals, commitments, and other business plans, and often may also be identified because they contain words such as “anticipate,” “believe,” “continue,” “could,” “estimate,” “e xpect,” “intend,” “likely,” “may,” “might,” “plan,” “potential,” “predict,” “project,” “seek,” “should,” “target,” “will,” “would,” or similar expressions and the negatives of those terms. These forward - looking statements are based o n the beliefs of Company management, as well as assumptions and estimates based on information available to the Company as of the dates such assumptions and estimates are made, and are subject to certain risk s a nd uncertainties that could cause actual results to differ materially from historical results or those anticipated, depending on a variety of factors, including: (i) factors that adversely affect the commercial aviation in dus try; (ii) the impact of pandemics and other disease outbreaks, such as COVID - 19, and similar public health threats on air travel, worldwide commercial activity and our and our customers’ ability to source parts and com pon ents; (iii) a reduction in the level of sales to the branches, agencies and departments of the U.S. government and their contractors (which were 29% of consolidated sales in fiscal year 2023); (iv) (v) cost overruns and lo sses on fixed - price contracts; (vi) nonperformance by subcontractors or suppliers; (vii) changes in or non - compliance with laws and regulations that may affect certain of our aviation and government and defense related activi ties that are subject to licensing, certification and other regulatory requirements imposed by the FAA, the U.S. State Department and other regulatory agencies, both domestic and foreign; (viii) a reduction in outsourcin g o f maintenance activity by airlines; (ix) a shortage of the skilled personnel on whom we depend to operate our business, or work stoppages; (x) competition from other companies, including original equipment manufacturers, so me of which have greater financial resources than we do; (xi) financial and operational risks arising as a result of operating internationally; (xii) inability to integrate acquisitions effectively and execute our opera tio nal and financial plan related to the acquisitions; (xiii) failure to realize the anticipated benefits of the acquisition of Trax USA Corp. (“ Trax ”) and difficulties integrating Trax’s operations:(xiv) inability to recover our costs due to fluctuations in market values for aviation products and equipment caus ed by various factors, including reductions in air travel, airline bankruptcies, consolidations and fleet reductions; (xv) asset impairment charges we may be required to recognize to reflect the non - recoverability of our assets or lowered expectations regarding businesses we have acquired; (xvi) threats to our systems technology from equipment failures, cyber or ot her security threats or other disruptions; (xvii) a need to make significant capital expenditures to keep pace with technological developments in our industry; (xviii) a need to reduce the carrying value of our assets; (xix ) i nability to fully execute our stock repurchase program and return capital to our stockholders; (xvii) restrictions on paying, or failure to maintain or pay dividends; (xx) limitations on our ability to access the debt and equit y c apital markets or to draw down funds under loan agreements; (xxi) non - compliance with restrictive and financial covenants contained in certain of our loan agreements; (xxii) non - compliance with laws and regulations relating to the formation, administration and performance of our U.S. government contracts; (xxiii) exposure to product liability and property claims that may be in excess of our liability insurance coverage; (xxiv) impacts f rom stakeholder and market focus on environmental, social and governance matters; and (xxv) the costs of compliance, and liability for non - compliance, with environmental regulations, including future requirements regarding c limate change and environmental, social and governance matters. Should one or more of those risks or uncertainties materialize adversely, or should underlying assumptions or estimates prove incorrect, actual results m ay vary materially from those described. Those events and uncertainties are difficult or impossible to predict accurately and many are beyond our control. For a discussion of these and other risks and uncertainties, refer to our Annual Report on Form 10 - K, Part I, “Item 1A, Risk Factors” and our other filings filed from time to time with the U.S. Securities and Exchange Commission. These events and uncertainties are difficult or impossible to predi ct accurately and many are beyond the Company’s control. We assume no obligation to update any forward - looking statements to reflect events or circumstances after the date of such statements or to reflect the occurrence of anticipated or unanticipated events. Fiscal 2024 Segment Realignment: As previously announced, during the first quarter of fiscal 2024, our chief operating decision maker implemented changes to t he organization of the business, allocation of resources, and performance assessment. Specifically, this new structure resulted in the separation of our Aviation Services segment into th ree new operating segments: Parts Supply, Integrated Solutions and Repair & Engineering. Beginning with the first quarter of fiscal 2024, the Company will report under this new structure using the following four op era ting segments: Parts Supply, Integrated Solutions, Repair & Engineering and Expeditionary Services. These changes will be initially reflected in the Company’s unaudited condensed consolidated financial statements fo r t he quarterly period ending August 31, 2023. This presentation and the related discussion, other than references to historical periods unless specifically noted, referenc e t he new reportable segments effective the beginning of fiscal 2024. See the Company’s Current Report on Form 8 - K, furnished on July 18, 2023, for certain recast historical summary financial inform ation under the Company’s new operating segment structure for fiscal years 2022 and 2023 and for the previously reported quarters in fiscal year 2023. Presentation Materials: The statements included and the information provided in this presentation are made as of July 20, 2023. Non - GAAP Financial Measures: This presentation includes certain non - GAAP financial measures. Please refer to the Appendix for additional information on these non - GAAP financial measures and reconciliations to the comparable GAAP measures.
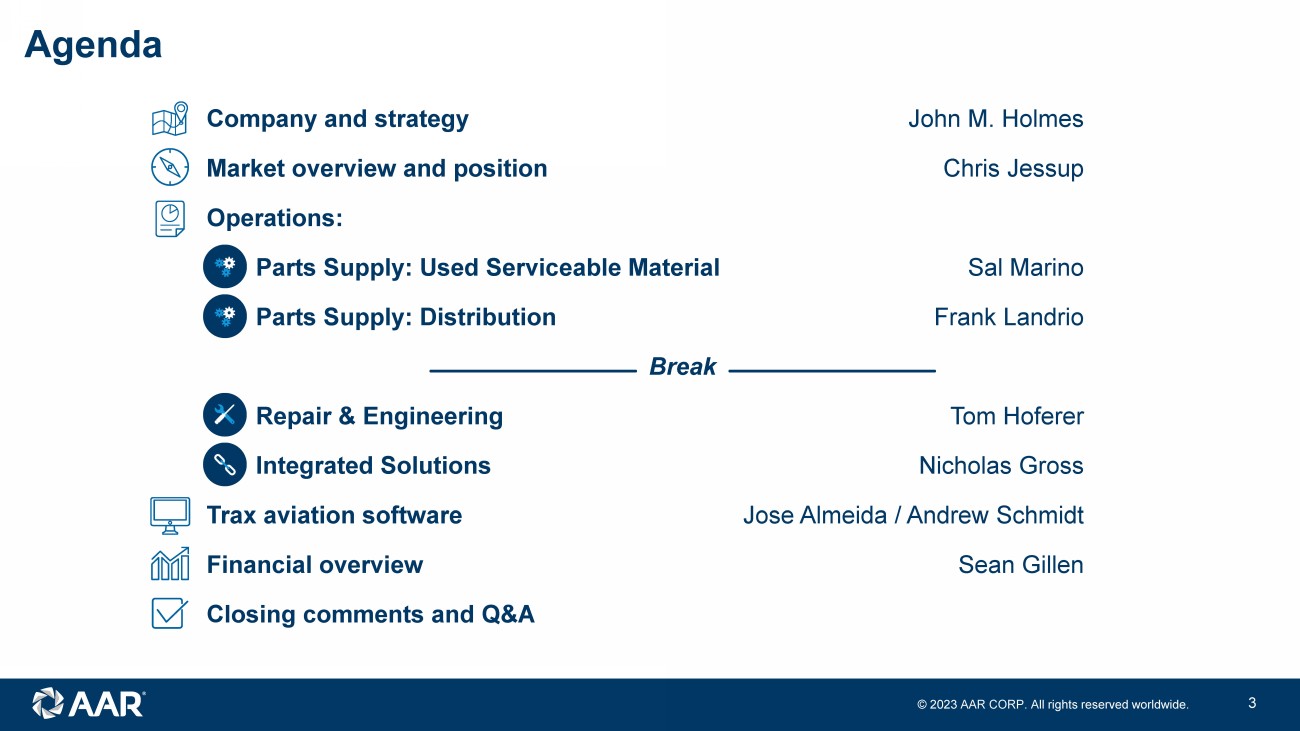
© 2023 AAR CORP. All rights reserved worldwide. 3 Agenda Company and strategy John M. Holmes Market overview and position Chris Jessup Operations: Parts Supply: Used Serviceable Material Sal Marino Parts Supply: Distribution Frank Landrio Break Repair & Engineering Tom Hoferer Integrated Solutions Nicholas Gross Trax aviation software Jose Almeida / Andrew Schmidt Financial overview Sean Gillen Closing comments and Q&A © 2023 AAR CORP.

All rights reserved worldwide. 4 Company and strategy John M. Holmes Chairman, President and Chief Executive Officer © 2023 AAR CORP.
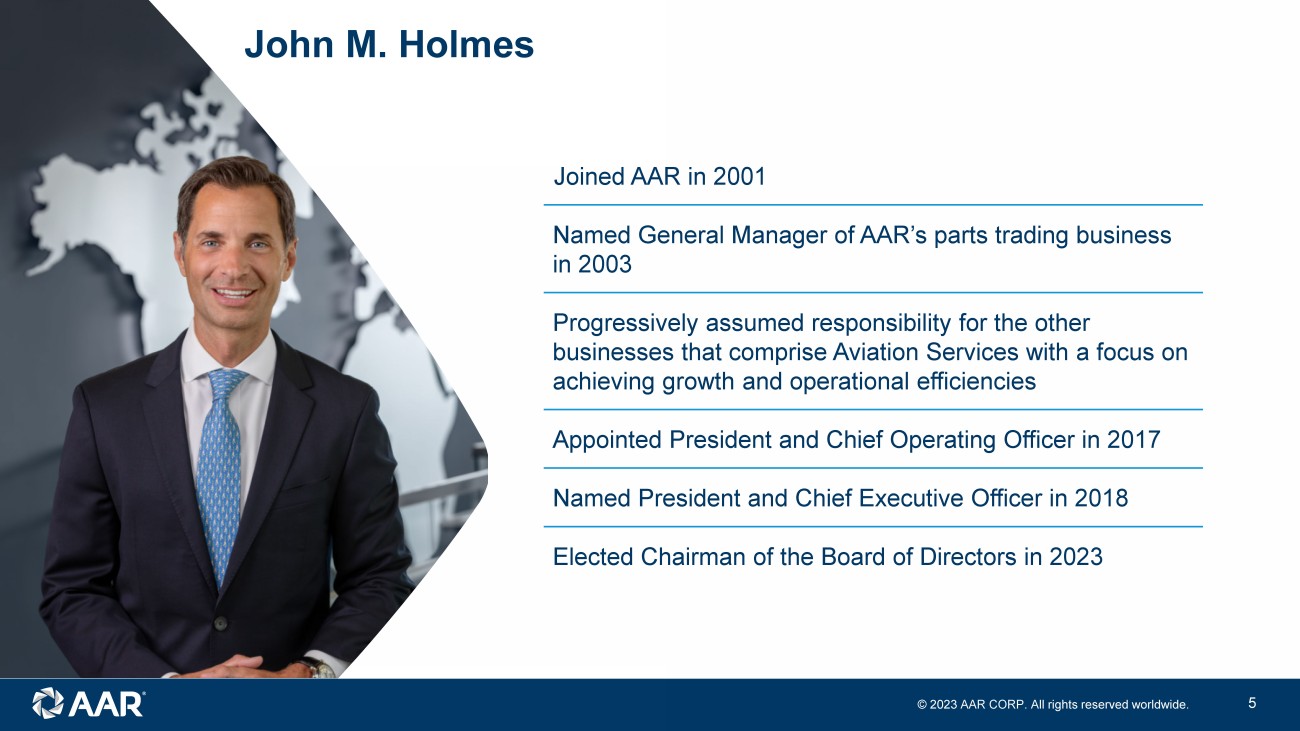
All rights reserved worldwide. 5 John M. Holmes Joined AAR in 2001 Named General Manager of AAR’s parts trading business in 2003 Progressively assumed responsibility for the other businesses that comprise Aviation Services with a focus on achieving growth and operational efficiencies Appointed President and Chief Operating Officer in 2017 Named President and Chief Executive Officer in 2018 Elected Chairman of the Board of Directors in 2023 © 2023 AAR CORP.
All rights reserved worldwide. 6 Vision Be the most respected global independent provider of aviation parts and repair services Create value for customers through differentiated capabilities and offerings, resulting in a sustainable, unique competitive advantage © 2023 AAR CORP.

All rights reserved worldwide. 7 Global aerospace and defense aftermarket solutions Company Founded 1951 Market cap ~$2B Adjusted sales $2.0B NYSE AIR Employees ~5,000 Adj. operating margin 7.5% Note: Adjusted sales, adjusted operating margin and employees for fiscal year ended May 31, 2023. Market cap as of July 18, 202 3. See Appendix for reconciliation of non - GAAP financial measures Key Metrics Businesses Parts Supply Repair & Engineering Integrated Solutions Expeditionary Services Selected Customers © 2023 AAR CORP.

All rights reserved worldwide. 8 Business overview Expanding from two reported segments to four Parts Supply 41% Repair & Engineering 27% Integrated Solutions 27% Expeditionary Services 5% $2.0B FY23 sales Commercial 67% Government 33% Note: Fiscal year (FY) ends May 31 Parts Supply • Used serviceable material (USM) • New parts distribution • Online P AAR TS SM Store • 24/7 global aircraft - on - ground (AOG) service Repair & Engineering • Airframe maintenance, repair & overhaul (MRO) • Component Repair & Landing Gear Overhaul • Engineering • Development of proprietary Parts Manufacturer Approval (PMA) parts Integrated Solutions • Government aircraft maintenance, logistics, and operations support programs • Commercial flight - hour - based aircraft component support • Consumable and expendable parts programs • Trax ERP software for aircraft MRO Expeditionary Services Mobility Systems: Rapid deployment sustainment solutions for government applications • Pallets for use in military transport aircraft • Containers for customized air - mobile shipping and storage of equipment • Shelter systems for military operations FY23 sales © 2023 AAR CORP.

All rights reserved worldwide. 9 Values: Doing It Right ® © 2023 AAR CORP.

All rights reserved worldwide. 10 Corporate citizenship ESG reporting • Published our first two ESG reports • Data reporting consistent with Global Reporting Initiative and Sustainable Accounting Standards Board • Added disclosures consistent with Task Force on Climate - Related Financial Disclosures in 2022 • Added results of impact assessment performed in 2022 Compliance commitment • Established Compliance Champion Network to broaden reach and further embed compliance into company culture • Enhanced due diligence practices, ongoing monitoring and targeted anti - corruption audits to reduce third party risk • Created Executive Compliance Committee to support growth and oversight of compliance program Significant recognition received • Newsweek’s America’s Greatest Workplaces 2023 • Newsweek’s America’s Greatest Workplaces for Diversity 2023 • 2023 Military Friendly® Employer, Military Friendly® Spouse Employer, Military Friendly® Top 10 Brand, and Military Friendly® Top 10 Supplier Diversity Program • Bloomberg Government’s BGOV 200 list of top federal contractors 2022 Committed to ESG and compliance leadership © 2023 AAR CORP.

All rights reserved worldwide. 11 Key messages Actions taken have produced a stronger, better business than pre - pandemic • Exited underperforming contracts and businesses • Consolidated facilities • Developed proprietary labor pipelines • Improved airframe maintenance efficiency Multiple growth prongs • Large and growing commercial markets; pandemic recovery still occurring • Increasing used serviceable material (USM) adoption and feedstock • Continued distribution share gain • Airframe maintenance capacity expansion • Government offering and recovery Driving greater differentiation into the business • Software solutions • Tech - based maintenance, repair and overhaul (MRO) proficiency • Proprietary Parts Manufacturer Approval (PMA) parts Raising the bar on shareholder value • Transparency • Profitability • Cash conversion • Innovation © 2023 AAR CORP.
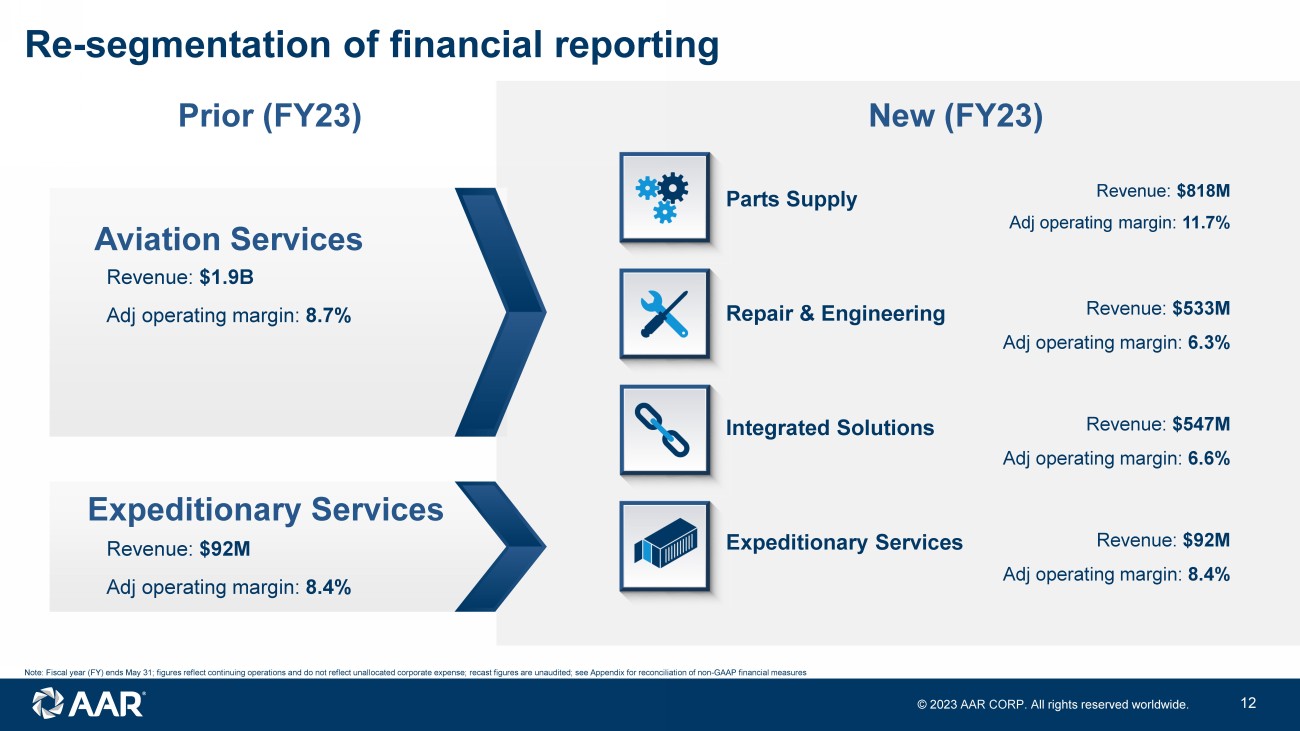
All rights reserved worldwide. 12 Aviation Services Re - segmentation of financial reporting Expeditionary Services Prior (FY23) New (FY23) Revenue: $1.9B Adj operating margin: 8.7% Revenue: $92M Adj operating margin: 8.4% Parts Supply Revenue: $818M Adj operating margin: 11.7% Repair & Engineering Integrated Solutions Expeditionary Services Revenue: $533M Adj operating margin: 6.3% Revenue: $547M Adj operating margin: 6.6% Revenue: $92M Adj operating margin: 8.4% Note: Fiscal year (FY) ends May 31; figures reflect continuing operations and do not reflect unallocated corporate expense; r eca st figures are unaudited; see Appendix for reconciliation of non - GAAP financial measures © 2023 AAR CORP.
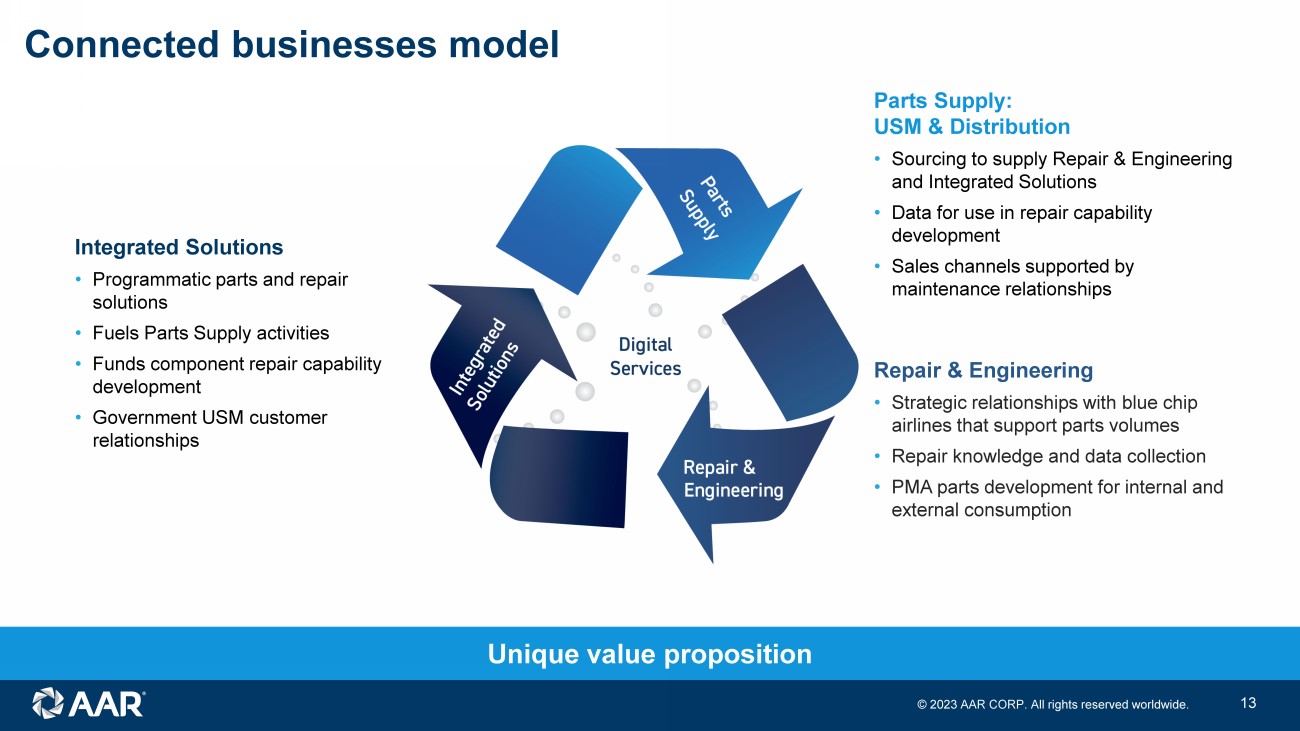
All rights reserved worldwide. 13 Connected businesses model Parts Supply: USM & Distribution • Sourcing to supply Repair & Engineering and Integrated Solutions • Data for use in repair capability development • Sales channels supported by maintenance relationships Repair & Engineering • Strategic relationships with blue chip airlines that support parts volumes • Repair knowledge and data collection • PMA parts development for internal and external consumption Integrated Solutions • Programmatic parts and repair solutions • Fuels Parts Supply activities • Funds component repair capability development • Government USM customer relationships Unique value proposition © 2023 AAR CORP.
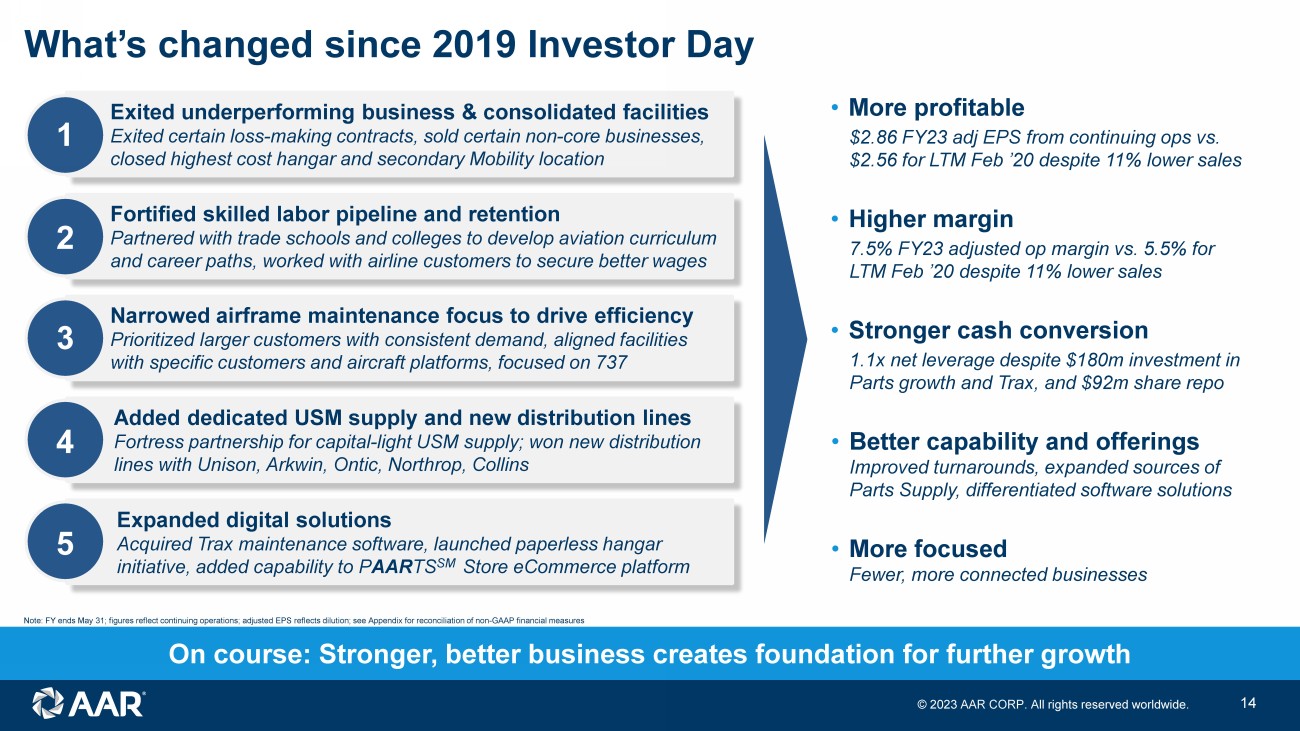
All rights reserved worldwide. 14 What’s changed since 2019 Investor Day 1 2 3 4 Added dedicated USM supply and new distribution lines Fortress partnership for capital - light USM supply; won new distribution lines with Unison, Arkwin , Ontic, Northrop, Collins On course: Stronger, better business creates foundation for further growth • More profitable $2.86 FY23 adj EPS from continuing ops vs. $2.56 for LTM Feb ’20 despite 11% lower sales • Higher margin 7.5% FY23 adjusted op margin vs. 5.5% for LTM Feb ’20 despite 11% lower sales • Stronger cash conversion 1.1x net leverage despite $180m investment in Parts growth and Trax , and $92m share repo • Better capability and offerings Improved turnarounds, expanded sources of Parts Supply, differentiated software solutions • More focused Fewer, more connected businesses 5 Expanded digital solutions Acquired Trax maintenance software, launched paperless hangar initiative, added capability to P AAR TS SM Store eCommerce platform Narrowed airframe maintenance focus to drive efficiency Prioritized larger customers with consistent demand, aligned facilities with specific customers and aircraft platforms, focused on 737 Fortified skilled labor pipeline and retention Partnered with trade schools and colleges to develop aviation curriculum and career paths, worked with airline customers to secure better wages Exited underperforming business & consolidated facilities Exited certain loss - making contracts, sold certain non - core businesses, closed highest cost hangar and secondary Mobility location Note: FY ends May 31; figures reflect continuing operations; adjusted EPS reflects dilution; see Appendix for reconciliation of non - GAAP financial measures © 2023 AAR CORP.

All rights reserved worldwide. 15 Growth drivers Large and growing markets with pandemic recovery still occurring and new aircraft delivery constraints further extending aftermarket demand Continuing government demand for commercial best practices approach to supporting its aircraft, which AAR is uniquely positioned to provide Increasing USM adoption by commercial customers and U.S. Government supported by proprietary AAR supply Trax and other digital offerings including Trax’s eMRO aviation software and eMobility suite of apps, and investments in eCommerce Continued market share gain in distribution leveraging technical global sales force delivering value - added “Sales as a Service” to component OEMs Technology - driven MRO efficiency: paperless hangar initiative, drone - based inspections, wearables to leverage fewer expert technicians Additional airframe maintenance capacity at existing locations that have deeper labors pools, paired with long - term customer commitments Development of proprietary PMA parts for internal and external consumption based on demand from MRO operations © 2023 AAR CORP.

All rights reserved worldwide. 16 3 - 5 year organic financial targets 5 - 10% annual revenue growth • Large and growing markets with pandemic recovery tailwinds • Multiple levers to take market share: proprietary USM supply, unique distribution model that is resonating with OEM partners, airframe hangar expansion, government value model • Aerospace aftermarket resilience to macroeconomic conditions Raising the bar on shareholder value creation 9 - 10%+ adjusted operating margin • Mix shift towards Parts Supply • Additional efficiencies and leverage on fixed cost base • Further addition of high margin software solutions and proprietary parts 10 - 15% annual adjusted EPS growth • Margin expansion • Balance sheet strength to support additional growth investments and/or capital return to shareholders Consistent year - over - year ROIC improvement • Mix shift towards higher ROIC activities including Parts Supply • Government programs growth • New wins with ROIC in excess of existing business © 2023 AAR CORP.
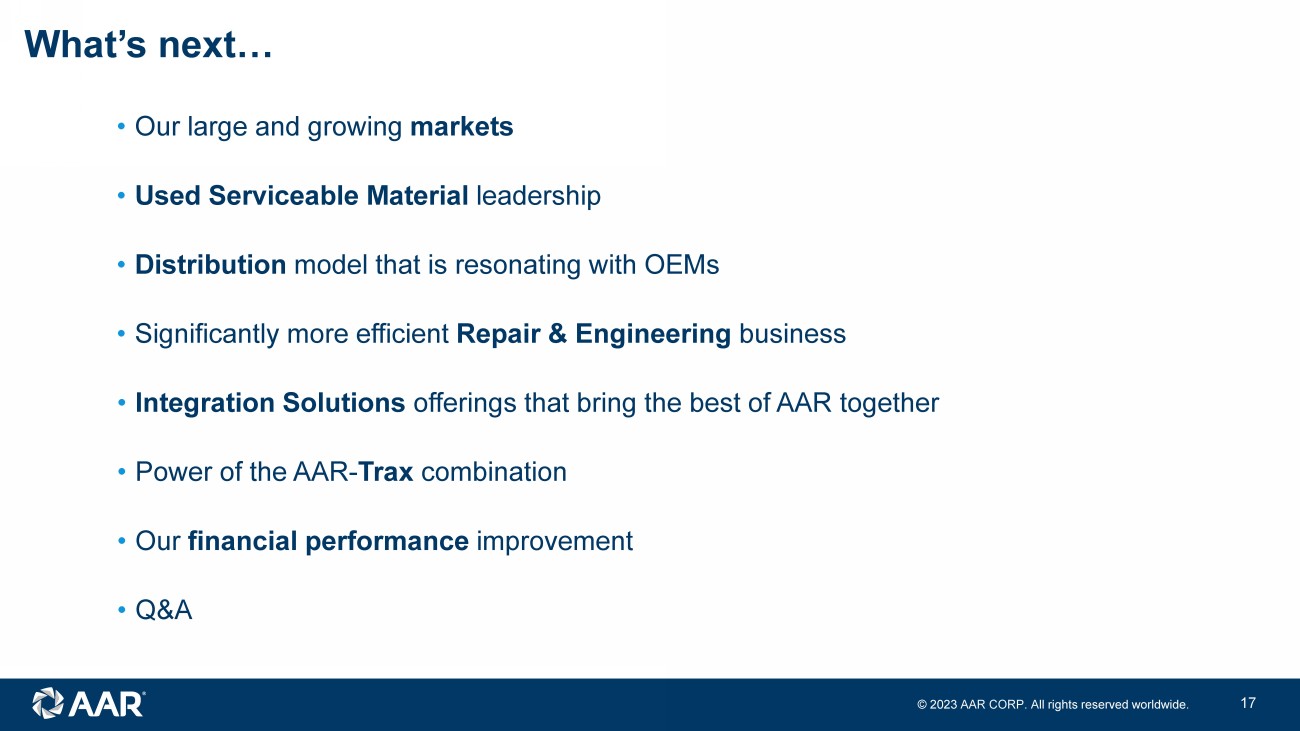
All rights reserved worldwide. 17 What’s next… • Our large and growing markets • Used Serviceable Material leadership • Distribution model that is resonating with OEMs • Significantly more efficient Repair & Engineering business • Integration Solutions offerings that bring the best of AAR together • Power of the AAR - Trax combination • Our financial performance improvement • Q&A © 2023 AAR CORP.

All rights reserved worldwide. 18 Market overview and positioning Chris Jessup Chief Commercial Officer © 2023 AAR CORP.

All rights reserved worldwide. 19 Chris Jessup Joined AAR in 2008 when the Company acquired Avborne , where he held various senior executive roles in sales, marketing and business development dating back to 2002 Served in various senior leadership sales and operational roles from 2008 to 2015 within AAR’s MRO Services group, concluding with Senior Vice President, Airframe MRO Services Promoted to Chief Commercial Officer of AAR’s Aviation Services segment in 2015 Named Chief Commercial Officer of AAR in 2017 Holds Bachelor of Business Administration and MBA in Aviation from Embry - Riddle Aeronautical University © 2023 AAR CORP.

All rights reserved worldwide. 20 Commercial air travel recovery and resilience • AAR’s commercial sales have closely tracked global commercial air travel historically • Air travel has recovered significantly, but is still not back to pre - pandemic levels Source: ASM data from Cirium Source: IATA AAR’s commercial businesses are driven by air travel • Global commercial air travel has been historically resilient through economics cycles • Aerospace aftermarket not historically subject to same cyclicality as new aircraft business $1,282 $1,342 $1,269 $794 $1,082 $1,321 $0 $200 $400 $600 $800 $1,000 $1,200 $1,400 $1,600 0.0 1.0 2.0 3.0 4.0 5.0 6.0 7.0 FY18 FY19 FY20 FY21 FY22 FY23 Global ASMs (trillions) AAR Commercial Aviation Services Sales ($M) Global Available Seat Miles (ASMs) 0.0 2.0 4.0 6.0 8.0 10.0 12.0 Trillions Global Available Seat Kilometers © 2023 AAR CORP.

All rights reserved worldwide. 21 0 200 400 600 800 1,000 1,200 1,400 1,600 1,800 2018 2019 2020 2021 2022 2023 2024 2025 Forecast 2023 - 2025 Actuals 2018 - 2022 Qty of Aircraft Retired per Year Retirements % of Active Fleet Qty of Aircraft Delivered per Year 0.0 0.5 1.0 1.5 2.0 2.5 3.0 3.5 0 100 200 300 400 500 600 700 800 900 2018 2019 2020 2021 2022 2023 Jan-Early July Retirements as % of In-Service Fleet Source: Teal Group February 2023. Naveo analysis Source: Aviation Week Fleet Discovery Early July 2023. Naveo analysis Depressed deliveries have limited retirements and aged the in - service fleet Aircraft deliveries and retirements Fewer deliveries have extended the existing fleet, which is expected to continue to drive higher aftermarket parts and maintenance requirements Reduction in retirements has limited the availability of USM supply; as new deliveries ramp and older aircraft are retired, USM supply expected to return © 2023 AAR CORP.

All rights reserved worldwide. 22 AAR’s markets are large and growing • Global MRO market spend forecasted to return to pre - pandemic levels in calendar year 2023 • Older aircraft fleet expected to drive incremental MRO demand in near - term • As new aircraft production ramps - up, older aircraft will be retired, providing USM feedstock • Engine MRO market drives majority of demand for AAR’s USM business • Long - term global demand driven currently by Asian markets, in which air travel per capita remains well below western markets Aircraft parts and maintenance markets Engine Maintenance Components Line Maintenance Airframe Heavy & Modifications $0 $20 $40 $60 $80 $100 $120 2022 2025 $B $102B 6.6% CAGR $84B 5.3% CAGR 3.7% CAGR 7.2% CAGR 8.0% CAGR A E Source: ICF, Aviation Week. Naveo analysis. Constant US$. Forecast from 2023 in 2022 $ © 2023 AAR CORP.

All rights reserved worldwide. 23 Government market • Global tensions causing need for increased military posturing and defense spending • Allies’ and enemies’ defense spending increasing - growing logistics requirements challenging European and Indo - Pacific nations Source: Congressional Budget Office Defense spending seeking to counter great - power aggression • USAF fleet readiness significantly below targets • Focus on developing new technologies to counter peer competitors • U.S. government seeking to sustain fleets on tighter budget Source: SIPRI % Goal Large government market with customer demand for efficient sustainment solutions Distribution of 2022 military spending worldwide, by country $2.24T, +3.7% USAF availability rates for fighters and attack aircraft United States 39% China 13% Russia 4% India 4% Saudi Arabia 3% UK 3% Germany 3% France 2% South Korea 2% Japan 2% Ukraine 2% All other 23% © 2023 AAR CORP.

All rights reserved worldwide. 24 Government market AAR well - positioned to support tighter U.S. sustainment budget environment • AAR long - term fleet support programs utilizing commercial best practices provide U.S. military with cost effective solutions • AAR used serviceable material solutions combined with recent DoD procurement legislation provide significant savings opportunities to U.S. government to achieve readiness targets within a constrained budget environment • AAR new parts distribution supports both U.S. Defense Logistics Agency through Captains of Industry status and foreign militaries Constrained sustainment funding creates opportunities for AAR to offer cost effective solutions © 2023 AAR CORP.

All rights reserved worldwide. 25 North America Headquarters and warehouse near Chicago’s O’Hare International Airport; airframe MRO network; component repair; landing gear overhaul; Mobility Systems United Kingdom Parts Supply sales office in London’s Heathrow Airport; Integrated Solutions – commercial and Parts Supply team in Gatwick Europe Component repair in Amsterdam; warehouse network includes Brussels and Hanover serving EMEA; sales office in Paris Asia Sales office in China; Regional sales office in Singapore; warehouse and engineering for interior modifications Middle East Warehouse and sales office in Dubai serving EMEA; Integrated Solutions – government Australasia Warehouse in Auckland; sales office in Melbourne Central and South America Sales office supporting customers in Latin America; Integrated Solutions – government Over 60 AAR sites around the world Corporate headquarters Repair & Engineering Parts Supply Integrated Solutions – commercial Integrated Solutions – government Mobility Systems Trax Global expertise and reach Customers in over 150 countries © 2023 AAR CORP.

All rights reserved worldwide. 26 15+ year relationship with each of top 10 customers Highly - diversified customer base with longstanding relationships OEMs Government Cargo airlines Regional airlines Commercial airlines United States Air Force (USAF) United States Navy (USN) United States Army (USA) International Narcotics and Law Enforcement (INL) Colombian Air Force Japan Ministry of Defense (JMOD) Norway – Royal Norwegian Air Force (RNAF) Royal Netherlands Air Force (RNLAF) United Kingdom Ministry of Defence (UK MoD)
© 2023 AAR CORP. All rights reserved worldwide. 27 Parts Supply: Used Serviceable Material Sal Marino Senior Vice President, Used Serviceable Material © 2023 AAR CORP.
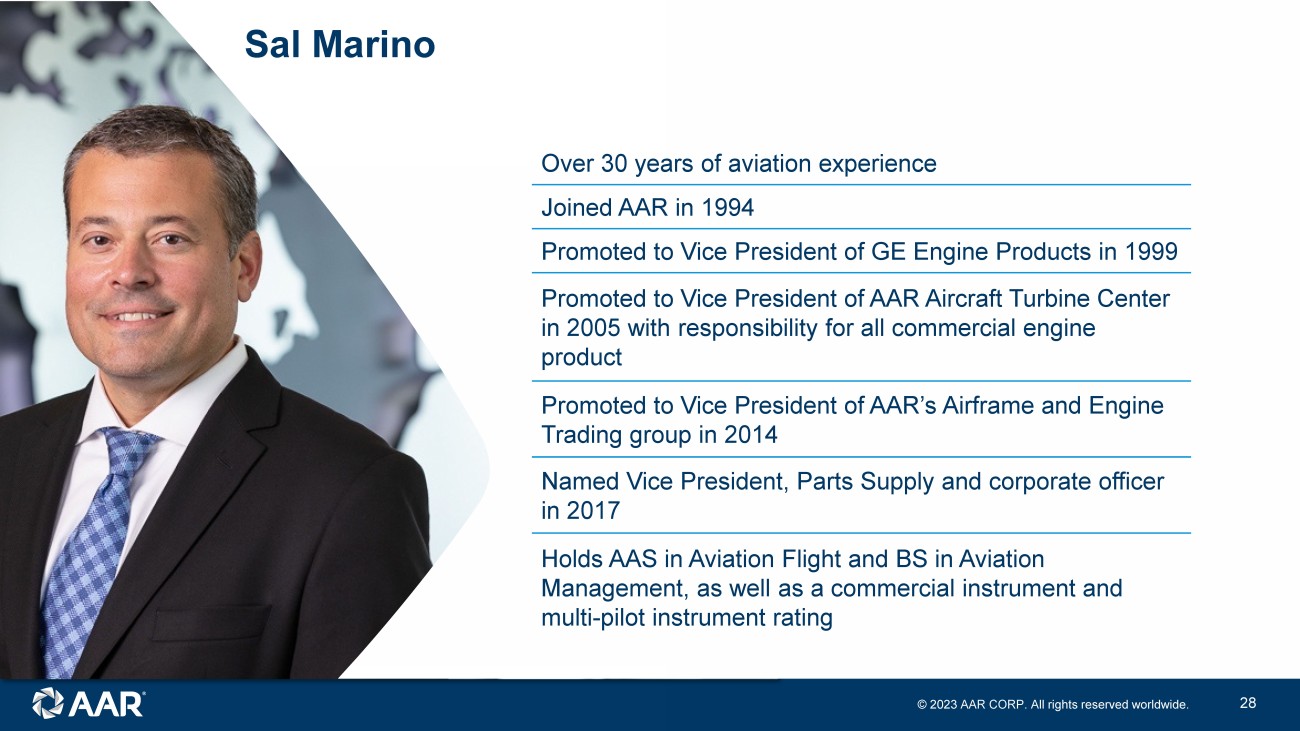
All rights reserved worldwide. 28 Sal Marino Over 30 years of aviation experience Joined AAR in 1994 Promoted to Vice President of GE Engine Products in 1999 Promoted to Vice President of AAR Aircraft Turbine Center in 2005 with responsibility for all commercial engine product Promoted to Vice President of AAR’s Airframe and Engine Trading group in 2014 Named Vice President, Parts Supply and corporate officer in 2017 Holds AAS in Aviation Flight and BS in Aviation Management, as well as a commercial instrument and multi - pilot instrument rating © 2023 AAR CORP.

All rights reserved worldwide. 29 Overview Parts Supply: Used Serviceable Material Key offerings • Used serviceable engine and airframe parts supply • Whole engine and aircraft sales and leasing • Engine and aircraft management and exchange • Focus platforms: ‒ CFM56 - 5B / 7B (737NG / A320) ‒ V2500 - A5 (A320) ‒ PW2000 (757) ‒ Rolls - Royce RB211 (757) ‒ PW4000 (747 / 767) ‒ CF6 - 80 (widebody) ‒ Boeing and Airbus Largest independent USM supplier globally Key customers Distribution USM Engines Airframe CFM P&W GE IAE Boeing RR Airbus Other Passenger Cargo Dual - Use FY23 breakdown Total Parts Supply segment sales © 2023 AAR CORP.

All rights reserved worldwide. 30 Asset selection What we do Parts Supply: Used Serviceable Material • Industry relationships / AAR reputation • Operators, lessors, MROs, trading companies • Cross - selling across AAR • AAR global sales org, product lines, tech department, compliance • Digital market platforms • Ability to close and fund quickly Robust markets • A320/737/CFM56 – 12,000+ aircraft • A320/V2500 – 3,000+ aircraft Exclusive customer contracts • PW2000 – through CY28 • CF6 - 80 – through CY28 Legacy product expertise • PW4000 • Rolls Royce Investment evaluation • Asset maintenance documentation • Cash flow projections and detailed valuation analysis • Target margins and IRR Financial performance review • Part pricing based on market and return expectations • Results reviewed and compared to investment expectations • Action quickly taken to liquidate investment if market changes Source: Cirium ; y - axis represents annual platform spend, bubble size represents fleet size New technology (19% of installed base) Mid - technology (76% of installed base) Old technology (5% of installed base) < 10 years 10 - 25 years 25+ years Maturity cycle AAR focus Asset sourcing Analysis and evaluation © 2023 AAR CORP.

All rights reserved worldwide. 31 Value proposition Parts Supply: Used Serviceable Material 30 - 50% savings over OEM prices Non - OEM, non - airline alternative Highly experienced with leading technical capability Speed, flexibility, and financial strength Customer confidence and trust Digital intelligence and transacting © 2023 AAR CORP.

All rights reserved worldwide. 32 Key achievements since 2019 Investor Day Parts Supply: Used Serviceable Material 1 2 3 4 Secured long - term, capital - light, dedicated supply of CFM56 material Drove cultural change with customers that have not historically bought USM Partnered with AAR Integrated Solutions to support government customers Took market share and repositioned inventory for post - pandemic growth © 2023 AAR CORP.

All rights reserved worldwide. 33 Case study: CFM56 partnership with FTAI Aviation (NYSE: FTAI) Parts Supply: Used Serviceable Material Leading aviation company with a portfolio of 350+ CFM56 - 5B and - 7B engines, which power the A320 and B737 AAR receives recovery of investment in teardown and repair plus incentive - based fee FTAI commits 40+ CFM56 engines annually to AAR for teardown on an exclusive basis through 2027 FTAI maintains ownership (capital - light model for AAR) AAR uses technical expertise to develop tailored approach for each engine based on condition and history AAR manages engine teardown and parts repair via network of providers, producing pool of USM AAR invests in teardown and repair 3 AAR manages USM sales and marketing to global aviation aftermarket Includes FTAI for use in overhauls of its existing engines 4 2 1 © 2023 AAR CORP.

All rights reserved worldwide. 34 Growth initiatives Parts Supply: USM Secure long - term supply on additional key platforms Continue to drive increased customer acceptance of USM Support USG customer’s requirement to consider USM Develop enhanced solutions for aircraft - on - ground End - to - end digital order fulfillment, including via Trax Mission: Be the most sought - after USM supplier to airlines, MROs, and leasing companies © 2023 AAR CORP.

All rights reserved worldwide. 35 Parts Supply: Distribution Frank Landrio Senior Vice President, Distribution (Interim)

© 2023 AAR CORP. All rights reserved worldwide. 36 Frank Landrio Over 20 years of aviation experience Joined AAR in 2007 as VP of Finance: AAR Aircraft Component Services Promoted in 2009 to General Manager: AAR Aircraft Component Services Promoted in 2010 to Group CFO: Aviation Supply Chain Group Promoted in 2012 to SVP of Strategy and OEM Development CEO of ASAS (Joint venture with Sumitomo) Sr. Vice President Distribution: Interim basis since March 2023 Holds a BBA degree in Accounting and is a Certified Management Accountant (CMA)
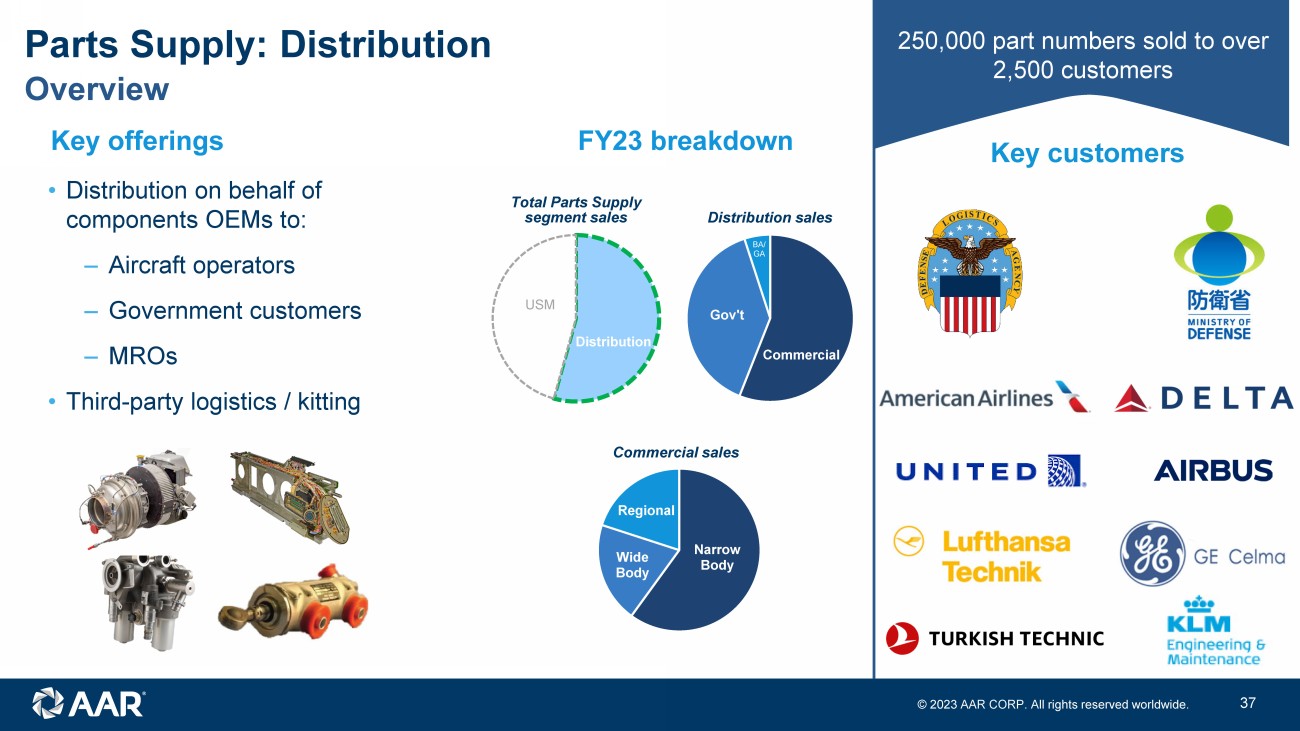
© 2023 AAR CORP. All rights reserved worldwide. 37 • Distribution on behalf of components OEMs to: ‒ Aircraft operators ‒ Government customers ‒ MROs • Third - party logistics / kitting Key customers 250,000 part numbers sold to over 2,500 customers Commercial Gov't BA/ GA Overview Parts Supply: Distribution Key offerings Narrow Body Wide Body Regional Distribution USM FY23 breakdown Total Parts Supply segment sales Commercial sales Distribution sales © 2023 AAR CORP.
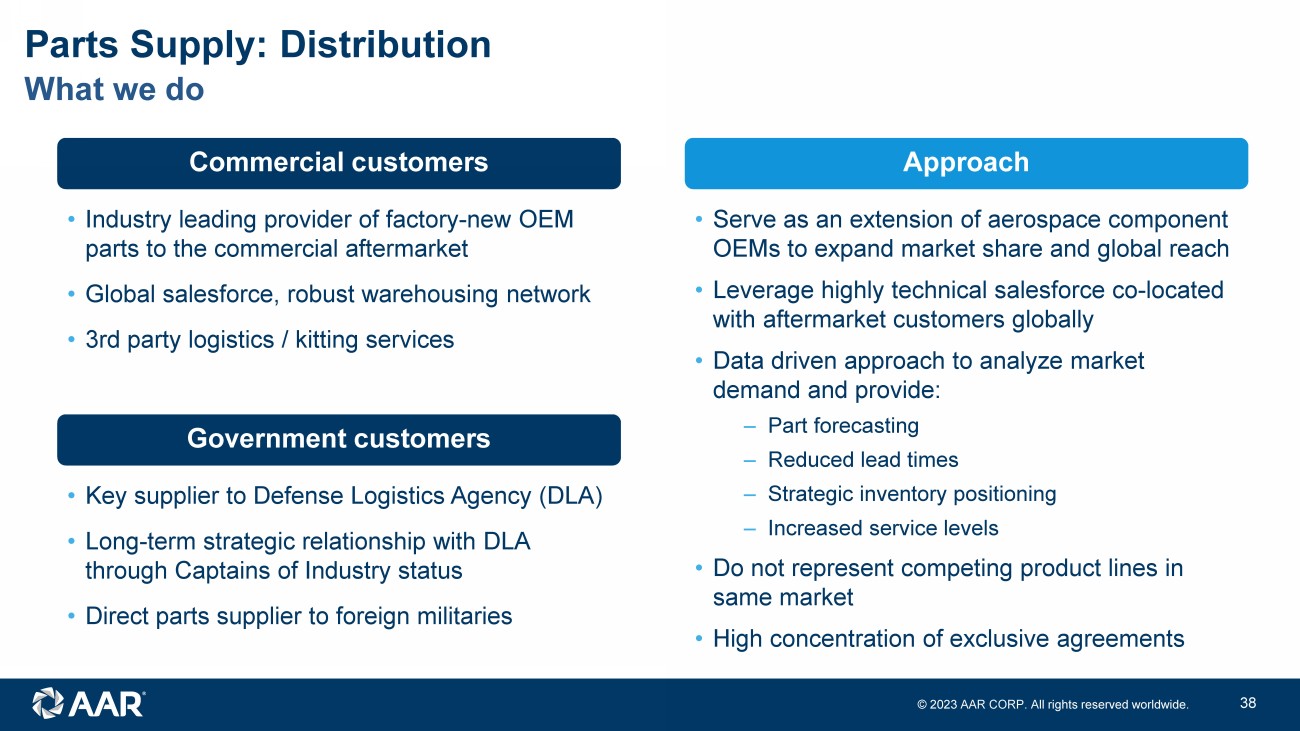
All rights reserved worldwide. 38 What we do Parts Supply: Distribution Commercial customers Government customers Approach • Industry leading provider of factory - new OEM parts to the commercial aftermarket • Global salesforce, robust warehousing network • 3rd party logistics / kitting services • Key supplier to Defense Logistics Agency (DLA) • Long - term strategic relationship with DLA through Captains of Industry status • Direct parts supplier to foreign militaries • Serve as an extension of aerospace component OEMs to expand market share and global reach • Leverage highly technical salesforce co - located with aftermarket customers globally • Data driven approach to analyze market demand and provide: ‒ Part forecasting ‒ Reduced lead times ‒ Strategic inventory positioning ‒ Increased service levels • Do not represent competing product lines in same market • High concentration of exclusive agreements © 2023 AAR CORP.

All rights reserved worldwide. 39 Value proposition Parts Supply: Distribution Data - driven, market intelligent sales strategies Underpinned by connectivity to AAR ecosystem Innovative planning, forecasting & value - added services Global, highly technical sales force Independence: non - OEM / airline alternative Financial strength and flexibility © 2023 AAR CORP.
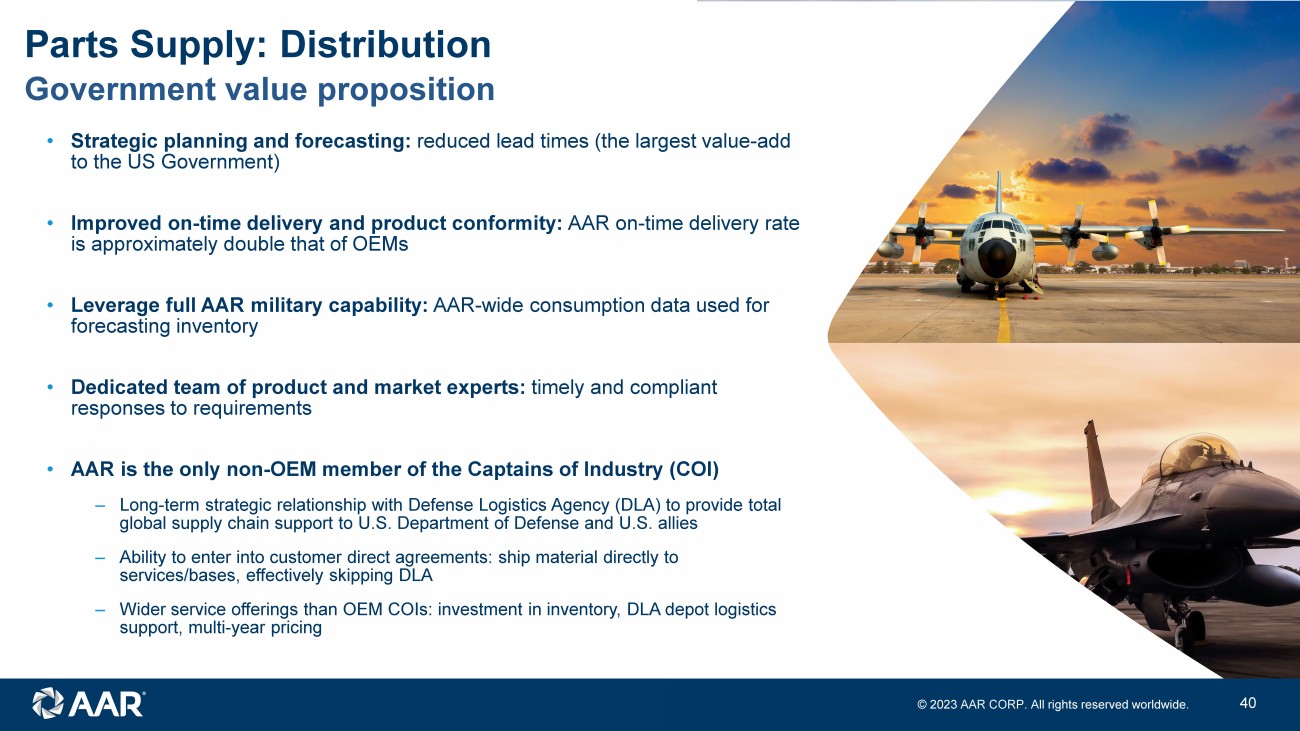
All rights reserved worldwide. 40 • Strategic planning and forecasting: reduced lead times (the largest value - add to the US Government) • Improved on - time delivery and product conformity: AAR on - time delivery rate is approximately double that of OEMs • Leverage full AAR military capability: AAR - wide consumption data used for forecasting inventory • Dedicated team of product and market experts: timely and compliant responses to requirements • AAR is the only non - OEM member of the Captains of Industry (COI) ‒ Long - term strategic relationship with Defense Logistics Agency (DLA) to provide total global supply chain support to U.S. Department of Defense and U.S. allies ‒ Ability to enter into customer direct agreements: ship material directly to services/bases, effectively skipping DLA ‒ Wider service offerings than OEM COIs: investment in inventory, DLA depot logistics support, multi - year pricing Parts Supply: Distribution Government value proposition © 2023 AAR CORP.

All rights reserved worldwide. 41 Key growth markets Parts Supply: Distribution Electronics Foreign Military Business & General Aviation Targeted markets Parts & capabilities • Asia Pacific (Japan, Korea and Thailand) • Europe (incl NATO) • Middle East (Saudi Arabia & UAE) Platforms • F15 & F16 • E2D • C130 • Filters • Electronic indicators • Engine accessories • Spare parts • EMEA & APAC expansion of existing lines • Unmanned drones and VTOL OEMs • MIL - Aero OEMs • Contract manufacturers • Electromechanical and Interconnect products • USA • UK • Germany • Australia • Bombardier • Cirrus • Gulf Stream • Textron • De - Ice and specialty heating • Landing gear; wheels & brakes • Interiors • Switches and indicators • Engine accessories © 2023 AAR CORP.

All rights reserved worldwide. 42 Key achievements since 2019 Investor Day Parts Supply: Distribution 1 2 3 4 Added new distribution lines: GE Unison, Raytheon (Pratt & Whitney), TransDigm , Parker Aerospace Entered new end - markets: Business & general aviation with exclusive product lines (Collins De - Ice and Ontic) Expanded service offerings: Captains of Industry umbrella contract for DoD and 3rd party logistics services and government source inspections Increased efficiency: Investments in digital tools, including pricing and customer quoting © 2023 AAR CORP.

All rights reserved worldwide. 43 Optimized customer experience, higher volumes, cost efficiency • Greater demand capture through improved Electronic Data Interchange and auto - quote functionalities • Real - time, dynamic market - driven pricing tailored to OEM and customer • Increased visibility and transparency for AAR Product Line and Sales teams • More seamless customer experience • Better ability to reach BGA customer base Investments in eCommerce Parts Supply: Distribution © 2023 AAR CORP.

All rights reserved worldwide. 44 FY12 FY13 FY14 FY15 FY16 FY17 FY18 FY19 FY20 FY21 FY22 FY23 Our journey: sales growth through consistent addition of new lines Parts Supply: Distribution Consistent track record of growing market share Note: Logos represent new distribution lines added in that year © 2023 AAR CORP.

All rights reserved worldwide. 45 Growth initiatives Parts Supply: Distribution Offer OEMs opportunities for retrofit and competitive displacement Expand foreign military sales capabilities Increase business & general aviation offering Expand eCommerce, including via Trax Mission: Be a value - added, data driven, customer centric growth driver for our OEM partners Secure new and expand existing OEM distribution agreements © 2023 AAR CORP.

All rights reserved worldwide. 1 Tom Hoferer Senior Vice President, Repair & Engineering Repair & Engineering © 2023 AAR CORP.

All rights reserved worldwide. 2 Tom Hoferer Over 30 years of aviation experience Joined AAR in 2023, VP Repair & Engineering USAF/Air National Guard Retired Chief Master Sergeant Served as President of GE Aerospace’s Unison Industries, a global leader in aircraft engine component solutions Held various leadership positions at GE Aerospace Holds MBA from the University of Cincinnati Carl H. Lindner College of Business and BS in Industrial Engineering from the University of Cincinnati © 2023 AAR CORP.

All rights reserved worldwide. 3 Overview Repair & Engineering #1 Independent North American MRO $533M FY23 sales Key customers Key activities Airframe Landing Gear Component Engineering • Airframe heavy maintenance • Landing gear overhaul via Miami facility • Component repair via facilities in New York and Amsterdam • Interior modification engineering and design • PMA parts • Manage relationships with 8 Eagle Career Pathways schools to bolster labor pipeline Commercial Government © 2023 AAR CORP.

All rights reserved worldwide. 4 What we do Repair & Engineering LARGEST INDEPENDENT USM SUPPLIER GLOBALLY Airframe MRO Six hangars providing maintenance, repair, and overhaul (MRO) services • “Heavy checks” performed every ~2 years • Nose - to - tail lines of maintenance • Support primarily narrow - body Airbus, Boeing, and Embraer regional aircraft Component Repair Test, repair, overhaul, and perform scheduled maintenance on 15,000+ rotable components Landing Gear Overhaul Full - service landing gear maintenance provider with complete wheels and brakes capability • Almost every major commercial and government aircraft type • Inspections, plating, machining, NDT, engineering, assembly, bushings Engineering • Aircraft interior reconfigurations and modifications ‒ Design and integration ‒ Engineering and certification • PMA parts development ‒ Candidate identification leveraging part utilization data ‒ Re - engineering of select parts • APUs • Electro - mechanical • Fuel • Gearbox • Generators • Hydraulics • Pneumatics • Instruments • Avionics • Electronic Bleed Air System (EBAS) for 737 MAX © 2023 AAR CORP.

All rights reserved worldwide. 5 3,300 employees 12 sites #1 MRO i n North America 4.6M+ l abor hours 750+ a ircraft per year 2 ,500 technicians ~800 l anding gears serviced per year 30+ ATA Chapters 15,000+ c omponents repaired Airframe Maintenance Component Repair Landing G ear Engineering Services Facility overview Repair & Engineering Oklahoma City Indianapolis Miami Rockford Trois - Rivières Windsor New York Amsterdam • Regional & narrow body MRO • 300,000 SF • Narrow body MRO • 367,000 SF • Narrow body MRO • 226,000 SF • Landing Gear MRO • 150,000 SF • Narrow body MRO • 200,000 SF • Narrow body & regional MRO • 150,000 SF • Narrow body MRO • 143,000 SF • Commercial & military component repair • 150,000 SF • Commercial & miliary component repair • 80,000 SF Note: figures for fiscal 2023; Engineering locations in Indianapolis and Singapore, and MRO joint venture in India, not inclu ded in table © 2023 AAR CORP.

All rights reserved worldwide. 6 Value proposition Repair & Engineering Large network with customer - focused solutions Quality workforce performing reliable repairs Digital investments to improve efficiency Vertical capabilities creating one - stop - shop for all processes Innovative design and PMA part solutions Materials sourcing from AAR Parts Supply © 2023 AAR CORP.

All rights reserved worldwide. 7 1 2 3 4 Retained and enhanced skilled workforce Optimized footprint and rationalized product lines Drove further internal and external emphasis on safety Focused on narrowbody market and anchor customers Key achievements since 2019 Investor Day Repair & Engineering © 2023 AAR CORP.
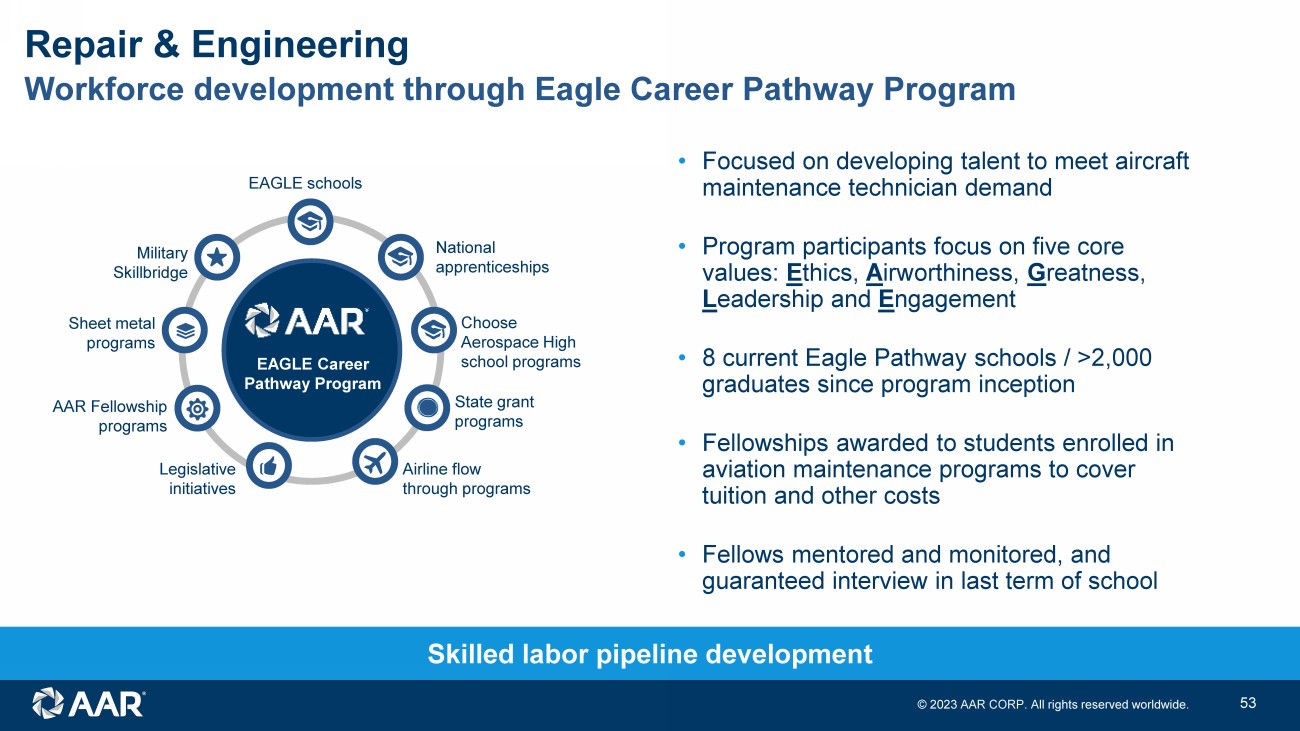
All rights reserved worldwide. 8 Workforce development through Eagle Career Pathway Program Repair & Engineering EAGLE Career Pathway Program EAGLE schools National apprenticeships Choose Aerospace High school programs State grant programs Airline flow through programs Legislative initiatives AAR Fellowship programs Sheet metal programs Military Skillbridge Skilled labor pipeline development • Focused on developing talent to meet aircraft maintenance technician demand • Program participants focus on five core values: E thics, A irworthiness, G reatness, L eadership and E ngagement • 8 current Eagle Pathway schools / >2,000 graduates since program inception • Fellowships awarded to students enrolled in aviation maintenance programs to cover tuition and other costs • Fellows mentored and monitored, and guaranteed interview in last term of school © 2023 AAR CORP.
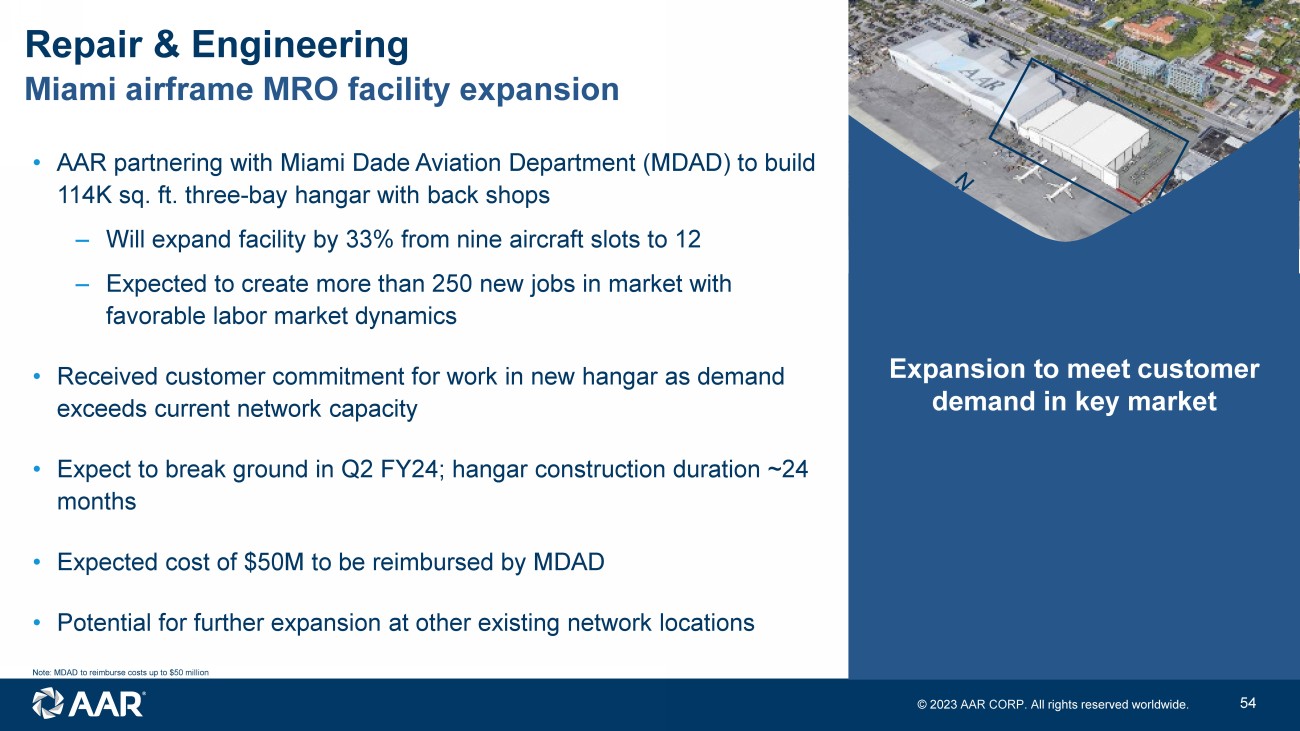
All rights reserved worldwide. 9 Miami airframe MRO facility expansion Repair & Engineering • AAR partnering with Miami Dade Aviation Department (MDAD) to build 114K sq. ft. three - bay hangar with back shops ‒ Will expand facility by 33% from nine aircraft slots to 12 ‒ Expected to create more than 250 new jobs in market with favorable labor market dynamics • Received customer commitment for work in new hangar as demand exceeds current network capacity • Expect to break ground in Q2 FY24; hangar construction duration ~24 months • Expected cost of $50M to be reimbursed by MDAD • Potential for further expansion at other existing network locations Note: MDAD to reimburse costs up to $50 million Expansion to meet customer demand in key market © 2023 AAR CORP.

All rights reserved worldwide. 10 Delivers labor efficiency and improved aircraft turnaround time • Transforming airframe MRO with AAR’s new “paperless” software • Electronic work card that improves labor efficiency and reduces aircraft turnaround time • Custom application developed by AAR • Implementation in process, expected to be complete in FY24 “Paperless” airframe maintenance Repair & Engineering © 2023 AAR CORP.
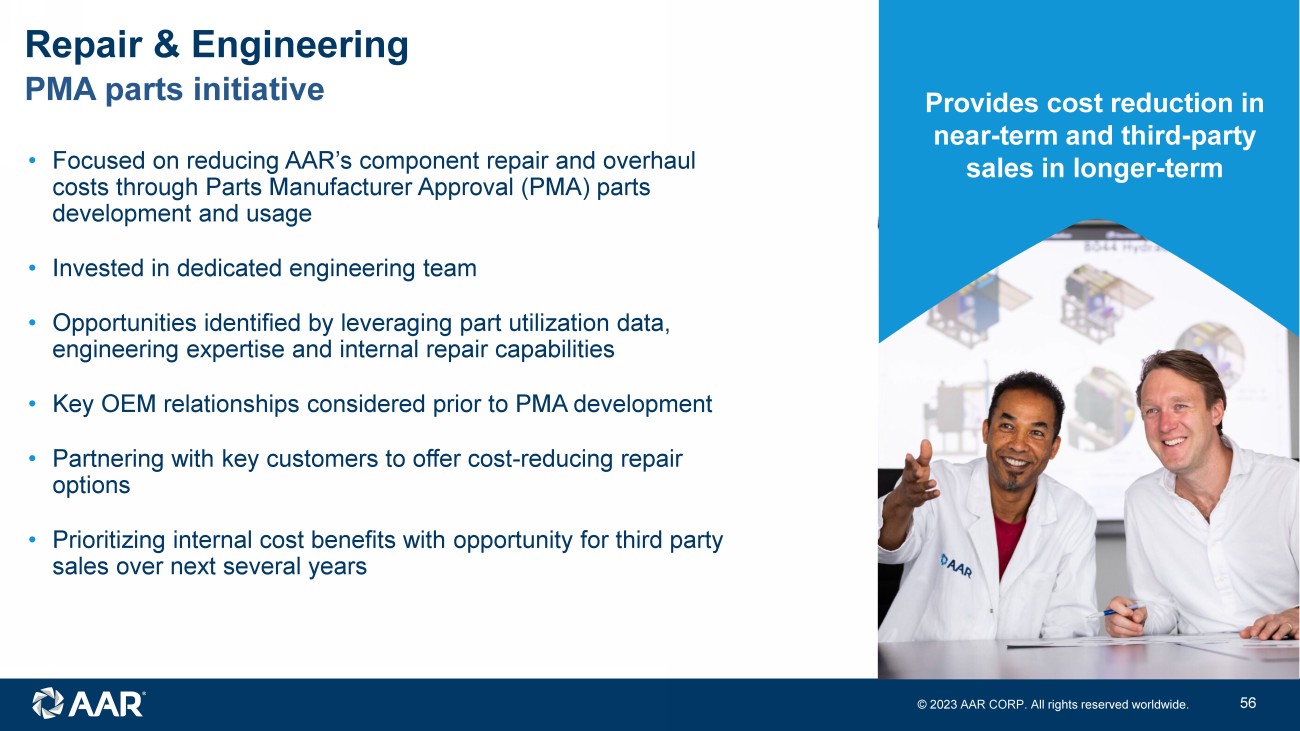
All rights reserved worldwide. 11 • Focused on reducing AAR’s component repair and overhaul costs through Parts Manufacturer Approval (PMA) parts development and usage • Invested in dedicated engineering team • Opportunities identified by leveraging part utilization data, engineering expertise and internal repair capabilities • Key OEM relationships considered prior to PMA development • Partnering with key customers to offer cost - reducing repair options • Prioritizing internal cost benefits with opportunity for third party sales over next several years PMA parts initiative Repair & Engineering Provides cost reduction in near - term and third - party sales in longer - term © 2023 AAR CORP.

All rights reserved worldwide. 12 Growth initiatives Repair & Engineering Expand Airframe MRO in areas with critical mass Implement “Paperless” airframe maintenance Grow industry - leading Eagle Career Pathways Program Scale PMA parts initiative Expand Component Repair capabilities Mission: Be the preferred independent third - party MRO providing high - quality, flexible solutions for commercial and government markets © 2023 AAR CORP.

All rights reserved worldwide. 13 Nicholas Gross Senior Vice President, Integrated Solutions Integrated Solutions © 2023 AAR CORP.

All rights reserved worldwide. 14 Nicholas Gross Over 20 years of aerospace and defense experience Prior service in the U.S. Air Force Joined AAR in 2016 as Vice President, Integrated Solutions - Government Named Vice President, Integrated Solutions, and corporate officer in 2019 Holds an MBA from Northwestern University - Kellogg School of Management and a BS in Business Administration from Troy University © 2023 AAR CORP.
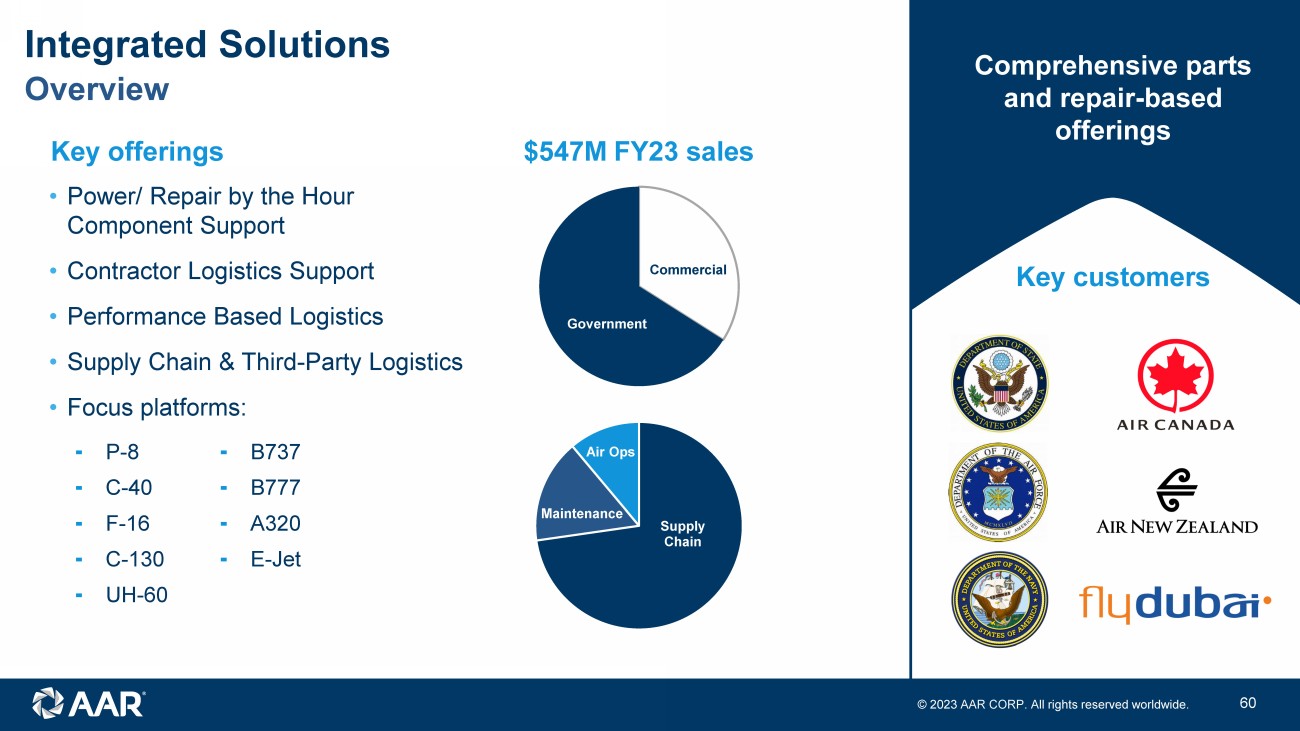
All rights reserved worldwide. 15 Overview Integrated Solutions Key offerings • Power/ Repair by the Hour Component Support • Contractor Logistics Support • Performance Based Logistics • Supply Chain & Third - Party Logistics • Focus platforms: Comprehensive parts and repair - based offerings Key customers Commercial Government Supply Chain Maintenance Air Ops $547M FY23 sales ⁃ P - 8 ⁃ B737 ⁃ C - 40 ⁃ B777 ⁃ F - 16 ⁃ A320 ⁃ C - 130 ⁃ E - Jet ⁃ UH - 60 © 2023 AAR CORP.

All rights reserved worldwide. 16 What we do Integrated Solutions Government: Contractor Logistics Support Contracted total platform sustainment managing e nd - user fleets across all aspects of flight operations • Provide all levels of maintenance, engineering, and modifications • Provide tip - to - tail supply chain support • Operate government owned aircraft Government: Supply Chain & Third - Party Logistics Establish supply base consistent with end user needs and manage warehouses in strategic locations • Control, manage, and maintain billions of dollars of US Government material • Distribute assets to directed locations • Oversee import/export of goods around the world Government: Performance Based Logistics Provide on demand material to government and military end users – direct to the point of use • Develop integrated supply chains to achieve forecasted demand • Qualify and diversify vendor base to enable material availability • Develop IP on non - standard repairs Commercial: Power - by - the - Hour Component Support Material component availability on a flight hour basis to enable fleet readiness • Invest and position stock to ensure point of use availability around the world • Manage a global network of repair suppliers to maintain assets • Establish long - term agreements to prevent shortages © 2023 AAR CORP.

All rights reserved worldwide. 17 Value proposition Integrated Solutions Commercial best practices applied to government customers Substantial savings relative to alternatives Global reach to support customers Skilled and empowered talent Tailored solutions to optimize fleet readiness Through - life support of systems and aircraft © 2023 AAR CORP.

All rights reserved worldwide. 18 Key achievements since 2019 Investor Day Integrated Solutions 1 2 3 4 Restructured power - by - the - hour portfolio to improve performance and reduce risk, and create foundation for selected additional growth Awarded and stood up new Air Force approved F - 16 depot in Poland Sourced, modified and sold six used aircraft to Govt end - users demonstrating the value proposition of the aftermarket Drove the adoption of legislation directing the use of Used Serviceable Material in commercially derivative platforms © 2023 AAR CORP.

All rights reserved worldwide. 19 Integrated Solutions F - 16 maintenance, modifications and upgrades for U.S. Air Force in Europe Significant savings for the Marine Corps vs. new aircraft Scalable operational c apability Established F - 16 MRO in 8 months Infrastructure Established MRO facility in Poland, aligned with USG planning requests Staffing Capable, expert technician team in place at AAR’s facility Coordination Key relationships in place with local stakeholders to support / enable operational coordination Compliance Infrastructure and staffing approach developed according to USAF and DCMA standards Service life extension program Post - block repair Avionics modifications Pre - block structural repair Other workload Operations i n practice 7 aircraft in flow USAF Engineering continues to champion AAR’s depot / SLEP approach as an industry - leading best practice, emphasizing workmanship and quality on maintenance work. Force enabler for global F - 16 operations © 2023 AAR CORP.

All rights reserved worldwide. 20 National Defense Authorization Act creates additional USM opportunity U.S. Air Force recently established KC - 46 Initial Spares contract vehicle for the procurement of USM • First of its kind contract enabling USM on a new platform • Offering immediate and significant material savings to the Air Force • AAR is one of the awardees on contract MILITARY AIRCRAFT COMMERCIAL DERIVATIVE AIRFRAME COMMERCIAL DERIVATIVE ENGINES VC - 25 747 CF6 - 80 KC - 46 767 PW4000 P - 8 737 CFM56 C - 40 737 CFM56 C - 32 757 PW2000 C - 17 None PW2000 C - 5M None CF6 - 80 Integrated Solutions Recent legislation included in National Defense Authorization Act directs the acquisition and use of Used Serviceable Material for all commercial derivative aircraft and engines Potential $200M+ annual market opportunity Select examples of commercial derivative airframes and engines © 2023 AAR CORP.
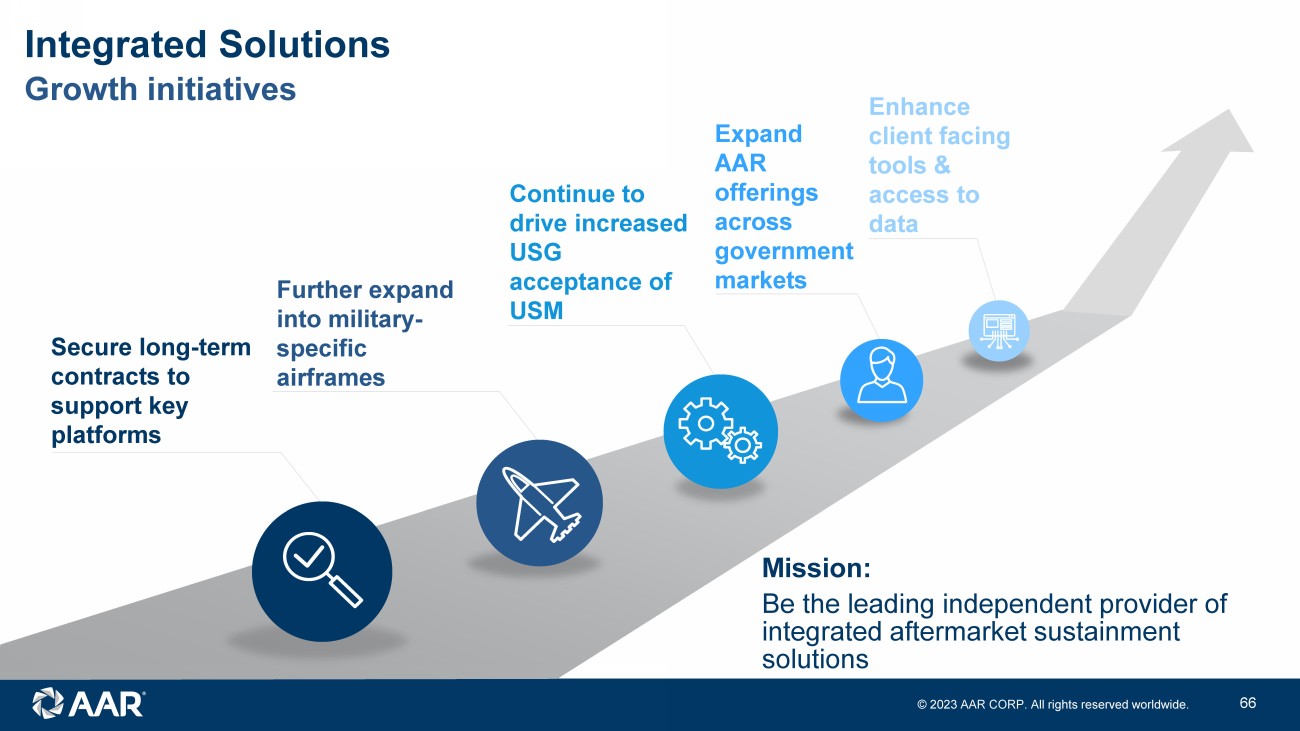
All rights reserved worldwide. 21 Growth initiatives Integrated Solutions Secure long - term contracts to support key platforms Further expand into military - specific airframes Continue to drive increased USG acceptance of USM Expand AAR offerings across government markets Enhance client facing tools & access to data Mission: Be the leading independent provider of integrated aftermarket sustainment solutions © 2023 AAR CORP.

All rights reserved worldwide. 22 Jose Almeida Andrew Schmidt President, Trax SVP, Digital Services & Trax Trax aviation software AAR CORP.

All rights reserved worldwide. Confidential and proprietary document. 23 Founded Trax 1997, saw need for a windows - based MRO ERP system… Y2K compliant and better user interface Rapidly grew Trax as customer felt assured by Y2K compliance and were elated with non - green - screen GUI First fully cloud - based MRO ERP, eMRO Followed this with first full suite of “paperless” mobility apps, eMobility (16 apps and growing) Sold Trax to AAR and now working on automating MRO with AI Began career as a flight test engineer at McDonnell Douglas Partner at AT Kearney and Oliver Wyman; Led Aerospace Practice at Oliver Wyman Joined Macquarie Capital to form Taurus Aerospace Joined AAR in 2010; started Digital Solutions group in 2014 Co - led Seabury Capital’s Private Investment Group, launched in 2018 Rejoined AAR this year after supporting Trax acquisition Jose Almeida (President, Trax) Andrew Schmidt (SVP, Digital Services & Trax) Leadership bios AAR CORP.

All rights reserved worldwide. Confidential and proprietary document. 24 Leading provider of mobile and cloud - based software for airlines, other aircraft operators and MROs 138 customers with an average tenure of 10+ years Products increase maintenance efficiency, improve asset utilization and streamline information flow between airlines, lessors & MROs Software creates the regulatory system of record required for airlines and lessors ~110 employees Competitive advantages Offline capability x Paperless x Web - based x Mobile | Role - based x Product Functionality • Web - based ERP for aircraft maintenance and fleet management (21 modules) • Suite of 16 iOS and web - based apps (role - based) • Real time transaction entry and information availability v15 • Original windows - based ERP • Supported, but no longer offered to new customers Services • Implementation & data migration • Integration with Trax customers’ existing systems • 24/7 support Hosting • Complete infrastructure capability with option to host all three solutions in the cloud Trax will remain independent and maintain its own identity in the market Trax company overview AAR CORP.
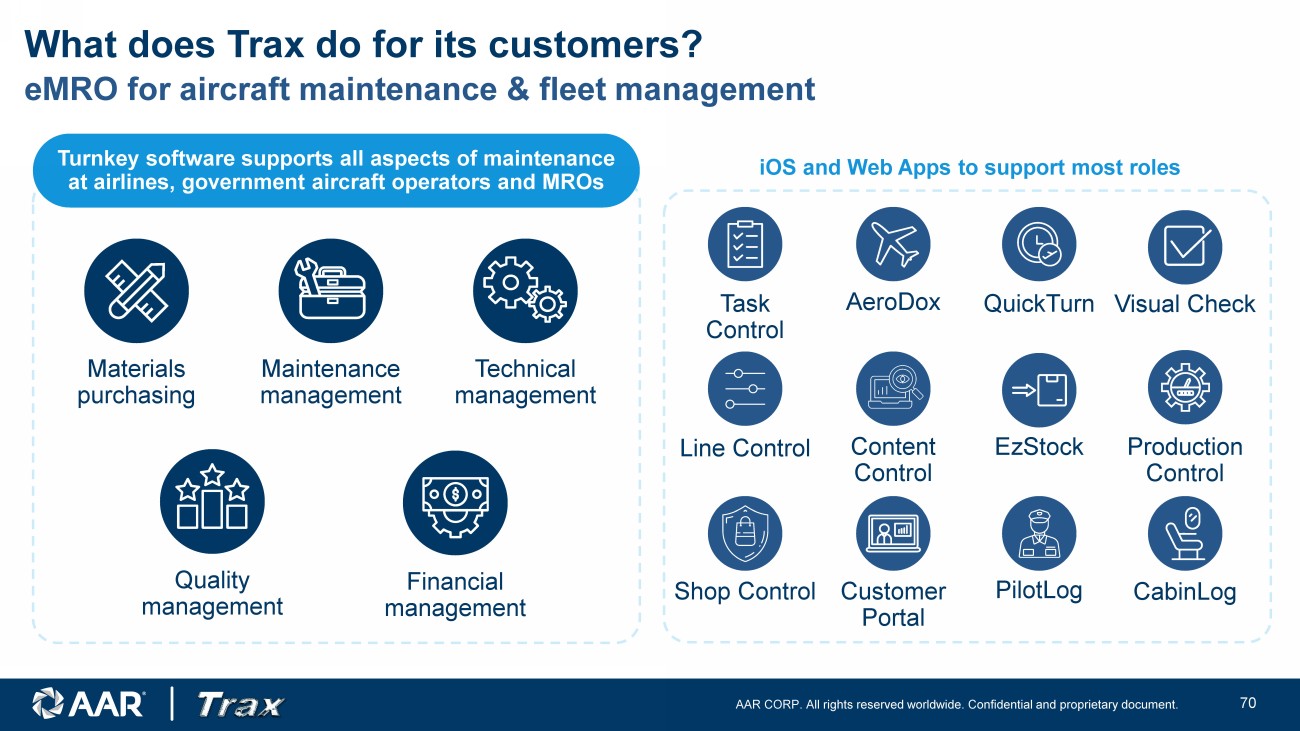
All rights reserved worldwide. Confidential and proprietary document. 25 Turnkey software supports all aspects of maintenance at airline s , government aircraft operators and MROs Maintenance management Technical management Quality management Materials purchasing Financial management Line Control QuickTurn PilotLog CabinLog Production Control Shop Control Customer Portal Content Control Task Control EzStock AeroDox Visual Check iOS and Web Apps to support most roles What does Trax do for its customers? eMRO for aircraft maintenance & fleet management AAR CORP.

All rights reserved worldwide. Confidential and proprietary document. 26 z • Used by over 138 individual airlines, government operators, and MROs • Supports over 5,000 aircraft in operation today (excludes MROs) • In the hands of and on the desktops of over 62,000 users • Used by over 8,500 parts and supply chain personnel Customers in 35 countries Customers and market Legacy ERP 2 Sceptre 3 Maxi Merlin 3 AMOS TRAX IFS Ultramain Ramco ~23k commercial jets 1 A l eading independent market position ~45% of market is still on legacy systems Notes: (1) 2022 AW&ST Fleet Database / Trax & Seabury Capital analysis, (2) Includes internally developed systems and smaller fleets with unknown systems, (3) Sceptre and Maxi Merlin (Wizard) developed in 1980s and still being used by major US Airlines AAR CORP.

All rights reserved worldwide. Confidential and proprietary document. 27 • AAR's parts and MRO experience plus Trax's software creates basis for a comprehensive offering • Maintenance processes are streamlined by integrating parts supply & MRO services with management software • Software enabled supply chain provides plug - and - play service for Trax, AAR and other MRO/OEM customers • Compatibility and seamless integration creates a reliable and cost - efficient market in the aviation industry • Seamless and efficient experience for airlines and MRO’s • One - stop solution reduces complexity and operational challenges associated with buying parts and using MRO services Integrated maintenance ecosystem Enhanced end - to - end solutions Powerful supply chain ecosystem Improved customer experience • AAR’s MRO and parts data/ experience can fuel TRAX’s software enhancements • Trax’s data analytics can identify trends and opportunities for AAR and other MROS to innovate in parts supply and services Data - driven insights and innovation By combining AAR’s MRO industry expertise with Trax’s software, we are poised to deliver unparalleled parts supply and maintenance services Strategic vision Unifying strengths AAR CORP.

All rights reserved worldwide. Confidential and proprietary document. 28 • Trax’s embedded market position helps foresee maintenance needs and parts replacements. • AAR and other supplier informed readiness with parts ensures that necessary replacements can be done just in time. • Aircraft downtime is minimized, ensuring continuous operations . • One - click access for customers to a streamlined ordering process for parts. • Rapid response and fulfilment through a curated Trusted Supplier Network (TSN), enabled by real - time data from Trax. • AAR’s leadership position forms the foundation for a new parts platform. With AAR’s agile parts supply expertise and Trax’s intelligent software, we’re forging an innovative alliance that elevates aviation efficiency, safety, and customer satisfaction Fewer aircraft delays for parts The “buy - now” button for instant access Vision: A new parts ecosystem Foundational features • Integrated with mobile apps and buyer queue on Trax desktop Trax users see integrated virtual inventory from TSN • Only parts with all necessary & screened documentation • Only suppliers that meet minimum customer ratings thresholds Mechanics Material planners Buyers Strategic vision One example: new parts ecosystem AAR CORP.
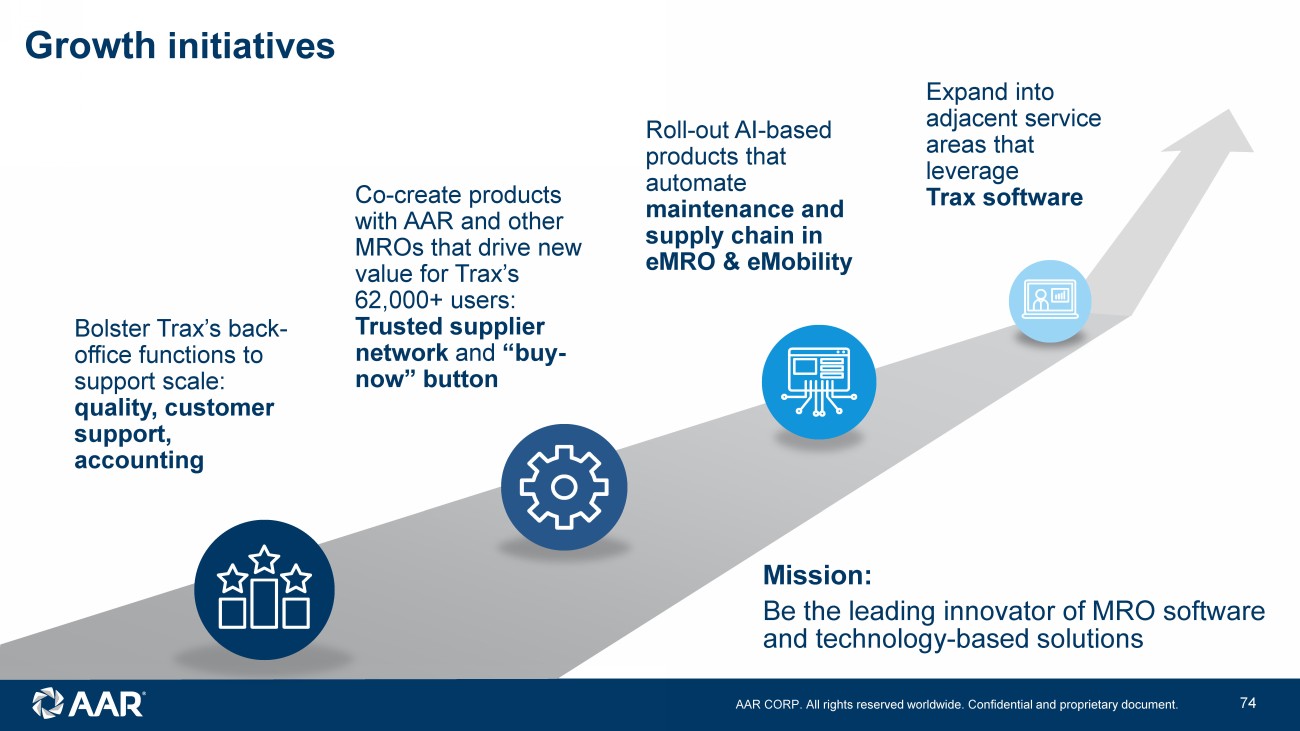
All rights reserved worldwide. Confidential and proprietary document. 29 Mission: Be the leading innovator of MRO software and technology - based solutions Bolster Trax’s back - office functions to support scale: quality, customer support, accounting Co - create products with AAR and other MROs that drive new value for Trax’s 62,000+ users: Trusted supplier network and “buy - now” button Roll - out AI - based products that automate maintenance and supply chain in eMRO & eMobility Expand into adjacent service areas that leverage Trax software Growth initiatives © 2023 AAR CORP.

All rights reserved worldwide. 30 Sean Gillen Chief Financial Officer Financial overview © 2023 AAR CORP.

All rights reserved worldwide. 31 Sean Gillen Joined AAR in 2019 in his current role where he oversees the financial, accounting, tax, treasury and investor relations functions Previously served as Vice President and Treasurer at USG Corporation Prior to USG, was employed at Goldman, Sachs & Company in the investment banking area Holds Bachelor of Business Administration from the University of Michigan © 2023 AAR CORP.

All rights reserved worldwide. 32 Historical financial performance Adjusted sales ($M) Adjusted diluted EPS Net debt / adjusted EBITDA Adjusted operating income ($M) and margin Note: FY ends May 31; figures reflect continuing operations; see Appendix for reconciliation of non - GAAP financial measures $1,748 $2,052 $2,072 $1,652 $1,820 $1,991 FY18 FY19 FY20 FY21 FY22 FY23 $90 $115 $105 $69 $115 $149 5.2% 5.6% 5.0% 4.2% 6.3% 7.5% FY18 FY19 FY20 FY21 FY22 FY23 $1.87 $2.44 $2.15 $1.31 $2.38 $2.86 FY18 FY19 FY20 FY21 FY22 FY23 1.0x 0.7x 1.3x 0.7x 0.3x 1.1x FY18 FY19 FY20 FY21 FY22 FY23 © 2023 AAR CORP.

All rights reserved worldwide. 33 x Consolidated footprint to optimize cost base and preferred customer support x Exited underperforming product lines and contracts x Reduced selected headcount x Eliminated non - essential spend x Used market dislocation and relative strength to take share x Added differentiated capability Actions taken have yielded consistent financial improvement Note: FY ends May 31; Adjusted EPS reflects dilution; figures reflect continuing operations; see Appendix for reconciliation of non - GAAP financial measures 4.9% 5.6% 5.9% 3.2% 2.5% 4.0% 5.0% 5.2% 5.5% 6.1% 6.7% 7.0% 6.9% 7.6% 7.6% 7.8% Quarterly Adjusted Operating Margin $0.57 $0.64 $0.67 $0.26 $0.17 $0.31 $0.37 $0.47 $0.52 $0.53 $0.63 $0.72 $0.61 $0.69 $0.75 $0.83 Quarterly Adjusted EPS © 2023 AAR CORP.

All rights reserved worldwide. 34 Significant progress since 2019 $2,052 $1,991 FY19 FY23 $115 $149 5.6% 7.5% FY19 FY23 $2.44 $2.86 FY19 FY23 Adjusted sales ($M) Adjusted operating income ($M) and margin Adjusted EPS Down 3% Up 30% Up 17% Higher margins and earnings on sales that are still below pre - pandemic level Note: FY ends May 31; Adjusted EPS reflects dilution; figures reflect continuing operations; see Appendix for reconciliation of non - GAAP financial measures © 2023 AAR CORP.

All rights reserved worldwide. 35 • Current leverage of 1.1x net debt / Adjusted EBITDA; S&P BB credit rating • Maintain conservative balance sheet; target net leverage ratio of 1.0x – 2.0x EBITDA • Max leverage ratio of 3.5x EBITDA • Support new business wins in Parts Supply via inventory in USM and Distribution • Select airframe maintenance expansion and new component repair capabilities • Development of proprietary PMA parts • Adherence to strategic filters and financial criteria • Focused on expanding in core Parts Supply, R&E, and Integrated Solutions • Increase intellectual property in portfolio • Initiated $150M Share Repurchase Program in December 2021 • Repurchased $92.4M to - date with remaining authorization of $57.6M • Will evaluate further usage and expansion based on alternative opportunities Maintain flexible balance sheet Organic investment to drive growth Opportunistic acquisitions Return to shareholders Capital allocation framework See Appendix for reconciliation of non - GAAP financial measures © 2023 AAR CORP.
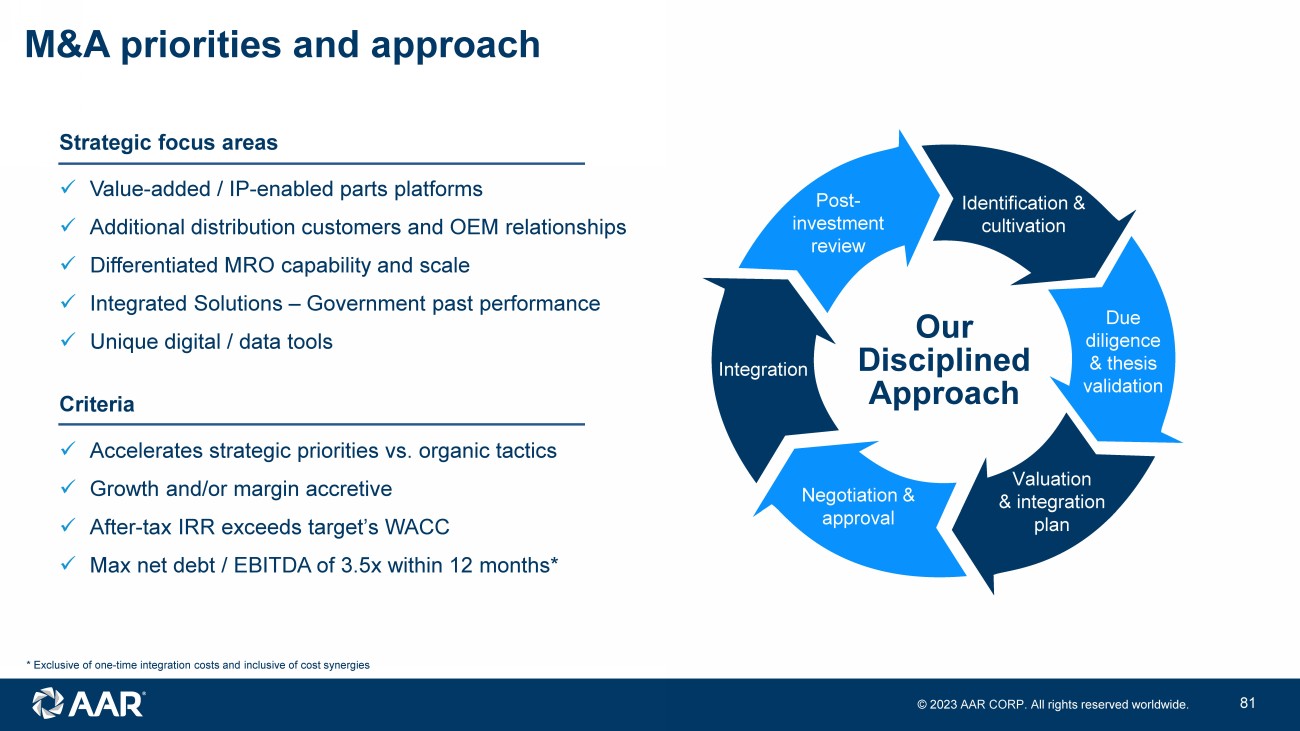
All rights reserved worldwide. 36 M&A priorities and approach Strategic focus areas x Value - added / IP - enabled parts platforms x Additional distribution customers and OEM relationships x Differentiated MRO capability and scale x Integrated Solutions – Government past performance x Unique digital / data tools Criteria x Accelerates strategic priorities vs. organic tactics x Growth and/or margin accretive x After - tax IRR exceeds target’s WACC x Max net debt / EBITDA of 3.5x within 12 months* Due Diligence Valuation & integration plan Negotiation & approval Integration Post - investment review Due diligence & thesis validation Identification & cultivation * Exclusive of one - time integration costs and inclusive of cost synergies Our Disciplined Approach © 2023 AAR CORP.

All rights reserved worldwide. 37 1 2 3 4 Focused portfolio of aftermarket aviation services expected to benefit from market growth and increased market share Operating margin significantly increased since pre - pandemic due to cost discipline and actions to improve underperforming activities Continued growth, margin expansion and capital allocation expected to drive increased shareholder value Strong balance sheet enables capital allocation across high - return organic investments, acquisitions, and share repurchase Key messages © 2023 AAR CORP.

All rights reserved worldwide. 38 Closing comments John M. Holmes Chairman, President and Chief Executive Officer © 2023 AAR CORP.

All rights reserved worldwide. 39 Key takeaways 2 3 4 5 1 6 Fundamentally improved the business since pre - pandemic and added greater transparency Large and growing markets Multiple levers to take market share Continued margin expansion opportunity History of aerospace aftermarket resiliency to macroeconomic conditions Strong balance sheet supports growth investments and/or capital return to shareholders © 2023 AAR CORP.

All rights reserved worldwide. 40 Q&A © 2023 AAR CORP.

All rights reserved worldwide. 41 Appendix © 2023 AAR CORP.

All rights reserved worldwide. 42 Non - GAAP financial measures This presentation includes financial results for the Company with respect to adjusted diluted earnings per share from continu ing operations, adjusted sales, adjusted EBITDA, adjusted operating income and net debt, which are “non - GAAP financial measures” as defined in Regulation G of the Securities Exchange Act of 1934, as amended (the “Exchange Act”). We believe these non - GAAP finan cial measures are relevant and useful for investors as they illustrate our actual operating performance unaffected by the impact o f c ertain items. When reviewed in conjunction with our GAAP results and the accompanying reconciliations, we believe these non - GAAP financ ial measures provide additional information that is useful to gain an understanding of the factors and trends affecting our busin ess and provide a means by which to compare our operating performance against that of other companies in the industries we compete. T hes e non - GAAP measures should be considered as a supplement to, and not as a substitute for, or superior to, the corresponding measur es calculated in accordance with GAAP. Adjusted EBITDA is income from continuing operations before interest income (expense), ot her income (expense), income taxes, depreciation and amortization, stock - based compensation and other items of an unusual nature including but not limited to business divestitures, workforce actions, subsidies and costs, impairment and exit charges, faci lit y consolidation and repositioning costs, investigation and remediation compliance costs, significant income tax adjustments, ga ins on asset sales, purchase accounting and legal settlements, strategic project costs and significant customer events such as early termi nat ions, contract restructurings, forward loss provisions, bankruptcies and credit charges. Adjusted operating income is adjusted EBIT DA gross of depreciation and amortization and stock - based compensation. Pursuant to the requirements of Regulation G of the Exchange Act, w e provide tables that reconcile the above - mentioned non - GAAP financial measures to the most directly comparable GAAP financial measures in the Appendix at the end of this presentation. The Company is not providing a reconciliation of forward - looking adjusted operating margin, net leverage ratio and annual adjust ed EPS growth to the most directly comparable forward - looking GAAP measure because the information is not available without unreasonabl e effort. This is due to the inherent difficulty of forecasting the timing and amount of certain items, such as, but not limite d t o, unusual gains and losses, the ultimate outcome of pending litigation, the impact and timing of potential acquisitions and divestitures, and ot her structural changes or their probable significance. Each of the adjustments has not occurred, are out of the Company's control and/or can not be reasonably predicted. For this reason, the Company is unable to address the probable significance of the unavailable informat ion .

© 2023 AAR CORP. All rights reserved worldwide. 43 Adjusted sales, adjusted operating income and adjusted operating margin Non - GAAP financial measures ($ in millions) Q1 FY20 Q2 FY20 Q3 FY20 Q4 FY20 Q1 FY21 Q2 FY21 Q3 FY21 Q4 FY21 Q1 FY22 Q2 FY22 Q3 FY22 Q4 FY22 Q1 FY23 Q2 FY23 Q3 FY23 Q4 FY23 Sales $541.5 $560.9 $553.1 $416.5 $400.8 $403.6 $410.3 $437.6 $455.1 $436.6 $452.2 $476.1 $446.3 $469.8 $521.1 $553.3 Contract termination/restructuring & loss provision, net - - 9.8 7.5 1.9 (2.3) 1.5 (2.4) 1.0 (2.5) (0.2) (1.2) 0.1 - - - Customer bankruptcy charge - - - - - 0.4 - - - - - - - - - - Adjusted sales $541.5 $560.9 $562.9 $424.0 $402.7 $401.7 $411.8 $435.2 $456.1 $434.1 $452.0 $474.9 $446.4 $469.8 $521.1 $553.3 Operating income $22.8 $28.1 $5.3 ($14.9) $3.2 $21.6 $39.7 $20.7 $15.1 $30.1 $30.3 $31.4 $31.2 $32.4 $34.0 $36.3 Investigation and remediation costs 3.1 2.4 2.7 1.8 1.3 2.8 0.3 - 0.2 0.8 1.6 1.1 0.8 1.1 1.2 1.6 Trax acquisition costs - - - - - - - - - - - - - - 1.9 5.1 Customer bankruptcy and credit charges - - - 1.6 0.2 1.3 1.0 2.4 - 1.0 - - - (0.3) 1.8 - Government subsidies - - - (2.8) (11.1) (18.7) (24.6) (1.8) (0.3) (2.5) (1.0) (1.1) (0.7) - (0.9) - Facility consolidation and repositioning costs - - - 4.9 2.0 0.4 - 2.1 0.1 0.1 - - - - - - Russian bankruptcy court clawback judgement - - - - - - - - - - - - - - 1.8 - Contract termination/restructuring & loss provision, net - - 24.7 6.6 2.2 4.5 4.0 (1.4) 6.7 (4.4) (1.1) (0.3) (0.3) 2.3 - - Asset impairment and exit charges - - - 11.0 5.8 1.2 - - 2.3 0.6 0.5 0.1 - - - - Severance and furlough costs 0.7 0.9 0.5 5.0 6.0 2.2 0.1 0.7 0.9 0.8 0.2 0.1 0.1 - - - Costs related to strategic projects - - 0.4 0.3 0.7 - - - - - 1.8 (0.2) - - - Adjusted operating income $26.6 $31.4 $33.2 $13.6 $9.9 $16.0 $20.5 $22.7 $25.0 $26.5 $30.5 $33.1 $30.9 $35.5 $39.8 $43.0 Adjusted operating margin 4.9% 5.6% 5.9% 3.2% 2.5% 4.0% 5.0% 5.2% 5.5% 6.1% 6.7% 7.0% 6.9% 7.6% 7.6% 7.8% © 2023 AAR CORP.

All rights reserved worldwide. 44 Adjusted diluted earnings per share from continuing operations Non - GAAP financial measures FY17 FY18 FY19 FY20 FY21 FY22 FY23 Q1 FY20 Q2 FY20 Q3 FY20 Q4 FY20 Q1 FY21 Q2 FY21 Q3 FY21 Q4 FY21Q1 FY22 Q2 FY22 Q3 FY22 Q4 FY22 Q1 FY23 Q2 FY23 Q3 FY23 Q4 FY23 Diluted earnings (loss) per share from continuing operations $1.51 $2.11 $2.40 $0.71 $1.30 $2.16 $2.52 $0.49 $0.57 $0.07 ($0.43) ($0.40) $0.41 $0.87 $0.41 $0.31 $0.58 $0.63 $0.66 $0.62 $0.64 $0.62 $0.66 Deferred tax re-measurement from the Tax Cuts and Jobs Act - ($0.41) - - - - - - - - - - - - - - - - - - - - - Investigation and remediation costs - - 0.08 0.22 0.10 0.07 0.13 0.07 0.05 0.06 0.04 0.03 0.06 0.01 - 0.01 0.01 0.03 0.02 0.02 0.03 0.04 0.04 (Gain) loss on sale/exit of business/asset (0.08) - - - 0.44 0.04 0.02 - - - - 0.42 - - 0.02 - 0.03 - 0.01 - - 0.01 0.01 Trax acquisition and amortization expenses - - - - - - 0.21 - - - - - - - - - - - - - - 0.06 0.15 Contract termination/restructuring & loss provision, net - 0.14 - 0.68 0.20 0.02 0.04 - - 0.53 0.15 0.05 0.10 0.08 (0.03) 0.14 (0.09) (0.02) (0.01) (0.01) 0.05 - - Customer bankruptcy and credit charges (recoveries) - - 0.27 0.04 0.10 0.02 0.04 - - - 0.04 - 0.04 0.02 0.05 - 0.02 - - - (0.01) 0.05 - Loss (gain) on equity investments - - - - - - 0.01 - - - - - - - - - - - - - (0.02) 0.03 Asset impairment charges - - - 0.25 0.15 0.07 - - - - 0.25 0.13 0.02 - - 0.05 0.01 0.01 - - - - Government subsidies - - - (0.06) (1.22) (0.10) (0.05) - - - (0.06) (0.24) (0.41) (0.53) (0.04) (0.01) (0.05) (0.02) (0.02) (0.02) - (0.03) - State income tax benefit - (0.06) (0.15) - - - - - - - - - - - - - - - - - - - - Recognition of previously reserved income tax benefits - - (0.19) - - - - - - - - - - - - - - - - - - - - Russian bankruptcy court clawback judgement - - - - - - 0.05 - - - - - - - - - - - - - - 0.05 - Facility consolidation and repositioning costs - - 0.02 0.11 0.09 0.01 - - - - 0.11 0.04 0.01 - 0.04 - 0.01 - - - - - - Severance, furlough & pension settlement costs 0.02 0.09 0.01 0.19 0.22 0.07 - 0.01 0.02 0.01 0.15 0.13 0.07 0.01 0.02 0.02 0.01 0.02 0.02 - - - - Gain on settlement of purchase accounting liabilities - - - - - (0.02) - - - - - - - - - - - (0.02) - - - - - Gain on legal settlement - - - - (0.09) - - - - - - - - (0.09) - - - - - - - - - Costs related to strategic projects - - - 0.01 0.02 0.04 - - - - 0.01 0.01 0.01 - - - - - 0.04 - - - - Tax effect on adjustments (a) - - - - - - (0.11) - - - - - - - - - - - - - - (0.05) (0.06) Adjusted diluted EPS from continuing operations $1.45 $1.87 $2.44 $2.15 $1.31 $2.38 $2.86 $0.57 $0.64 $0.67 $0.26 $0.17 $0.31 $0.37 $0.47 $0.52 $0.53 $0.63 $0.72 $0.61 $0.69 $0.75 $0.83 (a) Calculation uses estimated statutory tax rates on non-GAAP adjustments; began reporting tax effects separately in Q3 FY23 © 2023 AAR CORP.

All rights reserved worldwide. 45 Adjusted EBITDA Non - GAAP financial measures ($ in millions) 12 Months Ended FY17 FY18 FY19 FY20 FY21 FY22 FY23 Q1 FY20Q2 FY20Q3 FY20Q4 FY20Q1 FY21Q2 FY21Q3 FY21Q4 FY21Q1 FY22Q2 FY22Q3 FY22Q4 FY22Q1 FY23Q2 FY23Q3 FY23Q4 FY23 Q1 FY20Q2 FY20Q3 FY20Q1 FY21Q2 FY21Q3 FY21Q1 FY22Q2 FY22Q3 FY22Q1 FY23Q2 FY23Q3 FY23 Net income (loss) $56.5 $15.6 $7.5 $4.4 $35.8 $78.7 $90.2 $4.4 $14.2 $2.3 ($16.5) ($14.5) $8.2 $28.1 $14.0 $11.5 $20.8 $22.5 $23.9 $22.7 $22.5 $21.8 $23.2 ($3.2) $4.0 $43.7 ($14.5) ($20.5) $5.3 $61.8 $74.4 $68.8 $89.9 $91.6 $90.9 (Income) loss from discontinued operations (4.5) 58.1 76.6 20.4 10.5 (0.2) (0.4) 12.7 5.9 0.3 1.5 0.6 6.2 3.0 0.7 (0.3) - 0.1 - (0.4) - - - 85.5 87.2 22.7 8.3 8.6 11.3 9.6 3.4 0.5 (0.3) (0.3) (0.4) Income tax expense (benefit) 25.1 3.5 4.9 5.6 18.2 26.6 31.4 3.4 6.0 0.2 (4.0) (3.8) 5.2 12.0 4.8 3.9 7.9 8.2 6.6 8.1 8.3 8.0 7.0 6.0 9.0 9.8 (1.6) (2.4) 9.4 25.9 28.6 24.8 30.8 31.2 31.0 Other (income) expense, net - 0.9 0.8 2.1 (4.3) (2.2) 0.8 0.2 0.2 0.2 1.5 (0.2) 0.7 (4.4) (0.4) (0.7) (0.3) (1.1) (0.1) (0.2) (0.5) 0.3 1.2 1.4 1.4 1.0 1.7 2.2 (2.4) (4.8) (5.8) (2.5) (1.7) (1.9) (0.5) Interest expense, net 5.2 7.9 8.5 8.8 4.8 2.3 11.2 2.1 1.8 2.3 2.6 1.6 1.3 1.0 0.9 0.7 0.4 0.6 0.6 1.0 2.0 3.5 4.7 9.0 8.4 8.3 8.3 7.8 6.5 3.9 3.0 2.6 2.6 4.2 7.1 Depreciation and intangible amortization 35.7 40.5 42.8 43.7 36.3 33.1 27.9 10.8 11.0 11.0 10.9 9.0 9.2 8.9 9.2 8.9 8.9 7.7 7.6 6.8 6.5 6.9 7.7 43.5 44.1 44.3 41.9 40.1 38.0 36.2 35.9 34.7 31.0 28.6 27.8 Investigation and remediation costs - - 3.5 10.1 4.4 3.7 4.7 3.1 2.4 2.7 1.8 1.3 2.8 0.3 - 0.2 0.8 1.6 1.1 0.8 1.1 1.2 1.6 6.6 8.8 10.5 8.3 8.7 6.2 3.3 1.3 2.6 4.3 4.6 4.2 Losses related to sale and exit of business (2.6) - - - 20.2 1.7 0.7 - - - - 19.5 - - 0.7 - 1.3 - 0.4 - 0.1 0.4 0.2 - - - 19.5 19.5 19.5 0.7 2.0 2.0 1.7 0.5 0.9 Trax acquisition and amortization expenses - - - - - - 7.0 - - - - - - - - - - - - - - 1.9 5.1 - - - - - - - - - - - 1.9 Asset impairment and exit charges - - - 11.0 7.0 3.5 - - - - 11.0 5.8 1.2 - - 2.3 0.6 0.5 0.1 - - - - - - - 16.8 18.0 18.0 3.5 2.9 3.4 1.2 0.6 0.1 Contract termination/restructuring & loss provision, net - 7.1 - 31.3 9.3 0.9 2.0 - - 24.7 6.6 2.2 4.5 4.0 (1.4) 6.7 (4.4) (1.1) (0.3) (0.3) 2.3 - - - - 24.7 33.5 38.0 17.3 13.8 4.9 (0.2) (6.1) 0.6 1.7 Facility consolidation and repositioning costs - - 0.9 4.9 4.5 0.2 - - - - 4.9 2.0 0.4 - 2.1 0.1 0.1 - - - - - - 0.9 0.9 0.9 6.9 7.3 7.3 2.6 2.3 2.3 0.1 - - Severance and furlough costs 0.8 4.5 0.2 7.1 9.0 2.0 0.1 0.7 0.9 0.5 5.0 6.0 2.2 0.1 0.7 0.9 0.8 0.2 0.1 0.1 - - - 1.0 1.9 2.2 12.4 13.7 13.3 3.9 2.5 2.6 1.2 0.4 0.2 Customer bankruptcy and credit charges - - 12.4 1.6 4.9 1.0 1.5 - - - 1.6 0.2 1.3 1.0 2.4 - 1.0 - - - (0.3) 1.8 - 12.4 - - 1.8 3.1 4.1 4.7 4.4 3.4 1.0 (0.3) 1.5 Government subsidies - - - (2.8) (56.2) (4.9) (1.6) - - - (2.8) (11.1) (18.7) (24.6) (1.8) (0.3) (2.5) (1.0) (1.1) (0.7) - (0.9) - - - - (13.9) (32.6) (57.2) (45.4) (29.2) (5.6) (5.3) (2.8) (2.7) Russian bankruptcy court clawback judgement - - - - - - 1.8 - - - - - - - - - - - - - - 1.8 - - - - - - - - - - - - 1.8 Costs related to strategic projects - - - 0.4 1.0 1.8 (0.2) - - - 0.4 0.3 0.7 - - - - - 1.8 (0.2) - - - - - - 0.7 1.4 1.4 0.7 - - 1.6 1.6 1.6 Stock-based compensation 11.0 15.3 13.5 7.3 9.2 8.2 13.5 4.3 2.8 3.2 (3.0) 2.7 1.8 2.3 2.4 3.1 1.6 1.1 2.4 4.1 2.8 3.5 3.1 13.8 15.4 15.0 5.7 4.7 3.8 9.6 9.4 8.2 9.2 10.4 12.8 Adjusted EBITDA $127.2 $153.4 $171.6 $155.9 $114.6 $156.4 $190.6 $41.7 $45.2 $47.4 $21.5 $21.6 $27.0 $31.7 $34.3 $37.0 $37.0 $39.3 $43.1 $41.8 $44.8 $50.2 $53.8 $176.9 $181.1 $183.1 $135.8 $117.6 $101.8 $130.0 $140.0 $147.6 $161.2 $169.0 $179.9 Pro forma for Trax acquisition: Trax adjusted EBITDA for the twelve months ended February 28, 2023 $8.6 Adjusted EBITDA pro forma for Trax acquisition $188.5 © 2023 AAR CORP.

All rights reserved worldwide. 46 Net debt / adjusted EBITDA Non - GAAP financial measures ($ in millions) FY17 FY18 FY19 Q1 FY20 Q2 FY20 Q3 FY20 Q4 FY20 Q1 FY21 Q2 FY21 Q3 FY21 Q4 FY21 Q1 FY22 Q2 FY22 Q3 FY22 Q4 FY22 Q1 FY23 Q2 FY23 Q3 FY23 Q4 FY24 Total debt $156.2 $178.9 $142.9 $203.3 $198.3 $208.1 $602.0 $257.0 $222.1 $207.6 $135.2 $129.0 $104.5 $104.5 $100.0 $115.0 $198.0 $188.0 $272.0 Less: cash and cash equivalents (10.3) (31.1) (21.3) (39.9) (38.2) (37.0) (404.7) (107.7) (110.0) (99.2) (51.8) (48.8) (42.7) (40.6) (53.5) (44.3) (49.0) (52.7) (68.4) Net debt $145.9 $147.8 $121.6 $163.4 $160.1 $171.1 $197.3 $149.3 $112.1 $108.4 $83.4 $80.2 $61.8 $63.9 $46.5 $70.7 $149.0 $135.3 $203.6 Trax acquisition purchase price - - - - - - - - - - - - - - - - - 120.0 - Pro forma net debt $145.9 $147.8 $121.6 $163.4 $160.1 $171.1 $197.3 $149.3 $112.1 $108.4 $83.4 $80.2 $61.8 $63.9 $46.5 $70.7 $149.0 $255.3 $203.6 Adjusted EBITDA 127.2 153.4 171.6 176.9 181.1 183.1 155.9 135.8 117.6 101.8 114.6 130.0 140.0 147.6 156.4 161.2 169.0 179.9 190.6 Net debt to Adjusted EBITDA 1.1x 1.0x 0.7x 0.9x 0.9x 0.9x 1.3x 1.1x 1.0x 1.1x 0.7x 0.6x 0.4x 0.4x 0.3x 0.4x 0.9x 0.8x 1.1x Adjusted EBITDA pro forma for Trax acquisition 188.5 Pro forma net debt to Adjusted EBITDA 1.35x © 2023 AAR CORP.
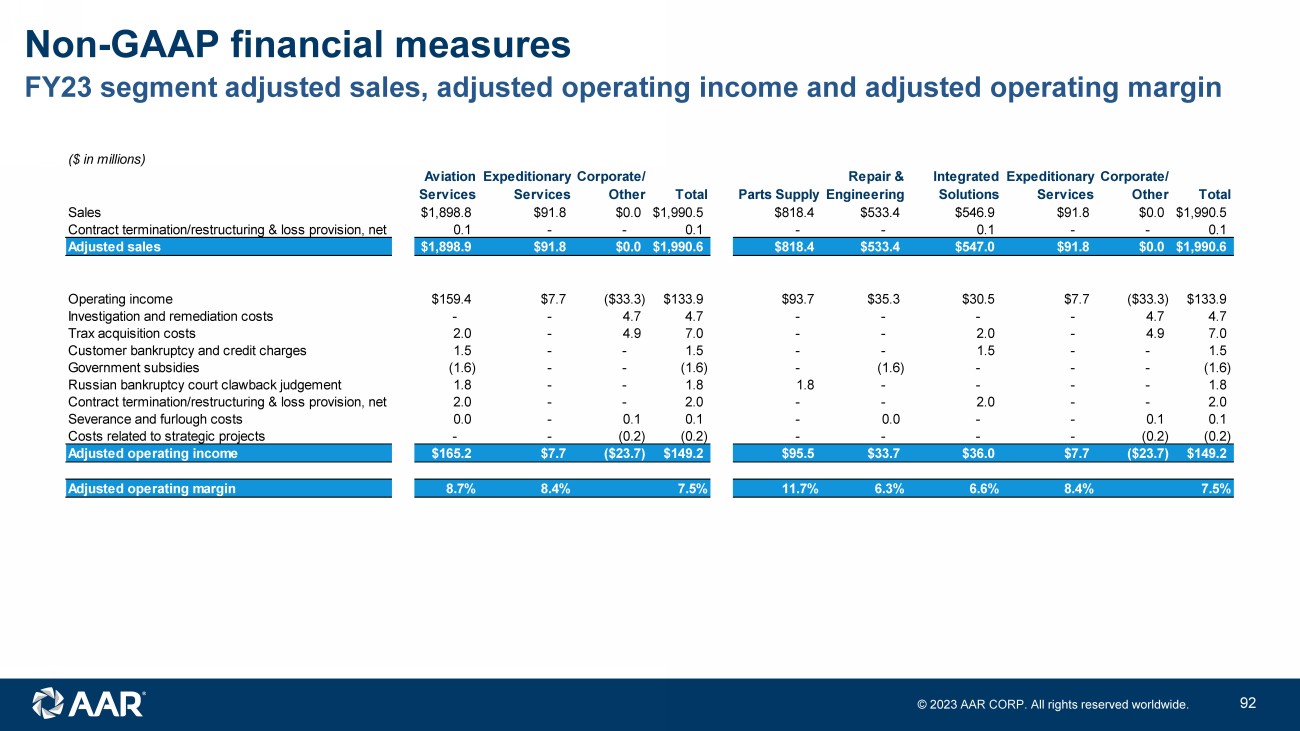
All rights reserved worldwide. 47 FY23 segment adjusted sales, adjusted operating income and adjusted operating margin Non - GAAP financial measures ($ in millions) Aviation Services Expeditionary Services Corporate/ Other Total Parts Supply Repair & Engineering Integrated Solutions Expeditionary Services Corporate/ Other Total Sales $1,898.8 $91.8 $0.0 $1,990.5 $818.4 $533.4 $546.9 $91.8 $0.0 $1,990.5 Contract termination/restructuring & loss provision, net 0.1 - - 0.1 - - 0.1 - - 0.1 Adjusted sales $1,898.9 $91.8 $0.0 $1,990.6 $818.4 $533.4 $547.0 $91.8 $0.0 $1,990.6 Operating income $159.4 $7.7 ($33.3) $133.9 $93.7 $35.3 $30.5 $7.7 ($33.3) $133.9 Investigation and remediation costs - - 4.7 4.7 - - - - 4.7 4.7 Trax acquisition costs 2.0 - 4.9 7.0 - - 2.0 - 4.9 7.0 Customer bankruptcy and credit charges 1.5 - - 1.5 - - 1.5 - - 1.5 Government subsidies (1.6) - - (1.6) - (1.6) - - - (1.6) Russian bankruptcy court clawback judgement 1.8 - - 1.8 1.8 - - - - 1.8 Contract termination/restructuring & loss provision, net 2.0 - - 2.0 - - 2.0 - - 2.0 Severance and furlough costs 0.0 - 0.1 0.1 - 0.0 - - 0.1 0.1 Costs related to strategic projects - - (0.2) (0.2) - - - - (0.2) (0.2) Adjusted operating income $165.2 $7.7 ($23.7) $149.2 $95.5 $33.7 $36.0 $7.7 ($23.7) $149.2 Adjusted operating margin 8.7% 8.4% 7.5% 11.7% 6.3% 6.6% 8.4% 7.5%