UNITED STATES
SECURITIES AND EXCHANGE COMMISSION
Washington, D.C. 20549
FORM 8-K
CURRENT REPORT
PURSUANT TO SECTION 13 OR 15(d) OF THE SECURITIES EXCHANGE ACT OF 1934
Date of Report (Date of earliest event reported): July 18, 2023
UNITED COMMUNITY BANKS, INC.
(Exact name of registrant as specified in its charter)
| Georgia | 001-35095 | 58-1807304 |
| (State or other jurisdiction of incorporation) | (Commission file number) | (IRS Employer Identification No.) |
125 Highway 515 East
Blairsville, Georgia 30512
(Address of principal executive offices)
Registrant's telephone number,
including area code:
(706) 781-2265
Not applicable
(Former name or former address, if changed since last report)
Check the appropriate box below if the Form 8-K filing is intended to simultaneously satisfy the filing obligation of the registrant under any of the following provisions:
| ¨ | Written communications pursuant to Rule 425 under the Securities Act (17 CFR 230.425) |
| ¨ | Soliciting material pursuant to Rule 14a-12 under the Exchange Act (17 CFR 240.14a-12) |
| ¨ | Pre-commencement communications pursuant to Rule 14d-2(b) under the Exchange Act (17 CFR 240.14d-2(b)) |
| ¨ | Pre-commencement communications pursuant to Rule 13e-4(c) under the Exchange Act (17 CFR 240.13e-4(c)) |
Securities registered pursuant to Section 12(b) of the Act:
| Title of Each Class | Trading Symbol(s) | Name of Each Exchange on Which Registered | ||
| Common stock, par value $1 per share | UCBI | Nasdaq Global Select Market | ||
| Depositary shares, each representing 1/1000th interest in a share of Series I Non-Cumulative Preferred Stock | UCBIO | Nasdaq Global Select Market |
Indicate by check mark whether the registrant is an emerging growth company as defined in as defined in Rule 405 of the Securities Act of 1933 (§230.405 of this chapter) or Rule 12b-2 of the Securities Exchange Act of 1934 (§240.12b-2 of this chapter).
Emerging growth company ¨
If an emerging growth company, indicate by check mark if the registrant has elected not to use the extended transition period for complying with any new or revised financial accounting standards provided pursuant to Section 13(a) of the Exchange Act. ¨
| Item 2.02 | Results of Operations and Financial Condition. |
| On July 18, 2023, United Community Banks, Inc. (“United”) issued a press release announcing financial results for its second fiscal quarter of 2023. The press release is furnished as Exhibit 99.1 to this Current Report on Form 8-K. | |
| The information furnished pursuant to this Item 2.02, including Exhibit 99.1, shall not be deemed “filed” for purposes of Section 18 of the Securities Exchange Act of 1934 (the “Exchange Act”) or otherwise subject to the liabilities under Section 18 of the Exchange Act and shall not be deemed to be incorporated by reference into any filing of the Company under the Securities Act of 1933 or the Exchange Act. | |
| Item 7.01 | Regulation FD Disclosure. |
| On July 19, 2023, United will hold an earnings conference call and webcast at 11:00 a.m. (Eastern Time) to discuss financial results for its second fiscal quarter of 2023. The press release referenced above in Item 2.02 contains information about how to access the conference call and webcast. A copy of the slide presentation to be used during the earnings call and webcast is furnished as Exhibit 99.2 to this Current Report on Form 8-K. The slide presentation also will be available on our website, www.ucbi.com, under the “Investor Relations – Events and Presentations” section. | |
| The information furnished pursuant to this Item 7.01, including Exhibit 99.2, shall not be deemed “filed” for purposes of Section 18 of the Exchange Act or otherwise subject to the liabilities under Section 18 of the Exchange Act and shall not be deemed to be incorporated by reference into any filing of the Company under the Securities Act of 1933 or the Exchange Act. | |
| Item 9.01 | Financial Statements and Exhibits. |
| (d) Exhibits |
| EXHIBIT INDEX |
| Exhibit No. | Description | |
| 99.1 | United Community Banks, Inc. Press Release, dated July 18, 2023. | |
| 99.2 | Slide presentation to be used during July 19, 2023 earnings call. | |
| 104 | The cover page from this Current Report on Form 8-K, formatted in Inline XBRL. |
SIGNATURES
Pursuant to the requirements of the Securities Exchange Act of 1934, the registrant has duly caused this report to be signed on its behalf by the undersigned hereunto duly authorized.
| UNITED COMMUNITY BANKS, INC. | ||
| By: | /s/ Jefferson L. Harralson | |
| Jefferson L. Harralson | ||
| Executive Vice President and | ||
| Chief Financial Officer | ||
| Date: July 18, 2023 | ||
Exhibit 99.1

For Immediate Release
For more information:
Jefferson Harralson
Chief Financial Officer
(864) 240-6208
Jefferson_Harralson@ucbi.com
United Community Banks, Inc. Reports Second Quarter Results
Maintained Strong Balance Sheet, Liquidity and Capital Levels; Annualized Loan Growth of 6.3%
GREENVILLE, SC – July 18, 2023 - United Community Banks, Inc. (NASDAQ: UCBI) (“United”) today announced net income for the second quarter of $63.3 million and pre-tax, pre-provision income of $104.3 million. Diluted earnings per share of $0.53 for the quarter represented an increase of $0.01 or 2% from the first quarter of 2023 and a decrease of $0.08 or 13%, from the second quarter of 2022. Industry-wide deposit price competition drove increased deposit costs, leading to an $11.2 million decrease in net interest revenue for the quarter. This was offset by a decline in quarterly noninterest expenses and an increase in noninterest income. On an operating basis, diluted earnings per share of $0.55 decreased $0.03 or 5% compared to last quarter mainly due to net interest margin compression despite lower noninterest expenses and noninterest income growth. Deposits grew by 4.5% annualized and loans grew at a 6.3% annualized rate during the quarter. Credit continues to perform well, with net charge offs of 20 basis points, up slightly from 17 basis points in the previous quarter.
For the quarter, United’s return on assets was 0.95%, or 1.00% on an operating basis. Return on common equity was 7.5% and return on tangible common equity was 11.4%. On a pre-tax, pre-provision basis, operating return on assets was 1.65% for the quarter. At quarter-end, tangible common equity to tangible assets was 8.21%, up four basis points from the first quarter of 2023.
Chairman and CEO Lynn Harton stated, “We are pleased to continue to perform well despite a challenging interest rate environment. In the face of increased deposit pricing competition, we grew customer deposits and funded solid loan growth. This reflects the strength of our franchise and the loyalty of our customer base. Our loan growth was within our stated target range of mid to high single digits. Higher deposit costs due to mix and rate changes resulted in a lower net interest margin from the previous quarter, however, we still delivered strong returns and continued to strengthen our balance sheet.” Harton continued, “We also completed some important steps with our recent strategic expansions. We completed the operational conversion of Progress, which means they now officially operate under the United Community brand across their outstanding Alabama and Florida Panhandle markets. Just a few weeks ago, on July 1, we completed our merger with First Miami Bancorp and its bank subsidiary, First National Bank of South Miami. We continue to be excited and highly optimistic about what the future holds for these two great partnerships.”
United’s net interest margin decreased by 24 basis points to 3.37% from the first quarter. The average yield on United’s interest-earning assets was up 21 basis points to 4.97%, but its cost of deposits increased by 54 basis points to 1.64%, leading to the reduction in the net interest margin. Net charge-offs were $8.4 million or 0.20% of average loans during the quarter, up three basis points compared to the first quarter of 2023, and NPAs were 40 basis points relative to total assets, up 12 basis points from the previous quarter.
Mr. Harton concluded, “We continue to be pleased with the performance of our teams and our markets during this uncertain economic environment and interest rate driven headwinds. Our focus continues to be putting our clients and communities first and on prudently growing our business. We are very excited about our ability to strengthen our teams and recruit great bankers in the Southeast’s most attractive metropolitan markets and we look forward to continuing to build a great franchise.”
Second Quarter 2023 Financial Highlights:
| · | Net income of $63.3 million and pre-tax, pre-provision income of $104.3 million |
| · | EPS decreased by 13% compared to last year on a GAAP basis and 17% on an operating basis; compared to first quarter 2023, EPS increased 2% on a GAAP basis and decreased 5% on an operating basis |
| · | Return on assets of 0.95%, or 1.00% on an operating basis |
| · | Pre-tax, pre-provision return on assets of 1.59%, or 1.65% when excluding merger-related and other charges |
| · | Return on common equity of 7.5% |
| · | Return on tangible common equity of 11.4% on an operating basis |
| · | Loan production of $1.5 billion, resulting in organic loan growth of 6.3% annualized for the quarter |
| · | Customer deposits, excluding brokered deposits and public funds, were up $109 million or 2.3% annualized from last quarter |
| · | Total deposits are estimated to be 77% insured or collateralized |
| · | Net interest margin of 3.37% was down 24 basis points from the first quarter due to increased deposit costs |
| · | Mortgage closings of $263 million compared to $498 million a year ago; mortgage rate locks of $305 million compared to $597 million a year ago |
| · | Noninterest income was up $6.2 million on a linked quarter basis with increases across multiple categories including services charges and fees, mortgage loan gains and related fees, as well as a one-time gain from the sale of our corporate benefits business; additionally, there were no losses on the sale of securities in the second quarter compared to $1.6 million in the first quarter |
| · | Noninterest expenses decreased by $7.4 million compared to the first quarter on a GAAP basis and by $2.4 million on an operating basis, mostly due to a decrease in salaries and employee benefits expenses and lower merger-related and other charges |
| · | Efficiency ratio of 55.7%, or 54.2% on an operating basis |
| · | Net charge-offs of $8.4 million, or 20 basis points as a percent of average loans, up three basis points from the net charge-offs level experienced in the first quarter |
| · | Nonperforming assets of 0.40% of total assets, up 12 basis points compared to March 31, 2023 |
| · | Quarterly common shareholder dividend of $0.23 per share declared during the quarter, an increase of 10% year-over-year |
Conference Call
United will hold a conference call on Wednesday, July 19, 2023, at 11 a.m. ET to discuss the contents of this press release and to share business highlights for the quarter. Participants can pre-register for the conference call by navigating to https://dpregister.com/sreg/10180523/f9d90a99ea. Those without internet access or who are unable to pre-register may dial in by calling 1-866-777-2509. Participants are encouraged to dial in 15 minutes prior to the call start time. The conference call also will be webcast and available for replay by selecting “Events and Presentations” under “News and Events” within the Investor Relations section of United’s website at www.ucbi.com.
UNITED COMMUNITY BANKS, INC.
Selected Financial Information
(in thousands, except per share data)
| 2023 | 2022 | Second Quarter | For the Six Months Ended June 30, |
YTD | ||||||||||||||||||||||||||||||||
| Second | First | Fourth | Third | Second | 2023 - 2022 | 2023 - 2022 | ||||||||||||||||||||||||||||||
| Quarter | Quarter | Quarter | Quarter | Quarter | Change | 2023 | 2022 | Change | ||||||||||||||||||||||||||||
| INCOME SUMMARY | ||||||||||||||||||||||||||||||||||||
| Interest revenue | $ | 295,775 | $ | 279,487 | $ | 240,831 | $ | 213,887 | $ | 187,378 | $ | 575,262 | $ | 358,437 | ||||||||||||||||||||||
| Interest expense | 95,489 | 68,017 | 30,943 | 14,113 | 8,475 | 163,506 | 15,742 | |||||||||||||||||||||||||||||
| Net interest revenue | 200,286 | 211,470 | 209,888 | 199,774 | 178,903 | 12 | % | 411,756 | 342,695 | 20 | % | |||||||||||||||||||||||||
| Provision for credit losses | 22,753 | 21,783 | 19,831 | 15,392 | 5,604 | 44,536 | 28,690 | |||||||||||||||||||||||||||||
| Noninterest income | 36,387 | 30,209 | 33,354 | 31,922 | 33,458 | 9 | 66,596 | 72,431 | (8 | ) | ||||||||||||||||||||||||||
| Total revenue | 213,920 | 219,896 | 223,411 | 216,304 | 206,757 | 3 | 433,816 | 386,436 | 12 | |||||||||||||||||||||||||||
| Noninterest expenses | 132,407 | 139,805 | 117,329 | 112,755 | 120,790 | 10 | 272,212 | 240,065 | 13 | |||||||||||||||||||||||||||
| Income before income tax expense | 81,513 | 80,091 | 106,082 | 103,549 | 85,967 | (5 | ) | 161,604 | 146,371 | 10 | ||||||||||||||||||||||||||
| Income tax expense | 18,225 | 17,791 | 24,632 | 22,388 | 19,125 | (5 | ) | 36,016 | 31,510 | 14 | ||||||||||||||||||||||||||
| Net income | 63,288 | 62,300 | 81,450 | 81,161 | 66,842 | (5 | ) | 125,588 | 114,861 | 9 | ||||||||||||||||||||||||||
| Merger-related and other charges | 3,645 | 8,631 | 1,470 | 1,746 | 7,143 | 12,276 | 16,159 | |||||||||||||||||||||||||||||
| Income tax benefit of merger-related and other charges | (820 | ) | (1,955 | ) | (323 | ) | (385 | ) | (1,575 | ) | (2,775 | ) | (3,538 | ) | ||||||||||||||||||||||
| Net income - operating (1) | $ | 66,113 | $ | 68,976 | $ | 82,597 | $ | 82,522 | $ | 72,410 | (9 | ) | $ | 135,089 | $ | 127,482 | 6 | |||||||||||||||||||
| Pre-tax pre-provision income (5) | $ | 104,266 | $ | 101,874 | $ | 125,913 | $ | 118,941 | $ | 91,571 | 14 | $ | 206,140 | $ | 175,061 | 18 | ||||||||||||||||||||
| PERFORMANCE MEASURES | ||||||||||||||||||||||||||||||||||||
| Per common share: | ||||||||||||||||||||||||||||||||||||
| Diluted net income - GAAP | $ | 0.53 | $ | 0.52 | $ | 0.74 | $ | 0.74 | $ | 0.61 | (13 | ) | $ | 1.05 | $ | 1.04 | 1 | |||||||||||||||||||
| Diluted net income - operating (1) | 0.55 | 0.58 | 0.75 | 0.75 | 0.66 | (17 | ) | 1.13 | 1.16 | (3 | ) | |||||||||||||||||||||||||
| Cash dividends declared | 0.23 | 0.23 | 0.22 | 0.22 | 0.21 | 10 | 0.46 | 0.42 | 10 | |||||||||||||||||||||||||||
| Book value | 25.98 | 25.76 | 24.38 | 23.78 | 23.96 | 8 | 25.98 | 23.96 | 8 | |||||||||||||||||||||||||||
| Tangible book value (3) | 17.83 | 17.59 | 17.13 | 16.52 | 16.68 | 7 | 17.83 | 16.68 | 7 | |||||||||||||||||||||||||||
| Key performance ratios: | ||||||||||||||||||||||||||||||||||||
| Return on common equity - GAAP (2)(4) | 7.47 | % | 7.34 | % | 10.86 | % | 11.02 | % | 9.31 | % | 7.41 | % | 8.07 | % | ||||||||||||||||||||||
| Return on common equity - operating (1)(2)(4) | 7.82 | 8.15 | 11.01 | 11.21 | 10.10 | 7.98 | 8.98 | |||||||||||||||||||||||||||||
| Return on tangible common equity - operating (1)(2)(3)(4) | 11.35 | 11.63 | 15.20 | 15.60 | 14.20 | 11.49 | 12.62 | |||||||||||||||||||||||||||||
| Return on assets - GAAP (4) | 0.95 | 0.95 | 1.33 | 1.32 | 1.08 | 0.95 | 0.93 | |||||||||||||||||||||||||||||
| Return on assets - operating (1)(4) | 1.00 | 1.06 | 1.35 | 1.34 | 1.17 | 1.03 | 1.03 | |||||||||||||||||||||||||||||
| Return on assets - pre-tax pre-provision (4)(5) | 1.59 | 1.58 | 2.07 | 1.94 | 1.49 | 1.58 | 1.43 | |||||||||||||||||||||||||||||
| Return on assets - pre-tax pre-provision, excluding merger- related and other charges (1)(4)(5) | 1.65 | 1.71 | 2.09 | 1.97 | 1.60 | 1.68 | 1.56 | |||||||||||||||||||||||||||||
| Net interest margin (fully taxable equivalent) (4) | 3.37 | 3.61 | 3.76 | 3.57 | 3.19 | 3.49 | 3.08 | |||||||||||||||||||||||||||||
| Efficiency ratio - GAAP | 55.71 | 57.20 | 47.95 | 48.41 | 56.58 | 56.46 | 57.00 | |||||||||||||||||||||||||||||
| Efficiency ratio - operating (1) | 54.17 | 53.67 | 47.35 | 47.66 | 53.23 | 53.92 | 53.16 | |||||||||||||||||||||||||||||
| Equity to total assets | 11.89 | 11.90 | 11.25 | 11.12 | 10.95 | 11.89 | 10.95 | |||||||||||||||||||||||||||||
| Tangible common equity to tangible assets (3) | 8.21 | 8.17 | 7.88 | 7.70 | 7.59 | 8.21 | 7.59 | |||||||||||||||||||||||||||||
| ASSET QUALITY | ||||||||||||||||||||||||||||||||||||
| Nonperforming assets ("NPAs") | $ | 103,737 | $ | 73,403 | $ | 44,281 | $ | 35,511 | $ | 34,428 | 201 | $ | 103,737 | $ | 34,428 | 201 | ||||||||||||||||||||
| Allowance for credit losses - loans | 190,705 | 176,534 | 159,357 | 148,502 | 136,925 | 39 | 190,705 | 136,925 | 39 | |||||||||||||||||||||||||||
| Allowance for credit losses - total | 212,277 | 197,923 | 180,520 | 167,300 | 153,042 | 39 | 212,277 | 153,042 | 39 | |||||||||||||||||||||||||||
| Net charge-offs (recoveries) | 8,399 | 7,084 | 6,611 | 1,134 | (1,069 | ) | 15,483 | 1,909 | ||||||||||||||||||||||||||||
| Allowance for credit losses - loans to loans | 1.10 | % | 1.03 | % | 1.04 | % | 1.00 | % | 0.94 | % | 1.10 | % | 0.94 | % | ||||||||||||||||||||||
| Allowance for credit losses - total to loans | 1.22 | 1.16 | 1.18 | 1.12 | 1.05 | 1.22 | 1.05 | |||||||||||||||||||||||||||||
| Net charge-offs to average loans (4) | 0.20 | 0.17 | 0.17 | 0.03 | (0.03 | ) | 0.18 | 0.03 | ||||||||||||||||||||||||||||
| NPAs to total assets | 0.40 | 0.28 | 0.18 | 0.15 | 0.14 | 0.40 | 0.14 | |||||||||||||||||||||||||||||
| AT PERIOD END ($ in millions) | ||||||||||||||||||||||||||||||||||||
| Loans | $ | 17,395 | $ | 17,125 | $ | 15,335 | $ | 14,882 | $ | 14,541 | 20 | $ | 17,395 | $ | 14,541 | 20 | ||||||||||||||||||||
| Investment securities | 5,914 | 5,915 | 6,228 | 6,539 | 6,683 | (12 | ) | 5,914 | 6,683 | (12 | ) | |||||||||||||||||||||||||
| Total assets | 26,120 | 25,872 | 24,009 | 23,688 | 24,213 | 8 | 26,120 | 24,213 | 8 | |||||||||||||||||||||||||||
| Deposits | 22,252 | 22,005 | 19,877 | 20,321 | 20,873 | 7 | 22,252 | 20,873 | 7 | |||||||||||||||||||||||||||
| Shareholders’ equity | 3,106 | 3,078 | 2,701 | 2,635 | 2,651 | 17 | 3,106 | 2,651 | 17 | |||||||||||||||||||||||||||
| Common shares outstanding (thousands) | 115,266 | 115,152 | 106,223 | 106,163 | 106,034 | 9 | 115,266 | 106,034 | 9 | |||||||||||||||||||||||||||
(1) Excludes merger-related and other charges. (2) Net income less preferred stock dividends, divided by average realized common equity, which excludes accumulated other comprehensive income (loss). (3) Excludes effect of acquisition related intangibles and associated amortization. (4) Annualized. (5) Excludes income tax expense and provision for credit losses.
UNITED COMMUNITY BANKS, INC.
Non-GAAP Performance Measures Reconciliation
Selected Financial Information
(in thousands, except per share data)
| 2023 | 2022 | For the Six Months Ended June 30, |
||||||||||||||||||||||||||
| Second Quarter |
First Quarter |
Fourth Quarter |
Third Quarter |
Second Quarter |
2023 | 2022 | ||||||||||||||||||||||
| Noninterest expense reconciliation | ||||||||||||||||||||||||||||
| Noninterest expenses (GAAP) | $ | 132,407 | $ | 139,805 | $ | 117,329 | $ | 112,755 | $ | 120,790 | $ | 272,212 | $ | 240,065 | ||||||||||||||
| Merger-related and other charges | (3,645 | ) | (8,631 | ) | (1,470 | ) | (1,746 | ) | (7,143 | ) | (12,276 | ) | (16,159 | ) | ||||||||||||||
| Noninterest expenses - operating | $ | 128,762 | $ | 131,174 | $ | 115,859 | $ | 111,009 | $ | 113,647 | $ | 259,936 | $ | 223,906 | ||||||||||||||
| Net income reconciliation | ||||||||||||||||||||||||||||
| Net income (GAAP) | $ | 63,288 | $ | 62,300 | $ | 81,450 | $ | 81,161 | $ | 66,842 | $ | 125,588 | $ | 114,861 | ||||||||||||||
| Merger-related and other charges | 3,645 | 8,631 | 1,470 | 1,746 | 7,143 | 12,276 | 16,159 | |||||||||||||||||||||
| Income tax benefit of merger-related and other charges | (820 | ) | (1,955 | ) | (323 | ) | (385 | ) | (1,575 | ) | (2,775 | ) | (3,538 | ) | ||||||||||||||
| Net income - operating | $ | 66,113 | $ | 68,976 | $ | 82,597 | $ | 82,522 | $ | 72,410 | $ | 135,089 | $ | 127,482 | ||||||||||||||
| Net income to pre-tax pre-provision income reconciliation | ||||||||||||||||||||||||||||
| Net income (GAAP) | $ | 63,288 | $ | 62,300 | $ | 81,450 | $ | 81,161 | $ | 66,842 | $ | 125,588 | $ | 114,861 | ||||||||||||||
| Income tax expense | 18,225 | 17,791 | 24,632 | 22,388 | 19,125 | 36,016 | 31,510 | |||||||||||||||||||||
| Provision for credit losses | 22,753 | 21,783 | 19,831 | 15,392 | 5,604 | 44,536 | 28,690 | |||||||||||||||||||||
| Pre-tax pre-provision income | $ | 104,266 | $ | 101,874 | $ | 125,913 | $ | 118,941 | $ | 91,571 | $ | 206,140 | $ | 175,061 | ||||||||||||||
| Diluted income per common share reconciliation | ||||||||||||||||||||||||||||
| Diluted income per common share (GAAP) | $ | 0.53 | $ | 0.52 | $ | 0.74 | $ | 0.74 | $ | 0.61 | $ | 1.05 | $ | 1.04 | ||||||||||||||
| Merger-related and other charges, net of tax | 0.02 | 0.06 | 0.01 | 0.01 | 0.05 | 0.08 | 0.12 | |||||||||||||||||||||
| Diluted income per common share - operating | $ | 0.55 | $ | 0.58 | $ | 0.75 | $ | 0.75 | $ | 0.66 | $ | 1.13 | $ | 1.16 | ||||||||||||||
| Book value per common share reconciliation | ||||||||||||||||||||||||||||
| Book value per common share (GAAP) | $ | 25.98 | $ | 25.76 | $ | 24.38 | $ | 23.78 | $ | 23.96 | $ | 25.98 | $ | 23.96 | ||||||||||||||
| Effect of goodwill and other intangibles | (8.15 | ) | (8.17 | ) | (7.25 | ) | (7.26 | ) | (7.28 | ) | (8.15 | ) | (7.28 | ) | ||||||||||||||
| Tangible book value per common share | $ | 17.83 | $ | 17.59 | $ | 17.13 | $ | 16.52 | $ | 16.68 | $ | 17.83 | $ | 16.68 | ||||||||||||||
| Return on tangible common equity reconciliation | ||||||||||||||||||||||||||||
| Return on common equity (GAAP) | 7.47 | % | 7.34 | % | 10.86 | % | 11.02 | % | 9.31 | % | 7.41 | % | 8.07 | % | ||||||||||||||
| Merger-related and other charges, net of tax | 0.35 | 0.81 | 0.15 | 0.19 | 0.79 | 0.57 | 0.91 | |||||||||||||||||||||
| Return on common equity - operating | 7.82 | 8.15 | 11.01 | 11.21 | 10.10 | 7.98 | 8.98 | |||||||||||||||||||||
| Effect of goodwill and other intangibles | 3.53 | 3.48 | 4.19 | 4.39 | 4.10 | 3.51 | 3.64 | |||||||||||||||||||||
| Return on tangible common equity - operating | 11.35 | % | 11.63 | % | 15.20 | % | 15.60 | % | 14.20 | % | 11.49 | % | 12.62 | % | ||||||||||||||
| Return on assets reconciliation | ||||||||||||||||||||||||||||
| Return on assets (GAAP) | 0.95 | % | 0.95 | % | 1.33 | % | 1.32 | % | 1.08 | % | 0.95 | % | 0.93 | % | ||||||||||||||
| Merger-related and other charges, net of tax | 0.05 | 0.11 | 0.02 | 0.02 | 0.09 | 0.08 | 0.10 | |||||||||||||||||||||
| Return on assets - operating | 1.00 | % | 1.06 | % | 1.35 | % | 1.34 | % | 1.17 | % | 1.03 | % | 1.03 | % | ||||||||||||||
| Return on assets to return on assets- pre-tax pre-provision reconciliation | ||||||||||||||||||||||||||||
| Return on assets (GAAP) | 0.95 | % | 0.95 | % | 1.33 | % | 1.32 | % | 1.08 | % | 0.95 | % | 0.93 | % | ||||||||||||||
| Income tax expense | 0.29 | 0.29 | 0.41 | 0.37 | 0.32 | 0.28 | 0.26 | |||||||||||||||||||||
| Provision for credit losses | 0.35 | 0.34 | 0.33 | 0.25 | 0.09 | 0.35 | 0.24 | |||||||||||||||||||||
| Return on assets - pre-tax, pre-provision | 1.59 | 1.58 | 2.07 | 1.94 | 1.49 | 1.58 | 1.43 | |||||||||||||||||||||
| Merger-related and other charges | 0.06 | 0.13 | 0.02 | 0.03 | 0.11 | 0.10 | 0.13 | |||||||||||||||||||||
| Return on assets - pre-tax pre-provision, excluding merger-related and other charges | 1.65 | % | 1.71 | % | 2.09 | % | 1.97 | % | 1.60 | % | 1.68 | % | 1.56 | % | ||||||||||||||
| Efficiency ratio reconciliation | ||||||||||||||||||||||||||||
| Efficiency ratio (GAAP) | 55.71 | % | 57.20 | % | 47.95 | % | 48.41 | % | 56.58 | % | 56.46 | % | 57.00 | % | ||||||||||||||
| Merger-related and other charges | (1.54 | ) | (3.53 | ) | (0.60 | ) | (0.75 | ) | (3.35 | ) | (2.54 | ) | (3.84 | ) | ||||||||||||||
| Efficiency ratio - operating | 54.17 | % | 53.67 | % | 47.35 | % | 47.66 | % | 53.23 | % | 53.92 | % | 53.16 | % | ||||||||||||||
| Tangible common equity to tangible assets reconciliation | ||||||||||||||||||||||||||||
| Equity to total assets (GAAP) | 11.89 | % | 11.90 | % | 11.25 | % | 11.12 | % | 10.95 | % | 11.89 | % | 10.95 | % | ||||||||||||||
| Effect of goodwill and other intangibles | (3.31 | ) | (3.36 | ) | (2.97 | ) | (3.01 | ) | (2.96 | ) | (3.31 | ) | (2.96 | ) | ||||||||||||||
| Effect of preferred equity | (0.37 | ) | (0.37 | ) | (0.40 | ) | (0.41 | ) | (0.40 | ) | (0.37 | ) | (0.40 | ) | ||||||||||||||
| Tangible common equity to tangible assets | 8.21 | % | 8.17 | % | 7.88 | % | 7.70 | % | 7.59 | % | 8.21 | % | 7.59 | % | ||||||||||||||
UNITED COMMUNITY BANKS, INC.
Financial Highlights
Loan Portfolio Composition at Period-End
| 2023 | 2022 | Linked | Year over | |||||||||||||||||||||||||
| (in millions) | Second Quarter |
First Quarter |
Fourth Quarter |
Third Quarter |
Second Quarter |
Quarter Change |
Year Change |
|||||||||||||||||||||
| LOANS BY CATEGORY | ||||||||||||||||||||||||||||
| Owner occupied commercial RE | $ | 3,111 | $ | 3,141 | $ | 2,735 | $ | 2,700 | $ | 2,681 | $ | (30 | ) | $ | 430 | |||||||||||||
| Income producing commercial RE | 3,670 | 3,611 | 3,262 | 3,299 | 3,273 | 59 | 397 | |||||||||||||||||||||
| Commercial & industrial | 2,550 | 2,442 | 2,252 | 2,238 | 2,253 | 108 | 297 | |||||||||||||||||||||
| Commercial construction | 1,739 | 1,806 | 1,598 | 1,514 | 1,514 | (67 | ) | 225 | ||||||||||||||||||||
| Equipment financing | 1,510 | 1,447 | 1,374 | 1,281 | 1,211 | 63 | 299 | |||||||||||||||||||||
| Total commercial | 12,580 | 12,447 | 11,221 | 11,032 | 10,932 | 133 | 1,648 | |||||||||||||||||||||
| Residential mortgage | 2,905 | 2,756 | 2,355 | 2,149 | 1,997 | 149 | 908 | |||||||||||||||||||||
| Home equity lines of credit | 927 | 930 | 850 | 832 | 801 | (3 | ) | 126 | ||||||||||||||||||||
| Residential construction | 463 | 492 | 443 | 423 | 381 | (29 | ) | 82 | ||||||||||||||||||||
| Manufactured housing | 340 | 326 | 317 | 301 | 287 | 14 | 53 | |||||||||||||||||||||
| Consumer | 180 | 174 | 149 | 145 | 143 | 6 | 37 | |||||||||||||||||||||
| Total loans | $ | 17,395 | $ | 17,125 | $ | 15,335 | $ | 14,882 | $ | 14,541 | $ | 270 | $ | 2,854 | ||||||||||||||
| LOANS BY MARKET | ||||||||||||||||||||||||||||
| Georgia | $ | 4,281 | $ | 4,177 | $ | 4,051 | $ | 4,003 | $ | 3,960 | $ | 104 | $ | 321 | ||||||||||||||
| South Carolina | 2,750 | 2,672 | 2,587 | 2,516 | 2,377 | 78 | 373 | |||||||||||||||||||||
| North Carolina | 2,355 | 2,257 | 2,186 | 2,117 | 2,006 | 98 | 349 | |||||||||||||||||||||
| Tennessee | 2,387 | 2,458 | 2,507 | 2,536 | 2,621 | (71 | ) | (234 | ) | |||||||||||||||||||
| Florida | 1,708 | 1,745 | 1,308 | 1,259 | 1,235 | (37 | ) | 473 | ||||||||||||||||||||
| Alabama | 1,062 | 1,029 | — | — | — | 33 | 1,062 | |||||||||||||||||||||
| Commercial Banking Solutions | 2,852 | 2,787 | 2,696 | 2,451 | 2,342 | 65 | 510 | |||||||||||||||||||||
| Total loans | $ | 17,395 | $ | 17,125 | $ | 15,335 | $ | 14,882 | $ | 14,541 | $ | 270 | $ | 2,854 | ||||||||||||||
UNITED COMMUNITY BANKS, INC.
Financial Highlights
Credit Quality
(in thousands)
| 2023 | 2022 | |||||||||||
| Second Quarter |
First Quarter |
Fourth Quarter |
||||||||||
| NONACCRUAL LOANS | ||||||||||||
| Owner occupied RE | $ | 3,471 | $ | 1,000 | $ | 523 | ||||||
| Income producing RE | 32,542 | 10,603 | 3,885 | |||||||||
| Commercial & industrial | 30,823 | 33,276 | 14,470 | |||||||||
| Commercial construction | 115 | 475 | 133 | |||||||||
| Equipment financing | 8,989 | 5,044 | 5,438 | |||||||||
| Total commercial | 75,940 | 50,398 | 24,449 | |||||||||
| Residential mortgage | 11,419 | 11,280 | 10,919 | |||||||||
| Home equity lines of credit | 2,777 | 2,377 | 1,888 | |||||||||
| Residential construction | 1,682 | 143 | 405 | |||||||||
| Manufactured housing | 10,782 | 8,542 | 6,518 | |||||||||
| Consumer | 19 | 55 | 53 | |||||||||
| Total nonaccrual loans | 102,619 | 72,795 | 44,232 | |||||||||
| OREO and repossessed assets | 1,118 | 608 | 49 | |||||||||
| Total NPAs | $ | 103,737 | $ | 73,403 | $ | 44,281 | ||||||
| 2023 | 2022 | |||||||||||||||||||||||
| Second Quarter | First Quarter | Fourth Quarter | ||||||||||||||||||||||
| (in thousands) | Net Charge- Offs |
Net Charge- Offs to Average Loans (1) |
Net Charge- Offs |
Net Charge- Offs to Average Loans (1) |
Net Charge- Offs |
Net Charge- Offs to Average Loans (1) |
||||||||||||||||||
| NET CHARGE-OFFS (RECOVERIES) BY CATEGORY | ||||||||||||||||||||||||
| Owner occupied RE | $ | (205 | ) | (0.03 | )% | $ | 90 | 0.01 | % | $ | (130 | ) | (0.02 | )% | ||||||||||
| Income producing RE | 1,184 | 0.13 | 2,306 | 0.26 | (113 | ) | (0.01 | ) | ||||||||||||||||
| Commercial & industrial | 2,746 | 0.44 | 225 | 0.04 | 4,577 | 0.81 | ||||||||||||||||||
| Commercial construction | (105 | ) | (0.02 | ) | (37 | ) | (0.01 | ) | (77 | ) | (0.02 | ) | ||||||||||||
| Equipment financing | 2,537 | 0.69 | 3,375 | 0.93 | 1,658 | 0.50 | ||||||||||||||||||
| Total commercial | 6,157 | 0.20 | 5,959 | 0.20 | 5,915 | 0.21 | ||||||||||||||||||
| Residential mortgage | (43 | ) | (0.01 | ) | (87 | ) | (0.01 | ) | (33 | ) | (0.01 | ) | ||||||||||||
| Home equity lines of credit | (59 | ) | (0.03 | ) | 33 | 0.01 | (89 | ) | (0.04 | ) | ||||||||||||||
| Residential construction | 623 | 0.53 | (15 | ) | (0.01 | ) | (23 | ) | (0.02 | ) | ||||||||||||||
| Manufactured housing | 620 | 0.75 | 628 | 0.76 | 246 | 0.32 | ||||||||||||||||||
| Consumer | 1,101 | 2.51 | 566 | 1.37 | 595 | 1.61 | ||||||||||||||||||
| Total | $ | 8,399 | 0.20 | $ | 7,084 | 0.17 | $ | 6,611 | 0.17 | |||||||||||||||
(1) Annualized.
| UNITED COMMUNITY BANKS, INC. |
| Consolidated Balance Sheets (Unaudited) |
| (in thousands, except share and per share data) | June 30, 2023 |
December 31, 2022 |
||||||
| ASSETS | ||||||||
| Cash and due from banks | $ | 267,075 | $ | 195,771 | ||||
| Interest-bearing deposits in banks | 443,661 | 316,082 | ||||||
| Federal funds and other short-term investments | — | 135,000 | ||||||
| Cash and cash equivalents | 710,736 | 646,853 | ||||||
| Debt securities available-for-sale | 3,359,989 | 3,614,333 | ||||||
| Debt securities held-to-maturity (fair value $2,132,396 and $2,191,073, respectively) | 2,553,835 | 2,613,648 | ||||||
| Loans held for sale | 27,104 | 13,600 | ||||||
| Loans and leases held for investment | 17,394,845 | 15,334,627 | ||||||
| Less allowance for credit losses - loans and leases | (190,705 | ) | (159,357 | ) | ||||
| Loans and leases, net | 17,204,140 | 15,175,270 | ||||||
| Premises and equipment, net | 353,317 | 298,456 | ||||||
| Bank owned life insurance | 342,966 | 299,297 | ||||||
| Goodwill and other intangible assets, net | 957,823 | 779,248 | ||||||
| Other assets | 610,287 | 568,179 | ||||||
| Total assets | $ | 26,120,197 | $ | 24,008,884 | ||||
| LIABILITIES AND SHAREHOLDERS' EQUITY | ||||||||
| Liabilities: | ||||||||
| Deposits: | ||||||||
| Noninterest-bearing demand | $ | 6,970,668 | $ | 7,643,081 | ||||
| NOW and interest-bearing demand | 5,076,371 | 4,350,878 | ||||||
| Money market | 5,036,665 | 4,510,680 | ||||||
| Savings | 1,261,138 | 1,456,337 | ||||||
| Time | 3,265,230 | 1,781,482 | ||||||
| Brokered | 641,916 | 134,049 | ||||||
| Total deposits | 22,251,988 | 19,876,507 | ||||||
| Short-term borrowings | — | 158,933 | ||||||
| Federal Home Loan Bank advances | — | 550,000 | ||||||
| Long-term debt | 324,754 | 324,663 | ||||||
| Accrued expenses and other liabilities | 437,864 | 398,107 | ||||||
| Total liabilities | 23,014,606 | 21,308,210 | ||||||
| Shareholders' equity: | ||||||||
| Preferred stock; $1 par value; 10,000,000 shares authorized; 3,989 and 4,000 shares Series I issued and outstanding, respectively, $25,000 per share liquidation preference | 96,165 | 96,422 | ||||||
| Common stock, $1 par value; 200,000,000 shares authorized, 115,265,912 and 106,222,758 shares issued and outstanding, respectively | 115,266 | 106,223 | ||||||
| Common stock issuable; 587,775 and 607,128 shares, respectively | 12,228 | 12,307 | ||||||
| Capital surplus | 2,610,523 | 2,306,366 | ||||||
| Retained earnings | 577,316 | 508,844 | ||||||
| Accumulated other comprehensive loss | (305,907 | ) | (329,488 | ) | ||||
| Total shareholders' equity | 3,105,591 | 2,700,674 | ||||||
| Total liabilities and shareholders' equity | $ | 26,120,197 | $ | 24,008,884 | ||||
| UNITED COMMUNITY BANKS, INC. |
| Consolidated Statements of Income (Unaudited) |
| Three Months Ended June 30, |
Six Months Ended June 30, |
|||||||||||||||
| (in thousands, except per share data) | 2023 | 2022 | 2023 | 2022 | ||||||||||||
| Interest revenue: | ||||||||||||||||
| Loans, including fees | $ | 250,484 | $ | 155,266 | $ | 486,915 | $ | 302,007 | ||||||||
| Investment securities, including tax exempt of $1,731, $2,539, $3,841 and $5,194, respectively | 41,060 | 30,425 | 81,046 | 54,090 | ||||||||||||
| Deposits in banks and short-term investments | 4,231 | 1,687 | 7,301 | 2,340 | ||||||||||||
| Total interest revenue | 295,775 | 187,378 | 575,262 | 358,437 | ||||||||||||
| Interest expense: | ||||||||||||||||
| Deposits: | ||||||||||||||||
| NOW and interest-bearing demand | 27,597 | 2,163 | 45,196 | 3,632 | ||||||||||||
| Money market | 33,480 | 1,515 | 58,546 | 2,527 | ||||||||||||
| Savings | 702 | 87 | 1,240 | 159 | ||||||||||||
| Time | 27,438 | 537 | 42,096 | 1,115 | ||||||||||||
| Deposits | 89,217 | 4,302 | 147,078 | 7,433 | ||||||||||||
| Short-term borrowings | 1,849 | — | 2,997 | — | ||||||||||||
| Federal Home Loan Bank advances | 649 | — | 5,761 | — | ||||||||||||
| Long-term debt | 3,774 | 4,173 | 7,670 | 8,309 | ||||||||||||
| Total interest expense | 95,489 | 8,475 | 163,506 | 15,742 | ||||||||||||
| Net interest revenue | 200,286 | 178,903 | 411,756 | 342,695 | ||||||||||||
| Provision for credit losses | 22,753 | 5,604 | 44,536 | 28,690 | ||||||||||||
| Net interest revenue after provision for credit losses | 177,533 | 173,299 | 367,220 | 314,005 | ||||||||||||
| Noninterest income: | ||||||||||||||||
| Service charges and fees | 9,777 | 10,005 | 18,476 | 19,075 | ||||||||||||
| Mortgage loan gains and other related fees | 6,584 | 6,971 | 11,105 | 23,123 | ||||||||||||
| Wealth management fees | 5,600 | 5,985 | 11,324 | 11,880 | ||||||||||||
| Gains from sales of other loans, net | 2,305 | 3,800 | 4,221 | 6,998 | ||||||||||||
| Lending and loan servicing fees | 2,978 | 1,586 | 6,994 | 4,572 | ||||||||||||
| Securities losses, net | — | 46 | (1,644 | ) | (3,688 | ) | ||||||||||
| Other | 9,143 | 5,065 | 16,120 | 10,471 | ||||||||||||
| Total noninterest income | 36,387 | 33,458 | 66,596 | 72,431 | ||||||||||||
| Total revenue | 213,920 | 206,757 | 433,816 | 386,436 | ||||||||||||
| Noninterest expenses: | ||||||||||||||||
| Salaries and employee benefits | 76,250 | 69,233 | 154,948 | 140,239 | ||||||||||||
| Communications and equipment | 10,744 | 9,675 | 20,752 | 18,923 | ||||||||||||
| Occupancy | 10,194 | 8,865 | 20,083 | 18,243 | ||||||||||||
| Advertising and public relations | 2,314 | 2,300 | 4,663 | 3,788 | ||||||||||||
| Postage, printing and supplies | 2,382 | 1,999 | 4,919 | 4,118 | ||||||||||||
| Professional fees | 6,592 | 5,402 | 12,664 | 9,849 | ||||||||||||
| Lending and loan servicing expense | 2,530 | 3,047 | 4,849 | 5,413 | ||||||||||||
| Outside services - electronic banking | 2,660 | 2,947 | 6,085 | 5,470 | ||||||||||||
| FDIC assessments and other regulatory charges | 4,142 | 2,267 | 8,143 | 4,440 | ||||||||||||
| Amortization of intangibles | 3,421 | 1,736 | 6,949 | 3,529 | ||||||||||||
| Merger-related and other charges | 3,645 | 7,143 | 12,276 | 16,159 | ||||||||||||
| Other | 7,533 | 6,176 | 15,881 | 9,894 | ||||||||||||
| Total noninterest expenses | 132,407 | 120,790 | 272,212 | 240,065 | ||||||||||||
| Income before income taxes | 81,513 | 85,967 | 161,604 | 146,371 | ||||||||||||
| Income tax expense | 18,225 | 19,125 | 36,016 | 31,510 | ||||||||||||
| Net income | 63,288 | 66,842 | 125,588 | 114,861 | ||||||||||||
| Preferred stock dividends | 1,719 | 1,719 | 3,438 | 3,438 | ||||||||||||
| Earnings allocated to participating securities | 342 | 362 | 680 | 596 | ||||||||||||
| Net income available to common shareholders | $ | 61,227 | $ | 64,761 | $ | 121,470 | $ | 110,827 | ||||||||
| Net income per common share: | ||||||||||||||||
| Basic | $ | 0.53 | $ | 0.61 | $ | 1.05 | $ | 1.04 | ||||||||
| Diluted | 0.53 | 0.61 | 1.05 | 1.04 | ||||||||||||
| Weighted average common shares outstanding: | ||||||||||||||||
| Basic | 115,774 | 106,610 | 115,614 | 106,580 | ||||||||||||
| Diluted | 115,869 | 106,716 | 115,795 | 106,697 | ||||||||||||
| Average Consolidated Balance Sheets and Net Interest Analysis |
| For the Three Months Ended June 30, |
| 2023 | 2022 | |||||||||||||||||||||||
| (dollars in thousands, fully taxable equivalent (FTE)) | Average Balance |
Interest | Average Rate |
Average Balance |
Interest | Average Rate |
||||||||||||||||||
| Assets: | ||||||||||||||||||||||||
| Interest-earning assets: | ||||||||||||||||||||||||
| Loans, net of unearned income (FTE) (1)(2) | $ | 17,166,129 | $ | 250,472 | 5.85 | % | $ | 14,382,324 | $ | 155,184 | 4.33 | % | ||||||||||||
| Taxable securities (3) | 5,956,193 | 39,329 | 2.64 | 6,436,992 | 27,886 | 1.73 | ||||||||||||||||||
| Tax-exempt securities (FTE) (1)(3) | 369,364 | 2,323 | 2.52 | 490,659 | 3,410 | 2.78 | ||||||||||||||||||
| Federal funds sold and other interest-earning assets | 461,022 | 4,658 | 4.05 | 1,302,935 | 2,066 | 0.64 | ||||||||||||||||||
| Total interest-earning assets (FTE) | 23,952,708 | 296,782 | 4.97 | 22,612,910 | 188,546 | 3.34 | ||||||||||||||||||
| Noninterest-earning assets: | ||||||||||||||||||||||||
| Allowance for credit losses | (181,769 | ) | (135,392 | ) | ||||||||||||||||||||
| Cash and due from banks | 251,691 | 203,291 | ||||||||||||||||||||||
| Premises and equipment | 345,771 | 286,417 | ||||||||||||||||||||||
| Other assets (3) | 1,500,827 | 1,286,107 | ||||||||||||||||||||||
| Total assets | $ | 25,869,228 | $ | 24,253,333 | ||||||||||||||||||||
| Liabilities and Shareholders' Equity: | ||||||||||||||||||||||||
| Interest-bearing liabilities: | ||||||||||||||||||||||||
| Interest-bearing deposits: | ||||||||||||||||||||||||
| NOW and interest-bearing demand | $ | 4,879,591 | 27,597 | 2.27 | $ | 4,561,162 | 2,163 | 0.19 | ||||||||||||||||
| Money market | 5,197,789 | 33,480 | 2.58 | 5,019,420 | 1,515 | 0.12 | ||||||||||||||||||
| Savings | 1,306,394 | 702 | 0.22 | 1,496,414 | 87 | 0.02 | ||||||||||||||||||
| Time | 2,976,482 | 22,471 | 3.03 | 1,671,632 | 491 | 0.12 | ||||||||||||||||||
| Brokered time deposits | 423,536 | 4,967 | 4.70 | 65,081 | 46 | 0.28 | ||||||||||||||||||
| Total interest-bearing deposits | 14,783,792 | 89,217 | 2.42 | 12,813,709 | 4,302 | 0.13 | ||||||||||||||||||
| Federal funds purchased and other borrowings | 145,233 | 1,849 | 5.11 | 66 | — | — | ||||||||||||||||||
| Federal Home Loan Bank advances | 50,989 | 649 | 5.11 | — | — | — | ||||||||||||||||||
| Long-term debt | 324,740 | 3,774 | 4.66 | 324,301 | 4,173 | 5.16 | ||||||||||||||||||
| Total borrowed funds | 520,962 | 6,272 | 4.83 | 324,367 | 4,173 | 5.16 | ||||||||||||||||||
| Total interest-bearing liabilities | 15,304,754 | 95,489 | 2.50 | 13,138,076 | 8,475 | 0.26 | ||||||||||||||||||
| Noninterest-bearing liabilities: | ||||||||||||||||||||||||
| Noninterest-bearing deposits | 7,072,760 | 8,025,947 | ||||||||||||||||||||||
| Other liabilities | 385,324 | 397,890 | ||||||||||||||||||||||
| Total liabilities | 22,762,838 | 21,561,913 | ||||||||||||||||||||||
| Shareholders' equity | 3,106,390 | 2,691,420 | ||||||||||||||||||||||
| Total liabilities and shareholders' equity | $ | 25,869,228 | $ | 24,253,333 | ||||||||||||||||||||
| Net interest revenue (FTE) | $ | 201,293 | $ | 180,071 | ||||||||||||||||||||
| Net interest-rate spread (FTE) | 2.47 | % | 3.08 | % | ||||||||||||||||||||
| Net interest margin (FTE) (4) | 3.37 | % | 3.19 | % | ||||||||||||||||||||
| (1) | Interest revenue on tax-exempt securities and loans has been increased to reflect comparable interest on taxable securities and loans. The rate used was 26%, reflecting the statutory federal income tax rate and the federal tax adjusted state income tax rate. |
| (2) | Included in the average balance of loans outstanding are loans on which the accrual of interest has been discontinued and loans that are held for sale. |
| (3) | Unrealized gains and losses on securities, including those related to the transfer from AFS to HTM, have been reclassified to other assets. Pretax unrealized losses of $389 million in 2023 and pretax unrealized losses of $271 million in 2022 are included in other assets for purposes of this presentation. |
| (4) | Net interest margin is taxable equivalent net interest revenue divided by average interest-earning assets. |
| Average Consolidated Balance Sheets and Net Interest Analysis |
| For the Six Months Ended June 30, |
| 2023 | 2022 | |||||||||||||||||||||||
| (dollars in thousands, fully taxable equivalent (FTE)) | Average Balance |
Interest | Average Rate |
Average Balance |
Interest | Average Rate |
||||||||||||||||||
| Assets: | ||||||||||||||||||||||||
| Interest-earning assets: | ||||||||||||||||||||||||
| Loans, net of unearned income (FTE) (1)(2) | $ | 17,032,493 | $ | 487,002 | 5.77 | % | $ | 14,308,585 | $ | 301,821 | 4.25 | % | ||||||||||||
| Taxable securities (3) | 6,007,471 | 77,205 | 2.57 | 6,142,723 | 48,896 | 1.59 | ||||||||||||||||||
| Tax-exempt securities (FTE) (1)(3) | 395,827 | 5,157 | 2.61 | 500,750 | 6,976 | 2.79 | ||||||||||||||||||
| Federal funds sold and other interest-earning assets | 466,642 | 8,010 | 3.46 | 1,604,995 | 3,086 | 0.39 | ||||||||||||||||||
| Total interest-earning assets (FTE) | 23,902,433 | 577,374 | 4.87 | 22,557,053 | 360,779 | 3.22 | ||||||||||||||||||
| Non-interest-earning assets: | ||||||||||||||||||||||||
| Allowance for loan losses | (174,716 | ) | (124,384 | ) | ||||||||||||||||||||
| Cash and due from banks | 261,397 | 184,751 | ||||||||||||||||||||||
| Premises and equipment | 337,499 | 281,842 | ||||||||||||||||||||||
| Other assets (3) | 1,492,926 | 1,329,359 | ||||||||||||||||||||||
| Total assets | $ | 25,819,539 | $ | 24,228,621 | ||||||||||||||||||||
| Liabilities and Shareholders' Equity: | ||||||||||||||||||||||||
| Interest-bearing liabilities: | ||||||||||||||||||||||||
| Interest-bearing deposits: | ||||||||||||||||||||||||
| NOW and interest-bearing demand | $ | 4,690,798 | 45,196 | 1.94 | $ | 4,613,838 | 3,632 | 0.16 | ||||||||||||||||
| Money market | 5,210,457 | 58,546 | 2.27 | 5,064,866 | 2,527 | 0.10 | ||||||||||||||||||
| Savings | 1,361,357 | 1,240 | 0.18 | 1,466,812 | 159 | 0.02 | ||||||||||||||||||
| Time | 2,664,269 | 34,784 | 2.63 | 1,715,022 | 1,025 | 0.12 | ||||||||||||||||||
| Brokered time deposits | 316,470 | 7,312 | 4.66 | 72,048 | 90 | 0.25 | ||||||||||||||||||
| Total interest-bearing deposits | 14,243,351 | 147,078 | 2.08 | 12,932,586 | 7,433 | 0.12 | ||||||||||||||||||
| Federal funds purchased and other borrowings | 126,697 | 2,997 | 4.77 | 337 | — | — | ||||||||||||||||||
| Federal Home Loan Bank advances | 250,912 | 5,761 | 4.63 | — | — | — | ||||||||||||||||||
| Long-term debt | 324,721 | 7,670 | 4.76 | 321,663 | 8,309 | 5.21 | ||||||||||||||||||
| Total borrowed funds | 702,330 | 16,428 | 4.72 | 322,000 | 8,309 | 5.20 | ||||||||||||||||||
| Total interest-bearing liabilities | 14,945,681 | 163,506 | 2.21 | 13,254,586 | 15,742 | 0.24 | ||||||||||||||||||
| Noninterest-bearing liabilities: | ||||||||||||||||||||||||
| Noninterest-bearing deposits | 7,383,575 | 7,847,284 | ||||||||||||||||||||||
| Other liabilities | 371,422 | 388,162 | ||||||||||||||||||||||
| Total liabilities | 22,700,678 | 21,490,032 | ||||||||||||||||||||||
| Shareholders' equity | 3,118,861 | 2,738,589 | ||||||||||||||||||||||
| Total liabilities and shareholders' equity | $ | 25,819,539 | $ | 24,228,621 | ||||||||||||||||||||
| Net interest revenue (FTE) | $ | 413,868 | $ | 345,037 | ||||||||||||||||||||
| Net interest-rate spread (FTE) | 2.66 | % | 2.98 | % | ||||||||||||||||||||
| Net interest margin (FTE) (4) | 3.49 | % | 3.08 | % | ||||||||||||||||||||
| (1) | Interest revenue on tax-exempt securities and loans has been increased to reflect comparable interest on taxable securities and loans. The rate used was 26%, reflecting the statutory federal income tax rate and the federal tax adjusted state income tax rate. |
| (2) | Included in the average balance of loans outstanding are loans on which the accrual of interest has been discontinued and loans that are held for sale. |
| (3) | Unrealized gains and losses on securities, including those related to the transfer from AFS to HTM, have been reclassified to other assets. Pretax unrealized losses of $404 million in 2023 and pretax unrealized losses of $175 million in 2022, respectively, are included in other assets for purposes of this presentation. |
| (4) | Net interest margin is taxable equivalent net-interest revenue divided by average interest-earning assets. |
About United Community Banks, Inc.
United Community Banks, Inc. (NASDAQ: UCBI) is a top 100 U.S. financial institution with $26.1 billion in assets as of June 30, 2023, and through its subsidiaries, provides a full range of banking, wealth management and mortgage services. United Community Banks, Inc. is the financial holding company for United Community Bank (“United Community”) which has 212 offices across Alabama, Florida, Georgia, North Carolina, South Carolina, and Tennessee, as well as a national SBA lending franchise and a national equipment financing subsidiary. United Community is committed to improving the financial health and well-being of its customers and ultimately the communities it serves. Among other awards, United Community is a nine-time winner of the J.D. Power award that ranked the bank #1 in customer satisfaction with consumer banking in the Southeast and was recognized in 2023 by Forbes as one of the World’s Best Banks and one of America’s Best Banks. The bank is also a multi-award recipient of the Greenwich Excellence Awards, including the 2022 awards for Small Business Banking-Likelihood to Recommend (South) and Overall Satisfaction (South), and was named one of the "Best Banks to Work For" by American Banker in 2022 for the sixth consecutive year. Additional information about United can be found at www.ucbi.com.
Non-GAAP Financial Measures
This press release, including the accompanying financial statement tables, contains financial information determined by methods other than in accordance with generally accepted accounting principles, or GAAP. This financial information includes certain operating performance measures, which exclude merger-related and other charges that are not considered part of recurring operations, such as “operating net income,” “pre-tax, pre-provision income,” “operating net income per diluted common share,” “operating earnings per share,” “tangible book value per common share,” “operating return on common equity,” “operating return on tangible common equity,” “operating return on assets,” “return on assets - pre-tax, pre-provision, excluding merger-related and other charges,” “return on assets - pre-tax, pre-provision,” “operating efficiency ratio,” and “tangible common equity to tangible assets.” These non-GAAP measures are included because United believes they may provide useful supplemental information for evaluating United’s underlying performance trends. These measures should be viewed in addition to, and not as an alternative to or substitute for, measures determined in accordance with GAAP, and are not necessarily comparable to non-GAAP measures that may be presented by other companies. To the extent applicable, reconciliations of these non-GAAP measures to the most directly comparable measures as reported in accordance with GAAP are included with the accompanying financial statement tables.
Caution About Forward-Looking Statements
This press release contains “forward-looking statements” within the meaning of Section 27A of the Securities Act of 1933, as amended, and Section 21E of the Securities Exchange Act of 1934, as amended. In general, forward-looking statements usually may be identified through use of words such as “may,” “believe,” “expect,” “anticipate,” “intend,” “will,” “should,” “plan,” “estimate,” “predict,” “continue” and “potential” or the negative of these terms or other comparable terminology, and include statements related to potential benefits of the First Miami merger, and the strength of our pipelines and their ability to support business growth across our markets and our belief that our high-quality balance sheet and business mix will support strong performance regardless of future economic conditions. Forward-looking statements are not historical facts and represent management’s beliefs, based upon information available at the time the statements are made, with regard to the matters addressed; they are not guarantees of future performance. Actual results may prove to be materially different from the results expressed or implied by the forward-looking statements. Forward-looking statements are subject to numerous assumptions, risks and uncertainties that change over time and could cause actual results or financial condition to differ materially from those expressed in or implied by such statements.
Factors that could cause or contribute to such differences include, but are not limited to (1) the risk that the cost savings and any revenue synergies from the merger may not be realized or take longer than anticipated to be realized, (2) disruption of customer, supplier, employee or other business partner relationships as a result of the merger, (3) reputational risk and the reaction of each of the companies’ customers, suppliers, employees or other business partners to the merger, (4) the risks relating to the integration of First Miami’s operations into the operations of United, including the risk that such integration will be materially delayed or will be more costly or difficult than expected, (5) the risks associated with United’s pursuit of future acquisitions, (6) the risk associated with expansion into new geographic or product markets, (7) the dilution caused by United’s issuance of additional shares of its common stock in the merger, and (8) general competitive, economic, political and market conditions. Further information regarding additional factors which could affect the forward-looking statements contained in this press release can be found in the cautionary language included under the headings “Cautionary Note Regarding Forward-Looking Statements” and “Risk Factors” in United’s Annual Report on Form 10-K for the year ended December 31, 2022, and other documents subsequently filed by United with the United States Securities and Exchange Commission (“SEC”).
Many of these factors are beyond United’s ability to control or predict. If one or more events related to these or other risks or uncertainties materialize, or if the underlying assumptions prove to be incorrect, actual results may differ materially from the forward-looking statements. Accordingly, shareholders and investors should not place undue reliance on any such forward-looking statements. Any forward-looking statement speaks only as of the date of this communication, and United undertakes no obligation to update or revise any forward-looking statements, whether as a result of new information, future events or otherwise, except as required by law. New risks and uncertainties may emerge from time to time, and it is not possible for United to predict their occurrence or how they will affect United.
United qualifies all forward-looking statements by these cautionary statements.
# # #
Exhibit 99.2

Member FDIC. © 2023 United Community Bank | ucbi.com 2 Q23 Investor Presentation July 18, 2023

Disclosures 2 CAUTIONARY STATEMENT This communication contains “forward - looking statements” within the meaning of Section 27 A of the Securities Act of 1933 , as amended, and Section 21 E of the Securities Exchange Act of 1934 , as amended . In general, forward - looking statements usually may be identified through use of words such as “may,” “believe,” “expect,” “anticipate,” “intend,” “will,” “should,” “plan,” “estimate,” “predict,” “continue” and “potential” or the negative of these terms or other comparable terminology, and include statements related to potential benefits of the First Miami merger, and the strength of our pipelines and their ability to support business growth across our markets and our belief that our high - quality balance sheet and business mix will support strong performance regardless of future economic conditions . Forward - looking statements are not historical facts and represent management’s beliefs, based upon information available at the time the statements are made, with regard to the matters addressed; they are not guarantees of future performance . Actual results may prove to be materially different from the results expressed or implied by the forward - looking statements . Forward - looking statements are subject to numerous assumptions, risks and uncertainties that change over time and could cause actual results or financial condition to differ materially from those expressed in or implied by such statements . Factors that could cause or contribute to such differences include, but are not limited to ( 1 ) the risk that the cost savings from the merger may not be realized or take longer than anticipated to be realized, ( 2 ) disruption from the merger with customer, supplier, employee or other business partner relationships, ( 3 ) reputational risk and the reaction of each of the companies’ customers, suppliers, employees or other business partners to the merger, ( 4 ) the risks relating to the integration of FMIA’s operations into the operations of United, including the risk that such integration will be materially delayed or will be more costly or difficult than expected, ( 5 ) the risks associated with United’s pursuit of future acquisitions, ( 6 ) the risk associated with expansion into new geographic or product markets, ( 7 ) the dilution caused by United’s issuance of additional shares of its common stock in the merger, and ( 8 ) general competitive, economic, political and market conditions . Further information regarding additional factors which could affect the forward - looking statements can be found in the cautionary language included under the headings “Cautionary Note Regarding Forward - Looking Statements” and “Risk Factors” in United’s Annual Report on Form 10 - K for the year ended December 31 , 2022 , and other documents subsequently filed by United with the SEC . Many of these factors are beyond United’s ability to control or predict . If one or more events related to these or other risks or uncertainties materialize, or if the underlying assumptions prove to be incorrect, actual results may differ materially from the forward - looking statements . Accordingly, shareholders and investors should not place undue reliance on any such forward - looking statements . Any forward - looking statement speaks only as of the date of this communication, and United undertakes no obligation to update or revise any forward - looking statements, whether as a result of new information, future events or otherwise, except as required by law . New risks and uncertainties may emerge from time to time, and it is not possible for United to predict their occurrence or how they will affect United . United qualifies all forward - looking statements by these cautionary statements .

Disclosures 3 NON - GAAP MEASURES This Investor Presentation includes financial information determined by methods other than in accordance with generally accepted accounting principles (“GAAP”) . This financial information includes certain operating performance measures, which exclude merger - related and other charges that are not considered part of recurring operations . Such measures include : “Earnings per share – operating,” “Diluted earnings per share – operating,” “Tangible book value per share,” “Return on common equity – operating,” “Return on tangible common equity – operating,” “Return on assets – operating,” “Return on assets – pre - tax pre - provision, excluding merger - related and other charges,” “Efficiency ratio – operating,” “Expenses – operating,” and “Tangible common equity to tangible assets . ” Management has included these non - GAAP measures because it believes these measures may provide useful supplemental information for evaluating United’s underlying performance trends . Further, management uses these measures in managing and evaluating United’s business and intends to refer to them in discussions about United’s operations and performance . Operating performance measures should be viewed in addition to, and not as an alternative to or substitute for, measures determined in accordance with GAAP, and are not necessarily comparable to non - GAAP measures that may be presented by other companies . To the extent applicable, reconciliations of these non - GAAP measures to the most directly comparable GAAP measures can be found in the ‘Non - GAAP Reconciliation Tables’ included in the exhibits to this Presentation .

212* BANKING OFFICES ACROSS THE SOUTHEAST Nine - time winner of the J.D. Power award that ranked us #1 IN CUSTOMER SATISFACTION with Consumer Banking in the Southeast AMERICA’S MOST TRUSTWORTHY COMPANIES in 2023 and #2 in the banking industry - Newsweek $0.23 QUARTERLY DIVIDEND – UP 10% YOY WORLD’S BEST BANKS in 2023 f or four of the last five years – Forbes United Community Banks, Inc. $26.1 BILLION IN TOTAL ASSETS $4.9* BILLION IN AUA $22.3 BILLION IN TOTAL DEPOSITS BEST BANKS TO WORK FOR in 2022 for the sixth consecutive year – American Banker 4 Premier Southeast Regional Bank – Committed to Service Since 1950 x Metro - focused branch network with locations in the fastest - growing MSAs in the Southeast x 204* branches, 8 LPOs, and 5 MLOs across six Southeast states; Top 10 market share in GA and SC Extended Navitas and SBA Markets $17.4 BILLION IN TOTAL LOANS Company Overview 12.7% TIER 1 RBC AMERICA’S BEST BANKS in 2023 f or the tenth consecutive year – Forbes x Navitas subsidiary is a technology - enabled, small - ticket, essential - use commercial equipment finance provider x SBA business has both in - footprint and national business (4 specific verticals) UCBI Banking Offices Note: See glossary located at the end of this presentation for reference on certain acronyms *Pro forma with First National Bank of South Miami; 2Q23 AUA of $308 million Regional Full Service Branch Network National Navitas and SBA Markets $23.96 $25.76 $25.98 $16.68 $17.59 $17.83 2Q22 1Q23 2Q23 Book Value Per Share GAAP Tangible 4.5% Annualized 2Q EOP deposit growth 7.47% Return on common equity – GAAP 11.35% Return on tangible common equity – operating (1) Other 2Q notable items: $1.6 mm GOS from commercial insurance business $1.4 mm MSR write - up $0.53 Diluted earnings per share – GAAP $0.55 Diluted earnings per share – operating (1) 0.95% Return on average assets – GAAP 1.00% Return on average assets – operating (1) 1.65% PTPP return on average assets – operating (1) 1.64% Cost of deposits 31% DDA / Total Deposits 2Q23 Highlights (1) See non - GAAP reconciliation table slides in the Appendix for a reconciliation of operating performance measures to GAAP performance $0.61 $0.52 $0.53 $0.66 $0.58 $0.55 2Q22 1Q23 2Q23 Diluted Earnings Per Share GAAP Operating (1) 1.08% 0.95% 0.95% 1.17% 1.06% 1.00% 2Q22 1Q23 2Q23 Return on Average Assets GAAP Operating 1.49% 1.58% 1.59% 1.60% 1.71% 1.65% 2Q22 1Q23 2Q23 PTPP Return on Average Assets PTPP Operating PTPP (1) (1) 6.3% Annualized 2Q EOP core loan growth 55.7% Efficiency ratio – GAAP 54.2% Efficiency ratio – operating (1) 5 (1)

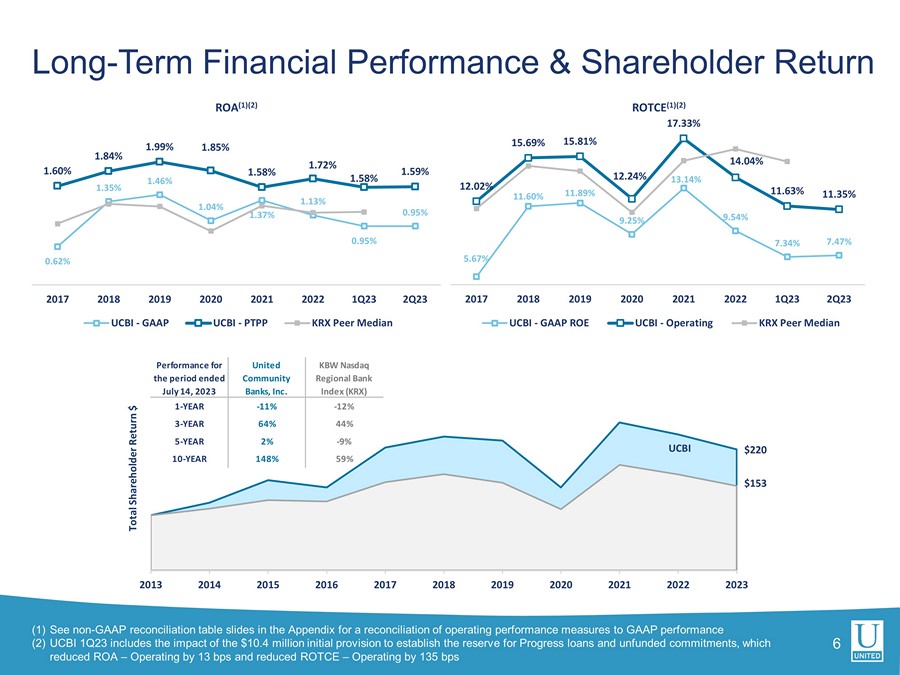
6 (1) See non - GAAP reconciliation table slides in the Appendix for a reconciliation of operating performance measures to GAAP performa nce (2) UCBI 1Q23 includes the impact of the $10.4 million initial provision to establish the reserve for Progress loans and unfunded co mmitments, which reduced ROA – Operating by 13 bps and reduced ROTCE – Operating by 135 bps Long - Term Financial Performance & Shareholder Return 0.62% 1.35% 1.46% 1.04% 1.37% 1.13% 0.95% 0.95% 1.60% 1.84% 1.99% 1.85% 1.58% 1.72% 1.58% 1.59% 2017 2018 2019 2020 2021 2022 1Q23 2Q23 ROA (1)(2) UCBI - GAAP UCBI - PTPP KRX Peer Median 5.67% 11.60% 11.89% 9.25% 13.14% 9.54% 7.34% 7.47% 12.02% 15.69% 15.81% 12.24% 17.33% 14.04% 11.63% 11.35% 2017 2018 2019 2020 2021 2022 1Q23 2Q23 ROTCE (1)(2) UCBI - GAAP ROE UCBI - Operating KRX Peer Median $220 $153 2013 2014 2015 2016 2017 2018 2019 2020 2021 2022 2023 Total Shareholder Return $ UCBI Performance for the period ended July 14, 2023 United Community Banks, Inc.

KBW Nasdaq Regional Bank Index (KRX) 1-YEAR -11% -12% 3-YEAR 64% 44% 5-YEAR 2% -9% 10-YEAR 148% 59% 4.7% 2.1% 12.7% 13.4% 1 2 UCBI MSA Presence 7 (1) Includes MSAs with a population greater than 1,000,000 (2) Includes MSAs with a population between 200,000 and 1,000,000 (3) Market Rank and (%) of Total Deposits pro forma for recently completed acquisition of Progress Financial Corporation Projected Population Growth (3) (2023 - 2028) Projected Household Income Growth (3) (2023 - 2028) National Avg. National Avg. Footprint Focused on High - Growth MSAs in Southeast Fastest Growing UCBI (3) ’23 – ’28 ’23 – ’28 ’22 Total Major Southeast Market (%) of Total Proj. Pop. Proj. HHI. Deposits MSAs (1) Rank Deposits Growth % Growth % ($M) 1) Raleigh, NC 11 3.67% 7.40% 11.77% 54,911 2) Jacksonville, FL 23 0.41% 6.89% 14.35% 103,192 3) Orlando, FL 15 3.33% 6.35% 10.63% 75,966 4) Nashville, TN 12 6.25% 6.12% 12.44% 92,625 5) Charlotte, NC 14 2.39% 5.80% 14.66% 336,500 6) Tampa, FL 43 0.17% 5.19% 11.68% 92,275 7) Atlanta, GA 9 20.74% 4.68% 14.16% 237,455 8) Richmond, VA -- -- 3.88% 12.78% 142,812 9) Washington DC -- -- 2.72% 11.66% 297,120 10) Virginia Beach, VA -- -- 2.25% 14.75% 35,868 11) Miami, FL 31 5.33% 1.95% 10.76% 352,009 Fastest Growing UCBI (3) ’23 – ’28 ’23 – ’28 ’22 Total Mid-Size Southeast Market (%) of Total Proj. Pop. Proj. HHI. Deposits MSAs (2) Rank Deposits Growth % Growth % ($M) 1) Myrtle Beach, SC 12 2.01% 9.38% 12.44% 13,698 2) Winter Haven, FL -- -- 9.37% 9.14% 11,738 3) Fort Myers, FL -- -- 8.93% 11.31% 23,119 4) Daphne, AL 25 0.06% 8.00% 8.53% 6,795 5) Sarasota, FL 32 0.26% 7.73% 12.11% 31,735 6) Port St.
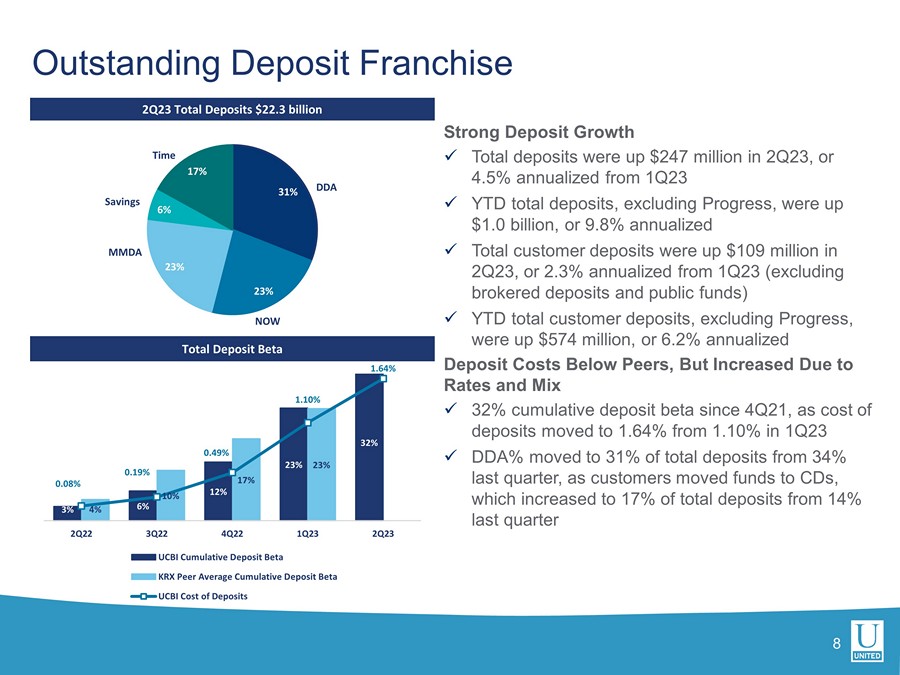
Lucie, FL 14 0.11% 7.53% 11.74% 13,322 7) Fayetteville, AR -- -- 6.99% 10.18% 17,477 8) Naples, FL 31 0.06% 6.83% 8.60% 22,814 9) Daytona Beach, FL -- -- 6.56% 10.27% 15,311 10) Hilton Head Island, SC 17 0.16% 6.33% 15.75% 7,121 11) Charleston, SC 15 1.18% 6.32% 14.65% 22,732 12) Destin, FL 12 1.00% 6.21% 13.20% 8,749 13) Clarksville, TN 7 1.51% 6.16% 10.22% 5,576 14) Ocala, FL -- -- 6.06% 16.04% 8,024 15) Spartanburg, SC 5 1.31% 6.01% 12.32% 6,180 16) Huntsville, AL 8 2.86% 5.93% 16.50% 11,727 17) Melbourne, FL 17 0.03% 5.29% 11.06% 13,211 18) Gainesville, GA 3 3.06% 5.20% 20.84% 6,040 19) Savannah, GA 8 1.31% 5.16% 9.66% 10,221 20) Wilmington, NC 17 0.23% 5.02% 12.29% 17,215 Strong Deposit Growth x Total deposits were up $247 million in 2Q23, or 4.5% annualized from 1Q23 x YTD total deposits, excluding Progress, were up $1.0 billion, or 9.8% annualized x Total customer deposits were up $109 million in 2Q23, or 2.3% annualized from 1Q23 (excluding brokered deposits and public funds) x YTD total customer deposits, excluding Progress, were up $574 million, or 6.2% annualized Deposit Costs Below Peers, But Increased Due to Rates and Mix x 32% cumulative deposit beta since 4Q21, as cost of deposits moved to 1.64% from 1.10% in 1Q23 x DDA% moved to 31% of total deposits from 34% last quarter, as customers moved funds to CDs, which increased to 17% of total deposits from 14% last quarter 31% 23% 23% 6% 17% DDA MMDA Savings Time NOW Outstanding Deposit Franchise 8 2Q23 Total Deposits $22.3 billion Total Deposit Beta 3% 6% 12% 23% 32% 4% 10% 17% 23% 0.08% 0.19% 0.49% 1.10% 1.64% -0.10% 0.10% 0.30% 0.50% 0.70% 0.90% 1.10% 1.30% 1.50% 1.70% 0% 5% 10% 15% 20% 25% 30% 2Q22 3Q22 4Q22 1Q23 2Q23 UCBI Cumulative Deposit Beta KRX Peer Average Cumulative Deposit Beta UCBI Cost of Deposits Deposit Trends 9 x Deposits are granular with a $33 thousand average account size and are diverse by industry and geography x Business deposits of $8.3 billion and personal deposits of $10.8 billion in 2Q23 2Q23 Total Deposits $22.3 billion Deposit Mix Shift Customer Deposit Granularity $20,083 $19,888 $19,677 $19,417 $19,613 $78,305 $76,084 $69,749 $72,650 $75,033 2Q22 3Q22 4Q22 1Q23 2Q23 Personal Deposits Avg.

Acct Size Business Deposits Avg.

Acct Size $ in billions 39% 40% 38% 34% 31% 61% 60% 62% 66% 69% 2Q22 3Q22 4Q22 1Q23 2Q23 Non Interest Bearing Deposits Interest Bearing Deposits $20.9 $20.3 $19.9 $20.7 $22.3 $1.3 2Q22 3Q22 4Q22 1Q23 2Q23 UCBI Progress 41% 10% 21% 1% 17% 5% 3% 2% Residential Mortgage Manufactured Housing 10 2Q23 Total Loans $17.4 billion Well - Diversified Loan Portfolio Quarter Highlights x Loans increased $270 million, or 6.3% annualized x Construction & CRE ratio as a percentage of total RBC = 78% / 201% x Top 25 relationships totaled $722 million, or 4.2% of total loans x SNCs outstanding of $367 million, or 2.1% of total loans x Project lending limit of $32 million x Conservative relationship lending limits driven by risk grades C&I Commercial Construction CRE Other Consumer Home Equity Residential Construction $2.5 $3.1 $1.5 Commercial & Industrial Owner Occupied CRE Equipment Financing $ in billions x Substantial balance sheet liquidity and above - peer capital ratios x $5.9 billion securities portfolio offers significant near - and medium - term cash flow opportunities x FHLB borrowings declined to zero in 2Q23 from $30 million in 1Q23 8.1% 7.7% 7.6% 7.7% 7.9% 8.2% 8.2% 7.2% 4Q21 1Q22 2Q22 3Q22 4Q22 1Q23 2Q23 UCBI KRX Peer Median 11 Loans / Deposits % Tangible Common Equity / Tangible Assets % Common Equity Tier 1 RBC %* 64% 68% 70% 73% 77% 78% 78% 86% 4Q21 1Q22 2Q22 3Q22 4Q22 1Q23 2Q23 UCBI KRX Peer Median 12.5% 11.9% 12.0% 12.1% 12.3% 12.1% 12.2% 11.0% 4Q21 1Q22 2Q22 3Q22 4Q22 1Q23 2Q23 UCBI KRX Peer Median Balance Sheet Strength – Liquidity and Capital *2Q23 regulatory capital ratios are preliminary


1 2 Risk - Based Capital Ratios* Tangible Book Value Per Share x 2Q23 regulatory risk - based capital ratios increased an average of 16 bps from 1Q23 x The leverage ratio increased 14 bps to 9.79%, as compared to 1Q23 x Quarterly dividend of $0.23 per share, an increase of 10% YOY x Repurchased a modest amount of preferred shares at an average price of $20.83 during 2Q23 x Net unrealized securities losses in AOCI increased by $13 million to $318 million in 2Q23 • AFS securities portfolio of $3.4 billion with a 2.5 - year duration x TCE % of 8.21% increased 4 bps from 1Q23 11.9% 12.0% 12.1% 12.3% 12.1% 11.0% 12.2% 0.6% 0.6% 0.6% 0.5% 0.5% 0.6% 0.5% 1.9% 1.9% 1.9% 2.0% 1.8% 1.7% 1.9% 14.3% 14.5% 14.6% 14.8% 14.4% 13.3% 14.6% 1Q22 2Q22 3Q22 4Q22 1Q23 1Q23 KRX Peer Median 2Q23* CET1 Non-common Tier 1 Tier 2 Total Capital *2Q23 regulatory capital ratios are preliminary $17.83 $17.59 $0.55 ( $0.02 ) ( $0.24 ) ( $0.10 ) $0.05 1Q23 TBV Operating Earnings Merger Charges Dividends Change in OCI Other 2Q23 TBV 3.37% 3.61% ( 0.05% ) ( 0.18% ) ( 0.01% ) 1Q23 NIM Mix Change Higher Interest Rates Loan Accretion 2Q23 NIM 13 Net Interest Revenue & Net Interest Margin 2Q23 NIM Compression x Net interest revenue decreased $11.2 million from 1Q23 x Net interest margin increased 18 bps compared to 2Q22, but decreased 24 bps from 1Q23, primarily driven by increased deposit costs x Core net interest margin of 3.30%, which excludes purchased loan accretion x Purchased loan accretion totaled $4.1 million and contributed 7 bps to the margin, down 1 bp from 1Q23 x Approximately $5.6 billion or 32% of total loans are floating rate with another $2.3 billion that will adjust beyond one year Net Interest Revenue / Margin (1) Yields & Costs $ in millions 4.33% 4.71% 5.22% 5.68% 5.85% 3.19% 3.57% 3.76% 3.61% 3.37% 1.81% 2.15% 2.44% 2.51% 2.63% 0.26% 0.44% 0.96% 1.89% 2.50% 2Q22 3Q22 4Q22 1Q23 2Q23 Loan Yield NIM Securities Yield Cost of IBL (1) Net interest margin is calculated on a fully - taxable equivalent basis (2) Core net interest margin excludes purchased loan accretion (2) (1) $178.9 $211.5 $200.3 3.19% 3.61% 3.37% 3.13% 3.53% 3.30% $- $50.0 $100.0 $150.0 $200.0 2.00% 2.50% 3.00% 3.50% 4.00% 2Q22 1Q23 2Q23 Net Interest Revenue Net Interest Margin Core Net Interest Margin Noninterest Income $ in millions $10.0 $9.6 $9.5 $8.7 $9.8 $7.0 $6.3 $3.1 $4.5 $6.6 $6.0 $5.9 $5.8 $5.7 $5.6 $3.8 $2.2 $1.5 $1.9 $2.3 $6.7 $7.9 $13.5 $9.4 $12.1 2Q22 3Q22 4Q22 1Q23 2Q23 Service Charges Mortgage Brokerage / Wealth Mgmt Loan sale gains Other $36.4 $33.4 $30.2 Linked Quarter x Noninterest income was up $6.2 million • Service charges drove $1.1 million of the increase from 1Q23 • A $655,000 increase in mortgage fees excluding the $1.4 million change in the mark on the MSR • $444,000 increase in gains on SBA and Navitas loan sales • $1.6 million in 2Q gains on $22.1 million of SBA loans sold • $738,000 in 2Q gains on $20.8 million of equipment finance loan sales • Other income was up $2.7 million due to the absence of 1Q23’s $1.6 million in securities losses and an approximate $1.6 million 2Q23 net gain from the sale of a commercial insurance business Year - over - Year x Noninterest income was up $2.9 million • Mortgage rate locks of $305 million in 2Q23 compared to $597 million in 2Q22 • Other noninterest income increased $5.4 million due to higher other investment income and the Progress acquisition 14 $31.9 $33.5


$120.8 $112.8 $117.3 $139.8 $132.4 $113.6 $111.0 $115.9 $131.2 $128.8 2Q22 3Q22 4Q22 1Q23 2Q23 GAAP Operating Disciplined Expense Management $ in millions x The GAAP efficiency ratio improved compared to last quarter x On an operating basis, the efficiency ratio increased modestly as lower expenses were more than offset by the impact of NIM pressure 15 Efficiency Ratio % Noninterest Expense $ 56.6% 48.4% 48.0% 57.2% 55.7% 53.2% 47.7% 47.4% 53.7% 54.2% 53.7% 2Q22 3Q22 4Q22 1Q23 2Q23 GAAP Operating KRX Peer Median x Total operating expenses decreased by $2.4 million, or 1.8%, quarter over quarter, mostly due to lower incentive accrual, group medical insurance costs and payroll taxes x 2Q23 net charge - offs of $8.4 million, or 0.20% of average loans, annualized • 2Q23 Navitas net charge - offs of $2.5 million, or 0.69% annualized x Non - performing assets increased $30.3 million during the quarter and were 0.60% of total loans, an increase of 17 bps from 1Q23, driven primarily by the movement of one senior care relationship to non - accrual x Special mention loans improved from $239 million in 1Q23 to $217 million in 2Q23 x Higher risk loans, defined as special mention plus substandard accruing, improved 0.3% from 1Q23 to 2.7% and were down 0.5% YOY Credit Quality Net Charge - Offs as % of Average Loans Non - Performing Assets & Past Due Loans as a % of Total Loans 16 0.55% 0.28% 0.29% 0.23% 0.24% 0.29% 0.43% 0.60% 0.18% 0.06% 0.09% 0.10% 0.14% 0.18% 0.31% 0.18% 2020 2021 1Q22 2Q22 3Q22 4Q22 1Q23 2Q23 NPAs (%) Past Dues (%) 2.6% 2.6% 2.1% 2.0% 2.1% 1.6% 1.4% 1.2% 1.5% 1.4% 1.2% 1.2% 1.1% 1.3% 1.6% 1.5% 2020 2021 1Q22 2Q22 3Q22 4Q22 1Q23 2Q23 Special Mention (%) Substandard Accruing(%) Special Mention & Substandard Accruing Loans as a % of Total Loans 0.17% 0.00% 0.08% - 0.03% 0.03% 0.17% 0.17% 0.20% 2020 2021 1Q22 2Q22 3Q22 4Q22 1Q23 2Q23 Allowance for Credit Losses Allowance for Credit Losses (ACL) Walk - Forward Allowance for Credit Losses (ACL) 17 Note: ACL includes the reserve for unfunded commitments x The provision for credit losses was $22.8 million in 2Q23 as compared to $8.4 million in net charge - offs x Loan growth accounted for $4.0 million of the provision increase x Economic forecast for the CRE price index created a build in the allowance of $7 million x ACL reserve levels remain strong at 1.22% of loans, up from 1.05% in 2Q22 $153 $167 $181 $198 $212 1.05% 1.12% 1.18% 1.16% 1.22% 0.65% 0.75% 0.85% 0.95% 1.05% 1.15% 1.25% 1.35% 1.45% 1.55% $30 $50 $70 $90 $110 $130 $150 $170 $190 $210 2Q22 3Q22 4Q22 1Q23 2Q23 ACL - Allowance for Credit Losses $ ACL - Allowance for Credit Losses % $197,923 $212,277 $4,003 ( $8,399 ) $738 $18,012 1Q23 ACL Loan Growth NCOs Specific Reserve Model / Forecast Changes 2Q23 ACL ($000)


Member FDIC.

© 2023 United Community Bank | ucbi.com 2 Q23 INVESTOR PRESENTATION Exhibits Navitas Portfolio Net Charge - Offs 19 x Navitas represents 8% of total loans x Navitas 2Q23 NCOs of 0.69%, or $2.5 million x Navitas ACL / Loans of 1.89% x We expect higher 3Q losses, however, full - year 2023 NCOs are expected to be in the 0.90% - 0.95% range due to recent stress in the transportation sector Navitas Performance $ in millions $913 $969 $1,017 $1,083 $1,148 $1,211 $1,281 $1,374 $1,447 $1,510 9.08% 9.08% 9.01% 8.89% 8.85% 8.80% 8.79% 8.88% 8.99% 9.12% 0.00% 1.00% 2.00% 3.00% 4.00% 5.00% 6.00% 7.00% 8.00% 9.00% 10.00% $0 $200 $400 $600 $800 $1,000 $1,200 $1,400 $1,600 1Q21 2Q21 3Q21 4Q21 1Q22 2Q22 3Q22 4Q22 1Q23 2Q23 Navitas Loans $ Portfolio Yield % 0.72% 0.83% 0.70% 0.13% 0.21% 0.29% 0.10% 0.31% 0.36% 0.50% 0.93% 0.69% 2019 2020 1Q21 2Q21 3Q21 4Q21 1Q22 2Q22 3Q22 4Q22 1Q23 2Q23 x Rate locks were $305 million compared to $335 million in 1Q23 x 22% of locked loans were variable rate mortgages in 2Q23, down from 27% in 1Q23 x Sold $131 million loans in 2Q23, up $52 million from $79 million sold in 1Q23 x Purchase / Refi mix shifted from 73% / 27% in 2Q22 to 86% / 14% in 2Q23 20 Mortgage Locks & Sales Mortgage Locks - Purchase vs. Refinance Mortgage Activity Shift to Saleable Production $597 $456 $364 $335 $305 $160 $93 $68 $79 $131 3.7% 3.1% 2.7% 2.9% 2.8% -0.5% 0.5% 1.5% 2.5% 3.5% 4.5% 5.5% $0 $100 $200 $300 $400 $500 $600 $700 2Q22 3Q22 4Q22 1Q23 2Q23 Mortgage locks $ Loans sold $ Gain on sale % 73% 71% 62% 87% 86% 27% 29% 38% 13% 14% 2Q22 3Q22 4Q22 1Q23 2Q23 Purchase Refinance $ in millions
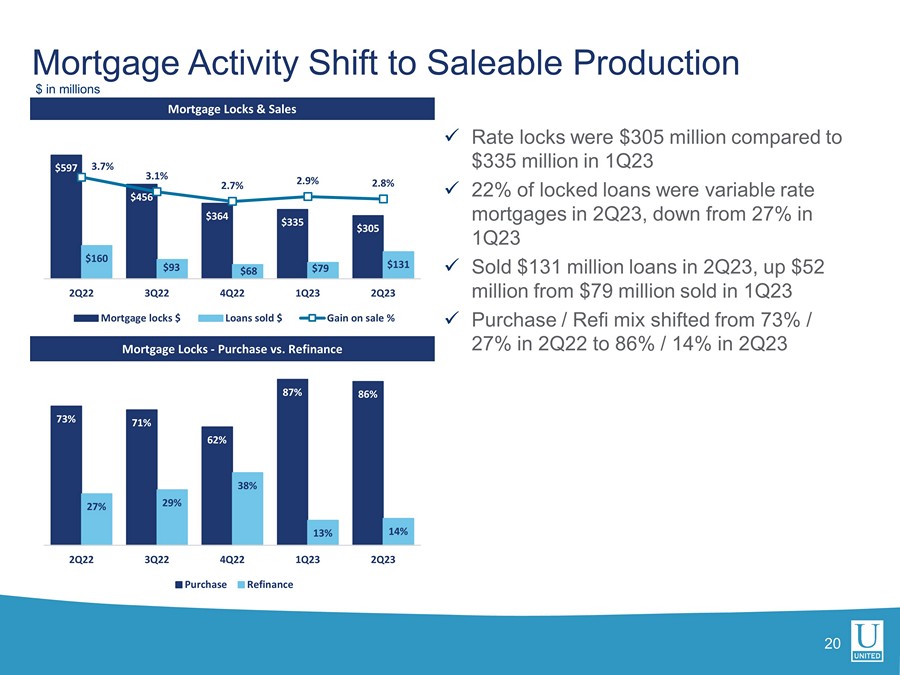


21 x Senior Care lending team are dedicated specialists with significant experience in the space x Senior Care portfolio outstanding totaled $394 million as of 2Q23, or 2.3% of total loans x As of June 30, $31.8 million of Senior Care loans were nonaccruing , an increase of $21.3 million from 1Q23 (included in substandard) x As of June 30, $107.9 million of Senior Care loans were special mention and $74.7 million were substandard accruing x Senior care loans account for approximately 37% of total criticized and classified loans 1% 20% 25% 49% 6% Selected Segments – Senior Care $ in millions $71 $80 $80 $73 $65 $60 $79 $106 $106 $170 $170 $169 $144 $135 $124 $111 $91 $108 $537 $549 $520 $518 $465 $442 $408 $410 $394 2Q21 3Q21 4Q21 1Q22 2Q22 3Q22 4Q22 1Q23 2Q23 Substandard $ Special Mention $ Pass $ 22 x Office portfolio is distributed across our Southeastern primary and secondary markets, with very few loans in central business districts x Office portfolio exposure has a small suburban business focus with a significant portion of well - located medical office buildings x Granular portfolio with an average office loan size of $1.3 million and a median loan size of $492,000 as of 2Q23 x Office portfolio outstanding totaled $722 million as of 2Q23, or 4.2% of total loans x Top 10 Office commitments total $129 million x As of June 30, $571,000 Office loans were nonaccruing x As of June 30, $8.9 million, or 1.2% of Office loans outstanding were special mention and $812,000, or 0.1% of Office loans outstanding were substandard accruing 1% 20% 25% 49% 6% Selected Segments – Office $ in millions $538 $531 $541 $666 $683 $664 $661 $710 $722 2Q21 3Q21 4Q21 1Q22 2Q22 3Q22 4Q22 1Q23 2Q23 Investment CRE – Office Exposure Outstanding $ Note: Reliant acquisition contributed $138 million of the increase in office loans outstanding from 4Q21 to 1Q22; Progress acquisition contributed $74 million of the increase in office loans outstanding from 4Q22 to 1Q23 Uninsured Deposits 23 x We estimate that 77% of our deposits were either insured or collateralized as of June 30, 2023, up 1% from 1Q23 x Our uninsured deposits have significant diversity with respect to industry type and geography x Our sweep accounts include ICS deposits, which increased approximately $610 million in 2Q23 $ in billions Deposit Type Total Deposits* Insured Deposits Collateralized Deposits Uninsured & Uncollateralized $ Uninsured & Uncollateralized % Retail $11.4 $9.6 - $1.8 16% Business $6.6 $3.4 - $3.2 48% Public $2.4 $0.1 $2.3 $0.0 0% Sweep $1.1 $1.1 - $0.0 0% Brokered $0.6 $0.6 - $0.0 0% Total $22.1 $14.8 $2.3 $5.0 23% *Estimates
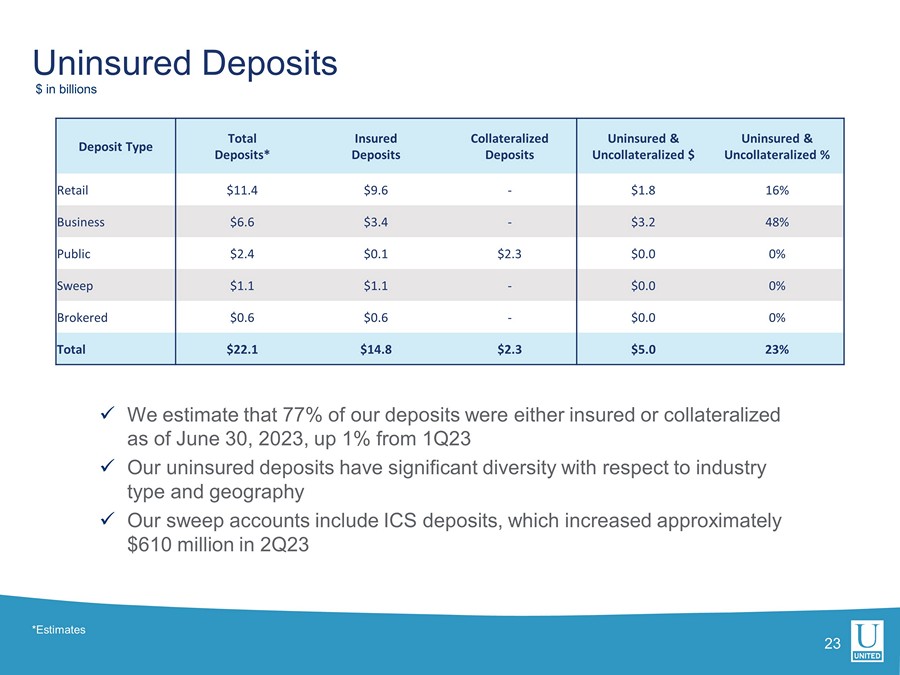

Non - GAAP Reconciliation Tables $ in thousands, except per share data 24 2Q22 3Q22 4Q22 1Q23 2Q23 Expenses Expenses - GAAP 120,790$ 112,755$ 117,329$ 139,805$ 132,407$ Merger-related and other charges (7,143) (1,746) (1,470) (8,631) (3,645) Expenses - Operating 113,647$ 111,009$ 115,859$ 131,174$ 128,762$ Diluted Earnings per share Diluted earnings per share - GAAP 0.61$ 0.74$ 0.74$ 0.52$ 0.53$ Merger-related and other charges 0.05 0.01 0.01 0.06 0.02 Diluted earnings per share - Operating 0.66 0.75 0.75 0.58 0.55 Book Value per share Book Value per share - GAAP 23.96$ 23.78$ 24.38$ 25.76$ 25.98$ Effect of goodwill and other intangibles (7.28) (7.26) (7.25) (8.17) (8.15) Tangible book value per share 16.68$ 16.52$ 17.13$ 17.59$ 17.83$ Return on Tangible Common Equity Return on common equity - GAAP 9.31 % 11.02 % 10.86 % 7.34 % 7.47 % Effect of merger-related and other charges 0.79 0.19 0.15 0.81 0.35 Return on common equity - Operating 10.10 11.21 11.01 8.15 7.82 Effect of goodwill and intangibles 4.10 4.39 4.19 3.48 3.53 Return on tangible common equity - Operating 14.20 % 15.60 % 15.20 % 11.63 % 11.35 % Return on Assets Return on assets - GAAP 1.08 % 1.32 % 1.33 % 0.95 % 0.95 % Merger-related and other charges 0.09 0.02 0.02 0.11 0.05 Return on assets - Operating 1.17 % 1.34 % 1.35 % 1.06 % 1.00 % Non - GAAP Reconciliation Tables $ in thousands, except per share data 25 2Q22 3Q22 4Q22 1Q23 2Q23 Return on Assets to return on assets- pre-tax pre-provision Return on assets - GAAP 1.08 % 1.32 % 1.33 % 0.95 % 0.95 % Income tax expense 0.32 0.37 0.41 0.29 0.29 (Release of) provision for credit losses 0.09 0.25 0.33 0.34 0.35 Return on assets - pre-tax, pre-provision 1.49 1.94 2.07 1.58 1.59 Merger-related and other charges 0.11 0.03 0.02 0.13 0.06 Return on assets - pre-tax, pre-provision, excluding merger-related and other charges 1.60 % 1.97 % 2.09 % 1.71 % 1.65 % Efficiency Ratio Efficiency Ratio - GAAP 56.58 % 48.41 % 47.95 % 57.20 % 55.71 % Merger-related and other charges (3.35) (0.75) (0.60) (3.53) (1.54) Efficiency Ratio - Operating, excluding PPP fees and MSR marks 53.23 % 47.66 % 47.35 % 53.67 % 54.17 % Tangible common equity to tangible assets Equity to assets ratio - GAAP 10.95 % 11.12 % 11.25 % 11.90 % 11.89 % Effect of goodwill and other intangibles (2.96) (3.01) (2.97) (3.36) (3.31) Effect of preferred equity (0.40) (0.41) (0.40) (0.37) (0.37) Tangible common equity to tangible assets ratio 7.59 % 7.70 % 7.88 % 8.17 % 8.21 %


Glossary 26 ACL – Allowance for Credit Losses MLO – Mortgage Loan Officer ALLL – Allowance for Loan Losses MMDA – Money Market Deposit Account AOCI – Accumulated Other Comprehensive Income (Loss) MTM – Marked-to-market AUA – Assets Under Administration MSA – Metropolitan Statistical Area BPS – Basis Points MSR – Mortgage Servicing Rights Asset C&I – Commercial and Industrial NCO – Net Charge-Offs C&D – Construction and Development NIM – Net Interest Margin CECL – Current Expected Credit Losses NOW – Negotiable Order of Withdrawal CET1 – Common Equity Tier 1 Capital NPA – Non-Performing Asset CRE – Commercial Real Estate NSF – Non-sufficient Funds CSP – Customer Service Profiles OO RE – Owner Occupied Commercial Real Estate DDA – Demand Deposit Account PCD – Loans Purchased with Credit Deterioration EOP – End of Period PPP – Paycheck Protection Program EPS – Earnings Per Share PTPP – Pre-Tax, Pre-Provision Earnings FHA – Federal Housing Administration RBC – Risk Based Capital FTE – Fully-taxable equivalent ROA – Return on Assets GAAP – Accounting Principles Generally Accepted in the USA SBA – United States Small Business Administration IBL – Interest-bearing liabilities TCE – Tangible Common Equity ICS – Insured Cash Sweep USDA – United States Department of Agriculture KRX – KBW Nasdaq Regional Banking Index VA – Veterans Affairs LPO – Loan Production Office YOY – Year over Year