UNITED STATES
SECURITIES AND EXCHANGE COMMISSION
WASHINGTON, DC 20549
FORM 8-K
CURRENT REPORT
Pursuant to Section 13 or 15(d) of the
Securities Exchange Act of 1934
Date of report (Date of earliest event reported): June 7, 2023
APOLLO MEDICAL HOLDINGS, INC.
(Exact Name of Registrant as Specified in Charter)
| Delaware | 001-37392 | 95-4472349 |
| (State or Other Jurisdiction | (Commission | (I.R.S. Employer |
| of Incorporation) | File Number) | Identification No.) |
1668 S. Garfield Avenue, 2nd Floor, Alhambra, California 91801
(Address of Principal Executive Offices) (Zip Code)
(626) 282-0288
Registrant’s Telephone Number, Including Area Code
(Former Name or Former Address, if Changed Since Last Report)
Check the appropriate box below if the Form 8-K filing is intended to simultaneously satisfy the filing obligation of the registrant under any of the following provisions:
| ¨ | Written communications pursuant to Rule 425 under the Securities Act (17 CFR 230.425) |
| ¨ | Soliciting material pursuant to Rule 14a-12 under the Exchange Act (17 CFR 240.14a-12) |
| ¨ | Pre-commencement communication pursuant to Rule 14d-2(b) under the Exchange Act (17 CFR 240.14d-2(b)) |
| ¨ | Pre-commencement communication pursuant to Rule 13e-4(c) under the Exchange Act (17 CFR 240.13e-4(c)) |
Securities registered pursuant to Section 12(b) of the Act:
| Title of each class | Trading Symbol(s) | Name of each exchange on which registered |
| Common Stock | AMEH | Nasdaq Capital Market |
Indicate by check mark whether the registrant is an emerging growth company as defined in Rule 405 of the Securities Act of 1933 (§230.405 of this chapter) or Rule 12b-2 of the Securities Exchange Act of 1934 (§240.12b-2 of this chapter).
Emerging growth company ¨
If an emerging growth company, indicate by check mark if the registrant has elected not to use the extended transition period for complying with any new or revised financial accounting standards provided pursuant to Section 13(a) of the Exchange Act. ¨
| Item 7.01 | Regulation FD Disclosure. |
Apollo Medical Holdings, Inc. (the “Company”) is scheduled to present to the investor community and has prepared presentation materials that the Company intends to use in this regard. A copy of the presentation materials to be used is furnished as Exhibit 99.1 to this Current Report on Form 8-K and is incorporated herein by reference.
The information contained in this Current Report on Form 8-K, including the exhibit referenced herein, is being furnished and shall not be deemed “filed” for purposes of Section 18 of the Securities Exchange Act of 1934, as amended (the “Exchange Act”), or otherwise subject to the liabilities of that section. Such information shall not be incorporated by reference into any filing under the Securities Act of 1933, as amended, or the Exchange Act, whether made before or after the date hereof, regardless of any general incorporation language in such filing. The furnishing of this information will not be deemed an admission as to the materiality of any information contained herein.
| Item 9.01 | Financial Statements and Exhibits. |
(d) Exhibits.
| Exhibit No. | Description | |
| 99.1 | Corporate Presentation | |
| 104 | Cover Page Interactive Data File (the cover page XBRL tags are embedded within the inline XBRL document) |
Forward-Looking Statements
This current report on Form 8-K contains forward-looking statements within the meaning of Section 27A of the Securities Act of 1933, as amended, and Section 21E of the Securities Exchange Act of 1934, as amended. These statements include words such as “forecast,” “guidance,” “projects,” “estimates,” “anticipates,” “believes,” “expects,” “intends,” “may,” “plans,” “seeks,” “should,” or “will,” or the negative of these words or similar words. Forward-looking statements involve certain risks and uncertainties, and actual results may differ materially from those discussed in each such statement. A number of important factors could cause actual results to differ materially from those included within or contemplated by the forward-looking statements, including, but not limited to, the factors described in our filings with the Securities and Exchange Commission, including the Company’s most recent annual report on Form 10-K and any subsequent quarterly reports on Form 10-Q. The Company does not undertake any responsibility to update any of these factors or to announce publicly any revisions to any of the forward-looking statements contained in this or any other document, whether as a result of new information, future events, or otherwise.
SIGNATURES
Pursuant to the requirements of the Securities Exchange Act of 1934, the registrant has duly caused this report to be signed on its behalf by the undersigned hereunto duly authorized.
| APOLLO MEDICAL HOLDINGS, INC. | ||
| Date: June 7, 2023 | By: | /s/ Thomas S. Lam |
| Name: | Thomas S. Lam, M.D., M.P.H. | |
| Title: | Co-Chief Executive Officer and President | |
Exhibit 99.1
|
Apollo Medical Holdings June 2023 Powered by Technology. Built by Doctors. For Patients. |
|
This presentation contains forward-looking statements within the meaning of the Private Securities Litigation Reform Act of 1995, Section 27A of the Securities Act and Section 21E of the Exchange Act. Forward-looking statements include any statements about the Company's business, financial condition, operating results, plans, objectives, expectations and intentions, expansion plans, integration of acquired companies and any projections of earnings, revenue, EBITDA, Adjusted EBITDA or other financial items, such as the Company's projected capitation and future liquidity, and may be identified by the use of forward-looking terms such as “anticipate,” “could,” “can,” “may,” “might,” “potential,” “predict,” “should,” “estimate,” “expect,” “project,” “believe,” “plan,” “envision,” “intend,” “continue,” “target,” “seek,” “will,” “would,” and the negative of such terms, other variations on such terms or other similar or comparable words, phrases or terminology. Forward-looking statements reflect current views with respect to future events and financial performance and therefore cannot be guaranteed. Such statements are based on the current expectations and certain assumptions of the Company's management, and some or all of such expectations and assumptions may not materialize or may vary significantly from actual results. Actual results may also vary materially from forward-looking statements due to risks, uncertainties and other factors, known and unknown, including the risk factors described from time to time in the Company’s reports to the U.S. Securities and Exchange Commission (the “SEC”), including without limitation the risk factors discussed in the Company's Annual Report on Form 10-K for the year ended December 31, 2022, and subsequent Quarterly Reports on Form 10-Q. Because the factors referred to above could cause actual results or outcomes to differ materially from those expressed or implied in any forward-looking statements, you should not place undue reliance on any such forward-looking statements. Any forward-looking statements speak only as of the date of this presentation and, unless legally required, the Company does not undertake any obligation to update any forward-looking statement, as a result of new information, future events or otherwise. Forward-looking statements 2 |
|
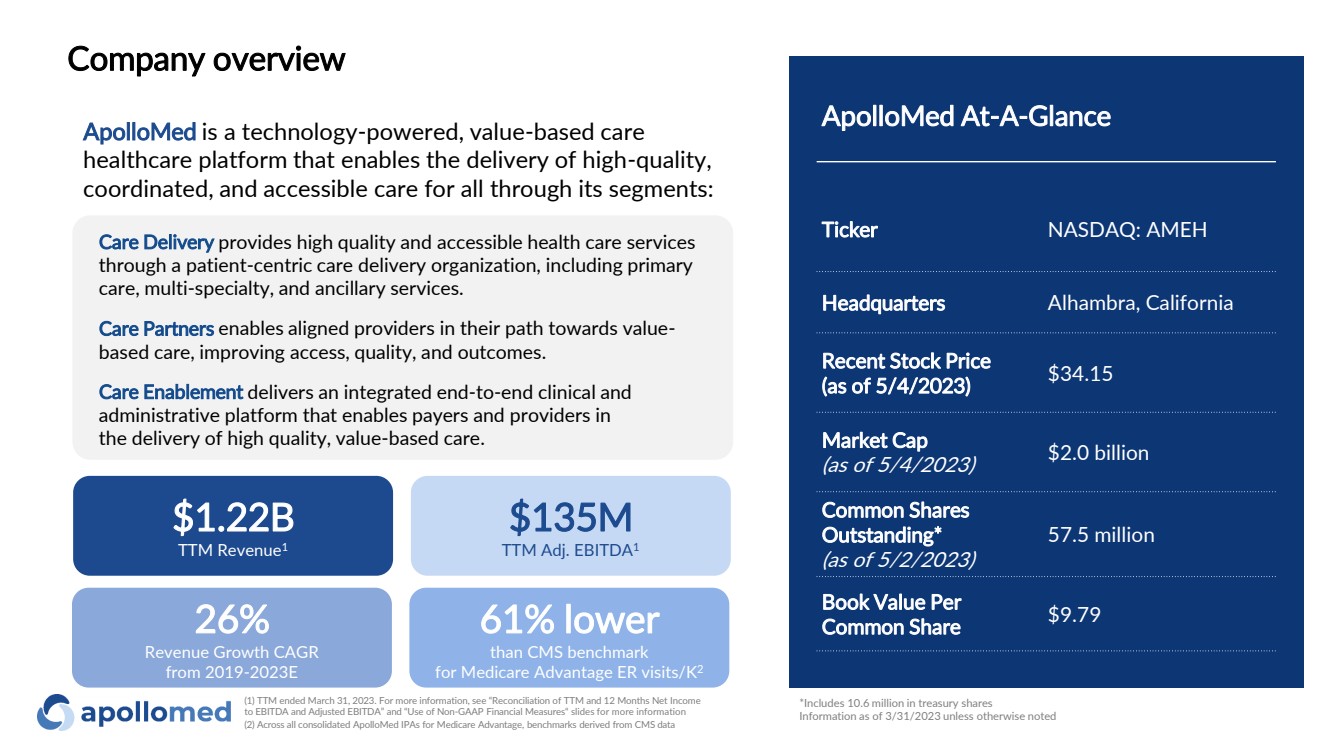
3 ApolloMed is a technology-powered, value-based care healthcare platform that enables the delivery of high-quality, coordinated, and accessible care for all through its segments: Care Delivery provides high quality and accessible health care services through a patient-centric care delivery organization, including primary care, multi-specialty, and ancillary services. Care Partners enables aligned providers in their path towards value-based care, improving access, quality, and outcomes. Care Enablement delivers an integrated end-to-end clinical and administrative platform that enables payers and providers in the delivery of high quality, value-based care. ApolloMed At-A-Glance Ticker NASDAQ: AMEH Headquarters Alhambra, California Recent Stock Price (as of 5/4/2023) $34.15 Market Cap (as of 5/4/2023) $2.0 billion Common Shares Outstanding* (as of 5/2/2023) 57.5 million Book Value Per Common Share $9.79 *Includes 10.6 million in treasury shares Information as of 3/31/2023 unless otherwise noted 26% Revenue Growth CAGR from 2019-2023E $135M TTM Adj. EBITDA1 61% lower than CMS benchmark for Medicare Advantage ER visits/K2 $1.22B TTM Revenue1 (1) TTM ended March 31, 2023. For more information, see “Reconciliation of TTM and 12 Months Net Income to EBITDA and Adjusted EBITDA” and “Use of Non-GAAP Financial Measures“ slides for more information (2) Across all consolidated ApolloMed IPAs for Medicare Advantage, benchmarks derived from CMS data Company overview |
|
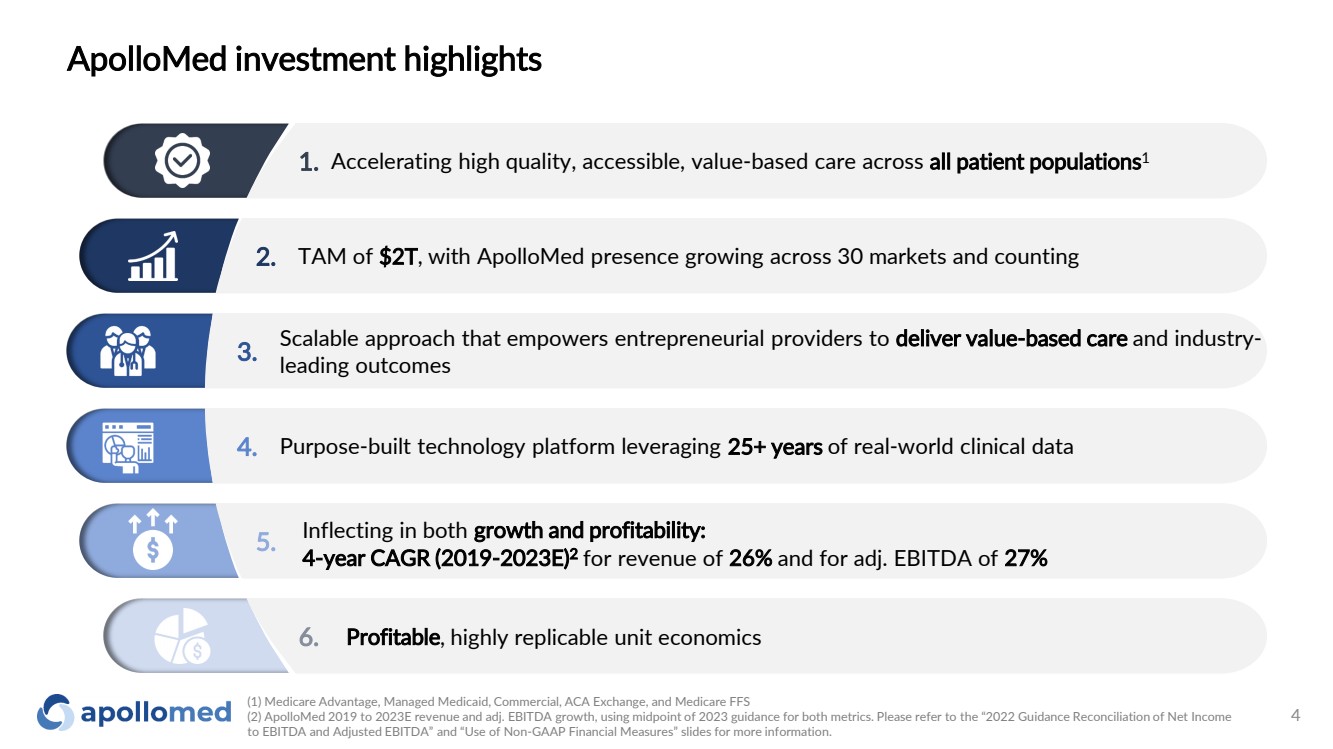
(1) Medicare Advantage, Managed Medicaid, Commercial, ACA Exchange, and Medicare FFS (2) ApolloMed 2019 to 2023E revenue and adj. EBITDA growth, using midpoint of 2023 guidance for both metrics. Please refer to the “2022 Guidance Reconciliation of Net Income to EBITDA and Adjusted EBITDA” and “Use of Non-GAAP Financial Measures” slides for more information. 4 1. 2. 3. 5. 6. 4. Accelerating high quality, accessible, value-based care across all patient populations1 Inflecting in both growth and profitability: 4-year CAGR (2019-2023E)2 for revenue of 26% and for adj. EBITDA of 27% Scalable approach that empowers entrepreneurial providers to deliver value-based care and industry-leading outcomes Purpose-built technology platform leveraging 25+ years of real-world clinical data Profitable, highly replicable unit economics TAM of $2T, with ApolloMed presence growing across 30 markets and counting ApolloMed investment highlights |
|
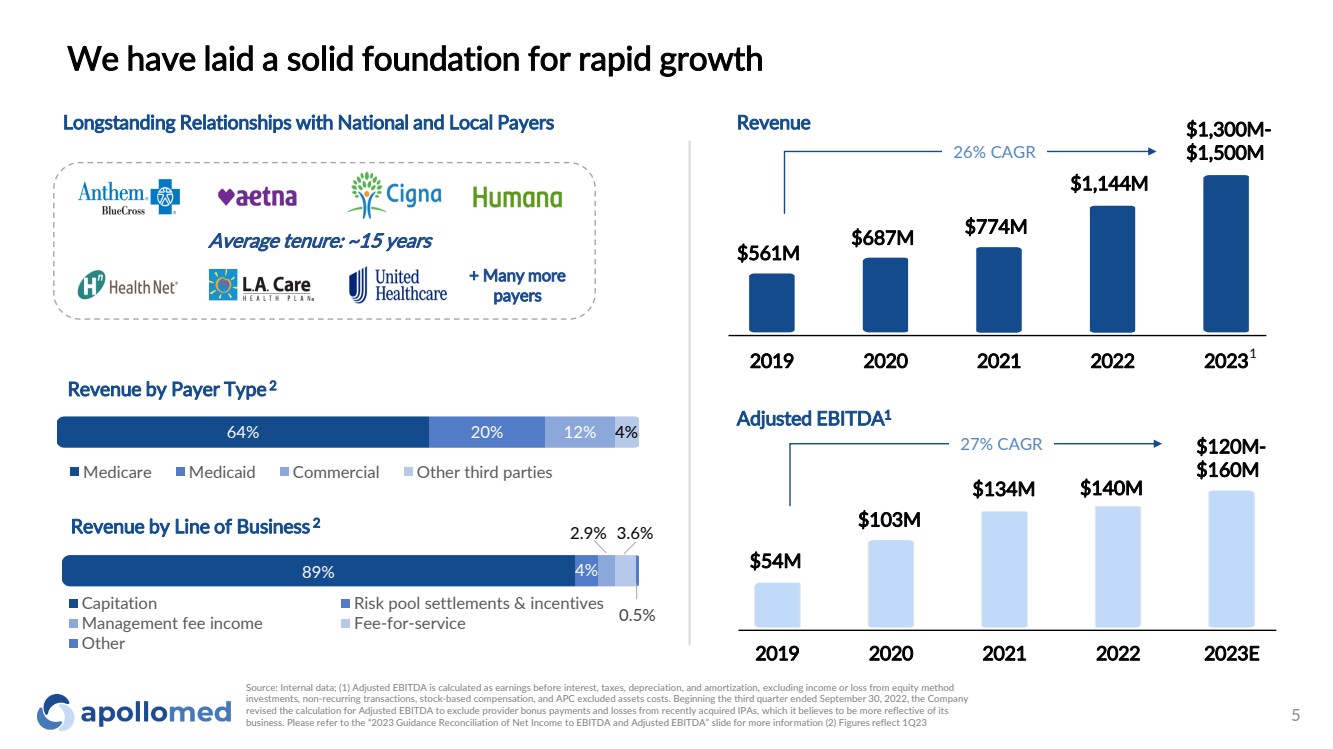
64% 20% 12% 4% Medicare Medicaid Commercial Other third parties Longstanding Relationships with National and Local Payers + Many more payers 2019 2020 2021 2022 2023 Revenue 1 Average tenure: ~15 years 89% 4% 2.9% 3.6% 0.5% Capitation Risk pool settlements & incentives Management fee income Fee-for-service Other Revenue by Payer Type 2 Revenue by Line of Business 2 $561M $687M $774M $1,300M-26% CAGR $1,500M 5 We have laid a solid foundation for rapid growth $1,144M Adjusted EBITDA1 2019 2020 2021 2022 2023E 27% CAGR $54M $103M $134M $120M- $160M $140M Source: Internal data; (1) Adjusted EBITDA is calculated as earnings before interest, taxes, depreciation, and amortization, excluding income or loss from equity method investments, non-recurring transactions, stock-based compensation, and APC excluded assets costs. Beginning the third quarter ended September 30, 2022, the Company revised the calculation for Adjusted EBITDA to exclude provider bonus payments and losses from recently acquired IPAs, which it believes to be more reflective of its business. Please refer to the “2023 Guidance Reconciliation of Net Income to EBITDA and Adjusted EBITDA” slide for more information (2) Figures reflect 1Q23 |
|
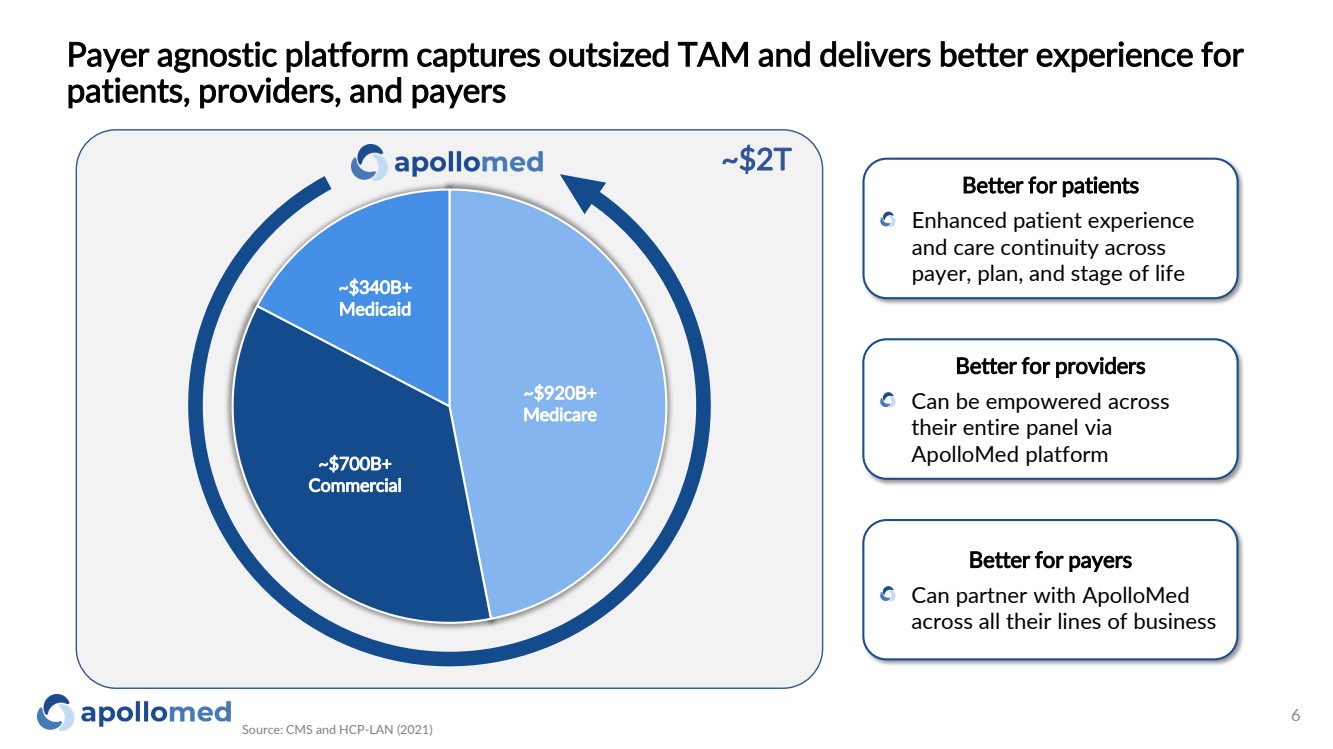
Payer agnostic platform captures outsized TAM and delivers better experience for patients, providers, and payers Source: CMS and HCP-LAN (2021) 6 Better for patients Enhanced patient experience and care continuity across payer, plan, and stage of life Better for providers Can be empowered across their entire panel via ApolloMed platform Better for payers Can partner with ApolloMed across all their lines of business ~$340B+ Medicaid ~$700B+ Commercial ~$920B+ Medicare ~$2T |
|
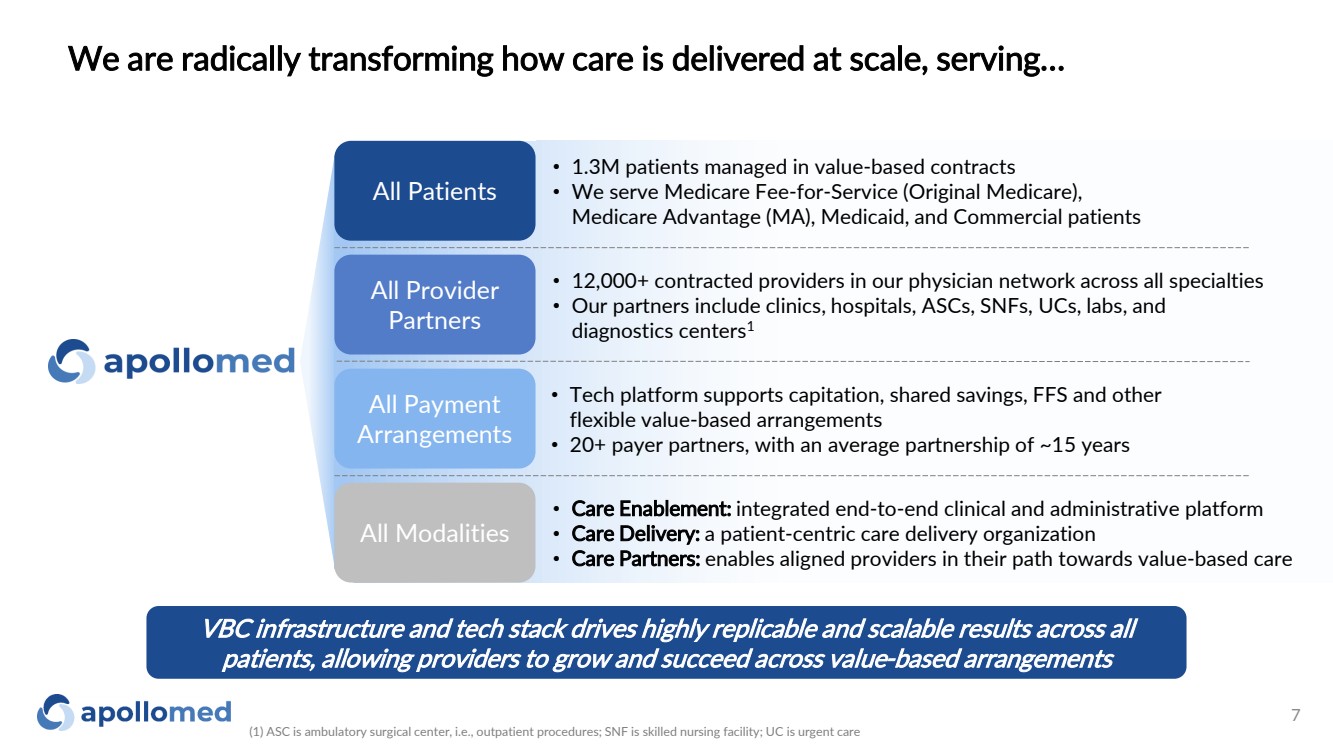
VBC infrastructure and tech stack drives highly replicable and scalable results across all patients, allowing providers to grow and succeed across value-based arrangements • 1.3M patients managed in value-based contracts • We serve Medicare Fee-for-Service (Original Medicare), Medicare Advantage (MA), Medicaid, and Commercial patients All Provider Partners • 12,000+ contracted providers in our physician network across all specialties • Our partners include clinics, hospitals, ASCs, SNFs, UCs, labs, and diagnostics centers1 All Payment Arrangements • Tech platform supports capitation, shared savings, FFS and other flexible value-based arrangements • 20+ payer partners, with an average partnership of ~15 years • Care Enablement: integrated end-to-end clinical and administrative platform • Care Delivery: a patient-centric care delivery organization • Care Partners: enables aligned providers in their path towards value-based care We are radically transforming how care is delivered at scale, serving… (1) ASC is ambulatory surgical center, i.e., outpatient procedures; SNF is skilled nursing facility; UC is urgent care 7 All Modalities All Patients |
|
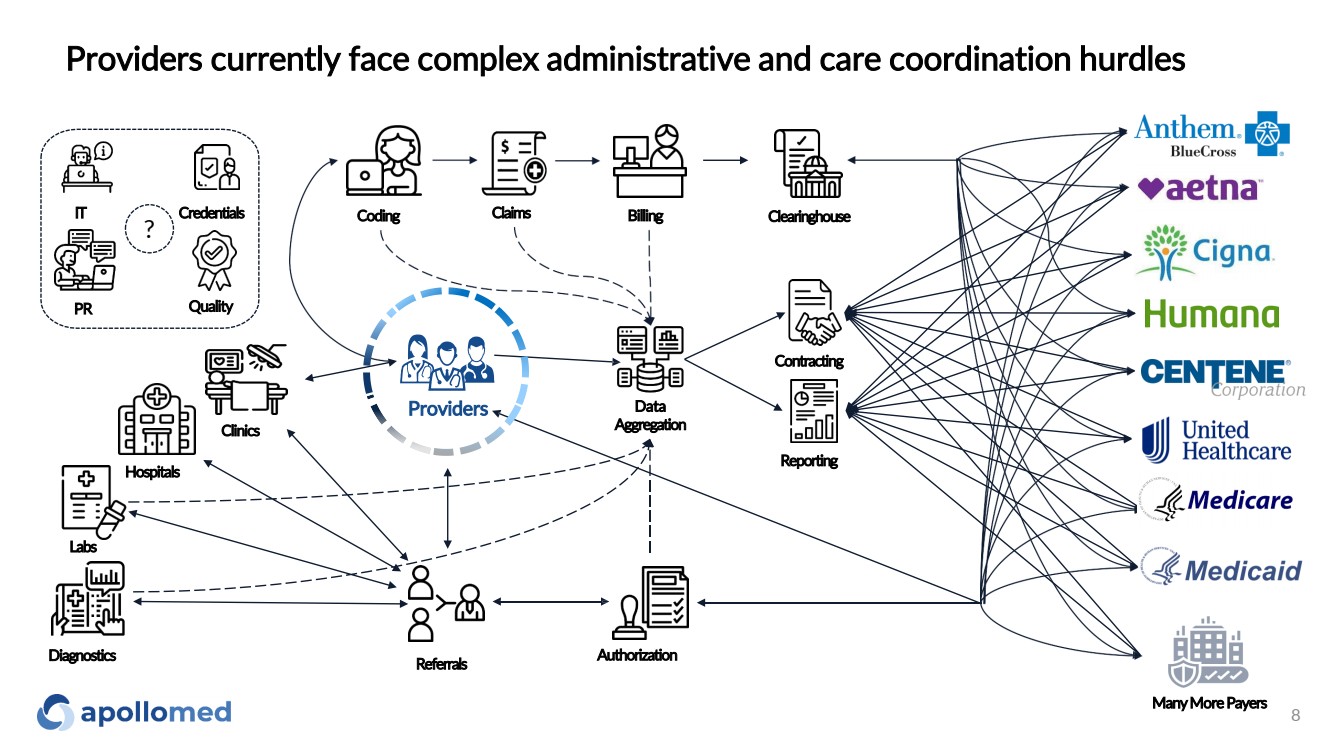
Providers currently face complex administrative and care coordination hurdles Reporting Contracting Claims Data Aggregation Coding Billing Hospitals Clinics Referrals Authorization IT Credentials Clearinghouse Quality Providers PR Labs Many MorePayers Diagnostics ? 8 |
|
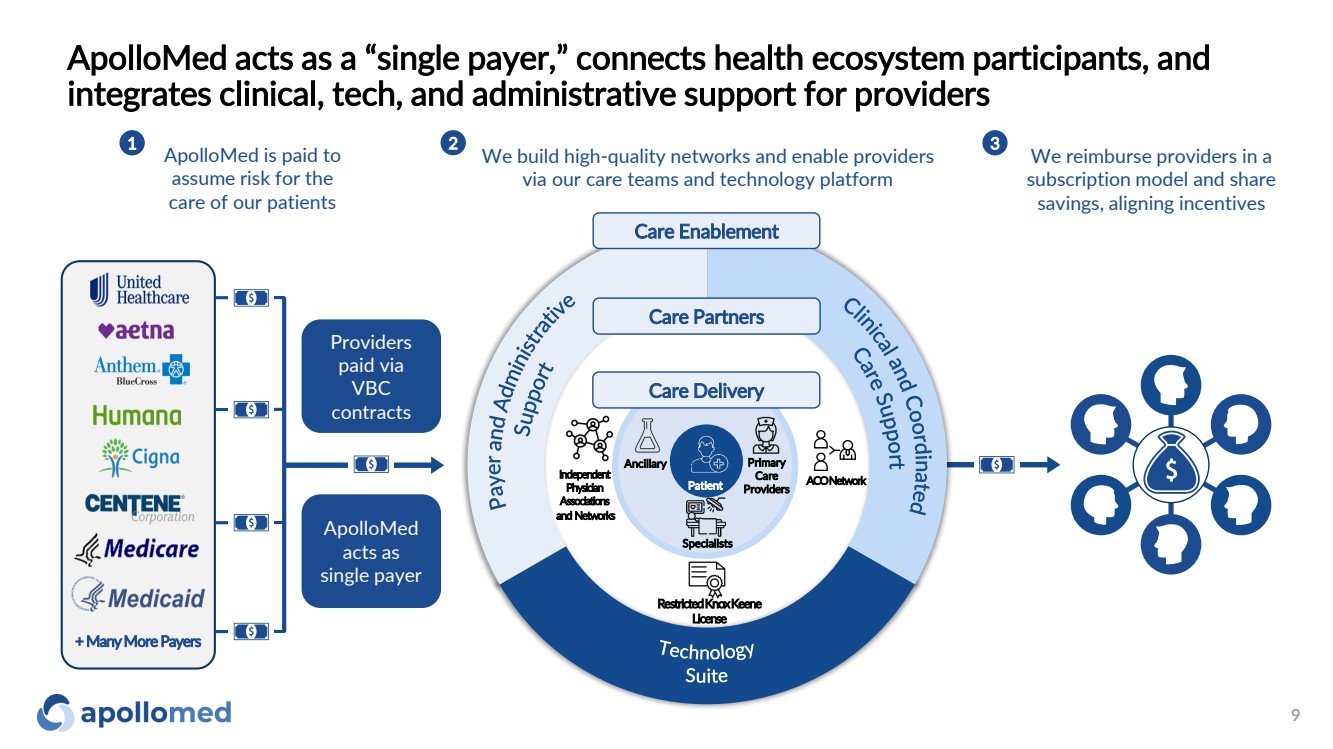
ApolloMed acts as a “single payer,” connects health ecosystem participants, and integrates clinical, tech, and administrative support for providers 9 ApolloMed is paid to assume risk for the care of our patients 1 We reimburse providers in a subscription model and share savings, aligning incentives 3 We build high-quality networks and enable providers via our care teams and technology platform 2 Care Enablement ApolloMed acts as single payer Providers paid via VBC contracts + Many MorePayers Care Partners ACO Network Independent Physician Associations and Networks Restricted Knox Keene License Specialists Ancillary Primary Care Providers Care Delivery Patient |
|
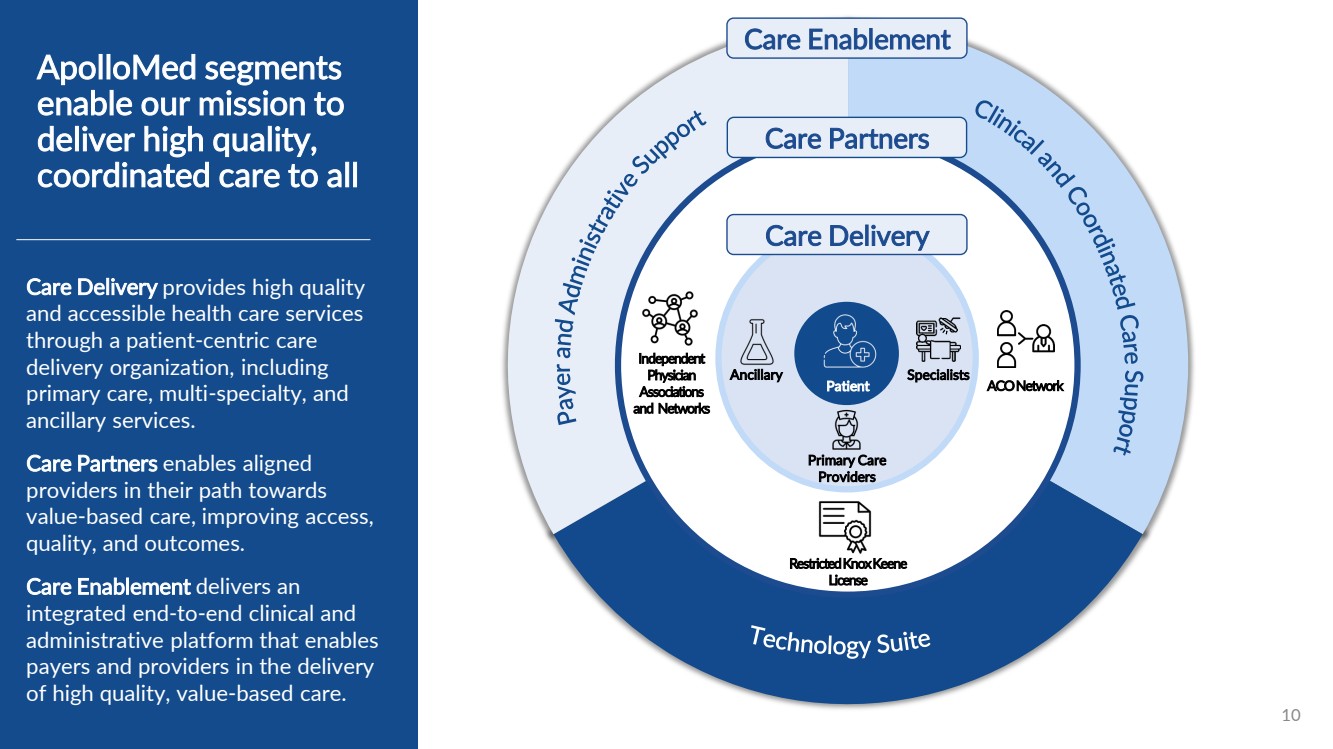
Care Partners ACO Network Independent Physician Associations and Networks Restricted Knox Keene License 10 Ancillary Specialists Primary Care Providers Care Delivery Care Delivery provides high quality and accessible health care services through a patient -centric care delivery organization, including primary care, multi -specialty, and ancillary services. Care Partners enables aligned providers in their path towards value -based care, improving access, quality, and outcomes. Care Enablement delivers an integrated end -to -end clinical and administrative platform that enables payers and providers in the delivery of high quality, value -based care. Patient ApolloMed segments enable our mission to deliver high quality, coordinated care to all Care Enablement |
|
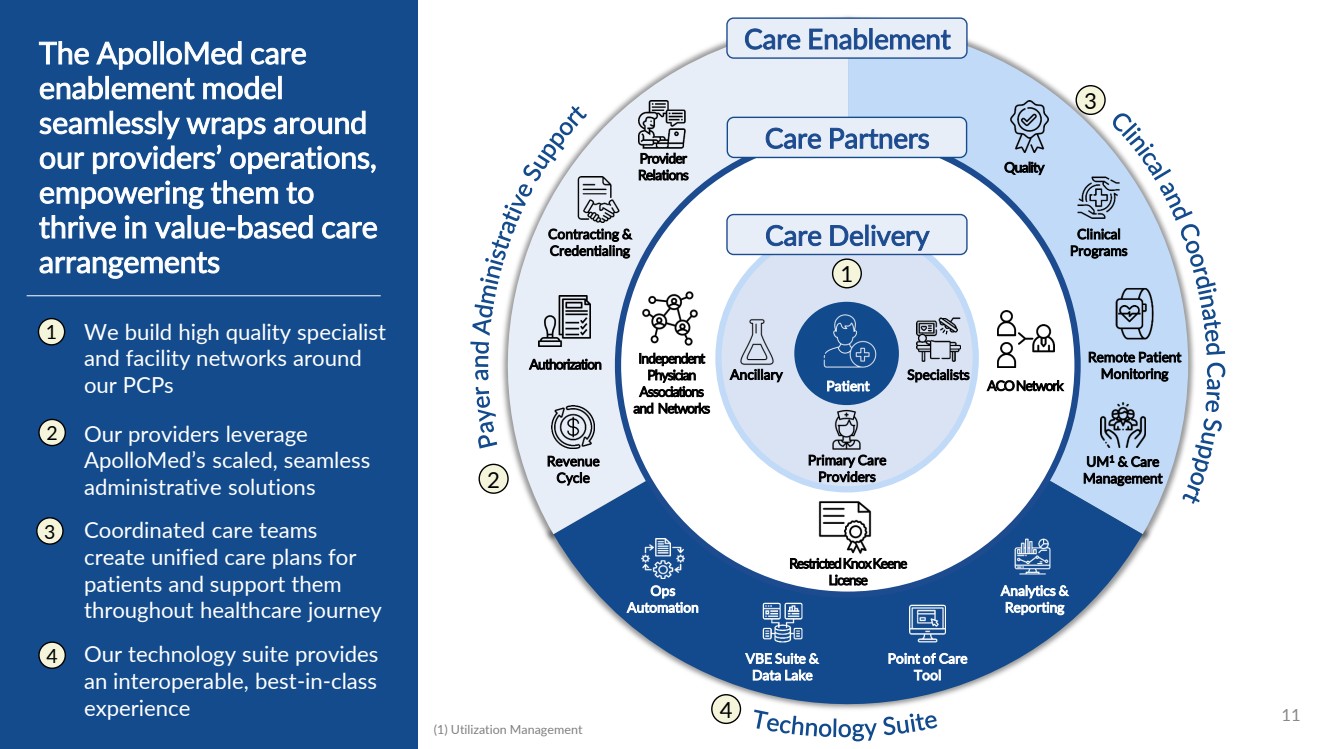
Care Partners ACO Network Independent Physician Associations and Networks Restricted Knox Keene License 11 Ancillary Specialists Primary Care Providers Care Delivery Patient Care Enablement Contracting & Credentialing Revenue Cycle Authorization Provider Relations UM1 & Care Management Clinical Programs Remote Patient Monitoring Quality Analytics & Reporting Point of Care Tool VBE Suite & Data Lake Ops Automation The ApolloMed care enablement model seamlessly wraps around our providers’ operations, empowering them to thrive in value-based care arrangements We build high quality specialist and facility networks around our PCPs 1 2 3 4 Our providers leverage ApolloMed’s scaled, seamless administrative solutions Coordinated care teams create unified care plans for patients and support them throughout healthcare journey Our technology suite provides an interoperable, best-in-class experience 1 2 3 4 (1) Utilization Management |
|
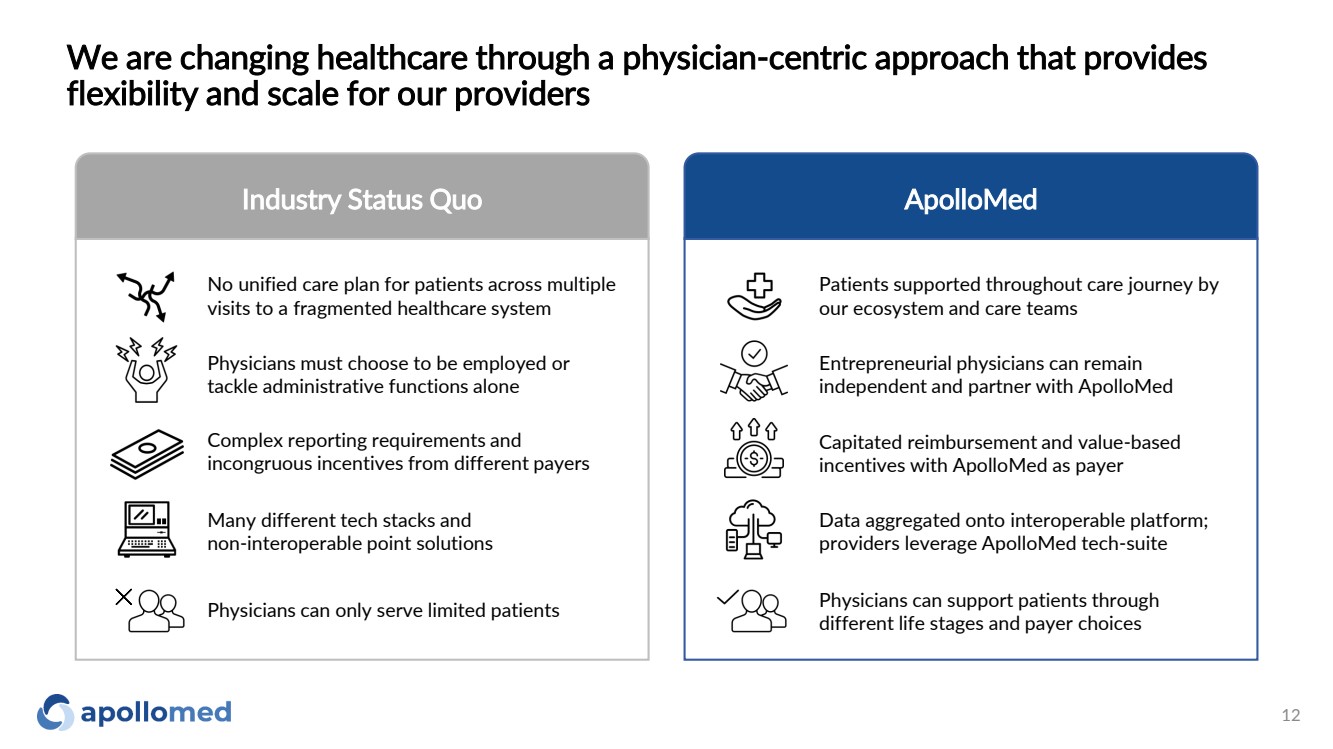
We are changing healthcare through a physician-centric approach that provides flexibility and scale for our providers Industry Status Quo ApolloMed Patients supported throughout care journey by our ecosystem and care teams Entrepreneurial physicians can remain independent and partner with ApolloMed Capitated reimbursement and value-based incentives with ApolloMed as payer Data aggregated onto interoperable platform; providers leverage ApolloMed tech-suite Physicians can support patients through different life stages and payer choices No unified care plan for patients across multiple visits to a fragmented healthcare system Physicians must choose to be employed or tackle administrative functions alone Complex reporting requirements and incongruous incentives from different payers Many different tech stacks and non-interoperable point solutions Physicians can only serve limited patients 12 |
|
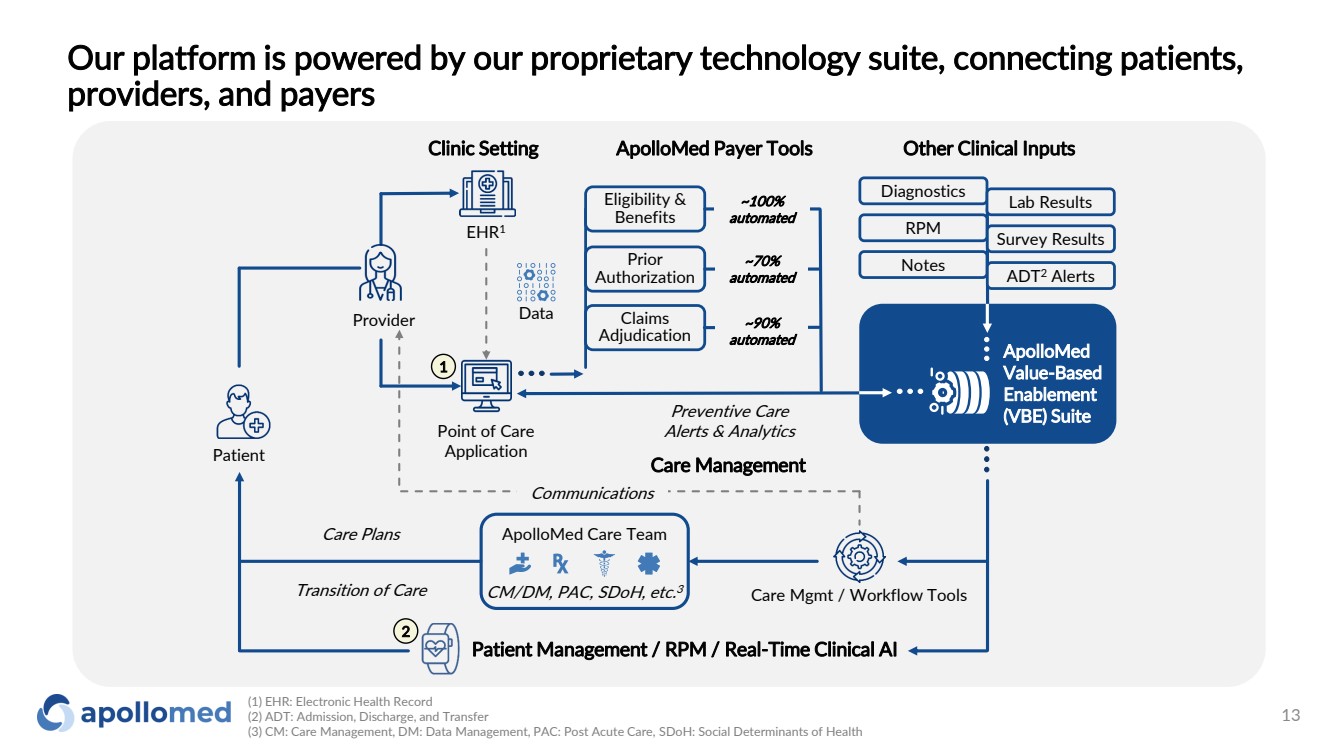
Our platform is powered by our proprietary technology suite, connecting patients, providers, and payers Provider Point of Care Application EHR1 Data Patient Care Management ApolloMed Care Team CM/DM, PAC, SDoH, etc. 3 Communications Patient Management / RPM / Real-Time Clinical AI Care Mgmt / Workflow Tools Eligibility & Benefits Claims Adjudication Prior Authorization Clinic Setting ApolloMed Payer Tools Other Clinical Inputs ~100% automated ~70% automated ~90% automated ApolloMed Value-Based Enablement (VBE) Suite Care Plans Transition of Care Preventive Care Alerts & Analytics Notes ADT2 Alerts Diagnostics Lab Results RPM Survey Results 2 1 (1) EHR: Electronic Health Record (2) ADT: Admission, Discharge, and Transfer (3) CM: Care Management, DM: Data Management, PAC: Post Acute Care, SDoH: Social Determinants of Health 13 |
|
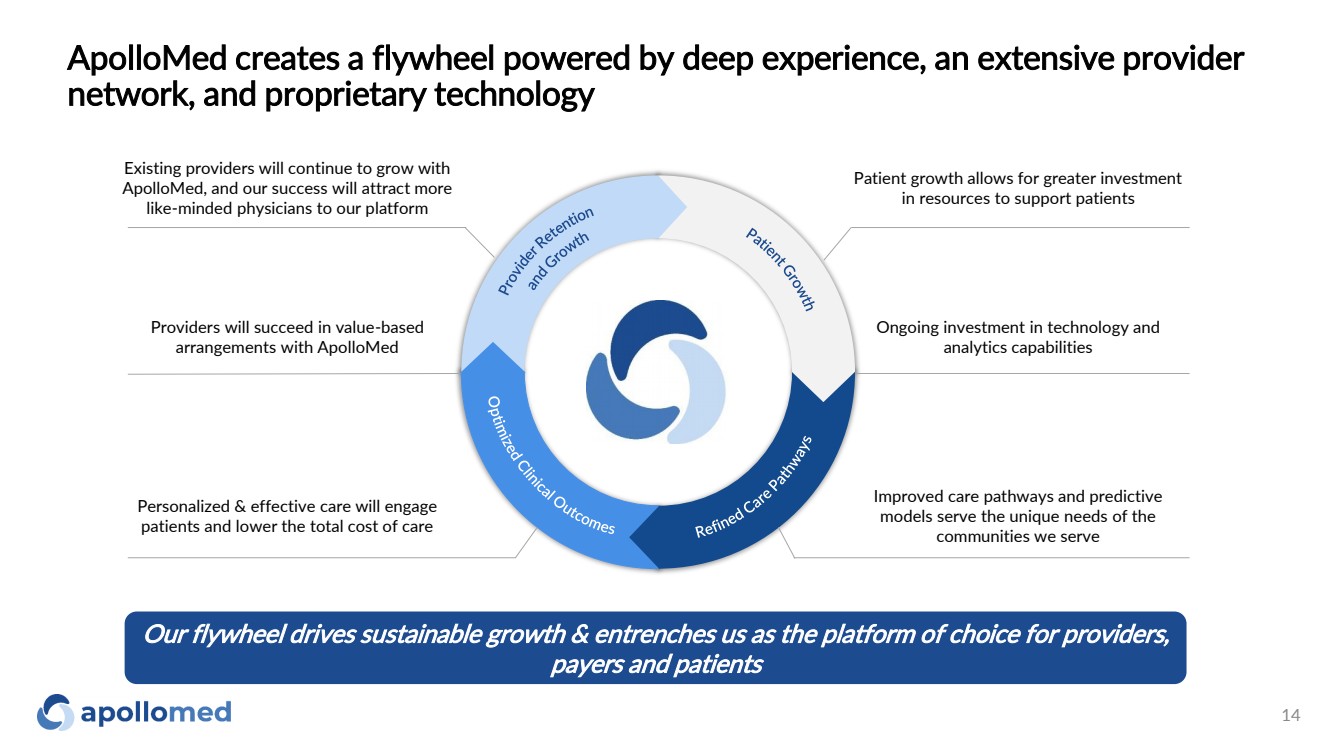
ApolloMed creates a flywheel powered by deep experience, an extensive provider network, and proprietary technology Providers will succeed in value-based arrangements with ApolloMed Personalized & effective care will engage patients and lower the total cost of care Improved care pathways and predictive models serve the unique needs of the communities we serve Ongoing investment in technology and analytics capabilities Patient growth allows for greater investment in resources to support patients Existing providers will continue to grow with ApolloMed, and our success will attract more like-minded physicians to our platform Our flywheel drives sustainable growth & entrenches us as the platform of choice for providers, payers and patients 14 |
|
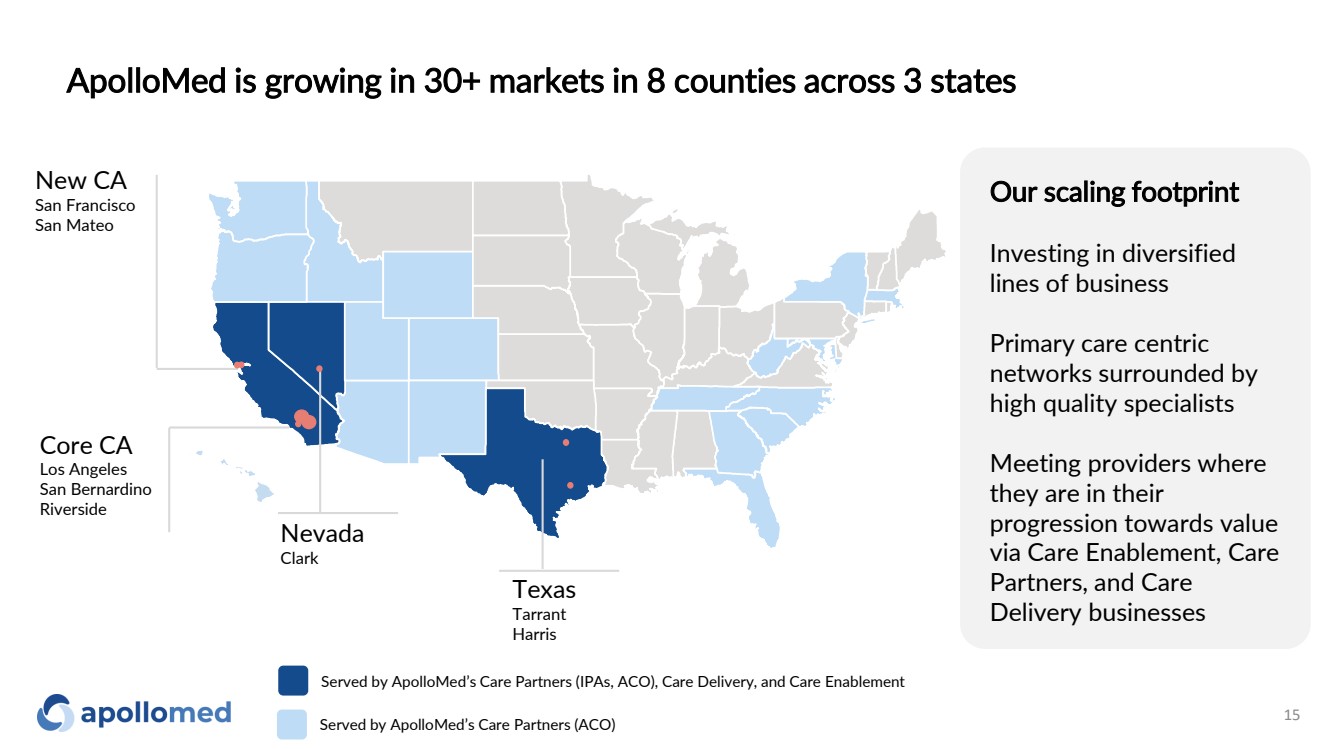
ApolloMed is growing in 30+ markets in 8 counties across 3 states 15 Served by ApolloMed’s Care Partners (IPAs, ACO), Care Delivery, and Care Enablement Served by ApolloMed’s Care Partners (ACO) New CA San Francisco San Mateo Nevada Clark Texas Tarrant Harris Core CA Los Angeles San Bernardino Riverside Our scaling footprint Investing in diversified lines of business Primary care centric networks surrounded by high quality specialists Meeting providers where they are in their progression towards value via Care Enablement, Care Partners, and Care Delivery businesses |
|
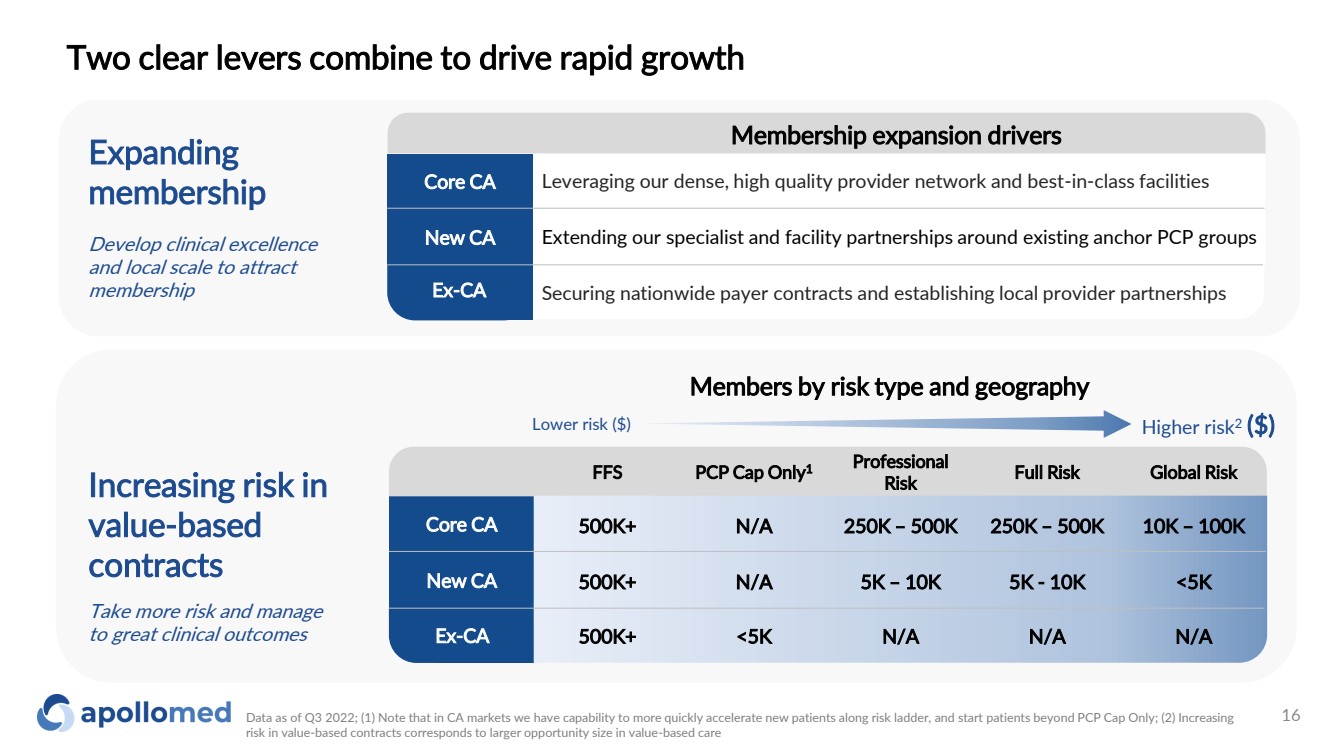
Two clear levers combine to drive rapid growth Data as of Q3 2022; (1) Note that in CA markets we have capability to more quickly accelerate new patients along risk ladder, and start patients beyond PCP Cap Only; (2) Increasing risk in value-based contracts corresponds to larger opportunity size in value-based care Lower risk ($) Higher risk2 ($) Members by risk type and geography Core CA New CA Ex-CA FFS PCP Cap Only1 Professional Risk Full Risk Global Risk 500K+ N/A 250K – 500K 250K – 500K 10K – 100K 500K+ N/A 5K – 10K 5K - 10K <5K 500K+ <5K N/A N/A N/A Increasing risk in value-based contracts Take more risk and manage to great clinical outcomes Expanding membership Develop clinical excellence and local scale to attract membership Core CA Ex-CA Securing nationwide payer contracts and establishing local provider partnerships Extending our specialist and facility partnerships around existing anchor PCP groups Leveraging our dense, high quality provider network and best-in-class facilities New CA Membership expansion drivers 16 |
|
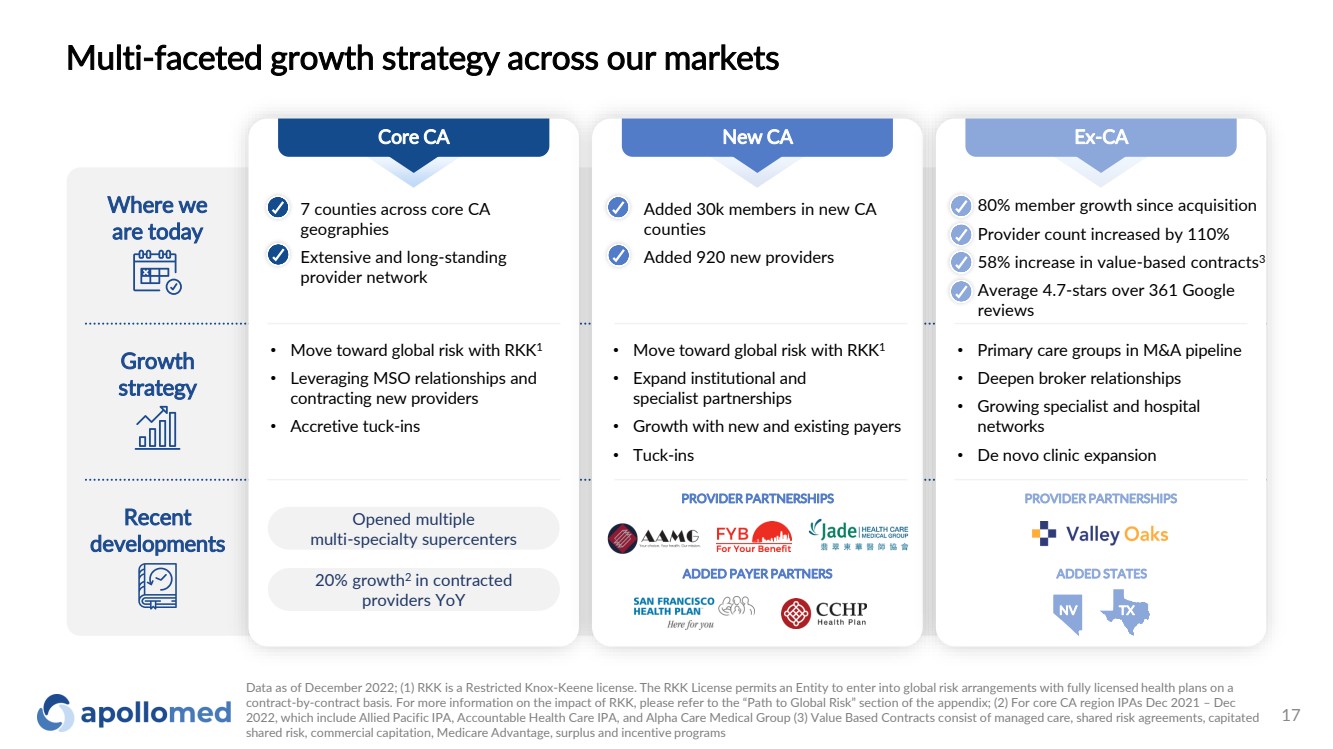
Multi-faceted growth strategy across our markets Where we are today Growth strategy Recent developments Core CA New CA Ex-CA ✓ 7 counties across core CA geographies ✓ Extensive and long-standing provider network ✓ 80% member growth since acquisition ✓ Provider count increased by 110% ✓ 58% increase in value-based contracts3 ✓ Average 4.7-stars over 361 Google reviews ✓ Added 30k members in new CA counties ✓ Added 920 new providers • Move toward global risk with RKK1 • Leveraging MSO relationships and contracting new providers • Accretive tuck-ins • Primary care groups in M&A pipeline • Deepen broker relationships • Growing specialist and hospital networks • De novo clinic expansion • Move toward global risk with RKK1 • Expand institutional and specialist partnerships • Growth with new and existing payers • Tuck-ins Opened multiple multi-specialty supercenters 20% growth2 in contracted providers YoY PROVIDER PARTNERSHIPS PROVIDER PARTNERSHIPS ADDED PAYER PARTNERS ADDED STATES NV TX Data as of December 2022; (1) RKK is a Restricted Knox-Keene license. The RKK License permits an Entity to enter into global risk arrangements with fully licensed health plans on a contract-by-contract basis. For more information on the impact of RKK, please refer to the “Path to Global Risk” section of the appendix; (2) For core CA region IPAs Dec 2021 – Dec 2022, which include Allied Pacific IPA, Accountable Health Care IPA, and Alpha Care Medical Group (3) Value Based Contracts consist of managed care, shared risk agreements, capitated shared risk, commercial capitation, Medicare Advantage, surplus and incentive programs 17 |
|
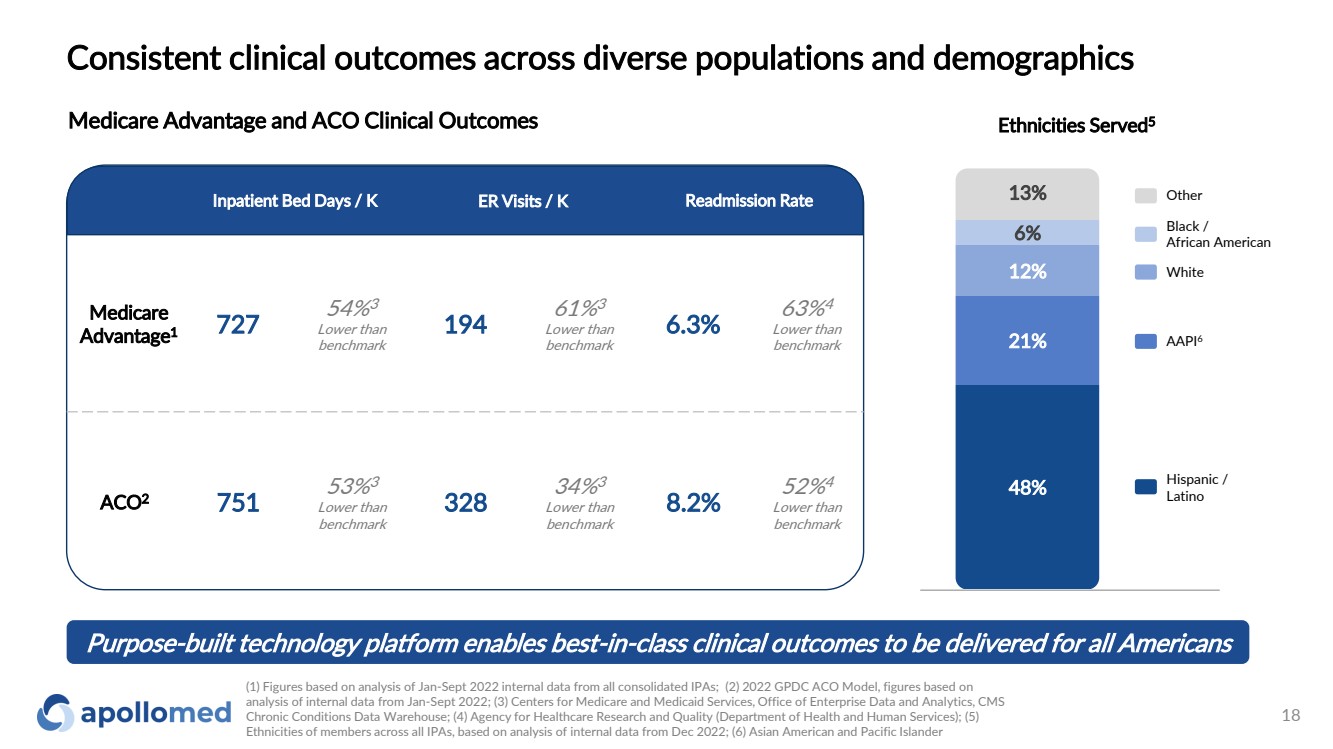
Consistent clinical outcomes across diverse populations and demographics Medicare Advantage and ACO Clinical Outcomes Purpose-built technology platform enables best-in-class clinical outcomes to be delivered for all Americans Ethnicities Served5 48% 21% 12% 6% 13% (1) Figures based on analysis of Jan-Sept 2022 internal data from all consolidated IPAs; (2) 2022 GPDC ACO Model, figures based on analysis of internal data from Jan-Sept 2022; (3) Centers for Medicare and Medicaid Services, Office of Enterprise Data and Analytics, CMS Chronic Conditions Data Warehouse; (4) Agency for Healthcare Research and Quality (Department of Health and Human Services); (5) Ethnicities of members across all IPAs, based on analysis of internal data from Dec 2022; (6) Asian American and Pacific Islander Hispanic / Latino AAPI6 White Black / African American Other Medicare Advantage1 727 54%3 Lower than benchmark 194 61%3 Lower than benchmark 6.3% 63%4 Lower than benchmark ACO2 751 53%3 Lower than benchmark 328 34%3 Lower than benchmark 8.2% 52%4 Lower than benchmark Inpatient Bed Days / K ER Visits / K Readmission Rate 18 |
|
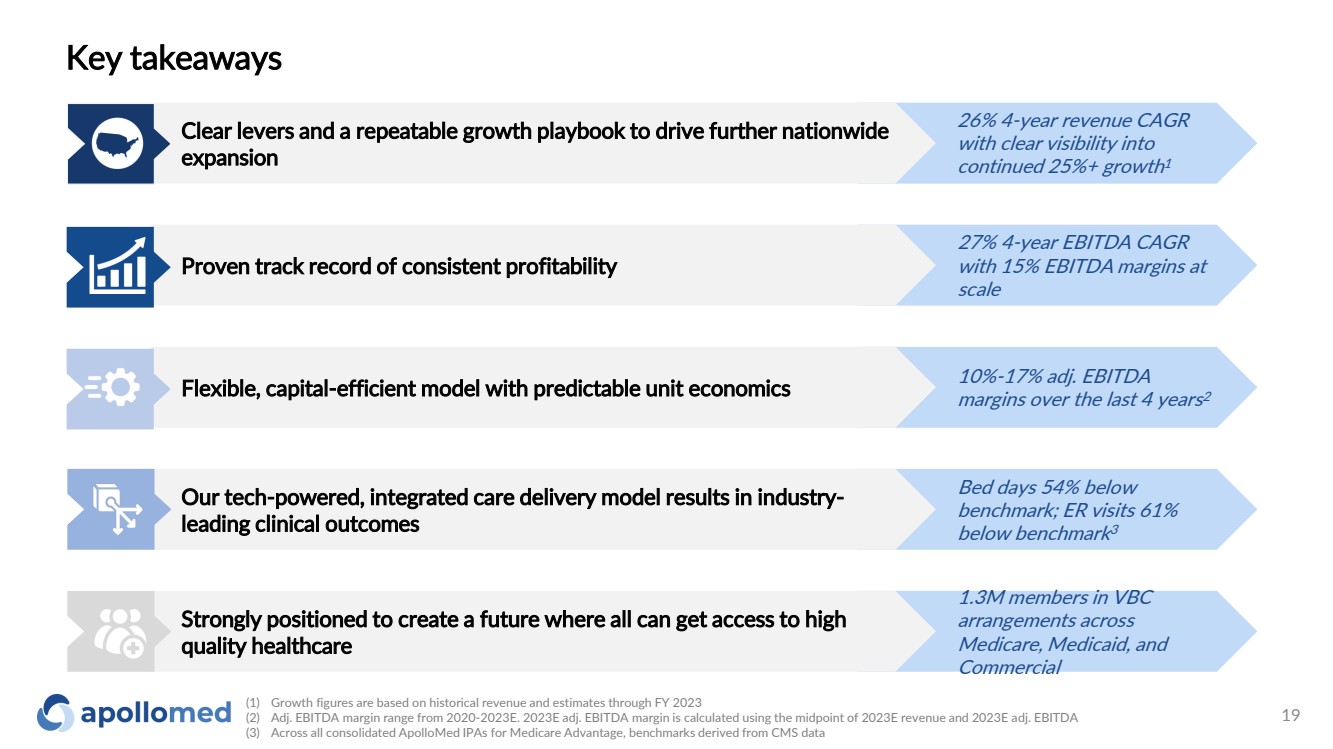
10%-17% adj. EBITDA margins over the last 4 years 2 Bed days 54% below benchmark; ER visits 61% below benchmark 3 1.3M members in VBC arrangements across Medicare, Medicaid, and Commercial 27% 4-year EBITDA CAGR with 15% EBITDA margins at scale Key takeaways Strongly positioned to create a future where all can get access to high quality healthcare Proven track record of consistent profitability Our tech-powered, integrated care delivery model results in industry-leading clinical outcomes Flexible, capital-efficient model with predictable unit economics Clear levers and a repeatable growth playbook to drive further nationwide expansion (1) Growth figures are based on historical revenue and estimates through FY 2023 (2) Adj. EBITDA margin range from 2020-2023E. 2023E adj. EBITDA margin is calculated using the midpoint of 2023E revenue and 2023E adj. EBITDA (3) Across all consolidated ApolloMed IPAs for Medicare Advantage, benchmarks derived from CMS data 26% 4-year revenue CAGR with clear visibility into continued 25%+ growth 1 19 |
|
Appendix |
|
Financial Data |
|
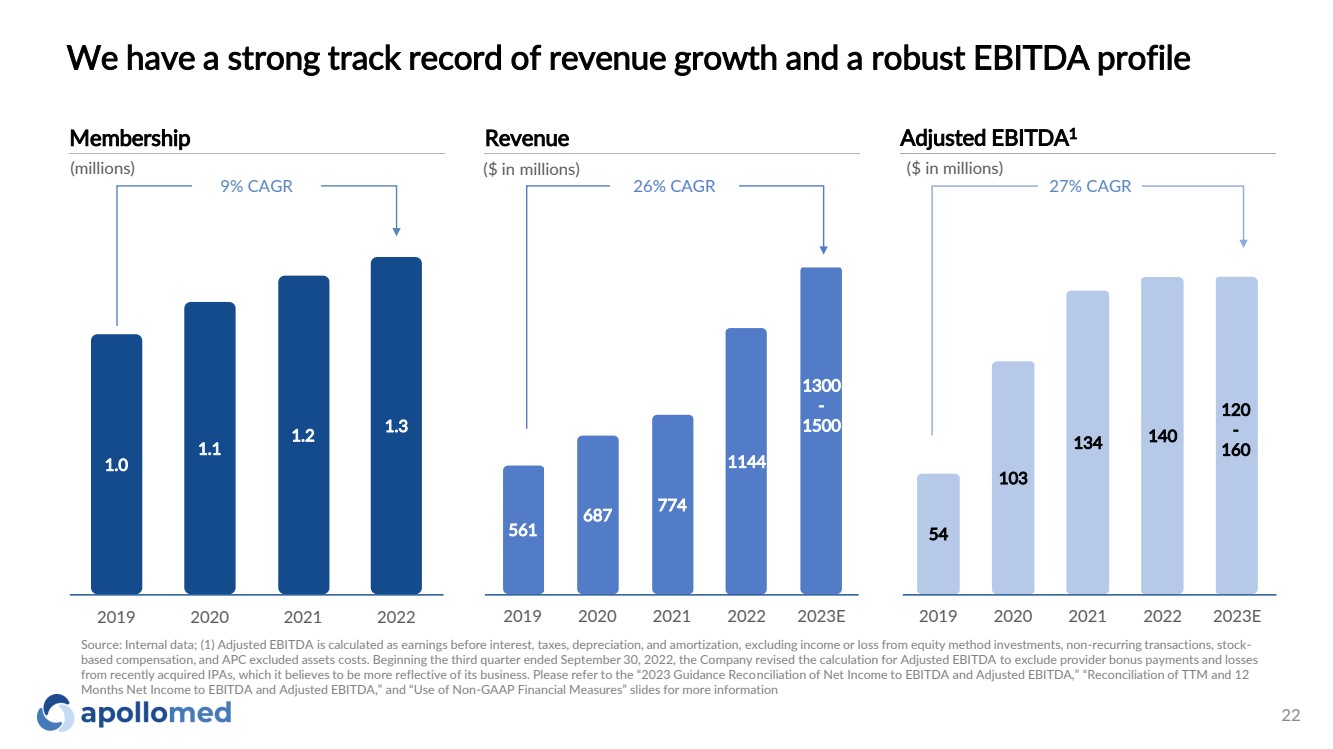
561 687 774 1144 1300 - 1500 2019 2020 2021 2022 2023E We have a strong track record of revenue growth and a robust EBITDA profile ($ in millions) Revenue 26% CAGR ($ in millions) Adjusted EBITDA1 27% CAGR Source: Internal data; (1) Adjusted EBITDA is calculated as earnings before interest, taxes, depreciation, and amortization, excluding income or loss from equity method investments, non-recurring transactions, stock-based compensation, and APC excluded assets costs. Beginning the third quarter ended September 30, 2022, the Company revised the calculation for Adjusted EBITDA to exclude provider bonus payments and losses from recently acquired IPAs, which it believes to be more reflective of its business. Please refer to the “2023 Guidance Reconciliation of Net Income to EBITDA and Adjusted EBITDA,” “Reconciliation of TTM and 12 Months Net Income to EBITDA and Adjusted EBITDA,” and “Use of Non-GAAP Financial Measures” slides for more information 54 103 134 140 120 - 160 2019 2020 2021 2022 2023E Membership 9% CAGR 1.0 1.1 1.2 1.3 2019 2020 2021 2022 (millions) 22 |
|
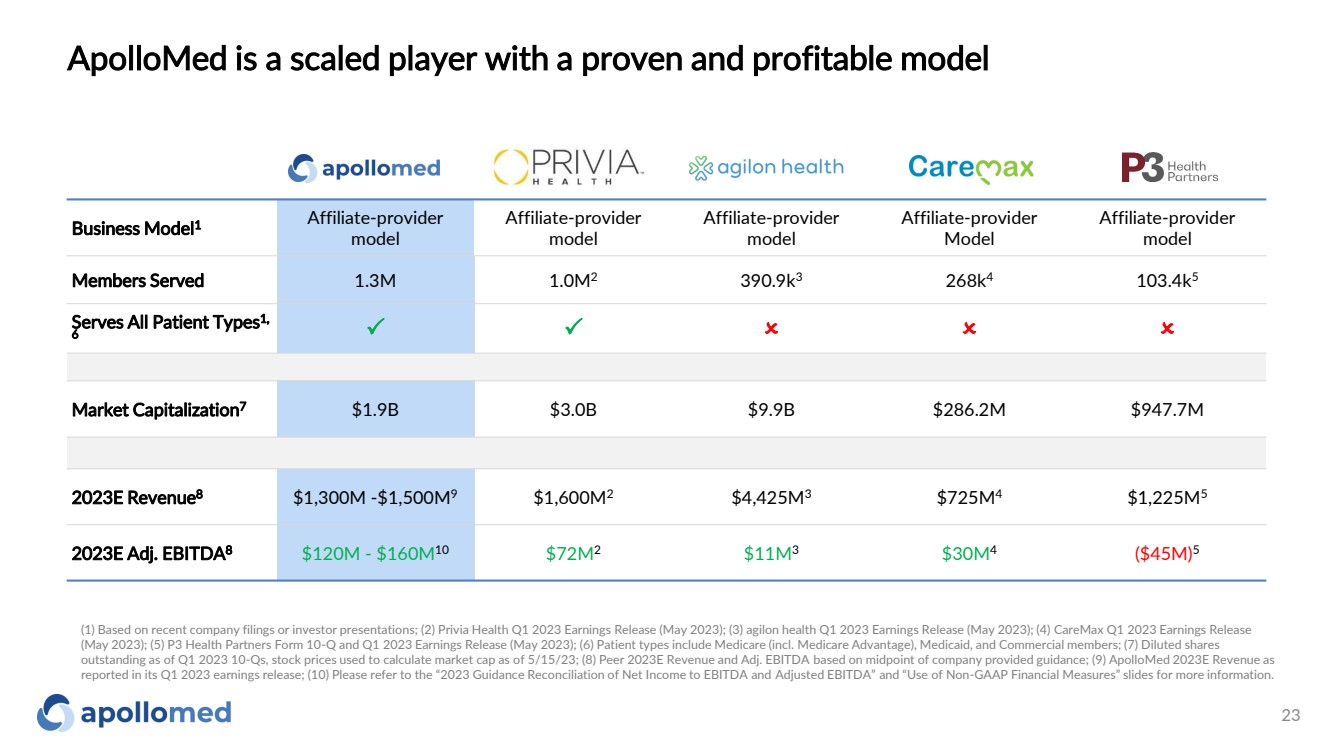
ApolloMed is a scaled player with a proven and profitable model Business Model1 Affiliate-provider model Affiliate-provider model Affiliate-provider model Affiliate-provider Model Affiliate-provider model Members Served 1.3M 1.0M2 390.9k3 268k4 103.4k5 Serves All Patient Types1, 6 P P O O O Market Capitalization7 $1.9B $3.0B $9.9B $286.2M $947.7M 2023E Revenue8 $1,300M -$1,500M9 $1,600M2 $4,425M3 $725M4 $1,225M5 2023E Adj. EBITDA8 $120M - $160M10 $72M2 $11M3 $30M4 ($45M)5 (1) Based on recent company filings or investor presentations; (2) Privia Health Q1 2023 Earnings Release (May 2023); (3) agilon health Q1 2023 Earnings Release (May 2023); (4) CareMax Q1 2023 Earnings Release (May 2023); (5) P3 Health Partners Form 10-Q and Q1 2023 Earnings Release (May 2023); (6) Patient types include Medicare (incl. Medicare Advantage), Medicaid, and Commercial members; (7) Diluted shares outstanding as of Q1 2023 10-Qs, stock prices used to calculate market cap as of 5/15/23; (8) Peer 2023E Revenue and Adj. EBITDA based on midpoint of company provided guidance; (9) ApolloMed 2023E Revenue as reported in its Q1 2023 earnings release; (10) Please refer to the “2023 Guidance Reconciliation of Net Income to EBITDA and Adjusted EBITDA” and “Use of Non-GAAP Financial Measures” slides for more information. 23 |
|
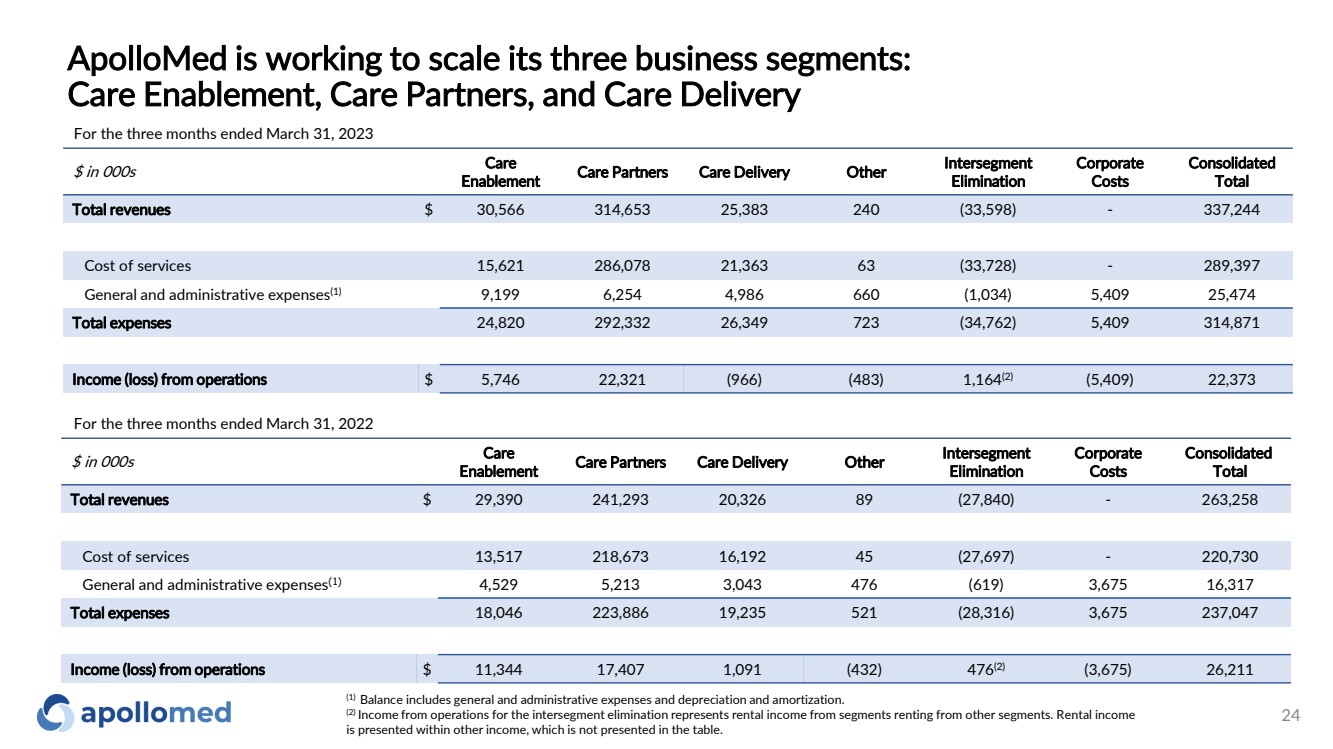
ApolloMed is working to scale its three business segments: Care Enablement, Care Partners, and Care Delivery 24 $ in 000s Care Enablement Care Partners Care Delivery Other Intersegment Elimination Corporate Costs Consolidated Total Total revenues $ 30,566 314,653 25,383 240 (33,598) - 337,244 Cost of services 15,621 286,078 21,363 63 (33,728) - 289,397 General and administrative expenses(1) 9,199 6,254 4,986 660 (1,034) 5,409 25,474 Total expenses 24,820 292,332 26,349 723 (34,762) 5,409 314,871 Income (loss) from operations $ 5,746 22,321 (966) (483) 1,164(2) (5,409) 22,373 For the three months ended March 31, 2023 $ in 000s Care Enablement Care Partners Care Delivery Other Intersegment Elimination Corporate Costs Consolidated Total Total revenues $ 29,390 241,293 20,326 89 (27,840) - 263,258 Cost of services 13,517 218,673 16,192 45 (27,697) - 220,730 General and administrative expenses(1) 4,529 5,213 3,043 476 (619) 3,675 16,317 Total expenses 18,046 223,886 19,235 521 (28,316) 3,675 237,047 Income (loss) from operations $ 11,344 17,407 1,091 (432) 476(2) (3,675) 26,211 For the three months ended March 31, 2022 (1) Balance includes general and administrative expenses and depreciation and amortization. (2) Income from operations for the intersegment elimination represents rental income from segments renting from other segments. Rental income is presented within other income, which is not presented in the table. |
|
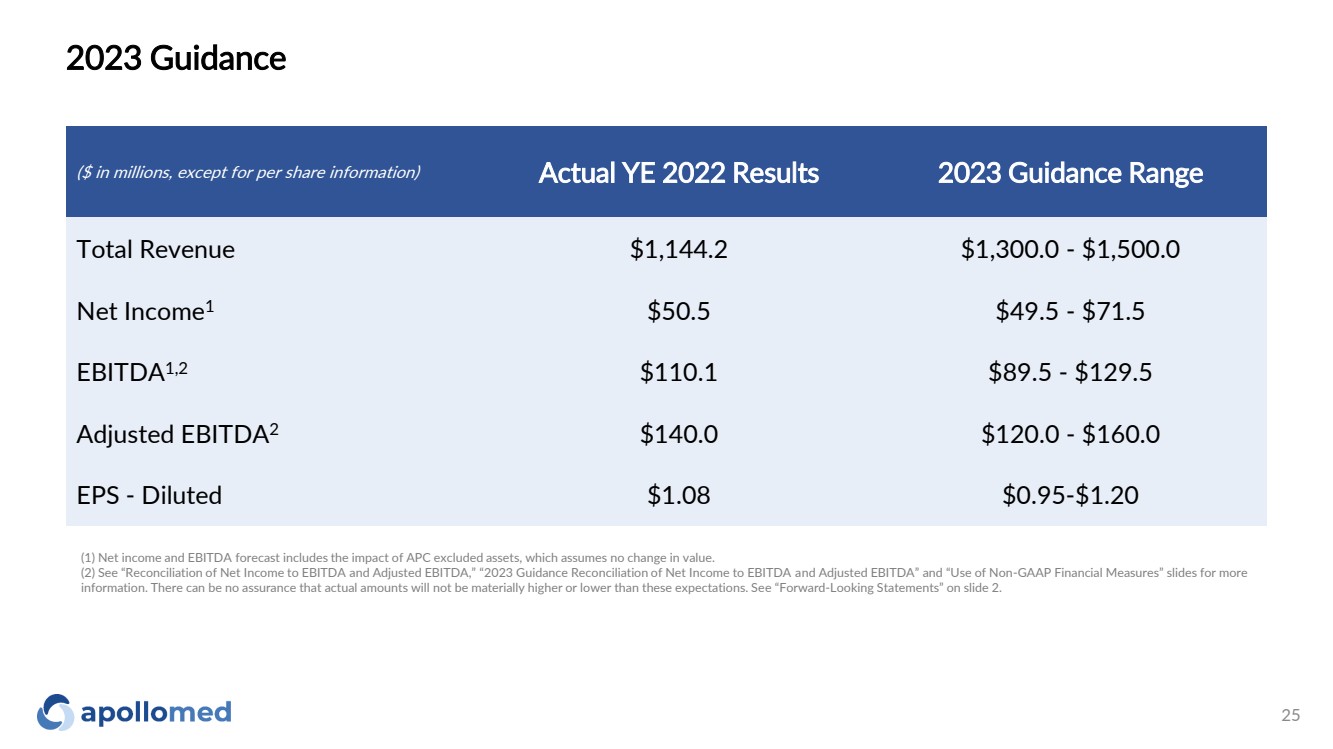
2023 Guidance ($ in millions, except for per share information) Actual YE 2022 Results 2023 Guidance Range Total Revenue $1,144.2 $1,300.0 - $1,500.0 Net Income1 $50.5 $49.5 - $71.5 EBITDA1,2 $110.1 $89.5 - $129.5 Adjusted EBITDA2 $140.0 $120.0 - $160.0 EPS - Diluted $1.08 $0.95-$1.20 (1) Net income and EBITDA forecast includes the impact of APC excluded assets, which assumes no change in value. (2) See “Reconciliation of Net Income to EBITDA and Adjusted EBITDA,” “2023 Guidance Reconciliation of Net Income to EBITDA and Adjusted EBITDA” and “Use of Non-GAAP Financial Measures” slides for more information. There can be no assurance that actual amounts will not be materially higher or lower than these expectations. See “Forward-Looking Statements” on slide 2. 25 |
|
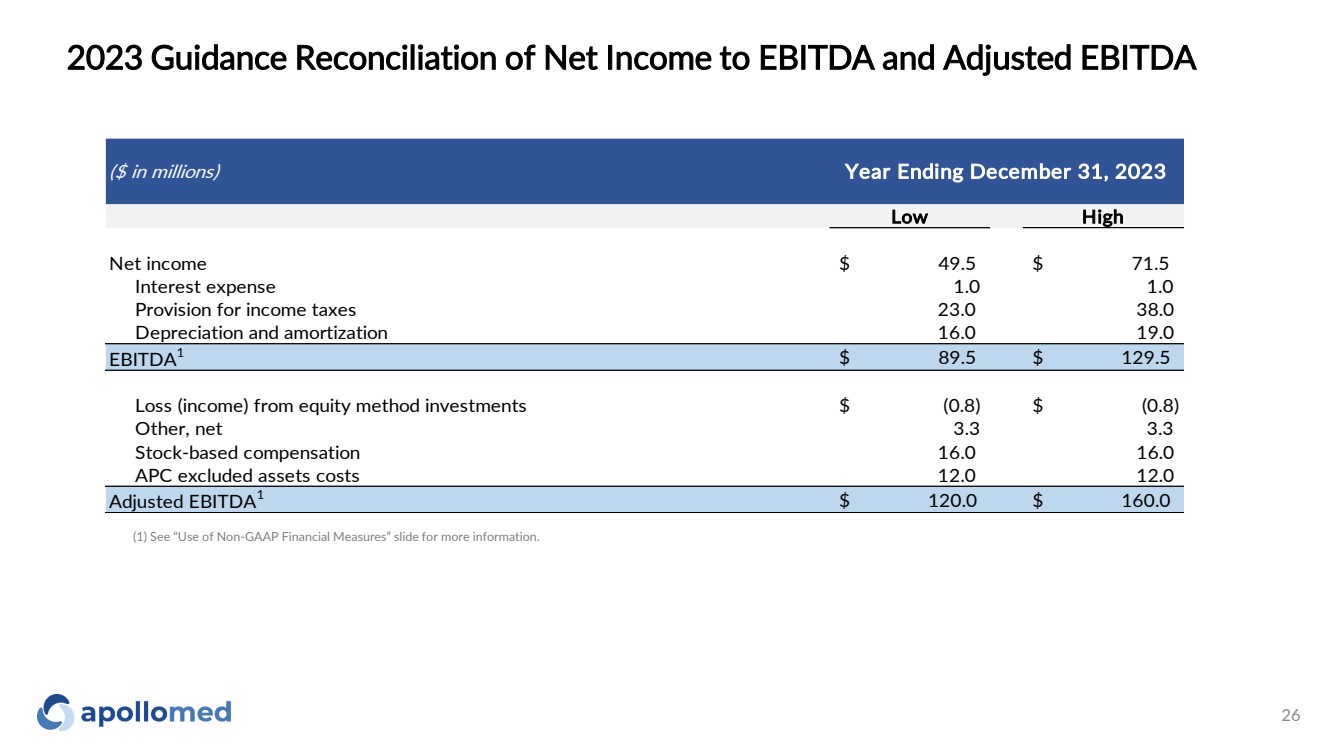
2023 Guidance Reconciliation of Net Income to EBITDA and Adjusted EBITDA ($ in millions) Low High Net income $ 49.5 $ 71.5 Interest expense 1.0 1.0 Provision for income taxes 23.0 38.0 Depreciation and amortization 16.0 19.0 EBITDA1 $ 89.5 $ 129.5 Loss (income) from equity method investments $ (0.8) $ (0.8) Other, net 3.3 3.3 Stock-based compensation 16.0 16.0 APC excluded assets costs 12.0 12.0 Adjusted EBITDA1 $ 120.0 $ 160.0 Year Ending December 31, 2023 (1) See “Use of Non-GAAP Financial Measures” slide for more information. 26 |
|
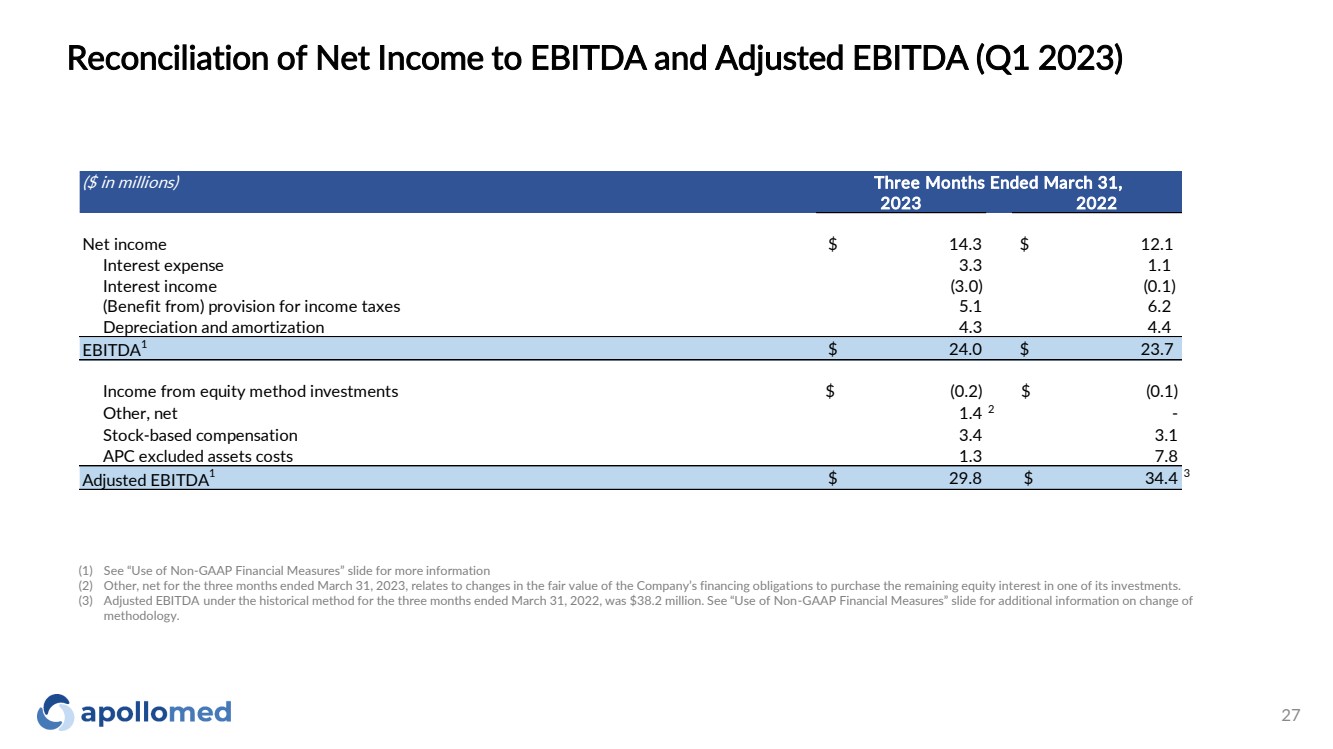
Reconciliation of Net Income to EBITDA and Adjusted EBITDA (Q1 2023) ($ in millions) 2023 2022 Net income $ 14.3 $ 12.1 Interest expense 3.3 1.1 Interest income (3.0) (0.1) (Benefit from) provision for income taxes 5.1 6.2 Depreciation and amortization 4.3 4.4 EBITDA1 $ 24.0 $ 23.7 Income from equity method investments $ (0.2) $ (0.1) Other, net 1.4 2 - Stock-based compensation 3.4 3.1 APC excluded assets costs 1.3 7.8 Adjusted EBITDA1 $ 29.8 $ 34.4 3 Three Months Ended March 31, (1) See “Use of Non-GAAP Financial Measures” slide for more information (2) Other, net for the three months ended March 31, 2023, relates to changes in the fair value of the Company’s financing obligations to purchase the remaining equity interest in one of its investments. (3) Adjusted EBITDA under the historical method for the three months ended March 31, 2022, was $38.2 million. See “Use of Non-GAAP Financial Measures” slide for additional information on change of methodology. 27 |
|
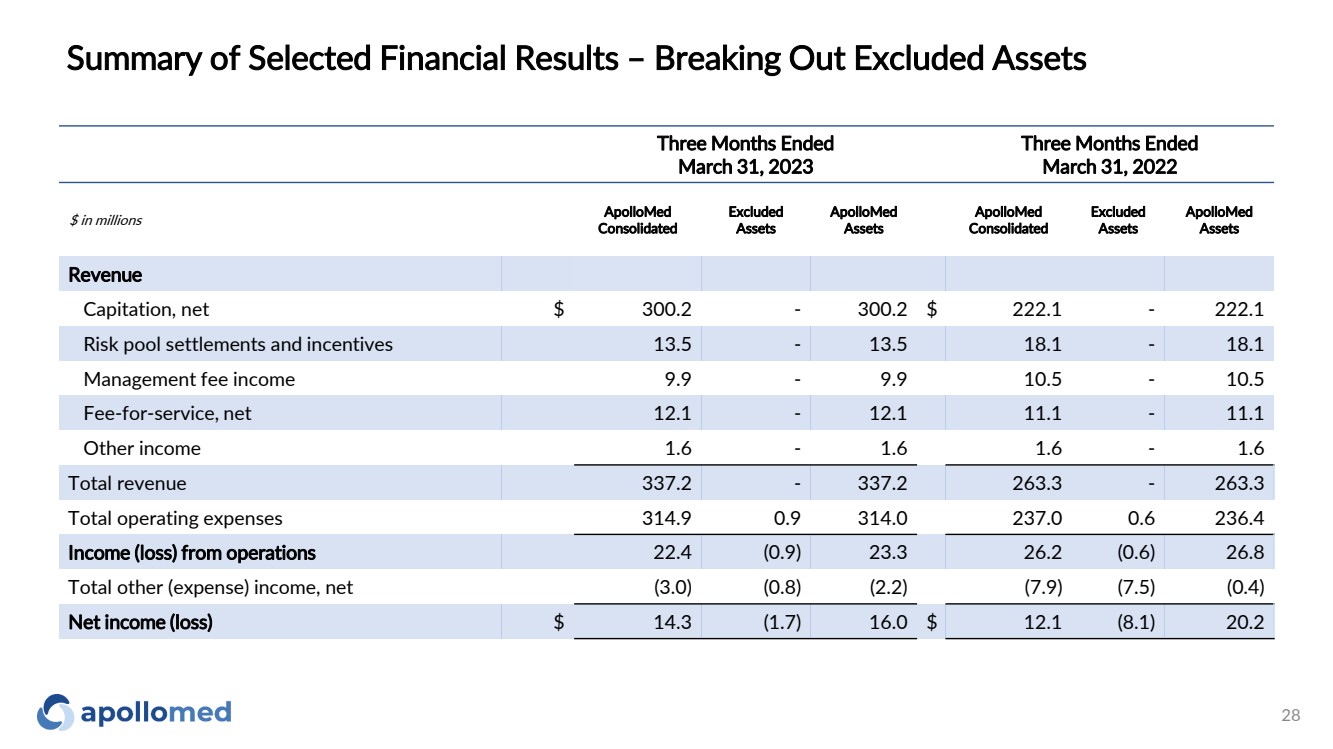
Summary of Selected Financial Results – Breaking Out Excluded Assets 28 Three Months Ended March 31, 2023 Three Months Ended March 31, 2022 $ in millions ApolloMed Consolidated Excluded Assets ApolloMed Assets ApolloMed Consolidated Excluded Assets ApolloMed Assets Revenue Capitation, net $ 300.2 - 300.2 $ 222.1 - 222.1 Risk pool settlements and incentives 13.5 - 13.5 18.1 - 18.1 Management fee income 9.9 - 9.9 10.5 - 10.5 Fee-for-service, net 12.1 - 12.1 11.1 - 11.1 Other income 1.6 - 1.6 1.6 - 1.6 Total revenue 337.2 - 337.2 263.3 - 263.3 Total operating expenses 314.9 0.9 314.0 237.0 0.6 236.4 Income (loss) from operations 22.4 (0.9) 23.3 26.2 (0.6) 26.8 Total other (expense) income, net (3.0) (0.8) (2.2) (7.9) (7.5) (0.4) Net income (loss) $ 14.3 (1.7) 16.0 $ 12.1 (8.1) 20.2 |
|
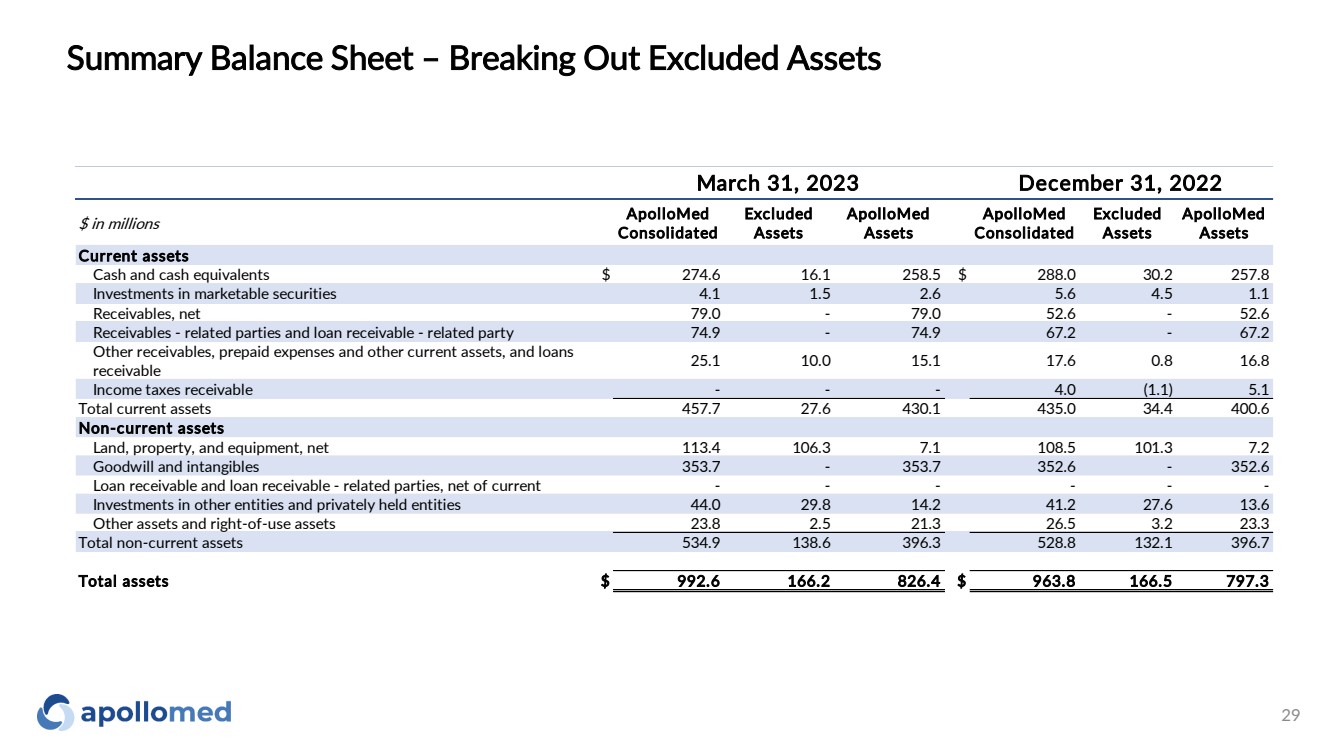
Summary Balance Sheet – Breaking Out Excluded Assets 29 $ in millions ApolloMed Consolidated Excluded Assets ApolloMed Assets ApolloMed Consolidated Excluded Assets ApolloMed Assets Current assets Cash and cash equivalents $ 274.6 16.1 258.5 $ 288.0 30.2 257.8 Investments in marketable securities 4.1 1.5 2.6 5.6 4.5 1.1 Receivables, net 79.0 - 79.0 52.6 - 52.6 Receivables - related parties and loan receivable - related party 74.9 - 74.9 67.2 - 67.2 Other receivables, prepaid expenses and other current assets, and loans receivable 25.1 10.0 15.1 17.6 0.8 16.8 Income taxes receivable - - - 4.0 (1.1) 5.1 Total current assets 457.7 27.6 430.1 435.0 34.4 400.6 Non-current assets Land, property, and equipment, net 113.4 106.3 7.1 108.5 101.3 7.2 Goodwill and intangibles 353.7 - 353.7 352.6 - 352.6 Loan receivable and loan receivable - related parties, net of current - - - - - - Investments in other entities and privately held entities 44.0 29.8 14.2 41.2 27.6 13.6 Other assets and right-of-use assets 23.8 2.5 21.3 26.5 3.2 23.3 Total non-current assets 534.9 138.6 396.3 528.8 132.1 396.7 Total assets $ 992.6 166.2 826.4 $ 963.8 166.5 797.3 March 31, 2023 December 31, 2022 |
|
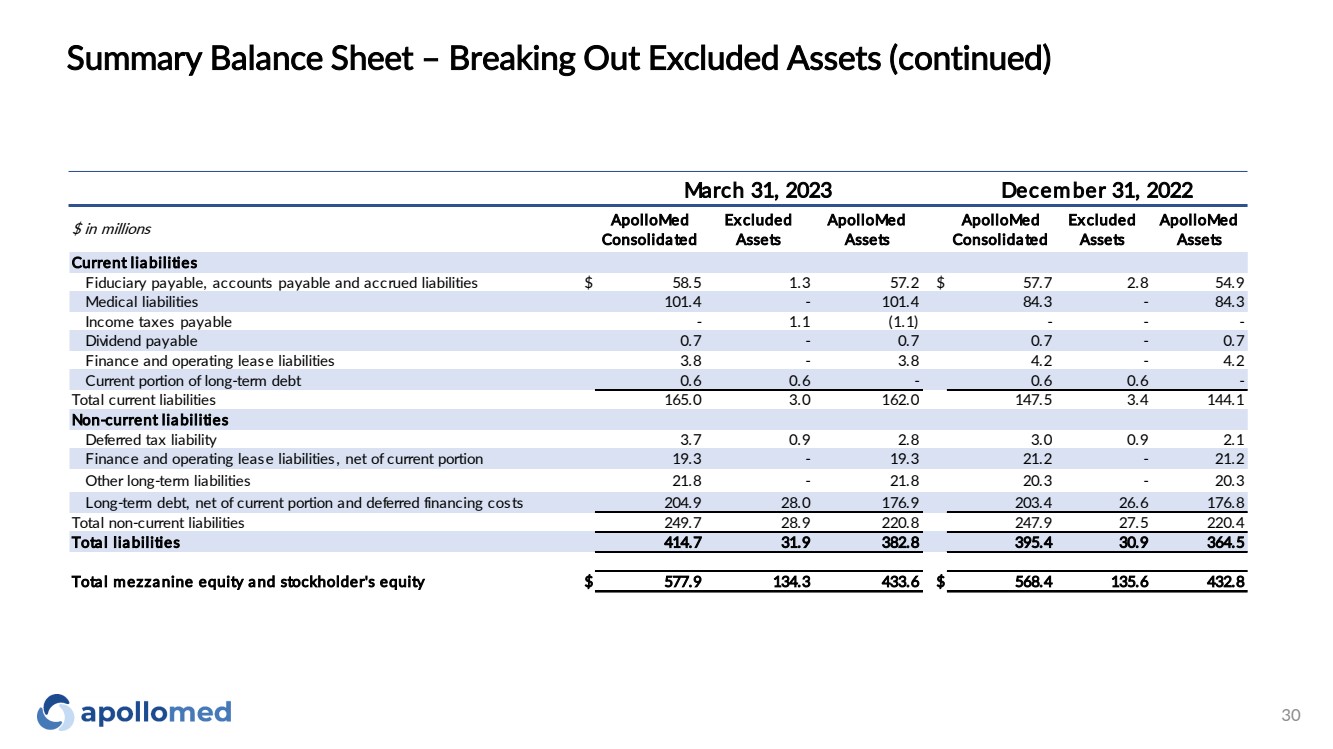
Summary Balance Sheet – Breaking Out Excluded Assets (continued) 30 $ in millions ApolloMed Consolidated Excluded Assets ApolloMed Assets ApolloMed Consolidated Excluded Assets ApolloMed Assets Current liabilities Fiduciary payable, accounts payable and accrued liabilities $ 58.5 1.3 57.2 $ 57.7 2.8 54.9 Medical liabilities 101.4 - 101.4 84.3 - 84.3 Income taxes payable - 1.1 (1.1) - - - Dividend payable 0.7 - 0.7 0.7 - 0.7 Finance and operating lease liabilities 3.8 - 3.8 4.2 - 4.2 Current portion of long-term debt 0.6 0.6 - 0.6 0.6 - Total current liabilities 165.0 3.0 162.0 147.5 3.4 144.1 Non-current liabilities Deferred tax liability 3.7 0.9 2.8 3.0 0.9 2.1 Finance and operating lease liabilities, net of current portion 19.3 - 19.3 21.2 - 21.2 Other long-term liabilities 21.8 - 21.8 20.3 - 20.3 Long-term debt, net of current portion and deferred financing costs 204.9 28.0 176.9 203.4 26.6 176.8 Total non-current liabilities 249.7 28.9 220.8 247.9 27.5 220.4 Total liabilities 414.7 31.9 382.8 395.4 30.9 364.5 Total mezzanine equity and stockholder's equity $ 577.9 134.3 433.6 $ 568.4 135.6 432.8 March 31, 2023 December 31, 2022 |
|
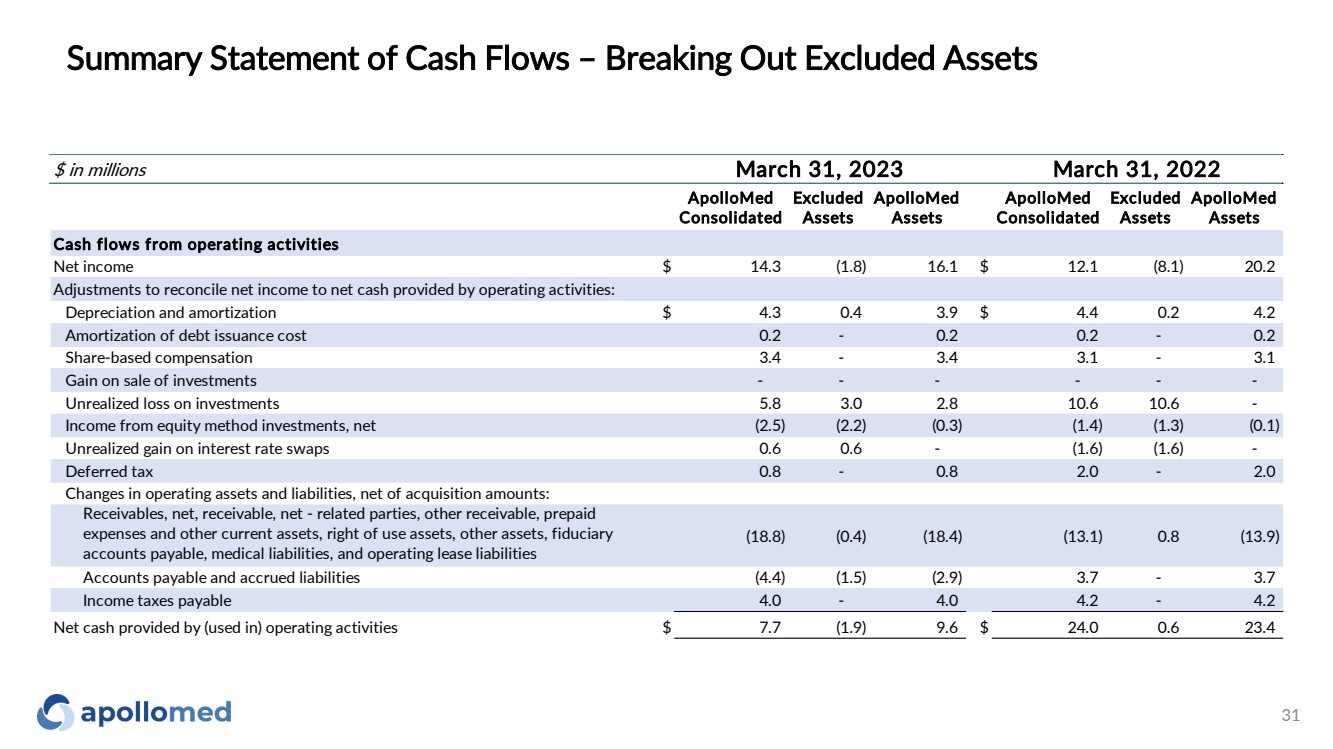
Summary Statement of Cash Flows – Breaking Out Excluded Assets 31 $ in millions ApolloMed Consolidated Excluded Assets ApolloMed Assets ApolloMed Consolidated Excluded Assets ApolloMed Assets Cash flows from operating activities Net income $ 14.3 (1.8) 16.1 $ 12.1 (8.1) 20.2 Adjustments to reconcile net income to net cash provided by operating activities: Depreciation and amortization $ 4.3 0.4 3.9 $ 4.4 0.2 4.2 Amortization of debt issuance cost 0.2 - 0.2 0.2 - 0.2 Share-based compensation 3.4 - 3.4 3.1 - 3.1 Gain on sale of investments - - - - - - Unrealized loss on investments 5.8 3.0 2.8 10.6 10.6 - Income from equity method investments, net (2.5) (2.2) (0.3) (1.4) (1.3) (0.1) Unrealized gain on interest rate swaps 0.6 0.6 - (1.6) (1.6) - Deferred tax 0.8 - 0.8 2.0 - 2.0 Changes in operating assets and liabilities, net of acquisition amounts: Receivables, net, receivable, net - related parties, other receivable, prepaid expenses and other current assets, right of use assets, other assets, fiduciary accounts payable, medical liabilities, and operating lease liabilities (18.8) (0.4) (18.4) (13.1) 0.8 (13.9) Accounts payable and accrued liabilities (4.4) (1.5) (2.9) 3.7 - 3.7 Income taxes payable 4.0 - 4.0 4.2 - 4.2 Net cash provided by (used in) operating activities $ 7.7 (1.9) 9.6 $ 24.0 0.6 23.4 March 31, 2023 March 31, 2022 |
|
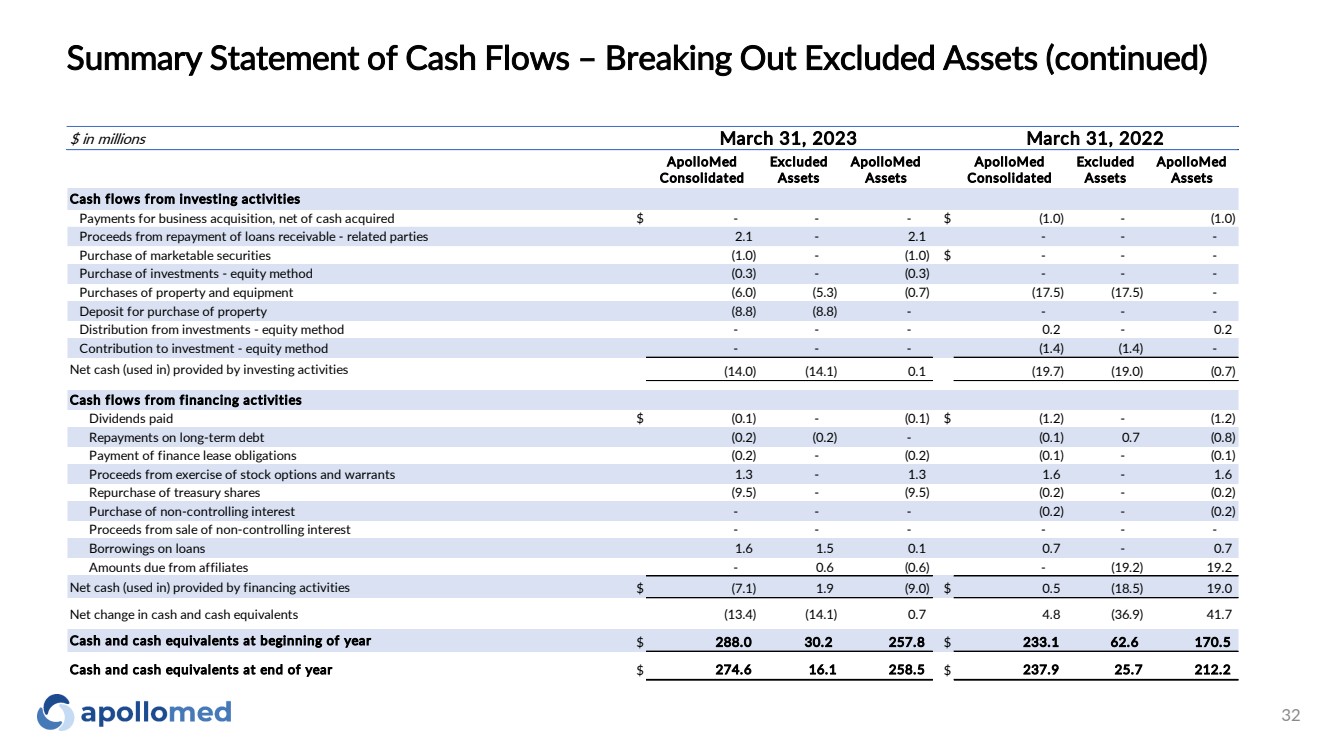
Summary Statement of Cash Flows – Breaking Out Excluded Assets (continued) 32 $ in millions ApolloMed Consolidated Excluded Assets ApolloMed Assets ApolloMed Consolidated Excluded Assets ApolloMed Assets Cash flows from investing activities Payments for business acquisition, net of cash acquired $ - - - $ (1.0) - (1.0) Proceeds from repayment of loans receivable - related parties 2.1 - 2.1 - - - Purchase of marketable securities (1.0) - (1.0) $ - - - Purchase of investments - equity method (0.3) - (0.3) - - - Purchases of property and equipment (6.0) (5.3) (0.7) (17.5) (17.5) - Deposit for purchase of property (8.8) (8.8) - - - - Distribution from investments - equity method - - - 0.2 - 0.2 Contribution to investment - equity method - - - (1.4) (1.4) - Net cash (used in) provided by investing activities (14.0) (14.1) 0.1 (19.7) (19.0) (0.7) Cash flows from financing activities Dividends paid $ (0.1) - (0.1) $ (1.2) - (1.2) Repayments on long-term debt (0.2) (0.2) - (0.1) 0.7 (0.8) Payment of finance lease obligations (0.2) - (0.2) (0.1) - (0.1) Proceeds from exercise of stock options and warrants 1.3 - 1.3 1.6 - 1.6 Repurchase of treasury shares (9.5) - (9.5) (0.2) - (0.2) Purchase of non-controlling interest - - - (0.2) - (0.2) Proceeds from sale of non-controlling interest - - - - - - Borrowings on loans 1.6 1.5 0.1 0.7 - 0.7 Amounts due from affiliates - 0.6 (0.6) - (19.2) 19.2 Net cash (used in) provided by financing activities $ (7.1) 1.9 (9.0) $ 0.5 (18.5) 19.0 Net change in cash and cash equivalents (13.4) (14.1) 0.7 4.8 (36.9) 41.7 Cash and cash equivalents at beginning of year $ 288.0 30.2 257.8 $ 233.1 62.6 170.5 Cash and cash equivalents at end of year $ 274.6 16.1 258.5 $ 237.9 25.7 212.2 March 31, 2023 March 31, 2022 |
|
Path to Global Risk |
|
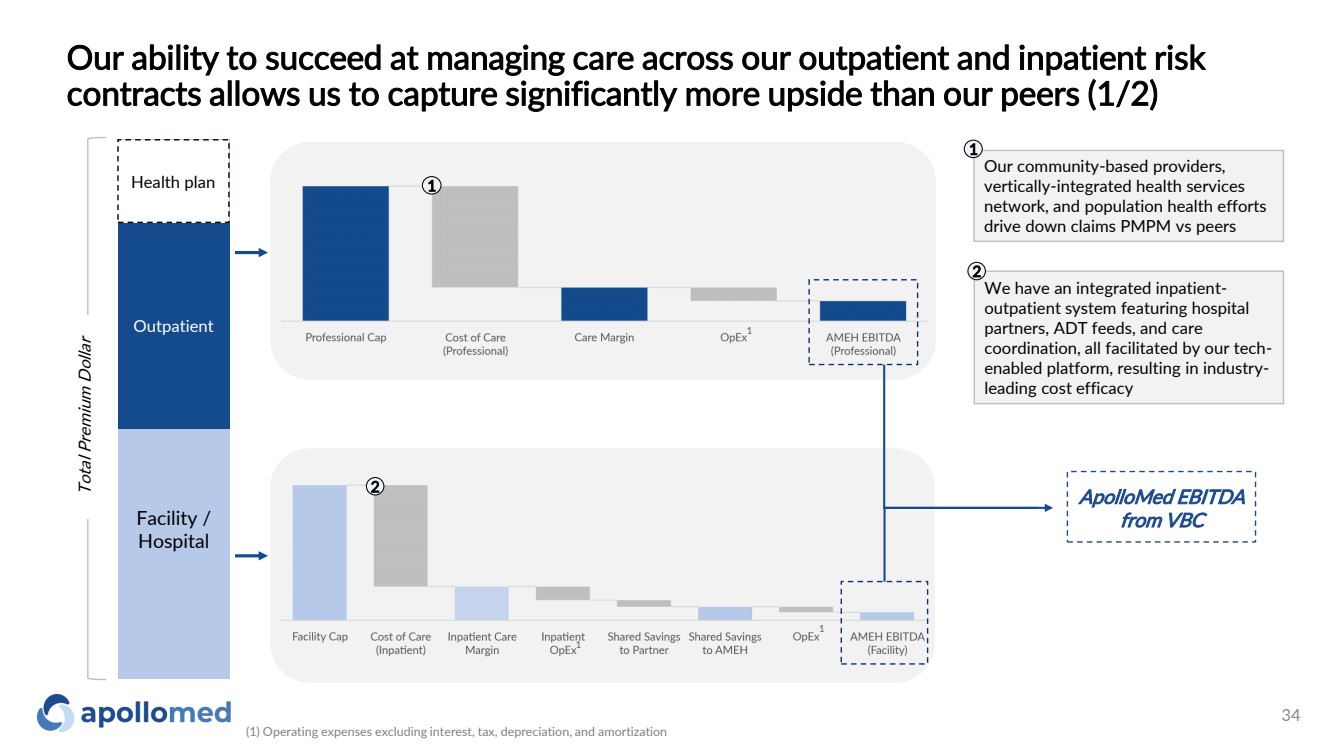
Our ability to succeed at managing care across our outpatient and inpatient risk contracts allows us to capture significantly more upside than our peers (1/2) Facility / Hospital Outpatient Total Premium Dollar ApolloMed EBITDA from VBC We have an integrated inpatient-outpatient system featuring hospital partners, ADT feeds, and care coordination, all facilitated by our tech-enabled platform, resulting in industry-leading cost efficacy 2 1 2 Health plan Our community-based providers, vertically-integrated health services network, and population health efforts drive down claims PMPM vs peers 1 1 1 (1) Operating expenses excluding interest, tax, depreciation, and amortization 1 34 |
|
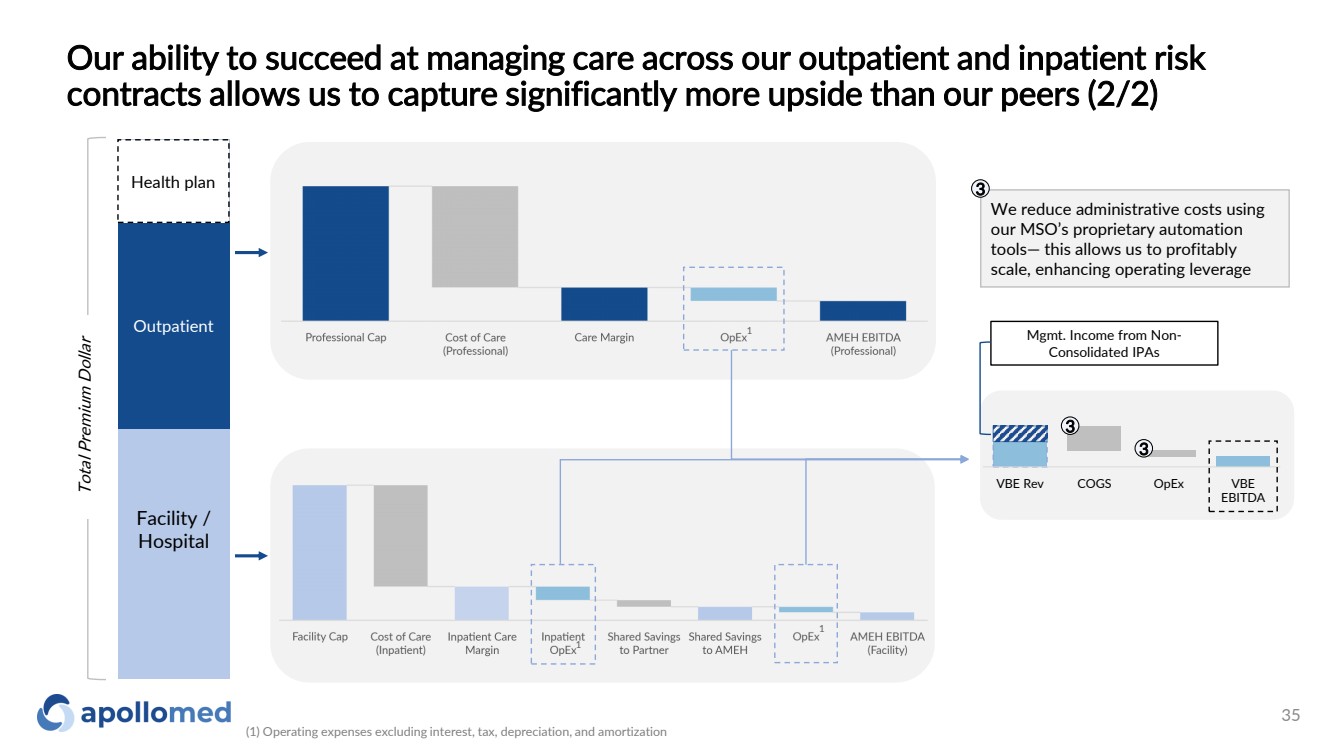
Facility / Hospital Outpatient Total Premium Dollar Health plan We reduce administrative costs using our MSO’s proprietary automation tools— this allows us to profitably scale, enhancing operating leverage 3 1 1 1 VBE Rev COGS OpEx VBE EBITDA 3 3 Mgmt. Income from Non-Consolidated IPAs Our ability to succeed at managing care across our outpatient and inpatient risk contracts allows us to capture significantly more upside than our peers (2/2) (1) Operating expenses excluding interest, tax, depreciation, and amortization 35 |
|
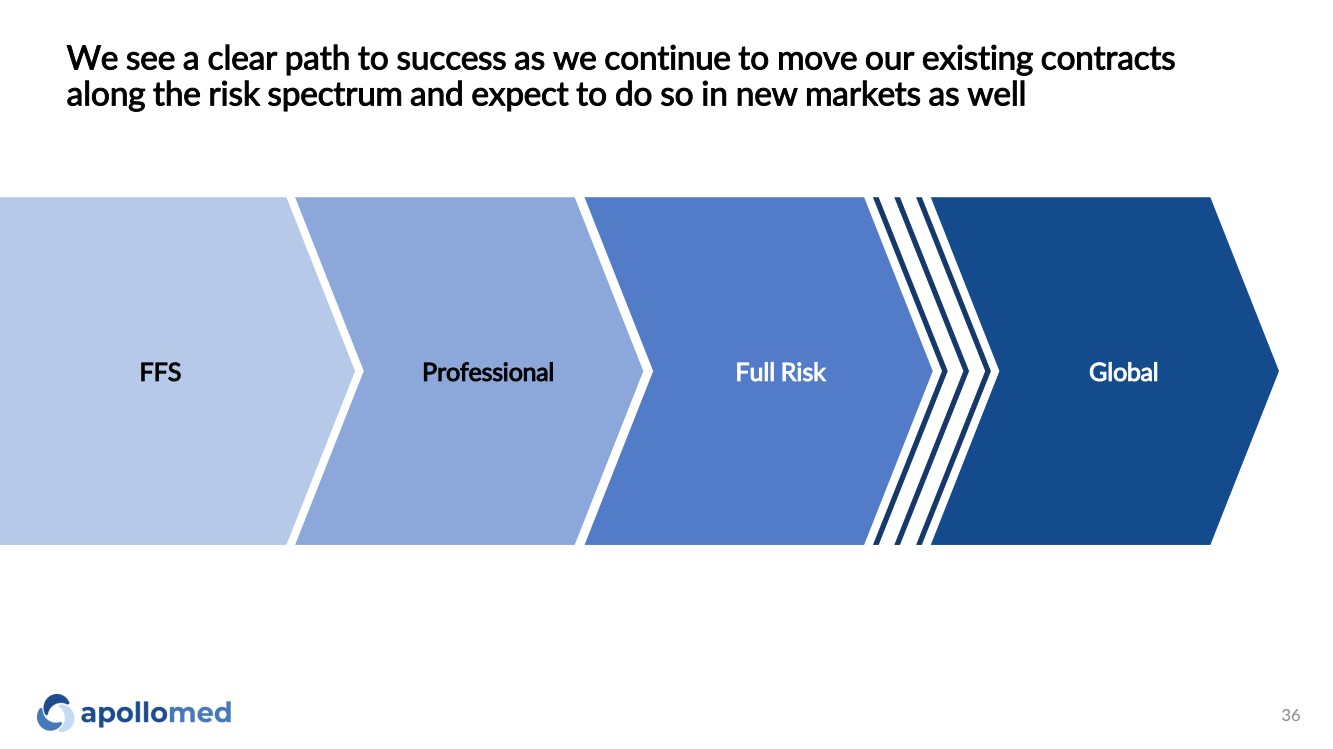
We see a clear path to success as we continue to move our existing contracts along the risk spectrum and expect to do so in new markets as well FFS Professional Full Risk Global 36 |
|
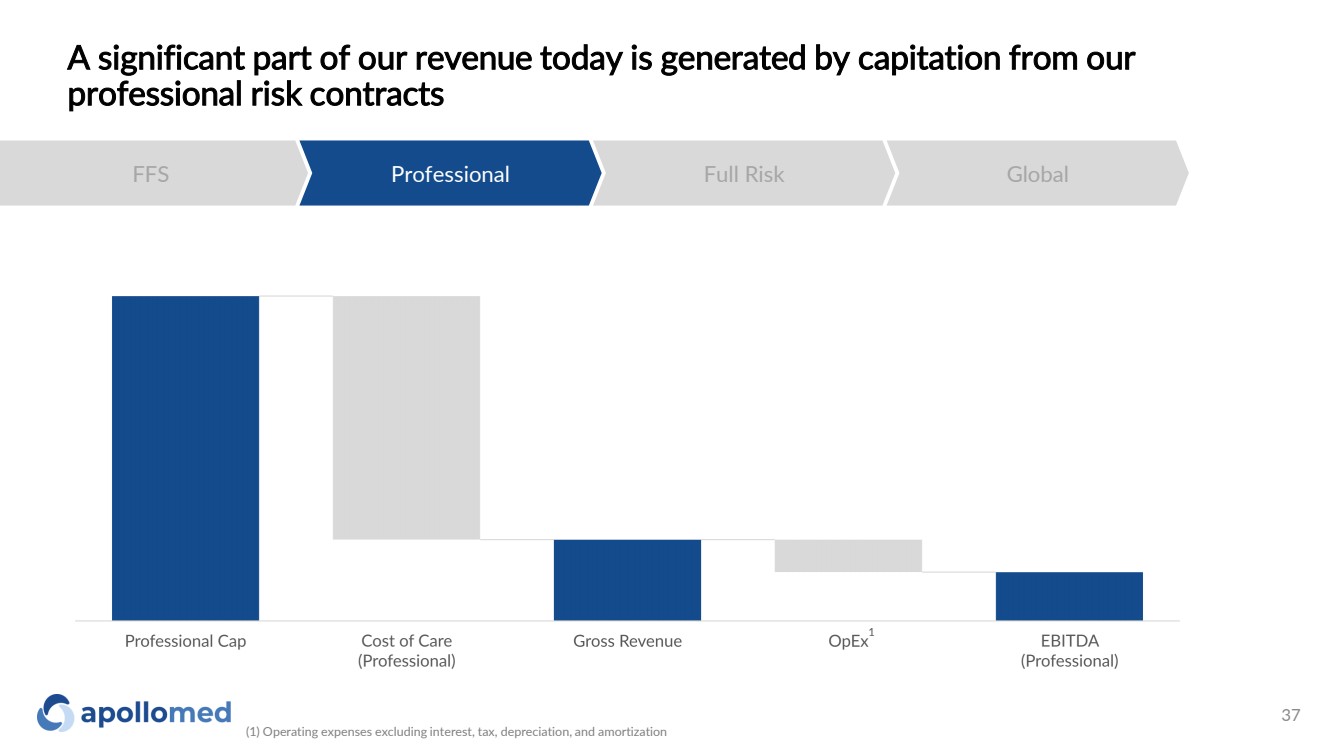
A significant part of our revenue today is generated by capitation from our professional risk contracts FFS Professional Full Risk Global 1 (1) Operating expenses excluding interest, tax, depreciation, and amortization 37 |
|
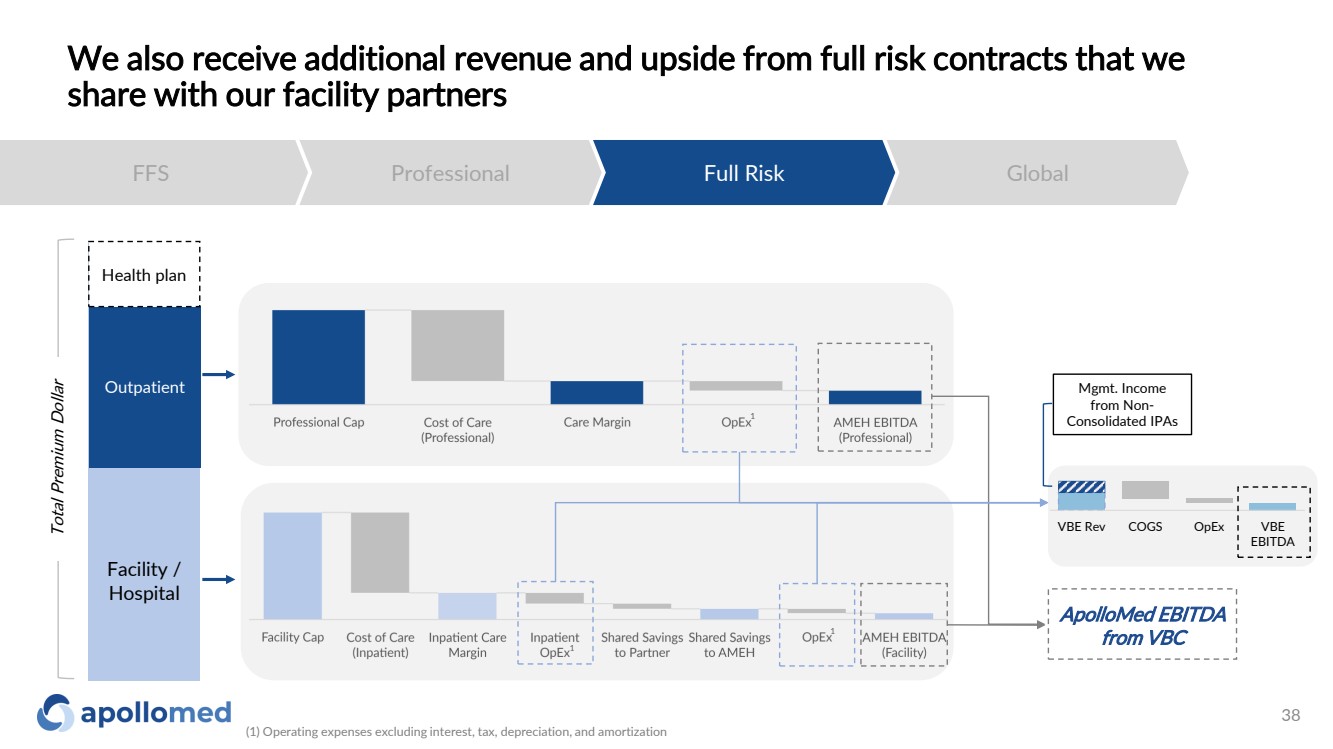
We also receive additional revenue and upside from full risk contracts that we share with our facility partners FFS Professional Full Risk Global Facility / Hospital Outpatient ApolloMed EBITDA from VBC Health plan 1 1 1 Total Premium Dollar VBE Rev COGS OpEx VBE EBITDA Mgmt. Income from Non-Consolidated IPAs (1) Operating expenses excluding interest, tax, depreciation, and amortization 38 |
|
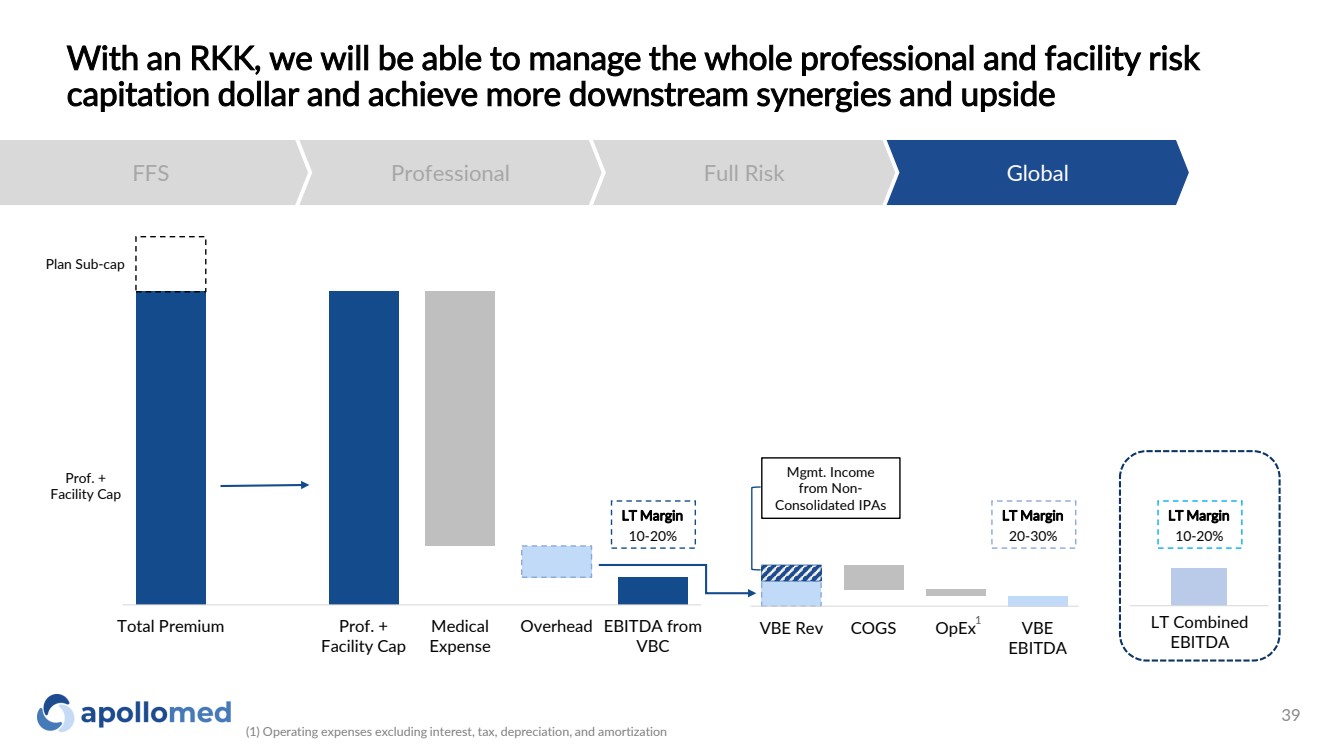
With an RKK, we will be able to manage the whole professional and facility risk capitation dollar and achieve more downstream synergies and upside FFS Professional Full Risk Global Total Premium Prof. + Facility Cap Medical Expense Overhead EBITDA from VBC VBE Rev COGS OpEx VBE EBITDA Plan Sub-cap Prof. + Facility Cap LT Margin 10-20% LT Margin 20-30% LT Margin 10-20% LT Combined EBITDA Mgmt. Income from Non-Consolidated IPAs 1 (1) Operating expenses excluding interest, tax, depreciation, and amortization 39 |
|
Key acronyms ◦ ACO: Accountable Care Organization ◦ ACO REACH: Accountable Care Organization Realizing Equity, Access, and Community Health ◦ AIPBP: All-Inclusive Population-Based Payments ◦ APC: Allied Physicians of California IPA ◦ CMMI: Centers for Medicare and Medicaid Innovation Center ◦ CMS: Centers for Medicare and Medicaid Services ◦ DC: Direct Contracting ◦ DCE: Direct Contracting Entity ◦ DME: Durable Medical Equipment ◦ Health Plan / Payers: Health Insurance Companies ◦ HMO: Health Maintenance Organization ◦ IPA: Independent Practice Association ◦ NCI: Non-Controlling Interest ◦ NMM: Network Medical Management, Inc. ◦ MSA: Master Service Agreement ◦ MSO: Management Services Organization ◦ NGACO: Next Generation Accountable Care Organization ◦ PCP: Primary Care Physician ◦ PMPM: Per Member Per Month ◦ SNF: Skilled Nursing Facility ◦ VIE: Variable Interest Entity ◦ RKK: Restricted Knox-Keene 40 |
|
Use of Non-GAAP Financial Measures This presentation contains the non-GAAP financial measures EBITDA and Adjusted EBITDA, of which the most directly comparable financial measure presented in accordance with U.S. generally accepted accounting principles (“GAAP”) is net income. These measures are not in accordance with, or alternatives to GAAP, and may be different from other non-GAAP financial measures used by other companies. The Company uses Adjusted EBITDA as a supplemental performance measure of our operations, for financial and operational decision-making, and as a supplemental means of evaluating period-to-period comparisons on a consistent basis. Adjusted EBITDA is calculated as earnings before interest, taxes, depreciation, and amortization, excluding income or loss from equity method investments, non-recurring transactions, stock-based compensation, and APC excluded assets costs. Beginning in the third quarter ended September 30, 2022, the Company has revised the calculation for Adjusted EBITDA to exclude provider bonus payments and losses from recently acquired IPAs, which it believes to be more reflective of its business. The Company believes the presentation of these non-GAAP financial measures provides investors with relevant and useful information, as it allows investors to evaluate the operating performance of the business activities without having to account for differences recognized because of non-core or non-recurring financial information. When GAAP financial measures are viewed in conjunction with non-GAAP financial measures, investors are provided with a more meaningful understanding of the Company’s ongoing operating performance. In addition, these non-GAAP financial measures are among those indicators the Company uses as a basis for evaluating operational performance, allocating resources, and planning and forecasting future periods. Non-GAAP financial measures are not intended to be considered in isolation, or as a substitute for, GAAP financial measures. To the extent this release contains historical or future non-GAAP financial measures, the Company has provided corresponding GAAP financial measures for comparative purposes. The reconciliation between certain GAAP and non-GAAP measures is provided above. 41 |
|
42 For inquiries, please contact: ApolloMed Investor Relations (626) 943 -6491 investors@apollomed.net Carolyne Sohn, The Equity Group (408) 538 -4577 csohn@equityny.com |