UNITED STATES
SECURITIES AND EXCHANGE COMMISSION
Washington, D.C. 20549
FORM 8-K
CURRENT REPORT
Pursuant to Section 13 or 15(d) of
The Securities Exchange Act of 1934
May 26, 2023
Date of Report (Date of earliest event reported)
PENNS WOODS BANCORP, INC.
(Exact name of registrant as specified in its charter)
| Pennsylvania | 000-17077 | 23-2226454 | ||
|
(State or other jurisdiction of incorporation) |
(Commission File Number) |
(IRS Employer Ident. No.) |
||
| 300 Market Street, P.O. Box 967, Williamsport, Pennsylvania | 17703-0967 | |||
| (Address of principal executive offices) | (Zip Code) | |||
|
(570) 322-1111 Registrant’s telephone number, including area code |
||||
| N/A | ||||
| (Former name or former address, if changed since last report.) | ||||
Check the appropriate box below if the Form 8-K filing is intended to simultaneously satisfy the filing obligation of the registrant under any of the following provisions:
o Written communications pursuant to Rule 425 under the Securities Act (17 CFR 230.425)
o Soliciting material pursuant to Rule 14a-12 under the Exchange Act (17 CFR 240.14a-12)
o Pre-commencement communications pursuant to Rule 14d-2(b) under the Exchange Act (17 CFR 240.14d-2(b))
o Pre-commencement communications pursuant to Rule 13e-4(c) under the Exchange Act (17 CFR 240.13e-4 (c))
Securities registered pursuant to Section 12(b) of the Act:
| Title of each class | Trading Symbol(s) | Name of each exchange on which registered |
| Common Stock, $5.55 par value | PWOD | The Nasdaq Global Select Market |
Indicate by check mark whether the registrant is an emerging growth company as defined in Rule 405 of the Securities Act of 1933 (17 CFR §230.405 of this chapter) or Rule 12b-2 of the Securities Exchange Act of 1934 (17 CFR §240.12b-2 of this chapter).
Emerging growth company ¨
If an emerging growth company, indicate by check mark if the registrant has elected not to use the extended transition period for complying with any new or revised financial accounting standards provided pursuant to Section 13(a) of the Exchange Act. ¨
| Item 7.01 | Regulation FD Disclosure. |
On May 26, 2023, Penns Woods Bancorp, Inc. (the “Company”) made available on its website an updated slide presentation regarding the Company, which presentation is furnished as Exhibit 99.1 attached hereto and is incorporated herein by reference.
The information contained in this Report, including Exhibit 99.1 attached hereto, is considered to be “furnished” and shall not be deemed to be “filed” for purposes of Section 18 of the Securities Exchange Act of 1934, as amended, or otherwise subject to liability under that section. The information contained in this Report, including Exhibit 99.1 attached hereto, shall not be incorporated by reference into any filing or other document pursuant to the Securities Act of 1933, as amended, or the Exchange Act, except as expressly set forth by specific reference in such filing.
| Item 9.01 | Financial Statements and Exhibits. |
| (d) | Exhibits: |
| 99.1 | Slide Presentation of Penn Woods Bancorp, Inc. (furnished pursuant to Item 7.01 of this Form 8-K) |
| 104 | Cover Page Interactive Data File (the cover page XBRL tags are embedded within the Inline XBRL document) |
SIGNATURES
Pursuant to the requirements of the Securities Exchange Act of 1934, the registrant has duly caused this report to be signed on its behalf by the undersigned hereunto duly authorized.
| PENNS WOODS BANCORP, INC. | ||
| Dated: May 26, 2023 | ||
| By: | /s/ Brian L. Knepp | |
| Brian L. Knepp | ||
| President and Chief Financial Officer | ||
|
1 Creating Success by Delivering Solutions Penns Woods Bancorp, Inc. May 2023 |
|
2 Forward-Looking Information Certain statements contained in this presentation are forward-looking in nature. These include all statements about PWB’s plans, objectives, expectations and other statements that are not historical facts, and usually use words such as "expect," "anticipate," "believe" and similar expressions. Such statements represent management's current beliefs, based upon information available at the time the statements are made, with regard to the matters addressed. All forward-looking statements are subject to risks and uncertainties that could cause PWB’s actual results or financial condition to differ materially from those expressed in or implied by such statements. Factors of particular importance to PWB include, but are not limited to: (1) changes in general, national or regional economic conditions; (2) changes in interest rates; (3) changes in loan default and charge-off rates; (4) changes in deposit levels; (5) changes in levels of income and expense in non-interest income and expense related activities; (6) residential mortgage and secondary market activity; (7) changes in accounting and regulatory guidance applicable to banks; (8) price levels and conditions in the public securities markets generally; (9) competition and its effect on pricing, spending, third-party relationships and revenues; (10) changes in regulation resulting from or relating to financial reform legislation; and (11) the risk factors identified in PWB’s Annual Report on Form 10-K for the year ended December 31, 2022 and in other filings made by PWB under the Securities Exchange Act of 1934. PWB does not undertake any obligation to update or revise any forward-looking statements, whether as a result of new information, future events or otherwise. Penns Woods Bancorp, Inc. |
|
3 Non-GAAP Financial Measures This presentation contains financial information determined by methods other than in accordance with generally accepted accounting principles in the United States (“GAAP”). These non-GAAP measures include tangible book value per share and return on average tangible common equity. Management uses these non-GAAP financial measures because this information is commonly utilized by regulators and investors to evaluate financial condition, and is therefore useful to investors. These disclosures should not be viewed as a substitute for operating results determined in accordance with GAAP, nor are they necessarily comparable to non-GAAP performance measures that may be presented by other companies. A reconciliation of the non-GAAP measures, tangible book value per share and return on average tangible common equity, used in this presentation to the related GAAP measure is included in the appendix to this presentation. Penns Woods Bancorp, Inc. |
|
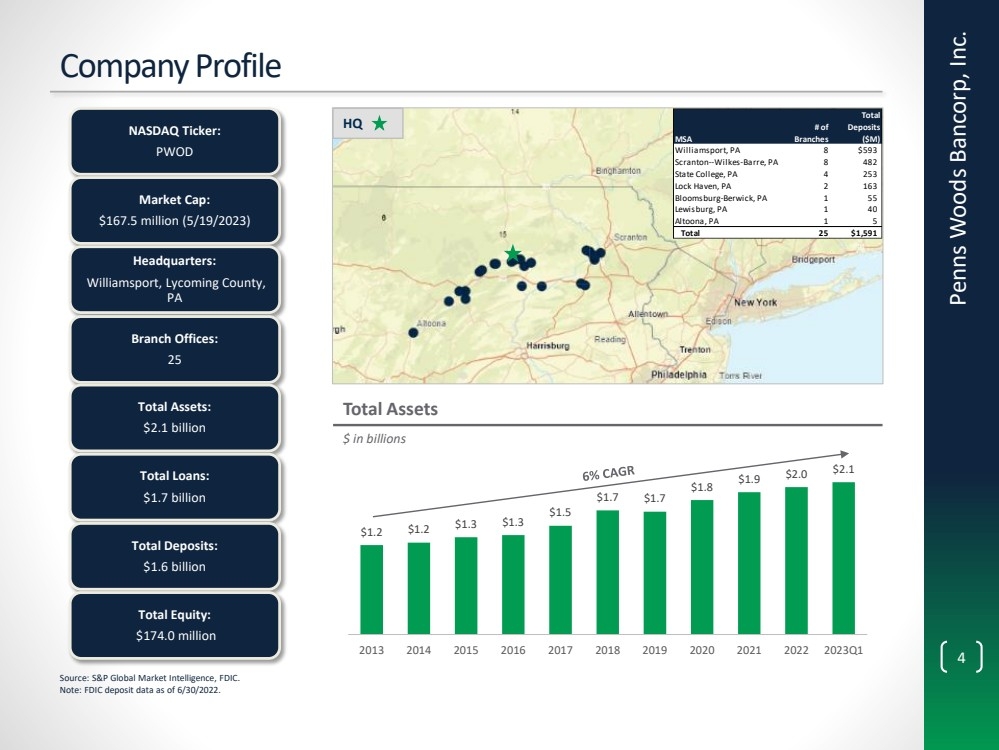
4 $1.2 $1.2 $1.3 $1.3 $1.5 $1.7 $1.7 $1.8 $1.9 $2.0 $2.1 2013 2014 2015 2016 2017 2018 2019 2020 2021 2022 2023Q1 Company Profile Penns Woods Bancorp, Inc. NASDAQ Ticker: PWOD Market Cap: $167.5 million (5/19/2023) Headquarters: Williamsport, Lycoming County, PA Branch Offices: 25 Total Assets: $2.1 billion Total Loans: $1.7 billion Total Deposits: $1.6 billion Total Equity: $174.0 million Total Assets $ in billions HQ MSA # of Branches Total Deposits ($M) Williamsport, PA 8 $593 Scranton--Wilkes-Barre, PA 8 482 State College, PA 4 253 Lock Haven, PA 2 163 Bloomsburg-Berwick, PA 1 55 Lewisburg, PA 1 40 Altoona, PA 1 5 Total 25 $1,591 Source: S&P Global Market Intelligence, FDIC. Note: FDIC deposit data as of 6/30/2022. |
|
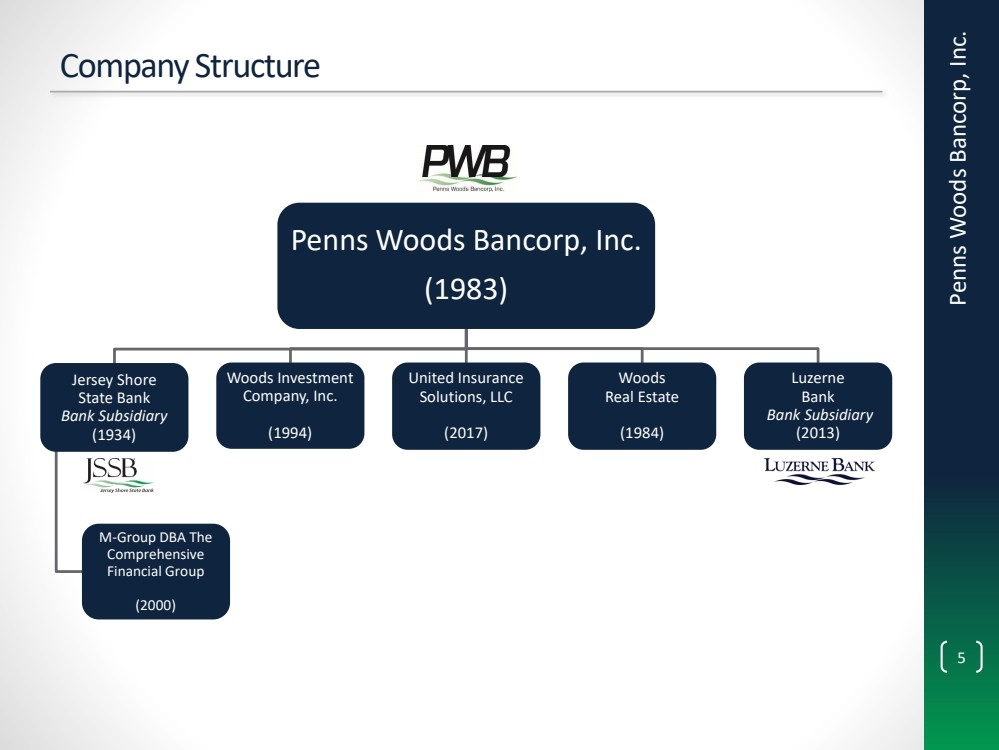
5 Company Structure Penns Woods Bancorp, Inc. (1983) Jersey Shore State Bank Bank Subsidiary (1934) M-Group DBA The Comprehensive Financial Group (2000) Woods Investment Company, Inc. (1994) United Insurance Solutions, LLC (2017) Woods Real Estate (1984) Luzerne Bank Bank Subsidiary (2013) Penns Woods Bancorp, Inc. |
|
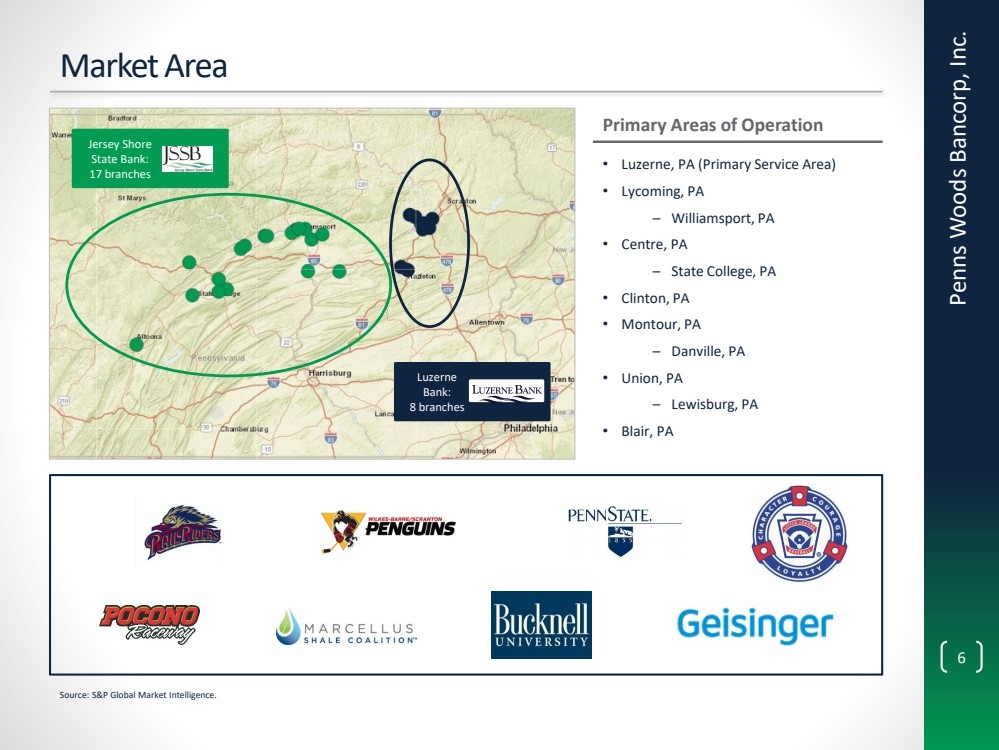
6 Market Area Penns Woods Bancorp, Inc. Jersey Shore State Bank: 17 branches Luzerne Bank: 8 branches Primary Areas of Operation • Luzerne, PA (Primary Service Area) • Lycoming, PA – Williamsport, PA • Centre, PA – State College, PA • Clinton, PA • Montour, PA – Danville, PA • Union, PA – Lewisburg, PA • Blair, PA Source: S&P Global Market Intelligence. |
|
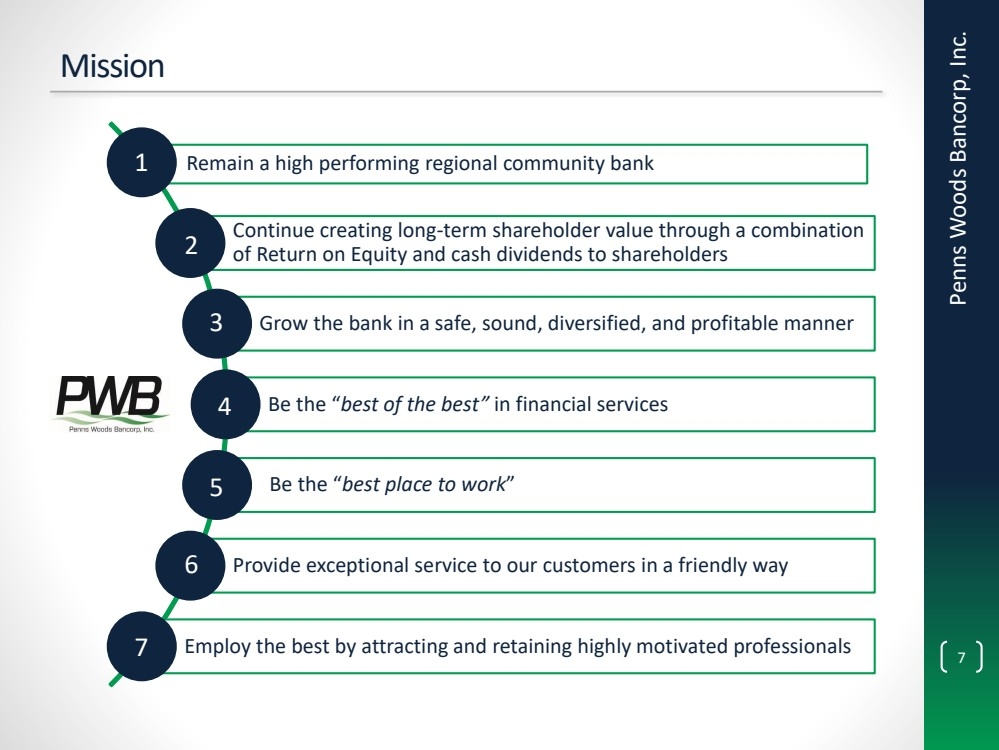
7 Mission Remain a high performing regional community bank Continue creating long-term shareholder value through a combination of Return on Equity and cash dividends to shareholders Grow the bank in a safe, sound, diversified, and profitable manner Be the “best of the best” in financial services Be the “best place to work” Provide exceptional service to our customers in a friendly way Employ the best by attracting and retaining highly motivated professionals Penns Woods Bancorp, Inc. 1 2 3 4 5 6 7 |
|
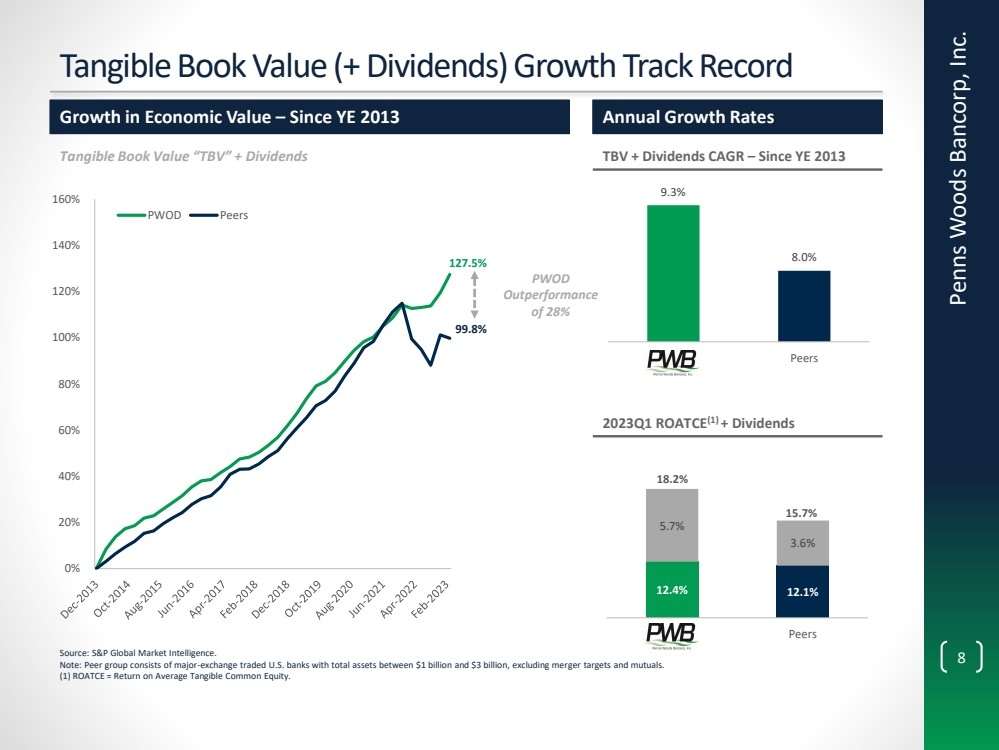
8 Tangible Book Value (+ Dividends) Growth Track Record Penns Woods Bancorp, Inc. Growth in Economic Value – Since YE 2013 Tangible Book Value “TBV” + Dividends Annual Growth Rates TBV + Dividends CAGR – Since YE 2013 2023Q1 ROATCE(1) + Dividends Source: S&P Global Market Intelligence. Note: Peer group consists of major-exchange traded U.S. banks with total assets between $1 billion and $3 billion, excluding merger targets and mutuals. (1) ROATCE = Return on Average Tangible Common Equity. 127.5% 99.8% 0% 20% 40% 60% 80% 100% 120% 140% 160% PWOD Peers PWOD Outperformance of 28% 9.3% 8.0% PWOD Peers 12.4% 12.1% 5.7% 3.6% PWOD Peers 18.2% 15.7% |
|
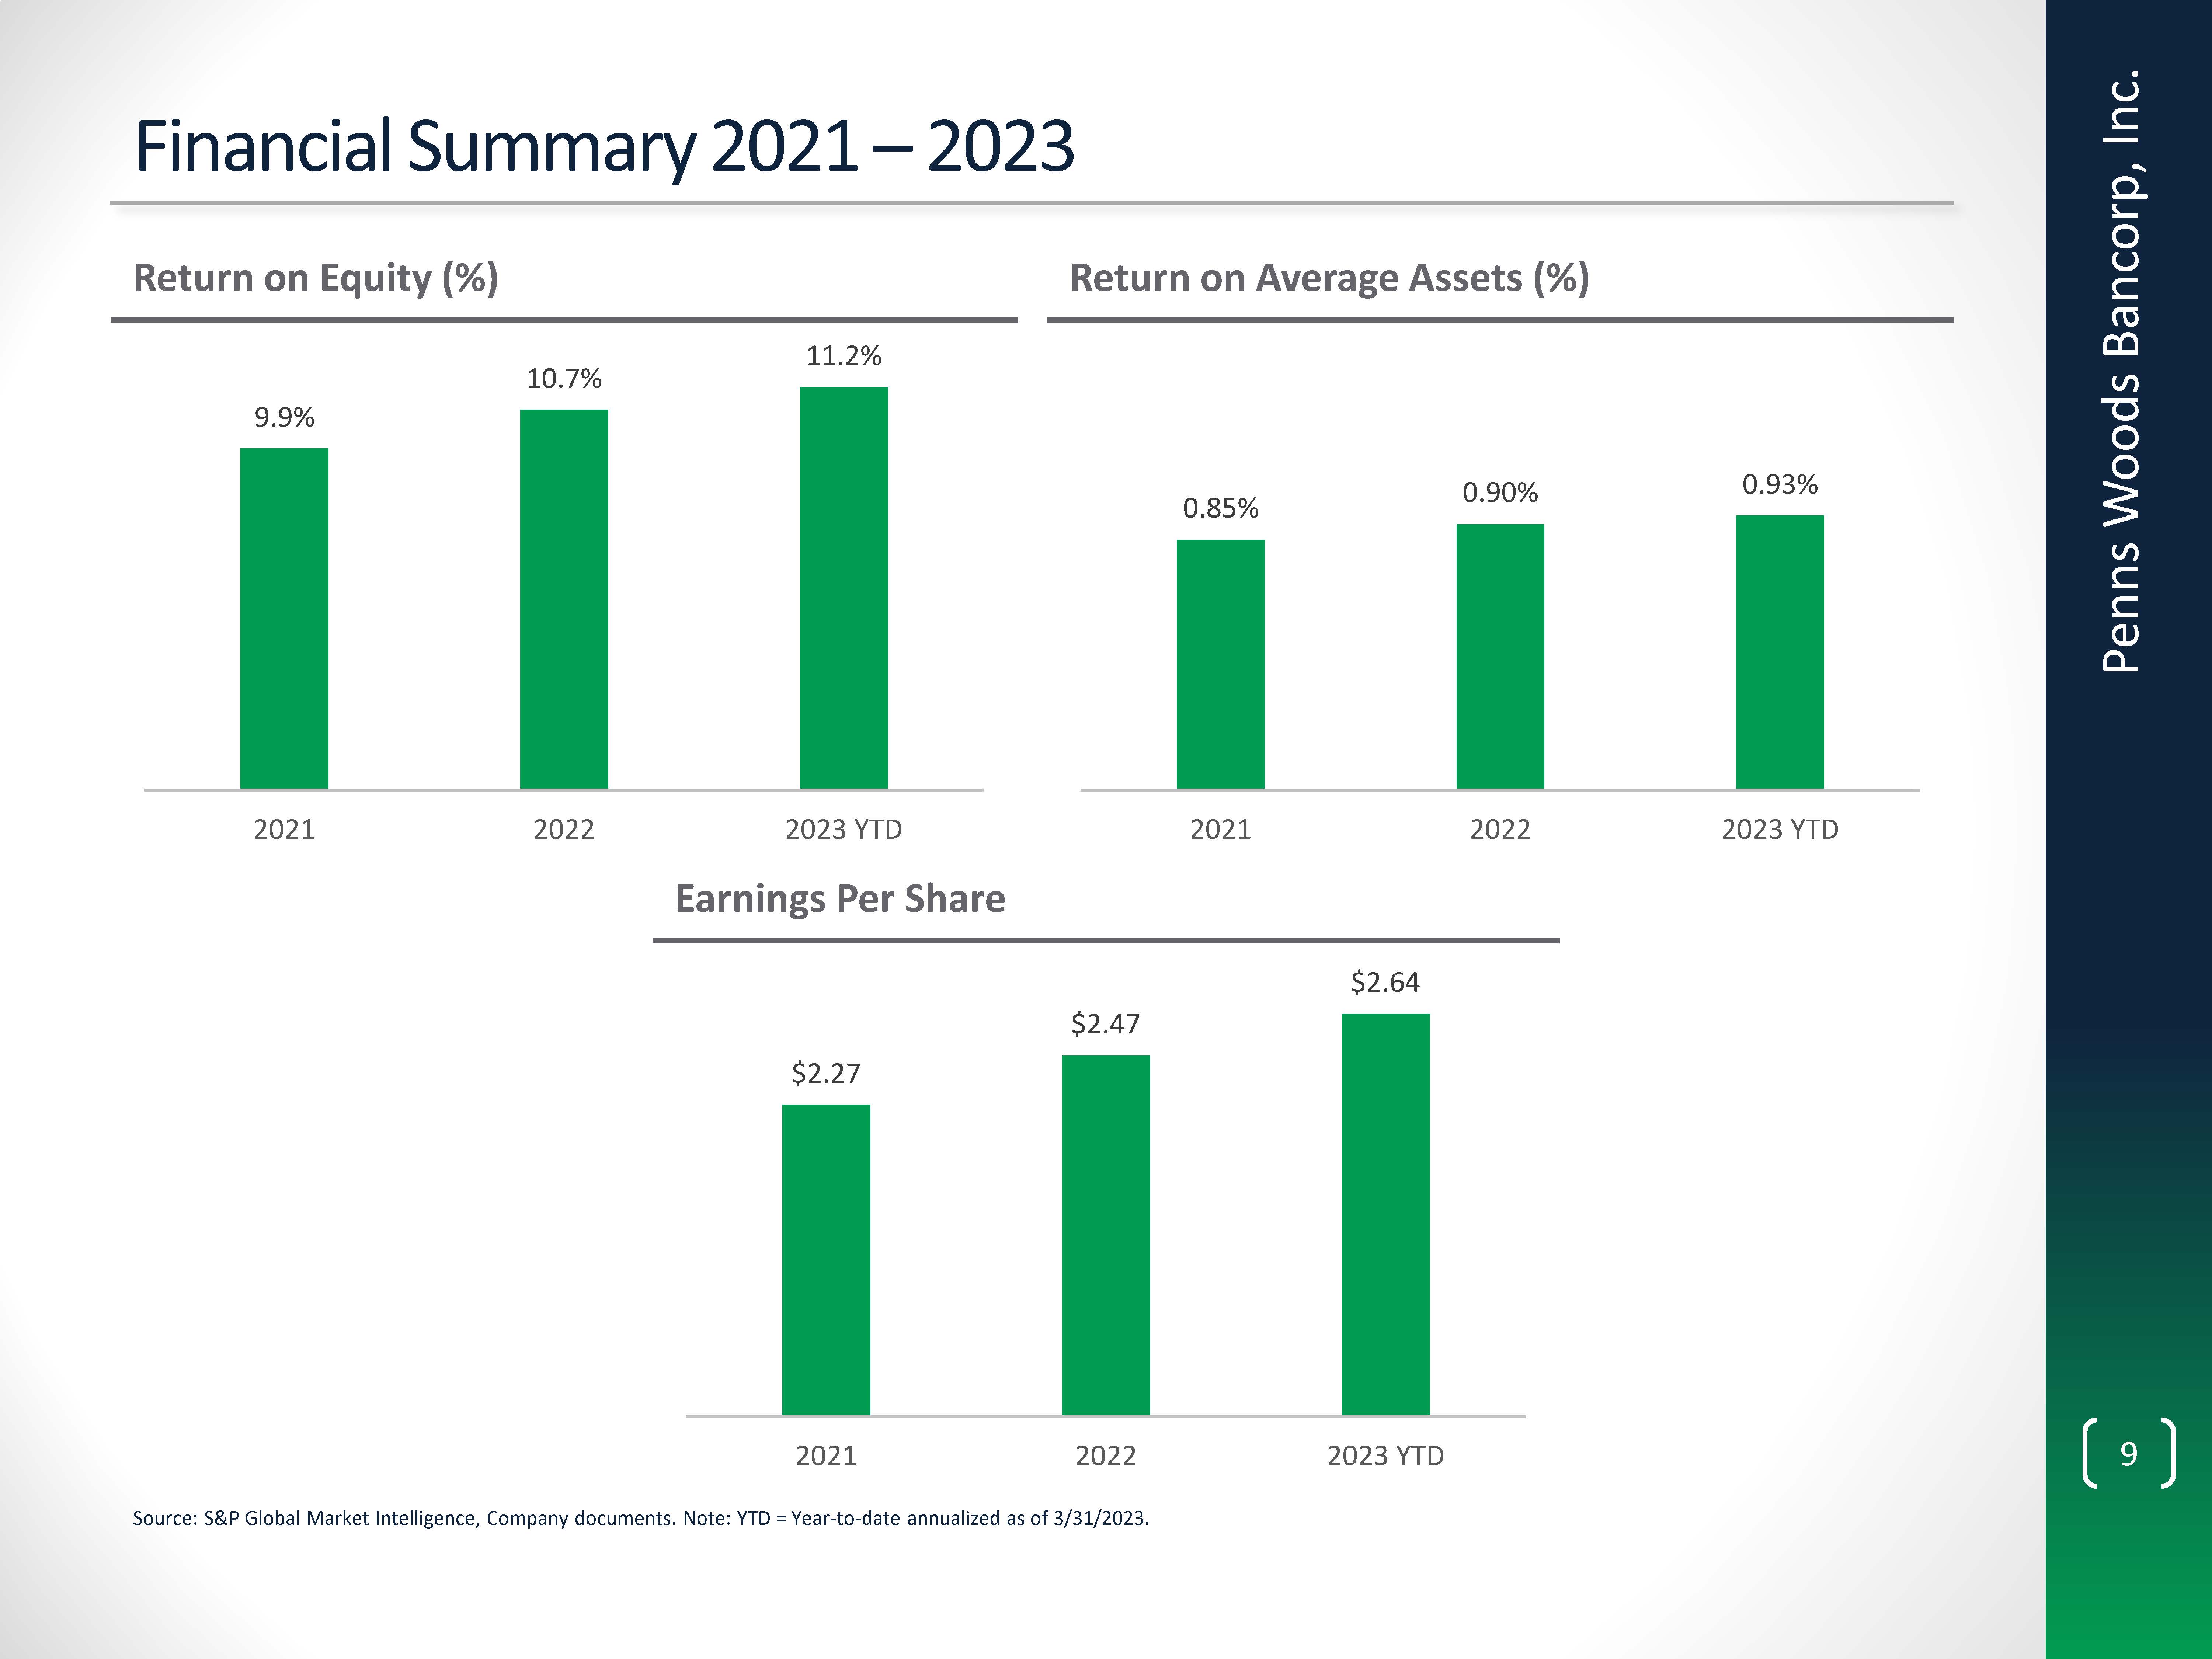
9 Financial Summary 2021 – 2023 Penns Woods Bancorp, Inc. Return on Equity (%) Return on Average Assets (%) 9.9% 10.7% 11.2% 2021 2022 2023 YTD 0.85% 0.90% 0.93% 2021 2022 2023 YTD Earnings Per Share $2.27 $2.47 $2.64 2021 2022 2023 YTD Source: S&P Global Market Intelligence, Company documents. Note: YTD = Year-to-date annualized as of 3/31/2023. |
|
10 Value Proposition Franchise Value Capital Balance Sheet Integrity Diversification Expansion Penns Woods Bancorp, Inc. 1 2 3 4 5 |
|
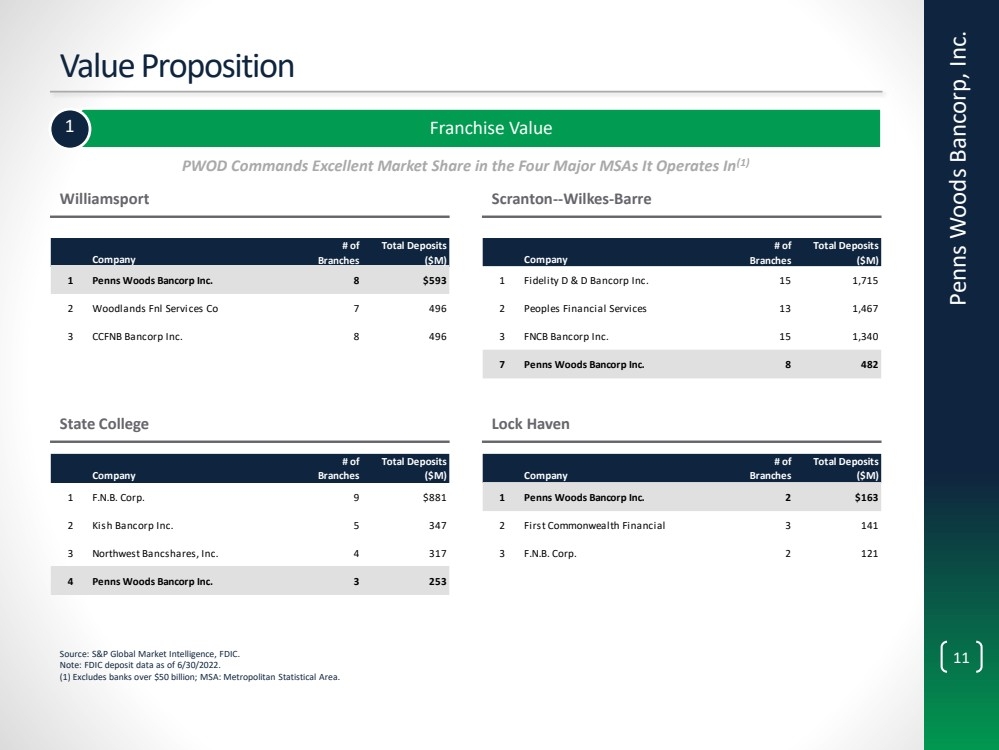
11 Value Proposition 1 Franchise Value Source: S&P Global Market Intelligence, FDIC. Note: FDIC deposit data as of 6/30/2022. (1) Excludes banks over $50 billion; MSA: Metropolitan Statistical Area. PWOD Commands Excellent Market Share in the Four Major MSAs It Operates In(1) Williamsport Scranton--Wilkes-Barre State College Lock Haven Company # of Branches Total Deposits ($M) 1 Penns Woods Bancorp Inc. 8 $593 2 Woodlands Fnl Services Co 7 496 3 CCFNB Bancorp Inc. 8 496 Company # of Branches Total Deposits ($M) 1 Fidelity D & D Bancorp Inc. 1 5 1,715 2 Peoples Financial Services 1 3 1,467 3 FNCB Bancorp Inc. 1 5 1,340 7 Penns Woods Bancorp Inc. 8 482 Company # of Branches Total Deposits ($M) 1 F.N.B. Corp. 9 $881 2 Kish Bancorp Inc. 5 347 3 Northwest Bancshares, Inc. 4 317 4 Penns Woods Bancorp Inc. 3 253 Company # of Branches Total Deposits ($M) 1 Penns Woods Bancorp Inc. 2 $163 2 First Commonwealth Financial 3 141 3 F.N.B. Corp. 2 121 Penns Woods Bancorp, Inc. |
|
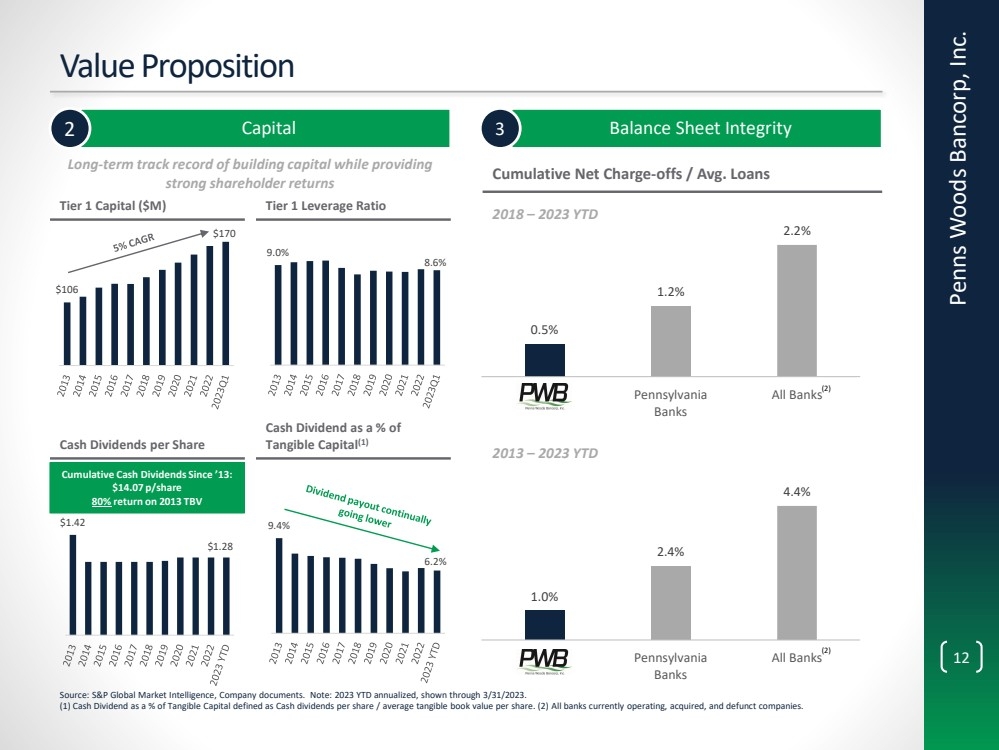
12 9.0% 8.6% 0.5% 1.2% 2.2% PWOD Pennsylvania Banks All Banks $106 $170 Value Proposition 3 Balance Sheet Integrity Cumulative Net Charge-offs / Avg. Loans 2 Capital 1.0% 2.4% 4.4% PWOD Pennsylvania Banks All Banks Long-term track record of building capital while providing strong shareholder returns 9.4% 6.2% Tier 1 Capital ($M) Tier 1 Leverage Ratio $1.42 $1.28 Cash Dividends per Share Cash Dividend as a % of Tangible Capital(1) 2018 – 2023 YTD 2013 – 2023 YTD Source: S&P Global Market Intelligence, Company documents. Note: 2023 YTD annualized, shown through 3/31/2023. (1) Cash Dividend as a % of Tangible Capital defined as Cash dividends per share / average tangible book value per share. (2) All banks currently operating, acquired, and defunct companies. Cumulative Cash Dividends Since ’13: $14.07 p/share 80% return on 2013 TBV Penns Woods Bancorp, Inc. (2) (2) |
|
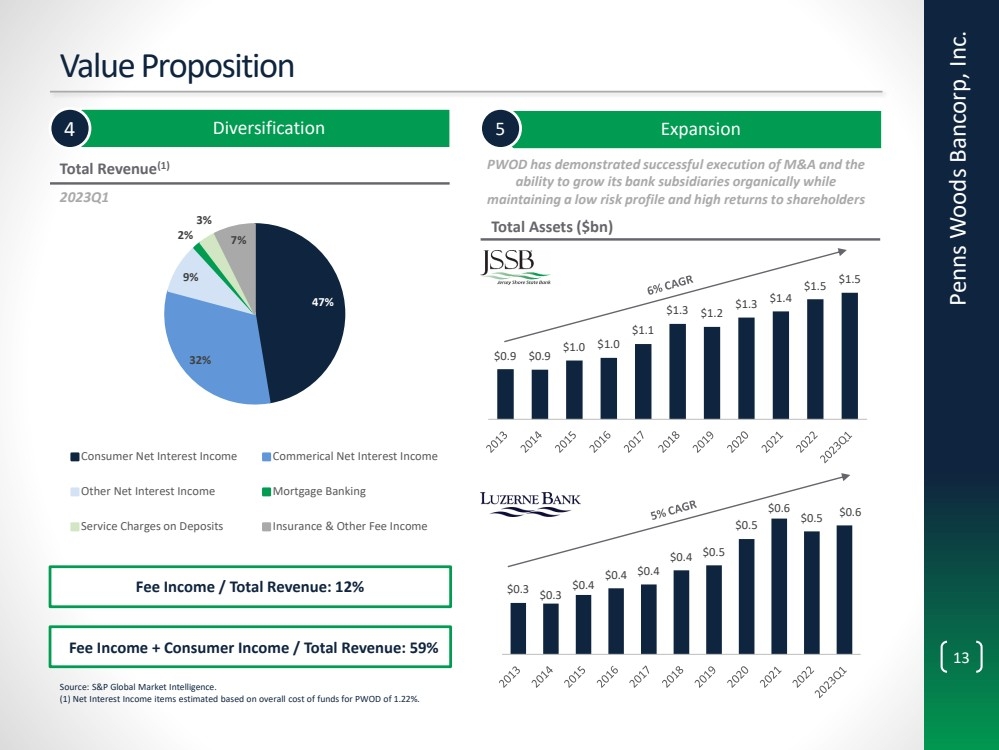
13 47% 32% 9% 2% 3% 7% Consumer Net Interest Income Commerical Net Interest Income Other Net Interest Income Mortgage Banking Service Charges on Deposits Insurance & Other Fee Income $0.3 $0.3 $0.4 $0.4 $0.4 $0.4 $0.5 $0.5 $0.6 $0.5 $0.6 Value Proposition 4 Diversification Total Revenue(1) 2023Q1 Source: S&P Global Market Intelligence. (1) Net Interest Income items estimated based on overall cost of funds for PWOD of 1.22%. 5 Expansion $0.9 $0.9 $1.0 $1.0 $1.1 $1.3 $1.2 $1.3 $1.4 $1.5 $1.5 Total Assets ($bn) Fee Income / Total Revenue: 12% PWOD has demonstrated successful execution of M&A and the ability to grow its bank subsidiaries organically while maintaining a low risk profile and high returns to shareholders Fee Income + Consumer Income / Total Revenue: 59% Penns Woods Bancorp, Inc. |
|
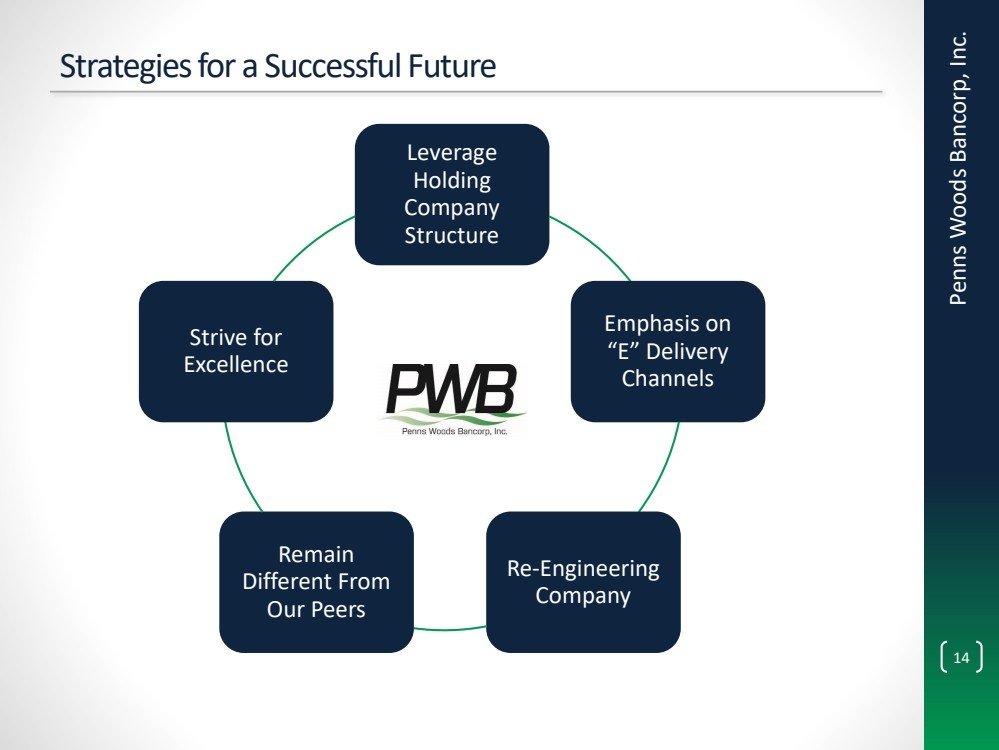
14Penns Woods Bancorp, Inc. Strategies for a Successful Future Leverage Holding Company Structure Emphasis on “E” Delivery Channels Re-Engineering Company Remain Different From Our Peers Strive for Excellence |
|
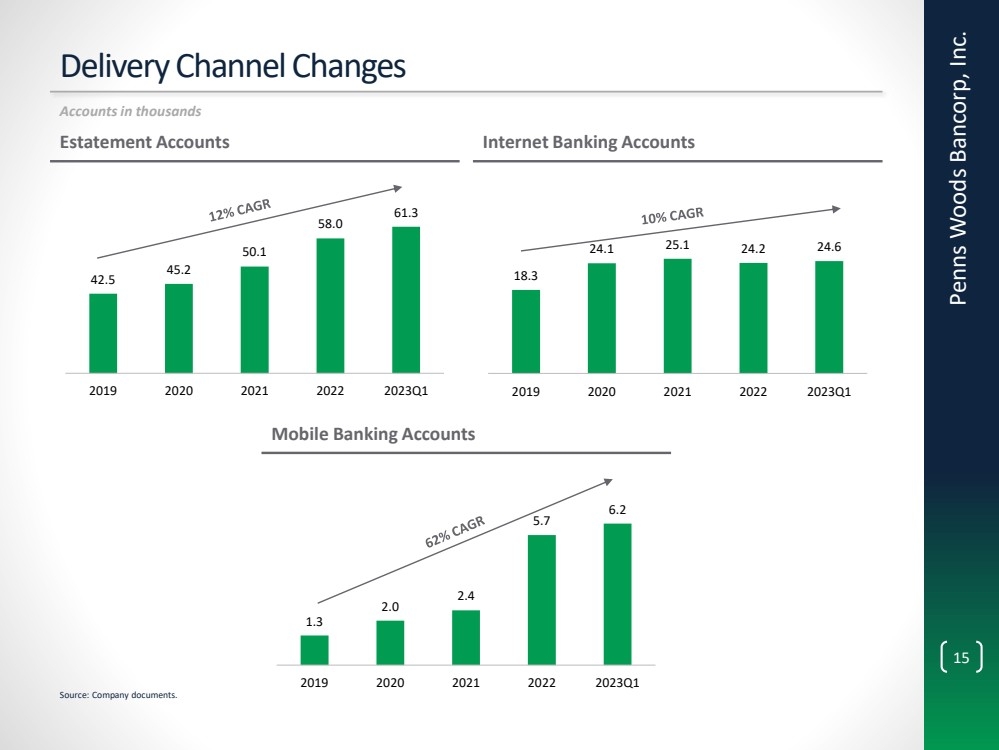
15 42.5 45.2 50.1 58.0 61.3 2019 2020 2021 2022 2023Q1 Delivery Channel Changes 18.3 24.1 25.1 24.2 24.6 2019 2020 2021 2022 2023Q1 1.3 2.0 2.4 5.7 6.2 2019 2020 2021 2022 2023Q1 Penns Woods Bancorp, Inc. Estatement Accounts Internet Banking Accounts Mobile Banking Accounts Accounts in thousands Source: Company documents. |
|
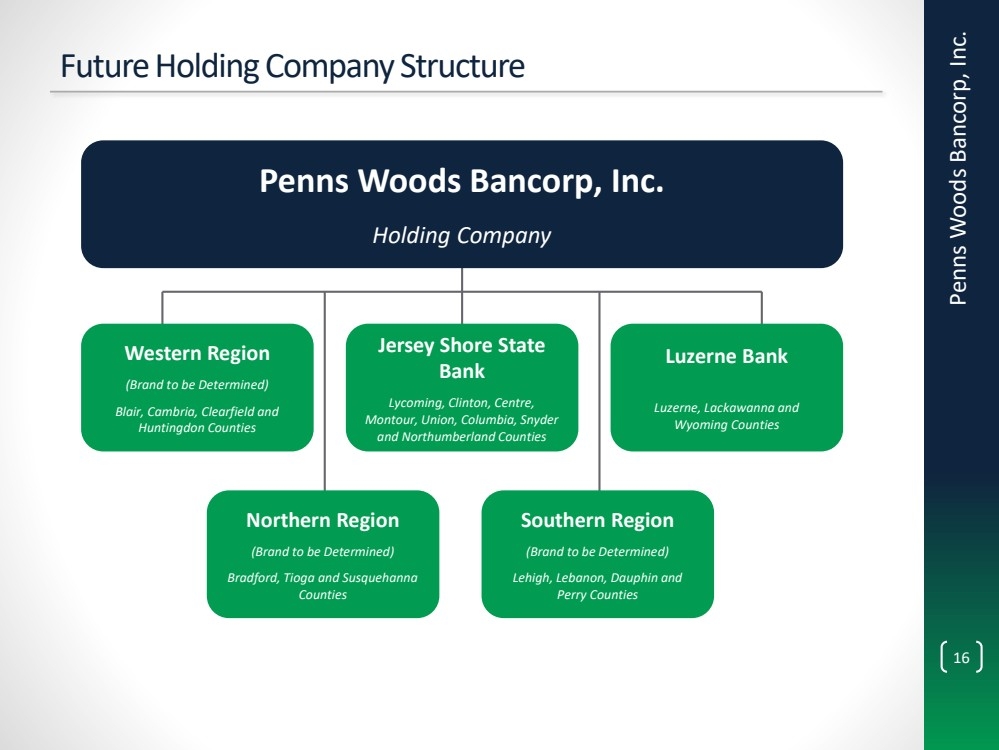
16Penns Woods Bancorp, Inc. Future Holding Company Structure Penns Woods Bancorp, Inc. Holding Company Western Region (Brand to be Determined) Blair, Cambria, Clearfield and Huntingdon Counties Jersey Shore State Bank Lycoming, Clinton, Centre, Montour, Union, Columbia, Snyder and Northumberland Counties Luzerne Bank Luzerne, Lackawanna and Wyoming Counties Northern Region (Brand to be Determined) Bradford, Tioga and Susquehanna Counties Southern Region (Brand to be Determined) Lehigh, Lebanon, Dauphin and Perry Counties |
|
17 Appendix Penns Woods Bancorp, Inc. |
|
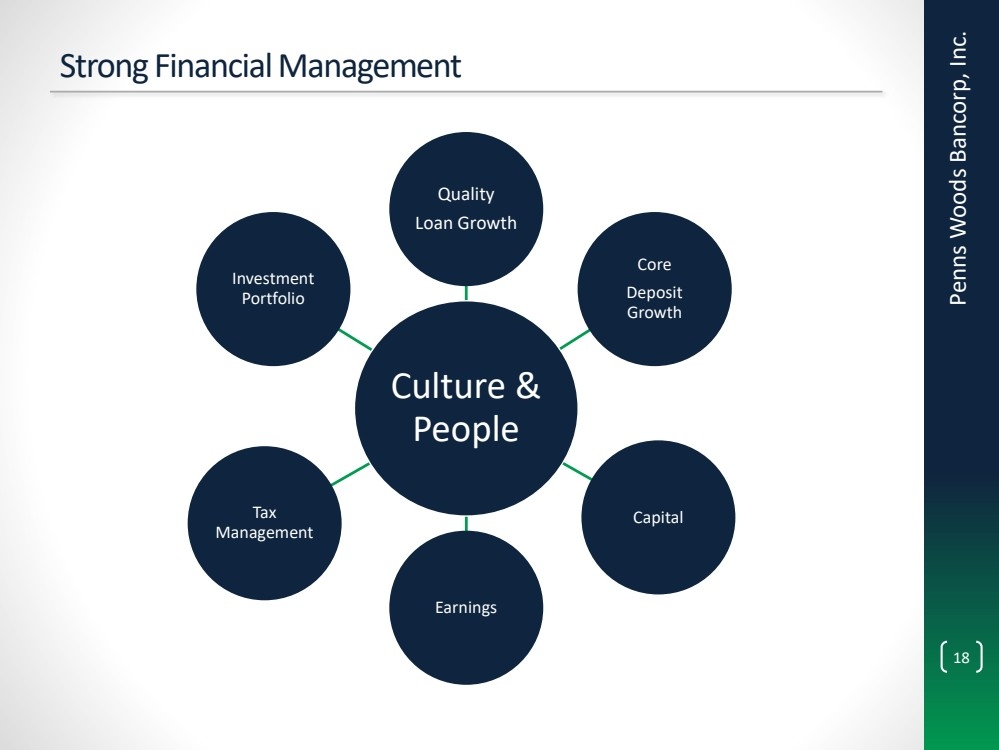
18 Strong Financial Management Penns Woods Bancorp, Inc. Culture & People Quality Loan Growth Core Deposit Growth Capital Earnings Tax Management Investment Portfolio |
|
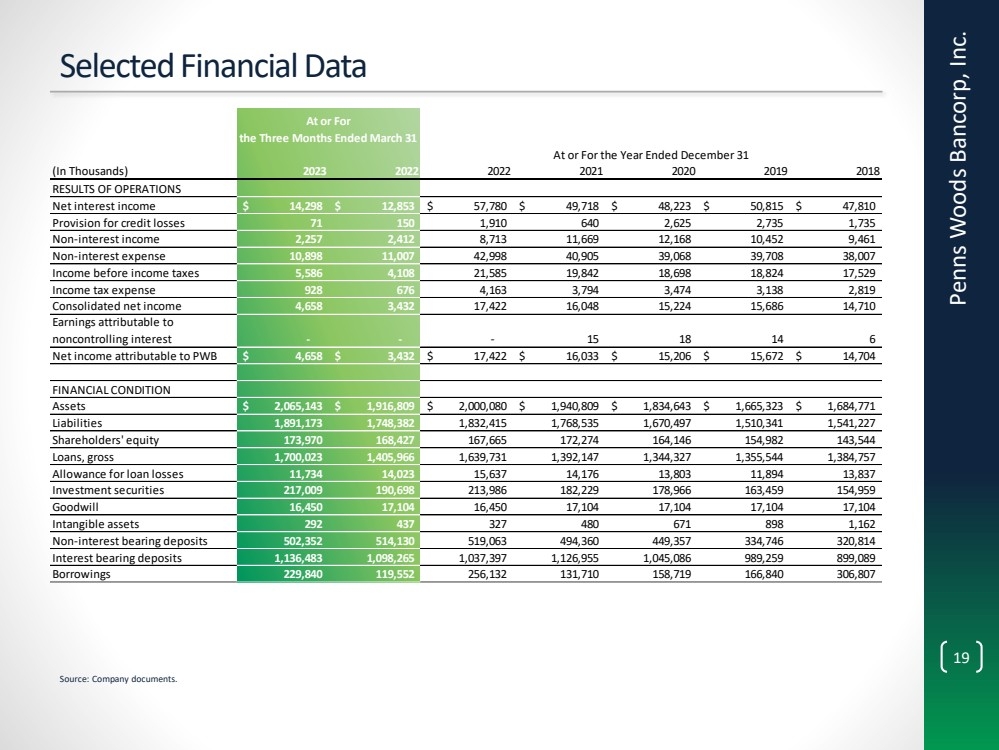
19 At or For the Three Months Ended March 31 (In Thousands) 2023 2022 2022 2021 2020 2019 2018 RESULTS OF OPERATIONS Net interest income $ 14,298 $ 12,853 $ 57,780 $ 49,718 $ 48,223 $ 50,815 $ 47,810 Provision for credit losses 71 150 1,910 640 2,625 2,735 1,735 Non-interest income 2,257 2,412 8,713 11,669 12,168 10,452 9,461 Non-interest expense 10,898 11,007 42,998 40,905 39,068 39,708 38,007 Income before income taxes 5,586 4,108 21,585 19,842 18,698 18,824 17,529 Income tax expense 928 676 4,163 3,794 3,474 3,138 2,819 Consolidated net income 4,658 3,432 17,422 16,048 15,224 15,686 14,710 Earnings attributable to noncontrolling interest - - - 15 18 14 6 Net income attributable to PWB $ 4,658 $ 3,432 $ 17,422 $ 16,033 $ 15,206 $ 15,672 $ 14,704 FINANCIAL CONDITION Assets $ 2,065,143 $ 1,916,809 $ 2,000,080 $ 1,940,809 $ 1,834,643 $ 1,665,323 $ 1,684,771 Liabilities 1,891,173 1,748,382 1,832,415 1,768,535 1,670,497 1,510,341 1,541,227 Shareholders' equity 173,970 168,427 167,665 172,274 164,146 154,982 143,544 Loans, gross 1,700,023 1,405,966 1,639,731 1,392,147 1,344,327 1,355,544 1,384,757 Allowance for loan losses 11,734 14,023 15,637 14,176 13,803 11,894 13,837 Investment securities 217,009 190,698 213,986 182,229 178,966 163,459 154,959 Goodwill 16,450 17,104 16,450 17,104 17,104 17,104 17,104 Intangible assets 292 437 327 480 671 898 1,162 Non-interest bearing deposits 502,352 514,130 519,063 494,360 449,357 334,746 320,814 Interest bearing deposits 1,136,483 1,098,265 1,037,397 1,126,955 1,045,086 989,259 899,089 Borrowings 229,840 119,552 256,132 131,710 158,719 166,840 306,807 At or For the Year Ended December 31 Selected Financial Data Penns Woods Bancorp, Inc. Source: Company documents. |
|
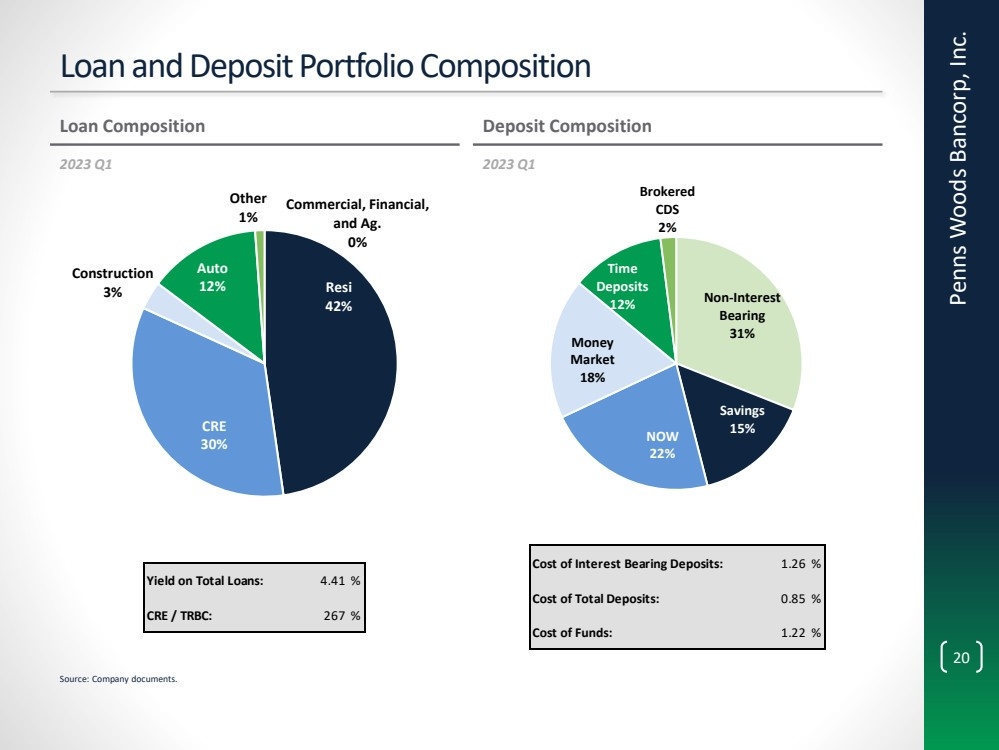
20 Loan and Deposit Portfolio Composition Penns Woods Bancorp, Inc. Loan Composition Deposit Composition Commercial, Financial, and Ag. 0% Resi 42% CRE 30% Construction 3% Auto 12% Other 1% Non-Interest Bearing 31% Savings 15% NOW 22% Money Market 18% Time Deposits 12% Brokered CDS 2% Yield on Total Loans: 4.41 % CRE / TRBC: 267 % Cost of Interest Bearing Deposits: 1.26 % Cost of Total Deposits: 0.85 % Cost of Funds: 1.22 % 2023 Q1 2023 Q1 Source: Company documents. |
|
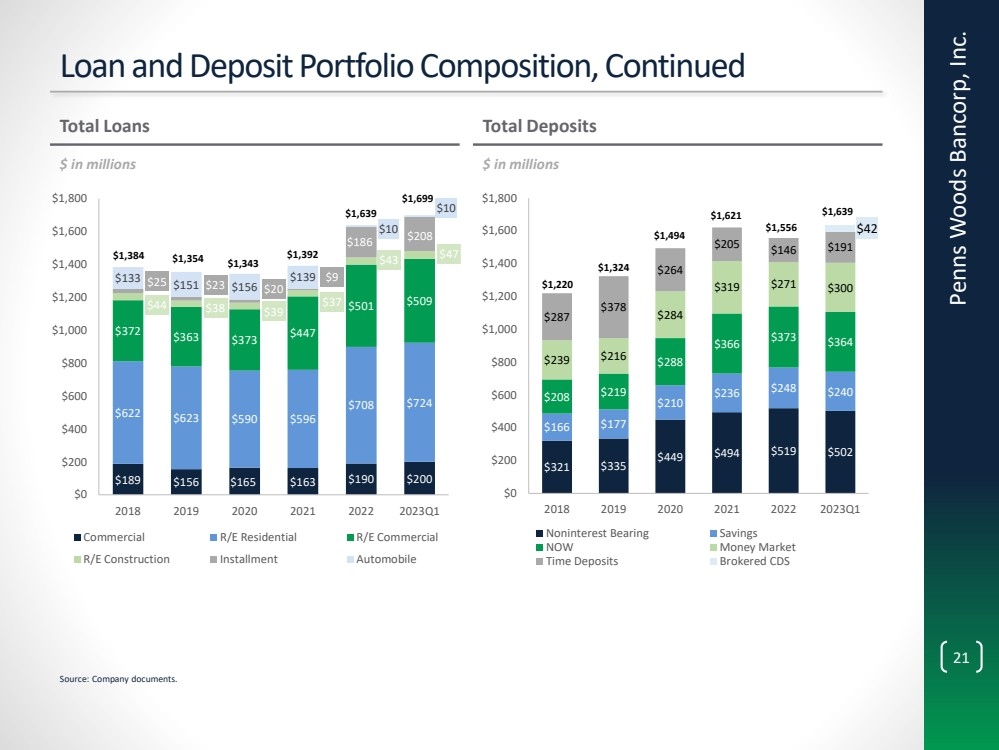
21 $321 $335 $449 $494 $519 $502 $166 $177 $210 $236 $248 $240 $208 $219 $288 $366 $373 $364 $239 $216 $284 $319 $271 $300 $287 $378 $264 $205 $146 $191 $42 $0 $200 $400 $600 $800 $1,000 $1,200 $1,400 $1,600 $1,800 2018 2019 2020 2021 2022 2023Q1 Noninterest Bearing Savings NOW Money Market Time Deposits Brokered CDS Loan and Deposit Portfolio Composition, Continued Penns Woods Bancorp, Inc. Total Loans Total Deposits $189 $156 $165 $163 $190 $200 $622 $623 $590 $596 $708 $724 $372 $363 $373 $447 $501 $509 $44 $38 $39 $37 $43 $47 $25 $23 $20 $9 $186 $208 $133 $151 $156 $139 $10 $10 $0 $200 $400 $600 $800 $1,000 $1,200 $1,400 $1,600 $1,800 2018 2019 2020 2021 2022 2023Q1 Commercial R/E Residential R/E Commercial R/E Construction Installment Automobile $1,354 $1,343 $ in millions $ in millions $1,324 $1,621 Source: Company documents. $1,392 $1,639 $1,494 $1,556 $1,384 $1,699 $1,220 $1,639 |
|
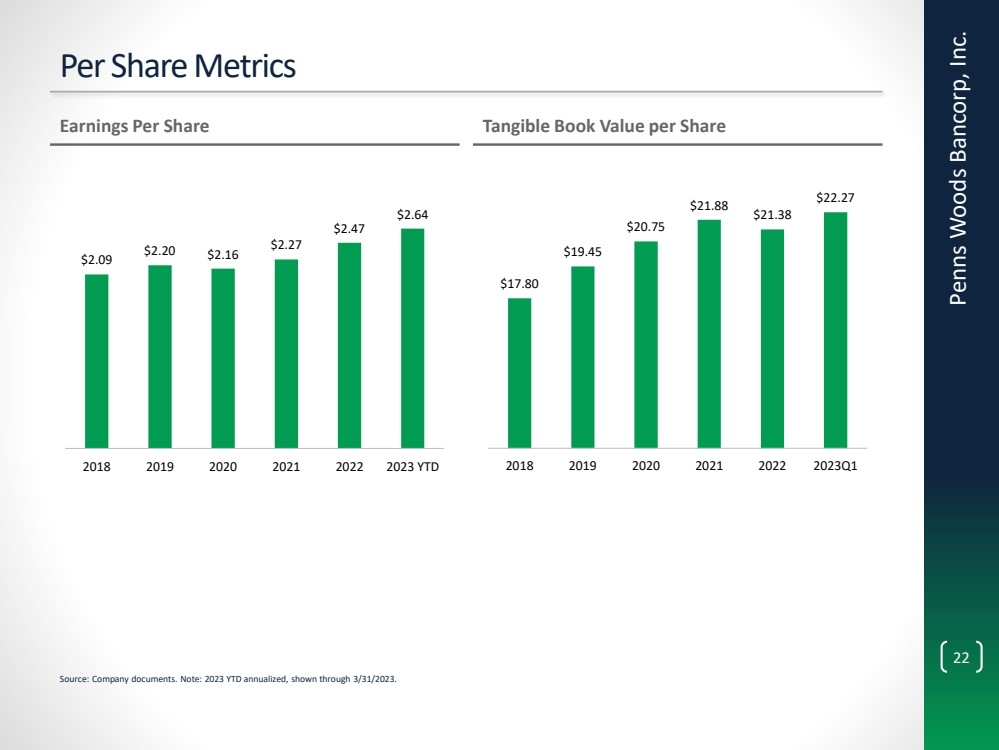
22 Per Share Metrics Penns Woods Bancorp, Inc. $2.09 $2.20 $2.16 $2.27 $2.47 $2.64 2018 2019 2020 2021 2022 2023 YTD Earnings Per Share Tangible Book Value per Share $17.80 $19.45 $20.75 $21.88 $21.38 $22.27 2018 2019 2020 2021 2022 2023Q1 Source: Company documents. Note: 2023 YTD annualized, shown through 3/31/2023. |
|
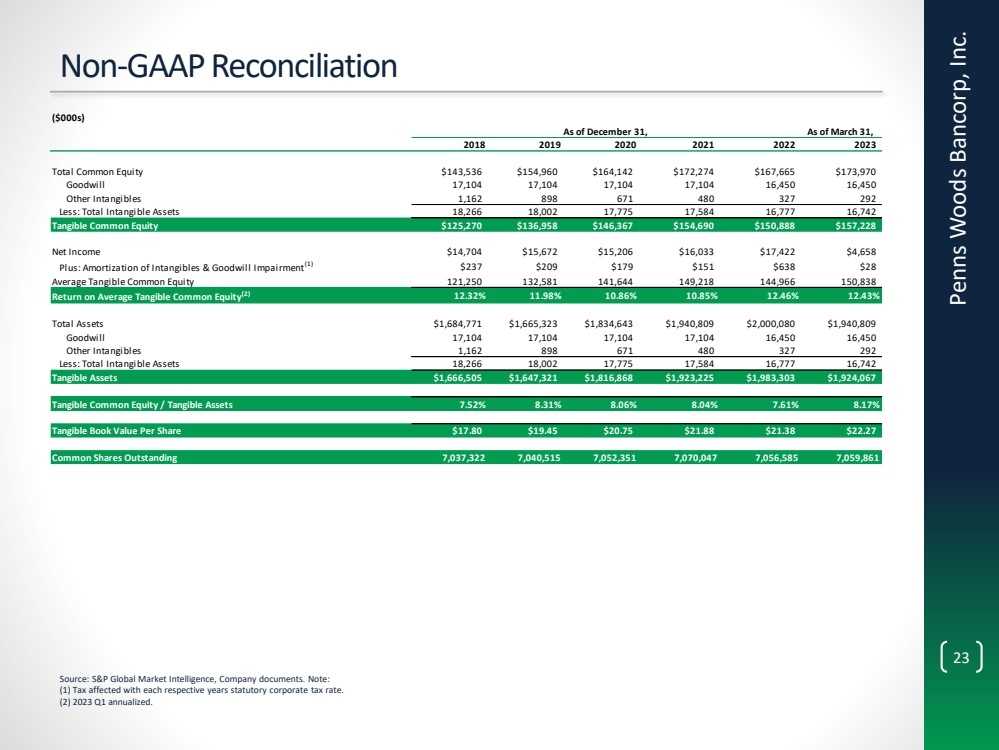
23 Non -GAAP Reconciliation Penns Woods Bancorp, Inc. Source: S&P Global Market Intelligence, Company documents. Note: (1) Tax affected with each respective years statutory corporate tax rate. (2) 2023 Q1 annualized. ($000s) As of December 31, As of March 31, 2018 2019 2020 2021 2022 2023 Total Common Equity $143,536 $154,960 $164,142 $172,274 $167,665 $173,970 Goodwill 17,104 17,104 17,104 17,104 16,450 16,450 Other Intangibles 1,162 898 671 480 327 292 Less: Total Intangible Assets 18,266 18,002 17,775 17,584 16,777 16,742 Tangible Common Equity $125,270 $136,958 $146,367 $154,690 $150,888 $157,228 Net Income $14,704 $15,672 $15,206 $16,033 $17,422 $4,658 Plus: Amortization of Intangibles & Goodwill Impairment(1) $237 $209 $179 $151 $638 $28 Average Tangible Common Equity 121,250 132,581 141,644 149,218 144,966 150,838 Return on Average Tangible Common Equity(2) 12.32% 11.98% 10.86% 10.85% 12.46% 12.43% Total Assets $1,684,771 $1,665,323 $1,834,643 $1,940,809 $2,000,080 $1,940,809 Goodwill 17,104 17,104 17,104 17,104 16,450 16,450 Other Intangibles 1,162 898 671 480 327 292 Less: Total Intangible Assets 18,266 18,002 17,775 17,584 16,777 16,742 Tangible Assets $1,666,505 $1,647,321 $1,816,868 $1,923,225 $1,983,303 $1,924,067 Tangible Common Equity / Tangible Assets 7.52% 8.31% 8.06% 8.04% 7.61% 8.17% Tangible Book Value Per Share $17.80 $19.45 $20.75 $21.88 $21.38 $22.27 Common Shares Outstanding 7,037,322 7,040,515 7,052,351 7,070,047 7,056,585 7,059,861 |