UNITED STATES
SECURITIES AND EXCHANGE COMMISSION
Washington, D.C. 20549
FORM 8-K
CURRENT REPORT
Pursuant to Section 13 OR 15(d) of the Securities Exchange Act of 1934
Date of Report (Date of earliest event reported): May 16, 2023
GRANITE RIDGE RESOURCES, INC.
(Exact name of registrant as specified in its charter)
| Delaware | 001-41537 | 88-2227812 | |
|
(State or other jurisdiction of incorporation) |
(Commission File Number) |
(IRS Employer Identification No.) |
|
|
5217 McKinney Avenue, Suite 400 Dallas, Texas |
75205 |
||
| (Address of principal executive offices) | (Zip Code) | ||
(214) 396-2850
(Registrant’s telephone number, including area code)
Not Applicable
(Former name or former address, if changed since last report.)
Check the appropriate box below if the Form 8-K filing is intended to simultaneously satisfy the filing obligation of the registrant under any of the following provisions:
| ¨ | Written communications pursuant to Rule 425 under the Securities Act (17 CFR 230.425) |
| ¨ | Soliciting material pursuant to Rule 14a-12 under the Exchange Act (17 CFR 240.14a-12) |
| ¨ | Pre-commencement communications pursuant to Rule 14d-2(b) under the Exchange Act (17 CFR 240.14d-2(b)) |
| ¨ | Pre-commencement communications pursuant to Rule 13e-4(c) under the Exchange Act (17 CFR 240.13e-4(c)) |
Securities registered pursuant to Section 12(b) of the Act:
| Title of each class | Trading Symbol(s) | Name of each exchange on which registered |
| Common stock, par value $0.0001 per share | GRNT | New York Stock Exchange |
| Warrants to purchase Common Stock, each whole warrant exercisable for one share of common stock at an exercise price of $11.50 per share | GRNT WS | New York Stock Exchange |
Indicate by check mark whether the registrant is an emerging growth company as defined in Rule 405 of the Securities Act of 1933 (§230.405 of this chapter) or Rule 12b-2 of the Securities Exchange Act of 1934 (§240.12b-2 of this chapter).
Emerging growth company x
If an emerging growth company, indicate by check mark if the registrant has elected not to use the extended transition period for complying with any new or revised financial accounting standards provided pursuant to Section 13(a) of the Exchange Act. ¨
| Item 7.01 | Regulation FD Disclosure. |
On May 16, 2023, Granite Ridge Resources, Inc. (the “Company”) published an Investor Presentation, which is available on the Company’s website, www.graniteridge.com, under “Investors.” The Company may from time to time publish additional materials for investors at the same website address. A copy of the Investor Presentation is attached as Exhibit 99.1 to this Current Report on Form 8-K and is incorporated herein by reference.
The information in this Current Report on Form 8-K is being furnished herewith and shall not be deemed “filed” for purposes of Section 18 of the Securities Exchange Act of 1934, as amended (the “Exchange Act”), or otherwise subject to liabilities of that section, and shall not be incorporated by reference into any filing under the Securities Act of 1933, as amended, or the Exchange Act except to the extent expressly stated in such filing.
| Item 9.01 | Financial Statements and Exhibits. |
(d) Exhibits.
| Exhibit No. | Description | |
| 99.1* | Investor Presentation of Granite Ridge Resources, Inc., dated as of May 2023. | |
| 104 | Cover Page Interactive Data File (embedded within the Inline XBRL document) |
*Filed herewith
SIGNATURE
Pursuant to the requirements of the Securities Exchange Act of 1934, the registrant has duly caused this report to be signed on its behalf by the undersigned hereunto duly authorized.
| GRANITE RIDGE RESOURCES, INC. | |||
| Date: May 16, 2023 | By: | /s/ Luke C. Brandenberg | |
| Name: | Luke C. Brandenberg | ||
| Title: | President and Chief Executive Officer | ||
|
GRANITE RIDGE RESOURCES I N V E S T O R P R E S E N T A T I O N | M A Y 2 0 2 3 |
|
Q 1 ’ 2 3 R E S U L T S & F Y ’ 2 3 G U I D A N C E |
|
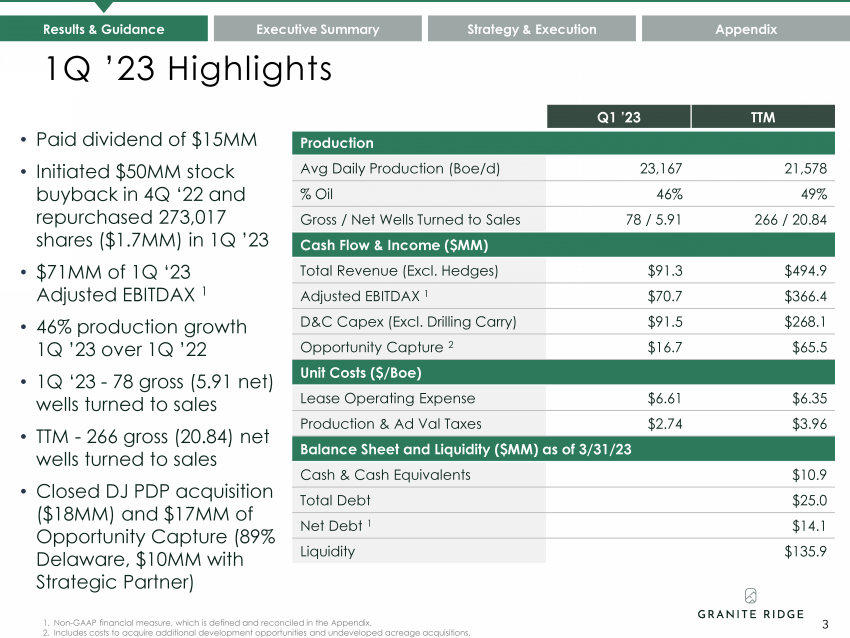
3 1Q ’23 Highlights Results & Guidance Executive Summary Strategy & Execution Appendix 1. Non-GAAP financial measure, which is defined and reconciled in the Appendix. 2. Includes costs to acquire additional development opportunities and undeveloped acreage acquisitions. 3 • Paid dividend of $15MM • Initiated $50MM stock buyback in 4Q ‘22 and repurchased 273,017 shares ($1.7MM) in 1Q ’23 • $71MM of 1Q ‘23 Adjusted EBITDAX 1 • 46% production growth 1Q ’23 over 1Q ’22 • 1Q ‘23 - 78 gross (5.91 net) wells turned to sales • TTM - 266 gross (20.84) net wells turned to sales • Closed DJ PDP acquisition ($18MM) and $17MM of Opportunity Capture (89% Delaware, $10MM with Strategic Partner) Q1 ’23 TTM Production Avg Daily Production (Boe/d) 23,167 21,578 % Oil 46% 49% Gross / Net Wells Turned to Sales 78 / 5.91 266 / 20.84 Cash Flow & Income ($MM) Total Revenue (Excl. Hedges) $91.3 $494.9 Adjusted EBITDAX 1 $70.7 $366.4 D&C Capex (Excl. Drilling Carry) $91.5 $268.1 Opportunity Capture 2 $16.7 $65.5 Unit Costs ($/Boe) Lease Operating Expense $6.61 $6.35 Production & Ad Val Taxes $2.74 $3.96 Balance Sheet and Liquidity ($MM) as of 3/31/23 Cash & Cash Equivalents $10.9 Total Debt $25.0 Net Debt 1 $14.1 Liquidity $135.9 |
|
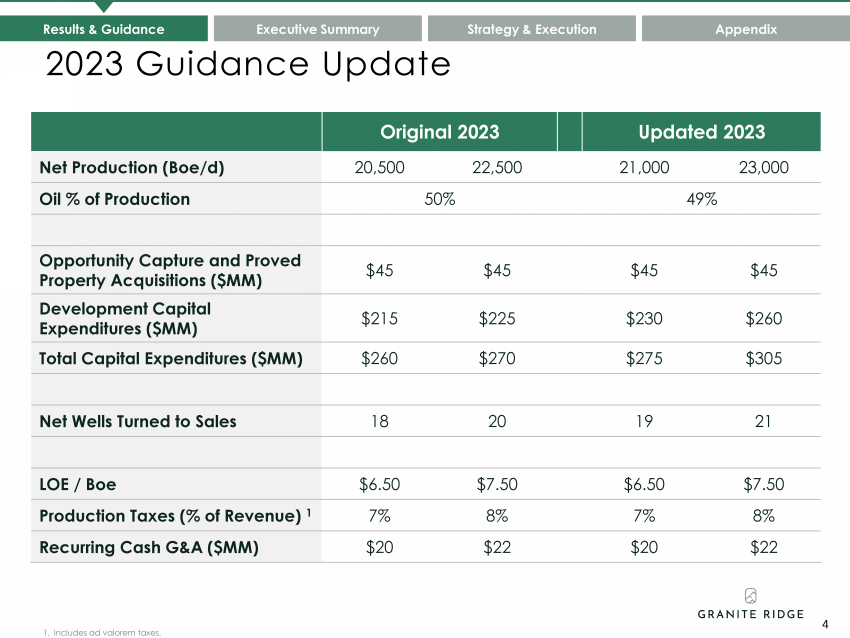
Original 2023 Updated 2023 Net Production (Boe/d) 20,500 22,500 21,000 23,000 Oil % of Production 50% 49% Opportunity Capture and Proved Property Acquisitions ($MM) $45 $45 $45 $45 Development Capital Expenditures ($MM) $215 $225 $230 $260 Total Capital Expenditures ($MM) $260 $270 $275 $305 Net Wells Turned to Sales 18 20 19 21 LOE / Boe $6.50 $7.50 $6.50 $7.50 Production Taxes (% of Revenue) 1 7% 8% 7% 8% Recurring Cash G&A ($MM) $20 $22 $20 $22 2023 Guidance Update 4 Results & Guidance Executive Summary Strategy & Execution Appendix 1. Includes ad valorem taxes. 4 |
|
E X E C U T I V E S U M M A R Y |
|
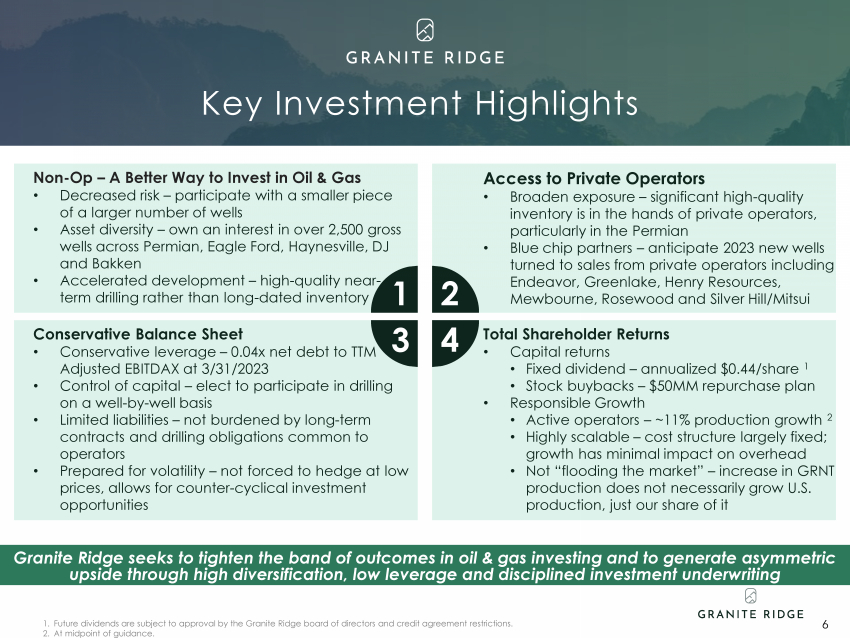
Total Shareholder Returns • Capital returns • Fixed dividend – annualized $0.44/share 1 • Stock buybacks – $50MM repurchase plan • Responsible Growth • Active operators – ~11% production growth 2 • Highly scalable – cost structure largely fixed; growth has minimal impact on overhead • Not “flooding the market” – increase in GRNT production does not necessarily grow U.S. production, just our share of it Conservative Balance Sheet • Conservative leverage – 0.04x net debt to TTM Adjusted EBITDAX at 3/31/2023 • Control of capital – elect to participate in drilling on a well-by-well basis • Limited liabilities – not burdened by long-term contracts and drilling obligations common to operators • Prepared for volatility – not forced to hedge at low prices, allows for counter-cyclical investment opportunities Non-Op – A Better Way to Invest in Oil & Gas • Decreased risk – participate with a smaller piece of a larger number of wells • Asset diversity – own an interest in over 2,500 gross wells across Permian, Eagle Ford, Haynesville, DJ and Bakken • Accelerated development – high-quality near-term drilling rather than long-dated inventory Access to Private Operators • Broaden exposure – significant high-quality inventory is in the hands of private operators, particularly in the Permian • Blue chip partners – anticipate 2023 new wells turned to sales from private operators including Endeavor, Greenlake, Henry Resources, Mewbourne, Rosewood and Silver Hill/Mitsui Key Investment Highlights Granite Ridge seeks to tighten the band of outcomes in oil & gas investing and to generate asymmetric upside through high diversification, low leverage and disciplined investment underwriting 6 1 2 3 4 1. Future dividends are subject to approval by the Granite Ridge board of directors and credit agreement restrictions. 2. At midpoint of guidance. |
|
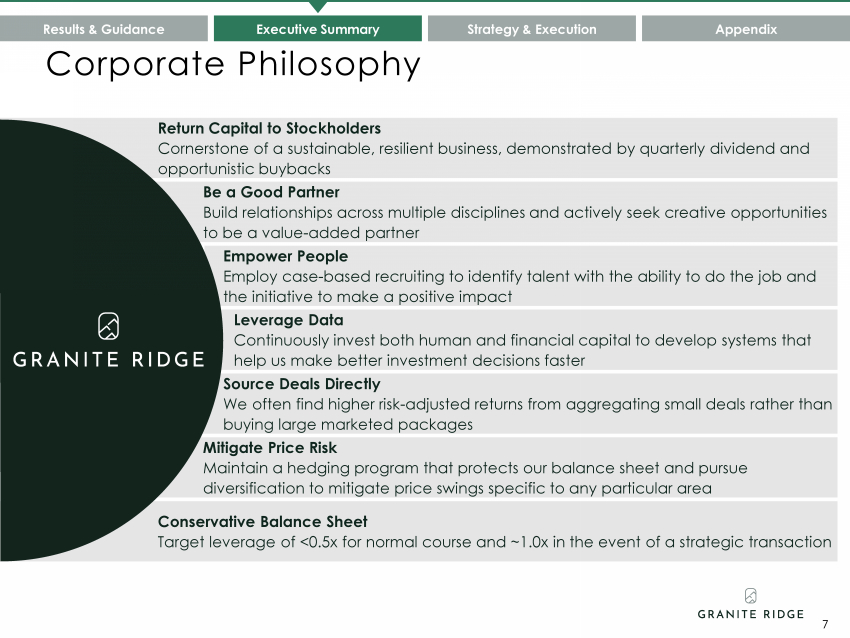
Corporate Philosophy Results & Guidance Executive Summary Strategy & Execution Appendix Return Capital to Stockholders Cornerstone of a sustainable, resilient business, demonstrated by quarterly dividend and opportunistic buybacks Empower People Employ case-based recruiting to identify talent with the ability to do the job and the initiative to make a positive impact Source Deals Directly We often find higher risk-adjusted returns from aggregating small deals rather than buying large marketed packages Mitigate Price Risk Maintain a hedging program that protects our balance sheet and pursue diversification to mitigate price swings specific to any particular area Be a Good Partner Build relationships across multiple disciplines and actively seek creative opportunities to be a value-added partner Leverage Data Continuously invest both human and financial capital to develop systems that help us make better investment decisions faster Conservative Balance Sheet Target leverage of <0.5x for normal course and ~1.0x in the event of a strategic transaction 7 |
|
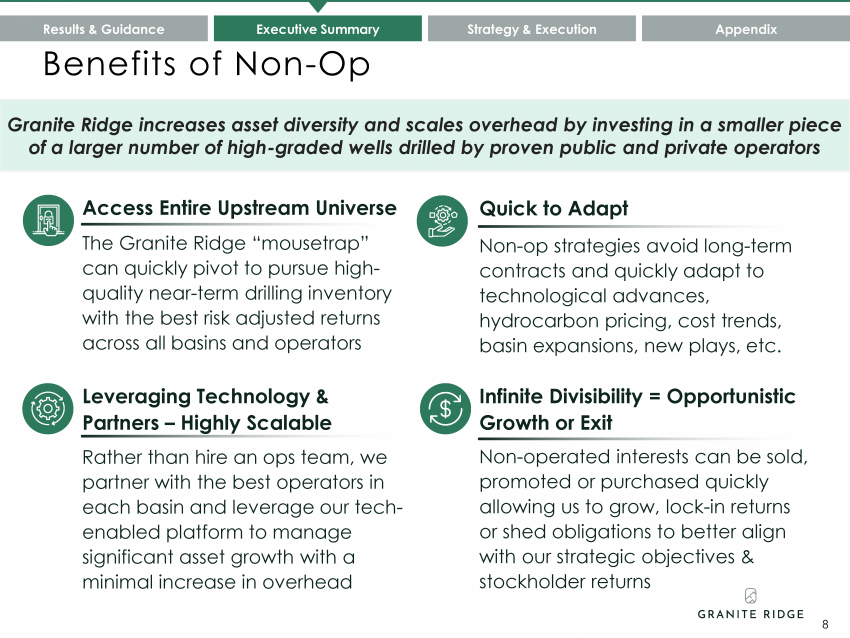
Benefits of Non-Op Results & Guidance Executive Summary Strategy & Execution Appendix 8 Access Entire Upstream Universe The Granite Ridge “mousetrap” can quickly pivot to pursue high-quality near-term drilling inventory with the best risk adjusted returns across all basins and operators Leveraging Technology & Partners – Highly Scalable Rather than hire an ops team, we partner with the best operators in each basin and leverage our tech-enabled platform to manage significant asset growth with a minimal increase in overhead Infinite Divisibility = Opportunistic Growth or Exit Non-operated interests can be sold, promoted or purchased quickly allowing us to grow, lock-in returns or shed obligations to better align with our strategic objectives & stockholder returns Quick to Adapt Non-op strategies avoid long-term contracts and quickly adapt to technological advances, hydrocarbon pricing, cost trends, basin expansions, new plays, etc. Granite Ridge increases asset diversity and scales overhead by investing in a smaller piece of a larger number of high-graded wells drilled by proven public and private operators |
|
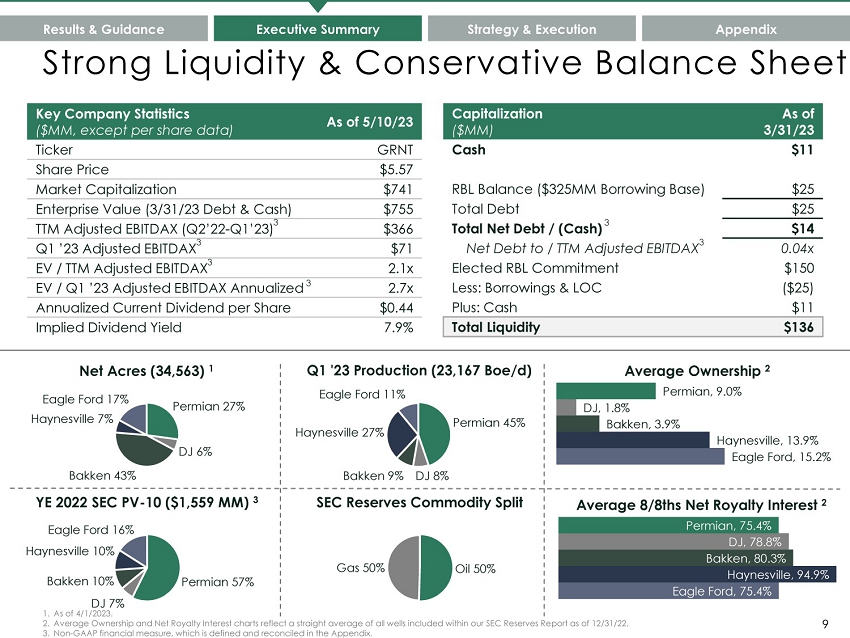
Permian 27% DJ 6% Bakken 43% Haynesville 7% Eagle Ford 17% FY '22 Production (19,765 Boe/d) Net Acres (34,563)1 Permian 45% Bakken 9% DJ 8% Haynesville 27% Eagle Ford 11% FY '22 Production (19,765 Boe/d) Q1 '23 Production (23,167 Boe/d) Eagle Ford, 15.2% Haynesville, 13.9% Bakken, 3.9% DJ, 1.8% Permian, 9.0% Average Ownership 2 Eagle Ford, 75.4% Haynesville, 94.9% Bakken, 80.3% DJ, 78.8% Permian, 75.4% Average 8/8ths Net Royalty Interest 2 Permian 57% DJ 7% Bakken 10% Haynesville 10% Eagle Ford 16% FY '22 Production (19,765 Boe/d) YE 2022 SEC PV Net Acres (34,311) SEC PV -10 ($1,559 MM) -10 ($1,559 MM) 3 Gas 50% Oil 50% FY '22 Production (19,765 Boe/d) FY '22 Production (19,765 Boe/d) SEC Reserves Commodity Split SEC PV Net Acres (34,311) -10 ($1,559 MM) 9 Strong Liquidity & Conservative Balance Sheet Results & Guidance Executive Summary Strategy & Execution Appendix 1. As of 4/1/2023. 2. Average Ownership and Net Royalty Interest charts reflect a straight average of all wells included within our SEC Reserves Report as of 12/31/22. 3. Non-GAAP financial measure, which is defined and reconciled in the Appendix. Capitalization ($MM) As of 3/31/23 Cash $11 RBL Balance ($325MM Borrowing Base) $25 Total Debt $25 Total Net Debt / (Cash) $14 Net Debt to / TTM Adjusted EBITDAX 0.04x Elected RBL Commitment $150 Less: Borrowings & LOC ($25) Plus: Cash $11 Total Liquidity $136 Key Company Statistics ($MM, except per share data) As of 5/10/23 Ticker GRNT Share Price $5.57 Market Capitalization $741 Enterprise Value (3/31/23 Debt & Cash) $755 TTM Adjusted EBITDAX (Q2’22-Q1’23) $366 Q1 ’23 Adjusted EBITDAX $71 EV / TTM Adjusted EBITDAX 2.1x EV / Q1 ’23 Adjusted EBITDAX Annualized 2.7x Annualized Current Dividend per Share $0.44 Implied Dividend Yield 7.9% |
|
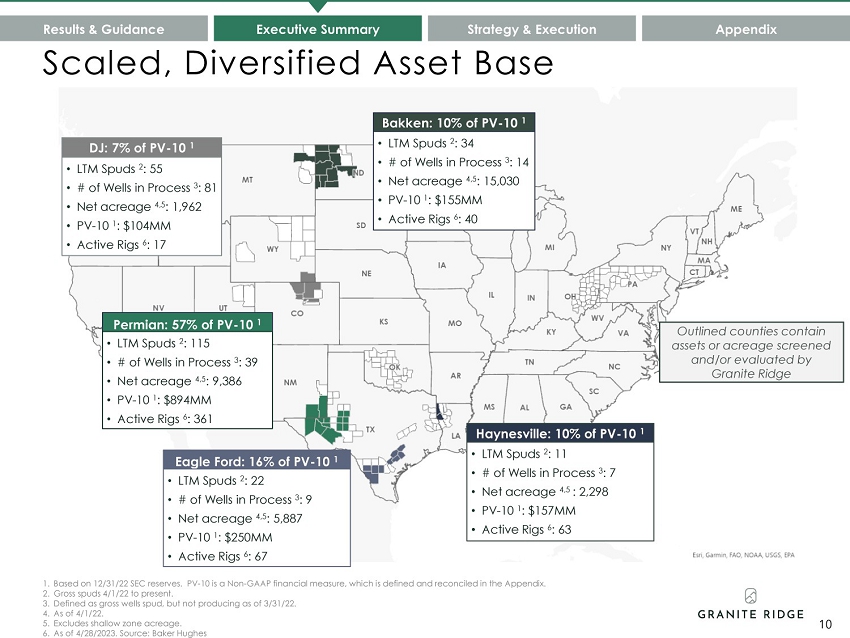
Scaled, Diversified Asset Base Results & Guidance Executive Summary Strategy & Execution Appendix Eagle Ford: 16% of PV-10 1 • LTM Spuds 2 : 22 • # of Wells in Process 3 : 9 • Net acreage 4,5: 5,887 • PV-10 1 : $250MM • Active Rigs 6 : 67 Haynesville: 10% of PV-10 1 • LTM Spuds 2 : 11 • # of Wells in Process 3 : 7 • Net acreage 4,5 : 2,298 • PV-10 1 : $157MM • Active Rigs 6 : 63 DJ: 7% of PV-10 1 • LTM Spuds 2 : 55 • # of Wells in Process 3 : 81 • Net acreage 4,5: 1,962 • PV-10 1 : $104MM • Active Rigs 6 : 17 Bakken: 10% of PV-10 1 • LTM Spuds 2 : 34 • # of Wells in Process 3 : 14 • Net acreage 4,5: 15,030 • PV-10 1 : $155MM • Active Rigs 6 : 40 Permian: 57% of PV-10 1 • LTM Spuds 2 : 115 • # of Wells in Process 3 : 39 • Net acreage 4,5: 9,386 • PV-10 1 : $894MM • Active Rigs 6 : 361 Outlined counties contain assets or acreage screened and/or evaluated by Granite Ridge 10 1. Third party SEC reserves with 12/31/22 effective date and SEC pricing. 2. Gross spuds 4/1/22 to present. 3. Defined as gross wells spud, but not producing as of 3/31/22. 4. As of 4/1/22. 5. Excludes shallow zone acreage. 6. As of 4/28/2023. Source: Baker Hughes |
|
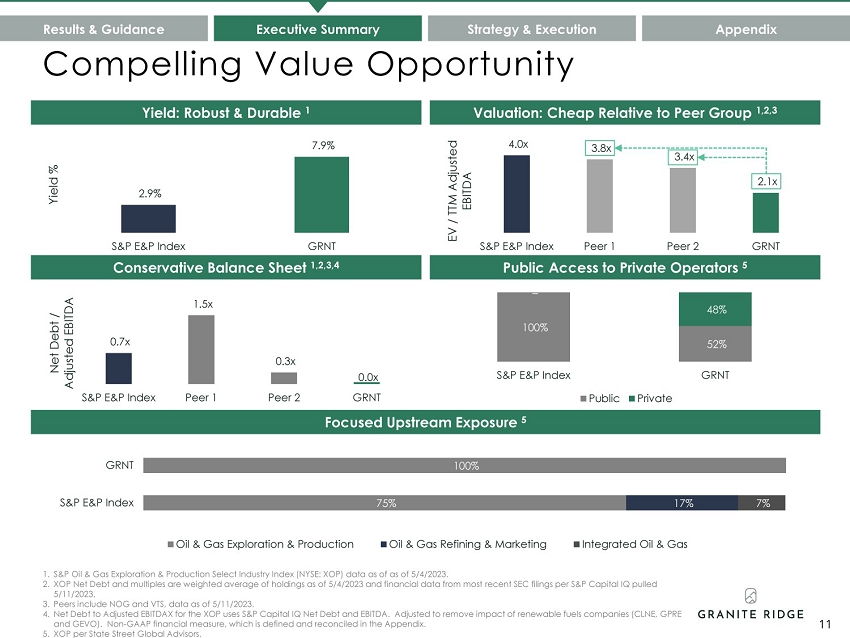
75% 100% S&P E&P Index 17% 7% GRNT Oil & Gas Exploration & Production Oil & Gas Refining & Marketing Integrated Oil & Gas 4.0x 3.8x 3.4x 2.1x S&P E&P Index Peer 1 Peer 2 GRNT EV / TTM Adjusted EBITDA 100% 52% – 48% S&P E&P Index GRNT Public Private 2.9% 7.9% S&P E&P Index GRNT Yield % 0.7x 1.5x 0.3x 0.0x S&P E&P Index Peer 1 Peer 2 GRNT Net Debt / Adjusted EBITDA Compelling Value Opportunity 1. S&P Oil & Gas Exploration & Production Select Industry Index (NYSE: XOP) data as of as of 5/4/2023. 2. XOP Net Debt and multiples are weighted average of holdings as of 5/4/2023 and financial data from most recent SEC filings per S&P Capital IQ pulled 5/11/2023. 3. Peers include NOG and VTS, data as of 5/11/2023. 4. Net Debt to Adjusted EBITDAX for the XOP uses S&P Capital IQ Net Debt and EBITDA. Adjusted to remove impact of renewable fuels companies (CLNE, GPRE and GEVO). 5. XOP per State Street Global Advisors. Yield: Robust & Durable 1 Valuation: Cheap Relative to Peer Group 1,2,3 Conservative Balance Sheet 1,2,3,4 Public Access to Private Operators 5 Focused Upstream Exposure 5 Results & Guidance Executive Summary Strategy & Execution Appendix 11 |
|
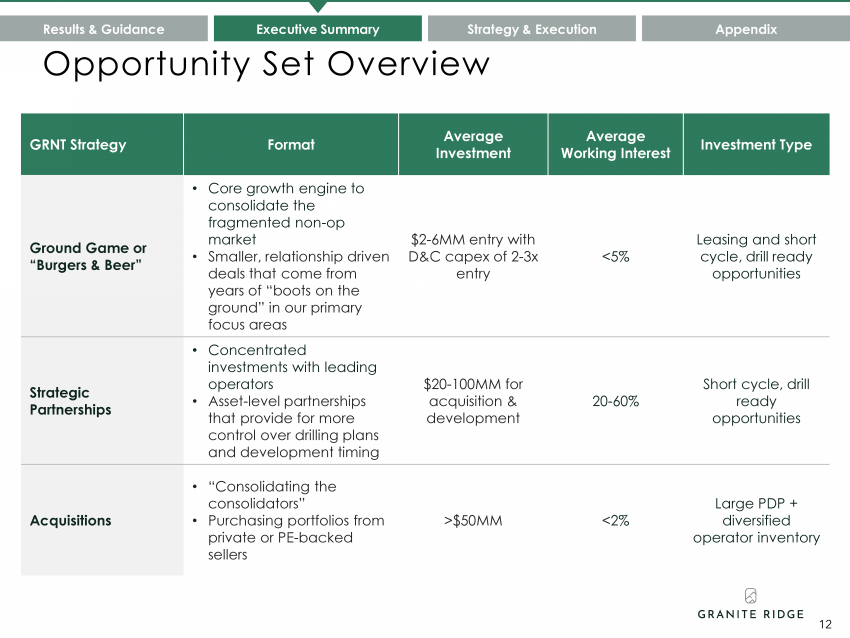
Opportunity Set Overview GRNT Strategy Format Average Investment Average Working Interest Investment Type Ground Game or “Burgers & Beer” • Core growth engine to consolidate the fragmented non-op market • Smaller, relationship driven deals that come from years of “boots on the ground” in our primary focus areas $2-6MM entry with D&C capex of 2-3x entry <5% Leasing and short cycle, drill ready opportunities Strategic Partnerships • Concentrated investments with leading operators • Asset-level partnerships that provide for more control over drilling plans and development timing $20-100MM for acquisition & development 20-60% Short cycle, drill ready opportunities Acquisitions • “Consolidating the consolidators” • Purchasing portfolios from private or PE-backed sellers >$50MM <2% Large PDP + diversified operator inventory Results & Guidance Executive Summary Strategy & Execution Appendix 12 |
|
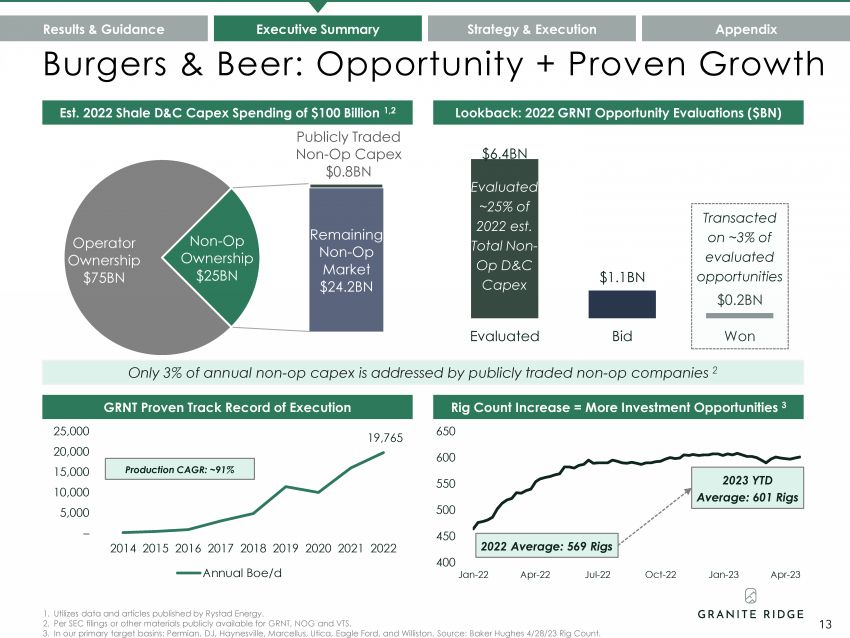
Operator Ownership $75BN Publicly Traded Non-Op Capex $0.8BN Remaining Non-Op Market $24.2BN Non-Op Ownership $25BN 400 450 500 550 600 650 Jan-22 Apr-22 Jul-22 Oct-22 Jan-23 Apr-23 19,765 – 5,000 10,000 15,000 20,000 25,000 2014 2015 2016 2017 2018 2019 2020 2021 2022 Annual Boe/d $6.4BN $1.1BN $0.2BN Evaluated Bid Won Burgers & Beer: Opportunity + Proven Growth Evaluated ~25% of 2022 est. Total Non-Op D&C Capex Production CAGR: ~91% Transacted on ~3% of evaluated opportunities Est. 2022 Shale D&C Capex Spending of $100 Billion 1,2 Lookback: 2022 GRNT Opportunity Evaluations ($BN) GRNT Proven Track Record of Execution Results & Guidance Executive Summary Strategy & Execution Appendix 13 Rig Count Increase = More Investment Opportunities 3 2023 YTD Average: 601 Rigs 1. Utilizes data and articles published by Rystad Energy. 2. Per SEC filings or other materials publicly available for GRNT, NOG and VTS. 3. In our primary target basins: Permian, DJ, Haynesville, Marcellus, Utica, Eagle Ford, and Williston. Source: Baker Hughes 4/28/23 Rig Count. 2022 Average: 569 Rigs Only 3% of annual non-op capex is addressed by publicly traded non-op companies 2 |
|
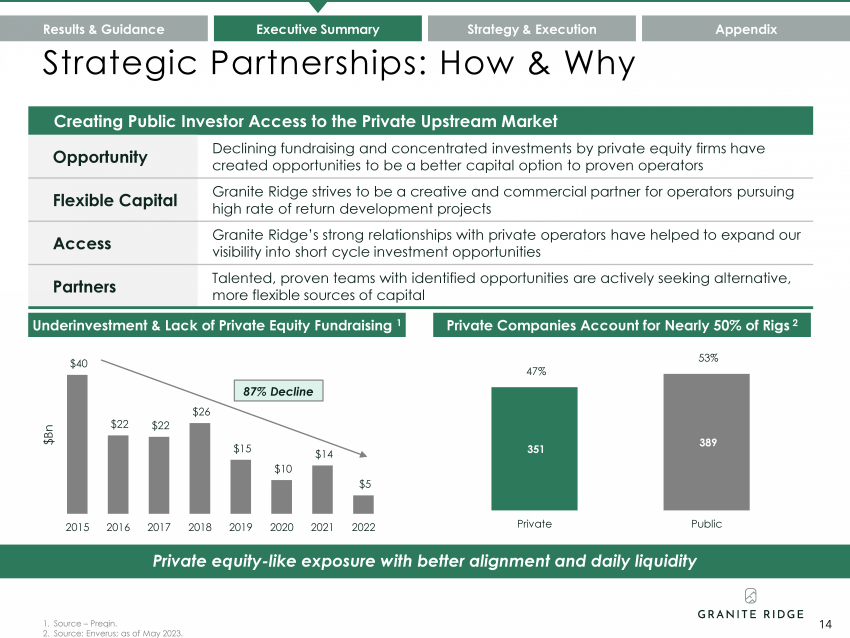
$40 $22 $22 $26 $15 $10 $14 $5 2015 2016 2017 2018 2019 2020 2021 2022 $Bn Strategic Partnerships: How & Why 87% Decline Underinvestment & Lack of Private Equity Fundraising 1 Private Companies Account for Nearly 50% of Rigs 2 Results & Guidance Executive Summary Strategy & Execution Appendix Creating Public Investor Access to the Private Upstream Market Opportunity Declining fundraising and concentrated investments by private equity firms have created opportunities to be a better capital option to proven operators Flexible Capital Granite Ridge strives to be a creative and commercial partner for operators pursuing high rate of return development projects Access Granite Ridge’s strong relationships with private operators have helped to expand our visibility into short cycle investment opportunities Partners Talented, proven teams with identified opportunities are actively seeking alternative, more flexible sources of capital 351 389 47% 53% – 10% 20% 30% 40% 50% 60% – 50 100 150 200 250 300 350 400 450 Private Public Private equity-like exposure with better alignment and daily liquidity 1. Source – Preqin. 14 2. Source: Enverus; as of May 2023. |
|
S T R A T E G Y & E X E C U T I O N |
|
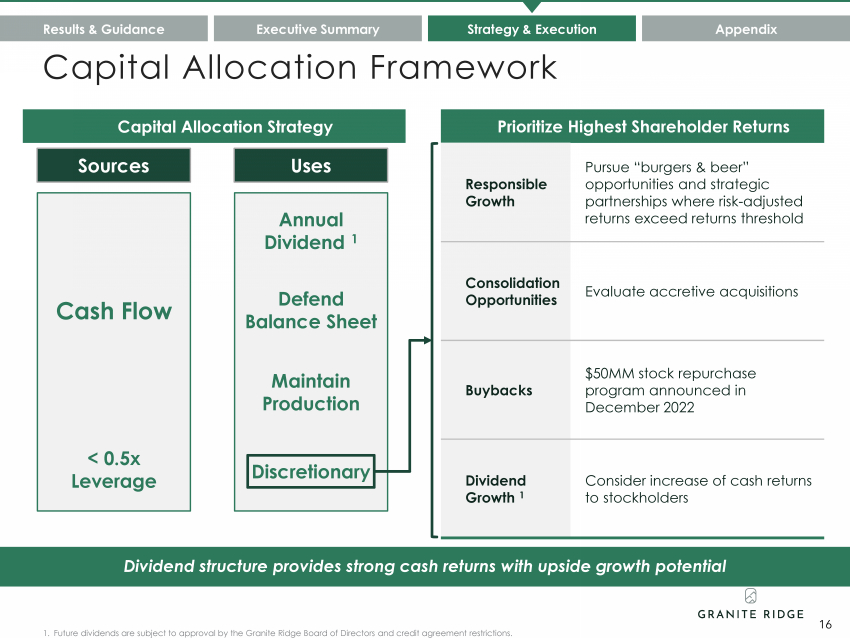
1. Future dividends are subject to approval by the Granite Ridge Board of Directors and credit agreement restrictions. Capital Allocation Strategy Results & Guidance Executive Summary Strategy & Execution Appendix Prioritize Highest Shareholder Returns Responsible Growth Pursue “burgers & beer” opportunities and strategic partnerships where risk-adjusted returns exceed returns threshold Consolidation Opportunities Evaluate accretive acquisitions Buybacks $50MM stock repurchase program announced in December 2022 Dividend Growth 1 Consider increase of cash returns to stockholders Cash Flow < 0.5x Leverage Annual Dividend 1 Maintain Production Defend Balance Sheet Sources Uses Discretionary Dividend structure provides strong cash returns with upside growth potential Capital Allocation Framework 16 |
|
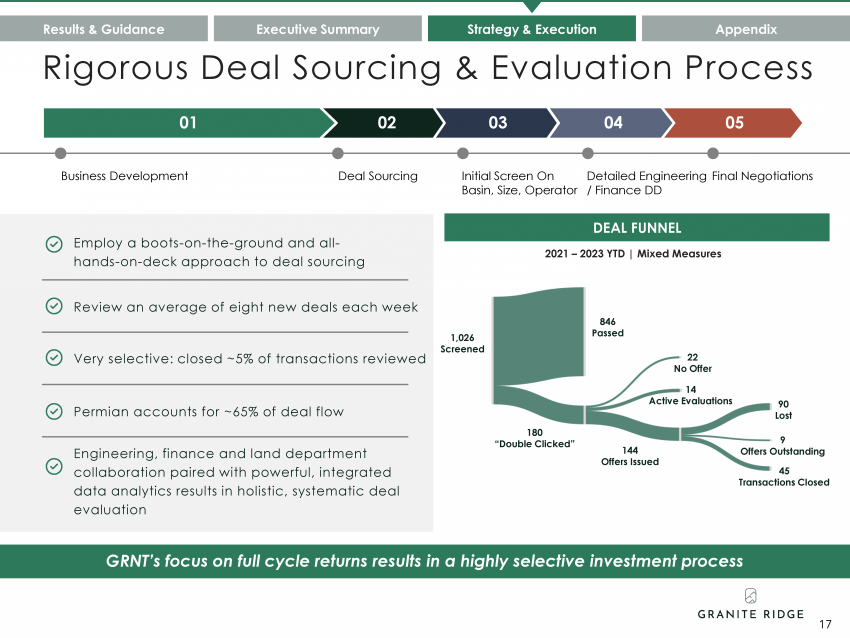
DEAL FUNNEL 2021 – 2023 YTD | Mixed Measures GRNT’s focus on full cycle returns results in a highly selective investment process Detailed Engineering / Finance DD Business Development Deal Sourcing 01 02 03 04 05 Employ a boots-on-the-ground and all-hands-on-deck approach to deal sourcing Review an average of eight new deals each week Very selective: closed ~5% of transactions reviewed Permian accounts for ~65% of deal flow Engineering, finance and land department collaboration paired with powerful, integrated data analytics results in holistic, systematic deal evaluation 1,026 Screened 180 “Double Clicked” 144 Offers Issued 45 Transactions Closed 14 Active Evaluations 846 Passed 22 No Offer 9 Offers Outstanding 90 Lost Results & Guidance Executive Summary Strategy & Execution Appendix 17 Rigorous Deal Sourcing & Evaluation Process Initial Screen On Final Negotiations Basin, Size, Operator |
|
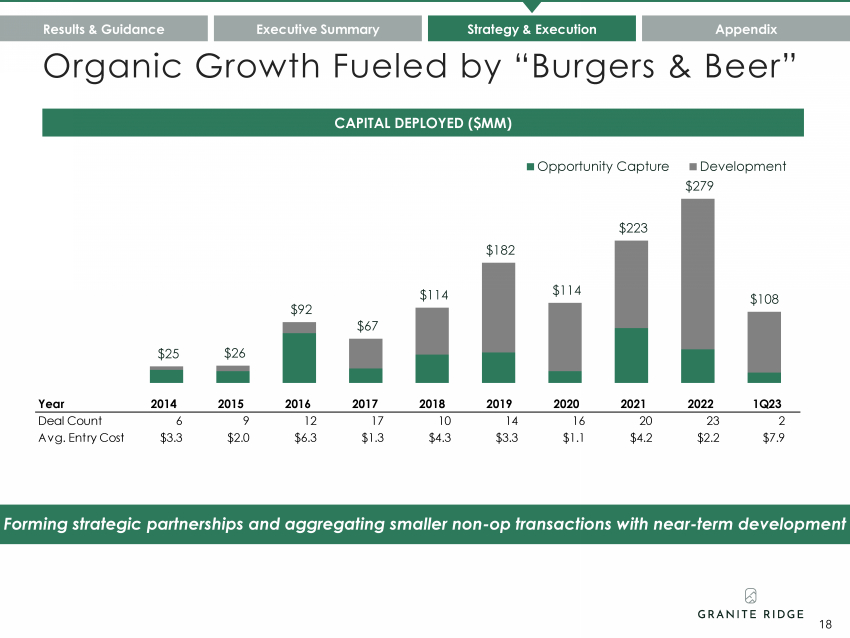
$25 $26 $92 $67 $114 $182 $114 $223 $279 $108 Opportunity Capture Development Forming strategic partnerships and aggregating smaller non-op transactions with near-term development CAPITAL DEPLOYED ($MM) Results & Guidance Executive Summary Strategy & Execution Appendix 18 Organic Growth Fueled by “Burgers & Beer” Year 2014 2015 2016 2017 2018 2019 2020 2021 2022 1Q23 Deal Count 6 9 12 17 10 14 16 20 23 2 Avg. Entry Cost $3.3 $2.0 $6.3 $1.3 $4.3 $3.3 $1.1 $4.2 $2.2 $7.9 |
|
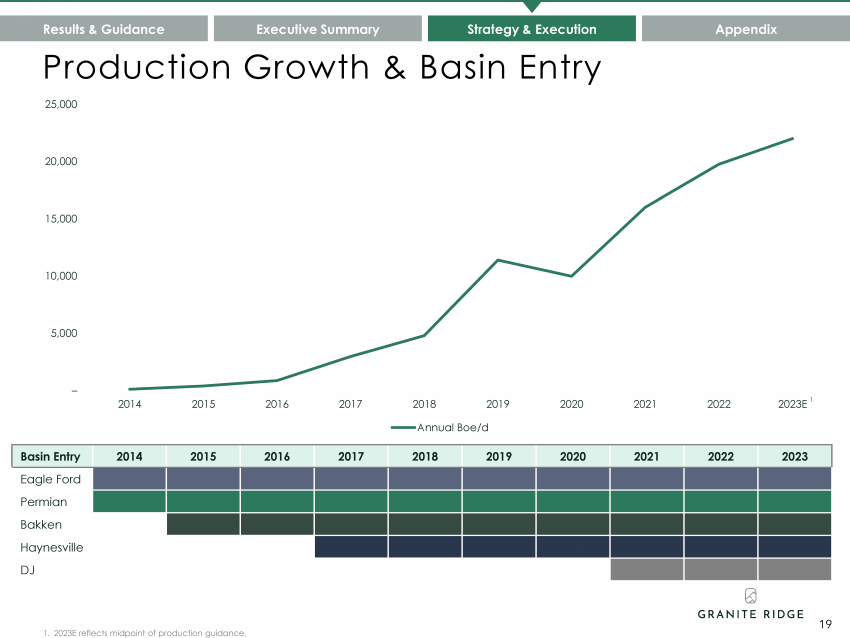
– 5,000 10,000 15,000 20,000 25,000 2014 2015 2016 2017 2018 2019 2020 2021 2022 2023E Annual Boe/d Production Growth & Basin Entry Results & Guidance Executive Summary Strategy & Execution Appendix Basin Entry 2014 2015 2016 2017 2018 2019 2020 2021 2022 2023 Eagle Ford Permian Bakken Haynesville DJ 19 1. 2023E reflects midpoint of production guidance. 1 |
|
A P P E N D I X |
|
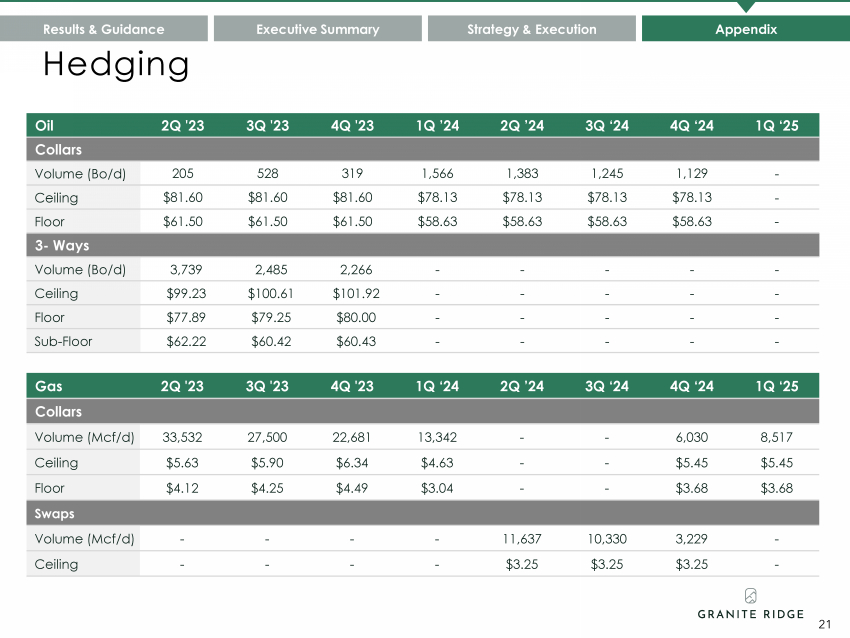
Hedging Results & Guidance Executive Summary Strategy & Execution Appendix 21 Oil 2Q '23 3Q '23 4Q '23 1Q ’24 2Q ’24 3Q ‘24 4Q ‘24 1Q ‘25 Collars Volume (Bo/d) 205 528 319 1,566 1,383 1,245 1,129 - Ceiling $81.60 $81.60 $81.60 $78.13 $78.13 $78.13 $78.13 - Floor $61.50 $61.50 $61.50 $58.63 $58.63 $58.63 $58.63 - 3- Ways Volume (Bo/d) 3,739 2,485 2,266 - - - - - Ceiling $99.23 $100.61 $101.92 - - - - - Floor $77.89 $79.25 $80.00 - - - - - Sub-Floor $62.22 $60.42 $60.43 - - - - - Gas 2Q '23 3Q '23 4Q '23 1Q ‘24 2Q ’24 3Q ‘24 4Q ‘24 1Q ‘25 Collars Volume (Mcf/d) 33,532 27,500 22,681 13,342 - - 6,030 8,517 Ceiling $5.63 $5.90 $6.34 $4.63 - - $5.45 $5.45 Floor $4.12 $4.25 $4.49 $3.04 - - $3.68 $3.68 Swaps Volume (Mcf/d) - - - - 11,637 10,330 3,229 - Ceiling - - - - $3.25 $3.25 $3.25 - |
|
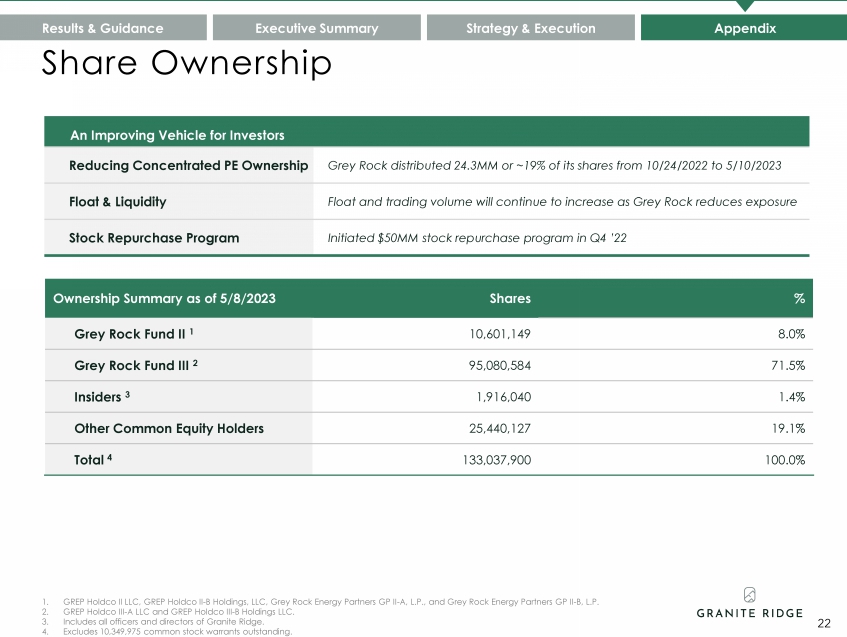
Share Ownership Results & Guidance Executive Summary Strategy & Execution Appendix 22 An Improving Vehicle for Investors Reducing Concentrated PE Ownership Grey Rock distributed 24.3MM or ~19% of its shares from 10/24/2022 to 5/10/2023 Float & Liquidity Float and trading volume will continue to increase as Grey Rock reduces exposure Stock Repurchase Program Initiated $50MM stock repurchase program in Q4 ’22 1. GREP Holdco II LLC, GREP Holdco II-B Holdings, LLC, Grey Rock Energy Partners GP II-A, L.P., and Grey Rock Energy Partners GP II-B, L.P. 2. GREP Holdco III-A LLC and GREP Holdco III-B Holdings LLC. 3. Includes all officers and directors of Granite Ridge. 4. Excludes 10,349,975 common stock warrants outstanding. Ownership Summary as of 5/8/2023 Shares % Grey Rock Fund II 1 10,601,149 8.0% Grey Rock Fund III 2 95,080,584 71.5% Insiders 3 1,916,040 1.4% Other Common Equity Holders 25,440,127 19.1% Total 4 133,037,900 100.0% |
|
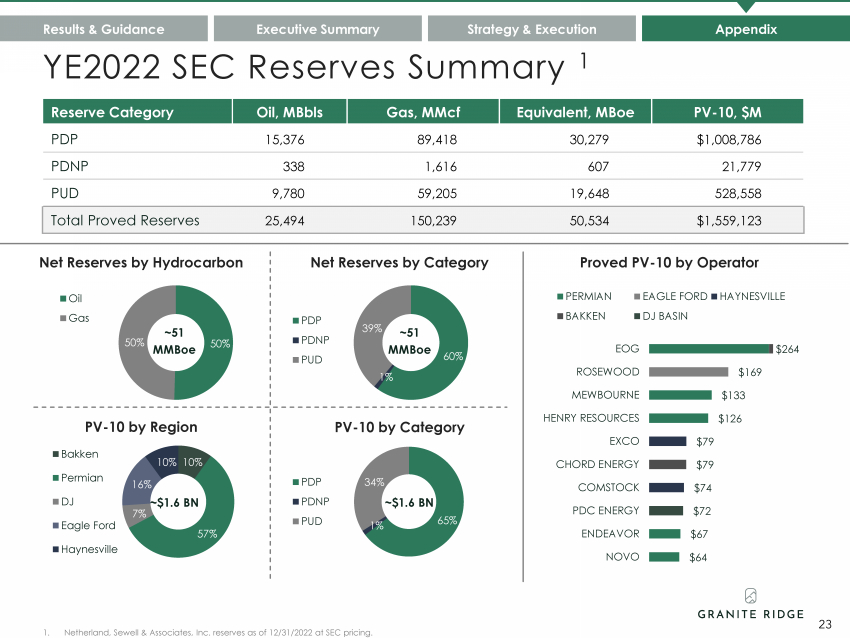
10% 57% 7% 16% 10% Bakken Permian DJ Eagle Ford Haynesville 65% 1% PDP 34% PDNP PUD 60% 1% 39% PDP PDNP PUD 50% 50% Oil Gas Net Reserves by Hydrocarbon Net Reserves by Category PV-10 by Category ~51 MMBoe ~51 MMBoe ~$1.6 BN PV-10 by Region ~$1.6 BN Results & Guidance Executive Summary Strategy & Execution Appendix Reserve Category Oil, MBbls Gas, MMcf Equivalent, MBoe PV-10, $M PDP 15,376 89,418 30,279 $1,008,786 PDNP 338 1,616 607 21,779 PUD 9,780 59,205 19,648 528,558 Total Proved Reserves 25,494 150,239 50,534 $1,559,123 $64 $67 $72 $74 $79 $79 $126 $133 $169 $264 NOVO ENDEAVOR PDC ENERGY COMSTOCK CHORD ENERGY EXCO HENRY RESOURCES MEWBOURNE ROSEWOOD EOG PERMIAN EAGLE FORD HAYNESVILLE BAKKEN DJ BASIN 23 Proved PV-10 by Operator YE2022 SEC Reserves Summary 1 1. Netherland, Sewell & Associates, Inc. reserves as of 12/31/2022 at SEC pricing. |
|
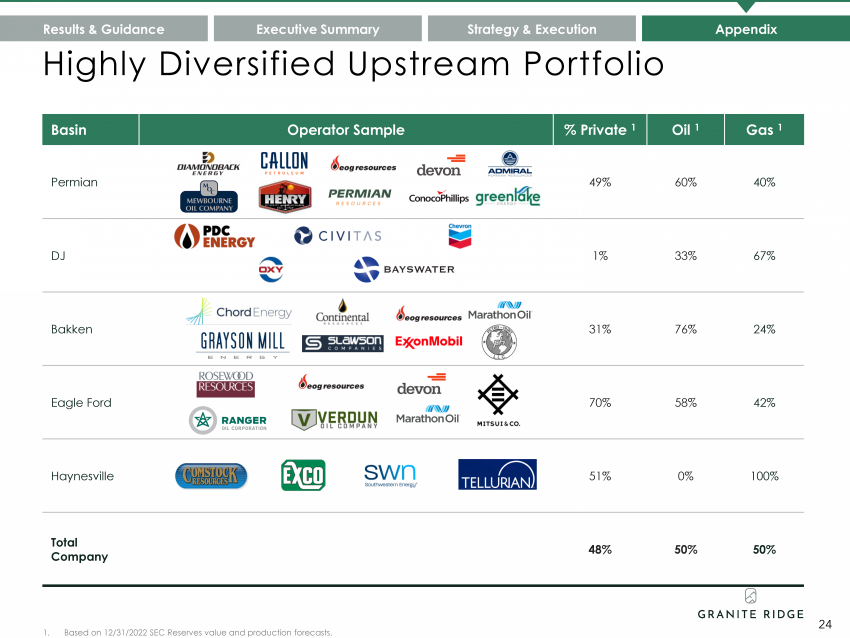
Highly Diversified Upstream Portfolio Basin Operator Sample % Private 1 Oil 1 Gas 1 Permian 49% 60% 40% DJ 1% 33% 67% Bakken 31% 76% 24% Eagle Ford 70% 58% 42% Haynesville 51% 0% 100% Total Company 48% 50% 50% Results & Guidance Executive Summary Strategy & Execution Appendix 24 1. Based on 12/31/2022 SEC Reserves value and production forecasts. |
|
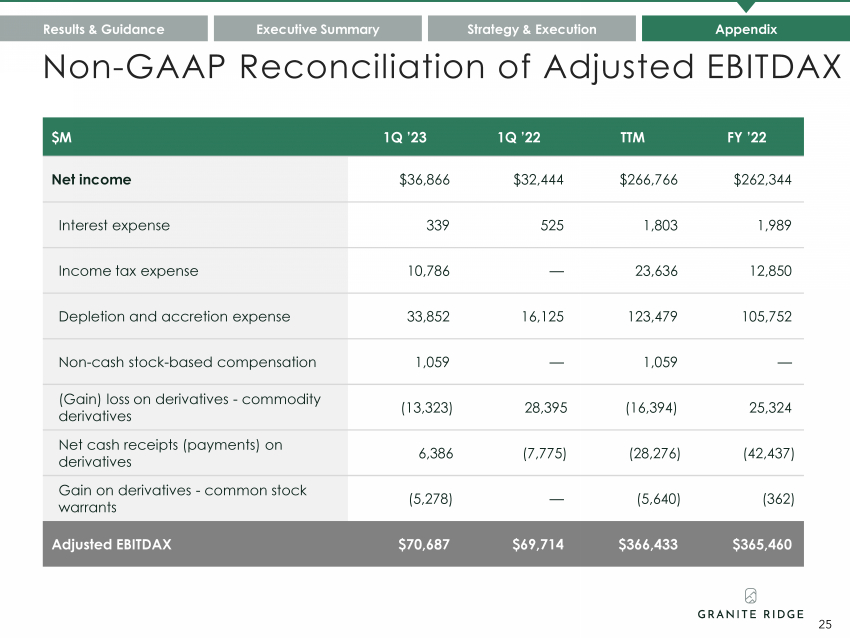
28 Results & Guidance Executive Summary Strategy & Execution Appendix $M 1Q ’23 1Q ’22 TTM FY ’22 Net income $36,866 $32,444 $266,766 $262,344 Interest expense 339 525 1,803 1,989 Income tax expense 10,786 — 23,636 12,850 Depletion and accretion expense 33,852 16,125 123,479 105,752 Non-cash stock-based compensation 1,059 — 1,059 — (Gain) loss on derivatives - commodity derivatives (13,323) 28,395 (16,394) 25,324 Net cash receipts (payments) on derivatives 6,386 (7,775) (28,276) (42,437) Gain on derivatives - common stock warrants (5,278) — (5,640) (362) Adjusted EBITDAX $70,687 $69,714 $366,433 $365,460 25 Non-GAAP Reconciliation of Adjusted EBITDAX |
|
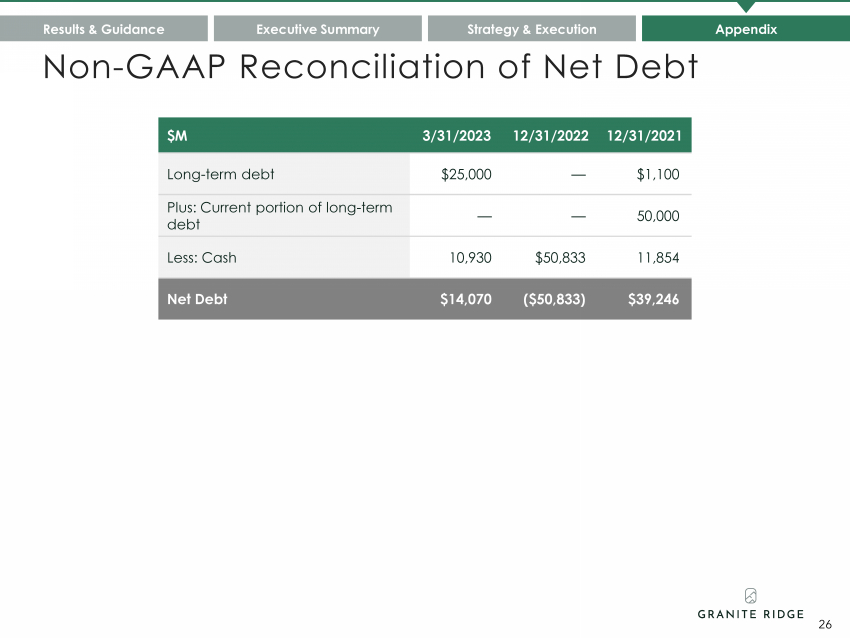
28 Results & Guidance Executive Summary Strategy & Execution Appendix $M 3/31/2023 12/31/2022 12/31/2021 Long-term debt $25,000 — $1,100 Plus: Current portion of long-term debt — — 50,000 Less: Cash 10,930 $50,833 11,854 Net Debt $14,070 ($50,833) $39,246 26 Non-GAAP Reconciliation of Net Debt |
|
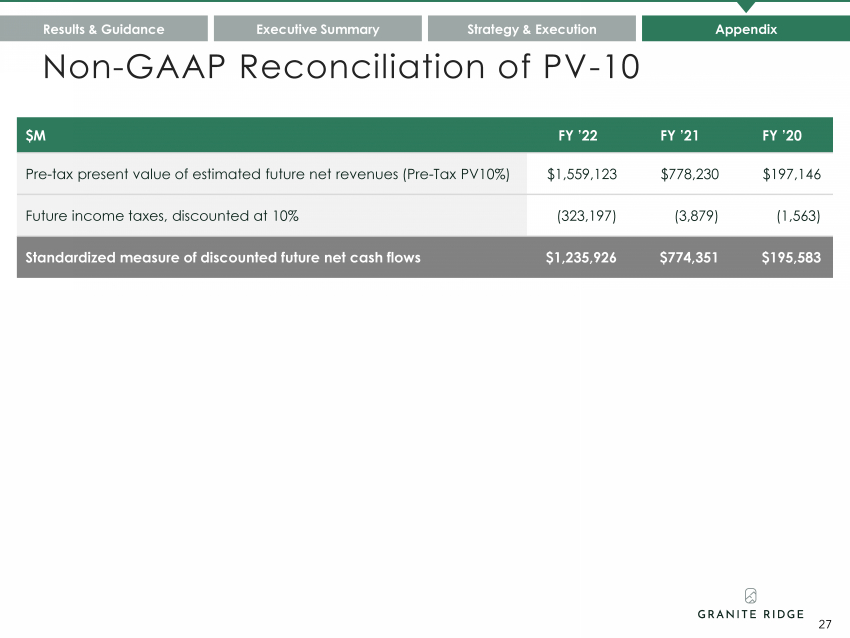
28 Results & Guidance Executive Summary Strategy & Execution Appendix 27 Non-GAAP Reconciliation of PV-10 $M FY ’22 FY ’21 FY ’20 Pre-tax present value of estimated future net revenues (Pre-Tax PV10%) $1,559,123 $778,230 $197,146 Future income taxes, discounted at 10% (323,197) (3,879) (1,563) Standardized measure of discounted future net cash flows $1,235,926 $774,351 $195,583 |
|
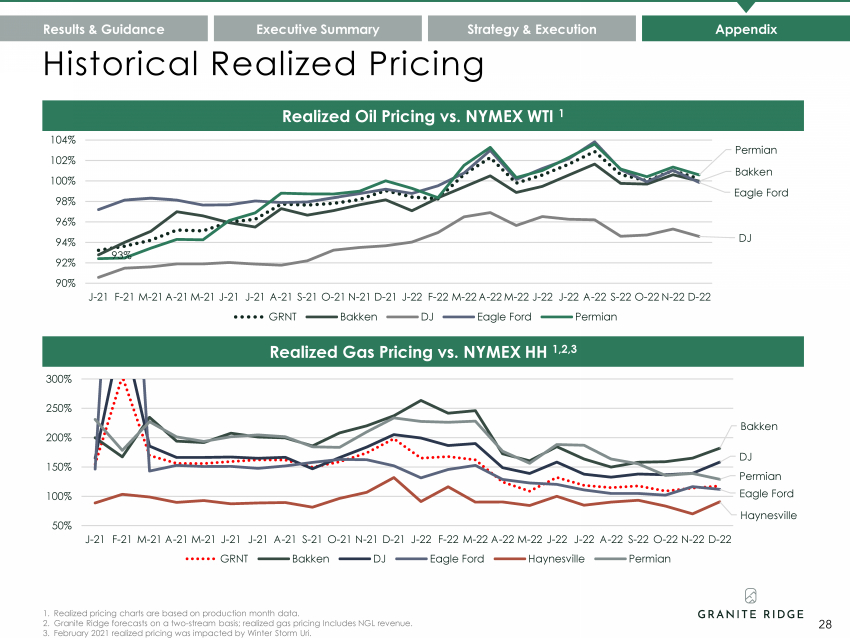
93% Bakken DJ Eagle Ford Permian 90% 92% 94% 96% 98% 100% 102% 104% J-21 F-21 M-21 A-21 M-21 J-21 J-21 A-21 S-21 O-21 N-21 D-21 J-22 F-22 M-22 A-22 M-22 J-22 J-22 A-22 S-22 O-22 N-22 D-22 GRNT Bakken DJ Eagle Ford Permian Historical Realized Pricing Results & Guidance Executive Summary Strategy & Execution Appendix Realized Oil Pricing vs. NYMEX WTI 1 Realized Gas Pricing vs. NYMEX HH 1,2,3 28 1. Realized pricing charts are based on production month data. 2. Granite Ridge forecasts on a two-stream basis; realized gas pricing Includes NGL revenue. 3. February 2021 realized pricing was impacted by Winter Storm Uri. Bakken DJ Eagle Ford Haynesville Permian 50% 100% 150% 200% 250% 300% J-21 F-21 M-21 A-21 M-21 J-21 J-21 A-21 S-21 O-21 N-21 D-21 J-22 F-22 M-22 A-22 M-22 J-22 J-22 A-22 S-22 O-22 N-22 D-22 GRNT Bakken DJ Eagle Ford Haynesville Permian |
|
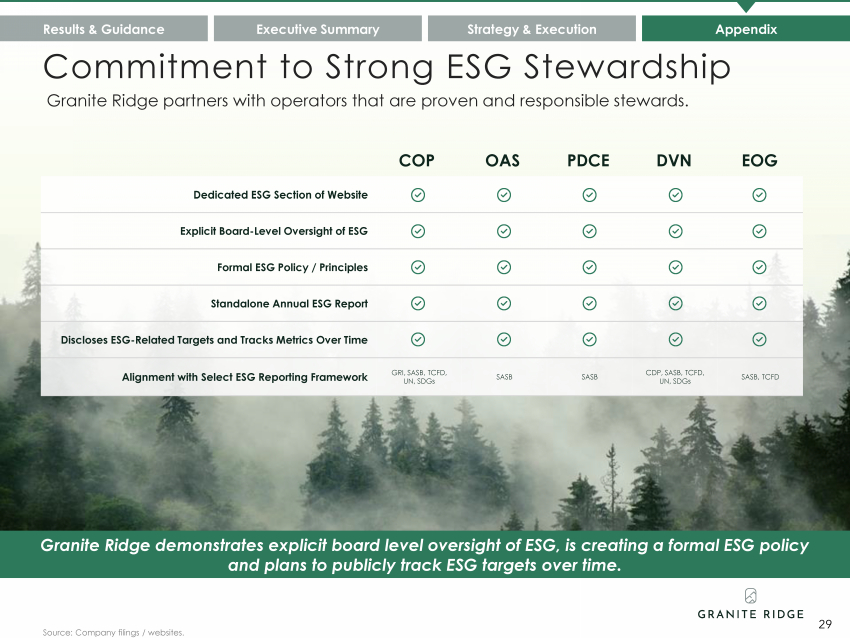
Commitment to Strong ESG Stewardship Source: Company filings / websites. Granite Ridge demonstrates explicit board level oversight of ESG, is creating a formal ESG policy and plans to publicly track ESG targets over time. Dedicated ESG Section of Website Explicit Board-Level Oversight of ESG Formal ESG Policy / Principles Standalone Annual ESG Report Discloses ESG-Related Targets and Tracks Metrics Over Time Alignment with Select ESG Reporting Framework GRI, SASB, TCFD, UN, SDGs SASB SASB CDP, SASB, TCFD, UN, SDGs SASB, TCFD COP OAS PDCE DVN EOG Results & Guidance Executive Summary Strategy & Execution Appendix 29 Granite Ridge partners with operators that are proven and responsible stewards. |
|
Disclaimer FORWARD-LOOKING STATEMENTS This investor presentation contains forward-looking statements regarding future events and future results that are subject to the safe harbors created under the Securities Act of 1933 (the “Securities Act”) and the Securities Exchange Act of 1934 (the “Exchange Act”). All statements other than statements of historical facts included in this presentation regarding Granite Ridge’s 2023 outlook, dividend plans and practices, financial position, operating and financial performance, business strategy, plans and objectives of management for future operations, industry conditions, and indebtedness covenant compliance are forward-looking statements. When used in this release, forward-looking statements are generally accompanied by terms or phrases such as “estimate,” “project,” “predict,” “believe,” “expect,” “continue,” “anticipate,” “target,” “could,” “plan,” “intend,” “seek,” “goal,” “will,” “should,” “may” or other words and similar expressions that convey the uncertainty of future events or outcomes. Items contemplating or making assumptions about actual or potential future production and sales, market size, collaborations, and trends or operating results also constitute such forward-looking statements. Forward-looking statements involve inherent risks and uncertainties, and important factors (many of which are beyond Granite Ridge’s control) that could cause actual results to differ materially from those set forth in the forward-looking statements, including the following: the ability to recognize the anticipated benefits of the business combination, Granite Ridge’s financial performance following the business combination, changes in Granite Ridge’s strategy, future operations, financial position, hedging positions, estimated revenues and losses, projected costs and cash flows, prospects and plans, changes in current or future commodity prices and interest rates, supply chain disruptions, infrastructure constraints and related factors affecting our properties, ability to acquire additional development opportunities or make acquisitions, changes in reserves estimates or the value thereof, operational risks including, but not limited to, the pace of drilling and completions activity on our properties, changes in the markets in which Granite Ridge competes, geopolitical risk and changes in applicable laws, legislation, or regulations, including those relating to environmental matters, cyber-related risks, the fact that reserve estimates depend on many assumptions that may turn out to be inaccurate and that any material inaccuracies in reserve estimates or underlying assumptions will materially affect the quantities and present value of the Granite Ridge’s reserves, the outcome of any known and unknown litigation and regulatory proceedings, legal and contractual limitations on the payment of dividends, limited liquidity and trading of Granite Ridge’s securities, acts of war or terrorism and market conditions and global, regulatory, technical, and economic factors beyond Granite Ridge’s control, including the potential adverse effects of the COVID 19 pandemic, or another major disease, affecting capital markets, general economic conditions, global supply chains and Granite Ridge’s business and operations, and increasing regulatory and investor emphasis on environmental, social and governance matters. Granite Ridge has based these forward-looking statements on its current expectations and assumptions about future events. While management considers these expectations and assumptions to be reasonable, they are inherently subject to significant business, economic, competitive, regulatory and other risks, contingencies and uncertainties, most of which are difficult to predict and many of which are beyond Granite Ridge’s control. Granite Ridge does not undertake any duty to update or revise any forward-looking statements, except as may be required by the federal securities laws. 30 |
|
Disclaimer INDUSTRY AND MARKET DATA The information, data and statistics contained herein are derived from various internal and external third-party sources. While Granite Ridge believes such third-party information is reliable, there can be no assurance as to the accuracy or completeness of the indicated information. Granite Ridge has not independently verified the accuracy or completeness of the information provided by third party sources. No representation is made by Granite Ridge’s management as to the reasonableness of the assumptions made within or the accuracy or completeness of any projections or modeling or any other information contained herein. Any information, data or statistics on past performance or modeling contained herein is not an indication as to the future performance. Granite Ridge assumes no obligation to update the information in this presentation. RESERVE INFORMATION Reserve engineering is a process of estimating underground accumulations of hydrocarbons that cannot be measured in an exact way. The accuracy of any reserve estimate depends on the quality of available data, the interpretation of such data, and price and cost assumptions made by reserve engineers. In addition, the results of drilling testing and production activities may justify revisions of estimates that were made previously. If significant, such revisions could impact Granite Ridge’s strategy and change the schedule of any further production and development drilling. Accordingly, reserve estimates may differ significantly from the quantities of oil and natural gas that are ultimately recovered. Estimated Ultimate Recoveries, or “EURs,” refer to estimates of the sum of total gross remaining proved reserves per well as of a given date and cumulative production prior to such given date for developed wells. These quantities do not necessarily constitute or represent reserves as defined by the Securities and Exchange Commission (“SEC”) and are not intended to be representative of all anticipated future well results. This presentation contains volumes and PV-10 values of our proved reserves and unproved reserves. The SEC strictly prohibits companies from aggregating proved, probable and possible reserves in filings with the SEC due to the different levels of certainty associated with each reserve category. The SEC also prohibits companies from including resources that are not proved, probable or possible reserves in filings with the SEC. Investors should be cautioned that estimates of volumes and PV-10 values of resources other than proved reserves are inherently more uncertain than comparable measures for proved reserves. Further, because estimated proved reserves and unproved resources have not been adjusted for risk due to this uncertainty of recovery, their summation may be of limited use. USE OF PROJECTIONS This investor presentation contains projections for Granite Ridge, including with respect to its EBITDA, net debt to EBITDA ratio, capital expenditures, cash flow, and net revenues as well as its production volumes. Granite Ridge’s independent auditors have not audited, reviewed, compiled, or performed any procedures with respect to the projections for the purpose of their inclusion in this investor presentation, and accordingly, have not expressed an opinion or provided any other form of assurance with respect thereto for the purpose of this investor presentation. These projections are for illustrative purposes only and should not be relied upon as being necessarily indicative of future results. In this investor presentation, certain of the above-mentioned projected information has been repeated (in each case, with an indication that the information is subject to the qualifications presented herein). 31 |