UNITED STATES
SECURITIES AND EXCHANGE COMMISSION
Washington, D.C. 20549
FORM 8-K
CURRENT REPORT
Pursuant to Section 13 or 15(d) of
the Securities Exchange Act of 1934
Date of Report (Date of earliest event reported) March 22, 2023
FATHOM HOLDINGS INC.
(Exact name of registrant as specified in its charter)
|
North Carolina (State or other jurisdiction of incorporation) |
||
| 001-39412 | 82-1518164 | |
| (Commission File Number) | (IRS Employer Identification No.) |
2000 Regency Parkway Drive, Suite 300, Cary, North Carolina 27518
(Address of principal executive offices) (Zip Code)
Registrant's telephone number, including area code 888-455-6040
Check the appropriate box below if the Form 8-K filing is intended to simultaneously satisfy the filing obligation of the registrant under any of the following provisions:
| ¨ | Written communications pursuant to Rule 425 under the Securities Act (17 CFR 230.425) | |
| ¨ | Soliciting material pursuant to Rule 14a-12 under the Exchange Act (17 CFR 240.14a-12) | |
| ¨ | Pre-commencement communications pursuant to Rule 14d-2(b) under the Exchange Act (17 CFR 240.14d-2(b)) | |
| ¨ | Pre-commencement communications pursuant to Rule 13e-4(c) under the Exchange Act (17 CFR 240.13e-4(c)) |
Securities registered pursuant to Section 12(b) of the Act:
| Title of each Class | Trading Symbol(s) | Name of each exchange on which registered |
| Common Stock, No Par Value | FTHM | Nasdaq Capital Market |
Indicate by check mark whether the registrant is an emerging growth company as defined in Rule 405 of the Securities Act of 1933 (§230.405 of this chapter) or Rule 12b-2 of the Securities Exchange Act of 1934 (§240.12b-2 of this chapter).
Emerging Growth Company x
If an emerging growth company, indicate by check mark if the registrant has elected not to use the extended transition period for complying with any new or revised financial accounting standards provided pursuant to Section 13(a) of the Exchange Act. x Item 2.02 Results of Operations and Financial Condition.
On March 22, 2023, Fathom Holdings Inc. issued a press release announcing its financial results for the year and quarter ended December 31, 2022. A copy of the press release is attached hereto as Exhibit 99.1 and is incorporated herein in its entirety by reference.
The information in this Item 2.02 (including Exhibit 99.1) shall not be deemed “filed” for purposes of Section 18 of the Securities Exchange Act of 1934 (the “Exchange Act”) or otherwise subject to the liabilities of that section, nor shall it be deemed incorporated by reference in any filing under the Securities Act of 1933 or the Exchange Act, except as expressly set forth by specific reference in such a filing.
Item 9.01 Financial Statements and Exhibits.
(d) Exhibits.
| Exhibit No. | Exhibit Description | |
| 99.1 | Press Release, dated March 22, 2023. | |
| 104 | Cover Page Interactive Data File (embedded within the Inline XBRL document). |
SIGNATURE
Pursuant to the requirements of the Securities Exchange Act of 1934, the registrant has duly caused this report to be signed on its behalf by the undersigned hereunto duly authorized.
| FATHOM HOLDINGS INC. | |
| Date: March 22, 2023 | /s/ Marco Fregenal |
| Marco Fregenal | |
| President and Chief Financial Officer |
Exhibit 99.1

Fathom Holdings Reports Fourth Quarter and Full Year 2022 Results
-- Reiterates Adjusted EBITDA Breakeven in the Second Quarter of 2023, Cash Flow Breakeven in the Third Quarter of 2023 --
CARY, NC, March 22, 2023 – Fathom Holdings Inc. (Nasdaq: FTHM) (“Fathom” or the “Company”), a national, technology-driven, end-to-end real estate services platform integrating residential brokerage, mortgage, title, insurance, and SaaS offerings for brokerages and agents, today reported financial results for the fourth quarter and full year ended December 31, 2022.
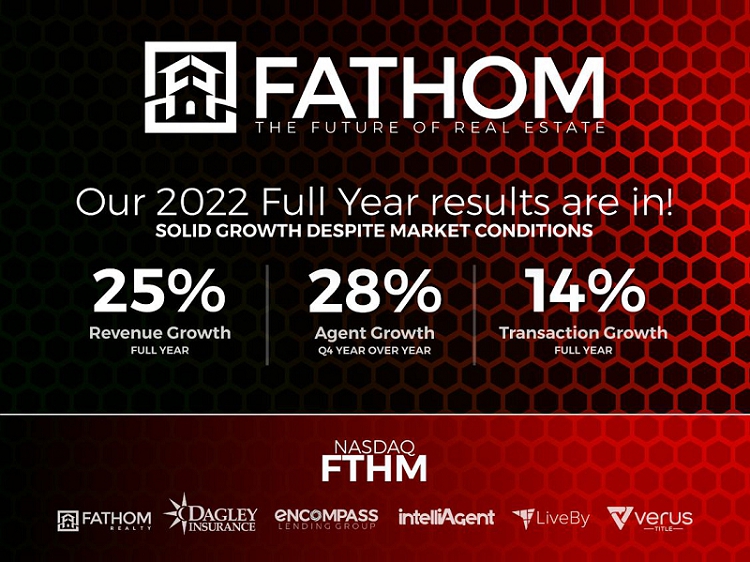
"Fathom delivered solid results in year-over-year revenue growth, agent growth, and transaction growth, and despite the current difficult market conditions, we remain optimistic about the year ahead. Our results validate our belief that our model offers the greatest value to agents in all market conditions," said Fathom CEO Joshua Harley. “Even with today's economic uncertainty and subdued real estate market conditions, we believe that Fathom has a long and positive runway ahead and we expect to turn the corner towards profitable growth in the coming quarters while starting to really show the operating leverage in our business. We remain focused on reaching total company Adjusted EBITDA breakeven in the second quarter of 2023 and generating positive cash flow in the third quarter of 2023.”
"We continue to maintain a strong balance sheet, that should facilitate our growing the business and executing our strategy through profitability," stated Fathom President and CFO Marco Fregenal. "As of December 31, 2022, we had reduced expenses by approximately $3.0 million per quarter. We should see the full benefit of these reductions in the first quarter of 2023. It is important to note that we believe these cost reductions were made without sacrificing our ability to continue growing our business. These reductions are far ahead of our initial plan to reduce expenses by $1.5 million per quarter.”
“We believe that these cost-reduction initiatives, combined with the increase in agent transaction fees that became effective in January of this year, have positioned our business for profitable growth and we remain on track to reach Adjusted EBITDA breakeven in the second quarter of 2023,” added Harley
Fourth Quarter 2022 Financial Results
Total revenue decreased 12.7% for the 2022 fourth quarter to $83.4 million, from $95.5 million for 2021’s fourth quarter. Fathom completed approximately 9,250 real estate transactions for the 2022 fourth quarter, a decrease of 14% from the 2021 fourth quarter. Fathom's real estate agent network grew 28% to approximately 10,370 agents at December 31, 2022, up from approximately 8,100 agents at December 31, 2021.
Segment revenue for the 2022 fourth quarter, compared with the 2021 fourth quarter was as follows:
| Three Months Ended | ||||||||
| December 31, | ||||||||
| (Revenue $ in millions) | 2022 | 2021 | ||||||
| Real Estate Brokerage | $ | 79.5 | $ | 89.7 | ||||
| Mortgage | 1.3 | 2.7 | ||||||
| Technology | 0.7 | 0.7 | ||||||
| Other* | 1.9 | 2.4 | ||||||
| Total revenue | $ | 83.4 | $ | 95.5 | ||||
*Other primarily includes revenue generated from Fathom’s title and insurance businesses.
GAAP net loss for the 2022 fourth quarter was $9.9 million, or a loss of $0.63 per share, compared with a loss of $3.6 million, or a loss of $0.24 per share, for the 2021 fourth quarter. Weighted average diluted shares outstanding increased approximately 4.1% for the 2022 fourth quarter, compared with the same quarter of 2021. The fourth quarter of 2022 was difficult for the real estate industry as a whole and Fathom was not immune. The second half of the quarter saw a significant number of transactions being cancelled as a result of the significant increase in interest rates during the year.
General and Administrative expense (G&A) totaled $8.5 million for the 2022 fourth quarter, compared with $9.1 million for the fourth quarter of 2021 and compared to $11.5 million for the third quarter of 2022. We have been able to reduce G&A expenses as we began implementing our cost-reduction initiatives. We should see the full benefit of G&A reductions in the first quarter of 2023 as we are committed to reaching Adjusted EBITDA breakeven in the second quarter of 2023.
Driven by many of the factors discussed above, Adjusted EBITDA, a non-GAAP measure, was a loss of approximately $5.9 million for the 2022 fourth quarter, compared with an Adjusted EBITDA loss of approximately $2.0 million for the 2021 fourth quarter.
Fathom provides Adjusted EBITDA, a non-GAAP financial measure, because it offers additional information for monitoring the Company's cash flow performance. A table providing a reconciliation of Adjusted EBITDA to its most comparable GAAP measure, as well as an explanation of, and important disclosures about, this non-GAAP measure, is included in the tables at the end of this press release.
Full Year 2022 Financial Results
Total revenue for 2022 grew 25% to $412.9 million, from $330.2 million for 2021.
Segment revenue for the 2022 full year, compared with the 2021 full year was as follows:
| Year Ended | ||||||||
| December 31, | ||||||||
| (Revenue $ in millions) | 2022 | 2021 | ||||||
| Real Estate Brokerage | $ | 390.6 | $ | 314.4 | ||||
| Mortgage | 9.6 | 6.8 | ||||||
| Technology | 2.7 | 2.0 | ||||||
| Other* | 10.0 | 7.0 | ||||||
| Total revenue | $ | 412.9 | $ | 330.2 | ||||
*Other primarily includes revenue generated from Fathom’s title and insurance businesses.
GAAP net loss for 2022 was $27.6 million, or a loss of $1.73 per share, compared with a GAAP net loss of $12.5 million, or a loss of $0.88 per share, for 2021. The increase in net loss was primarily attributable to a $5.1 million increase in non-cash stock compensation, a $2.6 million increase in non-cash depreciation and intangible asset amortization expense, the absence of approximately $3.2million of tax benefit, and an increase in operating losses primarily resulting from a significant number of transactions being cancelled in the second half of the year as a result of the significant increase in interest rates during the year.
Adjusted EBITDA loss was $12.2 million, versus an Adjusted EBITDA loss of $8.2 million for 2021.
Cash and cash equivalents at December 31, 2022 decreased to $8.3 million from $37.8 million at December 31, 2021. In addition to our cash operating losses, the decrease in cash was primarily attributable to stock repurchases of approximately $6.0 million, investments in technology and our businesses of approximately $4.1 million, and payments for acquisitions of approximately $3.0 million.
2022 Highlights
| · | Fathom's real estate agent network grew 28% to approximately 10,370 agents at December 31, 2022, up from approximately 8,100 at December 31, 2021. |
| · | Fathom completed approximately 44,700 real estate transactions in full year 2022, a 14% increase relative to the prior year. |
| · | Fathom announced an enhanced agent referral incentive program called Free4Life and revised agent commission structure to drive additional agents to Fathom's platform. |
| · | Fathom launched intelliAgent 2.0, the Company's next-generation proprietary, all-in-one technology platform designed to simplify all aspects of brokerage operations and agent transaction management. |
| · | Fathom Holdings subsidiary, Encompass Lending Group, acquired Cornerstone First Financial, a Washington, D.C.-based provider of mortgages for home purchase, debt consolidation and refinancing, as well as home loans for veterans and first-time home buyers. |
| · | Fathom Realty acquired Utah-based iPro Realty Network, a full-service residential real estate brokerage with 435 agents. |
| · | Fathom launched its Veteran Division to provide specialized resources, support and opportunities for Fathom's current and former military service members, as well as for veteran home buyers and sellers, and those still on active duty. |
| · | Fathom Holdings' board of directors authorized a $10 million stock repurchase plan. |
| · | We appointed Scott Flanders to the Company's board of directors. |
Q1 2023 and Recent Highlights
| · | Fathom Realty is now operating in 37 states and the District of Columbia; Encompass Lending Group in 46 states and the District of Columbia; Dagley Insurance in 47 states and the District of Columbia; and Verus Title in 29 states and the District of Columbia. |
| · | Fathom rolled out its Hometown Heroes initiative to generate leads for its real estate, mortgage, title, and insurance business, while providing a service and giving back to military service members, veterans, first responders, medical professionals, and teachers. |
Guidance/Long-Term Targets
Without giving a timeline for reaching this target, the Company reiterated that it believes it can generate Adjusted EBITDA exceeding $40.0 million per year at 100,000 to 110,000 transactions per year.
For the first quarter of 2023, Fathom expects total revenue in the range of $75.0 million – $77.0 million, and an Adjusted EBITDA loss in the range of $1.3 million – $1.5 million.
Conference Call
Fathom management will hold a conference call at 5:00 p.m. Eastern time (2:00 p.m. Pacific time) today to discuss its financial results for the fourth quarter and full year ended December 31, 2022.
Call Date: Wednesday, March 22, 2023
Time: 5:00 p.m. Eastern time (2:00 p.m. Pacific time)
U.S. dial-in: 833-685-0908
International dial-in: 412-317-5742
Please call the conference telephone number five minutes prior to the start time. An operator will register your name and organization.
A live audio webcast of the conference call will be available in listen-only mode simultaneously and available via the investor relations section of the Company’s website at www.FathomInc.com.
A telephone replay of the call will be available through March 29, 2023.
U.S. replay dial-in: 877-344-7529
International replay dial-in: 412-317-0088
Replay ID: 2712492
About Fathom Holdings Inc.
Fathom Holdings Inc. is a national, technology-driven, real estate services platform integrating residential brokerage, mortgage, title, insurance, and SaaS offerings to brokerages and agents by leveraging its proprietary cloud-based software, intelliAgent. The Company's brands include Fathom Realty, Dagley Insurance, Encompass Lending, intelliAgent, LiveBy, Real Results, and Verus Title. For more information, visit www.FathomInc.com.
Cautionary Note Concerning Forward-Looking Statements
This press release contains "forward-looking statements," including, but not limited to, its ability to achieve breakeven Adjusted EBITDA in the second quarter of 2023 and cash flow breakeven in the third quarter of 2023, its ability to continue attracting agents and generating higher revenue, and its ability to continue to reduce costs by approximately $3.0 million per quarter commencing in the first quarter of 2023, among others. Forward-looking statements are subject to numerous conditions, many of which are beyond the control of the Company, including: risks associated with general economic conditions, including rising interest rates; its ability to generate positive operational cash flow; risks associated with the Company's ability to continue achieving significant growth; its ability to continue its growth trajectory while achieving profitability over time; and other risks as set forth in the Risk Factors section of the Company's most recent Form 10-K as filed with the SEC and supplemented from time to time in other Company filings made with the SEC. Copies of Fathom's Form 10-K and other SEC filings are available on the SEC's website, www.sec.gov. The Company undertakes no obligation to update these statements for revisions or changes after the date of this release, except as required by law.
Investor Contact:
Alex Kovtun and Matt Glover
Gateway Group, Inc.
949-574-3860
FTHM@gatewayir.com
FATHOM HOLDINGS INC.
CONSOLIDATED STATEMENTS OF OPERATIONS
(in thousands, except share data)
| Three Months Ended December 31, | Year Ended December 31, | |||||||||||||||
| 2022 | 2021 | 2022 | 2021 | |||||||||||||
| Revenue | ||||||||||||||||
| Gross commission income | $ | 79,540 | $ | 89,670 | $ | 390,615 | $ | 314,373 | ||||||||
| Other service revenue | 3,897 | 5,791 | 22,349 | 15,857 | ||||||||||||
| Total revenue | 83,437 | 95,461 | 412,964 | 330,230 | ||||||||||||
| Operating expenses | ||||||||||||||||
| Commission and other agent-related costs | 77,009 | 86,117 | 372,246 | 300,509 | ||||||||||||
| Operations and support | 2,057 | 1,689 | 8,249 | 5,470 | ||||||||||||
| Technology and development | 3,784 | 1,796 | 7,715 | 3,911 | ||||||||||||
| General and administrative | 8,546 | 9,112 | 43,217 | 32,733 | ||||||||||||
| Marketing | 1,270 | 524 | 5,218 | 1,895 | ||||||||||||
| Depreciation and amortization | 859 | 453 | 3,096 | 1,817 | ||||||||||||
| Total operating expenses | 93,525 | 99,691 | 439,741 | 346,335 | ||||||||||||
| Loss from operations | (10,088 | ) | (4,230 | ) | (26,777 | ) | (16,105 | ) | ||||||||
| Other expense (income), net | ||||||||||||||||
| Gain on extinguishment of debt | - | (306 | ) | - | (433 | ) | ||||||||||
| Interest expense (income), net | (15 | ) | 4 | (11 | ) | 7 | ||||||||||
| Other nonoperating expense (income), net | 114 | 125 | 914 | 59 | ||||||||||||
| Other expense (income), net | 99 | (177 | ) | 903 | (367 | ) | ||||||||||
| Loss before income taxes | (10,187 | ) | (4,053 | ) | (27,680 | ) | (15,738 | ) | ||||||||
| Income tax expense (benefit) | (239 | ) | (427 | ) | (54 | ) | 3,247 | |||||||||
| Net loss | $ | (9,948 | ) | $ | (3,626 | ) | $ | (27,626 | ) | $ | (12,491 | ) | ||||
| Net loss per share: | ||||||||||||||||
| Basic | $ | (0.63 | ) | $ | (0.24 | ) | $ | (1.73 | ) | $ | (0.88 | ) | ||||
| Diluted | $ | (0.63 | ) | $ | (0.24 | ) | $ | (1.73 | ) | $ | (0.88 | ) | ||||
| Weighted average common shares outstanding: | ||||||||||||||||
| Basic | 15,845,111 | 15,219,284 | 16,001,367 | 14,269,078 | ||||||||||||
| Diluted | 15,845,111 | 15,219,284 | 16,001,367 | 14,269,078 | ||||||||||||
FATHOM HOLDINGS INC.
CONSOLIDATED BALANCE SHEETS
(in thousands, except share data)
| December 31, | December 31, | |||||||
| 2022 | 2021 | |||||||
| ASSETS | ||||||||
| Current assets: | ||||||||
| Cash and cash equivalents | $ | 8,320 | $ | 37,830 | ||||
| Restricted cash | 60 | 91 | ||||||
| Accounts receivable | 3,074 | 3,981 | ||||||
| Derivative assets | 7 | 53 | ||||||
| Mortgage loans held for sale, at fair value | 3,694 | 9,862 | ||||||
| Prepaid and other current assets | 3,661 | 2,633 | ||||||
| Total current assets | 18,816 | 54,450 | ||||||
| Property and equipment, net | 2,945 | 1,250 | ||||||
| Lease right of use assets | 5,508 | 4,353 | ||||||
| Intangible assets, net | 27,259 | 24,243 | ||||||
| Goodwill | 25,607 | 20,541 | ||||||
| Other assets | 52 | 93 | ||||||
| Total assets | $ | 80,187 | $ | 104,930 | ||||
| LIABILITIES AND STOCKHOLDERS’ EQUITY | ||||||||
| Current liabilities: | ||||||||
| Accounts payable | $ | 3,343 | $ | 5,303 | ||||
| Accrued and other current liabilities | 3,403 | 4,491 | ||||||
| Warehouse lines of credit | 3,580 | 9,577 | ||||||
| Lease liability - current portion | 1,609 | 870 | ||||||
| Long-term debt - current portion | 564 | 831 | ||||||
| Total current liabilities | 12,499 | 21,072 | ||||||
| Lease liability, net of current portion | 5,241 | 3,562 | ||||||
| Long-term debt, net of current portion | 129 | 146 | ||||||
| Other long-term liabilities | 297 | - | ||||||
| Total liabilities | 18,166 | 24,780 | ||||||
| Commitments and contingencies (Note 19) | ||||||||
| Stockholders’ equity: | ||||||||
| Common stock (no par value, shares authorized, 100,000,000; shares issued and outstanding, 17,468,562 and 16,751,606 as of December 31, 2022 and 2021, respectively) | - | - | ||||||
| Additional paid-in capital | 109,626 | 100,129 | ||||||
| Accumulated deficit | (47,605 | ) | (19,979 | ) | ||||
| Total stockholders’ equity | 62,021 | 80,150 | ||||||
| Total liabilities and stockholders’ equity | $ | 80,187 | $ | 104,930 | ||||
FATHOM HOLDINGS INC.
CONDENSED CONSOLIDATED STATEMENTS OF CASH FLOWS
(in thousands)
| Year Ended December 31, | ||||||||
| 2022 | 2021 | |||||||
| CASH FLOWS FROM OPERATING ACTIVITIES: | ||||||||
| Net loss | $ | (27,626 | ) | $ | (12,491 | ) | ||
| Adjustments to reconcile net loss to net cash (used in) provided by operating activities: | ||||||||
| Depreciation and amortization | 5,346 | 2,748 | ||||||
| Non-cash lease expense | 1856 | — | ||||||
| Gain on extinguishment of debt | — | (433 | ) | |||||
| Gain on sale of mortgages | (3,819 | ) | (5,205 | ) | ||||
| Stock-based compensation | 9,131 | 4,011 | ||||||
| Deferred income taxes | — | (3,339 | ) | |||||
| Bad debt expense | — | 248 | ||||||
| Other non-cash | — | 15 | ||||||
| Change in operating assets and liabilities: | ||||||||
| Accounts receivable | 485 | (1,254 | ) | |||||
| Derivative assets | 46 | 37 | ||||||
| Derivative liabilities | — | (120 | ) | |||||
| Prepaid and other current assets | (1,004 | ) | (1,248 | ) | ||||
| Other assets | 78 | (31 | ) | |||||
| Accounts payable | (1,959 | ) | 1,674 | |||||
| Accrued and other current liabilities | (1,081 | ) | 1,112 | |||||
| Operating lease liabilities | (1,867 | ) | (584 | ) | ||||
| Operating lease right of use assets | — | 675 | ||||||
| Other liabilities | 297 | (1,001 | ) | |||||
| Mortgage loans held for sale | (246,327 | ) | (179,297 | ) | ||||
| Proceeds from sale and principal payments on mortgage loans held for sale | 259,861 | 182,786 | ||||||
| Net cash used in operating activities | (6,583 | ) | (11,697 | ) | ||||
| CASH FLOWS FROM INVESTING ACTIVITIES: | ||||||||
| Purchase of property and equipment | (945 | ) | (877 | ) | ||||
| Amounts paid for business and asset acquisitions, net of cash acquired | (1,639 | ) | (11,081 | ) | ||||
| Deferred acquisition consideration payments | (1,400 | ) | — | |||||
| Purchase of intangible assets | (3,112 | ) | (2,602 | ) | ||||
| Net cash used in investing activities | (7,096 | ) | (14,560 | ) | ||||
| CASH FLOWS FROM FINANCING ACTIVITIES: | ||||||||
| Principal payments on long-term debt | (1,307 | ) | (740 | ) | ||||
| Proceeds from insurance note payables | 924 | |||||||
| Proceeds from issuance of common stock | — | 80 | ||||||
| Net borrowings on warehouse lines of credit | (9,434 | ) | 1,618 | |||||
| Proceeds from the issuance of common stock in connection with public offering | — | 35,000 | ||||||
| Repurchase of common stock | (6,045 | ) | — | |||||
| Payment of offering cost in connection with issuance of common stock in connection with public offering | — | (2,471 | ) | |||||
| Proceeds from note payable | — | 1,129 | ||||||
| Net cash (used in) provided by financing activities | (15,862 | ) | 34,616 | |||||
| Net decrease in cash, cash equivalents, and restricted cash | (29,541 | ) | 8,359 | |||||
| Cash, cash equivalents, and restricted cash at beginning of period | 37,921 | 29,562 | ||||||
| Cash, cash equivalents, and restricted cash at end of period | $ | 8,380 | $ | 37,921 | ||||
| Supplemental disclosure of cash and non-cash transactions: | ||||||||
| Cash paid for interest | $ | 4 | $ | 13 | ||||
| Income taxes paid | 111 | 39 | ||||||
| Amounts due to sellers | 1,100 | 1,477 | ||||||
| Right of use assets obtained in exchange for new lease liabilities | 2,934 | 1,839 | ||||||
| Issuance of common stock for purchase of business | 6,168 | 25,538 | ||||||
| Extinguishment of Paycheck Protection Program Loan | - | 433 | ||||||
| Loan receivable forgiven and used as purchase consideration | - | 165 | ||||||
| Reconciliation of cash and restricted cash: | ||||||||
| Cash and cash equivalents | $ | 8,320 | $ | 37,830 | ||||
| Restricted cash | 60 | 91 | ||||||
| Total cash, cash equivalents, and restricted cash shown in statement of cash flows | $ | 8,380 | $ | 37,921 | ||||
RECONCILIATION OF GAAP TO NON-GAAP FINANCIAL MEASURES
(UNAUDITED)
(In thousands)
| Three Months Ended | Year Ended | |||||||||||||||
| December 31, | December 31, | |||||||||||||||
| 2022 | 2021 | 2022 | 2021 | |||||||||||||
| Net loss | $ | (9,948 | ) | $ | (3,626 | ) | $ | (27,626 | ) | $ | (12,491 | ) | ||||
| Depreciation and amortization | 1,507 | 970 | 5,346 | 2,748 | ||||||||||||
| Other expense (income), net | 99 | (177 | ) | 903 | (366 | ) | ||||||||||
| Income tax expense (benefit) | (239 | ) | (428 | ) | (54 | ) | (3,247 | ) | ||||||||
| Stock based compensation | 2,661 | 1,177 | 9,131 | 4,011 | ||||||||||||
| Transaction-related costs | - | 47 | 73 | 1,186 | ||||||||||||
| Adjusted EBITDA | $ | (5,920 | ) | $ | (2,037 | ) | $ | (12,227 | ) | $ | (8,159 | ) | ||||
Note about Non-GAAP Financial Measures
To supplement Fathom's consolidated financial statements, which are prepared and presented in accordance with GAAP, the Company uses Adjusted EBITDA, a non-GAAP financial measure, to understand and evaluate our core operating performance. This non-GAAP financial measure, which may be different than similarly titled measures used by other companies, is presented to enhance investors' overall understanding of our financial performance and should not be considered a substitute for, or superior to, the financial information prepared and presented in accordance with GAAP.
Fathom defines the non-GAAP financial measure of Adjusted EBITDA as net income (loss), excluding other income and expense, income taxes, depreciation and amortization, share-based compensation expense, and transaction-related cost.
Fathom believes that Adjusted EBITDA provides useful information about the Company's financial performance, enhances the overall understanding of its past performance and future prospects, and allows for greater transparency with respect to a key metric used by Fathom's management for financial and operational decision-making. Fathom believes that Adjusted EBITDA helps identify underlying trends in its business that otherwise could be masked by the effect of the expenses that the Company excludes in Adjusted EBITDA. In particular, Fathom believes the exclusion of share-based compensation expense related to restricted stock awards and stock options, and transaction-related costs associated with the Company's acquisition activity, provides a useful supplemental measure in evaluating the performance of its operations and provides better transparency into its results of operations. Adjusted EBITDA also excludes other income and expense, net which primarily includes nonrecurring items, such as, gain on debt extinguishment and severance costs, if applicable.
Fathom is presenting the non-GAAP measure of Adjusted EBITDA to assist investors in seeing its financial performance through the eyes of management, and because the Company believes this measure provides an additional tool for investors to use in comparing Fathom's core financial performance over multiple periods with other companies in its industry.
Adjusted EBITDA should not be considered in isolation from, or as a substitute for, financial information prepared in accordance with GAAP. There are a number of limitations related to the use of Adjusted EBITDA compared to net income (loss), the closest comparable GAAP measure. Some of these limitations are that:
| · | Adjusted EBITDA excludes share-based compensation expense related to restricted stock and restricted stock unit awards and stock options, which have been, and will continue to be for the foreseeable future, significant recurring expenses in Fathom's business and an important part of its compensation strategy; |
| · | Adjusted EBITDA excludes transaction-related costs primarily consisting of professional fees and any other costs incurred directly related to acquisition activity, which is an ongoing part of Fathom's growth strategy and therefore likely to occur; and |
| · | Adjusted EBITDA excludes certain recurring, non-cash charges such as depreciation and amortization of property and equipment and capitalized software, and acquisition related intangible asset costs, however, the assets being depreciated and amortized may have to be replaced in the future. |
The following table presents a reconciliation of Adjusted EBITDA to net income (loss), the most comparable GAAP financial measure, for the three and twelve months ended December 31, 2022:
RECONCILIATION OF GAAP TO NON-GAAP FORWARD LOOKING GUIDANCE
(UNAUDITED)
(In thousands)
| Three Months Ended March 31, 2023 | ||||||||
| Low | High | |||||||
| Net loss | $ | (5,700,000 | ) | $ | (5,450,000 | ) | ||
| Depreciation and amortization | 1,325,000 | 1,325,000 | ||||||
| Other expense income, net | 25,000 | 25,000 | ||||||
| Stock based compensation | 2,850,000 | 2,800,000 | ||||||
| Adjusted EBITDA | $ | (1,500,000 | ) | $ | (1,300,000 | ) | ||