UNITED STATES
SECURITIES AND EXCHANGE COMMISSION
Washington, D.C. 20549
FORM 8-K
CURRENT REPORT
Pursuant to Section 13 or 15(d) of the
Securities Exchange Act of 1934
Date of Report (Date of earliest event reported): February 23, 2023
MFA FINANCIAL, INC.
(Exact name of registrant as specified in its charter)
| Maryland | 1-13991 | 13-3974868 | ||
(State or
other jurisdiction |
(Commission File Number) |
(IRS Employer |
| One Vanderbilt Avenue, 48th Floor | ||
| New York, New York | 10017 | |
| (Address of principal executive offices) | (Zip Code) |
Registrant's telephone number, including area code: (212) 207-6400
Not Applicable
(Former name or former address, if changed since last report)
Check the appropriate box below if the Form 8-K filing is intended to simultaneously satisfy the filing obligation of the registrant under any of the following provisions (see General Instruction A.2. below):
| ¨ | Written communications pursuant to Rule 425 under the Securities Act (17 CFR 230.425) |
| ¨ | Soliciting material pursuant to Rule 14a-12 under the Exchange Act (17 CFR 240.14a-12) |
| ¨ | Pre-commencement communications pursuant to Rule 14d-2(b) under the Exchange Act (17 CFR 240.14d-2(b)) |
| ¨ | Pre-commencement communications pursuant to Rule 13e-4(c) under the Exchange Act (17 CFR 240.13e-4(c)) |
Securities registered pursuant to Section 12(b) of the Act:
| Title of each class: |
Trading
|
Name
of each |
||
| Common Stock, par value $0.01 per share | MFA | New York Stock Exchange | ||
|
7.50% Series B Cumulative Redeemable Preferred Stock, par value $0.01 per share |
MFA/PB | New York Stock Exchange | ||
| 6.50% Series C Fixed-to-Floating Rate Cumulative Redeemable Preferred Stock, par value $0.01 per share | MFA/PC | New York Stock Exchange |
Indicate by check mark whether the registrant is an emerging growth company as defined in Rule 405 of the Securities Act of 1933 (§230.405 of this chapter) or Rule 12b-2 of the Securities Exchange Act of 1934 (§240.12b-2 of this chapter).
Emerging growth company ¨
If an emerging growth company, indicate by check mark if the registrant has elected not to use the extended transition period for complying with any new or revised financial accounting standards provided pursuant to Section 13(a) of the Exchange Act. ¨
Item 2.02 Results of Operations and Financial Condition and
Item 7.01 Regulation FD Disclosure
MFA Financial, Inc. (“MFA”) issued a press release, dated February 23, 2023, announcing its financial results for the quarter ended December 31, 2022, which is attached hereto as Exhibit 99.1 and is incorporated herein by reference. In addition, in conjunction with the announcement of its financial results, MFA issued additional information relating to its 2022 fourth quarter financial results. Such additional information is attached to this report as Exhibit 99.2 and is incorporated herein by reference.
The information referenced in this Current Report on Form 8-K (including Exhibits 99.1 and 99.2) is being “furnished” and, as such, shall not be deemed to be “filed” for the purposes of Section 18 of the Securities Exchange Act of 1934, as amended (the “Exchange Act”), or otherwise subject to the liabilities of that Section. The information set forth in this Current Report on Form 8-K (including Exhibits 99.1 and 99.2) is and will not be incorporated by reference into any registration statement or other document filed by MFA pursuant to the Securities Act of 1933, as amended (the “Securities Act”), except as may be expressly set forth by specific reference in such filing.
As discussed therein, the press release contains forward-looking statements within the meaning of the Securities Act and the Exchange Act and, as such, may involve known and unknown risks, uncertainties and assumptions. These forward-looking statements relate to MFA’s current expectations and are subject to the limitations and qualifications set forth in the press release as well as in MFA’s other documents filed with the SEC, including, without limitation, that actual events and/or results may differ materially from those projected in such forward-looking statements.
| Exhibit | |
| 99.1 | Press Release, dated February 23, 2023, announcing MFA’s financial results for the quarter ended December 31, 2022. |
| 99.2 | Additional information relating to the financial results of MFA for the quarter ended December 31, 2022. |
| 104 | Cover Page Interactive Data File (formatted as Inline XBRL). |
SIGNATURE
Pursuant to the requirements of the Securities Exchange Act of 1934, the registrant has duly caused this report to be signed on its behalf by the undersigned hereunto duly authorized.
| MFA FINANCIAL, INC. | ||
| (REGISTRANT) | ||
| By: | /s/ Harold E. Schwartz | |
| Name: Harold E. Schwartz | ||
| Title: Senior Vice President and General Counsel | ||
Date: February 23, 2023
EXHIBIT INDEX
| Exhibit No. | Description |
| 99.1 | Press Release, dated February 23, 2023, announcing MFA Financial Inc.’s financial results for the quarter ended December 31, 2022. |
| 99.2 | Additional information relating to the financial results of MFA Financial, Inc. for the quarter ended December 31, 2022. |
| 104 | Cover Page Interactive Data File (formatted as Inline XBRL). |
Exhibit 99.1

| MFA | ||
| FINANCIAL, INC. | ||
| One Vanderbilt Ave | ||
| New York, New York 10017 | ||
| PRESS RELEASE | FOR IMMEDIATE RELEASE | |
| February 23, 2023 | NEW YORK METRO | |
| INVESTOR CONTACT: | InvestorRelations@mfafinancial.com | NYSE: MFA |
| 212-207-6488 | ||
| www.mfafinancial.com | ||
| MEDIA CONTACT: | Abernathy MacGregor | |
| Tom Johnson | ||
| 212-371-5999 |
MFA Financial, Inc. Announces Fourth Quarter 2022 Financial Results
NEW YORK - MFA Financial, Inc. (NYSE:MFA) today provided its financial results for the fourth quarter ended December 31, 2022.
Fourth Quarter 2022 financial results update:
| ● | MFA generated a GAAP loss for the fourth quarter of ($1.5) million, or $(0.02) per common share. Distributable Earnings, a non-GAAP financial measure, was $49.4 million, or $0.48 per common share. |
| ● | GAAP book value at December 31, 2022 was $14.87 per common share, while Economic book value, a non-GAAP financial measure of MFA’s financial position, was $15.55 per common share at quarter-end. |
| ● | Financing cost (including the impact of hedging) for the fourth quarter of 3.7% was relatively unchanged from the prior quarter, despite the Fed increasing interest rates by 125 basis points during the fourth quarter and by 200 basis points since its September 2022 meeting, due to our strategic focus on hedging and liability management. |
| ● | As of December 31, 2022, recourse leverage was 1.8x and portfolio sensitivity to interest rate changes remained relatively low with net duration of 0.99. Throughout 2022 we prioritized maintaining prudent levels of liquidity in light of the challenging interest rate environment. We closed the year with unrestricted cash of $334 million. |
| ● | At December 31, 2022, MFA’s residential whole loan portfolio totaled $7.5 billion. Fourth quarter loan acquisition activity of $480.6 million included $378.9 million of funded originations of Business Purpose loans (including draws on Transitional loans) and $101.7 million of Non-QM loan acquisitions. Full year acquisition loan activity was $3.1 billion and included $2.0 billion of funded originations of Business Purpose loans (including draws on Transitional loans) and $1.1 billion of Non-QM loan acquisitions. |
|
|
| ● | MFA’s residential whole loan portfolio has benefited from strong home price appreciation (HPA) and loan amortization. At December 31, 2022, the portfolio has an estimated weighted average current loan-to-value ratio (LTV) of 58%. Loan delinquencies trended down across the portfolio during 2022. Measured as a percentage of the unpaid principal balance, 3.1% of the Purchased Performing Loan portfolio was 60 or more days delinquent at the end of the fourth quarter, down from 4.2% as of December 31, 2021. For Purchased Credit Deteriorated and Purchased Non-Performing loans, 31.6% were 60 or more days delinquent at the end of the fourth quarter, down from 36.7% as of December 31, 2021. The estimated weighted average current LTV of all loans in the portfolio that are 60 or more days delinquent at December 31, 2022 is 62%. |
| ● | Continued interest rate volatility and generally wider spreads during the fourth quarter resulted in losses of $68.8 million on MFA’s residential whole loans that are measured at fair value through earnings. These losses were partially offset by unrealized gains on securitized debt measured at fair value through earnings, as well as gains on derivatives used for risk management purposes totaling $44.5 million. |
| ● | Net interest income for the fourth quarter was $55.7 million. Interest income from residential whole loans increased 9% to $125.0 million as compared to the immediately prior quarter. Net interest income this quarter also included approximately $7.8 million in connection with the redemption of a MSR note at par. For the fourth quarter, the overall net interest spread generated by all of MFA’s interest-bearing assets, including the positive carry on our swaps, increased to 2.21%. Adjusting for the impact of the MSR note redemption, the overall net interest spread was 1.89%, compared to 1.64% in the immediately prior quarter, an increase of approximately 15%. |
| ● | On January 31, 2023, MFA paid a regular cash dividend for the fourth quarter of $0.35 per share of common stock. |
Commenting on the fourth quarter, Craig Knutson, MFA’s CEO and President said, “While rates ended the fourth quarter only slightly higher than at September 30, the fourth quarter was another very volatile period for fixed income and mortgages in particular. Two-year Treasuries began the fourth quarter at 4.28% and sold off to 4.72% in early November before rallying back to end the year at 4.43%. After beginning the quarter at 3.83%, ten-year Treasuries hit a high for the year of 4.24% in late October before rallying back to close the year at 3.87%. Agency mortgage spreads widened out to the widest levels since the Great Financial Crisis in late October, and securitization markets, while not closed, were dysfunctional as spreads on even AAA cash flows widened more than Agency MBS spreads. Nonetheless, as we had done all year, our team at MFA protected book value and preserved capital, as we awaited more favorable market conditions.”
Mr. Knutson continued, “Our book value was relatively flat in the fourth quarter. Although mortgage REIT book values are down substantially since the beginning of 2022, our book value performance and economic returns for the year were better than most in our peer group. Our focus has been on maintaining substantial liquidity, fortifying our balance sheet by continuing to increase non-mark-to-market financing for our loan portfolio and decreasing our sensitivity to future interest rate increases. We stated on our third quarter earnings call that 99% of our asset-based financing costs were effectively fixed, either through securitizations or interest rate swaps. To illustrate how impactful this positioning was, our fourth quarter 2022 cost of funds (including the impact of swaps) was 3.7%, which is only 10 basis points higher than our third quarter cost of funds. This is despite the fact that the Fed raised rates by 125 basis points in the fourth quarter and by 200 basis points since its September 2022 meeting. We ended the year with unrestricted cash of $334 million, which is approximately 17% of our equity, and currently have approximately $1.9 billion of unused financing capacity across all loan product types. Finally, our loan portfolio has significant embedded home price appreciation, which, when combined with principal amortization, lowers the average LTV of our mortgage loan portfolio to approximately 58%.”
|
|
Mr. Knutson added, “Our Lima One subsidiary produced a record $2.3 billion of originations in 2022, a 42% increase over 2021, and contributed approximately 65% of our asset acquisitions during 2022. We believe that these organically-produced business purpose loans have strong credit characteristics and provide attractive yields that we could not obtain through third party purchases. Lima One’s current origination pipeline has a weighted average coupon of over 10%. Although fourth quarter origination volume declined 37% from the third quarter, this was due to higher coupons and tighter underwriting standards that we implemented throughout 2022 to reflect higher interest rates and economic uncertainty. When market conditions improve, Lima One’s operational capacity should position us to increase production quickly and efficiently.”
Q4 2022 Portfolio Activity
Loan acquisitions were $480.6 million, including $378.9 million of funded originations of Business Purpose loans (including draws on Transitional loans) and $101.7 million of Non-QM loan acquisitions, partially offset by portfolio run-off and asset valuation declines. In addition, near the end of the quarter, we entered into transactions to sell the majority of our holdings of Agency Eligible Investor loans and deconsolidate securitization trusts that hold previously securitized Agency Eligible Investor loans. As a result of these transactions, our reported portfolio of Agency Eligible Investor loans decreased by approximately $780 million, which drove the overall $572.0 million decrease in MFA’s residential mortgage investment portfolio for the fourth quarter.
At December 31, 2022, our investments in residential whole loans totaled $7.5 billion. Of this amount, $6.3 billion are Purchased Performing Loans, $448.9 million are Purchased Credit Deteriorated Loans and $796.1 million are Purchased Non-performing Loans. Overall yields on our residential whole loans increased over the quarter resulting in a net interest spread of 2.06%, a 13.8% increase over the immediately prior quarter. During the quarter, we recognized approximately $125.0 million of Interest Income on residential whole loans in our consolidated statements of operations, representing a yield of 5.62%. Purchased Performing Loans generated a yield of 5.04%, Purchased Credit Deteriorated Loans generated a yield of 6.59% and Purchased Non-performing Loans generated a yield of 11.15%. Interest income from our residential whole loan portfolio increased on a sequential quarter basis by over 9%. Loan delinquencies have remained relatively low and trended down across the portfolio during 2022. Measured as a percentage of the unpaid principal balance, 3.1% of the Purchased Performing Loan portfolio was 60 or more days delinquent at the end of the fourth quarter, down from 4.2% as of December 31, 2021. For Purchased Credit Deteriorated and Purchased Non-Performing loans, 31.6% were 60 or more days delinquent at the end of the fourth quarter, down from 36.7% as of December 31, 2021. The estimated weighted average current LTV of loans that are 60 or more days delinquent at December 31, 2022 is 62%.
|
|
Lima One continued to perform well, funding more than $268.1 million of new business purpose loans with a maximum loan amount of approximately $406 million. Further, $110.8 million of draws were funded on previously originated Transitional loans. For the quarter, Lima One generated approximately $9.2 million of origination, servicing, and other fee income.
During the quarter we completed one loan securitization, with $234.8 million UPB of Single-Family Rental loans sold. Subsequent to the end of the quarter we completed three additional securitizations, selling $313.7 million UPB of Non-QM loans, $203.9 million UPB of Single Family Rental loans and $150.6 million UPB of Transitional loans.
During the fourth quarter we maintained our position in interest rate swaps at a notional amount of $3.2 billion. At December 31, 2022, these swaps had a weighted average fixed pay interest rate of 1.69% and a weighted average variable receive interest rate of 4.30%. After including the impact of these swaps, as well as the effect of securitized and other fixed rate debt, we estimate that the net effective duration of our investment portfolio at December 31, 2022 was 0.99.
We also continued to reduce our REO portfolio, selling 83 properties in the fourth quarter for aggregate proceeds of $28.8 million and generating $7.4 million of gains. For 2022, we sold 416 properties for aggregate proceeds of $133.8 million and generated $28.7 million of gains.
At the end of the fourth quarter, MFA held $333.4 million of Securities, at fair value, including $131.7 million of Agency MBS, $97.9 million of MSR-related assets, $79.2 million of CRT securities and $24.6 million of Non-Agency MBS securities recorded in connection with the deconsolidation of Agency Eligible Investor loan securitizations.
General and Administrative and other expenses
For the three months ended December 31, 2022, MFA’s compensation and benefits expense and other general and administrative expenses were $24.8 million. Expenses for the quarter included $13.0 million of compensation and other general and administrative expenses recorded at Lima One. Compensation related expenses were approximately $4.0 million lower than the immediately prior quarter due to lower incentive compensation expense in connection with the final determination of annual incentive awards and lower sales commission expense at Lima One due to lower origination volume in the fourth quarter.
Segment reporting
Included in this press release is information on our reportable segments, including GAAP Net Income and Distributable Earnings for each segment for the three month periods ended September 30 and December 31, 2022 and segment assets as of December 31, 2021 and December 31, 2022.
|
|
The following table presents MFA’s asset allocation as of December 31, 2022, and the fourth quarter 2022 yield on average interest-earning assets, average cost of funds and net interest rate spread for the various asset types.
Table 1 - Asset Allocation
| At December 31, 2022 | Purchased Performing Loans (1) |
Purchased Credit Deteriorated Loans (2) |
Purchased Non- Performing Loans |
Securities, at fair value |
Real
Estate Owned |
Other,
net (3) |
Total | |||||||||||||||||||||
| (Dollars in Millions) | ||||||||||||||||||||||||||||
| Fair Value/Carrying Value | $ | 6,274 | $ | 449 | $ | 796 | $ | 333 | $ | 131 | $ | 675 | $ | 8,658 | ||||||||||||||
| Receivable/(Payable) for Unsettled Transactions | 276 | — | — | (132 | ) | — | — | 144 | ||||||||||||||||||||
| Financing Agreements with Non-mark-to-market Collateral Provisions | (862 | ) | (37 | ) | (96 | ) | — | (9 | ) | — | (1,004 | ) | ||||||||||||||||
| Financing Agreements with Mark-to-market Collateral Provisions | (1,893 | ) | (89 | ) | (113 | ) | (112 | ) | (16 | ) | — | (2,223 | ) | |||||||||||||||
| Securitized Debt | (2,758 | ) | (249 | ) | (334 | ) | — | (17 | ) | — | (3,358 | ) | ||||||||||||||||
| Convertible Senior Notes | — | — | — | — | — | (228 | ) | (228 | ) | |||||||||||||||||||
| Net Equity Allocated | $ | 1,037 | $ | 74 | $ | 253 | $ | 89 | $ | 89 | $ | 447 | $ | 1,989 | ||||||||||||||
| Debt/Net Equity Ratio (4) | 5.3 | x | 5.1 | x | 2.1 | x | 2.7 | x | 0.5 | x | 3.5 | x | ||||||||||||||||
| For the Quarter Ended December 31, 2022 | ||||||||||||||||||||||||||||
| Yield on Average Interest Earning Assets (5) | 5.04 | % | 6.59 | % | 11.15 | % | 30.33 | % | N/A | 5.91 | % | |||||||||||||||||
| Less Average Cost of Funds (6) | (3.70 | ) | (2.13 | ) | (3.01 | ) | (5.47 | ) | (4.76 | ) | (3.70 | ) | ||||||||||||||||
| Net Interest Rate Spread | 1.34 | % | 4.46 | % | 8.14 | % | 24.86 | % | (4.76 | )% | 2.21 | % | ||||||||||||||||
| (1) | Includes $3.4 billion of Non-QM loans, $1.4 billion of Transitional loans, $1.4 billion of Single-family rental loans, $82.9 million of Seasoned performing loans, and $51.1 million of Agency eligible investor loans. At December 31, 2022, the total fair value of these loans is estimated to be approximately $6.2 billion. | |
| (2) | At December 31, 2022, the total fair value of these loans is estimated to be approximately $468.8 million. | |
| (3) | Includes $334.2 million of cash and cash equivalents, $159.9 million of restricted cash, and $28.3 million of capital contributions made to loan origination partners, as well as other assets and other liabilities. | |
| (4) | Total Debt/Net Equity ratio represents the sum of borrowings under our financing agreements and payable for unsettled transactions noted above as a multiple of net equity allocated. | |
| (5) | Yields reported on our interest earning assets are calculated based on the interest income recorded and the average amortized cost for the quarter of the respective asset. At December 31, 2022, the amortized cost of our Securities, at fair value, was $313.4 million. In addition, the yield for residential whole loans was 5.60%, net of two basis points of servicing fee expense incurred during the quarter. For GAAP reporting purposes, such expenses are included in Loan servicing and other related operating expenses in our statement of operations. | |
| (6) | Average cost of funds includes interest on financing agreements, Convertible Senior Notes and securitized debt. Cost of funding also includes the impact of the net carry (the difference between swap interest income received and swap interest expense paid) on our Swaps. While we have not elected hedge accounting treatment for Swaps and accordingly net carry is not presented in interest expense in our consolidated statement of operations, we believe it is appropriate to allocate net carry to the cost of funding to reflect the economic impact of our interest rate swap agreements (or Swaps) on the funding costs shown in the table above. For the quarter ended December 31, 2022, this decreased the overall funding cost by 84 basis points for our overall portfolio, 89 basis points for our Residential whole loans, 87 basis points for our Purchased Performing Loans, 141 basis points for our Purchased Credit Deteriorated Loans, and 76 basis points for our Purchased Non-Performing Loans. |
|
|
The following table presents the activity for our residential mortgage asset portfolio for the three months ended December 31, 2022:
Table 2 - Investment Portfolio Activity Q4 2022
| (In Millions) | September 30, 2022 | Runoff (1) | Acquisitions (2) | Other (3) | December 31, 2022 | Change | ||||||||||||||||||
| Residential whole loans and REO | $ | 8,327 | $ | (326 | ) | $ | 480 | $ | (832 | ) | $ | 7,649 | $ | (678 | ) | |||||||||
| Securities, at fair value | 227 | (49 | ) | 156 | (1 | ) | 333 | 106 | ||||||||||||||||
| Totals | $ | 8,554 | $ | (375 | ) | $ | 636 | $ | (833 | ) | $ | 7,982 | $ | (572 | ) | |||||||||
| (1) | Primarily includes principal repayments and sales of REO. | |
| (2) | Includes draws on previously originated Transitional loans. | |
| (3) | Primarily includes the impact of transactions that resulted in the sale of previously non-securitized Agency Eligible Investor loans and deconsolidation of Agency Eligible Investor loan securitizations, changes in fair value and changes in the allowance for credit losses. |
|
|
The following tables present information on our investments in residential whole loans.
Table 3 - Portfolio composition
| Held at Carrying Value | Held at Fair Value | Total | ||||||||||||||||||||||
| (Dollars in Thousands) | December 31, 2022 |
December 31, 2021 |
December 31, 2022 |
December 31, 2021 |
December 31, 2022 |
December 31, 2021 |
||||||||||||||||||
| Purchased Performing Loans: | ||||||||||||||||||||||||
| Non-QM loans | $ | 987,282 | $ | 1,448,162 | $ | 2,372,548 | $ | 2,013,369 | $ | 3,359,830 | $ | 3,461,531 | ||||||||||||
| Transitional loans (1) | 75,188 | 217,315 | 1,342,032 | 517,530 | 1,417,220 | 734,845 | ||||||||||||||||||
| Single-family rental loans | 210,833 | 331,808 | 1,165,741 | 619,415 | 1,376,574 | 951,223 | ||||||||||||||||||
| Seasoned performing loans | 82,932 | 102,041 | — | — | 82,932 | 102,041 | ||||||||||||||||||
| Agency eligible investor loans | — | — | 51,094 | 1,082,765 | 51,094 | 1,082,765 | ||||||||||||||||||
| Total Purchased Performing Loans | $ | 1,356,235 | $ | 2,099,326 | $ | 4,931,415 | $ | 4,233,079 | $ | 6,287,650 | $ | 6,332,405 | ||||||||||||
| Purchased Credit Deteriorated Loans | $ | 470,294 | $ | 547,772 | $ | — | $ | — | $ | 470,294 | $ | 547,772 | ||||||||||||
| Allowance for Credit Losses | $ | (35,314 | ) | $ | (39,447 | ) | $ | — | $ | — | $ | (35,314 | ) | $ | (39,447 | ) | ||||||||
| Purchased Non-Performing Loans | $ | — | $ | — | $ | 796,109 | $ | 1,072,270 | $ | 796,109 | $ | 1,072,270 | ||||||||||||
| Total Residential Whole Loans | $ | 1,791,215 | $ | 2,607,651 | $ | 5,727,524 | $ | 5,305,349 | $ | 7,518,739 | $ | 7,913,000 | ||||||||||||
| Number of loans | 7,126 | 9,361 | 16,717 | 14,734 | 23,843 | 24,095 | ||||||||||||||||||
| (1) | As of December 31, 2022 includes $784.9 million of loans collateralized by one-to-four family residential properties and $632.3 million of loans collateralized by multi-family properties. As of December 31, 2021, includes $521.0 million of loans collateralized by one-to-four family residential properties and $213.9 million of loans collateralized by multi-family properties. |
|
|
Table 4 - Yields and average balances
| For the Three-Month Period Ended | ||||||||||||||||||||||||||||||||||||
| (Dollars in Thousands) | December 31, 2022 | September 30, 2022 | December 31, 2021 | |||||||||||||||||||||||||||||||||
| Interest | Average
Balance |
Average
Yield |
Interest | Average
Balance |
Average Yield |
Interest | Average Balance |
Average Yield |
||||||||||||||||||||||||||||
| Purchased Performing Loans: | ||||||||||||||||||||||||||||||||||||
| Non-QM loans | $ | 41,621 | $ | 3,767,900 | 4.42 | % | $ | 40,658 | $ | 3,743,940 | 4.34 | % | $ | 28,902 | $ | 3,002,644 | 3.85 | % | ||||||||||||||||||
| Transitional loans | 26,134 | 1,335,471 | 7.83 | % | 19,342 | 1,126,178 | 6.87 | % | 9,214 | 652,663 | 5.65 | % | ||||||||||||||||||||||||
| Single-family rental loans | 20,237 | 1,483,529 | 5.46 | % | 18,998 | 1,391,769 | 5.46 | % | 10,684 | 828,183 | 5.16 | % | ||||||||||||||||||||||||
| Seasoned performing loans | 1,283 | 84,876 | 6.05 | % | 1,227 | 89,458 | 5.49 | % | 1,423 | 106,065 | 5.37 | % | ||||||||||||||||||||||||
| Agency eligible investor loans | 7,631 | 1,021,007 | 2.99 | % | 7,542 | 1,035,266 | 2.91 | % | 8,046 | 1,065,062 | 3.02 | % | ||||||||||||||||||||||||
| Total Purchased Performing Loans | 96,906 | 7,692,783 | 5.04 | % | 87,767 | 7,386,611 | 4.75 | % | 58,269 | 5,654,617 | 4.12 | % | ||||||||||||||||||||||||
| Purchased Credit Deteriorated Loans | 7,830 | 474,971 | 6.59 | % | 7,916 | 487,918 | 6.49 | % | 10,033 | 561,262 | 7.15 | % | ||||||||||||||||||||||||
| Purchased Non-Performing Loans | 20,252 | 726,303 | 11.15 | % | 18,732 | 761,706 | 9.84 | % | 22,010 | 895,472 | 9.83 | % | ||||||||||||||||||||||||
| Total Residential Whole Loans | $ | 124,988 | $ | 8,894,057 | 5.62 | % | $ | 114,415 | $ | 8,636,235 | 5.30 | % | $ | 90,312 | $ | 7,111,351 | 5.08 | % | ||||||||||||||||||
Table 5 - Net Interest Spread
| For the Three-Month Period Ended | ||||||||||||
| December 31, 2022 |
September 30, 2022 |
December 31, 2021 |
||||||||||
| Purchased Performing Loans | ||||||||||||
| Net Yield (1) | 5.04 | % | 4.75 | % | 4.12 | % | ||||||
| Cost of Funding (2) | 3.70 | % | 3.60 | % | 2.24 | % | ||||||
| Net Interest Spread | 1.34 | % | 1.15 | % | 1.88 | % | ||||||
| Purchased Credit Deteriorated Loans | ||||||||||||
| Net Yield (1) | 6.59 | % | 6.49 | % | 7.15 | % | ||||||
| Cost of Funding (2) | 2.13 | % | 2.72 | % | 2.32 | % | ||||||
| Net Interest Spread | 4.46 | % | 3.77 | % | 4.83 | % | ||||||
| Purchased Non-Performing Loans | ||||||||||||
| Net Yield (1) | 11.15 | % | 9.84 | % | 9.83 | % | ||||||
| Cost of Funding (2) | 3.01 | % | 2.86 | % | 2.53 | % | ||||||
| Net Interest Spread | 8.14 | % | 6.98 | % | 7.30 | % | ||||||
| Total Residential Whole Loans | ||||||||||||
| Net Yield (1) | 5.62 | % | 5.30 | % | 5.08 | % | ||||||
| Cost of Funding (2) | 3.56 | % | 3.49 | % | 2.28 | % | ||||||
| Net Interest Spread | 2.06 | % | 1.81 | % | 2.80 | % | ||||||
| (1) | Reflects annualized interest income on Residential whole loans divided by average amortized cost of Residential whole loans. Excludes servicing costs. |
| (2) | Reflects annualized interest expense divided by average balance of agreements with mark-to-market collateral provisions (repurchase agreements), agreements with non-mark-to-market collateral provisions, and securitized debt. Cost of funding shown in the table above includes the impact of the net carry (the difference between swap interest income received and swap interest expense paid) on our Swaps. While we have not elected hedge accounting treatment for Swaps, and, accordingly, net carry is not presented in interest expense in our consolidated statement of operations, we believe it is appropriate to allocate net carry to the cost of funding to reflect the economic impact of our Swaps on the funding costs shown in the table above. For the quarter ended December 31, 2022, this decreased the overall funding cost by 89 basis points for our Residential whole loans, 87 basis points for our Purchased Performing Loans, 141 basis points for our Purchased Credit Deteriorated Loans, and 76 basis points for our Purchased Non-Performing Loans. For the quarter ended September 30, 2022, this decreased the overall funding cost by 20 basis points for our Residential whole loans, 19 basis points for our Purchased Performing Loans, 43 basis points for our Purchased Credit Deteriorated Loans, and 24 basis points for our Purchased Non-Performing Loans. For the quarter ended December 31, 2021, this increased the overall funding cost by 5 basis points for our Residential whole loans, 5 basis points for our Purchased Performing Loans, 9 basis points for our Purchased Credit Deteriorated Loans, and 2 basis points for our Purchased Non-Performing Loans. |
|
|
Table 6 - Allowance for Credit Losses
The following table presents a roll-forward of the allowance for credit losses on the Company’s Residential Whole Loans, at Carrying Value:
| For the Year Ended December 31, 2022 | ||||||||||||||||||||||||
| (Dollars In Thousands) | Non-QM Loans |
Transitional Loans (1)(2) |
Single-family Rental Loans |
Seasoned Performing Loans |
Purchased Credit Deteriorated Loans (3) |
Totals | ||||||||||||||||||
| Allowance for credit losses at December 31, 2021 | $ | 8,289 | $ | 6,881 | $ | 1,451 | $ | 46 | $ | 22,780 | $ | 39,447 | ||||||||||||
| Current provision | (909 | ) | (1,460 | ) | (122 | ) | (1 | ) | (975 | ) | (3,467 | ) | ||||||||||||
| Write-offs | (51 | ) | (219 | ) | (27 | ) | — | (226 | ) | (523 | ) | |||||||||||||
| Allowance for credit losses at March 31, 2022 | $ | 7,329 | $ | 5,202 | $ | 1,302 | $ | 45 | $ | 21,579 | $ | 35,457 | ||||||||||||
| Current provision/(reversal) | (199 | ) | (23 | ) | 174 | 1 | 1,877 | 1,830 | ||||||||||||||||
| Write-offs | — | (118 | ) | (184 | ) | — | (58 | ) | (360 | ) | ||||||||||||||
| Allowance for credit losses at June 30, 2022 | $ | 7,130 | $ | 5,061 | $ | 1,292 | $ | 46 | $ | 23,398 | $ | 36,927 | ||||||||||||
| Current provision/(reversal) | (242 | ) | 583 | 83 | 3 | 120 | 547 | |||||||||||||||||
| Write-offs | — | (114 | ) | (61 | ) | — | (107 | ) | (282 | ) | ||||||||||||||
| Allowance for credit losses at September 30, 2022 | $ | 6,888 | $ | 5,530 | $ | 1,314 | $ | 49 | $ | 23,411 | $ | 37,192 | ||||||||||||
| Current provision/(reversal) | 471 | (13 | ) | (37 | ) | (1 | ) | (1,996 | ) | (1,576 | ) | |||||||||||||
| Write-offs | — | (294 | ) | — | — | (8 | ) | (302 | ) | |||||||||||||||
| Allowance for credit losses at December 31, 2022 | $ | 7,359 | $ | 5,223 | $ | 1,277 | $ | 48 | $ | 21,407 | $ | 35,314 | ||||||||||||
|
|
| For the Year Ended December 31, 2021 | ||||||||||||||||||||||||
| (Dollars In Thousands) | Non-QM Loans |
Transitional Loans (1)(2) |
Single-family Rental Loans |
Seasoned Performing Loans |
Purchased Credit Deteriorated Loans (3) |
Totals | ||||||||||||||||||
| Allowance for credit losses at December 31, 2020 | $ | 21,068 | $ | 18,371 | $ | 3,918 | $ | 107 | $ | 43,369 | $ | 86,833 | ||||||||||||
| Current provision | (6,523 | ) | (3,700 | ) | (1,172 | ) | (41 | ) | (10,936 | ) | (22,372 | ) | ||||||||||||
| Write-offs | — | (1,003 | ) | — | — | (214 | ) | (1,217 | ) | |||||||||||||||
| Allowance for credit and valuation losses at March 31, 2021 | $ | 14,545 | $ | 13,668 | $ | 2,746 | $ | 66 | $ | 32,219 | $ | 63,244 | ||||||||||||
| Current provision/(reversal) | (2,416 | ) | (1,809 | ) | (386 | ) | (9 | ) | (3,963 | ) | (8,583 | ) | ||||||||||||
| Write-offs | (37 | ) | (255 | ) | — | — | (108 | ) | (400 | ) | ||||||||||||||
| Allowance for credit losses at June 30, 2021 | $ | 12,092 | $ | 11,604 | $ | 2,360 | $ | 57 | $ | 28,148 | $ | 54,261 | ||||||||||||
| Current provision/(reversal) | (2,403 | ) | (2,526 | ) | (670 | ) | (7 | ) | (4,020 | ) | (9,626 | ) | ||||||||||||
| Write-offs | — | (393 | ) | (56 | ) | — | (84 | ) | (533 | ) | ||||||||||||||
| Allowance for credit losses at September 30, 2021 | $ | 9,689 | $ | 8,685 | $ | 1,634 | $ | 50 | $ | 24,044 | $ | 44,102 | ||||||||||||
| Current provision/(reversal) | $ | (1,400 | ) | $ | (706 | ) | $ | (178 | ) | $ | (4 | ) | $ | (1,142 | ) | $ | (3,430 | ) | ||||||
| Write-offs | $ | — | $ | (1,098 | ) | $ | (5 | ) | $ | — | $ | (122 | ) | $ | (1,225 | ) | ||||||||
| Allowance for credit losses at December 31, 2021 | $ | 8,289 | $ | 6,881 | $ | 1,451 | $ | 46 | $ | 22,780 | $ | 39,447 | ||||||||||||
| (1) | In connection with purchased Transitional loans at carrying value, the Company had unfunded commitments of $8.0 million and $18.5 million as of December 31, 2022 and 2021, respectively, with an allowance for credit losses of $29,000 and $205,000 at December 31, 2022 and 2021, respectively. Such allowance is included in “Other liabilities” in the Company’s consolidated balance sheets. |
| (2) | Includes $56.1 million and $87.0 million of loans that were assessed for credit losses based on a collateral dependent methodology as of December 31, 2022 and 2021, respectively. |
| (3) | Includes $48.5 million and $57.4 million of loans that were assessed for credit losses based on a collateral dependent methodology as of December 31, 2022 and 2021, respectively. |
|
|
Table 7 - Credit related metrics/Residential Whole Loans
December 31, 2022
| Aging by UPB | ||||||||||||||||||||||||||||||||||||||||||||
| Past Due Days | ||||||||||||||||||||||||||||||||||||||||||||
| (Dollars In Thousands) |
Fair Value / Carrying Value |
Unpaid Principal Balance (“UPB”) |
Weighted Average Coupon (2) |
Weighted Average Term to Maturity (Months) |
Weighted Average LTV Ratio (3) |
Weighted Average Original FICO (4) |
Current | 30-59 | 60-89 | 90+ | 60+ Delinquency % |
|||||||||||||||||||||||||||||||||
| Purchased Performing Loans: | ||||||||||||||||||||||||||||||||||||||||||||
| Non-QM loans | $ | 3,352,471 | $ | 3,671,468 | 5.13 | % | 351 | 65 | % | 733 | $ | 3,520,671 | $ | 56,825 | $ | 32,253 | $ | 61,719 | 2.6 | % | ||||||||||||||||||||||||
| Transitional loans (1) | 1,411,997 | 1,431,692 | 7.78 | 12 | 66 | 746 | 1,348,815 | 6,463 | 2,234 | 74,180 | 5.3 | |||||||||||||||||||||||||||||||||
| Single-family rental loans | 1,375,297 | 1,485,967 | 5.74 | 324 | 69 | 737 | 1,442,095 | 8,431 | 7,978 | 27,463 | 2.4 | |||||||||||||||||||||||||||||||||
| Seasoned performing loans | 82,884 | 90,843 | 3.31 | 151 | 30 | 714 | 84,514 | 993 | 937 | 4,399 | 5.9 | |||||||||||||||||||||||||||||||||
| Agency eligible investor loans | 51,094 | 61,816 | 3.44 | 344 | 68 | 757 | 61,816 | — | — | — | — | |||||||||||||||||||||||||||||||||
| Total Purchased Performing Loans | $ | 6,273,743 | $ | 6,741,786 | 5.78 | % | 271 | 3.1 | % | |||||||||||||||||||||||||||||||||||
| Purchased Credit Deteriorated Loans | $ | 448,887 | $ | 554,907 | 4.66 | % | 277 | 63 | % | N/A | $ | 403,042 | $ | 48,107 | $ | 16,270 | $ | 87,488 | 18.7 | % | ||||||||||||||||||||||||
| Purchased Non-Performing Loans | $ | 796,109 | $ | 884,257 | 5.01 | % | 277 | 68 | % | N/A | $ | 444,045 | $ | 89,623 | $ | 40,554 | $ | 310,035 | 39.6 | % | ||||||||||||||||||||||||
| Residential whole loans, total or weighted average | $ | 7,518,739 | $ | 8,180,950 | 5.64 | % | 272 | 8.1 | % | |||||||||||||||||||||||||||||||||||
December 31, 2021
| Aging by UPB | ||||||||||||||||||||||||||||||||||||||||||||
| Past Due Days | ||||||||||||||||||||||||||||||||||||||||||||
| (Dollars In Thousands) |
Fair
Value / Carrying Value |
Unpaid Principal Balance (“UPB”) |
Weighted Average Coupon (2) |
Weighted Average Term to Maturity (Months) |
Weighted Average LTV Ratio (3) |
Weighted Average Original FICO (4) |
Current | 30-59 | 60-89 | 90+ | 60+ Delinquency % |
|||||||||||||||||||||||||||||||||
| Purchased Performing Loans: | ||||||||||||||||||||||||||||||||||||||||||||
| Non-QM loans | $ | 3,453,242 | $ | 3,361,164 | 5.07 | % | 355 | 66 | % | 731 | $ | 3,165,964 | $ | 77,581 | $ | 22,864 | $ | 94,755 | 3.5 | % | ||||||||||||||||||||||||
| Transitional loans (1) | 727,964 | 731,154 | 7.18 | 11 | 67 | 735 | 616,733 | 5,834 | 5,553 | 103,034 | 14.9 | |||||||||||||||||||||||||||||||||
| Single-family rental loans | 949,772 | 924,498 | 5.46 | 329 | 70 | 732 | 898,166 | 2,150 | 695 | 23,487 | 2.6 | |||||||||||||||||||||||||||||||||
| Seasoned performing loans | 101,995 | 111,710 | 2.76 | 162 | 37 | 722 | 102,047 | 938 | 481 | 8,244 | 7.8 | |||||||||||||||||||||||||||||||||
| Agency eligible investor loans | 1,082,765 | 1,060,486 | 3.40 | 354 | 62 | 767 | 1,039,257 | 21,229 | — | — | — | |||||||||||||||||||||||||||||||||
| Total Purchased Performing Loans | $ | 6,315,738 | $ | 6,189,012 | 5.05 | % | 307 | 4.2 | % | |||||||||||||||||||||||||||||||||||
| Purchased Credit Deteriorated Loans | $ | 524,992 | $ | 643,187 | 4.55 | % | 283 | 69 | % | N/A | $ | 456,924 | $ | 50,048 | $ | 18,736 | $ | 117,479 | 21.2 | % | ||||||||||||||||||||||||
| Purchased Non-Performing Loans | $ | 1,072,270 | $ | 1,073,544 | 4.87 | % | 283 | 73 | % | N/A | $ | 492,481 | $ | 87,041 | $ | 40,876 | $ | 453,146 | 46.0 | % | ||||||||||||||||||||||||
| Residential whole loans, total or weighted average | $ | 7,913,000 | $ | 7,905,743 | 4.99 | % | 301 | 11.2 | % | |||||||||||||||||||||||||||||||||||
|
(1) |
As of December 31, 2022 Transitional loans includes $632.3 million of loans collateralized by multi-family properties with a weighted average term to maturity of 18 months and a weighted average LTV ratio of 73%. As of December 31, 2021, Transitional loans includes $213.9 million of loans collateralized by multi-family properties with a weighted average term to maturity of 23 months and a weighted average LTV ratio of 80%. | |
| (2) | Weighted average is calculated based on the interest bearing principal balance of each loan within the related category. For loans acquired with servicing rights released by the seller, interest rates included in the calculation do not reflect loan servicing fees. For loans acquired with servicing rights retained by the seller, interest rates included in the calculation are net of servicing fees. | |
| (3) | LTV represents the ratio of the total unpaid principal balance of the loan to the estimated value of the collateral securing the related loan as of the most recent date available, which may be the origination date. For Transitional loans, the LTV presented is the ratio of the maximum unpaid principal balance of the loan, including unfunded commitments, to the estimated “after repaired” value of the collateral securing the related loan, where available. For certain Transitional loans, totaling $223.2 million and $137.3 million at December 31, 2022 and 2021, respectively, an after repaired valuation was not obtained and the loan was underwritten based on an “as is” valuation. The weighted average LTV of these loans based on the current unpaid principal balance and the valuation obtained during underwriting, is 70% and 71% at December 31, 2022 and 2021, respectively. Excluded from the calculation of weighted average LTV are certain low value loans secured by vacant lots, for which the LTV ratio is not meaningful. | |
| (4) | Excludes loans for which no Fair Isaac Corporation (“FICO”) score is available. |
|
|
Table 8 - LTV 90+ Days Delinquencies
The following table presents certain information regarding the Company’s Residential whole loans that are 90 days or more delinquent:
| December 31, 2022 | ||||||||||||
| (Dollars In Thousands) | Carrying Value / Fair Value | UPB | LTV (1) | |||||||||
| Purchased Performing Loans | ||||||||||||
| Non-QM loans | $ | 61,812 | $ | 61,719 | 67.9 | % | ||||||
| Transitional loans | 73,266 | 74,180 | 68.1 | % | ||||||||
| Single-family rental loans | 27,466 | 27,463 | 72.9 | % | ||||||||
| Seasoned performing loans | 4,127 | 4,399 | 42.2 | % | ||||||||
| Agency eligible investor loans | — | — | — | |||||||||
| Total Purchased Performing Loans | $ | 166,671 | $ | 167,761 | ||||||||
| Purchased Credit Deteriorated Loans | $ | 69,402 | $ | 87,488 | 74.8 | % | ||||||
| Purchased Non-Performing Loans | $ | 296,697 | $ | 310,035 | 76.9 | % | ||||||
| Total Residential Whole Loans | $ | 532,770 | $ | 565,284 | ||||||||
| December 31, 2021 | ||||||||||||
| (Dollars In Thousands) | Carrying Value / Fair Value | UPB | LTV (1) | |||||||||
| Purchased Performing Loans | ||||||||||||
| Non-QM loans | $ | 96,473 | $ | 94,755 | 64.6 | % | ||||||
| Transitional loans | 103,166 | 103,034 | 67.6 | % | ||||||||
| Single-family rental loans | 23,524 | 23,487 | 73.4 | % | ||||||||
| Seasoned performing loans | 7,740 | 8,244 | 45.6 | % | ||||||||
| Agency eligible investor loans | — | — | — | |||||||||
| Total Purchased Performing Loans | $ | 230,903 | $ | 229,520 | ||||||||
| Purchased Credit Deteriorated Loans | $ | 95,899 | $ | 117,479 | 79.1 | % | ||||||
| Purchased Non-Performing Loans | $ | 454,443 | $ | 453,146 | 80.2 | % | ||||||
| Total Residential Whole Loans | $ | 781,245 | $ | 800,145 | ||||||||
| (1) | LTV represents the ratio of the total unpaid principal balance of the loan to the estimated value of the collateral securing the related loan as of the most recent date available, which may be the origination date. For Transitional loans, the LTV presented is the ratio of the maximum unpaid principal balance of the loan, including unfunded commitments, to the estimated “after repaired” value of the collateral securing the related loan, where available. For certain Transitional loans, an after repaired valuation was not obtained and the loan was underwritten based on an “as is” valuation. Excluded from the calculation of weighted average LTV are certain low value loans secured by vacant lots, for which the LTV ratio is not meaningful. |
|
|
Table 9 - Shock Table
The information presented in the following “Shock Table” projects the potential impact of sudden parallel changes in interest rates on the value of our portfolio, including the impact of Swaps and securitized debt, based on the assets in our investment portfolio at December 31, 2022. Changes in portfolio value are measured as the percentage change when comparing the projected portfolio value to the base interest rate scenario at December 31, 2022.
| Change in Interest Rates | Percentage Change |
Percentage
Change |
||||||
| +100 Basis Point Increase | (1.27 | )% | (5.54 | )% | ||||
| + 50 Basis Point Increase | (0.57 | )% | (2.48 | )% | ||||
| Actual at December 31, 2022 | — | % | — | % | ||||
| - 50 Basis Point Decrease | 0.43 | % | 1.89 | % | ||||
| -100 Basis Point Decrease | 0.73 | % | 3.20 | % | ||||
Webcast
MFA Financial, Inc. plans to host a live audio webcast of its investor conference call on Thursday, February 23, 2023, at 10:00 a.m. (Eastern Time) to discuss its fourth quarter 2022 financial results. The live audio webcast will be accessible to the general public over the internet at http://www.mfafinancial.com through the “Webcasts & Presentations” link on MFA’s home page. To listen to the conference call over the internet, please go to the MFA website at least 15 minutes before the call to register and to download and install any needed audio software. Earnings presentation materials will be posted on the MFA website prior to the conference call and an audio replay will be available on the website following the call.
|
|
Cautionary Note Regarding Forward-Looking Statements
When used in this press release or other written or oral communications, statements that are not historical in nature, including those containing words such as “will,” “believe,” “expect,” “anticipate,” “estimate,” “plan,” “continue,” “intend,” “should,” “could,” “would,” “may,” the negative of these words or similar expressions, are intended to identify “forward-looking statements” within the meaning of Section 27A of the Securities Act of 1933, as amended, and Section 21E of the Securities Exchange Act of 1934, as amended, and, as such, may involve known and unknown risks, uncertainties and assumptions. These forward-looking statements include information about possible or assumed future results with respect to MFA’s business, financial condition, liquidity, results of operations, plans and objectives. Among the important factors that could cause our actual results to differ materially from those projected in any forward-looking statements that we make are: general economic developments and trends and the performance of the housing, real estate, mortgage finance, broader financial markets; inflation, increases in interest rates and changes in the market (i.e., fair) value of MFA’s residential whole loans, MBS, securitized debt and other assets, as well as changes in the value of MFA’s liabilities accounted for at fair value through earnings; the effectiveness of hedging transactions; changes in the prepayment rates on residential mortgage assets, an increase of which could result in a reduction of the yield on certain investments in its portfolio and could require MFA to reinvest the proceeds received by it as a result of such prepayments in investments with lower coupons, while a decrease in which could result in an increase in the interest rate duration of certain investments in MFA’s portfolio making their valuation more sensitive to changes in interest rates and could result in lower forecasted cash flows; credit risks underlying MFA’s assets, including changes in the default rates and management’s assumptions regarding default rates on the mortgage loans in MFA’s residential whole loan portfolio; MFA’s ability to borrow to finance its assets and the terms, including the cost, maturity and other terms, of any such borrowings; implementation of or changes in government regulations or programs affecting MFA’s business; MFA’s estimates regarding taxable income, the actual amount of which is dependent on a number of factors, including, but not limited to, changes in the amount of interest income and financing costs, the method elected by MFA to accrete the market discount on residential whole loans and the extent of prepayments, realized losses and changes in the composition of MFA’s residential whole loan portfolios that may occur during the applicable tax period, including gain or loss on any MBS disposals or whole loan modifications, foreclosures and liquidations; the timing and amount of distributions to stockholders, which are declared and paid at the discretion of MFA’s Board of Directors and will depend on, among other things, MFA’s taxable income, its financial results and overall financial condition and liquidity, maintenance of its REIT qualification and such other factors as MFA’s Board of Directors deems relevant; MFA’s ability to maintain its qualification as a REIT for federal income tax purposes; MFA’s ability to maintain its exemption from registration under the Investment Company Act of 1940, as amended (or the “Investment Company Act”), including statements regarding the concept release issued by the Securities and Exchange Commission (“SEC”) relating to interpretive issues under the Investment Company Act with respect to the status under the Investment Company Act of certain companies that are engaged in the business of acquiring mortgages and mortgage-related interests; MFA’s ability to continue growing its residential whole loan portfolio, which is dependent on, among other things, the supply of loans offered for sale in the market; targeted or expected returns on our investments in recently-originated mortgage loans, the performance of which is, similar to our other mortgage loan investments, subject to, among other things, differences in prepayment risk, credit risk and financing costs associated with such investments; risks associated with the ongoing operation of Lima One Holdings, LLC (including, without limitation, unanticipated expenditures relating to or liabilities arising from its operation (including, among other things, a failure to realize management’s assumptions regarding expected growth in business purpose loan (BPL) origination volumes and credit risks underlying BPLs, including changes in the default rates and management’s assumptions regarding default rates on the BPLs originated by Lima One); expected returns on MFA’s investments in nonperforming residential whole loans (“NPLs”), which are affected by, among other things, the length of time required to foreclose upon, sell, liquidate or otherwise reach a resolution of the property underlying the NPL, home price values, amounts advanced to carry the asset (e.g., taxes, insurance, maintenance expenses, etc. on the underlying property) and the amount ultimately realized upon resolution of the asset; risks associated with our investments in MSR-related assets, including servicing, regulatory and economic risks; risks associated with our investments in loan originators; risks associated with investing in real estate assets generally, including changes in business conditions and the general economy; and other risks, uncertainties and factors, including those described in the annual, quarterly and current reports that we file with the SEC. These forward-looking statements are based on beliefs, assumptions and expectations of MFA’s future performance, taking into account information currently available. Readers and listeners are cautioned not to place undue reliance on these forward-looking statements, which speak only as of the date on which they are made. New risks and uncertainties arise over time and it is not possible to predict those events or how they may affect MFA. Except as required by law, MFA is not obligated to, and does not intend to, update or revise any forward-looking statements, whether as a result of new information, future events or otherwise.
|
|
MFA FINANCIAL, INC.
CONSOLIDATED BALANCE SHEETS
| (In Thousands, Except Per Share Amounts) | December 31, 2022 |
December 31, 2021 |
||||||
| (unaudited) | ||||||||
| Assets: | ||||||||
| Residential whole loans, net ($5,727,524 and $5,305,349 held at fair value, respectively) (1)(2) | $ | 7,518,739 | $ | 7,913,000 | ||||
| Securities, at fair value | 333,364 | 256,685 | ||||||
| Cash and cash equivalents | 334,183 | 304,696 | ||||||
| Restricted cash | 159,898 | 99,751 | ||||||
| Other assets | 766,221 | 565,556 | ||||||
| Total Assets | $ | 9,112,405 | $ | 9,139,688 | ||||
| Liabilities: | ||||||||
| Financing agreements ($3,898,744 and $3,266,773 held at fair value, respectively) | $ | 6,812,086 | $ | 6,378,782 | ||||
| Other liabilities | 311,470 | 218,058 | ||||||
| Total Liabilities | $ | 7,123,556 | $ | 6,596,840 | ||||
| Stockholders’ Equity: | ||||||||
| Preferred stock, $0.01 par value; 7.5% Series B cumulative redeemable; 8,050 shares authorized; 8,000 shares issued and outstanding ($200,000 aggregate liquidation preference) | $ | 80 | $ | 80 | ||||
| Preferred stock, $0.01 par value; 6.5% Series C fixed-to-floating rate cumulative redeemable; 12,650 shares authorized; 11,000 shares issued and outstanding ($275,000 aggregate liquidation preference) | 110 | 110 | ||||||
| Common stock, $0.01 par value; 874,300 and 874,300 shares authorized; 101,802 and 108,138 shares issued and outstanding, respectively |
1,018 | 1,082 | ||||||
| Additional paid-in capital, in excess of par | 3,684,291 | 3,775,482 | ||||||
| Accumulated deficit | (1,717,991 | ) | (1,279,484 | ) | ||||
| Accumulated other comprehensive income | 21,341 | 45,578 | ||||||
| Total Stockholders’ Equity | $ | 1,988,849 | $ | 2,542,848 | ||||
| Total Liabilities and Stockholders’ Equity | $ | 9,112,405 | $ | 9,139,688 | ||||
| (1) | Includes approximately $4.0 billion and $3.0 billion of Residential whole loans transferred to consolidated variable interest entities (“VIEs”) at December 31, 2022 and December 31, 2021, respectively. Such assets can be used only to settle the obligations of each respective VIE. |
|
|
MFA FINANCIAL, INC.
CONSOLIDATED STATEMENTS OF OPERATIONS
|
Three Months Ended December 31, |
Twelve Months Ended December 31, |
|||||||||||||||
| (In Thousands, Except Per Share Amounts) | 2022 | 2021 | 2022 | 2021 | ||||||||||||
| (Unaudited) | (Unaudited) | (Unaudited) | ||||||||||||||
| Interest Income: | ||||||||||||||||
| Residential whole loans | $ | 124,988 | $ | 90,312 | $ | 441,223 | $ | 303,468 | ||||||||
| Securities, at fair value | 12,740 | 14,257 | 28,921 | 56,690 | ||||||||||||
| Other interest-earning assets | 2,366 | 1,168 | 7,437 | 1,800 | ||||||||||||
| Cash and cash equivalent investments | 2,783 | 105 | 4,838 | 344 | ||||||||||||
| Interest Income | $ | 142,877 | $ | 105,842 | $ | 482,419 | $ | 362,302 | ||||||||
| Interest Expense: | ||||||||||||||||
| Asset-backed and other collateralized financing arrangements | $ | 83,277 | $ | 31,770 | $ | 243,083 | $ | 104,597 | ||||||||
| Other interest expense | 3,949 | 3,925 | 15,760 | 15,788 | ||||||||||||
| Interest Expense | $ | 87,226 | $ | 35,695 | $ | 258,843 | $ | 120,385 | ||||||||
| Net Interest Income | $ | 55,651 | $ | 70,147 | $ | 223,576 | $ | 241,917 | ||||||||
| Reversal of Provision/(Provision) for Credit Losses on Residential Whole Loans | $ | 1,540 | $ | 3,537 | $ | 2,646 | $ | 44,863 | ||||||||
| Provision for Credit Losses on Other Assets | — | — | (28,579 | ) | — | |||||||||||
| Net Interest Income after (Provision)/Reversal of Provision for Credit Losses | $ | 57,191 | $ | 73,684 | $ | 197,643 | $ | 286,780 | ||||||||
| Other (Loss)/Income, net: | ||||||||||||||||
| Net (loss)/gain on residential whole loans measured at fair value through earnings | (68,828 | ) | (42,564 | ) | (866,762 | ) | 16,243 | |||||||||
| Impairment and other net (loss)/gain on securities and other portfolio investments | (8,909 | ) | 23,594 | (25,067 | ) | 74,496 | ||||||||||
| Net gain on real estate owned | 5,602 | 9,113 | 25,379 | 22,838 | ||||||||||||
| Net gain/(loss) on derivatives used for risk management purposes | 1,458 | 399 | 255,179 | 1,426 | ||||||||||||
| Net gain/(loss) on securitized debt measured at fair value through earnings | 43,091 | 6,772 | 290,639 | 15,027 | ||||||||||||
| Lima One - origination, servicing and other fee income | 9,206 | 12,961 | 46,745 | 22,600 | ||||||||||||
| Other, net | 1,945 | 4,415 | 9,297 | 12,473 | ||||||||||||
| Other (Loss)/Income, net | $ | (16,435 | ) | $ | 14,690 | $ | (264,590 | ) | $ | 165,103 | ||||||
| Operating and Other Expense: | ||||||||||||||||
| Compensation and benefits | $ | 17,049 | $ | 20,284 | $ | 76,728 | $ | 53,817 | ||||||||
| Other general and administrative expense | 7,796 | 8,391 | 35,812 | 31,729 | ||||||||||||
| Loan servicing, financing and other related costs | 7,901 | 12,277 | 42,894 | 30,867 | ||||||||||||
| Amortization of intangible assets | 1,300 | 3,300 | 9,200 | 6,600 | ||||||||||||
| Costs associated with restructuring/forbearance agreement | — | — | — | — | ||||||||||||
| Operating and Other Expense | $ | 34,046 | $ | 44,252 | $ | 164,634 | $ | 123,013 | ||||||||
| Net (Loss)/Income | $ | 6,710 | $ | 44,122 | $ | (231,581 | ) | $ | 328,870 | |||||||
| Less Preferred Stock Dividend Requirement | $ | 8,219 | $ | 8,219 | $ | 32,875 | $ | 32,875 | ||||||||
| Net (Loss)/Income Available to Common Stock and Participating Securities | $ | (1,509 | ) | $ | 35,903 | $ | (264,456 | ) | $ | 295,995 | ||||||
| Basic (Loss)/Earnings per Common Share | $ | (0.02 | ) | $ | 0.32 | $ | (2.57 | ) | $ | 2.66 | ||||||
| Diluted (Loss)/Earnings per Common Share | $ | (0.02 | ) | $ | 0.34 | $ | (2.57 | ) | $ | 2.63 | ||||||
|
|
Segment Reporting
At December 31, 2022, the Company’s reportable segments include (i) mortgage-related assets and (ii) Lima One. The Corporate column in the table below primarily consists of corporate cash and related interest income, investments in loan originators and related economics, general and administrative expenses not directly attributable to Lima One, interest expense on unsecured convertible senior notes, securitization issuance costs, and preferred stock dividends.
The following tables summarize segment financial information, which in total reconciles to the same data for the Company as a whole:
| (Dollars in Thousands) | Mortgage- Related Assets |
Lima One | Corporate | Total | ||||||||||||
| Three months ended December 31, 2022 | ||||||||||||||||
| Interest Income | $ | 100,800 | $ | 39,398 | $ | 2,679 | $ | 142,877 | ||||||||
| Interest Expense | 56,046 | 27,231 | 3,949 | 87,226 | ||||||||||||
| Net Interest Income/(Expense) | $ | 44,754 | $ | 12,167 | $ | (1,270 | ) | $ | 55,651 | |||||||
| Reversal of Provision/(Provision) for Credit Losses on Residential Whole Loans | 1,631 | (91 | ) | — | 1,540 | |||||||||||
| Net Interest Income/(Expense) after Reversal of Provision/(Provision) for Credit Losses | $ | 46,385 | $ | 12,076 | $ | (1,270 | ) | $ | 57,191 | |||||||
| Net (loss)/gain on residential whole loans measured at fair value through earnings | $ | (72,805 | ) | $ | 3,977 | $ | — | $ | (68,828 | ) | ||||||
| Impairment and other net loss on securities and other portfolio investments | (383 | ) | — | (8,526 | ) | (8,909 | ) | |||||||||
| Net gain on real estate owned | 5,602 | — | — | 5,602 | ||||||||||||
| Net gain on derivatives used for risk management purposes | 621 | 837 | — | 1,458 | ||||||||||||
| Net gain on securitized debt measured at fair value through earnings | 29,159 | 13,932 | — | 43,091 | ||||||||||||
| Lima One - origination, servicing and other fee income | — | 9,206 | — | 9,206 | ||||||||||||
| Other, net | 86 | 472 | 1,387 | 1,945 | ||||||||||||
| Total Other (Loss)/Income, net | $ | (37,720 | ) | $ | 28,424 | $ | (7,139 | ) | $ | (16,435 | ) | |||||
| General and administrative expenses (including compensation) | $ | — | $ | 13,026 | $ | 11,819 | $ | 24,845 | ||||||||
| Loan servicing, financing, and other related costs | 5,876 | 281 | 1,744 | 7,901 | ||||||||||||
| Amortization of intangible assets | — | 1,300 | — | 1,300 | ||||||||||||
| Net Income/(Loss) | $ | 2,789 | $ | 25,893 | $ | (21,972 | ) | $ | 6,710 | |||||||
| Less Preferred Stock Dividend Requirement | $ | — | $ | — | $ | 8,219 | $ | 8,219 | ||||||||
| Net Income/(Loss) Available to Common Stock and Participating Securities | $ | 2,789 | $ | 25,893 | $ | (30,191 | ) | $ | (1,509 | ) | ||||||
|
|
| (Dollars in Thousands) | Mortgage- Related Assets |
Lima One | Corporate | Total | ||||||||||||
| Three Months Ended September 30, 2022 | ||||||||||||||||
| Interest Income | $ | 90,406 | $ | 31,883 | $ | 1,583 | $ | 123,872 | ||||||||
| Interest Expense | 47,780 | 19,856 | 3,943 | 71,579 | ||||||||||||
| Net Interest Income/(Expense) | $ | 42,626 | $ | 12,027 | $ | (2,360 | ) | $ | 52,293 | |||||||
| Provision for Credit Losses on Residential Whole Loans | $ | (520 | ) | $ | (68 | ) | $ | — | $ | (588 | ) | |||||
| Net Interest Income/(Expense) after Provision for Credit Losses | $ | 42,106 | $ | 11,959 | $ | (2,360 | ) | $ | 51,705 | |||||||
| Net loss on residential whole loans measured at fair value through earnings | $ | (226,894 | ) | $ | (64,924 | ) | $ | — | $ | (291,818 | ) | |||||
| Impairment and other net gain/(loss) on securities and other portfolio investments | 1,620 | — | (2,031 | ) | (411 | ) | ||||||||||
| Net gain on real estate owned | 3,860 | — | — | 3,860 | ||||||||||||
| Net gain on derivatives used for risk management purposes | 86,944 | 24,872 | — | 111,816 | ||||||||||||
| Net gain on securitized debt measured at fair value through earnings | 79,471 | 19,387 | — | 98,858 | ||||||||||||
| Lima One - origination, servicing and other fee income | — | 12,372 | — | 12,372 | ||||||||||||
| Other, net | 282 | 35 | 815 | 1,132 | ||||||||||||
| Total Other Loss, net | $ | (54,717 | ) | $ | (8,258 | ) | $ | (1,216 | ) | $ | (64,191 | ) | ||||
| General and administrative expenses (including compensation) | $ | — | $ | 14,926 | $ | 14,949 | $ | 29,875 | ||||||||
| Loan servicing, financing, and other related costs | 6,063 | 280 | 5,014 | 11,357 | ||||||||||||
| Amortization of intangible assets | — | 1,300 | — | 1,300 | ||||||||||||
| Net Loss | $ | (18,674 | ) | $ | (12,805 | ) | $ | (23,539 | ) | $ | (55,018 | ) | ||||
| Less Preferred Stock Dividend Requirement | $ | — | $ | — | $ | 8,218 | $ | 8,218 | ||||||||
| Net Loss Available to Common Stock and Participating Securities | $ | (18,674 | ) | $ | (12,805 | ) | $ | (31,757 | ) | $ | (63,236 | ) | ||||
| (Dollars in Thousands) | Mortgage- Related Assets |
Lima One | Corporate | Total | ||||||||||||
| December 31, 2022 | ||||||||||||||||
| Total Assets | $ | 6,065,557 | $ | 2,618,695 | $ | 428,153 | $ | 9,112,405 | ||||||||
| December 31, 2021 | ||||||||||||||||
| Total Assets | $ | 7,567,084 | $ | 1,200,737 | $ | 371,867 | $ | 9,139,688 | ||||||||
Reconciliation of GAAP Net Income to non-GAAP Distributable Earnings
“Distributable earnings” is a non-GAAP financial measure of our operating performance, within the meaning of Regulation G and Item 10(e) of Regulation S-K, as promulgated by the Securities and Exchange Commission. Distributable earnings is determined by adjusting GAAP net income/(loss) by removing certain unrealized gains and losses, primarily on residential mortgage investments, associated debt, and hedges that are, in each case, accounted for at fair value through earnings, certain realized gains and losses, as well as certain non-cash expenses and securitization-related transaction costs. Management believes that the adjustments made to GAAP earnings result in the removal of (i) income or expenses that are not reflective of the longer term performance of our investment portfolio, (ii) certain non-cash expenses, and (iii) expense items required to be recognized solely due to the election of the fair value option on certain related residential mortgage assets and associated liabilities. Distributable earnings is one of the factors that our Board of Directors considers when evaluating distributions to our shareholders. Accordingly, we believe that the adjustments to compute Distributable earnings specified below provide investors and analysts with additional information to evaluate our financial results.
|
|
Distributable earnings should be used in conjunction with results presented in accordance with GAAP. Distributable earnings does not represent and should not be considered as a substitute for net income or cash flows from operating activities, each as determined in accordance with GAAP, and our calculation of this measure may not be comparable to similarly titled measures reported by other companies.
The following table provides a reconciliation of our GAAP net (loss)/income used in the calculation of basic EPS to our non-GAAP Distributable earnings for the quarterly periods below:
| Quarter Ended | ||||||||||||||||||||
| (In Thousands, Except Per Share Amounts) | December 31, 2022 | September 30, 2022 | June 30, 2022 |
March 31, 2022 |
December 31, 2021 | |||||||||||||||
| GAAP Net income/(loss) used in the calculation of basic EPS | $ | (1,647 | ) | $ | (63,410 | ) | $ | (108,760 | ) | $ | (91,266 | ) | $ | 35,734 | ||||||
| Adjustments: | ||||||||||||||||||||
| Unrealized and realized gains and losses on: | ||||||||||||||||||||
| Residential whole loans held at fair value | 68,828 | 291,818 | 218,181 | 287,935 | 42,564 | |||||||||||||||
| Securities held at fair value | 383 | (1,549 | ) | 1,459 | 2,934 | 364 | ||||||||||||||
| Interest rate swaps | 12,725 | (108,917 | ) | (31,767 | ) | (80,753 | ) | (71 | ) | |||||||||||
| Securitized debt held at fair value | (44,988 | ) | (100,767 | ) | (84,348 | ) | (62,855 | ) | (6,137 | ) | ||||||||||
| Investments in loan origination partners | 8,526 | 2,031 | 39,162 | 780 | (23,956 | ) | ||||||||||||||
| Expense items: | ||||||||||||||||||||
| Amortization of intangible assets | 1,300 | 1,300 | 3,300 | 3,300 | 3,300 | |||||||||||||||
| Equity based compensation | 2,480 | 2,673 | 3,540 | 2,645 | 2,306 | |||||||||||||||
| Securitization-related transaction costs | 1,744 | 5,014 | 6,399 | 3,233 | 5,178 | |||||||||||||||
| Total adjustments | 50,998 | 91,603 | 155,926 | 157,219 | 23,548 | |||||||||||||||
| Distributable earnings | $ | 49,351 | $ | 28,193 | $ | 47,166 | $ | 65,953 | $ | 59,282 | ||||||||||
| GAAP earnings/(loss) per basic common share | $ | (0.02 | ) | $ | (0.62 | ) | $ | (1.06 | ) | $ | (0.86 | ) | $ | 0.33 | ||||||
| Distributable earnings per basic common share | $ | 0.48 | $ | 0.28 | $ | 0.46 | $ | 0.62 | $ | 0.54 | ||||||||||
| Weighted average common shares for basic earnings per share | 101,800 | 101,795 | 102,515 | 106,568 | 109,468 | |||||||||||||||
|
|
The following table presents our non-GAAP Distributable earnings by segment for the quarterly periods below:
| (Dollars in Thousands) | Mortgage- Related Assets |
Lima One | Corporate | Total | ||||||||||||
| Three months ended December 31, 2022 | ||||||||||||||||
| GAAP Net income/(loss) used in the calculation of basic EPS | $ | 2,789 | $ | 25,893 | $ | (30,329 | ) | $ | (1,647 | ) | ||||||
| Adjustments: | ||||||||||||||||
| Unrealized and realized gains and losses on: | ||||||||||||||||
| Residential whole loans held at fair value | 72,805 | (3,977 | ) | — | 68,828 | |||||||||||
| Securities held at fair value | 383 | — | — | 383 | ||||||||||||
| Interest rate swaps | 10,202 | 2,523 | — | 12,725 | ||||||||||||
| Securitized debt held at fair value | (30,453 | ) | (14,535 | ) | — | (44,988 | ) | |||||||||
| Investments in loan origination partners | — | — | 8,526 | 8,526 | ||||||||||||
| Expense items: | ||||||||||||||||
| Amortization of intangible assets | — | 1,300 | — | 1,300 | ||||||||||||
| Equity based compensation | — | 53 | 2,427 | 2,480 | ||||||||||||
| Securitization-related transaction costs | — | — | 1,744 | 1,744 | ||||||||||||
| Total adjustments | $ | 52,937 | $ | (14,636 | ) | $ | 12,697 | $ | 50,998 | |||||||
| Distributable earnings | $ | 55,726 | $ | 11,257 | $ | (17,632 | ) | $ | 49,351 | |||||||
| (Dollars in Thousands) | Mortgage- Related Assets |
Lima One | Corporate | Total | ||||||||||||
| Three months ended September 30, 2022 | ||||||||||||||||
| GAAP Net loss used in the calculation of basic EPS | $ | (18,674 | ) | $ | (12,805 | ) | $ | (31,931 | ) | $ | (63,410 | ) | ||||
| Adjustments: | ||||||||||||||||
| Unrealized and realized gains and losses on: | ||||||||||||||||
| Residential whole loans held at fair value | 226,894 | 64,924 | — | 291,818 | ||||||||||||
| Securities held at fair value | (1,549 | ) | — | — | (1,549 | ) | ||||||||||
| Interest rate swaps | (84,759 | ) | (24,158 | ) | — | (108,917 | ) | |||||||||
| Securitized debt held at fair value | (80,907 | ) | (19,860 | ) | — | (100,767 | ) | |||||||||
| Investments in loan origination partners | — | — | 2,031 | 2,031 | ||||||||||||
| Expense items: | ||||||||||||||||
| Amortization of intangible assets | — | 1,300 | — | 1,300 | ||||||||||||
| Equity based compensation | — | 61 | 2,612 | 2,673 | ||||||||||||
| Securitization-related transaction costs | — | — | 5,014 | 5,014 | ||||||||||||
| Total adjustments | $ | 59,679 | $ | 22,267 | $ | 9,657 | $ | 91,603 | ||||||||
| Distributable earnings | $ | 41,005 | $ | 9,462 | $ | (22,274 | ) | $ | 28,193 | |||||||
|
|
Reconciliation of GAAP Book Value per Common Share to non-GAAP Economic Book Value per Common Share
“Economic book value” is a non-GAAP financial measure of our financial position. To calculate our Economic book value, our portfolios of Residential whole loans and securitized debt held at carrying value are adjusted to their fair value, rather than the carrying value that is required to be reported under the GAAP accounting model applied to these financial instruments. These adjustments are also reflected in the table below in our end of period stockholders’ equity. Management considers that Economic book value provides investors with a useful supplemental measure to evaluate our financial position as it reflects the impact of fair value changes for all of our investment activities, irrespective of the accounting model applied for GAAP reporting purposes. Economic book value does not represent and should not be considered as a substitute for Stockholders’ Equity, as determined in accordance with GAAP, and our calculation of this measure may not be comparable to similarly titled measures reported by other companies.
The following table provides a reconciliation of our GAAP book value per common share to our non-GAAP Economic book value per common share as of the quarterly periods below:
| Quarter Ended: | ||||||||||||||||||||
| (In Millions, Except Per Share Amounts) | December 31, 2022 | September 30, 2022 | June 30, 2022 | March 31, 2022 | December 31, 2021 | |||||||||||||||
| GAAP Total Stockholders’ Equity | $ | 1,988.8 | $ | 2,033.9 | $ | 2,146.4 | $ | 2,349.0 | $ | 2,542.8 | ||||||||||
| Preferred Stock, liquidation preference | (475.0 | ) | (475.0 | ) | (475.0 | ) | (475.0 | ) | (475.0 | ) | ||||||||||
| GAAP Stockholders’ Equity for book value per common share | 1,513.8 | 1,558.9 | 1,671.4 | 1,874.0 | 2,067.8 | |||||||||||||||
| Adjustments: | ||||||||||||||||||||
| Fair value adjustment to Residential whole loans, at carrying value | (70.2 | ) | (58.2 | ) | 9.5 | 54.0 | 153.5 | |||||||||||||
| Fair value adjustment to Securitized debt, at carrying value | 139.7 | 109.6 | 75.4 | 47.7 | 4.3 | |||||||||||||||
| Stockholders’ Equity including fair value adjustments to Residential whole loans and Securitized debt held at carrying value (Economic book value) | $ | 1,583.3 | $ | 1,610.3 | $ | 1,756.3 | $ | 1,975.7 | $ | 2,225.6 | ||||||||||
| GAAP book value per common share | $ | 14.87 | $ | 15.31 | $ | 16.42 | $ | 17.84 | $ | 19.12 | ||||||||||
| Economic book value per common share | $ | 15.55 | $ | 15.82 | $ | 17.25 | $ | 18.81 | $ | 20.58 | ||||||||||
| Number of shares of common stock outstanding | 101.8 | 101.8 | 101.8 | 105.0 | 108.1 | |||||||||||||||
|
|
Exhibit 99.2

Company Update THIRD QUARTER 2022 DRAFT 10/27 Company Update FOURTH QUARTER 2022
2 Q2 202 2 Financial Snapshot Forward looking statements When used in this presentation or other written or oral communications, statements that are not historical in nature, including those containing words such as “will,” “believe,” “expect,” “anticipate,” “estimate,” “plan,” “continue,” “intend,” “should,” “could,” “would,” “may,” the negative of these words or similar expressions, are intended to identify “forward - looking statements” within the meaning of Section 27 A of the Securities Act of 1933 , as amended, and Section 21 E of the Securities Exchange Act of 1934 , as amended, and, as such, may involve known and unknown risks, uncertainties and assumptions . These forward - looking statements include information about possible or assumed future results with respect to MFA’s business, financial condition, liquidity, results of operations, plans and objectives . Among the important factors that could cause our actual results to differ materially from those projected in any forward - looking statements that we make are : general economic developments and trends and the performance of the housing, real estate, mortgage finance, broader financial markets ; inflation, increases in interest rates and changes in the market (i . e . , fair) value of MFA’s residential whole loans, MBS, securitized debt and other assets, as well as changes in the value of MFA’s liabilities accounted for at fair value through earnings ; the effectiveness of hedging transactions ; changes in the prepayment rates on residential mortgage assets, an increase of which could result in a reduction of the yield on certain investments in its portfolio and could require MFA to reinvest the proceeds received by it as a result of such prepayments in investments with lower coupons, while a decrease in which could result in an increase in the interest rate duration of certain investments in MFA’s portfolio making their valuation more sensitive to changes in interest rates and could result in lower forecasted cash flows ; credit risks underlying MFA’s assets, including changes in the default rates and management’s assumptions regarding default rates on the mortgage loans in MFA’s residential whole loan portfolio ; MFA’s ability to borrow to finance its assets and the terms, including the cost, maturity and other terms, of any such borrowings ; implementation of or changes in government regulations or programs affecting MFA’s business ; MFA’s estimates regarding taxable income, the actual amount of which is dependent on a number of factors, including, but not limited to, changes in the amount of interest income and financing costs, the method elected by MFA to accrete the market discount on residential whole loans and the extent of prepayments, realized losses and changes in the composition of MFA’s residential whole loan portfolios that may occur during the applicable tax period, including gain or loss on any MBS disposals or whole loan modifications, foreclosures and liquidations ; the timing and amount of distributions to stockholders, which are declared and paid at the discretion of MFA’s Board of Directors and will depend on, among other things, MFA’s taxable income, its financial results and overall financial condition and liquidity, maintenance of its REIT qualification and such other factors as MFA’s Board of Directors deems relevant ; MFA’s ability to maintain its qualification as a REIT for federal income tax purposes ; MFA’s ability to maintain its exemption from registration under the Investment Company Act of 1940 , as amended (or the “Investment Company Act”), including statements regarding the concept release issued by the Securities and Exchange Commission (“SEC”) relating to interpretive issues under the Investment Company Act with respect to the status under the Investment Company Act of certain companies that are engaged in the business of acquiring mortgages and mortgage - related interests ; MFA’s ability to continue growing its residential whole loan portfolio, which is dependent on, among other things, the supply of loans offered for sale in the market ; targeted or expected returns on our investments in recently - originated mortgage loans, the performance of which is, similar to our other mortgage loan investments, subject to, among other things, differences in prepayment risk, credit risk and financing costs associated with such investments ; risks associated with the ongoing operation of Lima One Holdings, LLC (including, without limitation, unanticipated expenditures relating to or liabilities arising from its operation (including, among other things, a failure to realize management’s assumptions regarding expected growth in business purpose loan (BPL) origination volumes and credit risks underlying BPLs, including changes in the default rates and management’s assumptions regarding default rates on the BPLs originated by Lima One) ; expected returns on MFA’s investments in nonperforming residential whole loans (“NPLs ”), which are affected by, among other things, the length of time required to foreclose upon, sell, liquidate or otherwise reach a resolution of the property underlying the NPL, home price values, amounts advanced to carry the asset (e . g . , taxes, insurance, maintenance expenses, etc . on the underlying property) and the amount ultimately realized upon resolution of the asset ; risks associated with our investments in MSR - related assets, including servicing, regulatory and economic risks ; risks associated with our investments in loan originators ; risks associated with investing in real estate assets generally, including changes in business conditions and the general economy ; and other risks, uncertainties and factors, including those described in the annual, quarterly and current reports that we file with the SEC . These forward - looking statements are based on beliefs, assumptions and expectations of MFA’s future performance, taking into account information currently available . Readers and listeners are cautioned not to place undue reliance on these forward - looking statements, which speak only as of the date on which they are made . New risks and uncertainties arise over time and it is not possible to predict those events or how they may affect MFA . Except as required by law, MFA is not obligated to, and does not intend to, update or revise any forward - looking statements, whether as a result of new information, future events or otherwise .
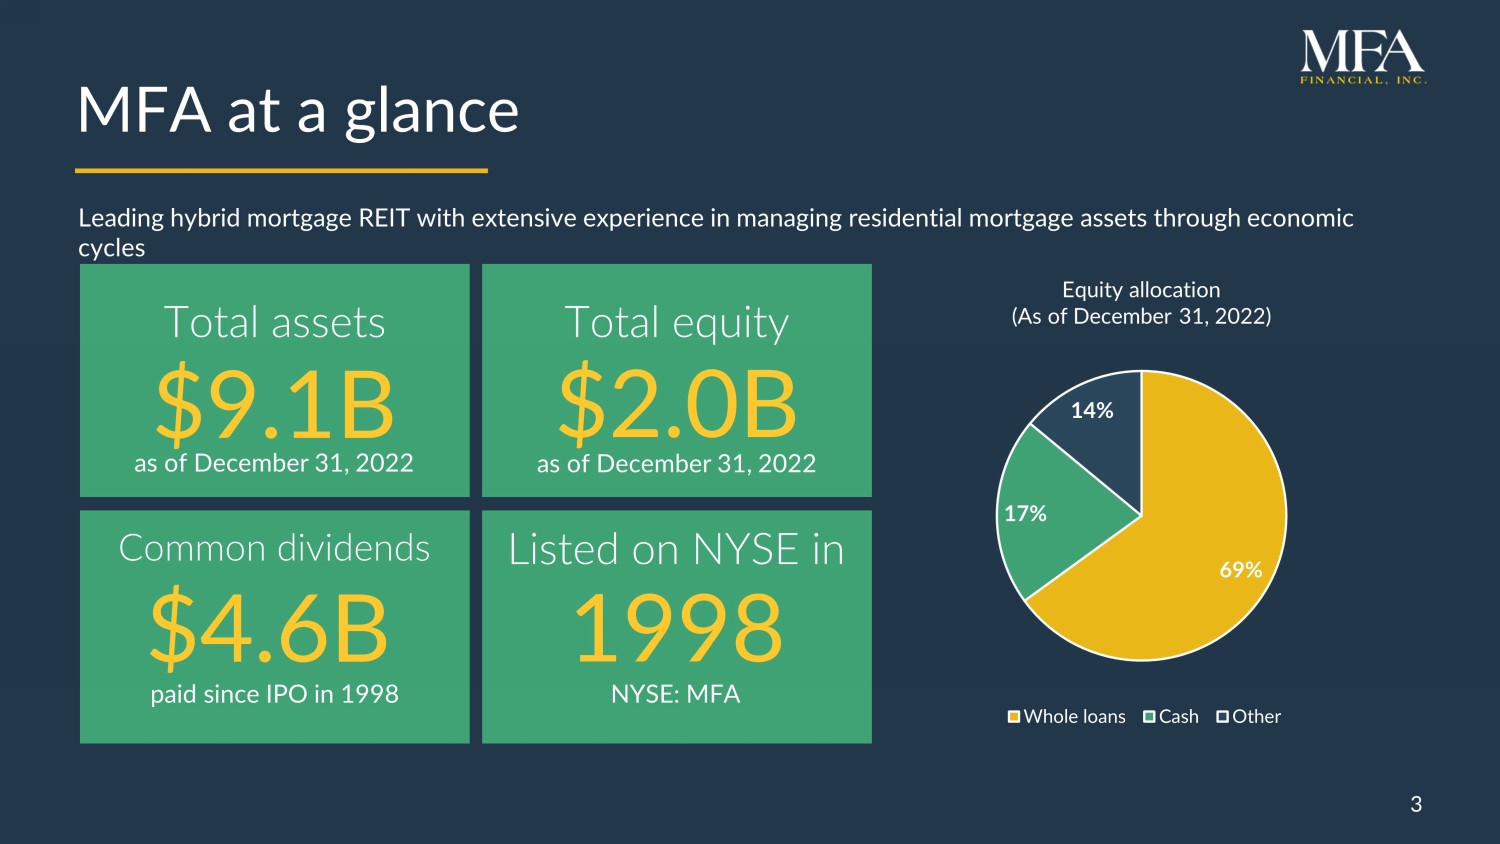
3 MFA at a glance 3 $2.0B Total equity $4.6B Common dividends Leading hybrid mortgage REIT with extensive experience in managing residential mortgage assets through economic cycles $9.1B Total assets p aid since IPO in 1998 1998 Listed on NYSE in a s of December 31, 2022 a s of December 31, 2022 69% 17% 14% Equity allocation (As of December 31, 2022) Whole loans Cash Other NYSE: MFA 4 Q 4 202 2 f inancial snapshot 1.
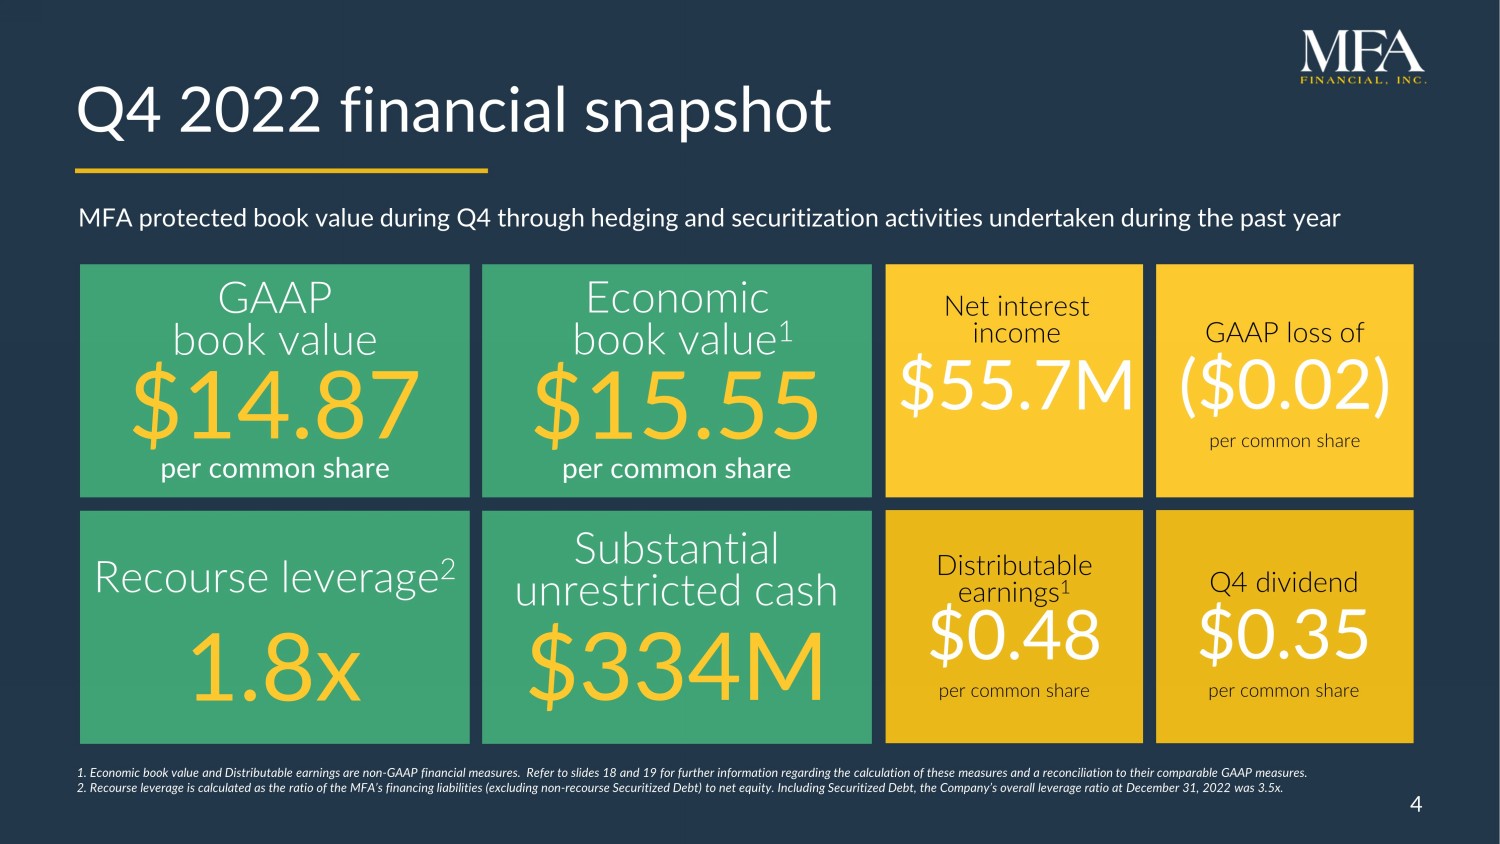
Economic book value and Distributable e arnings are n on - GAAP financial measures. Refer to slides 18 and 19 for further information regarding the calculation of these measures and a reconciliation to their comparable GAAP measures . 2. Recourse leverage is calculated as the ratio of the MFA’s financing liabilities (excluding non - recourse Securitized Debt) to net equity. Including Securitized Debt , the Company’s overall leverage r atio at December 31, 2022 was 3.5x. MFA protected book value during Q4 through hedging and securitization activities undertaken during the past year $14.87 $15.55 Net interest income $ 55.7M GAAP loss of ($0.02) per common share Distributable earnings 1 $0.48 per common share Q4 dividend $ 0.35 per common share GAAP book value Economic book value 1 per common share per common share $334M Substantial unrestricted cash 1.8x Recourse leverage 2 4 5 Active portfolio management limits changes to cost of funds and book value • Strategic focus on hedging and liability management during 2022 limited the impact of volatile markets in Q4 2022.
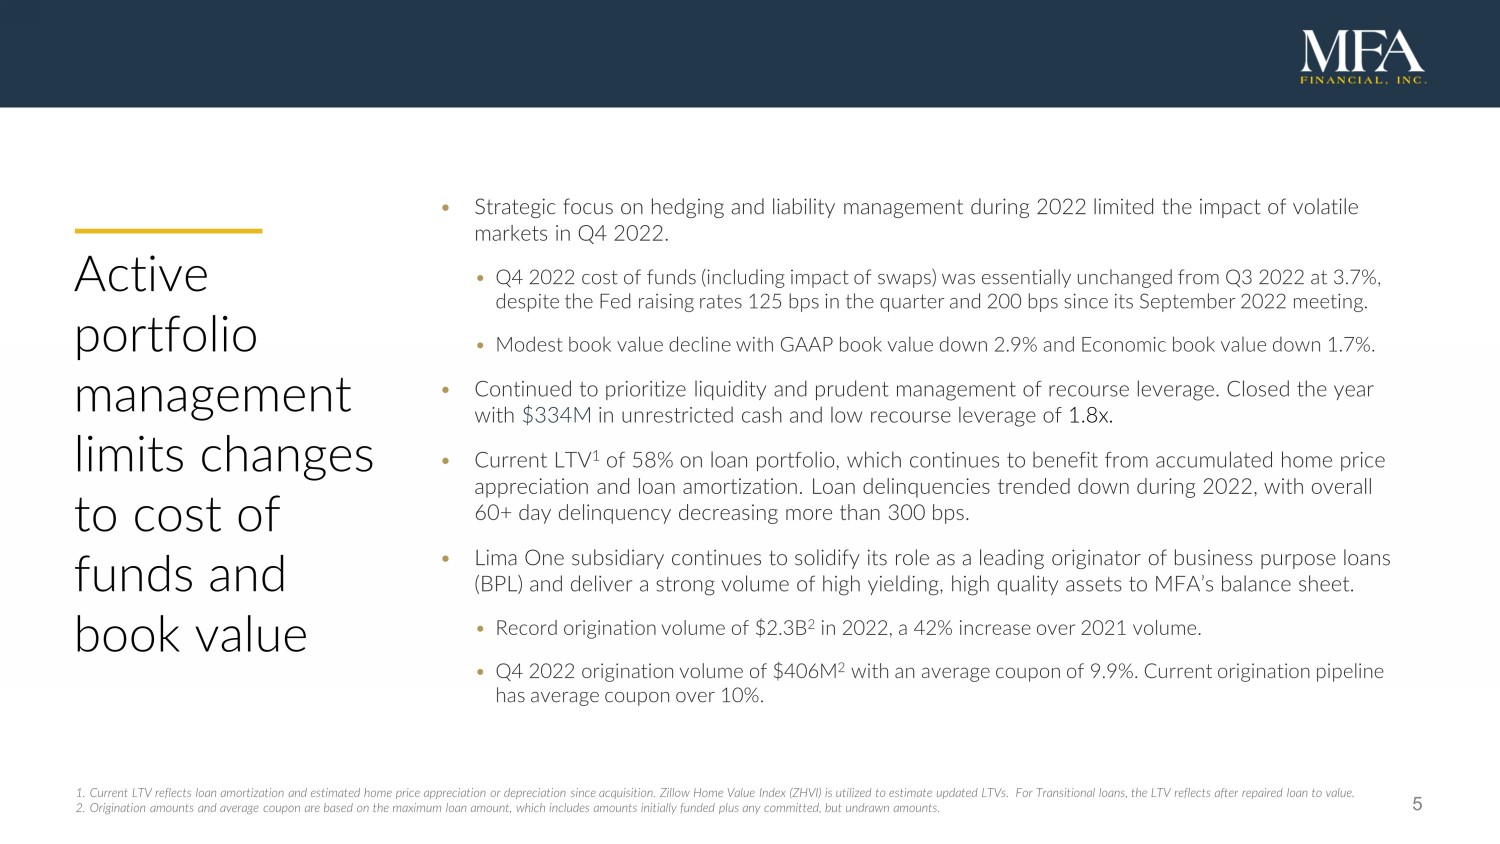
• Q4 2022 cost of funds (including impact of swaps) was essentially unchanged from Q3 2022 at 3.7%, despite the Fed raising rates 125 bps in the quarter and 200 bps since its September 2022 meeting. • Modest book value decline with GAAP book value down 2.9% and Economic book value down 1.7%. • C ontinued to prioritize liquidity and prudent management of recourse leverage. C losed the year with $ 334M in unrestricted cash and low recourse leverage of 1.8x. • Current LTV 1 of 58% on loan portfolio, which continues to benefit from accumulated home price appreciation and loan amortization. Loan delinquencies trended down during 2022, with overall 60+ day delinquency decreasing more than 300 bps. • Lima One subsidiary continues to solidify its role as a leading originator of business purpose loans (BPL) and deliver a strong volume of high yielding, high quality assets to MFA’s balance sheet. • Record origination volume of $2.3B 2 in 2022, a 42% increase over 2021 volume. • Q4 2022 origination volume of $ 406M 2 with an average coupon of 9.9%. Current origination pipeline has average coupon over 10%. 1. Current LTV reflects loan amortization and estimated home price appreciation or depreciation since acquisition. Zillow Home V alu e Index (ZHVI) is utilized to estimate updated LTVs. For Transitional loans, the LTV reflects after repaired loan to value. 2. Origination amounts and average coupon are based on the maximum loan amount, which includes amounts initially funded plus any committed, but undrawn amounts .

6 Balance sheet strength : Steps taken to fortify balance sheet during 2022 Balance sheet metric ($ in millions) Q4 2021 Q1 2022 Q2 2022 Q3 2022 Q4 2022 12 month change % non - MTM financing 58% 57% 63% 71% 67% +9% % of effective fixed - rate financing 58% 78% 95% 99% 99% +41% Securitized debt par outstanding $2,645 $2,920 $3,532 $4,116 $3,586 1 +$941 Swap notional $900 $2,400 $3,160 $3,160 $3,160 +$2,260 Cash $305 $411 $386 $434 $334 +$29 • Increased non - mark - to - market (non - MTM) financing to 67% of total asset - based financing at December 31, 2022. • Increased effective fixed - rate financing from 58% in Q4 2021 to 99 % in Q4 2022. • Issued $2.3B of non - recourse securitized debt across nine securitizations. • Added $2.3B of interest rate swaps, bringing total swap hedges to $3.2B at year end. • F ixed pay rate of 1.69% and variable receive rate of 4.30% at December 31, 2022. Increases in SOFR 2 (which tracks Fed Funds) will increase the variable receive rate. • Net positive swap carry for Q4 2022 of $16M, a sequential quarter increase of $13M. • S ubstantial unrestricted cash of $334M at December 31, 2022. 1. Par amount of securitized debt declined in Q4 2022 by approximately $570M due to the deconsolidation of Agency Eligible Investor Loan securitization trusts. 2. Secured Overnight Financing Rate (or SOFR) is a benchmark interest rate that reflects a broad measure of the cost of borrowin g c ash secured by Treasury securities.
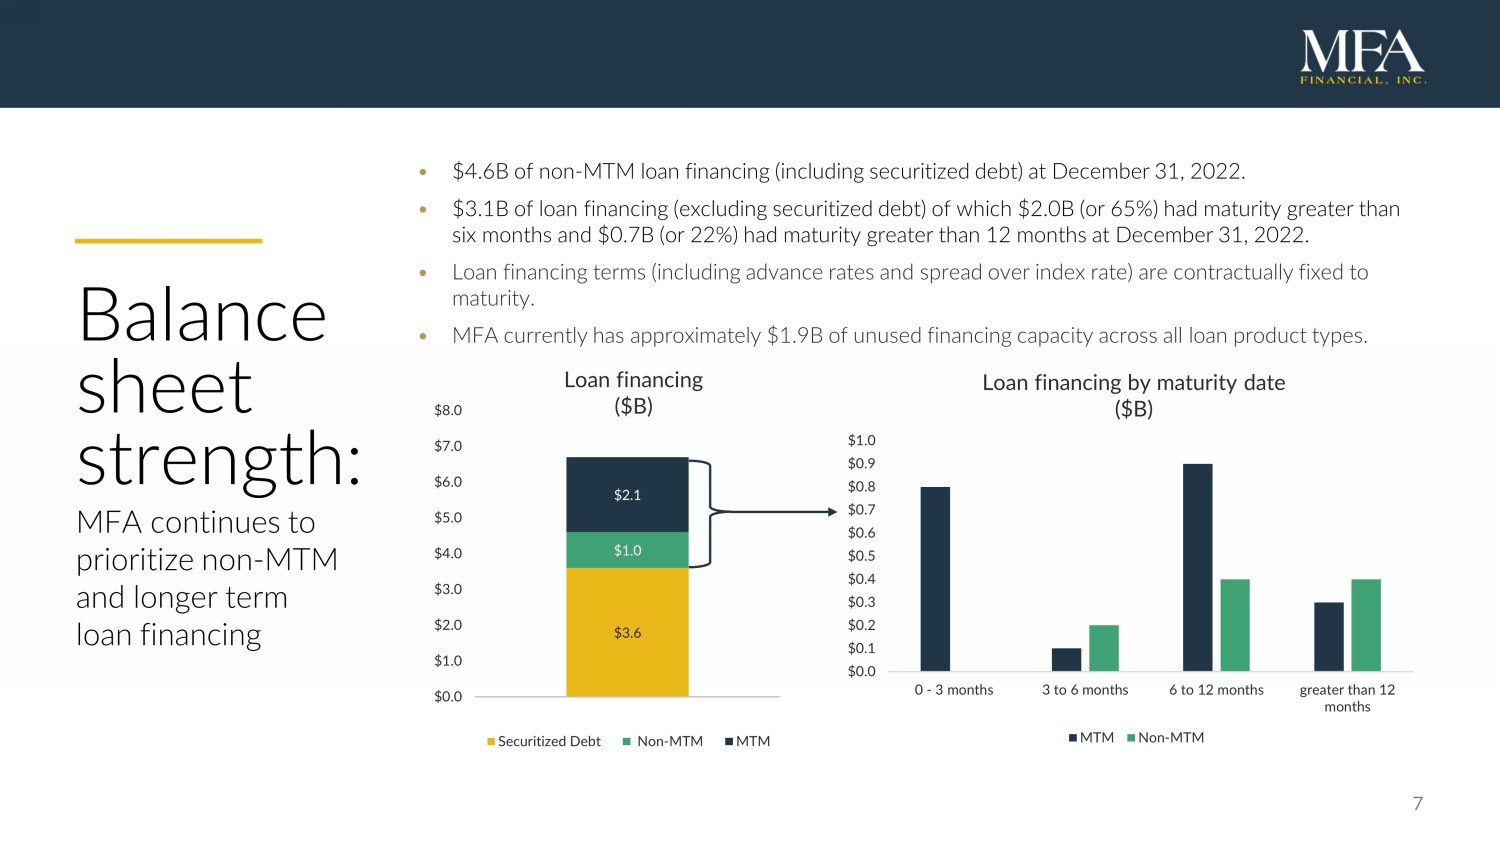
$3.6 $1.0 $2.1 $0.0 $1.0 $2.0 $3.0 $4.0 $5.0 $6.0 $7.0 $8.0 1 Loan financing ($ B) Securitized Debt Non-MTM MTM 7 Balance sheet strength : MFA continues to prioritize non - MTM and longer term loan financing • $4.6B of non - MTM loan financing (including securitized debt) at December 31, 2022. • $3.1B of loan financing (excluding securitized debt) of which $2.0B (or 65%) had maturity greater than six months and $0.7B (or 22%) had maturity greater than 12 months at December 31, 2022 . • Loan financing terms (including advance rates and spread over index rate) are contractually fixed to maturity . • MFA currently has approximately $1.9B of unused financing capacity across all loan product types. $0.0 $0.1 $0.2 $0.3 $0.4 $0.5 $0.6 $0.7 $0.8 $0.9 $1.0 0 - 3 months 3 to 6 months 6 to 12 months greater than 12 months Loan financing by maturity date ($B) MTM Non-MTM 8 0% 10% 20% 30% 40% Legacy RPL/NPL Legacy RPL/NPL 60+ day delinquency Q4 2021 Q4 2022 • Strong credit fundamentals.

• MFA’s loan portfolio has benefited from strong home price appreciation (HPA) and loan amortization, with Current LTV 1 of 58%. • Delinquencies trended down across the portfolio during 2022, with Purchased Performing 2 down to 3.1% from 4.2% and Legacy RPL/NPL 3 to 31.6% from 36.7%. Legacy RPL/NPL have Current LTV of 58%. • Potential for upside in economic book value. • L oan portfolio fair value at 12/31/22 is $732.4M below par, or $7.19 per common share. Securitized debt fair value at 12/31/22 is $368.5M below par, or $3.62 per common share. • P otential net upside in our economic book value of $ 363.9M, or $3.57 per common share, assuming all loans and securitized debt were to be repaid at par value. • Strong credit performance supports potential book value upside. 1. Current LTV reflects loan amortization and estimated home price appreciation or depreciation since acquisition. Zillow Home V alu e Index (ZHVI) is utilized to estimate updated LTVs. For Transitional loans, the LTV reflects after repaired loan to value. 2. Purchased Performing includes Non - QM, Transitional, Single - Family Rental, Seasoned Performing and Agency Eligible Investor loans . 3. Legacy RPL/NPL includes Purchased Credit Deteriorated and Purchased Non - Performing loans. 0% 1% 2% 3% 4% 5% Purchased Performing Purchased Performing 60+ day delinquency Q4 2021 Q4 2022 Strong credit fundamentals support potential book value upside 0% 20% 40% 60% 80% NonQM BPL Other Total Loans Current LTV Q4 2021 Q4 2022 9 Q 4 2022 p ortfolio highlights $8.0B Investment Portfolio as of December 31, 2022 1 Non - QM loans $3.4B Business Purpose Loans $2.8B 3 Legacy RPL & NPL loans $1.2B Other $0.6B 2 • Acquired $481M of higher yielding BPL and Non - QM loans.
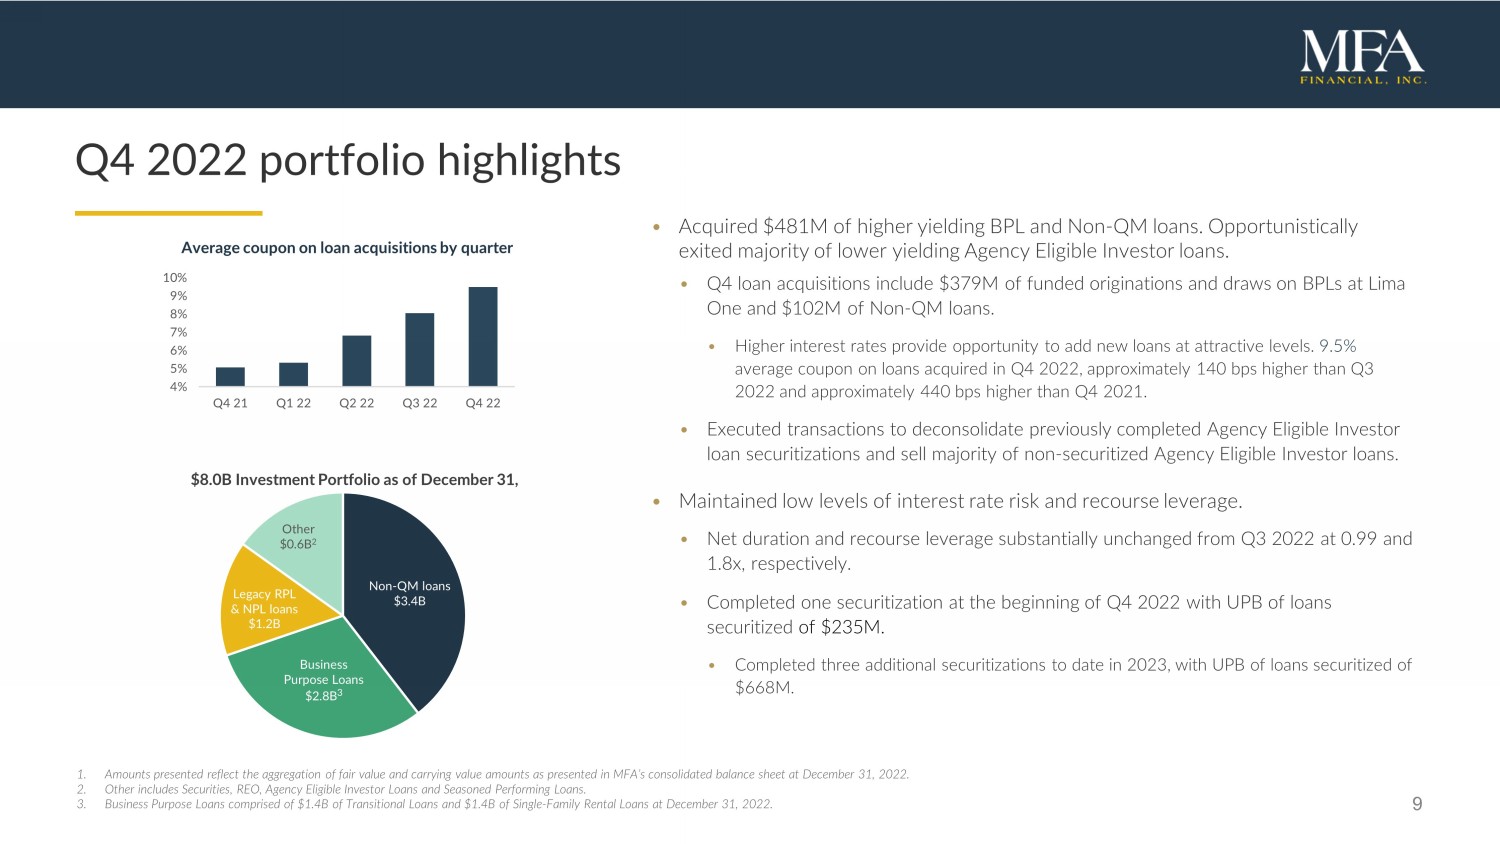
Opportunistically exited majority of lower yielding Agency Eligible Investor loans. • Q4 loan acquisitions include $379M of funded originations and draws on BPLs at Lima One and $102M of Non - QM loans. • Higher interest rates provide opportunity to add new loans at attractive levels . 9.5% average coupon on loans acquired in Q4 2022, approximately 140 bps higher than Q3 2022 and approximately 440 bps higher than Q4 2021. • Executed transactions to deconsolidate previously completed Agency Eligible Investor loan securitizations and sell majority of non - securitized Agency Eligible Investor loans. • Maintained low levels of interest rate risk and recourse leverage. • Net duration and recourse leverage substantially unchanged from Q3 2022 at 0.99 and 1.8x, respectively. • Completed one securitization at the beginning of Q4 2022 with UPB of loans securitized of $ 235M . • C ompleted three additional securitization s to date in 2023 , with UPB of loans securitized of $ 668M . 4% 5% 6% 7% 8% 9% 10% Q4 21 Q1 22 Q2 22 Q3 22 Q4 22 Average coupon on loan acquisitions by quarter 1. Amounts presented reflect the aggregation of fair value and carrying value amounts as presented in MFA’s consolidated balance sh eet at December 31, 2022. 2. Other includes Securities, REO, Agency Eligible Investor Loans and Seasoned Performing Loans. 3. Business Purpose Loans comprised of $1.4B of Transitional Loans and $1.4B of Single - Family R ental L oans at December 31, 2022.
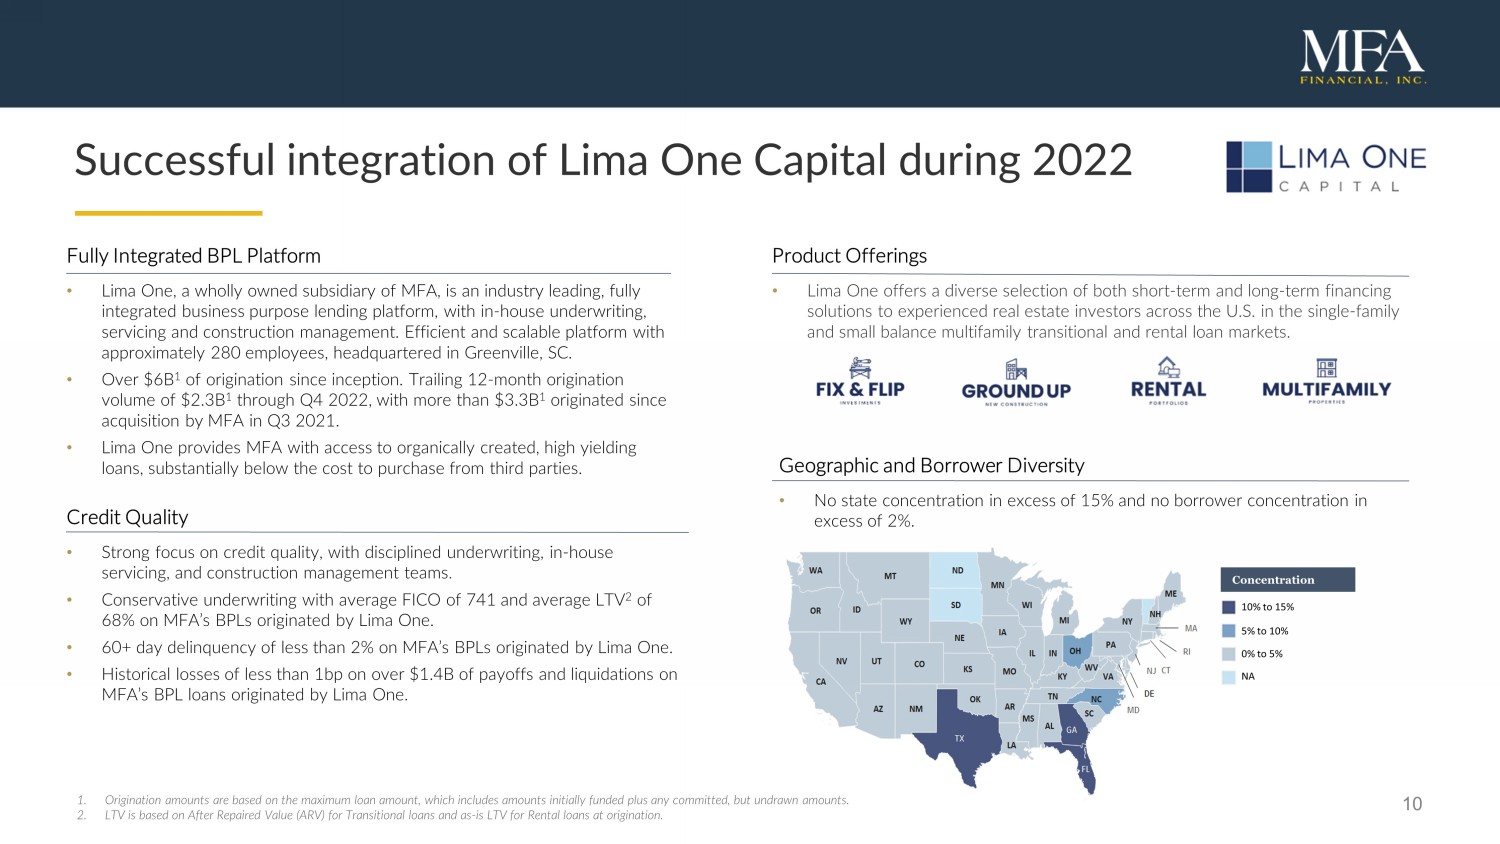
10 Successful integration of Lima One Capital during 2022 Product Offerings • Lima One offers a diverse selection of both short - term and long - term financing solutions to experienced real estate investors across the U.S. in the single - family and small balance multifamily transitional and rental loan markets. Fully Integrated BPL Platform • Lima One, a wholly owned subsidiary of MFA, is an industry leading, fully integrated business purpose lending platform, with in - house underwriting, servicing and construction management. Efficient and scalable platform with approximately 280 employees, headquartered in Greenville, SC. • Over $ 6B 1 of origination since inception. Trailing 12 - month origination volume of $ 2.3B 1 through Q4 2022, with more than $ 3.3B 1 originated since acquisition by MFA in Q3 2021. • Lima One provides MFA with access to organically created, high yielding loans, substantially below the cost to purchase from third parties. Credit Quality • Strong focus on credit quality, with disciplined underwriting, in - house servicing, and construction management teams . • Conservative underwriting with average FICO of 741 and average LTV 2 of 68% on MFA’s BPLs originated by Lima One. • 60+ day delinquency of less than 2% on MFA’s BPLs originated by Lima One. • Historical losses of less than 1bp on over $1.4B of payoffs and liquidations on MFA’s BPL loans originated by Lima One. Geographic and Borrower Diversity • No state concentration in excess of 15% and no borrower concentration in excess of 2 %. Concentration 10% to 15% 5% to 10% 0% to 5% NA 1. Origination amounts are based on the maximum loan amount, which includes amounts initially funded plus any committed, but und raw n amounts. 2. LTV is based on After Repaired Value (ARV) for Transitional loans and as - is LTV for Rental loans at origination.
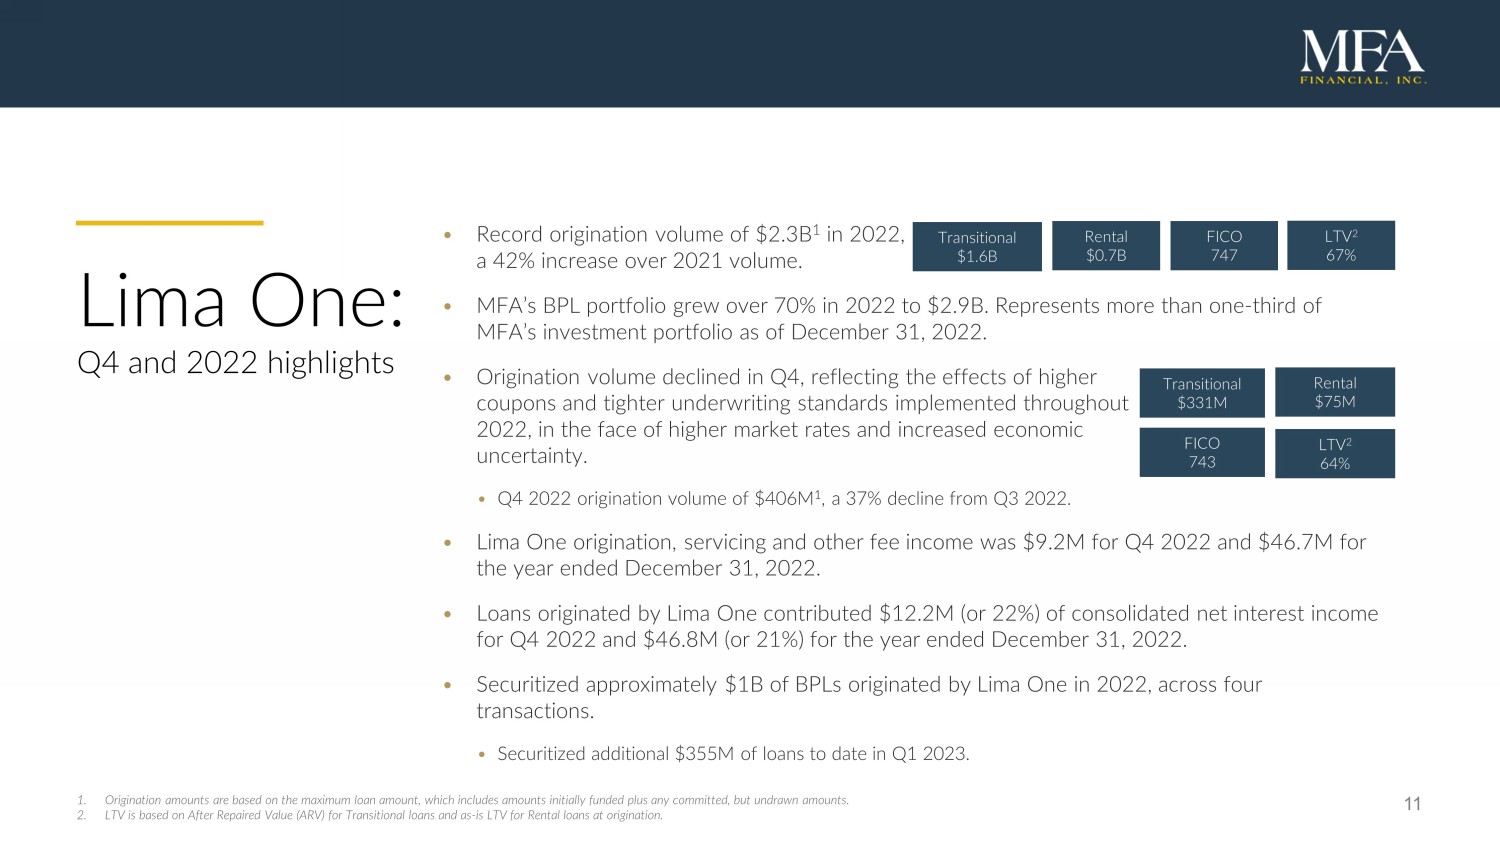
11 Lima One: Q4 and 2022 highlights • Record origination volume of $2.3B 1 in 2022, a 42% increase over 2021 volume. • MFA’s BPL portfolio grew over 70% in 2022 to $2.9B. Represents more than one - third of MFA’s investment portfolio as of December 31, 2022. • Origination volume declined in Q4, reflecting the effects of higher coupons and tighter underwriting standards implemented throughout 2022, in the face of higher market rates and increased economic uncertainty. • Q4 2022 origination volume of $406M 1 , a 37% decline from Q3 2022. • Lima One origination, servicing and other fee income was $9.2M for Q4 2022 and $46.7M for the year ended December 31, 2022. • Loans originated by Lima One contributed $12.2M (or 22%) of consolidated net interest income for Q4 2022 and $ 46.8M (or 21%) for the year ended December 31, 2022. • Securitized approximately $1B of BPLs originated by Lima One in 2022, across four transactions. • Securitized additional $355M of loans to date in Q1 2023. Transitional $1.6B Rental $0.7B FICO 747 LTV 2 67% Transitional $331M Rental $75M FICO 743 LTV 2 64% 1. Origination amounts are based on the maximum loan amount, which includes amounts initially funded plus any committed, but und raw n amounts. 2. LTV is based on After Repaired Value (ARV) for Transitional loans and as - is LTV for Rental loans at origination.
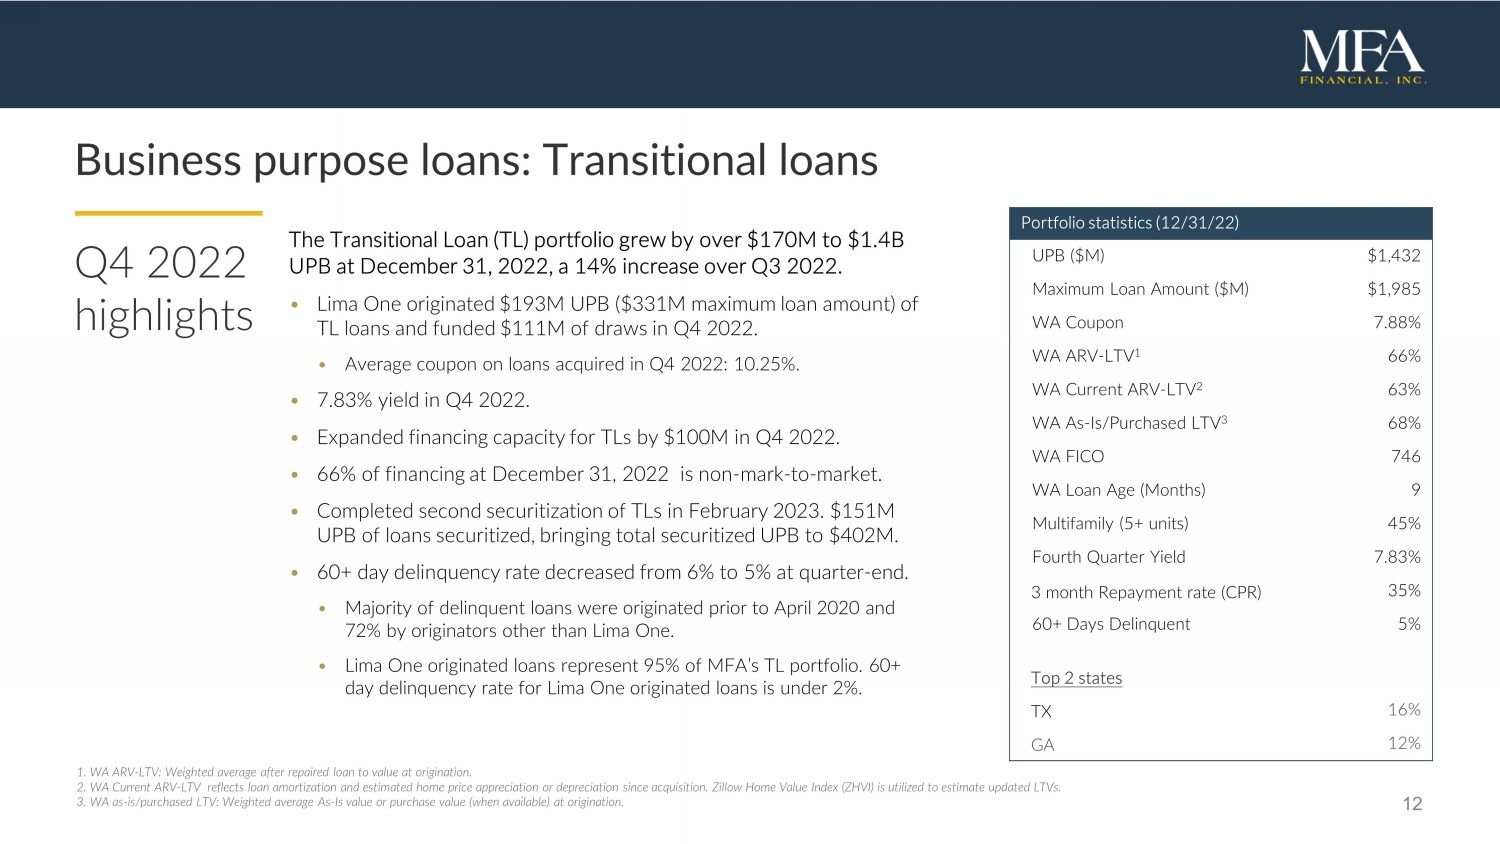
12 Business purpose loans: Transitional loans Q4 2022 highlights 1. WA ARV - LTV: Weighted average after repaired loan to value at origination. 2. WA Current ARV - LTV reflects loan amortization and estimated home price appreciation or depreciation since acquisition. Zillo w Home V alue I ndex (ZHVI) is utilized to estimate updated LTVs. 3. WA as - is/purchased LTV: Weighted average As - Is value or purchase value (when available) at origination. The Transitional Loan (TL ) portfolio grew by over $170M to $1.4B UPB at December 31, 2022, a 14% increase over Q3 2022. • Lima One originated $ 193M UPB ($ 331M maximum loan amount) of TL loans and funded $ 111M of draws in Q4 2022. • Average coupon on loans acquired in Q4 2022: 10.25 %. • 7.83% yield in Q4 2022. • Expanded financing capacity for TLs by $ 100M in Q4 2022. • 66% of financing at December 31, 2022 is non - mark - to - market. • Completed second securitization of TLs in February 2023. $151M UPB of loans securitized, bringing total securitized UPB to $402M. • 60+ day delinquency rate decreased from 6% to 5% at quarter - end. • Majority of delinquent loans were originated prior to April 2020 and 72% by originators other than Lima One. • Lima One originated loans represent 95% of MFA’s TL portfolio. 60+ day delinquency rate for Lima One originated loans is under 2%. Portfolio s tatistics ( 12/31 /22 ) UPB ($M) $1,432 Maximum Loan Amount ($M) $ 1,985 WA Coupon 7.88% WA ARV - LTV 1 66% WA Current ARV - LTV 2 63% WA As - Is/Purchased LTV 3 68% WA FICO 746 WA Loan Age (Months ) 9 Multifamily (5+ units) 45% Fourth Quarter Yield 7.83% 3 month Repayment rate (CPR) 35% 60+ Days Delinquent 5 % Top 2 states TX 16% GA 12% 13 Business purpose loans: Single - Family Rental loans Q4 2022 highlights 1.

Current LTV reflects loan amortization and estimated home price appreciation or depreciation since acquisition. Zillow Home Value Index (ZHVI) is utilized to estimate updated LTVs. 2. WA DSCR: Weighted average debt service coverage ratio. Single - Family Rental (SFR) loan portfolio is performing strongly, delivering attractive yields and good credit performance. • Lima One originated $75M in Q4 2022, resulting in portfolio growth of 3%. • Average coupon on loans acquired in Q4: 8.46 %. • Remained active in securitizing our SFR loans. • Fifth securitization completed in October 2022. $ 235M UPB of loans securitized. • Sixth securitization completed in February 2023. $204M UPB of loans securitized. • Securitized $1.4B of loans since Q1 2021. • Over 90% SFR financing at December 31, 2022 is non - mark - to - market. SFR p ortfolio s tatistics ( 12 /3 1 /22 ) UPB ($M) $ 1,486 WA LTV 69% Current LTV 1 61% WA FICO 737 WA DSCR 2 1.50x WA Coupon 5.74% WA Loan Age (Months ) 14 Hybrid ARMs 21% Fourth Quarter Yield 5.46% 3 - Month Prepayment Rate (CPR) 6% 60+ Days Delinquent 2% Top 2 states FL 11% GA 9% 14 Non - QM loans Portfolio s tatistics ( 12 /3 1 /22 ) Total UPB ( $M ) $ 3,6 71 Average b alance $ 50 6 , 200 WA LTV 1 65% Current LTV 2 56% WA FICO 73 3 WA c oupon 5.

27 % Hybrid ARM’s 2 5 % Fixed r ate 7 5 % Purchase 51% Cash - o ut r efinance 3 7 % 3 - m onth CPR 7 % Top 2 s tates CA 5 7 % FL 14% Q1 21 Q2 21 Q3 21 Q4 21 Q1 22 Q2 22 Q3 22 Q4 22 Loan c ount 5,442 5,390 5,846 6,706 7,240 7,137 7,199 7,253 Total UP B ( $M ) 2,290 2,363 2,738 3,361 3,671 3,637 3,669 3,671 % c urrent 88.0% 89.9% 92.3% 94.2% 93.5% 95.3% 96.3% 95.9% % 30 d ays 4.1% 2.6% 2.4% 2.3% 3.3% 2.1% 1.4% 1.5% % 60+ d ays 7.9% 7.5% 5.3% 3.5% 3.3% 2.6% 2.3% 2.6% WA LTV 63% 64% 64% 66% 65% 65% 65% 65% • Purchased $ 102M of Non - QM loans in Q4 2022, down from $179M in Q3 2022. • Loans purchased in the quarter had a weighted average coupon of 8.17%. • Portfolio credit performance remained strong with 60+ day delinquencies at 2.6%. • Continued securitization efforts with an additional securitization that closed in January 2023 . Since the beginning of 2022, we have securitized $ 1.8B UPB of Non - QM loans. Q4 2022 highlights 1. WA LTV is calculated as the current total unpaid principal balance (UPB) divided by the appraisal value at origination of the property underlying the loan. 2. Current LTV reflects loan amortization and estimated home price appreciation or depreciation since acquisition. Zillow Home V alu e Index (ZHVI) is utilized to estimate updated LTVs.

15 Legacy Non - Performing 1 and Re - Performing 2 Loans Non - Performing L oans (NPL) • I mprov ing outcomes for NPL portfolio by returning loans to performing or paid - in - full status . • A ggressively liquidating REO properties as market conditions remain favorable. S old $ 134M of properties in 2022 , realizing a net gain of $ 29M. • Measured by UPB at purchase, 39% of loans that were non - performing at purchase were performing or had paid in full as of December 31, 2022. • 75% of loans modified by MFA are either performing today or have paid in full. Re - Performing Loans (RPL) • Remaining UPB of $ 783M. • 8 3 % of RPL portfolio is less than 60 days delinquent as of December 31, 2022. • On average, 41 % of the 60+ days delinquent loans are making payments . • Portfolio LTV has decreased to 5 2 % due to significant home price appreciation and principal repayments . • Seasoned , stable portfolio with average loan age of 16 years . 1. Non - P erforming at purchase defined as greater than or equal to 60 days delinquent . 2. Includes Purchased Credit Deteriorated (PCD) and certain other loans that were purchased as Re - Performing L oans , but were not classified as PCD loans for accounting purposes. 3 . Performing as of December 31 , 2022, defined as less than 60 days delinquent or made a full P&I payment in September 2022 . Acquisition Year 2014 2015 2016 2017 2018 2019 Total UPB p urchased ($ M ) 161 620 280 716 497 227 2,502 Status 12/31 /2022 Performing 3 /PIF 37% 29% 31% 42% 52% 38% 39% Liquidation/REO 57% 63% 64% 49% 38% 41% 51% Non - p erforming 6% 8% 5 % 9% 10% 21% 10% Remaining UPB ($ M ) 33.8 128.6 46.7 229.4 189.3 119.0 746.8 0% 5% 10% 15% 20% 25% Jun-17 Dec-17 Jun-18 Dec-18 Jun-19 Dec-19 Jun-20 Dec-20 Jun-21 Dec-21 Jun-22 Dec-22 RPL Portfolio CPR (Voluntary Prepayments) 3-Month 1-Month 16 Appendix James Casebere , Landscape with Houses ( Dutchess County, NY) #2, 2010 ( detail)


17 MFA overview • MFA Financial, Inc. is a leading specialty finance company that invests in and finances residential mortgage assets. • Residential mortgage asset portfolio comprised of both transitional and term Business P urpose Loans (BPLs), Non - QM, Re - Performing and Non - Performing Loans and residential mortgage securities. • In the third quarter of 2021, MFA acquired Lima One, a leading nationwide originator and servicer of BPLs with over $6.0B in originations since inception. • MFA originates BPLs directly through Lima One and also acquires whole loans through a combination of flow and mini - bulk arrangements from a select group of originators with which it has strong relationships. • A leading residential credit securitization platform, with over $2.3B of issuance in 2022 and $6.5B since September 2020.

18 Reconciliation of GAAP net income to non - GAAP distributable earnings “Distributable earnings” is a non - GAAP financial measure of our operating performance, within the meaning of Regulation G and Item 10 (e) of Regulation S - K, as promulgated by the Securities and Exchange Commission . Distributable earnings is determined by adjusting GAAP net income/(loss) by removing certain unrealized gains and losses, primarily on residential mortgage investments, associated debt, and hedges that are, in each case, accounted for at fair value through earnings, certain realized gains and losses, as well as certain non - cash expenses and securitization - related transaction costs . Management believes that the adjustments made to GAAP earnings result in the removal of ( i ) income or expenses that are not reflective of the longer term performance of our investment portfolio, (ii) certain non - cash expenses, and (iii) expense items required to be recognized solely due to the election of the fair value option on certain related residential mortgage assets and associated liabilities . Distributable earnings is one of the factors that our Board of Directors considers when evaluating distributions to our shareholders . Accordingly, we believe that the adjustments to compute Distributable earnings specified below provide investors and analysts with additional information to evaluate our financial results . The following table provides a reconciliation of GAAP net (loss)/income used in the calculation of basic EPS to our non - GAAP Distributable earnings for the quarterly periods presented . ( $ i n m illions, e xcept p er s hare a mounts) Q 4 2022 Q 3 2022 Q2 2022 Q1 2022 Q 4 2021 GAAP Net (loss)/income used in the calculation of basic EPS $ (1.6) $ ( 63.4 ) $ (108.8) $ (91.3) $ 35.7 Adjustments: Unrealized and realized gains and losses on: Residential whole loans held at fair value 68.8 291.8 218.2 287.9 42.6 Securities held at fair value 0.4 ( 1.5 ) 1.5 2.9 0.4 Interest rate swaps 12.7 ( 108 . 9 ) (31.8) (80.8) (0.1) Securitized debt held at fair value ( 45.0 ) ( 100 . 8 ) (84.3) (62.9) (6.1) Investments in loan origination partners 8.5 2.0 39.2 0.8 (24.0) Expense items: Amortization of intangible assets 1.3 1.3 3.3 3.3 3.3 Equity based compensation 2.5 2.7 3.5 2.6 2.3 Securitization - related transaction costs 1.7 5.0 6.4 3.2 5.2 Total adjustments $ 51.0 $ 91.6 $ 155.9 $ 157.2 $ 23.5 Distributable earnings $ 49.4 $ 28.2 $ 47.2 $ 66.0 $ 59.3 GAAP (loss)/earnings per basic common share $ (0.02) $ ( 0 . 62 ) $ (1.06) $ (0.86) $ 0.33 Distributable earnings per basic common share $ 0.48 $ 0.28 $ 0.46 $ 0.62 $ 0.54 Weighted average common shares for basic earnings per share 10 1 . 8 10 1 .

8 102.5 106.6 109.5 19 Reconciliation of GAAP book value to Economic book value “Economic book value” is a non - GAAP financial measure of our financial position . To calculate our Economic book value, our portfolios of Residential whole loans and securitized debt( 1 ) held at carrying value are adjusted to their fair value, rather than the carrying value that is required to be reported under the GAAP accounting model applied to these financial instruments . These adjustments are also reflected in the table below in our end of period stockholders’ equity . Management considers that Economic book value provides investors with a useful supplemental measure to evaluate our financial position as it reflects the impact of fair value changes for all of our investment activities, irrespective of the accounting model applied for GAAP reporting purposes . Economic book value does not represent and should not be considered as a substitute for Stockholders’ Equity, as determined in accordance with GAAP, and our calculation of this measure may not be comparable to similarly titled measures reported by other companies . The following table provides a reconciliation of GAAP book value per common share to our non - GAAP Economic book value per common share as of the end of each quarter since Q 4 2021 . ($ i n millions, except per share amounts) 12 /3 1 /22 9 /30/22 6/30/22 3/31/22 12/31/21 GAAP Total Stockholders’ Equity $ 1,988.8 $ 2,033.9 $ 2,146.4 $ 2,349.0 $ 2,542.8 Preferred Stock, liquidation preference (475.0 ) (475.0 ) (475.0 ) (475.0 ) (475.0 ) GAAP Stockholders’ Equity for book value per common share $ 1, 513.8 $ 1, 558 . 9 $ 1,671.4 $ 1,874.0 $ 2,067.8 Adjustments: Fair value adjustment to Residential whole loans, at carrying value (70.2) (58.2) 9.5 54.0 153.5 Fair value adjustment to Securitized debt, at carrying value 139.7 109.6 75.4 47.7 4.3 Stockholders’ Equity including fair value adjustments to Residential whole loans and Securitized debt held at carrying value (Economic book value ) $ 1,583.3 $ 1,610.3 $ 1,756.3 $ 1,975.7 $ 2,225.6 GAAP book value per common share $ 14.87 $ 15.31 $ 16.42 $ 17.84 $ 19.12 Economic book value per common share $ 15.55 $ 15.82 $ 17.25 $ 18.81 $ 20.58 Number of shares of common stock outstanding 101.8 101.8 101.8 105.0 108.1 20 Book value and economic book value rollforward GAAP Economic Book value per common share as of 9/30/22 $15.31 $15.82 Net income available to common shareholders (0.02) (0.02) Common stock dividends declared ( 0.
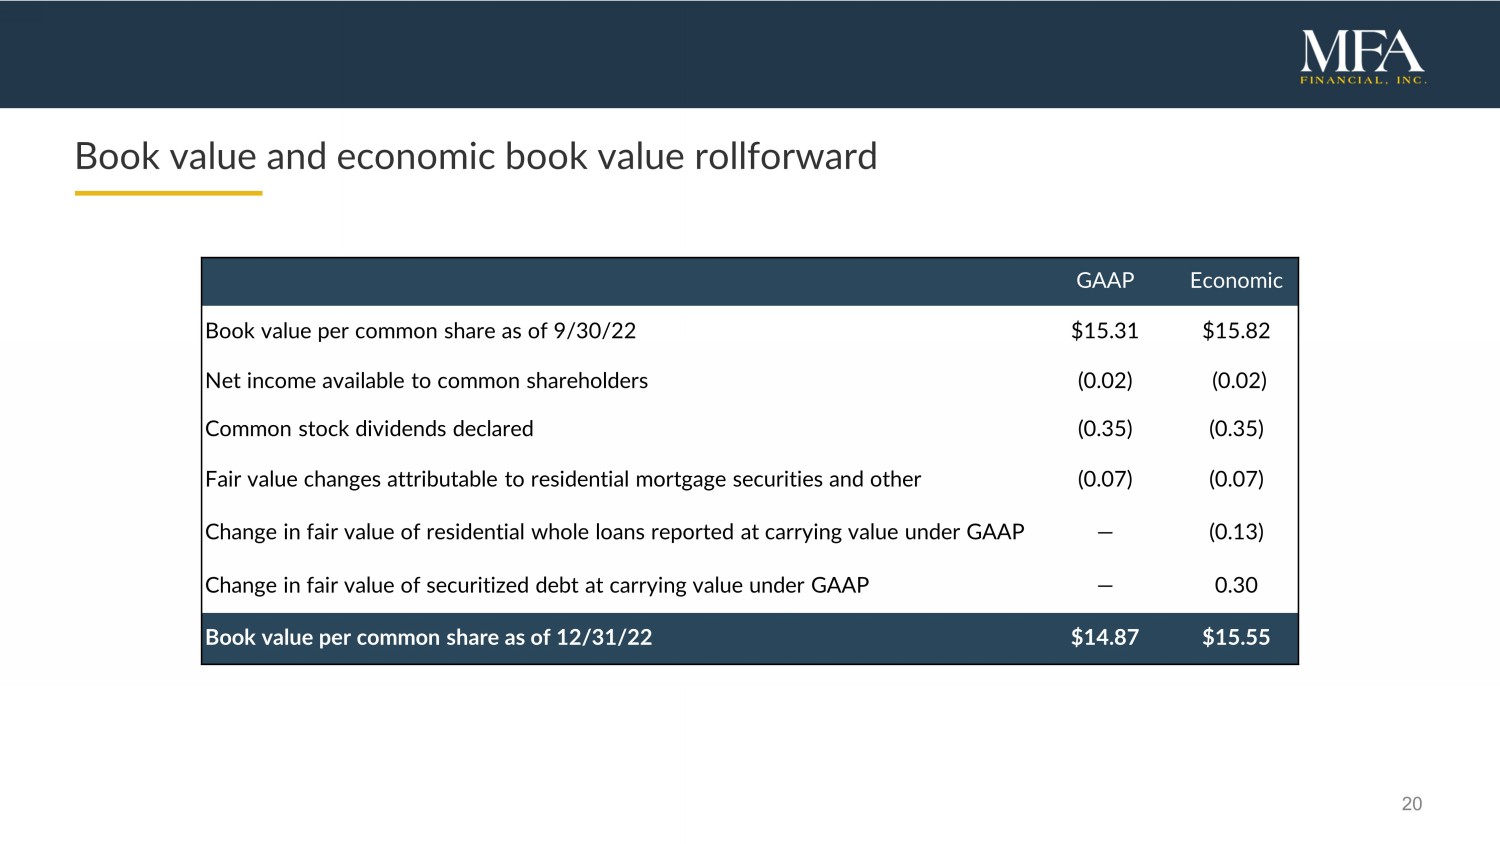
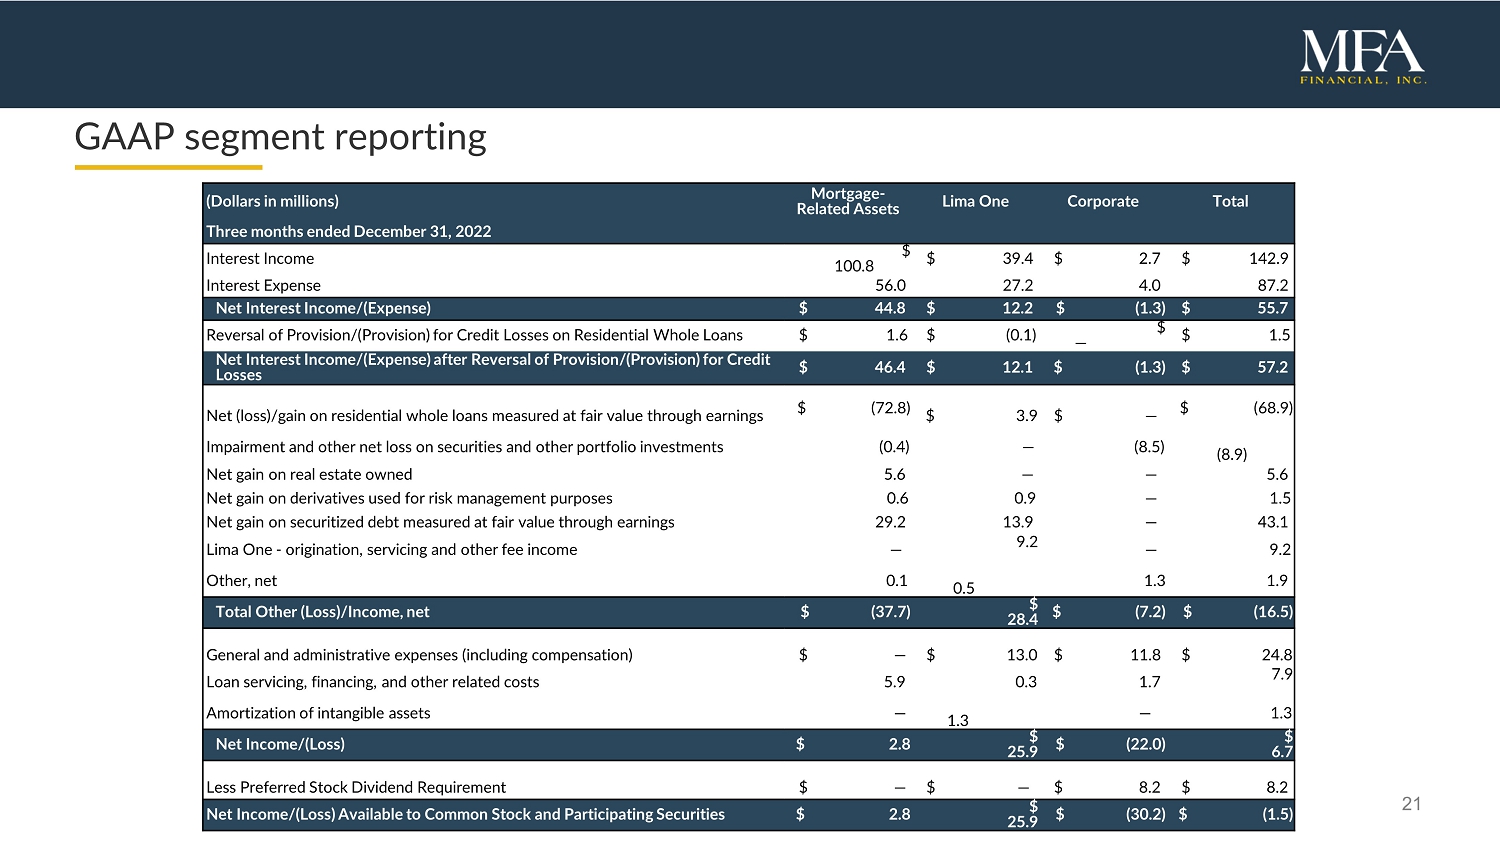
35 ) ( 0. 35 ) Fair value changes attributable to residential mortgage securities and other ( 0.0 7) ( 0.0 7) Change in fair value of residential whole loans reported at carrying value under GAAP — ( 0. 13 ) Change in fair value of securitized debt at carrying value under GAAP — 0.30 Book value per common share as of 12/31/22 $ 14.87 $ 15 . 55 21 GAAP segment reporting (Dollars in m illions) Mortgage - Related Assets Lima One Corporate Total Three months ended December 31, 2022 Interest Income $ 100.8 $ 39.4 $ 2.7 $ 142.9 Interest Expense 56.0 27.2 4 . 0 87.2 Net Interest Income /(Expense) $ 44.8 $ 12.2 $ ( 1.3 ) $ 5 5.7 Reversal of Provision /(Provision) for Credit Losses on Residential Whole Loans $ 1.6 $ (0.1) $ — $ 1.5 Net Interest Income /(Expense) after Reversal of Provision/( Provision ) for Credit Losses $ 4 6.4 $ 12.1 $ ( 1.3 ) $ 57.2 Net (loss)/gain on residential whole loans measured at fair value through earnings $ ( 72.8 ) $ 3.9 $ — $ ( 68.9 ) Impairment and other net loss on securities and other portfolio investments (0.4) — (8.5) (8.9) Net gain on real estate owned 5.6 — — 5.6 Net gain on derivatives used for risk management purposes 0.6 0.9 — 1.5 Net gain on securitized debt measured at fair value through earnings 29.2 13.9 — 43.1 Lima One - origination, servicing and other fee income — 9.2 — 9.2 Other, net 0.1 0.
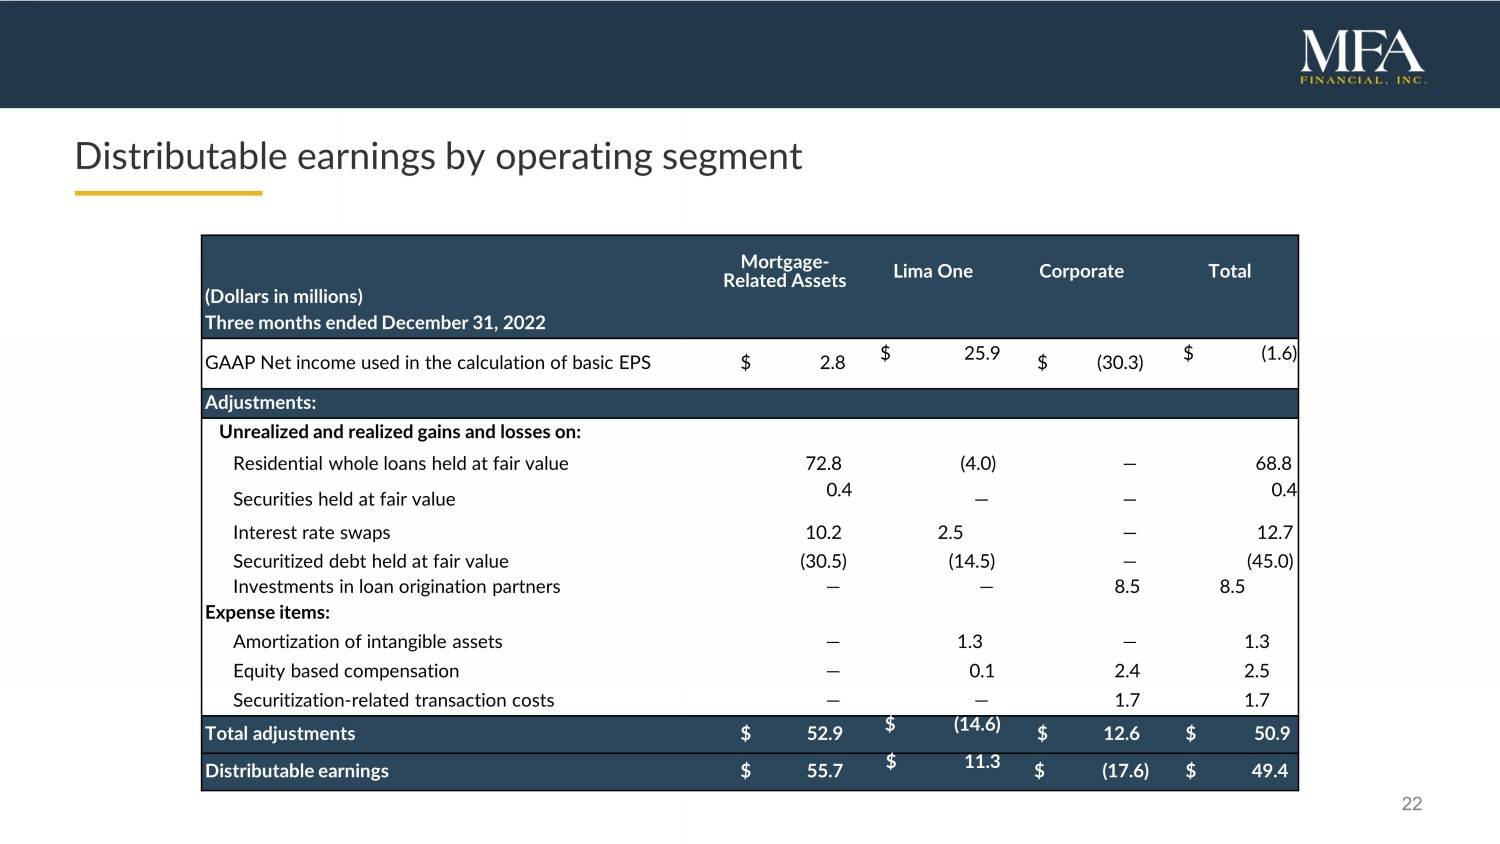
5 1.3 1.9 Total Other ( Loss )/Income , net $ ( 37.7 ) $ 28.4 $ (7.2) $ ( 16.5 ) General and administrative expenses (including compensation) $ — $ 13.0 $ 11.8 $ 2 4.8 Loan servicing, financing, and other related costs 5.9 0.3 1.7 7.9 Amortization of intangible assets — 1.3 — 1 .3 Net Income/( Loss ) $ 2.8 $ 25.9 $ ( 22.0 ) $ 6.7 Less Preferred Stock Dividend Requirement $ — $ — $ 8.2 $ 8.2 22 Distributable earnings by operating segment (Dollars in m illions ) Mortgage - Related Assets Lima One Corporate Total Three months ended December 3 1 , 2022 GAAP Net income used in the calculation of basic EPS $ 2.8 $ 25.9 $ ( 30.3 ) $ (1.6) Adjustments: Unrealized and realized gains and losses on: Residential whole loans held at fair value 72.8 (4.0) — 68.8 Securities held at fair value 0.4 — — 0.4 Interest rate swaps 10.2 2.5 — 12.7 Securitized debt held at fair value ( 30.5 ) ( 1 4 . 5 ) — ( 45.0 ) Investments in loan origination partners — — 8.5 8.5 Expense items: Amortization of intangible assets — 1.3 — 1.3 Equity based compensation — 0.1 2.4 2.5 Securitization - related transaction costs — — 1.7 1.7 Total adjustments $ 52.9 $ (14.6) $ 12.6 $ 50.9 Distributable earnings $ 55.7 $ 11.3 $ ( 17.6 ) $ 49.4