UNITED STATES
SECURITIES AND EXCHANGE COMMISSION
Washington, D.C. 20459
FORM 8-K
CURRENT REPORT PURSUANT TO SECTION 13 OR 15(D)
OF THE SECURITIES EXCHANGE ACT OF 1934
Date of report: February 16, 2023
(Date of earliest event reported)
LTC PROPERTIES, INC.
(Exact name of Registrant as specified in its charter)
| Maryland | 1-11314 | 71-0720518 | ||
| (State or other jurisdiction of | (Commission file number) | (I.R.S. Employer | ||
| incorporation or organization) | Identification No) |
2829 Townsgate Road, Suite 350
Westlake Village, CA 91361
(Address of principal executive offices)
(805) 981-8655
(Registrant’s telephone number, including area code)
Check the appropriate box below if the Form 8-K filing is intended to simultaneously satisfy the filing obligation of the registrant under any of the following provisions (see General Instruction A.2. below):
| ¨ | Written communications pursuant to Rule 425 under the Securities Act (17 CFR 230.425) |
| ¨ | Soliciting material pursuant to Rule 14a-12 under the Exchange Act (17 CFR 240.14a-12) |
| ¨ | Pre-commencement communications pursuant to Rule 14d-2(b) under the Exchange Act (17 CFR 240.14d-2(b)) |
| ¨ | Pre-commencement communications pursuant to Rule 13e-4(c) under the Exchange Act (17 CFR 240.13e-4(c)) |
Securities registered pursuant to Section 12(b) of the Act:
| Title of each class | Trading symbol(s) | Name of each exchange on which registered |
| Common stock, $.01 par value | LTC | New York Stock Exchange |
Indicate by check mark whether the registrant is an emerging growth company as defined in Rule 405 of the Securities Act of 1933 (§230.405 of this chapter) or Rule 12b-2 of the Securities Exchange Act of 1934 (§240.12b-2 of this chapter).
Emerging growth company ¨
If an emerging growth company, indicate by check mark if the registrant has elected not to use the extended transition period for complying with any new or revised financial accounting standards provided pursuant to Section 13(a) of the Exchange Act. ¨
Item 2.02. — Results of Operations and Financial Condition
On February 16, 2023, LTC Properties, Inc. announced the operating results for the three months ended December 31, 2022. The text of the press release and the supplemental information package are furnished herewith as Exhibits 99.1 and 99.2, respectively, and are specifically incorporated by reference herein.
The information in this Form 8-K and the related information in the exhibits attached hereto shall not be deemed “filed” for purposes of Section 18 of the Securities Exchange Act of 1934, as amended (the “Exchange Act”), or otherwise subject to the liabilities of that section and shall not be incorporated by reference into any filing of LTC under the Securities Act of 1933, as amended, or the Exchange Act, regardless of any general incorporation language in such filing, except as shall be expressly set forth by specific reference in any such filing.
Item 9.01. — Financial Statements and Exhibits
| 99.1 | Press Release issued February 16, 2023. |
| 99.2 | LTC Properties, Inc. Supplemental Information Package for the period ending December 31, 2022. |
| 104 | Cover Page Interactive Data File (embedded within the Inline XBRL document) |
SIGNATURE
Pursuant to the requirements of Section 13 or 15(d) of the Securities Exchange Act of 1934, the Registrant has duly caused this report to be signed on its behalf by the undersigned, hereunto duly authorized.
| LTC PROPERTIES, INC. | ||
| Dated: February 16, 2023 | By: | /s/ WENDY L. SIMPSON |
| Wendy L. Simpson | ||
| Chairman & CEO | ||
Exhibit 99.1
|
|
 |
FOR IMMEDIATE RELEASE
For more information contact: Mandi Hogan (805) 981-8655 |
LTC REPORTS 2022 FOURTH QUARTER RESULTS
AND DISCUSSES RECENT ACTIVITIES
WESTLAKE VILLAGE, CALIFORNIA, February 16, 2023-- LTC Properties, Inc. (NYSE: LTC) (“LTC” or the “Company”), a real estate investment trust that primarily invests in seniors housing and health care properties, today announced operating results for the fourth quarter ended December 31, 2022.
| Three Months Ended | ||||||||
| December 31, | ||||||||
| 2022 | 2021 | |||||||
| (unaudited) | ||||||||
| Net income available to common stockholders | $ | 17,809 | $ | 12,726 | ||||
| Diluted earnings per common share | $ | 0.44 | $ | 0.32 | ||||
| NAREIT funds from operations (“FFO”) attributable to common stockholders | $ | 29,218 | $ | 22,105 | ||||
| NAREIT diluted FFO per common share | $ | 0.72 | $ | 0.56 | ||||
| FFO attributable to common stockholders, excluding non-recurring items | $ | 29,218 | $ | 22,974 | ||||
| Funds available for distribution (“FAD”) | $ | 30,013 | $ | 24,023 | ||||
| FAD, excluding non-recurring items | $ | 30,013 | $ | 24,023 | ||||
Fourth quarter 2022 financial results were impacted by:
| · | Higher rental income from: |
| o | rent received from transitioned portfolios; |
| o | receipt of Anthem’s temporary rent reduction; |
| o | rent received from the acquisition of four skilled nursing centers during the 2022 second quarter; and |
| o | rental income from completed development projects and annual escalations. |
| o | The increase in rental income was partially offset by the sale of three assisted living communities and a skilled nursing center during the 2022 second quarter. |
| · | Higher interest income from financing receivables due to the acquisition of three skilled nursing centers during the 2022 third quarter, which is accounted for as a financing receivable in accordance with U.S. Generally Accepted Accounting Principles (“GAAP”). |
| · | Higher interest income from mortgage loans resulting from mortgage loan originations in 2022 and 2021 fourth quarter. |
| · | Higher interest and other income due to a mezzanine loan origination and additional funding under working capital loans, partially offset by loan payoffs. |
| · | Higher interest expense due to 2021 fourth quarter term loan originations, the issuance of $75.0 million senior unsecured notes during the 2022 second quarter, and higher interest rates on LTC’s revolving line of credit, partially offset by scheduled principal paydowns on the Company’s senior unsecured notes. |
| · | Lower provisions for credit losses due to more mortgage originations in the fourth quarter of 2021, compared with the same quarter in 2022. |
| · | Higher general and administrative expenses due to higher incentive compensation and increases in overall costs due to inflationary pressures. |
| · | $2.1 million of impairment losses related to a 70-unit assisted living community located in Florida and a closed memory care community located in Colorado as a result of our recoverability analysis. |
During the fourth quarter of 2022, LTC completed the following:
| · | Received payment of Anthem’s $1.5 million temporary rent reduction from May through September 2022 and a return to their previously agreed upon rent of $900,000 per month in the fourth quarter of 2022. During 2022, LTC received Anthem’s full agreed upon rent of $10.8 million; |
| · | Provided $670,000 of abated rent to the same operator for whom we have been providing assistance; |
| · | Paid $5.0 million in regular scheduled principal payments under the Company’s senior unsecured notes at a weighted average rate of 4.27%; |
| · | Amended LTC’s Credit Agreement to update its benchmark provisions to replace the London interbank offered rate (“LIBOR”) with the Secured Overnight Financing Rate (“SOFR”), plus a credit spread adjustment of 10 basis points, as the reference rate for purposes of calculating interest under the Credit Agreement. Other than the foregoing, the material terms of the Credit Agreement remain unchanged. Additionally, in connection with entering into the Amendment, LTC entered into amendments to its fixed interest rate swap agreements to account for SOFR as the updated reference rate in the Amended Credit Agreement; |
| · | Repaid $21.0 million under the Company’s revolving line of credit; and |
| · | Sold 757,400 shares of LTC’s common stock for $29.2 million in net proceeds under its equity distribution agreements. |
Subsequent to December 31, 2022, LTC completed the following:
| · | As previously announced, entered into a $121.3 million joint venture (“JV”) with an existing operator, and contributed $117.5 million into the JV that purchased 11 assisted living/memory care communities with a total of 523 units. The communities are located in North Carolina and will be operated under a 10-year master lease, with two five-year renewal options. The initial annual rent is at a rate of 7.25%, increasing to 7.50% in year three, then escalates thereafter based on CPI subject to a floor of 2% and ceiling of 4%. The master lease provides the operator with the option to buy up to 50% of the properties at the beginning of the third lease year and the remaining properties at the beginning of the fourth lease year through the end of the sixth lease year, with an exit IRR of 9.00% on any tranche of the properties being purchased. LTC will consolidate the joint venture’s acquired properties and the acquisition will be accounted for as a financing receivable due to the seller’s purchase option. LTC expects to record consolidated GAAP and cash rent interest income from financing receivable during 2023 of $9.7 million and $8.8 million, respectively, related to the joint venture investment; |
| · | As previously announced, originated a $10.8 million mortgage loan secured by a 45-unit memory care community located in North Carolina. The loan carries a two-year term with an interest-only rate of 7.25% and an IRR of 9.00%; |
| · | Received $4.5 million, which includes a prepayment fee and the exit IRR totaling $190,000, from a mezzanine loan prepayment. The mezzanine loan was on a 136-unit independent living community in Oregon; |
| · | Received a notice of intent to redeem LTC’s $13.0 million preferred equity investment in a joint venture to develop a 267-unit independent and assisted living community in Washington. LTC anticipates receiving $1.7 million of additional income in 2023 associated with the redemption representing the 14% IRR; |
| · | Borrowed $162.7 million under its unsecured revolving line of credit primarily for investments in 2023; |
| · | Paid $7.0 million under its senior unsecured notes; and |
| · | Provided $215,000 of abated rent in January 2023. LTC has agreed to provide rent abatements up to $215,000 for each of February and March of 2023. |
Conference Call Information
LTC will conduct a conference call on Thursday, February 16, 2023, at 10:00 a.m. Pacific Time (1:00 p.m. Eastern Time), to provide commentary on its performance and operating results for the quarter ended December 31, 2022. The conference call is accessible by telephone and the internet. Interested parties may access the live conference call via the following:
| Webcast | www.LTCreit.com |
| USA Toll-Free Number | 1-844-200-6205 |
| Canada Toll-Free Number | 1-833-950-0062 |
| Conference Access Code | 948633 |
Additionally, an audio replay of the call will be available one hour after the live call and through March 2, 2023 via the following:
| USA Toll-Free Number | 1-866-813-9403 |
| Canada Local Number | 1-226-828-7578 |
| International Toll-Free Number | +44 204 525 0658 |
| Conference Number | 340552 |
About LTC
LTC is a real estate investment trust (REIT) investing in seniors housing and health care properties primarily through sale-leasebacks, mortgage financing, joint-ventures and structured finance solutions including preferred equity and mezzanine lending. LTC’s investment portfolio includes 215 properties in 29 states with 31 operating partners. Based on its gross real estate investments, LTC’s investment portfolio is comprised of approximately 50% seniors housing and 50% skilled nursing properties. Learn more at www.LTCreit.com.
Forward-Looking Statements
This press release includes statements that are not purely historical and are “forward-looking statements” within the meaning of Section 27A of the Securities Act of 1933, as amended, and Section 21E of the Securities Exchange Act of 1934, as amended, including statements regarding the Company’s expectations, beliefs, intentions or strategies regarding the future. All statements other than historical facts contained in this press release are forward-looking statements. These forward-looking statements involve a number of risks and uncertainties. Please see LTC’s most recent Annual Report on Form 10-K, its subsequent Quarterly Reports on Form 10-Q, and its other publicly available filings with the Securities and Exchange Commission for a discussion of these and other risks and uncertainties. All forward-looking statements included in this press release are based on information available to the Company on the date hereof, and LTC assumes no obligation to update such forward-looking statements. Although the Company’s management believes that the assumptions and expectations reflected in such forward-looking statements are reasonable, no assurance can be given that such expectations will prove to have been correct. The actual results achieved by the Company may differ materially from any forward-looking statements due to the risks and uncertainties of such statements.
(financial tables follow)
LTC PROPERTIES, INC.
CONSOLIDATED STATEMENTS OF INCOME
(amounts in thousands, except per share amounts)
| Three Months Ended | Twelve Months Ended | |||||||||||||||
| December 31, | December 31, | |||||||||||||||
| 2022 | 2021 | 2022 | 2021 | |||||||||||||
| (unaudited) | (audited) | |||||||||||||||
| Revenues: | ||||||||||||||||
| Rental income | $ | 34,707 | $ | 30,028 | $ | 128,244 | $ | 121,125 | ||||||||
| Interest income from financing receivable(1) | 1,405 | — | 1,762 | — | ||||||||||||
| Interest income from mortgage loans | 10,488 | 9,032 | 40,600 | 32,811 | ||||||||||||
| Interest and other income | 1,239 | 381 | 4,547 | 1,386 | ||||||||||||
| Total revenues | 47,839 | 39,441 | 175,153 | 155,322 | ||||||||||||
| Expenses: | ||||||||||||||||
| Interest expense | 8,830 | 6,933 | 31,437 | 27,375 | ||||||||||||
| Depreciation and amortization | 9,294 | 9,449 | 37,496 | 38,296 | ||||||||||||
| Impairment loss | 2,136 | — | 3,422 | — | ||||||||||||
| Provision for credit losses | 74 | 962 | 1,528 | 1,021 | ||||||||||||
| Transaction costs | 100 | 162 | 828 | 4,433 | ||||||||||||
| Property tax expense | 3,306 | 3,679 | 15,486 | 15,392 | ||||||||||||
| General and administrative expenses | 6,299 | 5,772 | 23,706 | 21,460 | ||||||||||||
| Total expenses | 30,039 | 26,957 | 113,903 | 107,977 | ||||||||||||
| Other operating income: | ||||||||||||||||
| Gain on sale of real estate, net | 21 | 70 | 37,830 | 7,462 | ||||||||||||
| Operating income | 17,821 | 12,554 | 99,080 | 54,807 | ||||||||||||
| Income from unconsolidated joint ventures | 377 | 376 | 1,504 | 1,417 | ||||||||||||
| Net income | 18,198 | 12,930 | 100,584 | 56,224 | ||||||||||||
| Income allocated to non-controlling interests | (259 | ) | (92 | ) | (560 | ) | (363 | ) | ||||||||
| Net income attributable to LTC Properties, Inc. | 17,939 | 12,838 | 100,024 | 55,861 | ||||||||||||
| Income allocated to participating securities | (130 | ) | (112 | ) | (580 | ) | (458 | ) | ||||||||
| Net income available to common stockholders | $ | 17,809 | $ | 12,726 | $ | 99,444 | $ | 55,403 | ||||||||
| Earnings per common share: | ||||||||||||||||
| Basic | $ | 0.44 | $ | 0.32 | $ | 2.49 | $ | 1.41 | ||||||||
| Diluted | $ | 0.44 | $ | 0.32 | $ | 2.48 | $ | 1.41 | ||||||||
| Weighted average shares used to calculate earnings per | ||||||||||||||||
| common share: | ||||||||||||||||
| Basic | 40,596 | 39,177 | 39,894 | 39,156 | ||||||||||||
| Diluted | 40,769 | 39,177 | 40,067 | 39,156 | ||||||||||||
| Dividends declared and paid per common share | $ | 0.57 | $ | 0.57 | $ | 2.28 | $ | 2.28 | ||||||||
| (1) | Represents rental income from three skilled nursing centers acquired through a sale-leaseback transaction, subject to a lease which contains a purchase option. In accordance with GAAP, the properties are required to be presented as a financing receivable on our Consolidated Balance Sheets and the rental income to be presented as Interest income from financing receivable on our Consolidated Statements of Income. |
Supplemental Reporting Measures
FFO and FAD are supplemental measures of a real estate investment trust’s (“REIT”) financial performance that are not defined by U.S. generally accepted accounting principles (“GAAP”). Investors, analysts and the Company use FFO and FAD as supplemental measures of operating performance. The Company believes FFO and FAD are helpful in evaluating the operating performance of a REIT. Real estate values historically rise and fall with market conditions, but cost accounting for real estate assets in accordance with GAAP assumes that the value of real estate assets diminishes predictably over time. We believe that by excluding the effect of historical cost depreciation, which may be of limited relevance in evaluating current performance, FFO and FAD facilitate like comparisons of operating performance between periods. Occasionally, the Company may exclude non-recurring items from FFO and FAD in order to allow investors, analysts and our management to compare the Company’s operating performance on a consistent basis without having to account for differences caused by unanticipated items.
FFO, as defined by the National Association of Real Estate Investment Trusts (“NAREIT”), means net income available to common stockholders (computed in accordance with GAAP) excluding gains or losses on the sale of real estate and impairment write-downs of depreciable real estate, plus real estate depreciation and amortization, and after adjustments for unconsolidated partnerships and joint ventures. The Company’s computation of FFO may not be comparable to FFO reported by other REITs that do not define the term in accordance with the current NAREIT definition or have a different interpretation of the current NAREIT definition from that of the Company; therefore, caution should be exercised when comparing our Company’s FFO to that of other REITs.
We define FAD as FFO excluding the effects of straight-line rent, amortization of lease inducement, effective interest income, deferred income from unconsolidated joint ventures, non-cash compensation charges, capitalized interest and non-cash interest charges. GAAP requires rental revenues related to non-contingent leases that contain specified rental increases over the life of the lease to be recognized evenly over the life of the lease. This method results in rental income in the early years of a lease that is higher than actual cash received, creating a straight-line rent receivable asset included in our consolidated balance sheet. At some point during the lease, depending on its terms, cash rent payments exceed the straight-line rent which results in the straight-line rent receivable asset decreasing to zero over the remainder of the lease term. Effective interest method, as required by GAAP, is a technique for calculating the actual interest rate for the term of a mortgage loan based on the initial origination value. Similar to the accounting methodology of straight-line rent, the actual interest rate is higher than the stated interest rate in the early years of the mortgage loan thus creating an effective interest receivable asset included in the interest receivable line item in our consolidated balance sheet and reduces down to zero when, at some point during the mortgage loan, the stated interest rate is higher than the actual interest rate. FAD is useful in analyzing the portion of cash flow that is available for distribution to stockholders. Investors, analysts and the Company utilize FAD as an indicator of common dividend potential. The FAD payout ratio, which represents annual distributions to common shareholders expressed as a percentage of FAD, facilitates the comparison of dividend coverage between REITs.
While the Company uses FFO and FAD as supplemental performance measures of our cash flow generated by operations and cash available for distribution to stockholders, such measures are not representative of cash generated from operating activities in accordance with GAAP, and are not necessarily indicative of cash available to fund cash needs and should not be considered an alternative to net income available to common stockholders.
Reconciliation of FFO and FAD
The following table reconciles GAAP net income available to common stockholders to each of NAREIT FFO attributable to common stockholders and FAD (unaudited, amounts in thousands, except per share amounts):
| Three Months Ended | Twelve Months Ended | |||||||||||||||
| December 31, | December 31, | |||||||||||||||
| 2022 | 2021 | 2022 | 2021 | |||||||||||||
| GAAP net income available to common stockholders | $ | 17,809 | $ | 12,726 | $ | 99,444 | $ | 55,403 | ||||||||
| Add: Impairment loss | 2,136 | — | 3,422 | — | ||||||||||||
| Add: Depreciation and amortization | 9,294 | 9,449 | 37,496 | 38,296 | ||||||||||||
| Less: Gain on sale of real estate, net | (21 | ) | (70 | ) | (37,830 | ) | (7,462 | ) | ||||||||
| NAREIT FFO attributable to common stockholders | 29,218 | 22,105 | 102,532 | 86,237 | ||||||||||||
| Add: Non-recurring items | — | 869 | (2) | 824 | (3) | 5,947 | (6) | |||||||||
| FFO attributable to common stockholders, excluding non-recurring items | $ | 29,218 | $ | 22,974 | $ | 103,356 | $ | 92,184 | ||||||||
| NAREIT FFO attributable to common stockholders | $ | 29,218 | $ | 22,105 | $ | 102,532 | $ | 86,237 | ||||||||
| Non-cash income: | ||||||||||||||||
| Add (Less): straight-line rental adjustment (income) | 406 | 152 | 1,369 | (467 | ) | |||||||||||
| Add: amortization of lease costs | 212 | 222 | 1,133 | (4) | 608 | |||||||||||
| Add: Other non-cash expense | — | — | — | 758 | (7) | |||||||||||
| Less: Effective interest income | (1,910 | )(1) | (1,393 | ) | (6,461 | )(1) | (6,093 | ) | ||||||||
| Net non-cash income | (1,292 | ) | (1,019 | ) | (3,959 | ) | (5,194 | ) | ||||||||
| Non-cash expense: | ||||||||||||||||
| Add: Non-cash compensation charges | 2,013 | 1,975 | 7,964 | 7,760 | ||||||||||||
| Add: Provision for credit losses | 74 | 962 | 1,528 | 1,021 | ||||||||||||
| Net non-cash expense | 2,087 | 2,937 | 9,492 | 8,781 | ||||||||||||
| Funds available for distribution (FAD) | $ | 30,013 | $ | 24,023 | $ | 108,065 | $ | 89,824 | ||||||||
| (Less) Add: Non-recurring items | — | — | (681 | )(5) | 5,232 | (8) | ||||||||||
| Funds available for distribution (FAD), excluding non-recurring items | $ | 30,013 | $ | 24,023 | $ | 107,384 | $ | 95,056 | ||||||||
| (1) | Includes effective interest from three skilled nursing centers acquired through a sale-leaseback transaction, subject to a lease which contains a purchase option. In accordance with GAAP, the properties are required to be presented as a financing receivable on our Consolidated Balance Sheets and the rental income to be presented as Interest income from financing receivable on our Consolidated Statements of Income. | |
| (2) | Represents provision for credit losses related to the origination of $86,933 mortgage loans during 2021 fourth quarter. | |
| (3) | Represents (4) from below, $1,332 of provision for credit losses reserve related to the origination of the financing receivable noted in (1) above, two mortgage loans and a mezzanine loan, and a lease termination fee of $500 paid to a former operator of 12 assisted living communities in exchange for cooperation and assistance in facilitating an orderly transition of the communities to another operator partially offset by a lease termination fee of $1,181 received in connection with the sale of an assisted living community. | |
| (4) | Includes a lease incentive balance write-off of $173 related to a closed property and subsequent lease termination. | |
| (5) | Represents the lease termination fee of $1,181 received in connection with the sale of an assisted living community offset by the lease termination fee of $500 paid to a former operator of 12 assisted living communities in exchange for cooperation and assistance in facilitating an orderly transition of the communities to another operator. | |
| (6) | Represents (2) from above, (7) from below, the Senior Care and Abri Health settlement payment ($3,895) in accordance with a settlement agreement approved by the United States Bankruptcy Court and the GAAP impact of the 50% reduction of 2021 rent and interest escalation ($425). | |
| (7) | Represents a straight-line rent receivable write-off ($758) due to transitioning rental revenue recognition to cash basis. | |
| (8) | Represents the Senior Care and Abri Health settlement payment ($3,895) in accordance with a settlement agreement approved by the United States Bankruptcy Court and the cash impact of the 50% reduction of 2021 rent and interest escalations ($1,337). |
(Reconciliation of FFO and FAD continued on next page)
Reconciliation of FFO and FAD (continued)
The following table continues the reconciliation between GAAP net income available to common stockholders and each of NAREIT FFO attributable to common stockholders and FAD (unaudited, amounts in thousands, except per share amounts):
| Three Months Ended | Twelve Months Ended | |||||||||||||||
| December 31, | December 31, | |||||||||||||||
| 2022 | 2021 | 2022 | 2021 | |||||||||||||
| NAREIT Basic FFO attributable to common stockholders per share | $ | 0.72 | $ | 0.56 | $ | 2.57 | $ | 2.20 | ||||||||
| NAREIT Diluted FFO attributable to common stockholders per share | $ | 0.72 | $ | 0.56 | $ | 2.56 | $ | 2.20 | ||||||||
| NAREIT Diluted FFO attributable to common stockholders | $ | 29,348 | $ | 22,105 | $ | 103,112 | $ | 86,237 | ||||||||
| Weighted average shares used to calculate NAREIT diluted FFO per share | ||||||||||||||||
| attributable to common stockholders | 40,998 | 39,177 | 40,296 | 39,156 | ||||||||||||
| Diluted FFO attributable to common stockholders, excluding non-recurring items | $ | 29,348 | $ | 23,086 | $ | 103,936 | $ | 92,642 | ||||||||
| Weighted average shares used to calculate diluted FFO, excluding | ||||||||||||||||
| non-recurring items, per share attributable to common stockholders | 40,998 | 39,374 | 40,296 | 39,353 | ||||||||||||
| Diluted FAD | $ | 30,143 | $ | 24,135 | $ | 108,645 | $ | 89,824 | ||||||||
| Weighted average shares used to calculate diluted FAD per share | 40,998 | 39,374 | 40,296 | 39,156 | ||||||||||||
| Diluted FAD, excluding non-recurring items | $ | 30,143 | $ | 24,135 | $ | 107,964 | $ | 95,514 | ||||||||
| Weighted average shares used to calculate diluted FAD, excluding | ||||||||||||||||
| non-recurring items, per share | 40,998 | 39,374 | 40,296 | 39,353 | ||||||||||||
LTC PROPERTIES, INC.
CONSOLIDATED BALANCE SHEETS
(audited, amounts in thousands, except per share)
| December 31, 2022 | December 31, 2021 | |||||||
| ASSETS | ||||||||
| Investments: | ||||||||
| Land | $ | 124,665 | $ | 123,239 | ||||
| Buildings and improvements | 1,273,025 | 1,285,318 | ||||||
| Accumulated depreciation and amortization | (389,182 | ) | (374,606 | ) | ||||
| Operating real estate property, net | 1,008,508 | 1,033,951 | ||||||
| Properties held-for-sale, net of accumulated depreciation: 2022—$2,305; 2021—$0 | 10,710 | — | ||||||
| Real property investments, net | 1,019,218 | 1,033,951 | ||||||
| Financing receivable,(1) net of credit loss reserve: 2022—$768; 2021—$0 | 75,999 | — | ||||||
| Mortgage loans receivable, net of credit loss reserve: 2022—$3,930; 2021—$3,473 | 389,728 | 344,442 | ||||||
| Real estate investments, net | 1,484,945 | 1,378,393 | ||||||
| Notes receivable, net of credit loss reserve: 2022—$589; 2021—$286 | 58,383 | 28,337 | ||||||
| Investments in unconsolidated joint ventures | 19,340 | 19,340 | ||||||
| Investments, net | 1,562,668 | 1,426,070 | ||||||
| Other assets: | ||||||||
| Cash and cash equivalents | 10,379 | 5,161 | ||||||
| Debt issue costs related to revolving line of credit | 2,321 | 3,057 | ||||||
| Interest receivable | 46,000 | 39,522 | ||||||
| Straight-line rent receivable | 21,847 | 24,146 | ||||||
| Lease incentives | 1,789 | 2,678 | ||||||
| Prepaid expenses and other assets | 11,099 | 4,191 | ||||||
| Total assets | $ | 1,656,103 | $ | 1,504,825 | ||||
| LIABILITIES | ||||||||
| Revolving line of credit | $ | 130,000 | $ | 110,900 | ||||
| Term loans, net of debt issue costs: 2022—$489; 2021—$637 | 99,511 | 99,363 | ||||||
| Senior unsecured notes, net of debt issue costs: 2022—$1,477; 2021—$524 | 538,343 | 512,456 | ||||||
| Accrued interest | 5,234 | 3,745 | ||||||
| Accrued expenses and other liabilities | 32,708 | 33,234 | ||||||
| Total liabilities | 805,796 | 759,698 | ||||||
| EQUITY | ||||||||
| Stockholders’ equity: | ||||||||
| Common stock: $0.01 par value; 60,000 shares authorized; shares issued and outstanding: 2022—41,262; 2021—39,374 | 412 | 394 | ||||||
| Capital in excess of par value | 931,124 | 856,895 | ||||||
| Cumulative net income | 1,544,660 | 1,444,636 | ||||||
| Accumulated other comprehensive income (loss) | 8,719 | (172 | ) | |||||
| Cumulative distributions | (1,656,548 | ) | (1,565,039 | ) | ||||
| Total LTC Properties, Inc. stockholders’ equity | 828,367 | 736,714 | ||||||
| Non-controlling interests | 21,940 | 8,413 | ||||||
| Total equity | 850,307 | 745,127 | ||||||
| Total liabilities and equity | $ | 1,656,103 | $ | 1,504,825 | ||||
| (1) | Represents three skilled nursing centers acquired through a sale-leaseback transaction, subject to a lease which contains a purchase option. In accordance with GAAP, the properties are required to be presented as a financing receivable on our Consolidated Balance Sheets. |
Exhibit 99.2
RENEWAL AND TRANSITION SUPPLEMENTAL OPERATING AND FINANCIAL DATA FOURTH QUARTER 2022

4Q 2022 SUPPLEMENTAL REPORT FORWARD - LOOKING STATEMENTS This supplemental information contains forward - looking statements within the meaning of Section 27 A of the Securities Act of 1933 , as amended, and Section 21 E of the Securities Exchange Act of 1934 , as amended, adopted pursuant to the Private Securities Litigation Reform Act of 1995 . Statements that are not purely historical may be forward - looking . You can identify some of the forward - looking statements by their use of forward - looking words, such as ‘‘believes,’’ ‘‘expects,’’ ‘‘may,’’ ‘‘will,’’ ‘‘should,’’ ‘‘seeks,’’ ‘‘approximately,’’ ‘‘intends,’’ ‘‘plans,’’ ‘‘estimates’’ or ‘‘anticipates,’’ or the negative of those words or similar words . Forward - looking statements involve inherent risks and uncertainties regarding events, conditions and financial trends that may affect our future plans of operation, business strategy, results of operations and financial position . A number of important factors could cause actual results to differ materially from those included within or contemplated by such forward - looking statements, including, but not limited to, the status of the economy, the status of capital markets (including prevailing interest rates), and our access to capital ; the income and returns available from investments in health care related real estate, the ability of our borrowers and lessees to meet their obligations to us, our reliance on a few major operators ; competition faced by our borrowers and lessees within the health care industry, regulation of the health care industry by federal, state and local governments, changes in Medicare and Medicaid reimbursement amounts (including due to federal and state budget constraints), compliance with and changes to regulations and payment policies within the health care industry, debt that we may incur and changes in financing terms, our ability to continue to qualify as a real estate investment trust, the relative illiquidity of our real estate investments, potential limitations on our remedies when mortgage loans default, and risks and liabilities in connection with properties owned through limited liability companies and partnerships . For a discussion of these and other factors that could cause actual results to differ from those contemplated in the forward - looking statements, please see the discussion under ‘‘Risk Factors’’ and other information contained in our Annual Report on Form 10 - K for the fiscal year ended December 31 , 2022 and in our publicly available filings with the Securities and Exchange Commission . We do not undertake any responsibility to update or revise any of these factors or to announce publicly any revisions to forward - looking statements, whether as a result of new information, future events or otherwise . NON - GAAP INFORMATION This supplemental information contains certain non - GAAP information including EBITDA re , adjusted EBITDA re , FFO, FFO excluding non - recurring items, FAD, FAD excluding non - recurring items, adjusted interest coverage ratio, and adjusted fixed charges coverage ratio . A reconciliation of this non - GAAP information is provided on pages 22 , 25 and 26 of this supplemental information, and additional information is available under the “Non - GAAP Financial Measures” subsection under the “Selected Financial Data” section of our website at www . LTCreit . com .

TABLE OF CONTENTS 2 COMPANY Company Information & Leadership 3 INVESTMENTS Real Estate Activities Investments and Capital Recycling 4 Acquisitions and Financing Receivables 5 Mortgage and Mezzanine Loan Originations 6 Joint Ventures 7 Purchase Options and Renovations & Expansions 8 PORTFOLIO Proforma Overview 9-10 Proforma Diversification Operators 11-13 Maturity 14 Geography, MSA, Age of Portfolio 15-16 Real Estate Investments Metrics 17 FINANCIAL Proforma Enterprise Value 18 Proforma Debt Metrics 19 Proforma Debt Maturity 20 Financial Data Summary 21-22 Consolidated Statements of Income 23 Consolidated Balance Sheets 24 Funds from Operations 25-26 ESG and GLOSSARY ESG (Environmental, Social & Governance) 27 Glossary 28-29 4Q 2022 SUPPLEMENTAL REPORT 3 Founded in 1992 , LTC Properties, Inc . (NYSE : LTC) is a self - administered real estate investment trust (REIT) investing in seniors housing and health care properties primarily through sale - leaseback transactions, mortgage financing and structured finance solutions including preferred equity and mezzanine lending . LTC’s portfolio encompasses Skilled Nursing Facilities (SNF), Assisted Living Communities (ALF), Independent Living Communities (ILF), Memory Care Communities (MC) and combinations thereof . Our main objective is to build and grow a diversified portfolio that creates and sustains shareholder value while providing our stockholders current distribution income . To meet this objective, we seek properties operated by regional operators, ideally offering upside and portfolio diversification (geographic, operator, property type and investment vehicle) . For more information, visit www . LTCreit . com . Any opinions, estimates, or forecasts regarding LTC’s performance made by the analysts listed above do not represent the opinions, estimates, and forecasts of LTC or its management. BOARD OF DIRECTORS ANALYSTS WENDY SIMPSON Chairman and Chief Executive Officer PAM KESSLER Co - President, CFO and Secretary CLINT MALIN Co - President and Chief Investment Officer CECE CHIKHALE Executive Vice President, Chief Accounting Officer and Treasurer DOUG KOREY Executive Vice President, Managing Director of Business Development PETER LYEW Vice President, Director of Taxes GIBSON SATTERWHITE Senior Vice President, Asset Management MANDI HOGAN Vice President of Marketing, Investor Relations and ESG MIKE BOWDEN Vice President, Investments LEADERSHIP RACHEL SON Vice President and Controller LTC PROPERTIES, INC. 2829 Townsgate Road Suite 350 Westlake Village, CA 91361 805 - 981 - 8655 www.LTCreit.com TRANSFER AGENT Broadridge Shareholder Services c/o Broadridge Corporate Issuer Solutions 1155 Long Island Avenue Edgewood, NY 11717 - 8309 ATTN: IWS 866 - 708 - 5586 WENDY SIMPSON Chairman CORNELIA CHENG ESG Committee Chairman BOYD HENDRICKSON Lead Independent Director and Nominating & Corporate Governance Committee Chairman JAMES PIECZYNSKI Investment Committee Chairman DEVRA SHAPIRO Audit Committee Chairman TIMOTHY TRICHE, MD Compensation Committee Chairman JUAN SANABRIA BMO Capital Markets Corp. TAYO OKUSANYA Credit Suisse Securities (USA) LLC AARON HECHT JMP Securities, LLC AUSTIN WURSCHMIDT KeyBanc Capital Markets, Inc. MIKE CARROLL RBC Capital Markets Corporation RICHARD ANDERSON SMBC Nikko Securities STEVE MANAKER Stifel, Nicolaus & Company, Inc.

4Q 2022 SUPPLEMENTAL REPORT Million $ 386.9 Total Sales (2) INVESTMENTS I 4 Million 176.7 Total Gains $ Billion $ 1.5 Total Investments (1) MILLION REAL ESTATE ACTIVITIES – INVESTMENTS AND CAPITAL RECYCLING SINCE 2013 (FROM JANUARY 1, 2013 THROUGH FEBRUARY 16, 2023) $0 $50 $100 $150 $200 $250 $300 $350 $400 $450 2013 2014 2015 2016 2017 2018 2019 2020 2021 2022 YTD 2023 Investments Sales Loan Payoffs & JV Redemptions (1) Represents total investments. (2) Reflects total sales price.
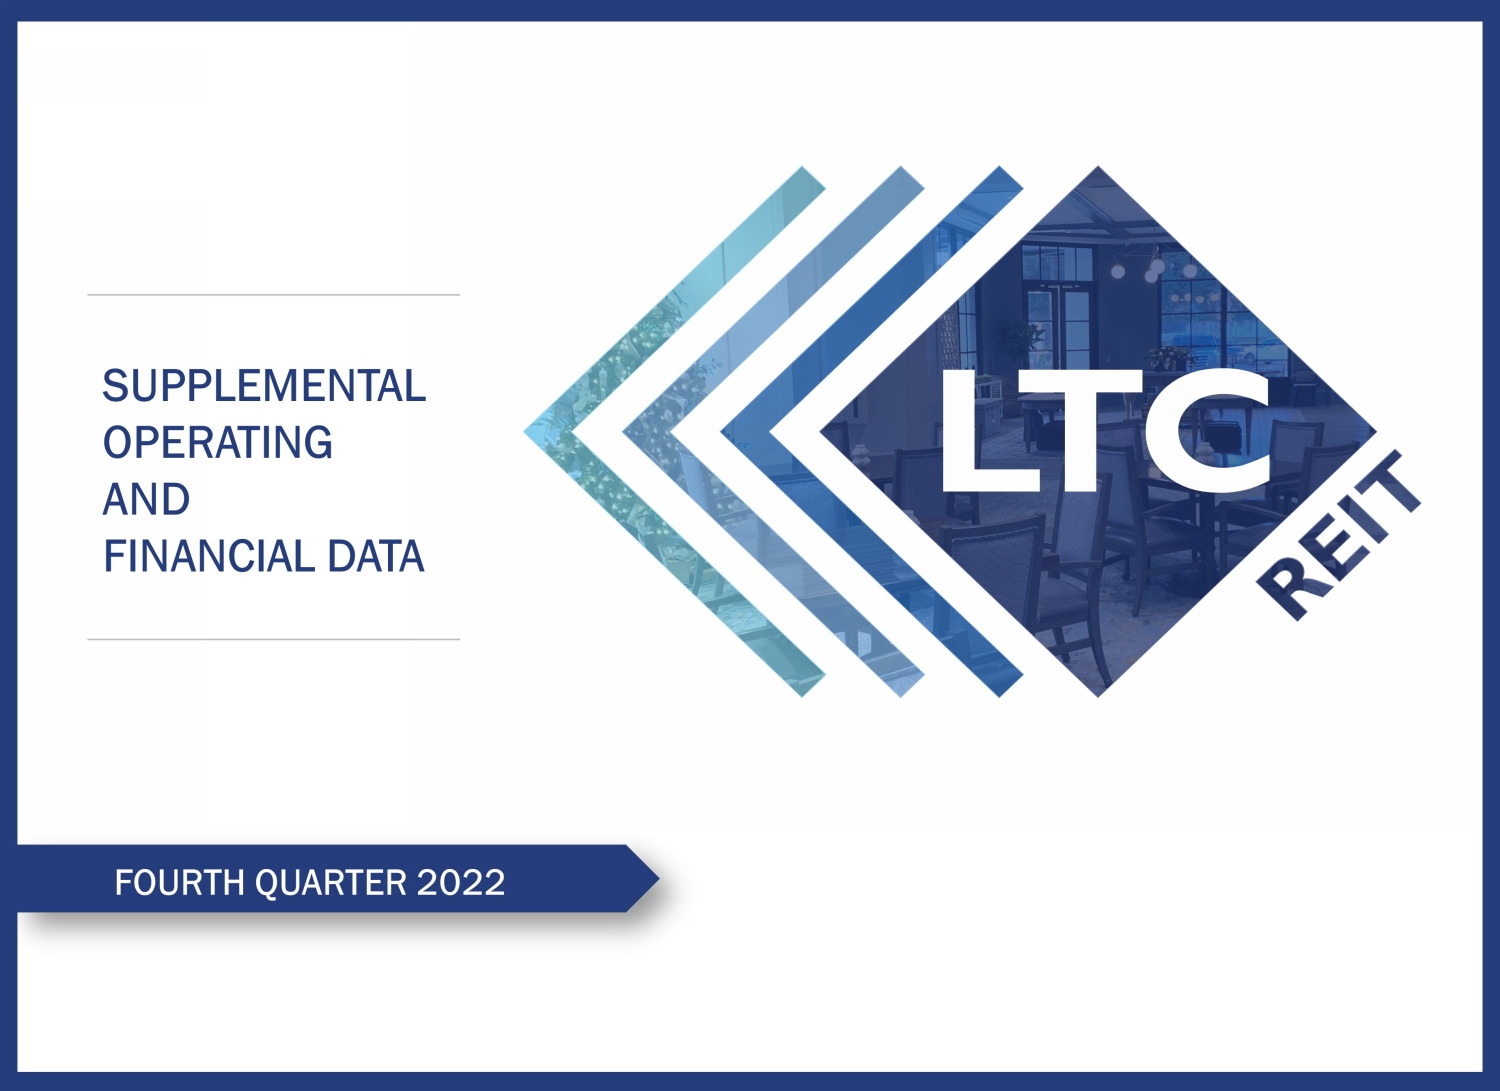
Million 88.8 Total Loan Payoffs and JV Redemptions $ 4Q 2022 SUPPLEMENTAL REPORT ACQUISITIONS 5 INVESTMENTS I REAL ESTATE ACTIVITIES – ACQUISITIONS AND FINANCING RECEIVABLES CONTRACTUAL # OF PROPERTY # OF DATE OF INITIAL PURCHASE PROPERTIES TYPE BEDS LOCATION OPERATOR CONSTRUCTION CASH YIELD PRICE 2022 4/1 4 SNF 339 beds Various cities in TX Ignite Medical Resorts 2017-2018 8.00% 51,534$ DATE FINANCING RECEIVABLES The lease term is 10 years, with two 5 - year renewal options, and contains a purchase option beginning in the sixth lease year th rough the end of the seventh lease year. The contractual rent in 2023 is approximately $4,300. Rent will increase annually beginning on the third anniversary of the lease by 2.0% to 4.0% based on the change in the Medica re Market Basket Rate. Additionally, we provided a 10 - year working capital loan at 8.00% for the first year increasing to 8.25% for the second year then increasing annually with the lease rate. At December 31, 2022, the wo rki ng capital loan had an outstanding balance of $1,642. (DOLLAR AMOUNTS IN THOUSANDS) CONTRACTUAL # OF PROPERTY # OF DATE OF INITIAL PURCHASE PROPERTIES TYPE BEDS LOCATION OPERATOR CONSTRUCTION CASH YIELD PRICE 2022 9/8 3 SNF 299 beds Various cities in FL PruittHealth 2018-2021 7.25% 75,825$ (1) 2023 1/5 11 ALF/MC 523 units Various cities in NC ALG Senior 1988-2018 7.25% 121,321 (2) DATE (1) We entered into a joint venture (“JV”) with an affiliate of PruittHealth, Inc. (“PruittHealth”) and contributed $61,661 into the JV that purchased three skilled nursing centers. The JV leased the centers to PruittHealth under a 10 - year master lease, with two five - year renewal options and provided PruittHealth with a purchase option, exercisable at the beginning of the fourth year through the end of the fifth year. In accordance with GAAP, the purchased assets are required to be presented as a financing receivable on our Consolidated Balance Sheets , since the JV acquired the centers through a sale - leaseback transaction subject to a lease agreement that contains a purchase o ption. LTC expects to record consolidated GAAP and cash interest income from financing receivables during 2023 of $5,621 and $5,615, res pec tively. See Consolidated Joint Ventures on page 7. (2) On January 5, 2023, we entered into a JV with an affiliate of ALG Senior and contributed $117,490 into the JV that purchased 11 assisted living/memory care communities from an affiliate of ALG Senior. The JV leased the communities to an affiliate of ALG Senior under a 10 - year master lease, with two five - year renewal options and provided a purcha se option to buy up to 50% of the properties at the beginning of the third lease year and the remaining properties at the beginning of the fourth lease year through the end of the sixth lease year, with an exit IRR of 9.0%. The c ont ractual initial cash yield of 7.25% increases to 7.50% in year three then escalates thereafter based on CPI subject to a floor of 2% and ceiling of 4%. In accordance with GAAP, the purchased assets are required to be presented as a f ina ncing receivable on our Consolidated Balance Sheets , since the JV acquired the communities through a sale - leaseback transaction subject to a lease agreement that contains a purchase option. LTC expects to record consolidated GAAP and cash interest income from financing receivables during 2023 of $9,706 and $8,796, respectively. See Consolidated Joint Ventures on page 7.
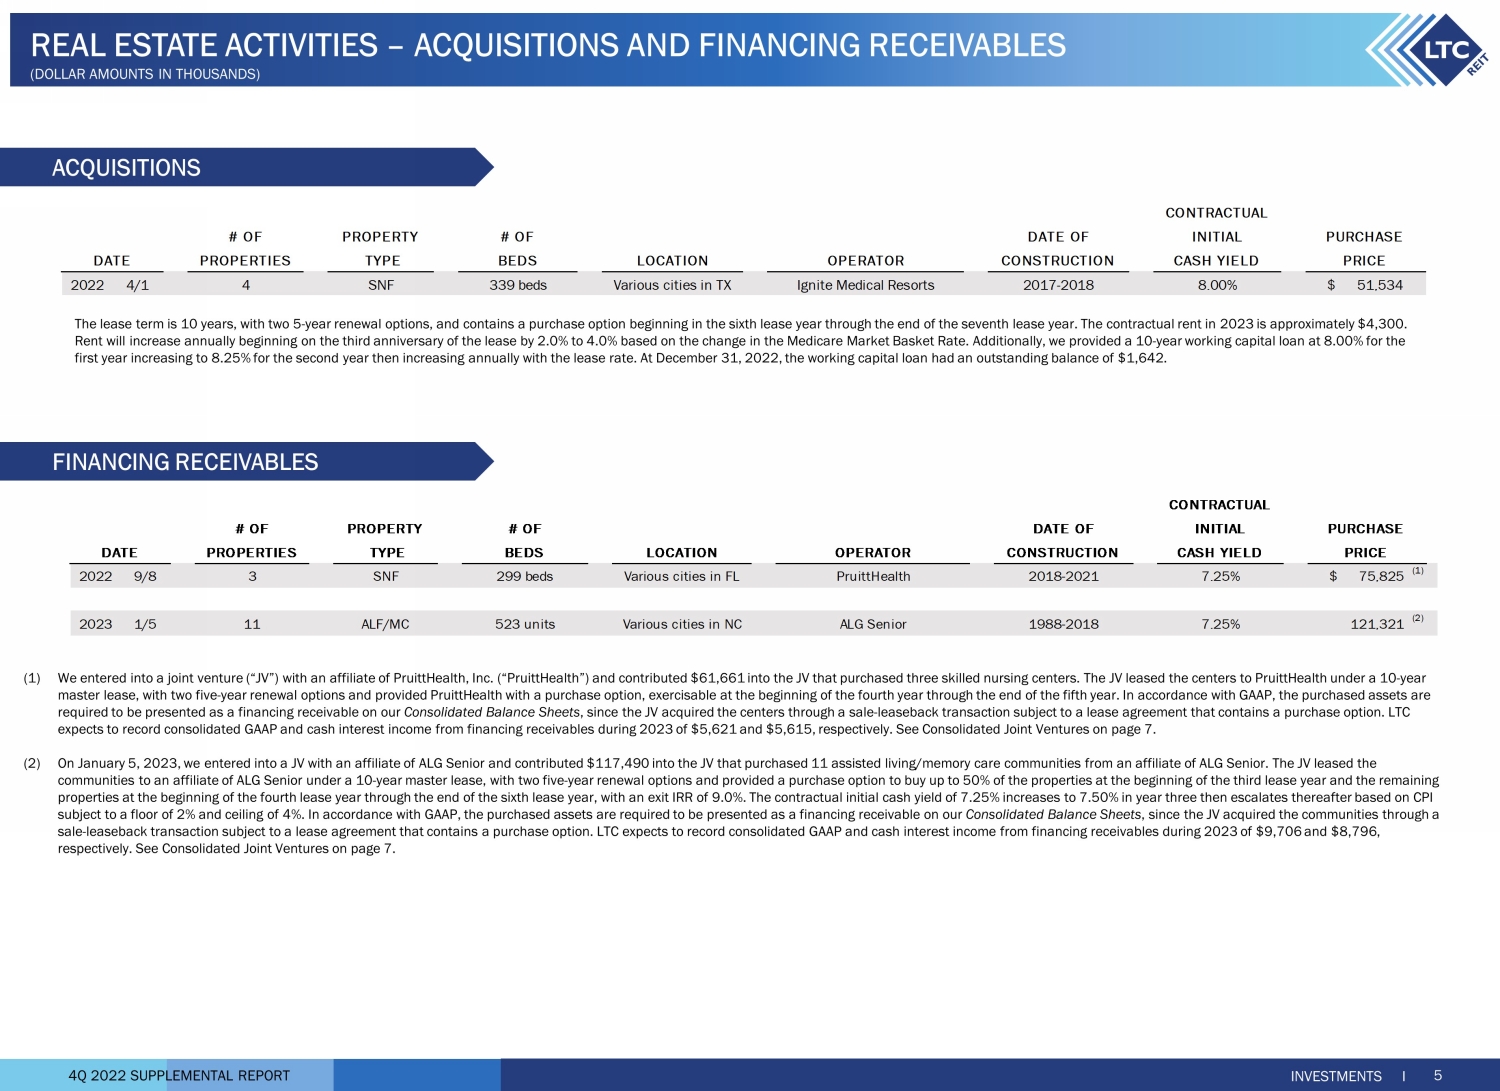
4Q 2022 SUPPLEMENTAL REPORT MORTGAGE LOANS 6 INVESTMENTS I REAL ESTATE ACTIVITIES – MORTGAGE & MEZZANINE LOAN ORIGINATIONS (DOLLAR AMOUNTS IN THOUSANDS) MEZZANINE LOANS (1) The loan includes two 12 - month extension options. The initial cash rate is 8.00% for the first 18 months then increasing to 10.5 0% thereafter with a 10.50% IRR. Our investment represents approximately 8.00% of the total investment. Subsequent to December 31, 2022, we received $4,545, which includes the exit IRR and a prepaym ent fee totaling $190, for the early payoff of this loan. (2) The loan includes two 12 - month extension options. The initial cash rate is 8.00% with a 11.00% IRR. Our investment represents ap proximately 12.00% of the total investment. # OF PROPERTY # OF MATURITY PROPERTIES TYPE UNITS LOCATION OPERATOR DATE 2021 1 ILF 136 units Bend, OR BPM Senior Living Oct-2024 (1) 8.00% (1) 4,355$ 2022 5 ILF/ALF/MC 621 units Various cities in OR & MT The Springs Living May-2027 (2) 8.00% (2) 25,000$ CONTRACTUAL YEAR RATE BALANCE COMMITMENT INITIAL INVESTMENT (1) We entered into a one - year loan agreement secured by a parcel of land for a future development of a post - acute skilled nursing c enter to be operated by Ignite Medical Resorts. On September 30, 2022, we extended the maturity date to July 1, 2023 and increased the loan to $1,886. (2) The loan includes a 12 - month extension option and the initial additional commitment was for capital improvement which was fully funded in 2Q22. (3) The initial additional commitment of $4,177 is for the construction of a memory care addition to the property. See Renovation s a nd Expansions on page 8. (4) The initial rate is 7.25% with an 8.00% IRR. The initial additional commitment is comprised of a $6,098 capital improvement c omm itment and a $650 working capital commitment, which has been fully funded. See Renovations and Expansions on page 8. (5) The initial rate is 7.25% with an 8.00% IRR. The initial additional commitment is for working capital. (6) Represents a mortgage loan on a parcel of land adjacent to one of the assisted living communities secured under the $35,074 A LG mortgage loan. The land is being held for the future development of a seniors housing community. The initial rate is 7.25% with an 8.00% IRR. (7) The initial rate is 7.25% with a 9.00% IRR. # OF PROPERTY # BEDS/ MATURITY INITIAL PROPERTIES TYPE UNITS LOCATION OPERATOR DATE ORIGINATION INVESTMENT 2021 9/30 — (1) OTH N/A St Peters, MO N/A (1) Jul-2023 7.50% 1,780$ 1,780$ —$ 10/1 1 SNF 189 beds Lafayette, LA Crossroads Area Management Oct-2024 (2) 7.50% 27,347 27,047 300 (2) 10/5 1 ALF/MC 68 units Ocala, FL Pointe Group Care Sep-2025 7.75% 16,707 12,530 4,177 (3) 12/1 13 ILF/ALF/MC 523 units Various cities in NC & SC ALG Senior Dec-2025 7.25% 59,250 52,502 6,748 (4) 15 189 beds/591 units 105,084$ 93,859$ 11,225$ 2022 5/5 4 ALF 217 units Various cities in NC ALG Senior Jun-2026 7.25% 35,074$ 33,842$ 1,232$ (5) 5/5 — (6) OTH N/A Mills River, NC ALG Senior Jun-2026 7.25% 826 826 — 4 217 units 35,900$ 34,668$ 1,232$ 2023 1/5 1 MC 45 units Canton, NC ALG Senior Jan-2025 7.25% (7) 10,750$ 10,750$ —$ INITIAL DATE COMMITMENT ADDITIONAL CONTRACTUAL INITIAL RATE 4Q 2022 SUPPLEMENTAL REPORT INVESTMENT PROPERTY # OF YEAR TYPE UNITS/BEDS LOCATION OPERATOR INVESTMENT PURPOSE 2017 ILF/ALF/MC 110 units Cedarburg, WI Tealwood Senior Living Owned Real Estate 22,244$ 2,305$ 19,939$ 2017 ALF 87 units Spartanburg, SC ALG Senior Owned Real Estate 11,660 1,241 10,419 197 units 33,904 3,546 30,358 2018 ALF/MC 78 units Medford, OR Fields Senior Living (1) Owned Real Estate 18,978 1,163 17,888 2018 ILF 89 units Medford, OR Fields Senior Living (1) Owned Real Estate 14,651 2,907 11,744 167 units 33,629 4,070 29,632 2022 SNF 299 beds Various cities in FL PruittHealth (2) Owned Real Estate (2) 75,986 14,325 61,661 2023 ALF/MC 523 units Various cities in NC ALG Senior Owned Real Estate (3) 121,321 3,831 117,490 887 units/299 beds 264,840$ 25,772$ 239,141$ CONTRIBUTION LTCJOINT VENTURES INTEREST TOTAL NON-CONTROLLING CONTRIBUTIONCOMMITMENT (1) The initial cash rate is 7.00% increasing to 9.00% in year - four until the IRR is 8.00%.

After achieving an 8.00% IRR, the cash r ate drops to 8.00% with an IRR ranging between of 12.00% and 14.00% depending upon timing of redemption. Our investment represents 15.50% of the total investment. The property opened in December 2021 and occupancy was 80% at December 31,2022. We have the option to require the JV partner to purchase our preferred equity interest at any time between August 17, 2031 and December 31, 2036. (2) The initial cash rate is 8.00% with an IRR of 14.00%. Our investment represents 11.60% of the total estimated project cost. T he estimated project completion is 1Q23. Subsequent to December 31, 2022, we received a notice of intent to redeem our preferred equity investment. We anticipate receiving $1,675 of additional income in 2023 associated with th e redemption representing the 14.00% IRR. CONSOLIDATED JOINT VENTURES UNCONSOLIDATED JOINT VENTURES INVESTMENTS I 7 REAL ESTATE ACTIVITIES – JOINT VENTURES (DOLLAR AMOUNTS IN THOUSANDS) # OF PROPERTY # OF INVESTMENT PROPERTIES TYPE UNITS LOCATION OPERATOR TYPE 2020 1 ALF/MC 95 units Arlington, WA Fields Senior Living Preferred Equity 7.00% (1) 6,340$ 2020 1 UDP-ILF/ALF 267 units Vancouver, WA Koelsch Communities Preferred Equity 8.00% (2) 13,000 2 362 units 19,340$ YEAR COMMITMENTRETURN COMMITMENT INVESTMENT (1) Represents a single joint venture with ownership in two properties. (2) We entered into a JV with an affiliate of PruittHealth and the JV purchased three skilled nursing centers. In accordance with GA AP, the purchased assets are required to be presented as a financing receivable on our Consolidated Balance Sheets , since the JV acquired the centers through a sale - leaseback transaction with PruittHealth, subject to a lease agreement that co ntains a purchase option. See further discussion of the PruittHealth financing receivable on page 5. (3) On January 5, 2023, we entered into a JV with an affiliate of ALG Senior to purchase 11 assisted living/memory care communiti es. In accordance with GAAP, the purchased assets are required to be presented as a financing receivable on our Consolidated Balance Sheets , since the JV acquired the communities through a sale - leaseback transaction with an affiliate of ALG Senior, subject to a lease agreement that contains a purchase option. See further discussion of the ALG Senior financing receivable on page 5.
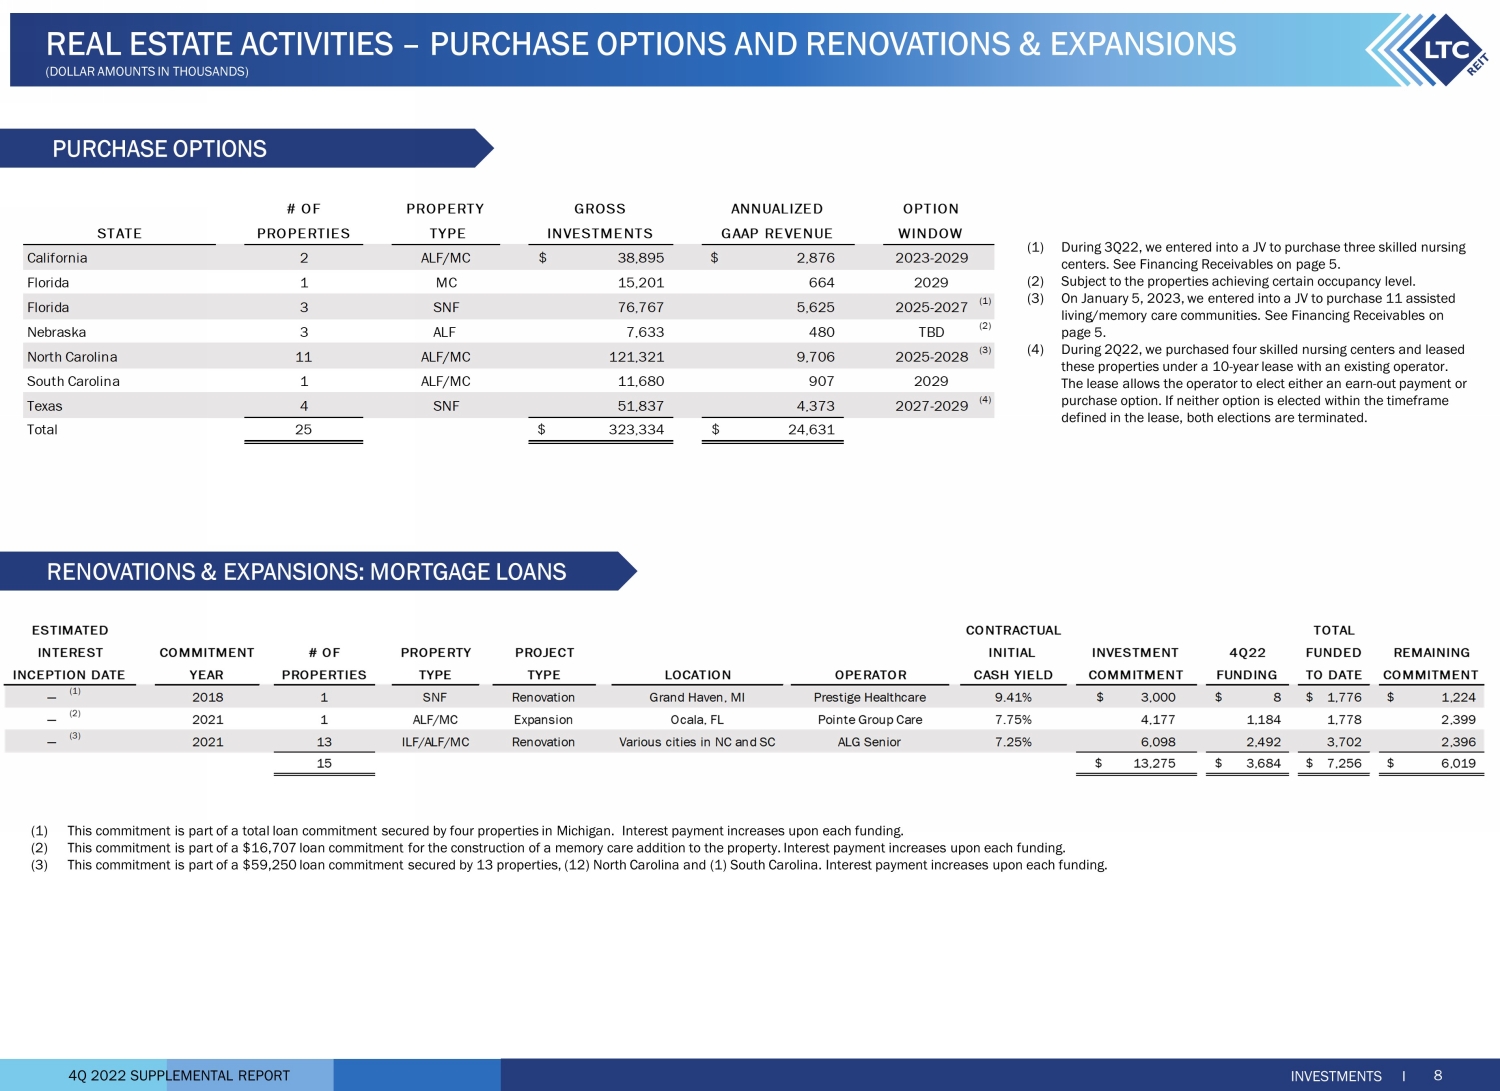
4Q 2022 SUPPLEMENTAL REPORT CONTRACTUAL TOTAL COMMITMENT # OF PROPERTY PROJECT INITIAL INVESTMENT 4Q22 FUNDED REMAINING YEAR PROPERTIES TYPE TYPE LOCATION OPERATOR CASH YIELD TO DATE COMMITMENT — (1) 2018 1 SNF Renovation Grand Haven, MI Prestige Healthcare 9.41% 3,000$ 8$ 1,776$ 1,224$ — (2) 2021 1 ALF/MC Expansion Ocala, FL Pointe Group Care 7.75% 4,177 1,184 1,778 2,399 — (3) 2021 13 ILF/ALF/MC Renovation Various cities in NC and SC ALG Senior 7.25% 6,098 2,492 3,702 2,396 15 13,275$ 3,684$ 7,256$ 6,019$ INCEPTION DATE COMMITMENT FUNDING INTEREST ESTIMATED (1) This commitment is part of a total loan commitment secured by four properties in Michigan. Interest payment increases upon e ach funding. (2) This commitment is part of a $16,707 loan commitment for the construction of a memory care addition to the property. Interest pa yment increases upon each funding. (3) This commitment is part of a $59,250 loan commitment secured by 13 properties, (12) North Carolina and (1) South Carolina. In ter est payment increases upon each funding. RENOVATIONS & EXPANSIONS: MORTGAGE LOANS INVESTMENTS I 8 REAL ESTATE ACTIVITIES – PURCHASE OPTIONS AND RENOVATIONS & EXPA NSIONS (DOLLAR AMOUNTS IN THOUSANDS) PURCHASE OPTIONS # OF PROPERTY GROSS OPTION STATE PROPERTIES TYPE INVESTMENTS WINDOW California 2 ALF/MC 38,895$ 2,876$ 2023-2029 Florida 1 MC 15,201 664 2029 Florida 3 SNF 76,767 5,625 2025-2027 (1) Nebraska 3 ALF 7,633 480 TBD (2) North Carolina 11 ALF/MC 121,321 9,706 2025-2028 (3) South Carolina 1 ALF/MC 11,680 907 2029 Texas 4 SNF 51,837 4,373 2027-2029 (4) Total 25 323,334$ 24,631$ ANNUALIZED GAAP REVENUE (1) During 3Q22, we entered into a JV to purchase three skilled nursing centers. See Financing Receivables on page 5. (2) Subject to the properties achieving certain occupancy level. (3) On January 5, 2023, we entered into a JV to purchase 11 assisted living/memory care communities. See Financing Receivables on page 5. (4) During 2Q22, we purchased four skilled nursing centers and leased these properties under a 10 - year lease with an existing operator. The lease allows the operator to elect either an earn - out payment or purchase option. If neither option is elected within the timeframe defined in the lease, both elections are terminated.
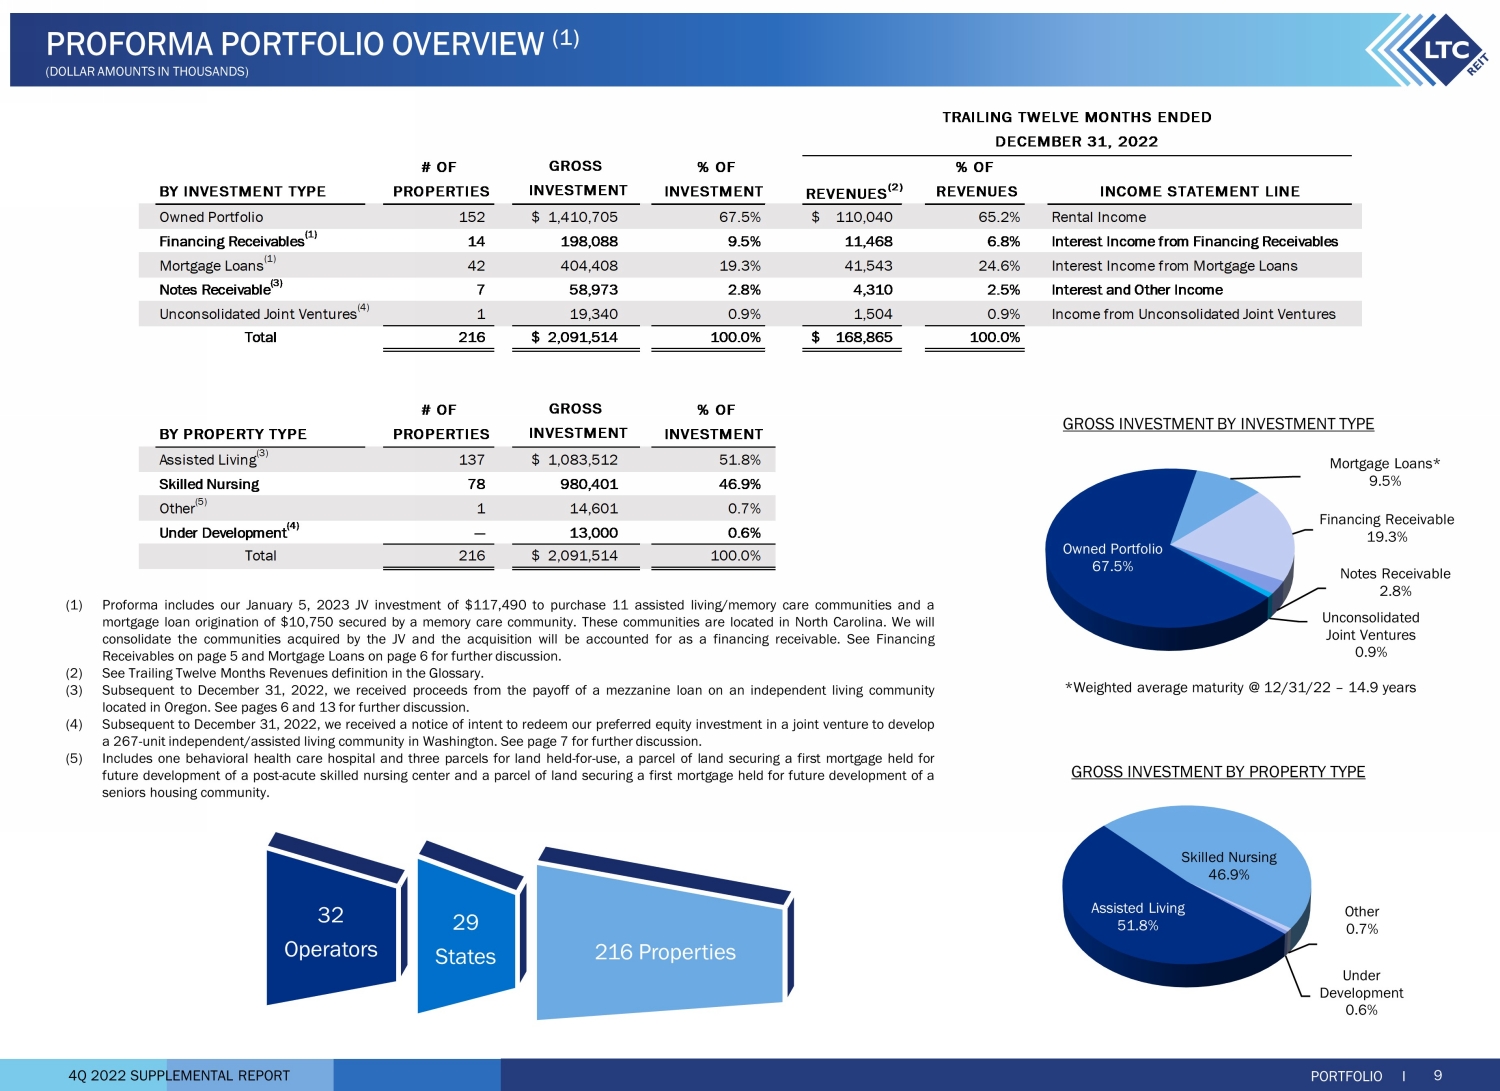
4Q 2022 SUPPLEMENTAL REPORT # OF % OF % OF BY INVESTMENT TYPE PROPERTIES INVESTMENT REVENUES (2) REVENUES INCOME STATEMENT LINE Owned Portfolio 152 1,410,705$ 67.5% 110,040$ 65.2% Rental Income Financing Receivables (1) 14 198,088 9.5% 11,468 6.8% Interest Income from Financing Receivables Mortgage Loans (1) 42 404,408 19.3% 41,543 24.6% Interest Income from Mortgage Loans Notes Receivable (3) 7 58,973 2.8% 4,310 2.5% Interest and Other Income Unconsolidated Joint Ventures (4) 1 19,340 0.9% 1,504 0.9% Income from Unconsolidated Joint Ventures Total 216 2,091,514$ 100.0% 168,865$ 100.0% # OF % OF BY PROPERTY TYPE PROPERTIES INVESTMENT Assisted Living (3) 137 1,083,512$ 51.8% Skilled Nursing 78 980,401 46.9% Other (5) 1 14,601 0.7% Under Development (4) — 13,000 0.6% Total 216 2,091,514$ 100.0% INVESTMENT GROSS INVESTMENT TRAILING TWELVE MONTHS ENDED DECEMBER 31, 2022 GROSS Owned Portfolio 67.5% Mortgage Loans* 9.5% Financing Receivable 19.3% Notes Receivable 2.8% Unconsolidated Joint Ventures 0.9% Assisted Living 51.8% Skilled Nursing 46.9% Other 0.7% Under Development 0.6% 32 Operators 29 States 216 Properties PORTFOLIO I 9 PROFORMA PORTFOLIO OVERVIEW (1) (DOLLAR AMOUNTS IN THOUSANDS) *Weighted average maturity @ 12/31/22 – 14.9 years GROSS INVESTMENT BY INVESTMENT TYPE GROSS INVESTMENT BY PROPERTY TYPE (1) Proforma includes our January 5 , 2023 JV investment of $ 117 , 490 to purchase 11 assisted living/memory care communities and a mortgage loan origination of $ 10 , 750 secured by a memory care community . These communities are located in North Carolina . We will consolidate the communities acquired by the JV and the acquisition will be accounted for as a financing receivable . See Financing Receivables on page 5 and Mortgage Loans on page 6 for further discussion . (2) See Trailing Twelve Months Revenues definition in the Glossary . (3) Subsequent to December 31 , 2022 , we received proceeds from the payoff of a mezzanine loan on an independent living community located in Oregon . See pages 6 and 13 for further discussion . (4) Subsequent to December 31 , 2022 , we received a notice of intent to redeem our preferred equity investment in a joint venture to develop a 267 - unit independent/assisted living community in Washington . See page 7 for further discussion . (5) Includes one behavioral health care hospital and three parcels for land held - for - use, a parcel of land securing a first mortgage held for future development of a post - acute skilled nursing center and a parcel of land securing a first mortgage held for future development of a seniors housing community .
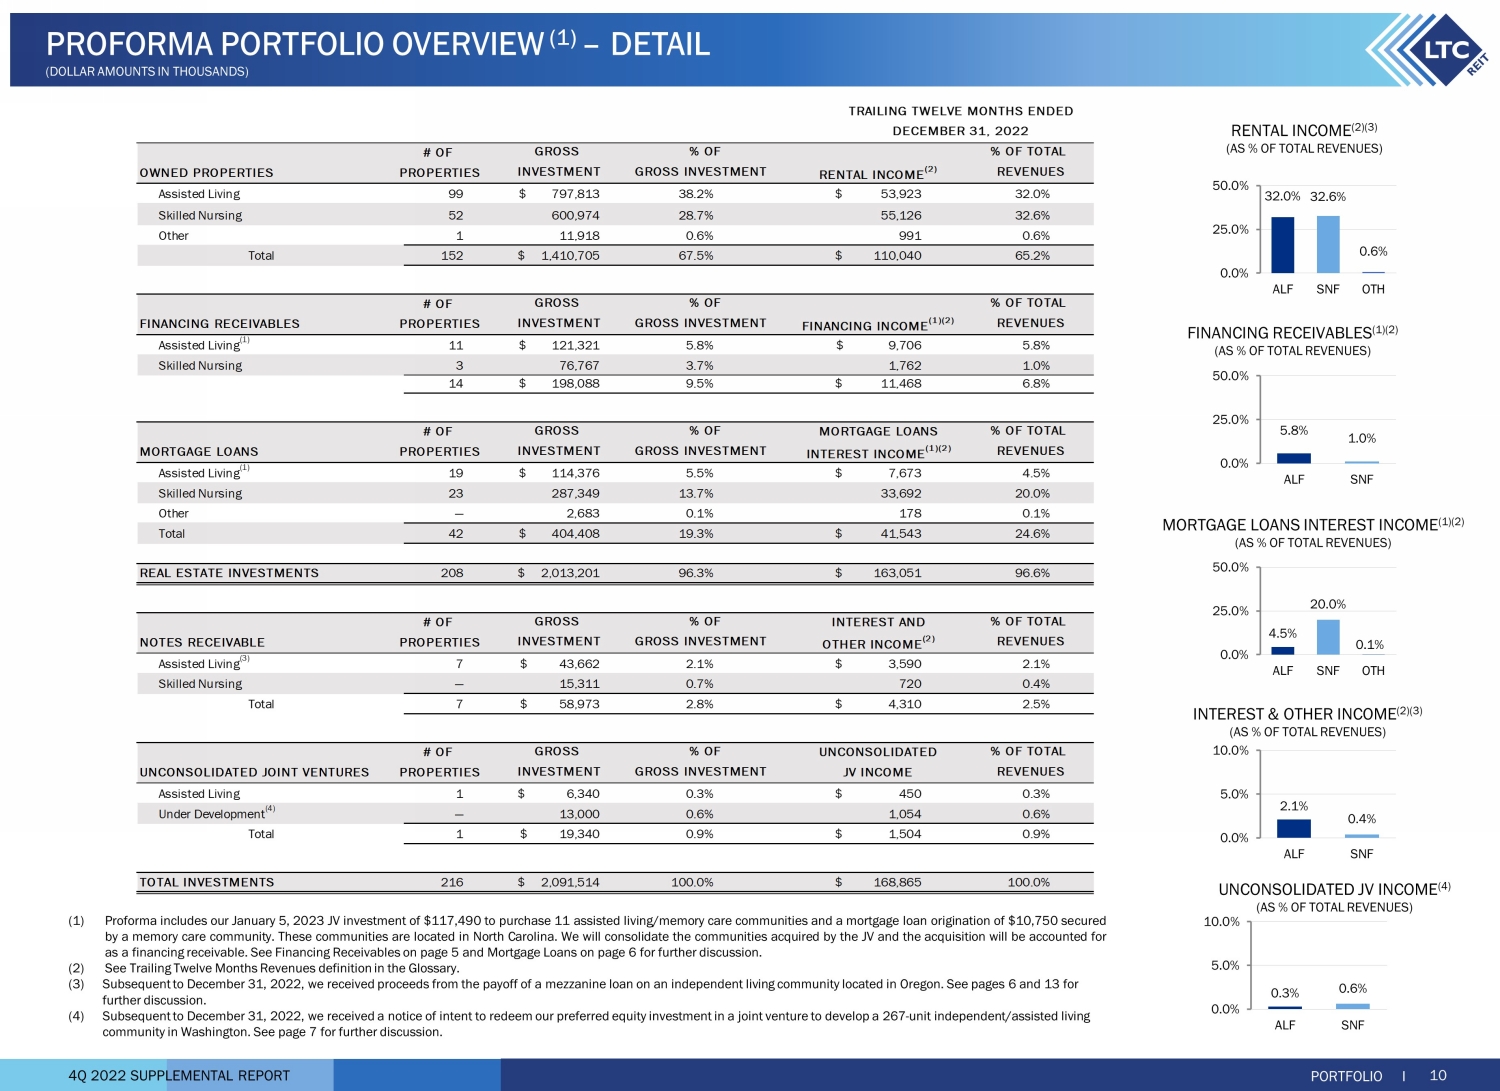
4Q 2022 SUPPLEMENTAL REPORT PORTFOLIO I 10 PROFORMA PORTFOLIO OVERVIEW (1) – DETAIL (DOLLAR AMOUNTS IN THOUSANDS) # OF OWNED PROPERTIES PROPERTIES RENTAL INCOME (2) Assisted Living 99 797,813$ 38.2% 53,923$ 32.0% Skilled Nursing 52 600,974 28.7% 55,126 32.6% Other 1 11,918 0.6% 991 0.6% Total 152 1,410,705$ 67.5% 110,040$ 65.2% # OF FINANCING RECEIVABLES PROPERTIES FINANCING INCOME (1)(2) Assisted Living (1) 11 121,321$ 5.8% 9,706$ 5.8% Skilled Nursing 3 76,767 3.7% 1,762 1.0% 14 198,088$ 9.5% 11,468$ 6.8% # OF MORTGAGE LOANS MORTGAGE LOANS PROPERTIES INTEREST INCOME (1)(2) Assisted Living (1) 19 114,376$ 5.5% 7,673$ 4.5% Skilled Nursing 23 287,349 13.7% 33,692 20.0% Other — 2,683 0.1% 178 0.1% Total 42 404,408$ 19.3% 41,543$ 24.6% REAL ESTATE INVESTMENTS 208 2,013,201$ 96.3% 163,051$ 96.6% # OF INTEREST AND NOTES RECEIVABLE PROPERTIES OTHER INCOME (2) Assisted Living (3) 7 43,662$ 2.1% 3,590$ 2.1% Skilled Nursing — 15,311 0.7% 720 0.4% Total 7 58,973$ 2.8% 4,310$ 2.5% # OF UNCONSOLIDATED UNCONSOLIDATED JOINT VENTURES PROPERTIES JV INCOME Assisted Living 1 6,340$ 0.3% 450$ 0.3% Under Development (4) — 13,000 0.6% 1,054 0.6% Total 1 19,340$ 0.9% 1,504$ 0.9% TOTAL INVESTMENTS 216 2,091,514$ 100.0% 168,865$ 100.0% GROSS % OF % OF TOTAL INVESTMENT GROSS INVESTMENT REVENUES INVESTMENT GROSS GROSS INVESTMENT GROSS INVESTMENT % OF GROSS INVESTMENT % OF INVESTMENT TRAILING TWELVE MONTHS ENDED DECEMBER 31, 2022 GROSS % OF GROSS INVESTMENT REVENUES % OF TOTAL GROSS INVESTMENT % OF GROSS INVESTMENT REVENUES % OF TOTAL REVENUES % OF TOTAL REVENUES % OF TOTAL (1) Proforma includes our January 5 , 2023 JV investment of $ 117 , 490 to purchase 11 assisted living/memory care communities and a mortgage loan origination of $ 10 , 750 secured by a memory care community . These communities are located in North Carolina . We will consolidate the communities acquired by the JV and the acquisition will be accounted for as a financing receivable . See Financing Receivables on page 5 and Mortgage Loans on page 6 for further discussion . (2) See Trailing Twelve Months Revenues definition in the Glossary . (3) Subsequent to December 31, 2022, we received proceeds from the payoff of a mezzanine loan on an independent living community loc ated in Oregon. See pages 6 and 13 for further discussion. (4) Subsequent to December 31, 2022, we received a notice of intent to redeem our preferred equity investment in a joint venture to develop a 267 - unit independent/assisted living community in Washington. See page 7 for further discussion. 32.0% 32.6% 0.6% 0.0% 25.0% 50.0% ALF SNF OTH RENTAL INCOME (2)(3) (AS % OF TOTAL REVENUES) MORTGAGE LOANS INTEREST INCOME (1)(2) (AS % OF TOTAL REVENUES) INTEREST & OTHER INCOME (2)(3) (AS % OF TOTAL REVENUES) UNCONSOLIDATED JV INCOME (4) (AS % OF TOTAL REVENUES) 4.5% 20.0% 0.1% 0.0% 25.0% 50.0% ALF SNF OTH 2.1% 0.4% 0.0% 5.0% 10.0% ALF SNF 0.3% 0.6% 0.0% 5.0% 10.0% ALF SNF 5.8% 1.0% 0.0% 25.0% 50.0% ALF SNF FINANCING RECEIVABLES (1)(2) (AS % OF TOTAL REVENUES)
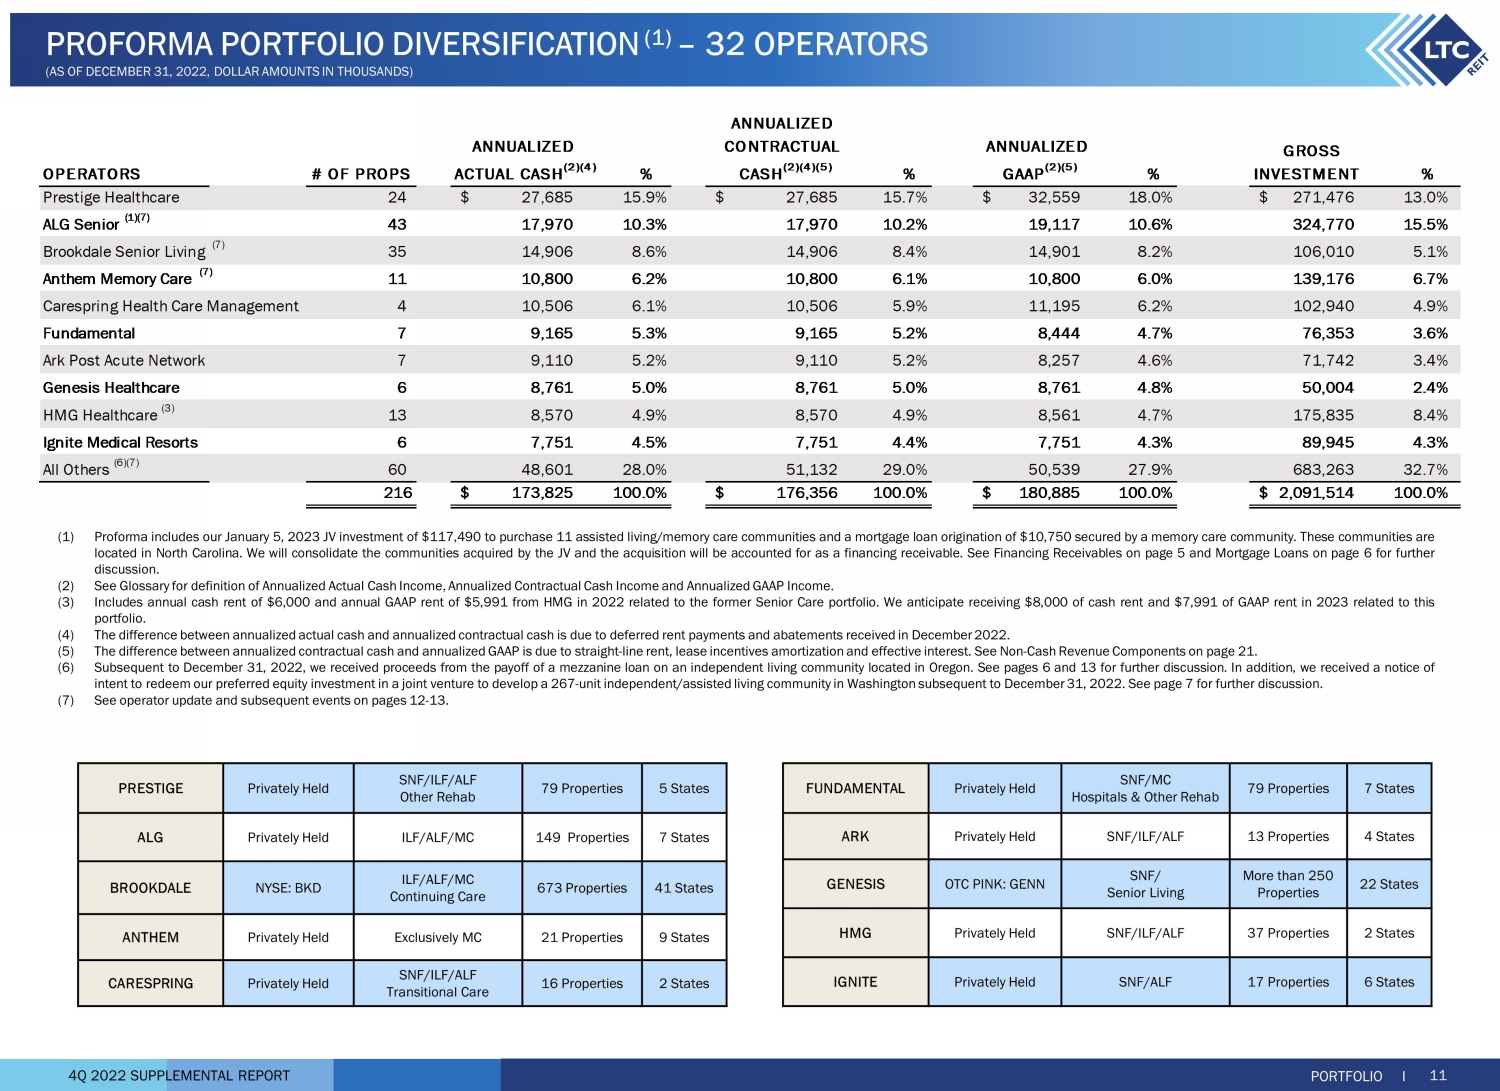
4Q 2022 SUPPLEMENTAL REPORT OPERATORS # OF PROPS % % % GROSS INVESTMENT % Prestige Healthcare 24 27,685$ 15.9% 27,685$ 15.7% 32,559$ 18.0% 271,476$ 13.0% ALG Senior (1)(7) 43 17,970 10.3% 17,970 10.2% 19,117 10.6% 324,770 15.5% Brookdale Senior Living (7) 35 14,906 8.6% 14,906 8.4% 14,901 8.2% 106,010 5.1% Anthem Memory Care 11 10,800 6.2% 10,800 6.1% 10,800 6.0% 139,176 6.7% Carespring Health Care Management 4 10,506 6.1% 10,506 5.9% 11,195 6.2% 102,940 4.9% Fundamental 7 9,165 5.3% 9,165 5.2% 8,444 4.7% 76,353 3.6% Ark Post Acute Network 7 9,110 5.2% 9,110 5.2% 8,257 4.6% 71,742 3.4% Genesis Healthcare 6 8,761 5.0% 8,761 5.0% 8,761 4.8% 50,004 2.4% HMG Healthcare (3) 13 8,570 4.9% 8,570 4.9% 8,561 4.7% 175,835 8.4% Ignite Medical Resorts 6 7,751 4.5% 7,751 4.4% 7,751 4.3% 89,945 4.3% All Others (6)(7) 60 48,601 28.0% 51,132 29.0% 50,539 27.9% 683,263 32.7% 216 173,825$ 100.0% 176,356$ 100.0% 180,885$ 100.0% 2,091,514$ 100.0% (7) ANNUALIZED GAAP (2)(5) ANNUALIZED ACTUAL CASH (2)(4) ANNUALIZED CONTRACTUAL CASH (2)(4)(5) PORTFOLIO I 11 PROFORMA PORTFOLIO DIVERSIFICATION (1) – 32 OPERATORS (AS OF DECEMBER 31, 2022, DOLLAR AMOUNTS IN THOUSANDS) FUNDAMENTAL Privately Held SNF/MC Hospitals & Other Rehab 79 Properties 7 States ARK Privately Held SNF/ILF/ALF 13 Properties 4 States GENESIS OTC PINK: GENN SNF/ Senior Living More than 250 Properties 22 States HMG Privately Held SNF/ILF/ALF 37 Properties 2 States IGNITE Privately Held SNF/ALF 17 Properties 6 States PRESTIGE Privately Held SNF/ILF/ALF Other Rehab 79 Properties 5 States ALG Privately Held ILF/ALF/MC 149 Properties 7 States BROOKDALE NYSE: BKD ILF/ALF/MC Continuing Care 673 Properties 41 States ANTHEM Privately Held Exclusively MC 21 Properties 9 States CARESPRING Privately Held SNF/ILF/ALF Transitional Care 16 Properties 2 States (1) Proforma includes our January 5 , 2023 JV investment of $ 117 , 490 to purchase 11 assisted living/memory care communities and a mortgage loan origination of $ 10 , 750 secured by a memory care community . These communities are located in North Carolina . We will consolidate the communities acquired by the JV and the acquisition will be accounted for as a financing receivable . See Financing Receivables on page 5 and Mortgage Loans on page 6 for further discussion . (2) See Glossary for definition of Annualized Actual Cash Income, Annualized Contractual Cash Income and Annualized GAAP Income . (3) Includes annual cash rent of $ 6 , 000 and annual GAAP rent of $ 5 , 991 from HMG in 2022 related to the former Senior Care portfolio . We anticipate receiving $ 8 , 000 of cash rent and $ 7 , 991 of GAAP rent in 2023 related to this portfolio . (4) The difference between annualized actual cash and annualized contractual cash is due to deferred rent payments and abatements received in December 2022 . (5) The difference between annualized contractual cash and annualized GAAP is due to straight - line rent, lease incentives amortization and effective interest . See Non - Cash Revenue Components on page 21 . (6) Subsequent to December 31 , 2022 , we received proceeds from the payoff of a mezzanine loan on an independent living community located in Oregon . See pages 6 and 13 for further discussion . In addition, we received a notice of intent to redeem our preferred equity investment in a joint venture to develop a 267 - unit independent/assisted living community in Washington subsequent to December 31 , 2022 . See page 7 for further discussion . (7) See operator update and subsequent events on pages 12 - 13 .
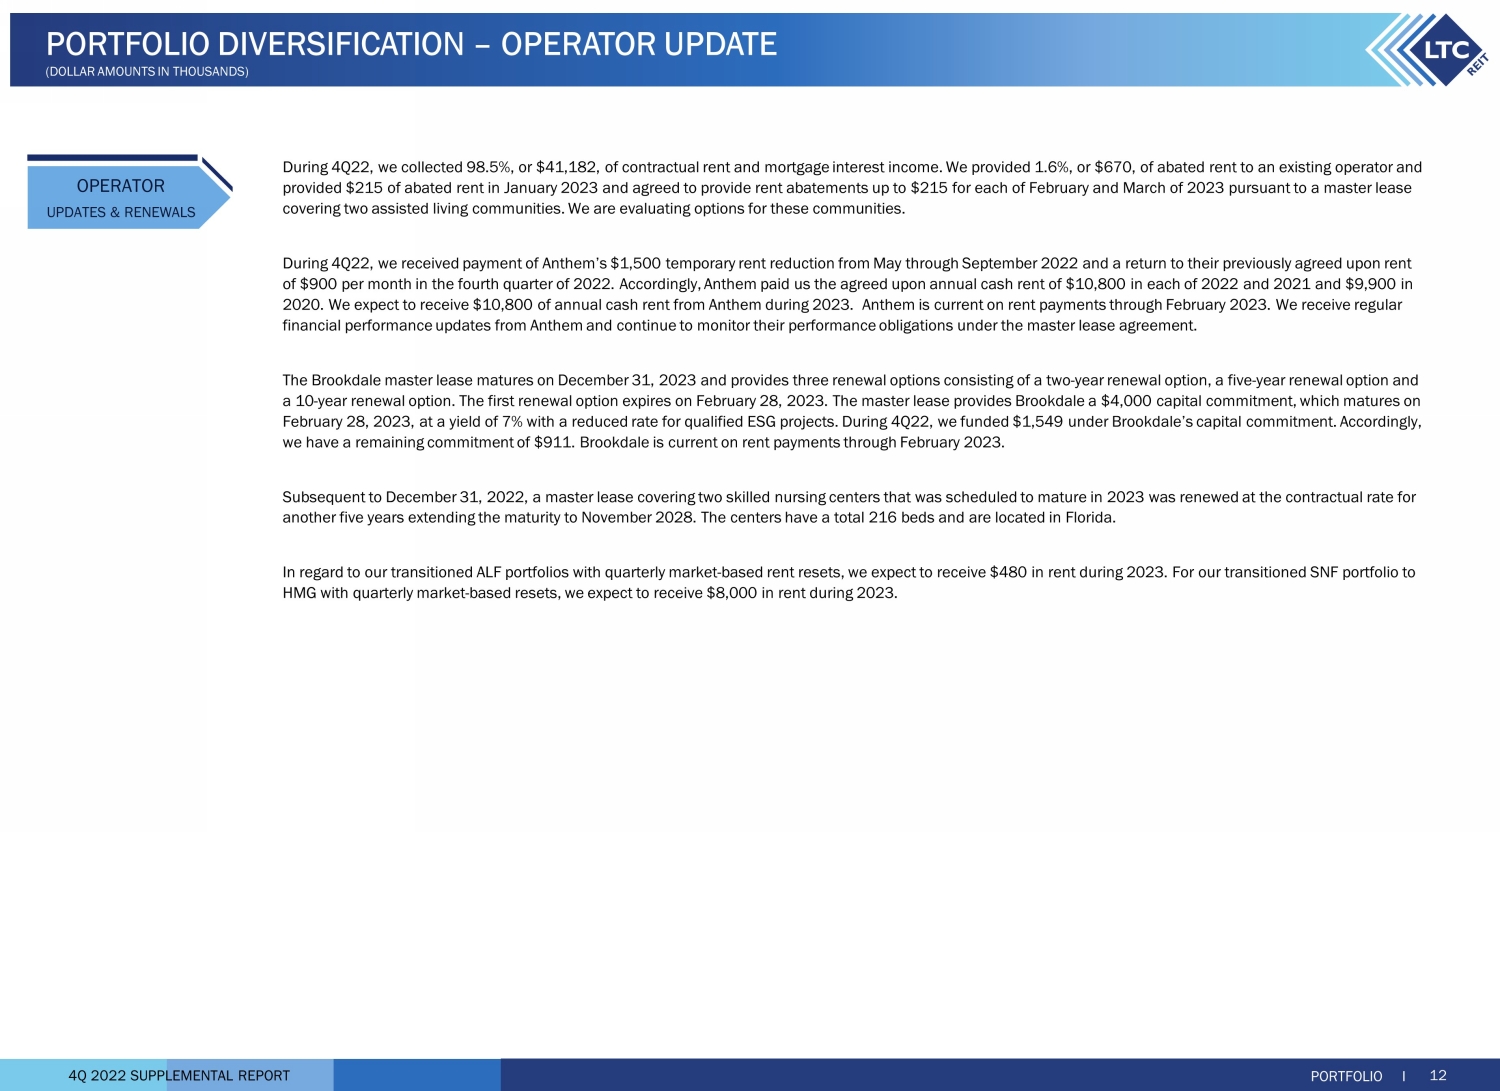
4Q 2022 SUPPLEMENTAL REPORT PORTFOLIO I 12 OPERATOR UPDATES & RENEWALS During 4Q22, we collected 98.5%, or $41,182, of contractual rent and mortgage interest income. We provided 1.6%, or $670, of aba ted rent to an existing operator and provided $215 of abated rent in January 2023 and agreed to provide rent abatements up to $215 for each of February and March of 2023 pursuant to a master lease covering two assisted living communities. We are evaluating options for these communities. During 4Q22, we received payment of Anthem’s $1,500 temporary rent reduction from May through September 2022 and a return to the ir previously agreed upon rent of $900 per month in the fourth quarter of 2022. Accordingly, Anthem paid us the agreed upon annual cash rent of $10,800 in e ach of 2022 and 2021 and $9,900 in 2020. We expect to receive $10,800 of annual cash rent from Anthem during 2023. Anthem is current on rent payments through F ebr uary 2023. We receive regular financial performance updates from Anthem and continue to monitor their performance obligations under the master lease agreem ent . The Brookdale master lease matures on December 31, 2023 and provides three renewal options consisting of a two - year renewal opti on, a five - year renewal option and a 10 - year renewal option. The first renewal option expires on February 28, 2023. The master lease provides Brookdale a $4,000 ca pital commitment, which matures on February 28, 2023, at a yield of 7% with a reduced rate for qualified ESG projects. During 4Q22, we funded $1,549 under Brook dal e’s capital commitment. Accordingly, we have a remaining commitment of $911. Brookdale is current on rent payments through February 2023. Subsequent to December 31, 2022, a master lease covering two skilled nursing centers that was scheduled to mature in 2023 was renewed at the contractual rate fo r another five years extending the maturity to November 2028. The centers have a total 216 beds and are located in Florida. In regard to our transitioned ALF portfolios with quarterly market - based rent resets, we expect to receive $480 in rent during 2 023. For our transitioned SNF portfolio to HMG with quarterly market - based resets, we expect to receive $8,000 in rent during 2023. PORTFOLIO DIVERSIFICATION – OPERATOR UPDATE (DOLLAR AMOUNTS IN THOUSANDS)
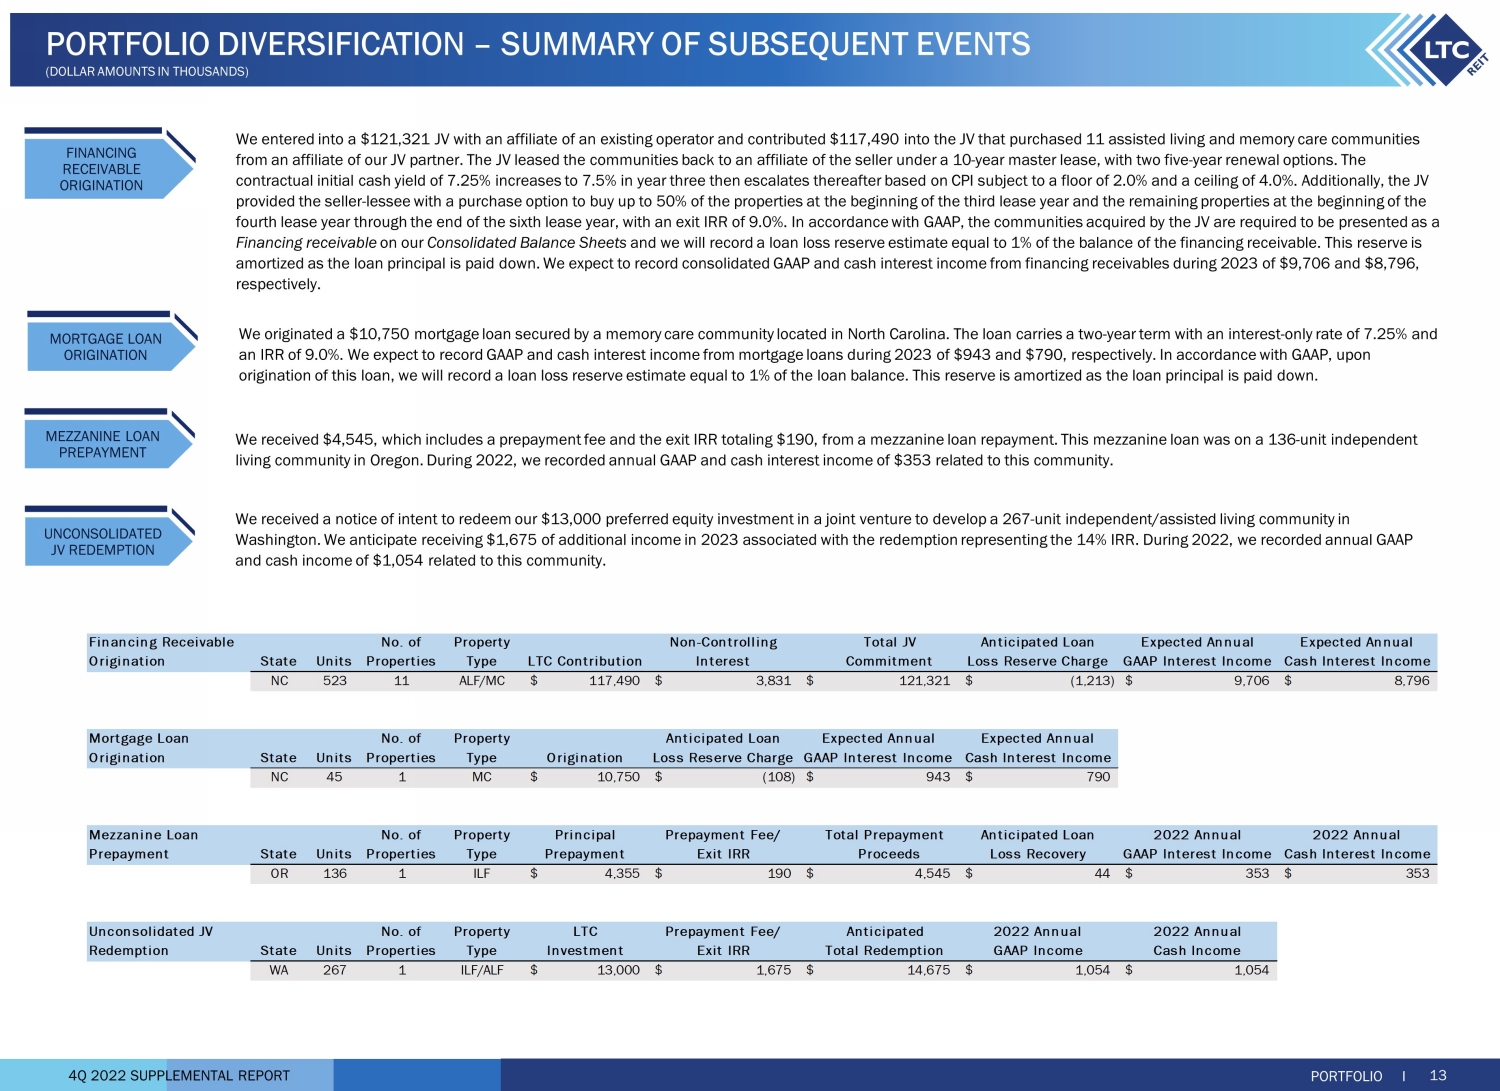
4Q 2022 SUPPLEMENTAL REPORT PORTFOLIO I 13 PORTFOLIO DIVERSIFICATION – SUMMARY OF SUBSEQUENT EVENTS (DOLLAR AMOUNTS IN THOUSANDS) We originated a $10,750 mortgage loan secured by a memory care community located in North Carolina. The loan carries a two - year term with an interest - only rate of 7.25% and an IRR of 9.0%. We expect to record GAAP and cash interest income from mortgage loans during 2023 of $943 and $790, respectiv ely . In accordance with GAAP, upon origination of this loan, we will record a loan loss reserve estimate equal to 1% of the loan balance. This reserve is amorti zed as the loan principal is paid down. We received $4,545, which includes a prepayment fee and the exit IRR totaling $190, from a mezzanine loan repayment. This mez zan ine loan was on a 136 - unit independent living community in Oregon. During 2022, we recorded annual GAAP and cash interest income of $353 related to this community. We received a notice of intent to redeem our $13,000 preferred equity investment in a joint venture to develop a 267 - unit indepe ndent/assisted living community in Washington. We anticipate receiving $1,675 of additional income in 2023 associated with the redemption rep resenting the 14% IRR. During 2022, we recorded annual GAAP and cash income of $1,054 related to this community. MORTGAGE LOAN ORIGINATION MEZZANINE LOAN PREPAYMENT UNCONSOLIDATED JV REDEMPTION We entered into a $121,321 JV with an affiliate of an existing operator and contributed $117,490 into the JV that purchased 11 a ssi sted living and memory care communities from an affiliate of our JV partner. The JV leased the communities back to an affiliate of the seller under a 10 - year master lea se, with two five - year renewal options. The contractual initial cash yield of 7.25% increases to 7.5% in year three then escalates thereafter based on CPI subject to a f loo r of 2.0% and a ceiling of 4.0%. Additionally, the JV provided the seller - lessee with a purchase option to buy up to 50% of the properties at the beginning of the third lease year an d the remaining properties at the beginning of the fourth lease year through the end of the sixth lease year, with an exit IRR of 9.0%. In accordance with GAAP, the communities ac quired by the JV are required to be presented as a Financing receivable on our Consolidated Balance Sheets and we will record a loan loss reserve estimate equal to 1% of the balance of the financing receivable. This reserve is amortized as the loan principal is paid down. We expect to record consolidated GAAP and cash interest income from financing r ece ivables during 2023 of $9,706 and $8,796, respectively. FINANCING RECEIVABLE ORIGINATION Financing Receivable No. of Property Non-Controlling Total JV Anticipated Loan Expected Annual Expected Annual Origination State Units Properties Type LTC Contribution Interest Commitment Loss Reserve Charge GAAP Interest Income Cash Interest Income NC 523 11 ALF/MC 117,490$ 3,831$ 121,321$ (1,213)$ 9,706$ 8,796$ Mortgage Loan No. of Property Anticipated Loan Expected Annual Expected Annual Origination State Units Properties Type Origination Loss Reserve Charge GAAP Interest Income Cash Interest Income NC 45 1 MC 10,750$ (108)$ 943$ 790$ Mezzanine Loan No. of Property Principal Prepayment Fee/ Total Prepayment Anticipated Loan 2022 Annual 2022 Annual Prepayment State Units Properties Type Prepayment Exit IRR Proceeds Loss Recovery GAAP Interest Income Cash Interest Income OR 136 1 ILF 4,355$ 190$ 4,545$ 44$ 353$ 353$ Unconsolidated JV No.
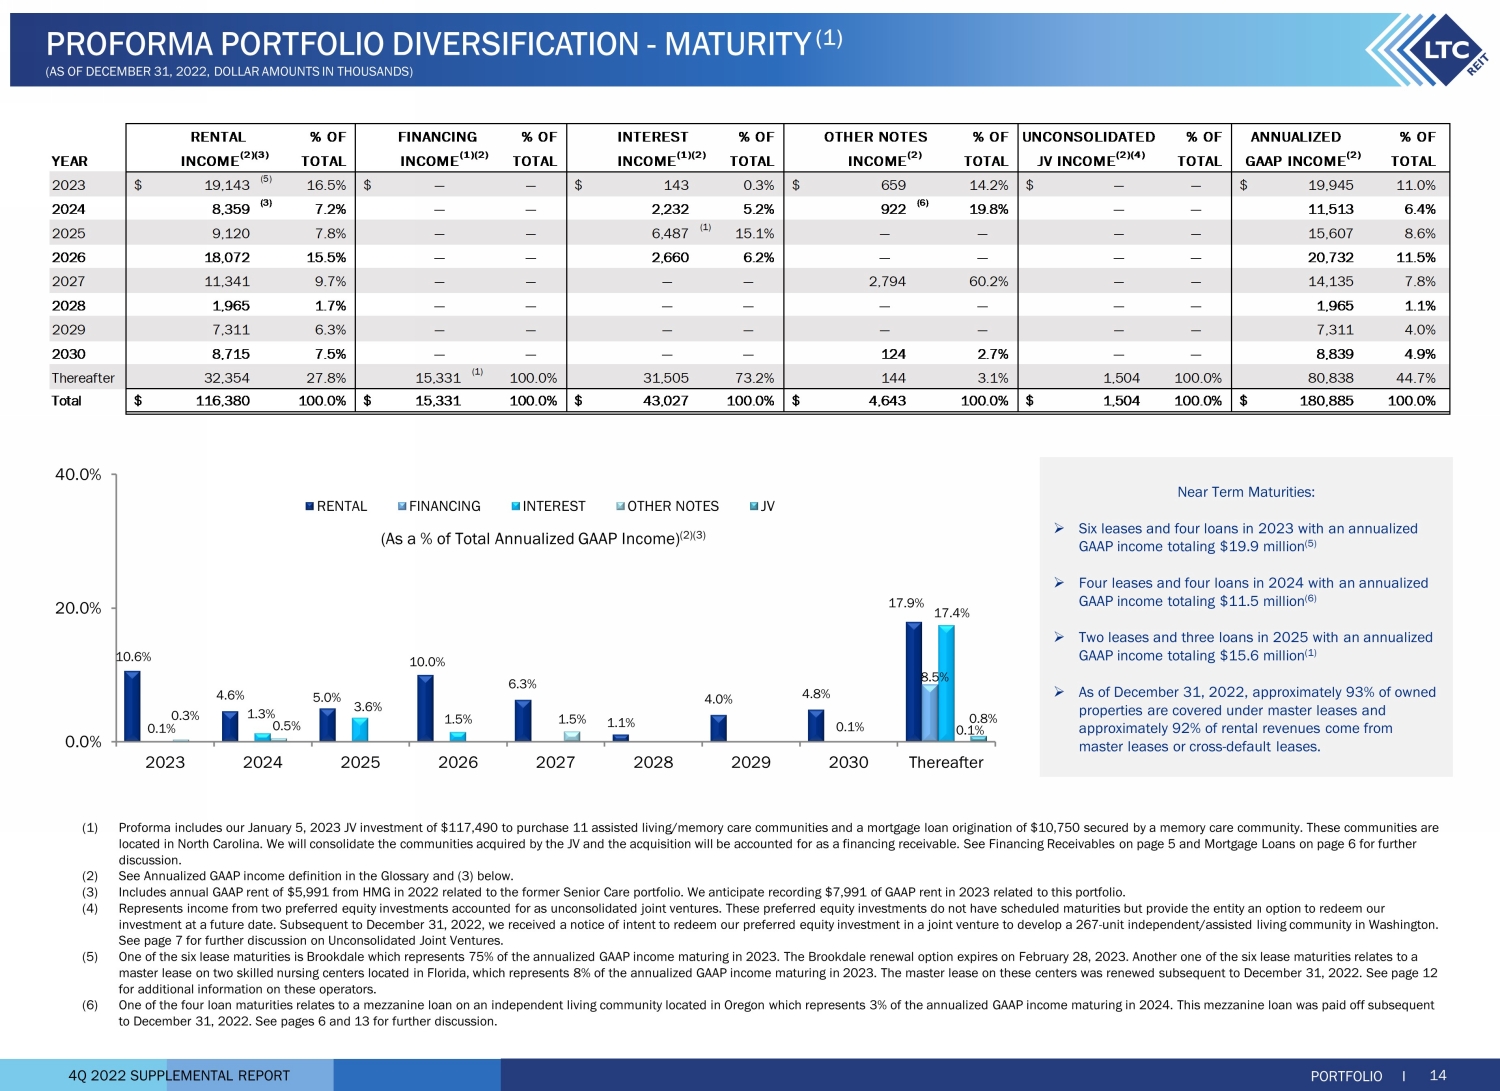
of Property LTC Prepayment Fee/ Anticipated 2022 Annual 2022 Annual Redemption State Units Properties Type Investment Exit IRR Total Redemption GAAP Income Cash Income WA 267 1 ILF/ALF 13,000$ 1,675$ 14,675$ 1,054$ 1,054$ 4Q 2022 SUPPLEMENTAL REPORT 10.6% 4.6% 5.0% 10.0% 6.3% 1.1% 4.0% 4.8% 17.9% 8.5% 0.1% 1.3% 3.6% 1.5% 17.4% 0.3% 0.5% 1.5% 0.1% 0.1% 0.8% 0.0% 20.0% 40.0% 2023 2024 2025 2026 2027 2028 2029 2030 Thereafter RENTAL FINANCING INTEREST OTHER NOTES JV (As a % of Total Annualized GAAP Income) (2)(3) Near Term Maturities: » Six leases and four loans in 2023 with an annualized GAAP income totaling $19.9 million (5) » Four leases and four loans in 2024 with an annualized GAAP income totaling $11.5 million (6) » Two leases and three loans in 2025 with an annualized GAAP income totaling $15.6 million (1) » As of December 31, 2022, approximately 93% of owned properties are covered under master leases and approximately 92% of rental revenues come from master leases or cross - default leases. PROFORMA PORTFOLIO DIVERSIFICATION - MATURITY (1) (AS OF DECEMBER 31, 2022, DOLLAR AMOUNTS IN THOUSANDS) % OF % OF INTEREST % OF % OF % OF ANNUALIZED % OF YEAR TOTAL TOTAL TOTAL TOTAL TOTAL TOTAL 2023 19,143$ (5) 16.5% —$ — 143$ 0.3% 659$ 14.2% —$ — 19,945$ 11.0% 2024 8,359 (3) 7.2% — — 2,232 5.2% 922 (6) 19.8% — — 11,513 6.4% 2025 9,120 7.8% — — 6,487 (1) 15.1% — — — — 15,607 8.6% 2026 18,072 15.5% — — 2,660 6.2% — — — — 20,732 11.5% 2027 11,341 9.7% — — — — 2,794 60.2% — — 14,135 7.8% 2028 1,965 1.7% — — — — — — — — 1,965 1.1% 2029 7,311 6.3% — — — — — — — — 7,311 4.0% 2030 8,715 7.5% — — — — 124 2.7% — — 8,839 4.9% Thereafter 32,354 27.8% 15,331 (1) 100.0% 31,505 73.2% 144 3.1% 1,504 100.0% 80,838 44.7% Total 116,380$ 100.0% 15,331$ 100.0% 43,027$ 100.0% 4,643$ 100.0% 1,504$ 100.0% 180,885$ 100.0% RENTAL UNCONSOLIDATED INCOME (2) OTHER NOTES INCOME (2)(3) JV INCOME (2)(4) GAAP INCOME (2) FINANCING INCOME (1)(2) INCOME (1)(2) PORTFOLIO I 14 (1) Proforma includes our January 5, 2023 JV investment of $117,490 to purchase 11 assisted living/memory care communities and a mor tgage loan origination of $10,750 secured by a memory care community. These communities are located in North Carolina. We will consolidate the communities acquired by the JV and the acquisition will be accounted for a s a financing receivable. See Financing Receivables on page 5 and Mortgage Loans on page 6 for further discussion. (2) See Annualized GAAP income definition in the Glossary and (3) below. (3) Includes annual GAAP rent of $5,991 from HMG in 2022 related to the former Senior Care portfolio. We anticipate recording $7, 991 of GAAP rent in 2023 related to this portfolio. (4) Represents income from two preferred equity investments accounted for as unconsolidated joint ventures. These preferred equit y i nvestments do not have scheduled maturities but provide the entity an option to redeem our investment at a future date. Subsequent to December 31, 2022, we received a notice of intent to redeem our preferred equity i nve stment in a joint venture to develop a 267 - unit independent/assisted living community in Washington. See page 7 for further discussion on Unconsolidated Joint Ventures. (5) One of the six lease maturities is Brookdale which represents 75% of the annualized GAAP income maturing in 2023. The Brookda le renewal option expires on February 28, 2023. Another one of the six lease maturities relates to a master lease on two skilled nursing centers located in Florida, which represents 8% of the annualized GAAP income maturing in 20 23. The master lease on these centers was renewed subsequent to December 31, 2022. See page 12 for additional information on these operators. (6) One of the four loan maturities relates to a mezzanine loan on an independent living community located in Oregon which repres ent s 3% of the annualized GAAP income maturing in 2024. This mezzanine loan was paid off subsequent to December 31, 2022. See pages 6 and 13 for further discussion.
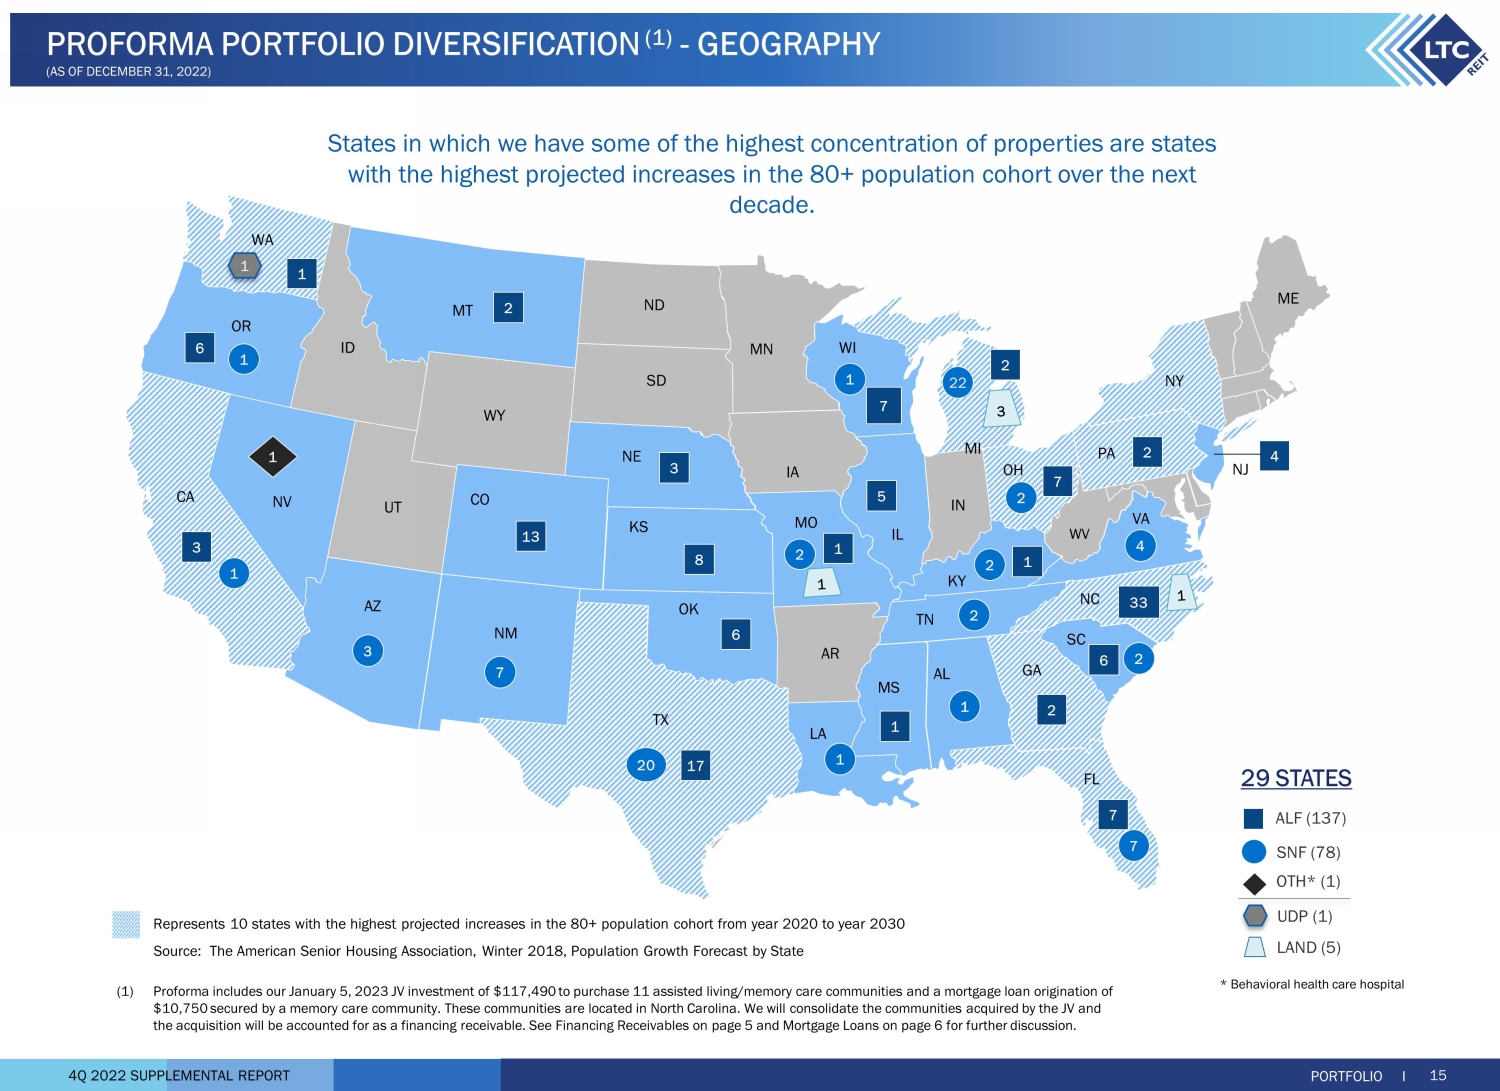
4Q 2022 SUPPLEMENTAL REPORT States in which we have some of the highest concentration of properties are states with the highest projected increases in the 80+ population cohort over the next decade. PORTFOLIO I 15 PROFORMA PORTFOLIO DIVERSIFICATION (1) - GEOGRAPHY (AS OF DECEMBER 31, 2022) 29 STATES * Behavioral health care hospital SNF (78) ALF (137) OTH* (1) LAND (5) UDP (1) CA WA ME NV WY IL AR WV ND NY OR AZ NM TX UT ID MT SD NE KS OK MS MN WI FL AL GA SC TN MO IA IN OH PA NJ NC VA CO KY 7 20 1 1 3 1 2 4 2 1 3 6 17 33 2 7 7 3 8 4 13 7 6 1 22 2 5 7 1 1 1 2 1 2 6 2 2 MI 1 1 LA 2 (1) Proforma includes our January 5, 2023 JV investment of $117,490 to purchase 11 assisted living/memory care communities and a mor tgage loan origination of $10,750 secured by a memory care community. These communities are located in North Carolina. We will consolidate the communit ies acquired by the JV and the acquisition will be accounted for as a financing receivable. See Financing Receivables on page 5 and Mortgage Loans on pa ge 6 for further discussion. Represents 10 states with the highest projected increases in the 80+ population cohort from year 2020 to year 2030 Source: The American Senior Housing Association, Winter 2018, Population Growth Forecast by State 4Q 2022 SUPPLEMENTAL REPORT 46.0% 18.5% 25.3% 7.1% 3.1% 0.0% 20.0% 40.0% 60.0% 80.0% MSAs 1-31 MSAs 32-100 MSAs > 100 Cities in Micro-SA Cities not in MSA or Micro-SA 20 years 15 years 0 10 20 30 40 Skilled Nursing Assisted Living Years (1) The MSA rank by population as of July 1, 2021, as estimated by the United States Census Bureau.
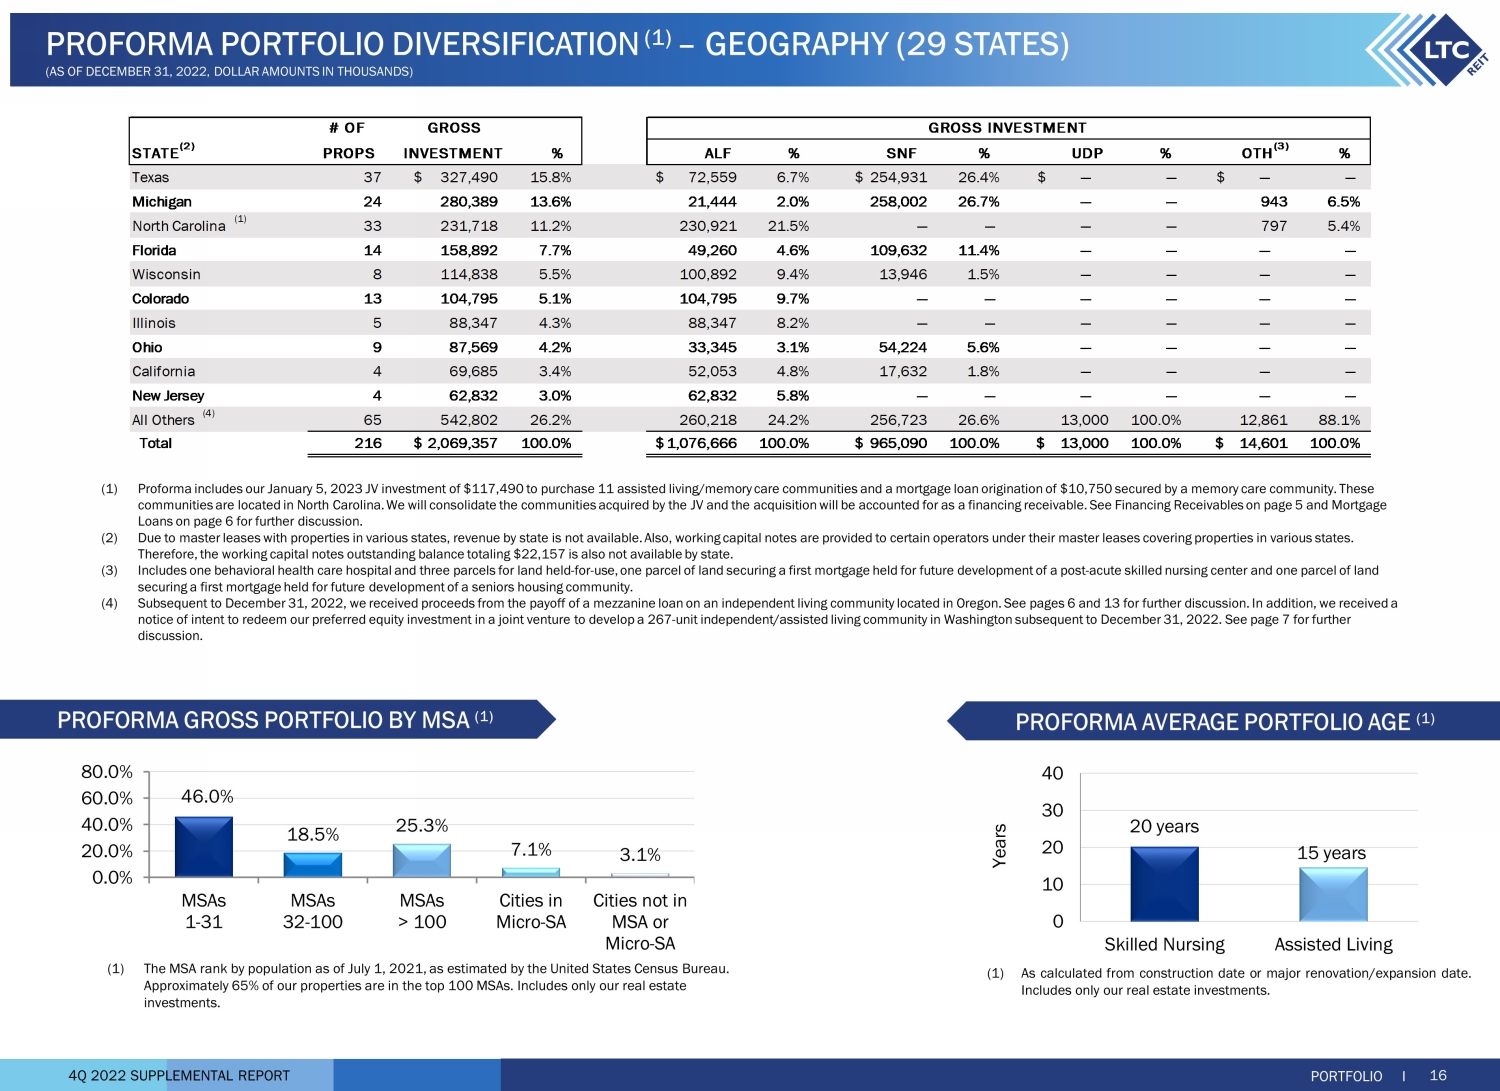
Approximately 65% of our properties are in the top 100 MSAs. Includes only our real estate investments. (1) As calculated from construction date or major renovation/expansion date . Includes only our real estate investments . PROFORMA GROSS PORTFOLIO BY MSA (1) PROFORMA AVERAGE PORTFOLIO AGE (1) PORTFOLIO I 16 PROFORMA PORTFOLIO DIVERSIFICATION (1) – GEOGRAPHY (29 STATES) (AS OF DECEMBER 31, 2022, DOLLAR AMOUNTS IN THOUSANDS) # OF STATE (2) PROPS % ALF % SNF % UDP % % Texas 37 327,490$ 15.8% 72,559$ 6.7% 254,931$ 26.4% —$ — —$ — Michigan 24 280,389 13.6% 21,444 2.0% 258,002 26.7% — — 943 6.5% North Carolina (1) 33 231,718 11.2% 230,921 21.5% — — — — 797 5.4% Florida 14 158,892 7.7% 49,260 4.6% 109,632 11.4% — — — — Wisconsin 8 114,838 5.5% 100,892 9.4% 13,946 1.5% — — — — Colorado 13 104,795 5.1% 104,795 9.7% — — — — — — Illinois 5 88,347 4.3% 88,347 8.2% — — — — — — Ohio 9 87,569 4.2% 33,345 3.1% 54,224 5.6% — — — — California 4 69,685 3.4% 52,053 4.8% 17,632 1.8% — — — — New Jersey 4 62,832 3.0% 62,832 5.8% — — — — — — All Others (4) 65 542,802 26.2% 260,218 24.2% 256,723 26.6% 13,000 100.0% 12,861 88.1% Total 216 2,069,357$ 100.0% 1,076,666$ 100.0% 965,090$ 100.0% 13,000$ 100.0% 14,601$ 100.0% OTH (3) INVESTMENT GROSS INVESTMENTGROSS (1) Proforma includes our January 5, 2023 JV investment of $117,490 to purchase 11 assisted living/memory care communities and a mor tgage loan origination of $10,750 secured by a memory care community. These communities are located in North Carolina. We will consolidate the communities acquired by the JV and the acquisition will be ac counted for as a financing receivable. See Financing Receivables on page 5 and Mortgage Loans on page 6 for further discussion. (2) Due to master leases with properties in various states, revenue by state is not available. Also, working capital notes are pr ovi ded to certain operators under their master leases covering properties in various states. Therefore, the working capital notes outstanding balance totaling $22,157 is also not available by state. (3) Includes one behavioral health care hospital and three parcels for land held - for - use, one parcel of land securing a first mortga ge held for future development of a post - acute skilled nursing center and one parcel of land securing a first mortgage held for future development of a seniors housing community. (4) Subsequent to December 31, 2022, we received proceeds from the payoff of a mezzanine loan on an independent living community loc ated in Oregon. See pages 6 and 13 for further discussion. In addition, we received a notice of intent to redeem our preferred equity investment in a joint venture to develop a 267 - unit independent/assisted living community in Washington subsequent to December 31, 2022. See page 7 for further discussion.
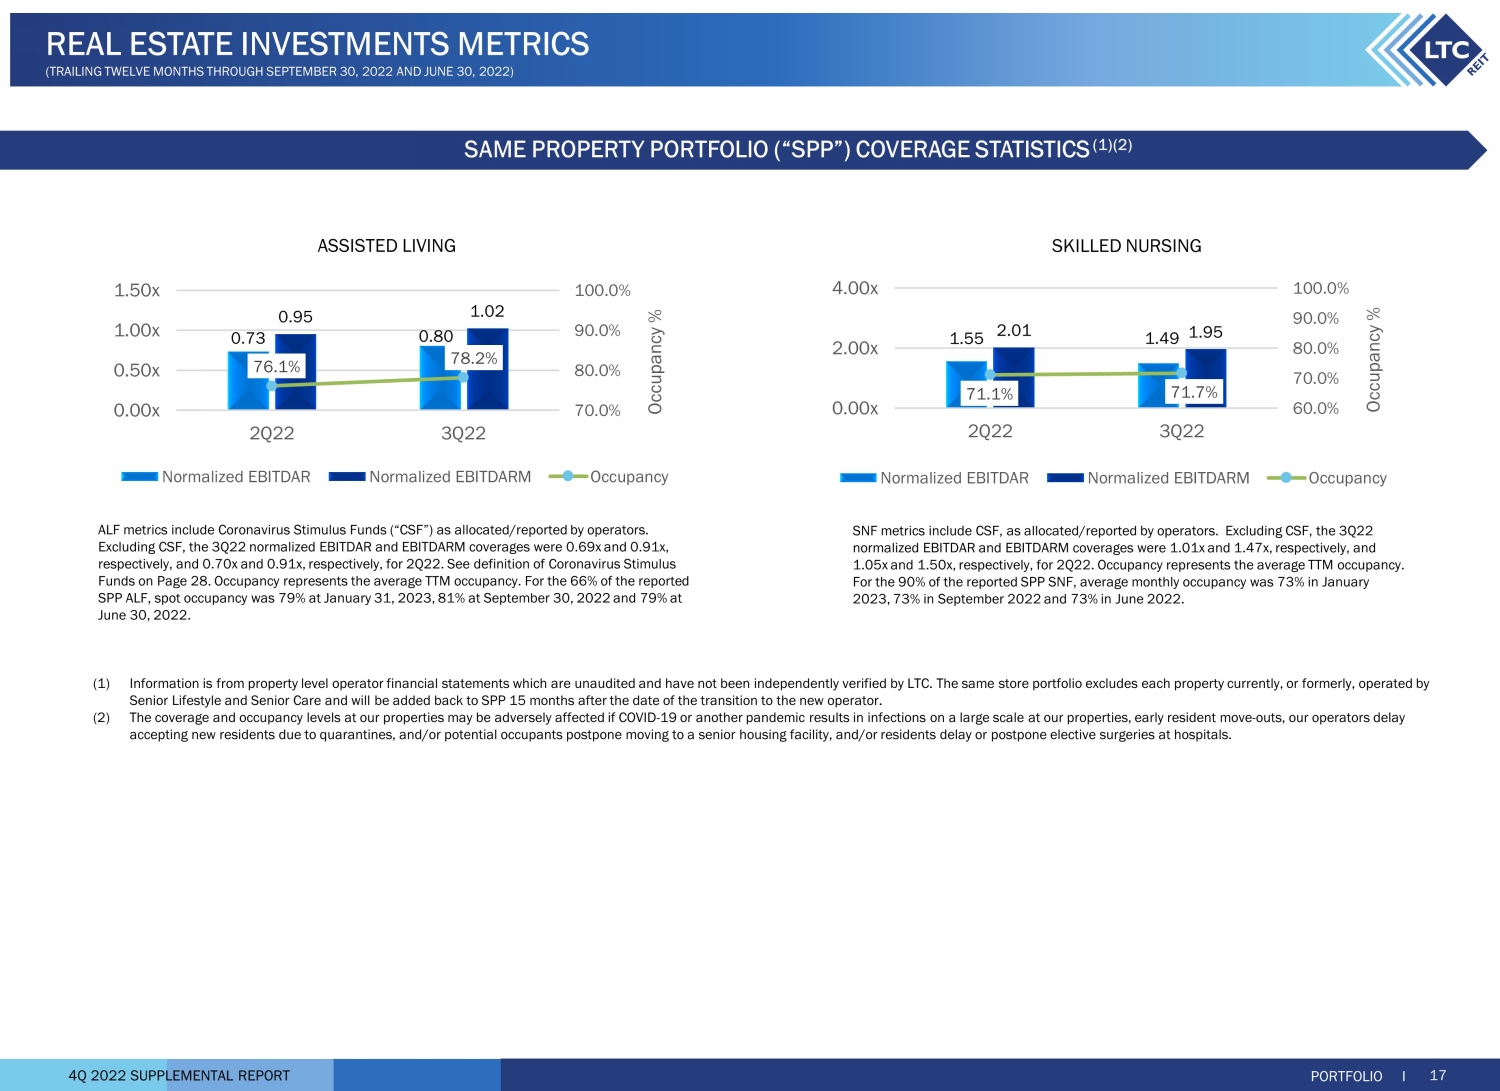
4Q 2022 SUPPLEMENTAL REPORT (1) Information is from property level operator financial statements which are unaudited and have not been independently verified by LTC. The same store portfolio excludes each property currently, or formerly, operated by Senior Lifestyle and Senior Care and will be added back to SPP 15 months after the date of the transition to the new operator . (2) The coverage and occupancy levels at our properties may be adversely affected if COVID - 19 or another pandemic results in infecti ons on a large scale at our properties, early resident move - outs, our operators delay accepting new residents due to quarantines, and/or potential occupants postpone moving to a senior housing facility, and/or r esi dents delay or postpone elective surgeries at hospitals. ASSISTED LIVING SKILLED NURSING 1.55 1.49 2.01 1.95 71.1% 71.7% 60.0% 70.0% 80.0% 90.0% 100.0% 0.00x 2.00x 4.00x 2Q22 3Q22 Occupancy % Normalized EBITDAR Normalized EBITDARM Occupancy 0.73 0.80 0.95 1.02 76.1% 78.2% 70.0% 80.0% 90.0% 100.0% 0.00x 0.50x 1.00x 1.50x 2Q22 3Q22 Occupancy % Normalized EBITDAR Normalized EBITDARM Occupancy SNF metrics include CSF, as allocated/reported by operators. Excluding CSF, the 3Q22 normalized EBITDAR and EBITDARM coverages were 1.01x and 1.47x, respectively, and 1.05x and 1.50x, respectively, for 2Q22. Occupancy represents the average TTM occupancy. For the 90% of the reported SPP SNF, average monthly occupancy was 73% in January 2023, 73% in September 2022 and 73% in June 2022. ALF metrics include Coronavirus Stimulus Funds (“CSF”) as allocated/reported by operators. Excluding CSF, the 3Q22 normalized EBITDAR and EBITDARM coverages were 0.69x and 0.91x, respectively, and 0.70x and 0.91x, respectively, for 2Q22. See definition of Coronavirus Stimulus Funds on Page 28. Occupancy represents the average TTM occupancy. For the 66% of the reported SPP ALF, spot occupancy was 79% at January 31, 2023, 81% at September 30, 2022 and 79% at June 30, 2022. PORTFOLIO I 17 REAL ESTATE INVESTMENTS METRICS (TRAILING TWELVE MONTHS THROUGH SEPTEMBER 30, 2022 AND JUNE 30, 2022) SAME PROPERTY PORTFOLIO (“SPP”) COVERAGE STATISTICS (1)(2)
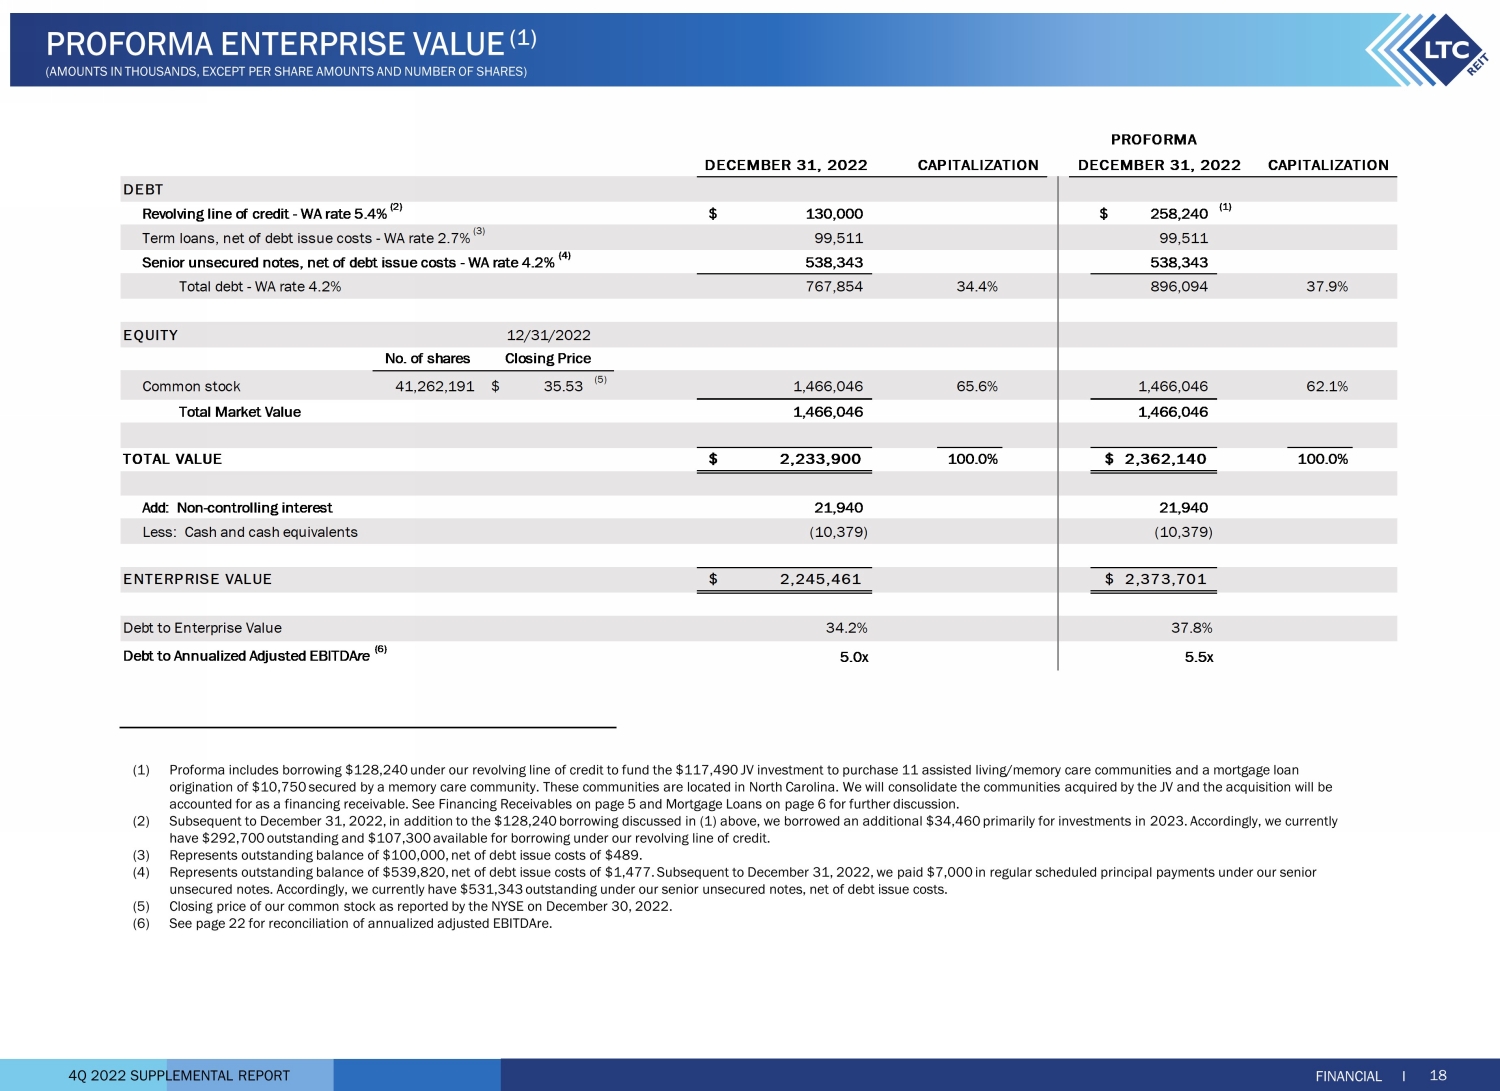
4Q 2022 SUPPLEMENTAL REPORT PROFORMA DECEMBER 31, 2022 Revolving line of credit - WA rate 5.4% (2) 130,000$ 258,240$ (1) Term loans, net of debt issue costs - WA rate 2.7% (3) 99,511 99,511 Senior unsecured notes, net of debt issue costs - WA rate 4.2% (4) 538,343 538,343 Total debt - WA rate 4.2% 767,854 34.4% 896,094 37.9% No. of shares Common stock 41,262,191 35.53$ (5) 1,466,046 65.6% 1,466,046 62.1% Total Market Value 1,466,046 1,466,046 2,233,900$ 100.0% 2,362,140$ 100.0% Add: Non-controlling interest 21,940 21,940 Less: Cash and cash equivalents (10,379) (10,379) 2,245,461$ 2,373,701$ Debt to Enterprise Value 34.2% 37.8% Debt to Annualized Adjusted EBITDAre (6) 5.0x 5.5x TOTAL VALUE ENTERPRISE VALUE CAPITALIZATION DECEMBER 31, 2022 CAPITALIZATION DEBT EQUITY Closing Price 12/31/2022 (1) Proforma includes borrowing $128,240 under our revolving line of credit to fund the $117,490 JV investment to purchase 11 ass ist ed living/memory care communities and a mortgage loan origination of $10,750 secured by a memory care community. These communities are located in North Carolina. We will consolida te the communities acquired by the JV and the acquisition will be accounted for as a financing receivable. See Financing Receivables on page 5 and Mortgage Loans on page 6 for further discuss ion . (2) Subsequent to December 31, 2022, in addition to the $128,240 borrowing discussed in (1) above, we borrowed an additional $34, 460 primarily for investments in 2023. Accordingly, we currently have $292,700 outstanding and $107,300 available for borrowing under our revolving line of credit. (3) Represents outstanding balance of $100,000, net of debt issue costs of $489. (4) Represents outstanding balance of $539,820, net of debt issue costs of $1,477. Subsequent to December 31, 2022, we paid $7,00 0 i n regular scheduled principal payments under our senior unsecured notes. Accordingly, we currently have $531,343 outstanding under our senior unsecured notes, net of debt issue cost s. (5) Closing price of our common stock as reported by the NYSE on December 30, 2022. (6) See page 22 for reconciliation of annualized adjusted EBITDAre. FINANCIAL I 18 PROFORMA ENTERPRISE VALUE (1) (AMOUNTS IN THOUSANDS, EXCEPT PER SHARE AMOUNTS AND NUMBER OF SH ARES)
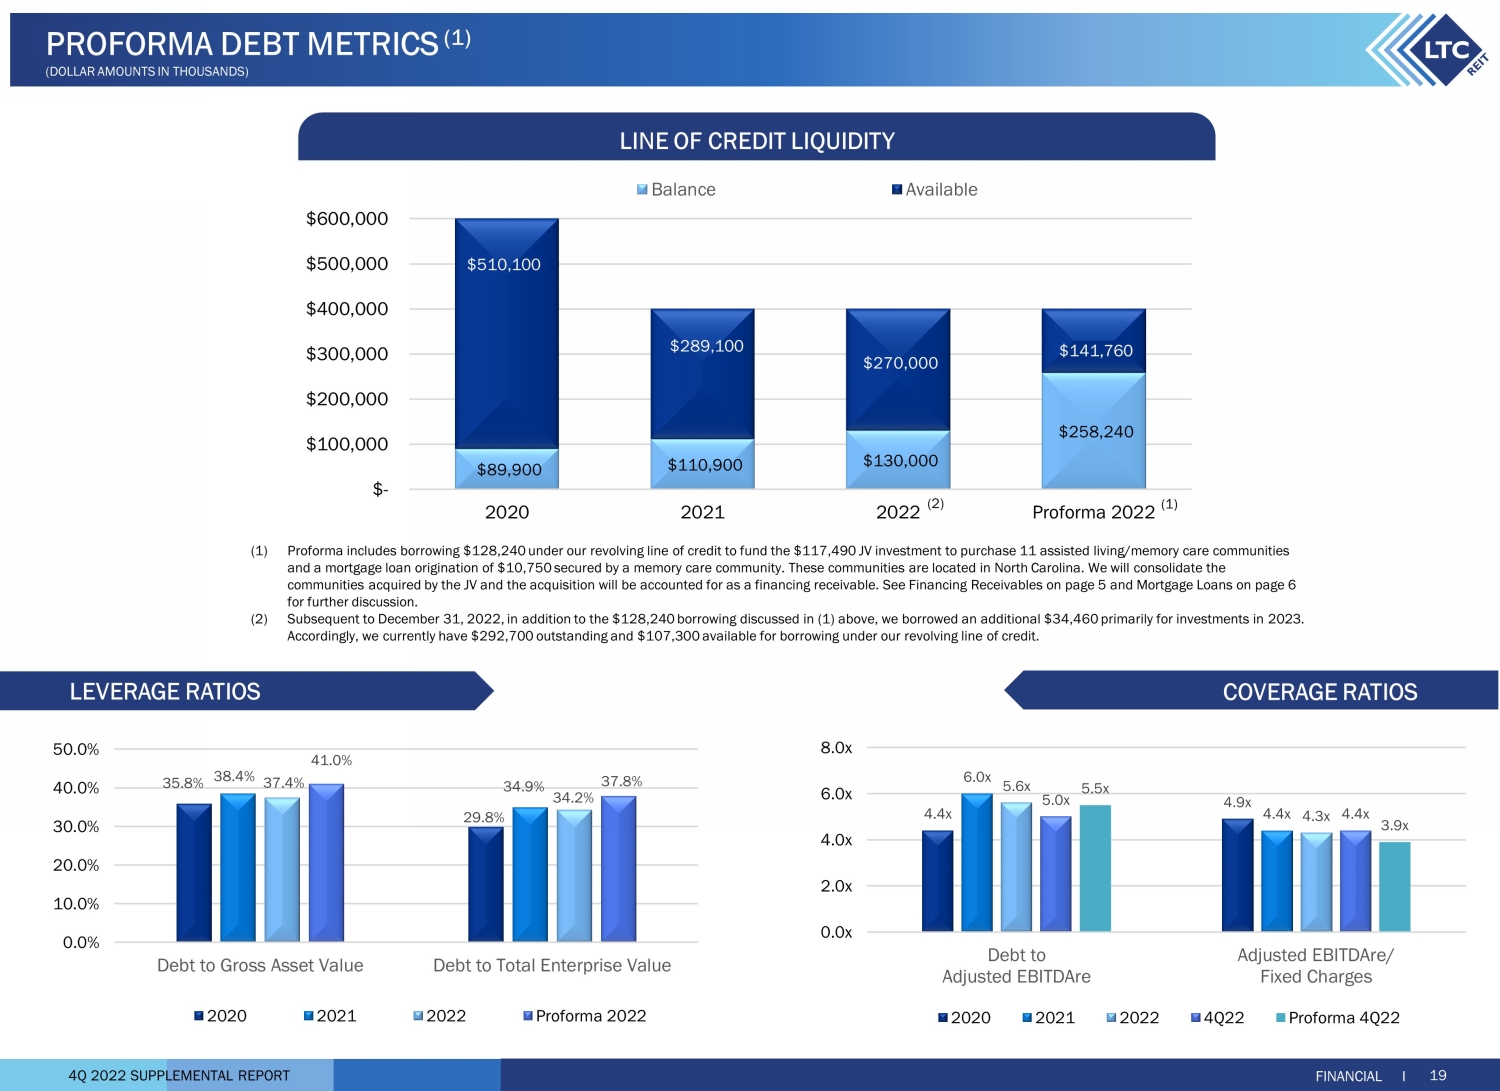
4Q 2022 SUPPLEMENTAL REPORT LEVERAGE RATIOS COVERAGE RATIOS LINE OF CREDIT LIQUIDITY FINANCIAL I 19 PROFORMA DEBT METRICS (1) (DOLLAR AMOUNTS IN THOUSANDS) 35.8% 29.8% 38.4% 34.9% 37.4% 34.2% 41.0% 37.8% 0.0% 10.0% 20.0% 30.0% 40.0% 50.0% Debt to Gross Asset Value Debt to Total Enterprise Value 2020 2021 2022 Proforma 2022 4.4x 4.9x 6.0x 4.4x 5.6x 4.3x 5.0x 4.4x 5.5x 3.9x 0.0x 2.0x 4.0x 6.0x 8.0x Debt to Adjusted EBITDAre Adjusted EBITDAre/ Fixed Charges 2020 2021 2022 4Q22 Proforma 4Q22 (1) Proforma includes borrowing $128,240 under our revolving line of credit to fund the $117,490 JV investment to purchase 11 ass ist ed living/memory care communities and a mortgage loan origination of $10,750 secured by a memory care community. These communities are located in North Carolin a. We will consolidate the communities acquired by the JV and the acquisition will be accounted for as a financing receivable. See Financing Receivables on page 5 and Mortgage Loans on page 6 for further discussion. (2) Subsequent to December 31, 2022, in addition to the $128,240 borrowing discussed in (1) above, we borrowed an additional $34, 460 primarily for investments in 2023. Accordingly, we currently have $292,700 outstanding and $107,300 available for borrowing under our revolving line of credit. $89,900 $110,900 $130,000 $258,240 $510,100 $289,100 $270,000 $141,760 $- $100,000 $200,000 $300,000 $400,000 $500,000 $600,000 2020 2021 2022 Proforma 2022 Balance Available (2) (1)
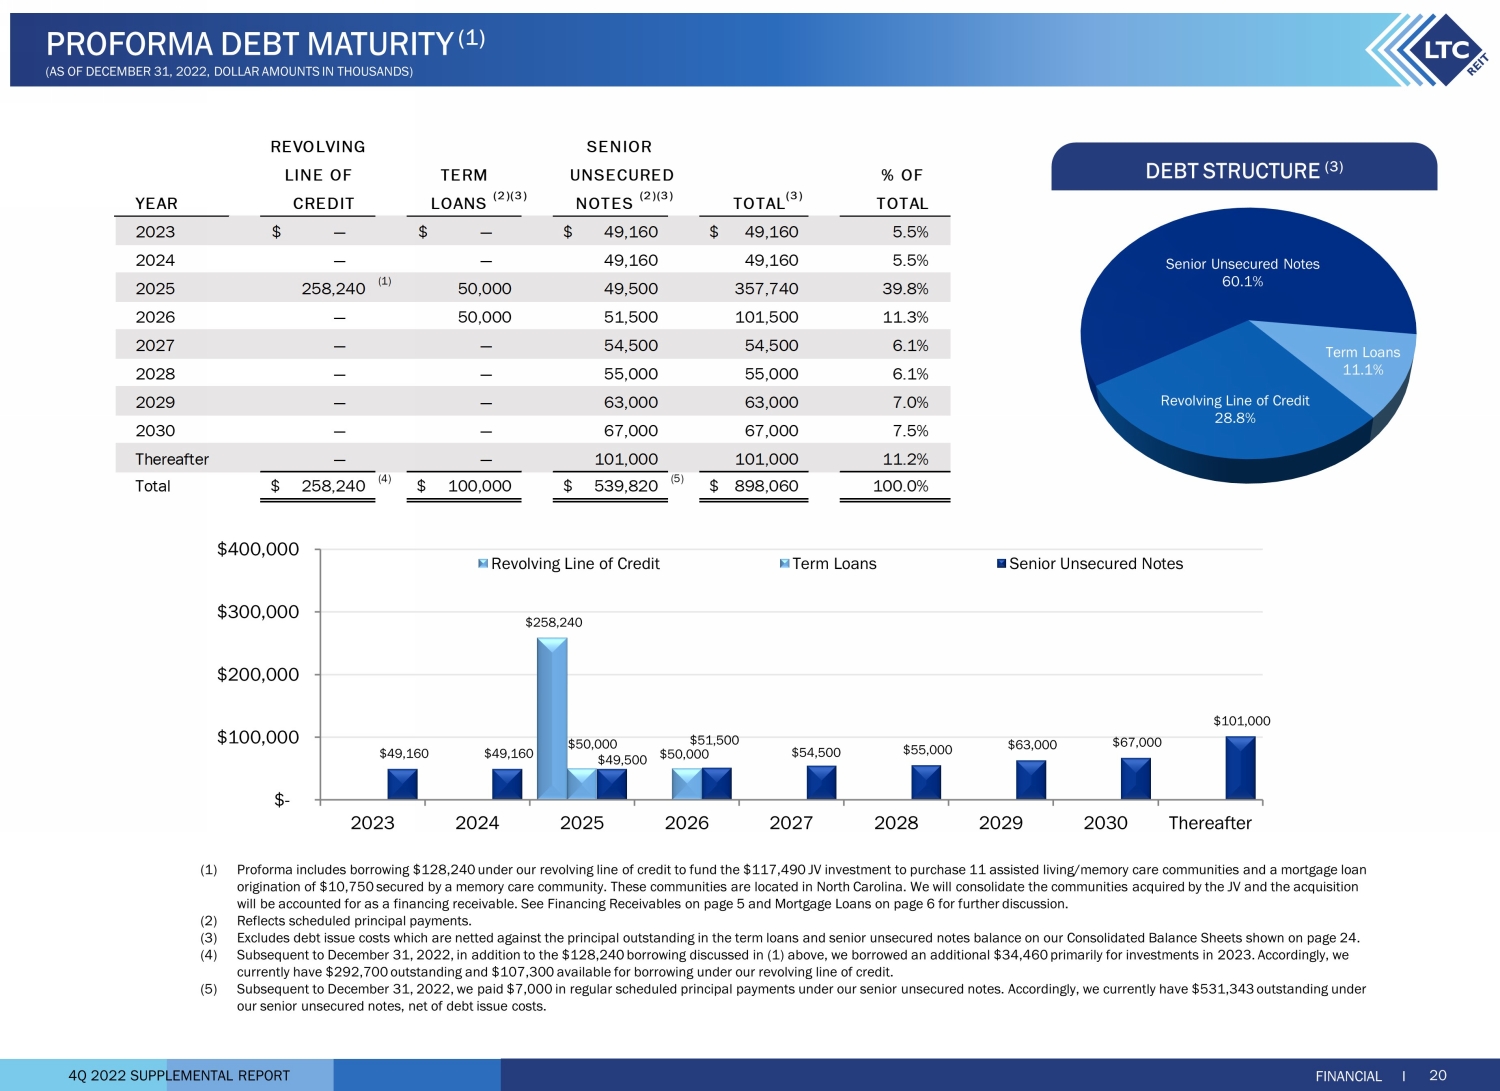
4Q 2022 SUPPLEMENTAL REPORT Senior Unsecured Notes 60.1% Term Loans 11.1% Revolving Line of Credit 28.8% $258,240 $50,000 $50,000 $49,160 $49,160 $49,500 $51,500 $54,500 $55,000 $63,000 $67,000 $101,000 $- $100,000 $200,000 $300,000 $400,000 2023 2024 2025 2026 2027 2028 2029 2030 Thereafter Revolving Line of Credit Term Loans Senior Unsecured Notes DEBT STRUCTURE (3) FINANCIAL I 20 PROFORMA DEBT MATURITY (1) (AS OF DECEMBER 31, 2022, DOLLAR AMOUNTS IN THOUSANDS) REVOLVING SENIOR LINE OF TERM UNSECURED % OF YEAR CREDIT LOANS (2)(3) NOTES (2)(3) TOTAL (3) TOTAL 2023 —$ —$ 49,160$ 49,160$ 5.5% 2024 — — 49,160 49,160 5.5% 2025 258,240 (1) 50,000 49,500 357,740 39.8% 2026 — 50,000 51,500 101,500 11.3% 2027 — — 54,500 54,500 6.1% 2028 — — 55,000 55,000 6.1% 2029 — — 63,000 63,000 7.0% 2030 — — 67,000 67,000 7.5% Thereafter — — 101,000 101,000 11.2% Total 258,240$ (4) 100,000$ 539,820$ (5) 898,060$ 100.0% (1) Proforma includes borrowing $128,240 under our revolving line of credit to fund the $117,490 JV investment to purchase 11 ass ist ed living/memory care communities and a mortgage loan origination of $10,750 secured by a memory care community. These communities are located in North Carolina. We will consolida te the communities acquired by the JV and the acquisition will be accounted for as a financing receivable. See Financing Receivables on page 5 and Mortgage Loans on page 6 for further di scussion. (2) Reflects scheduled principal payments. (3) Excludes debt issue costs which are netted against the principal outstanding in the term loans and senior unsecured notes bal anc e on our Consolidated Balance Sheets shown on page 24. (4) Subsequent to December 31, 2022, in addition to the $128,240 borrowing discussed in (1) above, we borrowed an additional $34, 460 primarily for investments in 2023. Accordingly, we currently have $292,700 outstanding and $107,300 available for borrowing under our revolving line of credit. (5) Subsequent to December 31, 2022, we paid $7,000 in regular scheduled principal payments under our senior unsecured notes. Acc ord ingly, we currently have $531,343 outstanding under our senior unsecured notes, net of debt issue costs.

4Q 2022 SUPPLEMENTAL REPORT (1) For leases and loans in place at December 31, 2022, assuming no renewals, modifications or replacements and no new investments are added to our portfolio except for the renewal of a lease covering two skilled nursing centers and the originations of a mortgage loan and financing receivable subsequent to December 31, 2022. See page 12 & 13 for further information. (2) Includes minimum rent credit on a sale - leaseback financing receivable. (3) Includes cash flow participation payment on a mezzanine loan. (1) QoQ: Increase primarily due to rent received from transitioned portfolios and repayment of Anthem’s temporary rent reduction and rental income from acquisitions, completed development projects and annual rent escalations offset by property sales. YoY: Increase primarily due to QoQ explanation and a lease termination fee received in connection with the sale of a 74 - unit ALF. (2) QoQ: Decrease primarily due to property tax reassessment and properties sold offset by transitioned portfolios and 2Q22 acquisitions. YoY: Increase primarily due to transitioned portfolios and 2Q22 acquisitions partially offset by property tax reassessment and properties sold. (3) QoQ: Decrease primarily due to normal amortization. YoY: Decrease primarily due to QoQ explanation, the impact of prior year’s 50% reduction of 2021 rent escalations for those leases accounted for on a straight - line basis, a deferred rent repayment and decrease from properties sold. (4) Represents a straight - line rent receivable write - off due to transitioning rental revenue recognition to cash basis for one lease. (5) Increase due to a lease incentive balance write - off related to a closed property and subsequent lease termination and additional lease incentives provided for a transitioned portfolio. NON - CASH REVENUE COMPONENTS COMPONENTS OF RENTAL INCOME FINANCIAL I 21 FINANCIAL DATA SUMMARY (DOLLAR AMOUNTS IN THOUSANDS) 12/31/20 12/31/21 12/31/22 PROFORMA 12/31/22 (2) Gross investments $ 1,737,795 $ 1,804,435 $ 1,959,442 $ 2,090,192 Net investments $ 1,385,414 $ 1,426,070 $ 1,562,668 $ 1,693,418 Gross asset value $ 1,811,867 $ 1,883,190 $ 2,052,877 $ 2,183,627 Total debt (1) $ 649,382 $ 722,719 $ 767,854 $ 896,094 Total liabilities (1) $ 683,680 $ 759,698 $ 805,796 $ 934,036 Total equity $ 775,806 $ 745,127 $ 850,307 $ 854,138 Cash rent 32,027$ 26,725$ 5,302$ (1) 115,287$ 107,692$ 7,595$ (1) Operator reimbursed real estate tax revenue 3,298 3,677 (379) (2) 15,459 14,332 1,127 (2) Straight-line rent (adjustment) income (406) (152) (254) (3) (1,369) 467 (1,836) (3) Straight-line rent write-off — — — — (758) 758 (4) Amortization of lease incentives (212) (222) 10 (1,133) (608) (525) (5) Total rental income 34,707$ 30,028$ 4,679$ 128,244$ 121,125$ 7,119$ Variance THREE MONTHS ENDED TWELVE MONTHS ENDED DECEMBER 31,DECEMBER 31, 2022 2021 2022 2021Variance (1) Includes outstanding gross revolving line of credit, term loans, net of debt issue costs, and senior unsecured notes, net of debt issue costs. (2) Proforma includes borrowing $128,240 under our revolving line of credit to fund the $117,490 JV investment to purchase 11 assisted living/memory care communities and a mortgage loan origination of $10,750 secured by a memory care community. These communities are located in North Carolina. We will consolidate the communities acquired by the JV and the acquisition will be accounted for as a financing receivable. See Financing Receivables on page 5 and Mortgage Loans on page 6 for further discussion.
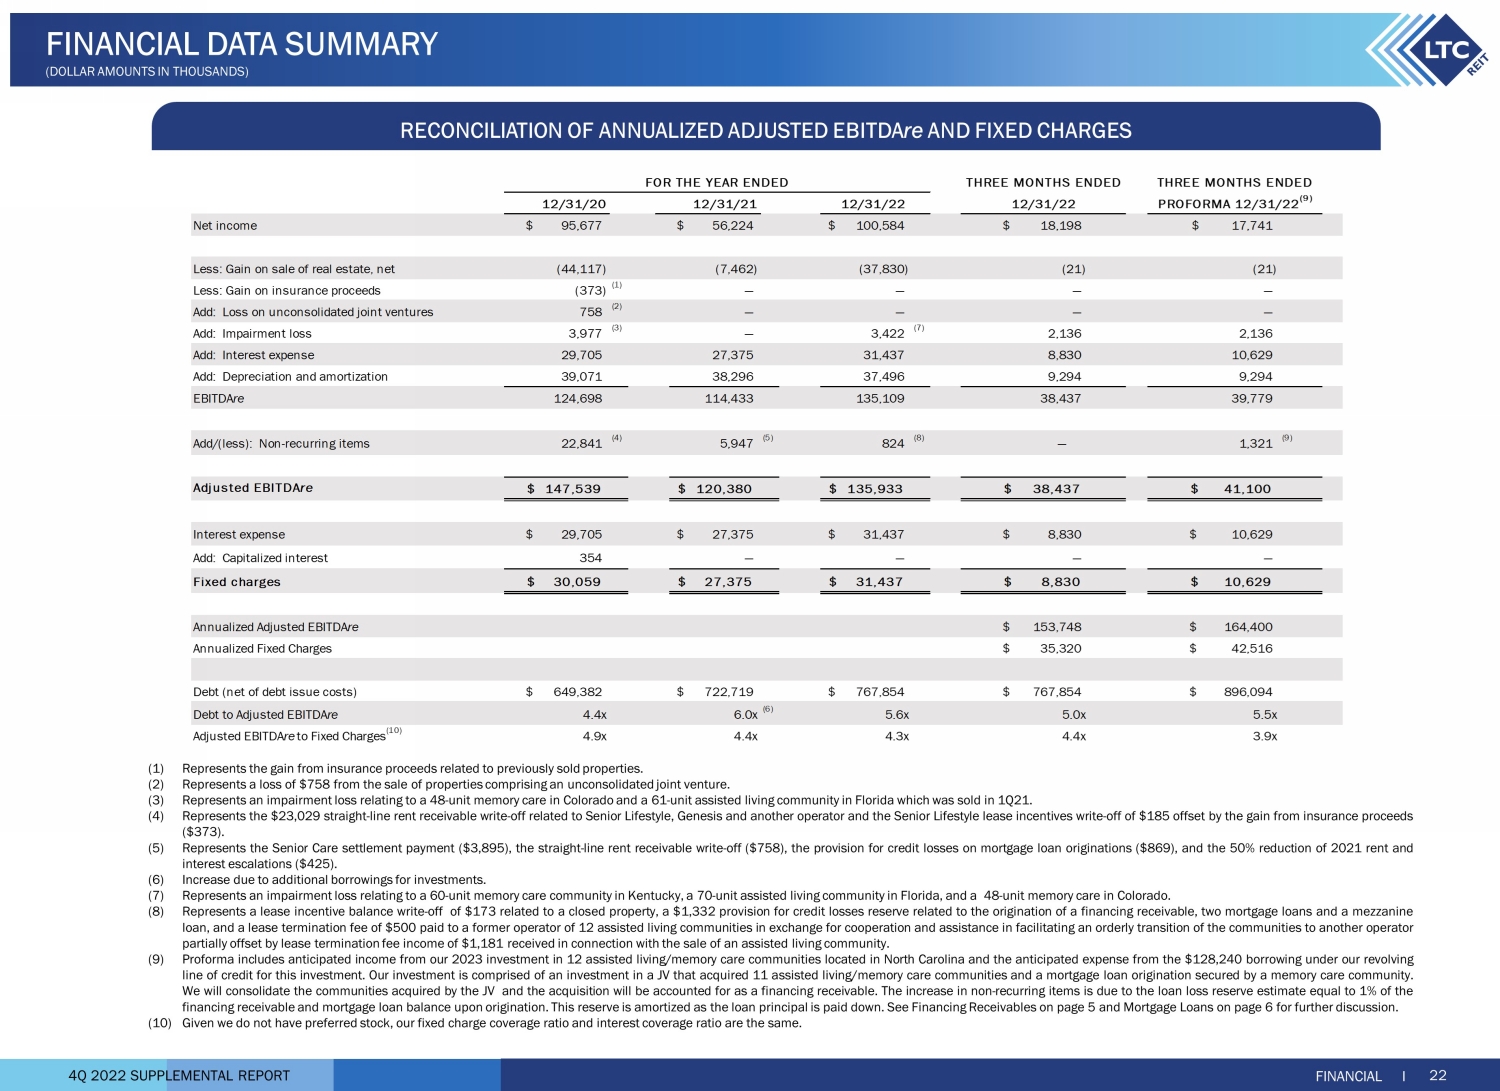
4Q22 1Q23 (1) 2Q23 (1) 3Q23 (1) 4Q23 (1) (406)$ (469)$ (424)$ (468)$ (557)$ (212) (212) (208) (164) (146) 552 (2) 234 241 241 192 1,331 1,342 1,351 1,344 1,265 27 (3) 181 181 181 181 1,292$ 1,076$ 1,141$ 1,134$ 935$ Effective interest - Mortgage loans receivable Effective interest - Notes receivable Straight-line rent adjustment Amortization of lease incentives Effective interest - Financing receivable Total non-cash revenue components 4Q 2022 SUPPLEMENTAL REPORT RECONCILIATION OF ANNUALIZED ADJUSTED EBITDA re AND FIXED CHARGES FINANCIAL I 22 FINANCIAL DATA SUMMARY (DOLLAR AMOUNTS IN THOUSANDS) (1) Represents the gain from insurance proceeds related to previously sold properties . (2) Represents a loss of $ 758 from the sale of properties comprising an unconsolidated joint venture . (3) Represents an impairment loss relating to a 48 - unit memory care in Colorado and a 61 - unit assisted living community in Florida which was sold in 1 Q 21 . (4) Represents the $ 23 , 029 straight - line rent receivable write - off related to Senior Lifestyle, Genesis and another operator and the Senior Lifestyle lease incentives write - off of $ 185 offset by the gain from insurance proceeds ( $ 373 ) . (5) Represents the Senior Care settlement payment ( $ 3 , 895 ), the straight - line rent receivable write - off ( $ 758 ), the provision for credit losses on mortgage loan originations ( $ 869 ), and the 50 % reduction of 2021 rent and interest escalations ( $ 425 ) . (6) Increase due to additional borrowings for investments . (7) Represents an impairment loss relating to a 60 - unit memory care community in Kentucky, a 70 - unit assisted living community in Florida, and a 48 - unit memory care in Colorado . (8) Represents a lease incentive balance write - off of $ 173 related to a closed property, a $ 1 , 332 provision for credit losses reserve related to the origination of a financing receivable, two mortgage loans and a mezzanine loan, and a lease termination fee of $ 500 paid to a former operator of 12 assisted living communities in exchange for cooperation and assistance in facilitating an orderly transition of the communities to another operator partially offset by lease termination fee income of $ 1 , 181 received in connection with the sale of an assisted living community . (9) Proforma includes anticipated income from our 2023 investment in 12 assisted living/memory care communities located in North Carolina and the anticipated expense from the $ 128 , 240 borrowing under our revolving line of credit for this investment . Our investment is comprised of an investment in a JV that acquired 11 assisted living/memory care communities and a mortgage loan origination secured by a memory care community . We will consolidate the communities acquired by the JV and the acquisition will be accounted for as a financing receivable . The increase in non - recurring items is due to the loan loss reserve estimate equal to 1 % of the financing receivable and mortgage loan balance upon origination . This reserve is amortized as the loan principal is paid down . See Financing Receivables on page 5 and Mortgage Loans on page 6 for further discussion . (10) Given we do not have preferred stock, our fixed charge coverage ratio and interest coverage ratio are the same . 12/31/22 Net income 95,677$ 56,224$ 100,584$ 18,198$ 17,741$ Less: Gain on sale of real estate, net (44,117) (7,462) (37,830) (21) (21) Less: Gain on insurance proceeds (373) (1) — — — — Add: Loss on unconsolidated joint ventures 758 (2) — — — — Add: Impairment loss 3,977 (3) — 3,422 (7) 2,136 2,136 Add: Interest expense 29,705 27,375 31,437 8,830 10,629 Add: Depreciation and amortization 39,071 38,296 37,496 9,294 9,294 EBITDAre 124,698 114,433 135,109 38,437 39,779 Add/(less): Non-recurring items 22,841 (4) 5,947 (5) 824 (8) — 1,321 (9) Adjusted EBITDAre 147,539$ 120,380$ 135,933$ 38,437$ 41,100$ Interest expense 29,705$ 27,375$ 31,437$ 8,830$ 10,629$ Add: Capitalized interest 354 — — — — Fixed charges 30,059$ 27,375$ 31,437$ 8,830$ 10,629$ Annualized Adjusted EBITDAre 153,748$ 164,400$ Annualized Fixed Charges 35,320$ 42,516$ Debt (net of debt issue costs) 649,382$ 722,719$ 767,854$ 767,854$ 896,094$ Debt to Adjusted EBITDAre 4.4x 6.0x (6) 5.6x 5.0x 5.5x Adjusted EBITDAreto Fixed Charges (10) 4.9x 4.4x 4.3x 4.4x 3.9x FOR THE YEAR ENDED THREE MONTHS ENDED THREE MONTHS ENDED 12/31/20 12/31/21 12/31/22 PROFORMA 12/31/22 (9)
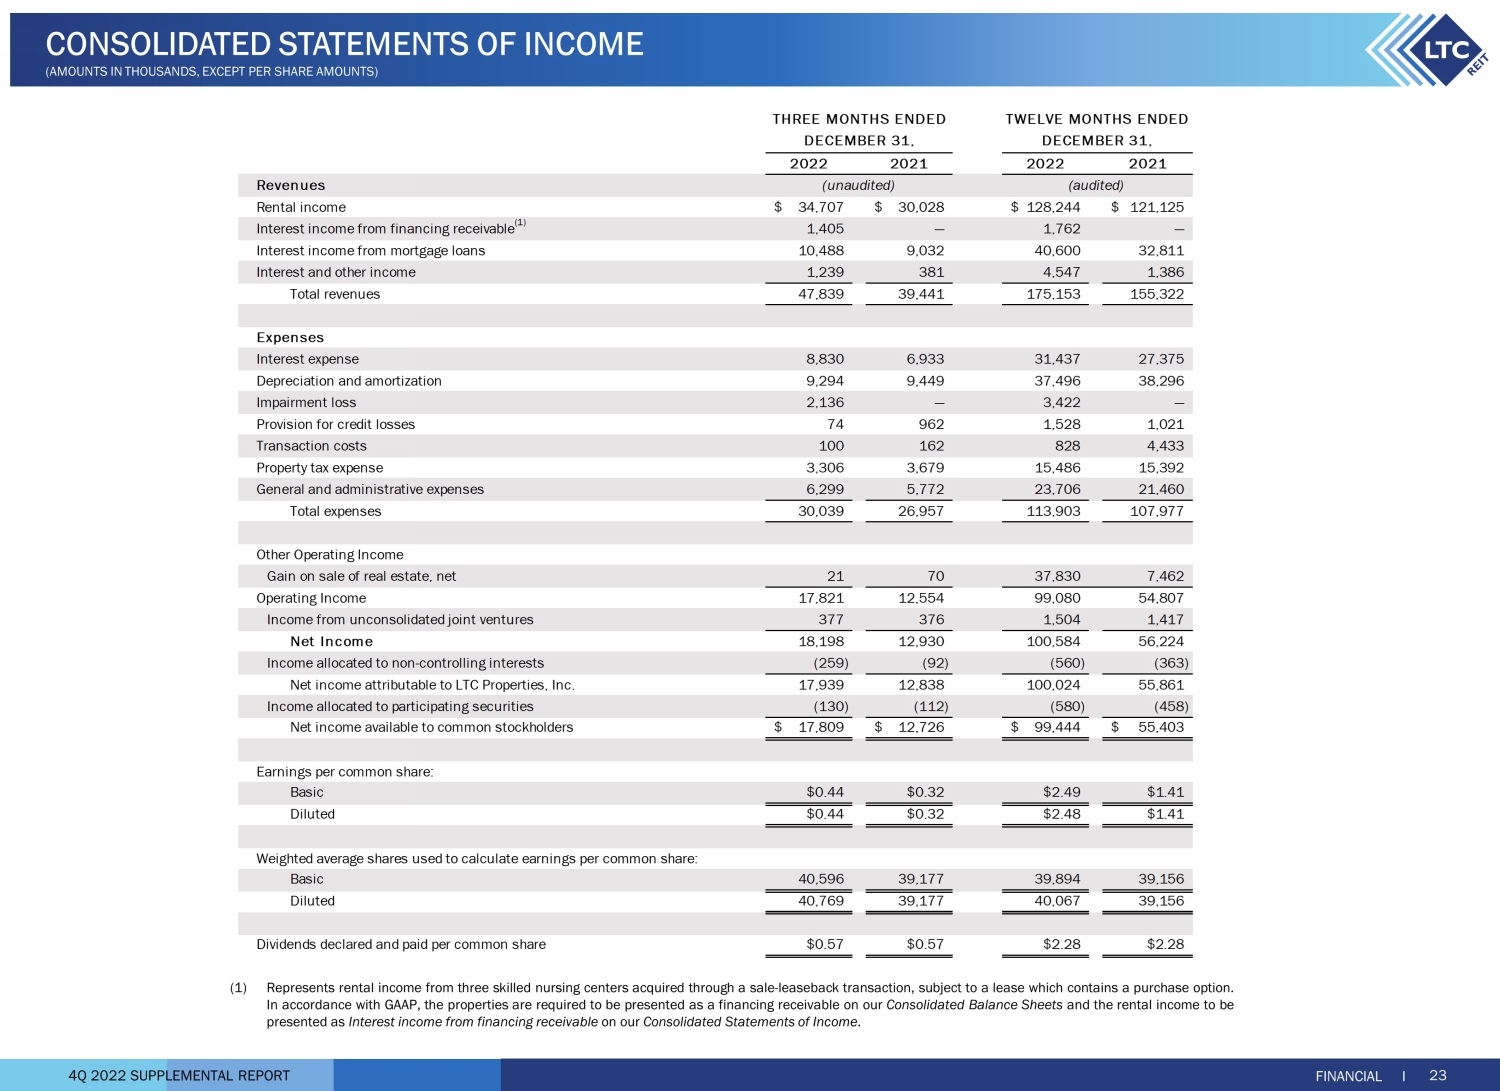
4Q 2022 SUPPLEMENTAL REPORT FINANCIAL I 23 CONSOLIDATED STATEMENTS OF INCOME (AMOUNTS IN THOUSANDS, EXCEPT PER SHARE AMOUNTS) 2022 2021 2022 2021 Revenues Rental income 34,707$ 30,028$ 128,244$ 121,125$ Interest income from financing receivable (1) 1,405 — 1,762 — Interest income from mortgage loans 10,488 9,032 40,600 32,811 Interest and other income 1,239 381 4,547 1,386 Total revenues 47,839 39,441 175,153 155,322 Expenses Interest expense 8,830 6,933 31,437 27,375 Depreciation and amortization 9,294 9,449 37,496 38,296 Impairment loss 2,136 — 3,422 — Provision for credit losses 74 962 1,528 1,021 Transaction costs 100 162 828 4,433 Property tax expense 3,306 3,679 15,486 15,392 General and administrative expenses 6,299 5,772 23,706 21,460 Total expenses 30,039 26,957 113,903 107,977 Other Operating Income Gain on sale of real estate, net 21 70 37,830 7,462 Operating Income 17,821 12,554 99,080 54,807 Income from unconsolidated joint ventures 377 376 1,504 1,417 Net Income 18,198 12,930 100,584 56,224 Income allocated to non-controlling interests (259) (92) (560) (363) Net income attributable to LTC Properties, Inc. 17,939 12,838 100,024 55,861 Income allocated to participating securities (130) (112) (580) (458) Net income available to common stockholders 17,809$ 12,726$ 99,444$ 55,403$ Earnings per common share: Basic $0.44 $0.32 $2.49 $1.41 Diluted $0.44 $0.32 $2.48 $1.41 Weighted average shares used to calculate earnings per common share: Basic 40,596 39,177 39,894 39,156 Diluted 40,769 39,177 40,067 39,156 Dividends declared and paid per common share $0.57 $0.57 $2.28 $2.28 (unaudited) (audited) THREE MONTHS ENDED DECEMBER 31, DECEMBER 31, TWELVE MONTHS ENDED (1) Represents rental income from three skilled nursing centers acquired through a sale - leaseback transaction, subject to a lease which contains a purchase option . In accordance with GAAP, the properties are required to be presented as a financing receivable on our Consolidated Balance Sheets and the rental income to be presented as Interest income from financing receivable on our Consolidated Statements of Income .

4Q 2022 SUPPLEMENTAL REPORT FINANCIAL I 24 CONSOLIDATED BALANCE SHEETS (AUDITED, AMOUNTS IN THOUSANDS, EXCEPT PER SHARE AMOUNTS) ASSETS Investments: Land $ 124,665 $ 123,239 Buildings and improvements 1,273,025 1,285,318 Accumulated depreciation and amortization (389,182) (374,606) Operating real estate property, net 1,008,508 1,033,951 Properties held-for-sale, net of accumulated depreciation: 2022—$2,305; 2021—$0 10,710 — Real property investments, net 1,019,218 1,033,951 Financing receivable, (1) net of loan loss reserve: 2022—$768; 2021—$0 75,999 — Mortgage loans receivable, net of loan loss reserve: 2022—$3,930; 2021—$3,473 389,728 344,442 Real estate investments, net 1,484,945 1,378,393 Notes receivable, net of loan loss reserve: 2022—$589; 2021—$286 58,383 28,337 Investments in unconsolidated joint ventures 19,340 19,340 Investments, net 1,562,668 1,426,070 Other assets: Cash and cash equivalents 10,379 5,161 Debt issue costs related to revolving line of credit 2,321 3,057 Interest receivable 46,000 39,522 Straight-line rent receivable 21,847 24,146 Lease incentives 1,789 2,678 Prepaid expenses and other assets 11,099 4,191 Total assets $ 1,656,103 $ 1,504,825 LIABILITIES Revolving line of credit $ 130,000 $ 110,900 Term loans, net of debt issue costs: 2022—$489; 2021—$637 99,511 99,363 Senior unsecured notes, net of debt issue costs: 2022—$1,477; 2021—$524 538,343 512,456 Accrued interest 5,234 3,745 Accrued expenses and other liabilities 32,708 33,234 Total liabilities 805,796 759,698 EQUITY Stockholders’ equity: Common stock: $0.01 par value; 60,000 shares authorized; shares issued and outstanding: 2022—41,262; 2021—39,374 412 394 Capital in excess of par value 931,124 856,895 Cumulative net income 1,544,660 1,444,636 Accumulated other comprehensive income (loss) 8,719 (172) Cumulative distributions (1,656,548) (1,565,039) Total LTC Properties, Inc. stockholders’ equity 828,367 736,714 Non-controlling interests 21,940 8,413 Total equity 850,307 745,127 Total liabilities and equity $ 1,656,103 $ 1,504,825 DECEMBER 31, 2021DECEMBER 31, 2022 (1) Represents three skilled nursing centers acquired through a sale - leaseback transaction, subject to a lease which contains a purchase option . In accordance with GAAP, the properties are required to be presented as a financing receivable on our Consolidated Balance Sheets .
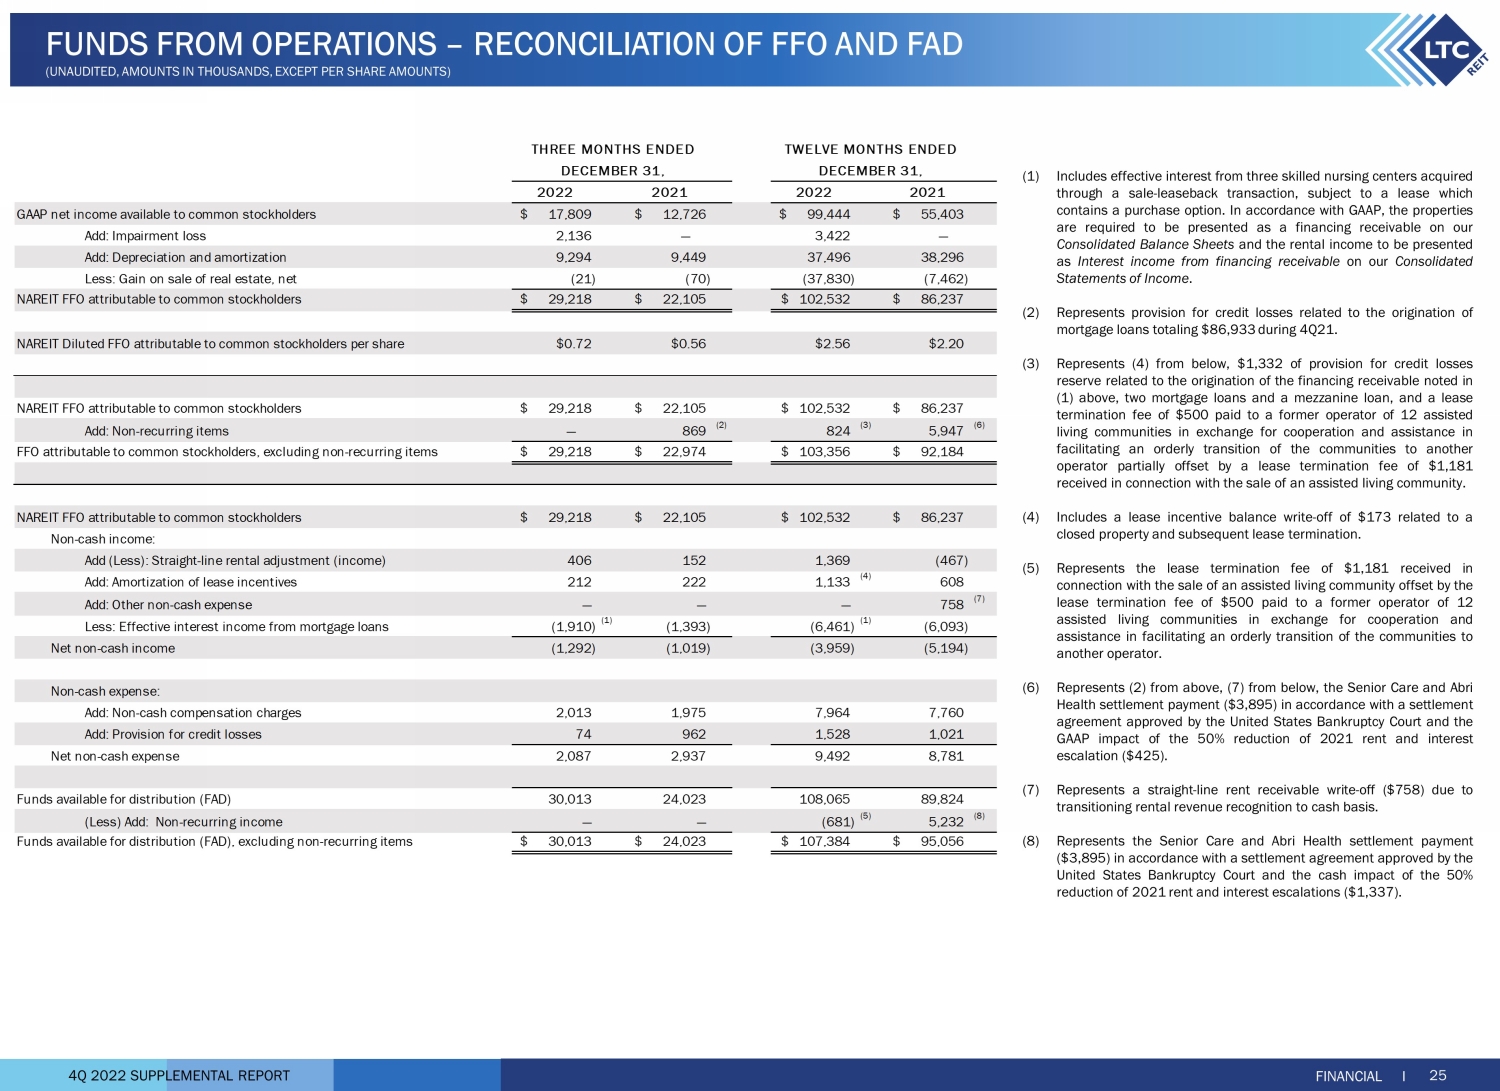
4Q 2022 SUPPLEMENTAL REPORT (1) Includes effective interest from three skilled nursing centers acquired through a sale - leaseback transaction, subject to a lease which contains a purchase option . In accordance with GAAP, the properties are required to be presented as a financing receivable on our Consolidated Balance Sheets and the rental income to be presented as Interest income from financing receivable on our Consolidated Statements of Income . (2) Represents provision for credit losses related to the origination of mortgage loans totaling $ 86 , 933 during 4 Q 21 . (3) Represents ( 4 ) from below, $ 1 , 332 of provision for credit losses reserve related to the origination of the financing receivable noted in ( 1 ) above, two mortgage loans and a mezzanine loan, and a lease termination fee of $ 500 paid to a former operator of 12 assisted living communities in exchange for cooperation and assistance in facilitating an orderly transition of the communities to another operator partially offset by a lease termination fee of $ 1 , 181 received in connection with the sale of an assisted living community . (4) Includes a lease incentive balance write - off of $ 173 related to a closed property and subsequent lease termination . (5) Represents the lease termination fee of $ 1 , 181 received in connection with the sale of an assisted living community offset by the lease termination fee of $ 500 paid to a former operator of 12 assisted living communities in exchange for cooperation and assistance in facilitating an orderly transition of the communities to another operator . (6) Represents ( 2 ) from above, ( 7 ) from below, the Senior Care and Abri Health settlement payment ( $ 3 , 895 ) in accordance with a settlement agreement approved by the United States Bankruptcy Court and the GAAP impact of the 50 % reduction of 2021 rent and interest escalation ( $ 425 ) . (7) Represents a straight - line rent receivable write - off ( $ 758 ) due to transitioning rental revenue recognition to cash basis . (8) Represents the Senior Care and Abri Health settlement payment ( $ 3 , 895 ) in accordance with a settlement agreement approved by the United States Bankruptcy Court and the cash impact of the 50 % reduction of 2021 rent and interest escalations ( $ 1 , 337 ) .

FINANCIAL I 25 FUNDS FROM OPERATIONS – RECONCILIATION OF FFO AND FAD (UNAUDITED, AMOUNTS IN THOUSANDS, EXCEPT PER SHARE AMOUNTS) 2022 2021 2022 2021 GAAP net income available to common stockholders 17,809$ 12,726$ 99,444$ 55,403$ Add: Impairment loss 2,136 — 3,422 — Add: Depreciation and amortization 9,294 9,449 37,496 38,296 Less: Gain on sale of real estate, net (21) (70) (37,830) (7,462) NAREIT FFO attributable to common stockholders 29,218$ 22,105$ 102,532$ 86,237$ $0.72 $0.56 $2.56 $2.20 NAREIT FFO attributable to common stockholders 29,218$ 22,105$ 102,532$ 86,237$ Add: Non-recurring items — 869 (2) 824 (3) 5,947 (6) 29,218$ 22,974$ 103,356$ 92,184$ NAREIT FFO attributable to common stockholders 29,218$ 22,105$ 102,532$ 86,237$ Non-cash income: Add (Less): Straight-line rental adjustment (income) 406 152 1,369 (467) Add: Amortization of lease incentives 212 222 1,133 (4) 608 Add: Other non-cash expense — — — 758 (7) Less: Effective interest income from mortgage loans (1,910) (1) (1,393) (6,461) (1) (6,093) Net non-cash income (1,292) (1,019) (3,959) (5,194) Non-cash expense: Add: Non-cash compensation charges 2,013 1,975 7,964 7,760 Add: Provision for credit losses 74 962 1,528 1,021 Net non-cash expense 2,087 2,937 9,492 8,781 Funds available for distribution (FAD) 30,013 24,023 108,065 89,824 (Less) Add: Non-recurring income — — (681) (5) 5,232 (8) Funds available for distribution (FAD), excluding non-recurring items 30,013$ 24,023$ 107,384$ 95,056$ FFO attributable to common stockholders, excluding non-recurring items THREE MONTHS ENDED TWELVE MONTHS ENDED DECEMBER 31, DECEMBER 31, NAREIT Diluted FFO attributable to common stockholders per share 4Q 2022 SUPPLEMENTAL REPORT FOR THE THREE MONTHS ENDED DECEMBER 31, FFO/FAD attributable to common stockholders 29,218$ 22,105$ 30,013$ 24,023$ Non-recurring one-time items — 869 (1) — — FFO/FAD attributable to common stockholders excluding non-recurring items 29,218 22,974 30,013 24,023 Effect of dilutive securities: Participating securities 130 112 130 112 Diluted FFO/FAD excluding non-recurring items 29,348$ 23,086$ 30,143$ 24,135$ 40,596 39,177 40,596 39,177 Effect of dilutive securities: Performance-based stock units 173 — 173 — Participating securities 229 197 229 197 Shares for diluted FFO/FAD per share 40,998 39,374 40,998 39,374 FOR THE TWELVE MONTHS ENDED DECEMBER 31, FFO/FAD attributable to common stockholders 102,532$ 86,237$ 108,065$ 89,824$ Non-recurring one-time items 824 (2) 5,947 (3) (681) (4) 5,232 (5) FFO/FAD attributable to common stockholders excluding non-recurring items 103,356 92,184 107,384 95,056 Effect of dilutive securities: Participating securities 580 458 580 458 Diluted FFO/FAD 103,936$ 92,642$ 107,964$ 95,514$ 39,894 39,156 39,894 39,156 Effect of dilutive securities: Performance based stock units 173 — 173 — Participating securities 229 197 229 197 Shares for diluted FFO/FAD per share 40,296 39,353 40,296 39,353 Shares for basic FFO/FAD per share 2022 2021 2021 Shares for basic FFO/FAD per share FFO FAD 2022 FFO FAD 2022 2021 2022 2021 FINANCIAL I 26 FUNDS FROM OPERATIONS – RECONCILIATION OF FFO PER SHARE (UNAUDITED, AMOUNTS IN THOUSANDS, EXCEPT PER SHARE AMOUNTS) (1) Represents provision for credit losses related to the origination of mortgage loans totaling $ 86 , 933 during 4 Q 21 . (2) Represents a lease incentive balance write - off of $ 173 related to a closed property and subsequent lease termination, a $ 1 , 332 of provision for credit losses reserve related to the origination of a financing receivable, two mortgage loans and a mezzanine loan, and a lease termination fee of $ 500 paid to a former operator of 12 assisted living communities in exchange for cooperation and assistance in facilitating an orderly transition of the communities to another operator partially offset by a lease termination fee of $ 1 , 181 received in connection with the sale of an assisted living community . (3) Represents ( 1 ) above, a straight - line rent receivable write - off ( $ 758 ) due to transitioning rental revenue recognition to cash basis, and the Senior Care and Abri Health settlement payment ( $ 3 , 895 ) in accordance with a settlement agreement approved by the United States Bankruptcy Court and the GAAP impact of the 50 % reduction of 2021 rent and interest escalation ( $ 425 ) . (4) Represents the lease termination fee of $ 1 , 181 received in connection with the sale of an assisted living community offset by the lease termination fee of $ 500 paid to a former operator of 12 assisted living communities in exchange for cooperation and assistance in facilitating an orderly transition of the communities to another operator . (5) Represents the Senior Care and Abri Health settlement payment ( $ 3 , 895 ) in accordance with a settlement agreement approved by the United States Bankruptcy Court and the cash impact of the 50 % reduction of 2021 rent and interest escalations ( $ 1 , 337 ) .
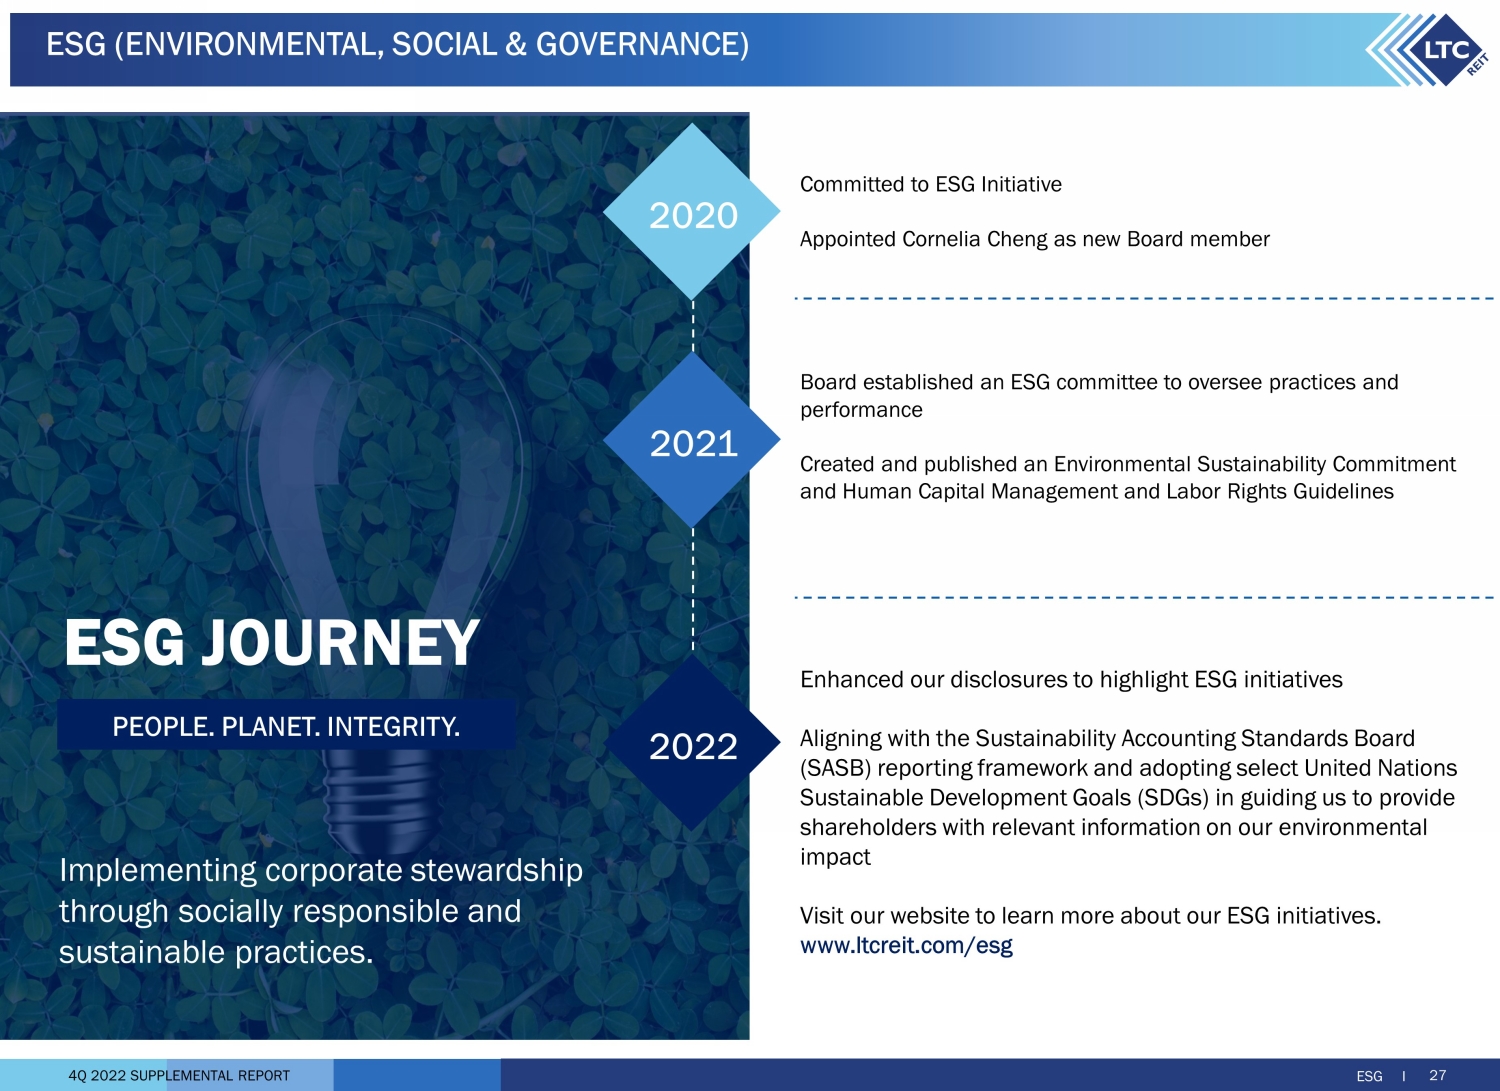
4Q 2022 SUPPLEMENTAL REPORT 27 ESG (ENVIRONMENTAL, SOCIAL & GOVERNANCE) ESG I Committed to ESG Initiative Appointed Cornelia Cheng as new Board member Board established an ESG committee to oversee practices and performance Created and published an Environmental Sustainability Commitment and Human Capital Management and Labor Rights Guidelines Enhanced our disclosures to highlight ESG initiatives Aligning with the Sustainability Accounting Standards Board (SASB) reporting framework and adopting select United Nations Sustainable Development Goals (SDGs) in guiding us to provide shareholders with relevant information on our environmental impact Visit our website to learn more about our ESG initiatives. www.ltcreit.com/esg 2020 2021 2022 ESG JOURNEY PEOPLE. PLANET. INTEGRITY. Implementing corporate stewardship through socially responsible and sustainable practices.
4Q 2022 SUPPLEMENTAL REPORT Annualized Actual Cash Income : Represents annualized cash rental income includes cash rent and excludes real estate tax reimbursement, interest income from financing receivables, mortgage loans, mezzanine loans and working capital notes, and income from unconsolidated joint ventures received for the month of December 2022 for investments as of December 31 , 2022 . Annualized Contractual Cash Income : Represents annualized contractual cash rental income prior to abatements & deferred rent repayment and excludes real estate tax reimbursement , interest income from financing receivables, mortgage loans, mezzanine loans and working capital notes, and income from unconsolidated joint ventures for the month of December 2022 for investments as of December 31 , 2022 . Annualized GAAP Income : Represents annualized GAAP rent which includes contractual cash rent, straight - line rent and amortization of lease incentives and excludes real estate tax reimbursement , GAAP interest income from financing receivables, mortgage loans, mezzanine loans and working capital notes, and income from unconsolidated joint ventures for the month of December 2022 for investments as of December 31 , 2022 . Assisted Living Communities (“ALF”) : The ALF portfolio consists of assisted living, independent living, and/or memory care properties . (See Independent Living and Memory Care) Assisted living properties are seniors housing properties serving elderly persons who require assistance with activities of daily living, but do not require the constant supervision skilled nursing properties provide . Services are usually available 24 hours a day and include personal supervision and assistance with eating, bathing, grooming and administering medication . The facilities provide a combination of housing, supportive services, personalized assistance and health care designed to respond to individual needs . Contractual Lease Rent : Rental revenue as defined by the lease agreement between us and the operator for the lease year . Coronavirus Stimulus Funds (“CSF”) : CSF includes funding from various state and federal programs to support healthcare providers in dealing with the challenges of the coronavirus pandemic . Included in CSF are state - specific payments identified by operators as well as federal payments connected to the Paycheck Protection Program and the Provider Relief Fund . CSF is self - reported by operators in unaudited financial statements provided to LTC . Specifically excluded from CSF are the suspension of the Medicare sequestration cut, and increases to the Federal Medical Assistance Percentages (FMAP), both of which are reflected in reported coverage both including and excluding CSF . Earnings Before Interest, Tax, Depreciation and Amortization for Real Estate (“EBITDA re”) : As defined by the National Association of Real Estate Investment Trusts (“ NAREIT”), EBITDA re is calculated as net income (computed in accordance with GAAP) excluding (i) interest expense, (ii) income tax expense, (iii) real estate depreciation and amortization, (iv) impairment write - downs of depreciable real estate, (v) gains or losses on the sale of depreciable real estate, and (vi) adjustments for unconsolidated partnerships and joint ventures . Financing Receivable : Properties acquired through a sale - leaseback transaction with an operating entity being the same before and after the sale - leaseback, subject to a lease contract that contains a purchase option . In accordance with GAAP, the purchased assets are required to be presented as Financing Receivable on our Consolidated Balance Sheets and the rental income to be presented as Interest income from financing receivable on our Consolidated Statements of Income . Funds Available for Distribution (“FAD”) : FFO excluding the effects of straight - line rent, amortization of lease costs, effective interest income, deferred income from unconsolidated joint ventures, non - cash compensation charges, capitalized interest and non - cash interest charges . Funds From Operations (“FFO”) : A s defined by NAREIT, net income available to common stockholders (computed in accordance with U . S . GAAP) excluding gains or losses on the sale of real estate and impairment write - downs of depreciable real estate plus real estate depreciation and amortization, and after adjustments for unconsolidated partnerships and joint ventures . GAAP Lease Yield : GAAP rent divided by the sum of the purchase price and transaction costs . GAAP Rent : Total rent we will receive as a fixed amount over the initial term of the lease and recognized evenly over that term . GAAP rent recorded in the early years of a lease is higher than the cash rent received and during the later years of the lease, the cash rent received is higher than GAAP rent recognized . GAAP rent is commonly referred to as straight - line rental income . Gross Asset Value : The carrying amount of total assets after adding back accumulated depreciation and loan loss reserves, as reported in the company’s consolidated financial statements . Gross Investment : Original price paid for an asset plus capital improvements funded by LTC, without any depreciation deductions . Gross Investment is commonly referred to as undepreciated book value . Independent Living Communities (“ILF”) : Seniors housing properties offering a sense of community and numerous levels of service, such as laundry, housekeeping, dining options/meal plans, exercise and wellness programs, transportation, social, cultural and recreational activities, on - site security and emergency response programs . Many offer on - site conveniences like beauty/barber shops, fitness facilities, game rooms, libraries and activity centers . ILFs are also known as retirement communities or seniors apartments . Interest Income : Represents interest income from mortgage loans and other notes . Licensed Beds/Units : The number of beds and/or units that an operator is authorized to operate at seniors housing and long - term care properties . Licensed beds and/or units may differ from the number of beds and/or units in service at any given time . Memory Care Communities (“MC”) : Seniors housing properties offering specialized options for seniors with Alzheimer’s disease and other forms of dementia . These facilities offer dedicated care and specialized programming for various conditions relating to memory loss in a secured environment that is typically smaller in scale and more residential in nature than traditional assisted living facilities . These facilities have staff available 24 hours a day to respond to the unique needs of their residents . Metropolitan Statistical Areas (“MSA”) : Based on the U . S . Census Bureau, MSA is a geographic entity defined by the Office of Management and Budget (OMB) for use by Federal statistical agencies in collecting, tabulating, and publishing Federal statistics . A metro area contains a core urban area of 50 , 000 or more population . MSAs 1 to 31 have a population of 19 . 8 M – 2 . 2 M . MSAs 32 to 100 have a population of 2 . 2 M – 0 . 6 M . MSAs greater than 100 have a population of 0 . 6 M – 59 K . Cities in a Micro - SA have a population of 223 K – 12 K . Cities not in a MSA has population of less than 100 K .
GLOSSARY I 28 GLOSSARY 4Q 2022 SUPPLEMENTAL REPORT Mezzanine : In certain circumstances, the Company strategically allocates a portion of its capital deployment toward mezzanine loans to grow relationships with operating companies that have not typically utilized sale - leaseback financing as a component of their capital structure . Mezzanine financing sits between senior debt and common equity in the capital structure, and typically is used to finance development projects, value - add opportunities on existing operational properties, partnership buy - outs and recapitalization of equity . We seek market - based, risk - adjusted rates of return typically between 9 % to 14 % with the loan term typically between three to 10 years . Security for mezzanine loans can include all or a portion of the following credit enhancements ; secured second mortgage, pledge of equity interests and personal/corporate guarantees . Mezzanine loans can be recorded for GAAP purposes as either a loan or joint venture depending upon specifics of the loan terms and related credit enhancements . Micropolitan Statistical Areas (“Micro - SA”) : Based on the U . S . Census Bureau, Micro - SA is a geographic entity defined by the Office of Management and Budget (OMB) for use by Federal statistical agencies in collecting, tabulating, and publishing Federal statistics . A micro area contains an urban core of at least 10 , 000 population . Mortgage Loan : Mortgage financing is provided on properties based on our established investment underwriting criteria and secured by a first mortgage . Subject to underwriting, additional credit enhancements may be required including, but not limited to, personal/corporate guarantees and debt service reserves . When possible, LTC attempts to negotiate a purchase option to acquire the property at a future time and lease the property back to the borrower . Net Real Estate Assets : Gross real estate investment less accumulated depreciation . Net Real Estate Asset is commonly referred to as Net Book Value (“NBV”) . Non - cash Rental Income : Straight - line rental income and amortization of lease inducement . Non - cash Compensation Charges : Vesting expense relating to stock options and restricted stock . Normalized EBITDAR Coverage : The trailing twelve month’s earnings from the operator financial statements adjusted for non - recurring, infrequent, or unusual items and before interest, taxes, depreciation, amortization, and rent divided by the operator’s contractual lease rent . Management fees are imputed at 5 % of revenues . Normalized EBITDARM Coverage : The trailing twelve month’s earnings from the operator financial statements adjusted for non - recurring, infrequent, or unusual items and before interest, taxes, depreciation, amortization, rent, and management fees divided by the operator’s contractual lease rent . Occupancy : The weighted average percentage of all beds and/or units that are occupied at a given time . The calculation uses the trailing twelve months and is based on licensed beds and/or units which may differ from the number of beds and/or units in service at any given time . Operator Financial Statements : Property level operator financial statements which are unaudited and have not been independently verified by us . Payor Source : LTC revenue by operator underlying payor source for the period presented . LTC is not a Medicaid or a Medicare recipient . Statistics represent LTC's rental revenues times operators' underlying payor source revenue percentage . Underlying payor source revenue percentage is calculated from property level operator financial statements which are unaudited and have not been independently verified by us . Private Pay : Private pay includes private insurance, HMO, VA, and other payors . Purchase Price : Represents the fair value price of an asset that is exchanged in an orderly transaction between market participants at the measurement date . An orderly transaction is a transaction that assumes exposure to the market for a period prior to the measurement date to allow for marketing activities that are usual and customary for transactions involving such assets ; it is not a forced transaction (for example, a forced liquidation or distress sale) . Real Estate Investments : Represents our investments in real property and mortgage loan receivables . Rental Income : Represents GAAP rent net of amortized lease inducement cost . Same Property Portfolio (“SPP”) : Same property statistics allow for the comparative evaluation of performance across a consistent population of LTC’s leased property portfolio and the Prestige Healthcare mortgage loan portfolio . Our SPP is comprised of stabilized properties occupied and operated throughout the duration of the quarter - over - quarter comparison periods presented (excluding assets sold and assets held - for - sale) . Accordingly, a property must be occupied and stabilized for a minimum of 15 months to be included in our SPP . Each property transitioned to a new operator has been excluded from SPP and will be added back to SPP for the SPP reporting period ending 15 months after the date of the transition . Skilled Nursing Properties (“SNF”) : Seniors housing properties providing restorative, rehabilitative and nursing care for people not requiring the more extensive and sophisticated treatment available at acute care hospitals . Many SNFs provide ancillary services that include occupational, speech, physical, respiratory and IV therapies, as well as sub - acute care services which are paid either by the patient, the patient’s family, private health insurance, or through the federal Medicare or state Medicaid programs . Stabilized : Properties are generally considered stabilized upon the earlier of achieving certain occupancy thresholds (e . g . 80 % for SNFs and 90 % for ALFs) and, as applicable, 12 months from the date of acquisition/lease transition or, in the event of a de novo development, redevelopment, major renovations or addition, 24 months from the date the property is first placed in or returned to service, or properties acquired in lease - up . Trailing Twelve Months Revenues : For the owned portfolio, rental income includes cash rent, straight - line rent and amortization of lease incentives and excludes real estate tax reimbursement and rental income from properties sold during the trailing twelve months . Financing receivables revenues include cash interest income and effective interest from financing receivables during the trailing twelve months . Mortgage loans revenues include cash interest income and effective interest from mortgage loans and construction loans during the trailing twelve months . Notes receivable revenues include cash interest income and effective interest from mezzanine loans and working capital notes during the trailing twelve months . Under Development Properties (“UDP”) : Development projects to construct seniors housing properties . GLOSSARY I 29 GLOSSARY