UNITED STATES
SECURITIES AND EXCHANGE COMMISSION
Washington, D.C. 20549
FORM 8-K
CURRENT REPORT
PURSUANT TO SECTION 13 OR 15(d) OF THE SECURITIES EXCHANGE ACT OF 1934
Date of Report (Date of earliest event reported): January 17, 2023
UNITED COMMUNITY BANKS, INC.
(Exact name of registrant as specified in its charter)
| Georgia | 001-35095 | 58-1807304 |
| (State or other jurisdiction of incorporation) | (Commission file number) | (IRS Employer Identification No.) |
125 Highway 515 East
Blairsville, Georgia 30512
(Address of principal executive offices)
Registrant's telephone number,
including area code:
(706) 781-2265
Not applicable
(Former name or former address, if changed since last report)
Check the appropriate box below if the Form 8-K filing is intended to simultaneously satisfy the filing obligation of the registrant under any of the following provisions:
| ¨ | Written communications pursuant to Rule 425 under the Securities Act (17 CFR 230.425) |
| ¨ | Soliciting material pursuant to Rule 14a-12 under the Exchange Act (17 CFR 240.14a-12) |
| ¨ | Pre-commencement communications pursuant to Rule 14d-2(b) under the Exchange Act (17 CFR 240.14d-2(b)) |
| ¨ | Pre-commencement communications pursuant to Rule 13e-4(c) under the Exchange Act (17 CFR 240.13e-4(c)) |
Securities registered pursuant to Section 12(b) of the Act:
| Title of Each Class | Trading Symbol(s) | Name of Each Exchange on Which Registered | ||
| Common stock, par value $1 per share | UCBI | Nasdaq Global Select Market | ||
| Depositary shares, each representing 1/1000th interest in a share of Series I Non-Cumulative Preferred Stock | UCBIO | Nasdaq Global Select Market |
Indicate by check mark whether the registrant is an emerging growth company as defined in as defined in Rule 405 of the Securities Act of 1933 (§230.405 of this chapter) or Rule 12b-2 of the Securities Exchange Act of 1934 (§240.12b-2 of this chapter).
Emerging growth company ¨
If an emerging growth company, indicate by check mark if the registrant has elected not to use the extended transition period for complying with any new or revised financial accounting standards provided pursuant to Section 13(a) of the Exchange Act. ¨
| Item 2.02 | Results of Operations and Financial Condition. |
| On January 17, 2023, United Community Banks, Inc. (“United”) issued a press release announcing financial results for the fourth quarter of 2022. The press release is furnished as Exhibit 99.1 to this Current Report on Form 8-K. | |
| Item 7.01 | Regulation FD Disclosure. |
| On January 18, 2023, United will hold an earnings conference call and webcast at 11:00 a.m. (Eastern Time) to discuss financial results for the fourth quarter of 2022. The press release referenced above in Item 2.02 contains information about how to access the conference call and webcast. A copy of the slide presentation to be used during the earnings call and webcast is furnished as Exhibit 99.2 to this Current Report on Form 8-K. The slide presentation also will be available on our website, www.ucbi.com, under the “Investor Relations – Events and Presentations” section. | |
| Item 9.01 | Financial Statements and Exhibits. |
| (d) Exhibits | The following exhibit index lists the exhibits that are either filed or furnished with the Current Report on Form 8-K. |
| EXHIBIT INDEX |
| Exhibit No. | Description | |
| 99.1 | United Community Banks, Inc. Press Release, dated January 17, 2023 (furnished only). | |
| 99.2 | Slide presentation to be used during January 18, 2023 earnings call (furnished only). | |
| 104 | The cover page from this Current Report on Form 8-K, formatted in Inline XBRL. | |
SIGNATURES
Pursuant to the requirements of the Securities Exchange Act of 1934, the registrant has duly caused this report to be signed on its behalf by the undersigned hereunto duly authorized.
| UNITED COMMUNITY BANKS, INC. | ||
| By: | /s/ Jefferson L. Harralson | |
| Jefferson L. Harralson | ||
| Executive Vice President and | ||
| Chief Financial Officer | ||
| Date: January 17, 2023 | ||
Exhibit 99.1
For Immediate Release
For more information:
Jefferson Harralson
Chief Financial Officer
(864) 240-6208
Jefferson_Harralson@ucbi.com
United Community Banks, Inc. Reports Fourth Quarter 2022 Results
GAAP EPS of $0.74, Return on Assets of 1.33% and Loan Growth of 12%
GREENVILLE, SC – January 17, 2023 - United Community Banks, Inc. (NASDAQ: UCBI) (United) today announced that net income for the 2022 fourth quarter was $81.5 million and pre-tax, pre-provision income was $125.9 million. Diluted earnings per share of $0.74 for the quarter represented an increase of $0.19 or 35%, from the fourth quarter a year ago, and was flat from the third quarter of 2022. On an operating basis, United’s diluted earnings per share of $0.75 was up 17% from the year ago quarter. The primary drivers of the increased earnings in both periods were increased interest rates and organic loan growth, as well as the acquisition of Reliant Bancorp, Inc., which closed on January 1, 2022 and was not reflected in the year-ago quarter. United’s return on assets was 1.33%, or 1.35% on an operating basis. Return on equity was 10.9% and return on tangible common equity was 15.2%. On a pre-tax, pre-provision basis, operating return on assets was 2.09% for the quarter. Highlights for the quarter include strong annualized loan growth of 12%, 19 basis points of net interest margin expansion and further improvement in the efficiency ratio to 47.95%, or 47.35% on an operating basis, which excludes the effect of merger-related and other charges.
Chairman and CEO Lynn Harton stated, “We are pleased with our performance during this quarter and in 2022. In the quarter, our loan growth across all categories was strong and our net interest margin continued to benefit from increasing interest rates. As a result, we generated positive operating leverage, resulting in a new record efficiency ratio for us.” Harton continued, “On the strategic front, we continue to benefit from the acquisitions we have completed over the past few years. These new partnerships have expanded the company into exciting growth markets and have brought talented bankers to United. While not included in these quarterly results, we are excited that we have now completed the addition of Progress Financial Corporation to the United family on January 3, 2023. Progress has a talented team, exceptional leadership, and operates in great markets in Alabama and the Florida Panhandle. I am very glad to welcome them to our team.”
The net interest margin increased by 19 basis points to 3.76% from the third quarter, while the average yield on interest-earning assets was up 49 basis points to 4.32% and United’s cost of deposits increased by 30 basis points to 0.49%. Net charge-offs increased to $6.6 million or 0.17% of average loans during the quarter, mainly driven by one C&I loan, and NPAs were up slightly from prior quarters to 18 basis points relative to total assets.
Mr. Harton concluded, “2023 will be another great year for United despite some changes in the environment. Deposit competition will continue to increase as depositors seek higher returns for their excess liquidity. Well publicized recession fears may drive increasing provision costs for the industry. We believe we are well prepared to navigate these conditions due to the strength of our balance sheet, and more importantly, the strength of our teams. In 2022, we further strengthened our Board of Directors, added new market leaders, new commercial bankers and new line-of-business leaders. We also expanded our service capabilities with new locations across our footprint. In closing, I would note that we are all very proud that in October, United was named one of the “Best Banks to Work For” by American Banker for the sixth consecutive year. Everything begins with being a great place to work for great people. One of my goals for the year is to do an even better job of making sure we keep our company feeling small and connected as we continue to grow.”
2022 Financial Highlights:
| · | Completed successful year with strong loan growth and historically high pre-credit profitability, and completed an acquisition in the high-growth Nashville, Tennessee MSA, which was a strategic priority |
| · | Full year EPS of $2.52, a decrease of 15% compared to 2021; full year operating EPS of $2.66, a decrease of 14% from 2021 |
| · | Return on assets of 1.13%, or 1.19% on an operating basis |
| · | Pre-tax, pre-provision return on assets of 1.80% on an operating basis |
| · | Return on common equity of 9.5% |
| · | Return on tangible common equity of 14.0% on an operating basis |
| · | A provision for credit losses of $63.9 million compared to a release of provision of $37.6 million in 2021, with $18.3 million attributable to establishing an initial allowance for loans acquired in the first quarter in the Reliant acquisition |
| · | Strong loan growth of $3.6 billion or $1.3 billion excluding loans acquired from Reliant and PPP loans |
| · | Core transaction deposits were up $1.3 billion compared to 2021; excluding Reliant, 2022 core transaction deposits were down $819 million, or 5.7%, reflecting runoff following 2021’s pandemic-related deposit surge |
| · | Net interest margin of 3.38%, which was up 31 basis points from last year primarily due to increased interest rates |
| · | Noninterest income was down 12.7% primarily due to a decline in mortgage fees, as higher rates softened demand |
| · | The efficiency ratio of 52.3%, or 50.2% on an operating basis, was improved as the combination of higher rates and the achievement of merger-related efficiencies drove the ratio to record low levels |
| · | Net charge-offs remained low at just $9.7 million, or 0.07% of average total loans |
Fourth Quarter 2022 Financial Highlights:
| · | Net income of $81.5 million and pre-tax, pre-provision income of $125.9 million |
| · | EPS increased by 35% compared to fourth quarter 2021 on a GAAP basis and 17% on an operating basis; compared to third quarter 2022, EPS remained flat on a GAAP basis and on an operating basis |
| · | Return on assets of 1.33%, or 1.35% on an operating basis |
| · | Pre-tax, pre-provision return on assets of 2.09% on an operating basis |
| · | Return on common equity of 10.9% |
| · | Return on tangible common equity of 15.2% on an operating basis |
| · | A provision for credit losses of $19.8 million, which increased the allowance for loan losses to 1.04% of loans from 1.00% in the third quarter |
| · | Loan production of $1.5 billion, resulting in loan growth of 12%, annualized for the quarter |
| · | Core transaction deposits were down $915 million; or 22% annualized |
| · | Net interest margin of 3.76% was up 19 basis points from the third quarter, due to increased interest rates and loan growth |
| · | Mortgage closings of $253 million compared to $522 million a year ago; mortgage rate locks of $364 million compared to $695 million a year ago |
| · | Noninterest income was up $1.4 million on a linked quarter basis, primarily driven by positive marks on certain investments and offset by lower mortgage fees |
| · | Noninterest expenses increased by $4.6 million compared to the third quarter on a GAAP basis and by $4.9 million on an operating basis, mostly due to lower deferred costs from lower mortgage loan volume and higher FDIC deposit insurance costs |
| · | Efficiency ratio of 48.0%, or 47.4% on an operating basis |
| · | Net charge-offs of $6.6 million, or 17 basis points as a percent of average loans, up 14 basis points from the net charge-offs experienced in the third quarter |
| · | Nonperforming assets of 0.18% of total assets, up 3 basis points compared to September 30, 2022 |
| · | Quarterly common shareholder dividend of $0.22 per share declared during the quarter, an increase of 10% year-over-year |
| · | After the end of the quarter, we completed the acquisition of Progress Financial Corporation and its banking subsidiary Progress Bank and Trust with $1.8 billion in assets on January 3, 2023; financial returns are expected to be within our desired thresholds |
Conference Call
United will hold a conference call on Wednesday, January 18, 2023, at 11 a.m. ET to discuss the contents of this press release and to share business highlights for the quarter. Participants can pre-register for the conference call by navigating to https://dpregister.com/sreg/10174303/f57c53ab13. Those without internet access or unable to pre-register may dial in by calling 1-866-777-2509. Participants are encouraged to dial in 15 minutes prior to the call start time. The conference call also will be webcast and can be accessed by selecting “Events and Presentations” under “News and Events” within the Investor Relations section of the company's website, www.ucbi.com.
|
UNITED COMMUNITY BANKS, INC. Selected Financial Information (in thousands, except per share data) |
||||||||||||||||||||||||||||||||||||
| 2022 | 2021 | Fourth Quarter | For the Twelve Months Ended December 31, |
YTD 2022- | ||||||||||||||||||||||||||||||||
| Fourth Quarter |
Third Quarter |
Second Quarter |
First Quarter |
Fourth Quarter |
2022- 2021 Change |
2022 | 2021 | 2021 Change |
||||||||||||||||||||||||||||
| INCOME SUMMARY | ||||||||||||||||||||||||||||||||||||
| Interest revenue | $ | 240,831 | $ | 213,887 | $ | 187,378 | $ | 171,059 | $ | 143,768 | $ | 813,155 | $ | 578,794 | ||||||||||||||||||||||
| Interest expense | 30,943 | 14,113 | 8,475 | 7,267 | 6,213 | 60,798 | 29,760 | |||||||||||||||||||||||||||||
| Net interest revenue | 209,888 | 199,774 | 178,903 | 163,792 | 137,555 | 53 | % | 752,357 | 549,034 | 37 | % | |||||||||||||||||||||||||
| Provision for credit losses | 19,831 | 15,392 | 5,604 | 23,086 | (647 | ) | 63,913 | (37,550 | ) | |||||||||||||||||||||||||||
| Noninterest income | 33,354 | 31,922 | 33,458 | 38,973 | 37,177 | (10 | ) | 137,707 | 157,818 | (13 | ) | |||||||||||||||||||||||||
| Total revenue | 223,411 | 216,304 | 206,757 | 179,679 | 175,379 | 27 | 826,151 | 744,402 | 11 | |||||||||||||||||||||||||||
| Noninterest expenses | 117,329 | 112,755 | 120,790 | 119,275 | 109,156 | 7 | 470,149 | 396,639 | 19 | |||||||||||||||||||||||||||
| Income before income tax expense | 106,082 | 103,549 | 85,967 | 60,404 | 66,223 | 356,002 | 347,763 | |||||||||||||||||||||||||||||
| Income tax expense | 24,632 | 22,388 | 19,125 | 12,385 | 14,204 | 78,530 | 77,962 | |||||||||||||||||||||||||||||
| Net income | 81,450 | 81,161 | 66,842 | 48,019 | 52,019 | 277,472 | 269,801 | |||||||||||||||||||||||||||||
| Merger-related and other charges | 1,470 | 1,746 | 7,143 | 9,016 | 9,912 | 19,375 | 13,970 | |||||||||||||||||||||||||||||
| Income tax benefit of merger-related and other charges | (323 | ) | (385 | ) | (1,575 | ) | (1,963 | ) | (2,265 | ) | (4,246 | ) | (3,174 | ) | ||||||||||||||||||||||
| Net income - operating (1) | $ | 82,597 | $ | 82,522 | $ | 72,410 | $ | 55,072 | $ | 59,666 | 38 | $ | 292,601 | $ | 280,597 | 4 | ||||||||||||||||||||
| Pre-tax pre-provision income (5) | $ | 125,913 | $ | 118,941 | $ | 91,571 | $ | 83,490 | $ | 65,576 | 92 | $ | 419,915 | $ | 310,213 | 35 | ||||||||||||||||||||
| PERFORMANCE MEASURES | ||||||||||||||||||||||||||||||||||||
| Per common share: | ||||||||||||||||||||||||||||||||||||
| Diluted net income - GAAP | $ | 0.74 | $ | 0.74 | $ | 0.61 | $ | 0.43 | $ | 0.55 | 35 | $ | 2.52 | $ | 2.97 | (15 | ) | |||||||||||||||||||
| Diluted net income - operating (1) | 0.75 | 0.75 | 0.66 | 0.50 | 0.64 | 17 | 2.66 | 3.09 | (14 | ) | ||||||||||||||||||||||||||
| Common stock cash dividends declared | 0.22 | 0.22 | 0.21 | 0.21 | 0.20 | 10 | 0.86 | 0.78 | 10 | |||||||||||||||||||||||||||
| Book value | 24.38 | 23.78 | 23.96 | 24.38 | 23.63 | 3 | 24.38 | 23.63 | 3 | |||||||||||||||||||||||||||
| Tangible book value (3) | 17.13 | 16.52 | 16.68 | 17.08 | 18.42 | (7 | ) | 17.13 | 18.42 | (7 | ) | |||||||||||||||||||||||||
| Key performance ratios: | ||||||||||||||||||||||||||||||||||||
| Return on common equity - GAAP (2)(4) | 10.86 | % | 11.02 | % | 9.31 | % | 6.80 | % | 9.32 | % | 9.54 | % | 13.14 | % | ||||||||||||||||||||||
| Return on common equity - operating (1)(2)(4) | 11.01 | 11.21 | 10.10 | 7.83 | 10.74 | 10.07 | 13.68 | |||||||||||||||||||||||||||||
| Return on tangible common equity - operating (1)(2)(3)(4) | 15.20 | 15.60 | 14.20 | 11.00 | 13.93 | 14.04 | 17.33 | |||||||||||||||||||||||||||||
| Return on assets - GAAP (4) | 1.33 | 1.32 | 1.08 | 0.78 | 0.96 | 1.13 | 1.37 | |||||||||||||||||||||||||||||
| Return on assets - operating (1)(4) | 1.35 | 1.34 | 1.17 | 0.89 | 1.10 | 1.19 | 1.42 | |||||||||||||||||||||||||||||
| Return on assets -pre-tax pre-provision (4)(5) | 2.07 | 1.94 | 1.49 | 1.37 | 1.21 | 1.72 | 1.58 | |||||||||||||||||||||||||||||
| Return on assets -pre-tax pre-provision, excluding merger related and other charges (1)(4)(5) | 2.09 | 1.97 | 1.60 | 1.52 | 1.40 | 1.80 | 1.65 | |||||||||||||||||||||||||||||
| Net interest margin (fully taxable equivalent) (4) | 3.76 | 3.57 | 3.19 | 2.97 | 2.81 | 3.38 | 3.07 | |||||||||||||||||||||||||||||
| Efficiency ratio - GAAP | 47.95 | 48.41 | 56.58 | 57.43 | 62.12 | 52.31 | 55.80 | |||||||||||||||||||||||||||||
| Efficiency ratio - operating (1) | 47.35 | 47.66 | 53.23 | 53.09 | 56.48 | 50.16 | 53.83 | |||||||||||||||||||||||||||||
| Equity to total assets | 11.25 | 11.12 | 10.95 | 11.06 | 10.61 | 11.25 | 10.61 | |||||||||||||||||||||||||||||
| Tangible common equity to tangible assets (3) | 7.88 | 7.70 | 7.59 | 7.72 | 8.09 | 7.88 | 8.09 | |||||||||||||||||||||||||||||
| ASSET QUALITY | ||||||||||||||||||||||||||||||||||||
| Nonperforming assets (“NPAs”) | $ | 44,281 | $ | 35,511 | $ | 34,428 | $ | 40,816 | $ | 32,855 | 35 | $ | 44,281 | $ | 32,855 | 35 | ||||||||||||||||||||
| Allowance for credit losses - loans | 159,357 | 148,502 | 136,925 | 132,805 | 102,532 | 55 | 159,357 | 102,532 | 55 | |||||||||||||||||||||||||||
| Allowance for credit losses - total | 180,520 | 167,300 | 153,042 | 146,369 | 113,524 | 59 | 180,520 | 113,524 | 59 | |||||||||||||||||||||||||||
| Net charge-offs (recoveries) | 6,611 | 1,134 | (1,069 | ) | 2,978 | 248 | 9,654 | 38 | ||||||||||||||||||||||||||||
| Allowance for credit losses - loans to loans | 1.04 | % | 1.00 | % | 0.94 | % | 0.93 | % | 0.87 | % | 1.04 | % | 0.87 | % | ||||||||||||||||||||||
| Allowance for credit losses - total to loans | 1.18 | 1.12 | 1.05 | 1.02 | 0.97 | 1.18 | 0.97 | |||||||||||||||||||||||||||||
| Net charge-offs to average loans (4) | 0.17 | 0.03 | (0.03 | ) | 0.08 | 0.01 | 0.07 | — | ||||||||||||||||||||||||||||
| NPAs to total assets | 0.18 | 0.15 | 0.14 | 0.17 | 0.16 | 0.18 | 0.16 | |||||||||||||||||||||||||||||
| AT PERIOD END ($ in millions) | ||||||||||||||||||||||||||||||||||||
| Loans | $ | 15,335 | $ | 14,882 | $ | 14,541 | $ | 14,316 | $ | 11,760 | 30 | $ | 15,335 | $ | 11,760 | 30 | ||||||||||||||||||||
| Investment securities | 6,228 | 6,539 | 6,683 | 6,410 | 5,653 | 10 | 6,228 | 5,653 | 10 | |||||||||||||||||||||||||||
| Total assets | 24,009 | 23,688 | 24,213 | 24,374 | 20,947 | 15 | 24,009 | 20,947 | 15 | |||||||||||||||||||||||||||
| Deposits | 19,877 | 20,321 | 20,873 | 21,056 | 18,241 | 9 | 19,877 | 18,241 | 9 | |||||||||||||||||||||||||||
| Shareholders’ equity | 2,701 | 2,635 | 2,651 | 2,695 | 2,222 | 22 | 2,701 | 2,222 | 22 | |||||||||||||||||||||||||||
| Common shares outstanding (thousands) | 106,223 | 106,163 | 106,034 | 106,025 | 89,350 | 19 | 106,223 | 89,350 | 19 | |||||||||||||||||||||||||||
(1) Excludes merger-related and other charges. (2) Net income less preferred stock dividends, divided by average realized common equity, which excludes accumulated other comprehensive income (loss). (3) Excludes effect of acquisition related intangibles and associated amortization. (4) Annualized. (5) Excludes income tax expense and provision for credit losses.
| UNITED COMMUNITY BANKS,
INC. Non-GAAP Performance Measures Reconciliation Selected Financial Information (in thousands, except per share data) |
||||||||||||||||||||||||||||
| 2022 | 2021 | Twelve Months Ended December 31, |
||||||||||||||||||||||||||
| Fourth Quarter |
Third Quarter |
Second Quarter |
First Quarter |
Fourth Quarter |
2022 | 2021 | ||||||||||||||||||||||
| Noninterest expense reconciliation | ||||||||||||||||||||||||||||
| Noninterest expenses (GAAP) | $ | 117,329 | $ | 112,755 | $ | 120,790 | $ | 119,275 | $ | 109,156 | $ | 470,149 | $ | 396,639 | ||||||||||||||
| Merger-related and other charges | (1,470 | ) | (1,746 | ) | (7,143 | ) | (9,016 | ) | (9,912 | ) | (19,375 | ) | (13,970 | ) | ||||||||||||||
| Expenses - operating | $ | 115,859 | $ | 111,009 | $ | 113,647 | $ | 110,259 | $ | 99,244 | $ | 450,774 | $ | 382,669 | ||||||||||||||
| Net income to operating income reconciliation | ||||||||||||||||||||||||||||
| Net income (GAAP) | $ | 81,450 | $ | 81,161 | $ | 66,842 | $ | 48,019 | $ | 52,019 | $ | 277,472 | $ | 269,801 | ||||||||||||||
| Merger-related and other charges | 1,470 | 1,746 | 7,143 | 9,016 | 9,912 | 19,375 | 13,970 | |||||||||||||||||||||
| Income tax benefit of merger-related and other charges | (323 | ) | (385 | ) | (1,575 | ) | (1,963 | ) | (2,265 | ) | (4,246 | ) | (3,174 | ) | ||||||||||||||
| Net income - operating | $ | 82,597 | $ | 82,522 | $ | 72,410 | $ | 55,072 | $ | 59,666 | $ | 292,601 | $ | 280,597 | ||||||||||||||
| Net income to pre-tax pre-provision income reconciliation | ||||||||||||||||||||||||||||
| Net income (GAAP) | $ | 81,450 | $ | 81,161 | $ | 66,842 | $ | 48,019 | $ | 52,019 | $ | 277,472 | $ | 269,801 | ||||||||||||||
| Income tax expense | 24,632 | 22,388 | 19,125 | 12,385 | 14,204 | 78,530 | 77,962 | |||||||||||||||||||||
| Provision for credit losses | 19,831 | 15,392 | 5,604 | 23,086 | (647 | ) | 63,913 | (37,550 | ) | |||||||||||||||||||
| Pre-tax pre-provision income | $ | 125,913 | $ | 118,941 | $ | 91,571 | $ | 83,490 | $ | 65,576 | $ | 419,915 | $ | 310,213 | ||||||||||||||
| Diluted income per common share reconciliation | ||||||||||||||||||||||||||||
| Diluted income per common share (GAAP) | $ | 0.74 | $ | 0.74 | $ | 0.61 | $ | 0.43 | $ | 0.55 | $ | 2.52 | $ | 2.97 | ||||||||||||||
| Merger-related and other charges | 0.01 | 0.01 | 0.05 | 0.07 | 0.09 | 0.14 | 0.12 | |||||||||||||||||||||
| Diluted income per common share - operating | $ | 0.75 | $ | 0.75 | $ | 0.66 | $ | 0.50 | $ | 0.64 | $ | 2.66 | $ | 3.09 | ||||||||||||||
| Book value per common share reconciliation | ||||||||||||||||||||||||||||
| Book value per common share (GAAP) | $ | 24.38 | $ | 23.78 | $ | 23.96 | $ | 24.38 | $ | 23.63 | $ | 24.38 | $ | 23.63 | ||||||||||||||
| Effect of goodwill and other intangibles | (7.25 | ) | (7.26 | ) | (7.28 | ) | (7.30 | ) | (5.21 | ) | (7.25 | ) | (5.21 | ) | ||||||||||||||
| Tangible book value per common share | $ | 17.13 | $ | 16.52 | $ | 16.68 | $ | 17.08 | $ | 18.42 | $ | 17.13 | $ | 18.42 | ||||||||||||||
| Return on tangible common equity reconciliation | ||||||||||||||||||||||||||||
| Return on common equity (GAAP) | 10.86 | % | 11.02 | % | 9.31 | % | 6.80 | % | 9.32 | % | 9.54 | % | 13.14 | % | ||||||||||||||
| Merger-related and other charges | 0.15 | 0.19 | 0.79 | 1.03 | 1.42 | 0.53 | 0.54 | |||||||||||||||||||||
| Return on common equity - operating | 11.01 | 11.21 | 10.10 | 7.83 | 10.74 | 10.07 | 13.68 | |||||||||||||||||||||
| Effect of goodwill and other intangibles | 4.19 | 4.39 | 4.10 | 3.17 | 3.19 | 3.97 | 3.65 | |||||||||||||||||||||
| Return on tangible common equity - operating | 15.20 | % | 15.60 | % | 14.20 | % | 11.00 | % | 13.93 | % | 14.04 | % | 17.33 | % | ||||||||||||||
| Return on assets reconciliation | ||||||||||||||||||||||||||||
| Return on assets (GAAP) | 1.33 | % | 1.32 | % | 1.08 | % | 0.78 | % | 0.96 | % | 1.13 | % | 1.37 | % | ||||||||||||||
| Merger-related and other charges | 0.02 | 0.02 | 0.09 | 0.11 | 0.14 | 0.06 | 0.05 | |||||||||||||||||||||
| Return on assets - operating | 1.35 | % | 1.34 | % | 1.17 | % | 0.89 | % | 1.10 | % | 1.19 | % | 1.42 | % | ||||||||||||||
| Return on assets to return on assets- pre-tax pre-provision reconciliation | ||||||||||||||||||||||||||||
| Return on assets (GAAP) | 1.33 | % | 1.32 | % | 1.08 | % | 0.78 | % | 0.96 | % | 1.13 | % | 1.37 | % | ||||||||||||||
| Income tax expense | 0.41 | 0.37 | 0.32 | 0.20 | 0.26 | 0.32 | 0.40 | |||||||||||||||||||||
| Provision for credit losses | 0.33 | 0.25 | 0.09 | 0.39 | (0.01 | ) | 0.27 | (0.19 | ) | |||||||||||||||||||
| Return on assets - pre-tax pre-provision | 2.07 | 1.94 | 1.49 | 1.37 | 1.21 | 1.72 | 1.58 | |||||||||||||||||||||
| Merger-related and other charges | 0.02 | 0.03 | 0.11 | 0.15 | 0.19 | 0.08 | 0.07 | |||||||||||||||||||||
| Return on assets - pre-tax pre-provision, excluding merger-related and other charges | 2.09 | % | 1.97 | % | 1.60 | % | 1.52 | % | 1.40 | % | 1.80 | % | 1.65 | % | ||||||||||||||
| Efficiency ratio reconciliation | ||||||||||||||||||||||||||||
| Efficiency ratio (GAAP) | 47.95 | % | 48.41 | % | 56.58 | % | 57.43 | % | 62.12 | % | 52.31 | % | 55.80 | % | ||||||||||||||
| Merger-related and other charges | (0.60 | ) | (0.75 | ) | (3.35 | ) | (4.34 | ) | (5.64 | ) | (2.15 | ) | (1.97 | ) | ||||||||||||||
| Efficiency ratio - operating | 47.35 | % | 47.66 | % | 53.23 | % | 53.09 | % | 56.48 | % | 50.16 | % | 53.83 | % | ||||||||||||||
| Tangible common equity to tangible assets reconciliation | ||||||||||||||||||||||||||||
| Equity to total assets (GAAP) | 11.25 | % | 11.12 | % | 10.95 | % | 11.06 | % | 10.61 | % | 11.25 | % | 10.61 | % | ||||||||||||||
| Effect of goodwill and other intangibles | (2.97 | ) | (3.01 | ) | (2.96 | ) | (2.94 | ) | (2.06 | ) | (2.97 | ) | (2.06 | ) | ||||||||||||||
| Effect of preferred equity | (0.40 | ) | (0.41 | ) | (0.40 | ) | (0.40 | ) | (0.46 | ) | (0.40 | ) | (0.46 | ) | ||||||||||||||
| Tangible common equity to tangible assets | 7.88 | % | 7.70 | % | 7.59 | % | 7.72 | % | 8.09 | % | 7.88 | % | 8.09 | % | ||||||||||||||
| UNITED COMMUNITY BANKS, INC. | ||||||||||||||||||||||||||||
| Financial Highlights | ||||||||||||||||||||||||||||
| Loan Portfolio Composition at Period-End | ||||||||||||||||||||||||||||
| (in millions) | ||||||||||||||||||||||||||||
| 2022 | 2021 | Linked | Year over | |||||||||||||||||||||||||
| Fourth Quarter |
Third Quarter |
Second Quarter |
First Quarter |
Fourth Quarter |
Quarter Change |
Year Change |
||||||||||||||||||||||
| LOANS BY CATEGORY | ||||||||||||||||||||||||||||
| Owner occupied commercial RE | $ | 2,735 | $ | 2,700 | $ | 2,681 | $ | 2,638 | $ | 2,322 | $ | 35 | $ | 413 | ||||||||||||||
| Income producing commercial RE | 3,262 | 3,299 | 3,273 | 3,328 | 2,601 | (37 | ) | 661 | ||||||||||||||||||||
| Commercial & industrial | 2,251 | 2,236 | 2,243 | 2,302 | 1,822 | 15 | 429 | |||||||||||||||||||||
| Paycheck protection program | 1 | 2 | 10 | 34 | 88 | (1 | ) | (87 | ) | |||||||||||||||||||
| Commercial construction | 1,598 | 1,514 | 1,514 | 1,482 | 1,015 | 84 | 583 | |||||||||||||||||||||
| Equipment financing | 1,374 | 1,281 | 1,211 | 1,148 | 1,083 | 93 | 291 | |||||||||||||||||||||
| Total commercial | 11,221 | 11,032 | 10,932 | 10,932 | 8,931 | 189 | 2,290 | |||||||||||||||||||||
| Residential mortgage | 2,355 | 2,149 | 1,997 | 1,826 | 1,638 | 206 | 717 | |||||||||||||||||||||
| Home equity lines of credit | 850 | 832 | 801 | 778 | 694 | 18 | 156 | |||||||||||||||||||||
| Residential construction | 443 | 423 | 381 | 368 | 359 | 20 | 84 | |||||||||||||||||||||
| Manufactured housing | 317 | 301 | 287 | 269 | — | 16 | 317 | |||||||||||||||||||||
| Consumer | 149 | 145 | 143 | 143 | 138 | 4 | 11 | |||||||||||||||||||||
| Total loans | $ | 15,335 | $ | 14,882 | $ | 14,541 | $ | 14,316 | $ | 11,760 | $ | 453 | $ | 3,575 | ||||||||||||||
| LOANS BY STATE | ||||||||||||||||||||||||||||
| Georgia | $ | 4,051 | $ | 4,003 | $ | 3,960 | $ | 3,879 | $ | 3,778 | $ | 48 | $ | 273 | ||||||||||||||
| South Carolina | 2,587 | 2,516 | 2,377 | 2,323 | 2,235 | 71 | 352 | |||||||||||||||||||||
| North Carolina | 2,186 | 2,117 | 2,006 | 1,879 | 1,895 | 69 | 291 | |||||||||||||||||||||
| Tennessee | 2,507 | 2,536 | 2,621 | 2,661 | 373 | (29 | ) | 2,134 | ||||||||||||||||||||
| Florida | 1,308 | 1,259 | 1,235 | 1,208 | 1,148 | 49 | 160 | |||||||||||||||||||||
| Commercial Banking Solutions | 2,696 | 2,451 | 2,342 | 2,366 | 2,331 | 245 | 365 | |||||||||||||||||||||
| Total loans | $ | 15,335 | $ | 14,882 | $ | 14,541 | $ | 14,316 | $ | 11,760 | $ | 453 | $ | 3,575 | ||||||||||||||
| UNITED COMMUNITY BANKS, INC. | ||||||||||||||||||||
| Financial Highlights | ||||||||||||||||||||
| Loan Portfolio Composition at Year-End | ||||||||||||||||||||
| (in millions) | ||||||||||||||||||||
| 2022 | 2021 | 2020 | 2019 | 2018 | ||||||||||||||||
| LOANS BY CATEGORY | ||||||||||||||||||||
| Owner occupied commercial RE | $ | 2,735 | $ | 2,322 | $ | 2,090 | $ | 1,720 | $ | 1,648 | ||||||||||
| Income producing commercial RE | 3,262 | 2,601 | 2,541 | 2,008 | 1,812 | |||||||||||||||
| Commercial & industrial | 2,251 | 1,822 | 1,853 | 1,221 | 1,278 | |||||||||||||||
| Paycheck protection program | 1 | 88 | 646 | — | — | |||||||||||||||
| Commercial construction | 1,598 | 1,015 | 967 | 976 | 796 | |||||||||||||||
| Equipment financing | 1,374 | 1,083 | 864 | 745 | 565 | |||||||||||||||
| Total commercial | 11,221 | 8,931 | 8,961 | 6,670 | 6,099 | |||||||||||||||
| Residential mortgage | 2,355 | 1,638 | 1,285 | 1,118 | 1,049 | |||||||||||||||
| Home equity lines of credit | 850 | 694 | 697 | 661 | 694 | |||||||||||||||
| Residential construction | 443 | 359 | 281 | 236 | 211 | |||||||||||||||
| Manufactured housing | 317 | — | — | — | — | |||||||||||||||
| Consumer | 149 | 138 | 147 | 128 | 330 | |||||||||||||||
| Total loans | $ | 15,335 | $ | 11,760 | $ | 11,371 | $ | 8,813 | $ | 8,383 | ||||||||||
| LOANS BY STATE | ||||||||||||||||||||
| Georgia | $ | 4,051 | $ | 3,778 | $ | 3,685 | $ | 3,606 | $ | 3,323 | ||||||||||
| South Carolina | 2,587 | 2,235 | 1,947 | 1,708 | 1,645 | |||||||||||||||
| North Carolina | 2,186 | 1,895 | 1,281 | 1,156 | 1,072 | |||||||||||||||
| Tennessee | 2,507 | 373 | 415 | 421 | 477 | |||||||||||||||
| Florida | 1,308 | 1,148 | 1,435 | — | — | |||||||||||||||
| Commercial Banking Solutions | 2,696 | 2,331 | 2,608 | 1,922 | 1,658 | |||||||||||||||
| Indirect auto | — | — | — | — | 208 | |||||||||||||||
| Total loans | $ | 15,335 | $ | 11,760 | $ | 11,371 | $ | 8,813 | $ | 8,383 | ||||||||||
| UNITED COMMUNITY BANKS, INC. | ||||||||||||||||||||||||
| Financial Highlights | ||||||||||||||||||||||||
| Credit Quality | ||||||||||||||||||||||||
| (in thousands) | ||||||||||||||||||||||||
| 2022 | ||||||||||||||||||||||||
| Fourth Quarter |
Third Quarter |
Second Quarter |
||||||||||||||||||||||
| NONACCRUAL LOANS | ||||||||||||||||||||||||
| Owner occupied RE | $ | 523 | $ | 877 | $ | 1,876 | ||||||||||||||||||
| Income producing RE | 3,885 | 2,663 | 7,074 | |||||||||||||||||||||
| Commercial & industrial | 14,470 | 11,108 | 4,548 | |||||||||||||||||||||
| Commercial construction | 133 | 150 | 208 | |||||||||||||||||||||
| Equipment financing | 5,438 | 3,198 | 3,249 | |||||||||||||||||||||
| Total commercial | 24,449 | 17,996 | 16,955 | |||||||||||||||||||||
| Residential mortgage | 10,919 | 10,424 | 12,228 | |||||||||||||||||||||
| Home equity lines of credit | 1,888 | 1,151 | 933 | |||||||||||||||||||||
| Residential construction | 405 | 104 | 198 | |||||||||||||||||||||
| Manufactured housing | 6,518 | 4,187 | 2,804 | |||||||||||||||||||||
| Consumer | 53 | 17 | 25 | |||||||||||||||||||||
| Total nonaccrual loans held for investment | 44,232 | 33,879 | 33,143 | |||||||||||||||||||||
| Nonaccrual loans HFS | — | 316 | 317 | |||||||||||||||||||||
| OREO and repossessed assets | 49 | 1,316 | 968 | |||||||||||||||||||||
| Total NPAs | $ | 44,281 | $ | 35,511 | $ | 34,428 | ||||||||||||||||||
| 2022 | ||||||||||||||||||||||||
| Fourth Quarter | Third Quarter | Second Quarter | ||||||||||||||||||||||
| (in thousands) | Net Charge- Offs |
Net Charge- Offs to Average Loans (1) |
Net Charge- Offs |
Net Charge- Offs to Average Loans (1) |
Net Charge- Offs |
Net Charge- Offs to Average Loans (1) |
||||||||||||||||||
| NET CHARGE-OFFS BY CATEGORY | ||||||||||||||||||||||||
| Owner occupied RE | $ | (130 | ) | (0.02 | )% | $ | (90 | ) | (0.01 | )% | $ | (1,496 | ) | (0.23 | )% | |||||||||
| Income producing RE | (113 | ) | (0.01 | ) | 176 | 0.02 | (116 | ) | (0.01 | ) | ||||||||||||||
| Commercial & industrial | 4,577 | 0.81 | (744 | ) | (0.13 | ) | (302 | ) | (0.05 | ) | ||||||||||||||
| Commercial construction | (77 | ) | (0.02 | ) | 10 | — | (144 | ) | (0.04 | ) | ||||||||||||||
| Equipment financing | 1,658 | 0.50 | 1,121 | 0.36 | 907 | 0.31 | ||||||||||||||||||
| Total commercial | 5,915 | 0.21 | 473 | 0.02 | (1,151 | ) | (0.04 | ) | ||||||||||||||||
| Residential mortgage | (33 | ) | (0.01 | ) | (66 | ) | (0.01 | ) | (51 | ) | (0.01 | ) | ||||||||||||
| Home equity lines of credit | (89 | ) | (0.04 | ) | (102 | ) | (0.05 | ) | (346 | ) | (0.18 | ) | ||||||||||||
| Residential construction | (23 | ) | (0.02 | ) | (109 | ) | (0.11 | ) | (76 | ) | (0.08 | ) | ||||||||||||
| Manufactured housing | 246 | 0.32 | 220 | 0.30 | 135 | 0.20 | ||||||||||||||||||
| Consumer | 595 | 1.61 | 718 | 1.98 | 420 | 1.18 | ||||||||||||||||||
| Total | $ | 6,611 | 0.17 | $ | 1,134 | 0.03 | $ | (1,069 | ) | (0.03 | ) | |||||||||||||
| (1) Annualized. | ||||||||||||||||||||||||
| UNITED COMMUNITY BANKS, INC. |
| Consolidated Balance Sheets (Unaudited) |
| (in thousands, except share and per share data) |
| December 31, 2022 |
December 31, 2021 |
|||||||
| ASSETS | ||||||||
| Cash and due from banks | $ | 195,771 | $ | 144,244 | ||||
| Interest-bearing deposits in banks | 316,082 | 2,147,266 | ||||||
| Federal funds and other short-term investments | 135,000 | 27,000 | ||||||
| Cash and cash equivalents | 646,853 | 2,318,510 | ||||||
| Debt securities available-for-sale | 3,614,333 | 4,496,824 | ||||||
| Debt securities held-to-maturity (fair value $2,191,073 and $1,148,804, respectively) | 2,613,648 | 1,156,098 | ||||||
| Loans held for sale at fair value | 13,600 | 44,109 | ||||||
| Loans and leases held for investment | 15,334,627 | 11,760,346 | ||||||
| Less allowance for credit losses - loans and leases | (159,357 | ) | (102,532 | ) | ||||
| Loans and leases, net | 15,175,270 | 11,657,814 | ||||||
| Premises and equipment, net | 298,456 | 245,296 | ||||||
| Bank owned life insurance | 299,297 | 217,713 | ||||||
| Accrued interest receivable | 72,807 | 42,999 | ||||||
| Net deferred tax asset | 129,313 | 41,322 | ||||||
| Derivative financial instruments | 50,636 | 42,480 | ||||||
| Goodwill and other intangible assets, net | 779,248 | 472,407 | ||||||
| Other assets | 315,423 | 211,199 | ||||||
| Total assets | $ | 24,008,884 | $ | 20,946,771 | ||||
| LIABILITIES AND SHAREHOLDERS’ EQUITY | ||||||||
| Liabilities: | ||||||||
| Deposits: | ||||||||
| Noninterest-bearing demand | $ | 7,643,081 | $ | 6,956,981 | ||||
| NOW and interest-bearing demand | 4,350,878 | 4,252,209 | ||||||
| Money market | 4,510,680 | 4,183,354 | ||||||
| Savings | 1,456,337 | 1,215,779 | ||||||
| Time | 1,781,482 | 1,442,498 | ||||||
| Brokered | 134,049 | 190,358 | ||||||
| Total deposits | 19,876,507 | 18,241,179 | ||||||
| Short-term borrowings | 158,933 | — | ||||||
| Federal Home Loan Bank advances | 550,000 | — | ||||||
| Long-term debt | 324,663 | 247,360 | ||||||
| Derivative financial instruments | 99,543 | 25,145 | ||||||
| Accrued expenses and other liabilities | 298,564 | 210,842 | ||||||
| Total liabilities | 21,308,210 | 18,724,526 | ||||||
| Shareholders' equity: | ||||||||
| Preferred stock, $1 par value: 10,000,000 shares authorized; Series I, $25,000 per share liquidation preference; 4,000 shares issued and outstanding | 96,422 | 96,422 | ||||||
| Common stock, $1 par value; 200,000,000 shares authorized; 106,222,758 and 89,349,826 shares issued and outstanding, respectively | 106,223 | 89,350 | ||||||
| Common stock issuable; 607,128 and 595,705 shares, respectively | 12,307 | 11,288 | ||||||
| Capital surplus | 2,306,366 | 1,721,007 | ||||||
| Retained earnings | 508,844 | 330,654 | ||||||
| Accumulated other comprehensive loss | (329,488 | ) | (26,476 | ) | ||||
| Total shareholders’ equity | 2,700,674 | 2,222,245 | ||||||
| Total liabilities and shareholders’ equity | $ | 24,008,884 | $ | 20,946,771 | ||||
| UNITED COMMUNITY BANKS, INC. |
| Consolidated Statements of Income (Unaudited) |
| (in thousands, except per share data) |
| Three Months Ended December 31, |
Twelve Months Ended December 31, |
|||||||||||||||
| 2022 | 2021 | 2022 | 2021 | |||||||||||||
| Interest revenue: | ||||||||||||||||
| Loans, including fees | $ | 197,330 | $ | 123,473 | $ | 673,402 | $ | 505,734 | ||||||||
| Investment securities, including tax exempt of $2,561, 2,293, $10,323 and $8,978 | 40,781 | 19,442 | 131,824 | 70,972 | ||||||||||||
| Deposits in banks and short-term investments | 2,720 | 853 | 7,929 | 2,088 | ||||||||||||
| Total interest revenue | 240,831 | 143,768 | 813,155 | 578,794 | ||||||||||||
| Interest expense: | ||||||||||||||||
| Deposits: | ||||||||||||||||
| NOW and interest-bearing demand | 9,688 | 1,310 | 17,312 | 5,468 | ||||||||||||
| Money market | 11,244 | 1,102 | 18,274 | 5,380 | ||||||||||||
| Savings | 356 | 60 | 693 | 217 | ||||||||||||
| Time | 3,498 | 392 | 5,820 | 3,780 | ||||||||||||
| Deposits | 24,786 | 2,864 | 42,099 | 14,845 | ||||||||||||
| Short-term borrowings | 480 | — | 507 | — | ||||||||||||
| Federal Home Loan Bank advances | 1,424 | 1 | 1,424 | 3 | ||||||||||||
| Long-term debt | 4,253 | 3,348 | 16,768 | 14,912 | ||||||||||||
| Total interest expense | 30,943 | 6,213 | 60,798 | 29,760 | ||||||||||||
| Net interest revenue | 209,888 | 137,555 | 752,357 | 549,034 | ||||||||||||
| Provision for credit losses | 19,831 | (647 | ) | 63,913 | (37,550 | ) | ||||||||||
| Net interest revenue after provision for credit losses | 190,057 | 138,202 | 688,444 | 586,584 | ||||||||||||
| Noninterest income: | ||||||||||||||||
| Service charges and fees | 9,519 | 8,613 | 38,163 | 33,868 | ||||||||||||
| Mortgage loan gains and related fees | 3,104 | 10,910 | 32,524 | 58,446 | ||||||||||||
| Wealth management fees | 5,835 | 6,117 | 23,594 | 18,998 | ||||||||||||
| Gains from other loan sales, net | 1,504 | 3,761 | 10,730 | 11,267 | ||||||||||||
| Other lending and loan servicing fees | 2,487 | 2,357 | 10,005 | 9,427 | ||||||||||||
| Securities (losses) gains, net | (184 | ) | 42 | (3,872 | ) | 83 | ||||||||||
| Other | 11,089 | 5,377 | 26,563 | 25,729 | ||||||||||||
| Total noninterest income | 33,354 | 37,177 | 137,707 | 157,818 | ||||||||||||
| Total revenue | 223,411 | 175,379 | 826,151 | 744,402 | ||||||||||||
| Noninterest expenses: | ||||||||||||||||
| Salaries and employee benefits | 68,143 | 60,986 | 276,205 | 241,443 | ||||||||||||
| Occupancy | 8,866 | 7,489 | 36,247 | 28,619 | ||||||||||||
| Communications and equipment | 10,516 | 7,850 | 38,234 | 29,829 | ||||||||||||
| FDIC assessments and other regulatory charges | 3,098 | 1,878 | 9,894 | 7,398 | ||||||||||||
| Professional fees | 5,496 | 6,080 | 20,166 | 20,589 | ||||||||||||
| Lending and loan servicing expense | 1,604 | 2,351 | 9,350 | 10,859 | ||||||||||||
| Outside services - electronic banking | 3,954 | 2,670 | 12,583 | 9,481 | ||||||||||||
| Postage, printing and supplies | 2,441 | 1,939 | 8,749 | 7,110 | ||||||||||||
| Advertising and public relations | 2,052 | 1,760 | 8,384 | 5,910 | ||||||||||||
| Amortization of intangibles | 1,619 | 1,103 | 6,826 | 4,045 | ||||||||||||
| Merger-related and other charges | 1,470 | 9,912 | 19,375 | 13,970 | ||||||||||||
| Other | 8,070 | 5,138 | 24,136 | 17,386 | ||||||||||||
| Total noninterest expenses | 117,329 | 109,156 | 470,149 | 396,639 | ||||||||||||
| Net income before income taxes | 106,082 | 66,223 | 356,002 | 347,763 | ||||||||||||
| Income tax expense | 24,632 | 14,204 | 78,530 | 77,962 | ||||||||||||
| Net income | $ | 81,450 | $ | 52,019 | $ | 277,472 | $ | 269,801 | ||||||||
| Preferred stock dividends | 1,718 | 1,718 | 6,875 | 6,875 | ||||||||||||
| Earnings allocated to participating securities | 461 | 317 | 1,462 | 1,657 | ||||||||||||
| Net income available to common shareholders | $ | 79,271 | $ | 49,984 | $ | 269,135 | $ | 261,269 | ||||||||
| Net income per common share: | ||||||||||||||||
| Basic | $ | 0.74 | $ | 0.56 | $ | 2.52 | $ | 2.97 | ||||||||
| Diluted | 0.74 | 0.55 | 2.52 | 2.97 | ||||||||||||
| Weighted average common shares outstanding: | ||||||||||||||||
| Basic | 106,795 | 89,916 | 106,661 | 87,940 | ||||||||||||
| Diluted | 106,916 | 90,089 | 106,778 | 88,097 | ||||||||||||
| Average Consolidated Balance Sheets and Net Interest Analysis |
| For the Three Months Ended December 31, |
| (dollars in thousands, fully taxable equivalent (FTE)) |
| 2022 | 2021 | |||||||||||||||||||||||
| Average Balance |
Interest | Average Rate |
Average Balance |
Interest | Average Rate |
|||||||||||||||||||
| Assets: | ||||||||||||||||||||||||
| Interest-earning assets: | ||||||||||||||||||||||||
| Loans, net of unearned income (FTE) (1)(2) | $ | 15,002,836 | $ | 197,502 | 5.22 | % | $ | 11,689,412 | $ | 123,250 | 4.18 | % | ||||||||||||
| Taxable securities (3) | 6,325,165 | 38,220 | 2.42 | 5,156,563 | 17,149 | 1.33 | ||||||||||||||||||
| Tax-exempt securities (FTE) (1)(3) | 490,838 | 3,440 | 2.80 | 387,638 | 3,080 | 3.18 | ||||||||||||||||||
| Federal funds sold and other interest-earning assets | 453,090 | 2,912 | 2.55 | 2,308,241 | 1,322 | 0.23 | ||||||||||||||||||
| Total interest-earning assets (FTE) | 22,271,929 | 242,074 | 4.32 | 19,541,854 | 144,801 | 2.94 | ||||||||||||||||||
| Noninterest-earning assets: | ||||||||||||||||||||||||
| Allowance for loan losses | (152,551 | ) | (103,167 | ) | ||||||||||||||||||||
| Cash and due from banks | 217,873 | 141,967 | ||||||||||||||||||||||
| Premises and equipment | 297,523 | 245,869 | ||||||||||||||||||||||
| Other assets (3) | 1,166,424 | 1,036,760 | ||||||||||||||||||||||
| Total assets | $ | 23,801,198 | $ | 20,863,283 | ||||||||||||||||||||
| Liabilities and Shareholders’ Equity: | ||||||||||||||||||||||||
| Interest-bearing liabilities: | ||||||||||||||||||||||||
| Interest-bearing deposits: | ||||||||||||||||||||||||
| NOW and interest-bearing demand | $ | 4,385,916 | 9,688 | 0.88 | $ | 4,080,621 | 1,310 | 0.13 | ||||||||||||||||
| Money market | 4,628,585 | 11,244 | 0.96 | 4,323,851 | 1,102 | 0.10 | ||||||||||||||||||
| Savings | 1,480,908 | 356 | 0.10 | 1,187,134 | 60 | 0.02 | ||||||||||||||||||
| Time | 1,708,311 | 3,143 | 0.73 | 1,461,231 | 567 | 0.15 | ||||||||||||||||||
| Brokered time deposits | 51,258 | 355 | 2.75 | 65,556 | (175 | ) | (1.06 | ) | ||||||||||||||||
| Total interest-bearing deposits | 12,254,978 | 24,786 | 0.80 | 11,118,393 | 2,864 | 0.10 | ||||||||||||||||||
| Federal funds purchased and other borrowings | 47,487 | 480 | 4.01 | 51 | — | — | ||||||||||||||||||
| Federal Home Loan Bank advances | 135,000 | 1,424 | 4.18 | 1,426 | 1 | 0.28 | ||||||||||||||||||
| Long-term debt | 324,590 | 4,253 | 5.20 | 247,251 | 3,348 | 5.37 | ||||||||||||||||||
| Total borrowed funds | 507,077 | 6,157 | 4.82 | 248,728 | 3,349 | 5.34 | ||||||||||||||||||
| Total interest-bearing liabilities | 12,762,055 | 30,943 | 0.96 | 11,367,121 | 6,213 | 0.22 | ||||||||||||||||||
| Noninterest-bearing liabilities: | ||||||||||||||||||||||||
| Noninterest-bearing deposits | 7,993,816 | 6,918,279 | ||||||||||||||||||||||
| Other liabilities | 383,270 | 354,665 | ||||||||||||||||||||||
| Total liabilities | 21,139,141 | 18,640,065 | ||||||||||||||||||||||
| Shareholders’ equity | 2,662,057 | 2,223,218 | ||||||||||||||||||||||
| Total liabilities and shareholders’ equity | $ | 23,801,198 | $ | 20,863,283 | ||||||||||||||||||||
| Net interest revenue (FTE) | $ | 211,131 | $ | 138,588 | ||||||||||||||||||||
| Net interest-rate spread (FTE) | 3.36 | % | 2.72 | % | ||||||||||||||||||||
| Net interest margin (FTE) (4) | 3.76 | % | 2.81 | % | ||||||||||||||||||||
| (1) | Interest revenue on tax-exempt securities and loans has been increased to reflect comparable interest on taxable securities and loans. The rate used was 26%, reflecting the statutory federal income tax rate and the federal tax adjusted state income tax rate. |
| (2) | Included in the average balance of loans outstanding are loans on which the accrual of interest has been discontinued and loans that are held for sale. |
| (3) | Unrealized gains and losses, including those related to the transfer from AFS to HTM, have been reclassified to other assets. Pretax unrealized losses of $454 million in 2022 and $1.64 million in 2021 are included in other assets for purposes of this presentation. |
| (4) | Net interest margin is taxable equivalent net interest revenue divided by average interest-earning assets. |
| Average Consolidated Balance Sheets and Net Interest Analysis |
| For the Twelve Months Ended December 31, |
| (dollars in thousands, fully taxable equivalent (FTE)) |
| 2022 | 2021 | |||||||||||||||||||||||
| Average Balance |
Interest | Average Rate |
Average Balance |
Interest | Average Rate |
|||||||||||||||||||
| Assets: | ||||||||||||||||||||||||
| Interest-earning assets: | ||||||||||||||||||||||||
| Loans, net of unearned income (FTE) (1)(2) | $ | 14,571,746 | $ | 673,491 | 4.62 | % | $ | 11,485,876 | $ | 504,015 | 4.39 | % | ||||||||||||
| Taxable securities (3) | 6,284,603 | 121,501 | 1.93 | 4,446,712 | 61,994 | 1.39 | ||||||||||||||||||
| Tax-exempt securities (FTE) (1)(3) | 496,327 | 13,865 | 2.79 | 382,915 | 12,059 | 3.15 | ||||||||||||||||||
| Federal funds sold and other interest-earning assets | 1,065,057 | 9,104 | 0.85 | 1,680,151 | 4,784 | 0.28 | ||||||||||||||||||
| Total interest-earning assets (FTE) | 22,417,733 | 817,961 | 3.65 | 17,995,654 | 582,852 | 3.24 | ||||||||||||||||||
| Non-interest-earning assets: | ||||||||||||||||||||||||
| Allowance for loan losses | (135,144 | ) | (121,586 | ) | ||||||||||||||||||||
| Cash and due from banks | 204,852 | 139,728 | ||||||||||||||||||||||
| Premises and equipment | 288,044 | 230,276 | ||||||||||||||||||||||
| Other assets (3) | 1,275,263 | 1,013,956 | ||||||||||||||||||||||
| Total assets | $ | 24,050,748 | $ | 19,258,028 | ||||||||||||||||||||
| Liabilities and Shareholders’ Equity: | ||||||||||||||||||||||||
| Interest-bearing liabilities: | ||||||||||||||||||||||||
| Interest-bearing deposits: | ||||||||||||||||||||||||
| NOW and interest-bearing demand | $ | 4,486,263 | 17,312 | 0.39 | $ | 3,610,601 | 5,468 | 0.15 | ||||||||||||||||
| Money market | 4,900,667 | 18,274 | 0.37 | 3,972,358 | 5,380 | 0.14 | ||||||||||||||||||
| Savings | 1,482,599 | 693 | 0.05 | 1,095,071 | 217 | 0.02 | ||||||||||||||||||
| Time | 1,693,307 | 5,152 | 0.30 | 1,529,072 | 3,663 | 0.24 | ||||||||||||||||||
| Brokered time deposits | 61,636 | 668 | 1.08 | 67,230 | 117 | 0.17 | ||||||||||||||||||
| Total interest-bearing deposits | 12,624,472 | 42,099 | 0.33 | 10,274,332 | 14,845 | 0.14 | ||||||||||||||||||
| Federal funds purchased and other borrowings | 13,004 | 507 | 3.90 | 44 | — | — | ||||||||||||||||||
| Federal Home Loan Bank advances | 34,027 | 1,424 | 4.18 | 1,195 | 3 | 0.25 | ||||||||||||||||||
| Long-term debt | 323,102 | 16,768 | 5.19 | 276,492 | 14,912 | 5.39 | ||||||||||||||||||
| Total borrowed funds | 370,133 | 18,699 | 5.05 | 277,731 | 14,915 | 5.37 | ||||||||||||||||||
| Total interest-bearing liabilities | 12,994,605 | 60,798 | 0.47 | 10,552,063 | 29,760 | 0.28 | ||||||||||||||||||
| Noninterest-bearing liabilities: | ||||||||||||||||||||||||
| Noninterest-bearing deposits | 7,967,321 | 6,276,094 | ||||||||||||||||||||||
| Other liabilities | 377,221 | 322,566 | ||||||||||||||||||||||
| Total liabilities | 21,339,147 | 17,150,723 | ||||||||||||||||||||||
| Shareholders’ equity | 2,711,601 | 2,107,305 | ||||||||||||||||||||||
| Total liabilities and shareholders’ equity | $ | 24,050,748 | $ | 19,258,028 | ||||||||||||||||||||
| Net interest revenue (FTE) | $ | 757,163 | $ | 553,092 | ||||||||||||||||||||
| Net interest-rate spread (FTE) | 3.18 | % | 2.96 | % | ||||||||||||||||||||
| Net interest margin (FTE) (4) | 3.38 | % | 3.07 | % | ||||||||||||||||||||
| (1) | Interest revenue on tax-exempt securities and loans has been increased to reflect comparable interest on taxable securities and loans. The rate used was 26%, reflecting the statutory federal income tax rate and the federal tax adjusted state income tax rate. |
| (2) | Included in the average balance of loans outstanding are loans on which the accrual of interest has been discontinued and loans that are held for sale. |
| (3) | Unrealized gains and losses, including those related to the transfer from AFS to HTM, have been reclassified to other assets. Pretax unrealized losses of $277 million in 2022 and pretax unrealized gains of $28.7 million in 2021 are included in other assets for purposes of this presentation. |
| (4) | Net interest margin is taxable equivalent net-interest revenue divided by average interest-earning assets. |
About United Community Banks, Inc.
United Community Banks, Inc. (NASDAQ: UCBI) provides a full range of banking, wealth management and mortgage services for consumers and business owners. As of December 31, 2022, United had $24.0 billion in assets and 192 offices in Florida, Georgia, North Carolina, South Carolina, and Tennessee, along with a national SBA lending franchise and a national equipment lending subsidiary. The company, known as "The Bank That SERVICE Built," has been recognized nationally for delivering award-winning service. In 2022, J.D. Power ranked United highest in customer satisfaction with consumer banking in the Southeast, marking eight out of the last nine years United has earned the coveted award. Forbes recognized United as one of the top ten World's Best Banks in 2022. Forbes also included United on its 2022 list of the 100 Best Banks in America for the ninth consecutive year. United also received ten Greenwich Excellence Awards in 2021 for excellence in Small Business Banking and Middle Market Banking, including national awards for Overall Satisfaction and Likelihood to Recommend. United was also named one of the "Best Banks to Work For" by American Banker in 2022 for the sixth consecutive year based on employee satisfaction. Additional information about United can be found at www.ucbi.com.
Non-GAAP Financial Measures
This press release, including the accompanying financial statement tables, contains financial information determined by methods other than in accordance with generally accepted accounting principles, or GAAP. This financial information includes certain operating performance measures, which exclude merger-related and other charges that are not considered part of recurring operations, such as “operating net income,” “pre-tax, pre-provision income,” “operating net income per diluted common share,” “operating earnings per share,” “tangible book value per common share,” “operating return on common equity,” “operating return on tangible common equity,” “operating return on assets,” “return on assets - pre-tax, pre-provision, excluding merger-related and other charges,” “return on assets - pre-tax, pre-provision,” “operating efficiency ratio,” and “tangible common equity to tangible assets.” These non-GAAP measures are included because United believes they may provide useful supplemental information for evaluating United’s underlying performance trends. These measures should be viewed in addition to, and not as an alternative to or substitute for, measures determined in accordance with GAAP, and are not necessarily comparable to non-GAAP measures that may be presented by other companies. To the extent applicable, reconciliations of these non-GAAP measures to the most directly comparable measures as reported in accordance with GAAP are included with the accompanying financial statement tables.
Caution About Forward-Looking Statements
This press release contains “forward-looking statements” within the meaning of Section 27A of the Securities Act of 1933, as amended, and Section 21E of the Securities Exchange Act of 1934, as amended. In general, forward-looking statements usually may be identified through use of words such as “may,” “believe,” “expect,” “anticipate,” “intend,” “will,” “should,” “plan,” “estimate,” “predict,” “continue” and “potential” or the negative of these terms or other comparable terminology, and include statements related to the expected financial returns of the Progress acquisition. Forward-looking statements are not historical facts and represent management’s beliefs, based upon information available at the time the statements are made, with regard to the matters addressed; they are not guarantees of future performance. Actual results may prove to be materially different from the results expressed or implied by the forward-looking statements. Forward-looking statements are subject to numerous assumptions, risks and uncertainties that change over time and could cause actual results or financial condition to differ materially from those expressed in or implied by such statements.
Factors that could cause or contribute to such differences include, but are not limited to (1) the risk that the cost savings and any revenue synergies from the Progress acquisition may not be realized or take longer than anticipated to be realized, (2) disruption of customer, supplier, employee or other business partner relationships as a result of the Progress acquisition, (3) the possibility that the costs, fees, expenses and charges related to the acquisition of Progress may be greater than anticipated, (4) reputational risk and the reaction of the companies’ customers, suppliers, employees or other business partners to the acquisition of Progress, (5) the risks relating to the integration of Progress’ operations into the operations of United, including the risk that such integration will be materially delayed or will be more costly or difficult than expected, (6) the risks associated with United’s pursuit of future acquisitions, (7) the risk of expansion into new geographic or product markets, (8) the dilution caused by United’s issuance of additional shares of its common stock in the Progress acquisition, and (9) general competitive, economic, political and market conditions. Further information regarding additional factors which could affect the forward-looking statements contained in this press release can be found in the cautionary language included under the headings “Cautionary Note Regarding Forward-Looking Statements” and “Risk Factors” in United’s Annual Report on Form 10-K for the year ended December 31, 2021, and other documents subsequently filed by United with the United States Securities and Exchange Commission (“SEC”).
Many of these factors are beyond United’s ability to control or predict. If one or more events related to these or other risks or uncertainties materialize, or if the underlying assumptions prove to be incorrect, actual results may differ materially from the forward-looking statements. Accordingly, shareholders and investors should not place undue reliance on any such forward-looking statements. Any forward-looking statement speaks only as of the date of this communication, and United undertakes no obligation to update or revise any forward-looking statements, whether as a result of new information, future events or otherwise, except as required by law. New risks and uncertainties may emerge from time to time, and it is not possible for United to predict their occurrence or how they will affect United or Progress.
United qualifies all forward-looking statements by these cautionary statements.
# # #

4 Q22 Investor Presentation January 17, 2023
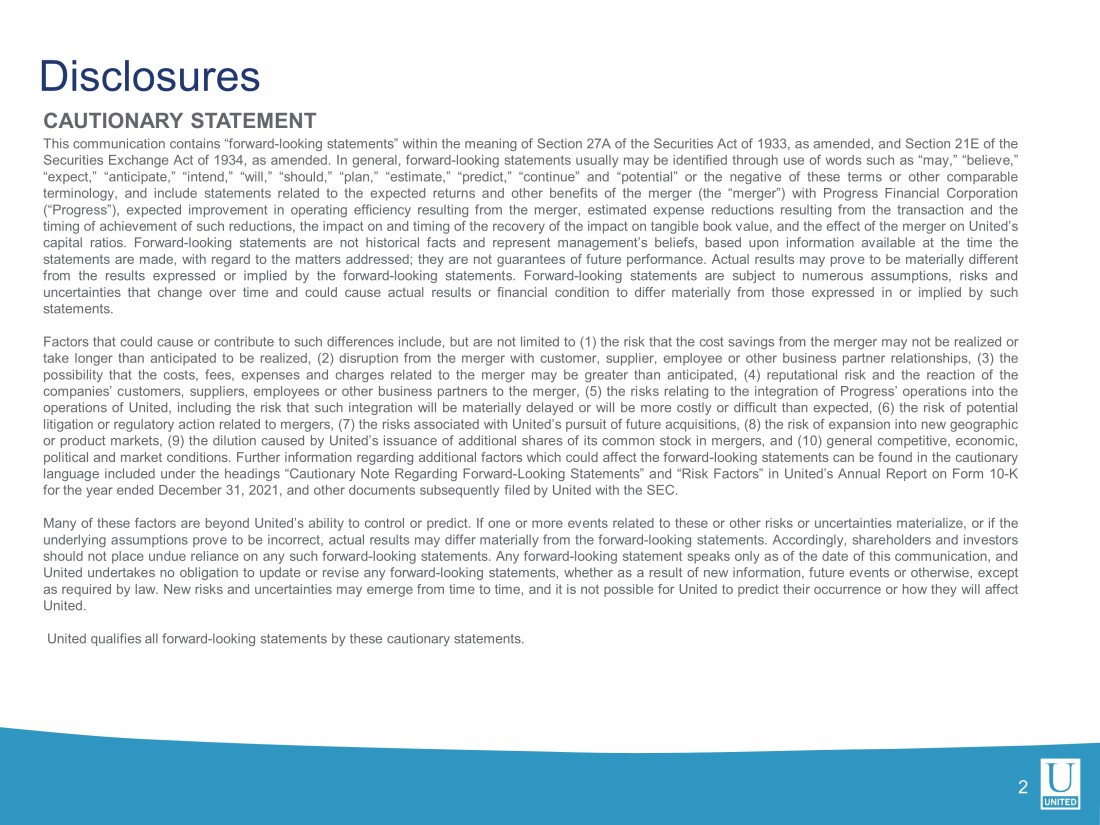
Disclosures 2 CAUTIONARY STATEMENT This communication contains “forward - looking statements” within the meaning of Section 27 A of the Securities Act of 1933 , as amended, and Section 21 E of the Securities Exchange Act of 1934 , as amended . In general, forward - looking statements usually may be identified through use of words such as “may,” “believe,” “expect,” “anticipate,” “intend,” “will,” “should,” “plan,” “estimate,” “predict,” “continue” and “potential” or the negative of these terms or other comparable terminology, and include statements related to the expected returns and other benefits of the merger (the “merger”) with Progress Financial Corporation (“Progress”), expected improvement in operating efficiency resulting from the merger, estimated expense reductions resulting from the transaction and the timing of achievement of such reductions, the impact on and timing of the recovery of the impact on tangible book value, and the effect of the merger on United’s capital ratios . Forward - looking statements are not historical facts and represent management’s beliefs, based upon information available at the time the statements are made, with regard to the matters addressed; they are not guarantees of future performance . Actual results may prove to be materially different from the results expressed or implied by the forward - looking statements . Forward - looking statements are subject to numerous assumptions, risks and uncertainties that change over time and could cause actual results or financial condition to differ materially from those expressed in or implied by such statements . Factors that could cause or contribute to such differences include, but are not limited to ( 1 ) the risk that the cost savings from the merger may not be realized or take longer than anticipated to be realized, ( 2 ) disruption from the merger with customer, supplier, employee or other business partner relationships, ( 3 ) the possibility that the costs, fees, expenses and charges related to the merger may be greater than anticipated, ( 4 ) reputational risk and the reaction of the companies’ customers, suppliers, employees or other business partners to the merger, ( 5 ) the risks relating to the integration of Progress’ operations into the operations of United, including the risk that such integration will be materially delayed or will be more costly or difficult than expected, ( 6 ) the risk of potential litigation or regulatory action related to mergers, ( 7 ) the risks associated with United’s pursuit of future acquisitions, ( 8 ) the risk of expansion into new geographic or product markets, ( 9 ) the dilution caused by United’s issuance of additional shares of its common stock in mergers, and ( 10 ) general competitive, economic, political and market conditions . Further information regarding additional factors which could affect the forward - looking statements can be found in the cautionary language included under the headings “Cautionary Note Regarding Forward - Looking Statements” and “Risk Factors” in United’s Annual Report on Form 10 - K for the year ended December 31 , 2021 , and other documents subsequently filed by United with the SEC . Many of these factors are beyond United’s ability to control or predict . If one or more events related to these or other risks or uncertainties materialize, or if the underlying assumptions prove to be incorrect, actual results may differ materially from the forward - looking statements . Accordingly, shareholders and investors should not place undue reliance on any such forward - looking statements . Any forward - looking statement speaks only as of the date of this communication, and United undertakes no obligation to update or revise any forward - looking statements, whether as a result of new information, future events or otherwise, except as required by law . New risks and uncertainties may emerge from time to time, and it is not possible for United to predict their occurrence or how they will affect United . United qualifies all forward - looking statements by these cautionary statements .
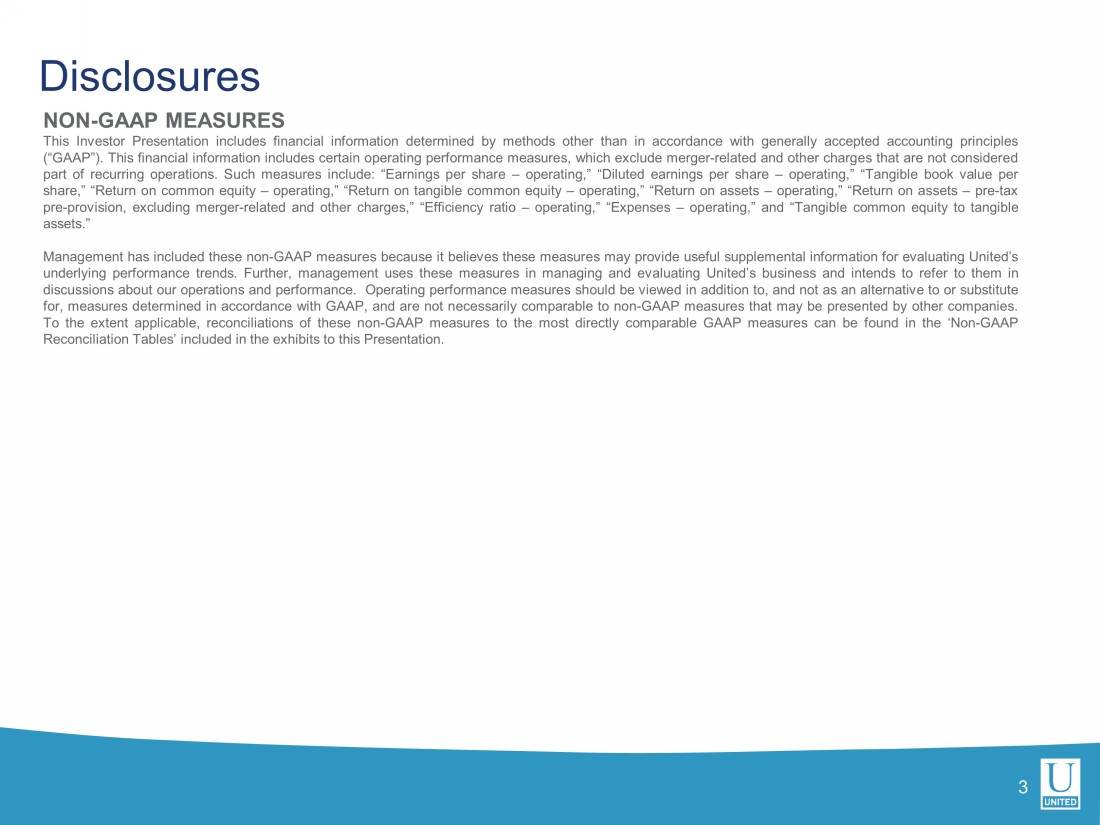
Disclosures 3 NON - GAAP MEASURES This Investor Presentation includes financial information determined by methods other than in accordance with generally accepted accounting principles (“GAAP”) . This financial information includes certain operating performance measures, which exclude merger - related and other charges that are not considered part of recurring operations . Such measures include : “Earnings per share – operating,” “Diluted earnings per share – operating,” “Tangible book value per share,” “Return on common equity – operating,” “Return on tangible common equity – operating,” “Return on assets – operating,” “Return on assets – pre - tax pre - provision, excluding merger - related and other charges,” “Efficiency ratio – operating,” “Expenses – operating,” and “Tangible common equity to tangible assets . ” Management has included these non - GAAP measures because it believes these measures may provide useful supplemental information for evaluating United’s underlying performance trends . Further, management uses these measures in managing and evaluating United’s business and intends to refer to them in discussions about our operations and performance . Operating performance measures should be viewed in addition to, and not as an alternative to or substitute for, measures determined in accordance with GAAP, and are not necessarily comparable to non - GAAP measures that may be presented by other companies . To the extent applicable, reconciliations of these non - GAAP measures to the most directly comparable GAAP measures can be found in the ‘Non - GAAP Reconciliation Tables’ included in the exhibits to this Presentation .
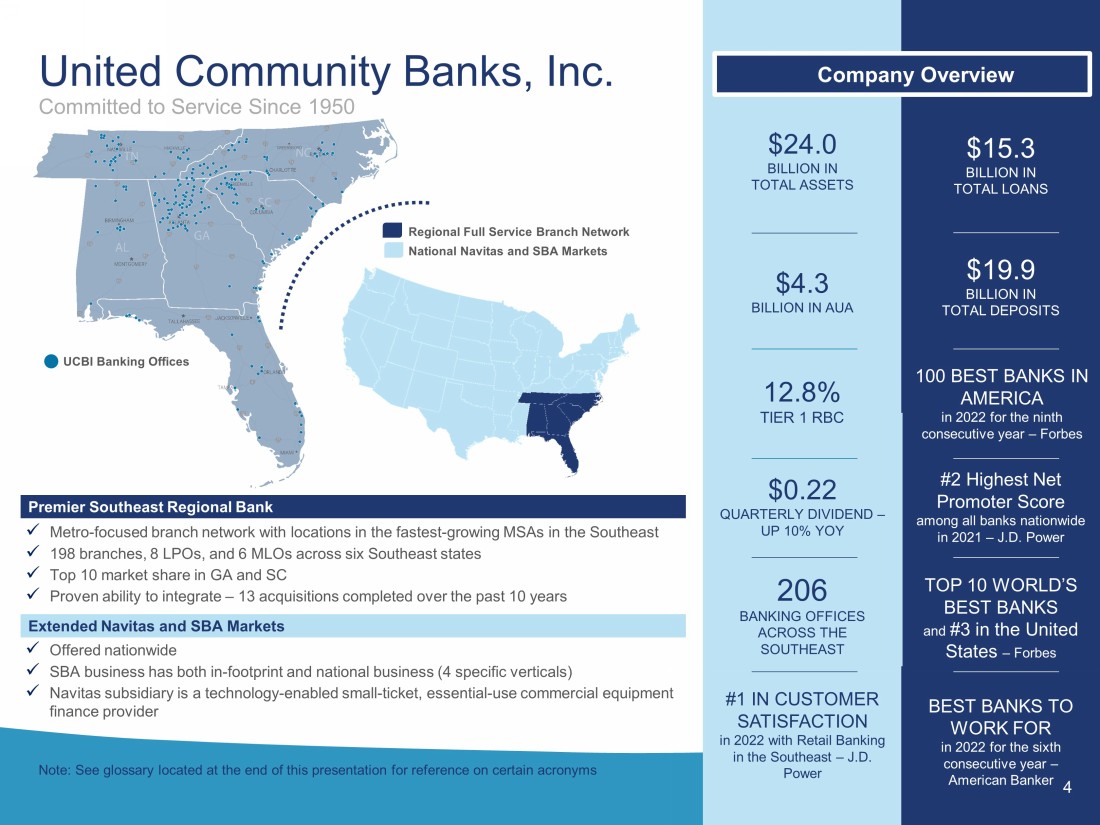
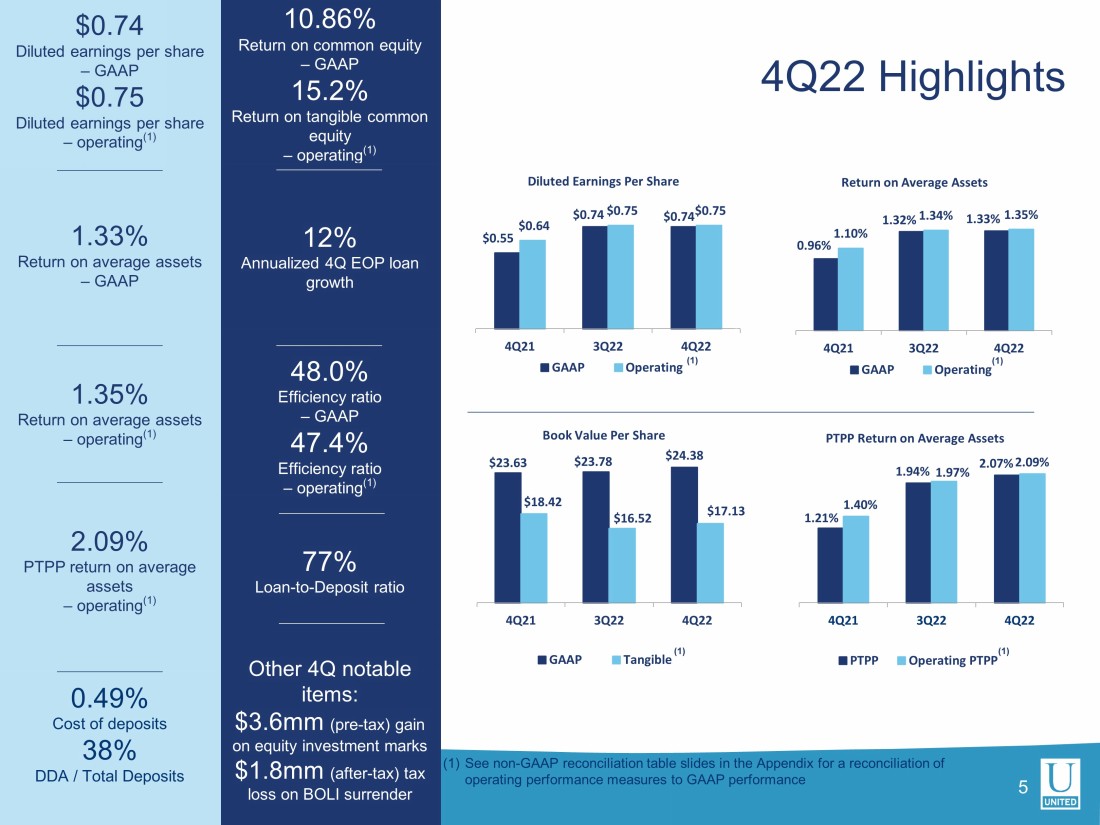
#2 Highest Net Promoter Score among all banks nationwide in 2021 – J.D. Power TOP 10 WORLD’S BEST BANKS and #3 in the United States – Forbes 206 BANKING OFFICES ACROSS THE SOUTHEAST #1 IN CUSTOMER SATISFACTION i n 2022 with Retail Banking in the Southeast – J.D. Power United Community Banks, Inc. $ 24.0 BILLION IN TOTAL ASSETS $4.3 BILLION IN AUA $ 19.9 BILLION IN TOTAL DEPOSITS BEST BANKS TO WORK FOR i n 2022 for the sixth consecutive year – American Banker $0.22 QUARTERLY DIVIDEND – UP 10% Y OY 4 Premier Southeast Regional Bank x Metro - focused branch network with locations in the fastest - growing MSAs in the Southeast x 198 branches, 8 LPOs, and 6 MLOs across six Southeast states x Top 10 market share in GA and SC x Proven ability to integrate – 13 acquisitions completed over the past 10 years Committed to Service Since 1950 Extended Navitas and SBA Markets $ 15.3 BILLION IN TOTAL LOANS Company Overview 12.8 % TIER 1 RBC 100 BEST BANKS IN AMERICA i n 2022 f or the ninth consecutive year – Forbes x Offered nationwide x SBA business has both in - footprint and national business (4 specific verticals) x Navitas subsidiary is a technology - enabled small - ticket, essential - use commercial equipment finance provider UCBI Banking Offices Note: See glossary located at the end of this presentation for reference on certain acronyms Regional Full Service Branch Network National Navitas and SBA Markets $23.63 $23.78 $24.38 $18.42 $16.52 $17.13 4Q21 3Q22 4Q22 Book Value Per Share GAAP Tangible 77% Loan - to - Deposit ratio 10.86% Return on common equity – GAAP 15.2% Return on tangible common equity – operating (1) Other 4Q notable items: $3.6mm (pre - tax) gain on equity investment marks $1.8mm (after - tax) tax loss on BOLI surrender $0.74 Diluted earnings per share – GAAP $0.75 Diluted earnings per share – operating (1) 1.33% Return on average assets – GAAP 1.35% Return on average assets – operating (1) 2.09% PTPP return on average assets – operating (1) 0.49% Cost of deposits 38% DDA / Total Deposits 4 Q22 Highlights (1) See non - GAAP reconciliation table slides in the Appendix for a reconciliation of operating performance measures to GAAP performance $0.55 $0.74 $0.74 $0.64 $0.75 $0.75 4Q21 3Q22 4Q22 Diluted Earnings Per Share GAAP Operating (1) 0.96% 1.32% 1.33% 1.10% 1.34% 1.35% 4Q21 3Q22 4Q22 Return on Average Assets GAAP Operating 1.21% 1.94% 2.07% 1.40% 1.97% 2.09% 4Q21 3Q22 4Q22 PTPP Return on Average Assets PTPP Operating PTPP (1) (1) 12% Annualized 4Q EOP loan growth 48.0% Efficiency ratio – GAAP 47.4% Efficiency ratio – operating (1) 5 (1)
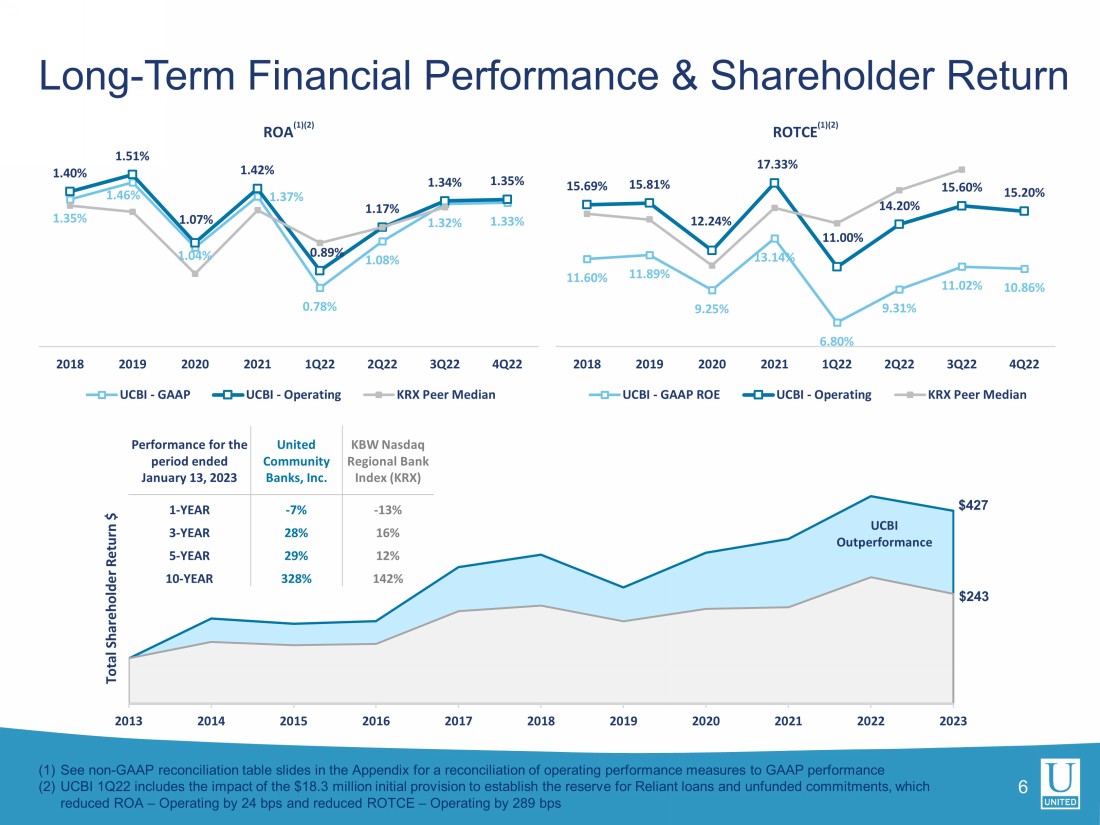
6 (1) See non - GAAP reconciliation table slides in the Appendix for a reconciliation of operating performance measures to GAAP performance (2) UCBI 1Q22 includes the impact of the $18.3 million initial provision to establish the reserve for Reliant loans and unfunded com mitments, which reduced ROA – Operating by 24 bps and reduced ROTCE – Operating by 289 bps Long - Term Financial Performance & Shareholder Return 1.35% 1.46% 1.04% 1.37% 0.78% 1.08% 1.32% 1.33% 1.40% 1.51% 1.07% 1.42% 0.89% 1.17% 1.34% 1.35% 2018 2019 2020 2021 1Q22 2Q22 3Q22 4Q22 ROA (1)(2) UCBI - GAAP UCBI - Operating KRX Peer Median 11.60% 11.89% 9.25% 13.14% 6.80% 9.31% 11.02% 10.86% 15.69% 15.81% 12.24% 17.33% 11.00% 14.20% 15.60% 15.20% 2018 2019 2020 2021 1Q22 2Q22 3Q22 4Q22 ROTCE (1)(2) UCBI - GAAP ROE UCBI - Operating KRX Peer Median $427 $243 2013 2014 2015 2016 2017 2018 2019 2020 2021 2022 2023 Total Shareholder Return $ UCBI Outperformance Performance for the period ended January 13, 2023 United Community Banks, Inc.
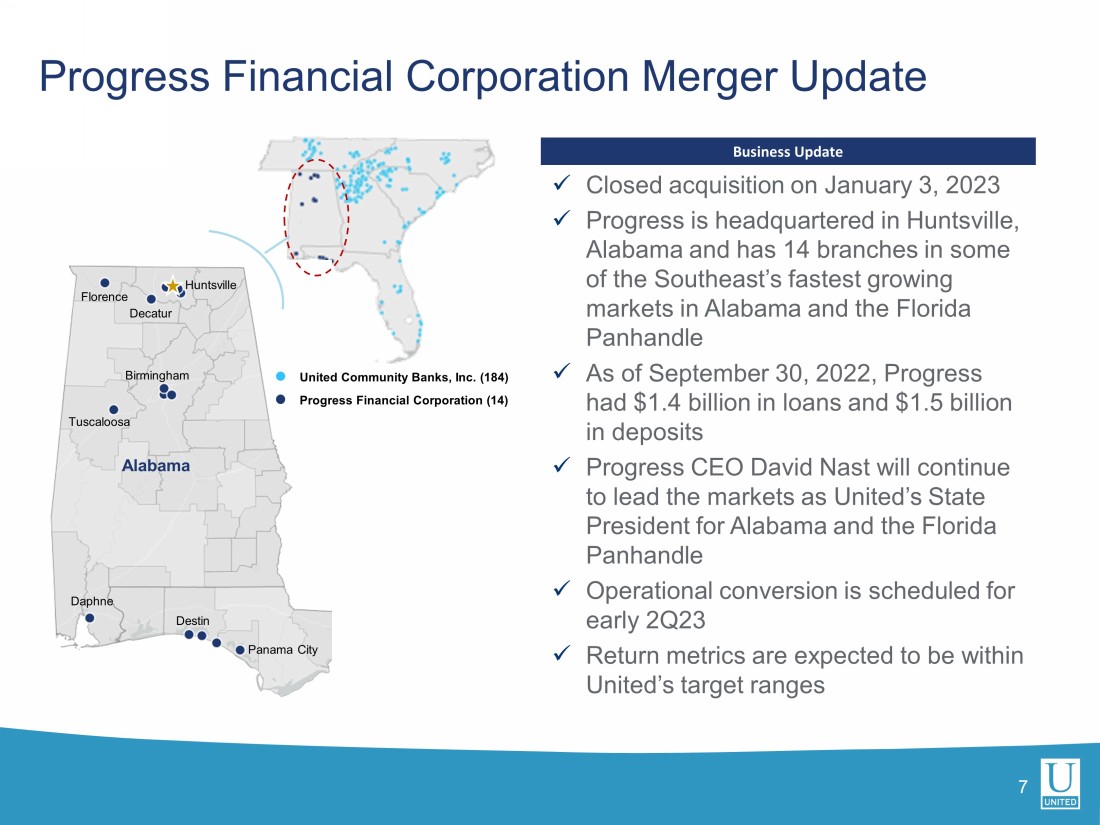
KBW Nasdaq Regional Bank Index (KRX) 1 - YEAR - 7% - 13% 3 - YEAR 28% 16% 5 - YEAR 29% 12% 10 - YEAR 328% 142% 7 1 % 20% 25% 49% 6% Progress Financial Corporation Merger Update Tuscaloosa Destin Huntsville Birmingham Alabama Florence Decatur Daphne Progress Financial Corporation (14) United Community Banks, Inc. ( 184) Panama City Business Update x Closed acquisition on January 3, 2023 x Progress is headquartered in Huntsville, Alabama and has 14 branches in some of the Southeast’s fastest growing markets in Alabama and the Florida Panhandle x As of September 30, 2022, Progress had $1.4 billion in loans and $1.5 billion in deposits x Progress CEO David Nast will continue to lead the markets as United’s State President for Alabama and the Florida Panhandle x Operational conversion is scheduled for early 2Q23 x Return metrics are expected to be within United’s target ranges 4.9% 3.2% (1) Includes MSAs with a population of greater than 1,000,000 (2) Includes MSAs with a population between 200,000 and 1,000,000 (3) Market Rank and (%) of Total Deposits pro forma for pending acquisition of Progress Financial Corporation Footprint Focused on High - Growth MSAs in Southeast 8 Projected Population Growth (2) (2022 - 2027) Projected Household Income Growth (2 ) (2022 - 2027) UCBI % of ’22 – ’27 ’22 – ’27 ’22 Total Market UCBI Proj.
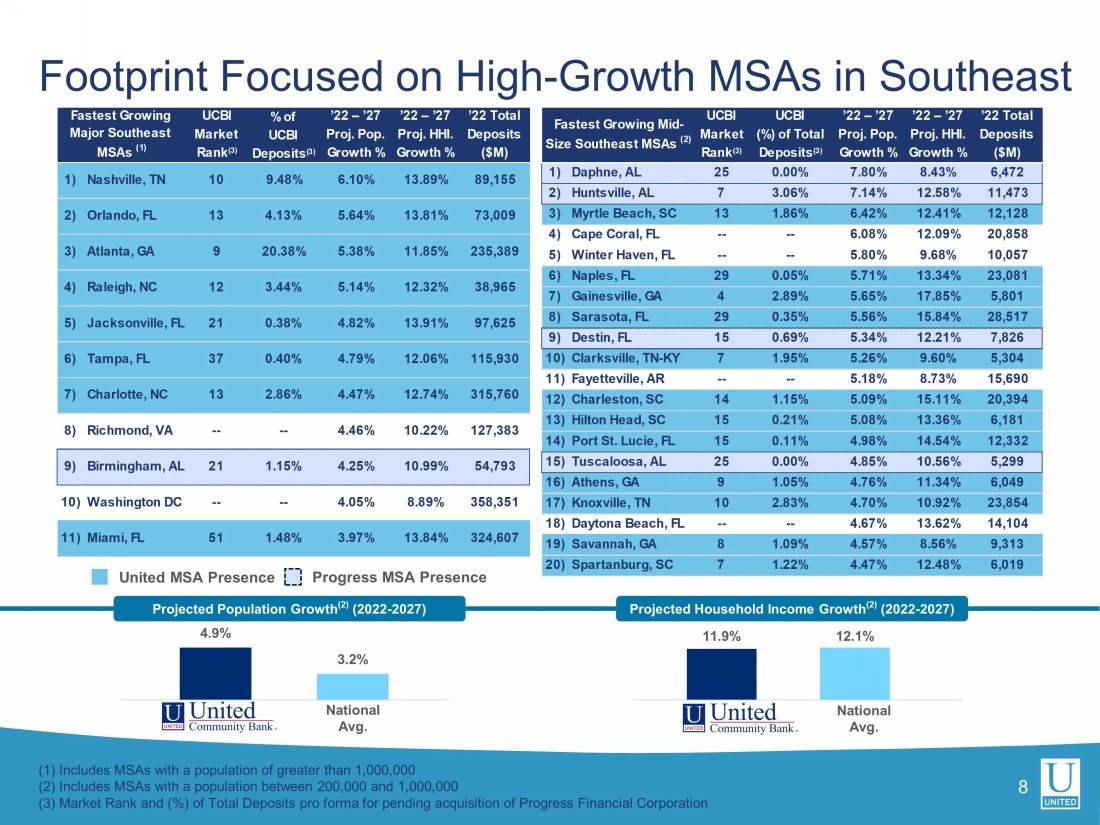
Pop. Proj. HHI. Deposits Rank (3) Deposits (3) Growth % Growth % ($M) 1) Nashville, TN 10 9.48% 6.10% 13.89% 89,155 2) Orlando, FL 13 4.13% 5.64% 13.81% 73,009 3) Atlanta, GA 9 20.38% 5.38% 11.85% 235,389 4) Raleigh, NC 12 3.44% 5.14% 12.32% 38,965 5) Jacksonville, FL 21 0.38% 4.82% 13.91% 97,625 6) Tampa, FL 37 0.40% 4.79% 12.06% 115,930 7) Charlotte, NC 13 2.86% 4.47% 12.74% 315,760 8) Richmond, VA -- -- 4.46% 10.22% 127,383 9) Birmingham, AL 21 1.15% 4.25% 10.99% 54,793 10)Washington DC -- -- 4.05% 8.89% 358,351 11)Miami, FL 51 1.48% 3.97% 13.84% 324,607 Fastest Growing Major Southeast MSAs (1) UCBI UCBI ’22 – ’27 ’22 – ’27 ’22 Total Market (%) of Total Proj. Pop. Proj. HHI. Deposits Rank (3) Deposits (3) Growth % Growth % ($M) 1) Daphne, AL 25 0.00% 7.80% 8.43% 6,472 2) Huntsville, AL 7 3.06% 7.14% 12.58% 11,473 3) Myrtle Beach, SC 13 1.86% 6.42% 12.41% 12,128 4) Cape Coral, FL -- -- 6.08% 12.09% 20,858 5) Winter Haven, FL -- -- 5.80% 9.68% 10,057 6) Naples, FL 29 0.05% 5.71% 13.34% 23,081 7) Gainesville, GA 4 2.89% 5.65% 17.85% 5,801 8) Sarasota, FL 29 0.35% 5.56% 15.84% 28,517 9) Destin, FL 15 0.69% 5.34% 12.21% 7,826 10)Clarksville, TN-KY 7 1.95% 5.26% 9.60% 5,304 11)Fayetteville, AR -- -- 5.18% 8.73% 15,690 12)Charleston, SC 14 1.15% 5.09% 15.11% 20,394 13)Hilton Head, SC 15 0.21% 5.08% 13.36% 6,181 14)Port St. Lucie, FL 15 0.11% 4.98% 14.54% 12,332 15)Tuscaloosa, AL 25 0.00% 4.85% 10.56% 5,299 16)Athens, GA 9 1.05% 4.76% 11.34% 6,049 17)Knoxville, TN 10 2.83% 4.70% 10.92% 23,854 18)Daytona Beach, FL -- -- 4.67% 13.62% 14,104 19)Savannah, GA 8 1.09% 4.57% 8.56% 9,313 20)Spartanburg, SC 7 1.22% 4.47% 12.48% 6,019 Fastest Growing Mid- Size Southeast MSAs (2) United MSA Presence Progress MSA Presence National Avg. 11.9% 12.1% National Avg.
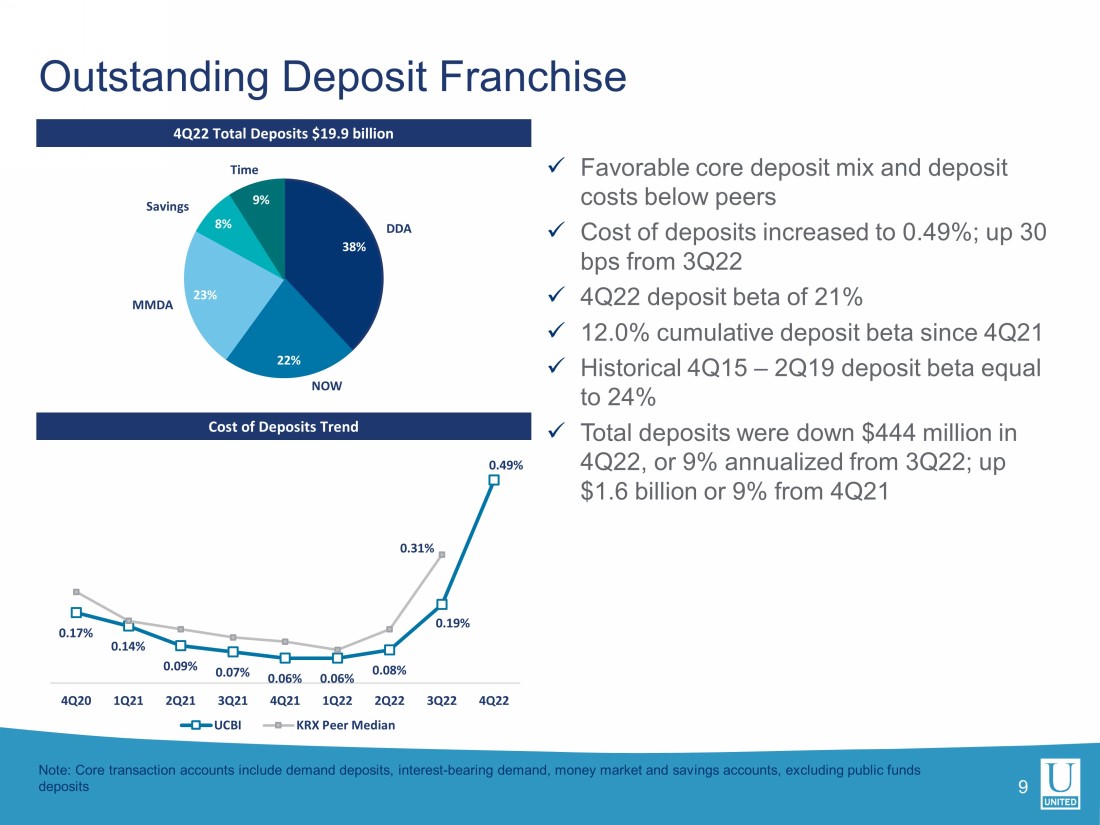
38% 22% 23% 8% 9% DDA MMDA Savings Time NOW Outstanding Deposit Franchise 9 Note: Core transaction accounts include demand deposits, interest - bearing demand, money market and savings accounts, excluding public funds deposits x Favorable core deposit mix and deposit costs below peers x Cost of deposits increased to 0.49%; up 30 bps from 3Q22 x 4Q22 deposit beta of 21 % x 12.0% cumulative deposit beta since 4Q21 x Historical 4Q15 – 2Q19 deposit beta equal to 24% x Total deposits were down $444 million in 4Q22, or 9% annualized from 3Q22; up $1.6 billion or 9% from 4Q21 4 Q22 Total Deposits $19.9 billion Cost of Deposits Trend 0.17% 0.14% 0.09% 0.07% 0.06% 0.06% 0.08% 0.19% 0.49% 0.31% 4Q20 1Q21 2Q21 3Q21 4Q21 1Q22 2Q22 3Q22 4Q22 UCBI KRX Peer Median Deposit Trends 10 x Business deposits decreased $622 million from 3Q22, primarily due to a $532 million decrease in Business DDA deposits • T he Business DDA outflow was driven by a combination of asset purchases, owner distributions, tax payments and movement into higher yielding accounts, both inside and outside of the bank x Personal deposits decreased $84 million from 3Q22, primarily due to a $141 million decrease in Personal DDA deposits • The Personal DDA outflow was primarily a result of individuals seeking higher rates for their excess liquidity, with more than half that moved into higher yielding accounts at United 3Q22 4Q22 Balance ($ in millions) Avg Cust.
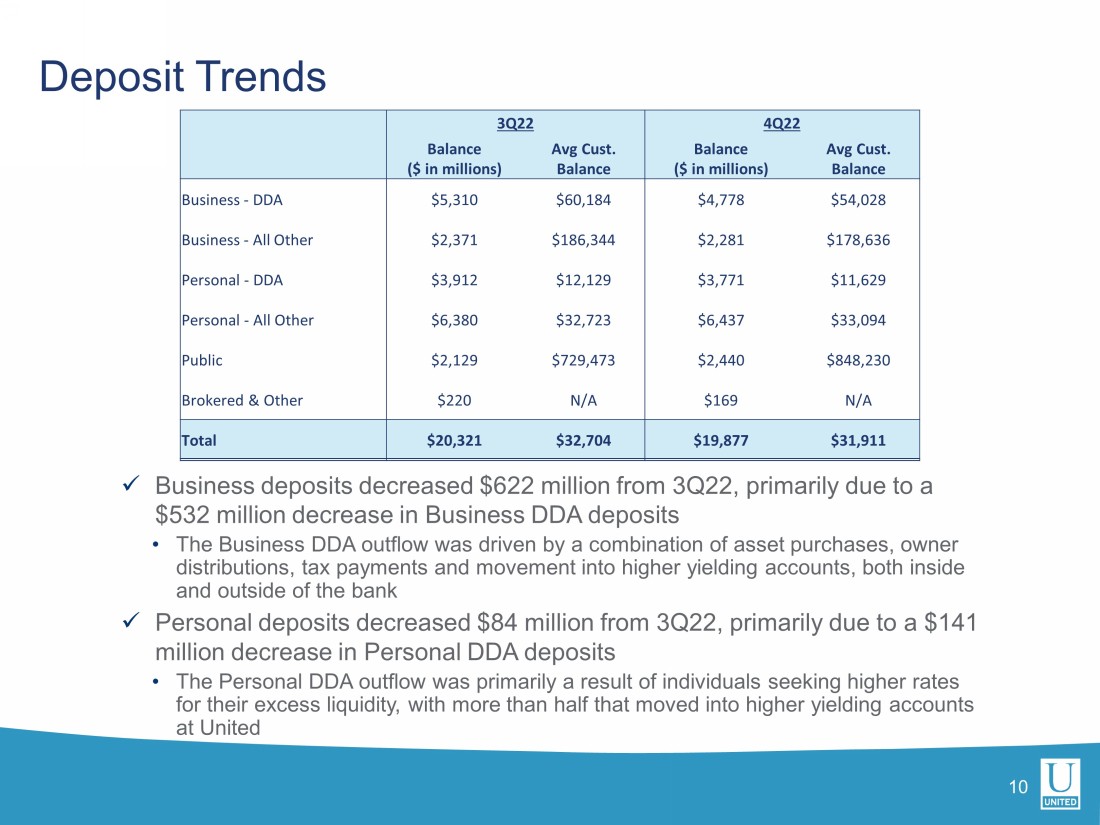
Balance Balance ($ in millions) Avg Cust.
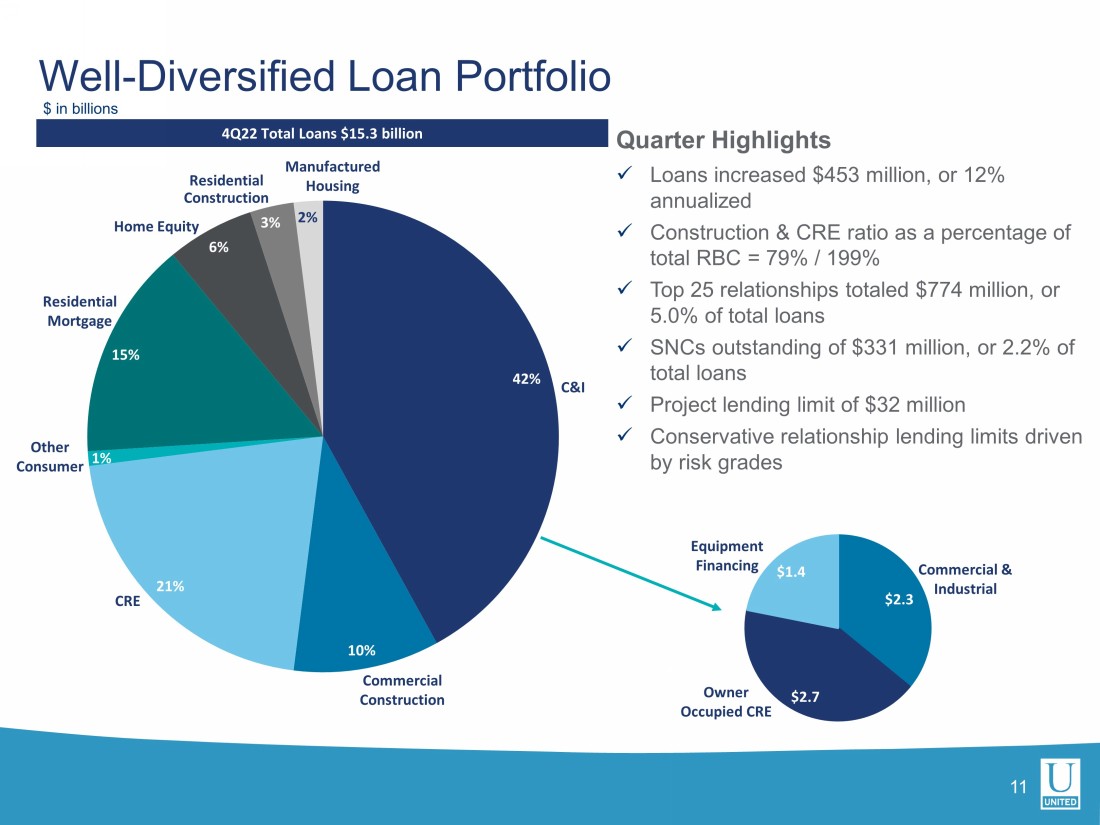
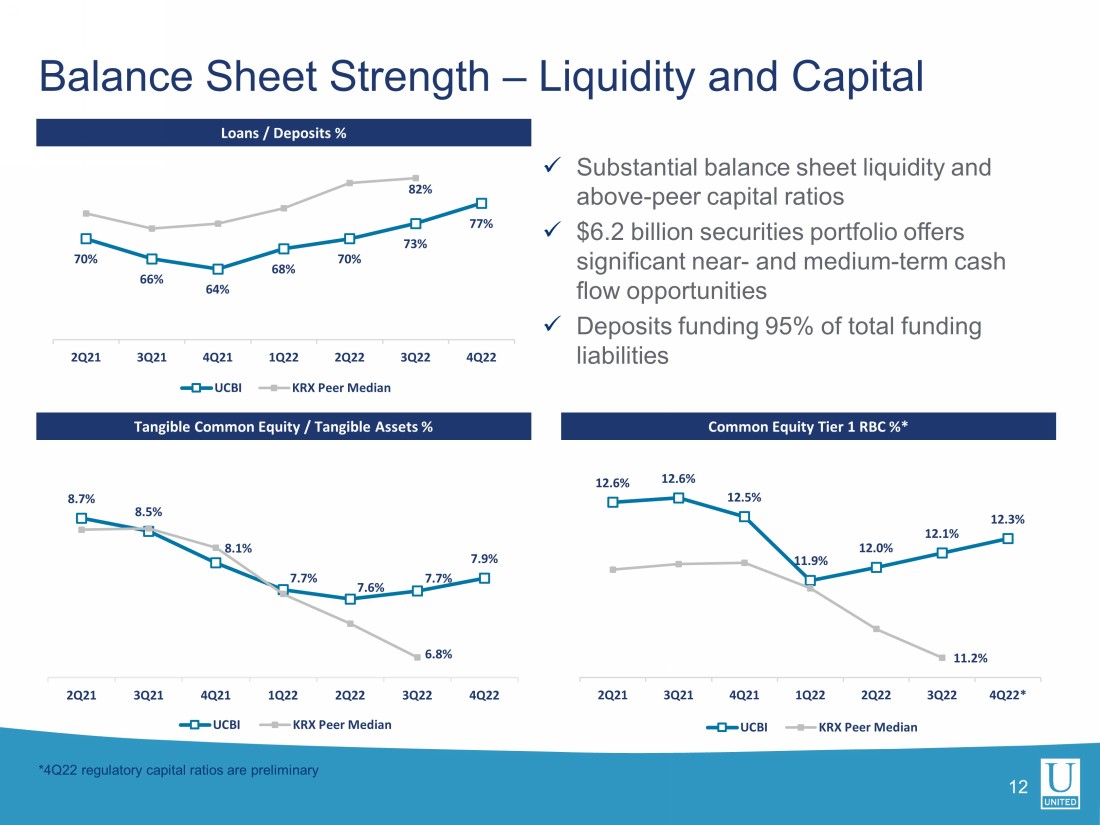
Balance Business - DDA $5,310 $60,184 $4,778 $54,028 Business - All Other $2,371 $186,344 $2,281 $178,636 Personal - DDA $3,912 $12,129 $3,771 $11,629 Personal - All Other $6,380 $32,723 $6,437 $33,094 Public $2,129 $729,473 $2,440 $848,230 Brokered & Other $220 N/A $169 N/A Total $20,321 $32,704 $19,877 $31,911 11 4 Q22 Total Loans $15.3 billion Well - Diversified Loan Portfolio Quarter Highlights x Loans increased $453 million, or 12% annualized x Construction & CRE ratio as a percentage of total RBC = 79% / 199% x Top 25 relationships totaled $774 million, or 5.0% of total loans x SNCs outstanding of $331 million, or 2.2% of total loans x Project lending limit of $32 million x Conservative relationship lending limits driven by risk grades 42% 10% 21% 1% 15% 6% 3% 2% Residential Mortgage Manufactured Housing C&I Commercial Construction CRE Other Consumer Home Equity Residential Construction $2.3 $2.7 $1.4 Commercial & Industrial Owner Occupied CRE Equipment Financing $ in billions 8.7% 8.5% 8.1% 7.7% 7.6% 7.7% 7.9% 6.8% 2Q21 3Q21 4Q21 1Q22 2Q22 3Q22 4Q22 UCBI KRX Peer Median 12 Loans / Deposits % Tangible Common Equity / Tangible Assets % Common Equity Tier 1 RBC %* 70% 66% 64% 68% 70% 73% 77% 82% 2Q21 3Q21 4Q21 1Q22 2Q22 3Q22 4Q22 UCBI KRX Peer Median x S ubstantial balance sheet liquidity and above - peer capital ratios x $6.2 billion securities portfolio offers significant near - and medium - term cash flow opportunities x Deposits funding 95% of total funding liabilities 12.6% 12.6% 12.5% 11.9% 12.0% 12.1% 12.3% 11.2% 2Q21 3Q21 4Q21 1Q22 2Q22 3Q22 4Q22* UCBI KRX Peer Median Balance Sheet Strength – Liquidity and Capital *4Q22 regulatory capital ratios are preliminary
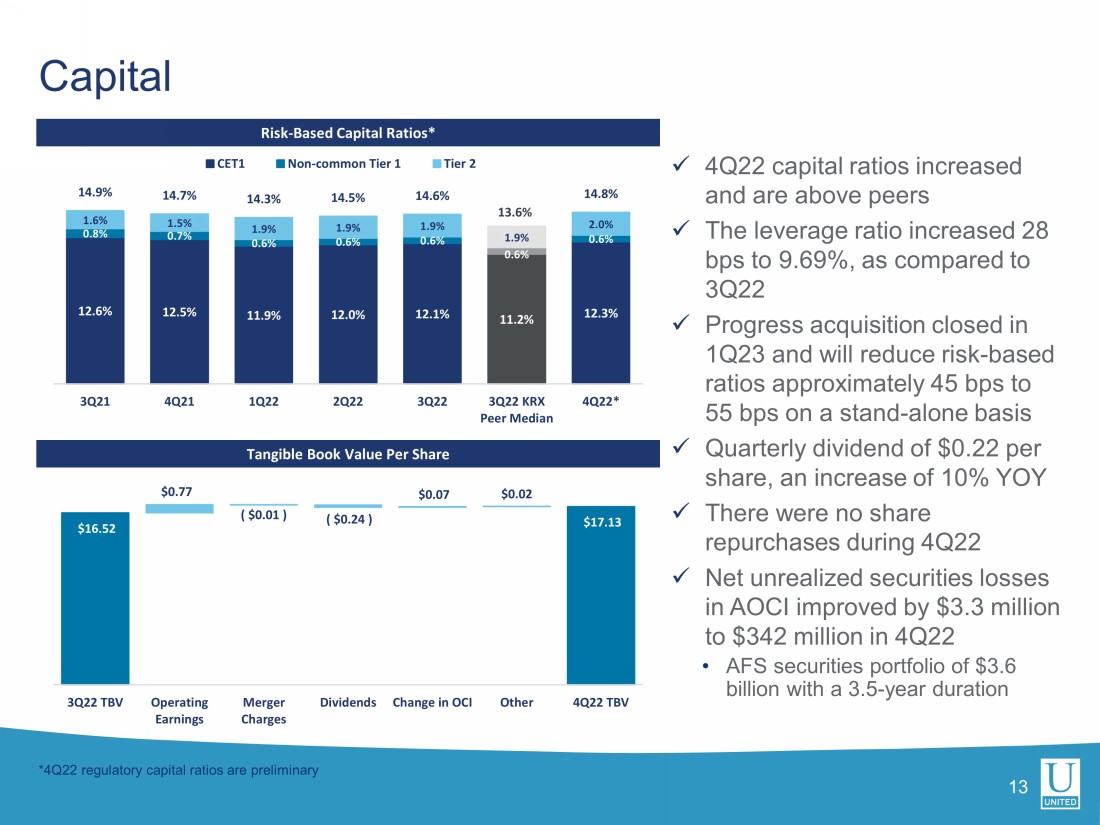
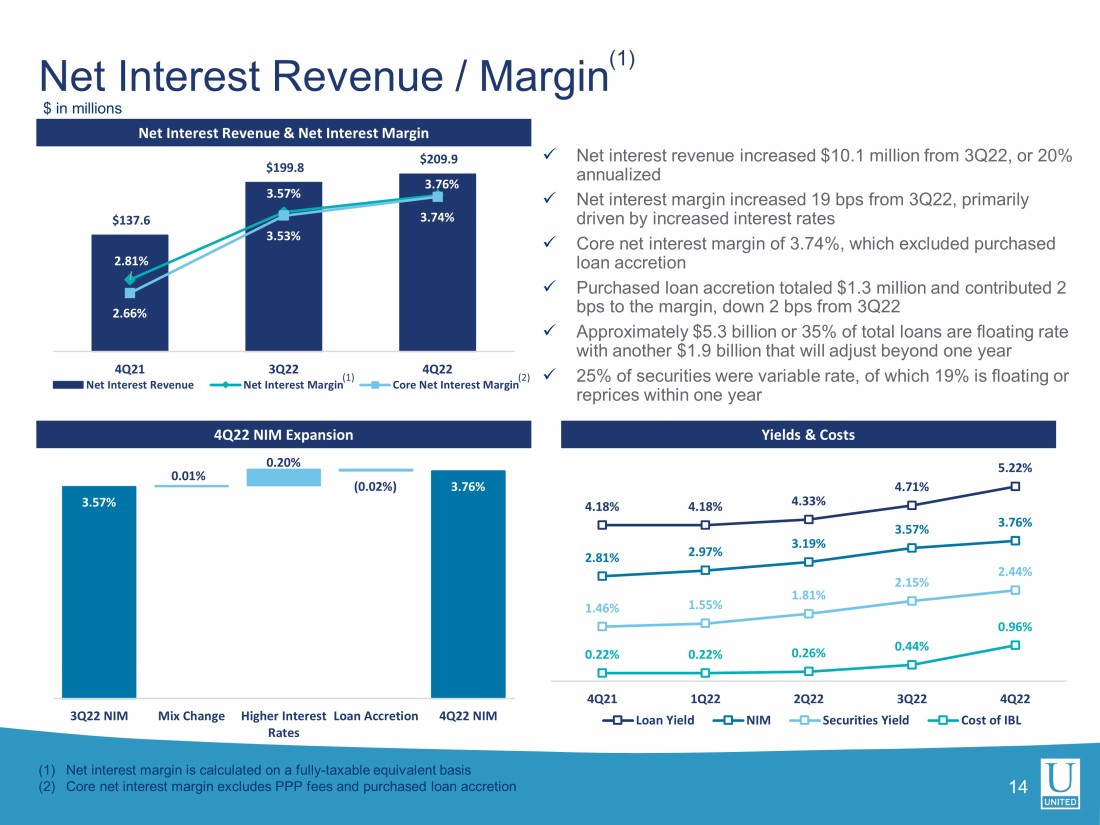
13 Risk - Based Capital Ratios* Tangible Book Value Per Share x 4 Q22 capital ratios increased and are above peers x The leverage ratio increased 28 bps to 9.69%, as compared to 3Q22 x Progress acquisition closed in 1Q23 and will reduce risk - based ratios approximately 45 bps to 55 bps on a stand - alone basis x Quarterly dividend of $0.22 per share, an increase of 10% YOY x There were no share repurchases during 4Q22 x Net unrealized securities losses in AOCI improved by $3.3 million to $342 million in 4Q22 • AFS securities portfolio of $3.6 billion with a 3.5 - year duration 12.6% 12.5% 11.9% 12.0% 12.1% 11.2% 12.3% 0.8% 0.7% 0.6% 0.6% 0.6% 0.6% 0.6% 1.6% 1.5% 1.9% 1.9% 1.9% 1.9% 2.0% 14.9% 14.7% 14.3% 14.5% 14.6% 13.6% 14.8% 3Q21 4Q21 1Q22 2Q22 3Q22 3Q22 KRX Peer Median 4Q22* CET1 Non-common Tier 1 Tier 2 Total $17.13 $16.52 $0.77 ( $0.01 ) ( $0.24 ) $0.07 $0.02 3Q22 TBV Operating Earnings Merger Charges Dividends Change in OCI Other 4Q22 TBV Capital *4Q22 regulatory capital ratios are preliminary 14 Net Interest Revenue & Net Interest Margin 4 Q22 NIM Expansion x Net interest revenue increased $10.1 million from 3Q22 , or 20% annualized x Net interest margin increased 19 bps from 3Q22 , primarily driven by increased interest rates x Core net interest margin of 3.74%, which excluded purchased loan accretion x Purchased loan accretion totaled $1.3 million and contributed 2 bps to the margin, down 2 bps from 3Q22 x Approximately $5.3 billion or 35% of total loans are floating rate with another $1.9 billion that will adjust beyond one year x 25 % of securities were variable rate, of which 19% is floating or reprices within one year Net Interest Revenue / Margin (1) Yields & Costs $137.6 $199.8 $209.9 2.81% 3.57% 3.76% 2.66% 3.53% 3.74% $- $50.0 $100.0 $150.0 $200.0 2.00% 2.50% 3.00% 3.50% 4.00% 4Q21 3Q22 4Q22 Net Interest Revenue Net Interest Margin Core Net Interest Margin $ in millions 4.18% 4.18% 4.33% 4.71% 5.22% 2.81% 2.97% 3.19% 3.57% 3.76% 1.46% 1.55% 1.81% 2.15% 2.44% 0.22% 0.22% 0.26% 0.44% 0.96% 4Q21 1Q22 2Q22 3Q22 4Q22 Loan Yield NIM Securities Yield Cost of IBL (1) Net interest margin is calculated on a fully - taxable equivalent basis (2) Core net interest margin excludes PPP fees and purchased loan accretion 3.76% 3.57% 0.01% 0.20% ( 0.02% ) 3Q22 NIM Mix Change Higher Interest Rates Loan Accretion 4Q22 NIM (2) (1)
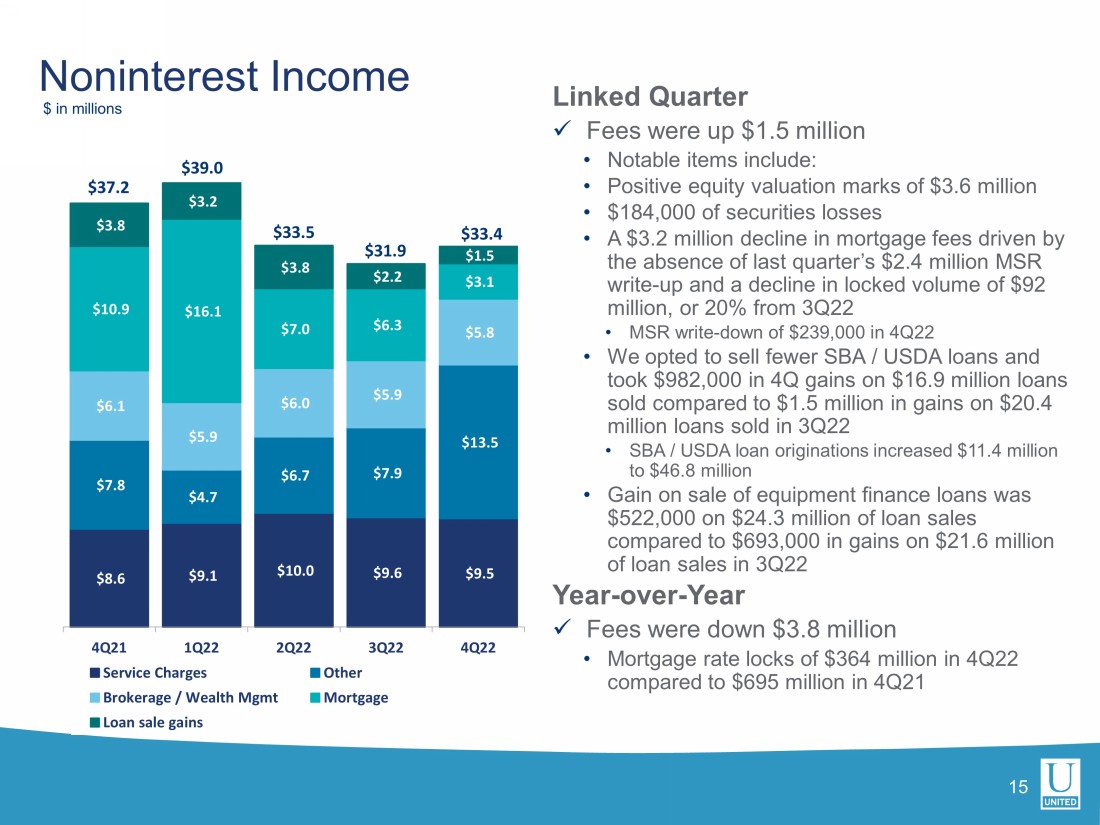
Noninterest Income $ in millions $8.6 $9.1 $10.0 $9.6 $9.5 $7.8 $4.7 $6.7 $7.9 $13.5 $6.1 $5.9 $6.0 $5.9 $5.8 $10.9 $16.1 $7.0 $6.3 $3.1 $3.8 $3.2 $3.8 $2.2 $1.5 4Q21 1Q22 2Q22 3Q22 4Q22 Service Charges Other Brokerage / Wealth Mgmt Mortgage Loan sale gains $37.2 $33.4 Linked Quarter x Fees were up $1.5 million • Notable items include: • Positive equity valuation marks of $3.6 million • $184,000 of securities losses • A $3.2 million decline in mortgage fees driven by the absence of last quarter’s $2.4 million MSR write - up and a decline in locked volume of $92 million, or 20% from 3Q22 • MSR write - down of $239,000 in 4Q22 • We opted to sell fewer SBA / USDA loans and took $982,000 in 4Q gains on $16.9 million loans sold compared to $1.5 million in gains on $20.4 million loans sold in 3Q22 • SBA / USDA loan originations increased $11.4 million to $46.8 million • Gain on sale of equipment finance loans was $522,000 on $24.3 million of loan sales compared to $693,000 in gains on $21.6 million of loan sales in 3Q22 Year - over - Year x Fees were down $3.8 million • Mortgage rate locks of $364 million in 4 Q22 compared to $695 million in 4Q21 15 $31.9 $39.0 $33.5 $109.2 $119.3 $120.8 $112.8 $117.3 $99.2 $110.3 $113.6 $111.0 $115.9 4Q21 1Q22 2Q22 3Q22 4Q22 GAAP Operating Disciplined Expense Management $ in millions x The efficiency ratio improved compared to last quarter due to continuing strong growth in Net Interest Income x Year over year comparisons are also positively impacted due to merger - related cost savings 16 Efficiency Ratio % Noninterest Expense $ 62.1% 57.4% 56.6% 48.4% 48.0% 56.5% 53.1% 53.2% 47.7% 47.4% 52.04% 4Q21 1Q22 2Q22 3Q22 4Q22 GAAP Operating KRX Peer Median x Total operating expenses increased by $4.9 million quarter over quarter; notable items include: x $939,000 in salaries driven by mid - year inflation driven increases x $1.1 million in lower deferred costs from lower mortgage volume x $700,000 in increased FDIC expenses, as assessment rates are increasing industry - wide
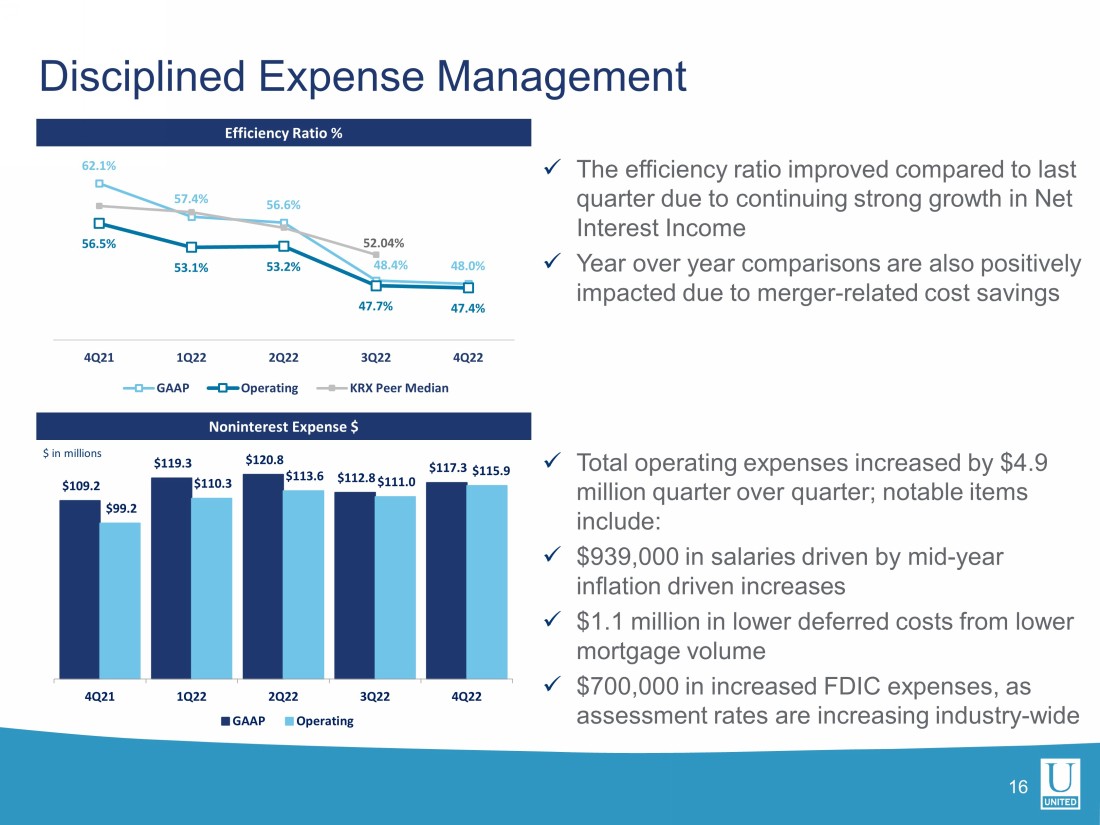
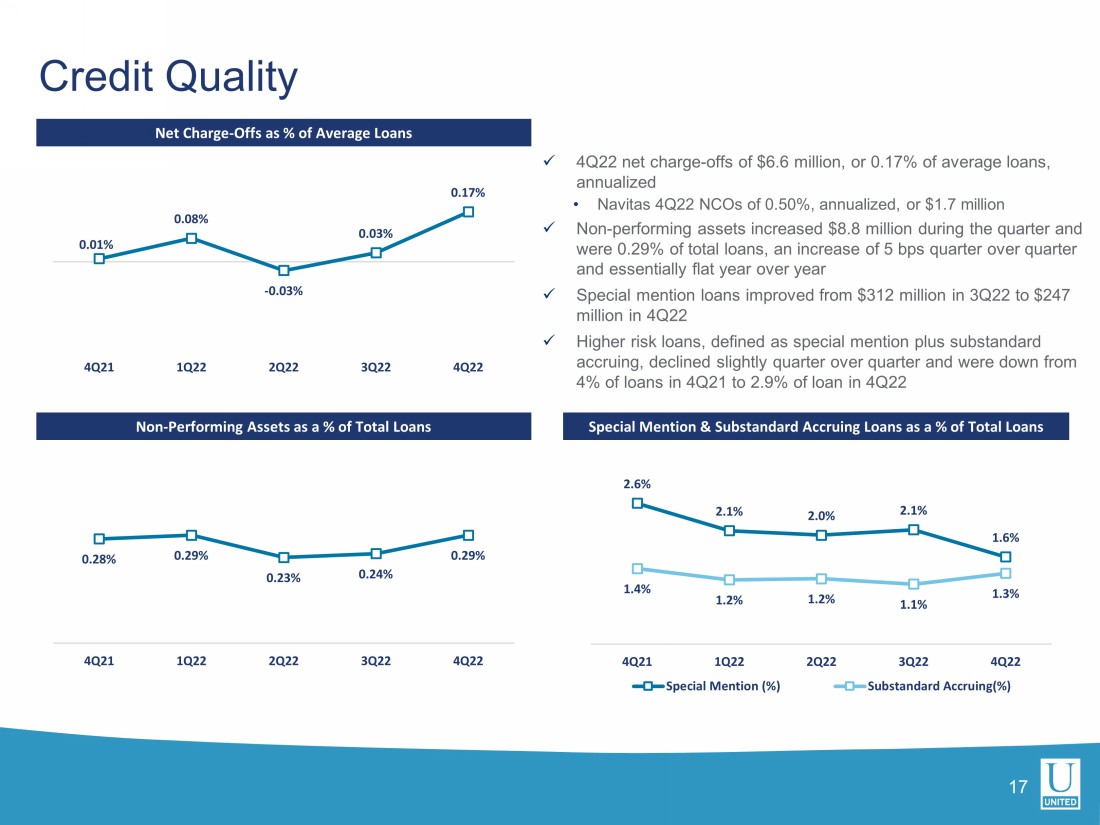
x 4 Q22 net charge - offs of $6.6 million, or 0.17% of average loans, annualized • Navitas 4Q22 NCOs of 0.50 %, annualized, or $1.7 million x Non - performing assets increased $8.8 million during the quarter and were 0.29% of total loans, an increase of 5 bps quarter over quarter and essentially flat year over year x Special mention loans improved from $312 million in 3Q22 to $247 million in 4Q22 x Higher risk loans, defined as special mention plus substandard accruing, declined slightly quarter over quarter and were down from 4% of loans in 4Q21 to 2.9% of loan in 4Q22 Credit Quality Net Charge - Offs as % of Average Loans Non - Performing Assets as a % of Total Loans 17 0.28% 0.29% 0.23% 0.24% 0.29% 4Q21 1Q22 2Q22 3Q22 4Q22 2.6% 2.1% 2.0% 2.1% 1.6% 1.4% 1.2% 1.2% 1.1% 1.3% 4Q21 1Q22 2Q22 3Q22 4Q22 Special Mention (%) Substandard Accruing(%) Special Mention & Substandard Accruing Loans as a % of Total Loans 0.01% 0.08% - 0.03% 0.03% 0.17% 4Q21 1Q22 2Q22 3Q22 4Q22 Allowance for Credit Losses Allowance for Credit Losses (ACL) Walk - Forward Allowance for Credit Losses (ACL) 18 Note: ACL includes the reserve for unfunded commitments x The provision for credit losses was $19.8 million in 4Q22 x L oan growth accounted for $7.0 million of the provision increase x A weakening Moody’s economic forecast drove $12.9 million in reserve build for the quarter x Reserve levels continue to strengthen to 1.18% of loans from 0.97% in 4Q21 $114 $146 $153 $167 $181 0.97% 1.02% 1.05% 1.12% 1.18% 0.00% 0.20% 0.40% 0.60% 0.80% 1.00% 1.20% 1.40% 1.60% 1.80% $30 $50 $70 $90 $110 $130 $150 $170 4Q21 1Q22 2Q22 3Q22 4Q22 ACL - Allowance for Credit Losses $ ACL - Allowance for Credit Losses % $167,300 $180,520 $6,996 ( $6,611 ) ( $20 ) $12,855 3Q22 ACL Loan Growth NCOs Specific Reserve Model / Forecast Changes 4Q22 ACL ($000)
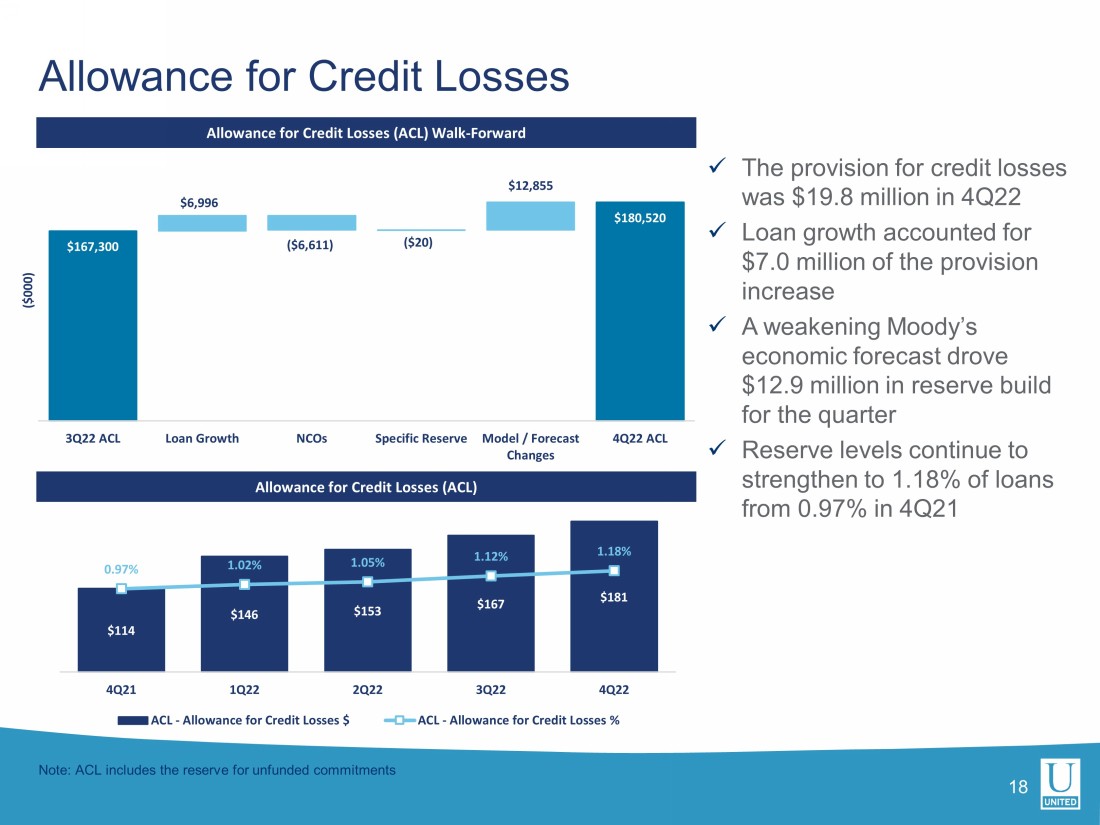
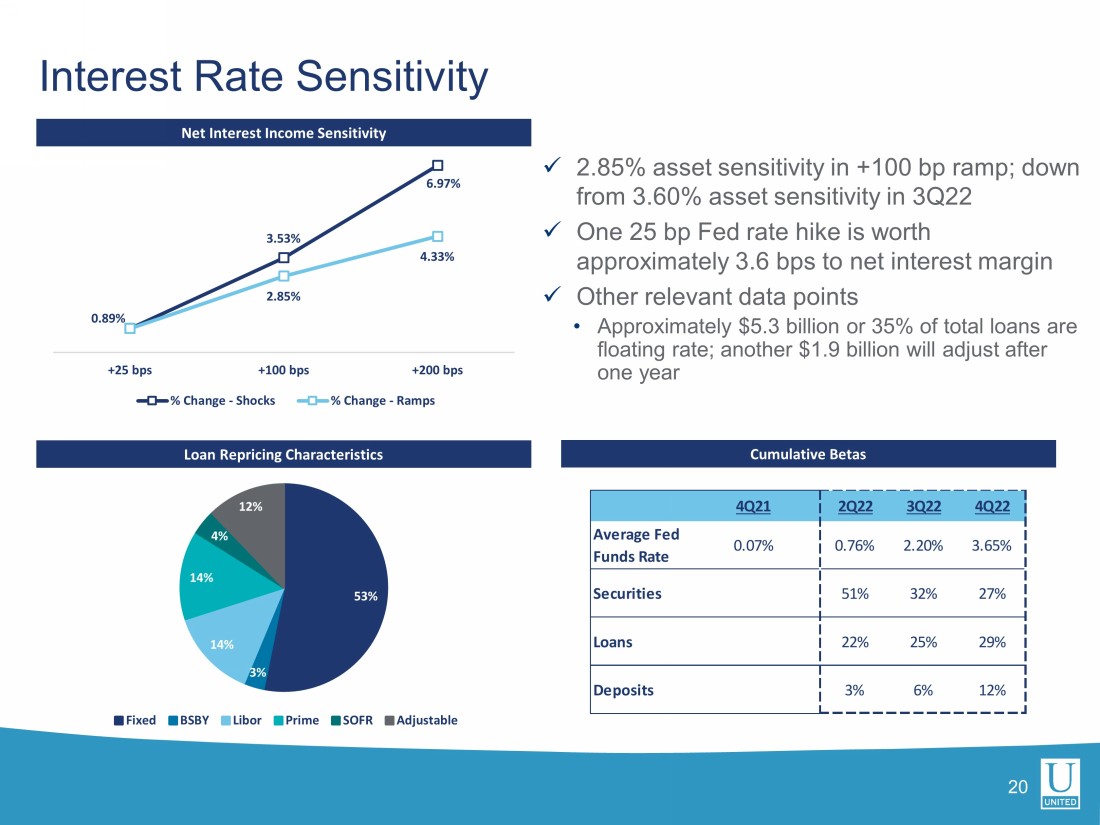
4 Q22 INVESTOR PRESENTATION Exhibits x 2.85% asset sensitivity in +100 bp ramp; down from 3.60% asset sensitivity in 3Q22 x One 25 bp Fed rate hike is worth approximately 3.6 bps to net interest margin x Other relevant data points • Approximately $5.3 billion or 35% of total loans are floating rate; another $1.9 billion will adjust after one year 20 Net Interest Income Sensitivity Loan Repricing Characteristics Cumulative Betas Interest Rate Sensitivity 0.89% 3.53% 6.97% 2.85% 4.33% +25 bps +100 bps +200 bps % Change - Shocks % Change - Ramps 4Q21 2Q22 3Q22 4Q22 Average Fed Funds Rate 0.07% 0.76% 2.20% 3.65% Securities 51% 32% 27% Loans 22% 25% 29% Deposits 3% 6% 12% 53% 3% 14% 14% 4% 12% Fixed BSBY Libor Prime SOFR Adjustable Navitas Portfolio Net Charge - Offs 21 x Navitas represents 9% of total loans x Navitas 4Q22 NCOs of 0.50%, or $1.7 million x Navitas ACL / Loans of 1.70% x After six quarters of lower than normal losses, NCOs have begun to normalize towards historical levels Navitas Performance $ in millions $823 $864 $913 $969 $1,017 $1,083 $1,148 $1,211 $1,281 $1,374 9.19% 9.12% 9.08% 9.08% 9.01% 8.89% 8.85% 8.80% 8.79% 8.88% 0.00% 1.00% 2.00% 3.00% 4.00% 5.00% 6.00% 7.00% 8.00% 9.00% 10.00% $0 $200 $400 $600 $800 $1,000 $1,200 $1,400 $1,600 3Q20 4Q20 1Q21 2Q21 3Q21 4Q21 1Q22 2Q22 3Q22 4Q22 Navitas Loans $ Portfolio Yield % 0.72% 0.83% 0.70% 0.13% 0.21% 0.29% 0.10% 0.31% 0.36% 0.50% 2019 2020 1Q21 2Q21 3Q21 4Q21 1Q22 2Q22 3Q22 4Q22
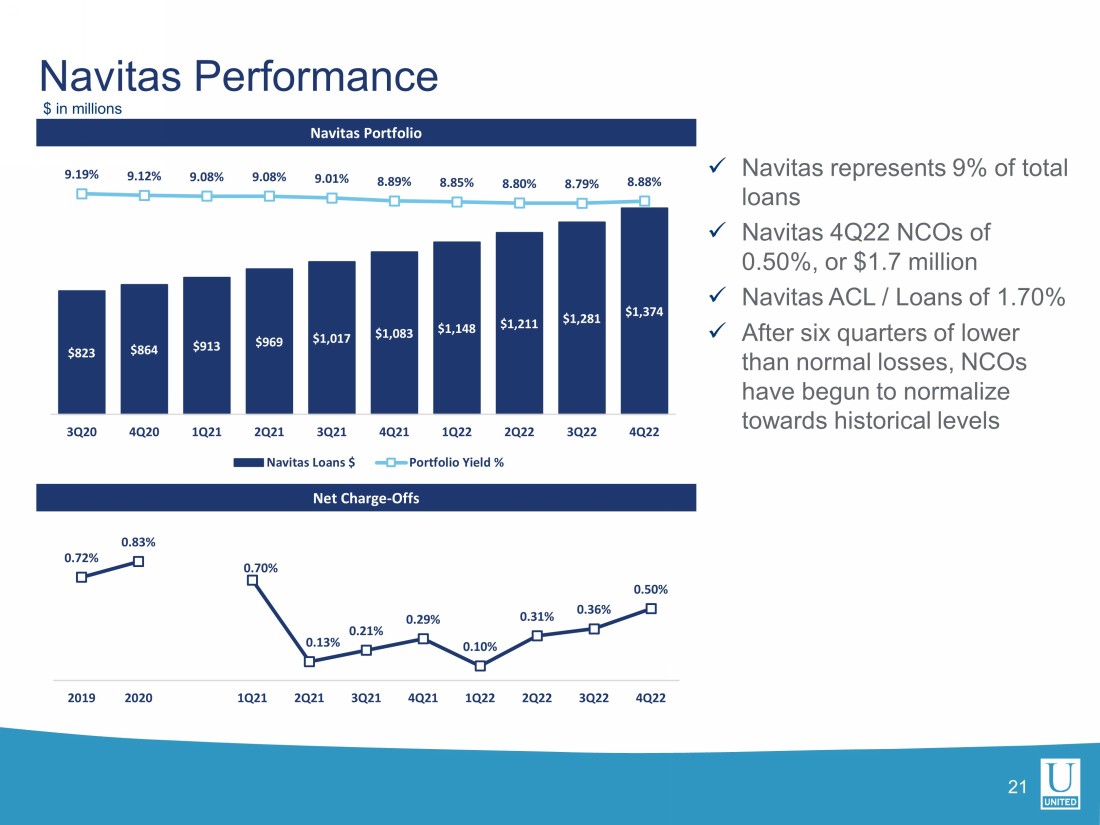
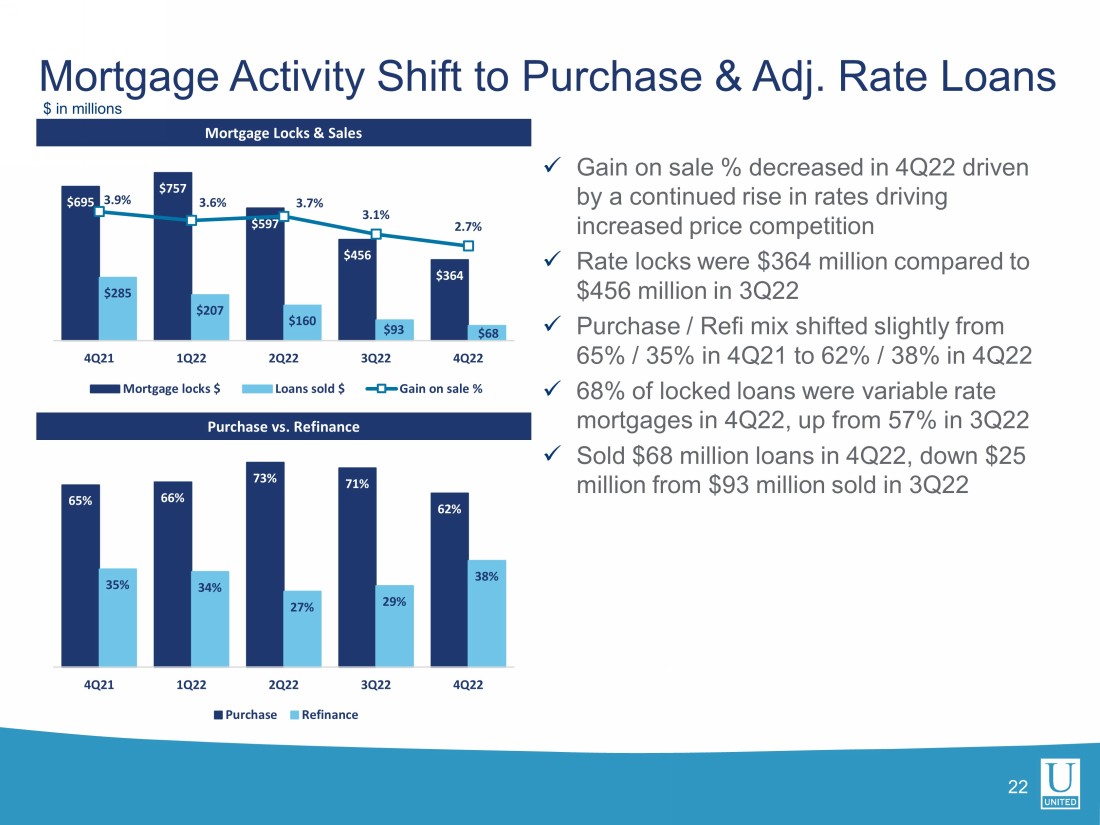
x Gain on sale % decreased in 4Q22 driven by a continued rise in rates driving increased price competition x Rate locks were $364 million compared to $456 million in 3Q22 x Purchase / Refi mix shifted slightly from 65% / 35% in 4Q21 to 62% / 38% in 4Q22 x 68% of locked loans were variable rate mortgages in 4Q22 , up from 57% in 3Q22 x Sold $68 million loans in 4Q22 , down $25 million from $93 million sold in 3 Q22 22 Mortgage Locks & Sales Purchase vs. Refinance Mortgage Activity Shift to Purchase & Adj.
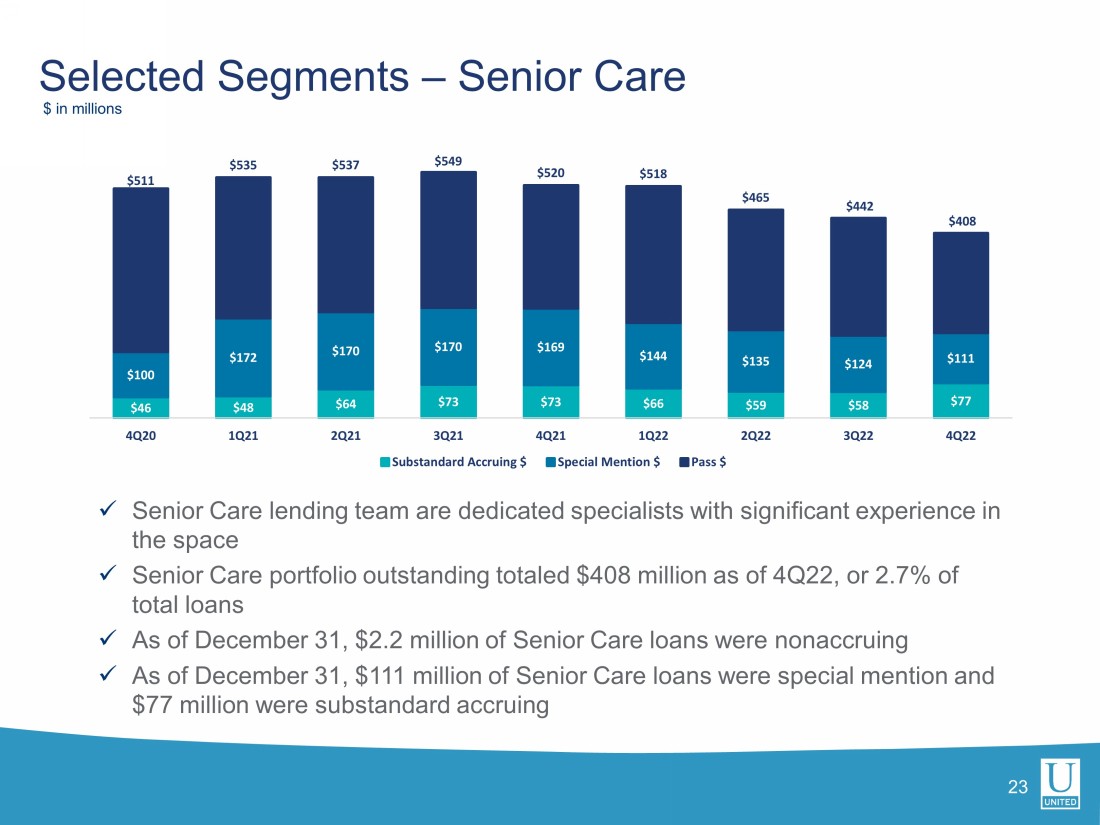
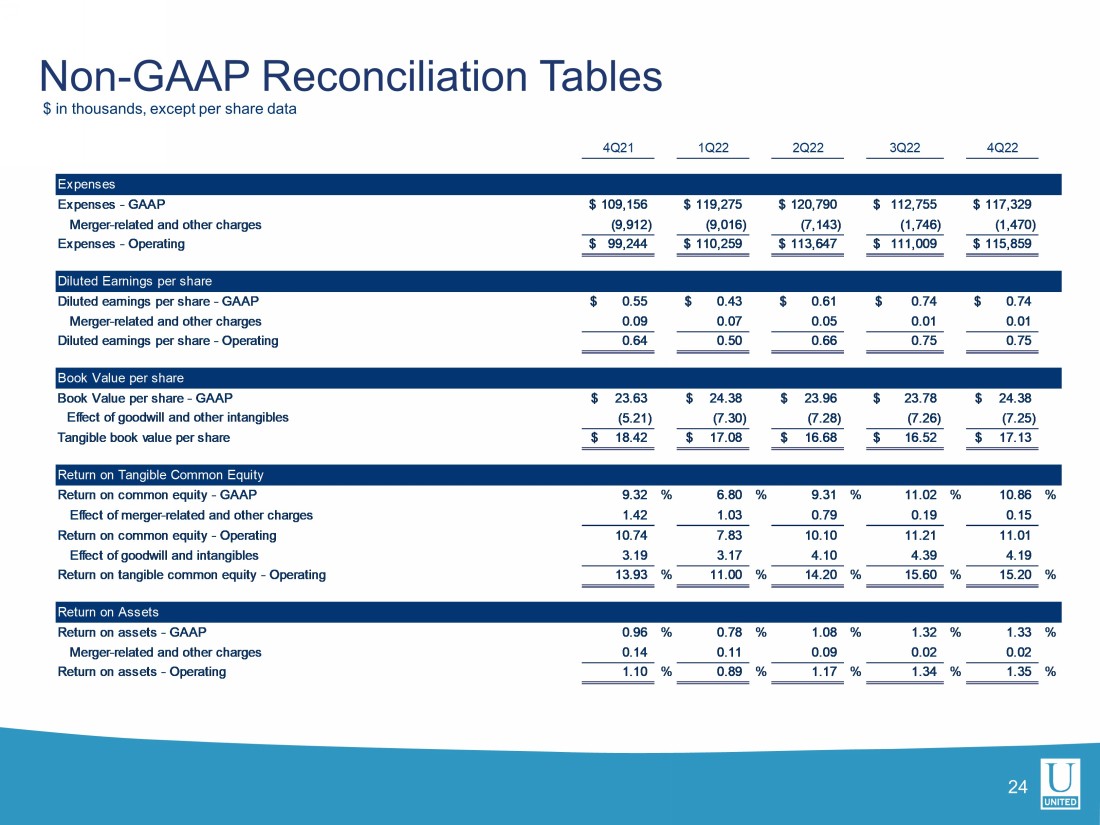
Rate Loans $695 $757 $597 $456 $364 $285 $207 $160 $93 $68 3.9% 3.6% 3.7% 3.1% 2.7% -0.5% 0.5% 1.5% 2.5% 3.5% 4.5% 5.5% $0 $100 $200 $300 $400 $500 $600 $700 $800 4Q21 1Q22 2Q22 3Q22 4Q22 Mortgage locks $ Loans sold $ Gain on sale % 65% 66% 73% 71% 62% 35% 34% 27% 29% 38% 4Q21 1Q22 2Q22 3Q22 4Q22 Purchase Refinance $ in millions 23 x Senior Care lending team are dedicated specialists with significant experience in the space x Senior Care portfolio outstanding totaled $408 million as of 4Q22, or 2.7% of total loans x As of December 31, $2.2 million of Senior Care loans were nonaccruing x As of December 31, $111 million of Senior Care loans were special mention and $77 million were substandard accruing 1 % 20% 25% 49% 6% Selected Segments – Senior Care $ in millions $46 $48 $64 $73 $73 $66 $59 $58 $77 $100 $172 $170 $170 $169 $144 $135 $124 $111 $511 $535 $537 $549 $520 $518 $465 $442 $408 4Q20 1Q21 2Q21 3Q21 4Q21 1Q22 2Q22 3Q22 4Q22 Substandard Accruing $ Special Mention $ Pass $ Non - GAAP Reconciliation Tables $ in thousands, except per share data 24 4Q21 1Q22 2Q22 3Q22 4Q22 Expenses Expenses - GAAP 109,156$ 119,275$ 120,790$ 112,755$ 117,329$ Merger-related and other charges (9,912) (9,016) (7,143) (1,746) (1,470) Expenses - Operating 99,244$ 110,259$ 113,647$ 111,009$ 115,859$ Diluted Earnings per share Diluted earnings per share - GAAP 0.55$ 0.43$ 0.61$ 0.74$ 0.74$ Merger-related and other charges 0.09 0.07 0.05 0.01 0.01 Diluted earnings per share - Operating 0.64 0.50 0.66 0.75 0.75 Book Value per share Book Value per share - GAAP 23.63$ 24.38$ 23.96$ 23.78$ 24.38$ Effect of goodwill and other intangibles (5.21) (7.30) (7.28) (7.26) (7.25) Tangible book value per share 18.42$ 17.08$ 16.68$ 16.52$ 17.13$ Return on Tangible Common Equity Return on common equity - GAAP 9.32 % 6.80 % 9.31 % 11.02 % 10.86 % Effect of merger-related and other charges 1.42 1.03 0.79 0.19 0.15 Return on common equity - Operating 10.74 7.83 10.10 11.21 11.01 Effect of goodwill and intangibles 3.19 3.17 4.10 4.39 4.19 Return on tangible common equity - Operating 13.93 % 11.00 % 14.20 % 15.60 % 15.20 % Return on Assets Return on assets - GAAP 0.96 % 0.78 % 1.08 % 1.32 % 1.33 % Merger-related and other charges 0.14 0.11 0.09 0.02 0.02 Return on assets - Operating 1.10 % 0.89 % 1.17 % 1.34 % 1.35 % Non - GAAP Reconciliation Tables $ in thousands, except per share data 25 4Q21 1Q22 2Q22 3Q22 4Q22 Return on Assets to return on assets- pre-tax pre-provision Return on assets - GAAP 0.96 % 0.78 % 1.08 % 1.32 % 1.33 % Income tax expense 0.26 0.20 0.32 0.37 0.41 (Release of) provision for credit losses (0.01) 0.39 0.09 0.25 0.33 Return on assets - pre-tax, pre-provision 1.21 1.37 1.49 1.94 2.07 Merger-related and other charges 0.19 0.15 0.11 0.03 0.02 Return on assets - pre-tax, pre-provision, excluding merger-related and other charges 1.40 % 1.52 % 1.60 % 1.97 % 2.09 % Efficiency Ratio Efficiency Ratio - GAAP 62.12 % 57.43 % 56.58 % 48.41 % 47.95 % Merger-related and other charges (5.64) (4.34) (3.35) (0.75) (0.60) Efficiency Ratio - Operating, excluding PPP fees and MSR marks 56.48 % 53.09 % 53.23 % 47.66 % 47.35 % Tangible common equity to tangible assets Equity to assets ratio - GAAP 10.61 % 11.06 % 10.95 % 11.12 % 11.25 % Effect of goodwill and other intangibles (2.06) (2.94) (2.96) (3.01) (2.97) Effect of preferred equity (0.46) (0.40) (0.40) (0.41) (0.40) Tangible common equity to tangible assets ratio 8.09 % 7.72 % 7.59 % 7.70 % 7.88 %
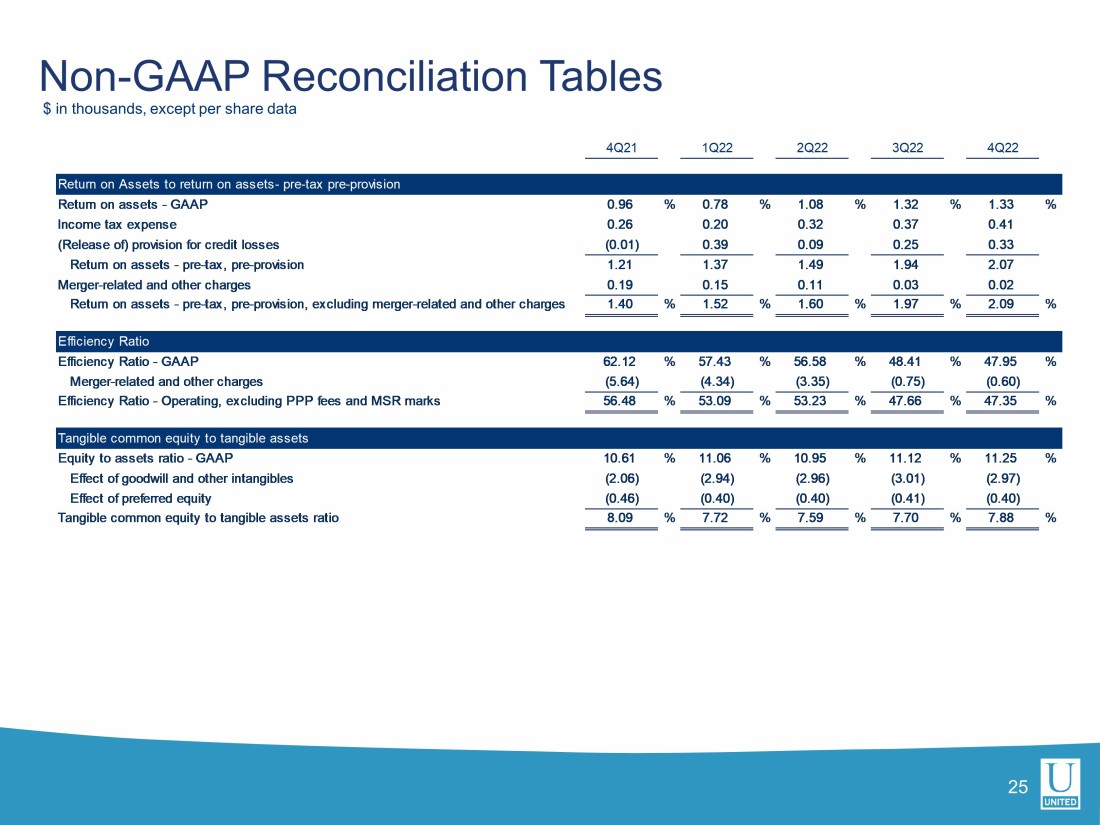
Glossary 26 ACL – Allowance for Credit Losses MLO – Mortgage Loan Officer ALLL – Allowance for Loan Losses MTM – Marked-to-market AUA – Assets Under Administration MSA – Metropolitan Statistical Area BPS – Basis Points MSR – Mortgage Servicing Rights Asset C&I – Commercial and Industrial NCO – Net Charge-Offs C&D – Construction and Development NIM – Net Interest Margin CECL – Current Expected Credit Losses NPA – Non-Performing Asset CET1 – Common Equity Tier 1 Capital NSF – Non-sufficient Funds CRE – Commercial Real Estate OO RE – Owner Occupied Commercial Real Estate CSP – Customer Service Profiles PCD – Loans Purchased with Credit Deterioration DDA – Demand Deposit Account PPP – Paycheck Protection Program EOP – End of Period PTPP – Pre-Tax, Pre-Provision Earnings EPS – Earnings Per Share RBC – Risk Based Capital FTE – Fully-taxable equivalent ROA – Return on Assets GAAP – Accounting Principles Generally Accepted in the USA SBA – United States Small Business Administration KRX – KBW Nasdaq Regional Banking Index TCE – Tangible Common Equity LPO – Loan Production Office USDA – United States Department of Agriculture YOY – Year over Year