UNITED STATES
SECURITIES AND EXCHANGE COMMISSION
WASHINGTON, D.C. 20549
FORM 8-K
CURRENT REPORT
Pursuant to Section 13 or 15(d) of the Securities Exchange Act of 1934
Date of Report (Date of earliest event reported) July 15, 2022
Citigroup Inc.
(Exact name of registrant as specified in its charter)
Delaware |
1-9924 |
52-1568099 |
(State or other jurisdiction |
(Commission |
(IRS Employer |
|
|
|
|
388 Greenwich Street, New York, (Address of principal executive offices) |
|
10013 |
(212) 559-1000
(Registrant's telephone number,
including area code)
Check the appropriate box below if the Form 8-K filing is intended to simultaneously satisfy the filing obligation of the registrant under any of the following provisions:
☐ Written communications pursuant to Rule 425 under the Securities Act (17 CFR 230.425)
☐ Soliciting material pursuant to Rule 14a-12 under the Exchange Act (17 CFR 240.14a-12)
☐ Pre-commencement communications pursuant to Rule 14d-2(b) under the Exchange Act (17 CFR 240.14d-2(b))
☐ Pre-commencement communications pursuant to Rule 13e-4(c) under the Exchange Act (17 CFR 240.13e-4(c))
Securities registered pursuant to Section 12(b) of the Securities Exchange Act of 1934 formatted in Inline XBRL: See Exhibit 99.3
Indicate by check mark whether the registrant is an emerging growth company as defined in Rule 405 of the Securities Act of 1933 (§230.405 of this chapter) or Rule 12b-2 of the Securities Exchange Act of 1934 (§240.12b-2 of this chapter).
Emerging growth company ☐
If an emerging growth company, indicate by check mark if the registrant has elected not to use the extended transition period for complying with any new or revised financial accounting standards provided pursuant to Section 13(a) of the Exchange Act. ☐
CITIGROUP INC.
Current Report on Form 8-K
Item 2.02 Results of Operations and Financial Condition.
On July 15, 2022, Citigroup Inc. announced its results for the quarter ended June 30, 2022. A copy of the related press release, filed as Exhibit 99.1 to this Form 8-K, is incorporated herein by reference in its entirety and shall be deemed to be “filed” for purposes of the Securities Exchange Act of 1934, as amended (the Act).
In addition, a copy of the Citigroup Inc. Quarterly Financial Data Supplement for the quarter ended June 30, 2022 is being furnished as Exhibit 99.2 to this Form 8-K and shall not be deemed to be “filed” for purposes of Section 18 of the Act or otherwise subject to the liabilities of that section.
Item 9.01 Financial Statements and Exhibits.
(d) Exhibits.
Exhibit Number |
|
|
|
|
|
99.1 |
|
|
|
|
|
99.2 |
|
Citigroup Inc. Quarterly Financial Data Supplement for the quarter ended June 30, 2022. |
|
|
|
99.3 |
|
|
|
|
|
104.1 |
|
See the cover page of this Current Report on Form 8-K, formatted in Inline XBRL. |
SIGNATURE
Pursuant to the requirements of the Securities Exchange Act of 1934, the registrant has duly caused this report to be signed on its behalf by the undersigned hereunto duly authorized.
|
|
CITIGROUP INC. |
|
|
|
Dated: July 15, 2022 |
|
|
|
By: |
/s/ Johnbull E. Okpara |
|
|
Johnbull E. Okpara |
|
|
Controller and Chief Accounting Officer |
|
|
(Principal Accounting Officer) |
Exhibit 99.1
|
For Immediate Release Citigroup Inc. (NYSE: C) July 15, 2022 |
|
|
|
SECOND QUARTER 2022 RESULTS AND KEY METRICS
|
|
CEO COMMENTARY |
|
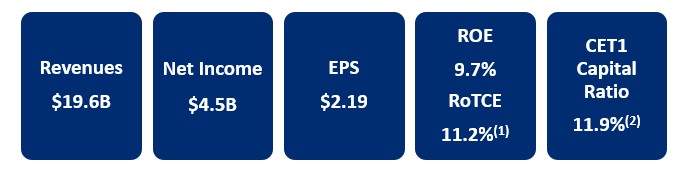
RETURNED $1.3 BILLION TO COMMON SHAREHOLDERS IN THE FORM OF DIVIDENDS AND REPURCHASES PAYOUT RATIO OF 29%(3) BOOK VALUE PER SHARE OF $92.95 TANGIBLE BOOK VALUE PER SHARE OF $80.25(4) New York, July 15, 2022 – Citigroup Inc. today reported net income for the second quarter 2022 of $4.5 billion, or $2.19 per diluted share, on revenues of $19.6 billion. This compared to net income of $6.2 billion, or $2.85 per diluted share, on revenues of $17.8 billion for the second quarter 2021. Revenues increased 11% from the prior-year period, with growth in both net interest income as well as non-interest revenue. Higher net interest income was primarily driven by the benefits of higher rates as well as strong volumes across Institutional Clients Group (ICG) and Personal Banking and Wealth Management (PBWM). Non-interest revenue also increased, driven by Fixed Income Markets and Services in ICG, which more than offset lower non-interest revenue in Investment Banking in ICG and PBWM. Net income of $4.5 billion decreased 27% from the prior-year period, as higher cost of credit and an 8% increase in expenses more than offset the 11% increase in revenues. Earnings per share of $2.19 decreased 23% from the prior-year period, reflecting the lower net income, partly offset by an approximate 4% decline in shares outstanding. Percentage comparisons throughout this press release are calculated for the second quarter 2022 versus the second quarter 2021, unless otherwise specified. |
|
Citi CEO Jane Fraser said, “While the world has changed since our Investor Day in March, our strategy has not and we are executing it with discipline and urgency. Treasury and Trade Solutions fired on all cylinders as clients took advantage of our global network, leading to the best quarter this business has had in a decade. Trading volatility continued to create strong corporate client activity for us, driving revenue growth of 25% in Markets. While economic sentiment clearly impacted Investment Banking and Wealth Management, we continue to invest in these businesses and we like where they are headed. In U.S. Personal Banking, the positive drivers we saw in our two credit cards businesses over the last few quarters converted into solid revenue growth this quarter, most notably, 10% growth in Branded Cards. “In a challenging macro and geopolitical environment, our team delivered solid results and we are in a strong position to weather uncertain times, given our liquidity, credit quality and reserve levels. I am particularly pleased with our capital strength. We ended the quarter with a Common Equity Tier 1 ratio of 11.9%, having built capital due to a higher regulatory requirement. We intend to generate significant capital for our investors, given our earnings power and the upcoming divestitures,” Ms. Fraser concluded. |
1
Second Quarter Financial Results
Citigroup |
|
2Q'22 |
|
1Q'22 |
|
2Q'21 |
|
QoQ% |
|
YoY% |
|||
Institutional Clients Group |
|
$ |
11,419 |
|
$ |
11,160 |
|
$ |
9,549 |
|
2% |
|
20% |
Personal Banking and Wealth Management |
|
|
6,029 |
|
|
5,905 |
|
|
5,698 |
|
2% |
|
6% |
Legacy Franchises |
|
|
1,935 |
|
|
1,931 |
|
|
2,279 |
|
- |
|
(15)% |
Corporate / Other |
|
|
255 |
|
|
190 |
|
|
227 |
|
34% |
|
12% |
Total revenues, net of interest expense |
|
|
19,638 |
|
|
19,186 |
|
|
17,753 |
|
2% |
|
11% |
|
|
|
|
|
|
|
|
||||||
Total operating expenses |
|
|
12,393 |
|
|
13,165 |
|
|
11,471 |
|
(6)% |
|
8% |
|
|
|
|
|
|
|
|
||||||
Net credit losses |
|
|
850 |
|
|
872 |
|
|
1,320 |
|
(3)% |
|
(36)% |
Net ACL build / (release)(a) |
|
|
375 |
|
|
(138) |
|
|
(2,402) |
|
NM |
|
NM |
Other provisions(b) |
|
|
49 |
|
|
21 |
|
|
16 |
|
NM |
|
NM |
Total cost of credit |
|
|
1,274 |
|
|
755 |
|
|
(1,066) |
|
69% |
|
NM |
|
|
|
|
|
|
|
|
||||||
Income from continuing operations before income taxes |
|
|
5,971 |
|
|
5,266 |
|
|
7,348 |
|
13% |
|
(19)% |
Provision for income taxes |
|
|
1,182 |
|
|
941 |
|
|
1,155 |
|
26% |
|
2% |
Income from continuing operations |
|
|
4,789 |
|
|
4,325 |
|
|
6,193 |
|
11% |
|
(23)% |
Income (loss) from discontinued operations, net of taxes(5) |
|
|
(221) |
|
|
(2) |
|
|
10 |
|
NM |
|
NM |
Net income attributable to non-controlling interest |
|
|
21 |
|
|
17 |
|
|
10 |
|
24% |
|
NM |
Citigroup's net income |
|
$ |
4,547 |
|
$ |
4,306 |
|
$ |
6,193 |
|
6% |
|
(27)% |
|
|
|
|
|
|
|
|
||||||
Income (loss) from continuing operations, net of taxes |
|
|
|
|
|
|
|
|
|||||
Institutional Clients Group |
|
|
3,978 |
|
|
2,658 |
|
|
3,433 |
|
50% |
|
16% |
Personal Banking and Wealth Management |
|
|
553 |
|
|
1,860 |
|
|
1,805 |
|
(70)% |
|
(69)% |
Legacy Franchises |
|
|
(15) |
|
|
(385) |
|
|
492 |
|
96% |
|
NM |
Corporate / Other |
|
|
273 |
|
|
192 |
|
|
463 |
|
42% |
|
(41)% |
|
|
|
|
|
|
|
|
||||||
EOP loans ($B) |
|
|
657 |
|
|
660 |
|
|
677 |
|
- |
|
(3)% |
EOP assets ($B) |
|
|
2,381 |
|
|
2,394 |
|
|
2,328 |
|
(1)% |
|
2% |
EOP deposits ($B) |
|
|
1,322 |
|
|
1,334 |
|
|
1,310 |
|
(1)% |
|
1% |
|
|
|
|
|
|
|
|
||||||
Book value per share |
|
$ |
92.95 |
|
$ |
92.03 |
|
$ |
90.86 |
|
1% |
|
2% |
Tangible book value per share(4) |
|
$ |
80.25 |
|
$ |
79.03 |
|
$ |
77.87 |
|
2% |
|
3% |
Common Equity Tier 1 (CET1) Capital ratio(2) |
|
|
11.9% |
|
|
11.4% |
|
|
11.8% |
|
|
||
Supplementary Leverage ratio (SLR)(2) |
|
|
5.6% |
|
|
5.6% |
|
|
5.8% |
|
|
||
Return on average common equity |
|
|
9.7% |
|
|
9.0% |
|
|
13.0% |
|
|
||
Return on average tangible common equity (RoTCE)(1) |
|
|
11.2% |
|
|
10.5% |
|
|
15.2% |
|
|
||
Note: Please refer to the Appendices and Footnotes at the end of this press release for additional information.
(a) Includes credit reserve build / (release) for loans and provision for credit losses on unfunded lending commitments.
(b) Includes provisions for policyholder benefits and claims, HTM debt securities and other assets.
Citigroup
Citigroup revenues of $19.6 billion in the second quarter 2022 increased 11%, driven by increased rates, client activity in Markets and continued momentum in the U.S. cards businesses, partially offset by a slowdown in Investment Banking activity as well as investment fee headwinds in Global Wealth Management.
Citigroup operating expenses of $12.4 billion in the second quarter 2022 increased 8%, driven by continued investments in Citi’s transformation, higher business-led investments and volume-related expenses, partially offset by productivity savings.
Citigroup cost of credit of $1.3 billion in the second quarter 2022 compared to $(1.1) billion in the prior-year period, reflecting a net build in the allowance for credit losses (ACL) of $0.4 billion, compared to a net ACL release of $2.4 billion in the prior-year period, partially offset by lower net credit losses.
Citigroup net income of $4.5 billion in the second quarter 2022 decreased 27% from the prior-year period, driven by the higher cost of credit and the higher expenses, partially offset by the increase in revenues. Citigroup’s effective tax rate was 19.8% in the current quarter versus 15.7% in the second quarter 2021.
2
The higher tax rate for the current quarter reflected lower tax benefits related to certain non-U.S. operations.
Citigroup’s total allowance for credit losses on loans was approximately $16.0 billion at quarter end, with a reserve-to-funded loans ratio of 2.44%, compared to $19.2 billion, or 2.88% of funded loans, at the end of the prior-year period. Total non-accrual loans decreased 31% from the prior-year period to $3.0 billion. Consumer non-accrual loans decreased 35% to $1.4 billion, while corporate non-accrual loans of $1.7 billion decreased 26% from the prior-year period.
Citigroup’s end-of-period loans were $657 billion as of quarter end, down 3% versus the prior-year period.
Citigroup’s end-of-period deposits were $1.3 trillion as of quarter end, up 1% versus the prior-year period.
Citigroup’s book value per share of $92.95 and tangible book value per share of $80.25 increased 2% and 3%, respectively, largely driven by net income and lower shares outstanding, partially offset by adverse movements in the accumulated other comprehensive income component of equity and common dividends. At quarter end, Citigroup’s CET1 Capital ratio was 11.9% versus 11.4% in the prior quarter. Citigroup’s SLR for the second quarter 2022 was 5.6%, unchanged from the prior quarter. During the quarter, Citigroup returned a total of $1.3 billion to common shareholders in the form of dividends and repurchases.
Institutional Clients Group |
|
2Q'22 |
|
1Q'22 |
|
2Q'21 |
|
QoQ% |
|
YoY% |
|||
Securities Services |
|
$ |
994 |
|
$ |
858 |
|
$ |
855 |
|
16% |
|
16% |
Treasury and Trade Solutions |
|
|
3,029 |
|
|
2,590 |
|
|
2,285 |
|
17% |
|
33% |
Total Services revenues |
|
|
4,023 |
|
|
3,448 |
|
|
3,140 |
|
17% |
|
28% |
Fixed Income Markets |
|
|
4,084 |
|
|
4,299 |
|
|
3,111 |
|
(5)% |
|
31% |
Equity Markets |
|
|
1,236 |
|
|
1,527 |
|
|
1,144 |
|
(19)% |
|
8% |
Total Markets revenues |
|
|
5,320 |
|
|
5,826 |
|
|
4,255 |
|
(9)% |
|
25% |
Investment Banking |
|
|
805 |
|
|
1,028 |
|
|
1,503 |
|
(22)% |
|
(46)% |
Corporate Lending(a) |
|
|
777 |
|
|
689 |
|
|
688 |
|
13% |
|
13% |
Total Banking revenues(a) |
|
|
1,582 |
|
|
1,717 |
|
|
2,191 |
|
(8)% |
|
(28)% |
Product revenues, net of interest expense(a) |
|
|
10,925 |
|
|
10,991 |
|
|
9,586 |
|
(1)% |
|
14% |
Gain / (loss) on loan hedges |
|
|
494 |
|
|
169 |
|
|
(37) |
|
NM |
|
NM |
Total revenues, net of interest expense |
|
|
11,419 |
|
|
11,160 |
|
|
9,549 |
|
2% |
|
20% |
|
|
|
|
|
|
|
|
||||||
Total operating expenses |
|
|
6,434 |
|
|
6,723 |
|
|
5,829 |
|
(4)% |
|
10% |
|
|
|
|
|
|
|
|
||||||
Net credit losses |
|
|
18 |
|
|
30 |
|
|
68 |
|
(40)% |
|
(74)% |
Net ACL build / (release)(b) |
|
|
(245) |
|
|
948 |
|
|
(765) |
|
NM |
|
68% |
Other provisions(c) |
|
|
25 |
|
|
(7) |
|
|
3 |
|
NM |
|
NM |
Total cost of credit |
|
|
(202) |
|
|
971 |
|
|
(694) |
|
NM |
|
71% |
|
|
|
|
|
|
|
|
||||||
Net income |
|
$ |
3,961 |
|
$ |
2,640 |
|
$ |
3,421 |
|
50% |
|
16% |
|
|
|
|
|
|
|
|
||||||
Services Key Drivers |
|
|
|
|
|
|
|
|
|||||
Cross border transaction value ($B) |
|
|
79 |
|
|
76 |
|
|
68 |
|
5% |
|
17% |
Commercial card spend volume ($B) |
|
|
15 |
|
|
11 |
|
|
9 |
|
32% |
|
61% |
US dollar clearing volume (#MM) |
|
|
37 |
|
|
36 |
|
|
36 |
|
2% |
|
2% |
Assets under custody and/or administration (AUC/AUA) ($T) |
|
|
21 |
|
|
23 |
|
|
23 |
|
(8)% |
|
(7)% |
Note: Please refer to the Appendices and Footnotes at the end of this press release for additional information.
(a) Excludes gain / (loss) on credit derivatives as well as the mark-to-market on loans at fair value. For additional information, please refer to Footnote 6.
(b) Includes credit reserve build / (release) for loans and provision for credit losses on unfunded lending commitments.
(c) Includes provisions for HTM debt securities and other assets.
Institutional Clients Group
ICG revenues of $11.4 billion increased 20% (including gain/(loss) on loan hedges(6)), driven by Services and Markets, partially offset by a decrease in Investment Banking revenues.
3
Services revenues of $4.0 billion increased 28% versus the prior year. Treasury and Trade Solutions revenues of $3.0 billion increased 33%, driven by 42% growth in net interest income, as well as 17% growth in non-interest revenue, reflecting strong growth with both mid and large corporate clients. Securities Services revenues of $994 million increased 16%, as net interest income grew 41%, driven by higher interest rates across currencies, and non-interest revenue grew 8%, reflecting elevated levels of corporate settlement activity in Issuer Services.
Markets revenues of $5.3 billion were up 25% versus the prior year, driven by higher volatility leading to elevated client engagement. Fixed Income Markets revenues of $4.1 billion increased 31%, primarily reflecting strong client engagement in the rates, currencies and commodities businesses. Equity Markets revenues of $1.2 billion were up 8%, driven by strong equity derivatives performance, partially offset by less client activity in cash, and a net decrease in prime balances, as lower asset valuations more than offset new client balances.
Banking revenues of $2.1 billion decreased 4% versus the prior-year period (including gain/(loss) on loan hedges). Excluding the gain/(loss) on loan hedges, Banking revenues of $1.6 billion decreased 28% versus the prior year. Investment Banking revenues of $805 million declined 46%, as heightened geopolitical uncertainty and the overall macroeconomic backdrop reduced capital markets activity and M&A. The decline in Investment Banking revenues were partially offset by higher revenues in Corporate Lending.
ICG operating expenses of $6.4 billion increased 10%, driven by continued investments in Citi’s transformation, higher business-led investments and volume-related expenses, partially offset by productivity savings.
ICG cost of credit of $(202) million compared to $(694) million in the prior-year period, with a net ACL release of $245 million and net credit losses of $18 million. The release was largely driven by a reduction in Russia-related risk in the quarter, partially offset by a build due to increased macroeconomic uncertainty.
ICG net income of $4.0 billion increased 16% from the prior year, driven by the higher revenues, partially offset by the higher expenses and the higher cost of credit.
4
Personal Banking and Wealth Management |
|
2Q'22 |
|
1Q'22 |
|
2Q'21 |
|
QoQ% |
|
YoY% |
|||
Branded Cards |
|
$ |
2,168 |
|
$ |
2,090 |
|
$ |
1,968 |
|
4% |
|
10% |
Retail Services |
|
|
1,300 |
|
|
1,299 |
|
|
1,210 |
|
- |
|
7% |
Retail Banking |
|
|
656 |
|
|
595 |
|
|
618 |
|
10% |
|
6% |
Total US Personal Banking revenues |
|
|
4,124 |
|
|
3,984 |
|
|
3,796 |
|
4% |
|
9% |
Private Bank |
|
|
745 |
|
|
779 |
|
|
747 |
|
(4)% |
|
- |
Wealth at Work |
|
|
170 |
|
|
183 |
|
|
171 |
|
(7)% |
|
(1)% |
Citigold |
|
|
990 |
|
|
959 |
|
|
984 |
|
3% |
|
1% |
Total Global Wealth Management revenues |
|
|
1,905 |
|
|
1,921 |
|
|
1,902 |
|
(1)% |
|
- |
Total revenues, net of interest expense |
|
|
6,029 |
|
|
5,905 |
|
|
5,698 |
|
2% |
|
6% |
|
|
|
|
|
|
|
|
||||||
Total operating expenses |
|
|
3,985 |
|
|
3,889 |
|
|
3,547 |
|
2% |
|
12% |
|
|
|
|
|
|
|
|
||||||
Net credit losses |
|
|
699 |
|
|
691 |
|
|
862 |
|
1% |
|
(19)% |
Net ACL build / (release)(a) |
|
|
651 |
|
|
(1,064) |
|
|
(1,035) |
|
NM |
|
NM |
Other provisions(b) |
|
|
5 |
|
|
(3) |
|
|
3 |
|
NM |
|
67% |
Total cost of credit |
|
|
1,355 |
|
|
(376) |
|
|
(170) |
|
NM |
|
NM |
|
|
|
|
|
|
|
|
||||||
Net income |
|
$ |
553 |
|
$ |
1,860 |
|
$ |
1,805 |
|
(70)% |
|
(69)% |
|
|
|
|
|
|
|
|
||||||
Key Indicators ($B) |
|
|
|
|
|
|
|
|
|||||
US Personal Banking average loans |
|
|
167 |
|
|
161 |
|
|
157 |
|
4% |
|
6% |
US Personal Banking average deposits |
|
|
116 |
|
|
118 |
|
|
113 |
|
(2)% |
|
3% |
US cards average loans |
|
|
133 |
|
|
128 |
|
|
122 |
|
4% |
|
9% |
US credit card spend volume(c) |
|
|
148 |
|
|
128 |
|
|
127 |
|
15% |
|
16% |
Global Wealth Management client assets |
|
|
730 |
|
|
788 |
|
|
790 |
|
(7)% |
|
(8)% |
Global Wealth Management average loans |
|
|
150 |
|
|
151 |
|
|
147 |
|
(1)% |
|
2% |
Global Wealth Management average deposits |
|
|
319 |
|
|
329 |
|
|
297 |
|
(3)% |
|
7% |
Note: Please refer to the Appendices and Footnotes at the end of this press release for additional information.
(a) Includes credit reserve build / (release) for loans and provision for credit losses on unfunded lending commitments.
(b) Includes provisions for policyholder benefits and claims, HTM debt securities and other assets.
(c) Credit card spend volume was previously referred to as card purchase sales
Personal Banking and Wealth Management
PBWM revenues of $6.0 billion increased 6%, as net interest income growth was partially offset by a decline in non-interest revenue, largely driven by partner payments in Retail Services.
US Personal Banking revenues of $4.1 billion increased 9%. Branded Cards revenues of $2.2 billion increased 10%, driven by higher interest on higher loan balances. New accounts and card spend volumes increased 18% while average loans increased 11%. Retail Services revenues of $1.3 billion increased 7%, driven by higher interest on higher loan balances, partially offset by higher partner payments. Retail Banking revenues of $656 million increased 6%, largely driven by higher deposit spreads and volumes.
Global Wealth Management revenues of $1.9 billion were flat, as investment fee headwinds, particularly in Asia, were offset by growth in average deposits and loans.
PBWM operating expenses of $4.0 billion increased 12%, driven by continued investments in Citi’s transformation, higher business-led investments and volume-driven expenses, partially offset by productivity savings.
PBWM cost of credit of $1.4 billion compared to $(170) million in the prior-year period, largely driven by a net ACL build of $651 million in the current quarter, compared to a net ACL release of $1.0 billion in the prior-year period, reflecting increased macroeconomic uncertainty. Net credit losses declined 19%, reflecting continued strong credit performance across portfolios.
PBWM net income of $553 million decreased 69%, largely driven by the higher expenses and the ACL build, partially offset by the higher revenues.
5
Legacy Franchises |
|
2Q'22 |
|
1Q'22 |
|
2Q'21 |
|
QoQ% |
|
YoY% |
|||
Asia Consumer |
|
$ |
880 |
|
$ |
787 |
|
$ |
1,052 |
|
12% |
|
(16)% |
Mexico Consumer/SBMM(a) |
|
|
1,184 |
|
|
1,139 |
|
|
1,184 |
|
4% |
|
- |
Legacy Holdings Assets |
|
|
(129) |
|
|
5 |
|
|
43 |
|
NM |
|
NM |
Total Legacy revenues, net of interest expense |
|
|
1,935 |
|
|
1,931 |
|
|
2,279 |
|
- |
|
(15)% |
|
|
|
|
|
|
|
|
||||||
Total operating expenses |
|
|
1,814 |
|
|
2,293 |
|
|
1,788 |
|
(21)% |
|
1% |
|
|
|
|
|
|
|
|
||||||
Net credit losses |
|
|
133 |
|
|
151 |
|
|
390 |
|
(12)% |
|
(66)% |
Net ACL build / (release)(b) |
|
|
(31) |
|
|
(22) |
|
|
(602) |
|
(41)% |
|
95% |
Other provisions(c) |
|
|
19 |
|
|
31 |
|
|
8 |
|
(39)% |
|
NM |
Total cost of credit |
|
|
121 |
|
|
160 |
|
|
(204) |
|
(24)% |
|
NM |
|
|
|
|
|
|
|
|
||||||
Net income (loss) |
|
$ |
(17) |
|
$ |
(383) |
|
$ |
494 |
|
96% |
|
NM |
|
|
|
|
|
|
|
|
||||||
Key Indicators ($B) |
|
|
|
|
|
|
|
|
|||||
Asia Consumer EOP loans |
|
|
17 |
|
|
20 |
|
|
54 |
|
(11)% |
|
(68)% |
Asia Consumer EOP deposits |
|
|
17 |
|
|
18 |
|
|
54 |
|
(2)% |
|
(68)% |
Mexico Consumer/SBMM EOP loans(a) |
|
|
21 |
|
|
21 |
|
|
20 |
|
- |
|
3% |
Mexico Consumer/SBMM EOP deposits(a) |
|
|
36 |
|
|
34 |
|
|
33 |
|
5% |
|
8% |
Legacy Holdings EOP loans |
|
|
3 |
|
|
4 |
|
|
5 |
|
(14)% |
|
(36)% |
Note: Please refer to the Appendices and Footnotes at the end of this press release for additional information.
(a) SBMM refers to Small Business & Middle Market Banking.
(b) Includes credit reserve build / (release) for loans and provision for credit losses on unfunded lending commitments.
(c) Includes provisions for policyholder benefits and claims, HTM debt securities and other assets.
Legacy Franchises
Legacy Franchises revenues of $1.9 billion decreased 15% versus the prior year, largely driven by the impacts related to the Australia consumer banking sale and Korea wind-down, as well as lower investment activity in Asia Consumer.
Legacy Franchises expenses of $1.8 billion increased 1%.
Legacy Franchises cost of credit of $121 million compared to $(204) million in the prior-year period, primarily driven by a lower net ACL release, partially offset by lower net credit losses.
Legacy Franchises net loss of $(17) million compared to net income of $494 million in the prior-year period, reflecting the lower revenues, the higher expenses and the higher cost of credit.
Corporate / Other |
|
2Q'22 |
|
1Q'22 |
|
2Q'21 |
|
QoQ% |
|
YoY% |
|||
Revenues, net of interest expense |
|
$ |
255 |
|
$ |
190 |
|
$ |
227 |
|
34% |
|
12% |
|
|
|
|
|
|
|
|
||||||
Total operating expenses |
|
|
160 |
|
|
260 |
|
|
307 |
|
(38)% |
|
(48)% |
|
|
|
|
|
|
|
|
||||||
Total cost of credit(a) |
|
|
- |
|
|
- |
|
|
2 |
|
- |
|
(100)% |
|
|
|
|
|
|
|
|
||||||
Income from continuing operations |
|
|
273 |
|
|
192 |
|
|
463 |
|
42% |
|
(41)% |
|
|
|
|
|
|
|
|
||||||
Net income |
|
$ |
50 |
|
$ |
189 |
|
$ |
473 |
|
(74)% |
|
(89)% |
(a) Includes provisions for HTM debt securities and other assets.
Corporate / Other
Corporate / Other revenues of $255 million increased 12%, largely driven by higher net revenues from the investment portfolio.
Corporate / Other expenses of $160 million decreased 48% versus the prior-year period, driven by certain settlements and the impact of foreign currency translation into U.S. Dollars for reporting purposes.
Corporate / Other income from continuing operations of $273 million compared to $463 million in the prior-year period, largely reflecting lower tax benefits related to certain non-U.S. operations.
6
Citigroup will host a conference call today at 11:00 AM (ET). A live webcast of the presentation, as well as financial results and presentation materials, will be available at www.citigroup.com/citi/investor. Dial-in numbers for the conference call are as follows: (800) 343-1703 (for U.S. and Canada callers) or (203) 518-9859 (for international callers).
Additional financial, statistical and business-related information, as well as business and segment trends, is included in a Quarterly Financial Data Supplement. Both this earnings release and Citigroup’s Second Quarter 2022 Quarterly Financial Data Supplement are available on Citigroup’s website at www.citigroup.com.
Citi is a preeminent banking partner for institutions with cross-border needs, a global leader in wealth management and a valued personal bank in its home market of the United States. Citi does business in more than 160 countries and jurisdictions, providing corporations, governments, investors, institutions and individuals with a broad range of financial products and services.
Additional information may be found at www.citigroup.com | Twitter: @Citi | YouTube: www.youtube.com/citi | Blog: http://blog.citigroup.com | Facebook: www.facebook.com/citi | LinkedIn: www.linkedin.com/company/citi
Certain statements in this release are “forward-looking statements” within the meaning of the rules and regulations of the Private Securities Litigation and Reform Act of 1995. These statements are based on management’s current expectations and are subject to uncertainty and changes in circumstances. These statements are not guarantees of future results or occurrences. Actual results and capital and other financial condition may differ materially from those included in these statements due to a variety of factors. These factors include, among others: higher inflation and its impacts; higher interest rates and the impacts on macroeconomic conditions, customer and client behavior, as well as Citi’s funding costs; the impacts related to or resulting from Russia’s military action in Ukraine, including the imposition of additional sanctions and export controls, as well as the broader impacts to financial markets and the global macroeconomic and geopolitical environments; consummation of Citi’s exits and wind-down, and the impact of any additional CTA or other losses; macroeconomic and other challenges and uncertainties related to the COVID-19 pandemic, such as the impacts to the U.S. and global economies; and the precautionary statements included in this release. These factors also consist of those contained in Citigroup’s filings with the U.S. Securities Exchange and Commission, including without limitation the “Risk Factors” section of Citigroup’s 2021 Form 10-K. Any forward-looking statements made by or on behalf of Citigroup speak only as to the date they are made, and Citi does not undertake to update forward-looking statements to reflect the impact of circumstances or events that arise after the date the forward-looking statements were made.
Contacts: |
|
|
|
Investors: Jennifer Landis (212) 559-2718 |
|
||
Press: Danielle Romero-Apsilos (212) 816-2264 |
|
|
|
7
Appendix A
Citigroup |
|
|
|
Net Income |
|
$ |
4,547 |
Less: Preferred Dividends |
|
|
238 |
Net Income to Common Shareholders |
|
$ |
4,309 |
|
|
|
|
Common Share Repurchases |
|
|
250 |
Common Dividends |
|
|
1,010 |
Total Capital Returned to Common Shareholders |
|
$ |
1,260 |
|
|
|
|
Payout Ratio |
|
|
29% |
|
|
|
|
Average TCE |
|
$ |
154,439 |
|
|
|
|
RoTCE |
|
|
11.2% |
Appendix B
($ in millions) |
|
|
2Q'22(1) |
|
|
1Q'22 |
|
|
2Q'21 |
|
|
|
|
|
|
|
|
|
|
|
|
|
|
|
|
|
|
|
|
Citigroup Common Stockholders' Equity(2) |
|
$ |
180,150 |
|
$ |
178,845 |
|
$ |
184,289 |
Add: Qualifying noncontrolling interests |
|
|
129 |
|
|
126 |
|
|
138 |
Regulatory Capital Adjustments and Deductions: |
|
|
|
|
|
|
|
|
|
Add: CECL transition provision(3) |
|
|
2,271 |
|
|
2,271 |
|
|
3,774 |
Less: |
|
|
|
|
|
|
|
|
|
Accumulated net unrealized gains (losses) on cash flow hedges, net of tax |
|
|
(2,106) |
|
|
(1,440) |
|
|
864 |
Cumulative unrealized net gain (loss) related to changes in fair value of financial liabilities attributable to own creditworthiness, net of tax |
|
|
2,145 |
|
|
27 |
|
|
(1,258) |
Intangible Assets: |
|
|
|
|
|
|
|
|
|
Goodwill, net of related deferred tax liabilities (DTLs)(4) |
|
|
19,504 |
|
|
20,120 |
|
|
20,999 |
Identifiable intangible assets other than mortgage servicing rights (MSRs), net of related DTLs |
|
|
3,599 |
|
|
3,698 |
|
|
3,986 |
Defined benefit pension plan net assets; other |
|
|
2,038 |
|
|
2,230 |
|
|
2,040 |
Deferred tax assets (DTAs) arising from net operating loss, foreign tax credit and general business credit carry-forwards |
|
|
11,757 |
|
|
11,701 |
|
|
11,192 |
Excess over 10% / 15% limitations for other DTAs, certain common stock investments, and MSRs(5) |
|
|
727 |
|
|
1,157 |
|
|
- |
|
|
|
|
|
|
|
|
|
|
Common Equity Tier 1 Capital (CET1)(6) |
|
$ |
144,886 |
|
$ |
143,749 |
|
$ |
150,378 |
|
|
|
|
|
|
|
|
|
|
Risk-Weighted Assets (RWA)(3)(6) |
|
$ |
1,220,000 |
|
$ |
1,263,298 |
|
$ |
1,277,234 |
|
|
|
|
|
|
|
|
|
|
Common Equity Tier 1 Capital Ratio (CET1 / RWA)(6) |
|
|
11.9% |
|
|
11.4% |
|
|
11.8% |
Note: Citi’s reportable CET1 Capital ratios were derived under the Basel III Standardized Approach framework for all periods reflected. This reflects the more binding CET1 Capital ratios under both the Standardized Approach and the Advanced Approaches under the Collins Amendment.
| (1) | Preliminary. |
| (2) | Excludes issuance costs related to outstanding preferred stock in accordance with Federal Reserve Board regulatory reporting requirements. |
| (3) | Please refer to Footnote 2 at the end of this press release for additional information. |
| (4) | Includes goodwill “embedded” in the valuation of significant common stock investments in unconsolidated financial institutions. |
| (5) | Assets subject to 10%/15% limitations include MSRs, DTAs arising from temporary differences and significant common stock investments in unconsolidated financial institutions. As of March 31, 2022 and June 30, 2022, the deduction related only to DTAs arising from temporary differences that exceeded the 10% limitation. |
| (6) | Certain prior period amounts and ratios have been revised to conform with enhancements made in the current period. |
8
Appendix C
($ in millions) |
|
|
2Q'22(1) |
|
|
1Q'22 |
|
|
2Q'21 |
|
|
|
|
|
|
|
|
|
|
Common Equity Tier 1 Capital (CET1)(2) |
|
$ |
144,886 |
|
$ |
143,749 |
|
$ |
150,378 |
|
|
|
|
|
|
|
|
|
|
Additional Tier 1 Capital (AT1)(3) |
|
|
20,265 |
|
|
20,266 |
|
|
19,258 |
|
|
|
|
|
|
|
|
|
|
Total Tier 1 Capital (T1C) (CET1 + AT1) |
|
$ |
165,151 |
|
$ |
164,015 |
|
$ |
169,636 |
|
|
|
|
|
|
|
|
|
|
Total Leverage Exposure (TLE)(2)(4) |
|
$ |
2,936,894 |
|
$ |
2,939,533 |
|
$ |
2,903,760 |
|
|
|
|
|
|
|
|
|
|
Supplementary Leverage Ratio (T1C / TLE) |
|
|
5.6% |
|
|
5.6% |
|
|
5.8% |
| (1) | Preliminary. |
| (2) | Please refer to Footnote 2 at the end of this press release for additional information. |
| (3) | Additional Tier 1 Capital primarily includes qualifying noncumulative perpetual preferred stock and qualifying trust preferred securities. |
| (4) | Certain prior period amounts and ratios have been revised to conform with enhancements made in the current period. |
Appendix D
($ and shares in millions, except per share amounts) |
|
2Q'22(1) |
|
1Q'22 |
|
2Q'21 |
|||
|
|
|
|
|
|
|
|
|
|
Common Stockholders' Equity |
|
$ |
180,019 |
|
$ |
178,714 |
|
$ |
184,164 |
Less: |
|
|
|
|
|
|
|
|
|
Goodwill |
|
|
19,597 |
|
|
19,865 |
|
|
22,060 |
Intangible Assets (other than MSRs) |
|
|
3,926 |
|
|
4,002 |
|
|
4,268 |
Goodwill and Identifiable Intangible Assets (other than MSRs) Related to Assets Held-for-Sale |
|
|
1,081 |
|
|
1,384 |
|
|
- |
Tangible Common Equity (TCE) |
|
$ |
155,415 |
|
$ |
153,463 |
|
$ |
157,836 |
|
|
|
|
|
|
|
|
|
|
Common Shares Outstanding (CSO) |
|
|
1,937 |
|
|
1,942 |
|
|
2,027 |
|
|
|
|
|
|
|
|
|
|
Tangible Book Value Per Share |
|
$ |
80.25 |
|
$ |
79.03 |
|
$ |
77.87 |
(1)Preliminary.
9
(1) Preliminary. Citigroup’s return on average tangible common equity (RoTCE) is a non-GAAP financial measure. RoTCE represents annualized net income available to common shareholders as a percentage of average tangible common equity (TCE). For the components of the calculation, see Appendix A.
(2) Ratios as of June 30, 2022 are preliminary. Citigroup’s Common Equity Tier 1 (CET1) Capital ratio and Supplementary Leverage ratio (SLR) reflect certain deferrals based on the modified regulatory capital transition provision related to the Current Expected Credit Losses (CECL) standard. Excluding these deferrals, Citigroup’s CET1 Capital ratio and SLR as of June 30, 2022 would be 11.7% and 5.5%, respectively, on a fully reflected basis. For additional information, please refer to the “Capital Resources” section of Citigroup’s 2021 Annual Report on Form 10-K. Certain prior-period amounts have been revised to conform with enhancements made in the current period.
For the composition of Citigroup’s CET1 Capital and ratio, see Appendix B. For the composition of Citigroup’s SLR, see Appendix C.
(3) Citigroup’s payout ratio is the sum of common dividends and common share repurchases divided by net income available to common shareholders. For the components of the calculation, see Appendix A.
(4) Citigroup’s tangible book value per share is a non-GAAP financial measure. For a reconciliation of this measure to reported results, see Appendix D.
(5) Second quarter 2022 discontinued operations reflects the release of a currency translation adjustment (CTA) loss (net of hedges) recorded in Accumulated Other Comprehensive Income (AOCI) related to the substantial liquidation of a legal entity (with a non-U.S. dollar functional currency) that had previously divested a legacy business.
(6) Credit derivatives are used to economically hedge a portion of the Corporate Loan portfolio that includes both accrual loans and loans at fair value. Gains / (losses) on loan hedges includes the mark-to-market on the credit derivatives and the mark-to-market on the loans in the portfolio that are at fair value. In the second quarter 2022, gains / (losses) on loan hedges included $494 million related to Corporate Lending, compared to $(37) million in the prior-year period. The fixed premium costs of these hedges are netted against the Corporate Lending revenues to reflect the cost of credit protection. Citigroup’s results of operations excluding the impact of gains / (losses) on loan hedges are non-GAAP financial measures.
10
Exhibit 99.2

CITIGROUP -- QUARTERLY FINANCIAL DATA SUPPLEMENT |
|
2Q22 |
|
|
|
|
|
|
|
||
|
|
|
|
|
|
|
Page |
|
|
||
Citigroup |
|
|
|
||
Financial Summary |
|
1 |
|
|
|
Consolidated Statement of Income |
|
2 |
|
|
|
Consolidated Balance Sheet |
|
3 |
|
|
|
Operating Segment and Reporting Unit - Net Revenues and Income |
|
4 |
|
|
|
|
|
|
|||
Institutional Clients Group (ICG) |
|
5 |
|
|
|
Reporting Unit Revenues |
|
6 |
|
|
|
Personal Banking and Wealth Management (PBWM) |
|
7 |
|
|
|
Metrics |
|
8 |
|
|
|
Legacy Franchises |
|
9 |
|
|
|
Corporate / Other |
|
10 |
|
|
|
|
|
|
|||
Citigroup Supplemental Detail |
|
|
|
||
Average Balances and Interest Rates |
|
11 |
|
|
|
EOP Loans |
|
12 |
|
|
|
Deposits |
|
13 |
|
|
|
Allowance for Credit Losses (ACL) Rollforward |
|
14 |
|
|
|
Allowance for Credit Losses on Loans and Unfunded Lending Commitments |
|
15 - 16 |
|
|
|
Non-Accrual Assets |
|
17 |
|
|
|
CET1 Capital and Supplementary Leverage Ratios, Tangible Common Equity, Book Value Per Share and Tangible Book Value Per Share |
|
18 |
|
|
|
|
|
|
|
|
|
|
|
|
|
|
CITIGROUP FINANCIAL SUMMARY
(In millions of dollars, except per share amounts and as otherwise noted)
|
|
2Q |
|
3Q |
|
4Q |
|
1Q |
|
2Q |
|
2Q22 Increase/ |
|
|
Six |
|
Six |
|
YTD 2022 vs. |
|||||||||
|
|
2021 |
|
2021 |
|
2021 |
|
2022 |
|
2022 |
|
1Q22 |
|
2Q21 |
|
|
2021 |
|
2022 |
|
(Decrease) |
|||||||
Total revenues, net of interest expense(1)(2) |
|
$ |
17,753 |
|
$ |
17,447 |
|
$ |
17,017 |
|
$ |
19,186 |
|
$ |
19,638 |
|
2% |
|
11% |
|
|
$ |
37,420 |
|
$ |
38,824 |
|
4% |
Total operating expenses(1)(3) |
|
|
11,471 |
|
|
11,777 |
|
|
13,532 |
|
|
13,165 |
|
|
12,393 |
|
(6%) |
|
8% |
|
|
|
22,884 |
|
|
25,558 |
|
12% |
Net credit losses (NCLs) |
|
|
1,320 |
|
|
961 |
|
|
866 |
|
|
872 |
|
|
850 |
|
(3%) |
|
(36%) |
|
|
|
3,068 |
|
|
1,722 |
|
(44%) |
Credit reserve build / (release) for loans |
|
|
(2,446) |
|
|
(1,149) |
|
|
(1,176) |
|
|
(612) |
|
|
534 |
|
NM |
|
NM |
|
|
|
(5,673) |
|
|
(78) |
|
99% |
Provision / (release) for unfunded lending commitments |
|
|
44 |
|
|
(13) |
|
|
(193) |
|
|
474 |
|
|
(159) |
|
NM |
|
NM |
|
|
|
(582) |
|
|
315 |
|
NM |
Provisions for benefits and claims, HTM debt securities and other assets |
|
|
16 |
|
|
9 |
|
|
38 |
|
|
21 |
|
|
49 |
|
NM |
|
NM |
|
|
|
66 |
|
|
70 |
|
6% |
Provisions for credit losses and for benefits and claims |
|
|
(1,066) |
|
|
(192) |
|
|
(465) |
|
|
755 |
|
|
1,274 |
|
69% |
|
NM |
|
|
|
(3,121) |
|
|
2,029 |
|
NM |
Income from continuing operations before income taxes |
|
|
7,348 |
|
|
5,862 |
|
|
3,950 |
|
|
5,266 |
|
|
5,971 |
|
13% |
|
(19%) |
|
|
|
17,657 |
|
|
11,237 |
|
(36%) |
Income taxes(4) |
|
|
1,155 |
|
|
1,193 |
|
|
771 |
|
|
941 |
|
|
1,182 |
|
26% |
|
2% |
|
|
|
3,487 |
|
|
2,123 |
|
(39%) |
Income from continuing operations |
|
|
6,193 |
|
|
4,669 |
|
|
3,179 |
|
|
4,325 |
|
|
4,789 |
|
11% |
|
(23%) |
|
|
|
14,170 |
|
|
9,114 |
|
(36%) |
Income (loss) from discontinued operations, net of taxes(5) |
|
|
10 |
|
|
(1) |
|
|
- |
|
|
(2) |
|
|
(221) |
|
NM |
|
NM |
|
|
|
8 |
|
|
(223) |
|
NM |
Net income before noncontrolling interests |
|
|
6,203 |
|
|
4,668 |
|
|
3,179 |
|
|
4,323 |
|
|
4,568 |
|
6% |
|
(26%) |
|
|
|
14,178 |
|
|
8,891 |
|
(37%) |
Net income (loss) attributable to noncontrolling interests |
|
|
10 |
|
|
24 |
|
|
6 |
|
|
17 |
|
|
21 |
|
24% |
|
NM |
|
|
|
43 |
|
|
38 |
|
(12%) |
Citigroup's net income |
|
$ |
6,193 |
|
$ |
4,644 |
|
$ |
3,173 |
|
$ |
4,306 |
|
$ |
4,547 |
|
6% |
|
(27%) |
|
|
$ |
14,135 |
|
$ |
8,853 |
|
(37%) |
|
|
|
|
|
|
|
|
|
|
|
|
|
|
|
|
|
|
|
|
|
|
|
|
|
|
|
|
|
Diluted earnings per share: |
|
|
|
|
|
|
|
|
|
|
|
|
|
|
|
|
|
|
|
|
|
|
|
|
|
|
|
|
Income from continuing operations |
|
$ |
2.84 |
|
$ |
2.15 |
|
$ |
1.46 |
|
$ |
2.02 |
|
$ |
2.30 |
|
14% |
|
(19%) |
|
|
$ |
6.47 |
|
$ |
4.32 |
|
(33%) |
Citigroup's net income |
|
$ |
2.85 |
|
$ |
2.15 |
|
$ |
1.46 |
|
$ |
2.02 |
|
$ |
2.19 |
|
8% |
|
(23%) |
|
|
$ |
6.47 |
|
$ |
4.20 |
|
(35%) |
|
|
|
|
|
|
|
|
|
|
|
|
|
|
|
|
|
|
|
|
|
|
|
|
|
|
|
|
|
Preferred dividends |
|
$ |
253 |
|
$ |
266 |
|
$ |
229 |
|
$ |
279 |
|
$ |
238 |
|
(15%) |
|
(6%) |
|
|
$ |
545 |
|
$ |
517 |
|
(5%) |
|
|
|
|
|
|
|
|
|
|
|
|
|
|
|
|
|
|
|
|
|
|
|
|
|
|
|
|
|
Income allocated to unrestricted common shareholders - basic |
|
|
|
|
|
|
|
|
|
|
|
|
|
|
|
|
|
|
|
|
|
|
|
|
|
|
|
|
Income from continuing operations |
|
$ |
5,889 |
|
$ |
4,353 |
|
$ |
2,924 |
|
$ |
4,004 |
|
$ |
4,495 |
|
12% |
|
(24%) |
|
|
$ |
13,474 |
|
$ |
8,499 |
|
(37%) |
Citigroup's net income |
|
$ |
5,899 |
|
$ |
4,352 |
|
$ |
2,924 |
|
$ |
4,002 |
|
4,274 |
|
7% |
|
(28%) |
|
|
$ |
13,482 |
|
$ |
8,276 |
|
(39%) |
|
|
|
|
|
|
|
|
|
|
|
|
|
|
|
|
|
|
|
|
|
|
|
|
|
|
|
|
|
|
Income allocated to unrestricted common shareholders - diluted |
|
|
|
|
|
|
|
|
|
|
|
|
|
|
|
|
|
|
|
|
|
|
|
|
|
|
|
|
Income from continuing operations |
|
$ |
5,897 |
|
$ |
4,361 |
|
$ |
2,932 |
|
$ |
4,012 |
|
$ |
4,506 |
|
12% |
|
(24%) |
|
|
$ |
13,490 |
|
$ |
8,518 |
|
(37%) |
Citigroup's net income |
|
$ |
5,907 |
|
$ |
4,360 |
|
$ |
2,932 |
|
$ |
4,010 |
|
$ |
4,285 |
|
7% |
|
(27%) |
|
|
$ |
13,498 |
|
$ |
8,295 |
|
(39%) |
|
|
|
|
|
|
|
|
|
|
|
|
|
|
|
|
|
|
|
|
|
|
|
|
|
|
|
|
|
Shares (in millions): |
|
|
|
|
|
|
|
|
|
|
|
|
|
|
|
|
|
|
|
|
|
|
|
|
|
|
|
|
Average basic |
|
|
2,056.5 |
|
|
2,009.3 |
|
|
1,984.3 |
|
|
1,971.7 |
|
|
1,941.5 |
|
(2%) |
|
(6%) |
|
|
|
2,069.3 |
|
|
1,956.6 |
|
(5%) |
Average diluted |
|
|
2,073.0 |
|
|
2,026.2 |
|
|
2,001.6 |
|
|
1,988.2 |
|
|
1,958.1 |
|
(2%) |
|
(6%) |
|
|
|
2,084.8 |
|
|
1,973.2 |
|
(5%) |
Common shares outstanding, at period end |
|
|
2,026.8 |
|
|
1,984.3 |
|
|
1,984.4 |
|
|
1,941.9 |
|
|
1,936.7 |
|
- |
|
(4%) |
|
|
|
|
|
|
|
|
|
|
|
|
|
|
|
|
|
|
|
|
|
|
|
|
|
|
|
|
|
|
|
|
|
|
|
|
|
|
Regulatory capital ratios and performance metrics: |
|
|
|
|
|
|
|
|
|
|
|
|
|
|
|
|
|
|
|
|
|
|
|
|
|
|
|
|
Common Equity Tier 1 (CET1) Capital ratio(6)(7)(8) |
|
|
11.77 |
% |
|
11.65 |
% |
|
12.25 |
% |
|
11.38 |
% |
|
11.9 |
% |
|
|
|
|
|
|
|
|
|
|
|
|
Tier 1 Capital ratio(6)(7)(8) |
|
|
13.28 |
% |
|
13.15 |
% |
|
13.91 |
% |
|
12.98 |
% |
|
13.5 |
% |
|
|
|
|
|
|
|
|
|
|
|
|
Total Capital ratio(6)(7)(8) |
|
|
15.58 |
% |
|
15.37 |
% |
|
16.04 |
% |
|
14.84 |
% |
|
15.1 |
% |
|
|
|
|
|
|
|
|
|
|
|
|
Supplementary Leverage ratio (SLR)(6)(8)(9) |
|
|
5.84 |
% |
|
5.80 |
% |
|
5.73 |
% |
|
5.58 |
% |
|
5.6 |
% |
|
|
|
|
|
|
|
|
|
|
|
|
Return on average assets |
|
|
1.06 |
% |
|
0.79 |
% |
|
0.53 |
% |
|
0.74 |
% |
|
0.77 |
% |
|
|
|
|
|
|
1.22 |
% |
|
0.75 |
% |
|
Return on average common equity |
|
|
13.0 |
% |
|
9.5 |
% |
|
6.4 |
% |
|
9.0 |
% |
|
9.7 |
% |
|
|
|
|
|
|
15.1 |
% |
|
9.3 |
% |
|
Average tangible common equity (TCE) (in billions of dollars) |
|
$ |
156.9 |
|
$ |
157.4 |
|
$ |
157.0 |
|
$ |
155.3 |
|
$ |
154.4 |
|
(1%) |
|
(2%) |
|
|
$ |
155.8 |
|
$ |
155.3 |
|
- |
Return on average tangible common equity (RoTCE) |
|
|
15.2 |
% |
|
11.0 |
% |
|
7.4 |
% |
|
10.5 |
% |
|
11.2 |
% |
|
|
|
|
|
|
17.6 |
% |
|
10.8 |
% |
|
Efficiency ratio (total operating expenses/total revenues, net) |
|
|
64.6 |
% |
|
67.5 |
% |
|
79.5 |
% |
|
68.6 |
% |
|
63.1 |
% |
-550 bps |
|
-150 bps |
|
|
|
61.2 |
% |
|
65.8 |
% |
460 bps |
|
|
|
|
|
|
|
|
|
|
|
|
|
|
|
|
|
|
|
|
|
|
|
|
|
|
|
|
|
Balance sheet data (in billions of dollars, except per share amounts): |
|
|
|
|
|
|
|
|
|
|
|
|
|
|
|
|
|
|
|
|
|
|
|
|
|
|
|
|
Total assets |
|
$ |
2,327.9 |
|
$ |
2,361.9 |
|
$ |
2,291.4 |
|
$ |
2,394.1 |
|
$ |
2,380.9 |
|
(1%) |
|
2% |
|
|
|
|
|
|
|
|
|
Total average assets |
|
|
2,341.8 |
|
|
2,346.0 |
|
|
2,386.2 |
|
|
2,374.0 |
|
|
2,380.1 |
|
- |
|
2% |
|
|
|
2,329.3 |
|
|
2,377.1 |
|
2% |
Total loans |
|
|
676.8 |
|
|
664.8 |
|
|
667.8 |
|
|
659.7 |
|
|
657.3 |
|
- |
|
(3%) |
|
|
|
|
|
|
|
|
|
Total deposits |
|
|
1,310.3 |
|
|
1,347.5 |
|
|
1,317.2 |
|
|
1,333.7 |
|
|
1,321.8 |
|
(1%) |
|
1% |
|
|
|
|
|
|
|
|
|
Citigroup's stockholders' equity |
|
|
202.2 |
|
|
200.9 |
|
|
202.0 |
|
|
197.7 |
|
|
199.0 |
|
1% |
|
(2%) |
|
|
|
|
|
|
|
|
|
Book value per share |
|
|
90.86 |
|
|
92.16 |
|
|
92.21 |
|
|
92.03 |
|
|
92.95 |
|
1% |
|
2% |
|
|
|
|
|
|
|
|
|
Tangible book value per share |
|
|
77.87 |
|
|
79.07 |
|
|
79.16 |
|
|
79.03 |
|
|
80.25 |
|
2% |
|
3% |
|
|
|
|
|
|
|
|
|
|
|
|
|
|
|
|
|
|
|
|
|
|
|
|
|
|
|
|
|
|
|
|
|
|
|
|
|
|
Direct staff (in thousands) |
|
|
214 |
|
|
220 |
|
|
223 |
|
|
228 |
|
|
231 |
|
1% |
|
8% |
|
|
|
|
|
|
|
|
|
|
|
|
|
|
|
|
|
|
|
|
|
|
|
|
|
|
|
|
|
|
|
|
|
|
|
|
|
|
(1) |
During the fourth quarter of 2021, Citi reclassified deposit insurance expenses from Interest expense to Other operating expenses for all periods presented. For additional information, see Note 1 to the Consolidated Financial Statements in Citi's 2021 Annual Report on Form 10-K. |
(2) |
The third quarter of 2021 includes an approximate $680 million loss on sale (an approximate $580 million after-tax), related to Citi's agreement to sell its Australia consumer banking business. |
(3) |
The fourth quarter of 2021 includes approximately $1.052 billion in expenses (approximately $792 million after-tax), primarily related to charges incurred from the voluntary early retirement plan (VERP) in connection with the wind-down of Citi's consumer banking business in Korea. |
(4) |
2021 includes an approximate $600 million benefit from a reduction in Citi’s valuation allowance related to its Deferred Tax Assets (DTAs). |
(5) |
2Q22 discontinued operations reflects the release of a currency translation adjustment (CTA) loss (net of hedges) recorded in Accumulated Other Comprehensive Income (AOCI) related to the substantial liquidation of a legal entity (with a non-U.S. dollar functional currency), that had previously divested a legacy business. |
(6) |
2Q22 is preliminary. |
(7) |
For all periods presented, Citi's reportable CET1 Capital and Tier 1 Capital ratios were derived under the Basel III Standardized Approach framework, whereas Citi's reportable Total Capital ratios were derived under the Basel III Advanced Approaches framework. These reportable ratios reflect the more binding ratios under both the Standardized Approach and the Advanced Approaches under the Collins Amendment. For the composition of Citi's CET1 Capital and ratio, see page 18. |
(8) |
Citi's regulatory capital ratios reflect certain deferrals based on the modified regulatory capital transition provision related to the Current Expected Credit Losses (CECL) standard. For additional information, see "Capital Resources" in Citi's 2021 Annual Report on Form 10-K. |
(9) |
For the composition of Citi's SLR, see page 18. |
Note: Ratios and variance percentages are calculated based on the displayed amounts.
NM Not meaningful.
Reclassified to conform to the current period's presentation.
Page 1
CITIGROUP CONSOLIDATED STATEMENT OF INCOME
(In millions of dollars)
|
|
2Q |
|
3Q |
|
4Q |
|
1Q |
|
2Q |
|
2Q22 Increase/ |
|
Six |
|
Six |
|
YTD 2022 vs. |
||||||||||
|
|
2021 |
|
2021 |
|
2021 |
|
2022 |
|
2022 |
|
1Q22 |
|
2Q21 |
|
|
2021 |
|
2022 |
|
(Decrease) |
|||||||
|
|
|
|
|
|
|
|
|
|
|
|
|
|
|
|
|
|
|
|
|
|
|
|
|
||||
Revenues |
|
|
|
|
|
|
|
|
|
|
|
|
|
|
|
|
|
|
|
|
|
|
||||||
Interest revenue |
|
$ |
12,463 |
|
$ |
12,650 |
|
$ |
12,828 |
|
$ |
13,151 |
|
$ |
15,630 |
|
19% |
|
25% |
|
|
$ |
24,997 |
|
$ |
28,781 |
|
15% |
Interest expense(1) |
|
|
1,985 |
|
|
1,959 |
|
|
2,009 |
|
|
2,280 |
|
|
3,666 |
|
61% |
|
85% |
|
|
|
4,013 |
|
|
5,946 |
|
48% |
Net interest income (NII) |
|
|
10,478 |
|
|
10,691 |
|
|
10,819 |
|
|
10,871 |
|
|
11,964 |
|
10% |
|
14% |
|
|
|
20,984 |
|
|
22,835 |
|
9% |
|
|
|
|
|
|
|
|
|
|
|
|
|
|
|
|
|
|
|
|
|
|
|||||||
Commissions and fees |
|
|
3,374 |
|
|
3,399 |
|
|
3,229 |
|
|
2,568 |
|
|
2,452 |
|
(5%) |
|
(27%) |
|
|
|
7,044 |
|
|
5,020 |
|
(29%) |
Principal transactions |
|
|
2,304 |
|
|
2,233 |
|
|
1,704 |
|
|
4,590 |
|
|
4,525 |
|
(1%) |
|
96% |
|
|
|
6,217 |
|
|
9,115 |
|
47% |
Administrative and other fiduciary fees |
|
|
1,022 |
|
|
1,007 |
|
|
953 |
|
|
966 |
|
|
1,023 |
|
6% |
|
- |
|
|
|
1,983 |
|
|
1,989 |
|
- |
Realized gains (losses) on investments |
|
|
137 |
|
|
117 |
|
|
10 |
|
|
80 |
|
|
(58) |
|
NM |
|
NM |
|
|
|
538 |
|
|
22 |
|
(96%) |
Impairment losses on investments and other assets |
|
|
(13) |
|
|
(30) |
|
|
(94) |
|
|
(90) |
|
|
(96) |
|
(7%) |
|
NM |
|
|
|
(82) |
|
|
(186) |
|
NM |
Provision for credit losses on AFS debt securities(2) |
|
|
- |
|
|
(1) |
|
|
(2) |
|
|
- |
|
|
2 |
|
NM |
|
NM |
|
|
|
- |
|
|
2 |
|
NM |
Other revenue (loss) |
|
|
451 |
|
|
31 |
|
|
398 |
|
|
201 |
|
|
(174) |
|
NM |
|
NM |
|
|
|
736 |
|
|
27 |
|
(96%) |
Total non-interest revenues (NIR) |
|
|
7,275 |
|
|
6,756 |
|
|
6,198 |
|
|
8,315 |
|
|
7,674 |
|
(8%) |
|
5% |
|
|
|
16,436 |
|
|
15,989 |
|
(3%) |
Total revenues, net of interest expense |
|
|
17,753 |
|
|
17,447 |
|
|
17,017 |
|
|
19,186 |
|
|
19,638 |
|
2% |
|
11% |
|
|
|
37,420 |
|
|
38,824 |
|
4% |
|
|
|
|
|
|
|
|
|
|
|
|
|
|
|
|
|
|
|
|
|
|
|
|
|||||
|
|
|
|
|
|
|
|
|
|
|
|
|
|
|
|
|
|
|
|
|
|
|||||||
Provisions for credit losses and for benefits and claims |
|
|
|
|
|
|
|
|
|
|
|
|
|
|
|
|
|
|
|
|
|
|
||||||
Net credit losses |
|
|
1,320 |
|
|
961 |
|
|
866 |
|
|
872 |
|
|
850 |
|
(3%) |
|
(36%) |
|
|
|
3,068 |
|
|
1,722 |
|
(44%) |
Credit reserve build / (release) for loans |
|
|
(2,446) |
|
|
(1,149) |
|
|
(1,176) |
|
|
(612) |
|
|
534 |
|
NM |
|
NM |
|
|
|
(5,673) |
|
|
(78) |
|
99% |
Provision for credit losses on loans |
|
|
(1,126) |
|
|
(188) |
|
|
(310) |
|
|
260 |
|
|
1,384 |
|
NM |
|
NM |
|
|
|
(2,605) |
|
|
1,644 |
|
NM |
Provision for credit losses on held-to-maturity (HTM) debt securities |
|
|
4 |
|
|
(10) |
|
|
14 |
|
|
(2) |
|
|
20 |
|
NM |
|
NM |
|
|
|
(7) |
|
|
18 |
|
NM |
Provision for credit losses on other assets |
|
|
(3) |
|
|
(3) |
|
|
(3) |
|
|
(4) |
|
|
7 |
|
NM |
|
NM |
|
|
|
6 |
|
|
3 |
|
(50%) |
Policyholder benefits and claims |
|
|
15 |
|
|
22 |
|
|
27 |
|
|
27 |
|
|
22 |
|
(19%) |
|
47% |
|
|
|
67 |
|
|
49 |
|
(27%) |
Provision for credit losses on unfunded lending commitments |
|
|
44 |
|
|
(13) |
|
|
(193) |
|
|
474 |
|
|
(159) |
|
NM |
|
NM |
|
|
|
(582) |
|
|
315 |
|
NM |
Total provisions for credit losses and for benefits and claims(3) |
|
|
(1,066) |
|
|
(192) |
|
|
(465) |
|
|
755 |
|
|
1,274 |
|
69% |
|
NM |
|
|
|
(3,121) |
|
|
2,029 |
|
NM |
|
|
|
|
|
|
|
|
|
|
|
|
|
|
|
|
|
|
|
|
|
|
|||||||
Operating expenses |
|
|
|
|
|
|
|
|
|
|
|
|
|
|
|
|
|
|
|
|
|
|
|
|
||||
Compensation and benefits |
|
|
5,982 |
|
|
6,058 |
|
|
7,093 |
|
|
6,820 |
|
|
6,472 |
|
(5%) |
|
8% |
|
|
|
11,983 |
|
|
13,292 |
|
11% |
Premises and equipment |
|
|
558 |
|
|
560 |
|
|
620 |
|
|
543 |
|
|
619 |
|
14% |
|
11% |
|
|
|
1,134 |
|
|
1,162 |
|
2% |
Technology / communication |
|
|
1,895 |
|
|
1,997 |
|
|
2,084 |
|
|
2,016 |
|
|
2,068 |
|
3% |
|
9% |
|
|
|
3,747 |
|
|
4,084 |
|
9% |
Advertising and marketing |
|
|
340 |
|
|
402 |
|
|
478 |
|
|
311 |
|
|
414 |
|
33% |
|
22% |
|
|
|
610 |
|
|
725 |
|
19% |
Other operating(1) |
|
|
2,696 |
|
|
2,760 |
|
|
3,257 |
|
|
3,475 |
|
|
2,820 |
|
(19%) |
|
5% |
|
|
|
5,410 |
|
|
6,295 |
|
16% |
Total operating expenses |
|
|
11,471 |
|
|
11,777 |
|
|
13,532 |
|
|
13,165 |
|
|
12,393 |
|
(6%) |
|
8% |
|
|
|
22,884 |
|
|
25,558 |
|
12% |
|
|
|
|
|
|
|
|
|
|
|
|
|
|
|
|
|
|
|
|
|
|
|||||||
Income from continuing operations before income taxes |
|
|
7,348 |
|
|
5,862 |
|
|
3,950 |
|
|
5,266 |
|
|
5,971 |
|
13% |
|
(19%) |
|
|
|
17,657 |
|
|
11,237 |
|
(36%) |
Provision for income taxes (4) |
|
|
1,155 |
|
|
1,193 |
|
|
771 |
|
|
941 |
|
|
1,182 |
|
26% |
|
2% |
|
|
|
3,487 |
|
|
2,123 |
|
(39%) |
|
|
|
|
|
|
|
|
|
|
|
|
|
|
|
|
|
|
|
|
|
|
|
|
|||||
Income (loss) from continuing operations |
|
|
6,193 |
|
|
4,669 |
|
|
3,179 |
|
|
4,325 |
|
|
4,789 |
|
11% |
|
(23%) |
|
|
|
14,170 |
|
|
9,114 |
|
(36%) |
Discontinued operations(5) |
|
|
|
|
|
|
|
|
|
|
|
|
|
|
|
|
|
|
|
|
|
|
|
|
|
|||
Income (loss) from discontinued operations |
|
|
10 |
|
|
(1) |
|
|
- |
|
|
(2) |
|
|
(262) |
|
NM |
|
NM |
|
|
|
8 |
|
|
(264) |
|
NM |
Provision (benefit) for income taxes |
|
|
- |
|
|
- |
|
|
- |
|
|
- |
|
|
(41) |
|
NM |
|
NM |
|
|
|
- |
|
|
(41) |
|
NM |
Income (loss) from discontinued operations, net of taxes |
|
|
10 |
|
|
(1) |
|
|
- |
|
|
(2) |
|
|
(221) |
|
NM |
|
NM |
|
|
|
8 |
|
|
(223) |
|
NM |
|
|
|
|
|
|
|
|
|
|
|
|
|
|
|
|
|
|
|
|
|
|
|
|
|
||||
Net income before noncontrolling interests |
|
|
6,203 |
|
|
4,668 |
|
|
3,179 |
|
|
4,323 |
|
|
4,568 |
|
6% |
|
(26%) |
|
|
|
14,178 |
|
|
8,891 |
|
(37%) |
Net income (loss) attributable to noncontrolling interests |
|
|
10 |
|
|
24 |
|
|
6 |
|
|
17 |
|
|
21 |
|
24% |
|
NM |
|
|
|
43 |
|
|
38 |
|
(12%) |
|
|
|
|
|
|
|
|
|
|
|
|
|
|
|
|
|
|
|
|
|
|
|
|
|
|
|
|
|
Citigroup's net income |
|
$ |
6,193 |
|
$ |
4,644 |
|
$ |
3,173 |
|
$ |
4,306 |
|
$ |
4,547 |
|
6% |
|
(27%) |
|
|
$ |
14,135 |
|
$ |
8,853 |
|
(37%) |
|
|
|
|
|
|
|
|
|
|
|
|
|
|
|
|
|
|
|
|
|
|
|
|
|
|
|
|
|
(1) |
See footnote 1 on page 1. |
(2) |
This presentation is in accordance with ASC 326, which requires the provision for credit losses on AFS securities to be included in revenue. |
(3) |
This total excludes the provision for credit losses on AFS securities, which is disclosed separately above. |
(4) |
See footnote 4 on page 1. |
(5) |
See footnote 5 on page 1. |
NM Not meaningful.
Reclassified to conform to the current period's presentation.
Page 2
CITIGROUP CONSOLIDATED BALANCE SHEET
(In millions of dollars)
|
|
|
|
|
|
|
|
|
|
|
|
|
2Q22 Increase/ |
||||||
|
|
June 30, |
|
September 30, |
|
December 31, |
|
March 31, |
|
June 30, |
|
(Decrease) from |
|||||||
|
|
2021 |
2021 |
2021 |
2022 |
2022(1) |
|
1Q22 |
|
2Q21 |
|||||||||
Assets |
|
|
|
|
|
|
|
|
|
|
|
|
|
|
|
|
|
|
|
Cash and due from banks (including segregated cash and other deposits) |
|
$ |
27,117 |
|
$ |
28,906 |
|
$ |
27,515 |
|
$ |
27,768 |
|
$ |
24,902 |
|
(10%) |
|
(8%) |
Deposits with banks, net of allowance |
|
|
272,121 |
|
|
294,902 |
|
|
234,518 |
|
|
244,319 |
|
|
259,128 |
|
6% |
|
(5%) |
Securities borrowed and purchased under agreements to resell, net of allowance |
|
|
309,047 |
|
|
337,696 |
|
|
327,288 |
|
|
345,410 |
|
|
361,334 |
|
5% |
|
17% |
Brokerage receivables, net of allowance |
|
|
61,138 |
|
|
59,487 |
|
|
54,340 |
|
|
89,218 |
|
|
80,486 |
|
(10%) |
|
32% |
Trading account assets |
|
|
370,950 |
|
|
342,914 |
|
|
331,945 |
|
|
357,997 |
|
|
340,875 |
|
(5%) |
|
(8%) |
Investments |
|
|
|
|
|
|
|
|
|
|
|
|
|
|
|||||
Available-for-sale debt securities, net of allowance |
|
|
302,977 |
|
|
295,573 |
|
|
288,522 |
|
|
264,774 |
|
|
238,499 |
|
(10%) |
|
(21%) |
Held-to-maturity debt securities, net of allowance |
|
|
176,742 |
|
|
198,056 |
|
|
216,963 |
|
|
242,547 |
|
|
267,592 |
|
10% |
|
51% |
Equity securities |
|
|
7,344 |
|
|
7,220 |
|
|
7,337 |
|
|
7,281 |
|
|
7,787 |
|
7% |
|
6% |
Total investments |
|
|
487,063 |
|
|
500,849 |
|
|
512,822 |
|
|
514,602 |
|
|
513,878 |
|
- |
|
6% |
Loans, net of unearned income |
|
|
|
|
|
|
|
|
|
|
|
|
|
|
|||||
Consumer(2) |
|
|
380,804 |
|
|
369,292 |
|
|
376,534 |
|
|
350,328 |
|
|
355,605 |
|
2% |
|
(7%) |
Corporate(3) |
|
|
296,030 |
|
|
295,472 |
|
|
291,233 |
|
|
309,341 |
|
|
301,728 |
|
(2%) |
|
2% |
Loans, net of unearned income |
|
|
676,834 |
|
|
664,764 |
|
|
667,767 |
|
|
659,669 |
|
|
657,333 |
|
- |
|
(3%) |
Allowance for credit losses on loans (ACLL) |
|
|
(19,238) |
|
|
(17,715) |
|
|
(16,455) |
|
|
(15,393) |
|
|
(15,952) |
|
(4%) |
|
17% |
Total loans, net |
|
|
657,596 |
|
|
647,049 |
|
|
651,312 |
|
|
644,276 |
|
|
641,381 |
|
- |
|
(2%) |
Goodwill |
|
|
22,060 |
|
|
21,573 |
|
|
21,299 |
|
|
19,865 |
|
|
19,597 |
|
(1%) |
|
(11%) |
Intangible assets (including MSRs) |
|
|
4,687 |
|
|
4,553 |
|
|
4,495 |
|
|
4,522 |
|
|
4,526 |
|
- |
|
(3%) |
Other assets, net of allowance |
|
|
116,089 |
|
|
123,947 |
|
|
125,879 |
|
|
146,128 |
|
|
134,797 |
|
(8%) |
|
16% |
Total assets |
|
$ |
2,327,868 |
|
$ |
2,361,876 |
|
$ |
2,291,413 |
|
$ |
2,394,105 |
|
$ |
2,380,904 |
|
(1%) |
|
2% |
|
|
|
|
|
|
|
|
|
|
|
|
|
|
||||||
Liabilities |
|
|
|
|
|
|
|
|
|
|
|
|
|
|
|||||
Non-interest-bearing deposits in U.S. offices |
|
$ |
149,373 |
|
$ |
145,103 |
|
$ |
158,552 |
|
$ |
153,666 |
|
$ |
147,214 |
|
(4%) |
|
(1%) |
Interest-bearing deposits in U.S. offices |
|
|
485,589 |
|
|
567,902 |
|
|
543,283 |
|
|
557,327 |
|
|
565,785 |
|
2% |
|
17% |
Total U.S. deposits |
|
|
634,962 |
|
|
713,005 |
|
|
701,835 |
|
|
710,993 |
|
|
712,999 |
|
- |
|
12% |
Non-interest-bearing deposits in offices outside the U.S. |
|
|
101,723 |
|
|
94,016 |
|
|
97,270 |
|
|
98,579 |
|
|
100,266 |
|
2% |
|
(1%) |
Interest-bearing deposits in offices outside the U.S. |
|
|
573,596 |
|
|
540,507 |
|
|
518,125 |
|
|
524,139 |
|
|
508,583 |
|
(3%) |
|
(11%) |
Total international deposits |
|
|
675,319 |
|
|
634,523 |
|
|
615,395 |
|
|
622,718 |
|
|
608,849 |
|
(2%) |
|
(10%) |
|
|
|
|
|
|
|
|
|
|
|
|
|
|
||||||
Total deposits |
|
|
1,310,281 |
|
|
1,347,528 |
|
|
1,317,230 |
|
|
1,333,711 |
|
|
1,321,848 |
|
(1%) |
|
1% |
Securities loaned and sold under agreements to resell |
|
|
221,817 |
|
|
209,184 |
|
|
191,285 |
|
|
204,494 |
|
|
198,472 |
|
(3%) |
|
(11%) |
Brokerage payables |
|
|
59,416 |
|
|
60,501 |
|
|
61,430 |
|
|
91,324 |
|
|
96,474 |
|
6% |
|
62% |
Trading account liabilities |
|
|
174,706 |
|
|
179,286 |
|
|
161,529 |
|
|
188,059 |
|
|
180,453 |
|
(4%) |
|
3% |
Short-term borrowings |
|
|
31,462 |
|
|
29,683 |
|
|
27,973 |
|
|
30,144 |
|
|
40,054 |
|
33% |
|
27% |
Long-term debt |
|
|
264,575 |
|
|
258,274 |
|
|
254,374 |
|
|
253,954 |
|
|
257,425 |
|
1% |
|
(3%) |
Other liabilities(4) |
|
|
62,701 |
|
|
75,810 |
|
|
74,920 |
|
|
94,066 |
|
|
86,552 |
|
(8%) |
|
38% |
Total liabilities |
|
$ |
2,124,958 |
|
$ |
2,160,266 |
|
$ |
2,088,741 |
|
$ |
2,195,752 |
|
$ |
2,181,278 |
|
(1%) |
|
3% |
|
|
|
|
|
|
|
|
|
|
|
|
|
|
||||||
Equity |
|
|
|
|
|
|
|
|
|
|
|
|
|
|
|||||
Stockholders' equity |
|
|
|
|
|
|
|
|
|
|
|
|
|
|
|||||
Preferred stock |
|
$ |
17,995 |
|
$ |
17,995 |
|
$ |
18,995 |
|
$ |
18,995 |
|
$ |
18,995 |
|
- |
|
6% |
Common stock |
|
|
31 |
|
|
31 |
|
|
31 |
|
|
31 |
|
|
31 |
|
- |
|
- |
Additional paid-in capital |
|
|
107,820 |
|
|
107,922 |
|
|
108,003 |
|
|
108,050 |
|
|
108,210 |
|
- |
|
- |
Retained earnings |
|
|
179,686 |
|
|
183,024 |
|
|
184,948 |
|
|
187,962 |
|
|
191,261 |
|
2% |
|
6% |
Treasury stock, at cost |
|
|
(68,253) |
|
|
(71,246) |
|
|
(71,240) |
|
|
(73,744) |
|
|
(73,988) |
|
- |
|
(8%) |
Accumulated other comprehensive income (loss) (AOCI)(5) |
|
|
(35,120) |
|
|
(36,851) |
|
|
(38,765) |
|
|
(43,585) |
|
|
(45,495) |
|
(4%) |
|
(30%) |
Total common equity |
|
$ |
184,164 |
|
$ |
182,880 |
|
$ |
182,977 |
|
$ |
178,714 |
|
$ |
180,019 |
|
1% |
|
(2%) |
|
|
|
|
|
|
|
|
|
|
|
|
|
|
||||||
Total Citigroup stockholders' equity |
|
$ |
202,159 |
|
$ |
200,875 |
|
$ |
201,972 |
|
$ |
197,709 |
|
$ |
199,014 |
|
1% |
|
(2%) |
Noncontrolling interests |
|
|
751 |
|
|
735 |
|
|
700 |
|
|
644 |
|
|
612 |
|
(5%) |
|
(19%) |
Total equity |
|
|
202,910 |
|
|
201,610 |
|
|
202,672 |
|
|
198,353 |
|
|
199,626 |
|
1% |
|
(2%) |
Total liabilities and equity |
|
$ |
2,327,868 |
|
$ |
2,361,876 |
|
$ |
2,291,413 |
|
$ |
2,394,105 |
|
$ |
2,380,904 |
|
(1%) |
|
2% |
|
|
|
|
|
|
|
|
|
|
|
|
|
|
|
|
|
|
|
|
| (1) | Preliminary. |
| (2) | Consumer loans include loans managed by PBWM and Legacy Franchises (other than Mexico Small Business & Middle-Market Banking (Mexico SBMM) loans). |
| (3) | Corporate loans include loans managed by ICG and Legacy Franchises-Mexico SBMM. |
| (4) | Includes allowance for credit losses for unfunded lending commitments. See page 15. |
| (5) | As discussed in footnote 2 on page 1, Citi's third quarter of 2021 results include an approximate $680 million loss on sale (an approximate $580 million after-tax), related to Citi’s agreement to sell its Australia consumer banking business. The loss primarily reflects the impact of an approximate $625 million ($475 million (after-tax)) currency translation adjustment (CTA) loss (net of hedges) at September 30, 2021, December 31, 2021 and March 31, 2022, already reflected in the Accumulated Other Comprehensive Income (AOCI) component of equity. The sale closed during the second quarter of 2022, and the CTA balance was removed from the AOCI component of equity as of the end of the second quarter of 2022, resulting in a neutral impact from CTA to Citi’s Common Equity Tier 1 Capital. |
NM Not meaningful.
Reclassified to conform to the current period's presentation.
Page 3
OPERATING SEGMENT AND REPORTING UNIT DETAILS
(In millions of dollars)
|
|
|
|
|
|
|
|
|
|
|
|
|
2Q22 Increase/ |
|
|
Six |
|
Six |
|
YTD 2022 vs. |
|
||||||||
|
|
2Q |
|
3Q |
|
4Q |
|
1Q |
|
2Q |
|
(Decrease) from |
|
|
Months |
|
Months |
|
YTD 2021 Increase/ |
|
|||||||||
|
|
2021 |
|
2021 |
|
2021 |
|
2022 |
|
2022 |
|
1Q22 |
|
2Q21 |
|
|
2021 |
|
2022 |
|
(Decrease) |
|
|||||||
Net revenues |
|
|
|
|
|
|
|
|
|
|
|
|
|
|
|
|
|
|
|
|
|
|
|
||||||
Institutional Clients Group |
|
$ |
9,549 |
|
$ |
9,991 |
|
$ |
8,908 |
|
$ |
11,160 |
|
$ |
11,419 |
|
2% |
|
20% |
|
|
$ |
20,937 |
|
$ |
22,579 |
|
8% |
|
Personal Banking and Wealth Management |
|
|
5,698 |
|
|
5,852 |
|
|
5,785 |
|
|
5,905 |
|
|
6,029 |
|
2% |
|
6% |
|
|
|
11,690 |
|
|
11,934 |
|
2% |
|
Legacy Franchises |
|
|
2,279 |
|
|
1,536 |
|
|
2,193 |
|
|
1,931 |
|
|
1,935 |
|
- |
|
(15%) |
|
|
|
4,522 |
|
|
3,866 |
|
(15%) |
|
Corporate/Other |
|
|
227 |
|
|
68 |
|
|
131 |
|
|
190 |
|
|
255 |
|
34% |
|
12% |
|
|
|
271 |
|
|
445 |
|
64% |
|
Total net revenues |
|
$ |
17,753 |
|
$ |
17,447 |
|
$ |
17,017 |
|
$ |
19,186 |
|
$ |
19,638 |
|
2% |
|
11% |
|
|
$ |
37,420 |
|
$ |
38,824 |
|
4% |
|
|
|
|
|
|
|
|
|
|
|
|
|
|
|
|
|
|
|
|
|
|
|
|
|
|
|||||
Income from continuing operations |
|
|
|
|
|
|
|
|
|
|
|
|
|
|
|
|
|
|
|
|
|
|
|
|
|
||||
Institutional Clients Group |
|
$ |
3,433 |
|
$ |
3,115 |
|
$ |
2,330 |
|
$ |
2,658 |
|
$ |
3,978 |
|
50% |
|
16% |
|
|
$ |
8,863 |
|
$ |
6,636 |
|
(25%) |
|
Personal Banking and Wealth Management |
|
|
1,805 |
|
|
1,896 |
|
|
1,613 |
|
|
1,860 |
|
|
553 |
|
(70%) |
|
(69%) |
|
|
|
4,225 |
|
|
2,413 |
|
(43%) |
|
Legacy Franchises |
|
|
492 |
|
|
(201) |
|
|
(620) |
|
|
(385) |
|
|
(15) |
|
96% |
|
NM |
|
|
|
812 |
|
|
(400) |
|
NM |
|
Corporate/Other |
|
|
463 |
|
|
(141) |
|
|
(144) |
|
|
192 |
|
|
273 |
|
42% |
|
(41%) |
|
|
|
270 |
|
|
465 |
|
72% |
|
Income from continuing operations |
|
$ |
6,193 |
|
$ |
4,669 |
|
$ |
3,179 |
|
$ |
4,325 |
|
$ |
4,789 |
|
11% |
|
(23%) |
|
|
$ |
14,170 |
|
$ |
9,114 |
|
(36%) |
|
|
|
|
|
|
|
|
|
|
|
|
|
|
|
|
|
|
|
|
|
|
|
|
|
|
|||||
Discontinued operations |
|
|
10 |
|
|
(1) |
|
|
- |
|
|
(2) |
|
|
(221) |
|
NM |
|
NM |
|
|
|
8 |
|
|
(223) |
|
NM |
|
|
|
|
|
|
|
|
|
|
|
|
|
|
|
|
|
|
|
|
|
|
|
|
|
|
|
|
|
|
|
Net income attributable to noncontrolling interests |
|
|
10 |
|
|
24 |
|
|
6 |
|
|
17 |
|
|
21 |
|
24% |
|
NM |
|
|
|
43 |
|
|
38 |
|
(12%) |
|
|
|
|
|
|
|
|
|
|
|
|
|
|
|
|
|
|
|
|
|
|
|
|
|
|
|||||
Net income |
|
$ |
6,193 |
|
$ |
4,644 |
|
$ |
3,173 |
|
$ |
4,306 |
|
$ |
4,547 |
|
6% |
|
(27%) |
|
|
$ |
14,135 |
|
$ |
8,853 |
|
(37%) |
|
NM Not meaningful.
Reclassified to conform to the current period's presentation.
Page 4
INSTITUTIONAL CLIENTS GROUP
(In millions of dollars, except as otherwise noted)
|
|
2Q |
|
3Q |
|
4Q |
|
1Q |
|
2Q |
|
2Q22 Increase/ |
|
Six |
|
Six |
|
YTD 2022 vs. |
||||||||||
|
|
2021 |
|
2021 |
|
2021 |
|
2022 |
|
2022 |
|
1Q22 |
|
2Q21 |
|
|
2021 |
|
2022 |
|
(Decrease) |
|||||||
Commissions and fees |
|
$ |
1,071 |
|
$ |
1,055 |
|
$ |
1,064 |
|
$ |
1,130 |
|
$ |
1,125 |
|
- |
|
5% |
|
|
|
2,181 |
|
|
2,255 |
|
3% |
Administration and other fiduciary fees |
|
|
698 |
|
|
676 |
|
|
662 |
|
|
672 |
|
|
732 |
|
9% |
|
5% |
|
|
|
1,355 |
|
|
1,404 |
|
4% |
Investment banking |
|
|
1,568 |
|
|
1,685 |
|
|
1,669 |
|
|
1,039 |
|
|
990 |
|
(5%) |
|
(37%) |
|
|
|
3,355 |
|
|
2,029 |
|
(40%) |
Principal transactions |
|
|
2,135 |
|
|
2,229 |
|
|
1,654 |
|
|
4,442 |
|
|
4,358 |
|
(2%) |
|
NM |
|
|
|
5,880 |
|
|
8,800 |
|
50% |
Other |
|
|
317 |
|
|
608 |
|
|
91 |
|
|
93 |
|
|
(306) |
|
NM |
|
NM |
|
|
|
673 |
|
|
(213) |
|
NM |
Total non-interest revenue |
|
|
5,789 |
|
|
6,253 |
|
|
5,140 |
|
|
7,376 |
|
|
6,899 |
|
(6%) |
|
19% |
|
|
|
13,444 |
|
|
14,275 |
|
6% |
Net interest income (including dividends) |
|
|
3,760 |
|
|
3,738 |
|
|
3,768 |
|
|
3,784 |
|
|
4,520 |
|
19% |
|
20% |
|
|
|
7,493 |
|
|
8,304 |
|
11% |
Total revenues, net of interest expense |
|
|
9,549 |
|
|
9,991 |
|
|
8,908 |
|
|
11,160 |
|
|
11,419 |
|
2% |
|
20% |
|
|
|
20,937 |
|
|
22,579 |
|
8% |
Total operating expenses |
|
|
5,829 |
|
|
5,963 |
|
|
6,225 |
|
|
6,723 |
|
|
6,434 |
|
(4%) |
|
10% |
|
|
|
11,761 |
|
|
13,157 |
|
12% |
Net credit losses on loans |
|
|
68 |
|
|
31 |
|
|
82 |
|
|
30 |
|
|
18 |
|
(40%) |
|
(74%) |
|
|
|
243 |
|
|
48 |
|
(80%) |
Credit reserve build / (release) for loans |
|
|
(812) |
|
|
14 |
|
|
(192) |
|
|
596 |
|
|
(76) |
|
NM |
|
91% |
|
|
|
(1,915) |
|
|
520 |
|
NM |
Provision for credit losses on unfunded lending commitments |
|
|
47 |
|
|
(13) |
|
|
(181) |
|
|
352 |
|
|
(169) |
|
NM |
|
NM |
|
|
|
(559) |
|
|
183 |
|
NM |
Provisions for credit losses for HTM debt securities and other assets |
|
|
3 |
|
|
(8) |
|
|
10 |
|
|
(7) |
|
|
25 |
|
NM |
|
NM |
|
|
|
(2) |
|
|
18 |
|
NM |
Provision for credit losses |
|
(694) |
|
24 |
|
(281) |
|
971 |
|
(202) |
|
NM |
|
71% |
|
|
|
(2,233) |
|
|
769 |
|
NM |
|||||
Income from continuing operations before taxes |
|
|
4,414 |
|
|
4,004 |
|
|
2,964 |
|
|
3,466 |
|
|
5,187 |
|
50% |
|
18% |
|
|
|
11,409 |
|
|
8,653 |
|
(24%) |
Income taxes |
|
|
981 |
|
|
889 |
|
|
634 |
|
|
808 |
|
|
1,209 |
|
50% |
|
23% |
|
|
|
2,546 |
|
|
2,017 |
|
(21%) |
Income from continuing operations |
|
|
3,433 |
|
|
3,115 |
|
|
2,330 |
|
|
2,658 |
|
|
3,978 |
|
50% |
|
16% |
|
|
|
8,863 |
|
|
6,636 |
|
(25%) |
Noncontrolling interests |
|
|
12 |
|
|
24 |
|
|
10 |
|
|
18 |
|
|
17 |
|
(6%) |
|
42% |
|
|
|
49 |
|
|
35 |
|
(29%) |
Net income |
|
$ |
3,421 |
|
$ |
3,091 |
|
$ |
2,320 |
|
$ |
2,640 |
|
$ |
3,961 |
|
50% |
|
16% |
|
|
$ |
8,814 |
|
$ |
6,601 |
|
(25%) |
EOP assets (in billions) |
|
$ |
1,654 |
|
$ |
1,670 |
|
$ |
1,613 |
|
$ |
1,704 |
|
$ |
1,700 |
|
- |
|
3% |
|
|
|
|
|
|
|
|
|
Average assets (in billions) |
|
|
1,667 |
|
|
1,660 |
|
|
1,698 |
|
|
1,685 |
|
|
1,698 |
|
1% |
|
2% |
|
|
|
1,658 |
|
|
1,692 |
|
2% |
Efficiency ratio |
|
|
61% |
|
|
60% |
|
|
70% |
|
|
60% |
|
|
56% |
|
(400) |
bps |
(500) |
bps |
|
|
56% |
|
|
58% |
|
200 bps |
|
|
|
|
|
|
|
|
|
|
|
|
|
|
|
|
|
|
|
|
|
|
|
|
|
|
|
|
|
Revenue by reporting unit |
|
|
|
|
|
|
|
|
|
|
|
|
|
|
|
|
|
|
|
|
|
|
|
|
|
|
|
|
Services |
|
$ |
3,140 |
|
$ |
3,141 |
|
$ |
3,258 |
|
$ |
3,448 |
|
$ |
4,023 |
|
17% |
|
28% |
|
|
$ |
6,140 |
|
$ |
7,471 |
|
22% |
Markets |
|
|
4,255 |
|
|
4,387 |
|
|
3,343 |
|
|
5,826 |
|
|
5,320 |
|
(9%) |
|
25% |
|
|
|
10,188 |
|
|
11,146 |
|
9% |
Banking |
|
|
2,154 |
|
|
2,463 |
|
|
2,307 |
|
|
1,886 |
|
|
2,076 |
|
10% |
|
(4%) |
|
|
|
4,609 |
|
|
3,962 |
|
(14%) |
Total revenues, net of interest expense |
|
$ |
9,549 |
|
$ |
9,991 |
|
$ |
8,908 |
|
$ |
11,160 |
|
$ |
11,419 |
|
2% |
|
20% |
|
|
$ |
20,937 |
|
$ |
22,579 |
|
8% |
|
|
|
|
|
|
|
|
|
|
|
|
|
|
|
|
|
|
|
|
|
|
|
|
|
|
|
|
|
Revenue by region |
|
|
|
|
|
|
|
|
|
|
|
|
|
|
|
|
|
|
|
|
|
|
|
|
|
|
|
|
North America |
|
$ |
3,279 |
|
$ |
3,727 |
|
$ |
3,278 |
|
$ |
3,722 |
|
$ |
4,410 |
|
18% |
|
34% |
|
|
$ |
7,754 |
|
$ |
8,132 |
|
5% |
EMEA |
|
|
3,127 |
|
|
2,981 |
|
|
2,705 |
|
|
4,030 |
|
|
3,566 |
|
(12%) |
|
14% |
|
|
|
6,729 |
|
|
7,596 |
|
13% |
Latin America |
|
|
1,035 |
|
|
1,129 |
|
|
1,113 |
|
|
1,141 |
|
|
1,266 |
|
11% |
|
22% |
|
|
|
2,035 |
|
|
2,407 |
|
18% |
Asia |
|
|
2,108 |
|
|
2,154 |
|
|
1,812 |
|
|
2,267 |
|
|
2,177 |
|
(4%) |
|
3% |
|
|
|
4,419 |
|
|
4,444 |
|
1% |
Total revenues, net of interest expense |
|
$ |
9,549 |
|
$ |
9,991 |
|
$ |
8,908 |
|
$ |
11,160 |
|
$ |
11,419 |
|
2% |
|
20% |
|
|
$ |
20,937 |
|
$ |
22,579 |
|
8% |
|
|
|
|
|
|
|
|
|
|
|
|
|
|
|
|
|
|
|
|
|
|
|
|
|
|
|
|
|
Income (loss) from continuing operations by region |
|
|
|
|
|
|
|
|
|
|
|
|
|
|
|
|
|
|
|
|
|
|
|
|||||
North America |
|
$ |
1,074 |
|
$ |
718 |
|
$ |
768 |
|
$ |
589 |
|
$ |
1,501 |
|
NM |
|
40% |
|
|
$ |
3,603 |
|
$ |
2,090 |
|
(42%) |
EMEA |
|
|
1,101 |
|
|
990 |
|
|
672 |
|
|
928 |
|
|
1,172 |
|
26% |
|
6% |
|
|
|
2,541 |
|
|
2,100 |
|
(17%) |
Latin America |
|
|
507 |
|
|
580 |
|
|
473 |
|
|
359 |
|
|
544 |
|
52% |
|
7% |
|
|
|
1,007 |
|
|
903 |
|
(10%) |
Asia |
|
|
751 |
|
|
827 |
|
|
417 |
|
|
782 |
|
|
761 |
|
(3%) |
|
1% |
|
|
|
1,712 |
|
|
1,543 |
|
(10%) |
Income from continuing operations |
|
$ |
3,433 |
|
$ |
3,115 |
|
$ |
2,330 |
|
$ |
2,658 |
|
$ |
3,978 |
|
50% |
|
16% |
|
|
$ |
8,863 |
|
$ |
6,636 |
|
(25%) |
|
|
|
|
|
|
|
|
|
|
|
|
|
|
|
|
|
|
|
|
|
|
|
|
|
|
|
|
|
Average loans by reporting unit (in billions) |
|
|
|
|
|
|
|
|
|
|
|
|
|
|
|
|
|
|
|
|
|
|
|
|||||
Services |
|
$ |
74 |
|
$ |
76 |
|
$ |
77 |
|
$ |
81 |
|
$ |
85 |
|
5% |
|
15% |
|
|
$ |
72 |
|
$ |
82 |
|
14% |
Banking |
|
|
197 |
|
|
196 |
|
|
195 |
|
|
194 |
|
|
199 |
|
3% |
|
1% |
|
|
|
197 |
|
|
197 |
|
- |
Markets |
|
|
16 |
|
|
17 |
|
|
17 |
|
|
14 |
|
|
13 |
|
(7%) |
|
(19%) |
|
|
|
15 |
|
|
14 |
|
(7%) |
Total |
|
$ |
287 |
|
$ |
289 |
|
$ |
289 |
|
$ |
289 |
|
$ |
297 |
|
3% |
|
3% |
|
|
$ |
284 |
|
$ |
293 |
|
3% |
|
|
|
|
|
|
|
|
|
|
|
|
|
|
|
|
|
|
|
|
|
|
|
|
|
|
|
|
|
Average deposits by reporting unit (in billions) |
|
|
|
|
|
|
|
|
|
|
|
|
|
|
|
|
|
|
|
|
|
|
|
|
|
|
|
|
Treasury and trade solutions (TTS) |
|
$ |
652 |
|
$ |
668 |
|
$ |
684 |
|
$ |
664 |
|
$ |
665 |
|
- |
|
2% |
|
|
$ |
652 |
|
$ |
664 |
|
2% |
Securities services |
|
|
137 |
|
|
135 |
|
|
140 |
|
|
135 |
|
|
137 |
|
1% |
|
- |
|
|
|
133 |
|
|
136 |
|
2% |
Services |
|
|
789 |
|
|
803 |
|
|
824 |
|
|
799 |
|
|
802 |
|
- |
|
2% |
|
|
|
785 |
|
|
800 |
|
2% |
Markets |
|
|
29 |
|
|
28 |
|
|
28 |
|
|
27 |
|
|
28 |
|
4% |
|
(3%) |
|
|
|
29 |
|
|
28 |
|
(3%) |
Total |
|
$ |
818 |
|
$ |
831 |
|
$ |
852 |
|
$ |
826 |
|
$ |
830 |
|
- |
|
1% |
|
|
$ |
814 |
|
$ |
828 |
|
2% |
|
|
|
|
|
|
|
|
|
|
|
|
|
|
|
|
|
|
|
|
|
|
|
|
|
|
|
|
|
Services Key Drivers (in billions of dollars, except as otherwise noted) |
|
|
|
|
|
|
|
|
|
|
|
|
|
|
|
|
|
|
|
|
|
|||||||
AUC/AUA (in trillions of dollars) |
|
$ |
22.7 |
|
$ |
22.6 |
|
$ |
23.7 |
|
$ |
23.0 |
|
$ |
21.2 |
|
(8%) |
|
(7%) |
|
|
|
|
|
|
|
|
|
Cross border transaction value |
|
$ |
67.8 |
|
$ |
69.0 |
|
$ |
78.2 |
|
$ |
75.6 |
|
$ |
79.3 |
|
5% |
|
17% |
|
|
$ |
132.3 |
|
$ |
154.9 |
|
17% |
U.S.-dollar clearing volume (in millions) |
|
|
36.0 |
|
|
37.0 |
|
|
37.8 |
|
|
36.1 |
|
|
36.7 |
|
2% |
|
2% |
|
|
|
71.4 |
|
|
72.8 |
|
2% |
Commercial card spend volume |
|
$ |
9.3 |
|
$ |
10.5 |
|
$ |
11.4 |
|
$ |
11.4 |
|
$ |
15.0 |
|
32% |
|
61% |
|
|
$ |
16.7 |
|
$ |
26.4 |
|
58% |
|
|
|
|
|
|
|
|
|
|
|
|
|
|
|
|
|
|
|
|
|
|
|
|
|
|
|
|
|
NM Not meaningful.
Reclassified to conform to the current period's presentation.
Page 5
INSTITUTIONAL CLIENTS GROUP
REPORTING UNIT REVENUES
(In millions of dollars, except as otherwise noted)
|
|
|
|
|
|
|
|
|
|
|
|
2Q22 Increase/ |
|
|
Six |
|
Six |
|
YTD 2022 vs. |
|||||||||
|
|
2Q |
|
3Q |
|
4Q |
|
1Q |
|
2Q |
|
(Decrease) from |
|
|
Months |
|
Months |
|
YTD 2021 Increase/ |
|||||||||
|
|
2021 |
|
2021 |
|
2021 |
|
2022 |
|
2022 |
|
1Q22 |
|
2Q21 |
|
|
2021 |
|
2022 |
|
(Decrease) |
|||||||
Services |
|
|
|
|
|
|
|
|
|
|
|
|
|
|
|
|
|
|
|
|
|
|
|
|
||||
Net interest income |
$ |
1,640 |
$ |
1,613 |
$ |
1,682 |
$ |
1,907 |
|
$ |
2,327 |
22% |
|
42% |
|
|
$ |
3,257 |
|
$ |
4,234 |
|
30% |
|||||
Non-interest revenue |
|
1,500 |
|
1,528 |
|
1,576 |
|
1,541 |
|
|
1,696 |
10% |
|
13% |
|
|
|
2,883 |
|
|
3,237 |
|
12% |
|||||
Total Services revenues |
$ |
3,140 |
$ |
3,141 |
$ |
3,258 |
$ |
3,448 |
|
$ |
4,023 |
17% |
|
28% |
|
|
$ |
6,140 |
|
$ |
7,471 |
|
22% |
|||||
|
|
|
|
|
|
|
|
|
|
|
|
|
|
|
|
|
|
|
|
|
|
|
|
|
|
|
|
|
Net interest income |
$ |
1,427 |
$ |
1,389 |
$ |
1,444 |
$ |
1,659 |
|
$ |
2,026 |
22% |
42% |
|
|
$ |
2,832 |
|
$ |
3,685 |
|
30% |
||||||
Non-interest revenue |
|
858 |
|
908 |
|
960 |
|
931 |
|
|
1,003 |
8% |
17% |
|
|
|
1,641 |
|
|
1,934 |
|
18% |
||||||
Treasury and trade solutions |
$ |
2,285 |
$ |
2,297 |
$ |
2,404 |
$ |
2,590 |
|
$ |
3,029 |
17% |
33% |
|
|
$ |
4,473 |
|
$ |
5,619 |
|
26% |
||||||
|
|
|
|
|
|
|
|
|
|
|
|
|
|
|
|
|
|
|
|
|
|
|
|
|
|
|
|
|
Net interest income |
$ |
213 |
$ |
224 |
$ |
238 |
$ |
248 |
|
$ |
301 |
21% |
41% |
|
|
$ |
425 |
|
$ |
549 |
|
29% |
||||||
Non-interest revenue |
|
642 |
|
620 |
|
616 |
|
610 |
|
|
693 |
14% |
8% |
|
|
|
1,242 |
|
|
1,303 |
|
5% |
||||||
Securities services |
$ |
855 |
$ |
844 |
$ |
854 |
$ |
858 |
|
$ |
994 |
16% |
16% |
|
|
$ |
1,667 |
|
$ |
1,852 |
|
11% |
||||||
|
|
|
|
|
|
|
|
|
|
|
|
|
|
|
|
|
|
|
|
|
|
|
|
|
|
|
|
|
Markets |
|
|
|
|
|
|
|
|
|
|
|
|
|
|
|
|
|
|
|
|
|
|
|
|
|
|
|
|
Net interest income |
$ |
1,379 |
$ |
1,265 |
$ |
1,250 |
$ |
1,109 |
|
$ |
1,383 |
25% |
- |
|
|
$ |
2,688 |
|
$ |
2,492 |
|
(7%) |
||||||
Non-interest revenue |
|
2,876 |
|
3,122 |
|
2,093 |
|
4,717 |
|
|
3,937 |
(17%) |
37% |
|
|
|
7,500 |
|
|
8,654 |
|
15% |
||||||
Total Markets revenues |
$ |
4,255 |
$ |
4,387 |
$ |
3,343 |
$ |
5,826 |
|
$ |
5,320 |
(9%) |
25% |
|
|
$ |
10,188 |
|
$ |
11,146 |
|
9% |
||||||
|
|
|
|
|
|
|
|
|
|
|
|
|
|
|
|
|
|
|
|
|
|
|
|
|
|
|
|
|
Fixed income markets |
$ |
3,111 |
$ |
3,040 |
$ |
2,425 |
$ |
4,299 |
|
$ |
4,084 |
(5%) |
31% |
|
|
$ |
7,457 |
|
$ |
8,383 |
|
12% |
||||||
Equity markets |
|
1,144 |
|
|
1,347 |
|
|
918 |
|
|
1,527 |
|
|
1,236 |
|
(19%) |
8% |
|
|
|
2,731 |
|
|
2,763 |
|
1% |
||
Total |
$ |
4,255 |
|
$ |
4,387 |
|
$ |
3,343 |
|
$ |
5,826 |
|
$ |
5,320 |
|
(9%) |
25% |
|
|
$ |
10,188 |
|
$ |
11,146 |
|
9% |
||
Rates and currencies |
$ |
1,978 |
|
$ |
2,112 |
|
$ |
1,721 |
|
$ |
3,231 |
|
$ |
3,277 |
|
1% |
66% |
|
|
$ |
5,002 |
|
$ |
6,508 |
|
30% |
||
Spread products / other fixed income |
|
1,133 |
|
928 |
|
704 |
|
1,068 |
|
|
807 |
(24%) |
(29%) |
|
|
|
2,455 |
|
|
1,875 |
|
(24%) |
||||||
Total fixed income markets revenues |
$ |
3,111 |
$ |
3,040 |
$ |
2,425 |
$ |
4,299 |
|
$ |
4,084 |
(5%) |
31% |
|
|
$ |
7,457 |
|
$ |
8,383 |
|
12% |
||||||
|
|
|
|
|
|
|
|
|
|
|
|
|
|
|
|
|
|
|
|
|
|
|
|
|
|
|
|
|
Banking |
|
|
|
|
|
|
|
|
|
|
|
|
|
|
|
|
|
|
|
|
|
|
|
|
|
|
|
|
Net interest income |
$ |
741 |
$ |
860 |
$ |
836 |
$ |
768 |
|
$ |
810 |
5% |
|
9% |
|
|
$ |
1,548 |
|
$ |
1,578 |
|
2% |
|||||
Non-interest revenue |
1,413 |
1,603 |
1,471 |
1,118 |
|
1,266 |
13% |
|
(10%) |
|
|
3,061 |
|
2,384 |
|
(22%) |
||||||||||||
Total Banking revenues, including gain/(loss) on loan hedges |
$ |
2,154 |
$ |
2,463 |
$ |
2,307 |
$ |
1,886 |
|
$ |
2,076 |
10% |
(4%) |
|
|
$ |
4,609 |
|
$ |
3,962 |
|
(14%) |
||||||
Investment banking |
|
|
|
|
|
|
|
|
|
|
|
|
|
|
|
|
|
|
|
|
|
|
|
|
|
|
|
|
Advisory |
$ |
405 |
$ |
539 |
$ |
571 |
$ |
347 |
|
$ |
357 |
3% |
(12%) |
|
|
$ |
686 |
|
$ |
704 |
|
3% |
||||||
Equity underwriting |
|
484 |
468 |
462 |
185 |
|
177 |
(4%) |
(63%) |
|
|
1,319 |
|
362 |
|
(73%) |
||||||||||||
Debt underwriting |
|
614 |
|
770 |
|
520 |
|
496 |
|
|
271 |
(45%) |
|
(56%) |
|
|
|
1,296 |
|
|
767 |
|
(41%) |
|||||
Total investment banking |
|
1,503 |
1,777 |
1,553 |
1,028 |
|
805 |
(22%) |
|
(46%) |
|
|
3,301 |
|
1,833 |
|
(44%) |
|||||||||||
Corporate lending - excluding gain/(loss) on loan hedges(1) |
|
688 |
732 |
733 |
689 |
|
777 |
13% |
|
13% |
|
|
1,423 |
|
1,466 |
|
3% |
|||||||||||
Total Banking revenues (ex-gain/(loss) on loan hedges)(1) |
$ |
2,191 |
$ |
2,509 |
$ |
2,286 |
$ |
1,717 |
|
$ |
1,582 |
(8%) |
|
(28%) |
|
|
$ |
4,724 |
|
$ |
3,299 |
|
(30%) |
|||||
Gain/(loss) on loan hedges(1) |
(37) |
(46) |
21 |
169 |
|
494 |
NM |
|
NM |
|
|
(115) |
|
663 |
|
NM |
||||||||||||
Total Banking revenues including gain/(loss) on loan hedges(1) |
$ |
2,154 |
$ |
2,463 |
$ |
2,307 |
$ |
1,886 |
|
$ |
2,076 |
10% |
|
(4%) |
|
|
$ |
4,609 |
|
$ |
3,962 |
|
(14%) |
|||||
|
|
|
|
|
|
|
|
|
|
|
|
|
|
|
|
|
|
|
|
|
|
|
|
|
|
|
|
|
Total ICG revenues, net of interest expense |
$ |
9,549 |
$ |
9,991 |
$ |
8,908 |
$ |
11,160 |
|
$ |
11,419 |
2% |
|
20% |
|
|
$ |
20,937 |
|
$ |
22,579 |
|
8% |
|||||
Taxable-equivalent adjustments(2) |
181 |
105 |
159 |
100 |
|
116 |
16% |
|
(36%) |
|
|
295 |
|
216 |
|
(27%) |
||||||||||||
Total ICG revenues - including taxable-equivalent adjustments(2) |
$ |
9,730 |
$ |
10,096 |
$ |
9,067 |
$ |
11,260 |
|
$ |
11,535 |
2% |
|
19% |
|
|
$ |
21,232 |
|
$ |
22,795 |
|
7% |
|||||
|
|
|
|
|
|
|
|
|
|
|
|
|
|
|
|
|
|
|
|
|
|
|
|
|
|
|
|
|
| (1) | Credit derivatives are used to economically hedge a portion of the corporate loan portfolio that includes both accrual loans and loans at fair value. Gain/(loss) on loan hedges includes the mark-to-market on the credit derivatives partially offset by the mark-to-market on the loans in the portfolio that are at fair value. Hedges on accrual loans reflect the mark-to-market on credit derivatives used to economically hedge the corporate loan accrual portfolio. The fixed premium costs of these hedges are netted against the corporate lending revenues to reflect the cost of credit protection. Citigroup’s results of operations excluding the impact of gain/(loss) on loan hedges are non-GAAP financial measures. |
| (2) | Primarily relates to income tax credits related to affordable housing and alternative energy investments as well as tax exempt income from municipal bond investments. |
NM Not meaningful.
Reclassified to conform to the current period’s presentation.
Page 6
PERSONAL BANKING AND WEALTH MANAGEMENT
(In millions of dollars, except as otherwise noted)
|
|
|
|
|
|
|
|
|
|
|
|
2Q22 Increase/ |
|
|
Six |
|
Six |
|
YTD 2022 vs. |
|
|||||||||
|
|
2Q |
|
3Q |
|
4Q |
|
1Q |
|
2Q |
|
(Decrease) from |
|
|
Months |
|
Months |
|
YTD 2021 Increase/ |
|
|||||||||
|
|
2021 |
|
2021 |
|
2021 |
|
2022 |
|
2022 |
|
1Q22 |
|
2Q21 |
|
|
2021 |
|
2022 |
|
(Decrease) |
|
|||||||
|
|
|
|
|
|
|
|
|
|
|
|
|
|
|
|
|
|
|
|
|
|
|
|
|
|||||
Net interest income |
$ |
4,985 |
$ |
5,174 |
$ |
5,322 |
$ |
5,385 |
|
$ |
5,569 |
3% |
|
12% |
|
|
$ |
10,150 |
|
$ |
10,954 |
|
8% |
|
|||||
Non-interest revenue |
|
713 |
|
678 |
|
463 |
|
520 |
|
|
460 |
(12%) |
|
(35%) |
|
|
|
1,540 |
|
|
980 |
|
(36%) |
|
|||||
Total revenues, net of interest expense |
|
5,698 |
|
5,852 |
|
5,785 |
|
5,905 |
|
|
6,029 |
2% |
|
6% |
|
|
|
11,690 |
|
|
11,934 |
|
2% |
|
|||||
Total operating expenses |
|
3,547 |
|
3,624 |
|
4,017 |
|
3,889 |
|
|
3,985 |
2% |
|
12% |
|
|
|
6,969 |
|
|
7,874 |
|
13% |
|
|||||
Net credit losses on loans |
|
862 |
|
641 |
|
568 |
|
691 |
|
|
699 |
1% |
|
(19%) |
|
|
|
1,852 |
|
|
1,390 |
|
(25%) |
|
|||||
Credit reserve build / (release) for loans |
|
(1,040) |
|
(836) |
|
(866) |
|
(1,062) |
|
|
638 |
NM |
|
NM |
|
|
|
(2,582) |
|
|
(424) |
|
84% |
|
|||||
Provision for credit losses on unfunded lending commitments |
|
5 |
|
(7) |
|
(3) |
|
(2) |
|
|
13 |
NM |
|
NM |
|
|
|
(6) |
|
|
11 |
|
NM |
|
|||||
Provisions for benefits and claims, and other assets |
|
3 |
|
1 |
|
5 |
|
(3) |
|
|
5 |
NM |
|
67% |
|
|
|
9 |
|
|
2 |
|
(78%) |
|
|||||
Provisions for credit losses and for benefits and claims (PBC) |
|
(170) |
|
(201) |
|
(296) |
|
(376) |
|
|
1,355 |
NM |
|
NM |
|
|
|
(727) |
|
|
979 |
|
NM |
|
|||||
Income (loss) from continuing operations before taxes |
|
2,321 |
|
2,429 |
|
2,064 |
|
2,392 |
|
|
689 |
(71%) |
|
(70%) |
|
|
|
5,448 |
|
|
3,081 |
|
(43%) |
|
|||||
Income taxes (benefits) |
|
516 |
|
533 |
|
451 |
|
532 |
|
|
136 |
(74%) |
|
(74%) |
|
|
|
1,223 |
|
|
668 |
|
(45%) |
|
|||||
Income (loss) from continuing operations |
|
1,805 |
|
1,896 |
|
1,613 |
|
1,860 |
|
|
553 |
(70%) |
|
(69%) |
|
|
|
4,225 |
|
|
2,413 |
|
(43%) |
|
|||||
Noncontrolling interests |
|
- |
|
- |
|
- |
|
- |
|
|
- |
- |
|
- |
|
|
|
- |
|
|
- |
|
- |
|
|||||
Net income (loss) |
$ |
1,805 |
$ |
1,896 |
$ |
1,613 |
$ |
1,860 |
|
$ |
553 |
(70%) |
|
(69%) |
|
|
$ |
4,225 |
|
$ |
2,413 |
|
(43%) |
|
|||||
EOP assets (in billions) |
$ |
452 |
$ |
477 |
$ |
464 |
$ |
476 |
|
$ |
479 |
1% |
|
6% |
|
|
|
|
|
||||||||||
Average assets (in billions) |
|
458 |
|
474 |
|
|
476 |
|
|
474 |
|
|
474 |
- |
|
3% |
|
|
|
458 |
|
|
474 |
|
3% |
|
|||
Efficiency ratio |
|
|
62% |
|
62% |
|
|
69% |
|
|
66% |
|
|
66% |
- |
bps |
400 |
bps |
|
|
60% |
|
|
66% |
|
600 |
bps |
||
|
|
|
|
|
|
|
|
|
|
|
|
|
|
|
|
|
|
|
|
|
|
|
|||||||
Revenue by reporting unit and component |
|
|
|
|
|
|
|
|
|
|
|
|
|
|
|
|
|
|
|
|
|
|
|
|
|
|
|
|
|
Branded cards |
$ |
1,968 |
$ |
2,045 |
$ |
2,073 |
$ |
2,090 |
|
$ |
2,168 |
4% |
|
10% |
|
|
$ |
4,072 |
|
$ |
4,258 |
|
5% |
|
|||||
Retail services |
|
1,210 |
|
1,277 |
|
1,290 |
|
1,299 |
|
|
1,300 |
- |
|
7% |
|
|
|
2,515 |
|
|
2,599 |
|
3% |
|
|||||
Retail banking |
618 |
629 |
624 |
595 |
|
656 |
10% |
|
6% |
|
|
1,253 |
|
1,251 |
|
- |
|
||||||||||||
U.S. Personal Banking |
|
3,796 |
|
3,951 |
|
3,987 |
|
3,984 |
|
|
4,124 |
4% |
|
9% |
|
|
|
7,840 |
|
|
8,108 |
|
3% |
|
|||||
Private bank |
|
747 |
|
722 |
|
688 |
|
779 |
|
|
745 |
(4%) |
|
- |
|
|
|
1,533 |
|
|
1,524 |
|
(1%) |
|
|||||
Wealth at Work |
171 |
172 |
177 |
183 |
|
170 |
(7%) |
|
(1%) |
|
|
342 |
|
353 |
|
3% |
|
||||||||||||
Citigold |
|
984 |
|
1,007 |
|
933 |
|
959 |
|
|
990 |
3% |
|
1% |
|
|
|
1,975 |
|
|
1,949 |
|
(1%) |
|
|||||
Global Wealth Management |
1,902 |
1,901 |
1,798 |
1,921 |
|
1,905 |
(1%) |
|
- |
|
|
3,850 |
|
3,826 |
|
(1%) |
|
||||||||||||
Total |
$ |
5,698 |
$ |
5,852 |
$ |
5,785 |
$ |
5,905 |
|
$ |
6,029 |
2% |
|
6% |
|
|
$ |
11,690 |
|
$ |
11,934 |
|
2% |
|
|||||
|
|
|
|
|
|
|
|
|
|
|
|
|
|
|
|
|
|
|
|
|
|
||||||||
Average loans by reporting unit (in billions) |
|
|
|
|
|
|
|
|
|
|
|
|
|
|
|
|
|
|
|
|
|
|
|||||||
U.S. Personal Banking |
$ |
157 |
$ |
158 |
$ |
162 |
$ |
161 |
|
$ |
167 |
4% |
|
6% |
|
|
$ |
158 |
|
$ |
164 |
|
4% |
|
|||||
Global Wealth Management |
|
147 |
|
151 |
|
150 |
|
151 |
|
|
150 |
(1%) |
|
2% |
|
|
|
146 |
|
|
151 |
|
3% |
|
|||||
Total |
$ |
304 |
$ |
309 |
$ |
312 |
$ |
312 |
|
$ |
317 |
2% |
|
4% |
|
|
$ |
304 |
|
$ |
315 |
|
4% |
|
|||||
|
|
|
|
|
|
|
|
|
|
|
|
|
|
|
|
|
|
|
|
|
|
||||||||
Average deposits by reporting unit (in billions) |
|
|
|
|
|
|
|
|
|
|
|
|
|
|
|
|
|
|
|
|
|
|
|||||||
U.S. Personal Banking |
$ |
113 |
$ |
114 |
$ |
114 |
$ |
118 |
|
$ |
116 |
(2%) |
|
3% |
|
|
$ |
111 |
|
$ |
117 |
|
5% |
|
|||||
Global Wealth Management |
|
297 |
|
310 |
|
323 |
|
329 |
|
|
319 |
(3%) |
|
7% |
|
|
|
293 |
|
|
324 |
|
11% |
|
|||||
Total |
$ |
410 |
$ |
424 |
$ |
437 |
$ |
447 |
|
$ |
435 |
(3%) |
|
6% |
|
|
$ |
404 |
|
$ |
441 |
|
9% |
|
|||||
|
|
|
|
|
|
|
|
|
|
|
|
|
|
|
|
|
|
|
|
|
|
|
|
|
|
|
|
|
|
NM Not meaningful.
Reclassified to conform to the current period's presentation.
Page 7
PERSONAL BANKING AND WEALTH MANAGEMENT
Metrics
|
|
|
|
|
|
|
|
|
|
|
|
|
|
|
|
|
2Q22 Increase/ |
||
|
|
2Q |
|
3Q |
|
4Q |
|
1Q |
|
2Q |
|
(Decrease) from |
|||||||
|
|
2021 |
|
2021 |
|
2021 |
|
2022 |
|
2022 |
|
1Q22 |
|
2Q21 |
|||||
|
|
|
|
|
|
|
|
|
|
|
|
|
|
|
|
|
|
|
|
U.S. Personal Banking Key Indicators (in billions of dollars, except as otherwise noted) |
|
|
|
|
|
|
|
|
|
|
|
|
|
|
|
|
|
|
|
|
|
|
|
|
|
|
|
|
|
|
|
|
|
|
|
|
|
|
|
New account acquisitions (in thousands) |
|
|
|
|
|
|
|
|
|
|
|
|
|
|
|
|
|
|
|
Branded cards |
|
907 |
|
|
995 |
|
|
1,069 |
|
|
991 |
|
|
1,069 |
|
8% |
|
18% |
|
Retail services |
2,792 |
|
|
2,526 |
|
|
3,126 |
|
|
2,178 |
|
|
2,634 |
|
21% |
|
(6%) |
||
Credit card spend volume |
|
|
|
|
|
|
|
|
|
|
|
|
|
|
|
|
|
|
|
Branded cards |
$ |
103.5 |
|
$ |
106.0 |
|
$ |
115.2 |
|
$ |
106.8 |
|
$ |
121.8 |
|
14% |
|
18% |
|
Retail services |
|
|
23.6 |
|
|
22.7 |
|
|
27.1 |
|
|
21.4 |
|
|
26.1 |
|
22% |
|
11% |
Average loans(1) |
|
|
|
|
|
|
|
|
|
|
|
|
|
|
|
|
|
|
|
Branded cards |
|
$ |
79.4 |
|
$ |
81.9 |
|
$ |
84.5 |
|
$ |
84.0 |
|
$ |
87.9 |
|
5% |
|
11% |
Retail services |
|
|
42.3 |
|
|
42.4 |
|
|
43.8 |
|
|
44.2 |
|
|
44.8 |
|
1% |
|
6% |
EOP loans(1) |
|
|
|
|
|
|
|
|
|
|
|
|
|
|
|
|
|
|
|
Branded cards |
|
$ |
82.1 |
|
$ |
82.8 |
|
$ |
87.9 |
|
$ |
85.9 |
|
$ |
91.6 |
|
7% |
|
12% |
Retail services |
|
42.7 |
|
42.7 |
|
46.0 |
|
44.1 |
|
|
45.8 |
4% |
|
7% |
|||||
NII as a % of average loans(2) |
|
|
|
|
|
|
|
|
|
|
|
|
|
|
|||||
Branded cards |
|
8.90% |
|
9.00% |
|
8.93% |
|
9.16% |
|
|
8.86% |
|
|
|
|||||
Retail services |
|
15.70% |
|
16.54% |
|
16.55% |
|
16.93% |
|
|
17.32% |
|
|
|
|||||
NCLs as a % of average loans |
|
|
|
|
|
|
|
|
|
|
|
|
|
|
|
|
|
|
|
Branded cards |
2.36% |
1.73% |
1.33% |
1.46% |
|
1.50% |
|
|
|
||||||||||
Retail services |
|
3.09% |
|
|
2.23% |
|
|
2.10% |
|
2.31% |
|
|
2.60% |
|
|
|
|||
Loans 90+ days past due as a % of EOP loans |
|
|
|
|
|
|
|
|
|
|
|
|
|
|
|
|
|
|
|
Branded cards |
|
0.56% |
|
|
0.44% |
|
|
0.44% |
|
|
0.47% |
|
|
0.46% |
|
|
|
||
Retail services |
1.08% |
|
0.99% |
|
1.05% |
|
1.15% |
|
1.16% |
|
|||||||||
Loans 30-89 days past due as a % of EOP loans |
|
|
|
|
|
|
|
|
|
|
|
|
|
|
|
|
|
|
|
Branded cards |
0.43% |
|
0.45% |
|
0.46% |
|
0.49% |
|
0.47% |
|
|||||||||
Retail services |
|
0.97% |
|
|
1.10% |
|
|
1.17% |
|
|
1.27% |
|
|
1.27% |
|
|
|
||
|
|
|
|
|
|
|
|
|
|
|
|
|
|||||||
Average deposits |
$ |
113 |
$ |
114 |
$ |
114 |
$ |
118 |
|
$ |
116 |
(2%) |
3% |
||||||
Branches (actual) |
659 |
658 |
658 |
658 |
|
658 |
- |
|
- |
||||||||||
Mortgage originations |
$ |
4.1 |
$ |
3.4 |
$ |
3.4 |
$ |
3.1 |
|
$ |
4.1 |
32% |
|
- |
|||||
|
|
|
|
|
|
|
|
|
|
|
|
|
|
||||||
Global Wealth Management Key Indicators (in billions of dollars) |
|
|
|
|
|
|
|
|
|
|
|
|
|
|
|
|
|
|
|
Client assets |
$ |
790 |
$ |
789 |
|
$ |
814 |
$ |
788 |
|
$ |
730 |
|
(7%) |
|
(8%) |
|||
Average loans |
|
147 |
151 |
|
150 |
151 |
|
150 |
|
(1%) |
|
2% |
|||||||
Average deposits |
|
297 |
|
310 |
|
|
323 |
|
|
329 |
|
|
319 |
|
(3%) |
|
7% |
||
U.S. mortgage originations |
|
5.0 |
3.8 |
|
3.5 |
|
3.7 |
|
5.3 |
|
43% |
|
6% |
||||||
|
|
|
|
|
|
|
|
|
|
|
|
|
|
|
|
|
|
|
|
(1) |
Average loans, EOP loans and the related consumer delinquency amounts and ratios include interest and fees receivables balances. |
(2) |
Net interest income includes certain fees that are recorded as interest revenue. |
Reclassified to conform to the current period’s presentation.
Page 8
LEGACY FRANCHISES(1)
(In millions of dollars, except as otherwise noted)
|
|
|
|
|
|
|
|
|
|
|
|
2Q22 Increase/ |
|
|
Six |
|
Six |
|
YTD 2022 vs. |
|||||||||
|
|
2Q |
|
3Q |
|
4Q |
|
1Q |
|
2Q |
|
(Decrease) from |
|
|
Months |
|
Months |
|
YTD 2021 Increase/ |
|||||||||
|
|
2021 |
|
2021 |
|
2021 |
|
2022 |
|
2022 |
|
1Q22 |
|
2Q21 |
|
|
2021 |
|
2022 |
|
(Decrease) |
|||||||
|
|
|
|
|
|
|
|
|
|
|
|
|
|
|
|
|
|
|
|
|
|
|
|
|||||
Net interest income |
$ |
1,621 |
$ |
1,532 |
$ |
1,534 |
$ |
1,508 |
|
$ |
1,474 |
(2%) |
|
(9%) |
|
|
$ |
3,184 |
|
$ |
2,982 |
|
(6%) |
|||||
Non-interest revenue(2) |
|
658 |
|
4 |
|
659 |
|
423 |
|
|
461 |
9% |
|
(30%) |
|
|
|
1,338 |
|
|
884 |
|
(34%) |
|||||
Total revenues, net of interest expense |
|
2,279 |
|
1,536 |
|
2,193 |
|
1,931 |
|
|
1,935 |
- |
|
(15%) |
|
|
|
4,522 |
|
|
3,866 |
|
(15%) |
|||||
Total operating expenses(3) |
|
1,788 |
|
1,748 |
|
2,971 |
|
2,293 |
|
|
1,814 |
(21%) |
|
1% |
|
|
|
3,540 |
|
|
4,107 |
|
16% |
|||||
Net credit losses on loans |
|
390 |
|
289 |
|
216 |
|
151 |
|
|
133 |
(12%) |
|
(66%) |
|
|
|
973 |
|
|
284 |
|
(71%) |
|||||
Credit reserve build / (release) for loans |
|
(594) |
|
(327) |
|
(118) |
|
(146) |
|
|
(28) |
81% |
|
95% |
|
|
|
(1,176) |
|
|
(174) |
|
85% |
|||||
Provision for credit losses on unfunded lending commitments |
|
(8) |
|
7 |
|
(9) |
|
124 |
|
|
(3) |
NM |
|
63% |
|
|
|
(17) |
|
|
121 |
|
NM |
|||||
Provisions for benefits and claims, HTM debt securities and other assets |
|
8 |
|
17 |
|
23 |
|
31 |
|
|
19 |
(39%) |
|
NM |
|
|
|
60 |
|
|
50 |
|
(17%) |
|||||
Provisions for credit losses and for benefits and claims (PBC) |
|
(204) |
|
(14) |
|
112 |
|
160 |
|
|
121 |
(24%) |
|
NM |
|
|
|
(160) |
|
|
281 |
|
NM |
|||||
Income from continuing operations before taxes |
|
695 |
|
(198) |
|
(890) |
|
(522) |
|
|
- |
100% |
|
(100%) |
|
|
|
1,142 |
|
|
(522) |
|
NM |
|||||
Income taxes (benefits) |
|
203 |
|
3 |
|
(270) |
|
(137) |
|
|
15 |
NM |
|
(93%) |
|
|
|
330 |
|
|
(122) |
|
NM |
|||||
Income (loss) from continuing operations |
|
492 |
|
(201) |
|
(620) |
|
(385) |
|
|
(15) |
96% |
|
NM |
|
|
|
812 |
|
|
(400) |
|
NM |
|||||
Noncontrolling interests |
|
(2) |
|
(1) |
|
(4) |
|
(2) |
|
|
2 |
NM |
|
NM |
|
|
|
(5) |
|
|
- |
|
100% |
|||||
Net income (loss) |
$ |
494 |
$ |
(200) |
$ |
(616) |
$ |
(383) |
|
$ |
(17) |
96% |
|
NM |
|
|
$ |
817 |
|
$ |
(400) |
|
NM |
|||||
EOP assets (in billions) |
$ |
131 |
$ |
124 |
$ |
125 |
$ |
122 |
|
$ |
108 |
(11%) |
|
(18%) |
|
|
|
|
|
|
|
|
|
|||||
Average assets (in billions) |
|
128 |
|
126 |
|
|
123 |
|
|
124 |
|
|
115 |
(7%) |
|
(10%) |
|
|
|
129 |
|
|
120 |
|
(7%) |
|||
Efficiency ratio |
|
|
78% |
|
114% |
|
|
135% |
|
|
119% |
|
|
94% |
|
|
|
|
78% |
|
|
106% |
|
|
||||
|
|
|
|
|
|
|
|
|
|
|
|
|
|
|
|
|
|
|
|
|
|
|||||||
Revenue by reporting unit and component |
|
|
|
|
|
|
|
|
|
|
|
|
|
|
|
|
|
|
|
|
|
|||||||
Asia Consumer |
$ |
1,052 |
$ |
330 |
$ |
948 |
$ |
787 |
|
$ |
880 |
12% |
|
(16%) |
|
|
$ |
2,127 |
|
$ |
1,667 |
|
(22%) |
|||||
Mexico Consumer/SBMM |
|
|
1,184 |
|
|
1,162 |
|
|
1,168 |
|
|
1,139 |
|
|
1,184 |
|
4% |
|
- |
|
|
|
2,321 |
|
|
2,323 |
|
- |
Legacy Holdings Assets |
|
43 |
|
44 |
|
77 |
|
5 |
|
|
(129) |
NM |
|
NM |
|
|
|
74 |
|
|
(124) |
|
NM |
|||||
Total |
$ |
2,279 |
$ |
1,536 |
$ |
2,193 |
$ |
1,931 |
|
$ |
1,935 |
- |
|
(15%) |
|
|
$ |
4,522 |
|
$ |
3,866 |
|
(15%) |
|||||
|
|
|
|
|
|
|
|
|
|
|
|
|
|
|
|
|
|
|
|
|
||||||||
Asia Consumer - Key Indicators (in billions of dollars) |
|
|
|
|
|
|
|
|
|
|
|
|
|
|
|
|
|
|
|
|
|
|||||||
EOP loans |
$ |
53.5 |
$ |
42.9 |
$ |
41.1 |
$ |
19.5 |
|
$ |
17.3 |
(11%) |
|
(68%) |
|
|
|
|
|
|
|
|
|
|||||
EOP deposits |
|
|
54.0 |
|
|
46.6 |
|
|
43.3 |
|
|
17.5 |
|
|
17.2 |
|
(2%) |
|
(68%) |
|
|
|
|
|
|
|
|
|
Average loans |
|
|
54.2 |
|
|
46.4 |
|
|
42.3 |
|
|
23.1 |
|
|
18.2 |
|
(21%) |
|
(66%) |
|
|
$ |
54.6 |
|
$ |
20.7 |
|
(62%) |
Net credit losses on loans as a % of average loans |
|
|
1.13% |
|
|
1.10% |
|
|
0.96% |
|
|
0.79% |
|
|
0.77% |
|
|
|
|
|
|
|
1.40% |
|
|
0.78% |
|
|
Loans 90+ days past due as a % of EOP loans |
|
|
0.65% |
|
|
0.60% |
|
|
0.51% |
|
|
0.28% |
|
|
0.29% |
|
|
|
|
|
|
|
|
|
|
|
|
|
Loans 30-89 days past due as a % of EOP loans |
|
0.87% |
|
0.80% |
|
0.69% |
|
0.32% |
|
|
0.40% |
|
|
|
|
|
|
|
|
|
|
|
|
|||||
|
|
|
|
|
|
|
|
|
|
|
|
|
|
|
|
|
|
|
|
|
||||||||
Mexico Consumer/SBMM - Key Indicators (in billions of dollars) |
|
|
|
|
|
|
|
|
|
|
|
|
|
|
|
|
|
|
|
|
|
|||||||
EOP loans |
$ |
20.0 |
$ |
19.4 |
$ |
20.0 |
$ |
20.7 |
|
$ |
20.6 |
- |
|
3% |
|
|
|
|
|
|
|
|
|
|||||
EOP deposits |
|
|
33.0 |
|
|
31.4 |
|
|
32.7 |
|
|
33.9 |
|
|
35.5 |
|
5% |
|
8% |
|
|
|
|
|
|
|
|
|
Average loans |
|
|
20.2 |
|
|
19.6 |
|
|
19.4 |
|
|
19.6 |
|
|
20.5 |
|
5% |
|
1% |
|
|
$ |
20.4 |
|
$ |
20.1 |
|
(1%) |
Net credit losses on loans as a % of average loans |
|
|
5.14% |
|
|
3.70% |
|
|
2.72% |
|
|
2.55% |
|
|
2.15% |
|
|
|
|
|
|
|
6.27% |
|
|
2.34% |
|
|
Loans 90+ days past due as a % of EOP loans (Mexico Consumer only) |
|
1.84% |
|
1.52% |
|
1.38% |
|
1.32% |
|
|
1.29% |
|
|
|
|
|
|
|
|
|
|
|
|
|||||
Loans 30-89 days past due as a % of EOP loans (Mexico Consumer only) |
1.60% |
1.46% |
1.30% |
1.30% |
|
1.18% |
|
|
|
|
|
|
|
|
|
|
|
|
||||||||||
|
|
|
|
|
|
|
|
|
|
|
|
|
|
|
|
|
|
|
|
|
||||||||
Legacy Holdings Assets - Key Indicators (in billions of dollars) |
|
|
|
|
|
|
|
|
|
|
|
|
|
|
|
|
|
|
|
|
|
|||||||
EOP loans |
$ |
5.0 |
$ |
4.2 |
$ |
3.9 |
$ |
3.7 |
|
$ |
3.2 |
(14%) |
|
(36%) |
|
|
|
|
|
|
|
|
|
|||||
|
|
|
|
|
|
|
|
|
|
|
|
|
|
|
|
|
|
|
|
|
|
|
|
|
|
|
|
|
(1) |
Legacy Franchises consists of the consumer franchises in 13 markets across Asia and EMEA that Citi intends to exit (Asia Consumer), the consumer, small business & middle-market banking (Mexico SBMM) operations in Mexico (collectively Mexico Consumer/SBMM); and Legacy Holdings Assets (primarily North America consumer mortgage loans and other legacy assets). |
(2) |
See footnote 2 on page 1. |
(3) |
See footnote 3 on page 1. |
NM Not meaningful.
Reclassified to conform to the current period's presentation.
Page 9
CORPORATE / OTHER(1)
(In millions of dollars, except as otherwise noted)
|
|
|
|
|
|
|
|
|
|
|
|
2Q22 Increase/ |
|
|
Six |
|
Six |
|
YTD 2022 vs. |
|
|||||||||
|
|
2Q |
|
3Q |
|
4Q |
|
1Q |
|
2Q |
|
(Decrease) from |
|
|
Months |
|
Months |
|
YTD 2021 Increase/ |
|
|||||||||
|
|
2021 |
|
2021 |
|
2021 |
|
2022 |
|
2022 |
|
1Q22 |
|
2Q21 |
|
|
2021 |
|
2022 |
|
(Decrease) |
|
|||||||
|
|
|
|
|
|
|
|
|
|
|
|
|
|
|
|
|
|
|
|
|
|
|
|||||||
Net interest income |
|
$ |
112 |
|
$ |
247 |
|
$ |
195 |
|
$ |
194 |
|
$ |
401 |
|
NM |
|
NM |
|
|
$ |
157 |
|
$ |
595 |
|
NM |
|
Non-interest revenue |
|
|
115 |
|
|
(179) |
|
|
(64) |
|
|
(4) |
|
|
(146) |
|
NM |
|
NM |
|
|
|
114 |
|
|
(150) |
|
NM |
|
Total revenues, net of interest expense |
|
|
227 |
|
|
68 |
|
|
131 |
|
|
190 |
|
|
255 |
|
34% |
|
12% |
|
|
|
271 |
|
|
445 |
|
64% |
|
Total operating expenses |
|
|
307 |
|
|
442 |
|
|
319 |
|
|
260 |
|
|
160 |
|
(38%) |
|
(48%) |
|
|
|
614 |
|
|
420 |
|
(32%) |
|
Provisions for HTM debt securities and other assets |
|
|
2 |
|
|
(1) |
|
|
— |
|
|
— |
|
|
— |
|
— |
|
(100%) |
|
|
|
(1) |
|
|
— |
|
100% |
|
Income (loss) from continuing operations before taxes |
|
|
(82) |
|
|
(373) |
|
|
(188) |
|
|
(70) |
|
|
95 |
|
NM |
|
NM |
|
|
|
(342) |
|
|
25 |
|
NM |
|
Income taxes (benefits) |
|
|
(545) |
|
|
(232) |
|
|
(44) |
|
|
(262) |
|
|
(178) |
|
32% |
|
67% |
|
|
|
(612) |
|
|
(440) |
|
28% |
|
Income (loss) from continuing operations |
|
|
463 |
|
|
(141) |
|
|
(144) |
|
|
192 |
|
|
273 |
|
42% |
|
(41%) |
|
|
|
270 |
|
|
465 |
|
72% |
|
Income (loss) from discontinued operations, net of taxes(2) |
|
|
10 |
|
|
(1) |
|
|
— |
|
|
(2) |
|
|
(221) |
|
NM |
|
NM |
|
|
|
8 |
|
|
(223) |
|
NM |
|
Noncontrolling interests |
|
|
— |
|
|
1 |
|
|
— |
|
|
1 |
|
|
2 |
|
100% |
|
NM |
|
|
|
(1) |
|
|
3 |
|
NM |
|
Net income (loss) |
|
$ |
473 |
|
$ |
(143) |
|
$ |
(144) |
|
$ |
189 |
|
$ |
50 |
|
(74%) |
|
(89%) |
|
|
$ |
279 |
|
$ |
239 |
|
(14%) |
|
EOP assets (in billions) |
|
$ |
91 |
|
$ |
91 |
|
$ |
89 |
|
$ |
92 |
|
$ |
94 |
|
2% |
|
3% |
|
|
|
|
|
|
|
|
|
|
|
|
|
|
|
|
|
|
|
|
|
|
|
|
|
|
|
|
|
|
|
|
|
|
|
|
|
|
|
|
| (1) | Includes certain unallocated costs of global staff functions (including finance, risk, human resources, legal and compliance), other corporate expenses and unallocated global operations and technology expenses and income taxes, as well as Corporate Treasury and discontinued operations. |
| (2) | See footnote 5 on page 1. |
NM Not meaningful.
Reclassified to conform to the current period's presentation.
Page 10
AVERAGE BALANCES AND INTEREST RATES (1)(2)(3)(4)(5)
Taxable Equivalent Basis
|
|
Average Volumes |
|
Interest |
|
% Average Rate (4) |
|
|
||||||||||||||||||
|
|
Second |
|
First |
|
Second |
|
Second |
|
First |
|
Second |
|
Second |
|
First |
|
Second |
|
|
||||||
|
|
Quarter |
|
Quarter |
|
Quarter |
|
Quarter |
|
Quarter |
|
Quarter |
|
Quarter |
|
Quarter |
|
Quarter |
|
|
||||||
In millions of dollars, except as otherwise noted |
|
2021 |
|
2022 |
|
2022(5) |
|
2021 |
|
2022 |
|
2022(5) |
|
2021 |
|
2022 |
|
2022(5) |
|
|
||||||
Assets |
|
|
|
|
|
|
|
|
|
|
|
|
|
|
|
|
|
|
|
|
|
|
|
|||
Deposits with banks |
|
$ |
296,445 |
|
$ |
260,536 |
|
$ |
227,377 |
|
$ |
126 |
|
$ |
296 |
|
$ |
658 |
|
0.17 |
% |
0.46 |
% |
1.16 |
% |
|
Securities borrowed and purchased under resale agreements(6) |
|
|
319,821 |
|
|
343,636 |
|
|
349,520 |
|
|
205 |
|
|
394 |
|
|
805 |
|
0.26 |
% |
0.46 |
% |
0.92 |
% |
|
Trading account assets(7) |
|
|
302,141 |
|
|
270,460 |
|
|
275,937 |
|
|
1,472 |
|
|
1,148 |
|
|
1,662 |
|
1.95 |
% |
1.72 |
% |
2.42 |
% |
|
Investments |
|
|
484,238 |
|
|
518,820 |
|
|
519,582 |
|
|
1,844 |
|
|
2,067 |
|
|
2,387 |
|
1.53 |
% |
1.62 |
% |
1.84 |
% |
|
|
|
|
|
|
|
|
|
|
|
|
|
|
|
|
|
|
|
|
|
|
|
|
|
|
|
|
Consumer loans |
|
|
377,131 |
|
|
352,230 |
|
|
352,531 |
|
|
6,521 |
|
|
6,262 |
|
|
6,601 |
|
6.94 |
% |
7.21 |
% |
7.51 |
% |
|
Corporate loans |
|
|
293,149 |
|
|
296,346 |
|
|
304,956 |
|
|
2,235 |
|
|
2,477 |
|
|
2,917 |
|
3.06 |
% |
3.39 |
% |
3.84 |
% |
|
Total loans (net of unearned income)(8) |
|
670,280 |
|
648,576 |
|
657,487 |
|
8,756 |
|
8,739 |
|
9,518 |
|
5.24 |
% |
5.46 |
% |
5.81 |
% |
|
||||||
Other interest-earning assets |
|
|
69,691 |
|
|
119,815 |
|
|
121,629 |
|
|
111 |
|
|
549 |
|
|
644 |
|
0.64 |
% |
1.86 |
% |
2.12 |
% |
|
Total average interest-earning assets |
|
$ |
2,142,616 |
|
$ |
2,161,843 |
|
$ |
2,151,532 |
|
$ |
12,514 |
|
$ |
13,193 |
|
$ |
15,674 |
|
2.34 |
% |
2.47 |
% |
2.92 |
% |
|
|
|
|
|
|
|
|
|
|
|
|
|
|
|
|
|
|
|
|
|
|
|
|
|
|
|
|
Liabilities |
|
|
|
|
|
|
|
|
|
|
|
|
|
|
|
|
|
|
|
|
|
|
|
|
||
Deposits(9) |
|
1,075,130 |
|
1,080,105 |
|
1,068,002 |
|
677 |
|
871 |
|
1,420 |
|
0.25 |
% |
0.33 |
% |
0.53 |
% |
|
||||||
Securities loaned and sold under repurchase agreements(6) |
|
|
236,639 |
|
|
210,101 |
|
|
208,399 |
|
|
260 |
|
|
282 |
|
|
655 |
|
0.44 |
% |
0.54 |
% |
1.26 |
% |
|
Trading account liabilities(7) |
|
|
122,138 |
|
|
114,313 |
|
|
124,810 |
|
|
150 |
|
|
147 |
|
|
137 |
|
0.49 |
% |
0.52 |
% |
0.44 |
% |
|
Short-term borrowings and other interest-bearing liabilities |
|
|
93,682 |
|
|
138,861 |
|
|
154,239 |
|
|
31 |
|
|
55 |
|
|
268 |
|
0.13 |
% |
0.16 |
% |
0.70 |
% |
|
Long-term debt(10) |
|
|
195,364 |
|
|
170,927 |
|
|
168,724 |
|
|
867 |
|
|
925 |
|
|
1,186 |
|
1.78 |
% |
2.19 |
% |
2.82 |
% |
|
Total average interest-bearing liabilities |
|
$ |
1,722,953 |
|
$ |
1,714,307 |
|
$ |
1,724,174 |
|
$ |
1,985 |
|
$ |
2,280 |
|
$ |
3,666 |
|
0.46 |
% |
0.54 |
% |
0.85 |
% |
|
|
|
|
|
|
|
|
|
|
|
|
|
|
|
|
|
|
|
|
|
|
|
|
||||
Net interest income as a % of average interest-earning assets (NIM)(9) |
|
|
|
|
|
|
|
|
|
|
$ |
10,529 |
|
$ |
10,913 |
|
$ |
12,008 |
|
1.97 |
% |
2.05 |
% |
2.24 |
% |
|
|
|
|
|
|
|
|
|
|
|
|
|
|
|
|
|
|
|
|
|
|
|
|
|
|
|
|
2Q22 increase (decrease) from: |
|
|
|
|
|
|
|
|
|
|
|
|
|
|
|
|
|
|
|
27 |
bps |
19 |
bps |
|
|
|
| (6) | Average volumes of securities borrowed or purchased under agreements to resell and securities loaned or sold under agreements to repurchase are reported net pursuant to FIN 41; the related interest excludes the impact of ASU 2013-01 (Topic 210). |
Reclassified to conform to the current period's presentation.
Page 11
EOP LOANS(1)(2)
(In billions of dollars)
|
|
|
|
|
|
|
|
|
|
|
|
|
|
|
|
|
2Q22 Increase/ |
||
|
|
2Q |
|
3Q |
|
4Q |
|
1Q |
|
2Q |
|
(Decrease) from |
|||||||
|
|
2021 |
|
2021 |
|
2021 |
|
2022 |
|
2022 |
|
1Q22 |
|
2Q21 |
|||||
|
|
|
|
|
|
|
|
|
|
|
|
|
|
|
|
|
|
|
|
Corporate loans - by region |
|
|
|
|
|
|
|
|
|
|
|
|
|||||||
North America |
|
$ |
127.6 |
|
$ |
127.7 |
|
$ |
126.7 |
|
$ |
129.2 |
|
$ |
129.9 |
|
1% |
|
2% |
EMEA |
|
77.6 |
|
77.4 |
|
75.7 |
|
81.2 |
|
76.8 |
|
(5%) |
|
(1%) |
|||||
Latin America |
|
|
32.6 |
|
|
31.6 |
|
|
32.2 |
|
|
35.9 |
|
|
36.2 |
|
1% |
|
11% |
Asia |
|
|
58.2 |
|
|
58.8 |
|
|
56.6 |
|
|
63.0 |
|
|
58.8 |
|
(7%) |
|
1% |
Total corporate loans |
|
$ |
296.0 |
|
$ |
295.5 |
|
$ |
291.2 |
|
$ |
309.3 |
|
$ |
301.7 |
|
(2%) |
|
2% |
|
|
|
|
|
|
|
|
|
|
|
|
|
|
|
|
|
|
|
|
Corporate loans - by reporting unit |
|
|
|
|
|
|
|
|
|
|
|
|
|||||||
Services |
|
$ |
77.5 |
|
$ |
79.8 |
|
$ |
75.2 |
|
$ |
86.7 |
|
$ |
86.1 |
|
(1%) |
|
11% |
Markets |
|
|
17.3 |
|
|
17.5 |
|
|
15.1 |
|
|
14.6 |
|
12.6 |
|
(14%) |
|
(27%) |
|
Banking |
|
|
194.7 |
|
|
191.8 |
|
|
194.2 |
|
|
200.9 |
|
|
195.9 |
|
(2%) |
|
1% |
Legacy Franchises - Mexico SBMM |
|
|
6.5 |
|
|
6.4 |
|
|
6.7 |
|
|
7.1 |
|
|
7.1 |
|
- |
|
9% |
Total corporate loans |
|
$ |
296.0 |
|
$ |
295.5 |
|
$ |
291.2 |
|
$ |
309.3 |
|
$ |
301.7 |
|
(2%) |
|
2% |
|
|
|
|
|
|
|
|
|
|
|
|
|
|||||||
Personal Banking and Wealth Management |
|
|
|
|
|
|
|
|
|
|
|
|
|
|
|
|
|
|
|
Branded cards |
|
$ |
82.1 |
|
$ |
82.8 |
|
$ |
87.9 |
|
$ |
85.9 |
|
$ |
91.6 |
|
7% |
|
12% |
Retail services |
|
|
42.7 |
|
|
42.7 |
|
|
46.0 |
|
|
44.1 |
|
45.8 |
|
4% |
|
7% |
|
Retail banking |
|
|
34.3 |
|
|
33.4 |
|
|
33.0 |
|
|
33.3 |
|
|
35.4 |
|
6% |
|
3% |
U.S. Personal Banking |
|
$ |
159.1 |
|
$ |
158.9 |
|
$ |
166.9 |
|
$ |
163.3 |
|
$ |
172.8 |
|
6% |
|
9% |
Global Wealth Management |
|
|
149.7 |
|
|
150.3 |
|
|
151.3 |
|
|
150.2 |
|
|
148.8 |
|
(1%) |
|
(1%) |
Total |
|
$ |
308.8 |
|
$ |
309.2 |
|
$ |
318.2 |
|
$ |
313.5 |
|
$ |
321.6 |
|
3% |
|
4% |
|
|
|
|
|
|
|
|
|
|
|
|
|
|||||||
Legacy Franchises - Consumer |
|
|
|
|
|
|
|
|
|
|
|
|
|||||||
Asia Consumer(3) |
|
$ |
53.5 |
|
$ |
42.9 |
|
$ |
41.1 |
|
$ |
19.5 |
|
$ |
17.3 |
|
(11%) |
|
(68%) |
Mexico Consumer |
|
|
13.5 |
|
|
13.0 |
|
|
13.3 |
|
|
13.6 |
|
|
13.5 |
|
(1%) |
|
- |
Legacy Holdings Assets |
|
|
5.0 |
|
|
4.2 |
|
|
3.9 |
|
|
3.7 |
|
|
3.2 |
|
(14%) |
|
(36%) |
Total |
|
$ |
72.0 |
|
$ |
60.1 |
|
$ |
58.3 |
|
$ |
36.8 |
|
$ |
34.0 |
|
(8%) |
|
(53%) |
|
|
|
|
|
|
|
|
|
|
|
|
|
|||||||
Total consumer loans |
|
$ |
380.8 |
|
$ |
369.3 |
|
$ |
376.5 |
|
$ |
350.3 |
|
$ |
355.6 |
|
2% |
|
(7%) |
|
|
|
|
|
|
|
|
|
|
|
|
|
|
|
|
|
|
|
|
Total loans |
|
$ |
676.8 |
|
$ |
664.8 |
|
$ |
667.8 |
|
$ |
659.7 |
|
$ |
657.3 |
|
- |
|
(3%) |
|
|
|
|
|
|
|
|
|
|
|
|
|
|
|
|
|
|
|
|
(1) |
Corporate loans include loans managed by ICG and Legacy Franchises-Mexico SBMM. |
(2) |
Consumer loans include loans managed by PBWM and Legacy Franchises (other than Mexico Small Business & Middle-Market Banking (Mexico SBMM) loans). |
(3) |
Asia Consumer includes loans of certain EMEA countries for all periods presented. |
Reclassified to conform to the current period's presentation.
Page 12
DEPOSITS
(In billions of dollars)
|
|
|
|
|
|
|
|
|
|
|
|
2Q22 Increase/ |
|||||||
|
|
2Q |
|
3Q |
|
4Q |
|
1Q |
|
2Q |
|
(Decrease) from |
|||||||
|
|
2021 |
|
2021 |
|
2021 |
|
2022 |
|
2022 |
|
1Q22 |
|
2Q21 |
|||||
ICG by region |
|
|
|
|
|
|
|
|
|
|
|
|
|||||||
North America |
|
$ |
379.1 |
|
$ |
408.0 |
|
$ |
382.8 |
|
$ |
390.5 |
|
$ |
404.3 |
|
4% |
|
7% |
EMEA |
|
|
204.3 |
|
|
200.3 |
|
|
193.1 |
|
|
208.6 |
|
|
210.7 |
|
1% |
|
3% |
Latin America |
|
|
36.7 |
|
|
38.8 |
|
|
37.7 |
|
|
38.9 |
|
|
37.7 |
|
(3%) |
|
3% |
Asia |
|
|
178.4 |
|
|
185.5 |
|
|
175.8 |
|
|
187.5 |
|
|
176.0 |
|
(6%) |
|
(1%) |
Total |
|
$ |
798.5 |
|
$ |
832.6 |
|
$ |
789.4 |
|
$ |
825.5 |
|
$ |
828.7 |
|
- |
|
4% |
|
|
|
|
|
|
|
|
|
|
|
|
|
|
|
|
|
|||
ICG by reporting unit |
|
|
|
|
|
|
|
|
|
|
|
|
|
|
|
|
|
||
Treasury and trade solutions |
|
$ |
634.9 |
|
$ |
667.8 |
|
$ |
627.9 |
|
$ |
657.5 |
|
$ |
663.5 |
|
1% |
|
5% |
Securities services |
|
|
135.2 |
|
|
136.7 |
|
|
133.8 |
|
|
138.7 |
|
|
136.3 |
|
(2%) |
|
1% |
Services |
|
$ |
770.1 |
|
$ |
804.5 |
|
$ |
761.7 |
|
$ |
796.2 |
|
$ |
799.8 |
|
- |
|
4% |
Markets |
|
|
26.5 |
|
|
26.7 |
|
|
26.4 |
|
|
27.8 |
|
|
27.7 |
|
- |
|
5% |
Banking |
|
|
1.9 |
|
|
1.4 |
|
|
1.3 |
|
|
1.5 |
|
|
1.2 |
|
(20%) |
|
(37%) |
Total |
|
$ |
798.5 |
|
$ |
832.6 |
|
$ |
789.4 |
|
$ |
825.5 |
|
$ |
828.7 |
|
- |
|
4% |
|
|
|
|
|
|
|
|
|
|
|
|
|
|
|
|
|
|||
Personal Banking and Wealth Management |
|
|
|
|
|
|
|
|
|
|
|
|
|
|
|
|
|
|
|
U.S. Personal Banking |
|
$ |
113.1 |
|
$ |
113.5 |
|
$ |
116.8 |
|
$ |
119.5 |
|
$ |
115.7 |
|
(3%) |
|
2% |
Global Wealth Management |
|
|
303.9 |
|
|
316.5 |
|
|
329.2 |
|
|
332.1 |
|
|
311.9 |
|
(6%) |
|
3% |
Total |
|
$ |
417.0 |
|
$ |
430.0 |
|
$ |
446.0 |
|
$ |
451.6 |
|
$ |
427.6 |
|
(5%) |
|
3% |
|
|
|
|
|
|
|
|
|
|
|
|
|
|
|
|
|
|
|
|
Legacy Franchises |
|
|
|
|
|
|
|
|
|
|
|
|
|
|
|
|
|
|
|
Asia Consumer(1) |
|
$ |
54.0 |
|
$ |
46.6 |
|
$ |
43.3 |
|
$ |
17.5 |
|
$ |
17.2 |
|
(2%) |
|
(68%) |
Mexico Consumer/SBMM |
|
|
33.0 |
|
|
31.4 |
|
|
32.7 |
|
|
33.9 |
|
|
35.5 |
|
5% |
|
8% |
Legacy Holdings Assets |
|
|
- |
|
|
- |
|
|
- |
|
|
- |
|
|
- |
|
- |
|
- |
Total |
|
$ |
87.0 |
|
$ |
78.0 |
|
$ |
76.0 |
|
$ |
51.4 |
|
$ |
52.7 |
|
3% |
|
(39%) |
|
|
|
|
|
|
|
|
|
|
|
|
|
|
|
|
|
|
|
|
Corporate/Other |
|
|
7.8 |
|
|
6.9 |
|
|
5.8 |
|
|
5.2 |
|
|
12.8 |
|
NM |
|
64% |
|
|
|
|
|
|
|
|
|
|
|
|
|
|
|
|
|
|||
Total deposits - EOP |
|
$ |
1,310.3 |
|
$ |
1,347.5 |
|
$ |
1,317.2 |
|
$ |
1,333.7 |
|
$ |
1,321.8 |
|
(1%) |
|
1% |
|
|
|
|
|
|
|
|
|
|
|
|
|
|
|
|
|
|||
Total deposits - average |
|
$ |
1,321.3 |
|
$ |
1,343.0 |
|
$ |
1,370.3 |
|
$ |
1,334.3 |
|
$ |
1,322.5 |
|
(1%) |
|
- |
|
|
|
|
|
|
|
|
|
|
|
|
|
|
|
|
|
|||
|
|
|
|
|
|
|
|
|
|
|
|
|
|
|
|
|
|
|
|
(1) |
Asia Consumer includes deposits of certain EMEA countries for all periods presented. |
Reclassified to conform to the current period’s presentation.
Page 13
ALLOWANCE FOR CREDIT LOSSES (ACL) ROLLFORWARD
(In millions of dollars, except for ratios)
|
|
|
|
|
|
|
|
|
|
|
|
|
|
|
|
|
|
|
|
|
|
|
|
|
|
|
|
|
|
|
ACLL/EOP |
||||||||||||
|
|
Balance |
|
Builds / (releases) |
|
FY 2021 |
|
|
Balance |
|
Builds / (releases) |
|
|
YTD 2022 |
|
Balance |
|
Loans |
|||||||||||||||||||||||||
|
|
12/31/20 |
|
1Q21 |
|
2Q21 |
|
3Q21 |
|
4Q21 |
|
FY 2021 |
|
FX/Other |
|
|
12/31/21 |
|
1Q22 |
|
2Q22 |
|
YTD 2022 |
|
|
FX/Other |
|
6/30/22 |
|
6/30/22 |
|||||||||||||
Allowance for credit losses on loans (ACLL) |
|
|
|
|
|
|
|
|
|
|
|
|
|
|
|
|
|
|
|
|
|
|
|
|
|
|
|
|
|
|
|
|
|
|
|
|
|||||||
ICG |
|
$ |
4,356 |
|
$ |
(1,103) |
|
$ |
(812) |
|
$ |
14 |
|
$ |
(192) |
|
$ |
(2,093) |
|
$ |
(22) |
|
|
$ |
2,241 |
|
$ |
596 |
|
$ |
(76) |
|
$ |
520 |
|
|
$ |
30 |
|
$ |
2,791 |
|
|
Legacy Franchises corporate (Mexico SBMM) |
|
|
420 |
|
|
(124) |
|
|
(51) |
|
|
(61) |
|
|
(1) |
|
|
(237) |
|
|
(9) |
|
|
|
174 |
|
|
5 |
|
|
(3) |
|
|
2 |
|
|
|
2 |
|
|
178 |
|
|
Total corporate ACLL |
|
$ |
4,776 |
|
$ |
(1,227) |
|
$ |
(863) |
|
$ |
(47) |
|
$ |
(193) |
|
$ |
(2,330) |
|
$ |
(31) |
|
|
$ |
2,415 |
|
$ |
601 |
|
$ |
(79) |
|
$ |
522 |
|
|
$ |
32 |
|
$ |
2,969 |
|
1.00% |
U.S. Cards |
|
$ |
14,665 |
|
$ |
(1,301) |
|
$ |
(840) |
|
$ |
(763) |
|
$ |
(921) |
|
$ |
(3,825) |
|
$ |
- |
|
|
$ |
10,840 |
|
$ |
(1,009) |
|
$ |
447 |
|
$ |
(562) |
|
|
$ |
- |
|
$ |
10,278 |
|
7.48% |
Retail banking and Global Wealth Management |
|
|
1,643 |
|
|
(241) |
|
|
(200) |
|
|
(73) |
|
|
55 |
|
|
(459) |
|
|
(3) |
|
|
|
1,181 |
|
|
(53) |
|
|
191 |
|
|
138 |
|
|
|
(6) |
|
|
1,313 |
|
|
Total PBWM |
|
$ |
16,308 |
|
|
$(1,542) |
|
$ |
(1,040) |
|
$ |
(836) |
|
$ |
(866) |
|
$ |
(4,284) |
|
$ |
(3) |
|
|
$ |
12,021 |
|
$ |
(1,062) |
|
$ |
638 |
|
$ |
(424) |
|
|
$ |
(6) |
|
$ |
11,591 |
|
|
Legacy Franchises consumer |
|
|
3,872 |
|
|
(458) |
|
|
(543) |
|
|
(266) |
|
|
(117) |
|
|
(1,384) |
|
|
(469) |
|
|
|
2,019 |
|
|
(151) |
|
|
(25) |
|
|
(176) |
|
|
|
(451) |
|
|
1,392 |
|
|
Total consumer ACLL |
|
$ |
20,180 |
|
$ |
(2,000) |
|
$ |
(1,583) |
|
$ |
(1,102) |
|
$ |
(983) |
|
$ |
(5,668) |
|
$ |
(472) |
|
|
$ |
14,040 |
|
$ |
(1,213) |
|
$ |
613 |
|
$ |
(600) |
|
|
$ |
(457) |
|
$ |
12,983 |
|
3.65% |
Total ACLL |
|
$ |
24,956 |
|
$ |
(3,227) |
|
$ |
(2,446) |
|
$ |
(1,149) |
|
$ |
(1,176) |
|
$ |
(7,998) |
|
$ |
(503) |
|
|
$ |
16,455 |
|
$ |
(612) |
|
$ |
534 |
|
$ |
(78) |
|
|
$ |
(425) |
|
$ |
15,952 |
|
2.44% |
Allowance for credit losses on unfunded lending commitments (ACLUC) |
|
|
2,655 |
|
|
(626) |
|
|
44 |
|
|
(13) |
|
|
(193) |
|
|
(788) |
|
|
4 |
|
|
|
1,871 |
|
|
474 |
|
|
(159) |
|
|
315 |
|
|
|
7 |
|
|
2,193 |
|
|
Total ACLL and ACLUC (EOP) |
|
|
27,611 |
|
|
|
|
|
|
|
|
|
|
|
|
|
|
|
|
|
18,326 |
|
|
|
|
|
|
|
|
|
|
|
|
18,145 |
|
|
|||||||
Other(1) |
|
|
146 |
|
|
1 |
|
|
1 |
|
|
(13) |
|
|
11 |
|
|
- |
|
|
2 |
|
|
|
148 |
|
|
(6) |
|
|
27 |
|
|
21 |
|
|
|
10 |
|
|
179 |
|
|
Total allowance for credit losses (ACL) |
|
$ |
27,757 |
|
$ |
(3,852) |
|
$ |
(2,401) |
|
$ |
(1,175) |
|
$ |
(1,358) |
|
$ |
(8,786) |
|
$ |
(497) |
|
|
$ |
18,474 |
|
$ |
(144) |
|
$ |
402 |
|
$ |
258 |
|
|
$ |
(408) |
|
$ |
18,324 |
|
|
|
|
|
|
|
|
|
|
|
|
|
|
|
|
|
|
|
|
|
|
|
|
|
|
|
|
|
|
|
|
|
|
|
|
|
|
|
|
|
|
|
|
|
|
(1) |
Includes ACL on HTM securities and Other assets. |
Reclassified to conform to the current period’s presentation.
Page 14
ALLOWANCE FOR CREDIT LOSSES ON LOANS AND UNFUNDED LENDING COMMITMENTS
Page 1
(In millions of dollars)
|
|
|
|
|
|
|
|
|
|
|
|
2Q22 Increase/ |
|
|
Six |
|
Six |
|
YTD 2022 vs. |
|||||||||
|
|
2Q |
|
3Q |
|
4Q |
|
1Q |
|
2Q |
|
(Decrease) from |
|
|
Months |
|
Months |
|
YTD 2021 Increase/ |
|||||||||
|
|
2021 |
|
2021 |
|
2021 |
|
2022 |
|
2022 |
|
1Q22 |
|
2Q21 |
|
|
2021 |
|
2022 |
|
(Decrease) |
|||||||
Total Citigroup |
|
|
|
|
|
|
|
|
|
|
|
|
|
|
|
|
|
|
|
|
|
|
|
|
|
|
|
|
Allowance for credit losses on loans (ACLL) at beginning of period |
|
$ |
21,638 |
|
$ |
19,238 |
|
$ |
17,715 |
|
$ |
16,455 |
|
$ |
15,393 |
|
(6%) |
|
(29%) |
|
|
$ |
24,956 |
|
$ |
16,455 |
|
|
Gross credit (losses) on loans |
|
|
(1,844) |
|
|
(1,389) |
|
|
(1,279) |
|
|
(1,240) |
|
|
(1,212) |
|
2% |
|
34% |
|
|
|
(4,052) |
|
|
(2,452) |
|
39% |
Gross recoveries on loans |
|
|
524 |
|
|
428 |
|
|
413 |
|
|
368 |
|
|
362 |
|
(2%) |
|
(31%) |
|
|
|
984 |
|
|
730 |
|
(26%) |
Net credit (losses) / recoveries on loans (NCLs) |
|
|
(1,320) |
|
|
(961) |
|
|
(866) |
|
|
(872) |
|
|
(850) |
|
(3%) |
|
(36%) |
|
|
|
(3,068) |
|
|
(1,722) |
|
(44%) |
Replenishment of NCLs |
|
|
1,320 |
|
|
961 |
|
|
866 |
|
|
872 |
|
|
850 |
|
(3%) |
|
(36%) |
|
|
|
3,068 |
|
|
1,722 |
|
(44%) |
Net reserve builds / (releases) for loans |
|
|
(2,446) |
|
|
(1,149) |
|
|
(1,176) |
|
|
(612) |
|
|
534 |
|
NM |
|
NM |
|
|
|
(5,673) |
|
|
(78) |
|
99% |
Provision for credit losses on loans (PCLL) |
|
|
(1,126) |
|
|
(188) |
|
|
(310) |
|
|
260 |
|
|
1,384 |
|
NM |
|
NM |
|
|
|
(2,605) |
|
|
1,644 |
|
NM |
Other, net(1)(2)(3)(4)(5)(6) |
|
|
46 |
|
|
(374) |
|
|
(84) |
|
|
(450) |
|
|
25 |
|
NM |
|
(46%) |
|
|
|
(45) |
|
|
(425) |
|
|
ACLL at end of period (a) |
|
$ |
19,238 |
|
$ |
17,715 |
|
$ |
16,455 |
|
$ |
15,393 |
|
$ |
15,952 |
|
4% |
|
(17%) |
|
|
$ |
19,238 |
|
$ |
15,952 |
|
|
|
|
|
|
|
|
|
|
|
|
|
|
|
|
|
|
|
|
|
|
|
|
|
|
|
|
|
|
|
Allowance for credit losses on unfunded lending commitments (ACLUC)(7) (a) |
|
$ |
2,073 |
|
$ |
2,063 |
|
$ |
1,871 |
|
$ |
2,343 |
|
$ |
2,193 |
|
(6%) |
|
6% |
|
|
$ |
2,073 |
|
$ |
2,193 |
|
|
|
|
|
|
|
|
|
|
|
|
|
|
|
|
|
|
|
|
|
|
|
|
|
|
|
|
|
|
|
Provision (release) for credit losses on unfunded lending commitments |
|
$ |
44 |
|
$ |
(13) |
|
$ |
(193) |
|
$ |
474 |
|
$ |
(159) |
|
NM |
|
NM |
|
|
$ |
(582) |
|
$ |
315 |
|
|
|
|
|
|
|
|
|
|
|
|
|
|
|
|
|
|
|
|
|
|
|
|
|
|
|
|
|
|
|
Total allowance for credit losses on loans, leases and |
|
$ |
21,311 |
|
$ |
19,778 |
|
$ |
18,326 |
|
$ |
17,736 |
|
$ |
18,145 |
|
2% |
|
(15%) |
|
|
$ |
21,311 |
|
$ |
18,145 |
|
|
|
|
|
|
|
|
|
|
|
|
|
|
|
|
|
|
|
|
|
|
|
|
|
|
|
|
|
|
|
Total ACLL as a percentage of total loans(8) |
|
|
2.88% |
|
|
2.69% |
|
|
2.49% |
|
|
2.35% |
|
|
2.44% |
|
|
|
|
|
|
|
|
|
|
|
|
|
|
|
|
|
|
|
|
|
|
|
|
|
|
|
|
|
|
|
|
|
|
|
|
|
|
|
|
|
|
Consumer |
|
|
|
|
|
|
|
|
|
|
|
|
|
|
|
|
|
|
|
|
|
|
|
|
|
|
|
|
ACLL at beginning of period |
|
$ |
18,096 |
|
$ |
16,566 |
|
$ |
15,105 |
|
$ |
14,040 |
|
$ |
12,368 |
|
(12%) |
|
(32%) |
|
|
$ |
20,180 |
|
$ |
14,040 |
|
|
|
|
|
|
|
|
|
|
|
|
|
|
|
|
|
|
|
|
|
|
|
|
|
|
|
|
|
|
|
NCLs |
|
|
(1,243) |
|
|
(922) |
|
|
(781) |
|
|
(841) |
|
|
(827) |
|
(2%) |
|
(33%) |
|
|
|
(2,806) |
|
|
(1,668) |
|
(41%) |
Replenishment of NCLs |
|
|
1,243 |
|
|
922 |
|
|
781 |
|
|
841 |
|
|
827 |
|
(2%) |
|
(33%) |
|
|
|
2,806 |
|
|
1,668 |
|
(41%) |
Net reserve builds/ (releases) for loans |
|
|
(1,583) |
|
|
(1,102) |
|
|
(983) |
|
|
(1,213) |
|
|
613 |
|
NM |
|
NM |
|
|
|
(3,583) |
|
|
(600) |
|
83% |
Provision for credit losses on loans (PCLL) |
|
|
(340) |
|
|
(180) |
|
|
(202) |
|
|
(372) |
|
|
1,440 |
|
NM |
|
NM |
|
|
|
(777) |
|
|
1,068 |
|
NM |
Other, net(1)(2)(3)(4)(5)(6) |
|
|
53 |
|
|
(359) |
|
|
(82) |
|
|
(459) |
|
|
2 |
|
100% |
|
(96%) |
|
|
|
(31) |
|
|
(457) |
|
NM |
ACLL at end of period (b) |
|
$ |
16,566 |
|
$ |
15,105 |
|
$ |
14,040 |
|
$ |
12,368 |
|
$ |
12,983 |
|
5% |
|
(22%) |
|
|
$ |
16,566 |
|
$ |
12,983 |
|
|
|
|
|
|
|
|
|
|
|
|
|
|
|
|
|
|
|
|
|
|
|
|
|
|
|
|
|
|
|
Consumer ACLUC(7) (b) |
|
$ |
44 |
|
$ |
35 |
|
$ |
29 |
|
$ |
139 |
|
$ |
165 |
|
19% |
|
NM |
|
|
$ |
44 |
|
$ |
165 |
|
|
|
|
|
|
|
|
|
|
|
|
|
|
|
|
|
|
|
|
|
|
|
|
|
|
|
|
|
|
|
Provision (release) for credit losses on unfunded lending commitments |
|
$ |
1 |
|
$ |
(9) |
|
$ |
(5) |
|
$ |
109 |
|
$ |
19 |
|
(83%) |
|
NM |
|
|
$ |
(14) |
|
$ |
127 |
|
|
|
|
|
|
|
|
|
|
|
|
|
|
|
|
|
|
|
|
|
|
|
|
|
|
|
|
|
|
|
Total allowance for credit losses on loans, leases and |
|
$ |
16,610 |
|
$ |
15,140 |
|
$ |
14,069 |
|
$ |
12,507 |
|
$ |
13,148 |
|
5% |
|
(21%) |
|
|
$ |
16,610 |
|
$ |
13,148 |
|
|
|
|
|
|
|
|
|
|
|
|
|
|
|
|
|
|
|
|
|
|
|
|
|
|
|
|
|
|
|
Consumer ACLL as a percentage of total consumer loans |
|
|
4.35 |
% |
|
4.09 |
% |
|
3.73 |
% |
|
3.53 |
% |
|
3.65 |
% |
|
|
|
|
|
|
|
|
|
|
|
|
|
|
|
|
|
|
|
|
|
|
|
|
|
|
|
|
|
|
|
|
|
|
|
|
|
|
|
|
|
Corporate |
|
|
|
|
|
|
|
|
|
|
|
|
|
|
|
|
|
|
|
|
|
|
|
|
|
|
|
|
ACLL at beginning of period |
|
$ |
3,542 |
|
$ |
2,672 |
|
$ |
2,610 |
|
$ |
2,415 |
|
$ |
3,025 |
|
25% |
|
(15%) |
|
|
$ |
4,776 |
|
$ |
2,415 |
|
|
|
|
|
|
|
|
|
|
|
|
|
|
|
|
|
|
|
|
|
|
|
|
|
|
|
|
|
|
|
NCLs |
|
|
(77) |
|
|
(39) |
|
|
(85) |
|
|
(31) |
|
|
(23) |
|
(26%) |
|
(70%) |
|
|
|
(262) |
|
|
(54) |
|
(79%) |
Replenishment of NCLs |
|
|
77 |
|
|
39 |
|
|
85 |
|
|
31 |
|
|
23 |
|
(26%) |
|
(70%) |
|
|
|
262 |
|
|
54 |
|
(79%) |
Net reserve builds / (releases) for loans |
|
|
(863) |
|
|
(47) |
|
|
(193) |
|
|
601 |
|
|
(79) |
|
NM |
|
91% |
|
|
|
(2,090) |
|
|
522 |
|
NM |
Provision for credit losses on loans (PCLL) |
|
|
(786) |
|
|
(8) |
|
|
(108) |
|
|
632 |
|
|
(56) |
|
NM |
|
93% |
|
|
|
(1,828) |
|
|
576 |
|
NM |
Other, net(1) |
|
|
(7) |
|
|
(15) |
|
|
(2) |
|
|
9 |
|
|
23 |
|
NM |
|
NM |
|
|
|
(14) |
|
|
32 |
|
|
ACLL at end of period (c) |
|
$ |
2,672 |
|
$ |
2,610 |
|
$ |
2,415 |
|
$ |
3,025 |
|
$ |
2,969 |
|
(2%) |
|
11% |
|
|
$ |
2,672 |
|
$ |
2,969 |
|
|
|
|
|
|
|
|
|
|
|
|
|
|
|
|
|
|
|
|
|
|
|
|
|
|
|
|
|
|
|
Corporate ACLUC(7) (c) |
|
$ |
2,029 |
|
$ |
2,028 |
|
$ |
1,842 |
|
$ |
2,204 |
|
$ |
2,028 |
|
(8%) |
|
- |
|
|
$ |
2,029 |
|
$ |
2,028 |
|
|
|
|
|
|
|
|
|
|
|
|
|
|
|
|
|
|
|
|
|
|
|
|
|
|
|
|
|
|
|
Provision (release) for credit losses on unfunded lending commitments |
|
$ |
43 |
|
$ |
(4) |
|
$ |
(188) |
|
$ |
365 |
|
$ |
(178) |
|
NM |
|
NM |
|
|
$ |
(568) |
|
$ |
188 |
|
|
|
|
|
|
|
|
|
|
|
|
|
|
|
|
|
|
|
|
|
|
|
|
|
|
|
|
|
|
|
Total allowance for credit losses on loans, leases and |
|
$ |
4,701 |
|
$ |
4,638 |
|
$ |
4,257 |
|
$ |
5,229 |
|
$ |
4,997 |
|
(4%) |
|
6% |
|
|
$ |
4,701 |
|
$ |
4,997 |
|
|
|
|
|
|
|
|
|
|
|
|
|
|
|
|
|
|
|
|
|
|
|
|
|
|
|
|
|
|
|
Corporate ACLL as a percentage of total corporate loans(7) |
|
|
0.93 |
% |
|
0.91 |
% |
|
0.85 |
% |
|
1.00 |
% |
|
1.00 |
% |
|
|
|
|
|
|
|
|
|
|
|
|
Footnotes to this table are on the following page (page 16). |
|
|
|
|
|
|
|
|
|
|
|
|
|
|
|
|
|
|
|
|
|
|
|
|
|
|
|
|
Page 15
ALLOWANCE FOR CREDIT LOSSES ON LOANS AND UNFUNDED LENDING COMMITMENTS
Page 2
The following footnotes relate to the table on the preceding page (page 15):
| (1) | Includes all adjustments to the allowance for credit losses, such as changes in the allowance from acquisitions, dispositions, securitizations, foreign currency translation (FX translation), purchase accounting adjustments, etc. |
| (2) | 2Q21 consumer includes an increase of approximately $53 million related to FX translation. |
| (3) | 3Q21 includes an approximate $280 million reclass related to the announced sale of Citi's consumer banking operations in Australia. The ACLL was reclassified to Other assets during 3Q21. 3Q21 consumer also includes a decrease of approximately $80 million related to FX translation. |
| (4) | 4Q21 includes an approximate $90 million reclass related to the announced sale of Citi's consumer banking operations in the Philippines. The ACLL was reclassified to Other assets during 4Q21. 4Q21 consumer also includes a decrease of approximately $6 million related to FX translation. |
| (5) | 1Q22 includes an approximate $350 million reclass related to the announced sales of Citi's consumer banking businesses in Thailand, India, Malaysia, Taiwan, Indonesia, Bahrain, and Vietnam. The ACLL was reclassified to Other assets during 1Q22. 1Q22 consumer also includes a decrease of approximately $100 million related to FX translation. |
| (6) | 2Q22 primarily relates to FX translation. |
| (7) | Represents additional credit reserves recorded as other liabilities on the Consolidated Balance Sheet. |
| (8) | June 30, 2021, September 30, 2021, December 31, 2021, March 31, 2022 and June 30, 2022 exclude $7.7 billion, $7.2 billion, $6.1 billion, $5.7 billion, and $4.5 billion respectively, of loans that are carried at fair value. |
NM Not meaningful.
Reclassified to conform to the current period's presentation.
Page 16
NON-ACCRUAL ASSETS
(In millions of dollars)
|
|
|
|
|
|
|
|
|
|
|
|
2Q22 Increase/ |
|||||||
|
|
2Q |
|
3Q |
|
4Q |
|
1Q |
|
2Q |
|
(Decrease) from |
|||||||
|
|
2021 |
|
2021 |
|
2021 |
|
2022 |
|
2022 |
|
1Q22 |
|
2Q21 |
|||||
|
|
|
|
|
|
||||||||||||||
Corporate non-accrual loans by region(1) |
|
|
|
|
|
|
|
|
|
|
|
|
|
|
|
|
|
|
|
North America |
$ |
895 |
$ |
923 |
$ |
510 |
$ |
462 |
$ |
304 |
|
(34%) |
(66%) |
||||||
EMEA |
|
447 |
|
407 |
|
367 |
|
688 |
|
712 |
|
3% |
59% |
||||||
Latin America |
|
767 |
|
679 |
|
568 |
|
631 |
|
563 |
|
(11%) |
(27%) |
||||||
Asia |
|
141 |
|
110 |
|
108 |
|
85 |
|
76 |
|
(11%) |
(46%) |
||||||
Total |
$ |
2,250 |
$ |
2,119 |
$ |
1,553 |
$ |
1,866 |
$ |
1,655 |
|
(11%) |
(26%) |
||||||
|
|
|
|
|
|
||||||||||||||
Corporate non-accrual loans(1) |
|
|
|
|
|
|
|||||||||||||
Banking |
$ |
1,852 |
$ |
1,739 |
$ |
1,239 |
$ |
1,323 |
$ |
1,015 |
|
(23%) |
(45%) |
||||||
Services |
|
81 |
|
74 |
|
70 |
|
297 |
|
353 |
|
19% |
NM |
||||||
Markets |
|
12 |
|
13 |
|
12 |
|
13 |
|
11 |
|
(15%) |
(8%) |
||||||
Mexico SBMM |
|
|
305 |
|
|
293 |
|
|
232 |
|
|
233 |
|
|
276 |
|
18% |
|
(10%) |
Total |
$ |
2,250 |
$ |
2,119 |
$ |
1,553 |
$ |
1,866 |
$ |
1,655 |
|
(11%) |
(26%) |
||||||
|
|
|
|
|
|
||||||||||||||
Consumer non-accrual loans(1) |
|
|
|
|
|
|
|||||||||||||
Personal Banking and Global Wealth Management |
$ |
711 |
$ |
637 |
$ |
680 |
$ |
586 |
$ |
536 |
|
(9%) |
(25%) |
||||||
Asia Consumer(2) |
|
303 |
|
259 |
|
209 |
|
38 |
|
34 |
|
(11%) |
(89%) |
||||||
Mexico Consumer |
|
612 |
|
549 |
|
524 |
|
512 |
|
493 |
|
(4%) |
(19%) |
||||||
Legacy Holdings Assets-Consumer |
|
|
506 |
|
|
425 |
|
|
413 |
|
|
381 |
|
|
317 |
|
(17%) |
|
(37%) |
Total |
$ |
2,132 |
$ |
1,870 |
$ |
1,826 |
$ |
1,517 |
$ |
1,380 |
|
(9%) |
(35%) |
||||||
|
|
|
|
|
|
||||||||||||||
Total non-accrual loans (NAL) |
|
$ |
4,382 |
|
$ |
3,989 |
|
$ |
3,379 |
|
$ |
3,383 |
|
$ |
3,035 |
|
(10%) |
|
(31%) |
|
|
|
|
|
|
|
|
|
|
|
|
|
|
|
|
|
|
|
|
Other real estate owned (OREO)(3) |
$ |
33 |
$ |
21 |
$ |
27 |
$ |
26 |
$ |
13 |
|
(50%) |
(61%) |
||||||
|
|
|
|
|
|
|
|
||||||||||||
NAL as a percentage of total loans |
|
0.65% |
|
|
0.60% |
|
|
0.51% |
|
|
0.51% |
|
|
0.46% |
|
|
|
||
|
|
|
|
|
|
|
|
|
|
|
|
||||||||
ACLL as a percentage of NAL |
|
439% |
|
|
444% |
|
|
487% |
|
|
455% |
|
|
526% |
|
|
|||
|
|
|
|
|
|
|
|
|
|
|
|
|
|
|
|
|
|
|
|
| (1) | Corporate loans are placed on non-accrual status based upon a review by Citigroup's risk officers. Corporate non-accrual loans may still be current on interest payments. With limited exceptions, the following practices are applied for consumer loans: consumer loans, excluding credit cards and mortgages, are placed on non-accrual status at 90 days past due, and are charged off at 120 days past due; residential mortgage loans are placed on non-accrual status at 90 days past due and written down to net realizable value at 180 days past due. Consistent with industry conventions, Citigroup generally accrues interest on credit card loans until such loans are charged off, which typically occurs at 180 days contractual delinquency. As such, the non-accrual loan disclosures do not include credit card loans. The balances above represent non-accrual loans within Consumer Loans and Corporate Loans on the Consolidated Balance Sheet. |
| (2) | Asia Consumer includes balances for certain EMEA countries for all periods presented. |
| (3) | Represents the carrying value of all property acquired by foreclosure or other legal proceedings when Citigroup has taken possession of the collateral. Also includes former premises and property for use that is no longer contemplated. |
NM Not meaningful.
Reclassified to conform to the current period's presentation.
Page 17
CITIGROUP
CET1 CAPITAL AND SUPPLEMENTARY LEVERAGE RATIOS, TANGIBLE COMMON EQUITY, BOOK VALUE PER
SHARE AND TANGIBLE BOOK VALUE PER SHARE
(In millions of dollars or shares, except per share amounts and ratios)
|
June 30, |
|
September 30, |
|
December 31, |
|
March 31, |
|
June 30, |
||||||
Common Equity Tier 1 Capital Ratio and Components (1) |
2021 |
2021(2) |
2021(2) |
2022(2) |
2022(3) |
||||||||||
|
|
|
|
|
|
|
|
|
|
|
|
|
|
|
|
Citigroup common stockholders' equity (4) |
$ |
184,289 |
|
$ |
183,005 |
|
$ |
183,108 |
|
$ |
178,845 |
|
$ |
180,150 |
|
Add: qualifying noncontrolling interests |
|
138 |
|
|
136 |
|
|
143 |
|
|
126 |
|
|
129 |
|
Regulatory capital adjustments and deductions: |
|
|
|
|
|
|
|
|
|
||||||
Add: |
|
|
|
|
|
|
|
|
|
|
|
|
|
|
|
CECL transition provision (5) |
|
|
3,774 |
|
|
3,389 |
|
|
3,028 |
|
|
2,271 |
|
|
2,271 |
Less: |
|
|
|
|
|
|
|
|
|
||||||
Accumulated net unrealized gains (losses) on cash flow hedges, net of tax |
|
864 |
|
|
663 |
|
|
101 |
|
|
(1,440) |
|
|
(2,106) |
|
Cumulative unrealized net gain (loss) related to changes in fair value of financial |
|
|
|
|
|
|
|
|
|
||||||
liabilities attributable to own creditworthiness, net of tax |
|
(1,258) |
|
|
(1,317) |
|
|
(896) |
|
|
27 |
|
|
2,145 |
|
Intangible assets: |
|
|
|
|
|
|
|
|
|
||||||
Goodwill, net of related deferred tax liabilities (DTLs)(6) |
|
20,999 |
|
|
20,689 |
|
|
20,619 |
|
|
20,120 |
|
|
19,504 |
|
Identifiable intangible assets other than mortgage servicing rights |
|
|
|
|
|
|
|
|
|
||||||
(MSRs), net of related DTLs |
|
3,986 |
|
|
3,899 |
|
|
3,800 |
|
|
3,698 |
|
|
3,599 |
|
Defined benefit pension plan net assets; other |
|
2,040 |
|
|
2,068 |
|
|
2,080 |
|
|
2,230 |
|
|
2,038 |
|
Deferred tax assets (DTAs) arising from net operating loss, foreign tax credit |
|
|
|
|
|
|
|
|
|
||||||
and general business credit carry-forwards |
|
11,192 |
|
|
10,897 |
|
|
11,270 |
|
|
11,701 |
|
|
11,757 |
|
Excess over 10% / 15% limitations for other DTAs, certain |
|
|
|
|
|
|
|
|
|
|
|
|
|
|
|
common stock investments and MSRs(8) |
|
|
- |
|
|
- |
|
|
- |
|
|
1,157 |
|
|
727 |
Common Equity Tier 1 Capital (CET1) |
$ |
150,378 |
|
$ |
149,631 |
|
$ |
149,305 |
|
$ |
143,749 |
|
$ |
144,886 |
|
Risk-Weighted Assets (RWA)(5) |
$ |
1,277,234 |
|
$ |
1,284,316 |
|
$ |
1,219,175 |
|
$ |
1,263,298 |
|
$ |
1,220,000 |
|
Common Equity Tier 1 Capital ratio (CET1/RWA) |
|
11.77% |
|
|
11.65% |
|
|
12.25% |
|
|
11.38% |
|
|
11.9% |
|
|
|
|
|
|
|
|
|
|
|||||||
Supplementary Leverage Ratio and Components |
|
|
|
|
|
|
|
|
|
||||||
Common Equity Tier 1 Capital (CET1)(5) |
$ |
150,378 |
|
$ |
149,631 |
|
$ |
149,305 |
|
$ |
143,749 |
|
$ |
144,886 |
|
Additional Tier 1 Capital (AT1)(7) |
|
19,258 |
|
|
19,271 |
|
|
20,263 |
|
|
20,266 |
|
|
20,265 |
|
Total Tier 1 Capital (T1C) (CET1 + AT1) |
$ |
169,636 |
|
$ |
168,902 |
|
$ |
169,568 |
|
$ |
164,015 |
|
$ |
165,151 |
|
Total Leverage Exposure (TLE)(5) |
$ |
2,903,760 |
|
$ |
2,911,050 |
|
$ |
2,957,764 |
|
$ |
2,939,533 |
|
$ |
2,936,894 |
|
Supplementary Leverage ratio (T1C/TLE) |
|
5.84% |
|
|
5.80% |
|
|
5.73% |
|
|
5.58% |
|
|
5.6% |
|
|
|
|
|
|
|
|
|
|
|
|
|
|
|
|
|
|
|
|
|
|
|
|
|
|
|||||||
Tangible Common Equity, Book Value and Tangible Book Value Per Share |
|
|
|
|
|
|
|
|
|
|
|
||||
Common stockholders' equity |
$ |
184,164 |
|
$ |
182,880 |
|
$ |
182,977 |
|
$ |
178,714 |
|
$ |
180,019 |
|
Less: |
|
|
|
|
|
|
|
|
|
|
|
||||
Goodwill |
|
22,060 |
|
|
21,573 |
|
|
21,299 |
|
|
19,865 |
|
|
19,597 |
|
Intangible assets (other than MSRs) |
|
4,268 |
|
|
4,144 |
|
|
4,091 |
|
|
4,002 |
|
|
3,926 |
|
Goodwill and identifiable intangible assets (other than MSRs) related to assets HFS |
|
|
- |
|
|
257 |
|
|
510 |
|
|
1,384 |
|
|
1,081 |
Tangible common equity (TCE) |
$ |
157,836 |
|
$ |
156,906 |
|
$ |
157,077 |
|
$ |
153,463 |
|
$ |
155,415 |
|
Common shares outstanding (CSO) |
|
2,026.8 |
|
|
1,984.3 |
|
|
1,984.4 |
|
|
1,941.9 |
|
|
1,936.7 |
|
Book value per share (common equity/CSO) |
$ |
90.86 |
|
$ |
92.16 |
|
$ |
92.21 |
|
$ |
92.03 |
|
$ |
92.95 |
|
Tangible book value per share (TCE/CSO) |
$ |
77.87 |
|
$ |
79.07 |
|
$ |
79.16 |
|
$ |
79.03 |
|
$ |
80.25 |
|
|
|
|
|
|
|
|
|
|
|
|
|
|
|
|
|
(1)See footnote 7 on page 1.
(2)See footnote 5 on page 3.
(3)2Q22 is preliminary.
(4)Excludes issuance costs related to outstanding preferred stock in accordance with Federal Reserve Board regulatory reporting requirements.
(5)See footnote 8 on page 1.
(6)Includes goodwill “embedded” in the valuation of significant common stock investments in unconsolidated financial institutions.
(7)Additional Tier 1 Capital primarily includes qualifying noncumulative perpetual preferred stock and qualifying trust preferred securities.
(8)Assets subject to 10%/15% limitations include MSRs, DTAs arising from temporary differences and significant common stock investments in unconsolidated
financial institutions. As of March 31, 2022 and June 30, 2022, the deduction related only to DTAs arising from temporary differences that exceeded the 10% limitation.
Reclassified to conform to the current period's presentation.
Page 18
|
|
|
Exhibit 99.3 |
|
|
|
|
Citigroup Inc. securities registered pursuant to Section 12(b) of the Securities Exchange Act of 1934: | |||
|
|
|
|
Title of each class |
Ticker |
Title for iXBRL |
Name of each |
|
|
||
Common Stock, par value $.01 per share |
C |
Common Stock, par value $.01 per share |
New York Stock Exchange |
Depositary Shares, each representing 1/1,000th interest in a share of 7.125% Fixed/Floating Rate Noncumulative Preferred Stock, Series J |
C Pr J |
Dep Shs, represent 1/1,000th interest in a share of 7.125% Fix/Float Rate Noncum Pref Stk, Ser J |
New York Stock Exchange |
Depositary Shares, each representing 1/1,000th interest in a share of 6.875% Fixed/Floating Rate Noncumulative Preferred Stock, Series K |
C Pr K |
Dep Shs, represent 1/1,000th interest in a share of 6.875% Fix/Float Rate Noncum Pref Stk, Ser K |
New York Stock Exchange |
7.625% Trust Preferred Securities of Citigroup Capital III (and registrant’s guaranty with respect thereto) |
C/36Y |
7.625% TRUPs of Cap III (and registrant’s guaranty) |
New York Stock Exchange |
7.875% Fixed Rate / Floating Rate Trust Preferred Securities (TruPS®) of Citigroup Capital XIII (and registrant’s guaranty with respect thereto) |
C N |
7.875% FXD / FRN TruPS of Cap XIII (and registrant’s guaranty) |
New York Stock Exchange |
Medium-Term Senior Notes, Series N, Callable Step-Up Coupon Notes Due March 31, 2036 of CGMHI (and registrant’s guaranty with respect thereto) |
C/36A |
MTN, Series N, Callable Step-Up Coupon Notes Due Mar 2036 of CGMHI (and registrant’s guaranty) |
New York Stock Exchange |
Medium-Term Senior Notes, Series N, Callable Step-Up Coupon Notes Due February 26, 2036 of CGMHI (and registrant's guaranty with respect thereto) |
C/36 |
MTN, Series N, Callable Step-Up Coupon Notes Due Feb 2036 of CGMHI (and registrant's guaranty) |
New York Stock Exchange |
Medium-Term Senior Notes, Series N, Callable Fixed Rate Notes Due December 18, 2035 of CGMHI (and registrant's guaranty with respect thereto) |
C/35 |
MTN, Series N, Callable Fixed Rate Notes Due Dec 2035 of CGMHI (and registrant's guaranty) |
New York Stock Exchange |
Medium-Term Senior Notes, Series N, Callable Fixed Rate Notes Due April 26, 2028 of CGMHI (and registrant’s guaranty with respect thereto) |
C/28 |
MTN, Series N, Callable Fixed Rate Notes Due Apr 2028 of CGMHI (and registrant’s guaranty) |
New York Stock Exchange |
Medium-Term Senior Notes, Series N, Floating Rate Notes Due September 17, 2026 of CGMHI (and registrant’s guaranty with respect thereto) |
C/26 |
MTN, Series N, Floating Rate Notes Due Sept 2026 of CGMHI (and registrat’s guaranty) |
New York Stock Exchange |
Medium-Term Senior Notes, Series N, Floating Rate Notes Due September 15, 2028 of CGMHI (and registrant’s guaranty with respect thereto) |
C/28A |
MTN, Series N, Floating Rate Notes Due Sept 2028 of CGMHI (and registrat’s guaranty) |
New York Stock Exchange |
Medium-Term Senior Notes, Series N, Floating Rate Notes Due October 6, 2028 of CGMHI (and registrant’s guaranty with respect thereto) |
C/28B |
MTN, Series N, Floating Rate Notes Due Oct 2028 of CGMHI (and registrat’s guaranty) |
New York Stock Exchange |
Medium-Term Senior Notes, Series N, Floating Rate Notes Due March 21, 2029 of CGMHI (and registrant’s guaranty with respect thereto) |
C/29A |
MTN, Series N, Floating Rate Notes Due Mar 2029 of CGMHI (and registrant’s guaranty) |
New York Stock Exchange |