UNITED STATES
SECURITIES AND EXCHANGE COMMISSION
Washington, D.C. 20549
FORM 8-K
CURRENT REPORT
Pursuant to Section 13 or 15(d) of the Securities Exchange Act of 1934
Date of Report (Date of earliest event reported): June 23, 2022
GMS INC.
(Exact name of registrant as specified in charter)
| Delaware | 001-37784 | 46-2931287 | ||
| (State or Other Jurisdiction of Incorporation) |
(Commission File Number) |
(I.R.S. Employer Identification No.) |
| 100 Crescent Centre Parkway, Suite 800 Tucker, Georgia |
30084 | |
| (Address of Principal Executive Offices) | (Zip Code) |
Registrant’s telephone number, including area code: (800) 392-4619
Check the appropriate box below if the Form 8-K filing is intended to simultaneously satisfy the filing obligation of the registrant under any of the following provisions:
| ¨ | Written communications pursuant to Rule 425 under the Securities Act (17 CFR 230.425) |
| ¨ | Soliciting material pursuant to Rule 14a-12 under the Exchange Act (17 CFR 240.14a-12) |
| ¨ | Pre-commencement communications pursuant to Rule 14d-2(b) under the Exchange Act (17 CFR 240.14d-2(b)) |
| ¨ | Pre-commencement communications pursuant to Rule 13e-4(c) under the Exchange Act (17 CFR 240.13e-4(c)) |
Securities registered pursuant to Section 12(b) of the Act:
| Title of each class | Trading Symbol(s) | Name of each exchanged on which registered | ||
| Common Stock, par value $0.01 per share | GMS | New York Stock Exchange |
Indicate by check mark whether the registrant is an emerging growth company as defined in Rule 405 of the Securities Act of 1933 (§230.405 of this chapter) or Rule 12b-2 of the Securities Exchange Act of 1934 (§240.12b-2 of this chapter).
Emerging growth company ¨
If an emerging growth company, indicate by check mark if the registrant has elected not to use the extended transition period for complying with any new or revised financial accounting standards provided pursuant to Section 13(a) of the Exchange Act ¨
Item 2.02. Results of Operations and Financial Condition.
On June 23, 2022, GMS Inc. (the “Company” or “GMS”) issued a press release, a copy of which is furnished as Exhibit 99.1 hereto and incorporated herein by reference, announcing the Company’s financial results for the three months and year ended April 30, 2022.
The information contained in Item 7.01 concerning the presentation to GMS investors is hereby incorporated into this Item 2.02 by reference.
In accordance with General Instruction B.2 of Form 8-K, the information in this Item 2.02 of this Current Report on Form 8-K, including Exhibits 99.1 and 99.2 attached hereto, shall not be deemed “filed” for the purposes of Section 18 of the Securities Exchange Act of 1934, as amended (the “Exchange Act”), or otherwise subject to the liabilities of that section, nor shall it be deemed incorporated by reference in any filing under the Securities Act of 1933, as amended (the “Securities Act”), or the Exchange Act, except as shall be expressly set forth by specific reference in such a filing.
Item 7.01. Regulation FD Disclosure.
The slide presentation furnished as Exhibit 99.2 hereto, and incorporated herein by reference, will be presented to certain investors of GMS on June 23, 2022, and may be used by GMS in various other presentations to investors on or after June 23, 2022.
In accordance with General Instruction B.2 of Form 8-K, the information in this Item 7.01 of this Current Report on Form 8-K, including Exhibit 99.2 attached hereto, shall not be deemed “filed” for the purposes of Section 18 of the Exchange Act, or otherwise subject to the liabilities of that section, nor shall it be deemed incorporated by reference in any filing under the Securities Act or the Exchange Act, except as shall be expressly set forth by specific reference in such a filing.
Item 9.01. Financial Statements and Exhibits.
(d) Exhibits.
| Exhibit | Description |
| 99.1* | Press release, dated June 23, 2022. |
| 99.2* | GMS Inc. presentation to investors. |
| 104 | The cover page from this Current Report on Form 8-K, formatted in Inline XBRL. |
*Furnished herewith
SIGNATURES
Pursuant to the requirements of the Securities Exchange Act of 1934, the Registrant has duly caused this report to be signed on its behalf by the undersigned hereunto duly authorized.
| GMS INC. | |||
| Date: June 23, 2022 | By: | /s/ Scott M. Deakin | |
| Name: | Scott M. Deakin | ||
| Title: | Chief Financial Officer | ||
Exhibit 99.1

GMS Reports Fourth Quarter and Fiscal Year 2022 Results
Record Levels of Net Sales, Net Income and Adjusted EBITDA
Announces Expanded Share Repurchase Authorization
Tucker, Georgia, June 23, 2022. GMS Inc. (NYSE: GMS), a leading North American specialty building products distributor, today reported financial results for the fourth quarter and fiscal year ended April 30, 2022.
Fourth Quarter Fiscal 2022 Highlights
(Comparisons are to the fourth quarter of fiscal 2021 unless otherwise noted)
| · | Net sales of $1,288.7 million increased 38.2%; organic net sales increased 28.9%. |
| · | Net income of $76.5 million, or $1.75 per diluted share, was more than double the net income of $33.7 million, or $0.77 per diluted share, recorded a year ago; Adjusted net income of $91.3 million, or $2.09 per diluted share, compared to $46.9 million, or $1.07 per diluted share. |
| · | Adjusted EBITDA of $154.2 million increased $63.0 million, or 69.1%; Adjusted EBITDA margin improved 220 basis points to 12.0% from 9.8%. |
| · | Cash provided by operating activities of $199.5 million, compared to $84.8 million. Free cash flow of $191.6 million, compared with $72.8 million. |
| · | Net debt leverage was 1.8 times as of the end of the fourth quarter of fiscal 2022, down from 2.3 at the end of the third quarter and down from 2.5 times at the end of the fourth quarter of fiscal 2021. |
Full Year Fiscal 2022 Highlights
(Comparisons are to the full year of fiscal 2021, unless otherwise noted.)
| · | Net sales of $4,634.9 million increased 40.5%; organic net sales increased 30.9%. |
| · | Net income of $273.4 million, or $6.23 per diluted share, compared to net income of $105.6 million or $2.44 per diluted share; Adjusted net income of $328.8 million, or $7.49 per diluted share, compared to $153.3 million, or $3.54 per diluted share. |
| · | Adjusted EBITDA of $566.9 million increased $247.6 million, or 77.5%; Adjusted EBITDA margin improved 250 basis points to 12.2% from 9.7%. |
| · | The Company completed five business acquisitions, including the acquisition of Westside Building Material, one of the largest independent distributors of interior building products in the US with nine locations across California and one in Nevada, as well as the acquisition of Ames Taping Tools Holding, LLC, the leading provider of automatic taping and finishing tools and related products to the professional drywall finishing industry. During fiscal 2022, the Company also opened 13 greenfield locations and five new AMES store locations under GMS ownership. |
“GMS achieved outstanding results for the fourth quarter and full year fiscal 2022,” said John C. Turner, Jr., President and Chief Executive Officer of GMS. “Our scale, balanced mix of products and customers, commitment to delivering best-in-class service and continued execution of our growth strategy, coupled with strong residential demand and an inflationary pricing environment, enabled us to deliver record levels of net sales, net income and Adjusted EBITDA. We remain optimistic about the year ahead, which, despite rising rates, is supported by a continuing fundamental underbuild of residential housing stock as well as signs of an improving commercial market.”
Turner continued, “We are also very pleased to announce that our Board of Directors has approved the repurchase of up to $200 million of the Company’s common stock. This expanded authorization demonstrates our Board’s continued confidence in the strength and future prospects of our business. We remain focused on the execution of our strategic priorities, including expanding our platform through both acquisitions and greenfield opportunities, as well as enhancing our product and service offerings and delivering improved profitability as we leverage technology and best practices to achieve advancements in productivity. Looking ahead, we are committed to driving long-term shareholder value with a disciplined capital allocation strategy that balances investing in our organic growth initiatives, pursuing accretive M&A transactions and opportunistically leveraging favorable market conditions for share repurchases as they arise.
Fourth Quarter Fiscal 2022 Results
Net sales for the fourth quarter of fiscal 2022 of $1.29 billion increased 38.2% as compared with the prior year quarter, primarily due to inflationary pricing, healthy residential end market demand, strong performance from our complementary products and the acquisitions of Westside Building Material and AMES Taping Tools. Organic net sales increased 28.9%.
Excluding the impact from one less selling day in the fourth quarter of fiscal 2022 compared to the same period a year ago, net sales and organic net sales were up 40.4% and 30.9%, respectively.
Fourth quarter year-over-year sales increases by product category were as follows:
· Wallboard sales of $491.1 million increased 30.3% (up 26.5% on an organic basis).
· Ceilings sales of $148.9 million increased 22.7% (up 17.0% on an organic basis).
· Steel framing sales of $276.9 million increased 93.3% (up 81.6% on an organic basis).
· Complementary product sales of $371.8 million increased 27.9% (up 11.1% on an organic basis).
Gross profit of $412.8 million increased 40.5% compared to the fourth quarter of fiscal 2021, and gross margin improved 50 basis points to 32.0%, both primarily due to the successful pass through of product price inflation, continued strength in residential market demand and incremental gross profit dollars along with accretive gross margins from acquisitions.
Selling, general and administrative (“SG&A”) expense as a percentage of net sales improved 170 basis points to 20.5% for the quarter compared to 22.2% in the fourth quarter of fiscal 2021. Adjusted SG&A expense as a percentage of net sales of 20.2% improved 170 basis points from 21.9% in the prior year quarter as product price inflation outpaced increases in operating costs.
Net income increased 126.7% to $76.5 million, or $1.75 per diluted share, compared to net income of $33.7 million, or $0.77 per diluted share, in the fourth quarter of fiscal 2021. Adjusted net income was $91.3 million, or $2.09 per diluted share, compared to $46.9 million, or $1.07 per diluted share, in the fourth quarter of the prior fiscal year.
Adjusted EBITDA increased $63.0 million, or 69.1%, to $154.2 million compared to the prior year quarter. Adjusted EBITDA margin of 12.0% improved 220 basis points from 9.8% for the fourth quarter of fiscal 2021.
Balance Sheet, Liquidity and Cash Flow
As of April 30, 2022, the Company had cash on hand of $101.9 million, total debt of $1.2 billion and $330.7 million of available liquidity under its revolving credit facilities. Net debt leverage was 1.8 times as of the end of the quarter, down from 2.5 times at the end of the fourth quarter of fiscal 2021.
The Company generated cash from operating activities and free cash flow of $199.5 million and $191.6 million, respectively, for the quarter ended April 30, 2022. For the quarter ended April 30, 2021, the Company generated cash from operating activities and free cash flow of $84.8 million and $72.8 million, respectively.
Expanded Share Repurchase Authorization
The Company’s Board of Directors has approved an expanded share repurchase program under which the Company is authorized to repurchase up to $200 million of its outstanding common stock. This expanded program replaces the Company’s previous share repurchase authorization of $75 million, which commenced in 2018, and reflects the Board’s confidence in the business going forward. The repurchases will be made from time to time on the open market at prevailing market prices or in negotiated transactions off the market.
Conference Call and Webcast
GMS will host a conference call and webcast to discuss its results for the fourth quarter of fiscal year 2022, which ended on April 30, 2022, and other information related to its business at 8:30 a.m. Eastern Time on Thursday, June 23, 2022. Investors who wish to participate in the call should dial 877-407-3982 (domestic) or 201-493-6780 (international) at least 5 minutes prior to the start of the call. The live webcast will be available on the Investors section of the Company’s website at www.gms.com. There will be a slide presentation of the results available on that page of the website as well. Replays of the call will be available through July 23, 2022 and can be accessed at 844-512-2921 (domestic) or 412-317-6671 (international) and entering the pass code 13728027.
About GMS Inc.
Founded in 1971, GMS operates a network of nearly 300 distribution centers with extensive product offerings of wallboard, ceilings, steel framing and complementary construction products. In addition, GMS operates nearly 100 tool sales, rental and service centers, providing a comprehensive selection of building products and solutions for its residential and commercial contractor customer base across the United States and Canada. The Company’s unique operating model combines the benefits of a national platform and strategy with a local go-to-market focus, enabling GMS to generate significant economies of scale while maintaining high levels of customer service.
Use of Non-GAAP Financial Measures
GMS reports its financial results in accordance with GAAP. However, it presents Adjusted net income, free cash flow, Adjusted SG&A, Adjusted EBITDA, and Adjusted EBITDA margin, which are not recognized financial measures under GAAP. GMS believes that Adjusted net income, free cash flow, Adjusted SG&A, Adjusted EBITDA, and Adjusted EBITDA margin assist investors and analysts in comparing its operating performance across reporting periods on a consistent basis by excluding items that the Company does not believe are indicative of its core operating performance. The Company’s management believes Adjusted net income, Adjusted SG&A, free cash flow, Adjusted EBITDA and Adjusted EBITDA margin are helpful in highlighting trends in its operating results, while other measures can differ significantly depending on long-term strategic decisions regarding capital structure, the tax jurisdictions in which the Company operates and capital investments. In addition, the Company utilizes Adjusted EBITDA in certain calculations in its debt agreements.
You are encouraged to evaluate each adjustment and the reasons GMS considers it appropriate for supplemental analysis. In addition, in evaluating Adjusted net income, Adjusted SG&A and Adjusted EBITDA, you should be aware that in the future, the Company may incur expenses similar to the adjustments in the presentation of Adjusted net income, Adjusted SG&A and Adjusted EBITDA. The Company’s presentation of Adjusted net income, Adjusted SG&A, Adjusted SG&A margin, Adjusted EBITDA, and Adjusted EBITDA margin should not be construed as an inference that its future results will be unaffected by unusual or non-recurring items. In addition, Adjusted net income, free cash flow, Adjusted SG&A and Adjusted EBITDA may not be comparable to similarly titled measures used by other companies in GMS’s industry or across different industries. Please see the tables at the end of this release for a reconciliation of Adjusted EBITDA, free cash flow, Adjusted SG&A and Adjusted net income to the most directly comparable GAAP financial measures.
When calculating organic net sales growth, the Company excludes from the calculation (i) net sales of acquired businesses until the first anniversary of the acquisition date, and (ii) the impact of foreign currency translation.
Forward-Looking Statements and Information
This press release includes “forward-looking statements” within the meaning of the Private Securities Litigation Reform Act of 1995. You can generally identify forward-looking statements by the Company’s use of forward-looking terminology such as “anticipate,” “believe,” “confident,” “continue,” “could,” “estimate,” “expect,” “intend,” “may,” “might,” “plan,” “potential,” “predict,” “seek,” or “should,” or the negative thereof or other variations thereon or comparable terminology. In particular, statements about the markets in which GMS operates, including in particular residential and commercial construction, and the economy generally, pricing, the demand for the Company’s products, the Company’s strategic priorities and the results thereof, service levels and the ability to drive value and results contained in this press release may be considered forward-looking statements. In addition, forward looking statements may include statements regarding the Company’s expectations concerning management’s plans for execution of a stock repurchase program, including the maximum amount, manner and duration of the purchase of the Company’s common stock under its authorized stock repurchase program. The Company has based forward-looking statements on its current expectations, assumptions, estimates and projections. While the Company believes these expectations, assumptions, estimates, and projections are reasonable, such forward-looking statements are only predictions and involve known and unknown risks and uncertainties, many of which are beyond its control, including current and future public health issues, economic issues and geopolitical issues that may affect the Company’s business. Forward-looking statements involve risks and uncertainties, including, but not limited to, those described in the “Risk Factors” section in the Company’s most recent Annual Report on Form 10-K, and in its other periodic reports filed with the SEC. In addition, the statements in this release are made as of June 23, 2022. The Company undertakes no obligation to update any of the forward-looking statements made herein, whether as a result of new information, future events, changes in expectation or otherwise. These forward-looking statements should not be relied upon as representing the Company’s views as of any date subsequent to June 23, 2022.
Contact Information:
Investors:
Carey Phelps
ir@gms.com
770-723-3369
GMS Inc.
Condensed Consolidated Statements of Operations (Unaudited)
(in thousands, except per share data)
| | Three Months Ended | Year Ended | ||||||||||||||
| April 30, | April 30, | |||||||||||||||
| | 2022 | 2021 | 2022 | 2021 | ||||||||||||
| Net sales | $ | 1,288,653 | $ | 932,203 | $ | 4,634,875 | $ | 3,298,823 | ||||||||
| Cost of sales (exclusive of depreciation and amortization shown separately below) | 875,853 | 638,353 | 3,146,600 | 2,236,120 | ||||||||||||
| Gross profit | 412,800 | 293,850 | 1,488,275 | 1,062,703 | ||||||||||||
| Operating expenses: | ||||||||||||||||
| Selling, general and administrative | 264,473 | 207,321 | 950,125 | 763,629 | ||||||||||||
| Depreciation and amortization | 32,365 | 28,221 | 119,232 | 108,125 | ||||||||||||
| Total operating expenses | 296,838 | 235,542 | 1,069,357 | 871,754 | ||||||||||||
| Operating income | 115,962 | 58,308 | 418,918 | 190,949 | ||||||||||||
| Other (expense) income: | ||||||||||||||||
| Interest expense | (14,267 | ) | (12,726 | ) | (58,097 | ) | (53,786 | ) | ||||||||
| Gain on legal settlement | — | — | — | 1,382 | ||||||||||||
| Write-off of debt discount and deferred financing fees | — | (4,606 | ) | — | (4,606 | ) | ||||||||||
| Other income, net | 1,227 | 714 | 3,998 | 3,155 | ||||||||||||
| Total other expense, net | (13,040 | ) | (16,618 | ) | (54,099 | ) | (53,855 | ) | ||||||||
| Income before taxes | 102,922 | 41,690 | 364,819 | 137,094 | ||||||||||||
| Provision for income taxes | 26,426 | 7,944 | 91,377 | 31,534 | ||||||||||||
| Net income | $ | 76,496 | $ | 33,746 | $ | 273,442 | $ | 105,560 | ||||||||
| Weighted average common shares outstanding: | ||||||||||||||||
| Basic | 42,977 | 42,994 | 43,075 | 42,765 | ||||||||||||
| Diluted | 43,776 | 43,828 | 43,898 | 43,343 | ||||||||||||
| Net income per common share: | ||||||||||||||||
| Basic | $ | 1.78 | $ | 0.78 | $ | 6.35 | $ | 2.47 | ||||||||
| Diluted | $ | 1.75 | $ | 0.77 | $ | 6.23 | $ | 2.44 | ||||||||
GMS Inc.
Condensed Consolidated Balance Sheets (Unaudited)
(in thousands, except per share data)
| April 30, 2022 |
April 30, 2021 |
|||||||
| Assets | ||||||||
| Current assets: | | |||||||
| Cash and cash equivalents | $ | 101,916 | $ | 167,012 | ||||
| Trade accounts and notes receivable, net of allowances of $9,346 and $6,282, respectively | 750,046 | 558,661 | ||||||
| Inventories, net | 550,953 | 357,054 | ||||||
| Prepaid expenses and other current assets | 20,212 | 19,525 | ||||||
| Total current assets | 1,423,127 | 1,102,252 | ||||||
| Property and equipment, net of accumulated depreciation of $227,288 and $193,364, respectively | 350,679 | 311,326 | ||||||
| Operating lease right-of-use assets | 153,271 | 118,413 | ||||||
| Goodwill | 695,897 | 576,330 | ||||||
| Intangible assets, net | 454,747 | 350,869 | ||||||
| Deferred income taxes | 17,883 | 15,715 | ||||||
| Other assets | 8,795 | 8,993 | ||||||
| Total assets | $ | 3,104,399 | $ | 2,483,898 | ||||
| Liabilities and Stockholders’ Equity | ||||||||
| Current liabilities: | ||||||||
| Accounts payable | $ | 367,315 | $ | 322,965 | ||||
| Accrued compensation and employee benefits | 107,925 | 72,906 | ||||||
| Other accrued expenses and current liabilities | 127,938 | 87,138 | ||||||
| Current portion of long-term debt | 47,605 | 46,018 | ||||||
| Current portion of operating lease liabilities | 38,415 | 33,474 | ||||||
| Total current liabilities | 689,198 | 562,501 | ||||||
| Non-current liabilities: | ||||||||
| Long-term debt, less current portion | 1,136,585 | 932,409 | ||||||
| Long-term operating lease liabilities | 112,161 | 90,290 | ||||||
| Deferred income taxes, net | 46,802 | 12,728 | ||||||
| Other liabilities | 55,155 | 63,508 | ||||||
| Total liabilities | 2,039,901 | 1,661,436 | ||||||
| Commitments and contingencies | ||||||||
| Stockholders' equity: | ||||||||
| Common stock, par value $0.01 per share, 500,000 shares authorized; 42,773 and 43,073 shares issued and outstanding as of April 30, 2022 and 2021, respectively | 428 | 431 | ||||||
| Preferred stock, par value $0.01 per share, 50,000 shares authorized; 0 shares issued and outstanding as of April 30, 2022 and 2021 | — | — | ||||||
| Additional paid-in capital | 522,136 | 542,737 | ||||||
| Retained earnings | 547,977 | 274,535 | ||||||
| Accumulated other comprehensive income (loss) | (6,043 | ) | 4,759 | |||||
| Total stockholders' equity | 1,064,498 | 822,462 | ||||||
| Total liabilities and stockholders' equity | $ | 3,104,399 | $ | 2,483,898 | ||||
GMS Inc.
Condensed Consolidated Statements of Cash Flows (Unaudited)
(in thousands)
| Year Ended April 30, | ||||||||
| | 2022 | 2021 | ||||||
| Cash flows from operating activities: | | |||||||
| Net income | $ | 273,442 | $ | 105,560 | ||||
| Adjustments to reconcile net income to net cash provided by operating activities: | ||||||||
| Depreciation and amortization | 119,232 | 108,125 | ||||||
| Write-off and amortization of debt discount and debt issuance costs | 2,744 | 7,568 | ||||||
| Equity-based compensation | 17,354 | 12,872 | ||||||
| Gain on disposal of assets | (913 | ) | (1,011 | ) | ||||
| Deferred income taxes | (351 | ) | (10,329 | ) | ||||
| Other items, net | 5,706 | 1,552 | ||||||
| Changes in assets and liabilities net of effects of acquisitions: | ||||||||
| Trade accounts and notes receivable | (162,118 | ) | (101,617 | ) | ||||
| Inventories | (156,311 | ) | (46,660 | ) | ||||
| Prepaid expenses and other assets | (92 | ) | (2,621 | ) | ||||
| Accounts payable | 28,423 | 65,446 | ||||||
| Accrued compensation and employee benefits | 32,564 | 4,477 | ||||||
| Other accrued expenses and liabilities | 19,931 | 9,942 | ||||||
| Cash provided by operating activities | 179,611 | 153,304 | ||||||
| Cash flows from investing activities: | ||||||||
| Purchases of property and equipment | (41,082 | ) | (29,873 | ) | ||||
| Proceeds from sale of assets | 1,922 | 2,262 | ||||||
| Acquisition of businesses, net of cash acquired | (348,050 | ) | (35,976 | ) | ||||
| Cash used in investing activities | (387,210 | ) | (63,587 | ) | ||||
| Cash flows from financing activities: | ||||||||
| Repayments on revolving credit facilities | (1,178,897 | ) | (102,189 | ) | ||||
| Borrowings from revolving credit facilities | 1,390,222 | 14,750 | ||||||
| Payments of principal on long-term debt | (5,110 | ) | (8,754 | ) | ||||
| Payments of principal on finance lease obligations | (31,365 | ) | (30,371 | ) | ||||
| Borrowings from term loan | — | 511,000 | ||||||
| Repayments of term loan | — | (869,427 | ) | |||||
| Issuance of Senior Notes | — | 350,000 | ||||||
| Repurchases of common stock | (35,488 | ) | (4,160 | ) | ||||
| Debt issuance costs | — | (6,299 | ) | |||||
| Proceeds from exercises of stock options | 4,434 | 7,559 | ||||||
| Payments for taxes related to net share settlement of equity awards | (2,850 | ) | (807 | ) | ||||
| Proceeds from issuance of stock pursuant to employee stock purchase plan | 2,332 | 2,076 | ||||||
| Cash provided by (used in) financing activities | 143,278 | (136,622 | ) | |||||
| Effect of exchange rates on cash and cash equivalents | (775 | ) | 3,008 | |||||
| Decrease in cash and cash equivalents | (65,096 | ) | (43,897 | ) | ||||
| Cash and cash equivalents, beginning of year | 167,012 | 210,909 | ||||||
| Cash and cash equivalents, end of year | $ | 101,916 | $ | 167,012 | ||||
| Supplemental cash flow disclosures: | ||||||||
| Cash paid for income taxes | $ | 86,288 | $ | 46,417 | ||||
| Cash paid for interest | 46,204 | 49,650 | ||||||
GMS Inc.
Net Sales by Product Group (Unaudited)
(dollars in thousands)
| | Three Months Ended | Year Ended | ||||||||||||||||||||||||||||||
| | April 30, 2022 |
%
of Total |
April 30, 2021 |
%
of Total |
April 30, 2022 |
%
of Total |
April 30, 2021 |
%
of Total |
||||||||||||||||||||||||
| Wallboard | $ | 491,062 | 38.1 | % | $ | 376,926 | 40.4 | % | $ | 1,710,851 | 36.9 | % | $ | 1,346,648 | 40.8 | % | ||||||||||||||||
| Ceilings | 148,869 | 11.6 | % | 121,286 | 13.0 | % | 567,700 | 12.2 | % | 451,766 | 13.7 | % | ||||||||||||||||||||
| Steel framing | 276,901 | 21.5 | % | 143,266 | 15.4 | % | 1,027,941 | 22.2 | % | 469,048 | 14.2 | % | ||||||||||||||||||||
| Complementary products | 371,821 | 28.8 | % | 290,725 | 31.2 | % | 1,328,383 | 28.7 | % | 1,031,361 | 31.3 | % | ||||||||||||||||||||
| Total net sales | $ | 1,288,653 | $ | 932,203 | $ | 4,634,875 | $ | 3,298,823 | ||||||||||||||||||||||||
GMS Inc.
Reconciliation of Net Income to Adjusted EBITDA (Unaudited)
(in thousands)
| | Three Months Ended | Year Ended | ||||||||||||||
| | April 30, | April 30, | ||||||||||||||
| | 2022 | 2021 | 2022 | 2021 | ||||||||||||
| Net income | $ | 76,496 | $ | 33,746 | $ | 273,442 | $ | 105,560 | ||||||||
| Interest expense | 14,267 | 12,726 | 58,097 | 53,786 | ||||||||||||
| Write-off of debt discount and deferred financing fees | — | 4,606 | — | 4,606 | ||||||||||||
| Interest income | (96 | ) | (29 | ) | (163 | ) | (86 | ) | ||||||||
| Provision for income taxes | 26,426 | 7,944 | 91,377 | 31,534 | ||||||||||||
| Depreciation expense | 14,993 | 13,572 | 55,437 | 50,480 | ||||||||||||
| Amortization expense | 17,372 | 14,649 | 63,795 | 57,645 | ||||||||||||
| EBITDA | $ | 149,458 | $ | 87,214 | $ | 541,985 | $ | 303,525 | ||||||||
| Stock appreciation expense(a) | 1,277 | 621 | 4,403 | 3,173 | ||||||||||||
| Redeemable noncontrolling interests(b) | 898 | 226 | 1,983 | 1,288 | ||||||||||||
| Equity-based compensation(c) | 2,718 | 1,708 | 10,968 | 8,442 | ||||||||||||
| Severance and other permitted costs(d) | 463 | 322 | 1,132 | 2,948 | ||||||||||||
| Transaction costs (acquisitions and other)(e) | (344 | ) | 279 | 3,545 | 1,068 | |||||||||||
| Gain on disposal of assets(f) | (439 | ) | (482 | ) | (913 | ) | (1,011 | ) | ||||||||
| Effects of fair value adjustments to inventory(g) | 217 | 788 | 3,818 | 788 | ||||||||||||
| Gain on legal settlement | — | — | — | (1,382 | ) | |||||||||||
| Debt transaction costs(h) | — | 532 | — | 532 | ||||||||||||
| EBITDA addbacks | 4,790 | 3,994 | 24,936 | 15,846 | ||||||||||||
| Adjusted EBITDA | $ | 154,248 | $ | 91,208 | $ | 566,921 | $ | 319,371 | ||||||||
| | ||||||||||||||||
| Net sales | $ | 1,288,653 | $ | 932,203 | $ | 4,634,875 | $ | 3,298,823 | ||||||||
| Adjusted EBITDA Margin | 12.0 | % | 9.8 | % | 12.2 | % | 9.7 | % | ||||||||
___________________________________
| (a) | Represents changes in the fair value of stock appreciation rights. |
| (b) | Represents changes in the fair values of noncontrolling interests. |
| (c) | Represents non-cash equity-based compensation expense related to the issuance of share-based awards. |
| (d) | Represents severance expenses and other costs permitted in the calculation of Adjusted EBITDA under the ABL Facility and the Term Loan Facility, including certain unusual, nonrecurring costs and credits due to COVID-19. |
| (e) | Represents costs related to acquisitions paid to third parties. |
| (f) | Includes gains from the sale of assets. |
| (g) | Represents the non-cash cost of sales impact of acquisition accounting adjustments to increase inventory to its estimated fair value. |
| (h) | Represents costs paid to third-party advisors related to debt refinancing activities. |
GMS Inc.
Reconciliation of Cash Provided By Operating Activities to Free Cash Flow (Unaudited)
(in thousands)
| | Three Months Ended | Year Ended | ||||||||||||||
| | April 30, | April 30, | ||||||||||||||
| | 2022 | 2021 | 2022 | 2021 | ||||||||||||
| Cash provided by operating activities | $ | 199,498 | $ | 84,808 | $ | 179,611 | $ | 153,304 | ||||||||
| Purchases of property and equipment | (7,921 | ) | (12,016 | ) | (41,082 | ) | (29,873 | ) | ||||||||
| Free cash flow (a) | $ | 191,577 | $ | 72,792 | $ | 138,529 | $ | 123,431 | ||||||||
________________________________________
(a) Free cash flow is a non-GAAP financial measure that we define as net cash provided by (used in) operations less capital expenditures.
GMS Inc.
Reconciliation of Selling, General and Administrative Expense to Adjusted SG&A (Unaudited)
(in thousands)
| | Three Months Ended | Year Ended | ||||||||||||||
| | April 30, | April 30, | ||||||||||||||
| | 2022 | 2021 | 2022 | 2021 | ||||||||||||
| Selling, general and administrative expense | $ | 264,473 | $ | 207,321 | $ | 950,125 | $ | 763,629 | ||||||||
| Adjustments | ||||||||||||||||
| Stock appreciation expense(a) | (1,277 | ) | (621 | ) | (4,403 | ) | (3,173 | ) | ||||||||
| Redeemable noncontrolling interests(b) | (898 | ) | (226 | ) | (1,983 | ) | (1,288 | ) | ||||||||
| Equity-based compensation(c) | (2,718 | ) | (1,708 | ) | (10,968 | ) | (8,442 | ) | ||||||||
| Severance and other permitted costs(d) | (476 | ) | (275 | ) | (1,216 | ) | (2,864 | ) | ||||||||
| Transaction costs (acquisitions and other)(e) | 344 | (279 | ) | (3,545 | ) | (1,068 | ) | |||||||||
| Gain on disposal of assets(f) | 439 | 482 | 913 | 1,011 | ||||||||||||
| Debt transaction costs(g) | — | (532 | ) | — | (532 | ) | ||||||||||
| Adjusted SG&A | $ | 259,887 | $ | 204,162 | $ | 928,923 | $ | 747,273 | ||||||||
| Net sales | $ | 1,288,653 | $ | 932,203 | $ | 4,634,875 | $ | 3,298,823 | ||||||||
| Adjusted SG&A margin | 20.2 | % | 21.9 | % | 20.0 | % | 22.7 | % | ||||||||
___________________________________
| (a) | Represents changes in the fair value of stock appreciation rights. |
| (b) | Represents changes in the fair values of noncontrolling interests. |
| (c) | Represents non-cash equity-based compensation expense related to the issuance of share-based awards. |
| (d) | Represents severance expenses and other costs permitted in the calculation of Adjusted EBITDA under the ABL Facility and the Term Loan Facility, including certain unusual, nonrecurring costs and credits due to COVID-19. |
| (e) | Represents costs related to acquisitions paid to third parties. |
| (f) | Includes gains from the sale of assets. |
| (g) | Represents costs paid to third-party advisors related to debt refinancing activities. |
GMS Inc.
Reconciliation of Income Before Taxes to Adjusted Net Income (Unaudited)
(in thousands, except per share data)
| | Three Months Ended | Year Ended | ||||||||||||||
| | April 30, | April 30, | ||||||||||||||
| | 2022 | 2021 | 2022 | 2021 | ||||||||||||
| Income before taxes | $ | 102,922 | $ | 41,690 | $ | 364,819 | $ | 137,094 | ||||||||
| EBITDA add-backs | 4,790 | 3,994 | 24,936 | 15,846 | ||||||||||||
| Write-off of debt discount and deferred financing fees | — | 4,606 | — | 4,606 | ||||||||||||
| Acquisition accounting depreciation and amortization (1) | 13,226 | 10,257 | 45,779 | 40,311 | ||||||||||||
| Adjusted pre-tax income | 120,938 | 60,547 | 435,534 | 197,857 | ||||||||||||
| Adjusted income tax expense | 29,630 | 13,623 | 106,706 | 44,518 | ||||||||||||
| Adjusted net income | $ | 91,308 | $ | 46,924 | $ | 328,828 | $ | 153,339 | ||||||||
| Effective tax rate (2) | 24.5 | % | 22.5 | % | 24.5 | % | 22.5 | % | ||||||||
| Weighted average shares outstanding: | ||||||||||||||||
| Basic | 42,977 | 42,994 | 43,075 | 42,765 | ||||||||||||
| Diluted | 43,776 | 43,828 | 43,898 | 43,343 | ||||||||||||
| Adjusted net income per share: | ||||||||||||||||
| Basic | $ | 2.12 | $ | 1.09 | $ | 7.63 | $ | 3.59 | ||||||||
| Diluted | $ | 2.09 | $ | 1.07 | $ | 7.49 | $ | 3.54 | ||||||||
________________________________________
| (1) | Depreciation and amortization from the increase in value of certain long-term assets associated with the April 1, 2014 acquisition of the predecessor company and amortization of intangible assets from the acquisitions of Titan, Westside Building Material and Ames Taping Tools. |
| (2) | Normalized cash tax rate excluding the impact of acquisition accounting and certain other deferred tax amounts. |
Exhibit 99.2

Q4 2022 Earnings Call June 23, 2022

2 Safe Harbor and B asis of Presentation Forward - Looking Statement Safe Harbor — This presentation includes “forward - looking statements” within the meaning of the Private Securities Litigation Reform Act of 1995. You can generally identify forward - looking statements by the Company’s use of forward - looking terminology such as “anticipate,” “bel ieve,” “confident,” “continue,” “could,” “estimate,” “expect,” “intend,” “may,” “might,” “plan,” “potential,” “predict,” “seek,” or “should,” or the negative thereof or other variations th ere on or comparable terminology. In particular, statements about the markets in which GMS operates and or our products, including potential growth in those markets and products, the economy gene ral ly, actions taken to optimize our operations and align our business consistent with demand, our ability to continue successfully navigating the evolving operating environment and e xec uting our business, strategic initiatives and priorities and growth potential, future M&A and greenfields , product availability, inflation, capital structure, pricing, net sales, organic sales, gross margins, incremental EBITDA an d A djusted EBITDA, interest expense, tax rates, capital expenditures, and free cash flow, cash flow generation and working capital management, f utu re financial performance and liquidity, the ability of the Company to grow stronger, and the ability to deliver growth, value creation and long - term success contained in this presentation may be considered forward - looking statements. Statements about our expectations, beliefs, plans, strategies, objectives, prospects, assumptions or future events or perform anc e may be considered forward - looking statements. The Company has based forward - looking statements on its current expectations, assumptions, estimates and projections. While the Comp any believes these expectations, assumptions, estimates and projections are reasonable, such forward - looking statements are only predictions and involve known and unknown ris ks and uncertainties, many of which are beyond its control, including current public health issues that may affect the Company’s business. Forward - looking statements involve risks and uncertainties, including, but not limited to, those described in the “Risk Factors” section in the Company’s most recent Annual Report on Form 10 - K, and in its other periodic repor ts filed with the SEC. In addition, the statements in this release are made as of June 23, 2022. The Company undertakes no obligation to update any of the forward - looking statements made herein, whether as a result of new information, future events, changes in expectation or otherwise. These forward - looking statements should not be relied upon as representing t he Company’s views as of any date subsequent to June 23, 2022. Use of Non - GAAP and Adjusted Financial Information — To supplement GAAP financial information, we use adjusted measures of operating results which are non - GAAP measures. This non - GAAP adjusted financial information is provided as additional information for investors. These adjusted results exclude certain costs, expenses, gains and losses, and we believe their exclusion can enhance an overall understanding of our past financial performance and also our prospects for the fu ture. These adjustments to our GAAP results are made with the intent of providing both management and investors a more complete understanding of our operating performance by excl udi ng non - recurring, infrequent or other non - cash charges that are not believed to be material to the ongoing performance of our business. The presentation of this additional inf ormation is not meant to be considered in isolation or as a substitute for GAAP measures of net income, diluted earnings per share or net cash provided by (used in) operating activities pr epared in accordance with generally accepted accounting principles in the United States. Please see the Appendix to this presentation for a further discussion on these non - GAAP measure s and a reconciliation of these non - GAAP measures to the most directly comparable GAAP measures.

3 Q4 Fiscal 2022 Highlights Record Levels of Net Sales, Net Income and Adjusted EBITDA 1 ▪ Quarterly net sales of $1.3 billion, up 38.2% from Q421 ‒ Same day sales growth of 40.4% ▪ Sales growth of more than 20% in all four major product categories, including Wallboard, Steel Framing, Ceilings and Complementary Products ‒ Sales growth driven by product inflation as well as year - over - year volume growth in Wallboard, Ceilings and Complementary Products ‒ Double digit organic revenue growth in each of our four major product categories ▪ Gross profit up 40.5% Net Income Up 126.7%; Adjusted EBITDA 1 Up $63.0 million, or 69.1% Adjusted EBITDA Margin 1 Up 220 Basis Points Strong Cash Generation ▪ Generated cash from operating activities of $199.5 million, compared to $84.8 million in Q421 ▪ Generated Free Cash Flow of $191.6 million, compared to $72.8 million in Q421 1 For a reconciliation of Adjusted SG&A, Adjusted Net Income, Adjusted EBITDA, and Adjusted EBITDA Margin to the most directly com parable GAAP metrics, see Appendix. $33.7 $46.9 $91.2 $76.5 $91.3 $154.2 $0 $50 $100 $150 Net Income Adj. Net Income Adj. EBITDA Net Income, Adj Net Income 1 & Adj EBITDA 1 Q4 FY21 Q4 FY22 Net Sales Gross Profit Net Income $1.3B $412.8M $76.5M 38.2% 40.5% 126.7%
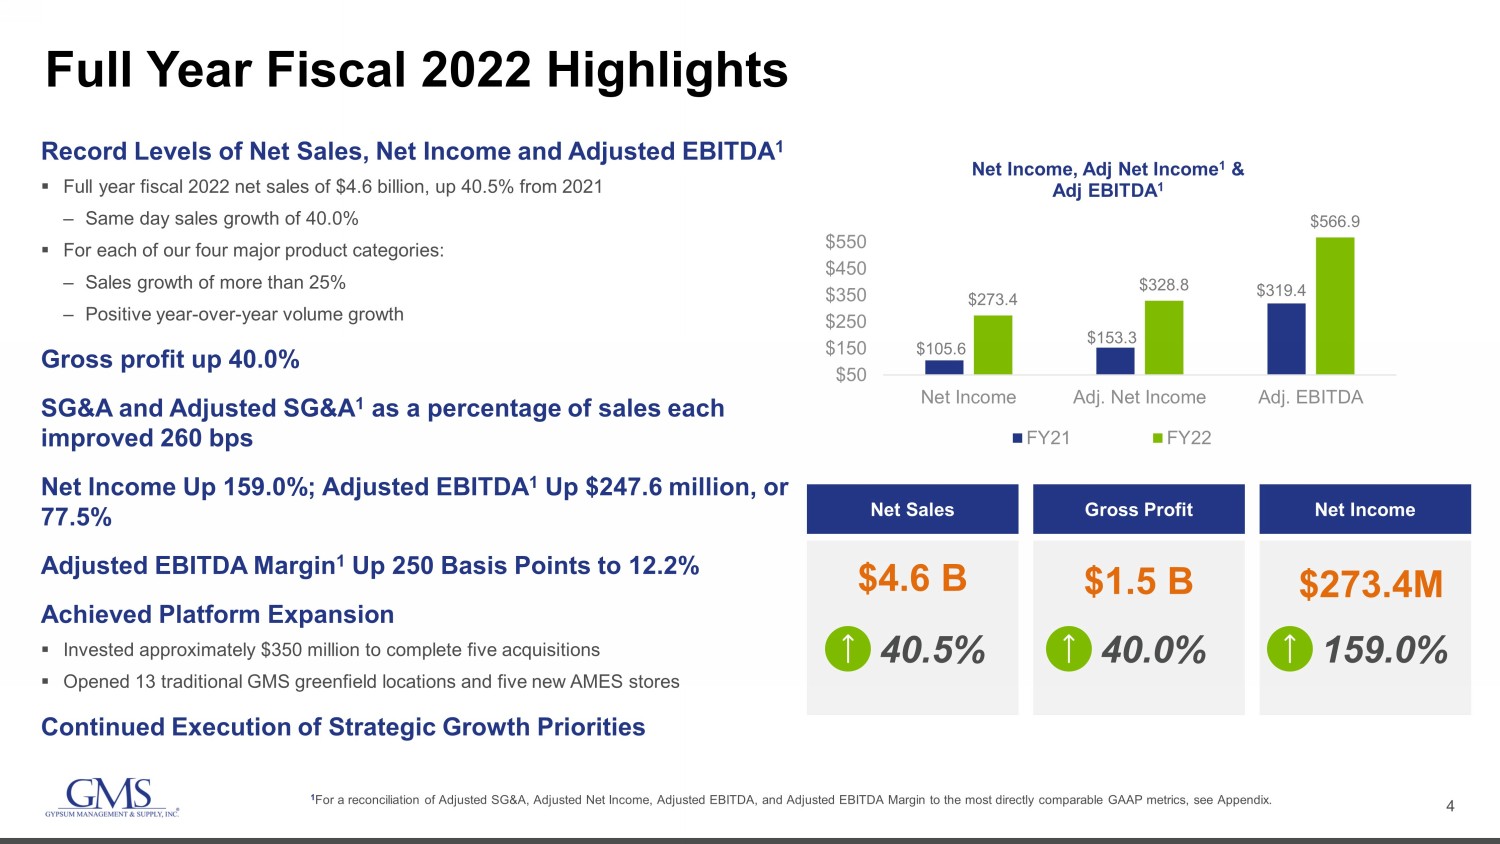
4 Full Year Fiscal 2022 Highlights Record Levels of Net Sales, Net Income and Adjusted EBITDA 1 ▪ Full year fiscal 2022 net sales of $4.6 billion, up 40.5% from 2021 ‒ Same day sales growth of 40.0% ▪ For each of our four major product categories: ‒ Sales growth of more than 25% ‒ Positive year - over - year volume growth Gross profit up 40.0% SG&A and Adjusted SG&A 1 as a percentage of sales each improved 260 bps Net Income Up 159.0%; Adjusted EBITDA 1 Up $247.6 million, or 77.5% Adjusted EBITDA Margin 1 Up 250 Basis Points to 12.2% Achieved Platform Expansion ▪ Invested approximately $350 million to complete five acquisitions ▪ Opened 13 traditional GMS greenfield locations and five new AMES stores Continued Execution of Strategic Growth Priorities 1 For a reconciliation of Adjusted SG&A, Adjusted Net Income, Adjusted EBITDA, and Adjusted EBITDA Margin to the most directly com parable GAAP metrics, see Appendix. $105.6 $153.3 $319.4 $273.4 $328.8 $566.9 $50 $150 $250 $350 $450 $550 Net Income Adj. Net Income Adj. EBITDA Net Income, Adj Net Income 1 & Adj EBITDA 1 FY21 FY22 Net Sales Gross Profit Net Income $4.6 B $1.5 B $273.4M 40.5% 40.0% 159.0%

5 Strategic Growth Priorities – Full Year Fiscal 2022 Update Capitalize on existing fixed investments in locations and equipment where we are underpenetrated or below expected share Grow Complementary Product opportunities outside of core products to diversify and profitably expand our product offering Expand the platform through accretive acquisition and greenfield opportunities, balanced with debt reduction priorities Leverage our scale and employ technology and best practices to deliver a best - in - class customer experience and further profit improvement • Year - over - year volume growth in each of our four product categories • Organic growth of roughly 20% for wallboard and ceilings • Steel up more than 100% organically • Benefits of scale and our commitment to service provide value to our customers and provide confidence for continued growth in our core products • 28% growth net sales of Complementary Products • 14.5% organic sales growth • 4Q22 was the 8 th straight quarter of growth for this category • Completed most significant acquisition in this space to date: AMES Tools closed on December 1, 2021 • Complementary Products has grown over time to contribute nearly 30% of our net sales • Invested approximately $350 million to acquire five companies in FY22 • Architectural Coatings Distributors • Westside Building Material • DK&B Construction Specialties, EIFS Division • AMES Taping Tools • Kimco Supply Company • Opened 13 new greenfield locations • Opened 5 new AMES stores in FY22 (under GMS ownership) • Robust pipeline of M&A and greenfield opportunities • Net debt leverage at Apr. 30, 2022 was 1.8 times • Providing customers with the ability to easily transact with us, implement automated orders, check delivery status and receive proof of delivery notifications and photos make us a more valuable partner • Driving purchasing and operational efficiencies by equipping our yards with automation tools and performing fleet upgrades • Helping to offset operational cost increases • Building our “Yard of the Future” to improve efficiency, productivity and profitability while delivering greater value to our customers and stakeholders Expand Share in Core Products Grow Complementary Products Platform Expansion Drive Improved Productivity & Profitability
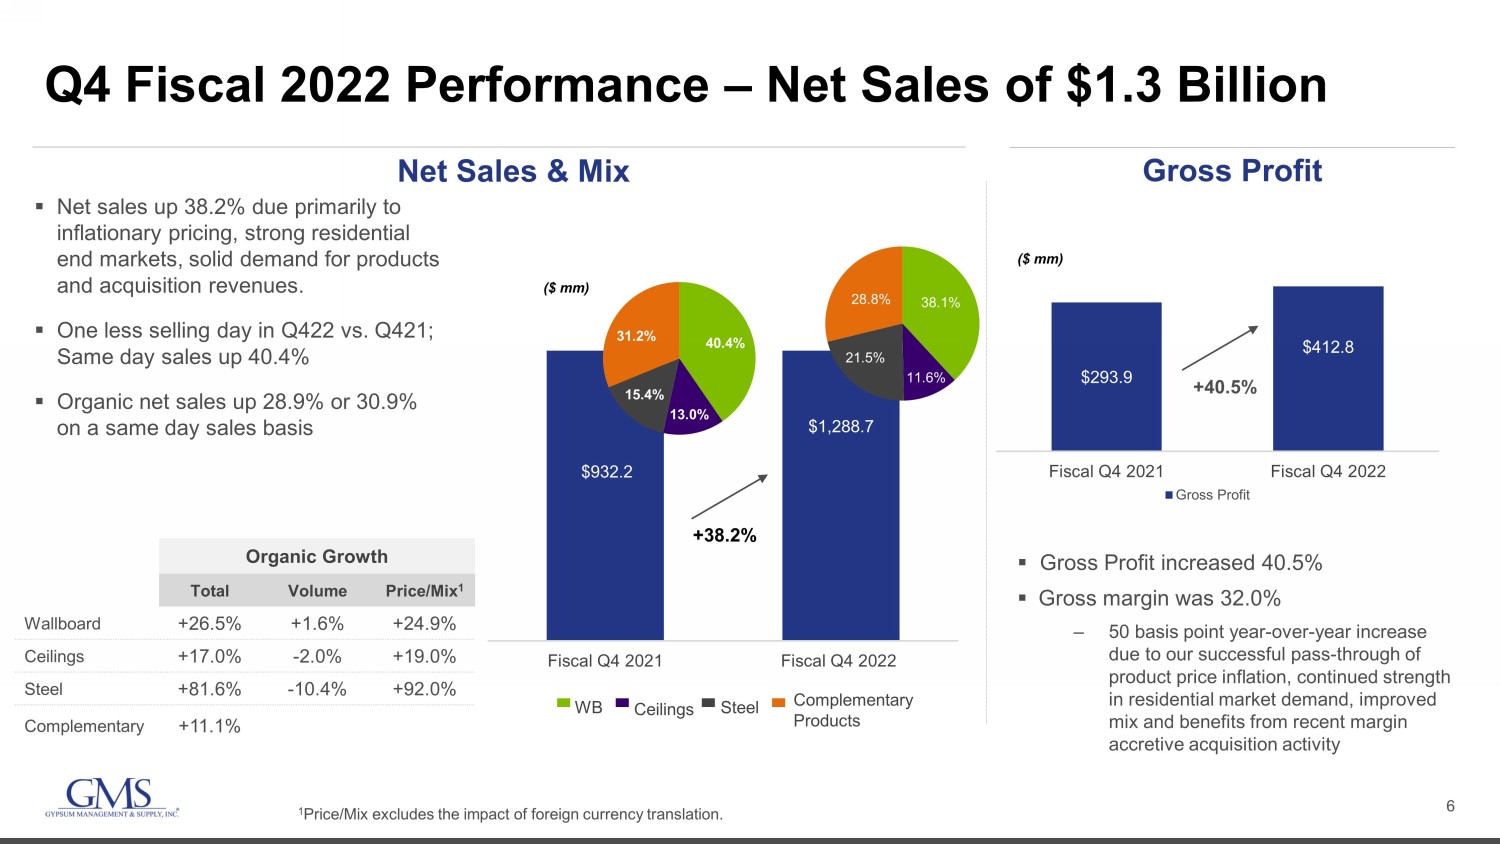
6 $293.9 $412.8 $0 $50 $100 $150 $200 $250 $300 Fiscal Q4 2021 Fiscal Q4 2022 Gross Profit Q4 Fiscal 2022 Performance – Net Sales of $1.3 Billion Net Sales & Mix Gross Profit ▪ Gross Profit increased 40.5% ▪ Gross margin was 32.0% ‒ 50 basis point year - over - year increase due to our successful pass - through of product price inflation, continued strength in residential market demand, improved mix and benefits from recent margin accretive acquisition activity ▪ Net sales up 38.2% due primarily to inflationary pricing, strong residential end markets, solid demand for products and acquisition revenues. ▪ One less selling day in Q422 vs. Q421; Same day sales up 40.4% ▪ Organic net sales up 28.9% or 30.9% on a same day sales basis Organic Growth Total Volume Price/Mix 1 Wallboard +26.5% +1.6% +24.9% Ceilings +17.0% - 2.0% +19.0% Steel +81.6% - 10.4% +92.0% Complementary +11.1% $932.2 $1,288.7 Fiscal Q4 2021 Fiscal Q4 2022 +38.2% 40.4% 13.0% 15.4% 31.2% 38.1% 11.6% 21.5% 28.8% WB Ceilings Steel Complementary Products ($ mm) ($ mm) 1 Price/Mix excludes the impact of foreign currency translation. +40.5%

7 $91.2 $154.2 9.8% 12.0% Fiscal Q4 2021 Fiscal Q4 2022 Adj. EBITDA Adj. EBITDA Margin $204.2 21.9% 20.2% 18.0% 18.5% 19.0% 19.5% 20.0% 20.5% 21.0% 21.5% 22.0% 22.5% 23.0% 23.5% 24.0% 24.5% 25.0% 25.5% 26.0% 26.5% 27.0% 27.5% 28.0% $0 $50 $100 $150 $200 $250 Fiscal Q4 2021 Fiscal Q4 2022 Adj. SG&A Adj. SG&A % ($ mm) Q4 Fiscal 2022 – Improved Profitability 1 For a reconciliation of Adjusted SG&A, Adjusted Net Income, Adjusted EBITDA and Adjusted EBITDA Margin to the most directly c omp arable GAAP metrics, see Appendix. SG&A and Adjusted SG&A 1 ▪ Reported SG&A was 20.5% of sales compared to 22.2% of sales a year ago, representing a 170 - basis point improvement. ▪ Adjusted SG&A 1 improved 170 - basis points as product inflation outpaced increases in operating costs. Net Income, Adjusted Net Income 1 & Adjusted EBITDA 1 ▪ Reported net income and Adjusted net income 1 totaled $76.5 million and $91.3 million, respectively. ▪ Adjusted EBITDA 1 increased 69.1% and Adjusted EBITDA margin 1 improved 220 basis points year - over - year. Adj. EBITDA 1 Up 69.1% 1 1 1 170 bps improvement 1 $259.9

8 Attractive Capital Structure Supports Strategic Priorities • Generated Cash from Operating Activities of $199.5 million, compared to $84.8 million in Q4 FY21 • Free Cash Flow 1 was $191.6 million, compared to $72.8 million in Q4 FY21 • Significant improvement in cash flow as we took down inventory as the supply chain improved, particularly in steel • Substantial liquidity, with $101.9 million of cash on hand and an additional $330.7 million available under our revolving credit facilities as of 4/30/2022 • Attractive capital structure • “Through the Cycle” objective of Free Cash Flow 1 : 40% - 50% of Adjusted EBITDA 1 ‒ Fiscal 2022 Free Cash Flow was below this level due to elevated inventory balances as GMS worked to ensure product availability for its customers. Cash From Operations and Free Cash Flow 1 $89.9 2.5 x 2.7 x 2.4 x 2.3 x 1.8 4/30/21 7/31/21 10/31/21 1/31/2022 4/30/2022 $48 $39 $239 $504 $9 $355 2023 2024 2025 2026 2027 Thereafter LTM Net Debt / PF Adjusted EBITDA 2 Debt 3 Maturity Schedule as of 4/30/2022 $ in millions 1. For a reconciliation of free cash flow to cash provided by (used in) operating activities, the most directly comparable GAAP met ric, see Appendix. 2. For detail, including a reconciliation of Pro Forma Adjusted EBITDA to net income, the most directly comparable GAAP metric, see Appendix. 3. Debt includes First Lien Term Loan, ABL Facility, Senior Notes, Finance Leases & Installment Notes. Expanded Share Repurchase Authorized
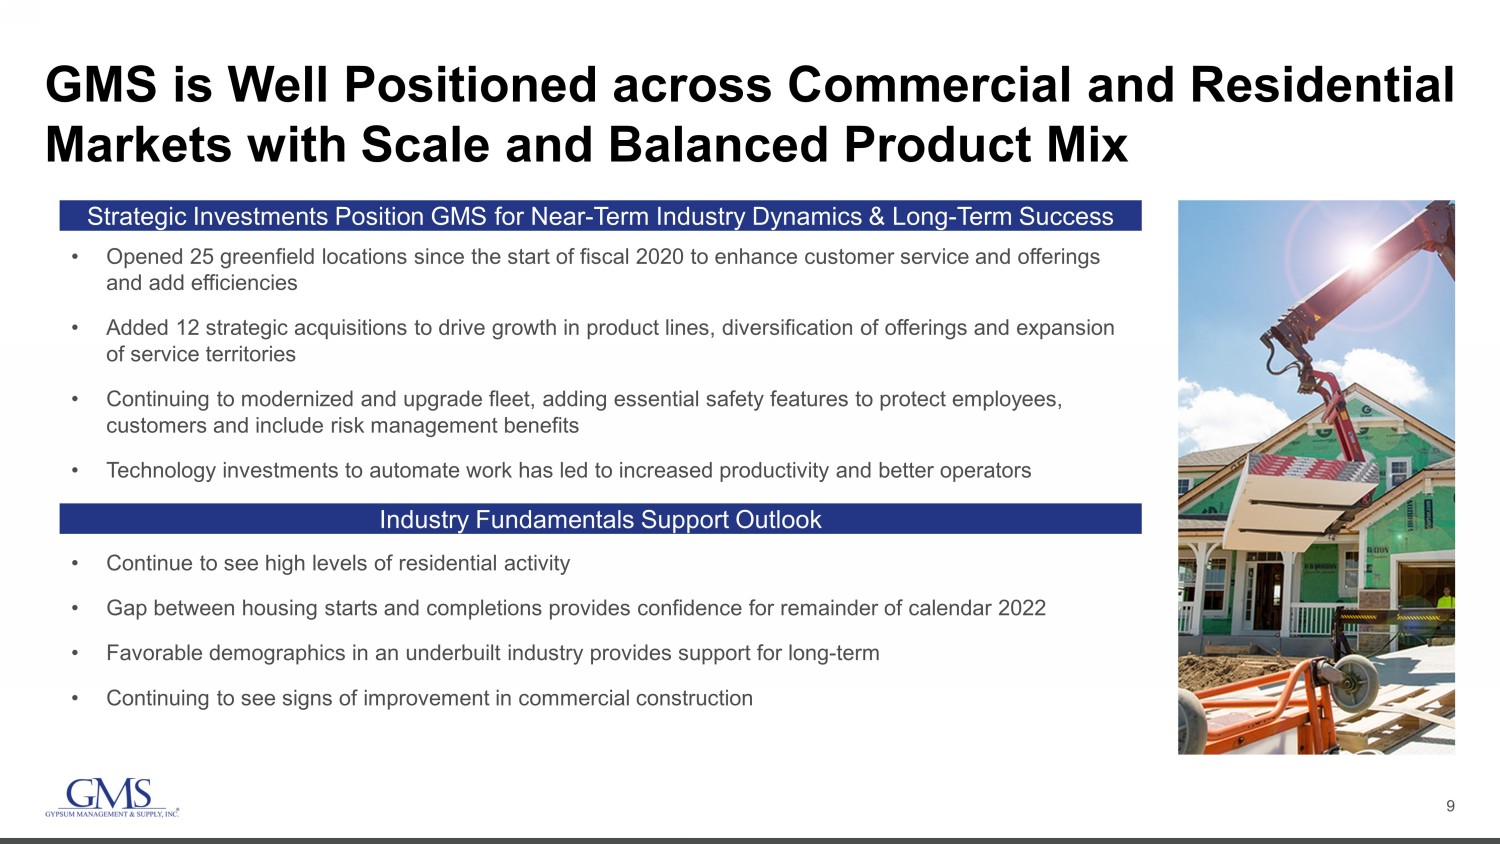
9 GMS is Well Positioned across Commercial and Residential Markets with Scale and Balanced Product Mix • Continue to see high levels of residential activity • Gap between housing starts and completions provides confidence for remainder of calendar 2022 • Favorable demographics in an underbuilt industry provides support for long - term • Continuing to see signs of improvement in commercial construction • Opened 25 greenfield locations since the start of fiscal 2020 to enhance customer service and offerings and add efficiencies • Added 12 strategic acquisitions to drive growth in product lines, diversification of offerings and expansion of service territories • Continuing to modernized and upgrade fleet, adding essential safety features to protect employees, customers and include risk management benefits • Technology investments to automate work has led to increased productivity and better operators Strategic Investments Position GMS for Near - Term Industry Dynamics & Long - Term Success Industry Fundamentals Support Outlook

10 Expectations 1. For a reconciliation of Adjusted SG&A, Adjusted Net Income, Adjusted EBITDA, Adjusted EBITDA Margin and Free Cash Flow to the mo st directly comparable GAAP metrics, see Appendix. Expectations for Q1 Fiscal 2023 Favorable pricing and continued strength in residential should result in: • Q1 FY23 Expected Year - Over - Year Net Sales Growth: ~30% • Q1 FY23 Expected Year - Over - Year Organic Sales Growth: low 20% range Gross Margin will benefit from higher prices in wallboard, while steel prices are expected to modestly decline. • Q1 FY23 Expected Gross Margin: In line with Q1 FY22 Incremental Adjusted EBITDA 1 : • Product price inflation is expected to exceed inflationary and activity - driven increases in operating expenses • Q1 FY23 Expected Incremental Adjusted EBITDA 1 : ~ 12% • FY23 full year interest expense: ~$60 million • Cash tax rate for Adjusted Net Income 1 for FY23: 25% – 26% • FY23 full year capital expenditures: Comparable to FY22 • Free Cash Flow 1 : Target is 40% - 50% of Adjusted EBITDA Full Year and Longer - Term Expectations

11 GMS is Well - Positioned Now and for the Long - Term Industry leader with local expertise and broad North American scale Superior safety track record and logistics execution Breadth of product offerings, with growing Complementary Product opportunities Strong balance sheet , substantial liquidity and expected strong long term cash flow generation to support future growth Differentiated service model with professional sales force delivering best - in - class customer service Successfully executing on strategic priorities to capitalize on long - term growth opportunities Hein – can you please replace this picture with the one of the guy accepting drywall thru the window? Also – I’m not sure if I like the numbers off to the left on this slide. Do you think there’s some sort of icon or something that might look better?

12 Appendix
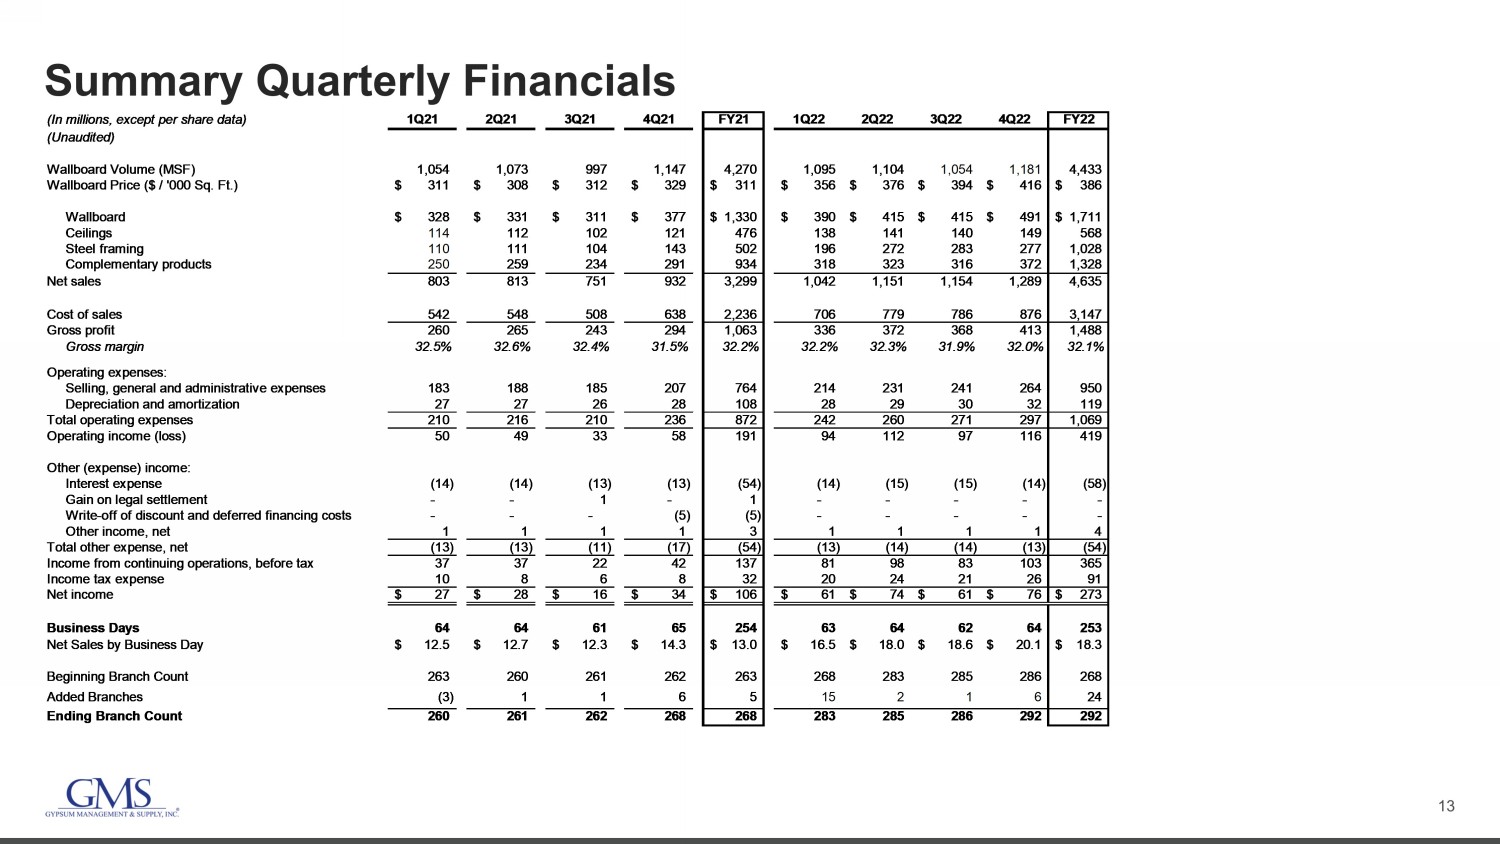
13 Summary Quarterly Financials (In millions, except per share data) 1Q21 2Q21 3Q21 4Q21 FY21 1Q22 2Q22 3Q22 4Q22 FY22 (Unaudited) Wallboard Volume (MSF) 1,054 1,073 997 1,147 4,270 1,095 1,104 1,054 1,181 4,433 Wallboard Price ($ / '000 Sq. Ft.) 311$ 308$ 312$ 329$ 311$ 356$ 376$ 394$ 416$ 386$ Wallboard 328$ 331$ 311$ 377$ 1,330$ 390$ 415$ 415$ 491$ 1,711$ Ceilings 114 112 102 121 476 138 141 140 149 568 Steel framing 110 111 104 143 502 196 272 283 277 1,028 Complementary products 250 259 234 291 934 318 323 316 372 1,328 Net sales 803 813 751 932 3,299 1,042 1,151 1,154 1,289 4,635 Cost of sales 542 548 508 638 2,236 706 779 786 876 3,147 Gross profit 260 265 243 294 1,063 336 372 368 413 1,488 Gross margin 32.5% 32.6% 32.4% 31.5% 32.2% 32.2% 32.3% 31.9% 32.0% 32.1% Operating expenses: Selling, general and administrative expenses 183 188 185 207 764 214 231 241 264 950 Depreciation and amortization 27 27 26 28 108 28 29 30 32 119 Total operating expenses 210 216 210 236 872 242 260 271 297 1,069 Operating income (loss) 50 49 33 58 191 94 112 97 116 419 Other (expense) income: Interest expense (14) (14) (13) (13) (54) (14) (15) (15) (14) (58) Gain on legal settlement - - 1 - 1 - - - - - Write-off of discount and deferred financing costs - - - (5) (5) - - - - - Other income, net 1 1 1 1 3 1 1 1 1 4 Total other expense, net (13) (13) (11) (17) (54) (13) (14) (14) (13) (54) Income from continuing operations, before tax 37 37 22 42 137 81 98 83 103 365 Income tax expense 10 8 6 8 32 20 24 21 26 91 Net income 27$ 28$ 16$ 34$ 106$ 61$ 74$ 61$ 76$ 273$ Business Days 64 64 61 65 254 63 64 62 64 253 Net Sales by Business Day 12.5$ 12.7$ 12.3$ 14.3$ 13.0$ 16.5$ 18.0$ 18.6$ 20.1$ 18.3$ Beginning Branch Count 263 260 261 262 263 268 283 285 286 268 Added Branches (3) 1 1 6 5 15 2 1 6 24 Ending Branch Count 260 261 262 268 268 283 285 286 292 292

14 Quarterly Cash Flows (1) Free cash flow is a non - GAAP financial measure defined as net cash provided by (used in) operations less capital expenditures. D ifferences may occur due to rounding. ($ in millions) (Unaudited) 1Q21 2Q21 3Q21 4Q21 FY21 1Q22 2Q22 3Q22 4Q22 FY22 Net income $ 27.2 $ 28.5 $ 16.1 $ 33.7 $ 105.5 $ 61.2 $ 74.4 $ 61.4 $ 76.5 $ 273.4 Non-cash changes & other changes (0.1) 46.4 31.5 52.8 130.6 28.8 57.8 43.9 65.6 196.2 Changes in primary working capital components: Trade accounts and notes receivable (41.5) (15.6) 41.7 (86.2) (101.6) (73.5) (73.9) 37.4 (52.2) (162.1) Inventories 14.0 (15.0) (23.4) (22.3) (46.7) (87.3) (81.2) (22.6) 34.8 (156.3) Accounts payable (15.4) (4.5) (21.5) 106.8 65.4 (4.3) 20.9 (62.9) 74.7 28.4 Cash provided by (used in) operating activities (15.7) 39.8 44.4 84.8 153.3 (75.1) (2.0) 57.2 199.5 179.6 Purchases of property and equipment (4.7) (7.1) (6.0) (12.0) (29.9) (6.8) (9.3) (17.0) (7.9) (41.1) Proceeds from sale of assets 0.3 0.4 0.5 1.0 2.3 0.3 0.2 0.7 0.8 1.9 Acquisitions of businesses, net of cash acquired (0.2) 0.2 - (35.9) (36.0) (123.0) (1.9) (220.4) (2.7) (348.1) Cash (used in) investing activities (4.6) (6.6) (5.5) (46.9) (63.6) (129.6) (11.1) (236.8) (9.8) (387.2) Cash provided by (used in) financing activities (51.8) (55.1) (7.8) (22.0) (136.6) 81.4 28.7 207.8 (174.6) 143.3 Effect of exchange rates 0.9 0.3 1.2 0.5 3.0 (0.2) 0.1 (0.5) (0.2) (0.8) Increase (decrease) in cash and cash equivalents (71.2) (21.5) 32.4 16.4 (43.9) (123.4) 15.7 27.7 14.9 (65.1) Balance, beginning of period 210.9 139.7 118.2 150.6 210.9 167.0 43.6 59.3 87.0 167.0 Balance, end of period $ 139.7 $ 118.2 $ 150.6 $ 167.0 $ 167.0 $ 43.6 $ 59.3 $ 87.0 $ 101.9 $ 101.9 Supplemental cash flow disclosures: Cash paid for income taxes $ 3.5 $ 16.7 $ 11.7 $ 14.5 $ 46.4 $ 1.0 $ 36.8 $ 23.3 $ 25.2 $ 86.3 Cash paid for interest $ 13.1 $ 12.6 $ 12.4 $ 11.5 $ 49.7 $ 8.6 $ 9.0 $ 18.1 $ 10.5 $ 46.2 Cash provided by (used in) operating activities $ (15.7) $ 39.8 $ 44.4 $ 84.8 $ 153.3 $ (75.1) $ (2.0) $ 57.2 $ 199.5 $ 179.6 Purchases of property and equipment (4.7) (7.1) (6.0) (12.0) (29.9) (6.8) (9.3) (17.0) (7.9) (41.1) Free cash flow (1) (20.5) 32.7 38.4 72.8 123.4 (81.9) (11.3) 40.2 191.6 138.5
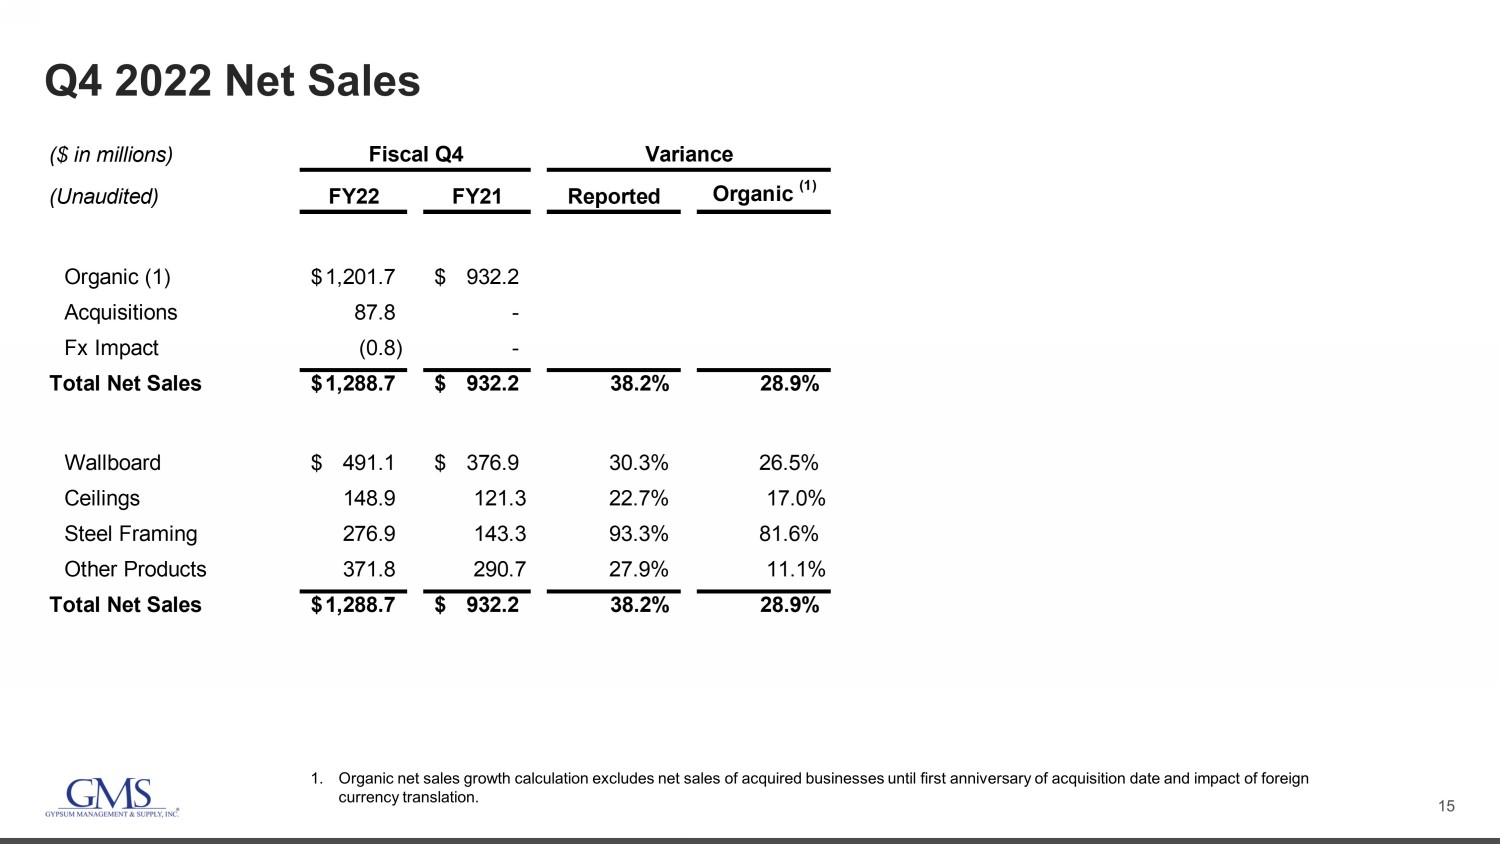
15 Q4 2022 Net Sales 1. Organic net sales growth calculation excludes net sales of acquired businesses until first anniversary of acquisition date an d i mpact of foreign currency translation. ($ in millions) (Unaudited) FY22 FY21 Reported Organic (1) Organic (1) 1,201.7$ 932.2$ Acquisitions 87.8 - Fx Impact (0.8) - Total Net Sales 1,288.7$ 932.2$ 38.2% 28.9% Wallboard 491.1$ 376.9$ 30.3% 26.5% Ceilings 148.9 121.3 22.7% 17.0% Steel Framing 276.9 143.3 93.3% 81.6% Other Products 371.8 290.7 27.9% 11.1% Total Net Sales 1,288.7$ 932.2$ 38.2% 28.9% Fiscal Q4 Variance

16 Quarterly Net Income to Adjusted EBITDA Reconciliation Commentary A. Represents changes in the fair value of stock appreciation rights B. Represents changes in the fair value of noncontrolling interests C. Represents non - cash equity - based compensation expense related to the issuance of share - based awards D. Represents severance expenses and other costs permitted in calculations under the ABL Facility and the Term Loan Facility, including certain unusual, nonrecurring costs and credits received due to the COVID - 19 pandemic. E. Represents one - time costs related to acquisitions paid to third parties F. Includes impairment of assets resulting from restructuring plans to close certain facilities and gains from the sale of assets. G. Represents the non - cash cost of sales impact of purchase accounting adjustments to increase inventory to its estimated fair value H. Represents expenses paid to third party advisors related to debt refinancing activities ( $ in 000s) 1Q21 2Q21 3Q21 4Q21 FY21 1Q22 2Q22 3Q22 4Q22 FY22 (Unaudited) Net Income 27,219$ 28,469$ 16,126$ 33,746$ 105,560$ 61,202$ 74,361$ 61,383$ 76,496$ 273,442$ Add: Interest Expense 14,081 13,525 13,454 12,726 53,786 13,657 14,744 15,429 14,267 58,097 Add: Write off of debt discount and deferred financing fees - - - 4,606 4,606 - - - - - Less: Interest Income (37) (14) (6) (29) (86) - (27) (40) (96) (163) Add: Income Tax Expense 9,604 8,277 5,709 7,944 31,534 19,971 23,769 21,211 26,426 91,377 Add: Depreciation Expense 12,827 12,710 11,371 13,572 50,480 12,925 13,703 13,816 14,993 55,437 Add: Amortization Expense 14,270 14,535 14,191 14,649 57,645 14,789 15,700 15,934 17,372 63,795 EBITDA 77,964$ 77,502$ 60,845$ 87,214$ 303,525$ 122,544$ 142,250$ 127,733$ 149,458$ 541,985$ Adjustments Stock appreciation rights (A) 792 314 1,446 621 3,173 892 983 1,251 1,277 4,403 Redeemable noncontrolling interests (B) 252 186 624 226 1,288 310 593 182 898 1,983 Equity-based compensation (C) 1,605 3,252 1,877 1,708 8,442 1,958 3,215 3,077 2,718 10,968 Severance and other permitted costs (D) 1,947 762 (83) 322 2,948 147 249 273 463 1,132 Transaction costs (acquisition and other) (E) 100 25 664 279 1,068 575 2,393 921 (344) 3,545 (Gain) loss on disposal of assets (F) 394 481 (1,404) (482) (1,011) (78) (144) (252) (439) (913) Effects of fair value adjustments to inventory (G) - - - 788 788 1,731 - 1,870 217 3,818 Gain on legal settlement - - (1,382) - (1,382) - - - - - Debt transaction costs (H) - - - 532 532 - - - - - Total Add-Backs 5,090$ 5,020$ 1,742$ 3,994$ 15,846$ 5,535$ 7,289$ 7,322$ 4,790$ 24,936$ Adjusted EBITDA (as reported) 83,054$ 82,522$ 62,587$ 91,208$ 319,371$ 128,079$ 149,539$ 135,055$ 154,248$ 566,921$ Net Sales $802,573 $812,856 $751,191 $932,203 $3,298,823 $1,042,076 $1,150,551 $1,153,595 $1,288,653 $4,634,875 Adjusted EBITDA Margin 10.3% 10.2% 8.3% 9.8% 9.7% 12.3% 13.0% 11.7% 12.0% 12.2%

17 Net Income to Pro Forma Adjusted EBITDA Reconciliation Commentary A. Represents changes in the fair value of stock appreciation rights B. Represents changes in the fair value of noncontrolling interests C. Represents non - cash equity - based compensation expense related to the issuance of share - based awards D. Represents severance expenses and other costs permitted in calculations under the ABL Facility and the Term Loan Facility, including certain unusual, nonrecurring costs and credits received due to the COVID - 19 pandemic. E. Represents one - time costs related to our initial public offering and acquisitions paid to third party advisors as well as costs related to the retirement of corporate stock appreciation rights F. Represents management fees paid to AEA, which were discontinued after the IPO G. Represents the non - cash cost of sales impact of purchase accounting adjustments to increase inventory to its estimated fair value H. Represents mark - to - market adjustments for derivative financial instruments I. Represents one - time costs related to our secondary offerings paid to third party advisors J. Represents expenses paid to third party advisors related to debt refinancing activities K. Pro forma impact of earnings from acquisitions from the beginning of the LTM period to the date of acquisition, including synergies ( $ in 000s) 2022 2021 2020 2019 2018 2017 (Unaudited) Net Income 273,442$ 105,560$ 23,381$ 56,002$ 62,971$ 48,886$ Add: Interest Expense 58,097 53,786 67,718 73,677 31,395 29,360 Add: Write off of debt discount and deferred financing fees - 4,606 1,331 - 74 7,103 Less: Interest Income (163) (86) (88) (66) (177) (152) Add: Income Tax Expense 91,377 31,534 22,944 14,039 20,883 22,654 Add: Depreciation Expense 55,437 50,480 51,332 46,456 24,075 25,565 Add: Amortization Expense 63,795 57,645 65,201 71,003 41,455 43,675 EBITDA 541,985$ 303,525$ 231,819$ 261,111$ 180,676$ 177,091$ Adjustments Impairment of goodwill - - 63,074 - - - Stock appreciation rights (A) 4,403 3,173 1,572 2,730 2,318 148 Redeemable noncontrolling interests (B) 1,983 1,288 520 1,188 1,868 3,536 Equity-based compensation (C) 10,968 8,442 7,060 3,906 1,695 2,534 Severance and other permitted costs (D) 1,132 2,948 5,733 8,152 581 (157) Transaction costs (acquisition and other) (E) 3,545 1,068 2,414 7,858 3,370 2,249 (Gain) loss on disposal of assets (913) (1,011) 658 (525) (509) (338) AEA management fee (F) - - - - - 188 Effects of fair value adjustments to inventory (G) 3,818 788 575 4,176 324 946 Gain on legal settlement - (1,382) (14,029) - - - Change in fair value of financial instruments (H) - - - 6,395 6,125 382 Secondary public offerings (I) - - 363 - 1,525 1,385 Debt transaction costs (J) - 532 - 678 1,285 265 Total Add-Backs 24,936$ 15,846$ 67,940$ 34,558$ 18,582$ 11,138$ Adjusted EBITDA (as reported) 566,921$ 319,371$ 299,759$ 295,669$ 199,258$ 188,229$ Contributions from acquisitions (K) 21,348 4,948 1,480 6,717 1,280 9,500 Pro Forma Adjusted EBITDA 588,269$ 324,319$ 301,239$ 302,386$ 200,538$ 197,729$ Net Sales $4,634,875 $3,298,823 $3,241,307 $3,116,032 $2,511,469 $2,319,146 Adjusted EBITDA margin (as reported) 12.2% 9.7% 9.2% 9.5% 7.9% 8.1%
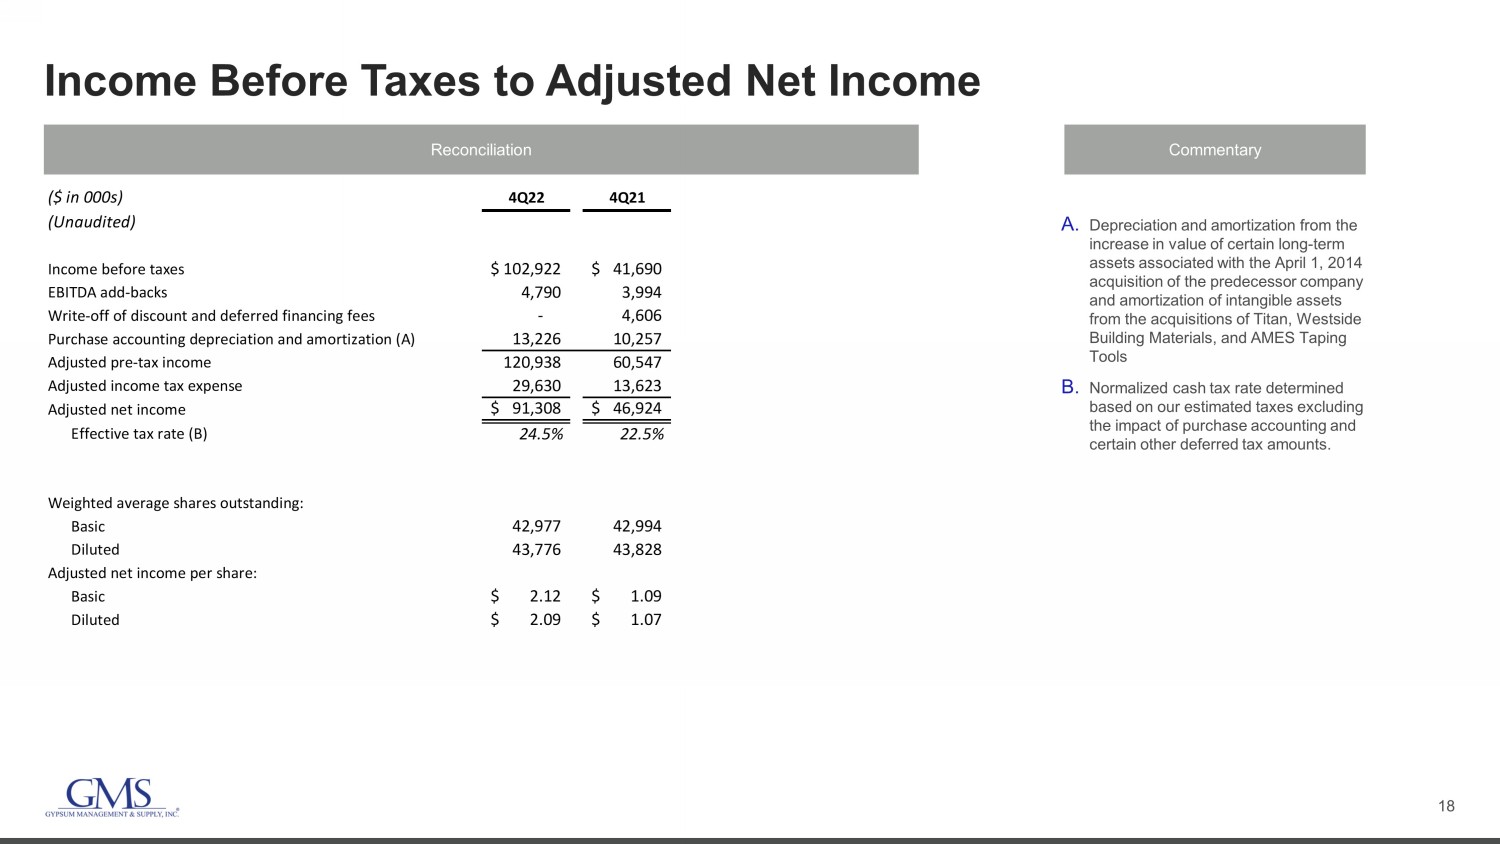
18 Income Before Taxes to Adjusted Net Income Reconciliation Commentary A. Depreciation and amortization from the increase in value of certain long - term assets associated with the April 1, 2014 acquisition of the predecessor company and amortization of intangible assets from the acquisitions of Titan, Westside Building Materials, and AMES Taping Tools B. Normalized cash tax rate determined based on our estimated taxes excluding the impact of purchase accounting and certain other deferred tax amounts. ($ in 000s) 4Q22 4Q21 (Unaudited) Income before taxes 102,922$ 41,690$ EBITDA add-backs 4,790 3,994 Write-off of discount and deferred financing fees - 4,606 Purchase accounting depreciation and amortization (A) 13,226 10,257 Adjusted pre-tax income 120,938 60,547 Adjusted income tax expense 29,630 13,623 Adjusted net income 91,308$ 46,924$ Effective tax rate (B) 24.5% 22.5% Weighted average shares outstanding: Basic 42,977 42,994 Diluted 43,776 43,828 Adjusted net income per share: Basic 2.12$ 1.09$ Diluted 2.09$ 1.07$

19 Reported SG&A to Adjusted SG&A Reconciliation Commentary A. Represents changes in the fair value of stock appreciation rights B. Represents changes in the fair value of noncontrolling interests C. Represents non - cash equity - based compensation expense related to the issuance of share - based awards D. Represents severance expenses and other costs permitted in calculations under the ABL Facility and the Term Loan Facility, including certain unusual, nonrecurring costs and credits received due to the COVID - 19 pandemic. E. Represents one - time costs related to acquisitions paid to third parties. (Unaudited) 1Q21 2Q21 3Q21 4Q21 FY2021 1Q22 2Q22 3Q22 4Q22 FY2022 ($ in millions) SG&A - Reported 183.1$ 188.4$ 184.8$ 207.3$ 763.6$ 214.1$ 230.5$ 241.0$ 264.5$ 950.1$ Adjustments Stock appreciation rights (A) (0.8) (0.3) (1.4) (0.6) (3.2) (0.9) (1.0) (1.3) (1.3) (4.4) Redeemable noncontrolling interests (B) (0.3) (0.2) (0.6) (0.2) (1.3) (0.3) (0.6) (0.2) (0.9) (2.0) Equity-based compensation (C) (1.6) (3.3) (1.9) (1.7) (8.4) (2.0) (3.2) (3.1) (2.7) (11.0) Severance and other permitted costs (D) (1.9) (0.8) 0.1 (0.3) (2.9) (0.2) (0.3) (0.3) (0.4) (1.1) Transaction costs (acquisition and other)(E) (0.1) (0.0) (0.7) (0.3) (1.1) (0.6) (2.4) (0.9) 0.3 (3.5) Gain (loss) on disposal of assets (0.4) (0.5) 1.4 0.5 1.0 0.1 0.1 0.3 0.4 0.9 Debt transaction costs - - - (0.5) (0.5) - - - - - SG&A - Adjusted 178.1$ 183.3$ 181.7$ 204.2$ 747.3$ 210.3$ 223.2$ 235.6$ 259.9$ 929.0$ % of net sales 22.2% 22.5% 24.2% 21.9% 22.7% 20.2% 19.4% 20.4% 20.2% 20.0%
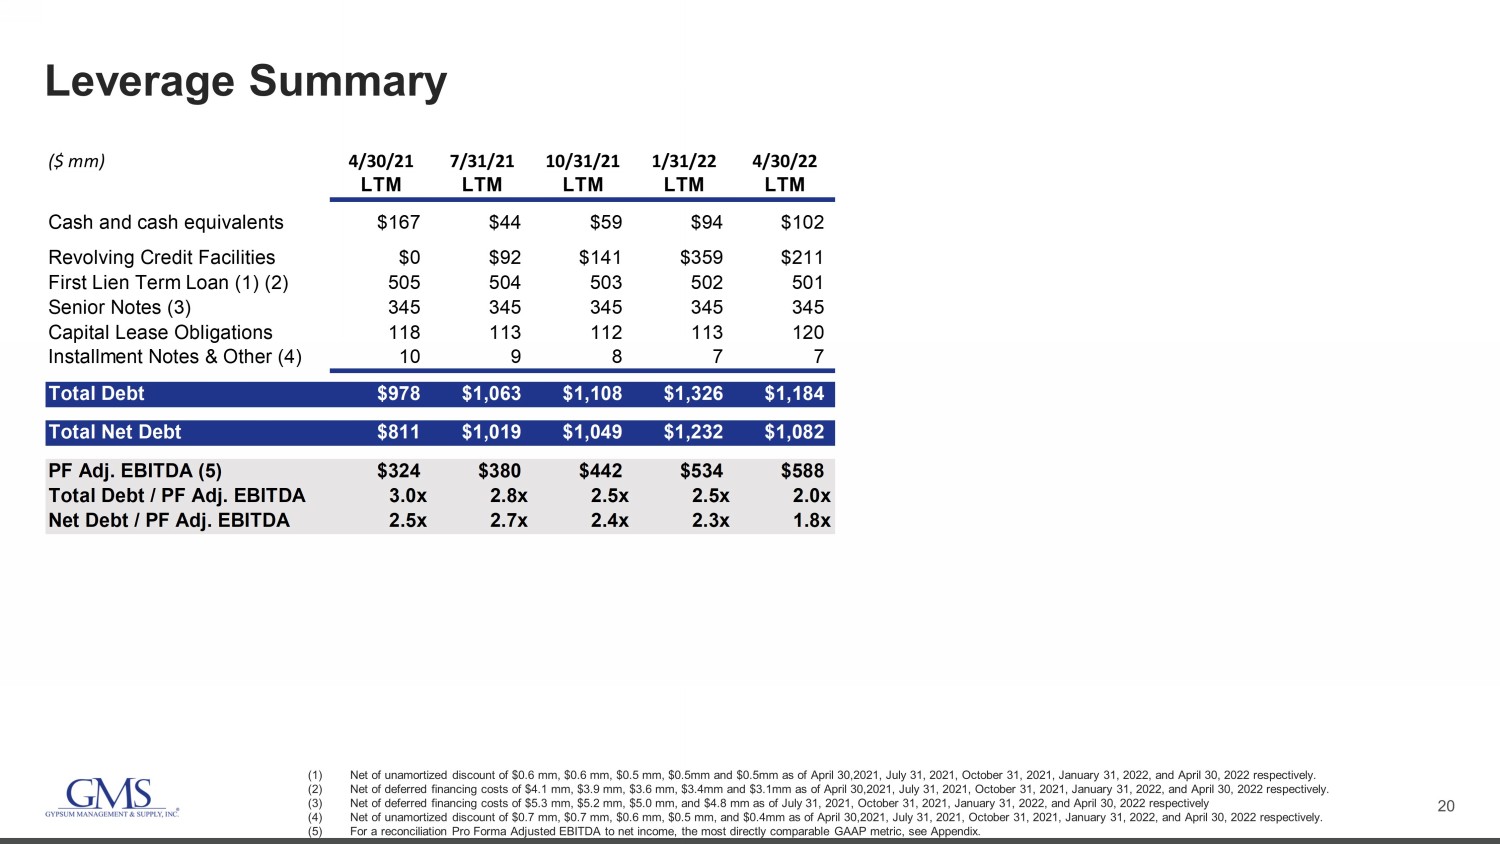
20 Leverage Summary (1) Net of unamortized discount of $0.6 mm, $0.6 mm , $0.5 mm, $0.5mm and $0.5mm as of April 30,2021, July 31, 2021, October 31, 2021, January 31, 2022, and April 30, 2022 respectively . (2) Net of deferred financing costs of $4.1 mm, $3.9 mm, $3.6 mm, $3.4mm and $3.1mm as of April 30,2021, July 31, 2021, October 31, 2021, January 31, 2022, and April 30, 2022 respectively. (3) Net of deferred financing costs of $5.3 mm, $5.2 mm, $5.0 mm, and $4.8 mm as of July 31, 2021, October 31, 2021, January 31, 202 2, and April 30, 2022 respectively (4) Net of unamortized discount of $0.7 mm, $0.7 mm, $0. 6 mm, $0.5 mm, and $0.4mm as of April 30,2021, July 31, 2021, October 31, 2021, January 31, 2022, and April 30, 2022 respective ly . (5) For a reconciliation Pro Forma Adjusted EBITDA to net income, the most directly comparable GAAP metric, see Appendix. ($ mm) 4/30/21 7/31/21 10/31/21 1/31/22 4/30/22 LTM LTM LTM LTM LTM Cash and cash equivalents $167 $44 $59 $94 $102 Revolving Credit Facilities $0 $92 $141 $359 $211 First Lien Term Loan (1) (2) 505 504 503 502 501 Senior Notes (3) 345 345 345 345 345 Capital Lease Obligations 118 113 112 113 120 Installment Notes & Other (4) 10 9 8 7 7 Total Debt $978 $1,063 $1,108 $1,326 $1,184 Total Net Debt $811 $1,019 $1,049 $1,232 $1,082 PF Adj. EBITDA (5) $324 $380 $442 $534 $588 Total Debt / PF Adj. EBITDA 3.0x 2.8x 2.5x 2.5x 2.0x Net Debt / PF Adj. EBITDA 2.5x 2.7x 2.4x 2.3x 1.8x
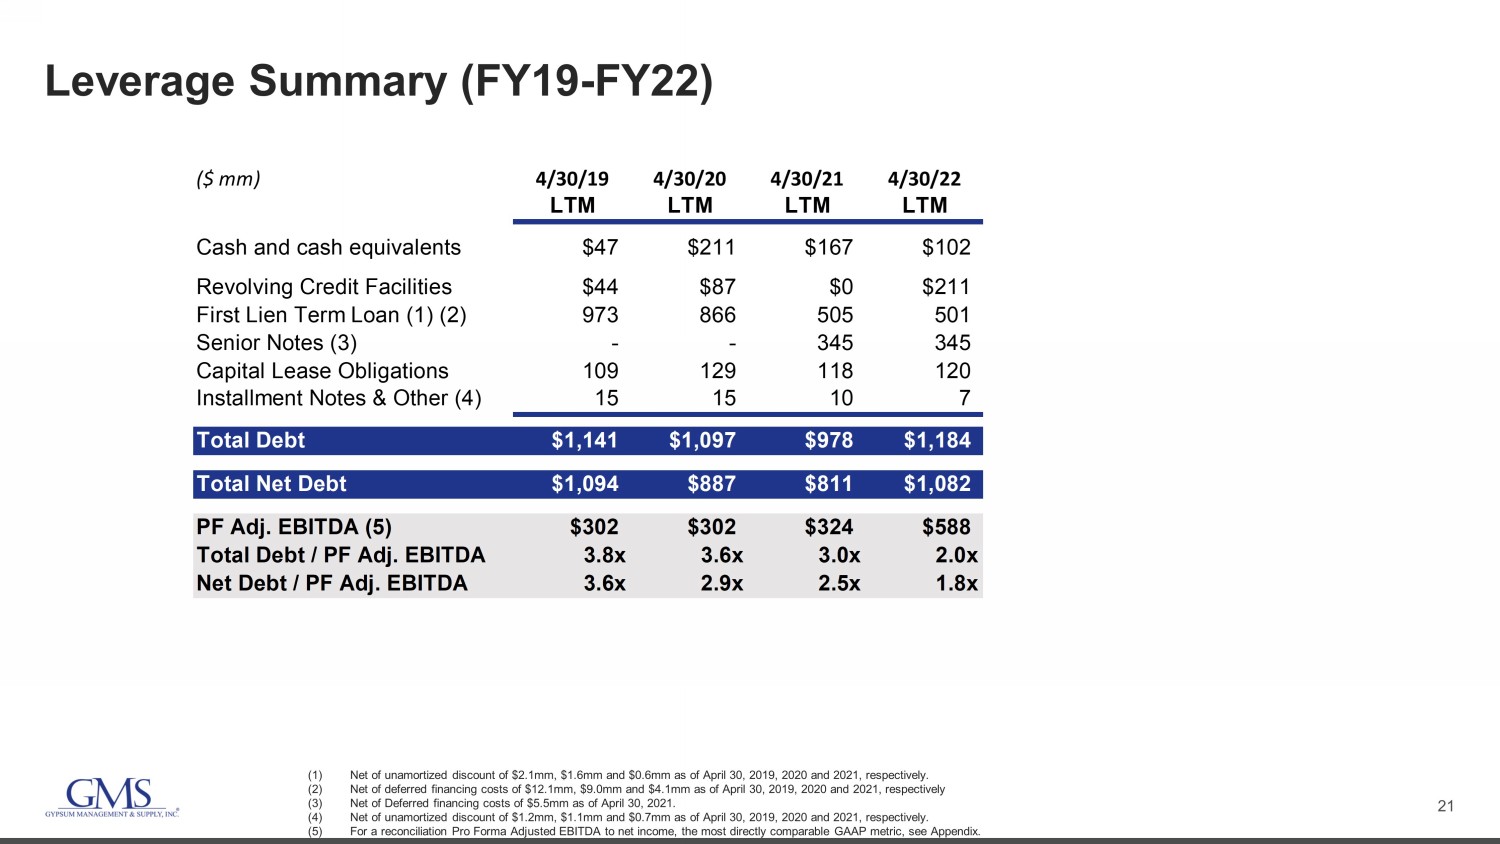
21 Leverage Summary (FY19 - FY22) (1) Net of unamortized discount of $2.1mm, $1.6mm and $0.6mm as of April 30, 2019, 2020 and 2021, respectively. (2) Net of deferred financing costs of $12.1mm, $9.0mm and $4.1mm as of April 30, 2019, 2020 and 2021, respectively (3) Net of Deferred financing costs of $5.5mm as of April 30, 2021. (4) Net of unamortized discount of $1.2mm, $1.1mm and $0.7mm as of April 30, 2019, 2020 and 2021, respectively. (5) For a reconciliation Pro Forma Adjusted EBITDA to net income, the most directly comparable GAAP metric, see Appendix. ($ mm) 4/30/19 4/30/20 4/30/21 4/30/22 LTM LTM LTM LTM Cash and cash equivalents $47 $211 $167 $102 Revolving Credit Facilities $44 $87 $0 $211 First Lien Term Loan (1) (2) 973 866 505 501 Senior Notes (3) - - 345 345 Capital Lease Obligations 109 129 118 120 Installment Notes & Other (4) 15 15 10 7 Total Debt $1,141 $1,097 $978 $1,184 Total Net Debt $1,094 $887 $811 $1,082 PF Adj. EBITDA (5) $302 $302 $324 $588 Total Debt / PF Adj. EBITDA 3.8x 3.6x 3.0x 2.0x Net Debt / PF Adj. EBITDA 3.6x 2.9x 2.5x 1.8x