Document
MANAGEMENT'S
DISCUSSION
AND ANALYSIS
|
|
|
|
|
|
|
|
|
|
|
|
|
|
|
|
|
A. HOW WE REPORT OUR RESULTS |
|
J. CAPITAL AND LIQUIDITY MANAGEMENT |
|
|
|
1. Capital |
|
B. OVERVIEW |
|
2. Capital Adequacy |
|
1. Strategy |
|
3. Shareholder Dividends |
|
2. Financial Objectives |
|
4. Principal Sources and Uses of Funds |
|
3. Sustainability Plan |
|
5. Liquidity |
|
4. Acquisitions and Other |
|
|
|
|
|
K. RISK MANAGEMENT |
|
C. FINANCIAL SUMMARY |
|
1. Risk Management Framework |
|
|
|
2. Risk Governance |
|
D. PROFITABILITY |
|
3. Risk Universe |
|
|
|
4. Risk Appetite |
|
E. GROWTH |
|
5. Risk Management Policies |
|
1. Sales, Gross Flows and Value of New Business |
|
6. Risk Management Process |
|
2. Assets Under Management |
|
7. Three Lines of Defence |
|
|
|
8. Risk Culture and Philosophy |
|
F. CONTRACTUAL SERVICE MARGIN |
|
9. Risk Categories |
|
|
|
|
|
G. FINANCIAL STRENGTH |
|
L. ADDITIONAL FINANCIAL DISCLOSURE |
|
|
|
1. Selected Annual Information |
|
H. PERFORMANCE BY BUSINESS GROUP |
|
2. Items related to Statement of Operations |
|
1. Asset Management |
|
3. Items related to Statement of Financial Position |
|
2. Canada |
|
4. Fourth Quarter 2023 Profitability |
|
3. U.S. |
|
5. Fourth Quarter 2023 Growth |
|
4. Asia |
|
6. Previous Quarters |
|
5. Corporate |
|
|
|
|
|
M. NON-IFRS FINANCIAL MEASURES |
|
I. INVESTMENTS |
|
|
|
1. Investment Profile |
|
N. ACCOUNTING AND CONTROL MATTERS |
|
2. Debt Securities |
|
1. Critical Accounting Policies and Estimates |
|
3. Equities |
|
2. Changes in Accounting Policies |
|
4. Mortgages and Loans |
|
3. Disclosure Controls and Procedures |
|
5. Derivatives |
|
|
|
6. Investment Properties |
|
O. LEGAL AND REGULATORY PROCEEDINGS |
|
7. Loss Allowance and Provision for Credit Loss |
|
|
|
|
|
P. FORWARD-LOOKING STATEMENTS |
|
|
|
|
|
|
|
|
|
|
|
|
MANAGEMENT'S DISCUSSION & ANALYSIS Sun Life Financial Inc. December 31, 2023 1
|
|
|
Management's Discussion and Analysis |
February 7, 2024
|
|
|
|
|
|
| A. How We Report Our Results |
|
Sun Life is a leading international financial services organization providing asset management, wealth, insurance and health solutions to individual and institutional Clients. Sun Life has operations in a number of markets worldwide, including Canada, the United States, the United Kingdom, Ireland, Hong Kong, the Philippines, Japan, Indonesia, India, China, Australia, Singapore, Vietnam, Malaysia and Bermuda. As of December 31, 2023, Sun Life had total assets under management ("AUM") of $1.40 trillion. For more information please visit www.sunlife.com.
Sun Life Financial Inc. trades on the Toronto (TSX), New York (NYSE) and Philippine (PSE) stock exchanges under the ticker symbol SLF.
Sun Life Financial Inc. ("SLF Inc.") is a publicly traded company domiciled in Canada and is the holding company of Sun Life Assurance Company of Canada ("Sun Life Assurance"). In this management's discussion and analysis ("MD&A"), SLF Inc., its subsidiaries and, where applicable, its joint ventures and associates are collectively referred to as "the Company", "Sun Life", "we", "our", and "us". Unless otherwise indicated, all information in this MD&A is presented as at and for the year ended December 31, 2023 and the information contained in this document is in Canadian dollars. Amounts in this document are impacted by rounding.
Where information at and for the year ended December 31, 2023 is not available, information available for the latest period before December 31, 2023 is used. Except where otherwise noted, financial information is presented in accordance with International Financial Reporting Standards ("IFRS") and the accounting requirements of the Office of the Superintendent of Financial Institutions ("OSFI"). Reported net income (loss) refers to Common shareholders' net income (loss) determined in accordance with IFRS.
We manage our operations and report our financial results in five business segments: Asset Management, Canada, United States ("U.S."), Asia, and Corporate. Information concerning these segments is included in our annual and interim consolidated financial statements and accompanying notes ("Annual Consolidated Financial Statements" and "Interim Consolidated Financial Statements", respectively, and "Consolidated Financial Statements" collectively), and this MD&A document.
On January 1, 2023 we adopted IFRS 17 Insurance Contracts ("IFRS 17"), which replaces IFRS 4 Insurance Contracts ("IFRS 4"). IFRS 17 establishes the principles for the recognition, measurement, presentation, and disclosure of insurance contracts. On January 1, 2023, we also adopted IFRS 9 Financial Instruments ("IFRS 9"), which replaces IAS 39 Financial Instruments: Recognition and Measurement ("IAS 39"). The nature and effects of the key changes in our critical accounting policies and estimated impacts from the adoption of the new standards are summarized in section N - Accounting and Control Matters in this document. For more information including the measurement and classification of opening balances, refer to Note 2 of our 2023 Annual Consolidated Financial Statements.
Note to Readers: 2022 Restated Results on Adoption of IFRS 17 and IFRS 9
2022 results have been restated for the adoption of IFRS 17 and the related IFRS 9 classification overlay (“the new standards”). The restated results may not be fully representative of our future earnings profile, as we were not managing our asset and liability portfolios under the new standards. The majority of the actions taken to re-balance asset portfolios and transition asset-liability management execution to an IFRS 17 basis occurred in Q1'23. Accordingly, analysis based on 2022 comparative results may not necessarily be indicative of future trends, and should be interpreted with this context. Using sensitivities to analyze the outlook for market risk and related impacts (e.g., interest rate sensitivities) will be more representative starting with the sensitivities disclosed for Q1’23 and onward in section K - Risk Management in this document and section I - Risk Management in each quarter's respective interim MD&A document. Certain 2022 restated results and 2023 interim results in the Drivers of Earnings and CSM Movement Analysis were refined to more accurately reflect how management views the business.
2 December 31, 2023 Sun Life Financial Inc. MANAGEMENT'S DISCUSSION & ANALYSIS Sun Life has a diversified mix of businesses and our earnings by business type supports the analysis of our results:
Underlying net income by Business Types
•Wealth & asset management: Sun Life’s wealth & asset management businesses generate fee income and/or spread on investment products.
•Group - Health & Protection: Group businesses provide health and protection benefits to employer and government plan members. The products generally have shorter-term coverage periods, and more frequent repricing. The revenues are driven by premiums for coverage provided as well as fee-based earnings (i.e., Administrative Services Only plans, and dental fees).
•Individual - Protection: Generally, individual protection businesses have a longer-term profitability profile and are more sensitive to experience trends. The premiums include a margin for providing protection and are invested to earn a return over the expected amounts required to fulfill insurance liabilities.
The following provides an overview of the business types in Sun Life's business segments/business groups:
1. Use of Non-IFRS Financial Measures
We report certain financial information using non-IFRS financial measures, as we believe that these measures provide information that is useful to investors in understanding our performance and facilitate a comparison of our quarterly and full year results from period to period. These non-IFRS financial measures do not have any standardized meaning and may not be comparable with similar measures used by other companies. For certain non-IFRS financial measures, there are no directly comparable amounts under IFRS. These non-IFRS financial measures should not be viewed in isolation from or as alternatives to measures of financial performance determined in accordance with IFRS. Additional information concerning non-IFRS financial measures and, if applicable, reconciliations to the closest IFRS measures are available in section M - Non-IFRS Financial Measures in this document and the Supplementary Financial Information package on www.sunlife.com under Investors - Financial results and reports.
2. Forward-looking Statements
Certain statements in this document are forward-looking statements within the meaning of certain securities laws, including the "safe harbour" provisions of the United States Private Securities Litigation Reform Act of 1995 and applicable Canadian securities legislation. Additional information concerning forward-looking statements and important risk factors that could cause our assumptions, estimates, expectations and projections to be inaccurate and our actual results or events to differ materially from those expressed in or implied by such forward-looking statements can be found in section P - Forward-looking Statements in this document.
3. Additional Information
Additional information about SLF Inc. can be found in the Consolidated Financial Statements, the annual and interim MD&A, and SLF Inc.'s Annual Information Form ("AIF") for the year ended December 31, 2023. These documents are filed with securities regulators in Canada and are available at www.sedarplus.ca. SLF Inc.'s Annual Consolidated Financial Statements, annual MD&A and AIF are filed with the United States Securities and Exchange Commission ("SEC") in SLF Inc.'s annual report on Form 40-F and SLF Inc.'s interim MD&A and Interim Consolidated Financial Statements are furnished to the SEC on Form 6-Ks and are available at www.sec.gov.
MANAGEMENT'S DISCUSSION & ANALYSIS Sun Life Financial Inc. December 31, 2023 3
Sun Life is a leading international financial services organization providing a diverse range of asset management, wealth, insurance, and health solutions to individual and institutional Clients. We have four business pillars: Asset Management, Canada, U.S. and Asia.
1. Strategy
Our strategy places the Client at the centre of everything we do. Our enterprise strategy, as described below, reflects our priorities and our diversified business mix. We believe by effectively executing on our strategy, we can fulfill our Purpose, create a positive impact for our Clients, and achieve our goal to be a leader in each of our four pillars.
Purpose and Ambition
Our Purpose is to help our Clients achieve lifetime financial security and live healthier lives.
We seek to provide outstanding value and impact for our Clients in three ways:
Driving positive financial actions by:
•Helping Clients build and protect their wealth.
•Providing quality products and solutions that meet the needs of our Clients.
•Delivering timely and expert advice through consistently superior Client experiences.
Delivering solid long-term Client investment returns by:
•Leveraging our collective expertise to make better investment decisions.
•Sourcing broad investment capabilities to serve global Client needs.
•Actively engaging with our Clients to think and act sustainably.
Driving positive health actions by:
•Being a trusted provider of a broad range of health and wellness coverages.
•Helping Clients access, navigate, manage, and receive the care they need.
•Improving health outcomes, including physical and mental well-being, by providing health solutions.
Our Ambition is "to be one of the best asset management and insurance companies in the world". We aim to achieve our ambition by maintaining our balanced business mix and leading positions across our pillars, delivering on our Purpose and Client Impact strategy, and focusing on strong execution to meet our medium-term financial objectives(1)(2):
•Underlying Earnings Per Share ("EPS") growth: 8-10%.
•Underlying Return on Equity ("ROE"): 18%+.
•Underlying Dividend Payout Ratio: 40%-50%.
(1)For more information about our medium-term financial objectives, see section B - Overview - 2 - Financial Objectives in this document. Underlying EPS, underlying ROE and underlying dividend payout ratio are Non-IFRS financial measures. See section M - Non-IFRS Financial Measures in this document.
(2)Our medium-term financial objective for underlying ROE changed to 18%+ following the adoption of IFRS 17 and IFRS 9, an increase from 16%+ prior to transition. Our medium-term financial objectives remain consistent for underlying earnings per share and underlying dividend payout ratio following the adoption of both standards.
4 December 31, 2023 Sun Life Financial Inc. MANAGEMENT'S DISCUSSION & ANALYSIS Our four pillars define the businesses and markets in which we operate.
Our Four Pillars
In each of these pillars, we focus on creating value and positively impacting our Clients through businesses that meet Client needs and have strong growth prospects, favourable ROE and strong capital generation in attractive global markets. We are well-positioned across each of our pillars.
Asset Management: A global leader in both public and alternative asset classes through MFS and SLC Management
We deliver value and drive positive Client impact through our offering of quality investment products:
•MFS Investment Management ("MFS") is a long-standing premier active investment manager offering a comprehensive set of asset management products and services to retail and institutional investors around the world.
•SLC Management is an institutional investment manager delivering alternative fixed income, private credit, infrastructure and global real estate solutions to institutional investors. In addition, with the acquisition of a majority interest in Advisors Asset Management, Inc. (“AAM”) and the partnership with Scotia Global Wealth Management, SLC Management will also deliver solutions to the retail High-Net-Worth ("HNW") market in North America.
Canada: A leader in health, wealth, and insurance
We deliver value and impact to approximately 5.5 million Clients via our group and individual businesses by:
•Providing a wide range of asset management, wealth, health and protection solutions to retail Clients.
•Helping Canadians live healthy lives, both as a major provider of group benefits and through a growing focus on innovative products and services that lead to better health outcomes.
•Remaining a market leader in group retirement services in the workplace, including defined contribution pensions, and defined benefit pension de-risking.
U.S.: A leader in health and benefits
We have deep expertise in the health care market, and help our Clients get the coverage they need while improving health outcomes. We are:
•The largest independent medical stop-loss provider in the U.S., offering protection against large medical claims for employers who self-insure their employee health plans and health care navigation services to help members improve outcomes.
•The second largest dental benefits provider in the U.S.(1), serving approximately 36 million members(2) through government programs and commercial group dental and vision solutions for employers of all sizes.
•A top ten group life and disability provider in the U.S., offering a broad portfolio of group insurance products and services, as well as turnkey risk management solutions for health plans and other insurance carriers.
Asia: A regional leader focused on fast-growing markets
We are well-positioned in Asia to achieve our growth aspirations, through our portfolio of distinct businesses in the Philippines, Indonesia, Vietnam, Hong Kong, China, India, Malaysia, and High-Net-Worth including International and Singapore. These markets account for approximately 67% of Asia’s GDP with high potential for future growth(3). We are:
•A provider of individual life and health insurance that delivers Client value across all of our markets.
•A provider, in select markets, of asset management and group retirement products and services.
•Among the global leaders in providing life insurance solutions to HNW Clients.
Our Client Impact Strategy
Our Client Impact strategy has seven areas of focus that we are pursuing across our four pillars. These areas of focus define how we compete in our markets, extend our competitive advantages, fulfill our Purpose and support our ambition to be one of the best asset management and insurance companies in the world.
Client Impact: Our Clients are at the centre of everything we do. Whether it is helping to navigate health concerns, save and plan for retirement or provide financial security for their families, our focus is on the positive impact we have on our Clients' lives. We believe this allows us to develop and offer the right solutions and experiences, build lasting and trusted Client relationships, and create value for Clients that also deliver better business outcomes for Sun Life. We are committed to helping Clients by driving positive health and financial actions, and delivering solid long-term investment returns.
Trusted Brand: Preserving our long standing reputation of being a trusted brand is paramount in an increasingly complex and digitized world. For more than 150 years, we have built and enjoyed strong, trusted relationships with our Clients in all Sun Life markets and through our distribution partnerships. Our brand reflects the differentiated Sun Life experiences we create, the products and service experiences we deliver, and the culture we live by, to achieve our Purpose. Our forward-looking brand strategy remains focused on delivering Client Impact and we will work to build our future competitive advantage and brand appeal with both new and existing Clients.
(1)Based on membership as of December 31, 2022. Ranking compiled by Sun Life and based on data disclosed by competitors.
(2)Includes members who also have a Sun Life Group coverage.
(3)Source: International Monetary Fund, October 2023.
MANAGEMENT'S DISCUSSION & ANALYSIS Sun Life Financial Inc. December 31, 2023 5
Distribution Excellence: We have established an omni-channel approach to distribution that makes it easier for Clients to do business with us across all markets. To excel at distribution, we prioritize exceptional service, connecting with our Clients when and how they want to engage, and providing personalized and holistic solutions. We are focused on meeting our Clients' needs by being an exceptional distribution partner that empowers our advisors and partners to provide seamless Client experiences.
Digital Leadership: We are focused on enabling our businesses to create meaningful, digitally-enabled connections with Clients to generate the greatest Client and Business impact. Through the Digital Leadership strategy, we are thinking and acting more like a digital company and deepening Client relationships in each Business Group by leveraging digital capabilities and ways of working.
Our Digital Enterprise strategy is focused on:
•Delivering exceptional and personalized digital experiences for Clients, employees, advisors and partners.
•Leveraging digital capabilities to deliver these experiences more quickly and cost-effectively.
•Evolving our digital ways of working for greater speed, agility, and Client-centric thinking.
Financial Discipline: Our strategy is underpinned by a continued commitment to strong financial performance and risk management, coupled with a focus on capital management. Sustained focus across these areas support our medium-term financial objectives and our aim of top quartile total shareholder returns. Specific areas of focus include:
•Delivering strong, stable earnings growth and disciplined expense management.
•Managing our capital to protect our policyholders and to maintain financial flexibility, to generate shareholder value.
•Disciplined organic investments and a programmatic M&A(1) approach to build scale and capabilities to drive future growth.
Sustainability Driven: Sustainability is essential to our long-term business success. We embed sustainability into our strategy, culture, and operations, to drive meaningful social and economic outcomes for our Clients, employees, advisors, investors and communities. We believe our actions will contribute to a healthier, more financially resilient, environmentally secure, and economically prosperous world. See
Section B - Overview - 3 - Sustainability Plan in this document for more information about our approach to sustainability.
Purpose-Driven People and Culture: Delivering on our strategy is supported by our ability to attract, retain, and develop the best talent, and to empower our people to drive results. We are focused on preserving and strengthening our strong culture of Client focus, integrity, collaboration and inclusivity. Specifically, our focus is to:
•Empower employees and advisors to take action, make decisions, and be accountable.
•Develop talent that combines strong leadership skills with technological savvy, to support our transformation to a leading digital organization.
•Maintain momentum on our diversity, equity and inclusion (“DE&I”) commitment, embedding DE&I into our decision-making to reflect our values.
•Design our Future of Work with intent, offering employees choice and flexibility in how and where we work.
•Be the employer of choice for top talent.
Key Strategic Priorities
Together with the strong foundation of our four pillars and key strategic areas of focus, our strategy emphasizes four key strategic priorities to accelerate growth and improve competitive positioning:
1.Develop deep Client relationships and drive outcomes through signature solutions, digital, and data.
2.Think and act more like a digital company.
3.Unleash our Talent & Culture strategy including effective decision-making and talent models alongside BOLDER (Biased for action, Open to listen, Learn all the time, Drive outcomes, Empowered, Resilient) behaviours.
4.Deliver the value from past M&A in SLC Management, the U.S., and Asia; consider opportunistic investments to further grow capability and scale.
We believe we are well-positioned to execute on each of these strategic priorities and that by doing so we will create positive Client Impact.
Our balanced four pillars, holistic Client Impact strategy, and focus on our key strategic priorities combine elements that have been core to our success. Looking ahead, we are confident that our strategy will allow us to deliver on our Purpose, drive positive Client outcomes, create meaningful value for our shareholders, and support our ambition to be one of the best asset management and insurance companies in the world.
(1)Mergers & Acquisitions ("M&A").
6 December 31, 2023 Sun Life Financial Inc. MANAGEMENT'S DISCUSSION & ANALYSIS Following the adoption of IFRS 17 and IFRS 9, progress against our medium-term financial objectives are measured on a two-year basis.
2. Financial Objectives
Our medium-term financial objectives are outlined as follows:
|
|
|
|
|
|
|
|
|
|
|
IFRS 17 and IFRS 9 |
|
Measure(1) |
Medium-term
financial objectives(2)(3)
|
2-Year(2)(4) |
|
|
Underlying EPS growth
Growth in EPS reflects the Company's focus on generating sustainable earnings for shareholders.
|
8%-10% |
11% |
|
|
Underlying ROE
ROE is a significant driver of shareholder value and is a major focus for management across all businesses.
|
18%+ |
17.4% |
|
|
Underlying dividend payout ratio
Payout of capital versus shareholder value, based on underlying net income.
|
40%-50% |
48% |
|
(1)Underlying EPS, underlying ROE and underlying dividend payout ratio are non-IFRS financial measures. See section M - Non-IFRS Financial Measures in this document. Underlying dividend payout ratio represents the ratio of common shareholders' dividends to diluted underlying EPS. See
section J - Capital and Liquidity Management - 3 - Shareholder Dividends in this document for further information regarding dividends.
(2)Our medium-term financial objective for underlying ROE changed to 18%+ following the adoption of IFRS 17 and IFRS 9, an increase from 16%+ prior to transition. Our medium-term financial objectives remain consistent for underlying earnings per share and underlying dividend payout ratio following the adoption of both standards. 2022 restated results may not be fully representative of our future earnings profile, as we were not managing our asset and liability portfolios under the new standards. See the heading "Note to Readers: 2022 Restated Results on Adoption of IFRS 17 and IFRS 9" in section A - How We Report Our Results in this document.
(3)Although considered reasonable, we may not be able to achieve our medium-term financial objectives as our assumptions may prove to be inaccurate. Accordingly, our actual results could differ materially from our medium-term financial objectives as described above. Our medium-term financial objectives do not constitute guidance. Our medium-term financial objectives are forward-looking non-IFRS financial measures and additional information is provided in this MD&A in section P - Forward-looking Statements - Medium-Term Financial Objectives.
(4)Underlying EPS growth, ROE and dividend payout ratio are calculated using an average. Underlying EPS growth reflects one-year growth (2023 over 2022). The beginning period is January 1, 2022 and ending period is December 31, 2023.
In the year and over the medium-term, we have performed well against our medium-term financial objectives in a challenging operating environment reflecting economic and geopolitical uncertainties.
3. Sustainability Plan
Our sustainability ambition is to maximize our positive impact and ensure the resiliency of our organization, in support of our Purpose of helping Clients achieve lifetime financial security and live healthier lives. We aim to create competitive advantage and differentiation for our business through the following focus areas of our sustainability plan:
Increasing Financial Security: We aspire to increase the lifetime financial security of our Clients, employees and communities. We’re increasing access to and use of insurance and wealth products, and empowering and educating people to improve financial security outcomes.
Fostering Healthier Lives: We aspire to improve health and wellness outcomes for our Clients, employees and communities. We're improving access to and use of health insurance and health care, and empowering people to navigate and manage their health journey to improve health outcomes. Our investments in community health complement these efforts.
Advancing Sustainable Investing: We aspire to deliver sustainable returns for Clients and drive the transition to a low-carbon, inclusive economy. We manage assets with material environmental, social and governance ("ESG") factors embedded in our investment processes and offer our Clients sustainable investing opportunities. In addition, we invest our own assets in ways that support a low-carbon and more inclusive economy.
Climate change: We are committed to being part of the climate solution. We’re decarbonizing our business and engaging with our stakeholders to support the transition to a low-carbon economy. Meaningful climate action is essential to delivering on our Purpose and ensuring the resiliency of our business.
Our sustainability plan builds from our foundation as a Trusted and Responsible Business. We aspire to be a responsibly-managed business that is Client-focused, competitive, forward-thinking and sustainable for the long term.
For additional information on our sustainability plan and recent progress, refer to www.sunlife.com/sustainability and the headings "2023 Highlights" throughout section H - Performance by Business Segment in this document. For more information on our approach to climate change, refer to the heading "Environmental and Social Risk Section" in section K - Risk Management - 9 - Risk Categories - iv - Business and Strategic Risk of this document, which includes our disclosure based on the recommendations of the Task Force on Climate-related Financial Disclosures ("TCFD").
MANAGEMENT'S DISCUSSION & ANALYSIS Sun Life Financial Inc. December 31, 2023 7
4. Acquisitions and Other
The following developments occurred since January 1, 2023. Additional information concerning acquisitions and dispositions is provided in Note 3 in our 2023 Annual Consolidated Financial Statements.
On February 1, 2023, we completed the acquisition of a 51%(1) interest in Advisors Asset Management, Inc. ("AAM"), a leading independent U.S. retail distribution firm. AAM's strong U.S. retail distribution capabilities provides an attractive opportunity for SLC Management to meet the growing demand for alternative assets among U.S. HNW investors. AAM provides a range of solutions and products to financial advisors at wirehouses, registered investment advisors and independent broker-dealers, overseeing US$41.4 billion (approximately C$54.9 billion) in assets as at December 31, 2023, with 10 offices across nine U.S. states. Sun Life has the option to acquire the remaining interest in AAM starting in 2028. As a result of the transaction, total shareholders’ equity was reduced by $156 million, primarily driven by the establishment of financial liabilities associated with the anticipated increase of our future ownership in AAM.
On February 1, 2023, we completed the sale of the sponsored markets business(2) from Sun Life Assurance to Canadian Premier Life Insurance
Company (re-branded to Securian Canada).
On April 3, 2023 we completed the sale of SLF of Canada UK Limited ("Sun Life UK") to Phoenix Group Holdings plc ("Phoenix Group") for approximately $418 million. Sun Life UK managed life and pension policies as well as payout annuities for UK Clients, was closed to new sales and operated as a run-off business since 2001. Under the agreement, we will retain our economic interest in the payout annuities business through a reinsurance treaty, which, effective Q2'23, is recorded in In-force Management within the U.S. business group. Phoenix Group is the UK's largest long-term savings and retirement business, with £269 billion(3) of assets under administration and approximately 12 million customers(3). As part of the sale, we will establish a long-term partnership to become a strategic asset management partner to Phoenix Group. Our asset management companies, MFS and SLC Management, will continue to manage approximately $8 billion of Sun Life UK's general account. In addition, Phoenix Group has set a goal to invest approximately US$25 billion in North American public and private fixed income and alternative investments over the next five years. MFS and SLC Management will be material partners to Phoenix Group in achieving this goal. In Q3'22, we recognized an impairment charge pertaining to the attributed goodwill that was not expected to be recovered through the sale. In Q2'23, we recognized a gain of $19 million in reported net income.
Effective July 1, 2023 we commenced our 15-year exclusive bancassurance partnership with Dah Sing Bank ("Dah Sing"). Under this
partnership, Sun Life will be the exclusive provider of life insurance solutions to Dah Sing's approximately 570,000 retail banking customers, helping to fulfill their savings and protection needs at different life stages. This is Sun Life's first exclusive bancassurance partnership in Hong Kong and will be a valuable complement to our existing network of over 2,500 expert insurance advisors.
On October 3, 2023, we acquired Dialogue Health Technologies Inc. ("Dialogue"). As a result of this acquisition, our ownership interest increased from 23% to 95% for cash proceeds of $272 million (for equity not previously owned by Sun Life or rolled by certain members of Dialogue's executive management). Dialogue is a Canadian based health and wellness virtual care platform.
(1)On a fully diluted basis.
(2)Sponsored markets include a variety of association & affinity, and group creditor clients. This business was previously part of the Sun Life Health business unit in the Canada business segment.
(3)As at June 30, 2023.
8 December 31, 2023 Sun Life Financial Inc. MANAGEMENT'S DISCUSSION & ANALYSIS
|
|
|
|
|
|
|
|
|
|
|
|
|
|
|
|
|
| ($ millions, unless otherwise noted) |
|
|
|
|
| Profitability |
|
|
|
|
|
2023 |
2022(1) |
|
Net income (loss) |
|
|
|
|
|
|
|
|
Underlying net income (loss)(2) |
|
|
|
|
|
3,728 |
3,369 |
|
Reported net income (loss) - Common shareholders |
|
|
|
|
|
3,086 |
2,871 |
|
Diluted earnings per share ("EPS") ($) |
|
|
|
|
|
|
|
|
Underlying EPS (diluted)(2) |
|
|
|
|
|
6.36 |
5.75 |
|
Reported EPS (diluted) |
|
|
|
|
|
5.26 |
4.89 |
|
Return on equity ("ROE") (%) |
|
|
|
|
|
|
|
|
Underlying ROE(2) |
|
|
|
|
|
17.8% |
17.0% |
|
Reported ROE(2) |
|
|
|
|
|
14.7% |
14.5% |
|
|
|
|
|
|
|
|
|
| Growth |
|
|
|
|
|
2023 |
2022(1) |
|
Sales |
|
|
|
|
|
|
|
|
Wealth sales & asset management gross flows(2)(3) |
|
|
|
|
|
173,820 |
198,650 |
|
Group - Health & Protection sales(2)(4) |
|
|
|
|
|
2,942 |
2,554 |
|
Individual - Protection sales(2) |
|
|
|
|
|
2,491 |
1,767 |
|
Total AUM ($ billions)(2) |
|
|
|
|
|
1,399.6 |
1,318.6 |
|
New business Contractual Service Margin ("CSM")(2) |
|
|
|
|
|
1,253 |
762 |
|
|
|
|
|
|
|
|
|
| Financial Strength |
|
|
|
|
|
2023 |
As at
January 1, 2023(6)
|
|
LICAT ratios(5)(6) |
|
|
|
|
|
|
|
|
Sun Life Financial Inc. |
|
|
|
|
|
149% |
142% |
|
Sun Life Assurance(7) |
|
|
|
|
|
141% |
139% |
|
Financial leverage ratio(2)(8) |
|
|
|
|
|
21.5% |
23.7% |
|
Book value per common share ($) |
|
|
|
|
|
36.51 |
34.60 |
|
Weighted average common shares outstanding for basic EPS (millions) |
|
|
|
|
|
586 |
586 |
|
Closing common shares outstanding (millions) |
|
|
|
|
|
585 |
586 |
(1)2022 restated results may not be fully representative of our future earnings profile, as we were not managing our asset and liability portfolios under the new standards. See the heading "Note to Readers: 2022 Restated Results on Adoption of IFRS 17 and IFRS 9" in section A - How We Report Our Results in this document.
(2)Represents a non-IFRS financial measure. For more details, see section M - Non-IFRS Financial Measures in this document.
(3)Effective January 1, 2023, Canada wealth sales & asset management gross flows have been updated to exclude retained sales. Prior period amounts have been updated to reflect this change.
(4)Prior period amounts related to U.S. Dental sales have been restated to reflect new information.
(5)Life Insurance Capital Adequacy Test ("LICAT") ratio. Our LICAT ratios are calculated in accordance with the OSFI-mandated guideline.
(6)OSFI's 2023 LICAT Guideline, effective January 1, 2023, specifies that available capital for LICAT purposes includes the Contractual Service Margin. Prior period restatement and resubmissions are not mandated. Pro-forma January 1, 2023 LICAT ratios are disclosed to illustrate transition impact. These pro-forma calculations will not be formally submitted to OSFI.
(7)Sun Life Assurance is SLF Inc.’s principal operating life insurance subsidiary.
(8)Effective January 1, 2023, the calculation for the financial leverage ratio was updated to include the CSM balance (net of taxes) in the denominator. The CSM (net of taxes) was $9.6 billion as at December 31, 2023 (January 1, 2023 - $8.7 billion).
MANAGEMENT'S DISCUSSION & ANALYSIS Sun Life Financial Inc. December 31, 2023 9
The following table reconciles our Common shareholders' net income ("reported net income") and underlying net income. All factors discussed in this document that impact underlying net income are also applicable to reported net income. Certain adjustments and notable items also impact the CSM, such as mortality experience and assumption changes; see section F - Contractual Service Margin in this document for more information.
|
|
|
|
|
|
|
|
|
|
|
|
|
|
|
| ($ millions, after-tax) |
|
|
|
2023 |
2022(1) |
Underlying net income by business type(2): |
|
|
|
|
|
| Wealth & asset management |
|
|
|
1,726 |
1,673 |
| Group - Health & Protection |
|
|
|
1,313 |
963 |
| Individual - Protection |
|
|
|
1,137 |
1,000 |
| Corporate expenses & other |
|
|
|
(448) |
(267) |
Underlying net income(2) |
|
|
|
3,728 |
3,369 |
Add: Market-related impacts(1) |
|
|
|
(454) |
(21) |
Assumption changes and management actions ("ACMA") |
|
|
|
36 |
(168) |
Other adjustments |
|
|
|
(224) |
(309) |
| Reported net income - Common shareholders |
|
|
|
3,086 |
2,871 |
Underlying ROE(2) |
|
|
|
17.8% |
17.0% |
Reported ROE(2) |
|
|
|
14.7% |
14.5% |
Notable items attributable to reported and underlying net income(2): |
|
|
|
|
|
| Mortality |
|
|
|
6 |
(152) |
| Morbidity |
|
|
|
324 |
175 |
| Lapse and other policyholder behaviour ("policyholder behaviour") |
|
|
|
(24) |
(14) |
| Expenses |
|
|
|
(72) |
2 |
Credit(3) |
|
|
|
(34) |
(28) |
Other(4) |
|
|
|
34 |
25 |
(1)2022 restated results may not be fully representative of our future earnings profile, as we were not managing our asset and liability portfolios under the new standards. See the heading "Note to Readers: 2022 Restated Results on Adoption of IFRS 17 and IFRS 9" in section A - How We Report Our Results in this document.
(2)Represents a non-IFRS financial measure. For more details, see section M - Non-IFRS Financial Measures in this document. For more information about business types in Sun Life's business groups, see section A - How We Report Our Results in this document.
(3)Credit includes rating changes on assets measured at Fair value through profit or loss ("FVTPL"), and the Expected credit loss ("ECL") impact for assets measured at Fair value through other comprehensive income ("FVOCI").
(4)Other notable items are recorded in Net Insurance Service Result and Net Investment Result in the Drivers of Earnings analysis. For more details, see section M - Non-IFRS Financial Measures in this document.
2023 vs. 2022
Underlying net income of $3,728 million increased $359 million or 11%, driven by:
•Wealth & asset management up $53 million: Higher investment income driven by volume growth and an increase in yields, partially offset by lower fee-related earnings in MFS, Canada, and Asia.
•Group - Health & Protection up $350 million: Business premium growth across all U.S. businesses and Canada, improved disability experience in Canada, higher investment contributions in the U.S., and DentaQuest contributions.
•Individual - Protection up $137 million: Business growth reflecting good sales momentum in Asia, improved protection experience, and higher investment contributions in Canada, partially offset by lower earnings due to the sale of Sun Life UK(1).
•Corporate expenses & other $(181) million increase in net loss includes higher debt financing costs.
•In addition, the earnings by business type above include higher earnings on surplus, driven by an increase in realized gains and net interest income from higher rates, and higher operating expenses reflecting volume growth and continued investments in the business.
(1)On April 3, 2023 we completed the sale of SLF of Canada UK Limited to Phoenix Group Holdings plc ("the sale of Sun Life UK"). For additional information, refer to Note 3 of our 2023 Annual Consolidated Financial Statements.
10 December 31, 2023 Sun Life Financial Inc. MANAGEMENT'S DISCUSSION & ANALYSIS Reported net income of $3,086 million increased $215 million or 7%, driven by the increase in underlying net income and:
•ACMA impacts;
•Gain on the sale of the sponsored markets business in Canada(1); and
•The impact of the Bermuda Corporate Income Tax Change(2); partially offset by
•Market-related impacts reflecting real estate experience(3) and interest rates, partially offset by equity markets;
•Fair value changes in management's ownership of MFS shares; and
•The impact of the Canada Tax Rate Change(4) and a gain on the sale-leaseback of the Wellesley office in the U.S. in the prior year were mostly offset by a $170 million charge related to the sale of Sun Life UK(5) and a higher increase in SLC Management's acquisition-related liabilities(6) in the prior year.
Foreign exchange translation led to an increase of $77 million and $73 million to underlying net income and reported net income, respectively.
Underlying ROE was 17.8% and reported ROE was 14.7% (2022 - 17.0% and 14.5%, respectively).
1.Market-related impacts
Market-related impacts represent the difference between actual versus expected market movements(7). Market-related impacts resulted in a decrease of $454 million to reported net income, primarily reflecting unfavourable real estate experience.
2.Assumption changes and management actions
The net impact of assumption changes and management actions was an increase of $36 million to reported net income and includes methods and assumptions changes on insurance contracts as well as related impacts. These included favourable impacts from modelling enhancements in Asia and financial-related assumptions, which were partially offset by unfavourable policyholder behaviour updates in Asia, mortality updates in the U.S., and refinements to Sun Life Health in Canada. For additional details refer to "Assumption Changes and Management Actions by Type" in section F - Contractual Service Margin in this document.
3.Other adjustments
Other adjustments decreased reported net income $224 million, reflecting DentaQuest integration costs and amortization of acquired intangible assets, and SLC Management acquisition-related costs(8), partially offset by gains on the sale of the sponsored markets business in Canada(1) and the sale of Sun Life UK(5), and the impact of the Bermuda Corporate Income Tax Change(2).
4. Experience-related items
Notable experience items in the current year included:
•Favourable morbidity experience largely in Canada and in U.S. medical stop-loss;
•Unfavourable expense experience largely in Canada, U.S. Dental, and Asia;
•Unfavourable credit experience that impacted Canada results; and
•Other experience was favourable reflecting various smaller items.
5.Income taxes
The statutory tax rate is impacted by various items, such as lower taxes on income subject to tax in foreign jurisdictions, tax-exempt investment income, and other sustainable tax benefits.
On December 27, 2023, Bermuda enacted its Corporate Income Tax Act 2023, which will apply a 15% income tax beginning on
January 1, 2025. Bermuda Corporate Income Taxes are expected to be a covered tax and will reduce Pillar Two top-up taxes which would otherwise be payable to other jurisdictions. The enacted legislation provides an economic transition adjustment that aligns an entity’s starting point for the tax regime more closely with its economic position prior to the application of the Corporate Income Tax 2023. The benefit of this economic transition adjustment has been recognized in 2023. As a result, total Company reported net income increased by $51 million, reflected in Other adjustments. The Bermuda Corporate Income Tax is not expected to have a material impact on Sun Life’s consolidated financial statements when it becomes effective in 2025. Refer to Note 19 in the 2023 Annual Consolidated Financial Statements for more information.
The effective income tax rate(9) on underlying net income and reported net income was 17.3% and 11.7%, respectively.
(1)On February 1, 2023, we completed the sale of the sponsored markets business from Sun Life Assurance, a wholly owned subsidiary of SLF Inc., to Canadian Premier Life Insurance Company (re-branded to Securian Canada) ("sale of the sponsored markets business").
(2)Refer to the heading "Income taxes" in this section for more information.
(3)Real estate experience reflects the difference between the actual value of real estate investments compared to management's longer-term expected returns supporting insurance contract liabilities ("real estate experience").
(4)On December 15, 2022, legislation implementing an additional surtax of 1.5% applicable to banks and life insurer's taxable income in excess of $100 million was enacted in Canada ("Canada Tax Rate Change"). This legislation applied retroactively to the Federal Budget date of April 7, 2022. As a result, total Company reported net income increased by $141 million in Q4'22, reflected in Other adjustments.
(5)On April 3, 2023 we completed the sale of SLF of Canada UK Limited to Phoenix Group Holdings plc ("the sale of Sun Life UK"). In Q3'22, we recognized an impairment charge of $170 million pertaining to the attributed goodwill that was not expected to be recovered through the sale.
(6)Reflects the changes in estimated future payments for acquisition-related contingent considerations and options to purchase remaining ownership interests of SLC Management affiliates.
(7)Except for risk free rates which are based on current rates, expected market movements are based on our medium-term outlook which is reviewed annually.
(8)Includes an increase in SLC Management's acquisition-related liabilities in Q3'23, which reflects the changes in estimated future payments for acquisition-related contingent considerations and options to purchase remaining ownership interests of SLC Management affiliates.
(9)Our effective income tax rate on reported net income is calculated using Total income (loss) before income taxes, as detailed in Note 19 in our 2023 Annual Consolidated Financial Statements. Our effective income tax rate on underlying net income is calculated using pre-tax underlying net income, as detailed in section M - Non-IFRS Financial Measures in this document, and the associated income tax expense.
MANAGEMENT'S DISCUSSION & ANALYSIS Sun Life Financial Inc. December 31, 2023 11
6. Impacts of foreign exchange translation
We operate in many markets worldwide, including Canada, the United States, the United Kingdom, Ireland, Hong Kong, the Philippines, Japan, Indonesia, India, China, Australia, Singapore, Vietnam, Malaysia and Bermuda, and generate revenues and incur expenses in local currencies in these jurisdictions, which are translated to Canadian dollars.
Items impacting a reporting period, such as Revenue, Expenses, and Reported net income (loss) in our Consolidated Statements of Operations, as well as underlying net income (loss), and sales, are translated into Canadian dollars using average exchange rates for the appropriate daily, monthly, or quarterly period. For Assets and Liabilities in our Consolidated Statements of Financial Position, as well as the AUM and certain components of the Drivers of Earnings disclosure, period-end rates are used for currency translation purposes.
The following table provides the foreign exchange rates for the U.S. dollar, which generates the most significant impact of foreign exchange translation, over the past four quarters and two years.
|
|
|
|
|
|
|
|
|
|
|
|
|
|
|
|
|
|
|
|
|
| Exchange rate |
Quarterly results |
Full year |
|
Q4'23 |
Q3'23 |
Q2'23 |
Q1'23 |
2023 |
2022 |
U.S. Dollar - Average |
1.361 |
1.341 |
1.343 |
1.352 |
1.350 |
1.301 |
U.S. Dollar - Period end |
1.325 |
1.358 |
1.324 |
1.352 |
1.325 |
1.355 |
The relative impacts of foreign exchange translation in any given period are driven by the movement of foreign exchange rates as well as the proportion of earnings generated in our foreign operations. In general, net income benefits from a weakening Canadian dollar and is adversely affected by a strengthening Canadian dollar as net income from the Company's international operations is translated back to Canadian dollars. Conversely, in a period of losses, the weakening of the Canadian dollar has the effect of increasing losses in foreign jurisdictions. We generally express the impacts of foreign exchange translation on net income on a year-over-year basis.
Foreign exchange translation led to an increase of $77 million and $73 million in underlying net income and reported net income, respectively.
12 December 31, 2023 Sun Life Financial Inc. MANAGEMENT'S DISCUSSION & ANALYSIS
1. Sales and Gross Flows
|
|
|
|
|
|
|
|
|
|
|
|
|
|
|
| ($ millions) |
|
|
|
2023 |
2022 |
Wealth sales & asset management gross flows by business segment(1) |
|
|
|
|
|
Asset Management gross flows |
|
|
|
151,068 |
172,881 |
Canada wealth sales & asset management gross flows(2) |
|
|
|
15,039 |
14,629 |
| Asia wealth sales & asset management gross flows |
|
|
|
7,713 |
11,140 |
Total wealth sales & asset management gross flows(1) |
|
|
|
173,820 |
198,650 |
Group - Health & Protection sales by business segment(1) |
|
|
|
|
|
| Canada |
|
|
|
591 |
533 |
|
U.S.(3) |
|
|
|
2,275 |
1,948 |
|
Asia(4) |
|
|
|
76 |
73 |
Total group sales(1) |
|
|
|
2,942 |
2,554 |
Individual - Protection sales by business segment(1) |
|
|
|
|
|
| Canada |
|
|
|
609 |
496 |
| Asia |
|
|
|
1,882 |
1,271 |
Total individual sales(1) |
|
|
|
2,491 |
1,767 |
CSM - Impact of new insurance business ("New business CSM")(1) |
|
|
|
1,253 |
762 |
(1)Represents a non-IFRS financial measure. For more details, see section M - Non-IFRS Financial Measures in this document.
(2)Effective January 1, 2023, Canada wealth sales & asset management gross flows have been updated to exclude retained sales. Prior period amounts have been updated to reflect this change.
(3)Prior period amounts related to U.S. Dental sales have been restated to reflect new information.
(4)In underlying net income by business type, Group businesses in Asia have been included with Individual – Protection. For more information about business types in Sun Life's business groups, see section A - How We Report Our Results in this document.
Total wealth sales & asset management gross flows decreased $24.8 billion or 12% year-over-year ($30.2 billion(1) or 15%(1), excluding foreign exchange translation).
•Asset Management gross flows decreased $27.1 billion(1) or 16%(1), reflecting lower gross flows in MFS and SLC Management.
•Canada wealth sales & asset management gross flows increased $0.4 billion or 3%, driven by higher Individual Wealth sales, primarily from mutual funds, largely offset by lower defined contribution sales in Group Retirement Services ("GRS").
•Asia wealth sales & asset management gross flows decreased $3.5 billion(1) or 31%(1), primarily reflecting lower money market fund sales in the Philippines.
Total group health & protection sales increased $388 million or 15% from prior year ($332 million(1) or 13%(1), excluding foreign exchange translation).
•Canada group sales increased $58 million or 11%, driven by higher large case sales.
•U.S. group sales increased $270 million(1) or 15%(1), driven by higher Dental(2) sales in Medicare Advantage, Medicaid, and commercial dental, as well as higher medical stop-loss sales, partially offset by lower employee benefits sales.
Total individual protection sales increased $724 million or 41% from prior year ($694 million(1) or 39%(1), excluding foreign exchange translation).
•Canada individual sales increased $113 million or 23%, driven by higher participating whole life insurance sales.
•Asia individual sales increased $581 million(1) or 46%(1), driven by higher sales in Hong Kong, International, and India, partially offset by lower sales in Vietnam.
New business CSM represents growth derived from sales activity in the period. The impact of new insurance business drove a $1,253 million increase in CSM, compared to $762 million in the prior year, driven by higher individual protection sales in Asia in Hong Kong and High-Net-Worth ("HNW"), and Canada.
1)This change excludes the impacts of foreign exchange translation. For more information about these non-IFRS financial measures, see section
M - Non-IFRS Financial Measures in this document.
2)Dental sales include sales from DentaQuest, acquired on June 1, 2022.
MANAGEMENT'S DISCUSSION & ANALYSIS Sun Life Financial Inc. December 31, 2023 13
2. Assets Under Management
AUM consists of general funds, the investments for segregated fund holders ("segregated funds") and third-party assets managed by the Company. Third-party AUM is comprised of institutional and managed funds, as well as other AUM related to our joint ventures.
|
|
|
|
|
|
|
|
|
|
|
|
|
|
|
|
|
|
| ($ millions) |
|
|
|
|
|
2023 |
2022 |
Assets under management(1) |
|
|
|
|
|
|
|
| General fund assets |
|
|
|
|
|
204,789 |
198,316 |
| Segregated funds |
|
|
|
|
|
128,452 |
125,292 |
Third-party assets under management(1) |
|
|
|
|
|
|
|
Retail |
|
|
|
|
|
567,657 |
527,617 |
Institutional, managed funds and other |
|
|
|
|
|
537,424 |
507,673 |
Total third-party AUM(1) |
|
|
|
|
|
1,105,081 |
1,035,290 |
| Consolidation adjustments |
|
|
|
|
|
(38,717) |
(40,337) |
Total assets under management(1) |
|
|
|
|
|
1,399,605 |
1,318,561 |
(1)Represents a non-IFRS financial measure. See section M - Non-IFRS Financial Measures in this document.
AUM increased $81.0 billion or 6% from December 31, 2022, primarily driven by:
(i)favourable market movements on the value of segregated, retail, institutional and managed funds of $126.9 billion;
(ii)an increase in AUM of general fund assets of $6.5 billion primarily due to net fair value growth from declining interest rates; and
(iii)an increase of $5.2 billion from AUM primarily driven by the AAM acquisition(1); partially offset by
(iv)net outflows from segregated funds and third-party AUM of $26.9 billion;
(v)a decrease of $24.4 billion from foreign exchange translation (excluding the impacts of general fund assets); and
(vi)Client distributions of $6.5 billion.
Segregated fund and third-party AUM net outflows of $26.9 billion for the year were comprised of:
|
|
|
|
|
|
|
|
|
|
|
|
|
|
|
|
|
|
| ($ billions) |
|
|
|
|
|
2023 |
2022 |
Net flows for Segregated fund and Third-party AUM: |
|
|
|
|
|
|
|
MFS |
|
|
|
|
|
(38.9) |
(43.4) |
| SLC Management |
|
|
|
|
|
12.5 |
21.4 |
| Canada, Asia and other |
|
|
|
|
|
(0.5) |
0.5 |
Total net flows for Segregated fund and Third-party AUM |
|
|
|
|
|
(26.9) |
(21.5) |
Third-Party AUM increased by $69.8 billion or 7% from December 31, 2022, primarily driven by:
(i)favourable market movements of $113.9 billion;
(ii)other business activities of $9.3 billion; and
(iii)an increase of $5.2 billion from AUM primarily driven by the AAM acquisition(1); partially offset by
(iv)net outflows of $27.0 billion;
(v)foreign exchange translation of $25.1 billion; and
(vi)Client distributions of $6.5 billion.
(1)The acquisition of a majority stake in Advisors Asset Management, Inc. ("AAM acquisition"). For additional information, refer to Note 3 in our 2023 Annual Consolidated Financial Statements.
14 December 31, 2023 Sun Life Financial Inc. MANAGEMENT'S DISCUSSION & ANALYSIS Contractual Service Margin represents a source of stored value for future insurance profits and qualifies as available capital for LICAT purposes.
|
|
|
|
|
|
| F. Contractual Service Margin |
|
CSM is a component of insurance contract liabilities. The following table shows the change in CSM including its recognition into net income in the period, as well as the growth from new insurance sales activity.
|
|
|
|
|
|
|
|
|
|
For the full year ended |
For the full year ended |
| ($ millions) |
December 31, 2023 |
December 31, 2022 |
| Beginning of Period |
10,865 |
9,797 |
Impact of new insurance business(1) |
1,253 |
762 |
Expected movements from asset returns & locked-in rates(1) |
560 |
362 |
Insurance experience gains/losses(1) |
67 |
89 |
| CSM recognized for services provided |
(919) |
(861) |
Organic CSM Movement(1) |
961 |
352 |
Impact of markets & other(1) |
(38) |
37 |
Impact of change in assumptions(1) |
364 |
431 |
| Currency impact |
(104) |
248 |
Disposition(2) |
(262) |
— |
| Total CSM Movement |
921 |
1,068 |
| Contractual Service Margin, End of Period |
11,786 |
10,865 |
(1)Represents a non-IFRS financial measure. For more details, see section M - Non-IFRS Financial Measures in this document.
(2)Relates to the sale of Sun Life UK. For additional information, refer to Note 3 in our 2023 Annual Consolidated Financial Statements.
Total CSM ended Q4'23 at $11.8 billion, an increase of $0.9 billion or 8% from December 31, 2022:
•Organic CSM movement was driven by the impact of new insurance business, reflecting strong individual protection sales in Asia and Canada.
•Favourable insurance experience occurred in Canada and Asia.
•Unfavourable markets and other impacts driven by interest rates.
•Impact of change in assumptions include favourable net mortality and net favourable model refinements.
•A $262 million reduction to the CSM balance from the sale of Sun Life UK.
MANAGEMENT'S DISCUSSION & ANALYSIS Sun Life Financial Inc. December 31, 2023 15
Assumption Changes and Management Actions by Type
The impact on CSM of ACMA is attributable to insurance contracts and related impacts under the general measurement approach ("GMA") and variable fee approach ("VFA"). For insurance contracts measured under the GMA, the impacts flow through the CSM at locked-in discount rates. For insurance contracts measured under the VFA, the impact flows through the CSM at current discount rates.
The following table sets out the impacts of ACMA on our reported net income and CSM in 2023.
|
|
|
|
|
|
|
|
|
|
|
|
At and For the Year Ended December 31, 2023 |
|
| ($ millions) |
Reported net income impacts (Post-tax)(1)(2)(3) |
Deferred in CSM (Pre-tax)(2)(3)(4) |
Comments |
| Mortality/morbidity |
(98) |
179 |
Updates to reflect mortality/morbidity experience in all jurisdictions. The largest items were favourable mortality impacts in the UK Annuities in the U.S and GRS in Canada.
These were offset partially by adverse mortality in In-force Management in the U.S. Mortality updates impacting CSM favourably are funded at locked-in rates that are lower than current rates resulting in a negative net income impact. Additionally, favourable morbidity impacts in Group Benefits in the U.S. were largely offset by unfavourable morbidity updates in Sun Life Health in Canada.
|
| Policyholder behaviour |
(91) |
(274) |
Updates to reflect lapse and policyholder behaviour in all jurisdictions. The largest items were an adverse lapse impact in Individual Term and Universal Life in Canada, and in International, Hong Kong and Vietnam in Asia. |
| Expense |
7 |
(171) |
Updates to reflect higher costs related to IFRS 17 infrastructure and higher costs in Canada. |
| Financial |
116 |
202 |
Updates to various financial related assumptions including the ultimate risk-free rate. |
| Modelling enhancement and other |
102 |
428 |
Various enhancements and methodology changes. The largest items were favourable impacts from refinements to the modelling of guarantees for the Individual Par in Canada and International Universal Life in Asia, as well as modelling enhancements in Vietnam in Asia offset partially by a refinement in Sun Life Health in Canada and to reinsurance and other provisions in Hong Kong in Asia. |
Total impact of change in assumptions |
36 |
364 |
|
(1)In this document, the reported net income impact of ACMA is shown in aggregate for Net insurance service result and Net investment result, and excludes amounts attributable to participating policyholders.
(2)CSM is shown on a pre-tax basis as it reflects the changes in our insurance contract liabilities, while reported net income is shown on a post-tax basis to reflect the impact on capital.
(3)The impact of ACMA of $90 million and $318 million of pre-tax net income and CSM, respectively, disclosed in Note 10.B of the 2023 Annual Consolidated Financial Statements, differs from the $36 million and $364 million, respectively, of ACMA shown above. This is a variance of $54 million and $(46) million, respectively. The difference is $16 million of tax on net income, and $38 million and $(46) million, respectively, of net income and CSM for non-liability impacts related to ACMA included in the above but excluded from Note 10.B in the 2023 Annual Consolidated Financial Statements.
(4)Total impact of change in assumptions represents a non-IFRS financial measure for amounts deferred in CSM. For more details, see section
M - Non-IFRS Financial Measures in this document.
16 December 31, 2023 Sun Life Financial Inc. MANAGEMENT'S DISCUSSION & ANALYSIS
|
|
|
|
|
|
|
|
|
|
|
|
|
|
|
|
|
|
|
IFRS 17 and IFRS 9 |
|
|
IFRS 4 and IAS 39(1) |
| ($ millions, unless otherwise stated) |
2023 |
|
|
|
|
As at
January 1, 2023(2)
|
|
|
2022 |
| LICAT ratio |
|
|
|
|
|
|
|
|
|
Sun Life Financial Inc.(1)(2) |
149% |
|
|
|
|
142% |
|
|
130% |
Sun Life Assurance(1)(2) |
141% |
|
|
|
|
139% |
|
|
127% |
Capital |
|
|
|
|
|
|
|
|
|
| Subordinated debt |
6,178 |
|
|
|
|
6,676 |
|
|
6,676 |
Innovative capital instruments(3) |
200 |
|
|
|
|
200 |
|
|
200 |
| Equity in the participating account |
457 |
|
|
|
|
268 |
|
|
1,837 |
| Non-controlling interests |
161 |
|
|
|
|
90 |
|
|
90 |
| Preferred shares and other equity instruments |
2,239 |
|
|
|
|
2,239 |
|
|
2,239 |
Common shareholders' equity(4) |
21,343 |
|
|
|
|
20,290 |
|
|
25,211 |
Contractual Service Margin(2)(5) |
11,786 |
|
|
|
|
10,865 |
|
|
|
Total capital(1)(2) |
42,364 |
|
|
|
|
40,628 |
|
|
36,253 |
Financial leverage ratio(1)(5)(6) |
21.5% |
|
|
|
|
23.7% |
|
|
25.1% |
| Dividend |
|
|
|
|
|
|
|
|
|
Underlying dividend payout ratio(1)(6) |
47% |
|
|
|
|
47% |
|
|
44% |
| Dividends per common share ($) |
3.000 |
|
|
|
|
0.720 |
|
|
2.760 |
Book value per common share ($)(1) |
36.51 |
|
|
|
|
34.60 |
|
|
42.99 |
(1)This measure has not been restated for periods in 2022 and earlier as IFRS 17 and IFRS 9 were not the accounting standards in effect, and therefore were not applicable to our capital management practices at the time.
(2)OSFI's 2023 LICAT Guideline, effective January 1, 2023, specifies that available capital for LICAT purposes includes the CSM, and as such total capital was also updated to include the CSM balance. Prior period restatement and resubmissions are not mandated. Pro-forma January 1, 2023 LICAT ratios are disclosed to illustrate transition impact. These pro-forma calculations will not be formally submitted to OSFI.
(3)Innovative capital instruments consist of Sun Life ExchangEable Capital Securities ("SLEECS"), see section J - Capital and Liquidity Management in this document.
(4)Common shareholders’ equity is equal to Total shareholders’ equity less Preferred shares and other equity instruments.
(5)Effective January 1, 2023, the calculation for the financial leverage ratio was updated to include the CSM balance (net of taxes) in the denominator. The CSM (net of taxes) was $9.6 billion as at December 31, 2023 (January 1, 2023 - $8.7 billion).
(6)Represents a non-IFRS financial measure. For more details, see section M - Non-IFRS Financial Measures in this document.
1. Life Insurance Capital Adequacy Test
The Office of the Superintendent of Financial Institutions has developed the regulatory capital framework referred to as the Life Insurance Capital Adequacy Test for Canada. LICAT measures the capital adequacy of an insurer using a risk-based approach and includes elements that contribute to financial strength through periods when an insurer is under stress as well as elements that contribute to policyholder and creditor protection wind-up.
SLF Inc. is a non-operating insurance company and is subject to the LICAT guideline. Sun Life Assurance, SLF Inc.'s principal operating life insurance subsidiary, is also subject to the LICAT guideline.
SLF Inc.'s LICAT ratio of 142% and Sun Life Assurance's LICAT ratio of 139% as at January 1, 2023 increased 12 percentage points compared to December 31, 2022, from the transition to IFRS 17. The largest driver of change was the reduction in the LICAT base solvency buffer ("BSB") scalar from 1.05 to 1.0 which contributed seven percentage points.
SLF Inc.'s LICAT ratio of 149% as at December 31, 2023 increased seven percentage points compared to January 1, 2023, driven by reported net income, capital optimization and market movements, partially offset by shareholder dividend payments, subordinated debt redemption, M&A activity, and share buybacks.
Sun Life Assurance's LICAT ratio of 141% as at December 31, 2023 increased two percentage points compared to January 1, 2023, driven by reported net income, capital optimization, and market movements, largely offset by dividend payments to SLF Inc. and M&A activity.
The Sun Life Assurance LICAT ratios in both periods are well above OSFI's supervisory ratio of 100% and regulatory minimum ratio of 90%.
MANAGEMENT'S DISCUSSION & ANALYSIS Sun Life Financial Inc. December 31, 2023 17
2. Capital
On transition to the new standards, total capital of $40.6 billion as at January 1, 2023 increased $4.4 billion compared to December 31, 2022 driven by the establishment of the CSM, which includes transfers from Common shareholders' equity and equity in the participating account to the CSM.
Our total capital consists of subordinated debt and other capital instruments, CSM, equity in the participating account and total shareholders' equity which includes common shareholders' equity, preferred shares and other equity instruments, and non-controlling interests. As at December 31, 2023, our total capital was $42.4 billion, an increase of $1.7 billion compared to January 1, 2023. The increase to total capital included reported net income of $3,086 million, an increase of $921 million in CSM, the issuance of $500 million principal amount of Series 2023-1 Subordinated Unsecured 5.50% Fixed/Floating Debentures, which is detailed below, and net unrealized gains on FVOCI assets of
$485 million. This was partially offset by the payment of $1,762 million of dividends on common shares of SLF Inc. ("common shares"), the redemption of $1 billion principal amount of Series 2016-2 Subordinated Unsecured 3.05% Fixed/Floating Debentures, which is detailed below, the unfavourable impacts of foreign exchange translation of $344 million included in other comprehensive income (loss) ("OCI"), a decrease of $186 million from the repurchase and cancellation of common shares, and the impact related to the acquisition of AAM of
$156 million(1).
Our capital and liquidity positions remain strong with a LICAT ratio of 149% at SLF Inc., a financial leverage ratio of 21.5%(2) and $1.6 billion in cash and other liquid assets(2) as at December 31, 2023 in SLF Inc.(3) (December 31, 2022 - $1.1 billion).
Capital Transactions
On July 4, 2023, SLF Inc. issued $500 million principal amount of Series 2023-1 Subordinated Unsecured 5.50% Fixed/Floating Debentures due 2035. Sun Life intends to use an amount equal to the net proceeds from the offering to finance or refinance, in whole or in part, eligible assets as defined in our Sustainability Bond Framework.
On September 19, 2023, SLF Inc. redeemed all of the outstanding $1 billion principal amount of Series 2016-2 Subordinated Unsecured 3.05% Fixed/Floating Debentures, in accordance with the redemption terms attached to such debentures. The redemptions were funded from existing cash and liquid assets in SLF Inc.
Normal Course Issuer Bids
On August 24, 2023, SLF inc. announced that OSFI and the Toronto Stock Exchange ("TSX") had approved its previously announced normal course issuer bid to purchase up to 17 million of its common shares (the "NCIB”). The NCIB commenced on August 29, 2023 and continues until
August 28, 2024, such earlier date as SLF Inc. may determine, or such date as SLF Inc. completes its purchases of common shares pursuant to the NCIB. Purchases under the NCIB may be made through the facilities of the TSX, other Canadian stock exchanges and/or alternative Canadian trading platforms, at prevailing market rates. Subject to regulatory approval, purchases under the NCIB may also be made by way of private agreements or share repurchase programs under issuer bid exemption orders issued by securities regulatory authorities. Any purchases made under an exemption order issued by a securities regulatory authority will generally be at a discount to the prevailing market price. The actual number of common shares purchased under the NCIB, and the timing of such purchases (if any), will be determined by SLF Inc. Any common shares purchased by SLF Inc. pursuant to the NCIB will be cancelled or used in connection with certain equity settled incentive arrangements. The NCIB will provide the Company with the flexibility to acquire common shares in order to return capital to shareholders as part of its overall capital management strategy.
In 2023, SLF Inc. purchased approximately 2.8 million common shares at a total cost of $186 million pursuant to the NCIB. All of the common shares purchased under SLF Inc.'s NCIB were subsequently cancelled.
Financial Strength Ratings
Independent rating agencies assign credit ratings to securities issued by companies and assign financial strength ratings to financial institutions such as Sun Life Assurance.
The financial strength ratings assigned by rating agencies are intended to provide an independent view of the creditworthiness and financial strength of a financial institution. Each rating agency has developed its own methodology for the assessment and subsequent rating of life insurance companies.
Rating agencies do not assign a financial strength rating for SLF Inc., however, credit ratings are assigned to the securities issued by SLF Inc. and its subsidiaries and are described in SLF Inc.'s AIF under the heading Security Ratings.
The following table summarizes the financial strength ratings for Sun Life Assurance as at January 31, 2024 and January 31, 2023.
|
|
|
|
|
|
|
|
|
|
|
|
|
|
|
|
A.M. Best |
DBRS |
Moody's |
Standard & Poor's |
| January 31, 2024 |
A+ |
AA |
Aa3 |
AA |
| January 31, 2023 |
A+ |
AA |
Aa3 |
AA |
Most recent rating agency actions on the financial strength rating of Sun Life Assurance:
•March 28, 2023 - Standard and Poor's ("S&P") affirmed the financial strength rating with a stable outlook.
•April 1, 2021 - Moody's affirmed the financial strength rating with a stable outlook.
•October 24, 2023 - DBRS affirmed the financial strength rating with a stable outlook.
•February 17, 2023 - A.M. Best affirmed the financial strength rating with a stable outlook.
(1)For additional information, refer to Note 3 in our 2023 Annual Consolidated Financial Statements.
(2)Represents a non-IFRS financial measure. For more details, see section M - Non-IFRS Financial Measures in this document.
(3)SLF Inc. (the ultimate parent company) and its wholly-owned holding companies.
18 December 31, 2023 Sun Life Financial Inc. MANAGEMENT'S DISCUSSION & ANALYSIS Sun Life's business is well-diversified across geographies and business types, supported by our four pillar strategy and diversified offerings of wealth and insurance products.
|
|
|
|
|
|
| H. Performance by Business Segment |
|
|
|
|
|
|
|
|
|
|
|
|
|
|
|
|
| ($ millions) |
|
|
|
2023 |
2022(1) |
Underlying net income (loss)(2) |
|
|
|
|
|
| Asset Management |
|
|
|
1,239 |
1,238 |
| Canada |
|
|
|
1,376 |
1,063 |
| U.S. |
|
|
|
890 |
698 |
| Asia |
|
|
|
600 |
539 |
| Corporate |
|
|
|
(377) |
(169) |
Total underlying net income (loss)(2) |
|
|
|
3,728 |
3,369 |
| Reported net income (loss) - Common shareholders |
|
|
|
|
|
| Asset Management |
|
|
|
1,067 |
1,148 |
| Canada |
|
|
|
1,252 |
1,241 |
| U.S. |
|
|
|
576 |
532 |
| Asia |
|
|
|
511 |
210 |
| Corporate |
|
|
|
(320) |
(260) |
| Total reported net income (loss) - Common shareholders |
|
|
|
3,086 |
2,871 |
(1)2022 restated results may not be fully representative of our future earnings profile, as we were not managing our asset and liability portfolios under the new standards. See the heading "Note to Readers: 2022 Restated Results on Adoption of IFRS 17 and IFRS 9" in section A - How We Report Our Results in this document.
(2)Represents a non-IFRS financial measure. For more details, see section M - Non-IFRS Financial Measures in this document.
All factors discussed in this document that impact our underlying net income are also applicable to reported net income.
MANAGEMENT'S DISCUSSION & ANALYSIS Sun Life Financial Inc. December 31, 2023 19
1. Asset Management
|
|
|
|
|
|
|
|
|
Our Asset Management business group is comprised of MFS and SLC Management. MFS is a premier global asset manager offering a comprehensive selection of financial products and services that deliver superior value, actively managing assets for retail and institutional investors around the world. SLC Management is a global asset manager with capabilities across fixed income and alternative asset classes including public and private fixed income, real estate equity and debt, and infrastructure equity, and manages assets on behalf of institutional investors and HNW Clients around the world. |
2023 Highlights
|
|
|
|
•We ended 2023 with $1,015.9 billion in assets under management consisting of $792.8 billion (US$598.6 billion) in MFS and $223.1 billion in SLC Management.
•Total Asset Management net outflows of $26.4 billion reflected net outflows of $38.9 billion (US$28.8 billion) from MFS partially offset by SLC Management net inflows of $12.5 billion.
|
|
|
|
|
MFS
•MFS generated solid net income and sustained a strong pre-tax net operating profit margin(1), despite challenging market conditions.
•Delivered strong long-term investment performance with 97%, 95% and 30% of MFS' U.S. retail mutual fund assets ranked in the top half of their Morningstar categories based on ten-, five- and three-year performance, respectively, as at December 31, 2023.
•During the year, MFS became the 9th largest fund group(2) for the U.S. retail mutual fund industry based on AUM.
•MFS is preparing to go to market with active exchange traded funds ("ETFs") over the next year, continuing to expand the diverse range of investment products offered to Clients.
|
|
|
|
|
SLC Management
•On February 1, we completed the acquisition of a 51%(3) interest in Advisors Asset Management, Inc. (“AAM”), a leading independent U.S. retail distribution firm, with the option to acquire the remaining interest starting in 2028. We also entered into a strategic partnership with Scotiabank in Q3'23 to distribute alternative investment capabilities to the Canadian retail market. AAM's strong U.S. retail distribution capabilities, coupled with the strategic partnership with Scotiabank, provides an attractive opportunity for SLC Management to meet the growing demand for alternative assets among HNW investors.
•AAM announced it will distribute BGO IREIT(4), a non-traded real estate investment trust launched by BentallGreenOak (“BGO”), and Crescent Private BDC, a non-traded closed-end fund launched by Crescent Capital Group LP ("Crescent"), in early 2023, highlighting the strategic benefit of adding this distribution channel.
•BGO achieved a successful final close of its third UK Secured Lending Fund, with a total of £1.4 billion in commitments from over 25 global institutional investors. The fund surpassed its initial target and has become one of the largest European fundraises for a debt strategy entirely focused on the UK.
•Crescent achieved a successful final close of its eighth private credit solutions fund(5), raising US$8 billion in investable capital. The fund exceeded its initial target and has become the largest capital raise in Crescent’s history.
•SLC Management continued to demonstrate its commitment to sustainable investing with BGO winning a number of awards including the 2023 ENERGY STAR® Partner of The Year – Sustained Excellence Award by the U.S. Environmental Protection Agency and the U.S. Department of Energy for the 13th consecutive year, and with InfraRed Capital Partners (“InfraRed”) continuing to invest capital in companies helping to build a sustainable future.
|
(1)Represents a non-IFRS financial measure. For more details, see section M - Non-IFRS Financial Measures in this document.
(2)Based on ISS Market Intelligence Simfund.
(3)On a fully diluted basis.
(4)BGO Industrial Real Estate Income Trust ("BGO IREIT").
(5)Crescent Capital Solutions VIII.
20 December 31, 2023 Sun Life Financial Inc. MANAGEMENT'S DISCUSSION & ANALYSIS Our strategy is to provide investment products through MFS and SLC Management that will deliver long-term value to our Clients in active asset management as well as fixed income and alternative asset classes.
Strategy and Outlook
MFS competes primarily in the global institutional, U.S. retail and select non-U.S. retail markets. SLC Management competes primarily in the global institutional market, offering a broad and deep fixed income and real assets platform through affiliate managers. SLC Management leverages Sun Life’s long-standing expertise in private asset class investments, augmented by the specialized alternative capabilities of SLC Management's affiliate managers, to offer customized investment solutions to investors. In addition, with the acquisition of a majority interest in AAM and the partnership with Scotia Global Wealth Management, SLC Management will also deliver solutions to the retail HNW market in North America.
|
|
|
|
MFS: Continue to deliver superior investment performance while allocating capital responsibly for our Clients
MFS' active management strategy focuses on delivering value to our Clients over the long-term. Our relative performance provides us with a strong competitive position:
•MFS is well-positioned to attract flows from all Client sectors that are seeking risk-managed capital appreciation over the long-term based on our disciplined, long-term approach. We are engaging Clients to align with MFS to focus on longer investment horizons, to leverage our proven ability to deliver over benchmark performance through a market cycle.
•Our strong leadership on ESG is embedded in our overall investment approach of allocating capital responsibly on behalf of our Clients.
•Our continued strategic focus to build out institutional fixed income product and sales capabilities and broaden our non-U.S. retail initiatives enables us to meet Clients' unique and local needs.
•MFS strives to maintain margins in the top quartile of active managers while maintaining our commitment to provide long-term value to Clients.
•We continue to focus on diversity at all levels and promoting an inclusive culture.
|
|
|
|
|
SLC Management: Help investors meet their investment objectives by offering a broad suite of alternative asset classes and fixed income strategies
We are well-positioned to take advantage of key trends in our target markets:
•Institutional investors continue to increase allocations to alternative investments and fixed income.
•Growing demand for alternative investments, including demand among North American HNW retail investors.
•Consolidation of investment manager relationships by institutional investors.
•Realizing the synergies from alternative asset management and insurance capabilities.
•An increasing focus by some investors on ESG and sustainable investing.
Our strategy is to continue to deliver superior investment performance, expand and deepen our distribution relationships, and build out our product lineup, while retaining our top talent. SLC Management is positioned for growth over the medium-term; our objectives(1) are to achieve AUM of $225 billion, operating margin of 30%-35%, and underlying net income of $235 million by 2025. We offer our Clients a compelling suite of investment capabilities to meet their needs, including:
•Leading public and private fixed income capabilities, spanning both investment grade and alternative credit
•Global real estate expertise across both equity and debt investments, and
•Global infrastructure capabilities.
|
|
|
|
Outlook |
|
MFS
The potential for a global recession remains. We are in an environment of slowing growth with capital and labour costs remaining high, which creates the need for more companies to recapitalize at higher rates in the face of softer revenue growth. This will continue to create a more challenging environment to generate value in the short to medium-term. Companies who can operate successfully in this more challenging, higher cost environment will be rewarded by investors. This could create greater opportunities for active managers to outperform benchmarks that have not been present. MFS employs an investment philosophy that involves a long-term approach and looks across the complete business cycle. Our scale, proven long-term track record and broad product portfolios, coupled with our investment philosophy, position us well to deliver strong results over a market cycle. Our expense structure leverages significant variable costs based on assets, sales or profitability, and as a result a majority of our expense base adjusts with market dynamics. In addition, we will continue to be diligent with discretionary spending while investing in strategic initiatives that help grow the business over the long-term.
SLC Management
With current economic and geopolitical uncertainty, we expect to see more volatility in equity markets driven by higher-for-longer interest rates and continued uncertainty on stabilization of rates. These macroeconomic headwinds are expected to moderate our ability to raise capital as investors rebalance their portfolios, or defer committing further capital, as well as to deploy capital given the challenging environment for transactions. However, we expect to see continued demand for yield-orientated fixed income and alternative assets classes, as these asset types continue to provide an opportunity for portfolio diversification, a potential hedge against inflation, and a reduction in overall risk exposure across investments. We believe that we are well positioned to meet this demand with our platform of world-class investment capabilities, complimentary businesses that drive product and distribution opportunities, and our ability to leverage global resources. The acquisition of a majority stake in AAM and partnership with Scotia Global Wealth Management provides further momentum to SLC Management to grow and expand our retail HNW business in North America. The investment capabilities we use for our Clients are the same capabilities that we use in managing the general account of Sun Life; this facilitates co-investment opportunities that result in an alignment of interest with our Clients and enables SLC Management's speed to market for products.
|
(1)Although considered reasonable by SLC Management, we may not be able to achieve our medium-term financial objectives as our assumptions may prove to be inaccurate. Accordingly, our actual results could differ materially from our medium-term financial objectives as described above. Our medium-term financial objectives do not constitute guidance. Our medium-term financial objectives are forward-looking non-IFRS financial measures. For more details, see section P - Forward-looking Statements - Medium-Term Financial Objectives in this document.
MANAGEMENT'S DISCUSSION & ANALYSIS Sun Life Financial Inc. December 31, 2023 21
Business Types and Business Units
|
|
|
|
|
|
|
|
|
|
|
|
| Business Type |
Business Unit |
Description |
Market position |
| Asset Management |
MFS |
• Actively manages assets for retail and institutional investors, including pension plans, sovereign wealth funds, monetary authorities, and endowments and foundations. • Retail products are distributed through financial advisors, brokerages and other professionals.
• Institutional products are distributed by an internal sales force, which is aided by a network of independent consultants.
|
• US$599 billion in AUM
• The 9th largest U.S. Retail funds manager(1)
|
| SLC Management |
• SLC Management delivers public and private credit, fixed income, real estate and infrastructure solutions to Clients through a group of affiliate managers, including:
• BentallGreenOak, a global real estate investment manager.
• InfraRed Capital Partners, a global infrastructure and real estate investment manager headquartered in London, UK.
• Crescent Capital Group, a U.S.-based global alternative credit investment manager.
• SLC Management, a North American institutional asset manager specializing in investment grade public and private fixed income portfolios.
• Institutional products are distributed by an internal sales force, which is aided by a network of independent consultants. The acquisition of a majority stake in AAM provides access to U.S. retail distribution and allows SLC Management to meet the growing demand for alternative assets among U.S. HNW investors. SLC Management also entered into a strategic partnership with Scotiabank to distribute alternative investment capabilities to the Canadian retail market through Scotia Global Wealth Management.
|
• $223 billion in AUM |
(1) As reported by ISS Market Intelligence Simfund based on AUM as at December 31, 2023.
22 December 31, 2023 Sun Life Financial Inc. MANAGEMENT'S DISCUSSION & ANALYSIS
Financial and Business Results
|
|
|
|
|
|
|
|
|
|
|
|
|
|
|
| Asset Management (C$ millions) |
|
|
|
2023 |
2022 |
Underlying net income(1) |
|
|
|
1,239 |
1,238 |
| Add: Market-related impacts |
|
|
|
(47) |
(22) |
Management's ownership of MFS shares |
|
|
|
12 |
115 |
Acquisition, integration and restructuring(2)(3) |
|
|
|
(114) |
(176) |
| Intangible asset amortization |
|
|
|
(23) |
(14) |
Other |
|
|
|
— |
7 |
| Reported net income - Common shareholders |
|
|
|
1,067 |
1,148 |
Assets under management (C$ billions)(1) |
|
|
|
1,015.9 |
952.0 |
Gross flows (C$ billions)(1) |
|
|
|
151.1 |
172.9 |
Net flows (C$ billions)(1) |
|
|
|
(26.4) |
(22.0) |
MFS (C$ millions) |
|
|
|
|
|
Underlying net income(1) |
|
|
|
1,044 |
1,080 |
Add: Management's ownership of MFS shares |
|
|
|
12 |
115 |
| Reported net income - Common shareholders |
|
|
|
1,056 |
1,195 |
Assets under management (C$ billions)(1) |
|
|
|
792.8 |
742.3 |
Gross flows (C$ billions)(1) |
|
|
|
126.4 |
140.6 |
Net flows (C$ billions)(1) |
|
|
|
(38.9) |
(43.4) |
| MFS (US$ millions) |
|
|
|
|
|
Underlying net income(1) |
|
|
|
773 |
832 |
Add: Management's ownership of MFS shares |
|
|
|
9 |
87 |
| Reported net income - Common shareholders |
|
|
|
782 |
919 |
Pre-tax net operating margin for MFS(1) |
|
|
|
38% |
39% |
Average net assets (US$ billions)(1) |
|
|
|
572.9 |
584.8 |
Assets under management (US$ billions)(1)(4) |
|
|
|
598.6 |
547.9 |
Gross flows (US$ billions)(1) |
|
|
|
93.7 |
108.4 |
Net flows (US$ billions)(1) |
|
|
|
(28.8) |
(33.1) |
| Asset appreciation (depreciation) (US$ billions) |
|
|
|
79.5 |
(111.8) |
| SLC Management (C$ millions) |
|
|
|
|
|
Underlying net income(1) |
|
|
|
195 |
158 |
| Add: Market-related impacts |
|
|
|
(47) |
(22) |
Acquisition, integration and restructuring(2)(3) |
|
|
|
(114) |
(176) |
Intangible asset amortization |
|
|
|
(23) |
(14) |
Other |
|
|
|
— |
7 |
| Reported net income (loss) - Common shareholders |
|
|
|
11 |
(47) |
Fee-related earnings(1) |
|
|
|
290 |
237 |
Pre-tax fee-related earnings margin(1)(5) |
|
|
|
24% |
24% |
Pre-tax net operating margin(1)(5) |
|
|
|
22% |
23% |
Assets under management (C$ billions)(1) |
|
|
|
223.1 |
209.6 |
Gross flows - AUM (C$ billions)(1) |
|
|
|
24.6 |
32.3 |
Net flows - AUM (C$ billions)(1) |
|
|
|
12.5 |
21.5 |
Fee earning assets under management ("FE AUM") (C$ billions)(1) |
|
|
|
176.9 |
164.4 |
|
Gross flows - FE AUM (C$ billions)(1) |
|
|
|
24.6 |
33.0 |
Net flows - FE AUM (C$ billions)(1) |
|
|
|
14.2 |
25.2 |
Assets under administration ("AUA") (C$ billions)(1) |
|
|
|
49.8 |
— |
Capital raising (C$ billions)(1) |
|
|
|
13.1 |
18.2 |
Deployment (C$ billions)(1) |
|
|
|
22.7 |
30.2 |
(1)Represents a non-IFRS financial measure. For more details, see section M - Non-IFRS Financial Measures in this document.
(2)Amounts relate to acquisition costs for our SLC Management affiliates, BentallGreenOak, InfraRed Capital Partners, Crescent Capital Group LP and Advisors Asset Management, Inc, which include the unwinding of the discount for Other financial liabilities of $86 million in 2023 (2022 - $64 million).
(3)Reflects the changes in estimated future payments for acquisition-related contingent considerations and options to purchase remaining ownership interests of SLC Management affiliates of $42 million (2022 - $80 million).
(4)Monthly information on AUM is provided by MFS in its Corporate Fact Sheet, which can be found at www.mfs.com/CorpFact. The Corporate Fact Sheet also provides MFS' U.S. GAAP assets and liabilities as at December 31, 2023.
(5)Based on a trailing 12-month basis. For more details, see section M - Non-IFRS Financial Measures in this document.
MANAGEMENT'S DISCUSSION & ANALYSIS Sun Life Financial Inc. December 31, 2023 23
Profitability
2023 vs. 2022
Asset Management underlying net income of $1,239 million increased $1 million driven by:
•MFS down $36 million (US$59 million): Lower fee income from average net assets ("ANA") and higher expenses, partially offset by an increase in net investment income and favourable foreign exchange translation.
•SLC Management up $37 million: The increase in underlying net income was driven by higher fee-related earnings, and higher retention expenses in the prior year that did not repeat. Fee-related earnings(1) increased 22% driven by higher AUM, reflecting strong capital raising and deployment across the platform and the AAM acquisition(2). Fee-related earnings margin(1) and pre-tax net operating profit margin(1) for 2023 were 24% and 22%, respectively (2022 - 24% and 23%, respectively).
Reported net income of $1,067 million decreased $81 million or 7%, reflecting fair value changes in management's ownership of MFS shares and a decline in value of real estate investments held in the SLC Management surplus account, partially offset by a lower increase in SLC Management's acquisition-related liabilities(3) compared to the prior year.
Foreign exchange translation led to an increase of $37 million and $35 million in underlying net income and reported net income, respectively.
Growth
2023 vs. 2022
Asset Management AUM of $1,015.9 billion increased $63.9 billion or 7% driven by:
•Net asset value changes of $91.6 billion; and
•AUM driven by the AAM acquisition of $5.2 billion; partially offset by
•Net outflows of $26.4 billion; and
•Client distributions of $6.5 billion.
MFS' AUM increased US$50.7 billion or 9%, driven by:
•Increase in asset values from higher equity markets of US$79.5 billion, partially offset by net outflows of US$28.8 billion.
In Q4'23, 97%, 95%, and 30% of MFS' U.S. retail mutual fund assets ranked in the top half of their Morningstar categories based on ten-, five- and three-year performance, respectively.
SLC Management's AUM increased $13.5 billion or 6% driven by:
•Net inflows of $12.5 billion, the AAM acquisition of $5.2 billion, and asset value changes of $2.3 billion, partially offset by Client distributions of $6.5 billion.
•Net inflows were comprised of capital raising and Client contributions, totaling $24.6 billion, partially offset by outflows of
$12.2 billion.
SLC Management's FE AUM increased $12.4 billion or 8% driven by:
•Net inflows of $14.2 billion, the AAM acquisition of $5.2 billion, and asset value changes of $0.2 billion, partially offset by Client distributions of $7.2 billion.
•Net inflows were comprised of capital deployment and Client contributions, totaling $24.6 billion, partially offset by outflows of
$10.4 billion.
Acquisition of Advisors Asset Management, Inc.
On February 1, 2023, we completed the acquisition of a 51%(4) interest in Advisors Asset Management, Inc. ("AAM"), a leading independent U.S. retail distribution firm. AAM's strong U.S. retail distribution capabilities provides an attractive opportunity for SLC Management to meet the growing demand for alternative assets among U.S. HNW investors. AAM provides a range of solutions and products to financial advisors at wirehouses, registered investment advisors and independent broker-dealers, overseeing US$41.4 billion (approximately C$54.9 billion) in assets as at December 31, 2023, with 10 offices across nine U.S. states. Sun Life has the option to acquire the remaining interest in AAM starting in 2028. As a result of the transaction, total shareholders' equity was reduced by $156 million, primarily driven by the establishment of financial liabilities associated with the anticipated increase of our future ownership in AAM. For additional information, refer to Note 3 in our 2023 Annual Consolidated Financial Statements.
(1)Represents a non-IFRS financial measure. For more details, see section M - Non-IFRS Financial Measures in this document.
(2)On February 1, 2023, we completed the acquisition of a majority stake interest in Advisors Asset Management, Inc. ("the AAM acquisition"), a leading independent U.S. retail distribution firm, with the option to acquire the remaining interest starting in 2028.
(3)Reflects the changes in estimated future payments for acquisition-related contingent considerations and options to purchase remaining ownership interests of SLC Management affiliates.
(4)On a fully diluted basis.
24 December 31, 2023 Sun Life Financial Inc. MANAGEMENT'S DISCUSSION & ANALYSIS
2. Canada
|
|
|
|
|
|
|
|
|
Our Canada business segment is a leading provider of protection, health, asset management and wealth solutions, providing products and services that deliver value to approximately 5.5 million Clients. We are the largest provider of benefits and pensions in the workplace, and offer a wide range of products to individuals via retail channels. We are focused on helping Canadians achieve lifetime financial security and live healthier lives. |
2023 Highlights
|
|
|
|
Advance our One Sun Client strategy
•Enhanced the Sun Life One Plan digital tool to enable Clients to directly update their financial roadmaps as frequently as they would like, while collaborating with their advisor on personalized goals. Approximately 140,000 financial roadmaps powered by Sun Life One Plan have been completed to date. We also launched self-serve Sun Life One Plan capabilities to GRS members in 2023.
•Continued to make it easier for Clients to do business with us by expanding digital capabilities, including increased feedback provided to Clients to help them track progress towards retirement goals, and integration of Lumino HealthTM provider search into Clients' claims journey removing manual input requirements, saving time and improving operational efficiency.
•Drove $2.4 billion in insurance coverage and $706 million in wealth deposits in Canada through nudges from our digital coach, Ella, an increase of 72% and 1%, respectively, over 2022. Ella delivers proactive and personalized interactions to help Clients achieve their health and financial goals.
|
|
|
|
|
Accelerate our wealth strategy
•SLGI Asset Management Inc. was awarded Wealth Professional Mutual Fund Provider of the year, demonstrating its commitment to consistently delivering superior advisor service and innovative investment solutions to Clients.
•Launched SLGI Virtual Xspace Retirement Hub for Advisors, a first of its kind virtual 3D platform offering advisors an immersive experience to engage meaningfully with high volumes of complex information, enhancing their education on holistic products and solutions available to meet Clients' evolving needs.
•We continue to expand our distribution capabilities through the creation of a securities investment dealer, Sun Life Canada Securities Inc. ("SLCSI"). We received approval from the Canadian Investment Regulatory Organization in the fourth quarter, and expect an operational launch in 2024. Our expanded offerings in SLCSI will broaden access to wealth solutions to help Clients achieve lifetime financial security.
•Expanded our suite of sustainable wealth and asset management product offerings with the launch of three sustainability funds.
|
|
|
|
|
Strengthen and expand our health business
•Completed the acquisition of Dialogue Health Technologies Inc. (“Dialogue”), Canada’s premier virtual health care and wellness platform, providing affordable on-demand access to quality care, which will help us empower Canadians with access to the care they need from the convenience of their home.
•Launched Lumino HealthTM Pharmacy, a new online pharmacy app, which will help group benefits plan members consult a knowledgeable pharmacist by chat or a phone call and have medications delivered to their door free of charge. This service helps Clients to keep track of their medications, usage, refills, and sends them important notifications regarding their prescriptions. Expanding on this launch, we also announced a minority investment in Simpill Health Group Inc., operating as Pillway, the virtual pharmacy provider for Lumino HealthTM Pharmacy.
•Finalized a contract with the Government of Canada to be the administrator of the Canadian Dental Care Plan (“CDCP”), which will provide access to dental care for Canadians in need. Through the CDCP, up to nine million additional Canadians will have access to dental care.
•Following a successful pilot program, launched Mental Health Coach ("MHC"), a digital tool that provides a personalized and proactive approach to help group benefits members take action and improve their mental well-being. Approximately 90% of pilot participants experienced a positive mental health outcome after using MHC.
•In support of our focus on inclusive workplace benefits, we are making it easier for plan members to understand and access culturally relevant covered health expenses under the standard Personal Spending Accounts (“PSA”). For example, we created a new Indigenous Health category which outlines and creates awareness that Sun Life provides coverage for traditional medicines, fees and supplies for Indigenous ceremonies, and more under the PSA.
•Conducted a pilot of our Diabetes Signature Solutions products and expanded the program beyond Type 2 diabetes to also include Type 1 diabetes, gestational diabetes and pre-diabetes. Full launch of the products is expected in 2024, offering Canadians with diabetes flexibility to get the coverage they need and live healthier lives.
•Continue to be a leader in gender affirmation coverage, adding increased annual maximums options and creating a Sun Life specific Prior Authorization process to make coverage more accessible.
|
|
|
|
|
Transform retail distribution
•Expanded our reach through Prospr by Sun Life by partnering with national mortgage brokers to offer Canadians access to protection advice and solutions to provide lifetime financial security to them and their beneficiaries.
|
|
|
|
|
Sustain Financial Discipline
•Contributed to Sun Life's strong capital position with proactive management actions, including the optimization of capital in our investment portfolio and the sale of the sponsored markets business(1).
•Made it easier for Clients to do business with us and achieved operational efficiencies by digital straight through processing 84% of group benefits health and dental claims and 57% Chatbot inquires throughout the year.
|
(1)On February 1, 2023, we completed the sale of the sponsored markets business from Sun Life Assurance, a wholly owned subsidiary of SLF Inc., to Canadian Premier Life Insurance Company (re-branded to Securian Canada) ("sale of the sponsored markets business").
MANAGEMENT'S DISCUSSION & ANALYSIS Sun Life Financial Inc. December 31, 2023 25
Strategy and Outlook
Our Canadian market continues to experience market uncertainties, an aging population, and a challenging healthcare landscape. Additionally, we see evolution in the technological, wealth management and distribution landscape. Our Client focused strategy, diversified business, and multi-channel distribution, enables us to address these trends and deliver on our Purpose. We continue to incorporate sustainability into our culture and decision making to deliver a positive social impact and increase Client and employee engagement. Our focus for the Canadian businesses is to:
|
|
|
|
Advance our One Sun Client strategy
•Support Clients across health, wealth and protection with holistic advice and solutions that build Sun Life Clients for life.
•Broaden and deepen Client relationships through personalized, seamless experiences across all Sun Life channels, for example through the use of Sun Life One Plan, and integrated health ecosystem offerings, for example Lumino Health™ Pharmacy.
|
|
|
|
|
Accelerate our wealth strategy
•Position SLGI Asset Management Inc. as a growth engine within Canada, providing third party and internal channels with more convenient access to investment solutions and a product suite to meet their asset management needs.
•Accelerate progress towards being the retirement income and estate solutions provider of choice with a focus on advice, experience and differentiated products.
•Focus on Client experience through enhanced planning tools and process simplification to drive asset consolidation and retention.
•Continue to be a market leader in the growing Canadian pension risk transfer market, with customized solutions to meet employers’ needs in managing and de-risking their defined benefit pension plans.
|
|
|
|
|
Strengthen and expand our health business
•Empower Canadians to act earlier to prevent and mitigate health risks by expanding our health solutions, including leveraging the capabilities from the acquisition of Dialogue.
•Develop targeted solutions for Canadians living with chronic conditions, for example diabetes, to improve insurability and health outcomes.
•Ensure group benefits plans are inclusive and aligned with sponsor’s focus on diversity, equity and inclusion, and drawing awareness to women’s health.
•Continue to augment predictive underwriting models to minimize risk, using advanced data analytics and predictive modelling.
|
|
|
|
|
Transform retail distribution
•Continue to build an omni-channel retail distribution continuum tailored to targeted Client segments’ preferences and needs, including digital, hybrid, dedicated face-to-face and independent insurance advisor channels.
•Modernize our dedicated face-to-face advice channel through digital, data and analytics capabilities that enable personalized holistic Client experiences and improve advisor productivity.
•Grow and scale Prospr by Sun Life, driving new-to-Sun Life Client relationships, targeting Canadians that prefer engagement through a hybrid human/digital experience.
•Build on strong momentum in the independent insurance advisor market, scale and expand relationships with group plan sponsors to drive growth.
|
|
|
|
|
Sustain financial discipline
•Enhance advisor and Client experiences and drive operational efficiencies through digital initiatives such as straight-through processing and data consolidation.
•Seek low-cost, innovative opportunities focusing on capital and risk optimization.
|
|
|
|
Outlook |
|
Our diversified business, which address Clients' needs in asset and wealth management, life and health protection, and our multi-channel distribution, position us well to deepen Client relationships and capture new opportunities. We continue to enhance our offerings across our Clients’ health, wealth and protection journeys, enabled by investments in systems, distribution, and digital capabilities. We are confident that our leadership position and scale in Canada will continue to help us provide positive outcomes for Clients.
We are well positioned to manage through prevailing demographic, healthcare, technological and macroeconomic trends, through pricing discipline, diversified Client centric businesses, and prudent risk management.
|
26 December 31, 2023 Sun Life Financial Inc. MANAGEMENT'S DISCUSSION & ANALYSIS
Business Types and Business Units
|
|
|
|
|
|
|
|
|
|
|
|
| Business Type |
Business Unit |
Description |
Market position |
Wealth & asset management |
Individual Wealth |
• Provides advice to individuals to help them and their families achieve lifetime financial security, leveraging a broad suite of wealth and insurance-based wealth solutions.
• Products distributed via multi-channel distribution model consisting of the SLFD network(1), third-party channels, including independent brokers and broker-dealers, and direct-to-consumer.
• SLGI manufactures wealth solutions for retail and institutional clients.
|
• 2nd in fixed product sales(2) and 4th place market position by total wealth deposits and premiums(2) |
| Group Retirement Services |
• Provides defined contribution pension plans and defined benefit solutions in Canada to employers of all sizes.
• Leverages our worksite advantage to offer voluntary savings plans, including post-employment plans, to those members exiting their employer-sponsored plans.
• Defined Benefit Solutions offers an expanding range of innovative de-risking solutions for defined benefit pension plans.
• Products distributed by sales representatives in collaboration with a multi-channel distribution network of pension consultants and advisors.
• Planning and asset consolidation capabilities for current and former plan members to benefit from a simplified and seamless experience with a single provider.
|
• Ranked 1st in the defined contribution market based on total Capital Accumulation Plan assets for the 21st consecutive year(3)
• Ranked 3rd in the defined benefit solutions annuity market(2)
|
Group -
Health & Protection |
Sun Life Health |
• Provides Clients with personalized and on-demand digital health experiences, by leveraging our acquisition of Dialogue, that will empower them to take action on their health earlier, ultimately improving their health outcomes.
• Offers group insurance products in Canada, including life, dental, extended health care, disability and critical illness, to employers of all sizes.
• Leverages our worksite advantage to offer voluntary benefits solutions to individual plan members, including post-employment life and health plans.
• Products distributed by sales representatives in collaboration with independent advisors, benefits consultants and the SLFD network.
|
• Leading group benefits provider in Canada for the 11th consecutive year(4) |
| Individual - Protection |
Individual Insurance |
• Offers comprehensive life and health insurance products to individuals to help them and their families achieve lifetime financial security, and live healthier lives.
• Products distributed via multi-channel distribution model consisting of the SLFD network, third-party channels, including independent brokers and broker-dealers, and direct-to-consumer including Prospr by Sun Life.
|
• Leading provider in the individual life and health market, by premiums, for the 3rd consecutive year (2) |
(1)Sun Life Financial Distribution ("SLFD") is our proprietary career advisory network.
(2)Life Insurance Marketing and Research Association ("LIMRA") Market Share as of Q3'23, on a year-to-date basis.
(3)Fraser Pension Universe Report, based on year-ended December 2022.
(4)Based on revenue for year ended December 2022 from 2023 Group Benefits Provider Report.
MANAGEMENT'S DISCUSSION & ANALYSIS Sun Life Financial Inc. December 31, 2023 27
Financial and Business Results
|
|
|
|
|
|
|
|
|
|
|
|
|
|
|
| ($ millions) |
|
|
|
2023 |
2022(1) |
Wealth & asset management(2) |
|
|
|
432 |
364 |
Group - Health & Protection(2) |
|
|
|
550 |
375 |
Individual - Protection(2) |
|
|
|
394 |
324 |
Underlying net income(2) |
|
|
|
1,376 |
1,063 |
Add: Market-related impacts(1) |
|
|
|
(243) |
330 |
| ACMA |
|
|
|
59 |
(228) |
| Acquisition, integration and restructuring |
|
|
|
76 |
(2) |
| Intangible asset amortization |
|
|
|
(16) |
(12) |
Other |
|
|
|
— |
90 |
Reported net income - Common shareholders(1) |
|
|
|
1,252 |
1,241 |
Underlying ROE (%)(2) |
|
|
|
21.4% |
16.3% |
Reported ROE (%)(2) |
|
|
|
19.4% |
19.1% |
Wealth sales & asset management gross flows(2)(3) |
|
|
|
15,039 |
14,629 |
Group - Health & Protection sales(2) |
|
|
|
591 |
533 |
Individual - Protection sales(2) |
|
|
|
609 |
496 |
(1)2022 restated results may not be fully representative of our future earnings profile, as we were not managing our asset and liability portfolios under the new standards. See the heading "Note to Readers: 2022 Restated Results on Adoption of IFRS 17 and IFRS 9" in section A - How We Report Our Results in this document.
(2)Represents a non-IFRS financial measure. For more details, see section M - Non-IFRS Financial Measures in this document. For more information about business types in Sun Life's business groups, see section A - How We Report Our Results in this document.
(3)Effective January 1, 2023, Canada wealth sales & asset management gross flows have been updated to exclude retained sales. Prior period amounts have been updated to reflect this change.
Profitability
2023 vs. 2022
Underlying net income of $1,376 million increased $313 million or 29%, reflecting:
•Wealth & asset management up $68 million: Increase in investment income driven by higher volume and yields, partially offset by lower fee-related earnings.
•Group - Health & Protection up $175 million: Business premium growth and improved disability experience reflecting higher margins, lower claims volumes, and shorter claims durations.
•Individual - Protection up $70 million: Growth of In-force business, higher investment contributions and improved protection experience.
•In addition the earnings across all businesses above include higher earnings on surplus driven by an increase in realized gains and net interest income from higher rates, and higher operating expenses reflecting volume growth and continued investments in the business.
Reported net income of $1,252 million was in line with prior year, as the increase in underlying net income, ACMA impacts, and a gain on the sale of the sponsored markets business was mostly offset by market-related impacts and the prior year impact from the Canada Tax Rate Change(1). Market-related impacts were primarily from interest rates and real estate experience, partially offset by higher equity markets.
Growth
2023 vs. 2022
Canada's sales included:
•Wealth sales & asset management gross flows of $15.0 billion were up 3%, driven by higher Individual Wealth sales, primarily from mutual funds, largely offset by lower defined contribution sales in GRS.
•Group - Health & Protection sales of $591 million were up 11% driven by higher large case sales.
•Individual - Protection sales of $609 million were up 23%, driven by higher participating whole life insurance sales.
AUM for wealth businesses, including GRS, was $166.7 billion as at December 31, 2023, an increase of $14.4 billion or 9.5%, reflecting market movements and net inflows.
Sale of Sponsored Markets Business
On February 1, 2023, we completed the sale of the sponsored markets business(2) from Sun Life Assurance to Canadian Premier Life Insurance
Company (re-branded to Securian Canada). For additional information, refer to Note 3 of our 2023 Annual Consolidated Financial Statements.
(1)On December 15, 2022, legislation implementing an additional surtax of 1.5% applicable to banks and life insurer's taxable income in excess of
$100 million was enacted in Canada ("Canada Tax Rate Change"). This legislation applied retroactively to the Federal Budget date of April 7, 2022. As a result, Canada reported net income increased by $90 million in Q4'22, reflected in Other adjustments.
(2)Sponsored markets include a variety of association & affinity, and group credit clients. This business was previously part of the Sun Life Health business unit.
28 December 31, 2023 Sun Life Financial Inc.
Acquisition of Dialogue Health Technologies Inc.
MANAGEMENT'S DISCUSSION & ANALYSIS On October 3, 2023, we acquired Dialogue Health Technologies Inc. ("Dialogue"). As a result of this acquisition, our ownership interest increased from 23% to 95% for cash proceeds of $272 million (for equity not previously owned by Sun Life or rolled by certain members of Dialogue's executive management). Dialogue is a Canadian-based health and wellness virtual care platform. For additional information, refer to Note 3 of our 2023 Annual Consolidated Financial Statements.
3. U.S.
|
|
|
|
|
|
|
|
|
Sun Life U.S. is one of the largest providers of employee and government benefits in the U.S., serving more than 50 million Americans with disability, life, supplemental health, medical stop-loss insurance, dental and vision benefits through employers, industry partners and government programs such as Medicaid, Medicare Advantage, and the Children's Health Insurance Program ("CHIP"). Services include absence management, dental care, and healthcare navigation. In addition, our U.S. business manages an in-force block of approximately 225,000 individual life insurance and annuity policies as well as a block of run-off reinsurance. |
2023 Highlights
|
|
|
|
Growing our business
•Sun Life U.S. delivered strong double-digit growth in underlying earnings, sales, and revenue again in 2023, driven by the successful execution of our strategy to help Clients access the health care and coverage they need as well as contributions from the DentaQuest acquisition.
•Recorded more than US$650 million in total new dental sales since closing the DentaQuest acquisition on June 1, 2022, including the largest Medicare Advantage sale in DentaQuest history in 2023. Commercial dental sales also increased 55% in 2023 as we leverage our combined strengths from the DentaQuest acquisition.
•Employee Benefits revenue increased 14% compared to 2022, reflecting strong sales and persistency results, supported by investments in products and technology, higher average premiums per case and disciplined pricing.
•Increased supplemental health premiums by 34% year-over-year and recognized in 2023 as the Voluntary Sales Growth Leader in the large carrier category by Eastbridge Consulting(1). Voluntary benefits include supplemental health benefits that help members pay for costs that may not be covered by their medical plans.
|
|
|
|
|
Helping Clients access the health care and coverage they need
•PinnacleCare's personalized care navigation solutions helped members get timely access to high quality healthcare and provided them with the knowledge to make confident decisions about their health. In 2023, more than 50% of the appointments secured for members facing a new or progressing cancer diagnosis were expedited by Health Navigator to a date sooner than the patient was able to schedule through typical hospital access channels.
•Expanded our Advantage Dental+ practices with five new offices in Texas. These practices are focused on providing high quality, preventive-focused oral health care to children with Medicaid coverage.
•Announced a relationship with Philadelphia-based Independence Health Group to exclusively provide medical stop-loss insurance to their self-funded group medical Clients to help protect against large, unpredictable health care expenses.
•Established a new preferred partnership with OptiMed Health Partners(2) to make specialty drugs more accessible and affordable for our stop-loss members. The new program will improve how specialty drugs are administered for members who need them, often in their own homes, while also managing rising health care costs.
•Launched an enhanced disability product suite specially designed for healthcare professionals, providing them with income replacement coverage that meets their specific needs.
•Launched two new commercial dental plan options that help members reduce out-of-pocket costs, encourage preventive care, and maximize their dental coverage.
•As the largest Medicaid dental benefits provider, DentaQuest was awarded four new Medicaid contracts, supporting our mission to provide access to dental care for families and children in underserved communities.
•Announced a partnership with in-home, tech-enabled medical care provider Somatus to provide one-on-one support to our members with chronic kidney disease and congestive heart failure, two common high-cost conditions.
•Established a partnership with Virtual MeTM(3) to provide our Health Navigator product through their telehealth services that cater to business clients, as well as individuals who are underinsured or uninsured.
|
|
|
|
|
Making care and benefits easier through digital solutions
•Expanded our partnership with AbleTo, a leading provider of high-quality, evidence-based virtual mental health therapy and coaching solutions, to add a digital, on-demand wellness program for our group life insurance members, supporting emotional and mental health.
•Partnered with Goodpath, an integrative, virtual clinic, to provide access to whole-person care services for our disability members to improve treatment for back and musculoskeletal conditions and long COVID-19.
•Extended our partnership with Teledentistry.com to include DentaQuest members, offering members in selected states 24/7 virtual access to dental providers, making it easier to get dental care and advice digitally.
•Improved the stop-loss underwriting process by introducing an advanced digital underwriting tool in the U.S. Leveraging this tool, which uses machine learning, we were able to provide medical stop-loss to more Clients.
•Enhanced Sun Life Onboard, our fully digital benefits implementation tool for employers and brokers, with the launch of our Digital Smart Form. This new digitally guided form captures information needed to complete employer benefits setup, which has reduced the time it takes Clients to complete onboarding paperwork from six to three days.
|
(1)Recognition based on 2022 sales. Eastbridge Consulting is the source for research, experience, and advice for companies competing in the voluntary/worksite space and for those wishing to enter. For over 25 years, they have built the industry's leading data warehouse and industry-specific consulting practice.
(2)OptiMed Health Partners is a nationally licensed, multi-accredited provider of specialty injectables and infusion services.
(3)Virtual MeTM provides a suite of telehealth services delivering quality health care directly to patients in need.
MANAGEMENT'S DISCUSSION & ANALYSIS Sun Life Financial Inc. December 31, 2023 29
Strategy and Outlook
Our strategy is to be a leader in health and benefits in the U.S. that helps members access the care and coverage they need. The
US$4.5 trillion and growing health and benefits ecosystem is complex and rapidly changing. Health care staffing shortages and increasing demand are reducing capacity in the U.S. health care system, making accessing care more challenging. Over 85%, or $7.2 billion, of our revenue now comes from health care products and services, and we are serving a key role as a connector in the health care system by helping our members get the right diagnoses, treatments, and benefits. We have significantly advanced our capabilities with our DentaQuest and PinnacleCare acquisitions, and the addition of clinical support initiatives in our disability business. We are a differentiated provider whose offerings complement core health insurance offerings from large U.S. health insurers. Our medical stop-loss and dental benefits businesses are leaders in their industry sectors, and our group life and disability benefits business is a top-10 provider. Through our dental business, we are also part of the large and growing government programs market that covers more than 160 million Americans.
Our digital tools and support services also make it easier to do business with us and close coverage gaps. We also continue to leverage our unique partnership capabilities to drive growth by delivering solutions to our more than 100 health plan and insurance industry partners to support their members.
|
|
|
|
Helping Clients access the health care and coverage they need
•Extend our leadership position in medical stop-loss and innovative risk management solutions for self-funded employers by continuing to deliver complementary health-adjacent offerings, including Health Navigator powered by PinnacleCare, to help members with serious conditions get the care they need, achieve better health outcomes, and reduce costs.
•Leverage DentaQuest's scale and expertise to provide quality oral health to all and help Americans live healthier lives, continue to grow in government programs, and become a leader in commercial dental through our leading capabilities.
•Focus employee benefits offerings on health and productivity through expanded and enhanced offerings across disability, absence, life, and supplemental health to provide income protection, fill gaps in coverage, and help Clients get the care they need so they can recover and get back to work and to their lives.
•Help employers comply with complex regulations and provide more Americans with access to paid family and medical leave.
•Drive growth in FullscopeRMS by leveraging our expertise, scale, and suite of turnkey solutions for insurance and health plan partners, to improve coverage for members.
|
|
|
|
|
Making care and benefits easier through digital solutions
•Expand our ability to integrate with other major platforms in the health and benefits ecosystem, delivering a better Client experience.
•Drive digital expansion through new capabilities and partnerships while leveraging existing assets to deliver predictive and personalized analytics to help Clients make decisions that are right for them.
•Leverage digital tools to increase Client interactions and virtual engagement, helping to better serve more members and deliver deeper insights for brokers and employers.
|
|
|
|
|
Help In-force Management policy-owners achieve lifetime financial security, while effectively managing our operations
•Continue to provide excellent service to our individual insurance and annuity policy owners.
•Optimize the value of the business by implementing opportunities to improve profitability, including expense efficiencies and alternative investment strategies.
•Effectively manage risk and capital through reinsurance and via product offerings for converting or maturing policies.
|
|
|
|
Outlook |
|
The U.S. health and employee benefits ecosystem is large and growing, with Clients becoming increasingly aware of the value of protection products and services. These markets remain competitive, and we are committed to growing profitably by leveraging our leadership positions, deep expertise, and new capabilities to extend further into the health benefits and services space in order to help Americans live healthier lives.
The strength of our U.S. business is reflected by the growth of our sales, revenues, and underlying net income in 2023. Significant enhancements to our products, systems, and digital capabilities over the past several years have contributed to our growth, in addition to our recent acquisitions.
We have a diversified business that served us well during the pandemic and is well-positioned for growth. While we have some short-term headwinds in Dental due to the state Medicaid redetermination process following the end of the federally declared Public Health Emergency, the business is growing, we have a strong new business pipeline, and the fundamentals remain strong. The DentaQuest integration remains on schedule, and we are on track to achieve our synergy targets. Health and Risk Solutions results have begun to moderate from pandemic-related performance but remain strong as we price our products responsibility, invest in health capabilities and leverage data analytics to differentiate our product and service offerings; this will enable us to continue to grow the business with strong profit margins. We are seeing significant improvements in Employee Benefits as COVID-19 impacts subside and the business benefits from ongoing pricing discipline, a strong focus on disability claims management, and investments in technology that have improved the Client experience and driven sales and strong persistency.
We continue to work with state and federal officials to increase access to benefits for our Clients. In addition to our focus on paid family and medical leave, we have increased our advocacy to expand dental coverage for beneficiaries of Medicaid and other government programs, and to keep employer-sponsored dental benefits affordable. We are also supporting the ERISA Advisory Council’s recommendation that Congress pass legislation to ensure mental health parity in long-term disability insurance, which is already required for health insurance. We continue to monitor possible legislative and regulatory changes to key areas that impact our business, such as data security and privacy, minimum loss ratios for employer-sponsored dental insurance plans, and state government contractor requirements.
|
30 December 31, 2023 Sun Life Financial Inc. MANAGEMENT'S DISCUSSION & ANALYSIS
Business Types and Business Units
|
|
|
|
|
|
|
|
|
|
|
|
Business Type |
Business Unit |
Description |
Market position |
| Group - Health & Protection |
Group Benefits |
• Employee Benefits provides group insurance products and services, including life, long-term and short-term disability, absence management, and voluntary and supplemental health insurance such as hospital indemnity, accident and critical illness. Includes our FullscopeRMS business, which provides turnkey risk management solutions for insurers and health plans.
• Health and Risk Solutions provides protection against large medical claims for employers who self-insure their employee health plans through medical stop-loss and health care navigation services to help members access care and improve health outcomes.
• Products distributed through more than 32,000 independent brokers and benefits consultants, supported by more than 165 employed sales representatives.
• Serves more than 60,000 employers in small, medium and large workplaces across the U.S. and approximately 19 million members(1).
|
• Largest independent medical stop-loss provider(2)
• Top 10 group life and disability benefits provider, including the leading turnkey disability provider(3)
|
Dental |
• Provides Medicaid and Medicare Advantage products and services, as well as commercial group dental and vision solutions for employers of all sizes.
• Serves approximately 36 million members(4).
•Supports preventive dental care through its innovative Preventistry® model, which focuses on early and quality care, access, and measurable outcomes.
•Approximately 80 Advantage Dental+ practices, which are located in underserved communities to help increase access to dental care.
|
•Second largest Dental benefits provider in the U.S(5)
• Largest Medicaid dental benefits provider(6)
• The commercial Sun Life Dental Network® includes more than 130,000 unique providers and offers easy access to care with in-network cost benefits(7)
|
Individual - Protection |
In-force Management |
• Manages approximately 80,000 individual life insurance policies, primarily universal life and participating whole life insurance, plus approximately 105,000 individual annuity policies that were originally sold in the UK. Also includes a block of approximately 40,000 policies from run-off reinsurance, which includes guaranteed minimum income, death benefits and individual long-term care, as well as personal accident policies and medical policies which are 100% retroceded. In-force Management is a run-off block with no new sales. |
|
(1)Includes members who also have a commercial Sun Life Dental and/or Vision coverage.
(2)Ranking compiled by Sun Life based on data contained in the 2022 Accident and Health Policy Experience Report from the National Association of Insurance Commissioners ("NAIC"). An independent stop-loss carrier is defined as a stop-loss carrier that does not also sell medical claim administration services.
(3)LIMRA 2022 Annual Sales & In-force Reports for Group Life & Disability. Long-term disability results exclude reserve buy outs. Group Term Life, long-term disability and short-term disability results exclude business sold through associations; includes BIF managed by Sun Life for insurance carrier partners.
(4)Includes members who also have a Sun Life Group coverage.
(5)Based on membership as of December 31, 2022. Ranking compiled by Sun Life and based on data disclosed by competitors.
(6)Based on membership as of September 2023. Ranking compiled by Sun Life using publicly available data from the September 2023 Medicaid & CHIP Enrollment Data Highlights, state Medicaid agencies and other sources, and information disclosed by competitors.
(7)Sun Life's commercial dental networks include its affiliate, Dental Health Alliance®, L.L.C. (DHA®), and dentists under access arrangements with other dental networks.
MANAGEMENT'S DISCUSSION & ANALYSIS Sun Life Financial Inc. December 31, 2023 31
Financial and Business Results
|
|
|
|
|
|
|
|
|
|
|
|
|
|
|
| (US$ millions) |
|
|
|
2023 |
2022(1) |
Group - Health & Protection(2) |
|
|
|
568 |
450 |
Individual - Protection(2)(3) |
|
|
|
95 |
81 |
Underlying net income(2) |
|
|
|
663 |
531 |
Add: Market-related impacts(1) |
|
|
|
(25) |
(30) |
| ACMA |
|
|
|
(48) |
40 |
Acquisition, integration and restructuring(4) |
|
|
|
(87) |
(103) |
| Intangible asset amortization |
|
|
|
(63) |
(47) |
| Other |
|
|
|
— |
13 |
Reported net income - Common shareholders(1) |
|
|
|
440 |
404 |
Underlying ROE (%)(2) |
|
|
|
14.2% |
13.6% |
Reported ROE (%)(2) |
|
|
|
9.4% |
10.3% |
After-tax profit margin for Group Benefits (%)(2)(5) |
|
|
|
10.0% |
8.1% |
Group - Health & Protection sales(2)(6) |
|
|
|
1,680 |
1,464 |
|
|
|
|
|
|
|
|
|
|
|
|
|
|
|
|
|
|
|
|
|
|
|
|
|
|
|
|
|
|
|
|
|
|
|
|
|
|
|
(1)2022 restated results may not be fully representative of our future earnings profile, as we were not managing our asset and liability portfolios under the new standards. See the heading "Note to Readers: 2022 Restated Results on Adoption of IFRS 17 and IFRS 9" in section A - How We Report Our Results in this document.
(2)Represents a non-IFRS financial measure. For more details, see section M - Non-IFRS Financial Measures in this document. For more information about business types in Sun Life's business groups, see section A - How We Report Our Results in this document.
(3)Effective Q2'23, the UK payout annuities run-off business was moved from the Corporate business segment to the U.S. business segment upon the sale of Sun Life UK. For additional information, refer to Note 3 of our 2023 Annual Consolidated Financial Statements. Also, effective Q3'23 the run-off reinsurance business was moved from the Corporate business segment to the U.S. business segment.
(4)Includes acquisition and integration costs associated with DentaQuest, acquired on June 1, 2022.
(5)Based on underlying net income, on a trailing four-quarter basis. For more details, see section M - Non-IFRS Financial Measures.
(6)Prior period amounts related to U.S. Dental sales have been restated to reflect new information.
Profitability
2023 vs. 2022
Underlying net income of US$663 million increased US$132 million or 25%, driven by:
•Group - Health & Protection up US$118 million: Strong premium growth across all businesses, contribution from the DentaQuest acquisition, and higher net investment results including higher earnings on surplus reflecting an increase in net interest income from higher rates. Experience in the year included favourable margins in medical stop-loss and favourable group disability morbidity, partially offset by unfavourable dental experience primarily reflecting the impact of Medicaid redeterminations following the end of the Public Health Emergency, and group mortality. Mortality improved significantly when compared to pandemic-related experience in the prior year.
•Individual - Protection up US$14 million: The inclusion of the UK payout annuity business(1) and improved mortality experience, partially offset by lower net investment results.
Reported net income of US$440 million increased US$36 million or 9%, driven by the increase in underlying net income, partially offset by ACMA impacts. The prior year included a gain on the sale-leaseback of the Wellesley office which was partially offset by a charge reflecting the resolution of a matter related to reinsurance pricing for the In-force Management business.
Foreign exchange translation led to an increase of $31 million and $26 million in underlying net income and reported net income, respectively.
Growth
2023 vs. 2022
U.S. group sales of US$1,680 million were up US$216 million or 15%, driven by higher Dental(2) sales in Medicare Advantage, Medicaid, and commercial dental, as well as higher medical stop-loss sales, partially offset by lower employee benefits sales.
(1)On April 3, 2023, we completed the sale of SLF of Canada UK Limited to Phoenix Group Holdings plc ("the sale of Sun Life UK"). Under the agreement, we will retain our economic interest in the payout annuities business through a reinsurance treaty, which, effective Q2'23 is recorded in In-force Management within the U.S. business group. For additional information, refer to Note 3 of our 2023 Annual Consolidated Financial Statements.
(2)Dental sales include sales from DentaQuest, acquired on June 1, 2022.
32 December 31, 2023 Sun Life Financial Inc. MANAGEMENT'S DISCUSSION & ANALYSIS
4. Asia
|
|
|
|
|
|
|
|
|
Our pan Asia businesses provides us with a strong footprint to take advantage of the high growth prospects in the region. We operate in eight Asian markets, delivering value to over 28 million Clients. ASEAN markets provides asset management and wealth, protection and health solutions through a multi-channel distribution approach in the Philippines, Indonesia, and Vietnam. The Hong Kong market offers individual protection and wealth products through agency, broker and bancassurance distribution channels. Our Joint Ventures in China, India and Malaysia, provide asset management and wealth, protection and health solutions. High-Net-Worth markets provides individual protection solutions to High-Net-Worth families and individuals, with operations in Singapore and Bermuda. Regional Office represents Asia’s headquarters based in Hong Kong. |
2023 Highlights
|
|
|
|
Leverage distribution excellence to diversify our mix, build scale and deliver Client Impact
•Strong protection sales momentum with growth of 44%(1) and total weighted premium income ("TWPI") of $6.0 billion up 23% over prior year reflecting increased demand as pandemic-related travel restrictions were lifted in early 2023, continued contribution from High-Net-Worth through our selected origination strategy, and investment in a well-balanced distribution mix.
•In Hong Kong, we opened Sun Gateway prestige Client center, which offers High-Net-Worth Clients professional insurance consultancy and one-stop financial products and services, with a dedicated team of onsite financial advisors and client service representatives catering to their wealth management and protection needs as they evolve through different life stages.
•In the Philippines, we maintained our leadership position ranking first for new business premiums and total premiums in 2022, reflecting our strong product offering and exceptional service to Clients. Our focus on making a difference in the lives of our Clients was recognized by our Platinum award(2) for most trusted brand in the life insurance industry in the Philippines for the 14th consecutive year.
•We continue to execute our growth strategy through strategic investments. In Hong Kong, we increased our strategic investment in Bowtie Life Insurance Company Limited (“Bowtie”), Hong Kong’s first virtual insurer with a leading market share of approximately 30%(3) in Hong Kong’s direct sales channel.
•Bancassurance is an essential distribution channel in Asia to deliver on our Purpose. We entered into a 15-year exclusive bancassurance partnership in Hong Kong with Dah Sing Bank (“Dah Sing”). Under this partnership, Sun Life will be the exclusive provider of life insurance solutions to Dah Sing's approximately 570,000 retail banking customers, helping to fulfill their savings and protection needs at different life stages. This is Sun Life's first exclusive bancassurance partnership in Hong Kong and will be a valuable complement to our existing network of over 2,500 expert insurance advisors. Sales started in July 2023 and we saw good sales momentum from this partnership in the second half of the year.
|
|
|
|
|
Be a digital leader, enhancing the digital experience to transform the Client and advisor experience, and enable greater efficiency and scalability
•As part of our aspiration to deliver meaningful impact to Clients through their life journey, we are continuing to improve the digital service experience to make it easier for them to do business with us. We made substantial progress in 2023, with 87% of policy applications and 48% of claims submitted digitally, up four and ten percentage points from prior year, respectively.
•In Malaysia and Indonesia, Client satisfaction scores(4) increased substantially, up eleven and three percentage points, respectively, from prior year. Enhancing our digital capabilities, promoting digital awareness, driving Client centricity through enhancing products, process and solutions, as well as building trusted Client and advisor relationships, contributed to this improvement.
•Developed and launched Sun Life’s first digital direct channel for Tax Deductible Voluntary Contributions ("TVC") for MPF Clients in Hong Kong, resulting in a 28% increase in overall TVC applications from prior year. This also creates an opportunity to apply direct selling capabilities to other products across our business in Hong Kong.
•In Vietnam, we launched a new Point of Sale solution creating a seamless, integrated advisor and Client experience, and established product configuration capabilities to reduce time to market.
|
(1)This change excludes the impacts of foreign exchange translation. For more information about these non-IFRS financial measures, see section M - Non-IFRS Financial Measures in this document.
(2)Trusted Brand Awards.
(3)According to Insurance Authority’s Provisional Statistics for Long Term Business 2021-2023, Bowtie ranked first in number of new individual paid policies through direct channel in Hong Kong.
(4)Sun Life's Overall Client Satisfaction ("CSAT") score is derived from a semi-annual survey that measures the overall relationship that Client's have with Sun Life. This measurement program is conducted in collaboration with an independent market research agency.
MANAGEMENT'S DISCUSSION & ANALYSIS Sun Life Financial Inc. December 31, 2023 33
|
|
|
|
Embed sustainability into our business to drive value creation, positive impact, and align with our Purpose
•To enable our Clients to achieve lifetime financial security in a more sustainable manner, we expanded our range of ESG products. We launched two new products(1) in Hong Kong designed to offer long-term financial growth potential and flexible cash withdrawal options for Clients, which actively integrate ESG concepts into investment strategies. We also launched the first ESG investing-focused whole life protection plans(2) in Hong Kong, the first low-carbon focused MPF fund(3) in Hong Kong, and the first sustainability driven variable universal life ("VUL") fund(4) for Sun Life in the Philippines.
•We started Cloud adoption this year and made significant progress by completing Vietnam’s migration, contributing to the reduction of our data center footprint by 2025.
•To promote financial security and living healthier lives as a trusted and responsible business, we place ongoing efforts to raise financial literacy in the Philippines, Vietnam, Malaysia and Indonesia, host various health and wellness campaigns and programs in the region, and sponsor ongoing philanthropic initiatives, some examples include:
◦Brighter Health Blood Glucose Screening program providing free glucose screenings at over 200 pharmacies and free eye health checks at 44 outlets in Malaysia;
◦Brighter School Program to revitalize school facilities for 600 school residents and Build Our Kids Success program helping approximately 12,000 children to live healthier lives in Indonesia; and
◦Established the Hoops + Health partnership with Beyond Sport, a global sport-for-social-change foundation, to refurbish courts across six markets in Asia to enable safe spaces for youth sports programs.
|
|
|
|
|
Risk management capabilities and financial strength
•Demonstrating our focus on adopting prudent financial practices that protect our Clients while strengthening our risk management capabilities, Sun Life Hong Kong received approval from the Hong Kong Insurance Authority for the early adoption of the Risk-Based Capital (“RBC”) regime, effective end of June 2023. Sun Life Hong Kong is among a few insurers in Hong Kong that has transitioned to the RBC regime earlier than scheduled, reflecting our risk management capabilities and financial strength.
|
(1)SunJoy and SunGift.
(2)SunGuardian and SunProtect. This is based on market conditions as of June 30, 2023 for SunGuardian and SunProtect and comparison among other whole life protection plans for new Composite and Long Term Businesses as defined by the Insurance Authority in the Register of Authorized Insurers.
(3)Sun Life MPF Global Low Carbon Index Fund. As of, July 28, 2023, according to MPFA website (https://www.mpfa.org.hk), Sun Life MPF Global Low Carbon Index Fund is the only Low Carbon MPF fund.
(4)Peso Global Sustainability Growth Fund.
34 December 31, 2023 Sun Life Financial Inc. MANAGEMENT'S DISCUSSION & ANALYSIS To achieve our ambitious growth objectives and driving scale in all our markets, we will continue to capitalize on new opportunities.
Strategy and Outlook
We are dedicated to building distribution excellence and offering a seamless, digital experience for Clients and advisors to deliver Client impact. We will continue to foster our strong and distinctive culture, while attracting, developing and empowering high calibre talent. We will embed sustainability into our business, as we engage Clients along their journeys towards lifetime financial security and healthier lives. Our areas of focus for Asia are to:
|
|
|
|
|
|
|
Deliver on bancassurance, sustainably grow agency, embed quality and optimize distribution mix
•Build sustainable scale through a diversified mix of high performing, quality-focused channels that enhance Client impact by offering holistic sales advice delivered through our expanding range of life, wealth and health solutions.
•Continue to effectively collaborate with existing bancassurance partners to unlock the potential of recent deals, and capture scale by embedding our insurance products into Clients’ bank journeys, integrating digital tools, and engaging with partners.
•Scale agency and become the partner of choice for advisors to develop active and sustainable agency talent.
|
|
|
|
|
|
Strengthen brand and differentiated Client value propositions to build and deepen quality Client, advisor, and employee relationships
•Deliver digital excellence that provides simple, relevant and reliable propositions and experiences for our Clients and partners.
•Build a distinctive, trusted brand through investing further in high visibility advertising that increases awareness and further builds consideration of Sun Life across Asia.
•Provide quality advice and offer relevant financial solutions to enable Clients to plan and protect themselves from adverse financial events and invest for their future.
•Become a partner in our Clients' health journeys by offering a wider set of valued health solutions and deepen the level of engagement across the Client relationship.
•Embed ESG into our investment processes and introduce ESG investment opportunities for our Clients.
|
|
|
|
|
|
|
|
Transform Client and advisor experience, capture efficiencies, retain and gain Client and scale markets
•Digitize our business and leverage common tools and technology platforms across the region to make it easier for Clients and advisors to do business with us.
•Increase engagement of prospective and existing Clients by being more personal, proactive and predictive. Create personalized experiences to deepen our relationship and improve retention with Clients.
•Empower advisors, including bancassurance distribution, by building best-in-class digital and data capabilities that provide leads generation, enable more engaging experiences, create Client impact, and enhance prospect conversion, advisor productivity, and recruitment and training. Accelerate technology foundation modernization and position digital investments to deliver unit cost reductions and enhance advisor and Client experience.
•Deliver digital innovation for our business units that unlocks meaningful growth, efficiencies, scale and distinctiveness.
|
|
|
|
|
Outlook |
|
Our diversified business, with a multi-country presence and multi-channel distribution, positions us well to deepen Client relationships, capture opportunities as they arise, and protects against adverse economic cycles and regulatory changes in any one market. Despite short-term headwinds from market volatility, we expect that the region’s economic growth will continue, and rapid wealth creation, coupled with low insurance penetration rates, will result in sustained growth across all our markets over the medium-term. In addition, we expect to continue to reach more Clients by expanding and deepening our high-quality agency force, diverse network of bancassurance partners and broker partnerships. We are confident that our position among the global leaders in the HNW space will continue to generate value and positive outcomes for Clients.
Economic and geopolitical uncertainty, as well as intense competition, equity market downturn, rise in interest rates and inflation continue to pose challenges to our businesses. However, our steadfast dedication to our Purpose and our Clients, strengthening market positions, key strategic relationships, investments in digital and analytics, and our ability to leverage Sun Life's global expertise position us well for the future. As local governments continue to push responsibility down to their people in both the retirement and health spaces, we are well-equipped to offer current and prospective Clients a diverse range of products and solutions.
|
MANAGEMENT'S DISCUSSION & ANALYSIS Sun Life Financial Inc. December 31, 2023 35
Business Types and Business Units
|
|
|
|
|
|
|
|
|
|
|
|
| Business Type |
Business Unit
& Market |
Description |
Market Position |
Wealth & asset management |
ASEAN
Philippines(1)
|
• Asset management for individual and institutional Clients through agency, brokerage, bancassurance and digital partners. |
• #2 mutual fund operation in the country(2) |
| Hong Kong |
• Mandatory Provident Fund (MPF) and pension administration to individuals and businesses through agency and brokerage distribution. |
• 3rd largest provider based on AUM, 3rd based on net inflows(3) |
|
Joint Ventures
China(4)
|
• Institutional asset management, passive third-party asset management and debt financing business through direct distribution. |
• 12th largest mutual fund provider(5) |
India(6) |
• Asset management for both individual and institutional investors through independent financial advisors, banks, and direct distribution channels. |
• 6th largest mutual fund operation in the country(7) |
| Individual - Protection |
ASEAN
Philippines
|
• Individual and group life and health insurance products to individuals and businesses through a multi-channel distribution network. |
• #1 ranked insurance company based on total premium(8) |
| Indonesia |
• Individual life and health insurance through agency, telco arrangements and banks, including a bancassurance partnership with CIMB Niaga, Indonesia's 2nd largest privately-owned bank |
• 11th ranked insurance company(9) |
| Vietnam |
• Individual insurance and pensions distributed through agency, corporate sales, and digital distribution channels and partnerships, including exclusive bancassurance agreements with TPBank(10) and ACB(10). |
• 5th in bancassurance sales, 5th ranked insurance company(11) |
| Hong Kong |
• Individual and group life and health insurance through agency, bancassurance agreement with Dah Sing(12) and brokerage distribution, including life insurance solutions for HNW Clients. |
• Top 10 in Agency for Life Insurance(13) |
|
Joint Ventures
China(4)
|
• Individual and group life and health insurance and savings products distributed through agency, brokerage, bancassurance and digital channels. |
• 10th ranked life insurance company in China among multinationals(14) |
India(6) |
• Individual and group insurance, savings and retirement products through agency, brokerage and bancassurance channels. |
• 7th largest life insurance company in India(15) |
Malaysia(16) |
• Individual and group insurance through banks and telco arrangements, including an exclusive bancassurance agreement with CIMB Bank, Malaysia's 2nd largest bank, and a growing agency force. |
• 1st in bancatakaful and 3rd in bancassurance sales, 7th overall(17) |
|
High-Net-Worth
International
|
• Individual life insurance solutions for HNW Clients residing outside the U.S. and Canada
• Manages a block of International wealth investment products closed to new sales.
|
• A leader in international HNW life insurance business |
| Singapore |
• Individual life insurance solutions for HNW Clients in Asia. |
• New entrant to the market in 2021 |
| Regional Office & other |
Regional Office |
• Asia's headquarters based in Hong Kong. |
|
(1)Philippines: Includes a joint venture with the Yuchengco Group - Sun Life Grepa Financial, Inc. (49%).
(2)Philippine Investment Funds Association, based on November 2023 ending AUM.
(3)Mercer MPF Market Shares Report, September 2023.
(4)China: Joint ventures with the China Everbright Group: Sun Life Everbright Life Insurance Company Limited (24.99%), Sun Life Everbright Asset Management Co., Ltd (24.74%).
(5)2022, based on total revenue amongst insurance asset management companies.
(6)India: Joint venture with Aditya Birla Group - Aditya Birla Sun Life Insurance Company Limited (49%) and Aditya Birla Sun Life Asset Management Company Limited (36.5% indirect ownership).
(7)Association of Mutual Funds in India, based on average AUM for the quarter ended November 30, 2023.
(8)Insurance Commission of the Philippines, based on Q3 2023 year-to-date total premium income for Sun Life of Canada (Philippines).
(9)Indonesia Life Insurance Association industry report, based on Q3 2023 year-to-date first year premiums.
(10)Tien Phong Commercial Bank ("TPBank") and Asia Commercial Joint Stock Bank ("ACB").
(11)December 2023 year-to-date annualized first year premiums based on data shared among industry players.
(12)Dah Sing Bank (‘Dah Sing”).
(13)Insurance Authority of Hong Kong, Provisional Statistics on Hong Kong Long Term Insurance Business, based on Q3'23 year-to-date annualized first year premiums.
(14)China: based on gross premiums for Q2'23 (excluding universal life insurance deposits and pension companies) amongst foreign multinationals.
(15)Insurance Regulatory Authority of India, based on Q4'23 year-to-date first year premiums among private players.
(16)Malaysia: Joint ventures with Khazanah Nasional Berhad and CIMB Group Holdings Berhad - Sun Life Malaysia Assurance Berhad (49%), Sun Life Malaysia Takaful Berhad (49%).
(17)Life Insurance Association of Malaysia and Insurance Services Malaysia Berhad, based on Q3'23 year-to-date annualized first year premium for conventional and takaful business.
36 December 31, 2023 Sun Life Financial Inc. MANAGEMENT'S DISCUSSION & ANALYSIS
Financial and Business Results
|
|
|
|
|
|
|
|
|
|
|
|
|
|
|
| ($ millions) |
|
|
|
2023 |
2022(1) |
Wealth & asset management(2) |
|
|
|
55 |
71 |
Individual - Protection(2)(3) |
|
|
|
587 |
479 |
Regional Office expenses & other(2) |
|
|
|
(42) |
(11) |
Underlying net income (loss)(2) |
|
|
|
600 |
539 |
Add: Market-related impacts(1) |
|
|
|
(153) |
(332) |
| ACMA |
|
|
|
39 |
1 |
| Acquisition, integration and restructuring |
|
|
|
(18) |
(7) |
| Intangible asset amortization |
|
|
|
(8) |
(8) |
Other |
|
|
|
51 |
17 |
Reported net income - Common shareholders(1) |
|
|
|
511 |
210 |
Underlying ROE (%)(2) |
|
|
|
11.0% |
11.1% |
Reported ROE (%)(2) |
|
|
|
9.4% |
4.3% |
Wealth sales & asset management gross flows(2) |
|
|
|
7,713 |
11,140 |
Individual - Protection sales(2) |
|
|
|
1,882 |
1,271 |
Group - Health & Protection sales(2)(3) |
|
|
|
76 |
73 |
|
|
|
|
|
|
New business CSM(2) |
|
|
|
681 |
322 |
(1)2022 restated results may not be fully representative of our future earnings profile, as we were not managing our asset and liability portfolios under the new standards. See the heading "Note to Readers: 2022 Restated Results on Adoption of IFRS 17 and IFRS 9" in section A - How We Report Our Results in this document.
(2)Represents a non-IFRS financial measure. For more details, see section M - Non-IFRS Financial Measures in this document. For more information about business types in Sun Life's business groups, see section A - How We Report Our Results in this document.
(3)In underlying net income by business type, Group businesses in Asia have been included with Individual – Protection.
Profitability
2023 vs. 2022
Underlying net income of $600 million increased $61 million or 11%, driven by:
•Wealth & asset management down $16 million: Lower earnings largely in the Philippines and Hong Kong.
•Individual - Protection up $108 million: Business growth reflecting good sales momentum, improved mortality, and contributions from joint ventures primarily driven by favourable policyholder behaviour and expense experience, partially offset by lower earnings on surplus.
•Regional office expenses & other $(31) million increased net loss primarily reflecting continued pan Asia investments in the business.
Reported net income of $511 million increased $301 million, driven by market-related impacts, the increase in underlying net income, the impact from the Bermuda Corporate Income Tax Change(1), and ACMA impacts. Market-related impacts were primarily driven by the steepening of the interest rate curve, partially offset by real estate experience.
Foreign exchange translation led to an increase of $9 million and $17 million in underlying net income and reported net income, respectively.
Growth
2023 vs. 2022
Asia's sales included:
•Individual sales of $1.9 billion were up 46%(2), driven by higher sales in Hong Kong, International, and India, partially offset by lower sales in Vietnam.
•Wealth sales & asset management gross flows of $7.7 billion were down 31%(2), primarily reflecting lower money market fund sales in the Philippines.
New business CSM of $681 million was up from $322 million in the prior year, primarily driven by sales in Hong Kong and High-Net-Worth.
(1)On December 27, 2023, Bermuda enacted its Corporate Income Tax Act 2023, which will apply a 15% income tax beginning on January 1, 2025 ("Bermuda Corporate Income Tax Change"). The enacted legislation provides an economic transition adjustment that aligns an entity’s starting point for the tax regime more closely with its economic position prior to the application of the Corporate Income Tax 2023. The benefit of this economic transition adjustment has been recognized in 2023. As a result, reported net income increased by $51 million in the fourth quarter, reflected in Other adjustments.
(2)This change excludes the impacts of foreign exchange translation. For more information about these non-IFRS financial measures, see section
M - Non-IFRS Financial Measures in this document.
MANAGEMENT'S DISCUSSION & ANALYSIS Sun Life Financial Inc. December 31, 2023 37
Dah Sing Bank Bancassurance Partnership
Effective July 1, 2023 we commenced our 15-year exclusive bancassurance partnership with Dah Sing Bank ("Dah Sing"). Under this
partnership, Sun Life will be the exclusive provider of life insurance solutions to Dah Sing's approximately 570,000 retail banking customers, helping to fulfill their savings and protection needs at different life stages. This is Sun Life's first exclusive bancassurance partnership in Hong Kong and will be a valuable complement to our existing network of over 2,500 expert insurance advisors.
Growth by Business Market - 2023 vs. 2022
We continued to maintain a strong Client focus, build our agency and strengthen bancassurance channels, leverage a more balanced product portfolio and increase productivity.
ASEAN Markets
•Philippines - Mutual and managed fund AUM was $1.5 billion as at December 31, 2023, a decrease of 35%, measured in local currency, reflecting lower money market fund sales. Individual protection sales increased 2% on a local currency basis.
Agency headcount was approximately 22,500 at the end of 2023, 4% lower than 2022.
•Indonesia - Individual protection sales decreased 17% on a local currency basis, reflecting lower sales mainly in the agency channel.
Agency headcount was approximately 5,400 at the end of 2023, 11% lower(1) than 2022.
•Vietnam - Individual protection sales decreased 36% on a local currency basis, reflecting lower sales in bancassurance and agency channels, which were impacted by market conditions.
Agency headcount was approximately 3,800 at the end of 2023, 53% lower than 2022.
Hong Kong
•AUM in the pension business was $21.9 billion as at December 31, 2023, 5% higher than prior year measured on a local currency basis, reflecting pension inflows partially offset by equity market declines.
•Individual protection sales were over three times the prior year on a local currency basis, driven by increased demand as pandemic-related travel restrictions were lifted in early 2023, and the new bancassurance channel with Dah Sing Bank.
•Agency headcount was approximately 2,600 at the end of 2023, 4% higher than 2022.
Joint Ventures
•China - Individual protection sales increased 2% on a local currency basis, reflecting higher sales in agency and broker channels, partially offset by the bancassurance channel.
Agency headcount was approximately 1,700 at the end of 2023, 35% lower than 2022 due to a focus on quality.
•India - Gross sales of equity and fixed income funds increased 3% on a local currency basis. Individual protection sales increased 25% on a local currency basis, with growth in all channels.
Agency headcount was approximately 51,500 at the end of 2023, 3% lower than 2022.
Total AUM as at December 31, 2023 was $51.7 billion, of which $18.9 billion is reported in our AUM based on Sun Life's 36.49% share, 14% higher than 2022, on a local currency basis.
•Malaysia - Individual protection sales increased 3% on a local currency basis, as higher sales in the agency channel were mostly offset by lower sales in the bancassurance and telemarketing channels.
Agency headcount was approximately 1,500 at the end of 2023, 25% higher than 2022.
High-Net-Worth
•International - Individual protection sales increased 86% on a local currency basis, due to the continued demand for our High-Net-Worth products and large case sales.
•Singapore - Individual protection sales decreased 21% on a local currency basis, reflecting higher large case sales in 2022.
(1)Prior period amounts adjusted to reflect a definition refinement.
38 December 31, 2023 Sun Life Financial Inc. MANAGEMENT'S DISCUSSION & ANALYSIS
5. Corporate
|
|
|
|
|
|
|
|
|
Corporate Support operations consist of certain expenses, investment income, capital, and other items. Corporate operations pertain to core enterprise oversight activities such as Finance, Risk and Compliance as well as enterprise enablement capabilities such as Strategy, Marketing, Sustainability and Philanthropy. Corporate Support is included in the 'Corporate expenses and other' business type. |
Financial and Business Results
|
|
|
|
|
|
|
|
|
|
|
|
|
|
|
| ($ millions) |
|
|
|
2023 |
2022(1) |
Individual - Protection(2)(3) |
|
|
|
29 |
87 |
Corporate expenses & other(2) |
|
|
|
(406) |
(256) |
Underlying net income (loss)(2) |
|
|
|
(377) |
(169) |
Add: Market-related impacts(1) |
|
|
|
33 |
38 |
| ACMA |
|
|
|
3 |
6 |
| Acquisition, integration and restructuring |
|
|
|
21 |
(170) |
|
|
|
|
|
|
| Other |
|
|
|
— |
35 |
Reported net income (loss) - Common shareholders(1) |
|
|
|
(320) |
(260) |
(1)2022 restated results may not be fully representative of our future earnings profile, as we were not managing our asset and liability portfolios under the new standards. See the heading "Note to Readers: 2022 Restated Results on Adoption of IFRS 17 and IFRS 9" in section A - How We Report Our Results in this document.
(2)Represents a non-IFRS financial measure. For more details, see section M - Non-IFRS Financial Measures in this document. For more information about business types in Sun Life's business groups, see section A - How We Report Our Results in this document.
(3)The UK annuities run-off businesses in Corporate has been included with Individual – Protection. Effective Q2'23, the UK annuities run-off business was moved from the Corporate business segment to the U.S. business segment upon the sale of Sun Life UK. For additional information, refer to Note 3 of our 2023 Annual Consolidated Financial Statements. Also, effective Q3'23 the run-off reinsurance business was moved from the Corporate business segment to the U.S. business segment.
Profitability
2023 vs. 2022
Underlying net loss was $377 million compared to underlying net loss of $169 million in the prior year, driven by the sale of Sun Life UK, higher operating expenses, and an increase in debt financing costs, partially offset by higher investment income from surplus assets.
Reported net loss was $320 million compared to reported net loss of $260 million in the prior year, reflecting the change in underlying net loss and the prior year impact of tax-related matters(1), partially offset by the impacts from the sale of Sun Life UK.
Sale of Sun Life UK
On April 3, 2023 we completed the sale of SLF of Canada UK Limited ("Sun Life UK") to Phoenix Group Holdings plc ("Phoenix Group") for approximately $418 million. Sun Life UK managed life and pension policies as well as payout annuities for UK Clients, was closed to new sales and operated as a run-off business since 2001. Under the agreement, we will retain our economic interest in the payout annuities business through a reinsurance treaty, which, effective Q2'23, is recorded in In-force Management within the U.S. business group. Phoenix Group is the UK's largest long-term savings and retirement business, with £269 billion(2) of assets under administration and approximately 12 million customers(2). As part of the sale, we will establish a long-term partnership to become a strategic asset management partner to Phoenix Group. Our asset management companies, MFS and SLC Management, will continue to manage approximately $8 billion of Sun Life UK's general account. In addition, Phoenix Group has set a goal to invest approximately US$25 billion in North American public and private fixed income and alternative investments over the next five years. MFS and SLC Management will be material partners to Phoenix Group in achieving this goal. In Q3'22, we recognized an impairment charge pertaining to the attributed goodwill that was not expected to be recovered through the sale. In Q2'23, we recognized a gain of $19 million in reported net income. For additional information, refer to Note 3 of our 2023 Annual Consolidated Financial Statements.
(1)Tax related matters include tax-exempt investment income in reported net income in both years and the impact of the Canada Tax Rate Change. On December 15, 2022, legislation implementing an additional surtax of 1.5% applicable to banks and life insurer's taxable income in excess of $100 million was enacted in Canada ("Canada Tax Rate Change"). This legislation applied retroactively to the Federal Budget date of April 7, 2022. As a result, Corporate reported net income increased by $51 million in Q4'22, reflected in Other adjustments.
(2)As at June 30, 2023.
MANAGEMENT'S DISCUSSION & ANALYSIS Sun Life Financial Inc. December 31, 2023 39
The Company strives to ensure that general fund investments are aligned with business objectives including meeting policyholder obligations and maintaining adequate liquidity at all times. Consideration is given to a wide range of factors in our investment process, including ensuring attractive risk and return profiles, appropriate diversification by asset type, credit exposure and sector, financial condition and ESG profile of issuers and borrowers, quality and value of underlying security and macro- and micro-economic developments and trends including prospects for specific industry sectors. The Risk Committee of the Board of Directors ("Risk Committee") approves policies that contain prudent standards and procedures for the investment of our general fund assets. These policies include requirements, restrictions and limitations for interest rate, credit, equity market, real estate market, liquidity, concentration, currency, and derivative risks. Compliance with these policies is monitored on a regular basis and reported annually to the Risk Committee. The Governance, Investment & Conduct Review Committee of the Board of Directors monitors the Company's Investment Plan and investment performance, oversees practices, procedures and controls related to the management of the general fund investment portfolio, and reviews corporate governance guidelines and processes.
1. Investment Profile
Total general fund invested assets of $174.3 billion as at December 31, 2023, were up $5.5 billion from December 31, 2022. The increase was primarily due to net fair value growth from declining interest rates. Our general fund invested assets are well-diversified across investment types, geographies and sectors with the majority of our portfolio invested in high quality fixed income assets.
The following table sets out the composition of our general fund invested assets:(1)
|
|
|
|
|
|
|
|
|
|
|
|
|
|
|
|
|
|
|
|
December 31, 2023 |
December 31, 2022 |
| ($ millions) |
Carrying value |
% of Total carrying value |
|
|
Carrying value |
% of Total carrying value |
|
|
| Cash, cash equivalents and short-term securities |
13,173 |
8% |
|
|
11,219 |
7% |
|
|
| Debt securities |
75,493 |
43% |
|
|
75,902 |
45% |
|
|
| Equity securities |
7,138 |
4% |
|
|
7,148 |
4% |
|
|
| Mortgages and loans |
54,600 |
31% |
|
|
51,253 |
30% |
|
|
| Derivative assets |
2,183 |
1% |
|
|
2,095 |
1% |
|
|
Other invested assets |
12,018 |
7% |
|
|
11,070 |
7% |
|
|
|
|
|
|
|
|
|
|
|
|
|
|
|
|
|
|
|
|
|
|
|
|
|
|
|
|
|
| Investment properties |
9,723 |
6% |
|
|
10,102 |
6% |
|
|
|
|
|
|
|
|
|
|
|
| Total invested assets |
174,328 |
100% |
|
|
168,789 |
100% |
|
|
(1)The values and ratios presented are based on the fair value of the respective asset categories. Generally, the carrying values for invested assets are equal to their fair values. For invested assets supporting insurance contracts, in the event of default, if the amounts recovered are insufficient to satisfy the related insurance contract liability cash flows that the assets are intended to support, credit exposure may be greater than the carrying value of the assets.
2. Debt Securities
The debt securities portfolio is actively managed through a regular program of purchases and sales aimed at optimizing yield, quality, and liquidity, while ensuring that it remains well-diversified and duration-matched to insurance contract liabilities. As at December 31, 2023, with the exception of certain countries where we have business operations, including Canada, the United States and the Philippines, our exposure to debt securities from any single country did not exceed 1% of total invested assets.
40 December 31, 2023 Sun Life Financial Inc. MANAGEMENT'S DISCUSSION & ANALYSIS
Debt Securities by Issuer and Industry Sector
|
|
|
|
|
|
|
|
|
|
|
|
|
|
|
|
December 31, 2023 |
December 31, 2022 |
| ($ millions) |
Total |
% of Total |
Total |
% of Total |
| Debt securities issued or guaranteed by: |
|
|
|
|
| Canadian federal government |
6,010 |
8 |
% |
5,611 |
8 |
% |
| Canadian provincial and municipal government |
14,251 |
20 |
% |
13,665 |
18 |
% |
| U.S. government and agency |
1,370 |
2 |
% |
1,537 |
2 |
% |
| Other foreign government |
3,802 |
5 |
% |
4,624 |
6 |
% |
| Total government issued or guaranteed debt securities |
25,433 |
35 |
% |
25,437 |
34 |
% |
Corporate debt securities by industry sector:(1) |
|
|
|
|
| Financials |
11,060 |
16 |
% |
11,355 |
15 |
% |
| Utilities |
7,059 |
9 |
% |
6,676 |
9 |
% |
| Industrials |
5,489 |
7 |
% |
5,575 |
7 |
% |
| Energy |
3,272 |
4 |
% |
3,342 |
4 |
% |
| Communication services |
3,149 |
4 |
% |
3,329 |
4 |
% |
Real estate |
2,525 |
3 |
% |
2,506 |
3 |
% |
| Health care |
2,038 |
3 |
% |
2,034 |
3 |
% |
| Consumer staples |
1,805 |
2 |
% |
1,978 |
3 |
% |
| Consumer discretionary |
1,726 |
2 |
% |
1,836 |
2 |
% |
| Information technology |
904 |
1 |
% |
1,384 |
2 |
% |
| Materials |
1,102 |
1 |
% |
1,295 |
2 |
% |
| Total corporate debt securities |
40,129 |
52 |
% |
41,310 |
54 |
% |
| Asset-backed securities |
9,931 |
13 |
% |
9,155 |
12 |
% |
| Total debt securities |
75,493 |
100 |
% |
75,902 |
100 |
% |
(1) Our grouping of debt securities by sector is based on the Global Industry Classification Standard and S&P Dow Jones Indices.
Debt Securities by Geography
The carrying value of our debt securities by geographic location is presented in the following table.
|
|
|
|
|
|
|
|
|
|
|
|
|
|
|
|
|
|
|
|
|
|
|
|
|
|
|
|
December 31, 2023 |
December 31, 2022 |
| ($ millions) |
FVTPL debt
securities |
FVOCI debt securities |
Total |
% of Total |
FVTPL debt
securities |
FVOCI debt securities |
Total |
% of Total |
| Debt securities by geography: |
|
|
|
|
|
|
|
|
| Canada |
30,180 |
4,339 |
34,519 |
46% |
26,613 |
6,064 |
32,677 |
43% |
| United States |
20,111 |
6,266 |
26,377 |
35% |
20,274 |
6,196 |
26,470 |
35% |
| Europe |
3,892 |
1,470 |
5,362 |
7% |
5,814 |
1,789 |
7,603 |
10% |
| Asia |
5,440 |
900 |
6,340 |
8% |
4,549 |
964 |
5,513 |
7% |
| Other |
1,557 |
1,338 |
2,895 |
4% |
2,107 |
1,532 |
3,639 |
5% |
| Total debt securities |
61,180 |
14,313 |
75,493 |
100% |
59,357 |
16,545 |
75,902 |
100% |
Our gross unrealized losses as at December 31, 2023 for fair value through profit or loss ("FVTPL") and fair value through other comprehensive income ("FVOCI") debt securities were $6,119 million and $615 million, respectively (December 31, 2022 - $9,384 million and $1,521 million, respectively). The decrease in gross unrealized losses was largely due to the impact from declining interest rates.
Debt Securities by Credit Rating
Debt securities with a credit rating of "A" or higher represented 72% of the total debt securities as at December 31, 2023 (December 31, 2022 - 72%). Debt securities with a credit rating of "BBB" or higher represented 99% of total debt securities as at December 31, 2023,
(December 31, 2022 - 99%).
MANAGEMENT'S DISCUSSION & ANALYSIS Sun Life Financial Inc. December 31, 2023 41
The credit risk ratings in the following table were established in accordance with the internal rating process described in this MD&A under the heading K - Risk Management - 9 - Risk Categories - Credit Risk Management Governance and Control.
|
|
|
|
|
|
|
|
|
|
|
|
|
|
|
|
|
|
|
|
|
|
|
|
|
|
|
|
December 31, 2023 |
December 31, 2022 |
| ($ millions) |
FVTPL debt
securities |
FVOCI debt securities |
Total |
% of Total |
FVTPL debt
securities |
FVOCI debt securities |
Total |
% of Total |
| Debt securities by credit rating: |
|
|
|
|
|
|
|
|
| AAA |
10,654 |
4,572 |
15,226 |
20 |
% |
9,440 |
5,822 |
15,262 |
20 |
% |
| AA |
9,632 |
1,453 |
11,085 |
15 |
% |
9,267 |
2,043 |
11,310 |
15 |
% |
| A |
23,523 |
4,653 |
28,176 |
37 |
% |
23,050 |
4,646 |
27,696 |
37 |
% |
| BBB |
16,872 |
3,210 |
20,082 |
27 |
% |
17,007 |
3,661 |
20,668 |
27 |
% |
| BB and lower |
499 |
425 |
924 |
1 |
% |
593 |
373 |
966 |
1 |
% |
| Total debt securities |
61,180 |
14,313 |
75,493 |
100 |
% |
59,357 |
16,545 |
75,902 |
100 |
% |
3. Equities
The equity portfolio is well-diversified with approximately 62% of the portfolio invested in exchange-traded funds as at December 31, 2023 (December 31, 2022 - 59%). Exchange-traded fund holdings are primarily in the SPDR S&P 500 ETF Trust and Tracker Fund of Hong Kong Ltd. The carrying value of equities by issuer geography as at December 31, 2023 is set out in the following table.
Equities by Issuer Geography
|
|
|
|
|
|
|
|
|
|
|
|
|
|
|
|
|
|
|
|
|
|
|
|
|
|
|
|
December 31, 2023 |
December 31, 2022 |
| ($ millions) |
FVTPL equities |
FVOCI equities |
Total |
% of Total |
FVTPL equities |
FVOCI equities |
Total |
% of Total |
| Equity securities: |
|
|
|
|
|
|
|
|
| Canada |
3,081 |
— |
3,081 |
43 |
% |
3,038 |
— |
3,038 |
|
42 |
% |
| United States |
2,185 |
68 |
2,253 |
32 |
% |
1,924 |
— |
1,924 |
|
27 |
% |
| Europe |
153 |
— |
153 |
2 |
% |
365 |
— |
365 |
|
5 |
% |
| Asia |
1,645 |
— |
1,645 |
23 |
% |
1,788 |
— |
1,788 |
|
25 |
% |
| Other |
6 |
— |
6 |
— |
% |
33 |
— |
33 |
|
1 |
% |
| Total equity securities |
7,070 |
68 |
7,138 |
100 |
% |
7,148 |
— |
7,148 |
100 |
% |
Excluding exchange-traded funds and mutual funds, there were no issuers exceeding 1% of the equity portfolio as at December 31, 2023.
4. Mortgages and Loans
Our mortgage portfolio consisted almost entirely of first mortgages and our loan portfolio consisted of private placement loans. Changes to fair value estimates for loans were implemented on January 1, 2023. For additional details, refer to Note 2 in the 2023 Annual Consolidated Financial Statements.
Mortgages and Loans by Geography
The carrying value of mortgages and loans by geographic location is presented in the following table.(1)
|
|
|
|
|
|
|
|
|
|
|
|
|
|
|
|
|
|
|
|
|
|
|
|
December 31, 2023 |
December 31, 2022 |
| ($ millions) |
Mortgages |
Loans |
Total |
|
Mortgages |
Loans |
Total |
|
| Canada |
9,377 |
12,924 |
22,301 |
|
9,363 |
12,433 |
21,796 |
|
| United States |
4,609 |
17,086 |
21,695 |
|
5,029 |
15,468 |
20,497 |
|
| Europe |
159 |
7,420 |
7,579 |
|
29 |
6,479 |
6,508 |
|
| Asia |
— |
550 |
550 |
|
— |
494 |
494 |
|
| Other |
— |
2,475 |
2,475 |
|
— |
1,958 |
1,958 |
|
| Total mortgages and loans |
14,145 |
40,455 |
54,600 |
|
14,421 |
36,832 |
51,253 |
|
| % of Total invested assets |
8% |
23% |
31% |
|
8% |
22% |
30% |
|
(1)The geographic location for mortgages is based on the location of the property and for loans it is based on the country of the creditor's parent.
As at December 31, 2023, our impaired mortgages and loans, net of allowances for losses, were $7 million (December 31, 2022 - $47 million).
42 December 31, 2023 Sun Life Financial Inc. MANAGEMENT'S DISCUSSION & ANALYSIS As at December 31, 2023, we held $14.1 billion of mortgages (December 31, 2022 - $14.4 billion).
Mortgage Portfolio
Our mortgage portfolio consists entirely of commercial mortgages, as presented in the following table.
|
|
|
|
|
|
|
|
|
|
|
|
|
|
|
|
|
|
|
|
|
|
December 31, 2023 |
December 31, 2022 |
| ($ millions) |
Insured |
Uninsured |
Total |
Insured |
Uninsured |
Total |
| Mortgages: |
|
|
|
|
|
|
| Retail |
— |
2,558 |
2,558 |
— |
2,819 |
2,819 |
| Office |
— |
2,754 |
2,754 |
— |
3,014 |
3,014 |
| Multi-family residential |
3,583 |
1,256 |
4,839 |
3,592 |
1,422 |
5,014 |
| Industrial |
— |
2,954 |
2,954 |
— |
2,665 |
2,665 |
| Other |
440 |
600 |
1,040 |
443 |
466 |
909 |
| Total mortgages |
4,023 |
10,122 |
14,145 |
4,035 |
10,386 |
14,421 |
| % of Total mortgages |
28% |
72% |
100% |
28% |
72% |
100% |
Our mortgage portfolio consists entirely of commercial mortgages, including retail, office, multi-family, and industrial properties. As at
December 31, 2023, 34% of our commercial mortgage portfolio consisted of multi-family residential mortgages; there are no single-family residential mortgages. Our uninsured commercial portfolio had a weighted average loan-to-value ratio of approximately 52% as at
December 31, 2023 (December 31, 2022 - 53%). While we generally limit the maximum loan-to-value ratio to 75% at issuance, we may invest in mortgages with a higher loan-to-value ratio in Canada if the mortgage is insured by the Canada Mortgage and Housing Corporation ("CMHC"). The estimated weighted average debt service coverage for our uninsured commercial portfolio is 1.75 times. Of the $3.8 billion of multi-family residential mortgages in the Canadian commercial mortgage portfolio, 93% were insured by the CMHC.
The following tables summarize our mortgages by credit quality indicator:
|
|
|
|
|
|
|
|
|
|
|
|
|
|
|
| ($ millions) |
December 31, 2023 |
As % of Total
Mortgages |
December 31, 2022 |
As % of Total
Mortgages |
| Mortgages by credit rating: |
|
|
|
|
| Insured |
4,023 |
28 |
% |
4,035 |
28 |
% |
| AAA |
7 |
— |
% |
— |
— |
% |
| AA |
1,990 |
14 |
% |
1,665 |
12 |
% |
| A |
5,158 |
37 |
% |
5,483 |
37 |
% |
| BBB |
2,425 |
17 |
% |
2,686 |
19 |
% |
| BB and lower |
530 |
4 |
% |
538 |
4 |
% |
| Impaired |
12 |
— |
% |
14 |
— |
% |
| Total mortgages |
14,145 |
100 |
% |
14,421 |
100 |
% |
Loan Portfolio
As at December 31, 2023, we held $40.5 billion of loans (December 31, 2022 - $36.8 billion). Private placement loans provide diversification by type of loan, industry segment and borrower credit quality. The private placement loan portfolio consists of senior secured and unsecured loans to large- and mid-market corporate borrowers, securitized lease/loan obligations secured by a variety of assets, and project finance loans in sectors such as power and infrastructure.
The credit risk ratings in the following table were established in accordance with the internal rating process described in this MD&A under the heading K - Risk Management - 9 - Risk Categories - Credit Risk Management Governance and Control. As at December 31, 2023, 95% of our total loan portfolio is investment grade (December 31, 2022 - 95%).
|
|
|
|
|
|
|
|
|
|
|
|
|
|
|
| ($ millions) |
December 31, 2023 |
As % of Total Loans |
December 31, 2022 |
As % of Total Loans |
| Loans by credit rating: |
|
|
|
|
| AAA |
180 |
— |
% |
285 |
1 |
% |
| AA |
5,815 |
14 |
% |
5,101 |
14 |
% |
| A |
16,507 |
42 |
% |
15,257 |
41 |
% |
| BBB |
15,896 |
39 |
% |
14,284 |
39 |
% |
| BB and lower |
1,950 |
5 |
% |
1,872 |
5 |
% |
| Impaired |
107 |
— |
% |
33 |
— |
% |
| Total loans |
40,455 |
100 |
% |
36,832 |
100 |
% |
MANAGEMENT'S DISCUSSION & ANALYSIS Sun Life Financial Inc. December 31, 2023 43
The following tables summarize our loans by sector:
|
|
|
|
|
|
|
|
|
|
|
|
|
|
|
| ($ millions) |
December 31, 2023 |
As % of Total Loans |
December 31, 2022 |
As % of Total Loans |
Loans by Sector(1): |
|
|
|
|
| Corporate issued loans |
33,189 |
83 |
% |
29,849 |
81 |
% |
| Canadian provincial & municipal government |
4,179 |
10 |
% |
3,941 |
11 |
% |
| U.S. government & agency |
2,173 |
5 |
% |
2,099 |
6 |
% |
| Other foreign government |
855 |
2 |
% |
880 |
2 |
% |
Canadian federal government |
59 |
— |
% |
63 |
— |
% |
| Total loans |
40,455 |
100 |
% |
36,832 |
100 |
% |
(1) Prior period balances have been updated to reflect current year refinements in sector classifications.
5. Derivatives
The fair value of derivative assets held by the Company was $2,183 million, while the fair value of derivative liabilities was $1,311 million as at December 31, 2023 (December 31, 2022 - $2,095 million and $2,351 million, respectively).
We use derivative instruments to manage risks related to interest rate, equity market and currency fluctuations and in replication strategies to reproduce permissible investments. Use of derivatives in these risk mitigation strategies does not mitigate all risk exposure; rather, they are used to keep us within our risk tolerance limits.
In addition to the general policies and monitoring, we use a variety of tools in counterparty risk management. Over-the-counter ("OTC") derivative transactions are executed under International Swaps and Derivatives Association ("ISDA") Master Agreements. A Credit Support Annex accompanies most of the ISDAs, which establish requirements for collateral.
Derivative Financial Instruments
The values associated with our derivative instruments are presented in the following table. Notional amounts serve as the basis for payments calculated under derivatives contracts and are generally not exchanged.
|
|
|
|
|
|
|
|
|
| ($ millions) |
December 31, 2023 |
December 31, 2022 |
| Net fair value asset (liability) |
872 |
(256) |
| Total notional amount |
70,421 |
|
69,768 |
|
Credit equivalent amount(1) |
1,594 |
|
1,173 |
|
Risk-weighted credit equivalent amount(1) |
34 |
|
26 |
|
(1)Amounts presented are net of collateral received.
The net fair value of derivatives was an asset of $872 million as at December 31, 2023 (December 31, 2022 - liability of $256 million). The increase in net fair value was driven by an increase in interest rate contracts due to downward shifts in yield curves and an increase in foreign exchange contracts due to the strengthening of the Canadian dollar against U.S. dollar.
The total notional amount of our derivatives increased to $70.4 billion as at December 31, 2023 (December 31, 2022 - $69.8 billion). The change in notional amount is mainly attributable to an increase in foreign exchange contracts used for hedging foreign currency assets.
Certain of our derivatives are designated in qualifying hedging relationships for accounting purposes, and represented $1.0 billion, or 1.5% of the total notional amount. Derivatives are designated in hedging relationships for accounting purposes to minimize accounting mismatches. These hedging relationships are documented at inception and hedge effectiveness is assessed on a quarterly basis.
Derivatives designated in qualifying hedging relationships for accounting purposes include foreign exchange agreements and equity forwards. We designate certain foreign exchange agreements in cash flow hedging relationships to manage foreign currency fluctuations associated with FVOCI assets. Additionally, we designate certain equity forwards in cash flow hedging relationships for anticipated payments of awards under certain stock-based compensation plans.
Credit Equivalent Amount
As the regulator of the Canadian insurance industry, OSFI provides guidelines to quantify the use of derivatives. The credit equivalent amount ("CEA"), a measure used to approximate the potential credit exposure, is determined as the replacement cost of the derivative contracts with a positive fair value plus an amount representing the potential future credit exposure.
44 December 31, 2023 Sun Life Financial Inc. MANAGEMENT'S DISCUSSION & ANALYSIS The risk-weighted credit equivalent amount is a measure used to determine the amount of capital necessary to support derivative transactions for certain Canadian regulatory purposes.
It is determined by weighting the credit equivalent amount according to the nature of the derivative and the creditworthiness of the counterparties.
|
|
|
|
|
|
|
|
|
|
|
|
|
|
|
|
December 31, 2023 |
December 31, 2022 |
| ($ millions) |
Credit equivalent amount ("CEA")(1) |
Risk
weighted CEA(1)
|
Credit equivalent amount ("CEA")(1) |
Risk
weighted CEA(1)
|
| Foreign exchange contracts |
1,488 |
32 |
1,049 |
24 |
| Interest rate contracts |
58 |
1 |
73 |
1 |
| Equity and other contracts |
48 |
1 |
51 |
1 |
| Total |
1,594 |
34 |
1,173 |
26 |
(1) Amounts presented are net of collateral received.
Credit Default Swaps By Underlying Financial Instrument Credit Rating
Credit default swaps ("CDS") are derivative contracts that transfer credit risk related to an underlying referenced financial instrument from one counterparty to another. The purchaser receives protection against the decline in the value of the referenced financial instrument as a result of specified credit events such as default or bankruptcy. The Company sells credit protection through CDS to replicate credit exposure of an underlying reference security and enhance investment returns. The credit risk ratings of the underlying reference securities for single name contracts were established in accordance with the internal rating process described in section K - Risk Management - 9 - Risk Categories - Credit Risk Management Governance and Control.
The following table provides a summary of the credit default swap protection sold by credit rating of the underlying reference security.
|
|
|
|
|
|
|
|
|
|
|
|
|
|
|
|
December 31, 2023 |
December 31, 2022 |
| ($ millions) |
Notional amount |
Fair value |
Notional amount |
Fair value |
| Single name credit default swap contracts |
|
|
|
|
| AA |
— |
— |
20 |
— |
| A |
491 |
5 |
587 |
4 |
| BBB |
540 |
15 |
706 |
5 |
| BB |
— |
— |
47 |
7 |
| Total single name credit default swap contracts |
1,031 |
20 |
1,360 |
16 |
| Credit default swap index contracts |
— |
|
— |
|
— |
|
— |
|
| Total credit default swap contracts sold |
1,031 |
|
20 |
|
1,360 |
|
16 |
|
Additional detail on our derivative portfolio by derivative type is provided in Note 6.A.v of our 2023 Annual Consolidated Financial Statements.
6. Investment Properties
As at December 31, 2023, we held $9.7 billion of investment properties (December 31, 2022 - $10.1 billion). The decrease in our investment property portfolio is predominantly driven by declines in market value, mainly in the office sector, and property sales in the industrial sector.
Investment Properties by Type and Geography
|
|
|
|
|
|
|
|
|
|
|
|
|
|
|
|
|
|
|
|
|
|
|
|
|
December 31, 2023 |
| ($ millions) |
Office |
Industrial |
Retail |
Multi-family
residential |
Other |
Total |
% of Total by Geography |
| Canada |
1,558 |
3,318 |
921 |
1,468 |
668 |
7,933 |
82% |
| United States |
476 |
1,046 |
232 |
34 |
2 |
1,790 |
18% |
|
|
|
|
|
|
|
|
| Total |
2,034 |
4,364 |
1,153 |
1,502 |
670 |
9,723 |
100% |
| % of Total by Type |
21% |
45% |
12% |
15% |
7% |
100% |
|
|
|
|
|
|
|
|
|
|
December 31, 2022 |
| ($ millions) |
Office |
Industrial |
Retail |
Multi-family
residential |
Other |
Total |
% of Total by Geography |
| Canada |
1,747 |
3,434 |
926 |
1,322 |
612 |
8,041 |
79% |
| United States |
647 |
1,105 |
263 |
— |
1 |
2,016 |
20% |
| Europe |
12 |
16 |
17 |
— |
— |
45 |
1% |
| Total |
2,406 |
4,555 |
1,206 |
1,322 |
613 |
10,102 |
100% |
| % of Total by Type |
24% |
45% |
12% |
13% |
6% |
100% |
|
MANAGEMENT'S DISCUSSION & ANALYSIS Sun Life Financial Inc. December 31, 2023 45
7. Loss Allowance and Provision for Credit Losses
The balance of the total loss allowance was $89 million as at December 31, 2023 (January 1, 2023(1) - $75 million) and the provision for credit losses was $14 million for the year ended December 31, 2023.
|
|
|
|
|
|
| J. Capital and Liquidity Management |
Capital and liquidity management is core to our business as an insurance company. We ensure adequate capital for the protection of our policyholders, Clients and creditors, while managing capital adequacy and allocation across our businesses for the benefit of our shareholders. In addition, we maintain strong financial flexibility by ensuring that sufficient liquid assets are available to cover our anticipated payment obligations and funding requirements. We invest in various types of assets with a view to matching them with liabilities of various durations.
The regulatory environments in which we operate are expected to evolve as governments and regulators work to develop the appropriate level of financial regulation required to ensure that capital, liquidity and risk management practices are sufficient to withstand severe economic downturns.
1. Capital
We have a capital risk policy designed to maintain a strong capital position and to provide the flexibility necessary to take advantage of growth opportunities, to support the risk associated with our businesses and to optimize shareholder return. Our capital risk policy is also intended to provide an appropriate level of risk management over capital adequacy risk, which is defined as the risk that capital is not or will not be sufficient to withstand adverse economic conditions, to maintain financial strength, or to allow the Company and its subsidiaries to take advantage of opportunities for expansion. Our capital base is structured to exceed minimum regulatory and internal capital targets and to maintain strong credit and financial strength ratings, while maintaining a capital-efficient structure. Capital is managed both on a consolidated basis under principles that consider all the risks associated with the business as well as at the business group level under the principles appropriate to the jurisdictions in which we operate. The capital of our foreign subsidiaries is managed on a local statutory basis in a manner commensurate with their individual risk profiles.
Sun Life, including all of its business groups, engages in a capital planning process annually in which capital deployment options, capital raising and dividend recommendations are presented to the Board of Directors ("Board"). Capital reviews are regularly conducted which consider the potential impacts under various business, interest rate and equity market scenarios. Relevant components of these capital reviews, including dividend recommendations, are presented to the Risk Committee on a quarterly basis. The Board is responsible for the approval of our annual capital plan and quarterly shareholder dividends.
The Company's capital risk policy establishes policies, operating guidelines and procedures that govern the management of capital. The capital risk policy is reviewed annually by the Risk Committee and any changes are approved by the Board. Our Corporate Capital and Risk Management functions are responsible for the development and implementation of the capital risk policy.
The Company's capital base consists mainly of common shareholders' equity. Other sources of capital include preferred shares and other equity instruments, non-controlling interests, equity in the participating account, CSM, subordinated debt issued by SLF Inc. and Sun Life Assurance, and certain other capital securities that qualify as regulatory capital. For Canadian regulatory purposes, our capital also includes innovative capital instruments issued by Sun Life Capital Trust.
(1)For financial assets in which the impairment requirements of IFRS 9 applies, we have elected to continue presenting the loss allowance that was determined in accordance with IAS 39 for balances at December 31, 2022. For additional information, refer to Note 2 in our 2023 Annual Consolidated Financial Statements.
46 December 31, 2023 Sun Life Financial Inc. MANAGEMENT'S DISCUSSION & ANALYSIS The following table summarizes the sources of our capital and our capital position over the past two years.
Notes 12, 13, 14 and 20 of our 2023 Annual Consolidated Financial Statements include additional details on our capital.
|
|
|
|
|
|
|
|
|
|
|
|
|
IFRS 17 and IFRS 9 |
IFRS 4 and IAS 39(1) |
| ($ millions) |
2023 |
As at
January 1, 2023(2)
|
2022 |
| Subordinated debt |
6,178 |
6,676 |
6,676 |
Innovative capital instruments(3) |
200 |
200 |
200 |
| Equity |
|
|
|
| Preferred shares and other equity instruments |
2,239 |
2,239 |
2,239 |
Common shareholders' equity(4) |
21,343 |
20,290 |
25,211 |
| Equity in the participating account |
457 |
268 |
1,837 |
| Non-controlling interests' equity |
161 |
90 |
90 |
| Total equity |
24,200 |
22,887 |
29,377 |
| Contractual Service Margin |
11,786 |
10,865 |
|
Total capital(1) |
42,364 |
40,628 |
36,253 |
Financial leverage ratio(1)(5)(6) |
21.5 |
% |
23.7 |
% |
25.1 |
% |
(1)This measure has not been restated for periods in 2022 and earlier as IFRS 17 and IFRS 9 were not the accounting standards in effect, and therefore were not applicable to our capital management practices at the time.
(2)Effective January 1, 2023, total capital was updated to include the CSM balance.
(3)Innovative capital instruments are presented net of associated transaction costs and consist of SLEECS, which were issued by Sun Life Capital Trust. SLEECS qualify as capital for Canadian regulatory purposes. However, under IFRS they are reported as Senior debentures in our Consolidated Financial Statements.
(4)Common shareholders’ equity is equal to Total shareholders’ equity less Preferred shares and other equity instruments.
(5)Effective January 1, 2023, the calculation for the financial leverage ratio was updated to include the CSM balance (net of taxes) in the denominator. The CSM (net of taxes) was $9.6 billion as at December 31, 2023 (January 1, 2023 - $8.7 billion).
(6)Represents a non-IFRS financial measure. See section M - Non-IFRS Financial Measures in this document.
Our total capital consists of subordinated debt and other capital instruments, participating policyholders' equity, non-controlling interests and total shareholders' equity, which includes common shareholders' equity, preferred shares and other equity instruments.
On transition to the new standards, Common shareholders' equity of $20.3 billion as at January 1, 2023 decreased $4.9 billion compared to December 31, 2022 primarily driven by the establishment of the CSM, which includes transfers from Common shareholders' equity and equity in the participating account to the CSM.
Common shareholders' equity was $21.3 billion as at December 31, 2023 (January 1, 2023 - $20.3 billion), an increase of $1.1 billion in 2023 primarily due to common shareholders' net income, partially offset by dividends, a decrease of $186 million from the repurchase and cancellation of common shares and the impact related to the AAM acquisition of $156 million(1). For additional information about the change in common shareholders' equity from the adoption of IFRS 17 and IFRS 9, refer to Note 2.A in our 2023 Annual Consolidated Financial Statements.
(1)For additional information, refer to Note 3 in our 2023 Annual Consolidated Financial Statements for the period ended December 31, 2023.
MANAGEMENT'S DISCUSSION & ANALYSIS Sun Life Financial Inc. December 31, 2023 47
The table below provides the earliest par call and maturity dates for our subordinated debt, innovative capital instruments, preferred shares and other equity instruments outstanding as at December 31, 2023.
|
|
|
|
|
|
|
|
|
|
|
|
|
|
|
| Description |
Interest Rate |
Earliest Par Call Date/Redemption Date(1) |
Maturity |
Principal/ Face Amount ($ millions) |
| Subordinated Debt Issued by Sun Life Assurance |
|
|
|
|
| 6.30% Debentures, Series 2 |
6.30% |
n/a |
2028 |
150 |
| Subordinated Debt Issued by SLF Inc. |
|
|
|
|
| Series 2007-1 |
5.40% |
May 29, 2037 |
2042 |
400 |
| Series 2019-1 |
2.38% |
August 13, 2024 |
2029 |
750 |
| Series 2020-1 |
2.58% |
May 10, 2027 |
2032 |
1,000 |
| Series 2020-2 |
2.06% |
October 1, 2030 |
2035 |
750 |
| Series 2021-1 |
2.46% |
November 18, 2026 |
2031 |
500 |
| Series 2021-2 |
2.80% |
November 21, 2028 |
2033 |
1,000 |
| Series 2021-3 |
3.15% |
November 18, 2031 |
2036 |
500 |
| Series 2022-1 |
4.78% |
August 10, 2029 |
2034 |
650 |
| Series 2023-1 |
5.50% |
July 4, 2030 |
2035 |
500 |
| Trust Units Issued by Sun Life Capital Trust |
|
|
|
|
| SLEECS - Series B |
7.093% |
June 30, 2032 |
Perpetual |
200 |
| Class A Preferred Shares and Other Equity Instruments Issued by SLF Inc. |
|
|
|
|
| Series 3 |
4.45% |
Any time |
Perpetual |
250 |
| Series 4 |
4.45% |
Any time |
Perpetual |
300 |
| Series 5 |
4.50% |
Any time |
Perpetual |
250 |
Series 8R(2) |
1.825% |
June 30, 2025 |
Perpetual |
155 |
Series 9QR(3) |
Floating |
June 30, 2025(5) |
Perpetual |
125 |
Series 10R(2) |
2.967% |
September 30, 2026 |
Perpetual |
171 |
Series 11QR(4) |
Floating |
September 30, 2026(5) |
Perpetual |
29 |
Series 2021-1 - LRCN(6) |
3.60% |
June 30, 2026 |
2081 |
1,000 |
(1)The earliest date on which the Company has the option, but not the obligation, to call securities for redemption at their par value. Redemption of these securities is subject to regulatory approval.
(2)On the earliest redemption date and every five years thereafter, the dividend rate will reset to an annual rate equal to the 5-year Government of Canada bond yield plus a spread specified for each series. The specified spread for Class A shares is: Series 8R - 1.41% and Series 10R - 2.17%. On the earliest redemption date and every five years thereafter, holders will have the right, at their option, to convert their shares into the series that is one number higher than their existing series.
(3)Holders of Series 9QR Shares will be entitled to receive quarterly floating rate non-cumulative dividends at an annual rate equal to the then 3-month Government of Canada treasury bill yield plus 1.41%. Holders of the Series 9QR Shares will have the right, at their option, to convert their Series 9QR Shares into Series 8R Shares on June 30, 2025, and on June 30 every five years thereafter.
(4)Holders of Series 11QR Shares will be entitled to receive quarterly floating rate non-cumulative dividends at an annual rate equal to the then 3-month Government of Canada treasury bill yield plus 2.17%. Holders of the Series 11QR Shares will have the right, at their option, to convert their Series 11QR Shares into Series 10R Shares on September 30, 2026, and on September 30 every five years thereafter.
(5)Redeemable on the redemption date and every five years thereafter, in whole or in part, at par, and on any other date at $25.50 per share.
(6)Series 2021-1 Notes bear interest at a fixed rate of 3.60% payable semi-annually until June 30, 2026. On June 30, 2026, and every five years thereafter until June 30, 2076, the interest rate on the Series 2021-1 Notes will be reset at an interest rate equal to the five-year Government of Canada yield, as defined in the prospectus, plus 2.604%. In case of non-payment of interest on or principal of the Series 2021-1 Notes when due, the recourse of each noteholder will be limited to that holder's proportionate share of the Limited Recourse Trust's assets. For more information about the LRCN, see Note 14.B of the 2023 Annual Consolidated Financial Statements.
48 December 31, 2023 Sun Life Financial Inc. MANAGEMENT'S DISCUSSION & ANALYSIS The following table shows the number of common shares and stock options outstanding of SLF Inc. for the last two years.
|
|
|
|
|
|
|
|
|
| Number of Common Shares Outstanding |
|
|
| (in millions) |
2023 |
|
2022 |
|
| Balance, beginning of year |
586.4 |
586.0 |
| Stock options exercised |
1.0 |
0.4 |
| Common shares repurchased and cancelled |
(2.8) |
— |
| Balance, end of year |
584.6 |
586.4 |
|
|
|
| Number of Stock Options Outstanding |
|
|
| (in millions) |
2023 |
|
2022 |
|
| Balance, beginning of year |
3.6 |
3.0 |
| Options issued |
0.8 |
0.7 |
| Options exercised, forfeited or expired |
(1.0) |
(0.1) |
| Balance, end of year |
3.4 |
3.6 |
Under our Canadian Dividend Reinvestment and Share Purchase Plan ("DRIP"), Canadian-resident common and preferred shareholders may choose to have their dividends automatically reinvested in common shares of SLF Inc. and may also purchase common shares through our DRIP with cash. For dividend reinvestments, we may, at our option, issue common shares of SLF Inc. from treasury at a discount of up to 5% to the volume-weighted average trading price or direct that common shares be purchased on behalf of participants on the open market through the TSX and alternative Canadian trading platforms (collectively, the "Exchanges") at the market price. Common shares of SLF Inc. acquired by participants through optional cash purchases may also be issued from treasury or purchased through the Exchanges at SLF Inc.'s option, in either case at no discount. Commencing with the dividends payable on March 31, 2016 and until further notice, common shares purchased under the Plan were purchased on the open market. There are no applicable discounts because the common shares are being purchased on the open market and are not being issued from treasury.
SLF Inc. grants stock options to certain employees. These options are granted at the closing price of SLF Inc.'s common shares on the TSX on the grant date.
As at January 26, 2024, SLF Inc. had 584,631,371 common shares, 3,428,382 options to acquire SLF Inc. common shares, and 52,200,000 Class A Shares outstanding.
2. Capital Adequacy
OSFI has indicated that it will review the effectiveness of the LICAT guideline and update it to keep abreast of development in the life insurance industry and evolving risk measurement and management practices.
SLF Inc.
SLF Inc. is a non-operating insurance company and was subject to OSFI's LICAT guideline as at December 31, 2023. In accordance with this guideline, SLF Inc. manages its capital in a manner commensurate with its risk profile and control environment, and SLF Inc.'s regulated subsidiaries comply with the capital adequacy requirements imposed in the jurisdictions in which they operate. SLF Inc.'s consolidated capital position is above its internal target. As at December 31, 2023, SLF Inc.'s LICAT ratio was 149%. For additional information, refer to section G - Financial Strength in this document.
Sun Life Assurance
Sun Life Assurance, SLF Inc.'s principal operating life insurance subsidiary in Canada, was subject to OSFI's LICAT guideline as at December 31, 2023. With a LICAT ratio of 141% as at December 31, 2023, Sun Life Assurance's capital ratio is well above OSFI's supervisory ratio of 100% and regulatory minimum ratio of 90%. The LICAT guideline uses a risk-based approach for measuring specific life insurer risks and for aggregating the results to calculate the amount of a life insurer's regulatory required capital to support these risks. Certain of these risk components, along with available capital, are sensitive to changes in equity markets and interest rates as outlined in the section K - Risk Management of this document. For additional information, refer to section G - Financial Strength in this document.
MANAGEMENT'S DISCUSSION & ANALYSIS Sun Life Financial Inc. December 31, 2023 49
The following table shows the components of SLF Inc.'s LICAT ratio for 2023.
SLF Inc. LICAT Ratio
|
|
|
|
|
|
|
|
IFRS 17 and IFRS 9 |
|
| ($ millions) |
2023 |
|
| Capital resources |
|
|
Adjusted retained earnings and contributed surplus (including contractual service margin)(1) |
24,076 |
|
| Adjusted accumulated other comprehensive income |
771 |
|
| Common and preferred shares |
10,566 |
|
| Innovative capital instruments and subordinated debt |
6,348 |
|
|
|
|
| Less: |
|
|
| Goodwill |
4,620 |
|
| Non-life investments and other |
10,668 |
|
| Available capital |
26,473 |
|
| Surplus allowance and eligible deposits |
6,165 |
|
| Total Capital resources |
32,638 |
|
| Capital requirements |
|
|
| Credit, market and insurance risks |
24,068 |
|
| Less: Diversification and other credits |
4,984 |
|
| Segregated fund guarantee risk |
719 |
|
| Operational risk |
2,139 |
|
| Base solvency buffer |
21,942 |
|
| LICAT ratio |
149 |
% |
|
(1)OSFI's 2023 LICAT Guideline, effective January 1, 2023, specifies that available capital for LICAT purposes includes the Contractual Service Margin. Prior period restatement and resubmissions are not mandated.
Foreign Life Insurance Companies
Foreign subsidiaries and foreign operations of SLF Inc. must comply with local capital or solvency requirements in the jurisdictions in which they operate. Our operations maintained capital levels above the minimum local regulatory requirements during 2023 and 2022. Additional information on capital and regulatory requirements for our foreign subsidiaries and foreign operations is provided in SLF Inc.'s AIF under the heading Regulatory Matters.
As at December 31, 2023, we have two internal reinsurance arrangements with affiliated reinsurance companies, in Delaware and Michigan, relating to our closed block of individual universal life insurance products with no-lapse guarantee benefits issued in the U.S. The Delaware reinsurance structure was established in 2013 and finances excess U.S. statutory reserves for certain universal life policies issued between January 2000 and February 2006. The financing of U.S. statutory reserve requirements in excess of those required under IFRS for the Delaware reinsurance company is supported by a guarantee from SLF Inc. The Michigan reinsurance structure was established in 2007 for certain policies issued between March 2006 and December 2008. The entity was redomesticated from Vermont to Michigan in 2020. Under the Michigan reinsurance structure, the related excess U.S. statutory reserve requirements are similarly supported by a guarantee from SLF Inc.
3. Shareholder Dividends
The declaration, amount and payment of dividends by SLF Inc. is subject to the approval of our Board and is dependent on our results of operations, our reported net income, financial condition, cash requirements and contractual restrictions. Capital management activities, as well as regulatory considerations and macro-economic factors including the economic outlook for the jurisdictions in which we do business, are also considered along with other factors. The Board reviews the level of dividends on a quarterly basis.
A regular and appropriate level of dividend payout and growth provides a stable source of return to common shareholders.
We target an underlying dividend payout ratio of between 40% and 50% based on underlying EPS.
During 2023, our dividend payout ratio to common shareholders based on our underlying EPS basis was 47% and on reported EPS was 57%.
Total common shareholder dividends declared in 2023 were $3.00 per share, compared to $2.76 in 2022.
50 December 31, 2023 Sun Life Financial Inc. MANAGEMENT'S DISCUSSION & ANALYSIS
Dividends declared
|
|
|
|
|
|
|
|
|
|
|
|
| Amount per share |
2023 |
2022 |
2021 |
| Common shares |
3.00 |
|
2.76 |
2.31 |
| Class A preferred shares |
|
|
|
Series 1(1) |
— |
— |
0.890625 |
Series 2(1) |
— |
— |
0.900000 |
| Series 3 |
1.112500 |
1.112500 |
1.112500 |
| Series 4 |
1.112500 |
1.112500 |
1.112500 |
| Series 5 |
1.125000 |
1.125000 |
1.125000 |
Series 8R(2)(3) |
0.456250 |
0.456250 |
0.456250 |
Series 9QR(4) |
1.504240 |
0.701122 |
0.382421 |
Series 10R(2)(5) |
0.741750 |
0.741750 |
0.718313 |
Series 11QR(6) |
1.694240 |
0.891122 |
0.572421 |
Series 12R(1) |
— |
— |
0.951500 |
(1)Series 1 and 2 Shares were redeemed on September 30, 2021. Series 12R Shares were redeemed on December 31, 2021.
(2)On the earliest redemption date and every five years thereafter, the dividend rate will reset to an annual rate equal to the 5-year Government of Canada bond yield plus a yield specified for each series. The specified yield for Class A shares is: Series 8R - 1.41% and Series 10R - 2.17%. On the earliest redemption date and every five years thereafter, holders will have the right, at their option, to convert their shares into the series that is one number higher than their existing series.
(3)The dividend rate was reset on June 30, 2020 to a fixed annual dividend rate of 1.825% until the earliest redemption date June 30, 2025.
(4)Holders of the Series 9QR Shares are entitled to receive quarterly floating rate non-cumulative dividends at an annual rate equal to the then 3-month Government of Canada treasury bill yield plus 1.41%. Holders of the Series 9QR Shares will have the right, at their option, to convert their Series 9QR Shares into Series 8R Shares on June 30, 2025 and on June 30 every five years thereafter.
(5)The dividend rate was reset on September 30, 2021 to a fixed annual dividend rate of 2.967% until the earliest redemption date September 30, 2026.
(6)Holders of the Series 11QR Shares are entitled to receive quarterly floating rate non-cumulative dividends at an annual rate equal to the then 3-month Government of Canada treasury bill yield plus 2.17%. Holders of the Series 11QR Shares will have the right, at their option, to convert their Series 11QR Shares into Series 10R Shares on September 30, 2026 and on September 30 every five years thereafter.
4. Principal Sources and Uses of Funds
Our primary source of funds is cash provided by operating activities, including premiums, investment management fees and net investment income. These funds are used primarily to pay policy benefits, dividends to policyholders, claims, commissions, operating expenses, interest expenses and shareholder dividends. Excess cash flows generated from operating activities are generally invested to support future payment requirements. We also raise funds from time to time, through borrowing and issuing of securities, to finance growth, acquisitions or other needs.
As at December 31, 2023, we maintained net cash, cash equivalents and short-term securities totaling $13.2 billion. In addition to providing for near-term funding commitments, cash, cash equivalents and short-term securities include amounts that support short-term payment obligations.
Net cash, cash equivalents and short-term securities increased $2.0 billion. The table below outlines our principal sources and uses of cash.
|
|
|
|
|
|
|
|
|
|
|
|
|
|
|
| ($ millions) |
|
|
|
2023 |
2022 |
| Net cash and cash equivalents, beginning of period |
|
|
|
9,372 |
7,693 |
| Cash flows provided by (used in): |
|
|
|
|
|
| Operating activities |
|
|
|
5,612 |
4,311 |
| Investing activities |
|
|
|
(559) |
(2,863) |
| Financing activities |
|
|
|
(3,086) |
(71) |
| Changes due to fluctuations in exchange rates |
|
|
|
(169) |
302 |
| Increase (decrease) in cash and cash equivalents |
|
|
|
1,798 |
1,679 |
| Net cash and cash equivalents, end of period |
|
|
|
11,170 |
9,372 |
| Short-term securities, end of period |
|
|
|
2,003 |
1,841 |
| Net cash, cash equivalents and short-term securities, end of period |
|
|
|
13,173 |
11,213 |
MANAGEMENT'S DISCUSSION & ANALYSIS Sun Life Financial Inc. December 31, 2023 51
5. Liquidity
We generally maintain an overall asset liquidity profile that exceeds requirements to fund insurance contract liabilities under prescribed adverse liability demand scenarios. To strengthen our liquidity further, we actively manage and monitor our:
•Capital levels
•Asset levels
•Matching position
•Diversification and credit quality of investments
•Cash forecasts and actual amounts against established targets
We are subject to various regulations in the jurisdictions in which we operate. The ability of SLF Inc.'s subsidiaries to pay dividends and transfer funds is regulated in certain jurisdictions and may require local regulatory approvals and the satisfaction of specific conditions in certain circumstances. Through effective cash management and capital planning, SLF Inc. ensures that its subsidiaries, as a whole and on a stand-alone basis, are properly funded and maintain adequate liquidity to meet obligations, both individually and in aggregate.
SLF Inc. (the ultimate parent company) and its wholly-owned holding companies had $1.6 billion in cash and other liquid assets(1) as at December 31, 2023. See section G - Financial Strength and M - Non-IFRS Financial Measures in this document for more information.
We maintain various credit facilities for general corporate purposes, as set out in the table below. Unless otherwise noted, all amounts are in Canadian dollars.
|
|
|
|
|
|
|
|
|
|
|
|
|
|
|
|
|
|
|
|
|
|
|
|
|
|
|
|
|
|
|
|
|
| ($ millions) |
December 31, 2023 |
December 31, 2022 |
| Credit Facility |
Amount |
Utilized |
Expiry |
Amount |
Utilized |
Expiry |
| Committed |
US |
$ |
400 |
|
US |
$ |
11 |
|
2025 |
US |
$ |
400 |
|
US |
$ |
11 |
|
2025 |
| Committed |
US |
$ |
1,710 |
|
US |
$ |
1,384 |
|
2024 |
US |
$ |
1,950 |
|
US |
$ |
1,358 |
|
2024 |
| Committed |
|
$ |
500 |
|
|
$ |
500 |
|
2025 |
|
$ |
500 |
|
|
$ |
500 |
|
2025 |
| Uncommitted |
US |
$ |
100 |
|
US |
$ |
— |
|
n/a |
US |
$ |
100 |
|
US |
$ |
— |
|
n/a |
| Uncommitted |
|
$ |
229 |
|
|
$ |
95 |
|
n/a |
|
$ |
227 |
|
|
$ |
89 |
|
n/a |
| Uncommitted |
US |
$ |
25 |
|
US |
$ |
3 |
|
n/a |
US |
$ |
25 |
|
US |
$ |
5 |
|
n/a |
The agreements relating to our committed credit facilities contain typical covenants for investment grade companies regarding solvency, credit ratings and financial strength, all of which were met as at December 31, 2023. These covenants include, but are not limited to, the maintenance of total equity by SLF Inc. of at least $12 billion, tested as of the last day of each fiscal quarter. SLF Inc.'s total equity was $24.2 billion as at December 31, 2023.
Our failure to comply with the covenants under the committed credit facility would, subject to grace periods in the case of certain covenants, result in an event of default. This could require us to repay any outstanding borrowings or to cash collateralize letters of credit under the facility. A failure by SLF Inc. (or any of its subsidiaries) to pay an obligation due for an amount exceeding $250 million would also result in an event of default under the committed credit facility described above.
Based on our historical cash flows and liquidity management processes, we believe that the cash flows from our operating activities will continue to provide sufficient liquidity for us to satisfy debt service obligations and to pay other expenses as they fall due.
(1)This is a non-IFRS financial measure. See section M - Non-IFRS Financial Measures in this document.
52 December 31, 2023 Sun Life Financial Inc. MANAGEMENT'S DISCUSSION & ANALYSIS The Company has an established Risk Management Framework ("Risk Framework") approved by the Board that prescribes a comprehensive set of protocols and programs that need to be followed in conducting business activities.
1. Risk Management Framework
The risks that arise when providing products and services to Clients, which are in line with our Purpose to help our Clients achieve lifetime financial security and live healthier lives, are managed within these protocols and programs. Effective risk management is critical to the overall profitability, competitive market positioning and long-term financial viability of the Company. While all risks cannot necessarily be eliminated or known with certainty, the Risk Framework seeks to ensure that risks to a business undertaking are appropriately managed to achieve the Company's business objectives over time and are not expected to exceed pre-established boundaries for risk taking. The Risk Framework, corporate strategy and business objectives are all aligned and risk management protocols and programs are embedded within every business segment.
MANAGEMENT'S DISCUSSION & ANALYSIS Sun Life Financial Inc. December 31, 2023 53
2. Risk Governance and Accountabilities
Our Risk Framework sets out lines of responsibility and authority for risk-taking, governance and control. These governance requirements are summarized below.
Board of Directors
The Board is responsible for ensuring the governance of all risks across the enterprise and has primary responsibility for taking action to ensure risk management policies, programs and practices are in place. By approving our Risk Framework and the Risk Appetite Policy and providing ongoing oversight of the risk management programs, the Board monitors that significant risks are appropriately identified and managed. The Board oversees business and strategic risk through review and approval of the Business and Strategic Plans, and regularly discusses key themes, issues and risks arising in connection with the design or implementation of these plans.
The Risk Committee is a standing committee of the Board whose primary functions are to assist the Board with oversight of the management of current and emerging risks enterprise-wide, and of the Risk Management function to ensure that management has in place programs, policies, processes and controls designed to identify and effectively manage the significant risks to which the Company is exposed and has sufficient capital to underpin those risks. It reviews and approves all risk management policies and reviews compliance with those policies. In addition, where the Board has delegated risk oversight to other committees of the Board ("Board Committees"), the Risk Committee provides the Board with an integrated view of oversight of risk management across all Board committees. The Risk Committee regularly monitors the Company's risk profile to ensure it is within the agreed risk appetite and that the Company's capital position exceeds regulatory capital requirements, and monitors and recommends to the Board for approval, the specific risk limits allocated to the businesses and the annual Capital Plan. The Risk Committee also oversees risk management activities of our subsidiaries and joint ventures under the Company's management control and risks posed to the Company through its other joint ventures.
The Governance, Investment & Sustainability Committee (“GISC”) of the Board is responsible for assisting the Board in overseeing (i) the development of effective corporate governance guidelines and processes, including those addressing the effectiveness of the Board and its committees and director succession planning and recruitment; (ii) the Company's Investment Plan and investment performance, including investment practices, procedures and controls related to the management of the general fund investment portfolio; (iii) sustainability matters including the Company's Sustainability Policy, Sustainability Report and Sustainability Plan; and (iv) compliance and compliance management programs, including compliance with legal and regulatory requirements, the identification and management of compliance risk, and the
54 December 31, 2023 Sun Life Financial Inc. MANAGEMENT'S DISCUSSION & ANALYSIS development of policies and processes to sustain ethical behaviour.
GISC also serves as the conduct review committee of the Company in accordance with applicable provisions of the Insurance Companies Act (Canada).
The Audit Committee of the Board is responsible for assisting the Board in overseeing the integrity of financial statements and related information provided to shareholders and other stakeholders, compliance with financial regulatory requirements, adequacy and effectiveness of the internal controls implemented and maintained by management, and assessing the qualifications, independence and performance of the external auditor.
The Management Resources Committee of the Board is responsible for assisting the Board with oversight of succession planning for senior executive positions and programs to effectively attract, retain, develop and reward employees. It provides guidance to management on advancing the talent agenda to achieve strategic objectives and foster the Company's culture. The Committee reviews incentive designs and governance of material incentive programs against alignment with business objectives and avoiding excessive risk taking. It reviews the implications of key enterprise risks, including people and culture risks pertaining to compensation design and human resources practices. In addition, the Committee reviews compensation matters, including the remuneration of executives who have a material impact on the risk exposure of the Company.
Senior Management Committees
The Executive Risk Committee ("ERC") provides executive management oversight of the Company's enterprise risk management activities. This includes the review and articulation of the risk appetite, overseeing that the risk profile is within the agreed risk appetite, and overseeing that there are policies, processes and controls are in place to identify and effectively manage the significant risks, in accordance with the risk appetite and the overall objective of promoting a balanced business and product model to achieve agreed upon risk-adjusted returns and allocate capital accordingly.
The Investment & Credit Risk Committee is responsible for reviewing critical matters related to the on-going management of the Company's General Fund. Accordingly, the Committee is responsible for overseeing, monitoring and reviewing current and potential credit and investment risk exposures, other credit and investment risk management issues and future credit and investment risk management strategies.
The Corporate Asset Liability Management Committee is responsible for providing oversight and input on the Asset Liability Management framework, policies, guidelines, limits, measurement and performance assessment applicable to the management of market and liquidity risks, as well as providing oversight of asset liability management and hedging strategy changes.
The Operational Risk & Compliance Committee is responsible for providing oversight of the Company's operational and compliance risk management practices, current and emerging operational risk exposures, and the processes to ensure ongoing identification of major operational and compliance risks facing the Company.
The Insurance Risk Committee is responsible for providing oversight and direction on insurance risk exposures facing the Company and to ensure that effective insurance risk management practices and controls are in place. This includes reviewing the current and emerging insurance risk profile; engaging in review of topical insurance, reinsurance and underwriting risk issues; and reviewing and recommending changes to the insurance risk measurement methodology.
Accountabilities
Primary accountability for risk management is delegated by the Board to our Chief Executive Officer ("CEO"). The CEO further delegates responsibilities throughout the Company through management authorities and responsibilities. The CEO delegates accountability for the various classes of risk management to our executive officers, who are accountable for ensuring that the management of risk in the scope of their business accountability is in accordance with the Board approved Risk Framework, Risk Appetite Policy and risk management policies.
3. Risk Universe
As a large financial services organization operating in a complex industry, the Company encounters a variety of risks and uncertainties. We face risks in formulating our business strategy and business objectives, in carrying on our business activities in the pursuit of our strategy and objectives, and from external factors such as changes in the economic, geopolitical, environmental, social and regulatory landscape. We are subject to financial and insurance risks that are connected to our liabilities and with the management and performance of our assets, including how we match returns from assets with the payment of liabilities to our Clients. Each of these risks is also considered from the perspective of different types of uncertainties under which either the outcomes and/or their probabilities of occurrence are unknown. The Risk Framework covers all risks and these have been grouped into six major categories: business and strategic, credit, market, liquidity, insurance and operational risks. The Risk Framework sets out the key risk management processes in the areas of risk: appetite, identification, measurement, management, monitoring and reporting. The Risk Framework sets out both qualitative and quantitative measures and processes to control the risk the Company will bear in respect of each of these categories of risk and in aggregate.
4. Risk Appetite
Our Risk Appetite Policy defines the amount and type of risk we are willing to accept in pursuit of our business objectives, and is approved by the Board. It is forward-looking and our Strategic Plan, Capital Plan, Business Plan and business objectives are established within its boundaries.
The Company's risk appetite seeks to balance the various needs, expectations, risk and reward perspectives and investment horizons of all stakeholders. In particular, our risk appetite supports the pursuit of shareholder value while ensuring that the Company's ability to pay claims and fulfill policyholder commitments is not compromised.
The Company's risk appetite is the primary mechanism to operationalize its risk philosophy and the boundaries of permissible risk-taking across the enterprise. It ensures that business activities are assessed against performance criteria that are appropriately risk-adjusted. Our risk appetite supports the objective of maintaining adequate capital, managing earnings volatility, managing operational risk and managing
MANAGEMENT'S DISCUSSION & ANALYSIS Sun Life Financial Inc. December 31, 2023 55
liquidity. To accomplish this, our risk appetite includes a wide array of qualitative and quantitative standards that reflect the Company's overall risk management principles and values.
We are generally comfortable accepting diversifiable risks where we are capable of using risk pooling to create liability portfolios with relatively low volatility. We take risk where we have internal expertise such as actuarial, underwriting, claims management, investment, risk management and distribution or where reinsurance partners are able to supplement our internal expertise. We prefer risks that arise across various dimensions, including products, geographies (intra-national and international), distribution channels and asset classes in order to maximize diversification opportunities.
Our Risk Appetite Policy sets out specific constraints which define the aggregate level of risk that the Company is willing to accept. We translate our risk appetite constraints into specific risk limits by risk class and business segment. Our risk profile is measured, managed and monitored regularly to ensure that we operate within our risk appetite. Our risk appetite limits are reviewed periodically to reflect the risks and opportunities inherent in our evolving business strategies and operating environment.
5. Risk Management Policies
In order to support the effective communication, implementation and governance of our Risk Framework, we have codified our processes and operational requirements in a comprehensive series of risk management frameworks, policies and operating guidelines. These frameworks, policies and guidelines promote the application of a consistent approach to managing risk exposures across our global business platform. The Board and Board Committees regularly review and approve significant changes to the risk management framework and policies and regularly review management's reporting and attestation on compliance to these policies.
6. Risk Management Process
The risk management process as set out in our Risk Framework is described below:
Risk Identification and Measurement
All business segments employ a common approach to identify and measure risks. Business segments have accountability for identifying and managing risks facing their business. We have a process to identify and monitor key and emerging risks that may have a material impact on our finances, operations or reputation. We evaluate potential correlations and inter-connections between various risk events and categories, and monitor key and emerging risks, emerging regulatory and rating agency requirements, or industry developments and various research reports.
Risk measurement involves determining and evaluating potential risk exposures and includes a number of techniques, such as monitoring key risk indicators, probability-severity assessments, stress testing (including sensitivity and scenario analysis), reverse stress testing and stochastic modelling. Risk measures are expressed in quantitative and qualitative terms.
A robust stress testing program is an essential component of the Company's Risk Framework used to measure, monitor, understand and mitigate the Company's risk exposures and to ensure ongoing capital adequacy under plausible stress events. Stress testing is performed on key metrics such as earnings, regulatory capital ratios and liquidity to identify and monitor potential vulnerabilities to key risk drivers and ensure that the Company is operating within its risk appetite.
We develop and test a range of scenarios based on our internal assessment and regulatory guidance. Emerging risks are one of the inputs to determine stress test scenarios. Sensitivity testing is conducted on a regular basis and measures the earnings and regulatory capital and liquidity impacts from changes in underlying risk factors, assuming that there are no changes to any of the other risk factors. Sensitivity testing is performed for individual risks and for consolidated risk exposures at different levels of stress and at various levels of aggregation. Scenario testing involves changes to a number of risk factors to assess the impact of and interaction between these risk factors. These scenarios include integrated scenario testing, reverse scenario testing and key assumption sensitivity testing. We also use the Financial Condition Testing ("FCT") process, as prescribed by the Canadian Institute of Actuaries, to satisfy requirements under the Canadian insurance Company Act, and OSFI regulations, to annually stress test capital.
Risk Management, Monitoring and Reporting
Risk management decisions are formed by evaluating whether the assessed risk for a business activity aligns to our risk appetite and meets the objective of risk-adjusted returns.
Monitoring processes include oversight by the Board, which is exercised through Board Committees and Senior Management committees described in the Risk Governance and Accountabilities section in this document.
At least on a quarterly basis, the Senior Management committees, Board Committees and the Board review reports that summarize our risk profile against the Board approved risk appetite, including the exposures across our principal risks, any changes in risk trends, forward-looking view of risks and emerging risks. These committees also review the effectiveness of the risk management strategies presented in the reports. On a regular basis, the Board and the Board Committees review and approve any significant changes to risk management frameworks and policies for the management of risk and review compliance with these frameworks and policies.
7. Three Lines of Defence
The Company has adopted the Three Lines of Defence ("LOD") model to provide a consistent, transparent and clearly documented allocation of accountability and segregation of functional responsibilities. This segregation of responsibility helps to establish a robust control framework that promotes transparent and independent challenge of all risk taking activities, and that encourages all functions to engage in self-critical examination to foster continuous improvement of the management of risk in our business.
56 December 31, 2023 Sun Life Financial Inc. MANAGEMENT'S DISCUSSION & ANALYSIS The first line of defence is represented by the business segment management who own the risks that are intrinsic to the business and have the primary responsibility to identify, measure, manage, monitor and report these risks.
Some of the first LOD risk related responsibilities include:
•Identification of key and emerging risks;
•Manage, measure, monitor and report on risk within their business operations;
•Accountability for business results and the risks taken to achieve business results and the resulting impact of those risks; and
•Operating within risk appetite and according to risk management policies.
The second line of defence includes the Chief Risk Officer ("CRO") and heads of the oversight functions who are responsible for providing independent oversight of our Company-wide risk management programs. The CRO is responsible for developing our Risk Framework and Risk Appetite Policy, and for overseeing the development and implementation of risk management strategies aimed at optimizing the risk-return profile of the Company. The CRO is supported by a network of business segment risk officers. The functional heads support the CRO in the implementation and communication of our Risk Framework and Risk Appetite Policy. Some of the key second LOD risk related responsibilities include:
•Establishment of the risk management framework and policies;
•Providing oversight and effective independent challenge of first line; and
•Independent reporting to Senior Management committees and the Board of Directors on the level of risk against risk appetite.
The third line of defence responsibilities are distinct from first and second LOD responsibilities. The Internal Audit function is the third LOD and is responsible for providing independent assurance to Senior Management and the Board and/or Board Committees on the design and operational effectiveness of the risk management practices and internal controls carried out by first LOD and second LOD. Internal Audit provides a quarterly opinion on the effectiveness of internal controls, risk management and governance processes to the Audit Committee of the Board. In addition, the Risk Committee may engage third-party independent reviews to supplement the third LOD review of the effectiveness of the Company's risk management programs.
8. Risk Culture and Philosophy
We have built a strong corporate culture on a foundation of ethical behaviour, high business standards, integrity and respect. The Board establishes the "tone from the top" and is accountable to ensure that the CEO and Senior Management create and sustain a culture of integrity throughout the organization. We work together through our focus on diversity, equity and inclusion and sustainability to fulfill our Purpose of helping our Clients to achieve lifetime financial security and to live healthier lives.
Risk culture relates to how we behave and respond, in addition to the requirements we set. It enables and rewards taking the right risks in an informed manner. It enables effective challenge and transparency regarding risks and outcomes without fear of reprisal. It drives us to understand Client needs and preferences so that we can act in their best interests. In order to support employees in fulfilling their role, we have taken action to ensure our risk protocols and procedures are well defined and embedded in our day-to-day business activities, assess that appropriate resources and training are provided, establish and communicate a common risk philosophy and a high bar for integrity and conduct, and encourage every employee to openly identify risk exposures and communicate escalating risk concerns. The following seven elements support our Risk Culture:
•Establishing tone from the top;
•Encouraging transparency in risk-taking;
•Performing effective challenge in conducting business decisions;
•Aligning incentives and risk management practices;
•Effectively communicating the risk culture expectations;
•Establishing clear accountabilities; and
•Promoting ongoing resiliency
A key premise of our culture is that all employees have an important role to play in managing the Company's risks. Risk Management is embedded in the enterprise's culture, which encourages ownership and responsibility for risk management at all levels. Our compensation programs are aligned to the organization's risk management practices through our governance structure for the design and approval of incentive compensation plans and processes used to support the alignment of compensation and risk management. We continuously reinforce and embed the culture through communication and training on risk culture elements at various forums and across various levels through training on the Code of Conduct annually, reinforcing accountability through performance reviews and compensation, continually monitoring processes and outcomes that drive expected behaviours, and through defining roles, responsibilities and expectations in the risk management policies.
The Company's risk philosophy includes the following core principles:
Strategic Alignment
Our corporate strategy and business objectives are required to be established within the boundaries and prescriptions set out in the Risk Framework and the Risk Appetite Policy. This requires us to consider whether a business activity, intended to achieve the business and financial objectives, will result in a risk profile that we are willing to accept and which we are prepared to manage. We have established a range of explicit risk appetite constraints for credit, market, insurance, operational and liquidity risks. Business and strategic risk is managed through our strategic and business planning process and through controls over the implementation of these Strategic and Business Plans. Risks associated with activities outside our risk appetite or outside the acceptable defined risks are avoided.
Client and Other Stakeholder Interests
Our Risk Appetite Policy considers the interests of a large number of key stakeholders, including Clients, shareholders, debt-holders, employees, regulators, distributors, rating agencies and other capital markets participants. The policy prescribes how to balance the needs, expectations, risk and reward perspectives, and investment horizons of these different stakeholders.
Effective risk management requires that objectives and incentives be aligned to ensure management's decisions are consistent with the Company's risk philosophy and risk appetite. To ensure this, the Business Plans and strategies are independently tested to ensure that they
MANAGEMENT'S DISCUSSION & ANALYSIS Sun Life Financial Inc. December 31, 2023 57
operate within the boundaries and requirements set out in the Risk Framework and the Risk Appetite Policy, and the results of this testing are reported to the Board. Compensation programs for employees are approved by the Board and the Board Committees and are aligned with the Company's risk philosophy, values, business and risk management strategies, and the long-term interests of stakeholders. In establishing annual performance objectives, we consider risk management goals to ensure that business decisions are consistent with the desired risk and return profile of the Company.
Capability Alignment
We seek out profitable risk-taking opportunities in those areas where we have established risk management skills and capabilities. Conversely, we endeavour to avoid or transfer risks that are beyond our risk-taking capability. Our ability to measure and evaluate risks, the quality of our risk governance and control environment, the depth and quality of our risk responses and the robustness of our pricing strategies are particularly important capabilities that we assess.
Portfolio Perspective
In evaluating a particular risk, consideration is given to a portfolio perspective of risk and return including the explicit recognition of the impacts of diversification and concentration and how different risks interact with each other. This perspective is extended to the development of risk mitigation and pricing strategies, recognizing that often the most cost-effective way of managing risk involves utilizing available relationships already inherent in our businesses.
Risk-Adjusted Returns
Financial return metrics used to assess business activities are developed in consideration of the constraints set out in the Risk Appetite Policy, and reflect the expected costs of mitigation and the cost of risk capital required to support the risk taking activity.
Culture
Culture is the sum of the shared assumptions, values and beliefs that create the unique character of an organization. Our culture encourages behaviour aligned with goals for long-term value creation. It defines the appropriate behaviour for any given situation, governs the interaction with Clients and affects how employees identify with the organization. Our culture has significant potential to impact our risk profile. An organization's culture impacts its ability to create value and to protect value. Maintaining the right balance of risk-taking and risk control activities is a key organizational capability and fundamental to our long-term sustainable success.
Sustainability
Sustainability addresses the Company’s material economic, environmental and social impacts, and the opportunities and risks they present in delivering long-term value to all key stakeholders for the Company. Our sustainability ambition is to help our Clients achieve lifetime financial security, foster healthier lives and advance sustainable investing. Policies, processes and controls are in place to identify and effectively manage significant risks, including sustainability-related risks, to which we are exposed while operating within the Risk Appetite Policy. Sustainability is considered essential to long-term business success and as a result, is a priority for Sun Life in order to maximize our impact on society and create competitive advantage and differentiation for our business.
9. Risk Categories
|
|
|
|
|
|
|
|
|
|
|
|
|
|
|
|
The text and tables in the following section of this MD&A include our disclosure on credit, market and liquidity risks in accordance with IFRS 7 Financial Instruments - Disclosures ("IFRS 7") and IFRS 17 Insurance Contracts, as well as a discussion on how we measure risk and our objectives, policies and methodologies for managing these risks. Disclosures in accordance with IFRS 7 and IFRS 17 are identified by a vertical line in the left margin of the page. The identified text and tables represent an integral part of our audited Annual Consolidated Financial Statements for the year ended December 31, 2023. The fact that certain text and tables are identified with a vertical line does not imply that these disclosures are of any greater importance than any other text or tables, and the Risk Management disclosure should be read in its entirely. |
|
|
|
|
|
|
The disclosures in the Risk Management section of this document should be considered carefully together with other information in this MD&A and in the 2023 AIF, our Consolidated Financial Statements and other reports and materials that we file with securities regulators. |
|
|
|
|
|
|
In this section, segregated funds include segregated fund guarantees, variable annuities and investment products, and includes Run-off reinsurance in U.S. In-force Management. |
Our Risk Framework groups all risks into six major risk categories: market, insurance, credit, business and strategic, operational and liquidity risks.
i. Market Risk
Risk Description
We are exposed to market risk, which is defined as the risk that the value or future cash flows of insurance and investment contract liabilities or financial assets will fluctuate because of changes or volatility in market prices. Market risk includes equity, interest rate and spread, real estate, foreign currency, and inflation risks.
Market Risk Management Governance and Control
We employ a wide range of market risk management practices and controls as outlined below:
•Market risk governance practices are in place, including independent monitoring and review and reporting to senior management and the Risk Committee.
58 December 31, 2023 Sun Life Financial Inc. MANAGEMENT'S DISCUSSION & ANALYSIS
•Income and regulatory capital sensitivities are monitored, managed, and reported against pre-established risk appetite limits for equity, interest rate, credit spread, real estate and foreign currency risks.
•Comprehensive asset-liability management and hedging policies, programs and practices are in place.
•Regulatory solvency requirements include risk-based capital requirements and are monitored regularly.
•Product Design and Pricing Policy requires a detailed risk assessment and pricing provisions for material risks.
•Stress-testing techniques, such as FCT, are used to measure the effects of large and sustained adverse market movements.
•Insurance contract liabilities are established in accordance with Canadian actuarial standards of practice and International Financial Reporting Standards.
•Internal capital targets are established at an enterprise level to cover all risks and are above minimum regulatory and supervisory levels. Actual capital levels are monitored to ensure they exceed internal targets.
Specific market risks and our risk management strategies are discussed below in further detail.
Equity Risk
Equity risk is the potential for financial loss arising from declines or volatility in equity market prices. We are exposed to equity risk from a number of sources.
We generate revenue in our asset management businesses and from certain insurance and annuity contracts where fees are levied on account balances that are affected directly by equity market levels. Accordingly, we have further exposure to equity risk as adverse fluctuations in the market value of such assets will result in corresponding adverse impacts on revenue, income, and the contractual service margin. In addition, declining and volatile equity markets may have a negative impact on sales and redemptions (surrenders) in these businesses, and this may result in further adverse impacts on net income, the contractual service margin, and capital.
A portion of our exposure to equity risk arises in connection with benefit guarantees on segregated fund products, some participating insurance contracts, some adjustable insurance contracts, and some universal life contracts. These benefit guarantees may be triggered upon death, maturity, withdrawal or annuitization. The cost of providing these guarantees is uncertain and depends upon a number of factors, including general capital market conditions, our hedging strategies, policyholder behaviour and mortality experience, each of which may result in negative impacts on net income, the contractual service margin, and capital.
We also have direct exposure to equity markets from the investments supporting other general account liabilities, surplus, and employee benefit plans. These exposures fall within our risk-taking philosophy and appetite, and are therefore generally not hedged.
|
|
|
|
|
|
|
Interest Rate and Spread Risk
Interest rate and spread risk includes the potential for financial loss arising from changes in the value of insurance and investment contract liabilities and financial assets due to changes or volatility in interest rates or spreads. In practice, when asset cash flows and the policy obligations they support are not matched, this may result in the need to either sell assets to meet policy payments and expenses or reinvest excess asset cash flows in unfavourable interest rate or credit spread environments. This risk is managed in our asset-liability management program. Details of the asset-liability management program are discussed under the heading "Market Risk Management Governance and Control" in section K - Risk Management in this document.
Our primary exposure to interest rate and spread risk arises from insurance and investment contracts that contain guarantees in the form of minimum crediting rates, maximum premium rates, settlement options, guaranteed annuitization options and minimum benefits. If investment returns fall below guaranteed levels, we may be required to increase liabilities or capital in respect of these contracts. The guarantees attached to these products may be applicable to both past premiums collected and future premiums not yet received. Segregated fund contracts provide benefit guarantees that are linked to underlying fund performance and may be triggered upon death, maturity, withdrawal or annuitization. Exposure to guarantees is managed within our risk appetite limits through our asset-liability management program, which may include the use of hedging strategies utilizing interest rate derivatives such as interest rate floors, swaps, futures and swaptions. The impact of these guarantees on net income, contractual service margin, and capital are included in the disclosed market risk sensitivities.
Significant changes or volatility in interest rates or spreads could have a negative impact on sales of certain insurance and annuity products, and adversely impact the expected pattern of redemptions (surrenders) on existing policies. Increases in interest rates or widening credit spreads may increase the risk that policyholders will surrender their contracts, potentially forcing us to liquidate assets at a loss. While we have established hedging programs in place and our insurance and annuity products often contain surrender mitigation features, these may not be sufficient to fully offset the adverse impact of changes in interest rates or spreads. Declines in interest rates or narrowing spreads can result in compression of the net spread between interest earned on investments and interest credited to policyholders. Declines in interest rates or narrowing spreads can also result in increased asset calls, mortgage prepayments, and net reinvestment of positive cash flows at lower yields, and therefore adversely impact our profitability and financial position. Negative interest rates may additionally result in losses on our cash and short-term deposits and low or negative returns on our fixed income assets impacting our profitability.
|
|
|
|
|
|
|
|
We also have direct exposure to interest rates and spreads from investments supporting other general account liabilities, surplus and employee benefit plans. Higher interest rates or wider spreads will reduce the value of our existing assets. Conversely, lower interest rates or a narrowing of spreads will result in reduced investment income on new fixed income asset purchases. These exposures fall within our risk-taking philosophy and appetite and are therefore generally not hedged. |
A sustained low interest rate environment may additionally adversely impact our net income, CSM, capital, and our ability to implement our business strategy and plans. This may be realized through lower sales, less profitable new business, changes in the pattern of redemptions on existing policies, among other impacts.
MANAGEMENT'S DISCUSSION & ANALYSIS Sun Life Financial Inc. December 31, 2023 59
Real Estate Risk
Real estate risk is the potential for financial loss arising from fluctuations in the value of, or future cash flows from, our investments in real estate. We are exposed to real estate risk and may experience financial losses resulting from the direct ownership of real estate investments or indirectly through fixed income investments secured by real estate property, leasehold interests, ground rents, and purchase and leaseback transactions. Real estate price risk may arise from external market conditions, inadequate property analysis, inadequate insurance coverage, inappropriate real estate appraisals, or from environmental risk exposures. We hold real estate investments that support general account liabilities and surplus, and fluctuations in value will affect our net income, CSM, and capital. A material and sustained increase in interest rates may lead to deterioration in real estate values.
|
|
|
|
|
|
|
Foreign Currency Risk
Foreign currency risk is the result of mismatches in the currency of our assets and liabilities (inclusive of capital), and cash flows. This risk may arise from a variety of sources such as foreign currency transactions and services, foreign currency hedging, investments denominated in foreign currencies, investments in foreign subsidiaries and net income from foreign operations. Changes or volatility in foreign exchange rates, including a change to currencies that are fixed in value to another currency, could adversely affect our net income, contractual service margin and capital.
As an international provider of financial services, we operate in a number of countries, with revenues and expenses denominated in several local currencies. In each country in which we operate, we generally maintain the currency profile of assets to match the currency of liabilities and required capital. This approach provides an operational hedge against disruptions in local operations caused by currency fluctuations. Foreign currency derivative contracts such as currency swaps and forwards are used as a risk management tool to manage the currency exposure in accordance with our Asset Liability Management Policy. As at December 31, 2023 and December 31, 2022, the Company did not have a material foreign currency risk exposure.
Changes in exchange rates can affect our net income and surplus when financial results in functional currencies are translated into Canadian dollars. Net income earned outside of Canada is generally not currency hedged and a weakening in the local currency of our foreign operations relative to the Canadian dollar can have a negative impact on our net income reported in Canadian currency. A strengthening in the local currency of our foreign operations relative to the Canadian dollar would have the opposite effect. Regulatory capital ratios could also be impacted by changes in exchange rates.
|
Inflation Risk
Inflation risk is the potential for financial loss arising from changes in inflation rates. This risk results from insurance contract liabilities that are linked to market measures of inflation such as the Consumer Price Index. The primary sources for this risk exposure are from certain group and retail annuity contracts and group long term disability contracts. In these contracts, the annuity and disability benefit payments may be linked to an indexing formula containing an inflation price index. Benefit payments linked to inflation indices may also include various caps, floors and averaging mechanisms that vary across product designs.
Exposure to inflation risk is managed within our asset-liability management program, primarily by investing in inflation linked assets to match liability exposures.
|
|
|
|
|
|
|
Market Risk Sensitivities |
|
|
|
|
|
We use a variety of methods and measures to manage and quantify our market risk exposures. These include duration and key rate duration management, convexity measures, cash flow gap analysis, scenario testing, and sensitivity testing of earnings and regulatory capital ratios.
The measurement of liabilities and assets are affected by the level of equity market performance, interest rates, credit and swap spreads and other market risk variables. The following sections set out the estimated immediate impact on, or sensitivity of, our net income(1), contractual service margin, OCI and SLF Inc.'s LICAT ratio to certain instantaneous changes in market variables as at December 31, 2023 and December 31, 2022(2).
|
|
|
|
|
|
|
|
|
|
|
|
|
|
|
|
|
|
|
|
|
|
|
(1)Net income in section K - Risk Management in this document refers to common shareholders' net income. |
(2)Effective January 1, 2023, we adopted IFRS 17 and IFRS 9, and certain financial assets were reclassified between measurement categories as permitted. December 31, 2022 amounts provided in the sensitivities in section K - Risk Management of this document have been adjusted to reflect these January 1, 2023 reclassifications. See Note 2 of the 2023 Annual Consolidated Financial Statements for further details on the reclassifications.
60 December 31, 2023 Sun Life Financial Inc.
|
|
|
|
|
|
|
The estimated sensitivities in the tables below reflect the impact of market movements on insurance contracts and investment contracts, assets backing insurance contracts, assets backing investment contracts, assets backing the surplus segment, and seed investments in our asset management subsidiaries.
Net income sensitivities to equity and real estate market movements are driven primarily by changes in the value of investments backing general account liabilities and surplus. Net income sensitivities to interest rates and spreads are driven by the net impact on liabilities and the assets backing them. Lower interest rates or a narrowing of spreads will result in increased liabilities for insurance contracts, offset by increased values of the assets backing general account liabilities. Higher interest rates or a widening of spreads will result in decreased liabilities for insurance contracts, offset by decreased values of the assets backing general account liabilities. Further detail on the impact of changes or volatility in market prices on assets and liabilities is provided under the headings "Equity Risk", "Interest Rate and Spread Risk", and "Real Estate Risk" above.
OCI sensitivities are impacted by changes in the market value of assets classified as FVOCI. The market value of FVOCI fixed income assets, which are held primarily in our surplus and investment contract segments, increases with lower interest rates or a narrowing of spreads, and decreases with higher interest rates or a widening of spreads.
As these market risk sensitivities reflect an instantaneous impact on net income, CSM, OCI and SLF Inc.'s LICAT ratio, they do not include impacts over time such as the effect on fee income in our asset management businesses.
Refer to Additional Cautionary Language and Key Assumptions Related to Sensitivities in this section for important additional information regarding these estimates.
|
Equity Market Sensitivities
MANAGEMENT'S DISCUSSION & ANALYSIS The following table sets out the estimated immediate impact on, or sensitivity of, our net income, CSM, OCI and SLF Inc.'s LICAT ratio to certain instantaneous changes in equity market prices as at December 31, 2023 and December 31, 2022(1).
|
|
|
|
|
|
|
|
|
|
|
|
|
|
|
|
|
|
|
|
|
|
|
|
|
|
|
|
|
|
|
($ millions, unless otherwise noted) |
|
|
|
|
|
As at December 31, 2023 |
|
Change in Equity Markets(2)(3)(4) |
25% decrease |
10% decrease |
10% increase |
25% increase |
|
Potential impact on net income
(after-tax)
|
|
(400) |
|
(175) |
|
175 |
|
425 |
|
Potential impact on CSM (pre-tax) |
|
(625) |
|
(250) |
|
250 |
|
600 |
|
|
|
|
|
|
|
|
|
|
|
Potential impact on LICAT ratio(5) |
3.0% point decrease |
1.0% point decrease |
1.0% point increase |
2.5% point increase |
|
|
|
|
|
|
|
|
|
|
($ millions, unless otherwise noted) |
|
|
|
|
|
As at December 31, 2022(1) |
|
Change in Equity Markets(2)(3)(4) |
25% decrease |
10% decrease |
10% increase |
25% increase |
|
Potential impact on net income
(after-tax)
|
|
(300) |
|
(125) |
|
125 |
|
325 |
|
Potential impact on CSM (pre-tax) |
|
(650) |
|
(250) |
|
250 |
|
625 |
|
|
|
|
|
|
|
|
|
|
|
Potential impact on LICAT ratio(5) |
3.5% point decrease |
1.0% point decrease |
0.5% point increase |
2.0% point increase |
|
(1)Effective January 1, 2023, we adopted IFRS 17 and IFRS 9, and certain financial assets were reclassified between measurement categories as permitted. December 31, 2022 amounts provided in the sensitivities in section K - Risk Management of this document have been adjusted to reflect these January 1, 2023 reclassifications. See Note 2 of the 2023 Annual Consolidated Financial Statements for further details on the reclassifications.
(2)Represents the respective change across all equity markets as at December 31, 2023 and December 31, 2022. Assumes that actual equity exposures consistently and precisely track the broader equity markets. Since in actual practice equity-related exposures differ from broad market indices (due to the impact of active management, basis risk, investments in private equity and other factors), realized sensitivities may differ significantly from those illustrated above. Sensitivities include the impact of re-balancing equity hedges for hedging programs at 2% intervals (for 10% changes in equity markets) and at 5% intervals (for 25% changes in equity markets).
(3)The market risk sensitivities include the estimated impact of our hedging programs in effect as at December 31, 2023 and December 31, 2022, and include new business added and product changes implemented prior to such dates.
(4)Net income, CSM and OCI sensitivities have been rounded in increments of $25 million. The sensitivities exclude the market impacts on the income from our joint ventures and associates, which we account for on an equity basis.
|
|
(5)The LICAT sensitivities illustrate the impact on SLF Inc. as at December 31, 2023 and December 31, 2022. LICAT ratios are rounded in increments of 0.5%. |
(1)Effective January 1, 2023, we adopted IFRS 17 and IFRS 9, and certain financial assets were reclassified between measurement categories as permitted. December 31, 2022 amounts provided in the sensitivities in section K - Risk Management of this document have been adjusted to reflect these January 1, 2023 reclassifications. See Note 2 of the 2023 Annual Consolidated Financial Statements for further details on the reclassifications.
MANAGEMENT'S DISCUSSION & ANALYSIS Sun Life Financial Inc. December 31, 2023 61
Interest Rate Sensitivities
The following table sets out the estimated immediate impact on, or sensitivity of, our net income, CSM, OCI and SLF Inc.'s LICAT ratio to certain instantaneous changes in interest rates as at December 31, 2023 and December 31, 2022(1).
|
|
|
|
|
|
|
|
|
|
|
|
|
|
|
|
|
|
|
|
|
|
|
|
|
|
|
|
|
|
|
($ millions, unless otherwise noted) |
As at December 31, 2023 |
As at December 31, 2022(1) |
|
Change in Interest Rates(2)(3)(4) |
50 basis point decrease |
50 basis point increase |
50 basis point decrease |
50 basis point increase |
|
Potential impact on net income (after-tax) |
|
(25) |
|
50 |
|
(100) |
|
75 |
|
Potential impact on CSM (pre-tax) |
|
75 |
|
(75) |
|
125 |
|
(150) |
|
Potential impact on OCI |
|
200 |
|
(200) |
|
225 |
|
(225) |
|
Potential impact on LICAT ratio(5) |
1.5% point increase |
1.5% point decrease |
1.5% point increase |
2.5% point decrease |
|
(1)Effective January 1, 2023, we adopted IFRS 17 and IFRS 9, and certain financial assets were reclassified between measurement categories as permitted. December 31, 2022 amounts provided in the sensitivities in section K - Risk Management of this document have been adjusted to reflect these January 1, 2023 reclassifications. See Note 2 of the 2023 Annual Consolidated Financial Statements for further details on the reclassifications.
(2)Interest rate sensitivities assume a parallel shift in assumed interest rates across the entire yield curve as at December 31, 2023 and December 31, 2022 with no change to the ultimate risk-free rate. Variations in realized yields based on factors such as different terms to maturity and geographies may result in realized sensitivities being significantly different from those illustrated above. Sensitivities include the impact of re-balancing interest rate hedges for hedging programs at 10 basis point intervals (for 50 basis point changes in interest rates).
(3)The market risk sensitivities include the estimated impact of our hedging programs in effect as at December 31, 2023 and December 31, 2022, and include new business added and product changes implemented prior to such dates.
(4)Net income, CSM and OCI sensitivities have been rounded in increments of $25 million. The sensitivities exclude the market impacts on the income from our joint ventures and associates, which we account for on an equity basis.
|
|
(5)The LICAT sensitivities illustrate the impact on SLF Inc. as at December 31, 2023 and December 31, 2022. The sensitivities reflect the worst scenario as at December 31, 2023 and assume that a scenario switch does not occur in the quarter. LICAT ratios are rounded in increments of 0.5%. |
The above sensitivities were determined using a 50 basis point change in interest rates and a 10% and 25% changes in our equity markets because we believe that these market shocks were reasonably possible as at December 31, 2023. Significant changes in market variables may result in other than proportionate impacts on our sensitivities.
Potential Impact of Change in Ultimate Risk-Free Rate
Interest rate sensitivities do not include any impact from changes to the ultimate risk-free rate. Our estimated sensitivity to a 10 basis point decrease in the ultimate risk-free rate assumed in our insurance contract liabilities is a decrease in reported net income of approximately $50 million after-tax, and a decrease in CSM of approximately $25 million.
|
|
|
|
|
|
|
Credit Spread and Swap Sensitivities
Credit spread sensitivities reflect the impact of changes in credit spreads on our asset and liability values (including provincial government bonds, corporate bonds, and other fixed income assets). Swap spread sensitivities reflect the impact of changes in swap spreads on swap-based derivative positions and liability values.
|
The following tables set out the estimated immediate impact on, or sensitivity of, our net income, CSM, OCI and SLF Inc.'s LICAT ratio to certain instantaneous changes in credit spreads and our net income, CSM, and OCI to certain changes in swap spreads as at December 31, 2023 and December 31, 2022(1).
|
|
|
|
|
|
|
|
|
|
|
|
|
|
|
|
|
|
|
|
|
|
|
|
|
|
|
|
|
|
|
($ millions, unless otherwise noted) |
As at December 31, 2023 |
As at December 31, 2022(1) |
|
Change in Credit Spreads(2)(3) |
50 basis point decrease |
50 basis point increase |
50 basis point decrease |
50 basis point increase |
|
Potential impact on net income (after-tax) |
|
50 |
|
(50) |
|
50 |
|
(50) |
|
Potential impact on CSM (pre-tax) |
|
75 |
|
(25) |
|
75 |
|
(100) |
|
Potential impact on OCI |
|
200 |
|
(175) |
|
200 |
|
(200) |
|
Potential impact on LICAT ratio(4) |
1.0% point increase |
1.0% point decrease |
1.0% point increase |
2.0% point decrease |
|
(1)Effective January 1, 2023, we adopted IFRS 17 and IFRS 9, and certain financial assets were reclassified between measurement categories as permitted. December 31, 2022 amounts provided in the sensitivities in section K - Risk Management of this document have been adjusted to reflect these January 1, 2023 reclassifications. See Note 2 of the 2023 Annual Consolidated Financial Statements for further details on the reclassifications.
(2)The credit spread sensitivities assume a parallel shift in the indicated spreads across the entire term structure with no change to the ultimate liquidity premium. The sensitivities reflect a floor of zero on credit spreads where the spreads are not currently negative. Variations in realized spread changes based on different terms to maturity, geographies, asset classes and derivative types, underlying interest rate movements, and ratings may result in realized sensitivities being significantly different from those provided above.
(3)Net income, CSM, and OCI sensitivities have been rounded in increments of $25 million.
|
|
(4)The LICAT sensitivities illustrate the impact on SLF Inc. as at December 31, 2023 and December 31, 2022. The sensitivities reflect the worst scenario as of December 31, 2023 and assume that a scenario switch does not occur in the quarter. LICAT ratios are rounded in increments of 0.5%. |
(1)Effective January 1, 2023, we adopted IFRS 17 and IFRS 9, and certain financial assets were reclassified between measurement categories as permitted. December 31, 2022 amounts provided in the sensitivities in section K - Risk Management of this document have been adjusted to reflect these January 1, 2023 reclassifications. See Note 2 of the 2023 Annual Consolidated Financial Statements for further details on the reclassifications.
62 December 31, 2023 Sun Life Financial Inc.
|
|
|
|
|
|
|
|
|
|
|
|
|
|
|
|
|
|
|
|
|
|
|
|
|
|
|
|
|
|
|
($ millions, unless otherwise noted) |
As at December 31, 2023 |
As at December 31, 2022(1) |
|
Change in Swap Spreads(2)(3) |
20 basis point decrease |
20 basis point increase |
20 basis point decrease |
20 basis point increase |
|
Potential impact on net income (after-tax) |
|
(25) |
|
25 |
|
(25) |
|
25 |
|
|
|
|
|
|
|
|
|
|
|
|
|
|
|
|
|
|
|
|
|
(1)Effective January 1, 2023, we adopted IFRS 17 and IFRS 9, and certain financial assets were reclassified between measurement categories as permitted. December 31, 2022 amounts provided in the sensitivities in section K - Risk Management of this document have been adjusted to reflect these January 1, 2023 reclassifications. See Note 2 of the 2023 Annual Consolidated Financial Statements for further details on the reclassifications.
(2)The swap spread sensitivities assume a parallel shift in the indicated spreads across the entire term structure. Variations in realized spread changes based on different terms to maturity, geographies, asset classes and derivative types, underlying interest rate movements, and ratings may result in realized sensitivities being significantly different from those provided above.
|
|
(3)Net income, CSM, and OCI sensitivities have been rounded in increments of $25 million. |
Real Estate Sensitivities
MANAGEMENT'S DISCUSSION & ANALYSIS The following table sets out the estimated immediate impact on, or sensitivity of, our net income, OCI and CSM to certain instantaneous changes in the value of our real estate investments as at December 31, 2023 and December 31, 2022(1).
|
|
|
|
|
|
|
|
|
|
|
|
|
|
|
| ($ millions, unless otherwise noted) |
As at December 31, 2023 |
As at December 31, 2022(1) |
Change in Real Estate Values (2) |
10% decrease |
10% increase |
10% decrease |
10% increase |
|
|
|
|
|
|
|
|
|
|
|
|
|
|
|
| Potential impact on net income (after-tax) |
(475) |
475 |
(500) |
500 |
| Potential impact on CSM (pre-tax) |
(100) |
100 |
(100) |
100 |
|
|
|
|
|
(1)Effective January 1, 2023, we adopted IFRS 17 and IFRS 9, and certain financial assets were reclassified between measurement categories as permitted. December 31, 2022 amounts provided in the sensitivities in section K - Risk Management of this document have been adjusted to reflect these January 1, 2023 reclassifications. See Note 2 of the 2023 Annual Consolidated Financial Statements for further details on the reclassifications.
(2)Net income, CSM, and OCI sensitivities have been rounded in increments of $25 million.
LICAT Interest Rate Scenario Switch
The LICAT interest rate risk is assessed under four different interest rate scenarios, and the scenario leading to the highest capital requirement is chosen as the worst scenario for each geographic region as defined by the LICAT guideline. Changes and interaction between the level and term movements in interest rates and credit spreads can shift the interest rate scenario applied in the LICAT calculation causing a discontinuity where capital requirements change materially. In 2020, OSFI updated the LICAT guideline for interest rate risk requirements for participating businesses to be smoothed over six quarters. As a result, the actual impact to the LICAT ratio from participating businesses in any quarter will reflect the scenarios from current quarter as well as the prior five quarters and switching between the scenarios would have the effect of offsetting the previous impacts over time. It should be noted that switching of the scenario can also change the direction of our sensitivities.
In Q4'23, SLF Inc. experienced a scenario switch, resulting in no change in the LICAT ratio. For SLF Inc., assuming no further scenario switches, the remaining impact of one percentage point is expected to decrease the LICAT ratio over the next five quarters.
In Q4'23, Sun Life Assurance experienced a scenario switch, resulting in one-and-a-half percentage change to the LICAT ratio. For Sun Life Assurance, assuming no further scenario switches, the remaining impact of four-and-a-half percentage points is expected to decrease the LICAT ratio over the next five quarters.
Market Risk Management Strategies
Market risk is managed at all stages during the product life cycle including product design and development, ongoing review and positioning of our suite of products, and ongoing asset-liability management and hedge re-balancing. Our market risk management strategies are developed based on policies and operating guidelines at the enterprise level, business segment level and product level. Liabilities having a similar risk profile are grouped together and a customized investment and hedging strategy is developed and implemented to optimize return within our risk appetite limits.
|
|
|
|
|
|
|
|
|
|
|
|
|
|
|
|
We have implemented asset-liability management and hedging programs involving regular monitoring and adjustment of market risk exposures using assets, derivative instruments and repurchase agreements to maintain market risk exposures within our risk appetite. The general availability and cost of these hedging instruments may be adversely impacted by a number of factors including changes in interest rates, increased volatility in capital markets, and changes in the general market and regulatory environment within which these hedging programs operate. In particular, regulations for derivatives could impose additional costs and could affect our hedging strategy. In addition, these programs may themselves expose us to other risks. |
In general, market risk exposure is mitigated by the assets supporting our products. This includes holdings of fixed income assets such as bonds and mortgages. Derivative instruments may supplement these assets to reduce the risk from cash flow mismatches and mitigate the market risk associated with liability features and optionality.
(1)Effective January 1, 2023, we adopted IFRS 17 and IFRS 9, and certain financial assets were reclassified between measurement categories as permitted. December 31, 2022 amounts provided in the sensitivities in section K - Risk Management of this document have been adjusted to reflect these January 1, 2023 reclassifications. See Note 2 of the 2023 Annual Consolidated Financial Statements for further details on the reclassifications.
MANAGEMENT'S DISCUSSION & ANALYSIS Sun Life Financial Inc. December 31, 2023 63
General Account Insurance and Annuity Products
Most of our expected net income sensitivity to changes in interest rates and equity markets is derived from our general account insurance and annuity products. We have implemented market risk management strategies to mitigate a portion of the market risk related to our general account insurance and annuity products.
Individual insurance products include universal life and other long-term life and health insurance products. Major sources of market risk exposure for individual insurance products include the reinvestment risk related to future premiums on regular premium policies, asset reinvestment risk on both regular premium and single premium policies and the guaranteed cost of insurance. Interest rate risk for individual insurance products is typically managed on a duration basis, within tolerance ranges set out in the applicable investment policy or guidelines. Targets and limits are established so that the level of residual exposure is commensurate with our risk appetite. Exposures are monitored frequently, and assets are re-balanced as necessary to maintain compliance within prescribed tolerances using a combination of assets and derivative instruments. A portion of the longer-term cash flows are backed with equities and real estate.
For participating insurance products and other insurance products with adjustable features, the investment strategy objective is to provide a total rate of return given a constant risk profile over the long term.
Fixed annuity products generally provide the policyholder with a guaranteed investment return or crediting rate. Interest rate risk for these products is typically managed on a duration basis, within tolerance ranges set out in the applicable investment guidelines. Targets and limits are established so that the level of residual exposure is commensurate with our risk appetite. Exposures are monitored frequently, and assets are re-balanced as necessary to maintain compliance within prescribed tolerances using a combination of fixed income assets and derivative instruments.
Certain insurance and annuity products contain minimum interest rate guarantees. Market risk management strategies are implemented to limit potential financial loss due to reductions in asset earned rates relative to contract guarantees. These typically involve the use of hedging strategies utilizing interest rate derivatives such as interest rate floors, swaps and swaptions.
Certain insurance and annuity products contain features which allow the policyholders to surrender their policy at book value. Market risk management strategies are implemented to limit the potential financial loss due to changes in interest rate levels and policyholder behaviour. These typically involve the use of dynamic hedging strategies and the purchase of interest rate swaptions.
Certain products have guaranteed minimum annuitization rates. Market risk management strategies are implemented to limit the potential financial loss and typically involve the use of fixed income assets, interest rate swaps, and swaptions.
Segregated Funds Products
Certain segregated fund products provide benefit guarantees, which are linked to underlying fund performance and may be triggered upon death, maturity, withdrawal or annuitization. The cost of providing these guarantees is uncertain and depends upon a number of factors including general capital market conditions, our hedging activities, policyholder behaviour and mortality experience, each of which may result in negative impacts on net income, the contractual service margin and capital.
Our hedging programs use derivative instruments and fixed income assets to mitigate the interest rate, equity market, and foreign currency exposure of our segregated fund contracts. As at December 31, 2023, over 90% of our segregated fund contracts, as measured by fund values, were included in a hedging program. While a large percentage of contracts are included in the hedging program, not all of our market risk exposure related to these contracts is hedged. For those segregated fund contracts included in the hedging program, we generally hedge the value of expected future net claims costs and associated risk adjustments for non-financial risk.
Our hedging strategy is applied both at the line of business or product level and at the total company level using a combination of hedging techniques such as re-balancing of short-dated interest rate and equity derivative contracts and longer-dated put options. We actively monitor our overall market exposure and may implement tactical hedge overlay strategies in order to align sensitivities with risk management objectives.
The impact of segregated fund guarantees and associated hedging programs on net income, contractual service margin and capital are included in the disclosed market risk sensitivities.
64 December 31, 2023 Sun Life Financial Inc. MANAGEMENT'S DISCUSSION & ANALYSIS The primary uses of derivatives are set out in the table below as at December 31, 2023.
Market Risk Management Applications for Derivative Usage
|
|
|
|
|
|
|
|
|
| Products/Application |
Uses of Derivative |
Derivatives Used |
| General asset-liability management - interest rate risk exposure for most insurance and annuity products |
To manage the sensitivity of the duration gap between assets and liabilities to interest rate changes |
Interest rate swaps, swaptions, floors and bond futures |
| Guarantees on insurance and annuity contracts - minimum interest rate guarantees, guaranteed surrender values and guaranteed annuitization options |
To limit potential financial losses from significant reductions in asset earned rates relative to contract guarantees |
Interest rate swaps, swaptions, floors and bond futures |
| Segregated fund guarantees |
To manage the exposure of product guarantees sensitive to movement in equity market and interest rate levels and currency fluctuations |
Put options, call options, futures and swaps on equity indices, interest rate swaps, bond futures, and foreign exchange forwards |
| Currency exposure in relation to asset-liability management |
To reduce the sensitivity to currency fluctuations by matching the value and cash flows of specific assets denominated in one currency with the value and cash flows of the corresponding liabilities denominated in another currency |
Currency swaps and forwards |
| Credit exposure |
To replicate credit exposures and enhance investment returns |
Credit default swaps |
|
|
|
|
|
|
|
Additional Cautionary Language and Key Assumptions Related to Sensitivities |
|
Our market risk sensitivities are measures of our estimated change in net income, OCI, CSM and LICAT ratio for changes in market risk variables described above, based on market risk variables and business in force as at the reporting date. These sensitivities are calculated independently for each risk factor, generally assuming that all other risk variables stay constant. The sensitivities do not take into account indirect effects such as potential impacts on goodwill impairment or valuation allowances on deferred tax assets. |
We have provided measures of our net income sensitivity to instantaneous changes in equity markets, interest rates, credit spreads, swap spreads, real estate price levels, and capital sensitivities to changes in equity price levels, interest rates and credit spreads. The LICAT ratio and CSM sensitivities are non-IFRS financial measures, and for additional information, see section M - Non-IFRS Financial Measures in this document. The cautionary language which appears in this section is applicable to all net income, CSM, OCI and LICAT ratio sensitivities.
|
|
|
|
|
|
|
Actual results can differ materially from these estimates for a variety of reasons, including differences in the pattern or distribution of the market shocks, the interaction between these risk factors, model error, or changes in other assumptions such as business mix, effective tax rates, policyholder behaviour, currency exchange rates and other market variables relative to those underlying the calculation of these sensitivities. The extent to which actual results may differ from the indicative ranges will generally increase with larger movements in risk variables. Our sensitivities as at December 31, 2022(1) have been included for comparative purposes only. |
Sensitivities to interest rates and credit spreads assume a parallel shift in assumed interest rates across the entire yield curve or a parallel shift in the indicated spreads across the entire term structure, with no change to the ultimate risk-free rate or ultimate liquidity premium. Realized sensitivities may be significantly differently from those illustrated based on factors such as different terms to maturity, geographies, asset classes and derivative types, and ratings.
|
|
|
|
|
|
|
The sensitivities reflect the composition of our assets and liabilities as at December 31, 2023 and December 31, 2022(1), respectively. Changes in these positions due to new sales or maturities, asset purchases/sales, or other management actions could result in material changes to these reported sensitivities. In particular, these sensitivities reflect the expected impact of hedging activities based on the hedging programs in place as at the respective calculation dates. The actual impact of hedging activity can differ materially from that assumed in the estimated sensitivities due to ongoing hedge re-balancing activities, changes in the scale or scope of hedging activities, changes in the cost or general availability of hedging instruments, basis risk (i.e., the risk that hedges do not exactly replicate the underlying portfolio experience), model risk, and other operational risks in the ongoing management of the hedge programs or the potential failure of hedge counterparties to perform in accordance with expectations. |
|
Our hedging programs may themselves expose us to other risks, including basis risk, volatility risk, and increased levels of derivative counterparty credit risk, liquidity risk, model risk and other operational risks. These factors may adversely impact the net effectiveness, costs, and financial viability of maintaining these hedging programs and therefore adversely impact our profitability and financial position. While our hedging programs are intended to mitigate these effects (e.g., hedge counterparty credit risk is managed by maintaining broad diversification, dealing primarily with highly-rated counterparties, and transacting through over-the-counter ("OTC") contracts cleared through central clearing houses, exchange-traded contracts or bilateral OTC contracts negotiated directly between counterparties that include credit support annexes), residual risk, potential reported earnings and capital volatility remain. |
(1)Effective January 1, 2023, we adopted IFRS 17 and IFRS 9, and certain financial assets were reclassified between measurement categories as permitted. December 31, 2022 amounts provided in the sensitivities in section K - Risk Management of this document have been adjusted to reflect these January 1, 2023 reclassifications. See Note 2 of the 2023 Annual Consolidated Financial Statements for further details on the reclassifications.
MANAGEMENT'S DISCUSSION & ANALYSIS Sun Life Financial Inc. December 31, 2023 65
|
|
|
|
|
|
|
The sensitivities are based on methods and assumptions in effect as at December 31, 2023 and December 31, 2022(1), as applicable. Changes in the regulatory environment, assumptions or methods used to measure assets and liabilities after those dates could result in material changes to the estimated sensitivities. Changes in market risk variables in excess of the changes illustrated may result in other than proportionate impacts. |
The sensitivities reflect the CSM as at December 31, 2023 and December 31, 2022(1). For insurance contracts measured using the VFA, where the change in the effect of the time value of money and financial risk not arising from the underlying items adjusts the CSM, changes in the CSM balance will affect the sensitivity of income to changes in market risk variables.
Our LICAT sensitivities may be non-linear and can change due to the interrelationship between market rates and spreads, actuarial assumptions and our LICAT calculations.
|
|
|
|
|
|
|
For the reasons outlined above, our sensitivities should only be viewed as indicative estimates of the underlying sensitivities of each factor under these specialized assumptions, and should not be viewed as predictors of our future income, OCI, CSM or capital. Given the nature of these calculations, we cannot provide assurance that actual impacts will be consistent with the estimates provided. |
Information related to market risk sensitivities should be read in conjunction with the information contained in section N - Accounting and Control Matters - 1 - Critical Accounting Policies and Estimates in this document. Additional information on market risk can be found in Note 2 and Note 6 of the 2023 Annual Consolidated Financial Statements and the Risk Factors section in the 2023 AIF.
ii. Insurance Risk
Risk Description
Insurance risk is the uncertainty of product performance due to actual experience emerging differently than expected in the areas of mortality, morbidity and longevity. In addition, policyholder behaviour, product design and pricing, expense and reinsurance risks impact multiple risk categories, including insurance risk.
Insurance Risk Management Governance and Control
We employ a wide range of insurance risk management practices and controls, as outlined below:
•Insurance risk governance practices are in place, including independent monitoring and review and reporting to senior management and the Risk Committee.
•Income and regulatory capital sensitivities are monitored, managed and reported against pre-established risk appetite limits for policyholder behaviour, mortality, morbidity and longevity risks.
•Comprehensive Insurance Risk Policy, guidelines and practices are in place.
•The global underwriting manual aligns underwriting practices with our corporate risk management standards and ensures a consistent approach in insurance underwriting.
•Board-approved maximum retention limits are in place. Amounts issued in excess of these limits are reinsured.
•Detailed procedures, including criteria for approval of risks and for claims adjudication are established and monitored for each business segment.
•Underwriting and risk selection standards and procedures are established and overseen by the corporate underwriting and claims risk management function.
•Diversification and risk pooling is managed by aggregation of exposures across product lines, geography and distribution channels.
•We use reinsurance to limit losses, minimize exposure to significant risks and to provide additional capacity for growth.
•The Insurance Risk Policy and Investment & Credit Risk Policy establish acceptance criteria and protocols to monitor the level of reinsurance ceded to any single reinsurer or group of reinsurers.
•Reinsurance counterparty risk is monitored, including annual reporting of reinsurance exposure to the Risk Committee.
•Various limits, restrictions and fee structures are introduced into plan designs in order to establish a more homogeneous policy risk profile and limit potential for anti-selection.
•Regulatory solvency requirements include risk-based capital requirements and are monitored regularly.
•The Product Design and Pricing Policy requires detailed risk assessment and pricing provision for material risks.
•Company specific and industry level experience studies and drivers of earnings analysis are monitored and factored into valuation, renewal and new business pricing processes.
•Stress-testing techniques, such as FCT, are used to measure the effects of large and sustained adverse movements in insurance risk factors.
•Internal capital targets are established at an enterprise level to cover all risks and are above minimum regulatory and supervisory levels.
The concentration for insurance risks is monitored geographically and its adverse effect is mitigated through a diversified product portfolio, product design, underwriting standards and practices, utilizing reinsurance as well as the Company's global operation. Specific to the reinsurance risk, the concentration is measured by aggregating the exposure to each reinsurance counterparty across all Business Groups to ensure it does not exceed a predefined risk level.
Specific insurance risks and our risk management strategies are discussed below in further detail.
(1)Effective January 1, 2023, we adopted IFRS 17 and IFRS 9, and certain financial assets were reclassified between measurement categories as permitted. December 31, 2022 amounts provided in the sensitivities in section K - Risk Management of this document have been adjusted to reflect these January 1, 2023 reclassifications. See Note 2 of the 2023 Annual Consolidated Financial Statements for further details on the reclassifications.
66 December 31, 2023 Sun Life Financial Inc. MANAGEMENT'S DISCUSSION & ANALYSIS
Policyholder Behaviour Risk
We can incur losses due to adverse policyholder behaviour relative to the assumptions used in the pricing and valuation of products regarding lapse of policies or exercise of other embedded policy options.
Uncertainty in policyholder behaviour can arise from several sources including unexpected events in the policyholder's life circumstances, the general level of economic activity (whether higher or lower than expected), changes in the financial and capital markets, changes in pricing and availability of current products, the introduction of new products, changes in underwriting technology and standards, as well as changes in our financial strength or reputation. Uncertainty in future cash flows affected by policyholder behaviour can be further exacerbated by unexpected behaviour during times of economic turbulence or at key option exercise points in the life of an insurance contract.
Various types of provisions are built into many of our products to reduce the impact of uncertain policyholder behaviour. These provisions include:
•Surrender charges that adjust the payout to the policyholder by taking into account prevailing market conditions.
•Limits on the amount that policyholders can surrender or borrow.
•Restrictions on the timing of policyholders' ability to exercise certain options.
•Restrictions on both the types of funds policyholders can select and the frequency with which they can change funds.
•Policyholder behaviour risk is also mitigated through reinsurance on some insurance contracts.
Internal experience studies are used to monitor, review and update policyholder behaviour assumptions as needed, which could result in updates to policy liabilities.
Mortality and Morbidity Risk
Mortality and morbidity risk is the risk that future experience could be unfavourable relative to the assumptions used in the pricing and valuation of products. Mortality and morbidity risk can arise in the normal course of business through random fluctuation in realized experience, through catastrophes, as a result of a pandemic, or in association with other risk factors such as product development and pricing risk. Adverse mortality and morbidity experience could also occur through systemic anti-selection, which could arise due to poor plan design, or underwriting process failure or the development of investor-owned and secondary markets for life insurance policies.
External factors could adversely affect our life insurance, health insurance, critical illness, disability, long-term care insurance and annuity businesses. Morbidity experience could be unfavourably impacted by external events, such as pandemics, increases in disability claims during economic slowdowns and increases in high medical treatment costs and growth in utilization of specialty drugs. This introduces the potential for adverse financial results.
Detailed uniform underwriting procedures have been established to determine the insurability of applicants and to manage exposure to large claims. These underwriting requirements are regularly scrutinized against industry guidelines and oversight is provided through a corporate underwriting and claim management function.
The Insurance Risk Policy, which is approved by the Risk Committee, sets out limits on the maximum amount of insurance risk per life that may be retained. Amounts in excess of the Board-approved maximum retention limits are reinsured. On a single life or joint-first-to-die basis our retention limit is $40 in Canada and US$40 outside of Canada. For survivorship life insurance, our maximum global retention limit is $50 in Canada and US$50 outside of Canada. In certain markets and jurisdictions, retention levels below the maximum are applied. Reinsurance is utilized for numerous products in most business segments, and placement is done on an automatic basis for defined insurance portfolios and on a facultative basis for individual risks with certain characteristics.
Concentration risk exposure is monitored on group policies in a single location. We do not have a high degree of concentration risk to single individuals or groups due to our well-diversified geographic and business mix. The largest portion of mortality risk within the Company is in North America. Individual and group insurance policies are underwritten prior to initial issue and renewals, based on risk selection, plan design, and rating techniques.
Retention limits per life vary by geographic region and amounts in excess of limits are reinsured to ensure there is no exposure to unreasonable concentration of risk.
Longevity Risk
Longevity risk is the potential for losses arising from adverse changes in rates of mortality improvement relative to the assumptions used in the pricing and valuation of products. This risk can manifest itself slowly over time as socioeconomic conditions improve and medical advances continue. It could also manifest itself more quickly, for example, due to medical breakthroughs that significantly extend life expectancy. Longevity risk affects contracts where benefits or costs are based upon the likelihood of survival and higher than expected improvements in insured life expectancy could therefore increase the ultimate cost of these benefits (for example, annuities, pensions, pure endowments, some segregated funds, and specific types of health contracts).
To improve management of longevity risk, we monitor research in the fields that could result in a change in expected mortality improvement. Stress-testing techniques are used to measure and monitor the impact of extreme mortality improvement on the aggregate portfolio of insurance and annuity products.
Product Design and Pricing Risk
Product design and pricing risk is the risk a product does not perform as expected, causing adverse financial consequences. This risk may arise from deviations in realized experience versus assumptions used in the pricing of products. Risk factors include uncertainty concerning future investment yields, policyholder behaviour, mortality and morbidity experience, sales levels, mix of business, expenses and taxes. Although some of our products permit us to increase premiums or adjust other charges and credits during the life of the policy or contract, the terms of these policies or contracts may not allow for sufficient adjustments to maintain expected profitability. This could have an adverse effect on our profitability and capital position.
MANAGEMENT'S DISCUSSION & ANALYSIS Sun Life Financial Inc. December 31, 2023 67
Our Product Design and Pricing Policy, approved by the Risk Committee, establishes the framework governing our product design and pricing practices and is designed to align our product offerings with our strategic objectives and risk-taking philosophy. Consistent with this policy, product development, design and pricing processes have been implemented throughout the Company. New products follow a stage-gate process with defined management approvals based on the significance of the initiative. Each initiative is subject to a risk assessment process to identify key risks and risk mitigation requirements and is reviewed by multiple stakeholders. Additional governance and control procedures are listed below:
•Pricing models, methods, and assumptions are subject to periodic internal peer reviews.
•Experience studies, drivers of earnings analysis, and product dashboards are used to monitor actual experience against those assumed in pricing and valuation.
•On experience rated, participating, and adjustable products, emerging experience is reflected through changes in policyholder dividend scales as well as other policy adjustment mechanisms such as premium and benefit levels.
•Limits and restrictions may be introduced into the design of products to mitigate adverse policyholder behaviour or apply upper thresholds on certain benefits.
Expense Risk
Expense risk is the risk that future expenses are higher than the assumptions used in the pricing and valuation of products. This risk can arise from general economic conditions, unexpected increases in inflation, slower than anticipated growth, or reduction in productivity leading to increases in unit expenses. Expense risk occurs in products where we cannot or will not pass increased costs onto the policyholder and will manifest itself in the form of a liability increase or a reduction in expected future profits.
We closely monitor expenses through an annual budgeting process and ongoing monitoring of any expense gaps between unit expenses assumed in pricing and actual expenses.
Reinsurance Risk
We purchase reinsurance for certain risks underwritten by our various insurance businesses. Reinsurance risk is the risk of financial loss due to adverse developments in reinsurance markets (for example, discontinuance or diminution of reinsurance capacity, or an increase in the cost of reinsurance), insolvency of a reinsurer or inadequate reinsurance coverage. While reinsurance arrangements provide for the recovery of claims arising from the liabilities ceded, we retain primary responsibility to the policyholders.
Rates for our in-force reinsurance treaties can be either guaranteed or adjustable for the life of the ceded policy. Changes in reinsurance market conditions, including actions taken by reinsurers to increase rates on existing and new coverage and our ability to obtain appropriate reinsurance, may adversely impact the availability or cost of maintaining existing or securing new reinsurance capacity, with adverse impacts on our business strategies, profitability and financial position. There is a possibility of rate increases or renegotiation of some of the legacy reinsurance contracts by our reinsurers, as the global reinsurance industry continues to review and optimize their business models. In addition, changes to the regulatory treatment of reinsurance arrangements could have an adverse impact on our capital position.
We have an Insurance Risk Policy approved by the Risk Committee and an Investment & Credit Risk Policy approved by the Governance, Investment & Sustainability Committee, which set acceptance criteria and processes to monitor and manage the level of reinsurance ceded to any single reinsurer. These policies are regularly reviewed and approved by the relevant Board Committee to ensure the alignment with our risk appetite levels and reinsurance risk guidelines.
The policies set the acceptance criteria which verify if a reinsurer qualifies as a suitable reinsurance counterparty, having the capability, expertise, governance practices and financial capacity to assume the risks being considered. In addition, a periodic due diligence is performed on the existing reinsurance counterparties, including an internal credit assessment for reinsurance counterparties with whom we have material exposure.
The exposure to each reinsurance counterparty is monitored closely to ensure that no single reinsurance counterparty represents an undue level of credit risk and does not exceed the predefined limits. In order to diversify our reinsurance risk, there is generally more than one reinsurance counterparty supporting a reinsurance pool. A summary of the reinsurance counterparty credit risk exposures is reported annually to the Risk Committee.
To further increase the reinsurance risk control, our reinsurance agreements include provisions to allow actions to be taken, such as recapture of ceded risk (at a potential cost to the Company), in the event that the reinsurance counterparty loses its legal ability to carry on business through insolvency or regulatory action.
In case of unfavourable developments in the reinsurance markets, we also have an option to discontinue or implement changes to the new sales of our products to better manage the associated risks.
Additional information on insurance risk can be found in Note 7 of our 2023 Annual Consolidated Financial Statements and in the Risk Factors section in the AIF.
iii. Credit Risk
Risk Description
Credit risk is the possibility of loss from amounts owed by our borrowers or financial counterparties. We are subject to credit risk in connection with issuers of securities held in our investment portfolio, debtors, structured securities, reinsurers, counterparties (including derivative, repurchase agreement and securities lending counterparties), other financial institutions and other entities. Losses may occur when a counterparty fails to make timely payments pursuant to the terms of the underlying contractual arrangement or when the counterparty's credit rating or risk profile otherwise deteriorates. Credit risk can also arise in connection with deterioration in the value of, or ability to realize, any underlying security that may be used as collateral for the debt obligation. Credit risk can occur as a result of broad economic conditions, challenges within specific sectors of the economy, or from issues affecting individual companies. Events that result in
68 December 31, 2023 Sun Life Financial Inc.
MANAGEMENT'S DISCUSSION & ANALYSIS defaults, impairments or downgrades of the securities in our investment portfolio would cause the Company to record realized or unrealized losses and may cause an increase in our provisions for asset default, adversely impacting earnings.
Credit Risk Management Governance and Control
We employ a wide range of credit risk management practices and controls, as outlined below:
•Credit risk governance practices are in place, including independent monitoring and review and reporting to senior management and the Risk Committee.
•Risk appetite limits have been established for credit risk.
•Income and regulatory capital sensitivities are monitored, managed and reported against pre-established risk limits.
•Comprehensive Investment and Credit Risk Management Policy, guidelines and practices are in place.
•Specific investment diversification requirements are in place, such as defined investment limits for asset class, geography, and industry.
•Risk-based credit portfolio, counterparty, and sector exposure limits have been established.
•Mandatory use of credit quality ratings for portfolio investments has been established and is reviewed regularly. These internal rating decisions for new fixed income investments and ongoing review of existing rating decisions are independently adjudicated by Corporate Risk Management.
•Comprehensive due diligence processes and ongoing credit analyses are conducted.
•Regulatory solvency requirements include risk-based capital requirements and are monitored regularly.
•Comprehensive compliance monitoring practices and procedures including reporting against pre-established investment limits are in place.
•Reinsurance exposures are monitored to ensure that no single reinsurer represents an undue level of credit risk.
•Stress-testing techniques, such as FCT, are used to measure the effects of large and sustained adverse credit developments.
•Insurance contract liabilities are established in accordance with Canadian actuarial standards of practice.
•Internal capital targets are established at an enterprise level to cover all risks and are above minimum regulatory and supervisory levels. Actual capital levels are monitored to ensure they exceed internal targets.
Our core principles of credit risk management include asset diversification, fundamental research and analysis of cash flows, proactive and continuous risk monitoring, active management and relative value assessment, all with the objective of optimizing risk-adjusted returns, with due consideration for the impacts of capital and taxation.
|
|
|
|
|
|
|
|
|
|
|
|
|
|
|
|
|
|
|
We rate fixed income investments primarily through the use of internally developed scorecards which combine an estimated probability of default and loss given default to determine an expected loss and credit risk rating. This rating is expressed using a 22-point scale that is generally consistent with those used by external rating agencies, and is based on detailed examination of the borrower's, or issuer's, credit quality and the characteristics of the specific instrument. The probability of default assessment is based on borrower-level or issuer-level analysis, which encompasses an assessment of industry risk, business strategy, competitiveness, strength of management and other financial information. The loss given default assessment is based on instrument-level analysis, which considers the impact of guarantees, covenants, liquidity and other structural features. These scorecards provide input to stochastic value-at-risk models and are used to stress test the portfolio, which provide insight into the distribution and characteristics of credit risk within our portfolios. In accordance with our policies and under normal circumstances, our ratings cannot be higher than the highest rating provided by certain Nationally Recognized Statistical Rating Organizations ("NRSROs"). Certain assets, including those in our sovereign debt and asset-backed securities portfolios, are assigned a rating based on ratings provided by NRSROs using a priority sequence order of Standard & Poor's, Moody's, Fitch and DBRS Limited. |
Additional information on credit risk can be found in Note 6 of our 2023 Annual Consolidated Financial Statements and in the Risk Factors section in the AIF.
iv. Business and Strategic Risk
Risk Description
Business and strategic risk is the risk of loss from the inability to adequately identify, plan or implement an appropriate strategy to achieve strategic and business objectives or adapt to changes in Client behaviours, the external business, economic, geopolitical, regulatory or environmental and social landscape or when assumptions made in strategy are not realized as expected.
Business and Strategic Risk Management Governance and Control
We employ a wide range of business and strategic risk management practices and controls, as outlined below:
•Business and strategic risk governance practices are in place, including independent monitoring, review and reporting to Senior Management, the Board and the Board Committees.
•Business and strategic risk is managed through our strategic and business planning process and controls over the implementation of these plans. These plans are reviewed and discussed at the executive level and the key themes, issues and risks emerging are discussed by the Board and the Board Committees.
•Our Business and Strategic Plans are subject to approval by the Board, which also receives regular reviews of implementation progress against key Business Plan objectives.
•Comprehensive policies including the Risk Management Framework, Risk Appetite Policy, Product Design and Pricing Policy, Mergers and Acquisition Policy, Capital and Liquidity Management Framework and Capital Risk Policy are in place.
•Our corporate strategy and business objectives are established within the boundaries of the Risk Appetite Policy. Our business strategies and plans are designed to align with our risk appetite, our capital position and our financial performance objectives.
•Our risk appetite is periodically assessed, taking into consideration the economic and regulatory environments in which we operate.
•Merger, acquisition, strategic investments and divestiture transactions are governed by a Board-approved Merger and Acquisition Risk Management Policy and significant transactions require the approval of the Board.
•Stress-testing techniques, such as FCT, are used to measure the effects of large and sustained adverse scenarios.
•Key and emerging risks are identified, monitored and reported, including emerging regulatory changes that may have a material impact on our finances, operations or reputation.
MANAGEMENT'S DISCUSSION & ANALYSIS Sun Life Financial Inc. December 31, 2023 69
•Internal capital targets are established at an enterprise level to cover all risks and are above minimum regulatory and supervisory levels. Actual capital levels are monitored to ensure they exceed internal targets.
We regularly review and adapt our business strategies and plans to take account of changes in the external business, economic, geopolitical and regulatory environments in which we operate. Our business strategies and plans are designed to align with our risk appetite, our capital position and our financial performance objectives. We periodically reassess our risk appetite taking into consideration the economic, regulatory and competitive environment in which we operate.
Specific business and strategic risks are discussed below in further detail.
Geopolitical Risk
Geopolitical risk is the wide array of risks associated with conflict or tensions between states as well as events or trends with global or international dimensions that increase risks for the operations of companies. We operate in various geographies and our business and financial operations are susceptible to regional and global economic, geopolitical and regulatory changes. Geopolitical risk may lead to increased volatility in the global capital and energy markets, difficulty in conducting business in certain geographies, an increased threat of targeted cyber-attacks, and has the potential to introduce reputational risk.
Economic Risk
We may be affected by economic and capital markets conditions and economic shocks around the globe as a result of increasingly connected global markets. Factors such as changes in interest rates, foreign exchange rates, market volatility, housing prices, consumer spending, saving and debt, business investment and inflation around the globe can affect the business and economic environments in which we operate. In addition, adverse economic conditions often arise in conjunction with volatile and deteriorating capital markets conditions, which can have an adverse impact on Client behaviour, our sales and profitability, credit and financial strength ratings, and capital and liquidity positions.
Execution Risk
Our business strategies and plans are dependent on the successful execution of organizational and strategic initiatives designed to support the growth of our business. Our ability to manage the execution of these initiatives effectively and prioritize initiatives directly affects our ability to execute our strategies. Identifying and implementing the right set of initiatives is critical to achieving our Business Plan targets. Failure to identify and implement the right set of initiatives could also lead to cost structure challenges and inability to achieve our growth objectives.
Distribution Risk
Failure to achieve planned distribution scale could materially impact our financial and strategic objectives. This includes the inability to attract and retain intermediaries and agents at a cost that is financially feasible to the Company, or to develop online sales and Client support capabilities and technologies. Distribution risk may also be influenced where our distribution or product strategy and related services (including online sales and Client support capabilities and technologies) are not developed, modified or executed in line with our strategic objectives or in consideration of the changes in Client behaviour or our regulatory environment. In addition, the lack of a well-diversified distribution model in the jurisdictions in which we do business may cause over-reliance on agency channel or key partners.
Risks Relating to Mergers, Acquisitions, Divestitures and Strategic Investments
We regularly explore opportunities to selectively acquire other businesses or to divest ourselves of all or part of certain businesses, in support of our growth and strategic objectives. Any transaction carries risks associated with economic, operational, strategic, financial, tax, legal, regulatory, compliance, environmental and social, and other factors.
There is a risk that we may be unable to make an appropriate acquisition in a desired market or business line or unable to realize the financial and strategic benefits of the transactions due to competitive factors, regulatory requirements or other aspects. There is a risk that the capital utilized to finance any transaction may limit our ability to deploy further capital to pursue other opportunities and initiatives. These risks could adversely impact our ability to achieve our financial and strategic objectives.
Our ability to realize the contemplated economic, financial, and strategic benefit of any transaction that we enter into is contingent on several factors. These include the effective separation and/or integration of the transferred businesses, restructure and/or reorganization of related businesses, and retention of key personnel to effectively execute these transactions. In addition, post-closing activities and the harmonization of any differences in organizational culture may require the dedication of significant management resources, which may distract management’s attention from our day-to-day business. Further, anticipated synergies and other benefits may not materialize due to a failure to successfully integrate the acquired businesses with our existing operations. Any of these risks, if realized, could prevent us from achieving the expected outcomes from a transaction and impact our financial and strategic objectives.
To mitigate these risks, we have established procedures to govern the evaluation, execution and integration of mergers and acquisitions transactions. Regular updates on execution and integration risks relating to these transactions are provided to the Board, its Committees and senior management teams, as appropriate, along with any mitigants developed to address such risks.
Competitive Environment
Competition from insurance companies, banks, asset managers, mutual fund companies, financial planners and other service providers (including new entrants and non-traditional financial services companies) is intense, and could adversely affect our business in certain countries.
The businesses in which we engage are highly competitive and our ability to sell our products is dependent on many factors, including scale, price and yields offered, distribution channels, digital capabilities, financial strength ratings, range of product lines and product and service quality, brand strength, investment performance, historical dividend levels and the ability to provide value added services to distributors and Clients. In certain markets, some of our competitors may be superior to us on one or more of these factors. Our competitors have significant
70 December 31, 2023 Sun Life Financial Inc. MANAGEMENT'S DISCUSSION & ANALYSIS potential to disrupt our business through targeted strategies to reduce our market share which may include targeting our key people or bancassurance partners and other distributors or aggressively pricing their products.
Our ability to achieve our Business Plans and strategies depends significantly upon our capacity to anticipate and respond quickly to these competitive pressures.
Technology is driving rapid change in the financial services sector and is enabling new entrants to compete or offer services to our competitors to enhance their ability to compete in certain segments of the insurance, wealth and asset management markets. The emergence of new technologies such as robotic process automation, artificial intelligence, blockchain and advanced analytics may have an impact on the financial services sector and how companies interact with their stakeholders. Our current competitors or new entrants may use these or other new technologies to provide services in various areas such as customized pricing, proactive outreach to Clients and targeted marketing in order to strengthen their Client relationships and influence Client behaviour. The impact of disruption from changing technology and innovation by traditional and non-traditional competitors who may offer a better user experience, functionality or lower priced products and may have lower distribution costs will require us to adapt at a more rapid pace and may create margin pressures. The risk of disruption may also impact our distribution models as new and low cost digital-based business models emerge in connection with the distribution of financial services and products, such as insurtechs and robo-advisors. These risks are evolving rapidly with an increasing number of digital users and are difficult to anticipate and respond to proactively, and may adversely impact our profitability and financial position.
Investment Performance
Investment performance risk is the possibility that we fail to achieve the desired return objectives on our investment portfolio, or that our asset management businesses fail to design or execute investment strategies in order to achieve competitive returns on the products and managed accounts offered by these businesses. Failure to achieve investment objectives may adversely affect our revenue and profitability through slower growth prospects and adverse impacts on policyholder or Client behaviour.
Changes in Legal and Regulatory Environment
Most of our businesses are subject to extensive regulation and supervision. Changes to legislation, regulations or government policies, or the manner in which they are interpreted or enforced, may require that we make significant changes to our strategy and may result in increased implementation costs and diversion of resources to manage the change. These changes could impact financial reporting, accounting processes, capital requirements, the regulatory framework for our products and services, the regulation of selling practices, sales intermediaries and product offerings, solvency requirements, executive compensation, and corporate governance practices and could impose restrictions on our foreign operations (such as limits on foreign ownership of local companies). All of these changes could have an adverse effect on our business and operations. Our failure to comply with existing and evolving regulatory requirements could also result in regulatory sanctions and could affect our relationships with regulatory authorities and our ability to execute our business strategies and plans.
Environmental and Social Risk
Our financial performance, operations, and reputation may be adversely affected if we do not adequately prepare for the direct or indirect impacts of environmental and social risks. Environmental and social risks include but are not limited to environmental damage on properties owned or managed by us, climate change-related physical and transition risks, as well as issues of public health and inequality. These risks may occur in our direct operations, investing activities or other areas of our value chain.
Business units in our Asset Management pillar integrate ESG considerations in their investment decision-making for Sun Life assets and Client assets, where applicable. Existing ESG risks are considered, subject to data availability and materiality, in initial and ongoing reviews and assessments of public equities, public fixed income, private fixed income, real estate, infrastructure and commercial mortgage investments, among others. In addition, we monitor our third-party managers in the asset management, general account and fund platform businesses through our International Investment Centre (“IIC”). In the due diligence and monitoring of third-party managers, the IIC, functioning as an investment research and consulting group, assesses each manager’s consideration of ESG risks in its investment processes, as well as other relevant sustainability factors, and monitors them on an ongoing basis. These activities may be undertaken on behalf of, or in partnership with, the relevant Sun Life businesses. These businesses may also undertake their own due diligence activities.
We engage in and monitor environmental, social and broader sustainability developments in part through our participation as a signatory to the United Nations-supported Principles for Responsible Investment ("PRI"), United Nations Environment Programme - Finance Initiative ("UNEP FI"), including the Principles for Sustainable Insurance, and CDP.
In line with our strategy and our Purpose, Sun Life aims to drive further actions that create a cleaner, more inclusive, and sustainable future. Strong governance will help us deliver on our commitments and remain accountable to our stakeholders:
•Our Chief Sustainability Officer (“CSO”) leads enterprise-wide efforts to embed sustainable practices across our businesses.
•Our Executive Sustainability and Climate Change Council (“ESC”), chaired by our CSO, is composed of senior executives from Sun Life’s Global Leadership Team. The ESC is the decision-making body for the approval of cross-enterprise sustainability programs and issues management (e.g., human rights), as well as external commitments and targets including related progress oversight (e.g., net zero, sustainable investing, diverse supplier spend). ESC members also provide oversight on the company’s implementation of OSFI Guideline B-15: Climate Risk Management and development of the enterprise climate transition plan.
•Our Global Sustainability Leadership Team (“GSLT”) is composed of senior executives from each of our business groups and key functions. The GSLT advises on and implements our Sustainability Strategy.
We report on sustainability performance, including reporting related to climate change and other environmental and social issues, in our annual Sustainability Report, which is published in tandem with our Annual Report and is available at sunlife.com/sustainability.
Climate Change
Climate change is one of the defining issues of our time. Governments, regulators, investors, Clients and other stakeholders are rapidly increasing efforts to tackle this global issue. We believe that it is incumbent upon us to respond and to take actions that support the goal of the Paris Agreement to limit the global temperature increase in this century to well below 2 degrees Celsius compared to pre-industrial levels and to pursue efforts to limit the temperature increase to 1.5 degrees Celsius above pre-industrial levels.
MANAGEMENT'S DISCUSSION & ANALYSIS Sun Life Financial Inc. December 31, 2023 71
The commitments we make to our Clients can often extend decades into the future. For this reason, we must account for climate-related risks across our operations and investments. These risks are likely to intensify and spread as climate-related impacts escalate in frequency and severity.
Meaningful climate action is essential to delivering on our Purpose of helping our Clients achieve lifetime financial security and live healthier lives. Our Purpose can best be realized through the integration of this mindset across our businesses, and through working collaboratively with other stakeholders towards a common goal of mitigating and adapting to the effects of climate change. Sun Life is doing its part to support the transition to a low-carbon economy and to ensure our organization is resilient to climate change. We set an enterprise-wide goal to achieve net-zero greenhouse gas (“GHG”) emissions by 2050 as well as multiple interim targets across our businesses (refer to Metrics and Targets for additional details).
Our approach to climate change includes the following elements:
•We recognize that as a long-term investor, we have the opportunity to be part of the solution to this global challenge and invest proactively in assets and businesses that support the transition to a low-carbon economy.
•We are committed to advocacy and collaboration with governments, regulators, investors and industry leaders to develop supportive net-zero programs and policies that pave a path towards decarbonization.
•We assess climate-related impacts on our businesses and investments with the aim of prudently managing the associated risks. We acknowledge the challenges of uncertainty and imperfect data to inform decision making.
•We advocate for better data and disclosures, so we can make better-informed assessments of climate-related risks. We support the actions of regulators, including OSFI, to align their reporting requirements to the International Sustainability Standards Board’s IFRS S1 and S2, and welcome ongoing efforts to improve disclosure standards.
•We commit to continuously improving our climate-related measurement, monitoring and reporting.
•We are focused on driving climate action and strengthening the resilience of our own operations around the world, as well as the properties that we own in our investment portfolio.
We commit to working together across industries, with our Clients, investees and other stakeholders to all do our part in addressing the climate crisis. We are working to understand the solutions to this complex, global challenge. Our approach to climate change will evolve over time, as we continue to build our internal expertise, obtain high-quality and industry-relevant data, and further align to external developments and regulatory requirements.
The following sets out our climate-related disclosures in line with the Task Force on Climate-related Financial Disclosures (“TCFD”) recommendations, which are structured around four themes that represent core elements of how organizations operate: governance, strategy, risk management, and metrics and targets.
Governance
The Board uses reports from the Board Committee Chairs (detailed below) and other presentations by management and external experts, to decide on the nature and extent of its input and to provide challenge, advice and guidance to senior management on the enterprise approach to climate change. In 2023, climate-related topics were reviewed by the Board or a Committee of the Board at each of the quarterly meetings as well as the annual board strategy meeting either as part of dedicated agenda topics on Sun Life’s Business and Strategic Plans, including Sun Life’s Sustainability Strategy, or as part of various committee, officer and business group reports. The Board has received climate change training and education focused on sustainability-related matters, including board oversight on the impact of climate-related risks on asset management and insurance and on the impact of ESG on board governance and compensation.
Three Board Committees have oversight over aspects of climate change:
•The Governance, Investment & Sustainability Committee of the Board ("GISC") assists the Board with oversight of sustainability matters, including those related to climate. The GISC is responsible for reviewing and approving Sun Life's Sustainability Policy, overseeing progress against Sun Life's Sustainability Strategy and commitments (including decarbonization targets), reviewing and recommending Board approval of the annual Sustainability Report and the annual CSO plan, and overseeing the development and implementation of Sun Life’s Climate Transition Plan. In addition, the GISC reviews any material issues related to sustainability raised by management throughout the year, including climate-related matters.
•The Risk Committee of the Board assists the Board with enterprise-wide oversight of the management of current and emerging risks, which may include climate-related risks and, broadly, environmental risks.
•The Audit Committee reviews ESG disclosures (including climate-related disclosures) required to be included in Sun Life’s financial disclosure documents, and reviews management's quarterly reports on the effectiveness of Sun Life's internal controls over financial reporting, including any evolving standards over ESG disclosures.
At the management level, the CSO, Chief Risk Officer (“CRO”), and Chief Investment Officer (“CIO”) play key roles in assessing and managing climate-related risks and opportunities. Additional committees are in place at SLC Management and MFS to support these activities.
•Our CSO has overall accountability for sustainability, including climate change, across the enterprise. This accountability includes setting the strategy and governance framework for our organization. The CSO chairs our ESC and GSLT. Sun Life’s Vice President of Climate Change and Environmental Impact reports directly to the CSO and oversees the development and implementation of the enterprise-wide climate change strategy, climate risk and decarbonization performance and reporting functions.
•Our CRO is responsible for leading the Risk Management function (as noted above in Risk Management sections 2 and 7). Key and emerging risks are monitored and reported to the Risk Committee of the Board.
•Our CIO chairs the Sustainability Committee and Sustainable Investment Council within SLC Fixed Income. The Sustainability Committee is responsible for overseeing the direction, priorities and implementation of sustainable investing initiatives across SLC Fixed Income. The Sustainable Investment Council, composed of investment team leaders, is a sub-committee of the Sustainability Committee. It is the steering body for ESG integration in SLC Fixed Income’s investment processes, representing and working across asset class teams.
•The SLC Risk Committee provides oversight of SLC Management’s investment advisors (which includes SLC Fixed Income, InfraRed, BGO, Crescent, and AAM), operational, investment, business and strategic risks, including those relating to ESG.
•MFS has oversight committees to provide strategic leadership and support the effective integration of sustainability across MFS. The MFS Sustainability Executive Group provides strategic leadership concerning MFS’ sustainability strategy. It includes various senior leaders responsible for the integration of sustainability across the firm. MFS also has committees that are a part of its
72 December 31, 2023 Sun Life Financial Inc. MANAGEMENT'S DISCUSSION & ANALYSIS existing committee governance structure.
These committees are devoted to the implementation of specific aspects of MFS’ sustainability strategy, including ESG integration strategy and policies, engagement, proxy voting and ESG Client and corporate strategies and policies.
Strategy
As part of our updated enterprise Sustainability Strategy, climate change has been elevated as a cross-cutting lens connected to our Purpose and our core pillars of Financial Security, Healthier Lives, Sustainable Investing and foundation as a Trusted and Responsible Business. Meaningful climate action is essential to achieving our Purpose and we are committed to doing our part to support the transition to a low-carbon economy and ensure we are an organization resilient to climate change. The strategy sets the foundation for how we will do this while creating competitive advantage and differentiation for our business.
Climate change has a variety of implications for our business as an asset management and insurance company, especially when considering the impacts of climate change on human health. As an organization that provides life and health insurance products to Clients across the globe, we are keenly aware of the vast implications of climate change on our Clients’ well-being. The increased severity and frequency of extreme weather events and the chronic shift towards higher temperatures have significant impacts on health. Heat-related deaths and hospitalizations have increased over the last decade and will continue to increase as temperatures rise. Lower air quality from pollutants, rising temperatures and wildfires can have long-term implications on respiratory health. Emotional distress, anxiety and trauma caused by these extreme weather events can also negatively impact mental health.
Changing precipitation and ensuing floods, droughts and wildfires directly impact food crops and can lead to food insecurity and malnutrition. Changing precipitation and warming temperatures also increase the proliferation of pests, causing direct damage to food crops, while also increasing the transmission of vector-borne disease like dengue fever and Zika virus.
From an investment perspective, climate change presents both risks and opportunities. A transition to a low-carbon economy could affect asset values over time. Among other impacts, portfolio investments in coal, conventional oil and oil sands producers, utilities and related fossil fuel industries, railways and pipelines, as well as markets that depend on these industries, may be subject to additional financial risk as a result of changes in regulation, cost of capital, consumer preferences, technological or business model disruption, etc. This may lead to lower overall profitability and/or stranded assets (assets for which the investment costs cannot be recovered as intended).
Physical climate impacts could affect investments in real assets such as real estate, commercial mortgages, and infrastructure, as well as our own operations, and operations and revenues of our Clients and businesses across our portfolios. Risks may result from increased severity and frequency of extreme weather events and from longer-term shifts in climate patterns, leading to declining asset values, increasing insurance costs or uninsurability.
For further discussion of potential climate-related risks, please refer to Environmental and Social Risk in Sun Life’s 2023 Annual Information Form (“AIF”) under Risk Factors – Business and Strategic Risk.
Climate-related opportunities include those related to sustainability and green bonds, investments in developing resilient and adaptive real estate and infrastructure as well as renewable energy and other assets and businesses that support or benefit from a transition to a low-carbon economy. Many companies and industries are benefiting from climate change-related tailwinds, such as mobility (vehicle electrification), energy efficiency services, battery technology and renewables. Through our asset managers’ ESG integration efforts, we seek to identify these investment opportunities in both public and private markets, including opportunities in securitized investments and direct investments (real estate, traditional public infrastructure, and other types of public infrastructure such as sustainable agriculture).
Climate-related risks and opportunities are considered in our asset management businesses’ investment processes and in our financing activities. In 2019, we were the first life insurer globally to issue a sustainability bond and in 2023, we issued our second sustainability bond. Issuing sustainability bonds demonstrates our commitment to embedding sustainability into our business while contributing positively to society and advancing technologies that enable the transition to a low-carbon economy. Through our Asset Management pillar, we believe we are well-positioned to support Clients who want to invest in the net-zero transition. Asset management is delivered by MFS as well as the businesses that operate under the SLC Management brand: SLC Fixed Income, InfraRed, BGO, Crescent, and AAM. Climate-related investment strategies for our asset managers are highlighted below:
•MFS, as a long-term investor in public issuers seeking to understand the duration and stability of financial returns, assesses climate change at both the issuer level and portfolio level. As with all risks and opportunities, MFS' assessment of environmental issues such as climate change begins with in-depth fundamental issuer and industry analysis. Climate change and regulations associated with climate change are materially impacting many businesses’ revenue growth, margins and returns, cash flows, capital expenditures and valuation. As long-term investors seeking to allocate capital responsibly, MFS can use a variety of tools to increase the rate of change, which MFS believes will improve investment results and create value for Clients. MFS also regularly engages with issuers to encourage better disclosure and management of climate-related risks and opportunities. MFS’ Strategic Climate Action Plan sets forth its investment philosophy with regard to the risks and opportunities associated with climate change, along with its expectations for issuers to have a climate plan to reduce or eliminate their emissions toward a goal of achieving net zero.
•SLC Fixed Income offers its institutional Clients opportunities to invest in sustainable infrastructure through its private fixed income investments. Sustainable infrastructure categories include renewable energy, energy efficiency and clean transportation. SLC Fixed Income engages with certain portfolio companies, where relevant, to help inform its understanding and management of climate-related risks and opportunities. SLC Fixed Income’s Climate Report sets forth its investment philosophy and associated disclosures with regard to risks, strategies and targets associated with climate change.
•InfraRed invests in and manages social infrastructure, low-carbon generation, renewable energy, energy efficiency and energy enabling infrastructure projects, which advances its sustainable investment options for institutional Clients while complementing its focus on sustainable investing and climate change. InfraRed also actively assesses the physical-related climate risks associated with its existing and new investments in order to actively manage the climate resilience of the essential infrastructure projects it manages.
•BGO analyzes climate-related risks for activities that are in scope using the following tools and programs. To help identify exposure to physical climate risks for certain new acquisitions, BGO utilizes Moody’s ESG Solutions as a Climate Risk Provider. Included in the assessment are projections of exposure to floods from extreme precipitation, hurricane-force winds, sea level rise, water stress,
MANAGEMENT'S DISCUSSION & ANALYSIS Sun Life Financial Inc. December 31, 2023 73
heat stress, wildfires, and earthquakes. Risks identified in this assessment are included in underwriting with details of what may be causing this risk and mitigation actions. As part of BGO’s ESG Risk Matrix for new acquisitions, assets are scanned for indicators that may impact transition risk, such as energy performance, GHG emissions, and the existence of any local regulations. Transition risk metrics such as utility price impacts and government regulations are continually monitored for certain assets at the property level through its sustainability data management systems.
•Crescent’s investment decisions are guided by Clients’ long-term interests, which are served through the incorporation of ESG considerations, including those related to climate change. Where possible, Crescent seeks to engage collaboratively with portfolio companies on topics such as understanding climate change risks and emissions intensity.
As longer-term investors, we believe that integrating climate change as a key element of our investment objectives can be a source of competitive advantage as it should lead to stronger risk-adjusted returns over time. The integration of climate change risks and opportunities may also result in stronger ESG investment ratings from groups such as PRI, Morningstar, GRESB and others, which can be key decision factors for Clients. Our asset managers may take the approach of active engagement and education to work with investee companies in their transition to net zero. SLC Fixed Income is a member of the Climate Engagement Canada and Climate Action 100+ investor initiatives. Through those initiatives and in its capacity as Sun Life’s primary general account asset manager, SLC Fixed Income engages with some of the world’s largest corporate GHG emitters with whom Sun Life has investments to support best practices around sustainability disclosures, and to better understand their management of climate-related risks and opportunities. MFS and Crescent are also signatories to Climate Action 100+.
For investment funds offered by the Sun Life Canada businesses, we recognize that our Clients are increasingly seeking a sustainable investment lens from our solutions. Our GRS business’ proprietary ESG integration evaluation framework helps sponsors of group retirement plans make informed decisions about the investment options they make available to their employees in their workplace plans. The evaluation framework uses detailed criteria in three key areas: firm policies, investment process and active ownership. SLGI evaluates its investment managers using similar criteria. This approach provides deeper insights into its investment managers’ direction on ESG matters and their ability to embed these considerations across all aspects of the investment decision process.
Sun Life’s general account, where Sun Life is the asset owner, is comprised of assets from proceeds of insurance policies. A series of publicly-disclosed climate-related investment beliefs and principles guide the investment decisions of the general account in-scope asset classes which have net-zero interim targets. When evaluating in-scope general account investments in carbon-intensive sectors, Sun Life will consider credible GHG reduction plans and alignment or commitment to alignment with net zero. Our in-scope general account investments prioritize companies that are either categorized as net zero aligned, aligning, or committed to aligning, informed by the Net Zero Investment Framework. We also regularly review the financial performance of our investments and incorporate non-financial metrics. Performance against GHG reduction targets, where material, are a part of this fundamental investment analysis and will inform our general account investment decisions. For more information, refer to Sun Life’s Net Zero by 2050: Sun Life’s Climate Journey report.
In addition to the asset management and investment activities above, our experience with climate scenario analysis also includes enterprise-wide testing as part of FCT(1). A focus of our FCT has been climate-related investment risks, which we believe are a larger and more immediate concern. More broadly, we continue to monitor emerging research on the scope and scale of climate-related life and health impacts as they remain a significant longer-term concern to our business. We expect to continue to build on our climate scenario testing in 2024. In addition to using climate scenarios in FCT, we continue to leverage learnings from our experience with climate scenario analysis including our participation in the pilot project between the Bank of Canada, OSFI, and a small group of Canadian financial institutions in 2021.
We engage on emerging climate regulation and policy impacting our business directly and through industry associations, such as the Canadian Life and Health Insurance Association, the American Council of Life Insurers and the Canadian Chamber of Commerce. We have advocated for improved climate-related financial disclosure and data, harmonization of emerging standards and regulations, and investments in data and scientific research on the link between climate change and life and health outcomes. Better and more consistent data across industries would allow for improved decision making and ultimately for capital to flow to those companies that are working to develop credible solutions for the transition to a low-carbon economy. In addition, we advocate for improving Canada’s sustainable finance market and expanding opportunities to invest in green buildings and sustainable infrastructure. We disclose our lobbying activities in compliance with regulatory obligations as determined by each jurisdiction.
In addition to the engagements above, our actuarial and sustainability teams, as well as our asset managers actively participate in industry consultations and working groups focused on scenario analysis and stress testing. We will continue to mature our climate scenario analysis capabilities as industry guidance, best practices, tools and our internal expertise grow.
Risk Management
Climate risk management is integrated into our Risk Framework, Governance, and supporting processes (as noted in preceding sections 1 through 8 and under Governance above). We continue to mature our climate risk management practices to ensure climate resiliency.
Our definition of climate risk includes physical impacts of climate change and impacts of the transition to a low-carbon economy. These impacts can include, but are not limited to, damage to owned and operated real assets including real estate and infrastructure, a reduction in the values of investments in public and private fixed income and non-fixed income assets tied to fossil fuels and carbon intensive industries, litigation risk to a company or sector in which we invest, health impacts to affected populations (which can affect long-term morbidity and mortality assumptions), and socio-economic, geopolitical and regulatory changes. We also include an assessment of climate change risk as part of our broader assessment of the risks associated with operating in various markets.
(1)Financial Condition Testing is a stress testing exercise to assess the future financial condition of Sun Life under adverse scenarios.
74 December 31, 2023 Sun Life Financial Inc.
MANAGEMENT'S DISCUSSION & ANALYSIS From an investment perspective, our asset managers integrate climate-related risks (where material to an issuer, industry and/or asset class) into the risk management process as they look to make long-term investments that are better positioned to withstand issues related to climate change from a financial materiality perspective. They incorporate a number of different analyses into their assessment of climate risks through both stand-alone analysis of physical risks by geographic region and through the assessment of business model and carbon transition risks. Climate-related risk categories monitored may include acute and chronic physical risks and transition risks related to current and emerging laws and regulation, changing technology, market and reputation risks or consumer preferences.
Each of our asset managers takes its own approach to identifying, assessing, monitoring and responding to climate-related risks and opportunities, based on the asset classes it invests in. Approaches are refined periodically. Examples of approaches include:
•Proprietary climate risk surveys to identify, assess and respond to climate-related risks and opportunities
•Portfolio and asset level risk analysis to inform investment decisions and resilience plans
•Scoring methodologies that look to standardize the assessment of transition risks
•Emissions data analysis
•Stranded asset modeling
•Real assets physical risk exposure assessment
•Carbon intensity monitoring and benchmarking
•Individual as well as collaborative engagements on topics such as decarbonization
Additionally, an environmental issue, whether caused by climate change or other factors, on a property owned or operated by us could have financial or reputational impacts. Our real estate asset manager maintains an environmental risk management program to help monitor and manage real estate investment assets from losses due to environmental issues and to ensure compliance with applicable laws. Where feasible, we maintain insurance policies to cover certain environmental risks on owned assets. We have implemented a business continuity program to facilitate the recovery of critical business operations if an environmental issue affects a location where we conduct operations. The Company’s corporate real estate group, together with our building owners and property managers, assesses the potential effects of climate change-related hazards and examines ways to improve the ability of our buildings to withstand these hazards. These hazards include tornadoes, flash floods, ice storms and coastline flooding.
Climate-related disclosure standards and regulatory requirements continue to be issued and evolve in the jurisdictions in which we operate. Potential divergence in expectations among regulators, as well as the pace of regulatory change in the area of climate change, could lead to additional risks. We continue to monitor our risk management practices and disclosures as new regulations and standards are implemented and as the external landscape continues to evolve. In addition, we participate in consultations with policymakers and regulators on policy and regulatory developments regarding climate-related disclosures.
Metrics and Targets
Sun Life has set a goal to achieve net-zero GHG emissions by 2050 for both its investments and operations. As an asset owner, Sun Life plans to achieve net-zero GHG emissions by 2050 for investments in its general account. Our approach for achieving net-zero emissions in the general account focuses on asset classes where we have access to quality data, established net-zero emissions methodologies and where we believe we can have the biggest real-world impact in reducing emissions. We use the Partnership for Carbon Accounting Financials (“PCAF”) Part A (Financed Emissions) methodology to calculate our financed emissions. In 2023, we set interim targets for the general account for 2030(1) for asset classes where there is industry guidance and we have the ability to have an immediate impact; this means our investments in listed corporate bonds (intensity and alignment targets), directly managed listed equities (intensity target), and commercial real estate (intensity target), which collectively cover 29% of Sun Life’s general account AUM(2). Our asset managers that are members of the Net Zero Asset Managers (“NZAM”) initiative have also set respective interim targets for the assets they manage. The NZAM initiative is an international group of asset managers committed to supporting the goal of net-zero emissions by 2050. NZAM members include MFS, SLGI, and SLC Management asset managers: SLC Fixed Income, InfraRed and BGO. Updated interim targets and a summary of our other commitments and progress towards net-zero GHG emissions are available in our Net Zero by 2050: Sun Life's Climate Journey report.
For our operations, we have set an interim target of a 50% absolute reduction of GHG emissions by 2030, relative to 2019(3). While we continue our efforts to reduce our operational GHG emissions, we purchase high-quality carbon offsets that are verified and additional (according to carbon standards) to compensate for the remaining emissions in our operations that we have yet to reduce. This approach of purchasing offsets is not part of our enterprise decarbonization strategy, but is one way to help manage the climate impact of our operations today while we work towards our interim 2030 operational target and enterprise-wide goal of net-zero GHG emissions by 2050.
Sun Life is continuing progress towards its target of $20 billion in new sustainable investments from 2021 to 2025 across its general account and Client investments, which are managed by SLC Management. Investments include, but are not limited to, renewable energy, energy efficiency, sustainable buildings, clean transportation, water management, and social infrastructure projects.
We report our progress on our operational emissions reduction targets and sustainable investment targets in our annual Sustainability Report available at www.sunlife.com/sustainability.
In 2023, the Board approved the addition of a Sustainability modifier to the Senior Executive Sun Share Unit Plan, which assesses performance over three years against four goals aligned to two of our Sustainability Pillars. Climate-related goals include sustainable investment and GHG emissions reduction in our operations.
(1)Relative to a 2019 baseline for intensity targets and a 2022 baseline for alignment target.
(2)As of December 31, 2019, Sun Life's general account invested assets AUM was $161.6 billion.
(3)Emissions resulting from global corporate offices and data centres as well as from business travel, inclusive of majority-owned Sun Life affiliate companies.
MANAGEMENT'S DISCUSSION & ANALYSIS Sun Life Financial Inc. December 31, 2023 75
Sun Life and majority-owned affiliate companies report global Scope 1 and 2 emissions from company-occupied real estate, data centres and real estate investments under our financial control (as defined in the GHG Protocol Corporate Accounting and Reporting Standard) as well as Scope 3 emissions (where data is available)(1) associated with business travel, real estate-related sources, and select asset classes within our general account in our annual Sustainability Report. We continue to advance the quality and availability of emissions data across our enterprise emissions inventory. All emissions reporting is aligned to the GHG Protocol Corporate Accounting and Reporting Standard using the financial control approach. Additional information on GHG emissions calculations can be found in Sun Life’s Financial GHG Reporting Methodology.
Please refer to Environmental and Social Risk in our AIF for additional climate-related risk discussion.
v. Operational Risk
Risk Description
Operational risk is the risk of loss (financial and non-financial) resulting from inadequate or failed internal processes, people and systems or from external events. Operational risk is present in all of our business activities and encompasses a broad range of risks as described below. Operational risk is embedded in the practices utilized to manage other risks and, therefore, if not managed effectively, operational risk can impact our ability to manage other key risks.
Operational Risk Management Governance and Control
We employ a wide range of operational risk management practices and controls, as outlined below:
•Operational risk governance practices are in place, including independent monitoring and review and reporting to senior management and the Board Committees.
•Risk appetite limits have been established in Operational Risk.
•Comprehensive Operational Risk Management Framework, Policies, guidelines and practices are in place.
•Our governance practices, corporate values, Code of Conduct and Company-wide approach to managing risk set the foundation for mitigating operational risks.
•Our Code of Conduct sets the tone for a strong ethical culture, and we regularly review and update the Code of Conduct to ensure that it continues to meet the expectations of regulators and other stakeholders. All our directors and employees must reconfirm annually their understanding of and commitment to comply with the Code of Conduct.
•We have established appropriate internal controls and systems for talent acquisition, rewards and development programs that attract, build and retain top talent and create strong succession plans as well as compensation programs, and we provide ongoing training to our people.
•We conduct regular monitoring of employee engagement to ensure we create and maintain a work environment where all employees are welcome and able to contribute effectively.
•Stress-testing techniques, such as FCT, are used to measure the effects of large and sustained adverse scenarios.
•We mitigate a portion of our operational risk exposure through our corporate insurance program by purchasing insurance coverage that seeks to provide insurance against unexpected material losses resulting from events such as criminal activity, property loss or damage and liability exposures, or that satisfies legal requirements and contractual obligations.
•Internal capital targets are established at an enterprise level to cover all risks and are above minimum regulatory and supervisory levels. Actual capital levels are monitored to ensure they exceed internal targets.
Specific operational risks and our risk management strategies are discussed below in further detail and in the Risk Factor section in the AIF.
Information Security and Privacy Risks
Information and technology are used in almost all aspects of our business and operations. As part of our Client strategy, we continue to enhance the digital side of our business to support and enable new business models and processes, that are more personal, proactive and predictive.
Our business and the successful implementation of our digital strategy are dependent on various factors including maintaining a secure environment for our Clients, employees and other parties' information. This requires the effective and secure use, management and oversight of information and physical assets. We engage with various stakeholders and leverage emerging technologies, including digital, mobile applications, cloud computing, artificial intelligence and robotic process automation. These technologies are used to collect, process and maintain information relating to business transactions and financial reporting, as well as the personal information of our Clients and employees. We also obtain services from a wide range of third-party service providers and have outsourced some business and information technology functions in various jurisdictions.
There continues to be an increasing number of information security compromises and privacy breaches across industry sectors, governments and individuals. The increasing scope and complexity of malicious activity poses a significant risk to our systems and these risks may be exacerbated by the breadth of our operations, our geographic footprint and the complexity of our technology systems. A serious security or privacy breach of either an internal or third-party service provider’s computer system that contains sensitive business, Client and/or employee information may result in business interruption, theft or misuse of confidential information, regulatory penalties and scrutiny, litigation, reputational damage and may have an adverse impact on current and future business opportunities with our Clients, employees and business relationships. We continue to actively monitor for increases in malicious activity due to escalating geopolitical tensions across the globe.
(1)Scope 3 emissions are related to global business travel (air, rail, car-rental and employee-claimed mileage), utilities for company-occupied real estate that are not under our financial control, water consumption and waste generated at real estate investments, as well as select asset classes within our general account.
76 December 31, 2023 Sun Life Financial Inc. MANAGEMENT'S DISCUSSION & ANALYSIS We continue investing in people, processes and technology to strengthen our abilities to respond to the evolving threat landscape.
Our Information Security framework is overseen by the Chief Information Security Officer, supported by senior leadership and by our Operational Risk Management Framework. Our information security framework and governance controls (policies, procedures, training) are aligned with recognized industry standards and are compliant with applicable laws and regulations. Our Chief Privacy Officer oversees the global privacy program and sets direction for privacy compliance across the enterprise. Over 30 Privacy Officers across the enterprise help our businesses make privacy-related decisions.
Our well-established security controls and processes are intent on protecting our information and computer systems and the information entrusted to us by our Clients and employees. Our protection strategy leverages information security risk assessments and privacy impact assessments to evaluate potential risks. The security framework also includes technology and process safeguards and regularly promotes secure behavioural practices. As part of our layered security approach, we deliver general security awareness training sessions to all employees every year that is reinforced with regular awareness resources and activities.
Many jurisdictions in which we do business are developing and implementing cyber security reporting requirements and more stringent consumer privacy legislation, many with greater enforcement powers for regulators and higher fines and penalties. Our global privacy program monitors adherence to our global privacy commitments, local laws and local privacy policies. We have also established a network of privacy officers across the Company who monitor emerging privacy legislation and provide guidance on handling personal information and help manage, report and resolve any privacy incidents that may occur. We also conduct privacy training, provide regular monitoring and reporting and carry cyber risk insurance to help mitigate the impact of privacy incidents.
Human Resources Risk
Our ability to achieve business objectives can be adversely affected if we are unable to attract, retain or effectively deploy resources with the in-depth knowledge and necessary skills required, or are unable to design compensation and talent programs that effectively drive employee behaviour and shape corporate culture. Failure to manage Human Resources risk can also lead to direct financial and reputational loss including losses arising from activity that is inconsistent with Human Rights or employment laws or health and safety regulations.
To mitigate this risk, we have comprehensive Human Resource policies, practices and programs in place to ensure compliance with employment legislation, minimize the risk of employee misconduct, and proactively develop employee skills, capabilities and behaviours to meet future business needs.
Regulatory Compliance, Legal and Conduct Risk
We are subject to extensive regulatory oversight by financial services regulators in the jurisdictions in which we conduct business. Failure to comply with applicable laws or to conduct our business consistent with changing regulatory or public expectations could adversely impact our reputation and may lead to regulatory investigations, examinations, proceedings, settlements, penalties, fines, restrictions on our business, litigation or an inability to carry out our business strategy.
Our Chief Compliance Officer oversees our comprehensive Enterprise-wide compliance framework, which is aligned with guidance from OSFI and other regulators. This framework promotes proactive, risk-based management of compliance and regulatory risk, and includes Enterprise and business segment policies and operating guidelines, programs to promote awareness of laws and regulations that impact us, ongoing monitoring of emerging legal issues and regulatory changes and training programs. The employee training programs include anti-money laundering and anti-terrorist financing, anti-bribery and corruption, fraud, privacy and information security risk management. Effective governance, oversight and implementation is a coordinated effort between first and second lines of defence functions. Second line oversight and effective challenge relies on a network of compliance officers. The Chief Compliance Officer reports regularly to the Board and Board Committees on the health of the compliance program, key compliance risks, emerging regulatory trends, escalation of significant issues and key risk indicators.
Information Technology Risk
The use of technology and computer systems is essential in supporting and maintaining business operations. We use technology to support virtually all aspects of our business and operations. The rapidly changing business environment increases the risk of our technology strategy not being agile enough to adapt to new business demands in a timely manner leading to financial losses, increased costs and the inability to meet Client needs.
Initiatives supporting our business strategy rely on developing innovative information technology solutions and upgrading our existing systems on a timely basis to meet business needs. Although every reasonable precaution is taken to ensure information technology systems remain available, stable and current, it is not possible to fully eliminate all risk. Some changes and upgrades are extremely complex and there is a chance that an undetected technical flaw may exist, which, when implemented, stops or disrupts critical information technology systems or business applications.
Third-Party Risk
We engage in a variety of third-party relationships, including with distributors, independent contractors, outsourcing service providers and suppliers. Our profitability or reputation could be impacted if these third parties are unable to meet their ongoing service commitments or fail to perform to expected standards.
To manage these risks, we have established Company-wide policies and guidelines which are consistent with OSFI's and other local regulatory requirements, and which set out our requirements to identify, assess, manage, monitor and report on third-party risks. Our program includes third-party risk assessments and enhanced due diligence if a supplier will have access to any personal data and/or confidential information or access to non-public systems. The key elements and risks associated with the third party are documented in the form of a written agreement, and the company monitors performance of its third parties in a manner that is commensurate to the size, risk, scope and complexity of the third-party relationship.
MANAGEMENT'S DISCUSSION & ANALYSIS Sun Life Financial Inc. December 31, 2023 77
Business Disruption Risk
To conduct operations, our businesses are dependent on the availability of trained employees, physical locations and access to technology. A significant business disruption to our operations can result if one or more of these key elements are negatively impacted. System disruptions as well as unanticipated events, including pandemics, can negatively affect staff, preventing them from getting to work or from operating business processes.
To manage this risk, we have implemented a business continuity program to facilitate the recovery of critical business operations. This program encompasses business continuity, crisis management and disaster recovery planning. Our policy, guidelines and operating procedures establish consistent processes designed to ensure that key business functions can continue and normal operations can resume effectively and efficiently should a major disruption occur. In addition, to regularly update and test business continuity plans for critical business operations, we conduct mandatory business continuity awareness training for all employees annually and have off-site backup facilities and failover capability designed to minimize downtime and accelerate recovery time in the event of a major disruption.
Model Risk
We use complex models to support many business functions including product development and pricing, capital management, valuation, financial reporting, planning, hedging, asset-liability management, risk management and advanced analytics (such as artificial intelligence, predictive modeling and decision making algorithms). Model risk is the risk of loss, either in the form of financial loss, inappropriate or poor business decisions, damage to reputation, or other adverse impact, arising from inaccurate model outputs or incorrect use or interpretation of model outputs.
To manage model risk, we have established robust, Company-wide model risk management procedures over the models' life cycle with respect to building, using, changing and retiring models. The policy and operating guidelines set out minimum, risk-based requirements to ensure that models are effectively controlled, maintained and appropriately understood by users.
Information Management Risk
As an international provider of financial services, we deal with extensive information across a number of countries. Information management risk is the a) inability to capture, manage, retain and appropriately dispose of business records, b) the inability to provide data that is valid, complete, accurate, consistent, unique, or timely to support business decisions, and c) the inability to manage data location and cross-border access appropriately. Failure to manage these risks could have financial or reputational impacts, and may lead to regulatory proceedings, penalties and litigation. To manage and monitor information management risk, we have a data governance framework, which includes a records management program, data quality best practices, and data residency controls.
We continue to evolve our risk management best practices to manage risks associated with Generative-AI as we identify use cases and run experiments designed to identify opportunities.
vi. Liquidity Risk
Risk Description
Liquidity risk is the possibility that we will not be able to fund all cash outflow commitments and collateral requirements as they fall due. This includes the risk of being forced to sell assets at depressed prices resulting in realized losses on sale. This risk also includes restrictions on our ability to efficiently allocate capital among our subsidiaries due to various market and regulatory constraints on the movement of funds. Our funding obligations arise in connection with the payment of policyholder benefits, expenses, reinsurance settlements, asset purchases, investment commitments, interest on debt, and dividends on common and preferred shares. Sources of available cash flow include general fund premiums and deposits, investment related inflows (such as maturities, principal repayments, investment income and proceeds of asset sales), proceeds generated from financing activities, and dividends and interest payments from subsidiaries. We have various financing transactions and derivative contracts under which we may be required to pledge collateral or to make payments to our counterparties for the decline in market value of specified assets. The amount of collateral or payments required may increase under certain circumstances (such as changes to interest rates, credit spreads, equity markets or foreign exchange rates), which could adversely affect our liquidity.
Liquidity Risk Management Governance and Control
We generally maintain a conservative liquidity position and employ a wide range of liquidity risk management practices and controls, which are described below:
•Liquidity risk governance practices are in place, including independent monitoring and review and reporting to senior management and the Risk Committee.
•Liquidity is managed in accordance with our Asset Liability Management Policy and operating guidelines.
•Liquidity contingency plans are maintained for the management of liquidity in a liquidity event.
•Stress testing is performed by comparing liquidity coverage risk metrics under a one-month stress scenario to our policy thresholds. These liquidity coverage risk metrics are measured and managed at the enterprise and legal entity levels.
•Stress testing of our collateral is performed by comparing collateral coverage ratios to our policy thresholds.
•Cash Management and asset-liability management programs support our ability to maintain our financial position by ensuring that sufficient cash flow and liquid assets are available to cover potential funding requirements. We invest in various types of assets with a view of matching them to our liabilities of various durations.
•Internal capital targets are established at an enterprise level to cover all risks and are above minimum regulatory and supervisory levels. Actual capital levels are monitored to ensure they exceed internal targets.
•We actively manage and monitor our capital and asset levels, and the diversification and credit quality of our investments.
•Various credit facilities for general corporate purposes are maintained.
78 December 31, 2023 Sun Life Financial Inc. MANAGEMENT'S DISCUSSION & ANALYSIS
We are subject to various regulations in the jurisdictions in which we operate. The ability of SLF Inc.'s subsidiaries to pay dividends and transfer funds is regulated in certain jurisdictions and may require local regulatory approvals and the satisfaction of specific conditions in certain circumstances. Through effective cash management and capital planning, SLF Inc. ensures that its subsidiaries, as a whole and on a stand-alone basis, are properly funded and maintain adequate liquidity to meet obligations, both individually and in aggregate.
Based on our historical cash flows and liquidity management processes, we believe that the cash flows from our operating activities will continue to provide sufficient liquidity for us to satisfy debt service obligations and to pay other expenses as they fall due.
Maturity Analysis for Insurance Contracts
|
|
|
|
|
|
|
|
|
|
|
|
|
|
|
|
The following tables present the undiscounted estimated future cash flows of insurance contract and reinsurance contract held assets and liabilities on our Consolidated Statements of Financial Position. These cash flows include estimates related to the timing and payment of death and disability claims, policy surrenders, policy maturities, annuity payments, minimum guarantees on segregated fund products, policyholder dividends, amounts on deposit, commissions and premium taxes offset by contractual future premiums and fees on in-force contracts. These estimated cash flows are based on the best estimated assumptions used in the determination of insurance contract and reinsurance contract held assets and liabilities. Due to the use of assumptions, actual cash flows will differ from these estimates. Amounts payable on demand, which includes amounts on deposit, dividends on deposit, outstanding claims and policyholder account values, are included in the 1 year or less time band. The amounts included in the table differ from the carrying value of the portfolio due to discounting, risk adjustments, and liability for remaining coverage for contracts using the premium allocation approach.
Amounts in this table include the liability for incurred claims for contracts measured using the PAA, but exclude the liability for remaining coverage for contracts measured using the PAA.
|
|
|
|
|
|
|
|
|
|
|
|
|
|
|
|
|
|
|
|
|
|
|
|
|
|
|
As at December 31, |
|
|
|
|
|
|
|
|
2023 |
2022 |
|
Insurance contract liabilities: |
|
|
|
|
|
|
|
|
|
|
|
|
|
|
1 year or less(1) |
|
|
|
|
|
|
|
|
|
|
|
$ |
11,428 |
|
$ |
11,980 |
|
|
1-2 years |
|
|
|
|
|
|
|
|
|
|
|
3,670 |
|
4,111 |
|
|
2-3 years |
|
|
|
|
|
|
|
|
|
|
|
3,887 |
|
4,018 |
|
|
3-4 years |
|
|
|
|
|
|
|
|
|
|
|
4,128 |
|
4,278 |
|
|
4-5 years |
|
|
|
|
|
|
|
|
|
|
|
4,451 |
|
4,511 |
|
|
Over 5 years |
|
|
|
|
|
|
|
|
|
|
|
556,052 |
|
469,366 |
|
|
Total |
|
|
|
|
|
|
|
|
|
|
|
$ |
583,616 |
|
$ |
498,264 |
|
|
Insurance contract assets: |
|
|
|
|
|
|
|
|
|
|
|
|
|
|
1 year or less(1) |
|
|
|
|
|
|
|
|
|
|
|
$ (463) |
$ (324) |
|
1-2 years |
|
|
|
|
|
|
|
|
|
|
|
(323) |
(341) |
|
2-3 years |
|
|
|
|
|
|
|
|
|
|
|
(276) |
(287) |
|
3-4 years |
|
|
|
|
|
|
|
|
|
|
|
(248) |
(254) |
|
4-5 years |
|
|
|
|
|
|
|
|
|
|
|
(225) |
(234) |
|
Over 5 years |
|
|
|
|
|
|
|
|
|
|
|
(3,305) |
(3,753) |
|
Total |
|
|
|
|
|
|
|
|
|
|
|
$ (4,840) |
$ (5,193) |
|
Reinsurance contract held liabilities: |
|
|
|
|
|
|
|
|
|
|
|
|
|
|
1 year or less(1) |
|
|
|
|
|
|
|
|
|
|
|
$ 140 |
$ 132 |
|
1-2 years |
|
|
|
|
|
|
|
|
|
|
|
83 |
80 |
|
2-3 years |
|
|
|
|
|
|
|
|
|
|
|
88 |
86 |
|
3-4 years |
|
|
|
|
|
|
|
|
|
|
|
91 |
89 |
|
4-5 years |
|
|
|
|
|
|
|
|
|
|
|
95 |
94 |
|
Over 5 years |
|
|
|
|
|
|
|
|
|
|
|
5,036 |
5,085 |
|
Total |
|
|
|
|
|
|
|
|
|
|
|
$ 5,533 |
$ 5,566 |
|
Reinsurance contract held assets: |
|
|
|
|
|
|
|
|
|
|
|
|
|
1 year or less(1) |
|
|
|
|
|
|
|
|
|
|
|
$ (520) |
$ (684) |
|
1-2 years |
|
|
|
|
|
|
|
|
|
|
|
(54) |
(20) |
|
2-3 years |
|
|
|
|
|
|
|
|
|
|
|
(69) |
(31) |
|
3-4 years |
|
|
|
|
|
|
|
|
|
|
|
(105) |
(66) |
|
4-5 years |
|
|
|
|
|
|
|
|
|
|
|
(130) |
(104) |
|
Over 5 years |
|
|
|
|
|
|
|
|
|
|
|
(11,330) |
(12,102) |
|
Total |
|
|
|
|
|
|
|
|
|
|
|
$ (12,208) |
$ (13,007) |
(1) Includes amounts payable on demand of $4,800 million (2022 - $4,779 million), $nil (2022 - $nil), $nil (2022 - $nil), and $(33) million (2022 -
$(88) million) for Insurance contract liabilities, Insurance contract assets, Reinsurance contract held liabilities, and Reinsurance contract held assets, respectively.
MANAGEMENT'S DISCUSSION & ANALYSIS Sun Life Financial Inc. December 31, 2023 79
Maturity Analysis - Other Financial Liabilities
|
|
|
|
|
|
|
|
|
|
|
|
|
|
|
|
|
|
|
|
|
|
|
|
|
|
|
|
|
|
|
|
|
|
|
|
|
The following table summarizes the contractual maturities of our significant financial liabilities and contractual commitments other than insurance contracts as at December 31, 2023 and 2022: |
|
|
|
Financial Liabilities and Contractual Obligations |
|
December 31, 2023
($ millions)
|
Within
1 year |
1 year to
3 years |
3 years to
5 years |
Over
5 years |
Total |
|
Investment contract liabilities(1) |
|
$ |
5,728 |
|
|
$ |
2,518 |
|
|
$ |
1,442 |
|
|
$ |
1,727 |
|
|
$ |
11,415 |
|
|
Senior debentures and unsecured financing(2) |
|
2,347 |
|
|
28 |
|
|
28 |
|
|
533 |
|
|
2,936 |
|
|
Subordinated debt(2) |
|
204 |
|
|
410 |
|
|
554 |
|
|
7,192 |
|
|
8,360 |
|
|
Bond repurchase agreements |
|
2,705 |
|
|
— |
|
|
— |
|
|
— |
|
|
2,705 |
|
|
Accounts payable and accrued expenses |
|
8,665 |
|
|
— |
|
|
— |
|
|
— |
|
|
8,665 |
|
|
Lease liabilities(3) |
|
188 |
|
|
319 |
|
|
228 |
|
|
534 |
|
|
1,269 |
|
|
Secured borrowings from mortgage securitization |
|
306 |
|
|
885 |
|
|
560 |
|
|
535 |
|
|
2,286 |
|
|
Borrowed funds(2) |
|
86 |
|
|
103 |
|
|
14 |
|
|
162 |
|
|
365 |
|
|
Credit facilities(4) |
|
2,330 |
|
|
— |
|
|
— |
|
|
— |
|
|
2,330 |
|
|
Total liabilities |
|
$ |
22,559 |
|
|
$ |
4,263 |
|
|
$ |
2,826 |
|
|
$ |
10,683 |
|
|
$ |
40,331 |
|
|
Contractual commitments:(5) |
|
|
|
|
|
|
|
|
|
|
|
Contractual loans, equities and mortgages |
|
$ |
39 |
|
|
$ |
1,199 |
|
|
$ |
915 |
|
|
$ |
2,756 |
|
|
$ |
4,909 |
|
|
Total contractual commitments |
|
$ |
39 |
|
|
$ |
1,199 |
|
|
$ |
915 |
|
|
$ |
2,756 |
|
|
$ |
4,909 |
|
|
|
|
|
|
|
|
|
|
|
|
|
|
December 31, 2022
($ millions)
|
Within
1 year |
1 year to
3 years |
3 years to
5 years |
Over
5 years |
Total |
|
Investment contract liabilities(1) |
|
$ |
5,581 |
|
|
$ |
2,037 |
|
|
$ |
1,421 |
|
|
$ |
1,609 |
|
|
$ |
10,648 |
|
|
Senior debentures and unsecured financing(2) |
|
2,353 |
|
|
28 |
|
|
28 |
|
|
548 |
|
|
2,957 |
|
|
Subordinated debt(2) |
|
208 |
|
|
416 |
|
|
416 |
|
|
7,856 |
|
|
8,896 |
|
|
Bond repurchase agreements |
|
2,725 |
|
|
— |
|
|
— |
|
|
— |
|
|
2,725 |
|
|
Accounts payable and accrued expenses |
|
8,080 |
|
|
— |
|
|
— |
|
|
— |
|
|
8,080 |
|
|
Lease liabilities(3) |
|
168 |
|
|
297 |
|
|
211 |
|
|
324 |
|
|
1,000 |
|
|
Secured borrowings from mortgage securitization |
|
87 |
|
|
767 |
|
|
757 |
|
|
762 |
|
|
2,373 |
|
|
Borrowed funds(2) |
|
210 |
|
|
26 |
|
|
38 |
|
|
170 |
|
|
444 |
|
|
Credit facilities(4) |
|
2,339 |
|
|
— |
|
|
— |
|
|
— |
|
|
2,339 |
|
|
Total liabilities |
|
$ |
21,751 |
|
|
$ |
3,571 |
|
|
$ |
2,871 |
|
|
$ |
11,269 |
|
|
$ |
39,462 |
|
|
Contractual commitments:(5) |
|
|
|
|
|
|
|
|
|
|
|
Contractual loans, equities and mortgages |
|
$ |
1,134 |
|
|
$ |
1,202 |
|
|
$ |
375 |
|
|
$ |
2,359 |
|
|
$ |
5,070 |
|
|
Total contractual commitments |
|
$ |
1,134 |
|
|
$ |
1,202 |
|
|
$ |
375 |
|
|
$ |
2,359 |
|
|
$ |
5,070 |
|
|
|
|
|
|
|
|
|
|
|
|
|
|
(1) These amounts represent the undiscounted estimated cash flows of investment contract liabilities on our Consolidated Statements of Financial Position. |
|
(2) Payments due based on maturity dates and include expected interest payments. Actual redemption of certain securities may occur sooner as some include an option for the issuer to call the security at par at an earlier date. |
|
(3) Lease liabilities are included on the Consolidated Statements of Financial Position due to the implementation of IFRS 16 Leases ("IFRS 16"). |
|
(4) Reflects a change in presentation effective December 31, 2022. |
|
(5) Contractual commitments and operating lease commitments are not reported on our Consolidated Statements of Financial Position. Additional information on these commitments is included in Note 22 of our 2023 Annual Consolidated Financial Statements. |
Additional information on liquidity risk can be found in Note 6 of our 2023 Annual Consolidated Financial Statements and the Risk Factors section in the 2023 AIF.
80 December 31, 2023 Sun Life Financial Inc. MANAGEMENT'S DISCUSSION & ANALYSIS Pandemics, epidemics or outbreaks of an infectious disease could have an adverse impact on our results, business, financial condition or liquidity, and could result in changes to the way we operate.
vii. Other Risks
Risks relating to Pandemics
Pandemics and measures imposed by governments around the world could disrupt the global economy, financial markets, supply chains, business activity and productivity. The potential worsening of the economic and market conditions caused by pandemics, and impact on Clients, industries and individual countries could have a material adverse effect on our businesses including sales, fee income, investment performance, expenses, results of operations, corporate reputation and financial condition. Sustained adverse effects could negatively impact profitability and also make it difficult for us to access capital markets, could impact our liquidity and capital position, or may result in downgrades in our credit ratings. These actions may also have the effect of heightening many of the other risks described in the Risk Factors section in our AIF and section K - Risk Management in this document. This includes, but is not limited to:
•Market risks, such as equity, interest rates and spread, real estate, and foreign currency risks, including impact on fee income;
•Insurance risk, including higher than expected mortality and, morbidity claims and adverse policyholder behaviour including but not limited to higher than expected policy lapses, withdrawals, and surrenders;
•Credit risk, including defaults, impairments and downgrades;
•Business and strategic risk including economic and geopolitical risk, business strategy implementation risk, distribution risk, expense risk, changes in Client behaviour, sales, investment performance, and changes in legal and regulatory environment;
•Operational risk, including information security and privacy risk, human resources risks, regulatory compliance, legal and conduct risk, information technology risk, processing risk, third-party risk, and business disruption risk, and change management risk with the need to quickly implement and execute new programs and procedures to support Clients, advisors, employees, products, and services; and
•Liquidity risk including collateral, and payment deferrals on invested assets or policyholder insurance premium impacts.
Consistent with the protocols and programs established in our Risk Management Framework, we continue to manage the risks that arise when providing products and services to Clients, which are in line with our Purpose to help Client achieve lifetime financial security and live healthier lives.
|
|
|
|
|
|
| L. Additional Financial Disclosure |
|
1. Selected Annual Information
|
|
|
|
|
|
|
|
|
|
|
|
|
IFRS 17 and IFRS 9 |
IFRS 4 and IAS 39(1) |
| ($ millions, after-tax, unless otherwise stated) |
2023 |
2022 |
2021 |
| Total revenue |
40,774 |
5,769 |
35,688 |
| Common shareholders' net income (loss) |
3,086 |
2,871 |
3,934 |
| Reported basic earnings per share ($) |
5.27 |
4.90 |
6.72 |
| Reported earnings per share (diluted) ($) |
5.26 |
4.89 |
6.69 |
| Total assets |
333,241 |
323,608 |
345,370 |
(1)IFRS 17 and IFRS 9 were adopted on January 1, 2023 and results in 2022 were restated, see Note 2 of the 2023 Annual Consolidated Financial Statements. 2021 results are shown on a IFRS 4 and IAS 39 basis.
MANAGEMENT'S DISCUSSION & ANALYSIS Sun Life Financial Inc. December 31, 2023 81
2. Items related to Statement of Operations
i. Business Group Summary Statements of Operations
|
|
|
|
|
|
|
|
|
|
|
|
|
|
|
|
|
|
|
|
|
|
|
|
| |
2023 |
2022 |
| ($ millions) |
Canada |
U.S. |
Asset
Management |
Asia |
Corporate |
Total |
Total |
| Insurance revenue |
8,165 |
11,721 |
— |
1,385 |
85 |
21,356 |
18,902 |
| Investment income (loss) |
7,514 |
1,321 |
187 |
2,347 |
217 |
11,586 |
(20,580) |
| Fee income |
1,483 |
458 |
5,953 |
300 |
(362) |
7,832 |
7,447 |
| Revenue |
17,162 |
13,500 |
6,140 |
4,032 |
(60) |
40,774 |
5,769 |
| Insurance service expenses |
6,855 |
10,522 |
— |
972 |
101 |
18,450 |
16,456 |
| Reinsurance contract held net (income) expense |
164 |
(100) |
— |
7 |
(2) |
69 |
153 |
| Insurance finance (income) expenses from insurance contracts issued |
6,415 |
1,250 |
— |
1,897 |
113 |
9,675 |
(22,595) |
| Reinsurance finance (income) expenses |
2 |
(57) |
— |
(4) |
— |
(59) |
440 |
| (Decrease) increase in investment contract liabilities |
326 |
— |
— |
5 |
— |
331 |
152 |
| Other income |
(102) |
— |
— |
— |
(67) |
(169) |
— |
| Interest expenses |
160 |
107 |
158 |
74 |
53 |
552 |
445 |
| Operating expenses and commissions |
1,751 |
1,031 |
4,480 |
489 |
244 |
7,995 |
7,092 |
| Total expenses |
15,571 |
12,753 |
4,638 |
3,440 |
442 |
36,844 |
2,143 |
| Income tax expense (benefit) |
275 |
148 |
309 |
(10) |
(261) |
461 |
546 |
| Dividends on preferred shares and distributions on other equity instruments |
— |
— |
— |
— |
79 |
79 |
70 |
| Non-controlling interests and participating policyholders' income in net income of subsidiaries |
64 |
23 |
126 |
91 |
— |
304 |
139 |
| Reported net income (loss) - Common shareholders |
1,252 |
576 |
1,067 |
511 |
(320) |
3,086 |
2,871 |
2023 vs. 2022
Canada
Canada's revenue increased $18.4 billion in 2023, primarily driven by higher net investment income from fair value changes of invested assets.
U.S.
U.S.'s revenue increased $8.0 billion in 2023, primarily driven by higher net investment income from fair value changes of invested assets and higher insurance revenue.
Asset Management
Asset Management's revenue increased $0.4 billion or 6% in 2023, driven by higher fee income in SLC Management partially offset by lower fee income in MFS.
Asia
Asia's revenue increased $7.1 billion in 2023, primarily driven by higher net investment income from fair value changes of invested assets.
Corporate
Corporate's loss of $0.1 billion in 2023 compared to a loss of $1.2 billion in 2022, was primarily driven by the sale of Sun Life UK.
ii. Revenue
Revenues are primarily derived from life and health insurance, investment management and annuities, and mutual funds, as well as Corporate investments and earnings on capital not attributed to a strategic business segment. Total revenue is comprised of: (i) insurance revenue; (ii) net investment income; and (iii) fee income. Total revenue excludes investment result for insurance contracts for account of segregated fund holders.
Insurance revenue is comprised of the portion of premiums that cover expected claims and directly attributable expenses in the period, as well as the release of risk adjustment and the amortization of CSM for the period. Insurance revenue excludes the portion of premiums that cover repayment of investment components.
Net investment income is comprised of interest income, dividends, realized and unrealized gains and losses, and other investment income earned on general fund assets. Net investment income, such as net rental income, fair value changes, and foreign exchange gains (losses) are also earned from non-financial instruments. Net investment income can experience volatility arising from the quarterly fluctuation in the
82 December 31, 2023 Sun Life Financial Inc. MANAGEMENT'S DISCUSSION & ANALYSIS value of FVTPL assets and foreign currency changes on assets and liabilities, which may in turn affect the comparability of revenue from period to period.
The change in fair value of FVTPL assets is driven largely by market-related factors such as interest rates, credit spreads and equity returns. The debt and equity securities that support insurance contract liabilities are generally designated or classified as FVTPL and changes in fair values of these assets are recorded in net investment income in our Consolidated Statements of Operations. Changes in the fair values of the FVTPL assets supporting insurance contract liabilities are largely offset by a corresponding change in the liabilities excluding those for account of segregated fund holders.
Fee income includes distribution fees, fund management and other asset-based fees, primarily earned in the Asset Management segment. Fee income also includes administrative service and other fees primarily earned in the Canada and U.S. segments. Premium and deposit equivalents from administrative services only ("ASO"), as well as deposits received by the Company on investment contracts such as segregated funds, mutual funds and managed funds are not included in revenue; however, the Company does receive fee income from these contracts, which is included in revenue. Fee income and ASO premium and deposit equivalents are an important part of our business and as a result, revenue does not fully represent sales and other activity taking place during the respective periods.
|
|
|
|
|
|
|
|
|
|
|
|
|
|
|
| ($ millions) |
|
|
|
2023 |
2022 |
| Insurance revenue |
|
|
|
|
|
| Annuities |
|
|
|
2,258 |
2,244 |
| Life insurance |
|
|
|
5,356 |
5,220 |
| Health insurance |
|
|
|
13,742 |
11,438 |
| Total insurance revenue |
|
|
|
21,356 |
18,902 |
| Net Investment income (loss) |
|
|
|
11,586 |
(20,580) |
| Fee income |
|
|
|
7,832 |
7,447 |
| Total revenue |
|
|
|
40,774 |
5,769 |
2023 vs. 2022
Total revenue increased by $35.0 billion, primarily driven by higher net investment income from fair value changes of invested asset and higher insurance revenue. Foreign exchange translation increased revenue by $0.7 billion. By business group, revenue reflected higher net investment income in Canada, Asia, the U.S., and Corporate, and higher insurance revenue primarily in the U.S.
Insurance revenue increased $2.5 billion or 13%, primarily driven by higher health insurance revenue in the U.S.
Net investment income increased $32.2 billion mainly from fair value changes of invested assets reflecting the impact of interest rates, credit spreads, and equity markets.
Fee income increased $0.4 billion or 5%, reflecting higher fee income in SLC Management, partially offset by lower fee income in our other wealth and asset management businesses
iii. Expenses
|
|
|
|
|
|
|
|
|
| ($ millions) |
2023 |
2022 |
| Expenses |
|
|
| Insurance service expenses |
18,450 |
|
16,456 |
|
Reinsurance contract held net (income) expense |
69 |
|
153 |
|
Insurance finance (income) expenses from insurance contracts issued |
9,675 |
|
(22,595) |
|
Reinsurance finance (income) expenses |
(59) |
|
440 |
|
(Decrease) increase in investment contract liabilities |
331 |
|
152 |
|
Other income |
(169) |
|
— |
|
| Interest expenses |
552 |
|
445 |
|
| Operating expenses and commissions |
7,995 |
|
7,092 |
|
| Total expenses |
36,844 |
|
2,143 |
|
Total expenses of $36.8 billion increased $34.7 billion in 2023 compared to the prior year, primarily reflecting higher insurance finance expenses from insurance contracts issued.
Insurance service expenses of $18.5 billion increased $2.0 billion or 12% in 2023 compared to the prior year, primarily driven by increases in the U.S.
Reinsurance contract held net expense decreased by $0.1 billion in 2023 compared to the prior year, primarily driven by Canada.
Insurance finance expenses from insurance contracts issued of $9.7 billion increased $32.3 billion in 2023, primarily driven by Canada, Asia and the U.S.
Reinsurance finance income was $59 million compared to an expense of $440 million in the prior year, mostly driven by income from reinsurance in the U.S.
Changes in investment contract liabilities increased $179 million, primarily driven by Canada.
MANAGEMENT'S DISCUSSION & ANALYSIS Sun Life Financial Inc. December 31, 2023 83
Other income relates to the sale of Sun Life UK and the sale of the sponsored markets business. For additional information, refer to Note 3 of our 2023 Annual Consolidated Financial Statements.
Interest expenses of $0.6 billion increased $0.1 billion or 24% in 2023 compared to the prior year.
Operating expenses and commissions increased $0.9 billion or 13% in 2023 compared to the prior year, driven by Asset Management, Canada, the U.S. and $191 million of unfavourable foreign exchange translation. For additional information, see Note 17 of our 2023 Annual Consolidated Financial Statements.
iv. Taxes
Income Taxes
In 2023, we had an income tax expense of $461 million on reported net income before taxes of $3,930 million, which resulted in an effective income tax rate of 11.7% (2022 - $546 million, $3,626 million, and 15.0%, respectively).
On an underlying basis(1), in 2023, we had an income tax expense of $811 million on our underlying net income before taxes of $4,685 million, representing an effective income tax rate of 17.3% which is within our expected range of 15% to 20% (2022 - $637 million, $4,127 million, and 15.5%, respectively).
See section D - Profitability - 5 - Income taxes in this document for additional information on our effective tax rates.
Other Taxes
In addition to income taxes, we pay various indirect taxes in jurisdictions in which we carry on business. Indirect taxes include premium taxes, investment income tax, payroll related taxes, property taxes, sales taxes, business taxes and other taxes, as follows:
|
|
|
|
|
|
|
|
|
| ($ millions) |
2023 |
2022 |
| Income tax expense |
461 |
546 |
| Indirect taxes |
|
|
Premium taxes (net of premium taxes on ceded business)(1) |
532 |
453 |
| Payroll taxes |
241 |
221 |
| Property taxes |
136 |
130 |
| Goods and services tax ("GST"), harmonized tax ("HST") and other sales taxes |
124 |
130 |
| Business taxes and other |
54 |
50 |
| Total indirect taxes |
1,087 |
984 |
| Total taxes |
1,548 |
1,530 |
|
|
|
|
|
|
(1) Premium taxes include investment income tax.
3. Items related to Statements of Financial Position
i. Changes in items related to the Statement of Financial Position
Total general fund assets was $204.8 billion as at December 31, 2023 (December 31, 2022 - $198.3 billion), primarily reflecting an increase in the fair value of invested assets driven by declining interest rates.
The net liabilities balance for insurance contracts issued(2) was $135.5 billion as at December 31, 2023 (December 31, 2022 - $131.2 billion), primarily reflecting insurance finance income and expenses and cashflows, partially offset by dispositions and the change in insurance service result.
Total shareholders' equity, including preferred shares and other equity instruments, is $23.6 billion as at December 31, 2023 (December 31, 2022 - $22.5 billion). The change in total shareholders' equity included:
(i)total shareholders' net income of $3,165 million, before preferred share dividends of $79 million; and
(ii)net unrealized gains on FVOCI assets of $485 million; partially offset by
(iii)common share dividend payments of $1,762 million;
(iv)unfavourable impacts from foreign exchange translation of $344 million included in other comprehensive income (loss) ("OCI");
(v)a decrease of $186 million from the repurchase and cancellation of common shares; and
(vi)the impact related to the AAM acquisition of $156 million(3).
As at January 26, 2024, SLF Inc. had 584,631,371 common shares, 3,428,382 options to acquire SLF Inc. common shares, and 52,200,000 Class A Shares outstanding.
(1)Our effective income tax rate on underlying net income is calculated using underlying net income and income tax expense associated with underlying net income, which excludes amounts attributable to participating policyholders.
(2)For more information about the changes in the net insurance contract liabilities, refer to Notes 10.A and 10.B of the 2023 Annual Consolidated Financial Statements.
(3)The acquisition of a majority stake in Advisors Asset Management, Inc. ("AAM acquisition"). For additional information, refer to Note 3 in our 2023 Annual Consolidated Financial Statements.
84 December 31, 2023 Sun Life Financial Inc. MANAGEMENT'S DISCUSSION & ANALYSIS In the normal course of business, we are engaged in a variety of financial arrangements.
ii. Off-Balance Sheet Arrangements
The principal purposes of these arrangements are to earn management fees and additional spread on a matched book of business and to reduce financing costs.
While most of these activities are reflected on our balance sheet with respect to assets and liabilities, certain of them are either not recorded on our balance sheet or are recorded on our balance sheet in amounts that differ from the full contract or notional amounts. The types of off-balance sheet activities we undertake primarily include asset securitizations and securities lending. For more information, see Note 5 in our 2023 Annual Consolidated Financial Statements.
iii. Goodwill and Intangibles Impairment
The Company completed its annual goodwill and indefinite life intangible asset impairment testing in the fourth quarter of 2023. Impairment charges on goodwill of $nil were recognized in 2023 (2022 - $170 million). Impairment charges on intangible assets of $5 million were recognized in 2023 (2022 - $18 million).
iv. Commitments, Guarantees, Contingencies and Reinsurance Matters
In the normal course of business, we enter into leasing agreements, outsourcing arrangements and agreements involving indemnities to third parties. We are also engaged in arbitration proceedings from time to time with certain companies that have contracts to provide reinsurance to the Company. Information regarding our commitments, guarantees and contingencies are summarized in Note 22 of our 2023 Annual Consolidated Financial Statements. A table summarizing our significant financial liabilities and contractual obligations can be found in this MD&A in the section K - Risk Management - 9 - Risk Categories - vi - Liquidity Risk.
MANAGEMENT'S DISCUSSION & ANALYSIS Sun Life Financial Inc. December 31, 2023 85
4. Fourth Quarter 2023 Profitability
The following table reconciles our Common shareholders' net income ("reported net income") and underlying net income in the fourth quarter of 2023 and 2022. All factors discussed in this document that impact underlying net income are also applicable to reported net income. Certain adjustments and notable items also impact the CSM, such as mortality experience and assumption changes; see section F - Contractual Service Margin in this document for more information.
|
|
|
|
|
|
|
|
|
|
|
|
| ($ millions, after-tax) |
Q4'23 |
|
Q4'22(1) |
Underlying net income by business type(2): |
|
|
|
| Wealth & asset management |
439 |
|
412 |
| Group - Health & Protection |
365 |
|
321 |
| Individual - Protection |
284 |
|
231 |
| Corporate expenses & other |
(105) |
|
(72) |
Underlying net income(2) |
983 |
|
892 |
Add: Market-related impacts(1) |
(193) |
|
224 |
Assumption changes and management actions |
(1) |
|
12 |
Other adjustments |
(40) |
|
37 |
| Reported net income - Common shareholders |
749 |
|
1,165 |
Underlying ROE(2) |
18.4% |
|
17.7% |
Reported ROE(2) |
14.0% |
|
23.2% |
Notable items attributable to reported and underlying net income(2): |
|
|
|
| Mortality |
(5) |
|
(43) |
| Morbidity |
91 |
|
110 |
Lapse and other policyholder behaviour |
(11) |
|
(1) |
| Expenses |
(26) |
|
(4) |
Credit(3) |
(18) |
|
(11) |
Other(4) |
(2) |
|
17 |
(1)2022 restated results may not be fully representative of our future earnings profile, as we were not managing our asset and liability portfolios under the new standards. See the heading "Note to Readers: 2022 Restated Results on Adoption of IFRS 17 and IFRS 9" in section A - How We Report Our Results in this document.
(2)Represents a non-IFRS financial measure. For more details, see section M - Non-IFRS Financial Measures in this document. For more information about business types in Sun Life's business groups, see Section A - How We Report Our Results in this document.
(3)Credit includes rating changes on assets measured at FVTPL, and the ECL impact for assets measured at FVOCI.
(4)Other notable items are recorded in Net Insurance Service Result and Net Investment Result in the Drivers of Earnings analysis. For more details, see section M - Non-IFRS Financial Measures in this document.
Quarterly Comparison - Q4'23 vs. Q4'22
Underlying net income(1) of $983 million increased $91 million or 10%, driven by:
•Wealth & asset management(1) up $27 million: Higher Asset Management fee-related earnings and higher investment income driven by volume growth and an increase in yields.
•Group - Health & Protection(1) up $44 million: Business premium growth in the U.S. and Canada, improved disability experience in Canada, and higher investment contributions in the U.S., partially offset by lower results in U.S. Dental.
•Individual - Protection(1) up $53 million: Business growth reflecting good sales momentum in Asia, and higher investment contributions in Canada, partially offset by lower earnings due to the sale of Sun Life UK(2).
•Corporate expenses & other(1) $(33) million increase in net loss driven by higher operating expenses reflecting business growth and continued investments in the business, partially offset by a lower effective tax rate.
•Higher earnings on surplus primarily driven by higher net interest income and lower realized losses.
Reported net income of $749 million decreased $416 million or 36%, driven by:
•Unfavourable market-related impacts primarily reflecting interest rates and real estate experience(2);
•The prior year impact of the Canada Tax Rate Change(2); and
•Fair value changes in management's ownership of MFS shares; partially offset by
•The increase in underlying net income;
•The impact of the Bermuda Corporate Income Tax Change(2); and
•Lower DentaQuest integration costs.
Foreign exchange translation led to an increase of $2 million and $3 million in underlying net income and reported net income, respectively.
(1)Refer to section D - Profitability in this document for more information on notable items attributable to reported and underlying net income items and section M - Non-IFRS Financial Measures in this document for a reconciliation between reported net income and underlying net income. For more information about the business types in Sun Life's operating segments/business groups, see section A - How We Report Our Results in this document.
(2)Refer to section D - Profitability in this document for more information on the sale of Sun Life UK, real estate experience, the Canada Tax Rate Change and the Bermuda Corporate Income Tax Change.
86 December 31, 2023 Sun Life Financial Inc. MANAGEMENT'S DISCUSSION & ANALYSIS The Q4'23 effective income tax rate (recovery)(1) on underlying net income and reported net income was 16.5% and (11.1)% respectively.
Our reported effective tax rate for the quarter represents a tax recovery. Declining interest rates led to higher tax-exempt investment income. We also recorded a $51 million tax recovery from establishing an economic transition deferred tax asset permitted under the new Bermuda Corporate Income Tax regime. These adjustments recorded in Q4'23 resulted in a net tax recovery.
Performance by Business Group - Fourth Quarter
We manage our operations and report our financial results in five business segments. The following section describes the operations and financial performance of Asset Management, Canada, U.S., Asia and Corporate.
The following table sets out the differences between our underlying net income (loss) and reported net income (loss) by business group.
|
|
|
|
|
|
|
|
|
|
|
|
|
|
|
|
|
|
|
|
|
|
Q4'23 |
| ($ millions) |
Asset
Management |
Canada |
U.S. |
Asia |
Corporate |
Total |
| Underlying net income (loss) |
331 |
350 |
253 |
143 |
(94) |
983 |
| Add: Market-related impacts (pre-tax) |
(11) |
(223) |
(60) |
(142) |
— |
(436) |
| ACMA (pre-tax) |
— |
72 |
(65) |
(1) |
— |
6 |
| Other adjustments (pre-tax) |
(39) |
(6) |
(65) |
(8) |
— |
(118) |
Tax expense (benefit) |
16 |
155 |
38 |
52 |
53 |
314 |
| Reported net income (loss) - Common shareholders |
297 |
348 |
101 |
44 |
(41) |
749 |
|
|
|
|
|
|
|
|
|
|
|
|
|
|
|
|
|
|
|
|
|
|
|
|
|
|
|
|
|
|
|
|
|
|
|
|
|
|
|
|
|
|
|
|
|
Q4'22(1) |
| Underlying net income (loss) |
324 |
265 |
230 |
135 |
(62) |
892 |
Add: Market-related impacts (pre-tax)(1) |
(8) |
250 |
21 |
(110) |
26 |
179 |
| ACMA (pre-tax) |
— |
(185) |
71 |
71 |
17 |
(26) |
| Other adjustments (pre-tax) |
1 |
(5) |
(135) |
15 |
(17) |
(141) |
Tax expense (benefit) |
4 |
128 |
15 |
(19) |
133 |
261 |
| Reported net income (loss) - Common shareholders |
321 |
453 |
202 |
92 |
97 |
1,165 |
(1)2022 restated results may not be fully representative of our future earnings profile, as we were not managing our asset and liability portfolios under the new standards. See the heading "Note to Readers: 2022 Restated Results on Adoption of IFRS 17 and IFRS 9" in section A - How We Report Our Results in this document.
Quarterly Comparison - Q4'23 vs. Q4'22
Asset Management
Asset Management underlying net income of $331 million increased $7 million or 2% driven by:
•MFS down $15 million (down US$11 million): Higher expenses offset by higher fee income from average net assets ("ANA"). The MFS pre-tax net operating profit margin(2) was 39% for Q4'23, compared to 40% in the prior year.
•SLC Management up $22 million: The increase in underlying net income was driven by higher fee-related earnings and higher net seed investment income. Fee-related earnings(2) increased 26% driven by higher AUM, reflecting strong capital raising and deployment across the platform and the AAM acquisition(3). Fee-related earnings margin(2) and pre-tax net operating profit margin(2) for Q4'23 were 24% and 22%, respectively (Q4'22 - 24% and 23%, respectively).
Asset Management reported net income of $297 million decreased $24 million or 7%, largely reflecting fair value changes in management's ownership of MFS shares.
Canada
Underlying net income of $350 million increased $85 million or 32%, reflecting:
•Wealth & asset management up $20 million: Increase in investment income driven by higher volume and yields.
•Group - Health & Protection up $57 million: Business premium growth and improved disability experience reflecting higher margins, lower claims volumes, and shorter claims durations.
•Individual - Protection up $8 million: Higher investment contributions partially offset by unfavourable mortality experience.
•Higher earnings on surplus, primarily driven by realized gains in the current year.
Reported net income of $348 million decreased $105 million or 23%, driven by market-related impacts primarily from interest rates and real estate experience, and the prior year impact of the Canada Tax Rate Change(4), partially offset by ACMA impacts and the increase in underlying net income.
(1)Our effective income tax rate on reported net income is calculated using Total income (loss) before income taxes, as detailed in Note 19 in our 2023 Annual Consolidated Financial Statements. Our effective income tax rate on underlying net income is calculated using pre-tax underlying net income, as detailed in section M - Non-IFRS Financial Measures in this document, and the associated income tax expense.
(2)Represents a non-IFRS financial measure. For more details, see section M - Non-IFRS Financial Measures in this document.
(3)On February 1, 2023, we completed the acquisition of a majority stake interest in Advisors Asset Management, Inc. ("the AAM acquisition"), a leading independent U.S. retail distribution firm, with the option to acquire the remaining interest starting in 2028.
(4)On December 15, 2022, legislation implementing an additional surtax of 1.5% applicable to banks and life insurer's taxable income in excess of $100 million was enacted in Canada ("Canada Tax Rate Change"). This legislation applied retroactively to the Federal Budget date of April 7, 2022. As a result, Canada reported net income increased by $90 million in Q4'22, reflected in Other adjustments.
MANAGEMENT'S DISCUSSION & ANALYSIS Sun Life Financial Inc. December 31, 2023 87
U.S.
Underlying net income of US$187 million increased US$14 million or 8%, driven by:
•Group - Health & Protection down US$7 million: Lower Dental results reflecting the impact of Medicaid redeterminations following the end of the Public Health Emergency, partially offset by higher Group Benefits results. In Group Benefits, strong revenue growth, higher net investment results and favourable mortality experience was partially offset by less favourable morbidity experience.
•Individual - Protection up US$21 million: The inclusion of the UK payout annuity business(1) and improved mortality experience.
Reported net income of US$77 million decreased US$74 million or 49%, driven by ACMA impacts, and market-related impacts largely from interest rates and real estate experience, partially offset by lower DentaQuest integration costs and the increase in underlying net income.
Asia
Underlying net income of $143 million increased $8 million or 6%, driven by:
•Individual - Protection up $20 million: Business growth reflecting good sales momentum, partially offset by lower earnings on surplus.
•Regional office expenses & other $(12) million increased net loss primarily reflecting continued pan Asia investments in the business.
Reported net income of $44 million decreased $48 million or 52%, driven by ACMA impacts, partially offset by the impact of the Bermuda Corporate Income Tax Change(2).
Corporate
Underlying net loss was $94 million compared to underlying net loss of $62 million in the prior year, driven by the sale of Sun Life UK(1) and higher operating expenses, partially offset by a lower effective tax rate.
Reported net loss was $41 million compared to $97 million reported net income in the prior year, reflecting the impacts from the sale of Sun Life UK (1), the prior year impact of tax-related matters(3), and the change in underlying net loss.
5. Fourth Quarter 2023 Growth
Revenue of $18.7 billion increased $10.2 billion compared to the same period in 2022, primarily reflecting fair value changes in invested assets driven by declining interest rates. Foreign exchange translation increased revenue by $30 million.
(1)On April 3, 2023, we completed the sale of SLF of Canada UK Limited to Phoenix Group Holdings plc ("the sale of Sun Life UK"). Under the agreement, we will retain our economic interest in the payout annuities business through a reinsurance treaty, which, effective Q2'23 is recorded in In-force Management within the U.S. business group. For additional information, refer to Note 3 of our 2023 Annual Consolidated Financial Statements.
(2)On December 27, 2023, Bermuda enacted its Corporate Income Tax Act 2023, which will apply a 15% income tax beginning on January 1, 2025 ("Bermuda Corporate Income Tax Change"). The enacted legislation provides an economic transition adjustment that aligns an entity’s starting point for the tax regime more closely with its economic position prior to the application of the Corporate Income Tax 2023. The benefit of this economic transition adjustment has been recognized in 2023. As a result, reported net income increased by $51 million in the fourth quarter, reflected in Other adjustments.
(3)Tax related matters include tax-exempt investment income in reported net income in both years and the impact of the Canada Tax Rate Change. On December 15, 2022, legislation implementing an additional surtax of 1.5% applicable to banks and life insurer's taxable income in excess of $100 million was enacted in Canada ("Canada Tax Rate Change"). This legislation applied retroactively to the Federal Budget date of April 7, 2022. As a result, Corporate reported net income increased by $51 million in Q4'22, reflected in Other adjustments.
88 December 31, 2023 Sun Life Financial Inc. MANAGEMENT'S DISCUSSION & ANALYSIS The following table provides a summary of our results for the eight most recently completed quarters.
6. Quarterly Financial Results
A more complete discussion of our historical quarterly results can be found in our Interim and Annual MD&A for the relevant periods.
|
|
|
|
|
|
|
|
|
|
|
|
|
|
|
|
|
|
|
|
|
|
|
|
|
|
|
|
|
|
|
|
|
|
|
|
|
|
|
|
Quarterly results |
|
IFRS 17 and IFRS 9(1) |
IFRS 4 and IAS 39(1) |
| ($ millions, unless otherwise noted) |
Q4'23 |
Q3'23 |
Q2'23 |
Q1'23 |
Q4'22 |
Q3'22 |
Q2'22 |
Q1'22 |
Q4'22 |
Q3'22 |
Q2'22 |
Q1'22 |
| Total revenue |
18,684 |
2,439 |
7,668 |
11,983 |
8,494 |
4,901 |
(2,967) |
(4,659) |
12,301 |
8,630 |
2,011 |
380 |
| Common shareholders' net income (loss) |
Underlying net income(2) |
983 |
930 |
920 |
895 |
892 |
949 |
808 |
720 |
990 |
949 |
892 |
843 |
Add: Market-related impacts |
(193) |
23 |
(220) |
(64) |
224 |
(361) |
118 |
(2) |
(136) |
(160) |
(152) |
38 |
| ACMA |
(1) |
35 |
7 |
(5) |
12 |
(131) |
(22) |
(27) |
54 |
7 |
— |
1 |
Other adjustments |
(40) |
(117) |
(47) |
(20) |
37 |
(346) |
26 |
(26) |
43 |
(330) |
45 |
(24) |
Reported net income - Common shareholder |
749 |
871 |
660 |
806 |
1,165 |
111 |
930 |
665 |
951 |
466 |
785 |
858 |
| Diluted EPS ($) |
Underlying(2) |
1.68 |
1.59 |
1.57 |
1.52 |
1.52 |
1.62 |
1.38 |
1.23 |
1.69 |
1.62 |
1.52 |
1.44 |
Reported |
1.28 |
1.48 |
1.12 |
1.37 |
1.98 |
0.19 |
1.58 |
1.13 |
1.62 |
0.80 |
1.34 |
1.46 |
| Basic reported EPS ($) |
| Reported |
1.28 |
1.49 |
1.12 |
1.37 |
1.99 |
0.19 |
1.59 |
1.13 |
1.62 |
0.80 |
1.34 |
1.46 |
Underlying net income (loss) by segment(2) |
| Asset Management |
331 |
330 |
296 |
282 |
324 |
298 |
295 |
321 |
313 |
295 |
270 |
326 |
| Canada |
350 |
338 |
372 |
316 |
265 |
293 |
299 |
206 |
324 |
300 |
344 |
298 |
| U.S. |
253 |
185 |
215 |
237 |
230 |
227 |
134 |
107 |
240 |
216 |
154 |
118 |
| Asia |
143 |
166 |
150 |
141 |
135 |
153 |
118 |
133 |
152 |
175 |
148 |
152 |
| Corporate |
(94) |
(89) |
(113) |
(81) |
(62) |
(22) |
(38) |
(47) |
(39) |
(37) |
(24) |
(51) |
Total underlying net income (loss)(2) |
983 |
930 |
920 |
895 |
892 |
949 |
808 |
720 |
990 |
949 |
892 |
843 |
Add: Market-related impacts (pre-tax) |
(436) |
107 |
(298) |
(99) |
179 |
(400) |
282 |
172 |
(273) |
(212) |
(109) |
193 |
| ACMA (pre-tax) |
6 |
41 |
11 |
(5) |
(26) |
(153) |
(30) |
(30) |
67 |
15 |
— |
1 |
Other adjustments
(pre-tax) |
(118) |
(156) |
(89) |
(10) |
(141) |
(385) |
29 |
(29) |
(88) |
(362) |
57 |
(26) |
| Tax expense (benefit) on above items |
314 |
(51) |
116 |
25 |
261 |
100 |
(159) |
(168) |
255 |
76 |
(55) |
(153) |
Reported net income (loss) by segment - Common shareholders |
Asset Management |
297 |
268 |
248 |
254 |
321 |
218 |
298 |
311 |
322 |
215 |
296 |
308 |
Canada |
348 |
365 |
210 |
329 |
453 |
56 |
476 |
256 |
367 |
210 |
160 |
263 |
U.S. |
101 |
132 |
175 |
168 |
202 |
125 |
149 |
56 |
110 |
94 |
213 |
169 |
Asia |
44 |
211 |
122 |
134 |
92 |
— |
7 |
111 |
98 |
125 |
131 |
161 |
Corporate |
(41) |
(105) |
(95) |
(79) |
97 |
(288) |
— |
(69) |
54 |
(178) |
(15) |
(43) |
Total reported net income (loss) - Common shareholders |
749 |
871 |
660 |
806 |
1,165 |
111 |
930 |
665 |
951 |
466 |
785 |
858 |
(1)IFRS 17 and IFRS 9 were adopted on January 1, 2023, see Note 2 of the 2023 Annual Consolidated Financial Statements for the period ended
December 31, 2023.
(2)Represents a non-IFRS financial measure. For more details, see section M - Non-IFRS Financial Measures in this document.
Third Quarter 2023
Underlying net income of $930 million decreased $19 million or 2%, driven by:
•Wealth & asset management up $38 million: Higher investment income driven by volume growth and an increase in yields, and higher Asset Management fee-related earnings.
•Group - Health & Protection up $4 million: Strong revenue growth across all U.S. businesses and better disability experience in Canada, largely offset by health and protection experience in the U.S., and lower fee-related earnings in Canada.
•Individual - Protection down $8 million: Lower earnings due to the sale of Sun Life UK, and lower net investment results in the U.S., partially offset by business growth reflecting good sales momentum during the past year in Asia.
•Corporate expenses & other $(53) million increase in net loss includes higher debt financing costs.
•Higher expenses across business types were driven by volume growth, continued investments in the business, and higher incentive compensation.
Reported net income of $871 million increased $760 million, driven by favourable market-related impacts primarily reflecting interest rates partially offset by real estate experience, a $170 million charge related to the sale of Sun Life UK and a higher increase in SLC Management's acquisition-related liabilities in the prior year, and ACMA impacts; partially offset by air value changes in management's ownership of MFS shares.
MANAGEMENT'S DISCUSSION & ANALYSIS Sun Life Financial Inc. December 31, 2023 89
Second Quarter 2023
Underlying net income of $920 million increased $112 million or 14%, driven by:
•Wealth & asset management down $1 million: Higher investment income driven by volume growth and an increase in yields was largely offset by lower fee-based earnings in MFS, reflecting equity market declines over the past year, as well as higher expenses in Canada.
•Group - Health & Protection up $122 million: Strong performance driven by good premium growth and better disability experience in Canada and the U.S., as well as a full quarter of DentaQuest contributions.
•Individual - Protection up $50 million: Higher premiums reflecting good sales momentum during the past year in Asia, and improved insurance experience in Canada and the U.S.
•Corporate expenses & other $(59) million increased net loss driven by higher operating expenses including incentive compensation and an increase in debt financing costs.
•Higher earnings on surplus reflecting an increase in realized gains and net interest income from higher rates.
Reported net income of $660 million decreased $270 million or 29%, driven by market-related impacts primarily reflecting interest rates and real estate investments, the prior year gain on the sale-leaseback of the Wellesley office in the U.S., and fair value changes in management's ownership of MFS shares; partially offset by the increase in underlying net income.
First Quarter 2023
Underlying net income of $895 million increased $175 million or 24%, driven by:
•Wealth & asset management down $11 million: Lower fee-based earnings in MFS, Canada, and Asia, reflecting equity market declines, largely offset by an increase in investment income driven by higher volumes and yields.
•Group - Health & Protection up $180 million: Strong performance including premium growth, improved disability in Canada and the U.S., strong medical stop-loss margins, and improved U.S. mortality. DentaQuest results also contributed to the increase.
•Individual - Protection up $42 million: Higher premiums reflecting good sales momentum during the past year, and improved mortality in Asia.
•Corporate Support & other $(36) million increased net loss: Higher operating expenses including long-term incentive compensation and IFRS 17 project spend, as well as an increase in debt financing costs.
•Higher investment income reflecting an increase in realized gains from surplus assets and net interest income from higher rates.
Reported net income of $806 million increased $141 million or 21%, driven by the increase in underlying net income and gain on the sale of the sponsored markets business in Canada, partially offset by market-related impacts, and DentaQuest integration and SLC Management acquisition-related costs.
Fourth Quarter 2022(1)
Reported net income of $951 million decreased $127 million or 12%, primarily reflecting unfavourable market-related impacts and DentaQuest integration costs, partially offset by the impact of the Canada Tax Rate Change, fair value changes on MFS' share-based payment awards and ACMA. Prior year reported net income included a gain on the initial public offering ("IPO") of our India asset management joint venture partially offset by an increase to SLC Management's acquisition-related liabilities. Underlying net income of $990 million increased $92 million or 10%, driven by business growth and experience in protection and health and contribution from the DentaQuest acquisition. This was partially offset by lower wealth and asset management earnings reflecting declines in global equity markets, and a higher effective tax rate compared to prior year.
Third Quarter 2022(1)
Reported net income of $466 million decreased $553 million or 54% from prior year, primarily reflecting unfavourable market-related impacts, a $170 million charge related to the sale of Sun Life UK, less favourable ACMA impacts, and an increase in SLC Management's acquisition-related liabilities, partially offset by fair value changes on MFS' share-based payment awards. Underlying net income of $949 million increased $47 million or 5%, driven by business growth and experience in protection and health including a strong contribution from the DentaQuest acquisition. This was partially offset by lower fee-based income in wealth and asset management, mainly driven by declines in global equity markets.
Second Quarter 2022(1)
Q2'22 reported net income of $785 million decreased $115 million or 13%, reflecting unfavourable market-related impacts and DentaQuest acquisition costs, partially offset by fair value changes on MFS' share-based payment awards and a gain on the sale-leaseback of our Wellesley office in the U.S. Underlying net income of $892 million was up slightly driven by business growth, new business gains, contribution from the DentaQuest acquisition, and lower incentive compensation expenses. This was largely offset by Asset Management results reflecting a decline in global equity markets driving lower average net assets, lower available-for-sale gains and morbidity experience in the U.S. Foreign exchange translation led to an increase of $16 million and $12 million in reported net income and underlying net income, respectively.
First Quarter 2022(1)
Q1'22 reported net income of $858 million decreased $79 million or 8%, driven by less favourable market-related impacts, partially offset by a Q1'21 restructuring charge and lower fair value changes on MFS' share-based payment awards. Underlying net income of $843 million was down slightly, driven by broad-based business growth, favourable expense experience and investment gains, offset by unfavourable mortality and morbidity experience, and lower AFS gains.
(1)This paragraph compares the results in two periods that preceded January 1, 2023 (prior to the adoption of IFRS 17 and IFRS 9), thus IFRS 4 and IAS 39 were the accounting standards in effect at the time. Refer to the results in the table above under the heading "IFRS 4 and IAS 39".
90 December 31, 2023 Sun Life Financial Inc. MANAGEMENT'S DISCUSSION & ANALYSIS The following table provides the reconciliation of the Drivers of Earnings ("DOE") analysis to the Statement of Operations total net income.
|
|
|
|
|
|
| M. Non-IFRS Financial Measures |
|
1. Common Shareholders' View of Reported Net Income
The DOE analysis provides additional detail on the sources of earnings, primarily for protection and health businesses, and explains the actual results compared to the longer term expectations. The underlying DOE and reported DOE are both presented on a common shareholders' basis by removing the allocations to participating policyholders.
|
|
|
|
|
|
|
|
|
|
|
|
|
|
|
|
|
|
|
|
|
|
|
| ($ millions) |
2023 |
| Statement of Operations |
Underlying DOE(1) |
Non-underlying adjustments(1) |
Common Shareholders' Reported DOE(2)(3) |
Adjustment for: |
Reported
(per IFRS) |
Par(2) |
Net(3) |
| Net insurance service result |
2,979 |
|
(29) |
2,950 |
|
149 |
|
(262) |
2,837 |
|
| Net investment result |
1,710 |
|
(682) |
1,028 |
|
94 |
|
517 |
1,639 |
|
ACMA(3) |
|
53 |
|
53 |
|
— |
|
(53) |
|
| Fee Income: |
|
|
|
|
|
|
| Asset Management |
1,677 |
|
(270) |
1,407 |
|
|
(1,407) |
|
| Other fee income |
247 |
|
12 |
|
259 |
|
(15) |
7,588 |
|
7,832 |
|
| Fee income |
|
|
|
|
|
7,832 |
|
| Other expenses |
(1,928) |
(167) |
|
(2,095) |
— |
|
(6,283) |
(8,378) |
| Income before taxes |
4,685 |
|
(1,083) |
3,602 |
|
228 |
|
100 |
|
3,930 |
|
| Income tax (expense) benefit |
(811) |
404 |
|
(407) |
(50) |
(4) |
(461) |
| Total net income |
3,874 |
|
(679) |
3,195 |
|
178 |
|
96 |
|
3,469 |
|
Allocated to Participating and NCI(4) |
(67) |
37 |
|
(30) |
(178) |
(96) |
(304) |
Dividends and Distributions(5) |
(79) |
— |
|
(79) |
— |
|
— |
|
(79) |
Underlying net income(1) |
3,728 |
|
|
|
|
|
|
| Reported net income - Common shareholders |
|
(642) |
3,086 |
|
— |
|
— |
|
3,086 |
|
|
|
|
|
|
|
|
|
|
|
|
|
|
|
|
|
|
|
|
|
|
|
|
| ($ millions) |
2022 |
| Statement of Operations |
Underlying DOE(1) |
Non-underlying adjustments(1) |
Common Shareholders' Reported DOE(2)(3) |
Adjustment for: |
Reported
(per IFRS) |
Par(2) |
Net(3) |
| Net insurance service result |
2,376 |
|
(75) |
2,301 |
|
18 |
(26) |
2,293 |
|
| Net investment result |
1,237 |
|
356 |
|
1,593 |
|
11 |
|
(181) |
1,423 |
|
ACMA(3) |
|
(239) |
(239) |
— |
|
239 |
|
|
| Fee income: |
|
|
|
|
|
|
| Asset Management |
1,651 |
|
(119) |
1,532 |
|
|
(1,532) |
|
| Other fee income |
298 |
|
— |
|
298 |
|
— |
|
7,149 |
|
7,447 |
|
| Fee income |
|
|
|
|
|
7,447 |
|
| Other expenses |
(1,435) |
(470) |
(1,905) |
— |
|
(5,632) |
(7,537) |
| Income before taxes |
4,127 |
|
(547) |
3,580 |
|
29 |
|
17 |
3,626 |
|
| Income tax (expense) benefit |
(637) |
34 |
(603) |
55 |
|
2 |
|
(546) |
| Total net income |
3,490 |
|
(513) |
2,977 |
|
84 |
|
19 |
|
3,080 |
|
Allocated to Participating and NCI(4) |
(51) |
15 |
|
(36) |
(84) |
(19) |
(139) |
Dividends and Distributions(5) |
(70) |
— |
|
(70) |
— |
|
— |
|
(70) |
Underlying net income(1) |
3,369 |
|
|
|
|
|
|
| Reported net income - Common shareholders |
|
(498) |
2,871 |
|
— |
|
— |
|
2,871 |
|
(1)For a breakdown of non-underlying adjustments made to arrive at underlying net income as well as the underlying DOE analysis, see the heading "Underlying Net Income and Underlying EPS" below.
(2)Removes the components attributable to the participating policyholders.
(3)Certain amounts within the Drivers of Earnings are presented on a net basis to reflect how management views the business, compared to a gross basis in the Consolidated Financial Statements. For more details, refer to "Drivers of Earnings" in section 3 - Additional Non-IFRS Financial Measures below. For example, in this document, the reported net income impact of ACMA is shown in aggregate for Net insurance service result and Net investment result, and excludes amounts attributable to participating policyholders and includes non-liability impacts. In contrast, Note 10.B.v of the Consolidated Financial Statements for the period ended December 31, 2023 shows the net income impacts of method and assumption changes separately in Net insurance service result and Net investment result, and includes amounts attributable to participating policyholders.
(4)Allocated to equity in the participating account and attributable to non-controlling interests.
(5)Dividends on preferred shares and distributions on other equity instruments.
MANAGEMENT'S DISCUSSION & ANALYSIS Sun Life Financial Inc. December 31, 2023 91
2. Underlying Net Income and Underlying EPS
Underlying net income is a non-IFRS financial measure that assists in understanding Sun Life's business performance by making certain adjustments to IFRS income. Underlying net income, along with common shareholders’ net income (Reported net income), is used as a basis for management planning, and is also a key measure in our employee incentive compensation programs. This measure reflects management's view of the underlying business performance of the company and long-term earnings potential. For example, due to the longer term nature of our individual protection businesses, market movements related to interest rates, equity markets and investment properties can have a significant impact on reported net income in the reporting period. However, these impacts are not necessarily realized, and may never be realized, if markets move in the opposite direction in subsequent periods or in the case of interest rates, the fixed income investment is held to maturity.
Effective January 1, 2023, we refined the definition of underlying net income as follows, and have updated prior period comparative figures to reflect these changes: (i) Market-related impacts was updated to reflect the adoption of IFRS 17 and IFRS 9; (ii) The adjustment for management’s ownership of MFS shares were updated to better reflect Sun Life’s interest in MFS’ earnings; and (iii) Removal of intangible asset amortization on acquired finite-life intangibles. Additional detail on these adjustments is provided below.
Underlying net income removes the impact of the following items from reported net income:
•Market-related impacts reflecting the after-tax difference in actual versus expected market movements, including:
i)Net interest impact from risk-free rate, credit spread, and swap spread movements, reflecting accounting mismatches between assets and liabilities:
a.Differences arising from fair value changes(1) of fixed income assets (including derivatives) measured at FVTPL supporting insurance contracts, compared to fair value changes of the liabilities(2);
b.Fair value changes of fixed income assets (including derivatives) measured at FVTPL supporting our investment contract liability and surplus portfolios(3); and
c.Tax-exempt investment income above or below expected long-term tax savings relating to our Canadian multi-national insurance operations.
ii)Non-fixed income investments where the weighted average expected return is approximately 2% per quarter, including:
a.Equity investments (including derivatives) supporting insurance contracts and surplus portfolios; and
b.Investment properties supporting insurance contracts and surplus portfolios.
•ACMA – captures the impact of method and assumption changes, and management actions on insurance and reinsurance contracts.
•Other adjustments:
i)Management’s ownership of MFS shares – this adjustment removes the change in fair value and other activity related to MFS common shares owned by management.
ii)Acquisition, integration, and restructuring - expense and income related to acquisition or disposal of a business. Also includes expenses related to restructuring activities.
iii)Intangible asset amortization - removes the amortization expense associated with finite life intangible assets arising from acquisitions or business combinations excluding amortization of software and distribution agreements.
iv)Other – represents items that are unusual or exceptional in nature which management believes are not representative of the long-term performance of the Company.
Underlying EPS (diluted). This measure is used in comparing the profitability across multiple periods and is calculated by dividing underlying net income by weighted average common shares outstanding for diluted EPS, excluding the dilutive impact of convertible instruments. For additional information about the underlying net income, see above. For additional information about the composition of the EPS, please refer to Note 25 of our 2023 Annual Consolidated Financial Statements for the period ended December 31, 2023. For additional information about the SLEECS, please refer to Note 12 of our 2023 Annual Consolidated Financial Statements.
(1)For fixed income assets, Underlying Net Income includes credit experience from rating changes on assets measured at FVTPL, and the ECL impact for assets measured at FVOCI.
(2)Underlying net income is based on observable discount curves and exchange rates at the beginning of the period.
(3)Underlying net income for earnings on surplus includes realized gains (losses) on fixed income assets classified as FVOCI.
92 December 31, 2023 Sun Life Financial Inc. MANAGEMENT'S DISCUSSION & ANALYSIS The following table sets out the post-tax amounts that were excluded from our underlying net income (loss) and underlying EPS and provides a reconciliation to our reported net income and EPS based on IFRS.
Reconciliations of Select Net Income Measures
|
|
|
|
|
|
|
|
|
|
|
|
|
|
|
| ($ millions, after-tax) |
|
|
|
2023 |
2022(1) |
| Underlying net income |
|
|
|
3,728 |
3,369 |
Market-related impacts(1) |
|
|
|
|
|
| Equity market impacts |
|
|
|
(13) |
(143) |
Interest rate impacts(2) |
|
|
|
(14) |
56 |
| Impacts of changes in the fair value of investment properties (real estate experience) |
|
|
|
(427) |
66 |
| Add: Market-related impacts |
|
|
|
(454) |
(21) |
| Add: Assumption changes and management actions |
|
|
|
36 |
(168) |
| Other adjustments |
|
|
|
|
|
| Management's ownership of MFS shares |
|
|
|
12 |
115 |
Acquisition, integration and restructuring(3)(4)(5)(6)(7) |
|
|
|
(155) |
(492) |
| Intangible asset amortization |
|
|
|
(132) |
(97) |
Other(8)(9)(10)(11) |
|
|
|
51 |
165 |
| Add: Total of other adjustments |
|
|
|
(224) |
(309) |
| Reported net income - Common shareholders |
|
|
|
3,086 |
2,871 |
| Underlying EPS (diluted) ($) |
|
|
|
6.36 |
5.75 |
| Add: Market-related impacts ($) |
|
|
|
(0.78) |
(0.04) |
| Assumption changes and management actions ($) |
|
|
|
0.06 |
(0.29) |
| Management's ownership of MFS shares ($) |
|
|
|
0.02 |
0.20 |
| Acquisition, integration and restructuring ($) |
|
|
|
(0.26) |
(0.86) |
| Intangible asset amortization ($) |
|
|
|
(0.23) |
(0.17) |
| Other ($) |
|
|
|
0.09 |
0.28 |
| Impact of convertible securities on diluted EPS ($) |
|
|
|
— |
0.02 |
| Reported EPS (diluted) ($) |
|
|
|
5.26 |
4.89 |
(1)2022 restated results may not be fully representative of our future earnings profile, as we were not managing our asset and liability portfolios under the new standards. See the heading "Note to Readers: 2022 Restated Results on Adoption of IFRS 17 and IFRS 9" in section A - How We Report Our Results in this document.
(2)Our results are sensitive to long term interest rates given the nature of our business and to non-parallel yield curve movements (for example flattening, inversion, steepening, etc.).
(3)Amounts relate to acquisition costs for our SLC Management affiliates, BentallGreenOak, InfraRed Capital Partners, Crescent Capital Group LP and Advisors Asset Management, Inc, which include the unwinding of the discount for Other financial liabilities of $86 million in 2023 ( 2022- $64 million).
(4)Reflects the changes in estimated future payments for acquisition-related contingent considerations and options to purchase remaining ownership interests of SLC Management affiliates of $42 million (2022 - $80 million).
(5)Includes acquisition and integration costs associated with DentaQuest, acquired on June 1, 2022.
(6)Includes a $65 million gain on the sale of the sponsored markets business in Canada in Q1'23 and a $19 million gain on the sale of Sun Life UK in Q2'23.
(7)Q3'22 reflects an impairment charge of $170 million pertaining to the attributed goodwill that was not expected to be recovered through the sale of Sun Life UK.
(8)Includes a charge of $48 million in Q3'22 reflecting the resolution of a matter related to reinsurance pricing for our U.S. In-force Management business, and Q2'22 reflects a gain on the sale-leaseback of the Wellesley office in the U.S.
(9)On December 15, 2022, legislation implementing an additional surtax of 1.5% applicable to banks and life insurer's taxable income in excess of $100 million was enacted in Canada ("Canada Tax Rate Change"). This legislation applied retroactively to the Federal Budget date of April 7, 2022. As a result, total Company reported net income increased by $141 million in Q4'22, reflected in Other adjustments.
(10)Q4'22 includes the unwinding of an internal reinsurance agreement.
(11)On December 27, 2023, Bermuda enacted its Corporate Income Tax Act 2023, which will apply a 15% income tax beginning on January 1, 2025 ("Bermuda Corporate Income Tax Change"). The enacted legislation provides an economic transition adjustment that aligns an entity’s starting point for the tax regime more closely with its economic position prior to the application of the Corporate Income Tax 2023. The benefit of this economic transition adjustment has been recognized in 2023. As a result, reported net income increased by $51 million in the fourth quarter, reflected in Other adjustments.
MANAGEMENT'S DISCUSSION & ANALYSIS Sun Life Financial Inc. December 31, 2023 93
The following table shows the pre-tax amount of underlying net income adjustments:
|
|
|
|
|
|
|
|
|
|
|
|
|
|
|
| ($ millions) |
|
|
|
2023 |
2022(1) |
| Underlying net income (after-tax) |
|
|
|
3,728 |
3,369 |
| Underlying net income adjustments (pre-tax): |
|
|
|
|
|
Add: Market-related impacts(1) |
|
|
|
(726) |
233 |
Assumption changes and management actions(2) |
|
|
|
53 |
(239) |
| Other adjustments |
|
|
|
(373) |
(526) |
| Total underlying net income adjustments (pre-tax) |
|
|
|
(1,046) |
(532) |
| Add: Taxes related to underlying net income adjustments |
|
|
|
404 |
34 |
| Reported net income - Common shareholders (after-tax) |
|
|
|
3,086 |
2,871 |
(1)2022 restated results may not be fully representative of our future earnings profile, as we were not managing our asset and liability portfolios under the new standards. See the heading "Note to Readers: 2022 Restated Results on Adoption of IFRS 17 and IFRS 9" in section A - How We Report Our Results in this document.
(2)In this document, the reported net income impact of ACMA is shown in aggregate for Net insurance service result and Net investment result, and excludes amounts attributable to participating policyholders and includes non-liability impacts. In contrast, Note 10.B.v of the 2023 Annual Consolidated Financial Statements shows the net income impacts of method and assumption changes separately in Net insurance service result and Net investment result, and includes amounts attributable to participating policyholders.
Taxes related to underlying net income adjustments may vary from the expected effective tax rate range reflecting the mix of business based on the Company's international operations and other tax-related adjustments.
3. Additional Non-IFRS Financial Measures
Management also uses the following non-IFRS financial measures:
After-tax profit margin for U.S. Group Benefits. This ratio expresses U.S. Group Benefits underlying net income as a percentage of net premiums. It assists in explaining our results from period to period and measures profitability. This ratio is calculated by dividing underlying net income (loss) by net premiums for the trailing four quarters. There is no directly comparable IFRS measure.
Assets under administration (in SLC Management). AUA represents Client assets for which Sun Life provides administrative services. In Asset Management, AUA includes assets distributed by SLC Management's affiliate, Advisors Asset Management, Inc. There is no directly comparable IFRS measure.
Assets under management. AUM is a non-IFRS financial measure that indicates the size of our Company's assets across asset management, wealth, and insurance. There is no standardized financial measure under IFRS. In addition to the most directly comparable IFRS measures, which are the balance of General funds and Segregated funds on our Statements of Financial Position, AUM also includes Third-party AUM and Consolidation adjustments. Effective January 1, 2023, "Other AUM" was renamed to "Third Party AUM", and "Consolidation adjustments" is presented separately as consolidation adjustments apply to all components of total AUM.
AUM not yet earning fees. This measure represents the committed uninvested capital portion of total AUM not currently earning management fees. The amount depends on the specific terms and conditions of each fund. There is no directly comparable IFRS measure.
Capital raising. This measure consists of increases in SLC Management's commitments from fund raising activities for all real estate, infrastructure and alternative credit Clients excluding leverage. Investment-grade fixed income capital raising consists of sales made to new Clients. There is no directly comparable IFRS measure.
Cash and other liquid assets. This measure is comprised of cash, cash equivalents, short-term investments, and publicly traded securities, net of loans related to acquisitions that are held at SLF Inc. (the ultimate parent company), and its wholly owned holding companies. This measure is a key consideration of available funds for capital re-deployment to support business growth.
|
|
|
|
|
|
|
|
|
| ($ millions) |
As at December 31, 2023 |
As at December 31, 2022 |
| Cash and other liquid assets (held at SLF Inc. and its wholly owned holding companies): |
|
|
| Cash, cash equivalents & short-term securities |
712 |
423 |
Debt securities(1) |
1,228 |
1,408 |
Equity securities(2) |
102 |
102 |
|
|
|
|
|
|
| Sub-total |
2,042 |
1,933 |
|
|
|
| Less: Loans related to acquisitions (held at SLF Inc. and its wholly owned holding companies) |
(411) |
(883) |
| Cash and other liquid assets (held at SLF Inc. and its wholly owned holding companies) |
1,631 |
1,050 |
(1)Includes publicly traded bonds.
(2)Includes ETF Investments.
94 December 31, 2023 Sun Life Financial Inc. MANAGEMENT'S DISCUSSION & ANALYSIS Constant currency.
We remove the impacts of foreign exchange translation from certain IFRS and non-IFRS measures to assist in comparing our results from period to period. The impacts of foreign exchange translation is approximated by using the foreign exchange rates in effect during the comparative period, using the average or period end foreign exchange rates, as appropriate.
CSM Movement Analysis includes certain non-IFRS financial measures, detailed below, and also presents certain measures on a net basis to reflect how management views the business, compared to a gross basis in the Consolidated Financial Statements. Examples include i) The impacts of insurance contracts issued is presented net of reinsurance; ii) Impact of new business is presented net of acquisition expense gain/loss; and iii) Certain methodology changes are presented as an impact of change in assumptions, whereas the Consolidated Financial Statement presentation is a contract modification.
•Organic CSM Movement is comprised of the Impact of new insurance business, Expected movements from asset returns & locked-in rates, Insurance experience gains/losses, and CSM recognized for services provided.
•Impact of new insurance business on CSM, also referred to as "new business CSM", represents growth from sales activity in the period, including individual protection sales (excluding joint ventures), and defined benefit solutions and segregated fund wealth sales in Canada. New business CSM is presented net of acquisition expense gain/loss.
•Expected movements from asset returns & locked-in rates applies to variable fee approach ("VFA") and general measurement approach ("GMA") contracts. For VFA contracts, this component of the CSM movement analysis is comprised of two factors: (i) the expected return on underlying assets and (ii) the measurement of financial guarantees. The difference between actual and expected results are reported as the impact of markets. For GMA contracts, this component of the CSM includes the accretion of the CSM balance at locked-in rates, which refer to the term structure associated with locked-in discount rates, set when the insurance contract was sold or on transition to IFRS 17. Average locked-in rates increase with the passage of time on in-force business and new business added at current rates.
•Impact of markets & other includes the difference between actual and expected movement for VFA contracts for: (i) the return on underlying assets and (ii) the measurement of financial guarantees. Also includes other amounts excluded from Organic CSM Movement.
•Insurance experience gains/losses represents the current period impacts of insurance experience, resulting in a change in future cash flows that adjust CSM.
•Impact of change in assumptions represents the future period impacts of changes in fulfilment cash flows that adjust CSM.
•CSM market sensitivities. CSM market sensitivities are non-IFRS financial measures for which there are no directly comparable measures under IFRS so it is not possible to provide a reconciliation of these amounts to the most directly comparable IFRS measures.
Deployment. This measure represents the amount of capital that has been invested in the period, including leverage where applicable. Deployment also includes capital committed in infrastructure deals to be invested in specific assets. There is no directly comparable IFRS measure.
Drivers of Earnings. The Drivers of Earnings ("DOE") analysis provides additional detail on the sources of earnings, primarily for protection and health businesses, and explains the actual results compared to the longer term expectations. The DOE is presented on a reported and underlying common shareholders' basis. Within the net insurance service result, the underlying DOE provides detail on expected insurance earnings, impact of new insurance business and experience gains (losses). Within the net investment result, the underlying DOE provides detail on expected investment earnings, credit experience, earnings on surplus, and joint ventures & other. For more information, refer to the headings "Underlying net income and Underlying EPS", "Earnings on surplus", "Notable items attributable to reported and underlying net income", in this document.
Certain amounts in the DOE are presented on a net basis to reflect how management views the business, compared to a gross basis in the Consolidated Financial Statements. Examples include: i) Net investment result and Other expenses of the Asset Management operating segment are combined with Fee Income to report the net contribution to earnings; ii) Income for fee-based businesses is reported net of the associated expenses; iii) Carried interest in SLC Management within Fee Income excludes the carried interest that Sun Life does not participate in economically, and nets the non-controlling interest portion of the carried interest against fee income and expenses of consolidated funds; iv) Net investment results include assets returns net of the crediting rate for investment contract liabilities and the unwinding of and changes in the discount rate for insurance contract liabilities; v) Earnings on surplus reflects net spread earned from investment strategies; vi) Earnings attributable to the participating account are excluded; and vii) Assumption changes and management actions combines the amounts included in Net insurance service result and Net investment result.
Earnings on Surplus. This component of the Drivers of Earnings represents the net income earned on a company’s surplus funds. Earnings on Surplus is comprised of realized gains on fair value through other comprehensive income assets, as well as net investment returns on surplus, such as investment income, gains (losses) on seed investments and investment properties mark-to-market, and also includes impacts from derivatives, currency and other items.
Experience-related items attributable to reported net income and underlying net income. These notable items attributable to reported net income and underlying net income are components of the Drivers of Earnings represents gains and losses that are due to differences between the actual results during the reporting period and management’s estimate of the expected longer-term returns on assets and liabilities (i.e. expected insurance earnings and expected investment earnings) at the start of the reporting period.
Fee earning AUM. FE AUM consists of assets managed by SLC Management, which are beneficially owned by Clients, on which we earn management fees for providing investment management, property management or advisory-related services. There is no directly comparable IFRS measure.
Fee-related earnings and Operating income. Fee-related earnings represent profitability of SLC Management's fee-related portfolios, and is calculated as Fee-related revenue less Fee-related expenses. Operating income represents profit realized from our business operations, and is calculated as the sum of Fee-related earnings, Investment income (loss) and performance fees, and Interest and other. Fee-related revenue represents all fee income, with the exception of performance fees, generated from third-party investors. Fee-related expenses represent all expenses directly related to generating fee revenue from third-party investors. Investment income (loss) and performance fees represent total income or loss from our seed investments, net of the related expenses. Interest and other represents performance fee compensation, our net interest income or expense and income from managing the General Account assets.
MANAGEMENT'S DISCUSSION & ANALYSIS Sun Life Financial Inc. December 31, 2023 95
Fee-related earnings and Operating income are non-IFRS financial measures within SLC Management's Supplemental Income Statement, which enhances the comparability of SLC Management's results with publicly traded alternative asset managers. For more details, see our Supplementary Financial Information package for the quarter.
The following table provides a reconciliation from Fee-related earnings and Operating income to SLC Management's Fee income and Total expenses based on IFRS.
|
|
|
|
|
|
|
|
|
|
|
|
| SLC Management |
|
|
|
|
|
|
|
|
| ($ millions) |
|
|
|
2023 |
2022 |
Fee income (per IFRS) |
|
|
|
1,640 |
1,412 |
Less: Non-fee-related revenue adjustments(1)(2) |
|
|
|
444 |
435 |
| Fee-related revenue |
|
|
|
1,196 |
977 |
| Total expenses (per IFRS) |
|
|
|
1,603 |
1,406 |
Less: Non-fee-related expense adjustments(2)(3) |
|
|
|
697 |
666 |
| Fee-related expenses |
|
|
|
906 |
740 |
| Fee-related earnings |
|
|
|
290 |
237 |
Add: Investment income (loss) and performance fees(4) |
|
|
|
102 |
56 |
Add: Interest and other(5) |
|
|
|
(110) |
(50) |
| Operating income |
|
|
|
282 |
243 |
(1)Includes Interest and other - fee income, Investment income (loss) and performance fees - fee income, and Other - fee income.
(2)Excludes the income and related expenses for certain property management agreements to provide more accurate metrics on our fee-related business.
(3)Includes Interest and other, Placement fees - other, Amortization of intangibles, Acquisition, integration and restructuring, and Other - expenses.
(4)Investment income (loss) and performance fee in SLC Management's Supplemental Income Statement relates to the underlying results of our seed investments. As such, we have excluded non-underlying market-related impacts as well as the gains or losses of certain non-seed hedges that are reported under Net investment income (loss) under IFRS. The reconciliation is as follows (amounts have been adjusted for rounding):
|
|
|
|
|
|
|
|
|
|
|
|
|
|
|
| ($ millions) |
|
|
|
2023 |
2022 |
| Net investment income (loss) (per IFRS) |
|
|
|
55 |
12 |
| Less: Market-related impacts and Other - Investment income (loss) |
|
|
|
(14) |
(36) |
| Add: Investment income (loss) and performance fees - fee income |
|
|
|
33 |
8 |
| Investment income (loss) and performance fees |
|
|
|
102 |
56 |
(5)Includes Interest and other reported under Fee income under IFRS, net of Interest and other reported under Total expenses under IFRS.
Financial leverage ratio. This ratio is an indicator of the Company's balance sheet strength measured by its proportion of capital qualifying debt in accordance with OSFI guidelines. This is calculated as the ratio of total debt plus preferred shares to total capital including the contractual service margin net of taxes, where debt consists of all capital-qualifying debt securities. Capital-qualifying debt securities consist of subordinated debt and innovative capital instruments. The CSM is included net of taxes because debts are repaid and serviced from available after-tax funds.
Effective January 1, 2023, the calculation for the financial leverage ratio was updated to include the CSM balance (net of taxes) in the denominator on adoption of IFRS 17 and IFRS 9.
Impacts of foreign exchange translation. To assist in comparing our results from period-to-period, the favourable or unfavourable impacts of foreign exchange translation are approximated using the foreign exchange rates, in effect during the comparative period, for several IFRS and Non-IFRS financial measures using the average or period end foreign exchange rates, as appropriate. Items impacting a reporting period, such as Revenue, Expenses, and Reported net income (loss) in our Consolidated Statements of Operations, as well as underlying net income (loss), and sales, are translated into Canadian dollars using average exchange rates for the appropriate daily, monthly, or quarterly period. For Assets and Liabilities in our Consolidated Statements of Financial Position, as well as the AUM and certain components of the Drivers of Earnings disclosure, period-end rates are used for currency translation purposes.
LICAT market sensitivities. LICAT market sensitivities are non-IFRS financial measures for which there are no directly comparable measures under IFRS so it is not possible to provide a reconciliation of these amounts to the most directly comparable IFRS measures.
Pre-tax fee related earnings margin. This ratio is a measure of SLC Management's profitability in relation to funds that earn recurring fee revenues, while excluding investment income and performance fees. The ratio is calculated by dividing fee-related earnings by fee-related revenues and is based on the last twelve months. There is no directly comparable IFRS measure.
Pre-tax net operating margin. This ratio is a measure of the profitability and there is no directly comparable IFRS measure. For MFS, this ratio is calculated by excluding management's ownership of MFS shares and certain commission expenses that are offsetting. These commission expenses are excluded in order to neutralize the impact these items have on the pre-tax net operating margin and have no impact on the profitability of MFS. For SLC Management, the ratio is calculated by dividing the total operating income by fee-related revenue plus investment Income (loss) and performance fees, and is based on the last twelve months.
96 December 31, 2023 Sun Life Financial Inc. MANAGEMENT'S DISCUSSION & ANALYSIS The following table provides a reconciliation to calculate MFS' pre-tax net operating margin:
|
|
|
|
|
|
|
|
|
|
|
|
| MFS |
|
|
|
|
|
|
|
|
| (US$ millions) |
|
|
|
2023 |
2022 |
Revenue |
|
|
|
|
|
| Fee income (per IFRS) |
|
|
|
3,196 |
3,323 |
| Less: Commissions |
|
|
|
395 |
433 |
Less: Other(1) |
|
|
|
(53) |
(53) |
| Adjusted revenue |
|
|
|
2,854 |
2,943 |
| Expenses |
|
|
|
|
|
| Expenses (per IFRS) |
|
|
|
2,244 |
2,162 |
| Net investment (income)/loss (per IFRS) |
|
|
|
(93) |
(18) |
Less: Management's ownership of MFS shares (net of NCI)(2) |
|
|
|
34 |
(45) |
| Compensation-related equity plan adjustments |
|
|
|
16 |
7 |
| Commissions |
|
|
|
395 |
433 |
Other(1) |
|
|
|
(52) |
(53) |
| Adjusted expenses |
|
|
|
1,758 |
1,802 |
| Pre-tax net operating margin |
|
|
|
38% |
39% |
(1)Other includes accounting basis differences, such as sub-advisory expenses and product allowances.
(2)Excluding non-controlling interest. For more information on Management's ownership of MFS shares, see the heading Underlying Net Income and Underlying EPS.
Return on equity. IFRS does not prescribe the calculation of ROE and therefore a comparable measure under IFRS is not available. To determine reported ROE and underlying ROE, respectively, reported net income (loss) and underlying net income (loss) is divided by the total weighted average common shareholders’ equity for the period. The ROE provides an indication of the overall profitability of the Company. The quarterly ROE is annualized.
Sales and flows. Asset Management gross flows includes funds from retail and institutional Clients; SLC Management gross flows include capital raising, such as uncalled capital commitments and fund leverage. Asset Management net flows consist of gross flows less gross outflows; SLC Management's net flows do not include Client distributions from the sale of underlying assets in closed-end funds. In Canada and in Asia, net sales consist of wealth sales & asset management gross flows less redemptions. In Canada, wealth sales & asset management gross flows consist of sales in Group Retirement Services and Individual Wealth; group - health & protection sales consist of workplace benefits sold by Sun Life Health; and individual - protection sales refer to individual insurance sales. In the U.S., group - health & protection sales consist of sales by Group Benefits and Dental. In Asia, wealth sales & asset management gross flows consist of Hong Kong wealth sales & asset management gross flows, Philippines mutual fund sales, wealth sales & asset management gross flows by our India and China joint ventures and associates, and Aditya Birla Sun Life AMC Limited's equity and fixed income mutual fund sales based on our proportionate equity interest, including sales as reported by our bank distribution partners; individual - protection sales consist of the individual insurance sales, by our subsidiaries and joint ventures and associates, based on our proportionate equity interest, in the Philippines, Indonesia, India, China, Malaysia, Vietnam, International, Hong Kong and Singapore. Asia also has group - health & protection sales in the Philippines, Hong Kong and our joint ventures. To provide greater comparability across reporting periods, we exclude the impacts of foreign exchange translation from sales and gross flows. There is no directly comparable IFRS measure.
Effective January 1, 2023, wealth sales & asset management gross flows in Group Retirement Services in Canada has been updated to exclude retained sales to better align with the methodology for LIMRA reporting. We have updated prior period amounts to reflect this change. Also effective January 1, 2023, insurance sales were renamed to "Group - Health & Protection sales" and "Individual - Protection sales" to better align to the business types within our business groups. For more information about business types, refer to section A - How We Report Our Results in this document.
Third-party AUM. Third-party AUM is composed of retail, institutional, and other third party assets, which includes general fund and segregated fund assets managed by our joint ventures. In Asset Management, third-party AUM includes Client assets for retail and institutional Clients, as well as capital raising, such as uncalled commitments and fund leverage in SLC Management. In Canada, third-party AUM includes Client assets in retail mutual fund products of Sun Life Global Investments. In Asia, third-party AUM includes Client assets in Hong Kong managed fund products, International wealth & asset management products, Philippines mutual and managed fund products, Aditya Birla Sun Life AMC Limited equity and fixed income mutual fund products, Sun Life Everbright Asset Management products and our joint ventures’ general fund and segregated fund assets based on our proportionate equity interest. There is no directly comparable IFRS financial measure.
Effective January 1, 2023, this measure was renamed to "third-party AUM", formerly "other AUM", in order to be more descriptive of the nature of these assets. Further, the presentation of "consolidation adjustments" has been updated in the current and prior periods to be shown separately from "third-party AUM", as consolidation adjustments apply to all components of total AUM.
Total weighted premium income ("TWPI"). This measure consists of 100% renewal premiums, 100% of first year premiums, and 10% of single premiums. In contrast to sales, which only includes premiums from new business, TWPI includes renewal premiums, reflecting the strength of the in-force block and providing a better understanding of both new and existing business. There is no directly comparable IFRS measure.
MANAGEMENT'S DISCUSSION & ANALYSIS Sun Life Financial Inc. December 31, 2023 97
Underlying dividend payout ratio. This is the ratio of dividends paid per share to diluted underlying EPS for the period. The ratio is utilized during the medium-term capital budgeting process to inform our planned capital initiatives. We target an underlying dividend payout ratio of between 40% and 50% based on underlying EPS. For more information, see Section J - Capital and Liquidity Management in the 2023 Annual MD&A.
Underlying effective tax rate. This measure is calculated using the pre-tax underlying net income and the income tax expense associated with it. Our statutory tax rate is normally reduced by various tax benefits, such as lower taxes on income subject to tax in foreign jurisdictions, a range of tax-exempt investment income, and other sustainable tax benefits. Our effective tax rate helps in the analysis of the income tax impacts in the period.
4. Reconciliations of Select Non-IFRS Financial Measures
Underlying Net Income to Reported Net Income Reconciliation - Pre-tax by Business Group
|
|
|
|
|
|
|
|
|
|
|
|
|
|
|
|
|
|
|
|
|
|
Q4'23 |
| ($ millions) |
Asset
Management |
Canada |
U.S. |
Asia |
Corporate |
Total |
| Underlying net income (loss) |
331 |
350 |
253 |
143 |
(94) |
983 |
| Add: Market-related impacts (pre-tax) |
(11) |
(223) |
(60) |
(142) |
— |
(436) |
| ACMA (pre-tax) |
— |
72 |
(65) |
(1) |
— |
6 |
| Other adjustments (pre-tax) |
(39) |
(6) |
(65) |
(8) |
— |
(118) |
Tax expense (benefit) |
16 |
155 |
38 |
52 |
53 |
314 |
| Reported net income (loss) - Common shareholders |
297 |
348 |
101 |
44 |
(41) |
749 |
|
|
|
|
|
|
|
|
|
|
|
|
|
|
|
|
|
|
|
|
|
|
|
|
|
|
|
|
|
|
|
|
|
|
|
|
|
|
|
|
|
|
|
|
|
Q4'22(1) |
| Underlying net income (loss) |
324 |
265 |
230 |
135 |
(62) |
892 |
Add: Market-related impacts (pre-tax)(1) |
(8) |
250 |
21 |
(110) |
26 |
179 |
| ACMA (pre-tax) |
— |
(185) |
71 |
71 |
17 |
(26) |
| Other adjustments (pre-tax) |
1 |
(5) |
(135) |
15 |
(17) |
(141) |
Tax expense (benefit) |
4 |
128 |
15 |
(19) |
133 |
261 |
| Reported net income (loss) - Common shareholders |
321 |
453 |
202 |
92 |
97 |
1,165 |
(1)2022 restated results may not be fully representative of our future earnings profile, as we were not managing our asset and liability portfolios under the new standards. See the heading "Note to Readers: 2022 Restated Results on Adoption of IFRS 17 and IFRS 9" in section A - How We Report Our Results in this document.
|
|
|
|
|
|
|
|
|
|
|
|
|
|
|
|
|
|
|
|
|
|
|
|
2023 |
| ($ millions) |
Asset
Management |
Canada |
U.S. |
Asia |
Corporate |
Total |
| Underlying net income (loss) |
1,239 |
1,376 |
890 |
600 |
(377) |
3,728 |
| Add: Market-related impacts (pre-tax) |
(61) |
(433) |
(59) |
(156) |
(17) |
(726) |
| ACMA (pre-tax) |
— |
82 |
(66) |
34 |
3 |
53 |
| Other adjustments (pre-tax) |
(172) |
90 |
(272) |
(28) |
9 |
(373) |
Tax expense (benefit) |
61 |
137 |
83 |
61 |
62 |
404 |
| Reported net income (loss) - Common shareholders |
1,067 |
1,252 |
576 |
511 |
(320) |
3,086 |
|
2022(1) |
| Underlying net income (loss) |
1,238 |
1,063 |
698 |
539 |
(169) |
3,369 |
Add: Market-related impacts (pre-tax)(1) |
(21) |
651 |
(41) |
(317) |
(39) |
233 |
| ACMA (pre-tax) |
— |
(312) |
66 |
1 |
6 |
(239) |
| Other adjustments (pre-tax) |
(83) |
(19) |
(240) |
2 |
(186) |
(526) |
Tax expense (benefit) |
14 |
(142) |
49 |
(15) |
128 |
34 |
| Reported net income (loss) - Common shareholders |
1,148 |
1,241 |
532 |
210 |
(260) |
2,871 |
(1)2022 restated results may not be fully representative of our future earnings profile, as we were not managing our asset and liability portfolios under the new standards. See the heading "Note to Readers: 2022 Restated Results on Adoption of IFRS 17 and IFRS 9" in section A - How We Report Our Results in this document.
98 December 31, 2023 Sun Life Financial Inc. MANAGEMENT'S DISCUSSION & ANALYSIS
Underlying Net Income to Reported Net Income Reconciliation - Pre-tax by Business Unit - Asset Management
|
|
|
|
|
|
|
|
|
|
|
|
|
|
|
|
|
|
Q4'23 |
|
Q4'22 |
| ($ millions) |
MFS |
SLC
Management |
|
|
MFS |
SLC
Management |
| Underlying net income (loss) |
261 |
70 |
|
|
276 |
48 |
| Add: Market-related impacts (pre-tax) |
— |
(11) |
|
|
— |
(8) |
Other adjustments (pre-tax) |
(7) |
(32) |
|
|
31 |
(30) |
Tax expense (benefit) |
(4) |
20 |
|
|
(4) |
8 |
| Reported net income (loss) - Common shareholders |
250 |
47 |
|
|
303 |
18 |
|
|
|
|
|
|
|
|
|
|
|
|
|
|
|
|
|
|
2023 |
2022 |
| ($ millions) |
MFS |
SLC
Management |
MFS |
SLC
Management |
| Underlying net income (loss) |
1,044 |
195 |
1,080 |
158 |
| Add: Market-related impacts (pre-tax) |
— |
(61) |
— |
(21) |
Other adjustments (pre-tax) |
30 |
(202) |
132 |
(215) |
| Tax expense (benefit) |
(18) |
79 |
(17) |
31 |
| Reported net income (loss) - Common shareholders |
1,056 |
11 |
1,195 |
(47) |
Underlying Net Income to Reported Net Income Reconciliation - Pre-tax in U.S. dollars
|
|
|
|
|
|
|
|
|
|
|
|
|
|
|
|
|
|
Q4'23 |
|
Q4'22(1) |
| (US$ millions) |
U.S. |
MFS |
|
|
U.S. |
MFS |
| Underlying net income (loss) |
187 |
191 |
|
|
173 |
202 |
Add: Market-related impacts (pre-tax)(1) |
(42) |
— |
|
|
15 |
— |
| ACMA (pre-tax) |
(49) |
— |
|
|
53 |
— |
| Other adjustments (pre-tax) |
(47) |
(5) |
|
|
(99) |
24 |
Tax expense (benefit) |
28 |
(3) |
|
|
9 |
(3) |
| Reported net income (loss) - Common shareholders |
77 |
183 |
|
|
151 |
223 |
|
|
|
|
|
|
|
|
|
|
|
|
|
|
|
|
|
|
|
|
|
|
|
|
|
|
|
|
|
|
|
|
|
|
|
|
|
|
|
|
|
|
|
|
|
|
|
(1)2022 restated results may not be fully representative of our future earnings profile, as we were not managing our asset and liability portfolios under the new standards. See the heading "Note to Readers: 2022 Restated Results on Adoption of IFRS 17 and IFRS 9" in section A - How We Report Our Results in this document.
|
|
|
|
|
|
|
|
|
|
|
|
|
|
|
|
|
|
2023 |
2022(1) |
| (US$ millions) |
U.S. |
MFS |
U.S. |
MFS |
| Underlying net income (loss) |
663 |
773 |
531 |
832 |
Add: Market-related impacts (pre-tax)(1) |
(40) |
— |
(43) |
— |
| ACMA (pre-tax) |
(48) |
— |
49 |
— |
| Other adjustments (pre-tax) |
(200) |
22 |
(181) |
100 |
Tax expense (benefit) |
65 |
(13) |
48 |
(13) |
| Reported net income (loss) - Common shareholders |
440 |
782 |
404 |
919 |
(1)2022 restated results may not be fully representative of our future earnings profile, as we were not managing our asset and liability portfolios under the new standards. See the heading "Note to Readers: 2022 Restated Results on Adoption of IFRS 17 and IFRS 9" in section A - How We Report Our Results in this document.
MANAGEMENT'S DISCUSSION & ANALYSIS Sun Life Financial Inc. December 31, 2023 99
Underlying Net Income to Reported Net Income Reconciliation - U.S. Group Benefits - Pre-tax in U.S. dollars
The following table sets out the amounts that were excluded from our reported net income (loss) for U.S. Group Benefits, which is used to calculate the trailing four-quarter after-tax profit margin for U.S. Group Benefits.
|
|
|
|
|
|
|
|
|
|
|
|
|
|
|
|
|
|
|
|
|
|
|
|
|
|
|
|
|
|
|
|
|
|
|
|
|
|
|
| (US$ millions) |
Q4'23 |
Q3'23 |
Q2'23 |
Q1'23 |
Q4'22(1) |
Q3'22(1) |
Q2'22(1) |
Q1'22(1) |
|
|
|
|
|
Underlying net income (loss) for U.S. Group Benefits(2) |
138 |
96 |
116 |
128 |
119 |
101 |
87 |
49 |
|
|
|
|
|
Add: Market-related impacts (pre-tax)(1) |
14 |
(10) |
(6) |
4 |
(1) |
(24) |
(10) |
(14) |
|
|
|
|
|
| ACMA (pre-tax) |
(11) |
47 |
— |
— |
8 |
(7) |
— |
— |
|
|
|
|
|
| Other adjustments (pre-tax) |
(9) |
(6) |
(6) |
(5) |
(5) |
(4) |
(6) |
(6) |
|
|
|
|
|
Tax expense (benefit) |
1 |
(6) |
2 |
1 |
(2) |
8 |
4 |
5 |
|
|
|
|
|
Reported net income (loss) - Common shareholders(2) |
133 |
121 |
106 |
128 |
119 |
74 |
75 |
34 |
|
|
|
|
|
(1)2022 restated results may not be fully representative of our future earnings profile, as we were not managing our asset and liability portfolios under the new standards. See the heading "Note to Readers: 2022 Restated Results on Adoption of IFRS 17 and IFRS 9" in section A - How We Report Our Results in this document.
(2)Effective Q2’22, we began reporting on the performance and results of our Dental business unit, which represents our existing dental and vision business within Group Benefits together with DentaQuest, acquired on June 1, 2022. We have updated prior periods to reflect this change in presentation.
100 December 31, 2023 Sun Life Financial Inc. MANAGEMENT'S DISCUSSION & ANALYSIS On January 1, 2023 we adopted IFRS 17 Insurance Contracts and IFRS 9 Financial Instruments, detailed below.
|
|
|
|
|
|
| N. Accounting and Control Matters |
We have also adopted several amended IFRS standards in the current year, which had no material impact on our Consolidated Financial Statements. For additional information, refer to Note 2 in our 2023 Annual Consolidated Financial Statements.
1. Critical Accounting Policies and Estimates
Our significant accounting and actuarial policies are described in Notes 1 and 6 of our 2023 Annual Consolidated Financial Statements. Management must make judgments involving assumptions and estimates, some of which may relate to matters that are inherently uncertain, under these policies. The estimates described below are considered particularly significant to understanding our financial performance. As part of our financial control and reporting, judgments involving assumptions and estimates are reviewed by the independent auditor and by other independent advisors on a periodic basis. Accounting policies requiring estimates are applied consistently in the determination of our financial results.
IFRS 17 and IFRS 9 require enhanced disclosures for insurance contracts and financial instruments. These disclosures are included primarily in Notes 5, 6, 10 and 22 of our Annual Consolidated Financial Statements for the period ended December 31, 2023. Certain disclosures in Note 2.B of the 2023 Annual Consolidated Financial Statements as well as the disclosures in this section of this document provide additional context during the first year of adoption of IFRS 17 and IFRS 9. The majority of these disclosures would otherwise only be reported by us annually.
1.A Insurance Contracts Summary and Methods and Assumptions
Summary
We sell a variety of insurance contracts that include many forms of life, health and critical illness insurance sold to individuals and groups, annuities, and segregated fund products with guarantees. We hold reinsurance contracts that transfer mortality and other risks following internal guidelines.
Insurance contracts with direct participation features are products where investments are managed on behalf of policyholders, and investment returns less a variable fee are passed through to policyholders with the insurance benefits they receive. Insurance contracts with direct participation features are measured using the VFA, and include segregated funds, unit-linked contracts, variable universal life contracts, and most participating insurance contracts. Reinsurance contracts (both issued and held) cannot be measured using the VFA.
Insurance contracts without direct participation features are eligible to use the PAA if the coverage period is one year or less, or if the result of applying the PAA is not expected to be a materially different result than applying the GMA in each reporting period over the life of the contract. Insurance contracts eligible to use the PAA include most group life and health contracts and the associated reinsurance contracts held.
Other insurance contracts are measured using the GMA. This includes most individual life and health insurance contracts and annuities and the associated reinsurance contracts held.
The Consolidated Statements of Financial Position present insurance contracts issued and reinsurance contracts held as both assets and liabilities, depending on whether the portfolio is in an asset or liability position.
For more information about insurance contracts issued and reinsurance contracts held, and Insurance contract liabilities for account of segregated fund holders, see Note 1, Note 10 and Note 21 of our 2023 Annual Consolidated Financial Statements.
Methods and Assumptions
General
A group of insurance contracts is measured as the total of FCF, which is the present value of future cash flows plus the risk adjustment for
non-financial risk, and, for groups measured using the GMA or VFA, the CSM. In measuring the present value of future cash flows, assumptions must be made about mortality and morbidity rates, lapse and other policyholder behaviour ("policyholder behaviour"), expenses and other factors over the life of our products, and the prevailing market view of the cost of financial risk in our products. Many of these assumptions relate to events that are anticipated to occur many years in the future. Assumptions require significant judgment and regular review and, where appropriate, revision.
The RA is the compensation we require for the uncertainty related to non-financial risk in the estimates of future cash flows. This compensation is measured by discounting cash flows from applying margins to the non-financial assumptions used in the estimate of future cash flows.
The CSM represents the unearned profit that will be recognized as insurance contract services are provided.
The methods and assumptions used in the measurement of insurance contracts are reviewed regularly and are subject to external actuarial peer review.
Present Value of Future Cash Flows
Assumptions for non-financial risk variables in the present value of future cash flows are intended to be current, neutral estimates of the expected outcome. The choice of assumptions takes into account current circumstances, past experience data from our own experience or from the industry, the relationship of past to expected future experience, anti-selection, the relationship among assumptions (including those for financial risk variables), and other relevant factors.
MANAGEMENT'S DISCUSSION & ANALYSIS Sun Life Financial Inc. December 31, 2023 101
Assumptions for financial risk variables in the present value of future cash flows are based on current observable market prices, adjusted to account for differences between the financial risk embedded in our products and those in the corresponding observed market instrument. Where no relevant market instrument is available, we use the best information available.
Mortality
Mortality refers to the rates at which death occurs for defined groups of people. Mortality assumptions are generally based on the past five to ten years of experience. Our experience is combined with industry experience or experience from reinsurers where our own experience is insufficient to be statistically valid. Assumed mortality rates for life insurance and annuity contracts include assumptions about future mortality improvement based on recent trends in population mortality and our outlook for future trends.
Morbidity
Morbidity refers to the rate of being unhealthy or disabled and the rates of recovery therefrom. Most of our disability insurance is marketed on a group basis. We offer critical illness policies on an individual basis in Canada and Asia, long-term care on an individual basis in Canada, and medical stop-loss insurance is offered on a group basis in the U.S. In Canada, group morbidity assumptions are based on our five-year average experience, modified to reflect any emerging trend in recovery rates. For Canadian long-term care and critical illness insurance in Canada and Asia, assumptions are developed in collaboration with our reinsurers and are largely based on their experience. In the U.S., our experience is used for both medical stop-loss and disability assumptions, with some consideration of industry or reinsurer experience.
Policyholder Behaviour
Lapse or surrender
Policyholders may allow their policies to lapse prior to the end of the contractual coverage period by choosing not to continue to pay premiums or by surrendering their policy for the cash surrender value. Assumptions for lapse or surrender experience on life insurance are generally based on our five-year average experience. Lapse or surrender rates vary by plan, age at issue, method of premium payment, policy duration and financial risk variables.
Premium payment patterns
For universal life contracts, it is necessary to set assumptions about premium payment patterns. Studies prepared by industry or the actuarial profession are used for products where our experience is insufficient to be statistically valid. Premium payment patterns usually vary by plan, age at issue, method of premium payment, policy duration and financial risk variables.
Expense
Future expenses directly attributable to the fulfilment of our insurance contracts include the costs of premium collection, claims adjudication and processing, actuarial calculations, preparation and mailing of policy statements, and related overhead. Future expense assumptions are mainly based on our recent experience using an internal expense allocation methodology. Inflationary increases assumed in future expenses are based on long-term expectations.
Acquisition expenses directly attributable to portfolios of insurance contracts include the costs of selling, underwriting and issuing insurance contracts. For new insurance contracts measured using the GMA or VFA, actual or estimated directly attributable acquisition expenses are recognized in the initial measurement of the contract. If estimates are used, the difference between estimated and actual acquisition expenses adjusts the CSM when the group of insurance contracts is closed to new contracts.
Current Discount Rates
Current discount rates are used to discount estimates of future cash flows in determining the present value of future cash flows. Current discount rates reflect the time value of money, the characteristics of the cash flows, and the liquidity characteristics of the insurance contracts.
Current discount rates for cash flows that do not vary based on returns on underlying items
Cash flows that do not vary at all based on the returns on any underlying items are discounted at rates that reflect the timing and currency of cash flows and the liquidity characteristics of the insurance contracts.
The timing of cash flows is reflected by constructing a discount curve, so that each cash flow is discounted consistent with the timing of the cash flow. In constructing the discount curve, a portion is based on market information (the observable period) and beyond that period, the discount rates are estimated (the unobservable period). The observable period, which varies by currency, is the time period where information on risk-free interest rates is deep and liquid. In the unobservable period, risk-free rates are interpolated between the last observable point and an ultimate risk-free rate at year 70. The ultimate risk-free rate is estimated using historical averages.
The currency of cash flows is reflected by using different discount curves for different currencies.
Liquidity is reflected by adding a liquidity premium to risk-free discount rates that is consistent with the liquidity characteristics of the insurance contracts. The liquidity premium in the observable period is based on the liquidity premium on assets with similar liquidity characteristics, which is estimated from the spread inherent in current market yields less a deduction for expected and unexpected credit losses. The deduction for expected and unexpected credit losses is estimated using historical rating agency data and current market conditions, and varies by asset type, quality, and duration. The liquidity premium in the unobservable period is interpolated between the last observable liquidity premium and an ultimate liquidity premium (at year 70) specific to liquid or illiquid contracts. See Note 10.A in the 2023 Annual Consolidated Financial Statements for further details, which provides a weighted average summary of the discount curves used to present value cash flows for all major products that do not vary based on the returns on underlying items.
Current discount rates for cash flows that vary with returns on underlying items
Discount rates for cash flows that vary directly with returns on underlying items reflect that variability. For the portion of cash flows that is a pass through of returns on underlying items to policyholders, the discount rate is such that the present value of cash flows equals the portion of the underlying items that is passed through to policyholders. For cash flows that vary, but not directly, with underlying items (e.g., financial
102 December 31, 2023 Sun Life Financial Inc. MANAGEMENT'S DISCUSSION & ANALYSIS guarantees), scenario testing may be necessary.
If so, discount rates used in the scenario projections are scenario-specific and based on the projected risk-free rates in the scenario plus liquidity premiums consistent with the liquidity characteristics of the contracts being measured.
Scenario Testing
Scenario testing may be required when the relationship between cash flows and financial risk variables is non-linear, or where there are complex interdependencies among cash flows. In scenario testing of financial risk variables, future cash flows are projected for each scenario path and discounted at the scenario-specific discount rates, resulting in a present value of future cash flows for each scenario. The provision for the projected cash flows is the average of the scenario-specific values. Assumptions for non-financial risk variables are the best estimate assumptions consistent with the scenario.
Scenarios are consistent with the current market environment. Our Economic Scenario Generator calibration process produces integrated stochastic scenarios of financial risk variables (e.g., risk-free interest rates, bond fund returns, equity returns) with parameters calibrated to replicate observable market prices of financial instruments available in the market. Adjustments are made when the insurance contracts being measured are illiquid but the financial instruments to which the scenarios are calibrated to are liquid.
Risk Adjustment for Non-Financial Risk
The RA for insurance contracts issued is the compensation we require for bearing uncertainty about the amount and timing of the cash flows that arises from non-financial risk. This amount is measured as the present value of the difference between estimated future cash flows with a margin applied to non-financial assumptions and estimated future cash flows without this adjustment. Margins generally range from 5% to 20% depending on the uncertainty in the determination of the assumption. The level of uncertainty, and hence the margin chosen, varies by assumption and by line of business and other factors. Considerations that would generally lead to a choice of margin at the higher end of the range are as follows:
•The statistical credibility of our experience is too low to be the primary source of data for choosing the assumption;
•Future experience is difficult to estimate;
•The cohort of risks lacks homogeneity;
•Operational risks adversely impact the ability to estimate the assumption; or
•Past experience may not be representative of future experience and the experience may deteriorate.
Margins are generally stable over time and are revised only to reflect changes in the level of uncertainty in the assumptions. Our margins tend to be at mid-range.
The RA for reinsurance contracts held represents the amount of risk transferred to the reinsurer. This is measured as the difference between the RA on the underlying insurance contracts without reinsurance and what the RA on the underlying insurance contracts would be with reinsurance. The RA for reinsurance contracts held increases the asset or reduces the liability for reinsurance contracts held.
The RA for insurance contracts issued and reinsurance contracts held corresponds to a confidence level of approximately 80-85% overall.
Contractual Service Margin
The initial and subsequent measurement of CSM is described in Note 2.A.i. in our 2023 Annual Consolidated Financial Statements. Additional detail about certain components of the measurement of CSM is provided below.
Interest accretion
For insurance contracts measured using the GMA, locked-in discount rates are used to accrete interest on the CSM. The locked-in discount rate for a group of insurance contracts is the weighted average of the current discount rates at initial recognition of the contracts in the group. For groups of contracts that are in-force as at transition (January 1, 2022), the locked-in discount rates are the discount rates in effect at the date of transition as the fair value approach was applied for these groups at transition.
For insurance contracts measured using the VFA, there is no accretion of interest. Rather, the CSM is adjusted by the change in our share of the fair value of underlying items.
Changes in FCF relating to future service
For insurance contracts measured using the GMA, locked-in discount rates are used to measure changes in FCF relating to future service. Changes in FCF relating to future service reflect changes in non-financial assumptions but not changes in assumptions related to financial risk.
For insurance contracts measured using the VFA, current discount rates are used to measure the change in FCF relating to future service. Changes in FCF relating to future service reflect both changes in non-financial assumptions and changes in assumptions related to financial risk.
Changes in FCF relating to future service include (Liability for Remaining Coverage only):
•All changes related to investment component payments (including current period payments);
•Changes arising from changes in assumptions used to derive the present value of future cash flows - limited to non-financial assumptions for insurance contracts measured using the GMA;
•Changes in future cash flows arising from claims in the current period; and
•For insurance contracts measured using the GMA, changes related to discretionary cash flows on some universal life and adjustable products. Discretionary cash flows are cash flows outside the guaranteed payments to the policyholder, and are described as a spread on earned rates (in the case of some universal life contracts) and in the policy on criteria for changes to adjustable policies for adjustable policies.
CSM recognized for services provided
The amount of CSM recognized as insurance revenue in each period to reflect the insurance contract services provided for a group of contracts in the period is determined by:
MANAGEMENT'S DISCUSSION & ANALYSIS Sun Life Financial Inc. December 31, 2023 103
•Identifying the total coverage units in the group (for services in current and future periods) – based on the quantity of insurance contract services;
•Allocating the CSM at the end of the period equally to each coverage unit in the current period and expected to be provided in the future (i.e., coverage units "unitize" the services provided); then
•Recognizing in insurance revenue the amount allocated to coverage units provided in the period.
Total coverage units for services expected to be provided in future periods is the present value of projected coverage units. The present value is measured using locked-in discount rates for groups measured using the GMA and current discount rates for groups measured using the VFA.
The coverage unit for a group is based on the nature of the insurance contract services provided. Insurance contract services comprise services for providing insurance coverage and, for some contracts, investment-return or investment-related services. It does not include services related to performing functions such as claims adjudication.
For insurance contracts measured using the VFA, coverage units are based on the policyholder's account value or the policyholders' share of the fair value of underlying items. For insurance contracts measured using the GMA, coverage units are based on the expected claim amount (excluding any investment component) for life and health insurance contracts, and the payment due in a period for annuity contracts.
For reinsurance contracts held, the amount of CSM recognized reflects the services received in the period.
Sensitivities to Insurance Methods and Assumptions
In addition to the insurance risks factors and risk management governance and controls described in section K - Risk Management in this document and the Risk Factors section of the 2023 AIF, we also note that on adoption of IFRS 17 and 9, the tables below include sensitivities of contractual service margins to insurance and other non-financial assumption risks.
The following table sets out the estimated immediate impact on, or sensitivity of, the CSM and net income to certain instantaneous changes in the insurance and other non-financial assumptions used in the calculation of our insurance contract liabilities, based on a starting point and business mix as at December 31, 2023 and December 31, 2022. These sensitivities are calculated independently for each risk factor, generally assuming that all other risk variables stay constant. The estimates are illustrative and different starting points for best estimate assumptions, CSM balances and business mix will result in different estimated sensitivities. These sensitivities represent the Company's estimate of changes in best estimate assumptions that are reasonably likely based on the Company's and/or the industry's historical experience and industry standards and best practices as at December 31, 2023 and December 31, 2022.
The impact on CSM is attributable to insurance contracts measured under the GMA and VFA. For insurance contracts measured under the GMA, the impact flows through the CSM at locked-in discount rates. For insurance contracts measured under the VFA, the impact flows through the CSM at current discount rates.
The impact on net income is attributable to any portion of the sensitivities for insurance contracts measured under the GMA and VFA that cannot be absorbed by CSM, the full impact for insurance contracts measured under the PAA, and the difference in impact between locked-in and current discount rates for insurance contracts measured under the GMA. If current discount rates are higher than locked-in rates, this generally results in a favourable impact to net income from contracts measured under the GMA.
|
|
|
|
|
|
|
|
|
|
|
|
|
|
|
| ($ millions) |
As at December 31, 2023 |
As at December 31, 2022 |
Sensitivity(1) |
Potential impact on CSM (pre-tax) |
Potential impact on
net income/equity (after-tax)
|
Potential impact on
CSM (pre-tax) |
Potential impact on
net income/equity (after-tax)
|
| Policyholder Behaviour (10% increase/decrease, where adverse) |
(950) |
100 |
(850) |
75 |
| Life Mortality rates (2% increase) |
(75) |
(25) |
(75) |
(25) |
| Annuity Mortality rates (2% decrease) |
(175) |
— |
(175) |
25 |
| Morbidity rates (5% incidence increase and 5% termination decrease) |
(100) |
(175) |
(75) |
(175) |
| Expenses (5% increase) |
(175) |
— |
(175) |
— |
(1) Sensitivities to insurance assumptions refer to insurance contracts issued net of reinsurance contracts held. Net income and CSM sensitivities have been rounded in increments of $25 million. The sensitivities exclude the impacts on the income from our joint ventures and associates, which we account for on an equity basis.
Fair Value of Assets and Liabilities
Debt securities, equity securities, most mortgages and loans and certain other invested assets are measured FVTPL or FVOCI and are recorded at fair value in our Consolidated Statements of Financial Position. Changes in fair value of assets measured FVTPL, and realized gains and losses on sale of FVTPL assets are recognized in income. Changes in fair value of FVOCI assets are recorded in OCI. For foreign currency translation, exchange differences calculated on the amortized cost of FVOCI assets are recognized in income and other changes in the carrying amount are recognized in OCI. Net impairment losses and realized gains and losses on sale of FVOCI assets (except for FVOCI equity securities as they remain in OCI) are reclassified from OCI to income.
The fair value of government and corporate debt securities is primarily determined using unadjusted quoted prices in active markets for identical or similar securities, where available. When quoted prices in active markets are not available, fair value is determined using market
104 December 31, 2023 Sun Life Financial Inc. MANAGEMENT'S DISCUSSION & ANALYSIS standard valuation methodologies, which include a discounted cash flow method, consensus pricing from various broker dealers that are typically the market makers, or other similar techniques.
The assumptions and valuation inputs in applying these market standard valuation methodologies are determined primarily using observable market inputs, which include, but are not limited to, benchmark yields, reported trades of identical or similar instruments, broker-dealer quotes, issuer spreads, bid prices, and reference data including market research publications. In limited circumstances, non-binding broker quotes are used.
The fair value of asset-backed securities is primarily determined using unadjusted quoted prices in active markets for identical or similar securities, where available, or valuation methodologies and valuation inputs similar to those used for government and corporate debt securities. Additional valuation inputs include structural characteristics of the securities, and the underlying collateral performance, such as prepayment speeds and delinquencies. Expected prepayment speeds are based primarily on those previously experienced in the market at projected future interest rate levels. In limited circumstances where there is a lack of sufficient observable market data to value the securities, non-binding broker quotes are used.
The fair value of equity securities is determined using unadjusted quoted prices in active markets for identical securities or similar securities. When quoted prices in active markets are not available, fair value is determined using equity valuation models, which include a discounted cash flow method and other techniques that involve benchmark comparison. Valuation inputs primarily include projected future operating cash flows and earnings, dividends, market discount rates, and earnings multiples of comparable companies. Where equity securities are less frequently traded, the most recent exchange-quoted pricing is used to determine fair value.
The fair value of mortgages and loans is determined by discounting the expected future contractual cash flows using a current market interest rate applicable to financial instruments with a similar yield, credit quality, and maturity characteristics. Valuation inputs typically include benchmark yields and risk-adjusted spreads from current internal lending activities or loan issuances. Beginning in the fourth quarter of 2022, valuation inputs also include external lending activities or loan issuances from both public and private markets, enhancing the market observability of inputs. The risk-adjusted spreads are determined based on the borrower’s credit and liquidity, as well as term and other loan-specific features.
The fair value of other financial liabilities is determined by using the discounted cash flow methodology at the incremental borrowing rate or the effective interest rate. Other financial liabilities categorized as Level 3 represent the present value of the estimated price we would pay to acquire any remaining outstanding shares upon exercise of a put option and any mandatory income distributions. The fair value of the liabilities is based on the average earnings before income tax, depreciation and amortization ("EBITDA") for the preceding years before the options’ exercise dates and EBITDA multiples in accordance with the put agreements as well as the expected amount of any mandatory income distributions. A change in EBITDA would impact the fair value of other financial liabilities and our net income (loss).
Derivative financial instruments are recorded at fair value with changes in fair value recorded in income unless the derivative is part of a qualifying hedging relationship for accounting purposes. The fair value of derivative financial instruments depends upon derivative types. The fair value of exchange-traded futures and options is determined using unadjusted quoted prices in active markets, while the fair value of OTC derivatives is determined using pricing models, such as a discounted cash flow method or other market standard valuation techniques, with primarily observable market inputs.
Valuation inputs used to price OTC derivatives may include swap interest rate curves, foreign exchange spot and forward rates, index prices, the value of underlying securities, projected dividends, volatility surfaces, and in limited circumstances, counterparty quotes.
The fair value of OTC derivative instruments also includes credit valuation adjustments to reflect the credit risk of both the derivative counterparty and ourselves as well as the impact of contractual factors designed to reduce our credit exposure, such as collateral and legal rights of offset under master netting agreements. Inputs into determining the appropriate credit valuation adjustments are typically obtained from publicly available information and include credit default swap spreads when available, credit spreads derived from specific bond yields, or published cumulative default experience data adjusted for current trends when credit default swap spreads are not available.
The fair value of other financial invested assets consists primarily of limited partnership investments which is based on net asset value ("NAV") provided by management of the limited partnership investments. Based on the unobservable nature of these NAVs, we do not assess whether applying reasonably possible alternative assumptions would have an impact on the fair value of the limited partnership investments.
Investment properties are recorded at fair value with changes in fair value recorded in income. The fair value of investment properties is generally determined using property valuation models that are based on expected capitalization rates and models that discount expected future net cash flows at current market interest rates reflective of the characteristics, location, and market of each property. Expected future net cash flows include contractual and projected cash flows and forecasted operating expenses, and take into account interest, rental and occupancy rates derived from market surveys. The estimates of future cash inflows, in addition to expected rental income from current leases, include projected income from future leases based on significant assumptions that are consistent with current market conditions. The future rental rates are estimated based on the location, type and quality of the properties, and take into account market data and projections at the valuation date. The fair values are typically compared to market-based information for reasonability, including recent transactions involving comparable assets. The methodologies and inputs used in these models are in accordance with real estate industry valuation standards. Valuations are prepared externally or internally by professionally accredited real estate appraisers.
Cash, cash equivalents and short-term securities are classified as held for trading for the purpose of meeting short-term cash requirements and accounted for at FVTPL due to their short-term nature or because they are frequently repriced to current market rates.
Investments for accounts of segregated fund holders are recorded at fair value with changes in fair value recorded in net realized and unrealized gains (losses) within the segregated fund and are not recorded in our Consolidated Statements of Operations. The fair value of investments for accounts of segregated fund holders is determined using unadjusted quoted prices in active markets or independent valuation information provided by investment managers. The fair value of direct investments within investments for accounts of segregated fund holders, such as short-term securities and government and corporate debt securities, is determined according to valuation methodologies and inputs described above in the respective asset type sections. The fair value of the secured borrowings from mortgage securitization is based on the methodologies and assumptions as described above for asset-backed securities.
MANAGEMENT'S DISCUSSION & ANALYSIS Sun Life Financial Inc. December 31, 2023 105
The fair value of investment contracts is measured through the use of prospective discounted cash flow method. For unit-linked contracts, the fair value is equal to the current unit fund value, plus additional non-unit liability amounts on a fair value basis if required. For non-unit-linked contracts, the fair value is equal to the present value of contractual cash flow. The fair value of the investment contract liabilities approximate their carrying values due to the nature of the contracts.
The fair values of these obligations are based on the fair value of the underlying securities, which can include debt or equity securities. The method used to determine fair value is based on the quoted market prices where available in an active market.
The fair value of underlying assets within our CLOs is determined primarily using observable market inputs, such as quoted prices for similar assets in active markets and other observable market data.
The fair value of underlying liabilities within our CLOs is determined by discounting expected future contractual cash flows using a current market interest rate applicable to financial instruments with a similar yield, credit quality, maturity characteristics, and structural credit protections. The valuation technique maximizes the use of observable inputs that incorporates comparable securities’ prices and other market intelligence.
The methodologies and assumptions for determining the fair values of investment contract liabilities are included in Note 10.A of the 2023 Annual Consolidated Financial Statements.
We categorize our assets and liabilities carried at fair value, based on the priority of the inputs to the valuation techniques used to measure fair value, into a three-level fair value hierarchy as follows:
Level 1: Fair value is based on the unadjusted quoted prices for identical assets or liabilities in an active market. The types of assets and liabilities classified as Level 1 generally include cash and cash equivalents, certain U.S. government and agency securities, exchange-traded equity securities, and certain segregated and mutual fund units held for account of segregated fund holders.
Level 2: Fair value is based on quoted prices for similar assets or liabilities traded in active markets, or prices from valuation techniques that use significant observable inputs, or inputs that are derived principally from or corroborated with observable market data through correlation or other means. The types of assets and liabilities classified as Level 2 generally include Canadian federal, provincial and municipal government, other foreign government and corporate debt securities, certain asset-backed securities, OTC derivatives, and certain segregated and mutual fund units held for account of segregated fund holders.
Level 3: Fair value is based on valuation techniques that require one or more significant inputs that are not based on observable market inputs. These unobservable inputs reflect our expectations about the assumptions market participants would use in pricing the asset or liability. The types of assets and liabilities classified as Level 3 generally include certain corporate bonds, certain other invested assets, and investment properties.
As pricing inputs become more or less observable, assets are transferred between levels in the hierarchy. Total gains and losses in income and OCI are calculated assuming transfers into or out of Level 3 occur at the beginning of the period. For a financial instrument that transfers into Level 3 during the reporting period, the entire change in fair value for the period is included in the Level 3 reconciliation schedule in Note 5 of our 2023 Annual Consolidated Financial Statements. For transfers out of Level 3 during the reporting period, the change in fair value for the period is excluded from the Level 3 reconciliation schedule in Note 5 of our 2023 Annual Consolidated Financial Statements. Transfers into Level 3 occur when the inputs used to price the financial instrument lack observable market data and as a result, no longer meet the Level 1 or 2 criteria at the reporting date. Transfers out of Level 3 occur when the pricing inputs become more transparent and satisfy the Level 1 or 2 criteria at the reporting date.
Transfers into and out of Level 3 for financial assets were $390 million and $918 million for the year ended December 31, 2023, respectively, (December 31, 2022 - $nil(1) and $123 million(1), respectively). The total amount of the net realized/unrealized gains (losses) related to financial instruments transferred out of Level 3 during the period, which were excluded from the Level 3 reconciliation, was a gain of $31 million as at December 31, 2023 (December 31, 2022 - loss of $18 million(1)).
Additional information on the fair value measurement of investments can be found in Note 5 of our 2023 Annual Consolidated Financial Statements.
Goodwill
Goodwill represents the excess of the cost of an acquisition over the fair value of the net identifiable tangible and intangible assets of the acquired businesses. Goodwill is carried at original cost less any impairment subsequently incurred. Goodwill is assessed for impairment annually or more frequently if events or circumstances occur that may result in the recoverable amount of a cash generating unit ("CGU") falling below its carrying value. A CGU is the smallest identifiable group of assets that generates cash inflows that are largely independent of cash inflows from other groups of assets. The goodwill balances are allocated to either individual or groups of CGUs that are expected to benefit from the synergies of the business combination. Goodwill impairment is quantified by comparing a CGU's or a group of CGU's carrying value to its recoverable amount, which is the higher of fair value less cost to sell and value in use. Impairment losses are recognized immediately and cannot be reversed in future periods.
Impairment charges on goodwill of $nil were recognized in 2023. We had a carrying value of $8,969 million in goodwill as at December 31, 2023. Additional information on goodwill can be found in Note 9 of our 2023 Annual Consolidated Financial Statements.
(1)Excludes transitional impacts on adoption of IFRS 9. For more information please refer to Note 5.A of our 2023 Annual Consolidated Financial Statements.
106 December 31, 2023 Sun Life Financial Inc. MANAGEMENT'S DISCUSSION & ANALYSIS Intangible assets consist of finite life and indefinite life intangible assets.
Intangible Assets
Finite life intangible assets are amortized on a straight-line basis or using a units-of-production method, over the useful economic lives: i) Distribution, sales potential of field force, client relationships and asset administration contracts - 3 to 40 years ii) and internally generated software - 3 to 10 years. Amortization is charged through operating expenses. The useful lives of finite life intangible assets are reviewed annually, and the amortization is adjusted as necessary. Indefinite life intangibles are not amortized, and are assessed for impairment annually or more frequently if events or changes in circumstances indicate that the asset may be impaired. Impairment is assessed by comparing the carrying values of the indefinite life intangible assets to their recoverable amounts. The recoverable amount is the higher of an asset's fair value less costs to sell and its value in use. If the carrying values of the indefinite life intangibles exceed their recoverable amounts, these assets are considered impaired, and a charge for impairment is recognized in our Consolidated Statements of Operations. The recoverable amount of intangible assets is determined using various valuation models, which require management to make certain judgments and assumptions that could affect the estimates of the recoverable amount. Impairment charges on intangible assets of $5 million were recognized in 2023 (2022 - $18 million).
As at December 31, 2023, our finite life intangible assets had a carrying value of $4 billion, which reflected the value of the field force, asset administration contracts, and Client relationships acquired as part of the Clarica, CMG Asia, Genworth EBG, Dialogue, Ryan Labs, Prime Advisors, AAM, Bentall Kennedy, DentaQuest and the U.S. employee benefits business acquisitions, the ACB bancassurance partnership, and Crescent, as well as software costs. Our indefinite life intangible assets had a carrying value of $1 billion as at December 31, 2023. The value of the indefinite life intangible assets reflected fund management contracts of MFS, BGO, InfraRed, Crescent and AAM.
Income Taxes
Income tax assets and liabilities for the current and prior periods are measured at the amount expected to be recovered from or paid to the taxation authorities. Deferred income tax is provided using the liability method. Our provision for income taxes is calculated based on the tax rates and tax laws that have been enacted or substantially enacted by the end of the reporting period.
As a multinational organization, we are subject to taxation in numerous jurisdictions. We seek to operate in a tax efficient manner while ensuring that we are in compliance with all laws and regulations. The determination of the required provision for current and deferred income taxes requires that we interpret tax legislation in the jurisdictions in which we operate and that we make assumptions about the expected timing of realization of deferred income tax assets and liabilities. Tax laws are complex and their interpretation requires significant judgment. The provision for income taxes reflects management's interpretation of the relevant tax laws and its best estimate of the income tax implications of the transactions and events during the period. We believe that our provisions for uncertain tax positions appropriately reflect the risk of tax positions that are under audit, dispute or appeal with tax authorities, or which are otherwise considered to involve uncertainty. The adequacy of our tax provision is reviewed at the end of each reporting period. To the extent that our interpretations differ from those of tax authorities or the timing of realization is not as expected, the provision for income taxes may increase or decrease in future periods to reflect actual experience. The amount of any increase or decrease cannot be reasonably estimated.
Deferred income tax assets are recognized for all deductible temporary differences, carry forward of unused tax losses and unused tax credits to the extent that it is probable that taxable profit will be available against which the temporary differences, unused tax losses and unused tax credits can be utilized. At each reporting period, we assess all available evidence, both positive and negative, to determine the amount of deferred income tax assets to be recorded. If it is probable that the benefit of tax losses and tax deductions will not be realized, a deferred income tax asset is not recognized. The assessment requires significant estimates and judgment about future events based on the information available at the reporting date.
From time to time, local governments, in countries in which we operate, enact changes to statutory corporate income tax rates. These changes require us to review and re-measure our deferred tax assets and liabilities as of the date of enactment. As at December 31, 2023, our net deferred tax asset in the Consolidated Statements of Financial Position was $3,597 million, primarily in Canada. Any future tax rate reductions in jurisdictions where we carry a net deferred tax asset, could result in a reduction in the carrying value of the deferred tax asset and a corresponding income tax expense at the time of substantial enactment of a rate reduction.
The Organisation for Economic Co-operation and Development’s (OECD’s) base erosion and profit shifting (BEPS) project has prompted governments around the world, including Canada, to consider wide-ranging tax reforms to address BEPS and transparency issues. The proposals include introducing a global minimum tax rate of 15% to ensure that large multinational enterprises pay a minimum level of tax on the income arising in each jurisdiction where they operate.
On August 4, 2023, the Canadian Department of Finance released draft legislation to implement certain previously announced measures, including application rules for a 15% global minimum tax under Pillar Two, which is applied on a jurisdiction-by-jurisdiction basis. The global minimum tax rules will apply to Sun Life effective January 1, 2024, however the timing of the substantive enactment of these rules in most jurisdictions where Sun Life operates is uncertain. Under the legislation, Sun Life is liable to pay a top-up tax for the difference between the effective tax rate under the Pillar Two rules on a jurisdiction-by-jurisdiction basis, and the 15% minimum rate. The Pillar Two rules are not expected to have a material impact on Sun Life’s consolidated financial statements when they become effective.
On December 27, 2023, Bermuda enacted its Corporate Income Tax Act 2023, which will apply a 15% income tax beginning on January 1, 2025. Bermuda Corporate Income Taxes are expected to be a covered tax and will reduce Pillar Two top-up taxes which would otherwise be payable to other jurisdictions. The enacted legislation provides an economic transition adjustment that aligns an entity’s starting point for the tax regime more closely with its economic position prior to the application of the Corporate Income Tax 2023. The benefit of this economic transition adjustment has been recognized in 2023. The Bermuda Corporate Income Tax is not expected to have a material impact on Sun Life’s consolidated financial statements when it becomes effective in 2025.
The Canadian Department of Finance has issued legislation which, if enacted, may limit the deductibility of interest and financing expenses for Canadian tax purposes, and would apply to Sun Life effective January 1, 2024. A Notice of Ways and Means Motion, which included this legislation, was released and tabled in Parliament in November 2023. We continue to monitor developments and assess the impact on our consolidated financial statements.
MANAGEMENT'S DISCUSSION & ANALYSIS Sun Life Financial Inc. December 31, 2023 107
Pension Plans and Other Post-Retirement Benefits
The Company sponsors defined benefit pension plans and defined contribution plans for eligible employees. All of our material defined benefit plans worldwide are closed to new entrants with new hires participating in defined contribution plans. Our defined benefit pension plans offer benefits based on length of service and final average earnings and certain plans offer some indexation of benefits. We maintain certain supplementary non-contributory defined benefit pension arrangements for eligible employees, which are primarily for benefits which are in excess of local tax limits. In addition to these plans, in some countries the Company sponsors certain post-retirement benefit plans (for medical, dental and/or life insurance benefits) for eligible qualifying employees and their dependents who meet certain requirements.
In Canada, since January 1, 2009, all new employees participate in a defined contribution plan, while existing employees continue to accrue future benefits in the prior plan which provides a defined benefit plan and an optional contributory defined contribution plan.
With the closure of the Canadian defined benefit plans to new entrants, the volatility associated with future service accruals for active members has been limited and will decline over time. As at December 31, 2023, there are no active employees accruing future service benefits in the U.S. defined benefit plans. In 2023 all assets and liabilities associated with the UK pension plans were transferred to the buyer as part of the sale of Sun Life's UK business.
The major risks remaining in relation to past service obligations are increases in liabilities due to a decline in discount rates, greater life expectancy than assumed and adverse asset returns. We have significantly de-risked the investments of our material defined benefit pension plans Company-wide by systematically shifting the pension asset mix towards liability matching investments. The target for our significant plans is to minimize volatility in funded status arising from changes in discount rates and exposure to equity markets.
Due to the long-term nature of these defined benefit plans, the calculation of benefit expenses and accrued benefit obligations depends on various assumptions, including discount rates, rates of compensation increases, health care cost trend rates, retirement ages, mortality rates and termination rates. Based upon consultation with external pension actuaries, management determines the assumptions used for these plans on an annual basis. The discount rate used for our material defined benefit plans is determined with reference to market yields of high-quality corporate bonds that are denominated in the same currency in which the benefits will be paid, and that have terms to maturity approximating the terms of obligations.
Actual experience may differ from that assumed, which would impact the valuation of defined benefit plans and the level of benefit expenses recognized in future years. Details of our pension and post-retirement benefit plans and the key assumptions used for the valuation these plans are included in Note 24 of our 2023 Annual Consolidated Financial Statements.
2. Changes in Accounting Policies
We have included in this section a summary of changes in accounting policies. Where there are references to Notes, these are part of our 2023 Annual Consolidated Financial Statements. Please also refer to Note 2 of our Annual Consolidated Financial Statements for more details.
2.A New and Amended International Financial Reporting Standards Adopted in 2023
2.A.i Adoption of IFRS 17 Insurance Contracts and IFRS 9 Financial Instruments
In May 2017, the IASB issued IFRS 17 Insurance Contracts ("IFRS 17"), with an amendment issued in June 2020 to defer the effective date of IFRS 17 to annual periods beginning on or after January 1, 2023. This standard is to be applied using a retrospective approach, with at least one year of comparative results provided. If retrospective application to a group of insurance contracts is impracticable, a modified retrospective or fair value approach may be used. IFRS 17 replaces IFRS 4 Insurance Contracts ("IFRS 4") and impacts how we recognize, measure, present, and disclose our insurance contracts in our Consolidated Financial Statements.
IFRS 17 and IFRS 9 Financial Instruments ("IFRS 9") were effective for us beginning January 1, 2023. IFRS 9 includes guidance on the classification and measurement of financial instruments, impairment of financial assets and hedge accounting, and does not require restatement of comparative periods. IFRS 9 replaces IAS 39 Financial Instruments: Recognition and Measurement ("IAS 39"). We are permitted, under IFRS 17, to present comparative information on financial assets as if IFRS 9 were applicable during the comparative period ("classification overlay"). We have elected to apply the classification overlay to our financial assets and their comparative period results as if IFRS 9 had been effective since January 1, 2022. Certain comparative period information will continue to be presented in accordance with our previous accounting policies.
For initial measurement of insurance contracts at the transition date of January 1, 2022, we have elected to use the fair value approach for all groups for which the retrospective approach is impracticable. For more information on the application of the fair value approach at transition, see the heading "Fair Value Measurement" in Note 2.A.i in our 2023 Annual Consolidated Financial Statements.
IFRS 17 establishes principles for the recognition, measurement, presentation, and disclosure of insurance contracts. The key principles of IFRS 17 are as follows:
•Insurance contracts are those under which an entity accepts significant insurance risk from another party ("policyholder") by agreeing to compensate the policyholder if a specified uncertain future event ("insured event") adversely affects the policyholder.
•Insurance contracts issued and reinsurance contracts held are divided into groups that will be separately recognized and measured.
•Groups of insurance contracts are recognized and measured as the total of the following measurement components: a) the present value of future cash flows; b) a risk adjustment for non-financial risk ("RA"); and c) the Contractual Service Margin ("CSM"), an amount that represents the unearned profit of the group of contracts. These measurement components apply to groups of insurance contracts measured using the GMA and the VFA. The VFA applies to insurance contracts issued with direct participation features, which are substantially investment-related service contracts under which the policyholder is promised an investment return based on underlying items, such as segregated funds and certain participating insurance contracts. For short duration contracts, such as most of our group life and health business, a simplified measurement approach (PAA) is applied. Under the PAA, insurance contracts are measured based on unearned profits and do not include a CSM.
108 December 31, 2023 Sun Life Financial Inc. MANAGEMENT'S DISCUSSION & ANALYSIS
•The profit from a group of insurance contracts is recognized into income over the period that insurance contract services are provided and as the non-financial risks related to providing the insurance contracts diminish.
•Insurance revenue, insurance service expenses and insurance finance income or expenses are presented separately.
Significant Differences between IFRS 17 and IFRS 4
The following section describes the most significant differences between IFRS 17 and the accounting policies applied under IFRS 4.
Scope
There is no substantial change in IFRS 17 compared to IFRS 4 with regards to which contracts fall within the scope of the standard. However, we have updated the accounting policy for classification that was adopted on the transition to IFRS 4 in 2011 to ensure consistency with the IFRS 17 definition of insurance contracts.
Under IFRS 17, an insurance contract is defined as a contract under which the issuer accepts significant insurance risk from the policyholder by agreeing to compensate the policyholder if an insured event adversely affects the policyholder. In assessing whether "significant" insurance risk exists, certain contracts that were classified as insurance contracts under IFRS 4 were reclassified as investment contracts under IFRS 17. Such changes in classification were limited to certain deferred annuity products where the insurance risk is limited to the right to annuitize the maturity benefit, which fell short of the threshold for "significant" insurance risk.
Furthermore, IFRS 17 includes new requirements for the separation of distinct investment components and distinct goods or non-insurance service components of insurance contracts. At transition to IFRS 17, there were no distinct investment components and only immaterial distinct service components in our insurance contracts.
Unlike IFRS 4, IFRS 17 requires reinsurance contracts held to be measured separately from the underlying direct contracts. A reinsurance contract is an insurance contract issued by the reinsurer to compensate another entity for claims arising from one or more insurance contracts issued by that other entity ("underlying contracts").
Only contracts that transfer insurance risk to the reinsurer are considered reinsurance contracts held from the ceding entity’s point of view. We have reinsurance treaties that transfer only non-insurance risks to the reinsurer, however these are not considered reinsurance contracts held in scope of IFRS 17, nor were they in scope of IFRS 4. Rather, they are treated as insurance contracts purchased.
Reinsurance treaties that are part of the underlying items of participating insurance contracts (i.e., where all the cash flows of the reinsurance treaty are fully passed through to the participating insurance policyholders) are measured and reported separately.
Investment contracts with DPF are in scope of IFRS 17 and were in scope of IFRS 4. However, such contracts were reported with other investment contracts under IFRS 4, and are reported with insurance contracts under IFRS 17.
Measurement
The measurement of insurance contracts under IFRS 17 differs from the Canadian Asset Liability Method previously applied under IFRS 4. The most significant differences by measurement component are as follows:
Present value of future cash flows:
•The discount rates used to present value future cash flows under IFRS 17 are based on the characteristics of the insurance contracts. Under IFRS 4, the Canadian Asset Liability Method is used to determine actuarial liabilities based on the portfolio of assets currently supporting the insurance contract liabilities and reinvestment assumptions.
•Estimates under IFRS 17 include the current market view of the cost of financial guarantees, which requires a valuation consistent with market option prices. Under IFRS 4, the cost of financial guarantees is based on the amount required to fulfill the obligation but not directly linked to market option prices.
•Expense cash flows under IFRS 17 are limited to those directly attributable to fulfillment of the obligations under insurance contracts.
•Future income taxes are excluded from future cash flows under IFRS 17.
Risk adjustment for non-financial risk:
•Measures the compensation required for uncertainty related to non-financial risk, such as mortality, morbidity, surrender and expenses under IFRS 17.
•Provisions for uncertainty related to financial risk are implicitly included in the present value of future cash flows under IFRS 17.
•No amount is provided for asset-liability mismatch risk under IFRS 17.
•Under IFRS 4, amounts provided for the risks listed above are reflected in a provision for adverse deviations included in insurance contract liabilities.
CSM:
•This is a new component of liabilities and necessitates the "grouping" of insurance contracts, which is not required under IFRS 4.
•The CSM represents unearned profits, as discussed above.
The measurement approaches under IFRS 17 and IFRS 4 are similar for insurance contracts measured using the PAA, such as our group life and health contracts. Differences arise mainly in the measurement of the liability for incurred claims ("LIC"), where the discount rate and risk adjustment for non-financial risk changes noted above apply.
Presentation
IFRS 17 requires that portfolios of insurance contracts that are in an asset position be presented separately from portfolios of insurance contracts that are in a liability position in the Consolidated Statements of Financial Position. Also, portfolios of insurance contracts issued must be presented separately from portfolios of reinsurance contracts held. Previously, insurance contracts issued were presented only as liabilities and reinsurance contracts held were presented only as assets. Certain balances, such as policy loans and outstanding and prepaid
MANAGEMENT'S DISCUSSION & ANALYSIS Sun Life Financial Inc. December 31, 2023 109
premiums, that were previously presented separately or included in Other assets and Other liabilities are now included in the assets or liabilities for insurance contracts issued or reinsurance contracts held.
The presentation of income from insurance contracts on the Consolidated Statements of Operations has changed significantly for IFRS 17. Prior to IFRS 17, insurance related income was presented separately in the lines Gross premiums, Ceded premiums, Gross claims and benefits paid, Reinsurance expenses (recoveries), Increase (decrease) in insurance contract liabilities, and Decrease (increase) in reinsurance assets. The line Operating expenses, commissions and premium taxes included all expenses, reflecting those from both insurance and non-insurance contracts.
Under IFRS 17, insurance-related income is presented in the Insurance service result section and the Insurance finance income (expenses) line in the Investment result section. Amounts are presented separately for insurance contracts issued and reinsurance contracts held. The Insurance service expenses line includes amounts previously reported as Gross claims and benefits paid, with the exclusion of repayments of investment components, which are amounts that are returned to policyholders under all circumstances. Directly attributable expenses are also presented as Insurance service expenses. Income or expense from reinsurance contracts held is now presented as one line, which includes an allocation of reinsurance premiums paid and amounts recovered from reinsurers.
For insurance contracts measured using the GMA or VFA, premiums are no longer reported as revenue or recognized in income when received. Insurance revenue in a reporting period is comprised of the portion of premiums that cover expected claims and directly attributable expenses in the period, as well as the release of RA and the amortization of CSM for the period. Insurance revenue excludes the portion of premiums that cover repayment of investment components.
Fee income excludes income from insurance contracts as any fees earned would be recognized in Insurance contract revenue. Similarly, the Operating expenses and commissions line excludes expenses that are directly attributable to issuing or fulfilling insurance contracts as these expenses, as well as premium taxes paid, are included in the Insurance service result section.
Revised accounting policies on adoption of IFRS 17
For more information about the revised accounting policies as a result of the adoption of IFRS 17 that differ from those included in our 2022 Annual Consolidated Financial Statements, refer to Note 2.A.i of our 2023 Annual Consolidated Financial Statements.
Impacts on our financial performance
We have highlighted in the following section certain impacts on our financial performance as a result of the differences between IFRS 17 and IFRS 4 described above:
•New business gains (unearned profits) are measured differently under IFRS 17, reflecting measurement differences on insurance contracts as discussed above. In addition, new business gains under IFRS 17 are deferred and recorded in the CSM and amortized into income as insurance contract services are provided. Losses on new business are also measured differently, but continue to be recognized in income immediately. Under IFRS 4, new business gains and losses were both recognized in income immediately.
•Discount rates used in calculating the present value of insurance contract liabilities are based on the characteristics of the insurance contracts rather than the assets supporting the liabilities. Amongst other differences, this results in changes in the timing of when investment-related income emerges.
•Under IFRS 17, changes related to financial risk (e.g. changes in the discount rate) continue to be recognized in income immediately, except for insurance contracts measured using the VFA, where the changes are recorded through the CSM. Assumption changes for non-financial risk, such as mortality, are reflected in the CSM and amortized into income as insurance contract services are provided. Under IFRS 4, assumption changes for both financial and non-financial risk variables were recognized in income immediately.
Significant Differences between IFRS 9 and IAS 39
The following section describes the most significant differences between IFRS 9 and the accounting policies applied under IAS 39.
Classification of financial assets and financial liabilities
IFRS 9 introduces three principal classification categories for financial assets. Financial assets are measured at initial recognition at fair value, and are classified as and subsequently measured at FVTPL, FVOCI or amortized cost based on our business model for managing the financial asset and the contractual cash flow characteristics of the asset.
IFRS 9 eliminates the previous IAS 39 categories of held-to-maturity, available-for-sale ("AFS"), and loans and receivable financial assets. Under IFRS 9, derivatives embedded in contracts where the host is a financial asset in scope of IFRS 9 are not separated. Instead, the hybrid financial instrument, as a whole, is assessed for classification.
IFRS 9 maintains the IAS 39 classification for financial liabilities. Under IFRS 9, financial liabilities are measured at either amortized cost or FVTPL.
Under IFRS 17, we elected to recognize all insurance finance income or expense in income rather than other comprehensive income. Consequently, to avoid an accounting mismatch, we are electing under IFRS 9 to classify most of our fixed income assets supporting insurance contracts as FVTPL.
Impairment of financial assets
IFRS 9 replaces the "incurred loss" model under IAS 39 with a forward-looking ECL model. The new impairment model applies to financial assets measured at amortized cost, debt securities measured at FVOCI, mortgages and loans measured at FVOCI, lease receivables, account receivables, loan commitments and financial guarantees not measured at FVTPL. Credit losses are recognized earlier under IFRS 9 as compared previously under IAS 39. IFRS 9 introduces an impairment model for financial assets not measured at FVTPL. The model requires the recognition of an allowance for 12-month expected losses at the initial recognition of a financial asset, and the recognition of an allowance for lifetime expected losses if certain criteria are met.
110 December 31, 2023 Sun Life Financial Inc. MANAGEMENT'S DISCUSSION & ANALYSIS In August 2020, the IASB issued the Interest Rate Benchmark Reform Phase 2, which includes amendments to IFRS 9, IAS 39, IFRS 7 Financial Instruments: Disclosures ("IFRS 7"), IFRS 4, and IFRS 16 Leases ("IFRS 16").
Hedge accounting
IFRS 9 introduced a new hedge accounting model, but permits entities to continue applying hedge accounting requirements under IAS 39 instead of those under IFRS 9. We have elected to continue applying the hedge accounting requirements under IAS 39.
Interest Rate Benchmark Reform - Phase 2 amendments
These amendments address issues that arise from the implementation of the reforms, including the replacement of a benchmark with an alternative reference rate (“ARR”), such as the Secured Overnight Financing Rate (“SOFR”), in the case of US dollar LIBOR, and the Canadian Overnight Repo Rate Average (“CORRA”), in the case of the Canadian Dollar Offered Rate ("CDOR"). The adoption of these amendments did not have a material impact on our Consolidated Financial Statements.
All LIBOR settings were either discontinued or declared non-representative on or before June 30, 2023. On May 16, 2022, Refinitiv Benchmark Services (UK) Limited, the administrator of CDOR, announced that it will permanently cease the publication of all three tenors of CDOR after June 28, 2024. Concurrently, OSFI published their expectation that Federally Regulated Financial Institutions ("FRFIs") transition all new derivatives and securities to an ARR by June 30, 2023, with no new CDOR exposure being recognized after that date (with limited exceptions for risk management requirements), and that loan agreements referencing CDOR be transitioned by June 28, 2024. FRFIs are also expected to prioritize system and model updates to accommodate the use of CORRA (or any alternative reference rates, as necessary) prior to such date.
Also, with the cessation of CDOR’s publication, the Bankers’ Acceptance (“BA”) lending model will be discontinued, and BA issuance is expected to cease. To facilitate the Canadian loan markets’ move away from CDOR and BAs, on July 27, 2023, the Canadian Alternative Reference Rate working group (“CARR”), established by the Canadian Fixed-Income Forum committee of the Bank of Canada (“CFIF”), has implemented a milestone in its two-stage transition plan whereby no new CDOR or BA-related contract should be entered into after November 1, 2023. CFIF has formed a BA-related working group to facilitate a smooth transition away from BAs and to assess potential options to replace them.
In preparation for the above-mentioned benchmark reform, we implemented an Interbank Offered Rate ("IBOR") Transition Program (the "Program") to manage the transition from LIBOR and CDOR to appropriate ARRs. The Program is cross-functional in nature and comprises key stakeholders across our organization and operates with executive oversight. The Program is on track in executing its transition plan, and is mindful of incorporating market developments as they arise. We also actively participate in industry associations and incorporate best practice guidance from these industry associations, as well as regulatory bodies, into the transition plan, such as reviewing and remediating our IBOR-based contracts to incorporate appropriate fallback language. The Program is designed to address the risk and uncertainty relating to our transition to ARRs and other factors relating to reform that could otherwise adversely affect our operations and cash flows and the value of and return on our investments that are IBOR-based. Our affiliated entities with IBOR exposure related to derivatives adhered to the ISDA 2020 IBOR Fallbacks Protocol prior to June 30, 2023, facilitating the transition of our legacy derivative contracts to appropriate ARRs. Our GBP LIBOR exposure transitioned to Sterling Overnight Index Average, and our remaining US dollar LIBOR and CDOR exposure has transitioned or is expected to transition to appropriate ARRs in the first half of 2024.
As at December 31, 2023, our exposure to US dollar LIBOR consists of non-derivative financial assets of $86 million (December 31, 2022 — $2,750 million), non-derivative financial liabilities of $nil (December 31, 2022 — $77 million) and derivative notional of $nil (December 31, 2022 — $1,683 million) that have not yet been confirmed to have transitioned to SOFR. Our exposure to CDOR consists of non-derivative financial assets of $589 million (December 31, 2022 — $396 million), non-derivative financial liabilities of $4,896 million (December 31, 2022 — $5,892 million), and derivative notional of $9,159 million (December 31, 2022 — $11,725 million) that have not yet transitioned to CORRA, excluding financial instruments maturing by June 28, 2024, and including derivatives that are expected to automatically transition to CDOR upon its cessation.
Revised accounting policies on adoption of IFRS 9
For more information about the revised accounting policies as a result of the adoption of IFRS 9 that differ from those included in our 2022
Annual Consolidated Financial Statements, refer to heading "IFRS 9 Financial Instruments" in Note 2.A.ii of our 2023 Annual Consolidated Financial Statements.
2.A.ii Other Amended International Financial Reporting Standards Adopted in 2023
We adopted the following amendments to IFRS on January 1, 2023. The adoption of these amendments did not have a material impact on our Consolidated Financial Statements:
In May 2021, the IASB issued amendments to IAS 12 Income Taxes ("IAS 12"). The amendments, Deferred Tax related to Assets and Liabilities arising from a Single Transaction, narrow the scope of the recognition exemption in IAS 12 so that it no longer applies to transactions that, on initial recognition, give rise to equal taxable and deductible temporary differences.
In February 2021, the IASB issued amendments to IAS 1 Presentation of Financial Statements ("IAS 1") and IFRS Practice Statement 2 Making Materiality Judgments ("IFRS Practice Statement 2"). The amendments to IAS 1 require companies to disclose their material accounting policy information rather than their significant accounting policies. The amendments to IFRS Practice Statement 2 provide guidance on how to apply the concept of materiality to accounting policy disclosures.
In February 2021, the IASB issued amendments to IAS 8 Accounting Policies, Changes in Accounting Estimates and Errors. The amendments clarify how companies should distinguish changes in accounting policies from changes in accounting estimates.
In May 2023, the IASB issued amendments to IAS 12 to give temporary relief from accounting for deferred taxes arising from Pillar Two model rules, which the Organization for Economic Co-operation and Development ("OECD") published in December 2021. The amendments introduce a mandatory temporary exception to the accounting for deferred taxes arising from jurisdictions implementing the global tax rules
MANAGEMENT'S DISCUSSION & ANALYSIS Sun Life Financial Inc. December 31, 2023 111
and disclosure requirements for affected entities to help users better understand an entity’s exposure to Pillar Two income taxes arising from that legislation, particularly before its effective date. Effective upon issuance, we have applied the mandatory temporary exception which is effective immediately.
On August 4, 2023, the Canadian Department of Finance released draft legislation to implement certain previously announced measures, including application rules for a 15% global minimum tax under OECD’s two-pillar plan, which will apply to Sun Life effective January 1, 2024, however the timing of the substantive enactment of these rules in most jurisdictions where Sun Life operates is uncertain. The Pillar Two rules are not expected to have a material impact on Sun Life’s consolidated financial statements when they become effective.
2.B New and Amended International Financial Reporting Standards to be Adopted in 2024
The following new and amended IFRS were issued by the IASB. We expect to adopt these in 2024:
In September 2022, the IASB issued amendments to IFRS 16 to add subsequent measurement requirements for sale and leaseback transactions that satisfy the requirements in IFRS 15 Revenue from Contracts with Customers to be accounted for as a sale. The amendments require a seller-lessee to subsequently measure lease liabilities arising from a leaseback in a way that it does not recognize any amount of the gain or loss that relates to the right of use it retains. The amendments to IFRS 16 will be effective for annual reporting period beginning on or after January 1, 2024, with early application permitted. We do not expect the adoption of these amendments to have a material impact on our Consolidated Financial Statements.
3. Disclosure Controls and Procedures
The Company has established disclosure controls and procedures that are designed to provide reasonable assurance that all relevant information is gathered and reported to senior management, including the Company's President and CEO, Executive Vice-President and Chief Financial Officer ("CFO"), and Executive Vice-President, Chief Legal Officer and Public Affairs, on a timely basis so that appropriate decisions can be made regarding public disclosure.
An evaluation of the effectiveness of our disclosure controls and procedures, as defined under rules adopted by the Canadian securities regulatory authorities and the SEC, as at December 31, 2023, was carried out under the supervision of and with the participation of the Company's management, including the CEO and the CFO. Based on our evaluation, the CEO and the CFO concluded that the design and operation of these disclosure controls and procedures were effective as at December 31, 2023.
Management's Report on Internal Control over Financial Reporting
Management is responsible for establishing and maintaining adequate internal control over financial reporting to provide reasonable assurance regarding the reliability of our financial reporting and the preparation of our financial statements in accordance with IFRS.
Due to its inherent limitations, internal control over financial reporting may not prevent or detect misstatements on a timely basis. Projections of any evaluation of the effectiveness of internal control over financial reporting to future periods are subject to the risk that the controls may become inadequate because of changes in conditions, or that the degree of compliance with the policies or procedures may deteriorate.
We conducted an assessment of the effectiveness of our internal control over financial reporting, as of December 31, 2023, based on the framework and criteria established in Internal Control-Integrated Framework (2013), issued by the Committee of Sponsoring Organizations of the Treadway Commission. Based on that assessment, we have concluded that our internal control over financial reporting was effective as of December 31, 2023.
Our internal control over financial reporting, as of December 31, 2023, has been audited by the Company's external auditor, Deloitte LLP, Independent Registered Public Accounting Firm, who also audited our Annual Consolidated Financial Statements for the year ended December 31, 2023. As stated in the Report of Independent Registered Public Accounting Firm, they have expressed an unqualified opinion on our internal control over financial reporting as of December 31, 2023.
Changes in Internal Control over Financial Reporting
As a result of the adoption of IFRS 17 and IFRS 9, effective January 1, 2023, we made the necessary technology updates and modifications to the financial reporting processes and controls related to actuarial, finance, ALM and investments to comply with the requirements of the new accounting standards. No changes were made in our internal control over financial reporting for the period which began on January 1, 2023 and ended December 31, 2023 that have materially affected or are reasonably likely to materially affect our internal control over financial reporting.
|
|
|
|
|
|
| O. Legal and Regulatory Proceedings |
|
Information concerning legal and regulatory matters is provided in our Annual Consolidated Financial Statements and the AIF, in each case for the year ended December 31, 2023.
112 December 31, 2023 Sun Life Financial Inc.
|
|
|
|
|
|
| P. Forward-looking Statements |
|
MANAGEMENT'S DISCUSSION & ANALYSIS From time to time, the Company makes written or oral forward-looking statements within the meaning of certain securities laws, including the “safe harbour” provisions of the United States Private Securities Litigation Reform Act of 1995 and applicable Canadian securities legislation. Forward-looking statements contained in this document include statements (i) relating to our strategies; (ii) relating to expectations with respect to the Bermuda Corporate Income Tax Change and its impact on our consolidated financial statements; (iii) relating to the use of proceeds of our sustainability bond offering; (iv) relating to our normal course issuer bid (including, but not limited to, statements regarding future purchases of common shares under the NCIB); (v) relating to MFS going to market with active ETFs over the next year; (vi) relating to the expected operational launch of SLCSI in 2024; (vii) relating to the expected full launch of our Diabetes Signature Solutions products in 2024; (viii) relating to expected changes in our LICAT ratio; (ix) relating to our growth initiatives and other business objectives; (x) relating to our targets, goals and commitments (including with respect to our sustainability plan and net zero emissions); (xi) relating to our expected tax range for future years; (xii) set out in this document under the heading K - Risk Management - Market Risk Sensitivities - Interest Rate Sensitivities; (xiii) relating to the expected impact of the Pillar Two rules; (xiv) relating to legislation issued by the Canadian Department of Finance potentially limiting the deductibility of interest and financing expenses for Canadian tax purposes, if enacted; (xv) relating to our remaining US dollar LIBOR and CDOR exposure transitioning to appropriate ARRs in the first half of 2024; (xvi) relating to the expected impact of the adoption of the amendments to IFRS 16; (xvii) that are predictive in nature or that depend upon or refer to future events or conditions; and (xviii) that include words such as “achieve”, “aim”, “ambition”, “anticipate”, “aspiration”, “assumption”, “believe”, “could”, “estimate”, “expect”, “goal”, “initiatives”, “intend”, “may”, “objective”, “outlook”, “plan”, “project”, “seek”, “should”, “strategy”, “strive”, “target”, “will”, and similar expressions. Forward-looking statements include the information concerning our possible or assumed future results of operations. These statements represent our current expectations, estimates, and projections regarding future events and are not historical facts, and remain subject to change.
Forward-looking statements are not a guarantee of future performance and involve risks and uncertainties that are difficult to predict. Future results and shareholder value may differ materially from those expressed in these forward-looking statements. Our ability to achieve our net-zero GHG emissions reduction goals and targets is based on a number of assumptions and is subject to a number of factors beyond our control, including the availability of comprehensive, comparable and high-quality GHG emissions data, the need for active and continued participation of stakeholders (including enterprises, financial institutions and governmental and non-governmental organizations), the establishment and fulfilment of climate commitments and net-zero targets by governments and companies, the development and deployment of new technologies and industry-specific solutions including in hard-to-abate sectors, international cooperation, and the development of regulations internationally. The energy transition will not be linear and the pace of decarbonization for different sectors and countries will vary. We intend to review and potentially revise our emissions reduction goals and targets as appropriate as data quality and methodologies improve and as best practices, regulations and climate science continue to evolve. Other factors that may cause actual results and shareholder value to differ materially from those expressed in the forward-looking statements include the matters set out in this document under the headings D - Profitability - 5 - Income taxes, G - Financial Strength and K - Risk Management and in SLF Inc.’s 2023 AIF under the heading Risk Factors, and the factors detailed in SLF Inc.’s other filings with Canadian and U.S. securities regulators, which are available for review at www.sedarplus.ca and www.sec.gov, respectively.
Medium-Term Financial Objectives
The Company's medium-term financial objectives set out in section B - Overview - 2 - Financial Objectives are forward-looking non-IFRS financial measures. Our ability to achieve those objectives is dependent on our success in achieving growth initiatives and business objectives and on certain key assumptions that include: (i) no significant changes in the level of interest rates; (ii) average total return on real estate and equity investments of approximately 8% per annum; (iii) credit experience in line with expectations; (iv) no significant changes in the level of our regulatory capital requirements; (v) no significant changes to our effective tax rate; (vi) no significant increase in the number of shares outstanding; and (vii) other key assumptions include: no material changes to our hedging program, hedging costs that are consistent with our expectations, no material assumption changes and no material accounting standard changes. Our underlying ROE is dependent upon capital levels and options for deployment of excess capital. Our medium-term financial objectives do not reflect the indirect effects of interest rate and equity market movements including the potential impacts on goodwill or the current valuation allowance on deferred tax assets as well as other items that may be non-operational in nature.
Our target dividend payout ratio of 40%-50% of our underlying net income assumes that economic conditions and our results will enable us to maintain our payout ratio in the target range, while maintaining a strong capital position. The declaration, amount and payment of dividends is subject to the approval of SLF Inc.'s Board of Directors and our compliance with the capital requirements in the Insurance Companies Act (Canada). Additional information on dividends is provided in the section J - Capital and Liquidity Management - 3 - Shareholder Dividends in this MD&A.
Although considered reasonable by the Company, we may not be able to achieve our medium-term financial objectives as the assumptions on which these objectives were based may prove to be inaccurate. Accordingly, our actual results could differ materially from our medium-term financial objectives as described in the section B - Overview - 2 - Financial Objectives in this MD&A. Our medium-term financial objectives do not constitute guidance.
MANAGEMENT'S DISCUSSION & ANALYSIS Sun Life Financial Inc. December 31, 2023 113
Risk Factors
Important risk factors that could cause our assumptions and estimates, and expectations and projections to be inaccurate and our actual results or events to differ materially from those expressed in or implied by the forward-looking statements contained in this document, are set out below. The realization of our forward-looking statements essentially depends on our business performance which, in turn, is subject to many risks. Factors that could cause actual results to differ materially from expectations include, but are not limited to: market risks - related to the performance of equity markets; changes or volatility in interest rates or credit spreads or swap spreads; real estate investments; fluctuations in foreign currency exchange rates; and inflation; insurance risks - related to mortality experience, morbidity experience and longevity; policyholder behaviour; product design and pricing; the impact of higher-than-expected future expenses; and the availability, cost and effectiveness of reinsurance; credit risks - related to issuers of securities held in our investment portfolio, debtors, structured securities, reinsurers, counterparties, other financial institutions and other entities; business and strategic risks - related to global economic and geopolitical conditions; the design and implementation of business strategies; changes in distribution channels or Client behaviour including risks relating to market conduct by intermediaries and agents; the impact of competition; the performance of our investments and investment portfolios managed for Clients such as segregated and mutual funds; shifts in investing trends and Client preference towards products that differ from our investment products and strategies; changes in the legal or regulatory environment, including capital requirements and tax laws; the environment, environmental laws and regulations; operational risks - related to breaches or failure of information system security and privacy, including cyber-attacks; our ability to attract and retain employees; legal, regulatory compliance and market conduct, including the impact of regulatory inquiries and investigations; the execution and integration of mergers, acquisitions, strategic investments and divestitures; our information technology infrastructure; a failure of information systems and Internet-enabled technology; dependence on third-party relationships, including outsourcing arrangements; business continuity; model errors; information management; liquidity risks - the possibility that we will not be able to fund all cash outflow commitments as they fall due; and other risks - changes to accounting standards in the jurisdictions in which we operate; risks associated with our international operations, including our joint ventures; market conditions that affect our capital position or ability to raise capital; downgrades in financial strength or credit ratings; and tax matters, including estimates and judgements used in calculating taxes.
The Company does not undertake any obligation to update or revise its forward-looking statements to reflect events or circumstances after the date of this document or to reflect the occurrence of unanticipated events, except as required by law.
114 December 31, 2023 Sun Life Financial Inc. MANAGEMENT'S DISCUSSION & ANALYSIS

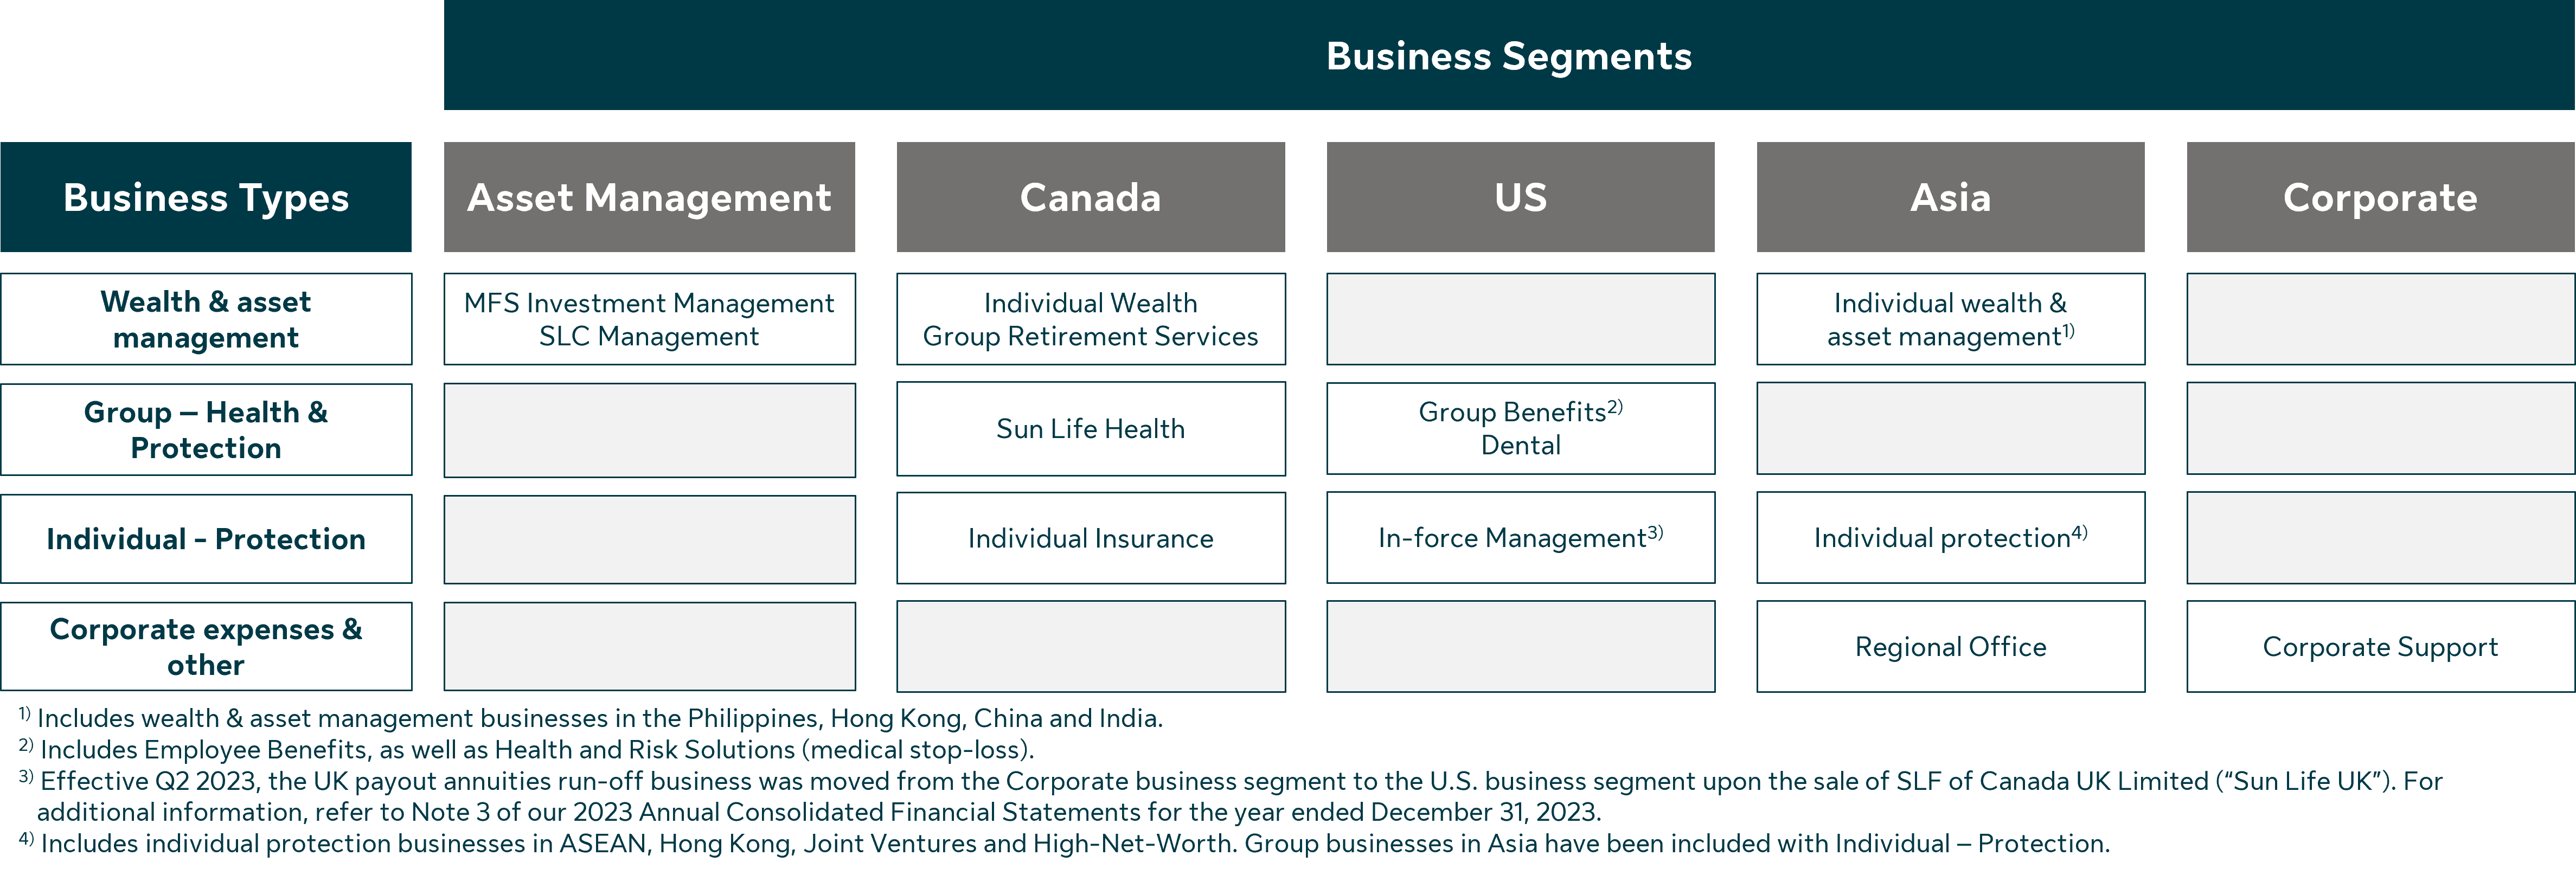
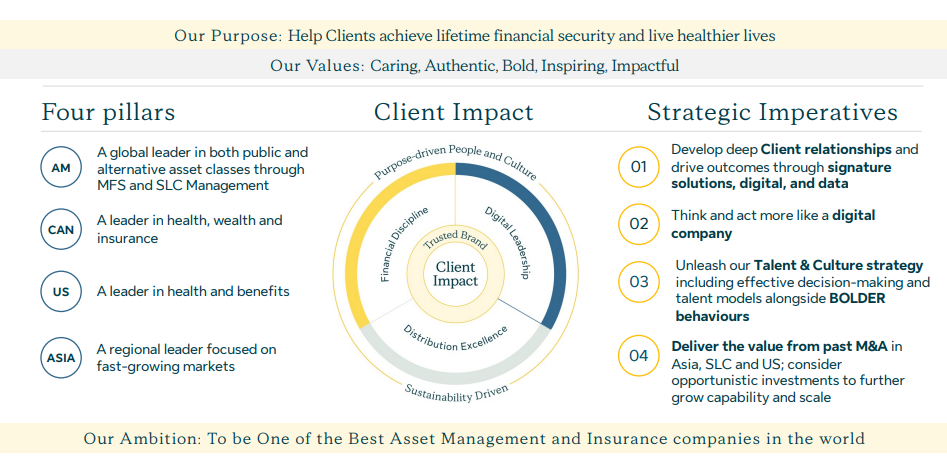
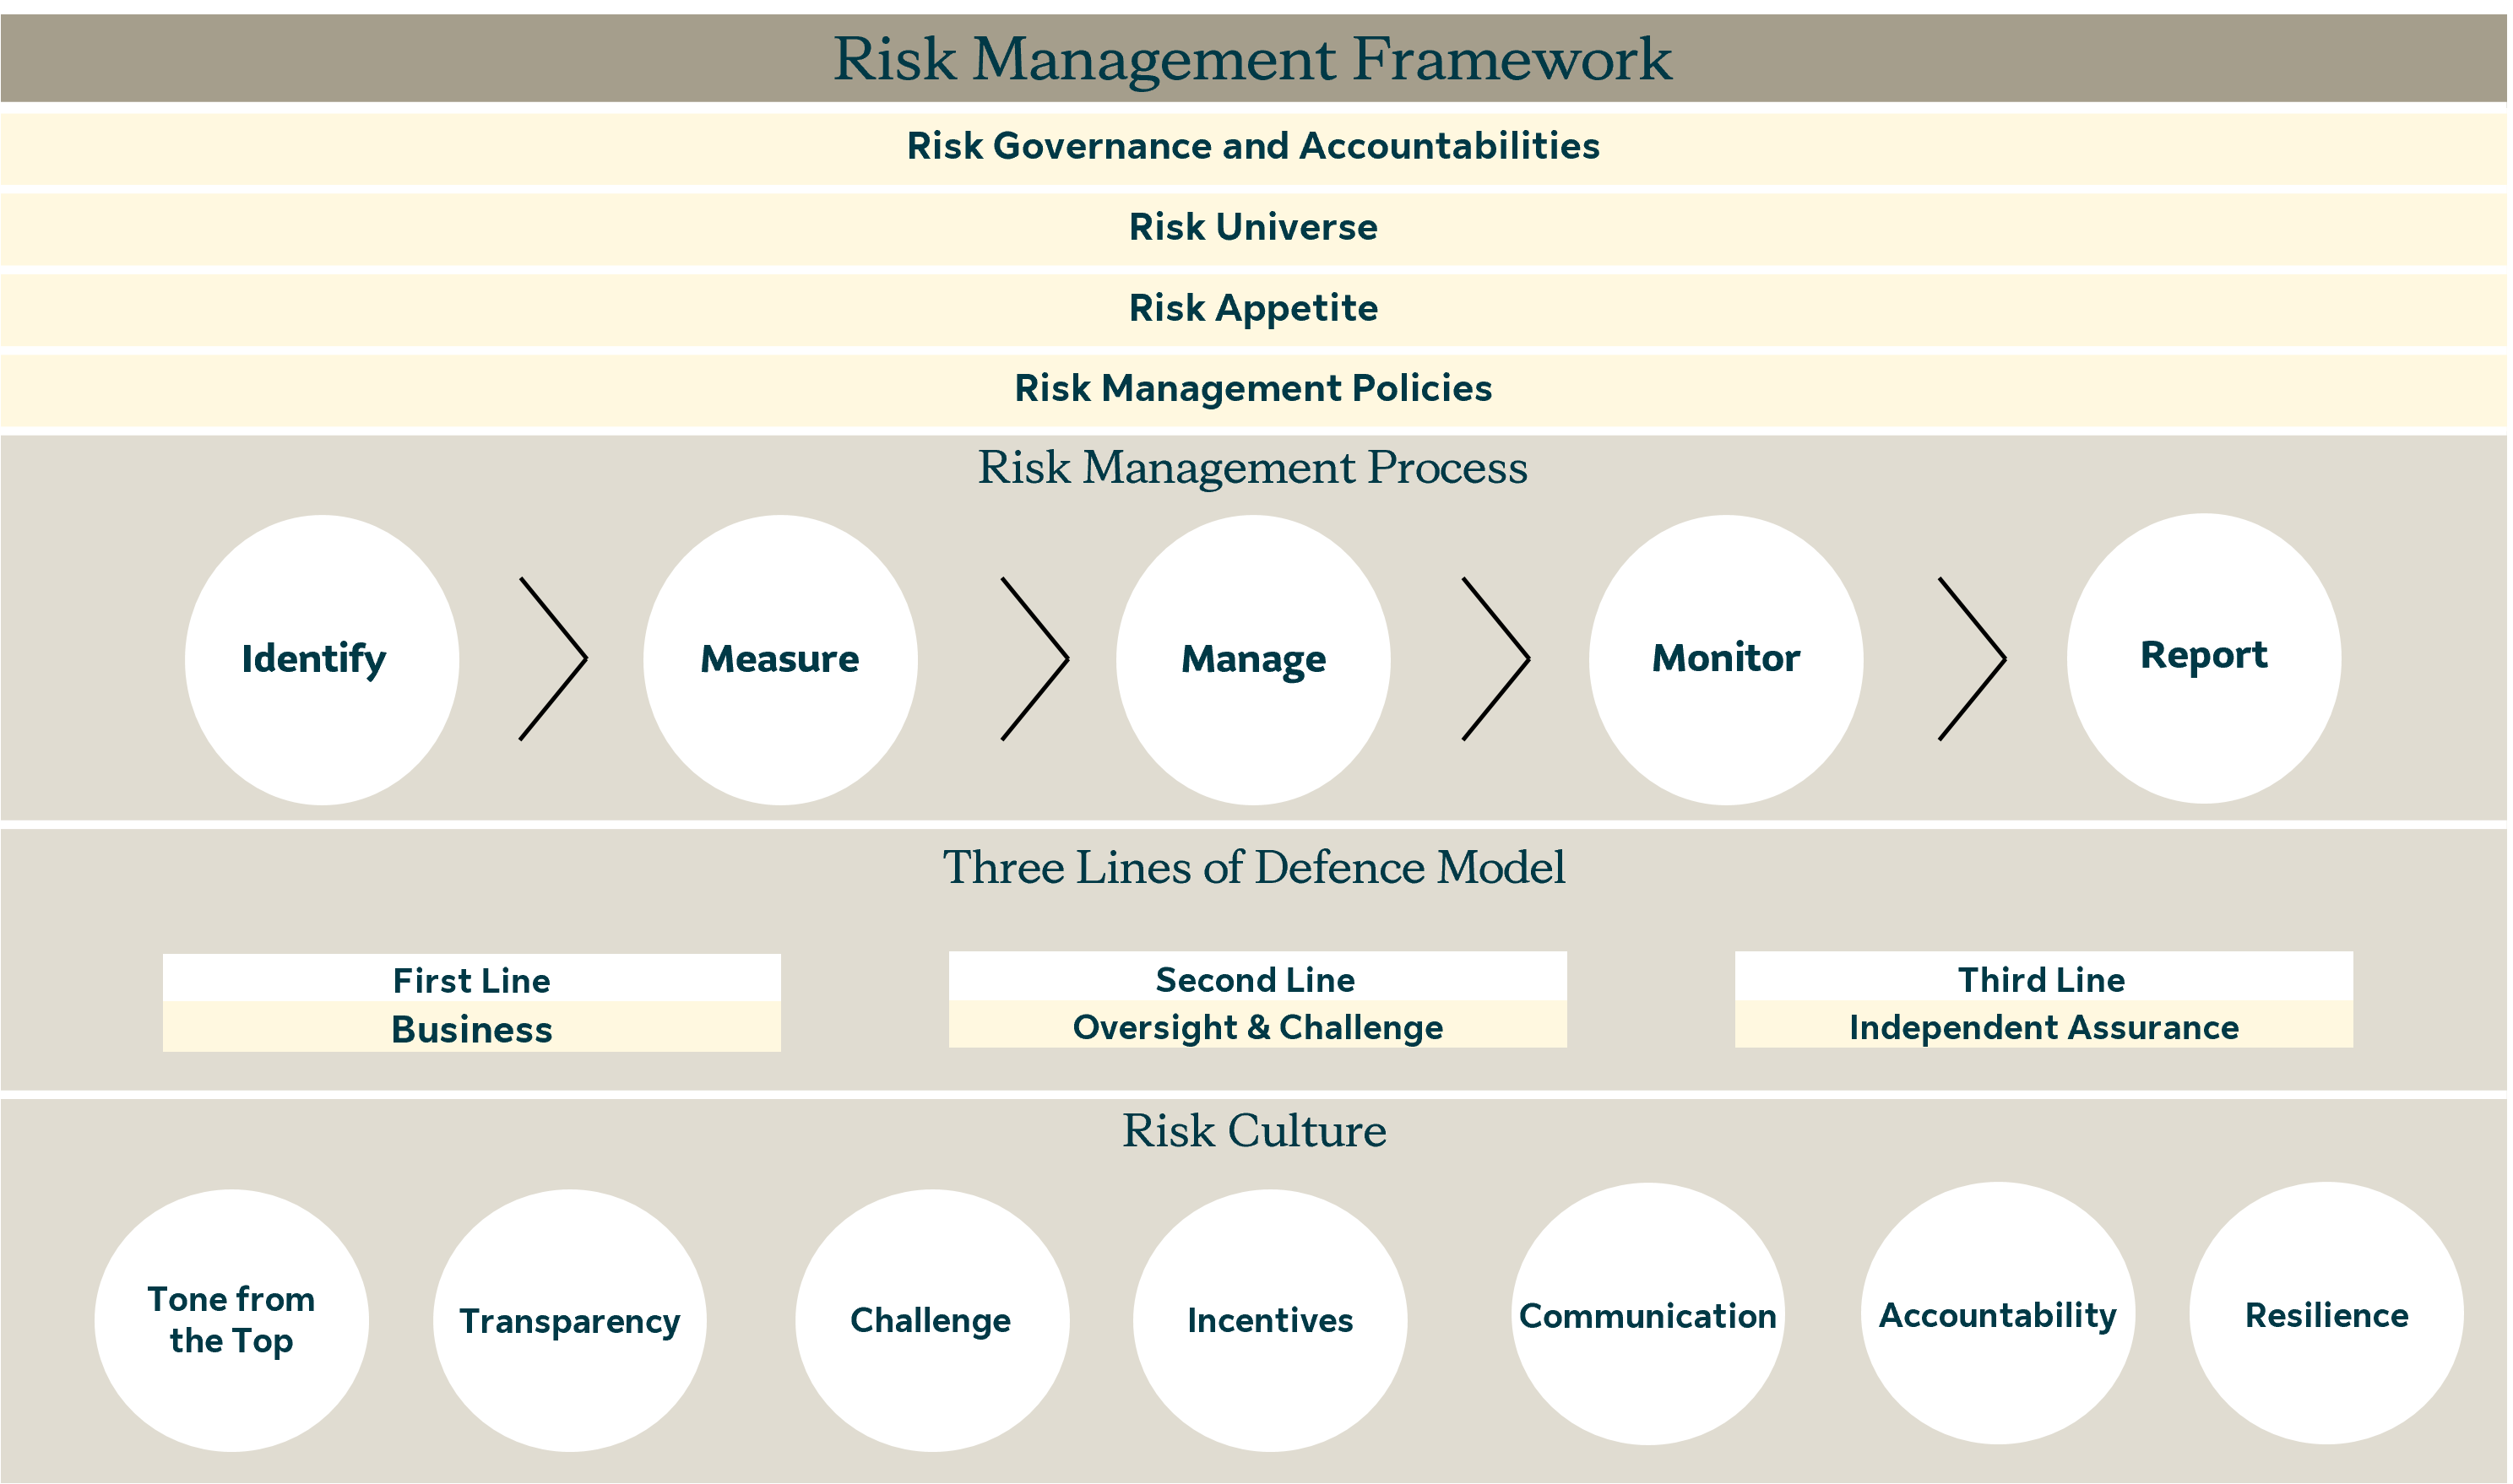
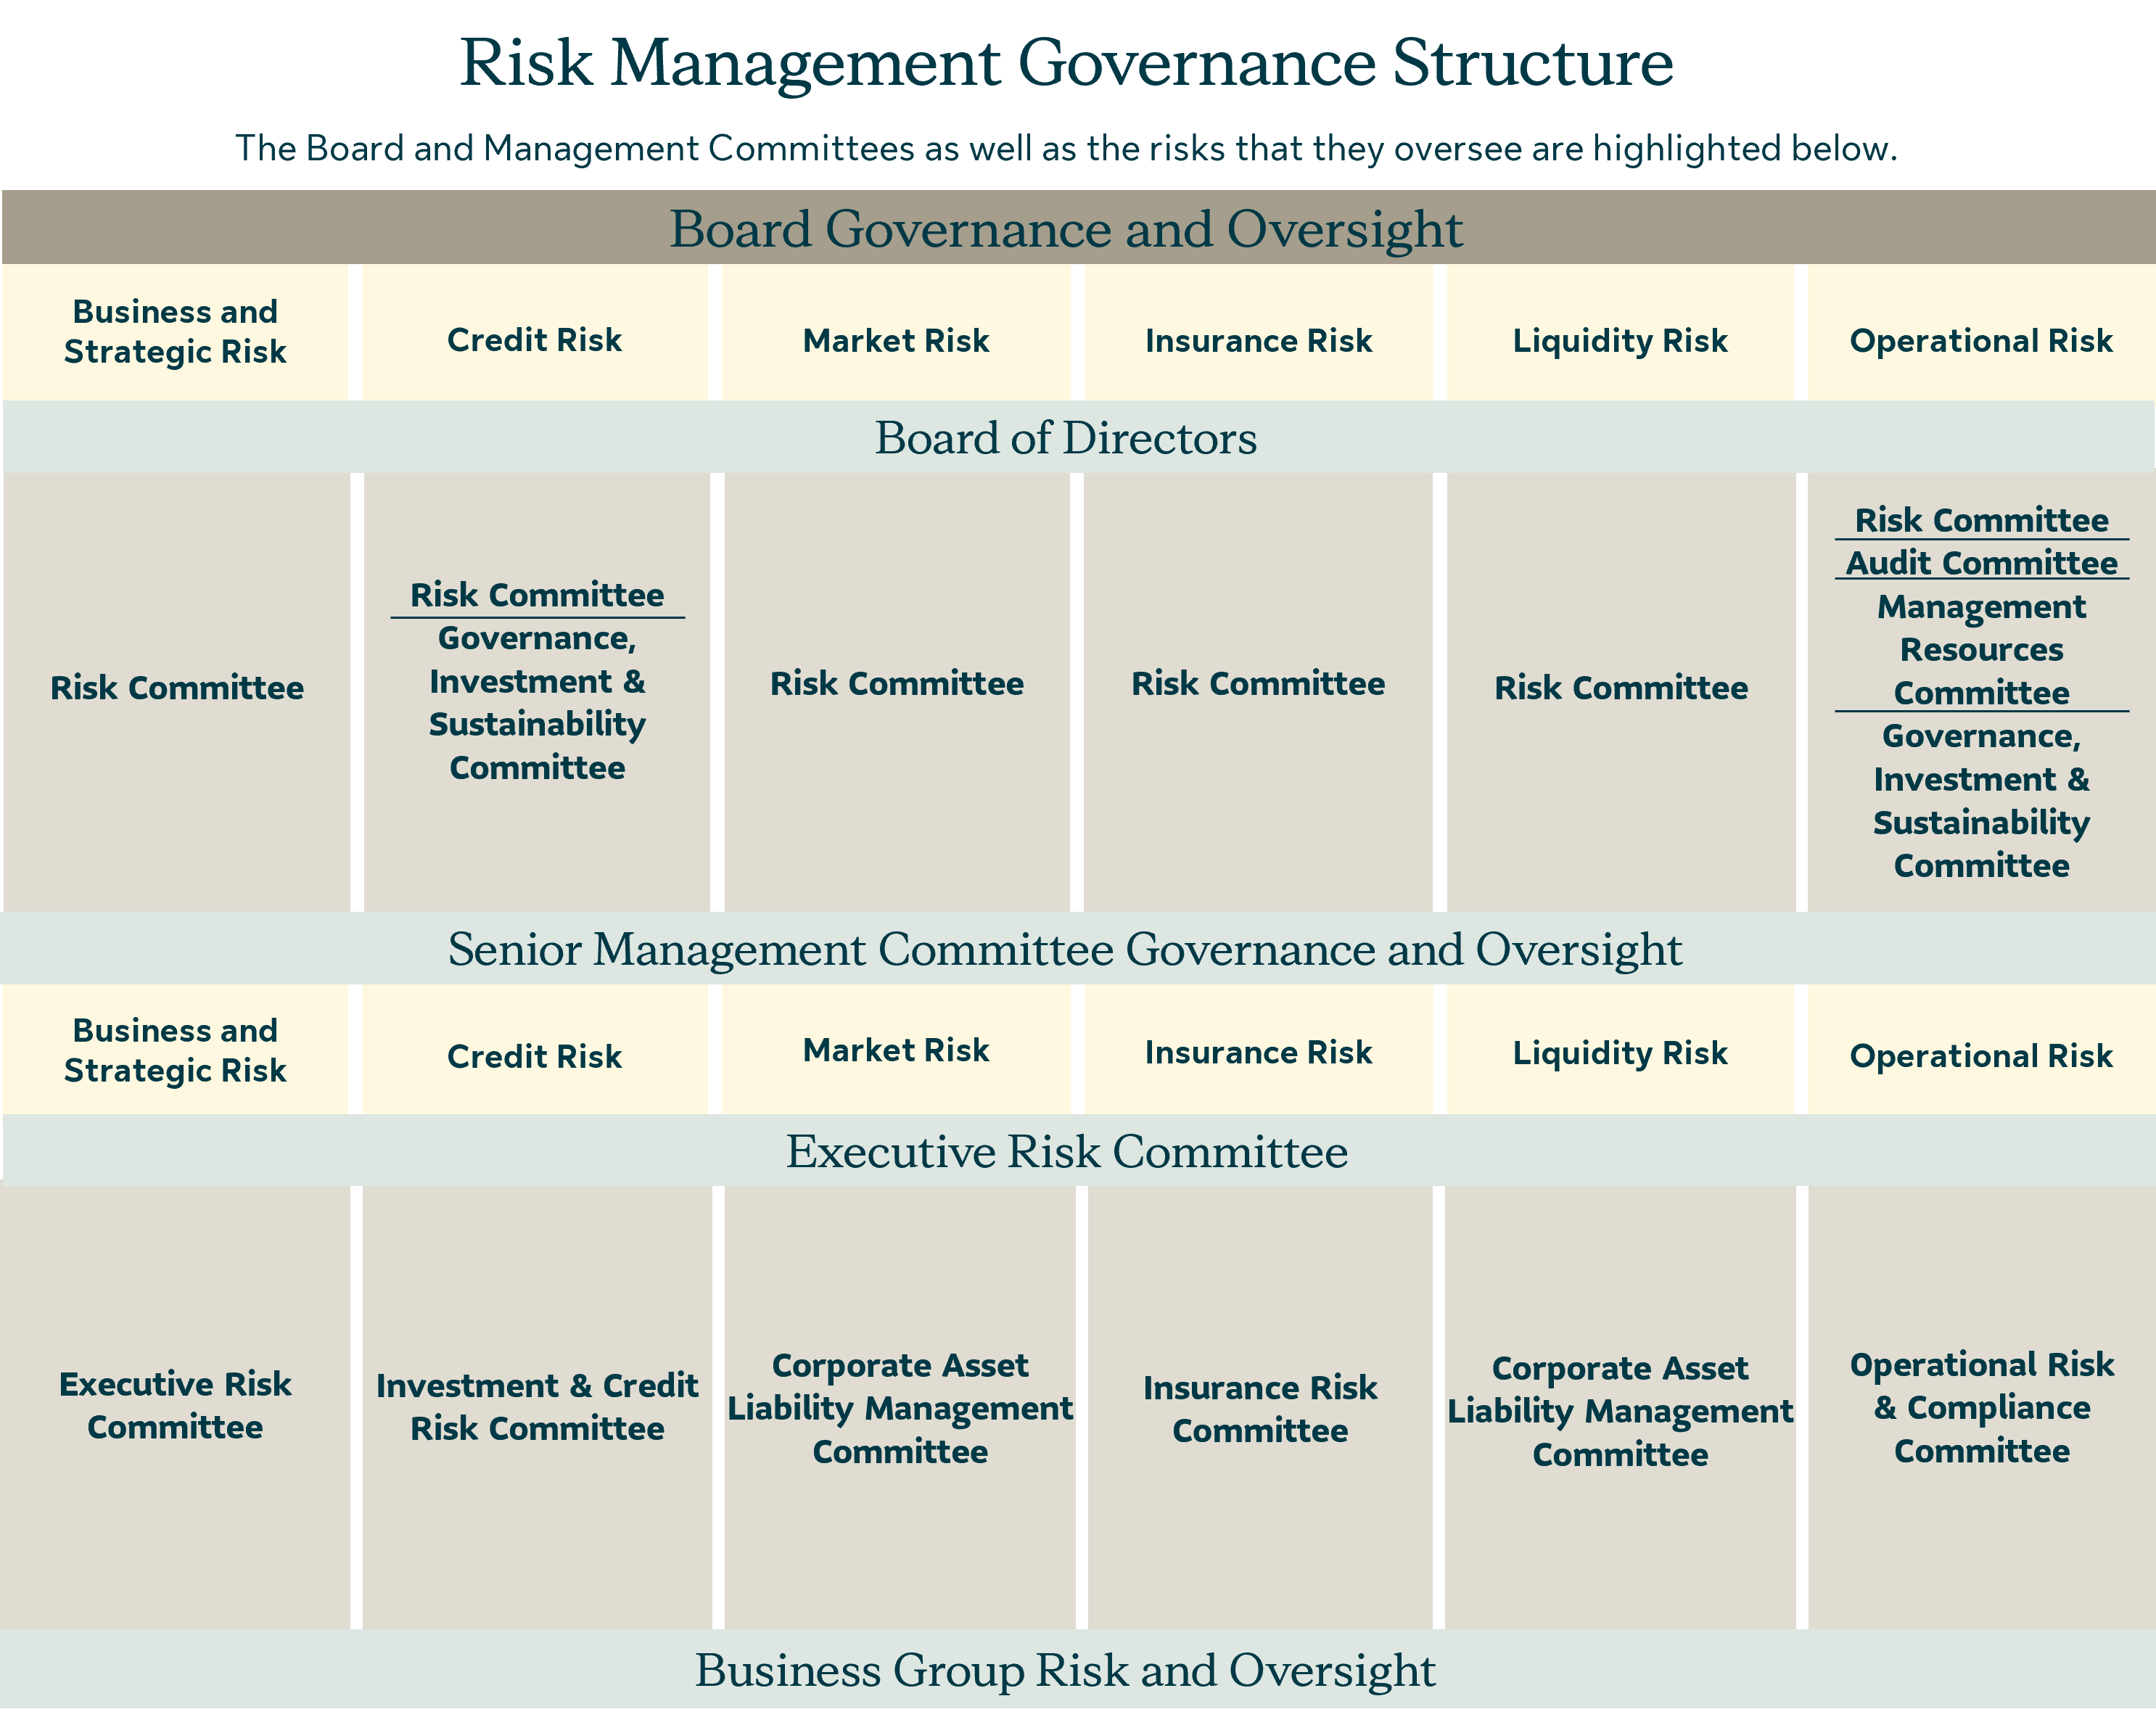


 APPENDIX A
