q32023shareholdersreport.htm
|
|
|
|
|
|
|
|
|
|
|
|
|
|
|
|
CANADIAN RESIDENTS PARTICIPATING IN THE SHARE ACCOUNT
Shareholders holding shares in the Canadian Share Account can sell their shares for $15 plus 3 cents per share. Complete Form A on the front of your Share Ownership Statement, tear it off and return it by mail to TSX Trust Company.
For more information call TSX Trust Company at 1 877 224-1760.
|
|
|
|
|
Sun Life Reports Third Quarter 2023 Results
Sun Life Financial Inc. ("SLF Inc."), its subsidiaries and, where applicable, its joint ventures and associates are collectively referred to as "the Company", "Sun Life", "we", "our", and "us". We manage our operations and report our financial results in five business segments: Canada, United States ("U.S."), Asset Management, Asia, and Corporate. The information in this document is based on the unaudited interim financial results of SLF Inc. for the period ended September 30, 2023 and should be read in conjunction with the interim management's discussion and analysis ("MD&A") and our unaudited interim consolidated financial statements and accompanying notes ("Interim Consolidated Financial Statements") for the period ended September 30, 2023, prepared in accordance with International Financial Reporting Standards ("IFRS"). We report certain financial information using non-IFRS financial measures. For more details, refer to the Non-IFRS Financial Measures section in this document. Additional information relating to SLF Inc. is available on www.sunlife.com under Investors – Financial results and reports, on the SEDAR+ website at www.sedarplus.ca, and on the U.S. Securities and Exchange Commission's website at www.sec.gov. Reported net income (loss) refers to Common shareholders' net income (loss) determined in accordance with IFRS. Unless otherwise noted, all amounts are in Canadian dollars. Amounts in this document may be impacted by rounding. On January 1, 2023 we adopted
IFRS 17 Insurance Contracts ("IFRS 17"), which replaces IFRS 4 Insurance Contracts, and IFRS 9 Financial Instruments ("IFRS 9"), which replaces IAS 39 Financial Instruments: Recognition and Measurement (collectively, "the new standards"). The nature and effects of the key changes to our critical accounting policies and estimated impacts from the adoption of the new standards are summarized in section L - Changes in Accounting Policies in our MD&A for the period ended September 30, 2023 ("Q3'23 MD&A").
TORONTO, ON - (November 13, 2023) - Sun Life Financial Inc. (TSX: SLF) (NYSE: SLF) announced its results for the third quarter ended September 30, 2023.
•Underlying net income(1) of $930 million decreased $19 million or 2% from Q3'22(2); underlying ROE(1) was 17.7%.
◦Wealth & asset management underlying net income(1): $457 million, up $38 million or 9%.
◦Group - Health & Protection underlying net income(1): $285 million, up $4 million or 1%.
◦Individual - Protection underlying net income(1): $297 million, down $8 million or 3%.
◦Corporate expenses & other(1): $(109) million net loss, increase in net loss of $(53) million or 95%.
•Reported net income of $871 million increased $760 million from Q3'22(2); reported ROE(1) was 16.6%.
•Increase to common share dividend from $0.75 to $0.78 per share.
“Sun Life delivered good results and we continue to benefit from our diversified business mix with strong net income in Canada, growth in SLC Management fee-related earnings and good growth in Asia," said Kevin Strain, President and CEO of Sun Life.
“We completed our acquisition of Dialogue, Canada’s leading virtual health and wellness provider that gives access to quality, high-touch care. In Asia, we increased our investment in Bowtie, Hong Kong’s first virtual insurer. Since the beginning of our partnership five years ago, Bowtie has grown in digital distribution, sales and increased market share. In the U.S., we’ve extended our Teledentistry.com partnership to DentaQuest, which will provide approximately 3.5 million people across 20 states access to oral and dental care. SLC Management's strategic relationship with Scotiabank Global Wealth Management to provide private asset solutions in the Canadian market will help to meet the growing demand for alternative investments.”
|
|
|
|
|
|
|
|
|
|
|
|
|
|
|
|
|
|
|
|
Quarterly results |
Year-to-date |
| Profitability |
Q3'23 |
Q3'22(2) |
2023 |
2022(2) |
|
Underlying net income ($ millions)(1) |
930 |
949 |
2,745 |
2,477 |
|
Reported net income - Common shareholders ($ millions) |
871 |
111 |
2,337 |
1,706 |
|
Underlying EPS ($)(1)(3) |
1.59 |
1.62 |
4.68 |
4.23 |
|
Reported EPS ($)(3) |
1.48 |
0.19 |
3.97 |
2.91 |
|
Underlying return on equity ("ROE")(1) |
17.7% |
19.4% |
17.6% |
17.1% |
|
Reported ROE(1) |
16.6% |
2.3% |
14.9% |
11.8% |
|
|
|
|
|
|
| Growth |
Q3'23 |
Q3'22(2) |
2023 |
2022(2) |
|
Wealth sales & asset management gross flows ($ millions)(1)(4) |
39,324 |
42,146 |
128,070 |
155,381 |
|
Group - Health & Protection sales ($ millions)(1) |
374 |
499 |
1,573 |
1,209 |
|
Individual - Protection sales ($ millions)(1) |
669 |
444 |
1,784 |
1,269 |
|
Assets under management ("AUM") ($ billions)(1) |
1,340 |
1,269 |
1,340 |
1,269 |
|
New business Contractual Service Margin ("CSM") ($ millions)(1) |
370 |
177 |
872 |
509 |
|
|
|
|
|
|
|
|
|
|
|
|
|
|
|
|
|
|
|
|
|
|
|
|
|
|
|
|
|
|
|
|
|
|
|
| Financial Strength |
Q3'23 |
As at January 1, 2023(5) |
|
|
|
LICAT ratios (at period end)(5) |
|
|
|
|
|
Sun Life Financial Inc. |
147% |
142% |
|
|
|
Sun Life Assurance(6) |
138% |
139% |
|
|
|
Financial leverage ratio (at period end)(2)(7) |
21.8% |
23.7% |
|
|
(1)Represents a non-IFRS financial measure. For more details, see the Non-IFRS Financial Measures section in this document and in the Q3'23 MD&A.
(2)2022 restated results may not be fully representative of our future earnings profile, as we were not managing our asset and liability portfolios under the new standards, IFRS 17 and IFRS 9. For more details, see the heading "Note to Readers: 2022 Restated Results on Adoption of IFRS 17 and IFRS 9" in this document.
(3)All earnings per share ("EPS") measures refer to fully diluted EPS, unless otherwise stated.
(4)Effective January 1, 2023, Canada wealth sales & asset management gross flows have been updated to exclude retained sales. Prior period amounts have been updated to reflect this change.
(5)OSFI's 2023 LICAT Guideline, effective January 1, 2023, specifies that available capital for LICAT purposes includes the Contractual Service Margin. Prior period restatement and resubmissions are not mandated. Pro-forma January 1, 2023 LICAT ratios are disclosed to illustrate transition impact. These pro-forma calculations will not be formally submitted to OSFI. Refer to section F - Financial Strength in the Q3'23 MD&A.
(6)Sun Life Assurance Company of Canada ("Sun Life Assurance") is SLF Inc.'s principal operating life insurance subsidiary.
(7)Effective January 1, 2023, the calculation for the financial leverage ratio was updated to include the CSM balance (net of taxes) in the denominator. The CSM (net of taxes) was $9.3 billion as at September 30, 2023 (January 1, 2023 - $8.7 billion).
EARNINGS NEWS RELEASE Sun Life Financial Inc. Third Quarter 2023 1
Financial and Operational Highlights - Quarterly Comparison (Q3'23 vs. Q3'22)
|
|
|
|
|
|
|
|
|
|
|
|
|
|
|
|
|
|
|
|
|
| ($ millions) |
Q3'23 |
Underlying net income by business type(1)(2): |
Sun Life |
Asset Management |
Canada |
U.S. |
Asia |
Corporate |
| Wealth & asset management |
457 |
330 |
116 |
— |
11 |
— |
| Group - Health & Protection |
285 |
— |
136 |
149 |
— |
— |
| Individual - Protection |
297 |
— |
86 |
36 |
175 |
— |
| Corporate expenses & other |
(109) |
— |
— |
— |
(20) |
(89) |
Underlying net income(1) |
930 |
330 |
338 |
185 |
166 |
(89) |
| Reported net income - Common shareholders |
871 |
268 |
365 |
132 |
211 |
(105) |
| Change in underlying net income (% year-over-year) |
(2)% |
11% |
15% |
(19)% |
8% |
nm(3) |
| Change in reported net income (% year-over-year) |
nm(3) |
23% |
nm(3) |
6% |
nm(3) |
nm(3) |
Wealth sales & asset management gross flows(1)(4) |
39,324 |
34,266 |
3,395 |
— |
1,663 |
— |
Group - Health & Protection sales(1) |
374 |
|
— |
119 |
239 |
16 |
— |
Individual - Protection sales(1) |
669 |
|
— |
148 |
— |
521 |
— |
Change in wealth sales & asset management gross flows
(% year-over-year) |
(7)% |
(6)% |
7% |
— |
(34)% |
— |
| Change in group sales (% year-over-year) |
(25)% |
— |
4% |
(35)% |
(16)% |
— |
| Change in individual sales (% year-over-year) |
51% |
— |
24% |
— |
60% |
— |
(1)Represents a non-IFRS financial measure. For more details, see the Non-IFRS Financial Measures section in this document and in the Q3'23 MD&A.
(2)For more information about the business types in Sun Life's business groups, see section A - How We Report Our Results in the Q3'23 MD&A.
(3)Not meaningful.
(4)Effective January 1, 2023, Canada wealth sales & asset management gross flows have been updated to exclude retained sales. Prior period amounts have been updated to reflect this change.
Underlying net income(1) of $930 million decreased $19 million or 2% from prior year, driven by:
•Wealth & asset management(1) up $38 million: Higher investment income driven by volume growth and an increase in yields, and higher Asset Management fee-related earnings.
•Group - Health & Protection(1) up $4 million: Strong revenue growth across all U.S. businesses and better disability experience in Canada, largely offset by health and protection experience in the U.S., and lower fee-related earnings in Canada.
•Individual - Protection(1) down $8 million: Lower earnings due to the sale of Sun Life UK(2), and lower net investment results in the U.S., partially offset by business growth reflecting good sales momentum during the past year in Asia.
•Corporate expenses & other(1) $(53) million increase in net loss includes higher debt financing costs.
•Higher expenses across business types were driven by volume growth, continued investments in the business, and higher incentive compensation.
•Favourable foreign currency translation led to an increase of $16 million.
Reported net income of $871 million increased $760 million, driven by:
•Favourable market-related impacts primarily reflecting interest rates partially offset by real estate experience(3);
•A $170 million charge related to the sale of Sun Life UK(2) and a higher increase in SLC Management's acquisition-related liabilities(4) in the prior year; and
•ACMA(5) impacts; partially offset by
•Fair value changes in management's ownership of MFS(6) shares.
(1)Refer to section C - Profitability in the Q3'23 MD&A for more information on notable items attributable to reported & underlying net income items and the Non-IFRS Financial Measures in this document for a reconciliation between reported net income and underlying net income. For more information about the business types in Sun Life's operating segments/business groups, see section A - How We Report Our Results in the Q3'23 MD&A.
(2)On April 3, 2023 we completed the sale of SLF of Canada UK Limited to Phoenix Group Holdings plc ("the sale of Sun Life UK"). In Q3'22, we recognized an impairment charge of $170 million pertaining to the attributed goodwill that was not expected to be recovered through the sale. For additional information, refer to Note 3 of our Interim Consolidated Financial Statements for the period ended September 30, 2023.
(3)Real estate experience reflects the difference between the actual value of real estate investments compared to management's longer-term expected returns supporting insurance contract liabilities ("real estate experience").
(4)Reflects the changes in estimated future payments for acquisition-related contingent considerations and options to purchase remaining ownership interests of SLC Management affiliates.
(5)Assumption changes and management actions ("ACMA").
(6)MFS Investment Management ("MFS").
2 Sun Life Financial Inc. Third Quarter 2023 EARNINGS NEWS RELEASE Asset Management underlying net income of $330 million increased $32 million or 11% from prior year, driven by:
Asset Management: A global leader in both public and alternative asset classes through MFS and SLC Management
•MFS up $4 million (down US$5 million): Higher average net assets ("ANA"), an increase in net investment income, favourable foreign exchange translation and higher variable compensation expenses. The MFS pre-tax net operating profit margin(1) was 41% for Q3'23, consistent with the prior year.
•SLC Management up $28 million: Fee-related earnings(1) increased 17% driven by higher AUM, reflecting strong capital raising and deployment across the platform and the AAM acquisition(2). Fee-related earnings margin(1) for Q3'23 of 24% was consistent with the prior year. The increase in underlying net income was driven by the higher fee-related earnings, a favourable tax rate(3), and higher retention expenses in the prior year that did not repeat.
Reported net income of $268 million increased $50 million or 23% from prior year, driven by a lower increase in SLC Management's acquisition-related liabilities(4) compared to the prior year and an increase in underlying net income, partially offset by fair value changes in management's ownership of MFS shares.
Foreign exchange translation led to an increase of $7 million in underlying net income and reported net income.
Asset Management ended Q3'23 with $974 billion of AUM, consisting of $755 billion (US$556 billion) in MFS and $219 billion in SLC Management. Total Asset Management net outflows of $9.1 billion in Q3'23 reflected MFS net outflows of $12.5 billion (US$9.3 billion) partially offset by SLC Management net inflows of $3.4 billion.
MFS maintained good momentum in growing the defined contribution business. On a year-to-date basis, defined contribution gross sales are up 14% compared to prior year due to strong placement on consultant, advisor and recordkeeping platforms’ select lists, driving approximately US$3 billion in net inflows, despite challenging market conditions.
In October, SLC Management entered into a strategic partnership with Scotiabank to distribute alternative investment capabilities to the Canadian retail market through Scotia Global Wealth Management. This will allow SLC Management to extend alternative investment capabilities to new Clients and expands the roster of investment solutions Scotiabank can offer the Canadian wealth management market. This strategic partnership, coupled with the recent acquisition of Advisors Asset Management, Inc. (“AAM”), positions SLC Management to meet the growing demand for alternative assets among High-Net-Worth ("HNW") investors. AAM also announced it will distribute Crescent Private BDC, a non-traded closed-end fund launched by Crescent Capital Group LP. This is the second collaboration between AAM and other SLC Management affiliates since its acquisition in Q1, highlighting the strategic benefit of adding this distribution channel.
Canada: A leader in health, wealth, and insurance
Canada underlying net income of $338 million increased $45 million or 15% from prior year, reflecting:
•Wealth & asset management up $14 million: Increase in investment income driven by higher volume and yields.
•Group - Health & Protection up $34 million: Improved disability experience reflecting higher margins and shorter claims durations, partially offset by lower fee-related earnings.
•Individual - Protection down $3 million: In line with prior year.
•Higher expenses across all businesses were driven by volume growth, continued investments in the business, and higher incentive compensation.
Reported net income of $365 million increased $309 million from prior year, driven by more favourable market-related impacts primarily from interest rates, ACMA impacts, and the increase in underlying net income, partially offset by real estate experience.
Canada's sales(5):
•Wealth sales & asset management gross flows of $3 billion were up 7%, driven by higher Individual Wealth sales, primarily from mutual funds, partially offset by lower defined contribution sales in Group Retirement Services ("GRS").
•Group - Health & Protection sales of $119 million were up 4%, reflecting higher health sales.
•Individual - Protection sales of $148 million were up 24%, reflecting higher participating whole life insurance sales.
We continue to execute on our strategy of helping Clients access the care they need to prevent and mitigate health risks and live healthier lives. In Q3, Sun Life was selected to move forward in the final stages of contract negotiations with the Government of Canada to be the administrator of the Canadian Dental Care Plan (“CDCP”), which will provide access to dental care for Canadians in need. Through the CDCP, up to nine million additional Canadians will have access to dental care.
(1)Represents a non-IFRS financial measure. For more details, see the Non-IFRS Financial Measures section in this document and in the Q3'23 MD&A.
(2)On February 1, 2023, we completed the acquisition of a majority stake interest in Advisors Asset Management, Inc. ("the AAM acquisition"), a leading independent U.S. retail distribution firm, with the option to acquire the remaining interest starting in 2028.
(3)Underlying net income includes favourable adjustments related to tax filings.
(4)Reflects the changes in estimated future payments for acquisition-related contingent considerations and options to purchase remaining ownership interests of SLC Management affiliates.
(5)Compared to the prior year.
EARNINGS NEWS RELEASE Sun Life Financial Inc. Third Quarter 2023 3
In support of our focus on inclusive workplace benefits, we are making it easier for plan members to understand and access culturally relevant covered health expenses under the standard Personal Spending Accounts (“PSA”). For example, we created a new Indigenous Health category which outlines and creates awareness that Sun Life provides coverage for traditional medicines, fees and supplies for Indigenous ceremonies, and more under the PSA. We also expanded our partnership with Spirit North, a national charitable organization, committing $1 million in funding over three years, to deliver physical health programs and address health inequities in underserved Indigenous communities.
U.S.: A leader in health and benefits
U.S. underlying net income of US$140 million decreased US$33 million or 19% ($185 million decreased $42 million or 19%) from prior year, driven by:
•Group - Health & Protection down US$24 million: Lower Dental results as strong revenue growth was more than offset by the impact of Medicaid redeterminations following the end of the Public Health Emergency and investments in the Advantage Dental+ business. In Group Benefits, strong revenue growth was largely offset by less favourable morbidity experience.
•Individual - Protection down US$9 million: The inclusion of the UK payout annuity business(1) was more than offset by lower net investment results.
Reported net income of US$105 million increased US$9 million or 9% ($132 million increased $7 million or 6%) from prior year, driven by market-related impacts largely from interest rates, offset by the decrease in underlying net income and ACMA impacts.
Foreign exchange translation led to an increase of $5 million and $4 million in underlying net income and reported net income, respectively.
U.S. group sales(2) of US$179 million were down US$102 million or 36% ($239 million, down $127 million or 35%), reflecting lower large case Medicaid sales in Dental, partially offset by higher commercial dental sales.
As a leader in health and benefits, we are helping Clients get access to the right care at the right time to live healthier lives. In Q3, we established a new preferred partnership with OptiMed, a U.S. national health care organization, to make specialty drugs more accessible and affordable for our stop-loss members. The new program will improve how specialty drugs are administered for members who need them, often in their own home, while also managing rising health care costs. Also, in employee benefits, we launched an enhanced disability product suite specially designed for healthcare professionals, providing them with income replacement coverage that meets their specific needs.
We extended our partnership with Teledentistry.com to include DentaQuest members. The service offers members 24/7 virtual access to dental providers, making it easier to get dental care and advice digitally. It is expected to be available to Medicaid and commercial dental plan members in 20 states by the end of 2023, increasing access to oral health care for approximately 3.5 million members in those states.
Asia: A regional leader focused on fast-growing markets
Asia underlying net income of $166 million increased $13 million or 8% from prior year, driven by:
•Wealth & asset management down $8 million: Lower earnings in the Philippines.
•Individual - Protection up $39 million: Business growth reflecting good sales momentum during the past year. Experience in the quarter included favourable mortality from lower claims volumes, largely offset by higher expense experience.
•Regional office expenses & other $(18) million increased net loss primarily reflecting higher incentive compensation.
Reported net income of $211 million compared to nil reported net income in the prior year, driven by ACMA impacts, and favourable market-related impacts largely from interest rates partially offset by real estate experience.
Foreign exchange translation led to an increase of $3 million and $5 million in underlying net income and reported net income, respectively.
Asia's sales(2):
•Wealth sales & asset management gross flows of $2 billion were down 34%, primarily reflecting lower money market fund sales in the Philippines.
•Individual sales of $521 million were up 60%, driven by higher sales in Hong Kong reflecting increased demand as pandemic-related travel restrictions were lifted in early 2023, and in International reflecting large case sales, partially offset by lower sales in Vietnam reflecting market conditions.
New business CSM of $238 million in Q3'23, compared to $79 million in the prior year, was primarily driven by sales in Hong Kong and High-Net-Worth.
We continue to execute on our growth strategy through strategic partnerships and investments. We launched our 15-year exclusive bancassurance partnership with Dah Sing Bank in Hong Kong with strong sales. We also increased our strategic investment in Bowtie Life Insurance Company Limited, Hong Kong’s first virtual insurer with a leading market share of approximately 30%(3) in Hong Kong’s direct sales channel.
(1)On April 3, 2023, we completed the sale of SLF of Canada UK Limited to Phoenix Group Holdings plc ("the sale of Sun Life UK"). Under the agreement, we will retain our economic interest in the payout annuities business through a reinsurance treaty, which, effective Q2'23 is recorded in In-force Management within the U.S. business group. For additional information, refer to Note 3 of our Interim Consolidated Financial Statements for the period ended September 30, 2023.
(2)Compared to the prior year.
(3)According to Insurance Authority’s Provisional Statistics for Long Term Business 2021-2023, Bowtie ranked first in number of new individual paid policies through direct channel in Hong Kong.
4 Sun Life Financial Inc. Third Quarter 2023 EARNINGS NEWS RELEASE
Demonstrating our focus on adopting prudent financial practices that protect our Clients while strengthening our risk management capabilities, Sun Life Hong Kong received approval from the Hong Kong Insurance Authority for the early adoption of the Risk-Based Capital (“RBC”) regime, effective end of June 2023. Sun Life Hong Kong is among the few insurers in Hong Kong that has transitioned to the RBC regime earlier than scheduled, reflecting our risk management capabilities and financial strength.
Corporate
Corporate underlying net loss was $89 million compared to underlying net loss of $22 million in the prior year, driven by the sale of Sun Life UK(1), higher operating expenses including incentive compensation, an increase in debt financing costs, partially offset by higher investment income from surplus assets.
Reported net loss was $105 million compared to reported net loss of $288 million in the prior year, driven by the impacts from the sale of Sun Life UK(2) , partially offset by the change in underlying net loss.
(1)On April 3, 2023 we completed the sale of SLF of Canada UK Limited to Phoenix Group Holdings plc ("the sale of Sun Life UK"). Under the agreement, we will retain our economic interest in the payout annuities business through a reinsurance treaty, which, effective Q2'23, is recorded in In-force Management within the U.S. business group.
(2)In Q3'22, we recognized an impairment charge of $170 million pertaining to the attributed goodwill that was not expected to be recovered through the sale of Sun Life UK. For additional information, refer to Note 3 of our Interim Consolidated Financial Statements for the period ended September 30, 2023. Also, the prior year included market-related losses from Sun Life UK.
EARNINGS NEWS RELEASE Sun Life Financial Inc. Third Quarter 2023 5
Sun Life Financial Inc.
Management's Discussion and Analysis
For the period ended September 30, 2023
Dated November 13, 2023
|
|
|
|
|
|
|
|
|
| Table of Contents |
| A. |
How We Report Our Results |
|
| B. |
Financial Summary |
|
| C. |
Profitability |
|
| D. |
Growth |
|
| E. |
Contractual Service Margin |
|
| F. |
Financial Strength |
|
| G. |
Performance by Business Segment |
|
|
1. Asset Management |
|
|
2. Canada |
|
|
3. U.S. |
|
|
4. Asia |
|
|
5. Corporate |
|
| H. |
Investments |
|
| I. |
Risk Management |
|
| J. |
Additional Financial Disclosure |
|
| K. |
Legal and Regulatory Proceedings |
|
| L. |
Changes in Accounting Policies |
|
| M. |
Internal Control Over Financial Reporting |
|
| N. |
Non-IFRS Financial Measures |
|
| O. |
Forward-looking Statements |
|
|
|
|
6 Sun Life Financial Inc. Third Quarter 2023 MANAGEMENT'S DISCUSSION AND ANALYSIS Sun Life is a leading international financial services organization providing asset management, wealth, insurance and health solutions to individual and institutional Clients.
About Sun Life
Sun Life has operations in a number of markets worldwide, including Canada, the United States, the United Kingdom, Ireland, Hong Kong, the Philippines, Japan, Indonesia, India, China, Australia, Singapore, Vietnam, Malaysia and Bermuda. As of September 30, 2023, Sun Life had total assets under management ("AUM") of $1.34 trillion. For more information please visit www.sunlife.com.
Sun Life Financial Inc. trades on the Toronto (TSX), New York (NYSE) and Philippine (PSE) stock exchanges under the ticker symbol SLF.
|
|
|
|
|
|
| A. How We Report Our Results |
|
Sun Life Financial Inc. ("SLF Inc."), its subsidiaries and, where applicable, its joint ventures and associates are collectively referred to as "the Company", "Sun Life", "we", "our", and "us". We manage our operations and report our financial results in five business segments: Canada, United States ("U.S."), Asset Management, Asia, and Corporate. Information concerning these segments is included in our annual and interim consolidated financial statements and accompanying notes ("Annual Consolidated Financial Statements" and "Interim Consolidated Financial Statements", respectively, and "Consolidated Financial Statements" collectively) and interim and annual management's discussion and analysis ("MD&A"). We prepare our unaudited Interim Consolidated Financial Statements using International Financial Reporting Standards ("IFRS"), the accounting requirements of the Office of the Superintendent of Financial Institutions ("OSFI") and in accordance with the International Accounting Standard ("IAS") 34 Interim Financial Reporting. Reported net income (loss) refers to Common shareholders' net income (loss) determined in accordance with IFRS.
On January 1, 2023 we adopted IFRS 17 Insurance Contracts ("IFRS 17"), which replaces IFRS 4 Insurance Contracts. IFRS 17 establishes the principles for the recognition, measurement, presentation, and disclosure of insurance contracts. On January 1, 2023, we also adopted IFRS 9 Financial Instruments ("IFRS 9"), which replaces IAS 39 Financial Instruments: Recognition and Measurement. The nature and effects of the key changes in our critical accounting policies and estimated impacts from the adoption of the new standards are summarized in section
L - Changes in Accounting Policies in this document. For more information including the measurement and classification of opening balances, refer to Note 2 of our Interim Consolidated Financial Statements for the period ended September 30, 2023.
Unless otherwise noted, all amounts are in Canadian dollars. Amounts in this document may be impacted by rounding.
Note to Readers: 2022 Restated Results on Adoption of IFRS 17 and IFRS 9
2022 results have been restated for the adoption of IFRS 17 and the related IFRS 9 classification overlay (“the new standards”). The restated results may not be fully representative of our future earnings profile, as we were not managing our asset and liability portfolios under the new standards. The majority of the actions taken to re-balance asset portfolios and transition asset-liability management execution to an IFRS 17 basis occurred in Q1'23. Accordingly, analysis based on 2022 comparative results may not necessarily be indicative of future trends, and should be interpreted with this context. Using sensitivities to analyze the outlook for market risk and related impacts (e.g., interest rate sensitivities) will be more representative starting with the sensitivities disclosed for Q1’23 and onward in section I - Risk Management in each quarter's respective MD&A document. Certain 2022 restated results and 2023 interim results in the Drivers of Earnings and CSM Movement Analysis were refined to more accurately reflect how management views the business. As these results are not audited, or have not yet been audited, they may still be subject to change.
MANAGEMENT'S DISCUSSION AND ANALYSIS Sun Life Financial Inc. Third Quarter 2023 7
Underlying net income by Business Types
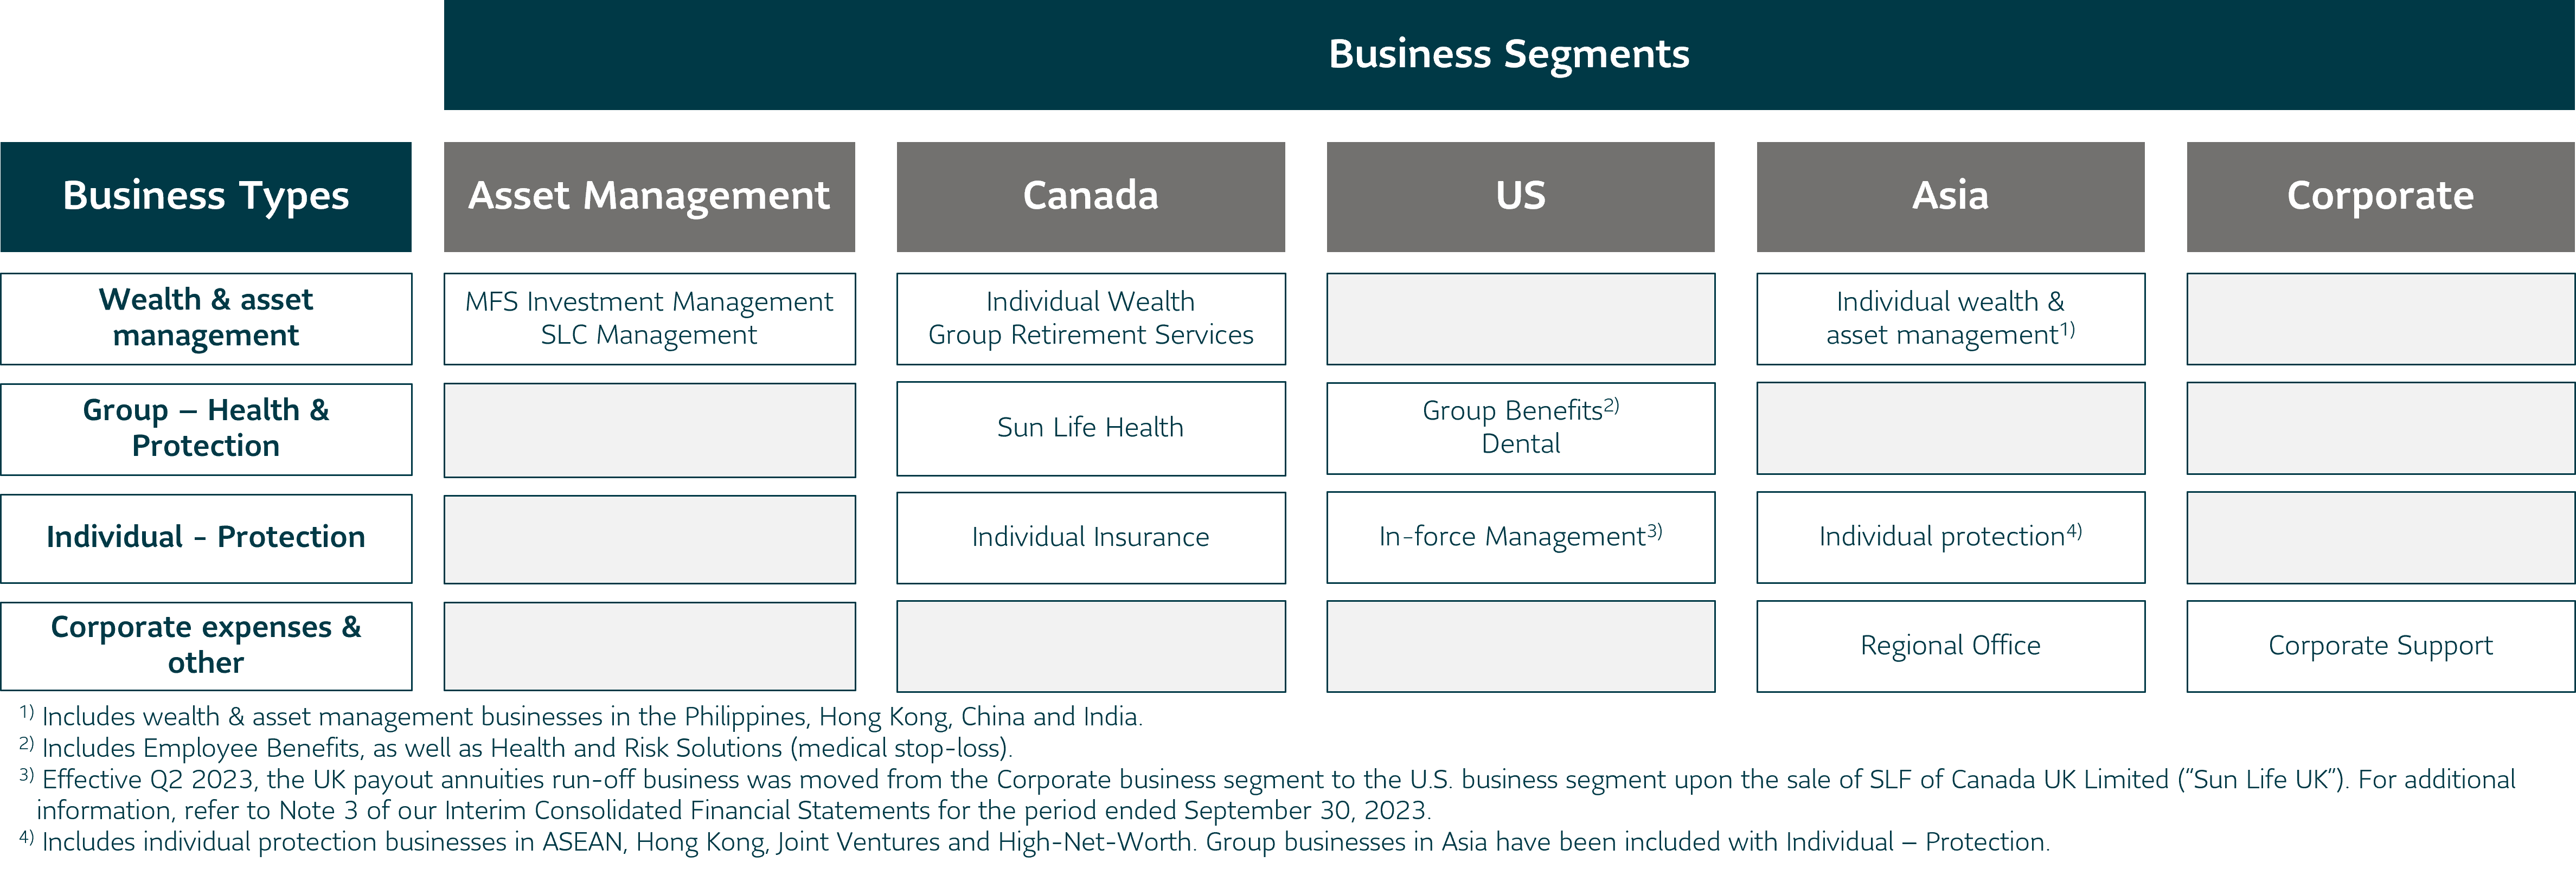
Sun Life has a diversified mix of businesses and our earnings by business type supports the analysis of our results:
•Wealth & asset management: Sun Life’s wealth & asset management businesses generate fee income and/or spread on investment products.
•Group - Health & Protection: Group businesses provide health and protection benefits to employer and government plan members. The products generally have shorter-term coverage periods, and more frequent repricing. The revenues are driven by premiums for coverage provided as well as fee-based earnings (i.e., Administrative Services Only plans, and dental fees).
•Individual - Protection: Generally, individual protection businesses have a longer-term profitability profile and are more sensitive to experience trends. The premiums include a margin for providing protection and are invested to earn a return over the expected amounts required to fulfill insurance liabilities.
The following provides an overview of the business types in Sun Life's business segments/business groups:
1. Use of Non-IFRS Financial Measures
We report certain financial information using non-IFRS financial measures, as we believe that these measures provide information that is useful to investors in understanding our performance and facilitate a comparison of our quarterly and full year results from period to period. These non-IFRS financial measures do not have any standardized meaning and may not be comparable with similar measures used by other companies. For certain non-IFRS financial measures, there are no directly comparable amounts under IFRS. These non-IFRS financial measures should not be viewed in isolation from or as alternatives to measures of financial performance determined in accordance with IFRS. Additional information concerning non-IFRS financial measures and, if applicable, reconciliations to the closest IFRS measures are available in section N - Non-IFRS Financial Measures in this document and the Supplementary Financial Information package on www.sunlife.com under Investors - Financial results and reports.
2. Forward-looking Statements
Certain statements in this document are forward-looking statements within the meaning of certain securities laws, including the "safe harbour" provisions of the United States Private Securities Litigation Reform Act of 1995 and applicable Canadian securities legislation. Additional information concerning forward-looking statements and important risk factors that could cause our assumptions, estimates, expectations and projections to be inaccurate and our actual results or events to differ materially from those expressed in or implied by such forward-looking statements can be found in section O - Forward-looking Statements in this document.
3. Additional Information
Additional information about SLF Inc. can be found in the Consolidated Financial Statements, the annual and interim MD&A, and SLF Inc.'s Annual Information Form ("AIF") for the year ended December 31, 2022. These documents are filed with securities regulators in Canada and are available at www.sedarplus.ca. SLF Inc.'s Annual Consolidated Financial Statements, annual MD&A and AIF are filed with the United States Securities and Exchange Commission ("SEC") in SLF Inc.'s annual report on Form 40-F and SLF Inc.'s interim MD&A and Interim Consolidated Financial Statements are furnished to the SEC on Form 6-Ks and are available at www.sec.gov.
8 Sun Life Financial Inc. Third Quarter 2023 MANAGEMENT'S DISCUSSION AND ANALYSIS
|
|
|
|
|
|
|
|
|
|
|
|
|
|
|
|
|
|
|
|
|
|
|
| ($ millions, unless otherwise noted) |
Quarterly results |
Year-to-date |
|
|
| Profitability |
Q3'23 |
Q2'23 |
Q3'22(1) |
2023 |
2022(1) |
|
|
|
Net income (loss) |
|
|
|
|
|
|
|
|
Underlying net income (loss)(2) |
930 |
920 |
949 |
2,745 |
2,477 |
|
|
|
Reported net income (loss) - Common shareholders |
871 |
660 |
111 |
2,337 |
1,706 |
|
|
|
Diluted earnings per share ("EPS") ($) |
|
|
|
|
|
|
|
|
Underlying EPS (diluted)(2) |
1.59 |
1.57 |
1.62 |
4.68 |
4.23 |
|
|
|
Reported EPS (diluted) |
1.48 |
1.12 |
0.19 |
3.97 |
2.91 |
|
|
|
Return on equity ("ROE") (%) |
|
|
|
|
|
|
|
|
Underlying ROE(2) |
17.7% |
17.7% |
19.4% |
17.6% |
17.1% |
|
|
|
Reported ROE(2) |
16.6% |
12.7% |
2.3% |
14.9% |
11.8% |
|
|
|
|
|
|
|
|
|
|
|
| Growth |
Q3'23 |
Q2'23 |
Q3'22(1) |
2023 |
2022(1) |
|
|
|
Sales |
|
|
|
|
|
|
|
|
Wealth sales & asset management gross flows(2)(3) |
39,324 |
42,397 |
42,146 |
128,070 |
155,381 |
|
|
|
Group - Health & Protection sales(2) |
374 |
656 |
499 |
1,573 |
1,209 |
|
|
|
Individual - Protection sales(2) |
669 |
604 |
444 |
1,784 |
1,269 |
|
|
|
Total AUM ($ billions)(2) |
1,340.1 |
1,366.8 |
1,269.4 |
1,340.1 |
1,269.4 |
|
|
|
New business Contractual Service Margin ("CSM")(2) |
370 |
270 |
177 |
872 |
509 |
|
|
|
|
|
|
|
|
|
|
|
| Financial Strength |
Q3'23 |
Q2'23 |
As at January 1, 2023(4) |
|
|
|
|
|
LICAT ratios(4)(5) |
|
|
|
|
|
|
|
|
Sun Life Financial Inc. |
147% |
148% |
142% |
|
|
|
|
|
Sun Life Assurance(6) |
138% |
139% |
139% |
|
|
|
|
|
Financial leverage ratio(2)(7) |
21.8% |
23.3% |
23.7% |
|
|
|
|
|
Book value per common share ($) |
35.91 |
34.86 |
34.60 |
|
|
|
|
|
Weighted average common shares outstanding for basic EPS (millions) |
586 |
587 |
586 |
|
|
|
|
|
Closing common shares outstanding (millions) |
584 |
587 |
586 |
|
|
|
|
(1)2022 restated results may not be fully representative of our future earnings profile, as we were not managing our asset and liability portfolios under the new standards. See the heading "Note to Readers: 2022 Restated Results on Adoption of IFRS 17 and IFRS 9" in section A - How We Report Our Results in this document.
(2)Represents a non-IFRS financial measure. For more details, see section N - Non-IFRS Financial Measures in this document.
(3)Effective January 1, 2023, Canada wealth sales & asset management gross flows have been updated to exclude retained sales. Prior period amounts have been updated to reflect this change.
(4)OSFI's 2023 LICAT Guideline, effective January 1, 2023, specifies that available capital for LICAT purposes includes the Contractual Service Margin. Prior period restatement and resubmissions are not mandated. Pro-forma January 1, 2023 LICAT ratios are disclosed to illustrate transition impact. These pro-forma calculations will not be formally submitted to OSFI.
(5)Life Insurance Capital Adequacy Test ("LICAT") ratio. Our LICAT ratios are calculated in accordance with the OSFI-mandated guideline.
(6)Sun Life Assurance Company of Canada ("Sun Life Assurance") is SLF Inc.’s principal operating life insurance subsidiary.
(7)Effective January 1, 2023, the calculation for the financial leverage ratio was updated to include the CSM balance (net of taxes) in the denominator. The CSM (net of taxes) was $9.3 billion as at September 30, 2023 (June 30, 2023 - $9.1 billion; January 1, 2023 - $8.7 billion).
MANAGEMENT'S DISCUSSION AND ANALYSIS Sun Life Financial Inc. Third Quarter 2023 9
The following table reconciles our Common shareholders' net income ("reported net income") and underlying net income. All factors discussed in this document that impact underlying net income are also applicable to reported net income. Certain adjustments and notable items also impact the CSM, such as mortality experience and assumption changes; see section E - Contractual Service Margin in this document for more information.
|
|
|
|
|
|
|
|
|
|
|
|
|
|
|
|
|
|
|
Quarterly results |
Year-to-date |
| ($ millions, after-tax) |
Q3'23 |
Q2'23 |
Q3'22(1) |
2023 |
2022(1) |
Underlying net income by business type(2): |
|
|
|
|
|
| Wealth & asset management |
457 |
419 |
419 |
1,287 |
1,261 |
| Group - Health & Protection |
285 |
360 |
281 |
948 |
642 |
| Individual - Protection |
297 |
265 |
305 |
853 |
769 |
| Corporate expenses & other |
(109) |
(124) |
(56) |
(343) |
(195) |
Underlying net income(2) |
930 |
920 |
949 |
2,745 |
2,477 |
Add: Market-related impacts(1) |
23 |
(220) |
(361) |
(261) |
(245) |
Assumption changes and management actions ("ACMA") |
35 |
7 |
(131) |
37 |
(180) |
Other adjustments |
(117) |
(47) |
(346) |
(184) |
(346) |
| Reported net income - Common shareholders |
871 |
660 |
111 |
2,337 |
1,706 |
Underlying ROE(2) |
17.7% |
17.7% |
19.4% |
17.6% |
17.1% |
Reported ROE(2) |
16.6% |
12.7% |
2.3% |
14.9% |
11.8% |
Notable items attributable to reported and underlying net income(2): |
|
|
|
|
|
| Mortality |
18 |
19 |
4 |
11 |
(109) |
| Morbidity |
79 |
93 |
44 |
233 |
65 |
| Lapse and other policyholder behaviour ("policyholder behaviour") |
(3) |
(2) |
(1) |
(13) |
(13) |
| Expenses |
(34) |
(7) |
(8) |
(46) |
(6) |
Credit(3) |
(7) |
(3) |
(4) |
(16) |
(17) |
Other(4) |
5 |
9 |
28 |
36 |
8 |
(1)2022 restated results may not be fully representative of our future earnings profile, as we were not managing our asset and liability portfolios under the new standards. See the heading "Note to Readers: 2022 Restated Results on Adoption of IFRS 17 and IFRS 9" in section A - How We Report Our Results in this document.
(2)Represents a non-IFRS financial measure. For more details, see section N - Non-IFRS Financial Measures in this document. For more information about business types in Sun Life's business groups, see section A - How We Report Our Results in this document.
(3)Credit includes rating changes on assets measured at Fair value through profit or loss ("FVTPL"), and the Expected credit loss ("ECL") impact for assets measured at Fair value through other comprehensive income ("FVOCI").
(4)Other notable items are recorded in Net Insurance Service Result and Net Investment Result in the Drivers of Earnings analysis. For more details, see section N - Non-IFRS Financial Measures in this document.
Quarterly Comparison - Q3'23 vs. Q3'22
Underlying net income(1) of $930 million decreased $19 million or 2%, driven by:
•Wealth & asset management(1) up $38 million: Higher investment income driven by volume growth and an increase in yields, and higher Asset Management fee-related earnings.
•Group - Health & Protection(1) up $4 million: Strong revenue growth across all U.S. businesses and better disability experience in Canada, largely offset by health and protection experience in the U.S., and lower fee-related earnings in Canada.
•Individual - Protection(1) down $8 million: Lower earnings due to the sale of Sun Life UK(2), and lower net investment results in the U.S., partially offset by business growth reflecting good sales momentum during the past year in Asia.
•Corporate expenses & other(1) $(53) million increase in net loss includes higher debt financing costs.
•Higher expenses across business types were driven by volume growth, continued investments in the business, and higher incentive compensation.
Reported net income of $871 million increased $760 million, driven by:
•Favourable market-related impacts primarily reflecting interest rates partially offset by real estate experience(3);
•A $170 million charge related to the sale of Sun Life UK(2) and a higher increase in SLC Management's acquisition-related liabilities(4) in the prior year; and
•ACMA impacts; partially offset by
•Fair value changes in management's ownership of MFS(5) shares.
(1)Refer to section N - Non-IFRS Financial Measures in this document for a reconciliation between reported net income and underlying net income.
(2)On April 3, 2023 we completed the sale of SLF of Canada UK Limited to Phoenix Group Holdings plc ("the sale of Sun Life UK"). In Q3'22, we recognized an impairment charge of $170 million pertaining to the attributed goodwill that was not expected to be recovered through the sale. For additional information, refer to Note 3 of our Interim Consolidated Financial Statements for the period ended September 30, 2023.
(3)Real estate experience reflects the difference between the actual value of real estate investments compared to management's longer-term expected returns supporting insurance contract liabilities ("real estate experience").
(4)Reflects the changes in estimated future payments for acquisition-related contingent considerations and options to purchase remaining ownership interests of SLC Management affiliates.
(5)MFS Investment Management ("MFS").
10 Sun Life Financial Inc. Third Quarter 2023 MANAGEMENT'S DISCUSSION AND ANALYSIS Underlying ROE was 17.7% and reported ROE was 16.6% (Q3'22 - 19.4% and 2.3%, respectively).
Foreign exchange translation led to an increase of $16 million and $17 million in underlying net income and reported net income, respectively.
1.Market-related impacts
Market-related impacts represent the difference between actual versus expected market movements. Market-related impacts resulted in an increase of $23 million to reported net income, driven by interest rate impacts partially offset by real estate experience. Interest rate impacts primarily reflected non-parallel curve changes during the quarter. Real estate experience was primarily in Canada and Asia.
2.Assumption changes and management actions
The net impact of assumption changes and management actions was an increase of $35 million to reported net income. These included favourable impacts from modelling enhancements in Asia, which were partially offset by unfavourable policyholder behaviour updates in Asia and mortality updates in the U.S. For additional details refer to "Assumption Changes and Management Actions by Type" in
Section E - Contractual Service Margin in this document.
3.Other adjustments
Other adjustments decreased reported net income by $117 million, reflecting DentaQuest integration costs and amortization of acquired intangible assets, and an increase in SLC Management's acquisition-related liabilities(1).
4.Experience-related items
In the third quarter of 2023, notable experience items included:
•Favourable mortality experience in Asia and Canada, partially offset by U.S. group life;
•Favourable morbidity experience largely in Canada and in U.S. group disability and medical stop-loss; and
•Unfavourable expense experience largely in Canada, Dental in the U.S., and Asia.
5.Income taxes
The statutory tax rate is impacted by various tax items, such as lower taxes on income subject to tax in foreign jurisdictions, tax-exempt investment income, and other sustainable tax benefits.
The Q3'23 effective income tax rate(2) on underlying net income and reported net income was 15.9% and 20.7% respectively.
6.Impacts of foreign exchange translation
Foreign exchange translation led to an increase of $16 million and $17 million in underlying net income and reported net income, respectively.
Year-to-Date Comparison - Q3'23 vs. Q3'22
Underlying net income of $2,745 million increased $268 million or 11%, driven by:
•Wealth & asset management up $26 million: Higher investment income driven by volume growth and an increase in yields, partially offset by lower fee-related earnings in MFS, Canada, and Asia.
•Group - Health & Protection up $306 million: Strong premium growth across all U.S. businesses, better disability experience in Canada and the U.S., as well as DentaQuest contribution.
•Individual - Protection up $84 million: Business growth reflecting good sales momentum during the past year in Asia, and improved protection experience, partially offset by lower earnings due to the sale of Sun Life UK.
•Corporate expenses & other $(148) million increase in net loss includes higher debt financing costs.
•In addition, the earnings by business type above include higher earnings on surplus and higher expenses.
•Higher earnings on surplus reflects an increase in realized gains and net interest income from higher rates.
•Higher expenses were driven by volume growth, continued investments in the business, and higher incentive compensation.
Reported net income of $2,337 million increased $631 million or 37%, driven by the increase in underlying net income and:
•ACMA impacts;
•A $170 million charge related to the sale of Sun Life UK and a higher increase in SLC Management's acquisition-related liabilities(1), partially offset by a gain on the sale-leaseback of the Wellesley office in the U.S., in the prior year; and
•Gain on the sale of the sponsored markets business in Canada(3); partially offset by
•Fair value changes in management's ownership of MFS shares; and
•Market-related impacts reflecting real estate experience, largely offset by interest rates and equity markets.
(1)Reflects the changes in estimated future payments for acquisition-related contingent considerations and options to purchase remaining ownership interests of SLC Management affiliates.
(2)Our effective income tax rate on reported net income is calculated using Total income (loss) before income taxes, as detailed in Note 9 in our Interim Consolidated Financial Statements for the period ended September 30, 2023. Our effective income tax rate on underlying net income is calculated using pre-tax underlying net income, as detailed in section N - Non-IFRS Financial Measures in this document, and the associated income tax expense.
(3)On February 1, 2023, we completed the sale of the sponsored markets business from Sun Life Assurance, a wholly owned subsidiary of SLF Inc., to Canadian Premier Life Insurance Company ("sale of the sponsored markets business").
MANAGEMENT'S DISCUSSION AND ANALYSIS Sun Life Financial Inc. Third Quarter 2023 11
Foreign exchange translation led to an increase of $75 million and $70 million to underlying net income and reported net income, respectively.
Underlying ROE was 17.6% and reported ROE was 14.9% (2022 - 17.1% and 11.8%, respectively).
1.Market-related impacts
Market-related impacts represent the difference between actual versus expected market movements. Market-related impacts resulted in a decrease of $261 million to reported net income, primarily reflecting unfavourable real estate experience, partially offset by interest rate impacts. The unfavourable real estate experience was driven by Asia and Canada. Interest rate impacts primarily reflected non-parallel curve changes during the year.
2.Assumption changes and management actions
The net impact of assumption changes and management actions was an increase of $37 million to reported net income.
3.Other adjustments
Other adjustments decreased reported net income by $184 million, reflecting DentaQuest integration costs and amortization of acquired intangible assets, and SLC Management acquisition-related costs(1), partially offset by gains on the sale of the sponsored markets business in Canada and the sale of Sun Life UK.
4. Experience-related items
Notable experience items in the current year included:
•Favourable morbidity experience largely in Canada and in U.S. medical stop-loss;
•Unfavourable expense experience largely in Canada, Dental in the U.S., and Asia; and
•Other experience was favourable reflecting various smaller items.
5.Income taxes
The statutory tax rate is impacted by various tax items, such as lower taxes on income subject to tax in foreign jurisdictions, tax-exempt investment income, and other sustainable tax benefits.
The effective income tax rate on underlying net income(2) and reported net income was 17.6% and 17.4%, respectively.
6.Impacts of foreign exchange translation
Foreign exchange translation led to an increase of $75 million and $70 million in underlying net income and reported net income, respectively.
(1)Includes an increase in SLC Management's acquisition-related liabilities in Q3'23, which reflects the changes in estimated future payments for acquisition-related contingent considerations and options to purchase remaining ownership interests of SLC Management affiliates.
(2)Our effective income tax rate on reported net income is calculated using Total income (loss) before income taxes, as detailed in Note 9 in our Interim Consolidated Financial Statements for the period ended September 30, 2023. Our effective income tax rate on underlying net income is calculated using pre-tax underlying net income, as detailed in section N - Non-IFRS Financial Measures in this document, and the associated income tax expense.
12 Sun Life Financial Inc. Third Quarter 2023 MANAGEMENT'S DISCUSSION AND ANALYSIS
1. Sales and Gross Flows
|
|
|
|
|
|
|
|
|
|
|
|
|
|
|
|
|
|
|
Quarterly results |
Year-to-date |
| ($ millions) |
Q3'23 |
Q2'23 |
Q3'22 |
2023 |
2022 |
Wealth sales & asset management gross flows by business segment(1) |
|
|
|
|
|
Asset Management gross flows |
34,266 |
37,651 |
36,434 |
112,746 |
135,501 |
Canada wealth sales & asset management gross flows(2) |
3,395 |
3,130 |
3,181 |
9,615 |
10,530 |
| Asia wealth sales & asset management gross flows |
1,663 |
1,616 |
2,531 |
5,709 |
9,350 |
Total wealth sales & asset management gross flows(1) |
39,324 |
42,397 |
42,146 |
128,070 |
155,381 |
Group - Health & Protection sales by business segment(1) |
|
|
|
|
|
| Canada |
119 |
153 |
114 |
417 |
426 |
|
| U.S. |
239 |
484 |
366 |
1,096 |
727 |
|
Asia(3) |
16 |
19 |
19 |
60 |
56 |
Total group sales(1) |
374 |
656 |
499 |
1,573 |
1,209 |
Individual - Protection sales by business segment(1) |
|
|
|
|
|
| Canada |
148 |
154 |
119 |
438 |
357 |
| Asia |
521 |
450 |
325 |
1,346 |
912 |
Total individual sales(1) |
669 |
604 |
444 |
1,784 |
1,269 |
CSM - Impact of new insurance business ("New business CSM")(1) |
370 |
270 |
177 |
872 |
509 |
(1)Represents a non-IFRS financial measure. For more details, see section N - Non-IFRS Financial Measures in this document.
(2)Effective January 1, 2023, Canada wealth sales & asset management gross flows have been updated to exclude retained sales. Prior period amounts have been updated to reflect this change.
(3)In underlying net income by business type, Group businesses in Asia have been included with Individual – Protection. For more information about business types in Sun Life's business groups, see section A - How We Report Our Results in this document.
Total wealth sales & asset management gross flows decreased $2.8 billion or 7% year-over-year ($3.7 billion(1) or 9%(1), excluding foreign exchange translation).
•Asset Management gross flows decreased $3.1 billion(1) or 8%(1), reflecting lower gross flows in SLC Management and MFS.
•Canada wealth sales & asset management gross flows increased $0.2 billion or 7%, driven by higher Individual Wealth sales, primarily from mutual funds, partially offset by lower defined contribution sales in Group Retirement Services ("GRS").
•Asia wealth sales & asset management gross flows decreased $0.9 billion(1) or 35%(1), primarily reflecting lower money market fund sales in the Philippines.
Total group health & protection sales decreased $125 million or 25% from prior year ($130 million(1) or 26%(1), excluding foreign exchange translation).
•Canada group sales increased $5 million or 4%, reflecting higher health sales.
•U.S. group sales decreased $133 million(1) or 36%(1), reflecting lower large case Medicaid sales in Dental, partially offset by higher commercial dental sales.
Total individual protection sales increased $225 million or 51% from prior year ($213 million(1) or 48%(1), excluding foreign exchange translation).
•Canada individual sales increased $29 million or 24%, reflecting higher participating whole life insurance sales.
•Asia individual sales increased $184 million(1) or 57%(1), driven by higher sales in Hong Kong reflecting increased demand as pandemic-related travel restrictions were lifted in early 2023, and in International reflecting large case sales, partially offset by lower sales in Vietnam reflecting market conditions.
New business CSM represents growth derived from sales activity in the period. The impact of new insurance business drove a $370 million increase in CSM, compared to new business CSM of $177 million in the prior year, driven by strong individual protection sales in Asia in Hong Kong and High-Net-Worth ("HNW"), and Canada.
(1)This change excludes the impacts of foreign exchange translation. For more information about these non-IFRS financial measures, see section
N - Non-IFRS Financial Measures in this document.
MANAGEMENT'S DISCUSSION AND ANALYSIS Sun Life Financial Inc. Third Quarter 2023 13
2. Assets Under Management
AUM consists of general funds, the investments for segregated fund holders ("segregated funds") and third-party assets managed by the Company. Third-party AUM is comprised of institutional and managed funds, as well as other AUM related to our joint ventures.
|
|
|
|
|
|
|
|
|
|
|
|
|
|
|
|
|
|
|
|
|
Quarterly results |
|
|
| ($ millions) |
Q3'23 |
Q2'23 |
Q1'23 |
Q4'22 |
Q3'22 |
|
|
Assets under management(1) |
|
|
|
|
|
|
|
| General fund assets |
193,858 |
196,575 |
201,792 |
198,316 |
198,181 |
|
|
| Segregated funds |
119,988 |
123,366 |
131,033 |
125,292 |
118,564 |
|
|
Third-party assets under management(1) |
|
|
|
|
|
|
|
Retail(2) |
544,946 |
557,093 |
543,847 |
527,617 |
505,679 |
|
|
Institutional, managed funds and other(2) |
518,129 |
527,344 |
528,897 |
507,673 |
485,670 |
|
|
Total third-party AUM(1) |
1,063,075 |
1,084,437 |
1,072,744 |
1,035,290 |
991,349 |
|
|
Consolidation adjustments |
(36,780) |
(37,536) |
(41,947) |
(40,337) |
(38,725) |
|
|
Total assets under management(1) |
1,340,141 |
1,366,842 |
1,363,622 |
1,318,561 |
1,269,369 |
|
|
(1)Represents a non-IFRS financial measure. See section N - Non-IFRS Financial Measures in this document.
(2)Effective October 1, 2022, the classification of a MFS fund has changed from Institutional and managed funds to Retail. Other retail and trust accounts have also been reclassified from Institutional and managed funds to Retail. Prior periods have been restated.
AUM increased $21.6 billion or 2% from December 31, 2022, primarily driven by:
(i)favourable market movements on the value of segregated, retail, institutional and managed funds of $40.6 billion; and
(ii)an increase of $5.2 billion from AUM primarily driven by the AAM acquisition(1); partially offset by
(iii)net outflows from segregated funds and third-party AUM of $15.5 billion;
(iv)Client distributions of $4.7 billion; and
(v)a decrease in AUM of general fund assets of $4.5 billion primarily due to the decline in net fair value from rising interest rates.
Segregated fund and third-party AUM net outflows of $10.5 billion during the quarter were comprised of:
|
|
|
|
|
|
|
|
|
|
|
|
|
|
|
|
|
|
|
|
|
Quarterly results |
|
|
| ($ billions) |
Q3'23 |
Q2'23 |
Q1'23 |
Q4'22 |
Q3'22 |
|
|
Net flows for Segregated fund and Third-party AUM: |
|
|
|
|
|
|
|
MFS |
(12.5) |
(5.3) |
(5.8) |
(16.1) |
(13.4) |
|
|
| SLC Management |
3.4 |
2.0 |
3.2 |
3.5 |
5.7 |
|
|
| Canada, Asia and other |
(1.4) |
1.1 |
(0.2) |
(0.1) |
(0.6) |
|
|
Total net flows for Segregated fund and Third-party AUM |
(10.5) |
(2.2) |
(2.8) |
(12.7) |
(8.3) |
|
|
(1)The acquisition of a majority stake in Advisors Asset Management, Inc. ("AAM acquisition"). For additional information, refer to Note 3 in our Interim Consolidated Financial Statements for the period ended September 30, 2023.
14 Sun Life Financial Inc. Third Quarter 2023 MANAGEMENT'S DISCUSSION AND ANALYSIS Contractual Service Margin represents a source of stored value for future insurance profits and qualifies as available capital for LICAT purposes.
|
|
|
|
|
|
| E. Contractual Service Margin |
|
CSM is a component of insurance contract liabilities. The following table shows the change in CSM including its recognition into net income in the period, as well as the growth from new insurance sales activity.
|
|
|
|
|
|
|
|
|
|
For the nine months ended |
For the full year ended |
| ($ millions) |
September 30, 2023 |
December 31, 2022 |
| Beginning of Period |
10,865 |
9,797 |
Impact of new insurance business(1) |
872 |
762 |
Expected movements from asset returns & locked-in rates(1) |
408 |
362 |
Insurance experience gains/losses(1) |
86 |
89 |
| CSM recognized for services provided |
(655) |
(861) |
Organic CSM Movement(1) |
711 |
352 |
Impact of markets & other(1) |
(151) |
37 |
Impact of change in assumptions(1) |
287 |
431 |
| Currency impact |
2 |
248 |
Disposition(2) |
(262) |
— |
| Total CSM Movement |
587 |
1,068 |
| Contractual Service Margin, End of Period |
11,452 |
10,865 |
(1)Represents a non-IFRS financial measure. For more details, see section N - Non-IFRS Financial Measures in this document.
(2)Relates to the sale of Sun Life UK. For additional information, refer to Note 3 in our Interim Consolidated Financial Statements for the period ended
September 30, 2023.
Total CSM ended Q3'23 at $11.5 billion, an increase of $0.6 billion or 5% for the first nine months of 2023:
•Organic CSM movement was driven by the impact of new insurance business, reflecting strong individual protection sales in Asia and Canada.
•Favourable insurance experience in Canada, partially offset by Asia which included unfavourable policyholder behaviour in Vietnam and High-Net-Worth.
•Unfavourable markets and other impacts driven by interest rates.
•Impact of change in assumptions include favourable net mortality and net favourable model refinements.
•A $262 million reduction to the CSM balance from the sale of Sun Life UK.
MANAGEMENT'S DISCUSSION AND ANALYSIS Sun Life Financial Inc. Third Quarter 2023 15
Assumption Changes and Management Actions by Type
The impact on CSM of ACMA is attributable to insurance contracts under the general measurement approach ("GMA") and variable fee approach ("VFA"). For insurance contracts measured under the GMA, the impacts flow through the CSM at locked-in discount rates. For insurance contracts measured under the VFA, the impact flows through the CSM at current discount rates.
The following table sets out the impacts of ACMA on our reported net income and CSM in the third quarter of 2023.
|
|
|
|
|
|
|
|
|
|
|
|
| As at September 30, 2023 |
|
|
|
($ millions) |
Reported net income impacts (Post-tax)(1)(2) |
Deferred in CSM (Pre-tax)(2)(3)(4) |
Comments |
Mortality/morbidity |
(87) |
154 |
Updates to reflect mortality/morbidity experience in all jurisdictions. The largest items were favourable mortality impacts in the UK Annuities in the U.S. and Group Retirement Services ("GRS") in Canada. These were offset partially by adverse mortality in In-force Management in the U.S. Mortality updates impacting CSM favourably are funded at locked-in rates that are lower than current rates resulting in a negative net income impact. Additionally, favourable morbidity impacts in Group Benefits in the U.S. were largely offset by unfavourable morbidity updates in Sun Life Health in Canada. |
| Policyholder behaviour |
(105) |
(251) |
Updates to reflect lapse and policyholder behaviour in all jurisdictions. The largest items were an adverse lapse impact in Individual Term and Universal Life in Canada, and in International, Hong Kong and Vietnam in Asia. |
Expense |
24 |
(198) |
Updates to reflect higher costs related to IFRS 17 infrastructure and higher costs in Canada. |
Financial |
10 |
50 |
Updates to various financial related assumptions. |
Modelling enhancement and other |
193 |
202 |
Various enhancements and methodology changes. The largest items were favourable impacts from refinements to the modelling of guarantees for the Individual Par in Canada and International Universal Life in Asia, as well as modelling enhancements in Vietnam in Asia. |
Total impact of change in assumptions |
35 |
(43) |
|
(1)In this document, the reported net income impact of ACMA is shown in aggregate for Net insurance service result and Net investment result, and excludes amounts attributable to participating policyholders.
(2)CSM is shown on a pre-tax basis as it reflects the changes in our insurance contract liabilities, while reported net income is shown on a post-tax basis to reflect the impact on capital.
(3)The impact of change in assumptions in the CSM rollforward of $287 million is comprised of $46 million for the three months ended March 31, 2023 from various small enhancements, $284 million for the three months ended June 30, 2023 which included a contract modification resulting in a change in the fulfilment cash flows offset by CSM within insurance contract liabilities, and $(43) million for the three months ended September 30, 2023, as referenced in the table above.
(4)Total impact of change in assumptions represents a non-IFRS financial measure for amounts deferred in CSM. For more details, see section
N - Non-IFRS Financial Measures in this document.
16 Sun Life Financial Inc. Third Quarter 2023 MANAGEMENT'S DISCUSSION AND ANALYSIS
|
|
|
|
|
|
|
|
|
|
|
|
|
|
|
|
|
|
|
|
|
|
|
IFRS 17 and IFRS 9 |
IFRS 4 and IAS 39(1) |
| ($ millions, unless otherwise stated) |
Q3'23 |
Q2'23 |
Q1'23 |
|
As at
January 1, 2023(2)
|
Q4'22 |
Q3'22 |
| LICAT ratio |
|
|
|
|
|
|
|
Sun Life Financial Inc.(1)(2) |
147% |
148% |
148% |
|
142% |
130% |
129% |
Sun Life Assurance(1)(2) |
138% |
139% |
144% |
|
139% |
127% |
123% |
Capital |
|
|
|
|
|
|
|
| Subordinated debt |
6,177 |
6,679 |
6,677 |
|
6,676 |
6,676 |
7,075 |
Innovative capital instruments(3) |
200 |
200 |
200 |
|
200 |
200 |
200 |
| Equity in the participating account |
397 |
354 |
303 |
|
268 |
1,837 |
1,764 |
| Non-controlling interests |
147 |
138 |
133 |
|
90 |
90 |
64 |
| Preferred shares and other equity instruments |
2,239 |
2,239 |
2,239 |
|
2,239 |
2,239 |
2,239 |
Common shareholders' equity(4) |
20,984 |
20,461 |
20,735 |
|
20,290 |
25,211 |
24,718 |
Contractual Service Margin(2)(5) |
11,452 |
11,258 |
11,243 |
|
10,865 |
|
|
Total capital(1)(2) |
41,596 |
41,329 |
41,530 |
|
40,628 |
36,253 |
36,060 |
Financial leverage ratio(1)(5)(6) |
21.8% |
23.3% |
23.2% |
|
23.7% |
25.1% |
26.4% |
| Dividend |
|
|
|
|
|
|
|
Underlying dividend payout ratio(1)(6) |
47% |
48% |
47% |
|
47% |
43% |
43% |
| Dividends per common share ($) |
0.750 |
0.750 |
0.720 |
|
0.720 |
0.720 |
0.690 |
Book value per common share ($)(1) |
35.91 |
34.86 |
35.34 |
|
34.60 |
42.99 |
42.18 |
(1)This measure has not been restated for periods in 2022 and earlier as IFRS 17 and IFRS 9 were not the accounting standards in effect, and therefore were not applicable to our capital management practices at the time.
(2)OSFI's 2023 LICAT Guideline, effective January 1, 2023, specifies that available capital for LICAT purposes includes the CSM, and as such total capital was also updated to include the CSM balance. Prior period restatement and resubmissions are not mandated. Pro-forma January 1, 2023 LICAT ratios are disclosed to illustrate transition impact. These pro-forma calculations will not be formally submitted to OSFI.
(3)Innovative capital instruments consist of Sun Life ExchangEable Capital Securities ("SLEECS"), see section I - Capital and Liquidity Management in the 2022 Annual MD&A.
(4)Common shareholders’ equity is equal to Total shareholders’ equity less Preferred shares and other equity instruments.
(5)Effective January 1, 2023, the calculation for the financial leverage ratio was updated to include the CSM balance (net of taxes) in the denominator. The CSM (net of taxes) was $9.3 billion as at September 30, 2023 (June 30, 2023 - $9.1 billion; March 31, 2023 - $9.0 billion; January 1, 2023 - $8.7 billion).
(6)Represents a non-IFRS financial measure. For more details, see section N - Non-IFRS Financial Measures in this document.
1. Life Insurance Capital Adequacy Test
The Office of the Superintendent of Financial Institutions has developed the regulatory capital framework referred to as the Life Insurance Capital Adequacy Test for Canada. LICAT measures the capital adequacy of an insurer using a risk-based approach and includes elements that contribute to financial strength through periods when an insurer is under stress as well as elements that contribute to policyholder and creditor protection wind-up.
SLF Inc. is a non-operating insurance company and is subject to the LICAT guideline. Sun Life Assurance, SLF Inc.'s principal operating life insurance subsidiary, is also subject to the LICAT guideline.
SLF Inc.'s LICAT ratio of 142% and Sun Life Assurance's LICAT ratio of 139% as at January 1, 2023 increased 12 percentage points compared to December 31, 2022, from the transition to IFRS 17. The largest driver of change was the reduction in the LICAT base solvency buffer ("BSB") scalar from 1.05 to 1.0 which contributed seven percentage points.
SLF Inc.'s LICAT ratio of 147% as at September 30, 2023 increased five percentage points compared to January 1, 2023, driven by reported net income and capital optimization, partially offset by shareholder dividend payments, subordinated debt redemption, market movements, and share buybacks.
Sun Life Assurance's LICAT ratio of 138% as at September 30, 2023 decreased one percentage point compared to January 1, 2023, reflecting dividend payments to SLF Inc. and market movements, largely offset by the impact of reported net income and capital optimization.
The Sun Life Assurance LICAT ratios in both periods are well above OSFI's supervisory ratio of 100% and regulatory minimum ratio of 90%.
MANAGEMENT'S DISCUSSION AND ANALYSIS Sun Life Financial Inc. Third Quarter 2023 17
2. Capital
On transition to the new standards, total capital of $40.6 billion as at January 1, 2023 increased $4.4 billion compared to December 31, 2022 driven by the establishment of the CSM, which includes transfers from Common shareholders' equity and equity in the participating account to the CSM.
Our total capital consists of subordinated debt and other capital instruments, CSM, equity in the participating account and total shareholders' equity which includes common shareholders' equity, preferred shares and other equity instruments, and non-controlling interests. As at
September 30, 2023, our total capital was $41.6 billion, an increase of $1.0 billion compared to January 1, 2023. The increase to total capital included reported net income of $2,337 million, an increase of $587 million in CSM, and the issuance of $500 million principal amount of Series 2023-1 Subordinated Unsecured 5.50% Fixed/Floating Debentures, which is detailed below. This was partially offset by the payment of $1,304 million of dividends on common shares of SLF Inc. ("common shares"), the redemption of $1 billion principal amount of Series 2016-2 Subordinated Unsecured 3.05% Fixed/Floating Debentures, which is detailed below, a decrease of $186 million from the repurchase and cancellation of common shares, and the impact related to the acquisition of AAM of $158 million(1).
Our capital and liquidity positions remain strong with a LICAT ratio of 147% at SLF Inc., a financial leverage ratio of 21.8%(2) and $1.4 billion in cash and other liquid assets(2) as at September 30, 2023 in SLF Inc.(3) (December 31, 2022 - $1.1 billion).
Capital Transactions
On July 4, 2023, SLF Inc. issued $500 million principal amount of Series 2023-1 Subordinated Unsecured 5.50% Fixed/Floating Debentures due 2035. Sun Life intends to use an amount equal to the net proceeds from the offering to finance or refinance, in whole or in part, eligible assets as defined in our Sustainability Bond Framework.
On September 19, 2023, SLF Inc. redeemed all of the outstanding $1 billion principal amount of Series 2016-2 Subordinated Unsecured 3.05% Fixed/Floating Debentures, in accordance with the redemption terms attached to such debentures. The redemptions were funded from existing cash and liquid assets in SLF Inc.
Subsequent Events
On October 3, 2023, we acquired Dialogue Health Technologies Inc. ("Dialogue"). As a result of this acquisition, our ownership interest increased from approximately 23% to approximately 95% for cash proceeds of approximately $272 million (for equity not previously owned by Sun Life or rolled by certain members of Dialogue's executive management). Dialogue is a Canadian based health and wellness virtual care platform. For additional information, refer to Note 3 and Note 16 of our Interim Consolidated Financial Statements for the period ended September 30, 2023.
Normal Course Issuer Bids
On August 24, 2023, SLF inc. announced that OSFI and the Toronto Stock Exchange ("TSX") had approved its previously announced normal course issuer bid to purchase up to 17 million of its common shares (the "NCIB”). The NCIB commenced on August 29, 2023 and continues until
August 28, 2024, such earlier date as SLF Inc. may determine, or such date as SLF Inc. completes its purchases of common shares pursuant to the NCIB. Purchases under the NCIB may be made through the facilities of the TSX, other Canadian stock exchanges and/or alternative Canadian trading platforms, at prevailing market rates. Subject to regulatory approval, purchases under the NCIB may also be made by way of private agreements or share repurchase programs under issuer bid exemption orders issued by securities regulatory authorities. Any purchases made under an exemption order issued by a securities regulatory authority will generally be at a discount to the prevailing market price. The actual number of common shares purchased under the NCIB, and the timing of such purchases (if any), will be determined by SLF Inc. Any common shares purchased by SLF Inc. pursuant to the NCIB will be cancelled or used in connection with certain equity settled incentive arrangements. The NCIB will provide the Company with the flexibility to acquire common shares in order to return capital to shareholders as part of its overall capital management strategy.
During the third quarter, SLF Inc. purchased approximately 2.8 million common shares at a total cost of $186 million pursuant to the NCIB. All of the common shares purchased under SLF Inc.'s NCIB were subsequently cancelled.
(1)For additional information, refer to Note 3 in our interim Consolidated Financial Statements for the period ended September 30, 2023.
(2)Represents a non-IFRS financial measure. For more details, see section N - Non-IFRS Financial Measures in this document.
(3)SLF Inc. (the ultimate parent company) and its wholly-owned holding companies.
18 Sun Life Financial Inc. Third Quarter 2023 MANAGEMENT'S DISCUSSION AND ANALYSIS
|
|
|
|
|
|
| G. Performance by Business Segment |
|
|
|
|
|
|
|
|
|
|
|
|
|
|
|
|
|
|
|
|
Quarterly results |
Year-to-date |
| ($ millions) |
Q3'23 |
Q2'23 |
Q3'22(1) |
2023 |
2022(1) |
Underlying net income (loss)(2) |
|
|
|
|
|
| Asset Management |
330 |
296 |
298 |
908 |
914 |
| Canada |
338 |
372 |
293 |
1,026 |
798 |
| U.S. |
185 |
215 |
227 |
637 |
468 |
| Asia |
166 |
150 |
153 |
457 |
404 |
| Corporate |
(89) |
(113) |
(22) |
(283) |
(107) |
Total underlying net income (loss)(2) |
930 |
920 |
949 |
2,745 |
2,477 |
| Reported net income (loss) - Common shareholders |
|
|
|
|
|
| Asset Management |
268 |
248 |
218 |
770 |
827 |
| Canada |
365 |
210 |
56 |
904 |
788 |
| U.S. |
132 |
175 |
125 |
475 |
330 |
| Asia |
211 |
122 |
— |
467 |
118 |
| Corporate |
(105) |
(95) |
(288) |
(279) |
(357) |
| Total reported net income (loss) - Common shareholders |
871 |
660 |
111 |
2,337 |
1,706 |
(1)2022 restated results may not be fully representative of our future earnings profile, as we were not managing our asset and liability portfolios under the new standards. See the heading "Note to Readers: 2022 Restated Results on Adoption of IFRS 17 and IFRS 9" in section A - How We Report Our Results in this document.
(2)Represents a non-IFRS financial measure. For more details, see section N - Non-IFRS Financial Measures in this document.
All factors discussed in this document that impact our underlying net income are also applicable to reported net income.
MANAGEMENT'S DISCUSSION AND ANALYSIS Sun Life Financial Inc. Third Quarter 2023 19
1. Asset Management
|
|
|
|
|
|
|
|
|
|
|
|
|
|
|
|
|
|
|
Quarterly results |
Year-to-date |
| Asset Management (C$ millions) |
Q3'23 |
Q2'23 |
Q3'22 |
2023 |
2022 |
Underlying net income(1) |
330 |
296 |
298 |
908 |
914 |
Add: Market-related impacts |
(3) |
(31) |
3 |
(41) |
(14) |
Management's ownership of MFS shares |
7 |
(1) |
37 |
23 |
88 |
Acquisition, integration and restructuring(2)(3) |
(58) |
(11) |
(117) |
(102) |
(150) |
Intangible asset amortization |
(8) |
(5) |
(3) |
(18) |
(11) |
|
|
|
|
|
|
| Reported net income - Common shareholders |
268 |
248 |
218 |
770 |
827 |
Assets under management (C$ billions)(1) |
974.2 |
997.8 |
911.6 |
974.2 |
911.6 |
Gross flows (C$ billions)(1) |
34.3 |
37.7 |
36.4 |
112.7 |
135.5 |
Net flows (C$ billions)(1) |
(9.1) |
(3.3) |
(7.7) |
(14.9) |
(9.4) |
MFS (C$ millions) |
|
|
|
|
|
Underlying net income(1) |
277 |
252 |
273 |
783 |
804 |
Add: Management's ownership of MFS shares |
7 |
(1) |
37 |
23 |
88 |
| Reported net income - Common shareholders |
284 |
251 |
310 |
806 |
892 |
Assets under management (C$ billions)(1) |
754.8 |
779.8 |
703.4 |
754.8 |
703.4 |
Gross flows (C$ billions)(1) |
28.3 |
33.3 |
28.2 |
96.1 |
109.3 |
Net flows (C$ billions)(1) |
(12.5) |
(5.3) |
(13.4) |
(23.6) |
(27.3) |
| MFS (US$ millions) |
|
|
|
|
|
Underlying net income(1) |
207 |
187 |
212 |
582 |
630 |
Add: Management's ownership of MFS shares |
5 |
— |
28 |
17 |
66 |
| Reported net income - Common shareholders |
212 |
187 |
240 |
599 |
696 |
Pre-tax net operating margin for MFS(1) |
41% |
37% |
41% |
38% |
38% |
Average net assets (US$ billions)(1) |
581.6 |
577.1 |
560.9 |
575.1 |
599.7 |
Assets under management (US$ billions)(1)(4) |
555.9 |
589.1 |
508.7 |
555.9 |
508.7 |
Gross flows (US$ billions)(1) |
21.1 |
24.8 |
21.6 |
71.4 |
85.4 |
Net flows (US$ billions)(1) |
(9.3) |
(4.0) |
(10.3) |
(17.5) |
(21.2) |
| Asset appreciation (depreciation) (US$ billions) |
(23.9) |
22.8 |
(33.9) |
25.6 |
(162.8) |
| SLC Management (C$ millions) |
|
|
|
|
|
Underlying net income(1) |
53 |
44 |
25 |
125 |
110 |
Add: Market-related impacts |
(3) |
(31) |
3 |
(41) |
(14) |
Acquisition, integration and restructuring(2)(3) |
(58) |
(11) |
(117) |
(102) |
(150) |
Intangible asset amortization |
(8) |
(5) |
(3) |
(18) |
(11) |
|
|
|
|
|
|
| Reported net income (loss) - Common shareholders |
(16) |
(3) |
(92) |
(36) |
(65) |
Fee-related earnings(1) |
68 |
62 |
58 |
198 |
164 |
Pre-tax fee-related earnings margin(1)(5) |
24% |
24% |
24% |
23% |
24% |
Pre-tax net operating margin(1)(5) |
20% |
20% |
22% |
19% |
22% |
Assets under management (C$ billions)(1) |
219.5 |
218.1 |
208.2 |
219.5 |
208.2 |
Gross flows - AUM (C$ billions)(1) |
6.0 |
4.4 |
8.2 |
16.7 |
26.2 |
Net flows - AUM (C$ billions)(1) |
3.4 |
2.0 |
5.7 |
8.6 |
17.9 |
Fee earning assets under management ("FE AUM") (C$ billions)(1) |
172.6 |
171.1 |
|
162.9 |
172.6 |
162.9 |
|
Gross flows - FE AUM (C$ billions)(1) |
6.2 |
4.2 |
10.2 |
15.4 |
25.1 |
Net flows - FE AUM (C$ billions)(1) |
4.1 |
2.0 |
8.8 |
8.6 |
19.4 |
Assets under administration ("AUA") (C$ billions)(1) |
48.4 |
49.9 |
— |
48.4 |
— |
Capital raising (C$ billions)(1) |
3.2 |
2.1 |
3.8 |
7.6 |
15.2 |
Deployment (C$ billions)(1) |
4.8 |
4.7 |
9.5 |
15.4 |
23.3 |
(1)Represents a non-IFRS financial measure. For more details, see section N - Non-IFRS Financial Measures in this document.
(2)Amounts relate to acquisition costs for our SLC Management affiliates, BentallGreenOak, InfraRed Capital Partners, Crescent Capital Group LP and Advisors Asset Management, Inc, which include the unwinding of the discount for Other financial liabilities of $21 million in Q3'23 and $62 million for the first nine months of 2023 (Q2'23 - $21 million; Q3'22 -$15 million; the first nine months of 2022 - $47 million).
(3)Q3'23 reflects the changes in estimated future payments for acquisition-related contingent considerations and options to purchase remaining ownership interests of SLC Management affiliates of $42 million (Q3'22 - $80 million).
(4)Monthly information on AUM is provided by MFS in its Corporate Fact Sheet, which can be found at www.mfs.com/CorpFact. The Corporate Fact Sheet also provides MFS' U.S. GAAP assets and liabilities as at December 31, 2022.
(5)Based on a trailing 12-month basis. IFRS 9 was adopted on January 1, 2023, as such the Q3'22 pre-tax net operating margin reflects earnings on an IAS 39 basis. For more details, see section N - Non-IFRS Financial Measures in this document.
20 Sun Life Financial Inc. Third Quarter 2023 MANAGEMENT'S DISCUSSION AND ANALYSIS Asset Management underlying net income of $330 million increased $32 million or 11% driven by:
Profitability
Quarterly Comparison - Q3'23 vs. Q3'22
•MFS up $4 million (down US$5 million): Higher average net assets ("ANA"), an increase in net investment income, favourable foreign exchange translation and higher variable compensation expenses. The MFS pre-tax net operating profit margin(1) was 41% for Q3'23, consistent with the prior year.
•SLC Management up $28 million: Fee-related earnings(1) increased 17% driven by higher AUM, reflecting strong capital raising and deployment across the platform and the AAM acquisition(2). Fee-related earnings margin(1) and pre-tax net operating profit margin(1) for Q3'23 were 24% and 20%, respectively (Q3'22 - 24% and 22%, respectively). The increase in underlying net income was driven by the higher fee-related earnings, a favourable tax rate(3), and higher retention expenses in the prior year that did not repeat.
Reported net income of $268 million increased $50 million or 23%, driven by a lower increase in SLC Management's acquisition-related liabilities(4) compared to the prior year and an increase in underlying net income, partially offset by fair value changes in management's ownership of MFS shares.
Foreign exchange translation led to an increase of $7 million in underlying net income and reported net income.
Year-to-Date Comparison - Q3'23 vs. Q3'22
Asset Management underlying net income of $908 million decreased $6 million or 1% driven by:
•MFS down $21 million (US$48 million): Lower ANA partially offset by an increase in net investment income and favourable foreign exchange translation.
•SLC Management up $15 million: Fee-related earnings(1) increased 21% driven by higher AUM, reflecting strong capital raising and deployment across the platform and the AAM acquisition. The increase in underlying net income was driven by the higher fee-related earnings, a favourable tax rate(3), and higher retention expenses in the prior year that did not repeat. This was partially offset by higher financing costs on seed investments and higher compensation expenses.
Reported net income of $770 million decreased $57 million or 7%, reflecting fair value changes in management's ownership of MFS shares, a decline in value of real estate investments held in the SLC Management surplus account, partially offset by a lower increase in SLC Management's acquisition-related liabilities(4) compared to the prior year.
Foreign exchange translation led to an increase of $36 million and $34 million in underlying net income and reported net income, respectively.
Growth
Asset Management AUM of $974.2 billion increased $22.3 billion or 2% from December 31, 2022 driven by:
•Net asset value changes of $36.7 billion; and
•AUM driven by the AAM acquisition of $5.2 billion; partially offset by
•Net outflows of $14.9 billion; and
•Client distributions of $4.7 billion.
MFS' AUM increased US$8.0 billion or 1% from December 31, 2022, driven by:
•Increase in asset values from higher equity markets of US$25.6 billion, partially offset by net outflows of US$17.5 billion.
In Q3'23, 96%, 91%, and 24% of MFS' U.S. retail mutual fund assets ranked in the top half of their Morningstar categories based on ten-, five- and three-year performance, respectively.
SLC Management's AUM increased $9.8 billion or 5% from December 31, 2022 driven by:
•Net inflows of $8.6 billion, the AAM acquisition of $5.2 billion, and asset value changes of $0.7 billion, partially offset by Client distributions of $4.7 billion.
•Net inflows were comprised of capital raising and Client contributions, totaling $16.7 billion, partially offset by outflows of $8.0 billion.
SLC Management's FE AUM increased $8.2 billion or 5% from December 31, 2022, driven by:
•Net inflows of $8.6 billion and the AAM acquisition of $5.2 billion, partially offset by Client distributions of $5.0 billion and asset value changes of $0.7 billion.
•Net inflows were comprised of capital deployment and Client contributions, totaling $15.4 billion, partially offset by outflows of
$6.8 billion.
(1)Represents a non-IFRS financial measure. For more details, see section N - Non-IFRS Financial Measures in this document.
(2)On February 1, 2023, we completed the acquisition of a majority stake interest in Advisors Asset Management, Inc. ("the AAM acquisition"), a leading independent U.S. retail distribution firm, with the option to acquire the remaining interest starting in 2028.
(3)Underlying net income includes favourable adjustments related to tax filings.
(4)Reflects the changes in estimated future payments for acquisition-related contingent considerations and options to purchase remaining ownership interests of SLC Management affiliates.
MANAGEMENT'S DISCUSSION AND ANALYSIS Sun Life Financial Inc. Third Quarter 2023 21
2. Canada
|
|
|
|
|
|
|
|
|
|
|
|
|
|
|
|
|
|
|
Quarterly results |
Year-to-date |
| ($ millions) |
Q3'23 |
Q2'23 |
Q3'22(1) |
2023 |
2022(1) |
Wealth & asset management(2) |
116 |
110 |
102 |
340 |
292 |
Group - Health & Protection(2) |
136 |
160 |
102 |
391 |
273 |
Individual - Protection(2) |
86 |
102 |
89 |
295 |
233 |
Underlying net income(2) |
338 |
372 |
293 |
1,026 |
798 |
Add: Market-related impacts(1) |
10 |
(156) |
(172) |
(193) |
95 |
ACMA |
15 |
(6) |
(61) |
7 |
(95) |
Acquisition, integration and restructuring |
5 |
3 |
(1) |
73 |
(1) |
Intangible asset amortization |
(3) |
(3) |
(3) |
(9) |
(9) |
|
|
|
|
|
|
Reported net income - Common shareholders(1) |
365 |
210 |
56 |
904 |
788 |
Underlying ROE (%)(2) |
22.2% |
23.5% |
17.6% |
21.2% |
16.7% |
Reported ROE (%)(2) |
23.9% |
13.2% |
3.3% |
18.7% |
16.5% |
Wealth sales & asset management gross flows(2)(3) |
3,395 |
3,130 |
3,181 |
9,615 |
10,530 |
Group - Health & Protection sales(2) |
119 |
153 |
114 |
417 |
426 |
Individual - Protection sales(2) |
148 |
154 |
119 |
438 |
357 |
(1)2022 restated results may not be fully representative of our future earnings profile, as we were not managing our asset and liability portfolios under the new standards. See the heading "Note to Readers: 2022 Restated Results on Adoption of IFRS 17 and IFRS 9" in section A - How We Report Our Results in this document.
(2)Represents a non-IFRS financial measure. For more details, see section N - Non-IFRS Financial Measures in this document. For more information about business types in Sun Life's business groups, see section A - How We Report Our Results in this document.
(3)Effective January 1, 2023, Canada wealth sales & asset management gross flows have been updated to exclude retained sales. Prior period amounts have been updated to reflect this change.
Profitability
Quarterly Comparison - Q3'23 vs. Q3'22
Underlying net income of $338 million increased $45 million or 15%, reflecting:
•Wealth & asset management up $14 million: Increase in investment income driven by higher volume and yields.
•Group - Health & Protection up $34 million: Improved disability experience reflecting higher margins and shorter claims durations, partially offset by lower fee-related earnings.
•Individual - Protection down $3 million: In line with prior year.
•Higher expenses across all businesses were driven by volume growth, continued investments in the business, and higher incentive compensation.
Reported net income of $365 million increased $309 million, driven by more favourable market-related impacts primarily from interest rates, ACMA impacts, and the increase in underlying net income, partially offset by real estate experience.
Year-to-Date Comparison - Q3'23 vs. Q3'22
Underlying net income of $1,026 million increased $228 million or 29%, reflecting:
•Wealth & asset management up $48 million: Increase in investment income driven by higher volume and yields, partially offset by lower fee-related earnings.
•Group - Health & Protection up $118 million: Improved disability experience reflecting higher margins, lower claims volumes, and shorter claims durations.
•Individual - Protection up $62 million: Growth of in-force business, improved protection experience and higher investment contributions.
•In addition the earnings across all businesses above include higher earnings on surplus and higher expenses.
•Higher earnings on surplus reflects an increase in realized gains and net interest income from higher rates.
•Higher expenses were driven by volume growth, continued investments in the business and higher incentive compensation.
Reported net income of $904 million increased $116 million or 15%, driven by the increase in underlying net income, ACMA impacts, and a gain on the sale of the sponsored markets business, partially offset by market-related impacts. The market-related impacts were primarily from interest rates and real estate experience partially offset by equity markets.
Growth
Quarterly Comparison - Q3'23 vs. Q3'22
Canada's sales included:
•Wealth sales & asset management gross flows of $3.4 billion were up 7%, driven by higher Individual Wealth sales, primarily from mutual funds, partially offset by lower defined contribution sales in GRS.
•Group - Health & Protection sales of $119 million were up 4%, reflecting higher health sales.
•Individual - Protection sales of $148 million were up 24%, reflecting higher participating whole life insurance sales.
22 Sun Life Financial Inc. Third Quarter 2023 MANAGEMENT'S DISCUSSION AND ANALYSIS
Year-to-Date Comparison - Q3'23 vs. Q3'22
Canada's sales included:
•Wealth sales & asset management gross flows of $9.6 billion were down 9%, reflecting lower defined contribution and defined benefit solution sales in GRS.
•Group - Health & Protection sales of $417 million were in line with prior year.
•Individual - Protection sales of $438 million were up 23%, reflecting higher participating whole life insurance sales.
3. U.S.
|
|
|
|
|
|
|
|
|
|
|
|
|
|
|
|
|
|
|
Quarterly results |
Year-to-date |
| (US$ millions) |
Q3'23 |
Q2'23 |
Q3'22(1) |
2023 |
2022(1) |
Group - Health & Protection(2) |
112 |
149 |
136 |
415 |
290 |
Individual - Protection(2)(3) |
28 |
11 |
37 |
61 |
68 |
Underlying net income(2) |
140 |
160 |
173 |
476 |
358 |
Add: Market-related impacts(1) |
30 |
(9) |
(8) |
8 |
(41) |
ACMA |
(26) |
18 |
(3) |
(8) |
(2) |
Acquisition, integration and restructuring(4) |
(23) |
(24) |
(18) |
(68) |
(60) |
Intangible asset amortization |
(16) |
(12) |
(11) |
(45) |
(23) |
Other |
— |
— |
(37) |
— |
21 |
Reported net income - Common shareholders(1) |
105 |
133 |
96 |
363 |
253 |
Underlying ROE (%)(2) |
12.2% |
13.8% |
15.0% |
13.6% |
13.1% |
Reported ROE (%)(2) |
9.2% |
11.4% |
8.3% |
10.4% |
9.3% |
After-tax profit margin for Group Benefits (%)(2)(5) |
9.9% |
10.2% |
5.9% |
9.9% |
5.9% |
Group - Health & Protection sales(2) |
179 |
360 |
281 |
814 |
565 |
|
|
|
|
|
|
|
|
|
|
|
|
|
|
|
|
|
|
|
|
|
|
|
|
|
|
|
|
|
|
|
|
|
|
|
|
|
|
|
(1)2022 restated results may not be fully representative of our future earnings profile, as we were not managing our asset and liability portfolios under the new standards. See the heading "Note to Readers: 2022 Restated Results on Adoption of IFRS 17 and IFRS 9" in section A - How We Report Our Results in this document.
(2)Represents a non-IFRS financial measure. For more details, see section N - Non-IFRS Financial Measures in this document. For more information about business types in Sun Life's business groups, see section A - How We Report Our Results in this document.
(3)Effective Q2'23, the UK payout annuities run-off business was moved from the Corporate business segment to the U.S. business segment upon the sale of Sun Life UK. For additional information, refer to Note 3 of our Interim Consolidated Financial Statements for the period ended September 30, 2023. Also, effective Q3'23 the run-off reinsurance business was moved from the Corporate business segment to the U.S. business segment.
(4)Includes acquisition and integration costs associated with DentaQuest, acquired on June 1, 2022.
(5)Based on underlying net income, on a trailing four-quarter basis. IFRS 17 and IFRS 9 were adopted on January 1, 2023, as such the Q3'22 margin reflects underlying net income on an IFRS 4 and IAS 39 basis. For more details, see section N - Non-IFRS Financial Measures in this document.
Profitability
Quarterly Comparison - Q3'23 vs. Q3'22
Underlying net income of US$140 million decreased US$33 million or 19%, driven by:
•Group - Health & Protection down US$24 million: Lower Dental results as strong revenue growth was more than offset by the impact of Medicaid redeterminations following the end of the Public Health Emergency and investments in the Advantage Dental+ business. In Group Benefits, strong revenue growth was largely offset by less favourable morbidity experience.
•Individual - Protection down US$9 million: The inclusion of the UK payout annuity business(1) was more than offset by lower net investment results.
Reported net income of US$105 million increased US$9 million or 9%, driven by market-related impacts largely from interest rates, and a prior year charge reflecting the resolution of a matter related to our reinsurance pricing in the In-force Management business, partially offset by the decrease in underlying net income and ACMA impacts.
Foreign exchange translation led to an increase of $5 million and $4 million in underlying net income and reported net income, respectively.
(1)On April 3, 2023, we completed the sale of SLF of Canada UK Limited to Phoenix Group Holdings plc ("the sale of Sun Life UK"). Under the agreement, we will retain our economic interest in the payout annuities business through a reinsurance treaty, which, effective Q2'23 is recorded in In-force Management within the U.S. business group. For additional information, refer to Note 3 of our Interim Consolidated Financial Statements for the period ended September 30, 2023.
MANAGEMENT'S DISCUSSION AND ANALYSIS Sun Life Financial Inc. Third Quarter 2023 23
Year-to-Date Comparison - Q3'23 vs. Q3'22
Underlying net income of US$476 million increased US$118 million or 33%, driven by:
•Group - Health & Protection up US$125 million: Strong premium growth across all businesses, contribution from the DentaQuest acquisition, higher investment contributions, and more favourable experience. Experience in the year included higher medical stop-loss margins and favourable group disability. This was partially offset by unfavourable dental experience primarily reflecting the impact of Medicaid redeterminations following the end of the Public Health Emergency, and group mortality. During the year, mortality improved significantly when compared to pandemic-related experience in the prior year.
•Individual - Protection down US$7 million: The inclusion of the UK payout annuity business(1) was more than offset by lower net investment results. Mortality experience in the year improved compared to prior year.
•Higher earnings on surplus reflecting an increase in net interest income from higher rates.
Reported net income of US$363 million increased US$110 million or 43%, driven by the increase in underlying net income and market-related impacts, partially offset by amortization of DentaQuest acquired intangible assets. The prior year included a gain on the sale-leaseback of the Wellesley office which was partially offset by a charge reflecting the resolution of a matter related to reinsurance pricing for the In-force Management business.
Foreign exchange translation led to an increase of $31 million and $26 million in underlying net income and reported net income, respectively.
Growth
Quarterly Comparison - Q3'23 vs. Q3'22
U.S. group sales of US$179 million were down US$102 million or 36%, reflecting lower large case Medicaid sales in Dental, partially offset by higher commercial dental sales.
Year-to-Date Comparison - Q3'23 vs. Q3'22
U.S. group sales of US$814 million were up US$249 million or 44%, driven by higher Dental(2) sales in Medicaid, Medicare Advantage and commercial dental.
(1)On April 3, 2023, we completed the sale of SLF of Canada UK Limited to Phoenix Group Holdings plc ("the sale of Sun Life UK"). Under the agreement, we will retain our economic interest in the payout annuities business through a reinsurance treaty, which, effective Q2'23 is recorded in In-force Management within the U.S. business group. For additional information, refer to Note 3 of our Interim Consolidated Financial Statements for the period ended September 30, 2023.
(2)Dental sales include sales from DentaQuest, acquired on June 1, 2022.
24 Sun Life Financial Inc. Third Quarter 2023 MANAGEMENT'S DISCUSSION AND ANALYSIS
4. Asia
|
|
|
|
|
|
|
|
|
|
|
|
|
|
|
|
|
|
|
Quarterly results |
Year-to-date |
| ($ millions) |
Q3'23 |
Q2'23 |
Q3'22(1) |
2023 |
2022(1) |
Wealth & asset management(2) |
11 |
13 |
19 |
39 |
55 |
Individual - Protection(2)(3) |
175 |
144 |
136 |
449 |
361 |
Regional Office expenses & other(2) |
(20) |
(7) |
(2) |
(31) |
(12) |
Underlying net income (loss)(2) |
166 |
150 |
153 |
457 |
404 |
Add: Market-related impacts(1) |
(4) |
(12) |
(97) |
(11) |
(203) |
ACMA |
56 |
(10) |
(54) |
40 |
(70) |
Acquisition, integration and restructuring |
(5) |
(4) |
— |
(13) |
(7) |
Intangible asset amortization |
(2) |
(2) |
(2) |
(6) |
(6) |
|
|
|
|
|
|
Reported net income - Common shareholders(1) |
211 |
122 |
— |
467 |
118 |
Underlying ROE (%)(2) |
12.2% |
10.9% |
12.1% |
11.2% |
11.3% |
Reported ROE (%)(2) |
15.5% |
9.0% |
—% |
11.5% |
3.3% |
Wealth sales & asset management gross flows(2) |
1,663 |
1,616 |
2,531 |
5,709 |
9,350 |
Individual - Protection sales(2) |
521 |
450 |
325 |
1,346 |
912 |
Group - Health & Protection sales(2)(3) |
16 |
19 |
19 |
60 |
56 |
|
|
|
|
|
|
New business CSM(2) |
238 |
118 |
79 |
458 |
200 |
(1)2022 restated results may not be fully representative of our future earnings profile, as we were not managing our asset and liability portfolios under the new standards. See the heading "Note to Readers: 2022 Restated Results on Adoption of IFRS 17 and IFRS 9" in section A - How We Report Our Results in this document.
(2)Represents a non-IFRS financial measure. For more details, see section N - Non-IFRS Financial Measures in this document. For more information about business types in Sun Life's business groups, see section A - How We Report Our Results in this document.
(3)In underlying net income by business type, Group businesses in Asia have been included with Individual – Protection.
Profitability
Quarterly Comparison - Q3'23 vs. Q3'22
Underlying net income of $166 million increased $13 million or 8%, driven by:
•Wealth & asset management down $8 million: Lower earnings in the Philippines.
•Individual - Protection up $39 million: Business growth reflecting good sales momentum during the past year. Experience in the quarter included favourable mortality from lower claims volumes, largely offset by higher expense experience.
•Regional office expenses & other $(18) million increased net loss primarily reflecting higher incentive compensation.
Reported net income of $211 million compared to nil reported net income in the prior year, driven by ACMA impacts, and favourable market-related impacts largely from interest rates partially offset by real estate experience.
Foreign exchange translation led to an increase of $3 million and $5 million in underlying net income and reported net income, respectively.
Year-to-Date Comparison - Q3'23 vs. Q3'22
Underlying net income of $457 million increased $53 million or 13%, driven by:
•Wealth & asset management down $16 million: Lower earnings largely in the Philippines and Hong Kong.
•Individual - Protection up $88 million: Business growth reflecting good sales momentum during the past year, improved mortality, and contributions from joint ventures driven by favourable policyholder behaviour and expense experience, partially offset by lower investment contributions.
•Regional office expenses & other $(19) million increased net loss primarily reflecting higher incentive compensation.
Reported net income of $467 million increased $349 million, driven by lower market-related impacts, ACMA impacts, and the increase in underlying net income. The market-related impacts were primarily driven by the steepening of the interest rate curve, partially offset by real estate experience.
Foreign exchange translation led to an increase of $9 million and $15 million in underlying net income and reported net income, respectively.
MANAGEMENT'S DISCUSSION AND ANALYSIS Sun Life Financial Inc. Third Quarter 2023 25
Growth
Quarterly Comparison - Q3'23 vs. Q3'22
Asia's sales included:
•Wealth sales & asset management gross flows of $1.7 billion were down 35%(1), primarily reflecting lower money market fund sales in the Philippines.
•Individual sales of $521 million were up 57%(1), driven by higher sales in Hong Kong reflecting increased demand as pandemic-related travel restrictions were lifted in early 2023, and in International reflecting large case sales, partially offset by lower sales in Vietnam reflecting market conditions.
New business CSM of $238 million, compared to $79 million in the prior year, was primarily driven by sales in Hong Kong and High-Net-Worth.
Year-to-Date Comparison - Q3'23 vs. Q3'22
Asia's sales included:
•Wealth sales & asset management gross flows of $5.7 billion were down 40%(1), primarily reflecting lower money market fund sales in the Philippines.
•Individual sales of $1,346 million were up 45%(1), driven by higher sales in Hong Kong, International, India, and China, partially offset by lower sales in Vietnam.
New business CSM of $458 million, compared to $200 million in the prior year, was primarily driven by sales in Hong Kong and High-Net-Worth.
Dah Sing Bank Bancassurance Partnership
Effective July 1, 2023 we commenced our 15-year exclusive bancassurance partnership with Dah Sing Bank ("Dah Sing"). Under this
partnership, Sun Life will be the exclusive provider of life insurance solutions to Dah Sing's approximately 570,000 retail banking customers, helping to fulfill their savings and protection needs at different life stages. This is Sun Life's first exclusive bancassurance partnership in Hong Kong and will be a valuable complement to our existing network of over 2,500 expert insurance advisors.
(1)This change excludes the impacts of foreign exchange translation. For more information about these non-IFRS financial measures, see section N - Non-IFRS Financial Measures in this document.
26 Sun Life Financial Inc. Third Quarter 2023 MANAGEMENT'S DISCUSSION AND ANALYSIS
5. Corporate
|
|
|
|
|
|
|
|
|
|
|
|
|
|
|
|
|
|
|
Quarterly results |
Year-to-date |
| ($ millions) |
Q3'23 |
Q2'23 |
Q3'22(1) |
2023 |
2022(1) |
Individual - Protection(2)(3) |
— |
4 |
32 |
29 |
76 |
Corporate expenses & other(2) |
(89) |
(117) |
(54) |
(312) |
(183) |
Underlying net income (loss)(2) |
(89) |
(113) |
(22) |
(283) |
(107) |
Add: Market-related impacts(1) |
(16) |
(6) |
(85) |
(20) |
(70) |
ACMA |
— |
— |
(11) |
3 |
(11) |
Acquisition, integration and restructuring |
— |
24 |
(170) |
21 |
(170) |
|
|
|
|
|
|
Other |
— |
— |
— |
— |
1 |
Reported net income (loss) - Common shareholders(1) |
(105) |
(95) |
(288) |
(279) |
(357) |
(1)2022 restated results may not be fully representative of our future earnings profile, as we were not managing our asset and liability portfolios under the new standards. See the heading "Note to Readers: 2022 Restated Results on Adoption of IFRS 17 and IFRS 9" in section A - How We Report Our Results in this document.
(2)Represents a non-IFRS financial measure. For more details, see section N - Non-IFRS Financial Measures in this document. For more information about business types in Sun Life's business groups, see section A - How We Report Our Results in this document.
(3)The UK annuities run-off businesses in Corporate has been included with Individual – Protection. Effective Q2'23, the UK annuities run-off business was moved from the Corporate business segment to the U.S. business segment upon the sale of Sun Life UK. For additional information, refer to Note 3 of our Interim Consolidated Financial Statements for the period ended September 30, 2023. Also, effective Q3'23 the run-off reinsurance business was moved from the Corporate business segment to the U.S. business segment.
Profitability
Quarterly Comparison - Q3'23 vs. Q3'22
Underlying net loss was $89 million compared to underlying net loss of $22 million in the prior year, driven by the sale of Sun Life UK(1), higher operating expenses including incentive compensation, an increase in debt financing costs, partially offset by higher investment income from surplus assets.
Reported net loss was $105 million compared to reported net loss of $288 million in the prior year, driven by the impacts from the sale of Sun Life UK(2) , partially offset by the change in underlying net loss.
Year-to-Date Comparison - Q3'23 vs. Q3'22
Underlying net loss was $283 million compared to underlying net loss of $107 million in the prior year, driven by the sale of Sun Life UK(1), higher operating expenses including incentive compensation, an increase in debt financing costs, partially offset by higher investment income from surplus assets.
Reported net loss was $279 million compared to reported net loss of $357 million in the prior year, driven by the impacts from the sale of Sun Life UK(2) , partially offset by the change in underlying net loss.
(1)On April 3, 2023 we completed the sale of SLF of Canada UK Limited to Phoenix Group Holdings plc ("the sale of Sun Life UK"). Under the agreement, we will retain our economic interest in the payout annuities business through a reinsurance treaty, which, effective Q2'23, is recorded in In-force Management within the U.S. business group.
(2)In Q3'22, we recognized an impairment charge of $170 million pertaining to the attributed goodwill that was not expected to be recovered through the sale of Sun Life UK. In Q2'23, we recognized a gain of $19 million for the sale of Sun Life UK. For additional information, refer to Note 3 of our Interim Consolidated Financial Statements for the period ended September 30, 2023. Also, the prior year included market-related losses from Sun Life UK.
MANAGEMENT'S DISCUSSION AND ANALYSIS Sun Life Financial Inc. Third Quarter 2023 27
Total general fund invested assets of $162.8 billion as at September 30, 2023, were down $6.0 billion from December 31, 2022. The decrease was primarily due to decline in net fair value from rising interest rates. Our general fund invested assets are well-diversified across investment types, geographies and sectors with the majority of our portfolio invested in high quality fixed income assets.
The following table sets out the composition of our general fund invested assets:(1)
|
|
|
|
|
|
|
|
|
|
|
|
|
|
|
|
|
|
|
|
September 30, 2023 |
December 31, 2022 |
| ($ millions) |
Carrying value |
% of Total carrying value |
|
|
Carrying value |
% of Total carrying value |
|
|
| Cash, cash equivalents and short-term securities |
11,026 |
7% |
|
|
11,219 |
7% |
|
|
| Debt securities |
68,879 |
43% |
|
|
75,902 |
45% |
|
|
| Equity securities |
7,080 |
4% |
|
|
7,148 |
4% |
|
|
| Mortgages and loans |
51,994 |
32% |
|
|
51,253 |
30% |
|
|
| Derivative assets |
1,878 |
1% |
|
|
2,095 |
1% |
|
|
Other invested assets |
11,955 |
7% |
|
|
11,070 |
7% |
|
|
|
|
|
|
|
|
|
|
|
|
|
|
|
|
|
|
|
|
|
|
|
|
|
|
|
|
|
| Investment properties |
9,952 |
6% |
|
|
10,102 |
6% |
|
|
|
|
|
|
|
|
|
|
|
| Total invested assets |
162,764 |
100% |
|
|
168,789 |
100% |
|
|
(1)The values and ratios presented are based on the fair value of the respective asset categories. Generally, the carrying values for invested assets are equal to their fair values. For invested assets supporting insurance contracts, in the event of default, if the amounts recovered are insufficient to satisfy the related insurance contract liability cash flows that the assets are intended to support, credit exposure may be greater than the carrying value of the assets.
1. Debt Securities
The debt securities portfolio is actively managed through a regular program of purchases and sales aimed at optimizing yield, quality, and liquidity, while ensuring that it remains well-diversified and duration-matched to insurance contract liabilities. As at September 30, 2023, with the exception of certain countries where we have business operations, including Canada, the United States and the Philippines, our exposure to debt securities from any single country did not exceed 1% of total invested assets.
Debt Securities by Geography
The carrying value of our debt securities by geographic location is presented in the following table.
|
|
|
|
|
|
|
|
|
|
|
|
|
|
|
|
|
|
|
|
|
|
|
|
|
|
|
|
September 30, 2023 |
December 31, 2022 |
| ($ millions) |
FVTPL debt
securities |
FVOCI debt securities |
Total |
% of Total |
FVTPL debt
securities |
FVOCI debt securities |
Total |
% of Total |
| Debt securities by geography: |
|
|
|
|
|
|
|
|
| Canada |
26,158 |
4,298 |
30,456 |
44% |
26,613 |
6,064 |
32,677 |
43% |
| United States |
18,637 |
5,972 |
24,609 |
36% |
20,274 |
6,196 |
26,470 |
35% |
| Europe |
3,716 |
1,504 |
5,220 |
8% |
5,814 |
1,789 |
7,603 |
10% |
| Asia |
4,920 |
830 |
5,750 |
8% |
4,549 |
964 |
5,513 |
7% |
| Other |
1,558 |
1,286 |
2,844 |
4% |
2,107 |
1,532 |
3,639 |
5% |
| Total debt securities |
54,989 |
13,890 |
68,879 |
100% |
59,357 |
16,545 |
75,902 |
100% |
Our gross unrealized losses as at September 30, 2023 for fair value through profit or loss ("FVTPL") and fair value through other comprehensive income ("FVOCI") debt securities were $11,211 million and $1,057 million, respectively (December 31, 2022 - $9,384 million and $1,521 million, respectively). The increase in gross unrealized losses was largely due to the impact from rising interest rates.
Debt Securities by Credit Rating
Debt securities with a credit rating of "A" or higher represented 71% of the total debt securities as at September 30, 2023 (December 31, 2022 - 72%). Debt securities with a credit rating of "BBB" or higher represented 99% of total debt securities as at September 30, 2023, (December 31, 2022 - 99%).
28 Sun Life Financial Inc. Third Quarter 2023 MANAGEMENT'S DISCUSSION AND ANALYSIS Our mortgage portfolio consisted almost entirely of first mortgages and our loan portfolio consisted of private placement loans.
2. Mortgages and Loans
Changes to fair value estimates for loans was implemented on January 1, 2023. For additional details, refer to Note 2 in the Interim Consolidated Financial Statements for the period ended September 30, 2023.
Mortgages and Loans by Geography
The carrying value of mortgages and loans by geographic location is presented in the following table.(1)
|
|
|
|
|
|
|
|
|
|
|
|
|
|
|
|
|
|
|
|
|
|
|
|
September 30, 2023 |
December 31, 2022 |
| ($ millions) |
Mortgages |
Loans |
Total |
|
Mortgages |
Loans |
Total |
|
| Canada |
9,249 |
12,114 |
21,363 |
|
9,363 |
12,433 |
21,796 |
|
| United States |
4,652 |
16,472 |
21,124 |
|
5,029 |
15,468 |
20,497 |
|
| Europe |
147 |
6,686 |
6,833 |
|
29 |
6,479 |
6,508 |
|
| Asia |
— |
535 |
535 |
|
— |
494 |
494 |
|
| Other |
— |
2,139 |
2,139 |
|
— |
1,958 |
1,958 |
|
| Total mortgages and loans |
14,048 |
37,946 |
51,994 |
|
14,421 |
36,832 |
51,253 |
|
| % of Total invested assets |
9% |
23% |
32% |
|
8% |
22% |
30% |
|
(1)The geographic location for mortgages is based on the location of the property and for loans it is based on the country of the creditor's parent.
Mortgage Portfolio
As at September 30, 2023, we held $14.0 billion of mortgages (December 31, 2022 - $14.4 billion). Our mortgage portfolio consists entirely of commercial mortgages, as presented in the following table.
|
|
|
|
|
|
|
|
|
|
|
|
|
|
|
|
|
|
|
|
|
|
September 30, 2023 |
December 31, 2022 |
| ($ millions) |
Insured |
Uninsured |
Total |
Insured |
Uninsured |
Total |
| Mortgages: |
|
|
|
|
|
|
| Retail |
— |
2,586 |
2,586 |
— |
2,819 |
2,819 |
| Office |
— |
2,745 |
2,745 |
— |
3,014 |
3,014 |
| Multi-family residential |
3,590 |
1,256 |
4,846 |
3,592 |
1,422 |
5,014 |
| Industrial |
— |
2,921 |
2,921 |
— |
2,665 |
2,665 |
| Other |
421 |
529 |
950 |
443 |
466 |
909 |
| Total mortgages |
4,011 |
10,037 |
14,048 |
4,035 |
10,386 |
14,421 |
| % of Total mortgages |
29% |
71% |
100% |
28% |
72% |
100% |
Our mortgage portfolio consists entirely of commercial mortgages, including retail, office, multi-family, and industrial properties. As at
September 30, 2023, 35% of our commercial mortgage portfolio consisted of multi-family residential mortgages; there are no single-family residential mortgages. Our uninsured commercial portfolio had a weighted average loan-to-value ratio of approximately 52% as at
September 30, 2023 (December 31, 2022 - 53%). While we generally limit the maximum loan-to-value ratio to 75% at issuance, we may invest in mortgages with a higher loan-to-value ratio in Canada if the mortgage is insured by the Canada Mortgage and Housing Corporation ("CMHC"). The estimated weighted average debt service coverage for our uninsured commercial portfolio is 1.74 times. Of the $3.8 billion of multi-family residential mortgages in the Canadian commercial mortgage portfolio, 93% were insured by the CMHC.
As at September 30, 2023, we held $37.9 billion of loans (December 31, 2022 - $36.8 billion). Private placement loans provide diversification by type of loan, industry segment and borrower credit quality. The private placement loan portfolio consists of senior secured and unsecured loans to large- and mid-market corporate borrowers, securitized lease/loan obligations secured by a variety of assets, and project finance loans in sectors such as power and infrastructure.
As at September 30, 2023, our impaired mortgages and loans, net of allowances for losses, were $3 million (December 31, 2022 - $47 million).
3. Derivatives
The values associated with our derivative instruments are presented in the following table. Notional amounts serve as the basis for payments calculated under derivatives contracts and are generally not exchanged.
|
|
|
|
|
|
|
|
|
| ($ millions) |
September 30, 2023 |
December 31, 2022 |
| Net fair value asset (liability) |
(663) |
(256) |
| Total notional amount |
68,963 |
|
69,768 |
|
Credit equivalent amount(1) |
1,262 |
|
1,173 |
|
Risk-weighted credit equivalent amount(1) |
29 |
|
26 |
|
(1)Amounts presented are net of collateral received.
The net fair value of derivatives was a liability of $663 million as at September 30, 2023 (December 31, 2022 - liability of $256 million). The decrease in net fair value was driven by a decrease in interest rate contracts due to upward shifts in yield curves.
MANAGEMENT'S DISCUSSION AND ANALYSIS Sun Life Financial Inc. Third Quarter 2023 29
The total notional amount of our derivatives decreased to $69.0 billion as at September 30, 2023 (December 31, 2022 - $69.8 billion). The change in notional amount is mainly attributable to a decrease in interest rate contracts for duration matching.
4. Investment Properties
As at September 30, 2023, we held $10.0 billion of investment properties (December 31, 2022 - $10.1 billion). The decrease in our investment property portfolio is predominantly driven by net sales.
Investment Properties by Type and Geography
|
|
|
|
|
|
|
|
|
|
|
|
|
|
|
|
|
|
|
|
|
|
|
|
|
September 30, 2023 |
| ($ millions) |
Office |
Industrial |
Retail |
Multi-family
residential |
Other |
Total |
% of Total by Geography |
| Canada |
1,631 |
3,421 |
920 |
1,458 |
618 |
8,048 |
81% |
| United States |
553 |
1,101 |
247 |
— |
3 |
1,904 |
19% |
|
|
|
|
|
|
|
|
| Total |
2,184 |
4,522 |
1,167 |
1,458 |
621 |
9,952 |
100% |
| % of Total by Type |
22% |
45% |
12% |
15% |
6% |
100% |
|
|
|
|
|
|
|
|
|
|
December 31, 2022 |
| ($ millions) |
Office |
Industrial |
Retail |
Multi-family
residential |
Other |
Total |
% of Total by Geography |
| Canada |
1,747 |
3,434 |
926 |
1,322 |
612 |
8,041 |
79% |
| United States |
647 |
1,105 |
263 |
— |
1 |
2,016 |
20% |
| Europe |
12 |
16 |
17 |
— |
— |
45 |
1% |
| Total |
2,406 |
4,555 |
1,206 |
1,322 |
613 |
10,102 |
100% |
| % of Total by Type |
24% |
45% |
12% |
13% |
6% |
100% |
|
5. Loss Allowance and Provision for Credit Losses
The balance of the total loss allowance was $81 million as at September 30, 2023 (January 1, 2023(1) - $75 million) and the provision for credit losses was $6 million for the nine months ended September 30, 2023.
(1)For financial assets in which the impairment requirements of IFRS 9 applies, we have elected to continue presenting the loss allowance that was determined in accordance with IAS 39 for balances at December 31, 2022. For additional information, refer to Note 2 in our Interim Consolidated Financial Statements for the period ended September 30, 2023.
30 Sun Life Financial Inc. Third Quarter 2023 MANAGEMENT'S DISCUSSION AND ANALYSIS This section includes our disclosure on market risks and should be read in conjunction with our unaudited Interim Consolidated Financial Statements
for the quarter ended September 30, 2023.
We have established a Risk Management Framework to assist in identifying, measuring, managing, monitoring and reporting risks. The Risk
Management Framework covers all risks and these have been grouped into six major categories: market, insurance, credit, business and strategic,
operational and liquidity risks. Risk appetite limits are established for equity, interest rate, credit spread, real estate and foreign currency risks. Through our enterprise risk management processes, we oversee the various risk factors identified in the Risk Management Framework and provide reports to senior management and to the Board Committees at least quarterly. Our enterprise risk management processes and risk factors are described in our 2022 Annual MD&A and AIF.
On adoption of IFRS 17 and IFRS 9, we have updated the descriptions of risk factors related to equity, interest rates, credit and swap spreads, and real estate. For more information about the adoption of IFRS 17 and IFRS 9, see Note 2 of the Interim Consolidated Financial Statements for the period ended September 30, 2023.
When referring to segregated funds in this section, it is inclusive of segregated fund guarantees, variable annuities and investment products.
Equity Risk
Equity risk is the potential for financial loss arising from declines or volatility in equity market prices. We are exposed to equity risk from a number of sources.
We generate revenue in our asset management businesses and from certain insurance and annuity contracts where fees are levied on account balances that are affected directly by equity market levels. Accordingly, we have further exposure to equity risk as adverse fluctuations in the market value of such assets will result in corresponding adverse impacts on revenue, income, and the CSM. In addition, declining and volatile equity markets may have a negative impact on sales and redemptions (surrenders) in these businesses, and this may result in further adverse impacts on net income, the CSM, and capital.
A portion of our exposure to equity risk arises in connection with benefit guarantees on segregated fund products, some participating insurance contracts, some adjustable insurance contracts, and some universal life contracts. These benefit guarantees may be triggered upon death, maturity, withdrawal or annuitization. The cost of providing these guarantees is uncertain and depends upon a number of factors, including general capital market conditions, our hedging strategies, policyholder behaviour and mortality experience, each of which may result in negative impacts on net income, the CSM, and capital.
We also have direct exposure to equity markets from the investments supporting other general account liabilities, surplus, and employee benefit plans. These exposures fall within our risk-taking philosophy and appetite, and are therefore generally not hedged.
|
|
|
|
|
|
|
Interest Rate and Spread Risk
Interest rate and spread risk includes the potential for financial loss arising from changes in the value of insurance and investment contract liabilities and financial assets due to changes or volatility in interest rates or spreads. In practice, when asset cash flows and the policy obligations they support are not matched, this may result in the need to either sell assets to meet policy payments and expenses or reinvest excess asset cash flows in unfavourable interest rate or credit spread environments. This risk is managed in our asset-liability management program. Details of the asset-liability management program are discussed under the heading "Market Risk Management Governance and Control" in section J - Risk Management in our 2022 Annual MD&A.
Our primary exposure to interest rate and spread risk arises from insurance and investment contracts that contain guarantees in the form of minimum crediting rates, maximum premium rates, settlement options, guaranteed annuitization options and minimum benefits. If investment returns fall below guaranteed levels, we may be required to increase liabilities or capital in respect of these contracts. The guarantees attached to these products may be applicable to both past premiums collected and future premiums not yet received. Segregated fund contracts provide benefit guarantees that are linked to underlying fund performance and may be triggered upon death, maturity, withdrawal or annuitization. We are also exposed to interest rate risk through guaranteed annuitization options included primarily in retirement contracts and pension plans. These embedded options give policyholders the right to convert their investment into a pension on a guaranteed basis, thereby exposing us to declining long-term interest rates as the annuity guarantee rates come into effect. The cost of providing these guarantees is uncertain and depends upon a number of factors including the level and concentration of the guarantees relative to prevailing interest rates, credit spreads, non-fixed income returns, and policyholder behaviour. Exposure to guarantees is managed within our risk appetite limits through our asset-liability management program, which may include the use of hedging strategies utilizing interest rate derivatives such as interest rate floors, swaps, futures and swaptions. The impact of these guarantees on net income, CSM and capital are included in the disclosed market risk sensitivities.
Declines in interest rates or narrowing spreads can result in compression of the net spread between interest earned on investments and interest credited to policyholders. Declines in interest rates or narrowing spreads can also result in increased asset calls, mortgage prepayments, and net reinvestment of positive cash flows at lower yields, and therefore adversely impact our profitability and financial position. Negative interest rates may additionally result in losses on our cash and short-term deposits and low or negative returns on our fixed income assets impacting our profitability. In contrast, increases in interest rates or a widening of credit spreads can reduce market values of fixed income assets, which may lead to lower capital or losses in the event of the liquidation of assets prior to maturity.
|
MANAGEMENT'S DISCUSSION AND ANALYSIS Sun Life Financial Inc. Third Quarter 2023 31
|
|
|
|
|
|
|
Significant changes or volatility in interest rates or spreads could have a negative impact on sales of certain insurance and annuity products, and adversely impact the expected pattern of redemptions (surrenders) on existing policies. Increases in interest rates or widening credit spreads may increase the risk that policyholders will surrender their contracts, potentially forcing us to liquidate assets at a loss. While we have established hedging programs in place and our insurance and annuity products often contain surrender mitigation features, these may not be sufficient to fully offset the adverse impact of changes in interest rates or spreads.
We also have direct exposure to interest rates and spreads from investments supporting other general account liabilities, surplus and employee benefit plans. Lower interest rates or a narrowing of spreads will result in reduced investment income on new fixed income asset purchases. Conversely, higher interest rates or wider spreads will reduce the value of our existing assets. These exposures fall within our risk-taking philosophy and appetite and are therefore generally not hedged.
|
A sustained low interest rate environment may adversely impact our net income, CSM, capital, and our ability to implement our business strategy and plans in several ways, including:
•Lower sales of certain insurance and wealth products, which can in turn put pressure on our operating expense levels;
•Shifts in the expected pattern of redemptions (surrenders) on existing policies;
•Higher losses on new business;
•Reduced return on new fixed income asset purchases, and higher hedging costs;
•The impact of consequent changes in assumptions used to measure insurance contracts;
•Impairment of goodwill; and
•Valuation allowances against our deferred tax assets.
Real Estate Risk
Real estate risk is the potential for financial loss arising from fluctuations in the value of, or future cash flows from, our investments in real estate. We are exposed to real estate risk and may experience financial losses resulting from the direct ownership of real estate investments or indirectly through fixed income investments secured by real estate property, leasehold interests, ground rents, and purchase and leaseback transactions. Real estate price risk may arise from external market conditions, inadequate property analysis, inadequate insurance coverage, inappropriate real estate appraisals, or from environmental risk exposures. We hold real estate investments that support general account liabilities and surplus, and fluctuations in value will affect our net income, CSM, and capital. A material and sustained increase in interest rates may lead to deterioration in real estate values.
|
|
|
|
|
|
|
i.Market Risk Sensitivities |
|
|
|
|
|
We use a variety of methods and measures to manage and quantify our market risk exposures. These include duration and key rate duration management, convexity measures, cash flow gap analysis, scenario testing, and sensitivity testing of earnings and regulatory capital ratios.
The measurement of liabilities and assets are affected by the level of equity market performance, interest rates, credit and swap spreads and other market risk variables. The following sections set out the estimated immediate impact on, or sensitivity of, our net income(1), CSM, other comprehensive income (loss) ("OCI") and SLF Inc.'s LICAT ratio to certain instantaneous changes in market variables as at September 30, 2023 and December 31, 2022(2).
|
|
|
|
|
|
|
|
The estimated sensitivities in the tables below reflect the impact of market movements on insurance contracts and investment contracts, assets backing insurance contracts, assets backing investment contracts, assets backing the surplus segment, and seed investments in our asset management subsidiaries.
Net income sensitivities to equity and real estate market movements are driven primarily by changes in the value of investments backing general account liabilities and surplus. Net income sensitivities to interest rates and spreads are driven by the net impact on liabilities and the assets backing them. Lower interest rates or a narrowing of spreads will result in increased liabilities for insurance contracts, offset by increased values of the assets backing general account liabilities. Higher interest rates or a widening of spreads will result in decreased liabilities for insurance contracts, offset by decreased values of the assets backing general account liabilities. Further detail on the impact of changes or volatility in market prices on assets and liabilities is provided under the headings "Equity Risk", "Interest Rate and Spread Risk", and "Real Estate Risk" above.
OCI sensitivities are impacted by changes in the market value of assets classified as FVOCI. The market value of FVOCI fixed income assets, which are held primarily in our surplus and investment contract segments, increases with lower interest rates or a narrowing of spreads, and decreases with higher interest rates or a widening of spreads.
As these market risk sensitivities reflect an instantaneous impact on net income, CSM, OCI and SLF Inc.'s LICAT ratio, they do not include impacts over time such as the effect on fee income in our asset management businesses.
Refer to Additional Cautionary Language and Key Assumptions Related to Sensitivities in this section for important additional information regarding these estimates.
|
(1)Net income in section I - Risk Management in this document refers to common shareholders' net income.
(2)Effective January 1, 2023, we adopted IFRS 17 and IFRS 9, and certain financial assets were reclassified between measurement categories as permitted. December 31, 2022 amounts provided in the sensitivities in section I - Risk Management of this document have been adjusted to reflect these January 1, 2023 reclassifications. See Note 2 of the Interim Consolidated Financial Statements for the period ended September 30, 2023 for further details on the reclassifications.
32 Sun Life Financial Inc. Third Quarter 2023 MANAGEMENT'S DISCUSSION AND ANALYSIS
1.Equity Market Sensitivities
The following table sets out the estimated immediate impact on, or sensitivity of, our net income, CSM, OCI and SLF Inc.'s LICAT ratio to certain instantaneous changes in equity market prices as at September 30, 2023 and December 31, 2022(1).
|
|
|
|
|
|
|
|
|
|
|
|
|
|
|
|
|
|
|
|
|
|
|
|
|
|
|
|
|
|
|
($ millions, unless otherwise noted) |
|
|
|
|
|
As at September 30, 2023 |
|
Change in Equity Markets(2)(3)(4) |
25% decrease |
10% decrease |
10% increase |
25% increase |
|
Potential impact on net income (after-tax) |
|
(400) |
|
(150) |
|
175 |
|
425 |
|
Potential impact on CSM (pre-tax) |
|
(575) |
|
(225) |
|
200 |
|
525 |
|
|
|
|
|
|
|
|
|
|
|
Potential impact on LICAT ratio(5) |
4.0% point decrease |
1.5% point decrease |
1.0% point increase |
2.5% point increase |
|
|
|
|
|
|
|
|
|
|
($ millions, unless otherwise noted) |
|
|
|
|
|
As at December 31, 2022(1) |
|
Change in Equity Markets(2)(3)(4) |
25% decrease |
10% decrease |
10% increase |
25% increase |
|
Potential impact on net income (after-tax) |
|
(300) |
|
(125) |
|
125 |
|
325 |
|
Potential impact on CSM (pre-tax) |
|
(650) |
|
(250) |
|
250 |
|
625 |
|
|
|
|
|
|
|
|
|
|
|
Potential impact on LICAT ratio(5) |
3.5% point decrease |
1.0% point decrease |
0.5% point increase |
2.0% point increase |
|
(1)Effective January 1, 2023, we adopted IFRS 17 and IFRS 9, and certain financial assets were reclassified between measurement categories as permitted. December 31, 2022 amounts provided in the sensitivities in section I - Risk Management of this document have been adjusted to reflect these January 1, 2023 reclassifications. See Note 2 of the Interim Consolidated Financial Statements for the period ended September 30, 2023 for further details on the reclassifications.
(2)Represents the respective change across all equity markets as at September 30, 2023 and December 31, 2022. Assumes that actual equity exposures consistently and precisely track the broader equity markets. Since in actual practice equity-related exposures differ from broad market indices (due to the impact of active management, basis risk, and other factors), realized sensitivities may differ significantly from those illustrated above. Sensitivities include the impact of re-balancing equity hedges for hedging programs at 2% intervals (for 10% changes in equity markets) and at 5% intervals (for 25% changes in equity markets).
(3)The market risk sensitivities include the estimated impact of our hedging programs in effect as at September 30, 2023 and December 31, 2022, and include new business added and product changes implemented prior to such dates.
(4)Net income, CSM and OCI sensitivities have been rounded in increments of $25 million. The sensitivities exclude the market impacts on the income from our joint ventures and associates, which we account for on an equity basis.
|
|
(5)The LICAT sensitivities illustrate the impact on SLF Inc. as at September 30, 2023 and December 31, 2022. LICAT ratios are rounded in increments of 0.5%. |
2.Interest Rate Sensitivities
The following table sets out the estimated immediate impact on, or sensitivity of, our net income, CSM, OCI and SLF Inc.'s LICAT ratio to certain instantaneous changes in interest rates as at September 30, 2023 and December 31, 2022(1).
|
|
|
|
|
|
|
|
|
|
|
|
|
|
|
|
|
|
|
|
|
|
|
|
|
|
|
|
|
|
|
($ millions, unless otherwise noted) |
As at September 30, 2023 |
As at December 31, 2022(1) |
|
Change in Interest Rates(2)(3)(4) |
50 basis point decrease |
50 basis point increase |
50 basis point decrease |
50 basis point increase |
|
Potential impact on net income (after-tax) |
|
(25) |
|
25 |
|
(100) |
|
75 |
|
Potential impact on CSM (pre-tax) |
|
75 |
|
(100) |
|
125 |
|
(150) |
|
Potential impact on OCI |
|
200 |
|
(200) |
|
225 |
|
(225) |
|
Potential impact on LICAT ratio(5) |
3.0% point increase |
1.0% point decrease |
1.5% point increase |
2.5% point decrease |
|
(1)Effective January 1, 2023, we adopted IFRS 17 and IFRS 9, and certain financial assets were reclassified between measurement categories as permitted. December 31, 2022 amounts provided in the sensitivities in section I - Risk Management of this document have been adjusted to reflect these January 1, 2023 reclassifications. See Note 2 of the Interim Consolidated Financial Statements for the period ended September 30, 2023 for further details on the reclassifications.
(2)Interest rate sensitivities assume a parallel shift in assumed interest rates across the entire yield curve as at September 30, 2023 and December 31, 2022 with no change to the ultimate risk-free rate. Variations in realized yields based on factors such as different terms to maturity and geographies may result in realized sensitivities being significantly different from those illustrated above. Sensitivities include the impact of re-balancing interest rate hedges for hedging programs at 10 basis point intervals (for 50 basis point changes in interest rates).
(3)The market risk sensitivities include the estimated impact of our hedging programs in effect as at September 30, 2023 and December 31, 2022, and include new business added and product changes implemented prior to such dates.
(4)Net income, CSM and OCI sensitivities have been rounded in increments of $25 million. The sensitivities exclude the market impacts on the income from our joint ventures and associates, which we account for on an equity basis.
|
|
(5)The LICAT sensitivities illustrate the impact on SLF Inc. as at September 30, 2023 and December 31, 2022. The sensitivities reflect the worst scenario as at September 30, 2023 and assume that a scenario switch does not occur in the quarter. LICAT ratios are rounded in increments of 0.5%. |
The above sensitivities were determined using a 50 basis point change in interest rates and a 10% and 25% changes in our equity markets because we believe that these market shocks were reasonably possible as at September 30, 2023. Significant changes in market variables may result in other than proportionate impacts on our sensitivities.
(1)Effective January 1, 2023, we adopted IFRS 17 and IFRS 9, and certain financial assets were reclassified between measurement categories as permitted. December 31, 2022 amounts provided in the sensitivities in section I - Risk Management of this document have been adjusted to reflect these January 1, 2023 reclassifications. See Note 2 of the Interim Consolidated Financial Statements for the period ended September 30, 2023 for further details on the reclassifications.
MANAGEMENT'S DISCUSSION AND ANALYSIS Sun Life Financial Inc. Third Quarter 2023 33
|
|
|
|
|
|
|
3. Credit Spread and Swap Sensitivities
Credit spread sensitivities reflect the impact of changes in credit spreads on our asset and liability values (including provincial government bonds, corporate bonds, and other fixed income assets). Swap spread sensitivities reflect the impact of changes in swap spreads on swap-based derivative positions and liability values.
|
The following tables set out the estimated immediate impact on, or sensitivity of, our net income, CSM, OCI and SLF Inc.'s LICAT ratio to certain instantaneous changes in credit spreads and our net income, CSM, and OCI to certain changes in swap spreads as at September 30, 2023 and December 31, 2022(1).
|
|
|
|
|
|
|
|
|
|
|
|
|
|
|
|
|
|
|
|
|
|
|
|
|
|
|
|
|
|
|
($ millions, unless otherwise noted) |
As at September 30, 2023 |
As at December 31, 2022(1) |
|
Change in Credit Spreads(2)(3) |
50 basis point decrease |
50 basis point increase |
50 basis point decrease |
50 basis point increase |
|
Potential impact on net income (after-tax) |
|
75 |
|
(100) |
|
50 |
|
(50) |
|
Potential impact on CSM (pre-tax) |
|
125 |
|
(125) |
|
75 |
|
(100) |
|
Potential impact on OCI |
|
175 |
|
(175) |
|
200 |
|
(200) |
|
Potential impact on LICAT ratio(4) |
2.0% point increase |
2.5% point decrease |
1.0% point increase |
2.0% point decrease |
|
(1)Effective January 1, 2023, we adopted IFRS 17 and IFRS 9, and certain financial assets were reclassified between measurement categories as permitted. December 31, 2022 amounts provided in the sensitivities in section I - Risk Management of this document have been adjusted to reflect these January 1, 2023 reclassifications. See Note 2 of the Interim Consolidated Financial Statements for the period ended September 30, 2023 for further details on the reclassifications.
(2)The credit spread sensitivities assume a parallel shift in the indicated spreads across the entire term structure with no change to the ultimate liquidity premium. The sensitivities reflect a floor of zero on credit spreads where the spreads are not currently negative. Variations in realized spread changes based on different terms to maturity, geographies, asset classes and derivative types, underlying interest rate movements, and ratings may result in realized sensitivities being significantly different from those provided above.
(3)Net income, CSM, and OCI sensitivities have been rounded in increments of $25 million.
|
|
(4)The LICAT sensitivities illustrate the impact on SLF Inc. as at September 30, 2023 and December 31, 2022. The sensitivities reflect the worst scenario as of September 30, 2023 and assume that a scenario switch does not occur in the quarter. LICAT ratios are rounded in increments of 0.5%. |
|
|
|
|
|
|
|
|
|
|
|
|
|
|
|
|
|
|
|
|
|
|
|
|
|
|
|
|
|
|
|
($ millions, unless otherwise noted) |
As at September 30, 2023 |
As at December 31, 2022(1) |
|
Change in Swap Spreads(2)(3) |
20 basis point decrease |
20 basis point increase |
20 basis point decrease |
20 basis point increase |
|
Potential impact on net income (after-tax) |
|
(25) |
|
25 |
|
(25) |
|
25 |
|
|
|
|
|
|
|
|
|
|
|
|
|
|
|
|
|
|
|
|
|
(1)Effective January 1, 2023, we adopted IFRS 17 and IFRS 9, and certain financial assets were reclassified between measurement categories as permitted. December 31, 2022 amounts provided in the sensitivities in section I - Risk Management of this document have been adjusted to reflect these January 1, 2023 reclassifications. See Note 2 of the Interim Consolidated Financial Statements for the period ended September 30, 2023 for further details on the reclassifications.
(2)The swap spread sensitivities assume a parallel shift in the indicated spreads across the entire term structure. Variations in realized spread changes based on different terms to maturity, geographies, asset classes and derivative types, underlying interest rate movements, and ratings may result in realized sensitivities being significantly different from those provided above.
|
|
(3)Net income, CSM, and OCI sensitivities have been rounded in increments of $25 million. |
LICAT Interest Rate Scenario Switch
The LICAT interest rate risk is assessed under four different interest rate scenarios, and the scenario leading to the highest capital requirement is chosen as the worst scenario for each geographic region as defined by the LICAT guideline. Changes and interaction between the level and term movements in interest rates and credit spreads can shift the interest rate scenario applied in the LICAT calculation causing a discontinuity where capital requirements change materially. In 2020, OSFI updated the LICAT guideline for interest rate risk requirements for participating businesses to be smoothed over six quarters. As a result, the actual impact to the LICAT ratio from participating businesses in any quarter will reflect the scenarios from current quarter as well as the prior five quarters and switching between the scenarios would have the effect of offsetting the previous impacts over time. It should be noted that switching of the scenario can also change the direction of our sensitivities.
This quarter, SLF Inc. experienced a scenario switch, resulting in an increase in the LICAT ratio of approximately one percentage point. For SLF Inc., assuming no further scenario switches, the remaining impact of one-half percentage point is expected to increase the LICAT ratio over the next five quarters.
This quarter, Sun Life Assurance experienced a scenario switch, resulting in no change to the LICAT ratio. For Sun Life Assurance, assuming no further scenario switches, the LICAT ratio is expected to increase one-half percentage point over the next five quarters.
(1)Effective January 1, 2023, we adopted IFRS 17 and IFRS 9, and certain financial assets were reclassified between measurement categories as permitted. December 31, 2022 amounts provided in the sensitivities in section I - Risk Management of this document have been adjusted to reflect these January 1, 2023 reclassifications. See Note 2 of the Interim Consolidated Financial Statements for the period ended September 30, 2023 for further details on the reclassifications.
34 Sun Life Financial Inc. Third Quarter 2023 MANAGEMENT'S DISCUSSION AND ANALYSIS
4.Real Estate Sensitivities
The following table sets out the estimated immediate impact on, or sensitivity of, our net income, OCI and CSM to certain instantaneous changes in the value of our real estate investments as at September 30, 2023 and December 31, 2022(1).
|
|
|
|
|
|
|
|
|
|
|
|
|
|
|
| ($ millions, unless otherwise noted) |
As at September 30, 2023 |
As at December 31, 2022(1) |
Change in Real Estate Values (2) |
10% decrease |
10% increase |
10% decrease |
10% increase |
|
|
|
|
|
|
|
|
|
|
|
|
|
|
|
| Potential impact on net income (after-tax) |
(475) |
475 |
(500) |
500 |
| Potential impact on CSM (pre-tax) |
(100) |
100 |
(100) |
100 |
|
|
|
|
|
(1)Effective January 1, 2023, we adopted IFRS 17 and IFRS 9, and certain financial assets were reclassified between measurement categories as permitted. December 31, 2022 amounts provided in the sensitivities in section I - Risk Management of this document have been adjusted to reflect these January 1, 2023 reclassifications. See Note 2 of the Interim Consolidated Financial Statements for the period ended September 30, 2023 for further details on the reclassifications.
(2)Net income, CSM, and OCI sensitivities have been rounded in increments of $25 million.
5.Segregated Funds Risk & Hedging
Certain segregated fund products provide benefit guarantees, which are linked to underlying fund performance and may be triggered upon death, maturity, withdrawal or annuitization. The cost of providing these guarantees is uncertain and depends upon a number of factors including general capital market conditions, our hedging activities, policyholder behaviour and mortality experience, each of which may result in negative impacts on net income, the CSM and capital.
Our hedging programs use derivative instruments and fixed income assets to mitigate the interest rate and equity market exposure of our segregated fund contracts. As at September 30, 2023, over 90% of our segregated fund contracts, as measured by fund values, were included in a hedging program. While a large percentage of contracts are included in the hedging program, not all of our market risk exposure related to these contracts is hedged. For those segregated fund contracts included in the hedging program, we generally hedge the value of expected future net claims costs and associated risk adjustments for non-financial risk.
Our hedging strategy is applied both at the line of business or product level and at the total company level using a combination of hedging techniques such as re-balancing of short-dated interest rate and equity derivative contracts and longer-dated put options. We actively monitor our overall market exposure and may implement tactical hedge overlay strategies in order to align sensitivities with risk management objectives.
The impact of segregated fund guarantees and associated hedging programs on net income, CSM and capital are included in
the disclosed market risk sensitivities.
6. Additional Cautionary Language and Key Assumptions Related to Sensitivities
Our market risk sensitivities are measures of our estimated change in net income, OCI, CSM and LICAT ratio for changes in market risk variables described above, based on market risk variables and business in force as at the reporting date. These sensitivities are calculated independently for each risk factor, generally assuming that all other risk variables stay constant. The sensitivities do not take into account indirect effects such as potential impacts on goodwill impairment or valuation allowances on deferred tax assets.
We have provided measures of our net income sensitivity to instantaneous changes in equity markets, interest rates, credit spreads, swap spreads, real estate price levels, and capital sensitivities to changes in equity price levels, interest rates and credit spreads. The LICAT ratio and CSM sensitivities are non-IFRS financial measures, and for additional information, see section N - Non-IFRS Financial Measures in this document. The cautionary language which appears in this section is applicable to all net income, CSM, OCI and LICAT ratio sensitivities.
|
|
|
|
|
|
|
Actual results can differ materially from these estimates for a variety of reasons, including differences in the pattern or distribution of the market shocks, the interaction between these risk factors, model error, or changes in other assumptions such as business mix, effective tax rates, policyholder behaviour, currency exchange rates and other market variables relative to those underlying the calculation of these sensitivities. The extent to which actual results may differ from the indicative ranges will generally increase with larger movements in risk variables. Our sensitivities as at December 31, 2022(1) have been included for comparative purposes only. |
|
|
|
|
|
|
|
The sensitivities reflect the composition of our assets and liabilities as at September 30, 2023 and December 31, 2022(1), respectively. Changes in these positions due to new sales or maturities, asset purchases/sales, or other management actions could result in material changes to these reported sensitivities. In particular, these sensitivities reflect the expected impact of hedging activities based on the hedging programs in place as at the September 30 and December 31(1) calculation dates. The actual impact of hedging activity can differ materially from that assumed in the estimated sensitivities due to ongoing hedge re-balancing activities, changes in the scale or scope of hedging activities, changes in the cost or general availability of hedging instruments, basis risk (i.e., the risk that hedges do not exactly replicate the underlying portfolio experience), model risk, and other operational risks in the ongoing management of the hedge programs or the potential failure of hedge counterparties to perform in accordance with expectations. |
(1)Effective January 1, 2023, we adopted IFRS 17 and IFRS 9, and certain financial assets were reclassified between measurement categories as permitted. December 31, 2022 amounts provided in the sensitivities in section I - Risk Management of this document have been adjusted to reflect these January 1, 2023 reclassifications. See Note 2 of the Interim Consolidated Financial Statements for the period ended September 30, 2023 for further details on the reclassifications.
MANAGEMENT'S DISCUSSION AND ANALYSIS Sun Life Financial Inc. Third Quarter 2023 35
|
|
|
|
|
|
|
Our hedging programs may themselves expose us to other risks, including basis risk, volatility risk, and increased levels of derivative counterparty credit risk, liquidity risk, model risk and other operational risks. These factors may adversely impact the net effectiveness, costs, and financial viability of maintaining these hedging programs and therefore adversely impact our profitability and financial position. While our hedging programs are intended to mitigate these effects (e.g., hedge counterparty credit risk is managed by maintaining broad diversification, dealing primarily with highly-rated counterparties, and transacting through over-the-counter ("OTC") contracts cleared through central clearing houses, exchange-traded contracts or bilateral OTC contracts negotiated directly between counterparties that include credit support annexes), residual risk, potential reported earnings and capital volatility remain.
The sensitivities are based on methods and assumptions in effect as at September 30, 2023 and December 31, 2022(1), as applicable. Changes in the regulatory environment, assumptions or methods used to measure assets and liabilities after those dates could result in material changes to the estimated sensitivities. Changes in market risk variables in excess of the changes illustrated may result in other than proportionate impacts.
|
The sensitivities reflect the CSM as at September 30, 2023 and December 31, 2022(1). For insurance contracts measured using the VFA, where the change in the effect of the time value of money and financial risk not arising from the underlying items adjusts the CSM, changes in the CSM balance will affect the sensitivity of income to changes in market risk variables.
Our LICAT sensitivities may be non-linear and can change due to the interrelationship between market rates and spreads, actuarial assumptions and our LICAT calculations.
|
|
|
|
|
|
|
For the reasons outlined above, our sensitivities should only be viewed as indicative estimates of the underlying sensitivities of each factor under these specialized assumptions, and should not be viewed as predictors of our future income, OCI, CSM or capital. Given the nature of these calculations, we cannot provide assurance that actual impacts will be consistent with the estimates provided. |
Information related to market risk sensitivities should be read in conjunction with the information contained in section M - Accounting and Control Matters - 1 - Critical Accounting Policies and Estimates in the 2022 Annual MD&A. Additional information on market risk can be found in Note 2 of the 2022 Annual Consolidated Financial Statements and the Risk Factors section in the 2022 AIF.
(1)Effective January 1, 2023, we adopted IFRS 17 and IFRS 9, and certain financial assets were reclassified between measurement categories as permitted. December 31, 2022 amounts provided in the sensitivities in section I - Risk Management of this document have been adjusted to reflect these January 1, 2023 reclassifications. See Note 2 of the Interim Consolidated Financial Statements for the period ended September 30, 2023 for further details on the reclassifications.
36 Sun Life Financial Inc. Third Quarter 2023 MANAGEMENT'S DISCUSSION AND ANALYSIS Revenue decreased $2.5 billion compared to the prior year, primarily driven by higher net investment losses from fair value changes of assets.
|
|
|
|
|
|
| J. Additional Financial Disclosure |
|
1. Revenue
|
|
|
|
|
|
|
|
|
|
|
|
|
|
|
|
|
|
|
Quarterly results |
Year-to-date |
| ($ millions) |
Q3'23 |
Q2'23 |
Q3'22 |
2023 |
2022 |
| Insurance revenue |
|
|
|
|
|
| Annuities |
555 |
563 |
544 |
1,686 |
1,682 |
| Life insurance |
1,337 |
1,314 |
1,397 |
3,941 |
3,804 |
| Health insurance |
3,441 |
3,406 |
3,208 |
10,271 |
8,111 |
| Total insurance revenue |
5,333 |
5,283 |
5,149 |
15,898 |
13,597 |
| Net Investment income (loss) |
(4,824) |
449 |
(2,056) |
425 |
(21,748) |
| Fee income |
1,930 |
1,936 |
1,808 |
5,767 |
5,426 |
| Total revenue |
2,439 |
7,668 |
4,901 |
22,090 |
(2,725) |
Foreign exchange translation led to a $0.1 billion increase in revenue. By business group, revenue reflected higher net investment losses in Canada partially offset by higher net investment income in Asia, Corporate and the U.S., and higher insurance revenue primarily in the U.S.
Revenue increased $24.8 billion in the first nine months of 2023 compared to the same period in 2022, driven by higher net investment income from fair value of assets. Foreign exchange translation led to a $0.7 billion increase in revenue. By business group, revenue reflected higher net investment income in Canada, Asia, the U.S., and Corporate, and higher insurance revenue primarily in the U.S.
2. Changes in the Statements of Financial Position and in Shareholders' Equity
Total general fund assets was $193.9 billion as at September 30, 2023 (December 31, 2022 - $198.3 billion), primarily reflecting a decline in the fair value of assets driven by rising interest rates.
The net liabilities balance for insurance contracts issued(1) was $124.7 billion as at September 30, 2023 (December 31, 2022 - $131.2 billion), mainly due to dispositions, the change in insurance service result and insurance finance income and expenses, partially offset by cash flows.
Total shareholders' equity, including preferred shares and other equity instruments, is $23.2 billion as at September 30, 2023 (December 31, 2022 - $22.5 billion). The change in total shareholders' equity included:
(i)total shareholders' net income of $2,396 million, before preferred share dividends of $59 million; partially offset by
(ii)common share dividend payments of $1,304 million;
(iii)a decrease of $186 million from the repurchase and cancellation of common shares; and
(iv)the impact related to the AAM acquisition of $158 million(2).
As at November 3, 2023, SLF Inc. had 584,295,400 common shares, 3,720,172 options to acquire SLF Inc. common shares, and 52,200,000 Class A Shares outstanding.
(1)For more information about the changes in the net insurance contract liabilities, refer to Notes 7.A and 7.B of the Interim Consolidated Financial Statements for the period ended September 30, 2023.
(2)For additional information, refer to Note 3 in our Interim Consolidated Financial Statements for the period ended September 30, 2023.
MANAGEMENT'S DISCUSSION AND ANALYSIS Sun Life Financial Inc. Third Quarter 2023 37
3. Cash Flows
|
|
|
|
|
|
|
|
|
|
|
|
|
|
|
|
|
|
|
Quarterly results |
Year-to-date |
| ($ millions) |
Q3'23 |
Q2'23 |
Q3'22 |
2023 |
2022 |
| Net cash and cash equivalents, beginning of period |
8,374 |
8,851 |
7,485 |
9,372 |
7,693 |
| Cash flows provided by (used in): |
|
|
|
|
|
| Operating activities |
1,900 |
289 |
1,885 |
2,209 |
3,397 |
| Investing activities |
(138) |
64 |
(96) |
(318) |
(2,737) |
| Financing activities |
(1,427) |
(756) |
(213) |
(2,447) |
694 |
| Changes due to fluctuations in exchange rates |
227 |
(74) |
334 |
120 |
348 |
| Increase (decrease) in cash and cash equivalents |
562 |
(477) |
1,910 |
(436) |
1,702 |
| Net cash and cash equivalents, end of period |
8,936 |
8,374 |
9,395 |
8,936 |
9,395 |
| Short-term securities, end of period |
2,090 |
1,824 |
1,990 |
2,090 |
1,990 |
| Net cash, cash equivalents and short-term securities, end of period |
11,026 |
10,198 |
11,385 |
11,026 |
11,385 |
Our operating activities generate cash flows which include net premiums, net investment income, fee income, and the sale and maturity of investments. They are the principal source of funds to pay for policyholder claims and benefits, commissions, operating expenses, and the purchase of investments. Cash flows used in investing activities primarily include transactions related to associates, joint ventures and acquisitions. Cash flows provided by and used in financing activities largely reflect capital transactions including payments of dividends, the issuance and repurchase of shares, as well as the issuance and retirement of debt instruments and preferred shares.
Q3'23 cash flows provided by financing activities decreased year-over-year primarily due to the redemption of $1 billion principal amount of Series 2016-2 Subordinated Unsecured 3.05% Fixed/Floating Debentures.
38 Sun Life Financial Inc. Third Quarter 2023 MANAGEMENT'S DISCUSSION AND ANALYSIS The following table provides a summary of our results for the eight most recently completed quarters.
4. Quarterly Financial Results
A more complete discussion of our historical quarterly results can be found in our Interim and Annual MD&A for the relevant periods.
|
|
|
|
|
|
|
|
|
|
|
|
|
|
|
|
|
|
|
|
|
|
|
|
|
|
|
|
|
|
|
|
|
|
|
|
|
Quarterly results |
|
IFRS 17 and IFRS 9(1) |
IFRS 4 and IAS 39(1) |
| ($ millions, unless otherwise noted) |
Q3'23 |
Q2'23 |
Q1'23 |
Q4'22 |
Q3'22 |
Q2'22 |
Q4'22 |
Q3'22 |
Q2'22 |
Q1'22 |
Q4'21 |
| Total revenue |
2,439 |
7,668 |
11,983 |
8,494 |
4,901 |
(2,967) |
12,301 |
8,630 |
2,011 |
380 |
12,995 |
| Common shareholders' net income (loss) |
Underlying net income(2) |
930 |
920 |
895 |
892 |
949 |
808 |
990 |
949 |
892 |
843 |
898 |
Add: Market-related impacts |
23 |
(220) |
(64) |
224 |
(361) |
118 |
(136) |
(160) |
(152) |
38 |
156 |
ACMA |
35 |
7 |
(5) |
12 |
(131) |
(22) |
54 |
7 |
— |
1 |
(19) |
Other adjustments |
(117) |
(47) |
(20) |
37 |
(346) |
26 |
43 |
(330) |
45 |
(24) |
43 |
Reported net income - Common shareholder |
871 |
660 |
806 |
1,165 |
111 |
930 |
951 |
466 |
785 |
858 |
1,078 |
| Diluted EPS ($) |
Underlying(2) |
1.59 |
1.57 |
1.52 |
1.52 |
1.62 |
1.38 |
1.69 |
1.62 |
1.52 |
1.44 |
1.53 |
Reported |
1.48 |
1.12 |
1.37 |
1.98 |
0.19 |
1.58 |
1.62 |
0.80 |
1.34 |
1.46 |
1.83 |
| Basic reported EPS ($) |
| Reported |
1.49 |
1.12 |
1.37 |
1.99 |
0.19 |
1.59 |
1.62 |
0.80 |
1.34 |
1.46 |
1.84 |
Underlying net income (loss) by segment(2) |
| Asset Management |
330 |
296 |
282 |
324 |
298 |
295 |
313 |
295 |
270 |
326 |
382 |
| Canada |
338 |
372 |
316 |
265 |
293 |
299 |
324 |
300 |
344 |
298 |
266 |
| U.S. |
185 |
215 |
237 |
230 |
227 |
134 |
240 |
216 |
154 |
118 |
72 |
| Asia |
166 |
150 |
141 |
135 |
153 |
118 |
152 |
175 |
148 |
152 |
130 |
| Corporate |
(89) |
(113) |
(81) |
(62) |
(22) |
(38) |
(39) |
(37) |
(24) |
(51) |
48 |
Total underlying net income (loss)(2) |
930 |
920 |
895 |
892 |
949 |
808 |
990 |
949 |
892 |
843 |
898 |
Add: Market-related impacts (pre-tax) |
107 |
(298) |
(99) |
179 |
(400) |
282 |
(273) |
(212) |
(109) |
193 |
153 |
ACMA (pre-tax) |
41 |
11 |
(5) |
(26) |
(153) |
(30) |
67 |
15 |
— |
1 |
(23) |
|
Other adjustments
(pre-tax)
|
(156) |
(89) |
(10) |
(141) |
(385) |
29 |
(88) |
(362) |
57 |
(26) |
67 |
| Tax expense (benefit) on above items |
(51) |
116 |
25 |
261 |
100 |
(159) |
255 |
76 |
(55) |
(153) |
(17) |
Reported net income (loss) by segment - Common shareholders |
Asset Management |
268 |
248 |
254 |
321 |
218 |
298 |
322 |
215 |
296 |
308 |
140 |
Canada |
365 |
210 |
329 |
453 |
56 |
476 |
367 |
210 |
160 |
263 |
356 |
U.S. |
132 |
175 |
168 |
202 |
125 |
149 |
110 |
94 |
213 |
169 |
85 |
Asia |
211 |
122 |
134 |
92 |
— |
7 |
98 |
125 |
131 |
161 |
446 |
Corporate |
(105) |
(95) |
(79) |
97 |
(288) |
— |
54 |
(178) |
(15) |
(43) |
51 |
Total reported net income (loss) - Common shareholders |
871 |
660 |
806 |
1,165 |
111 |
930 |
951 |
466 |
785 |
858 |
1,078 |
(1)IFRS 17 and IFRS 9 were adopted on January 1, 2023, see Note 2 of the Interim Consolidated Financial Statements for the period ended
September 30, 2023.
(2)Represents a non-IFRS financial measure. For more details, see section N - Non-IFRS Financial Measures in this document.
Second Quarter 2023
Underlying net income of $920 million increased $112 million or 14%, driven by:
•Wealth & asset management down $1 million: Higher investment income driven by volume growth and an increase in yields was largely offset by lower fee-based earnings in MFS, reflecting equity market declines over the past year, as well as higher expenses in Canada.
•Group - Health & Protection up $122 million: Strong performance driven by good premium growth and better disability experience in Canada and the U.S., as well as a full quarter of DentaQuest contributions.
•Individual - Protection up $50 million: Higher premiums reflecting good sales momentum during the past year in Asia, and improved insurance experience in Canada and the U.S.
•Corporate expenses & other $(59) million increased net loss driven by higher operating expenses including incentive compensation and an increase in debt financing costs.
•Higher earnings on surplus reflecting an increase in realized gains and net interest income from higher rates.
Reported net income of $660 million decreased $270 million or 29%, driven by market-related impacts primarily reflecting interest rates and real estate investments, the prior year gain on the sale-leaseback of the Wellesley office in the U.S., and fair value changes in management's ownership of MFS shares; partially offset by the increase in underlying net income.
MANAGEMENT'S DISCUSSION AND ANALYSIS Sun Life Financial Inc. Third Quarter 2023 39
First Quarter 2023
Underlying net income of $895 million increased $175 million or 24%, driven by:
•Wealth & asset management down $11 million: Lower fee-based earnings in MFS, Canada, and Asia, reflecting equity market declines, largely offset by an increase in investment income driven by higher volumes and yields.
•Group - Health & Protection up $180 million: Strong performance including premium growth, improved disability in Canada and the U.S., strong medical stop-loss margins, and improved U.S. mortality. DentaQuest results also contributed to the increase.
•Individual - Protection up $42 million: Higher premiums reflecting good sales momentum during the past year, and improved mortality in Asia.
•Corporate Support & other $(36) million increased net loss: Higher operating expenses including long-term incentive compensation and IFRS 17 project spend, as well as an increase in debt financing costs.
•Higher investment income reflecting an increase in realized gains from surplus assets and net interest income from higher rates.
Reported net income of $806 million increased $141 million or 21%, driven by the increase in underlying net income and gain on the sale of the sponsored markets business in Canada, partially offset by market-related impacts, and DentaQuest integration and SLC Management acquisition-related costs.
Fourth Quarter 2022(1)
Reported net income of $951 million decreased $127 million or 12%, primarily reflecting unfavourable market-related impacts and DentaQuest integration costs, partially offset by the impact of the Canada Tax Rate Change, fair value changes on MFS' share-based payment awards and ACMA. Prior year reported net income included a gain on the initial public offering ("IPO") of our India asset management joint venture partially offset by an increase to SLC Management's acquisition-related liabilities. Underlying net income of $990 million increased $92 million or 10%, driven by business growth and experience in protection and health and contribution from the DentaQuest acquisition. This was partially offset by lower wealth and asset management earnings reflecting declines in global equity markets, and a higher effective tax rate compared to prior year.
Third Quarter 2022(1)
Reported net income of $466 million decreased $553 million or 54% from prior year, primarily reflecting unfavourable market-related impacts, a
$170 million charge related to the sale of Sun Life UK, less favourable ACMA impacts, and an increase in SLC Management's acquisition-related
liabilities, partially offset by fair value changes on MFS' share-based payment awards. Underlying net income of $949 million increased $47 million or 5%, driven by business growth and experience in protection and health including a strong contribution from the DentaQuest acquisition. This was partially offset by lower fee-based income in wealth and asset management, mainly driven by declines in global equity markets.
Second Quarter 2022(1)
Q2'22 reported net income of $785 million decreased $115 million or 13%, reflecting unfavourable market-related impacts and DentaQuest acquisition costs, partially offset by fair value changes on MFS' share-based payment awards and a gain on the sale-leaseback of our Wellesley office in the U.S. Underlying net income of $892 million was up slightly driven by business growth, new business gains, contribution from the DentaQuest acquisition, and lower incentive compensation expenses. This was largely offset by Asset Management results reflecting a decline in global equity markets driving lower average net assets, lower available-for-sale gains and morbidity experience in the U.S. Foreign exchange translation led to an increase of $16 million and $12 million in reported net income and underlying net income, respectively.
First Quarter 2022(1)
Q1'22 reported net income of $858 million decreased $79 million or 8%, driven by less favourable market-related impacts, partially offset by a Q1'21 restructuring charge and lower fair value changes on MFS' share-based payment awards. Underlying net income of $843 million was down slightly, driven by broad-based business growth, favourable expense experience and investment gains, offset by unfavourable mortality and morbidity experience, and lower AFS gains.
Fourth Quarter 2021(1)
Q4'21 reported net income of $1,078 million increased $334 million or 45% compared to the prior year, driven by a $297 million gain on the IPO of our India asset management joint venture and an increase in the value of our real estate investments, partially offset by a $153 million increase in SLC Management's acquisition-related liabilities. Underlying net income of $898 million increased $36 million or 4%, driven by broad-based business growth across our pillars, with particular strength in asset management and wealth. Underlying net income also benefited from a lower effective tax rate in the quarter, largely offset by $113 million of ongoing COVID-19-related mortality and morbidity experience. Foreign exchange translation led to a decline of $33 million in reported net income and $22 million in underlying net income.
|
|
|
|
|
|
| K. Legal and Regulatory Proceedings |
|
Information concerning legal and regulatory matters is provided in our Annual Consolidated Financial Statements, our annual MD&A, and the AIF, in each case for the year ended December 31, 2022, and in our Interim Consolidated Financial Statements for the period ended September 30, 2023.
(1) This paragraph compares the results in two periods that preceded January 1, 2023 (prior to the adoption of IFRS 17 and IFRS 9), thus IFRS 4 and IAS 39 were the accounting standards in effect at the time. Refer to the results in the table above under the heading "IFRS 4 and IAS 39".
40 Sun Life Financial Inc. Third Quarter 2023 MANAGEMENT'S DISCUSSION AND ANALYSIS On January 1, 2023 we adopted IFRS 17 Insurance Contracts and IFRS 9 Financial Instruments, detailed below.
|
|
|
|
|
|
|
|
|
|
|
|
|
|
|
| L. Changes in Accounting Policies |
We have also adopted several amended IFRS standards in the current year, which had no material impact on our Consolidated Financial Statements. For additional information, refer to Note 2 in our Interim Consolidated Financial Statements for the period ended September 30, 2023.
1. Changes in Accounting Policies
We have included in this section a summary of changes in accounting policies.
1.A. Adoption of IFRS 17 Insurance Contracts and IFRS 9 Financial Instruments
In May 2017, the IASB issued IFRS 17 Insurance Contracts ("IFRS 17"), with an amendment issued in June 2020 to defer the effective date of IFRS 17 to annual periods beginning on or after January 1, 2023. This standard is to be applied using a retrospective approach, with at least one year of comparative results provided. If retrospective application to a group of insurance contracts is impracticable, a modified retrospective or fair value approach may be used. IFRS 17 replaces IFRS 4 Insurance Contracts ("IFRS 4") and impacts how we recognize, measure, present, and disclose our insurance contracts in our Consolidated Financial Statements.
IFRS 17 and IFRS 9 Financial Instruments ("IFRS 9") were effective for us beginning January 1, 2023. IFRS 9 includes guidance on the classification and measurement of financial instruments, impairment of financial assets and hedge accounting, and does not require restatement of comparative periods. IFRS 9 replaces IAS 39 Financial Instruments: Recognition and Measurement ("IAS 39"). We are permitted, under IFRS 17, to present comparative information on financial assets as if IFRS 9 were applicable during the comparative period ("classification overlay"). We have elected to apply the classification overlay to our financial assets and their comparative period results as if IFRS 9 had been effective since January 1, 2022. Certain comparative period information will continue to be presented in accordance with our previous accounting policies.
For initial measurement of insurance contracts at the transition date of January 1, 2022, we have elected to use the fair value approach for all groups for which the retrospective approach is impracticable. For more information on the application of the fair value approach at transition, see the heading "Fair Value Measurement" in Note 2.A.i in our Interim Consolidated Financial Statements for the period ended September 30, 2023.
IFRS 17 establishes principles for the recognition, measurement, presentation, and disclosure of insurance contracts. The key principles of IFRS 17 are as follows:
•Insurance contracts are those under which an entity accepts significant insurance risk from another party ("policyholder") by agreeing to compensate the policyholder if a specified uncertain future event ("insured event") adversely affects the policyholder.
•Insurance contracts issued and reinsurance contracts held are divided into groups that will be separately recognized and measured.
•Groups of insurance contracts are recognized and measured as the total of the following measurement components: a) the present value of future cash flows; b) a risk adjustment for non-financial risk ("RA"); and c) the Contractual Service Margin ("CSM"), an amount that represents the unearned profit of the group of contracts. These measurement components apply to groups of insurance contracts measured using the general measurement approach ("GMA") and the variable fee approach ("VFA"). The VFA applies to insurance contracts issued with direct participation features, which are substantially investment-related service contracts under which the policyholder is promised an investment return based on underlying items, such as segregated funds and certain participating insurance contracts. For short duration contracts, such as most of our group life and health business, a simplified measurement approach (the premium allocation approach ("PAA") is applied. Under the PAA, insurance contracts are measured based on unearned profits and do not include a CSM.
•The profit from a group of insurance contracts is recognized into income over the period that insurance contract services are provided and as the non-financial risks related to providing the insurance contracts diminish.
•Insurance revenue, insurance service expenses and insurance finance income or expenses are presented separately.
Significant Differences between IFRS 17 and IFRS 4
The following section describes the most significant differences between IFRS 17 and the accounting policies applied under IFRS 4.
Scope
There is no substantial change in IFRS 17 compared to IFRS 4 with regards to which contracts fall within the scope of the standard. However, we have updated the accounting policy for classification that was adopted on the transition to IFRS 4 in 2011 to ensure consistency with the IFRS 17 definition of insurance contracts.
Under IFRS 17, an insurance contract is defined as a contract under which the issuer accepts significant insurance risk from the policyholder by agreeing to compensate the policyholder if an insured event adversely affects the policyholder. In assessing whether "significant" insurance risk exists, certain contracts that were classified as insurance contracts under IFRS 4 were reclassified as investment contracts under IFRS 17. Such changes in classification were limited to certain deferred annuity products where the insurance risk is limited to the right to annuitize the maturity benefit, which fell short of the threshold for "significant" insurance risk.
Furthermore, IFRS 17 includes new requirements for the separation of distinct investment components and distinct goods or non-insurance service components of insurance contracts. At transition to IFRS 17, there were no distinct investment components and only immaterial distinct service components in our insurance contracts.
Unlike IFRS 4, IFRS 17 requires reinsurance contracts held to be measured separately from the underlying direct contracts. A reinsurance contract is an insurance contract issued by the reinsurer to compensate another entity for claims arising from one or more insurance contracts issued by that other entity ("underlying contracts").
MANAGEMENT'S DISCUSSION AND ANALYSIS Sun Life Financial Inc. Third Quarter 2023 41
Only contracts that transfer insurance risk to the reinsurer are considered reinsurance contracts held from the ceding entity’s point of view. We have reinsurance treaties that transfer only non-insurance risks to the reinsurer, however these are not considered reinsurance contracts held in scope of IFRS 17, nor were they in scope of IFRS 4. Rather, they are insurance contracts purchased.
Reinsurance treaties that are part of the underlying items of participating insurance contracts (i.e., where all the cash flows of the reinsurance treaty are fully passed through to the participating insurance policyholders) are measured and reported separately.
Investment contracts with discretionary participation features ("DPF") are in scope of IFRS 17 and were in scope of IFRS 4. However, such contracts were reported with other investment contracts under IFRS 4, and are reported with insurance contracts under IFRS 17.
Measurement
The measurement of insurance contracts under IFRS 17 differs from the Canadian Asset Liability Method previously applied under IFRS 4. The most significant differences by measurement component are as follows:
Present value of future cash flows:
•The discount rates used to present value future cash flows under IFRS 17 are based on the characteristics of the insurance contracts. Under IFRS 4, the Canadian Asset Liability Method is used to determine actuarial liabilities based on the portfolio of assets currently supporting the insurance contract liabilities and reinvestment assumptions.
•Estimates under IFRS 17 include the current market view of the cost of financial guarantees, which requires a valuation consistent with market option prices. Under IFRS 4, the cost of financial guarantees is based on the amount required to fulfill the obligation but not directly linked to market option prices.
•Expense cash flows under IFRS 17 are limited to those directly attributable to fulfillment of the obligations under insurance contracts.
•Future income taxes are excluded from future cash flows under IFRS 17.
Risk adjustment for non-financial risk:
•Measures the compensation required for uncertainty related to non-financial risk, such as mortality, morbidity, surrender and expenses under IFRS 17.
•Provisions for uncertainty related to financial risk are implicitly included in the present value of future cash flows under IFRS 17.
•No amount is provided for asset-liability mismatch risk under IFRS 17.
•Under IFRS 4, amounts provided for the risks listed above are reflected in a provision for adverse deviations included in insurance contract liabilities.
CSM:
•This is a new component of liabilities and necessitates the "grouping" of insurance contracts, which is not required under IFRS 4.
•The CSM represents unearned profits, as discussed above.
The measurement approaches under IFRS 17 and IFRS 4 are similar for insurance contracts measured using the PAA, such as our group life and health contracts. Differences arise mainly in the measurement of the liability for incurred claims ("LIC"), where the discount rate and risk adjustment for non-financial risk changes noted above apply.
Presentation
IFRS 17 requires that portfolios of insurance contracts that are in an asset position be presented separately from portfolios of insurance contracts that are in a liability position in the Consolidated Statements of Financial Position. Also, portfolios of insurance contracts issued must be presented separately from portfolios of reinsurance contracts held. Previously, insurance contracts issued were presented only as liabilities and reinsurance contracts held were presented only as assets. Certain balances, such as policy loans and outstanding and prepaid premiums, that were previously presented separately or included in Other assets and Other liabilities are now included in the assets or liabilities for insurance contracts issued or reinsurance contracts held.
The presentation of income from insurance contracts on the Consolidated Statements of Operations has changed significantly for IFRS 17. Prior to IFRS 17, insurance related income was presented separately in the lines Gross premiums, Ceded premiums, Gross claims and benefits paid, Reinsurance expenses (recoveries), Increase (decrease) in insurance contract liabilities, and Decrease (increase) in reinsurance assets. The line Operating expenses, commissions and premium taxes included all expenses, reflecting those from both insurance and non-insurance contracts.
Under IFRS 17, insurance-related income is presented in the Insurance service result section and the Insurance finance income (expenses) line in the Investment result section. Amounts are presented separately for insurance contracts issued and reinsurance contracts held. The Insurance service expenses line includes amounts previously reported as Gross claims and benefits paid, with the exclusion of repayments of investment components, which are amounts that are returned to policyholders under all circumstances. Directly attributable expenses are also presented as Insurance service expenses. Income or expense from reinsurance contracts held is now presented as one line, which includes an allocation of reinsurance premiums paid and amounts recovered from reinsurers.
For insurance contracts measured using the GMA or VFA, premiums are no longer reported as revenue or recognized in income when received. Insurance revenue in a reporting period is comprised of the portion of premiums that cover expected claims and directly attributable expenses in the period, as well as the release of RA and the amortization of CSM for the period. Insurance revenue excludes the portion of premiums that cover repayment of investment components.
Fee income excludes income from insurance contracts as any fees earned would be recognized in Insurance contract revenue. Similarly, the Operating expenses and commissions line excludes expenses that are directly attributable to issuing or fulfilling insurance contracts as these expenses, as well as premium taxes paid, are included in the Insurance service result section.
42 Sun Life Financial Inc.
Revised accounting policies on adoption of IFRS 17
Third Quarter 2023 MANAGEMENT'S DISCUSSION AND ANALYSIS For more information about the revised accounting policies as a result of the adoption of IFRS 17 that differ from those included in our 2022 Annual Consolidated Financial Statements, refer to the heading "Revised Accounting Policies" in Note 2.A.i of our Interim Consolidated Financial Statements for the period ended September 30, 2023.
Impacts on our financial performance
We have highlighted in the following section certain impacts on our financial performance as a result of the differences between IFRS 17 and IFRS 4 described above:
•New business gains (unearned profits) are measured differently under IFRS 17, reflecting measurement differences on insurance contracts as discussed above. In addition, new business gains under IFRS 17 are deferred and recorded in the CSM and amortized into income as insurance contract services are provided. Losses on new business are also measured differently, but continue to be recognized in income immediately. Under IFRS 4, new business gains and losses were both recognized in income immediately.
•Discount rates used in calculating the present value of insurance contract liabilities are based on the characteristics of the insurance contracts rather than the assets supporting the liabilities. Amongst other differences, this results in changes in the timing of when investment-related income emerges.
•Under IFRS 17, changes related to financial risk (e.g. changes in the discount rate) continue to be recognized in income immediately, except for insurance contracts measured using the VFA, where the changes are recorded through the CSM. Assumption changes for non-financial risk, such as mortality, are reflected in the CSM and amortized into income as insurance contract services are provided. Under IFRS 4, assumption changes for both financial and non-financial risk variables were recognized in income immediately.
Significant Differences between IFRS 9 and IAS 39
The following section describes the most significant differences between IFRS 9 and the accounting policies applied under IAS 39.
Classification of financial assets and financial liabilities
IFRS 9 introduces three principal classification categories for financial assets. Financial assets are measured at initial recognition at fair value, and are classified as and subsequently measured at fair value through profit or loss ("FVTPL"), FVOCI or amortized cost based on our business model for managing the financial asset and the contractual cash flow characteristics of the asset.
IFRS 9 eliminates the previous IAS 39 categories of held-to-maturity ("HTM"), available-for-sale ("AFS"), and loans and receivable financial assets. Under IFRS 9, derivatives embedded in contracts where the host is a financial asset in scope of IFRS 9 are not separated. Instead, the hybrid financial instrument, as a whole, is assessed for classification.
IFRS 9 maintains the IAS 39 classification for financial liabilities. Under IFRS 9, financial liabilities are measured at either amortized cost or FVTPL.
Under IFRS 17, we elected to recognize all insurance finance income or expense in income rather than other comprehensive income. Consequently, to avoid an accounting mismatch, we are electing under IFRS 9 to classify most of our fixed income assets supporting insurance contracts as FVTPL.
Impairment of financial assets
IFRS 9 replaces the "incurred loss" model under IAS 39 with a forward-looking "expected credit loss" ("ECL") model. The new impairment model applies to financial assets measured at amortized cost, debt securities measured at FVOCI, mortgages and loans measured at FVOCI, lease receivables, account receivables, loan commitments and financial guarantees not measured at FVTPL. Credit losses are recognized earlier under IFRS 9 as compared previously under IAS 39. IFRS 9 introduces an impairment model for financial assets not measured at FVTPL. The model requires the recognition of an allowance for 12-month expected losses at the initial recognition of a financial asset, and the recognition of an allowance for lifetime expected losses if certain criteria are met.
Hedge accounting
IFRS 9 introduced a new hedge accounting model, but permits entities to continue applying hedge accounting requirements under IAS 39 instead of those under IFRS 9. We have elected to continue applying the hedge accounting requirements under IAS 39.
Revised accounting policies on adoption of IFRS 9
For more information about the revised accounting policies as a result of the adoption of IFRS 9 that differ from those included in our 2022 Annual Consolidated Financial Statements, refer to the heading "Policies applicable beginning January 1, 2023 (IFRS 9)" in Note 2.A.ii of our Interim Consolidated Financial Statements for the period ended September 30, 2023.
2. Critical Accounting Policies and Estimates
Our significant accounting and actuarial policies are described in Notes 2 and 6 of our Interim Consolidated Financial Statements for the period ended September 30, 2023. Management must make judgments involving assumptions and estimates, some of which may relate to matters that are inherently uncertain, under these policies. The estimates described below are considered particularly significant to understanding our financial performance. As part of our financial control and reporting, judgments involving assumptions and estimates are reviewed by the independent auditor and by other independent advisors on a periodic basis. Accounting policies requiring estimates are applied consistently in the determination of our financial results.
IFRS 17 and IFRS 9 require enhanced disclosures for insurance contracts and financial instruments. These disclosures are included primarily in Notes 5, 6, 7 and 12 of our Interim Consolidated Financial Statements for the period ended September 30, 2023. Certain disclosures in Note 2.B of the
MANAGEMENT'S DISCUSSION AND ANALYSIS Sun Life Financial Inc. Third Quarter 2023 43
Interim Consolidated Financial Statements as well as the disclosures in this section of the interim MD&A provide additional context during the first year of adoption of IFRS 17 and IFRS 9. The majority of these disclosures would otherwise only be reported by us annually.
2.A Insurance Contracts Summary and Methods and Assumptions
Summary
We sell a variety of insurance contracts that include many forms of life, health and critical illness insurance sold to individuals and groups, annuities, and segregated fund products with guarantees. We hold reinsurance contracts that transfer mortality and other risks following internal guidelines.
Insurance contracts with direct participation features are products where investments are managed on behalf of policyholders, and investment returns less a variable fee are passed through to policyholders with the insurance benefits they receive. Insurance contracts with direct participation features are measured using the VFA, and include segregated funds, unit-linked contracts, variable universal life contracts, and most participating insurance contracts. Reinsurance contracts (both issued and held) cannot be measured using the VFA.
Insurance contracts without direct participation features are eligible to use the PAA if the coverage period is one year or less, or if the result of applying the PAA is not expected to be a materially different result than applying the GMA in each reporting period over the life of the contract. Insurance contracts eligible to use the PAA include most group life and health contracts and the associated reinsurance contracts held.
Other insurance contracts are measured using the GMA. This includes most individual life and health insurance contracts and annuities and the associated reinsurance contracts held.
The Consolidated Statements of Financial Position present insurance contracts issued and reinsurance contracts held as both assets and liabilities, depending on whether the portfolio is in an asset or liability position.
For more information about insurance contracts issued and reinsurance contracts held, and Insurance contract liabilities for account of segregated fund holders, see Note 2, Note 7 and Note 11 of our Interim Consolidated Financial Statements for the period ended September 30, 2023.
Methods and Assumptions
General
A group of insurance contracts is measured as the total of FCF, which is the present value of future cash flows plus the risk adjustment for
non-financial risk, and, for groups measured using the GMA or VFA, the CSM. In measuring the present value of future cash flows, assumptions must be made about mortality and morbidity rates, lapse and other policyholder behaviour ("policyholder behaviour"), expenses and other factors over the life of our products, and the prevailing market view of the cost of financial risk in our products. Many of these assumptions relate to events that are anticipated to occur many years in the future. Assumptions require significant judgment and regular review and, where appropriate, revision.
The RA is the compensation we require for the uncertainty related to non-financial risk in the estimates of future cash flows. This compensation is measured by discounting cash flows from applying margins to the non-financial assumptions used in the estimate of future cash flows.
The CSM represents the unearned profit that will be recognized as insurance contract services are provided.
The methods and assumptions used in the measurement of insurance contracts are reviewed regularly and are subject to external actuarial peer review.
Present Value of Future Cash Flows
Assumptions for non-financial risk variables in the present value of future cash flows are intended to be current, neutral estimates of the expected outcome. The choice of assumptions takes into account current circumstances, past experience data from our own experience or from the industry, the relationship of past to expected future experience, anti-selection, the relationship among assumptions (including those for financial risk variables), and other relevant factors.
Assumptions for financial risk variables in the present value of future cash flows are based on current observable market prices, adjusted to account for differences between the financial risk embedded in our products and those in the corresponding observed market instrument. Where no relevant market instrument is available, we use the best information available.
Mortality
Mortality refers to the rates at which death occurs for defined groups of people. Mortality assumptions are generally based on the past five to ten years of experience. Our experience is combined with industry experience or experience from reinsurers where our own experience is insufficient to be statistically valid. Assumed mortality rates for life insurance and annuity contracts include assumptions about future mortality improvement based on recent trends in population mortality and our outlook for future trends.
Morbidity
Morbidity refers to the rate of being unhealthy or disabled and the rates of recovery therefrom. Most of our disability insurance is marketed on a group basis. We offer critical illness policies on an individual basis in Canada and Asia, long-term care on an individual basis in Canada, and medical stop-loss insurance is offered on a group basis in the U.S. In Canada, group morbidity assumptions are based on our five-year average experience, modified to reflect any emerging trend in recovery rates. For Canadian long-term care and critical illness insurance in Canada and Asia, assumptions are developed in collaboration with our reinsurers and are largely based on their experience. In the U.S., our experience is used for both medical stop-loss and disability assumptions, with some consideration of industry or reinsurer experience.
44 Sun Life Financial Inc. Third Quarter 2023 MANAGEMENT'S DISCUSSION AND ANALYSIS
Policyholder Behaviour
Lapse or surrender
Policyholders may allow their policies to lapse prior to the end of the contractual coverage period by choosing not to continue to pay premiums or by surrendering their policy for the cash surrender value. Assumptions for lapse or surrender experience on life insurance are generally based on our five-year average experience. Lapse or surrender rates vary by plan, age at issue, method of premium payment, policy duration and financial risk variables.
Premium payment patterns
For universal life contracts, it is necessary to set assumptions about premium payment patterns. Studies prepared by industry or the actuarial profession are used for products where our experience is insufficient to be statistically valid. Premium payment patterns usually vary by plan, age at issue, method of premium payment, policy duration and financial risk variables.
Expense
Future expenses directly attributable to the fulfilment of our insurance contracts include the costs of premium collection, claims adjudication and processing, actuarial calculations, preparation and mailing of policy statements, and related overhead. Future expense assumptions are mainly based on our recent experience using an internal expense allocation methodology. Inflationary increases assumed in future expenses are based on long-term expectations.
Acquisition expenses directly attributable to portfolios of insurance contracts include the costs of selling, underwriting and issuing insurance contracts. For new insurance contracts measured using the GMA or VFA, actual or estimated directly attributable acquisition expenses are recognized in the initial measurement of the contract. If estimates are used, the difference between estimated and actual acquisition expenses adjusts the CSM when the group of insurance contracts is closed to new contracts.
Current Discount Rates
Current discount rates are used to discount estimates of future cash flows in determining the present value of future cash flows. Current discount rates reflect the time value of money, the characteristics of the cash flows, and the liquidity characteristics of the insurance contracts.
Current discount rates for cash flows that do not vary based on returns on underlying items
Cash flows that do not vary at all based on the returns on any underlying items are discounted at rates that reflect the timing and currency of cash flows and the liquidity characteristics of the insurance contracts.
The timing of cash flows is reflected by constructing a discount curve, so that each cash flow is discounted consistent with the timing of the cash flow. In constructing the discount curve, a portion is based on market information (the observable period) and beyond that period, the discount rates are estimated (the unobservable period). The observable period, which varies by currency, is the time period where information on risk-free interest rates is deep and liquid. In the unobservable period, risk-free rates are interpolated between the last observable point and an ultimate risk-free rate at year 70. The ultimate risk-free rate is estimated using historical averages.
The currency of cash flows is reflected by using different discount curves for different currencies.
Liquidity is reflected by adding a liquidity premium to risk-free discount rates that is consistent with the liquidity characteristics of the insurance contracts. The liquidity premium in the observable period is based on the liquidity premium on assets with similar liquidity characteristics, which is estimated from the spread inherent in current market yields less a deduction for expected and unexpected credit losses. The deduction for expected and unexpected credit losses is estimated using historical rating agency data and current market conditions, and varies by asset type, quality, and duration. The liquidity premium in the unobservable period is interpolated between the last observable liquidity premium and an ultimate liquidity premium (at year 70) specific to liquid or illiquid contracts. See Note 7.A in our Interim Consolidated Financial Statements for further details, which provides a weighted average summary of the discount curves used to present value cash flows for all major products that do not vary based on the returns on underlying items.
Current discount rates for cash flows that vary with returns on underlying items
Discount rates for cash flows that vary directly with returns on underlying items reflect that variability. For the portion of cash flows that is a pass through of returns on underlying items to policyholders, the discount rate is such that the present value of cash flows equals the portion of the underlying items that is passed through to policyholders. For cash flows that vary, but not directly, with underlying items (e.g., financial guarantees), scenario testing may be necessary. If so, discount rates used in the scenario projections are scenario-specific and based on the projected risk-free rates in the scenario plus liquidity premiums consistent with the liquidity characteristics of the contracts being measured.
Scenario Testing
Scenario testing may be required when the relationship between cash flows and financial risk variables is non-linear, or where there are complex interdependencies among cash flows. In scenario testing of financial risk variables, future cash flows are projected for each scenario path and discounted at the scenario-specific discount rates, resulting in a present value of future cash flows for each scenario. The provision for the projected cash flows is the average of the scenario-specific values. Assumptions for non-financial risk variables are the best estimate assumptions consistent with the scenario.
Scenarios are consistent with the current market environment. Our Economic Scenario Generator calibration process produces integrated stochastic scenarios of financial risk variables (e.g., risk-free interest rates, bond fund returns, equity returns) with parameters calibrated to replicate observable market prices of financial instruments available in the market. Adjustments are made when the insurance contracts being measured are illiquid but the financial instruments to which the scenarios are calibrated to are liquid.
MANAGEMENT'S DISCUSSION AND ANALYSIS Sun Life Financial Inc. Third Quarter 2023 45
Risk Adjustment for Non-Financial Risk
The RA for insurance contracts issued is the compensation we require for bearing uncertainty about the amount and timing of the cash flows that arises from non-financial risk. This amount is measured as the present value of the difference between estimated future cash flows with a margin applied to non-financial assumptions and estimated future cash flows without this adjustment. Margins generally range from 5% to 20% depending on the uncertainty in the determination of the assumption. The level of uncertainty, and hence the margin chosen, varies by assumption and by line of business and other factors. Considerations that would generally lead to a choice of margin at the higher end of the range are as follows:
•The statistical credibility of our experience is too low to be the primary source of data for choosing the assumption;
•Future experience is difficult to estimate;
•The cohort of risks lacks homogeneity;
•Operational risks adversely impact the ability to estimate the assumption; or
•Past experience may not be representative of future experience and the experience may deteriorate.
Margins are generally stable over time and are revised only to reflect changes in the level of uncertainty in the assumptions. Our margins tend to be at mid-range.
The RA for reinsurance contracts held represents the amount of risk transferred to the reinsurer. This is measured as the difference between the RA on the underlying insurance contracts without reinsurance and what the RA on the underlying insurance contracts would be with reinsurance. The RA for reinsurance contracts held increases the asset or reduces the liability for reinsurance contracts held.
The RA for insurance contracts issued and reinsurance contracts held corresponds to a confidence level of approximately 80-85% overall.
Contractual Service Margin
The initial and subsequent measurement of CSM is described in 2.A.i. in our Interim Consolidated Financial Statements. Additional detail about certain components of the measurement of CSM is provided below.
Interest accretion
For insurance contracts measured using the GMA, locked-in discount rates are used to accrete interest on the CSM. The locked-in discount rate for a group of insurance contracts is the weighted average of the current discount rates at initial recognition of the contracts in the group. For groups of contracts that are in-force as at transition (January 1, 2022), the locked-in discount rates are the discount rates in effect at the date of transition as the fair value approach was applied for these groups at transition.
For insurance contracts measured using the VFA, there is no accretion of interest. Rather, the CSM is adjusted by the change in our share of the fair value of underlying items.
Changes in FCF relating to future service
For insurance contracts measured using the GMA, locked-in discount rates are used to measure changes in FCF relating to future service. Changes in FCF relating to future service reflect changes in non-financial assumptions but not changes in assumptions related to financial risk.
For insurance contracts measured using the VFA, current discount rates are used to measure the change in FCF relating to future service. Changes in FCF relating to future service reflect both changes in non-financial assumptions and changes in assumptions related to financial risk.
Changes in FCF relating to future service include (Liability for Remaining Coverage only):
•All changes related to investment component payments (including current period payments);
•Changes arising from changes in assumptions used to derive the present value of future cash flows - limited to non-financial assumptions for insurance contracts measured using the GMA;
•Changes in future cash flows arising from claims in the current period; and
•For insurance contracts measured using the GMA, changes related to discretionary cash flows on some universal life and adjustable products. Discretionary cash flows are cash flows outside the guaranteed payments to the policyholder, and are described as a spread on earned rates (in the case of some universal life contracts) and in the policy on criteria for changes to adjustable policies for adjustable policies.
CSM recognized for services provided
The amount of CSM recognized as insurance revenue in each period to reflect the insurance contract services provided for a group of contracts in the period is determined by:
•Identifying the total coverage units in the group (for services in current and future periods) – based on the quantity of insurance contract services;
•Allocating the CSM at the end of the period equally to each coverage unit in the current period and expected to be provided in the future (i.e., coverage units "unitize" the services provided); then
•Recognizing in insurance revenue the amount allocated to coverage units provided in the period.
Total coverage units for services expected to be provided in future periods is the present value of projected coverage units. The present value is measured using locked-in discount rates for groups measured using the GMA and current discount rates for groups measured using the VFA.
The coverage unit for a group is based on the nature of the insurance contract services provided. Insurance contract services comprise services for providing insurance coverage and, for some contracts, investment-return or investment-related services. It does not include services related to performing functions such as claims adjudication.
46 Sun Life Financial Inc. Third Quarter 2023 MANAGEMENT'S DISCUSSION AND ANALYSIS For reinsurance contracts held, the amount of CSM recognized reflects the services received in the period.
For insurance contracts measured using the VFA, coverage units are based on the policyholder's account value or the policyholders' share of the fair value of underlying items. For insurance contracts measured using the GMA, coverage units are based on the expected claim amount (excluding any investment component) for life and health insurance contracts, and the payment due in a period for annuity contracts.
Sensitivities to Insurance Methods and Assumptions
In addition to the insurance risks factors and risk management governance and controls described in section J - Risk Management in the 2022 Annual MD&A and the Risk Factors section of the 2022 AIF, we also note that on adoption of IFRS 17 and 9, the tables below include sensitivities of contractual service margins to insurance and other non-financial assumption risks.
The following table sets out the estimated immediate impact on, or sensitivity of, the CSM and net income to certain instantaneous changes in the insurance and other non-financial assumptions used in the calculation of our insurance contract liabilities, based on a starting point and business mix as at December 31, 2022. These estimates are illustrative and different starting points for best estimate assumptions, CSM balances and business mix will result in different estimated sensitivities. These sensitivities represent the Company's estimate of changes in best estimate assumptions that are reasonably likely based on the Company's and/or the industry's historical experience and industry standards and best practices as at December 31, 2022.
The impact on CSM is attributable to insurance contracts measured under the GMA and VFA. For insurance contracts measured under the GMA, the impact flows through the CSM at locked-in discount rates. For insurance contracts measured under the VFA, the impact flows through the CSM at current discount rates.
The impact on net income is attributable to any portion of the sensitivities for insurance contracts measured under the GMA and VFA that cannot be absorbed by CSM, the full impact for insurance contracts measured under the PAA, and the difference in impact between locked-in and current discount rates for insurance contracts measured under the GMA. If current discount rates are higher than locked-in rates, this generally results in a favourable impact to net income from contracts measured under the GMA.
|
|
|
|
|
|
|
|
|
|
|
| ($ millions) |
|
As at December 31, 2022 |
Sensitivity(1) |
|
|
Potential impact on
CSM (pre-tax) |
Potential impact on
net income (after-tax) |
| Policyholder Behaviour (10% increase/decrease, where adverse) |
|
|
(850) |
75 |
| Life Mortality rates (2% increase) |
|
|
(75) |
(25) |
| Annuity Mortality rates (2% decrease) |
|
|
(175) |
25 |
| Morbidity rates (5% incidence increase and 5% termination decrease) |
|
|
(75) |
(175) |
| Expenses (5% increase) |
|
|
(175) |
— |
(1) Sensitivities to insurance assumptions refer to insurance contracts issued net of reinsurance contracts held. Net income and CSM sensitivities have been rounded in increments of $25 million.
|
|
|
|
|
|
|
|
|
|
|
|
|
|
|
| M. Internal Control Over Financial Reporting |
Management is responsible for establishing and maintaining adequate internal control over financial reporting to provide reasonable assurance regarding the reliability of the Company's financial reporting and the preparation of its financial statements in accordance with IFRS.
During fiscal 2022, we continuously assessed the impact of internal controls over financial reporting and modified certain internal controls over financial reporting to reflect key changes in the Company's financial reporting and the preparation of its financial statements in the 2022 comparative reporting periods as a result of IFRS 17 and IFRS 9 implementations.
To manage our transition to IFRS 17 and IFRS 9, we established a comprehensive enterprise-wide governance structure to monitor the risks arising from changes to the financial reporting processes and controls related to finance, actuarial, asset and liability management, investments, and financial reporting-related system implementation. Throughout the transition, we have provided regular updates to senior management and the Audit Committee to ensure escalation of key issues and risks.
We believe there are no changes in the Company's internal control over financial reporting as a result of the adoption of new accounting standards during the period ended September 30, 2023 that have materially affected, or are reasonably likely to materially affect, the Company's internal control over financial reporting.
MANAGEMENT'S DISCUSSION AND ANALYSIS Sun Life Financial Inc. Third Quarter 2023 47
|
|
|
|
|
|
| N. Non-IFRS Financial Measures |
|
1. Common Shareholders' View of Reported Net Income
The following table provides the reconciliation of the Drivers of Earnings ("DOE") analysis to the Statement of Operations total net income. The DOE analysis provides additional detail on the sources of earnings, primarily for protection and health businesses, and explains the actual results compared to the longer term expectations. The underlying DOE and reported DOE are both presented on a common shareholders' basis by removing the allocations to participating policyholders.
|
|
|
|
|
|
|
|
|
|
|
|
|
|
|
|
|
|
|
|
|
| ($ millions) |
Q3'23 |
| Statement of Operations |
Underlying DOE(1) |
Non-underlying adjustments(1) |
Common Shareholders' Reported DOE(2)(3) |
Adjustment for: |
Reported
(per IFRS) |
Par(2) |
Net(3) |
| Net insurance service result |
740 |
— |
740 |
30 |
(58) |
712 |
| Net investment result |
416 |
108 |
524 |
21 |
158 |
703 |
ACMA(3) |
|
41 |
41 |
— |
(41) |
|
| Fee income: |
|
|
|
|
|
|
| Asset Management |
437 |
(92) |
345 |
|
(345) |
|
| Other fee income |
39 |
5 |
|
44 |
(3) |
1,889 |
1,930 |
| Fee income |
|
|
|
|
|
1,930 |
| Other expenses |
(486) |
(78) |
(564) |
— |
(1,600) |
(2,164) |
| Income before taxes |
1,146 |
(16) |
1,130 |
48 |
3 |
1,181 |
| Income tax (expense) benefit |
(182) |
(51) |
(233) |
(11) |
— |
(244) |
| Total net income |
964 |
(67) |
897 |
37 |
3 |
937 |
Allocated to Participating and NCI(4) |
(15) |
8 |
(7) |
(37) |
(3) |
(47) |
Dividends and Distributions(5) |
(19) |
— |
(19) |
— |
— |
(19) |
Underlying net income(1) |
930 |
|
|
|
|
|
| Reported net income - Common shareholders |
|
(59) |
871 |
— |
— |
871 |
|
|
|
|
|
|
|
|
|
|
|
|
|
|
|
|
|
|
|
|
|
| ($ millions) |
Q2'23 |
| Statement of Operations |
Underlying DOE(1) |
Non-underlying adjustments(1) |
Common Shareholders' Reported DOE(2)(3) |
Adjustment for: |
Reported
(per IFRS) |
Par(2) |
Net(3) |
| Net insurance service result |
794 |
|
(29) |
765 |
|
27 |
|
(17) |
775 |
|
| Net investment result |
430 |
|
(283) |
147 |
|
36 |
|
71 |
|
254 |
|
ACMA(3) |
|
11 |
|
11 |
|
— |
|
(11) |
|
|
| Fee income: |
|
|
|
|
|
|
| Asset Management |
403 |
|
(76) |
327 |
|
|
(327) |
|
| Other fee income |
47 |
|
4 |
|
51 |
|
(4) |
1,889 |
|
1,936 |
|
| Fee income |
|
|
|
|
|
1,936 |
|
| Other expenses |
(483) |
(10) |
(493) |
— |
|
(1,605) |
(2,098) |
| Income before taxes |
1,191 |
|
(383) |
808 |
|
59 |
|
— |
|
867 |
|
| Income tax (expense) benefit |
(235) |
116 |
|
(119) |
(8) |
— |
(127) |
| Total net income |
956 |
|
(267) |
689 |
|
51 |
|
— |
|
740 |
|
Allocated to Participating and NCI(4) |
(16) |
7 |
|
(9) |
(51) |
— |
(60) |
Dividends and Distributions(5) |
(20) |
— |
|
(20) |
— |
|
— |
|
(20) |
Underlying net income(1) |
920 |
|
|
|
|
|
|
| Reported net income - Common shareholders |
|
(260) |
660 |
|
— |
|
— |
|
660 |
|
(1)For a breakdown of non-underlying adjustments made to arrive at underlying net income as well as the underlying DOE analysis, see the heading "Underlying Net Income and Underlying EPS" below.
(2)Removes the components attributable to the participating policyholders.
(3)Certain amounts within the Drivers of Earnings are presented on a net basis to reflect how management views the business, compared to a gross basis in the Consolidated Financial Statements. For more details, refer to "Drivers of Earnings" in section 3 - Additional Non-IFRS Financial Measures below. For example, in this document, the reported net income impact of ACMA is shown in aggregate for Net insurance service result and Net investment result, and excludes amounts attributable to participating policyholders. In contrast, Note 7.B.iv of the Consolidated Financial Statements for the period ended September 30, 2023 shows the net income impacts of method and assumption changes separately in Net insurance service result and Net investment result, and includes amounts attributable to participating policyholders.
(4)Allocated to equity in the participating account and attributable to non-controlling interests.
(5)Dividends on preferred shares and distributions on other equity instruments.
48 Sun Life Financial Inc. Third Quarter 2023 MANAGEMENT'S DISCUSSION AND ANALYSIS
|
|
|
|
|
|
|
|
|
|
|
|
|
|
|
|
|
|
|
|
|
| ($ millions) |
Q3'22 |
| Statement of Operations |
Underlying DOE(1) |
Non-underlying adjustments(1) |
Common Shareholders' Reported DOE(2)(3) |
Adjustment for: |
Reported
(per IFRS) |
Par(2) |
Net(3) |
| Net insurance service result |
685 |
|
(61) |
624 |
— |
|
(33) |
591 |
| Net investment result |
357 |
|
(402) |
(45) |
(2) |
(92) |
(139) |
ACMA(3) |
|
(153) |
(153) |
— |
|
153 |
|
|
| Fee income: |
|
|
|
|
|
|
|
|
|
|
|
|
|
| Asset Management |
407 |
|
(96) |
311 |
|
(311) |
|
| Other fee income |
90 |
|
— |
|
90 |
|
— |
|
1,718 |
|
1,808 |
|
| Fee income |
|
|
|
|
|
1,808 |
|
| Other expenses |
(365) |
(230) |
(595) |
— |
|
(1,435) |
(2,030) |
| Income before taxes |
1,174 |
|
(942) |
232 |
|
(2) |
— |
|
230 |
|
| Income tax (expense) benefit |
(193) |
100 |
|
(93) |
17 |
|
(1) |
(77) |
| Total net income |
981 |
|
(842) |
139 |
|
15 |
|
(1) |
153 |
|
Allocated to Participating and NCI(4) |
(13) |
4 |
|
(9) |
(15) |
— |
(24) |
Dividends and Distributions(5) |
(19) |
— |
|
(19) |
— |
|
1 |
|
(18) |
Underlying net income(1) |
949 |
|
|
|
|
|
|
| Reported net income - Common shareholders |
|
(838) |
111 |
|
— |
|
— |
|
111 |
|
Refer to the footnotes on the previous page.
|
|
|
|
|
|
|
|
|
|
|
|
|
|
|
|
|
|
|
|
|
|
Year-to-date |
| ($ millions) |
2023 |
| Statement of Operations |
Underlying DOE(1) |
Non-underlying adjustments(1) |
Common Shareholders' Reported DOE(2)(3) |
Adjustment for: |
Reported
(per IFRS) |
Par(2) |
Net(3) |
| Net insurance service result |
2,210 |
|
(29) |
2,181 |
|
88 |
|
(94) |
2,175 |
|
| Net investment result |
1,283 |
|
(267) |
1,016 |
|
69 |
|
293 |
1,378 |
|
ACMA(3) |
|
47 |
|
47 |
|
— |
|
(47) |
|
| Fee Income: |
|
|
|
|
|
|
| Asset Management |
1,217 |
|
(213) |
1,004 |
|
|
(1,004) |
|
| Other fee income |
155 |
|
9 |
|
164 |
|
(10) |
5,613 |
|
5,767 |
|
| Fee income |
|
|
|
|
|
5,767 |
|
| Other expenses |
(1,413) |
(75) |
|
(1,488) |
— |
|
(4,689) |
(6,177) |
| Income before taxes |
3,452 |
|
(528) |
2,924 |
|
147 |
|
72 |
|
3,143 |
|
| Income tax (expense) benefit |
(608) |
90 |
|
(518) |
(26) |
(4) |
(548) |
| Total net income |
2,844 |
|
(438) |
2,406 |
|
121 |
|
68 |
|
2,595 |
|
Allocated to Participating and NCI(4) |
(40) |
30 |
|
(10) |
(121) |
(68) |
(199) |
Dividends and Distributions(5) |
(59) |
— |
|
(59) |
— |
|
— |
|
(59) |
Underlying net income(1) |
2,745 |
|
|
|
|
|
|
| Reported net income - Common shareholders |
|
(408) |
2,337 |
|
— |
|
— |
|
2,337 |
|
Refer to the footnotes on the previous page.
MANAGEMENT'S DISCUSSION AND ANALYSIS Sun Life Financial Inc. Third Quarter 2023 49
|
|
|
|
|
|
|
|
|
|
|
|
|
|
|
|
|
|
|
|
|
|
Year-to-date |
| ($ millions) |
2022 |
| Statement of Operations |
Underlying DOE(1) |
Non-underlying adjustments(1) |
Common Shareholders' Reported DOE(2)(3) |
Adjustment for: |
Reported
(per IFRS) |
Par(2) |
Net(3) |
| Net insurance service result |
1,635 |
|
(61) |
1,574 |
|
(9) |
(23) |
1,542 |
|
| Net investment result |
921 |
|
168 |
|
1,089 |
|
43 |
|
(192) |
940 |
|
ACMA(3) |
|
(213) |
(213) |
— |
|
213 |
|
|
| Fee income: |
|
|
|
|
|
|
| Asset Management |
1,222 |
|
(109) |
1,113 |
|
|
(1,113) |
|
| Other fee income |
244 |
|
— |
|
244 |
|
— |
|
5,182 |
|
5,426 |
|
| Fee income |
|
|
|
|
|
5,426 |
|
| Other expenses |
(1,006) |
(341) |
(1,347) |
— |
|
(4,068) |
(5,415) |
| Income before taxes |
3,016 |
|
(556) |
2,460 |
|
34 |
|
(1) |
2,493 |
|
| Income tax (expense) benefit |
(450) |
(227) |
(677) |
65 |
|
1 |
|
(611) |
| Total net income |
2,566 |
|
(783) |
1,783 |
|
99 |
|
— |
|
1,882 |
|
Allocated to Participating and NCI(4) |
(38) |
12 |
|
(26) |
(99) |
(1) |
(126) |
Dividends and Distributions(5) |
(51) |
— |
|
(51) |
— |
|
1 |
|
(50) |
Underlying net income(1) |
2,477 |
|
|
|
|
|
|
| Reported net income - Common shareholders |
|
(771) |
1,706 |
|
— |
|
— |
|
1,706 |
|
Refer to the footnotes on the previous page.
50 Sun Life Financial Inc. Third Quarter 2023 MANAGEMENT'S DISCUSSION AND ANALYSIS Underlying net income is a non-IFRS financial measure that assists in understanding Sun Life's business performance by making certain adjustments to IFRS income.
2. Underlying Net Income and Underlying EPS
Underlying net income, along with common shareholders’ net income (Reported net income), is used as a basis for management planning, and is also a key measure in our employee incentive compensation programs. This measure reflects management's view of the underlying business performance of the company and long-term earnings potential. For example, due to the longer term nature of our individual protection businesses, market movements related to interest rates, equity markets and investment properties can have a significant impact on reported net income in the reporting period. However, these impacts are not necessarily realized, and may never be realized, if markets move in the opposite direction in subsequent periods or in the case of interest rates, the fixed income investment is held to maturity.
Effective January 1, 2023, we refined the definition of underlying net income as follows, and have updated prior period comparative figures to reflect these changes: (i) Market-related impacts was updated to reflect the adoption of IFRS 17 and IFRS 9; (ii) The adjustment for management’s ownership of MFS shares were updated to better reflect Sun Life’s interest in MFS’ earnings; and (iii) Removal of intangible asset amortization on acquired finite-life intangibles. Additional detail on these adjustments is provided below.
Underlying net income removes the impact of the following items from reported net income:
•Market-related impacts reflecting the after-tax difference in actual versus expected market movements, including:
i)Net interest impact from risk-free rate, credit spread, and swap spread movements, reflecting accounting mismatches between assets and liabilities:
a.Differences arising from fair value changes(1) of fixed income assets (including derivatives) measured at fair value through profit or loss ("FVTPL") supporting insurance contracts, compared to fair value changes of the liabilities(2);
b.Fair value changes of fixed income assets (including derivatives) measured at FVTPL supporting our investment contract liability and surplus portfolios(3); and
c.Tax-exempt investment income above or below expected long-term tax savings relating to our Canadian multi-national insurance operations.
ii)Non-fixed income investments where the weighted average expected return is approximately 2% per quarter, including:
a.Equity investments (including derivatives) supporting insurance contracts and surplus portfolios; and
b.Investment properties supporting insurance contracts and surplus portfolios.
•Assumptions changes and management actions ("ACMA") – captures the impact of method and assumption changes, and management actions on insurance and reinsurance contracts.
•Other adjustments:
i)Management’s ownership of MFS shares – this adjustment removes the change in fair value and other activity related to MFS common shares owned by management.
ii)Acquisition, integration, and restructuring - expense and income related to acquisition or disposal of a business. Also includes expenses related to restructuring activities.
iii)Intangible asset amortization - removes the amortization expense associated with finite life intangible assets arising from acquisitions or business combinations excluding amortization of software and distribution agreements.
iv)Other – represents items that are unusual or exceptional in nature which management believes are not representative of the long-term performance of the Company.
Underlying EPS (diluted). This measure is used in comparing the profitability across multiple periods and is calculated by dividing underlying net income by weighted average common shares outstanding for diluted EPS, excluding the dilutive impact of convertible instruments. For additional information about the underlying net income, see above. For additional information about the composition of the EPS, please refer to Note 13 of our Interim Consolidated Financial Statements for the period ended September 30, 2023. For additional information about the SLEECS, please refer to Note 13 of our 2022 Annual Consolidated Financial Statements.
(1)For fixed income assets, Underlying Net Income includes credit experience from rating changes on assets measured at FVTPL, and the Expected credit loss (ECL) impact for assets measured at Fair value through other comprehensive income (FVOCI).
(2)Underlying net income is based on observable discount curves and exchange rates at the beginning of the period.
(3)Underlying net income for earnings on surplus includes realized gains (losses) on fixed income assets classified as FVOCI.
MANAGEMENT'S DISCUSSION AND ANALYSIS Sun Life Financial Inc. Third Quarter 2023 51
The following table sets out the post-tax amounts that were excluded from our underlying net income (loss) and underlying EPS and provides a reconciliation to our reported net income and EPS based on IFRS.
Reconciliations of Select Net Income Measures
|
|
|
|
|
|
|
|
|
|
|
|
|
|
|
|
|
|
|
Quarterly results |
Year-to-date |
| ($ millions, after-tax) |
Q3'23 |
Q2'23 |
Q3'22(1) |
2023 |
2022(1) |
| Underlying net income |
930 |
920 |
949 |
2,745 |
2,477 |
Market-related impacts(1) |
|
|
|
|
|
| Equity market impacts |
(21) |
(13) |
(36) |
(21) |
(165) |
Interest rate impacts(2) |
127 |
(99) |
(338) |
39 |
(223) |
| Impacts of changes in the fair value of investment properties (real estate experience) |
(83) |
(108) |
13 |
(279) |
143 |
| Add: Market-related impacts |
23 |
(220) |
(361) |
(261) |
(245) |
| Add: Assumption changes and management actions |
35 |
7 |
(131) |
37 |
(180) |
| Other adjustments |
|
|
|
|
|
| Management's ownership of MFS shares |
7 |
(1) |
37 |
23 |
88 |
Acquisition, integration and restructuring(3)(4)(5)(6)(7) |
(89) |
(20) |
(312) |
(113) |
(406) |
| Intangible asset amortization |
(35) |
(26) |
(23) |
(94) |
(56) |
Other(8) |
— |
— |
(48) |
— |
28 |
| Add: Total of other adjustments |
(117) |
(47) |
(346) |
(184) |
(346) |
| Reported net income - Common shareholders |
871 |
660 |
111 |
2,337 |
1,706 |
| Underlying EPS (diluted) ($) |
1.59 |
1.57 |
1.62 |
4.68 |
4.23 |
| Add: Market-related impacts ($) |
0.04 |
(0.38) |
(0.62) |
(0.44) |
(0.42) |
| Assumption changes and management actions ($) |
0.06 |
0.01 |
(0.22) |
0.06 |
(0.31) |
| Management's ownership of MFS shares ($) |
0.01 |
— |
0.06 |
0.04 |
0.15 |
| Acquisition, integration and restructuring ($) |
(0.16) |
(0.03) |
(0.53) |
(0.20) |
(0.70) |
| Intangible asset amortization ($) |
(0.06) |
(0.05) |
(0.04) |
(0.17) |
(0.10) |
| Other ($) |
— |
— |
(0.08) |
— |
0.05 |
| Impact of convertible securities on diluted EPS ($) |
— |
— |
— |
— |
0.01 |
| Reported EPS (diluted) ($) |
1.48 |
1.12 |
0.19 |
3.97 |
2.91 |
(1)2022 restated results may not be fully representative of our future earnings profile, as we were not managing our asset and liability portfolios under the new standards. See the heading "Note to Readers: 2022 Restated Results on Adoption of IFRS 17 and IFRS 9" in section A - How We Report Our Results in this document.
(2)Our results are sensitive to long term interest rates given the nature of our business and to non-parallel yield curve movements (for example flattening, inversion, steepening, etc.).
(3)Amounts relate to acquisition costs for our SLC Management affiliates, BentallGreenOak, InfraRed Capital Partners, Crescent Capital Group LP and Advisors Asset Management, Inc, which include the unwinding of the discount for Other financial liabilities of $21 million in Q3'23 and $62 million for the first nine months of 2023 (Q2'23 - $21 million; Q3'22 - $15 million; the first nine months of 2022 - $47 million).
(4)Q3'23 reflects the changes in estimated future payments for acquisition-related contingent considerations and options to purchase remaining ownership interests of SLC Management affiliates of $42 million (Q3'22 - $80 million).
(5)Includes acquisition and integration costs associated with DentaQuest, acquired on June 1, 2022.
(6)Includes a $65 million gain on the sale of the sponsored markets business in Canada in Q1'23 and a $19 million gain on the sale of Sun Life UK in Q2'23.
(7)Q3'22 reflects an impairment charge of $170 million pertaining to the attributed goodwill that was not expected to be recovered through the sale of Sun Life UK.
(8)Includes a charge of $48 million in Q3'22 reflecting the resolution of a matter related to reinsurance pricing for our U.S. In-force Management business, and Q2'22 reflects a gain on the sale-leaseback of the Wellesley office in the U.S.
52 Sun Life Financial Inc. Third Quarter 2023 MANAGEMENT'S DISCUSSION AND ANALYSIS The following table shows the pre-tax amount of underlying net income adjustments:
|
|
|
|
|
|
|
|
|
|
|
|
|
|
|
|
|
|
|
Quarterly results |
Year-to-date |
| ($ millions) |
Q3'23 |
Q2'23 |
Q3'22(1) |
2023 |
2022(1) |
| Underlying net income (after-tax) |
930 |
920 |
949 |
2,745 |
2,477 |
| Underlying net income adjustments (pre-tax): |
|
|
|
|
|
Add: Market-related impacts(1) |
107 |
(298) |
(400) |
(290) |
54 |
Assumption changes and management actions(2) |
41 |
11 |
(153) |
47 |
(213) |
| Other adjustments |
(156) |
(89) |
(385) |
(255) |
(385) |
| Total underlying net income adjustments (pre-tax) |
(8) |
(376) |
(938) |
(498) |
(544) |
Add: Taxes related to underlying net income adjustments |
(51) |
116 |
100 |
90 |
(227) |
| Reported net income - Common shareholders (after-tax) |
871 |
660 |
111 |
2,337 |
1,706 |
(1)2022 restated results may not be fully representative of our future earnings profile, as we were not managing our asset and liability portfolios under the new standards. See the heading "Note to Readers: 2022 Restated Results on Adoption of IFRS 17 and IFRS 9" in section A - How We Report Our Results in this document.
(2)In this document, the reported net income impact of ACMA is shown in aggregate for Net insurance service result and Net investment result, and excludes amounts attributable to participating policyholders. In contrast, Note 7.B.iv of the Consolidated Financial Statements for the period ended
September 30, 2023 shows the net income impacts of method and assumption changes separately in Net insurance service result and Net investment result, and includes amounts attributable to participating policyholders.
Taxes related to underlying net income adjustments may vary from the expected effective tax rate range reflecting the mix of business based on the Company's international operations and other tax-related adjustments.
3. Additional Non-IFRS Financial Measures
Management also uses the following non-IFRS financial measures:
After-tax profit margin for U.S. Group Benefits. This ratio expresses U.S. Group Benefits underlying net income as a percentage of net premiums. It assists in explaining our results from period to period and measures profitability. This ratio is calculated by dividing underlying net income (loss) by net premiums for the trailing four quarters. There is no directly comparable IFRS measure.
Assets under administration (in SLC Management). AUA represents Client assets for which Sun Life provides administrative services. In Asset Management, AUA includes assets distributed by SLC Management's affiliate, Advisors Asset Management, Inc. There is no directly comparable IFRS measure.
Assets under management. AUM is a non-IFRS financial measure that indicates the size of our Company's assets across asset management, wealth, and insurance. There is no standardized financial measure under IFRS. In addition to the most directly comparable IFRS measures, which are the balance of General funds and Segregated funds on our Statements of Financial Position, AUM also includes Third-party AUM and Consolidation adjustments. Effective January 1, 2023, "Other AUM" was renamed to "Third Party AUM", and "Consolidation adjustments" is presented separately as consolidation adjustments apply to all components of total AUM.
AUM not yet earning fees. This measure represents the committed uninvested capital portion of total AUM not currently earning management fees. The amount depends on the specific terms and conditions of each fund. There is no directly comparable IFRS measure.
Capital raising. This measure consists of increases in SLC Management's commitments from fund raising activities for all real estate, infrastructure and alternative credit Clients excluding leverage. Investment-grade fixed income capital raising consists of sales made to new Clients. There is no directly comparable IFRS measure.
Cash and other liquid assets. This measure is comprised of cash, cash equivalents, short-term investments, and publicly traded securities, net of loans related to acquisitions that are held at SLF Inc. (the ultimate parent company), and its wholly owned holding companies. This measure is a key consideration of available funds for capital re-deployment to support business growth.
|
|
|
|
|
|
|
|
|
| ($ millions) |
As at September 30, 2023 |
As at December 31, 2022 |
| Cash and other liquid assets (held at SLF Inc. and its wholly owned holding companies): |
|
|
| Cash, cash equivalents & short-term securities |
533 |
423 |
Debt securities(1) |
1,310 |
1,408 |
Equity securities(2) |
102 |
102 |
|
|
|
|
|
|
| Sub-total |
1,945 |
1,933 |
|
|
|
| Less: Loans related to acquisitions (held at SLF Inc. and its wholly owned holding companies) |
(543) |
(883) |
| Cash and other liquid assets (held at SLF Inc. and its wholly owned holding companies) |
1,402 |
1,050 |
(1)Includes publicly traded bonds.
(2)Includes ETF Investments.
MANAGEMENT'S DISCUSSION AND ANALYSIS Sun Life Financial Inc. Third Quarter 2023 53
Constant currency. We remove the impacts of foreign exchange translation from certain IFRS and non-IFRS measures to assist in comparing our results from period to period. The impacts of foreign exchange translation is approximated by using the foreign exchange rates in effect during the comparative period, using the average or period end foreign exchange rates, as appropriate.
CSM Movement Analysis includes certain non-IFRS financial measures, detailed below, and also presents certain measures on a net basis to reflect how management views the business, compared to a gross basis in the Consolidated Financial Statements. Examples include i) The impacts of insurance contracts issued is presented net of reinsurance; ii) Impact of new business is presented net of acquisition expense gain/loss; and iii) Certain methodology changes are presented as an impact of change in assumptions, whereas the Consolidated Financial Statement presentation is a contract modification.
•Organic CSM Movement is comprised of the Impact of new insurance business, Expected movements from asset returns & locked-in rates, Insurance experience gains/losses, and CSM recognized for services provided.
•Impact of new insurance business on CSM, also referred to as "new business CSM", represents growth from sales activity in the period, including individual protection sales (excluding joint ventures), and defined benefit solutions and segregated fund wealth sales in Canada. New business CSM is presented net of acquisition expense gain/loss.
•Expected movements from asset returns & locked-in rates applies to variable fee approach ("VFA") and general measurement approach ("GMA") contracts. For VFA contracts, this component of the CSM movement analysis is comprised of two factors: (i) the expected return on underlying assets and (ii) the measurement of financial guarantees. The difference between actual and expected results are reported as the impact of markets. For GMA contracts, this component of the CSM includes the accretion of the CSM balance at locked-in rates, which refer to the term structure associated with locked-in discount rates, set when the insurance contract was sold or on transition to IFRS 17. Average locked-in rates increase with the passage of time on in-force business and new business added at current rates.
•Impact of markets & other includes the difference between actual and expected movement for VFA contracts for: (i) the return on underlying assets and (ii) the measurement of financial guarantees. Also includes other amounts excluded from Organic CSM Movement.
•Insurance experience gains/losses represents the current period impacts of insurance experience, resulting in a change in future cash flows that adjust CSM.
•Impact of change in assumptions represents the future period impacts of changes in fulfilment cash flows that adjust CSM.
•CSM market sensitivities. CSM market sensitivities are non-IFRS financial measures for which there are no directly comparable measures under IFRS so it is not possible to provide a reconciliation of these amounts to the most directly comparable IFRS measures.
Deployment. This measure represents the amount of capital that has been invested in the period, including leverage where applicable. Deployment also includes capital committed in infrastructure deals to be invested in specific assets. There is no directly comparable IFRS measure.
Drivers of Earnings. The Drivers of Earnings ("DOE") analysis provides additional detail on the sources of earnings, primarily for protection and health businesses, and explains the actual results compared to the longer term expectations. The DOE is presented on a reported and underlying common shareholders' basis. Within the net insurance service result, the underlying DOE provides detail on expected insurance earnings, impact of new insurance business and experience gains (losses). Within the net investment result, the underlying DOE provides detail on expected investment earnings, credit experience, earnings on surplus, and joint ventures & other. For more information, refer to the headings "Underlying net income and Underlying EPS", "Earnings on surplus", "Notable items attributable to reported and underlying net income", in this document.
Certain amounts in the DOE are presented on a net basis to reflect how management views the business, compared to a gross basis in the Consolidated Financial Statements. Examples include: i) Net investment result and Other expenses of the Asset Management operating segment are combined with Fee Income to report the net contribution to earnings; ii) Income for fee-based businesses is reported net of the associated expenses; iii) Carried interest in SLC Management within Fee Income excludes the carried interest that Sun Life does not participate in economically, and nets the non-controlling interest portion of the carried interest against fee income and expenses of consolidated funds; iv) Net investment results include assets returns net of the crediting rate for investment contract liabilities and the unwinding of and changes in the discount rate for insurance contract liabilities; v) Earnings on surplus reflects net spread earned from investment strategies; vi) Earnings attributable to the participating account are excluded; and vii) Assumption changes and management actions combines the amounts included in Net insurance service result and Net investment result.
Earnings on Surplus. This component of the Drivers of Earnings represents the net income earned on a company’s surplus funds. Earnings on Surplus is comprised of realized gains on fair value through other comprehensive income assets, as well as net investment returns on surplus, such as investment income, gains (losses) on seed investments and investment properties mark-to-market, and also includes impacts from derivatives, currency and other items.
Experience-related items attributable to reported net income and underlying net income. These notable items attributable to reported net income and underlying net income are components of the Drivers of Earnings represents gains and losses that are due to differences between the actual results during the reporting period and management’s estimate of the expected longer-term returns on assets and liabilities (i.e. expected insurance earnings and expected investment earnings) at the start of the reporting period.
Fee earning AUM. FE AUM consists of assets managed by SLC Management, which are beneficially owned by Clients, on which we earn management fees for providing investment management, property management or advisory-related services. There is no directly comparable IFRS measure.
Fee-related earnings and Operating income. Fee-related earnings represent profitability of SLC Management's fee-related portfolios, and is calculated as Fee-related revenue less Fee-related expenses. Operating income represents profit realized from our business operations, and is calculated as the sum of Fee-related earnings, Investment income (loss) and performance fees, and Interest and other. Fee-related revenue represents all fee income, with the exception of performance fees, generated from third-party investors. Fee-related expenses represent all expenses directly related to generating fee revenue from third-party investors. Investment income (loss) and performance fees represent total
54 Sun Life Financial Inc. Third Quarter 2023 MANAGEMENT'S DISCUSSION AND ANALYSIS income or loss from our seed investments, net of the related expenses.
Interest and other represents performance fee compensation, our net interest income or expense and income from managing the General Account assets.
Fee-related earnings and Operating income are non-IFRS financial measures within SLC Management's Supplemental Income Statement, which enhances the comparability of SLC Management's results with publicly traded alternative asset managers. For more details, see our Supplementary Financial Information package for the quarter.
The following table provides a reconciliation from Fee-related earnings and Operating income to SLC Management's Fee income and Total expenses based on IFRS.
|
|
|
|
|
|
|
|
|
|
|
|
|
|
|
|
|
|
| SLC Management |
Quarterly results |
Year-to-date |
| ($ millions) |
Q3'23 |
Q2'23 |
Q3'22 |
2023 |
2022 |
Fee income (per IFRS) |
393 |
375 |
310 |
1,137 |
911 |
Less: Non-fee-related revenue adjustments(1)(2) |
94 |
83 |
67 |
263 |
200 |
| Fee-related revenue |
299 |
292 |
243 |
874 |
711 |
| Total expenses (per IFRS) |
450 |
377 |
388 |
1,163 |
952 |
Less: Non-fee-related expense adjustments(2)(3) |
219 |
147 |
203 |
487 |
405 |
| Fee-related expenses |
231 |
230 |
185 |
676 |
547 |
| Fee-related earnings |
68 |
62 |
58 |
198 |
164 |
Add: Investment income (loss) and performance fees(4) |
16 |
24 |
3 |
45 |
36 |
Add: Interest and other(5) |
(20) |
(19) |
(15) |
(71) |
(29) |
| Operating income |
64 |
67 |
46 |
172 |
171 |
(1)Includes Interest and other - fee income, Investment income (loss) and performance fees - fee income, and Other - fee income.
(2)Excludes the income and related expenses for certain property management agreements to provide more accurate metrics on our fee-related business.
(3)Includes Interest and other, Placement fees - other, Amortization of intangibles, Acquisition, integration and restructuring, and Other - expenses.
(4)Investment income (loss) and performance fee in SLC Management's Supplemental Income Statement relates to the underlying results of our seed investments. As such, we have excluded non-underlying market-related impacts as well as the gains or losses of certain non-seed hedges that are reported under Net investment income (loss) under IFRS. The reconciliation is as follows (amounts have been adjusted for rounding):
|
|
|
|
|
|
|
|
|
|
|
|
|
|
|
|
|
|
|
Quarterly results |
Year-to-date |
| ($ millions) |
Q3'23 |
Q2'23 |
Q3'22 |
2023 |
2022 |
| Net investment income (loss) (per IFRS) |
26 |
(7) |
(11) |
27 |
6 |
| Less: Market-related impacts and Other - Investment income (loss) |
10 |
(31) |
(14) |
(17) |
(27) |
| Add: Investment income (loss) and performance fees - fee income |
— |
— |
— |
1 |
3 |
| Investment income (loss) and performance fees |
16 |
24 |
3 |
45 |
36 |
(5)Includes Interest and other reported under Fee income under IFRS, net of Interest and other reported under Total expenses under IFRS.
Financial leverage ratio. This ratio is an indicator of the Company's balance sheet strength measured by its proportion of capital qualifying debt in accordance with OSFI guidelines. This is calculated as the ratio of total debt plus preferred shares to total capital including the contractual service margin net of taxes, where debt consists of all capital-qualifying debt securities. Capital-qualifying debt securities consist of subordinated debt and innovative capital instruments. The CSM is included net of taxes because debts are repaid and serviced from available after-tax funds.
Effective January 1, 2023, the calculation for the financial leverage ratio was updated to include the CSM balance (net of taxes) in the denominator on adoption of IFRS 17 and IFRS 9.
Impacts of foreign exchange translation. To assist in comparing our results from period-to-period, the favourable or unfavourable impacts of foreign exchange translation are approximated using the foreign exchange rates, in effect during the comparative period, for several IFRS and Non-IFRS financial measures using the average or period end foreign exchange rates, as appropriate. Items impacting a reporting period, such as Revenue, Expenses, and Reported net income (loss) in our Consolidated Statements of Operations, as well as underlying net income (loss), and sales, are translated into Canadian dollars using average exchange rates for the appropriate daily, monthly, or quarterly period. For Assets and Liabilities in our Consolidated Statements of Financial Position, as well as the AUM and certain components of the Drivers of Earnings disclosure, period-end rates are used for currency translation purposes.
LICAT market sensitivities. LICAT market sensitivities are non-IFRS financial measures for which there are no directly comparable measures under IFRS so it is not possible to provide a reconciliation of these amounts to the most directly comparable IFRS measures.
Pre-tax fee related earnings margin. This ratio is a measure of SLC Management's profitability in relation to funds that earn recurring fee revenues, while excluding investment income and performance fees. The ratio is calculated by dividing fee-related earnings by fee-related revenues and is based on the last twelve months. There is no directly comparable IFRS measure.
Pre-tax net operating margin. This ratio is a measure of the profitability and there is no directly comparable IFRS measure. For MFS, this ratio is calculated by excluding management's ownership of MFS shares and certain commission expenses that are offsetting. These commission expenses are excluded in order to neutralize the impact these items have on the pre-tax net operating margin and have no impact on the profitability of MFS. For SLC Management, the ratio is calculated by dividing the total operating income by fee-related revenue plus investment Income (loss) and performance fees, and is based on the last twelve months.
MANAGEMENT'S DISCUSSION AND ANALYSIS Sun Life Financial Inc. Third Quarter 2023 55
The following table provides a reconciliation to calculate MFS' pre-tax net operating margin:
|
|
|
|
|
|
|
|
|
|
|
|
|
|
|
|
|
|
| MFS |
Quarterly results |
Year-to-date |
| (US$ millions) |
Q3'23 |
Q2'23 |
Q3'22 |
2023 |
2022 |
Revenue |
|
|
|
|
|
| Fee income (per IFRS) |
815 |
804 |
801 |
2,406 |
2,548 |
| Less: Commissions |
100 |
99 |
104 |
298 |
334 |
Less: Other(1) |
(13) |
(14) |
(13) |
(40) |
(40) |
| Adjusted revenue |
728 |
719 |
710 |
2,148 |
2,254 |
| Expenses |
|
|
|
|
|
| Expenses (per IFRS) |
553 |
577 |
500 |
1,674 |
1,648 |
| Net investment (income)/loss (per IFRS) |
(20) |
(24) |
(7) |
(64) |
4 |
Less: Management's ownership of MFS shares (net of NCI)(2) |
6 |
12 |
(17) |
16 |
(35) |
| Compensation-related equity plan adjustments |
5 |
1 |
— |
6 |
8 |
| Commissions |
100 |
99 |
104 |
298 |
334 |
Other(1) |
(11) |
(14) |
(13) |
(41) |
(40) |
| Adjusted expenses |
433 |
455 |
419 |
1,331 |
1,385 |
| Pre-tax net operating margin |
41% |
37% |
41% |
38% |
38% |
(1)Other includes accounting basis differences, such as sub-advisory expenses and product allowances.
(2)Excluding non-controlling interest. For more information on Management's ownership of MFS shares, see the heading Underlying Net Income and Underlying EPS.
Return on equity. IFRS does not prescribe the calculation of ROE and therefore a comparable measure under IFRS is not available. To determine reported ROE and underlying ROE, respectively, reported net income (loss) and underlying net income (loss) is divided by the total weighted average common shareholders’ equity for the period. The ROE provides an indication of the overall profitability of the Company. The quarterly ROE is annualized.
Sales and flows. Asset Management gross flows includes funds from retail and institutional Clients; SLC Management gross flows include capital raising, such as uncalled capital commitments and fund leverage. Asset Management net flows consist of gross flows less gross outflows; SLC Management's net flows do not include Client distributions from the sale of underlying assets in closed-end funds. In Canada and in Asia, net sales consist of wealth sales & asset management gross flows less redemptions. In Canada, wealth sales & asset management gross flows consist of sales in Group Retirement Services and Individual Wealth; group - health & protection sales consist of workplace benefits sold by Sun Life Health; and individual - protection sales refer to individual insurance sales. In the U.S., group - health & protection sales consist of sales by Group Benefits and Dental. In Asia, wealth sales & asset management gross flows consist of Hong Kong wealth sales & asset management gross flows, Philippines mutual fund sales, wealth sales & asset management gross flows by our India and China joint ventures and associates, and Aditya Birla Sun Life AMC Limited's equity and fixed income mutual fund sales based on our proportionate equity interest, including sales as reported by our bank distribution partners; individual - protection sales consist of the individual insurance sales, by our subsidiaries and joint ventures and associates, based on our proportionate equity interest, in the Philippines, Indonesia, India, China, Malaysia, Vietnam, International, Hong Kong and Singapore. Asia also has group - health & protection sales in the Philippines, Hong Kong and our joint ventures. To provide greater comparability across reporting periods, we exclude the impacts of foreign exchange translation from sales and gross flows. There is no directly comparable IFRS measure.
Effective January 1, 2023, wealth sales & asset management gross flows in Group Retirement Services in Canada has been updated to exclude retained sales to better align with the methodology for Life Insurance Marketing and Research Association ("LIMRA") reporting. We have updated prior period amounts to reflect this change. Also effective January 1, 2023, insurance sales were renamed to "Group - Health & Protection sales" and "Individual - Protection sales" to better align to the business types within our business groups. For more information about business types, refer to section A - How We Report Our Results in this document.
Third-party AUM. Third-party AUM is composed of retail, institutional, and other third party assets, which includes general fund and segregated fund assets managed by our joint ventures. In Asset Management, third-party AUM includes Client assets for retail and institutional Clients, as well as capital raising, such as uncalled commitments and fund leverage in SLC Management. In Canada, third-party AUM includes Client assets in retail mutual fund products of Sun Life Global Investments. In Asia, third-party AUM includes Client assets in Hong Kong managed fund products, International wealth & asset management products, Philippines mutual and managed fund products, Aditya Birla Sun Life AMC Limited equity and fixed income mutual fund products, Sun Life Everbright Asset Management products and our joint ventures’ general fund and segregated fund assets based on our proportionate equity interest. There is no directly comparable IFRS financial measure.
Effective January 1, 2023, this measure was renamed to "third-party AUM", formerly "other AUM", in order to be more descriptive of the nature of these assets. Further, the presentation of "consolidation adjustments" has been updated in the current and prior periods to be shown separately from "third-party AUM", as consolidation adjustments apply to all components of total AUM.
Total weighted premium income ("TWPI"). This measure consists of 100% renewal premiums, 100% of first year premiums, and 10% of single premiums. In contrast to sales, which only includes premiums from new business, TWPI includes renewal premiums, reflecting the strength of the in-force block and providing a better understanding of both new and existing business. There is no directly comparable IFRS measure.
Underlying dividend payout ratio. This is the ratio of dividends paid per share to diluted underlying EPS for the period. The ratio is utilized during the medium-term capital budgeting process to inform our planned capital initiatives. We target an underlying dividend payout ratio of between 40% and 50% based on underlying EPS. For more information, see Section I - Capital and Liquidity Management in the 2022 Annual MD&A.
56 Sun Life Financial Inc. Third Quarter 2023 MANAGEMENT'S DISCUSSION AND ANALYSIS Underlying effective tax rate.
This measure is calculated using the pre-tax underlying net income and the income tax expense associated with it. Our statutory tax rate is normally reduced by various tax benefits, such as lower taxes on income subject to tax in foreign jurisdictions, a range of tax-exempt investment income, and other sustainable tax benefits. Our effective tax rate helps in the analysis of the income tax impacts in the period.
4. Reconciliations of Select Non-IFRS Financial Measures
Underlying Net Income to Reported Net Income Reconciliation - Pre-tax by Business Group
|
|
|
|
|
|
|
|
|
|
|
|
|
|
|
|
|
|
|
|
|
|
Q3'23 |
| ($ millions) |
Asset
Management |
Canada |
U.S. |
Asia |
Corporate |
Total |
| Underlying net income (loss) |
330 |
338 |
185 |
166 |
(89) |
930 |
Add: Market-related impacts (pre-tax) |
(3) |
94 |
39 |
(1) |
(22) |
107 |
| ACMA (pre-tax) |
— |
20 |
(30) |
51 |
— |
41 |
Other adjustments (pre-tax) |
(81) |
3 |
(71) |
(7) |
— |
(156) |
| Tax expense (benefit) on above items |
22 |
(90) |
9 |
2 |
6 |
(51) |
| Reported net income (loss) - Common shareholders |
268 |
365 |
132 |
211 |
(105) |
871 |
|
Q2'23 |
| Underlying net income (loss) |
296 |
372 |
215 |
150 |
(113) |
920 |
Add: Market-related impacts (pre-tax) |
(40) |
(212) |
(17) |
(30) |
1 |
(298) |
| ACMA (pre-tax) |
— |
(8) |
29 |
(10) |
— |
11 |
Other adjustments (pre-tax) |
(29) |
(1) |
(65) |
(7) |
13 |
(89) |
| Tax expense (benefit) on above items |
21 |
59 |
13 |
19 |
4 |
116 |
| Reported net income (loss) - Common shareholders |
248 |
210 |
175 |
122 |
(95) |
660 |
|
Q3'22(1) |
| Underlying net income (loss) |
298 |
293 |
227 |
153 |
(22) |
949 |
Add: Market-related impacts (pre-tax)(1) |
3 |
(206) |
(13) |
(107) |
(77) |
(400) |
| ACMA (pre-tax) |
— |
(82) |
(6) |
(54) |
(11) |
(153) |
Other adjustments (pre-tax) |
(95) |
(6) |
(112) |
(2) |
(170) |
(385) |
| Tax expense (benefit) on above items |
12 |
57 |
29 |
10 |
(8) |
100 |
| Reported net income (loss) - Common shareholders |
218 |
56 |
125 |
— |
(288) |
111 |
(1)2022 restated results may not be fully representative of our future earnings profile, as we were not managing our asset and liability portfolios under the new standards, IFRS 17 and IFRS 9. For more details, see the heading "Note to Readers: 2022 Restated Results on Adoption of IFRS 17 and IFRS 9" in this document.
|
|
|
|
|
|
|
|
|
|
|
|
|
|
|
|
|
|
|
|
|
|
Year-to-date |
|
2023 |
| ($ millions) |
Asset
Management |
Canada |
U.S. |
Asia |
Corporate |
Total |
| Underlying net income (loss) |
908 |
1,026 |
637 |
457 |
(283) |
2,745 |
Add: Market-related impacts (pre-tax) |
(50) |
(210) |
1 |
(14) |
(17) |
(290) |
| ACMA (pre-tax) |
— |
10 |
(1) |
35 |
3 |
47 |
Other adjustments (pre-tax) |
(133) |
96 |
(207) |
(20) |
9 |
(255) |
| Tax expense (benefit) on above items |
45 |
(18) |
45 |
9 |
9 |
90 |
| Reported net income (loss) - Common shareholders |
770 |
904 |
475 |
467 |
(279) |
2,337 |
|
2022(1) |
| Underlying net income (loss) |
914 |
798 |
468 |
404 |
(107) |
2,477 |
Add: Market-related impacts (pre-tax)(1) |
(13) |
401 |
(62) |
(207) |
(65) |
54 |
| ACMA (pre-tax) |
— |
(127) |
(5) |
(70) |
(11) |
(213) |
Other adjustments (pre-tax) |
(84) |
(14) |
(105) |
(13) |
(169) |
(385) |
| Tax expense (benefit) on above items |
10 |
(270) |
34 |
4 |
(5) |
(227) |
| Reported net income (loss) - Common shareholders |
827 |
788 |
330 |
118 |
(357) |
1,706 |
(1)2022 restated results may not be fully representative of our future earnings profile, as we were not managing our asset and liability portfolios under the new standards, IFRS 17 and IFRS 9. For more details, see the heading "Note to Readers: 2022 Restated Results on Adoption of IFRS 17 and IFRS 9" in this document.
MANAGEMENT'S DISCUSSION AND ANALYSIS Sun Life Financial Inc. Third Quarter 2023 57
Underlying Net Income to Reported Net Income Reconciliation - Pre-tax by Business Unit - Asset Management
|
|
|
|
|
|
|
|
|
|
|
|
|
|
|
|
|
|
|
|
|
|
Q3'23 |
Q2'23 |
Q3'22 |
| ($ millions) |
MFS |
SLC
Management |
MFS |
SLC
Management |
MFS |
SLC
Management |
| Underlying net income (loss) |
277 |
53 |
252 |
44 |
273 |
25 |
Add: Market-related impacts (pre-tax) |
— |
(3) |
— |
(40) |
— |
3 |
Other adjustments (pre-tax) |
12 |
(93) |
4 |
(33) |
42 |
(137) |
| Tax expense (benefit) on above items |
(5) |
27 |
(5) |
26 |
(5) |
17 |
| Reported net income (loss) - Common shareholders |
284 |
(16) |
251 |
(3) |
310 |
(92) |
|
|
|
|
|
|
|
|
|
|
|
|
|
|
|
|
Year-to-date |
|
2023 |
2022 |
| ($ millions) |
MFS |
SLC
Management |
MFS |
SLC
Management |
| Underlying net income (loss) |
783 |
125 |
804 |
110 |
Add: Market-related impacts (pre-tax) |
— |
(50) |
— |
(13) |
Other adjustments (pre-tax) |
37 |
(170) |
101 |
(185) |
| Tax expense (benefit) on above items |
(14) |
59 |
(13) |
23 |
| Reported net income (loss) - Common shareholders |
806 |
(36) |
892 |
(65) |
Underlying Net Income to Reported Net Income Reconciliation - Pre-tax in U.S. dollars
|
|
|
|
|
|
|
|
|
|
|
|
|
|
|
|
|
|
|
|
|
|
Q3'23 |
Q2'23 |
Q3'22(1) |
| (US$ millions) |
U.S. |
MFS |
U.S. |
MFS |
U.S. |
MFS |
| Underlying net income (loss) |
140 |
207 |
160 |
187 |
173 |
212 |
Add: Market-related impacts (pre-tax)(1) |
33 |
— |
(10) |
— |
(10) |
— |
| ACMA (pre-tax) |
(22) |
— |
23 |
— |
(5) |
— |
Other adjustments (pre-tax) |
(53) |
9 |
(49) |
3 |
(87) |
32 |
| Tax expense (benefit) on above items |
7 |
(4) |
9 |
(3) |
25 |
(4) |
| Reported net income (loss) - Common shareholders |
105 |
212 |
133 |
187 |
96 |
240 |
|
|
|
|
|
|
|
|
|
|
|
|
|
|
|
|
|
|
|
|
|
|
|
|
|
|
|
|
|
|
|
|
|
|
|
|
|
|
|
|
|
|
|
|
|
|
|
(1)2022 restated results may not be fully representative of our future earnings profile, as we were not managing our asset and liability portfolios under the new standards, IFRS 17 and IFRS 9. For more details, see the heading "Note to Readers: 2022 Restated Results on Adoption of IFRS 17 and IFRS 9" in this document.
|
|
|
|
|
|
|
|
|
|
|
|
|
|
|
|
Year-to-date |
|
2023 |
2022(1) |
| (US$ millions) |
U.S. |
MFS |
U.S. |
MFS |
| Underlying net income (loss) |
476 |
582 |
358 |
630 |
Add: Market-related impacts (pre-tax)(1) |
2 |
— |
(58) |
— |
| ACMA (pre-tax) |
1 |
— |
(4) |
— |
Other adjustments (pre-tax) |
(153) |
27 |
(82) |
76 |
| Tax expense (benefit) on above items |
37 |
(10) |
39 |
(10) |
| Reported net income (loss) - Common shareholders |
363 |
599 |
253 |
696 |
(1)2022 restated results may not be fully representative of our future earnings profile, as we were not managing our asset and liability portfolios under the new standards, IFRS 17 and IFRS 9. For more details, see the heading "Note to Readers: 2022 Restated Results on Adoption of IFRS 17 and IFRS 9" in this document.
58 Sun Life Financial Inc. Third Quarter 2023 MANAGEMENT'S DISCUSSION AND ANALYSIS The following table sets out the amounts that were excluded from our reported net income (loss) for U.S. Group Benefits, which is used to calculate the trailing four-quarter after-tax profit margin for U.S. Group Benefits.
Underlying Net Income to Reported Net Income Reconciliation - U.S. Group Benefits - Pre-tax in U.S. dollars
|
|
|
|
|
|
|
|
|
|
|
|
|
|
|
|
|
|
|
|
|
|
|
|
|
|
|
|
|
|
|
|
IFRS 17 and IFRS 9(1) |
|
IFRS 4 and IAS 39(1) |
| (US$ millions) |
Q3'23 |
Q2'23 |
Q1'23 |
Q4'22 |
Q3'22 |
|
Q3'22 |
Q2'22 |
Q1'22 |
Q4'21 |
Underlying net income (loss) for U.S. Group Benefits(2) |
96 |
116 |
128 |
119 |
101 |
|
103 |
89 |
58 |
— |
Add: Market-related impacts (pre-tax)(3) |
(10) |
(6) |
4 |
(1) |
(24) |
|
(5) |
(4) |
2 |
8 |
| ACMA (pre-tax) |
47 |
— |
— |
8 |
(7) |
|
(8) |
— |
— |
— |
Other adjustments (pre-tax) |
(6) |
(6) |
(5) |
(5) |
(4) |
|
(1) |
— |
(1) |
(1) |
| Tax expense (benefit) on above items |
(6) |
2 |
1 |
(2) |
8 |
|
3 |
1 |
— |
(1) |
Reported net income (loss) - Common shareholders(2) |
121 |
106 |
128 |
119 |
74 |
|
92 |
86 |
59 |
6 |
(1)IFRS 17 and IFRS 9 were adopted on January 1, 2023, see Note 2 of the Interim Consolidated Financial Statements for the period ended September 30, 2023. The after-tax profit margin is on a trailing four-quarter basis, and thus the Q3'22 margin reflects underlying net income on an IFRS 4 and IAS 39 basis.
(2)Effective Q2’22, we began reporting on the performance and results of our Dental business unit, which represents our existing dental and vision business within Group Benefits together with DentaQuest, acquired on June 1, 2022. We have updated prior periods to reflect this change in presentation.
(3)2022 restated results may not be fully representative of our future earnings profile, as we were not managing our asset and liability portfolios under the new standards, IFRS 17 and IFRS 9. For more details, see the heading "Note to Readers: 2022 Restated Results on Adoption of IFRS 17 and IFRS 9" in this document.
|
|
|
|
|
|
| O. Forward-looking Statements |
|
From time to time, the Company makes written or oral forward-looking statements within the meaning of certain securities laws, including the “safe harbour” provisions of the United States Private Securities Litigation Reform Act of 1995 and applicable Canadian securities legislation. Forward-looking statements contained in this document include statements (i) relating to our strategies; (ii) relating to expected changes in our LICAT ratio; (iii) relating to the use of proceeds of our sustainability bond offering; (iv) relating to our normal course issuer bid (including, but not limited to, statements regarding future purchases of common shares under the NCIB); (v) relating to our growth initiatives and other business objectives; (vi) relating to our expected tax range for future years; (vii) set out in this document under the heading I - Risk Management - Market Risk Sensitivities - Interest Rate Sensitivities; (viii) that are predictive in nature or that depend upon or refer to future events or conditions; and (ix) that include words such as “achieve”, “aim”, “ambition”, “anticipate”, “aspiration”, “assumption”, “believe”, “could”, “estimate”, “expect”, “goal”, “initiatives”, “intend”, “may”, “objective”, “outlook”, “plan”, “project”, “seek”, “should”, “strategy”, “strive”, “target”, “will”, and similar expressions. Forward-looking statements include the information concerning our possible or assumed future results of operations. These statements represent our current expectations, estimates, and projections regarding future events and are not historical facts, and remain subject to change.
Forward-looking statements are not a guarantee of future performance and involve risks and uncertainties that are difficult to predict. Future results and shareholder value may differ materially from those expressed in these forward-looking statements due to, among other factors, the matters set out in this document under the headings C - Profitability - 5 - Income taxes, F - Financial Strength and I - Risk Management and in SLF Inc.’s 2022 AIF under the heading Risk Factors, and the factors detailed in SLF Inc.’s other filings with Canadian and U.S. securities regulators, which are available for review at www.sedarplus.ca and www.sec.gov, respectively.
Important risk factors that could cause our assumptions and estimates, and expectations and projections to be inaccurate and our actual results or events to differ materially from those expressed in or implied by the forward-looking statements contained in this document, are set out below. The realization of our forward-looking statements essentially depends on our business performance which, in turn, is subject to many risks. Factors that could cause actual results to differ materially from expectations include, but are not limited to: market risks - related to the performance of equity markets; changes or volatility in interest rates or credit spreads or swap spreads; real estate investments; fluctuations in foreign currency exchange rates; and inflation; insurance risks - related to mortality experience, morbidity experience and longevity; policyholder behaviour; product design and pricing; the impact of higher-than-expected future expenses; and the availability, cost and effectiveness of reinsurance; credit risks - related to issuers of securities held in our investment portfolio, debtors, structured securities, reinsurers, counterparties, other financial institutions and other entities; business and strategic risks - related to global economic and political conditions; the design and implementation of business strategies; changes in distribution channels or Client behaviour including risks relating to market conduct by intermediaries and agents; the impact of competition; the performance of our investments and investment portfolios managed for Clients such as segregated and mutual funds; shifts in investing trends and Client preference towards products that differ from our investment products and strategies; changes in the legal or regulatory environment, including capital requirements and tax laws; the environment, environmental laws and regulations; operational risks - related to breaches or failure of information system security and privacy, including cyber-attacks; our ability to attract and retain employees; legal, regulatory compliance and market conduct, including the impact of regulatory inquiries and investigations; the execution and integration of mergers, acquisitions, strategic investments and divestitures; our information technology infrastructure; a failure of information systems and Internet-enabled technology; dependence on third-party relationships, including outsourcing arrangements; business continuity; model errors; information management; liquidity risks - the possibility that we will not be able to fund all cash outflow commitments as they fall due; and other risks - changes to accounting standards in the jurisdictions in which we operate; risks associated with our international operations, including our joint ventures; market conditions that affect our capital position or ability to raise capital; downgrades in financial strength or credit ratings; and tax matters, including estimates and judgements used in calculating taxes.
The Company does not undertake any obligation to update or revise its forward-looking statements to reflect events or circumstances after the date of this document or to reflect the occurrence of unanticipated events, except as required by law.
MANAGEMENT'S DISCUSSION AND ANALYSIS Sun Life Financial Inc. Third Quarter 2023 59
|
|
|
|
|
|
|
|
|
|
|
|
|
|
|
| CONSOLIDATED STATEMENTS OF OPERATIONS |
|
|
|
|
|
|
|
|
|
|
|
|
|
|
|
|
|
|
|
|
|
|
|
|
|
|
|
|
|
|
|
|
|
|
|
|
|
For the three months ended |
For the nine months ended |
| (unaudited, in millions of Canadian dollars, except for per share amounts) |
September 30 2023 |
September 30 2022 |
September 30 2023 |
September 30 2022 |
|
(restated, see Note 2) |
|
(restated, see Note 2) |
Insurance service result |
|
|
|
|
|
|
|
|
Insurance revenue (Note 7) |
|
$ |
5,333 |
|
|
$ |
5,149 |
|
|
$ |
15,898 |
|
|
$ |
13,597 |
|
Insurance service expenses (Note 7) |
|
(4,555) |
|
|
(4,269) |
|
|
(13,647) |
|
|
(11,965) |
|
Reinsurance contract held net income (expenses) (Note 7) |
|
(66) |
|
|
(289) |
|
|
(76) |
|
|
(90) |
|
Net insurance service result |
|
712 |
|
|
591 |
|
|
2,175 |
|
|
1,542 |
|
Investment result |
|
|
|
|
|
|
|
|
| Investment result excluding result for account of segregated fund holders: |
|
|
|
|
|
|
|
|
Net investment income (loss) (Note 5) |
|
(4,824) |
|
|
(2,056) |
|
|
425 |
|
|
(21,748) |
|
Insurance finance income (expenses) from insurance contracts issued (Note 5) |
|
5,759 |
|
|
2,105 |
|
|
1,307 |
|
|
23,235 |
|
Insurance finance income (expenses) from reinsurance contracts held (Note 5) |
|
(144) |
|
|
(143) |
|
|
(119) |
|
|
(445) |
|
Decrease (increase) in investment contract liabilities |
|
(88) |
|
|
(45) |
|
|
(235) |
|
|
(102) |
|
Net investment result excluding result for account of segregated fund holders |
|
703 |
|
|
(139) |
|
|
1,378 |
|
|
940 |
|
| Investment result for insurance contracts for account of segregated fund holders: |
|
|
|
|
|
|
|
|
Investment income (loss) on investments for account of segregated fund holders (Note 11) |
|
(362) |
|
|
(403) |
|
|
684 |
|
|
(3,445) |
|
Insurance finance income (expenses) (Note 11) |
|
362 |
|
|
403 |
|
|
(684) |
|
|
3,445 |
|
| Net investment result for insurance contracts for account of segregated fund holders |
|
— |
|
|
— |
|
|
— |
|
|
— |
|
Net investment result |
|
703 |
|
|
(139) |
|
|
1,378 |
|
|
940 |
|
Fee income (Note 8) |
|
1,930 |
|
|
1,808 |
|
|
5,767 |
|
|
5,426 |
|
Other expenses (income) |
|
|
|
|
|
|
|
|
| Other income |
|
— |
|
|
— |
|
|
(169) |
|
|
— |
|
Operating expenses and commissions |
|
2,004 |
|
|
1,911 |
|
|
5,909 |
|
|
5,097 |
|
| Interest expenses |
|
160 |
|
|
119 |
|
|
437 |
|
|
318 |
|
Total other expenses (income) |
|
2,164 |
|
|
2,030 |
|
|
6,177 |
|
|
5,415 |
|
| Income (loss) before income taxes |
|
1,181 |
|
|
230 |
|
|
3,143 |
|
|
2,493 |
|
Less: Income tax expense (benefit) (Note 9) |
|
244 |
|
|
77 |
|
|
548 |
|
|
611 |
|
| Total net income (loss) |
|
937 |
|
|
153 |
|
|
2,595 |
|
|
1,882 |
|
| Less: Net income (loss) allocated to the participating account |
|
37 |
|
|
15 |
|
|
121 |
|
|
99 |
|
| Less: Net income (loss) attributable to non-controlling interests |
|
10 |
|
|
9 |
|
|
78 |
|
|
27 |
|
| Shareholders' net income (loss) |
|
890 |
|
|
129 |
|
|
2,396 |
|
|
1,756 |
|
| Less: Dividends on preferred shares and distributions on other equity instruments |
|
19 |
|
|
18 |
|
|
59 |
|
|
50 |
|
| Common shareholders' net income (loss) |
|
$ |
871 |
|
|
$ |
111 |
|
|
$ |
2,337 |
|
|
$ |
1,706 |
|
|
|
|
|
|
|
|
|
|
Average exchange rates during the reporting periods: U.S. dollars |
1.34 |
|
|
1.30 |
|
|
1.35 |
|
|
1.28 |
|
|
|
|
|
|
|
|
|
|
Earnings (loss) per share (Note 13) |
|
|
|
|
|
|
|
|
| Basic |
|
$ |
1.49 |
|
|
$ |
0.19 |
|
|
$ |
3.98 |
|
|
$ |
2.91 |
|
| Diluted |
|
$ |
1.48 |
|
|
$ |
0.19 |
|
|
$ |
3.97 |
|
|
$ |
2.91 |
|
|
|
|
|
|
|
|
|
|
| Dividends per common share |
|
$ |
0.750 |
|
|
$ |
0.690 |
|
|
$ |
2.220 |
|
|
$ |
2.040 |
|
The attached notes form part of these Interim Consolidated Financial Statements.
60 Sun Life Financial Inc. Third Quarter 2023 INTERIM CONSOLIDATED FINANCIAL STATEMENTS (UNAUDITED)
|
|
|
|
|
|
|
|
|
|
|
|
|
|
|
CONSOLIDATED STATEMENTS OF COMPREHENSIVE INCOME (LOSS) |
|
|
|
|
|
|
|
|
|
|
|
|
|
|
|
|
|
|
|
|
|
|
|
|
|
|
|
|
|
|
|
|
|
|
|
|
|
For the three months ended |
For the nine months ended |
| (unaudited, in millions of Canadian dollars) |
September 30 2023 |
September 30 2022 |
September 30 2023 |
September 30 2022 |
|
(restated, see Note 2) |
|
(restated, see Note 2) |
| Total net income (loss) |
|
$ |
937 |
|
|
$ |
153 |
|
|
$ |
2,595 |
|
|
$ |
1,882 |
|
| Other comprehensive income (loss), net of taxes: |
|
|
|
|
|
|
|
|
| Items that may be reclassified subsequently to income: |
|
|
|
|
|
|
|
|
| Change in unrealized foreign currency translation gains (losses): |
|
|
|
|
|
|
|
|
| Unrealized gains (losses) |
|
280 |
|
|
799 |
|
|
7 |
|
|
756 |
|
| Reclassifications to net income (loss) |
|
— |
|
|
— |
|
|
(49) |
|
|
— |
|
| Change in unrealized gains (losses) on investments at fair value through other comprehensive income: |
|
|
|
|
|
|
|
|
| Unrealized gains (losses) |
|
(164) |
|
|
(253) |
|
|
(93) |
|
|
(1,320) |
|
| Reclassifications to net income (loss) and provision for credit losses recognized into income |
|
119 |
|
|
(5) |
|
|
130 |
|
|
(25) |
|
Classification overlay (Note 2) |
|
|
|
(44) |
|
|
|
|
(204) |
|
|
|
|
|
|
|
|
|
|
|
|
|
|
|
|
|
|
|
|
|
|
|
|
|
|
|
|
|
|
|
|
|
|
|
|
|
|
|
|
|
|
|
|
|
|
|
|
|
|
|
|
|
|
|
|
|
|
|
|
|
|
|
|
|
|
|
|
|
|
|
|
|
|
|
|
|
|
|
|
|
|
|
|
|
|
|
|
|
|
|
|
|
|
|
|
|
|
|
|
| Change in unrealized gains (losses) on cash flow hedges: |
|
|
|
|
|
|
|
|
| Unrealized gains (losses) |
|
15 |
|
|
54 |
|
|
— |
|
|
51 |
|
| Reclassifications to net income (loss) |
|
(22) |
|
|
(52) |
|
|
14 |
|
|
(61) |
|
| Share of other comprehensive income (loss) in joint ventures and associates: |
|
|
|
|
|
|
|
|
| Unrealized gains (losses) |
|
19 |
|
|
36 |
|
|
(9) |
|
|
(29) |
|
| Total items that may be reclassified subsequently to income |
|
247 |
|
|
535 |
|
|
— |
|
|
(832) |
|
| Items that will not be reclassified subsequently to income: |
|
|
|
|
|
|
|
|
| Remeasurement of defined benefit plans |
|
30 |
|
|
10 |
|
|
(33) |
|
|
95 |
|
| Share of other comprehensive income (loss) in joint ventures and associates |
|
(2) |
|
|
— |
|
|
5 |
|
|
(3) |
|
|
|
|
|
|
|
|
|
|
| Total items that will not be reclassified subsequently to income |
|
28 |
|
|
10 |
|
|
(28) |
|
|
92 |
|
| Total other comprehensive income (loss) |
|
275 |
|
|
545 |
|
|
(28) |
|
|
(740) |
|
| Total comprehensive income (loss) |
|
1,212 |
|
|
698 |
|
|
2,567 |
|
|
1,142 |
|
Less: Comprehensive income (loss) allocated to the participating account |
|
43 |
|
|
6 |
|
|
127 |
|
|
81 |
|
Non-controlling interests' comprehensive income (loss) |
|
11 |
|
|
12 |
|
|
79 |
|
|
29 |
|
| Shareholders’ comprehensive income (loss) |
|
$ |
1,158 |
|
|
$ |
680 |
|
|
$ |
2,361 |
|
|
$ |
1,032 |
|
The attached notes form part of these Interim Consolidated Financial Statements.
INTERIM CONSOLIDATED FINANCIAL STATEMENTS (UNAUDITED) Sun Life Financial Inc. Third Quarter 2023 61
|
|
|
|
|
|
|
|
|
|
|
|
|
|
|
| INCOME TAXES INCLUDED IN OTHER COMPREHENSIVE INCOME (LOSS) |
|
|
|
|
|
|
|
|
|
|
|
|
|
|
|
|
|
|
|
|
|
|
|
|
|
|
|
|
|
|
|
|
|
|
|
|
|
|
|
|
|
|
|
|
|
|
|
|
|
|
For the three months ended |
For the nine months ended |
|
|
|
| (unaudited, in millions of Canadian dollars) |
September 30 2023 |
September 30 2022 |
September 30 2023 |
September 30 2022 |
|
|
|
|
|
(restated, see Note 2) |
|
(restated, see Note 2) |
|
|
|
|
|
|
| Income tax benefit (expense): |
|
|
|
|
|
|
|
|
|
|
|
|
|
|
| Items that may be reclassified subsequently to income: |
|
|
|
|
|
|
|
|
|
|
|
|
|
|
| Unrealized foreign currency translation gains (losses) |
|
$ |
(10) |
|
|
$ |
2 |
|
|
$ |
(6) |
|
|
$ |
5 |
|
|
|
|
|
|
|
| Change in unrealized gains (losses) on investments at fair value through other comprehensive income: |
|
|
|
|
|
|
|
|
|
|
|
|
|
|
| Unrealized gains (losses) |
|
55 |
|
|
54 |
|
|
29 |
|
|
301 |
|
|
|
|
|
|
|
|
|
|
|
|
|
|
|
|
|
|
|
|
|
|
| Reclassifications to net income (loss) and provision for credit losses recognized into income |
|
(31) |
|
|
(1) |
|
|
(40) |
|
|
5 |
|
|
|
|
|
|
|
Classification overlay (Note 2) |
|
|
|
12 |
|
|
|
|
63 |
|
|
|
|
|
|
|
| Unrealized gains (losses) on cash flow hedges |
|
2 |
|
|
— |
|
|
2 |
|
|
5 |
|
|
|
|
|
|
|
| Reclassifications to net income for cash flow hedges |
|
(3) |
|
|
(1) |
|
|
(6) |
|
|
(2) |
|
|
|
|
|
|
|
| Total items that may be reclassified subsequently to income |
|
13 |
|
|
66 |
|
|
(21) |
|
|
377 |
|
|
|
|
|
|
|
| Items that will not be reclassified subsequently to income: |
|
|
|
|
|
|
|
|
|
|
|
|
|
|
| Remeasurement of defined benefit plans |
|
(10) |
|
|
(3) |
|
|
13 |
|
|
(45) |
|
|
|
|
|
|
|
|
|
|
|
|
|
|
|
|
|
|
|
|
|
|
| Total items that will not be reclassified subsequently to income |
|
(10) |
|
|
(3) |
|
|
13 |
|
|
(45) |
|
|
|
|
|
|
|
| Total income tax benefit (expense) included in other comprehensive income (loss) |
|
$ |
3 |
|
|
$ |
63 |
|
|
$ |
(8) |
|
|
$ |
332 |
|
|
|
|
|
|
|
The attached notes form part of these Interim Consolidated Financial Statements.
62 Sun Life Financial Inc. Third Quarter 2023 INTERIM CONSOLIDATED FINANCIAL STATEMENTS (UNAUDITED)
|
|
|
|
|
|
|
|
|
|
|
|
|
|
|
| CONSOLIDATED STATEMENTS OF FINANCIAL POSITION |
|
|
|
|
|
|
|
|
|
|
|
|
|
|
|
|
|
|
|
|
|
|
|
As at |
(unaudited, in millions of Canadian dollars) |
September 30, 2023 |
December 31, 2022 |
January 1, 2022 |
|
|
(restated, see Note 2) |
(restated, see Note 2) |
| Assets |
|
|
|
|
|
|
Cash, cash equivalents and short-term securities (Note 5) |
|
$ |
11,026 |
|
|
$ |
11,219 |
|
|
$ |
12,278 |
|
Debt securities (Notes 5 and 6) |
|
68,879 |
|
|
75,902 |
|
|
88,727 |
|
Equity securities (Notes 5 and 6) |
|
7,080 |
|
|
7,148 |
|
|
9,113 |
|
Mortgages and loans (Notes 5 and 6) |
|
51,994 |
|
|
51,253 |
|
|
55,727 |
|
| Derivative assets |
|
1,878 |
|
|
2,095 |
|
|
1,583 |
|
Other financial invested assets (Note 5) |
|
10,203 |
|
|
9,418 |
|
|
7,071 |
|
| Financial assets |
|
151,060 |
|
|
157,035 |
|
|
174,499 |
|
Investment properties (Note 5) |
|
9,952 |
|
|
10,102 |
|
|
9,109 |
|
| Other non-financial invested assets |
|
1,752 |
|
|
1,652 |
|
|
1,660 |
|
| Invested assets |
|
162,764 |
|
|
168,789 |
|
|
185,268 |
|
Other assets |
|
7,601 |
|
|
6,442 |
|
|
4,279 |
|
Reinsurance contract held assets (Note 7) |
|
5,766 |
|
|
6,115 |
|
|
6,612 |
|
Insurance contract assets (Note 7) |
|
208 |
|
|
75 |
|
|
162 |
|
Deferred tax assets |
|
3,421 |
|
|
3,466 |
|
|
2,940 |
|
Intangible assets |
|
5,161 |
|
|
4,724 |
|
|
3,370 |
|
Goodwill |
|
8,937 |
|
|
8,705 |
|
|
6,517 |
|
| Total general fund assets |
|
193,858 |
|
|
198,316 |
|
|
209,148 |
|
Investments for account of segregated fund holders (Note 11) |
|
119,988 |
|
|
125,292 |
|
|
139,996 |
|
| Total assets |
|
$ |
313,846 |
|
|
$ |
323,608 |
|
|
$ |
349,144 |
|
| Liabilities and equity |
|
|
|
|
|
|
| Liabilities |
|
|
|
|
|
|
Insurance contract liabilities excluding those for account of segregated fund holders (Note 7) |
|
$ |
124,873 |
|
|
$ |
131,294 |
|
|
$ |
149,412 |
|
Reinsurance contract held liabilities (Note 7) |
|
1,543 |
|
|
1,603 |
|
|
1,994 |
|
Investment contract liabilities (Note 5) |
|
11,344 |
|
|
10,728 |
|
|
9,914 |
|
| Derivative liabilities |
|
2,541 |
|
|
2,351 |
|
|
1,392 |
|
Deferred tax liabilities |
|
305 |
|
|
468 |
|
|
234 |
|
Other liabilities |
|
23,108 |
|
|
22,109 |
|
|
17,371 |
|
Senior debentures |
|
200 |
|
|
200 |
|
|
200 |
|
Subordinated debt |
|
6,177 |
|
|
6,676 |
|
|
6,425 |
|
| Total general fund liabilities |
|
170,091 |
|
|
175,429 |
|
|
186,942 |
|
Insurance contract liabilities for account of segregated fund holders (Note 11) |
|
18,377 |
|
|
23,139 |
|
|
26,079 |
|
Investment contract liabilities for account of segregated fund holders (Note 11) |
101,611 |
|
|
102,153 |
|
|
113,917 |
|
| Total liabilities |
|
$ |
290,079 |
|
|
$ |
300,721 |
|
|
$ |
326,938 |
|
| Equity |
|
|
|
|
|
|
| Issued share capital and contributed surplus |
|
$ |
10,642 |
|
|
$ |
10,640 |
|
|
$ |
10,615 |
|
| Shareholders’ retained earnings and accumulated other comprehensive income |
12,581 |
|
|
11,889 |
|
|
11,342 |
|
| Total shareholders’ equity |
|
23,223 |
|
|
22,529 |
|
|
21,957 |
|
| Equity in the participating account |
|
397 |
|
|
268 |
|
|
190 |
|
| Non-controlling interests’ equity |
|
147 |
|
|
90 |
|
|
59 |
|
| Total equity |
|
$ |
23,767 |
|
|
$ |
22,887 |
|
|
$ |
22,206 |
|
| Total liabilities and equity |
|
$ |
313,846 |
|
|
$ |
323,608 |
|
|
$ |
349,144 |
|
|
|
|
|
|
|
|
Exchange rates at the end of the reporting periods: U.S. dollars |
|
1.36 |
|
|
1.35 |
|
|
1.26 |
|
The attached notes form part of these Interim Consolidated Financial Statements.
Approved on behalf of the Board of Directors on November 13, 2023.
|
|
|
|
|
|
|
|
| Kevin Strain |
Barbara G. Stymiest |
| Chief Executive Officer |
Director |
INTERIM CONSOLIDATED FINANCIAL STATEMENTS (UNAUDITED) Sun Life Financial Inc. Third Quarter 2023 63
|
|
|
|
|
|
|
|
|
|
|
|
|
|
|
| CONSOLIDATED STATEMENTS OF CHANGES IN EQUITY |
|
|
|
|
|
|
|
|
|
|
|
|
|
|
|
|
|
|
|
|
For the nine months ended |
| (unaudited, in millions of Canadian dollars) |
September 30, 2023 |
September 30, 2022 |
|
|
(restated, see Note 2) |
| Shareholders: |
|
|
|
|
| Preferred shares and other equity instruments |
|
|
|
|
|
|
|
|
|
|
|
|
|
|
|
|
|
|
|
Balance, beginning and end of period |
|
$ |
2,239 |
|
|
$ |
2,239 |
|
Common shares (Note 10) |
|
|
|
|
Balance, beginning of period |
|
8,311 |
|
|
8,305 |
|
| Stock options exercised |
|
38 |
|
|
3 |
|
Common shares purchased for cancellation (Note 10) |
|
(40) |
|
|
— |
|
|
|
|
|
|
Balance, end of period |
|
8,309 |
|
|
8,308 |
|
| Contributed surplus |
|
|
|
|
Balance, beginning of period |
|
90 |
|
|
71 |
|
| Share-based payments |
|
9 |
|
|
25 |
|
| Stock options exercised |
|
(5) |
|
|
— |
|
Balance, end of period |
|
94 |
|
|
96 |
|
| Retained earnings |
|
|
|
|
Balance, beginning of period |
|
11,729 |
|
|
14,713 |
|
Transition adjustment - IFRS 17 (Note 2) |
|
|
|
(7,114) |
|
Transition adjustment - IFRS 9 (Note 2) |
|
(553) |
|
|
|
Transition adjustment - Classification overlay (Note 2) |
|
|
|
2,873 |
|
Balance, beginning of period, after change in accounting policies |
|
11,176 |
|
|
10,472 |
|
| Net income (loss) |
|
2,396 |
|
|
1,756 |
|
| Dividends on common shares |
|
(1,304) |
|
|
(1,192) |
|
| Dividends on preferred shares and distributions on other equity instruments |
|
(59) |
|
|
(50) |
|
Common shares purchased for cancellation (Note 10) |
|
(146) |
|
|
— |
|
| Transfer from accumulated other comprehensive income (loss) |
|
(37) |
|
|
— |
|
|
|
|
|
|
Changes attributable to acquisition (Note 3) |
|
(160) |
|
|
— |
|
|
|
|
|
|
Balance, end of period |
|
11,866 |
|
|
10,986 |
|
Accumulated other comprehensive income (loss), net of taxes (Note 14) |
|
|
|
|
Balance, beginning of period |
|
160 |
|
|
986 |
|
Transition adjustment - IFRS 9 (Note 2) |
|
553 |
|
|
|
Transition adjustment - Classification overlay (Note 2) |
|
|
|
(116) |
|
Balance, beginning of period, after change in accounting policy |
|
713 |
|
|
870 |
|
| Total other comprehensive income (loss) for the period |
|
(35) |
|
|
(724) |
|
| Transfer to retained earnings |
|
37 |
|
|
— |
|
Balance, end of period |
|
715 |
|
|
146 |
|
Total shareholders’ equity, end of period |
|
$ |
23,223 |
|
|
$ |
21,775 |
|
| Equity in the participating account: |
|
|
|
|
Balance, beginning of period |
|
$ |
268 |
|
|
$ |
1,700 |
|
Transition adjustment - IFRS 17 (Note 2) |
|
|
|
(1,907) |
|
Transition adjustment - IFRS 9 (Note 2) |
|
2 |
|
|
|
Transition adjustment - Classification overlay (Note 2) |
|
|
|
397 |
|
Balance, beginning of period, after changes in accounting policies |
|
270 |
|
|
190 |
|
| Net income (loss) |
|
121 |
|
|
99 |
|
Total other comprehensive income (loss) for the period (Note 14) |
|
6 |
|
|
(18) |
|
|
|
|
|
|
Total equity in the participating account, end of period |
|
$ |
397 |
|
|
$ |
271 |
|
| Non-controlling interests: |
|
|
|
|
Balance, beginning of period |
|
$ |
90 |
|
|
$ |
59 |
|
| Net income (loss) |
|
78 |
|
|
27 |
|
|
|
|
|
|
| Additional contribution |
|
— |
|
|
2 |
|
Total other comprehensive income (loss) for the period (Note 14) |
|
1 |
|
|
2 |
|
| Distribution to non-controlling interests |
|
(22) |
|
|
(26) |
|
Total non-controlling interests’ equity, end of period |
|
$ |
147 |
|
|
$ |
64 |
|
| Total equity |
|
$ |
23,767 |
|
|
$ |
22,110 |
|
The attached notes form part of these Interim Consolidated Financial Statements.
64 Sun Life Financial Inc. Third Quarter 2023 INTERIM CONSOLIDATED FINANCIAL STATEMENTS (UNAUDITED)
|
|
|
|
|
|
|
|
|
|
|
|
|
|
|
| CONSOLIDATED STATEMENTS OF CASH FLOWS |
|
|
|
|
|
|
|
|
|
|
|
|
|
|
|
|
|
|
|
|
|
|
|
|
|
|
|
|
|
|
|
|
|
|
|
|
|
|
|
|
|
|
|
|
|
|
For the three months ended |
For the nine months ended |
|
| (unaudited, in millions of Canadian dollars) |
September 30 2023 |
September 30 2022 |
September 30 2023 |
September 30 2022 |
|
|
|
(restated, see Note 2) |
|
(restated, see Note 2) |
|
|
|
|
| Cash flows provided by (used in) operating activities |
|
|
|
|
|
|
|
|
|
|
|
|
Income (loss) before income taxes |
|
$ |
1,181 |
|
|
$ |
230 |
|
|
$ |
3,143 |
|
|
$ |
2,493 |
|
|
|
|
|
Adjustments: |
|
|
|
|
|
|
|
|
|
|
|
|
Interest expense related to financing activities |
|
107 |
|
|
72 |
|
|
306 |
|
|
192 |
|
|
|
|
|
| (Decrease) increase in investment contract liabilities |
|
88 |
|
|
45 |
|
|
235 |
|
|
102 |
|
|
|
|
|
| Changes in insurance contract liabilities and assets |
|
(6,537) |
|
|
(2,985) |
|
|
(3,558) |
|
|
(24,867) |
|
|
|
|
|
| Changes in reinsurance contract held assets and liabilities |
|
210 |
|
|
432 |
|
|
195 |
|
|
535 |
|
|
|
|
|
| Realized and unrealized (gains) losses and foreign currency changes on invested assets |
|
6,574 |
|
|
3,577 |
|
|
4,637 |
|
|
26,030 |
|
|
|
|
|
| Sales, maturities and repayments of invested assets |
|
10,029 |
|
|
9,894 |
|
|
34,894 |
|
|
39,810 |
|
|
|
|
|
| Purchases of invested assets |
|
(10,656) |
|
|
(11,834) |
|
|
(37,532) |
|
|
(41,184) |
|
|
|
|
|
| Income taxes received (paid) |
|
(301) |
|
|
(159) |
|
|
(952) |
|
|
(638) |
|
|
|
|
|
Mortgage securitization (Note 5) |
|
— |
|
|
56 |
|
|
(39) |
|
|
151 |
|
|
|
|
|
| Other operating activities |
|
1,205 |
|
|
2,557 |
|
|
880 |
|
|
773 |
|
|
|
|
|
| Net cash provided by (used in) operating activities |
|
1,900 |
|
|
1,885 |
|
|
2,209 |
|
|
3,397 |
|
|
|
|
|
| Cash flows provided by (used in) investing activities |
|
|
|
|
|
|
|
|
|
|
|
|
| Net (purchase) sale of property and equipment |
|
(46) |
|
|
(42) |
|
|
(156) |
|
|
112 |
|
|
|
|
|
Investment in and transactions with joint ventures and associates |
|
(32) |
|
|
2 |
|
|
(60) |
|
|
(53) |
|
|
|
|
|
Dividends and other proceeds related to joint ventures and associates |
|
9 |
|
|
20 |
|
|
32 |
|
|
27 |
|
|
|
|
|
Acquisitions, net of cash and cash equivalents acquired (Note 3)(1) |
|
— |
|
|
— |
|
|
(232) |
|
|
(2,638) |
|
|
|
|
|
Dispositions, net of cash and cash equivalents disposed (Note 3)(2) |
|
— |
|
|
— |
|
|
297 |
|
|
— |
|
|
|
|
|
| Other investing activities |
|
(69) |
|
|
(76) |
|
|
(199) |
|
|
(185) |
|
|
|
|
|
| Net cash provided by (used in) investing activities |
|
(138) |
|
|
(96) |
|
|
(318) |
|
|
(2,737) |
|
|
|
|
|
| Cash flows provided by (used in) financing activities |
|
|
|
|
|
|
|
|
|
|
|
|
Increase in (repayment of) borrowed funds |
|
(1) |
|
|
4 |
|
|
(94) |
|
|
(225) |
|
|
|
|
|
Issuance of subordinated debt, net of issuance costs |
|
497 |
|
|
647 |
|
|
497 |
|
|
647 |
|
|
|
|
|
| Increase in (repayment of) borrowings from credit facility |
|
(161) |
|
|
(366) |
|
|
97 |
|
|
1,778 |
|
|
|
|
|
Redemption of senior debentures and subordinated debt |
|
(1,000) |
|
|
— |
|
|
(1,000) |
|
|
— |
|
|
|
|
|
| Issuance of common shares on exercise of stock options |
|
9 |
|
|
2 |
|
|
33 |
|
|
3 |
|
|
|
|
|
| Transactions with non-controlling interests |
|
— |
|
|
(4) |
|
|
(16) |
|
|
(24) |
|
|
|
|
|
Common shares purchased for cancellation |
|
(186) |
|
|
— |
|
|
(186) |
|
|
— |
|
|
|
|
|
| Dividends paid on common and preferred shares |
|
(453) |
|
|
(412) |
|
|
(1,361) |
|
|
(1,238) |
|
|
|
|
|
| Payment of lease liabilities |
|
(46) |
|
|
(40) |
|
|
(132) |
|
|
(109) |
|
|
|
|
|
| Interest expense paid |
|
(86) |
|
|
(44) |
|
|
(285) |
|
|
(164) |
|
|
|
|
|
Other financing activities |
|
— |
|
|
— |
|
|
— |
|
|
26 |
|
|
|
|
|
| Net cash provided by (used in) financing activities |
|
(1,427) |
|
|
(213) |
|
|
(2,447) |
|
|
694 |
|
|
|
|
|
| Changes due to fluctuations in exchange rates |
|
227 |
|
|
334 |
|
|
120 |
|
|
348 |
|
|
|
|
|
Increase (decrease) in cash and cash equivalents |
|
562 |
|
|
1,910 |
|
|
(436) |
|
|
1,702 |
|
|
|
|
|
Net cash and cash equivalents, beginning of period |
|
8,374 |
|
|
7,485 |
|
|
9,372 |
|
|
7,693 |
|
|
|
|
|
Net cash and cash equivalents, end of period |
|
8,936 |
|
|
9,395 |
|
|
8,936 |
|
|
9,395 |
|
|
|
|
|
Short-term securities, end of period |
|
2,090 |
|
|
1,990 |
|
|
2,090 |
|
|
1,990 |
|
|
|
|
|
Net cash, cash equivalents and short-term securities, end of period (Note 5) |
$ |
11,026 |
|
|
$ |
11,385 |
|
|
$ |
11,026 |
|
|
$ |
11,385 |
|
|
|
|
|
(1) Consists of total cash consideration paid of $nil, less cash and cash equivalents acquired of $nil for the three months ended September 30, 2023 (September 30, 2022 — $nil) and total cash consideration paid of $248, less cash and cash equivalents acquired of $16 for the nine months ended September 30, 2023 (September 30, 2022 — $3,269, less cash and cash equivalents acquired of $638).
(2) Consists of total cash consideration received of $nil, less cash and cash equivalents disposed of $nil for the three months ended September 30, 2023 and total cash consideration received of $516, less cash and cash equivalents disposed of $219 for the nine months ended September 30, 2023 (three and nine months ended September 30, 2022 — $nil).
The attached notes form part of these Interim Consolidated Financial Statements.
INTERIM CONSOLIDATED FINANCIAL STATEMENTS (UNAUDITED) Sun Life Financial Inc. Third Quarter 2023 65
|
|
|
|
|
|
|
|
|
|
|
|
|
|
|
Condensed Notes to the Interim Consolidated Financial Statements |
|
(Unaudited, in millions of Canadian dollars, except for per share amounts and where otherwise stated. All amounts stated in U.S. dollars are in millions.)
Description of Business
Sun Life Financial Inc. ("SLF Inc.") is a publicly traded company domiciled in Canada and is the holding company of Sun Life Assurance Company of Canada ("Sun Life Assurance"). SLF Inc. and its subsidiaries are collectively referred to as "us", "our", "ours", "we", or "the Company".
Our Interim Consolidated Financial Statements have been prepared in accordance with International Accounting Standard ("IAS") 34 Interim Financial Reporting as issued and adopted by the International Accounting Standards Board ("IASB"). We have used accounting policies which are consistent with our accounting policies in our 2022 Annual Consolidated Financial Statements, except as updated in Note 2 below. Our Interim Consolidated Financial Statements should be read in conjunction with our 2022 Annual Consolidated Financial Statements, as interim financial statements do not include all the information incorporated in annual consolidated financial statements prepared in accordance with International Financial Reporting Standards ("IFRS") as issued by the IASB.
|
|
|
|
|
|
|
|
|
|
|
|
|
|
|
| 2. Summary of Accounting Policies |
|
Our material accounting policies and future changes in accounting policies that are not yet effective for us are disclosed in Note 1 and Note 2 of our 2022 Annual Consolidated Financial Statements.
2.A New and Amended International Financial Reporting Standards Adopted in 2023
We adopted the following new and amended IFRS on January 1, 2023.
2.A.i IFRS 17 Insurance Contracts ("IFRS 17")
Summary
In May 2017, the IASB issued IFRS 17, with an amendment issued in June 2020 to defer the effective date of IFRS 17 to annual periods beginning on or after January 1, 2023. This standard is to be applied using a retrospective approach, with at least one year of comparative results provided. If retrospective application to a group of insurance contracts is impracticable, a modified retrospective or fair value approach may be used. IFRS 17 replaces IFRS 4 Insurance Contracts ("IFRS 4") and impacts how we recognize, measure, present, and disclose our insurance contracts in our Consolidated Financial Statements.
IFRS 17 and IFRS 9 Financial Instruments ("IFRS 9") were effective for us beginning January 1, 2023. Restated comparative period results have been provided for IFRS 17. As permitted by IFRS 9, we elected not to restate comparative period results, and as permitted by IFRS 17, we have elected to present comparative information on financial assets as if IFRS 9 were applicable during the comparative period.
For initial measurement of insurance contracts at the transition date of January 1, 2022, we have elected to use the fair value approach for all groups for which the retrospective approach is impracticable. For more information on the application of the fair value approach at transition, see the Fair value measurement section below.
IFRS 17 establishes principles for the recognition, measurement, presentation, and disclosure of insurance contracts. The key principles of IFRS 17 are as follows:
•Insurance contracts are those under which an entity accepts significant insurance risk from another party ("policyholder") by agreeing to compensate the policyholder if a specified uncertain future event ("insured event") adversely affects the policyholder.
•Insurance contracts issued and reinsurance contracts held are divided into groups that will be separately recognized and measured.
•Groups of insurance contracts are recognized and measured as the total of the following measurement components: a) the present value of future cash flows; b) a risk adjustment for non-financial risk ("RA"); and c) the Contractual Service Margin ("CSM"), an amount that represents the unearned profit of the group of contracts. These measurement components apply to groups of insurance contracts measured using the general measurement approach ("GMA") and the variable fee approach ("VFA"). The VFA applies to insurance contracts issued with direct participation features, which are substantially investment-related service contracts under which the policyholder is promised an investment return based on underlying items, such as segregated funds and certain participating insurance contracts. For short duration contracts, such as most of our group life and health business, a simplified measurement approach (the premium allocation approach ("PAA") is applied. Under the PAA, insurance contracts are measured based on unearned profits and do not include a CSM.
•The profit from a group of insurance contracts is recognized into income over the period that insurance contract services are provided and as the non-financial risks related to providing the insurance contracts diminish.
•Insurance revenue, insurance service expenses and insurance finance income or expenses are presented separately.
66 Sun Life Financial Inc. Third Quarter 2023 CONDENSED NOTES TO THE INTERIM CONSOLIDATED FINANCIAL STATEMENTS (UNAUDITED)
Significant Differences between IFRS 17 and IFRS 4
The following section describes the most significant differences between IFRS 17 and the accounting policies applied under IFRS 4.
Scope
There is no substantial change in IFRS 17 compared to IFRS 4 with regards to which contracts fall within the scope of the standard. However, we have updated the accounting policy for classification that was adopted on the transition to IFRS 4 in 2011 to ensure consistency with the IFRS 17 definition of insurance contracts.
Under IFRS 17, an insurance contract is defined as a contract under which the issuer accepts significant insurance risk from the policyholder by agreeing to compensate the policyholder if an insured event adversely affects the policyholder. In assessing whether "significant" insurance risk exists, certain contracts that were classified as insurance contracts under IFRS 4 were reclassified as investment contracts under IFRS 17. Such changes in classification were limited to certain deferred annuity products where the insurance risk is limited to the right to annuitize the maturity benefit, which fell short of the threshold for "significant" insurance risk.
Furthermore, IFRS 17 includes new requirements for the separation of distinct investment components and distinct goods or non-insurance service components of insurance contracts. At transition to IFRS 17, there were no distinct investment components and only immaterial distinct service components in our insurance contracts.
Unlike IFRS 4, IFRS 17 requires reinsurance contracts held to be measured separately from the underlying direct contracts. A reinsurance contract is an insurance contract issued by the reinsurer to compensate another entity for claims arising from one or more insurance contracts issued by that other entity ("underlying contracts").
Only contracts that transfer insurance risk to the reinsurer are considered reinsurance contracts held from the ceding entity’s point of view. We have reinsurance treaties that transfer only non-insurance risks to the reinsurer, however these are not considered reinsurance contracts held in scope of IFRS 17, nor were they in scope of IFRS 4. Rather, they are insurance contracts purchased.
Reinsurance treaties that are part of the underlying items of participating insurance contracts (i.e., where all the cash flows of the reinsurance treaty are fully passed through to the participating insurance policyholders) are measured and reported separately.
Investment contracts with discretionary participation features ("DPF") are in scope of IFRS 17 and were in scope of IFRS 4. However, such contracts were reported with other investment contracts under IFRS 4, and are reported with insurance contracts under IFRS 17.
Measurement
The measurement of insurance contracts under IFRS 17 differs from the Canadian Asset Liability Method ("CALM") previously applied under IFRS 4. The most significant differences by measurement component are as follows:
Present value of future cash flows:
•The discount rates used to present value future cash flows under IFRS 17 are based on the characteristics of the insurance contracts. Under IFRS 4, the CALM is used to determine actuarial liabilities based on the portfolio of assets currently supporting the insurance contract liabilities and reinvestment assumptions.
•Estimates under IFRS 17 include the current market view of the cost of financial guarantees, which requires a valuation consistent with market option prices. Under IFRS 4, the cost of financial guarantees is based on the amount required to fulfill the obligation but not directly linked to market option prices.
•Expense cash flows under IFRS 17 are limited to those directly attributable to fulfilment of the obligations under insurance contracts.
•Future income taxes are excluded from future cash flows under IFRS 17.
Risk adjustment for non-financial risk:
•Measures the compensation required for uncertainty related to non-financial risk, such as mortality, morbidity, surrender and expenses under IFRS 17.
•Provisions for uncertainty related to financial risk are implicitly included in the present value of future cash flows under IFRS 17.
•No amount is provided for asset-liability mismatch risk under IFRS 17.
•Under IFRS 4, amounts provided for the risks listed above are reflected in a provision for adverse deviations included in insurance contract liabilities.
CSM:
•This is a new component of liabilities and necessitates the "grouping" of insurance contracts, which is not required under IFRS 4.
•The CSM represents unearned profits, as discussed above.
The measurement approaches under IFRS 17 and IFRS 4 are similar for insurance contracts measured using the PAA. Differences arise mainly in the measurement of the liability for incurred claims ("LIC"), where the discount rate and risk adjustment for non-financial risk changes noted above apply.
Presentation
IFRS 17 requires that portfolios of insurance contracts that are in an asset position be presented separately from portfolios of insurance contracts that are in a liability position in the Consolidated Statements of Financial Position. Also, portfolios of insurance contracts issued must be presented separately from portfolios of reinsurance contracts held. Previously, insurance contracts issued were presented only as liabilities and reinsurance contracts held were presented only as assets. Certain balances, such as policy loans and outstanding and prepaid premiums, that were previously presented separately or included in Other assets and Other liabilities are now included in the assets or liabilities for insurance contracts issued or reinsurance contracts held.
CONDENSED NOTES TO THE INTERIM CONSOLIDATED FINANCIAL STATEMENTS (UNAUDITED) Sun Life Financial Inc. Third Quarter 2023 67
The presentation of income from insurance contracts on the Consolidated Statements of Operations has changed significantly for IFRS 17. Prior to IFRS 17, insurance related income was presented separately in the lines Gross premiums, Ceded premiums, Gross claims and benefits paid, Reinsurance expenses (recoveries), Increase (decrease) in insurance contract liabilities, and Decrease (increase) in reinsurance assets. The line Operating expenses, commissions and premium taxes included all expenses, reflecting those from both insurance and non-insurance contracts.
Under IFRS 17, insurance-related income is presented in the Insurance service result section and the Insurance finance income (expenses) line in the Investment result section. Amounts are presented separately for insurance contracts issued and reinsurance contracts held. The Insurance service expenses line includes amounts previously reported as Gross claims and benefits paid, with the exclusion of repayments of investment components, which are amounts that are returned to policyholders under all circumstances. Directly attributable expenses are also presented as Insurance service expenses. Income or expense from reinsurance contracts held is now presented as one line, which includes an allocation of reinsurance premiums paid and amounts recovered from reinsurers.
For insurance contracts measured using the GMA or VFA, premiums are no longer reported as revenue or recognized in income when received. Insurance revenue in a reporting period is comprised of the portion of premiums that cover expected claims and directly attributable expenses in the period, as well as the release of RA and the amortization of CSM for the period. Insurance revenue excludes the portion of premiums that cover repayment of investment components.
Fee income excludes income from insurance contracts as any fees earned would be recognized in Insurance contract revenue. Similarly, the Operating expenses and commissions line excludes expenses that are directly attributable to issuing or fulfilling insurance contracts as these expenses, as well as premium taxes paid, are included in the Insurance service result section.
Revised Accounting Policies
The material accounting policies used in the preparation of these Consolidated Financial Statements as a result of the adoption of IFRS 17 are summarized below. These policies differ from those included in Note 1 of our 2022 Annual Consolidated Financial Statements.
Insurance Contracts
Classification
Insurance contracts are comprised of insurance contracts issued, which are insurance and reinsurance or retrocession contracts that are issued by us, and reinsurance contracts held.
Insurance contracts issued are contracts under which we accept significant insurance risk from a policyholder by agreeing to compensate the policyholder if a specified uncertain future event adversely affects the policyholder. The presence of significant insurance risk in individual contracts is assessed by reviewing books of contracts with homogeneous risk features.
Reinsurance contracts held are insurance contracts under which we are the policyholder and have transferred insurance risk to the issuer of the contract, either the reinsurer or the retrocessionaire. In the normal course of business, we use reinsurance to limit our exposure to large losses. We have a retention policy that requires that such arrangements be placed with well-established, highly-rated reinsurers.
Certain investment contracts contain DPF, whereby the policyholder has the right to receive, in addition to guaranteed amounts, potentially significant benefits based on returns on a specified pool of assets. For entities like us that issue insurance contracts, investment contracts with DPF are measured and reported as insurance contracts.
Judgment is required to determine the classification of a contract as an insurance contract, investment contract or a service contract. Contracts are classified at initial recognition. Once a contract is classified as an insurance contract, it remains an insurance contract until all rights and obligations are extinguished or the contract is derecognized.
Combination and Separation of Contracts
Derivatives embedded in insurance contracts are treated as separate contracts and measured at fair value with changes in fair value recognized in income unless the embedded derivative itself meets the definition of an insurance contract or when the risks and characteristics of the embedded derivative are closely related to those of the host contract. Embedded derivatives that are not separated are accounted for with the host insurance contract.
Investment components of insurance contracts are amounts we repay to a policyholder in all circumstances (e.g., cash surrender values). Investment components of insurance contracts are treated as separate investment contracts only if the investment component is not highly interrelated with the insurance component and a contract with equivalent terms could be sold separately in the same market. Investment components that are not separated are accounted for as non-distinct investment components of insurance contracts.
Service components of insurance contracts are treated as separate service contracts only if the service component is not highly interrelated with the insurance component and we provide no significant service in integrating the service component with the insurance component. Service components that are not separated are accounted for with insurance contracts.
Insurance components of insurance contracts are treated as separate contracts only if the insurance component constitutes a separate insurance contract (e.g., certain reinsurance treaties that transfer risk on different types of insurance contracts).
For insurance contracts where both parties to the contract have the practical ability to terminate the contract, the extension of the contract beyond the termination date is treated as a new and separate contract. This occurs for most group life and health insurance contracts every year, when we have the right to reprice the contract and the policyholder has the option to not renew the contract. In such instances, each renewal is considered a new and separate contract. This also applies for many reinsurance contracts held, where the reinsurer has the right to reprice new cessions and we
68 Sun Life Financial Inc. Third Quarter 2023 CONDENSED NOTES TO THE INTERIM CONSOLIDATED FINANCIAL STATEMENTS (UNAUDITED)
have the right to cease ceding new contracts with a notice period. In such instances, the cessions within each notice period are considered a new and separate reinsurance contract held.
Measurement
Insurance contracts are measured in accordance with Canadian accepted actuarial practice, including IFRS 17, using one of the following approaches:
•VFA: This approach applies to insurance contracts (excluding reinsurance contracts) with direct participation features, which are substantially investment-related service contracts where the policyholder is promised an investment return based on underlying items.
•PAA: This is a simplified measurement approach and is applied to all insurance contracts that are eligible to use it, such as the majority of those in our group life and health businesses.
•GMA: This approach applies to all insurance contracts not measured using the VFA or the PAA.
Reinsurance contracts held are measured in a manner consistent with the associated underlying insurance contracts and in accordance with the terms of each reinsurance contract held. Reinsurance contracts held cannot be measured using the VFA. The measurement of reinsurance contracts held includes a provision for the risk that the reinsurer will not honour its obligations under the contract.
The carrying value of insurance contracts comprises the liability for remaining coverage ("LRC") and the LIC:
•The LRC is the measurement of our obligation to investigate and pay valid claims for insured events that have not yet occurred (i.e., the obligation that relates to the unexpired portion of the coverage period).
•The LIC is the measurement of our obligation to investigate and pay valid claims for insured events that have already occurred, including events that have occurred but for which claims have not been reported. For reinsurance contracts held, the LIC is an asset for incurred claims.
•For blocks of businesses acquired prior to January 1, 2023, any previously incurred claims where the amount paid to the beneficiary is subject to insurance risk are treated as LIC. For blocks of businesses acquired on or after January 1, 2023, such claims are treated as LRC.
Significant judgment is required in measuring assets or liabilities for insurance contracts, including the assumptions that are used for their measurement. Application of different assumptions may result in different measurement of the insurance contracts. Actual experience may differ from assumptions, and estimates may change from period to period based on future events or revisions of assumptions. Key assumptions and considerations in selecting these assumptions as well as the sensitivity of the measurement of insurance contracts to changes in risk variables are discussed in Note 2.B.
Level of Aggregation
The unit of account for the measurement of insurance contracts is a group. Each insurance contract is assigned to a group at initial recognition and remains in that group until the insurance contract is derecognized.
Groups are subdivisions of portfolios. Portfolios are insurance contracts subject to similar risks and managed together, and a portfolio is the level at which expenses are attributed and the level at which insurance contracts issued and reinsurance contracts held are presented.
We have established portfolios in each reportable business segment, distinguished between:
•Insurance contracts issued and reinsurance contracts held;
•Group insurance contracts and individual insurance contracts;
•Participating insurance contracts and non-participating insurance contracts;
•Adjustable insurance contracts and non-adjustable insurance contracts;
•Traditional life insurance contracts and universal life insurance contracts; and
•Pass-through insurance contracts and discretionary crediting contracts.
Within each portfolio, separate groups are established by:
•Date of issue: To be in the same group, contracts must be issued within the same time period, and the period cannot be longer than one year; and
•Level of profitability: Insurance contracts are separated into groups of contracts that are onerous at initial recognition, contracts that do not have a significant possibility of becoming onerous subsequently, and other contracts. The level of profitability for an insurance contract is based on the CSM at initial recognition of the contract (as described below in Initial Measurement).
We do not establish additional groups beyond the minimum required except for some portfolios of reinsurance contracts held where grouping is established to line up with the grouping of the underlying insurance contracts issued.
Initial Measurement
Groups of insurance contracts are recognized and measured as the total of the following measurement components:
•Fulfilment cash flows ("FCF"), which is comprised of:
–The present value of future cash flows (including the provisions for financial risk), and
–The risk adjustment for non-financial risk; and
•A CSM, representing the unearned profit that will be recognized in income as insurance contract services are provided.
These measurement components apply to groups of insurance contracts measured using the GMA and the VFA. Under the PAA, which is a simplified measurement approach, insurance contracts are measured based on unearned profits and do not include a CSM.
CONDENSED NOTES TO THE INTERIM CONSOLIDATED FINANCIAL STATEMENTS (UNAUDITED) Sun Life Financial Inc. Third Quarter 2023 69 Using the GMA or VFA, a group of insurance contracts is measured as the total of the three measurement components, as described above.
GMA or VFA
Estimates of the present value of future cash flows are explicit and current, and consider all reasonable and supportable information available at the reporting date without undue cost or effort. The portion of the present value of future cash flows related to financial risk variables is consistent with observable market prices and, where necessary, considers a range of scenarios that provides a good representation of possible outcomes. The cash flows for each scenario are probability-weighted and discounted using current assumptions.
The risk adjustment for non-financial risk represents the compensation required for uncertainty related to non-financial risk (mortality, morbidity, surrender and expenses, etc.). The risk adjustment is reduced as the non-financial risks of our insurance contracts diminish over time ("release of risk adjustment").
The CSM at the initial recognition of an insurance contract issued is the amount that fully offsets the FCF at initial recognition, and represents unearned profits on new business that are deferred and only amortized into income as insurance contract services are provided. For insurance contracts issued that are not profitable at initial recognition ("onerous insurance contracts"), a CSM is not established and losses are recognized in income immediately.
For reinsurance contracts held, there is no restriction on the CSM based on profitability at initial recognition, and any losses are deferred in the same manner as profits. In addition, the CSM for reinsurance contracts held can be adjusted to offset any gains or losses on the groups of underlying direct contracts that would have gone through CSM if the group of underlying direct contracts had a CSM balance.
For onerous insurance contracts, the loss recognized in the Consolidated Statements of Operations at initial recognition is added to the loss component of the group to which the contract is assigned. The loss component is a notional portion of the LRC that represents the amount of loss that can be reversed by future profit before a CSM is re-established for the group. For groups of reinsurance contracts held for which the CSM has been adjusted to offset gains and losses on groups of underlying direct contracts without a CSM, a loss recovery component is established.
PAA
For groups of insurance contracts using the PAA, there is no liability established at initial recognition, unless factors indicate that the group is onerous, in which case the group is initially recognized at the amount it is onerous, and a loss of that amount is recognized in the Consolidated Statements of Operations and becomes the loss component of the group. For groups using the PAA, insurance acquisition cash flows are recognized in the Consolidated Statements of Operations when incurred, rather than including such expenses in the measurement of LRC.
Subsequent Measurement
The subsequent measurement of FCF uses the same approach as described above for initial measurement, but with current inputs for each subsequent reporting date.
For contracts measured using the PAA, the LRC subsequent to initial recognition is the amount of unearned revenue and the remaining loss component for any groups that are onerous. We do not adjust the LRC to reflect the time value of money and the effects of financial risk when we expect the time between providing coverage and the related premiums to be no more than one year. We do not adjust the LIC to reflect the time value of money and the effects of financial risk when we expect the claims to be fully paid within one year of the insured event occurring.
For contracts measured using the GMA or VFA, the measurement of CSM subsequent to initial recognition is described below.
For groups of insurance contracts issued using the GMA, the CSM at the end of a reporting period is measured as the CSM at the beginning of the reporting period, adjusted for:
•The effect of any new contracts added to the group;
•Interest accretion on the carrying amount of the CSM;
•The change in FCF relating to future service, except to the extent that increases exceed the carrying amount of the CSM (giving rise to a loss) or decreases are allocated to the loss component of the LRC (reversing a prior loss);
•The effect of any currency exchange differences on the CSM; and
•The amount recognized as Insurance revenue due to the performance of insurance contract services in the period ("CSM amortization").
For groups of insurance contracts issued using the VFA, the CSM at the end of a reporting period is measured as the CSM at the beginning of the reporting period, adjusted for:
•The effect of any new contracts added to the group;
•The change in the entity's share of the fair value of underlying items, except to the extent a decrease exceeds the carrying amount of the CSM (giving rise to a loss) or an increase reverses a prior loss, or that risk mitigation applies (see below);
•The change in FCF relating to future service, except to the extent that increases exceed the carrying amount of the CSM (giving rise to a loss) or decreases are allocated to the loss component of the LRC (reversing a prior loss), or that risk mitigation applies (see below);
•The effect of any currency exchange differences on the CSM; and
•CSM amortization.
The risk mitigation option is provided to avoid accounting mismatches that would otherwise occur when the financial risk of a group of insurance contracts is mitigated outside the underlying items of the group. For insurance contracts issued using the VFA, changes related to financial risk adjust the CSM, but offsetting changes from risk mitigation (e.g., derivatives) may go through income. The risk mitigation option allows for a change that would otherwise adjust CSM to be recognized in income instead, to avoid such a mismatch. We apply the risk mitigation option where applicable to reduce accounting mismatches. The effect on CSM of applying the risk mitigation option is disclosed in more detail in Note 5.C.
70 Sun Life Financial Inc. Third Quarter 2023 CONDENSED NOTES TO THE INTERIM CONSOLIDATED FINANCIAL STATEMENTS (UNAUDITED)
For groups of reinsurance contracts held, the CSM at the end of a reporting period is measured as the CSM at the start of the reporting period, adjusted for:
•The effect of any new contracts added to the group;
•Interest accretion on the carrying amount of the CSM;
•Income recognized in the reporting period as a result of gains or losses recognized to offset gains or losses on groups of underlying direct contracts with no CSM;
•Reversals of a loss-recovery component to the extent those reversals are not changes in the FCF of the group of reinsurance contracts held;
•The change in FCF relating to future service, unless the change offsets a gain or loss on groups of underlying direct contracts with no CSM or the change is related to groups of onerous insurance contracts using the PAA;
•The effect of any currency exchange differences on the CSM; and
•The amount recognized in income due to services received in the period.
We have not changed the accounting estimates made in previous interim financial statements in the preparation of these Consolidated Financial Statements. In particular, the CSM at the end of each reporting period is the CSM at the beginning of the reporting period adjusted as described above, rather than the CSM at the beginning of the calendar year adjusted as described above.
Presentation on the Consolidated Financial Statements
The carrying value of portfolios of insurance contracts issued and reinsurance contracts held that are in an asset position are presented as Insurance contract assets and Reinsurance contract held assets in the Consolidated Statements of Financial Position, while the carrying value of portfolios of insurance contracts issued and reinsurance contracts held that are liabilities are presented as Insurance Contract liabilities excluding those for account of segregated fund holders and Reinsurance contract held liabilities. Assets for insurance acquisition cash flows incurred before initial recognition of the contracts to which they are attributable are included in the carrying value of the portfolio associated with those contracts.
Amounts related to insurance contracts that impact income are included in the Net insurance service result of the Consolidated Statements of Operations and the Insurance finance income (expenses) line in the Net investment result section. Results in those sections are presented separately for insurance contracts issued and reinsurance contracts held. We have chosen to disaggregate changes in the RA between the Insurance revenue line in Net insurance service result, and the Insurance finance income (expenses) line in Net investment result.
Net insurance service result
Insurance revenue is recognized as insurance contract services are provided for groups of insurance contracts. For insurance contracts issued that are measured using the GMA or the VFA, Insurance revenue includes the following services for which consideration in the form of premiums, net of premium taxes, is expected to be received:
•Expected claims and other expenses directly attributable to fulfilling insurance contracts, measured at the amounts expected at the beginning of the period, and excluding investment components and amounts allocated to the loss component;
•Release of the RA for the period, excluding amounts allocated to the loss component and amounts related to changes in the time value of money, which are recognized in Insurance finance income (expenses);
•CSM amortization to reflect services provided in the period, measured using the coverage units for the reporting period as a proportion of total coverage units (additional detail on coverage units is provided in Note 2.B);
•Amortization of insurance acquisition cash flows;
•Premium experience adjustments that relate to current or past service; and
•Expected amounts related to income taxes specifically chargeable to the policyholder.
Amortization of insurance acquisition cash flows in Insurance revenue is an allocation of the portion of the premiums that relates to the recovery of insurance acquisition cash flows, determined in a systematic way based on the passage of time. An equal and offsetting amount is included in Insurance service expenses.
For insurance contracts issued measured using the PAA, expected premium receipts (net of premium taxes and excluding investment components) are recognized as revenue, generally based on the passage of time.
Insurance service expenses include:
•Claims incurred in the period (excluding investment components and amounts allocated to the loss component),
•Expenses incurred that are directly attributable to fulfilling the insurance contracts;
•Losses on onerous contracts and reversals of those losses;
•Changes related to past service (e.g., changes in the LIC in periods subsequent to the claim being incurred);
•Amortization of insurance acquisition cash flows;
•Insurance acquisition cash flows expensed as incurred related to PAA contracts; and
•Impairment and reversals of impairment of assets for insurance acquisition cash flows.
For reinsurance contracts held, we have elected to present income and expenses arising from these contracts as a single amount in the Reinsurance contract held net income (expense) line on the Consolidated Statements of Operations. This amount includes an allocation of reinsurance premiums, amounts recovered from reinsurers, and changes in the risk of non-performance by the reinsurer. Allocations of reinsurance premiums are recognized as services are received for the reinsurance contract held.
For reinsurance contracts held measured using the GMA, the services received for which consideration is paid include:
•Expected recoveries and expenses, excluding amounts that are paid regardless of claims;
•Release of the RA for the period;
•CSM recognized for services received; and
•Premium experience adjustments that relate to current or past service.
CONDENSED NOTES TO THE INTERIM CONSOLIDATED FINANCIAL STATEMENTS (UNAUDITED) Sun Life Financial Inc.
Third Quarter 2023 71 For reinsurance contracts held measured using the PAA, expected premium payments (net of premium taxes and excluding amounts that are paid regardless of claims) are recognized as an allocation of reinsurance premiums based on the passage of time. Amounts recovered from reinsurers includes incurred claims (excluding amounts that are paid regardless of claims) and expenses, loss recoveries and reversals of loss recoveries, and changes related to past service (e.g., changes in the asset for incurred claims in periods subsequent to the claim being incurred).
Insurance finance income (expenses)
Changes in the carrying value of insurance contracts issued not measured using the VFA and reinsurance contracts held that are due to changes in the time value of money and in financial risk are recognized in the Insurance finance income (expenses) line on the Consolidated Statements of Operations. For insurance contracts issued measured using the VFA, Insurance finance income (expenses) includes changes in the fair value of underlying items and changes not recognized in the CSM when the risk mitigation option is applied. We have elected to recognize all insurance finance income (expenses) in the Consolidated Statements of Operations and not in Other comprehensive income. Insurance finance income (expense) for insurance contracts for account of segregated fund holders is discussed in the Segregated Funds section of this Note.
Derecognition and Modification
Insurance contracts are derecognized when the obligations in the contract expire, are discharged or cancelled, or when it is modified and the modification is substantial, such as when the modification results in a change in the measurement approach. When a contract modification results in derecognition, the original contract is derecognized and the modified contract is recognized as a new contract. Modifications that do not result in derecognition are treated as changes in FCF.
Segregated Funds
Segregated funds are products where the benefit amount is directly linked to the fair value of the investments held in the particular segregated fund. Although the underlying assets are registered in our name and the segregated fund contract holder has no direct access to the specific assets, the contractual arrangements are such that the segregated fund policyholders bear the risks and rewards of the fund’s investment performance. In addition, certain segregated funds contracts include guarantees from us. Segregated fund contracts are classified as insurance contracts or investment contracts following the classification criteria described in the Insurance Contracts section of this Note and Note 2.A.ii.
Investments for Account of Segregated Fund Holders
Investments for account of segregated fund holders are recorded separately from the Total general fund assets in our Consolidated Statements of Financial Position and are carried at fair value. Fair values are determined using quoted market values or, where quoted market values are not available, estimated fair values as determined by us. Investments for account of segregated fund holders includes investments for contracts that are classified as insurance contracts and investments for contracts that are classified as investment contracts. Unrealized gains and losses and other investment income from investments for account of segregated fund holders classified as insurance contracts is reported as Net investment income (loss) within the Net investment result for insurance contracts for account of segregated fund holders in the Consolidated Statements of Operations. Such investment income (loss) will be offset by the corresponding increase in the insurance contract liabilities for account of segregated fund holders. Changes in the fair value of the investments for account of segregated fund holders classified as investment contracts are recorded in net realized and unrealized gains (losses) within the segregated fund and are not recorded in our Consolidated Statements of Operations.
Insurance Contract Liabilities for Account of Segregated Fund Holders
Segregated fund products classified as insurance contracts are contracts with direct participation features and are therefore measured using the VFA described in the Insurance contracts section of this Note. Insurance contract liabilities for these contracts are presented as two separate lines on the Consolidated Statements of Financial Position: Insurance contract liabilities excluding those for account of segregated fund holders, and Insurance contract liabilities for account of segregated fund holders. The Insurance contract liabilities for account of segregated fund holders represents the obligation to pay the policyholder an amount equal to the fair value of the underlying items. Changes in this obligation due to changes in fair value of the underlying items are recognized as Insurance finance income or expenses in the Net investment result for insurance contracts for account of segregated fund holders in the Consolidated Statements of Operations. Such insurance finance income or expenses will be offset by the corresponding increase in Investments for account of segregated fund holders. Deposits into and payments from the segregated funds are investment components and thus excluded from insurance revenue and insurance service expenses. The Insurance contract liabilities excluding those for account of segregated fund holders on the Consolidated Statements of Financial Position includes the remaining insurance contract liabilities for these contracts, which comprises the provision for guarantees, future expenses (less future fees), the RA and the CSM. Revenue and expenses related to these items are included in the Insurance service result on the Consolidated Statements of Operations.
Investment Contract Liabilities for Account of Segregated Fund Holders
Investment contract liabilities for account of segregated fund holders are recorded separately from the Total general fund liabilities in our Consolidated Statements of Financial Position. The liabilities reported as Investment contracts for account of segregated fund holders are measured at the aggregate of the policyholder account balances. We derive fee income from segregated funds classified as investment contracts, which is included in Fee income in our Consolidated Statements of Operations. Deposits to segregated funds and payments made from segregated funds are reflected as increases or decreases in Investment contract liabilities for account of segregated fund holders and Investments for account of segregated fund holders and are not reported as revenues or expenses in our Consolidated Statements of Operations.
Foreign Currency Translation
Translation of Transactions in Foreign Currencies
The financial results of SLF Inc. and its subsidiaries, joint ventures and associates are prepared in the currency in which they conduct their ordinary course of business, which is referred to as functional currency. Transactions occurring in currencies other than the functional currency are translated to the functional currency using the spot exchange rates at the dates of the transactions.
Monetary assets and liabilities in foreign currencies are translated to the functional currency at the exchange rate at the statement of financial position date. Insurance contract and reinsurance contract held assets and liabilities, including the CSM, are monetary items. Non-monetary assets and liabilities in foreign currencies that are held at fair value are translated using the exchange rate at the statement of financial position date, while non-monetary assets and liabilities that are measured at historical cost are translated using the exchange rate at the date of the transaction.
72 Sun Life Financial Inc. Third Quarter 2023 CONDENSED NOTES TO THE INTERIM CONSOLIDATED FINANCIAL STATEMENTS (UNAUDITED)
The resulting exchange differences from the translation of monetary items and non-monetary items held at fair value, with changes in fair value recorded to income, are recognized in our Consolidated Statements of Operations. For monetary assets classified as fair value through other comprehensive income ("FVOCI"), translation differences calculated on amortized cost are recognized in our Consolidated Statements of Operations and other changes in carrying amount are recognized in other comprehensive income ("OCI"). The exchange differences from the translation of non-monetary items on these assets are recognized in OCI.
Transition Impacts
Transition Method
The retrospective application of IFRS 17 at the transition date of January 1, 2022, was implemented using the fair value approach where a full retrospective approach was impracticable. The full retrospective approach was deemed impracticable for all groups of insurance contracts measured using the GMA or VFA, because estimates required information that was either not available or would not have been available in a usable form in prior periods. For groups of insurance contracts measured using the PAA, we applied full retrospective measurement at transition.
Under the fair value approach, the CSM at transition for a group of insurance contracts is equal to the fair value of the group of insurance contracts less the fulfilment cash flows (which is the present value of future cash flows plus the risk adjustment for non-financial risk) measured using IFRS 17. The fair value of a group of insurance contracts is the amount that a market participant would require to take over the obligations of the group of insurance contracts.
Transition Grouping
As permitted under IFRS 17 when using the fair value approach, groups of insurance contracts at transition were formed according to the IFRS 17 grouping requirements, but without the restriction that groups should not contain contracts that are issued more than one year apart. Also, given the definition of fair value, all insurance contracts issued in a portfolio were in the same profitability group. Therefore, there was only one group for each portfolio of insurance contracts issued at transition. Portfolios of reinsurance contracts held at transition were grouped according to the grouping of the direct underlying contracts.
Fair Value Measurement
The fair value of a group of insurance contracts issued as at the transition date was measured using one of two approaches, the current pricing margin approach or the adjusted fulfilment cash flows approach. For both approaches, our requirements were considered a reasonable proxy for a market participant's requirements, as we share the characteristics of a typical market participant in the insurance market. The determination of fair value requires us to make estimates and assumptions that require significant judgment.
The "adjusted fulfilment cash flows" approach identifies specific amounts a market participant would require, in addition to the fulfilment cash flows, to take over the obligations of the group. These include:
•A provision for reinvestment risk, which was measured as the cost of capital for interest rate risk using the higher of the Life Insurance Capital Adequacy Test ("LICAT") and local capital requirements;
•An amount for overhead and other non-directly attributable expenses not covered by fulfilment cash flows; and
•Other adjustments, including a provision for general operational risk and an amount to compensate for the expectation, as at the transition date, that CSM would not be tax-deductible.
The current pricing margin approach identifies the amount a market participant would require by identifying the amount that we require in the current pricing of insurance contracts.
The adjusted fulfilment cash flows approach was used for most non-participating insurance and annuity contracts. The current pricing margin approach was used for most fee-based and pass-through contracts.
The fair value of a group of reinsurance contracts held as at the transition date was measured as the difference between the fair value of the group of underlying insurance contracts without consideration of reinsurance, and the fair value of the group of underlying insurance contracts together with the corresponding group of reinsurance contracts held.
CSM at Transition
The CSM at transition for each group of insurance contracts is the fair value of the contracts less the fulfilment cash flows. The fulfilment cash flows at transition were measured using the IFRS 17 policies described in this Note and Note 2.B. The discount curve was established as at the transition date, and became the locked-in discount curve for the group going forward, as the fair value method was applied.
Details on the impacts on the Consolidated Financial Statements due to the adoption of IFRS 17 are included in Note 2.A.iv.
2.A.ii IFRS 9 Financial Instruments
Summary
During the first quarter, we adopted IFRS 9 Financial Instruments ("IFRS 9"), which includes guidance on the classification and measurement of financial instruments, impairment of financial assets and hedge accounting, and does not require restatement of comparative periods. IFRS 9 replaces IAS 39 Financial Instruments: Recognition and Measurement ("IAS 39"). As a result of the application of IFRS 9, we changed our accounting policies in the areas indicated below, which were effective beginning January 1, 2023. We are permitted, under IFRS 17, to present comparative information on financial assets as if IFRS 9 were applicable during the comparative period ("classification overlay"). We have elected to apply the classification overlay to our financial assets and their comparative period results as if IFRS 9 had been effective since January 1, 2022. Certain comparative period information will continue to be presented in accordance with our previous accounting policies, as indicated below.
CONDENSED NOTES TO THE INTERIM CONSOLIDATED FINANCIAL STATEMENTS (UNAUDITED) Sun Life Financial Inc. Third Quarter 2023 73 The material accounting policies used in the preparation of these Consolidated Financial Statements as a result of the adoption of IFRS 9 are summarized below.
Revised Accounting Policies
These policies differ from those included in Note 1 of our 2022 Annual Consolidated Financial Statements. For all other policies not impacted by IFRS 9, refer to Note 1 in our 2022 Annual Consolidated Financial Statements.
Classification of financial assets and financial liabilities
IFRS 9 introduces three principal classification categories for financial assets. Financial assets are measured at initial recognition at fair value, and are classified as and subsequently measured at fair value through profit or loss ("FVTPL"), FVOCI or amortized cost based on our business model for managing the financial asset and the contractual cash flow characteristics of the asset.
IFRS 9 eliminates the previous IAS 39 categories of held-to-maturity ("HTM"), available-for-sale ("AFS"), and loans and receivable financial assets. Under IFRS 9, derivatives embedded in contracts where the host is a financial asset in scope of IFRS 9 are not separated. Instead, the hybrid financial instrument, as a whole, is assessed for classification.
IFRS 9 maintains the IAS 39 classification for financial liabilities. Under IFRS 9, financial liabilities are measured at either amortized cost or FVTPL.
Further details on how we classify and measure our financial assets and financial liabilities and account for the related gains and losses under IFRS 9 are provided below.
Impairment of financial assets
IFRS 9 replaces the "incurred loss" model under IAS 39 with a forward-looking "expected credit loss" ("ECL") model. The new impairment model applies to financial assets measured at amortized cost, debt securities measured at FVOCI, mortgages and loans measured at FVOCI, lease receivables, account receivables, loan commitments and financial guarantees not measured at FVTPL. Credit losses are recognized earlier under IFRS 9 as compared previously under IAS 39. Refer to the impairment section below for further details.
Hedge accounting
IFRS 9 introduced a new hedge accounting model, but permits entities to continue applying hedge accounting requirements under IAS 39 instead of those under IFRS 9. We have elected to continue applying the hedge accounting requirements under IAS 39.
Invested Assets
Policies applicable beginning January 1, 2023 (IFRS 9)
Financial Assets Excluding Derivative Financial Instruments (IFRS 9)
Financial assets include cash, cash equivalents and short-term securities, debt securities, equity securities, mortgages and loans, and other financial invested assets.
i) Initial Recognition and Subsequent Measurement
Classification of financial assets
Financial assets are measured at initial recognition at fair value and are classified as and subsequently measured at FVTPL, FVOCI, or amortized cost based on the business model used to manage the financial asset and the contractual cash flow characteristics of the asset. Amortized cost is determined using the effective interest rate method, which is the gross carrying amount less the allowance for ECL. Financial assets are not reclassified subsequent to initial recognition unless the business model used to manage the financial asset has changed.
A financial asset is measured at amortized cost if both of the following conditions are met and the asset is not designated at FVTPL:
•The asset is held within a business model that is held to collect ("HTC"), in which the collection of contractual cash flows from the financial asset is the primary objective and sales are expected to be insignificant or infrequent; and
•The contractual terms of the asset give rise to cash flows that are solely payments of principal and interest ("SPPI") on the principal amount outstanding.
A financial asset is measured at FVOCI if both of the following conditions are met and the asset is not designated at FVTPL:
•The asset is held within a business model that is held to collect and sell ("HTC&S"), in which both the collection of contractual cash flows and the sale of financial assets are integral to achieving the objective of the business model; and
•The contractual terms of the asset give rise, on specified dates, to cash flows that are SPPI.
Financial assets that are managed on a fair value basis and do not meet the objectives of a HTC or HTC&S business model, such as financial assets that are held for trading, are measured at FVTPL and fall within the scope of other business models.
All financial assets not classified as amortized cost or FVOCI, as described above, are measured at FVTPL. Financial assets at FVTPL include financial assets that are held-for-trading. A financial asset is classified as held-for-trading if it is acquired principally for the purpose of selling in the near term. Cash, cash equivalents and short-term securities are held for trading for the purpose of meeting short-term cash requirements and are measured at FVTPL. On initial recognition, we may also make an irrevocable election to designate a financial asset that would otherwise be measured at amortized cost or FVOCI as measured at FVTPL if the financial asset is managed together with a related financial liability and their performance is evaluated on a fair value basis. Certain debt securities, mortgages and loan instruments that support insurance contract liabilities, which are measured at fair value, have been designated at FVTPL, as doing so significantly reduces measurement inconsistency with the related insurance contract liabilities. These financial assets would otherwise have been measured at FVOCI.
Equity securities are measured at FVTPL, unless the asset is not held for trading purposes and we make an irrevocable election to designate the asset at FVOCI. This election is made on an instrument-by-instrument basis. If such an election is made, the fair value changes, including any
74 Sun Life Financial Inc. Third Quarter 2023 CONDENSED NOTES TO THE INTERIM CONSOLIDATED FINANCIAL STATEMENTS (UNAUDITED)
associated foreign exchange gains or losses, are recognized in OCI and are not subsequently reclassified to the Consolidated Statements of Operations, including upon disposal. Realized gains and losses are transferred directly to retained earnings upon disposal.
The following table summarizes the financial assets included in our Consolidated Statements of Financial Position and the applicable classifications:
|
|
|
|
|
|
|
IFRS 9 |
| Cash, cash equivalents and short-term securities |
FVTPL |
| Debt securities |
FVTPL, FVOCI |
| Equity securities |
FVTPL, FVOCI |
| Mortgages and loans |
FVTPL, FVOCI, Amortized cost |
Other financial invested assets |
FVTPL |
Business model assessment
We determine our business models at the level that best reflects how we manage portfolios of financial assets to achieve our business objectives. Judgment is used in determining our business models, which is supported by relevant, objective evidence including:
•How the economic activities of our businesses generate benefits, for example, through enhancing yields or hedging and how such economic activities are evaluated and reported to key management personnel;
•The significant risks affecting the performance of our businesses, for example, market risk, credit risk, or other risks as described in the Risk Management section of Management’s Discussion and Analysis, and the activities undertaken to manage those risks;
•The frequency, volume, and timing of sales in prior periods, the reasons for the sales and expectations about future sales activity. Information about sales activity is not considered in isolation, but as part of an overall assessment of how our stated objective for managing the financial assets is achieved and how cash flows are realized; and
•The compensation structures for managers of our businesses, to the extent that these are directly linked to the economic performance of the business model.
Our business models include HTC, HTC&S and other, as described above.
Assessment of whether contractual cash flows are SPPI
Financial assets held within a HTC or HTC&S business model are assessed to evaluate if their contractual cash flows are comprised of SPPI. SPPI payments are those which would typically be expected from basic lending arrangements, such as interest and basic lending returns, compensation for credit risk and the time value of money, costs associated with holding the financial asset for a period of time, and a profit margin. In making the SPPI assessment, we consider the contractual terms of the instrument, including assessment of whether the timing or amount of the contractual cash flows could change by a contractual term of the financial asset. A prepayment feature is consistent with the SPPI criterion if the prepayment amount substantially represents unpaid amounts of principal and interest on the principal amount outstanding, which may include reasonable compensation for early termination of the contract.
Where the contractual terms introduce exposure to risk or variability of the cash flows that are inconsistent with a basic lending arrangement, the related financial asset is classified as and measured at FVTPL.
Subsequent measurement
Equity securities, debt securities, mortgages and loans, and assets related to Collateralized Loan Obligations ("CLOs") that are classified or designated at FVTPL are recorded at fair value in our Consolidated Statements of Financial Position, and gains or losses, including interest or dividend income and foreign exchange gains and losses, are recognized in Net investment income (loss) in the Consolidated Statements of Operations.
Debt securities, and mortgages and loans that are classified as FVOCI are recorded at fair value. Interest income, foreign exchange gains (losses), and impairment are recognized in Net investment income (loss) in the Consolidated Statements of Operations. Other gains or losses are recognized in OCI.
Mortgages and loans classified as amortized cost are subsequently measured using the effective interest rate method. Interest income, foreign exchange gains and losses, and impairment are presented in Net investment income (loss) in the Consolidated Statements of Operations.
Other financial invested assets include investments in limited partnerships, segregated funds, mutual funds, and assets related to CLOs that are classified as FVTPL. These financial assets are recorded at fair value, and gains or losses are recognized in Net investment income (loss) in the Consolidated Statements of Operations. Debt securities and Mortgages and loans included in Other financial invested assets that are classified as FVOCI are recorded at fair value.
Cash equivalents are highly liquid instruments with a term to maturity of three months or less. Cash and cash equivalents are classified as FVTPL and the fair values are assumed to approximate their carrying values, due to their short-term nature or because they are frequently repriced to current market rates. Short-term securities are those that have a term to maturity exceeding three months but less than one year. The fair value of short-term securities is approximated by their carrying amount.
ii) Derecognition
Financial assets are derecognized when our contractual rights to the cash flows of the financial asset have expired, or when we transfer the rights to receive contractual cash flows and substantially all the risks and rewards of owning the financial assets have been transferred. When we neither retain nor transfer substantially all the risks and rewards of ownership, the financial assets are derecognized if control over the financial assets have
CONDENSED NOTES TO THE INTERIM CONSOLIDATED FINANCIAL STATEMENTS (UNAUDITED) Sun Life Financial Inc. Third Quarter 2023 75 been relinquished.
If we retain control of the financial assets, we continue to recognize the transferred assets to the extent of our continuing involvement.
When financial assets are derecognized, the difference between the carrying amount and the consideration received on the date of derecognition is recognized in Net investment income (loss) in the Consolidated Statements of Operations. For debt securities at FVOCI, the cumulative gains (losses) previously recognized in OCI are reclassified to Net investment income (loss) in the Consolidated Statements of Operations. For equity investments designated at FVOCI, the cumulative gains (losses) previously recognized in OCI are not reclassified to income.
For financial assets measured at amortized cost in which modifications have resulted in derecognition, the gain (loss) is presented together with impairment losses if the modification was a result of financial difficulties of the borrower. Otherwise, the gain (loss) is presented as Net investment income (loss) in the Consolidated Statements of Operations.
Judgment is applied in determining whether contractual rights to the cash flows from the transferred assets have expired or whether we retain the rights to receive the cash flows on the assets but have assumed an obligation to pay for those cash flows.
iii) Impairment
We establish an allowance for ECL for financial assets not classified or designated at FVTPL. Financial assets measured at amortized cost are presented at their carrying amounts on the Consolidated Statements of Financial Position, which is the gross carrying amount less the allowance for ECL, with changes in the allowance for ECL recognized in Provision for credit losses in Net investment income (loss) in the Consolidated Statements of Operations. The allowance for ECL on financial assets measured at FVOCI does not reduce the carrying amount of the assets in the Consolidated Statements of Financial Position, which remains at fair value. Rather, an amount equal to the allowance for ECL that would arise if the assets were measured at amortized cost is recognized in OCI, with changes in the allowance for ECL recognized in Provision for credit losses in Net investment income (loss) in the Consolidated Statements of Operations.
At the end of each reporting period, we apply a three-stage impairment approach to measure the ECL on financial assets measured at amortized cost or at FVOCI:
•Stage 1: For financial assets that have not experienced a significant increase in credit risk since the date of initial recognition, a loss allowance equal to the credit losses expected to result from default events occurring over the 12 months following the reporting date is recognized.
•Stage 2: For financial assets that have experienced a significant increase in credit risk since the date of initial recognition, a loss allowance equal to the credit losses expected to result from default events occurring over the remaining lifetime of the financial asset is recognized.
•Stage 3: When a financial asset is considered to be credit-impaired, a loss allowance equal to the expected credit losses over the remaining lifetime of the financial asset is recognized. Interest income is calculated based on the carrying amount of the asset, net of the loss allowance.
We monitor all financial assets that are subject to impairment for significant increase in credit risk. In making this assessment, we consider both quantitative and qualitative information that is reasonable and supportable, including historical experience and forward-looking information that is available without undue cost or effort. Additional details about significant increase in credit risk and forward-looking information are provided in Note 6.A.
Modified financial assets
The contractual terms of a financial asset may be modified for a number of reasons, including changing market conditions and other factors not related to a current or potential credit deterioration of the borrower. An existing financial asset whose terms have been modified may be derecognized and the renegotiated asset recognized as a new financial asset at fair value in accordance with the accounting policies in this Note.
If modification does not result in derecognition, the financial asset continues to be subject to the assessment for significant increase in credit risk relative to initial recognition. Expected cash flows arising from the modified contractual terms are considered when calculating the ECL for the modified asset. For loans that were modified while having lifetime ECLs, such loans can revert to having 12-month ECLs if the borrower's financial condition that led to it being identified as credit-impaired are no longer present.
Definition of default
The definition of default used in the measurement of ECL is consistent with the definition of default used for our internal credit risk management purposes. We consider a financial asset to be in default when the issuer is unlikely to meet its credit obligations in full, without recourse action on our part, or when the financial asset is 90 days past due. Our definition of default may differ across financial assets and consider qualitative factors, such as the terms of financial covenants, breaches of such covenants, and other indicators of financial distress, as well as quantitative factors, such as overdue status and non-payment of other obligations under the same issuer. We use internally developed data and those obtained from external sources when assessing default.
Credit-impaired financial assets (Stage 3)
At each reporting date, we assess whether financial assets measured at amortized cost and FVOCI are credit-impaired. A financial asset is credit-impaired when one or more events that have a detrimental impact on the estimated future cash flows of the financial asset have occurred. Evidence of credit-impairment may include indications that the borrower is experiencing significant financial difficulty, probability of bankruptcy or other financial reorganization, as well as a measurable decrease in the estimated future cash flows evidenced by the adverse changes in the payments status of the borrower or economic conditions that correlate with defaults. If a financial asset is credit-impaired, interest income is calculated based on the carrying amount of the asset, which is net of the allowance for ECL, rather than on the gross carrying amount.
Write-off of financial assets
The gross carrying amount of a financial asset, and the related allowance for ECL, is written off (either partially or in full) to the extent that there is no realistic prospect of recovery. This is generally the case when we determine that the borrower does not have assets or sources of income that
76 Sun Life Financial Inc. Third Quarter 2023 CONDENSED NOTES TO THE INTERIM CONSOLIDATED FINANCIAL STATEMENTS (UNAUDITED)
could generate sufficient cash flows to repay the amounts subject to the write-off. However, financial assets that are written off could still be subject to enforcement activities in order to comply with procedures for recovery of amounts due.
iv) Embedded Derivatives
Under IFRS 9, derivatives embedded in contracts where the host is a financial asset in scope of IFRS 9 are not separated. Instead, the hybrid financial instrument, as a whole, is assessed for classification.
For policies applicable prior to January 1, 2023 under IAS 39 on Impairment, refer to Note 1 of our 2022 Annual Consolidated Financial Statements.
Financial Liabilities
Policies applicable beginning January 1, 2023 (IFRS 9)
Classification and initial measurement
Our financial liabilities are classified and measured at amortized cost, except for financial guarantees, derivative liabilities, and liabilities related to CLOs. Financial guarantees, derivative liabilities, and liabilities related to CLOs are classified as FVTPL. For further details on the liabilities related to CLOs, refer to Note 5.A.i. We may also designate certain investment contracts liabilities and third-party interests in consolidated funds at FVTPL on initial recognition, and once designated, the designation is irrevocable. Financial liabilities are designated at FVTPL if doing so either eliminates or significantly reduces accounting mismatch with the supporting assets or that the liabilities and supporting assets are managed together and their performance is evaluated on a fair value basis. Liabilities related to CLOs are designated at FVTPL on initial recognition as doing so either eliminates or significantly reduces an accounting mismatch with the supporting assets. The FVTPL designation is available only for those financial liabilities for which a reliable estimate of fair value can be obtained. All other investment contracts are measured at amortized cost using the effective interest rate method.
Subsequent measurement
Financial liabilities classified or designated at FVTPL are measured at fair value. Any interest expenses, foreign exchange gains (losses), and fair value changes that are not due to changes in own credit risk are recognized in Net investment income (loss) in the Consolidated Statements of Operations, unless they arise from derivatives designated as hedging instruments in net investment hedges. For financial liabilities designated at FVTPL, fair value changes attributable to changes in our own credit risk are recorded in OCI, and are not reclassified subsequently to Net investment income (loss) in the Consolidated Statements of Operations.
Financial liabilities at amortized cost are measured at fair value less transaction costs at initial recognition, and subsequently at amortized cost using the effective interest rate method. Interest expense and foreign exchange gains (losses) are recorded in Net investment income (loss) in the Consolidated Statements of Operations.
Derecognition
We generally derecognize a financial liability when the contractual obligations expire or are discharged or cancelled. We also derecognize a financial liability when the terms are modified and the cash flows of the modified liability are substantially different, in which case a new financial liability based on the modified terms is recognized at fair value. On derecognition of a financial liability, the difference between the carrying amount extinguished and the consideration paid (including any new non-cash assets transferred or liabilities assumed) is recognized in the Consolidated Statements of Operations.
Investment Contract Liabilities (IFRS 9)
Contracts issued by us that do not transfer significant insurance risk, but do transfer financial risk from the policyholder to us, are financial liabilities and are accounted for as investment contracts, unless they have DPF, in which case they are accounted for as insurance contracts (Note 2.A.i). Distinct service components of investment contracts are treated as service contracts.
Investment contract liabilities without DPF are initially recognized at fair value, less transaction costs directly attributable to the issue of the contract, and are subsequently held at amortized cost using the effective interest rate method. Amortization is recorded as a Decrease (increase) in investment contract liabilities in our Consolidated Statements of Operations. Deposits collected from and payments made to contract holders are recorded as changes in our Investment contract liabilities balance in the Consolidated Statements of Financial Position. Investment contract liabilities are derecognized when the obligation of the contract is discharged, cancelled or expired. Investment contract liabilities without DPF include term certain payout annuities in Canada, accumulation annuities and guaranteed investment contracts in Canada, unit-linked products issued in the UK and Hong Kong, and non-unit linked pensions contracts issued in the UK and Hong Kong.
As discussed in Note 2.A.i, investment contracts under which the policyholder bears the risks associated with the underlying investments are classified as Investment contracts for account of segregated fund holders in the Consolidated Statements of Financial Position.
Obligations for Securities Borrowing (IFRS 9)
The obligation for securities borrowing represents our commitment to deliver securities under the short sale program. Under the program, we short sell the securities that we borrowed from a third party. The obligation to return the securities is not recognized in the Consolidated Statements of Financial Position until they are sold, and the risks and rewards of ownership have been transferred. Upon recognition, they are measured at fair value. The securities borrowings are returnable to the lender upon demand or at our discretion.
CONDENSED NOTES TO THE INTERIM CONSOLIDATED FINANCIAL STATEMENTS (UNAUDITED) Sun Life Financial Inc. Third Quarter 2023 77 The changes in accounting policies resulting from the adoption of IFRS 9 have been applied retrospectively, except as described below:
Transition
•The following assessments have been made on the basis of facts and circumstances that existed as at January 1, 2023:
–The determination of the business model within which financial assets are held,
–The designation and revocation of previous designations of certain financial assets and financial liabilities as measured at FVTPL.
•Hedging relationships that were designated under IAS 39 as at December 31, 2022, meet the criteria for hedge accounting under IFRS 9 as at January 1, 2023, and were reflected as continuing hedging relationships.
•If an investment in a debt security had low credit risk as at January 1, 2023, we determined that the credit risk on the asset had not increased significantly since initial recognition.
•We have elected to apply the classification overlay to the financial assets for the comparative period, results are reported as if IFRS 9 had been effective since January 1, 2022.
Further detail on the impacts on the Consolidated Financial Statements due to the adoption of IFRS 9 are included in Note 2.A.iv.
2.A.iii Other Amended International Financial Reporting Standards Adopted in 2023
We adopted the following amendments to IFRS on January 1, 2023. The adoption of these amendments did not have a material impact on our Consolidated Financial Statements:
In May 2021, the IASB issued amendments to IAS 12 Income Taxes ("IAS 12"). The amendments, Deferred Tax related to Assets and Liabilities arising from a Single Transaction, narrow the scope of the recognition exemption in IAS 12 so that it no longer applies to transactions that, on initial recognition, give rise to equal taxable and deductible temporary differences.
In February 2021, the IASB issued amendments to IAS 1 Presentation of Financial Statements ("IAS 1") and IFRS Practice Statement 2 Making Materiality Judgments ("IFRS Practice Statement 2"). The amendments to IAS 1 require companies to disclose their material accounting policy information rather than their significant accounting policies. The amendments to IFRS Practice Statement 2 provide guidance on how to apply the concept of materiality to accounting policy disclosures.
In February 2021, the IASB issued amendments to IAS 8 Accounting Policies, Changes in Accounting Estimates and Errors ("IAS 8"). The amendments clarify how companies should distinguish changes in accounting policies from changes in accounting estimates.
In May 2023, the IASB issued amendments to IAS 12 to give temporary relief from accounting for deferred taxes arising from Pillar Two model rules, which the Organization for Economic Co-operation and Development published in December 2021. The amendments introduce a mandatory temporary exception to the accounting for deferred taxes arising from jurisdictions implementing the global tax rules and disclosure requirements for affected entities to help users better understand an entity’s exposure to Pillar Two income taxes arising from that legislation, particularly before its effective date. The amendments to IAS 12 for disclosure will be effective for annual reporting periods beginning on or after January 1, 2023. We have applied the temporary exception to the accounting for deferred taxes and are further assessing the impact of these amendments on our Consolidated Financial Statements.
78 Sun Life Financial Inc. Third Quarter 2023 CONDENSED NOTES TO THE INTERIM CONSOLIDATED FINANCIAL STATEMENTS (UNAUDITED)
2.A.iv Summary of Impact of the New and Amended International Financial Reporting Standards Adopted in 2023
Due to the adoption of IFRS 17 and IFRS 9, key financial items on our Consolidated Statements of Financial position were impacted as follows:
|
|
|
|
|
|
|
|
|
|
|
|
|
|
|
|
|
|
|
|
|
|
|
|
|
|
|
|
|
|
|
|
|
|
As at January 1, 2022 |
IFRS 9 Adjustments(1) |
IFRS 17 Adjustments |
Other(2) |
As at January 1, 2022 subsequent to transition |
| Invested assets |
|
$ |
181,261 |
|
|
$ |
4,007 |
|
|
$ |
— |
|
|
$ |
— |
|
|
$ |
185,268 |
|
Policy loans(3) |
|
3,261 |
|
|
— |
|
|
(3,261) |
|
|
— |
|
|
— |
|
Reinsurance contract held assets and Insurance contract assets(4) |
|
3,683 |
|
|
— |
|
|
3,091 |
|
|
— |
|
|
6,774 |
|
Other assets(3) |
|
157,165 |
|
|
— |
|
|
(1,156) |
|
|
1,093 |
|
|
157,102 |
|
| Total Assets |
|
$ |
345,370 |
|
|
$ |
4,007 |
|
|
$ |
(1,326) |
|
|
$ |
1,093 |
|
|
$ |
349,144 |
|
Insurance contract liabilities and Reinsurance contract held liabilities(5) |
|
$ |
147,811 |
|
|
$ |
— |
|
|
$ |
3,595 |
|
|
$ |
— |
|
|
$ |
151,406 |
|
Investment contract liabilities(6) |
|
3,368 |
|
|
— |
|
|
6,546 |
|
|
— |
|
|
9,914 |
|
Other liabilities(3) |
|
166,118 |
|
|
— |
|
|
(412) |
|
|
(88) |
|
|
165,618 |
|
| Total liabilities |
|
$ |
317,297 |
|
|
$ |
— |
|
|
$ |
9,729 |
|
|
$ |
(88) |
|
|
$ |
326,938 |
|
Total equity(7) |
|
$ |
28,073 |
|
|
$ |
4,007 |
|
|
$ |
(11,055) |
|
|
$ |
1,181 |
|
|
$ |
22,206 |
|
| Total liabilities and equity |
|
$ |
345,370 |
|
|
$ |
4,007 |
|
|
$ |
(1,326) |
|
|
$ |
1,093 |
|
|
$ |
349,144 |
|
(1) Primarily due to measurement impacts from IFRS 9 classification changes on Mortgages and loans of $4,025.
(2) Due to tax impacts from IFRS 17 and IFRS 9 adoption.
(3) Certain balances, such as Policy loans and amounts related to premiums, that were previously presented separately or included in Other assets and Other liabilities, are included in the assets or liabilities for Insurance contracts issued or Reinsurance contracts held balances under IFRS 17.
(4) Increase primarily due to IFRS 17 remeasurement impacts and a requirement to present Insurance contract assets and Reinsurance contract held liabilities separately from Insurance contract liabilities and Reinsurance contract held assets.
(5) Increase in Insurance contract liabilities and Reinsurance contract held liabilities balances is primarily due to IFRS 17 remeasurement impacts, partially offset by IFRS 17 reclassification impacts. Remeasurement impacts are primarily due to the establishment of CSM of $9.8 billion, the impact of discount rate changes under IFRS 17, and the release of certain reserves held under IFRS 4. Reclassification impacts are primarily offset in Policy loans and Investment contract liabilities.
(6) Certain contracts previously included in Insurance contract liabilities under IFRS 4 are reclassified to Investment contract liabilities under IFRS 17.
(7) Consists of a $4.4 billion reduction to Shareholders' equity and a $1.5 billion reduction to Equity in the participating account.
CONDENSED NOTES TO THE INTERIM CONSOLIDATED FINANCIAL STATEMENTS (UNAUDITED) Sun Life Financial Inc.
Impact of applying the classification overlay on January 1, 2022
Third Quarter 2023 79 As permitted by IFRS 17 and IFRS 9, we have elected to apply the classification and measurement requirements of IFRS 9 to remeasure all financial assets held in comparative periods, including those that were derecognized during that period. The classification and measurement of these financial assets were based on our expected business model as at January 1, 2022. For financial assets in which the impairment requirements of IFRS 9 applies, we have elected to continue presenting the loss allowance that was determined in accordance with IAS 39.
The impact of applying the classification overlay on the classification and measurement of financial assets for the comparative years are presented below:
|
|
|
|
|
|
|
|
|
|
|
|
|
|
|
|
|
|
|
|
|
|
|
|
|
|
|
|
|
|
|
|
|
|
|
|
|
|
|
|
|
|
|
|
|
|
|
Classification Category |
|
IAS 39 |
|
|
|
IFRS 9 |
|
| Financial instrument |
|
IAS 39 |
|
IFRS 9 |
|
As at
December 31, 2021 |
|
Impact of classification overlay |
|
As at
January 1, 2022 |
|
| Assets impacted by the classification overlay: |
|
| Debt securities |
|
AFS |
|
FVTPL |
|
|
$ |
125 |
|
|
|
$ |
— |
|
|
|
$ |
125 |
|
(1) |
| Debt securities |
|
AFS |
|
FVOCI |
|
|
12,604 |
|
|
|
— |
|
|
|
12,604 |
|
|
| Debt securities |
|
FVTPL |
|
FVOCI |
|
|
3,549 |
|
|
|
— |
|
|
|
3,549 |
|
(2) |
| Equity securities |
|
AFS |
|
FVTPL |
|
|
1,575 |
|
|
|
— |
|
|
|
1,575 |
|
(3) |
|
|
|
|
|
|
|
|
|
|
|
|
|
|
|
| Mortgages and loans |
|
Loans and receivables |
|
FVTPL |
|
|
47,772 |
|
|
|
4,015 |
|
|
|
51,787 |
|
(4) |
| Mortgages and loans |
|
Loans and receivables |
|
FVOCI |
|
|
1,594 |
|
|
|
20 |
|
|
|
1,614 |
|
(5) |
| Mortgages and loans |
|
Loans and receivables |
|
Amortized cost |
|
|
2,326 |
|
|
|
— |
|
|
|
2,326 |
|
(6) |
| Other financial invested assets |
|
AFS |
|
FVTPL |
|
|
781 |
|
|
|
— |
|
|
|
781 |
|
(3) |
| Other financial invested assets (CLOs) |
|
Loans and receivables |
|
FVOCI |
|
|
1,865 |
|
|
|
(10) |
|
|
|
1,855 |
|
(7) |
| Assets not impacted by the classification overlay: |
|
| Derivative assets |
|
FVTPL |
|
FVTPL |
|
|
1,583 |
|
|
|
— |
|
|
|
1,583 |
|
|
| Other financial invested assets |
|
FVTPL |
|
FVTPL |
|
|
4,435 |
|
|
|
— |
|
|
|
4,435 |
|
|
| Cash, cash equivalents and short-term securities |
|
FVTPL |
|
FVTPL |
|
|
12,278 |
|
|
|
— |
|
|
|
12,278 |
|
|
| Debt securities |
|
FVTPL |
|
FVTPL |
|
|
72,449 |
|
|
|
— |
|
|
|
72,449 |
|
|
| Equity securities |
|
FVTPL |
|
FVTPL |
|
|
7,538 |
|
|
|
— |
|
|
|
7,538 |
|
|
| Total |
|
|
|
|
|
|
$ |
170,474 |
|
|
|
$ |
4,025 |
|
|
|
$ |
174,499 |
|
|
(1) Certain debt securities classified as AFS under IAS 39 are reclassified to FVTPL under IFRS 9, primarily because doing so can eliminate or significantly reduce an accounting mismatch.
(2) Certain debt securities previously designated at FVTPL under IAS 39 are reclassified to FVOCI under IFRS 9 as they are managed within a business model of collecting contractual cash flows and selling the financial assets, and pass the SPPI test.
(3) Certain equity securities and other financial invested assets were classified as AFS under IAS 39 are reclassified to FVTPL under IFRS 9 and we have not elected to designate them at FVOCI.
(4) Certain mortgages and loans classified as loans and receivables under IAS 39 are reclassified to FVTPL under IFRS 9, primarily because doing so can eliminate or significantly reduce an accounting mismatch. The carrying value of these mortgages and loans was adjusted to reflect their fair value with the difference recorded in retained earnings.
(5) Certain mortgages and loans classified as loans and receivables under IAS 39 are reclassified to FVOCI under IFRS 9 as they are held within a business model of collecting contractual cash flows and selling the financial assets, and pass the SPPI test.
(6) Certain mortgages and loans classified as loans and receivables under IAS 39 are reclassified to amortized cost under IFRS 9 as they are held within a business model of collecting contractual cash flows, and pass the SPPI test.
(7) Under IAS 39, assets related to CLOs within other financial invested assets were classified as loans and receivables. These assets are managed within a business model of collecting contractual cash flows and selling the financial assets, and pass the SPPI test. Accordingly, we have reclassified these other financial invested assets from amortized cost to FVOCI under IFRS 9.
The classification overlay was applied as at January 1, 2022, with a post-tax impact of $2,873 to opening retained earnings and $(116) to AOCI. Equity in the participating account increased by a post-tax amount of $397. Our accounting policies for the classification of financial instruments under IFRS 9 are set out in Note 2.A.ii. The application of those accounting policies resulted in the reclassifications presented in the table above.
80 Sun Life Financial Inc. Third Quarter 2023 CONDENSED NOTES TO THE INTERIM CONSOLIDATED FINANCIAL STATEMENTS (UNAUDITED)
Impact of IFRS 9 adoption on January 1, 2023
Classification of financial assets and financial liabilities
The following table summarizes the classification and measurement impact of IFRS 9 as at January 1, 2023, including any reclassification and remeasurement changes from how assets were measured using the classification overlay. Reclassifications represent movements of the carrying amount of financial assets and financial liabilities whose classifications have changed as a result of IFRS 9. Remeasurement represents changes in the carrying amount of the financial assets and financial liabilities due to changes in their measurement.
|
|
|
|
|
|
|
|
|
|
|
|
|
|
|
|
|
|
|
|
|
|
|
|
|
|
|
|
|
|
|
|
|
|
|
|
|
|
Reconciliation of carrying amount |
Classification Category |
|
IFRS 9(1) |
|
|
|
|
IFRS 9 |
| As at |
|
IFRS 9(4) |
|
December 31,
2022
|
Reclassification(2) |
Remeasurement(3) |
January 1,
2023
|
| Financial assets with transition impact: |
|
|
|
|
|
|
|
|
|
|
Debt securities |
|
FVTPL |
|
|
$ |
302 |
|
|
$ |
3,079 |
|
|
$ |
— |
|
|
$ |
3,381 |
|
Debt securities |
|
FVOCI |
|
|
16,545 |
|
|
(2,285) |
|
|
— |
|
|
14,260 |
|
Debt securities |
|
FVTPL |
|
|
59,055 |
|
|
(794) |
|
|
— |
|
|
58,261 |
|
Equity securities |
|
FVTPL |
|
|
324 |
|
|
(70) |
|
|
— |
|
|
254 |
|
Equity securities |
|
FVOCI |
|
|
— |
|
|
70 |
|
|
— |
|
|
70 |
|
Mortgages and loans |
|
FVTPL |
|
|
47,208 |
|
|
150 |
|
|
— |
|
|
47,358 |
|
Mortgages and loans |
|
FVOCI |
|
|
1,804 |
|
|
(150) |
|
|
— |
|
|
1,654 |
|
Mortgages and loans |
|
Amortized cost |
|
|
2,241 |
|
|
— |
|
|
19 |
|
|
2,260 |
|
Other financial invested assets |
|
FVTPL |
|
|
996 |
|
|
— |
|
|
— |
|
|
996 |
|
|
|
|
|
|
|
|
|
|
|
|
|
Other financial invested assets (CLOs)(5) |
|
FVTPL |
|
|
2,880 |
|
|
— |
|
|
— |
|
|
2,880 |
|
| Financial assets with no transition impact: |
|
|
|
|
|
|
|
|
|
|
Derivative assets |
|
FVTPL |
|
|
2,095 |
|
|
— |
|
|
— |
|
|
2,095 |
|
Other financial invested assets |
|
FVTPL |
|
|
5,542 |
|
|
— |
|
|
— |
|
|
5,542 |
|
Cash, cash equivalents and short-term securities |
|
FVTPL |
|
|
11,219 |
|
|
— |
|
|
— |
|
|
11,219 |
|
Equity securities |
|
FVTPL |
|
|
6,824 |
|
|
— |
|
|
— |
|
|
6,824 |
|
Total financial assets |
|
|
|
|
$ |
157,035 |
|
|
$ |
— |
|
|
$ |
19 |
|
|
$ |
157,054 |
|
|
|
|
|
|
|
|
|
|
|
|
|
|
|
|
|
|
|
|
|
|
|
|
|
|
|
|
|
|
|
|
|
|
|
|
|
|
|
|
|
|
|
|
|
|
|
|
|
(1) Amounts for the year ended December 31, 2022 were adjusted to reflect application of the classification overlay, the recognition of unfunded commitments on FVTPL fixed income assets and the impact of enhancements to our fair value methodology for private fixed income assets. The enhancements increased observability of inputs to the fair valuation of private fixed income assets and resulted in a decrease of $634 in the carrying value of our private fixed income assets as at December 31, 2022. The recognition of unfunded commitments resulted in a decrease of $98 in the carrying value of our mortgages and loans as at December 31, 2022.
(2) Certain financial assets were reclassified between classification categories upon the adoption of IFRS 17 and IFRS 9 on January 1, 2023. The reclassifications were primarily driven by asset rebalancing between segments where level of sensitivity to interest rates resulted in the designation of certain fixed income assets at FVTPL or a reclassification from FVTPL to FVOCI.
(3) We adopted impairment requirements under IFRS 9 on January 1, 2023. Remeasurement primarily reflects the difference between IAS 39 incurred loss allowance and IFRS 9 allowance for ECL that affect carrying value. Refer to the Impairment of financial assets table below for remaining adjustments that did not affect carrying value.
(4) The IAS 39 classification category for financial asset balances as at December 31, 2022 can be referenced in the table above describing the impact of the classification overlay.
(5) The classification of Other financial invested assets related to CLOs as well as the corresponding liabilities were revised from FVOCI and Amortized cost, respectively, to FVTPL to reflect the business model used to manage the assets and liabilities related to CLOs. The impact of this change is not material.
Our financial liabilities were not significantly impacted by the adoption of IFRS 9 on January 1, 2023. Segregated fund contracts and supporting assets were also not significantly impacted by the adoption of IFRS 9 on January 1, 2023, as they maintained a FVTPL classification. The post-tax amounts recognized in opening retained earnings and AOCI on January 1, 2023, as a result of the adoption of IFRS 9, were $(553) and $553, respectively.
Items previously designated at FVTPL
The following financial assets are classified under IFRS 9 as FVTPL by nature because the assets are managed on a fair value basis, or FVOCI because they are managed under a business model of HTC&S.
|
|
|
|
|
|
|
|
|
|
|
|
|
|
|
|
|
|
|
|
|
|
|
|
|
IAS 39 |
IFRS 9 |
| As at |
December 31, 2022 |
January 1, 2023 |
|
Previous measurement category |
Carrying amount |
Measurement category |
Carrying amount |
| Financial assets: |
|
|
|
|
|
|
|
|
|
|
|
|
|
|
| Debt securities |
|
FVTPL (designated) |
|
$ |
3,703 |
|
FVOCI |
|
$ |
4,497 |
|
| Equity securities |
|
FVTPL (designated) |
|
$ |
6,824 |
|
FVTPL |
|
$ |
6,824 |
|
| Other financial invested assets |
|
FVTPL (designated) |
|
$ |
5,542 |
|
FVTPL |
|
$ |
5,542 |
|
CONDENSED NOTES TO THE INTERIM CONSOLIDATED FINANCIAL STATEMENTS (UNAUDITED) Sun Life Financial Inc. Third Quarter 2023 81 The following table reconciles the loss allowance under IAS 39 as at December 31, 2022 with the allowance for ECL under IFRS 9 as at January 1, 2023.
Impairment of financial assets
|
|
|
|
|
|
|
|
|
|
|
|
|
|
|
|
|
|
|
|
|
|
IAS 39
December 31, 2022
|
Remeasurement |
IFRS 9
January 1, 2023
|
Debt securities at FVOCI under IFRS 9: |
|
|
|
|
|
|
From AFS under IAS 39 |
|
$ |
— |
|
|
$ |
15 |
|
|
$ |
15 |
|
From FVTPL under IAS 39 |
|
— |
|
|
17 |
|
|
17 |
|
Mortgages and loans at FVTPL under IFRS 9: |
|
|
|
|
|
|
From loans and receivables under IAS 39 |
|
151 |
|
|
(151) |
|
|
— |
|
Mortgages and loans at FVOCI under IFRS 9: |
|
|
|
|
|
|
From loans and receivables under IAS 39 |
|
33 |
|
|
1 |
|
|
34 |
|
Mortgages and loans at amortized cost under IFRS 9: |
|
|
|
|
|
|
| From loans and receivables under IAS 39 |
|
8 |
|
|
1 |
|
|
9 |
|
|
|
|
|
|
|
|
|
|
|
|
|
|
|
Total |
|
$ |
192 |
|
|
$ |
(117) |
|
|
$ |
75 |
|
2.B Additional Disclosures
IFRS 17 and IFRS 9 require enhanced disclosures for insurance contracts and financial instruments. These disclosures are included primarily in Notes 5, 6, 7 and 12 of our Interim Consolidated Financial Statements. The disclosures in this section are being added to our Interim Consolidated Financial Statements to provide additional context during the first year of adoption of IFRS 17 and IFRS 9. The majority of these disclosures would otherwise only be reported by us in our Annual Consolidated Financial Statements. These bridging disclosures are limited to those items or balances that have had material recognition, classification, measurement or presentation changes upon adoption of IFRS 17 and IFRS 9.
2.B.i Insurance Contracts
2.B.i.(a) Insurance Contracts Summary and Methods and Assumptions
Summary
We sell a variety of insurance contracts that include many forms of life, health and critical illness insurance sold to individuals and groups, annuities, and segregated fund products with guarantees. We hold reinsurance contracts that transfer mortality and other risks following internal guidelines.
Insurance contracts with direct participation features are products where investments are managed on behalf of policyholders, and investment returns less a variable fee are passed through to policyholders with the insurance benefits they receive. Insurance contracts with direct participation features are measured using the VFA, and include segregated funds, unit-linked contracts, variable universal life contracts, and most participating insurance contracts. Reinsurance contracts (both issued and held) cannot be measured using the VFA.
Insurance contracts without direct participation features are eligible to use the PAA if the coverage period is one year or less, or if the result of applying the PAA is not expected to be a materially different result than applying the GMA in each reporting period over the life of the contract. Insurance contracts eligible to use the PAA include most group life and health contracts and the associated reinsurance contracts held.
Other insurance contracts are measured using the GMA. This includes most individual life and health insurance contracts and annuities and the associated reinsurance contracts held.
The Consolidated Statements of Financial Position present insurance contracts issued and reinsurance contracts held as both assets and liabilities, depending on whether the portfolio is in an asset or liability position. Certain disclosures in this Note exclude assets and liabilities for contracts measured using the PAA, as indicated.
82 Sun Life Financial Inc. Third Quarter 2023 CONDENSED NOTES TO THE INTERIM CONSOLIDATED FINANCIAL STATEMENTS (UNAUDITED)
The following table shows the insurance contracts issued and reinsurance contracts held, excluding insurance contract liabilities for account of segregated fund holders. Further details on Insurance contract liabilities for account of segregated fund holders are included in Note 11 and Note 2.B.ii. Total insurance contract liabilities, including Insurance contract liabilities for account of segregated fund holders, are $175,491 as at January 1, 2022.
|
|
|
|
|
|
|
|
|
|
|
| As at January 1, 2022 |
| Total contracts: |
|
|
|
|
| Insurance contract assets |
|
|
|
$ |
162 |
|
Insurance contract liabilities(1) |
|
|
|
149,412 |
|
| Net insurance contract liabilities |
|
|
|
149,250 |
|
| Reinsurance contract held assets |
|
|
|
6,612 |
|
| Reinsurance contract held liabilities |
|
|
|
1,994 |
|
| Net reinsurance contract held assets |
|
|
|
4,618 |
|
| Contracts measured using the PAA: |
|
|
|
|
| Insurance contract assets |
|
|
|
— |
|
| Insurance contract liabilities |
|
|
|
17,395 |
|
| Net insurance contract liabilities - PAA |
|
|
|
17,395 |
|
| Reinsurance contract held assets |
|
|
|
437 |
|
| Reinsurance contract held liabilities |
|
|
|
— |
|
| Net reinsurance contract held assets - PAA |
|
|
|
437 |
|
| Contracts not measured using the PAA: |
|
|
|
|
| Insurance contract assets |
|
|
|
162 |
|
Insurance contract liabilities(1) |
|
|
|
132,017 |
|
| Net insurance contract liabilities - non-PAA |
|
|
|
131,855 |
|
| Reinsurance contract held assets |
|
|
|
6,175 |
|
| Reinsurance contract held liabilities |
|
|
|
1,994 |
|
| Net reinsurance contract held assets - non-PAA |
|
|
|
$ |
4,181 |
|
(1) Includes liabilities of $195 for segregated fund insurance contracts that are not backed by the related Investments for account of segregated fund holders.
Methods and Assumptions
General
A group of insurance contracts is measured as the total of FCF, which is the present value of future cash flows plus the risk adjustment for
non-financial risk, and, for groups measured using the GMA or VFA, the CSM. In measuring the present value of future cash flows, assumptions must be made about mortality and morbidity rates, lapse and other policyholder behaviour ("policyholder behaviour"), expenses and other factors over the life of our products, and the prevailing market view of the cost of financial risk in our products. Many of these assumptions relate to events that are anticipated to occur many years in the future. Assumptions require significant judgment and regular review and, where appropriate, revision.
The RA is the compensation we require for the uncertainty related to non-financial risk in the estimates of future cash flows. This compensation is measured by discounting cash flows from applying margins to the non-financial assumptions used in the estimate of future cash flows.
The CSM represents the unearned profit that will be recognized as insurance contract services are provided.
The methods and assumptions used in the measurement of insurance contracts are reviewed regularly and are subject to external actuarial peer review.
Present Value of Future Cash Flows
Assumptions for non-financial risk variables in the present value of future cash flows are intended to be current, neutral estimates of the expected outcome. The choice of assumptions takes into account current circumstances, past experience data from our own experience or from the industry, the relationship of past to expected future experience, anti-selection, the relationship among assumptions (including those for financial risk variables), and other relevant factors.
Assumptions for financial risk variables in the present value of future cash flows are based on current observable market prices, adjusted to account for differences between the financial risk embedded in our products and those in the corresponding observed market instrument. Where no relevant market instrument is available, we use the best information available.
Mortality
Mortality refers to the rates at which death occurs for defined groups of people. Mortality assumptions are generally based on the past five to ten years of experience. Our experience is combined with industry experience or experience from reinsurers where our own experience is insufficient to be statistically valid. Assumed mortality rates for life insurance and annuity contracts include assumptions about future mortality improvement based on recent trends in population mortality and our outlook for future trends.
CONDENSED NOTES TO THE INTERIM CONSOLIDATED FINANCIAL STATEMENTS (UNAUDITED) Sun Life Financial Inc. Third Quarter 2023 83
Morbidity
Morbidity refers to the rate of being unhealthy or disabled and the rates of recovery therefrom. Most of our disability insurance is marketed on a group basis. We offer critical illness policies on an individual basis in Canada and Asia, long-term care on an individual basis in Canada, and medical stop-loss insurance is offered on a group basis in the U.S. In Canada, group morbidity assumptions are based on our five-year average experience, modified to reflect any emerging trend in recovery rates. For Canadian long-term care and critical illness insurance in Canada and Asia, assumptions are developed in collaboration with our reinsurers and are largely based on their experience. In the U.S., our experience is used for both medical stop-loss and disability assumptions, with some consideration of industry or reinsurer experience.
Policyholder Behaviour
Lapse or surrender
Policyholders may allow their policies to lapse prior to the end of the contractual coverage period by choosing not to continue to pay premiums or by surrendering their policy for the cash surrender value. Assumptions for lapse or surrender experience on life insurance are generally based on our five-year average experience. Lapse or surrender rates vary by plan, age at issue, method of premium payment, policy duration and financial risk variables.
Premium payment patterns
For universal life contracts, it is necessary to set assumptions about premium payment patterns. Studies prepared by industry or the actuarial profession are used for products where our experience is insufficient to be statistically valid. Premium payment patterns usually vary by plan, age at issue, method of premium payment, policy duration and financial risk variables.
Expense
Future expenses directly attributable to the fulfilment of our insurance contracts include the costs of premium collection, claims adjudication and processing, actuarial calculations, preparation and mailing of policy statements, and related overhead. Future expense assumptions are mainly based on our recent experience using an internal expense allocation methodology. Inflationary increases assumed in future expenses are based on long-term expectations.
Acquisition expenses directly attributable to portfolios of insurance contracts include the costs of selling, underwriting and issuing insurance contracts. For new insurance contracts measured using the GMA or VFA, actual or estimated directly attributable acquisition expenses are recognized in the initial measurement of the contract. If estimates are used, the difference between estimated and actual acquisition expenses adjusts the CSM when the group of insurance contracts is closed to new contracts.
Current Discount Rates
Current discount rates are used to discount estimates of future cash flows in determining the present value of future cash flows. Current discount rates reflect the time value of money, the characteristics of the cash flows, and the liquidity characteristics of the insurance contracts.
Current discount rates for cash flows that do not vary based on returns on underlying items
Cash flows that do not vary at all based on the returns on any underlying items are discounted at rates that reflect the timing and currency of cash flows and the liquidity characteristics of the insurance contracts.
The timing of cash flows is reflected by constructing a discount curve, so that each cash flow is discounted consistent with the timing of the cash flow. In constructing the discount curve, a portion is based on market information (the observable period) and beyond that period, the discount rates are estimated (the unobservable period). The observable period, which varies by currency, is the time period where information on risk-free interest rates is deep and liquid. In the unobservable period, risk-free rates are interpolated between the last observable point and an ultimate risk-free rate at year 70. The ultimate risk-free rate is estimated using historical averages.
The currency of cash flows is reflected by using different discount curves for different currencies.
Liquidity is reflected by adding a liquidity premium to risk-free discount rates that is consistent with the liquidity characteristics of the insurance contracts. The liquidity premium in the observable period is based on the liquidity premium on assets with similar liquidity characteristics, which is estimated from the spread inherent in current market yields less a deduction for expected and unexpected credit losses. The deduction for expected and unexpected credit losses is estimated using historical rating agency data and current market conditions, and varies by asset type, quality, and duration. The liquidity premium in the unobservable period is interpolated between the last observable liquidity premium and an ultimate liquidity premium (at year 70) specific to liquid or illiquid contracts. See Note 7.A for further details, which provides a weighted average summary of the discount curves used to present value cash flows for all major products that do not vary based on the returns on underlying items.
Current discount rates for cash flows that vary with returns on underlying items
Discount rates for cash flows that vary directly with returns on underlying items reflect that variability. For the portion of cash flows that is a pass through of returns on underlying items to policyholders, the discount rate is such that the present value of cash flows equals the portion of the underlying items that is passed through to policyholders. For cash flows that vary, but not directly, with underlying items (e.g., financial guarantees), scenario testing may be necessary. If so, discount rates used in the scenario projections are scenario-specific and based on the projected risk-free rates in the scenario plus liquidity premiums consistent with the liquidity characteristics of the contracts being measured.
Scenario Testing
Scenario testing may be required when the relationship between cash flows and financial risk variables is non-linear, or where there are complex interdependencies among cash flows. In scenario testing of financial risk variables, future cash flows are projected for each scenario path and discounted at the scenario-specific discount rates, resulting in a present value of future cash flows for each scenario. The provision for the projected cash flows is the average of the scenario-specific values. Assumptions for non-financial risk variables are the best estimate assumptions consistent with the scenario.
84 Sun Life Financial Inc. Third Quarter 2023 CONDENSED NOTES TO THE INTERIM CONSOLIDATED FINANCIAL STATEMENTS (UNAUDITED)
Scenarios are consistent with the current market environment. Our Economic Scenario Generator calibration process produces integrated stochastic scenarios of financial risk variables (e.g., risk-free interest rates, bond fund returns, equity returns) with parameters calibrated to replicate observable market prices of financial instruments available in the market. Adjustments are made when the insurance contracts being measured are illiquid but the financial instruments to which the scenarios are calibrated to are liquid.
Risk Adjustment for Non-Financial Risk
The RA for insurance contracts issued is the compensation we require for bearing uncertainty about the amount and timing of the cash flows that arises from non-financial risk. This amount is measured as the present value of the difference between estimated future cash flows with a margin applied to non-financial assumptions and estimated future cash flows without this adjustment. Margins generally range from 5% to 20% depending on the uncertainty in the determination of the assumption. The level of uncertainty, and hence the margin chosen, varies by assumption and by line of business and other factors. Considerations that would generally lead to a choice of margin at the higher end of the range are as follows:
•The statistical credibility of our experience is too low to be the primary source of data for choosing the assumption;
•Future experience is difficult to estimate;
•The cohort of risks lacks homogeneity;
•Operational risks adversely impact the ability to estimate the assumption; or
•Past experience may not be representative of future experience and the experience may deteriorate.
Margins are generally stable over time and are revised only to reflect changes in the level of uncertainty in the assumptions. Our margins tend to be at mid-range.
The RA for reinsurance contracts held represents the amount of risk transferred to the reinsurer. This is measured as the difference between the RA on the underlying insurance contracts without reinsurance and what the RA on the underlying insurance contracts would be with reinsurance. The RA for reinsurance contracts held increases the asset or reduces the liability for reinsurance contracts held.
The RA for insurance contracts issued and reinsurance contracts held corresponds to a confidence level of approximately 80-85% overall.
Contractual Service Margin
The initial and subsequent measurement of CSM is described in Note 2.A.i. Additional detail about certain components of the measurement of CSM is provided below.
Interest accretion
For insurance contracts measured using the GMA, locked-in discount rates are used to accrete interest on the CSM. The locked-in discount rate for a group of insurance contracts is the weighted average of the current discount rates at initial recognition of the contracts in the group. For groups of contracts that are in-force as at transition (January 1, 2022), the locked-in discount rates are the discount rates in effect at the date of transition as the fair value approach was applied for these groups at transition.
For insurance contracts measured using the VFA, there is no accretion of interest. Rather, the CSM is adjusted by the change in our share of the fair value of underlying items.
Changes in FCF relating to future service
For insurance contracts measured using the GMA, locked-in discount rates are used to measure changes in FCF relating to future service. Changes in FCF relating to future service reflect changes in non-financial assumptions but not changes in assumptions related to financial risk.
For insurance contracts measured using the VFA, current discount rates are used to measure the change in FCF relating to future service. Changes in FCF relating to future service reflect both changes in non-financial assumptions and changes in assumptions related to financial risk.
Changes in FCF relating to future service include (Liability for Remaining Coverage only):
•All changes related to investment component payments (including current period payments);
•Changes arising from changes in assumptions used to derive the present value of future cash flows - limited to non-financial assumptions for insurance contracts measured using the GMA;
•Changes in future cash flows arising from claims in the current period; and
•For insurance contracts measured using the GMA, changes related to discretionary cash flows on some universal life and adjustable products. Discretionary cash flows are cash flows outside the guaranteed payments to the policyholder, and are described as a spread on earned rates (in the case of some universal life contracts) and in the policy on criteria for changes to adjustable policies for adjustable policies.
CSM amortization
The amount of CSM recognized as insurance revenue in each period to reflect the insurance contract services provided for a group of contracts in the period is determined by:
•Identifying the total coverage units in the group (for services in current and future periods) – based on the quantity of insurance contract services;
•Allocating the CSM at the end of the period equally to each coverage unit in the current period and expected to be provided in the future (i.e., coverage units "unitize" the services provided); then
•Recognizing in insurance revenue the amount allocated to coverage units provided in the period.
Total coverage units for services expected to be provided in future periods is the present value of projected coverage units. The present value is measured using locked-in discount rates for groups measured using the GMA and current discount rates for groups measured using the VFA.
CONDENSED NOTES TO THE INTERIM CONSOLIDATED FINANCIAL STATEMENTS (UNAUDITED) Sun Life Financial Inc. Third Quarter 2023 85 For reinsurance contracts held, CSM amortization reflects the services received in the period.
The coverage unit for a group is based on the nature of the insurance contract services provided. Insurance contract services comprise services for providing insurance coverage and, for some contracts, investment-return or investment-related services. It does not include services related to performing functions such as claims adjudication.
For insurance contracts measured using the VFA, coverage units are based on the policyholder's account value or the policyholders' share of the fair value of underlying items. For insurance contracts measured using the GMA, coverage units are based on the expected claim amount (excluding any investment component) for life and health insurance contracts, and the payment due in a period for annuity contracts.
2.B.i.(b) Expectation of When CSM Will Be Recognized in Income
Insurance Contracts Issued
The following table illustrates the expected timing of CSM amortization into insurance revenue for insurance contracts issued.
|
|
|
|
|
|
| As at December 31, 2022 |
| Within 1 year |
$ |
844 |
|
| 1-3 years |
1,506 |
|
| 3-5 years |
1,292 |
|
| 5-10 years |
2,470 |
|
| Over 10 years |
4,858 |
|
| Total |
$ |
10,970 |
|
Reinsurance Contracts Held
The following table illustrates the expected timing of CSM amortization into Reinsurance contract held net income (expenses) for reinsurance contracts held.
|
|
|
|
|
|
As at December 31, 2022 |
| Within 1 year |
$ |
(8) |
|
| 1-3 years |
(15) |
|
| 3-5 years |
(14) |
|
| 5-10 years |
(27) |
|
| Over 10 years |
(41) |
|
| Total |
$ |
(105) |
|
86 Sun Life Financial Inc. Third Quarter 2023 CONDENSED NOTES TO THE INTERIM CONSOLIDATED FINANCIAL STATEMENTS (UNAUDITED)
2.B.i.(c) CSM and Insurance Revenue by Transition Method
Insurance Contracts Issued
The following tables show the reconciliations of the CSM and the amount of insurance revenue recognized separately for insurance contracts that existed at the transition date to which the fair value transition approach was applied. The reconciliation of the CSM for all other contracts is for contracts issued after the transition date that are not measured using the PAA. Insurance revenue for all other contracts includes contracts issued after the transition date as well as all revenue from all contracts measured using the PAA.
|
|
|
|
|
|
|
|
|
For the year ended December 31, 2022 |
Insurance contracts issued at transition measured using the fair value approach: |
|
|
Contractual Service Margin: |
|
|
| Balance, beginning of period |
|
$ |
9,886 |
|
| Changes related to current service: |
|
|
| CSM recognized for services provided |
|
(843) |
|
|
|
|
| Changes related to future service: |
|
|
| Changes in estimates that adjust CSM |
|
1,274 |
|
|
|
|
| Insurance finance income (expenses) from insurance contracts issued |
|
(352) |
|
Foreign currency translation |
|
240 |
|
Balance, end of period |
|
10,205 |
|
Insurance revenue |
|
5,892 |
|
All other insurance contracts issued: |
|
|
Contractual Service Margin: |
|
|
| Balance, beginning of period |
|
18 |
|
| Changes related to current service: |
|
|
| CSM recognized for services provided |
|
(28) |
|
|
|
|
| Changes related to future service: |
|
|
| Changes in estimates that adjust CSM |
|
(141) |
|
| Effect of contracts initially recognized in the period (new business) |
|
894 |
|
| Insurance finance income (expenses) from insurance contracts issued |
|
5 |
|
Foreign currency translation |
|
17 |
|
Balance, end of period |
|
765 |
|
Insurance revenue |
|
$ |
13,010 |
|
CONDENSED NOTES TO THE INTERIM CONSOLIDATED FINANCIAL STATEMENTS (UNAUDITED) Sun Life Financial Inc. Third Quarter 2023 87 The following table shows the reconciliation of the CSM separately for reinsurance contracts held assets that existed at the transition date to which the fair value transition approach was applied.
Reinsurance Contracts Held
The reconciliation of the CSM for all other contracts is for contracts issued after the transition date that are not measured using the PAA.
|
|
|
|
|
|
|
|
|
| For the year ended December 31, 2022 |
Reinsurance contracts held at transition measured using the fair value approach: |
|
|
Contractual Service Margin: |
|
|
Balances, beginning of period |
|
$ |
107 |
|
Changes related to current service: |
|
|
CSM recognized for services received |
|
(13) |
|
|
|
|
Changes related to future service: |
|
|
Changes in estimates that adjust CSM |
|
81 |
|
|
|
|
Changes in estimates that relate to losses and reversals of losses on groups of underlying contracts |
|
(9) |
|
|
|
|
| Insurance finance income (expenses) from reinsurance contracts held |
|
1 |
|
Foreign currency translation |
|
8 |
|
Balances, end of period |
|
175 |
|
All other reinsurance contracts held: |
|
|
Contractual Service Margin: |
|
|
Balances, beginning of period |
|
— |
|
Changes related to current service: |
|
|
CSM recognized for services received |
|
3 |
|
|
|
|
Changes related to future service: |
|
|
Changes in estimates that adjust CSM |
|
(25) |
|
Loss recoveries at initial recognition of onerous underlying contracts |
|
23 |
|
Changes in estimates that relate to losses and reversals of losses on groups of underlying contracts |
|
(14) |
|
Contracts initially recognized in the period |
|
(58) |
|
|
|
|
Foreign currency translation |
|
1 |
|
Balances, end of period |
|
$ |
(70) |
|
2.B.i.(d) Underlying Items for Insurance Contracts Issued with Direct Participation Features
The fair value of the underlying items for insurance contract liabilities for the account of segregated fund holders are included in Note 11.
The composition and fair value of the underlying items for other insurance contracts with direct participation features included in the Consolidated Statements of Financial Position, are as follows:
|
|
|
|
|
|
|
|
|
| As at December 31, 2022 |
Cash, cash equivalents and short-term securities |
|
$ |
2,339 |
|
Debt securities |
|
22,140 |
|
Equity securities |
|
4,750 |
|
Mortgages and loans |
|
9,749 |
|
Derivative assets |
|
131 |
|
Other financial invested assets |
|
2,187 |
|
Investment properties |
|
6,346 |
|
Total |
|
$ |
47,642 |
|
2.B.ii Segregated Funds
Investments for account of segregated fund holders on the Consolidated Statements of Financial Position includes investments both for segregated funds classified as insurance contracts and segregated funds classified as investment contracts. The breakdown as follows:
|
|
|
|
|
|
|
|
|
|
|
|
|
|
|
|
|
As at January 1, 2022 |
Investments for account of segregated fund holders - investment contracts |
|
|
|
$ |
113,917 |
|
Investments for account of segregated fund holders - insurance contracts |
|
|
|
26,079 |
|
Total investments for account of segregated fund holders |
|
|
|
$ |
139,996 |
|
88 Sun Life Financial Inc. Third Quarter 2023 CONDENSED NOTES TO THE INTERIM CONSOLIDATED FINANCIAL STATEMENTS (UNAUDITED)
Investments for Account of Segregated Fund Holders - Investment Contracts
The carrying value of investments for account of segregated fund holders for contracts classified as investment contracts are as follows:
|
|
|
|
|
|
|
|
|
| As at January 1, 2022 |
Segregated and mutual fund units |
|
$ |
107,277 |
|
Equity securities |
|
4,317 |
|
Debt securities |
|
1,753 |
|
Cash, cash equivalents and short-term securities |
|
264 |
|
Investment properties |
|
226 |
|
Mortgages |
|
1 |
|
Other assets |
|
98 |
|
Total assets |
|
113,936 |
|
Less: Liabilities arising from investing activities |
|
19 |
|
Total investments for account of segregated fund holders |
|
$ |
113,917 |
|
Investments for Account of Segregated Fund Holders - Insurance Contracts
The carrying value of investments for account of segregated fund holders for contracts classified as insurance contracts, which are the underlying items for the insurance contracts, are as follows:
|
|
|
|
|
|
|
|
|
As at January 1, 2022 |
| Segregated and mutual fund units |
|
$ |
18,667 |
|
| Equity securities |
|
5,646 |
|
| Debt securities |
|
1,657 |
|
| Cash, cash equivalents and short-term securities |
|
514 |
|
| Investment properties |
|
220 |
|
| Mortgages |
|
18 |
|
| Other assets |
|
43 |
|
| Total assets |
|
26,765 |
|
| Less: Liabilities arising from investing activities |
|
686 |
|
| Total investments for account of segregated fund holders |
|
$ |
26,079 |
|
2.B.iii Insurance Risk
The following table sets out the estimated immediate impact on, or sensitivity of, the CSM and net income to certain instantaneous changes in the insurance and other non-financial assumptions used in the calculation of our insurance contract liabilities, based on a starting point and business mix as at December 31, 2022. These estimates are illustrative and different starting points for best estimate assumptions, CSM balances and business mix will result in different estimated sensitivities.
The impact on CSM is attributable to insurance contracts measured using the GMA and VFA. For insurance contracts measured using the GMA, the impact flows through the CSM at locked-in discount rates. For insurance contracts measured using the VFA, the impact flows through the CSM at current discount rates.
The impact on net income is attributable to any portion of the sensitivities for insurance contracts measured under GMA and VFA that cannot be absorbed by CSM, the full impact for insurance contracts measured under the PAA, and the difference in impact between locked-in and current discount rates for insurance contracts measured using the GMA. If current discount rates are higher than locked-in rates, this generally results in a favourable impact to net income from contracts measured using the GMA.
|
|
|
|
|
|
|
|
|
|
|
|
|
|
|
|
|
|
|
|
|
|
|
|
|
|
|
|
|
|
|
|
|
|
|
|
|
|
|
|
|
|
|
|
|
|
|
As at December 31, 2022 |
|
|
|
|
Potential impact on CSM
(pre-tax) |
Potential impact on net income / equity
(post-tax) |
Sensitivities(1) |
|
|
|
|
|
|
Insurance contracts issued |
Net of reinsurance contracts held |
|
Insurance contracts issued |
Net of reinsurance contracts held |
| Policyholder Behaviour (10% increase/decrease, where adverse) |
|
|
|
|
|
|
|
|
|
|
$ |
(825) |
|
|
$ |
(850) |
|
|
|
$ |
75 |
|
|
$ |
75 |
|
| Life Mortality rates (2% increase) |
|
|
|
|
|
|
|
|
|
|
$ |
(450) |
|
|
$ |
(75) |
|
|
|
$ |
50 |
|
|
$ |
(25) |
|
| Annuity Mortality rates (2% decrease) |
|
|
|
|
|
|
|
|
|
|
$ |
(175) |
|
|
$ |
(175) |
|
|
|
$ |
25 |
|
|
$ |
25 |
|
| Morbidity rates (5% incidence increase and 5% termination decrease) |
|
|
|
|
|
|
|
|
|
$ |
(200) |
|
|
$ |
(75) |
|
|
|
$ |
(175) |
|
|
$ |
(175) |
|
| Expenses (5% increase) |
|
|
|
|
|
|
|
|
|
|
$ |
(175) |
|
|
$ |
(175) |
|
|
|
$ |
— |
|
|
$ |
— |
|
(1) Net income and CSM sensitivities have been rounded in increments of $25.
CONDENSED NOTES TO THE INTERIM CONSOLIDATED FINANCIAL STATEMENTS (UNAUDITED) Sun Life Financial Inc. Third Quarter 2023 89 Effective January 1, 2023, our total capital base was re-measured due to our adoption of IFRS 17.
2.B.iv Capital Management
We exceeded our minimum capital requirements as at January 1, 2023.
We have provided our adjusted total capital base as at January 1, 2023, below, which consists mainly of common shareholders’ equity, preferred shareholders’ equity, equity in the participating account, non-controlling interests’ equity, CSM, and certain other capital securities that qualify as regulatory capital.
|
|
|
|
|
|
|
|
|
|
|
|
|
|
|
|
IFRS 17 and IFRS 9 |
IFRS 4 and IAS 39 |
As at |
January 1, 2023 |
December 31, 2022 |
Subordinated debt |
|
$ |
6,676 |
|
|
$ |
6,676 |
|
Innovative capital instruments(1) |
|
200 |
|
|
200 |
|
Equity: |
|
|
|
|
Preferred shareholders’ equity |
|
2,239 |
|
|
2,239 |
|
Common shareholders’ equity(2) |
|
20,290 |
|
|
25,211 |
|
Equity in the participating account |
|
268 |
|
|
1,837 |
|
Non-controlling interests’ equity |
|
90 |
|
|
90 |
|
Contractual Service Margin(3) |
|
10,865 |
|
|
|
Total capital(3)(4) |
|
$ |
40,628 |
|
|
$ |
36,253 |
|
(1) Innovative capital instruments are SLEECS issued by SLCT I. SLCT I is not consolidated by us.
(2) Common shareholders' equity is equal to Total shareholders' equity less Preferred shares and other equity instruments.
(3) Effective January 1, 2023, the Office of the Superintendent of Financial Institutions, Canada ("OSFI") LICAT Guideline was updated to include CSM as part of Available Capital. Prior period restatements are not required.
(4) For regulatory reporting purposes under the LICAT framework, there were further adjustments, including goodwill, non-life investments, and others as prescribed by OSFI, to the total capital figure presented in the table above.
Further details on our capital, and how it is managed, are included in Note 21 of our 2022 Annual Consolidated Financial Statements. An update as at September 30, 2023 is provided in Note 10 of our Interim Consolidated Financial Statements.
90 Sun Life Financial Inc. Third Quarter 2023 CONDENSED NOTES TO THE INTERIM CONSOLIDATED FINANCIAL STATEMENTS (UNAUDITED)
|
|
|
|
|
|
|
|
|
|
|
|
|
|
|
3. Acquisitions and Other |
|
Dialogue Health Technologies
On July 26, 2023, we announced that we entered into an agreement to acquire Dialogue Health Technologies ("Dialogue") in which our current ownership interest will increase from 23% to 95% for cash proceeds of approximately $272. Dialogue is a Canadian based health and wellness virtual care platform and will form a part of our Canada business segment.
SLF of Canada UK Limited Disposition
On August 4, 2022, we entered into an agreement to sell SLF of Canada UK Limited ("Sun Life UK"). Effective April 3, 2023, we completed the sale of Sun Life UK to Phoenix Group Holdings plc. Sun Life UK manages life and pension policies as well as payout annuities blocks for UK Clients. Sun Life UK was closed to new sales and had operated as a run-off business since 2001. We retained our economic interest in the payout annuities business after the sale through a reinsurance treaty that is reported within our U.S. segment.
During the second quarter of 2023, a gain of $12 on the sale of the business was recognized in Total net income on the Consolidated Statements of Operations. The disposal is included within our Corporate business segment. Prior to the completion of the sale, we had recorded an impairment charge of $170 pertaining to goodwill that was written off during the third quarter of 2022.
The details of the disposition are summarized as follows:
|
|
|
|
|
|
|
|
|
|
|
|
|
|
|
| As at April 3, 2023 |
| Cash consideration |
$ |
418 |
|
| Less: Net assets |
(359) |
|
| Less: Foreign currency translation, transaction costs, and other adjustments |
(47) |
|
| Total gain recognized in Total net income in current period |
$ |
12 |
|
|
|
DentaQuest
On June 1, 2022, we acquired DentaQuest, the second-largest provider of dental benefits in the United States by membership, for $3,267 (US$2,584). Total consideration for the 100% acquisition of DentaQuest was paid with cash of $3,267, and primarily comprised of goodwill and intangibles, including contractual relationships, software, and brand. DentaQuest is reported in the Dental CGU of our U.S. business segment. The acquisition of DentaQuest aligns to our business strategy of being a leader in health and group benefits, with an increasing focus on health.
The fair values of the identifiable assets and liabilities acquired were:
|
|
|
|
|
|
|
|
|
|
|
|
|
|
|
| As at June 1, 2022 |
| Intangible assets |
$ |
1,074 |
|
| Net assets |
255 |
| Deferred tax liabilities |
(189) |
|
| Total identifiable net assets at fair value |
1,140 |
|
|
|
Goodwill arising on acquisition(1) |
2,127 |
| Total consideration |
$ |
3,267 |
|
(1) Goodwill primarily reflects expected synergies from the combination of DentaQuest and our existing Dental and Vision business within the U.S. Group Benefits business, as well as the future growth potential of the DentaQuest business. Goodwill is not tax deductible.
The fair value of the identifiable assets and liabilities were subject to refinement and have been adjusted.
CONDENSED NOTES TO THE INTERIM CONSOLIDATED FINANCIAL STATEMENTS (UNAUDITED) Sun Life Financial Inc.
Advisors Asset Management Inc.
Third Quarter 2023 91 On February 1, 2023, we completed the acquisition of a 51% interest, on a fully diluted basis, in Advisors Asset Management Inc. ("AAM"), as well as the ability to acquire the remaining interest in the future. AAM is a leading independent U.S. retail distribution firm, and forms part of our Asset Management business segment. AAM will become the U.S. retail distribution arm of SLC Management. Consideration included $248 (US$187) in cash.
The fair values of the identifiable assets and liabilities acquired were:
|
|
|
|
|
|
| As at February 1, 2023 |
| Intangible assets and Goodwill |
$ |
515 |
|
| Net assets |
44 |
|
| Deferred tax liability |
(100) |
|
| Total identifiable net assets at fair value |
459 |
|
Non-controlling interest(1) |
(211) |
|
| Total consideration |
$ |
248 |
|
(1) We have elected to measure non-controlling interest ("NCI") at fair value for this acquisition. The fair value was determined by calculating the proportionate share of the present value of future cash flows relating to NCI. Significant assumptions inherent in the valuation of NCI include the estimated after-tax cash flows expected to be received and an assessment of the appropriate discount rate.
The fair values of the identifiable assets and liabilities are subject to refinement and may be retroactively adjusted to reflect new information obtained about facts and circumstances that existed at the acquisition date during the measurement period.
AAM minority shareholders also have the option to require us to purchase their shares ("put option") in 2028. We have a call option to acquire the remaining outstanding shares held by these minority shareholders commencing in 2028. The fair value of the put option liability was recognized in Other financial liabilities and any excess over the carrying amounts arising from transactions relating to non-controlling shareholders was recorded as a reduction to Retained earnings. Any changes to the carrying value of the financial liability after the acquisition date will be recognized in the Consolidated Statements of Operations.
|
|
|
|
|
|
|
|
|
|
|
|
|
|
|
|
|
|
|
|
|
| As at February 1, 2023 |
Share purchase |
Put option adjustments |
Total |
| Cash consideration |
|
$ |
(248) |
|
|
$ |
— |
|
|
$ |
(248) |
|
Intangible assets and Goodwill(1) |
|
515 |
|
|
— |
|
|
515 |
|
| Net assets |
|
44 |
|
|
— |
|
|
44 |
|
| Total assets |
|
$ |
311 |
|
|
$ |
— |
|
|
$ |
311 |
|
| Deferred tax liability |
|
$ |
(100) |
|
|
$ |
— |
|
|
$ |
(100) |
|
| Other financial liabilities - put option |
|
— |
|
|
(369) |
|
|
(369) |
|
| Total liabilities |
|
$ |
(100) |
|
|
$ |
(369) |
|
|
$ |
(469) |
|
| Non-controlling interest |
|
$ |
(211) |
|
|
$ |
211 |
|
|
$ |
— |
|
| Retained earnings |
|
— |
|
|
158 |
|
|
158 |
|
| Total equity |
|
$ |
(211) |
|
|
$ |
369 |
|
|
$ |
158 |
|
(1) Goodwill primarily reflects non-contractual customer relationships, including synergies from the combination of AAM with our existing investment management relationships within our Asset Management segment. Goodwill is not tax deductible.
Other
On January 20, 2023, we announced our entry into a 15-year exclusive bancassurance partnership with Dah Sing Bank, Limited. This is our first exclusive bancassurance partnership in Hong Kong and will be a valuable complement to our existing network of insurance advisors. Effective July 1, 2023, we commenced the partnership. We will pay an amount of approximately $260 for this exclusive arrangement, with ongoing variable payments to Dah Sing Bank, Limited based on the success of the partnership.
Effective February 1, 2023, we completed the sale of our sponsored markets business to Canadian Premier Life Insurance Company. Our sponsored markets business includes a variety of association & affinity, and group creditor clients. We disposed of assets of approximately $638 and liabilities of approximately $638. Total consideration received consisted of cash consideration of $98 and contingent consideration of $25. During the first quarter of 2023, we recorded a pre-tax gain on the sale of the business of $102 in Other income on the Consolidated Statements of Operations. The gain on the sale of the business net of goodwill disposed, transaction costs and taxes is $65.
92 Sun Life Financial Inc. Third Quarter 2023 CONDENSED NOTES TO THE INTERIM CONSOLIDATED FINANCIAL STATEMENTS (UNAUDITED)
We have five reportable business segments: Canada, U.S., Asset Management, Asia, and Corporate. These business segments operate in the financial services industry and reflect our management structure and internal financial reporting. Asset Management includes the results of our MFS and SLC Management business units. Corporate includes the results of our UK business unit and our Corporate Support operations, which include run-off reinsurance operations, as well as investment income, expenses, capital and other items not allocated to our other business groups. Effective the second quarter of 2023, we completed the sale of our UK Business unit. We have retained our economic interest in the annuity business via a reinsurance arrangement that will be reported under the U.S. reportable segment on a prospective basis.
Revenues from our business segments are derived primarily from life and health insurance, investment management and annuities, and mutual funds. Revenues not attributed to the strategic business units are derived primarily from Corporate investments and earnings on capital. Transactions between segments are executed and priced at an arm's-length basis in a manner similar to transactions with third parties.
The expenses in each business segment may include costs or services directly incurred or provided on their behalf at the enterprise level. For other costs not directly attributable to one of our business segments, we use a management reporting framework that uses assumptions, judgments, and methodologies for allocating overhead costs and indirect expenses to our business segments.
Intersegment transactions consist primarily of internal financing agreements which are measured at fair values prevailing when the arrangements are negotiated. Intersegment investment income consists primarily of interest paid by U.S. to Corporate. Intersegment fee income is primarily asset management fees paid by our business segments to Asset Management. SLC Management collects fee income and incurs the operational expenses associated with the management of the general fund assets. Intersegment transactions are eliminated in the Consolidation adjustments column in the following tables.
Management considers its external Clients to be individuals and corporations. We are not reliant on any individual Client as none is individually significant to our operations.
CONDENSED NOTES TO THE INTERIM CONSOLIDATED FINANCIAL STATEMENTS (UNAUDITED) Sun Life Financial Inc. Third Quarter 2023 93
|
|
|
|
|
|
|
|
|
|
|
|
|
|
|
|
|
|
|
|
|
|
|
|
|
|
|
|
|
|
|
|
|
|
|
|
|
|
|
|
|
|
|
|
|
For the three months ended |
Canada |
|
U.S. |
Asset Management |
|
Asia |
Corporate |
Consolidation adjustments |
Total |
| September 30, 2023 |
|
|
|
|
|
|
|
|
|
|
|
|
|
|
| Insurance revenue: |
|
|
|
|
|
|
|
|
|
|
|
|
|
|
| Annuities |
|
$ |
478 |
|
|
$ |
75 |
|
|
$ |
— |
|
|
$ |
6 |
|
|
$ |
(4) |
|
|
$ |
— |
|
|
$ |
555 |
|
| Life insurance |
|
521 |
|
|
559 |
|
|
— |
|
|
254 |
|
|
3 |
|
|
— |
|
|
1,337 |
|
| Health insurance |
|
1,021 |
|
|
2,368 |
|
|
— |
|
|
52 |
|
|
— |
|
|
— |
|
|
3,441 |
|
| Total Insurance revenue |
|
2,020 |
|
|
3,002 |
|
|
— |
|
|
312 |
|
|
(1) |
|
|
— |
|
|
5,333 |
|
| Net investment income (loss) |
|
(3,636) |
|
|
(712) |
|
|
54 |
|
|
(532) |
|
|
24 |
|
|
(22) |
|
|
(4,824) |
|
Fee income |
|
349 |
|
|
111 |
|
|
1,486 |
|
|
76 |
|
|
31 |
|
|
(123) |
|
|
1,930 |
|
Total revenue(1) |
|
(1,267) |
|
|
2,401 |
|
|
1,540 |
|
|
(144) |
|
|
54 |
|
|
(145) |
|
|
2,439 |
|
| Expenses: |
|
|
|
|
|
|
|
|
|
|
|
|
|
|
| Insurance service expenses |
|
1,671 |
|
|
2,656 |
|
|
— |
|
|
224 |
|
|
4 |
|
|
— |
|
|
4,555 |
|
Reinsurance contract held net (income) expenses |
|
51 |
|
|
8 |
|
|
— |
|
|
10 |
|
|
(3) |
|
|
— |
|
|
66 |
|
| Insurance finance (income) expenses from insurance contracts issued |
|
(4,082) |
|
|
(901) |
|
|
— |
|
|
(776) |
|
|
— |
|
|
— |
|
|
(5,759) |
|
| Reinsurance finance (income) expenses |
|
(30) |
|
|
174 |
|
|
— |
|
|
— |
|
|
— |
|
|
— |
|
|
144 |
|
| (Decrease) increase in investment contract liabilities |
86 |
|
|
— |
|
|
— |
|
|
2 |
|
|
— |
|
|
— |
|
|
88 |
|
|
|
|
|
|
|
|
|
|
|
|
|
|
|
|
| Interest expenses |
|
53 |
|
|
29 |
|
|
40 |
|
|
21 |
|
|
38 |
|
|
(21) |
|
|
160 |
|
| Operating expenses and commissions |
|
424 |
|
|
263 |
|
|
1,152 |
|
|
137 |
|
|
152 |
|
|
(124) |
|
|
2,004 |
|
Total expenses(1) |
|
(1,827) |
|
|
2,229 |
|
|
1,192 |
|
|
(382) |
|
|
191 |
|
|
(145) |
|
|
1,258 |
|
Income (loss) before income taxes |
|
560 |
|
|
172 |
|
|
348 |
|
|
238 |
|
|
(137) |
|
|
— |
|
|
1,181 |
|
Less: Income tax expense (benefit) |
|
183 |
|
|
34 |
|
|
70 |
|
|
8 |
|
|
(51) |
|
|
— |
|
|
244 |
|
Total net income (loss) |
|
377 |
|
|
138 |
|
|
278 |
|
|
230 |
|
|
(86) |
|
|
— |
|
|
937 |
|
| Less: |
|
|
|
|
|
|
|
|
|
|
|
|
|
|
| Net income (loss) allocated to the participating account |
12 |
|
|
6 |
|
|
— |
|
|
19 |
|
|
— |
|
|
— |
|
|
37 |
|
| Net income (loss) attributable to non-controlling interests
|
|
— |
|
|
— |
|
|
10 |
|
|
— |
|
|
— |
|
|
— |
|
|
10 |
|
Shareholders' net income (loss) |
|
$ |
365 |
|
|
$ |
132 |
|
|
$ |
268 |
|
|
$ |
211 |
|
|
$ |
(86) |
|
|
$ |
— |
|
|
$ |
890 |
|
| September 30, 2022 |
|
|
|
|
|
|
|
|
|
|
|
|
|
|
| (restated, see Note 2) |
|
|
|
|
|
|
|
|
|
|
|
|
|
|
| Insurance revenue: |
|
|
|
|
|
|
|
|
|
|
|
|
|
|
| Annuities |
|
$ |
450 |
|
|
$ |
(1) |
|
|
$ |
— |
|
|
$ |
6 |
|
|
$ |
89 |
|
|
$ |
— |
|
|
$ |
544 |
|
| Life insurance |
|
539 |
|
|
543 |
|
|
— |
|
|
300 |
|
|
15 |
|
|
— |
|
|
1,397 |
|
| Health insurance |
|
1,059 |
|
|
2,127 |
|
|
— |
|
|
20 |
|
|
2 |
|
|
— |
|
|
3,208 |
|
| Total Insurance revenue |
|
2,048 |
|
|
2,669 |
|
|
— |
|
|
326 |
|
|
106 |
|
|
— |
|
|
5,149 |
|
| Net investment income (loss) |
|
947 |
|
|
(1,027) |
|
|
(1) |
|
|
(1,384) |
|
|
(567) |
|
|
(24) |
|
|
(2,056) |
|
Fee income |
|
343 |
|
|
103 |
|
|
1,354 |
|
|
71 |
|
|
51 |
|
|
(114) |
|
|
1,808 |
|
Total revenue(1) |
|
3,338 |
|
|
1,745 |
|
|
1,353 |
|
|
(987) |
|
|
(410) |
|
|
(138) |
|
|
4,901 |
|
| Expenses: |
|
|
|
|
|
|
|
|
|
|
|
|
|
|
| Insurance service expenses |
|
1,736 |
|
|
2,238 |
|
|
— |
|
|
226 |
|
|
69 |
|
|
— |
|
|
4,269 |
|
Reinsurance contract held net (income) expenses |
|
106 |
|
|
191 |
|
|
— |
|
|
(8) |
|
|
— |
|
|
— |
|
|
289 |
|
| Insurance finance (income) expenses from insurance contracts issued |
|
955 |
|
|
(1,220) |
|
|
— |
|
|
(1,346) |
|
|
(494) |
|
|
— |
|
|
(2,105) |
|
| Reinsurance finance (income) expenses |
|
10 |
|
|
138 |
|
|
— |
|
|
(5) |
|
|
— |
|
|
— |
|
|
143 |
|
| (Decrease) increase in investment contract liabilities |
42 |
|
|
— |
|
|
— |
|
|
(3) |
|
|
6 |
|
|
— |
|
|
45 |
|
|
|
|
|
|
|
|
|
|
|
|
|
|
|
|
|
|
|
|
|
|
|
|
|
|
|
|
|
|
|
| Interest expenses |
|
56 |
|
|
24 |
|
|
25 |
|
|
18 |
|
|
17 |
|
|
(21) |
|
|
119 |
|
| Operating expenses and commissions |
|
358 |
|
|
223 |
|
|
1,018 |
|
|
143 |
|
|
286 |
|
|
(117) |
|
|
1,911 |
|
Total expenses(1) |
|
3,263 |
|
|
1,594 |
|
|
1,043 |
|
|
(975) |
|
|
(116) |
|
|
(138) |
|
|
4,671 |
|
Income (loss) before income taxes |
|
75 |
|
|
151 |
|
|
310 |
|
|
(12) |
|
|
(294) |
|
|
— |
|
|
230 |
|
Less: Income tax expense (benefit) |
|
3 |
|
|
30 |
|
|
83 |
|
|
(15) |
|
|
(24) |
|
|
— |
|
|
77 |
|
Total net income (loss) |
|
72 |
|
|
121 |
|
|
227 |
|
|
3 |
|
|
(270) |
|
|
— |
|
|
153 |
|
| Less: |
|
|
|
|
|
|
|
|
|
|
|
|
|
|
| Net income (loss) allocated to the participating account |
16 |
|
|
(4) |
|
|
— |
|
|
3 |
|
|
— |
|
|
— |
|
|
15 |
|
| Net income (loss) attributable to non-controlling interests |
|
— |
|
|
— |
|
|
9 |
|
|
— |
|
|
— |
|
|
— |
|
|
9 |
|
Shareholders' net income (loss) |
|
$ |
56 |
|
|
$ |
125 |
|
|
$ |
218 |
|
|
$ |
— |
|
|
$ |
(270) |
|
|
$ |
— |
|
|
$ |
129 |
|
(1) Total revenue and total expenses exclude Investment result for insurance contracts for account of segregated fund holders.
94 Sun Life Financial Inc. Third Quarter 2023 CONDENSED NOTES TO THE INTERIM CONSOLIDATED FINANCIAL STATEMENTS (UNAUDITED)
|
|
|
|
|
|
|
|
|
|
|
|
|
|
|
|
|
|
|
|
|
|
|
|
|
|
|
|
|
|
|
|
|
|
|
|
|
|
|
|
|
|
|
|
|
For the nine months ended |
Canada |
|
U.S. |
Asset Management |
|
Asia |
Corporate |
Consolidation adjustments |
Total |
| September 30, 2023 |
|
|
|
|
|
|
|
|
|
|
|
|
|
|
| Insurance revenue: |
|
|
|
|
|
|
|
|
|
|
|
|
|
|
| Annuities |
|
$ |
1,429 |
|
|
$ |
146 |
|
|
$ |
— |
|
|
$ |
15 |
|
|
$ |
96 |
|
|
$ |
— |
|
|
$ |
1,686 |
|
| Life insurance |
|
1,588 |
|
|
1,490 |
|
|
— |
|
|
878 |
|
|
(15) |
|
|
— |
|
|
3,941 |
|
| Health insurance |
|
3,046 |
|
|
7,125 |
|
|
— |
|
|
95 |
|
|
5 |
|
|
— |
|
|
10,271 |
|
| Total Insurance revenue |
|
6,063 |
|
|
8,761 |
|
|
— |
|
|
988 |
|
|
86 |
|
|
— |
|
|
15,898 |
|
| Net investment income (loss) |
|
(351) |
|
|
(60) |
|
|
114 |
|
|
534 |
|
|
254 |
|
|
(66) |
|
|
425 |
|
| Fee income |
|
1,098 |
|
|
330 |
|
|
4,373 |
|
|
227 |
|
|
106 |
|
|
(367) |
|
|
5,767 |
|
Total revenue(1) |
|
6,810 |
|
|
9,031 |
|
|
4,487 |
|
|
1,749 |
|
|
446 |
|
|
(433) |
|
|
22,090 |
|
| Expenses: |
|
|
|
|
|
|
|
|
|
|
|
|
|
|
| Insurance service expenses |
|
5,018 |
|
|
7,826 |
|
|
— |
|
|
700 |
|
|
103 |
|
|
— |
|
|
13,647 |
|
Reinsurance contract held net (income) expenses |
|
124 |
|
|
(55) |
|
|
— |
|
|
9 |
|
|
(2) |
|
|
— |
|
|
76 |
|
| Insurance finance (income) expenses from insurance contracts issued |
|
(1,131) |
|
|
(337) |
|
|
— |
|
|
48 |
|
|
113 |
|
|
— |
|
|
(1,307) |
|
| Reinsurance finance (income) expenses |
|
(15) |
|
|
124 |
|
|
— |
|
|
10 |
|
|
— |
|
|
— |
|
|
119 |
|
| (Decrease) increase in investment contract liabilities |
231 |
|
|
— |
|
|
— |
|
|
5 |
|
|
(1) |
|
|
— |
|
|
235 |
|
| Other income |
|
(102) |
|
|
— |
|
|
— |
|
|
— |
|
|
(67) |
|
|
— |
|
|
(169) |
|
| Interest expenses |
|
142 |
|
|
79 |
|
|
112 |
|
|
51 |
|
|
118 |
|
|
(65) |
|
|
437 |
|
| Operating expenses and commissions |
|
1,283 |
|
|
779 |
|
|
3,304 |
|
|
364 |
|
|
547 |
|
|
(368) |
|
|
5,909 |
|
Total expenses(1) |
|
5,550 |
|
|
8,416 |
|
|
3,416 |
|
|
1,187 |
|
|
811 |
|
|
(433) |
|
|
18,947 |
|
Income (loss) before income taxes |
|
1,260 |
|
|
615 |
|
|
1,071 |
|
|
562 |
|
|
(365) |
|
|
— |
|
|
3,143 |
|
| Less: Income tax expense (benefit) |
|
317 |
|
|
123 |
|
|
223 |
|
|
30 |
|
|
(145) |
|
|
— |
|
|
548 |
|
| Total net income (loss) |
|
943 |
|
|
492 |
|
|
848 |
|
|
532 |
|
|
(220) |
|
|
— |
|
|
2,595 |
|
| Less: |
|
|
|
|
|
|
|
|
|
|
|
|
|
|
| Net income (loss) allocated to the participating account |
39 |
|
|
17 |
|
|
— |
|
|
65 |
|
|
— |
|
|
— |
|
|
121 |
|
| Net income (loss) attributable to non-controlling interests
|
|
— |
|
|
— |
|
|
78 |
|
|
— |
|
|
— |
|
|
— |
|
|
78 |
|
Shareholders' net income (loss) |
|
$ |
904 |
|
|
$ |
475 |
|
|
$ |
770 |
|
|
$ |
467 |
|
|
$ |
(220) |
|
|
$ |
— |
|
|
$ |
2,396 |
|
| September 30, 2022 |
|
|
|
|
|
|
|
|
|
|
|
|
|
|
| (restated, see Note 2) |
|
|
|
|
|
|
|
|
|
|
|
|
|
|
| Insurance revenue: |
|
|
|
|
|
|
|
|
|
|
|
|
|
|
| Annuities |
|
$ |
1,370 |
|
|
$ |
— |
|
|
$ |
— |
|
|
$ |
22 |
|
|
$ |
290 |
|
|
$ |
— |
|
|
$ |
1,682 |
|
| Life insurance |
|
1,557 |
|
|
1,356 |
|
|
— |
|
|
837 |
|
|
54 |
|
|
— |
|
|
3,804 |
|
| Health insurance |
|
3,105 |
|
|
4,939 |
|
|
— |
|
|
59 |
|
|
8 |
|
|
— |
|
|
8,111 |
|
| Total Insurance revenue |
|
6,032 |
|
|
6,295 |
|
|
— |
|
|
918 |
|
|
352 |
|
|
— |
|
|
13,597 |
|
| Net investment income (loss) |
|
(10,995) |
|
|
(3,997) |
|
|
(1) |
|
|
(5,234) |
|
|
(1,452) |
|
|
(69) |
|
|
(21,748) |
|
| Fee income |
|
1,046 |
|
|
182 |
|
|
4,177 |
|
|
241 |
|
|
100 |
|
|
(320) |
|
|
5,426 |
|
Total revenue(1) |
|
(3,917) |
|
|
2,480 |
|
|
4,176 |
|
|
(4,075) |
|
|
(1,000) |
|
|
(389) |
|
|
(2,725) |
|
| Expenses: |
|
|
|
|
|
|
|
|
|
|
|
|
|
|
| Insurance service expenses |
|
5,220 |
|
|
5,811 |
|
|
— |
|
|
687 |
|
|
247 |
|
|
— |
|
|
11,965 |
|
Reinsurance contract held net (income) expenses |
|
189 |
|
|
(83) |
|
|
— |
|
|
(17) |
|
|
1 |
|
|
— |
|
|
90 |
|
| Insurance finance (income) expenses from insurance contracts issued |
|
(11,816) |
|
|
(4,741) |
|
|
— |
|
|
(5,306) |
|
|
(1,372) |
|
|
— |
|
|
(23,235) |
|
| Reinsurance finance (income) expenses |
|
(75) |
|
|
529 |
|
|
— |
|
|
(12) |
|
|
3 |
|
|
— |
|
|
445 |
|
| (Decrease) increase in investment contract liabilities |
107 |
|
|
— |
|
|
— |
|
|
(11) |
|
|
6 |
|
|
— |
|
|
102 |
|
|
|
|
|
|
|
|
|
|
|
|
|
|
|
|
| Interest expenses |
|
152 |
|
|
50 |
|
|
66 |
|
|
50 |
|
|
61 |
|
|
(61) |
|
|
318 |
|
| Operating expenses and commissions |
|
1,098 |
|
|
480 |
|
|
2,997 |
|
|
343 |
|
|
507 |
|
|
(328) |
|
|
5,097 |
|
Total expenses(1) |
|
(5,125) |
|
|
2,046 |
|
|
3,063 |
|
|
(4,266) |
|
|
(547) |
|
|
(389) |
|
|
(5,218) |
|
Income (loss) before income taxes |
|
1,208 |
|
|
434 |
|
|
1,113 |
|
|
191 |
|
|
(453) |
|
|
— |
|
|
2,493 |
|
| Less: Income tax expense (benefit) |
|
396 |
|
|
87 |
|
|
259 |
|
|
15 |
|
|
(146) |
|
|
— |
|
|
611 |
|
| Total net income (loss) |
|
812 |
|
|
347 |
|
|
854 |
|
|
176 |
|
|
(307) |
|
|
— |
|
|
1,882 |
|
| Less: |
|
|
|
|
|
|
|
|
|
|
|
|
|
|
| Net income (loss) allocated to the participating account |
24 |
|
|
17 |
|
|
— |
|
|
58 |
|
|
— |
|
|
— |
|
|
99 |
|
| Net income (loss) attributable to non-controlling interests |
|
— |
|
|
— |
|
|
27 |
|
|
— |
|
|
— |
|
|
— |
|
|
27 |
|
Shareholders' net income (loss) |
|
$ |
788 |
|
|
$ |
330 |
|
|
$ |
827 |
|
|
$ |
118 |
|
|
$ |
(307) |
|
|
$ |
— |
|
|
$ |
1,756 |
|
(1) Total revenue and total expenses exclude Investment result for insurance contracts for account of segregated fund holders.
CONDENSED NOTES TO THE INTERIM CONSOLIDATED FINANCIAL STATEMENTS (UNAUDITED) Sun Life Financial Inc. Third Quarter 2023 95 The carrying values and fair values of our financial assets and liabilities are shown in the following table:
|
|
|
|
|
|
|
|
|
|
|
|
|
|
|
| 5. Total Invested Assets and Related Net Investment Income |
|
5.A Fair Value of Financial Instruments
5.A.i Carrying Value and Fair Value of Financial Assets and Financial Liabilities
|
|
|
|
|
|
|
|
|
|
|
|
|
|
|
|
|
|
|
|
|
|
|
|
|
|
|
| As at |
September 30, 2023 |
December 31, 2022 |
|
|
|
|
(restated, see Note 2) |
|
Carrying value |
|
Fair value |
Carrying value |
|
Fair value |
| Financial assets |
|
|
|
|
|
|
|
|
| Cash, cash equivalents and short-term securities - FVTPL |
|
$ |
11,026 |
|
|
$ |
11,026 |
|
|
$ |
11,219 |
|
|
$ |
11,219 |
|
Debt securities - FVTPL(1) |
|
54,989 |
|
|
54,989 |
|
|
59,357 |
|
|
59,357 |
|
| Debt securities - FVOCI |
|
13,890 |
|
|
13,890 |
|
|
16,545 |
|
|
16,545 |
|
| Equity securities - FVTPL |
|
7,010 |
|
|
7,010 |
|
|
7,148 |
|
|
7,148 |
|
| Equity securities - FVOCI |
|
70 |
|
|
70 |
|
|
|
|
|
Mortgages and loans - FVTPL(2) |
|
47,988 |
|
|
47,988 |
|
|
47,208 |
|
|
47,208 |
|
| Mortgages and loans - FVOCI |
|
1,817 |
|
|
1,817 |
|
|
1,804 |
|
|
1,804 |
|
Mortgages and loans - Amortized cost(3) |
|
2,189 |
|
|
2,027 |
|
|
2,241 |
|
|
2,106 |
|
| Derivative assets - FVTPL |
|
1,878 |
|
|
1,878 |
|
|
2,095 |
|
|
2,095 |
|
Other financial invested assets (excluding CLOs) - FVTPL(4) |
|
6,923 |
|
|
6,923 |
|
|
6,538 |
|
|
6,538 |
|
Other financial invested assets (CLOs) - FVTPL(7) |
|
3,280 |
|
|
3,280 |
|
|
2,880 |
|
|
2,880 |
|
Total (5) |
|
$ |
151,060 |
|
|
$ |
150,898 |
|
|
$ |
157,035 |
|
|
$ |
156,900 |
|
| Financial liabilities |
|
|
|
|
|
|
|
|
| Investment contract liabilities - Amortized cost |
|
$ |
11,344 |
|
|
$ |
11,344 |
|
|
$ |
10,728 |
|
|
$ |
10,728 |
|
| Obligations for securities borrowing - FVTPL |
|
194 |
|
|
194 |
|
|
73 |
|
|
73 |
|
| Derivative liabilities - FVTPL |
|
2,541 |
|
|
2,541 |
|
|
2,351 |
|
|
2,351 |
|
Other financial liabilities - Amortized cost(6) |
|
2,483 |
|
|
2,304 |
|
|
1,996 |
|
|
1,852 |
|
Other financial liabilities (CLOs) - FVTPL(7) |
|
3,064 |
|
|
3,064 |
|
|
2,816 |
|
|
2,688 |
|
Total (8) |
|
$ |
19,626 |
|
|
$ |
19,447 |
|
|
$ |
17,964 |
|
|
$ |
17,692 |
|
(1) Includes primarily debt securities that are designated at FVTPL.
(2) Includes primarily mortgages and loans that are designated at FVTPL.
(3) Certain mortgages and loans are carried at amortized cost. The fair value of these mortgages and loans, for disclosure purposes, is determined based on the methodology and assumptions described in Note 5.A.iii. As at September 30, 2023, $2,018 and $9 are categorized in Level 2 and Level 3, respectively, of the fair value hierarchy described in this Note (December 31, 2022 — $2,105 and $1, respectively).
(4) Other financial invested assets include our investments in segregated funds, mutual funds, and limited partnerships.
(5) Invested assets on our Consolidated Statements of Financial Position of $162,764 (December 31, 2022 — $168,789) includes Total financial assets in this table, Investment properties of $9,952 (December 31, 2022 — $10,102), and Other non-financial invested assets of $1,752 (December 31, 2022 — $1,652). Other non-financial invested assets consists of investment in associates, subsidiaries and joint ventures which are not consolidated.
(6) Amount reflects the obligations to purchase outstanding shares of certain SLC Management subsidiaries.
(7) See below for details on CLOs.
(8) Total financial liabilities excluding Senior debentures and Subordinated debt.
Collateralized Loan Obligations Structure
Crescent, a subsidiary within our Asset Management business segment, issues and manages CLOs. Each CLO is a special purpose vehicle that owns a portfolio of investments, consisting primarily of senior secured loans, and issues various tranches of senior and subordinated notes to third parties for the purpose of financing the purchase of those investments. Assets of the special purpose vehicle, the senior secured loans, are included in Other financial invested assets and the associated liabilities, the senior and subordinated notes issued to third parties, are included in Other liabilities in our Consolidated Statements of Financial Position.
As at September 30, 2023, the carrying value of the assets related to CLOs are $3,280 (December 31, 2022 — $2,880), which consists of cash and accounts receivable of $228 (December 31, 2022 — $292) and loans of $3,052 (December 31, 2022 — $2,588). These underlying loans are mainly below investment grade.
As at September 30, 2023, the carrying value of the liabilities related to CLOs are $3,064 (December 31, 2022 — $2,816). Our maximum contractual exposure to loss related to the CLOs is limited to our investment of $181 (December 31, 2022 — $159) in the most subordinated tranche. The net realized and unrealized loss incurred to date is $38.
5.A.ii Non-Financial Invested Assets
Non-financial invested assets consist of investment properties, investment in associates, subsidiaries and joint ventures which are not consolidated. As at September 30, 2023, the carrying value and fair value of investment properties was $9,952 (December 31, 2022 — $10,102) and $9,952 (December 31, 2022 — $10,102), respectively. The carrying value of other non-financial invested assets which were measured using the equity method of accounting was $1,752 as at September 30, 2023 (December 31, 2022 — $1,652).
96 Sun Life Financial Inc. Third Quarter 2023 CONDENSED NOTES TO THE INTERIM CONSOLIDATED FINANCIAL STATEMENTS (UNAUDITED)
5.A.iii Fair Value Hierarchy
The fair value methodologies and assumptions for assets and liabilities carried at fair value, as well as disclosures on unobservable inputs, sensitivities and valuation processes for Level 3 assets can be found in Note 5 of our 2022 Annual Consolidated Financial Statements, and as updated below.
Fair Value Methodologies and Assumptions
Collateralized loan obligations
The fair value of underlying assets within our CLOs is determined primarily using observable market inputs, such as quoted prices for similar assets in active markets and other observable market data.
The fair value of underlying liabilities within our CLOs is determined by discounting expected future contractual cash flows using a current market interest rate applicable to financial instruments with a similar yield, credit quality, maturity characteristics, and structural credit protections. The valuation technique maximizes the use of observable inputs that incorporates comparable securities’ prices and other market intelligence.
Mortgages and loans
The fair value of mortgages and loans is determined by discounting the expected future contractual cash flows using a current market interest rate applicable to financial instruments with a similar yield, credit quality, and maturity characteristics. Valuation inputs typically include benchmark yields and risk-adjusted spreads from current internal lending activities or loan issuances. Beginning in the fourth quarter of 2022, valuation inputs also include external lending activities or loan issuances from both public and private markets, enhancing the market observability of inputs. The risk-adjusted spreads are determined based on the borrower’s credit and liquidity, as well as term and other loan-specific features.
Unobservable Inputs and Sensitivity for Level 3 Assets
Our Mortgages and loans, categorized in Level 3, are included in Mortgages and loans – FVTPL and Mortgages and loans – FVOCI in the Level 3 roll forward table, and Mortgages and loans – amortized cost in Note 5.A.i. The fair value of these mortgages and loans is determined by using the discounted cash flow methodology. The key unobservable inputs used in the valuation of mortgages and loans as at September 30, 2023 include credit spreads and liquidity adjustments. The credit spread is the difference between the instrument yield and the benchmark yield. The benchmark yield is determined by matching each asset by geography, sector, rating and maturity to a matrix comprised of spreads of publicly available corporate bonds. In some cases, a liquidity premium or discount may be applied if recent private spreads differ from public spreads. The credit spreads range from 0.50% to 4.50%. The liquidity adjustments range from a discount of 1.00% to a premium of 2.00%. Changes in the fair value of mortgages and loans are negatively correlated with changes in credit spread and liquidity adjustments.
Valuation Process for Level 3 Assets
The fair value of mortgages and loans is based on an internal discounted cash flow model, subject to detailed review and validation to ensure overall reasonability.
CONDENSED NOTES TO THE INTERIM CONSOLIDATED FINANCIAL STATEMENTS (UNAUDITED) Sun Life Financial Inc. Third Quarter 2023 97 Our assets and liabilities that are carried at fair value on a recurring basis by hierarchy level are as follows:
|
|
|
|
|
|
|
|
|
|
|
|
|
|
|
|
|
|
|
|
|
|
|
|
|
|
|
|
|
|
|
|
|
|
|
|
|
|
|
|
|
|
|
|
|
|
|
|
|
|
|
| As at |
September 30, 2023 |
December 31, 2022 |
|
|
|
|
|
|
|
|
(restated, see Note 2) |
|
|
Level 1 |
|
Level 2 |
|
Level 3 |
|
Total |
|
Level 1 |
|
Level 2 |
|
Level 3 |
|
Total |
| Assets |
|
|
|
|
|
|
|
|
|
|
|
|
|
|
|
|
| Cash, cash equivalents and short-term securities - FVTPL |
|
$ |
10,280 |
|
|
$ |
746 |
|
|
$ |
— |
|
|
$ |
11,026 |
|
|
$ |
10,622 |
|
|
$ |
597 |
|
|
$ |
— |
|
|
$ |
11,219 |
|
| Debt securities - FVTPL |
|
475 |
|
|
54,159 |
|
|
355 |
|
|
54,989 |
|
|
650 |
|
|
58,313 |
|
|
394 |
|
|
59,357 |
|
| Debt securities - FVOCI |
|
539 |
|
|
13,278 |
|
|
73 |
|
|
13,890 |
|
|
772 |
|
|
15,721 |
|
|
52 |
|
|
16,545 |
|
| Equity securities - FVTPL |
|
4,106 |
|
|
2,786 |
|
|
118 |
|
|
7,010 |
|
|
4,133 |
|
|
2,844 |
|
|
171 |
|
|
7,148 |
|
| Equity securities - FVOCI |
|
— |
|
|
— |
|
|
70 |
|
|
70 |
|
|
|
|
|
|
|
|
|
Mortgages and loans - FVTPL(1) |
|
— |
|
|
46,153 |
|
|
1,835 |
|
|
47,988 |
|
|
— |
|
|
45,154 |
|
|
2,054 |
|
|
47,208 |
|
Mortgages and loans - FVOCI(1) |
|
— |
|
|
1,817 |
|
|
— |
|
|
1,817 |
|
|
— |
|
|
1,788 |
|
|
16 |
|
|
1,804 |
|
| Derivative assets - FVTPL |
|
33 |
|
|
1,845 |
|
|
— |
|
|
1,878 |
|
|
37 |
|
|
2,058 |
|
|
— |
|
|
2,095 |
|
Other financial invested assets (excluding CLOs) - FVTPL(2) |
|
575 |
|
|
207 |
|
|
6,141 |
|
|
6,923 |
|
|
789 |
|
|
194 |
|
|
5,555 |
|
|
6,538 |
|
Other financial invested assets (CLOs) - FVTPL (3) |
|
— |
|
|
3,280 |
|
|
— |
|
|
3,280 |
|
|
— |
|
|
2,880 |
|
|
— |
|
|
2,880 |
|
| Investment properties - FVTPL |
|
— |
|
|
— |
|
|
9,952 |
|
|
9,952 |
|
|
— |
|
|
— |
|
|
10,102 |
|
|
10,102 |
|
|
|
|
|
|
|
|
|
|
|
|
|
|
|
|
|
|
| Total invested assets measured at fair value |
|
$ |
16,008 |
|
|
$ |
124,271 |
|
|
$ |
18,544 |
|
|
$ |
158,823 |
|
|
$ |
17,003 |
|
|
$ |
129,549 |
|
|
$ |
18,344 |
|
|
$ |
164,896 |
|
| Investments for account of segregated fund holders - FVTPL |
|
16,067 |
|
|
103,702 |
|
|
219 |
|
|
119,988 |
|
|
23,933 |
|
|
100,728 |
|
|
631 |
|
|
125,292 |
|
| Total assets measured at fair value |
|
$ |
32,075 |
|
|
$ |
227,973 |
|
|
$ |
18,763 |
|
|
$ |
278,811 |
|
|
$ |
40,936 |
|
|
$ |
230,277 |
|
|
$ |
18,975 |
|
|
$ |
290,188 |
|
| Liabilities |
|
|
|
|
|
|
|
|
|
|
|
|
|
|
|
|
| Obligations for securities borrowing - FVTPL |
|
$ |
4 |
|
|
$ |
190 |
|
|
$ |
— |
|
|
$ |
194 |
|
|
$ |
— |
|
|
$ |
73 |
|
|
$ |
— |
|
|
$ |
73 |
|
| Derivative liabilities - FVTPL |
|
8 |
|
|
2,533 |
|
|
— |
|
|
2,541 |
|
|
10 |
|
|
2,341 |
|
|
— |
|
|
2,351 |
|
| Investment contracts for account of segregated fund liabilities - FVTPL |
|
— |
|
|
— |
|
|
101,611 |
|
|
101,611 |
|
|
— |
|
|
— |
|
|
102,153 |
|
|
102,153 |
|
Other financial liabilities (CLOs) - FVTPL(3) |
|
— |
|
|
3,064 |
|
|
— |
|
|
3,064 |
|
|
— |
|
|
2,688 |
|
|
— |
|
|
2,688 |
|
| Total liabilities measured at fair value |
|
$ |
12 |
|
|
$ |
5,787 |
|
|
$ |
101,611 |
|
|
$ |
107,410 |
|
|
$ |
10 |
|
|
$ |
5,102 |
|
|
$ |
102,153 |
|
|
$ |
107,265 |
|
(1) Mortgages and loans were classified as amortized cost under IAS 39 for the year ended December 31, 2021. On application of the classification overlay on January 1, 2022, mortgages and loans are measured at FVTPL or FVOCI. During the fourth quarter of 2022, we had a change to our fair value methodology for mortgages and loans that constitutes a change in estimate as at December 31, 2022. Levelling changed from Level 3 to Level 2 as a result of applying fair value enhancements in valuing mortgages and loans supporting insurance liabilities. See Mortgages and loans section above for further details.
(2) Other financial invested assets (excluding CLOs) - FVTPL include our investments in segregated funds, mutual funds, and limited partnerships.
(3) For details on CLOs, refer to Note 5.A.i.
Debt securities at FVTPL consist of the following:
|
|
|
|
|
|
|
|
|
|
|
|
|
|
|
|
|
|
|
|
|
|
|
|
|
|
|
|
|
|
|
|
|
|
|
|
|
|
|
|
|
|
|
|
|
|
|
|
|
|
|
| As at |
|
September 30, 2023 |
|
December 31, 2022 |
|
|
|
|
|
|
|
|
|
(restated, see Note 2) |
|
|
Level 1 |
|
Level 2 |
|
Level 3 |
|
Total |
|
Level 1 |
|
Level 2 |
|
Level 3 |
|
Total |
| Canadian federal government |
|
$ |
— |
|
|
$ |
4,076 |
|
|
$ |
14 |
|
|
$ |
4,090 |
|
|
$ |
— |
|
|
$ |
3,684 |
|
|
$ |
12 |
|
|
$ |
3,696 |
|
| Canadian provincial and municipal government |
— |
|
|
11,770 |
|
|
— |
|
|
11,770 |
|
|
— |
|
|
12,612 |
|
|
— |
|
|
12,612 |
|
| U.S. government and agency |
|
475 |
|
|
151 |
|
|
— |
|
|
626 |
|
|
650 |
|
|
109 |
|
|
— |
|
|
759 |
|
| Other foreign government |
|
— |
|
|
3,135 |
|
|
— |
|
|
3,135 |
|
|
— |
|
|
3,755 |
|
|
— |
|
|
3,755 |
|
| Corporate |
|
— |
|
|
29,243 |
|
|
304 |
|
|
29,547 |
|
|
— |
|
|
32,566 |
|
|
296 |
|
|
32,862 |
|
| Asset-backed securities: |
|
|
|
|
|
|
|
|
|
|
|
|
|
|
|
|
| Commercial mortgage-backed securities |
|
— |
|
|
1,916 |
|
|
5 |
|
|
1,921 |
|
|
— |
|
|
1,856 |
|
|
56 |
|
|
1,912 |
|
| Residential mortgage-backed securities |
|
— |
|
|
2,133 |
|
|
— |
|
|
2,133 |
|
|
— |
|
|
2,323 |
|
|
— |
|
|
2,323 |
|
| Collateralized debt obligations |
|
— |
|
|
225 |
|
|
— |
|
|
225 |
|
|
— |
|
|
189 |
|
|
— |
|
|
189 |
|
| Other |
|
— |
|
|
1,510 |
|
|
32 |
|
|
1,542 |
|
|
— |
|
|
1,219 |
|
|
30 |
|
|
1,249 |
|
| Total debt securities at FVTPL |
|
$ |
475 |
|
|
$ |
54,159 |
|
|
$ |
355 |
|
|
$ |
54,989 |
|
|
$ |
650 |
|
|
$ |
58,313 |
|
|
$ |
394 |
|
|
$ |
59,357 |
|
98 Sun Life Financial Inc. Third Quarter 2023 CONDENSED NOTES TO THE INTERIM CONSOLIDATED FINANCIAL STATEMENTS (UNAUDITED)
Debt securities at FVOCI consist of the following:
|
|
|
|
|
|
|
|
|
|
|
|
|
|
|
|
|
|
|
|
|
|
|
|
|
|
|
|
|
|
|
|
|
|
|
|
|
|
|
|
|
|
|
|
|
|
|
|
|
|
|
| As at |
|
September 30, 2023 |
|
December 31, 2022 |
|
|
Level 1 |
|
Level 2 |
|
Level 3 |
|
Total |
|
Level 1 |
|
Level 2 |
|
Level 3 |
|
Total |
| Canadian federal government |
|
$ |
— |
|
|
$ |
779 |
|
|
$ |
— |
|
|
$ |
779 |
|
|
$ |
— |
|
|
$ |
1,915 |
|
|
$ |
— |
|
|
$ |
1,915 |
|
| Canadian provincial and municipal government |
|
— |
|
|
742 |
|
|
— |
|
|
742 |
|
|
— |
|
|
1,053 |
|
|
— |
|
|
1,053 |
|
| U.S. government and agency |
|
539 |
|
|
7 |
|
|
— |
|
|
546 |
|
|
772 |
|
|
6 |
|
|
— |
|
|
778 |
|
| Other foreign government |
|
— |
|
|
520 |
|
|
11 |
|
|
531 |
|
|
— |
|
|
858 |
|
|
11 |
|
|
869 |
|
| Corporate |
|
— |
|
|
7,682 |
|
|
32 |
|
|
7,714 |
|
|
— |
|
|
8,415 |
|
|
33 |
|
|
8,448 |
|
| Asset-backed securities: |
|
|
|
|
|
|
|
|
|
|
|
|
|
|
|
|
| Commercial mortgage-backed securities |
|
— |
|
|
991 |
|
|
— |
|
|
991 |
|
|
— |
|
|
965 |
|
|
— |
|
|
965 |
|
| Residential mortgage-backed securities |
|
— |
|
|
900 |
|
|
— |
|
|
900 |
|
|
— |
|
|
722 |
|
|
— |
|
|
722 |
|
| Collateralized debt obligations |
|
— |
|
|
734 |
|
|
— |
|
|
734 |
|
|
— |
|
|
857 |
|
|
— |
|
|
857 |
|
| Other |
|
— |
|
|
923 |
|
|
30 |
|
|
953 |
|
|
— |
|
|
930 |
|
|
8 |
|
|
938 |
|
| Total debt securities at FVOCI |
|
$ |
539 |
|
|
$ |
13,278 |
|
|
$ |
73 |
|
|
$ |
13,890 |
|
|
$ |
772 |
|
|
$ |
15,721 |
|
|
$ |
52 |
|
|
$ |
16,545 |
|
Mortgages and loans at FVTPL consist of the following:
|
|
|
|
|
|
|
|
|
|
|
|
|
|
|
|
|
|
|
|
|
|
|
|
|
|
|
|
|
|
|
|
|
|
|
|
|
|
|
|
|
|
|
|
|
|
|
|
|
|
|
| As at |
|
September 30, 2023 |
|
December 31, 2022 |
|
|
Level 1 |
|
Level 2 |
|
Level 3 |
|
Total |
|
Level 1 |
|
Level 2 |
|
Level 3 |
|
Total |
| Mortgages: |
|
|
|
|
|
|
|
|
|
|
|
|
|
|
|
|
| Retail |
|
$ |
— |
|
|
$ |
2,552 |
|
|
$ |
12 |
|
|
$ |
2,564 |
|
|
$ |
— |
|
|
$ |
2,764 |
|
|
$ |
15 |
|
|
$ |
2,779 |
|
| Office |
|
— |
|
|
2,694 |
|
|
10 |
|
|
2,704 |
|
|
— |
|
|
2,958 |
|
|
— |
|
|
2,958 |
|
| Multi-family residential |
|
— |
|
|
2,920 |
|
|
— |
|
|
2,920 |
|
|
— |
|
|
2,915 |
|
|
— |
|
|
2,915 |
|
| Industrial |
|
— |
|
|
2,765 |
|
|
— |
|
|
2,765 |
|
|
— |
|
|
2,482 |
|
|
— |
|
|
2,482 |
|
| Other |
|
— |
|
|
927 |
|
|
— |
|
|
927 |
|
|
— |
|
|
818 |
|
|
— |
|
|
818 |
|
| Corporate loans |
|
— |
|
|
34,295 |
|
|
1,813 |
|
|
36,108 |
|
|
— |
|
|
33,217 |
|
|
2,039 |
|
|
35,256 |
|
| Total mortgages and loans at FVTPL |
|
$ |
— |
|
|
$ |
46,153 |
|
|
$ |
1,835 |
|
|
$ |
47,988 |
|
|
$ |
— |
|
|
$ |
45,154 |
|
|
$ |
2,054 |
|
|
$ |
47,208 |
|
Mortgages and loans at FVOCI consist of the following:
|
|
|
|
|
|
|
|
|
|
|
|
|
|
|
|
|
|
|
|
|
|
|
|
|
|
|
|
|
|
|
|
|
|
|
|
|
|
|
|
|
|
|
|
|
|
|
|
|
|
|
| As at |
|
September 30, 2023 |
|
December 31, 2022 |
|
|
Level 1 |
|
Level 2 |
|
Level 3 |
|
Total |
|
Level 1 |
|
Level 2 |
|
Level 3 |
|
Total |
| Mortgages: |
|
|
|
|
|
|
|
|
|
|
|
|
|
|
|
|
Retail |
|
$ |
— |
|
|
$ |
22 |
|
|
$ |
— |
|
|
$ |
22 |
|
|
$ |
— |
|
|
$ |
40 |
|
|
$ |
— |
|
|
$ |
40 |
|
| Office |
|
— |
|
|
41 |
|
|
— |
|
|
41 |
|
|
— |
|
|
51 |
|
|
— |
|
|
51 |
|
| Multi-family residential |
|
— |
|
|
87 |
|
|
— |
|
|
87 |
|
|
— |
|
|
197 |
|
|
— |
|
|
197 |
|
| Industrial |
|
— |
|
|
155 |
|
|
— |
|
|
155 |
|
|
— |
|
|
178 |
|
|
— |
|
|
178 |
|
| Other |
|
— |
|
|
— |
|
|
— |
|
|
— |
|
|
— |
|
|
62 |
|
|
— |
|
|
62 |
|
| Corporate loans |
|
— |
|
|
1,512 |
|
|
— |
|
|
1,512 |
|
|
— |
|
|
1,260 |
|
|
16 |
|
|
1,276 |
|
| Total mortgages and loans at FVOCI |
|
$ |
— |
|
|
$ |
1,817 |
|
|
$ |
— |
|
|
$ |
1,817 |
|
|
$ |
— |
|
|
$ |
1,788 |
|
|
$ |
16 |
|
|
$ |
1,804 |
|
There were no significant transfers between Level 1 and Level 2 for the three and nine months ended September 30, 2023 (September 30, 2022 — $nil).
CONDENSED NOTES TO THE INTERIM CONSOLIDATED FINANCIAL STATEMENTS (UNAUDITED) Sun Life Financial Inc. Third Quarter 2023 99 The following table provides a reconciliation of the beginning and ending balances for assets that are categorized in Level 3:
|
|
|
|
|
|
|
|
|
|
|
|
|
|
|
|
|
|
|
|
|
|
|
|
|
|
|
|
|
|
|
|
|
|
|
|
|
|
|
|
|
|
|
|
|
|
|
|
|
|
|
|
|
|
|
|
|
|
|
|
|
|
|
|
|
|
|
|
|
|
|
For the three months ended |
Debt
securities at FVTPL |
Debt
securities at FVOCI |
Equity
securities at FVTPL |
Equity
securities at FVOCI |
Mortgages
& loans at FVTPL |
Mortgages
& loans at FVOCI |
Other financial invested assets at FVTPL |
|
Investment properties |
Total
invested
assets
measured
at fair
value |
Investments
for account
of
segregated
fund holders |
Total
assets
measured
at fair
value |
| September 30, 2023 |
|
|
|
|
|
|
|
|
|
|
|
|
|
|
|
|
|
|
|
|
|
|
|
|
| Beginning balance |
|
$ |
437 |
|
|
$ |
51 |
|
|
$ |
120 |
|
|
$ |
68 |
|
|
$ |
1,790 |
|
|
$ |
8 |
|
|
$ |
5,879 |
|
|
|
|
$ |
10,001 |
|
|
$ |
18,354 |
|
|
$ |
214 |
|
|
$ |
18,568 |
|
|
|
|
|
|
|
|
|
|
|
|
|
|
|
|
|
|
|
|
|
|
|
|
|
|
Included in net income(1)(2)(3) |
|
(10) |
|
|
— |
|
|
(2) |
|
|
— |
|
|
(107) |
|
|
— |
|
|
59 |
|
|
|
|
(70) |
|
|
(130) |
|
|
(3) |
|
|
(133) |
|
Included in OCI(2) |
|
— |
|
|
(2) |
|
|
— |
|
|
— |
|
|
— |
|
|
— |
|
|
— |
|
|
|
|
— |
|
|
(2) |
|
|
— |
|
|
(2) |
|
| Purchases / Issuances |
|
37 |
|
|
23 |
|
|
2 |
|
|
— |
|
|
52 |
|
|
8 |
|
|
195 |
|
|
|
|
67 |
|
|
384 |
|
|
12 |
|
|
396 |
|
| Sales / Payments |
|
— |
|
|
— |
|
|
(2) |
|
|
— |
|
|
(7) |
|
|
(16) |
|
|
(30) |
|
|
|
|
(96) |
|
|
(151) |
|
|
(4) |
|
|
(155) |
|
| Settlements |
|
(2) |
|
|
— |
|
|
— |
|
|
— |
|
|
— |
|
|
— |
|
|
— |
|
|
|
|
— |
|
|
(2) |
|
|
— |
|
|
(2) |
|
Transfers into Level 3(4) |
|
— |
|
|
— |
|
|
— |
|
|
— |
|
|
105 |
|
|
— |
|
|
— |
|
|
|
|
— |
|
|
105 |
|
|
— |
|
|
105 |
|
Transfers (out) of Level 3(4) |
|
(108) |
|
|
— |
|
|
— |
|
|
— |
|
|
— |
|
|
— |
|
|
— |
|
|
|
|
— |
|
|
(108) |
|
|
— |
|
|
(108) |
|
Foreign currency translation(5) |
|
1 |
|
|
1 |
|
|
— |
|
|
2 |
|
|
2 |
|
|
— |
|
|
38 |
|
|
|
|
50 |
|
|
94 |
|
|
— |
|
|
94 |
|
| Ending balance |
|
$ |
355 |
|
|
$ |
73 |
|
|
$ |
118 |
|
|
$ |
70 |
|
|
$ |
1,835 |
|
|
$ |
— |
|
|
$ |
6,141 |
|
|
|
|
$ |
9,952 |
|
|
$ |
18,544 |
|
|
$ |
219 |
|
|
$ |
18,763 |
|
Unrealized gains (losses) included in earnings relating to instruments still held(1) |
|
$ |
(14) |
|
|
$ |
— |
|
|
$ |
(2) |
|
|
$ |
— |
|
|
$ |
(106) |
|
|
$ |
— |
|
|
$ |
44 |
|
|
|
|
$ |
(65) |
|
|
$ |
(143) |
|
|
$ |
— |
|
|
$ |
(143) |
|
| September 30, 2022 |
|
|
|
|
|
|
|
|
|
|
|
|
|
|
|
|
|
|
|
|
|
|
|
|
| (restated, see Note 2) |
|
|
|
|
|
|
|
|
|
|
|
|
|
|
|
|
|
|
|
|
|
|
|
|
| Beginning balance |
|
$ |
135 |
|
|
$ |
63 |
|
|
$ |
169 |
|
|
|
|
$ |
8,003 |
|
|
$ |
20 |
|
|
$ |
4,476 |
|
|
|
|
$ |
9,781 |
|
|
$ |
22,647 |
|
|
$ |
593 |
|
|
$ |
23,240 |
|
|
|
|
|
|
|
|
|
|
|
|
|
|
|
|
|
|
|
|
|
|
|
|
|
|
|
|
|
|
|
|
|
|
|
|
|
|
|
|
|
|
|
|
|
|
|
|
|
|
|
Included in net income(1)(2)(3) |
|
(10) |
|
|
— |
|
|
7 |
|
|
|
|
(681) |
|
|
(5) |
|
|
193 |
|
|
|
|
89 |
|
|
(407) |
|
|
(11) |
|
|
(418) |
|
Included in OCI(2) |
|
— |
|
|
1 |
|
|
— |
|
|
|
|
— |
|
|
— |
|
|
— |
|
|
|
|
— |
|
|
1 |
|
|
— |
|
|
1 |
|
| Purchases / Issuances |
|
91 |
|
|
5 |
|
|
3 |
|
|
|
|
617 |
|
|
— |
|
|
334 |
|
|
|
|
153 |
|
|
1,203 |
|
|
31 |
|
|
1,234 |
|
| Sales / Payments |
|
— |
|
|
— |
|
|
(1) |
|
|
|
|
(109) |
|
|
— |
|
|
(67) |
|
|
|
|
(20) |
|
|
(197) |
|
|
(6) |
|
|
(203) |
|
| Settlements |
|
— |
|
|
— |
|
|
— |
|
|
|
|
— |
|
|
— |
|
|
— |
|
|
|
|
— |
|
|
— |
|
|
(1) |
|
|
(1) |
|
Transfers into Level 3(4) |
|
— |
|
|
— |
|
|
— |
|
|
|
|
25 |
|
|
— |
|
|
— |
|
|
|
|
— |
|
|
25 |
|
|
— |
|
|
25 |
|
Transfers (out) of Level 3(4)(6) |
|
— |
|
|
— |
|
|
— |
|
|
|
|
(832) |
|
|
— |
|
|
— |
|
|
|
|
— |
|
|
(832) |
|
|
— |
|
|
(832) |
|
Foreign currency translation(5) |
|
5 |
|
|
1 |
|
|
5 |
|
|
|
|
135 |
|
|
— |
|
|
97 |
|
|
|
|
146 |
|
|
389 |
|
|
(4) |
|
|
385 |
|
| Ending balance |
|
$ |
221 |
|
|
$ |
70 |
|
|
$ |
183 |
|
|
|
|
$ |
7,158 |
|
|
$ |
15 |
|
|
$ |
5,033 |
|
|
|
|
$ |
10,149 |
|
|
$ |
22,829 |
|
|
$ |
602 |
|
|
$ |
23,431 |
|
Unrealized gains (losses) included in earnings relating to instruments still held(1) |
|
$ |
(10) |
|
|
$ |
— |
|
|
$ |
7 |
|
|
|
|
$ |
(689) |
|
|
$ |
(5) |
|
|
$ |
162 |
|
|
|
|
$ |
87 |
|
|
$ |
(448) |
|
|
$ |
(10) |
|
|
$ |
(458) |
|
100 Sun Life Financial Inc. Third Quarter 2023 CONDENSED NOTES TO THE INTERIM CONSOLIDATED FINANCIAL STATEMENTS (UNAUDITED)
|
|
|
|
|
|
|
|
|
|
|
|
|
|
|
|
|
|
|
|
|
|
|
|
|
|
|
|
|
|
|
|
|
|
|
|
|
|
|
|
|
|
|
|
|
|
|
|
|
|
|
|
|
|
|
|
|
|
|
|
|
|
|
|
|
|
|
|
|
For the nine months ended |
Debt
securities at FVTPL
|
Debt
securities at FVOCI |
Equity
securities at FVTPL |
Equity Securities at FVOCI |
Mortgages
& loans at FVTPL |
Mortgages
& loans at FVOCI |
Other financial invested assets at FVTPL |
Investment Properties |
Total
invested
assets
measured
at fair
value |
Investments for account of segregated fund holders |
Total assets measured at fair value |
| September 30, 2023 |
|
|
|
|
|
|
|
|
|
|
|
|
|
|
|
|
|
|
|
|
|
|
| Beginning balance |
|
$ |
394 |
|
|
$ |
52 |
|
|
$ |
101 |
|
|
$ |
70 |
|
|
$ |
2,054 |
|
|
$ |
16 |
|
|
$ |
5,555 |
|
|
$ |
10,102 |
|
|
$ |
18,344 |
|
|
$ |
631 |
|
|
$ |
18,975 |
|
|
|
|
|
|
|
|
|
|
|
|
|
|
|
|
|
|
|
|
|
|
|
|
Included in net income(1)(2)(3) |
|
(3) |
|
|
— |
|
|
19 |
|
|
— |
|
|
(68) |
|
|
(8) |
|
|
(72) |
|
|
(220) |
|
|
(352) |
|
|
(17) |
|
|
(369) |
|
Included in OCI(2) |
|
— |
|
|
1 |
|
|
— |
|
|
— |
|
|
— |
|
|
— |
|
|
— |
|
|
— |
|
|
1 |
|
|
— |
|
|
1 |
|
| Purchases / Issuances |
|
173 |
|
|
34 |
|
|
16 |
|
|
— |
|
|
269 |
|
|
8 |
|
|
813 |
|
|
274 |
|
|
1,587 |
|
|
37 |
|
|
1,624 |
|
| Sales / Payments |
|
(8) |
|
|
(6) |
|
|
(18) |
|
|
(1) |
|
|
(58) |
|
|
(16) |
|
|
(157) |
|
|
(219) |
|
|
(483) |
|
|
(428) |
|
|
(911) |
|
| Settlements |
|
(5) |
|
|
— |
|
|
— |
|
|
— |
|
|
(2) |
|
|
— |
|
|
— |
|
|
— |
|
|
(7) |
|
|
(1) |
|
|
(8) |
|
Transfers into Level 3(4) |
|
8 |
|
|
— |
|
|
— |
|
|
— |
|
|
317 |
|
|
— |
|
|
— |
|
|
— |
|
|
325 |
|
|
— |
|
|
325 |
|
Transfers (out) of Level 3(4) |
|
(200) |
|
|
(8) |
|
|
— |
|
|
— |
|
|
(678) |
|
|
— |
|
|
— |
|
|
— |
|
|
(886) |
|
|
— |
|
|
(886) |
|
Foreign currency translation(5) |
|
(4) |
|
|
— |
|
|
— |
|
|
1 |
|
|
1 |
|
|
— |
|
|
2 |
|
|
15 |
|
|
15 |
|
|
(3) |
|
|
12 |
|
| Ending balance |
|
$ |
355 |
|
|
$ |
73 |
|
|
$ |
118 |
|
|
$ |
70 |
|
|
$ |
1,835 |
|
|
$ |
— |
|
|
$ |
6,141 |
|
|
$ |
9,952 |
|
|
$ |
18,544 |
|
|
$ |
219 |
|
|
$ |
18,763 |
|
Unrealized gains (losses) included in earnings relating to instruments still held(1) |
|
$ |
(7) |
|
|
$ |
— |
|
|
$ |
15 |
|
|
$ |
— |
|
|
$ |
(69) |
|
|
$ |
(8) |
|
|
$ |
(77) |
|
|
$ |
(222) |
|
|
$ |
(368) |
|
|
$ |
(18) |
|
|
$ |
(386) |
|
| September 30, 2022 |
|
|
|
|
|
|
|
|
|
|
|
|
|
|
|
|
|
|
|
|
|
|
| (restated, see Note 2) |
|
|
|
|
|
|
|
|
|
|
|
|
|
|
|
|
|
|
|
|
|
|
| Beginning balance |
|
$ |
152 |
|
|
$ |
53 |
|
|
$ |
170 |
|
|
|
|
$ |
12,251 |
|
|
$ |
17 |
|
|
$ |
3,650 |
|
|
$ |
9,109 |
|
|
$ |
25,402 |
|
|
$ |
611 |
|
|
$ |
26,013 |
|
|
|
|
|
|
|
|
|
|
|
|
|
|
|
|
|
|
|
|
|
|
|
|
Included in net income(1)(2)(3) |
|
(24) |
|
|
1 |
|
|
15 |
|
|
|
|
(3,060) |
|
|
(15) |
|
|
364 |
|
|
652 |
|
|
(2,067) |
|
|
4 |
|
|
(2,063) |
|
Included in OCI(2) |
|
— |
|
|
(3) |
|
|
— |
|
|
|
|
— |
|
|
(1) |
|
|
— |
|
|
— |
|
|
(4) |
|
|
— |
|
|
(4) |
|
| Purchases / Issuances |
|
141 |
|
|
78 |
|
|
5 |
|
|
|
|
1,714 |
|
|
— |
|
|
1,169 |
|
|
524 |
|
|
3,631 |
|
|
41 |
|
|
3,672 |
|
| Sales / Payments |
|
— |
|
|
(2) |
|
|
(13) |
|
|
|
|
(480) |
|
|
— |
|
|
(220) |
|
|
(310) |
|
|
(1,025) |
|
|
(3) |
|
|
(1,028) |
|
| Settlements |
|
(1) |
|
|
— |
|
|
— |
|
|
|
|
— |
|
|
— |
|
|
(47) |
|
|
— |
|
|
(48) |
|
|
(1) |
|
|
(49) |
|
Transfers into Level 3(4) |
|
— |
|
|
— |
|
|
— |
|
|
|
|
25 |
|
|
14 |
|
|
— |
|
|
— |
|
|
39 |
|
|
— |
|
|
39 |
|
Transfers (out) of Level 3(4)(6) |
|
(49) |
|
|
(56) |
|
|
— |
|
|
|
|
(3,447) |
|
|
— |
|
|
— |
|
|
— |
|
|
(3,552) |
|
|
— |
|
|
(3,552) |
|
Foreign currency translation(5) |
|
2 |
|
|
(1) |
|
|
6 |
|
|
|
|
155 |
|
|
— |
|
|
117 |
|
|
174 |
|
|
453 |
|
|
(50) |
|
|
403 |
|
| Ending balance |
|
$ |
221 |
|
|
$ |
70 |
|
|
$ |
183 |
|
|
|
|
$ |
7,158 |
|
|
$ |
15 |
|
|
$ |
5,033 |
|
|
$ |
10,149 |
|
$ |
— |
|
$ |
22,829 |
|
|
$ |
602 |
|
|
$ |
23,431 |
|
Unrealized gains (losses) included in earnings relating to instruments still held(1) |
|
$ |
(24) |
|
|
$ |
— |
|
|
$ |
10 |
|
|
|
|
$ |
(3,063) |
|
|
$ |
(15) |
|
|
$ |
332 |
|
|
$ |
637 |
|
|
$ |
(2,123) |
|
|
$ |
16 |
|
|
$ |
(2,107) |
|
(1) Included in Net investment income (loss) in our Consolidated Statements of Operations for Total invested assets measured at fair value.
(2) Total gains and losses in net income (loss) and OCI are calculated assuming transfers into or out of Level 3 occur at the beginning of the period. For an asset or liability that transfers into Level 3 during the reporting period, the entire change in fair value for the period is included in the table above. For transfers out of Level 3 during the reporting period, the change in fair value for the period is excluded from the table above.
(3) Investment properties included in net income is comprised of fair value changes on investment properties of $(60) and $(194) for the three and nine months ended September 30, 2023, respectively (September 30, 2022 — $96 and $681, respectively), net of amortization of leasing commissions and tenant inducements of $10 and $26 for the three and nine months ended September 30, 2023, respectively (September 30, 2022 — $7 and $29, respectively). As at September 30, 2023, we have used assumptions that reflect known changes in the property values including changes in expected future cash flows.
(4) Transfers into Level 3 occur when the inputs used to price the assets and liabilities lack observable market data, and as a result, no longer meet the Level 1 or 2 definitions at the reporting date. Transfers out of Level 3 occur when the pricing inputs become more transparent and satisfy the Level 1 or 2 criteria and are primarily the result of observable market data being available at the reporting date, thus removing the requirement to rely on inputs that lack observability.
(5) Foreign currency translation relates to the foreign exchange impact of translating Level 3 assets and liabilities of foreign subsidiaries from their functional currencies to Canadian dollars.
(6) Mortgages and loans were classified as amortized cost under IAS 39 for the year ended December 31, 2021. On application of the classification overlay on January 1, 2022, mortgages and loans are measured at FVTPL or FVOCI. During the fourth quarter of 2022, we had a change to our fair value methodology for mortgages and loans that constitutes a change in estimate as at December 31, 2022. Levelling changed from Level 3 to Level 2 as a result of applying fair value enhancements in valuing mortgages and loans supporting insurance liabilities. See Mortgages and loans section above for further details.
CONDENSED NOTES TO THE INTERIM CONSOLIDATED FINANCIAL STATEMENTS (UNAUDITED) Sun Life Financial Inc. Third Quarter 2023 101
5.B Net Investment Income (Loss)
|
|
|
|
|
|
|
|
|
|
|
|
|
|
|
|
|
|
|
|
|
|
|
|
|
|
|
For the three months ended September 30, 2023 |
Financial Instruments at Amortized Cost |
Financial Instruments at FVOCI |
Financial Instruments at FVTPL |
Total |
Interest income (expense): |
|
|
|
|
|
|
|
|
Cash, cash equivalents and short-term investments |
|
|
|
|
|
$ |
126 |
|
|
$ |
126 |
|
| Debt securities |
|
|
|
153 |
|
|
661 |
|
|
814 |
|
Mortgages and loans |
|
18 |
|
|
25 |
|
|
639 |
|
|
682 |
|
| Derivative investments |
|
|
|
|
|
13 |
|
|
13 |
|
| Other financial invested assets |
|
— |
|
|
(113) |
|
|
176 |
|
|
63 |
|
Other financial liabilities |
|
55 |
|
|
|
|
(153) |
|
|
(98) |
|
Total interest income (expense) |
|
73 |
|
|
65 |
|
|
1,462 |
|
|
1,600 |
|
Dividend & other investment income: |
|
|
|
|
|
|
|
|
| Equity securities |
|
|
|
— |
|
|
31 |
|
|
31 |
|
Other financial invested assets |
|
— |
|
|
— |
|
|
55 |
|
|
55 |
|
Total dividend & other investment income |
|
— |
|
|
— |
|
|
86 |
|
|
86 |
|
| Net realized and unrealized gains (losses): |
|
|
|
|
|
|
|
|
| Cash, cash equivalents and short-term investments |
|
|
|
|
|
4 |
|
|
4 |
|
| Debt securities |
|
|
|
(216) |
|
|
(3,966) |
|
|
(4,182) |
|
| Equity securities |
|
|
|
— |
|
|
(194) |
|
|
(194) |
|
| Mortgages and loans |
|
|
|
(1) |
|
|
(1,177) |
|
|
(1,178) |
|
Derivative investments |
|
|
|
|
|
(1,305) |
|
|
(1,305) |
|
| Other financial invested assets |
|
|
|
167 |
|
|
(42) |
|
|
125 |
|
| Other financial liabilities |
|
|
|
|
|
55 |
|
|
55 |
|
Total net realized and unrealized gains (losses) |
|
|
|
(50) |
|
|
(6,625) |
|
|
(6,675) |
|
Provision for credit losses |
|
— |
|
|
2 |
|
|
— |
|
|
2 |
|
| Net investment income (loss) from financial instruments |
|
$ |
73 |
|
|
$ |
17 |
|
|
$ |
(5,077) |
|
|
$ |
(4,987) |
|
| Net Investment income (loss) from non-financial instruments: |
|
|
|
|
|
|
|
|
| Investment properties rental income |
|
|
|
|
|
|
|
162 |
|
| Investment properties expenses |
|
|
|
|
|
|
|
(65) |
|
| Investment expenses and taxes |
|
|
|
|
|
|
|
(70) |
|
| Fair value changes on investment properties |
|
|
|
|
|
|
|
(60) |
|
Other investment income (loss) |
|
|
|
|
|
|
|
49 |
|
Foreign exchange gains (losses) |
|
|
|
|
|
|
|
91 |
|
| Net investment income (loss) from non-financial instruments |
|
|
|
|
|
|
|
$ |
107 |
|
| Total Net investment income (loss) |
|
|
|
|
|
|
|
$ |
(4,880) |
|
Net investment income (loss) recognized in income |
|
|
|
|
|
|
|
$ |
(4,824) |
|
| Net investment income (loss) recognized in OCI |
|
|
|
|
|
|
|
$ |
(56) |
|
102 Sun Life Financial Inc. Third Quarter 2023 CONDENSED NOTES TO THE INTERIM CONSOLIDATED FINANCIAL STATEMENTS (UNAUDITED)
|
|
|
|
|
|
|
|
|
|
|
|
|
|
|
|
|
|
|
|
|
|
|
|
|
|
|
For the nine months ended September 30, 2023 |
Financial Instruments at Amortized Cost |
Financial Instruments at FVOCI |
Financial Instruments at FVTPL |
Total |
| Interest income (expense): |
|
|
|
|
|
|
|
|
| Cash, cash equivalents and short-term investments |
|
|
|
|
|
$ |
334 |
|
|
$ |
334 |
|
| Debt securities |
|
|
|
402 |
|
|
1,997 |
|
|
2,399 |
|
| Mortgages and loans |
|
56 |
|
|
72 |
|
|
1,856 |
|
|
1,984 |
|
| Derivative investments |
|
|
|
|
|
52 |
|
|
52 |
|
| Other financial invested assets |
|
— |
|
|
1 |
|
|
176 |
|
|
177 |
|
| Other financial liabilities |
|
(112) |
|
|
|
|
(153) |
|
|
(265) |
|
| Total interest income (expense) |
|
(56) |
|
|
475 |
|
|
4,262 |
|
|
4,681 |
|
| Dividend & other investment income: |
|
|
|
|
|
|
|
|
| Equity securities |
|
|
|
— |
|
|
76 |
|
|
76 |
|
| Other financial invested assets |
|
— |
|
|
— |
|
|
155 |
|
|
155 |
|
| Total dividend & other investment income |
|
— |
|
|
— |
|
|
231 |
|
|
231 |
|
| Net realized and unrealized gains (losses): |
|
|
|
|
|
|
|
|
| Cash, cash equivalents and short-term investments |
|
|
|
|
|
3 |
|
|
3 |
|
| Debt securities |
|
|
|
(59) |
|
|
(2,787) |
|
|
(2,846) |
|
| Equity securities |
|
|
|
(1) |
|
|
149 |
|
|
148 |
|
| Mortgages and loans |
|
|
|
2 |
|
|
(1,197) |
|
|
(1,195) |
|
| Derivative investments |
|
|
|
|
|
(564) |
|
|
(564) |
|
| Other financial invested assets |
|
|
|
161 |
|
|
(101) |
|
|
60 |
|
| Other financial liabilities |
|
|
|
|
|
52 |
|
|
52 |
|
| Total net realized and unrealized gains (losses) |
|
|
|
103 |
|
|
(4,445) |
|
|
(4,342) |
|
| Provision for credit losses |
|
— |
|
|
(6) |
|
|
— |
|
|
(6) |
|
| Net investment income (loss) from financial instruments |
|
$ |
(56) |
|
|
$ |
572 |
|
|
$ |
48 |
|
|
$ |
564 |
|
| Net Investment income (loss) from non-financial instruments: |
|
|
|
|
|
|
|
|
| Investment properties rental income |
|
|
|
|
|
|
|
478 |
|
| Investment properties expenses |
|
|
|
|
|
|
|
(196) |
|
| Investment expenses and taxes |
|
|
|
|
|
|
|
(211) |
|
| Fair value changes on investment properties |
|
|
|
|
|
|
|
(194) |
|
| Other investment income (loss) |
|
|
|
|
|
|
|
79 |
|
| Foreign exchange gains (losses) |
|
|
|
|
|
|
|
(38) |
|
| Net investment income (loss) from non-financial instruments |
|
|
|
|
|
|
|
$ |
(82) |
|
| Total Net investment income (loss) |
|
|
|
|
|
|
|
$ |
482 |
|
| Net investment income (loss) recognized in income |
|
|
|
|
|
|
|
$ |
425 |
|
| Net investment income (loss) recognized in OCI |
|
|
|
|
|
|
|
$ |
57 |
|
CONDENSED NOTES TO THE INTERIM CONSOLIDATED FINANCIAL STATEMENTS (UNAUDITED) Sun Life Financial Inc. Third Quarter 2023 103 Interest and other investment income presented in our Consolidated Statements of Operations consist of the following:
5.B.i Interest and Other Investment Income
|
|
|
|
|
|
|
|
|
|
|
|
|
|
|
|
|
|
For the three months ended September 30, 2022 |
For the nine months ended September 30, 2022 |
|
(restated, see Note 2) |
(restated, see Note 2) |
| Interest income: |
|
|
|
|
Cash, cash equivalents and short-term securities |
|
$ |
48 |
|
|
$ |
81 |
|
| Debt securities - FVTPL |
|
667 |
|
|
1,925 |
|
| Debt securities - FVOCI |
|
95 |
|
|
242 |
|
| Mortgages and loans |
|
564 |
|
|
1,635 |
|
| Derivative investments |
|
29 |
|
|
93 |
|
| Total interest income |
|
1,403 |
|
|
3,976 |
|
Equity securities |
|
27 |
|
|
73 |
|
Investment properties rental income(1) |
|
150 |
|
|
435 |
|
| Investment properties expenses |
|
(59) |
|
|
(178) |
|
| Other income |
|
70 |
|
|
172 |
|
| Investment expenses and taxes |
|
(70) |
|
|
(196) |
|
| Total interest and other investment income |
|
$ |
1,521 |
|
|
$ |
4,282 |
|
(1) Includes operating lease rental income from investment properties.
5.B.ii Fair Value and Foreign Currency Changes on Assets and Liabilities
Fair value and foreign currency changes on assets and liabilities presented in our Consolidated Statements of Operations consist of the following:
|
|
|
|
|
|
|
|
|
|
|
|
|
|
|
|
|
|
For the three months ended September 30, 2022 |
For the nine months ended September 30, 2022 |
|
(restated, see Note 2) |
(restated, see Note 2) |
| Fair value change: |
|
|
|
|
| Cash, cash equivalents and short-term securities |
|
$ |
1 |
|
|
$ |
2 |
|
| Debt securities |
|
(2,201) |
|
|
(15,864) |
|
| Equity securities |
|
(437) |
|
|
(1,438) |
|
| Mortgages and loans |
|
(1,731) |
|
|
(8,201) |
|
| Derivative investments |
|
(144) |
|
|
(1,907) |
|
| Other financial invested assets |
|
133 |
|
|
127 |
|
| Other liabilities – obligations for securities borrowing |
|
— |
|
|
14 |
|
| Total change in fair value of assets and liabilities recognized in income |
|
(4,379) |
|
|
(27,267) |
|
| Fair value changes on investment properties |
|
96 |
|
|
681 |
|
Foreign exchange gains (losses)(1) |
|
706 |
|
|
456 |
|
Realized gains (losses) on property and equipment(2) |
|
— |
|
|
100 |
|
Fair value and foreign currency changes on assets and liabilities(3) |
|
$ |
(3,577) |
|
|
$ |
(26,030) |
|
(1) Primarily arises from the translation of foreign currency denominated FVOCI monetary assets and mortgage and loans. Any offsetting amounts arising from foreign currency derivatives are included in the fair value change on derivative investments.
(2) In June 2022, we sold and leased back our Wellesley office in the U.S. The transaction qualified as a sale and operating lease and as a result, we recognized a pre-tax gain of $100 for the nine months ended September 30, 2022.
(3) Net investment income (loss) on our Consolidated Statements of Operations of $(2,056) and $(21,748) for the three and nine months ended September 30, 2022, respectively, include Fair value and foreign currency changes on assets and liabilities in this table of $(3,577) and $(26,030) for the three and nine months ended September 30, 2022, respectively, and Total interest and other investment income of $1,521 and $4,282 for the three and nine months ended September 30, 2022, respectively.
104 Sun Life Financial Inc. Third Quarter 2023 CONDENSED NOTES TO THE INTERIM CONSOLIDATED FINANCIAL STATEMENTS (UNAUDITED)
5.C Explanation of Investment Result
Net investment result excluding result for account of segregated fund holders consists of the following:
|
|
|
|
|
|
|
|
|
|
|
|
|
|
|
|
|
|
|
|
|
|
|
|
|
|
|
|
|
|
|
|
|
For the three months ended September 30, 2023 |
Insurance contracts Issued |
Reinsurance
contracts
held |
Total insurance contracts |
Non-insurance (all other) |
|
Total |
Net investment income (loss): |
|
|
|
|
|
|
|
|
|
|
Net investment income (loss) recognized in net income |
|
|
|
|
|
$ |
(5,165) |
|
|
$ |
341 |
|
|
$ |
(4,824) |
|
Net investment income (loss) recognized in OCI |
|
|
|
|
|
(58) |
|
|
2 |
|
|
(56) |
|
Total net investment income (loss) |
|
|
|
|
|
(5,223) |
|
|
343 |
|
|
(4,880) |
|
| Total insurance finance income (expenses) recognized in net income: |
|
|
|
|
|
|
|
|
|
| Effect of time value of money (Interest on carrying value) including interest on policy loans and interest on amounts on deposit |
|
(1,170) |
|
|
36 |
|
|
(1,134) |
|
|
|
|
(1,134) |
|
| Impact of change in discount rate on fulfilment cash flows excluding where measured at locked-in rates and effect of changes in financial risk |
|
5,239 |
|
|
(180) |
|
|
5,059 |
|
|
|
|
5,059 |
|
|
|
|
|
|
|
|
|
|
|
|
Application of risk mitigation option(1) |
|
159 |
|
|
— |
|
|
159 |
|
|
|
|
159 |
|
Changes in fair value of underlying items for contracts with direct participation features (excluding segregated funds)(2) |
|
1,547 |
|
|
— |
|
|
1,547 |
|
|
|
|
1,547 |
|
| Foreign exchange gains (losses) |
|
(43) |
|
|
1 |
|
|
(42) |
|
|
|
|
(42) |
|
| Other |
|
27 |
|
|
(1) |
|
|
26 |
|
|
|
|
26 |
|
| Total insurance finance income (expenses) recognized in income |
|
5,759 |
|
|
(144) |
|
|
5,615 |
|
|
|
|
5,615 |
|
Decrease (increase) in investment contract liabilities |
|
|
|
|
|
|
|
(88) |
|
|
(88) |
|
| Net investment result |
|
|
|
|
|
$ |
392 |
|
|
$ |
255 |
|
|
$ |
647 |
|
| Net investment result recognized in net income |
|
|
|
|
|
$ |
450 |
|
|
$ |
253 |
|
|
$ |
703 |
|
| Net investment result recognized in OCI |
|
|
|
|
|
$ |
(58) |
|
|
$ |
2 |
|
|
$ |
(56) |
|
|
|
|
|
|
|
|
|
|
|
|
|
|
|
|
|
|
|
|
|
|
|
|
|
|
|
|
|
|
|
|
|
|
For the three months ended September 30, 2022 |
Insurance contracts Issued |
Reinsurance contracts
held |
Total insurance contracts |
Non-insurance (all other) |
|
Total |
Net investment income (loss) (restated, see Note 2): |
|
|
|
|
|
|
|
|
|
|
Net investment income (loss) recognized in net income |
|
|
|
|
|
$ |
(2,257) |
|
|
$ |
201 |
|
|
$ |
(2,056) |
|
Net investment income (loss) recognized in OCI |
|
|
|
|
|
(111) |
|
|
(217) |
|
|
(328) |
|
Total net investment income (loss) (restated, see Note 2) |
|
|
|
|
|
(2,368) |
|
|
(16) |
|
|
(2,384) |
|
| Total insurance finance income (expenses) recognized in net income: |
|
|
|
|
|
|
|
|
|
| Effect of time value of money (Interest on carrying value) including interest on policy loans and interest on amounts on deposit |
|
(947) |
|
|
16 |
|
|
(931) |
|
|
|
|
(931) |
|
| Impact of change in discount rate on fulfilment cash flows excluding where measured at locked-in rates and effect of changes in financial risk |
|
2,101 |
|
|
(164) |
|
|
1,937 |
|
|
|
|
1,937 |
|
|
|
|
|
|
|
|
|
|
|
|
Application of risk mitigation option(1) |
|
112 |
|
|
— |
|
|
112 |
|
|
|
|
112 |
|
Changes in fair value of underlying items for contracts with direct participation features (excluding segregated funds)(2) |
|
818 |
|
|
— |
|
|
818 |
|
|
|
|
818 |
|
| Foreign exchange gains (losses) |
|
19 |
|
|
7 |
|
|
26 |
|
|
|
|
26 |
|
| Other |
|
2 |
|
|
(2) |
|
|
— |
|
|
|
|
— |
|
| Total insurance finance income (expenses) recognized in income |
|
2,105 |
|
|
(143) |
|
|
1,962 |
|
|
|
|
1,962 |
|
Decrease (increase) in investment contract liabilities |
|
|
|
|
|
|
|
(45) |
|
|
(45) |
|
| Net investment result |
|
|
|
|
|
$ |
(406) |
|
|
$ |
(61) |
|
|
$ |
(467) |
|
| Net investment result recognized in net income |
|
|
|
|
|
$ |
(295) |
|
|
$ |
156 |
|
|
$ |
(139) |
|
| Net investment result recognized in OCI |
|
|
|
|
|
$ |
(111) |
|
|
$ |
(217) |
|
|
$ |
(328) |
|
(1) Changes in our share of the fair value of underlying items and FCF arising from changes in the effect of financial risk that are mitigated by the use of derivatives and non derivative financial instruments are recognized in income rather than adjusting the CSM. These amounts are offset by changes in the fair value of the derivatives and non-derivative financial instruments included in Investment income. The amount above would have resulted in an adjustment to the CSM if it was recorded to the CSM.
(2) These amounts are offset by changes in fair value of the underlying items included in Net investment income (loss).
CONDENSED NOTES TO THE INTERIM CONSOLIDATED FINANCIAL STATEMENTS (UNAUDITED) Sun Life Financial Inc. Third Quarter 2023 105
|
|
|
|
|
|
|
|
|
|
|
|
|
|
|
|
|
|
|
|
|
|
|
|
|
|
|
|
|
|
|
|
|
For the nine months ended September 30, 2023 |
Insurance contracts Issued |
Reinsurance
contracts
held |
Total insurance contracts |
Non-insurance (all other) |
|
Total |
Net investment income (loss): |
|
|
|
|
|
|
|
|
|
|
Net investment income (loss) recognized in net income |
|
|
|
|
|
$ |
(467) |
|
|
$ |
892 |
|
|
$ |
425 |
|
Net investment income (loss) recognized in OCI |
|
|
|
|
|
9 |
|
|
48 |
|
|
57 |
|
Total net investment income (loss) |
|
|
|
|
|
(458) |
|
|
940 |
|
|
482 |
|
| Total insurance finance income (expenses) recognized in net income: |
|
|
|
|
|
|
|
|
|
| Effect of time value of money (Interest on carrying value) including interest on policy loans and interest on amounts on deposit |
|
(3,332) |
|
|
103 |
|
|
(3,229) |
|
|
|
|
(3,229) |
|
| Impact of change in discount rate on fulfilment cash flows excluding where measured at locked-in rates and effect of changes in financial risk |
|
4,627 |
|
|
(216) |
|
|
4,411 |
|
|
|
|
4,411 |
|
|
|
|
|
|
|
|
|
|
|
|
Application of risk mitigation option(1) |
|
235 |
|
|
— |
|
|
235 |
|
|
|
|
235 |
|
Changes in fair value of underlying items for contracts with direct participation features (excluding segregated funds)(2) |
|
(134) |
|
|
— |
|
|
(134) |
|
|
|
|
(134) |
|
|
|
|
|
|
|
|
|
|
|
|
| Foreign exchange gains (losses) |
|
(24) |
|
|
(2) |
|
|
(26) |
|
|
|
|
(26) |
|
| Other |
|
(65) |
|
|
(4) |
|
|
(69) |
|
|
|
|
(69) |
|
| Total insurance finance income (expenses) recognized in income |
|
1,307 |
|
|
(119) |
|
|
1,188 |
|
|
|
|
1,188 |
|
Decrease (increase) in investment contract liabilities |
|
|
|
|
|
|
|
(235) |
|
|
(235) |
|
| Net investment result |
|
|
|
|
|
$ |
730 |
|
|
$ |
705 |
|
|
$ |
1,435 |
|
| Net investment result recognized in net income |
|
|
|
|
|
$ |
721 |
|
|
$ |
657 |
|
|
$ |
1,378 |
|
| Net investment result recognized in OCI |
|
|
|
|
|
$ |
9 |
|
|
$ |
48 |
|
|
$ |
57 |
|
|
|
|
|
|
|
|
|
|
|
|
|
|
|
|
|
|
|
|
|
|
|
|
|
|
|
|
|
|
|
|
|
|
For the nine months ended September 30, 2022 |
Insurance contracts Issued |
Reinsurance
contracts held |
Total insurance contracts |
Non-insurance (all other) |
|
Total |
Net investment income (loss) (restated, see Note 2): |
|
|
|
|
|
|
|
|
|
|
Net investment income (loss) recognized in net income |
|
|
|
|
|
$ |
(22,064) |
|
|
$ |
316 |
|
|
$ |
(21,748) |
|
Net investment income (loss) recognized in OCI |
|
|
|
|
|
(517) |
|
|
(1,443) |
|
|
(1,960) |
|
Total net investment income (loss) (restated, see Note 2) |
|
|
|
|
|
(22,581) |
|
|
(1,127) |
|
|
(23,708) |
|
| Total insurance finance income (expenses) recognized in net income: |
|
|
|
|
|
|
|
|
|
| Effect of time value of money (Interest on carrying value) including interest on policy loans and interest on amounts on deposit |
|
(1,244) |
|
|
(14) |
|
|
(1,258) |
|
|
|
|
(1,258) |
|
| Impact of change in discount rate on fulfilment cash flows excluding where measured at locked-in rates and effect of changes in financial risk |
|
17,634 |
|
|
(435) |
|
|
17,199 |
|
|
|
|
17,199 |
|
|
|
|
|
|
|
|
|
|
|
|
Application of risk mitigation option(1) |
|
580 |
|
|
— |
|
|
580 |
|
|
|
|
580 |
|
Changes in fair value of underlying items for contracts with direct participation features (excluding segregated funds)(2) |
|
6,314 |
|
|
— |
|
|
6,314 |
|
|
|
|
6,314 |
|
|
|
|
|
|
|
|
|
|
|
|
| Foreign exchange gains (losses) |
|
(56) |
|
|
8 |
|
|
(48) |
|
|
|
|
(48) |
|
| Other |
|
7 |
|
|
(4) |
|
|
3 |
|
|
|
|
3 |
|
| Total insurance finance income (expenses) recognized in income |
|
23,235 |
|
|
(445) |
|
|
22,790 |
|
|
|
|
22,790 |
|
Decrease (increase) in investment contract liabilities |
|
|
|
|
|
|
|
(102) |
|
|
(102) |
|
| Net investment result |
|
|
|
|
|
$ |
209 |
|
|
$ |
(1,229) |
|
|
$ |
(1,020) |
|
| Net investment result recognized in net income |
|
|
|
|
|
$ |
726 |
|
|
$ |
214 |
|
|
$ |
940 |
|
| Net investment result recognized in OCI |
|
|
|
|
|
$ |
(517) |
|
|
$ |
(1,443) |
|
|
$ |
(1,960) |
|
(1) Changes in our share of the fair value of underlying items and FCF arising from changes in the effect of financial risk that are mitigated by the use of derivatives and non derivative financial instruments are recognized in income rather than adjusting the CSM. These amounts are offset by changes in the fair value of the derivatives and non-derivative financial instruments included in Investment income. The amount above would have resulted in an adjustment to the CSM if it was recorded to the CSM.
(2) These amounts are offset by changes in fair value of the underlying items included in Net investment income (loss).
106 Sun Life Financial Inc. Third Quarter 2023 CONDENSED NOTES TO THE INTERIM CONSOLIDATED FINANCIAL STATEMENTS (UNAUDITED)
5.D Cash, Cash Equivalents and Short-Term Securities
Cash, cash equivalents and short-term securities presented in our Consolidated Statements of Financial Position and Net cash, cash equivalents and short-term securities presented in our Consolidated Statements of Cash Flows consist of the following:
|
|
|
|
|
|
|
|
|
|
|
|
|
|
|
|
|
|
|
|
|
|
|
|
|
|
|
|
| As at |
September 30, 2023 |
December 31, 2022 |
September 30, 2022 |
| Cash |
|
$ |
2,368 |
|
|
$ |
3,068 |
|
|
$ |
3,372 |
|
| Cash equivalents |
|
6,568 |
|
|
6,310 |
|
|
6,024 |
|
| Short-term securities |
|
2,090 |
|
|
1,841 |
|
|
1,990 |
|
| Cash, cash equivalents and short-term securities |
|
11,026 |
|
|
11,219 |
|
|
11,386 |
|
| Less: Bank overdraft, recorded in Other liabilities |
|
— |
|
|
6 |
|
|
1 |
|
| Net cash, cash equivalents and short-term securities |
|
$ |
11,026 |
|
|
$ |
11,213 |
|
|
$ |
11,385 |
|
5.E Mortgage Securitization
We securitize certain insured fixed rate commercial mortgages as described in Note 5 of our 2022 Annual Consolidated Financial Statements.
The carrying value and fair value of the securitized mortgages as at September 30, 2023 are $1,860 and $1,701, respectively (December 31, 2022 — $1,926 and $1,793, respectively). The carrying value and fair value of the associated liabilities as at September 30, 2023 are $2,119 and $1,942, respectively (December 31, 2022 — $2,158 and $2,018, respectively). The carrying value of securities in the principal reinvestment account (''PRA'') as at September 30, 2023 is $266 (December 31, 2022 — $244). There are $nil cash and cash equivalents in the PRA as at September 30, 2023 (December 31, 2022 — $nil).
The fair value of the secured borrowings from mortgage securitization is based on the methodologies and assumptions for asset-backed securities described in Note 5 of our 2022 Annual Consolidated Financial Statements. The fair value of these liabilities is categorized in Level 2 of the fair value hierarchy as at September 30, 2023 and December 31, 2022.
|
|
|
|
|
|
|
|
|
|
|
|
|
|
|
6. Financial Instrument Risk Management |
|
The significant risks related to financial instruments are credit risk, market risk (including equity risk, real estate risk, interest rate and spread risk, foreign currency risk, and inflation risk) and liquidity risk.
Our financial instruments risk management policies and procedures are described in our Management’s Discussion and Analysis ("MD&A") as at September 30, 2023 and December 31, 2022. The text and tables in the Risk Management section of the MD&A represent part of our disclosures on credit, market and liquidity risks and include a description of how we measure our risk and our objectives, policies and methodologies for managing these risks. Therefore, the text and tables in our MD&A form an integral part of these Consolidated Financial Statements.
We use derivative instruments to manage market risks related to equity market, interest rate and currency fluctuations and in replication strategies for permissible investments. We do not engage in speculative investment in derivatives. The gap in market sensitivities or exposures between liabilities and supporting assets is monitored and managed within defined tolerance limits, by using derivative instruments, where appropriate. We use models and techniques to measure the effectiveness of our risk management strategies.
6.A Impairment of Financial Assets
Refer to accounting policies in Note 2.A.ii.
Policies after January 1, 2023 (IFRS 9)
Significant increase in credit risk
The assessment of significant increase in credit risk requires judgment. We assign counterparties a relevant internal credit risk rating grade depending on their credit quality. Changes in borrower-specific internal risk ratings is a primary indicator of significant increase in credit risk.
At each reporting date, movements between Stage 1 and Stage 2 are determined based on whether an instrument’s internal rating as at the reporting date has increased (decreased) significantly relative to the date it was initially recognized. We assess whether there has been a significant increase in credit risk for exposures since initial recognition by comparing the risk of default occurring over the remaining expected life from the reporting date and the date of initial recognition. The assessment considers borrower-specific quantitative and qualitative information without consideration of collateral, and the impact of forward-looking macroeconomic factors. Unless identified at an earlier stage, the credit risk of financial assets is deemed to have increased significantly when more than 30 days past due or moved to Watch List status and such assets are automatically migrated to Stage 2. Exposures are classified as "Watch List" when there is a moderate deterioration in credit quality, but the full payment of principal and interest is still expected to be collected, or there is an increased possibility of the exposure being impaired in the near term. No impairment charge is recorded for unrealized losses on assets related to these debtors.
Incorporation of forward-looking information
The measurement of ECL for each stage and the assessment of significant increase in credit risk considers future events and economic conditions. The estimation and application of forward-looking information requires significant judgment.
CONDENSED NOTES TO THE INTERIM CONSOLIDATED FINANCIAL STATEMENTS (UNAUDITED) Sun Life Financial Inc.
Third Quarter 2023 107 The probability of default ("PD"), loss given default ("LGD") and exposure at default ("EAD") inputs used to estimate allowance for ECL are modelled based on the macroeconomic variables (or changes in macroeconomic variables) that are most closely correlated with credit losses in the relevant portfolio.
Our estimation of ECL is a discounted probability-weighted estimate that considers a minimum of three future macroeconomic scenarios (base case, upside and downside) and probability weights are attributed to each scenario. All scenarios considered are applied to all portfolios subject to ECL with the same probabilities. Our assessment of significant increase in credit risk is based on changes in internal rating as at the reporting date.
We subscribe to Moody's Analytics economic forecasting services and leverage its forward-looking macroeconomic information to model ECL.
Measurement of ECL
ECL is measured as the probability-weighted present value of expected cash shortfalls expected to result from defaults over the relevant time horizon, which is the maximum contractual period over which we are exposed to credit risk, including consideration of prepayments, and extensions.
The mechanics of the ECL calculations are outlined below and the key elements are as follows: PD, LGD, and EAD.
The PD is an estimate of the likelihood of default over a given time horizon. It is estimated as at a point in time based on historical losses, along with consideration of economic scenarios and forward-looking information.
LGD is the magnitude of the likely loss if there is a default at a given time. It is based on the difference in the present values of the contractual cash flows due and those that the lender would expect to receive, including from the realization of any collateral (net of directly attributable costs).
EAD represents the expected exposure in the event of a default. We derive the EAD from the current exposure to the counterparty and potential changes to the current amount allowed under the contract, including amortization, and prepayments.
An ECL estimate is produced for each individual exposure. Relevant parameters are modelled on a collective basis using portfolio segmentation that allows for appropriate incorporation of forward-looking information. To reflect other characteristics that are not already considered through modelling, expert credit judgment can be exercised in determining the final ECL.
Qualitative adjustments or overlays
The inputs and models used for calculating ECL may not always capture all characteristics of the market at the date of the financial statements. This could be a case where a major event occurs close to the reporting date, so that the potential effects are not appropriately captured in the models and inputs. To reflect this, qualitative adjustments or overlays are occasionally made as temporary adjustments when such differences are material.
The following tables show reconciliations from the opening balance to the closing balance of the allowance for ECL by class of financial instrument.
|
|
|
|
|
|
|
|
|
|
|
|
|
|
|
|
|
|
|
|
|
|
|
|
|
|
|
|
|
|
|
|
|
|
|
|
|
|
|
|
|
|
Performing |
|
Impaired |
|
Total |
|
|
|
|
|
|
For the three months ended September 30, 2023 |
|
Stage 1 |
|
Stage 2 |
|
Stage 3 |
|
|
|
|
|
|
|
|
| Debt securities: |
|
|
|
|
|
|
|
|
|
|
|
|
|
|
|
|
Balance, beginning of period |
|
$ |
27 |
|
|
$ |
2 |
|
|
$ |
— |
|
|
$ |
29 |
|
|
|
|
|
|
|
|
|
| Provision for credit losses: |
|
|
|
|
|
|
|
|
|
|
|
|
|
|
|
|
| Transfer to stage 1 |
|
— |
|
|
— |
|
|
— |
|
|
— |
|
|
|
|
|
|
|
|
|
| Transfer to stage 2 |
|
— |
|
|
— |
|
|
— |
|
|
— |
|
|
|
|
|
|
|
|
|
| Transfer to stage 3 |
|
— |
|
|
— |
|
|
— |
|
|
— |
|
|
|
|
|
|
|
|
|
| New originations or purchases |
|
1 |
|
|
— |
|
|
— |
|
|
1 |
|
|
|
|
|
|
|
|
|
| Derecognition or maturities |
|
(1) |
|
|
— |
|
|
— |
|
|
(1) |
|
|
|
|
|
|
|
|
|
Net remeasurement(1) |
|
(2) |
|
|
— |
|
|
— |
|
|
(2) |
|
|
|
|
|
|
|
|
|
| Write-offs, net of recoveries, and other adjustments |
|
— |
|
|
— |
|
|
— |
|
|
— |
|
|
|
|
|
|
|
|
|
Balance, end of period |
|
$ |
25 |
|
|
$ |
2 |
|
|
$ |
— |
|
|
$ |
27 |
|
|
|
|
|
|
|
|
|
| Mortgages and loans: |
|
|
|
|
|
|
|
|
|
|
|
|
|
|
|
|
Balance, beginning of period |
|
$ |
6 |
|
|
$ |
1 |
|
|
$ |
47 |
|
|
$ |
54 |
|
|
|
|
|
|
|
|
|
| Provision for credit losses: |
|
|
|
|
|
|
|
|
|
|
|
|
|
|
|
|
| Transfer to stage 1 |
|
— |
|
|
— |
|
|
— |
|
|
— |
|
|
|
|
|
|
|
|
|
| Transfer to stage 2 |
|
— |
|
|
— |
|
|
— |
|
|
— |
|
|
|
|
|
|
|
|
|
| Transfer to stage 3 |
|
— |
|
|
— |
|
|
— |
|
|
— |
|
|
|
|
|
|
|
|
|
| New originations or purchases |
|
1 |
|
|
— |
|
|
— |
|
|
1 |
|
|
|
|
|
|
|
|
|
| Derecognition or maturities |
|
— |
|
|
— |
|
|
— |
|
|
— |
|
|
|
|
|
|
|
|
|
Net remeasurement(1) |
|
(1) |
|
|
(1) |
|
|
1 |
|
|
(1) |
|
|
|
|
|
|
|
|
|
| Write-offs, net of recoveries, and other adjustments |
|
— |
|
|
— |
|
|
— |
|
|
— |
|
|
|
|
|
|
|
|
|
Balance, end of period |
|
$ |
6 |
|
|
$ |
— |
|
|
$ |
48 |
|
|
$ |
54 |
|
|
|
|
|
|
|
|
|
|
|
|
|
|
|
|
|
|
|
|
|
|
|
|
|
|
|
|
|
|
|
|
|
|
|
|
|
|
|
|
|
|
|
|
|
|
|
|
|
|
|
|
|
|
|
|
|
|
|
|
|
|
|
|
|
|
|
|
|
|
|
|
|
|
|
|
|
|
|
|
|
|
|
|
|
|
|
|
|
|
|
|
|
|
|
|
|
|
|
|
|
|
|
|
|
|
|
|
|
|
|
|
|
|
|
|
|
|
|
|
|
|
|
|
|
|
|
|
|
|
|
|
|
|
|
|
|
|
|
|
|
|
|
|
|
|
|
|
|
|
|
|
|
|
|
|
|
|
|
|
|
|
|
|
|
|
|
|
|
|
|
|
|
|
|
|
|
|
|
|
|
|
|
|
|
|
|
|
|
|
|
|
|
|
|
|
|
|
|
|
|
|
|
|
|
|
|
|
|
|
|
|
|
(1) Includes changes in the measurement resulting from the significant changes in credit risk and from changes in credit risk that did not result in a transfer between stages, changes in model inputs and assumptions and changes in forward looking macroeconomic conditions.
108 Sun Life Financial Inc. Third Quarter 2023 CONDENSED NOTES TO THE INTERIM CONSOLIDATED FINANCIAL STATEMENTS (UNAUDITED)
|
|
|
|
|
|
|
|
|
|
|
|
|
|
|
|
|
|
|
|
|
|
|
|
|
|
|
|
|
Performing |
Impaired |
|
Total |
For the nine months ended September 30, 2023 |
|
Stage 1 |
|
Stage 2 |
|
Stage 3 |
|
| Debt securities: |
|
|
|
|
|
|
|
|
| Balance, beginning of period |
|
$ |
30 |
|
|
$ |
2 |
|
|
$ |
— |
|
|
$ |
32 |
|
| Provision for credit losses: |
|
|
|
|
|
|
|
|
| Transfer to stage 1 |
|
— |
|
|
— |
|
|
— |
|
|
— |
|
| Transfer to stage 2 |
|
— |
|
|
— |
|
|
— |
|
|
— |
|
| Transfer to stage 3 |
|
— |
|
|
— |
|
|
— |
|
|
— |
|
| New originations or purchases |
|
6 |
|
|
— |
|
|
— |
|
|
6 |
|
| Derecognition or maturities |
|
(5) |
|
|
— |
|
|
— |
|
|
(5) |
|
Net remeasurement(1) |
|
(6) |
|
|
— |
|
|
— |
|
|
(6) |
|
| Write-offs, net of recoveries, and other adjustments |
|
— |
|
|
— |
|
|
— |
|
|
— |
|
| Balance, end of period |
|
$ |
25 |
|
|
$ |
2 |
|
|
$ |
— |
|
|
$ |
27 |
|
| Mortgages and loans: |
|
|
|
|
|
|
|
|
| Balance, beginning of period |
|
$ |
4 |
|
|
$ |
— |
|
|
$ |
39 |
|
|
$ |
43 |
|
| Provision for credit losses: |
|
|
|
|
|
|
|
|
| Transfer to stage 1 |
|
— |
|
|
— |
|
|
— |
|
|
— |
|
| Transfer to stage 2 |
|
— |
|
|
— |
|
|
— |
|
|
— |
|
| Transfer to stage 3 |
|
— |
|
|
— |
|
|
— |
|
|
— |
|
| New originations or purchases |
|
4 |
|
|
1 |
|
|
— |
|
|
5 |
|
| Derecognition or maturities |
|
— |
|
|
— |
|
|
— |
|
|
— |
|
Net remeasurement(1) |
|
(2) |
|
|
(1) |
|
|
9 |
|
|
6 |
|
|
|
|
|
|
|
|
|
|
| Write-offs, net of recoveries, and other adjustments |
|
— |
|
|
— |
|
|
— |
|
|
— |
|
| Balance, end of period |
|
$ |
6 |
|
|
$ |
— |
|
|
$ |
48 |
|
|
$ |
54 |
|
|
|
|
|
|
|
|
|
|
|
|
|
|
|
|
|
|
|
|
|
|
|
|
|
|
|
|
|
|
|
|
|
|
|
|
|
|
|
|
|
|
|
|
|
|
|
|
|
|
|
|
|
|
|
|
|
|
|
|
|
|
|
|
|
|
|
|
|
|
|
|
|
|
|
|
|
|
|
|
|
|
|
|
|
|
|
|
|
|
|
|
|
|
|
|
|
|
|
|
|
|
|
|
|
|
|
|
|
(1) Includes changes in the measurement resulting from the significant changes in credit risk and from changes in credit risk that did not result in a transfer between stages, changes in model inputs and assumptions and changes in forward looking macroeconomic conditions.
Changes in Allowances for Losses
The changes in the allowances for losses are as follows:
|
|
|
|
|
|
|
|
|
|
|
|
|
|
|
|
|
|
|
|
|
|
Mortgages |
|
Loans |
|
Total |
Balance, January 1, 2022 |
|
$ |
80 |
|
|
$ |
52 |
|
|
$ |
132 |
|
| Provision for (reversal of) losses |
|
(2) |
|
|
57 |
|
|
55 |
|
| Foreign exchange rate movements |
|
2 |
|
|
3 |
|
|
5 |
|
Balance, December 31, 2022 |
|
$ |
80 |
|
|
$ |
112 |
|
|
$ |
192 |
|
CONDENSED NOTES TO THE INTERIM CONSOLIDATED FINANCIAL STATEMENTS (UNAUDITED) Sun Life Financial Inc. Third Quarter 2023 109 The following table presents the gross carrying amount of mortgages and loans at amortized cost and the fair value of mortgages and loans and debt securities at FVOCI.
Credit risk exposure by internal rating
Risk ratings are based on internal ratings used in the measurement of ECL, as at the reporting date.
|
|
|
|
|
|
|
|
|
|
|
|
|
|
|
|
|
|
|
|
|
|
|
|
|
Performing |
|
Impaired |
|
Total |
| As at September 30, 2023 |
Stage 1 |
|
Stage 2 |
|
Stage 3 |
|
| Mortgages and loans at amortized cost: |
|
|
|
|
|
|
|
| Investment grade |
$ |
2,128 |
|
|
$ |
25 |
|
|
$ |
— |
|
|
$ |
2,153 |
|
| Non-investment grade |
— |
|
|
36 |
|
|
— |
|
|
36 |
|
| Impaired |
— |
|
|
— |
|
|
10 |
|
|
10 |
|
| Total mortgages and loans at amortized cost |
2,128 |
|
|
61 |
|
|
10 |
|
|
2,199 |
|
| Less: Total allowance for ECL |
1 |
|
|
— |
|
|
9 |
|
|
10 |
|
| Total mortgages and loans at amortized cost, net of total allowance for ECL |
$ |
2,127 |
|
|
$ |
61 |
|
|
$ |
1 |
|
|
$ |
2,189 |
|
| Mortgages and loans at FVOCI: |
|
|
|
|
|
|
|
| Investment grade |
$ |
1,675 |
|
|
$ |
12 |
|
|
$ |
— |
|
|
$ |
1,687 |
|
| Non-investment grade |
73 |
|
|
55 |
|
|
— |
|
|
128 |
|
| Impaired |
— |
|
|
— |
|
|
2 |
|
|
2 |
|
| Total mortgages and loans at FVOCI |
$ |
1,748 |
|
|
$ |
67 |
|
|
$ |
2 |
|
|
$ |
1,817 |
|
| Debt securities at FVOCI: |
|
|
|
|
|
|
|
| Investment grade |
$ |
13,452 |
|
|
$ |
14 |
|
|
$ |
— |
|
|
$ |
13,466 |
|
| Non-investment grade |
382 |
|
|
42 |
|
|
— |
|
|
424 |
|
| Impaired |
— |
|
|
— |
|
|
— |
|
|
— |
|
| Total debt securities at FVOCI |
$ |
13,834 |
|
|
$ |
56 |
|
|
$ |
— |
|
|
$ |
13,890 |
|
|
|
|
|
|
|
|
|
|
|
|
|
|
|
|
|
|
|
|
|
|
|
|
|
|
|
|
|
|
|
|
|
|
|
|
|
|
|
|
|
Debt Securities by Credit Rating
Investment grade debt securities are those rated BBB and above. Our debt security portfolio was 99% investment grade based on carrying value as at December 31, 2022. The credit risk ratings were established in accordance with the internal rating process described in the Credit Risk Management Governance and Control section.
The following table summarizes our debt securities by credit quality:
|
|
|
|
|
|
|
|
|
|
|
|
|
|
|
|
|
|
|
|
|
|
|
|
|
|
|
|
|
|
|
As at December 31, 2022
(restated, see Note 2)
|
FVTPL |
FVOCI |
Total debt
securities |
|
|
|
| Debt securities by credit rating: |
|
|
|
|
|
|
|
|
|
|
|
|
| AAA |
|
$ |
9,440 |
|
|
$ |
5,822 |
|
|
$ |
15,262 |
|
|
|
|
|
|
|
| AA |
|
9,267 |
|
|
2,043 |
|
|
11,310 |
|
|
|
|
|
|
|
| A |
|
23,050 |
|
|
4,646 |
|
|
27,696 |
|
|
|
|
|
|
|
| BBB |
|
17,007 |
|
|
3,661 |
|
|
20,668 |
|
|
|
|
|
|
|
| BB and lower |
|
593 |
|
|
373 |
|
|
966 |
|
|
|
|
|
|
|
| Total debt securities |
|
$ |
59,357 |
|
|
$ |
16,545 |
|
|
$ |
75,902 |
|
|
|
|
|
|
|
Mortgages and Loans by Credit Rating
The credit quality of mortgages and loans is evaluated internally through regular monitoring of credit-related exposures. We use judgment and experience to determine what factors should be considered when assigning an internal credit rating, which is validated through the use of credit scoring models, to a particular mortgage or corporate loan. The internal credit ratings reflect the credit quality of the borrower as well as the value of any collateral held as security.
The following tables summarize our mortgages and loans by credit quality indicator:
|
|
|
|
|
|
|
|
|
|
|
|
|
|
|
|
|
|
|
|
|
|
|
|
|
|
|
|
|
|
|
|
|
|
|
|
|
|
|
|
|
|
|
|
|
|
|
|
|
|
|
|
As at December 31, 2022
(restated, see Note 2)
|
|
Insured |
|
AAA |
|
AA |
|
A |
|
BBB |
BB and lower |
|
Impaired |
|
Total |
| Mortgages by credit rating |
|
$ |
4,035 |
|
|
$ |
— |
|
|
$ |
1,665 |
|
|
$ |
5,483 |
|
|
$ |
2,686 |
|
|
$ |
538 |
|
|
$ |
14 |
|
|
$ |
14,421 |
|
| Loans by credit rating |
|
n/a |
|
$ |
285 |
|
|
$ |
5,101 |
|
|
$ |
15,257 |
|
|
$ |
14,284 |
|
|
$ |
1,872 |
|
|
$ |
33 |
|
|
$ |
36,832 |
|
110 Sun Life Financial Inc. Third Quarter 2023 CONDENSED NOTES TO THE INTERIM CONSOLIDATED FINANCIAL STATEMENTS (UNAUDITED)
6.B Market Risk
Risk Description
We are exposed to market risk, which is defined as the risk that the value or future cash flows of insurance and investment contract liabilities or financial assets will fluctuate because of changes or volatility in market prices. Market risk includes equity, interest rate and spread, real estate, foreign currency, and inflation risks.
Market Risk Management Governance and Control
We employ a wide range of market risk management practices and controls as outlined below:
•Market risk governance practices are in place, including independent monitoring and review and reporting to senior management and the Risk Committee.
•Risk appetite limits have been established for equity, interest rate, credit spread, real estate and foreign currency risks.
•Income and regulatory capital sensitivities are monitored, managed and reported against pre-established risk limits.
•Comprehensive asset-liability management and hedging policies, programs and practices are in place.
•Regulatory solvency requirements include risk-based capital requirements and are monitored regularly.
•Product Design and Pricing Policy requires a detailed risk assessment and pricing provisions for material risks.
•Stress-testing techniques, such as FCT, are used to measure the effects of large and sustained adverse market movements.
•Insurance contract liabilities are established in accordance with Canadian actuarial standards of practice and International Financial Reporting Standards.
•Internal capital targets are established at an enterprise level to cover all risks and are above minimum regulatory and supervisory levels. Actual capital levels are monitored to ensure they exceed internal targets.
Specific market risks and our risk management strategies are discussed below in further detail.
6.B.i Equity Risk
Equity risk is the potential for financial loss arising from declines or volatility in equity market prices. We are exposed to equity risk from a number of sources.
We generate revenue in our asset management businesses and from certain insurance and annuity contracts where fees are levied on account balances that are affected directly by equity market levels. Accordingly, we have further exposure to equity risk as adverse fluctuations in the market value of such assets will result in corresponding adverse impacts on revenue and income. In addition, declining and volatile equity markets may have a negative impact on sales and redemptions (surrenders) in these businesses, and this may result in further adverse impacts on net income.
A portion of our exposure to equity risk arises in connection with benefit guarantees on segregated fund products, some participating insurance contracts, some adjustable insurance contracts, and some universal life contracts. These benefit guarantees may be triggered upon death, maturity, withdrawal or annuitization. The cost of providing these guarantees is uncertain and depends upon a number of factors, including general capital market conditions, our hedging strategies, policyholder behaviour and mortality experience, each of which may result in negative impacts on net income.
We also have direct exposure to equity markets from the investments supporting other general account liabilities, surplus, and employee benefit plans. These exposures fall within our risk-taking philosophy and appetite, and are therefore generally not hedged.
6.B.ii Interest Rate and Credit Spread Risk
Interest rate and spread risk includes the potential for financial loss arising from changes in the value of insurance and investment contract liabilities and financial assets due to changes or volatility in interest rates or spreads. In practice, when asset cash flows and the policy obligations they support are not matched, this may result in the need to either sell assets to meet policy payments and expenses or reinvest excess asset cash flows in unfavourable interest rate or credit spread environments. This risk is managed in our asset-liability management program.
Our primary exposure to interest rate and spread risk arises from insurance and investment contracts that contain guarantees in the form of minimum crediting rates, maximum premium rates, settlement options, guaranteed annuitization options and minimum benefits. If investment returns fall below guaranteed levels, we may be required to increase liabilities or capital in respect of these contracts. The guarantees attached to these products may be applicable to both past premiums collected and future premiums not yet received. Segregated fund contracts provide benefit guarantees that are linked to underlying fund performance and may be triggered upon death, maturity, withdrawal or annuitization. We are also exposed to interest rate risk through guaranteed annuitization options included primarily in retirement contracts and pension plans. These embedded options give policyholders the right to convert their investment into a pension on a guaranteed basis, thereby exposing us to declining long-term interest rates as the annuity guarantee rates come into effect. The cost of providing these guarantees is uncertain and depends upon a number of factors including the level and concentration of the guarantees relative to prevailing interest rates, credit spreads, non-fixed income returns, and policyholder behaviour. Exposure to guarantees is managed within our risk appetite limits through our asset-liability management program, which may include the use of hedging strategies utilizing interest rate derivatives such as interest rate floors, swaps, futures and swaptions. The impact of these guarantees on net income are included in the disclosed market risk sensitivities.
Declines in interest rates or narrowing spreads can result in compression of the net spread between interest earned on investments and interest credited to policyholders. Declines in interest rates or narrowing spreads can also result in increased asset calls, mortgage prepayments, and net reinvestment of positive cash flows at lower yields, and therefore adversely impact our profitability and financial position. Negative interest rates may additionally result in losses on our cash and short-term deposits and low or negative returns on our fixed income assets impacting our profitability. In contrast, increases in interest rates or a widening of credit spreads can reduce market values of fixed income assets, which may lead to lower capital or losses in the event of the liquidation of assets prior to maturity.
CONDENSED NOTES TO THE INTERIM CONSOLIDATED FINANCIAL STATEMENTS (UNAUDITED) Sun Life Financial Inc.
Third Quarter 2023 111 Significant changes or volatility in interest rates or spreads could have a negative impact on sales of certain insurance and annuity products, and adversely impact the expected pattern of redemptions (surrenders) on existing policies. Increases in interest rates or widening credit spreads may increase the risk that policyholders will surrender their contracts, potentially forcing us to liquidate assets at a loss. While we have established hedging programs in place and our insurance and annuity products often contain surrender mitigation features, these may not be sufficient to fully offset the adverse impact of changes in interest rates or spreads.
We also have direct exposure to interest rates and spreads from investments supporting other general account liabilities, surplus and employee benefit plans. Lower interest rates or a narrowing of spreads will result in reduced investment income on new fixed income asset purchases. Conversely, higher interest rates or wider spreads will reduce the value of our existing assets. These exposures fall within our risk-taking philosophy and appetite and are therefore generally not hedged.
6.B.iii Real Estate Risk
Real estate risk is the potential for financial loss arising from fluctuations in the value of, or future cash flows from, our investments in real estate. We are exposed to real estate risk and may experience financial losses resulting from the direct ownership of real estate investments or indirectly through fixed income investments secured by real estate property, leasehold interests, ground rents, and purchase and leaseback transactions. Real
estate price risk may arise from external market conditions, inadequate property analysis, inadequate insurance coverage, inappropriate real estate appraisals, or from environmental risk exposures. We hold real estate investments that support general account liabilities and surplus, and fluctuations in value will affect our net income. A material and sustained increase in interest rates may lead to deterioration in real estate values.
6.B.iv Market Risk Sensitivities
We use a variety of methods and measures to manage and quantify our market risk exposures. These include duration and key rate duration management, convexity measures, cash flow gap analysis, scenario testing, and sensitivity testing of earnings and regulatory capital ratios.
The measurement of liabilities and assets are affected by the level of equity market performance, interest rates, credit and swap spreads and other market risk variables. The following sections set out the estimated immediate impact on, or sensitivity of, our net income and OCI to certain instantaneous changes in market variables as at September 30, 2023 and December 31, 2022.
The estimated sensitivities in the tables below reflect the impact of market movements on insurance contracts and investment contracts, assets backing insurance contracts, assets backing investment contracts, assets backing the surplus segment, and seed investments in our asset management subsidiaries.
Net income sensitivities to equity and real estate market movements are driven primarily by changes in the value of investments backing general account liabilities and surplus. Net income sensitivities to interest rates and spreads are driven by the net impact on liabilities and the assets backing them. Lower interest rates or a narrowing of spreads will result in increased liabilities for insurance contracts, offset by increased values of the assets backing general account liabilities. Higher interest rates or a widening of spreads will result in decreased liabilities for insurance contracts, offset by decreased values of the assets backing general account liabilities. Further detail on the impact of changes or volatility in market prices on assets and liabilities is provided under the headings "Equity Risk", "Interest Rate and Credit Spread Risk", and "Real Estate Risk" above.
OCI sensitivities are impacted by changes in the market value of assets classified as FVOCI. The market value of FVOCI fixed income assets, which are held primarily in our surplus and investment contract segments, increases with lower interest rates or a narrowing of spreads, and decreases with higher interest rates or a widening of spreads.
As these market risk sensitivities reflect an instantaneous impact on net income and OCI, they do not include impacts over time such as the effect on fee income in our asset management businesses.
Refer to Additional Cautionary Language and Key Assumptions Related to Sensitivities in this section for important additional information regarding these estimates.
112 Sun Life Financial Inc. Third Quarter 2023 CONDENSED NOTES TO THE INTERIM CONSOLIDATED FINANCIAL STATEMENTS (UNAUDITED)
Equity Market Sensitivities
The following table sets out the estimated immediate impact on, or sensitivity of, our net income and OCI to certain instantaneous changes in equity market prices as at September 30, 2023 and December 31, 2022.
|
|
|
|
|
|
|
|
|
|
|
|
|
|
|
|
|
|
|
|
|
|
|
|
|
|
|
|
|
|
|
|
|
|
|
|
|
|
|
|
|
|
|
|
|
|
|
|
|
|
|
| As at |
September 30, 2023 |
December 31, 2022(4) |
|
|
|
|
|
|
|
|
(restated, see Note 2) |
Change in Equity Markets(1)(2)(3) |
25% decrease |
10% decrease |
10% increase |
25% increase |
25%
decrease |
10% decrease |
10% increase |
25% increase |
| Potential impact on net income (after-tax) |
|
$ |
(400) |
|
|
$ |
(150) |
|
|
$ |
175 |
|
|
$ |
425 |
|
|
$ |
(300) |
|
|
$ |
(125) |
|
|
$ |
125 |
|
|
$ |
325 |
|
|
|
|
|
|
|
|
|
|
|
|
|
|
|
|
|
|
|
|
|
|
|
|
|
|
|
|
|
|
|
|
|
|
|
|
|
|
|
|
|
|
|
|
|
|
|
|
|
|
|
|
|
|
|
|
|
|
|
|
|
|
|
|
|
|
|
|
|
|
|
|
|
|
|
|
|
|
|
|
|
|
|
|
|
|
|
|
|
|
|
|
|
|
|
|
|
|
|
|
|
|
|
|
|
|
|
|
|
|
|
|
|
|
|
|
|
|
|
|
|
|
|
|
|
|
|
|
|
|
|
|
|
|
|
|
|
|
|
|
|
|
|
|
|
|
|
|
|
|
|
|
|
|
|
|
|
|
|
|
|
|
|
|
|
|
|
|
|
|
|
(1)Represents the respective change across all equity markets as at September 30, 2023 and December 31, 2022. Assumes that actual equity exposures consistently and precisely track the broader equity markets. Since in actual practice equity-related exposures differ from broad market indices (due to the impact of active management, basis risk, and other factors), realized sensitivities may differ significantly from those illustrated above. Sensitivities include the impact of re-balancing equity hedges for hedging programs at 2% intervals (for 10% changes in equity markets) and at 5% intervals (for 25% changes in equity markets).
(2)The market risk sensitivities include the estimated impact of our hedging programs in effect as at September 30, 2023 and December 31, 2022, and include new business added and product changes implemented prior to such dates.
(3)Net income and OCI sensitivities have been rounded in increments of $25. The sensitivities exclude the market impacts on the income from our joint ventures and associates, which we account for on an equity basis.
(4)Effective January 1, 2023, we adopted IFRS 17 and IFRS 9, and certain financial assets were reclassified between measurement categories as permitted. December 31, 2022 amounts provided in the sensitivities tables have been adjusted to reflect these January 1, 2023 reclassifications. See Note 2 for further details on the reclassifications.
Interest Rate Sensitivities
The following table sets out the estimated immediate impact on, or sensitivity of, our net income and OCI to certain instantaneous changes in interest rates as at September 30, 2023 and December 31, 2022.
|
|
|
|
|
|
|
|
|
|
|
|
|
|
|
|
|
|
|
|
|
|
|
|
|
|
|
| As at |
September 30, 2023 |
December 31, 2022(4) |
|
|
|
|
|
(restated, see Note 2) |
Change in Interest Rates(1)(2)(3) |
50 basis point decrease |
50 basis point increase |
50 basis point decrease |
50 basis point increase |
| Potential impact on net income (after-tax) |
|
$ |
(25) |
|
|
$ |
25 |
|
|
$ |
(100) |
|
|
$ |
75 |
|
|
|
|
|
|
|
|
|
|
| Potential impact on OCI |
|
$ |
200 |
|
|
$ |
(200) |
|
|
$ |
225 |
|
|
$ |
(225) |
|
|
|
|
|
|
(1)Interest rate sensitivities assume a parallel shift in assumed interest rates across the entire yield curve as at September 30, 2023 and December 31, 2022 with no change to the ultimate risk-free rate. Variations in realized yields based on factors such as different terms to maturity and geographies may result in realized sensitivities being significantly different from those illustrated above. Sensitivities include the impact of re-balancing interest rate hedges for hedging programs at 10 basis point intervals (for 50 basis point changes in interest rates).
(2)The market risk sensitivities include the estimated impact of our hedging programs in effect as at September 30, 2023 and December 31, 2022, and include new business added and product changes implemented prior to such dates.
(3)Net income and OCI sensitivities have been rounded in increments of $25. The sensitivities exclude the market impacts on the income from our joint ventures and associates, which we account for on an equity basis.
(4)Effective January 1, 2023, we adopted IFRS 17 and IFRS 9, and certain financial assets were reclassified between measurement categories as permitted. December 31, 2022 amounts provided in the sensitivities tables have been adjusted to reflect these January 1, 2023 reclassifications. See Note 2 for further details on the reclassifications.
The above sensitivities were determined using a 50 basis point change in interest rates and a 10% and 25% changes in our equity markets because we believe that these market shocks were reasonably possible as at September 30, 2023. Significant changes in market variables may result in other than proportionate impacts on our sensitivities.
CONDENSED NOTES TO THE INTERIM CONSOLIDATED FINANCIAL STATEMENTS (UNAUDITED) Sun Life Financial Inc. Third Quarter 2023 113 Credit spread sensitivities reflect the impact of changes in credit spreads on our asset and liability values (including provincial government bonds, corporate bonds, and other fixed income assets).
Credit Spread and Swap Sensitivities
Swap spread sensitivities reflect the impact of changes in swap spreads on swap-based derivative positions and liability values.
The following tables set out the estimated immediate impact on, or sensitivity of, our net income and OCI to certain instantaneous changes in credit spreads and our net income and OCI to certain changes in swap spreads as at September 30, 2023 and December 31, 2022.
|
|
|
|
|
|
|
|
|
|
|
|
|
|
|
|
|
|
|
|
|
|
|
|
|
|
|
| As at |
September 30, 2023 |
December 31, 2022(3) |
|
|
|
|
|
(restated, see Note 2) |
Change in Credit Spreads(1)(2) |
50 basis point decrease |
50 basis point increase |
50 basis point decrease |
50 basis point increase |
| Potential impact on net income (after-tax) |
|
$ |
75 |
|
|
$ |
(100) |
|
|
$ |
50 |
|
|
$ |
(50) |
|
|
|
|
|
|
|
|
|
|
| Potential impact on OCI |
|
$ |
175 |
|
|
$ |
(175) |
|
|
$ |
200 |
|
|
$ |
(200) |
|
|
|
|
|
|
|
|
|
|
(1)The credit spread sensitivities assume a parallel shift in the indicated spreads across the entire term structure with no change to the ultimate liquidity premium. The sensitivities reflect a floor of zero on credit spreads where the spreads are not currently negative. Variations in realized spread changes based on different terms to maturity, geographies, asset classes and derivative types, underlying interest rate movements, and ratings may result in realized sensitivities being significantly different from those provided above.
(2)Net income and OCI sensitivities have been rounded in increments of $25.
(3)Effective January 1, 2023, we adopted IFRS 17 and IFRS 9, and certain financial assets were reclassified between measurement categories as permitted. December 31, 2022 amounts provided in the sensitivities tables have been adjusted to reflect these January 1, 2023 reclassifications. See Note 2 for further details on the reclassifications.
|
|
|
|
|
|
|
|
|
|
|
|
|
|
|
|
|
|
|
|
|
|
|
|
|
|
|
| As at |
September 30, 2023 |
December 31, 2022(3) |
|
|
|
|
|
(restated, see Note 2) |
Change in Swap Spreads(1)(2) |
20 basis point decrease |
20 basis point increase |
20 basis point decrease |
20 basis point increase |
| Potential impact on net income (after-tax) |
|
$ |
(25) |
|
|
$ |
25 |
|
|
$ |
(25) |
|
|
$ |
25 |
|
|
|
|
|
|
|
|
|
|
|
|
|
|
|
|
|
|
|
(1)The swap spread sensitivities assume a parallel shift in the indicated spreads across the entire term structure. Variations in realized spread changes based on different terms to maturity, geographies, asset classes and derivative types, underlying interest rate movements, and ratings may result in realized sensitivities being significantly different from those provided above.
(2)Net income and OCI sensitivities have been rounded in increments of $25.
(3)Effective January 1, 2023, we adopted IFRS 17 and IFRS 9, and certain financial assets were reclassified between measurement categories as permitted. December 31, 2022 amounts provided in the sensitivities tables have been adjusted to reflect these January 1, 2023 reclassifications. See Note 2 for further details on the reclassifications.
Real Estate Sensitivities
The following tables set out the estimated immediate impact on, or sensitivity of, our net income and OCI to certain instantaneous changes in the value of our real estate investments as at September 30, 2023 and December 31, 2022.
|
|
|
|
|
|
|
|
|
|
|
|
|
|
|
|
|
|
|
|
|
|
|
|
|
|
|
|
|
As at |
|
September 30, 2023 |
|
December 31, 2022(2) |
|
|
|
|
|
|
(restated, see Note 2) |
|
Change in Real Estate Values (1) |
10% decrease |
10% increase |
10% decrease |
10% increase |
|
|
|
|
|
|
|
|
|
|
|
|
|
|
|
|
|
|
|
|
|
|
|
|
|
|
|
|
|
|
|
Potential impact on net income (after-tax) |
|
$ |
(475) |
|
|
$ |
475 |
|
|
$ |
(500) |
|
|
$ |
500 |
|
|
|
|
|
|
|
|
|
|
|
|
|
|
|
|
|
|
|
|
|
(1)Net income and OCI sensitivities have been rounded in increments of $25.
(2)Effective January 1, 2023, we adopted IFRS 17 and IFRS 9, and certain financial assets were reclassified between measurement categories as permitted. December 31, 2022 amounts provided in the sensitivities tables have been adjusted to reflect these January 1, 2023 reclassifications. See Note 2 for further details on the reclassifications.
6.B.v Foreign Currency Risk
Foreign currency risk is the result of mismatches in the currency of our assets and liabilities (inclusive of capital), and cash flows. This risk may arise from a variety of sources such as foreign currency transactions and services, foreign currency hedging, investments denominated in foreign currencies, investments in foreign subsidiaries and net income from foreign operations. Changes or volatility in foreign exchange rates, including a change to currencies that are fixed in value to another currency, could adversely affect our net income.
As an international provider of financial services, we operate in a number of countries, with revenues and expenses denominated in several local currencies. In each country in which we operate, we generally maintain the currency profile of assets to match the currency of liabilities and required capital. This approach provides an operational hedge against disruptions in local operations caused by currency fluctuations. Foreign currency derivative contracts such as currency swaps and forwards are used as a risk management tool to manage the currency exposure in accordance with our Asset Liability Management Policy. As at September 30, 2023 and December 31, 2022, the Company did not have a material foreign currency risk exposure.
Changes in exchange rates can affect our net income and surplus when financial results in functional currencies are translated into Canadian dollars. Net income earned outside of Canada is generally not currency hedged and a weakening in the local currency of our foreign operations relative to the Canadian dollar can have a negative impact on our net income reported in Canadian currency. A strengthening in the local currency of our foreign operations relative to the Canadian dollar would have the opposite effect. Regulatory capital ratios could also be impacted by changes in exchange rates.
114 Sun Life Financial Inc. Third Quarter 2023 CONDENSED NOTES TO THE INTERIM CONSOLIDATED FINANCIAL STATEMENTS (UNAUDITED)
6.B.vi Inflation Risk
Inflation risk is the potential for financial loss arising from changes in inflation rates. This risk results from insurance contract liabilities that are linked to market measures of inflation such as the Consumer Price Index. The primary sources for this risk exposure are from certain group and retail annuity contracts and group long term disability contracts. In these contracts, the annuity and disability benefit payments may be linked to an indexing formula containing an inflation price index. Benefit payments linked to inflation indices may also include various caps, floors and averaging mechanisms that vary across product designs.
Exposure to inflation risk is managed within our asset-liability management program, primarily by investing in inflation linked assets to match liability exposures.
6.B.vii Additional Cautionary Language and Key Assumptions Related to Sensitivities
Our market risk sensitivities are measures of our estimated change in net income and OCI for changes in market risk variables described above, based on market risk variables and business in force as at the reporting date. These sensitivities are calculated independently for each risk factor, generally assuming that all other risk variables stay constant. The sensitivities do not take into account indirect effects such as potential impacts on goodwill impairment or valuation allowances on deferred tax assets.
We have provided measures of our net income sensitivity to instantaneous changes in equity markets, interest rates, credit spreads, swap spreads, and real estate price levels. The cautionary language which appears in this section is applicable to all net income and OCI sensitivities.
Actual results can differ materially from these estimates for a variety of reasons, including differences in the pattern or distribution of the market shocks, the interaction between these risk factors, model error, or changes in other assumptions such as business mix, effective tax rates, policyholder behaviour, currency exchange rates and other market variables relative to those underlying the calculation of these sensitivities. The extent to which actual results may differ from the indicative ranges will generally increase with larger movements in risk variables. Our sensitivities as at December 31, 2022 have been included for comparative purposes only.
The sensitivities reflect the composition of our assets and liabilities as at September 30, 2023 and December 31, 2022, respectively. Changes in these positions due to new sales or maturities, asset purchases/sales, or other management actions could result in material changes to these reported sensitivities. In particular, these sensitivities reflect the expected impact of hedging activities based on the hedging programs in place as at the September 30 and December 31 calculation dates. The actual impact of hedging activity can differ materially from that assumed in the estimated sensitivities due to ongoing hedge re-balancing activities, changes in the scale or scope of hedging activities, changes in the cost or general availability of hedging instruments, basis risk (i.e., the risk that hedges do not exactly replicate the underlying portfolio experience), model risk, and other operational risks in the ongoing management of the hedge programs or the potential failure of hedge counterparties to perform in accordance with expectations.
Our hedging programs may themselves expose us to other risks, including basis risk, volatility risk, and increased levels of derivative counterparty credit risk, liquidity risk, model risk and other operational risks. These factors may adversely impact the net effectiveness, costs, and financial viability of maintaining these hedging programs and therefore adversely impact our profitability and financial position. While our hedging programs are intended to mitigate these effects (e.g., hedge counterparty credit risk is managed by maintaining broad diversification, dealing primarily with highly-rated counterparties, and transacting through over-the-counter ("OTC") contracts cleared through central clearing houses, exchange-traded contracts or bilateral OTC contracts negotiated directly between counterparties that include credit support annexes), residual risk, potential reported earnings and capital volatility remain.
The sensitivities are based on methods and assumptions in effect as at September 30, 2023 and December 31, 2022, as applicable. Changes in the regulatory environment, assumptions or methods used to measure assets and liabilities after those dates could result in material changes to the estimated sensitivities. Changes in market risk variables in excess of the changes illustrated may result in other than proportionate impacts.
The sensitivities reflect the CSM as at September 30, 2023 and December 31, 2022. For insurance contracts measured using the VFA, where the change in the effect of the time value of money and financial risk not arising from the underlying items adjusts the CSM, changes in the CSM balance will affect the sensitivity of income to changes in market risk variables.
For the reasons outlined above, our sensitivities should only be viewed as indicative estimates of the underlying sensitivities of each factor under these specialized assumptions, and should not be viewed as predictors of our future income and OCI. Given the nature of these calculations, we cannot provide assurance that actual impacts will be consistent with the estimates provided.
CONDENSED NOTES TO THE INTERIM CONSOLIDATED FINANCIAL STATEMENTS (UNAUDITED) Sun Life Financial Inc. Third Quarter 2023 115 The Consolidated Statements of Financial Position present insurance contracts issued and reinsurance contracts held as both assets and liabilities, depending on whether the portfolio is in an asset or liability position.
The disclosures in this Note are for the net insurance contract asset or liability, and net reinsurance contract held asset or liability. In addition, certain disclosures in this Note exclude assets and liabilities for contracts measured using the PAA, as indicated.
The following table shows the insurance contracts issued and reinsurance contracts held, excluding Insurance contract liabilities for account of segregated fund holders. Further details on Insurance contract liabilities for account of segregated fund holders are included in Note 11. Total insurance contract liabilities, including Insurance contract liabilities for account of segregated fund holders, are $143,250 as at September 30, 2023 (December 31, 2022 — $154,433).
7.A Summary
|
|
|
|
|
|
|
|
|
|
|
|
|
|
|
|
|
|
| As at |
September 30, 2023 |
|
December 31, 2022 |
| Total contracts: |
|
|
|
|
|
| Insurance contract assets |
|
$ |
208 |
|
|
|
$ |
75 |
|
Insurance contract liabilities(1) |
|
124,873 |
|
|
|
131,294 |
|
| Net insurance contract liabilities |
|
$ |
124,665 |
|
|
|
$ |
131,219 |
|
| Reinsurance contract held assets |
|
$ |
5,766 |
|
|
|
$ |
6,115 |
|
| Reinsurance contract held liabilities |
|
1,543 |
|
|
|
1,603 |
|
| Net reinsurance contract held assets |
|
$ |
4,223 |
|
|
|
$ |
4,512 |
|
| Contracts measured using the PAA: |
|
|
|
|
|
| Insurance contract assets |
|
$ |
— |
|
|
|
$ |
— |
|
| Insurance contract liabilities |
|
16,544 |
|
|
|
16,923 |
|
| Net insurance contract liabilities - PAA |
|
$ |
16,544 |
|
|
|
$ |
16,923 |
|
| Reinsurance contract held assets |
|
$ |
436 |
|
|
|
$ |
441 |
|
| Reinsurance contract held liabilities |
|
112 |
|
|
|
41 |
|
| Net reinsurance contract held assets - PAA |
|
$ |
324 |
|
|
|
$ |
400 |
|
| Contracts not measured using the PAA: |
|
|
|
|
|
| Insurance contract assets |
|
$ |
208 |
|
|
|
$ |
75 |
|
Insurance contract liabilities(1) |
|
108,329 |
|
|
|
114,371 |
|
| Net insurance contract liabilities - non-PAA |
|
$ |
108,121 |
|
|
|
$ |
114,296 |
|
| Reinsurance contract held assets |
|
$ |
5,330 |
|
|
|
$ |
5,674 |
|
| Reinsurance contract held liabilities |
|
1,431 |
|
|
|
1,562 |
|
| Net reinsurance contract held assets - non-PAA |
|
$ |
3,899 |
|
|
|
$ |
4,112 |
|
(1) Includes liabilities of $(343) (December 31, 2022 — $(154)) for segregated fund insurance contracts that are not backed by the related Investments for account of segregated fund holders.
Current Discount Rates
The following table provides a weighted average summary of the discount curves used to present value cash flows that do not vary based on the returns on underlying items for all major products by business group:
|
|
|
|
|
|
|
|
|
|
|
|
|
|
|
|
|
|
|
|
|
|
|
|
|
|
|
|
|
|
|
|
|
|
|
|
|
|
|
| As at |
September 30, 2023 |
|
December 31, 2022 |
|
|
1 year |
5 years |
10 years |
30 years |
Ultimate |
|
1 year |
5 years |
10 years |
30 years |
Ultimate |
| Canada |
CAD |
6.29 |
% |
5.89 |
% |
5.69 |
% |
5.20 |
% |
4.65 |
% |
|
5.36 |
% |
5.00 |
% |
5.02 |
% |
4.80 |
% |
4.65 |
% |
| U.S. |
USD |
6.97 |
% |
6.41 |
% |
6.01 |
% |
5.88 |
% |
4.65 |
% |
|
6.06 |
% |
5.83 |
% |
5.47 |
% |
5.33 |
% |
4.65 |
% |
| Asia |
USD |
6.70 |
% |
6.03 |
% |
6.71 |
% |
5.89 |
% |
4.65 |
% |
|
5.88 |
% |
5.61 |
% |
6.35 |
% |
5.38 |
% |
4.65 |
% |
116 Sun Life Financial Inc. Third Quarter 2023 CONDENSED NOTES TO THE INTERIM CONSOLIDATED FINANCIAL STATEMENTS (UNAUDITED)
7.B Changes in Insurance Contracts
7.B.i Changes in Insurance Contracts Issued and Reinsurance Contracts Held Net Asset or Liability
The following tables show the changes in the net assets or liabilities for insurance contracts issued and reinsurance contracts held. The tables that illustrate changes by Measurement component exclude insurance contracts measured using the PAA. The tables that illustrate changes by Remaining coverage and incurred claims include insurance contracts measured using the PAA. Changes in the liabilities for insurance contract liabilities for account of segregated fund holders are provided in Note 11.
Insurance Contracts Issued By Measurement Component
The following table shows the changes in net liabilities for insurance contracts issued by measurement component:
|
|
|
|
|
|
|
|
|
|
|
|
|
|
|
|
|
|
|
|
|
|
|
|
|
|
|
|
|
|
|
|
|
For the nine months ended and as at September 30, 2023 |
For the year ended December 31, 2022 |
|
Estimates of PV of future cash flows |
Risk adjustment |
CSM |
Total |
Estimates of PV of future cash flows |
Risk adjustment |
CSM |
Total |
|
|
|
|
|
|
|
|
|
|
|
|
|
|
|
|
|
|
|
|
|
|
|
|
|
|
|
|
|
|
|
|
|
|
|
|
|
|
|
|
|
|
|
|
|
|
|
|
|
|
|
|
|
|
|
|
|
|
|
|
|
|
|
|
|
|
| Balances, beginning of period |
|
$ |
96,428 |
|
$ |
6,898 |
|
$ |
10,970 |
|
$ |
114,296 |
|
|
$ |
113,208 |
|
$ |
8,743 |
|
$ |
9,904 |
|
$ |
131,855 |
|
Changes related to current service: |
|
|
|
|
|
|
|
|
|
|
| CSM recognized for services provided |
|
|
|
(657) |
|
(657) |
|
|
|
|
(871) |
|
(871) |
|
| Risk adjustment recognized for non-financial risk expired |
|
|
(391) |
|
|
(391) |
|
|
|
(493) |
|
|
(493) |
|
| Income taxes specifically chargeable to the policyholder |
|
— |
|
— |
|
|
— |
|
|
71 |
|
— |
|
|
71 |
|
|
|
|
|
|
|
|
|
|
|
|
| Experience adjustments |
|
80 |
|
|
|
80 |
|
|
229 |
|
|
|
229 |
|
| Total changes related to current service |
|
80 |
|
(391) |
|
(657) |
|
(968) |
|
|
300 |
|
(493) |
|
(871) |
|
(1,064) |
|
| Changes related to future service: |
|
|
|
|
|
|
|
|
|
|
Changes in estimates that adjust CSM(1) |
|
(879) |
|
260 |
|
619 |
|
— |
|
|
(920) |
|
(213) |
|
1,133 |
|
— |
|
| Changes in estimates that do not adjust CSM (losses on onerous groups and reversals of such losses) |
|
35 |
|
11 |
|
|
46 |
|
|
55 |
|
2 |
|
|
57 |
|
| Contracts initially recognized in the period |
|
(1,219) |
|
378 |
|
881 |
|
40 |
|
|
(1,259) |
|
456 |
|
894 |
|
91 |
|
| Total changes related to future service |
|
(2,063) |
|
649 |
|
1,500 |
|
86 |
|
|
(2,124) |
|
245 |
|
2,027 |
|
148 |
|
Changes related to past service - Adjustments to FCF for incurred claims |
|
(63) |
|
(11) |
|
|
(74) |
|
|
(25) |
|
(2) |
|
|
(27) |
|
| Insurance service result |
|
(2,046) |
|
247 |
|
843 |
|
(956) |
|
|
(1,849) |
|
(250) |
|
1,156 |
|
(943) |
|
| Insurance finance (income) expenses from insurance contracts issued |
|
(986) |
|
(213) |
|
(171) |
|
(1,370) |
|
|
(19,140) |
|
(1,694) |
|
(347) |
|
(21,181) |
|
Total changes recognized in income |
|
(3,032) |
|
34 |
|
672 |
|
(2,326) |
|
|
(20,989) |
|
(1,944) |
|
809 |
|
(22,124) |
|
| Foreign currency translation |
|
102 |
|
3 |
|
— |
|
105 |
|
|
2,737 |
|
99 |
|
257 |
|
3,093 |
|
Total changes recognized in income and OCI |
|
(2,930) |
|
37 |
|
672 |
|
(2,221) |
|
|
(18,252) |
|
(1,845) |
|
1,066 |
|
(19,031) |
|
Cash flows: |
|
|
|
|
|
|
|
|
|
|
| Premiums received |
|
9,760 |
|
|
|
9,760 |
|
|
12,610 |
|
|
|
12,610 |
|
| Amounts paid to policyholders and other insurance service expenses paid |
|
(8,789) |
|
|
|
(8,789) |
|
|
(9,499) |
|
|
|
(9,499) |
|
| Insurance acquisition cash flows |
|
(1,432) |
|
|
|
(1,432) |
|
|
(1,572) |
|
|
|
(1,572) |
|
| Fees received from segregated funds |
|
294 |
|
|
|
294 |
|
|
451 |
|
|
|
451 |
|
| Other |
|
405 |
|
|
|
405 |
|
|
(518) |
|
|
|
(518) |
|
Total cash flows |
|
238 |
|
|
|
238 |
|
|
1,472 |
|
|
|
1,472 |
|
|
|
|
|
|
|
|
|
|
|
|
| Dispositions (Note 3) |
|
(3,885) |
|
(92) |
|
(261) |
|
(4,238) |
|
|
— |
|
— |
|
— |
|
— |
|
Contracts modified |
|
46 |
|
— |
|
— |
|
46 |
|
|
— |
|
— |
|
— |
|
— |
|
| Balances, end of period |
|
$ |
89,897 |
|
$ |
6,843 |
|
$ |
11,381 |
|
$ |
108,121 |
|
|
$ |
96,428 |
|
$ |
6,898 |
|
$ |
10,970 |
|
$ |
114,296 |
|
|
|
|
|
|
|
|
|
|
|
|
|
|
|
|
|
|
|
|
|
|
|
|
|
|
|
|
|
|
|
|
|
|
|
|
|
|
|
|
|
|
|
|
|
(1) Reflective of a contract modification resulting in the recognition of CSM related to a health contract in Asia Hong Kong effective June 30, 2023.
CONDENSED NOTES TO THE INTERIM CONSOLIDATED FINANCIAL STATEMENTS (UNAUDITED) Sun Life Financial Inc. Third Quarter 2023 117 The following table shows the changes in net liabilities for remaining coverage and incurred claims for insurance contracts issued:
Insurance Contracts Issued By Remaining Coverage and Incurred Claims
|
|
|
|
|
|
|
|
|
|
|
|
|
|
|
|
|
|
|
|
|
|
|
|
|
|
|
|
|
|
|
|
|
|
|
|
|
|
|
|
|
|
Liability for remaining coverage |
|
|
Liability for incurred claims |
|
|
|
|
|
|
|
|
Contracts using PAA |
|
|
For the nine months ended and as at September 30, 2023 |
Excluding loss component |
Loss component |
|
|
Contracts not using PAA |
Estimates of PV of future cash flows |
Risk Adjustment |
|
Total |
|
|
|
|
|
|
|
|
|
|
|
|
|
|
|
|
|
|
|
|
|
|
|
|
|
|
|
|
| Balances, beginning of period |
|
$ |
113,119 |
|
|
$ |
204 |
|
|
|
$ |
1,827 |
|
|
$ |
15,233 |
|
|
$ |
836 |
|
|
$ |
131,219 |
|
| Insurance revenue |
|
(15,898) |
|
|
|
|
|
|
|
|
|
|
|
(15,898) |
|
| Insurance service expenses: |
|
|
|
|
|
|
|
|
|
|
|
|
|
| Incurred claims and other expenses |
|
|
|
— |
|
|
|
3,621 |
|
|
8,969 |
|
|
47 |
|
|
12,637 |
|
| Amortization of insurance acquisition cash flows |
|
123 |
|
|
|
|
|
|
|
|
|
|
|
123 |
|
|
|
|
|
|
|
|
|
|
|
|
|
|
|
| Changes related to future service (losses on onerous groups and reversals of such losses) |
|
|
|
100 |
|
|
|
|
|
|
|
|
|
100 |
|
| Changes related to past service (changes in FCF related to liability for incurred claims) |
|
|
|
|
|
|
(74) |
|
|
73 |
|
|
(88) |
|
|
(89) |
|
| Total insurance service expenses |
|
123 |
|
|
100 |
|
|
|
3,547 |
|
|
9,042 |
|
|
(41) |
|
|
12,771 |
|
| Insurance service result |
|
(15,775) |
|
|
100 |
|
|
|
3,547 |
|
|
9,042 |
|
|
(41) |
|
|
(3,127) |
|
| Insurance finance (income) expenses |
|
(1,449) |
|
|
4 |
|
|
|
47 |
|
|
94 |
|
|
(3) |
|
|
(1,307) |
|
| Total changes recognized in income |
|
(17,224) |
|
|
104 |
|
|
|
3,594 |
|
|
9,136 |
|
|
(44) |
|
|
(4,434) |
|
| Foreign currency translation |
|
57 |
|
|
— |
|
|
|
(2) |
|
|
26 |
|
|
(3) |
|
|
78 |
|
| Total changes recognized in income and OCI |
|
(17,167) |
|
|
104 |
|
|
|
3,592 |
|
|
9,162 |
|
|
(47) |
|
|
(4,356) |
|
| Cash flows: |
|
|
|
|
|
|
|
|
|
|
|
|
|
| Premiums received |
|
22,517 |
|
|
|
|
|
|
|
|
|
|
|
22,517 |
|
| Amounts paid to policyholders and other insurance service expenses paid |
|
— |
|
|
|
|
|
(8,853) |
|
|
(10,324) |
|
|
— |
|
|
(19,177) |
|
| Insurance acquisition cash flows |
|
(1,459) |
|
|
|
|
|
— |
|
|
— |
|
|
— |
|
|
(1,459) |
|
| Fees received from segregated funds |
|
294 |
|
|
|
|
|
— |
|
|
— |
|
|
— |
|
|
294 |
|
| Other |
|
318 |
|
|
|
|
|
78 |
|
|
40 |
|
|
— |
|
|
436 |
|
| Total cash flows |
|
21,670 |
|
|
|
|
|
(8,775) |
|
|
(10,284) |
|
|
— |
|
|
2,611 |
|
| Investment component excluded from insurance revenue and insurance service expense: |
|
|
|
|
|
|
|
|
|
|
|
|
|
| Expected/incurred claims |
|
(5,102) |
|
|
|
|
|
5,152 |
|
|
1,698 |
|
|
— |
|
|
1,748 |
|
| Experience adjustment |
|
(1,748) |
|
|
|
|
|
— |
|
|
— |
|
|
— |
|
|
(1,748) |
|
| Total investment component excluded from insurance revenue and insurance service expense |
|
(6,850) |
|
|
|
|
|
5,152 |
|
|
1,698 |
|
|
— |
|
|
— |
|
|
|
|
|
|
|
|
|
|
|
|
|
|
|
| Dispositions (Note 3) |
|
(1,178) |
|
|
|
|
|
(3,070) |
|
|
(561) |
|
|
— |
|
|
(4,809) |
|
| Balances, end of period |
|
$ |
109,594 |
|
|
$ |
308 |
|
|
|
$ |
(1,274) |
|
|
$ |
15,248 |
|
|
$ |
789 |
|
|
$ |
124,665 |
|
|
|
|
|
|
|
|
|
|
|
|
|
|
|
|
|
|
|
|
|
|
|
|
|
|
|
|
|
|
|
|
|
|
|
|
|
|
|
|
|
|
|
118 Sun Life Financial Inc. Third Quarter 2023 CONDENSED NOTES TO THE INTERIM CONSOLIDATED FINANCIAL STATEMENTS (UNAUDITED)
|
|
|
|
|
|
|
|
|
|
|
|
|
|
|
|
|
|
|
|
|
|
|
|
|
|
|
|
|
|
|
|
|
|
|
|
|
|
|
|
Liability for remaining coverage |
|
Liability for incurred claims |
|
|
|
|
|
Contracts using PAA |
|
|
For the year ended December 31, 2022 |
Excluding loss component |
Loss component |
|
Contracts not using PAA |
Estimates of PV of future cash flows |
Risk Adjustment |
|
Total |
|
|
|
|
|
|
|
|
|
|
|
|
|
|
|
|
|
|
|
|
|
|
|
|
|
|
| Balances, beginning of period |
|
$ |
131,232 |
|
|
$ |
47 |
|
|
$ |
1,422 |
|
|
$ |
15,658 |
|
|
$ |
891 |
|
|
$ |
149,250 |
|
| Insurance revenue |
|
(18,902) |
|
|
|
|
|
|
|
|
|
|
(18,902) |
|
| Insurance service expenses: |
|
|
|
|
|
|
|
|
|
|
|
|
| Incurred claims and other expenses |
|
|
|
(3) |
|
|
4,925 |
|
|
9,931 |
|
|
270 |
|
|
15,123 |
|
| Amortization of insurance acquisition cash flows |
|
56 |
|
|
|
|
|
|
|
|
|
|
56 |
|
|
|
|
|
|
|
|
|
|
|
|
|
|
| Changes related to future service (losses on onerous groups and reversals of such losses) |
|
|
|
153 |
|
|
|
|
|
|
|
|
153 |
|
| Changes related to past service (changes in FCF related to liability for incurred claims) |
|
|
|
|
|
(29) |
|
|
267 |
|
|
(221) |
|
|
17 |
|
| Total insurance service expenses |
|
56 |
|
|
150 |
|
|
4,896 |
|
|
10,198 |
|
|
49 |
|
|
15,349 |
|
| Insurance service result |
|
(18,846) |
|
|
150 |
|
|
4,896 |
|
|
10,198 |
|
|
49 |
|
|
(3,553) |
|
| Insurance finance (income) expenses |
|
(21,257) |
|
|
4 |
|
|
86 |
|
|
(1,325) |
|
|
(103) |
|
|
(22,595) |
|
| Total changes recognized in income |
|
(40,103) |
|
|
154 |
|
|
4,982 |
|
|
8,873 |
|
|
(54) |
|
|
(26,148) |
|
| Foreign currency translation |
|
2,636 |
|
|
3 |
|
|
198 |
|
|
494 |
|
|
(1) |
|
|
3,330 |
|
| Total changes recognized in income and OCI |
|
(37,467) |
|
|
157 |
|
|
5,180 |
|
|
9,367 |
|
|
(55) |
|
|
(22,818) |
|
| Cash flows: |
|
|
|
|
|
|
|
|
|
|
|
|
Premiums received(1) |
|
27,655 |
|
|
|
|
|
|
|
|
|
|
27,655 |
|
Amounts paid to policyholders and other insurance service expenses paid(1) |
|
— |
|
|
|
|
(9,419) |
|
|
(12,136) |
|
|
— |
|
|
(21,555) |
|
| Insurance acquisition cash flows |
|
(1,552) |
|
|
|
|
— |
|
|
— |
|
|
— |
|
|
(1,552) |
|
| Fees received from segregated funds |
|
451 |
|
|
|
|
— |
|
|
— |
|
|
— |
|
|
451 |
|
| Other |
|
139 |
|
|
|
|
(638) |
|
|
(58) |
|
|
— |
|
|
(557) |
|
Total cash flows(1) |
|
26,693 |
|
|
|
|
(10,057) |
|
|
(12,194) |
|
|
— |
|
|
4,442 |
|
| Investment component excluded from insurance revenue and insurance service expense: |
|
|
|
|
|
|
|
|
|
|
|
|
| Expected/incurred claims |
|
(6,837) |
|
|
|
|
5,282 |
|
|
2,062 |
|
|
— |
|
|
507 |
|
| Experience adjustment |
|
(507) |
|
|
|
|
— |
|
|
— |
|
|
— |
|
|
(507) |
|
| Total investment component excluded from insurance revenue and insurance service expense |
|
(7,344) |
|
|
|
|
5,282 |
|
|
2,062 |
|
|
— |
|
|
— |
|
| Acquisitions |
|
5 |
|
|
|
|
— |
|
|
340 |
|
|
— |
|
|
345 |
|
|
|
|
|
|
|
|
|
|
|
|
|
|
Balances, end of period(1) |
|
$ |
113,119 |
|
|
$ |
204 |
|
|
$ |
1,827 |
|
|
$ |
15,233 |
|
|
$ |
836 |
|
|
$ |
131,219 |
|
|
|
|
|
|
|
|
|
|
|
|
|
|
|
|
|
|
|
|
|
|
|
|
|
|
|
|
|
|
|
|
|
|
|
|
|
|
|
|
(1) Reflects a change in presentation effective June 30, 2023. We have updated our prior period to reflect this change in presentation.
CONDENSED NOTES TO THE INTERIM CONSOLIDATED FINANCIAL STATEMENTS (UNAUDITED) Sun Life Financial Inc. Third Quarter 2023 119 The following table shows the changes in net assets for reinsurance contracts held by measurement component:
Reinsurance Contracts Held By Measurement Component
|
|
|
|
|
|
|
|
|
|
|
|
|
|
|
|
|
|
|
|
|
|
|
|
|
|
|
|
|
|
|
|
|
For the nine months ended and as at September 30, 2023 |
For the year ended December 31, 2022 |
|
Estimates of PV of future cash flows |
Risk adjustment |
CSM |
Total |
Estimates of PV of future cash flows |
Risk adjustment |
CSM |
Total |
|
|
|
|
|
|
|
|
|
|
|
|
|
|
|
|
|
|
|
|
|
|
|
|
|
|
|
|
|
|
|
|
|
|
|
|
|
|
|
|
|
|
|
|
|
|
|
|
|
|
|
|
|
|
|
|
|
|
|
|
|
|
|
|
|
|
| Balances, beginning of period |
|
$ |
1,786 |
|
$ |
2,221 |
|
$ |
105 |
|
$ |
4,112 |
|
|
$ |
1,375 |
|
$ |
2,699 |
|
$ |
107 |
|
$ |
4,181 |
|
| Changes related to current service: |
|
|
|
|
|
|
|
|
|
|
| CSM recognized for services received |
|
|
|
(2) |
|
(2) |
|
|
|
|
(10) |
|
(10) |
|
| Risk adjustment recognized for non-financial risk expired |
|
|
(100) |
|
|
(100) |
|
|
|
(131) |
|
|
(131) |
|
|
|
|
|
|
|
|
|
|
|
|
| Experience adjustments |
|
75 |
|
|
|
75 |
|
|
(105) |
|
|
|
(105) |
|
| Total changes related to current service |
|
75 |
|
(100) |
|
(2) |
|
(27) |
|
|
(105) |
|
(131) |
|
(10) |
|
(246) |
|
| Changes related to future service: |
|
|
|
|
|
|
|
|
|
|
| Changes in estimates that adjust CSM |
|
138 |
|
13 |
|
(151) |
|
— |
|
|
(203) |
|
147 |
|
56 |
|
— |
|
| Loss recoveries at initial recognition of onerous underlying contracts |
|
|
|
23 |
|
23 |
|
|
|
|
23 |
|
23 |
|
| Changes in estimates that relate to losses and reversals of losses on groups of underlying contracts |
|
(8) |
|
26 |
|
(7) |
|
11 |
|
|
(4) |
|
25 |
|
(23) |
|
(2) |
|
| Contracts initially recognized in the period |
|
(31) |
|
70 |
|
(39) |
|
— |
|
|
(37) |
|
95 |
|
(58) |
|
— |
|
| Total changes related to future service |
|
99 |
|
109 |
|
(174) |
|
34 |
|
|
(244) |
|
267 |
|
(2) |
|
21 |
|
| Changes related to past service - Adjustments to FCF for incurred claims |
|
(37) |
|
(5) |
|
|
(42) |
|
|
249 |
|
(4) |
|
|
245 |
|
|
|
|
|
|
|
|
|
|
|
|
| Reinsurance contract held net income (expense) |
|
137 |
|
4 |
|
(176) |
|
(35) |
|
|
(100) |
|
132 |
|
(12) |
|
20 |
|
| Insurance finance income (expenses) from reinsurance contracts held |
|
32 |
|
(150) |
|
1 |
|
(117) |
|
|
229 |
|
(648) |
|
1 |
|
(418) |
|
| Total changes recognized in income |
|
169 |
|
(146) |
|
(175) |
|
(152) |
|
|
129 |
|
(516) |
|
(11) |
|
(398) |
|
| Foreign currency translation |
|
19 |
|
2 |
|
(2) |
|
19 |
|
|
359 |
|
38 |
|
9 |
|
406 |
|
| Total changes recognized in income and OCI |
|
188 |
|
(144) |
|
(177) |
|
(133) |
|
|
488 |
|
(478) |
|
(2) |
|
8 |
|
| Cash flows: |
|
|
|
|
|
|
|
|
|
|
| Premiums paid |
|
1,132 |
|
|
|
1,132 |
|
|
1,562 |
|
|
|
1,562 |
|
| Amounts recovered from reinsurers |
|
(912) |
|
|
|
(912) |
|
|
(1,711) |
|
|
|
(1,711) |
|
| Other |
|
(272) |
|
|
|
(272) |
|
|
72 |
|
|
|
72 |
|
| Total cash flows |
|
(52) |
|
|
|
(52) |
|
|
(77) |
|
|
|
(77) |
|
|
|
|
|
|
|
|
|
|
|
|
| Dispositions (Note 3) |
|
(25) |
|
(9) |
|
1 |
|
(33) |
|
|
— |
|
— |
|
— |
|
— |
|
| Contracts modified |
|
5 |
|
— |
|
— |
|
5 |
|
|
— |
|
— |
|
— |
|
— |
|
| Balances, end of period |
|
$ |
1,902 |
|
$ |
2,068 |
|
$ |
(71) |
|
$ |
3,899 |
|
|
$ |
1,786 |
|
$ |
2,221 |
|
$ |
105 |
|
$ |
4,112 |
|
|
|
|
|
|
|
|
|
|
|
|
|
|
|
|
|
|
|
|
|
|
|
|
|
|
|
|
|
|
|
|
|
|
|
|
|
|
|
|
|
|
|
|
|
120 Sun Life Financial Inc. Third Quarter 2023 CONDENSED NOTES TO THE INTERIM CONSOLIDATED FINANCIAL STATEMENTS (UNAUDITED)
Reinsurance Contracts Held By Remaining Coverage and Incurred Claims
The following table shows the changes in net assets for remaining coverage and incurred claims for reinsurance contracts held:
|
|
|
|
|
|
|
|
|
|
|
|
|
|
|
|
|
|
|
|
|
|
|
|
|
|
|
|
|
|
|
|
|
|
|
|
|
|
|
|
|
Asset for remaining coverage |
|
|
Asset for incurred claims |
|
|
|
|
|
|
|
Contracts using PAA |
|
|
For the nine months ended and as at September 30, 2023 |
Excluding loss-recovery component |
Loss-recovery component |
|
|
Contracts not using PAA |
Estimates of PV of future cash flows |
Risk Adjustment |
|
Total |
|
|
|
|
|
|
|
|
|
|
|
|
|
|
|
|
|
|
|
|
|
|
|
|
|
|
|
|
| Balances, beginning of period |
|
$ |
3,393 |
|
|
$ |
18 |
|
|
|
$ |
712 |
|
|
$ |
380 |
|
|
$ |
9 |
|
|
$ |
4,512 |
|
| Reinsurance contract held net income (expense) excluding changes in risk of non-performance by the reinsurer |
|
(1,522) |
|
|
29 |
|
|
|
960 |
|
|
449 |
|
|
8 |
|
|
(76) |
|
| Changes in the risk of non-performance by the reinsurer |
|
23 |
|
|
— |
|
|
|
(23) |
|
|
— |
|
|
— |
|
|
— |
|
| Reinsurance contract held net income (expense) |
|
(1,499) |
|
|
29 |
|
|
|
937 |
|
|
449 |
|
|
8 |
|
|
(76) |
|
| Insurance finance income (expenses) from reinsurance contracts held |
|
(125) |
|
|
1 |
|
|
|
4 |
|
|
1 |
|
|
— |
|
|
(119) |
|
| Total changes recognized in income |
|
(1,624) |
|
|
30 |
|
|
|
941 |
|
|
450 |
|
|
8 |
|
|
(195) |
|
| Foreign currency translation |
|
23 |
|
|
— |
|
|
|
(63) |
|
|
(16) |
|
|
— |
|
|
(56) |
|
| Total changes recognized in income and OCI |
|
(1,601) |
|
|
30 |
|
|
|
878 |
|
|
434 |
|
|
8 |
|
|
(251) |
|
| Cash flows: |
|
|
|
|
|
|
|
|
|
|
|
|
|
| Premiums paid |
|
1,717 |
|
|
|
|
|
|
|
|
|
|
|
1,717 |
|
| Amounts recovered from reinsurers |
|
|
|
|
|
|
(1,020) |
|
|
(426) |
|
|
|
|
(1,446) |
|
| Other |
|
(126) |
|
|
|
|
|
(61) |
|
|
(2) |
|
|
|
|
(189) |
|
| Total cash flows |
|
1,591 |
|
|
|
|
|
(1,081) |
|
|
(428) |
|
|
|
|
82 |
|
| Investment component excluded from reinsurance contract held net income (expense): |
|
|
|
|
|
|
|
|
|
|
|
|
|
| Expected/incurred claims |
|
92 |
|
|
— |
|
|
|
32 |
|
|
18 |
|
|
— |
|
|
142 |
|
| Experience adjustment |
|
(142) |
|
|
— |
|
|
|
|
|
— |
|
|
— |
|
|
(142) |
|
| Total investment component excluded from reinsurance contract held net income (expense) |
|
(50) |
|
|
— |
|
|
|
32 |
|
|
18 |
|
|
— |
|
|
— |
|
|
|
|
|
|
|
|
|
|
|
|
|
|
|
| Dispositions (Note 3) |
|
7 |
|
|
— |
|
|
|
(22) |
|
|
(105) |
|
|
— |
|
|
(120) |
|
| Balances, end of period |
|
$ |
3,340 |
|
|
$ |
48 |
|
|
|
$ |
519 |
|
|
$ |
299 |
|
|
$ |
17 |
|
|
$ |
4,223 |
|
|
|
|
|
|
|
|
|
|
|
|
|
|
|
|
|
|
|
|
|
|
|
|
|
|
|
|
|
|
|
|
|
|
|
|
|
|
|
|
|
|
|
|
|
|
|
|
|
|
|
|
|
|
|
|
|
|
|
|
|
|
|
|
|
|
|
|
|
|
|
|
|
|
|
|
|
|
|
|
|
|
|
|
Asset for remaining coverage |
|
|
Asset for incurred claims |
|
|
|
|
|
|
Contracts using PAA |
|
|
For the year ended December 31, 2022 |
Excluding loss-recovery component |
Loss-recovery component |
|
|
Contracts not using PAA |
Estimates of PV of future cash flows |
Risk Adjustment |
|
Total |
|
|
|
|
|
|
|
|
|
|
|
|
|
|
|
|
|
|
|
|
|
|
|
|
|
|
|
|
| Balances, beginning of period |
|
$ |
3,643 |
|
|
$ |
— |
|
|
|
$ |
521 |
|
|
$ |
444 |
|
|
$ |
10 |
|
|
$ |
4,618 |
|
| Reinsurance contract held net income (expense) excluding changes in risk of non-performance by the reinsurer |
|
(2,279) |
|
|
18 |
|
|
|
1,407 |
|
|
701 |
|
|
— |
|
|
(153) |
|
| Changes in the risk of non-performance by the reinsurer |
|
38 |
|
|
— |
|
|
|
(38) |
|
|
— |
|
|
— |
|
|
— |
|
| Reinsurance contract held net income (expense) |
|
(2,241) |
|
|
18 |
|
|
|
1,369 |
|
|
701 |
|
|
— |
|
|
(153) |
|
| Insurance finance income (expenses) from reinsurance contracts held |
|
(430) |
|
|
— |
|
|
|
9 |
|
|
(18) |
|
|
(1) |
|
|
(440) |
|
| Total changes recognized in income |
|
(2,671) |
|
|
18 |
|
|
|
1,378 |
|
|
683 |
|
|
(1) |
|
|
(593) |
|
| Foreign currency translation |
|
227 |
|
|
— |
|
|
|
165 |
|
|
(17) |
|
|
— |
|
|
375 |
|
| Total changes recognized in income and OCI |
|
(2,444) |
|
|
18 |
|
|
|
1,543 |
|
|
666 |
|
|
(1) |
|
|
(218) |
|
| Cash flows: |
|
|
|
|
|
|
|
|
|
|
|
|
|
| Premiums paid |
|
2,489 |
|
|
|
|
|
|
|
|
|
|
|
2,489 |
|
| Amounts recovered from reinsurers |
|
|
|
|
|
|
(1,702) |
|
|
(753) |
|
|
|
|
(2,455) |
|
| Other |
|
(217) |
|
|
|
|
|
295 |
|
|
— |
|
|
|
|
78 |
|
| Total cash flows |
|
2,272 |
|
|
|
|
|
(1,407) |
|
|
(753) |
|
|
|
|
112 |
|
| Investment component excluded from reinsurance contract held net income (expense): |
|
|
|
|
|
|
|
|
|
|
|
|
|
| Expected/incurred claims |
38 |
|
|
— |
|
|
|
55 |
|
|
23 |
|
|
— |
|
|
116 |
|
| Experience adjustment |
|
(116) |
|
|
— |
|
|
|
|
|
— |
|
|
— |
|
|
(116) |
|
| Total investment component excluded from reinsurance contract held net income (expense) |
|
(78) |
|
|
— |
|
|
|
55 |
|
|
23 |
|
|
— |
|
|
— |
|
|
|
|
|
|
|
|
|
|
|
|
|
|
|
|
|
|
|
|
|
|
|
|
|
|
|
|
|
| Balances, end of period |
|
$ |
3,393 |
|
|
$ |
18 |
|
|
|
$ |
712 |
|
|
$ |
380 |
|
|
$ |
9 |
|
|
$ |
4,512 |
|
|
|
|
|
|
|
|
|
|
|
|
|
|
|
|
|
|
|
|
|
|
|
|
|
|
|
|
|
|
|
|
|
|
|
|
|
|
|
|
|
|
|
CONDENSED NOTES TO THE INTERIM CONSOLIDATED FINANCIAL STATEMENTS (UNAUDITED) Sun Life Financial Inc. Third Quarter 2023 121 Insurance revenue in the Consolidated Statements of Operations consists of the following:
7.B.ii Analysis of Insurance Revenue
|
|
|
|
|
|
|
|
|
|
|
|
|
|
|
|
|
|
|
|
|
|
|
|
|
|
|
|
For the three months ended |
For the nine months ended |
|
September 30 2023 |
September 30 2022 |
September 30 2023 |
September 30 2022 |
|
|
|
|
|
|
|
|
|
For contracts not measured using the PAA: |
|
|
|
|
|
|
|
|
Amounts relating to changes in liabilities for remaining coverage: |
|
|
|
|
|
|
|
|
Expected claims and other expenses(1) |
|
$ |
1,212 |
|
|
$ |
1,243 |
|
|
$ |
3,526 |
|
|
$ |
3,475 |
|
Release of risk adjustment(1) |
|
147 |
|
|
142 |
|
|
391 |
|
|
372 |
|
| CSM recognized for services provided |
|
210 |
|
|
210 |
|
|
657 |
|
|
646 |
|
Income taxes specifically chargeable to the policyholder |
|
(2) |
|
|
(14) |
|
|
— |
|
|
(71) |
|
|
|
|
|
|
|
|
|
|
|
|
|
|
|
|
|
|
|
| Amortization of insurance acquisition cash flows |
|
50 |
|
|
17 |
|
|
123 |
|
|
32 |
|
| Total insurance revenue for contracts not measured using the PAA |
|
1,617 |
|
|
1,598 |
|
|
4,697 |
|
|
4,454 |
|
| For contracts measured using the PAA: |
|
|
|
|
|
|
|
|
| Insurance revenue |
|
3,716 |
|
|
3,551 |
|
|
11,201 |
|
|
9,143 |
|
| Total insurance revenue |
|
$ |
5,333 |
|
|
$ |
5,149 |
|
|
$ |
15,898 |
|
|
$ |
13,597 |
|
(1)Expected claims and other expenses excludes investment components and amounts allocated to the loss component. Release of risk adjustment excludes amounts allocated to the loss component and amounts related to changes in the time value of money, which are recognized in Insurance finance income (expenses).
7.B.iii Contracts initially Recognized in the Period
The tables in this section illustrate the effect on the Consolidated Statements of Financial Position of insurance contracts initially recognized during the period, excluding contracts measured using the PAA.
Insurance Contracts Issued
|
|
|
|
|
|
|
|
|
|
|
|
|
|
|
|
|
|
|
|
|
|
|
|
|
|
|
|
|
|
|
|
|
|
|
|
|
|
|
|
|
For the nine months ended and as at September 30, 2023 |
|
|
|
|
|
|
|
|
For the year ended December 31, 2022 |
|
|
|
|
|
|
|
|
|
|
|
|
|
|
|
|
|
|
| Contracts initially recognized in the period (excluding acquisitions): |
|
|
|
|
|
|
|
|
|
|
|
|
|
|
|
|
|
|
|
|
|
| Amounts related to all contracts initially recognized: |
|
|
|
|
|
|
|
|
|
|
|
|
|
|
|
|
|
|
|
|
|
| Estimates of present value of future cash inflows |
|
|
|
|
|
|
|
|
|
|
$ |
(10,346) |
|
|
|
|
|
|
|
|
|
|
$ |
(11,290) |
|
| Estimates of present value of future cash outflows: |
|
|
|
|
|
|
|
|
|
|
|
|
|
|
|
|
|
|
|
|
|
| Insurance acquisition cash flows |
|
|
|
|
|
|
|
|
|
|
1,578 |
|
|
|
|
|
|
|
|
|
|
1,347 |
|
| Other cash outflows |
|
|
|
|
|
|
|
|
|
|
7,549 |
|
|
|
|
|
|
|
|
|
|
8,684 |
|
| Risk adjustment |
|
|
|
|
|
|
|
|
|
|
378 |
|
|
|
|
|
|
|
|
|
|
456 |
|
| CSM |
|
|
|
|
|
|
|
|
|
|
881 |
|
|
|
|
|
|
|
|
|
|
894 |
|
| Total contracts initially recognized in the period (excluding acquisitions) |
|
|
|
|
|
|
|
|
|
|
40 |
|
|
|
|
|
|
|
|
|
|
91 |
|
| Amounts related to onerous contracts included in total contracts above: |
|
|
|
|
|
|
|
|
|
|
|
|
|
|
|
|
|
|
|
|
|
| Estimates of present value of future cash inflows |
|
|
|
|
|
|
|
|
|
|
(552) |
|
|
|
|
|
|
|
|
|
|
(1,034) |
|
| Estimates of present value of future cash outflows: |
|
|
|
|
|
|
|
|
|
|
|
|
|
|
|
|
|
|
|
|
|
| Insurance acquisition cash flows |
|
|
|
|
|
|
|
|
|
|
63 |
|
|
|
|
|
|
|
|
|
|
87 |
|
| Other cash outflows |
|
|
|
|
|
|
|
|
|
|
460 |
|
|
|
|
|
|
|
|
|
|
923 |
|
| Risk adjustment |
|
|
|
|
|
|
|
|
|
|
69 |
|
|
|
|
|
|
|
|
|
|
115 |
|
| Total onerous contracts |
|
|
|
|
|
|
|
|
|
|
$ |
40 |
|
|
|
|
|
|
|
|
|
|
$ |
91 |
|
|
|
|
|
|
|
|
|
|
|
|
|
|
|
|
|
|
|
|
|
|
|
|
|
|
|
|
|
|
|
|
|
|
|
|
|
|
|
|
|
|
|
|
|
|
|
|
|
|
|
|
|
|
|
|
|
|
|
|
|
|
|
|
|
|
|
|
|
|
|
|
|
|
|
|
|
|
|
|
|
|
|
|
|
|
|
|
|
|
|
|
|
|
|
|
|
|
|
|
|
|
|
|
|
|
|
|
|
|
|
|
|
|
|
|
|
|
|
|
|
|
|
|
|
|
|
|
|
|
|
|
|
|
|
|
|
|
|
|
|
|
|
|
|
|
|
|
|
|
|
|
|
|
|
|
|
|
|
|
|
|
|
|
|
|
|
|
|
|
|
|
|
|
|
|
|
122 Sun Life Financial Inc. Third Quarter 2023 CONDENSED NOTES TO THE INTERIM CONSOLIDATED FINANCIAL STATEMENTS (UNAUDITED)
Reinsurance Contracts Held
|
|
|
|
|
|
|
|
|
|
|
|
|
|
|
|
|
|
|
|
|
|
|
|
|
|
|
|
|
|
|
|
|
|
For the nine months ended and as at September 30, 2023 |
|
|
|
|
|
For the year ended December 31, 2022 |
|
|
|
|
|
|
|
|
|
|
|
|
|
|
|
|
|
| Contracts initially recognized in the period (excluding acquisitions): |
|
|
|
|
|
|
|
|
|
|
| Amounts related to all contracts initially recognized: |
|
|
|
|
|
|
|
|
|
|
|
|
|
|
|
| Estimates of present value of future cash inflows |
|
|
|
|
|
|
|
|
$ |
236 |
|
|
|
|
|
|
|
$ |
300 |
|
| Estimates of present value of future cash outflows: |
|
|
|
|
|
|
|
|
|
|
|
|
|
|
|
|
| Premiums and other expenses |
|
|
|
|
|
|
|
|
(267) |
|
|
|
|
|
|
|
(337) |
|
|
|
|
|
|
|
|
|
|
|
|
|
|
|
|
|
|
| Risk adjustment |
|
|
|
|
|
|
|
|
70 |
|
|
|
|
|
|
|
95 |
|
| CSM |
|
|
|
|
|
|
|
|
(39) |
|
|
|
|
|
|
|
(58) |
|
| Total contracts initially recognized in the period (excluding acquisitions) |
|
|
|
|
|
|
|
|
— |
|
|
|
|
|
|
|
— |
|
| Amounts related to contracts initially recognized in the period with a loss recovery component included in total contracts above: |
|
|
|
|
|
|
|
|
|
|
|
|
|
|
|
|
| Estimates of present value of future cash inflows |
|
|
|
|
|
|
|
|
103 |
|
|
|
|
|
|
|
146 |
|
| Estimates of present value of future cash outflows: |
|
|
|
|
|
|
|
|
|
|
|
|
|
|
|
|
| Premiums and other expenses |
|
|
|
|
|
|
|
|
(103) |
|
|
|
|
|
|
|
(143) |
|
|
|
|
|
|
|
|
|
|
|
|
|
|
|
|
|
|
| Risk adjustment |
|
|
|
|
|
|
|
|
31 |
|
|
|
|
|
|
|
42 |
|
| CSM |
|
|
|
|
|
|
|
|
(31) |
|
|
|
|
|
|
|
(45) |
|
| Total reinsurance contracts held with a loss recovery component |
|
|
|
|
|
|
|
|
— |
|
|
|
|
|
|
|
— |
|
| Loss recoveries at initial recognition of onerous underlying contracts |
|
|
|
|
|
|
|
|
$ |
23 |
|
|
|
|
|
|
|
$ |
23 |
|
|
|
|
|
|
|
|
|
|
|
|
|
|
|
|
|
|
|
|
|
|
|
|
|
|
|
|
|
|
|
|
|
|
|
|
|
|
|
|
|
|
|
|
|
|
|
|
|
|
|
|
|
|
|
|
|
|
|
|
|
|
|
|
|
|
|
|
|
|
|
|
|
|
|
|
|
|
|
|
|
|
|
|
|
|
|
|
|
|
|
|
|
|
|
|
|
|
|
|
|
|
|
|
|
|
|
|
|
|
|
|
|
|
|
|
|
|
|
|
|
|
|
|
|
|
|
|
|
|
|
|
|
|
|
|
|
CONDENSED NOTES TO THE INTERIM CONSOLIDATED FINANCIAL STATEMENTS (UNAUDITED) Sun Life Financial Inc. Third Quarter 2023 123 Impacts of method and assumption changes on insurance contracts, are as follows:
7.B.iv Impact of Method and Assumption Changes
|
|
|
|
|
|
|
|
|
|
|
|
|
|
|
|
|
|
|
|
|
|
|
|
|
|
|
|
|
|
|
|
|
|
|
|
|
For the three months ended September 30, 2023 |
|
Income impact |
|
Deferred in CSM |
|
|
|
|
|
Description |
|
|
|
|
|
|
|
|
|
|
|
|
|
|
|
|
|
|
|
|
|
|
|
|
|
|
|
|
|
|
|
|
|
|
|
|
| Mortality / Morbidity |
|
|
|
|
|
$ |
(102) |
|
|
|
$ |
154 |
|
|
|
|
|
|
|
|
|
|
|
Updates to reflect mortality/morbidity experience in all jurisdictions. The largest items were favourable mortality impacts in the UK Annuities in the U.S. and Group Retirement Services ("GRS") in Canada. These were offset partially by adverse mortality in In-force Management in the U.S. Mortality updates impacting CSM favourably are funded at locked-in rates that are lower than current rates resulting in a negative net income impact. Additionally, favourable morbidity impacts in Group Benefits in the U.S. were largely offset by unfavourable morbidity updates in Sun Life Health in Canada. |
| Expense |
|
|
|
|
|
$ |
32 |
|
|
|
$ |
(198) |
|
|
|
|
|
|
|
|
|
|
|
Updates to reflect higher costs related to IFRS 17 infrastructure and higher costs in Canada. |
| Financial |
|
|
|
|
|
$ |
10 |
|
|
|
$ |
50 |
|
|
|
|
|
|
|
|
|
|
|
Updates to various financial related assumptions. |
| Policyholder Behaviour |
|
|
|
|
|
$ |
(93) |
|
|
|
$ |
(251) |
|
|
|
|
|
|
|
|
|
|
|
Updates to reflect lapse and policyholder behaviour in all jurisdictions. The largest items were an adverse lapse impact in Individual Term and Universal Life in Canada, and in International, Hong Kong and Vietnam in Asia. |
| Model enhancements and other |
|
|
|
|
|
$ |
194 |
|
|
|
$ |
202 |
|
|
|
|
|
|
|
|
|
|
|
Various enhancements and methodology changes. The largest items were favourable impacts from refinements to the modelling of guarantees for the Individual Par in Canada and International Universal Life in Asia, as well as modelling enhancements in Vietnam in Asia. |
| Total (pre-tax) |
|
|
|
|
|
$ |
41 |
|
|
|
$ |
(43) |
|
|
|
|
|
|
|
|
|
|
|
|
|
|
|
|
|
|
|
|
|
|
|
|
|
|
|
|
|
|
|
|
|
|
|
|
|
|
|
|
|
|
|
|
|
|
|
|
For the three months ended September 30, 2022 |
| (restated, see Note 2) |
|
Income impact |
|
Deferred in CSM |
|
|
|
|
|
Description |
|
|
|
|
|
|
|
|
|
|
|
|
|
|
|
|
|
|
|
|
|
|
|
|
|
|
|
|
|
|
|
|
|
|
|
| Mortality / Morbidity |
|
$ |
(95) |
|
|
|
|
|
|
$ |
136 |
|
|
|
|
|
|
|
|
|
|
|
Updates to reflect mortality/morbidity experience in all jurisdictions. The largest items were favourable mortality impacts in the UK Annuity block in Corporate and in Group Retirement Services ("GRS") in Canada offset partially by adverse morbidity impacts in Sun Life Health in Canada. Mortality updates impacting CSM favourably are funded at locked-in rates that are lower than the then current rates resulting in a negative net income impact. |
| Expense |
|
$ |
(9) |
|
|
|
|
|
|
$ |
12 |
|
|
|
|
|
|
|
|
|
|
|
Updates to reflect expense experience. |
| Financial |
|
$ |
— |
|
|
|
|
|
|
$ |
(11) |
|
|
|
|
|
|
|
|
|
|
|
Updates to various financial related assumptions. |
| Policyholder Behaviour |
|
$ |
(35) |
|
|
|
|
|
|
$ |
(30) |
|
|
|
|
|
|
|
|
|
|
|
Updates to lapse and policyholder behaviour in all jurisdictions. |
| Model enhancements and other |
|
$ |
(15) |
|
|
|
|
|
|
$ |
143 |
|
|
|
|
|
|
|
|
|
|
|
Various enhancements and methodology changes. The largest being a refinement to Hong Kong variable universal life contracts in Asia and refinements to Segregated Fund modelling in Canada. |
| Total (pre-tax) |
|
$ |
(154) |
|
|
|
|
|
|
$ |
250 |
|
|
|
|
|
|
|
|
|
|
|
|
124 Sun Life Financial Inc. Third Quarter 2023 CONDENSED NOTES TO THE INTERIM CONSOLIDATED FINANCIAL STATEMENTS (UNAUDITED)
|
|
|
|
|
|
|
|
|
|
|
|
|
|
|
|
|
|
|
|
|
|
|
|
|
|
|
|
|
|
|
|
|
|
|
|
For the nine months ended September 30, 2023 |
|
Income impact |
|
Deferred in CSM |
|
|
|
|
|
Description |
|
|
|
|
|
|
|
|
|
|
|
|
|
|
|
|
|
|
|
|
|
|
|
|
|
|
|
|
|
|
|
|
|
| Mortality / Morbidity |
|
$ |
(105) |
|
|
|
|
|
|
$ |
166 |
|
|
|
|
|
|
|
|
|
|
|
Updates to reflect mortality/morbidity experience in all jurisdictions. The largest items were favourable mortality impacts in the UK Annuities in the U.S., Group Retirement Services ("GRS") in Canada, these were offset partially by adverse mortality in In-force Management in the U.S. Mortality updates impacting CSM favourably are funded at locked-in rates that are lower than current rates resulting in a negative net income impact. Additionally, favourable morbidity impacts in Group Benefits in the U.S. were offset largely by unfavourable morbidity updates in Sun Life Health in Canada. |
| Expense |
|
$ |
22 |
|
|
|
|
|
|
$ |
(190) |
|
|
|
|
|
|
|
|
|
|
|
Updates to reflect higher costs related to IFRS 17 infrastructure and higher costs in Canada. |
| Financial |
|
$ |
7 |
|
|
|
|
|
|
$ |
50 |
|
|
|
|
|
|
|
|
|
|
|
Updates to various financial related assumptions. |
| Policyholder Behaviour |
|
$ |
(93) |
|
|
|
|
|
|
$ |
(251) |
|
|
|
|
|
|
|
|
|
|
|
Updates to lapse and policyholder behaviour in all jurisdictions. |
| Model enhancements and other |
|
$ |
215 |
|
|
|
|
|
|
$ |
513 |
|
|
|
|
|
|
|
|
|
|
|
Various enhancements and methodology changes. The largest items were favourable impacts from refinements to the modelling of contractual services margins in Hong Kong Health and Accident products in Asia, refinements to the modelling of guarantees for the Individual Par in Canada and International Universal Life in Asia, as well as modelling enhancements in Vietnam in Asia. |
| Total (pre-tax) |
|
$ |
46 |
|
|
|
|
|
|
$ |
288 |
|
|
|
|
|
|
|
|
|
|
|
|
|
|
|
|
|
|
|
|
|
|
|
|
|
|
|
|
|
|
|
|
|
|
|
|
|
|
|
|
|
|
|
|
|
|
|
|
For the nine months ended September 30, 2022 |
| (restated, see Note 2) |
|
Income impact |
|
Deferred in CSM |
|
|
|
|
|
Description |
|
|
|
|
|
|
|
|
|
|
|
|
|
|
|
|
|
|
|
|
|
|
|
|
|
|
|
|
|
|
|
|
|
| Mortality / Morbidity |
|
$ |
(95) |
|
|
|
|
|
|
$ |
136 |
|
|
|
|
|
|
|
|
|
|
|
Updates to reflect mortality/morbidity experience in all jurisdictions. The largest items were favourable mortality impacts in the UK Annuity block in Corporate and in Group Retirement Services ("GRS") in Canada offset partially by adverse morbidity impacts in Sun Life Health in Canada. Mortality updates impacting CSM favourably are funded at locked-in rates that are lower than the then current rates resulting in a negative net income impact. |
| Expense |
|
$ |
(9) |
|
|
|
|
|
|
$ |
12 |
|
|
|
|
|
|
|
|
|
|
|
Updates to reflect expense experience. |
| Financial |
|
$ |
1 |
|
|
|
|
|
|
$ |
(21) |
|
|
|
|
|
|
|
|
|
|
|
Updates to various financial related assumptions. |
| Policyholder Behaviour |
|
$ |
(35) |
|
|
|
|
|
|
$ |
(30) |
|
|
|
|
|
|
|
|
|
|
|
Updates to lapse and policyholder behaviour in all jurisdictions. |
| Model enhancements and other |
|
$ |
(75) |
|
|
|
|
|
|
$ |
174 |
|
|
|
|
|
|
|
|
|
|
|
Various enhancements and methodology changes. The largest being a refinement to Hong Kong variable universal life contracts in Asia and refinements to Segregated Fund modelling in Canada. |
| Total (pre-tax) |
|
$ |
(213) |
|
|
|
|
|
|
$ |
271 |
|
|
|
|
|
|
|
|
|
|
|
|
7.C Insurance Service Expenses
|
|
|
|
|
|
|
|
|
|
|
|
|
|
|
|
|
|
|
|
|
|
|
|
|
|
|
|
For the three months ended |
For the nine months ended |
|
September 30 2023 |
September 30 2022 |
September 30 2023 |
September 30 2022 |
| Incurred claims |
|
$ |
3,504 |
|
|
$ |
3,382 |
|
|
$ |
11,142 |
|
|
$ |
9,636 |
|
| Directly attributable operating expenses and commissions |
|
499 |
|
|
472 |
|
|
1,495 |
|
|
1,336 |
|
Total incurred claims and other expenses(1) |
|
4,003 |
|
|
3,854 |
|
|
12,637 |
|
|
10,972 |
|
| Amortization of insurance acquisition cash flows |
|
50 |
|
|
17 |
|
|
123 |
|
|
32 |
|
| Insurance acquisition cash flows expensed as incurred |
|
289 |
|
|
280 |
|
|
876 |
|
|
809 |
|
|
|
|
|
|
|
|
|
|
Changes related to future service (losses on onerous groups and reversals of such losses) |
|
50 |
|
|
21 |
|
|
100 |
|
|
111 |
|
Changes related to past service (changes in FCF related to liability for incurred claims) |
|
163 |
|
|
97 |
|
|
(89) |
|
|
41 |
|
| Total insurance service expenses |
|
$ |
4,555 |
|
|
$ |
4,269 |
|
|
$ |
13,647 |
|
|
$ |
11,965 |
|
(1)Total incurred claims and other expenses excludes investment components.
CONDENSED NOTES TO THE INTERIM CONSOLIDATED FINANCIAL STATEMENTS (UNAUDITED) Sun Life Financial Inc. Third Quarter 2023 125 Distribution fees and Fund management and other asset-based fees are primarily earned in the Asset Management segment.
|
|
|
|
|
|
|
|
|
|
|
|
|
|
|
|
|
|
|
|
|
|
|
|
|
|
|
|
|
|
|
|
|
|
|
For the three months ended |
For the nine months ended |
|
September 30, 2023 |
September 30, 2022 |
September 30, 2023 |
September 30, 2022 |
|
|
|
(restated, see Note 2) |
|
|
(restated, see Note 2) |
| Fee income from service contracts: |
|
|
|
|
|
|
|
|
| Distribution fees |
|
$ |
236 |
|
|
$ |
212 |
|
|
$ |
721 |
|
|
$ |
672 |
|
| Fund management and other asset-based fees |
|
1,393 |
|
|
1,309 |
|
|
4,123 |
|
|
4,042 |
|
| Administrative service and other fees |
|
301 |
|
|
287 |
|
|
923 |
|
|
712 |
|
| Total fee income |
|
$ |
1,930 |
|
|
$ |
1,808 |
|
|
$ |
5,767 |
|
|
$ |
5,426 |
|
Administrative service and other fees are primarily earned in the Canada and U.S. segments. The fee income by business segment is presented in Note 4.
The Company’s effective income tax rate is generally lower than our statutory income tax rate of 27.8% due to various tax benefits, such as lower taxes on income subject to tax in foreign jurisdictions and a range of tax-exempt investment income.
Our effective income tax rate for the three and nine months ended September 30, 2023 was 20.7% and 17.4%, respectively, compared to 33.5% and 24.5%, respectively, (restated, see Note 2) for the three and nine months ended September 30, 2022. The effective income tax rate for the three and nine months ended September 30, 2023 was lower than the effective income tax rate for the three and nine months ended September 30, 2022 primarily due to the impact of higher income in jurisdictions with low statutory tax rates, and more favourable adjustments in respect of prior periods compared to 2022.
In our Consolidated Statements of Operations, Income tax expense (benefit) has the following components:
|
|
|
|
|
|
|
|
|
|
|
|
|
|
|
|
|
|
|
|
|
|
|
|
|
|
|
|
For the three months ended |
For the nine months ended |
|
September 30, 2023 |
September 30, 2022 |
September 30, 2023 |
September 30, 2022 |
|
|
|
(restated, see Note 2) |
|
|
(restated, see Note 2) |
| Current income tax expense (benefit) |
|
$ |
437 |
|
|
$ |
159 |
|
|
$ |
849 |
|
|
$ |
565 |
|
| Deferred income tax expense (benefit) |
|
(193) |
|
|
(82) |
|
|
(301) |
|
|
46 |
|
| Total income tax expense (benefit) |
|
$ |
244 |
|
|
$ |
77 |
|
|
$ |
548 |
|
|
$ |
611 |
|
10.A Capital
Our capital base is structured to exceed minimum regulatory and internal capital targets and maintain strong credit and financial strength ratings, while maintaining a capital efficient structure. We strive to achieve an optimal capital structure by balancing the use of debt and equity financing. Capital is managed both on a consolidated basis under the principles that consider all the risks associated with the business, as well as at the business group level under the principles appropriate to the jurisdiction in which each operates. We manage the capital for all of our international subsidiaries on a local statutory basis in a manner commensurate with their individual risk profiles. Further details on our capital, and how it is managed, are included in Note 21 of our 2022 Annual Consolidated Financial Statements and Note 2.B.iv of our Consolidated Financial Statements.
SLF Inc. is a non-operating insurance company and is subject to the LICAT guideline. As at September 30, 2023, SLF Inc.’s LICAT ratio exceeded the regulatory minimum target as set out by the OSFI.
Sun Life Assurance, SLF Inc.’s principal operating life insurance subsidiary in Canada, is also subject to the LICAT guideline. As at September 30, 2023, Sun Life Assurance's LICAT ratio exceeded OSFI’s minimum regulatory target; as well as OSFI’s supervisory target applicable to operating life insurance companies.
In the U.S., Sun Life Assurance operates through a branch which is subject to U.S. regulatory supervision and it exceeded the levels under which regulatory action would be required as at September 30, 2023. In addition, other subsidiaries of SLF Inc. that must comply with local capital or solvency requirements in the jurisdiction in which they operate maintained capital levels above minimum local requirements as at September 30, 2023.
Our capital base consists mainly of common shareholders’ equity, preferred shareholders’ equity, equity in the participating account, non-controlling interest's equity, CSM, and certain other capital securities that qualify as regulatory capital.
126 Sun Life Financial Inc. Third Quarter 2023 CONDENSED NOTES TO THE INTERIM CONSOLIDATED FINANCIAL STATEMENTS (UNAUDITED)
10.B Significant Capital Transactions
10.B.i Common Shares
Changes in common shares issued and outstanding were as follows:
|
|
|
|
|
|
|
|
|
|
|
|
|
|
|
|
|
|
|
|
|
|
|
|
|
|
|
For the nine months ended |
September 30, 2023 |
September 30, 2022 |
|
|
|
| Common shares (in millions of shares) |
Number of shares |
|
Amount |
Number of shares |
|
Amount |
| Balance, beginning of period |
|
586.4 |
|
|
$ |
8,311 |
|
|
586.0 |
|
|
$ |
8,305 |
|
| Stock options exercised |
|
0.7 |
|
|
38 |
|
|
0.1 |
|
|
3 |
|
Common shares purchased for cancellation |
|
(2.8) |
|
|
(40) |
|
|
— |
|
|
— |
|
|
|
|
|
|
|
|
|
|
| Balance, end of period |
|
584.3 |
|
|
$ |
8,309 |
|
|
586.1 |
|
|
$ |
8,308 |
|
On August 29, 2023, we launched a normal course issuer bid (the "NCIB") to purchase up to 17 million of our common shares between August 29, 2023 and at the latest August 28, 2024 and implemented an automatic repurchase plan with our designated broker in order to facilitate purchases of common shares under this bid. Under the automatic repurchase plan, our designated broker is able to purchase common shares pursuant to the NCIB at times when we ordinarily would not be active in the market due to applicable securities laws or self-imposed blackout periods. Purchases under the NCIB may be made through the facilities of the Toronto Stock Exchange ("TSX"), other Canadian stock exchanges
and/or alternative Canadian trading platforms, at prevailing market rates. Subject to regulatory approval, purchases under the NCIB may also be made by way of private agreements or share repurchase programs under issuer bid exemption orders issued by securities regulatory authorities. Any purchases made under an exemption order issued by a securities regulatory authority will generally be at a discount to the prevailing market price. The actual number of common shares purchased under the NCIB, and the timing of such purchases (if any), will be determined by us. Any common shares purchased by us pursuant to the NCIB will be cancelled or used in connection with certain equity settled incentive arrangements.
For the nine months ended September 30, 2023, we purchased and cancelled approximately 2.8 million common shares at an average price per share of $66.61 for a total amount of $186 under the NCIB. The total amount paid to purchase the shares is allocated to Common shares and Retained earnings in our Consolidated Statements of Changes in Equity. The amount allocated to Common shares is based on the average cost per common share and amounts paid above the average cost are allocated to Retained earnings.
10.B.ii Other Capital Transactions
On July 4, 2023, SLF Inc. issued $500 principal amount of Series 2023-1 Subordinated Unsecured 5.50% Fixed/Floating Debentures due 2035. SLF Inc.
intends to use an amount equal to the net proceeds from the offering to finance or refinance, in whole or in part, eligible assets as defined in our
Sustainability Bond Framework.
On September 19, 2023, SLF Inc. redeemed all of the outstanding $1,000 principal amount of Series 2016-2 Subordinated Unsecured 3.05% Fixed/Floating Debentures (the "Debentures") in accordance with the redemption terms attached to the Debentures.
11.A Segregated Funds Classified as Investment Contracts
11.A.i Investments for Account of Segregated Fund Holders - Investment Contracts
The carrying value of investments for account of segregated fund holders for contracts classified as investment contracts are as follows:
|
|
|
|
|
|
|
|
|
|
|
|
|
|
|
|
|
| As at |
September 30, 2023 |
December 31, 2022 |
|
| Segregated and mutual fund units |
|
$ |
99,509 |
|
|
$ |
97,347 |
|
|
|
| Equity securities |
|
1,243 |
|
|
3,801 |
|
|
|
| Debt securities |
|
796 |
|
|
1,441 |
|
|
|
| Cash, cash equivalents and short-term securities |
|
4 |
|
|
181 |
|
|
|
| Investment properties |
|
— |
|
|
271 |
|
|
|
|
|
|
|
|
|
|
| Other assets |
|
69 |
|
|
75 |
|
|
|
| Total assets |
|
101,621 |
|
|
103,116 |
|
|
|
| Less: Liabilities arising from investing activities |
|
10 |
|
|
963 |
|
|
|
| Total investments for account of segregated fund holders |
|
$ |
101,611 |
|
|
$ |
102,153 |
|
|
|
CONDENSED NOTES TO THE INTERIM CONSOLIDATED FINANCIAL STATEMENTS (UNAUDITED) Sun Life Financial Inc. Third Quarter 2023 127
11.A.ii Changes in Account of Segregated Fund Holders - Investment Contracts
|
|
|
|
|
|
|
|
|
|
|
|
|
|
|
|
|
|
|
For the nine months ended and as at September 30, 2023 |
For the year ended and as at December 31, 2022 |
|
|
|
|
|
|
|
|
|
|
(restated, see Note 2) |
Balance, beginning of period |
|
|
|
$ |
102,153 |
|
|
$ |
113,917 |
|
| Additions to segregated funds: |
|
|
|
|
|
|
| Deposits |
|
|
|
8,570 |
|
|
11,542 |
|
|
|
|
|
|
|
|
| Net realized and unrealized gains (losses) |
|
|
|
702 |
|
|
(15,359) |
|
| Other investment income |
|
|
|
3,206 |
|
|
4,029 |
|
| Total additions |
|
|
|
12,478 |
|
|
212 |
|
| Deductions from segregated funds: |
|
|
|
|
|
|
| Payments to policyholders and their beneficiaries |
|
|
|
7,896 |
|
|
11,049 |
|
| Management fees |
|
|
|
517 |
|
|
697 |
|
| Taxes and other expenses |
|
|
|
37 |
|
|
43 |
|
| Foreign exchange rate movements |
|
|
|
(78) |
|
|
187 |
|
| Total deductions |
|
|
|
8,372 |
|
|
11,976 |
|
| Net additions (deductions) |
|
|
|
4,106 |
|
|
(11,764) |
|
|
|
|
|
|
|
|
| Dispositions (Note 3) |
|
|
|
(4,648) |
|
|
— |
|
Balance, end of period |
|
|
|
$ |
101,611 |
|
|
$ |
102,153 |
|
11.B Segregated Funds Classified as Insurance Contracts
11.B.i Investments for Account of Segregated Fund Holders - Insurance Contracts
The carrying value of investments for account of segregated fund holders for contracts classified as insurance contracts, which are the underlying items for the insurance contracts, are as follows:
|
|
|
|
|
|
|
|
|
|
|
|
|
|
|
|
|
|
|
|
|
|
|
As at |
|
|
|
|
|
|
|
|
September 30, 2023 |
December 31, 2022 |
|
|
|
|
|
|
|
|
|
|
|
|
|
Segregated and mutual fund units |
|
|
|
|
|
|
|
|
|
$ |
13,759 |
|
|
$ |
15,723 |
|
Equity securities |
|
|
|
|
|
|
|
|
|
2,820 |
|
|
4,450 |
|
Debt securities |
|
|
|
|
|
|
|
|
|
1,200 |
|
|
1,417 |
|
| Cash, cash equivalents and short-term securities |
|
|
|
|
|
|
|
|
|
555 |
|
|
624 |
|
| Investment properties |
|
|
|
|
|
|
|
|
|
— |
|
|
167 |
|
| Mortgages |
|
|
|
|
|
|
|
|
|
16 |
|
|
17 |
|
| Other assets |
|
|
|
|
|
|
|
|
|
76 |
|
|
55 |
|
Total assets |
|
|
|
|
|
|
|
|
|
18,426 |
|
|
22,453 |
|
| Less: Liabilities arising from investing activities |
|
|
|
|
|
|
|
|
|
49 |
|
|
(686) |
|
| Total investments for account of segregated fund holders |
|
|
|
|
|
|
|
|
|
$ |
18,377 |
|
|
$ |
23,139 |
|
11.B.ii Changes in Account of Segregated Fund Holders - Insurance Contracts
Changes by Measurement Component
The following reconciliations illustrate the insurance contract liabilities for account of segregated fund holders by measurement component. For insurance contract liabilities for account of segregated fund holders, the entire amount is included in the present value of estimates of future cash flows. Reconciliations for the net liabilities of segregated fund insurance contracts that are not backed by investments for account of segregated fund holders are included as part of the insurance contract liabilities in Note 7.B.i.
|
|
|
|
|
|
|
|
|
|
|
|
|
|
|
|
|
|
|
|
|
|
|
|
|
For the nine months ended and as at September 30, 2023 |
For the year ended and as at December 31, 2022 |
|
|
|
|
|
|
|
|
|
|
|
|
|
Balance, beginning of period |
|
|
|
|
|
|
|
|
|
$ |
23,139 |
|
|
$ |
26,079 |
|
| Insurance finance (income) expenses |
|
|
|
|
|
|
|
|
|
684 |
|
|
(2,353) |
|
| Foreign currency translation |
|
|
|
|
|
|
|
|
|
(101) |
|
|
(163) |
|
| Cash flows: |
|
|
|
|
|
|
|
|
|
|
|
|
| Premiums received |
|
|
|
|
|
|
|
|
|
1,376 |
|
|
2,725 |
|
| Amounts paid to policyholders and other insurance service expenses paid |
|
|
|
|
|
|
|
|
|
(1,843) |
|
|
(2,310) |
|
| Management fees, taxes and other expenses |
|
|
|
|
|
|
|
|
|
(624) |
|
|
(839) |
|
| Total cash flows |
|
|
|
|
|
|
|
|
|
(1,091) |
|
|
(424) |
|
|
|
|
|
|
|
|
|
|
|
|
|
|
| Dispositions (Note 3) |
|
|
|
|
|
|
|
|
|
(4,254) |
|
|
— |
|
Balance, end of period |
|
|
|
|
|
|
|
|
|
$ |
18,377 |
|
|
$ |
23,139 |
|
128 Sun Life Financial Inc. Third Quarter 2023 CONDENSED NOTES TO THE INTERIM CONSOLIDATED FINANCIAL STATEMENTS (UNAUDITED)
Changes by Remaining Coverage and Incurred Claims
The following tables show the changes in the liabilities for insurance contracts for account of segregated fund holders by liability for remaining coverage and liability for incurred claims. Reconciliations for the remainder of liabilities for segregated funds that are classified as insurance contracts are in Note 7.B.i.
|
|
|
|
|
|
|
|
|
|
|
|
|
|
|
|
|
|
|
|
|
|
|
|
|
|
|
|
|
|
|
|
|
|
|
For the nine months ended and as at September 30, 2023 |
For the year ended and as at December 31, 2022 |
|
|
|
|
|
|
|
|
|
| Net liabilities for remaining coverage: |
|
|
|
|
|
|
|
|
|
|
|
|
|
|
Balances, beginning of period |
|
|
|
|
|
|
|
|
|
|
|
$ |
23,139 |
|
|
$ |
26,079 |
|
| Insurance finance (income) expenses |
|
|
|
|
|
|
|
|
|
|
|
684 |
|
|
(2,353) |
|
| Foreign currency translation |
|
|
|
|
|
|
|
|
|
|
|
(101) |
|
|
(163) |
|
| Total changes |
|
|
|
|
|
|
|
|
|
|
|
583 |
|
|
(2,516) |
|
| Cash flows: |
|
|
|
|
|
|
|
|
|
|
|
|
|
|
| Premiums received |
|
|
|
|
|
|
|
|
|
|
|
1,376 |
|
|
2,725 |
|
|
|
|
|
|
|
|
|
|
|
|
|
|
|
|
| Management fees, taxes and other expenses |
|
|
|
|
|
|
|
|
|
|
|
(624) |
|
|
(839) |
|
| Total cash flows |
|
|
|
|
|
|
|
|
|
|
|
752 |
|
|
1,886 |
|
| Expected investment component excluded from insurance revenue |
|
|
|
|
|
|
|
|
|
|
|
(1,843) |
|
|
(2,310) |
|
| Dispositions (Note 3) |
|
|
|
|
|
|
|
|
|
|
|
(4,254) |
|
|
— |
|
Balances, liability for remaining coverage, end of period |
|
|
|
|
|
|
|
|
|
|
|
$ |
18,377 |
|
|
$ |
23,139 |
|
| Liability for incurred claims: |
|
|
|
|
|
|
|
|
|
|
|
|
|
|
Balances, beginning of period |
|
|
|
|
|
|
|
|
|
|
|
$ |
— |
|
|
$ |
— |
|
|
|
|
|
|
|
|
|
|
|
|
|
|
|
|
| Cash flows: |
|
|
|
|
|
|
|
|
|
|
|
|
|
|
| Amounts paid to policyholders and other insurance service expenses paid |
|
|
|
|
|
|
|
|
|
|
|
(1,843) |
|
|
(2,310) |
|
| Total cash flows |
|
|
|
|
|
|
|
|
|
|
|
(1,843) |
|
|
(2,310) |
|
| Actual investment component excluded from insurance service expense |
|
|
|
|
|
|
|
|
|
|
|
1,843 |
|
|
2,310 |
|
Balances, liability for incurred claims, end of period |
|
|
|
|
|
|
|
|
|
|
|
$ |
— |
|
|
$ |
— |
|
| Total net insurance contract liability: |
|
|
|
|
|
|
|
|
|
|
|
|
|
|
Balances, beginning of period |
|
|
|
|
|
|
|
|
|
|
|
$ |
23,139 |
|
|
$ |
26,079 |
|
| Insurance finance (income) expenses |
|
|
|
|
|
|
|
|
|
|
|
684 |
|
|
(2,353) |
|
| Foreign currency translation |
|
|
|
|
|
|
|
|
|
|
|
(101) |
|
|
(163) |
|
| Total changes |
|
|
|
|
|
|
|
|
|
|
|
583 |
|
|
(2,516) |
|
| Cash flows: |
|
|
|
|
|
|
|
|
|
|
|
|
|
|
| Premiums received |
|
|
|
|
|
|
|
|
|
|
|
1,376 |
|
|
2,725 |
|
| Amounts paid to policyholders and other insurance service expenses paid |
|
|
|
|
|
|
|
|
|
|
|
(1,843) |
|
|
(2,310) |
|
| Management fees, taxes and other expenses |
|
|
|
|
|
|
|
|
|
|
|
(624) |
|
|
(839) |
|
| Total cash flows |
|
|
|
|
|
|
|
|
|
|
|
(1,091) |
|
|
(424) |
|
|
|
|
|
|
|
|
|
|
|
|
|
|
|
|
|
|
|
|
|
|
|
|
|
|
|
|
|
|
|
| Dispositions (Note 3) |
|
|
|
|
|
|
|
|
|
|
|
(4,254) |
|
|
— |
|
Balances, total net insurance contract liability, end of period |
|
|
|
|
|
|
|
|
|
|
$ |
18,377 |
|
|
$ |
23,139 |
|
CONDENSED NOTES TO THE INTERIM CONSOLIDATED FINANCIAL STATEMENTS (UNAUDITED) Sun Life Financial Inc.
|
|
|
|
|
|
|
|
|
|
|
|
|
|
|
12. Commitments, Guarantees and Contingencies |
|
Guarantees of Sun Life Assurance Preferred Shares and Subordinated Debentures
Third Quarter 2023 129 SLF Inc. has provided a guarantee on the $150 of 6.30% subordinated debentures due 2028 issued by Sun Life Assurance. Claims under this guarantee will rank equally with all other subordinated indebtedness of SLF Inc. SLF Inc. has also provided a subordinated guarantee of preferred shares issued from time to time by Sun Life Assurance, other than such preferred shares which are held by SLF Inc. and its affiliates. Sun Life Assurance has no outstanding preferred shares subject to the guarantee. As a result of these guarantees, Sun Life Assurance is entitled to rely on exemptive relief from most continuous disclosure and the certification requirements of Canadian securities laws.
The following tables set forth certain consolidating summary financial information for SLF Inc. and Sun Life Assurance (consolidated):
|
|
|
|
|
|
|
|
|
|
|
|
|
|
|
|
|
|
|
|
|
|
|
|
|
|
|
|
|
|
|
|
|
| For the three months ended |
SLF Inc.(unconsolidated) |
Sun Life
Assurance
(consolidated) |
Other
subsidiaries of
SLF Inc.
(combined) |
Consolidation
adjustments |
SLF Inc.
(consolidated) |
September 30, 2023 |
|
|
|
|
|
|
|
|
|
|
| Insurance revenue |
|
$ |
— |
|
|
$ |
4,463 |
|
|
$ |
412 |
|
|
$ |
458 |
|
|
$ |
5,333 |
|
| Net investment income (loss) excluding result for segregated fund holders |
|
119 |
|
|
(4,534) |
|
|
(309) |
|
|
(100) |
|
|
(4,824) |
|
| Fee income |
|
— |
|
|
399 |
|
|
1,654 |
|
|
(123) |
|
|
1,930 |
|
|
|
|
|
|
|
|
|
|
|
|
| Total revenue |
|
$ |
119 |
|
|
$ |
328 |
|
|
$ |
1,757 |
|
|
$ |
235 |
|
|
$ |
2,439 |
|
| Shareholders’ net income (loss) |
|
$ |
891 |
|
|
$ |
538 |
|
|
$ |
306 |
|
|
$ |
(845) |
|
|
$ |
890 |
|
September 30, 2022 |
|
|
|
|
|
|
|
|
|
|
| (restated, see Note 2) |
|
|
|
|
|
|
|
|
|
|
| Insurance revenue |
|
$ |
— |
|
|
$ |
4,352 |
|
|
$ |
1,084 |
|
|
$ |
(287) |
|
|
$ |
5,149 |
|
| Net investment income (loss) excluding result for segregated fund holders |
|
149 |
|
|
(1,534) |
|
|
(512) |
|
|
(159) |
|
|
(2,056) |
|
| Fee income |
|
— |
|
|
409 |
|
|
1,506 |
|
|
(107) |
|
|
1,808 |
|
| Total revenue |
|
$ |
149 |
|
|
$ |
3,227 |
|
|
$ |
2,078 |
|
|
$ |
(553) |
|
|
$ |
4,901 |
|
Shareholders’ net income (loss) |
|
$ |
130 |
|
|
$ |
(96) |
|
|
$ |
149 |
|
|
$ |
(54) |
|
|
$ |
129 |
|
|
|
|
|
|
|
|
|
|
|
|
|
|
|
|
|
|
|
|
|
|
|
|
|
|
|
|
|
|
|
|
|
|
For the nine months ended |
SLF Inc.(unconsolidated) |
Sun Life
Assurance
(consolidated) |
Other
subsidiaries of
SLF Inc.
(combined) |
Consolidation
adjustments |
SLF Inc.
(consolidated) |
September 30, 2023 |
|
|
|
|
|
|
|
|
|
|
| Insurance revenue |
|
$ |
— |
|
|
$ |
13,214 |
|
|
$ |
3,665 |
|
|
$ |
(981) |
|
|
$ |
15,898 |
|
| Net investment income (loss) excluding result for segregated fund holders |
|
346 |
|
|
479 |
|
|
13 |
|
|
(413) |
|
|
425 |
|
| Fee income |
|
1 |
|
|
1,256 |
|
|
4,882 |
|
|
(372) |
|
|
5,767 |
|
| Other income |
|
— |
|
|
169 |
|
|
— |
|
|
— |
|
|
169 |
|
| Total revenue |
|
$ |
347 |
|
|
$ |
15,118 |
|
|
$ |
8,560 |
|
|
$ |
(1,766) |
|
|
$ |
22,259 |
|
| Shareholders’ net income (loss) |
|
$ |
2,397 |
|
|
$ |
1,531 |
|
|
$ |
739 |
|
|
$ |
(2,271) |
|
|
$ |
2,396 |
|
September 30, 2022 |
|
|
|
|
|
|
|
|
|
|
| (restated, see Note 2) |
|
|
|
|
|
|
|
|
|
|
| Insurance revenue |
|
$ |
— |
|
|
$ |
12,522 |
|
|
$ |
1,932 |
|
|
$ |
(857) |
|
|
$ |
13,597 |
|
| Net investment income (loss) excluding result for segregated fund holders |
|
423 |
|
|
(19,656) |
|
|
(1,887) |
|
|
(628) |
|
|
(21,748) |
|
| Fee income |
|
1 |
|
|
1,227 |
|
|
4,516 |
|
|
(318) |
|
|
5,426 |
|
| Total revenue |
|
$ |
424 |
|
|
$ |
(5,907) |
|
|
$ |
4,561 |
|
|
$ |
(1,803) |
|
|
$ |
(2,725) |
|
Shareholders’ net income (loss) |
|
$ |
1,757 |
|
|
$ |
835 |
|
|
$ |
678 |
|
|
$ |
(1,514) |
|
|
$ |
1,756 |
|
130 Sun Life Financial Inc. Third Quarter 2023 CONDENSED NOTES TO THE INTERIM CONSOLIDATED FINANCIAL STATEMENTS (UNAUDITED)
|
|
|
|
|
|
|
|
|
|
|
|
|
|
|
|
|
|
|
|
|
|
|
|
|
|
|
|
|
|
|
|
|
| Assets and liabilities as at |
SLF Inc.(unconsolidated) |
Sun Life
Assurance
(consolidated) |
Other
subsidiaries of
SLF Inc.
(combined) |
Consolidation
adjustments |
SLF Inc.
(consolidated) |
September 30, 2023 |
|
|
|
|
|
|
|
|
|
|
| Invested assets |
|
$ |
26,018 |
|
|
$ |
153,499 |
|
|
$ |
14,270 |
|
|
$ |
(31,023) |
|
|
$ |
162,764 |
|
| Reinsurance contract held assets |
|
$ |
— |
|
|
$ |
5,842 |
|
|
$ |
3 |
|
|
$ |
(79) |
|
|
$ |
5,766 |
|
| Insurance contract assets |
|
$ |
— |
|
|
$ |
208 |
|
|
$ |
1,079 |
|
|
$ |
(1,079) |
|
|
$ |
208 |
|
| Total other general fund assets |
|
$ |
6,623 |
|
|
$ |
14,072 |
|
|
$ |
14,037 |
|
|
$ |
(9,612) |
|
|
$ |
25,120 |
|
| Investments for account of segregated fund holders |
$ |
— |
|
|
$ |
119,936 |
|
|
$ |
52 |
|
|
$ |
— |
|
|
$ |
119,988 |
|
| Insurance contract liabilities excluding those for account of segregated fund holders |
|
$ |
— |
|
|
$ |
124,464 |
|
|
$ |
488 |
|
|
$ |
(79) |
|
|
$ |
124,873 |
|
| Reinsurance contract held liabilities |
|
$ |
— |
|
|
$ |
2,622 |
|
|
$ |
— |
|
|
$ |
(1,079) |
|
|
$ |
1,543 |
|
| Investment contract liabilities |
|
$ |
— |
|
|
$ |
11,343 |
|
|
$ |
1 |
|
|
$ |
— |
|
|
$ |
11,344 |
|
| Total other general fund liabilities |
|
$ |
9,418 |
|
|
$ |
16,024 |
|
|
$ |
19,772 |
|
|
$ |
(12,883) |
|
|
$ |
32,331 |
|
| Insurance contract liabilities for account of segregated fund holders |
|
$ |
— |
|
|
$ |
18,325 |
|
|
$ |
52 |
|
|
$ |
— |
|
|
$ |
18,377 |
|
| Investment contract liabilities for account of segregated fund holders |
|
$ |
— |
|
|
$ |
101,611 |
|
|
$ |
— |
|
|
$ |
— |
|
|
$ |
101,611 |
|
|
|
|
|
|
|
|
|
|
|
|
|
|
|
|
|
|
|
|
|
|
|
|
|
|
|
|
|
|
|
|
|
|
|
|
|
|
|
|
|
|
|
|
|
|
|
|
|
|
|
|
|
|
|
|
|
|
|
|
|
|
|
|
|
|
|
|
|
|
|
|
|
|
|
|
|
|
|
|
|
|
|
|
|
|
|
|
|
|
|
|
|
|
|
|
|
|
|
|
|
|
|
|
|
|
|
|
|
|
|
|
|
|
|
|
|
|
|
|
|
|
|
|
|
|
|
|
|
|
|
|
|
|
|
|
|
|
|
|
|
|
|
|
|
|
|
|
|
|
|
|
|
|
|
|
|
|
|
|
|
|
|
|
|
|
|
|
|
|
|
|
|
|
|
|
|
|
|
|
|
|
|
|
|
|
|
|
|
|
|
|
|
|
|
|
|
|
|
|
|
|
|
|
|
|
|
|
|
|
|
|
|
|
|
|
|
|
|
|
|
|
|
|
|
|
|
|
|
|
|
|
|
|
|
|
|
|
|
|
|
|
|
|
|
|
|
|
|
|
|
|
|
|
|
|
|
|
|
|
|
|
|
|
|
|
|
|
|
|
|
|
|
|
|
|
|
|
|
|
|
|
|
|
|
|
|
|
|
|
|
|
|
|
|
|
|
|
|
|
|
|
| December 31, 2022 |
|
|
|
|
|
|
|
|
|
|
| (restated, see Note 2) |
|
|
|
|
|
|
|
|
|
|
| Invested assets |
|
$ |
25,851 |
|
|
$ |
159,311 |
|
|
$ |
12,322 |
|
|
$ |
(28,695) |
|
|
$ |
168,789 |
|
| Reinsurance contract held assets |
|
$ |
— |
|
|
$ |
6,182 |
|
|
$ |
3 |
|
|
$ |
(70) |
|
|
$ |
6,115 |
|
| Insurance contract assets |
|
$ |
— |
|
|
$ |
75 |
|
|
$ |
719 |
|
|
$ |
(719) |
|
|
$ |
75 |
|
| Total other general fund assets |
|
$ |
6,594 |
|
|
$ |
12,877 |
|
|
$ |
14,570 |
|
|
$ |
(10,704) |
|
|
$ |
23,337 |
|
| Investments for account of segregated fund holders |
$ |
— |
|
|
$ |
125,242 |
|
|
$ |
50 |
|
|
$ |
— |
|
|
$ |
125,292 |
|
| Insurance contract liabilities excluding those for account of segregated fund holders |
|
$ |
— |
|
|
$ |
130,908 |
|
|
$ |
456 |
|
|
$ |
(70) |
|
|
$ |
131,294 |
|
| Reinsurance contract held liabilities |
|
$ |
— |
|
|
$ |
2,322 |
|
|
$ |
— |
|
|
$ |
(719) |
|
|
$ |
1,603 |
|
| Investment contract liabilities |
|
$ |
— |
|
|
$ |
10,728 |
|
|
$ |
1 |
|
|
$ |
(1) |
|
|
$ |
10,728 |
|
| Total other general fund liabilities |
|
$ |
9,916 |
|
|
$ |
14,580 |
|
|
$ |
18,886 |
|
|
$ |
(11,578) |
|
|
$ |
31,804 |
|
| Insurance contract liabilities for account of segregated fund holders |
|
$ |
— |
|
|
$ |
23,089 |
|
|
$ |
50 |
|
|
$ |
— |
|
|
$ |
23,139 |
|
| Investment contract liabilities for account of segregated fund holders |
|
$ |
— |
|
|
$ |
102,153 |
|
|
$ |
— |
|
|
$ |
— |
|
|
$ |
102,153 |
|
|
|
|
|
|
|
|
|
|
|
|
|
|
|
|
13. Earnings (Loss) Per Share |
|
Details of the calculation of the net income (loss) and the weighted average number of shares used in the earnings per share computations are as follows:
|
|
|
|
|
|
|
|
|
|
|
|
|
|
|
|
|
|
|
|
|
|
|
|
|
|
|
|
|
|
|
|
|
|
|
|
|
For the three months ended |
For the nine months ended |
|
September 30 2023 |
September 30 2022 |
September 30 2023 |
September 30 2022 |
|
|
|
(restated, see Note 2) |
|
|
(restated, see Note 2) |
| Common shareholders’ net income (loss) for basic earnings per share |
|
$ |
871 |
|
|
$ |
111 |
|
|
$ |
2,337 |
|
|
$ |
1,706 |
|
Add: Increase in income due to convertible instruments(1) |
|
3 |
|
|
3 |
|
|
8 |
|
|
8 |
|
| Common shareholders’ net income (loss) on a diluted basis |
|
$ |
874 |
|
|
$ |
114 |
|
|
$ |
2,345 |
|
|
$ |
1,714 |
|
| Weighted average number of common shares outstanding for basic earnings per share (in millions) |
|
586 |
|
|
586 |
|
|
587 |
|
|
586 |
|
Add: Dilutive impact of stock options(2) (in millions) |
|
— |
|
|
— |
|
|
— |
|
|
— |
|
Dilutive impact of convertible instruments(1) (in millions) |
|
3 |
|
|
3 |
|
|
3 |
|
|
3 |
|
| Weighted average number of common shares outstanding on a diluted basis (in millions) |
|
$ |
589 |
|
|
$ |
589 |
|
|
$ |
590 |
|
|
$ |
589 |
|
| Basic earnings (loss) per share |
|
$ |
1.49 |
|
|
$ |
0.19 |
|
|
$ |
3.98 |
|
|
$ |
2.91 |
|
| Diluted earnings (loss) per share |
|
$ |
1.48 |
|
|
$ |
0.19 |
|
|
$ |
3.97 |
|
|
$ |
2.91 |
|
(1) The convertible instruments are the SLEECS B issued by SLCT I.
(2) Excludes the impact of 2 million stock options for both the three and nine months ended September 30, 2023 (September 30, 2022 — 2 million and 1 million, respectively) because these stock options were anti-dilutive for the period.
CONDENSED NOTES TO THE INTERIM CONSOLIDATED FINANCIAL STATEMENTS (UNAUDITED) Sun Life Financial Inc. Third Quarter 2023 131 Changes in accumulated other comprehensive income (loss), net of taxes, are as follows:
|
|
|
|
|
|
|
|
|
|
|
|
|
|
|
14. Accumulated Other Comprehensive Income (Loss) |
|
|
|
|
|
|
|
|
|
|
|
|
|
|
|
|
|
|
|
|
|
|
|
|
|
|
|
|
|
|
|
|
|
|
|
|
|
|
|
|
|
|
|
|
|
|
|
|
|
For the three months ended |
|
September 30, 2023 |
September 30, 2022 |
|
|
|
|
|
|
|
|
|
|
|
|
|
|
|
|
(restated, see Note 2) |
|
Balance,
beginning
of period |
|
|
Other
comprehensive income (loss) |
|
|
Balance,
end of
period |
Balance,
beginning
of period |
Other
comprehensive
income (loss) |
Balance,
end of
period |
| Items that may be reclassified subsequently to income: |
|
|
|
|
|
|
|
|
|
|
|
|
|
|
|
|
|
|
|
| Unrealized foreign currency translation gains (losses), net of hedging activities |
|
$ |
1,367 |
|
|
|
|
|
|
$ |
280 |
|
|
|
|
|
$ |
1,647 |
|
|
$ |
910 |
|
|
$ |
799 |
|
|
$ |
1,709 |
|
| Unrealized gains (losses) on FVOCI assets |
|
(757) |
|
|
|
|
|
|
(45) |
|
|
|
|
|
(802) |
|
|
(1,097) |
|
|
(302) |
|
|
(1,399) |
|
| Unrealized gains (losses) on cash flow hedges |
|
3 |
|
|
|
|
|
|
(7) |
|
|
|
|
|
(4) |
|
|
(19) |
|
|
2 |
|
|
(17) |
|
| Share of other comprehensive income (loss) in joint ventures and associates |
|
(135) |
|
|
|
|
|
|
19 |
|
|
|
|
|
(116) |
|
|
(112) |
|
|
36 |
|
|
(76) |
|
| Items that will not be reclassified subsequently to income: |
|
|
|
|
|
|
|
|
|
|
|
|
|
|
|
|
|
|
|
| Remeasurement of defined benefit plans |
|
(175) |
|
|
|
|
|
|
30 |
|
|
|
|
|
(145) |
|
|
(235) |
|
|
10 |
|
|
(225) |
|
| Share of other comprehensive income (loss) in joint ventures and associates |
|
2 |
|
|
|
|
|
|
(2) |
|
|
|
|
|
— |
|
|
(5) |
|
|
— |
|
|
(5) |
|
| Revaluation of property, plant and equipment |
|
143 |
|
|
|
|
|
|
— |
|
|
|
|
|
143 |
|
|
145 |
|
|
— |
|
|
145 |
|
| Total |
|
$ |
448 |
|
|
|
|
|
|
$ |
275 |
|
|
|
|
|
$ |
723 |
|
|
$ |
(413) |
|
|
$ |
545 |
|
|
$ |
132 |
|
| Total attributable to: |
|
|
|
|
|
|
|
|
|
|
|
|
|
|
|
|
|
|
|
| Participating account |
|
$ |
(3) |
|
|
|
|
|
|
$ |
6 |
|
|
|
|
|
$ |
3 |
|
|
$ |
(7) |
|
|
$ |
(9) |
|
|
$ |
(16) |
|
| Non-controlling interests |
|
4 |
|
|
|
|
|
|
1 |
|
|
|
|
|
5 |
|
|
(1) |
|
|
3 |
|
|
2 |
|
| Shareholders |
|
447 |
|
|
|
|
|
|
268 |
|
|
|
|
|
715 |
|
|
(405) |
|
|
551 |
|
|
146 |
|
| Total |
|
$ |
448 |
|
|
|
|
|
|
$ |
275 |
|
|
|
|
|
$ |
723 |
|
|
$ |
(413) |
|
|
$ |
545 |
|
|
$ |
132 |
|
132 Sun Life Financial Inc. Third Quarter 2023 CONDENSED NOTES TO THE INTERIM CONSOLIDATED FINANCIAL STATEMENTS (UNAUDITED)
|
|
|
|
|
|
|
|
|
|
|
|
|
|
|
|
|
|
|
|
|
|
|
|
|
|
|
|
|
|
|
|
|
|
|
|
|
|
|
|
|
|
|
|
|
|
|
|
|
|
|
|
|
|
|
|
|
|
|
|
|
|
|
|
|
|
|
|
|
|
|
For the nine months ended |
|
September 30, 2023 |
September 30, 2022 |
|
|
|
|
|
|
|
|
|
|
|
|
|
|
|
|
|
|
(restated, see Note 2) |
|
Balance,
beginning
of period (restated, see Note 2)
|
Transition adjustment |
Balance, beginning of period (adjusted) |
Other
comprehensive income (loss) |
Other |
Balance, end of
period
|
Balance,
beginning
of period
|
Transition adjustment |
Balance,
beginning
of period (adjusted)
|
Other
comprehensive
income (loss) |
Balance, end of period |
| Items that may be reclassified subsequently to income: |
|
|
|
|
|
|
|
|
|
|
|
|
|
|
|
|
|
|
|
|
|
|
| Unrealized foreign currency translation gains (losses), net of hedging activities |
$ |
1,630 |
|
|
$ |
59 |
|
|
$ |
1,689 |
|
|
$ |
(42) |
|
|
$ |
— |
|
|
|
$ |
1,647 |
|
|
$ |
953 |
|
|
$ |
— |
|
|
$ |
953 |
|
|
$ |
756 |
|
$ |
1,709 |
|
| Unrealized gains (losses) on FVOCI assets |
(1,333) |
|
|
494 |
|
|
(839) |
|
|
37 |
|
|
— |
|
|
|
(802) |
|
|
266 |
|
|
(116) |
|
|
150 |
|
|
(1,549) |
|
(1,399) |
|
| Unrealized gains (losses) on cash flow hedges |
(18) |
|
|
— |
|
|
(18) |
|
|
14 |
|
|
— |
|
|
|
(4) |
|
|
(7) |
|
|
— |
|
|
(7) |
|
|
(10) |
|
(17) |
|
| Share of other comprehensive income (loss) in joint ventures and associates |
(107) |
|
|
— |
|
|
(107) |
|
|
(9) |
|
|
— |
|
|
|
(116) |
|
|
(47) |
|
|
— |
|
|
(47) |
|
|
(29) |
|
(76) |
|
| Items that will not be reclassified subsequently to income: |
|
|
|
|
|
|
|
|
|
|
|
|
|
|
|
|
|
|
|
|
|
|
| Remeasurement of defined benefit plans |
(149) |
|
|
— |
|
|
(149) |
|
|
(33) |
|
|
37 |
|
(1) |
|
(145) |
|
|
(320) |
|
|
— |
|
|
(320) |
|
|
95 |
|
(225) |
|
| Share of other comprehensive income (loss) in joint ventures and associates |
(5) |
|
|
— |
|
|
(5) |
|
|
5 |
|
|
— |
|
|
|
— |
|
|
(2) |
|
|
— |
|
|
(2) |
|
|
(3) |
|
(5) |
|
| Revaluation surplus on transfers to investment properties |
143 |
|
|
— |
|
|
143 |
|
|
— |
|
|
— |
|
|
|
143 |
|
|
145 |
|
|
— |
|
|
145 |
|
|
— |
|
145 |
|
| Total |
|
$ |
161 |
|
|
$ |
553 |
|
|
$ |
714 |
|
|
$ |
(28) |
|
|
$ |
37 |
|
|
|
$ |
723 |
|
|
$ |
988 |
|
|
$ |
(116) |
|
|
$ |
872 |
|
|
$ |
(740) |
|
$ |
132 |
|
| Total attributable to: |
|
|
|
|
|
|
|
|
|
|
|
|
|
|
|
|
|
|
|
|
|
|
| Participating account |
$ |
(3) |
|
|
$ |
— |
|
|
$ |
(3) |
|
|
$ |
6 |
|
|
$ |
— |
|
|
|
$ |
3 |
|
|
$ |
2 |
|
|
$ |
— |
|
|
$ |
2 |
|
|
$ |
(18) |
|
$ |
(16) |
|
| Non-controlling interests |
|
4 |
|
|
— |
|
|
4 |
|
|
1 |
|
|
— |
|
|
|
5 |
|
|
— |
|
|
— |
|
|
— |
|
|
2 |
|
2 |
|
| Shareholders |
|
160 |
|
|
553 |
|
|
713 |
|
|
(35) |
|
|
37 |
|
|
|
715 |
|
|
986 |
|
|
(116) |
|
|
870 |
|
|
(724) |
|
146 |
|
| Total |
|
$ |
161 |
|
|
$ |
553 |
|
|
$ |
714 |
|
|
$ |
(28) |
|
|
$ |
37 |
|
|
|
$ |
723 |
|
|
$ |
988 |
|
|
$ |
(116) |
|
|
$ |
872 |
|
|
$ |
(740) |
|
$ |
132 |
|
(1) During the second quarter of 2023, the Company transferred cumulative remeasurement losses of $37 from Accumulated other comprehensive income (loss) to Retained earnings due to the sale of Sun Life UK.
CONDENSED NOTES TO THE INTERIM CONSOLIDATED FINANCIAL STATEMENTS (UNAUDITED) Sun Life Financial Inc. Third Quarter 2023 133 We are regularly involved in legal actions, both as a defendant and as a plaintiff.
|
|
|
|
|
|
|
|
|
|
|
|
|
|
|
15. Legal and Regulatory Proceedings |
|
Legal actions naming us as a defendant ordinarily involve our activities as a provider of insurance protection and wealth management products, as an investor and investment advisor, and as an employer. In addition, government and regulatory bodies in Canada, the U.S., the UK, and Asia, including federal, provincial, and state securities and insurance regulators and government authorities, from time to time, make inquiries and require the production of information or conduct examinations or investigations concerning our compliance with insurance, securities, and other laws.
Provisions for legal proceedings related to insurance contracts, such as for disability and life insurance claims and the cost of litigation, are included in Insurance contract liabilities in our Consolidated Statements of Financial Position. Other provisions are established outside of the Insurance contract liabilities if, in the opinion of management, it is both probable that a payment will be required and a reliable estimate can be made of the amount of the obligation. Management reviews the status of all proceedings on an ongoing basis and exercises judgment in resolving them in such manner as management believes to be in our best interest.
Our significant legal proceedings and regulatory matters are disclosed in Note 23.G of our 2022 Annual Consolidated Financial Statements. Other than the below described class action lawsuit, there have been no significant updates to such legal and regulatory proceedings.
An Ontario class action lawsuit has been certified against Sun Life Assurance regarding the administration of disability benefits under the Government of Canada employee benefits plan (Belec v Sun Life Assurance Company of Canada). Notice of the class action will be sent to potential class members. The Company has substantive defences to the claims and is defending this lawsuit.
On October 3, 2023, we completed the acquisition of Dialogue. Due to the recent close of this transaction, the fair value determination and purchase accounting have not been completed.
134 Sun Life Financial Inc. Third Quarter 2023 CONDENSED NOTES TO THE INTERIM CONSOLIDATED FINANCIAL STATEMENTS (UNAUDITED)
Corporate and Shareholder Information
|
|
|
|
|
|
|
|
|
|
|
|
|
|
|
|
|
|
| For information about Sun Life, corporate |
United States |
Direct deposit of dividends |
| news and financial results, please visit |
Equiniti Trust Company, LLC |
Common shareholders residing in Canada, |
| sunlife.com |
6201 15th Ave. |
or the U.S. may have their dividend |
|
Brooklyn, NY 11219 |
payments deposited directly into their |
| Corporate office |
Tel: 1-877-224-1760 |
bank account. |
| Sun Life Financial Inc. |
Email: sunlifeinquiries@tmx.com |
|
| 1 York Street |
|
The Request for Electronic Payment of |
| Toronto, Ontario |
United Kingdom |
Dividends Form is available for |
| Canada M5J 0B6 |
Link Group |
downloading from the TSX Trust |
| Tel: 416-979-9966 |
Central Square |
Company website, |
| Website: www.sunlife.com |
29 Wellington Street |
https://tsxtrust.com/sun-life/forms, |
|
Leeds LS1 4DL |
or you can contact TSX Trust Company |
| Investor Relations |
Tel: +44 (0) 345-602-1587 |
have a form sent to you. |
| For financial analysts, portfolio managers |
Email: shareholderenquiries@linkgroup.co.uk |
|
| and institutional investors requiring |
|
Canadian dividend reinvestment |
| information, please contact: |
Philippines |
and share purchase plan |
| Investor Relations |
Rizal Commercial Banking Corporation |
Canadian-resident common shareholders |
| Tel: 416-979-6496 |
(RCBC) |
can enroll in the Dividend Reinvestment |
| Email: investor_relations@sunlife.com |
RCBC Stock Transfer Processing Section |
and Share Purchase Plan. For details visit |
| Please note that financial information can |
Ground Floor, West Wing, |
our website at sunlife.com or contact the |
| also be obtained from www.sunlife.com. |
GPL (Grepalife) Building, |
Plan Agent, TSX Trust Company |
|
221 Senator Gil Puyat Avenue |
at sunlifeinquiries@tmx.com. |
| Transfer agent |
Makati City, 1200, |
|
| For information about your shareholdings, |
Philippines |
Stock exchange listings |
| dividends, change in share registration or |
From Metro Manila: 632-8894-9909 |
Sun Life Financial Inc. common shares are |
| address, estate transfers, lost certificates, |
From the Provinces: 1-800-1-888-2422 |
listed on the Toronto (TSX), New York |
| or to advise of duplicate mailings, please |
Email: rcbcstocktransfer@rcbc.com |
(NYSE) and Philippine (PSE) stock |
| contact the Transfer Agent in the country |
|
exchanges. Ticker Symbol: SLF |
| where you reside. If you do not live in any |
Hong Kong, SAR |
|
| of the countries listed, please contact the |
Computershare Hong Kong Investor |
Sun Life Financial Inc. Class A Preferred |
| Canadian Transfer Agent. |
Services Limited |
Shares are listed on the Toronto Stock |
|
17M Floor, Hopewell Centre |
Exchange (TSX). |
| Canada |
183 Queen’s Road East |
|
|
| TSX Trust Company |
Wanchai, Hong Kong |
Ticker Symbols: |
Series 3 - SLF.PR.C |
| 301 - 100 Adelaide Street West |
Tel: 852-2862-8555 |
|
Series 4 - SLF.PR.D |
| Toronto, ON |
Shareholders can submit inquiries online at: |
|
Series 5 - SLF.PR.E |
| M5H 4H1 |
https://www.computershare.com/hk/en/ |
|
Series 8R - SLF.PR.G |
| Within North America: |
online_feedback |
|
|
|
Series 9QR - SLF.PR.J |
| Tel: 1-877-224-1760 |
|
|
|
|
Series 10R - SLF.PR.H |
| Outside of North America: |
Shareholder services |
|
Series 11QR - SLF.PR.K |
| Tel: 416-682-3865 |
For shareholder account inquiries, please |
|
|
| Fax: 1-888-249-6189 |
contact the Transfer Agent in the country |
|
| Email: sunlifeinquiries@tmx.com |
where you reside, or Shareholder Services: |
|
| Website: https://tsxtrust.com/sun-life |
English Email: |
|
| Shareholders can view their account |
shareholderservices@sunlife.com |
|
| details using TSX Trust Company's |
French Email: |
|
| Internet service, Investor Central. |
servicesauxactionnaires@sunlife.com |
|
| Register at https://tsxtrust.com/sun-life. |
|
|
|
2023 dividend dates |
|
|
Common Shares |
|
|
|
|
|
|
|
Record dates |
Payment dates |
|
|
|
March 1, 2023 |
March 31, 2023 |
|
|
|
May 31, 2023 |
June 30, 2023 |
|
|
|
August 30, 2023 |
September 29, 2023 |
|
|
|
November 29, 2023 |
December 29, 2023 |
|
|
|
|
|
|
|
|
|
|
|
|
|
|
|
|
|
|
|
CORPORATE AND SHAREHOLDER INFORMATION Sun Life Financial Inc. Third Quarter 2023 135