 |
 |
||||
Form 20-F þ |
Form 40-F o |
|||||||
Yes o |
No þ |
|||||||
| Exhibit Number | Description | ||||
1 | ||
|
|
||||
|
BANCOLOMBIA S.A.
(Registrant)
|
||||||||
| Date April 4, 2025 | By: | /s/ MAURICIO BOTERO WOLFF. | ||||||
| Name: | Mauricio Botero Wolff | |||||||
| Title: | Vice President of Strategy and Finance | |||||||
| Mauricio Botero Wolff | Catalina Tobón Rivera | |||||||
| Strategy and Financial VP | IR Director | |||||||
| Tel.: (57 604) 4040858 | Tel.: (57 601) 4885950 | |||||||
2 | ||
 BANCOLOMBIA S.A.
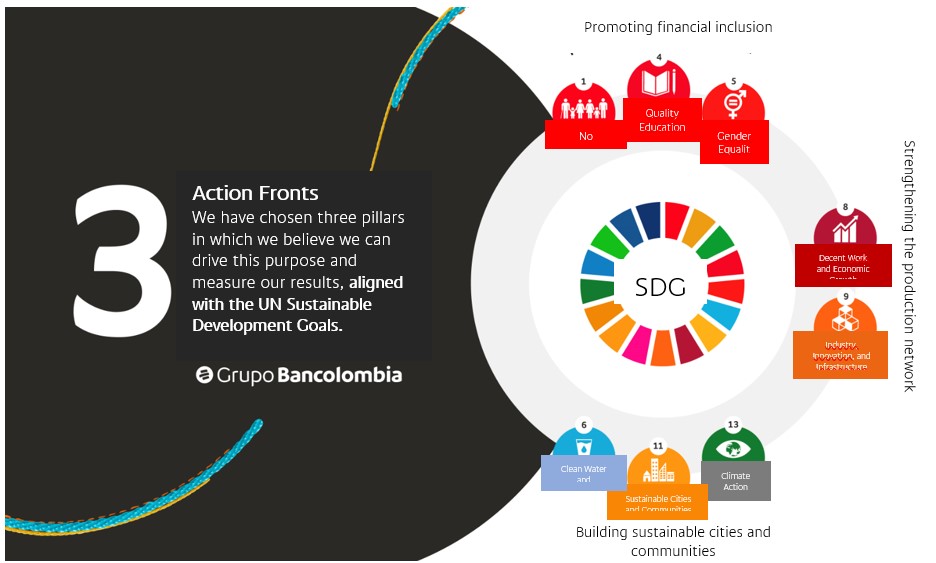
| Common | Preferred | Total | |||||||||
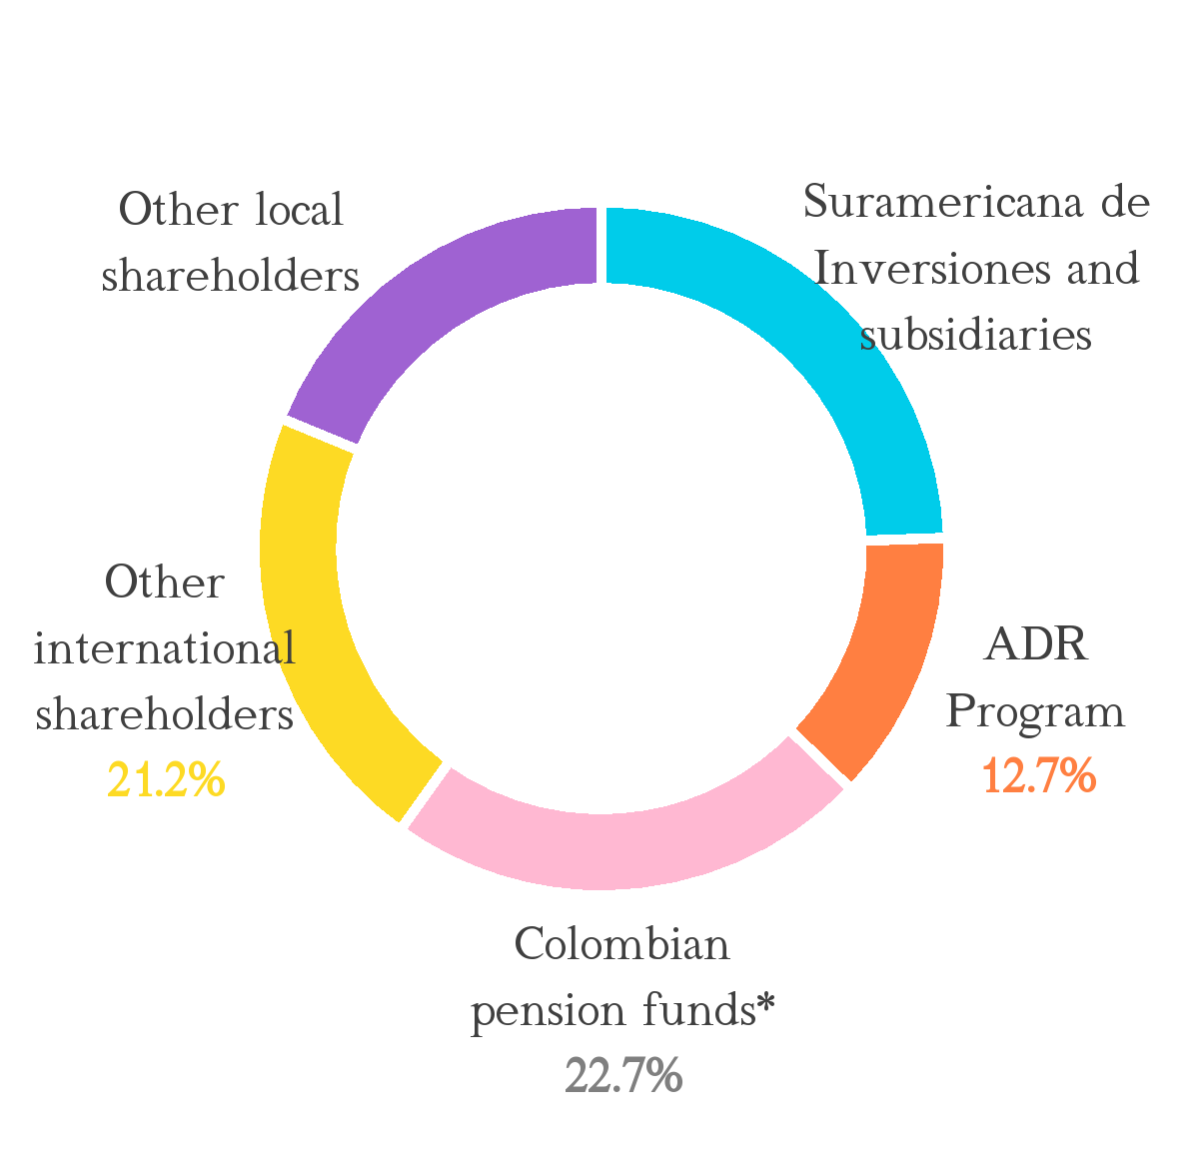
| Suramericana de Inversiones and Subsidiaries | 46.2% | 0.0% | 24.5% | ||||||||
| ADR program | 0.0% | 27.0% | 12.7% | ||||||||
| Colombian Pension Funds* | 22.0% | 23.4% | 22.7% | ||||||||
| Other International Shareholders | 17.9% | 25.0% | 21.2% | ||||||||
| Other Local Shareholders | 13.9% | 24.6% | 18.9% | ||||||||
| Asset Type | Common Shares | Preferred Shares | ||||||
| Trading System | Stock Exchange | Stock Exchange | ||||||
| Stock Exchange | Colombian Stock Exchange (BVC) | Colombian Stock Exchange (BVC) | ||||||
| Outstanding Shares (12/31/2024) | 509,704,584 | 452,122,416 | ||||||
| Number of Shareholders | 17,822 | 28,888 | ||||||
| Amount Issued | 509,704,584 | 452,122,416 | ||||||
| Amount Placed | 509,704,584 | 452,122,416 | ||||||
| Type of Shares | Number of Outstanding Shares | Number of Shareholders owning the Exclusive Types of Shares | Percentage of Participation in Share Capital for Each Type of Share | ||||||||
| Common | 509,704,584 | 14,634 | 52.99% | ||||||||
| Preferred | 452,122,416 | 25,700 | 47.01% | ||||||||
| Total | 961,827,000 | 43,522* | 100% | ||||||||


| GDP Growth in Latin America (Annual Variation %) | ||||||||||||||
| Country | 2022 | 2023 | 2024 | 2025 | ||||||||||
| Latin America* | 3.9% | 2.2% | 1.8% | 2.2% | ||||||||||
| Peru* | 2.8% | -0.4% | 2.9% | 2.8% | ||||||||||
| Mexico* | 3.7% | 3.3% | 1.5% | 1.3% | ||||||||||
| Chile* | 2.1% | 0.2% | 2.3% | 2.2% | ||||||||||
| Brazil* | 3.0% | 2.9% | 3.0% | 2.0% | ||||||||||
| Colombia | 7.3% | 0.6% | 1.8% | 2.6% | ||||||||||
| Panama | 10.8% | 7.4% | 2.5% | 3.5% | ||||||||||
| Costa Rica* | 4.6% | 5.1% | 3.9% | 3.5% | ||||||||||
| Guatemala | 4.2% | 3.5% | 3.5% | 3.5% | ||||||||||
| Honduras* | 4.1% | 3.6% | 3.4% | 3.2% | ||||||||||
| Nicaragua* | 3.8% | 4.6% | 3.5% | 3.0% | ||||||||||
| El Salvador | 2.8% | 3.5% | 2.6% | 2.4% | ||||||||||
| BANCOLOMBIA GROUP | |||||||||||||||||
| CONSOLIDATED FINANCIAL RESULTS | |||||||||||||||||
| RESULTS AND BALANCE | |||||||||||||||||
| (Amounts in millions of Colombian pesos, as of year-end) | December | 2023 vs 2022 | |||||||||||||||
| 2024 | 2023 | 2022 | Var $ | Var % | |||||||||||||
| Operational Income | 46,379,617 | 48,316,872 | 35,456,762 | -1,937,255 | -4.01% | ||||||||||||
| Net Operational Result | 8,757,917 | 8,147,526 | 9,744,786 | 610,391 | 7.49% | ||||||||||||
| Net Profit (Attributable to Shareholders) | 6,267,744 |
6,116,936 | 6,783,490 | 150,808 | 2.47% | ||||||||||||
| Total Assets | 372,215,382 | 342,928,809 | 352,814,733 | 29,286,573 | 8.54% | ||||||||||||
| Credit Portfolio and Financial Leasing, Net | 263,274,170 |
237,728,544 | 254,444,099 | 25,545,626 | 10.75% | ||||||||||||
| Investments, Net | 40,499,254 | 28,671,798 | 30,855,773 | 11,827,456 | 41.25% | ||||||||||||
| Total Liabilities | 327,631,107 | 303,879,080 | 312,817,182 | 23,752,027 | 7.82% | ||||||||||||
|
Deposits
(Current Accounts, Savings Accounts, and Term Deposits)
|
279,059,401 |
247,941,180 | 250,992,323 | 31,118,221 | 12.55% | ||||||||||||
| Equity | 44,584,275 | 39,049,729 | 39,997,551 | 5,534,546 | 14.17% | ||||||||||||
| EFFICIENCY AND PROFITABILITY | |||||||||||
| December | |||||||||||
| 2024 | 2023 | 2022 | |||||||||
| Net interest margin | 6.85% | 6.99% | 6.80% | ||||||||
| Financial efficiency | 48.96% | 45.33% | 44.58% | ||||||||
| Operational efficiency | 3.90% | 3.77% | 3.45% | ||||||||
| Average return on total assets | 1.79% | 1.78% | 2.15% | ||||||||
| Average return on equity | 15.77% | 16.14% | 19.80% | ||||||||
|
Portfolio quality
(Past-due portfolio / Gross portfolio)
|
4.78% | 5.01% | 3.24% | ||||||||
|
Total past due portfolio coverage
(Provisions / Past-due portfolio)
|
112.39% | 120.04% | 168.73% | ||||||||
| Basic solvency | 11.89% | 11.42% | 10.37% | ||||||||
| Total solvency | 13.75% | 13.40% | 12.79% | ||||||||
| Framework of accounting accounts according to the board of directors’ report and press release. | |||||||||||
Liquid assets (1) |
December 31, 2024 | December 31, 2023 | ||||||||||||
| High-quality liquid assets* | ||||||||||||||
| Cash | 27,931,834 | 25,273,317 | ||||||||||||
| High-quality liquid marketable securities | 24,862,860 | 19,951,771 | ||||||||||||
| Other liquid assets | ||||||||||||||
| Other marketable securities** | 6,823,145 | 5,455,735 | ||||||||||||
| Total liquid assets | 59,617,839 | 50,680,823 | ||||||||||||
| As of December 31, | ||||||||
| 2024 | 2023 | |||||||
| In millions of COP | ||||||||
| Total financing | ||||||||
| In COP | 204,977,765 | 197,575,174 | ||||||
| In USD | 122,653,342 | 106,303,906 | ||||||
| Total liabilities | 327,631,107 | 303,879,080 | ||||||
| As of December 31, | ||||||||||||||
| 2024 | 2023 | |||||||||||||
| In millions of COP | ||||||||||||||
| Total deposits | 279,059,401 | 247,941,180 | ||||||||||||
| 2024 | 2023 | ||||||||||||||||
| Savings deposits | 38.1 | % | 35.8 | % | |||||||||||||
| Fixed-term deposits | 33.5 | % | 32.5 | % | |||||||||||||
| Check deposits | 11.6 | % | 11.6 | % | |||||||||||||
| Other deposits | 2.0 | % | 1.7 | % | |||||||||||||
| Percentage of total liabilities | 85.2 | % | 81.6 | % | |||||||||||||
| As of December 31, | |||||||||||||||||
| 2024 | 2023 | ||||||||||||||||
| Net Portfolio / Deposits | 89.32 | % | 90.19 | % | |||||||||||||
| 2025 | 2026 | 2027 | 2028 | 2029 | 2030 and later | Total | |||||||||||||||||
| In millions of COP | |||||||||||||||||||||||
| Bonds issued | 1,297,811 | 1,052,776 | 4,461,862 | - | 360,713 | 4,102,054 | 11,275,216 | ||||||||||||||||
| At the end of December | ||||||||||||||
| 2024 | % of total financing | 2023 | % of total financing | |||||||||||
| (In millions of COP, except percentages) | ||||||||||||||
| Savings accounts | ||||||||||||||
| In COP | 93,938,152 | 28.7% | 83,053,422 | 27.3% | ||||||||||
| In USD | 30,698,842 | 9.4% | 25,917,912 | 8.5% | ||||||||||
| Total | 124,636,994 | 38.1% | 108,971,334 | 35.8% | ||||||||||
| Fixed-term deposits | ||||||||||||||
| In COP | 60,608,350 | 18.5% | 59,146,972 | 19.5% | ||||||||||
| In USD | 49,152,372 | 15.0% | 39,539,544 | 13.0% | ||||||||||
| Total | 109,760,722 | 33.5% | 98,686,516 | 32.5% | ||||||||||
| Checking accounts | ||||||||||||||
| In COP | 20,567,300 | 6.3% | 19,712,279 | 6.5% | ||||||||||
| In USD | 17,466,396 | 5.3% | 15,280,787 | 5.1% | ||||||||||
| Total | 38,033,696 | 11.6% | 34,993,066 | 11.6% | ||||||||||
| Other deposits | ||||||||||||||
| In COP | 5,863,094 | 1.8% | 4,336,318 | 1.4% | ||||||||||
| In USD | 764,895 | 0.2% | 953,946 | 0.3% | ||||||||||
| Total | 6,627,989 | 2.0% | 5,290,264 | 1.7% | ||||||||||
| Interbank deposits | ||||||||||||||
| In COP | 0 | 0.0% | 0 | 0.0% | ||||||||||
| In USD | 716,493 | 0.2% | 606,141 | 0.2% | ||||||||||
| Total | 716,493 | 0.2% | 606,141 | 0.2% | ||||||||||
| Derivative financial instrument-Liabilities | ||||||||||||||
| In COP | 2,642,149 | 0.8% | 6,635,034 | 2.2% | ||||||||||
| In USD | 37,494 | 0.0% | 75,330 | 0.0% | ||||||||||
| Total | 2,679,643 | 0.8% | 6,710,364 | 2.2% | ||||||||||
| Borrowings from other financial institutions (1) | ||||||||||||||
| In COP | 5,055,039 | 1.5% | 6,488,331 | 2.1% | ||||||||||
| In USD | 10,634,493 | 3.3% | 9,160,275 | 3.0% | ||||||||||
| Total | 15,689,532 | 4.8% | 15,648,606 | 5.1% | ||||||||||
| Bonds issued | ||||||||||||||
| In COP | 2,241,026 | 0.7% | 4,097,729 | 1.3% | ||||||||||
| In USD | 9,034,190 | 2.8% | 10,565,847 | 3.5% | ||||||||||
| Total | 11,275,216 | 3.5% | 14,663,576 | 4.8% | ||||||||||
| Repurchase agreements and other similar secured borrowings | ||||||||||||||
| In COP | 679,878 | 0.2% | 308,711 | 0.1% | ||||||||||
| In USD | 380,594 | 0.1% | 161,584 | 0.1% | ||||||||||
| Total | 1,060,472 | 0.3% | 470,295 | 0.2% | ||||||||||
| Leases | ||||||||||||||
| In COP | 1,141,239 | 0.4% | 1,107,405 | 0.4% | ||||||||||
| In USD | 748,125 | 0.2% | 666,205 | 0.2% | ||||||||||
| Total | 1,889,364 | 0.6% | 1,773,610 | 0.6% | ||||||||||
| Other liabilities | ||||||||||||||
| In COP | 12,241,538 | 3.7% | 12,688,973 | 4.2% | ||||||||||
| In USD | 3,019,448 | 0.9% | 3,376,335 | 1.1% | ||||||||||
| Total | 15,260,986 | 4.6% | 16,065,308 | 5.3% | ||||||||||
| Total financing | ||||||||||||||
| In COP | 204,977,765 | 62.6% | 197,575,174 | 65.0% | ||||||||||
| In USD | 122,653,342 | 37.4% | 106,303,906 | 35.0% | ||||||||||
| Total liabilities | 327,631,107 | 100% | 303,879,080 | 100% | ||||||||||
| 2024 | 2023 | 2022 | |||||||||
| In millions of COP | |||||||||||
| Operational activities | 435,895 | 19,153,084 | 6,339,438 | ||||||||
| Investment activities | (559,196) | (159,689) | (4,654,502) | ||||||||
| Financing activities | (9,244,376) | (5,430,672) | 853436 | ||||||||
| Increase (decrease) in cash and cash equivalents | (9,367,677) | 13,562,723 | 2,538,372 | ||||||||
| December 31, 2024 | |||||||||||||||||
| Denominated in |
Uninsured
Denominated in
|
Total | |||||||||||||||
| Pesos | Foreign Currency | ||||||||||||||||
| In millions of Colombian pesos | |||||||||||||||||
| Less than 3 months | 17,810,529 | 10,773,646 | 28,584,175 | ||||||||||||||
| Between 3 and 6 months | 7,967,231 | 6,678,490 | 14,645,721 | ||||||||||||||
| Between 6 and 12 months | 5,179,422 | 8,418,227 | 13,597,649 | ||||||||||||||
| More than 12 months | 15,895,727 | 1,545,271 | 17,440,998 | ||||||||||||||
| Total Term Deposits | 46,852,909 | 27,415,634 | 74,268,543 | ||||||||||||||
| December 31, 2023 | |||||||||||||||||
| Denominated in |
Uninsured
Denominated in
|
Total | |||||||||||||||
| Pesos | Foreign Currency | ||||||||||||||||
| In millions of Colombian pesos | |||||||||||||||||
| Less than 3 months | 14,028,847 | 5,592,275 | 19,621,122 | ||||||||||||||
| Between 3 and 6 months | 5,856,589 | 4,632,261 | 10,488,850 | ||||||||||||||
| Between 6 and 12 months | 7,986,745 | 8,756,038 | 16,742,783 | ||||||||||||||
| More than 12 months | 18,798,384 | 3,279,197 | 22,077,581 | ||||||||||||||
| Total Term Deposits | 46,670,565 | 22,259,771 | 68,930,336 | ||||||||||||||
| Positive factors for the Colombian economy in the medium term | Challenges for the Colombian economy in the medium term | ||||
|
Rapid economic recovery after the sustained increase in local and global interest rates.
The country is expected to continue to pursue responsible monetary policies.
Institutional strength will continue to be a guarantee of a stable political environment.
Colombia's democracy, the division of power and checks and balances underpin the predictability of policy measures and economic pragmatism.
A sharp drop in the current account deficit in 2024 to levels between 1% and 2% of GDP from 6.1% in 2022 means lower external vulnerabilities in the short term.
Colombian Central Bank continues to adhere to its institutional tradition of targeting inflation and allowing the currency to float freely.
The country’s ample international reserves help mitigate external vulnerabilities arising from the checking account deficit. Despite a decrease, this deficit remains relatively high compared to peer countries.
|
Private investment remains low, which will limit medium-term economic growth.
Persistently low investor confidence could affect private investment and translate into risks to the expectation that GDP growth will return to its potential level, slightly above 3%, in the coming years.
A low medium-term potential growth could lead to challenges for public finances or increased external vulnerabilities.
Colombia is exposed to the adverse effects of climate change, especially flooding. With over 80% of its population and economic activity concentrated in roughly 20% of its territory, the country is vulnerable to natural disasters.
In terms of revenue, public finances could be affected if commodity prices decline in international markets.
The country is exposed to significant volatility in terms of international trade due to its dependence on hydrocarbons.
A low level of trade openness and an commodity-dependent export base imply high vulnerability to price shocks.
High spending expectations for 2025, relative to revenues, represent risks to compliance with the Fiscal Rule.
The risk of civil unrest will remain high throughout the forecast period of 2024-2028, reflecting deep divisions within Colombian society. Likewise, the fragmentation in Congress will hinder rapid progress in addressing issues such as poverty and low-quality education.
|
||||
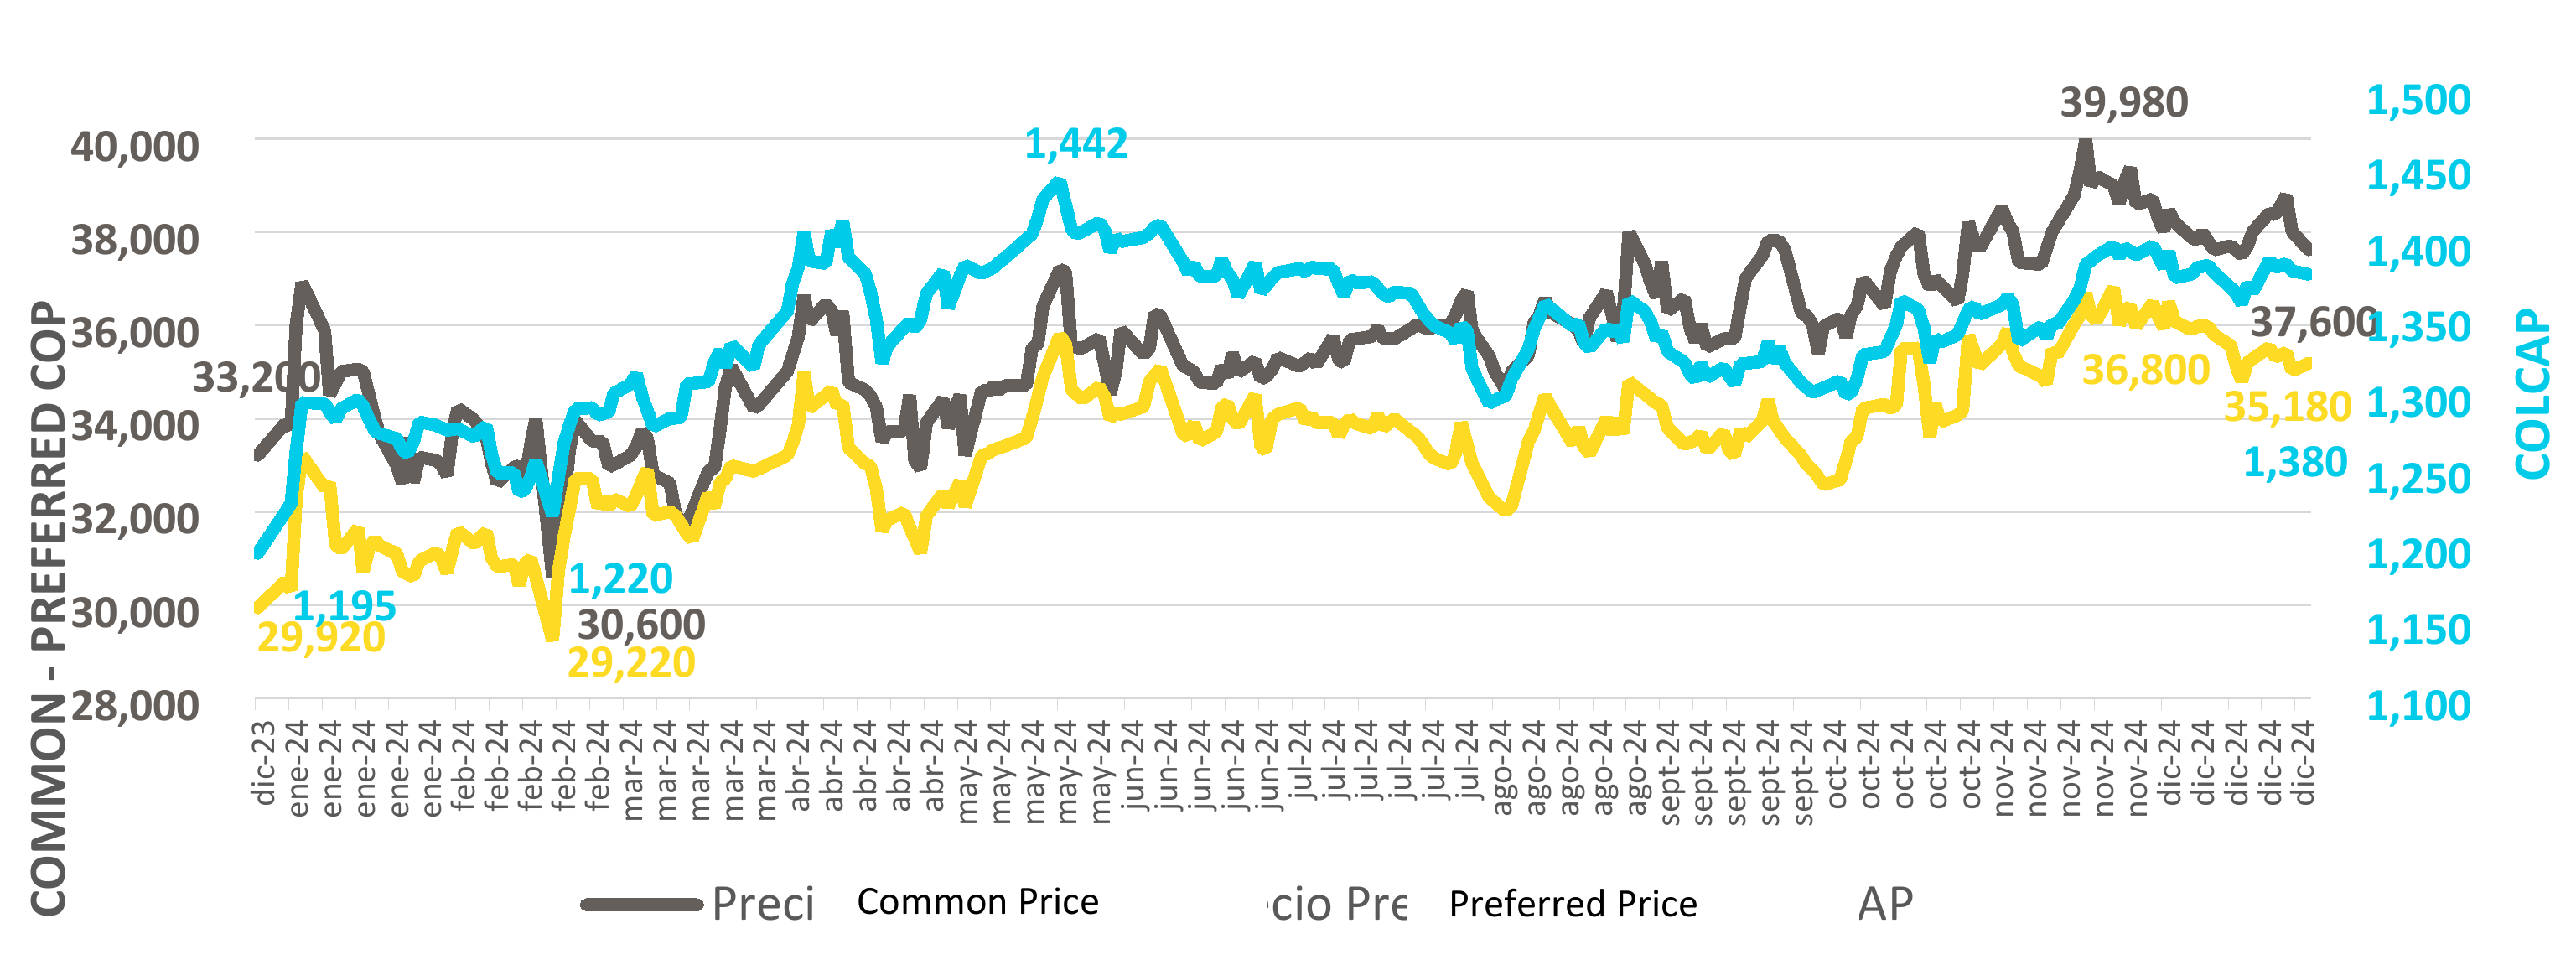
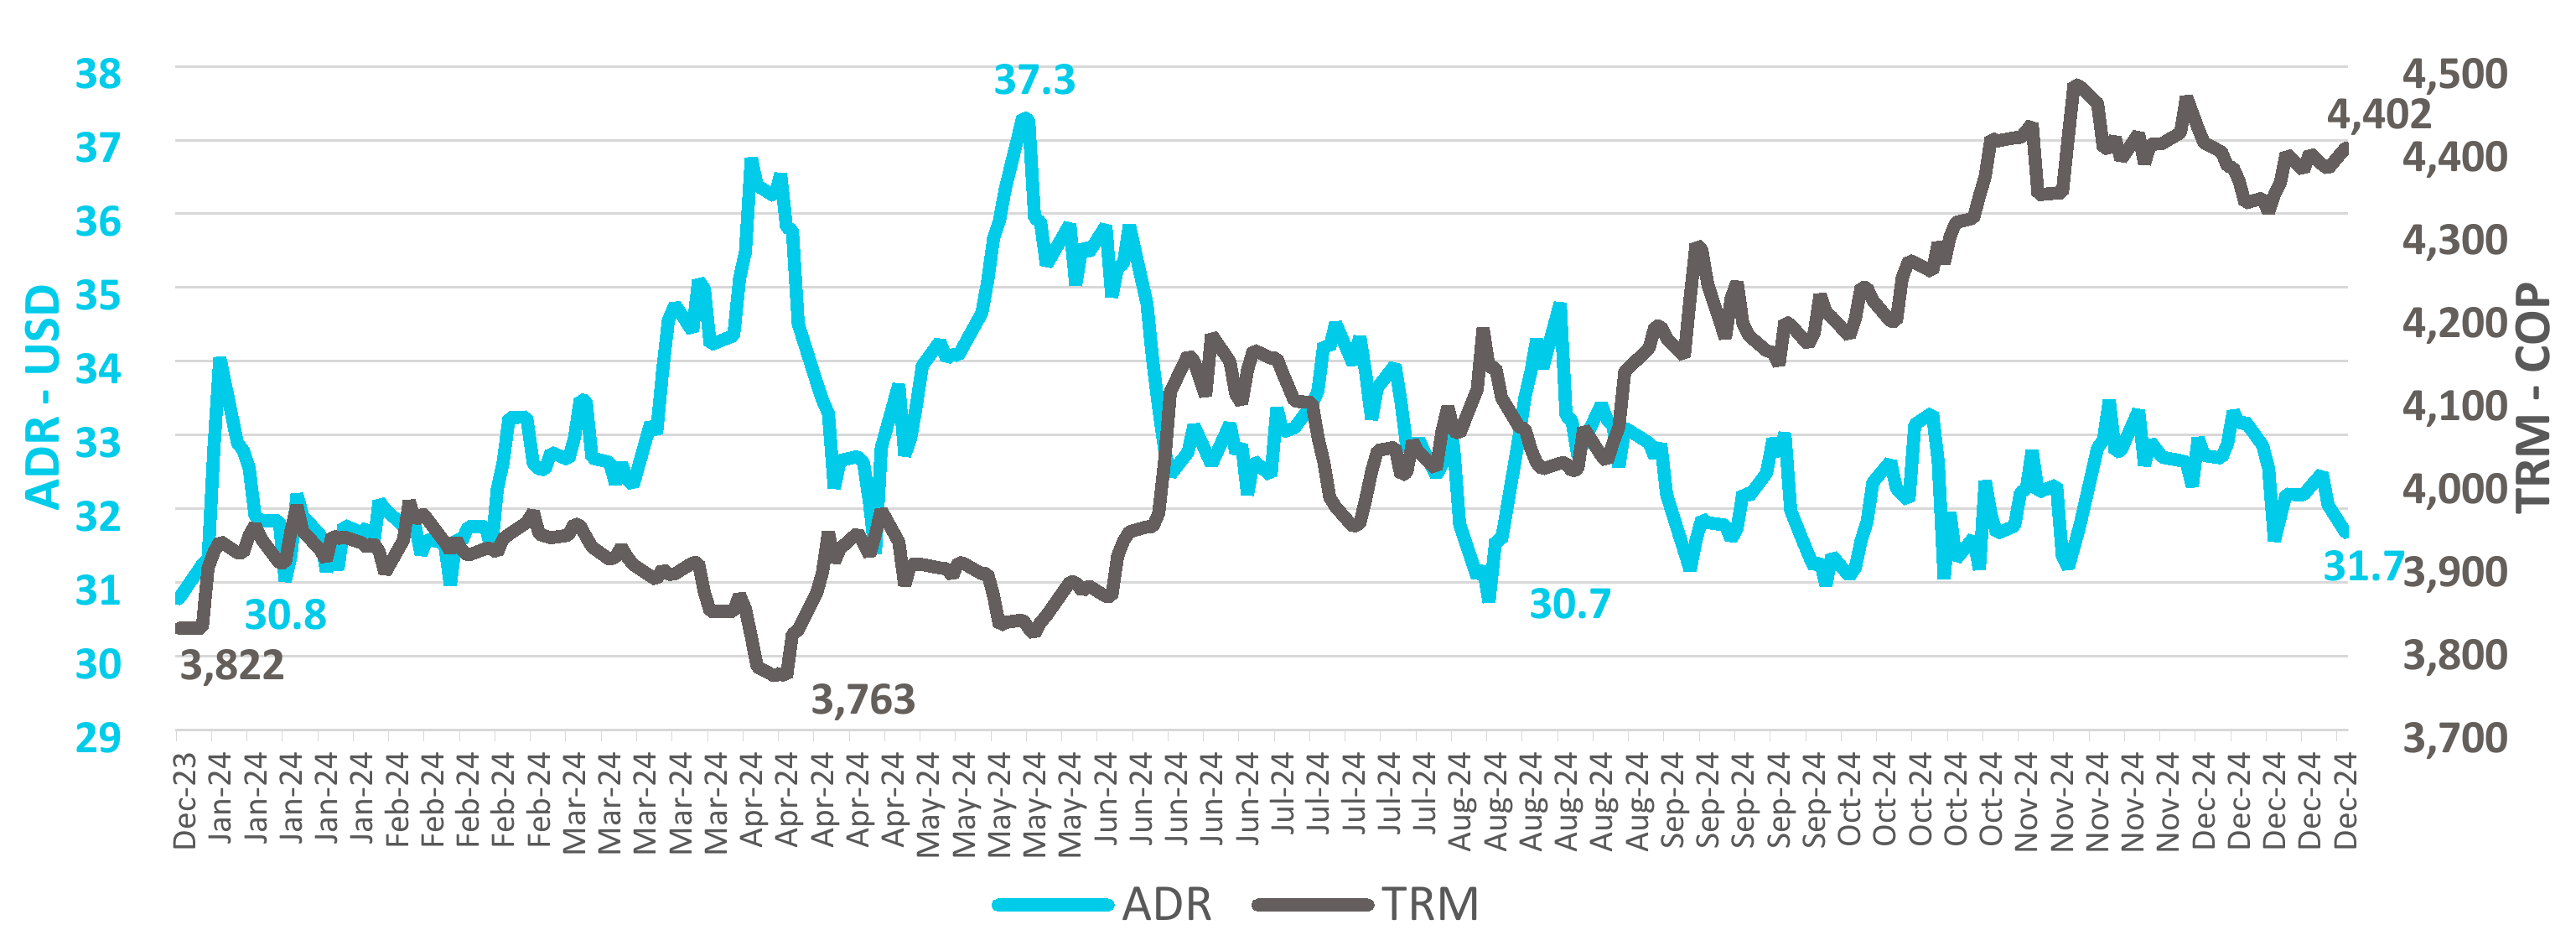
| Date |
ADR
(USD)
|
Common
(COP)
|
Preferred (COP) | TRM (COP) |
COLCAP
(points)
|
||||||||||||
| Dec 28, 2023 | 30.77 | 33,200 | 29,920 | 3,822 | 1,195 | ||||||||||||
| Dec 30, 2024 | 31.67 | 37,600 | 35,180 | 4,402 | 1,380 | ||||||||||||
| Var % | 3% | 13% | 18% | 15% | 15% | ||||||||||||
| Type | Nemo | Registration Date | Outstanding Shares |
Market Capitalization*
(COP million)
|
||||||||||
| Common | BCOLOMBIA | 07-01-1945 | 509,704,584 | 19,164,892.36 | ||||||||||
| Preferred | PFBCOLOM | 07-26-1995 | 452,122,416 | 15,905,666.59 | ||||||||||
| Nemo | Average Daily Price | Maximum Price (COP) | Maximum Price Date | Minimum Price (COP) | Minimum Price Date | ||||||||||||
| BCOLOMBIA | 35,612 | 39,980 | 11/20/2024 | 30,600 | 02/19/2024 | ||||||||||||
| PFBCOLOM | 33,517 | 36,800 | 11/25/2024 | 29,220 | 02/19/2024 | ||||||||||||
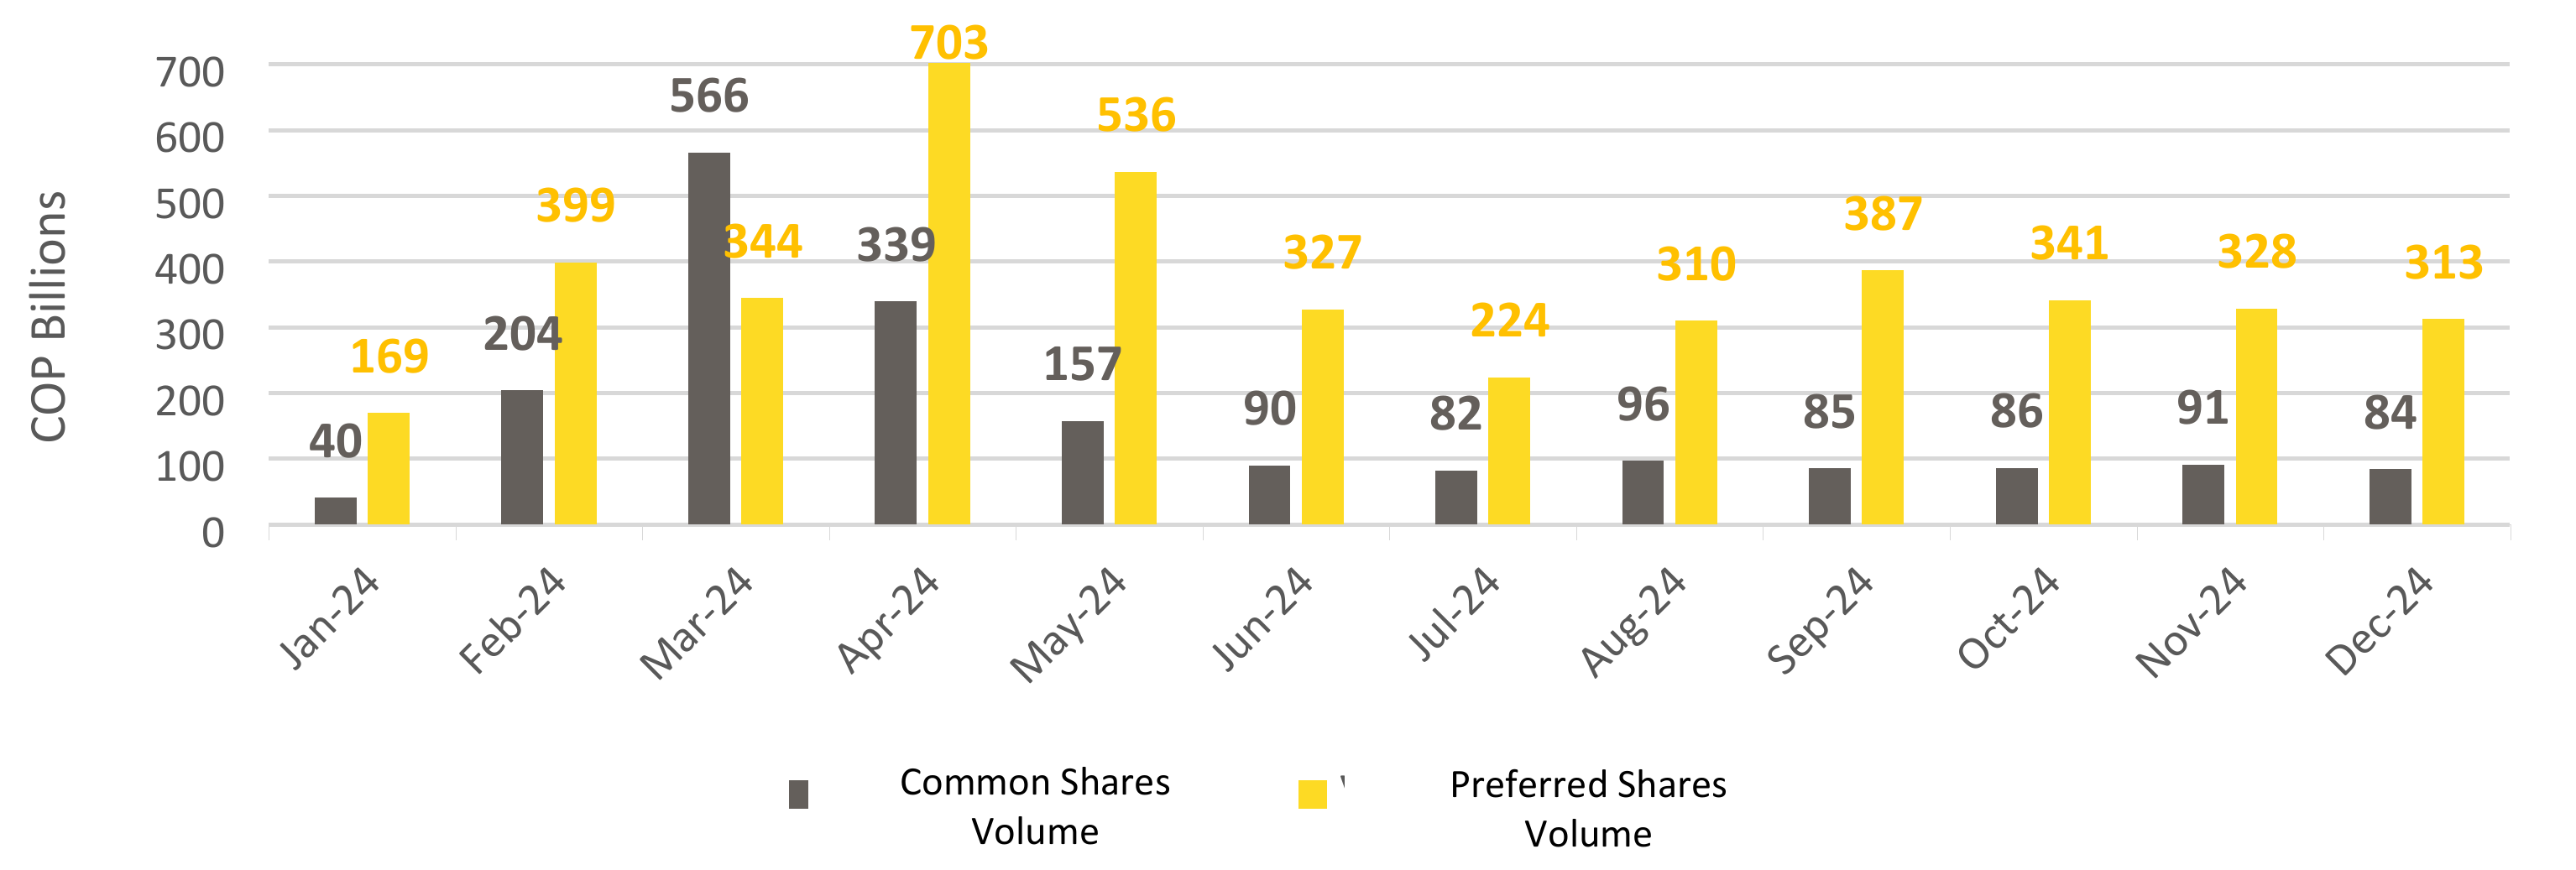
| Nemo | Operations | Amount | ||||||
| BCOLOMBIA | Operation number | 52,799 | ||||||
| Average daily operations | 232 | |||||||
| PFBCOLOM | Operation number | 135,336 | ||||||
| Average daily operations | 576 | |||||||
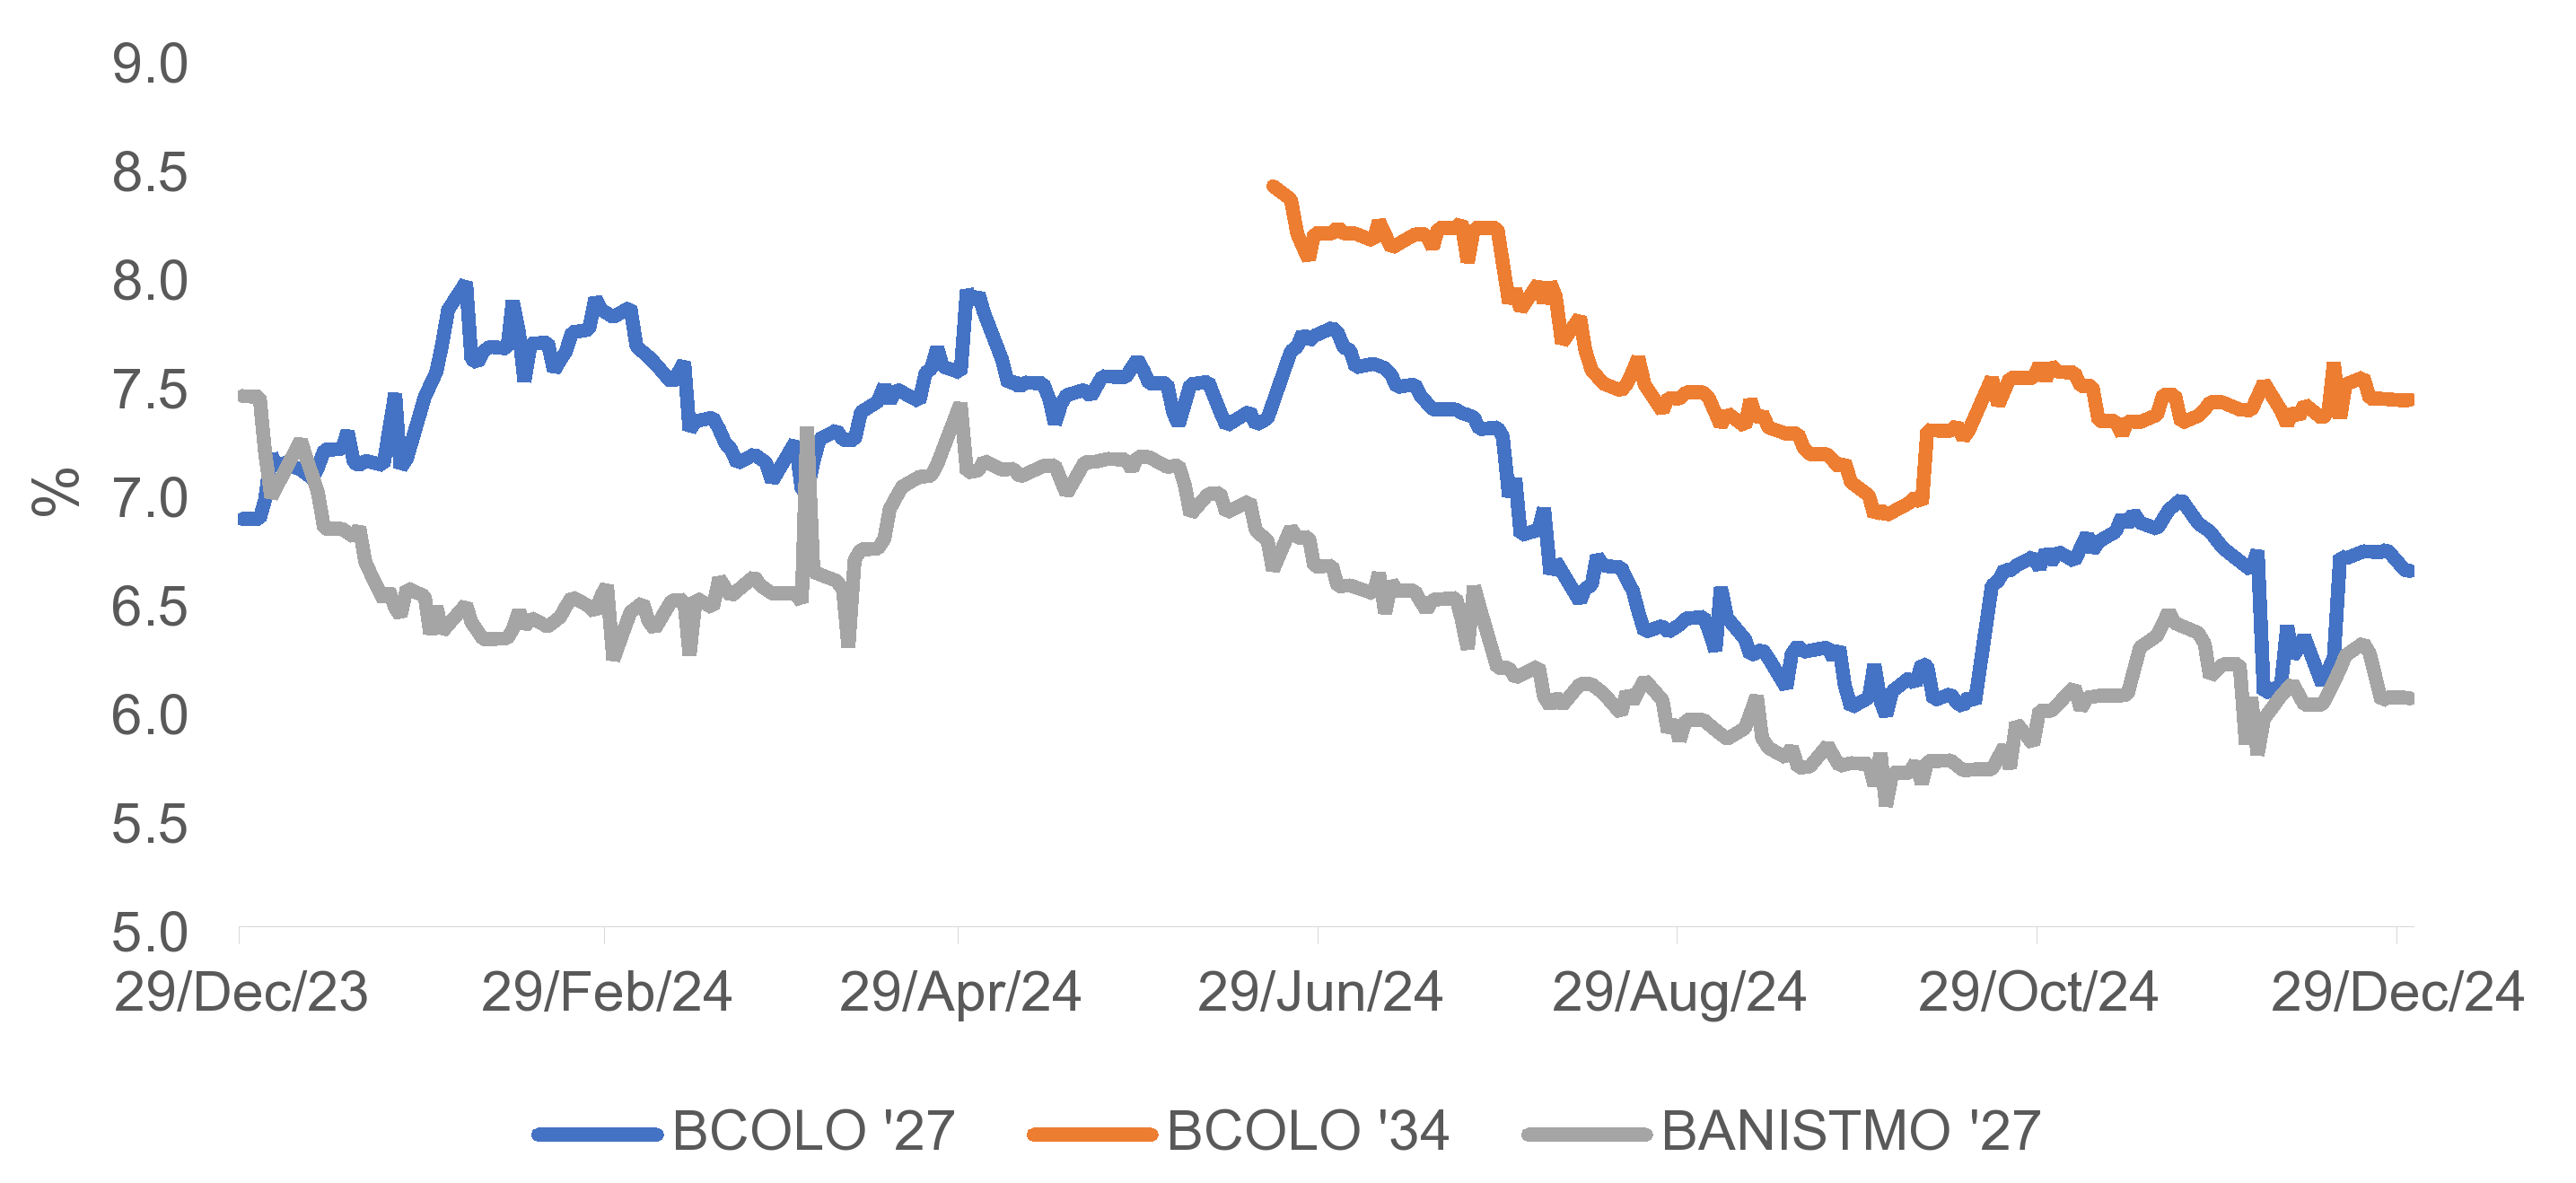
| Bond | Amount | Yield | Price L | G-Spread | ||||||||||
| Subordinates | ||||||||||||||
| BCOLO SUB 27 | USD 462 million | 6.159% | 101.887 | 189 | ||||||||||
| BCOLO SUB 34 | USD 800 million | 7.951% | 104.784 | 297 | ||||||||||
| Regular | ||||||||||||||
| BANISTMSR 27 | USD 400 million | 6.098% | 95.648 | 184 | ||||||||||
| Primary Nemo | Secondary Nemo | Date of Issue | Expiration Date | Term (Years) | Bond Type | Reference Rate | Issue Date | Currency | Amount Issued (COP Millions) | ||||||||||||||||||||
| BBCB209D15 | 7/27/11 | 7/27/26 | 15 | ORDINARY BONDS | CPI | 4.6 | COP | 248,030 | |||||||||||||||||||||
| BBCB319D15 | 11/2/11 | 11/2/26 | 15.01 | ORDINARY BONDS | CPI | 4.62 | COP | 224,050 | |||||||||||||||||||||
| BBCB149D15 | 9/24/14 | 9/24/29 | 15 | SUBORDINATED BONDS | CPI | 4.65 | COP | 360,000 | |||||||||||||||||||||
| BBCB149D20 | 9/24/14 | 9/24/34 | 20 | SUBORDINATED BONDS | CPI | 4.79 | COP | 254,500 | |||||||||||||||||||||
| BLGC659C10 | 3/18/15 | 3/18/25 | 10 | ORDINARY BONDS | CPI | 4 | COP | 91,884 | |||||||||||||||||||||
| BSBCB219C5 | BSBCB2219C05 | 9/16/21 | 9/16/26 | 5 | ORDINARY BONDS | CPI | 2.47 | COP | 183,797 | ||||||||||||||||||||
| BSBCB219C1 | BSBCB2219C12 | 9/16/21 | 9/16/33 | 12.01 | ORDINARY BONDS | CPI | 3.69 | COP | 251,500 | ||||||||||||||||||||
| Gross profit 2024 | 7,103,221,483,848.23 | |||||||
| Allocations for income tax and deferred tax | (1,525,001,351,375.72) | |||||||
| Liquid profit for the period 2024 | 5,578,220,132,472.51 | |||||||
| Plus retained earnings recognized in opening balance and effectively realized during 2024 | 9,448,864,614.99 | |||||||
| Plus release of provisioned resources for payment of preferred shares dividends | 57,701,443,512.77 | |||||||
| Total Distributable | 5,645,370,440,600.27 | |||||||
| Reserve for equity strengthening and future growth | 1,860,245,140,600.27 | |||||||
| To pay a dividend corresponding to 509,704,584 common shares and 452,122,416 preferred dividend shares without voting rights, subscribed and paid as of December 31, 2024, at a rate of COP 3,900 per share, payable as follows: COP 3,900 per share in a single payment on April 01, 2025 | 3,751,125,300,000.00 | |||||||
| Occasional reserve at the Board's disposal for donations to social benefit projects | 34,000,000,000.00 | |||||||
| EQUAL TOTALS | 5,645,370,440,600.27 | 5,645,370,440,600.27 | ||||||
| Disbursements (Colombia) | 2023 | 2024 | Annual Variation | ||||||||
| Corporate | 55,737,618 | 74,589,733 | 33.82% | ||||||||
| Individuals | 16,376,287 | 20,472,709 | 25.01% | ||||||||
| SMEs | 17,055,984 | 18,789,471 | 10.2% | ||||||||
| Independents | 2,144,241 | 2,038,767 | -4.92 | ||||||||
| Business | 17,866,711 | 20,998,523 | 17.5 | ||||||||
| Modality | 2023 | 2024 | Var % | ||||||||
| Commercial | 95,614,822 | 102,823,571 | 7.5% | ||||||||
| Consumption | 38,862,513 | 37,130,451 | -4.5% | ||||||||
| Leasing | 26,056,199 | 26,154,135 | 0.4% | ||||||||
| Housing | 21,840,258 | 25,163,198 | 15.2% | ||||||||
| Microcredit | 547,677 | 656,350 | 19.8% | ||||||||
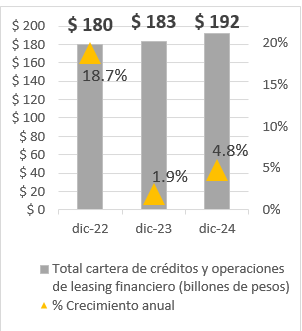
| Total | 182,921,469 | 191,927,705 | 4.9% | ||||||||
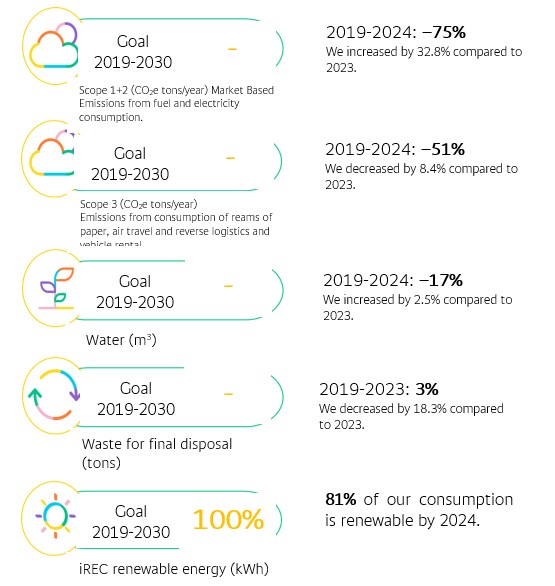

| Year | Self-generated renewable energy (MJ) | Purchased renewable energy (MJ) | Renewable electric energy (MJ) | TOTAL RENEWABLE ENERGY (MJ) | ||||||||||
| 2024 | 4,362,841.5 | 257,903,992.6 | 35,829,031.3 | 298,095,865.4 | ||||||||||
| Year | DIESEL or ACPM (diesel oil) (MJ) | B8 (MJ) | B2 (MJ) | B10 (MJ) | Gasoline E10 (MJ) | Non-renewable electric energy (MJ) | TOTAL NON-RENEWABLE ENERGY (MJ) | ||||||||||||||||
| 2024 | 3,026,985.8 | 53,744,987 | 1,201,302.2 | 5,031,842.8 | 181,394.8 | 25,283,501.81 | 34,778,772.49 | ||||||||||||||||
| ENERGY MATRIX | ||||||||
| GUATEMALA | EL SALVADOR | |||||||
| Renewable | 62.2% | 56.95% | ||||||
| Non-renewable | 37.8% | 43.05% | ||||||
| YEAR | TOTAL ENERGY CONSUMPTION (MJ) | YEAR-TO-YEAR VARIATION (MJ) | YEAR-TO-YEAR VARIATION (%) | ENERGY/EMPLOYEE (MJ/employee) | YEAR-TO-YEAR VARIATION (%) | ||||||||||||
| 2019 | 398,555,002.8 | -4.0% | 7,477.6 | -8.5% | |||||||||||||
| 2020 | 336,718,154.2 | -61,836,848.6 | -15.5% | 6,079.5 | -19% | ||||||||||||
| 2021 | 321,108,100.5 | -15,610,053.7 | -4.6% | 5,388.8 | -11% | ||||||||||||
| 2022 | 328,967,626.3 | 7,859,525.8 | 2.4% | 5,400.1 | 0.2% | ||||||||||||
| 2023 | 328,756,823 | -210,803 | -0.1% | 5,595 | 4% | ||||||||||||
| 2024 | 332,874,637.9 | 4,117,814.9 | 1.3% | 6,459.7 | 15% | ||||||||||||
| YEAR | TOTAL ENERGY CONSUMPTION (MJ) | 2024 target compared to 2019 | Achievement of 2024 target compared to 2019 | ||||||||
| 2024 | 332,874,637.9 | -10% | -16% | ||||||||
| YEAR | TOTAL ELECTRICITY CONSUMPTION (MJ) | ||||
| 2024 | 323,379,367,2 | ||||

| YEAR | SCOPE 1 (TonCO2e) |
SCOPE 2 (TonCO2e) |
SCOPE 1+2 (TonCO2e) |
2024 target compared to 2019 | Achievement of 2024 target compared to 2019 | ||||||||||||||||||
| Location Based | Market Based | Location Based | Market Based | ||||||||||||||||||||
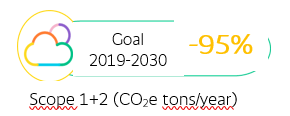
| 2024 | 671.50 | 13,200.82 | 4,135.66 | 13,872.33 | 4,807.16 | -47.5% | -75% | ||||||||||||||||
| YEAR | Biogenic emissions (Tons of CO2e) |
||||
| 2024 | 26.66 | ||||
| YEAR | SCOPE 3 (Tons of CO2e) |
2024 target compared to 2019 | Achievement of 2024 target compared to 2019 | ||||||||
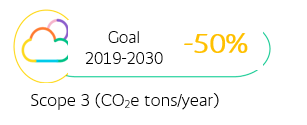
| 2024 | 1,545.37 | -25% | -51% | ||||||||
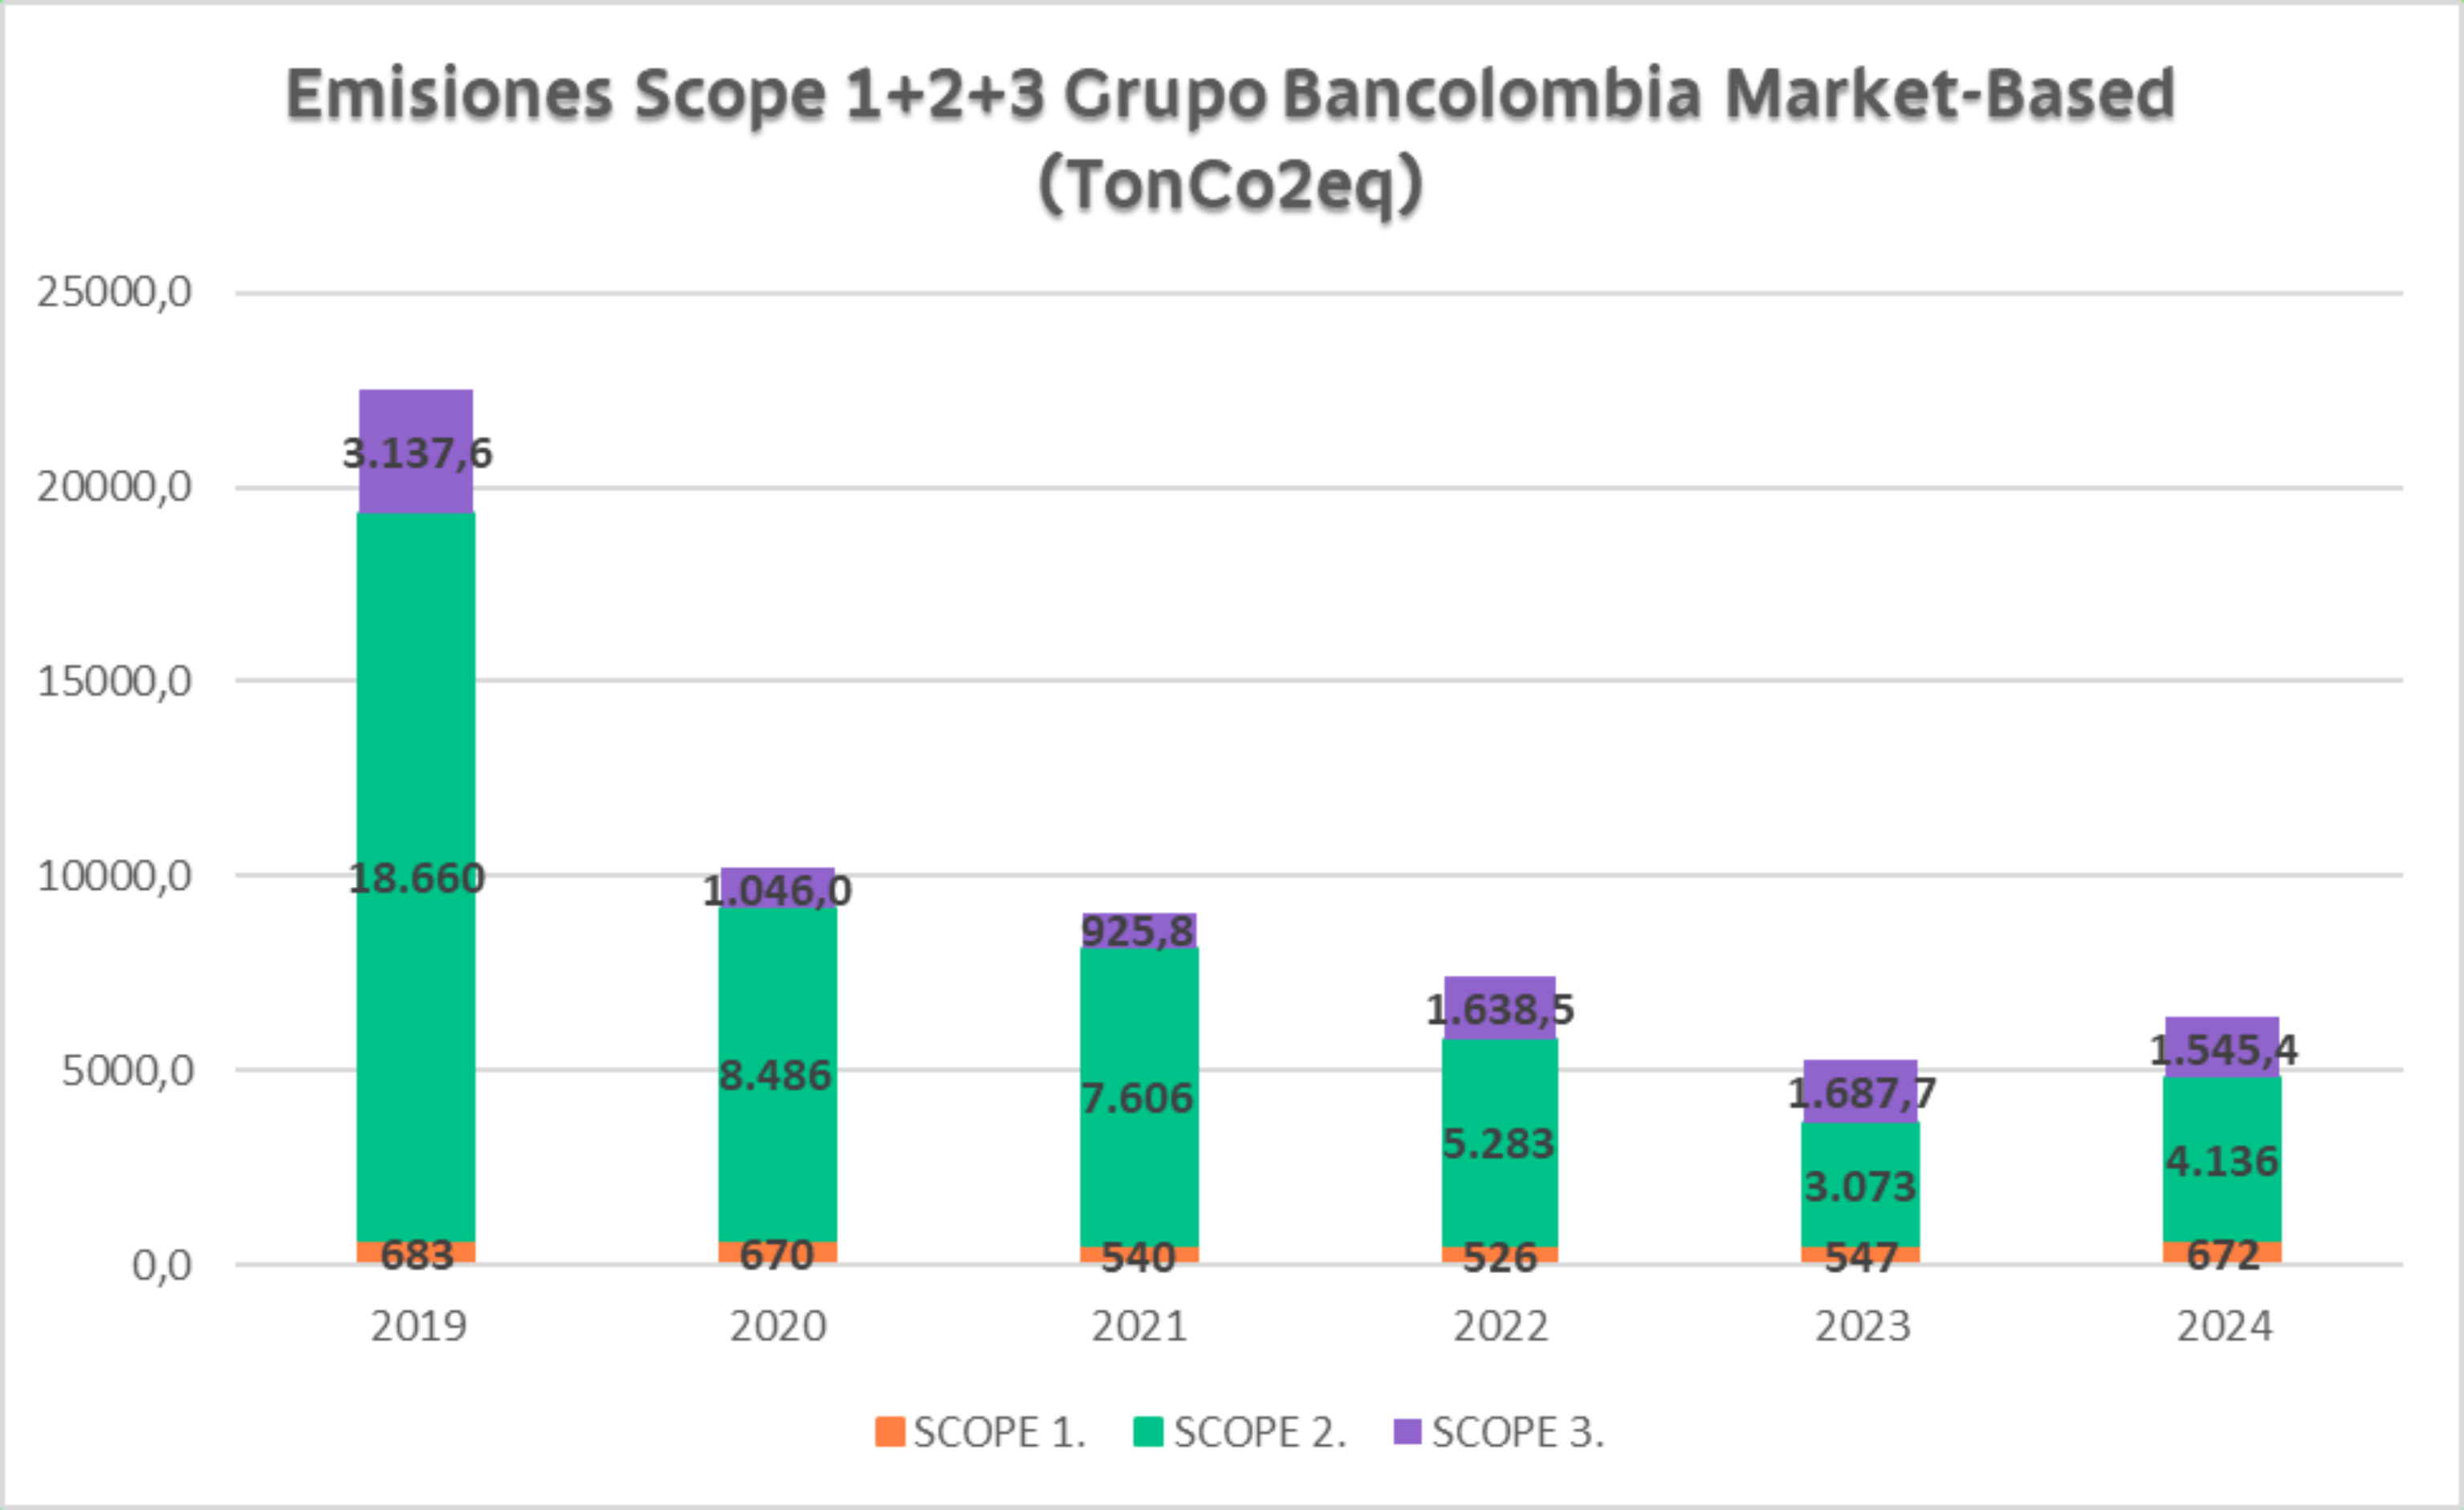
| YEAR | SCOPE 1 | SCOPE 2 | SCOPE 2 | SCOPE 1+2 | SCOPE 1+2 | SCOPE 3 | TOTAL | TOTAL | VARIATION | VARIATION | TOTAL/EMPLOYEE | TOTAL/EMPLOYEE | VARIATION (Total/Employee) | VARIATION (Total/Employee) | ||||||||||||||||||||||||||||||
| Location Based | Market Based | Location Based | Market Based | Location Based | Market Based | Total Location Based | Total Market Based | Location Based | Market Based | Location Based | Market Based | |||||||||||||||||||||||||||||||||
| 2019 | 682.64 | 22,717.14 | 18,660.33 | 23,399.78 | 19,342.97 | 3,137.63 | 26,537.41 | 22,480.60 | -9% | -23% | 0.50 | 0.42 | -13% | -26% | ||||||||||||||||||||||||||||||
| 2020 | 670.28 | 19,127.70 | 8,486.25 | 19,797.97 | 9,156.53 | 1,046.00 | 20,843.98 | 10,202.53 | -21% | -55% | 0.38 | 0.18 | -24% | -56% | ||||||||||||||||||||||||||||||
| 2021 | 540.26 | 19,997.80 | 7,605.60 | 20,538.06 | 8,145.86 | 925.82 | 21,463.87 | 9,071.68 | 3% | -11% | 0.36 | 0.15 | -4% | -17% | ||||||||||||||||||||||||||||||
| 2022 | 526.10 | 20,847.68 | 5,283.00 | 21,373.78 | 5,809.10 | 1,638.55 | 23,012.33 | 7,447.65 | 7% | -18% | 0.38 | 0.12 | 5% |
-20% | ||||||||||||||||||||||||||||||
| 2023 | 546.74 | 14,720.66 | 3,072.74 | 15,267.39 | 3,619.48 | 1,687.71 | 16,955.10 | 5,307.19 | -26% | -29% | 0.29 | 0.09 | -24% | -26% | ||||||||||||||||||||||||||||||
| 2024 | 671.50 | 13,200.82 | 4,135.66 | 13,872.33 | 4,807.16 | 1,545.37 | 15,417.70 | 6,352.54 | -9% | 20% | 0.30 | 0.12 | 4% | 36% | ||||||||||||||||||||||||||||||
| Year | Scope 1+2 (Tons of CO2e) |
Total/Employee Scope 1+2 (TonCO2e/employee) |
Scope 3 (Tons of CO2e) |
Total/Employee Scope 3 (TonCO2e/employee) |
||||||||||||||||
| Location Based | Market Based | Location Based | Market Based | |||||||||||||||||
| 2019 | 23,400 | 19,343 | 0.44 | 0.36 | 3,138 | 0.06 | ||||||||||||||
| 2020 | 19,798 | 9,157 | 0.36 | 0.17 | 1,046 | 0.02 | ||||||||||||||
| 2021 | 20,538 | 8,146 | 0.34 | 0.14 | 926 | 0.02 | ||||||||||||||
| 2022 | 21,374 | 5,809 | 0.35 | 0.10 | 1,638 | 0.03 | ||||||||||||||
| 2023 | 15,267 | 3,619 | 0.26 | 0.06 | 1,688 | 0.03 | ||||||||||||||
| 2024 | 13,872 | 4,807 | 0.27 | 0.09 | 1,545 | 0.03 | ||||||||||||||
| EMISSION REDUCTIONS | ||||||||||||||
| IREC | SELF-GENERATED ENERGY | |||||||||||||
| COUNTRY | CONSUMPTION | TONS OF CO2 AVOIDED |
CONSUMPTION | TONS OF CO2 AVOIDED |
||||||||||
| El Salvador | 462,010.85 | 107.16 | ||||||||||||
| Panama | 9,171,614.67 | 1,807.73 | ||||||||||||
| Guatemala | 1,665,489.80 | 447.52 | ||||||||||||
| Colombia | 60,802,893.46 | 6,809.92 | ||||||||||||
| TOTAL | 71,639,997.93 | 9,065.17 | 107.16 | |||||||||||
| WASTE NOT INTENDED FOR OFF-SITE DISPOSAL (TONS) | ||||||||||||||||||||
| HAZARDOUS WASTE | 2019 | 2020 | 2021 | 2022 | 2023 | 2024 | ||||||||||||||
| Reuse/recycling | 0 | 0 | 4.45 | 0 | 3.09 | 219.84 | ||||||||||||||
| Other types of classification | 0 | 0 | 0 | 0 | 0 | 0 | ||||||||||||||
| TOTAL | 0 | 0 | 4.45 | 0 | 3.09 | 219.84 | ||||||||||||||
| NON-HAZARDOUS WASTE | 2019 | 2020 | 2021 | 2022 | 2023 | 2024 | ||||||||||||||
| Reuse/recycling | 1,184.33 | 2,428.08 | 883.68 | 887.94 | 1,138 | 308.90 | ||||||||||||||
| Other types of classification | 0 | 0 | 0 | 0 | 0 | 0 | ||||||||||||||
| TOTAL | 1,184.33 | 2,428.08 | 883.68 | 887.94 | 1,138 | 308.90 | ||||||||||||||
| WASTE DESTINED FOR OFF-SITE DISPOSAL | ||||||||||||||||||||
| HAZARDOUS WASTE | 2019 | 2020 | 2021 | 2022 | 2023 | 2024 | ||||||||||||||
| Waste incinerated with energy recovery | 12.45 | 6.96 | 0.11 | 0.7 | 0.11 | 0.08 | ||||||||||||||
| Waste incinerated without energy recovery | 0.12 | 0.07 | 3.14 | 5.2 | 1.90 | 3.32 | ||||||||||||||
| Landfill waste | 0 | 0 | 0 | 0 | 0 | 0.00 | ||||||||||||||
| Waste disposed of in other ways (cells) | 0 | 0 | 1.07 | 1.93 | 1.10 | 0.50 | ||||||||||||||
| TOTAL | 12.56 | 7.03 | 4.32 | 7.82 | 3.11 | 3.90 | ||||||||||||||
| NON-HAZARDOUS WASTE | 2019 | 2020 | 2021 | 2022 | 2023 | 2024 | ||||||||||||||
| Waste incinerated with energy recovery | 0 | 0 | 0 | 0 | 0 | 0.00 | ||||||||||||||
| Waste incinerated without energy recovery | 0 | 0 | 0 | 0 | 0 | 0.00 | ||||||||||||||
| Landfill waste | 1,090.31 | 581.49 | 682.74 | 681 | 1,387 | 1132.08 | ||||||||||||||
| Waste disposed of in other ways (cells) | 0 | 0 | 0 | 0 | 0 | 0.00 | ||||||||||||||
| TOTAL | 1,090.31 | 581.49 | 682.74 | 681.00 | 1,387 | 1,132.08 | ||||||||||||||
| TOTAL WASTE | 2,287 | 3,017 | 1,575 | 1,577 | 2,532 | 1,665 | ||||||||||||||
| Recycling % | 52% | 80% | 56% | 56% | 45% | 19% | ||||||||||||||
| YEAR | Waste not intended for off-site disposal (Ton) | Waste intended for off-site disposal (Ton) | ||||||
| 2024 | 528,74 | 1,135.98 | ||||||
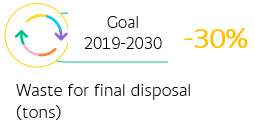
| YEAR | Waste for final disposal (Tons) | 2024 target compared to 2019 | Achievement of 2024 target compared to 2019 | ||||||||
| 2024 | 1,136 | -15% | 3.0% | ||||||||
| Environmental Investments | Costs (COP) | ||||
| Investments in energy and water management systems, replacement of equipment, and facilities’ adaptations | 25,481,126,190.83 | ||||
| Waste management | 6,360,994 | ||||
| Emissions | 125,254,325 | ||||
| Other | 15,700,000,000 | ||||
| TOTAL | 41,312,741,509 | ||||
| Type of Shares | Number of Outstanding Shares | Number of Shareholders Owning a Type of Shares | Percentage of Participation in Share Capital for Each Type of Share | ||||||||
| Common | 509,704,584 | 14,634 | 52.99% | ||||||||
| Preferred | 452,122,416 | 28,888 | 47.01% | ||||||||
| Total | 961,827,000 | 43,522 | 100% | ||||||||
| Name | Common % | Preferred % | Total % | ||||||||
| Grupo de Inversiones Suramericana S.A. | 46.11% | 0.00% | 24.43% | ||||||||
| Fondo Bancolombia ADR Program | 0.0% | 27.02% | 12.70% | ||||||||
| Fondo de Pensiones Obligatorias Porvenir Moderado | 8.19% | 1.97% | 5.27% | ||||||||
| Fondo de Pensiones Obligatorias Protección Moderado | 5.65% | 3.58% | 4.68% | ||||||||
| Fondo Bursátil Ishares MSIC COLCAP | 3.63% | 7.26% | 5.34% | ||||||||
| Shareholder Name | Total Shares | % Interest | ||||||
| Juan David Escobar Franco | 88 | 0.00% | ||||||
| Stages | Identification | Measurement | Control | Monitoring | ||||||||||
| Tools | Risk assessments | Impact measurement | Controls policy | Risk indicators | ||||||||||
| Risk certification | Frequency measurement | Control certification | Operations monitoring | |||||||||||
| Accounting cycle paths | Accounting and financial materiality analysis | Access certification | Transactional monitoring | |||||||||||
| Segregation analysis | Risk maps | Action plans management | Behavioral monitoring | |||||||||||
| Event report | Business Impact Analysis (BIA) | Control effectiveness measurement | Risks tracking | |||||||||||
| Among others | ||||||||||||||
| Risks | Operational Risks / Financial Reporting Risks / Fraud Risks / Compliance Risks (AML/ATF, Corruption, Regulatory Compliance). | |||||||||||||
| Taxes registered by region | ||||||||
| Region |
Registered Taxes
(COP million)
|
Share in total | ||||||
| Colombia | 3,547,724 | 92.8% | ||||||
| El Salvador | 185,059 | 4.8% | ||||||
| Guatemala | 36,025 | 0.9% | ||||||
| Panama | 54,311 | 1.5% | ||||||
| TOTAL | 3,823,119 | 100% | ||||||
| December 2024 | ||||||||||||||||||||||||||
| In Millions of Colombian Pesos | ||||||||||||||||||||||||||
| Factor | End of the Year | Average | Maximum | Minimum | ||||||||||||||||||||||
| Interest Rate | 540,397 | 507,425 | 586,194 | 433,465 | ||||||||||||||||||||||
| Exchange Rate | 764,920 | 554,900 | 764,920 | 364,421 | ||||||||||||||||||||||
| Share Price | 360,287 | 351,134 | 360,287 | 340,363 | ||||||||||||||||||||||
| Collective Portfolios | 31,962 | 25,653 | 31,962 | 18,005 | ||||||||||||||||||||||
| Total VaR | 1,697,566 | 1,439,112 | ||||||||||||||||||||||||
| December 2023 | ||||||||||||||||||||||||||
| In Millions of Colombian Pesos | ||||||||||||||||||||||||||
| Factor | End of the Year | Average | Maximum | Minimum | ||||||||||||||||||||||
| Interest Rate | 405,467 | 418,472 | 542,464 | 383,914 | ||||||||||||||||||||||
| Exchange Rate | 332,662 | 185,624 | 374,407 | 51,410 | ||||||||||||||||||||||
| Share Price | 342,024 | 332,443 | 347,539 | 312,136 | ||||||||||||||||||||||
| Collective Portfolios | 15,847 | 23,292 | 27,923 | 15,847 | ||||||||||||||||||||||
| Total VaR | 1,096,000 | 959,832 | ||||||||||||||||||||||||
| Legal Currency | December 31, 2024 | December 31, 2023 | ||||||
| In Millions of Colombian Pesos | ||||||||
| Asset sensitivity to 100 bps | 1,262,776 | 1,152,782 | ||||||
| Liability sensitivity at 100 bps | 915,528 | 595,749 | ||||||
| Sensitivity of Net Interest Margin to 100 bps | 347,248 | 557,033 | ||||||
| Foreign Currency | December 31, 2024 | December 31, 2023 | ||||||
| In Thousands of USD | ||||||||
| Asset sensitivity to 100 bps | 76,219 | 75,052 | ||||||
| Liability sensitivity at 100 bps | 83,051 | 74,800 | ||||||
| Sensitivity of Net Interest Margin to 100 bps | -6,832 | 252 | ||||||
| December 31, 2024 | December 31, 2023 | |||||||
| Amount | 36,226 | 41,096 | ||||||
| Delta | 14.70% | 14.70% | ||||||
| Sensitivity | 5,325 | 6,041 | ||||||
| Assets | 0-30 days | 31 Days – 1 Year |
1–3 Years | 3–5 Years | More Than 5 Years | ||||||||||||
| December 31, 2024 | In Millions of Colombian Pesos | ||||||||||||||||
| Available in | 13,292,127 | - | - | - | - | ||||||||||||
| Asset liquidity transactions | 5,697,440 | - | - | - | - | ||||||||||||
| Investments | 995,155 | 7,699,148 | 8,727,586 | 2,430,000 | 5,325,958 | ||||||||||||
| Loan portfolio | 8,128,320 | 65,765,834 | 78,036,549 | 46,330,763 | 78,012,086 | ||||||||||||
| Derivative financial assets | 8,676,006 | 4,685,855 | 1,694,141 | 743,790 | 836,395 | ||||||||||||
| Total Assets | 36,789,048 | 78,150,837 | 88,458,276 | 49,504,553 | 84,174,439 | ||||||||||||
| Liabilities | 0-30 days | 31 days–1 year | 1–3 Years | 3–5 Years | More Than 5 Years | ||||||||||||
| December 31, 2024 | In Millions of Colombian Pesos | ||||||||||||||||
| Deposit accounts | 115,768,639 | - | - | - | - | ||||||||||||
| Term deposits | 11,309,077 | 35,826,396 | 8,349,029 | 3,583,268 | 15,246,849 | ||||||||||||
| Liability liquidity transactions | 646,806 | - | - | - | - | ||||||||||||
| Bank loans | 148,800 | 4,123,676 | 4,830,763 | 865,447 | 1,205,849 | ||||||||||||
| Outstanding investment securities | 40,491 | 759,393 | 4,581,252 | 1,131,868 | 5,761,272 | ||||||||||||
| Preferred shares | - | 57,701 | 115,403 | 115,403 | 295,697 | ||||||||||||
| Derivative financial liabilities | 8,444,434 | 4,517,066 | 1,559,856 | 763,789 | 754,418 | ||||||||||||
| Total Liabilities | 136,358,247 | 45,284,232 | 19,436,303 | 6,459,775 | 23,264,085 | ||||||||||||
| December 31, 2024 | December 31, 2023 | ||||||||||||||||||||||
| Book value | Fair Value | Book Value | Fair Value | ||||||||||||||||||||
| In Millions of Colombian Pesos | |||||||||||||||||||||||
| Assets | |||||||||||||||||||||||
Debt securities, marketable investments and pledged financial assets (1) |
13,866,824 | 13,866,824 | 6,942,468 | 6,942,468 | |||||||||||||||||||
Debt securities, available-for-sale investments (1) |
3,326,813 | 3,326,813 | 3,211,425 | 3,211,425 | |||||||||||||||||||
Debt securities, held-to-maturity investments, net (1) |
4,117,051 | 4,095,270 | 3,423,265 | 3,410,468 | |||||||||||||||||||
Equity instruments (1) |
445,356 | 454,423 | 180,744 | 188,124 | |||||||||||||||||||
Hedging instruments (1) |
2,924,434 | 2,924,434 | 6,215,942 | 6,215,942 | |||||||||||||||||||
Loan portfolio and financial leasing operations (2) (3) |
178,098,539 | 185,267,812 | 170,029,117 | 171,005,705 | |||||||||||||||||||
Investment properties (4) |
846,853 | 846,853 | 574,550 | 574,550 | |||||||||||||||||||
| Total Assets | 203,625,870 | 210,782,429 | 190,577,511 | 191,548,682 | |||||||||||||||||||
| Liabilities | |||||||||||||||||||||||
Customer deposits (5) |
185,801,073 | 186,106,658 | 170,231,400 | 171,398,021 | |||||||||||||||||||
Repos (6) |
628,483 | 628,483 | 263,751 | 263,751 | |||||||||||||||||||
Hedging instruments (1) |
2,667,439 | 2,667,439 | 6,699,521 | 6,699,521 | |||||||||||||||||||
Financial obligations (7) |
10,557,864 | 10,557,864 | 12,000,269 | 12,000,269 | |||||||||||||||||||
Debt securities issued (8) |
7,801,008 | 8,006,510 | 10,958,823 | 10,919,613 | |||||||||||||||||||
Preferred shares (9) |
584,204 | 407,174 | 584,204 | 394,550 | |||||||||||||||||||
| Total liabilities | 208,040,071 | 208,374,128 | 200,737,968 | 201,675,725 | |||||||||||||||||||
| December 2024 | ||||||||||||||||||||||||||
| In Millions of Colombian Pesos | ||||||||||||||||||||||||||
| Factor | End of the Year | Average | Maximum | Minimum | ||||||||||||||||||||||
| Interest Rate | 413,000 | 405,330 | 452,682 | 351,696 | ||||||||||||||||||||||
| Exchange Rate | 615,479 | 404,782 | 615,479 | 234,652 | ||||||||||||||||||||||
| Share Price | 14,996 | 15,638 | 26,578 | 11,674 | ||||||||||||||||||||||
| Collective Portfolios | 439,564 | 417,525 | 439,564 | 401,821 | ||||||||||||||||||||||
| Total VaR | 1,483,039 | 1,243,275 | ||||||||||||||||||||||||
| December 2023 | ||||||||||||||||||||||||||
| In Millions of Colombian Pesos | ||||||||||||||||||||||||||
| Factor | End of the Year | Average | Maximum | Minimum | ||||||||||||||||||||||
| Interest Rate | 334,375 | 352,633 | 484,964 | 308,204 | ||||||||||||||||||||||
| Exchange Rate | 203,244 | 128,096 | 239,366 | 42,283 | ||||||||||||||||||||||
| Share Price | 25,951 | 20,880 | 25,951 | 17,313 | ||||||||||||||||||||||
| Collective Portfolios | 402,159 | 396,851 | 412,474 | 370,716 | ||||||||||||||||||||||
| Total VaR | 965,729 | 898,460 | ||||||||||||||||||||||||
| Currency (c) | Parallel (+/-) | ||||
| COP | 400 | ||||
| RVU | 200 | ||||
| USD | 200 | ||||
|
Positions
|
December 31, 2024 | ||||
| (In Millions of COP) | |||||
| Asset sensitivity | 5,047,412 | ||||
| Liability sensitivity | 3,989,352 | ||||
| NIM Sensitivity (Delta NIM) | 1,058,060 | ||||
| Currency (c) | Parallel | Short-Term | Long-Term | ||||||||
| COP | 400 | 500 | 300 | ||||||||
| RVU | 200 | 300 | 100 | ||||||||
| USD | 200 | 300 | 150 | ||||||||
| Positions | December 31, 2024 | ||||
| In Millions of COP | |||||
| Asset sensitivity | 6,848,837 | ||||
| Liability sensitivity | 4,985,977 | ||||
| EVE Sensitivity (Delta EVE) | 1,862,860 | ||||
| Liquidity Coverage Ratio | December 31, 2024 | December 31, 2023 | ||||||
| In Millions of Colombian Pesos | ||||||||
| 30-day Liquidity Requirement | 23,887,074 | 13,752,496 | ||||||
| Liquid Assets | 59,617,840 | 50,680,823 | ||||||
| Liquidity Ratio* | 249.58% | 368.52% | ||||||
| Liquidity Coverage Ratio | December 31, 2024 | December 31, 2023 | ||||||
| In Millions of Colombian Pesos | ||||||||
| 30-day liquidity requirement | 18,811,459 | 10,179,043 | ||||||
| Liquid assets | 35,329,433 | 28,612,973 | ||||||
| Liquidity Ratio | 187.80% | 281.10% | ||||||
Liquid Assets (1) |
December 31, 2024 | December 31, 2023 | ||||||
| In Millions of Colombian Pesos | ||||||||
| Highly Liquid Assets | ||||||||
| Available in | 12,463,277 | 12,314,552 | ||||||
| High-quality securities | 20,622,441 | 14,197,252 | ||||||
| Other Liquid Assets | ||||||||
| Other securities | 2,243,715 | 2,101,169 | ||||||
| Total Liquid Assets | 35,329,433 | 28,612,973 | ||||||
| Net Stable Funding Ratio | ||||||||
| In Millions of Colombian Pesos | ||||||||
| CATEGORY | December 31, 2024 | December 31, 2023 | ||||||
| Available Stable Funding (ASF) | 205,786.90 | 192,571.29 | ||||||
| Required Stable Funding (RSF) | 168,405.51 | 158,734.45 | ||||||
| NSFR | 122.20% | 121.32% | ||||||
| Bancolombia Group | Amount (USD) | Number of Clients | ||||||||||||
| Bancolombia | 4,576,938,127 | 127 | ||||||||||||
| Banco Agromercantil de Guatemala (BAM) | 1,255,836,277 | 49 | ||||||||||||
| Banco Agrícola | 648,752,187 | 25 | ||||||||||||
| Banistmo | 117,730,352 | 15 | ||||||||||||
| Total | 2024 | 6,599,256,943 |   216 216 |
|||||||||||
| 2023 | 3,218,454,620 | 130 clients | ||||||||||||
| Bancolombia Group | Favorable | Favorable with Conditions | Not Favorable | ||||||||
| Banco Agromercantil de Guatemala (BAM) | 71.43% | 24.49% | 4.08% | ||||||||
| Banco Agrícola | 88.00% | 12.00% | 0.00% | ||||||||
| Bancolombia | 66.14% | 29.92% | 3.94% | ||||||||
| Banistmo | 33.33% | 66.67% | 0.00% | ||||||||
| Total | 68% | 29% | 3% | ||||||||
| Sector / Risk Level |
High Risk (A)
(COP)
|
Medium Risk (B)
(COP)
|
Total
(COP)
|
||||||||
| Infrastructure | 694,569,654 | 694,569,654 | |||||||||
| Agribusiness | 40,501,056 | 17,357,595 | 57,858,651 | ||||||||
| Energy | 90,720,434 | 243,587,028 | 334,307,462 | ||||||||
| Sector | 6,970,330 | 6,970,330 | |||||||||
| Other sectors | 5,000,000 | 5,000,000 | |||||||||
| Total | 825,791,144 | 272,914,953 | 1,098,706,097 | ||||||||
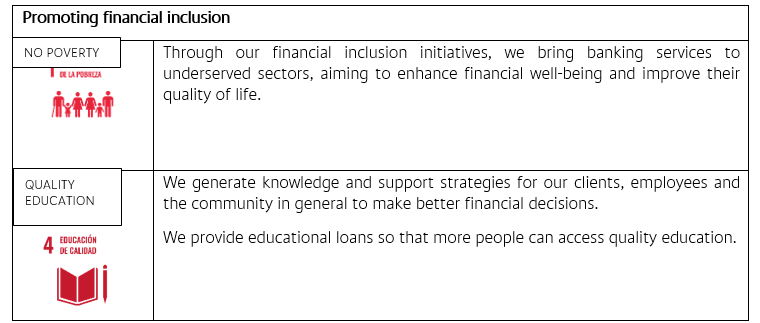

| Promoting financial inclusion | |||||
| Through our financial inclusion initiatives, we bring banking services to underserved sectors, aiming to enhance financial well-being and improve their quality of life. | |||||
|
We generate knowledge and support strategies for our clients, employees and the community in general to make better financial decisions.
We provide educational loans so that more people can access quality education.
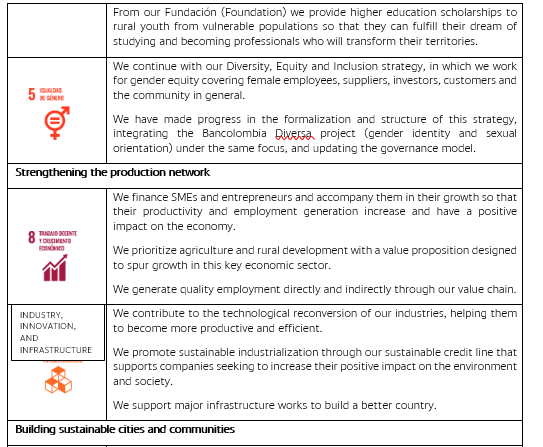
From our Fundación (Foundation) we provide higher education scholarships to rural youth from vulnerable populations so that they can fulfill their dream of studying and becoming professionals who will transform their territories.
|
|||||
|
We continue with our Diversity, Equity and Inclusion strategy, in which we work for gender equity covering female employees, suppliers, investors, customers and the community in general.
We have made progress in the formalization and structure of this strategy, integrating the Bancolombia Diversa project (gender identity and sexual orientation) under the same focus, and updating the governance model.
|
|||||
| Strengthening the production network | |||||
|
We finance SMEs and entrepreneurs and accompany them in their growth so that their productivity and employment generation increase and have a positive impact on the economy.
We prioritize agriculture and rural development with a value proposition designed to spur growth in this key economic sector.
We generate quality employment directly and indirectly through our value chain.
|
|||||
|
We contribute to the technological reconversion of our industries, helping them to become more productive and efficient.
We promote sustainable industrialization through our sustainable credit line that supports companies seeking to increase their positive impact on the environment and society.
We support major infrastructure works to build a better country.
|
|||||
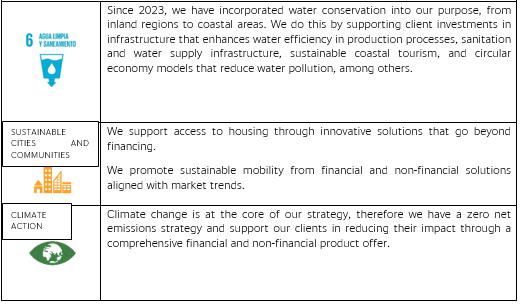
| Building sustainable cities and communities | |||||
| Since 2023, we have incorporated water conservation into our purpose, from inland regions to coastal areas. We do this by supporting client investments in infrastructure that enhances water efficiency in production processes, sanitation and water supply infrastructure, sustainable coastal tourism, and circular economy models that reduce water pollution, among others. | |||||
|
We support access to housing through innovative solutions that go beyond financing.
We promote sustainable mobility from financial and non-financial solutions aligned with market trends.
|
|||||
| Climate change is at the core of our strategy, therefore we have a zero net emissions strategy and support our clients in reducing their impact through a comprehensive financial and non-financial product offer. | |||||
| SUSTAINABLE FINANCING IMPACTS 2024 | VALUES | EQUIVALENTS | BASELINE | |||||||||||
| WATER SAVED (m³/year) | 39,151,099 | 15,660 | Filling 15,660 Olympic-sized swimming pools | (assuming each pool holds 2,500 m³ of water) | ||||||||||
| WASTE UTILIZED (tons/year) | 20,988,090 | 1.7 | Preventing waste generated by Bogotá for one year and seven months (Bogotá generates 12 million tons per year, according to the Bogotá Planning Office 2023) | |||||||||||
|
WASTE AVOIDED
(tons/year)
|
68,282 | 2,968,792 | Equivalent to the waste generation of 2,968,792 people in Colombia per month | (average Colombian generates about 0.75 kg of waste per day, totaling 23 kg per month). In 11.6 weeks, a person could generate an average of their body weight in waste. Only 12.9% of the waste generated in the country is recycled repositorio.cepal.org/repositorio.cepal.org/sever/api/core/blitstreams/bf1b769d-2ea1-434d-b2c3-0d1/content |
||||||||||
| RECIRCULATED WATER (m³/year) | 13,332 | 5 | Filling 5 Olympic-sized swimming pools | (assuming each pool holds 2,500 m³ of water) | ||||||||||
|
ENERGY GENERATED
(MWh/year)
|
1,017,141 | 470,899 | Supplying the energy demand of 470,899 households in Colombia for one year. | Colombia’s energy demand is 255.39 GWh/day, according to UPME data |
||||||||||
|
EMISSIONS AVOIDED
(tons CO2e/year)
|
1,142,931 | 799,253 | Equivalent to removing 799,253 combustion vehicles from the market. According to the European Agency, a vehicle traveling 10,000 km per year emits 1.43 tons of CO2 annually. | According to data from the European Environment Agency, a medium-sized gasoline car emits an average of about 143 grams of CO2 per kilometer. |
||||||||||
|
ENERGY SAVED
(MWh/year)
|
2,572,617 | 1,191,026 | Supplying the energy demand of 1,191,026 households in Colombia for one year. | Colombia’s energy demand is 255.39 GWh/day, according to UPME data |
||||||||||
| 2023 (COP) | 2024 (COP) | ||||||||||
| Own Resources | Sustainable Housing Line | 0.186 trillion | 0.431 trillion | ||||||||
| Leasing, Rent, and Use | 0.697 trillion | 1.3 trillion | |||||||||
| Sufi Third-Party Channels (Electric Mobility) | 0.35 trillion | 0.57 trillion | |||||||||
| Local Development Banks | Rediscount (Bancóldex, Findeter, Finagro) Bank and Leasing | 0.66 trillion |
2.27 trillion | ||||||||
|
Purpose-Driven Business: Climate Commitment
Goals and Compliance
| ||||||||||||||
| Year | Goal (COP millions) | Disbursements (COP millions) | Compliance | |||||||||||
| 2024 | 3,086,000 | 5,410,000 | 140% | |||||||||||
| Dec-24 | Dec-23 | Variation | |||||||||
| Number of Bancolombia A La Mano clients |
6,372,171 | 6,364,050 | 0.1% | ||||||||
| Total Balance in Bancolombia A la Mano (COP millions) | 1,148,021 | 970,584 | 18.3% | ||||||||
| Number of Loans Granted | 155,268 | 164,314 | -5.5% | ||||||||
| Loan Amount Granted (COP millions) | 199,338 | 190,592 | 4.6% | ||||||||
| Loan Portfolio Balance (COP millions) | 121,710 | 103,583 | 17.5% | ||||||||
| 2023 | 2024 | |||||||
| Total users (#) | 18,598,442 | 21,320,389 | ||||||
| Active users per month (#) | 13,399,397 | 16,499,498 | ||||||
| Deposit balance (COP millions) | 2,924,906 | 4,449,420 | ||||||
| Loan portfolio balance (COP millions) | 157,705 | 603,482 | ||||||
| Loans disbursed (COP millions) | 140,302 | 502,901 | ||||||
| Emergency loans disbursed (#) | 68,440 | 189,037 | ||||||
| Propulsor loans disbursed (#) | 71,862 | 313,864 | ||||||
| # | TIN | Product Name | Subcategory | Level | Certification Year | ||||||||||||
| 1 | Bancolombia | Elévate – Financial Education Program | Education Program | One | 2022 | ||||||||||||
| 2 | Fundación Bancolombia (Bancolombia Foundation) | Cuentas sin Cuento – Libertat | Education Program | One | 2022 | ||||||||||||
| 3 | Bancolombia | Financial Well-being Platform – Day to Day | Education Program | One | 2023 | ||||||||||||
| 4 | Bancolombia | Financiera-Mente | Education Program | One | 2023 | ||||||||||||
| 5 | Bancolombia | Elévate – Financial Education Program | Education Program | Two | 2023 | ||||||||||||
| 6 | Nequi | Financial Education – Nequi | Education Program | One | 2023 | ||||||||||||
| 7 | Fundación Bancolombia (Bancolombia Foundation) | Cuentas sin Cuento – Libertat | Education Program | Two | 2023 | ||||||||||||
| 8 | Bancolombia | Bus Escuela – Bancolombia | Education Program | Unique | 2023 | ||||||||||||
| 9 | Bancolombia | A la Mano Te Enseña | Campaign | One | 2023 | ||||||||||||
| 10 | Fiduciaria (Fiduciary) | Invernews | Education Program | One | 2023 | ||||||||||||
| 11 | Values | Telegram | Education Program | One | 2023 | ||||||||||||
| 12 | Bancolombia | Sueños a la Mano | Education Program | One | 2024 | ||||||||||||
| 13 | Fundación Bancolombia (Bancolombia Foundation) | Cuentas sin Cuento – Libertat | Education Program | Three | 2024 | ||||||||||||
| 14 | Bancolombia | A la Mano Te Enseña | Campaign | Two | 2024 | ||||||||||||
| 15 | Bancolombia | Financial Well-Being Indicator | Education Program | One | 2024 | ||||||||||||
| 16 | Values | Mercado en Movimiento | Education Program | One | 2024 | ||||||||||||
| 17 | Bancolombia | Emprender Mujer | Education Program | One | 2024 | ||||||||||||
| 18 | Fundación Bancolombia (Bancolombia Foundation) | Cuentas sin Cuento – DID | Education Program | One | 2024 | ||||||||||||
| # of Initiatives | # of Participants/Scope | Budget (COP) | ||||||||||||||||||||||||
| TIN | Semester 1 | Semester 2 | Semester 1 | Semester 2 | Semester 1 | Semester 2 | ||||||||||||||||||||
|
# People/
Companies
|
#Views/Likes/ Replays |
# People/
Companies
|
#Views/Likes/ Replays |
|||||||||||||||||||||||
| Bancolombia | 42 | 27 | 52,724,452 | 32,385,151 | 69,083,737 | 184,878 | 4,519,614,327 | 3,646,059,958 | ||||||||||||||||||
| Values | 6 | 9 | 1,266 | 0 | 2,752 | 0 | 0 | 762,895 | ||||||||||||||||||
| Fiduciaria (Fiduciary) | 7 | 4 | 1,450 | 199 | 1,631 | 561 | 0 | 0 | ||||||||||||||||||
| Banca de Inversión (Investment Banking) | 1 | 2 | 21 | 0 | 130 | 0 | 0 | 0 | ||||||||||||||||||
| Sufi | 2 | 3 | 231,739 | 0 | 545,100 | 0 | 0 | 0 | ||||||||||||||||||
| Nequi | 7 | 8 | 981,622 | 2,670,546 | 40 | 76,794,526 | 73,021,446 | 119,150,633 | ||||||||||||||||||
| Fundación Bancolombia (Bancolombia Foundation) | 3 | 5 | 4,373 | 0 | 23,206 | 0 | 1,067,791,897 | 2,279,953,493 | ||||||||||||||||||
| Cross-cutting Actions (affecting multiple TINs) | 9 | 8 | 28,295 | 1,300 | 7,150 | 347 | 154,636,746 | 65,000,000 | ||||||||||||||||||
| Total per Semester | 77 | 66 | 53,973,218 | 35,057,196 | 69,663,746 | 76,980,312 | 5,815,064,416 | 6,110,926,979 | ||||||||||||||||||
| Total Annual | 143 | 235,674,472 | 11,925,991,395 | |||||||||||||||||||||||
| Line | Program | Beneficiaries | Total Investment (USD) | ||||||||
| Quality of Life | FESA “Lindo del Fútbol” 2024 | 7,127 | 310,297 | ||||||||
| Financial Education | 2,776,440 reach on Radio and TV; average social media reach 4,507,589 | 150,335 | |||||||||
| Banco de la TELETÓN support for the Asociación Teletón Pro- Rehabilitación – FUNTER 2023 | 8,000 therapies | 80,000 | |||||||||
| La Cuenta del Mar (Sea Account) |
113 blue jobs,
direct beneficiaries involved in mangrove rehabilitation actions
|
399,109 | |||||||||
| TOTAL | 4 programs | 939,741 | |||||||||
| LINE | PROGRAM | BENEFICIARIES | TOTAL INVESTMENT (USD) | |||||||||||||||||
| Education | Nacer Aprendiendo – United Way (Early Childhood) | 1,900 | 15,000 | |||||||||||||||||
| Financial Education for the Youth – Asociación Bancaria de Panamá | 65 | 5,000 | ||||||||||||||||||
| Financial Education and Entrepreneurship for Children, Youth, and Women – Junior Achievement Panama | 2,710 | 47,250 | ||||||||||||||||||
| Women and Girls in STEAM | 58 | 30,500 | ||||||||||||||||||
| Impulsa: Mentoring Program for Women Entrepreneurs – Glasswing Foundation | 78 | 80,000 | ||||||||||||||||||
| Environment | Environmental Conservation and Community Support in the Panama Canal Watershed – Fundación Natura | 2,410 | 71,250 | |||||||||||||||||
| CONSOLIDATED TOTAL | 6 programs | 7,721 | 249,000 | |||||||||||||||||
| LINE | PROGRAM | BENEFICIARIES | TOTAL INVESTMENT (USD) | |||||||||||||||||
| Support to Communities | Fighting Chronic Malnutrition – Partnership with United Way | 150 families - 5 communities | 25,000 | |||||||||||||||||
| Emprender Mujer | 24 women-led SMEs, 22 mentors | 15,466 | ||||||||||||||||||
| Strengthening the education of Guatemalan children and youth – Partnership with Funsepa | 5,695 children and teenagers, 253 teachers | 125,000 | ||||||||||||||||||
| Financial Education | Annual campaign | 11,646,958 people* | 29,386 | |||||||||||||||||
| La Casa de la Plata | 8,581,000 people* | 30,685 | ||||||||||||||||||
| Environmental Care | La Cuenta del Mar – Marine Conservation Center |
15,516 turtles, 11 beaches, 6 communities
1,500 people trained
2,000 mangroves planted
|
38,000 | |||||||||||||||||
| CONSOLIDATED TOTAL | 6 programs | 263,537 | ||||||||||||||||||
| Sustainability Index | 2023 | 2024 | ||||||
| Dow Jones Sustainability Index |
78 points out of 100
Included in the Global index
|
85 points out of 100, included in the Global Index, ranked 1st in Emerging Markets and MILA | ||||||
| CDP | B | B | ||||||
| MSCI ESG Research | YY | YY | ||||||
| Moody’s formerly Vigeo | 57 “Robust” | 57 “Robust” | ||||||
| PRI (Investments) |
Policy Governance and Strategy: 74
Direct - Listed equity - Active fundamental: 42
Direct - Fixed income - SSA: 42
Direct - Fixed income - Corporate: 42
Confidence building measures: 40
|
Policy Governance and Strategy: 64
Direct - Listed equity - Active fundamental: 42
Direct - Fixed income - SSA: 52
Direct - Fixed income - Corporate: 52
Confidence building measures: 60
|
||||||
| Sustainalytics (ESG Risk Rating) | 17.8, positioning us positively in a “Low Risk” category | 16.3, positioning us positively in a “Low Risk” category | ||||||
| IR Recognition | 98.3% | 98.4% | ||||||
| Engagement Strategy | No. of Engagements | ||||
| ESG Assessment Issuers | 6 issuers | ||||
| Sustainability as a Service* | 264 clients | ||||
| Climate change | 45 clients | ||||

| Company* | Branches 2024 | Branches 2023 | Branches 2022 | ||||||||
| Bancolombia S.A. (Colombia) | 575 | 578 | 583 | ||||||||
| BAM (Guatemala) | 151 | 155 | 157 | ||||||||
| Renting Colombia** | 37 | 63 | 65 | ||||||||
| Banco Agrícola | 91 | 91 | 90 | ||||||||
| Banistmo | 37 | 39 | 39 | ||||||||
| Valores Bancolombia | 17 | 19 | 19 | ||||||||
| Fiduciaria Bancolombia | 8 | 8 | 7 | ||||||||
| Financomer | 1 | 3 | 4 | ||||||||
| SUFI | 2 | 2 | 2 | ||||||||
| Inversiones CFNS S.A.S. | 2 | 2 | 2 | ||||||||
| Banca de Inversión (Investment Banking) | 2 | 2 | 2 | ||||||||
| Bancolombia Panamá | 1 | 1 | 1 | ||||||||
| Bancolombia S.A. Panamá Branch | 1 | 1 | 1 | ||||||||
| Valores Banistmo | 1 | 1 | 1 | ||||||||
| Bancolombia Puerto Rico International Inc. | 1 | 1 | 1 | ||||||||
| Arrendadora Financiera S.A. | 1 | 1 | 1 | ||||||||
| Valores Banagrícola, S.A. de C.V. | 1 | 1 | 1 | ||||||||
| Bancolombia Capital Holding LLC (Miami) | 1 | 1 | 1 | ||||||||
| Transportempo S.A.S. | 0 | 0 | 1 | ||||||||
| Total | 930 | 969 | 978 | ||||||||
| Bancolombia, Domestic Subsidiaries and Foreign Subsidiaries | |||||||||||
| Country | No. Employees | ||||||||||
| Bancolombia (Colombia) | 23,113 | ||||||||||
| Banco Agrícola (El Salvador) | 3,079 | ||||||||||
| Banistmo (Panama) | 2,326 | ||||||||||
| OffShore | 181 | ||||||||||
| BAM (Guatemala) | 3,691 | ||||||||||
| Other Bancolombia Group Companies | |||||||||||
|
Other Bancolombia Group Companies:
*Number of employees: Renting, Nequi, Wenia, Wompi, Valores Simesa, among others.
|
1724 | ||||||||||
| Other Types of Non-Direct Contracts | |||||||||||
| External - Service Contract | 27,572 | ||||||||||
| Interns/trainees | 578 | ||||||||||
| Subtotal Employees | 32,390 | ||||||||||
| Other companies | 1724 | ||||||||||
| Total Employees | 34,114 | ||||||||||
| Index | 2023 | 2024 | Variation (%) | Numerical Variation | ||||||||||
| Number | Number | |||||||||||||
| Number of employees | 32,945 | 32,390 | -1.71% | -555 | ||||||||||
| Index | 2023 | 2024 | |||||||||||||||
| Number | % | Number | % | ||||||||||||||
| Gender | Women | 19,700 | 60% | 19,264 | 59% | ||||||||||||
| Men | 13,245 | 40% | 13,126 | 41% | |||||||||||||
| Age | Employees under 30 years old | 9,743 | 30% | 8,927 | 28% | ||||||||||||
| Employees aged 30 - 50 years old | 20,669 | 63% | 20,787 | 64% | |||||||||||||
| Employees over 50 years old | 2,533 | 8% | 2,676 | 8% | |||||||||||||
| Seniority | Employees with less than 3 years of service | 10,271 | 31% | 9,468 | 29% | ||||||||||||
| Employees with 3-10 years of service | 9,508 | 29% | 9,568 | 30% | |||||||||||||
| Employees with more than 10 years of service | 13,166 | 40% | 13,354 | 41% | |||||||||||||
| Diversity | Number and % of women in leadership roles | 1,955 | 52% | 2012 | 50% | ||||||||||||
| Number of women in junior roles | 1,763 | 53% | 1,796 | 52% | |||||||||||||
| Number and % of women in senior management | 192 | 40% | 216 | 40% | |||||||||||||
| Number and % of women in commercial roles | 1,165 | 58% | 951 | 58% | |||||||||||||
| Number and % of women in STEM (Science, Technology, Engineering, and Mathematics) roles | 3,542 | 40% | 3,937 | 39% | |||||||||||||
| Number of minority employees (people with disabilities, ethnic minorities, Afro-descendants, etc.) | 248 | 0.8% | 256 | 0.8% | |||||||||||||
| Women in Leadership Positions (Colombia): | ||||||||||||||
| CLASSIFICATION | 2023 | 2024 | ||||||||||||
| Number of Employees | Participation | Number of Employees | Participation | |||||||||||
| Female | 145 | 40.2% | 151 | 40.3% | ||||||||||
| Male | 216 | 59.8% | 224 | 59.7% | ||||||||||
| Grand Total | 361 | 100.0% | 375 | 100.0% | ||||||||||
| Index | 2023 | 2024 | ||||||||||||
| Cases | % / rate | Cases | % / rate | |||||||||||
| Total Revenues | 4,686 | 14% | 2,985 | 9% | ||||||||||
| Female Hires | 2,571 | 55% | 1,633 | 55% | ||||||||||
| Male Hires | 2,115 | 45% | 1,352 | 45% | ||||||||||
| Employee Hires under 30 years old | 3,143 | 67% | 2,132 | 71% | ||||||||||
| Employee Hires aged 30 - 50 years old | 1,517 | 32% | 831 | 28% | ||||||||||
| Employee Hires over 50 years old | 26 | 1% | 22 | 1% | ||||||||||
| Hires at Bancolombia | 2,731 | 12% | 1,064 | 5% | ||||||||||
| Hires at Banistmo | 446 | 18% | 383 | 16% | ||||||||||
| Hires OffShore | 22 | 13.66% | 40 | 22% | ||||||||||
| Hires at Banco Agrícola | 517 | 18% | 602 | 20% | ||||||||||
| Hires at BAM | 970 | 26% | 896 | 24% | ||||||||||
Index |
2023 | 2024 | ||||||||||||
| Cases | % Turnover | Cases | % Turnover | |||||||||||
| Total resignations | 2,910 | 8.83% | 3,512 | 10.84% | ||||||||||
| Female Departures | 1,678 | 58% | 2,041 | 58% | ||||||||||
| Male Departures | 1,232 | 42% | 1,471 | 42% | ||||||||||
| Employee Departures under 30 years old | 1,168 | 40% | 1,392 | 40% | ||||||||||
| Employee Departures aged 30 - 50 years old | 1,430 | 49% | 1,695 | 48% | ||||||||||
| Employee Departures over 50 years old | 312 | 11% | 425 | 12% | ||||||||||
| Voluntary Departures | 1,452 | 50% | 1,333 | 38% | ||||||||||
| Departures without just cause (dismissals) | 257 | 9% | 449 | 13% | ||||||||||
| Departures by mutual agreement | 626 | 22% | 897 | 26% | ||||||||||
| Departures with just cause | 122 | 4% | 165 | 5% | ||||||||||
| Departures due to retirement/pension | 55 | 2% | 89 | 3% | ||||||||||
| Departures during probation period | 44 | 2% | 34 | 1% | ||||||||||
| Departures due to death | 15 | 1% | 23 | 1% | ||||||||||
| Departures due to contract termination | 331 | 11% | 512 | 15% | ||||||||||
| Departures - pension due to disability | 0 | 0% | 0 | 0% | ||||||||||
| Departures due to other reasons | 8 | 0% | 10 | 0% | ||||||||||
| Representative Turnover Indicator | 2023 | 2024 | ||||||||||||
| Cases | % Turnover | Cases | % Turnover | |||||||||||
| Rotation of Bancolombia Withdrawals | 1,370 | 5.8% | 1,649 | 7.1% | ||||||||||
| Turnover Banistmo Departures | 306 | 12.6% | 469 | 20.2% | ||||||||||
| Turnover OffShore Departures | 13 | 8.1% | 20 | 11.0% | ||||||||||
| Turnover Banco Agrícola Departures | 463 | 15.7% | 463 | 15.0% | ||||||||||
| Turnover BAM Departures | 758 | 20.5% | 911 | 24.7% | ||||||||||
Index |
2023 | 2024 | ||||||||||||
| Cases | % Turnover | Cases | % Turnover | |||||||||||
| Voluntary Departures | 1,452 | 4.41% | 1,333 | 4.12% | ||||||||||
| Departures without just cause (dismissals) | 257 | 0.78% | 449 | 1.39% | ||||||||||
| Departures by mutual agreement | 626 | 1.90% | 897 | 2.77% | ||||||||||
| Departures with just cause | 122 | 0.37% | 165 | 0.51% | ||||||||||
| Departures due to retirement/pension | 55 | 0.17% | 89 | 0.27% | ||||||||||
| Departures during probation period | 44 | 0.13% | 34 | 0.10% | ||||||||||
| Departures due to death | 15 | 0.05% | 23 | 0.07% | ||||||||||
| Departures due to contract termination | 331 | 1.00% | 512 | 1.58% | ||||||||||
| Departures - pension due to disability | 0 | 0.00% | 0 | 0.00% | ||||||||||
| Departures due to other reasons | 8 | 0.02% | 10 | 0.03% | ||||||||||
Index |
2023 | 2024 | ||||||||||||
| Cases | Promotions rate | Cases | Promotion Rate | |||||||||||
| Total Promotions | 4,093 | 12% | 3,930 | 12% | ||||||||||
| Female Promotions | 2300 | 56% | 2,025 | 52% | ||||||||||
| Male Promotions | 1,793 | 44% | 1,905 | 48% | ||||||||||
| Bancolombia – Colombia 2024 | |||||||||||||||||||||||
| Hierarchical Level | Gender | 2023 | 2024 | ||||||||||||||||||||
| Population Percentage | Average Monthly Salary (COP) | % Below Men | Population Percentage | Average Monthly Salary (COP) | % Below Men | ||||||||||||||||||
| Senior Management | Female | 40% | 19,187,110 | 2.18% | 40% | 21,195,674 | 2.38% | ||||||||||||||||
| Male | 60% | 20,820,116 | 60% | 23,552,368 | |||||||||||||||||||
| Mid-Level Strategic | Female | 55% | 9,116,748 | 3.99% | 53% | 9,815,593 | 3.57% | ||||||||||||||||
| Male | 45% | 9,583,151 | 47% | 10,118,809 | |||||||||||||||||||
| Professional | Female | 54% | 5,011,414 | 0.29% | 53% | 5,511,662 | 0.49% | ||||||||||||||||
| Male | 46% | 5,140,476 | 47% | 5,695,473 | |||||||||||||||||||
| Operational | Female | 69% | 3,457,890 | 0.98% | 69% | 3,952,365 | 0.49% | ||||||||||||||||
| Male | 31% | 3,529,151 | 31% | 3,995,963 | |||||||||||||||||||
| Banistmo 2024 | |||||||||||||||||||||||
| Hierarchical Level | Gender | 2023 | 2024 | ||||||||||||||||||||
| Population Percentage | Average Monthly Salary (USD) | % Below Men | Population Percentage | Average Monthly Salary (USD) | % Below Men | ||||||||||||||||||
| Senior Management | Female | 50% | 9,875 | 4.34% | 45% | 10,471 | 3.40% | ||||||||||||||||
| Male | 50% | 10,455 | 55% | 10,450 | |||||||||||||||||||
| Mid-Level Strategic | Female | 62% | 4,138 | 5.77% | 58% | 4,259 | 3.30% | ||||||||||||||||
| Male | 38% | 4,452 | 42% | 4,437 | |||||||||||||||||||
| Professional | Female | 57% | 1,870 | 9.07% | 57% | 1,896 | 8.14% | ||||||||||||||||
| Male | 43% | 2,101 | 43% | 2,162 | |||||||||||||||||||
| Operational | Female | 77% | 937 | 1.14% | 77% | 954 | 1.56% | ||||||||||||||||
| Male | 23% | 968 | 23% | 991 | |||||||||||||||||||
| Offshore 2024 | |||||||||||||||||||||||
| Hierarchical Level | Gender | 2023 | 2024 | ||||||||||||||||||||
| Population Percentage | Average Monthly Salary (USD) | % Below Men | Population Percentage | Average Monthly Salary (USD) | % Below Men | ||||||||||||||||||
| Senior Management | Female | 50% | 12,544 | -9.32% | 20% | 14,386 | -3.36%* | ||||||||||||||||
| Male | 50% | 12,339 | 80% | 13,918 | |||||||||||||||||||
| Mid-Level Strategic | Female | 59% | 4,374 | -3.70% | 69% | 4,835 | -5.03% | ||||||||||||||||
| Male | 41% | 3,617 | 31% | 4,658 | |||||||||||||||||||
| Professional | Female | 68% | 2,146 | 2.36% | 66% | 2,209 | 0.82% | ||||||||||||||||
| Male | 32% | 2,174 | 34% | 2,304 | |||||||||||||||||||
| Operational | Female | 70% | 1,015 | 10.44% | 67% | 1,051 | 5.38% | ||||||||||||||||
| Male | 30% | 1,163 | 33% | 1,112 | |||||||||||||||||||
| Banco Agrícola 2024 | |||||||||||||||||||||||
| Hierarchical Level | Gender | 2023 | 2024 | ||||||||||||||||||||
| Population Percentage | Average Monthly Salary (COP) | % Below Men | Population Percentage | Average Monthly Salary (COP) | % Below Men | ||||||||||||||||||
| Senior Management | Female | 39% | 6,563 | 7.73% | 43% | 6,862 | 3.03% | ||||||||||||||||
| Male | 61% | 7,583 | 57% | 7,984 | |||||||||||||||||||
| Mid-Level Strategic | Female | 51% | 2,680 | 3.03% | 51% | 2,752 | 1.85% | ||||||||||||||||
| Male | 49% | 2,909 | 49% | 2,934 | |||||||||||||||||||
| Professional | Female | 50% | 1,278 | 1.62% | 50% | 1,307 | 0.86% | ||||||||||||||||
| Male | 50% | 1,341 | 50% | 1,363 | |||||||||||||||||||
| Operational | Female | 59% | 580 | 0.29% | 59% | 594 | 0.40% | ||||||||||||||||
| Male | 41% | 578 | 41% | 595 | |||||||||||||||||||
| BAM 2024 | |||||||||||||||||||||||
| Hierarchical Level | Gender | 2023 | 2024 | ||||||||||||||||||||
| Population Percentage | Average monthly salary | % Below Men | Population Percentage | Average monthly salary | % Below Men | ||||||||||||||||||
| Senior Management | Female | 27% | 11,695 | -10.58% | 30% | 11,345 | -6.85% | ||||||||||||||||
| Male | 73% | 10,032 | 70% | 10,509 | |||||||||||||||||||
| Mid-Level Strategic | Female | 34% | 3,974 | 0.68% | 36% | 4,020 | 0.85% | ||||||||||||||||
| Male | 66% | 3,444 | 64% | 3,597 | |||||||||||||||||||
| Professional | Female | 46% | 1,323 | 3.69% | 46% | 1,386 | 4.20% | ||||||||||||||||
| Male | 54% | 1,412 | 54% | 1,527 | |||||||||||||||||||
| Operational | Female | 58% | 519 | -0.38% | 60% | 550 | -1.13% | ||||||||||||||||
| Male | 42% | 523 | 40% | 564 | |||||||||||||||||||
| Index | 2024 | |||||||
| Leaders trained in the Instituto de Liderazgo (Leadership Institute) program* | 5,696 managers, 98% of the total managers. |
|||||||
| New trained managers* | 689 managers, 88% of new managers. |
|||||||
| Total training hours | 1,192,519 | |||||||
| Average training hours per employee | 36 hours/employee |
|||||||
| Average virtual training hours per employee | ||||||||
28 hours/employee |
||||||||
| Average face-to-face training hours per employee | ||||||||
8 hours/employee |
||||||||
| Average hours of training per male employee | ||||||||
37 hours/employee |
||||||||
| Average hours of training per female employee | 36 hours/employee |
|||||||
| Index | 2024 | ||||
| Average hours of training per employee managers | 59 | ||||
| Average hours of training per non-managers employee | 33 | ||||
| Average investment in training per person* | USD 206 | ||||
| In-person and virtual trainees | 70 employees | ||||
| Compliance with Anti-Corruption and Anti-Fraud Training 2024 | ||||||||||||||
| Employees | Approved | In progress | Grand Total | Compliance % | ||||||||||
| Bancolombia Panamá | 128 | 0 | 128 | 100.00% | ||||||||||
| Banistmo | 1,761 | 1 | 1,762 | 99.94% | ||||||||||
| BAM | 2,864 | 7 | 2,871 | 99.76% | ||||||||||
| Banco Agrícola | 2,501 | 0 | 2,501 | 100.00% | ||||||||||
| Bancolombia | 19,106 | 64 | 19,170 | 99.67% | ||||||||||
| Puerto Rico | 5 | 0 | 5 | 100.00% | ||||||||||
| Grand Total | 26,365 | 72 | 26,437 | 99.73% | ||||||||||
| Managers | Approved | In progress | Grand Total | Compliance % | ||||||||||
| Bancolombia Panamá | 28 | 0 | 28 | 100.00% | ||||||||||
| Banistmo | 389 | 0 | 389 | 100.00% | ||||||||||
| BAM | 628 | 1 | 629 | 99.84% | ||||||||||
| Banco Agrícola | 446 | 1 | 447 | 99.78% | ||||||||||
| Bancolombia | 2,651 | 5 | 2,656 | 99.81% | ||||||||||
| Puerto Rico | 1 | 0 | 1 | 100.00% | ||||||||||
| Grand Total | 4,143 | 7 | 4,150 | 99.83% | ||||||||||
| Compliance with Free Competition Training 2024 | ||||||||||||||
| Employees | Approved | In progress | Grand Total | Compliance % | ||||||||||
| Bancolombia | 19,128 | 42 | 19,170 | 99.78% | ||||||||||
| Grand Total | 19,128 | 42 | 19,170 | 99.78% | ||||||||||
| Managers | Approved | In progress | Grand Total | Compliance % | ||||||||||
| Bancolombia | 2653 | 3 | 2,656 | 99.89% | ||||||||||
| Grand Total | 2653 | 3 | 2,656 | 99.89% | ||||||||||
| Compliance with Cybersecurity Training 2024 | ||||||||||||||
| Employees | Approved | In progress | Grand Total | Compliance % | ||||||||||
| Bancolombia Panamá | 128 | 0 | 128 | 100.00% | ||||||||||
| Banistmo | 1,761 | 1 | 1,762 | 99.94% | ||||||||||
| Banco Agromercantil de Guatemala (BAM) | 2,864 | 7 | 2,871 | 99.76% | ||||||||||
| Banco Agrícola | 2,501 | 0 | 2,501 | 100.00% | ||||||||||
| Bancolombia | 19,122 | 48 | 19,170 | 99.75% | ||||||||||
| Puerto Rico | 5 | 0 | 5 | 100.00% | ||||||||||
| Grand Total | 26,381 | 56 | 26,437 | 99.79% | ||||||||||
| Managers | Approved | In progress | Grand Total | Compliance % | ||||||||||
| Bancolombia Panamá | 28 | 0 | 28 | 100.00% | ||||||||||
| Banistmo | 389 | 0 | 389 | 100.00% | ||||||||||
| Banco Agromercantil de Guatemala (BAM) | 628 | 1 | 629 | 99.84% | ||||||||||
| Banco Agrícola | 446 | 1 | 447 | 99.78% | ||||||||||
| Bancolombia | 2653 | 3 | 2,656 | 99.89% | ||||||||||
| Puerto Rico | 1 | 0 | 1 | 100.00% | ||||||||||
| Grand Total | 4,145 | 5 | 4,150 | 99.88% | ||||||||||
| Compliance with Ethics Code Training 2024 | ||||||||||||||
| Employees | Approved | In Progress | Grand Total | Compliance % | ||||||||||
| Bancolombia Panamá | 128 | 0 | 128 | 100.00% | ||||||||||
| Banistmo | 1,762 | 0 | 1,762 | 100.00% | ||||||||||
| Banco Agromercantil de Guatemala (BAM) | 2,867 | 4 | 2,871 | 99.86% | ||||||||||
| Banco Agrícola | 2,501 | 0 | 2,501 | 100.00% | ||||||||||
| Bancolombia | 19,141 | 29 | 19,170 | 99.85% | ||||||||||
| Puerto Rico | 5 | 0 | 5 | 100.00% | ||||||||||
| Grand Total | 26,404 | 33 | 26,437 | 99.88% | ||||||||||
| Managers | Approved | In Progress | Grand Total | Compliance % | ||||||||||
| Bancolombia Panamá | 28 | 0 | 28 | 100.00% | ||||||||||
| Banistmo | 389 | 0 | 389 | 100.00% | ||||||||||
| Banco Agromercantil de Guatemala (BAM) | 628 | 1 | 629 | 99.84% | ||||||||||
| Banco Agrícola | 447 | 0 | 447 | 100.00% | ||||||||||
| Bancolombia | 2653 | 3 | 2,656 | 99.89% | ||||||||||
| Puerto Rico | 1 | 0 | 1 | 100.00% | ||||||||||
| Grand Total | 4,146 | 4 | 4,150 | 99.90% | ||||||||||
| Compliance with Diversity, Equity, and Inclusion Training 2024 | ||||||||||||||
| Employees | Approved | In progress | Grand Total | Compliance % | ||||||||||
| Bancolombia Panamá | 128 | 0 | 128 | 100.00% | ||||||||||
| Banistmo | 1,761 | 1 | 1,762 | 99.94% | ||||||||||
| Banco Agromercantil de Guatemala (BAM) | 2,862 | 9 | 2,871 | 99.69% | ||||||||||
| Banco Agrícola | 2,499 | 2 | 2,501 | 99.92% | ||||||||||
| Bancolombia | 19,096 | 74 | 19,170 | 99.61% | ||||||||||
| Puerto Rico | 5 | 0 | 5 | 100.00% | ||||||||||
| Grand Total | 26,351 | 86 | 26,437 | 99.67% | ||||||||||
| Managers | Approved | In progress | Grand Total | Compliance % | ||||||||||
| Bancolombia Panamá | 28 | 0 | 28 | 100.00% | ||||||||||
| Banistmo | 389 | 0 | 389 | 100.00% | ||||||||||
| Banco Agromercantil de Guatemala (BAM) | 628 | 1 | 629 | 99.84% | ||||||||||
| Banco Agrícola | 447 | 1 | 448 | 99.78% | ||||||||||
| Bancolombia | 2652 | 4 | 2,656 | 99.85% | ||||||||||
| Puerto Rico | 1 | 0 | 1 | 100.00% | ||||||||||
| Grand Total | 4,145 | 6 | 4,151 | 99.86% | ||||||||||
| Compliance with Occupational Health and Safety Risk Management Training 2024 | ||||||||||||||
| Employees | Approved | In Progress | Grand Total | Compliance % | ||||||||||
| Banco Agromercantil de Guatemala (BAM) | 2,864 | 7 | 2,871 | 99.76% | ||||||||||
| Bancolombia | 19,085 | 85 | 19,170 | 99.56% | ||||||||||
| Grand Total | 21,949 | 0 | 22,041 | 99.58% | ||||||||||
| Managers | Approved | In Progress | Grand Total | Compliance % | ||||||||||
| Banco Agromercantil de Guatemala (BAM) | 628 | 1 | 629 | 99.84% | ||||||||||
| Bancolombia | 2,650 | 6 | 2,656 | 99.77% | ||||||||||
| Grand Total | 3,278 | 7 | 3,285 | 99.79% | ||||||||||
| Compliance with Personal Data Protection Training 2024 | ||||||||||||||
| Employees | Approved | In Progress | Grand Total | Compliance % | ||||||||||
| Bancolombia Panamá | 128 | 0 | 128 | 100.00% | ||||||||||
| Banistmo | 1,761 | 1 | 1,762 | 99.94% | ||||||||||
| Banco Agrícola | 2,501 | 0 | 2,501 | 100.00% | ||||||||||
| Bancolombia | 19,106 | 64 | 19,170 | 99.67% | ||||||||||
| Grand Total | 23,496 | 65 | 23,561 | 99.72% | ||||||||||
| Managers | Approved | In Progress | Grand Total | Compliance % | ||||||||||
| Bancolombia Panamá | 28 | 0 | 28 | 100.00% | ||||||||||
| Banistmo | 389 | 0 | 389 | 100.00% | ||||||||||
| Banco Agrícola | 446 | 1 | 447 | 99.78% | ||||||||||
| Bancolombia | 2,651 | 5 | 2,656 | 99.81% | ||||||||||
| Grand Total | 3,514 | 6 | 3,520 | 99.83% | ||||||||||
| Compliance with SAC and Conduct Risk Training 2024 | ||||||||||||||
| Employees | Approved | In Progress | Grand Total | Compliance % | ||||||||||
| Bancolombia | 19,088 | 82 | 19,170 | 99.57% | ||||||||||
| Grand Total | 19,088 | 82 | 19,170 | 99.57% | ||||||||||
| Managers | Approved | In Progress | Grand Total | Compliance % | ||||||||||
| Bancolombia | 2,649 | 7 | 2,656 | 99.74% | ||||||||||
| Grand Total | 2,649 | 7 | 2,656 | 99.74% | ||||||||||
| Compliance with SARLAFT Training 2024 | ||||||||||||||
| Employees | Approved | In Progress | Grand Total | Compliance % | ||||||||||
| Bancolombia Panamá | 128 | 0 | 128 | 100.00% | ||||||||||
| Banistmo | 1,761 | 1 | 1,762 | 99.94% | ||||||||||
| Banco Agromercantil de Guatemala (BAM) | 2,864 | 7 | 2,871 | 99.76% | ||||||||||
| Banco Agrícola | 2,499 | 2 | 2,501 | 99.92% | ||||||||||
| Bancolombia | 19,093 | 77 | 19,170 | 99.60% | ||||||||||
| Puerto Rico | 5 | 0 | 5 | 100.00% | ||||||||||
| Grand Total | 26,350 | 87 | 26,437 | 99.67% | ||||||||||
| Managers | Approved | In Progress | Grand Total | Compliance % | ||||||||||
| Bancolombia Panamá | 28 | 0 | 28 | 100.00% | ||||||||||
| Banistmo | 389 | 0 | 389 | 100.00% | ||||||||||
| Banco Agromercantil de Guatemala (BAM) | 628 | 1 | 629 | 99.84% | ||||||||||
| Banco Agrícola | 446 | 1 | 447 | 99.78% | ||||||||||
| Bancolombia | 2,650 | 6 | 2,656 | 99.77% | ||||||||||
| Puerto Rico | 1 | 0 | 1 | 100.00% | ||||||||||
| Grand Total | 4,142 | 8 | 4,150 | 99.81% | ||||||||||
| Compliance with SARO Training 2024 | ||||||||||||||
| Employees | Approved | In Progress | Grand Total | Compliance % | ||||||||||
| Bancolombia Panamá | 128 | 0 | 128 | 100.00% | ||||||||||
| Banistmo | 1,761 | 1 | 1,762 | 99.94% | ||||||||||
| Banco Agromercantil de Guatemala (BAM) | 2,864 | 7 | 2,871 | 99.76% | ||||||||||
| Banco Agrícola | 2,499 | 2 | 2,501 | 99.92% | ||||||||||
| Bancolombia | 19,092 | 78 | 19,170 | 99.59% | ||||||||||
| Puerto Rico | 5 | 0 | 5 | 100.00% | ||||||||||
| Grand Total | 26,349 | 88 | 26,437 | 99.67% | ||||||||||
| Managers | Approved | In Progress | Grand Total | Compliance % | ||||||||||
| Bancolombia Panamá | 28 | 0 | 28 | 100.00% | ||||||||||
| Banistmo | 389 | 0 | 389 | 100.00% | ||||||||||
| Banco Agromercantil de Guatemala (BAM) | 628 | 1 | 629 | 99.84% | ||||||||||
| Banco Agrícola | 446 | 1 | 447 | 99.78% | ||||||||||
| Bancolombia | 2,650 | 6 | 2,656 | 99.77% | ||||||||||
| Puerto Rico | 1 | 0 | 1 | 100.00% | ||||||||||
| Grand Total | 4,142 | 8 | 4,150 | 99.81% | ||||||||||
| Compliance with Information Security Training 2024 | ||||||||||||||
| Employees | Approved | In Progress | Grand Total | Compliance % | ||||||||||
| Bancolombia Panamá | 128 | 0 | 128 | 100.00% | ||||||||||
| Banistmo | 1,761 | 1 | 1,762 | 99.94% | ||||||||||
| Banco Agromercantil de Guatemala (BAM) | 2,864 | 7 | 2,871 | 99.76% | ||||||||||
| Banco Agrícola | 2,501 | 0 | 2,501 | 100.00% | ||||||||||
| Bancolombia | 19,114 | 56 | 19,170 | 99.71% | ||||||||||
| Puerto Rico | 5 | 0 | 5 | 100.00% | ||||||||||
| Grand Total | 26,373 | 64 | 26,437 | 99.76% | ||||||||||
| Managers | Approved | In Progress | Grand Total | Compliance % | ||||||||||
| Bancolombia Panamá | 28 | 0 | 28 | 100.00% | ||||||||||
| Banistmo | 389 | 0 | 389 | 100.00% | ||||||||||
| Banco Agromercantil de Guatemala (BAM) | 628 | 1 | 629 | 99.84% | ||||||||||
| Banco Agrícola | 446 | 1 | 447 | 99.78% | ||||||||||
| Bancolombia | 2652 | 4 | 2,656 | 99.85% | ||||||||||
| Puerto Rico | 1 | 0 | 1 | 100.00% | ||||||||||
| Grand Total | 4,144 | 6 | 4,150 | 99.86% | ||||||||||
| Compliance with Sustainability Training 2024 | ||||||||||||||
| Employees | Approved | In Progress | Grand Total | Compliance % | ||||||||||
| Bancolombia Panamá | 128 | 0 | 128 | 100.00% | ||||||||||
| Banistmo | 1,757 | 5 | 1,762 | 99.72% | ||||||||||
| Banco Agromercantil de Guatemala (BAM) | 2,866 | 5 | 2,871 | 99.83% | ||||||||||
| Banco Agrícola | 2,501 | 0 | 2,501 | 100.00% | ||||||||||
| Bancolombia | 19,136 | 34 | 19,170 | 99.82% | ||||||||||
| Puerto Rico | 5 | 0 | 5 | 100.00% | ||||||||||
| Grand Total | 26,393 | 44 | 26,437 | 99.83% | ||||||||||
| Managers | Approved | In Progress | Grand Total | Compliance % | ||||||||||
| Bancolombia Panamá | 28 | 0 | 28 | 100.00% | ||||||||||
| Banistmo | 389 | 0 | 389 | 100.00% | ||||||||||
| Banco Agromercantil de Guatemala (BAM) | 628 | 1 | 629 | 99.84% | ||||||||||
| Banco Agrícola | 447 | 0 | 447 | 100.00% | ||||||||||
| Bancolombia | 2653 | 3 | 2,656 | 99.89% | ||||||||||
| Puerto Rico | 1 | 0 | 1 | 100.00% | ||||||||||
| Grand Total | 4,146 | 4 | 4,150 | 99.90% | ||||||||||
| Compliance with SOX Training 2024 | ||||||||||||||
| Employees | Approved | In Progress | Grand Total | Compliance % | ||||||||||
| Bancolombia Panamá | 126 | 0 | 126 | 100.00% | ||||||||||
| Banistmo | 1,761 | 1 | 1,762 | 99.94% | ||||||||||
| Banco Agromercantil de Guatemala (BAM) | 2,864 | 7 | 2,871 | 99.76% | ||||||||||
| Banco Agrícola | 2,500 | 1 | 2,501 | 99.96% | ||||||||||
| Bancolombia | 19,099 | 71 | 19,170 | 99.63% | ||||||||||
| Puerto Rico | 5 | 0 | 5 | 100.00% | ||||||||||
| Grand Total | 26,355 | 80 | 26,435 | 99.70% | ||||||||||
| Managers | Approved | In Progress | Grand Total | Compliance % | ||||||||||
| Bancolombia Panamá | 28 | 0 | 28 | 100.00% | ||||||||||
| Banistmo | 389 | 0 | 389 | 100.00% | ||||||||||
| Banco Agromercantil de Guatemala (BAM) | 628 | 1 | 629 | 99.84% | ||||||||||
| Banco Agrícola | 446 | 1 | 447 | 99.78% | ||||||||||
| Bancolombia | 2,650 | 6 | 2,656 | 99.77% | ||||||||||
| Puerto Rico | 1 | 0 | 1 | 100.00% | ||||||||||
| Grand Total | 4,142 | 8 | 4,150 | 99.81% | ||||||||||
| Compliance with Employee Knowledge Training 2024 | ||||||||||||||
| Managers | Approved | In Progress | Grand Total | Compliance % | ||||||||||
| Bancolombia Panamá | 28 | 0 | 28 | 100.00% | ||||||||||
| Banistmo | 389 | 0 | 389 | 100.00% | ||||||||||
| Banco Agromercantil de Guatemala (BAM) | 628 | 1 | 629 | 99.84% | ||||||||||
| Banco Agrícola | 446 | 1 | 447 | 99.78% | ||||||||||
| Bancolombia | 2653 | 3 | 2,656 | 99.89% | ||||||||||
| Puerto Rico | 1 | 0 | 1 | 100.00% | ||||||||||
| Grand Total | 4,145 | 5 | 4,150 | 99.88% | ||||||||||
Index |
2023 | 2024 | ||||||||||||
| Number | % | Number | % | |||||||||||
| Employees with performance appraisal** | 31,845 | 100% | 31,275 | 100% | ||||||||||
| Women with performance appraisal** | 19,082 | 100% | 18,627 | 100% | ||||||||||
| Men with performance appraisal** | 12,763 | 100% | 12,648 | 100% | ||||||||||
| Employees with performance appraisal by Labor Category | Women | Men | Total | % by Labor Category | ||||||||||
| Senior Management | 213 | 321 | 534 | 1.71% | ||||||||||
| Mid-Level Strategic | 1,777 | 1,640 | 3,417 | 10.93% | ||||||||||
| Professional | 6,529 | 5,888 | 12,417 | 39.70% | ||||||||||
| Operational | 10,108 | 4,799 | 14,907 | 47.66% | ||||||||||
| Percentage by Gender | 60% | 40% | 31,275 | 100.00% | ||||||||||
| Bancolombia and Domestic Subsidiaries (Figures in COP) | |||||
| Investment in Quality of Life programs | COP 13,654,322,599 | ||||
| Number of Quality of Life activities developed | 33,264 | ||||
| Number of wellness activities developed | 1,436 | ||||
| Number of activities developed for the employee's health | 6,875 | ||||
| Number of activities developed in human security | 24,953 | ||||
| Number of employees and their families participating in Quality of Life programs | 169,835 | ||||
| Banistmo (Figures in USD) | |||||
| Investment in Quality of Life programs | USD 473,517 | ||||
| Number of Quality of Life activities developed | 407 | ||||
| Number of wellness activities developed | 238 | ||||
| Number of activities developed for the employee's health | 112 | ||||
| Number of activities developed in human security | 57 | ||||
| Number of employees and their families participating in Quality of Life programs | 60,711 | ||||
| Offshore (Bancolombia Panamá and Puerto Rico – Figures in USD) | |||||
| Investment in Quality of Life programs | USD 150,472 | ||||
| Number of Quality of Life activities developed | 73 | ||||
| Number of wellness activities developed | 39 | ||||
| Number of activities developed for the employee's health | 24 | ||||
| Number of activities developed in human security | 10 | ||||
| Number of employees and their families participating in Quality of Life programs | 3,763 | ||||
| Banco Agrícola (El Salvador – Figures in USD) | |||||
| Investment in Quality of Life programs | USD 609,104 | ||||
| Number of Quality of Life activities developed | 85 | ||||
| Number of wellness activities developed | 41 | ||||
| Number of activities developed for the employee's health | 29 | ||||
| Number of activities developed in human security | 15 | ||||
| Number of employees and their families participating in Quality of Life programs | 10,870 | ||||
| BAM (Guatemala – Figures in USD) | |||||
| Investment in Quality of Life programs | USD 616,208 | ||||
| Number of Quality of Life activities developed | 59 | ||||
| Number of wellness activities developed | 51 | ||||
| Number of activities developed for the employee's health | 1 | ||||
| Number of activities developed in human security | 7 | ||||
| Number of employees and their families participating in Quality of Life programs | 20,117 | ||||
| Bancolombia and Domestic Subsidiaries | ||||||||||||||||||||
| 2024 | ||||||||||||||||||||
| Loans disbursed | Values (COP) | # Credits | ||||||||||||||||||
| Disbursed loan amounts | 744,660,483,598 | 7,950 | ||||||||||||||||||
| Education loans | 3,538,485,042 | 215 | ||||||||||||||||||
| Housing loans | 584,441,163,878 | 2,493 | ||||||||||||||||||
| Other | 156,680,834,678 | 5,242 | ||||||||||||||||||
| Banistmo | ||||||||||||||||||||
| 2024 | ||||||||||||||||||||
| Loans disbursed | Values (USD) | # Credits | ||||||||||||||||||
| Disbursed loan amounts | 20,051,726 | 631 | ||||||||||||||||||
| Education loans | 0 | 0 | ||||||||||||||||||
| Housing loans | 11,529,382 | 100 | ||||||||||||||||||
| Other | 8,522,344 | 531 | ||||||||||||||||||
| Banco Agrícola | ||||||||||||||||||||
| 2024 | ||||||||||||||||||||
| Loans disbursed | Values (USD) | # Credits | ||||||||||||||||||
| Disbursed loan amounts | 13,867,627 | 1,596 | ||||||||||||||||||
| Education loans | 8,300 | 1 | ||||||||||||||||||
| Housing loans | 1,622,396 | 52 | ||||||||||||||||||
| Other | 12,236,931 | 1,543 | ||||||||||||||||||
| Banco Agromercantil de Guatemala (BAM) | ||||||||||||||||||||
| 2024 | ||||||||||||||||||||
| Loans disbursed | Values (USD) | # Credits | ||||||||||||||||||
| Disbursed loan amounts | 14,436,141 | 976 | ||||||||||||||||||
| Education loans | 584,888 | 45 | ||||||||||||||||||
| Housing loans | 4,757,322 | 383 | ||||||||||||||||||
| Other | 9,093,930 | 548 | ||||||||||||||||||
BAM (Figures in USD) | ||||||||
2024 |
||||||||
Loans disbursed |
Values (USD) |
# Credits |
||||||
Disbursed loan amounts |
774,991 |
18 |
||||||
Education loans |
- |
- |
||||||
Housing loans |
592,630 |
5 |
||||||
Other |
182,361 |
13 |
||||||
| Bancolombia Colombia | ||||||||||||||
| 2024 | ||||||||||||||
|
Organizational Investment
(COP)
|
Employee Contributions (COP) | Employees Benefited | Family Members Benefited | |||||||||||
| Investment / Organizational Contribution | 79,509,580,010 | 84,529,738,716 | 23,644 | 12,641 | ||||||||||
| Health | 64,363,216,928 | 63,404,346,490 | 16,228 | 11,982 | ||||||||||
| Group life (employer) | 7,041,184,803 | 0 | 23,644 | 0 | ||||||||||
| Personal accidents (employer) | 1,248,552,996 | 0 | 23,644 | 0 | ||||||||||
| Other | 6,856,625,283 | 21,125,392,226 | 7,970 | 659 | ||||||||||
| Banistmo | ||||||||||||||
| 2024 | ||||||||||||||
|
Organizational Investment
(USD)
|
Employee Contributions
(USD)
|
Employees Benefited | Family Members Benefited | |||||||||||
| Investment / Organizational Contribution | 3,575,550 | 501,950 | 2,284 | 1,487 | ||||||||||
| Health | 3,247,917 | 501,950 | 2,284 | 1,487 | ||||||||||
| Group life (employer) | 327,633 | 0 | 2,284 | 0 | ||||||||||
| Other | 0 | 0 | 0 | 0 | ||||||||||
| Banco Agrícola (Figures in USD) | ||||||||||||||
| 2024 | ||||||||||||||
|
Organizational Investment
(USD)
|
Employee Contributions
(USD)
|
Employees Benefited | Family Members Benefited | |||||||||||
| Investment / Organizational Contribution | 5,709,564 | 831,031 | 3,079 | 3,437 | ||||||||||
| Health | 5,418,132 | 831,031 | 3,079 | 3,437 | ||||||||||
| Group life (employer) | 291,432 | 0 | 3,079 | 0 | ||||||||||
| Other | 0 | 0 | 0 | 0 | ||||||||||
| Offshore (Bancolombia Panamá and Puerto Rico) | ||||||||||||||
| 2024 | ||||||||||||||
|
Organizational Investment
(USD)
|
Employee Contributions
(USD)
|
Employees Benefited | Family Members Benefited | |||||||||||
| Investment / Organizational Contribution | 335,513 | 19,662 | 181 | 149 | ||||||||||
| Health | 298,541 | 19,662 | 178 | 149 | ||||||||||
| Group life (employer) | 36,972 | 0 | 181 | 0 | ||||||||||
| Other | 0 | 0 | 0 | 0 | ||||||||||
| Banco Agromercantil de Guatemala (BAM) | ||||||||||||||
| 2024 | ||||||||||||||
|
Organizational Investment
(USD)
|
Employee Contributions
(USD)
|
Employees Benefited | Family Members Benefited | |||||||||||
| Investment / Organizational Contribution | 1,793,816 | 933,690 | 3,691 | 2,117 | ||||||||||
| Health | 1,550,727 | 933,690 | 2,542 | 2,117 | ||||||||||
| Group life (employer) | 243,089 | 0 | 3,691 | 0 | ||||||||||
| Other | 0 | 0 | 0 | 0 | ||||||||||
| Bancolombia (COP) | ||||||||
| 2024 | ||||||||
| Investment / Organizational Contribution | 15,598,734,181.74 | |||||||
| Employee Contribution | 31,197,468,363.57 | |||||||
| Total Savings | 46,796,202,545.34 | |||||||
| # of employees benefited | 14,939 | |||||||
| Banistmo (USD) | ||||||||
| 2024 | ||||||||
| Investment / Organizational Contribution | 979,423.47 | |||||||
| Employee Contribution | 1,086,310.96 | |||||||
| Total Savings | 2,065,734.43 | |||||||
| # of employees benefited | 1530 | |||||||
| Bancolombia Puerto Rico (USD) | ||||||||
| 2024 | ||||||||
| Investment / Organizational Contribution | 11,450.00 | |||||||
| Employee Contribution | 22,900.00 | |||||||
| Total Savings | 34,350.00 | |||||||
| # of employees benefited | 5 | |||||||
| Bancolombia Group | 2023 | 2024 | ||||||
| Absenteeism rate for maternity/paternity leave | 0.89 | 0.91 | ||||||
| Women | 1.42 | 1.47 | ||||||
| Men | 0.11 | 0.09 | ||||||
| Suppliers | 0.18 | 0.20 | ||||||
| Objective | Compliance | ||||
| Maintain a minimum 90% compliance level of the Occupational Health and Safety Management System (SG-SST) with Resolution 312 by December 2024. | 100% | ||||
| Increase the evaluation score of the Strategic Road Safety Plan (PESV) from 70% to 75%, according to Resolution 40595, by December 2024.* | 100% | ||||
| Achieve 90% coverage of the target population in response to the EFRPS by the end of Q1 (May 7, 2024), deliver results, and define intervention plans for the remainder of 2024. | 100% | ||||
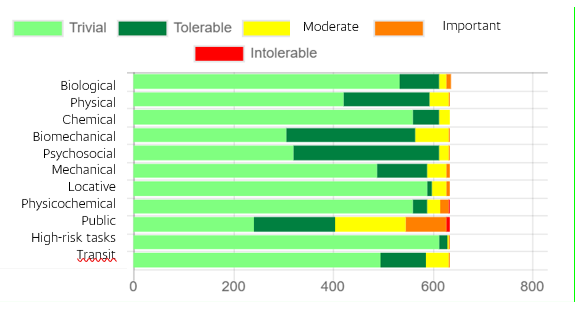
Bancolombia Group Indicator |
2023 |
2024 |
||||||
Days of absenteeism due to illness |
242,917 |
209,279 |
||||||
Women |
130,546 |
116,618 |
||||||
Men |
44,050 |
42,446 |
||||||
Suppliers |
68,321 |
50,214 |
||||||
Absenteeism rate due to illness |
2.09 |
1.97 |
||||||
Women |
2.61 |
2.43 |
||||||
Men |
1.31 |
1.29 |
||||||
Suppliers |
1.09 |
1.10 |
||||||
| Bancolombia Group Indicator | 2023 | 2024 | ||||||
| Number of workplace accident fatalities | 0 | 1 | ||||||
| Women | 0 | 0 | ||||||
| Men | 0 | 0 | ||||||
| Suppliers | 0 | 1 | ||||||
| Workplace accident fatality rate | 0.00 | 0.00 | ||||||
| Women | 0.00 | 0.00 | ||||||
| Men | 0.00 | 0.00 | ||||||
| Suppliers | 0.00 | 0.01 | ||||||
| Number of severe workplace injuries | 18 | 7 | ||||||
| Women | 11 | 2 | ||||||
| Men | 4 | 3 | ||||||
| Suppliers | 3 |
1
2
|
||||||
| Severe work-related injury rate | 0.03 | 0.02 | ||||||
| Women | 0.06 | 0.01 | ||||||
| Men | 0.03 | 0.03 | ||||||
| Suppliers | 0.01 | 0.01 | ||||||
| Total number of workplace injuries | 530 | 388 | ||||||
| Women | 359 | 254 | ||||||
| Men | 119 | 72 | ||||||
| Suppliers | 52 | 62 | ||||||
| Workplace injury rate | 1.00 | 0.85 | ||||||
| Women | 2.03 | 1.49 | ||||||
| Men | 0.97 | 0.60 | ||||||
| Suppliers | 0.22 | 0.37 | ||||||
| Main Types of Workplace Injuries | 2023% | 2024% | ||||||
| Blunt force trauma, contusions, or crushing injuries | 0.78 | 0.33 | ||||||
| Acute poisoning, intoxication, or allergic reaction | 0.22 | 0.15 | ||||||
| Total Hours Worked | No. 2023 | No. 2024 | ||||||
| Bancolombia Group | 106,030,825 | 91,543,633 | ||||||
| Bancolombia Group | |||||
| c. Work-related hazards posing a risk of injury due to workplace accidents with significant consequences, indicating: | |||||
| i. How these hazards are determined. | Hazards are identified through risk and hazard matrix analysis for each subsidiary. | ||||
| ii. Which of these hazards have caused or contributed to high-consequence workplace injuries during the reporting period. |
The main hazards for each subsidiary are listed below:
BAM:
•Falls from different levels
•Mechanical risks from impacts
Banco Agrícola
•No reported incidents
Bancolombia:
•Public safety risks
•Falls at the same level and from different levels
•Mechanical risks from impacts
Banistmo
•Mechanical risks from impacts
Bancolombia Panamá
•No reported incidents
|
||||
| iii. Measures taken or planned to eliminate such hazards and minimize risks through the control hierarchy. | Administrative controls: including demarcation, reinforcement of best practices, development of standards, and Lessons Learned. | ||||
| d. Whether the rates have been calculated per 200,000 or per 1,000,000 hours worked. | 200,000 | ||||
| e. Whether any workers have been excluded from this Content, including the type of worker and the reason for exclusion. | All subsidiaries are included except Bancolombia Puerto Rico, which does not measure risks and hazards. | ||||
| f. Any contextual information necessary to understand how the data has been collected, as well as any standards, methodologies or assumptions used. | Through the collection of employee reports to the bank and the respective reports of each subsidiary where information on alleged workplace accidents is recorded and the respective management is carried out, with this information, different prevention and control actions of the risks are generated, as well as follow-up on the health of the affected individuals. | ||||
| Bancolombia Group Indicator | 2023 | 2024 | ||||||
| Number of fatalities due to occupational disease | 0 | 0 | ||||||
| Women | 0 | 0 | ||||||
| Men | 0 | 0 | ||||||
| Suppliers | 0 | 0 | ||||||
| Fatality rate due to occupational disease | 0.00 | 0.00 | ||||||
| Women | 0.00 | 0.00 | ||||||
| Men | 0.00 | 0.00 | ||||||
| Suppliers | 0.00 | 0.00 | ||||||
| Number of occupational disease injuries | 24 | 15 | ||||||
| Women | 11 | 13 | ||||||
| Men | 13 | 1 | ||||||
| Suppliers | 0 | 1 | ||||||
| Occupational disease injury rate | 0.05 | 0.03 | ||||||
| Women | 0.06 | 0.08 | ||||||
| Men | 0.11 | 0.01 | ||||||
| Suppliers | 0.00 | 0.00 | ||||||
| Bancolombia Group | |||||
| c. Work-related hazards posing a risk of illness and disease, including: | |||||
| i. How these hazards have been determined; | Hazards are identified through risk and hazard matrix analysis for each subsidiary. | ||||
| ii. Which of these hazards have caused or contributed to occupational illnesses and diseases during the reporting period; |
•Dynamic load
•Prolonged postures
•Sustained postures
|
||||
| iii. Measures taken or planned to eliminate these hazards and minimize risks through the hierarchy of control. | Administrative controls: including demarcation, reinforcement of best practices, development of standards, and Lessons Learned. The respective follow-up is conducted for each reported illness. | ||||
| d. Whether any workers have been excluded from this report, including worker types and the reason for exclusion. | This criterion applies to Bancolombia and Banco Agrícola. | ||||
| e. Any necessary contextual information to understand how the data has been collected, such as standards, methodologies, or assumptions used. | Through the collection of employee reports to the bank and the respective reports of each subsidiary where information on occupational diseases is recorded, and the respective management is carried out, with this information, different prevention and control actions of the risks are generated, as well as follow-up on the health of the affected individuals. | ||||
| Portfolio Quality | Coverage | ||||||||||||||||||||||||||||||||||||||||||||||||||||||||||||||||
ROAE (1) |
ROAA (2) |
Solvency Level | |||||||||||||||||||||||||||||||||||||||||||||||||||||||||||||||
|
Nov-
2024
|
Dec-
2023
|
Nov-
2024
|
Dec-
2023
|
Nov-
2024
|
Dec-
2023
|
Nov-
2024
|
Dec-
2023
|
Nov-
2024
|
Dec-
2023
|
||||||||||||||||||||||||||||||||||||||||||||||||||||||||
| Bancolombia | 13.0 | % | 16.1 | % | 2.0 | % | 2.3 | % | 4.7 | % | 4.6 | % | 152.1 | % | 150.8 | % | 19.7 | % | 18.1 | % | |||||||||||||||||||||||||||||||||||||||||||||
| Banco de Bogotá | 7.4 | % | 6.8 | % | 0.9 | % | 0.9 | % | 4.9 | % | 4.4 | % | 100.4 | % | 124.7 | % | 18.0 | % | 18.6 | % | |||||||||||||||||||||||||||||||||||||||||||||
| Davivienda | 6.0 | % | 0.8 | % | 0.6 | % | 0.1 | % | 6.3 | % | 6.9 | % | 100.2 | % | 97.1 | % | 18.2 | % | 16.7 | % | |||||||||||||||||||||||||||||||||||||||||||||
| BBVA | -5.4 | % | 3.2 | % | -0.3 | % | 0.2 | % | 4.7 | % | 3.8 | % | 125.1 | % | 131.1 | % | 12.8 | % | 12.4 | % | |||||||||||||||||||||||||||||||||||||||||||||
| Banco de Occidente | 9.4 | % | 8.3 | % | 0.7 | % | 0.6 | % | 3.3 | % | 4.0 | % | 141.9 | % | 127.8 | % | 12.5 | % | 11.7 | % | |||||||||||||||||||||||||||||||||||||||||||||
| Itaú Corpbanca | 2.3 | % | 0.9 | % | 0.2 | % | 0.1 | % | 4.8 | % | 4.3 | % | 111.9 | % | 134.4 | % | 16.3 | % | 14.7 | % | |||||||||||||||||||||||||||||||||||||||||||||
| Scotiabank Colpatria | -6.3 | % | -10.1 | % | -0.5 | % | -0.7 | % | 5.2 | % | 5.2 | % | 114.6 | % | 110.4 | % | 11.8 | % | 11.8 | % | |||||||||||||||||||||||||||||||||||||||||||||
| Net Portfolio - Market Share (%) | Nov-2024 | Dec-2023 | |||||||||||||||
| Bancolombia | 26.9 | % | 26.8 | % | |||||||||||||
| Davivienda | 15.6 | % | 15.6 | % | |||||||||||||
| Banco de Bogotá | 12.9 | % | 12.4 | % | |||||||||||||
| BBVA | 11.1 | % | 11.4 | % | |||||||||||||
| Banco de Occidente | 7.3 | % | 7.0 | % | |||||||||||||
| Scotiabank Colpatria | 4.0 | % | 4.7 | % | |||||||||||||
| Itaú Corpbanca | 2.7 | % | 2.9 | % | |||||||||||||
| Other | 19.5 | % | 19.2 | % | |||||||||||||
| Current Account - Market Share (%) | Nov-2024 | Dec-2023 | |||||||||||||||
| Bancolombia | 27.1 | % | 26.9 | % | |||||||||||||
| Banco de Bogotá | 17.9 | % | 18.3 | % | |||||||||||||
| Davivienda | 11.0 | % | 11.1 | % | |||||||||||||
| BBVA | 10.5 | % | 10.5 | % | |||||||||||||
| Banco de Occidente | 8.1 | % | 8.7 | % | |||||||||||||
| Itaú Corpbanca | 2.4 | % | 2.7 | % | |||||||||||||
| Scotiabank Colpatria | 2.2 | % | 2.6 | % | |||||||||||||
| Other | 20.8 | % | 19.2 | % | |||||||||||||
| Time Deposits - Share (%) | Nov-2024 | Dec-2023 | |||||||||||||||
| Bancolombia | 22.4 | % | 22.5 | % | |||||||||||||
| Davivienda | 18.0 | % | 16.9 | % | |||||||||||||
| BBVA | 13.0 | % | 13.4 | % | |||||||||||||
| Banco de Bogotá | 14.1 | % | 12.5 | % | |||||||||||||
| Banco de Occidente | 4.5 | % | 5.4 | % | |||||||||||||
| Scotiabank Colpatria | 4.7 | % | 5.5 | % | |||||||||||||
| Itaú Corpbanca | 3.3 | % | 3.4 | % | |||||||||||||
| Other | 20.0 | % | 20.4 | % | |||||||||||||
| Savings Account - Share (%) | Nov-2024 | Dec-2023 | |||||||||||||||
| Bancolombia | 29.7 | % | 29.7 | % | |||||||||||||
| Davivienda | 12.7 | % | 13.6 | % | |||||||||||||
| BBVA | 10.6 | % | 11.2 | % | |||||||||||||
| Banco de Bogotá | 10.5 | % | 10.0 | % | |||||||||||||
| Banco de Occidente | 9.5 | % | 8.5 | % | |||||||||||||
| Scotiabank Colpatria | 3.6 | % | 4.0 | % | |||||||||||||
| Itaú Corpbanca | 2.0 | % | 2.1 | % | |||||||||||||
| Other | 21.4 | % | 20.9 | % | |||||||||||||
| Assets | Equity | Loans | Deposits | Profits | |||||||||||||
| Banco Agrícola | 24.0% | 24.1% | 24.2% | 25.4% | 39.0% | ||||||||||||
| Cuscatlán | 16.8% | 17.4% | 17.9% | 17.4% | 17.6% | ||||||||||||
| Davivienda | 13.3% | 13.7% | 14.2% | 13.6% | 10.2% | ||||||||||||
| BAC | 14.6% | 13.3% | 15.6% | 15.0% | 10.5% | ||||||||||||
| Hipotecario | 9.0% | 7.8% | 6.2% | 8.2% | 6.7% | ||||||||||||
| Promérica | 5.8% | 4.4% | 5.7% | 5.8% | 2.2% | ||||||||||||
| Other | 16.5% | 19.3% | 16.2% | 14.6% | 13.8% | ||||||||||||
| 2024 | 2023 | |||||||
| Banco Agrícola | 24.2% | 24.8% | ||||||
| Cuscatlán | 17.9% | 17.9% | ||||||
| Davivienda | 14.2% | 14.4% | ||||||
| BAC | 15.6% | 15.3% | ||||||
| Hipotecario | 6.2% | 6.5% | ||||||
| Promérica | 5.7% | 6.1% | ||||||
Other (1) |
16.2% | 15.0% | ||||||
| 2024 | 2023 | |||||||
| Banco Agrícola | 31.3% | 30.4% | ||||||
| Cuscatlán | 18.7% | 18.4% | ||||||
| Davivienda | 12.6% | 12.9% | ||||||
| BAC | 15.6% | 15.3% | ||||||
| Hipotecario | 6.0% | 6.2% | ||||||
| Promérica | 5.0% | 5.5% | ||||||
Other (1) |
10.8% | 11.3% | ||||||
| Time Deposits - Market Share (%) | 2024 | 2023 | ||||||
| Banco Agrícola | 15.1% | 14.2% | ||||||
| Cuscatlán | 15.0% | 14.9% | ||||||
| Davivienda | 15.2% | 14.9% | ||||||
| BAC | 14.2% | 13.4% | ||||||
| Hipotecario | 12.0% | 16.2% | ||||||
| Promérica | 7.2% | 7.1% | ||||||
Other (1) |
21.3% | 19.3% | ||||||
| MARKET SHARE | |||||||||||||||||
| Assets | Capital | Loans | Deposits | Profit | |||||||||||||
| Banistmo | 7.6% | 7.0% | 8.6% | 9.9% | 1.2% | ||||||||||||
| Banco General | 13.4% | 12.9% | 13.2% | 19.4% | 25.6% | ||||||||||||
| Global Bank | 6.4% | 3.6% | 7.1% | 7.5% | 0.9% | ||||||||||||
| Banesco | 4.0% | 2.9% | 4.4% | 5.9% | 2.4% | ||||||||||||
| BAC | 8.9% | 24.4% | 6.3% | 8.8% | 28.1% | ||||||||||||
| Other | 59.7% | 49.2% | 60.4% | 48.5% | 41.8% | ||||||||||||
|
Total Loans
Market Share
| ||||||||
| Total Loans - Market Share (%) | 2024 | 2023 | ||||||
| Banistmo | 8.6% | 9.3% | ||||||
| Banco General | 13.2% | 13.4% | ||||||
| Global Bank | 7.1% | 7.5% | ||||||
| Banesco | 4.4% | 4.4% | ||||||
| BAC | 6.3% | 6.0% | ||||||
| Other | 60.4% | 59.4% | ||||||
|
Savings Deposits
Market Share
| |||||||||||
| Savings Deposits – Market Share (%) | 2024 | 2023 | |||||||||
| Banistmo | 10.4% | 11.2% | |||||||||
| Banco General | 28.7% | 30.9% | |||||||||
| Global Bank | 7.4% | 7.2% | |||||||||
| Banesco | 7.3% | 7.0% | |||||||||
| BAC | 5.0% | 4.3% | |||||||||
| Other | 41.2% | 39.4% | |||||||||
|
Demand Deposits
Market Share
| |||||||||||
| Demand Deposits - Market Share (%) | 2024 | 2023 | |||||||||
| Banistmo | 9.2% | 9.9% | |||||||||
| Banco General | 23.7% | 24.0% | |||||||||
| Global Bank | 4.1% | 4.3% | |||||||||
| Banesco | 9.9% | 8.7% | |||||||||
| BAC | 10.8% | 10.9% | |||||||||
| Other | 42.3% | 42.2% | |||||||||
|
Time Deposits
Market Share
| ||||||||||||||
| Time Deposits – Market Share (%) | 2024 | 2023 | ||||||||||||
| Banistmo | 9.9% | 10.0% | ||||||||||||
| Banco General | 14.9% | 14.2% | ||||||||||||
| Global Bank | 8.4% | 8.3% | ||||||||||||
| Banesco | 4.3% | 4.3% | ||||||||||||
| BAC | 9.7% | 9.9% | ||||||||||||
| Other | 52.8% | 53.3% | ||||||||||||
| MARKET SHARE | |||||||||||||||||
| Assets | Shareholders' Equity | Loan Portfolio | Deposits | Profits | |||||||||||||
| Banco Industrial | 28.1% | 23.1% | 29.2% | 26.8% | 28.9% | ||||||||||||
| Banrural | 21.3% | 24.1% | 16.3% | 22.7% | 32.3% | ||||||||||||
| Banco G&T Continental | 12.0% | 11.0% | 11.2% | 12.1% | 11.2% | ||||||||||||
| BAC-Reformador | 8.3% | 7.7% | 9.9% | 8.5% | 4.1% | ||||||||||||
| Banco Agromercantil | 8.2% | 6.6% | 10.0% | 7.9% | 1.2% | ||||||||||||
| Bantrab | 7.5% | 11.6% | 8.2% | 7.7% | 7.6% | ||||||||||||
| Banco Promerica | 5.7% | 5.5% | 7.0% | 5.5% | 6.6% | ||||||||||||
| Other* | 8.9% | 10.4% | 8.2% | 8.8% | 8.1% | ||||||||||||
| Loan Portfolio - Market Share (%) | 2024 | 2023 | ||||||
| Banco Industrial | 29.2% | 29.1% | ||||||
| Banrural | 16.3% | 15.5% | ||||||
| Banco G&T Continental | 11.2% | 11.0% | ||||||
| Banco Agromercantil | 10.0% | 10.5% | ||||||
| BAC-Reformador | 9.9% | 10.5% | ||||||
| Bantrab | 8.2% | 8.5% | ||||||
| Banco Promerica | 7.0% | 6.8% | ||||||
| Other* | 8.2% | 8.1% | ||||||
| Monetary Deposits - Market Share (%) | 2024 | 2023 | ||||||
| Banco Industrial | 33.9% | 33.7% | ||||||
| Banrural | 24.0% | 23.2% | ||||||
| Banco G&T Continental | 12.1% | 12.7% | ||||||
| BAC-Reformador | 11.0% | 11.6% | ||||||
| Banco Agromercantil | 5.9% | 6.2% | ||||||
| Banco Promerica | 3.5% | 3.1% | ||||||
| Bantrab | 2.1% | 2.1% | ||||||
| Other* | 7.5% | 7.5% | ||||||
|
Time Deposits – Market
Share (%)
|
2024 | 2023 | ||||||
| Banco Industrial | 23.1% | 23.6% | ||||||
| Banrural | 16.5% | 16.6% | ||||||
| Bantrab | 13.7% | 14.8% | ||||||
| Banco Promerica | 9.4% | 8.4% | ||||||
| Banco G&T Continental | 8.8% | 8.6% | ||||||
| Banco Agromercantil | 8.7% | 9.5% | ||||||
| BAC-Reformador | 8.2% | 8.4% | ||||||
| Other* | 11.6% | 10.1% | ||||||
| Savings Deposits - Market Share (%) | 2024 | 2023 | ||||||
| Banrural | 30.2% | 28.9% | ||||||
| Banco Industrial | 23.2% | 25.3% | ||||||
| Banco G&T Continental | 16.8% | 17.9% | ||||||
| Banco Agromercantil | 9.3% | 8.0% | ||||||
| Bantrab | 6.1% | 6.3% | ||||||
| BAC-Reformador | 5.9% | 5.7% | ||||||
| Banco Promerica | 2.4% | 2.0% | ||||||
| Other* | 6.1% | 5.9% | ||||||
| Colombia Banking | Panama Banking | El Salvador Banking | Guatemala Banking | Fiduciary | Investment Banking | Brokerage | International Banking | All other segments | Total | |||||||||||||||||||||||
| In millions of Colombian pesos | ||||||||||||||||||||||||||||||||
| Revenue from customer contracts | ||||||||||||||||||||||||||||||||
| Commissions and other services | ||||||||||||||||||||||||||||||||
Debit & credit cards and affiliated merchants |
2,657,690 | 282,611 | 257,697 | 85,841 | - | - | - | 1,934 | - | 3,285,773 | ||||||||||||||||||||||
Insurance banking |
958,311 | 67,197 | 47 | - | 6 | - | 3 | - | - | 1,025,564 | ||||||||||||||||||||||
Banking services |
694,554 | 131,958 | 166,713 | 65,432 | - | - | - | 43,540 | 34,580 | 1,136,777 | ||||||||||||||||||||||
Payments and collections |
1,024,053 | 15,735 | - | - | - | - | - | - | - | 1,039,788 | ||||||||||||||||||||||
Fiduciary activities |
- | 18,962 | 6,515 | 904 | 448,848 | - | 95,972 | 50 | - | 571,251 | ||||||||||||||||||||||
Acceptances, guarantees, and letters of credit |
73,302 | 27,365 | 5,789 | 1,880 | - | - | - | 679 | - | 109,015 | ||||||||||||||||||||||
Investment Banking |
- | 1,670 | 2,097 | - | - | 69,266 | 8,854 | - | - | 81,887 | ||||||||||||||||||||||
Brokerage |
- | 16,473 | - | - | - | - | 20,648 | - | - | 37,121 | ||||||||||||||||||||||
Other |
252,445 | 359 | 76,876 | 57,721 | - | - | 6,715 | 5,698 | 1,848 | 401,662 | ||||||||||||||||||||||
Total revenue from customer contracts |
5,660,355 | 562,330 | 515,734 | 211,778 | 448,854 | 69,266 | 132,192 | 51,901 | 36,428 | 7,688,838 | ||||||||||||||||||||||
| Colombia Banking | Panama Banking | El Salvador Banking | Guatemala Banking | Fiduciary | Investment Banking | Brokerage | International Banking | All other segments | Total | |||||||||||||||||||||||
| In millions of Colombian pesos | ||||||||||||||||||||||||||||||||
| Revenue from customer contracts | ||||||||||||||||||||||||||||||||
| Commissions and other services | ||||||||||||||||||||||||||||||||
Debit & credit cards and affiliated merchants |
2,467,174 | 272,380 | 233,049 | 95,833 | - | - | - | 1,992 | - | 3,070,428 | |||||||||||||||||||||||||||||||||||||||||||||||||||||||
Insurance banking |
924,280 | 72,705 | 77 | - | 104 | 29 | 126 | - | - | 997,321 | |||||||||||||||||||||||||||||||||||||||||||||||||||||||
Banking services |
593,729 | 110,271 | 157,386 | 68,857 | - | - | - | 37,746 | 23,574 | 991,563 | |||||||||||||||||||||||||||||||||||||||||||||||||||||||
Payments and collections |
950,167 | 15,236 | - | - | - | - | - | - | - | 965,403 | |||||||||||||||||||||||||||||||||||||||||||||||||||||||
Fiduciary activities |
- | 20,233 | 6,399 | 851 | 361,632 | - | 74,377 | 54 | - | 463,546 | |||||||||||||||||||||||||||||||||||||||||||||||||||||||
Acceptances, guarantees, and letters of credit |
72,335 | 25,159 | 5,211 | 3,173 | - | - | - | 1,803 | - | 107,681 | |||||||||||||||||||||||||||||||||||||||||||||||||||||||
Investment Banking |
- | 980 | 1,225 | - | - | 55,888 | 10,728 | - | - | 68,821 | |||||||||||||||||||||||||||||||||||||||||||||||||||||||
Brokerage |
- | 15,568 | - | - | - | - | 11,140 | - | - | 26,708 | |||||||||||||||||||||||||||||||||||||||||||||||||||||||
Other |
244,414 | 398 | 76,221 | 54,486 | 229 | - | 7,614 | 5,633 | 412 | 389,407 | |||||||||||||||||||||||||||||||||||||||||||||||||||||||
Total revenue from customer contracts |
5,252,099 | 532,930 | 479,568 | 223,200 | 361,965 | 55,917 | 103,985 | 47,228 | 23,986 | 7,080,878 | |||||||||||||||||||||||||||||||||||||||||||||||||||||||
| Growth | |||||||||||||||||||||||
| 2024 | VS. | 2023 | |||||||||||||||||||||
| COP | % | ||||||||||||||||||||||
| Revenue from customer contracts – Commissions and other services | |||||||||||||||||||||||
| Debit & credit cards and affiliated merchants | 215,345 | 7.01% | |||||||||||||||||||||
| Insurance banking | 28,243 | 2.83% | |||||||||||||||||||||
| Banking services | 145,214 | 14.64% | |||||||||||||||||||||
| Payments and collections | 74,385 | 7.71% | |||||||||||||||||||||
| Fiduciary activities | 107,705 | 23.24% | |||||||||||||||||||||
| Acceptances, guarantees, and letters of credit | 1,334 | 1.24% | |||||||||||||||||||||
| Investment Banking | 13,066 | 18.99% | |||||||||||||||||||||
| Brokerage | 10,413 | 38.99% | |||||||||||||||||||||
| Other | 12,255 | 3.15% | |||||||||||||||||||||
| Total revenue from customer contracts | 607,960 | 8.59% | |||||||||||||||||||||
| Year | Growth | ||||||||||||||||||||||||||||
| 2024 | 2023 | 2024-2023 | |||||||||||||||||||||||||||
| In millions of Colombian pesos | |||||||||||||||||||||||||||||
| Banking services | 1,704,221 | 1,483,785 | 220,436 | 14.86% | |||||||||||||||||||||||||
| Sales, collections, and other services | 894,836 | 855,480 | 39,356 | 4.60% | |||||||||||||||||||||||||
| Banking correspondents | 623,193 | 507,586 | 115,607 | 22.78% | |||||||||||||||||||||||||
| Payments and collections | 46,792 | 41,820 | 4,972 | 11.89% | |||||||||||||||||||||||||
| Other | 242,732 | 208,609 | 34,123 | 16.36% | |||||||||||||||||||||||||
| Total commission expenses | 3,511,774 |
3,097,280 |
414,494 | 13.38% | |||||||||||||||||||||||||
| Year | Growth | ||||||||||||||||||||||||||||
| 2024 | 2023 | 2023-2022 | |||||||||||||||||||||||||||
| In millions of Colombian pesos | |||||||||||||||||||||||||||||
| Commission income | 7,688,838 | 7,080,878 | 607,960 | 8.59% | |||||||||||||||||||||||||
| Commission expenses | (3,511,774) | (3,097,280) | (414,494) | 13.38% | |||||||||||||||||||||||||
| Total net commission income | 4,177,064 |
3,983,598 | 193,466 | 4.86% | |||||||||||||||||||||||||
| 2024 | 2023 | Variation / 2024-2022 | 3 | ||||||||||||||||||||||||||
| In millions of Colombian pesos | |||||||||||||||||||||||||||||
| Operating Expenses | |||||||||||||||||||||||||||||
| Employee salaries and benefits | 5,628,062 | 5,350,234 | 277,828 | 5.19 | % | ||||||||||||||||||||||||
| Other administrative and general expenses | 5,445,212 | 5,033,944 | 411,268 | 8.17 | % | ||||||||||||||||||||||||
| Taxes other than income tax | 1,442,511 | 1,433,148 | 9,363 | 0.65 | % | ||||||||||||||||||||||||
| Amortization, depreciation, and impairment | 1,117,881 | 1,124,859 | (6,978) | -0.62 | % | ||||||||||||||||||||||||
| Total operating expenses | 13,633,666 | 12,942,185 | 691,481 | 5.34 | % | ||||||||||||||||||||||||
| 2023 | 2022 | Variation / 2023-2022 | |||||||||||||||||||||||||||
| In millions of Colombian pesos | |||||||||||||||||||||||||||||
| Operating Expenses | |||||||||||||||||||||||||||||
| Employee salaries and benefits | 5,350,234 | 4,417,656 | 932,578 | 21.11 | % | ||||||||||||||||||||||||
| Other administrative and general expenses | 5,033,944 | 4,559,900 | 474,044 | 10.40 | % | ||||||||||||||||||||||||
| Taxes other than income tax | 1,433,148 | 929,512 | 503,636 | 54.18 | % | ||||||||||||||||||||||||
| Amortization, depreciation, and impairment | 1,124,859 | 980,575 | 144,284 | 14.71 | % | ||||||||||||||||||||||||
| Total operating expenses | 12,942,185 | 10,887,643 | 2,054,542 | 18.87 | % | ||||||||||||||||||||||||
| For the year ended December 31, | |||||||||||||||||
| 2024 | 2023 | 2022 | Variation 2024-2023 | Variation 2023-2022 | |||||||||||||
| In millions of Colombian pesos | |||||||||||||||||
| Total interest income and financial instrument valuation | 27,543,286 | 29,230,060 | 20,727,335 | (5.77)% | 41.02% | ||||||||||||
| Interest on loan portfolio and financial leasing operations | 25,632,102 | 28,366,678 | 19,263,960 | (9.64)% | 47.25% | ||||||||||||
| Debt securities | 1,503,298 | 937,090 | 1,361,299 | 60.42% | (31.16)% | ||||||||||||
| Derivatives, net | 155,794 | (167,887) | 108,255 | 192.80% | (255.08)% | ||||||||||||
| Liquidity operations, net | 252.092 | 94,179 | (6,179) | 167.67% | 1,624.18% | ||||||||||||
| Interest expense | (11,588,039) | (13,464,980) | (6,333,834) | (13.94)% | 112.59% | ||||||||||||
| Net interest margin and financial instrument valuation before provision for loan portfolio impairment, off-balance sheet commitments, and other financial instruments | 15,955,247 | 15,765,080 | 14,393,501 | 1.21% | 9.53% | ||||||||||||
| Provisions and credit risk impairment, net | (4,220,207) | (6,480,377) | (2,971,599) | (34.88)% | 118.08% | ||||||||||||
| Net interest income and financial instruments valuation after provisions and impairment | 11,735,040 | 9,284,703 | 11,421,902 | 26.39% | (18.71)% | ||||||||||||
| Expenses from transactions with other operating segments of the Bank | (151,933) | (187,467) | (32,163) | (18.95)% | 482.87% | ||||||||||||
| Commission income | 5,660,355 | 5,252,099 | 4,684,563 | 7.77% | 12.12% | ||||||||||||
| Commission expenses | (2,885,272) | (2,522,927) | (2,099,585) | 14.36% | 20.16% | ||||||||||||
| Total commission income, net | 2,775,083 | 2,729,172 | 2,584,978 | 1.68% | 5.58% | ||||||||||||
Other operating income (expenses)(1) |
800,252 | 1,575,845 | (72,994) | (49.22)% | 2,258.87% | ||||||||||||
| Dividends and other net income from equity participation | (121,975) | 17,613 | (8,058) | (792.53)% | 318.58% | ||||||||||||
| Total net income | 15,036,467 | 13,419,866 | 13,893,665 | 12.05% | (3.41)% | ||||||||||||
Operating expenses(2) |
(8,651,424) | (8,022,042) | (6,600,686) | 7.85% | 21.53% | ||||||||||||
| Amortization, depreciation, and impairment | (770,207) | (744,346) | (613,807) | 3.47% | 21.27% | ||||||||||||
| Total operating expenses | (9,421,631) | (8,766,388) | (7,214,493) | 7.47% | 21.51% | ||||||||||||
| Profit before income tax | 5,614,836 | 4,653,478 | 6,679,172 | 20.66% | (30.33)% | ||||||||||||
| Segment assets | 266,593,755 | 254,367,378 | 247,113,605 | 4.81% | 2.94% | ||||||||||||
| Segment liabilities | 222,402,215 | 216,200,157 | 207,293,246 | 2.87% | 4.30% | ||||||||||||
| For the year ended December 31, | |||||||||||||||||
| 2024 | 2023 | 2022 | Variation 2024-2023 | Variation 2023-2022 | |||||||||||||
| In millions of Colombian pesos | |||||||||||||||||
| Total interest income and financial instrument valuation | 1,851,126 | 1,773,140 | 1,527,860 | 4.40% | 16.05% | ||||||||||||
| Interest on loan portfolio and financial leasing operations | 1,623,427 | 1,524,765 | 1,293,556 | 6.47% | 17.87% | ||||||||||||
| Debt securities | 226,122 | 236,350 | 170,423 | (4.33)% | 38.68% | ||||||||||||
| Derivatives, net | 775 | 11,187 | 63,494 | (93.07)% | (82.38)% | ||||||||||||
| Liquidity operations, net | 802 | 838 | 387 | (4.30)% | 116.54% | ||||||||||||
| Interest expense | (437,244) | (464,851) | (297,839) | (5.94)% | 56.07% | ||||||||||||
| Net interest margin and financial instrument valuation before provision for loan portfolio impairment, off-balance sheet commitments, and other financial instruments | 1,413,882 | 1,308,289 | 1,230,021 | 8.07% | 6.36% | ||||||||||||
| Provisions and credit risk impairment, net | (236,086) | (154,938) | (102,710) | 52.37% | 50.85% | ||||||||||||
| Net interest income and financial instruments valuation after provisions and impairment | 1,177,796 | 1,153,351 | 1,127,311 | 2.12% | 2.31% | ||||||||||||
| Expenses from transactions with other operating segments of the Bank | (19,110) | (17,844) | (7,371) | 7.09% | 142.08% | ||||||||||||
| Commission income | 515,734 | 479,568 | 444,177 | 7.54% | 7.97% | ||||||||||||
| Commission expenses | (226,445) | (188,972) | (170,563) | 19.83% | 10.79% | ||||||||||||
| Total commission income, net | 289,289 | 290,596 | 273,614 | (0.45)% | 6.21% | ||||||||||||
Other operating income(1) |
40,818 | 51,656 | 19,685 | (20.98)% | 162.41% | ||||||||||||
| Dividends and other net income from equity participation | 4,338 | 10,982 | 5,340 | (60.50)% | 105.66% | ||||||||||||
| Total net income | 1,493,131 | 1,488,741 | 1,418,579 | 0.29% | 4.95% | ||||||||||||
Operating expenses(2) |
(771,078) | (668,105) | (639,748) | 15.41% | 4.43% | ||||||||||||
| Amortization, depreciation, and impairment | (93,982) | (131,921) | (106,601) | (28.76)% | 23.75% | ||||||||||||
| Total operating expenses | (865,060) | (800,026) | (746,349) | 8.13% | 7.19% | ||||||||||||
| Profit before income tax | 628,071 | 688,715 | 672,230 | (8.81)% | 2.45% | ||||||||||||
| Segment assets | 26,670,513 | 21,608,586 | 26,696,524 | 23.43% | 19.06% | ||||||||||||
| Segment liabilities | 23,889,120 | 19,220,367 | 23,738,984 | 24.29% | (19.03)% | ||||||||||||
| For the year ended December 31, | |||||||||||||||||
| 2024 | 2023 | 2022 | Variation 2024-2023 | Variation 2023-2022 | |||||||||||||
| In millions of Colombian pesos | |||||||||||||||||
| Total interest income and financial instrument valuation | 2,689,904 | 2,826,559 | 2,364,820 | (4.83)% | 19.53% | ||||||||||||
| Interest on loan portfolio and financial leasing operations | 2,283,111 | 2,415,234 | 2,154,151 | (5.47)% | 12.12% | ||||||||||||
| Debt securities | 316,205 | 301,167 | 161,974 | 4.99% | 85.94% | ||||||||||||
| Derivatives, net | 3,322 | 817 | (1,026) | 306.61% | 179.63% | ||||||||||||
| Liquidity operations, net | 87,266 | 109,341 | 49,721 | (20.19)% | 119.91% | ||||||||||||
| Interest expense | (1,336,250) | (1,238,112) | (910,937) | 7.93% | 35.92% | ||||||||||||
| Net interest margin and financial instrument valuation before provision for loan portfolio impairment, off-balance sheet commitments, and other financial instruments | 1,353,654 | 1,588,447 | 1,453,883 | (14.78)% | 9.26% | ||||||||||||
| Provisions and credit risk impairment, net | (456,748) | (270,501) | (545,012) | 68.85% | (50.37)% | ||||||||||||
| Net interest income and financial instruments valuation after provisions and impairment | 896,906 | 1,317,946 | 908,871 | (31.95)% | 45.01% | ||||||||||||
| Expenses from transactions with other operating segments of the Bank | (40,110) | (34,105) | (25,022) | 17.61% | 36.30% | ||||||||||||
| Commission income | 562,330 | 532,930 | 446,583 | 5.52% | 19.34% | ||||||||||||
| Commission expenses | (286,392) | (258,897) | (210,004) | 10.62% | 23.28% | ||||||||||||
| Total commission income, net | 275,938 | 274,033 | 236,579 | 0.70% | 15.83% | ||||||||||||
Other operating income(1) |
65,876 | 36,939 | 51,494 | 78.34% | (28.27)% | ||||||||||||
| Dividends and other net income from equity participation | 11,474 | 13,498 | 9,655 | (14.99)% | 39.80% | ||||||||||||
| Total net income | 1,210,084 | 1,608,311 | 1,181,577 | (24.76)% | 36.12% | ||||||||||||
Operating expenses(2) |
(853,980) | (909,843) | (797,091) | (6.14)% | 14.15% | ||||||||||||
| Amortization, depreciation, and impairment | (128,544) | (107,716) | (110,293) | 19.34% | (2.34)% | ||||||||||||
| Total operating expenses | (982,524) | (1,017,559) | (907,384) | (3.44)% | 12.14% | ||||||||||||
| Profit before income tax | 227,560 | 590,752 | 274,193 | (61.48)% | 115.45% | ||||||||||||
| Segment assets | 45,964,767 | 40,740,495 | 52,445,934 | 12.82% | (22.32)% | ||||||||||||
| Segment liabilities | 41,132,907 | 36,315,750 | 47,081,613 | 13.26% | (22.87)% | ||||||||||||
| For the year ended December 31, | |||||||||||||||||
| 2024 | 2023 | 2022 | Variation 2024-2023 | Variation 2023-2022 | |||||||||||||
| In millions of Colombian pesos | |||||||||||||||||
| Total interest income and financial instrument valuation | 1,939,602 | 1,795,543 | 1,537,801 | 8.02% | 16.76% | ||||||||||||
| Interest on loan portfolio and financial leasing operations | 1,807,334 | 1,726,821 | 1,509,143 | 4.66% | 14.42% | ||||||||||||
| Debt securities | 134,101 | 60,534 | 27,089 | 121.53% | 123.46% | ||||||||||||
| Liquidity operations, net | (1,833) | 8,188 | 1,569 | (122.39)% | 421.86% | ||||||||||||
| Interest expense | (804,815) | (731,886) | (528,459) | 9.96% | 38.49% | ||||||||||||
| Net interest margin and financial instrument valuation before provision for loan portfolio impairment, off-balance sheet commitments, and other financial instruments | 1,134,787 | 1,063,657 | 1,009,342 | 6.69% | 5.38% | ||||||||||||
| Provisions and credit risk impairment, net | (394,589) | (499,368) | (168,834) | (20.98)% | 195.77% | ||||||||||||
| Net interest income and financial instruments valuation after provisions and impairment | 740,198 | 564,289 | 840,508 | 31.17% | (32.86)% | ||||||||||||
| Expenses from transactions with other operating segments of the Bank | (87,061) | (76,054) | (45,526) | 14.47% | 67.06% | ||||||||||||
| Commission income | 211,778 | 223,200 | 218,554 | (5.12)% | 2.13% | ||||||||||||
| Commission expenses | (85,700) | (89,405) | (91,424) | (4.14)% | (2.21)% | ||||||||||||
| Total commission income, net | 126,078 | 133,795 | 127,130 | (5.77)% | 5.24% | ||||||||||||
Other operating income(1) |
130,140 | 130,757 | 129,403 | (0.47)% | 1.05% | ||||||||||||
| Dividends and other net income from equity participation | 1,555 | 1,827 | 828 | (14.89)% | 120.65% | ||||||||||||
| Total net income | 910,910 | 754,614 | 1,052,343 | 20.71% | (28.29)% | ||||||||||||
Operating expenses(2) |
(645,310) | (620,928) | (577,497) | 3.93% | 7.52% | ||||||||||||
| Amortization, depreciation, and impairment | (61,471) | (55,243) | (54,999) | 11.27% | 0.44% | ||||||||||||
| Total operating expenses | (706,781) | (676,171) | (632,496) | 4.53% | 6.91% | ||||||||||||
| Profit before income tax | 204,129 | 78,443 | 419,847 | 160.23% | (81.32)% | ||||||||||||
| Segment assets | 27,332,834 | 21,377,205 | 26,143,629 | 27.86% | (18.23)% | ||||||||||||
| Segment liabilities | 25,018,466 | 19,469,075 | 23,635,998 | 28.50% | (17.63)% | ||||||||||||
| For the year ended December 31, | |||||||||||||||||
| 2024 | 2023 | 2022 | Variation 2024-2023 | Variation 2023-2022 | |||||||||||||
| In millions of Colombian pesos | |||||||||||||||||
| Total interest income and financial instrument valuation | 61 | 47 | 72 | 29.79% | (34.72)% | ||||||||||||
| Interest on loan portfolio and financial leasing operations | 61 | 47 | 72 | 29.79% | (34.72)% | ||||||||||||
| Interest expense | (192) | (179) | (150) | 7.26% | 19.33% | ||||||||||||
| Net interest margin and financial instrument valuation before provision for loan portfolio impairment, off-balance sheet commitments, and other financial instruments | (131) | (132) | (78) | (0.76)% | 69.23% | ||||||||||||
| Provisions and credit risk impairment, net | (554) | (2,893) | (796) | (80.85)% | 263.44% | ||||||||||||
| Net interest income and financial instruments valuation after provisions and impairment | (685) | (3,025) | (874) | (77.36)% | 246.11% | ||||||||||||
| Expenses from transactions with other operating segments of the Bank | (58,498) | (16,518) | (12,658) | 254.15% | 30.49% | ||||||||||||
| Commission income | 448,854 | 361,965 | 318,869 | 24.00% | 13.52% | ||||||||||||
| Commission expenses | (3,804) | (4,244) | (3,668) | (10.37)% | 15.70% | ||||||||||||
| Total commission income, net | 445,050 | 357,721 | 315,201 | 24.41% | 13.49% | ||||||||||||
Other operating income(1) |
13,737 | 14,107 | 14,897 | (2.62)% | (5.30)% | ||||||||||||
| Dividends and other net income from equity participation | 45,558 | 33,275 | 2,164 | 36.91% | 1,437.66% | ||||||||||||
| Total net income | 445,162 | 385,560 | 318,730 | 15.46% | 20.97% | ||||||||||||
Operating expenses(2) |
(168,494) | (177,626) | (153,377) | (5.14)% | 15.81% | ||||||||||||
| Amortization, depreciation, and impairment | (3,000) | (2,218) | (1,630) | 35.26% | 36.07% | ||||||||||||
| Total operating expenses | (171,494) | (179,844) | (155,007) | (4.64)% | 16.02% | ||||||||||||
| Profit before income tax | 273,668 | 205,716 | 163,723 | 33.03% | 25.65% | ||||||||||||
| Segment assets | 719,006 | 658,547 | 603,486 | 9.18% | 9.12% | ||||||||||||
| Segment liabilities | 153,181 | 138,171 | 126,307 | 10.86% | 9.39% | ||||||||||||
| For the year ended December 31, | |||||
| 2024 | 2023 | 2022 | Variation 2024-2023 | Variation 2023-2022 | |||||||||||||
| In millions of Colombian pesos | |||||||||||||||||
| Total interest income and financial instrument valuation | 6 | 6 | 4 | -% |
50.00% | ||||||||||||
| Debt securities | 6 | 6 | 4 | -% | 50.00% | ||||||||||||
| Interest expense | - | (1) | (4) | (100.00)% | (75.00)% | ||||||||||||
| Net interest margin and financial instrument valuation before provision for loan portfolio impairment, off-balance sheet commitments, and other financial instruments | 6 | 5 | - | 20.00% | 100.00% | ||||||||||||
| Provisions and credit risk impairment, net | 768 | (380) | (924) | 302.11% | (58.87)% | ||||||||||||
| Net interest income and financial instruments valuation after provisions and impairment | 774 | (375) | (924) | 306.40% | (59.42)% | ||||||||||||
| Income from transactions with other operating segments of the Bank | 7,823 | 13,949 | 3,404 | (43.92)% | 309.78% | ||||||||||||
| Commission income | 69,266 | 55,917 | 86,232 | 23.87% | (35.16)% | ||||||||||||
| Commission expenses | (115) | (238) | (269) | (51.68)% | (11.52)% | ||||||||||||
| Total commission income, net | 69,151 | 55,679 | 85,963 | 24.20% | (35.23)% | ||||||||||||
Other operating income (expenses)(1) |
1,609 | (1,011) | 671 | 259.15% | (250.67)% | ||||||||||||
| Dividends and other net income from equity participation | (97,585) | (98,512) | 8,760 | (0.94)% | (1,224.57)% | ||||||||||||
| Total net income | (18,228) | (30,270) | 97,874 | (39.78)% | (130.93)% | ||||||||||||
Operating expenses(2) |
(55,157) | (49,759) | (47,997) | 10.85% | 3.67% | ||||||||||||
| Amortization, depreciation, and impairment | (89) | (208) | (232) | (57.21)% | (10.34)% | ||||||||||||
| Total operating expenses | (55,246) | (49,967) | (48,229) | 10.56% | 3.60% | ||||||||||||
| Profit before income tax | (73,474) | (80,237) | 49,645 | (8.43)% | (261.62)% | ||||||||||||
| Segment assets | 1,464,180 | 1,719,824 | 2,116,143 | (14.86)% | (18.73)% | ||||||||||||
| Segment liabilities | 48,620 | 51,841 | 80,162 | (6.21)% | (35.33)% | ||||||||||||
| For the year ended December 31, | |||||||||||||||||
| 2024 | 2023 | 2022 | Variation 2024-2023 | Variation 2023-2022 | |||||||||||||
| In millions of Colombian pesos | |||||||||||||||||
| Total interest income and financial instrument valuation | 44,750 | 45,875 | 12,996 | (2.45)% | 252.99% | ||||||||||||
| Interest on loan portfolio and financial leasing operations | 5,327 | 5,076 | 511 | 4.94% | 893.35% | ||||||||||||
| Debt securities | 37,480 | 36,538 | 20,024 | 2.58% | 82.47% | ||||||||||||
| Derivatives, net | (2,463) | (1,747) | 658 | 40.98% | (365.50)% | ||||||||||||
| Liquidity operations, net | 4,406 | 6,008 | (8,197) | (26.66)% | 173.30% | ||||||||||||
| Interest expense | (165) | (222) | (104) | (25.68)% | 113.46% | ||||||||||||
| Net interest margin and financial instrument valuation before provision for loan portfolio impairment, off-balance sheet commitments, and other financial instruments | 44,585 | 45,653 | 12,892 | (2.34)% | 254.12% | ||||||||||||
| Provisions and credit risk impairment, net | - | 106 | 3,133 | (100.00)% | (96.62)% | ||||||||||||
| Net interest income and financial instruments valuation after provisions and impairment | 44,585 | 45,759 | 16,025 | (2.57)% | 185.55% | ||||||||||||
| Income from transactions with other operating segments of the Bank | 86,150 | 68,617 | 53,229 | 25.55% | 28.91% | ||||||||||||
| Commission income | 132,192 | 103,985 | 111,366 | 27.13% | (6.63)% | ||||||||||||
| Commission expenses | (8,600) | (8,645) | (6,160) | (0.52)% | 40.34% | ||||||||||||
| Total commission income, net | 123,592 | 95,340 | 105,206 | 29.63% | (9.38)% | ||||||||||||
Other operating income(1) |
7,566 | 4,737 | 13,575 | 59.72% | (65.10)% | ||||||||||||
| Dividends and other net income from equity participation | 3,622 | 6,416 | (4,314) | (43.55)% | 248.73% | ||||||||||||
| Total net income | 265,515 | 220,869 | 183,721 | 20.21% | 20.22% | ||||||||||||
Operating expenses(2) |
(188,573) | (186,212) | (153,317) | 1.27% | 21.46% | ||||||||||||
| Amortization, depreciation, and impairment | (2,759) | (2,950) | (1,754) | (6.47)% | 68.19% | ||||||||||||
| Total operating expenses | (191,332) | (189,162) | (155,071) | 1.15% | 21.98% | ||||||||||||
| Profit before income tax | 74,183 | 31,707 | 28,650 | 133.96% | 10.67% | ||||||||||||
| Segment assets | 398,066 | 351,694 | 326,047 | 13.19% | 7.87% | ||||||||||||
| Segment liabilities | 122,213 | 121,423 | 106,115 | 0.65% | 14.43% | ||||||||||||
| For the year ended December 31, | |||||||||||||||||
| 2024 | 2023 | 2022 | Variation 2024-2023 | Variation 2023-2022 | |||||||||||||
| In millions of Colombian pesos | |||||||||||||||||
| Total interest income and financial instrument valuation | 1,203,838 | 1,112,171 | 512,417 | 8.24% | 117.04% | ||||||||||||
| Interest on loan portfolio and financial leasing operations | 987,378 | 940,091 | 446,028 | 5.03% | 110.77% | ||||||||||||
| Debt securities | 116,662 | 85,091 | 48,722 | 37.10% | 74.65% | ||||||||||||
| Derivatives, net | (94) | (188) | - | (50.00)% | 100.00% | ||||||||||||
| Liquidity operations, net | 99,892 | 87,177 | 17,667 | 14.59% | 393.45% | ||||||||||||
| Interest expense | (708,671) | (596,039) | (271,280) | 18.90% | 119.71% | ||||||||||||
| Net interest margin and financial instrument valuation before provision for loan portfolio impairment, off-balance sheet commitments, and other financial instruments | 495,167 | 516,132 | 241,137 | (4.06)% | 114.04% | ||||||||||||
| Provisions and credit risk impairment, net | (91,617) | 4,164 | 25,029 | (2,300.22)% | (83.36)% | ||||||||||||
| Net interest income and financial instruments valuation after provisions and impairment | 403,550 | 520,296 | 266,166 | (22.44)% | 95.48% | ||||||||||||
| Income from transactions with other operating segments of the Bank | 410,003 | 415,508 | 212,049 | (1.32)% | 95.95% | ||||||||||||
| Commission income | 51,901 | 47,228 | 42,021 | 9.89% | 12.39% | ||||||||||||
| Commission expenses | (10,116) | (11,042) | (8,025) | (8.39)% | 37.60% | ||||||||||||
| Total commission income, net | 41,785 | 36,186 | 33,996 | 15.47% | 6.44% | ||||||||||||
Other operating income(1) |
12,435 | 16,794 | 9,954 | (25.96)% | 68.72% | ||||||||||||
| Dividends and other net income from equity participation | 25 | 37 | 35 | (32.43)% | 5.71% | ||||||||||||
| Total net income | 867,798 | 988,821 | 522,200 | (12.24)% | 89.36% | ||||||||||||
Operating expenses(2) |
(98,570) | (89,219) | (79,814) | 10.48% | 11.78% | ||||||||||||
| Amortization, depreciation, and impairment | (8,016) | (4,259) | (2,626) | 88.21% | 62.19% | ||||||||||||
| Total operating expenses | (106,586) | (93,478) | (82,440) | 14.02% | 13.39% | ||||||||||||
| Profit before income tax | 761,212 | 895,343 | 439,760 | (14.98)% | 103.60% | ||||||||||||
| Segment assets | 35,272,842 | 30,199,897 | 35,131,458 | 16.80% | (14.04)% | ||||||||||||
| Segment liabilities | 24,248,959 | 20,734,521 | 23,216,118 | 16.95% | (10.69)% | ||||||||||||
| For the year ended December 31, | |||||||||||||||||
| 2024 | 2023 | 2022 | Variation 2024-2023 | Variation 2023-2022 | |||||||||||||
| In millions of Colombian pesos | |||||||||||||||||
| Total interest income and financial instrument valuation | 271,648 | 262,758 | 113,642 | 3.38% | 131.22% | ||||||||||||
| Interest on loan portfolio and financial leasing operations | 274,811 | 262,075 | 116,072 | 4.86% | 125.79% | ||||||||||||
| Debt securities | 41 | 683 | (2,447) | (94.00)% | 127.91% | ||||||||||||
| Derivatives, net | (3,204) | - | - | 100.00% | -% | ||||||||||||
| Liquidity operations, net | - | - | 17 | -% | (100.00)% | ||||||||||||
| Interest expense | (148,535) | (172,025) | (99,863) | (13.65)% | 72.26% | ||||||||||||
| Net interest margin and financial instrument valuation before provision for loan portfolio impairment, off-balance sheet commitments, and other financial instruments | 123,113 | 90,733 | 13,779 | 35.69% | 558.49% | ||||||||||||
| Provisions and credit risk impairment, net | (53,316) | (57,399) | (29,984) | (7.11)% | 91.43% | ||||||||||||
| Net interest income and financial instruments valuation after provisions and impairment | 69,797 | 33,334 | (16,205) | 109.39% | 305.70% | ||||||||||||
| Expenses from transactions with other operating segments of the Bank | (147,264) | (166,086) | (145,942) | (11.33)% | 13.80% | ||||||||||||
| Commission income | 36,428 | 23,986 | 18,161 | 51.87% | 32.07% | ||||||||||||
| Commission expenses | (5,330) | (12,910) | (468) | (58.71)% | 2,658.55% | ||||||||||||
| Total commission income, net | 31,098 | 11,076 | 17,693 | 180.77% | (37.40)% | ||||||||||||
Other operating income(1) |
1,969,552 | 2,149,826 | 1,886,750 | (8.39)% | 13.94% | ||||||||||||
| Dividends and other net income from equity participation | 257,561 | 225,049 | 221,444 | 14.45% | 1.63% | ||||||||||||
| Total net income | 2,180,744 | 2,253,199 | 1,963,740 | (3.22)% | 14.74% | ||||||||||||
Operating expenses(2) |
(1,083,199) | (1,093,592) | (857,541) | (0.95)% | 27.53% | ||||||||||||
| Amortization, depreciation, and impairment | (49,813) | (75,998) | (88,633) | (34.45)% | (14.26)% | ||||||||||||
| Total operating expenses | (1,133,012) | (1,169,590) | (946,174) | (3.13)% | 23.61% | ||||||||||||
| Profit before income tax | 1,047,732 | 1,083,609 | 1,017,566 | (3.31)% | 6.49% | ||||||||||||
| Segment assets | 10,901,576 | 10,224,734 | 9,222,529 | 6.62% | 10.87% | ||||||||||||
| Segment liabilities | 4,639,406 | 4,874,547 | 4,320,836 | (4.82)% | 12.81% | ||||||||||||
Average Statement of Financial Position and Interest Income from Average Assets as of December 31:(1) | ||||||||||||||||||||
| 2024 | 2023 | |||||||||||||||||||
| In millions of Colombian pesos (except percentages) | ||||||||||||||||||||
| Average | Interest included in results | Average interest / assets | Average | Interest included in results | Average interest / assets | |||||||||||||||
| ASSET | ||||||||||||||||||||
| Interest-earning assets | ||||||||||||||||||||
| Interbank | ||||||||||||||||||||
| Local activities | 98,288 | 8,507 | 8.66% | 91,258 | 10,028 | 11.00% | ||||||||||||||
| Foreign activities | 3,197,413 | 199,984 | 6.25% | 2,981,291 | 187,279 | 6.30% | ||||||||||||||
| Total | 3,295,701 | 208,491 | 6.33% | 3,072,549 | 197,307 | 6.40% | ||||||||||||||
| Repos | ||||||||||||||||||||
| Local activities | 4,343,154 | 284,814 | 6.56% | 2,676,670 | 292,971 | 10.90% | ||||||||||||||
| Foreign activities | 96,642 | 15,401 | 15.94% | 73,920 | 11,777 | 15.90% | ||||||||||||||
| Total | 4,439,796 | 300,215 | 6.76% | 2,750,590 | 304,748 | 11.10% | ||||||||||||||
Debt securities(2) |
||||||||||||||||||||
| Local activities | 15,172,478 | 1,144,392 | 7.54% | 10,599,721 | 1,376,246 | 13.00% | ||||||||||||||
| Foreign activities | 15,663,891 | 1,189,523 | 7.59% | 16,826,459 | 281,213 | 1.70% | ||||||||||||||
| Total | 30,836,369 | 2,333,915 | 7.57% | 27,426,180 | 1,657,459 | 6.00% | ||||||||||||||
| Customer loan portfolio | ||||||||||||||||||||
| Local activities | 178,959,009 | 25,309,441 | 14.14% | 172,515,187 | 27,947,473 | 16.20% | ||||||||||||||
| Foreign activities | 87,001,331 | 7,304,110 | 8.40% | 89,986,484 | 7,293,314 | 8.10% | ||||||||||||||
| Total | 265,960,340 | 32,613,551 | 12.26% | 262,501,671 | 35,240,787 | 13.40% | ||||||||||||||
| Total interest-earning assets | ||||||||||||||||||||
| Local activities | 198,572,929 | 26,747,154 | 13.47% | 185,882,836 | 29,626,718 | 15.90% | ||||||||||||||
| Foreign activities | 105,959,277 | 8,709,018 | 8.22% | 109,868,154 | 7,773,583 | 7.10% | ||||||||||||||
| Total | 304,532,206 | 35,456,172 | 11.64% | 295,750,990 | 37,400,301 | 12.60% | ||||||||||||||
| Total non-interest-earning assets | ||||||||||||||||||||
| Local activities | 20,705,057 | — | — | 23,428,476 | — | — | ||||||||||||||
Foreign activities(3) |
23,959,853 | — | — | 24,158,685 | — | — | ||||||||||||||
| Total | 44,664,910 | — | — | 47,587,161 | — | — | ||||||||||||||
| Total assets | ||||||||||||||||||||
| Local activities | 219,277,986 | 26,747,154 | 12.20% | 209,311,312 | 29,626,718 | 14.20% | ||||||||||||||
Foreign activities(3) |
129,919,130 | 8,709,018 | 6.70% | 134,026,839 | 7,773,583 | 5.80% | ||||||||||||||
| Total assets | 349,197,116 | 35,456,172 | 10.15% | 343,338,151 | 37,400,301 | 10.90% | ||||||||||||||
Statement of average financial position and interest expense paid on average liabilities, as of December 31,:(1) | ||||||||||||||||||||
| 2024 | 2023 | |||||||||||||||||||
| In millions of Colombian pesos (except percentages) | ||||||||||||||||||||
| Average | Interest included in results | Average interest / liabilities(2) |
Average | Interest included in results | Average interest / liabilities(2) |
|||||||||||||||
| LIABILITIES AND STOCKHOLDERS’ EQUITY | ||||||||||||||||||||
| Interest-bearing liabilities | ||||||||||||||||||||
| Checking accounts | ||||||||||||||||||||
| Local activities | 22,466,429 | 23,764 | 0.11% | 22,001,228 | 22,131 | 0.10% | ||||||||||||||
| Foreign activities | 17,357,904 | 81,415 | 0.47% | 18,432,636 | 68,657 | 0.40% | ||||||||||||||
| Total | 39,824,333 | 105,179 | 0.26% | 40,433,864 | 90,788 | 0.20% | ||||||||||||||
| Savings accounts | ||||||||||||||||||||
| Local activities | 83,711,882 | 2,676,437 | 3.20% | 79,151,508 | 3,463,957 | 4.40% | ||||||||||||||
| Foreign activities | 27,779,679 | 463,925 | 1.67% | 29,694,615 | 395,108 | 1.30% | ||||||||||||||
| Total | 111,491,561 | 3,140,362 | 2.82% | 108,846,123 | 3,859,065 | 3.50% | ||||||||||||||
| Time deposits | ||||||||||||||||||||
| Local activities | 60,786,003 | 6,880,218 | 11.32% | 54,810,787 | 7,586,429 | 13.80% | ||||||||||||||
| Foreign activities | 44,402,637 | 2,089,914 | 4.71% | 42,637,064 | 1,787,234 | 4.20% | ||||||||||||||
| Total | 105,188,640 | 8,970,132 | 8.53% | 97,447,851 | 9,373,663 | 9.60% | ||||||||||||||
| Repos | ||||||||||||||||||||
| Local activities | 1,068,567 | 45,253 | 4.23% | 968,917 | 160,766 | 16.60% | ||||||||||||||
| Foreign activities | 226,752 | 17,641 | 7.78% | 54,757 | 6,968 | 12.70% | ||||||||||||||
| Total | 1,295,319 | 62,894 | 4.86% | 1,023,674 | 167,734 | 16.40% | ||||||||||||||
Financial obligations(2) |
||||||||||||||||||||
| Local activities | 5,662,586 | 669,512 | 11.82% | 5,645,529 | 798,977 | 14.20% | ||||||||||||||
| Foreign activities | 8,518,466 | 680,401 | 7.99% | 11,769,294 | 860,019 | 7.30% | ||||||||||||||
| Total | 14,181,052 | 1,349,913 | 9.52% | 17,414,823 | 1,658,996 | 9.50% | ||||||||||||||
Interbank(2)(3) |
||||||||||||||||||||
| Local activities | — | 2,958 | — | 71,595 | 11,260 | 15.70% | ||||||||||||||
| Foreign activities | 639,639 | 19,348 | 3.02% | 723,898 | 19,280 | 2.70% | ||||||||||||||
| Total | 639,639 | 22,306 | 3.49% | 795,493 | 30,540 | 3.80% | ||||||||||||||
| Debt securities issued | ||||||||||||||||||||
| Local activities | 3,211,356 | 591,122 | 18.41% | 4,602,387 | 895,296 | 19.50% | ||||||||||||||
| Foreign activities | 11,248,144 | 610,990 | 5.43% | 12,856,710 | 531,319 | 4.10% | ||||||||||||||
| Total | 14,459,500 | 1,202,112 | 8.31% | 17,459,097 | 1,426,615 | 8.20% | ||||||||||||||
| Lease liabilities | ||||||||||||||||||||
| Local activities | 1,105,501 | 95,481 | 8.64% | 987,982 | 71,808 | 7.30% | ||||||||||||||
| Foreign activities | 703,013 | 40,065 | 5.70% | 802,540 | 42,007 | 5.20% | ||||||||||||||
| Total | 1,808,514 | 135,546 | 7.49% | 1,790,522 | 113,815 | 6.40% | ||||||||||||||
| Total interest-bearing liabilities | ||||||||||||||||||||
| Local activities | 178,012,324 | 10,984,745 | 6.17% | 168,239,933 | 13,010,624 | 7.70% | ||||||||||||||
| Foreign activities | 110,876,234 | 4,003,699 | 3.61% | 116,971,514 | 3,710,592 | 3.20% | ||||||||||||||
| Total | 288,888,558 | 14,988,444 | 5.19% | 285,211,447 | 16,721,216 | 5.90% | ||||||||||||||
| Total non-interest-bearing liabilities | ||||||||||||||||||||
| Local activities | 16,624,159 | — | — | 15,982,833 | — | — | ||||||||||||||
| Foreign activities | 2,947,687 | — | — | 3,298,036 | — | — | ||||||||||||||
| Total | 19,571,846 | — | — | 19,280,869 | — | — | ||||||||||||||
| Shareholders' equity | ||||||||||||||||||||
| Local activities | 32,207,927 | — | — | 29,371,732 | — | — | ||||||||||||||
| Foreign activities | 8,528,785 | — | — | 9,474,103 | — | — | ||||||||||||||
| Total | 40,736,712 | — | — | 38,845,835 | — | — | ||||||||||||||
Total Shareholders' Liabilities and Equity(4) |
||||||||||||||||||||
| Local activities | 226,844,411 | 10,984,745 | 4.84% | 213,594,498 | 13,010,624 | 6.10% | ||||||||||||||
Foreign activities(4) |
122,352,705 | 4,003,699 | 3.27% | 129,743,653 | 3,710,592 | 2.90% | ||||||||||||||
| Total | 349,197,116 | 14,988,444 | 4.29% | 343,338,151 | 16,721,216 | 4.90% | ||||||||||||||
| December 31, 2024 - December 31, 2023 | |||||||||||
| Increases (decreases) due to changes in: | |||||||||||
| Volume | Rate | Net change | |||||||||
| Interest-earning assets | |||||||||||
| Interbank | |||||||||||
| Local activities | 867 | (2,388) | (1,521) | ||||||||
| Foreign activities | 13,513 | (808) | 12,705 | ||||||||
| Total | 14,380 | (3,196) | 11,184 | ||||||||
| December 31, 2024 - December 31, 2023 | ||||||||||||||
| Increases (decreases) due to changes in: | ||||||||||||||
| Repos | ||||||||||||||
| Local activities | (22,904) | 14,747 | (8,157) | |||||||||||
| Foreign activities | 3,621 | 3 | 3,624 | |||||||||||
| Total | (19,283) | 14,750 | (4,533) | |||||||||||
Debt securities(1) |
||||||||||||||
| Local activities | (8,116,489) | 7,884,635 | (231,854) | |||||||||||
| Foreign activities | (18,060) | 926,370 | 908,310 | |||||||||||
| Total | (8,134,549) | 8,811,005 | 676,456 | |||||||||||
| Client loan portfolio, net | ||||||||||||||
| Local activities | 1,099,138 | (3,737,170) | (2,638,032) | |||||||||||
| Foreign activities | (134,170) | 144,966 | 10,796 | |||||||||||
| Total | 964,968 | (3,592,204) | (2,627,236) | |||||||||||
| Total interest-earning assets | ||||||||||||||
| Local activities | (7,039,388) | 4,159,824 | (2,879,564) | |||||||||||
| Foreign activities | (135,096) | 1,070,531 | 935,435 | |||||||||||
| Total | (7,174,484) | 5,230,355 | (1,944,129) | |||||||||||
| Interest-bearing liabilities | ||||||||||||||
| Checking accounts | ||||||||||||||
| Local activities | 474 | 1,159 | 1,633 | |||||||||||
| Foreign activities | (3,702) | 16,460 | 12,758 | |||||||||||
| Total | (3,228) | 17,619 | 14,391 | |||||||||||
| Savings accounts | ||||||||||||||
| Local activities | 214,206 | (1,001,726) | (787,520) | |||||||||||
| Foreign activities | (23,282) | 92,099 | 68,817 | |||||||||||
| Total | 190,924 | (909,627) | (718,703) | |||||||||||
| Time deposits | ||||||||||||||
| Local activities | 1,051,429 | (1,757,640) | (706,211) | |||||||||||
| Foreign activities | 76,300 | 226,380 | 302,680 | |||||||||||
| Total | 1,127,729 | (1,531,260) | (403,531) | |||||||||||
| Repos | ||||||||||||||
| December 31, 2024 - December 31, 2023 | ||||||||||||||
| Increases (decreases) due to changes in: | ||||||||||||||
| Local activities | 18,507 | (134,020) | (115,513) | |||||||||||
| Foreign activities | 12,180 | (1,507) | 10,673 | |||||||||||
| Total | 30,687 | (135,527) | (104,840) | |||||||||||
| Financial Obligations | ||||||||||||||
| Local activities | 2,421 | (131,886) | (129,465) | |||||||||||
| Foreign activities | (270,890) | 91,272 | (179,618) | |||||||||||
| Total | (268,469) | (40,614) | (309,083) | |||||||||||
| Interbank | ||||||||||||||
| Local activities | (3,523) | (4,779) | (8,302) | |||||||||||
| Foreign activities | (409) | 477 | 68 | |||||||||||
| Total | (3,932) | (4,302) | (8,234) | |||||||||||
| Debt securities issued | ||||||||||||||
| Local activities | (258,246) | (45,928) | (304,174) | |||||||||||
| Foreign activities | (52,660) | 132,331 | 79,671 | |||||||||||
| Total | (310,906) | 86,403 | (224,503) | |||||||||||
| Lease liabilities | ||||||||||||||
| Local activities | 9,165 | 14,508 | 23,673 | |||||||||||
| Foreign activities | (6,840) | 4,898 | (1,942) | |||||||||||
| Total | 2,325 | 19,406 | 21,731 | |||||||||||
| Total interest-bearing liabilities | ||||||||||||||
| Local activities | 1,034,433 | (3,060,312) | (2,025,879) | |||||||||||
| Foreign activities | (269,303) | 562,410 | 293,107 | |||||||||||
| Total | 765,130 | (2,497,902) | (1,732,772) | |||||||||||
| Yields on Interest-Earning Assets | ||
| As of December 31 | ||||||||
| 2024 | 2023 | |||||||
| In millions of Colombian pesos (except percentages) | ||||||||
| Interest-earning assets | ||||||||
| Local activities | 198,572,929 | 185,882,836 | ||||||
| Foreign activities | 105,959,277 | 109,868,154 | ||||||
| Total | 304,532,206 | 295,750,990 | ||||||
Net interest income(1) |
||||||||
| Local activities | 15,762,409 | 16,616,094 | ||||||
| Foreign activities | 4,705,319 | 4,062,991 | ||||||
| Total | 20,467,728 | 20,679,085 | ||||||
| Average yield on interest-earning assets | ||||||||
| Local activities | 13.47% | 15.94% | ||||||
| Foreign activities | 8.22% | 7.08% | ||||||
| Total | 11.64% | 12.65% | ||||||
Net Interest Margin(2) |
||||||||
| Local activities | 7.94% | 8.94% | ||||||
| Foreign activities | 4.44% | 3.70% | ||||||
| Total | 6.72% | 6.99% | ||||||
Interest margin(3) |
||||||||
| Local activities | 7.30% | 8.21% | ||||||
| Foreign activities | 4.61% | 3.90% | ||||||
| Total | 6.45% | 6.78% | ||||||
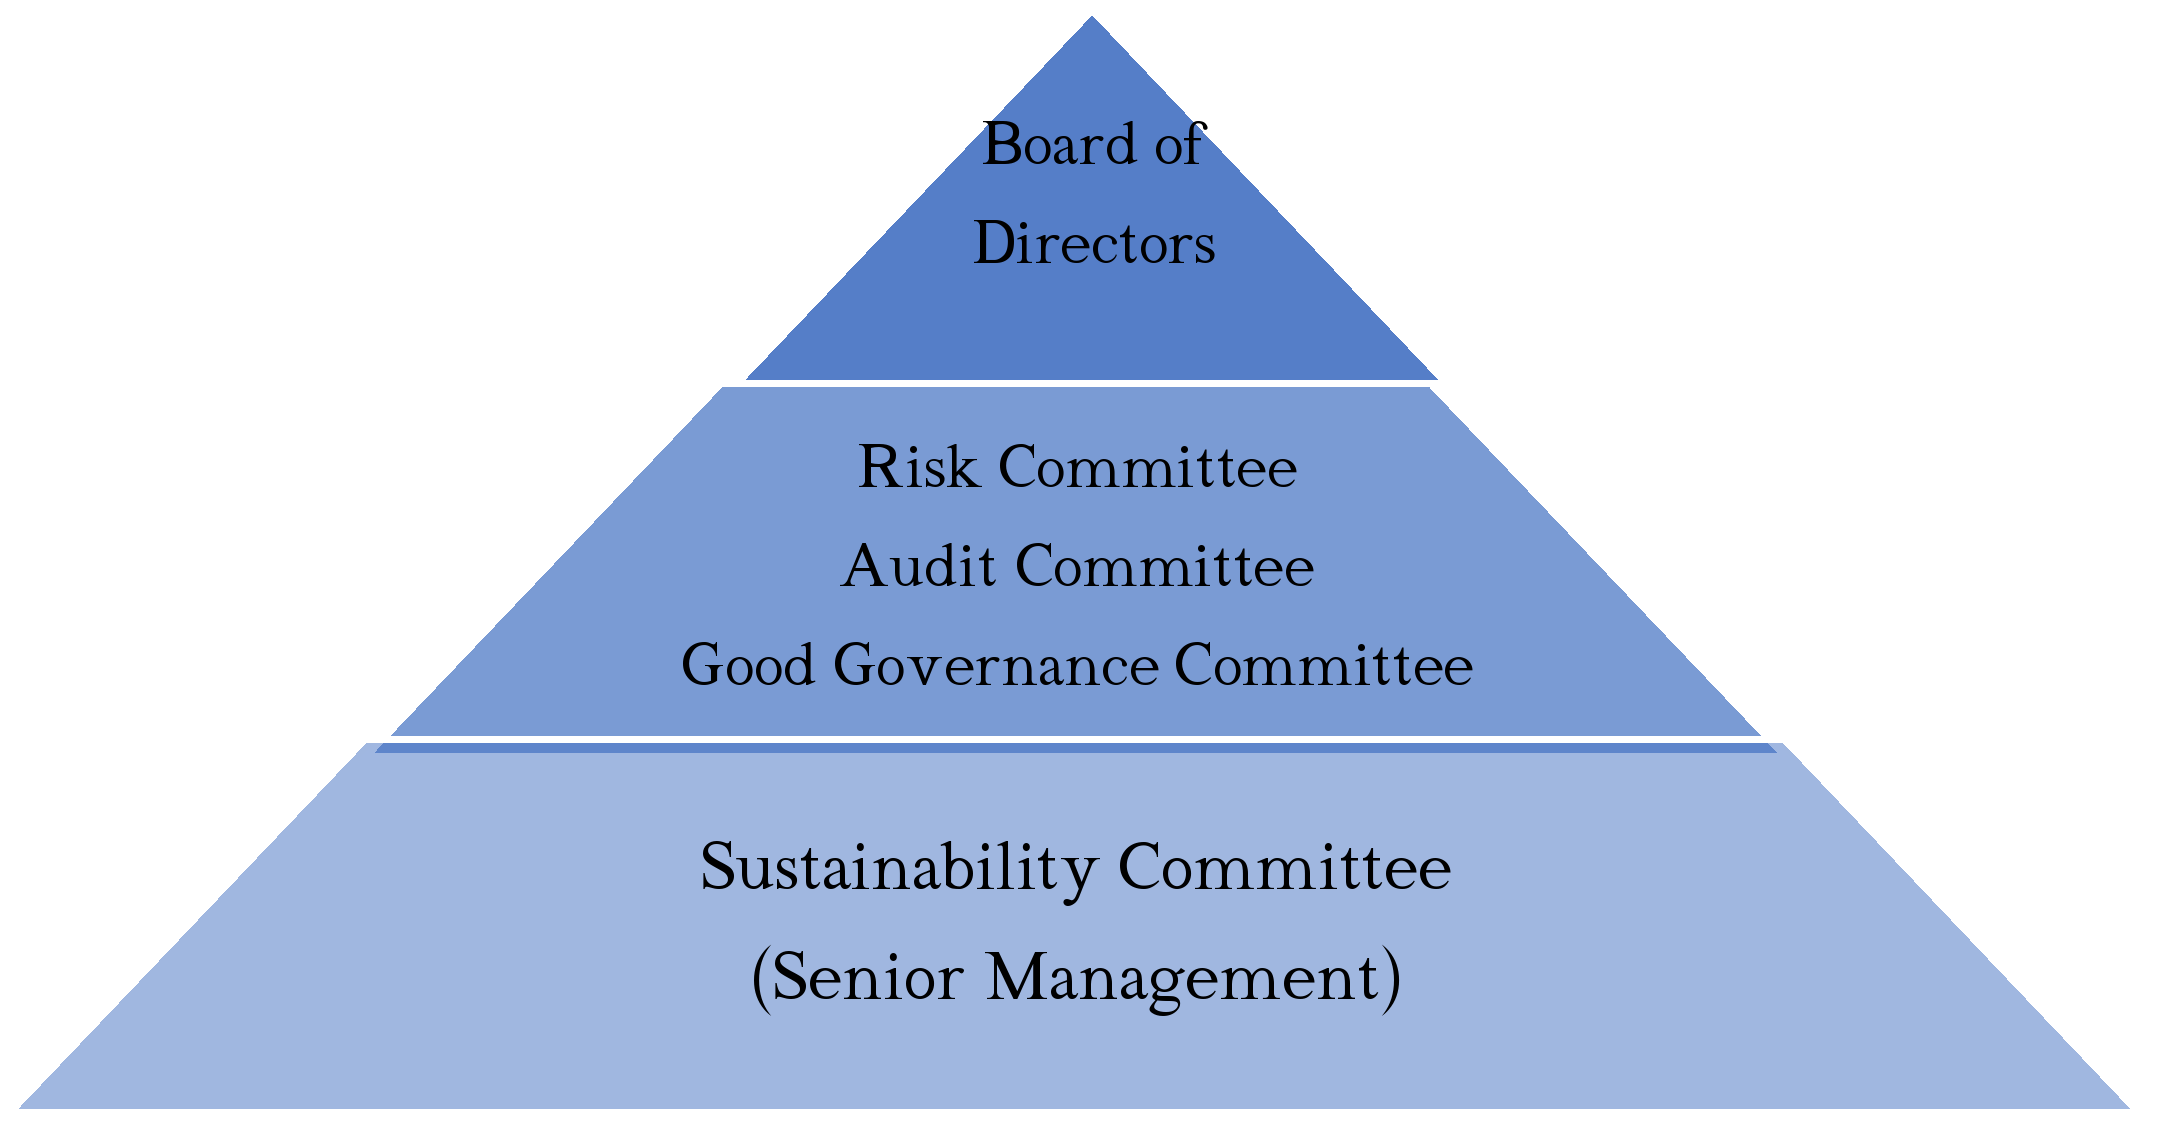
| Entity | Actions in 2024 | Sessions Held in 2024 | ||||||
| Board of Directors |
•Monitored progress on the ESG strategy.
•Was informed about ESG advancements within Bancolombia Group.
•Reviewed ESG trends, with a focus on biodiversity in the financial sector.
•Received ESG Certification on “ESG Factors as Determinants in Banking Sector Decision-Making,” provided to Board members by UPF Barcelona School of Management.
|
2 | ||||||
| Good Governance Committee |
•Approved the ESG strategy, emphasizing the Social pillar.
•Monitored compliance with ESG strategy and indicators, including climate strategy and targets.
•Was informed about the validation and certification process of ESG information disclosed in 2023, as well as the disclosure framework and work plan for 2024.
•Reviewed and provided recommendations on ESG disclosures.
•Assessed progress in defining ESG roles and responsibilities across different Bank areas and the results of the double materiality assessment.
•Reviewed the engagement policy proposal.
|
4 | ||||||
| Risk Committee |
•Monitored the corporate ESG risk strategy and exposure to sensitive industries.
•Was updated on climate change regulatory frameworks in Colombia and the United States.
•Reviewed progress in the methodology for assessing physical risks and biodiversity risks.
•Monitored the climate change strategy and reviewed the engagement policy.
•Examined the Three Lines Model for climate change, as well as updates and management of the corporate ESG policy, including the ESRA policy, the controversial business policy, and the policy on industries sensitive to climate change.
•Reviewed the ESG acceleration model, results from several Vice Presidencies, and the proposed timeline through 2026.
|
2 | ||||||
| Audit Committee |
•Reviewed ESG disclosures being integrated into management reports.
•Examined the standards used for ESG disclosures by Bancolombia Group: SASB, TCFD, and GRI.
•Identified ESG-related gaps and reviewed action plans to address them.
•Reviewed the business ambition for 2030 and the sustainable business framework.
|
2 | ||||||
| Sustainability Committee |
•Monitored the implementation and compliance of the ESG strategy.
•Tracked progress on legal compliance regarding ESG information disclosure.
•Reviewed and approved Bancolombia’s engagement policy and its disclosure.
•Was informed about the implications of biodiversity for the financial sector.
|
2 | ||||||
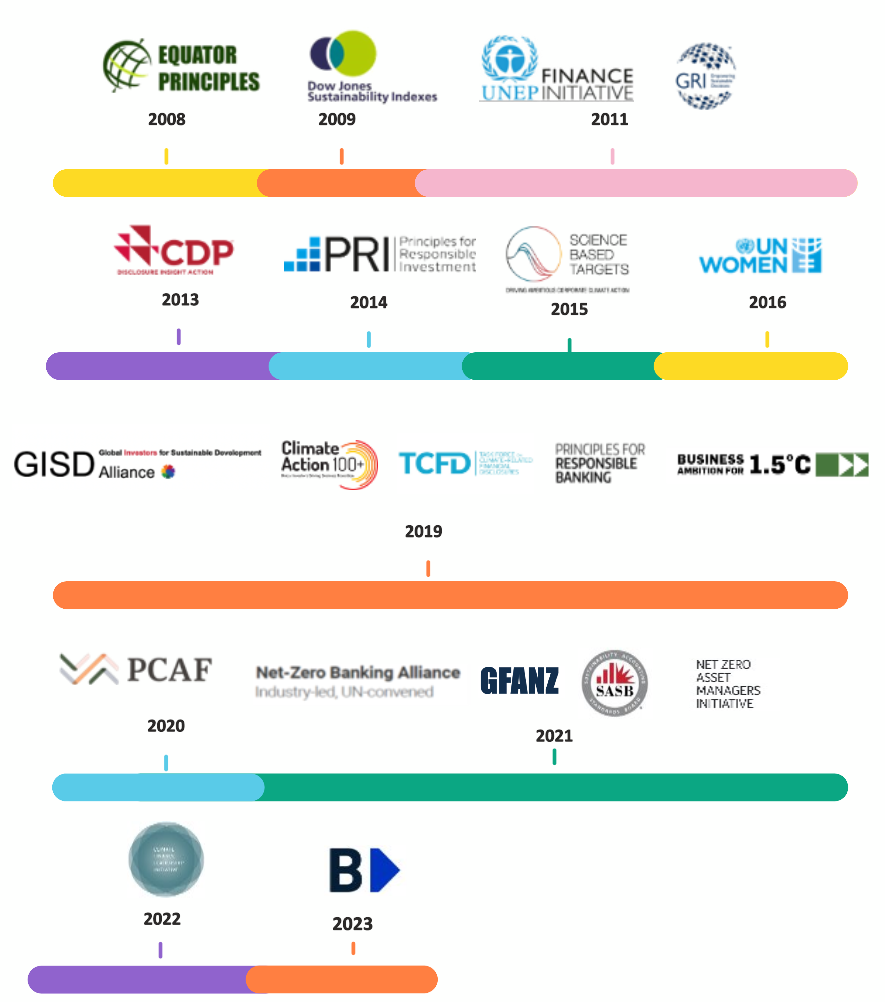
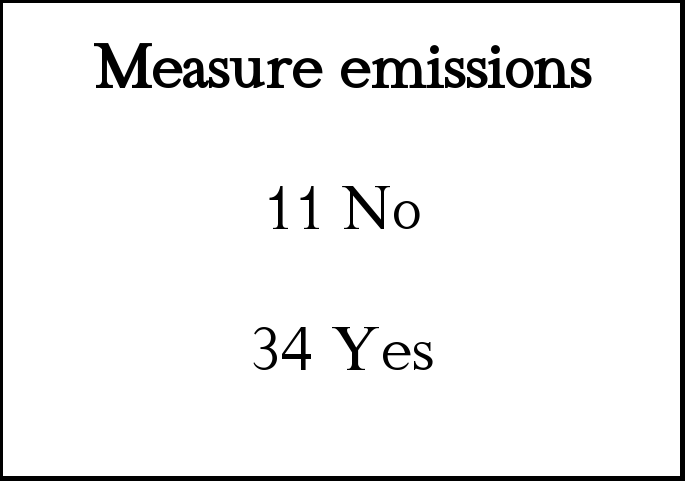
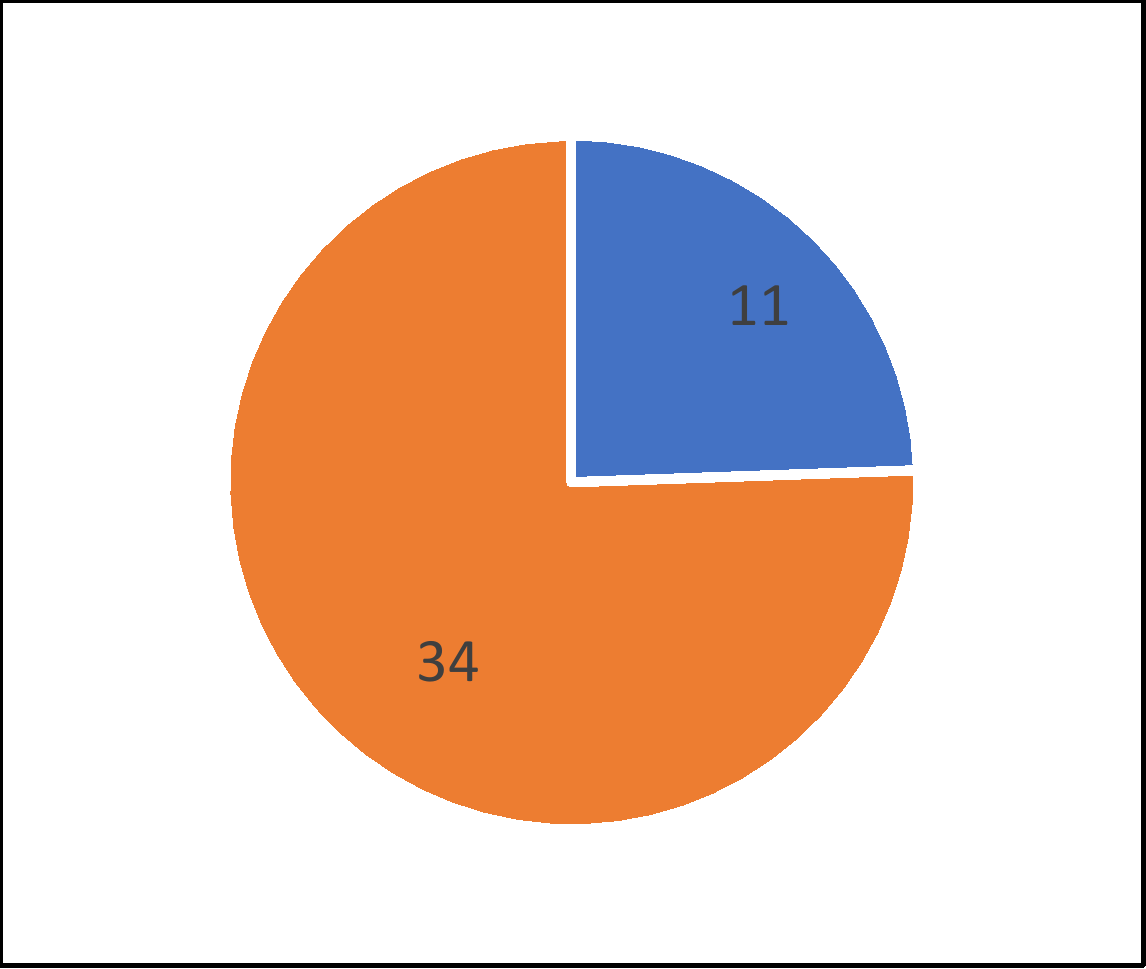
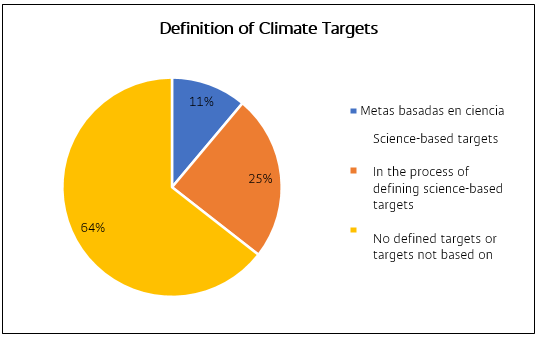
| Sector | 2024 Portfolio Exposure* | ||||
| Coal mining | 0.02% | ||||
| Other mining | 0.24% | ||||
| Coal-fired electricity | 0.27% | ||||
| Electricity from other sources | 5.05% | ||||
| Cement | 0.29% | ||||
| Oil & gas | 1.11% | ||||
| Steel | 0.13% | ||||
| Livestock | 0.26% | ||||
| Transport | 2.23% | ||||
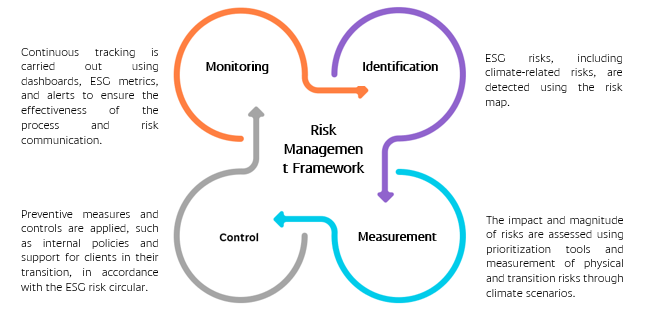
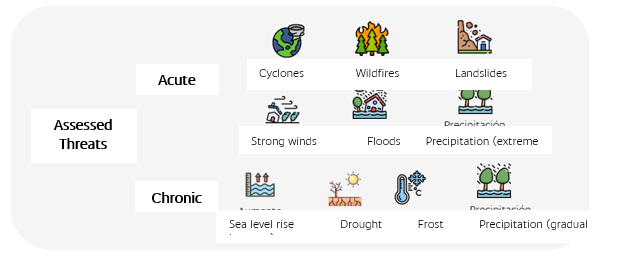
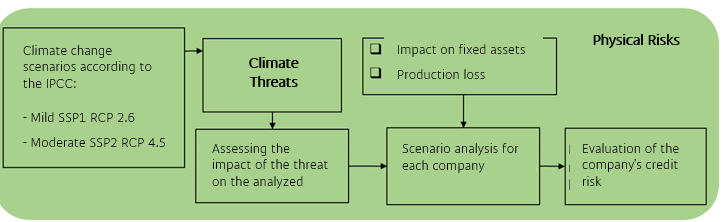
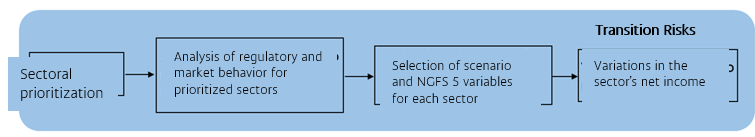
| Country | Number of Cases Conducted | Amount Evaluated (COP trillions) | ||||||
| Colombia | 127 | 18.93 | ||||||
| Guatemala | 49 | 5.13 | ||||||
| El Salvador | 25 | 2.73 | ||||||
| Panama | 15 | 0.49 | ||||||
| 2024 Target (COP Trillions) | 2024 Disbursements (COP Trillions) | 2024 Compliance | ||||||
| 3.86 | 5.41 | 140% | ||||||
| Country |
Scope 1 Emissions
tCO2/year
|
Scope 2 Emissions
tCO2/year (Market Based)
|
Scope 3 Emissions (categories 1, 4, 6)
tCO2/year
|
||||||||
| Bancolombia Group | 667.55 | 4,135.66 | 1,545.37 | ||||||||
| Bancolombia | 465.96 | 0 | 1,178.25 | ||||||||
| Banistmo | 18.09 | 0 | 139.56 | ||||||||
| Banco Agrícola | 121.85 | 2,686.07 | 130.82 | ||||||||
| Banco Agromercantil | 61.64 | 1,449.58 | 96.75 | ||||||||
Country |
Self-Generated Energy
kWh/year
|
RECs |
||||||
Bancolombia Group |
1,211,900.4 |
71,639,998 |
||||||
Bancolombia |
678,399.55 |
60,802,893.5 |
||||||
Banistmo |
48,750 |
9,171,614.7 |
||||||
Banco Agrícola |
462,010.9 |
0 |
||||||
| Banco Agromercantil | 22,740 | 1,665,489.8 | ||||||
| Year | Financed Emissions – Commercial Loan Portfolio (MtCO2)* |
Financed Emissions – Assets Under Management (MtCO2)* |
||||||
| 2023 | 15.6 | 0.16 | ||||||
| Sector | 2023 Result | 2030 Target | ||||||
| Cement | 0.63 tCO2/t |
0.52 tCO2/t |
||||||
| Energy - Commercial Loans | 0.24 tCO2/MWh |
0.06 tCO2/MWh |
||||||
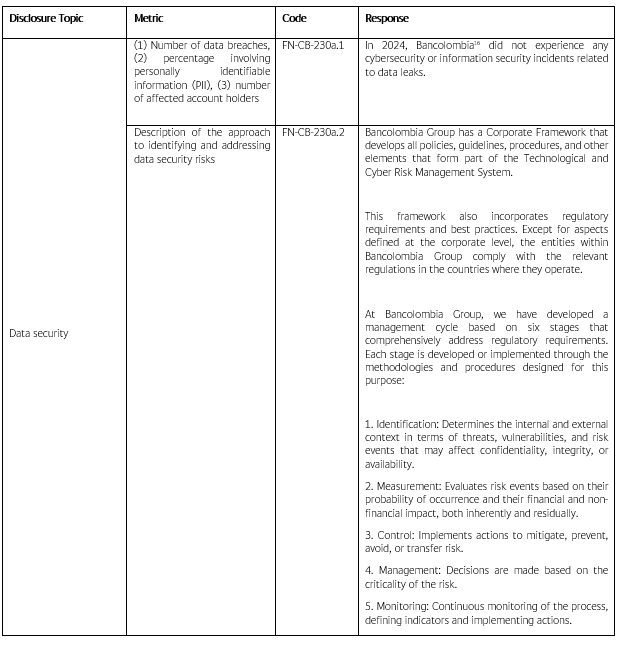
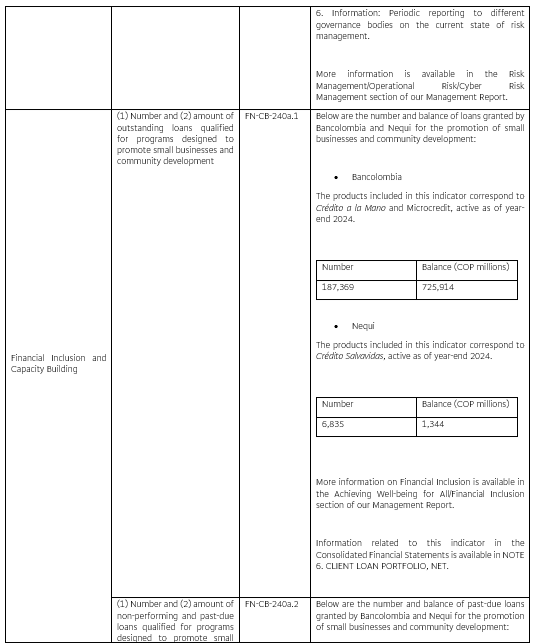
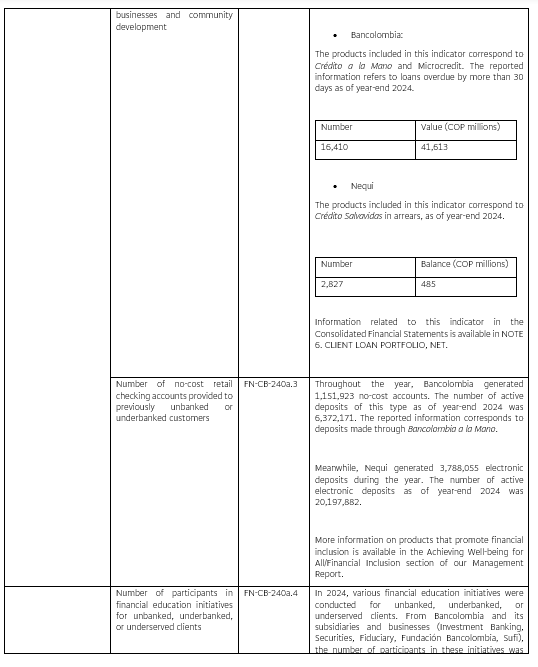
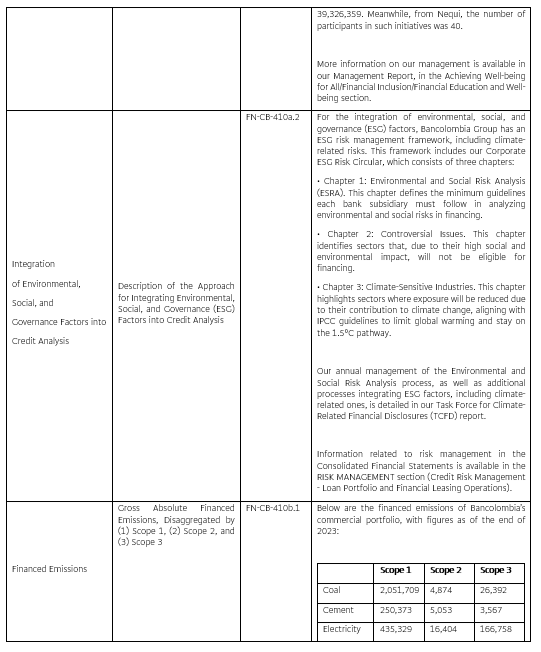
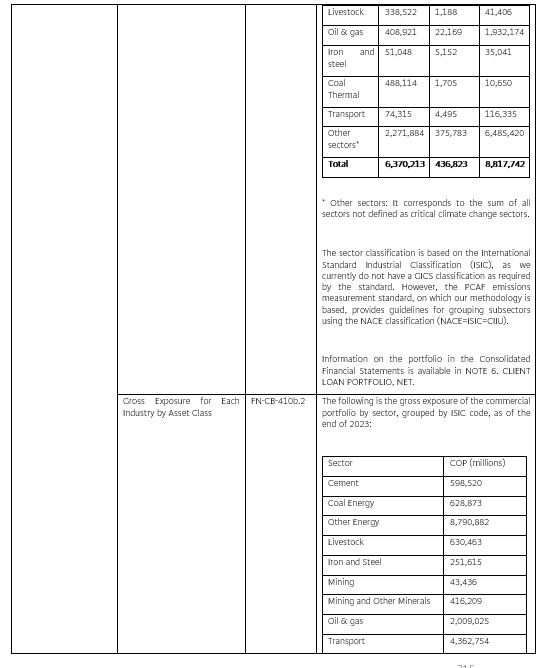
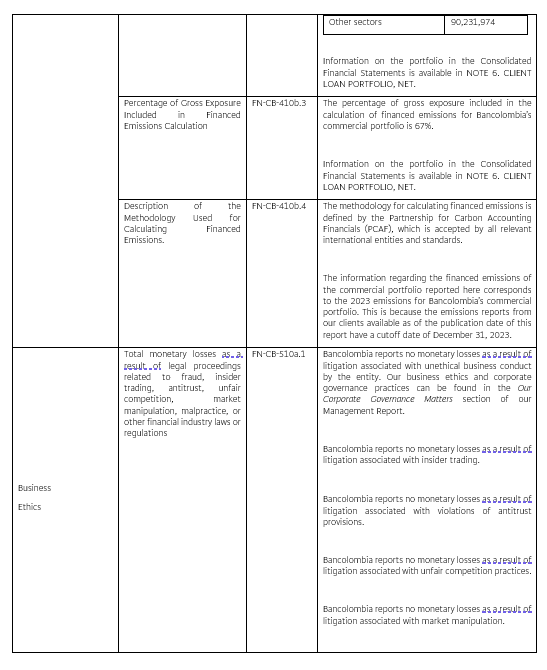
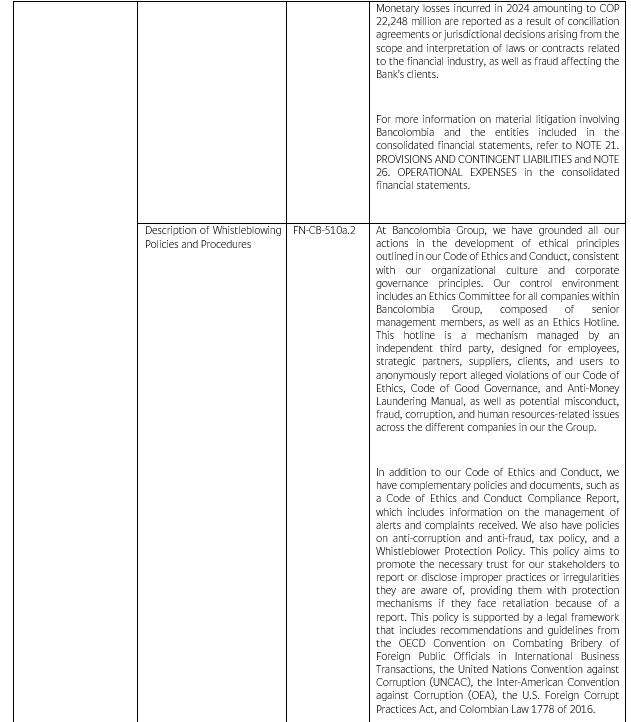
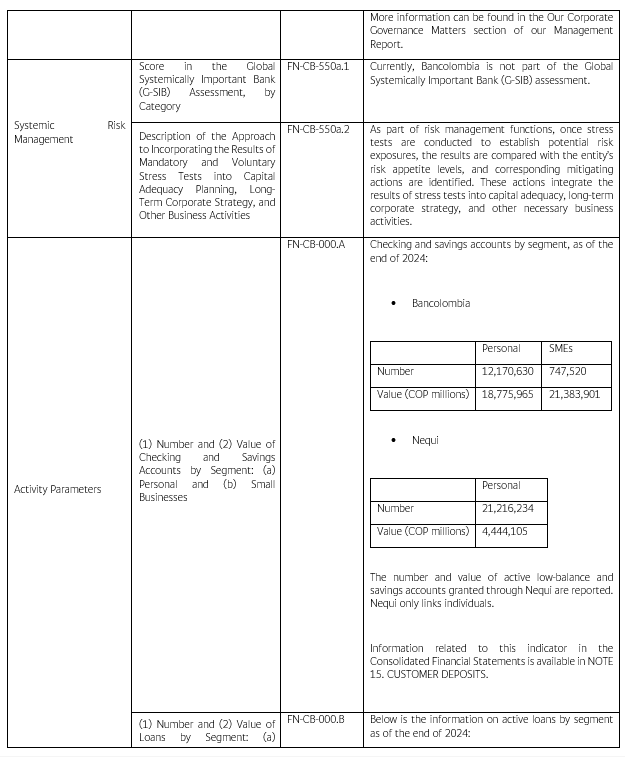


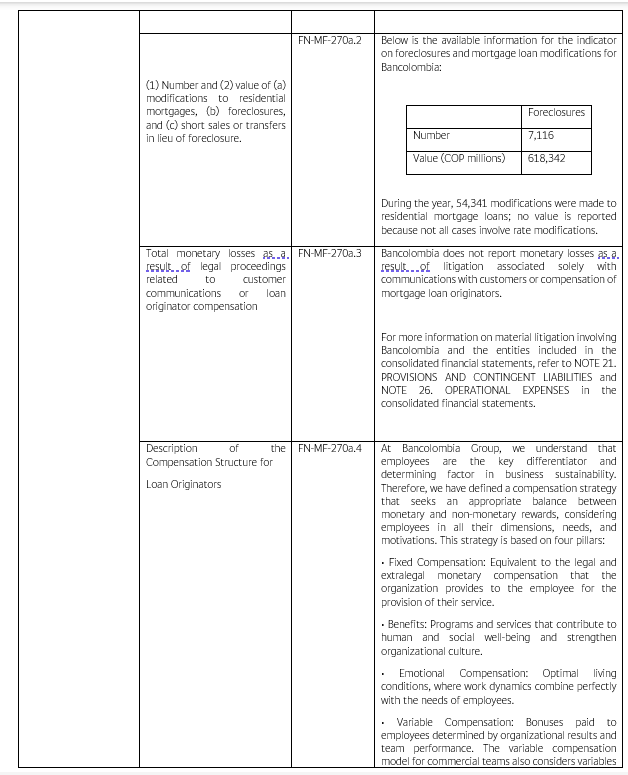
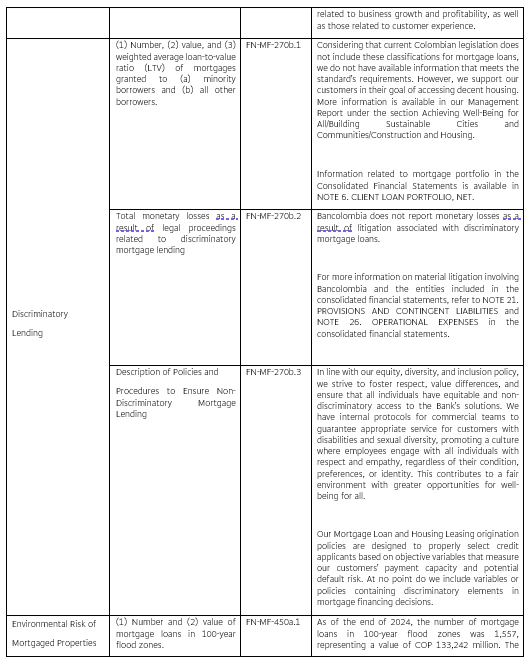
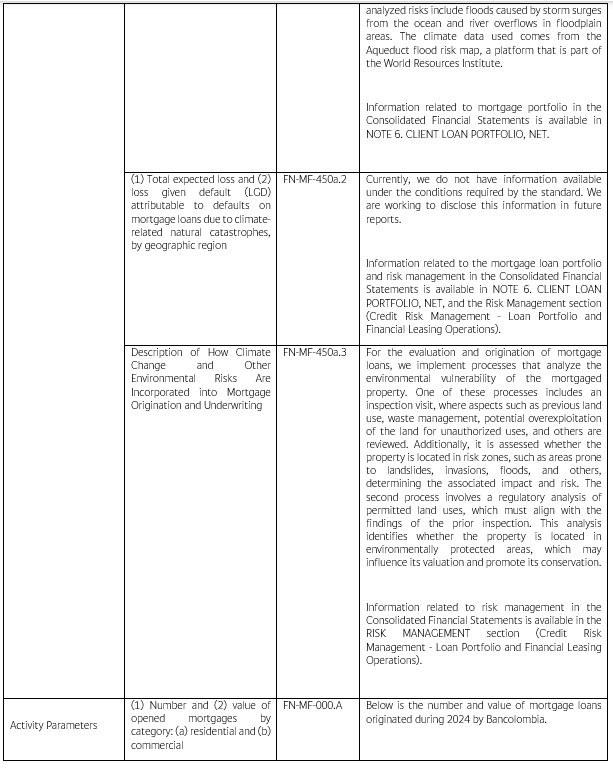
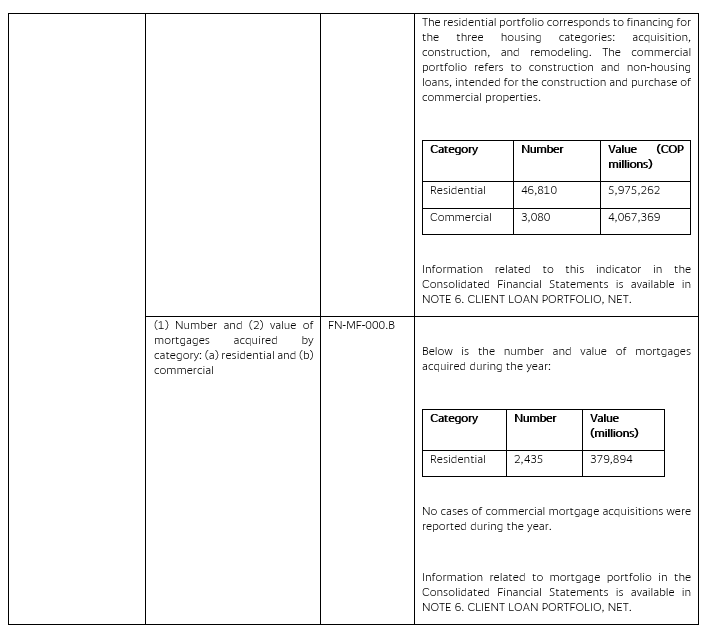
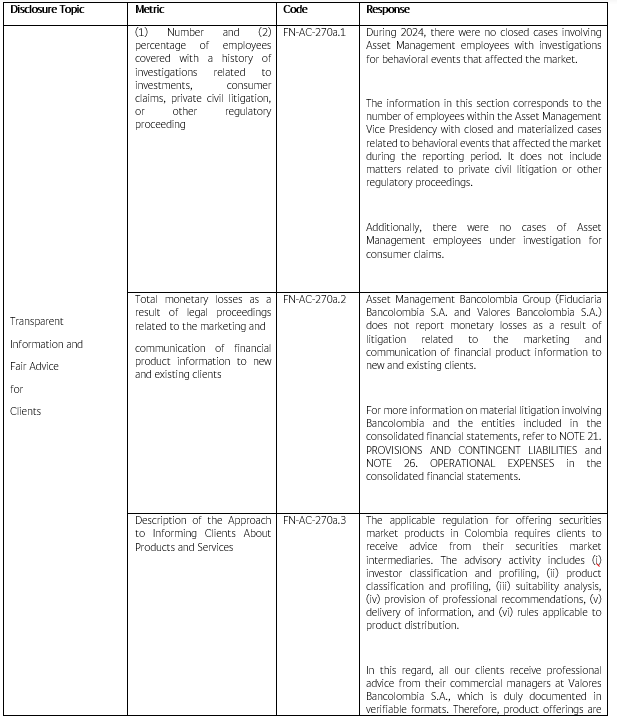
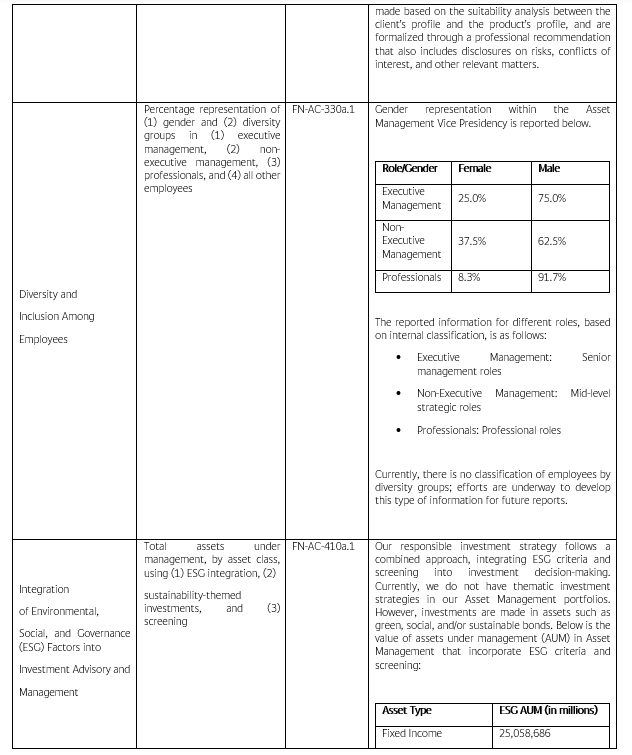
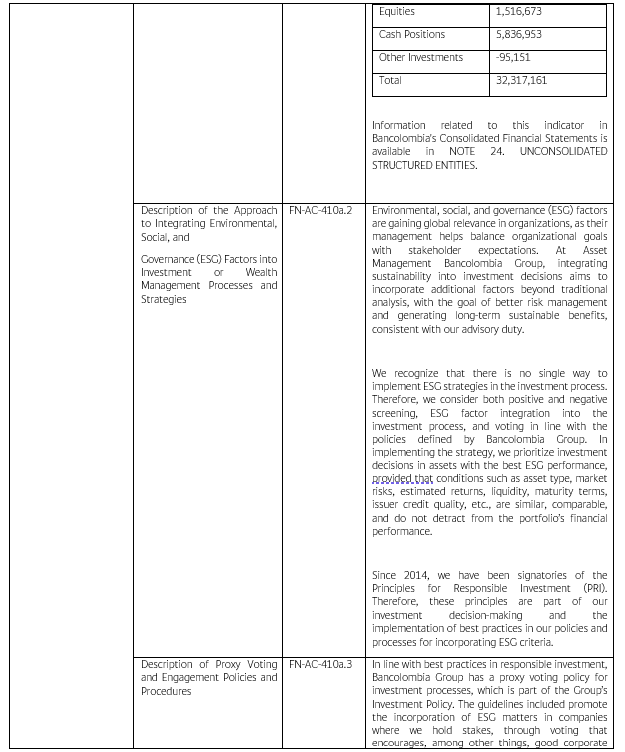
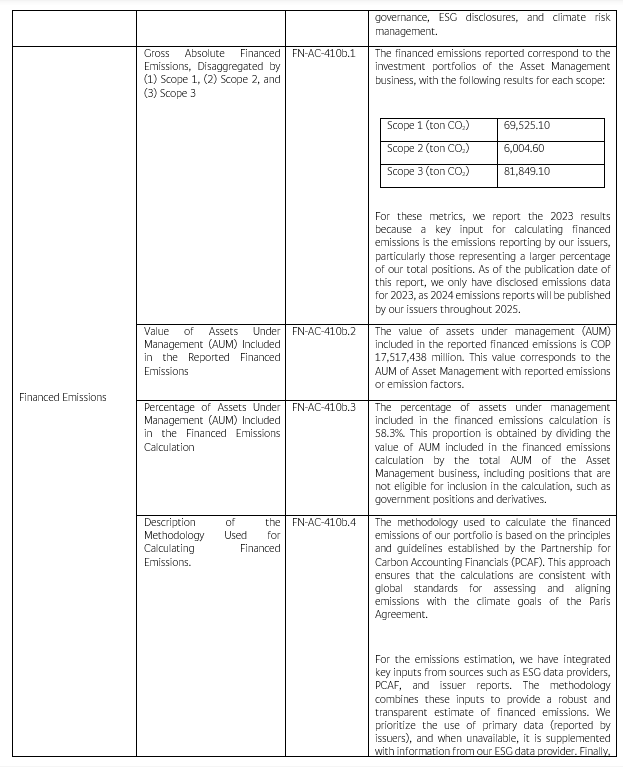
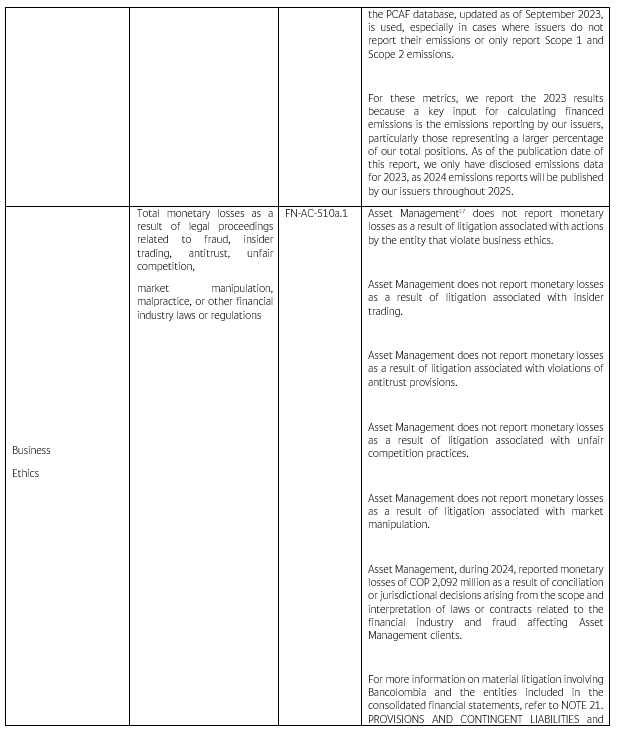
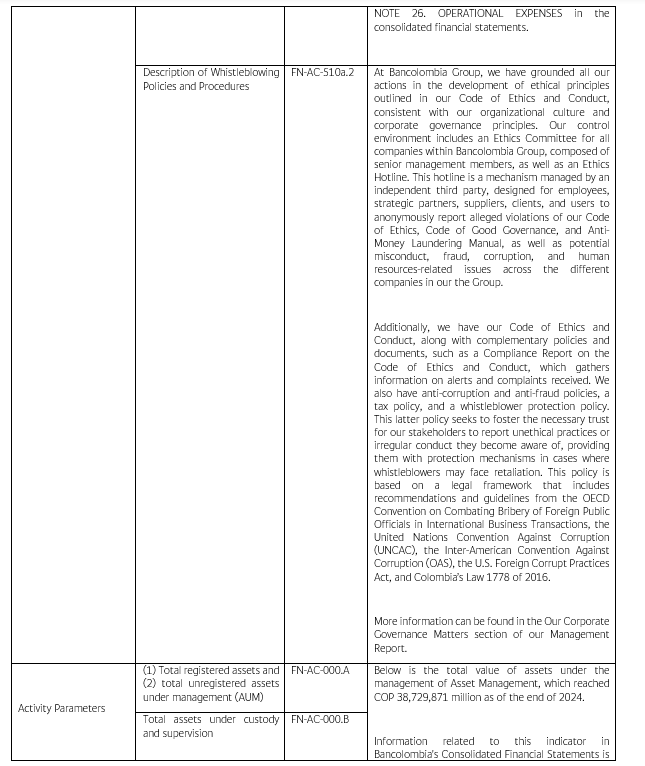

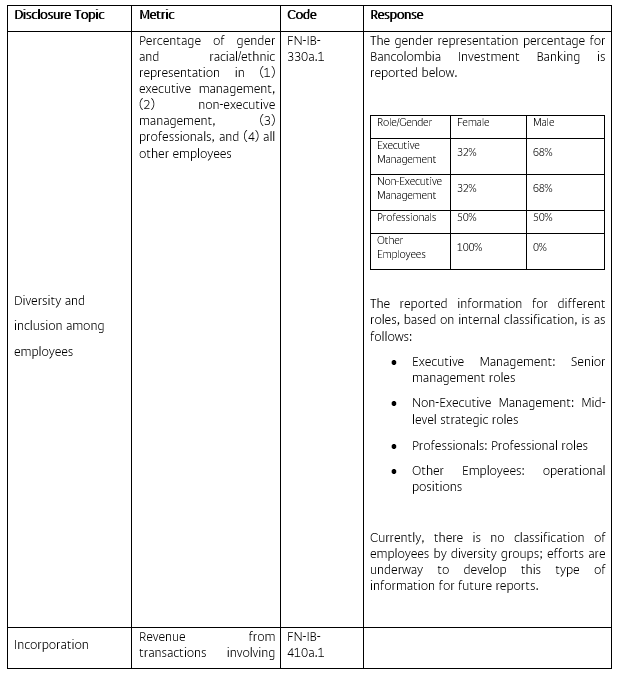
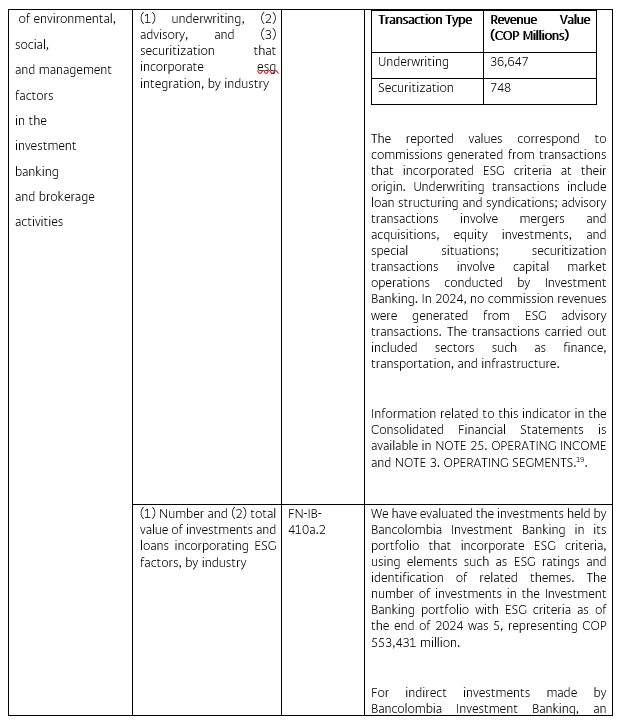
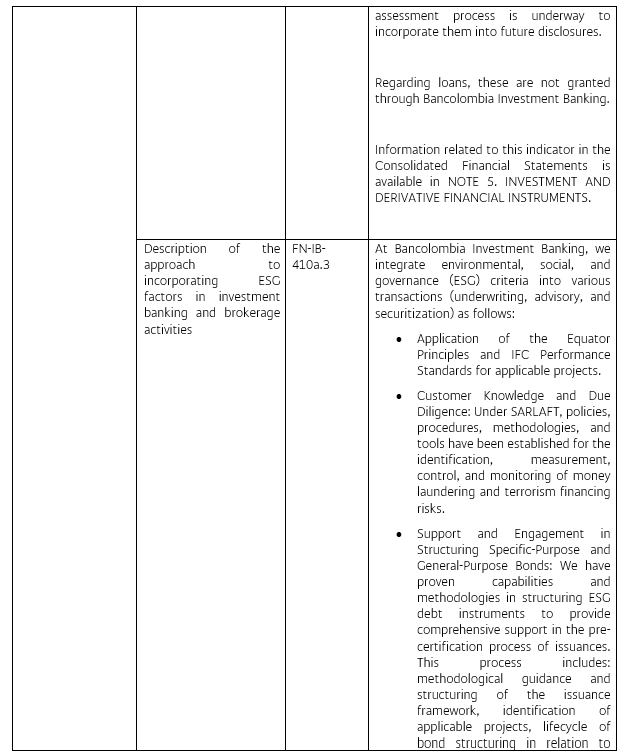
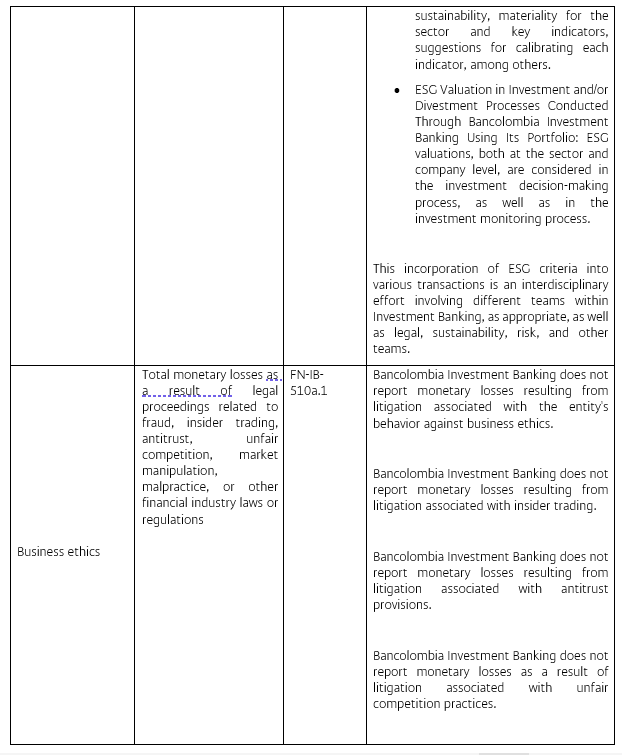
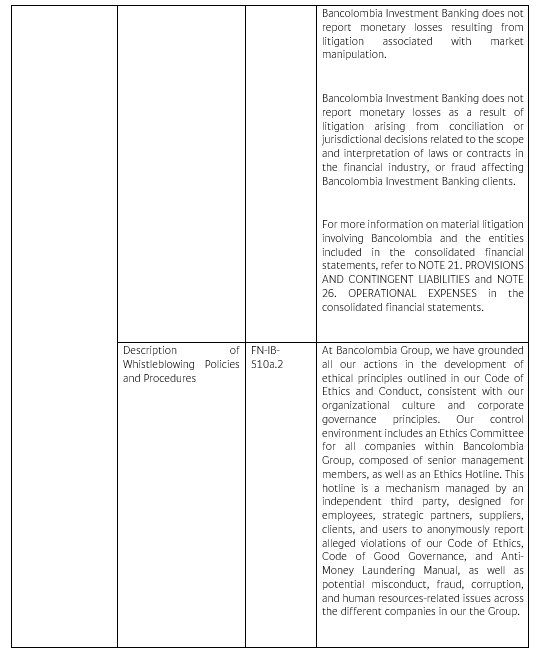
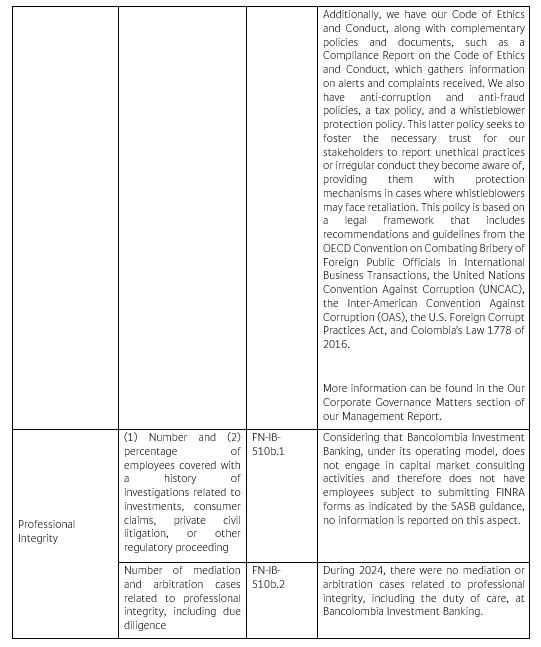
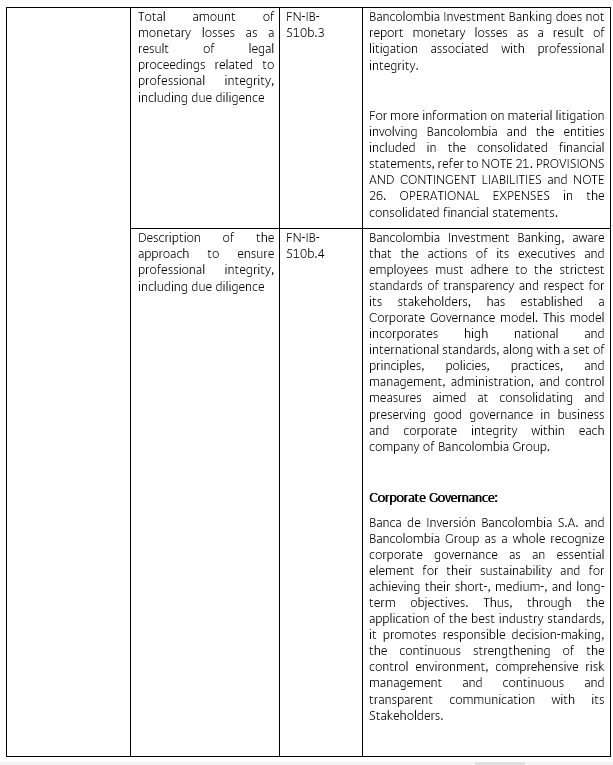
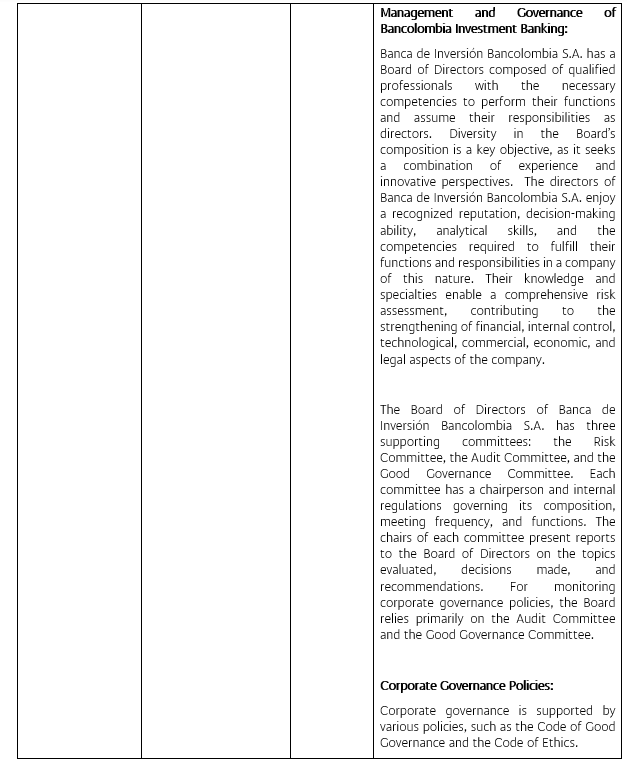
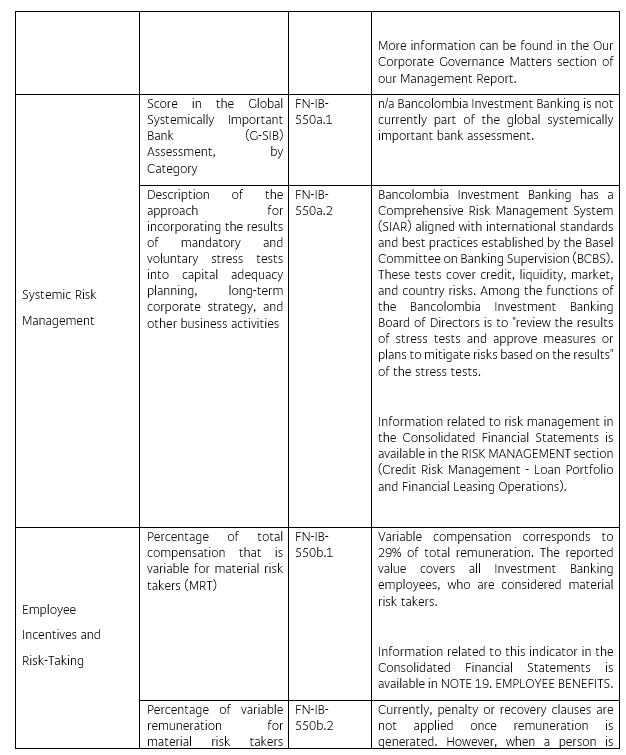
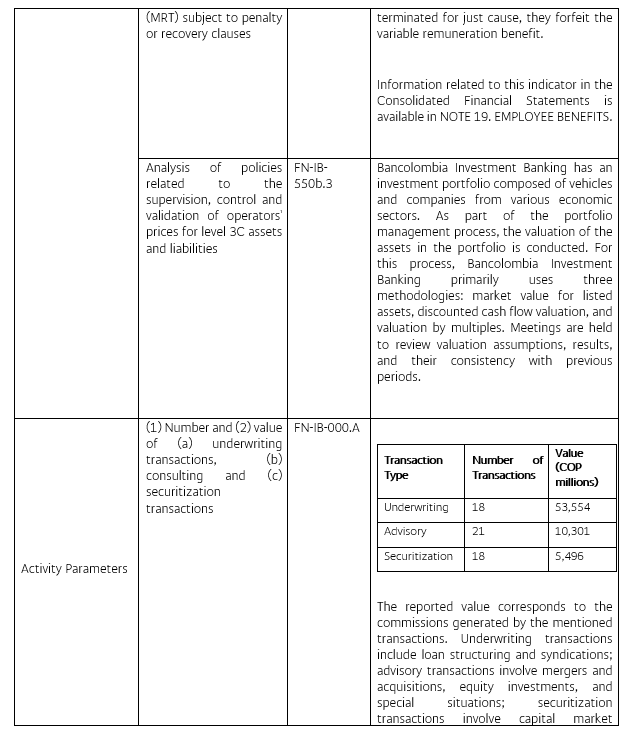
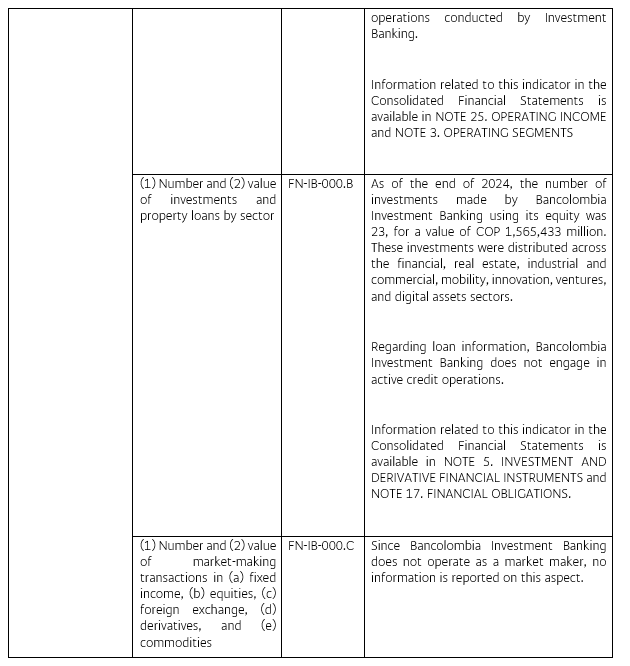
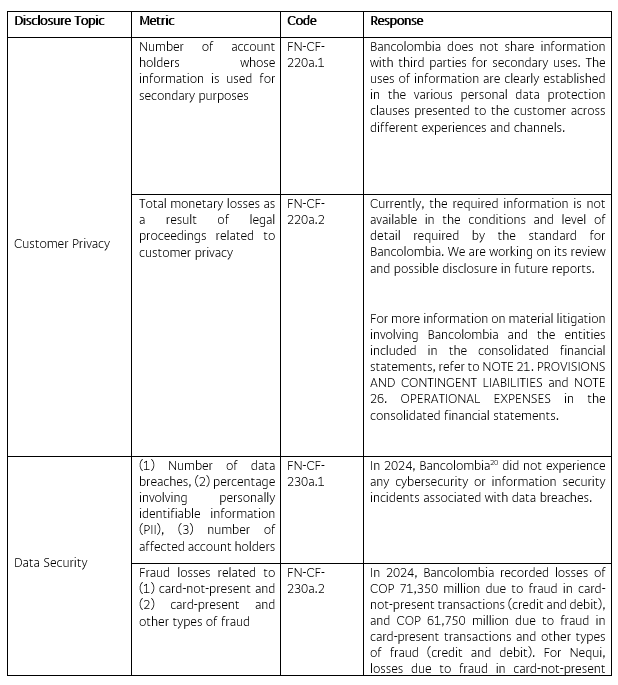
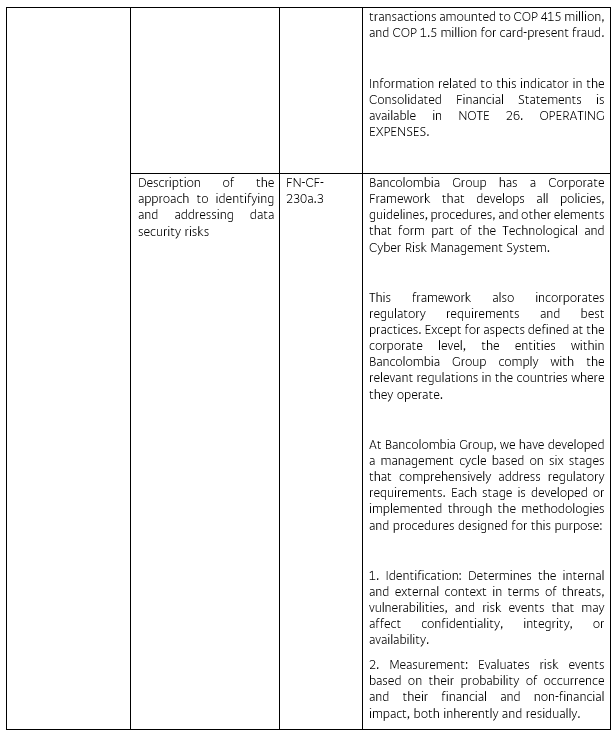
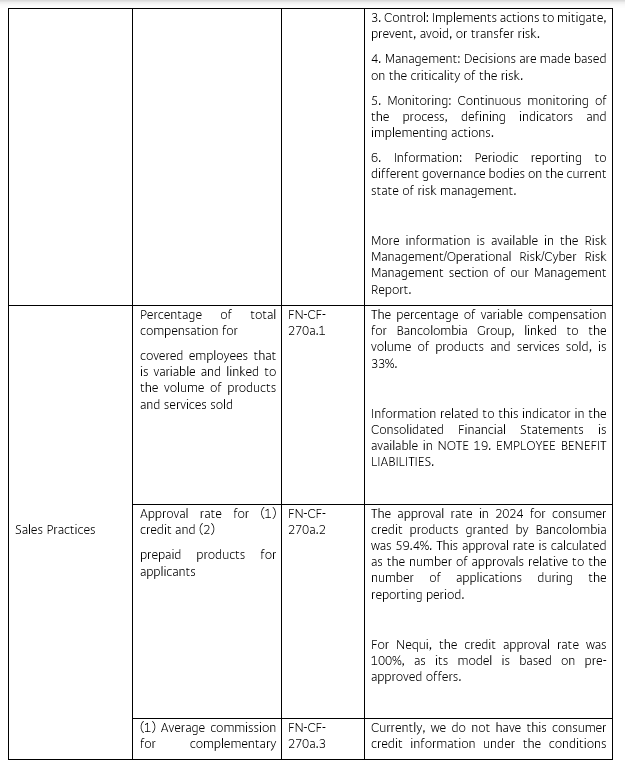
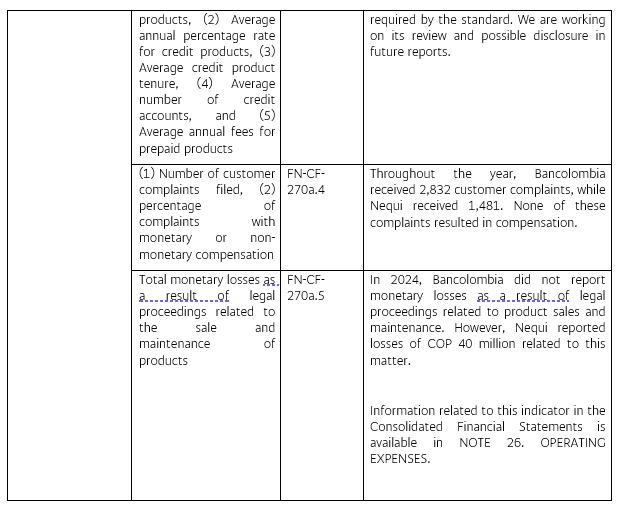
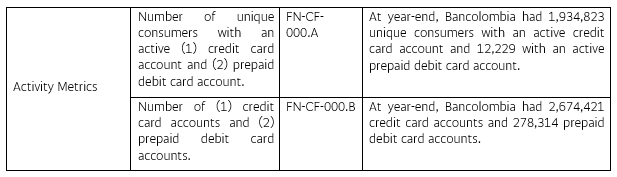
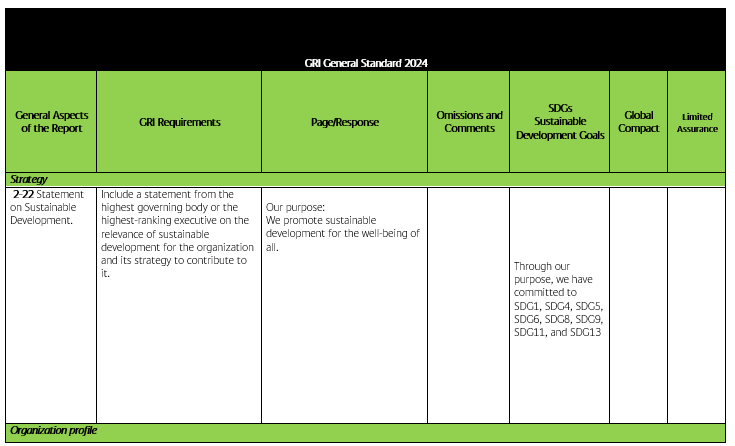
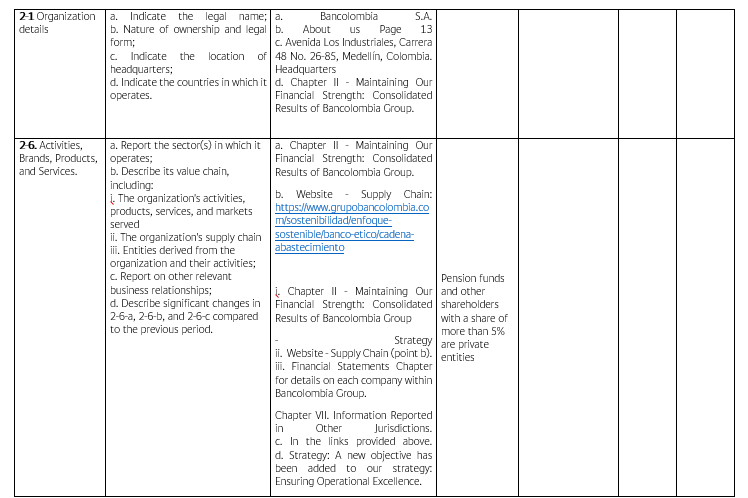
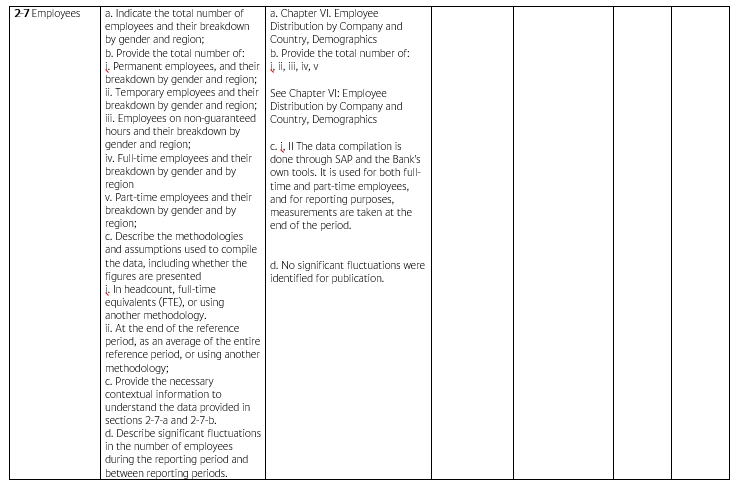
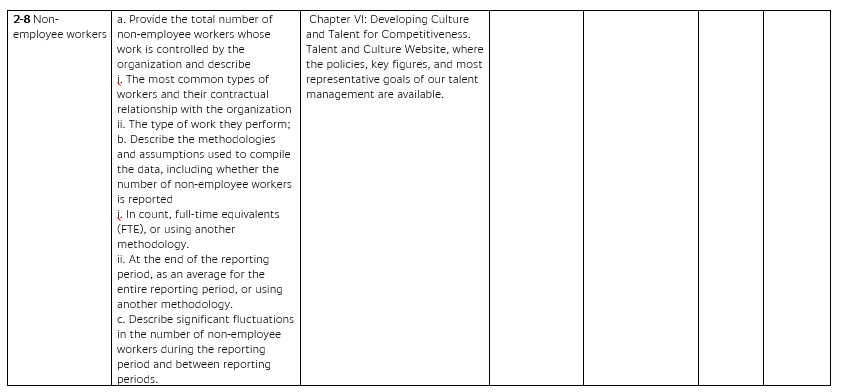
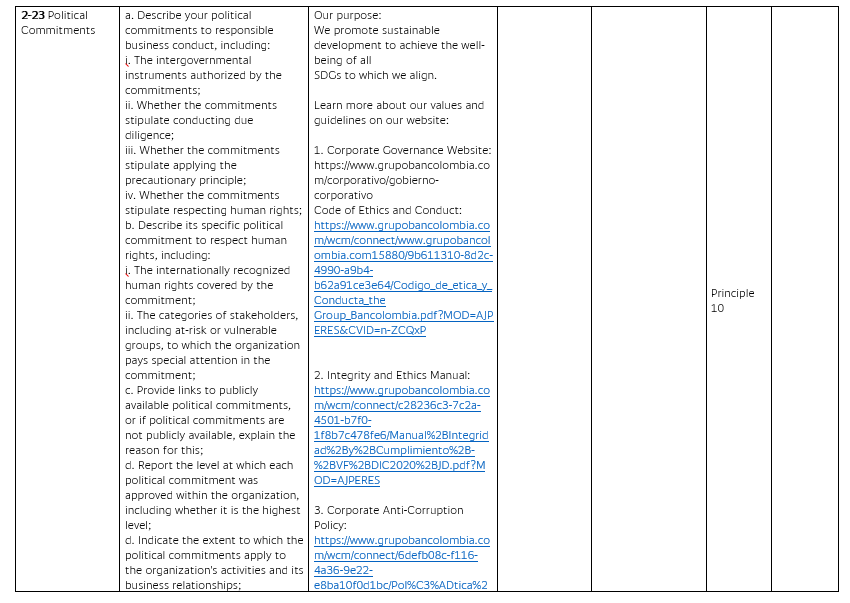
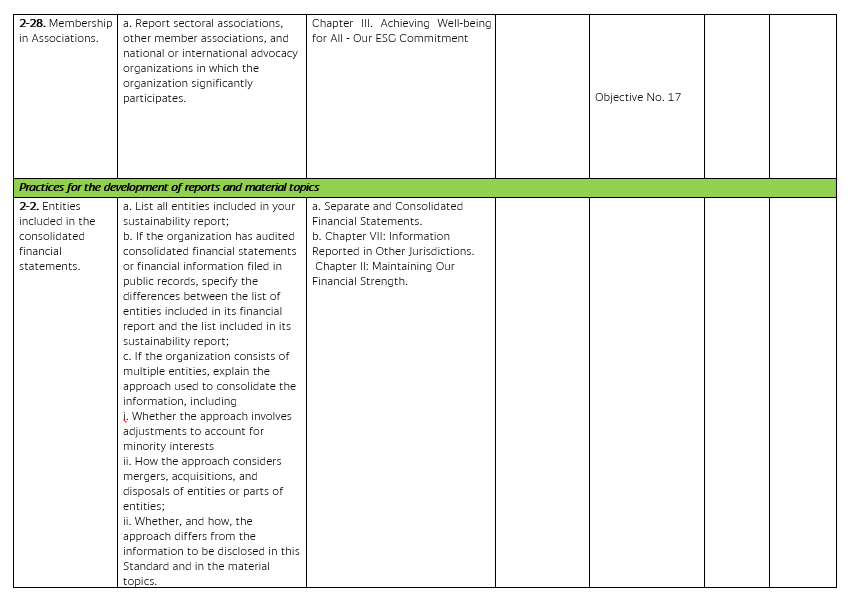
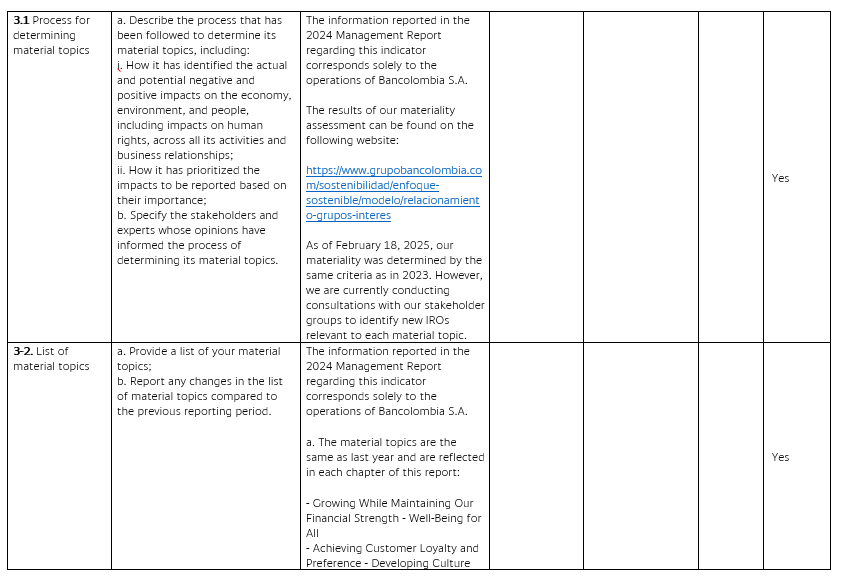
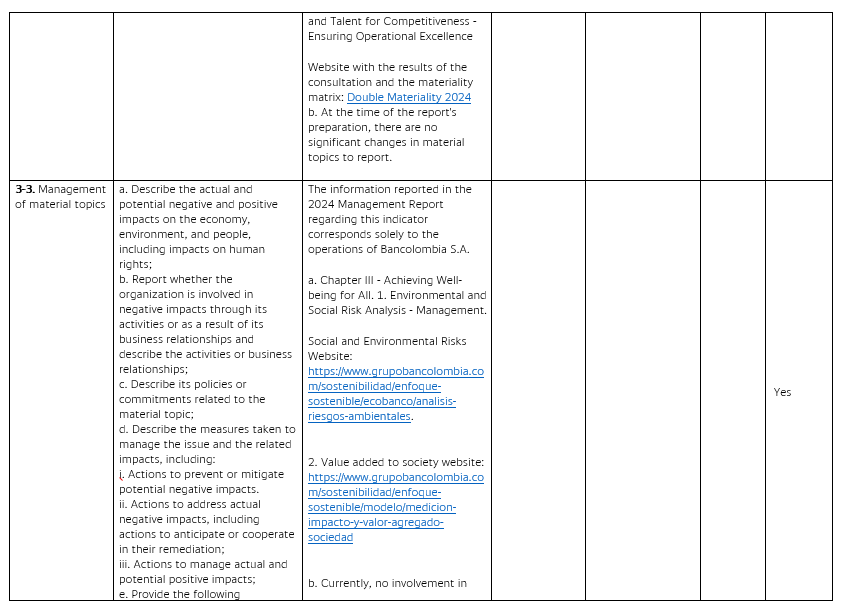
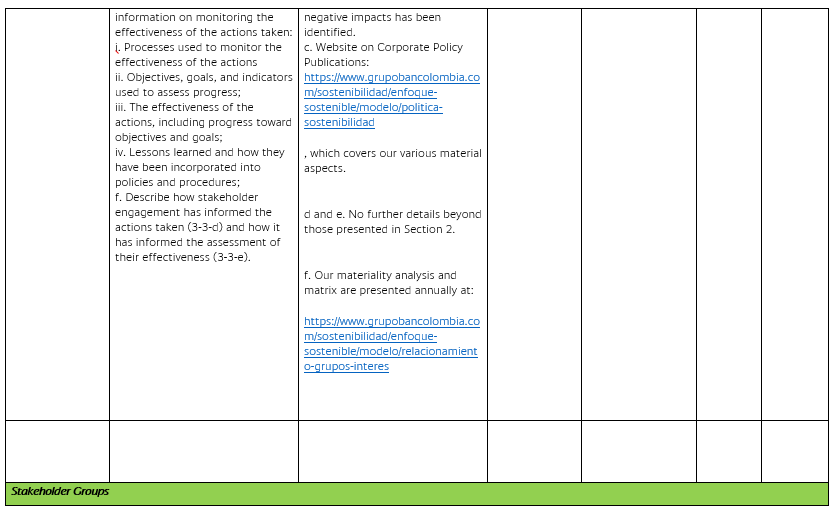
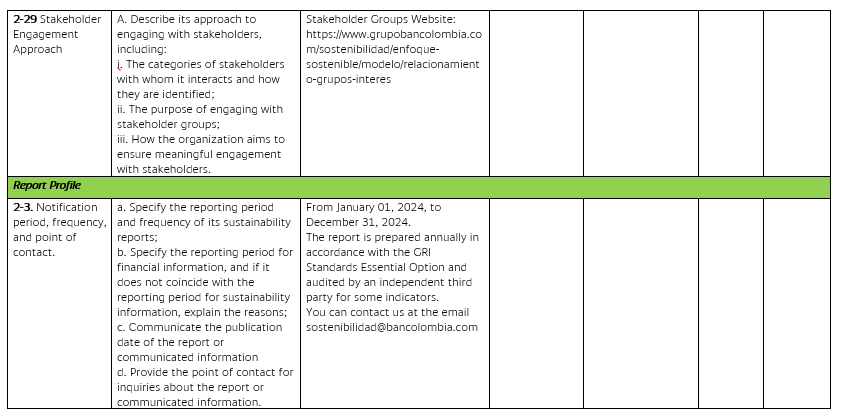
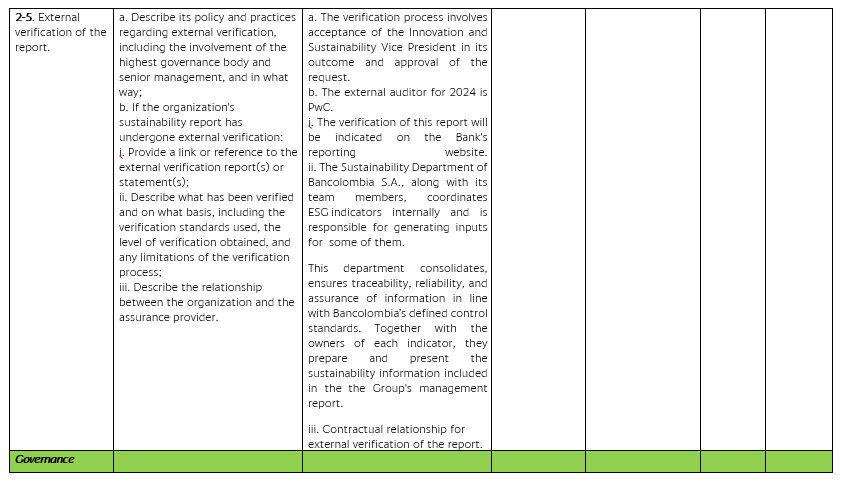
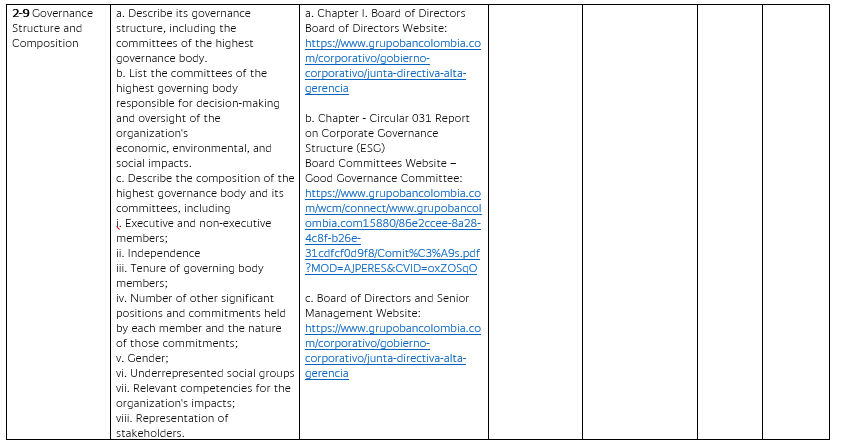

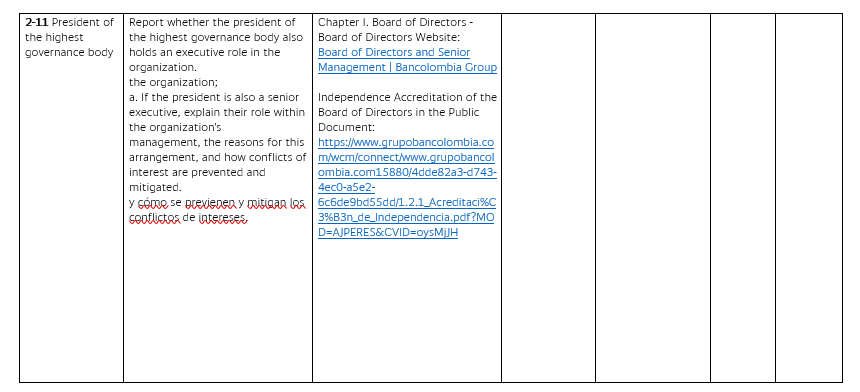
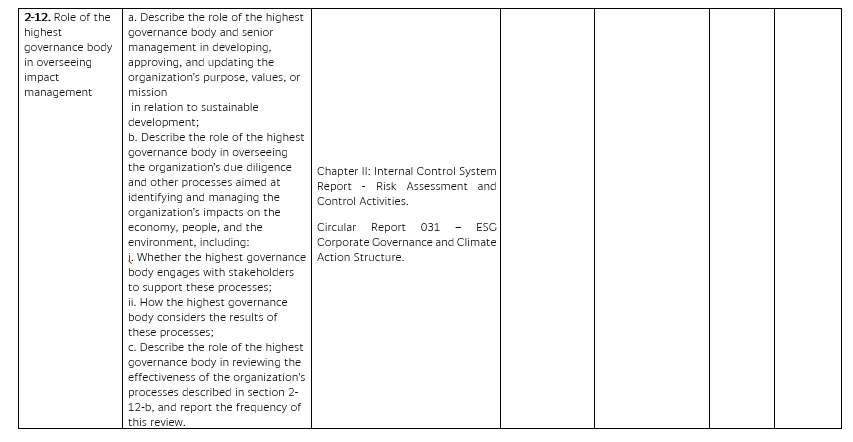
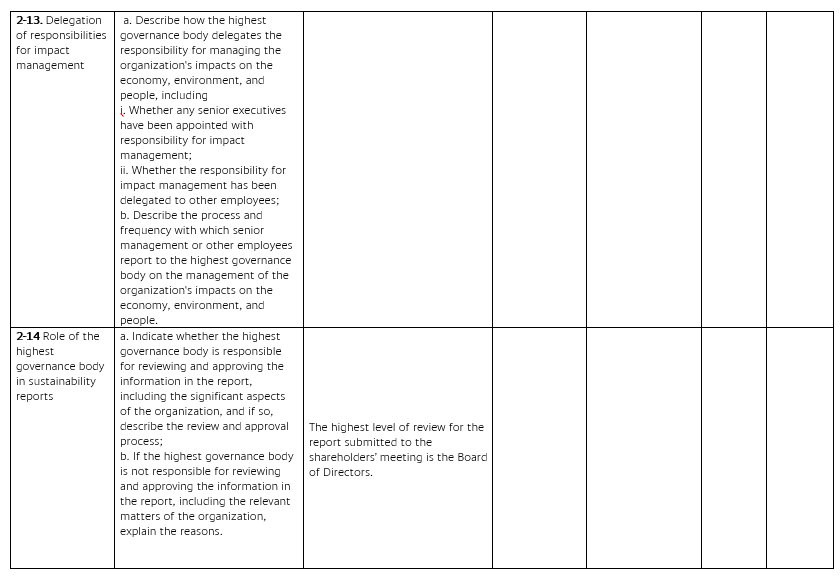
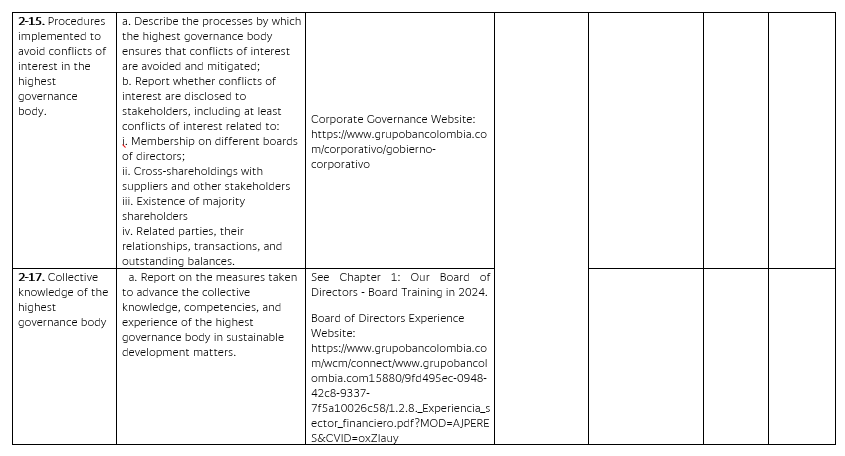

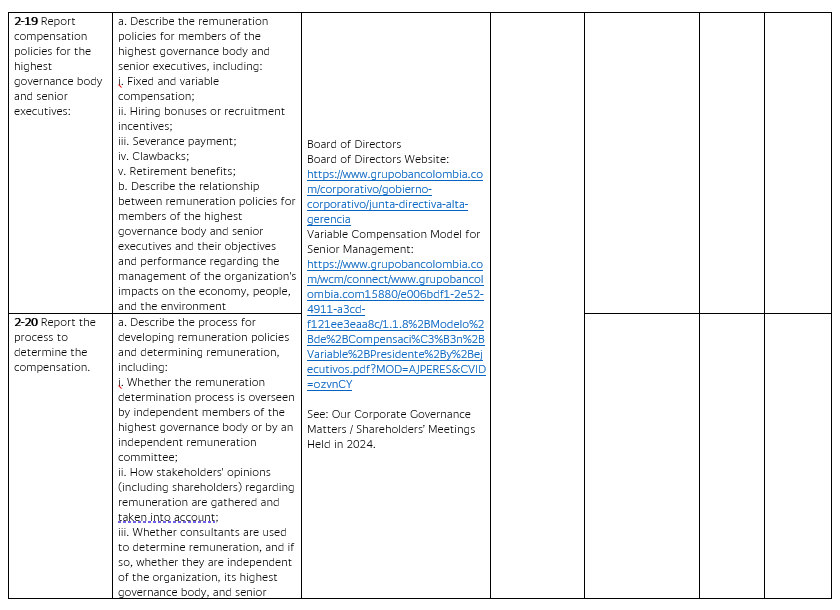
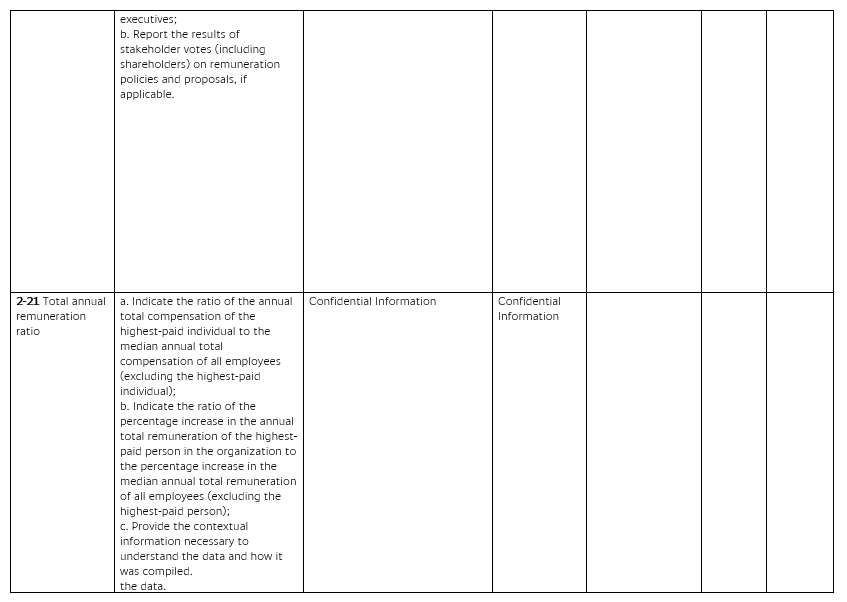
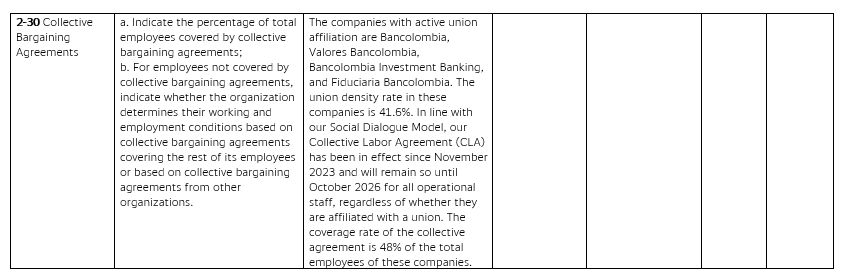
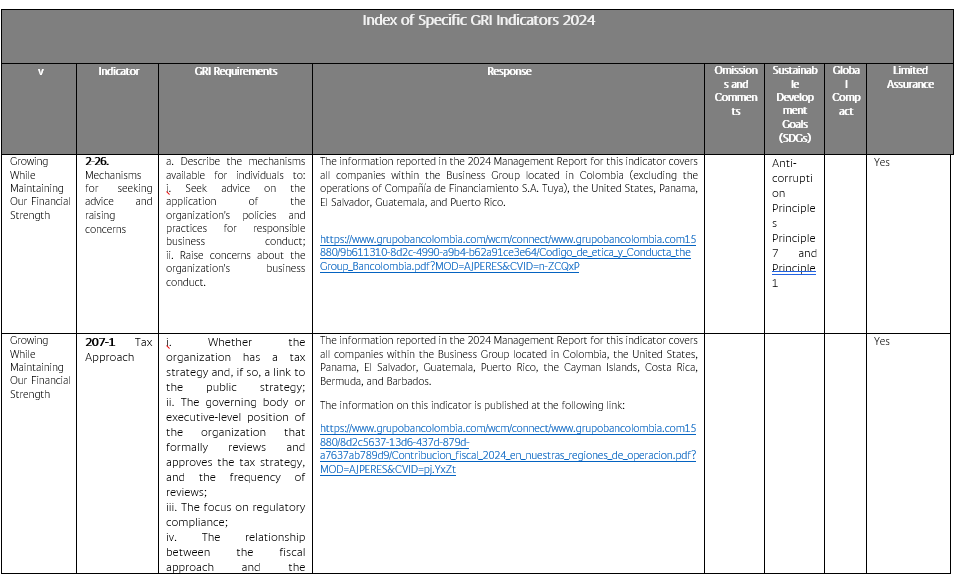
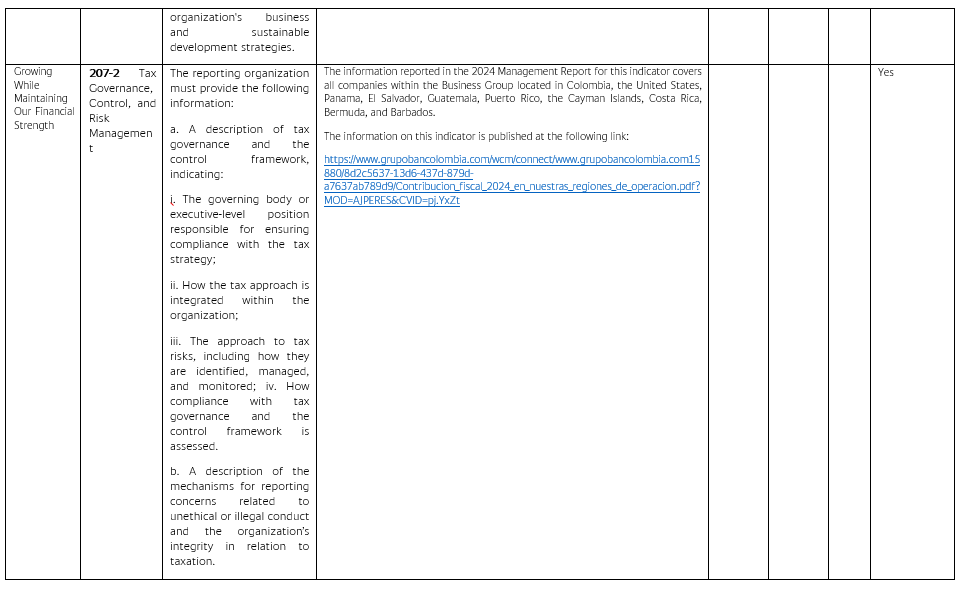
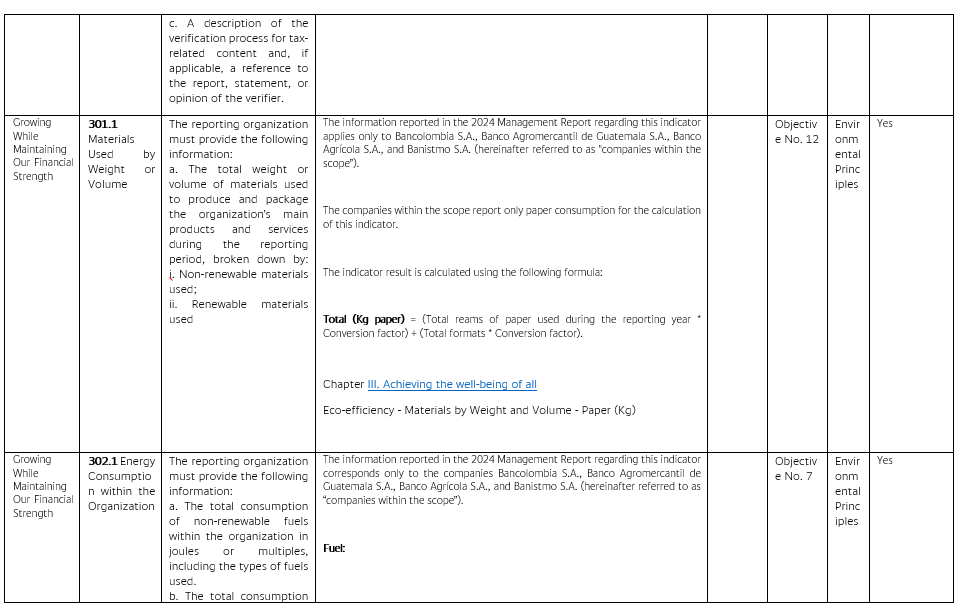

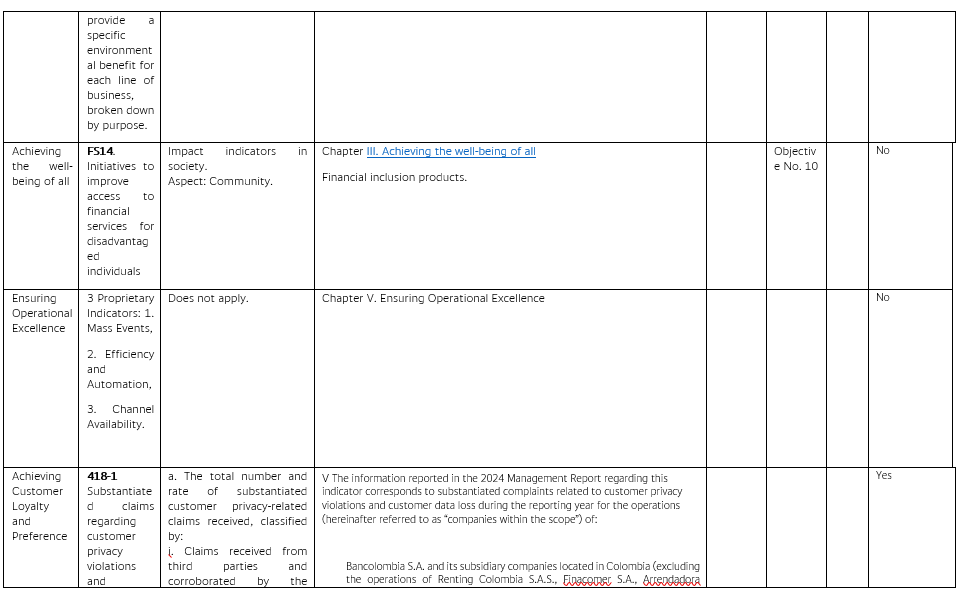
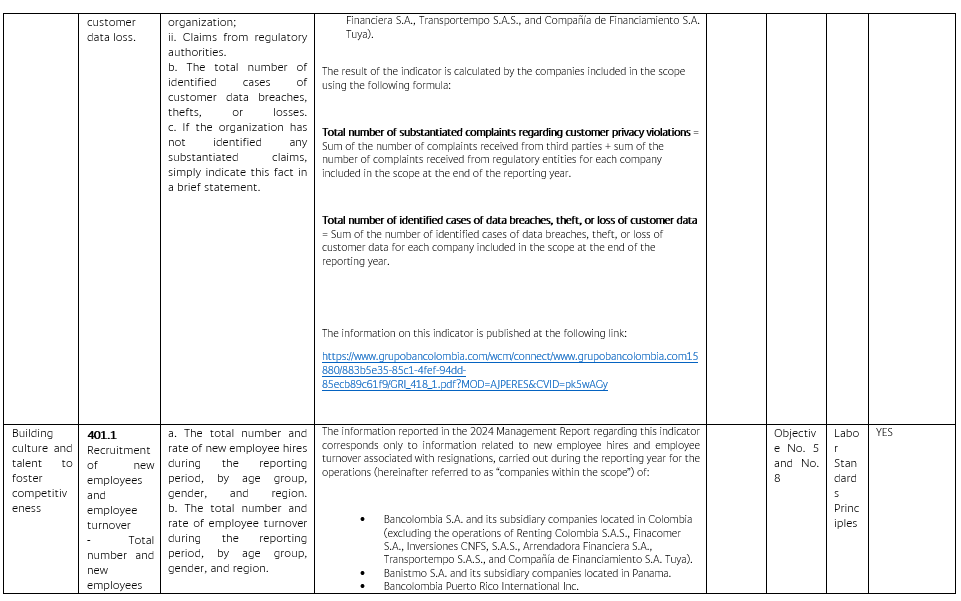
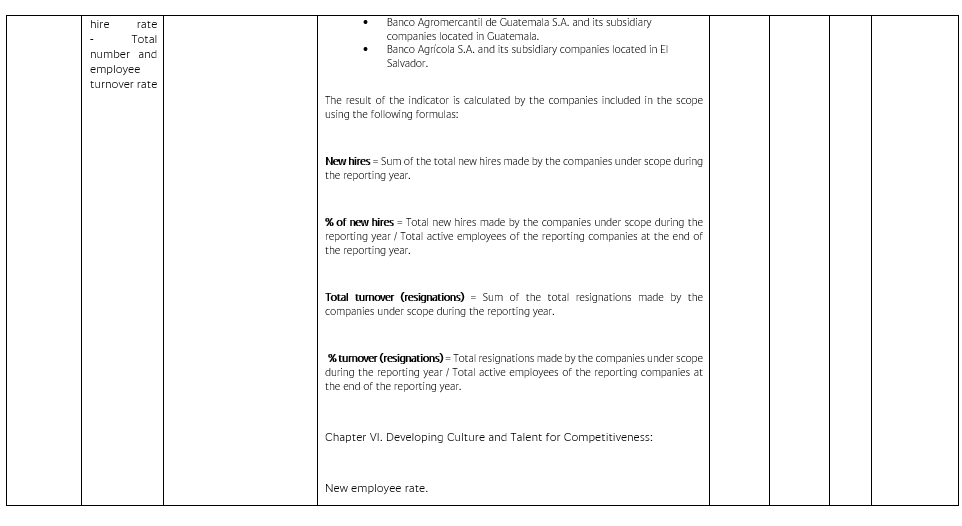
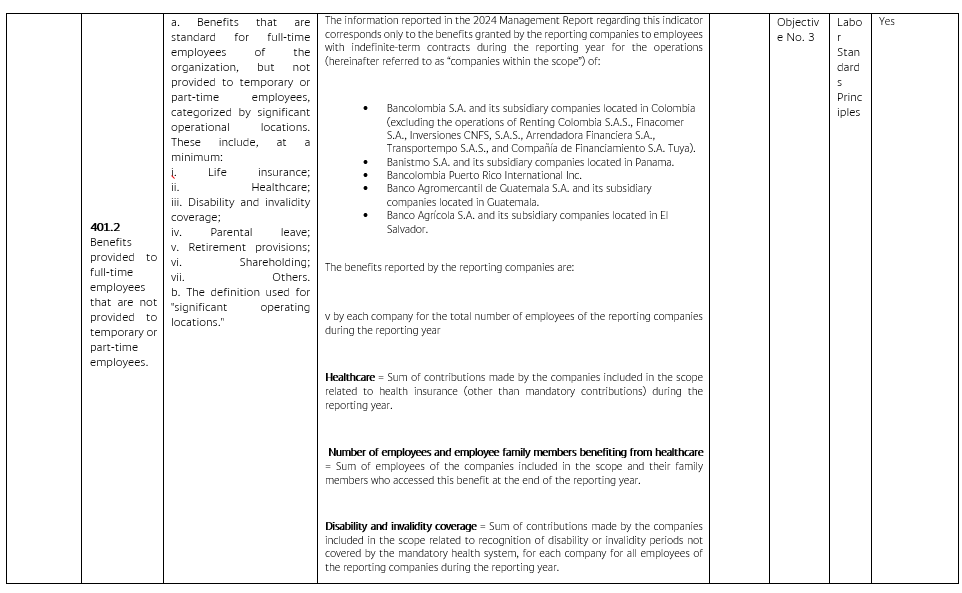


| Indicator | Relevant Information | Limited Assurance | ||||||
| Use of Funds from the 2019 Sustainable Bond Issuance |
In accordance with the Sustainable Bond issuance framework, the use of funds from the issuance must be allocated to green and social projects in the categories of renewable energy, energy efficiency, cleaner production, sustainable construction, basic infrastructure, sustainable transportation, social infrastructure,
VIS (social interest housing), sustainable agriculture, aquaculture, and fisheries, as of December 31, 2024.
The percentage distribution between green and social projects is determined as follows:
Green projects = (Balance of projects in green categories as of July 31, 2024 / Total project balance as of July 31, 2024) * 100
Social projects = (Balance of projects in social categories as of July 31, 2024 / Total project balance as of July 31, 2024) * 100
Bancolombia reports on the allocation of resources in the Sustainable Bonds Report, published as part of Bancolombia's annual sustainability report.
|
Yes | ||||||
| Use of Funds from the 2021 Sustainable Bond Issuance |
In accordance with the Sustainable Bond issuance framework, the use of funds from the issuance must be allocated to green and social projects in the categories of renewable energy, energy efficiency, circular economy (cleaner production), sustainable construction, basic infrastructure, transportation, social infrastructure, financing for entrepreneurs, women's empowerment, VIS (social interest housing), sustainable agriculture, aquaculture, and fisheries, as of December 31, 2024.
The percentage distribution between green and social projects is determined as follows:
Green projects = (Balance of projects in green categories as of December 31, 2024 / Total project balance as of December 31, 2024) * 100
Social projects = (Balance of projects in social categories as of December 31, 2024 / Total project balance as of December 31, 2024) * 100
Bancolombia reports on the allocation of resources in the Sustainable Bonds Report, published as part of Bancolombia's annual sustainability report.
|
Yes | ||||||
| Indicator | Relevant Information | Limited Assurance | ||||||
|
Absolute CO2
Emissions (Scope 1 + Scope 2)
|
In accordance with the KPIs established in the loan agreements, Bancolombia S.A. must report the total direct and indirect greenhouse gas (GHG) emissions as of December 31, 2024. To do so, the company follows the requirements set out in GRI 305.
The indicator result is determined as follows:
Absolute CO2 Emissions = Total direct emissions generated during 2024 + Total indirect GHG emissions associated with energy generation during 2024.
The scope of this indicator covers Bancolombia Group, including information from all the geographical areas where the Group operates.
|
Yes | ||||||
| Percentage of Women in Leadership Positions |
In accordance with the KPIs established in the loan agreements, Bancolombia S.A. must report the percentage of women in leadership positions as of December 31, 2024.
The indicator result is determined as follows:
Percentage of Women in Leadership Positions = Total number of women in senior management positions as of December 31, 2024 / Total number of active employees as of December 31, 2024.
The definition of "senior management" corresponds to positions at the senior manager level and above, according to the Bank's internal categories.
The scope of this indicator applies to the Bank's operations in Colombia.
|
Yes | ||||||


PwC Contadores y Auditores S.A.S., Calle 7 Sur No. 42-70, Torre 2, Piso 11, Edificio Forum, Medellín, Colombia. | ||
Tel: (60-4) 6040606, www.pwc.com/co | ||
© 2025 PricewaterhouseCoopers. PwC se refiere a las Firmas colombianas que hacen parte de la red global de PricewaterhouseCoopers International Limited, cada una de las cuales es una entidad legal separada e independiente. Todos los derechos reservados. | ||
Note |
December 31, 2024 |
December 31, 2023 |
|||||||||
ASSETS |
|||||||||||
Cash and cash equivalents |
4 |
32,844,099 |
39,799,609 |
||||||||
Financial assets investments |
5.1 |
37,570,270 |
25,674,195 |
||||||||
Derivative financial instruments |
5.2 |
2,938,142 |
6,252,270 |
||||||||
Financial assets investments and derivative financial instruments |
40,508,412 |
31,926,465 |
|||||||||
Loans and advances to customers |
279,453,908 |
253,951,647 |
|||||||||
Allowance for loans, advances and lease losses |
(16,179,738) |
(16,223,103) |
|||||||||
Loans and advances to customers, net |
6 |
263,274,170 |
237,728,544 |
||||||||
Assets held for sale and inventories, net |
7 |
1,106,399 |
906,753 |
||||||||
Investment in associates and joint ventures |
8 |
2,928,984 |
2,997,603 |
||||||||
Investment properties |
9 |
5,580,109 |
4,709,911 |
||||||||
Premises and equipment, net |
10 |
5,906,064 |
6,522,534 |
||||||||
Right-of-use assets, lease |
11.2 |
1,757,206 |
1,634,045 |
||||||||
Goodwill and intangible assets, net |
12 |
9,767,903 |
8,489,697 |
||||||||
Deferred tax, net |
13.5 |
763,757 |
685,612 |
||||||||
Other assets, net |
14 |
7,778,279 |
7,528,036 |
||||||||
TOTAL ASSETS |
372,215,382 |
342,928,809 |
|||||||||
LIABILITIES AND EQUITY |
|||||||||||
LIABILITIES |
|||||||||||
Deposits by customers |
15 |
279,059,401 |
247,941,180 |
||||||||
Interbank deposits and repurchase agreements and other similar secured borrowing |
16 |
1,776,965 |
1,076,436 |
||||||||
Derivative financial instruments |
5.2 |
2,679,643 |
6,710,364 |
||||||||
Borrowings from other financial institutions |
17 |
15,689,532 |
15,648,606 |
||||||||
Debt instruments in issue |
18 |
11,275,216 |
14,663,576 |
||||||||
Lease liabilities |
11.2 |
1,889,364 |
1,773,610 |
||||||||
Preferred shares |
584,204 |
584,204 |
|||||||||
Current tax |
156,162 |
164,339 |
|||||||||
Deferred tax, net |
13.5 |
2,578,504 |
1,785,230 |
||||||||
Employee benefit plans |
19 |
951,555 |
882,954 |
||||||||
Other liabilities |
20 |
10,990,561 |
12,648,581 |
||||||||
TOTAL LIABILITIES |
327,631,107 |
303,879,080 |
|||||||||
EQUITY |
|||||||||||
Share capital |
22 |
480,914 |
480,914 |
||||||||
Additional paid-in-capital |
4,857,454 |
4,857,454 |
|||||||||
Appropriated reserves |
23 |
22,575,837 |
20,044,769 |
||||||||
Retained earnings |
2,715,313 |
2,515,278 |
|||||||||
Net income attributable to equity holders of the Parent Company |
6,267,744 |
6,116,936 |
|||||||||
Accumulated other comprehensive income, net of tax |
6,645,206 |
4,074,161 |
|||||||||
SHAREHOLDERS’ EQUITY ATTRIBUTABLE TO THE OWNERS OF THE PARENT COMPANY |
43,542,468 |
38,089,512 |
|||||||||
Non-controlling interest |
1,041,807 |
960,217 |
|||||||||
TOTAL EQUITY |
44,584,275 |
39,049,729 |
|||||||||
TOTAL LIABILITIES AND EQUITY |
372,215,382 |
342,928,809 |
|||||||||
Note |
2024 |
2023 |
2022 |
|||||||||||
Interest on loans and financial leases |
||||||||||||||
Commercial |
16,550,290 |
17,277,481 |
10,950,463 |
|||||||||||
Consumer |
8,502,467 |
10,062,092 |
7,821,758 |
|||||||||||
Mortgage |
3,790,158 |
3,852,725 |
3,377,432 |
|||||||||||
Financial leases |
3,559,814 |
3,879,188 |
2,461,456 |
|||||||||||
Small business loans |
210,822 |
169,301 |
172,384 |
|||||||||||
Total interest income on loans and financial leases |
32,613,551 |
35,240,787 |
24,783,493 |
|||||||||||
Interest on debt instruments using the effective interest method |
25.1 |
965,935 |
1,029,377 |
588,792 |
||||||||||
Total Interest on financial instruments using the effective interest method |
33,579,486 |
36,270,164 |
25,372,285 |
|||||||||||
Interest income on overnight and market funds |
208,491 |
197,307 |
61,962 |
|||||||||||
Interest and valuation on financial instruments |
25.1 |
1,756,244 |
578,688 |
1,362,700 |
||||||||||
Total interest and valuation on financial instruments |
35,544,221 |
37,046,159 |
26,796,947 |
|||||||||||
Interest expenses |
25.2 |
(15,023,911) |
(16,668,295) |
(8,442,470) |
||||||||||
Net interest margin and valuation on financial instruments before impairment on loans and financial leases, off balance sheet credit instruments and other financial instruments |
20,520,310 |
20,377,864 |
18,354,477 |
|||||||||||
Credit impairment charges on loans, advances and financial leases, net |
6 |
(5,413,652) |
(7,461,479) |
(3,721,353) |
||||||||||
Credit impairment for other financial instruments |
5.1 - 21.1 |
(38,697) |
(107) |
(70,344) |
||||||||||
Total credit impairment charges, net |
(5,452,349) |
(7,461,586) |
(3,791,697) |
|||||||||||
Net interest margin and valuation on financial instruments after impairment on loans and financial leases and off balance sheet credit instruments and other financial instruments |
15,067,961 |
12,916,278 |
14,562,780 |
|||||||||||
Fees and commissions income |
25.3 |
7,688,838 |
7,080,878 |
6,370,526 |
||||||||||
Fees and commissions expenses |
25.3 |
(3,511,774) |
(3,097,280) |
(2,590,166) |
||||||||||
Total fees and commissions, net |
4,177,064 |
3,983,598 |
3,780,360 |
|||||||||||
Other operating income |
25.4 |
3,041,985 |
3,979,650 |
2,053,435 |
||||||||||
Dividends and net income on equity investments |
25.5 |
104,573 |
210,185 |
235,854 |
||||||||||
Total operating income, net |
22,391,583 |
21,089,711 |
20,632,429 |
|||||||||||
Operating expenses |
||||||||||||||
Salaries and employee benefits |
26.1 |
(5,628,062) |
(5,350,234) |
(4,417,656) |
||||||||||
Other administrative and general expenses |
26.2 |
(5,445,212) |
(5,033,944) |
(4,559,900) |
||||||||||
Taxes other than income tax |
26.2 |
(1,442,511) |
(1,433,148) |
(929,512) |
||||||||||
Impairment, depreciation and amortization |
26.3 |
(1,117,881) |
(1,124,859) |
(980,575) |
||||||||||
Total operating expenses |
(13,633,666) |
(12,942,185) |
(10,887,643) |
|||||||||||
Profit before income tax |
8,757,917 |
8,147,526 |
9,744,786 |
|||||||||||
Income tax |
13.3 |
(2,392,336) |
(1,932,555) |
(2,748,421) |
||||||||||
Net income |
6,365,581 |
6,214,971 |
6,996,365 |
|||||||||||
Net income attributable to equity holders of the Parent Company |
6,267,744 |
6,116,936 |
6,783,490 |
|||||||||||
Non-controlling interest |
97,837 |
98,035 |
212,875 |
|||||||||||
Basic and diluted earnings per share to common shareholders, stated in units of pesos |
27 |
6,576 |
6,420 |
7,113 |
||||||||||
Note |
2024 |
2023 |
2022 |
|||||||||||
Net income |
6,365,581 |
6,214,971 |
6,996,365 |
|||||||||||
Other comprehensive income/(loss) that will not be reclassified to net income |
||||||||||||||
Remeasurement income related to defined benefit liability |
6,041 |
(44,594) |
69,249 |
|||||||||||
Income tax |
13.4 |
(4,747) |
13,234 |
(25,090) |
||||||||||
Net of tax amount |
1,294 |
(31,360) |
44,159 |
|||||||||||
Investments in equity instruments measured at fair value through other comprehensive income (FVTOCI) |
||||||||||||||
Unrealized gain |
22,109 |
11,144 |
33,354 |
|||||||||||
Income tax |
13.4 |
6,463 |
(246) |
(1,282) |
||||||||||
Net of tax amount |
28,572 |
10,898 |
32,072 |
|||||||||||
Gains on asset revaluation |
||||||||||||||
Income tax |
13.4 |
- |
- |
(71) |
||||||||||
Net of tax amount |
- |
- |
(71) |
|||||||||||
Total other comprehensive income that will not be reclassified to net income, net of tax |
29,866 |
(20,462) |
76,160 |
|||||||||||
Other comprehensive income/(loss) that may be reclassified to net income |
||||||||||||||
Investments in debt instruments measured at fair value through other comprehensive income (FVTOCI) |
||||||||||||||
(Loss)/Gain on investments recycled to profit or loss upon disposal |
(5,996) |
(8,679) |
15,250 |
|||||||||||
Unrealized gain/(loss) |
20,272 |
119,225 |
(182,729) |
|||||||||||
Unrealized loss for fair value hedging |
- |
- |
(3,647) |
|||||||||||
Changes in loss allowance for credit losses |
538 |
3,741 |
(1,259) |
|||||||||||
Income tax |
8,422 |
(21,023) |
7,843 |
|||||||||||
Net of tax amount |
23,236 |
93,264 |
(164,542) |
|||||||||||
Foreign currency translation adjustments: |
||||||||||||||
Exchange differences arising on translating the foreign operations |
2,978,351 |
(4,963,913) |
4,064,795 |
|||||||||||
(Loss)/Gain on net investment hedge in foreign operations |
(742,930) |
1,948,833 |
(1,833,087) |
|||||||||||
Income tax |
13.4 |
307,656 |
(772,755) |
746,232 |
||||||||||
Net of tax amount(1) |
2,543,077 |
(3,787,835) |
2,977,940 |
|||||||||||
Cash flow hedges |
||||||||||||||
Net gains from cash flow hedges |
351 |
- |
- |
|||||||||||
Reclassification to the Statement of Income |
(135) |
- |
- |
|||||||||||
Income tax |
13.4 |
(87) |
- |
- |
||||||||||
Net of tax amount |
129 |
- |
- |
|||||||||||
Unrealized loss on investments in associates and joint ventures using equity method |
(7,690) |
(2,225) |
(1,929) |
|||||||||||
Income tax |
13.4 |
1,348 |
2,223 |
(1,221) |
||||||||||
Net of tax amount |
(6,342) |
(2) |
(3,150) |
|||||||||||
Total other comprehensive income that may be reclassified to net income, net of tax |
2,560,100 |
(3,694,573) |
2,810,248 |
|||||||||||
Other comprehensive income, attributable to the owners of the Parent Company, net of tax |
2,589,966 |
(3,715,035) |
2,886,408 |
|||||||||||
Other comprehensive income, attributable to the Non-controlling interest |
3,278 |
(5,222) |
3,441 |
|||||||||||
Total comprehensive income attributable to: |
8,958,825 |
2,494,714 |
9,886,214 |
|||||||||||
Equity holders of the Parent Company |
8,857,710 |
2,401,901 |
9,669,898 |
|||||||||||
Non-controlling interest |
101,115 |
92,813 |
216,316 |
|||||||||||
Attributable to owners of Parent Company |
|||||||||||||||||||||||||||||||||||||||||||||||
Accumulated other comprehensive income |
|||||||||||||||||||||||||||||||||||||||||||||||
|
Share
Capital
(Note 22)
|
Additional
Paid in
capital
|
Appropiated
Reserves
(Note 23)
|
Translation
adjustment
|
Cash flow hedging |
Equity
Securities
through OCI
|
Debt
instruments
at fair value
through OCI
|
Revaluation
of assets
|
Associates |
Employee
Benefits
|
Retained
earnings
|
Net
Income
|
Attributable
to owners
of Parent
Company
|
Non-
Controlling
interest
|
Total
equity
|
|||||||||||||||||||||||||||||||||
Balance as of January 1, 2024 |
480,914 |
4,857,454 |
20,044,769 |
3,974,379 |
- |
193,906 |
(67,306) |
2,137 |
11,520 |
(40,475) |
2,515,278 |
6,116,936 |
38,089,512 |
960,217 |
39,049,729 |
||||||||||||||||||||||||||||||||
Transfer to profit from previous years |
- |
- |
- |
- |
- |
- |
- |
- |
- |
- |
6,116,936 |
(6,116,936) |
- |
- |
- |
||||||||||||||||||||||||||||||||
Dividend payment corresponding to 509,704,584 common shares and 452,122,416 preferred shares without voting rights, subscribed and paid as of December 31, 2023, at a rate of COP 3,536 per share. |
- |
- |
- |
- |
- |
- |
- |
- |
- |
- |
(3,343,319) |
- |
(3,343,319) |
- |
(3,343,319) |
||||||||||||||||||||||||||||||||
Other reserves |
- |
- |
2,531,068 |
- |
- |
- |
- |
- |
- |
- |
(2,566,144) |
- |
(35,076) |
- |
(35,076) |
||||||||||||||||||||||||||||||||
Realization of retained earnings(1) |
- |
- |
- |
- |
- |
(18,921) |
- |
- |
- |
- |
18,921 |
- |
- |
- |
- |
||||||||||||||||||||||||||||||||
Others |
- |
- |
- |
- |
- |
- |
- |
- |
- |
- |
(26,359) |
- |
(26,359) |
- |
(26,359) |
||||||||||||||||||||||||||||||||
Non-controlling interest |
- |
- |
- |
- |
- |
- |
- |
- |
- |
- |
- |
- |
- |
(19,525) |
(19,525) |
||||||||||||||||||||||||||||||||
Net Income |
- |
- |
- |
- |
- |
- |
- |
- |
- |
- |
- |
6,267,744 |
6,267,744 |
97,837 |
6,365,581 |
||||||||||||||||||||||||||||||||
Other comprehensive income |
- |
- |
- |
2,543,077 |
129 |
28,572 |
23,236 |
- |
(6,342) |
1,294 |
- |
- |
2,589,966 |
3,278 |
2,593,244 |
||||||||||||||||||||||||||||||||
Balance as of December 31, 2024 |
480,914 |
4,857,454 |
22,575,837 |
6,517,456 |
129 |
203,557 |
(44,070) |
2,137 |
5,178 |
(39,181) |
2,715,313 |
6,267,744 |
43,542,468 |
1,041,807 |
44,584,275 |
||||||||||||||||||||||||||||||||
Attributable to owners of Parent Company |
||||||||||||||||||||||||||||||||||||||||||||
Accumulated other comprehensive income |
||||||||||||||||||||||||||||||||||||||||||||
|
Share
Capital
(Note 22)
|
Additional
Paid in
capital
|
Appropiated
Reserves
(Note 23)
|
Translation
adjustment
|
Equity
Securities
through OCI
|
Debt
instruments
at fair value
through OCI
|
Revaluation
of assets
|
Associates |
Employee
Benefits
|
Retained
earnings
|
Net
Income
|
Attributable
to owners
of Parent
Company
|
Non-
Controlling
interest
|
Total
equity
|
|||||||||||||||||||||||||||||||
Balance as of January 1, 2023 |
480,914 |
4,857,454 |
15,930,665 |
7,762,214 |
152,028 |
(160,570) |
2,137 |
11,522 |
(9,115) |
3,278,164 |
6,783,490 |
39,088,903 |
908,648 |
39,997,551 |
||||||||||||||||||||||||||||||
Transfer to profit from previous years |
- |
- |
- |
- |
- |
- |
- |
- |
- |
6,783,490 |
(6,783,490) |
- |
- |
- |
||||||||||||||||||||||||||||||
Dividend payment corresponding to 509,704,584 common shares and 452,122,416 preferred shares without voting rights, subscribed and paid as of December 31, 2022, at a rate of COP 3,536 per share. |
- |
- |
- |
- |
- |
- |
- |
- |
- |
(3,343,319) |
- |
(3,343,319) |
- |
(3,343,319) |
||||||||||||||||||||||||||||||
Other reserves |
- |
- |
4,114,104 |
- |
- |
- |
- |
- |
- |
(4,149,684) |
- |
(35,580) |
- |
(35,580) |
||||||||||||||||||||||||||||||
Realization of retained earnings(1) |
- |
- |
- |
- |
30,980 |
- |
- |
- |
- |
(30,980) |
- |
- |
- |
- |
||||||||||||||||||||||||||||||
Others |
- |
- |
- |
- |
- |
- |
- |
- |
- |
(22,393) |
- |
(22,393) |
- |
(22,393) |
||||||||||||||||||||||||||||||
Non-controlling interest |
- |
- |
- |
- |
- |
- |
- |
- |
- |
- |
- |
- |
(41,244) |
(41,244) |
||||||||||||||||||||||||||||||
Net Income |
- |
- |
- |
- |
- |
- |
- |
- |
- |
- |
6,116,936 |
6,116,936 |
98,035 |
6,214,971 |
||||||||||||||||||||||||||||||
Other comprehensive income |
- |
- |
- |
(3,787,835) |
10,898 |
93,264 |
- |
(2) |
(31,360) |
- |
- |
(3,715,035) |
(5,222) |
(3,720,257) |
||||||||||||||||||||||||||||||
Balance as of December 31, 2023 |
480,914 |
4,857,454 |
20,044,769 |
3,974,379 |
193,906 |
(67,306) |
2,137 |
11,520 |
(40,475) |
2,515,278 |
6,116,936 |
38,089,512 |
960,217 |
39,049,729 |
||||||||||||||||||||||||||||||
Attributable to owners of Parent Company |
||||||||||||||||||||||||||||||||||||||||||||
Accumulated other comprehensive income |
||||||||||||||||||||||||||||||||||||||||||||
|
Share
Capital
(Note 22)
|
Additional
Paid in
capital
|
Appropiated
Reserves
(Note 23)
|
Translation
adjustment
|
Equity
Securities
through OCI
|
Debt
instruments
at fair value
through OCI
|
Revaluation
of assets
|
Associates |
Employee
Benefits
|
Retained
earnings
|
Net
Income
|
Attributable
to owners
of Parent
Company
|
Non-
Controlling
interest
|
Total
equity
|
|||||||||||||||||||||||||||||||
Balance as of January 1, 2022 |
480,914 |
4,857,454 |
14,661,007 |
4,784,274 |
135,364 |
3,972 |
2,208 |
13,874 |
(65,303) |
3,273,788 |
4,086,795 |
32,234,347 |
1,691,111 |
33,925,458 |
||||||||||||||||||||||||||||||
Transfer to profit from previous years |
- |
- |
- |
- |
- |
- |
- |
- |
- |
4,086,795 |
(4,086,795) |
- |
- |
- |
||||||||||||||||||||||||||||||
Dividend payment corresponding to 509,704,584 common shares and 452,122,416 preferred shares without voting rights, subscribed and paid as of December 31, 2021, at a rate of COP 3,120 per share. |
- |
- |
- |
- |
- |
- |
- |
- |
- |
(2,943,199) |
- |
(2,943,199) |
- |
(2,943,199) |
||||||||||||||||||||||||||||||
Other reserves |
- |
- |
1,269,658 |
- |
- |
- |
- |
- |
- |
(1,299,084) |
- |
(29,426) |
- |
(29,426) |
||||||||||||||||||||||||||||||
Realization of retained earnings(1)(2) |
- |
- |
- |
- |
(15,408) |
- |
- |
798 |
12,029 |
2,581 |
- |
- |
- |
- |
||||||||||||||||||||||||||||||
Others |
- |
- |
- |
- |
- |
- |
- |
- |
- |
11,776 |
- |
11,776 |
- |
11,776 |
||||||||||||||||||||||||||||||
Acquisition Non-controlling interest (3) |
- |
- |
- |
- |
- |
- |
- |
- |
- |
145,507 |
- |
145,507 |
(961,588) |
(816,081) |
||||||||||||||||||||||||||||||
Non-controlling interest |
- |
- |
- |
- |
- |
- |
- |
- |
- |
- |
- |
- |
(37,191) |
(37,191) |
||||||||||||||||||||||||||||||
Net Income |
- |
- |
- |
- |
- |
- |
- |
- |
- |
- |
6,783,490 |
6,783,490 |
212,875 |
6,996,365 |
||||||||||||||||||||||||||||||
Other comprehensive income |
- |
- |
- |
2,977,940 |
32,072 |
(164,542) |
(71) |
(3,150) |
44,159 |
- |
- |
2,886,408 |
3,441 |
2,889,849 |
||||||||||||||||||||||||||||||
Balance as of December 31, 2022 |
480,914 |
4,857,454 |
15,930,665 |
7,762,214 |
152,028 |
(160,570) |
2,137 |
11,522 |
(9,115) |
3,278,164 |
6,783,490 |
39,088,903 |
908,648 |
39,997,551 |
||||||||||||||||||||||||||||||
Note |
2024 |
2023 |
2022 |
|||||||||||
Net income |
6,365,581 |
6,214,971 |
6,996,365 |
|||||||||||
Adjustments to reconcile net income to net cash provided by operating activities: |
||||||||||||||
Depreciation and amortization |
26.3 |
1,011,455 |
1,082,838 |
949,448 |
||||||||||
Other assets impairment |
26.3 |
106,426 |
42,021 |
31,127 |
||||||||||
Impairment of investments in associates and joint ventures |
8 - 25.5 |
314,347 |
108,175 |
9,633 |
||||||||||
Equity method |
8 - 25.5 |
(222,572) |
(113,115) |
(219,105) |
||||||||||
Credit impairment charges on loans and advances and financial leases |
6 |
5,413,652 |
7,461,479 |
3,721,353 |
||||||||||
Credit impairment charges on off balance sheet credit and other financial instruments(1) |
38,697 |
107 |
70,344 |
|||||||||||
Gain on sales of assets |
25.4 |
(103,481) |
(170,910) |
(171,482) |
||||||||||
Valuation gain on investment securities |
25.1 - 25.5 |
(2,376,109) |
(1,680,403) |
(1,786,416) |
||||||||||
Loss upon disposal of investment in subsidiary, associates and joint ventures(2) |
- |
- |
41,434 |
|||||||||||
Valuation gain on derivative financial instruments |
(323,784) |
(180,246) |
(68,055) |
|||||||||||
Income tax |
13.2 |
2,392,336 |
1,932,555 |
2,748,421 |
||||||||||
Bonuses and short-term benefits |
811,648 |
734,916 |
640,458 |
|||||||||||
Dividends |
25.5 |
(140,634) |
(127,427) |
(59,072) |
||||||||||
Investment property valuation |
25.4 |
(200,256) |
(197,526) |
(236,617) |
||||||||||
Effect of exchange rate changes |
307,689 |
(245,915) |
(224,788) |
|||||||||||
Other non-cash items |
(10,276) |
74,905 |
22,632 |
|||||||||||
Net interest |
(17,589,640) |
(18,572,492) |
(16,341,023) |
|||||||||||
Change in operating assets and liabilities: |
||||||||||||||
(Increase) / decrease in derivative financial instruments |
(394,624) |
859,961 |
348,554 |
|||||||||||
(Increase) / decrease in accounts receivable |
(713,069) |
(525,550) |
515,052 |
|||||||||||
Increase in loans and advances to customers |
(21,622,099) |
(10,554,946) |
(37,593,875) |
|||||||||||
Decrease / (increase) in other assets |
895,908 |
(1,151,822) |
(724,769) |
|||||||||||
(Decrease) / increase in accounts payable |
(859,352) |
945,923 |
2,719,586 |
|||||||||||
(Decrease) / increase in other liabilities |
(1,393,618) |
245,593 |
(127,044) |
|||||||||||
Increase in deposits by customers |
18,329,816 |
17,025,357 |
23,214,318 |
|||||||||||
Decrease in estimated liabilities and provisions |
(18,204) |
(40,602) |
(31,945) |
|||||||||||
Net changes in investment securities recognized at fair value through profit or loss |
(8,401,726) |
(1,988,166) |
6,321,440 |
|||||||||||
Proceeds from sales of assets held for sale and inventories |
1,380,264 |
1,060,642 |
778,328 |
|||||||||||
Recovery of charged-off loans |
6 |
926,268 |
770,934 |
674,966 |
||||||||||
Income tax paid |
(1,954,871) |
(2,737,511) |
(2,057,388) |
|||||||||||
Dividend received |
223,313 |
155,676 |
81,899 |
|||||||||||
Interest received |
33,225,177 |
34,702,410 |
23,603,725 |
|||||||||||
Interest paid |
(14,982,367) |
(15,978,748) |
(7,508,066) |
|||||||||||
Net cash (used) / provided by operating activities |
435,895 |
19,153,084 |
6,339,438 |
|||||||||||
Cash flows from investment activities: |
||||||||||||||
Purchases of debt instruments at amortized cost |
(2,114,414) |
(3,629,543) |
(4,915,717) |
|||||||||||
Proceeds from maturities of debt instruments at amortized cost |
1,622,184 |
4,738,686 |
4,260,063 |
|||||||||||
Purchases of debt instruments at fair value through OCI |
(448,930) |
(7,837,997) |
(6,562,334) |
|||||||||||
Proceeds from debt instruments at fair value through OCI |
2,307,032 |
9,253,538 |
6,797,420 |
|||||||||||
Purchases of equity instruments at fair value through OCI and interests in associates and joint ventures |
(134,381) |
(122,910) |
(255,129) |
|||||||||||
Proceeds from equity instruments at fair value through OCI and interests in associates and joint ventures |
40,489 |
16,804 |
198,807 |
|||||||||||
Consideration paid to non-controlling interests(3) |
- |
- |
(816,081) |
|||||||||||
Purchases of premises and equipment and investment properties |
(2,042,094) |
(2,412,123) |
(3,538,855) |
|||||||||||
Acquisition of subsidiaries |
- |
- |
799 |
|||||||||||
Proceeds from sales of premises and equipment and investment properties |
414,030 |
185,324 |
421,729 |
|||||||||||
Purchase of other long-term assets |
(203,112) |
(351,468) |
(245,204) |
|||||||||||
Net cash used in investing activities |
(559,196) |
(159,689) |
(4,654,502) |
|||||||||||
Cash flows from financing activities: |
||||||||||||||
Increase / (decrease) in repurchase agreements and other similar secured borrowing |
550,584 |
304,846 |
(579,488) |
|||||||||||
Proceeds from borrowings from other financial institutions |
9,416,739 |
9,855,033 |
14,374,110 |
|||||||||||
Repayment of borrowings from other financial institutions |
(10,496,891) |
(9,921,582) |
(5,874,833) |
|||||||||||
Payment of lease liability |
(174,818) |
(182,596) |
(157,402) |
|||||||||||
Placement of debt instruments in issue(4) |
4,155,253 |
1,781,728 |
2,138,125 |
|||||||||||
Payment of debt instruments in issue(4) |
(9,276,962) |
(3,928,673) |
(6,699,219) |
|||||||||||
Dividends paid |
(3,398,756) |
(3,298,183) |
(2,310,666) |
|||||||||||
Transactions with non-controlling interests |
(19,525) |
(41,245) |
(37,191) |
|||||||||||
Net cash (used) provided in financing activities(5) |
(9,244,376) |
(5,430,672) |
853,436 |
|||||||||||
Effect of exchange rate changes on cash and cash equivalents |
2,412,167 |
(5,408,405) |
3,777,073 |
|||||||||||
(Decrease) / increase in cash and cash equivalents |
(9,367,677) |
13,562,723 |
2,538,372 |
|||||||||||
Cash and cash equivalents at beginning of year |
4 |
39,799,609 |
31,645,291 |
25,329,846 |
||||||||||
Cash and cash equivalents at end of year |
4 |
32,844,099 |
39,799,609 |
31,645,291 |
||||||||||
| ENTITY |
JURISDICTION
OF
INCORPORATION
|
BUSINESS |
PROPORTION OF
OWNERSHIP
INTEREST AND
VOTING POWER
HELD BY THE
BANK 2024
|
PROPORTION OF
OWNERSHIP
INTEREST AND
VOTING POWER
HELD BY THE
BANK 2023
|
PROPORTION OF
OWNERSHIP
INTEREST AND
VOTING POWER
HELD BY THE
BANK 2022
|
||||||||||||
| Fiduciaria Bancolombia S.A. Sociedad Fiduciaria | Colombia |
Trust |
98.81 % |
98.81 % |
98.81 % |
||||||||||||
Banca de Inversión Bancolombia S.A. Corporación Financiera |
Colombia |
Investment banking |
100.00 % |
100.00 % |
100.00 % |
||||||||||||
| Valores Bancolombia S.A. Comisionista de Bolsa | Colombia |
Securities brokerage |
100.00 % |
100.00 % |
100.00 % |
||||||||||||
Wompi S.A.S.(1) |
Colombia |
Technology services provider |
100.00 % |
100.00 % |
99.98 % |
||||||||||||
| Renting Colombia S.A.S. | Colombia |
Operating leasing |
100.00 % |
100.00 % |
100.00 % |
||||||||||||
Transportempo S.A.S. “En liquidación”(2) |
Colombia |
Transportation |
- % |
100.00 % |
100.00 % |
||||||||||||
Inversiones CFNS S.A.S.(3) |
Colombia |
Investments |
100.00 % |
99.94 % |
99.94 % |
||||||||||||
| Negocios Digitales Colombia S.A.S. | Colombia |
Payment solutions |
100.00 % |
100.00 % |
100.00 % |
||||||||||||
| Fondo de Capital Privado Fondo Inmobiliario Colombia | Colombia |
Real estate investment fund |
80.47 % |
80.47 % |
80.47 % |
||||||||||||
| P.A. Inmuebles CEM | Colombia |
Mercantile trust |
80.47 % |
80.47 % |
80.47 % |
||||||||||||
| P.A. Calle 92 FIC-11 | Colombia |
Mercantile trust |
52.31 % |
52.31 % |
52.31 % |
||||||||||||
| P.A. FIC Edificio Corfinsura | Colombia |
Mercantile trust |
80.47 % |
80.47 % |
80.47 % |
||||||||||||
| P.A. FIC-A5 | Colombia |
Mercantile trust |
80.47 % |
80.47 % |
80.47 % |
||||||||||||
| P.A. FIC Inmuebles | Colombia |
Mercantile trust |
80.47 % |
80.47 % |
80.47 % |
||||||||||||
P.A. FIC Clínica de Prado |
Colombia |
Mercantile trust |
62.00 % |
62.00 % |
62.00 % |
||||||||||||
| P. A. FIC A6 | Colombia |
Mercantile trust |
80.47 % |
80.47 % |
80.47 % |
||||||||||||
| P.A. Central Point | Colombia |
Mercantile trust |
60.35 % |
60.35 % |
60.35 % |
||||||||||||
Fideicomiso Irrevocable de Garantía, Fuente de Pago y Administración Inmobiliaria Polaris(4) |
Colombia |
Mercantile trust |
- % |
80.47 % |
80.47 % |
||||||||||||
| P.A. Fideicomiso Twins Bay | Colombia |
Mercantile trust |
80.47 % |
80.47 % |
80.47 % |
||||||||||||
Fideicomiso Lote Av San Martín |
Colombia |
Mercantile trust |
80.47 % |
80.47 % |
80.47 % |
||||||||||||
| P.A. Fideicomiso Lote 30 | Colombia |
Mercantile trust |
80.47 % |
80.47 % |
80.47 % |
||||||||||||
| Fideicomiso Fondo Inmobiliario Bancolombia | Colombia |
Mercantile trust |
80.47 % |
80.47 % |
80.47 % |
||||||||||||
P.A. Florencia Ferrara(5) |
Colombia |
Mercantile trust |
44.26 % |
44.26 % |
44.26 % |
||||||||||||
P.A. Flor Morado Plaza(5) |
Colombia |
Mercantile trust |
80.47 % |
80.47 % |
80.47 % |
||||||||||||
P.A. Galería la 33(6) |
Colombia |
Mercantile trust |
80.47 % |
80.47 % |
- % |
||||||||||||
P.A. Linz Granz del Rio(7) |
Colombia |
Mercantile trust |
44.26 % |
- % |
- % |
||||||||||||
Fideicomiso Selecto Terrazu E1(7) |
Colombia |
Mercantile trust |
64.38 % |
- % |
- % |
||||||||||||
Valores Simesa S.A.(8) |
Colombia |
Investments |
62.75 % |
64.93 % |
66.33 % |
||||||||||||
Fideicomiso Lote Distrito Vera B1B2(8) |
Colombia |
Mercantile trust |
62.44 % |
64.61 % |
66.00 % |
||||||||||||
Fideicomiso Lote Distrito Vera B3B4(9) |
Colombia |
Mercantile trust |
- % |
64.61 % |
66.00 % |
||||||||||||
Fideicomiso Lote B6 Ciudad del Rio(10) |
Colombia |
Mercantile trust |
- % |
- % |
66.00 % |
||||||||||||
P.A. FAI Calle 77(11) |
Colombia |
Mercantile trust |
98.00 % |
98.00 % |
98.00 % |
||||||||||||
P.A. Nomad Salitre(12) |
Colombia |
Mercantile trust |
98.00 % |
98.00 % |
98.00 % |
||||||||||||
P.A. Nomad Central-2(13) |
Colombia |
Mercantile trust |
98.00 % |
98.00 % |
- % |
||||||||||||
P.A. Calle 84 (2)(13) |
Colombia |
Mercantile trust |
98.00 % |
98.00 % |
- % |
||||||||||||
P.A. Calle 84 (3)(13) |
Colombia |
Mercantile trust |
98.00 % |
98.00 % |
- % |
||||||||||||
P.A. Nomad Distrito Vera(14) |
Colombia |
Mercantile trust |
98.00 % |
- % |
- % |
||||||||||||
P.A. Nexo(14) |
Colombia |
Mercantile trust |
98.00 % |
- % |
- % |
||||||||||||
P.A. Mercurio(15) |
Colombia |
Mercantile trust |
100.00 % |
100.00 % |
100.00 % |
||||||||||||
P.A. CEDIS Sodimac(14) |
Colombia |
Mercantile trust |
100.00 % |
- % |
- % |
||||||||||||
Wenia S.A.S.(16) |
Colombia |
Technology services |
100.00 % |
100.00 % |
100.00 % |
||||||||||||
P.A. Wenia(16) |
Colombia |
Mercantile trust |
100.00 % |
100.00 % |
- % |
||||||||||||
Nequi S.A. Compañía de Financiamiento(17) |
Colombia |
Financial services |
100.00 % |
100.00 % |
100.00 % |
||||||||||||
Sociedad Beneficiaria BC Panamá S.A.S.(18) |
Colombia |
Holding |
100.00 % |
- % |
- % |
||||||||||||
Bancolombia Panamá S.A. |
Panama |
Banking |
100.00 % |
100.00 % |
100.00 % |
||||||||||||
| Sistemas de Inversiones y Negocios S.A. Sinesa | Panama |
Investments |
100.00 % |
100.00 % |
100.00 % |
||||||||||||
Banagrícola S.A. |
Panama |
Holding |
99.17 % |
99.17 % |
99.17 % |
||||||||||||
| Banistmo S.A. | Panama |
Banking |
100.00 % |
100.00 % |
100.00 % |
||||||||||||
| Banistmo Investment Corporation S.A. | Panama |
Trust |
100.00 % |
100.00 % |
100.00 % |
||||||||||||
| Leasing Banistmo S.A. | Panama |
Leasing |
100.00 % |
100.00 % |
100.00 % |
||||||||||||
| Valores Banistmo S.A. | Panama |
Purchase and sale of securities |
100.00 % |
100.00 % |
100.00 % |
||||||||||||
Banistmo Panamá Fondos de Inversión S.A.(19) |
Panama |
Investment fund holder |
100.00 % |
100.00 % |
100.00 % |
||||||||||||
Banistmo Capital Markets Group Inc.(19) |
Panama |
Purchase and sale of securities |
100.00 % |
100.00 % |
100.00 % |
||||||||||||
Anavi Investment Corporation S.A.(19) |
Panama |
Real estate |
100.00 % |
100.00 % |
100.00 % |
||||||||||||
Desarrollo de Oriente S.A.(19) |
Panama |
Real estate |
100.00 % |
100.00 % |
100.00 % |
||||||||||||
Steens Enterprises S.A.(19) |
Panama |
Portfolio holder |
100.00 % |
100.00 % |
100.00 % |
||||||||||||
Ordway Holdings S.A.(19) |
Panama |
Real estate broker |
100.00 % |
100.00 % |
100.00 % |
||||||||||||
| Grupo Agromercantil Holding S.A. | Panama |
Holding |
100.00 % |
100.00 % |
100.00 % |
||||||||||||
| Banco Agromercantil de Guatemala S.A. | Guatemala |
Banking |
99.68 % |
99.68 % |
99.68 % |
||||||||||||
| Seguros Agromercantil de Guatemala S.A. | Guatemala |
Insurance agency |
79.92 % |
79.92 % |
79.92 % |
||||||||||||
| Financiera Agromercantil S.A. | Guatemala |
Financial services |
100.00 % |
100.00 % |
100.00 % |
||||||||||||
| Agrovalores S.A. | Guatemala |
Securities brokerage |
100.00 % |
100.00 % |
100.00 % |
||||||||||||
| Arrendadora Agromercantil S.A. | Guatemala |
Financial Leasing |
100.00 % |
100.00 % |
100.00 % |
||||||||||||
Agencia de Seguros y Fianzas Agromercantil S.A.(20) |
Guatemala |
Insurance agency |
- % |
- % |
100.00 % |
||||||||||||
| Asistencia y Ajustes S.A. | Guatemala |
Roadside and medical assistance services |
100.00 % |
100.00 % |
100.00 % |
||||||||||||
| Serproba S.A. | Guatemala |
Maintenance and remodeling services |
100.00 % |
100.00 % |
100.00 % |
||||||||||||
Servicios de Formalización S.A. |
Guatemala |
Loans formalization |
100.00 % |
100.00 % |
100.00 % |
||||||||||||
Conserjeria, Mantenimiento y Mensajería S.A. “En liquidación” |
Guatemala |
Maintenance services |
100.00 % |
100.00 % |
100.00 % |
||||||||||||
Mercom Bank Ltd.(21) |
Barbados |
Banking |
99.68 % |
99.68 % |
99.68 % |
||||||||||||
| New Alma Enterprises Ltd. | Bahamas |
Investments |
99.68 % |
99.68 % |
99.68 % |
||||||||||||
| Bancolombia Puerto Rico Internacional Inc. | Puerto Rico |
Banking |
100.00 % |
100.00 % |
100.00 % |
||||||||||||
Sinesa Cayman, Inc. (before Bancolombia Cayman S.A)(22) |
Cayman Islands |
Banking |
100.00 % |
100.00 % |
100.00 % |
||||||||||||
Banco Agrícola S.A. |
El Salvador |
Banking |
97.36 % |
97.36 % |
97.36 % |
||||||||||||
| Arrendadora Financiera S.A. Arfinsa | El Salvador |
Leasing |
97.37 % |
97.37 % |
97.37 % |
||||||||||||
| Accelera S.A. de C.V. (before Credibac S.A. de C.V) | El Salvador |
Credit card services |
97.36 % |
97.36 % |
97.36 % |
||||||||||||
Valores Banagrícola S.A. de C.V. |
El Salvador |
Securities brokerage |
98.89 % |
98.89 % |
98.89 % |
||||||||||||
Inversiones Financieras Banco Agrícola S.A. IFBA |
El Salvador |
Holding |
98.89 % |
98.89 % |
98.89 % |
||||||||||||
Gestora de Fondos de Inversión Banagrícola S.A. |
El Salvador |
Administers investment funds |
98.89 % |
98.89 % |
98.89 % |
||||||||||||
Bagrícola Costa Rica S.A. |
Costa Rica |
Business and management advising |
99.17 % |
99.17 % |
99.17 % |
||||||||||||
| Bancolombia Capital Holdings USA LLC | United States |
Holding |
100.00 % |
100.00 % |
100.00 % |
||||||||||||
| Bancolombia Capital Advisers LLC | United States |
Investment advisor |
100.00 % |
100.00 % |
100.00 % |
||||||||||||
| Bancolombia Capital LLC | United States |
Securities brokerage |
100.00 % |
100.00 % |
100.00 % |
||||||||||||
Wenia Ltd.(16) |
Bermuda |
Technology services |
100.00 % |
100.00 % |
100.00 % |
||||||||||||
Name |
Country |
% of ownership interest held by the Bank, 2024 |
% of ownership interest held by the Bank, 2023 |
% of ownership interest held by the Bank, 2022 |
Assets managed |
|||||||||||||||
December 31, 2024 |
December 31, 2023 |
|||||||||||||||||||
Fondo de Capital Privado Fondo Inmobiliario Colombia(1) |
Colombia |
80.47 % |
80.47 % |
80.47 % |
6,039,891 |
5,503,022 |
||||||||||||||
Fideicomiso Lote Distrito Vera B1B2(2) |
Colombia |
62.44 % |
64.61 % |
66.00 % |
26,367 |
25,073 |
||||||||||||||
Fideicomiso Lote Distrito Vera B3B4(3) |
Colombia |
- |
64.61 % |
66.00 % |
- |
56,295 |
||||||||||||||
Fideicomiso Lote B6 Ciudad del Rio(4) |
Colombia |
- |
- |
66.00 % |
- |
- |
||||||||||||||
Banistmo Panamá Fondos de Inversión S.A.(5) |
Panama |
100.00 % |
100.00 % |
100.00 % |
126,092 |
132,496 |
||||||||||||||
December 31, 2024 |
December 31, 2023 |
December 31, 2022 |
|||||||||
Year-end exchange rate |
4,409.15 |
3,822.05 |
4,810.20 |
||||||||
Average rate for the period ended at |
4,073.75 |
4,330.14 |
4,257.12 |
||||||||
Optimistic |
Base |
Pessimistic |
||||||||||||||||||||||||||||||||||||
Country |
2024 |
2023 |
2024 |
2023 |
2024 |
2023 |
||||||||||||||||||||||||||||||||
Colombia |
15.00 % |
15.00 % |
60.00 % |
50.00 % |
25.00 % |
35.00 % |
||||||||||||||||||||||||||||||||
Panama |
20.00 % |
20.00 % |
55.00 % |
50.00 % |
25.00 % |
30.00 % |
||||||||||||||||||||||||||||||||
El Salvador |
20.00 % |
20.00 % |
55.00 % |
55.00 % |
25.00 % |
25.00 % |
||||||||||||||||||||||||||||||||
Guatemala |
20.00 % |
20.00 % |
55.00 % |
55.00 % |
25.00 % |
25.00 % |
||||||||||||||||||||||||||||||||
As of December 31, 2024 | ||||||||||||||||||||||||||
Colombia |
Panama |
|||||||||||||||||||||||||
Cutoff |
Optimistic |
Base |
Pessimistic |
Optimistic |
Base |
Pessimistic |
||||||||||||||||||||
2024 |
1.98 % |
1.80 % |
1.59 % |
3.51 % |
2.46 % |
1.41 % |
||||||||||||||||||||
2025 |
3.89 % |
2.57 % |
1.23 % |
6.04 % |
3.48 % |
0.92 % |
||||||||||||||||||||
2026 |
4.76 % |
2.96 % |
1.16 % |
6.68 % |
3.76 % |
0.85 % |
||||||||||||||||||||
As of December 31, 2024 | ||||||||||||||||||||||||||
Guatemala |
El Salvador |
|||||||||||||||||||||||||
Cutoff |
Optimistic |
Base |
Pessimistic |
Optimistic |
Base |
Pessimistic |
||||||||||||||||||||
2024 |
3.83 % |
3.48 % |
3.12 % |
3.10 % |
2.59 % |
2.09 % |
||||||||||||||||||||
2025 |
4.46 % |
3.46 % |
2.45 % |
3.77 % |
2.36 % |
0.95 % |
||||||||||||||||||||
2026 |
4.55 % |
3.35 % |
2.14 % |
3.93 % |
2.25 % |
0.58 % |
||||||||||||||||||||
As of December 31, 2023 | ||||||||||||||||||||||||||
Colombia |
Panama |
|||||||||||||||||||||||||
Cutoff |
Optimistic |
Base |
Pessimistic |
Optimistic |
Base |
Pessimistic |
||||||||||||||||||||
2023 |
1.64 % |
1.16 % |
0.68 % |
7.92 % |
5.95 % |
3.99 % |
||||||||||||||||||||
2024 |
2.37 % |
0.87 % |
(0.63) % |
6.68 % |
4.00 % |
1.33 % |
||||||||||||||||||||
2025 |
4.47 % |
2.60 % |
0.73 % |
7.17 % |
4.20 % |
1.23 % |
||||||||||||||||||||
As of December 31, 2023 | ||||||||||||||||||||||||||
Guatemala |
El Salvador |
|||||||||||||||||||||||||
Cutoff |
Optimistic |
Base |
Pessimistic |
Optimistic |
Base |
Pessimistic |
||||||||||||||||||||
2023 |
3.69 % |
3.12 % |
2.55 % |
2.75 % |
2.25 % |
1.74 % |
||||||||||||||||||||
2024 |
4.33 % |
3.26 % |
2.19 % |
3.32 % |
1.90 % |
0.49 % |
||||||||||||||||||||
2025 |
4.61 % |
3.38 % |
2.15 % |
3.76 % |
2.08 % |
0.41 % |
||||||||||||||||||||
EXTERNAL RATING ORIGIN |
SIGNIFICANT INCREASE
IN RISK
|
||||
Ba1/BB+ |
3 Notches |
||||
Ba2/BB |
3 Notches |
||||
Ba3/BB- |
3 Notches |
||||
B1/B+ |
2 Notches |
||||
B2/B |
2 Notches |
||||
B3/B- |
1 Notch |
||||
Caa/CCC |
1 Notch |
||||
Length of delinquency (days) |
|||||||||||||||||
Type |
Collateral |
Grupo Agromercantil Holding S.A. |
Banistmo S.A. |
Banco Agrícola S.A. |
Bancolombia S.A. |
||||||||||||
Without collateral |
180 |
||||||||||||||||
Commercial |
With collateral |
N/A(1) |
360 |
360 |
360 |
||||||||||||
Without collateral |
180 |
180 |
180 |
180 | |||||||||||||
Consumer |
With collateral |
540 for vehicles collateral | 1080 for mortgage collateral | 720 for mortgage collateral | |||||||||||||
Without collateral |
180 |
||||||||||||||||
Small Business Loan |
With collateral |
N/A(1) |
1080 for mortgage collateral | 180 |
180 |
||||||||||||
Mortgage |
With collateral |
1440 |
1080 | 720 |
N/A(1) |
||||||||||||
Asset group |
Useful life range |
||||
Buildings |
10 to 75 years |
||||
Furniture and fixtures |
3 to 20 years |
||||
Computer equipment |
3 to 20 years |
||||
Equipment and machinery |
2 to 40 years |
||||
Vehicles |
3 to 10 years |
||||
For the year ended December 31, 2024 |
||||||||||||||||||||||||||||||||
|
Banking
Colombia
|
Banking
Panama
|
Banking El
Salvador
|
Banking
Guatemala
|
Trust |
Investment
banking
|
Brokerage |
International
Banking
|
All other
segments
|
Total
segments
|
|||||||||||||||||||||||
In millions of COP | ||||||||||||||||||||||||||||||||
Total interest and valuation on financial instruments |
27,543,286 |
2,689,904 |
1,851,126 |
1,939,602 |
61 |
6 |
44,750 |
1,203,838 |
271,648 |
35,544,221 |
||||||||||||||||||||||
Interest income on loans and financial leases |
25,632,102 |
2,283,111 |
1,623,427 |
1,807,334 |
61 |
- |
5,327 |
987,378 |
274,811 |
32,613,551 |
||||||||||||||||||||||
Debt investments |
1,503,298 |
316,205 |
226,122 |
134,101 |
- |
6 |
37,480 |
116,662 |
41 |
2,333,915 |
||||||||||||||||||||||
Derivatives, net |
155,794 |
3,322 |
775 |
- |
- |
- |
(2,463) |
(94) |
(3,204) |
154,130 |
||||||||||||||||||||||
Liquidity operations, net |
252,092 |
87,266 |
802 |
(1,833) |
- |
- |
4,406 |
99,892 |
- |
442,625 |
||||||||||||||||||||||
Interest expenses |
(11,588,039) |
(1,336,250) |
(437,244) |
(804,815) |
(192) |
- |
(165) |
(708,671) |
(148,535) |
(15,023,911) |
||||||||||||||||||||||
Net interest margin and valuation on financial instruments before impairment on loans and financial leases, off balance sheet credit instruments and other financial instruments |
15,955,247 |
1,353,654 |
1,413,882 |
1,134,787 |
(131) |
6 |
44,585 |
495,167 |
123,113 |
20,520,310 |
||||||||||||||||||||||
Credit impairment charges, net |
(4,220,207) |
(456,748) |
(236,086) |
(394,589) |
(554) |
768 |
- |
(91,617) |
(53,316) |
(5,452,349) |
||||||||||||||||||||||
Net interest margin and valuation on financial instruments after impairment on loans and financial leases, off balance sheet credit instruments and other financial instruments |
11,735,040 |
896,906 |
1,177,796 |
740,198 |
(685) |
774 |
44,585 |
403,550 |
69,797 |
15,067,961 |
||||||||||||||||||||||
(Expenses) Revenues from transactions by the operating segments of the Bank |
(151,933) |
(40,110) |
(19,110) |
(87,061) |
(58,498) |
7,823 |
86,150 |
410,003 |
(147,264) |
- |
||||||||||||||||||||||
Fees and commissions income(1) |
5,660,355 |
562,330 |
515,734 |
211,778 |
448,854 |
69,266 |
132,192 |
51,901 |
36,428 |
7,688,838 |
||||||||||||||||||||||
Fees and commissions expenses |
(2,885,272) |
(286,392) |
(226,445) |
(85,700) |
(3,804) |
(115) |
(8,600) |
(10,116) |
(5,330) |
(3,511,774) |
||||||||||||||||||||||
Total fees and commissions, net |
2,775,083 |
275,938 |
289,289 |
126,078 |
445,050 |
69,151 |
123,592 |
41,785 |
31,098 |
4,177,064 |
||||||||||||||||||||||
Other operating income |
800,252 |
65,876 |
40,818 |
130,140 |
13,737 |
1,609 |
7,566 |
12,435 |
1,969,552 |
3,041,985 |
||||||||||||||||||||||
Dividends and net income on equity investments(2) |
(121,975) |
11,474 |
4,338 |
1,555 |
45,558 |
(97,585) |
3,622 |
25 |
257,561 |
104,573 |
||||||||||||||||||||||
Total operating income, net |
15,036,467 |
1,210,084 |
1,493,131 |
910,910 |
445,162 |
(18,228) |
265,515 |
867,798 |
2,180,744 |
22,391,583 |
||||||||||||||||||||||
Operating expenses(3) |
(8,651,424) |
(853,980) |
(771,078) |
(645,310) |
(168,494) |
(55,157) |
(188,573) |
(98,570) |
(1,083,199) |
(12,515,785) |
||||||||||||||||||||||
Impairment, depreciation and amortization |
(770,207) |
(128,544) |
(93,982) |
(61,471) |
(3,000) |
(89) |
(2,759) |
(8,016) |
(49,813) |
(1,117,881) |
||||||||||||||||||||||
Total operating expenses |
(9,421,631) |
(982,524) |
(865,060) |
(706,781) |
(171,494) |
(55,246) |
(191,332) |
(106,586) |
(1,133,012) |
(13,633,666) |
||||||||||||||||||||||
Profit before income tax |
5,614,836 |
227,560 |
628,071 |
204,129 |
273,668 |
(73,474) |
74,183 |
761,212 |
1,047,732 |
8,757,917 |
||||||||||||||||||||||
For the year ended December 31, 2023 |
||||||||||||||||||||||||||||||||
|
Banking
Colombia
|
Banking
Panama
|
Banking El
Salvador
|
Banking
Guatemala
|
Trust |
Investment
banking
|
Brokerage |
International
Banking
|
All other
segments
|
Total
segments
|
|||||||||||||||||||||||
In millions of COP | ||||||||||||||||||||||||||||||||
Total interest and valuation on financial instruments |
29,230,060 |
2,826,559 |
1,773,140 |
1,795,543 |
47 |
6 |
45,875 |
1,112,171 |
262,758 |
37,046,159 |
||||||||||||||||||||||
Interest income on loans and financial leases |
28,366,678 |
2,415,234 |
1,524,765 |
1,726,821 |
47 |
- |
5,076 |
940,091 |
262,075 |
35,240,787 |
||||||||||||||||||||||
Debt investments |
937,090 |
301,167 |
236,350 |
60,534 |
- |
6 |
36,538 |
85,091 |
683 |
1,657,459 |
||||||||||||||||||||||
Derivatives, net |
(167,887) |
817 |
11,187 |
- |
- |
- |
(1,747) |
(188) |
- |
(157,818) |
||||||||||||||||||||||
Liquidity operations, net |
94,179 |
109,341 |
838 |
8,188 |
- |
- |
6,008 |
87,177 |
- |
305,731 |
||||||||||||||||||||||
Interest expenses |
(13,464,980) |
(1,238,112) |
(464,851) |
(731,886) |
(179) |
(1) |
(222) |
(596,039) |
(172,025) |
(16,668,295) |
||||||||||||||||||||||
Net interest margin and valuation on financial instruments before impairment on loans and financial leases, off balance sheet credit instruments and other financial instruments |
15,765,080 |
1,588,447 |
1,308,289 |
1,063,657 |
(132) |
5 |
45,653 |
516,132 |
90,733 |
20,377,864 |
||||||||||||||||||||||
Credit impairment charges, net |
(6,480,377) |
(270,501) |
(154,938) |
(499,368) |
(2,893) |
(380) |
106 |
4,164 |
(57,399) |
(7,461,586) |
||||||||||||||||||||||
Net interest margin and valuation on financial instruments after impairment on loans and financial leases, off balance sheet credit instruments and other financial instruments |
9,284,703 |
1,317,946 |
1,153,351 |
564,289 |
(3,025) |
(375) |
45,759 |
520,296 |
33,334 |
12,916,278 |
||||||||||||||||||||||
(Expenses) Revenues from transactions by the operating segments of the Bank |
(187,467) |
(34,105) |
(17,844) |
(76,054) |
(16,518) |
13,949 |
68,617 |
415,508 |
(166,086) |
- |
||||||||||||||||||||||
Fees and commissions income(1) |
5,252,099 |
532,930 |
479,568 |
223,200 |
361,965 |
55,917 |
103,985 |
47,228 |
23,986 |
7,080,878 |
||||||||||||||||||||||
Fees and commissions expenses |
(2,522,927) |
(258,897) |
(188,972) |
(89,405) |
(4,244) |
(238) |
(8,645) |
(11,042) |
(12,910) |
(3,097,280) |
||||||||||||||||||||||
Total fees and commissions, net |
2,729,172 |
274,033 |
290,596 |
133,795 |
357,721 |
55,679 |
95,340 |
36,186 |
11,076 |
3,983,598 |
||||||||||||||||||||||
Other operating income (expenses) |
1,575,845 |
36,939 |
51,656 |
130,757 |
14,107 |
(1,011) |
4,737 |
16,794 |
2,149,826 |
3,979,650 |
||||||||||||||||||||||
Dividends and net income on equity investments(2) |
17,613 |
13,498 |
10,982 |
1,827 |
33,275 |
(98,512) |
6,416 |
37 |
225,049 |
210,185 |
||||||||||||||||||||||
Total operating income, net |
13,419,866 |
1,608,311 |
1,488,741 |
754,614 |
385,560 |
(30,270) |
220,869 |
988,821 |
2,253,199 |
21,089,711 |
||||||||||||||||||||||
Operating expenses(3) |
(8,022,042) |
(909,843) |
(668,105) |
(620,928) |
(177,626) |
(49,759) |
(186,212) |
(89,219) |
(1,093,592) |
(11,817,326) |
||||||||||||||||||||||
Impairment, depreciation and amortization |
(744,346) |
(107,716) |
(131,921) |
(55,243) |
(2,218) |
(208) |
(2,950) |
(4,259) |
(75,998) |
(1,124,859) |
||||||||||||||||||||||
Total operating expenses |
(8,766,388) |
(1,017,559) |
(800,026) |
(676,171) |
(179,844) |
(49,967) |
(189,162) |
(93,478) |
(1,169,590) |
(12,942,185) |
||||||||||||||||||||||
Profit before income tax |
4,653,478 |
590,752 |
688,715 |
78,443 |
205,716 |
(80,237) |
31,707 |
895,343 |
1,083,609 |
8,147,526 |
||||||||||||||||||||||
For the year ended December 31, 2022 |
||||||||||||||||||||||||||||||||
|
Banking
Colombia
|
Banking
Panama
|
Banking El
Salvador
|
Banking
Guatemala
|
Trust |
Investment
banking
|
Brokerage |
International
Banking
|
All other
segments
|
Total
segments
|
|||||||||||||||||||||||
In millions of COP | ||||||||||||||||||||||||||||||||
Total interest and valuation on financial instruments |
20,727,335 |
2,364,820 |
1,527,860 |
1,537,801 |
72 |
4 |
12,996 |
512,417 |
113,642 |
26,796,947 |
||||||||||||||||||||||
Interest income on loans and financial leases |
19,263,960 |
2,154,151 |
1,293,556 |
1,509,143 |
72 |
- |
511 |
446,028 |
116,072 |
24,783,493 |
||||||||||||||||||||||
Debt investments |
1,361,299 |
161,974 |
170,423 |
27,089 |
- |
4 |
20,024 |
48,722 |
(2,447) |
1,787,088 |
||||||||||||||||||||||
Derivatives, net |
108,255 |
(1,026) |
63,494 |
- |
- |
- |
658 |
- |
- |
171,381 |
||||||||||||||||||||||
Liquidity operations, net |
(6,179) |
49,721 |
387 |
1,569 |
- |
- |
(8,197) |
17,667 |
17 |
54,985 |
||||||||||||||||||||||
Interest expenses |
(6,333,834) |
(910,937) |
(297,839) |
(528,459) |
(150) |
(4) |
(104) |
(271,280) |
(99,863) |
(8,442,470) |
||||||||||||||||||||||
Net interest margin and valuation on financial instruments before impairment on loans and financial leases, off balance sheet credit instruments and other financial instruments |
14,393,501 |
1,453,883 |
1,230,021 |
1,009,342 |
(78) |
- |
12,892 |
241,137 |
13,779 |
18,354,477 |
||||||||||||||||||||||
Credit impairment charges, net |
(2,971,599) |
(545,012) |
(102,710) |
(168,834) |
(796) |
(924) |
3,133 |
25,029 |
(29,984) |
(3,791,697) |
||||||||||||||||||||||
Net interest margin and valuation on financial instruments after impairment on loans and financial leases, off balance sheet credit instruments and other financial instruments |
11,421,902 |
908,871 |
1,127,311 |
840,508 |
(874) |
(924) |
16,025 |
266,166 |
(16,205) |
14,562,780 |
||||||||||||||||||||||
(Expenses) Revenues from transactions by the operating segments of the Bank |
(32,163) |
(25,022) |
(7,371) |
(45,526) |
(12,658) |
3,404 |
53,229 |
212,049 |
(145,942) |
- |
||||||||||||||||||||||
Fees and commissions income(1) |
4,684,563 |
446,583 |
444,177 |
218,554 |
318,869 |
86,232 |
111,366 |
42,021 |
18,161 |
6,370,526 |
||||||||||||||||||||||
Fees and commissions expenses |
(2,099,585) |
(210,004) |
(170,563) |
(91,424) |
(3,668) |
(269) |
(6,160) |
(8,025) |
(468) |
(2,590,166) |
||||||||||||||||||||||
Total fees and commissions, net |
2,584,978 |
236,579 |
273,614 |
127,130 |
315,201 |
85,963 |
105,206 |
33,996 |
17,693 |
3,780,360 |
||||||||||||||||||||||
Other operating (expenses) income |
(72,994) |
51,494 |
19,685 |
129,403 |
14,897 |
671 |
13,575 |
9,954 |
1,886,750 |
2,053,435 |
||||||||||||||||||||||
Dividends and net income on equity investments(2) |
(8,058) |
9,655 |
5,340 |
828 |
2,164 |
8,760 |
(4,314) |
35 |
221,444 |
235,854 |
||||||||||||||||||||||
Total operating income, net |
13,893,665 |
1,181,577 |
1,418,579 |
1,052,343 |
318,730 |
97,874 |
183,721 |
522,200 |
1,963,740 |
20,632,429 |
||||||||||||||||||||||
Operating expenses(3) |
(6,600,686) |
(797,091) |
(639,748) |
(577,497) |
(153,377) |
(47,997) |
(153,317) |
(79,814) |
(857,541) |
(9,907,068) |
||||||||||||||||||||||
Impairment, depreciation and amortization |
(613,807) |
(110,293) |
(106,601) |
(54,999) |
(1,630) |
(232) |
(1,754) |
(2,626) |
(88,633) |
(980,575) |
||||||||||||||||||||||
Total operating expenses |
(7,214,493) |
(907,384) |
(746,349) |
(632,496) |
(155,007) |
(48,229) |
(155,071) |
(82,440) |
(946,174) |
(10,887,643) |
||||||||||||||||||||||
Profit before income tax |
6,679,172 |
274,193 |
672,230 |
419,847 |
163,723 |
49,645 |
28,650 |
439,760 |
1,017,566 |
9,744,786 |
||||||||||||||||||||||
As of December 31, 2024 | ||||||||||||||||||||||||||||||||||||||
In millions of COP | ||||||||||||||||||||||||||||||||||||||
|
Banking
Colombia
|
Banking
Panama
|
Banking El
Salvador
|
Banking
Guatemala
|
Trust |
Investment
banking
|
Brokerage |
International
Banking
|
All other
segments
|
Total before
eliminations
|
Adjustments
for
consolidation
|
Total after
eliminations
|
|||||||||||||||||||||||||||
Total assets |
266,593,755 |
45,964,767 |
26,670,513 |
27,332,834 |
719,006 |
1,464,180 |
398,066 |
35,272,842 |
10,901,576 |
415,317,539 |
(43,102,157) |
372,215,382 |
||||||||||||||||||||||||||
Total liabilities |
222,402,215 |
41,132,907 |
23,889,120 |
25,018,466 |
153,181 |
48,620 |
122,213 |
24,248,959 |
4,639,406 |
341,655,087 |
(14,023,980) |
327,631,107 |
||||||||||||||||||||||||||
As of December 31, 2023 | ||||||||||||||||||||||||||||||||||||||
In millions of COP | ||||||||||||||||||||||||||||||||||||||
|
Banking
Colombia
|
Banking
Panama
|
Banking El
Salvador
|
Banking
Guatemala
|
Trust |
Investment
banking
|
Brokerage |
International
Banking
|
All other
segments
|
Total before
eliminations
|
Adjustments
for
consolidation
|
Total after
eliminations
|
|||||||||||||||||||||||||||
Total assets |
254,367,378 |
40,740,495 |
21,608,586 |
21,377,205 |
658,547 |
1,719,824 |
351,694 |
30,199,897 |
10,224,734 |
381,248,360 |
(38,319,551) |
342,928,809 |
||||||||||||||||||||||||||
Total liabilities |
216,200,157 |
36,315,750 |
19,220,367 |
19,469,075 |
138,171 |
51,841 |
121,423 |
20,734,521 |
4,874,547 |
317,125,852 |
(13,246,772) |
303,879,080 |
||||||||||||||||||||||||||
As of December 31, 2024(1) | ||||||||||||||||||||
|
Banking
Colombia
|
Banking El
Salvador
|
Trust |
Investment
banking
|
All other
segments
|
Total |
|||||||||||||||
In millions of COP | ||||||||||||||||||||
Investments in associates and joint ventures |
205,311 |
27,621 |
300,881 |
499,195 |
1,895,976 |
2,928,984 |
||||||||||||||
Equity method |
(28,130) |
4,320 |
45,312 |
58,507 |
142,563 |
222,572 |
||||||||||||||
As of December 31, 2023(1) | ||||||||||||||||||||
|
Banking
Colombia
|
Banking El
Salvador
|
Trust |
Investment
banking
|
All other
segments
|
Total |
|||||||||||||||
In millions of COP | ||||||||||||||||||||
Investments in associates and joint ventures |
332,862 |
21,292 |
285,838 |
617,982 |
1,739,629 |
2,997,603 |
||||||||||||||
Equity method |
(52,183) |
2,730 |
30,043 |
4,398 |
128,127 |
113,115 |
||||||||||||||
2024 |
2023 |
2022 |
||||||||||||||||||
| Geographic information |
Interest and
valuation(1)
|
Long-lived
assets(2)
|
Interest and
valuation(1)
|
Long-lived
assets(2)
|
Interest and
valuation(1)
|
Long-lived
assets(2)
|
||||||||||||||
In millions of COP | ||||||||||||||||||||
Colombia |
28,127,681 |
13,614,718 |
29,812,448 |
13,466,457 |
20,977,845 |
12,666,847 |
||||||||||||||
Panama |
4,156,413 |
995,045 |
4,234,542 |
877,407 |
3,023,461 |
1,042,824 |
||||||||||||||
El Salvador |
1,852,097 |
607,601 |
1,774,165 |
547,357 |
1,528,264 |
636,071 |
||||||||||||||
Guatemala |
1,939,808 |
436,804 |
1,795,597 |
361,840 |
1,537,811 |
445,288 |
||||||||||||||
United States of America |
63 |
4,176 |
55 |
4,805 |
- |
7,504 |
||||||||||||||
Bermuda |
177 |
4,416 |
184 |
3,434 |
2 |
- |
||||||||||||||
Puerto Rico |
187,913 |
1,552 |
149,541 |
1,297 |
64,709 |
2,328 |
||||||||||||||
Total |
36,264,152 |
15,664,312 |
37,766,532 |
15,262,597 |
27,132,092 |
14,800,862 |
||||||||||||||
Eliminations and adjustment |
(719,931) |
8,453,369 |
(720,373) |
7,000,343 |
(335,145) |
8,795,011 |
||||||||||||||
Total, net |
35,544,221 |
24,117,681 |
37,046,159 |
22,262,940 |
26,796,947 |
23,595,873 |
||||||||||||||
December 31, 2024 |
December 31, 2023 |
|||||||
In millions of COP | ||||||||
Cash and balances at central bank |
||||||||
Cash |
9,439,363 |
8,830,305 |
||||||
Due from central banks(1)(2) |
7,504,135 |
11,248,230 |
||||||
Due from other private financial entities |
7,778,937 |
7,607,921 |
||||||
Checks on hold |
132,929 |
214,004 |
||||||
Remittances of domestic negotiated checks in transit |
26,172 |
74,524 |
||||||
Total cash and due from banks |
24,881,536 |
27,974,984 |
||||||
Money market transactions |
||||||||
Interbank borrowings |
2,239,615 |
3,983,699 |
||||||
Reverse repurchase agreements and other similar secured loans(3) |
5,722,948 |
7,840,926 |
||||||
Total money market transactions |
7,962,563 |
11,824,625 |
||||||
Total cash and cash equivalents |
32,844,099 |
39,799,609 |
||||||
| Financial assets investments | Measurement methodology |
Total carrying
value, net
|
||||||||||||
|
Fair value through
profit or loss
|
Fair value through other
comprehensive income, net
|
Amortized
cost, net
|
||||||||||||
In millions of COP | ||||||||||||||
Securities issued by the Colombian Government(1) |
11,644,181 |
2,683,925 |
159,323 |
14,487,429 |
||||||||||
Securities issued by foreign governments(2) |
10,283,450 |
1,484,546 |
651,494 |
12,419,490 |
||||||||||
Corporate bonds |
257,326 |
639,108 |
3,612,049 |
4,508,483 |
||||||||||
Securities issued by government entities |
118,760 |
- |
3,380,491 |
3,499,251 |
||||||||||
Securities issued by other financial institutions(3) |
731,564 |
276,837 |
601,521 |
1,609,922 |
||||||||||
Total debt instruments(4) |
23,035,281 |
5,084,416 |
8,404,878 |
36,524,575 |
||||||||||
Total equity securities |
537,213 |
474,097 |
- |
1,011,310 |
||||||||||
Total other instruments financial(5) |
34,385 |
- |
- |
34,385 |
||||||||||
Total financial assets investments |
23,606,879 |
5,558,513 |
8,404,878 |
37,570,270 |
||||||||||
| Financial assets investments | Measurement methodology |
Total carrying
value, net
|
||||||||||||
|
Fair value through
profit or loss
|
Fair value through other
comprehensive income, net
|
Amortized
cost, net
|
||||||||||||
In millions of COP | ||||||||||||||
Securities issued by foreign governments |
6,274,400 |
2,437,996 |
537,831 |
9,250,227 |
||||||||||
Securities issued by the Colombian Government |
4,725,605 |
2,725,722 |
68,624 |
7,519,951 |
||||||||||
Corporate bonds |
237,234 |
611,153 |
2,559,336 |
3,407,723 |
||||||||||
Securities issued by government entities |
84,990 |
- |
3,129,501 |
3,214,491 |
||||||||||
Securities issued by other financial institutions(1) |
774,178 |
373,306 |
552,790 |
1,700,274 |
||||||||||
Total debt instruments(2) |
12,096,407 |
6,148,177 |
6,848,082 |
25,092,666 |
||||||||||
Total equity securities |
98,853 |
444,357 |
- |
543,210 |
||||||||||
Total other instruments financial(3) |
38,319 |
- |
- |
38,319 |
||||||||||
Total financial assets investments |
12,233,579 |
6,592,534 |
6,848,082 |
25,674,195 |
||||||||||
Less than 1 year |
Between 1 and 3 years |
Between 3 and 5 years |
Greater than 5 years |
Total |
|||||||||||||
In millions of COP | |||||||||||||||||
Securities at fair value through profit or loss |
|||||||||||||||||
Securities issued by the Colombian Government |
1,019,028 |
6,767,240 |
1,157,703 |
2,700,210 |
11,644,181 |
||||||||||||
Securities issued by foreign governments |
7,088,685 |
1,835,751 |
651,529 |
707,485 |
10,283,450 |
||||||||||||
Securities issued by other financial institutions |
192,039 |
235,209 |
200,251 |
104,065 |
731,564 |
||||||||||||
Securities issued by government entities |
33,854 |
82,536 |
2,370 |
- |
118,760 |
||||||||||||
Corporate bonds |
42,395 |
28,019 |
41,022 |
145,890 |
257,326 |
||||||||||||
Subtotal |
8,376,001 |
8,948,755 |
2,052,875 |
3,657,650 |
23,035,281 |
||||||||||||
Fair value through other comprehensive income |
|||||||||||||||||
Securities issued by the Colombian Government |
2,648,354 |
35,571 |
- |
- |
2,683,925 |
||||||||||||
Securities issued by foreign governments |
169,992 |
648,246 |
497,967 |
168,341 |
1,484,546 |
||||||||||||
Corporate bonds |
- |
73,409 |
60,922 |
504,777 |
639,108 |
||||||||||||
Securities issued by other financial institutions |
119,479 |
51,275 |
49,744 |
56,339 |
276,837 |
||||||||||||
Subtotal |
2,937,825 |
808,501 |
608,633 |
729,457 |
5,084,416 |
||||||||||||
Securities at amortized cost |
|||||||||||||||||
Corporate bonds |
56,847 |
1,086,392 |
847,742 |
1,621,068 |
3,612,049 |
||||||||||||
Securities issued by government entities |
3,330,223 |
- |
- |
50,268 |
3,380,491 |
||||||||||||
Securities issued by foreign governments |
143,911 |
162,996 |
85,772 |
258,815 |
651,494 |
||||||||||||
Securities issued by other financial institutions |
201,944 |
44,699 |
271,793 |
83,085 |
601,521 |
||||||||||||
Securities issued by the Colombian Government |
- |
51,260 |
46,598 |
61,465 |
159,323 |
||||||||||||
Subtotal |
3,732,925 |
1,345,347 |
1,251,905 |
2,074,701 |
8,404,878 |
||||||||||||
Total debt instruments |
15,046,751 |
11,102,603 |
3,913,413 |
6,461,808 |
36,524,575 |
||||||||||||
Less than 1 year |
Between 1 and 3 years |
Between 3 and 5 years |
Greater than 5 years |
Total |
|||||||||||||
In millions of COP | |||||||||||||||||
Securities at fair value through profit or loss |
|||||||||||||||||
Securities issued by foreign governments |
4,864,121 |
513,546 |
283,020 |
613,713 |
6,274,400 |
||||||||||||
Securities issued by the Colombian Government |
390,307 |
2,759,392 |
491,867 |
1,084,039 |
4,725,605 |
||||||||||||
Securities issued by other financial institutions |
312,749 |
236,597 |
89,526 |
135,306 |
774,178 |
||||||||||||
Corporate bonds |
39,361 |
40,930 |
28,624 |
128,319 |
237,234 |
||||||||||||
Securities issued by government entities |
48,893 |
33,601 |
2,496 |
- |
84,990 |
||||||||||||
Subtotal |
5,655,431 |
3,584,066 |
895,533 |
1,961,377 |
12,096,407 |
||||||||||||
Fair value through other comprehensive income |
|||||||||||||||||
Securities issued by the Colombian Government |
2,672,090 |
53,632 |
- |
- |
2,725,722 |
||||||||||||
Securities issued by foreign governments |
1,346,171 |
598,014 |
355,927 |
137,884 |
2,437,996 |
||||||||||||
Corporate bonds |
549 |
- |
63,474 |
547,130 |
611,153 |
||||||||||||
Securities issued by other financial institutions |
149,124 |
154,659 |
- |
69,523 |
373,306 |
||||||||||||
Subtotal |
4,167,934 |
806,305 |
419,401 |
754,537 |
6,148,177 |
||||||||||||
Securities at amortized cost |
|||||||||||||||||
Securities issued by government entities |
3,078,744 |
- |
- |
50,757 |
3,129,501 |
||||||||||||
Corporate bonds |
229,811 |
46,925 |
322,314 |
1,960,286 |
2,559,336 |
||||||||||||
Securities issued by other financial institutions |
103,414 |
106,681 |
46,969 |
295,726 |
552,790 |
||||||||||||
Securities issued by foreign governments |
188,651 |
189,744 |
56,703 |
102,733 |
537,831 |
||||||||||||
Securities issued by the Colombian Government |
39,046 |
- |
7,350 |
22,228 |
68,624 |
||||||||||||
Subtotal |
3,639,666 |
343,350 |
433,336 |
2,431,730 |
6,848,082 |
||||||||||||
Total debt instruments |
13,463,031 |
4,733,721 |
1,748,270 |
5,147,644 |
25,092,666 |
||||||||||||
Equity securities |
Carrying amount |
|||||||
December 31, 2024 |
December 31, 2023 |
|||||||
In millions of COP | ||||||||
Securities at fair value through OCI: |
||||||||
Equity securities listed in Colombia |
2 |
2 |
||||||
Equity securities listed in foreign countries |
76,795 |
78,787 |
||||||
Equity securities unlisted: |
||||||||
Telered S.A. |
160,761 |
164,981 |
||||||
Asociación Gremial de Instituciones Financieras Credibanco S.A. |
109,011 |
110,786 |
||||||
Transacciones y Transferencias, S. A.(1) |
55,401 |
17,346 |
||||||
Compañía de Procesamiento de Medios de Pago Guatemala (Bahamas), S. A. |
18,913 |
16,333 |
||||||
Cámara de Riesgo Central de Contraparte de Colombia S.A. |
17,385 |
14,998 |
||||||
Derecho Fiduciario Inmobiliaria Cadenalco |
4,212 |
4,449 |
||||||
Others |
31,617 |
36,675 |
||||||
Total equity securities at fair value through OCI |
474,097 |
444,357 |
||||||
Pledged financial assets |
Term |
Security pledged |
Carrying amount |
||||||||
In millions of COP | |||||||||||
Investments pledged as collateral in money market |
|||||||||||
Securities issued by foreign governments |
Up to 3 months |
Time deposits |
43,424 |
||||||||
Securities issued by foreign governments |
Between 6 and 12 months |
Bonds |
26,314 |
||||||||
Securities issued by foreign governments |
Between 6 and 12 months |
Time deposits |
109,792 |
||||||||
Securities issued by foreign governments |
Greater than 12 months |
Bonds |
48,841 |
||||||||
Securities issued by foreign governments |
Greater than 12 months |
Time deposits |
166,849 |
||||||||
Securities issued by the Colombian Government |
Greater than 12 months |
TES - Treasury instruments |
491,472 |
||||||||
Securities issued by other financial institutions |
Between 3 and 6 months |
Time deposits |
5,037 |
||||||||
Securities issued by other financial institutions |
Between 6 and 12 months |
Time deposits |
4,019 |
||||||||
Securities issued by other financial institutions |
Greater than 12 months |
Bonds |
1,876 |
||||||||
Securities issued by other financial institutions |
Greater than 12 months |
Time deposits |
29,058 |
||||||||
Subtotal investments pledged as collateral in money market |
926,682 |
||||||||||
Investments pledged as collateral in derivative operations |
|||||||||||
Securities issued by the Colombian Government |
Up to 3 months |
TES - Treasury instruments |
68,903 |
||||||||
Securities issued by the Colombian Government |
Between 3 and 6 months |
TES - Treasury instruments |
414,296 |
||||||||
Securities issued by the Colombian Government |
Greater than 12 months |
TES - Treasury instruments |
200,561 |
||||||||
Securities issued by foreign governments |
Between 6 and 12 months |
Foreign issueds |
2,229 |
||||||||
Subtotal investments pledged as collateral in derivative operations |
685,989 |
||||||||||
Total securities pledged as collateral |
1,612,671 |
||||||||||
Pledged financial assets |
Term |
Security pledged |
Carrying amount |
||||||||
In millions of COP | |||||||||||
Investments pledged as collateral in money market |
|||||||||||
Securities issued by foreign governments |
Up to 3 months |
Time deposits |
120,477 |
||||||||
Securities issued by foreign governments |
Between 3 and 6 months |
Time deposits |
94,582 |
||||||||
Securities issued by other financial institutions |
Up to 3 months |
Time deposits |
5,443 |
||||||||
Securities issued by other financial institutions |
Between 6 and 12 months |
Time deposits |
2,179 |
||||||||
Securities issued by other financial institutions |
Greater than 12 months |
Time deposits |
25,938 |
||||||||
Securities issued by other financial institutions |
Greater than 12 months |
Bonds |
6,687 |
||||||||
Corporate bonds |
Up to 3 months |
Bonds |
4,570 |
||||||||
Subtotal investments pledged as collateral in money market |
259,876 |
||||||||||
Investments pledged as collateral in derivative operations |
|||||||||||
Securities issued by the Colombian Government |
Up to 3 months |
TES - Treasury instruments |
39,257 |
||||||||
Securities issued by the Colombian Government |
Between 6 and 12 months |
TES - Treasury instruments |
7,821 |
||||||||
Securities issued by the Colombian Government |
Greater than 12 months |
TES - Treasury instruments |
1,244,190 |
||||||||
Securities issued by foreign governments |
Between 3 and 6 months |
Foreign issueds |
1,875 |
||||||||
Subtotal investments pledged as collateral in derivative operations |
1,293,143 |
||||||||||
Total securities pledged as collateral |
1,553,019 |
||||||||||
Debt instruments portfolio measure at fair value through OCI and amortized cost |
Stage 1 |
Stage 2 |
Stage 3 |
Total |
||||||||||
In millions of COP | ||||||||||||||
Gross carrying amount as at 1 January 2024 |
12,760,342 |
205,133 |
30,784 |
12,996,259 |
||||||||||
Transfer from stage 1 to stage 2(1) |
(294,440) |
294,440 |
- |
- |
||||||||||
Transfer from stage 2 to stage 1(2) |
12,678 |
(12,678) |
- |
- |
||||||||||
Sales and maturities |
(7,928,390) |
(171,505) |
- |
(8,099,895) |
||||||||||
Purchases |
7,975,932 |
129,455 |
- |
8,105,387 |
||||||||||
Valuation and payments |
(125,564) |
3,806 |
984 |
(120,774) |
||||||||||
Foreign Exchange |
598,094 |
5,414 |
4,809 |
608,317 |
||||||||||
Gross carrying amount as at 31 December 2024 |
12,998,652 |
454,065 |
36,577 |
13,489,294 |
||||||||||
Debt instruments portfolio measure at fair value through OCI and amortized cost |
Stage 1 |
Stage 2 |
Stage 3 |
Total |
||||||||||
In millions of COP | ||||||||||||||
Gross carrying amount as at 1 January 2023 |
15,973,144 |
340,891 |
- |
16,314,035 |
||||||||||
Transfer from stage 1 to stage 3(1) |
(30,784) |
- |
30,784 |
- |
||||||||||
Transfer from stage 2 to stage 1(1) |
6,627 |
(6,627) |
- |
- |
||||||||||
Sales and maturities |
(9,792,950) |
- |
- |
(9,792,950) |
||||||||||
Purchases |
7,701,763 |
- |
- |
7,701,763 |
||||||||||
Valuation and payments |
84,609 |
(66,959) |
- |
17,650 |
||||||||||
Foreign Exchange |
(1,182,067) |
(62,172) |
- |
(1,244,239) |
||||||||||
Gross carrying amount as at 31 December 2023 |
12,760,342 |
205,133 |
30,784 |
12,996,259 |
||||||||||
Concept |
Stage 1 |
Stage 2 |
Stage 3 |
Total |
||||||||||
In millions of COP | ||||||||||||||
Securities at amortized cost, net |
7,975,158 |
393,143 |
36,577 |
8,404,878 |
||||||||||
Carrying amount |
8,008,567 |
401,263 |
53,985 |
8,463,815 |
||||||||||
Loss allowance |
(33,409) |
(8,120) |
(17,408) |
(58,937) |
||||||||||
Securities at fair value through other comprehensive income(1) |
5,023,494 |
60,922 |
- |
5,084,416 |
||||||||||
Total debt instruments portfolio measure at fair value through OCI and amortized cost |
12,998,652 |
454,065 |
36,577 |
13,489,294 |
||||||||||
Concept |
Stage 1 |
Stage 2 |
Stage 3 |
Total |
||||||||||
In millions of COP | ||||||||||||||
Securities at amortized cost, net |
6,612,165 |
205,133 |
30,784 |
6,848,082 |
||||||||||
Carrying amount |
6,642,104 |
217,046 |
44,735 |
6,903,885 |
||||||||||
Loss allowance |
(29,939) |
(11,913) |
(13,951) |
(55,803) |
||||||||||
Securities at fair value through other comprehensive income(1) |
6,148,177 |
- |
- |
6,148,177 |
||||||||||
Total debt instruments portfolio measure at fair value through OCI and amortized cost |
12,760,342 |
205,133 |
30,784 |
12,996,259 |
||||||||||
Concept |
Stage 1 |
Stage 2 |
Stage 3 |
Total |
||||||||||
In millions of COP | ||||||||||||||
Loss allowance of January 1, 2024 |
29,939 |
11,913 |
13,951 |
55,803 |
||||||||||
Transfer from stage 1 to stage 2(1) |
(3,213) |
3,213 |
- |
- |
||||||||||
Transfer from stage 2 to stage 1(2) |
298 |
(298) |
- |
- |
||||||||||
Sales and maturities |
(11,187) |
(5,895) |
- |
(17,082) |
||||||||||
New debt instruments purchased(3) |
13,296 |
3,114 |
- |
16,410 |
||||||||||
Net provisions recognised during the period |
1,465 |
(4,482) |
1,214 |
(1,803) |
||||||||||
Foreign Exchange(4) |
2,811 |
555 |
2,243 |
5,609 |
||||||||||
Loss allowance of December 31, 2024 |
33,409 |
8,120 |
17,408 |
58,937 |
||||||||||
Concept |
Stage 1 |
Stage 2 |
Stage 3 |
Total |
||||||||||
In millions of COP | ||||||||||||||
Loss allowance of January 1, 2023 |
29,881 |
35,020 |
- |
64,901 |
||||||||||
Transfer from stage 1 to stage 3(1) |
(13,951) |
- |
13,951 |
- |
||||||||||
Transfer from stage 2 to stage 1(1) |
129 |
(129) |
- |
- |
||||||||||
Sales and maturities |
(9,459) |
- |
- |
(9,459) |
||||||||||
New debt instruments purchased(2) |
10,497 |
- |
- |
10,497 |
||||||||||
Net provisions recognised during the period(3) |
19,030 |
(17,882) |
- |
1,148 |
||||||||||
Foreign Exchange(4) |
(6,188) |
(5,096) |
- |
(11,284) |
||||||||||
Loss allowance of December 31, 2023 |
29,939 |
11,913 |
13,951 |
55,803 |
||||||||||
Concept |
Stage 1 |
Stage 2 |
Total |
||||||||
In millions of COP | |||||||||||
Loss allowance of January 1, 2022 |
17,690 |
6,989 |
24,679 |
||||||||
Transfer from stage 1 to stage 2(1) |
(3,808) |
3,808 |
- |
||||||||
Transfer from stage 2 to stage 1(2) |
526 |
(526) |
- |
||||||||
Change in measure(3) |
(213) |
- |
(213) |
||||||||
Sales and maturities |
(6,097) |
(1,170) |
(7,267) |
||||||||
New debt instruments purchased |
16,104 |
28,795 |
44,899 |
||||||||
Net provisions recognised during the period |
3,482 |
(4,088) |
(606) |
||||||||
Foreign Exchange |
2,197 |
1,212 |
3,409 |
||||||||
Loss allowance of December 31, 2022 |
29,881 |
35,020 |
64,901 |
||||||||
Derivatives |
December 31, 2024 |
December 31, 2023 |
||||||
In millions of COP | ||||||||
Forwards |
||||||||
Assets |
||||||||
Foreign exchange contracts |
1,084,830 |
4,381,906 |
||||||
Equity contracts |
51,645 |
3,015 |
||||||
Subtotal assets |
1,136,475 |
4,384,921 |
||||||
Liabilities |
||||||||
Foreign exchange contracts |
972,295 |
4,526,353 |
||||||
Equity contracts |
1,367 |
10,481 |
||||||
Subtotal liabilities |
973,662 |
4,536,834 |
||||||
Total forwards(1) |
162,813 |
(151,913) |
||||||
Swaps |
||||||||
Assets |
||||||||
Foreign exchange contracts |
1,463,256 |
1,304,337 |
||||||
Interest rate contracts |
236,033 |
352,424 |
||||||
Subtotal assets |
1,699,289 |
1,656,761 |
||||||
Liabilities |
||||||||
Foreign exchange contracts |
1,332,431 |
1,491,086 |
||||||
Interest rate contracts |
291,068 |
449,857 |
||||||
Subtotal liabilities |
1,623,499 |
1,940,943 |
||||||
Total swaps |
75,790 |
(284,182) |
||||||
Options |
||||||||
Assets |
||||||||
Foreign exchange contracts |
102,378 |
210,588 |
||||||
Subtotal assets |
102,378 |
210,588 |
||||||
Liabilities |
||||||||
Foreign exchange contracts |
82,482 |
232,587 |
||||||
Subtotal liabilities |
82,482 |
232,587 |
||||||
Total options |
19,896 |
(21,999) |
||||||
Derivative assets |
2,938,142 |
6,252,270 |
||||||
Derivative liabilities |
2,679,643 |
6,710,364 |
||||||
Forwards |
Swaps |
Options |
Total |
|||||||||||
In millions of COP | ||||||||||||||
Assets |
1,136,475 |
1,699,289 |
102,378 |
2,938,142 |
||||||||||
Less than 1 year |
1,105,226 |
440,817 |
96,891 |
1,642,934 |
||||||||||
Between 1 and 3 years |
31,249 |
651,770 |
5,487 |
688,506 |
||||||||||
Greater than 3 years |
- |
606,702 |
- |
606,702 |
||||||||||
Liabilities |
973,662 |
1,623,499 |
82,482 |
2,679,643 |
||||||||||
Less than 1 year |
943,804 |
376,346 |
76,537 |
1,396,687 |
||||||||||
Between 1 and 3 years |
29,858 |
604,473 |
5,945 |
640,276 |
||||||||||
Greater than 3 years |
- |
642,680 |
- |
642,680 |
||||||||||
Forwards |
Swaps |
Options |
Total |
|||||||||||
In millions of COP | ||||||||||||||
Assets |
4,384,921 |
1,656,761 |
210,588 |
6,252,270 |
||||||||||
Less than 1 year |
4,235,981 |
642,305 |
135,559 |
5,013,845 |
||||||||||
Between 1 and 3 years |
147,826 |
517,314 |
75,029 |
740,169 |
||||||||||
Greater than 3 years |
1,114 |
497,142 |
- |
498,256 |
||||||||||
Liabilities |
4,536,834 |
1,940,943 |
232,587 |
6,710,364 |
||||||||||
Less than 1 year |
4,419,918 |
419,251 |
152,285 |
4,991,454 |
||||||||||
Between 1 and 3 years |
116,916 |
979,130 |
80,302 |
1,176,348 |
||||||||||
Greater than 3 years |
- |
542,562 |
- |
542,562 |
||||||||||
December 31, 2024 |
December 31, 2023 |
|||||||
In millions of COP | ||||||||
Collateral granted |
1,157,880 |
2,326,977 |
||||||
Collateral received |
378,767 |
795,628 |
||||||
Forward |
Swaps |
Options |
Total |
|||||||||||
In millions of COP | ||||||||||||||
Balance at January 1, 2024 |
36,289 |
(13,630) |
63,068 |
85,727 |
||||||||||
New trades |
702,001 |
(978) |
117,125 |
818,148 |
||||||||||
Amortization |
(687,024) |
(8,767) |
(130,767) |
(826,558) |
||||||||||
Early cancellations and level transfers |
(8,292) |
168 |
(12,989) |
(21,113) |
||||||||||
Balance at December 31, 2024 |
42,974 |
(23,207) |
36,437 |
56,204 |
||||||||||
Forward |
Swaps |
Options |
Total |
|||||||||||
In millions of COP | ||||||||||||||
Balance at January 1, 2023 |
61,724 |
16,580 |
39,714 |
118,018 |
||||||||||
New trades |
1,159,069 |
(26,905) |
195,456 |
1,327,620 |
||||||||||
Amortization |
(1,176,173) |
4,166 |
(148,299) |
(1,320,306) |
||||||||||
Early cancellations and level transfers |
(8,331) |
(7,471) |
(23,803) |
(39,605) |
||||||||||
Balance at December 31, 2023 |
36,289 |
(13,630) |
63,068 |
85,727 |
||||||||||
Derivatives Assets |
Derivatives Liabilities |
|||||||
In millions of COP | ||||||||
Over-the-counter |
||||||||
Foreign exchange contracts |
||||||||
Forwards |
1,084,830 |
972,295 |
||||||
Swaps |
1,463,256 |
1,332,431 |
||||||
Options |
102,378 |
82,482 |
||||||
Interest rate contracts |
||||||||
Swaps |
236,033 |
291,068 |
||||||
Equity contracts |
||||||||
Forwards |
51,645 |
1,367 |
||||||
Gross derivative assets/liabilities |
2,938,142 |
2,679,643 |
||||||
Offseting of derivates |
- |
- |
||||||
Derivative financial instruments in statement of financial position |
2,938,142 |
2,679,643 |
||||||
Master netting agreements |
(2,540,752) |
(2,679,643) |
||||||
Collateral received/paid |
(378,767) |
- |
||||||
Total derivative financial instruments assetss/ liabilities before collateral and Master netting agreements |
18,623 |
- |
||||||
Derivatives Assets |
Derivatives Liabilities |
|||||||
In millions of COP | ||||||||
Over-the-counter |
||||||||
Foreign exchange contracts |
||||||||
Forwards |
4,381,906 |
4,526,353 |
||||||
Swaps |
1,304,337 |
1,491,086 |
||||||
Options |
210,588 |
232,587 |
||||||
Interest rate contracts |
||||||||
Swaps |
352,424 |
449,857 |
||||||
Equity contracts |
||||||||
Forwards |
3,015 |
10,481 |
||||||
Gross derivative assets/liabilities |
6,252,270 |
6,710,364 |
||||||
Offsetting of derivates |
- |
- |
||||||
Derivative financial instruments in statement of financial position |
6,252,270 |
6,710,364 |
||||||
Master netting agreements |
(6,215,727) |
(5,548,746) |
||||||
Collateral received/paid |
(36,543) |
(1,161,618) |
||||||
Total derivative financial instruments assets/ liabilities before collateral and Master netting agreements |
- |
- |
||||||
| Maturity | Total | |||||||
| Less than 1 year | ||||||||
| In millions of COP (Except average rate) | ||||||||
| Foreign currency risk | ||||||||
| Forward exchange contracts | ||||||||
| Notional amount of hedging instruments | 6,614 |
6,614 |
||||||
| Average rate of hedging instruments (COP/USD) | 4,496 |
|||||||
| Interest rate risk | ||||||||
| Interest rate swaps | ||||||||
| Notional amount of hedging instruments | 188,000 |
188,000 |
||||||
| Average fixed interest rate | 8.63 % |
|||||||
| Notional amount | Carrying amount | Line item in the Consolidated Statement of Financial Position | Change in fair value used for measuring ineffectiveness for the period | ||||||||||||||
| Assets | Liabilities | ||||||||||||||||
| In millions of COP | |||||||||||||||||
| Foreign currency risk | |||||||||||||||||
Forward exchange contracts(1) |
6,614 |
- |
- |
Derivative financial instruments | (65) |
||||||||||||
| Interest rate risk | |||||||||||||||||
Interest rate swaps(1) |
188,000 |
- |
- |
Derivative financial instruments | 281 |
||||||||||||
| Change in fair value used for measuring ineffectiveness | Cash flow hedge reserve (OCI) | Balances remaining in the cash flow hedge reserve from hedging relationships for which hedge accounting is no longer applied | |||||||||
| In millions of COP | |||||||||||
| Foreign currency risk | |||||||||||
| Forecast transactions | 65 |
(65) |
- |
||||||||
| Interest rate risk | |||||||||||
| Deposits | (298) |
281 |
- |
||||||||
| Total hedging gain/(loss) recognised in OCI | Ineffectiveness recognised in profit or loss | Line item in the Consolidated Statement of Income that includes the recognised hedge ineffectiveness | Amount reclassified from OCI to profit or loss | Line item in the Consolidated Statement of Income that includes the the reclassification adjustment | |||||||||||||
| In millions of COP | |||||||||||||||||
| Foreign currency risk | |||||||||||||||||
| Forecast transactions | (65) |
- |
Other operating income | - |
Other administrative and general expenses | ||||||||||||
| Interest rate risk | |||||||||||||||||
| Deposits | 416 |
- |
Other operating income | (135) |
Interest expense | ||||||||||||
| Foreign currency risk | Interest rate risk | Total | |||||||||
| In millions of COP | |||||||||||
| As of January 1, 2024 | - |
||||||||||
| Total hedging (loss)/gain recognized in OCI | (65) |
416 |
351 |
||||||||
| Amount reclassified to profit or loss | - |
(135) |
(135) |
||||||||
| Amount included in the cost of non-financial items | - |
- |
- |
||||||||
| Total cash flow hedging | (65) |
281 |
216 |
||||||||
| Income tax | (87) |
||||||||||
| As of December 31, 2024 | 129 |
||||||||||
| Notional amount | Carrying amount | Line item in the Consolidated Statement of Financial Position | Change in fair value used for measuring ineffectiveness for the period | ||||||||||||||
| Assets | Liabilities | ||||||||||||||||
| In millions of COP | |||||||||||||||||
| Interest rate risk | |||||||||||||||||
Interest rate swaps(1) |
134,000 |
- |
- |
Derivative financial instruments | (1,044) |
||||||||||||
| Carrying amount | Accumulated fair value adjustments | Line item in the Consolidated Statement of Financial Position | Change in fair value used for measuring ineffectiveness for the period | Accumulated amount of fair value hedge adjustments remaining in the Statement of Financial Position for any hedged items that have ceased to be adjusted for hedging gains and losses | |||||||||||||
| In millions of COP | |||||||||||||||||
| Interest rate risk | |||||||||||||||||
| Deposits | 128,454 |
(963) |
Deposits by customers | 963 |
- |
||||||||||||
| Ineffectiveness recognised in profit or loss | Line item in the Consolidated Statement of Income that includes the recognised hedge ineffectiveness | |||||||
| In millions of COP | ||||||||
| Interest rate risk | ||||||||
| Deposits | (81) |
Other operating income | ||||||
| Hedges of a net asset in a foreign operation | December 31, 2024 | December 31, 2023 | ||||||
| In thousands of USD | ||||||||
Hedged(1) |
884,544 |
1,592,034 |
||||||
| Non hedged | 1,723,889 |
1,004,000 |
||||||
| Total net asset in a foreign operation | 2,608,433 |
2,596,034 |
||||||
Debt securities issued designated as a hedging instrument | ||||||||||||||
In thousands of USD | ||||||||||||||
Opening date |
Expiration date |
Rate |
Principal balance |
Designated capital as a hedged instrument |
||||||||||
18/10/2017 |
18/10/2027 |
7.03 % |
461,707 |
355,339 |
||||||||||
18/12/2019 |
18/12/2029 |
4.68 % |
800,000 |
529,205 |
||||||||||
Total debt securities issued |
1,261,707 |
884,544 |
||||||||||||
Debt securities issued designated as a hedging instrument | ||||||||||||||
In thousands of USD | ||||||||||||||
Opening date |
Expiration date |
Rate |
Principal balance |
Designated capital as a hedged instrument |
||||||||||
18/10/2017 |
18/10/2027 |
7.03 % |
750,000 |
360,000 |
||||||||||
18/12/2019 |
18/12/2029 |
4.68 % |
436,516 |
436,516 |
||||||||||
18/12/2019 |
18/12/2029 |
4.68 % |
85,710 |
85,710 |
||||||||||
18/12/2019 |
18/12/2029 |
4.68 % |
27,774 |
27,774 |
||||||||||
29/01/2020 |
29/01/2025 |
3.02 % |
482,034 |
482,034 |
||||||||||
Total debt securities issued |
1,782,034 |
1,392,034 |
||||||||||||
Financing with correspondent banks designated as a hedging instrument | ||||||||||||||
31/03/2022 |
17/03/2025 |
6.06 % |
150,000 |
150,000 |
||||||||||
07/09/2022 |
05/09/2025 |
6.36 % |
50,000 |
50,000 |
||||||||||
Total financing with correspondent banks |
200,000 |
200,000 |
||||||||||||
Total |
1,982,034 |
1,592,034 |
||||||||||||
Composition |
December 31, 2024 |
December 31, 2023 |
||||||
In millions of COP | ||||||||
Commercial |
153,252,811 |
134,687,396 |
||||||
Consumer |
55,815,683 |
54,591,769 |
||||||
Mortgage |
41,741,601 |
36,250,408 |
||||||
Financial Leases(1) |
27,291,604 |
27,277,057 |
||||||
Small Business Loans |
1,352,209 |
1,145,017 |
||||||
Total gross loans and advances to customers(2) |
279,453,908 |
253,951,647 |
||||||
Total allowance |
(16,179,738) |
(16,223,103) |
||||||
Total Net loans and advances to customers |
263,274,170 |
237,728,544 |
||||||
Concept |
Commercial |
Consumer |
Mortgage |
Financial
Leases
|
Small
business
loans
|
Total |
||||||||||||||
In millions of COP | ||||||||||||||||||||
Balance at beginning of period January 1, 2024 |
6,290,266 |
7,717,038 |
1,023,206 |
1,024,575 |
168,018 |
16,223,103 |
||||||||||||||
Loan sales(1) |
(178,128) |
- |
- |
- |
- |
(178,128) |
||||||||||||||
Recovery of charged - off loans(2) |
85,858 |
637,131 |
48,029 |
150,466 |
4,784 |
926,268 |
||||||||||||||
Credit impairment charges on loans, advances and financial leases, net(3) |
1,462,622 |
3,660,321 |
215,240 |
62,708 |
12,761 |
5,413,652 |
||||||||||||||
Adjusted stage 3(4) |
331,332 |
579,861 |
41,563 |
72,432 |
9,010 |
1,034,198 |
||||||||||||||
Charges-off(2) |
(977,743) |
(6,406,521) |
(143,885) |
(228,639) |
(99,124) |
(7,855,912) |
||||||||||||||
Translation adjustment(5) |
245,023 |
309,947 |
51,024 |
6,730 |
3,833 |
616,557 |
||||||||||||||
Balance at December 31, 2024 |
7,259,230 |
6,497,777 |
1,235,177 |
1,088,272 |
99,282 |
16,179,738 |
||||||||||||||
| Concept | Commercial | Consumer | Mortgage |
Financial
Leases
|
Small
business
loans
|
Total | ||||||||||||||
In millions of COP | ||||||||||||||||||||
Balance at beginning of period January 1, 2023 |
7,270,305 |
6,047,135 |
1,024,091 |
1,013,074 |
125,035 |
15,479,640 |
||||||||||||||
Loan sales(1) |
(829,547) |
- |
- |
- |
- |
(829,547) |
||||||||||||||
Recovery of charged - off loans(2) |
93,251 |
548,655 |
64,573 |
61,749 |
2,706 |
770,934 |
||||||||||||||
Credit impairment charges on loans, advances and financial leases, net |
756,174 |
6,313,453 |
104,417 |
167,904 |
119,531 |
7,461,479 |
||||||||||||||
Adjusted stage 3(3) |
427,283 |
509,668 |
33,465 |
67,288 |
11,201 |
1,048,905 |
||||||||||||||
Charges-off(2) |
(970,685) |
(5,261,966) |
(128,532) |
(277,904) |
(81,276) |
(6,720,363) |
||||||||||||||
Translation adjustment(4) |
(456,515) |
(439,907) |
(74,808) |
(7,536) |
(9,179) |
(987,945) |
||||||||||||||
Balance at December 31, 2023 |
6,290,266 |
7,717,038 |
1,023,206 |
1,024,575 |
168,018 |
16,223,103 |
||||||||||||||
| Concept | Commercial | Consumer | Mortgage |
Financial
Leases
|
Small
business
loans
|
Total | ||||||||||||||
In millions of COP | ||||||||||||||||||||
Balance at beginning of period January 1, 2022 |
7,813,023 |
5,305,267 |
1,061,058 |
1,521,067 |
164,067 |
15,864,482 |
||||||||||||||
Loan sales(1) |
(225,226) |
- |
- |
- |
- |
(225,226) |
||||||||||||||
Recovery of charged - off loans(2) |
188,018 |
385,011 |
28,690 |
72,056 |
1,191 |
674,966 |
||||||||||||||
Credit impairment charges on loans, advances and financial leases, net |
502,577 |
3,447,515 |
183,436 |
(461,665) |
49,490 |
3,721,353 |
||||||||||||||
Adjusted stage 3(3) |
323,196 |
279,843 |
38,769 |
48,836 |
11,989 |
702,633 |
||||||||||||||
Charges-off(2) |
(1,742,895) |
(3,788,517) |
(345,991) |
(176,407) |
(111,092) |
(6,164,902) |
||||||||||||||
Translation adjustment(4) |
411,612 |
418,016 |
58,129 |
9,187 |
9,390 |
906,334 |
||||||||||||||
Balance at December 31, 2022 |
7,270,305 |
6,047,135 |
1,024,091 |
1,013,074 |
125,035 |
15,479,640 |
||||||||||||||
Changes in the contractual cash flows of the loan portfolio that did not result in derecognition | ||||||||
In millions of COP | ||||||||
December 31, 2024 |
December 31, 2023 |
|||||||
Loan portfolio modified during the period |
||||||||
Amortized cost before modification |
7,563,621 |
7,566,692 |
||||||
Net gain or loss on changes |
(560,552) |
(182,023) |
||||||
Loan portfolio modified since initial recognition |
||||||||
Gross carrying value of the previously modified loan portfolio for which the allowance for losses has been changed from the asset's life to the expected credit losses for 12 months. |
325,028 |
393,789 |
||||||
Stage1 |
Stage2 |
Stage3 |
Total |
|||||||||||||||||||||||
|
Gross
carrying
|
Allowance |
Gross
carrying
|
Allowance |
Gross
carrying
|
Allowance |
Gross
carrying
|
Allowance |
|||||||||||||||||||
In millions of COP | ||||||||||||||||||||||||||
Balance at January 1, 2024 |
120,773,927 |
(638,095) |
5,453,537 |
(425,470) |
8,459,932 |
(5,226,701) |
134,687,396 |
(6,290,266) |
||||||||||||||||||
Transfers of financial instruments: |
(1,548,717) |
(13,835) |
(200,399) |
101,921 |
1,749,116 |
(88,086) |
- |
- |
||||||||||||||||||
Transfers from stage 1 to stage 2 |
(1,625,193) |
22,890 |
1,625,193 |
(22,890) |
- |
- |
- |
- |
||||||||||||||||||
Transfers from stage 1 to stage 3 |
(1,207,431) |
36,155 |
- |
- |
1,207,431 |
(36,155) |
- |
- |
||||||||||||||||||
Transfers from stage 2 to stage 1 |
1,278,864 |
(70,018) |
(1,278,864) |
70,018 |
- |
- |
- |
- |
||||||||||||||||||
Transfers from stage 2 to stage 3 |
- |
- |
(633,645) |
86,370 |
633,645 |
(86,370) |
- |
- |
||||||||||||||||||
Transfers from stage 3 to stage 1 |
5,043 |
(2,862) |
- |
- |
(5,043) |
2,862 |
- |
- |
||||||||||||||||||
Transfers from stage 3 to stage 2 |
- |
- |
86,917 |
(31,577) |
(86,917) |
31,577 |
- |
- |
||||||||||||||||||
Remeasurement arising from transfer of stage |
(537,295) |
42,814 |
(254,631) |
(33,104) |
(236,667) |
(1,205,996) |
(1,028,593) |
(1,196,286) |
||||||||||||||||||
Remeasurement from remaining in the stage |
(7,993,068) |
112,459 |
(269,421) |
38,168 |
29,358 |
(329,489) |
(8,233,131) |
(178,862) |
||||||||||||||||||
Remeasurement due to changes in economics factors |
- |
3,800 |
- |
(1,359) |
- |
109 |
- |
2,550 |
||||||||||||||||||
Remeasurement due to changes in model inputs |
- |
12,929 |
- |
(60,157) |
- |
28,775 |
- |
(18,453) |
||||||||||||||||||
New financial assets purchased/originated(1) |
83,411,122 |
(234,532) |
2,012,893 |
(166,762) |
1,595,995 |
(954,919) |
87,020,010 |
(1,356,213) |
||||||||||||||||||
Financial assets that have been derecognized |
(61,617,701) |
229,467 |
(1,631,559) |
81,976 |
(1,177,975) |
734,137 |
(64,427,235) |
1,045,580 |
||||||||||||||||||
Charges-off |
(18,847) |
872 |
(71,910) |
24,045 |
(886,986) |
952,826 |
(977,743) |
977,743 |
||||||||||||||||||
Foreign Exchange and other movements |
5,292,046 |
(17,916) |
507,278 |
(18,768) |
412,783 |
(208,339) |
6,212,107 |
(245,023) |
||||||||||||||||||
Balance at December 31, 2024 |
137,761,467 |
(502,037) |
5,545,788 |
(459,510) |
9,945,556 |
(6,297,683) |
153,252,811 |
(7,259,230) |
||||||||||||||||||
Stage1 |
Stage2 |
Stage3 |
Total |
|||||||||||||||||||||||
|
Gross
carrying
|
Allowance |
Gross
carrying
|
Allowance |
Gross
carrying
|
Allowance |
Gross
carrying
|
Allowance |
|||||||||||||||||||
In millions of COP | ||||||||||||||||||||||||||
Balance at January 1, 2024 |
46,060,615 |
(2,672,234) |
4,407,067 |
(1,584,505) |
4,124,087 |
(3,460,299) |
54,591,769 |
(7,717,038) |
||||||||||||||||||
Transfers of financial instruments: |
(3,287,690) |
167,853 |
1,334,175 |
(32,948) |
1,953,515 |
(134,905) |
- |
- |
||||||||||||||||||
Transfers from stage 1 to stage 2 |
(2,355,931) |
236,700 |
2,355,931 |
(236,700) |
- |
- |
- |
- |
||||||||||||||||||
Transfers from stage 1 to stage 3 |
(1,694,306) |
185,537 |
- |
- |
1,694,306 |
(185,537) |
- |
- |
||||||||||||||||||
Transfers from stage 2 to stage 1 |
705,570 |
(207,512) |
(705,570) |
207,512 |
- |
- |
- |
- |
||||||||||||||||||
Transfers from stage 2 to stage 3 |
- |
- |
(572,936) |
195,424 |
572,936 |
(195,424) |
- |
- |
||||||||||||||||||
Transfers from stage 3 to stage 1 |
56,977 |
(46,872) |
- |
- |
(56,977) |
46,872 |
- |
- |
||||||||||||||||||
Transfers from stage 3 to stage 2 |
- |
- |
256,750 |
(199,184) |
(256,750) |
199,184 |
- |
- |
||||||||||||||||||
Remeasurement arising from transfer of stage |
(322,470) |
214,334 |
(389,162) |
(153,151) |
1,432,594 |
(4,673,940) |
720,962 |
(4,612,757) |
||||||||||||||||||
Remeasurement from remaining in the stage |
(3,891,488) |
246,406 |
(137,592) |
(27,302) |
27,126 |
(96,141) |
(4,001,954) |
122,963 |
||||||||||||||||||
Remeasurement due to changes in economics factors |
- |
13,782 |
- |
8,102 |
- |
(4,463) |
- |
17,421 |
||||||||||||||||||
Remeasurement due to changes in model inputs |
- |
370,905 |
- |
(37,890) |
- |
(28,501) |
- |
304,514 |
||||||||||||||||||
New financial assets purchased/originated(1) |
18,171,352 |
(503,056) |
1,702,506 |
(592,301) |
1,099,137 |
(970,118) |
20,972,995 |
(2,065,475) |
||||||||||||||||||
Financial assets that have been derecognized |
(11,013,532) |
597,248 |
(895,311) |
336,485 |
(525,071) |
422,288 |
(12,433,914) |
1,356,021 |
||||||||||||||||||
Charges-off |
(1,093,049) |
266,898 |
(1,092,436) |
502,944 |
(4,221,036) |
5,636,679 |
(6,406,521) |
6,406,521 |
||||||||||||||||||
Foreign Exchange and other movements |
2,073,275 |
(72,848) |
189,360 |
(63,708) |
109,711 |
(173,391) |
2,372,346 |
(309,947) |
||||||||||||||||||
Balance at December 31, 2024 |
46,697,013 |
(1,370,712) |
5,118,607 |
(1,644,274) |
4,000,063 |
(3,482,791) |
55,815,683 |
(6,497,777) |
||||||||||||||||||
Stage1 |
Stage2 |
Stage3 |
Total |
|||||||||||||||||||||||
|
Gross
carrying
|
Allowance |
Gross
carrying
|
Allowance |
Gross
carrying
|
Allowance |
Gross
carrying
|
Allowance |
|||||||||||||||||||
In millions of COP | ||||||||||||||||||||||||||
Balance at January 1, 2024 |
22,553,128 |
(145,429) |
3,293,100 |
(206,641) |
1,430,829 |
(672,505) |
27,277,057 |
(1,024,575) |
||||||||||||||||||
Transfers of financial instruments: |
(626,993) |
(32,495) |
164,252 |
42,979 |
462,741 |
(10,484) |
- |
- |
||||||||||||||||||
Transfers from stage 1 to stage 2 |
(807,360) |
11,270 |
807,360 |
(11,270) |
- |
- |
- |
- |
||||||||||||||||||
Transfers from stage 1 to stage 3 |
(301,609) |
5,217 |
- |
- |
301,609 |
(5,217) |
- |
- |
||||||||||||||||||
Transfers from stage 2 to stage 1 |
476,482 |
(48,011) |
(476,482) |
48,011 |
- |
- |
- |
- |
||||||||||||||||||
Transfers from stage 2 to stage 3 |
- |
- |
(261,903) |
28,911 |
261,903 |
(28,911) |
- |
- |
||||||||||||||||||
Transfers from stage 3 to stage 1 |
5,494 |
(971) |
- |
- |
(5,494) |
971 |
- |
- |
||||||||||||||||||
Transfers from stage 3 to stage 2 |
- |
- |
95,277 |
(22,673) |
(95,277) |
22,673 |
- |
- |
||||||||||||||||||
Remeasurement arising from transfer of stage |
(29,224) |
26,927 |
(111,911) |
(24,264) |
82,688 |
(332,058) |
(58,447) |
(329,395) |
||||||||||||||||||
Remeasurement from remaining in the stage |
(2,030,801) |
1,024 |
(36,408) |
6,618 |
(48,471) |
19,994 |
(2,115,680) |
27,636 |
||||||||||||||||||
Remeasurement due to changes in economics factors |
- |
388 |
- |
(1,315) |
- |
3,278 |
- |
2,351 |
||||||||||||||||||
Remeasurement due to changes in model inputs |
- |
33,405 |
- |
(39,054) |
- |
(19,599) |
- |
(25,248) |
||||||||||||||||||
New financial assets purchased/originated(1) |
4,685,664 |
(16,709) |
265,140 |
(61,525) |
43,177 |
(26,867) |
4,993,981 |
(105,101) |
||||||||||||||||||
Financial assets that have been derecognized |
(2,161,635) |
14,818 |
(369,040) |
13,130 |
(232,037) |
116,203 |
(2,762,712) |
144,151 |
||||||||||||||||||
Charges-off |
(2,309) |
116 |
(626) |
38,690 |
(225,704) |
189,833 |
(228,639) |
228,639 |
||||||||||||||||||
Foreign Exchange and other movements |
173,604 |
(873) |
8,203 |
(2,848) |
4,237 |
(3,009) |
186,044 |
(6,730) |
||||||||||||||||||
Balance at December 31, 2024 |
22,561,434 |
(118,828) |
3,212,710 |
(234,230) |
1,517,460 |
(735,214) |
27,291,604 |
(1,088,272) |
||||||||||||||||||
Stage1 |
Stage2 |
Stage3 |
Total |
|||||||||||||||||||||||
|
Gross
carrying
|
Allowance |
Gross
carrying
|
Allowance |
Gross
carrying
|
Allowance |
Gross
carrying
|
Allowance |
|||||||||||||||||||
In millions of COP | ||||||||||||||||||||||||||
Balance at January 1, 2024 |
32,210,648 |
(184,915) |
2,628,654 |
(284,921) |
1,411,106 |
(553,370) |
36,250,408 |
(1,023,206) |
||||||||||||||||||
Transfers of financial instruments: |
(530,580) |
(63,741) |
(110,527) |
65,658 |
641,107 |
(1,917) |
- |
- |
||||||||||||||||||
Transfers from stage 1 to stage 2 |
(1,054,660) |
17,932 |
1,054,660 |
(17,932) |
- |
- |
- |
- |
||||||||||||||||||
Transfers from stage 1 to stage 3 |
(388,239) |
7,709 |
- |
- |
388,239 |
(7,709) |
- |
- |
||||||||||||||||||
Transfers from stage 2 to stage 1 |
911,038 |
(89,109) |
(911,038) |
89,109 |
- |
- |
- |
- |
||||||||||||||||||
Transfers from stage 2 to stage 3 |
- |
- |
(575,585) |
77,114 |
575,585 |
(77,114) |
- |
- |
||||||||||||||||||
Transfers from stage 3 to stage 1 |
1,281 |
(273) |
- |
- |
(1,281) |
273 |
- |
- |
||||||||||||||||||
Transfers from stage 3 to stage 2 |
- |
- |
321,436 |
(82,633) |
(321,436) |
82,633 |
- |
- |
||||||||||||||||||
Remeasurement arising from transfer of stage |
(46,383) |
71,166 |
(34,361) |
(69,232) |
58,849 |
(197,427) |
(21,895) |
(195,493) |
||||||||||||||||||
Remeasurement from remaining in the stage |
(1,500,100) |
146 |
(28,254) |
(50,026) |
(14,983) |
(92,113) |
(1,543,337) |
(141,993) |
||||||||||||||||||
Remeasurement due to changes in economics factors |
- |
(655) |
- |
232 |
- |
- |
- |
(423) |
||||||||||||||||||
Remeasurement due to changes in model inputs |
- |
35,570 |
- |
38,196 |
- |
(59,346) |
- |
14,420 |
||||||||||||||||||
New financial assets purchased/originated(1) |
7,250,404 |
(24,146) |
89,441 |
(15,434) |
38,103 |
(15,032) |
7,377,948 |
(54,612) |
||||||||||||||||||
Financial assets that have been derecognized |
(2,219,679) |
13,232 |
(88,540) |
12,205 |
(114,124) |
47,832 |
(2,422,343) |
73,269 |
||||||||||||||||||
Charges-off |
(3,221) |
263 |
(2,019) |
1,789 |
(138,645) |
141,833 |
(143,885) |
143,885 |
||||||||||||||||||
Foreign Exchange and other movements |
1,915,491 |
(5,340) |
247,536 |
(14,193) |
81,678 |
(31,491) |
2,244,705 |
(51,024) |
||||||||||||||||||
Balance at December 31, 2024 |
37,076,580 |
(158,420) |
2,701,930 |
(315,726) |
1,963,091 |
(761,031) |
41,741,601 |
(1,235,177) |
||||||||||||||||||
Stage1 |
Stage2 |
Stage3 |
Total |
|||||||||||||||||||||||
|
Gross
carrying
|
Allowance |
Gross
carrying
|
Allowance |
Gross
carrying
|
Allowance |
Gross
carrying
|
Allowance |
|||||||||||||||||||
In millions of COP | ||||||||||||||||||||||||||
Balance at January 1, 2024 |
774,571 |
(55,230) |
260,303 |
(34,865) |
110,143 |
(77,923) |
1,145,017 |
(168,018) |
||||||||||||||||||
Transfers of financial instruments: |
48,693 |
4,363 |
(90,096) |
465 |
41,403 |
(4,828) |
- |
- |
||||||||||||||||||
Transfers from stage 1 to stage 2 |
(32,175) |
5,260 |
32,175 |
(5,260) |
- |
- |
- |
- |
||||||||||||||||||
Transfers from stage 1 to stage 3 |
(26,237) |
3,577 |
- |
- |
26,237 |
(3,577) |
- |
- |
||||||||||||||||||
Transfers from stage 2 to stage 1 |
106,886 |
(4,362) |
(106,886) |
4,362 |
- |
- |
- |
- |
||||||||||||||||||
Transfers from stage 2 to stage 3 |
- |
- |
(22,854) |
3,333 |
22,854 |
(3,333) |
- |
- |
||||||||||||||||||
Transfers from stage 3 to stage 1 |
219 |
(112) |
- |
- |
(219) |
112 |
- |
- |
||||||||||||||||||
Transfers from stage 3 to stage 2 |
- |
- |
7,469 |
(1,970) |
(7,469) |
1,970 |
- |
- |
||||||||||||||||||
Remeasurement arising from transfer of stage |
(8,293) |
2,046 |
(11,218) |
(35) |
2,245 |
(59,190) |
(17,266) |
(57,179) |
||||||||||||||||||
Remeasurement from remaining in the stage |
(119,140) |
13,134 |
(1,716) |
9,558 |
(4,671) |
(1,179) |
(125,527) |
21,513 |
||||||||||||||||||
Remeasurement due to changes in economics factors |
- |
549 |
- |
103 |
- |
(52) |
- |
600 |
||||||||||||||||||
Remeasurement due to changes in model inputs |
- |
9,603 |
- |
(169) |
- |
(740) |
- |
8,694 |
||||||||||||||||||
New financial assets purchased/originated(1) |
774,418 |
(15,290) |
42,211 |
(6,973) |
18,044 |
(12,363) |
834,673 |
(34,626) |
||||||||||||||||||
Financial assets that have been derecognized |
(323,208) |
12,414 |
(120,903) |
5,663 |
(27,026) |
16,366 |
(471,137) |
34,443 |
||||||||||||||||||
Charges-off |
(19,210) |
3,952 |
(19,407) |
7,670 |
(60,507) |
87,502 |
(99,124) |
99,124 |
||||||||||||||||||
Foreign Exchange and other movements |
47,972 |
(523) |
32,082 |
(1,438) |
5,519 |
(1,872) |
85,573 |
(3,833) |
||||||||||||||||||
Balance at December 31, 2024 |
1,175,803 |
(24,982) |
91,256 |
(20,021) |
85,150 |
(54,279) |
1,352,209 |
(99,282) |
||||||||||||||||||
Stage1 |
Stage2 |
Stage3 |
Total |
|||||||||||||||||||||||
|
Gross
carrying
|
Allowance |
Gross
carrying
|
Allowance |
Gross
carrying
|
Allowance |
Gross
carrying
|
Allowance |
|||||||||||||||||||
In millions of COP | ||||||||||||||||||||||||||
Balance at January 1, 2023 |
126,530,862 |
(665,259) |
8,062,435 |
(751,728) |
8,944,556 |
(5,853,318) |
143,537,853 |
(7,270,305) |
||||||||||||||||||
Transfers of financial instruments: |
(1,248,210) |
(73,788) |
(565,802) |
157,677 |
1,814,012 |
(83,889) |
- |
- |
||||||||||||||||||
Transfers from stage 1 to stage 2 |
(1,286,292) |
24,362 |
1,286,292 |
(24,362) |
- |
- |
- |
- |
||||||||||||||||||
Transfers from stage 1 to stage 3 |
(900,645) |
26,071 |
- |
- |
900,645 |
(26,071) |
- |
- |
||||||||||||||||||
Transfers from stage 2 to stage 1 |
931,660 |
(118,403) |
(931,660) |
118,403 |
- |
- |
- |
- |
||||||||||||||||||
Transfers from stage 2 to stage 3 |
- |
- |
(1,081,128) |
139,257 |
1,081,128 |
(139,257) |
- |
- |
||||||||||||||||||
Transfers from stage 3 to stage 1 |
7,067 |
(5,818) |
- |
- |
(7,067) |
5,818 |
- |
- |
||||||||||||||||||
Transfers from stage 3 to stage 2 |
- |
- |
160,694 |
(75,621) |
(160,694) |
75,621 |
- |
- |
||||||||||||||||||
Remeasurement arising from transfer of stage |
(172,134) |
98,684 |
(190,275) |
(7,563) |
(153,574) |
(1,140,608) |
(515,983) |
(1,049,487) |
||||||||||||||||||
Remeasurement from remaining in the stage |
(10,087,837) |
69,038 |
(444,057) |
97,791 |
(135,588) |
(159,438) |
(10,667,482) |
7,391 |
||||||||||||||||||
Remeasurement due to changes in economics factors |
- |
(14,781) |
- |
(19,968) |
- |
7,515 |
- |
(27,234) |
||||||||||||||||||
Remeasurement due to methodological changes |
- |
19,001 |
- |
53,533 |
- |
25,299 |
- |
97,833 |
||||||||||||||||||
New financial assets purchased/originated(1) |
60,154,305 |
(302,169) |
1,192,219 |
(143,442) |
1,296,765 |
(725,298) |
62,643,289 |
(1,170,909) |
||||||||||||||||||
Financial assets that have been derecognized |
(45,206,464) |
181,931 |
(1,519,892) |
121,596 |
(1,715,530) |
1,391,718 |
(48,441,886) |
1,695,245 |
||||||||||||||||||
Charges-off |
(19,285) |
973 |
(81,528) |
17,475 |
(869,872) |
952,237 |
(970,685) |
970,685 |
||||||||||||||||||
Foreign Exchange and other movements |
(9,177,310) |
48,275 |
(999,563) |
49,159 |
(720,837) |
359,081 |
(10,897,710) |
456,515 |
||||||||||||||||||
Balance at December 31, 2023 |
120,773,927 |
(638,095) |
5,453,537 |
(425,470) |
8,459,932 |
(5,226,701) |
134,687,396 |
(6,290,266) |
||||||||||||||||||
Stage1 |
Stage2 |
Stage3 |
Total |
|||||||||||||||||||||||
|
Gross
carrying
|
Allowance |
Gross
carrying
|
Allowance |
Gross
carrying
|
Allowance |
Gross
carrying
|
Allowance |
|||||||||||||||||||
In millions of COP | ||||||||||||||||||||||||||
Balance at January 1, 2023 |
51,510,943 |
(1,823,841) |
5,288,921 |
(1,868,882) |
2,788,857 |
(2,354,412) |
59,588,721 |
(6,047,135) |
||||||||||||||||||
Transfers of financial instruments: |
(2,366,645) |
(213,509) |
299,377 |
313,735 |
2,067,268 |
(100,226) |
- |
- |
||||||||||||||||||
Transfers from stage 1 to stage 2 |
(1,890,263) |
116,262 |
1,890,263 |
(116,262) |
- |
- |
- |
- |
||||||||||||||||||
Transfers from stage 1 to stage 3 |
(1,805,932) |
124,706 |
- |
- |
1,805,932 |
(124,706) |
- |
- |
||||||||||||||||||
Transfers from stage 2 to stage 1 |
1,252,391 |
(381,036) |
(1,252,391) |
381,036 |
- |
- |
- |
- |
||||||||||||||||||
Transfers from stage 2 to stage 3 |
- |
- |
(547,962) |
230,723 |
547,962 |
(230,723) |
- |
- |
||||||||||||||||||
Transfers from stage 3 to stage 1 |
77,159 |
(73,441) |
- |
- |
(77,159) |
73,441 |
- |
- |
||||||||||||||||||
Transfers from stage 3 to stage 2 |
- |
- |
209,467 |
(181,762) |
(209,467) |
181,762 |
- |
- |
||||||||||||||||||
Remeasurement arising from transfer of stage |
(176,080) |
281,499 |
(103,802) |
(541,174) |
990,976 |
(4,445,663) |
711,094 |
(4,705,338) |
||||||||||||||||||
Remeasurement from remaining in the stage |
(4,024,103) |
(79,073) |
(162,497) |
(79,505) |
278,004 |
(493,421) |
(3,908,596) |
(651,999) |
||||||||||||||||||
Remeasurement due to changes in economics factors |
- |
(242,317) |
- |
(32,244) |
- |
989 |
- |
(273,572) |
||||||||||||||||||
Remeasurement due to methodological changes |
- |
(423,782) |
- |
252,110 |
- |
19,805 |
- |
(151,867) |
||||||||||||||||||
New financial assets purchased/originated(1) |
15,350,895 |
(866,684) |
1,429,142 |
(584,910) |
1,275,594 |
(1,053,814) |
18,055,631 |
(2,505,408) |
||||||||||||||||||
Financial assets that have been derecognized |
(9,643,264) |
349,930 |
(858,742) |
315,991 |
(294,422) |
250,487 |
(10,796,428) |
916,408 |
||||||||||||||||||
Charges-off |
(1,299,715) |
231,387 |
(1,129,877) |
542,312 |
(2,832,374) |
4,488,267 |
(5,261,966) |
5,261,966 |
||||||||||||||||||
Foreign Exchange and other movements |
(3,291,416) |
114,156 |
(355,455) |
98,062 |
(149,816) |
227,689 |
(3,796,687) |
439,907 |
||||||||||||||||||
Balance at December 31, 2023 |
46,060,615 |
(2,672,234) |
4,407,067 |
(1,584,505) |
4,124,087 |
(3,460,299) |
54,591,769 |
(7,717,038) |
||||||||||||||||||
Stage1 |
Stage2 |
Stage3 |
Total |
|||||||||||||||||||||||
|
Gross
carrying
|
Allowance |
Gross
carrying
|
Allowance |
Gross
carrying
|
Allowance |
Gross
carrying
|
Allowance |
|||||||||||||||||||
In millions of COP | ||||||||||||||||||||||||||
Balance at January 1, 2023 |
23,566,544 |
(151,328) |
3,172,285 |
(238,920) |
1,358,887 |
(622,826) |
28,097,716 |
(1,013,074) |
||||||||||||||||||
Transfers of financial instruments: |
(33,774) |
(56,552) |
(337,901) |
74,010 |
371,675 |
(17,458) |
- |
- |
||||||||||||||||||
Transfers from stage 1 to stage 2 |
(886,398) |
15,837 |
886,398 |
(15,837) |
- |
- |
- |
- |
||||||||||||||||||
Transfers from stage 1 to stage 3 |
(214,258) |
6,202 |
- |
- |
214,258 |
(6,202) |
- |
- |
||||||||||||||||||
Transfers from stage 2 to stage 1 |
1,065,222 |
(77,927) |
(1,065,222) |
77,927 |
- |
- |
- |
- |
||||||||||||||||||
Transfers from stage 2 to stage 3 |
- |
- |
(211,221) |
26,291 |
211,221 |
(26,291) |
- |
- |
||||||||||||||||||
Transfers from stage 3 to stage 1 |
1,660 |
(664) |
- |
- |
(1,660) |
664 |
- |
- |
||||||||||||||||||
Transfers from stage 3 to stage 2 |
- |
- |
52,144 |
(14,371) |
(52,144) |
14,371 |
- |
- |
||||||||||||||||||
Remeasurement arising from transfer of stage |
(67,839) |
66,879 |
(66,232) |
(43,021) |
38,500 |
(275,772) |
(95,571) |
(251,914) |
||||||||||||||||||
Remeasurement from remaining in the stage |
(1,719,440) |
7,812 |
(84,050) |
27,024 |
(16,635) |
(44,480) |
(1,820,125) |
(9,644) |
||||||||||||||||||
Remeasurement due to changes in economics factors |
- |
(2,286) |
- |
(4,103) |
- |
8,419 |
- |
2,030 |
||||||||||||||||||
Remeasurement due to methodological changes |
- |
(1,756) |
- |
(5,150) |
- |
8,486 |
- |
1,580 |
||||||||||||||||||
New financial assets purchased/originated(1) |
2,926,745 |
(21,654) |
915,316 |
(57,704) |
67,467 |
(45,494) |
3,909,528 |
(124,852) |
||||||||||||||||||
Financial assets that have been derecognized |
(1,780,980) |
11,596 |
(264,866) |
12,186 |
(129,570) |
62,077 |
(2,175,416) |
85,859 |
||||||||||||||||||
Charges-off |
(863) |
29 |
(25,471) |
27,464 |
(251,570) |
250,411 |
(277,904) |
277,904 |
||||||||||||||||||
Foreign Exchange and other movements |
(337,265) |
1,831 |
(15,981) |
1,573 |
(7,925) |
4,132 |
(361,171) |
7,536 |
||||||||||||||||||
Balance at December 31, 2023 |
22,553,128 |
(145,429) |
3,293,100 |
(206,641) |
1,430,829 |
(672,505) |
27,277,057 |
(1,024,575) |
||||||||||||||||||
Stage1 |
Stage2 |
Stage3 |
Total |
|||||||||||||||||||||||
|
Gross
carrying
|
Allowance |
Gross
carrying
|
Allowance |
Gross
carrying
|
Allowance |
Gross
carrying
|
Allowance |
|||||||||||||||||||
In millions of COP | ||||||||||||||||||||||||||
Balance at January 1, 2023 |
34,067,734 |
(206,800) |
1,997,270 |
(256,275) |
1,306,369 |
(561,016) |
37,371,373 |
(1,024,091) |
||||||||||||||||||
Transfers of financial instruments: |
(1,226,789) |
(46,563) |
838,151 |
32,285 |
388,638 |
14,278 |
- |
- |
||||||||||||||||||
Transfers from stage 1 to stage 2 |
(1,419,929) |
20,379 |
1,419,929 |
(20,379) |
- |
- |
- |
- |
||||||||||||||||||
Transfers from stage 1 to stage 3 |
(330,417) |
7,821 |
- |
- |
330,417 |
(7,821) |
- |
- |
||||||||||||||||||
Transfers from stage 2 to stage 1 |
523,311 |
(74,687) |
(523,311) |
74,687 |
- |
- |
- |
- |
||||||||||||||||||
Transfers from stage 2 to stage 3 |
- |
- |
(306,993) |
52,110 |
306,993 |
(52,110) |
- |
- |
||||||||||||||||||
Transfers from stage 3 to stage 1 |
246 |
(76) |
- |
- |
(246) |
76 |
- |
- |
||||||||||||||||||
Transfers from stage 3 to stage 2 |
- |
- |
248,526 |
(74,133) |
(248,526) |
74,133 |
- |
- |
||||||||||||||||||
Remeasurement arising from transfer of stage |
(18,655) |
45,186 |
(8,302) |
(84,371) |
63,442 |
(154,335) |
36,485 |
(193,520) |
||||||||||||||||||
Remeasurement from remaining in the stage |
(1,240,204) |
(6,873) |
(12,416) |
(5,955) |
(20,842) |
(125,459) |
(1,273,462) |
(138,287) |
||||||||||||||||||
Remeasurement due to changes in economics factors |
- |
(8,108) |
- |
(1,386) |
- |
- |
- |
(9,494) |
||||||||||||||||||
Remeasurement due to methodological changes |
- |
54,756 |
- |
17,730 |
- |
58,972 |
- |
131,458 |
||||||||||||||||||
New financial assets purchased/originated(1) |
5,361,515 |
(36,938) |
102,552 |
(19,513) |
37,864 |
(11,435) |
5,501,931 |
(67,886) |
||||||||||||||||||
Financial assets that have been derecognized |
(1,428,077) |
11,130 |
(69,961) |
10,885 |
(106,100) |
53,259 |
(1,604,138) |
75,274 |
||||||||||||||||||
Charges-off |
(2,088) |
8 |
(2,446) |
497 |
(123,998) |
128,027 |
(128,532) |
128,532 |
||||||||||||||||||
Foreign Exchange and other movements |
(3,302,788) |
9,287 |
(216,194) |
21,182 |
(134,267) |
44,339 |
(3,653,249) |
74,808 |
||||||||||||||||||
Balance at December 31, 2023 |
32,210,648 |
(184,915) |
2,628,654 |
(284,921) |
1,411,106 |
(553,370) |
36,250,408 |
(1,023,206) |
||||||||||||||||||
Stage1 |
Stage2 |
Stage3 |
Total |
|||||||||||||||||||||||
|
Gross
carrying
|
Allowance |
Gross
carrying
|
Allowance |
Gross
carrying
|
Allowance |
Gross
carrying
|
Allowance |
|||||||||||||||||||
In millions of COP | ||||||||||||||||||||||||||
Balance at January 1, 2023 |
1,093,973 |
(28,564) |
135,528 |
(29,024) |
98,575 |
(67,447) |
1,328,076 |
(125,035) |
||||||||||||||||||
Transfers of financial instruments: |
(210,552) |
3,957 |
155,467 |
(680) |
55,085 |
(3,277) |
- |
- |
||||||||||||||||||
Transfers from stage 1 to stage 2 |
(177,024) |
4,932 |
177,024 |
(4,932) |
- |
- |
- |
- |
||||||||||||||||||
Transfers from stage 1 to stage 3 |
(46,849) |
2,745 |
- |
- |
46,849 |
(2,745) |
- |
- |
||||||||||||||||||
Transfers from stage 2 to stage 1 |
13,169 |
(3,625) |
(13,169) |
3,625 |
- |
- |
- |
- |
||||||||||||||||||
Transfers from stage 2 to stage 3 |
- |
- |
(17,243) |
5,043 |
17,243 |
(5,043) |
- |
- |
||||||||||||||||||
Transfers from stage 3 to stage 1 |
152 |
(95) |
- |
- |
(152) |
95 |
- |
- |
||||||||||||||||||
Transfers from stage 3 to stage 2 |
- |
- |
8,855 |
(4,416) |
(8,855) |
4,416 |
- |
- |
||||||||||||||||||
Remeasurement arising from transfer of stage |
(2,939) |
2,268 |
(4,798) |
(5,519) |
(8,155) |
(58,743) |
(15,892) |
(61,994) |
||||||||||||||||||
Remeasurement from remaining in the stage |
(133,210) |
5,932 |
(9,475) |
(7,767) |
(94) |
(9,821) |
(142,779) |
(11,656) |
||||||||||||||||||
Remeasurement due to changes in economics factors |
- |
(3,185) |
- |
(882) |
- |
24 |
- |
(4,043) |
||||||||||||||||||
Remeasurement due to methodological changes |
- |
(14,202) |
- |
3,792 |
- |
2,808 |
- |
(7,602) |
||||||||||||||||||
New financial assets purchased/originated(1) |
395,777 |
(29,237) |
31,394 |
(8,643) |
32,093 |
(28,378) |
459,264 |
(66,258) |
||||||||||||||||||
Financial assets that have been derecognized |
(220,594) |
5,021 |
(13,738) |
3,545 |
(12,904) |
9,549 |
(247,236) |
18,115 |
||||||||||||||||||
Charges-off |
(17,840) |
1,787 |
(17,376) |
7,174 |
(46,060) |
72,315 |
(81,276) |
81,276 |
||||||||||||||||||
Foreign Exchange and other movements |
(130,044) |
993 |
(16,699) |
3,139 |
(8,397) |
5,047 |
(155,140) |
9,179 |
||||||||||||||||||
Balance at December 31, 2023 |
774,571 |
(55,230) |
260,303 |
(34,865) |
110,143 |
(77,923) |
1,145,017 |
(168,018) |
||||||||||||||||||
Assets held for sale and inventories |
December 31, 2024 |
December 31, 2023 |
||||||
In millions of COP | ||||||||
Inventories, net |
932,657 |
747,302 |
||||||
Assets held for sale, net |
173,742 |
159,451 |
||||||
Total assets held for sale and inventories, net |
1,106,399 |
906,753 |
||||||
Inventories |
December 31, 2024 |
December 31, 2023 |
||||||
In millions of COP | ||||||||
Lands and buildings(1) |
576,556 |
275,808 |
||||||
Vehicles(2) |
365,173 |
469,949 |
||||||
Machinery and others |
32,166 |
38,310 |
||||||
Total inventory cost |
973,895 |
784,067 |
||||||
Impairment |
(41,238) |
(36,765) |
||||||
Total inventories, net |
932,657 |
747,302 |
||||||
Assets held for sale |
Banking
Colombia
|
Banking
Panama
|
Banking
El Salvador
|
Banking
Guatemala
|
Total | ||||||||||||
In millions of COP | |||||||||||||||||
Machinery and equipment |
5,563 |
4,522 |
- |
- |
10,085 |
||||||||||||
Cost |
5,660 |
4,532 |
- |
- |
10,192 |
||||||||||||
Impairment |
(97) |
(10) |
- |
- |
(107) |
||||||||||||
Real estate for residential purposes |
2,887 |
111,983 |
6,349 |
12,644 |
133,863 |
||||||||||||
Cost |
2,887 |
116,214 |
6,374 |
12,673 |
138,148 |
||||||||||||
Impairment |
- |
(4,231) |
(25) |
(29) |
(4,285) |
||||||||||||
Real estate different from residential properties |
182 |
29,612 |
- |
- |
29,794 |
||||||||||||
Cost |
182 |
29,787 |
- |
- |
29,969 |
||||||||||||
Impairment |
- |
(175) |
- |
- |
(175) |
||||||||||||
Total assets held for sale - cost |
8,729 |
150,533 |
6,374 |
12,673 |
178,309 |
||||||||||||
Total assets held for sale - impairment |
(97) |
(4,416) |
(25) |
(29) |
(4,567) |
||||||||||||
Total assets held for sale(1) |
8,632 |
146,117 |
6,349 |
12,644 |
173,742 |
||||||||||||
Assets held for sale |
Banking
Colombia
|
Banking
Panama
|
Banking
El Salvador
|
Banking
Guatemala
|
Total | ||||||||||||
In millions of COP | |||||||||||||||||
Machinery and equipment |
9,238 |
2,464 |
- |
- |
11,702 |
||||||||||||
Cost |
9,300 |
2,473 |
- |
- |
11,773 |
||||||||||||
Impairment |
(62) |
(9) |
- |
- |
(71) |
||||||||||||
Real estate for residential purposes |
6,191 |
104,934 |
3,091 |
3,260 |
117,476 |
||||||||||||
Cost |
6,191 |
106,642 |
3,148 |
4,060 |
120,041 |
||||||||||||
Impairment |
- |
(1,708) |
(57) |
(800) |
(2,565) |
||||||||||||
Real estate different from residential properties |
5,406 |
24,867 |
- |
- |
30,273 |
||||||||||||
Cost |
5,947 |
24,980 |
- |
- |
30,927 |
||||||||||||
Impairment |
(541) |
(113) |
- |
- |
(654) |
||||||||||||
Total assets held for sale - cost |
21,438 |
134,095 |
3,148 |
4,060 |
162,741 |
||||||||||||
Total assets held for sale - impairment |
(603) |
(1,830) |
(57) |
(800) |
(3,290) |
||||||||||||
Total assets held for sale(1) |
20,835 |
132,265 |
3,091 |
3,260 |
159,451 |
||||||||||||
Composition |
December 31, 2024 |
December 31, 2023 |
||||||
In millions of COP | ||||||||
Investments in associates(1) |
2,768,611 |
2,526,073 |
||||||
Investments in joint ventures(2) |
160,373 |
471,530 |
||||||
Total investments in associates and joint ventures |
2,928,984 |
2,997,603 |
||||||
Company name |
Main activity |
Country |
December 31, 2024 |
December 31, 2023 |
||||||||||||||||||||||
|
% of Ownership
interest
|
Carrying
amount
|
% of Ownership
interest
|
Carrying
amount
|
|||||||||||||||||||||||
| In millions of COP | ||||||||||||||||||||||||||
P.A Viva Malls(1) |
Development and operation of commercial spaces |
Colombia |
49.00 % |
1,817,503 |
49.00 % |
1,661,679 |
||||||||||||||||||||
Protección S.A.(1) |
Administration of pension funds and severances |
Colombia |
20.58 % |
625,370 |
20.58 % |
594,105 |
* |
|||||||||||||||||||
P.A El Bosque |
Real estate ecosystems |
Colombia |
14.11 % |
85,863 |
* |
14.11 % |
57,120 |
* |
||||||||||||||||||
Redeban Multicolor S.A. |
Network data transmission services |
Colombia |
20.36 % |
42,190 |
* |
20.36 % |
35,735 |
* |
||||||||||||||||||
Titularizadora Colombiana S.A. Hitos. |
Mortgage portfolio securities |
Colombia |
26.98 % |
42,050 |
* |
26.98 % |
37,950 |
* |
||||||||||||||||||
P.A El Otoño |
Real estate ecosystems |
Colombia |
16.30 % |
36,676 |
* |
16.30 % |
33,442 |
* |
||||||||||||||||||
ACH Colombia S.A. |
Electronic transfer services |
Colombia |
19.94 % |
23,706 |
* |
19.94 % |
21,952 |
* |
||||||||||||||||||
Patria Asset Management S.A. (before Gestoría Externa de Portafolios S.A.) |
Investment management service |
Colombia |
49.31 % |
20,428 |
49.31 % |
11,278 |
* |
|||||||||||||||||||
Servicio Salvadoreño de Protección, S. A. de C.V. |
Custodial services and transfer of monetary types |
El Salvador |
25.00 % |
13,382 |
* |
25.00 % |
10,223 |
* |
||||||||||||||||||
P.A Distrito Vera |
Real estate ecosystems |
Colombia |
33.33 % |
13,325 |
33.33 % |
9,103 |
||||||||||||||||||||
Servicios Financieros, S.A. de C.V. |
Processing of financial transactions and electronic payment methods |
El Salvador |
49.78 % |
12,695 |
* |
49.78 % |
9,514 |
* |
||||||||||||||||||
Internacional Ejecutiva de Aviación S.A.S.(2) |
Aircraft and aircraft travel service |
Colombia |
37.50 % |
9,158 |
25.00 % |
6,093 |
* |
|||||||||||||||||||
P.A Boreal |
Real estate ecosystems |
Colombia |
20.00 % |
8,658 |
* |
20.00 % |
7,579 |
* |
||||||||||||||||||
P.A Mirador de la Ciénaga. |
Real estate ecosystems |
Colombia |
13.00 % |
4,326 |
* |
13.00 % |
4,518 |
* |
||||||||||||||||||
P.A La Felicidad |
Real estate ecosystems |
Colombia |
20.00 % |
4,067 |
* |
20.00 % |
6,938 |
* |
||||||||||||||||||
Reintegra S.A.S. |
Collections and recovery of portfolio |
Colombia |
46.00 % |
3,520 |
46.00 % |
5,864 |
* |
|||||||||||||||||||
P.A Madrid II |
Real estate ecosystems |
Colombia |
20.00 % |
3,103 |
* |
20.00 % |
9,208 |
* |
||||||||||||||||||
ACH de El Salvador, S. A. de C.V. |
Electronic transfer services |
El Salvador |
25.00 % |
1,544 |
* |
25.00 % |
1,554 |
* |
||||||||||||||||||
Agricapital S.A.S. |
Financial services |
Colombia |
10.79 % |
991 |
* |
10.79 % |
1,262 |
* |
||||||||||||||||||
Fideicomiso Locales Distrito Vera |
Real estate ecosystems |
Colombia |
33.33 % |
56 |
— % |
— |
||||||||||||||||||||
Servicios de Identidad Digital S.A.S.(3) |
Digital services |
Colombia |
33.33 % |
— |
* |
33.33 % |
956 |
|||||||||||||||||||
Total, investments in associates |
2,768,611 |
2,526,073 |
||||||||||||||||||||||||
December 31, 2024 |
December 31, 2023 |
|||||||||||||||||||||||||
In millions of COP |
||||||||||||||||||||||||||
P.A Viva Malls |
Protección S.A. |
Others |
Total |
P.A Viva Malls |
Protección S.A. |
Others |
Total |
|||||||||||||||||||
Balance at January 1, |
1,661,679 |
594,105 |
270,289 |
2,526,073 |
1,530,459 |
533,584 |
236,407 |
2,300,450 |
||||||||||||||||||
Equity method(1) |
155,824 |
94,180 |
61,189 |
311,193 |
128,028 |
62,442 |
40,234 |
230,704 |
||||||||||||||||||
OCI (Equity method) |
- |
(8,464) |
1,642 |
(6,822) |
- |
(1,921) |
(1,039) |
(2,960) |
||||||||||||||||||
OCI (Translation adjustment) |
- |
- |
3,395 |
3,395 |
- |
- |
(5,674) |
(5,674) |
||||||||||||||||||
Purchase / capitalizations |
- |
- |
38,285 |
38,285 |
3,192 |
- |
35,561 |
38,753 |
||||||||||||||||||
Sells or refund of contributions |
- |
- |
(21,041) |
(21,041) |
- |
- |
(6,428) |
(6,428) |
||||||||||||||||||
Impairment loss(2) |
- |
- |
(26) |
(26) |
- |
- |
(2,017) |
(2,017) |
||||||||||||||||||
Dividends |
- |
(55,558) |
(27,432) |
(82,990) |
- |
- |
(28,249) |
(28,249) |
||||||||||||||||||
Others |
- |
1,107 |
(563) |
544 |
- |
- |
1,494 |
1,494 |
||||||||||||||||||
Balance at December 31, |
1,817,503 |
625,370 |
325,738 |
2,768,611 |
1,661,679 |
594,105 |
270,289 |
2,526,073 |
||||||||||||||||||
Company name |
Assets
(unaudited)
|
Liabilities
(unaudited)
|
OCI
(unaudited)
|
Income from
ordinary activities
(unaudited)
|
Profits
(unaudited)
|
||||||||||||
In millions of COP | |||||||||||||||||
P.A Viva Malls |
3,823,893 |
114,703 |
- |
761,198 |
487,123 |
||||||||||||
Protección S.A. |
3,194,045 |
752,834 |
38,953 |
1,884,277 |
446,532 |
||||||||||||
Company name |
Assets
(unaudited)
|
Liabilities
(unaudited)
|
OCI
(unaudited)
|
Income from
ordinary activities
(unaudited)
|
Profits
(unaudited)
|
||||||||||||
In millions of COP | |||||||||||||||||
P.A Viva Malls |
3,492,834 |
101,653 |
- |
849,928 |
327,838 |
||||||||||||
Protección S.A. |
2,955,547 |
666,280 |
80,088 |
1,597,171 |
303,460 |
||||||||||||
Company name |
Main activity |
Country |
December 31, 2024 |
December 31, 2023 |
||||||||||||||||||||||
|
% of Ownership
interest
|
Carrying
amount
|
% of Ownership
interest
|
Carrying
amount
|
|||||||||||||||||||||||
| In millions of COP | ||||||||||||||||||||||||||
Compañía de Financiamiento TUYA S.A.(1) |
Financing Services |
Colombia |
50.00 % |
95,106 |
50.00 % |
410,324 |
||||||||||||||||||||
P.A Laurel |
Renewable energies |
Colombia |
50.00 % |
27,835 |
50.00 % |
27,364 |
* |
|||||||||||||||||||
Puntos Colombia S.A.S. |
Administration of the customers loyalty |
Colombia |
50.00 % |
17,691 |
50.00 % |
10,922 |
* |
|||||||||||||||||||
Fondo de Capital Privado Ruta del Sol compartimento A |
Investment in infrastructure projects |
Colombia |
26.30 % |
10,597 |
* |
26.30 % |
10,588 |
* |
||||||||||||||||||
P.A Blup |
Inventory finance and comprehensive logistics operation |
Colombia |
50.00 % |
3,888 |
50.00 % |
3,313 |
||||||||||||||||||||
Ecosistemas Digitales de Negocio S.A.S. |
Digital electronic billing services |
Colombia |
50.00 % |
3,182 |
50.00 % |
6,293 |
* |
|||||||||||||||||||
P.A Coba(2)(3) |
Technological platform development |
Colombia |
51.78 % |
1,720 |
— % |
- |
||||||||||||||||||||
P.A Acelera TI(2) |
IT talent development |
Colombia |
50.00 % |
279 |
— % |
- |
||||||||||||||||||||
Avicapital |
Purchase and sale of loans and receivables |
Colombia |
50.00 % |
75 |
* |
50.00 % |
- |
|||||||||||||||||||
P.A. Finsocial |
Purchase and sale of loans and receivables |
Colombia |
— % |
- |
50.00 % |
42 |
* |
|||||||||||||||||||
P.A Reintegra(4) |
Collections and recovery of portfolio |
Colombia |
46.00 % |
- |
* |
46.00 % |
- |
* |
||||||||||||||||||
P.A Muverang(5) |
Sustainable mobility services |
Colombia |
33.33 % |
- |
* |
33.33 % |
2,684 |
|||||||||||||||||||
Total investments in joint venture |
160,373 |
471,530 |
||||||||||||||||||||||||
December 31, 2024 |
December 31, 2023 |
|||||||||||||||||||
In millions of COP |
||||||||||||||||||||
|
Compañía de
financiamiento
Tuya S.A.
|
Others |
Total |
Compañía de
financiamiento
Tuya S.A.
|
Others |
Total |
|||||||||||||||
Balance at January 1, |
410,324 |
61,206 |
471,530 |
564,998 |
50,185 |
615,183 |
||||||||||||||
Equity method(1) |
(79,681) |
(8,940) |
(88,621) |
(110,600) |
(6,989) |
(117,589) |
||||||||||||||
Purchase / capitalizations |
76,751 |
15,437 |
92,188 |
62,500 |
17,890 |
80,390 |
||||||||||||||
Sells or refund of contributions |
- |
(403) |
(403) |
- |
(296) |
(296) |
||||||||||||||
(Impairment loss) / Recovery(2) |
(312,288) |
(2,033) |
(314,321) |
(106,574) |
416 |
(106,158) |
||||||||||||||
Balance at December 31, |
95,106 |
65,267 |
160,373 |
410,324 |
61,206 |
471,530 |
||||||||||||||
Company name |
Assets
(unaudited)(1)
|
Liabilities
(unaudited)
|
Income from
ordinary activities
(unaudited)
|
Loss
(unaudited)(2)
|
||||||||||
In millions of COP | ||||||||||||||
Compañía de financiamiento Tuya S.A. |
2,830,280 |
2,322,251 |
1,505,074 |
155,514 |
||||||||||
Company name |
Assets
(unaudited)(1)
|
Liabilities
(unaudited)
|
Income from
ordinary activities
(unaudited)
|
Loss
(unaudited)(2)
|
||||||||||
In millions of COP | ||||||||||||||
Compañía de financiamiento Tuya S.A. |
3,827,631 |
3,313,741 |
2,205,538 |
221,199 |
||||||||||
December 31, 2024 |
December 31, 2023 |
|||||||
In millions of COP | ||||||||
Balance at the beginning of the year |
4,709,911 |
3,994,058 |
||||||
Acquisitions(1) |
682,334 |
294,569 |
||||||
Subsequent expenditure recognized as an asset |
222,167 |
170,920 |
||||||
Sales/Write-offs(2) |
(156,697) |
(21,194) |
||||||
Amount reclassified (to) from other assets(3) |
(77,862) |
39,096 |
||||||
Gains on valuation(4) |
200,256 |
232,462 |
||||||
Balance at the end of the period(5) |
5,580,109 |
4,709,911 |
||||||
Type of asset |
Balance at the
beginning of the
year
|
Appraisals |
Net increase(1) |
Amount reclassified (to) from other asset(2) |
Amount reclassified from construction to finished(3) |
Adjusted fair
value at the end
of the year
|
||||||||||||||
In millions of COP | ||||||||||||||||||||
Buildings |
4,369,629 |
191,051 |
578,639 |
(77,862) |
18,819 |
5,080,276 |
||||||||||||||
Lands |
340,282 |
9,205 |
169,165 |
- |
(18,819) |
499,833 |
||||||||||||||
Total |
4,709,911 |
200,256 |
747,804 |
(77,862) |
- |
5,580,109 |
||||||||||||||
Type of asset |
Balance at the
beginning of the
year
|
Appraisals |
Net increase (1)(2) |
Acquisitions
from business
combination(3)
|
Adjusted fair
value at the end
of the year
|
||||||||||||
In millions of COP | |||||||||||||||||
Buildings |
3,870,706 |
194,608 |
265,219 |
39,096 |
4,369,629 |
||||||||||||
Lands |
123,352 |
37,854 |
179,076 |
- |
340,282 |
||||||||||||
Total |
3,994,058 |
232,462 |
444,295 |
39,096 |
4,709,911 |
||||||||||||
December 31, 2024 |
December 31, 2023 |
December 31, 2022 |
|||||||||
In millions of COP |
|||||||||||
Income from rentals |
325,286 |
228,325 |
157,511 |
||||||||
Operating expenses due to: |
60,334 |
39,191 |
40,288 |
||||||||
Investment properties that generated income through rentals |
37,394 |
28,813 |
21,267 |
||||||||
Investment properties that did not generate income through rentals |
22,940 |
10,378 |
19,021 |
||||||||
Composition |
December 31, 2024 |
December 31, 2023 |
||||||
In millions of COP | ||||||||
Premises and equipment for own use, net |
2,650,602 |
2,525,254 |
||||||
Premises and equipment in operating leases, net |
3,255,462 |
3,997,280 |
||||||
Total premises and equipment, net |
5,906,064 |
6,522,534 |
||||||
Premises and equipment for own use |
Balance at January 1, 2024 |
Roll - forward |
Balance at December 31, 2024 |
||||||||||||||||||||
Additions(1) |
Expenses
depreciation and
impairment(2)
|
Disposals(3) |
Transfers(4) |
Effect of
changes in
foreign
exchange
rate
|
|||||||||||||||||||
In millions of COP | |||||||||||||||||||||||
Land |
|||||||||||||||||||||||
Cost |
517,405 |
- |
- |
(8,729) |
1,437 |
28,520 |
538,633 |
||||||||||||||||
Construction in progress |
|||||||||||||||||||||||
Cost |
83,633 |
27,273 |
- |
(19,945) |
(51,842) |
7,570 |
46,689 |
||||||||||||||||
Buildings |
|||||||||||||||||||||||
Cost |
1,740,005 |
14,187 |
- |
(17,843) |
42,645 |
97,040 |
1,876,034 |
||||||||||||||||
Accumulated depreciation |
(493,196) |
- |
(36,311) |
5,581 |
865 |
(51,608) |
(574,669) |
||||||||||||||||
Furniture and fixtures |
|||||||||||||||||||||||
Cost |
678,138 |
88,033 |
- |
(20,444) |
98 |
34,340 |
780,165 |
||||||||||||||||
Accumulated depreciation |
(415,517) |
- |
(42,332) |
15,163 |
(6) |
(22,020) |
(464,712) |
||||||||||||||||
Accumulated impairment |
- |
- |
(441) |
441 |
- |
- |
- |
||||||||||||||||
Computer equipment |
|||||||||||||||||||||||
Cost |
974,433 |
163,304 |
- |
(111,079) |
(1,857) |
48,143 |
1,072,944 |
||||||||||||||||
Accumulated depreciation |
(592,436) |
- |
(116,102) |
93,511 |
6 |
(31,407) |
(646,428) |
||||||||||||||||
Accumulated impairment |
- |
- |
(401) |
401 |
- |
- |
- |
||||||||||||||||
Vehicles |
|||||||||||||||||||||||
Cost |
33,980 |
4,809 |
- |
(5,174) |
445 |
2,374 |
36,434 |
||||||||||||||||
Accumulated depreciation |
(17,306) |
- |
(6,007) |
4,762 |
17 |
(1,276) |
(19,810) |
||||||||||||||||
Leasehold improvements |
|||||||||||||||||||||||
Cost |
16,637 |
33,848 |
- |
- |
(44,781) |
203 |
5,907 |
||||||||||||||||
Accumulated depreciation |
(522) |
- |
(23) |
- |
- |
(40) |
(585) |
||||||||||||||||
Total premises and equipment for own use - cost |
4,044,231 |
331,454 |
- |
(183,214) |
(53,855) |
218,190 |
4,356,806 |
||||||||||||||||
Total premises and equipment - accumulated depreciation |
(1,518,977) |
- |
(200,775) |
119,017 |
882 |
(106,351) |
(1,706,204) |
||||||||||||||||
Total premises and equipment - accumulated impairment |
- |
- |
(842) |
842 |
- |
- |
- |
||||||||||||||||
Total premises and equipment for own use, net |
2,525,254 |
331,454 |
(201,617) |
(63,355) |
(52,973) |
111,839 |
2,650,602 |
||||||||||||||||
Premises and equipment in operating leases |
Balance at January 1, 2024 |
Roll - forward |
Balance at December 31, 2024 |
||||||||||||||||||||
Additions |
Expenses
depreciation and
impairment(1)
|
Disposals |
Transfers |
Effect of
changes in
foreign
exchange
rate
|
|||||||||||||||||||
In millions of COP | |||||||||||||||||||||||
Furniture and fixtures |
|||||||||||||||||||||||
Cost |
2,091 |
- |
- |
- |
- |
- |
2,091 |
||||||||||||||||
Accumulated depreciation |
(614) |
- |
(254) |
- |
- |
- |
(868) |
||||||||||||||||
Computer equipment |
|||||||||||||||||||||||
Cost |
228,161 |
73,678 |
- |
(15,015) |
(21,594) |
- |
265,230 |
||||||||||||||||
Accumulated depreciation |
(95,638) |
- |
(63,251) |
12,730 |
21,294 |
- |
(124,865) |
||||||||||||||||
Vehicles(2) |
|||||||||||||||||||||||
Cost |
4,787,645 |
673,997 |
- |
(148,572) |
(1,246,104) |
- |
4,066,966 |
||||||||||||||||
Accumulated depreciation |
(924,365) |
- |
(369,475) |
30,259 |
310,489 |
- |
(953,092) |
||||||||||||||||
Total premises and equipment in operating leases - cost |
5,017,897 |
747,675 |
- |
(163,587) |
(1,267,698) |
- |
4,334,287 |
||||||||||||||||
Total premises and equipment - accumulated depreciation |
(1,020,617) |
- |
(432,980) |
42,989 |
331,783 |
- |
(1,078,825) |
||||||||||||||||
Total premises and equipment in operating leases, net |
3,997,280 |
747,675 |
(432,980) |
(120,598) |
(935,915) |
- |
3,255,462 |
||||||||||||||||
Premises and equipment total |
Balance at January 1, 2024 |
Roll - forward |
Balance at December 31, 2024 |
||||||||||||||||||||
Additions |
Expenses
depreciation and
impairment(1)
|
Disposals |
Transfers |
Effect of
changes in
foreign
exchange
rate
|
|||||||||||||||||||
In millions of COP | |||||||||||||||||||||||
Total premises and equipment - cost |
9,062,128 |
1,079,129 |
- |
(346,801) |
(1,321,553) |
218,190 |
8,691,093 |
||||||||||||||||
Total premises and equipment - accumulated depreciation |
(2,539,594) |
- |
(633,755) |
162,006 |
332,665 |
(106,351) |
(2,785,029) |
||||||||||||||||
Total premises and equipment - accumulated impairment |
- |
- |
(842) |
842 |
- |
- |
- |
||||||||||||||||
Total premises and equipment, net |
6,522,534 |
1,079,129 |
(634,597) |
(183,953) |
(988,888) |
111,839 |
5,906,064 |
||||||||||||||||
Premises and equipment for own use |
Balance at January 1, 2023 |
Roll - forward |
Balance at December 31, 2023 |
||||||||||||||||||||
Additions |
Expenses
depreciation and
impairment(1)
|
Disposals |
Transfers |
Effect of
changes in
foreign
exchange
rate
|
|||||||||||||||||||
In millions of COP | |||||||||||||||||||||||
Land |
|||||||||||||||||||||||
Cost |
605,713 |
3,750 |
- |
(3,738) |
(39,665) |
(48,655) |
517,405 |
||||||||||||||||
Construction in progress |
|||||||||||||||||||||||
Cost |
51,839 |
46,846 |
- |
- |
- |
(15,052) |
83,633 |
||||||||||||||||
Buildings |
|||||||||||||||||||||||
Cost |
1,878,689 |
25,644 |
- |
(30,968) |
18,311 |
(151,671) |
1,740,005 |
||||||||||||||||
Accumulated depreciation |
(535,550) |
- |
(38,565) |
10,828 |
(11,916) |
82,007 |
(493,196) |
||||||||||||||||
Accumulated impairment |
- |
- |
(153) |
153 |
- |
- |
- |
||||||||||||||||
Furniture and fixtures |
|||||||||||||||||||||||
Cost |
709,894 |
57,565 |
- |
(29,474) |
(6,522) |
(53,325) |
678,138 |
||||||||||||||||
Accumulated depreciation |
(432,992) |
- |
(44,238) |
25,956 |
- |
35,757 |
(415,517) |
||||||||||||||||
Accumulated impairment |
- |
- |
(797) |
797 |
- |
- |
- |
||||||||||||||||
Computer equipment |
|||||||||||||||||||||||
Cost |
1,007,230 |
129,012 |
- |
(91,096) |
2,416 |
(73,129) |
974,433 |
||||||||||||||||
Accumulated depreciation |
(595,991) |
- |
(114,887) |
73,226 |
(4,100) |
49,316 |
(592,436) |
||||||||||||||||
Accumulated impairment |
- |
- |
(1,507) |
1,507 |
- |
- |
- |
||||||||||||||||
Vehicles |
|||||||||||||||||||||||
Cost |
31,713 |
9,967 |
- |
(6,709) |
2,489 |
(3,480) |
33,980 |
||||||||||||||||
Accumulated depreciation |
(19,506) |
- |
(5,331) |
5,650 |
(14) |
1,895 |
(17,306) |
||||||||||||||||
Leasehold improvements |
|||||||||||||||||||||||
Cost |
9,661 |
26,950 |
- |
- |
(19,436) |
(538) |
16,637 |
||||||||||||||||
Accumulated depreciation |
(627) |
- |
(25) |
- |
- |
130 |
(522) |
||||||||||||||||
Total premises and equipment for own use - cost |
4,294,739 |
299,734 |
- |
(161,985) |
(42,407) |
(345,850) |
4,044,231 |
||||||||||||||||
Total premises and equipment - accumulated depreciation |
(1,584,666) |
- |
(203,046) |
115,660 |
(16,030) |
169,105 |
(1,518,977) |
||||||||||||||||
Total premises and equipment - accumulated impairment |
- |
- |
(2,457) |
2,457 |
- |
- |
- |
||||||||||||||||
Total premises and equipment for own use, net |
2,710,073 |
299,734 |
(205,503) |
(43,868) |
(58,437) |
(176,745) |
2,525,254 |
||||||||||||||||
Premises and equipment in operating leases |
Balance at January 1, 2023 |
Roll - forward |
Balance at December 31, 2023 |
||||||||||||||||||||
Additions |
Expenses
depreciation and
impairment(1)
|
Disposals |
Transfers |
Effect of
changes in
foreign
exchange
rate
|
|||||||||||||||||||
In millions of COP | |||||||||||||||||||||||
Furniture and fixtures |
|||||||||||||||||||||||
Cost |
2,091 |
- |
- |
- |
- |
- |
2,091 |
||||||||||||||||
Accumulated depreciation |
(360) |
- |
(254) |
- |
- |
- |
(614) |
||||||||||||||||
Computer equipment |
|||||||||||||||||||||||
Cost |
150,969 |
66,833 |
- |
(4,463) |
14,822 |
- |
228,161 |
||||||||||||||||
Accumulated depreciation |
(66,577) |
- |
(49,364) |
3,855 |
16,448 |
- |
(95,638) |
||||||||||||||||
Vehicles |
|||||||||||||||||||||||
Cost |
4,718,405 |
1,156,419 |
- |
(79,280) |
(1,007,899) |
- |
4,787,645 |
||||||||||||||||
Accumulated depreciation |
(787,535) |
- |
(383,712) |
18,181 |
228,701 |
- |
(924,365) |
||||||||||||||||
Accumulated impairment |
- |
- |
(2,023) |
2,023 |
- |
- |
- |
||||||||||||||||
Total premises and equipment in operating leases - cost |
4,871,465 |
1,223,252 |
- |
(83,743) |
(993,077) |
- |
5,017,897 |
||||||||||||||||
Total premises and equipment - accumulated depreciation |
(854,472) |
- |
(433,330) |
22,036 |
245,149 |
- |
(1,020,617) |
||||||||||||||||
Total premises and equipment - accumulated impairment |
- |
- |
(2,023) |
2,023 |
- |
- |
- |
||||||||||||||||
Total premises and equipment in operating leases, net |
4,016,993 |
1,223,252 |
(435,353) |
(59,684) |
(747,928) |
- |
3,997,280 |
||||||||||||||||
Premises and equipment total |
Balance at January 1, 2023 |
Roll - forward |
Balance at December 31, 2023 |
||||||||||||||||||||
Additions |
Expenses
depreciation and
impairment(1)
|
Disposals |
Transfers |
Effect of
changes in
foreign
exchange
rate
|
|||||||||||||||||||
In millions of COP | |||||||||||||||||||||||
Total premises and equipment - cost |
9,166,204 |
1,522,986 |
- |
(245,728) |
(1,035,484) |
(345,850) |
9,062,128 |
||||||||||||||||
Total premises and equipment - accumulated depreciation |
(2,439,138) |
- |
(636,376) |
137,696 |
229,119 |
169,105 |
(2,539,594) |
||||||||||||||||
Total premises and equipment - accumulated impairment |
- |
- |
(4,480) |
4,480 |
- |
- |
- |
||||||||||||||||
Total premises and equipment, net |
6,727,066 |
1,522,986 |
(640,856) |
(103,552) |
(806,365) |
(176,745) |
6,522,534 |
||||||||||||||||
Period |
Gross investment in finance
lease receivable
|
Present value of minimum
payments
|
||||||
In millions of COP | ||||||||
Less than 1 year |
1,443,191 |
1,253,099 |
||||||
Between 1 and 5 years |
10,610,800 |
8,446,425 |
||||||
Greater than 5 years |
31,988,317 |
17,592,080 |
||||||
Total gross investment in finance lease receivable/ present value of minimum payments |
44,042,308 |
27,291,604 |
||||||
Less: Future financial income(1) |
(16,750,704) |
- |
||||||
Present value of payments receivable(2) |
27,291,604 |
27,291,604 |
||||||
Minimum non-collectable payments impairment |
(1,088,272) |
(1,088,272) |
||||||
Total |
26,203,332 |
26,203,332 |
||||||
Period |
Gross investment in finance
lease receivable
|
Present value of minimum
payments
|
||||||
In millions of COP | ||||||||
Less than 1 year |
1,481,313 |
1,257,859 |
||||||
Between 1 and 5 years |
10,967,173 |
8,338,151 |
||||||
Greater than 5 years |
34,066,937 |
17,681,047 |
||||||
Total gross investment in finance lease receivable/ present value of minimum payments |
46,515,423 |
27,277,057 |
||||||
Less: Future financial income(1) |
(19,238,366) |
- |
||||||
Present value of payments receivable(2) |
27,277,057 |
27,277,057 |
||||||
Minimum non-collectable payments impairment |
(1,024,575) |
(1,024,575) |
||||||
Total |
26,252,482 |
26,252,482 |
||||||
Type of asset |
December 31, 2024 |
December 31, 2023 |
||||||
In millions of COP | ||||||||
Technological equipment |
58,357 |
49,990 |
||||||
Vehicles |
15,966 |
14,243 |
||||||
Machinery and equipment |
20,650 |
11,930 |
||||||
Furniture and fixtures |
14 |
12 |
||||||
Other assets |
1,862 |
1,417 |
||||||
Total |
96,849 |
77,592 |
||||||
Type of asset |
December 31, 2024 |
December 31, 2023 |
||||||
In millions of COP | ||||||||
Technological equipment |
15,572 |
20,717 |
||||||
Buildings |
9,254 |
8,088 |
||||||
Machinery and equipment |
236 |
532 |
||||||
Vehicles |
200 |
102 |
||||||
Total |
25,262 |
29,439 |
||||||
December 31, 2024 |
December 31, 2023 |
|||||||
In millions of COP | ||||||||
Less than 1 year |
246,875 |
259,277 |
||||||
Between 1 and 5 years |
186,465 |
524,293 |
||||||
Greater than 5 years |
56,999 |
60,619 |
||||||
Total(1) |
490,339 |
844,189 |
||||||
Roll - forward |
||||||||||||||||||||||||||
Right-of-use assets |
Balance at January 01, 2024 |
Acquisitions |
Additions |
Expenses
depreciation(1)
|
Disposals |
Revaluation(2) |
Effect of changes
in foreign
exchange rate
|
Balance at December 31, 2024 |
||||||||||||||||||
In millions of COP | ||||||||||||||||||||||||||
Buildings |
||||||||||||||||||||||||||
Cost |
2,302,922 |
105,666 |
61,879 |
- |
(62,106) |
91,414 |
144,744 |
2,644,519 |
||||||||||||||||||
Accumulated depreciation |
(706,786) |
- |
- |
(191,472) |
34,561 |
- |
(62,201) |
(925,898) |
||||||||||||||||||
Computer equipment |
||||||||||||||||||||||||||
Cost |
58,069 |
4,552 |
195 |
- |
(3,538) |
803 |
7,620 |
67,701 |
||||||||||||||||||
Accumulated depreciation |
(34,936) |
- |
- |
(12,352) |
3,398 |
- |
(5,026) |
(48,916) |
||||||||||||||||||
Furniture and fixtures |
||||||||||||||||||||||||||
Cost |
2,762 |
5,083 |
- |
- |
(509) |
33 |
617 |
7,986 |
||||||||||||||||||
Accumulated depreciation |
(2,607) |
- |
- |
(656) |
509 |
- |
(317) |
(3,071) |
||||||||||||||||||
Vehicles |
||||||||||||||||||||||||||
Cost |
19,755 |
89,733 |
- |
- |
(90,464) |
21 |
244 |
19,289 |
||||||||||||||||||
Accumulated depreciation |
(5,134) |
- |
- |
(3,080) |
4,005 |
- |
(195) |
(4,404) |
||||||||||||||||||
Total right-of-use assets – cost |
2,383,508 |
205,034 |
62,074 |
- |
(156,617) |
92,271 |
153,225 |
2,739,495 |
||||||||||||||||||
Total right-of-use assets - accumulated depreciation |
(749,463) |
- |
- |
(207,560) |
42,473 |
- |
(67,739) |
(982,289) |
||||||||||||||||||
Total right-of-use assets, net |
1,634,045 |
205,034 |
62,074 |
(207,560) |
(114,144) |
92,271 |
85,486 |
1,757,206 |
||||||||||||||||||
Roll - forward |
||||||||||||||||||||||||||
Right-of-use assets |
Balance at
January 01, 2023
|
Acquisitions |
Additions |
Expenses
depreciation(1)
|
Disposals |
Revaluation(2) |
Effect of changes
in foreign
exchange rate
|
Balance at
December 31, 2023
|
||||||||||||||||||
In millions of COP | ||||||||||||||||||||||||||
Buildings |
||||||||||||||||||||||||||
Cost |
2,319,471 |
67,049 |
11,861 |
- |
(75,701) |
218,592 |
(238,350) |
2,302,922 |
||||||||||||||||||
Accumulated depreciation |
(637,615) |
- |
- |
(198,156) |
41,560 |
- |
87,425 |
(706,786) |
||||||||||||||||||
Computer equipment |
||||||||||||||||||||||||||
Cost |
95,240 |
7,965 |
- |
- |
(30,650) |
(2,773) |
(11,713) |
58,069 |
||||||||||||||||||
Accumulated depreciation |
(53,757) |
- |
- |
(17,043) |
29,864 |
- |
6,000 |
(34,936) |
||||||||||||||||||
Furniture and fixtures |
||||||||||||||||||||||||||
Cost |
4,449 |
620 |
- |
- |
(1,783) |
- |
(524) |
2,762 |
||||||||||||||||||
Accumulated depreciation |
(4,291) |
- |
- |
(548) |
1,708 |
- |
524 |
(2,607) |
||||||||||||||||||
Vehicles |
||||||||||||||||||||||||||
Cost |
136,560 |
418,773 |
- |
- |
(539,293) |
4,419 |
(704) |
19,755 |
||||||||||||||||||
Accumulated depreciation |
(32,949) |
- |
- |
(13,918) |
41,128 |
- |
605 |
(5,134) |
||||||||||||||||||
Total right-of-use assets – cost |
2,555,720 |
494,407 |
11,861 |
- |
(647,427) |
220,238 |
(251,291) |
2,383,508 |
||||||||||||||||||
Total right-of-use assets - accumulated depreciation |
(728,612) |
- |
- |
(229,665) |
114,260 |
- |
94,554 |
(749,463) |
||||||||||||||||||
Total right-of-use assets, net |
1,827,108 |
494,407 |
11,861 |
(229,665) |
(533,167) |
220,238 |
(156,737) |
1,634,045 |
||||||||||||||||||
Concept |
Total |
||||
In millions of COP | |||||
Balance at January 01, 2024 |
1,773,610 |
||||
(+) New contracts |
114,425 |
||||
(+/-) Reassessment of the lease liability(1) |
74,457 |
||||
(-) Payments |
(311,082) |
||||
(+) Accrued Interest(2) |
136,924 |
||||
(+/-) Effect of changes in foreign exchange rate(3) |
101,030 |
||||
Balance at December 31, 2024 |
1,889,364 |
||||
Concept |
Total |
||||
In millions of COP | |||||
Balance at January 01, 2023 |
1,900,268 |
||||
(+) New contracts |
75,345 |
||||
(+/-) Reassessment of the lease liability(1) |
161,787 |
||||
(-) Payments |
(305,413) |
||||
(+) Accrued Interest(2) |
123,175 |
||||
(+/-) Effect of changes in foreign exchange rate(3) |
(181,552) |
||||
Balance at December 31, 2023 |
1,773,610 |
||||
Type of assets |
Maturity less than 1 year |
Maturity between 1 and 3 years |
Maturity between 3 and 5 years |
Maturity more than 5 years |
Total lease liabilities |
||||||||||||
In millions of COP | |||||||||||||||||
Buildings |
20,467 |
71,155 |
220,050 |
1,551,740 |
1,863,412 |
||||||||||||
Computer equipment |
1,332 |
9,683 |
8,693 |
1,224 |
20,932 |
||||||||||||
Furniture and fixtures |
- |
890 |
3,954 |
- |
4,844 |
||||||||||||
Vehicles |
- |
176 |
- |
- |
176 |
||||||||||||
Total lease liabilities |
21,799 |
81,904 |
232,697 |
1,552,964 |
1,889,364 |
||||||||||||
Type of assets |
Maturity less than 1 year |
Maturity between 1 and 3 years |
Maturity between 3 and 5 years |
Maturity more than 5 years |
Total lease liabilities |
||||||||||||
In millions of COP | |||||||||||||||||
Buildings |
17,345 |
58,438 |
230,397 |
1,441,288 |
1,747,468 |
||||||||||||
Computer equipment |
2,733 |
14,124 |
7,524 |
1,391 |
25,772 |
||||||||||||
Vehicles |
125 |
245 |
- |
- |
370 |
||||||||||||
Total lease liabilities |
20,203 |
72,807 |
237,921 |
1,442,679 |
1,773,610 |
||||||||||||
Right-of-use assets |
Weighted average life |
Weighted average
remaining lease terms
|
Weighted average discount rates |
||||||||
Buildings |
222 months |
109 months |
7.11 % |
||||||||
Computer equipment |
82 months |
32 months |
7.52 % |
||||||||
Furniture and fixtures |
53 months |
53 months |
8.71 % |
||||||||
Vehicles |
49 months |
17 months |
10.44 % |
||||||||
Right-of-use assets |
Weighted average life |
Weighted average
remaining lease terms
|
Weighted average discount rates |
||||||||
Buildings |
209 months |
99 months |
6.67 % |
||||||||
Computer equipment |
73 months |
31 months |
8.36 % |
||||||||
Vehicles |
51 months |
22 months |
9.81 % |
||||||||
Right-of-use assets |
Financial interest(1) |
Expenses depreciation(2) |
Short-term leases |
Leases for which the underlying asset is of low value |
Variable payments |
||||||||||||
In millions of COP | |||||||||||||||||
Buildings |
133,176 |
191,472 |
1,350 |
639 |
5,300 |
||||||||||||
Computer equipment |
2,170 |
12,352 |
169 |
9,098 |
- |
||||||||||||
Furniture and fixtures |
93 |
656 |
410 |
303 |
- |
||||||||||||
Vehicles |
107 |
3,080 |
5 |
59 |
- |
||||||||||||
Total |
135,546 |
207,560 |
1,934 |
10,099 |
5,300 |
||||||||||||
Right-of-use assets |
Financial interest(1) |
Expenses
depreciation(2)
|
Short-term leases |
Leases for which the underlying asset is of low value |
Variable payments |
||||||||||||
In millions of COP | |||||||||||||||||
Buildings |
109,800 |
198,156 |
983 |
235 |
7,577 |
||||||||||||
Computer equipment |
3,907 |
17,043 |
- |
6,545 |
- |
||||||||||||
Furniture and fixtures |
68 |
548 |
904 |
432 |
- |
||||||||||||
Vehicles |
40 |
13,918 |
51 |
- |
- |
||||||||||||
Total |
113,815 |
229,665 |
1,938 |
7,212 |
7,577 |
||||||||||||
Type of assets |
Maturity less than 1 year |
Maturity between 1 and 3 years |
Maturity between 3 and 5 years |
Maturity more than 5 years |
Total minimum payments lease liabilities |
||||||||||||
In millions of COP | |||||||||||||||||
Buildings |
24,464 |
87,714 |
318,197 |
2,530,561 |
2,960,936 |
||||||||||||
Computer equipment |
1,523 |
10,641 |
9,755 |
1,267 |
23,186 |
||||||||||||
Furniture and fixtures |
- |
986 |
4,625 |
- |
5,611 |
||||||||||||
Vehicles |
72 |
120 |
- |
- |
192 |
||||||||||||
Total minimum payments lease liabilities |
26,059 |
99,461 |
332,577 |
2,531,828 |
2,989,925 |
||||||||||||
Type of assets |
Maturity less than 1 year |
Maturity between 1 and 3 years |
Maturity between 3 and 5 years |
Maturity more than 5 years |
Total minimum payments lease liabilities |
||||||||||||
In millions of COP | |||||||||||||||||
Buildings |
21,050 |
73,316 |
301,470 |
2,074,687 |
2,470,523 |
||||||||||||
Computer equipment |
2,964 |
16,263 |
1,550 |
8,323 |
29,100 |
||||||||||||
Vehicles |
193 |
206 |
- |
- |
399 |
||||||||||||
Total minimum payments lease liabilities |
24,207 |
89,785 |
303,020 |
2,083,010 |
2,500,022 |
||||||||||||
December 31, 2024 |
December 31, 2023 |
|||||||
In millions of COP | ||||||||
Goodwill |
9,017,419 |
7,818,125 |
||||||
Intangible assets, net |
750,484 |
671,572 |
||||||
Total intangible assets and goodwill, net |
9,767,903 |
8,489,697 |
||||||
| Cost | Trademarks |
Licenses, software
and computer
applications
|
Client
relationships
|
Total | ||||||||||
In millions of COP | ||||||||||||||
Balance at January 1, 2024 |
22,596 |
1,409,836 |
440,636 |
1,873,068 |
||||||||||
Acquisitions |
- |
211,456 |
- |
211,456 |
||||||||||
Write off |
- |
(85,717) |
- |
(85,717) |
||||||||||
Foreign currency translation adjustment |
3,471 |
119,874 |
67,686 |
191,031 |
||||||||||
Balance at December 31, 2024 |
26,067 |
1,655,449 |
508,322 |
2,189,838 |
||||||||||
| Amortization | Trademarks |
Licenses, software
and computer
applications
|
Client
relationships
|
Total | ||||||||||
In millions of COP | ||||||||||||||
Balance at January 1, 2024 |
22,596 |
741,765 |
437,135 |
1,201,496 |
||||||||||
Write off |
- |
(76,876) |
- |
(76,876) |
||||||||||
Amortization expense(1) |
- |
168,647 |
1,493 |
170,140 |
||||||||||
Foreign currency translation adjustment |
3,471 |
73,853 |
67,270 |
144,594 |
||||||||||
Balance at December 31, 2024 |
26,067 |
907,389 |
505,898 |
1,439,354 |
||||||||||
Intangible assets at December 31, 2024, net |
- |
748,060 |
2,424 |
750,484 |
||||||||||
| Cost | Trademarks |
Licenses, software
and computer
applications
|
Client
relationships
|
Total | ||||||||||
In millions of COP | ||||||||||||||
Balance at January 1, 2023 |
28,438 |
1,361,258 |
554,558 |
1,944,254 |
||||||||||
Acquisitions |
- |
352,248 |
- |
352,248 |
||||||||||
Write off |
- |
(119,482) |
- |
(119,482) |
||||||||||
Foreign currency translation adjustment |
(5,842) |
(184,188) |
(113,922) |
(303,952) |
||||||||||
Balance at December 31, 2023 |
22,596 |
1,409,836 |
440,636 |
1,873,068 |
||||||||||
| Amortization | Trademarks |
Licenses, software
and computer
applications
|
Client
relationships
|
Total | ||||||||||
In millions of COP | ||||||||||||||
Balance at January 1, 2023 |
28,437 |
765,339 |
547,947 |
1,341,723 |
||||||||||
Write off |
- |
(119,482) |
- |
(119,482) |
||||||||||
Amortization expense(1) |
- |
210,333 |
1,984 |
212,317 |
||||||||||
Foreign currency translation adjustment |
(5,841) |
(114,425) |
(112,796) |
(233,062) |
||||||||||
Balance at December 31, 2023 |
22,596 |
741,765 |
437,135 |
1,201,496 |
||||||||||
Intangible assets at December 31, 2023, net |
- |
668,071 |
3,501 |
671,572 |
||||||||||
December 31, 2024 |
December 31, 2023 |
|||||||
In millions of COP | ||||||||
Balance at beginning of the year, net |
7,818,125 |
9,836,661 |
||||||
Effect of change in foreign exchange rate(1) |
1,199,294 |
(2,018,536) |
||||||
Balance at end of the year, net |
9,017,419 |
7,818,125 |
||||||
Operating segment |
Valuation methodology |
Key assumptions |
Discount rate (real)(1) |
Growth rate (real)(2) |
Goodwill 2024 |
||||||||||||
In millions of COP | |||||||||||||||||
Banking Panama |
Discounted Cash flow |
5 years plan |
10.50 % |
4.40 % |
6,733,971 |
||||||||||||
Banking El Salvador(3) |
Discounted Cash flow |
5 years plan |
14.90% and 14.30% |
3.90 % |
1,243,711 |
||||||||||||
Banking Guatemala |
Discounted Cash flow |
5 years plan |
11.70 % |
5.10 % |
1,029,077 |
||||||||||||
Others segments |
Comparable multiples |
Multiples EV/ Revenue and EV/EBITDA |
Does not apply |
Does not apply |
10,660 |
||||||||||||
Total |
9,017,419 |
||||||||||||||||
Operating segment |
Valuation methodology |
Key assumptions |
Discount rate (real)(1) |
Growth rate (real)(2) |
Goodwill 2023 |
||||||||||||
In millions of COP | |||||||||||||||||
Banking Panama |
Discounted Cash flow |
5 years plan |
10.90 % |
4.50 % |
5,837,310 |
||||||||||||
Banking El Salvador(3) |
Discounted Cash flow |
5 years plan |
17.10% and 15.50% |
3.70 % |
1,078,105 |
||||||||||||
Banking Guatemala |
Discounted Cash flow |
5 years plan |
12.30 % |
4.80 % |
892,050 |
||||||||||||
Others segments |
Comparable multiples |
Multiples EV/ Revenue and EV/EBITDA |
Does not apply |
Does not apply |
10,660 |
||||||||||||
Total |
7,818,125 |
||||||||||||||||
+50 bips |
Discount rate |
-50 bips |
|||||||||
Growth rate |
11.00% |
10.50% |
10.00% |
||||||||
4.40% |
12,069,096 |
13,061,970 |
14,232,692 |
||||||||
-50 bips |
Growth rate |
+50bips |
|||||||||
Discount rate |
3.90% |
4.40% |
4.90% |
||||||||
10.50% |
12,512,669 |
13,061,970 |
13,709,357 |
||||||||
+100 bips |
Discount rate |
-100 bips |
|||||||||
15.90 % |
14.90 % |
13.90 % |
|||||||||
Growth rate |
15.30 % |
14.30 % |
13.30 % |
||||||||
3.90% |
4,821,361 |
5,290,874 |
5,861,625 |
||||||||
-50 bips |
Growth rate |
+50 bips |
|||||||||
Discount rate |
3.40 % |
3.90 % |
4.40 % |
||||||||
14.90% and 14.30% |
5,201,761 |
5,290,874 |
5,388,987 |
||||||||
+50 bips |
Discount rate |
-50 bips |
|||||||||
Growth rate |
12.20% |
11.70% |
11.20% |
||||||||
5.10% |
4,433,281 |
4,819,854 |
5,271,139 |
||||||||
-50 bips |
Growth rate |
+50 bips |
|||||||||
Discount rate |
4.60% |
5.10% |
5.60% |
||||||||
11.70% |
4,665,498 |
4,819,854 |
4,999,513 |
||||||||
+50 bips |
Discount rate |
-50 bips |
|||||||||
Growth rate |
11.40 % |
10.90 % |
10.40 % |
||||||||
4.50% |
10,826,278 |
11,721,608 |
12,770,528 |
||||||||
-50 bips |
Growth rate |
+50bips |
|||||||||
Discount rate |
4.00 % |
4.50 % |
5.00 % |
||||||||
10.90% |
11,224,673 |
11,721,608 |
12,302,770 |
||||||||
+100 bips |
Discount rate |
-100 bips |
|||||||||
18.10% |
17.10% |
16.10% |
|||||||||
Growth rate |
16.50% |
15.50% |
14.50% |
||||||||
3.70% |
3,909,551 |
4,241,177 |
4,634,962 |
||||||||
-50 bips |
Growth rate |
+50 bips |
|||||||||
Discount rate |
3.20% |
3.70% |
4.20% |
||||||||
17.10% and 15.50% |
4,182,324 |
4,241,177 |
4,305,238 |
||||||||
+50 bips |
Discount rate |
-50 bips |
|||||||||
Growth rate |
12.80 % |
12.30 % |
11.80 % |
||||||||
4.80% |
3,903,356 |
4,224,256 |
4,592,449 |
||||||||
-50 bips |
Growth rate |
+50 bips |
|||||||||
Discount rate |
4.30 % |
4.80 % |
5.30 % |
||||||||
12.30% |
4,090,025 |
4,224,256 |
4,377,661 |
||||||||
In millions of COP |
|||||
Purchase Price Allocation |
|||||
Pruchase price on June 9, 2021 |
56,968 |
||||
Non-controlling interest at fair value |
1,166 |
||||
TOTAL |
58,134 |
||||
Fair value of net assets acquired |
|||||
ASSETS |
|||||
Cash and cash equivalents |
799 |
||||
Accounts receivable |
299 |
||||
Premises and equipment, net |
3 |
||||
Investments property |
60,850 |
||||
Other assets |
78 |
||||
Total Assets |
62,029 |
||||
LIABILITIES |
|||||
Accounts payable |
1,080 |
||||
Deferred tax |
283 |
||||
Other liabilities |
99 |
||||
Total Liabilities |
1,462 |
||||
Fair value of net assets acquired |
60,567 |
||||
Gain from a bargain purchase |
2,433 |
||||
December 31, 2024 |
December 31, 2023 |
December 31, 2022 |
|||||||||
In millions of COP | |||||||||||
Current tax(1) |
|||||||||||
Fiscal term |
(1,814,435) |
(1,779,538) |
(2,644,173) |
||||||||
Prior fiscal terms(2) |
161,501 |
46,791 |
39,137 |
||||||||
Total current tax |
(1,652,934) |
(1,732,747) |
(2,605,036) |
||||||||
Deferred tax |
|||||||||||
Fiscal term (3) |
(660,591) |
(258,046) |
(80,663) |
||||||||
Prior fiscal terms(2) |
(67,083) |
(23,966) |
— |
||||||||
Adjustments for consolidation purposes |
(11,728) |
82,204 |
(62,722) |
||||||||
Total deferred tax |
(739,402) |
(199,808) |
(143,385) |
||||||||
Total income tax(4) |
(2,392,336) |
(1,932,555) |
(2,748,421) |
||||||||
| Reconciliation of the tax rate | December 31, 2024 |
December 31, 2023 |
December 31, 2022 |
||||||||
In millions of COP | |||||||||||
Accounting profit |
8,757,917 |
8,147,526 |
9,744,786 |
||||||||
Applicable tax with nominal rate(1) |
(3,503,167) |
(3,259,011) |
(3,703,019) |
||||||||
Non-deductible expenses to determine taxable profit (loss) |
(378,428) |
(478,901) |
(425,458) |
||||||||
Accounting and non-tax expense (income) to determine taxable profit (loss) |
665,224 |
667,744 |
978,468 |
||||||||
Differences in accounting bases(2) |
559,244 |
(106,648) |
(19,448) |
||||||||
Fiscal and non-accounting expense (income) to determine taxable profit (loss) |
(982,937) |
(652,607) |
(470,063) |
||||||||
Ordinary activities income exempt from taxation |
1,550,137 |
1,563,793 |
832,822 |
||||||||
Ordinary activities income not constituting income or occasional tax gain |
79,525 |
67,132 |
120,513 |
||||||||
Tax deductions |
209,076 |
156,543 |
374,233 |
||||||||
Goodwill Depreciation |
461 |
2,478 |
461 |
||||||||
Tax depreciation surplus |
212,694 |
223,901 |
162,111 |
||||||||
Untaxed recoveries |
(103,017) |
(64,516) |
(40,559) |
||||||||
Tax rate effect in other countries |
(293,596) |
(121,597) |
(319,825) |
||||||||
Prior fiscal terms |
94,418 |
22,825 |
39,137 |
||||||||
Tax discounts |
8,250 |
— |
— |
||||||||
Other effects of the tax rate by reconciliation between accounting profit and tax expense (income) |
(510,220) |
46,309 |
(277,794) |
||||||||
Total income tax |
(2,392,336) |
(1,932,555) |
(2,748,421) |
||||||||
December 31, 2024 | |||||||||||
In millions of COP | |||||||||||
Amounts before taxes |
Deferred tax |
Net taxes |
|||||||||
Remeasurement income related to defined benefit liability |
6,041 |
(4,747) |
1,294 |
||||||||
Unrealized gain Investments in equity instruments measured at fair value through other comprehensive income (FVTOCI) |
22,109 |
6,463 |
28,572 |
||||||||
Unrealized loss Investments in debt instruments measured at fair value through other comprehensive income (FVTOCI) |
14,814 |
8,422 |
23,236 |
||||||||
Loss on net investment hedge in foreign operations |
(742,930) |
307,656 |
(435,274) |
||||||||
Exchange differences arising on translating the foreign operations. |
2,978,351 |
- |
2,978,351 |
||||||||
Unrealized gain Cash flow hedge |
216 |
(87) |
129 |
||||||||
Unrealized loss on investments in associates and joint ventures using equity method |
(7,690) |
1,348 |
(6,342) |
||||||||
Net |
2,270,911 |
319,055 |
2,589,966 |
||||||||
December 31, 2023 | |||||||||||
In millions of COP | |||||||||||
Amounts before taxes |
Deferred tax |
Net taxes |
|||||||||
Remeasurement income related to defined benefit liability |
(44,594) |
13,234 |
(31,360) |
||||||||
Unrealized loss Investments in equity instruments measured at fair value through other comprehensive income (FVTOCI) |
11,144 |
(246) |
10,898 |
||||||||
Unrealized gain Investments in debt instruments measured at fair value through other comprehensive income (FVTOCI) |
114,287 |
(21,023) |
93,264 |
||||||||
Loss on net investment hedge in foreign operations |
1,948,833 |
(772,755) |
1,176,078 |
||||||||
Exchange differences arising on translating the foreign operations. |
(4,963,913) |
- |
(4,963,913) |
||||||||
Unrealized gains on investments in associates and joint ventures using equity method |
(2,225) |
2,223 |
(2) |
||||||||
Net |
(2,936,468) |
(778,567) |
(3,715,035) |
||||||||
December 31, 2022 | |||||||||||
In millions of COP | |||||||||||
Amounts before taxes |
Deferred tax |
Net taxes |
|||||||||
Remeasurement expense related to defined benefit liability |
69,249 |
(25,090) |
44,159 |
||||||||
Unrealized gain Investments in equity instruments measured at fair value through other comprehensive income (FVTOCI)(1) |
33,354 |
(1,282) |
32,072 |
||||||||
Gains due to asset revaluation |
- |
(71) |
(71) |
||||||||
Unrealized gain Investments in debt instruments measured at fair value through other comprehensive income (FVTOCI) |
(172,385) |
7,843 |
(164,542) |
||||||||
Loss on net investment hedge in foreign operations |
(1,833,087) |
746,232 |
(1,086,855) |
||||||||
Exchange differences arising on translating the foreign operations. |
4,064,795 |
- |
4,064,795 |
||||||||
Unrealized gains on investments in associates and joint ventures using equity method |
(1,929) |
(1,221) |
(3,150) |
||||||||
Net |
2,159,997 |
726,411 |
2,886,408 |
||||||||
December 31, 2023 |
Effect on
Income
Statement
|
Effect on
OCI
|
Effect on
Equity(1)
|
Tax Made(2) |
Foreign
Exchange
|
Adjustments for
consolidation
purposes
|
December 31, 2024 |
|||||||||||||||||||
| In millions of COP | ||||||||||||||||||||||||||
Asset Deferred Tax: |
||||||||||||||||||||||||||
Property and equipment |
5,982 |
350 |
- |
(11) |
- |
(3,586) |
(67) |
2,668 |
||||||||||||||||||
Employee Benefits |
259,406 |
23,532 |
(4,747) |
- |
- |
4,410 |
- |
282,601 |
||||||||||||||||||
Deterioration assessment |
416,452 |
20,417 |
- |
- |
- |
65,956 |
109,388 |
612,213 |
||||||||||||||||||
Investments evaluation |
5,061 |
316 |
(118) |
- |
- |
19 |
- |
5,278 |
||||||||||||||||||
Derivatives Valuation |
235,067 |
(230,193) |
- |
- |
- |
- |
1,189 |
6,063 |
||||||||||||||||||
Tax credits settlement (4) |
34,940 |
(29,859) |
- |
(2,690) |
- |
2,587 |
- |
4,978 |
||||||||||||||||||
Financial Obligations |
— |
197,660 |
- |
- |
- |
- |
- |
197,660 |
||||||||||||||||||
Insurance operations |
13,319 |
19,541 |
- |
— |
- |
2,046 |
- |
34,906 |
||||||||||||||||||
Net investment coverage in operations abroad |
528,438 |
(94,400) |
307,656 |
- |
(378,908) |
- |
- |
362,786 |
||||||||||||||||||
Other deductions |
241,635 |
39,211 |
- |
- |
- |
9,438 |
- |
290,284 |
||||||||||||||||||
implementation adjustment |
376,216 |
114 |
- |
- |
- |
25,500 |
- |
401,830 |
||||||||||||||||||
Total Asset Deferred Tax (3) |
2,116,516 |
(53,311) |
302,791 |
(2,701) |
(378,908) |
106,370 |
110,510 |
2,201,267 |
||||||||||||||||||
Liability Deferred Tax: |
||||||||||||||||||||||||||
Property and equipment |
(144,988) |
20,635 |
- |
- |
- |
(3,124) |
12,839 |
(114,638) |
||||||||||||||||||
Deterioration assessment |
(113,391) |
(714,178) |
- |
- |
- |
(2,773) |
(143,478) |
(973,820) |
||||||||||||||||||
Participatory titles evaluation |
(369,809) |
(25,930) |
15,003 |
- |
- |
2,742 |
— |
(377,994) |
||||||||||||||||||
Derivatives evaluation |
(10,045) |
(71,636) |
(87) |
- |
- |
(1,179) |
572 |
(82,375) |
||||||||||||||||||
Lease restatement |
(215,411) |
(106,402) |
- |
- |
- |
- |
- |
(321,813) |
||||||||||||||||||
Investments in associates. Adjustment for equity method |
(79,584) |
7,552 |
1,348 |
(89) |
- |
38,139 |
7,829 |
(24,805) |
||||||||||||||||||
Financial Obligations |
(179,947) |
179,496 |
- |
- |
- |
(105) |
- |
(556) |
||||||||||||||||||
Goodwill |
(1,573,966) |
641 |
- |
- |
- |
(1,035) |
- |
(1,574,360) |
||||||||||||||||||
Insurance operations |
(13,949) |
(21,287) |
- |
— |
- |
(2,143) |
- |
(37,379) |
||||||||||||||||||
Properties received in payment |
(148,462) |
45,504 |
- |
- |
- |
(2,032) |
- |
(104,990) |
||||||||||||||||||
Other deductions |
(366,557) |
11,242 |
- |
- |
- |
(47,944) |
- |
(403,259) |
||||||||||||||||||
implementation adjustment |
(25) |
- |
- |
- |
- |
- |
- |
(25) |
||||||||||||||||||
Total Liability Deferred Tax (3) |
(3,216,134) |
(674,363) |
16,264 |
(89) |
- |
(19,454) |
(122,238) |
(4,016,014) |
||||||||||||||||||
Net Deferred Tax |
(1,099,618) |
(727,674) |
319,055 |
(2,790) |
(378,908) |
86,916 |
(11,728) |
(1,814,747) |
||||||||||||||||||
December 31, 2024 |
December 31, 2023 |
|||||||
In millions of COP | ||||||||
Temporary differences |
||||||||
Local Subsidiaries |
(373,971) |
(1,378,775) |
||||||
Foreign Subsidiaries |
(20,176,494) |
(17,696,145) |
||||||
| Company | Base |
Deferred tax
recognized asset
|
||||||
In millions of COP | ||||||||
Renting Colombia S.A.S. |
15,085 |
4,978 |
||||||
Total |
15,085 |
4,978 |
||||||
Other Assets, net |
December 31, 2024 |
December 31, 2023 |
||||||
In millions of COP | ||||||||
Tax advance(1) |
2,014,638 |
1,461,816 |
||||||
Other receivables(2) |
1,110,974 |
1,193,294 |
||||||
Marketable and non-marketable for sale assets(3) |
1,049,169 |
890,653 |
||||||
Prepaid expenses(4) |
907,620 |
713,505 |
||||||
Assets pledged as collateral (cash)(5) |
530,924 |
1,082,611 |
||||||
Receivables related to abandoned accounts(6) |
453,956 |
403,432 |
||||||
Balance in credit card clearing house |
298,677 |
185,164 |
||||||
Accounts receivable from contracts with customers(7) |
257,262 |
259,516 |
||||||
Receivable Sales of goods and service |
251,904 |
254,607 |
||||||
Operating leases |
176,585 |
201,302 |
||||||
Other receivables of commission for letters of credit(8) |
95,008 |
207,327 |
||||||
Debtors |
84,453 |
85,698 |
||||||
Others |
556,044 |
595,799 |
||||||
Total other assets |
7,787,214 |
7,534,724 |
||||||
Allowance others |
(8,935) |
(6,688) |
||||||
Total other assets, net |
7,778,279 |
7,528,036 |
||||||
Deposits |
December 31, 2024 |
December 31, 2023 |
||||||
In millions of COP |
||||||||
Saving accounts(1)(2) |
124,636,994 |
108,971,334 |
||||||
Time deposits(3) |
109,760,722 |
98,686,516 |
||||||
Checking accounts |
38,033,696 |
34,993,066 |
||||||
Other deposits(1) |
6,627,989 |
5,290,264 |
||||||
Total deposits by customers |
279,059,401 |
247,941,180 |
||||||
Time deposits |
Effective interest rate |
December 31, 2024 |
||||||||||||
Modality |
Minimum |
Maximum |
Carrying Value |
Fair value(1) |
||||||||||
In millions of COP | ||||||||||||||
Less than 6 months |
0.01% |
10.60% |
27,429,721 |
27,305,410 |
||||||||||
Between 6 months and 12 months |
0.01% |
12.00% |
21,295,319 |
21,140,127 |
||||||||||
Between 12 months and 18 months |
1.35% |
14.55% |
17,826,919 |
17,878,843 |
||||||||||
Greater than 18 months |
0.01% |
17.65% |
43,208,763 |
43,839,953 |
||||||||||
Total time deposits |
109,760,722 |
110,164,333 |
||||||||||||
Time deposits |
Effective interest rate |
December 31, 2023 |
||||||||||||
Modality |
Minimum |
Maximum |
Carrying Value |
Fair value(1) |
||||||||||
In millions of COP | ||||||||||||||
Less than 6 months |
0.10% |
15.52% |
17,641,158 |
17,494,878 |
||||||||||
Between 6 months and 12 months |
0.50% |
17.32% |
18,422,400 |
18,314,065 |
||||||||||
Between 12 months and 18 months |
0.85% |
20.52% |
17,523,847 |
17,647,508 |
||||||||||
Greater than 18 months |
0.01% |
20.86% |
45,099,111 |
46,629,404 |
||||||||||
Total time deposits |
98,686,516 |
100,085,855 |
||||||||||||
December 31, 2024 | ||||||||
Period |
Carrying value |
Fair value(1) |
||||||
In millions of COP | ||||||||
Less than 1 year |
86,592,320 |
86,553,690 |
||||||
Between 1 and 3 years |
10,868,175 |
10,919,972 |
||||||
Between 3 and 5 years |
2,490,326 |
2,462,312 |
||||||
Greater than 5 years |
9,809,901 |
10,228,359 |
||||||
Total |
109,760,722 |
110,164,333 |
||||||
December 31, 2023 | ||||||||
Period |
Carrying value |
Fair value(1) |
||||||
In millions of COP | ||||||||
Less than 1 year |
71,178,788 |
71,315,171 |
||||||
Between 1 and 3 years |
13,715,792 |
13,949,647 |
||||||
Between 3 and 5 years |
3,197,528 |
3,256,102 |
||||||
Greater than 5 years |
10,594,408 |
11,564,935 |
||||||
Total |
98,686,516 |
100,085,855 |
||||||
Interbank and repurchase agreements and other similar secured borrowing |
December 31, 2024 |
December 31, 2023 |
||||||
In millions of COP | ||||||||
Interbank Deposits |
||||||||
Interbank liabilities |
716,493 |
606,141 |
||||||
Total interbank |
716,493 |
606,141 |
||||||
Repurchase agreements and other similar secured borrowing |
||||||||
Short selling operations |
155,973 |
273,791 |
||||||
Temporary transfer of securities |
532,495 |
44,888 |
||||||
Repurchase agreements |
372,004 |
151,616 |
||||||
Total Repurchase agreements and other similar secured borrowing(1) |
1,060,472 |
470,295 |
||||||
Total money market transactions |
1,776,965 |
1,076,436 |
||||||
|
Assets /
liabilities gross
|
Amounts offset in
the statement of
financial position
|
Net balance
presented in the
statement of financial
position
|
Financial
instruments as
collaterals
|
Assets /
liabilities
net
|
|||||||||||||
In millions of COP | |||||||||||||||||
Securities purchased under resale agreements(1) |
5,725,166 |
- |
5,725,166 |
(5,725,166) |
- |
||||||||||||
Securities sold under repurchase agreements |
(1,060,472) |
- |
(1,060,472) |
1,060,472 |
- |
||||||||||||
Total repurchase and resale agreements |
4,664,694 |
- |
4,664,694 |
(4,664,694) |
- |
||||||||||||
|
Assets /
liabilities gross
|
Amounts offset in
the statement of
financial position
|
Net balance
presented in the
statement of financial
position
|
Financial
instruments as
collaterals
|
Assets /
liabilities
net
|
|||||||||||||
In millions of COP | |||||||||||||||||
Securities purchased under resale agreements(1) |
7,850,516 |
- |
7,850,516 |
(7,850,516) |
- |
||||||||||||
Securities sold under repurchase agreements |
(470,295) |
- |
(470,295) |
470,295 |
- |
||||||||||||
Total repurchase and resale agreements |
7,380,221 |
- |
7,380,221 |
(7,380,221) |
- |
||||||||||||
Borrowings from other financial institutions |
December 31, 2024 |
December 31, 2023 |
||||||
In millions of COP | ||||||||
Obligations granted by foreign banks |
10,619,033 |
9,139,834 |
||||||
Obligations granted by domestic banks(1) |
5,070,499 |
6,508,772 |
||||||
Total borrowings from other financial institutions |
15,689,532 |
15,648,606 |
||||||
Financial entity |
Rate Minimum |
Rate Maximum |
December 31, 2024 |
||||||||
In millions of COP | |||||||||||
Financing with Correspondent Banks and Multilateral Entities(1) |
1.50 % |
8.99 % |
9,959,214 |
||||||||
Banco Interamericano de Desarrollo (BID) |
8.47 % |
9.62 % |
614,946 |
||||||||
Banco Latinoamericano de Comercio Exterior (Bladex) |
5.80 % |
5.80 % |
44,873 |
||||||||
Total |
10,619,033 |
||||||||||
Financial entity |
Rate Minimum |
Rate Maximum |
December 31, 2023 |
||||||||
In millions of COP | |||||||||||
Financing with Correspondent Banks and Multilateral Entities(1) |
1.21 % |
10.06 % |
8,566,580 |
||||||||
Banco Interamericano de Desarrollo (BID) |
9.50 % |
10.64 % |
532,899 |
||||||||
Banco Latinoamericano de Comercio Exterior (Bladex) |
6.91 % |
6.91 % |
40,355 |
||||||||
Total |
9,139,834 |
||||||||||
Foreign |
December 31, 2024 |
December 31, 2023 |
||||||
In millions of COP | ||||||||
Amount expected to be settled: |
||||||||
No more than twelve months after the reporting period |
7,428,943 |
3,813,504 |
||||||
More than twelve months after the reporting period(1) |
3,190,090 |
5,326,330 |
||||||
Total |
10,619,033 |
9,139,834 |
||||||
Financial entity |
Rate
Minimum
|
Rate
Maximum
|
December 31, 2024 |
||||||||
In millions of COP | |||||||||||
Financiera de desarrollo territorial (Findeter) |
4.15% |
17.21% |
2,239,644 |
||||||||
Fondo para el financiamiento del sector agropecuario (Finagro) |
5.09% |
13.59% |
1,363,891 |
||||||||
Banco de comercio exterior de Colombia (Bancoldex)(1) |
2.17% |
17.50% |
399,266 |
||||||||
Other private financial entities |
5.11% |
13.01% |
1,067,698 |
||||||||
Total |
5,070,499 |
||||||||||
| Financial entity |
Rate
Minimum
|
Rate
Maximum
|
December 31, 2023 | ||||||||
In millions of COP | |||||||||||
Financiera de desarrollo territorial (Findeter) |
8.15% |
20.85% |
2,530,570 |
||||||||
Fondo para el financiamiento del sector agropecuario (Finagro) |
8.37% |
15.88% |
1,509,594 |
||||||||
Banco de comercio exterior de Colombia (Bancoldex) |
2.17% |
21.46% |
1,404,873 |
||||||||
Other private financial entities |
12.88% |
16.67% |
1,063,735 |
||||||||
Total |
6,508,772 |
||||||||||
Domestic |
December 31, 2024 |
December 31, 2023 |
||||||
In millions of COP | ||||||||
Amount expected to be settled: |
||||||||
No more than twelve months after the reporting period |
679,069 |
767,470 |
||||||
More than twelve months after the reporting period(1) |
4,391,430 |
5,741,302 |
||||||
Total |
5,070,499 |
6,508,772 |
||||||
Issuer |
Currency |
Face value(1) |
Balance COP |
Rate Range |
|||||||||||||
Bancolombia S.A.(2)(3) |
Local |
COP |
2,253,761 |
2,244,212 |
7.80%-12.49% |
||||||||||||
Bancolombia S.A.(4)(5)(6) |
Foreign |
USD |
1,247,766 |
5,553,607 |
5.20%-8.82% |
||||||||||||
Banistmo S.A.(7) |
Foreign |
USD |
585,051 |
2,617,132 |
4.25%-6.35% |
||||||||||||
Banco Agrícola S.A.(8) |
Foreign |
USD |
117,182 |
517,068 |
5.60%-7.70% |
||||||||||||
Bancolombia Puerto Rico Internacional Inc. |
Foreign |
USD |
51,734 |
246,083 |
5.15%-5.50% |
||||||||||||
Bancolombia Panamá S.A. |
Foreign |
USD |
20,338 |
95,070 |
5.00%-6.00% |
||||||||||||
Grupo Agromercantil Holding S.A. |
Foreign |
USD |
464 |
2,044 |
0.25%-7.25% |
||||||||||||
Total debt instruments in issue |
11,275,216 |
||||||||||||||||
Issuer |
Currency |
Face value(1) |
Balance COP |
Rate Range |
|||||||||||||
Bancolombia S.A. |
Local |
COP |
4,029,882 |
4,097,727 |
12.87%-21.06% |
||||||||||||
Bancolombia S.A.(2) |
Foreign |
USD |
1,832,534 |
6,861,098 |
3.02%-7.03% |
||||||||||||
Banistmo S.A.(3) |
Foreign |
USD |
679,395 |
2,626,235 |
3.00%-6.25% |
||||||||||||
Banco Agrícola S.A.(4) |
Foreign |
USD |
162,700 |
623,568 |
5.58%-7.57% |
||||||||||||
Bancolombia Puerto Rico Internacional Inc. |
Foreign |
USD |
69,648 |
276,451 |
5.05%-5.50% |
||||||||||||
Bancolombia Panamá S.A. |
Foreign |
USD |
44,924 |
176,376 |
4.70%-6.10% |
||||||||||||
Grupo Agromercantil Holding S.A. |
Foreign |
USD |
555 |
2,121 |
0.25%-7.25% |
||||||||||||
Total debt instruments in issue |
14,663,576 |
||||||||||||||||
| Issuer |
Less than
1 year
|
Between
1 and 3 years
|
Between
3 and 5 years
|
Greater than 5 years | Total amortized cost | ||||||||||||
In millions of COP | |||||||||||||||||
Local currency |
|||||||||||||||||
Subordinated bonds(1) |
- |
- |
- |
615,699 |
615,699 |
||||||||||||
Ordinary bonds |
- |
- |
- |
1,628,513 |
1,628,513 |
||||||||||||
Foreign currency |
|||||||||||||||||
Subordinated bonds(1) |
- |
- |
- |
5,516,940 |
5,516,940 |
||||||||||||
Ordinary bonds |
243,861 |
1,097,493 |
7,684 |
2,165,026 |
3,514,064 |
||||||||||||
Total |
243,861 |
1,097,493 |
7,684 |
9,926,178 |
11,275,216 |
||||||||||||
| Issuer |
Less than
1 year
|
Between
1 to 3 years
|
Between
3 to 5 years
|
Greater than 5 years | Total amortized cost | ||||||||||||
In millions of COP | |||||||||||||||||
Local currency |
|||||||||||||||||
Subordinated bonds(1) |
- |
- |
- |
1,236,385 |
1,236,385 |
||||||||||||
Ordinary bonds |
- |
- |
165,589 |
2,695,753 |
2,861,342 |
||||||||||||
Foreign currency |
|||||||||||||||||
Subordinated bonds(1) |
- |
- |
- |
4,822,273 |
4,822,273 |
||||||||||||
Ordinary bonds |
106,707 |
1,375,723 |
137,613 |
4,123,533 |
5,743,576 |
||||||||||||
Total |
106,707 |
1,375,723 |
303,202 |
12,877,944 |
14,663,576 |
||||||||||||
Issuer |
December 31, 2024 |
December 31, 2023 |
||||||
In millions of COP | ||||||||
Amount expected to be settled: |
||||||||
No more than twelve months after the reporting period |
1,297,811 |
3,368,076 |
||||||
More than twelve months after the reporting period |
9,977,405 |
11,295,500 |
||||||
Total |
11,275,216 |
14,663,576 |
||||||
| Employee benefit plans | December 31, 2024 |
December 31, 2023 |
||||||
In millions of COP | ||||||||
19.1 Defined benefit pension plan |
140,996 |
132,854 |
||||||
19.2 Severance obligation |
9,351 |
14,360 |
||||||
19.3 Retirement Pension Premium Plan and Executive Pension Plan Premium |
222,786 |
195,295 |
||||||
19.4 Other long term benefits |
581,168 |
543,210 |
||||||
Total Post-employment and long-term benefit plans |
954,301 |
885,719 |
||||||
Fair value Plan assets |
2,746 |
2,765 |
||||||
Total Unfunded Post-employment and long-term benefit plans |
951,555 |
882,954 |
||||||
Defined benefit pension plan and other benefits |
2024 |
2023 |
||||||
In millions of COP | ||||||||
Present value of the obligation as of January 1 |
101,778 |
95,081 |
||||||
Interest cost |
10,459 |
11,409 |
||||||
Benefits paid |
(13,003) |
(12,237) |
||||||
Net actuarial loss due to changes in assumptions |
2,229 |
7,025 |
||||||
Net actuarial (gain) / loss due to plan experience |
(366) |
500 |
||||||
Others |
2,150 |
- |
||||||
Defined obligation, unfunded as of December 31 |
103,247 |
101,778 |
||||||
Defined benefit pension plan |
2024 |
2023 |
||||||
In millions of COP | ||||||||
Present value of the obligation as of January 1 |
3,051 |
5,296 |
||||||
Interest cost |
234 |
312 |
||||||
Benefits paid from plan assets |
(524) |
(1,088) |
||||||
Net actuarial loss / (gain) due to changes in assumptions |
117 |
(174) |
||||||
Net actuarial gain due to plan experience |
(63) |
(361) |
||||||
Foreign currency translation effect |
450 |
(934) |
||||||
Defined obligation, funded as of December 31 |
3,265 |
3,051 |
||||||
Banistmo’s Plan assets |
2024 |
2023 |
||||||
In millions of COP | ||||||||
Fair value of assets as of January 1 |
2,765 |
4,619 |
||||||
Interest income on plan assets |
129 |
80 |
||||||
Benefits paid |
(540) |
(1,105) |
||||||
Foreign currency translation effect |
392 |
(829) |
||||||
Fair value assets as of December 31 |
2,746 |
2,765 |
||||||
Defined benefit pension plan |
2024 |
2023 |
||||||
In millions of COP | ||||||||
Present value of the obligation as of January 1 |
28,025 |
30,878 |
||||||
Current cost of service |
1,136 |
878 |
||||||
Interest cost |
2,657 |
2,757 |
||||||
Past service cost(1) |
– |
(4,821) |
||||||
Benefits paid |
(1,668) |
(1,764) |
||||||
Net actuarial (gain) / loss due to changes in assumptions(2) |
(556) |
5,544 |
||||||
Net actuarial (gain) / loss due to plan experience |
(61) |
1,272 |
||||||
Foreign currency translation effect |
4,951 |
(6,719) |
||||||
Defined obligation, unfunded as of December 31 |
34,484 |
28,025 |
||||||
Severance obligation |
2024 |
2023 |
||||||
In millions of COP | ||||||||
Present value of the obligation as of January 1 |
14,360 |
15,446 |
||||||
Current cost of service |
267 |
357 |
||||||
Interest cost |
1,116 |
1,566 |
||||||
Benefits paid |
(5,369) |
(6,594) |
||||||
Net actuarial loss due to changes in assumptions |
13 |
888 |
||||||
Net actuarial (gain) / loss due to plan experience |
(1,036) |
2,697 |
||||||
Defined obligation, unfunded as of December 31 |
9,351 |
14,360 |
||||||
Retirement Pension Premium Plan |
2024 |
2023 |
||||||
In millions of COP | ||||||||
Present value of the obligation as of January 1 |
195,295 |
176,816 |
||||||
Current service cost |
20,632 |
18,427 |
||||||
Interest cost |
18,157 |
17,338 |
||||||
Benefits paid |
(22,004) |
(18,889) |
||||||
Net actuarial loss / (gain) due to changes in assumptions |
1,046 |
(565) |
||||||
Net actuarial (gain) / loss due to plan experience(1) |
(6,103) |
24,238 |
||||||
Foreign currency translation effect(2) |
15,763 |
(22,070) |
||||||
Defined obligation, unfunded as of December 31 |
222,786 |
195,295 |
||||||
Other long term benefits |
2024 |
2023 |
||||||
In millions of COP | ||||||||
Present value of the obligation as of January 1 |
543,210 |
446,473 |
||||||
Current service cost |
57,653 |
48,790 |
||||||
Interest cost |
56,157 |
54,878 |
||||||
Benefits paid |
(62,762) |
(55,257) |
||||||
Net actuarial (gain) / loss due to changes in assumptions(1) |
(8,083) |
38,497 |
||||||
Net actuarial (gain) / loss due to plan experience(2) |
(11,655) |
18,721 |
||||||
Foreign currency translation effect |
6,648 |
(8,892) |
||||||
Defined obligation, unfunded as of December 31 |
581,168 |
543,210 |
||||||
Defined contribution plans |
2024 |
2023 |
||||||
In millions of COP | ||||||||
Pension |
318,988 |
286,621 |
||||||
Current severance regimen |
92,729 |
82,963 |
||||||
Total |
411,717 |
369,584 |
||||||
Main projected assumptions |
December 31, 2024 |
December 31, 2023 |
|||||||||
Discount rate |
11.00 % |
11.75 % |
|||||||||
Rate of wage increase |
7.90 % |
8.85 % |
|||||||||
Projected inflation |
5.40 % |
6.35 % |
|||||||||
Rate of pension increase |
5.40 % |
6.35 % |
|||||||||
Main projected assumptions |
December 31, 2024 |
December 31, 2023 |
|||||||||
Discount rate |
6.50 % |
7.00 % |
|||||||||
Rate of wage increase |
2.00 % |
2.00 % |
|||||||||
Projected inflation |
2.00 % |
2.00 % |
|||||||||
Main projected assumptions |
December 31, 2024 |
December 31, 2023 |
|||||||||
Discount rate |
7.00 % |
7.60 % |
|||||||||
Expected long-term rate of return on plan assets |
5.40 % |
2.20 % |
|||||||||
Main projected assumptions |
December 31, 2024 |
December 31, 2023 |
|||||||||
Discount rate |
5.20 % |
6.20 % |
|||||||||
Rate of wage increase |
2.50 % |
2.50 % |
|||||||||
Projected inflation |
1.50 % |
1.50 % |
|||||||||
Main projected assumptions |
December 31, 2024 |
December 31, 2023 |
|||||||||
Discount rate |
9.10 % |
9.00 % |
|||||||||
Rate of wage increase |
5.00 % |
5.00 % |
|||||||||
Projected inflation |
4.00 % |
4.00 % |
|||||||||
Investment risk |
The present value of the obligation for the defined benefits plan is calculated using a discount rate determined with reference to high quality sovereign yields of each country. Currently, the plan includes investment in financial instruments that are not vulnerable to market risks |
||||
Interest rate risks |
A reduction of the bond interest rates will increase the obligation of the plan |
||||
Longevity risk |
The present value of the obligation of the defined benefit plan is calculated with reference to the highest estimate of the mortality of participants during their time of employment. An increase in the life expectancy of the participants will increase the plan obligation |
||||
Salary risk |
The present value of the obligation of the benefit plan is calculated with reference to the future salaries of the participants. As such, an increase in the participants’ wages will increase the obligation of the plan |
||||
Years |
Pension Benefits |
Other benefits |
||||||
In millions of COP | ||||||||
2025 |
15,775 |
94,112 |
||||||
2026 |
15,866 |
102,009 |
||||||
2027 |
15,726 |
94,663 |
||||||
2028 |
15,638 |
106,651 |
||||||
2029 |
15,281 |
99,247 |
||||||
2030 to 2034 |
68,560 |
524,305 |
||||||
Assumption |
Value |
(Increase/Decrease) |
Effect on DBO |
||||||||
In millions of COP | |||||||||||
Discount rate |
11.50 % |
0.50% increase |
(2,916) |
||||||||
Discount rate |
10.50 % |
0.50% decrease |
3,089 |
||||||||
Pension increases |
5.90 % |
0.50% increase |
3,456 |
||||||||
Pension decreases |
4.90 % |
0.50% decrease |
(3,285) |
||||||||
Mortality Table |
RV-08 ("Rentistas Válidos") |
One year increase in life expectancy |
4,245 |
||||||||
Mortality Table |
RV-08 ("Rentistas Válidos") |
One year decrease in life expectancy |
36 |
||||||||
Assumption |
Value |
(Increase/Decrease) |
Effect on DBO |
||||||||
In millions of COP | |||||||||||
Discount rate |
11.50 % |
0.50% increase |
(5,630) |
||||||||
Discount rate |
10.50 % |
0.50% decrease |
6,119 |
||||||||
Salary increases |
8.40 % |
0.50% increase |
6,304 |
||||||||
Salary decreases |
7.40 % |
0.50% decrease |
(5,840) |
||||||||
Assumption |
Value |
(Increase/Decrease) |
Effect on DBO |
||||||||
In millions of COP | |||||||||||
Discount rate |
10.00 % |
0.50% increase |
(114) |
||||||||
Discount rate |
9.00 % |
0.50% decrease |
117 |
||||||||
Salary increases |
8.40 % |
0.50% increase |
286 |
||||||||
Salary decreases |
7.40 % |
0.50% decrease |
(280) |
||||||||
Assumption |
Value |
(Increase/Decrease) |
Effect on DBO |
||||||||
In millions of COP | |||||||||||
Discount rate |
7.50 % |
0.50% increase |
(106) |
||||||||
Discount rate |
6.50 % |
0.50% decrease |
113 |
||||||||
Mortality Table |
RP-2000 |
One year increase in life expectancy |
102 |
||||||||
Assumption |
Value |
(Increase/Decrease) |
Effect on DBO |
||||||||
In millions of COP | |||||||||||
Discount rate |
9.60 % |
0.50% increase |
(2,780) |
||||||||
Discount rate |
8.60 % |
0.50% decrease |
3,179 |
||||||||
Salary increases |
5.50 % |
0.50% increase |
2,097 |
||||||||
Salary decreases |
4.50 % |
0.50% decrease |
(1,882) |
||||||||
Mortality Table |
RP-2000 |
One year increase in life expectancy |
978 |
||||||||
Assumption |
Value |
(Increase/Decrease) |
Effect on DBO |
||||||||
In millions of COP | |||||||||||
Discount rate |
8.40 % |
0.50% increase |
(1,842) |
||||||||
Discount rate |
7.40 % |
0.50% decrease |
1,927 |
||||||||
Salary increases |
5.50 % |
0.50% increase |
1,973 |
||||||||
Salary decreases |
4.50 % |
0.50% decrease |
(1,901) |
||||||||
Assumption |
Value |
(Increase/Decrease) |
Effect on DBO |
||||||||
In millions of COP | |||||||||||
Discount rate |
5.70 % |
0.50% increase |
(979) |
||||||||
Discount rate |
4.70 % |
0.50% decrease |
1,055 |
||||||||
Salary increases |
3.00 % |
0.50% increase |
154 |
||||||||
Salary decreases |
2.00 % |
0.50% decrease |
(228) |
||||||||
Assumption |
Value |
(Increase/Decrease) |
Effect on DBO |
||||||||
In millions of COP | |||||||||||
Discount rate |
11.50 % |
0.50% increase |
(15,480) |
||||||||
Discount rate |
10.50 % |
0.50% decrease |
16,430 |
||||||||
Salary increases |
8.40 % |
0.50% increase |
16,811 |
||||||||
Salary decreases |
7.40 % |
0.50% decrease |
(15,967) |
||||||||
Assumption |
Value |
(Increase/Decrease) |
Effect on DBO |
||||||||
In millions of COP | |||||||||||
Discount rate |
8.60 % |
0.50% increase |
(1,223) |
||||||||
Discount rate |
7.60 % |
0.50% decrease |
1,307 |
||||||||
Salary increases |
5.50 % |
0.50% increase |
1,340 |
||||||||
Salary decreases |
4.50 % |
0.50% decrease |
(1,264) |
||||||||
Assumption |
Value |
(Increase/Decrease) |
Effect on DBO |
||||||||
In millions of COP | |||||||||||
Discount rate |
5.70 % |
0.50% increase |
(168) |
||||||||
Discount rate |
4.70 % |
0.50% decrease |
179 |
||||||||
| Other employment benefit plans | December 31, 2024 |
December 31, 2023 |
||||||
In millions of COP | ||||||||
Current severance obligation |
107,938 |
95,732 |
||||||
Bonuses and short-term benefits(1) |
676,967 |
734,916 |
||||||
Other employment benefit plans |
784,905 |
830,648 |
||||||
Other liabilities |
December 31, 2024 |
December 31, 2023 |
||||||
In millions of COP | ||||||||
Payables(1) |
3,547,341 |
4,746,323 |
||||||
Suppliers |
1,840,622 |
1,653,424 |
||||||
Advances to obligations |
1,373,401 |
1,199,509 |
||||||
Dividends(2) |
873,598 |
870,846 |
||||||
Bonuses and short-term benefits(3) |
676,967 |
734,916 |
||||||
Security contributions |
559,038 |
524,741 |
||||||
Collection services(4) |
480,202 |
820,393 |
||||||
Provisions(5) |
439,095 |
401,111 |
||||||
Salaries and other labor obligations(3) |
428,077 |
396,734 |
||||||
Deposits delivered as security(6) |
378,767 |
795,628 |
||||||
Advances in leasing operations and loans |
173,168 |
186,547 |
||||||
Deferred interests |
106,058 |
217,507 |
||||||
Liabilities from contracts with customers(7) |
68,040 |
60,128 |
||||||
Other financial liabilities |
46,187 |
40,774 |
||||||
Total |
10,990,561 |
12,648,581 |
||||||
|
Judicial
proceedings(1)
|
Administrative
proceedings(2)
|
Financial
guarantees(3)
|
Loan
commitments
|
Onerous
contracts(4)
|
Total | |||||||||||||||
In millions of COP | ||||||||||||||||||||
Balance at January 1, 2024 |
50,812 |
92,380 |
2,238 |
252,381 |
3,300 |
401,111 |
||||||||||||||
Net provisions recognized during the period |
24,985 |
1,038 |
2,192 |
31,826 |
5,420 |
65,461 |
||||||||||||||
Provisions used during the period |
(33,333) |
(9,976) |
- |
- |
- |
(43,309) |
||||||||||||||
Translation adjustment |
1,581 |
26 |
63 |
12,722 |
- |
14,392 |
||||||||||||||
Effect of discounted cash flows |
1,440 |
- |
- |
- |
- |
1,440 |
||||||||||||||
Final balance at December 31, 2024 |
45,485 |
83,468 |
4,493 |
296,929 |
8,720 |
439,095 |
||||||||||||||
|
Judicial
proceedings
|
Administrative
proceedings(1)
|
Financial
guarantees(2)
|
Loan
commitments
|
Onerous
contracts(3)
|
Total | |||||||||||||||
In millions of COP | ||||||||||||||||||||
Balance at January 1, 2023 |
47,577 |
84,997 |
16,501 |
265,405 |
2,762 |
417,242 |
||||||||||||||
Net provisions recognized during the period |
19,427 |
11,248 |
(14,139) |
4,394 |
538 |
21,468 |
||||||||||||||
Provisions used during the period |
(10,666) |
(3,865) |
- |
- |
- |
(14,531) |
||||||||||||||
Translation adjustment |
(1,395) |
- |
(124) |
(17,418) |
- |
(18,937) |
||||||||||||||
Effect of discounted cash flows |
(4,131) |
- |
- |
- |
- |
(4,131) |
||||||||||||||
Final balance at December 31, 2023 |
50,812 |
92,380 |
2,238 |
252,381 |
3,300 |
401,111 |
||||||||||||||
Stage 1 |
Stage 2 |
Stage 3 |
Total |
|||||||||||
Balance at January 1, 2024 |
158,337 |
45,058 |
51,224 |
254,619 |
||||||||||
Transfers |
5,186 |
4,587 |
(9,773) |
- |
||||||||||
Transfer to stage 1 |
12,161 |
(6,950) |
(5,211) |
- |
||||||||||
Transfer to stage 2 |
(4,383) |
14,688 |
(10,305) |
- |
||||||||||
Transfer to stage 3 |
(2,592) |
(3,151) |
5,743 |
- |
||||||||||
Provisions recognized during the period |
74,787 |
51,131 |
44,387 |
170,305 |
||||||||||
Provisions reversed during the period |
(91,105) |
(26,271) |
(18,911) |
(136,287) |
||||||||||
Translation adjustment |
8,851 |
3,875 |
59 |
12,785 |
||||||||||
Balance at December 31, 2024 |
156,056 |
78,380 |
66,986 |
301,422 |
||||||||||
Stage 1 |
Stage 2 |
Stage 3 |
Total |
|||||||||||
Balance at January 1, 2023 |
140,574 |
82,615 |
58,717 |
281,906 |
||||||||||
Transfers |
34,443 |
(23,490) |
(10,953) |
- |
||||||||||
Transfer to stage 1 |
33,530 |
(24,858) |
(8,672) |
- |
||||||||||
Transfer to stage 2 |
2,384 |
4,992 |
(7,376) |
- |
||||||||||
Transfer to stage 3 |
(1,471) |
(3,624) |
5,095 |
- |
||||||||||
Provisions recognized during the period |
56,254 |
11,515 |
9,928 |
77,697 |
||||||||||
Provisions reversed during the period |
(60,779) |
(20,306) |
(6,357) |
(87,442) |
||||||||||
Translation adjustment |
(12,155) |
(5,276) |
(111) |
(17,542) |
||||||||||
Balance at December 31, 2023 |
158,337 |
45,058 |
51,224 |
254,619 |
||||||||||
Maturity |
Financial guarantees |
||||
In millions of COP | |||||
Guarantees under 1 month |
744,077 |
||||
Guarantees greater than 1 month and up to 3 months(1) |
1,498,132 |
||||
Guarantees greater than 3 months and up to 1 years (1) |
5,036,939 |
||||
Guarantees greater than 1 year and up to 3 years(2) |
2,135,249 |
||||
Guarantees greater than 3 years and up to 5 years |
60,876 |
||||
Guarantees greater than 5 years |
669,028 |
||||
Total |
10,144,301 |
||||
Maturity |
Financial guarantees |
||||
In millions of COP | |||||
Guarantees under 1 month |
826,699 |
||||
Guarantees greater than 1 month and up to 3 months |
3,778,824 |
||||
Guarantees greater than 3 months and up to 1 years |
5,609,521 |
||||
Guarantees greater than 1 year and up to 3 years(1) |
1,489,899 |
||||
Guarantees greater than 3 years and up to 5 years |
450,875 |
||||
Guarantees greater than 5 years |
535,380 |
||||
Total |
12,691,198 |
||||
Maturity |
Loan commitments |
||||
In millions of COP | |||||
Commitments under 1 month |
606,027 |
||||
Commitments greater than 1 month and up to 3 months |
20,060 |
||||
Commitments greater than 3 months and up to 1 years |
5,962,608 |
||||
Commitments greater than 1 year and up to 3 years |
2,100,683 |
||||
Commitments greater than 3 years and up to 5 years |
2,959,532 |
||||
Commitments greater than 5 years |
395,847 |
||||
Total |
12,044,757 |
||||
Maturity |
Loan commitments |
||||
In millions of COP | |||||
Commitments under 1 month |
687,405 |
||||
Commitments greater than 1 month and up to 3 months |
11,373 |
||||
Commitments greater than 3 months and up to 1 years |
4,205,833 |
||||
Commitments greater than 1 year and up to 3 years |
2,269,280 |
||||
Commitments greater than 3 years and up to 5 years |
3,411,570 |
||||
Commitments greater than 5 years |
648,153 |
||||
Total |
11,233,614 |
||||
| Standard | PD range | Stage 1 | Stage 2 | Stage 3 | Total | ||||||||||||||||||||||||
| Exposure | Provision | Exposure | Provision | Exposure | Provision | Exposure | Provision | ||||||||||||||||||||||
| Normal risk | 0% - 3.11% | 9,738,866 |
12 |
267 |
- |
- |
- |
9,739,133 |
12 |
||||||||||||||||||||
| Acceptable risk | > 3.11% - 11.15% | 173,730 |
14 |
10,563 |
1 |
8,000 |
2 |
192,293 |
17 |
||||||||||||||||||||
| Appreciable risk | > 11.15% - 72.75% | 14,123 |
1 |
6,970 |
3 |
48,221 |
- |
69,314 |
4 |
||||||||||||||||||||
| Significant risk | > 72.75% - 89.89% | - |
- |
- |
- |
- |
- |
- |
- |
||||||||||||||||||||
| Bad risk | > 89.89% - 100% | - |
- |
- |
- |
143,561 |
4,460 |
143,561 |
4,460 |
||||||||||||||||||||
| Total | 9,926,719 |
27 |
17,800 |
4 |
199,782 |
4,462 |
10,144,301 |
4,493 |
|||||||||||||||||||||
| Standard | PD range | Stage 1 | Stage 2 | Stage 3 | Total | ||||||||||||||||||||||||
| Exposure | Provision | Exposure | Provision | Exposure | Provision | Exposure | Provision | ||||||||||||||||||||||
| Normal risk | 0% - 3.11% | 11,885,724 |
6 |
5,165 |
- |
- |
- |
11,890,889 |
6 |
||||||||||||||||||||
| Acceptable risk | > 3.11% - 11.15% | 629,867 |
15 |
5,974 |
1 |
- |
- |
635,841 |
16 |
||||||||||||||||||||
| Appreciable risk | > 11.15% - 72.75% | 18,277 |
1 |
15,750 |
23 |
- |
- |
34,027 |
24 |
||||||||||||||||||||
| Significant risk | > 72.75% - 89.89% | - |
- |
- |
- |
- |
- |
- |
- |
||||||||||||||||||||
| Bad risk | > 89.89% - 100% | - |
- |
- |
- |
130,441 |
2,192 |
130,441 |
2,192 |
||||||||||||||||||||
| Total | 12,533,868 |
22 |
26,889 |
24 |
130,441 |
2,192 |
12,691,198 |
2,238 |
|||||||||||||||||||||
Share capital |
December 31, 2024 |
December 31, 2023 |
||||||
Authorized shares |
1,400,000,000 |
1,400,000,000 |
||||||
Subscribed and paid-in shares: |
||||||||
Ordinary shares with a nominal value of COP 500 pesos |
509,704,584 |
509,704,584 |
||||||
Preferred shares with dividend without voting rights with nominal value of COP 500 pesos |
452,122,416 |
452,122,416 |
||||||
Total subscribed and paid-in shares |
961,827,000 |
961,827,000 |
||||||
Subscribed and paid capital (nominal value, in millions of COP) |
480,914 |
480,914 |
||||||
|
Dividends declared with respect to
net income earned in:
|
Cash dividends per share
(Stated in COP)
|
||||
2024 |
3,900 |
||||
2023 |
3,536 |
||||
2022 |
3,536 |
||||
2021 |
3,120 |
||||
2020 |
260 |
||||
Concept |
December 31, 2024 |
December 31, 2023 |
||||||
In millions of COP | ||||||||
Appropriation of net income(1)(2) |
12,700,961 |
12,794,057 |
||||||
Others(3) |
9,874,876 |
7,250,712 |
||||||
Total appropriated reserves |
22,575,837 |
20,044,769 |
||||||
Securitizations |
The Bank’s managed funds |
Total |
|||||||||
In millions of COP | |||||||||||
Total assets of the entities |
792,368 |
176,591,828 |
177,384,196 |
||||||||
The Bank’s interest-assets |
|||||||||||
Investments at fair value through profit or loss |
68,710 |
- |
68,710 |
||||||||
Investments at fair value through other comprehensive income |
8,649 |
- |
8,649 |
||||||||
Loans and advances to customers |
- |
8,435,301 |
8,435,301 |
||||||||
Total assets in relation to the Bank’s interests in the unconsolidated structured entities |
77,359 |
8,435,301 |
8,512,660 |
||||||||
The Bank’s maximum exposure |
77,359 |
8,435,301 |
8,512,660 |
||||||||
Fees income |
3,065 |
558,877 |
561,942 |
||||||||
Securitizations |
The Bank’s managed funds |
Total |
|||||||||
In millions of COP | |||||||||||
Total assets of the entities |
1,028,501 |
159,609,365 |
160,637,866 |
||||||||
The Bank’s interest-assets |
|||||||||||
Investments at fair value through profit or loss |
80,436 |
- |
80,436 |
||||||||
Investments at fair value through other comprehensive income |
22,149 |
- |
22,149 |
||||||||
Loans and advances to customers |
- |
7,997,406 |
7,997,406 |
||||||||
Total assets in relation to the Bank’s interests in the unconsolidated structured entities |
102,585 |
7,997,406 |
8,099,991 |
||||||||
The Bank’s maximum exposure |
102,585 |
7,997,406 |
8,099,991 |
||||||||
Fees income |
3,763 |
474,136 |
477,899 |
||||||||
2024 |
2023 |
2022 |
|||||||||
In millions of COP | |||||||||||
Interest on debt instruments using the effective interest method |
965,935 |
1,029,377 |
588,792 |
||||||||
Interest and valuation on financial instruments |
|||||||||||
Debt investments(1) |
1,367,980 |
628,082 |
1,198,296 |
||||||||
Repos |
237,321 |
137,014 |
(84,410) |
||||||||
Derivatives(2) |
154,130 |
(157,818) |
171,381 |
||||||||
Spot transactions |
(3,187) |
(28,590) |
77,433 |
||||||||
Total valuation on financial instruments |
1,756,244 |
578,688 |
1,362,700 |
||||||||
Total Interest and valuation on financial instruments |
2,722,179 |
1,608,065 |
1,951,492 |
||||||||
2024 |
2023 |
2022 |
|||||||||
In millions of COP | |||||||||||
Deposits(1) |
12,215,673 |
13,323,516 |
6,141,680 |
||||||||
Borrowing costs(1) |
1,349,913 |
1,658,996 |
763,717 |
||||||||
Debt instruments in issue(2) |
1,202,112 |
1,426,615 |
1,328,511 |
||||||||
Lease liabilities |
135,546 |
113,815 |
111,349 |
||||||||
Preferred shares |
57,701 |
57,701 |
57,701 |
||||||||
Overnight funds |
22,306 |
30,540 |
11,375 |
||||||||
Other interest (expense) |
40,660 |
57,112 |
28,137 |
||||||||
Total interest expenses |
15,023,911 |
16,668,295 |
8,442,470 |
||||||||
Fees and Commissions |
Description |
||||
Banking services |
Banking Services are related to commissions from the use of digital physical channels or once the customer makes a transaction. The performance obligation is fulfilled once the payment is delivered to its beneficiary and the proof of receipt of the payment is sent, in that moment, the collection of the commission charged to the customer is generated, which is a fixed amount. The commitment is satisfied during the entire validity of the contract with the customer. The Bank acts as principal. |
||||
Credit and debit card fees |
In debit card product contracts, it is identified that the price assigned to the services promised by the Bank to the customers is fixed. Given that no financing component exists, it is established on the basis of the national and international interbank rate. Additionally, the product charges to the customers commissions for handling fees, at a determined time and with a fixed rate.
For Credit Cards, the commissions are the handling fees and depend on the card franchise. The commitment is satisfied in so far that the customer has capacity available on the card.
Other revenue received by the (issuer) credit card product, is advance commission; this revenue is the charge generated each time the customer makes a national or international advance, at owned or non-owned ATMs, or through a physical branch. The exchange bank fee is a revenue for the Issuing Bank of the credit card for the services provided to the business for the transaction effected at the point of sale. The commission is accrued and collected immediately at the establishment and has a fixed amount.
In the credit cards product there is a customer loyalty program, in which points are awarded for each transaction made by the customer in a retail establishment. The program is administrated by a third party who assumes the inventory and claims risks, for which it acts as agent. The Bank, recognized it as a lower value of the revenue from the exchange bank fee.
The rights and obligations of each party in respect of the goods and services for transfer are clearly identified, the payment terms are explicit, and it is probable, that is, it takes into consideration the capacity of the customer and the intention of having to pay the consideration at termination to those entitled to change the transferred goods or services. The revenue is recognized at a point in time: the Bank satisfies the performance obligation when the “control” of the goods or services was transferred to the customers.
|
||||
Deposits |
Deposits are related to the services generated from the offices network of the Bank once a customer makes a transaction. The Bank generally commits to maintain active channels for the products that the customer has with the Bank, with the purpose of making payments and transfers, sending statements and making transactions in general. The commissions are deducted from the deposit account, and they are incurred at a point in time. The Bank acts as principal. |
||||
Electronic services and ATMs |
Revenue received from electronic services and ATMs arises through the provision of services so that the customers may make required transactions, and which are enabled by the Bank. These include online and real-time payments by the customers of the Bank holding a checking or savings accounts, with a debit or credit card for the products and services that the customer offers. Each transaction has a single price, for a single service. The provision of collection services or other different services provided by the Bank, through electronic equipment, generates consideration chargeable to the customer established contractually by the Bank as a fee. The Bank acts as principal and the revenue is recognized at a point in time. |
||||
Brokerage |
Brokerage is a group of services for the negotiation and administration of operations for purchasing fixed revenue securities, equities and operations with derivatives in its own name, but on the account of others. The performance obligations are fulfilled at a point in time when the commission agent in making its best effort can execute the business entrusted by the customer in the best conditions. The performance obligations are considered satisfied once the service stipulated in the contract is fulfilled, as consideration fixed, or variable payments are agreed, depending on the service. The Bank acts generally as principle and in some special cases as agent. |
||||
Remittance |
Revenue for remittance is received as consideration for the commitment established by the Bank to pay remittances sent by the remitting companies to the beneficiaries of the same. The commitment is satisfied at a point in time to the extent that the remittance is paid to the beneficiary.
The price is fixed, but may vary in accordance to the transferred amount, due to the operation being dependent on the volume of operations generated and the transaction type. There is no component of financing, nor the right to receive consideration dependent on the occurrence or not of a future event.
|
||||
Acceptances, Guarantees and Standby Letters of Credit |
Banking Service from acceptances, guarantees and standby letters of credit which are not part of the portfolio of the Bank. There exist different performance obligations; the satisfaction of performance obligations occurs when the service is given to the customer. The consideration in these types of contracts may include fixed amounts, variable amounts, or both, and the Bank acts as principal. The revenue is recognized at a point in time. |
||||
Trust |
Revenue related to Trust are received from the administration of the customer resources in the business of investment trusts, property trusts, management trusts, guarantee trusts, for the resources of the general social security system, Collective portfolios and Private Equity Funds (PEF). The commitments are established in contracts independently and in an explicit manner, and the services provided by the Bank are not inter-related between the contracts. The performance obligation corresponds to performing the best management in terms of the services to be provided in relation to trust characteristics, thus fixed and variable prices are established depending on the complexity of the business, similarly, revenues are recognized throughout or at a determined time. In all the established businesses it acts as principal. |
||||
Placement of Securities |
Valores Bancolombia makes available its commercial strength for the deposit, reinvestment of resources through financial instruments to the issuing company. It receives a payment for deposits made. The commitment of the contract is satisfied to the extent that the resources requested by the issuer are obtained through the distribution desks of Valores Bancolombia. The collection is made monthly. It is established that Valores Bancolombia may undertake collection of these commissions at the end of the month through a collection account charged to the issuer, acting as principal. |
||||
Bancassurance |
The bank receives a commission for collecting insurance premiums at a given time and for allowing the use of its network to sell insurance from different insurance companies over time. The Bank in these bancassurance contracts acts as agent (intermediary between the customer and the insurance company), since it is the insurance company which assumes the risks, and which handles the complaints and claims of the customers inherent in each insurance. Therefore, the insurance company acts as principal before the customer. The prices agreed in bancassurance are defined as a percentage on the value of the policy premiums. The payment shall be tied to the premiums collected, sold or taken for the case of employees’ insurance. The aforementioned then means that the price is variable, since, the revenue will depend on the quantity of policies or calculations made by the insurance companies. |
||||
Collections |
The Bank acting as principal, commits to collect outstanding invoices receivable by the collecting customers through the different channels offered by the bank, send the information of the collections made and credit the money to the savings or checking account defined by the collecting customer. The commitment is satisfied at a point in time to the extent that the money is collected by the different channels, the information of the said collections is delivered appropriately, and the resources are credited in real-time to the account agreed with the customer. For the service, the Bank receives a fixed payment, which is received for each transaction once the contract is in effect. |
||||
Services |
These are the maintenance services performed on the fleet owned by the customers, these services are performed on demand, and the value of the service cost is invoiced plus an intermediation margin. The collection is made by the amount of expense invoiced by the provider plus an intermediation percentage, which ranges between 5% and 10% depending on the customer.
The contract is written, is based on a framework contract which is held between the customers which contains the general terms of negotiation and the payment terms are generally 30 days after generating the invoice. The revenue is recognized when the service is provided. There is no financing nor sanctions for early cancellations. To view the details of the balance, refer to line ‘Logistics services’ in Note 25.4 Other operational Income.
|
||||
Gains on sale of assets |
These are the revenue from the sale of assets, where the sale value is higher than the book value recorded in the accounts, the difference representing the gains. The recognition of the revenue is at a point in time once the sale is realized. The Bank acts as principal in this type of transaction and the transaction price is determined by the market value of the asset being sold.
To view the details of the balance, refer to line ‘Gain on sale of assets’ in Note 25.4 Other operational Income.
|
||||
Investment Banking |
Investment Banking offers to customer’s financial advisory services in the structuring of businesses in accordance with the needs of each one of them. The advisory services consist in realizing a financial structuring of a credit or bond in which the Investment Bank offers the elements so that the company decides the best option for structuring the instrument. In the financial advisory contract, a best efforts clause is included.
The promises given to the customers are established in the contracts independently and explicitly. The services provided by the Investment Bank are not interrelated between the contracts, correspond to the independent advice agreed and do not include additional services in the commission agreed with the customer. The advisory services offered in each one of the contracts are identifiable separately from the other performance commitments that the Investment Bank may have with the customers. The Investment Bank does not have a standard contract for the provision of advisory services, given than each contract is tailored to the customer’s needs.
The transaction price is defined at the start of the contract and is assigned to each service provided independently. The price contains a fixed and a variable portion which is provided in the contracts. The variation depends on the placement amount for the case of a financial structuring contract and coordination of the issuance and conditions of the same. In these operations Banca de Inversion Bancolombia provides advice to the customers and the price shall depend at times on the success and amount of the operation. In the contracts subject to evaluation there are no incremental costs associated with the satisfaction of the commitments of the Bank with the customers provided for.
In the contracts signed with the customers, a penalty clause is established in case of a customer withdrawing from continuing with the provision of the services established in the commercial offer. The penalty shall be recognized in the financial statements once the Investment Bank is notified on the withdrawal under the concept of charges for early termination of the contract.
|
||||
|
Banking
Colombia
|
Banking
Panama
|
Banking El
Salvador
|
Banking
Guatemala
|
Trust |
Investment
Banking
|
Brokerage |
International
Banking
|
All Other
Segments
|
Total | |||||||||||||||||||||||
Revenue from contracts with customers |
In millions of COP |
|||||||||||||||||||||||||||||||
Fees and Commissions income |
||||||||||||||||||||||||||||||||
Credit and debit card fees and commercial establishments |
2,657,690 |
282,611 |
257,697 |
85,841 |
- |
- |
- |
1,934 |
- |
3,285,773 |
||||||||||||||||||||||
Banking services |
694,554 |
131,958 |
166,713 |
65,432 |
- |
- |
- |
43,540 |
34,580 |
1,136,777 |
||||||||||||||||||||||
Payment and collections |
1,024,053 |
15,735 |
- |
- |
- |
- |
- |
- |
- |
1,039,788 |
||||||||||||||||||||||
Bancassurance |
958,311 |
67,197 |
47 |
- |
6 |
- |
3 |
- |
- |
1,025,564 |
||||||||||||||||||||||
Fiduciary Activities and Securities |
- |
18,962 |
6,515 |
904 |
448,848 |
- |
95,972 |
50 |
- |
571,251 |
||||||||||||||||||||||
Acceptances, Guarantees and Standby Letters of Credit |
73,302 |
27,365 |
5,789 |
1,880 |
- |
- |
- |
679 |
- |
109,015 |
||||||||||||||||||||||
Investment banking |
- |
1,670 |
2,097 |
- |
- |
69,266 |
8,854 |
- |
- |
81,887 |
||||||||||||||||||||||
Brokerage |
- |
16,473 |
- |
- |
- |
- |
20,648 |
- |
- |
37,121 |
||||||||||||||||||||||
Others |
252,445 |
359 |
76,876 |
57,721 |
- |
- |
6,715 |
5,698 |
1,848 |
401,662 |
||||||||||||||||||||||
Total revenue of contracts with customers |
5,660,355 |
562,330 |
515,734 |
211,778 |
448,854 |
69,266 |
132,192 |
51,901 |
36,428 |
7,688,838 |
||||||||||||||||||||||
|
Banking
Colombia
|
Banking
Panama
|
Banking El
Salvador
|
Banking
Guatemala
|
Trust |
Investment
Banking
|
Brokerage |
International
Banking
|
All Other
Segments
|
Total | |||||||||||||||||||||||
Revenue from contracts with customers |
In millions of COP | |||||||||||||||||||||||||||||||
Fees and Commissions income |
||||||||||||||||||||||||||||||||
Credit and debit card fees and commercial establishments |
2,467,174 |
272,380 |
233,049 |
95,833 |
- |
- |
- |
1,992 |
- |
3,070,428 |
||||||||||||||||||||||
Banking services |
593,729 |
110,271 |
157,386 |
68,857 |
- |
- |
- |
37,746 |
23,574 |
991,563 |
||||||||||||||||||||||
Payment and collections |
950,167 |
15,236 |
- |
- |
- |
- |
- |
- |
- |
965,403 |
||||||||||||||||||||||
Bancassurance |
924,280 |
72,705 |
77 |
- |
104 |
29 |
126 |
- |
- |
997,321 |
||||||||||||||||||||||
Fiduciary Activities and Securities |
- |
20,233 |
6,399 |
851 |
361,632 |
- |
74,377 |
54 |
- |
463,546 |
||||||||||||||||||||||
Acceptances, Guarantees and Standby Letters of Credit |
72,335 |
25,159 |
5,211 |
3,173 |
- |
- |
- |
1,803 |
- |
107,681 |
||||||||||||||||||||||
Investment banking |
- |
980 |
1,225 |
- |
- |
55,888 |
10,728 |
- |
- |
68,821 |
||||||||||||||||||||||
Brokerage |
- |
15,568 |
- |
- |
- |
- |
11,140 |
- |
- |
26,708 |
||||||||||||||||||||||
Others |
244,414 |
398 |
76,221 |
54,486 |
229 |
- |
7,614 |
5,633 |
412 |
389,407 |
||||||||||||||||||||||
Total revenue of contracts with customers |
5,252,099 |
532,930 |
479,568 |
223,200 |
361,965 |
55,917 |
103,985 |
47,228 |
23,986 |
7,080,878 |
||||||||||||||||||||||
|
Banking
Colombia
|
Banking
Panama
|
Banking El
Salvador
|
Banking
Guatemala
|
Trust |
Investment
Banking
|
Brokerage |
International
Banking
|
All Other
Segments
|
Total | |||||||||||||||||||||||
Revenue from contracts with customers |
In millions of COP | |||||||||||||||||||||||||||||||
Fees and Commissions income |
||||||||||||||||||||||||||||||||
Credit and debit card fees and commercial establishments |
2,248,727 |
232,637 |
216,977 |
79,551 |
- |
- |
- |
1,868 |
- |
2,779,760 |
||||||||||||||||||||||
Banking services |
481,103 |
91,938 |
142,047 |
78,264 |
- |
- |
- |
31,277 |
12,732 |
837,361 |
||||||||||||||||||||||
Payment and collections |
851,983 |
13,975 |
- |
- |
- |
- |
- |
- |
- |
865,958 |
||||||||||||||||||||||
Bancassurance |
814,653 |
57,858 |
97 |
- |
29 |
8 |
32 |
- |
- |
872,677 |
||||||||||||||||||||||
Fiduciary Activities and Securities |
- |
18,975 |
6,522 |
803 |
318,840 |
- |
78,509 |
53 |
- |
423,702 |
||||||||||||||||||||||
Acceptances, Guarantees and Standby Letters of Credit |
58,293 |
18,382 |
10,081 |
3,774 |
- |
- |
- |
828 |
- |
91,358 |
||||||||||||||||||||||
Investment banking |
- |
550 |
1,482 |
- |
- |
86,224 |
15,667 |
- |
- |
103,923 |
||||||||||||||||||||||
Brokerage |
- |
11,888 |
- |
- |
- |
- |
15,960 |
- |
- |
27,848 |
||||||||||||||||||||||
Others |
229,804 |
380 |
66,971 |
56,162 |
- |
- |
1,198 |
7,995 |
5,429 |
367,939 |
||||||||||||||||||||||
Total revenue of contracts with customers |
4,684,563 |
446,583 |
444,177 |
218,554 |
318,869 |
86,232 |
111,366 |
42,021 |
18,161 |
6,370,526 |
||||||||||||||||||||||
2024 |
2023 |
2022 |
|||||||||
In millions of COP | |||||||||||
Accounts receivable from contracts with customers(1) |
257,262 |
259,516 |
192,029 |
||||||||
Liabilities from contracts with customers(2)(3)(4) |
68,040 |
60,128 |
56,856 |
||||||||
Fees and Commissions Expenses |
2024 |
2023 |
2022 |
||||||||
In millions of COP | |||||||||||
Banking services |
1,704,221 |
1,483,785 |
1,242,590 |
||||||||
Sales, collections and other services |
894,836 |
855,480 |
712,266 |
||||||||
Correspondent banking |
623,193 |
507,586 |
409,455 |
||||||||
Payments and collections |
46,792 |
41,820 |
34,720 |
||||||||
Others |
242,732 |
208,609 |
191,135 |
||||||||
Total expenses for commissions |
3,511,774 |
3,097,280 |
2,590,166 |
||||||||
Other operating income |
2024 |
2023 |
2022 |
||||||||
In millions of COP | |||||||||||
Leases and related services(1) |
1,827,163 |
1,771,016 |
1,362,677 |
||||||||
Net foreign exchange and Derivatives Foreign exchange contracts(2) |
437,884 |
1,215,064 |
(373,045) |
||||||||
Investment property valuation(3) |
200,256 |
197,526 |
236,617 |
||||||||
Gains on sale of assets(4) |
103,481 |
170,910 |
171,482 |
||||||||
Insurance(5) |
85,993 |
86,330 |
92,294 |
||||||||
Other reversals |
75,928 |
67,617 |
64,467 |
||||||||
Logistics services(6) |
47,880 |
136,118 |
165,738 |
||||||||
Penalties for failure to contracts |
7,952 |
13,855 |
6,833 |
||||||||
Others |
255,448 |
321,214 |
326,372 |
||||||||
Total Other operating income |
3,041,985 |
3,979,650 |
2,053,435 |
||||||||
Dividends and net income on equity investments |
2024 |
2023 |
2022 |
||||||||
In millions of COP |
|||||||||||
Equity method(1) |
222,572 |
113,115 |
219,105 |
||||||||
Dividends(2) |
140,634 |
127,427 |
59,072 |
||||||||
Equity investments and other financial instruments(3) |
42,194 |
22,944 |
(672) |
||||||||
(Losses) Gains on sale of investments in associates(4) |
- |
- |
(34,451) |
||||||||
Impairment of investments in associates and joint ventures(5) |
(314,347) |
(108,175) |
(9,633) |
||||||||
Others(6) |
13,520 |
54,874 |
2,433 |
||||||||
Total dividends received, and share of profits of equity method investees |
104,573 |
210,185 |
235,854 |
||||||||
Salaries and employee benefit |
2024 |
2023 |
2022 |
||||||||
In millions of COP | |||||||||||
Salaries(1) |
2,452,902 |
2,286,471 |
1,897,710 |
||||||||
Bonuses(2) |
873,739 |
940,292 |
823,517 |
||||||||
Private premium |
628,882 |
651,048 |
423,261 |
||||||||
Social security contributions |
599,171 |
546,434 |
447,017 |
||||||||
Indemnization payment |
229,909 |
179,916 |
189,643 |
||||||||
Other benefits(3) |
843,459 |
746,073 |
636,508 |
||||||||
Total salaries and employee benefit |
5,628,062 |
5,350,234 |
4,417,656 |
||||||||
Other administrative and general expenses |
2024 |
2023 |
2022 |
||||||||
In millions of COP | |||||||||||
Maintenance and repairs(1) |
1,012,853 |
900,251 |
757,861 |
||||||||
Fees |
937,643 |
943,781 |
864,520 |
||||||||
Insurance |
734,358 |
738,786 |
640,753 |
||||||||
Data processing(2) |
560,016 |
473,059 |
362,621 |
||||||||
Frauds and claims(3) |
419,920 |
346,899 |
258,834 |
||||||||
Transport |
257,703 |
233,856 |
232,471 |
||||||||
Advertising |
179,122 |
175,690 |
185,122 |
||||||||
Cleaning and security services |
136,242 |
129,460 |
117,966 |
||||||||
Public services |
135,328 |
125,433 |
119,949 |
||||||||
Contributions and affiliations |
115,939 |
109,038 |
116,118 |
||||||||
Useful and stationery(4) |
97,871 |
57,061 |
55,045 |
||||||||
Communications |
76,268 |
74,685 |
72,501 |
||||||||
Properties improvements and installation |
68,335 |
66,438 |
70,845 |
||||||||
Disputes, fines and sanctions(5) |
46,093 |
43,499 |
63,519 |
||||||||
Real estate management |
38,396 |
33,637 |
30,216 |
||||||||
Travel expenses |
32,031 |
31,813 |
25,600 |
||||||||
Publications and subscriptions |
23,412 |
22,574 |
20,644 |
||||||||
Storage services |
17,845 |
16,321 |
15,013 |
||||||||
Short-term and low-value leases |
17,333 |
11,577 |
19,926 |
||||||||
Legal expenses |
12,676 |
14,136 |
10,573 |
||||||||
Joint operations activities |
9,471 |
8,892 |
8,357 |
||||||||
Others |
516,357 |
477,058 |
511,446 |
||||||||
Total other administrative and general expenses |
5,445,212 |
5,033,944 |
4,559,900 |
||||||||
Taxes other than income tax |
1,442,511 |
1,433,148 |
929,512 |
||||||||
Impairment, depreciation and amortization |
2024 |
2023 |
2022 |
||||||||
In millions of COP | |||||||||||
Depreciation of premises and equipment(1) |
633,755 |
636,376 |
560,596 |
||||||||
Depreciation of right-of-use assets(2) |
207,560 |
229,665 |
212,861 |
||||||||
Amortization of intangible assets(3) |
170,140 |
212,317 |
175,991 |
||||||||
Impairment of other assets, net(4)(5) |
106,426 |
46,501 |
31,127 |
||||||||
Total impairment, depreciation and amortization |
1,117,881 |
1,124,859 |
980,575 |
||||||||
Impairment (recovery) of other assets, net |
2024 |
2023 |
2022 |
||||||||
In millions of COP | |||||||||||
Banking Colombia(1) |
51,626 |
45,122 |
24,187 |
||||||||
Banking Panama(1) |
28,475 |
5,290 |
12,599 |
||||||||
Banking Guatemala |
13,703 |
8,929 |
12,101 |
||||||||
International Banking |
5,999 |
1,730 |
314 |
||||||||
All other segments |
5,826 |
4,713 |
1,803 |
||||||||
Banking El Salvador(2) |
732 |
(19,283) |
(19,877) |
||||||||
Brokerage |
65 |
- |
- |
||||||||
Total |
106,426 |
46,501 |
31,127 |
||||||||
2024 |
2023 |
2022 |
|||||||||
Income from continuing operations before attribution of non-controlling interests |
6,365,581 |
6,214,971 |
6,996,365 |
||||||||
Less: Non-controlling interests from continuing operations |
97,837 |
98,035 |
212,875 |
||||||||
Net income from controlling interest |
6,267,744 |
6,116,936 |
6,783,490 |
||||||||
Less: Preferred dividends declared |
1,541,003 |
1,541,003 |
1,352,921 |
||||||||
Less: Allocation of undistributed earnings to preferred stockholders |
1,374,673 |
1,303,784 |
1,805,191 |
||||||||
Net income allocated to common shareholders for basic and diluted EPS |
3,352,068 |
3,272,149 |
3,625,378 |
||||||||
Weighted average number of common shares outstanding used in basic EPS calculation (In millions) |
510 |
510 |
510 |
||||||||
Basic and diluted earnings per share to common shareholders |
6,576 |
6,420 |
7,113 |
||||||||
Basic and diluted earnings per share from continuing operations |
6,576 |
6,420 |
7,113 |
||||||||
|
Stockholders with an
interest equal or
higher than 20% of
the Bank's capital(1)
|
Directors and
senior
management
|
Associates and
joint ventures
|
|||||||||
In millions of COP | |||||||||||
Assets |
|||||||||||
Financial assets investments |
1,232 |
- |
49,643 |
||||||||
Derivative financial instruments |
1,283 |
729 |
53 |
||||||||
Loans and advances to customers |
2,562,324 |
23,973 |
294,674 |
||||||||
Allowance for loans, advances and lease losses |
(2,759) |
(19) |
(2,453) |
||||||||
Investment in associates and joint ventures |
- |
- |
2,928,984 |
||||||||
Other assets |
17,685 |
16 |
332,811 |
||||||||
Total assets |
2,579,765 |
24,699 |
3,603,712 |
||||||||
Liabilities |
|||||||||||
Deposits by customers |
1,522,278 |
16,807 |
242,996 |
||||||||
Derivative financial instruments |
53,051 |
183 |
10,116 |
||||||||
Other liabilities |
20,044 |
91 |
73,838 |
||||||||
Total liabilities |
1,595,373 |
17,081 |
326,950 |
||||||||
Income |
|||||||||||
Interest on loans and financial leases |
268,820 |
1,834 |
27,177 |
||||||||
Valuation on financial instruments |
145 |
- |
9,504 |
||||||||
Fees and commissions income |
750,416 |
159 |
18,004 |
||||||||
Dividends and net income on equity investments |
75 |
- |
30,202 |
||||||||
Derivatives Foreign exchange contracts |
(68,910) |
1,442 |
(6,797) |
||||||||
Other operating income |
43,476 |
70 |
47,629 |
||||||||
Net income |
994,022 |
3,505 |
125,719 |
||||||||
Expenses |
|||||||||||
Interest expenses |
136,562 |
876 |
9,066 |
||||||||
Credit impairment (recovery) charges, net |
1,566 |
(29) |
2,742 |
||||||||
Fees and commissions expenses |
477 |
- |
186,384 |
||||||||
Employee benefits(2) |
105,604 |
131 |
- |
||||||||
Other administrative and general expenses |
130,571 |
2,711 |
77,086 |
||||||||
Total expenses |
374,780 |
3,689 |
275,278 |
||||||||
|
Stockholders with an
interest equal or
higher than 20% of
the Bank's capital(1)
|
Directors and
senior
management
|
Associates and
joint ventures
|
|||||||||
In millions of COP | |||||||||||
Assets |
|||||||||||
Financial assets investments |
6,050 |
- |
54,001 |
||||||||
Derivative financial instruments |
48,747 |
- |
7,297 |
||||||||
Loans and advances to customers |
1,850,407 |
22,437 |
271,676 |
||||||||
Allowance for loans, advances and lease losses |
(1,455) |
(50) |
(760) |
||||||||
Investment in associates and joint ventures |
- |
- |
2,997,603 |
||||||||
Other assets |
17,951 |
18 |
271,263 |
||||||||
Total assets |
1,921,700 |
22,405 |
3,601,080 |
||||||||
Liabilities |
|||||||||||
Deposits by customers |
1,434,117 |
16,312 |
141,853 |
||||||||
Derivative financial instruments |
14 |
209 |
1,068 |
||||||||
Other liabilities |
23,070 |
59 |
70,387 |
||||||||
Total liabilities |
1,457,201 |
16,580 |
213,308 |
||||||||
Income |
|||||||||||
Interest on loans and financial leases |
157,451 |
1,783 |
27,925 |
||||||||
Valuation on financial instruments |
97 |
- |
11,998 |
||||||||
Fees and commissions income |
744,000 |
98 |
14,647 |
||||||||
Dividends and net income on equity investments(2) |
213 |
- |
109,563 |
||||||||
Derivatives Foreign exchange contracts |
63,060 |
(218) |
27,174 |
||||||||
Other operating income |
48,531 |
9 |
9,806 |
||||||||
Net income |
1,013,352 |
1,672 |
201,113 |
||||||||
Expenses |
|||||||||||
Interest expenses |
181,085 |
1,038 |
8,261 |
||||||||
Credit impairment (recovery) charges, net |
(8,307) |
4 |
(1,193) |
||||||||
Fees and commissions expenses |
590 |
- |
152,563 |
||||||||
Employee benefits(3) |
89,199 |
93 |
- |
||||||||
Other administrative and general expenses |
159,184 |
2,492 |
23,644 |
||||||||
Total expenses |
421,751 |
3,627 |
183,275 |
||||||||
|
Stockholders with an
interest equal or
higher than 20% of
the Bank’s capital(1)
|
Directors and
senior
management
|
Associates and
joint ventures
|
|||||||||
In millions of COP | |||||||||||
Assets |
|||||||||||
Financial assets investments |
5,711 |
- |
51,991 |
||||||||
Derivative financial instruments |
191 |
5 |
8 |
||||||||
Loans and advances to customers |
947,150 |
28,935 |
342,896 |
||||||||
Allowance for loans, advances and lease losses |
(9,746) |
(49) |
(3,470) |
||||||||
Investment in associates and joint ventures |
- |
- |
2,915,633 |
||||||||
Other assets(2) |
17,520 |
41 |
209,350 |
||||||||
Total assets |
960,826 |
28,932 |
3,516,408 |
||||||||
Liabilities |
|||||||||||
Deposits by customers |
1,364,663 |
14,433 |
161,708 |
||||||||
Derivative financial instruments |
23 |
- |
27,571 |
||||||||
Other liabilities(2) |
26,803 |
56 |
54,017 |
||||||||
Total liabilities |
1,391,489 |
14,489 |
243,296 |
||||||||
Income |
|||||||||||
Interest on loans and financial leases |
74,896 |
1,249 |
21,715 |
||||||||
Valuation on financial instruments |
- |
- |
994 |
||||||||
Fees and commissions income |
929,721 |
100 |
20,574 |
||||||||
Dividends and net income on equity investments |
30 |
- |
224,602 |
||||||||
Derivatives Foreign exchange contracts |
(10,158) |
984 |
(30,484) |
||||||||
Other operating income |
50,816 |
28 |
99,855 |
||||||||
Net income |
1,045,305 |
2,361 |
337,256 |
||||||||
Expenses |
|||||||||||
Interest expenses |
112,403 |
301 |
8,483 |
||||||||
Credit impairment (recovery) charges, net |
10,171 |
50 |
(550) |
||||||||
Fees and commissions expenses |
19 |
- |
180,951 |
||||||||
Employee benefits(3) |
76,455 |
117 |
- |
||||||||
Other administrative and general expenses |
161,367 |
2,056 |
30,792 |
||||||||
Total expenses |
360,415 |
2,524 |
219,676 |
||||||||
Balance as of January 1, 2024 |
Cash flows |
Non-cash changes |
Balance as of December 31, 2024 |
|||||||||||||||||
|
Foreign
currency
translation
adjustment
|
Interests
accrued
|
Other
movements
|
||||||||||||||||||
In millions of COP |
||||||||||||||||||||
Liabilities from financing activities |
||||||||||||||||||||
Repurchase agreements and other similar secured borrowing |
470,295 |
550,584 |
39,593 |
- |
- |
1,060,472 |
||||||||||||||
Borrowings from other financial institutions(1) |
15,648,606 |
(2,506,604) |
1,196,756 |
1,349,913 |
861 |
15,689,532 |
||||||||||||||
Debt instruments in issue(1) |
14,663,576 |
(6,226,196) |
1,635,724 |
1,202,112 |
- |
11,275,216 |
||||||||||||||
Preferred shares(2) |
584,204 |
(57,701) |
- |
57,701 |
- |
584,204 |
||||||||||||||
Total liabilities from financing activities |
31,366,681 |
(8,239,917) |
2,872,073 |
2,609,726 |
861 |
28,609,424 |
||||||||||||||
Balance as of January 1, 2023 |
Cash flows |
Non-cash changes |
Balance as of December 31, 2023 |
|||||||||||||||||
|
Foreign
currency
translation
adjustment
|
Interests
accrued
|
Other
movements
|
||||||||||||||||||
In millions of COP |
||||||||||||||||||||
Liabilities from financing activities |
||||||||||||||||||||
Repurchase agreements and other similar secured borrowing |
189,052 |
304,846 |
(23,603) |
- |
- |
470,295 |
||||||||||||||
Borrowings from other financial institutions(1) |
19,692,638 |
(1,674,476) |
(4,029,947) |
1,658,996 |
1,395 |
15,648,606 |
||||||||||||||
Debt instruments in issue(1) |
19,575,988 |
(3,494,834) |
(2,844,193) |
1,426,615 |
- |
14,663,576 |
||||||||||||||
Preferred shares(2) |
584,204 |
(57,701) |
- |
57,701 |
- |
584,204 |
||||||||||||||
Total liabilities from financing activities |
40,041,882 |
(4,922,165) |
(6,897,743) |
3,143,312 |
1,395 |
31,366,681 |
||||||||||||||
Note |
December 31, 2024 |
December 31, 2023 |
|||||||||||||||
|
Carrying
amount
|
Fair
Value
|
Carrying
amount
|
Fair
Value
|
||||||||||||||
In millions of COP | |||||||||||||||||
Assets |
|||||||||||||||||
Debt instruments at fair value through profit or loss |
5.1 |
23,035,281 |
23,035,281 |
12,096,407 |
12,096,407 |
||||||||||||
Debt instruments at fair value through OCI |
5.1 |
5,084,416 |
5,084,416 |
6,148,177 |
6,148,177 |
||||||||||||
Debt instruments at amortized cost |
5.1 |
8,404,878 |
8,403,740 |
6,848,082 |
6,840,867 |
||||||||||||
Derivative financial instruments |
5.2 |
2,938,142 |
2,938,142 |
6,252,270 |
6,252,270 |
||||||||||||
Equity securities at fair value |
5.1 |
1,011,310 |
1,011,310 |
543,210 |
543,210 |
||||||||||||
Other financial instruments |
5.1 |
34,385 |
34,385 |
38,319 |
38,319 |
||||||||||||
Loans and advances to customers at amortized cost, net |
6 |
263,274,170 |
269,345,583 |
237,728,544 |
238,771,724 |
||||||||||||
Investment properties |
9 |
5,580,109 |
5,580,109 |
4,709,911 |
4,709,911 |
||||||||||||
Investments in associates(1) |
8 |
1,830,884 |
1,830,884 |
1,670,782 |
1,670,782 |
||||||||||||
Total |
311,193,575 |
317,263,850 |
276,035,702 |
277,071,667 |
|||||||||||||
Liabilities |
|||||||||||||||||
Deposits by customers |
15 |
279,059,401 |
279,463,012 |
247,941,180 |
249,340,519 |
||||||||||||
Interbank deposits |
16 |
716,493 |
716,493 |
606,141 |
606,141 |
||||||||||||
Repurchase agreements and other similar secured borrowing |
16 |
1,060,472 |
1,060,472 |
470,295 |
470,295 |
||||||||||||
Derivative financial instruments |
5.2 |
2,679,643 |
2,679,643 |
6,710,364 |
6,710,364 |
||||||||||||
Borrowings from other financial institutions |
17 |
15,689,532 |
15,689,532 |
15,648,606 |
15,648,606 |
||||||||||||
Preferred shares |
584,204 |
407,174 |
584,204 |
394,550 |
|||||||||||||
Debt instruments in issue |
18 |
11,275,216 |
11,389,498 |
14,663,576 |
14,468,650 |
||||||||||||
Total |
311,064,961 |
311,405,824 |
286,624,366 |
287,639,125 |
|||||||||||||
Financial Assets | ||||||||||||||||||||||||||
| Type of instrument | December 31, 2024 |
December 31, 2023 |
||||||||||||||||||||||||
Fair value hierarchy |
Total fair
value
|
Fair value hierarchy |
Total fair
value
|
|||||||||||||||||||||||
Level 1 |
Level 2 |
Level 3 |
Level 1 |
Level 2 |
Level 3 |
|||||||||||||||||||||
In millions of COP | ||||||||||||||||||||||||||
Investment securities |
||||||||||||||||||||||||||
Debt instruments at fair value through profit or loss |
||||||||||||||||||||||||||
Securities issued by the Colombian Government |
10,625,153 |
1,019,028 |
- |
11,644,181 |
4,363,135 |
362,470 |
- |
4,725,605 |
||||||||||||||||||
Securities issued or secured by government entities |
- |
118,760 |
- |
118,760 |
- |
84,990 |
- |
84,990 |
||||||||||||||||||
Securities issued by other financial institutions |
140,703 |
513,040 |
77,821 |
731,564 |
41,003 |
654,446 |
78,729 |
774,178 |
||||||||||||||||||
Securities issued by foreign governments |
6,191,395 |
4,092,055 |
- |
10,283,450 |
3,621,960 |
2,652,440 |
- |
6,274,400 |
||||||||||||||||||
Corporate bonds |
124,812 |
98,255 |
34,259 |
257,326 |
125,010 |
97,940 |
14,284 |
237,234 |
||||||||||||||||||
Total debt instruments at fair value through profit or loss |
17,082,063 |
5,841,138 |
112,080 |
23,035,281 |
8,151,108 |
3,852,286 |
93,013 |
12,096,407 |
||||||||||||||||||
Debt instruments at fair value through OCI |
||||||||||||||||||||||||||
Securities issued by the Colombian Government |
35,570 |
- |
2,648,355 |
2,683,925 |
61,427 |
- |
2,664,295 |
2,725,722 |
||||||||||||||||||
Securities issued by other financial institutions |
119,479 |
107,614 |
49,744 |
276,837 |
224,049 |
149,257 |
- |
373,306 |
||||||||||||||||||
Securities issued by foreign governments |
368,736 |
1,115,810 |
- |
1,484,546 |
1,675,193 |
762,803 |
- |
2,437,996 |
||||||||||||||||||
Corporate bonds |
60,922 |
747 |
577,439 |
639,108 |
63,475 |
547,678 |
- |
611,153 |
||||||||||||||||||
Total debt instruments at fair value through OCI |
584,707 |
1,224,171 |
3,275,538 |
5,084,416 |
2,024,144 |
1,459,738 |
2,664,295 |
6,148,177 |
||||||||||||||||||
Total debt instruments |
17,666,770 |
7,065,309 |
3,387,618 |
28,119,697 |
10,175,252 |
5,312,024 |
2,757,308 |
18,244,584 |
||||||||||||||||||
Equity securities |
||||||||||||||||||||||||||
Equity securities |
31,086 |
262,351 |
717,873 |
1,011,310 |
89,128 |
69,400 |
384,682 |
543,210 |
||||||||||||||||||
Total equity securities |
31,086 |
262,351 |
717,873 |
1,011,310 |
89,128 |
69,400 |
384,682 |
543,210 |
||||||||||||||||||
Other financial assets |
||||||||||||||||||||||||||
Other financial assets |
- |
- |
34,385 |
34,385 |
- |
- |
38,319 |
38,319 |
||||||||||||||||||
Total other financial assets |
- |
- |
34,385 |
34,385 |
- |
- |
38,319 |
38,319 |
||||||||||||||||||
Derivative financial instruments |
||||||||||||||||||||||||||
Forwards |
||||||||||||||||||||||||||
Foreign exchange contracts |
- |
617,961 |
466,869 |
1,084,830 |
- |
3,308,258 |
1,073,648 |
4,381,906 |
||||||||||||||||||
Equity contracts |
- |
298 |
51,347 |
51,645 |
- |
152 |
2,863 |
3,015 |
||||||||||||||||||
Total forwards |
- |
618,259 |
518,216 |
1,136,475 |
- |
3,308,410 |
1,076,511 |
4,384,921 |
||||||||||||||||||
Swaps |
||||||||||||||||||||||||||
Foreign exchange contracts |
- |
1,200,777 |
262,479 |
1,463,256 |
- |
1,066,915 |
237,422 |
1,304,337 |
||||||||||||||||||
Interest rate contracts |
105,560 |
114,980 |
15,493 |
236,033 |
130,792 |
206,011 |
15,621 |
352,424 |
||||||||||||||||||
Total swaps |
105,560 |
1,315,757 |
277,972 |
1,699,289 |
130,792 |
1,272,926 |
253,043 |
1,656,761 |
||||||||||||||||||
Options |
||||||||||||||||||||||||||
Foreign exchange contracts |
161 |
36,207 |
66,010 |
102,378 |
6 |
136,979 |
73,603 |
210,588 |
||||||||||||||||||
Total options |
161 |
36,207 |
66,010 |
102,378 |
6 |
136,979 |
73,603 |
210,588 |
||||||||||||||||||
Total derivative financial instruments |
105,721 |
1,970,223 |
862,198 |
2,938,142 |
130,798 |
4,718,315 |
1,403,157 |
6,252,270 |
||||||||||||||||||
Investment properties |
||||||||||||||||||||||||||
Lands |
- |
- |
499,833 |
499,833 |
- |
- |
325,394 |
325,394 |
||||||||||||||||||
Buildings |
- |
- |
5,080,276 |
5,080,276 |
- |
- |
4,384,517 |
4,384,517 |
||||||||||||||||||
Total investment properties |
- |
- |
5,580,109 |
5,580,109 |
- |
- |
4,709,911 |
4,709,911 |
||||||||||||||||||
Investment in associates at fair value |
||||||||||||||||||||||||||
Investment in associates at fair value |
- |
- |
1,830,884 |
1,830,884 |
- |
- |
1,670,782 |
1,670,782 |
||||||||||||||||||
Total investment in associates at fair value |
- |
- |
1,830,884 |
1,830,884 |
- |
- |
1,670,782 |
1,670,782 |
||||||||||||||||||
Total |
17,803,577 |
9,297,883 |
12,413,067 |
39,514,527 |
10,395,178 |
10,099,739 |
10,964,159 |
31,459,076 |
||||||||||||||||||
Financial liabilities | ||||||||||||||||||||||||||
| Type of instrument | December 31, 2024 |
December 31, 2023 |
||||||||||||||||||||||||
Fair value hierarchy |
Total fair
value
|
Fair value hierarchy |
Total fair
value
|
|||||||||||||||||||||||
Level 1 |
Level 2 |
Level 3 |
Level 1 |
Level 2 |
Level 3 |
|||||||||||||||||||||
In millions of COP | ||||||||||||||||||||||||||
Derivative financial instruments |
||||||||||||||||||||||||||
Forwards |
||||||||||||||||||||||||||
Foreign exchange contracts |
- |
885,520 |
86,775 |
972,295 |
- |
4,458,528 |
67,825 |
4,526,353 |
||||||||||||||||||
Equity contracts |
- |
89 |
1,278 |
1,367 |
- |
8,629 |
1,852 |
10,481 |
||||||||||||||||||
Total forwards |
- |
885,609 |
88,053 |
973,662 |
- |
4,467,157 |
69,677 |
4,536,834 |
||||||||||||||||||
Swaps |
||||||||||||||||||||||||||
Foreign exchange contracts |
- |
1,264,593 |
67,838 |
1,332,431 |
- |
1,388,113 |
102,973 |
1,491,086 |
||||||||||||||||||
Interest rate contracts |
102,701 |
160,721 |
27,646 |
291,068 |
126,728 |
312,051 |
11,078 |
449,857 |
||||||||||||||||||
Total swaps |
102,701 |
1,425,314 |
95,484 |
1,623,499 |
126,728 |
1,700,164 |
114,051 |
1,940,943 |
||||||||||||||||||
Options |
||||||||||||||||||||||||||
Foreign exchange contracts |
421 |
82,061 |
- |
82,482 |
19 |
232,568 |
- |
232,587 |
||||||||||||||||||
Total options |
421 |
82,061 |
- |
82,482 |
19 |
232,568 |
- |
232,587 |
||||||||||||||||||
Total derivative financial instruments |
103,122 |
2,392,984 |
183,537 |
2,679,643 |
126,747 |
6,399,889 |
183,728 |
6,710,364 |
||||||||||||||||||
Total |
103,122 |
2,392,984 |
183,537 |
2,679,643 |
126,747 |
6,399,889 |
183,728 |
6,710,364 |
||||||||||||||||||
Assets | ||||||||||||||||||||||||||
| Type of instrument | December 31, 2024 |
December 31, 2023 |
||||||||||||||||||||||||
Fair value hierarchy |
Total fair
value
|
Fair value hierarchy |
Total fair
value
|
|||||||||||||||||||||||
Level 1 |
Level 2 |
Level 3 |
Level 1 |
Level 2 |
Level 3 |
|||||||||||||||||||||
In millions of COP | ||||||||||||||||||||||||||
Debt instruments |
||||||||||||||||||||||||||
Securities issued by the Colombian Government |
156,209 |
- |
- |
156,209 |
67,514 |
- |
- |
67,514 |
||||||||||||||||||
Securities issued or secured by government entities |
- |
46,272 |
3,326,959 |
3,373,231 |
- |
49,980 |
3,075,936 |
3,125,916 |
||||||||||||||||||
Securities issued by other financial institutions |
284,281 |
57,091 |
250,508 |
591,880 |
209,178 |
280,662 |
55,112 |
544,952 |
||||||||||||||||||
Securities issued by foreign governments |
412,579 |
227,076 |
- |
639,655 |
150,695 |
377,560 |
- |
528,255 |
||||||||||||||||||
Corporate bonds |
1,050,588 |
14,017 |
2,578,160 |
3,642,765 |
774,624 |
12,620 |
1,786,986 |
2,574,230 |
||||||||||||||||||
Total – Debt instruments |
1,903,657 |
344,456 |
6,155,627 |
8,403,740 |
1,202,011 |
720,822 |
4,918,034 |
6,840,867 |
||||||||||||||||||
Loans and advances to customers, net |
- |
- |
269,345,583 |
269,345,583 |
- |
- |
238,771,724 |
238,771,724 |
||||||||||||||||||
Total |
1,903,657 |
344,456 |
275,501,210 |
277,749,323 |
1,202,011 |
720,822 |
243,689,758 |
245,612,591 |
||||||||||||||||||
Liabilities | ||||||||||||||||||||||||||
| Type of instruments | December 31, 2024 |
December 31, 2023 |
||||||||||||||||||||||||
Fair value hierarchy |
Total fair
value
|
Fair value hierarchy |
Total fair
value
|
|||||||||||||||||||||||
Level 1 |
Level 2 |
Level 3 |
Level 1 |
Level 2 |
Level 3 |
|||||||||||||||||||||
In millions of COP | ||||||||||||||||||||||||||
Deposits by customers |
- |
60,894,992 |
218,568,020 |
279,463,012 |
- |
60,236,355 |
189,104,164 |
249,340,519 |
||||||||||||||||||
Interbank deposits |
- |
- |
716,493 |
716,493 |
- |
- |
606,141 |
606,141 |
||||||||||||||||||
Repurchase agreements and other similar secured borrowing |
- |
- |
1,060,472 |
1,060,472 |
- |
- |
470,295 |
470,295 |
||||||||||||||||||
Borrowings from other financial institutions |
- |
- |
15,689,532 |
15,689,532 |
- |
- |
15,648,606 |
15,648,606 |
||||||||||||||||||
Debt instruments in issue |
5,811,412 |
2,669,991 |
2,908,095 |
11,389,498 |
8,021,700 |
4,025,322 |
2,421,628 |
14,468,650 |
||||||||||||||||||
Preferred shares |
- |
- |
407,174 |
407,174 |
- |
- |
394,550 |
394,550 |
||||||||||||||||||
Total |
5,811,412 |
63,564,983 |
239,349,786 |
308,726,181 |
8,021,700 |
64,261,677 |
208,645,384 |
280,928,761 |
||||||||||||||||||
December 31, 2024 |
December 31, 2023 |
|||||||||||||||||||||||||
| Type of instruments | Fair-value hierarchy |
Total fair
value
|
Fair-value hierarchy |
Total fair
value
|
||||||||||||||||||||||
Level 1 |
Level 2 |
Level 3 |
Level 1 |
Level 2 |
Level 3 |
|||||||||||||||||||||
In millions of COP | ||||||||||||||||||||||||||
Machinery and equipment |
- |
- |
10,085 |
10,085 |
- |
- |
11,702 |
11,702 |
||||||||||||||||||
Real estate for residential purposes |
- |
- |
133,863 |
133,863 |
- |
- |
117,476 |
117,476 |
||||||||||||||||||
Real estate different from residential properties |
- |
- |
29,794 |
29,794 |
- |
- |
30,273 |
30,273 |
||||||||||||||||||
Total |
- |
- |
173,742 |
173,742 |
- |
- |
159,451 |
159,451 |
||||||||||||||||||
| Type of instruments | Balance, January 1, 2024 |
Included
in
earnings
|
OCI | Purchases | Settlement | Reclassifications(1) |
Prepaids |
Transfers
in to
level 3
|
Transfers
out of
level 3
|
Balance, December 31, 2024 |
||||||||||||||||||||||
In millions of COP | ||||||||||||||||||||||||||||||||
Assets |
||||||||||||||||||||||||||||||||
Debt instruments at fair value though profit or loss |
||||||||||||||||||||||||||||||||
Securities issued or secured by other financial entities |
78,729 |
2,042 |
- |
14,696 |
(12,157) |
- |
(3,117) |
3,195 |
(5,567) |
77,821 |
||||||||||||||||||||||
Corporate bonds |
14,284 |
538 |
- |
2,994 |
- |
- |
- |
16,443 |
- |
34,259 |
||||||||||||||||||||||
Total |
93,013 |
2,580 |
- |
17,690 |
(12,157) |
- |
(3,117) |
19,638 |
(5,567) |
112,080 |
||||||||||||||||||||||
Debt instruments at fair value through OCI |
||||||||||||||||||||||||||||||||
Securities issued by the Colombian Government |
2,664,295 |
- |
157,708 |
2,490,647 |
(2,664,295) |
- |
- |
- |
- |
2,648,355 |
||||||||||||||||||||||
Securities issued or secured by other financial entities |
- |
- |
(272) |
50,016 |
- |
- |
- |
- |
- |
49,744 |
||||||||||||||||||||||
Corporate bonds |
- |
- |
1,892 |
71,517 |
- |
- |
- |
504,030 |
- |
577,439 |
||||||||||||||||||||||
Total |
2,664,295 |
- |
159,328 |
2,612,180 |
(2,664,295) |
- |
- |
504,030 |
- |
3,275,538 |
||||||||||||||||||||||
Derivative financial instruments |
||||||||||||||||||||||||||||||||
Foreign exchange contracts |
1,384,673 |
(45,870) |
- |
592,047 |
(1,193,801) |
(11,487) |
- |
155,582 |
(85,786) |
795,358 |
||||||||||||||||||||||
Interest rate contracts |
15,621 |
(2,591) |
- |
6,910 |
(3,606) |
(138) |
- |
3,909 |
(4,612) |
15,493 |
||||||||||||||||||||||
Equity contracts |
2,863 |
- |
- |
51,347 |
(2,863) |
- |
- |
- |
- |
51,347 |
||||||||||||||||||||||
Total |
1,403,157 |
(48,461) |
- |
650,304 |
(1,200,270) |
(11,625) |
- |
159,491 |
(90,398) |
862,198 |
||||||||||||||||||||||
Equity securities |
||||||||||||||||||||||||||||||||
Equity securities |
384,682 |
48,562 |
50,303 |
261,301 |
(26,973) |
- |
- |
- |
(2) |
717,873 |
||||||||||||||||||||||
Total |
384,682 |
48,562 |
50,303 |
261,301 |
(26,973) |
- |
- |
- |
(2) |
717,873 |
||||||||||||||||||||||
Other financial instruments |
||||||||||||||||||||||||||||||||
Other financial instruments |
38,319 |
(5,646) |
- |
1,712 |
- |
- |
- |
- |
- |
34,385 |
||||||||||||||||||||||
Total |
38,319 |
(5,646) |
- |
1,712 |
- |
- |
- |
- |
- |
34,385 |
||||||||||||||||||||||
Investment in associates |
||||||||||||||||||||||||||||||||
P.A. Viva Malls |
1,661,679 |
155,824 |
- |
- |
- |
- |
- |
- |
- |
1,817,503 |
||||||||||||||||||||||
P.A. Distrito Vera |
9,103 |
(401) |
- |
5,186 |
(563) |
- |
- |
- |
- |
13,325 |
||||||||||||||||||||||
Fideicomiso Locales Distrito Vera |
- |
(5) |
- |
61 |
- |
- |
- |
- |
- |
56 |
||||||||||||||||||||||
Total |
1,670,782 |
155,418 |
- |
5,247 |
(563) |
- |
- |
- |
- |
1,830,884 |
||||||||||||||||||||||
Total Assets |
6,254,248 |
152,453 |
209,631 |
3,548,434 |
(3,904,258) |
(11,625) |
(3,117) |
683,159 |
(95,967) |
6,832,958 |
||||||||||||||||||||||
Liabilities |
||||||||||||||||||||||||||||||||
Derivative financial instruments |
||||||||||||||||||||||||||||||||
Foreign exchange contracts |
170,798 |
48,127 |
- |
114,156 |
(95,051) |
(11,487) |
- |
3,194 |
(75,124) |
154,613 |
||||||||||||||||||||||
Interest rate contracts |
11,078 |
(50) |
- |
206 |
(4,595) |
(138) |
- |
27,432 |
(6,287) |
27,646 |
||||||||||||||||||||||
Equity contracts |
1,852 |
- |
- |
1,278 |
(1,852) |
- |
- |
- |
- |
1,278 |
||||||||||||||||||||||
Total |
183,728 |
48,077 |
- |
115,640 |
(101,498) |
(11,625) |
- |
30,626 |
(81,411) |
183,537 |
||||||||||||||||||||||
Total liabilities |
183,728 |
48,077 |
- |
115,640 |
(101,498) |
(11,625) |
- |
30,626 |
(81,411) |
183,537 |
||||||||||||||||||||||
| Type of instruments | Balance, January 1, 2023 |
Included
in
earnings
|
OCI | Purchases | Settlement | Reclassifications(1) |
Prepaids |
Transfers
in to
level 3
|
Transfers
out of
level 3
|
Balance, December 31, 2023 |
||||||||||||||||||||||
In millions of COP | ||||||||||||||||||||||||||||||||
Assets |
||||||||||||||||||||||||||||||||
Debt instruments at fair value though profit or loss |
||||||||||||||||||||||||||||||||
Securities issued by the Colombian Government |
- |
(4,150) |
- |
4,150 |
- |
- |
- |
- |
- |
- |
||||||||||||||||||||||
Securities issued or secured by other financial entities |
81,389 |
12,869 |
- |
2,639 |
(12,767) |
- |
(9,613) |
4,212 |
- |
78,729 |
||||||||||||||||||||||
Corporate bonds |
- |
- |
- |
- |
- |
- |
- |
14,284 |
- |
14,284 |
||||||||||||||||||||||
Total |
81,389 |
8,719 |
- |
6,789 |
(12,767) |
- |
(9,613) |
18,496 |
- |
93,013 |
||||||||||||||||||||||
Debt instruments at fair value through OCI |
||||||||||||||||||||||||||||||||
Securities issued by the Colombian Government |
- |
- |
173,648 |
2,490,647 |
- |
- |
- |
- |
- |
2,664,295 |
||||||||||||||||||||||
Total |
- |
- |
173,648 |
2,490,647 |
- |
- |
- |
- |
- |
2,664,295 |
||||||||||||||||||||||
Derivative financial instruments |
||||||||||||||||||||||||||||||||
Foreign exchange contracts |
1,163,336 |
(60,699) |
- |
1,295,089 |
(812,275) |
(13,559) |
- |
46,459 |
(233,678) |
1,384,673 |
||||||||||||||||||||||
Interest rate contracts |
29,170 |
(10,694) |
- |
6,957 |
(4,593) |
(38) |
- |
525 |
(5,706) |
15,621 |
||||||||||||||||||||||
Equity contracts |
105 |
- |
- |
2,863 |
(105) |
- |
- |
- |
- |
2,863 |
||||||||||||||||||||||
Total |
1,192,611 |
(71,393) |
- |
1,304,909 |
(816,973) |
(13,597) |
- |
46,984 |
(239,384) |
1,403,157 |
||||||||||||||||||||||
Equity securities |
||||||||||||||||||||||||||||||||
Equity securities |
462,253 |
(3,577) |
(8,087) |
6,740 |
(72,647) |
- |
- |
- |
- |
384,682 |
||||||||||||||||||||||
Total |
462,253 |
(3,577) |
(8,087) |
6,740 |
(72,647) |
- |
- |
- |
- |
384,682 |
||||||||||||||||||||||
Other financial instruments |
||||||||||||||||||||||||||||||||
Other financial instruments |
42,171 |
(13,746) |
- |
9,894 |
- |
- |
- |
- |
- |
38,319 |
||||||||||||||||||||||
Total |
42,171 |
(13,746) |
- |
9,894 |
- |
- |
- |
- |
- |
38,319 |
||||||||||||||||||||||
Investment in associates |
||||||||||||||||||||||||||||||||
P.A. Viva Malls |
1,530,459 |
128,028 |
- |
3,192 |
- |
- |
- |
- |
- |
1,661,679 |
||||||||||||||||||||||
P.A. Distrito Vera |
1,697 |
1,179 |
- |
6,227 |
- |
- |
- |
- |
- |
9,103 |
||||||||||||||||||||||
Total |
1,532,156 |
129,207 |
- |
9,419 |
- |
- |
- |
- |
- |
1,670,782 |
||||||||||||||||||||||
Total Assets |
3,310,580 |
49,210 |
165,561 |
3,828,398 |
(902,387) |
(13,597) |
(9,613) |
65,480 |
(239,384) |
6,254,248 |
||||||||||||||||||||||
Liabilities |
||||||||||||||||||||||||||||||||
Derivative financial instruments |
||||||||||||||||||||||||||||||||
Foreign exchange contracts |
348,027 |
15,346 |
- |
164,179 |
(329,858) |
(13,559) |
- |
4,330 |
(17,667) |
170,798 |
||||||||||||||||||||||
Interest rate contracts |
51,662 |
(6,297) |
- |
3,628 |
(41,002) |
(38) |
- |
3,734 |
(609) |
11,078 |
||||||||||||||||||||||
Equity contracts |
- |
- |
- |
1,852 |
- |
- |
- |
- |
- |
1,852 |
||||||||||||||||||||||
Total |
399,689 |
9,049 |
- |
169,659 |
(370,860) |
(13,597) |
- |
8,064 |
(18,276) |
183,728 |
||||||||||||||||||||||
Total liabilities |
399,689 |
9,049 |
- |
169,659 |
(370,860) |
(13,597) |
- |
8,064 |
(18,276) |
183,728 |
||||||||||||||||||||||
December 31, 2024 |
December 31, 2023 |
|||||||||||||
| Type of instruments |
Transfers level 1
to level 2
|
Transfers level
2 to level 1
|
Transfers level
1 to level 2
|
Transfers level
2 to level 1
|
||||||||||
| In millions of COP | ||||||||||||||
Debt instruments at fair value though profit or loss |
||||||||||||||
Securities issued by the Colombian Government |
202,779 |
- |
- |
- |
||||||||||
Securities issued or secured by foreign government |
26,866 |
929 |
1,712 |
- |
||||||||||
Securities issued or secured by government entities |
- |
- |
13,619 |
- |
||||||||||
Corporate bonds |
- |
- |
- |
8,397 |
||||||||||
Securities issued or secured by other financial entities |
- |
- |
1,848 |
- |
||||||||||
Total |
229,645 |
929 |
17,179 |
8,397 |
||||||||||
Debt instruments at fair value through OCI |
||||||||||||||
Securities issued or secured by foreign government |
467,133 |
137,884 |
572,800 |
- |
||||||||||
Securities issued or secured by other financial entities |
- |
- |
64,944 |
- |
||||||||||
Corporate bonds |
- |
- |
- |
95,572 |
||||||||||
Total |
467,133 |
137,884 |
637,744 |
95,572 |
||||||||||
Equity securities |
||||||||||||||
Equity securities |
63,827 |
- |
13,740 |
7 |
||||||||||
Total |
63,827 |
- |
13,740 |
7 |
||||||||||
Type of instruments |
Fair Value |
Valuation
technique
|
Significant
unobservable input
|
Range of
inputs
|
Weighted
average
|
Sensitivity
100
basis point
increase
|
Sensitivity
100
basis point
decrease
|
||||||||||||||||
In millions of COP | |||||||||||||||||||||||
Debt instruments |
|||||||||||||||||||||||
Securities issued by other financial institutions |
|||||||||||||||||||||||
Yield |
0.14% to 10.66% |
3.61% |
61,474 |
65,164 |
|||||||||||||||||||
TIPS |
63,280 |
Discounted cash flow |
Prepayment Speed |
n/a |
n/a |
65,081 |
n/a |
||||||||||||||||
Prepayment Speed |
n/a |
n/a |
60,732 |
n/a |
|||||||||||||||||||
Other bonds |
62,558 |
Discounted cash flow |
Interest rate |
0.10% to 1.12% |
0.94% |
61,003 |
64,177 |
||||||||||||||||
Time deposits |
1,727 |
Discounted cash flow |
Yield / Interest rate |
0.91% to 6.40% |
3.36% |
1,441 |
1,772 |
||||||||||||||||
Total securities issued by other financial institutions |
127,565 |
||||||||||||||||||||||
Securities issued by the Colombian Government |
|||||||||||||||||||||||
Bonds by government entities |
2,648,355 |
Discounted cash flow |
Yield |
1.18% to 1.18% |
1.18% |
2,639,349 |
2,660,301 |
||||||||||||||||
Corporate bonds |
|||||||||||||||||||||||
Corporate bonds |
611,698 |
Discounted cash flow |
Yield |
0.00% to 5.25% |
0.98% |
573,929 |
647,264 |
||||||||||||||||
Total debt instruments |
3,387,618 |
||||||||||||||||||||||
Equity securities |
|||||||||||||||||||||||
Equity securities |
717,873 |
Price-based |
Price |
n/a |
n/a |
n/a |
n/a |
||||||||||||||||
Other financial instruments |
|||||||||||||||||||||||
Other financial instruments |
34,385 |
Internal valuation methodology |
Internal valuation methodology |
n/a |
n/a |
n/a |
n/a |
||||||||||||||||
Derivative financial instruments |
|||||||||||||||||||||||
Forward |
430,163 |
Discounted cash flow |
Credit spread / Yield |
0.00% to 20.80% |
7.05% |
429,581 |
430,753 |
||||||||||||||||
Swaps |
182,488 |
Discounted cash flow |
Credit spread |
0.00% to 56.14% |
4.03% |
166,650 |
204,677 |
||||||||||||||||
Options |
66,010 |
Discounted cash flow |
Credit spread |
0.12% to 34.75% |
0.50% |
65,512 |
66,242 |
||||||||||||||||
Total derivative financial instruments |
678,661 |
||||||||||||||||||||||
Investment in associates |
|||||||||||||||||||||||
P.A. Viva Malls |
1,817,503 |
Price-based |
Price |
n/a |
n/a |
n/a |
n/a |
||||||||||||||||
P.A. Distrito Vera |
13,325 |
Price-based |
Price |
n/a |
n/a |
n/a |
n/a |
||||||||||||||||
Fideicomiso Locales Distrito Vera |
56 |
Price-based |
Price |
n/a |
n/a |
n/a |
n/a |
||||||||||||||||
Total investment in associates |
1,830,884 |
||||||||||||||||||||||
Type of instruments |
Fair Value |
Valuation
technique
|
Significant
unobservable input
|
Range of
inputs
|
Weighted
average
|
Sensitivity
100
basis point
increase
|
Sensitivity
100
basis point
decrease
|
||||||||||||||||
In millions of COP | |||||||||||||||||||||||
Debt instruments |
|||||||||||||||||||||||
Securities issued by other financial institutions |
|||||||||||||||||||||||
Yield |
2.06% to 10.73% |
5.48% |
70,982 |
75,852 |
|||||||||||||||||||
TIPS |
74,087 |
Discounted cash flow |
Prepayment Speed |
n/a |
n/a |
78,953 |
n/a |
||||||||||||||||
Prepayment Speed |
n/a |
n/a |
73,271 |
n/a |
|||||||||||||||||||
Time deposits |
4,642 |
Discounted cash flow |
Yield / Interest rate |
2.15% to 5.70% |
3.78% |
4,277 |
4,701 |
||||||||||||||||
Total securities issued by other financial institutions |
78,729 |
||||||||||||||||||||||
Securities issued by the Colombian Government |
|||||||||||||||||||||||
Bonds by government entities |
2,664,295 |
Discounted cash flow |
Yield |
0.00% to 1.18% |
1.17% |
2,658,010 |
2,679,372 |
||||||||||||||||
Corporate bonds |
|||||||||||||||||||||||
Corporate bonds |
14,284 |
Discounted cash flow |
Yield |
3.49% to 3.49% |
3.49% |
13,700 |
14,912 |
||||||||||||||||
Total debt instruments |
2,757,308 |
||||||||||||||||||||||
Equity securities |
|||||||||||||||||||||||
Equity securities |
384,682 |
Price-based |
Price |
n/a |
n/a |
n/a |
n/a |
||||||||||||||||
Other financial instruments |
|||||||||||||||||||||||
Other financial instruments |
38,319 |
Internal valuation methodology |
Internal valuation methodology |
n/a |
n/a |
n/a |
n/a |
||||||||||||||||
Derivative financial instruments |
|||||||||||||||||||||||
Forward |
1,006,834 |
Discounted cash flow |
Credit spread / Yield |
0.00% to 50.58% |
7.22% |
1,004,399 |
1,009,283 |
||||||||||||||||
Swaps |
138,992 |
Discounted cash flow |
Credit spread |
0.00% to 63.39% |
5.86% |
139,451 |
138,577 |
||||||||||||||||
Options |
73,603 |
Discounted cash flow |
Credit spread |
0.13% to 33.77% |
0.57% |
73,048 |
73,870 |
||||||||||||||||
Total derivative financial instruments |
1,219,429 |
||||||||||||||||||||||
Investment in associates |
|||||||||||||||||||||||
P.A. Viva Malls |
1,661,679 |
Price-based |
Price |
n/a |
n/a |
n/a |
n/a |
||||||||||||||||
P.A. Distrito Vera |
9,103 |
Price-based |
Price |
n/a |
n/a |
n/a |
n/a |
||||||||||||||||
Total investment in associates |
1,670,782 |
||||||||||||||||||||||
Methodology |
Valuation technique |
Significant unobservable input |
Description of sensitivity |
||||||||
|
Sales Comparison Approach - SCA
The fair value assessment is based on the examination of prices at which similar properties in the same area recently sold. Since no two properties are identical the measurement valuation must take into account adjustments for the differences between the sold properties and those held by the Bank to earn rentals or for capital appreciation.
|
Comparable prices |
The weighted average rates used in the capitalization methodology for revenues in the last quarter for 2024 are:
•Direct capitalization: initial rate 8.13%.
•Discounted cash flow: discount rate: 12.27%, terminal rate: 8.29%.
The same weighted rates for the last quarter of 2023 were:
•Direct capitalization: initial rate 8.07%
•Discounted cash flow: discount rate: 12.44%, terminal rate: 8.25%.
The ratio between monthly gross income and real estate value directly administered by the FIC (rental rate) considering the differences in placements and individual factors between properties and in a weighted way in the last quarter of 2024 are 0.88% and for December 31, 2023 was 0.82%.
|
An increase (light, normal, considerable, significant) in the capitalization rate used would generate a decrease (significant, considerable, normal, light) in the fair value of the asset, and vice versa.
An increase (light, normal, considerable, significant) in the leases used in the valuation would generate a (significant, light, considerable) increase in the fair value of the asset, and vice versa.
|
||||||||
|
Income Approach
Used to estimate the fair value of the property by taking future net cash flows and discounting them at the capitalization rate.
|
Direct capitalization
Discounted cash flows
|
||||||||||
|
Cost approach
Used to estimate the fair value of the property considering the cost to replace or build a property at the same or equal conditions of the asset to be measured, deducting the accumulated depreciation charge and adding-up the amount of the land.
|
Replacement cost |
||||||||||
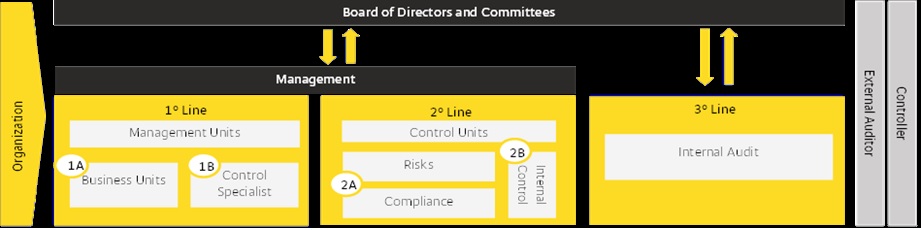
Maximum exposure to credit risk - Financial instruments subject to impairment | ||||||||||||||
In millions of COP | ||||||||||||||
Stage 1 |
Stage 2 |
Stage 3 |
Total |
|||||||||||
Loans and Advances |
245,272,297 |
16,670,291 |
17,511,320 |
279,453,908 |
||||||||||
Commercial |
137,761,467 |
5,545,788 |
9,945,556 |
153,252,811 |
||||||||||
Consumer |
46,697,013 |
5,118,607 |
4,000,063 |
55,815,683 |
||||||||||
Mortgage |
37,076,580 |
2,701,930 |
1,963,091 |
41,741,601 |
||||||||||
Small Business Loans |
1,175,803 |
91,256 |
85,150 |
1,352,209 |
||||||||||
Financial Leases |
22,561,434 |
3,212,710 |
1,517,460 |
27,291,604 |
||||||||||
Off-Balance Sheet Exposures |
43,604,372 |
223,317 |
256,249 |
44,083,938 |
||||||||||
Financial Guarantees |
9,926,719 |
17,800 |
199,782 |
10,144,301 |
||||||||||
Loan Commitments |
33,677,653 |
205,517 |
56,467 |
33,939,637 |
||||||||||
Loss Allowance |
(2,331,035) |
(2,752,141) |
(11,397,984) |
(16,481,160) |
||||||||||
Total |
286,545,634 |
14,141,467 |
6,369,585 |
307,056,686 |
||||||||||
Maximum exposure to credit risk - Financial instruments subject to impairment | ||||||||||||||
In millions of COP | ||||||||||||||
Stage 1 |
Stage 2 |
Stage 3 |
Total |
|||||||||||
Loans and Advances |
222,372,889 |
16,042,661 |
15,536,097 |
253,951,647 |
||||||||||
Commercial |
120,773,927 |
5,453,537 |
8,459,932 |
134,687,396 |
||||||||||
Consumer |
46,060,615 |
4,407,067 |
4,124,087 |
54,591,769 |
||||||||||
Mortgage |
32,210,648 |
2,628,654 |
1,411,106 |
36,250,408 |
||||||||||
Small Business Loans |
774,571 |
260,303 |
110,143 |
1,145,017 |
||||||||||
Financial Leases |
22,553,128 |
3,293,100 |
1,430,829 |
27,277,057 |
||||||||||
Off-Balance Sheet Exposures |
39,266,370 |
154,567 |
157,801 |
39,578,738 |
||||||||||
Financial Guarantees |
12,533,868 |
26,889 |
130,441 |
12,691,198 |
||||||||||
Loan Commitments(1) |
26,732,502 |
127,678 |
27,360 |
26,887,540 |
||||||||||
Loss Allowance |
(3,854,240) |
(2,581,460) |
(10,042,022) |
(16,477,722) |
||||||||||
Total |
257,785,019 |
13,615,768 |
5,651,876 |
277,052,663 |
||||||||||
Maximum Exposure to Credit Risk - Other Financial Instruments | ||||||||||||||||||||
| In millions of COP | ||||||||||||||||||||
Maximum Exposure |
Collateral |
Net Exposure |
||||||||||||||||||
| 2024 | 2023 | 2024 | 2023 | 2024 | 2023 | |||||||||||||||
Maximum Exposure to Credit Risk |
||||||||||||||||||||
Debt instruments |
36,583,512 |
25,148,469 |
(1,669,011) |
(1,407,484) |
34,914,501 |
23,740,985 |
||||||||||||||
Derivatives |
929,498 |
1,824,750 |
(589,098) |
(698,662) |
340,400 |
1,126,088 |
||||||||||||||
Equity |
1,011,310 |
543,210 |
- |
- |
1,011,310 |
543,210 |
||||||||||||||
Other financial instruments |
34,385 |
38,319 |
- |
- |
34,385 |
38,319 |
||||||||||||||
Total |
38,558,705 |
27,554,748 |
(2,258,109) |
(2,106,146) |
36,300,596 |
25,448,602 |
||||||||||||||
| Note: Collateral Held (-) and Collateral Pledged (+) | ||||||||||||||||||||
Segment |
Incomes/Sales |
||||
Corporate |
Companies with consolidated annual sales by economic group >= COP 100,000M. Banistmo places borrowers with annual sales >= USD10M. BAM place borrowers with annual sales >= USD25M. Banco Agricola place borrowers with annual sales >= USD30M. |
||||
Business |
Companies with consolidated annual sales by economic group > = COP 13,000M and < COP 100,000M. For Banco Agricola borrowers with annual sales >= USD7 MM y < USD30M and BAM, with annual sales >= USD5M and < USD25M. |
||||
Commercial |
For BAM, companies with annual sales >= USD2M y < USD5M. |
||||
Business Construction |
Constructors who dedicate themselves professionally to the construction of buildings to be sold or rented as their main activity, with consolidated annual sales by economic group >= COP 58,000M and <= COP 200,000M or commercial size > = COP 15,000M and < COP 70,000M, or project size >= COP 500,000M and < COP 2.2 billion |
||||
Corporate Construction |
Constructors who dedicate themselves to the construction of buildings to be sold or rented as their main activity, with consolidated annual sales by economic group > COP 200,000M or commercial size > = COP 70,000M or project size >=COP 2.2 billion |
||||
SME Construction |
Constructors who dedicate themselves professionally to the construction of buildings to be sold or rented as their main activity with consolidated annual sales by economic group >= COP 380M and <= COP 58,000M or commercial size < COP 15,000M or project size < COP 500,000M. |
||||
Institutional Financing |
Financial sector institutions. |
||||
Government |
Municipalities, districts, departments with their respective decentralized organizations and entities at the national level with incomes >= COP 20,000M. |
||||
SME |
Annual sales < COP 13,000M, with a classification between small, medium, large and plus except for Banistmo which places borrowers < USD10M in annual sales. For Banco Agrícola, borrowers with annual sales < USD7M and BAM, borrowers with annual sales < USD2M. |
||||
Classification | |||||
Vehicles |
Credits granted for the acquisition of vehicles and motorcycles. The vehicle financed is used as collateral for the loan. |
||||
Credit cards |
Revolving credit limits for the acquisition of consumer goods, utilized by means of a plastic card, a virtual card or a token in digital wallets. |
||||
Payroll loans |
It is a credit line attached to an authorized individual payroll and pension amount. |
||||
Other loans |
Loans granted for the acquisition of consumer goods other than vehicles and Payroll loans Credit cards are not included in this segment. |
||||
Watch List December 31,2024 | |||||||||||
In millions of COP | |||||||||||
Risk Level |
Amount |
% |
Allowance |
||||||||
Level 1 – Low Risk |
14,081,182 |
0.72% |
101,994 |
||||||||
Level 2 – Medium Risk |
5,708,673 |
6.50% |
370,892 |
||||||||
Level 3 – High Risk |
3,811,886 |
53.84% |
2,052,135 |
||||||||
Level 4 – High Risk |
5,948,366 |
61.67% |
3,668,615 |
||||||||
Total |
29,550,107 |
20.96% |
6,193,636 |
||||||||
Watch List December 31,2023 | |||||||||||
In millions of COP | |||||||||||
Risk Level |
Amount |
% |
Allowance |
||||||||
Level 1 – Low Risk |
14,358,838 |
1.02% |
146,014 |
||||||||
Level 2 – Medium Risk |
4,744,341 |
7.38% |
349,972 |
||||||||
Level 3 – High Risk |
2,886,649 |
53.31% |
1,538,882 |
||||||||
Level 4 – High Risk |
5,239,356 |
73.24% |
3,837,196 |
||||||||
Total |
27,229,184 |
21.57% |
5,872,064 |
||||||||
December 31, 2024 | ||||||||||||||||||||
In Millions of COP | ||||||||||||||||||||
Amount Covered by Collateral | ||||||||||||||||||||
Nature of the Collateral |
Commercial |
Consumer |
Mortgage |
Financial
Leasing
|
Small
Business
|
Total |
||||||||||||||
Real Estate and Residential |
25,163,297 |
1,816,374 |
39,092,440 |
39 |
363,465 |
66,435,615 |
||||||||||||||
Goods Given in Real Estate Leasing |
- |
- |
183 |
17,382,691 |
- |
17,382,874 |
||||||||||||||
Goods Given in Leasing Other Than Real Estate |
- |
32 |
- |
8,181,007 |
- |
8,181,039 |
||||||||||||||
Stand by Letters of Credit |
1,540,179 |
- |
- |
- |
- |
1,540,179 |
||||||||||||||
Security Deposits |
1,398,254 |
326,722 |
- |
- |
139,481 |
1,864,457 |
||||||||||||||
Guarantee Fund |
3,653,583 |
37 |
- |
45,720 |
251,827 |
3,951,167 |
||||||||||||||
Sovereign of the Nation |
- |
- |
- |
- |
- |
- |
||||||||||||||
Collection Rights |
7,757,578 |
109,946 |
- |
- |
— |
7,867,524 |
||||||||||||||
Other Collateral (Pledges) |
3,688,378 |
8,039,811 |
30,223 |
280 |
6,209 |
11,764,901 |
||||||||||||||
Without Guarantee (Uncovered Balance) |
110,051,542 |
45,522,761 |
2,618,755 |
1,681,867 |
591,227 |
160,466,152 |
||||||||||||||
Total loans and financial leases |
153,252,811 |
55,815,683 |
41,741,601 |
27,291,604 |
1,352,209 |
279,453,908 |
||||||||||||||
December 31, 2023 | ||||||||||||||||||||
In Millions of COP | ||||||||||||||||||||
Amount Covered by Collateral | ||||||||||||||||||||
Nature of the Collateral |
Commercial |
Consumer |
Mortgage |
Financial
Leasing
|
Small
Business
|
Total |
||||||||||||||
Real Estate and Residential |
23,368,950 |
1,693,007 |
34,253,140 |
10 |
319,038 |
59,634,145 |
||||||||||||||
Goods Given in Real Estate Leasing |
- |
- |
189 |
17,104,180 |
- |
17,104,369 |
||||||||||||||
Goods Given in Leasing Other Than Real Estate |
- |
26 |
- |
8,580,543 |
- |
8,580,569 |
||||||||||||||
Stand by Letters of Credit |
1,052,764 |
- |
- |
- |
- |
1,052,764 |
||||||||||||||
Security Deposits |
447,306 |
370,286 |
- |
- |
103,013 |
920,605 |
||||||||||||||
Guarantee Fund |
4,012,115 |
191 |
- |
60,242 |
52,222 |
4,124,770 |
||||||||||||||
Sovereign of the Nation |
- |
- |
- |
- |
- |
- |
||||||||||||||
Collection Rights |
6,673,320 |
57,306 |
- |
- |
420 |
6,731,046 |
||||||||||||||
Other Collateral (Pledges) |
2,957,482 |
7,286,581 |
39,432 |
- |
2,499 |
10,285,994 |
||||||||||||||
Without Guarantee (Uncovered Balance) |
96,175,459 |
45,184,372 |
1,957,647 |
1,532,082 |
667,825 |
145,517,385 |
||||||||||||||
Total loans and financial leases |
134,687,396 |
54,591,769 |
36,250,408 |
27,277,057 |
1,145,017 |
253,951,647 |
||||||||||||||
December 31, 2024 | ||||||||||||||
In Millions of COP | ||||||||||||||
Classification |
Amount |
Allowance |
Total |
Fair Value of Collateral |
||||||||||
Commercial |
783,435 |
372,156 |
411,279 |
1,660,829 |
||||||||||
Consumer |
||||||||||||||
Mortgage |
616,432 |
143,894 |
472,538 |
762,652 |
||||||||||
Small Business Loans |
||||||||||||||
Financial Leases |
761,892 |
327,257 |
434,635 |
1,305,365 |
||||||||||
Total credit assets |
2,161,759 |
843,307 |
1,318,452 |
3,728,846 |
||||||||||
December 31, 2023 | ||||||||||||||
In Millions of COP | ||||||||||||||
Classification |
Amount |
Allowance |
Total |
Fair Value of Collateral |
||||||||||
Commercial |
700,120 |
274,641 |
425,479 |
1,176,130 |
||||||||||
Consumer |
||||||||||||||
Mortgage |
383,878 |
94,260 |
289,618 |
331,738 |
||||||||||
Small Business Loans |
||||||||||||||
Financial Leases |
699,803 |
383,127 |
316,676 |
1,263,274 |
||||||||||
Total credit assets |
1,783,801 |
752,028 |
1,031,773 |
2,771,142 |
||||||||||
Composition |
2024 |
2023 |
||||||
In millions of COP | ||||||||
Commercial |
153,252,811 |
134,687,396 |
||||||
Corporate |
85,278,293 |
69,843,654 |
||||||
SME |
15,203,496 |
14,200,557 |
||||||
Others |
52,771,022 |
50,643,185 |
||||||
Consumer |
55,815,683 |
54,591,769 |
||||||
Credit card |
11,992,511 |
11,207,731 |
||||||
Vehicle |
5,635,858 |
5,409,226 |
||||||
Payroll loans |
10,381,247 |
9,461,889 |
||||||
Others |
27,806,067 |
28,512,923 |
||||||
Mortgage |
41,741,601 |
36,250,408 |
||||||
VIS2 |
16,183,280 |
12,997,624 |
||||||
Non- VIS |
25,558,321 |
23,252,784 |
||||||
Financial Leases |
27,291,604 |
27,277,057 |
||||||
Small Business Loans |
1,352,209 |
1,145,017 |
||||||
Loans and advances to customers and financial institutions |
279,453,908 |
253,951,647 |
||||||
Allowance for loans and advances and lease losses |
(16,179,738) |
(16,223,103) |
||||||
Total net loan and financial leases |
263,274,170 |
237,728,544 |
||||||
December 31, 2024 | |||||||||||||||||
In millions of COP | |||||||||||||||||
Maturity |
Less Than 1 Year |
Between 1 and 5
Years
|
Between 5 and 15
Years
|
Greater Than 15
Years
|
Total |
||||||||||||
In millions of COP | |||||||||||||||||
Commercial |
48,186,159 |
62,610,478 |
41,614,622 |
841,552 |
153,252,811 |
||||||||||||
Corporate |
29,076,028 |
32,243,275 |
23,454,114 |
504,876 |
85,278,293 |
||||||||||||
SME |
4,771,087 |
8,555,996 |
1,727,911 |
148,502 |
15,203,496 |
||||||||||||
Others |
14,339,044 |
21,811,207 |
16,432,597 |
188,174 |
52,771,022 |
||||||||||||
Consumer |
1,267,269 |
34,216,968 |
19,553,651 |
777,795 |
55,815,683 |
||||||||||||
Credit card |
234,325 |
9,587,518 |
2,170,668 |
- |
11,992,511 |
||||||||||||
Vehicle |
81,066 |
3,270,554 |
2,283,873 |
365 |
5,635,858 |
||||||||||||
Order of payment |
47,981 |
2,261,874 |
7,525,578 |
545,814 |
10,381,247 |
||||||||||||
Others |
903,897 |
19,097,022 |
7,573,532 |
231,616 |
27,806,067 |
||||||||||||
Mortgage |
79,304 |
1,095,329 |
10,509,429 |
30,057,539 |
41,741,601 |
||||||||||||
VIS |
14,439 |
284,872 |
2,540,655 |
13,343,314 |
16,183,280 |
||||||||||||
Non-VIS |
64,865 |
810,457 |
7,968,774 |
16,714,225 |
25,558,321 |
||||||||||||
Financial Leases |
1,804,964 |
8,586,693 |
13,202,556 |
3,697,391 |
27,291,604 |
||||||||||||
Small business loans |
194,013 |
919,392 |
208,405 |
30,399 |
1,352,209 |
||||||||||||
Total gross loans and financial leases |
51,531,709 |
107,428,860 |
85,088,663 |
35,404,676 |
279,453,908 |
||||||||||||
December 31, 2023 | |||||||||||||||||
In millions of COP | |||||||||||||||||
Maturity |
Less Than 1 Year |
Between 1 and 5
Years
|
Between 5 and 15
Years
|
Greater Than 15
Years
|
Total |
||||||||||||
Commercial |
40,601,345 |
57,828,301 |
35,936,869 |
320,881 |
134,687,396 |
||||||||||||
Corporate |
22,360,108 |
27,329,312 |
19,970,727 |
183,507 |
69,843,654 |
||||||||||||
SME |
4,486,326 |
7,497,307 |
2,200,274 |
16,650 |
14,200,557 |
||||||||||||
Others |
13,754,911 |
23,001,682 |
13,765,868 |
120,724 |
50,643,185 |
||||||||||||
Consumer |
1,289,150 |
26,549,043 |
26,086,537 |
667,039 |
54,591,769 |
||||||||||||
Credit card |
417,390 |
1,755,518 |
9,034,823 |
- |
11,207,731 |
||||||||||||
Vehicle |
55,295 |
2,982,439 |
2,371,163 |
329 |
5,409,226 |
||||||||||||
Order of payment |
57,211 |
1,872,546 |
7,061,605 |
470,527 |
9,461,889 |
||||||||||||
Others |
759,254 |
19,938,540 |
7,618,946 |
196,183 |
28,512,923 |
||||||||||||
Mortgage |
75,189 |
1,005,831 |
9,601,783 |
25,567,605 |
36,250,408 |
||||||||||||
VIS |
23,303 |
264,232 |
2,157,322 |
10,552,767 |
12,997,624 |
||||||||||||
Non-VIS |
51,886 |
741,599 |
7,444,461 |
15,014,838 |
23,252,784 |
||||||||||||
Financial Leases |
1,639,218 |
9,165,622 |
12,939,908 |
3,532,309 |
27,277,057 |
||||||||||||
Small business loans |
208,429 |
737,255 |
194,581 |
4,752 |
1,145,017 |
||||||||||||
Total gross loans and financial leases |
43,813,331 |
95,286,052 |
84,759,678 |
30,092,586 |
253,951,647 |
||||||||||||
December 31, 2024 | ||||||||||||||||||||
In millions of COP | ||||||||||||||||||||
Past-due | ||||||||||||||||||||
Period |
0 - 30 Days |
31 - 90 Days |
91 - 120 Days |
121 - 360 Days |
More Than 360
Days
|
Total |
||||||||||||||
Commercial |
147,402,632 |
531,609 |
280,750 |
1,515,324 |
3,522,496 |
153,252,811 |
||||||||||||||
Consumer |
51,393,527 |
1,761,496 |
624,945 |
1,776,361 |
259,354 |
55,815,683 |
||||||||||||||
Mortgage |
38,560,253 |
1,184,755 |
285,466 |
830,743 |
880,384 |
41,741,601 |
||||||||||||||
Financial Leases |
26,331,118 |
247,056 |
58,435 |
273,619 |
381,376 |
27,291,604 |
||||||||||||||
Small Business Loans |
1,242,568 |
36,196 |
8,848 |
45,608 |
18,989 |
1,352,209 |
||||||||||||||
Total |
264,930,098 |
3,761,112 |
1,258,444 |
4,441,655 |
5,062,599 |
279,453,908 |
||||||||||||||
December 31, 2023 | ||||||||||||||||||||
In millions of COP | ||||||||||||||||||||
Past-due | ||||||||||||||||||||
Period |
0 - 30 Days |
31 - 90 Days |
91 - 120 Days |
121 - 360 Days |
More Than 360
Days
|
Total |
||||||||||||||
Commercial |
129,866,971 |
500,794 |
205,141 |
1,777,620 |
2,336,870 |
134,687,396 |
||||||||||||||
Consumer |
49,418,431 |
2,244,017 |
794,005 |
1,994,748 |
140,568 |
54,591,769 |
||||||||||||||
Mortgage |
33,524,034 |
1,290,817 |
212,433 |
599,351 |
623,773 |
36,250,408 |
||||||||||||||
Financial Leases |
26,436,493 |
247,124 |
56,434 |
196,578 |
340,428 |
27,277,057 |
||||||||||||||
Small Business Loans |
1,005,725 |
50,138 |
14,859 |
58,244 |
16,051 |
1,145,017 |
||||||||||||||
Total |
240,251,654 |
4,332,890 |
1,282,872 |
4,626,541 |
3,457,690 |
253,951,647 |
||||||||||||||
December 31, 2024 | |||||||||||
In millions of COP | |||||||||||
Economic sector |
Loans and advances |
||||||||||
Local |
Foreign |
Total |
|||||||||
Agriculture |
5,520,414 |
2,813,604 |
8,334,018 |
||||||||
Petroleum and Mining Products |
2,126,602 |
636,010 |
2,762,612 |
||||||||
Food, Beverages and Tobacco |
10,132,520 |
2,164,911 |
12,297,431 |
||||||||
Chemical Production |
4,507,362 |
364,649 |
4,872,011 |
||||||||
Government |
10,256,608 |
627,705 |
10,884,313 |
||||||||
Construction |
14,441,608 |
9,134,115 |
23,575,723 |
||||||||
Commerce and Tourism |
24,920,337 |
8,480,380 |
33,400,717 |
||||||||
Transport and Communications |
12,313,907 |
597,216 |
12,911,123 |
||||||||
Public Services |
13,253,631 |
1,265,243 |
14,518,874 |
||||||||
Consumer Services |
61,263,015 |
35,692,512 |
96,955,527 |
||||||||
Commercial Services |
30,662,353 |
13,347,867 |
44,010,220 |
||||||||
Other Industries and Manufactured Products |
9,671,905 |
5,259,434 |
14,931,339 |
||||||||
Total |
199,070,262 |
80,383,646 |
279,453,908 |
||||||||
December 31, 2023 | |||||||||||
In millions of COP | |||||||||||
Economic sector |
Loans and advances |
||||||||||
Local |
Foreign |
Total |
|||||||||
Agriculture |
5,162,973 |
2,488,789 |
7,651,762 |
||||||||
Petroleum and Mining Products |
1,846,238 |
234,523 |
2,080,761 |
||||||||
Food, Beverages and Tobacco |
9,147,936 |
888,429 |
10,036,365 |
||||||||
Chemical Production |
4,299,308 |
25,409 |
4,324,717 |
||||||||
Government |
8,369,707 |
887,448 |
9,257,155 |
||||||||
Construction |
16,202,035 |
5,561,782 |
21,763,817 |
||||||||
Commerce and Tourism |
23,803,830 |
11,068,049 |
34,871,879 |
||||||||
Transport and Communications |
9,574,318 |
351,176 |
9,925,494 |
||||||||
Public Services |
11,758,265 |
1,286,561 |
13,044,826 |
||||||||
Consumer Services |
59,032,642 |
32,965,565 |
91,998,207 |
||||||||
Commercial Services |
27,474,593 |
7,217,591 |
34,692,184 |
||||||||
Other Industries and Manufactured Products |
8,679,684 |
5,624,796 |
14,304,480 |
||||||||
Total |
185,351,529 |
68,600,118 |
253,951,647 |
||||||||
December 31, 2024 | ||||||||||||||
In millions of COP | ||||||||||||||
Country |
Loans and advances |
% Participation |
Allowance for loans and
advances and lease losses
|
% Participation |
||||||||||
Colombia |
190,956,423 |
68.33% |
(12,490,991) |
77.20% |
||||||||||
Panamá |
47,300,183 |
16.93% |
(2,089,269) |
12.91% |
||||||||||
El Salvador |
18,712,218 |
6.70% |
(598,710) |
3.70% |
||||||||||
Guatemala |
21,125,637 |
7.56% |
(995,339) |
6.15% |
||||||||||
Puerto Rico |
1,359,447 |
0.49% |
(5,429) |
0.03% |
||||||||||
Total |
279,453,908 |
100.00% |
(16,179,738) |
100.00% |
||||||||||
December 31, 2023 | ||||||||||||||
In millions of COP | ||||||||||||||
Country |
Loans and advances |
% Participation |
Allowance for loans and
advances and lease losses
|
% Participation |
||||||||||
Colombia |
181,951,462 |
71.65% |
(13,133,577) |
80.96% |
||||||||||
Panamá |
38,599,152 |
15.20% |
(1,645,802) |
10.14% |
||||||||||
El Salvador |
15,373,156 |
6.05% |
(552,236) |
3.40% |
||||||||||
Guatemala |
16,958,954 |
6.68% |
(887,518) |
5.47% |
||||||||||
Puerto Rico |
1,068,923 |
0.42% |
(3,970) |
0.02% |
||||||||||
Total |
253,951,647 |
100.00% |
(16,223,103) |
100.00% |
||||||||||
December 31, 2024 | ||||||||||||||
In millions of COP | ||||||||||||||
Classification |
Stage 1 |
Stage 2 |
Stage 3 |
Total |
||||||||||
Commercial |
137,761,467 |
5,545,788 |
9,945,556 |
153,252,811 |
||||||||||
Consumer |
46,697,013 |
5,118,607 |
4,000,063 |
55,815,683 |
||||||||||
Mortgage |
37,076,580 |
2,701,930 |
1,963,091 |
41,741,601 |
||||||||||
Small Business Loans |
1,175,803 |
91,256 |
85,150 |
1,352,209 |
||||||||||
Financial Leases |
22,561,434 |
3,212,710 |
1,517,460 |
27,291,604 |
||||||||||
Loans and Advances |
245,272,297 |
16,670,291 |
17,511,320 |
279,453,908 |
||||||||||
December 31, 2023 | ||||||||||||||
In millions of COP | ||||||||||||||
Classification |
Stage 1 |
Stage 2 |
Stage 3 |
Total |
||||||||||
Commercial |
120,773,927 |
5,453,537 |
8,459,932 |
134,687,396 |
||||||||||
Consumer |
46,060,615 |
4,407,067 |
4,124,087 |
54,591,769 |
||||||||||
Mortgage |
32,210,648 |
2,628,654 |
1,411,106 |
36,250,408 |
||||||||||
Small Business Loans |
774,571 |
260,303 |
110,143 |
1,145,017 |
||||||||||
Financial Leases |
22,553,128 |
3,293,100 |
1,430,829 |
27,277,057 |
||||||||||
Loans and Advances |
222,372,889 |
16,042,661 |
15,536,097 |
253,951,647 |
||||||||||
December 31, 2024 | ||||||||||||||
In millions of COP | ||||||||||||||
Impairment |
Individual Evaluation |
Collective Evaluation |
||||||||||||
Amount |
ECL |
Amount |
ECL |
|||||||||||
Commercial |
6,007,099 |
3,443,047 |
3,938,457 |
2,854,636 |
||||||||||
Consumer |
- |
- |
4,000,063 |
3,482,791 |
||||||||||
Mortgage |
- |
- |
1,963,091 |
761,031 |
||||||||||
Financial Leases |
519,462 |
290,932 |
997,998 |
444,282 |
||||||||||
Small Business Loan |
- |
- |
85,150 |
54,279 |
||||||||||
Total |
6,526,561 |
3,733,979 |
10,984,759 |
7,597,019 |
||||||||||
December 31, 2023 | ||||||||||||||
In millions of COP | ||||||||||||||
Impairment |
Individual Evaluation |
Collective Evaluation |
||||||||||||
Amount |
ECL |
Amount |
ECL |
|||||||||||
Commercial |
5,198,384 |
2,825,357 |
3,261,548 |
2,401,344 |
||||||||||
Consumer |
- |
- |
4,124,087 |
3,460,299 |
||||||||||
Mortgage |
- |
- |
1,411,106 |
553,370 |
||||||||||
Financial Leases |
562,716 |
315,979 |
868,113 |
356,526 |
||||||||||
Small Business Loan |
- |
- |
110,143 |
77,923 |
||||||||||
Total |
5,761,100 |
3,141,336 |
9,774,997 |
6,849,462 |
||||||||||
Interest Rate - Trade balance - Fiscal balance | ||||||||||||||
In Millions of COP | ||||||||||||||
[+1%] |
Unchanged |
[-1%] |
||||||||||||
[+1%] |
182,233 |
88,755 |
4,983 |
|||||||||||
Inflation |
Unchanged |
93,478 |
- |
-83,772 |
||||||||||
[-1%] |
13,601 |
(79,877) |
-163,649 |
|||||||||||
Expected credit loss by scenarios | ||||||||||||||
In millions of COP | ||||||||||||||
2024 |
2023 |
|||||||||||||
| Methodologies | Optimistic |
Pessimistic |
Optimistic |
Pessimistic |
||||||||||
Collective methodology |
(435,740) |
368,782 |
(437,294) |
343,209 |
||||||||||
Collateral methodology |
(155,591) |
173,438 |
(149,983) |
137,172 |
||||||||||
Individual methodology(1) |
(408,368) |
763,362 |
(240,474) |
605,152 |
||||||||||
Total |
(999,699) |
1,305,582 |
(827,751) |
1,085,533 |
||||||||||
| Maximum Exposure to Credit Risk | ||||||||||||||||||||||||||
| In millions of COP | ||||||||||||||||||||||||||
Debt instruments |
Equity |
Other financial instruments(1) |
Derivatives(2) |
|||||||||||||||||||||||
| 2024 | 2023 | 2024 | 2023 | 2024 | 2023 | 2024 | 2023 | |||||||||||||||||||
Low Risk |
29,130,380 |
21,078,496 |
363,198 |
220,967 |
1,712 |
21,976 |
834,821 |
1,711,788 |
||||||||||||||||||
Medium Risk |
4,873,025 |
827,469 |
57,119 |
17,354 |
16,479 |
- |
1,154 |
316 |
||||||||||||||||||
High Risk |
2,580,107 |
3,242,504 |
677 |
587 |
2,966 |
2,966 |
7,086 |
17,327 |
||||||||||||||||||
Without Rating |
- |
- |
590,316 |
304,302 |
13,228 |
13,377 |
86,437 |
95,319 |
||||||||||||||||||
Total |
36,583,512 |
25,148,469 |
1,011,310 |
543,210 |
34,385 |
38,319 |
929,498 |
1,824,750 |
||||||||||||||||||
| Maximum Exposure to Credit Risk | ||||||||||||||||||||
| In millions of COP | ||||||||||||||||||||
Maximum Exposure |
Collateral(1) |
Net Exposure |
||||||||||||||||||
| 2024 | 2023 | 2024 | 2023 | 2024 | 2023 | |||||||||||||||
Debt instruments |
36,583,512 |
25,148,469 |
(1,669,011) |
(1,407,484) |
34,914,501 |
23,740,985 |
||||||||||||||
Derivatives ** |
929,498 |
1,824,750 |
(589,098) |
(698,662) |
340,400 |
1,126,088 |
||||||||||||||
Equity |
1,011,310 |
543,210 |
- |
- |
1,011,310 |
543,210 |
||||||||||||||
Other financial instruments |
34,385 |
38,319 |
- |
- |
34,385 |
38,319 |
||||||||||||||
Total |
38,558,705 |
27,554,748 |
(2,258,109) |
(2,106,146) |
36,300,596 |
25,448,602 |
||||||||||||||
| Maximum Exposure to Credit Risk | ||||||||||||||||||||
| In millions of COP | ||||||||||||||||||||
Exposure |
Impairment |
Final Exposure |
||||||||||||||||||
| 2024 | 2023 | 2024 | 2023 | 2024 | 2023 | |||||||||||||||
Fair Value |
28,119,697 |
18,244,584 |
6,513 |
5,562 |
28,113,184 |
18,239,022 |
||||||||||||||
Amortized Cost |
8,463,815 |
6,903,885 |
58,937 |
55,803 |
8,404,878 |
6,848,082 |
||||||||||||||
Total |
36,583,512 |
25,148,469 |
65,450 |
61,365 |
36,518,062 |
25,087,104 |
||||||||||||||
| Maximum Exposure to Credit Risk | ||||||||||||||||||||
| In millions of COP | ||||||||||||||||||||
Exposure |
Impairment |
Final Exposure |
||||||||||||||||||
| 2024 | 2023 | 2024 | 2023 | 2024 | 2023 | |||||||||||||||
Fair Value through profit or loss |
537,213 |
98,853 |
- |
- |
537,213 |
98,853 |
||||||||||||||
Fair Value through OCI |
474,097 |
444,357 |
- |
- |
474,097 |
444,357 |
||||||||||||||
Total |
1,011,310 |
543,210 |
- |
- |
1,011,310 |
543,210 |
||||||||||||||
| Maximum Exposure to Credit Risk | ||||||||||||||||||||
| In millions of COP | ||||||||||||||||||||
Maximum Exposure |
Collateral(1) |
Net Exposure |
||||||||||||||||||
| 2024 | 2023 | 2024 | 2023 | 2024 | 2023 | |||||||||||||||
Debt instruments |
36,583,512 |
25,148,469 |
(1,669,011) |
(1,407,484) |
34,914,501 |
23,740,985 |
||||||||||||||
Derivatives ** |
929,498 |
1,824,750 |
(589,098) |
(698,662) |
340,400 |
1,126,088 |
||||||||||||||
Equity |
1,011,310 |
543,210 |
- |
- |
1,011,310 |
543,210 |
||||||||||||||
Other financial instruments |
34,385 |
38,319 |
- |
- |
34,385 |
38,319 |
||||||||||||||
Total |
38,558,705 |
27,554,748 |
(2,258,109) |
(2,106,146) |
36,300,596 |
25,448,602 |
||||||||||||||
Debt instruments |
Equity |
Other financial instruments(1) |
Derivatives(2) |
|||||||||||||||||||||||
| 2024 | 2023 | 2024 | 2023 | 2024 | 2023 | 2024 | 2023 | |||||||||||||||||||
Sector Concentration |
||||||||||||||||||||||||||
Corporate |
4,764,748 |
3,675,913 |
337,332 |
279,396 |
16,479 |
23,887 |
362,568 |
951,573 |
||||||||||||||||||
Financial |
5,612,993 |
4,626,294 |
252,731 |
211,037 |
17,906 |
14,432 |
317,722 |
870,598 |
||||||||||||||||||
Government |
26,201,390 |
16,827,596 |
- |
- |
- |
- |
829 |
- |
||||||||||||||||||
Funds ETF |
4,381 |
18,666 |
421,247 |
52,777 |
- |
248,379 |
2,579 |
|||||||||||||||||||
Total |
36,583,512 |
25,148,469 |
1,011,310 |
543,210 |
34,385 |
38,319 |
929,498 |
1,824,750 |
||||||||||||||||||
Concentration by Region |
||||||||||||||||||||||||||
North America |
6,109,348 |
4,666,195 |
273 |
197 |
- |
- |
132,870 |
344,639 |
||||||||||||||||||
Latam |
30,441,888 |
20,440,893 |
706,437 |
529,033 |
34,385 |
38,319 |
426,424 |
1,009,595 |
||||||||||||||||||
Europe |
32,276 |
41,381 |
3,908 |
- |
- |
— |
147,533 |
467,937 |
||||||||||||||||||
Others (Includes Funds and ETF) |
- |
— |
300,692 |
13,980 |
- |
- |
222,671 |
2,579 |
||||||||||||||||||
Total |
36,583,512 |
25,148,469 |
1,011,310 |
543,210 |
34,385 |
38,319 |
929,498 |
1,824,750 |
||||||||||||||||||
Maximum Exposure to Credit Risk | ||||||||
In millions of COP | ||||||||
Other financial instruments(1) |
||||||||
| 2024 | 2023 | |||||||
Sovereign Risk |
14,487,622 |
7,520,002 |
||||||
AAA |
10,113,581 |
9,613,353 |
||||||
AA+ |
4,714,501 |
2,934,561 |
||||||
AA |
770,266 |
761,139 |
||||||
AA- |
68,124 |
285,253 |
||||||
A+ |
906,847 |
763,754 |
||||||
A |
465,978 |
465,025 |
||||||
A- |
352,619 |
396,755 |
||||||
BBB+ |
587,802 |
604,672 |
||||||
BBB |
221,092 |
243,820 |
||||||
BBB- |
219,676 |
1,808,396 |
||||||
Other |
4,960,616 |
1,745,020 |
||||||
Not rated |
689,981 |
412,998 |
||||||
Total |
38,558,705 |
27,554,748 |
||||||
Modified Duration |
Changes in Interest Rates (bps) |
|||||||||||||||||||
Zone |
Band |
Lower Limit |
Upper Limit |
Legal Currency |
UVR |
Currency
Currency
|
||||||||||||||
1 |
0 |
0.08 |
274 |
274 |
100 |
|||||||||||||||
Zone 1 |
2 |
0.08 |
0.25 |
268 |
274 |
100 |
||||||||||||||
3 |
0.25 |
0.5 |
259 |
274 |
100 |
|||||||||||||||
4 |
0.5 |
1 |
233 |
274 |
100 |
|||||||||||||||
5 |
1 |
1.9 |
222 |
250 |
90 |
|||||||||||||||
Zone 2 |
6 |
1.9 |
2.8 |
222 |
250 |
80 |
||||||||||||||
7 |
2.8 |
3.6 |
211 |
220 |
75 |
|||||||||||||||
8 |
3.6 |
4.3 |
211 |
220 |
75 |
|||||||||||||||
9 |
4.3 |
5.7 |
172 |
200 |
70 |
|||||||||||||||
10 |
5.7 |
7.3 |
162 |
170 |
65 |
|||||||||||||||
Zone 3 |
11 |
7.3 |
9.3 |
162 |
170 |
60 |
||||||||||||||
12 |
9.3 |
10.6 |
162 |
170 |
60 |
|||||||||||||||
13 |
10.6 |
12 |
162 |
170 |
60 |
|||||||||||||||
14 |
12 |
20 |
162 |
170 |
60 |
|||||||||||||||
15 |
20 |
162 |
170 |
60 |
||||||||||||||||
Currency |
Sensitivity Factor |
|||||||
United States Dollar |
12.49 % |
|||||||
Euro |
11.00 % |
|||||||
Other currencies |
13.02 % |
|||||||
Equity and Fund Risk |
14.70 % |
|||||||
December 2024 | ||||||||||||||
In millions of COP | ||||||||||||||
Factor |
December 31 |
Average |
Maximum |
Minimum |
||||||||||
Interest Rate Risk VaR |
540,397 |
507,425 |
586,194 |
433,465 |
||||||||||
Foreign Exchange Rate Risk VaR |
764,920 |
554,900 |
764,920 |
364,421 |
||||||||||
Equity Risk VaR |
360,287 |
351,134 |
360,287 |
340,363 |
||||||||||
Fund Risk VaR |
31,962 |
25,653 |
31,962 |
18,005 |
||||||||||
Total Value at Risk |
1,697,566 |
1,439,112 |
||||||||||||
December 2023 | ||||||||||||||
In millions of COP | ||||||||||||||
Factor |
December 31 |
Average |
Maximum |
Minimum |
||||||||||
Interest Rate Risk VaR |
405,467 |
418,472 |
542,464 |
383,914 |
||||||||||
Foreign Exchange Rate Risk VaR |
332,662 |
185,624 |
374,407 |
51,410 |
||||||||||
Equity Risk VaR |
342,024 |
332,443 |
347,539 |
312,136 |
||||||||||
Fund Risk VaR |
15,847 |
23,292 |
27,923 |
15,847 |
||||||||||
Total Value at Risk |
1,096,000 |
959,831 |
||||||||||||
December 31, 2024 |
December 31, 2023 |
|||||||
In millions of COP | ||||||||
Assets sensitivity 100 bps |
1,262,776 |
1,152,782 |
||||||
Liabilities sensitivity 100 bps |
915,528 |
595,749 |
||||||
Net interest income sensitivity 100 bps |
347,248 |
557,033 |
||||||
December 31, 2024 |
December 31, 2023 |
|||||||
In millions of USD | ||||||||
Assets sensitivity 100 bps |
76,219 |
75,052 |
||||||
Liabilities sensitivity 100 bps |
83,051 |
74,800 |
||||||
Net interest income sensitivity 100 bps |
(6,832) |
252 |
||||||
December 31, 2024 |
December 31, 2023 |
||||||||||
Fair Value |
36,226 |
41,096 |
|||||||||
Delta |
14.70 % |
14.70 % |
|||||||||
Sensitivity |
5,325 |
6,041 |
|||||||||
Liquidity Coverage Ratio |
December 31, 2024 |
December 31, 2023 |
|||||||||
Net cash outflows into 30 days |
23,887,074 |
13,752,496 |
|||||||||
Liquid Assets |
59,617,840 |
50,680,823 |
|||||||||
Liquidity coverage ratio(1) |
249.58 % |
368.52 % |
|||||||||
Liquid Assets(1) |
December 31, 2024 |
December 31, 2023 |
||||||
High quality liquid assets(2) |
||||||||
Cash |
27,931,834 |
25,273,317 |
||||||
High quality liquid securities |
24,862,861 |
19,951,771 |
||||||
Other Liquid Assets |
||||||||
Other securities(3) |
6,823,145 |
5,455,735 |
||||||
Total Liquid Assets |
59,617,840 |
50,680,823 |
||||||
Financial Assets |
0 – 30 days |
31 days – 1 Year |
1 - 3 Years |
3 - 5 Years |
More than 5 years |
||||||||||||
Cash and balances with central bank |
24,881,536 |
||||||||||||||||
Interbank borrowings - Repurchase agreements |
7,815,791 |
146,772 |
|||||||||||||||
Financial assets investments |
2,303,523 |
13,929,810 |
13,318,529 |
5,257,338 |
7,910,771 |
||||||||||||
Loans and advances to customers |
13,067,571 |
102,476,191 |
106,645,598 |
61,320,760 |
113,075,471 |
||||||||||||
Derivative financial instruments |
8,858,966 |
5,306,353 |
2,288,557 |
757,393 |
847,796 |
||||||||||||
Total financial assets |
56,927,387 |
121,859,126 |
122,252,684 |
67,335,491 |
121,834,038 |
||||||||||||
Financial Assets |
0 – 30 days |
31 days – 1 Year |
1 - 3 Years |
3 - 5 Years |
More than 5 years |
||||||||||||
Cash and balances with central bank |
24,461,384 |
- |
- |
- |
- |
||||||||||||
Interbank borrowings - Repurchase agreements |
14,497,024 |
452,847 |
- |
- |
- |
||||||||||||
Financial assets investments |
2,467,493 |
12,311,055 |
5,462,198 |
2,597,787 |
5,525,545 |
||||||||||||
Loans and advances to customers |
12,474,473 |
90,653,852 |
96,770,268 |
57,038,679 |
104,103,871 |
||||||||||||
Derivative financial instruments |
3,922,735 |
12,977,266 |
4,141,896 |
1,699,943 |
1,405,850 |
||||||||||||
Total financial assets |
57,823,109 |
116,395,020 |
106,374,362 |
61,336,409 |
111,035,266 |
||||||||||||
Financial Liabilities |
0 – 30 days |
31 days – 1 Year |
1 - 3 Years |
3 - 5 Years |
More than 5 years |
||||||||||||
Demand deposit from customers |
162,015,643 |
||||||||||||||||
Time deposits from customers |
16,673,292 |
64,079,401 |
16,502,005 |
5,879,599 |
17,667,549 |
||||||||||||
Interbank deposits-Repurchase agreements |
1,801,163 |
46,538 |
— |
||||||||||||||
Borrowings from other financial institutions |
381,534 |
8,811,727 |
3,537,113 |
1,815,062 |
2,013,978 |
||||||||||||
Debt securities in issue |
56,666 |
1,698,794 |
6,917,904 |
1,131,868 |
5,846,266 |
||||||||||||
Preferred Shares |
57,701 |
115,403 |
115,403 |
295,697 |
|||||||||||||
Derivative financial instruments |
8,644,300 |
5,100,947 |
2,152,992 |
777,663 |
766,037 |
||||||||||||
Total financial liabilities |
189,572,598 |
79,795,108 |
29,225,417 |
9,719,595 |
26,589,527 |
||||||||||||
Financial Liabilities |
0 – 30 days |
31 days – 1 Year |
1 - 3 Years |
3 - 5 Years |
More than 5 years |
||||||||||||
Demand deposit from customers |
143,307,149 |
- |
- |
- |
- |
||||||||||||
Time deposits from customers |
15,107,203 |
57,588,430 |
17,737,464 |
6,671,911 |
18,331,091 |
||||||||||||
Interbank deposits-Repurchase agreements |
809,027 |
242,810 |
23,431 |
- |
- |
||||||||||||
Borrowings from other financial institutions |
763,580 |
5,604,327 |
6,651,228 |
2,403,786 |
2,661,657 |
||||||||||||
Debt securities in issue |
124,055 |
3,913,687 |
4,363,593 |
6,023,469 |
3,836,353 |
||||||||||||
Preferred Shares |
— |
57,701 |
115,403 |
115,403 |
295,697 |
||||||||||||
Derivative financial instruments |
3,337,039 |
13,511,532 |
4,146,259 |
1,688,473 |
1,484,149 |
||||||||||||
Total financial liabilities |
163,448,053 |
80,918,487 |
33,037,378 |
16,903,042 |
26,608,947 |
||||||||||||
December 31, 2024 |
0 – 30 days |
31 days – 1 Year |
1 - 3 Years |
3 - 5 Years |
More than 5 years |
||||||||||||
In millions of COP | |||||||||||||||||
Financial guarantees |
744,077 |
6,535,071 |
2,135,249 |
60,876 |
669,028 |
||||||||||||
December 31, 2023 |
0 – 30 days |
31 days – 1 Year |
1 - 3 Years |
3 - 5 Years |
More than 5 years |
||||||||||||
In millions of COP | |||||||||||||||||
Financial guarantees |
826,699 |
9,388,345 |
1,489,899 |
450,875 |
535,380 |
||||||||||||
December 31, 2024 | |||||
In millions of COP | |||||
USD LIBOR(1) |
|||||
Assets |
|||||
Loans |
1,890 |
||||
Bonds |
- |
||||
Derivatives |
- |
||||
Total Assets |
1,890 |
||||
Liabilities |
|||||
Loans |
- |
||||
Term deposits |
- |
||||
Total Liabilities |
- |
||||
December 31, 2023 | |||||
In millions of COP | |||||
USD LIBOR(1) |
|||||
Assets |
|||||
Loans |
66,351 |
||||
Bonds |
- |
||||
Derivatives |
- |
||||
Total Assets |
66,351 |
||||
Liabilities |
|||||
Loans |
323 |
||||
Term deposits |
6,750 |
||||
Total Liabilities |
7,073 |
||||
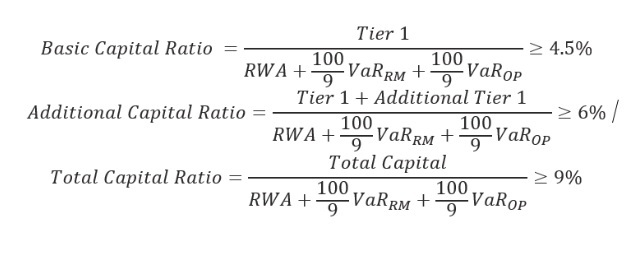
Technical Capital |
Asof |
||||||||||
A diciembre 31, 2024 |
A diciembre 31, 2023 |
||||||||||
In millions of COP |
|||||||||||
Primary capital |
45,245,389 |
39,704,542 |
|||||||||
Share Capital |
480,914 |
480,914 |
|||||||||
Additional paid-in capital |
4,857,454 |
4,857,454 |
|||||||||
Preferred shares |
584,204 |
584,204 |
|||||||||
Legal reserve |
14,429,333 |
14,541,561 |
|||||||||
Occasional reserves |
9,874,876 |
7,250,712 |
|||||||||
Non-controlling interest |
1,041,807 |
960,217 |
|||||||||
Other comprehensive income |
6,642,526 |
4,065,182 |
|||||||||
Net income attributable to equity holders of the Parent Company |
6,267,744 |
6,116,936 |
|||||||||
Retained earnings |
1,066,531 |
847,362 |
|||||||||
Less: |
(10,188,105) |
(8,919,345) |
|||||||||
Prior-year losses |
(79,590) |
(79,587) |
|||||||||
Intangibles assets |
(9,017,419) |
(7,818,125) |
|||||||||
Revaluation property, plant and equipment |
(340,612) |
(350,061) |
|||||||||
Other intangibles |
(750,484) |
(671,572) |
|||||||||
Deferred net income tax |
- |
— |
|||||||||
Primary capital (Tier I) |
35,057,283 |
30,785,197 |
|||||||||
Hybrid bonds |
4,669,804 |
4,283,448 |
|||||||||
Subordinated bonds |
595,442 |
678,797 |
|||||||||
General provisions |
220,519 |
375,902 |
|||||||||
Computed secondary capital (Tier II) |
5,485,765 |
5,338,147 |
|||||||||
Less: |
(13,798) |
(10,687) |
|||||||||
Technical capital (1) |
40,529,250 |
36,112,657 |
|||||||||
Capital Ratios |
|||||||||||
Primary capital to risk-weighted assets (Tier I) |
11.89 % |
11.42 % |
|||||||||
Secondary capital to risk-weighted assets (Tier II) |
1.86 % |
1.98 % |
|||||||||
Risk-weighted assets including market risk and operational risk |
294,794,366 |
269,591,211 |
|||||||||
Technical capital to risk-weighted assets (2) |
13.75 % |
13.40 % |
|||||||||
|
| ||
|
| ||
|
SEPARATE FINANCIAL STATEMENTS
2024 & 2023
| ||

| Note | December 31, 2024 |
December 31, 2023 | |||||||||
| ASSETS | |||||||||||
| Cash and cash equivalents | 3 | 19,025,227 | 24,348,860 | ||||||||
| Financial assets investments, net | 4.1 | 21,756,044 | 13,757,902 | ||||||||
| Derivative financial instruments | 4.2 | 2,924,434 | 6,215,942 | ||||||||
| Financial assets investments, net and derivative financial instruments | 24,680,478 | 19,973,844 | |||||||||
| Loans and advances to customers | 191,927,705 | 182,921,469 | |||||||||
| Allowance for loans, advances and lease losses | (13,829,166) | (12,892,352) | |||||||||
| Cartera de créditos y operaciones de leasing financiero, neto | 5 | 178,098,539 | 170,029,117 | ||||||||
Assets held for sale and inventories, net |
13 | 392,746 | 459,328 | ||||||||
Investment in subsidiaries |
7 | 28,718,183 | 24,751,945 | ||||||||
Investment in associates and joint ventures |
8 | 205,312 | 298,598 | ||||||||
Premises and equipment, net |
10 | 4,866,583 | 5,446,056 | ||||||||
Investment properties |
11 | 846,853 | 574,550 | ||||||||
Right of use asset under lease agreements |
6.2.1 | 1,296,314 | 1,228,649 | ||||||||
Intangible assets, net |
9 | 370,461 | 345,553 | ||||||||
Other assets, net |
14 | 4,084,045 | 4,133,838 | ||||||||
| TOTAL ASSETS | 262,584,741 | 251,590,338 | |||||||||
| LIABILITIES AND EQUITY | |||||||||||
| LIABILITIES | |||||||||||
| Deposits by customers | 15 | 185,801,073 | 170,231,400 | ||||||||
| Interbank deposits and repurchase agreements and other similar secured borrowing | 16 | 628,483 | 263,751 | ||||||||
| Derivative financial instruments | 4.2 | 2,667,439 | 6,699,521 | ||||||||
| Borrowings from other financial institutions | 17 | 10,557,864 | 12,000,269 | ||||||||
| Debt instruments in issue | 18 | 7,801,008 | 10,958,823 | ||||||||
| lease contracts liabilities, net | 6.2.2 | 1,391,215 | 1,352,302 | ||||||||
| Preferred shares | 19 | 584,204 | 584,204 | ||||||||
| Current tax | 1,069 | 1,520 | |||||||||
| Deferred tax, net | 12.4 | 1,387,838 | 1,113,359 | ||||||||
| Employee benefit plans | 20 | 711,067 | 684,439 | ||||||||
| Other liabilities | 21, 22 | 8,782,160 | 10,619,082 | ||||||||
| TOTAL LIABILITIES | 220,313,420 | 214,508,670 | |||||||||
| EQUITY | |||||||||||
| Share capital | 23 | 480,914 | 480,914 | ||||||||
| Additional paid-in-capital | 4,837,497 | 4,837,497 | |||||||||
| Appropriated reserves | 24 | 22,898,182 | 20,292,454 | ||||||||
| Retained earnings | 5,544,752 | 5,935,658 | |||||||||
| Accumulated other comprehensive income, net of tax | 8,509,976 | 5,535,145 | |||||||||
| TOTAL EQUITY | 42,271,321 | 37,081,668 | |||||||||
| TOTAL LIABILITIES AND EQUITY | 262,584,741 | 251,590,338 | |||||||||
| Note | 2024 | 2023 | ||||||||||||
| Interest on loans and financial leases | ||||||||||||||
| Commercial | 12,533,239 | 13,496,215 | ||||||||||||
| Consumer | 6,953,090 | 8,138,830 | ||||||||||||
| Small business loans | 117,938 | 142,804 | ||||||||||||
| Mortgage | 2,806,292 | 2,916,180 | ||||||||||||
| Financial leases | 3,375,713 | 3,623,476 | ||||||||||||
| Total interest income on loans and financial leases | 25,786,272 | 28,317,505 | ||||||||||||
| Interest income on overnight and market funds | 27,296 | 10,404 | ||||||||||||
| Interest and valuation on financial instruments | 25.1 | 1,885,906 | 837,862 | |||||||||||
| Other interest income | 195,137 | 198,822 | ||||||||||||
| Total interest and valuation on financial instruments | 27,894,611 | 29,364,593 | ||||||||||||
| Interest expenses | 25.2 | (11,974,718) | (13,887,154) | |||||||||||
| Net interest margin and valuation on financial instruments before impairment on loans and financial leases, off balance sheet credit instruments and other financial instruments | 15,919,893 | 15,477,439 | ||||||||||||
| Credit impairment charges on loans, advances and financial leases, net | 5 | (5,824,678) | (6,723,335) | |||||||||||
| Credit (impairment) recovery for other financial instruments | (73,116) | (8,858) | ||||||||||||
| Total credit impairment charges, net | (5,897,794) | (6,732,193) | ||||||||||||
| Net interest margin and valuation on financial instruments after impairment on loans and financial leases and off balance sheet credit instruments and other financial instruments | 10,022,099 | 8,745,246 | ||||||||||||
| Fees and commissions income | 25.3.1 | 5,738,904 | 5,333,049 | |||||||||||
| Fees and commissions expenses | 25.3.2 | (3,022,011) | (2,641,905) | |||||||||||
| Total fees and commissions, net | 2,716,893 | 2,691,144 | ||||||||||||
| Other operating income, net | 25.4 | 1,929,017 | 2,903,331 | |||||||||||
| Dividends and other net income from equity interests | 7,8,25.5 | 1,842,218 | 2,112,255 | |||||||||||
| Total income, net | 16,510,227 | 16,451,976 | ||||||||||||
| Operating expenses | ||||||||||||||
| Salaries and employee benefits | 26.1 | (3,788,535) | (3,504,950) | |||||||||||
| Other administrative and general expenses | 26.2 | (3,497,556) | (3,201,592) | |||||||||||
| Taxes other than income tax | 26.2 | (1,182,868) | (1,183,244) | |||||||||||
| Impairment, depreciation and amortization | 26.3 | (938,047) | (899,647) | |||||||||||
| Total operating expenses | (9,407,006) | (8,789,433) | ||||||||||||
| Profit before income tax | 7,103,221 | 7,662,543 | ||||||||||||
| Income tax | 12 | (1,525,001) | (1,682,813) | |||||||||||
| Net income | 5,578,220 | 5,979,730 | ||||||||||||
| Note | 2024 | 2023 |
|||||||||
| Net income | 5,578,220 | 5,979,730 | |||||||||
| Other comprehensive income/(loss) that will not be reclassified to net income | |||||||||||
| Remeasurement (loss)/income related to defined benefit liability | 20.1 |
7,731 | (24,291) | ||||||||
| Income tax | 12.3 |
(3,043) | 9,061 | ||||||||
| Net of tax amount | 4,688 | (15,230) | |||||||||
| Other comprehensive income/(loss) that may be reclassified to net income | |||||||||||
Net gain (loss) on valuation of financial instruments (1) |
4.1 |
(35,842) | 68,819 | ||||||||
| Income tax | 12.3 |
16,082 | (19,335) | ||||||||
| Net of tax amount | (19,760) |
49,484 |
|||||||||
| Surplus from equity method | |||||||||||
Unrealized gain/(loss) on investments in subsidiaries using equity method |
7 |
3,434,684 | (5,431,964) | ||||||||
Gain/(loss) on valuation of investments in associates and joint ventures (2) |
8 |
(187) | 172 | ||||||||
| Net of tax amount | 3,434,497 |
(5,431,792) |
|||||||||
| Effects of hedge accounting application | |||||||||||
| (Loss) gain on hedge of net investment in a foreign operation | 4.3 |
(742,930) | 1,948,833 | ||||||||
| Income tax | 12.3 |
307,656 | (772,755) | ||||||||
Net of tax amount (3) |
(435,274) | 1,176,078 | |||||||||
| Unrealized gain on cash flow hedges | 4.3 |
351 | - | ||||||||
| Reclassification to profit or loss | 4.3 |
(135) | - | ||||||||
| Income tax | 12.3 |
(87) | - | ||||||||
| Net of tax amount | 129 | - | |||||||||
| Total other comprehensive income that may be reclassified to net income | 2,979,592 | (4,206,230) | |||||||||
| Total other comprehensive income, net of tax | 2,984,280 | (4,221,460) | |||||||||
| Total comprehensive income | 8,562,500 | 1,758,270 | |||||||||
| Accumulated other comprehensive income | |||||||||||||||||||||||||||||||||||||||||
| Note |
Share
capital
|
Additional
paid in capital
|
Appropriated reserves | Financial instruments | Adjustments on first-time application of IFRS | Revaluation of assets | Employee benefits | Equity method surplus (1) |
Cash flow hedges | Total other comprehensive income, net |
Retained earnings
|
Total equity | |||||||||||||||||||||||||||||
Balance as of January 1, 2024 |
480,914 | 4,837,497 | 20,292,454 | 173,289 | 2,555,858 | 2,137 | (15,765) | 2,819,626 | . | 5,535,145 | 5,935,658 | 37,081,668 | |||||||||||||||||||||||||||||
| To pay a dividend corresponding to 509,704,584 common shares and 452,122,416 shares with preferred dividend and without voting rights, subscribed and paid as of December 31, 2023, at the rate of COP 3,536 per share, payable as follows: COP 884 per share and quarter, on the following dates: April 1, July 2, July 2, October 1, 2024 and January 2, 2025. | - | - | - | - | - | - | - | - | - | (3,343,319) | (3,343,319) | ||||||||||||||||||||||||||||||
| Reserve for equity strengthening and future growth. | - | - | 2,605,222 | - | - | - | - | - | - | (2,605,222) | - | ||||||||||||||||||||||||||||||
| Reserve for social benefit projects and donations. | - | - | - | - | - | - | - | - | - | (33,000) | (33,000) | ||||||||||||||||||||||||||||||
| Reclassification of unclaimed dividends in accordance with Article 85 of the Bank's bylaws to reserves. | - | - | 506 | - | - | - | - | - | - | - | 506 | ||||||||||||||||||||||||||||||
| Realization of retained earnings. | - | - | - | - | (9,449) | - | - | - | (9,449) | 9,449 | - | ||||||||||||||||||||||||||||||
| Equity method from participation in subsidiaries, associates and joint ventures. | - | - | - | - | - | - | - | - | - | 2,966 | 2,966 | ||||||||||||||||||||||||||||||
| Net income | - | - | - | - | - | - | - | - | - | 5,578,220 | 5,578,220 | ||||||||||||||||||||||||||||||
| Other comprehensive income | 12.3 | - | - | - | (19,760) (2) |
- | - | 4,688 | 2,999,223 | 129 | 2,984,280 | - | 2,984,280 | ||||||||||||||||||||||||||||
| Equity as of December 31, 2024 | 480,914 | 4,837,497 | 22,898,182 | 153,529 | 2,546,409 | 2,137 | (11,077) | 5,818,849 | 129 | 8,509,976 | 5,544,752 | 42,271,321 | |||||||||||||||||||||||||||||
| Accumulated other comprehensive income | |||||||||||||||||||||||||||||||||||||||||||||||||||||||||||
| Note |
Share
capital
|
Additional
paid in capital
|
Appropriated reserves | Financial instruments | Adjustments on first-time application of IFRS | Revaluation of assets | Employee benefits | Equity method surplus (1) |
Total other comprehensive income, net |
Retained earnings
|
Total equity | ||||||||||||||||||||||||||||||||||||||||||||||||
Balance as of January 1, 2023 |
480,914 | 4,837,497 | 16,733,917 | 123,805 | 2,557,668 | 2,137 | (535) | 7,075,340 | 9,758,415 | 6,931,037 | 38,741,780 | ||||||||||||||||||||||||||||||||||||||||||||||||
| Dividend payment corresponding to 509,704,584 common shares and 452,122,416 preferred shares without voting rights, subscribed and paid as of December 31, 2022, at a rate of COP 3,536 per share, payable as follows: COP 884 per share quarterly, on the following dates: April 3, July 4, October 2, 2023 and January 2, 2024. | - | - | - | - | - | - | - | - | - | (3,343,319) | (3,343,319) | ||||||||||||||||||||||||||||||||||||||||||||||||
| Reserve for equity strengthening and future growth. | - | - | 3,557,980 | - | - | - | - | - | - | (3,557,980) | - | ||||||||||||||||||||||||||||||||||||||||||||||||
| Reserve for social benefit projects and donations. | - | - | - | - | - | - | - | - | - | (33,000) | (33,000) | ||||||||||||||||||||||||||||||||||||||||||||||||
| Reclassification of unclaimed dividends in accordance with Article 85 of the Bank's bylaws to reserves. | - | - | 557 | - | - | - | - | - | - | - | 557 | ||||||||||||||||||||||||||||||||||||||||||||||||
| Realization of retained earnings. | - | - | - | - | (1,810) | - | - | - | (1,810) | 1,810 | - | ||||||||||||||||||||||||||||||||||||||||||||||||
| Equity method from participation in subsidiaries, associates and joint ventures. | - | - | - | - | - | - | - | - | - | (42,620) | (42,620) | ||||||||||||||||||||||||||||||||||||||||||||||||
| Net income | - | - | - | - | - | - | - | - | - | 5,979,730 | 5,979,730 | ||||||||||||||||||||||||||||||||||||||||||||||||
| Other comprehensive income | 12.3 | - | - | - | 49,484 (2) |
- | - | (15,230) | (4,255,714) | (4,221,460) | - | (4,221,460) | |||||||||||||||||||||||||||||||||||||||||||||||
| Equity as of December 31, 2023 | 480,914 | 4,837,497 | 20,292,454 | 173,289 | 2,555,858 | 2,137 | (15,765) | 2,819,626 | 5,535,145 | 5,935,658 | 37,081,668 | ||||||||||||||||||||||||||||||||||||||||||||||||
| Note | 2024 | 2023 | ||||||||||||
| Net income | 5,578,220 | 5,979,730 | ||||||||||||
| Adjustments to reconcile net income to net cash provided by operating activities: | ||||||||||||||
| Depreciation, amortization and impairment | 26.3 | 938,047 | 899,647 | |||||||||||
| Equity method | 25.5 | (1,883,281) | (2,040,133) | |||||||||||
| Impairment (recovery) of provision for investments | 4.1 | 121,788 | (7,381) | |||||||||||
| Credit impairment charges on loans and financial leases, net | 5 | 5,824,678 | 6,723,335 | |||||||||||
| Other assets impairment | 73,116 | 16,239 | ||||||||||||
| Net interest income | (14,057,928) | (14,679,270) | ||||||||||||
| Gain on sale of equity instruments | 25.5 | (18,516) | (9,553) | |||||||||||
| Gain on sale of portfolio | 25.4 | (112,128) | (271,834) | |||||||||||
| Gain on sale of property and equipment | 25.4 | (37,249) | (107,390) | |||||||||||
| Gain on repositioning of inventories and sale of assets held for sale | 25.4 | (133,659) | (140,668) | |||||||||||
| Interest and valuation of financial instruments at fair value - Debt securities | 25.1 | (1,224,421) | (622,737) | |||||||||||
| Interest on debt securities held to maturity | 25.1 | (279,830) | (299,236) | |||||||||||
| Gain on valuation of equity instruments | (58,399) | (58,086) | ||||||||||||
| Loss on valuation of cash operations | 25.1 | 13,812 | 48,373 | |||||||||||
| Gain on valuation of derivatives | (324,505) | (171,022) | ||||||||||||
| Loss on valuation of investment properties | 11, 25.4 | (68,536) | (27,818) | |||||||||||
| Other provisions | 22,767 | 29,568 | ||||||||||||
| Bonds and short-term benefits | 496,716 | 553,823 | ||||||||||||
| Other non-cash items | 8,245 | 872 | ||||||||||||
| Preferred shares dividend expense | 25.2 | 57,701 | 57,701 | |||||||||||
| Dividends on equity investments | 25.5 | (3,810) | (4,482) | |||||||||||
| Effect of exchange rate changes | 310,453 | (251,857) | ||||||||||||
| Income tax expense | 12 | 1,525,001 | 1,682,813 | |||||||||||
| Change in operating assets and liabilities: | ||||||||||||||
| (Increase) decrease Financial instruments measured at fair value through profit and loss | (6,056,732) | 394,688 | ||||||||||||
| Increase Loan portfolio and financial leasing operations | (14,097,565) | (8,499,818) | ||||||||||||
| Increase Other accounts receivable | (183,100) | (319,730) | ||||||||||||
| (Increase) Decrease Derivatives | (415,243) | 797,574 | ||||||||||||
| Decrease (Increase) Other assets | 125,251 | (814,622) | ||||||||||||
| Increase Deposits | 15,189,956 | 13,012,343 | ||||||||||||
| Increase decrease Increase in accounts payable | (1,134,780) | 619,969 | ||||||||||||
| Increase in other liabilities and provisions | (455,315) | (291,028) | ||||||||||||
| Interest received | 25,754,683 | 26,877,239 | ||||||||||||
| Received dividends | 2,084,851 | 1,861,195 | ||||||||||||
| Proceeds from sale of assets held for sale and inventories | 1,069,561 | 714,668 | ||||||||||||
| Recovery of charged-off receivables account | 5 | 645,742 | 428,298 | |||||||||||
| Interest paid | (11,995,666) | (13,005,427) | ||||||||||||
| Income tax paid | (1,603,815) | (2,358,248) | ||||||||||||
| Net cash provided by (used in) operating activities | 5,696,110 | 16,717,735 | ||||||||||||
| Cash flows from investment activities | ||||||||||||||
| Investments Purchase: | (4,422,310) | (3,927,726) | ||||||||||||
Investments at amortized cost |
(3,903,857) | (3,111,805) | ||||||||||||
Financial instruments measured at fair value through OCI - Debt securities |
(171,495) | (500,235) | ||||||||||||
Investments in subsidiaries |
(267,721) | (250,655) | ||||||||||||
Investments in associates and joint ventures |
(79,237) | (65,031) | ||||||||||||
| Investments sale: | 3,898,463 | 3,600,551 | ||||||||||||
Investments at amortized cost |
3,489,901 | 3,367,609 | ||||||||||||
Financial instruments measured at fair value through OCI - Debt securities |
388,001 | 223,199 | ||||||||||||
Financial instruments measured at fair value through OCI – Equity investment |
18,516 | 8,956 | ||||||||||||
Investments in subsidiaries |
2,045 | 787 | ||||||||||||
| Acquisition of property and equipment | (940,855) | (1,353,713) | ||||||||||||
| Acquisition of investment property | 11 | (203,767) | (97,479) | |||||||||||
| Proceeds from sale of property and equipment | 156,124 | 170,304 | ||||||||||||
| Acquisition of intangible assets | (95,485) | (129,764) | ||||||||||||
| Net cash used in investing activities | (1,607,830) | (1,737,827) | ||||||||||||
| Cash flows from financial activities: | ||||||||||||||
| Decrease Interbank | - | (482,766) | ||||||||||||
| Increase in monetary and related market operations | 364,732 | 107,576 | ||||||||||||
| Opening of financial obligations | 2,939,675 | 4,147,659 | ||||||||||||
| Cancellation of financial obligations | (5,340,559) | (4,249,291) | ||||||||||||
| Lease liabilities | (114,620) | (118,385) | ||||||||||||
| Issuance of debt securities | 3,251,009 | 277,506 | ||||||||||||
| Cancellation of debt securities | (7,626,421) | (2,672,528) | ||||||||||||
| Dividends paid | (3,398,756) | (3,298,183) | ||||||||||||
| Net cash (used in) provided by Financial activities | (9,924,940) | (6,288,412) | ||||||||||||
| (Decrease) / Increase in cash and cash equivalents, before the effect of exchange rate changes | (5,836,660) | 8,691,496 | ||||||||||||
| Effect of exchange rate variations on cash and cash equivalents | 513,027 | (576,440) | ||||||||||||
| (Decrease) Increase in cash and cash equivalents | (5,323,633) | 8,115,056 | ||||||||||||
| Cash and cash equivalents at the beginning of the period | 3 | 24,348,860 | 16,233,804 | |||||||||||
| Cash and cash equivalents at the end of the period | 3 | 19,025,227 | 24,348,860 | |||||||||||
| ENTITY | JURISDICTION OF INCORPORATION | BUSINESS | PROPORTION OF OWNERSHIP INTEREST AND VOTING POWER HELD BY THE BANK 2024 |
PROPORTION OF OWNERSHIP INTEREST AND VOTING POWER HELD BY THE BANK 2023 |
||||||||||
| Fiduciaria Bancolombia S.A. Sociedad Fiduciaria | Colombia | Trust | 98.81% | 98.81% | ||||||||||
| Banca de Inversión Bancolombia S.A. Corporación Financiera | Colombia | Investment banking | 100.00% | 100.00% | ||||||||||
| Valores Bancolombia S.A. Comisionista de Bolsa | Colombia | Securities brokerage | 100.00% | 100.00% | ||||||||||
| Wompi S.A.S. | Colombia | Technology services provider | 100.00% | 100.00% | ||||||||||
| Renting Colombia S.A.S. | Colombia | Operating leasing | 100.00% | 100.00% | ||||||||||
Transportempo S.A.S. “En liquidación”(1) |
Colombia | Transportation | - | 100.00% | ||||||||||
Inversiones CFNS S.A.S.(2) |
Colombia | Investments | 100.00% | 99.94% | ||||||||||
| Negocios Digitales Colombia S.A.S. | Colombia | Payment solutions | 100.00% | 100.00% | ||||||||||
| Fondo de Capital Privado Fondo Inmobiliario Colombia | Colombia | Real estate investment fund | 80.47% | 80.47% | ||||||||||
| P.A. Inmuebles CEM | Colombia | Mercantile trust | 80.47% | 80.47% | ||||||||||
| P.A. Calle 92 FIC-11 | Colombia | Mercantile trust | 52.31% | 52.31% | ||||||||||
| P.A. FIC Edificio Corfinsura | Colombia | Mercantile trust | 80.47% | 80.47% | ||||||||||
| P.A. FIC-A5 | Colombia | Mercantile trust | 80.47% | 80.47% | ||||||||||
| P.A. FIC Inmuebles | Colombia | Mercantile trust | 80.47% | 80.47% | ||||||||||
| P.A. FIC Clínica de Prado | Colombia | Mercantile trust | 62.00% | 62.00% | ||||||||||
| P. A. FIC A6 | Colombia | Mercantile trust | 80.47% | 80.47% | ||||||||||
| P.A. Central Point | Colombia | Mercantile trust | 60.35% | 60.35% | ||||||||||
Fideicomiso Irrevocable de Garantía, Fuente de Pago y Administración Inmobiliaria Polaris(3) |
Colombia | Mercantile trust | - | 80.47% | ||||||||||
| P.A. Fideicomiso Twins Bay | Colombia | Mercantile trust | 80.47% | 80.47% | ||||||||||
| Fideicomiso Lote Av San Martín | Colombia | Mercantile trust | 80.47% | 80.47% | ||||||||||
| P.A. Fideicomiso Lote 30 | Colombia | Mercantile trust | 80.47% | 80.47% | ||||||||||
| Fideicomiso Fondo Inmobiliario Bancolombia | Colombia | Mercantile trust | 80.47% | 80.47% | ||||||||||
P.A. Florencia Ferrara(4) |
Colombia | Mercantile trust | 44.26% | 44.26% | ||||||||||
| P.A. Flor Morado Plaza | Colombia | Mercantile trust | 80.47% | 80.47% | ||||||||||
| P.A. Galería la 33 | Colombia | Mercantile trust | 80.47% | 80.47% | ||||||||||
P.A Linz Granz del Rio(5) |
Colombia | Mercantile trust | 44.26% | - | ||||||||||
Fideicomiso Selecto Terrazu E1(5) |
Colombia | Mercantile trust | 64.38% | - | ||||||||||
| Valores Simesa S.A. | Colombia | Investments | 62.75% | 64.93% | ||||||||||
Fideicomiso Lote Distrito Vera B1B2(6) |
Colombia | Mercantile trust | 62.44% | 64.61% | ||||||||||
Fideicomiso Lote Distrito Vera B3B4(7) |
Colombia | Mercantile trust | - | 64.61% | ||||||||||
| Fideicomiso Lote B6 Ciudad del Rio | Colombia | Mercantile trust | - | - | ||||||||||
| P.A. FAI Calle 77 | Colombia | Mercantile trust | 98.00% | 98.00% | ||||||||||
| P.A. Nomad Salitre | Colombia | Mercantile trust | 98.00% | 98.00% | ||||||||||
| P.A. Nomad Central-2 | Colombia | Mercantile trust | 98.00% | 98.00% | ||||||||||
| P.A. Calle 84 (2) | Colombia | Mercantile trust | 98.00% | 98.00% | ||||||||||
| P.A. Calle 84 (3) | Colombia | Mercantile trust | 98.00% | 98.00% | ||||||||||
P.A. Nomad Distrito Vera(8) |
Colombia | Mercantile trust | 98.00% | - | ||||||||||
P.A Nexo(8) |
Colombia | Mercantile trust | 98.00% | - | ||||||||||
| P.A. Mercurio | Colombia | Mercantile trust | 100.00% | 100.00% | ||||||||||
P.A CEDIS Sodimac(8) |
Colombia | Mercantile trust | 100.00% | - | ||||||||||
| Wenia S.A.S. | Colombia | Technology services | 100.00% | 100.00% | ||||||||||
| P.A. Wenia | Colombia | Mercantile trust | 100.00% | 100.00% | ||||||||||
| Nequi S.A. Compañía de Financiamiento | Colombia | Financial services | 100.00% | 100.00% | ||||||||||
Sociedad Beneficiaria BC Panamá S.A.(9) |
Colombia | Holding | 100.00% | - | ||||||||||
| Bancolombia Panamá S.A. | Panama | Banking | 100.00% | 100.00% | ||||||||||
| Sistemas de Inversiones y Negocios S.A. Sinesa | Panama | Investments | 100.00% | 100.00% | ||||||||||
| Banagrícola S.A. | Panama | Holding | 99.17% | 99.17% | ||||||||||
| Banistmo S.A. | Panama | Banking | 100.00% | 100.00% | ||||||||||
| Banistmo Investment Corporation S.A. | Panama | Trust | 100.00% | 100.00% | ||||||||||
| Leasing Banistmo S.A. | Panama | Leasing | 100.00% | 100.00% | ||||||||||
| Valores Banistmo S.A. | Panama | Purchase and sale of securities | 100.00% | 100.00% | ||||||||||
Banistmo Panamá Fondos de Inversión S.A.(10) |
Panama | Investment fund holder | 100.00% | 100.00% | ||||||||||
Banistmo Capital Markets Group Inc.(10) |
Panama | Purchase and sale of securities | 100.00% | 100.00% | ||||||||||
Anavi Investment Corporation S.A.(10) |
Panama | Real estate | 100.00% | 100.00% | ||||||||||
Desarrollo de Oriente S.A.(10) |
Panama | Real estate | 100.00% | 100.00% | ||||||||||
Steens Enterprises S.A.(10) |
Panama | Portfolio holder | 100.00% | 100.00% | ||||||||||
Ordway Holdings S.A.(10) |
Panama | Real estate broker | 100.00% | 100.00% | ||||||||||
| Grupo Agromercantil Holding S.A. | Panama | Holding | 100.00% | 100.00% | ||||||||||
| Banco Agromercantil de Guatemala S.A. | Guatemala | Banking | 99.68% | 99.68% | ||||||||||
| Seguros Agromercantil de Guatemala S.A. | Guatemala | Insurance agency | 79.92% | 79.92% | ||||||||||
| Financiera Agromercantil S.A. | Guatemala | Financial services | 100.00% | 100.00% | ||||||||||
| Agrovalores S.A. | Guatemala | Securities brokerage | 100.00% | 100.00% | ||||||||||
| Arrendadora Agromercantil S.A. | Guatemala | Financial Leasing | 100.00% | 100.00% | ||||||||||
| Agencia de Seguros y Fianzas Agromercantil S.A. | Guatemala | Insurance agency | - | - | ||||||||||
| Asistencia y Ajustes S.A. | Guatemala | Roadside and medical assistance services | 100.00% | 100.00% | ||||||||||
| Serproba S.A. | Guatemala | Maintenance and remodeling services | 100.00% | 100.00% | ||||||||||
| Servicios de Formalización S.A. | Guatemala | Loans formalization | 100.00% | 100.00% | ||||||||||
| Conserjeria, Mantenimiento y Mensajería S.A. “En liquidación” | Guatemala | Maintenance services | 100.00% | 100.00% | ||||||||||
Mercom Bank Ltd.(11) |
Barbados | Banking | 99.68% | 99.68% | ||||||||||
| New Alma Enterprises Ltd. | Bahamas | Investments | 99.68% | 99.68% | ||||||||||
| Bancolombia Puerto Rico Internacional Inc. | Puerto Rico | Banking | 100.00% | 100.00% | ||||||||||
Sinesa Cayman, Inc. (before Bancolombia Cayman S.A)(11) |
Cayman Islands | Banking | 100.00% | 100.00% | ||||||||||
| Banco Agrícola S.A. | El Salvador | Banking | 97.36% | 97.36% | ||||||||||
| Arrendadora Financiera S.A. Arfinsa | El Salvador | Leasing | 97.37% | 97.37% | ||||||||||
| Accelera S.A. de C.V. (before Credibac S.A. de C.V) | El Salvador | Credit card services | 97.36% | 97.36% | ||||||||||
| Valores Banagrícola S.A. de C.V. | El Salvador | Securities brokerage | 98.89% | 98.89% | ||||||||||
| Inversiones Financieras Banco Agrícola S.A. IFBA | El Salvador | Holding | 98.89% | 98.89% | ||||||||||
| Gestora de Fondos de Inversión Banagrícola S.A. | El Salvador | Administers investment funds | 98.89% | 98.89% | ||||||||||
| Bagrícola Costa Rica S.A. | Costa Rica | Business and management advising | 99.17% | 99.17% | ||||||||||
| Bancolombia Capital Holdings USA LLC | United States | Holding | 100.00% | 100.00% | ||||||||||
| Bancolombia Capital Advisers LLC | United States | Investment advisor | 100.00% | 100.00% | ||||||||||
| Bancolombia Capital LLC | United States | Securities brokerage | 100.00% | 100.00% | ||||||||||
| Wenia Ltd. | Bermuda | Technology services | 100.00% | 100.00% | ||||||||||
| December 31, 2023 | December 31, 2022 | |||||||
| Year-end exchange rate | 3,822.05 | 4,810.20 | ||||||
| Long-Term Rating | Maximum% | Short-Term Rating | Maximum% | ||||||||
| BB+, BB, BB- | Ninety (90) | 3 | Ninety (90) | ||||||||
| B+, B, B- | Seventy (70) | 4 | Fifty (50) | ||||||||
| CCC | Fifty (50) | 5 y 6 | Zero (0) | ||||||||
| DD, EE | Zero (0) | ||||||||||
| Category | Maximum recorded value % (1) |
Investment characteristics | ||||||
| B Acceptable risk, higher than normal | eighty (80) | They present uncertainty factors that could affect the ability to continue to adequately comply with debt services and weaknesses that may affect their financial situation. | ||||||
| C Appreciable risk | Sixty (60) | They have a high or medium probability of non-compliance with the timely payment of capital and interest and deficiencies in their financial situation that compromise the recovery of the investment. | ||||||
| D Significant risk | Forty (40) | They present non-compliance with the terms agreed in the title and accentuated deficiencies in their financial situation, so that the probability of recovering the investment is highly doubtful. | ||||||
| E Bad | Zero (0) | It is estimated to be uncollectible. | ||||||
 3.1.6.1 Evaluation, rating, and provisions for credit risks
| December 31, 2022 | December 31, 2023 | |||||||
| Additional Consumer AMP C026 of 2022 | 353,159 | 353,159 | ||||||
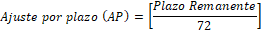
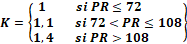
| Classification of the commercial portfolio by asset level | |||||
| Company size | Level of assets in SMMLV | ||||
| Large companies | More than 15,000 | ||||
| Medium-sized companies | Between 5,000 and 15,000 | ||||
| Small companies | Less than 5,000 | ||||
| SMMLV: Minimum Monthly Legal Minimum Wage in force | |||||
| Classification of the commercial portfolio by credit risk level | |||||
| Category | Blackberry height (days) | ||||
| Category AA | Between 0 and 29 | ||||
| Category A | Between 30 and 59 | ||||
| Category BB | Between 60 and 89 | ||||
| Category B | Between 90 and 119 | ||||
| Category CC | Between 120 and 149 | ||||
| Noncompliance | More than 150 | ||||
| MATRIX A | ||||||||||||||
| Rating | Large company | Medium-sized company | Small business | Individuals | ||||||||||
| AA | 1.53% | 1.51% | 4.18% | 5.27% | ||||||||||
| A | 2.24% | 2.40% | 5.30% | 6.39% | ||||||||||
| BB | 9.55% | 11.65% | 18.56% | 18.72% | ||||||||||
| B | 12.24% | 14.64% | 22.73% | 22.00% | ||||||||||
| CC | 19.77% | 23.09% | 32.50% | 32.21% | ||||||||||
| Noncompliance | 100% | 100% | 100% | 100% | ||||||||||
| MATRIX B | ||||||||||||||
| Rating | Large company | Medium-sized company | Small business | Individuals | ||||||||||
| AA | 2.19% | 4.19% | 7.52% | 8.22% | ||||||||||
| A | 3.54% | 6.32% | 8.64% | 9.41% | ||||||||||
| BB | 14.13% | 18.49% | 20.26% | 22.36% | ||||||||||
| B | 15.22% | 21.45% | 24.15% | 25.81% | ||||||||||
| CC | 23.35% | 26.70% | 33.57% | 37.01% | ||||||||||
| Noncompliance | 100% | 100% | 100% | 100% | ||||||||||
| MRC | |||||||||||||||||
| Code | Warranty Type | SEG.PDI SFC | SEG.PDI Policy | ||||||||||||||
| A-B-C-G-1-2-3-7-8 | 4-5-6-9-M-S | ||||||||||||||||
| Days Noncompliance | PDI | Days Noncompliance | PDI | ||||||||||||||
| 16 | Assets leased other than real estate | 0-360 | 45% | 0 | 45% | ||||||||||||
| 361-720 | 80% | 1-720 | 80% | ||||||||||||||
| >720 | 100% | >720 | 100% | ||||||||||||||
| 17 | Assets leased under real estate leases | 0-540 | 35% | 0-540 | 35% | ||||||||||||
| 541-1080 | 70% | 541-1080 | 70% | ||||||||||||||
| >1080 | 100% | >1080 | 100% | ||||||||||||||
| 6-11-1 | Commercial and residential real estate | 0 - 540 | 40% | 0 | 40% | ||||||||||||
| 541 - 1080 | 70% | >=1- 90 | 60% | ||||||||||||||
| >1080 | 100% | 91-210 | 80% | ||||||||||||||
| >210 | 100% | ||||||||||||||||
| A-B | Eligible financial collateral: FNG, FAG | 0-99999 | 12% | 0-359 | 12% | ||||||||||||
| 360-539 | 70% | ||||||||||||||||
| >=540 | 100% | ||||||||||||||||
4-12-13 |
Sovereign nation, Letters of Credit, Deposits Guarantee | 0-99999 | 0% | 0-99999 | 0% | ||||||||||||
| 9-10 | Collection rights | 0-360 | 45% | 0 | 45% | ||||||||||||
| 361-720 | 80% | >=1- 90 | 60% | ||||||||||||||
| >720 | 100% | 91-210 | 80% | ||||||||||||||
| >210 | 100% | ||||||||||||||||
| 5 | Ineligible collateral | 0-270 | 55% | 0 | 55% | ||||||||||||
| 271-520 | 70% | >0 | 100% | ||||||||||||||
| >520 | 100% | ||||||||||||||||
| No Warranty | 0-210 | 55% | 0 | 55% | |||||||||||||
| 211-420 | 80% | >0 | 100% | ||||||||||||||
| >420 | 100% | ||||||||||||||||
| 2-3-7-8 | Other collateral | 0-360 | 50% | 0 | 50% | ||||||||||||
| 361-720 | 80% | >=1- 89 | 90% | ||||||||||||||
| >720 | 100% | >89 | 100% | ||||||||||||||
| Commercial portfolio | ||||||||
| MRC Ratings | Approved Ratings | Corporate Business | ||||||
| A | B | 0% <6.4% | ||||||
| BB | B | >=6.4% <7.9% | ||||||
| B | C | >=7.9% <11.0% | ||||||
| CC | C | >=11.0% <53.6% | ||||||
| Default | D - E | >=53.6% | ||||||
Classification of the consumer portfolio by segment | |||||
| General - automobile | Credits for acquisition of automobile. | ||||
| Credit cards | Revolving credit for the acquisition of consumer goods that is used through a plastic card. | ||||
| General - others | Credits for the acquisition of consumer goods other than automobile. Credit cards are not included in this segment. | ||||

| Score | General – automobiles | Credit card | General – others | ||||||||
| AA | 0,2484 | 0,3735 | 0,3767 | ||||||||
| A | 0,6842 | 0,6703 | 0,8205 | ||||||||
| BB | 0,81507 | 0,9382 | 0,89 | ||||||||
| B | 0,94941 | 0,9902 | 0,9971 | ||||||||
| CC | 1 | 1 | 1 | ||||||||
| I | 1 | 1 | 1 | ||||||||
| MATRIX A | |||||||||||
| Rating | General - automobiles | Credit card | General - other | ||||||||
| AA | 0.97% | 1.58% | 2.10% | ||||||||
| A | 3.12% | 5.35% | 3.88% | ||||||||
| BB | 7.48% | 9.53% | 12.68% | ||||||||
| B | 15.76% | 14.17% | 14.16% | ||||||||
| CC | 31.01% | 17.06% | 22.57% | ||||||||
| Non-compliance | 100% | 100% | 100% | ||||||||
| MATRIX B | |||||||||||
| Rating | General - automobiles | Credit card | General - other | ||||||||
| AA | 2.75% | 3.36% | 3.88% | ||||||||
| A | 4.91% | 7.13% | 5.67% | ||||||||
| BB | 16.53% | 18.57% | 21.72% | ||||||||
| B | 24.80% | 23.21% | 23.20% | ||||||||
| CC | 44.84% | 30.89% | 36.40% | ||||||||
| Non-compliance | 100% | 100% | 100% | ||||||||
| MRCO | |||||||||||||||||
| Code | Warranty Type | SEG.PDI SFC | SEG.PDI Policy | ||||||||||||||
| A-B-C-G-1-2-3-7-8-4-5-6-9-M-S | |||||||||||||||||
| Days Noncompliance | PDI | Days Noncompliance | PDI | ||||||||||||||
| 16 | Assets leased other than real estate | 0-270 | 45% | 0 | 45% | ||||||||||||
| 271-540 | 70% | 1-540 | 80% | ||||||||||||||
| >540 | 100% | >540 | 100% | ||||||||||||||
| 17 | Assets leased under real estate leases | 0-360 | 35% | 0-360 | 35% | ||||||||||||
| 360-720 | 70% | 361-720 | 70% | ||||||||||||||
| >720 | 100% | >720 | 100% | ||||||||||||||
| 6-11-1 | Commercial and residential real estate | 0-360 | 40% | 0 | 40% | ||||||||||||
| 360-720 | 70% | >0-29 | 80% | ||||||||||||||
| >720 | 100% | 30-89 | 90% | ||||||||||||||
| >89 | 100% | ||||||||||||||||
| A-B | Eligible financial collateral: FNG, FAG | 0-99999 | 12% | 0-359 | 12% | ||||||||||||
| 360-539 | 70% | ||||||||||||||||
| >539 | 100% | ||||||||||||||||
| 4-12-13 | Sovereign nation, Letters of Credit, Deposits Guarantee | 0-99999 | 0% | 0-99999 | 0% | ||||||||||||
| Collection rights | 0-360 | 45% | 0 | 45% | |||||||||||||
| 9-10 | 361-720 | 80% | >=1-29 | 80% | |||||||||||||
| >720 | 100% | 30-89 | 90% | ||||||||||||||
| >89 | 100% | ||||||||||||||||
| 5 | Ineligible collateral | 0-210 | 60% | 0 | 75% | ||||||||||||
| 211-420 | 70% | >=1 - 89 | 90% | ||||||||||||||
| >420 | 100% | >=90 | 100% | ||||||||||||||
Ineligible collateral (Payroll Loans) |
<30/06/2018
<30/06/2018
|
60%
45%
|
< 30/06/2018 | 60% | |||||||||||||
| >30/06/2018 | 45% | ||||||||||||||||
| No warranty | 0-30 | 75% | 0 | 75% | |||||||||||||
| 31-90 | 85% | >=1 - 89 | 90% | ||||||||||||||
| >90 | 100% | >=90 | 100% | ||||||||||||||
| Other collateral | 0-270 | 50% | 0 | 50% | |||||||||||||
| 2-3-7-8 | 271-540 | 70% | >=1-29 | 85% | |||||||||||||
| >540 | 100% | 30-89 | 90% | ||||||||||||||
| >=90 | 100% | ||||||||||||||||
| Score by credit risk level | |||||
| Score | Height of arrears (month) | ||||
| “A” Normal | Until 2 | ||||
| “B” Acceptable | More than 2 - until 5 | ||||
| “C” Appreciable | More than 5 - until 12 | ||||
| “D” Significant | More than 12 - until 18 | ||||
| “E” Bad | More than 18 | ||||
| Ranking | Capital | Interest and other items | |||||||||
| On guaranteed portion | Unsecured portion | ||||||||||
| "A" Normal | 1% | 1% | 1% | ||||||||
| "B" Acceptable | 3.2% | 100% | 100% | ||||||||
| "C" Appreciated | 50% | 100% | 100% | ||||||||
| "D" Significant | 75% | 100% | 100% | ||||||||
| "E" Uncollectible | 100% | 100% | 100% | ||||||||
| Score by credit risk level | |||||
| Score | Height of arrears (month) | ||||
| “A” Normal | Until 1 month | ||||
| “B” Acceptable | More than 1 - until 2 | ||||
| “C” Appreciable | More than 2 - until 3 | ||||
| “D” Significant | More than 3 y until 4 | ||||
| “E” Bad | More than 4 | ||||
| Ranking | Capital | ||||||||||
| On guaranteed portion | Unsecured portion | Interest and other items | |||||||||
| "A" Normal | 1% | 1% | 1% | ||||||||
| "B" Acceptable | 2.20% | 3.20% | 100% | ||||||||
| "C" Appreciated | 60% | 60% | 100% | ||||||||
| "D" Significant | 100% | 100% | 100% | ||||||||
| "E" Uncollectible | 100% | 100% | 100% | ||||||||
| Grouped category | Report category | |||||||
| Commercial | Consumer | |||||||
| A | AA | AA | ||||||
A with height of arrears between 0 and 30 days |
||||||||
| B | A | A with more than 30 days of height of arrears | ||||||
| BB | BB | |||||||
| C | B | B | ||||||
| CC | CC | |||||||
| C | C | |||||||
| D | D | D | ||||||
| E | E | E | ||||||
| CREDIT MODE | ARREARS IN EXCESS OF | ||||
Commercial |
3 months | ||||
Consumer |
2 months | ||||
Mortgage |
2 months | ||||
Small business |
1 month | ||||
| Consumer | 180 days | ||||
| Commercial: | 360 days | ||||
| Small Business loan: | 180 days | ||||
| Mortgage: | N/A 1 |
||||
| Accounts receivable from bank employees: | 360 days | ||||
| Asset Bank | Useful life range | ||||
| Buildings | 10 to 75 years | ||||
| Furniture and fixtures | 3 to 20 years | ||||
| Computer equipment | 3 to 20 years | ||||
| Equipment and machinery | 2 to 40 years | ||||
| Vehicles | 3 to 10 years | ||||
December 31, 2024 |
December 31, 2023 | |||||||
| In millions of COP | ||||||||
| Cash | ||||||||
| Cash | 7,125,488 | 6,846,978 | ||||||
Deposits from Colombian Central Bank (1)(2) |
2,562,485 | 7,318,665 | ||||||
Deposits from banks and other private financial institutions (3) |
3,604,035 | 2,203,471 | ||||||
| Checks on hold | 118 | 309 | ||||||
| Remittances of domestic negotiated checks in transit | - | 7,508 | ||||||
| Total cash | 13,292,126 | 16,376,931 | ||||||
| Monetary market transactions | ||||||||
Reverse repurchases agreements (4) |
5,613,041 | 7,792,496 | ||||||
| Interbank borrowings | 120,060 | 179,433 | ||||||
| Total monetary market transactions | 5,733,101 | 7,971,929 | ||||||
| Total cash and cash equivalents | 19,025,227 | 24,348,860 | ||||||
| Investment financial instruments and derivatives | December 31, 2024 | December 31, 2023 | ||||||
| In millions of COP | ||||||||
| Investments in debt securities | ||||||||
Negotiable investments (1) |
12,710,200 | 5,655,077 | ||||||
Available-for-sale investments (2) |
3,326,813 | 3,211,425 | ||||||
Held-to-maturity investments (3) |
4,117,051 | 3,423,265 | ||||||
Subtotal debt securities, net (4) |
20,154,064 | 12,289,767 | ||||||
Pledged financial assets (4) |
1,156,624 | 1,287,391 | ||||||
| Total debt securities | 21,310,688 | 13,577,158 | ||||||
Total equity securities (4) |
445,356 | 180,744 | ||||||
| Total investment financial assets, net | 21,756,044 | 13,757,902 | ||||||
Total derivative assets (5) |
2,924,434 | 6,215,942 | ||||||
Total derivative liabilities (5) |
(2,667,439) | (6,699,521) | ||||||
| 4.1. Financial assets investments, net | ||
| Debt securities | Measurement methodology | Total carrying amount | ||||||||||||
| Held for trading | Available-for-sale investments | Held-to-maturity investments | ||||||||||||
| In millions of COP | ||||||||||||||
| Treasury securities issued by the Colombian Government - TES | 10,134,956 | - | - | 10,134,956 | ||||||||||
| Bonds | 2,116,724 |
133,059 | 780,678 | 3,030,461 | ||||||||||
| Agricultural Development Securities issued by the Colombian Government (TDA) | - | - | 3,336,373 | 3,336,373 | ||||||||||
| Solidarity Securities issued by the Colombian Government (TDS) | - | 2,648,355 | - | 2,648,355 | ||||||||||
| Other public debt | - | 545.399 | - | 545,399 | ||||||||||
| Other financial investment assets | 315,575 | - | - | 315,575 | ||||||||||
| Mortgage securities - TIPS | 142,945 | - | - | 142,945 | ||||||||||
| Total debt securities | 12,710,200 | 3,326,813 | 4,117,051 | 20,154,064 | ||||||||||
| Debt securities | Measurement methodology | Total carrying amount | ||||||||||||
| Held for trading | Available-for-sale investments | Held-to-maturity investments | ||||||||||||
| In millions of COP | ||||||||||||||
| Treasury securities issued by the Colombian Government - TES | 3,126,666 | - | - | 3,126,666 | ||||||||||
| Bonds | 2,002,423 |
- | 336,794 | 2,339,217 | ||||||||||
| Agricultural Development Securities issued by the Colombian Government (TDA) | - | - | 3,086,471 | 3,086,471 | ||||||||||
| Solidarity Securities issued by the Colombian Government (TDS) | - | 2,664,295 | - | 2,664,295 | ||||||||||
| Other public debt | - | 547,130 | - | 547,130 | ||||||||||
| Other financial investment assets | 441,687 | - | - | 441,687 | ||||||||||
| Mortgage securities - TIPS | 84,301 | - | - | 84,301 | ||||||||||
| Total debt securities | 5,655,077 | 3,211,425 | 3,423,265 | 12,289,767 | ||||||||||
| Debt securities | Less than 1 year | Between 1 and 3 years | Between 3 and 5 years | Greater than 5 years | Total | |||||||||||||||
| In millions of COP | ||||||||||||||||||||
| Negotiable investments | ||||||||||||||||||||
| Treasury securities issued by the Colombian Government - TES | 478,761 | 6,182,314 | 1,120,892 | 2,352,989 | 10,134,956 | |||||||||||||||
| Bonds | 1,511,689 | 148,443 | 91,011 | 365,581 | 2,116,724 | |||||||||||||||
| Other financial investment assets | 94,669 | 111,231 | 104,206 | 5,469 | 315,575 | |||||||||||||||
| Mortgage- backed securities | 2,749 | 185 | 45,842 | 94,169 | 142,945 | |||||||||||||||
| Subtotal negotiable investments | 2,087,868 | 6,442,173 | 1,361,951 | 2,818,208 | 12,710,200 | |||||||||||||||
| Available-for-sale investments | ||||||||||||||||||||
| Solidarity Securities issued by the Colombian Government (TDS) | 2,648,355 | - | - | - | 2,648,355 | |||||||||||||||
| Bonds | - | 83,315 | 49,744 | - | 133,059 | |||||||||||||||
| Other public debt | - | 41,369 | - | 504,030 | 545,399 | |||||||||||||||
| Subtotal available-for-sale investments | 2,648,355 | 124,684 | 49,744 | 504,030 | 3,326,813 | |||||||||||||||
| Held-to-maturity investments | ||||||||||||||||||||
| Agricultural Development Securities issued by the Colombian Government (TDA) | 3,336,373 | - | - | - | 3,336,373 | |||||||||||||||
| Bonds | - | 471,587 | 208,606 | 100,485 | 780,678 | |||||||||||||||
| Mortgage-backed securities | 3,336,373 | 471,587 | 208,606 | 100,485 | 4,117,051 | |||||||||||||||
Subtotal held-to-maturity investments |
8,072,596 | 7,038,444 | 1,620,301 | 3,422,723 | 20,154,064 | |||||||||||||||
| Debt securities | Less than 1 year | Between 1 and 3 years | Between 3 and 5 years | Greater than 5 years | Total | |||||||||||||||
| In millions of COP | ||||||||||||||||||||
| Negotiable investments | ||||||||||||||||||||
| Treasury securities issued by the Colombian Government - TES | 301,849 | 1,757,746 | 365,919 | 701,152 | 3,126,666 | |||||||||||||||
| Bonds | 1,540,796 | 101,294 | 42,733 | 317,600 | 2,002,423 | |||||||||||||||
| Other financial investment assets | 160,177 | 146,411 | 72,981 | 62,118 | 441,687 | |||||||||||||||
| Mortgage- backed securities | 848 | 2,559 | 10,651 | 70,243 | 84,301 | |||||||||||||||
| Subtotal negotiable investments | 2,003,670 | 2,008,010 | 492,284 | 1,151,113 | 5,655,077 | |||||||||||||||
| Available-for-sale investments | ||||||||||||||||||||
| Solidarity Securities issued by the Colombian Government (TDS) | 2,664,295 | - | - | - | 2,664,295 | |||||||||||||||
| Other public debt | - | - | - | 547,130 | 547,130 | |||||||||||||||
| Subtotal available-for-sale investments | 2,664,295 | - | - | 547,130 | 3,211,425 | |||||||||||||||
| Held-to-maturity investments | ||||||||||||||||||||
| Agricultural Development Securities issued by the Colombian Government (TDA) | 3,086,471 | - | - | - | 3,086,471 | |||||||||||||||
| Bonds | - | - | - | 336,794 | 336,794 | |||||||||||||||
| Mortgage-backed securities | 3,086,471 | - | - | 336,794 | 3,423,265 | |||||||||||||||
Subtotal held-to-maturity investments |
7,754,436 | 2,008,010 | 492,284 | 2,035,037 | 12,289,767 | |||||||||||||||
| Pledged financial assets | Term | Security type | Carrying amount | ||||||||
| In millions of COP | |||||||||||
| Securities issued by the Colombian government | |||||||||||
| Investments pledged as collateral in transactions with reverse repurchase agreements | Up to 1 month | Treasury securities | 480,435 | ||||||||
| Investments pledged as collateral in transactions with derivatives | Between 1 and 3 months | Treasury securities | 676,189 | ||||||||
| Total securities issued by the Colombian government | 1,156,624 | ||||||||||
| Total pledged financial assets | 1,156,624 | ||||||||||
| Pledged financial assets | Term | Security type | Carrying amount | ||||||||
| In millions of COP | |||||||||||
| Securities issued by the Colombian government | |||||||||||
| Investments pledged as collateral in transactions with reverse repurchase agreements | Up to 1 month | Treasury securities | 810,101 | ||||||||
| Investments pledged as collateral in transactions with derivatives | Between 1 and 3 months | Treasury securities | 477,290 | ||||||||
| Total securities issued by the Colombian government | 1,287,391 | ||||||||||
| Total pledged financial assets | 1,287,391 | ||||||||||
Equity financial securities |
December 31, 2024 | December 31, 2023 | ||||||
| In millions of COP | ||||||||
Investments at fair value through OCI (1) (2) |
279,966 | 2,701 | ||||||
Financial assets measured at changes in equity through OCI (3) |
157,331 | 170,534 | ||||||
| Investments at fair value through income statement | 8,059 | 7,509 | ||||||
Total equity financial securities |
445,356 | 180,744 | ||||||
| Investments at fair value through OCI | Carrying amount | |||||||
| December 31, 2024 | December 31, 2023 | |||||||
| In millions of COP | ||||||||
| Credibanco S.A. | 109,011 | 110,785 | ||||||
Holding Bursatil Regional S.A. (1) |
20,978 | 23,040 | ||||||
Derechos Residuales (2) |
12,051 | 25,579 | ||||||
| Banco Latinoamericano de Comercio Exterior, S.A. Bladex | 11,078 | 6,679 | ||||||
| Derecho Fiduciario Inmobiliaria Cadenalco | 4,212 | 4,449 | ||||||
Bolsa de Valores de Colombia S.A. (1) |
1 | 2 | ||||||
| Total investments at fair value through OCI | 157,331 | 170,534 | ||||||
| 4.2. Derivative financial instruments | ||
| Derivatives | December 31, 2024 | December 31, 2023 | ||||||
| In millions of COP | ||||||||
| Forwards | ||||||||
| Assets | ||||||||
Foreign currencies (1) |
1,074,137 | 4,377,677 | ||||||
| Securities | 51,645 | 3,014 | ||||||
| Subtotal assets | 1,125,782 | 4,380,691 | ||||||
| Liabilities | ||||||||
Foreign currencies (1) |
(963,535) | (4,522,580) | ||||||
| Securities | (1,367) | (10,481) | ||||||
| Subtotal Liabilities | (964,902) | (4,533,061) | ||||||
| Total forwards | 160,880 | (152,370) | ||||||
| Swaps | ||||||||
| Assets | ||||||||
| Foreign currencies | 1,463,256 | 1,304,338 | ||||||
| Interest rate | 233,019 | 320,325 | ||||||
| Subtotal assets | 1,696,275 | 1,624,663 | ||||||
| Liabilities | ||||||||
| Foreign currencies | (1,332,432) | (1,491,086) | ||||||
| Interest rate | (287,623) | (442,787) | ||||||
| Subtotal liabilities | (1,620,055) | (1,933,873) | ||||||
| Total swaps | 76,220 | (309,210) | ||||||
| Options | ||||||||
| Assets | ||||||||
| Foreign currencies | 102,377 | 210,588 | ||||||
| Subtotal assets | 102,377 | 210,588 | ||||||
| Liabilities | ||||||||
| Foreign currencies | (82,482) | (232,587) | ||||||
| Subtotal liabilities | (82,482) | (232,587) | ||||||
| Total options | 19,895 | (21,999) | ||||||
| Derivative assets | 2,924,434 | 6,215,942 | ||||||
| Derivative liabilities | (2,667,439) | (6,699,521) | ||||||
| Forward | Swaps | Options | Total | |||||||||||
| Assets | 1,125,782 | 1,696,275 | 102,377 | 2,924,434 | ||||||||||
| Less than 1 year | 1,094,845 | 440,816 | 96,891 | 1,632,552 | ||||||||||
| Between 1 and 3 years | 30,937 | 649,909 | 5,486 | 686,332 | ||||||||||
| More than 3 years | - | 605,550 | - | 605,550 | ||||||||||
| Liabilities | (964,902) | (1,620,055) | (82,482) | (2,667,439) | ||||||||||
| Less than 1 year | (934,875) | (375,375) | (76,536) | (1,386,786) | ||||||||||
| Between 1 and 3 years | (30,027) | (604,227) | (5,946) | (640,200) | ||||||||||
| More than 3 years | - | (640,453) | - | (640,453) | ||||||||||
| Forward | Swaps | Options | Total | |||||||||||
| Assets | 4,380,691 | 1,624,663 | 210,588 | 6,215,942 | ||||||||||
| Less than 1 year | 4,231,752 | 611,487 | 135,559 | 4,978,798 | ||||||||||
| Between 1 and 3 years | 147,826 | 517,205 | 75,029 | 740,060 | ||||||||||
| More than 3 years | 1,113 | 495,971 | - | 497,084 | ||||||||||
| Liabilities | (4,533,061) | (1,933,873) | (232,587) | (6,699,521) | ||||||||||
| Less than 1 year | (4,416,129) | (414,233) | (152,284) | (4,982,646) | ||||||||||
| Between 1 and 3 years | (116,932) | (979,130) | (80,303) | (1,176,365) | ||||||||||
| More than 3 years | - | (540,510) | - | (540,510) | ||||||||||
| December 31, 2024 | December 31, 2023 | |||||||
| In millions of COP | ||||||||
| Guarantees delivered | 1,117,651 | 2,297,681 | ||||||
| Guarantees received | (371,426) | (787,640) |
||||||
| Forward | Swaps | Options | Total | |||||||||||
| In millions of COP | ||||||||||||||
| Balance as of January 1, 2023 | 36,289 | (13,630) | 63,068 | 85,727 | ||||||||||
| New trades | 702,001 | (978) | 117,125 | 818,148 | ||||||||||
| Amortization | (687,024) | (8,767) | (130,767) | (826,558) | ||||||||||
| Sale or transfer | (8,292) | 168 | (12,989) | (21,113) | ||||||||||
| Balance as of December 31, 2023 | 42,974 | (23,207) | 36,437 | 56,204 | ||||||||||
| Forward | Swaps | Options | Total | |||||||||||
| In millions of COP | ||||||||||||||
| Balance as of January 1, 2023 | 61,724 | 16,580 | 39,714 | 118,018 | ||||||||||
| New trades | 1,159,069 | (26,905) | 195,456 | 1,327,620 | ||||||||||
| Amortization | (1,176,173) | 4,166 | (148,299) | (1,320,306) | ||||||||||
| Sale or transfer | (8,331) | (7,471) | (23,803) | (39,605) | ||||||||||
| Balance as of December 31, 2023 | 36,289 | (13,630) | 63,068 | 85,727 | ||||||||||
| Derivative assets | Derivative liabilities | |||||||
| In millions of COP | ||||||||
| Over the counter | ||||||||
| Foreign exchange contracts | ||||||||
| Swaps | 1,463,256 | (1,332,432) | ||||||
| Forwards | 1,074,137 | (963,535) | ||||||
| Options | 102,377 | (82,482) | ||||||
| Interest rate contracts | ||||||||
| Swaps | 233,019 | (287,623) | ||||||
| Securities contracts | ||||||||
| Forwards | 51,645 | (1,367) | ||||||
| Gross derivative | 2,924,434 | (2,667,439) | ||||||
| Netting derivatives | - | - | ||||||
| Master netting agreements | (2,815,157) | 2,538,407 | ||||||
| Collateral received/paid | (109,277) | 129,032 | ||||||
| Total derivative financial instruments assets/ liabilities after collateral and Master netting agreements | - | - | ||||||
| Derivative assets | Derivative liabilities | |||||||
| In millions of COP | ||||||||
| Over the counter | ||||||||
| Foreign exchange contracts | ||||||||
| Swaps | 1,304,338 | (1,491,086) | ||||||
| Forwards | 4,377,677 | (4,522,580) | ||||||
| Options | 210,588 | (232,587) | ||||||
| Interest rate contracts | ||||||||
| Swaps | 320,325 | (442,787) | ||||||
| Securities contracts | ||||||||
| Forwards | 3,014 | (10,481) | ||||||
| Gross derivative | 6,215,942 | (6,699,521) | ||||||
| Netting derivatives | - | - | ||||||
| Master netting agreements | (6,190,847) | 5,377,895 | ||||||
| Collateral received/paid | (25,095) | 1,321,626 | ||||||
| Total derivative financial instruments assets/ liabilities after collateral and Master netting agreements | - | - | ||||||
| 4.3. Hedge accounting | ||
| Maturity | Total | |||||||
| Less than 1 year | ||||||||
|
In millions of COP
Except for the Average forward rate
| ||||||||
| Foreign currency risk | ||||||||
| Forward exchange contracts | ||||||||
| Notional amount | 6,614 | 6,614 | ||||||
| Average forward rate (COP/USD) | 4,496 | 4,496 | ||||||
| Interest rate risk | ||||||||
| Interest rate swaps | ||||||||
| Notional amount | 188,000 | 188,000 | ||||||
| Average fixed interest rate | 8.63% | - | ||||||
| Notional amount | Carrying amount | Line item in the Separate Statement of Financial Position | Change in fair value used for measuring ineffectiveness for the period | ||||||||||||||
| Assets | Liabilities | ||||||||||||||||
| In millions of COP | |||||||||||||||||
| Foreign currency risk | |||||||||||||||||
| Forward exchange contracts | 6,614 | - | - | Derivative financial instruments | (65) | ||||||||||||
| Interest rate risk | |||||||||||||||||
Interest rate swaps (1) |
188,000 | - | - | Derivative financial instruments | 281 | ||||||||||||
| Change in fair value used for measuring ineffectiveness | Cash flow hedge reserve (OCI) | Balances remaining in the cash flow hedge reserve from hedging relationships for which hedge accounting is no longer applied | |||||||||
| In millions of COP | |||||||||||
| Foreign currency risk | |||||||||||
| Forecast transactions | 65 | (65) | - | ||||||||
| Interest rate risk | |||||||||||
| Deposits | (298) | 281 | - | ||||||||
| Total hedging gain/(loss) recognised in OCI | Ineffectiveness recognised in profit or loss | Line item in the Separate Statement of Income that includes the recognised hedge ineffectiveness | Amount reclassified from OCI to profit or loss | Line item in the Separate Statement of Income that includes the reclassification adjustment | |||||||||||||
| In millions of COP | |||||||||||||||||
| Foreign currency risk | |||||||||||||||||
| Forecast transactions | (65) | - | Interest and valuation on financial instruments | - | Other administrative and general expenses | ||||||||||||
| Interest rate risk | |||||||||||||||||
| Deposits | 416 | - | Interest and valuation on financial instruments | (135) | Interest expenses | ||||||||||||
| Foreign currency risk | Interest rate risk | Total | |||||||||
| In millions of COP | |||||||||||
| As of January 1, 2024 | - | - | - | ||||||||
| Total hedging (loss)/gain recognized in OCI | (65) | 416 | 351 | ||||||||
| Amount reclassified to profit or loss | - | (135) | (135) | ||||||||
| Amount included in the cost of non-financial items | - | - | - | ||||||||
| Total cash flow hedging | (65) | 281 | 216 | ||||||||
| Income tax | (87) | ||||||||||
| As of December 31, 2024 | 129 | ||||||||||
| Notional amount | Carrying amount | Line item in the Separate Statement of Financial Position | Change in fair value used for measuring ineffectiveness for the period | ||||||||||||||
| Assets | Liabilities | ||||||||||||||||
| In millions of COP | |||||||||||||||||
| Interest rate risk | |||||||||||||||||
Interest rate swaps (1) |
134,000 | - | - | Derivative financial instruments | (1,044) | ||||||||||||
| Carrying amount | Accumulated fair value adjustments | Line item in the Separated Statement of Financial Position | Change in fair value used for measuring ineffectiveness for the period | Accumulated amount of fair value hedge adjustments remaining in the Statement of Financial Position for any hedged items that have ceased to be adjusted for hedging gains and losses | |||||||||||||
| In millions of COP | |||||||||||||||||
| Interest rate risk | |||||||||||||||||
| Deposits | 128,454 | (963) | Deposits by customers | 963 | - | ||||||||||||
Ineffectiveness recognised in Separate Statement of Income (1) |
Line item in the Separated Statement of Income that includes the recognised hedge ineffectiveness | |||||||
| In millions of COP | ||||||||
| Riesgo de tasa de interés | ||||||||
| Deposits | (81) | Interest and valuation on financial instruments | ||||||
| Banistmo S.A. | December 31, 2024 | December 31, 2023 | ||||||
| In thousands of USD | ||||||||
| Investment portion covered in the hedging relationship | 884,544 | 1,592,034 | ||||||
| Investment portion uncovered | 1,723,889 | 1,004,000 | ||||||
| Total investment in Banistmo S.A. | 2,608,433 | 2,596,034 | ||||||
| Debt securities issued in thousands of USD, designated as hedging instruments | ||||||||||||||
| Opening date | Due date | E.A. rate | Capital balance | Capital designated as hedging instrument | ||||||||||
| 18/10/2017 | 18/10/2027 | 7.03% | 461,707 | 355,339 | ||||||||||
| 24/06/2024 | 24/12/2034 | 4.68% | 800,000 | 529,205 | ||||||||||
Total debt securities |
1,261,707 | 884,544 | ||||||||||||
| Debt securities issued in thousands of USD, designated as hedging instruments | ||||||||||||||||||||
| Opening date | Due date | E.A. rate | Capital balance | Capital designated as hedging instrument | ||||||||||||||||
| 18/10/2017 | 18/10/2027 | 7.03% | 750,000 | 360,000 | ||||||||||||||||
| 18/12/2019 | 18/12/2029 | 4.68% | 550,000 | 550,000 | ||||||||||||||||
| 29/01/2020 | 29/01/2025 | 3.02% | 482,034 | 482,034 | ||||||||||||||||
| 1,782,034 | 1,392,034 | |||||||||||||||||||
| Borrowings from international banks in thousands of U.S. dollars, designated as hedging instruments | ||||||||||||||||||||
| 31/03/2022 | 17/03/2025 | 6.06% | 150,000 | 150,000 | ||||||||||||||||
| 07/09/2022 | 05/09/2025 | 6.36% | 50,000 | 50,000 | ||||||||||||||||
| 200,000 | 200,000 | |||||||||||||||||||
Total debt securities issued and loans with correspondent banks |
1,982,034 | 1,592,034 | ||||||||||||||||||
| Composition | December 31, 2024 | December 31, 2023 | ||||||
| In millions of COP | ||||||||
| Commercial | 102,823,571 | 95,614,822 | ||||||
| Consumer | 37,130,451 | 38,862,513 | ||||||
Leasing (1) |
26,154,135 | 26,056,199 | ||||||
| Mortgage | 25,163,198 | 21,840,258 | ||||||
| Small business loans | 656,350 | 547,677 | ||||||
| Total loan portfolio and financial leasing operations | 191,927,705 | 182,921,469 | ||||||
|
Total provision for loan portfolio and
leasing operations impairment (2)
|
(13,829,166) | (12,892,352) | ||||||
| Total loan portfolio and leasing operations, net | 178,098,539 | 170,029,117 | ||||||
| Provision concept | December 31, 2024 | December 31, 2023 | ||||||
| In millions of COP | ||||||||
General provision (Circular 026, 2022) (1) |
- | 353,159 | ||||||
| General provision Small business loans and Mortgage (Circular 100, 1995) | 256,011 | 221,529 | ||||||
| Total general provision | 256,011 | 574,688 | ||||||
| Commercial | Loans | Provision | Other items | ||||||||||||||||||||
| Category | Capital | Interest and/or financial component | Other items | Capital | Interest and/or financial component | Other items | |||||||||||||||||
| In millions of COP | |||||||||||||||||||||||
| A – Normal risk | 93,518,674 | 1,163,523 | 14,050 | 1,316,245 | 19,548 | 392 | 93,360,062 | ||||||||||||||||
| B – Acceptable risk | 1,494,066 | 23,438 | 1,623 | 63,573 | 2,047 | 292 | 1,453,215 | ||||||||||||||||
| C – Appreciable risk | 1,391,353 | 91,893 | 1,326 | 451,521 | 90,701 | 1,184 | 941,166 | ||||||||||||||||
| D – Significant risk | 2,363,500 | 71,352 | 14,343 | 1,712,661 | 71,352 | 14,312 | 650,870 | ||||||||||||||||
| E – Unrecoverable risk | 2,621,618 | 44,396 | 8,416 | 2,205,917 | 44,396 | 8,249 | 415,868 | ||||||||||||||||
| Total | 101,389,211 | 1,394,602 | 39,758 | 5,749,917 | 228,044 | 24,429 | 96,821,181 | ||||||||||||||||
| Consumer | Loans | Provision | Total net | |||||||||||||||||||||||
| Category | Capital | Interest and/or financial component | Other items | Capital | Interest and/or financial component | Other items | ||||||||||||||||||||
| In millions of COP | ||||||||||||||||||||||||||
| A – Normal risk | 30,764,653 | 385,004 | 55,730 | 917,778 | 14,658 | 2639 | 30,270,312 | |||||||||||||||||||
| B – Acceptable risk | 821,642 | 22,653 | 3,633 | 122,317 | 7,039 | 1603 | 716,969 | |||||||||||||||||||
| C – Appreciable risk | 756,964 | 18,313 | 3,539 | 196,859 | 13,998 | 3,000 | 564,959 | |||||||||||||||||||
| D – Significant risk | 1,117,242 | 27,980 | 6,792 | 1,058,048 | 27,980 | 6,783 | 59,203 | |||||||||||||||||||
| E – Unrecoverable risk | 3,039,743 | 82,528 | 24,035 | 2,928,664 | 82,528 | 23,590 | 111,524 | |||||||||||||||||||
| Total | 36,500,244 | 536,478 | 93,729 | 5,223,666 | 146,203 | 37,615 | 31,722,967 | |||||||||||||||||||
| Leasing | Loans | Provision | Total net | |||||||||||||||||||||||
| Category | Capital | Interest and/or financial component | Other items | Capital | Interest and/or financial component | Other items | ||||||||||||||||||||
| In millions of COP | ||||||||||||||||||||||||||
| A – Normal risk | 21,194,174 | 132,244 | 2,589,208 | 385,259 | 3,031 | 46891 | 23,480,445 | |||||||||||||||||||
| B – Acceptable risk | 582,525 | 7,561 | 31,141 | 23,652 | 1,003 | 1416 | 595,156 | |||||||||||||||||||
| C – Appreciable risk | 482,049 | 6,193 | 18,406 | 99,424 | 5,517 | 14,588 | 387,119 | |||||||||||||||||||
| D – Significant risk | 641,233 | 57,034 | 37,158 | 339,518 | 57,033 | 36,619 | 302,255 | |||||||||||||||||||
| E – Unrecoverable risk | 267,640 | 76,025 | 31,544 | 256,572 | 76,023 | 31,544 | 11,070 | |||||||||||||||||||
| Total | 23,167,621 | 279,057 | 2,707,457 | 1,104,425 | 142,607 | 131,058 | 24,776,045 | |||||||||||||||||||
| Mortgage | Loans | Provision | Total net | ||||||||||||||||||||
| Category | Capital | Interest and/or financial component | Other items | Capital | Interest and/or financial component | Other items | |||||||||||||||||
| In Millions of COP | |||||||||||||||||||||||
| A – Normal risk | 23,413,649 | 177,235 | 1,750 | 483,766 | 1,861 | 18 | 23,106,989 | ||||||||||||||||
| B – Acceptable risk | 457,800 | 4,759 | 699 | 29,489 | 4,759 | 699 | 428,311 | ||||||||||||||||
| C – Appreciable risk | 359,989 | 6,146 | 1,153 | 49,697 | 6,146 | 1,153 | 310,292 | ||||||||||||||||
| D – Significant risk | 445,213 | 4,970 | 1,688 | 99,614 | 4,970 | 1,688 | 345,599 | ||||||||||||||||
| E – Unrecoverable risk | 279,846 | 4,093 | 4,208 | 279,846 | 4,093 | 4,208 | - | ||||||||||||||||
| Total | 24,956,497 | 197,203 | 9,498 | 942,412 | 21,829 | 7,766 | 24,191,191 | ||||||||||||||||
| Small business loans | Loans | Provision | Total net | ||||||||||||||||||||
| Category | Capital | Interest and/or financial component | Other items | Capital | Interest and/or financial component | Other items | |||||||||||||||||
| In millions of COP | |||||||||||||||||||||||
| A – Normal risk | 576,447 | 6,595 | 1,952 | 12,214 | 99 | 32 | 572,649 | ||||||||||||||||
| B – Acceptable risk | 9,059 | 249 | 69 | 320 | 249 | 69 | 8,739 | ||||||||||||||||
| C – Appreciable risk | 7,226 | 227 | 63 | 4,441 | 227 | 63 | 2,785 | ||||||||||||||||
| D – Significant risk | 14,176 | 421 | 165 | 14,045 | 421 | 165 | 131 | ||||||||||||||||
| E – Unrecoverable risk | 37,470 | 1,252 | 979 | 34,624 | 1,252 | 974 | 2,851 | ||||||||||||||||
| Total | 644,378 | 8,744 | 3,228 | 65,644 | 2,248 | 1,303 | 587,155 | ||||||||||||||||
| Total loans | Loans | Provision | Total Net | |||||||||||||||||||||||
| Category | Capital | Interest and/or financial component | Other items | Capital | Interest and/or financial component | Other items | ||||||||||||||||||||
| In millions of COP | ||||||||||||||||||||||||||
| A – Normal risk | 169,467,597 | 1,864,601 | 2,662,690 | 3,115,262 | 39,197 | 49972 | 170,790,457 | |||||||||||||||||||
| B – Acceptable risk | 3,365,092 | 58,660 | 37,165 | 239,351 | 15,097 | 4079 | 3,202,390 | |||||||||||||||||||
| C – Appreciable risk | 2,997,581 | 122,772 | 24,487 | 801,942 | 116,589 | 19,988 | 2,206,321 | |||||||||||||||||||
| D – Significant risk | 4,581,364 | 161,757 | 60,146 | 3,223,886 | 161,756 | 59,567 | 1,358,058 | |||||||||||||||||||
| E – Unrecoverable risk | 6,246,317 | 208,294 | 69,182 | 5,705,623 | 208,292 | 68,565 | 541,313 | |||||||||||||||||||
| Total | 186,657,951 | 2,416,084 | 2,853,670 | 13,086,064 | 540,931 | 202,171 | 178,098,539 | |||||||||||||||||||
| Commercial | Loans | Provision | Other items | ||||||||||||||||||||
| Category | Capital | Interest and/or financial component | Other items | Capital | Interest and/or financial component | Other items | |||||||||||||||||
| In millions of COP | |||||||||||||||||||||||
| A – Normal risk | 87,655,242 | 1,502,565 | 16,158 | 1,232,376 | 24,530 | 578 | 87,916,481 | ||||||||||||||||
| B – Acceptable risk | 1,300,166 | 74,543 | 1,854 | 197,071 | 8,079 | 392 | 1,171,021 | ||||||||||||||||
| C – Appreciable risk | 631,082 | 12,217 | 1,564 | 156,946 | 9,861 | 1,385 | 476,671 | ||||||||||||||||
| D – Significant risk | 1,779,007 | 43,394 | 11,537 | 1,223,780 | 43,394 | 11,523 | 555,241 | ||||||||||||||||
| E – Unrecoverable risk | 2,550,668 | 28,750 | 6,075 | 2,142,931 | 28,750 | 5,931 | 407,881 | ||||||||||||||||
| Total | 93,916,165 | 1,661,469 | 37,188 | 4,953,104 | 114,614 | 19,809 | 90,527,295 | ||||||||||||||||
| Consumer | Loans | Provision | Total net | ||||||||||||||||||||
| Category | Capital | Interest and/or financial component | Other items | Capital | Interest and/or financial component | Other items | |||||||||||||||||
| In millions of COP | |||||||||||||||||||||||
| A – Normal risk | 32,413,615 | 517,717 | 64,264 | 1,372,121 | 21,829 | 3,139 | 31,598,507 | ||||||||||||||||
| B – Acceptable risk | 1,062,168 | 35,307 | 5,318 | 127,120 | 11,640 | 2,299 | 961,734 | ||||||||||||||||
| C – Appreciable risk | 898,748 | 29,112 | 5,546 | 193,193 | 22,939 | 4,826 | 712,448 | ||||||||||||||||
| D – Significant risk | 1,511,693 | 52,257 | 11,365 | 1,448,226 | 52,257 | 11,350 | 63,482 | ||||||||||||||||
| E – Unrecoverable risk | 2,173,238 | 64,509 | 17,656 | 2,108,782 | 64,509 | 17,496 | 64,616 | ||||||||||||||||
| Total | 38,059,462 | 698,902 | 104,149 | 5,249,442 | 173,174 | 39,110 | 33,400,787 | ||||||||||||||||
| Leasing | Loans | Provision | Total net | |||||||||||||||||||||||
| Category | Capital | Interest and/or financial component | Other items | Capital | Interest and/or financial component | Other items | ||||||||||||||||||||
| In millions of COP | ||||||||||||||||||||||||||
| A – Normal risk | 21,592,066 | 175,325 | 2,404,759 | 435,169 | 3,829 | 37,879 | 23,695,273 | |||||||||||||||||||
| B – Acceptable risk | 538,105 | 7,852 | 12,592 | 25,701 | 565 | 907 | 531,376 | |||||||||||||||||||
| C – Appreciable risk | 328,825 | 4,816 | 16,995 | 27,587 | 3,234 | 12,688 | 307,127 | |||||||||||||||||||
| D – Significant risk | 430,928 | 35,678 | 55,351 | 224,699 | 35,664 | 42,956 | 218,638 | |||||||||||||||||||
| E – Unrecoverable risk | 346,214 | 73,062 | 33,631 | 326,783 | 72,005 | 33,320 | 20,799 | |||||||||||||||||||
| Total | 23,236,138 | 296,733 | 2,523,328 | 1,039,939 | 115,297 | 127,750 | 24,773,213 | |||||||||||||||||||
| Mortgage | Loans | Provision | Total net | ||||||||||||||||||||
| Category | Capital | Interest and/or financial component | Other items | Capital | Interest and/or financial component | Other items | |||||||||||||||||
| In Millions of COP | |||||||||||||||||||||||
| A – Normal risk | 20,535,984 | 200,004 | 2,549 | 421,655 | 2,073 | 26 | 20,314,783 | ||||||||||||||||
| B – Acceptable risk | 424,654 | 4,934 | 654 | 34,213 | 4,934 | 654 | 390,441 | ||||||||||||||||
| C – Appreciable risk | 210,292 | 921 | 866 | 110,781 | 921 | 866 | 99,511 | ||||||||||||||||
| D – Significant risk | 249,828 | 2,383 | 1,076 | 188,885 | 2,383 | 1,076 | 60,943 | ||||||||||||||||
| E – Unrecoverable risk | 198,883 | 3,279 | 3,951 | 198,883 | 3,279 | 3,951 | - | ||||||||||||||||
| Total | 21,619,641 | 211,521 | 9,096 | 954,417 | 13,590 | 6,573 | 20,865,678 | ||||||||||||||||
| Small business loans | Loans | Provision | Total net | ||||||||||||||||||||
| Category | Capital | Interest and/or financial component | Other items | Capital | Interest and/or financial component | Other items | |||||||||||||||||
| In millions of COP | |||||||||||||||||||||||
| A – Normal risk | 439,705 | 7,609 | 1,040 | 9,739 | 173 | 29 | 438,413 | ||||||||||||||||
| B – Acceptable risk | 16,911 | 774 | 127 | 644 | 774 | 127 | 16,267 | ||||||||||||||||
| C – Appreciable risk | 11,175 | 503 | 109 | 6,858 | 503 | 109 | 4,317 | ||||||||||||||||
| D – Significant risk | 19,715 | 867 | 244 | 19,257 | 867 | 243 | 459 | ||||||||||||||||
| E – Unrecoverable risk | 45,559 | 2,216 | 1,123 | 42,875 | 2,216 | 1,119 | 2,688 | ||||||||||||||||
| Total | 533,065 | 11,969 | 2,643 | 79,373 | 4,533 | 1,627 | 462,144 | ||||||||||||||||
| Total loans | Loans | Provision | Total Net | |||||||||||||||||||||||
| Category | Capital | Interest and/or financial component | Other items | Capital | Interest and/or financial component | Other items | ||||||||||||||||||||
| In millions of COP | ||||||||||||||||||||||||||
| A – Normal risk | 162,636,612 | 2,403,220 | 2,488,770 | 3,471,060 | 52,434 | 41,651 | 163,963,457 | |||||||||||||||||||
| B – Acceptable risk | 3,342,004 | 123,410 | 20,545 | 384,749 | 25,992 | 4,379 | 3,070,839 | |||||||||||||||||||
| C – Appreciable risk | 2,080,122 | 47,569 | 25,080 | 495,365 | 37,458 | 19,874 | 1,600,074 | |||||||||||||||||||
| D – Significant risk | 3,991,171 | 134,579 | 79,573 | 3,104,847 | 134,565 | 67,148 | 898,763 | |||||||||||||||||||
| E – Unrecoverable risk | 5,314,562 | 171,816 | 62,436 | 4,820,254 | 170,759 | 61,817 | 495,984 | |||||||||||||||||||
| Total | 177,364,471 | 2,880,594 | 2,676,404 | 12,276,275 | 421,208 | 194,869 | 170,029,117 | |||||||||||||||||||
|
Location
|
Loans | Provision | Total net | ||||||||||||||||||||
| Capital | Interest and/or financial component | Other items | Capital | Interest and/or financial component | Other items | ||||||||||||||||||
| In millions of COP | |||||||||||||||||||||||
| Antioquia | 64,022,324 | 814,961 | 881,205 | 4,304,988 | 180,417 | 55,332 | 61,177,753 | ||||||||||||||||
| Bogotá y Sabana | 58,631,221 | 817,642 | 1,171,514 | 3,378,560 | 168,711 | 69,290 | 57,003,816 | ||||||||||||||||
| Centro | 15,071,122 | 192,481 | 205,600 | 1,412,494 | 44,862 | 21,659 | 13,990,188 | ||||||||||||||||
| Norte | 25,392,035 | 324,571 | 268,015 | 1,869,083 | 75,903 | 35,410 | 24,004,225 | ||||||||||||||||
| Sur | 20,045,168 | 229,012 | 327,336 | 1,931,417 | 52,447 | 20,480 | 18,597,172 | ||||||||||||||||
| Panamá | 3,496,081 | 37,417 | - | 189,522 | 18,591 | - | 3,325,385 | ||||||||||||||||
| Total | 186,657,951 | 2,416,084 | 2,853,670 | 13,086,064 | 540,931 | 202,171 | 178,098,539 | ||||||||||||||||
|
Location
|
Loans | Provision | Total net | |||||||||||||||||||||||
| Capital | Interest and/or financial component | Other items | Capital | Interest and/or financial component | Other items | |||||||||||||||||||||
| In millions of COP | ||||||||||||||||||||||||||
| Antioquia | 62,217,145 | 979,180 | 1,008,386 | 4,334,701 | 106,060 | 54,155 | 59,709,795 | |||||||||||||||||||
| Bogotá y Sabana | 56,091,415 | 982,157 | 1,128,678 | 3,079,839 | 153,992 | 60,403 | 54,908,016 | |||||||||||||||||||
| Centro | 14,886,930 | 246,096 | 118,041 | 1,296,201 | 45,362 | 15,414 | 13,894,090 | |||||||||||||||||||
| Norte | 19,324,428 | 309,431 | 262,998 | 1,512,356 | 55,796 | 45,406 | 18,283,299 | |||||||||||||||||||
| Sur | 21,843,035 | 319,516 | 158,301 | 1,891,575 | 50,028 | 19,491 | 20,359,758 | |||||||||||||||||||
| Panamá | 3,001,518 | 44,214 | - | 161,603 | 9,970 | - | 2,874,159 | |||||||||||||||||||
| Total | 177,364,471 | 2,880,594 | 2,676,404 | 12,276,275 | 421,208 | 194,869 | 170,029,117 | |||||||||||||||||||
| Monetary units | ||||||||||||||
| Category | Legal Currency | Foreign Currency | UVR | Total | ||||||||||
| In millions of COP | ||||||||||||||
| Commercial | 91,386,452 | 5,905,883 | 5,531,236 | 102,823,571 | ||||||||||
| Consumer | 36,235,940 | 894,511 | - | 37,130,451 | ||||||||||
| Leasing | 26,075,531 | 78,604 | - | 26,154,135 | ||||||||||
| Mortgage | 19,162,182 | - | 6,001,016 | 25,163,198 | ||||||||||
| Small business loans | 656,350 | - | - | 656,350 | ||||||||||
| Total | 173,516,455 | 6,878,998 | 11,532,252 | 191,927,705 | ||||||||||
| Monetary units | ||||||||||||||
| Category | Legal Currency | Foreign Currency | UVR | Total | ||||||||||
| In millions of COP | ||||||||||||||
| Commercial | 84,690,072 | 5,233,176 | 5,691,574 | 95,614,822 | ||||||||||
| Consumer | 38,189,099 | 673,414 | - | 38,862,513 | ||||||||||
| Leasing | 25,937,719 | 118,480 | - | 26,056,199 | ||||||||||
| Mortgage | 16,919,390 | - | 4,920,868 | 21,840,258 | ||||||||||
| Small business loans | 547,677 | - | - | 547,677 | ||||||||||
| Total | 166,283,957 | 6,025,070 | 10,612,442 | 182,921,469 | ||||||||||
| Type | Loans | Provision | Total net | ||||||||||||||||||||
| Capital | Interest and/or financial component | Other items | Capital | Interest and/or financial component | Other items | ||||||||||||||||||
| In millions of COP | |||||||||||||||||||||||
| Law 550 and/or 1116 | 1,498,345 | 20,901 | 11,155 | 1,093,579 | 19,724 | 11,032 | 406,066 | ||||||||||||||||
| Restructuring due to conciliations with clients | 5,573,555 | 172,592 | 50,802 | 3,912,573 | 158,836 | 46,931 | 1,678,609 | ||||||||||||||||
| Total | 7,071,900 | 193,493 | 61,957 | 5,006,152 | 178,560 | 57,963 | 2,084,675 | ||||||||||||||||
| Type | Loans | Provision | Total net | ||||||||||||||||||||
| Capital | Interest and/or financial component | Other items | Capital | Interest and/or financial component | Other items | ||||||||||||||||||
| In millions of COP | |||||||||||||||||||||||
| Law 550 and/or 1116 | 1,288,215 | 16,174 | 10,686 | 928,120 | 15,885 | 10,585 | 360,485 | ||||||||||||||||
| Restructuring due to conciliations with clients | 4,021,739 | 135,538 | 51,892 | 2,658,408 | 114,820 | 48,199 | 1,387,742 | ||||||||||||||||
| Total | 5,309,954 | 151,712 | 62,578 | 3,586,528 | 130,705 | 58,784 | 1,748,227 | ||||||||||||||||
| Rating | Loans | Provision | Total net | ||||||||||||||||||||
| Capital | Interest and/or financial component | Other items | Capital | Interest and/or financial component | Other items | ||||||||||||||||||
| In millions of COP | |||||||||||||||||||||||
| A – Normal risk | 151,060 | 4,722 | 373 | 7,354 | 425 | 171 | 148,205 | ||||||||||||||||
| B – Acceptable risk | 463,940 | 15,660 | 3,530 | 56,382 | 7,805 | 996 | 417,947 | ||||||||||||||||
| C – Appreciable risk | 636,586 | 15,952 | 2,405 | 133,032 | 13,300 | 1,752 | 506,859 | ||||||||||||||||
| D – Significant risk | 1,656,111 | 43,978 | 21,711 | 1,087,976 | 43,973 | 21,674 | 568,177 | ||||||||||||||||
| E – Unrecoverable risk | 4,164,203 | 113,181 | 33,938 | 3,721,408 | 113,057 | 33,370 | 443,487 | ||||||||||||||||
| Total | 7,071,900 | 193,493 | 61,957 | 5,006,152 | 178,560 | 57,963 | 2,084,675 | ||||||||||||||||
| Rating | Loans | Provision | Total net | ||||||||||||||||||||
| Capital | Interest and/or financial component | Other items | Capital | Interest and/or financial component | Other items | ||||||||||||||||||
| In millions of COP | |||||||||||||||||||||||
| A – Normal risk | 439,339 | 14,899 | 1,480 | 20,388 | 3,284 | 551 | 431,495 | ||||||||||||||||
| B – Acceptable risk | 381,691 | 14,956 | 2,617 | 47,690 | 8,489 | 888 | 342,197 | ||||||||||||||||
| C – Appreciable risk | 395,430 | 9,180 | 12,291 | 78,466 | 6,295 | 11,416 | 320,724 | ||||||||||||||||
| D – Significant risk | 1,121,405 | 37,991 | 14,992 | 898,684 | 37,982 | 14,980 | 222,742 | ||||||||||||||||
| E – Unrecoverable risk | 2,972,089 | 74,686 | 31,198 | 2,541,300 | 74,655 | 30,949 | 431,069 | ||||||||||||||||
| Total | 5,309,954 | 151,712 | 62,578 | 3,586,528 | 130,705 | 58,784 | 1,748,227 | ||||||||||||||||
| Location | Loans | Provision | Total net | ||||||||||||||||||||
| Capital | Interest and/or financial component | Other items | Capital | Interest and/or financial component | Other items | ||||||||||||||||||
| In millions of COP | |||||||||||||||||||||||
| Antioquia | 1,855,677 | 59,641 | 12,294 | 1,373,737 | 54,194 | 11,580 | 488,101 | ||||||||||||||||
| Bogotá y Sabana | 1,990,781 | 68,230 | 28,285 | 1,321,462 | 63,680 | 26,363 | 675,791 | ||||||||||||||||
| Centro | 814,919 | 16,069 | 6,297 | 549,718 | 14,640 | 5,901 | 267,026 | ||||||||||||||||
| Norte | 1,064,160 | 20,694 | 8,637 | 726,646 | 19,093 | 8,054 | 339,698 | ||||||||||||||||
| Sur | 1,346,363 | 28,859 | 6,444 | 1,034,589 | 26,953 | 6,065 | 314,059 | ||||||||||||||||
| Total | 7,071,900 | 193,493 | 61,957 | 5,006,152 | 178,560 | 57,963 | 2,084,675 | ||||||||||||||||
| Location | Loans | Provision | Total net | ||||||||||||||||||||
| Capital | Interest and/or financial component | Other items | Capital | Interest and/or financial component | Other items | ||||||||||||||||||
| In millions of COP | |||||||||||||||||||||||
| Antioquia | 1,344,322 | 42,394 | 19,127 | 891,364 | 36,652 | 18,576 | 459,251 | ||||||||||||||||
| Bogotá y Sabana | 1,454,189 | 53,477 | 17,491 | 917,580 | 47,328 | 15,801 | 544,448 | ||||||||||||||||
| Centro | 626,267 | 15,105 | 4,399 | 405,743 | 12,106 | 3,987 | 223,935 | ||||||||||||||||
| Norte | 796,059 | 19,349 | 10,028 | 533,914 | 16,833 | 9,490 | 265,199 | ||||||||||||||||
| Sur | 1,089,117 | 21,387 | 11,533 | 837,927 | 17,786 | 10,930 | 255,394 | ||||||||||||||||
| Total | 5,309,954 | 151,712 | 62,578 | 3,586,528 | 130,705 | 58,784 | 1,748,227 | ||||||||||||||||
| Sector | Loans | Provision | Total net | ||||||||||||||||||||
| Capital | Interest and/or financial component | Other items | Capital | Interest and/or financial component | Other items | ||||||||||||||||||
| In millions of COP | |||||||||||||||||||||||
| Agriculture, forestry, fishing and hunting | 316,567 | 8,146 | 4,896 | 219,495 | 7,864 | 4,837 | 97,413 | ||||||||||||||||
| Customer portfolio for natural person | 3,487,969 | 103,060 | 22,914 | 2,538,338 | 93,519 | 20,872 | 961,214 | ||||||||||||||||
| Commerce, restaurants and hotels | 1,021,700 | 28,422 | 7,013 | 676,586 | 26,031 | 6,789 | 347,729 | ||||||||||||||||
| Manufacturing | 1,460,384 | 42,525 | 16,657 | 1,036,421 | 40,633 | 15,320 | 427,192 | ||||||||||||||||
| Social and personal communal services | 332,971 | 5,409 | 3,061 | 185,311 | 4,965 | 2,965 | 148,200 | ||||||||||||||||
| Financial services, real estate, business | 27,364 | 960 | 340 | 21,457 | 925 | 196 | 6,086 | ||||||||||||||||
| Transport and communications | 424,945 | 4,971 | 7,076 | 328,544 | 4,623 | 6,984 | 96,841 | ||||||||||||||||
| Total | 7,071,900 | 193,493 | 61,957 | 5,006,152 | 178,560 | 57,963 | 2,084,675 | ||||||||||||||||
| Sector | Loans | Provision | Total net | ||||||||||||||||||||
| Capital | Interest and/or financial component | Other items | Capital | Interest and/or financial component | Other items | ||||||||||||||||||
| In millions of COP | |||||||||||||||||||||||
| Agriculture, forestry, fishing and hunting | 158,148 | 4,786 | 1,956 | 101,439 | 4,005 | 1,823 | 57,623 | ||||||||||||||||
| Customer portfolio for natural person | 2,505,994 | 84,824 | 15,823 | 1,732,561 | 70,237 | 14,284 | 789,559 | ||||||||||||||||
| Commerce, restaurants and hotels | 841,391 | 19,019 | 7,595 | 553,552 | 17,361 | 6,991 | 290,101 | ||||||||||||||||
| Manufacturing | 1,149,875 | 31,250 | 25,370 | 734,136 | 28,322 | 24,375 | 419,662 | ||||||||||||||||
| Social and personal communal services | 239,834 | 6,623 | 2,457 | 146,518 | 6,161 | 2,010 | 94,225 | ||||||||||||||||
| Financial services, real estate, business | 12,950 | 575 | 129 | 8,529 | 544 | 127 | 4,454 | ||||||||||||||||
| Transport and communications | 401,762 | 4,635 | 9,248 | 309,793 | 4,075 | 9,174 | 92,603 | ||||||||||||||||
| Total | 5,309,954 | 151,712 | 62,578 | 3,586,528 | 130,705 | 58,784 | 1,748,227 | ||||||||||||||||
| Loans | Commercial | Consumer | Leasing | Mortgage | Small business loans | Total | ||||||||||||||
| In millions of COP | ||||||||||||||||||||
| (+) Balance as of December 31, 2023 | 5,087,527 | 5,461,726 | 1,282,986 | 974,580 | 85,533 | 12,892,352 | ||||||||||||||
| (+) Charged-off-loan recovery | 58,405 | 400,304 | 148,291 | 35,924 | 2,818 | 645,742 | ||||||||||||||
| (+) Impairment of loan portfolio and leasing operations, net | 1,670,285 | 3,929,541 | 135,741 | 27,824 | 61,287 | 5,824,678 | ||||||||||||||
(-) Period charges-off (1) |
601,552 | 4,384,087 | 188,928 | 66,321 | 80,443 | 5,321,331 | ||||||||||||||
| (-) Sold portfolio provisions | 212,275 | - |
- |
- |
- |
212,275 | ||||||||||||||
| Balance as of December 31, 2024 | 6,002,390 | 5,407,484 | 1,378,090 | 972,007 | 69,195 | 13,829,166 | ||||||||||||||
| Loans | Commercial | Consumer | Leasing | Mortgage | Small business loans | Total | ||||||||||||||
| In millions of COP | ||||||||||||||||||||
| (+) Balance as of December 31, 2022 | 5,034,160 | 4,069,098 | 1,278,586 | 813,264 | 73,476 | 11,268,584 | ||||||||||||||
| (+) Charged-off-loan recovery | 47,591 | 285,768 | 59,732 | 33,410 | 1,797 | 428,298 | ||||||||||||||
| (+) Impairment of loan portfolio and leasing operations, net | 1,362,636 | 4,891,574 | 194,354 | 201,287 | 73,484 | 6,723,335 | ||||||||||||||
(-) Period charges-off (1) |
621,663 | 3,784,714 | 249,686 | 73,381 | 63,224 | 4,792,668 | ||||||||||||||
| (-) Sold portfolio provisions | 735,197 | - | - | - | - | 735,197 | ||||||||||||||
| Balance as of December 31, 2023 | 5,087,527 | 5,461,726 | 1,282,986 | 974,580 | 85,533 | 12,892,352 | ||||||||||||||
| Loans | Capital | Interest and/or financial component | Other items | Total | ||||||||||
| In millions of COP | ||||||||||||||
| Commercial | 552,569 | 35,430 | 13,553 | 601,552 | ||||||||||
| Consumer | 4,163,088 | 143,798 | 77,201 | 4,384,087 | ||||||||||
| Leasing | 117,524 | 62,512 | 8,892 | 188,928 | ||||||||||
| Mortgage | 52,791 | 12,256 | 1,274 | 66,321 | ||||||||||
| Small business loans | 74,112 | 4,180 | 2,151 | 80,443 | ||||||||||
| Total | 4,960,084 | 258,176 | 103,071 | 5,321,331 | ||||||||||
| Loans | Capital | Interest and/or financial component | Other items | Total | ||||||||||
| In millions of COP | ||||||||||||||
| Commercial | 579,463 | 28,893 | 13,307 | 621,663 | ||||||||||
| Consumer | 3,590,857 | 124,065 | 69,792 | 3,784,714 | ||||||||||
| Leasing | 168,045 | 54,331 | 27,310 | 249,686 | ||||||||||
| Mortgage | 57,466 | 14,713 | 1,202 | 73,381 | ||||||||||
| Small business loans | 57,132 | 4,057 | 2,035 | 63,224 | ||||||||||
| Total | 4,452,963 | 226,059 | 113,646 | 4,792,668 | ||||||||||
| Loan sales | ||||||||
| In millions of COP | ||||||||
| Entity name | Sale price (1) |
% of the loan sold | ||||||
| Alicudi S.A.S | 73,430 | 100% | ||||||
| Metro Cali S.A. | 35,000 | 100% | ||||||
| Amasya S.A.S | 2,200 | 100% | ||||||
| Operación Estratégica S.A.S | 1,337 | 100% | ||||||
| Bluetrade S.A.S | 200 | 100% | ||||||
| Georg S.A.S | - | 100% | ||||||
| Loan sales | ||||||||
| In million of COP | ||||||||
| Entity name | Sale price (1) |
% of the loan sold | ||||||
| Transición Express SAS. | 243,363 | 100% | ||||||
| Cerberus South American Investments. | 22,157 | 100% | ||||||
| CI RAM Inversiones BVI de Colombia S.A.S. | 4,063 | 100% | ||||||
| SKEMA Promotora S.A. | 2,251 | 100% | ||||||
6.1 Lessor | ||
| Period | Gross investment |
Present value of minimum
payments
|
||||||
| In millions of COP | ||||||||
| Less than 1 year | 919,614 | 737,197 | ||||||
| Between 1 and 3 years | 3,896,988 | 2,817,093 | ||||||
| Between 3 and 5 years | 6,131,466 | 4,065,360 | ||||||
| More than 5 years | 32,008,887 | 18,534,485 | ||||||
| Total gross investment/ present value of minimum payments | 42,956,955 | 26,154,135 | ||||||
Future financial income (1) |
(16,802,820) | - | ||||||
Present value of payments receivable (2) |
26,154,135 | 26,154,135 | ||||||
| Minimum non-collectable payments impairment | (1,378,090) | (1,378,090) | ||||||
| Total | 24,776,045 | 24,776,045 | ||||||
| Period | Gross investment |
Present value of minimum
payments
|
||||||
| In millions of COP | ||||||||
| Less than 1 year | 966,212 | 777,995 | ||||||
| Between 1 and 3 years | 4,189,482 | 2,695,144 | ||||||
| Between 3 and 5 years | 6,384,736 | 3,861,606 | ||||||
| More than 5 years | 34,029,393 | 18,721,454 | ||||||
| Total gross investment/ present value of minimum payments | 45,569,823 | 26,056,199 | ||||||
Future financial income (1) |
(19,513,624) | - | ||||||
Present value of payments receivable (2) |
26,056,199 | 26,056,199 | ||||||
| Minimum non-collectable payments impairment | (1,282,986) | (1,282,986) | ||||||
| Total | 24,773,213 | 24,773,213 | ||||||
| Type of asset | December 31, 2024 | December 31, 20223 | ||||||
| In millions of COP | ||||||||
|
Vehicles
Technological equipment
Machinery and equipment
|
115,553
57,939
10,557
|
99,874
49,457
3,031
|
||||||
| Total | 184,049 | 152,362 | ||||||
| Type of asset | December 31, 2024 | December 31, 2023 | ||||||
| In millions of COP | ||||||||
| Technological equipment | 15,572 | 20,717 | ||||||
| Buildings | 9,254 | 8,088 | ||||||
| Machinery and equipment | 236 | 532 | ||||||
| Vehicles | 200 | 102 | ||||||
| Total | 25,262 | 29,439 | ||||||
| December 31, 2024 | December 31, 2023 | |||||||
| In millions of COP | ||||||||
| Gross investment in finance leases | 6,788,756 | 7,352,215 | ||||||
| Unearned income | (2,722,593) | (3,159,541) | ||||||
| Written off leases | (1,479,013) | (1,363,613) | ||||||
| Total | 2,587,150 | 2,829,061 | ||||||
| Period | December 31, 2024 | December 31, 2023 | ||||||||||||
| In millions of COP | ||||||||||||||
| Less than 1 year | 330,756 | 116,193 | ||||||||||||
| Between 1 and 3 years | 631,153 | 945,825 | ||||||||||||
| Between 3 and 5 years | 738,002 | 1,124,074 | ||||||||||||
| Greater than 5 years | 360,474 | 398,645 | ||||||||||||
| Total | 2,060,385 | 2,584,737 | ||||||||||||
6.2. Lessee | ||
6.2.1. Right-of-use assets under lease, net | ||
| Right-of-use assets |
Balance as of
January 01, 2024
|
Roll - forward |
Balance as of
December 31, 2024
|
|||||||||||||||||||||||||||||
Acquisitions (1) |
Additions (2) |
Depreciation expense (3) |
Impairment expense (3) |
Disposals (4) |
Revaluation (5) |
|||||||||||||||||||||||||||
| In millions of COP | ||||||||||||||||||||||||||||||||
| Buildings | ||||||||||||||||||||||||||||||||
| Cost | 1,696,191 | 72,211 | 41,929 | - | - | (19,856) | 87,044 | 1,877,519 | ||||||||||||||||||||||||
| Accumulated depreciation | (471,270) | - | - | (130,010) | - | 17,549 | - | (583,731) | ||||||||||||||||||||||||
| Impairment | - | - | - | - | (196) | 196 | - | - | ||||||||||||||||||||||||
| Computer equipment | ||||||||||||||||||||||||||||||||
| Cost | 575 | - | - | - | - | - | 193 | 768 | ||||||||||||||||||||||||
| Accumulated depreciation | (375) | - | - | (188) | - | - | - | (563) | ||||||||||||||||||||||||
| Vehicles | ||||||||||||||||||||||||||||||||
| Cost | 5,635 | - | - | - | - | (1,716) | (44) | 3,875 | ||||||||||||||||||||||||
| Accumulated depreciation | (2,107) | - | - | (1,105) | - | 1,658 | - | (1,554) | ||||||||||||||||||||||||
| Total cost | 1,702,401 | 72,211 | 41,929 | - | - | (21,572) | 87,193 | 1,882,162 | ||||||||||||||||||||||||
| Total accumulated depreciation | (473,752) | - | - | (131,303) | - | 19,207 | - | (585,848) | ||||||||||||||||||||||||
| Total impairment | - | - | - | - | (196) | 196 | - | - | ||||||||||||||||||||||||
| Total right-of-use assets, net | 1,228,649 | 72,211 | 41,929 | (131,303) | (196) | (2,169) | 87,193 | 1,296,314 | ||||||||||||||||||||||||
| Right-of-use assets |
Balance as of
January 01, 2023
|
Roll - forward |
Balance as of
December 31, 2023
|
|||||||||||||||||||||||||||||
Acquisitions (1) |
Additions (2) |
Depreciation expense (3) |
Impairment expense (3) |
Disposals (4) |
Revaluation (5) |
|||||||||||||||||||||||||||
| In millions of COP | ||||||||||||||||||||||||||||||||
| Buildings | ||||||||||||||||||||||||||||||||
| Cost | 1,476,159 | 37,443 | 19,436 | - | - | (42,578) | 205,731 | 1,696,191 | ||||||||||||||||||||||||
| Accumulated depreciation | (367,891) | - | - | (129,221) | - | 25,842 | - | (471,270) | ||||||||||||||||||||||||
| Impairment | - | - | - | - | (489) | 489 | - | - | ||||||||||||||||||||||||
| Computer equipment | ||||||||||||||||||||||||||||||||
| Cost | 32,734 | - | - | - | - | (28,478) | (3,681) | 575 | ||||||||||||||||||||||||
| Accumulated depreciation | (24,518) | - | - | (3,706) | - | 27,849 | - | (375) | ||||||||||||||||||||||||
| Vehicles | ||||||||||||||||||||||||||||||||
| Cost | 1,260 | 3,853 | - | - | - | - | 522 | 5,635 | ||||||||||||||||||||||||
| Accumulated depreciation | (1,091) | - | - | (1,016) | - | - | - | (2,107) | ||||||||||||||||||||||||
| Total cost | 1,510,153 | 41,296 | 19,436 | - | - | (71,056) | 202,572 | 1,702,401 | ||||||||||||||||||||||||
| Total accumulated depreciation | (393,500) | - | - | (133,943) | - | 53,691 | - | (473,752) | ||||||||||||||||||||||||
| Total impairment | - | - | - | - | (489) | 489 | - | - | ||||||||||||||||||||||||
| Total right-of-use assets, net | 1,116,653 | 41,296 | 19,436 | (133,943) | (489) | (16,876) | 202,572 | 1,228,649 | ||||||||||||||||||||||||
6.2.2. Lease liabilities, net | ||
| Concept | Total | ||||
| In millions of COP | |||||
| Balance as of January 01, 2024 | 1,352,302 | ||||
| (+) New contracts | 72,059 | ||||
(+) Reassessment of the lease liability (1) |
80,777 | ||||
| (-) Made-payments amortization | 234,277 | ||||
| (+) Accrued Interest | 120,354 | ||||
| Balance as of December 31, 2024 | 1,391,215 | ||||
| Concept | Total | ||||
| In millions of COP | |||||
| Balance as of January 01, 2023 | 1,252,263 | ||||
| (+) New contracts | 41,132 | ||||
| (+) Reassessment of the lease liability | 175,809 | ||||
| (-) Made-payments amortization | 218,112 | ||||
| (+) Accrued Interest | 101,210 | ||||
| Balance as of December 31, 2023 | 1,352,302 | ||||
| Type of assets | Maturity less than 1 year | Maturity between 1 and 3 years | Maturity between 3 and 5 years | Maturity greater than 5 years |
Total lease liabilities, net | ||||||||||||
| In millions of COP | |||||||||||||||||
| Buildings | 6,201 | 38,131 | 200,156 | 1,143,788 | 1,388,276 | ||||||||||||
| Vehicles | - | 146 | 2,601 | - | 2,747 | ||||||||||||
| Computer equipment | 192 | - | - | - | 192 | ||||||||||||
Total lease liabilities, net |
6,393 | 38,277 | 202,757 | 1,143,788 | 1,391,215 | ||||||||||||
| Type of assets | Maturity less than 1 year | Maturity between 1 and 3 years | Maturity between 3 and 5 years | Maturity greater than 5 years | Total lease liabilities, net | ||||||||||||
| In millions of COP | |||||||||||||||||
| Buildings | 7,837 | 27,130 | 225,727 | 1,087,682 | 1,348,376 | ||||||||||||
| Vehicles | 94 | - | 3,634 | - | 3,728 | ||||||||||||
Computer equipment (1) |
198 | - | - | - | 198 | ||||||||||||
Total lease liabilities, net |
8,129 | 27,130 | 229,361 | 1,087,682 | 1,352,302 | ||||||||||||
| Type of assets | Weighted average life (months) |
Weighted average
remaining lease terms (months)
|
Weighted average discount
rates
|
||||||||
| Buildings | 278 | 155 | 9.23% | ||||||||
| Vehicles | 58 | 37 | 18.93% | ||||||||
| Computer equipment | 47 | 11 | 6.22% | ||||||||
| Type of assets | Weighted average life (months) |
Weighted average
remaining lease terms (months)
|
Weighted average discount
rates
|
||||||||
| Buildings | 259 | 140 | 8.77% | ||||||||
| Vehicles | 62 | 47 | 18.34% | ||||||||
| Computer equipment | 35 | 11 | 6.22% | ||||||||
| Type of assets | Financial interest (1) |
Depreciation expenses
(2)
|
Impairment expenses (2) |
Short-term leases | Low-cost leasing (3) |
Early termination fine expense (4) |
||||||||||||||
| In millions of COP | ||||||||||||||||||||
| Buildings | 115,384 | 130,010 | 196 | 84 | - | 533 | ||||||||||||||
| Vehicles | 661 | 1,105 | - | 166 | - | - | ||||||||||||||
| Computer equipment | 7 | 188 | - | - | - | - | ||||||||||||||
| Furniture and fixtures | - | - | - | - | - | - | ||||||||||||||
| Total | 116,052 | 131,303 | 196 | 250 | - | 533 | ||||||||||||||
| Type of assets | Financial interest (1) |
Depreciation expenses
(2)
|
Impairment expenses (2) |
Short-term leases | Low-cost leasing (3) |
Early termination fine expense (4) |
||||||||||||||
| In millions of COP | ||||||||||||||||||||
| Buildings | 89,368 | 129,221 | 489 | - | - | 1,281 | ||||||||||||||
| Vehicles | 567 | 1,016 | - | 121 | - | - | ||||||||||||||
| Computer equipment | 737 | 3,706 | - | - | - | - | ||||||||||||||
| Furniture and fixtures | - | - | - | - | - | - | ||||||||||||||
| Total | 90,672 | 133,943 | 489 | 121 | - | 1,281 | ||||||||||||||
| December 31, 2024 | December 31, 2023 | |||||||||||||||||||
| In millions of COP | ||||||||||||||||||||
| Company name | Main activity | Country | % of ownership | Investment value | % of ownership | Investment value | ||||||||||||||
Banistmo S.A. (1) |
Financial services | Panamá | 100.00% | 11,500,974 | 100.00% | 9,920,304 | ||||||||||||||
Bancolombia Panamá S.A. (1) |
Financial services | Panamá | 100.00% | 10,206,593 | 100.00% | 8,838,482 | ||||||||||||||
FCP Inmobiliario Colombia S.A. |
Real estate services | Colombia | 80.43% | 2,987,499 | 80.43% | 2,733,074 | ||||||||||||||
| Banca de Inversión Bancolombia S.A. Corporación Financiera | Financial services | Colombia | 94.90% | 1,156,057 | 94.90% | 1,394,710 | ||||||||||||||
Bancolombia Puerto Rico Internacional Inc. (1) |
Financial services | Puerto Rico | 100.00% | 761,560 | 100.00% | 580,423 | ||||||||||||||
| Fiduciaria Bancolombia S.A. Sociedad Fiduciaria | Financial trust services | Colombia | 94.97% | 533,885 | 94.97% | 490,721 | ||||||||||||||
P.A. Sodimac (2) |
Real estate services | Colombia | 100.00% | 500,744 | - | - | ||||||||||||||
P.A. Mercurio (3) |
Real estate services | Colombia | 100.00% | 318,453 | 100.00% | 279,491 | ||||||||||||||
| Valores Bancolombia S.A. Comisionista de Bolsa | Trade-broker dealer | Colombia | 93.61% | 254,025 | 93.61% | 213,275 | ||||||||||||||
P.A. Nomad Cabrera (4) |
Real estate services | Colombia | 98.00% | 154,492 | 98.00% | 99,109 | ||||||||||||||
P.A. Nomad Central (5) |
Real estate services | Colombia | 98.00% | 133,572 | 98.00% | 101,260 | ||||||||||||||
P.A. Nomad Salitre (6) |
Real estate services | Colombia | 98.00% | 88,832 | 98.00% | 43,790 | ||||||||||||||
P.A. FAI Calle 77 (Nomad77) (7) |
Real estate services | Colombia | 98.00% | 62,656 | 98.00% | 57,306 | ||||||||||||||
P.A. Nomad Distrito Vera (8) |
Real estate services | Colombia | 98.00% | 58,827 | - | - | ||||||||||||||
P.A. Nomad Nexo (9) |
Real estate services | Colombia | 98.00% | 14 | - | - | ||||||||||||||
Sociedad Beneficiaria BC Panamá S.A.S. (10) |
Investments | Colombia | 100.00% | - | - | - | ||||||||||||||
| Total investment in subsidiaries | 28,718,183 | 24,751,945 | ||||||||||||||||||
| December 31, 2024 | |||||||||||||||||||||||||||||
| Banistmo S.A. | Bancolombia Panamá S.A. | FCP Fondo Inmobiliario Colombia. | Banca de Inversión Bancolombia S.A. Corporación Financiera. | Bancolombia Puerto Rico Internacional Inc. | Fiduciaria Bancolombia S.A. Sociedad Fiduciaria. | Valores Bancolombia S.A. Comisionista de Bolsa. | Others | Total | |||||||||||||||||||||
| In millions of COP | |||||||||||||||||||||||||||||
| Initial balance | 9,920,304 | 8,838,482 | 2,733,074 | 1,394,710 | 580,423 | 490,721 | 213,275 | 580,956 | 24,751,945 | ||||||||||||||||||||
Equity method through income statement. (1) |
215,595 | 1,324,141 | 254,425 | (244,727) | 84,983 | 176,777 | 38,778 | 61,440 | 1,911,412 | ||||||||||||||||||||
OCI (Equity method) (2) |
1,859,077 | 1,472,293 | - | 8,171 | 96,154 | (3,781) | 2,770 | - | 3,434,684 | ||||||||||||||||||||
| Purchase / capitalizations | - | - | - | - | - | - | - | 678,239 | 678,239 | ||||||||||||||||||||
| Dividends | (495,524) | (1,432,156) | - | - | - | (130,301) | - | - | (2,057,981) | ||||||||||||||||||||
| Restitution of contributions | - | - | - | - | - | - | - | (3,045) | (3,045) | ||||||||||||||||||||
| Profit for previous years | 1,522 | 3,833 | - | (2,097) | - | 469 | (798) | - | 2,929 | ||||||||||||||||||||
| Final balance | 11,500,974 | 10,206,593 | 2,987,499 | 1,156,057 | 761,560 | 533,885 | 254,025 | 1,317,590 | 28,718,183 | ||||||||||||||||||||
| December 31, 2023 | |||||||||||||||||||||||||||||
| Banistmo S.A. | Bancolombia Panamá S.A. | FCP Fondo Inmobiliario Colombia. | Banca de Inversión Bancolombia S.A. Corporación Financiera. | Bancolombia Puerto Rico Internacional Inc. | Fiduciaria Bancolombia S.A. Sociedad Fiduciaria | Valores Bancolombia S.A. Comisionista de Bolsa | Others | Total | |||||||||||||||||||||
| In millions of COP | |||||||||||||||||||||||||||||
| Initial balance | 12,640,048 | 11,221,104 | 2,493,826 | 1,744,834 | 636,656 | 449,696 | 200,611 | 331,922 | 29,718,697 | ||||||||||||||||||||
| Equity method through income statement. | 485,132 | 1,431,958 | 239,248 | (294,003) | 84,465 | 132,456 | 13,878 | (817) | 2,092,317 | ||||||||||||||||||||
| OCI (Equity method) | (2,909,771) | (2,407,969) | - | 22,718 | (140,698) | 2,192 | 1,564 | - | (5,431,964) | ||||||||||||||||||||
| Purchase / capitalizations | - | - | - | - | - | - | - | 250,655 | 250,655 | ||||||||||||||||||||
| Dividends | (285,530) | (1,406,611) | - | (54,427) | - | (91,467) | - | - | (1,838,035) | ||||||||||||||||||||
| Restitution of contributions | - | - | - | - | - | - | - | (787) | (787) | ||||||||||||||||||||
| Profit for previous years | (9,575) | - | - | (24,412) | - | (2,156) | (2,778) | (17) | (38,938) | ||||||||||||||||||||
| Final balance | 9,920,304 | 8,838,482 | 2,733,074 | 1,394,710 | 580,423 | 490,721 | 213,275 | 580,956 | 24,751,945 | ||||||||||||||||||||
| Company name | Assets | Liabilities | Income from ordinary activities | Gain / (Loss) | ||||||||||
| In millions of COP | ||||||||||||||
| Banistmo S.A. | 45,964,767 | 41,132,908 | 4,343,350 | 215,595 | ||||||||||
| Bancolombia Panamá S.A. | 32,095,844 | 21,889,251 | 2,190,330 | 1,324,141 | ||||||||||
| FCP Fondo Inmobiliario Colombia | 6,039,891 | 2,112,456 | 882,817 | 316,349 | ||||||||||
| Banca de Inversión Bancolombia S.A. Corporación Financiera | 1,464,181 | 48,620 | 190,300 | (258,823) | ||||||||||
| Company name | Assets | Liabilities | Income from ordinary activities | Gain / (Loss) | ||||||||||
| In millions of COP | ||||||||||||||
| Banistmo S.A. | 40,740,495 | 36,315,750 | 4,551,651 | 485,132 | ||||||||||
| Bancolombia Panamá S.A. | 27,550,302 | 18,711,820 | 2,116,383 | 1,431,958 | ||||||||||
| FCP Fondo Inmobiliario Colombia | 5,503,022 | 1,905,773 | 889,683 | 297,475 | ||||||||||
| Banca de Inversión Bancolombia S.A. Corporación Financiera | 1,719,824 | 52,784 | 150,732 | (309,804) | ||||||||||
| Composition | December 31,2024 | December 31,2023 | ||||||
| In millions of COP | ||||||||
| Investments in associates | 129,807 | 117,682 | ||||||
| Investments in joint ventures | 75,505 | 180,916 | ||||||
| Total | 205,312 | 298,598 | ||||||
| Company name | Main activity | Country |
% of
Ownership
interest
|
Investment |
% of
Ownership
interest
|
Investment | ||||||||||||||
| December 31,2024 | December 31,2023 | |||||||||||||||||||
| Redeban Multicolor S.A. | Network data transmission services | Colombia | 20.36% | 42,190 | 20.36% | 35,735 | ||||||||||||||
| Titularizadora Colombiana S.A. Hitos | Mortgage portfolio securities | Colombia | 26.98% | 42,050 | 26.98% | 37,950 | ||||||||||||||
| Protección S.A. | Administration of pension funds and severances | Colombia | 0.69% | 20,870 | 0.69% | 19,827 | ||||||||||||||
| ACH Colombia S.A. | Electronic transfer services | Colombia | 19.94% | 23,706 | 19.94% | 21,952 | ||||||||||||||
| Agricapital S.A.S | Financial services | Colombia | 10.79% | 991 | 10.79% | 1,262 | ||||||||||||||
Servicios de Identidad Digital S.A.S. (1) |
Digital services | Colombia | 33.33% | - | 33.33% | 956 | ||||||||||||||
| Total, investments in associates | 129,807 | 117,682 | ||||||||||||||||||
| December 31, 2024 | |||||||||||||||||||||||
| Redeban Multicolor S.A. | Titularizadora Colombiana S.A. Hitos | Protección S.A. | ACH Colombia S.A. | Agricapital S.A.S. | Servicios de Identidad Digital S.A.S | Total | |||||||||||||||||
| In millions of COP | |||||||||||||||||||||||
| Initial balance | 35,735 | 37,950 | 19,827 | 21,952 | 1,262 | 956 | 117,682 | ||||||||||||||||
Equity method through income statement. (1) |
6,452 | 3,090 | 3,143 | 23,271 | (271) | (3,443) | 32,242 | ||||||||||||||||
OCI (Equity method) (2) |
3 | 92 | (282) | - | - | - | (187) | ||||||||||||||||
Purchase / capitalizations (3) |
- | 918 | - | - | - | 2,487 | 3,405 | ||||||||||||||||
| Dividends | - | - | (1,855) | (21,517) | - | - | (23,372) | ||||||||||||||||
| Profit for previous years | - | - | 37 | - | - | - | 37 | ||||||||||||||||
| Final balance | 42,190 | 42,050 | 20,870 | 23,706 | 991 | - | 129,807 | ||||||||||||||||
| December 31, 2023 | |||||||||||||||||||||||
| Redeban Multicolor S.A. | Titularizadora Colombiana S.A. Hitos | Protección S.A. | ACH Colombia S.A. | Agricapital S.A.S. | Servicios de Identidad Digital S.A.S | Total | |||||||||||||||||
| In millions of COP | |||||||||||||||||||||||
| Initial balance | 31,876 | 35,756 | 17,807 | 19,005 | 1,408 | 7,049 | 112,901 | ||||||||||||||||
| Equity method through income statement. | 4,021 | 2,119 | 2,084 | 21,624 | (243) | (10,345) | 19,260 | ||||||||||||||||
| OCI (Equity method) | (162) | 398 | (64) | - | - | - | 172 | ||||||||||||||||
| Purchase / capitalizations | - | - | - | - | 97 | 2,434 | 2,531 | ||||||||||||||||
| Dividends | - | - | - | (18,677) | - | - | (18,677) | ||||||||||||||||
| Profit for previous years | - | (323) | - | - | - | 1,818 | 1,495 | ||||||||||||||||
| Final balance | 35,735 | 37,950 | 19,827 | 21,952 | 1,262 | 956 | 117,682 | ||||||||||||||||
Company name |
Main activity |
Country |
December 31,2024 |
December 31,2023 |
||||||||||||||||
|
% of
Ownership
interest
|
Investment |
% of
Ownership
interest
|
vestment |
|||||||||||||||||
Compañía de Financiamiento Tuya S.A. |
Financial services |
Colombia |
38.62% |
75,505 |
35.17% |
180,916 |
||||||||||||||
Total investments in joint venture |
75,505 |
180,916 |
||||||||||||||||||
Compañía de financiamiento TUYA S.A. |
December 31, 2024 | December 31, 2023 | ||||||
| In millions of COP | ||||||||
| Initial balance | 180,916 | 189,860 | ||||||
Equity method through income statement (1) |
(60,373) | (71,444) | ||||||
| Purchase / capitalizations | 76,750 | 62,500 | ||||||
Deterioration (2) |
(121,788) | - | ||||||
| Final balance | 75,505 | 180,916 | ||||||
| Company name | Classification | Assets | Liabilities |
Income from
ordinary activities
|
Profit / (Loss) | ||||||||||||
| In millions of COP | |||||||||||||||||
| Redeban Multicolor S.A. | Associates | 8,834,257 | 8,619,344 | 514,796 | 28,912 | ||||||||||||
| Titularizadora Colombiana S.A. Hitos | Associates | 248,267 | 99,870 | 48,212 | 10,159 | ||||||||||||
| Protección S.A. | Associates | 3,194,045 | 752,834 | 1,884,277 | 446,532 | ||||||||||||
| Compañía de Financiamiento Tuya S.A. | Joint ventures | 2,888,860 | 2,380,831 | 1,505,074 | (155,514) | ||||||||||||
| Company name | Classification | Assets | Liabilities |
Income from
ordinary activities
|
Profit / (Loss) | ||||||||||||
| In millions of COP | |||||||||||||||||
| Redeban Multicolor S.A. | Associates | 2,101,985 | 1,918,782 | 446,419 | 32,351 | ||||||||||||
| Titularizadora Colombiana S.A. Hitos | Associates | 233,582 | 96,975 | 38,599 | 7,268 | ||||||||||||
| Protección S.A. | Associates | 2,955,547 | 666,280 | 1,597,171 | 303,460 | ||||||||||||
| Compañía de financiamiento Tuya S.A. | Joint ventures | 3,827,631 | 3,313,741 | 2,205,537 | (221,199) | ||||||||||||
| Licenses, software and computer applications | ||||||||
| Cost | December 31, 2024 | December 31, 2023 | ||||||
| In millions of COP | ||||||||
| Initial balance | 615,817 | 488,817 | ||||||
Acquisitions (1) |
95,500 | 129,692 | ||||||
Write off (2) |
(34,376) | (2,692) | ||||||
| Final balance | 676,941 | 615,817 | ||||||
| Licenses, software and computer applications | ||||||||
| Amortization | December 31, 2024 | December 31, 2023 | ||||||
| In millions of COP | ||||||||
| Initial balance | (270,264) | (211,752) | ||||||
Amortization expense (1) |
(70,592) | (61,204) | ||||||
Write off (2) |
34,376 | 2,692 | ||||||
| Final balance | (306,480) | (270,264) | ||||||
| Net | 370,461 | 345,553 | ||||||
| Composition | December 31,2024 | Decembre 31,2023 | ||||||
| In millions of COP | ||||||||
| Premises and equipment for own use | 1,770,827 | 1,757,039 | ||||||
| Premises and equipment in operating leases | 3,095,756 | 3,689,017 | ||||||
| Total premises and equipment, net | 4,866,583 | 5,446,056 | ||||||
| Premises and equipment for own use |
Balance as of
January 1, 2024
|
Roll - forward | Balance as of December 31, 2024 | |||||||||||||||||||||||
Additions (1) |
Expenses depreciation | Expenses impairment (2) |
Written off (3) |
Movements (4) |
||||||||||||||||||||||
| In millions of COP | ||||||||||||||||||||||||||
| Land | ||||||||||||||||||||||||||
| Cost | 311,778 | - | - | - | - | 1,437 | 313,215 | |||||||||||||||||||
| Construction in progress | ||||||||||||||||||||||||||
| Costo | 7,690 | 8,620 | - | - | - | (2,724) | 13,586 | |||||||||||||||||||
| Impairment | - | - | - | - | - | - | - | |||||||||||||||||||
| Buildings | ||||||||||||||||||||||||||
| Cost | 1,102,332 | 1,364 | - | - | - | (4,809) | 1,098,887 | |||||||||||||||||||
| Accumulated depreciation | (158,997) | - | (20,918) | - | - | 806 | (179,109) | |||||||||||||||||||
| Furniture and fixtures | ||||||||||||||||||||||||||
| Cost | 366,790 | 47,774 | - | - | (8,074) | - | 406,490 | |||||||||||||||||||
| Accumulated depreciation | (200,437) | - | (25,125) | - | 6,748 | - | (218,814) | |||||||||||||||||||
| Impairment | - | - | - | (288) | 288 | - | - | |||||||||||||||||||
| Computer equipment | ||||||||||||||||||||||||||
| Cost | 661,417 | 95,628 | - | - | (61,743) | - | 695,302 | |||||||||||||||||||
| Accumulated depreciation | (379,474) | - | (80,184) | - | 60,959 | - | (398,699) | |||||||||||||||||||
| Impairment | - | - | - | (387) | 387 | - | - | |||||||||||||||||||
| Vehicles | ||||||||||||||||||||||||||
| Cost | 16,717 | 4,065 | - | - | (3,209) | - | 17,573 | |||||||||||||||||||
| Accumulated depreciation | (9,276) | - | (3,190) | - | 3,127 | - | (9,339) | |||||||||||||||||||
| Machinery | ||||||||||||||||||||||||||
| Cost | 91,761 | 7,199 | - | - | (2,235) | - | 96,725 | |||||||||||||||||||
| Accumulated depreciation | (68,263) | - | (2,819) | - | 2,024 | - | (69,058) | |||||||||||||||||||
| Impairment | - | - | - | (54) | 54 | - | - | |||||||||||||||||||
| Leasehold improvements | ||||||||||||||||||||||||||
| Cost | 15,001 | 33,848 | - | - | - | (44,781) | 4,068 | |||||||||||||||||||
| Accumulated depreciation | - | - | - | - | - | - | - | |||||||||||||||||||
| Total cost | 2,573,486 | 198,498 | - | - | (75,261) | (50,877) | 2,645,846 | |||||||||||||||||||
| Total accumulated depreciation | (816,447) | - | (132,236) | - | 72,858 | 806 | (875,019) | |||||||||||||||||||
| Total accumulated impairment, net | - | - | - | (729) | 729 | - | - | |||||||||||||||||||
| Total premises and equipment for own use, net | 1,757,039 | 198,498 | (132,236) | (729) | (1,674) | (50,071) | 1,770,827 | |||||||||||||||||||
| Premises and equipment in operating leases |
Balance as of
January 1,
2024
|
Roll - forward | Balance as of December 31, 2024 | ||||||||||||||||||||
Additions (1) |
Expenses depreciation | Expenses impairment | Written off | Movements (2) |
|||||||||||||||||||
| In millions of COP | |||||||||||||||||||||||
| Furniture and fixtures | |||||||||||||||||||||||
| Cost | 2,091 | - | - | - | - | - | 2,091 | ||||||||||||||||
| Accumulated depreciation | (614) | - | (254) | - | - | - | (868) | ||||||||||||||||
| Vehicles | |||||||||||||||||||||||
| Cost | 4,227,271 | 668,679 | - | - | (142,435) | (1,050,206) | 3,703,309 | ||||||||||||||||
| Accumulated depreciation | (672,254) | - | (351,398) | - | 27,517 | 246,994 | (749,141) | ||||||||||||||||
| Computer equipment | |||||||||||||||||||||||
| Cost | 228,161 | 73,678 | - | - | (15,015) | (21,594) | 265,230 | ||||||||||||||||
| Accumulated depreciation | (95,638) | - | (63,251) | - | 12,730 | 21,294 | (124,865) | ||||||||||||||||
| Total cost | 4,457,523 | 742,357 | - | - | (157,450) | (1,071,800) | 3,970,630 | ||||||||||||||||
| Total accumulated depreciation | (768,506) | - | (414,903) | - | 40,247 | 268,288 | (874,874) | ||||||||||||||||
| Total premises and equipment in operating leases, net | 3,689,017 | 742,357 | (414,903) | - | (117,203) | (803,512) | 3,095,756 | ||||||||||||||||
| Total premises and equipment |
Balance as of
January 1,
2024
|
Roll - forward | Balance as of December 31, 2024 | ||||||||||||||||||||
| Additions | Expenses depreciation (1) |
Expenses impairment | Written off | Movements | |||||||||||||||||||
| In millions of COP | |||||||||||||||||||||||
| Total premises and equipment - cost | 7,031,009 | 940,855 | - | - | (232,711) | (1,122,677) | 6,616,476 | ||||||||||||||||
| Total premises and equipment - accumulated depreciation | (1,584,953) | - | (547,139) | - | 113,105 | 269,094 | (1,749,893) | ||||||||||||||||
| Total premises and equipment -impairment | - | - | - | (729) | 729 | - | - | ||||||||||||||||
| Total premises and equipment, net | 5,446,056 | 940,855 | (547,139) | (729) | (118,877) | (853,583) | 4,866,583 | ||||||||||||||||
| Premises and equipment for own use |
Balance as of
January 1, 2023
|
Roll - forward | Balance as of December 31, 2023 | |||||||||||||||||||||||
Additions (1) |
Expenses depreciation | Expenses impairment (2) |
Written off (3) |
Movements (4) |
||||||||||||||||||||||
| In millions of COP | ||||||||||||||||||||||||||
| Land | ||||||||||||||||||||||||||
| Cost | 308,934 | 3,266 | - | - | (422) | - | 311,778 | |||||||||||||||||||
| Construction in progress | ||||||||||||||||||||||||||
| Costo | 2,114 | 5,576 | - | - | - | - | 7,690 | |||||||||||||||||||
| Impairment | - | - | - | - | - | - | - | |||||||||||||||||||
| Buildings | ||||||||||||||||||||||||||
| Cost | 1,102,310 | 19,079 | - | - | (19,203) | 146 | 1,102,332 | |||||||||||||||||||
| Accumulated depreciation | (137,652) | - | (21,293) | - | (10) | (42) | (158,997) | |||||||||||||||||||
| Furniture and fixtures | ||||||||||||||||||||||||||
| Cost | 343,946 | 29,519 | - | - | (6,931) | 256 | 366,790 | |||||||||||||||||||
| Accumulated depreciation | (178,187) | - | (27,414) | - | 5,420 | (256) | (200,437) | |||||||||||||||||||
| Impairment | - | - | - | (305) | 305 | - | - | |||||||||||||||||||
| Computer equipment | ||||||||||||||||||||||||||
| Cost | 652,224 | 64,355 | - | - | (59,262) | 4,100 | 661,417 | |||||||||||||||||||
| Accumulated depreciation | (353,259) | - | (79,479) | - | 57,364 | (4,100) | (379,474) | |||||||||||||||||||
| Impairment | - | - | - | (1,147) | 1,147 | - | - | |||||||||||||||||||
| Vehicles | ||||||||||||||||||||||||||
| Cost | 14,161 | 5,545 | - | - | (2,989) | - | 16,717 | |||||||||||||||||||
| Accumulated depreciation | (9,395) | - | (2,629) | - | 2,748 | - | (9,276) | |||||||||||||||||||
| Machinery | ||||||||||||||||||||||||||
| Cost | 95,113 | 2,000 | - | - | (5,096) | (256) | 91,761 | |||||||||||||||||||
| Accumulated depreciation | (70,174) | - | (3,060) | - | 4,715 | 256 | (68,263) | |||||||||||||||||||
| Impairment | - | - | - | (304) | 304 | - | - | |||||||||||||||||||
| Leasehold improvements | ||||||||||||||||||||||||||
| Cost | 7,487 | 26,950 | - | - | - | (19,436) | 15,001 | |||||||||||||||||||
| Accumulated depreciation | - | - | - | - | - | - | - | |||||||||||||||||||
| Total cost | 2,526,289 | 156,290 | - | - | (93,903) | (15,190) | 2,573,486 | |||||||||||||||||||
| Total accumulated depreciation | (748,667) | - | (133,875) | - | 70,237 | (4,142) | (816,447) | |||||||||||||||||||
| Total accumulated impairment, net | - | - | - | (1,756) | 1,756 | - | - | |||||||||||||||||||
| Total premises and equipment for own use, net | 1,777,622 | 156,290 | (133,875) | (1,756) | (21,910) | (19,332) | 1,757,039 | |||||||||||||||||||
| Premises and equipment in operating leases |
Balance as of
January 1,
2023
|
Roll - forward | Balance as of December 31, 2023 | ||||||||||||||||||||
Additions (1) |
Expenses depreciation | Expenses impairment | Written off | Movements (2) |
|||||||||||||||||||
| In millions of COP | |||||||||||||||||||||||
| Furniture and fixtures | |||||||||||||||||||||||
| Cost | 2,091 | - | - | - | - | - | 2,091 | ||||||||||||||||
| Accumulated depreciation | (360) | - | (254) | - | - | - | (614) | ||||||||||||||||
| Vehicles | |||||||||||||||||||||||
| Cost | 3,896,727 | 1,146,580 | - | - | (67,686) | (748,350) | 4,227,271 | ||||||||||||||||
| Accumulated depreciation | (478,042) | - | (350,362) | - | 13,485 | 142,665 | (672,254) | ||||||||||||||||
| Computer equipment | |||||||||||||||||||||||
| Cost | 150,969 | 66,833 | - | - | (4,463) | 14,822 | 228,161 | ||||||||||||||||
| Accumulated depreciation | (66,577) | - | (49,364) | - | 3,855 | 16,448 | (95,638) | ||||||||||||||||
| Total cost | 4,049,787 | 1,213,413 | - | - | (72,149) | (733,528) | 4,457,523 | ||||||||||||||||
| Total accumulated depreciation | (544,979) | - | (399,980) | - | 17,340 | 159,113 | (768,506) | ||||||||||||||||
| Total premises and equipment in operating leases, net | 3,504,808 | 1,213,413 | (399,980) | - | (54,809) | (574,415) | 3,689,017 | ||||||||||||||||
| Total premises and equipment |
Balance as of
January 1,
2024
|
Roll - forward | Balance as of December 31, 2024 | ||||||||||||||||||||
| Additions | Expenses depreciation (1) |
Expenses impairment | Written off | Movements | |||||||||||||||||||
| In millions of COP | |||||||||||||||||||||||
| Total premises and equipment - cost | 6,576,076 | 1,369,703 | - | - | (166,052) | (748,718) | 7,031,009 | ||||||||||||||||
| Total premises and equipment - accumulated depreciation | (1,293,646) | - | (533,855) | - | 87,577 | 154,971 | (1,584,953) | ||||||||||||||||
| Total premises and equipment -impairment | - | - | - | (1,756) | 1,756 | - | - | ||||||||||||||||
| Total premises and equipment, net | 5,282,430 | 1,369,703 | (533,855) | (1,756) | (76,719) | (593,747) | 5,446,056 | ||||||||||||||||
| December 31, 2024 | December 31, 2023 | |||||||
| In millions of COP | ||||||||
| Balance as of the beginning of the year | 574,550 | 449,253 | ||||||
Acquisitions (1) |
203,767 | 97,479 | ||||||
Gains on valuation (2) |
68,536 | 27,818 | ||||||
Balance at end of period (3) |
846,853 | 574,550 | ||||||
| December 31, 2024 | December 31, 2023 | ||||||||||
| In millions of COP | |||||||||||
Income from rentals (1) |
58,700 | 40,371 | |||||||||
| Administration and other expenses | (7,442) | (5,338) | |||||||||
| December 31, 2024 | December 31, 2023 | |||||||
| In millions of Colombian pesos | ||||||||
| Current tax | ||||||||
| Fiscal term | (1,453,375) | (1,382,864) | ||||||
| Vigencia fiscal sucursal exterior | (1,069) | (1,520) | ||||||
Prior fiscal terms (1) |
145,622 | 45,403 | ||||||
| Total current tax | (1,308,822) | (1,338,981) | ||||||
| Deferred tax | ||||||||
| Fiscal term | (149,096) | (319,866) | ||||||
Prior fiscal terms (1) |
(67,083) | (23,966) | ||||||
| Total deferred tax | (216,179) | (343,832) | ||||||
| Total income tax | (1,525,001) | (1,682,813) | ||||||
| Reconciliation of the tax rate | December 31, 2024 | December 31, 2023 | ||||||
| In millions of Colombian pesos | ||||||||
| Accounting profit | 7,103,221 | 7,662,543 | ||||||
| Applicable tax with nominal rate | (2,841,289) | (3,065,017) | ||||||
Non-deductible expenses to determine taxable profit (loss) |
(170,961) | (144,351) | ||||||
Accounting and non-tax expense (income) to determine taxable profit (loss) (1) |
813,566 | 908,189 | ||||||
| Fiscal and non-accounting expense (income) to determine taxable profit (loss) | (993,205) | (689,101) | ||||||
| Ordinary activities income exempt from taxation | 1,155,204 | 1,011,561 | ||||||
| Ordinary activities income not constituting income or occasional tax gain | 52,862 | 61,553 | ||||||
| Tax deductions | 214,983 | 163,886 | ||||||
| Tax depreciation surplus | 208,945 | 211,839 | ||||||
| Untaxed recoveries | (103,380) | (64,522) | ||||||
| Prior fiscal terms | 78,539 | 21,437 | ||||||
| Tax discounts | 8,250 | - | ||||||
Other effects of the tax rate by reconciliation between accounting profit and tax expense (income) (2) |
51,485 | (98,287) | ||||||
| Total income tax | (1,525,001) | (1,682,813) | ||||||
| December 31, 2024 | |||||||||||
| In millions of Colombian pesos | |||||||||||
| Amounts before taxes | Deferred tax | Net taxes | |||||||||
| Revaluation gain related to defined benefit liability | 7,731 | (3,043) | 4,688 | ||||||||
| Net loss on financial instruments measured at fair value. | (35,842) | 16,082 | (19,760) | ||||||||
| Net income (loss) from investments in subsidiaries accounted for using the equity method | 3,434,684 | - | 3,434,684 | ||||||||
| Net loss on valuation of investments in associates and joint ventures. | (187) | - | (187) | ||||||||
| Unrealized gain on cash flow hedge | 216 | (87) | 129 | ||||||||
| Net loss on net investment hedge in foreign operations | (742,930) | 307,656 | (435,274) | ||||||||
| Net | 2,663,672 | 320,608 | 2,984,280 | ||||||||
| December 31, 2023 | |||||||||||
| In millions of Colombian pesos | |||||||||||
| Amounts before taxes | Deferred tax | Net taxes | |||||||||
| Remeasurement loss related to defined benefit liability | (24,291) | 9,061 | (15,230) | ||||||||
| Net gain on financial instruments measured at fair value. | 68,819 | (19,335) | 49,484 | ||||||||
| Net income (loss) from investments in subsidiaries accounted for using the equity method | (5,431,964) | - | (5,431,964) | ||||||||
| Net gain on valuation of investments in associates and joint ventures. | 172 | - | 172 | ||||||||
| Unrealized gain on cash flow hedge | - | - | - | ||||||||
| Gain on net investment hedge in foreign operations | 1,948,833 | (772,755) | 1,176,078 | ||||||||
| Net | (3,438,431) | (783,029) | (4,221,460) | ||||||||
| December 31, 2023 | Effect on Income Statement | Effect on OCI | Realized tax | December 31, 2024 | |||||||||||||
| In millions of Colombian pesos | |||||||||||||||||
| Asset Deferred Tax: | |||||||||||||||||
| Employee Benefits | 214,426 | 7,627 | (3,043) | - | 219,010 | ||||||||||||
| Deterioration assessment | 253,299 | (144,386) | - | - | 108,913 | ||||||||||||
| Financial Obligations | - | 184,392 | - | - | 184,392 | ||||||||||||
| Derivatives Valuation | 230,192 | (230,192) | - | - | - | ||||||||||||
Net investment coverage in operations abroad (1) |
528,436 | (94,400) | 307,656 | (378,908) | 362,784 | ||||||||||||
| Properties received in payment | 86,530 | 37,508 | - | - | 124,038 | ||||||||||||
| Other deductions | 115,167 | 51,958 | - | - | 167,125 | ||||||||||||
| implementation adjustment | 90,895 | - | - | - | 90,895 | ||||||||||||
| Total Asset Deferred Tax | 1,518,945 | (187,493) | 304,613 | (378,908) | 1,257,157 | ||||||||||||
| Liability Deferred Tax: | |||||||||||||||||
| Property and equipment | (34,142) | (44,000) | - | - | (78,142) | ||||||||||||
| Lease restatement | (414,969) | (48,214) | - | - | (463,183) | ||||||||||||
| Deterioration assessment | - | (80,407) | (87) | - | (80,494) | ||||||||||||
| Valuation of equity instruments | (354,956) | (32,523) | 16,082 | - | (371,397) | ||||||||||||
| Financial Obligations | (192,530) | 192,530 | - | - | - | ||||||||||||
| Goodwill | (1,567,225) | - | - | - | (1,567,225) | ||||||||||||
| Other deductions | (68,482) | (16,072) | - | - | (84,554) | ||||||||||||
| Total Liability Deferred Tax | (2,632,304) | (28,686) | 15,995 | - | (2,644,995) | ||||||||||||
| Net Deferred Tax | (1,113,359) | (216,179) | 320,608 | (378,908) | (1,387,838) | ||||||||||||
December 31, 2024 |
December 31, 2023 |
|||||||
In millions of Colombian pesos | ||||||||
| Temporary differences | ||||||||
| Local Subsidiaries | (214,304) | (868,405) | ||||||
| Foreign Subsidiaries | (20,176,494) | (17,696,145) | ||||||
| Assets held for sale and inventories | December 31, 2024 | December 31, 2023 | |||||||||
| In millions of COP | |||||||||||
Inventories, net (1) |
387,022 | 445,816 | |||||||||
Assets held for sale, net (2) |
5,724 | 13,512 | |||||||||
| Total assets held for sale and inventories, net | 392,746 | 459,328 | |||||||||
13.1. Inventories, net | ||
| Inventories | December 31, 2024 | December 31, 2023 | |||||||||
| In millions of COP | |||||||||||
Lands and buildings (1) |
301,400 | 275,808 | |||||||||
Vehicles (2) |
322,394 | 379,928 | |||||||||
| Computer equipment | 15,412 | 15,824 | |||||||||
| Machinery and equipment | 9,629 | 7,906 | |||||||||
| Other assets | 601 | 625 | |||||||||
| Subtotal, inventories | 649,436 | 680,091 | |||||||||
| Impairment | (262,414) | (234,275) | |||||||||
| Total inventories, net | 387,022 | 445,816 | |||||||||
13.2. Assets held for sale, net | ||
| Assets held for sale | December 31, 2024 | December 31, 2023 | ||||||
| In millions of COP | ||||||||
Movable property (1) |
5,660 | 9,299 | ||||||
Real estate for residential purposes (2) |
2,887 | 6,191 | ||||||
Real estate different from residential properties (2) |
182 | 5,947 | ||||||
| Total assets held for sale | 8,729 | 21,437 | ||||||
| Impairment | (3,005) | (7,925) | ||||||
| Total assets held for sale, net | 5,724 | 13,512 | ||||||
| December 31, 2024 | December 31, 2023 | |||||||
| In millions of COP | ||||||||
| Balance in favorable income tax | 1,714,585 | 1,184,129 | ||||||
Other accounts receivable (1) |
881,606 | 776,813 | ||||||
Receivables related to abandoned accounts (2) |
453,956 | 403,432 | ||||||
Assets pledged as collateral (cash) (3) |
441,849 | 1,010,562 | ||||||
Prepaid expenses (5) |
186,018 | 161,018 | ||||||
Accounts receivable from contracts with customers (4) |
170,397 | 169,182 | ||||||
Marketable and non-marketable assets, net (6) |
86,818 | 88,976 | ||||||
| Operating leasing fee, net | 49,408 | 66,614 | ||||||
| Payments on customers account | 32,875 | 31,861 | ||||||
| Receivable Sales of goods and service | 8,247 | 13,906 | ||||||
| Other | 177,051 | 304,818 | ||||||
| Subtotal other assets | 4,202,810 | 4,211,311 | ||||||
| Deterioration of accounts receivable | (82,450) | (47,113) | ||||||
| Deterioration of assets from customer contracts | (24,017) | (23,681) | ||||||
| Deterioration of other assets | (12,298) | (6,679) | ||||||
| Subtotal other assets deterioration | (118,765) | (77,473) | ||||||
| Total other assets, net | 4,084,045 | 4,133,838 | ||||||
| December 31, 2024 | December 31, 2023 | |||||||
| In millions of COP | ||||||||
License renewal (*) |
149,273 | 129,663 | ||||||
| Insurance | 22,500 | 21,819 | ||||||
| Contract advances | 3,562 | 4,089 | ||||||
| Other | 10,683 | 5,447 | ||||||
| Total | 186,018 | 161,018 | ||||||
| December 31, 2024 | December 31, 2023 | |||||||
| In millions of COP | ||||||||
| Assent Type | ||||||||
| Real estate different from residential properties | 402,066 | 471,141 | ||||||
| Real estate for residential purposes | 56,143 | 45,291 | ||||||
| Trust | 33,829 | 33,878 | ||||||
| Machinery, fixtures and fittings and others | 26,268 | 32,474 | ||||||
| Vehicles | 6,941 | 3,657 | ||||||
| Shares | 373 | 373 | ||||||
| Total | 525,620 | 586,814 | ||||||
| Deterioration | (438,802) | (497,838) | ||||||
| Total marketable and non-marketable, net | 86,818 | 88,976 | ||||||
| December 31, 2024 | December 31, 2023 | |||||||
| In millions of COP | ||||||||
| Saving accounts | 94,644,219 | 83,841,543 | ||||||
Time deposits (1) (2) |
63,637,941 | 61,106,144 | ||||||
| Checking accounts | 21,124,420 | 20,270,659 | ||||||
| Other deposits | 6,394,493 | 5,013,054 | ||||||
Total (3) |
185,801,073 | 170,231,400 | ||||||
| Time deposits | Effective interest rate (1) |
December 31, 2024 | |||||||||
| Modality | Minimum | Maximum | Carrying Value | ||||||||
| Less than 6 months | 0.10% | 10.60% | 24,962,895 | ||||||||
| Between 6 months and 12 months | 4.60% | 12.00% | 9,423,320 | ||||||||
| Between 12 months and 18 months | 5.00% | 14.35% | 7,310,170 | ||||||||
| Greater than 18 months | 3.30% | 17.65% | 21,941,556 | ||||||||
| Total | 63,637,941 | ||||||||||
| Time deposits | Effective interest rate (1) |
December 31, 2023 | |||||||||
| Modality | Minimum | Maximum | Carrying Value | ||||||||
| Less than 6 months | 0.10% | 15.52% | 14,755,244 | ||||||||
| Between 6 months and 12 months | 5.15% | 16.89% | 9,022,876 | ||||||||
| Between 12 months and 18 months | 5.30% | 20.56% | 12,595,855 | ||||||||
| Greater than 18 months | 1.85% | 20.86% | 24,732,169 | ||||||||
| Total | 61,106,144 | ||||||||||
| December 31, 2024 | December 31, 2023 | |||||||
| In millions of COP | ||||||||
| Less than 1 year | 47,346,967 | 41,575,609 | ||||||
| Between 1 and 3 years | 5,400,904 | 7,404,119 | ||||||
| Between 3 and 5 years | 1,085,237 | 1,533,206 | ||||||
| Greater than 5 years | 9,804,833 | 10,593,210 | ||||||
| Total | 63,637,941 | 61,106,144 | ||||||
| December 31, 2024 | December 31, 2023 | |||||||
| Repurchase agreements and other similar secured borrowing | ||||||||
Temporary transfer of securities (1) |
481,111 | - | ||||||
| Short selling operations | 147,372 | 263,751 | ||||||
Total Repurchase agreements (2) |
628,483 | 263,751 | ||||||
| Total interbank deposits and repurchase agreements | 628,483 | 263,751 | ||||||
| December 31, 2024 | |||||||||||
| In millions of COP | |||||||||||
|
Assets /
liabilities gross
|
Financial
instruments as
collaterals
|
Assets /
liabilities
net
|
|||||||||
Securities purchased under resale agreements (1) |
5,613,041 | (5,613,041) | - | ||||||||
| Securities sold under repurchase agreements | (628,483) | 628,483 | - | ||||||||
| Total repurchase and resale agreements | 4,984,558 | (4,984,558) | - | ||||||||
| December 31, 2023 | |||||||||||
| In millions of COP | |||||||||||
|
Assets /
liabilities gross
|
Financial
instruments as
collaterals
|
Assets /
liabilities
net
|
|||||||||
Securities purchased under resale agreements (1) |
7,792,496 | (7,792,496) | - | ||||||||
| Securities sold under repurchase agreements | (263,751) | 263,751 | - | ||||||||
| Total repurchase and resale agreements | 7,528,745 | (7,528,745) | - | ||||||||
December 31, 2024 |
December 31, 2023 | |||||||
| In millions of COP | ||||||||
Obligations granted by foreign banks (1) |
6,555,063 |
6,555,231 |
||||||
Obligations granted by domestic banks (2) |
4,002,801 |
5,445,038 |
||||||
| Total | 10,557,864 |
12,000,269 |
||||||
| Financial entity | Rate Minimum | Rate Maximum | December 31, 2024 | ||||||||
| In millions of COP | |||||||||||
| Financing with Correspondent Banks | 5.45% | 7.45% | 6,555,063 | ||||||||
| Total | 6,555,063 | ||||||||||
| Financial entity | Rate Minimum | Rate Maximum | December 31, 2023 |
||||||||
In millions of COP | |||||||||||
Financing with Correspondent Banks (1) |
1.21% | 8.87% | 6,555,231 |
||||||||
| Total | 6,555,231 |
||||||||||
December 31, 2024 |
December 31, 2023 | |||||||
| In millions of COP | ||||||||
| Short term (less than 1 year) | 3,150,200 |
1,742,300 |
||||||
| Long term (more than 1 year) | 3,404,863 |
4,812,931 |
||||||
| Total | 6,555,063 |
6,555,231 |
||||||
| Financial entity | Rate Minimum (1) |
Rate Maximum (1) |
December 31, 2024 | |||||||||||
| In millions of COP | ||||||||||||||
| Financiera de desarrollo territorial (Findeter) | 4.15% | 17.21% | 2,239,644 | |||||||||||
| Fondo para el financiamiento del sector agropecuario (Finagro) | 5.09% | 13.59% | 1,363,891 | |||||||||||
| Banco de comercio exterior de Colombia (Bancoldex) | 2.17% | 17.50% | 399,266 | |||||||||||
| Total | 4,002,801 | |||||||||||||
| Financial entity | Rate Minimum (1) |
Rate Maximum (1) |
December 31, 2023 | |||||||||||
| In millions of COP | ||||||||||||||
| Financiera de desarrollo territorial (Findeter) | 8.15% | 20.85% | 2,530,570 | |||||||||||
| Fondo para el financiamiento del sector agropecuario (Finagro) | 8.37% | 15.88% | 1,509,595 | |||||||||||
| Banco de comercio exterior de Colombia (Bancoldex) | 2.17% | 21.46% | 1,404,873 | |||||||||||
| Total | 5,445,038 | |||||||||||||
December 31, 2024 |
December 31, 2023 | |||||||
| In millions of COP | ||||||||
| Short term (less than 1 year) | 125,568 |
213,557 |
||||||
| Long term (more than 1 year) | 3,877,233 |
5,231,481 |
||||||
| Total | 4,002,801 |
5,445,038 |
||||||
| December 31, 2024 | ||||||||||||||
| Amount Issued | Carrying balance | E.A. Rate Range | ||||||||||||
Securities issued in foreign currency (1) |
USD | 1,269,707 | 5,556,796 | 5.2% -8.82% | ||||||||||
Securities issued in local currency |
COP | 2,253,761 | 2,244,212 | 7.8% -12.49% | ||||||||||
| Total | 7,801,008 | |||||||||||||
| December 31, 2023 | ||||||||||||||
| Amount Issued | Carrying balance | E.A. Rate Range | ||||||||||||
Securities issued in foreign currency (1) |
USD | 1,832,534 | 6,861,097 | 3.02% -7.03% | ||||||||||
| Securities issued in local currency | COP | 4,029,882 | 4,097,726 | 12.87% -21.06% | ||||||||||
| Total | 10,958,823 | |||||||||||||
| December 31, 2024 | ||||||||||||||||||||
| Issuance date | Maturity date | Currency | Payment method (*) |
Amount issued (in thousands of USD) | Carrying balance (in millions of COP) | EIR (1) |
||||||||||||||
| October 18, 2017 | October 18, 2027 | USD | SD | 461,707 | 2,010,380 | 7.03% | ||||||||||||||
January 19, 2024 (1) |
January 22, 2025 | USD | M | 3,000 |
13,945 | 5.70% | ||||||||||||||
January 29, 2024 (1) |
February 25, 2025 |
USD | M | 3,000 | 13,900 | 5.50% | ||||||||||||||
| June 24, 2024 | December 24, 2034 | USD | SD | 800,000 |
3,509,728 | 8.82% | ||||||||||||||
December 13, 2024 (1) |
December 19, 2025 | USD | M | 2,000 |
8,843 | 5.20% | ||||||||||||||
| Total | 1,269,707 | 5,556,796 | ||||||||||||||||||
| December 31, 2023 | ||||||||||||||||||||
| Issuance date | Maturity date | Currency | Payment method (*) |
Amount issued (in thousands of USD) | Carrying balance (in millions of COP) | EIR (1) |
||||||||||||||
| October 18, 2017 | October 18, 2027 | USD | SD | 750,000 | 2,810,736 | 7.03% | ||||||||||||||
| December 18, 2019 | December 18, 2029 | USD | SD | 550,000 | 2,011,536 | 4.68% | ||||||||||||||
| January 29, 2020 | January 29, 2025 | USD | SD | 482,034 | 1,835,514 | 3.02% | ||||||||||||||
January 13, 2023 (1) |
January 26, 2024 | USD | M | 4,000 | 16,176 | 6.00% | ||||||||||||||
January 26, 2020 (1) |
July 26, 2024 | USD | M | 25,000 | 100,944 | 6.05% | ||||||||||||||
January 26, 2023 (1) |
January 26, 2024 | USD | M | 4,000 | 16,144 | 6.00% | ||||||||||||||
March 9, 2023 (1) |
March 8, 2024 | USD | M | 3,000 | 12,025 | 6.00% | ||||||||||||||
March 14, 2023 (1) |
March 14, 2024 | USD | M | 11,500 | 46,059 | 6.00% | ||||||||||||||
March 29, 2023 (1) |
April 2, 2024 | USD | M | 3,000 | 11,963 | 5.70% | ||||||||||||||
| Total | 1,832,534 | 6,861,097 | ||||||||||||||||||
| December 31, 2024 | ||||||||||||||||||||
| Issuance date | Maturity date | Currency | Payment method (*) |
Amount issued (in thousands of USD) | Carrying balance (in millions of COP) | E.A rate (1) |
||||||||||||||
| July 27, 2011 | July 27, 2026 | COP | QD | 248,030 | 252,640 | 10.68% | ||||||||||||||
| November 2, 2011 | November 2, 2026 | COP | QD | 224,050 | 227,844 | 10.70% | ||||||||||||||
| September 24, 2014 | September 24, 2034 | COP | QD | 254,500 | 254,986 | 10.24% | ||||||||||||||
| September 24, 2014 | September 24, 2029 | COP | QD | 360,000 | 360,713 | 10.09% | ||||||||||||||
| March 18, 2015 | March 18, 2025 | COP | QD | 91,884 | 72,117 | 9.41% | ||||||||||||||
| September 16, 2021 | September 16, 2033 | COP | QD | 251,500 | 252,300 | 9.08% | ||||||||||||||
| September 16, 2021 | September 16, 2026 | COP | QD | 183,797 | 184,358 | 7.80% | ||||||||||||||
| October 25 de 2022 | October 25, 2027 | COP | MD | 640,000 | 639,254 | 12.49% | ||||||||||||||
Total |
2,253,761 | 2,244,212 | ||||||||||||||||||
| December 31, 2023 | ||||||||||||||||||||
| Issuance date | Maturity date | Currency | Payment method (*) |
Amount issued (in thousands of USD) | Carrying balance (in millions of COP) | E.A rate (1) |
||||||||||||||
| March 4, 2009 | March 4, 2024 | COP | YD | 209,000 | 245,539 | 21.06% | ||||||||||||||
| July 27, 2011 | July 27, 2026 | COP | QD | 248,030 | 254,852 | 16.10% | ||||||||||||||
| November 2, 2011 | November 2, 2023 | COP | QD | 224,050 | 229,659 | 16.12% | ||||||||||||||
| April 18, 2012 | April 18, 2024 | COP | QD | 192,916 | 198,906 | 15.98% | ||||||||||||||
| July 23, 2014 | July 23, 2024 | COP | QD | 178,750 | 183,844 | 15.71% | ||||||||||||||
| September 24, 2014 | September 24, 2034 | COP | QD | 254,500 | 255,152 | 15.43% | ||||||||||||||
| September 24, 2014 | September 24, 2029 | COP | QD | 360,000 | 360,945 | 15.27% | ||||||||||||||
| September 24, 2014 | September 24, 2024 | COP | QD | 373,752 | 374,749 | 14.88% | ||||||||||||||
| March 18, 2015 | March 18, 2025 | COP | QD | 91,884 | 92,333 | 14.56% | ||||||||||||||
| July 19, 2019 | July 19, 2024 | COP | MD | 657,000 | 659,796 | 14.72% | ||||||||||||||
| September 16, 2021 | September 16, 2033 | COP | QD | 251,500 | 252,719 | 14.21% | ||||||||||||||
| September 16, 2021 | September 16, 2026 | COP | QD | 183,797 | 184,646 | 12.87% | ||||||||||||||
| September 16, 2021 | September 16, 2024 | COP | MD | 164,703 | 165,589 | 14.39% | ||||||||||||||
| October 25, 2022 | October 25 de 2027 | COP | MD | 640,000 | 638,997 | 16.01% | ||||||||||||||
Total |
4,029,882 | 4,097,726 | ||||||||||||||||||
| Less than 1 year | Between 1 and 3 years |
Between 3 and 5 years |
Greater than 5 years |
Total amortized cost | |||||||||||||
| In millions of COP | |||||||||||||||||
| Local currency | |||||||||||||||||
| Ordinary bonds | - | - | - | 1,628,513 | 1,628,513 | ||||||||||||
Subordinated bonds (1) |
- | - | - | 615,699 | 615,699 | ||||||||||||
| Foreign currency | |||||||||||||||||
| Ordinary bonds | - | 36,688 | - | - | 36,688 | ||||||||||||
Subordinated bonds (1) |
- | - | - | 5,520,108 | 5,520,108 | ||||||||||||
| Total | 36,688 | 7,764,320 | 7,801,008 | ||||||||||||||
| Less than 1 year | Between 1 and 3 years |
Between 3 and 5 years |
Greater than 5 years |
Total amortized cost | |||||||||||||
| In millions of COP | |||||||||||||||||
| Local currency | |||||||||||||||||
| Ordinary bonds | - | - | 165,589 | 2,695,751 | 2,861,340 | ||||||||||||
Subordinated bonds (1) |
- | - | - | 1,236,385 | 1,236,385 | ||||||||||||
| Foreign currency | |||||||||||||||||
| Ordinary bonds | 28,169 | 175,142 | - | 1,835,514 | 2,038,825 | ||||||||||||
Subordinated bonds (1) |
- | - | - | 4,822,273 | 4,822,273 | ||||||||||||
| Total | 28,169 | 175,142 | 165,589 | 10,589,923 | 10,958,823 | ||||||||||||
| December 31, 2024 | December 31, 2023 | |||||||
| In millions of COP | ||||||||
| Short term (less than 1 year) | 108,805 | 2,031,732 | ||||||
| Long term (more than 1 year) | 7,692,203 | 8,927,091 | ||||||
| Total | 7,801,008 | 10,958,823 | ||||||
| December 31, 2024 | December 31, 2023 | |||||||
| In millions of COP | ||||||||
| Initial balance - minimum dividend on preferred shares | 584,204 | 584,204 | ||||||
| Interest expense on preferred shares | 57,701 | 57,701 | ||||||
| Payment of dividends declared during the period | (57,701) | (57,701) | ||||||
| Total | 584,204 | 584,204 | ||||||
| Concept | December 31, 2024 | December 31, 2023 | |||||||||
| In millions of COP | |||||||||||
Post-employment benefits (1) (2) |
|||||||||||
| Defined benefit pension plan and other benefits | 103,247 | 101,778 | |||||||||
| Pension bonus | 105,809 | 100,158 | |||||||||
| Severance obligation under the previous regime | 9,351 | 14,360 | |||||||||
| Total post-employment | 218,407 | 216,296 | |||||||||
Long-term benefits (1) (3) |
|||||||||||
| Seniority bonus | 492,660 | 468,143 | |||||||||
| Total long-term benefits | 492,660 | 468,143 | |||||||||
| Total | 711,067 | 684,439 | |||||||||
20.1. Present value of defined benefit plan obligations in the statement of financial position | ||
| Defined benefit pension plan and other benefits | Pension bonus | Severance obligation under the previous regime | Seniority bonus | |||||||||||
| In millions of COP | ||||||||||||||
| Initial balance as of January 1, 2023 | 95,081 | 72,365 | 15,446 | 373,621 |
||||||||||
| Cost per current service | - | 6,146 | 357 | 41,786 |
||||||||||
| Interest cost | 11,408 | 10,077 | 1,566 | 47,693 |
||||||||||
| Actuarial loss, net income | - | - | - | 51,752 |
||||||||||
| Actuarial loss, other comprehensive income | 7,525 | 13,181 | 3,585 | - |
||||||||||
| Benefits payments | (12,236) | (1,611) | (6,594) | (46,709) |
||||||||||
| Final Balance as of December 31, 2023 | 101,778 | 100,158 | 14,360 | 468,143 |
||||||||||
| Cost per current service | - | 7,118 | 267 | 49,958 |
||||||||||
| Interest cost | 10,459 | 10,655 | 1,116 | 48,831 |
||||||||||
| Others | 2,150 | - | - | - |
||||||||||
| Actuarial gain, net income | - | - | - | (19,795) |
||||||||||
| Actuarial gain, other comprehensive income | 1,863 | (8,571) | (1,023) | - |
||||||||||
| Benefits payments | (13,003) | (3,551) | (5,369) | (54,477) |
||||||||||
| Final Balance as of December 31, 2024 | 103,247 | 105,809 | 9,351 | 492,660 |
||||||||||
| 20.2. Post-employment benefit | ||
| 20.3. Long-term benefit | ||
| 20.4. Assumptions | ||
| Main actuarial assumptions | December 31, 2024 | December 31, 2023 | ||||||
| Nominal discount rate | 11.00% | 11.75% | ||||||
| Rate of salary increase | 5.40% | 6.35% | ||||||
| Annual inflation rate | 5.40% | 6.35% | ||||||
| Main actuarial assumptions | December 31, 2024 | December 31, 2023 | ||||||
| Nominal discount rate | 11.00% | 11.75% | ||||||
| Rate of salary increase | 7.90% | 8.85% | ||||||
| Annual inflation rate | 5.40% | 6.35% | ||||||
| Main actuarial assumptions | December 31, 2024 | December 31, 2023 | ||||||
| Nominal discount rate | 9.50% | 11.25% | ||||||
| Rate of salary increase | 7.90% | 8.85% | ||||||
| Annual inflation rate | 5.40% | 6.35% | ||||||
| Main actuarial assumptions | December 31, 2024 | December 31, 2023 | ||||||
| Nominal discount rate | 11.00% | 11.75% | ||||||
| Rate of salary increase | 7.90% | 8.85% | ||||||
| Annual inflation rate | 5.40% | 6.35% | ||||||
| Interest rate risks | A decrease in the rate of return on government bonds implies a decrease in the discount rate which in turn will increase the obligation of the plans. The same applies in reverse when the rate of return increases. | ||||
| Longevity risk | The present value of the defined benefit plan liability is calculated using the mortality tables recommended by the national government. An increase in the life expectancy of the participants will also increase the liability. | ||||
| Salary risk | The present value of the benefit plans' obligation includes the Bank's long-term salary increase expectation. As such, an increase in participants' salaries beyond what is forecasted will increase the obligation of the plans. | ||||
20.5. Estimated payment of future benefits | ||
| Year | Defined benefit pension plan and other benefits |
Pension bonus | Severance obligation under the previous regime | Seniority bonuses | ||||||||||
| In millions of COP | ||||||||||||||
| 2025 | 13,691 | 6,245 | 2,707 | 53,896 | ||||||||||
| 2026 | 13,761 | 4,415 | 1,944 | 66,444 | ||||||||||
| 2027 | 13,714 | 5,072 | 1,200 | 58,721 | ||||||||||
| 2028 | 13,679 | 5,389 | 724 | 68,835 | ||||||||||
| 2029 | 13,423 | 6,952 | 815 | 63,699 | ||||||||||
| 2030 a 2034 | 60,529 | 48,640 | 3,796 | 323,987 | ||||||||||
20.6. Sensitivity analysis | ||
Defined benefit pension plan and other benefits |
(Increase/Decrease) | Effect on DBO | ||||||||||||
| In millions of COP | ||||||||||||||
| Discount rate | 11.50% | 0.50% increase | (2,916) | |||||||||||
| Discount rate | 10.50% | 0.50% decrease | 3,089 |
|||||||||||
| Pension increase rate | 5.90% | 0.50% increase | 3,456 | |||||||||||
| Pension increase rate | 4.90% | 0.50% decrease | (3,285) | |||||||||||
| Mortality table Pension plan | One year increase in life expectancy. | 4,245 | ||||||||||||
| Mortality table other benefits | Reducing the life expectancy of plan participants by one year. | 36 | ||||||||||||
| Pension bonus | (Increase/Decrease) | Effect on DBO | |||||||||||||||
| In millions of COP | |||||||||||||||||
| Discount rate | 11.50% | 0.50% increase | (5,426) | ||||||||||||||
| Discount rate | 10.50% | 0.50% decrease | 5,898 | ||||||||||||||
| Rate of Salary Increase | 8.40% | 0.50% increase | 6,075 | ||||||||||||||
| Rate of Salary Increase | 7.40% | 0.50% decrease | (5,628) | ||||||||||||||
| Severance obligation under the previous regime | (Increase/Decrease) | Effect on DBO | |||||||||||||||
| In millions of COP | |||||||||||||||||
| Discount rate | 10.00% | 0.50% increase | (114) | ||||||||||||||
| Discount rate | 9.00% | 0.50% decrease | 117 | ||||||||||||||
| Rate of Salary Increase | 8.40% | 0.50% increase | 286 | ||||||||||||||
| Rate of Salary Increase | 7.40% | 0.50% decrease | (280) | ||||||||||||||
| Seniority bonus | (Increase/Decrease) | Effect on DBO | |||||||||||||||
| In millions of COP | |||||||||||||||||
| Discount rate | 11.50% | 0.50% increase | (14,357) | ||||||||||||||
| Discount rate | 10.50% | 0.50% decrease | 15,240 | ||||||||||||||
| Rate of Salary Increase | 8.40% | 0.50% increase | 15,593 | ||||||||||||||
| Rate of Salary Increase | 7.40% | 0.50% decrease | (14,809) | ||||||||||||||
| 20.7. Disclosures under Decree 2131 of December 2016 | ||
| Liabilities calculation | IAS 19 (1) |
Decree 1625 of December 2016 | ||||||
| In millions of COP | ||||||||
| Defined benefit pension plan | 101,097 | 101,058 | ||||||
| Assumptions | IAS 19 (1) |
Decree 1625 of December 2016 | ||||||
| Discount rate | 11.00% | 15.23% | ||||||
| Pension increase rate | 5.40% | 9.95% | ||||||
| Annual inflation rate | 5.40% | 9.95% | ||||||
| 20.8. Defined contribution plans | ||
| Plan | December 31, 2024 | December 31, 2023 | ||||||
| In millions of COP | ||||||||
| Pension | 257,760 | 227,315 | ||||||
| Severance obligations current regime | 92,729 | 82,963 | ||||||
| 20.9. Short-term benefits | ||
| December 31, 2024 | December 31, 2023 | |||||||
| In millions of COP | ||||||||
Bonuses and benefit plans (1) |
461,139 | 520,342 | ||||||
Salaries and labor obligations (2) |
335,761 | 315,038 | ||||||
| Other benefits and short-term bonuses | 796,900 | 835,380 | ||||||
| December 31, 2024 | December 31, 2023 | |||||||||||||
| In millions of COP | ||||||||||||||
Payables (1) |
2,849,007 | 4,126,706 | ||||||||||||
| Suppliers | 1,669,077 | 1,437,329 | ||||||||||||
Dividends (2) |
865,387 | 863,629 | ||||||||||||
| Deferred income | 552,620 | 532,668 | ||||||||||||
| Withholdings and labor contributions | 479,416 | 452,164 | ||||||||||||
Bonuses and short-term benefits (3) |
461,139 | 520,342 | ||||||||||||
| Collection services | 453,541 | 764,080 | ||||||||||||
Deposits delivered as security (4) |
371,426 | 787,640 | ||||||||||||
Salaries and other labor obligations (3) |
335,761 | 315,038 | ||||||||||||
| Surplus to be applied | 324,830 | 414,509 | ||||||||||||
| Advances in leasing operations | 173,168 | 186,547 | ||||||||||||
Provisions (5) |
117,616 | 130,081 | ||||||||||||
| Credits for factoring operations | 59,478 | 26,056 | ||||||||||||
Liabilities from contracts with customers (6) |
47,863 | 41,730 | ||||||||||||
| Others | 21,831 | 20,563 | ||||||||||||
| Total | 8,782,160 | 10,619,082 | ||||||||||||
22.1. Provisions | ||
|
Judicial
Proceedings (1)
|
Administrative
Proceedings (2)
|
Financial guarantees and letters of credit (3) |
Loan commitments (4)
|
Total provisions | |||||||||||||
| In millions of COP | |||||||||||||||||
| Balance as of January 1, 2024 | 29,231 | 92,380 | 1,831 | 6,639 | 130,081 | ||||||||||||
| Additional provisions recognized during the period | 26,892 | 1,038 | 2,176 | 2,635 | 32,741 | ||||||||||||
| Provisions used during the period | (24,664) | (9,976) | - | - | (34,640) | ||||||||||||
| Provisions reversed during the period | (6,770) | - | (1) | (5,402) | (12,173) | ||||||||||||
| Effect of discounted cash flows | 1,581 | 26 | - | - | 1,607 | ||||||||||||
| Final Balance as of December 31, 2024 | 26,270 | 83,468 | 4,006 | 3,872 | 117,616 | ||||||||||||
|
Judicial
proceedings
|
Administrative
Proceedings
|
Financial guarantees and letters of credit |
Loan commitments
|
Total provisions | |||||||||||||
| In millions of COP | |||||||||||||||||
| Balance as of January 1, 2023 | 15,524 | 84,997 | 15,797 | 13,663 | 129,981 | ||||||||||||
| Additional provisions recognized during the period | 24,644 | 11,535 | - | 1,722 | 37,901 | ||||||||||||
| Provisions used during the period | (4,613) | (3,865) | - | - | (8,478) | ||||||||||||
| Provisions reversed during the period | (5,706) | (287) | (13,966) | (8,746) | (28,705) | ||||||||||||
| Effect of discounted cash flows | (618) | - | - | - | (618) | ||||||||||||
| Final Balance as of December 31, 2023 | 29,231 | 92,380 | 1,831 | 6,639 | 130,081 | ||||||||||||
-Lack of energy supply due to low availability from the generating company (the guaranteed entity) | |||||
-Non-compliance with the contract signed by the guaranteed entity |
|||||
-Non-compliance with the payment for energy supply |
|||||
-Non-compliance with the construction and operating of power plants | |||||
-Non-compliance with the construction and operating of transmission lines | |||||
Ranges |
Private guarantees and letters of credit | |||||||
| In millions of COP | ||||||||
Guarantees less than 1 month |
522,590 | |||||||
Warranties greater than 1 month and up to 3 months (1) |
765,066 | |||||||
Warranties greater than 3 months and up to 1 year (1) |
3,891,220 | |||||||
Warranties longer than 1 year and up to 5 years (2) |
2,030,722 | |||||||
Warranties longer than 5 years |
602,640 | |||||||
Total |
7,812,238 | |||||||
Ranges |
Private guarantees and letters of credit | |||||||
| In millions of COP | ||||||||
Guarantees less than 1 month |
628,556 | |||||||
Warranties greater than 1 month and up to 3 months |
1,048,867 | |||||||
Warranties greater than 3 months and up to 1 year |
4,795,148 | |||||||
Warranties longer than 1 year and up to 5 years |
1,625,168 | |||||||
Warranties longer than 5 years |
472,725 | |||||||
Total |
8,570,464 | |||||||
| Level | PD range | Stage 1 | Stage 2 | Stage 3 | Total | ||||||||||||||||||||||||
| Exposure | Provision | Exposure | Provision | Exposure | Provision | Exposure | Provision | ||||||||||||||||||||||
| In millions of COP | |||||||||||||||||||||||||||||
| Normal Risk | 0% - 3.11% | 7,605,050 | - | - | - | - | - | 7,605,050 | - | ||||||||||||||||||||
| Acceptable Risk | > 3.11% - 11.15% | 8,547 | - | 225 | - | 8,000 | 2 | 16,772 | 2 | ||||||||||||||||||||
| Appreciable Risk | > 11.15% - 72.75% | 201 | - | 664 | - | 48,221 | - | 49,086 | - | ||||||||||||||||||||
| Significant Risk | > 72.75% - 89.89% | - | - | - | - | - | - | - | - | ||||||||||||||||||||
| Bad Risk | > 89.89% - 100% | - | - | - | - | 141,330 | 4,004 | 141,330 | 4,004 | ||||||||||||||||||||
| Total | 7,613,798 | - | 889 | - | 197,551 | 4,006 | 7,812,238 | 4,006 | |||||||||||||||||||||
| Level | PD range | Stage 1 | Stage 2 | Stage 3 | Total | ||||||||||||||||||||||||
| Exposure | Provision | Exposure | Provision | Exposure | Provision | Exposure | Provision | ||||||||||||||||||||||
| In millions of COP | |||||||||||||||||||||||||||||
| Normal Risk | 0% - 3.11% | 8,405,750 | 1 | 1,321 | - | - | - | 8,407,071 | 1 | ||||||||||||||||||||
| Acceptable Risk | > 3.11% - 11.15% | 32,466 | - | 733 | - | - | - | 33,199 | - | ||||||||||||||||||||
| Appreciable Risk | > 11.15% - 72.75% | 1,783 | - | - | - | - | - | 1,783 | - | ||||||||||||||||||||
| Significant Risk | > 72.75% - 89.89% | - | - | - | - | - | - | - | - | ||||||||||||||||||||
| Bad Risk | > 89.89% - 100% | - | - | - | - | 128,411 | 1,830 | 128,411 | 1,830 | ||||||||||||||||||||
| Total | 8,439,999 | 1 | 2,054 | - | 128,411 | 1,830 | 8,570,464 | 1.831 | |||||||||||||||||||||
| Stage 1 | Stage 2 | Stage 3 | Total | |||||||||||
| Balance as of January, 2024 | 1 | - | 1,830 | 1,831 | ||||||||||
| Transfers | - | - | - | - | ||||||||||
| Transfer to stage 1 | - | - | - | - | ||||||||||
| Transfer to stage 2 | - | - | - | - | ||||||||||
| Transfer to stage 3 | - | - | - | - | ||||||||||
| Provisions recognized during the period | - | - | 2,176 | 2,176 | ||||||||||
| Provisions reversed during the period | (1) | - | - | (1) | ||||||||||
| Translation adjustment | - | - | - | - | ||||||||||
| Balance as of December 31, 2024 | - | - | 4,006 | 4,006 | ||||||||||
| Stage 1 | Stage 2 | Stage 3 | Total | |||||||||||
| Balance as of January, 2023 | 1 | - | 15,796 | 15,797 | ||||||||||
| Transfers | - | - | - | - | ||||||||||
| Transfer to stage 1 | - | - | - | - | ||||||||||
| Transfer to stage 2 | - | - | - | - | ||||||||||
| Transfer to stage 3 | - | - | - | - | ||||||||||
| Provisions recognized during the period | - | - | - | - | ||||||||||
| Provisions reversed during the period | - | - | (13,966) | (13,966) | ||||||||||
| Translation adjustment | - | - | - | - | ||||||||||
| Balance as of December 31, 2023 | 1 | - | 1,830 | 1,831 | ||||||||||
Maturity |
Loan Commitments | |||||||
| In million of COP | ||||||||
Commitments under 1 month |
588,172 | |||||||
Commitments greater than 1 month and up to 3 months |
3,300 | |||||||
Commitments greater than 3 months and up to 1 years |
2,115,537 | |||||||
Commitments greater than 1 year and up to 3 years |
4,756,498 | |||||||
Commitments greater than 3 years and up to 5 years |
353,124 | |||||||
Total |
7,816,631 | |||||||
Maturity |
Loan Commitments | |||||||
| In millions of COP | ||||||||
Commitments under 1 month |
664,667 | |||||||
Commitments greater than 1 month and up to 3 months |
5,227 | |||||||
Commitments greater than 3 months and up to 1 years |
1,022,171 | |||||||
Commitments greater than 1 year and up to 3 years |
4,109,339 | |||||||
Commitments greater than 3 years and up to 5 years |
609,196 | |||||||
Total |
6,410,600 | |||||||
| Stage 1 | Stage 2 | Stage 3 | Total | |||||||||||
| Balance as of January 1, 2024 | 6,639 | - | - | 6,639 | ||||||||||
| Transfers: | - | - | - | - | ||||||||||
| Transfer to stage 1 | - | - | - | - | ||||||||||
| Transfer to stage 2 | - | - | - | - | ||||||||||
| Transfer to stage 3 | - | - | - | - | ||||||||||
| Provisions recognized during the period | 2,635 | - | - | 2,635 | ||||||||||
| Provisions reversed during the period | (5,402) | - | - | (5,402) | ||||||||||
| Balance as of December 31, 2024 | 3,872 | - | - | 3,872 | ||||||||||
| Stage 1 | Stage 2 | Stage 3 | Total | |||||||||||
| Balance as of January 1, 2023 | 12,663 | - | 1,000 | 13,663 | ||||||||||
| Transfers: | - | - | - | - | ||||||||||
| Transfer to stage 1 | - | - | - | - | ||||||||||
| Transfer to stage 2 | - | - | - | - | ||||||||||
| Transfer to stage 3 | - | - | - | - | ||||||||||
| Provisions recognized during the period | 1,722 | - | - | 1,722 | ||||||||||
| Provisions reversed during the period | (7,746) | - | (1,000) | (8,746) | ||||||||||
| Balance as of December 31, 2023 | 6,639 | - | - | 6,639 | ||||||||||
| 22.2. Contingent liabilities | ||
| December 31, 2024 | December 31, 2023 | |||||||
| Authorized shares | 1,400,000,000 | 1,400,000,000 | ||||||
| Subscribed and paid-in shares: | ||||||||
Ordinary shares with a nominal value of COP 500 |
509,704,584 | 509,704,584 | ||||||
| Preferred shares with dividend without voting rights with nominal value of COP 500. | 452,122,416 | 452,122,416 | ||||||
| Total shares | 961,827,000 | 961,827,000 | ||||||
| Subscribed and paid capital (nominal value, in millions of COP) | 480,914 | 480,914 | ||||||
| Authorized shares (nominal value, in millions of COP) | 700,000 | 700,000 | ||||||
|
Dividends declared with respect to
net income earned in:
|
Cash dividends per share | ||||
| In millions of COP | |||||
| 2023 | 3,536 | ||||
| 2022 | 3,536 | ||||
| 2021 | 3,120 | ||||
| 2020 | 260 | ||||
| 2019 | 1,638 | ||||
| December 31, 2024 | December 31, 2023 | |||||||
| In millions of COP | ||||||||
Appropriation of net income (1) (2) |
14,208,820 | 14,208,314 | ||||||
Occasional reserve (3) |
8,689,362 | 6,084,140 | ||||||
Total Appropriated reserves (4) |
22,898,182 | 20,292,454 | ||||||
25.1. Interest and valuation on financial instruments | ||
| December 31, 2024 | December 31, 2023 | |||||||
| In millions of COP | ||||||||
| Interest on debt securities through OCI | 355,085 | 291,705 | ||||||
| Debt securities held to maturity | 279,830 | 299,236 | ||||||
Total interest on debt instruments measured by the effective interest method |
634,915 | 590,941 | ||||||
| Net income from activities measured at fair value through income statement | ||||||||
Debt securities (1) |
869,336 | 331,032 | ||||||
| Monetary market operations | 239,754 | 132,149 | ||||||
Derivatives (2) |
155,794 | (167,887) | ||||||
| Cash operations | (13,812) | (48,373) | ||||||
Hedging derivatives (3) |
(81) | - | ||||||
| Total activities measured at fair value through income statement, net | 1,250,991 | 246,921 | ||||||
| Total interest and valuation of financial instruments | 1,885,906 | 837,862 | ||||||
| 25.2. Interest expenses | ||
| Interest expenses | December 31, 2024 | December 31, 2023 | ||||||
| In millions of COP | ||||||||
Deposits (1) |
9,786,962 | 11,232,123 | ||||||
| Debt securities issued (bonds) | 1,014,710 | 1,241,398 | ||||||
Financial obligations (1) |
955,236 | 1,190,779 | ||||||
Lease liabilities (2) |
116,052 | 90,672 | ||||||
| Preferred share | 57,701 | 57,701 | ||||||
| Interbank deposits purchased | 3,651 | 17,413 | ||||||
| Other interest | 40,406 | 57,068 | ||||||
| Total interest expenses | 11,974,718 | 13,887,154 | ||||||
25.3. Fees and commissions | ||
25.3.1. Income from fees and commissions | ||
| Fees and Commissions | Description | ||||
| Debit and credit cards fees |
In debit card product contracts, it is identified that the price assigned to the services promised by the Bank to the customers is fixed, given that no financing component exists, it is established on the basis of the national and international interbank rate, additionally, the product charges to the customers commissions for handling fees, at a determined time and with a fixed rate.
For Credit Cards, the commissions are the handling fees and depend on the card franchise. The commitment is satisfied in so far that the customer has capacity available on the card.
Other revenue received by the (issuer) credit card product, is advance commission; this revenue is the charge generated each time the customer makes a national or international advance, at owned or non-owned ATMs, or through a physical branch. The exchange bank fee is a revenue for the Issuing Bank of the credit card for the services provided to the business for the transaction effected at the point of sale, the commission is accrued and collected immediately at the establishment and has a fixed amount.
In the credit cards product there is a customer loyalty program, in which points are awarded for each transaction made by the customer in a retail establishment. The program is administrated by a third party who assumes the inventory and claims risks, for which it acts as agent. The Bank, recognized it as a lower value of the revenue from the exchange bank fee.
The rights and obligations of each party in respect of the goods and services for transfer are clearly identified, the payment terms are explicit, and it is probable, that is, it takes into consideration the capacity of the customer and the intention of having to pay the consideration at termination to those entitled to change the transferred goods or services. The revenue is recognized at a point in time: the Bank satisfies the performance obligation when the “control” of the goods or services was transferred to the customers.
|
||||
| Bancassurance | The Bank receives a commission for collecting insurance premiums at a given time and for allowing the use of its network to sell insurance from different insurance companies over time. The Bank in these bancassurance contracts acts as agent (intermediary between the customer and the insurance company), since it is the insurance company which assumes the risks, and which handles the complaints and claims of the customers inherent in each insurance. Therefore, the insurance company acts as principal before the customer. The prices agreed in bancassurance are defined as a percentage on the value of the policy premiums. The payment shall be tied to the premiums collected, sold or taken for the case of employees’ insurance. The aforementioned then means that the price is variable, since the revenue will depend on the quantity of policies or calculations made by the insurance companies. | ||||
| Payments | Service in which the Bank's customers can automatically perform whereby transactional channels, banking transactions for payroll payments, cancellation of invoices and credits, to beneficiaries of the Bank, as well as other financial entities affiliated to Automated Clearing House ACH, the commitment is satisfied once the Bank performs the transaction. The rate stipulated for this commission is variable, the income is recognized at a given time and acts as principal. | ||||
| Collections | The Bank acting as principal, commits to collect outstanding invoices receivable by the collecting customers through the different channels offered by the bank, send the information of the collections made and credit the money to the savings or checking account defined by the collecting customer. The commitment is satisfied at a point in time to the extent that the money is collected by the different channels, the information of the said collections is delivered appropriately, and the resources are credited in real-time to the account agreed with the customer. For the service, the Bank receives a fixed payment, which is received for each transaction once the contract is in effect. | ||||
| Electronic services and ATMs | Revenue received from electronic services and ATMs arises through the provision of services so that the customers may make required transactions, and which are enabled by the Bank. These include online and real-time payments by the customers of the Bank holding a checking or savings accounts, with a debit or credit card for the products and services that the customer offers. Each transaction has a single price, for a single service. The provision of collection services or other different services provided by the Bank, through electronic equipment, generates consideration chargeable to the customer established contractually by the Bank as a fee. The Bank acts as principal and the revenue is recognized at a point in time. | ||||
| Banking services | Banking Services are related to commissions from the use of digital physical channels or once the customer makes a transaction. The performance obligation is fulfilled once the payment is delivered to its beneficiary and the proof of receipt of the payment is sent, in that moment, the collection of the commission charged to the customer is generated, which is a fixed amount. The commitment is satisfied during the entire validity of the contract with the customer. The Bank acts as principal. | ||||
| Letters of credit | Banking service corresponding to a documentary credit in which the Bank acquires the commitment to guarantee the fulfillment of financial, commercial or service obligations to a supplier of the contracting party, called beneficiary, in import or export operations through a correspondent bank. The consideration in this type of contract may include fixed amounts, variable amounts, or both, and is acted as principal. | ||||
| Acceptances, guarantees and standby letters of credit | Bank service of acceptances guarantees and standby letters of credit that are not part of the Bank's portfolio. There are different performance obligations; the satisfaction of performance obligations occurs when the service is rendered to the customer. The consideration in these types of contracts may include fixed amounts, variable amounts, or both, and the Bank acts as principal. Revenue is recognized at a point in time. | ||||
| Checks | Service through which the Bank offers its customers alternatives to avoid the risk of mobilizing cash, through the sale of domestic checks that can be exchanged in any place where the Bank has a presence. The consideration in this type of contract is fixed, the income is recognized at a determined time and acts as principal. | ||||
| Deposits | Deposits are related to the services generated from the offices network of the Bank once a customer makes a transaction. The Bank generally commits to maintain active channels for the products that the customer has with the Bank, with the purpose of making payments and transfers, sending statements and making transactions in general. The commissions are deducted from the deposit account, and they are incurred at a point in time. The Bank acts as principal. | ||||
| Gains on sale of assets | These are the revenue from the sale of assets, where the sale value is higher than the book value recorded in the accounts, the difference representing the gains. The recognition of the revenue is at a point in time once the sale is realized. The Bank acts as principal in this type of transaction and the transaction price is determined by the market value of the asset being sold. For a detail of the balance see Note 25.4. Other operating income, net | ||||
| Ingreso por comisiones y otros servicios | December 31, 2024 | December 31, 2023 | ||||||
| In millions of COP | ||||||||
Debit and credit cards and affiliated establishments (1) |
2,720,929 |
2,534,776 |
||||||
Bancassurance (2) |
958,311 | 924,280 | ||||||
| Collections | 517,282 | 499,425 | ||||||
Electronic services and ATMs (3) |
515,810 | 411,300 | ||||||
Payment (4) |
506,814 | 450,742 | ||||||
| Acceptances, guarantees and Standby Letters of Credit and commissions for operations in foreign currencies | 198,976 | 195,538 | ||||||
| Banking services | 169,884 | 169,495 | ||||||
| Placements | 60,160 | 56,339 | ||||||
| Checks | 20,036 | 20,248 | ||||||
Others (5) |
70,702 | 70,906 | ||||||
| Ingresos por comisiones y otros servicios | 5,738,904 | 5,333,049 | ||||||
| December 31, 2024 | December 31, 2023 | |||||||
| In millions of COP | ||||||||
Accounts receivable from contracts with clients (1) |
170,397 |
169,182 | ||||||
Liabilities from contracts with clients (2) |
47,863 | 41,730 | ||||||
25.3.2. Fees and Commissions Expenses | ||
| Fees and Commissions Expenses | December 31, 2024 | December 31, 2023 | ||||||
| In millions of COP | ||||||||
Banking services (1) |
1,026,309 | 901,112 | ||||||
Sales, collections and other services (2) |
934,570 | 891,791 | ||||||
Correspondent banking (1) |
619,856 | 504,227 | ||||||
ACH y PSE services (1) |
177,420 | 136,939 | ||||||
| Placements | 63,217 | 63,970 | ||||||
| Payments and collections | 46,887 | 41,904 | ||||||
Other (3) |
153,752 | 101,962 | ||||||
| Total expenses for fees and commissions | 3,022,011 | 2,641,905 | ||||||
| Total income for fees and commissions, net | 2,716,893 | 2,691,144 | ||||||
| 25.4. Other operating income, net | ||
| December 31, 2024 | December 31, 2023 | ||||||||||
| In millions of COP | |||||||||||
Operating leases (1) |
936,787 | 999,207 | |||||||||
Exchange difference and foreign exchange derivatives net (2) |
395,690 | 1,159,575 | |||||||||
| Gain on sale of assets held for sale and inventories | 133,659 | 140,668 | |||||||||
Profit on portfolio sale (3) |
112,128 | 271,834 | |||||||||
| Recoveries | 89,122 | 59,898 | |||||||||
| Leases | 81,854 | 57,754 | |||||||||
Investment property valuation (4) |
68,536 | 27,818 | |||||||||
Gain on sale of assets held for sale (leasing) (5) |
33,576 | 101,862 | |||||||||
| Gain on sale of property and equipment | 3,673 | 5,527 | |||||||||
| Profit on sale of assets – Financial leasing | 3,577 | 4,572 | |||||||||
| Penalties for noncompliance with leasing contracts | 3,051 | 2,411 | |||||||||
| Other | 67,364 | 72,205 | |||||||||
| Total other operating income, net | 1,929,017 | 2,903,331 | |||||||||
25.5. Dividends and other net income from equity participation | ||
| December 31, 2024 | December 31, 2023 | |||||||
| In millions of COP | ||||||||
Equity method (1) (2) |
1,883,281 | 2,040,133 | ||||||
Valuation and sale of equity investments (3) |
76,915 | 67,640 | ||||||
Dividends (4) |
3,810 | 4,482 | ||||||
Investment impairment (5) |
(121,788) | - | ||||||
| Total dividends and other net income from equity participation | 1,842,218 | 2,112,255 | ||||||
26.1. Salaries and employee benefit | ||
| Salaries and employee benefit | December 31, 2024 | December 31, 2023 | ||||||||||||
| In millions of COP | ||||||||||||||
Salaries (1) |
1,480,280 | 1,316,292 | ||||||||||||
Bonuses (2) |
558,806 | 603,095 | ||||||||||||
| Private premium | 546,426 | 566,181 | ||||||||||||
| Social security contributions | 473,792 | 419,843 | ||||||||||||
| Indemnization payment | 204,104 | 134,526 | ||||||||||||
| Defined benefit severance obligation and interest | 158,726 | 141,795 | ||||||||||||
| vacation expenses | 99,638 | 98,368 | ||||||||||||
| Pension plan | 10,459 | 11,408 | ||||||||||||
Others (3) |
256,304 | 213,442 | ||||||||||||
| Total salaries and employee benefit | 3,788,535 | 3,504,950 | ||||||||||||
| 26.2. Other administrative and general expenses | ||
| Other administrative and general expenses | December 31, 2024 | December 31, 2023 | ||||||
| In millions of COP | ||||||||
| Fees | 660,703 | 663,492 | ||||||
Insurance (1) |
524,543 | 499,754 | ||||||
| Maintenance and repairs | 440,149 | 404,924 | ||||||
| Data processing | 415,731 | 358,349 | ||||||
| Fraud and claims | 350,548 | 297,405 | ||||||
| Transport | 212,516 | 183,343 | ||||||
| Advertising | 115,044 | 110,183 | ||||||
| Cleaning and surveillance services | 79,317 | 71,568 | ||||||
| Cleaning and security services | 77,169 | 69,251 | ||||||
Useful and stationery (2) |
76,494 | 36,159 | ||||||
| Communications | 76,268 | 74,685 | ||||||
| Contributions and affiliations | 70,838 | 61,185 | ||||||
| Adaptation and installation | 61,858 | 59,112 | ||||||
| Real estate management | 38,396 | 33,637 | ||||||
| Disputes, fines and sanctions | 31,748 | 27,572 | ||||||
| Travel expenses | 18,783 | 20,808 | ||||||
| Warehouse service | 17,845 | 16,321 | ||||||
| Tax fee inspection and External audit | 17,021 | 12,067 | ||||||
| Transactional services | 10,749 | 10,627 | ||||||
| Minor furniture and fixtures | 9,270 | 9,480 | ||||||
| Legal expenses | 5,560 | 4,814 | ||||||
| Temporary services | 5,558 | 4,218 | ||||||
| Publishing and subscriptions | 3,732 | 3,838 | ||||||
| Exchange processing | 3,283 | 3,209 | ||||||
| Other | 174,433 | 165,591 | ||||||
| Total other administrative and general expenses | 3,497,556 | 3,201,592 | ||||||
Taxes other than income tax (3) |
1,182,868 | 1,183,244 | ||||||
| 26.3. Impairment, depreciation and amortization | ||
| Impairment, depreciation and amortization | December 31, 2024 | December 31, 2023 | ||||||
| In millions of COP | ||||||||
Depreciation of premises and equipment (1) |
547,139 | 533,855 | ||||||
Impairment of negotiable assets and inventories, net (2) |
188,088 | 168,400 | ||||||
Depreciation of right-of-use assets, on lease (3) |
131,303 | 133,943 | ||||||
Amortization of intangible assets (4) |
70,592 | 61,204 | ||||||
Impairment of premises and equipment (1) |
729 | 1,756 | ||||||
Impairment of right-of-use assets, on lease (3) |
196 | 489 | ||||||
| Total amortización, depreciación y deterioro | 938,047 | 899,647 | ||||||
Stockholders with an interest equal or higher than 20% of the Bank's capital (1) |
Associates and joint ventures | Directly controlled subsidiaries | Indirectly controlled subsidiaries | Directors and senior management | |||||||||||||
| In millions of COP | |||||||||||||||||
| Assets | |||||||||||||||||
| Cash and cash equivalents | - | - | 319,678 | - | - | ||||||||||||
| Financial investment instruments, net | - | 49,643 | - | - | - | ||||||||||||
| Investments in associates and joint ventures | - | 205,312 | - | - | - | ||||||||||||
| Derivative financial instruments | 1,283 | 53 | 913 | 779 | 729 | ||||||||||||
| Investments in subsidiaries | - | - | 28,718,183 | - | - | ||||||||||||
| Loans and receivables and financial leasing operations | 2,562,325 | 110,629 | 919,582 | 191,826 | 21,432 | ||||||||||||
| Provision for impairment of loans and receivables and financial leasing operations | (2,757) | (2,251) | (908) | (817) | (17) | ||||||||||||
| Right-of-use lease assets, net | - | - | 293,467 | - | - | ||||||||||||
| Other assets | 12,807 | 332,279 | 5,617 | 9,051 | 9 | ||||||||||||
| Total assets | 2,573,658 | 695,665 | 30,256,532 | 200,839 | 22,153 | ||||||||||||
| Liabilities | |||||||||||||||||
| Customer deposits | 1,278,064 | 146,896 | 712,953 | 194,959 | 8,597 | ||||||||||||
| Derivative financial instruments | 53,050 | 10,116 | 285 | - | 183 | ||||||||||||
| Financial obligations | - | - | 5,332,004 | - | - | ||||||||||||
| Lease liabilities, net | - | - | 361,241 | - | - | ||||||||||||
| Other liabilities | 2,179 | 68,559 | 2,821 | 13,246 | 87 | ||||||||||||
| Total liabilities | 1,333,293 | 225,571 | 6,409,304 | 208,205 | 8,867 | ||||||||||||
| Income | |||||||||||||||||
| Interest on loans and financial leases | 265,052 | 15,527 | 146,489 | 47,097 | 1,772 | ||||||||||||
| Valuation on financial instruments | 144 | 9,504 | - | - | - | ||||||||||||
| Fees and commissions income | 740,719 | 6,196 | - | - | 97 | ||||||||||||
| Equity participation method | - | (28,131) | 1,911,412 | - | - | ||||||||||||
| Investment impairment | - | (121,788) | - | - | - | ||||||||||||
| Exchange difference and foreign exchange derivatives, net | (68,910) | (6,858) | - | - | 1,442 | ||||||||||||
Other operating income (2) |
6,445 | 65,357 | 28,095 | 26,819 | - | ||||||||||||
| Total Income | 943,450 | (60,193) | 2,085,996 | 73,916 | 3,311 | ||||||||||||
| Expenses | |||||||||||||||||
| Interest expenses | 126,206 | 5,941 | 415,172 | 11,823 | 757 | ||||||||||||
| Credit impairment charges, net | 1,391 | 2,547 | - | - | (31) | ||||||||||||
| Fees and commissions expenses | 477 | 186,370 | - | - | - | ||||||||||||
Employee benefits (3) |
98,307 | - | - | - | 131 | ||||||||||||
| Other administrative and general expenses | 12,652 | 27,577 | 2,163 | 32,875 | 2,536 | ||||||||||||
| Total expenses | 239,033 | 222,435 | 417,335 | 44,698 | 3,393 | ||||||||||||
Stockholders with an interest equal or higher than 20% of the Bank's capital (1) |
Associates and joint ventures | Directly controlled subsidiaries |
Indirectly controlled subsidiaries | Directors and senior management | |||||||||||||
| In millions of COP | |||||||||||||||||
| Assets | |||||||||||||||||
| Cash and cash equivalents | - | - | 121,069 | - | - | ||||||||||||
| Financial investment instruments, net | - | 50,270 | - | - | - | ||||||||||||
| Investments in associates and joint ventures | - | 298,598 | - | - | - | ||||||||||||
| Derivative financial instruments | 48,747 | 7,297 | - | 225 | - | ||||||||||||
| Investments in subsidiaries | - | - | 24,751,945 | - | - | ||||||||||||
| Loans and receivables and financial leasing operations | 1,850,296 | 125,253 | 1,092,075 | 325,904 | 22,428 | ||||||||||||
| Provision for impairment of loans and receivables and financial leasing operations | (1,456) | (479) | (623) | (533) | (50) | ||||||||||||
| Right-of-use lease assets, net | - | - | 322,068 | - | - | ||||||||||||
| Other assets | 13,572 | 268,647 | 3,579 | 4,389 | 9 | ||||||||||||
| Total assets | 1,911,159 | 749,586 | 26,290,113 | 329,985 | 22,387 | ||||||||||||
| Liabilities | |||||||||||||||||
| Customer deposits | 1,212,866 | 141,714 | 795,782 | 216,799 | 10,220 | ||||||||||||
| Derivative financial instruments | 14 | 1,068 | 2,973 | 323 | 209 | ||||||||||||
| Financial obligations | - | - | 4,524,872 | - | - | ||||||||||||
| Lease liabilities, net | - | - | 389,536 | - | - | ||||||||||||
| Other liabilities | 2,629 | 66,310 | 10,518 | 10,888 | 59 | ||||||||||||
| Total liabilities | 1,215,509 | 209,092 | 5,723,681 | 228,010 | 10,488 | ||||||||||||
| Income | |||||||||||||||||
| Interest on loans and financial leases | 156,519 | 15,743 | 155,119 | 52,939 | 1,778 | ||||||||||||
| Valuation on financial instruments | - | 11,919 | - | - | - | ||||||||||||
| Fees and commissions income | 740, 880 | 5,918 | - | - | 70 | ||||||||||||
| Dividends and net income on equity investments | - | (52,184) | 2,092,317 | - | - | ||||||||||||
| Net foreign exchange and Derivatives Foreign exchange contracts | 63,059 | 27,174 | - | - | (218) | ||||||||||||
| Other operating income | 7,191 | 2,307 | 30,176 | 7,868 | - | ||||||||||||
| Total Income | 967,649 | 10,877 | 2,277,612 | 60,807 | 1,630 | ||||||||||||
| Expenses | |||||||||||||||||
| Interest expenses | 177,999 | 8,186 | 446,875 | 19,422 | 909 | ||||||||||||
| Credit impairment charges, net | (8,343) | (1,936) | - | - | 4 | ||||||||||||
| Fees and commissions expenses | 590 | 144,585 | - | - | - | ||||||||||||
Employee benefits (2) |
82,515 | - | - | - | 93 | ||||||||||||
| Other administrative and general expenses | 13,423 | 23,883 | 2,840 | 21,837 | 2,415 | ||||||||||||
| Total expenses | 266,184 | 174,718 | 449,715 | 41,259 | 3,421 | ||||||||||||
|
Balance as of
January 1, 2024
|
Cash flows | Non-cash changes |
Balance as of
December 31, 2024
|
||||||||||||||
|
Foreign
currency
translation
adjustment
|
Interests accrued | ||||||||||||||||
| In millions of COP | |||||||||||||||||
| Liabilities from financing activities | |||||||||||||||||
| Debt instruments in issue | 12,000,269 | (3,385,663) | 988,022 | 955,236 | 10,557,864 | ||||||||||||
| Borrowings from other financial institutions | 10,958,823 | (5,299,720) | 1,127,195 | 1,014,710 | 7,801,008 | ||||||||||||
| Interbank and repurchase agreements | 263,751 | 364,732 | - | - | 628,483 | ||||||||||||
Preferred shares (1) |
584,204 | (57,701) | - | 57,701 | 584,204 | ||||||||||||
| Total liabilities from financing activities | 23,807,047 | (8,378,352) | 2,115,217 | 2,027,647 | 19,571,559 | ||||||||||||
| December 31, 2024 | December 31, 2023 | |||||||||||||
| Carrying value | Fair value | Carrying value | Fair value | |||||||||||
| In millions of COP | ||||||||||||||
| Assets | ||||||||||||||
Debt securities negotiable investments and pledged financial assets (1) |
13,866,824 | 13,866,824 | 6,942,468 | 6,942,468 | ||||||||||
Debt securities available for sale investments (1) |
3,326,813 | 3,326,813 | 3,211,425 | 3,211,425 | ||||||||||
Debt securities held to maturity investments, net (1) |
4,117,051 | 4,095,270 | 3,423,265 | 3,410,468 | ||||||||||
Equity instruments (1) |
445,356 | 454,423 | 180,744 | 188,124 | ||||||||||
Derivative financial instruments (1) |
2,924,434 | 2,924,434 | 6,215,942 | 6,215,942 | ||||||||||
Loans and leasing transactions (2) (3) |
178,098,539 | 185,329,424 | 170,029,117 | 171,005,705 | ||||||||||
Investment property (4) |
846,853 | 846,853 | 574,550 | 574,550 | ||||||||||
| Total assets | 203,625,870 | 210,844,041 | 190,577,511 | 191,548,682 | ||||||||||
| Liabilities | ||||||||||||||
Deposits by customers (5) |
185,801,073 | 186,106,658 | 170,231,400 | 171,398,021 | ||||||||||
Repurchase agreements and other similar secured borrowing (6) |
628,483 | 628,483 | 263,751 | 263,751 | ||||||||||
Derivative financial instruments (1) |
2,667,439 | 2,667,439 | 6,699,521 | 6,699,521 | ||||||||||
Borrowings from other financial institutions (7) |
10,557,864 | 10,557,864 | 12,000,269 | 12,000,269 | ||||||||||
Debt instruments in issue (8) |
7,801,008 | 8,006,510 | 10,958,823 | 10,919,613 | ||||||||||
Preferred shares (9) |
584,204 | 407,174 | 584,204 | 394,550 | ||||||||||
| Total liabilities | 208,040,071 | 208,374,128 | 200,737,968 | 201,675,725 | ||||||||||
ASSETS | ||||||||||||||||||||||||||
Type of instrument |
December 31, 2024 |
December 31, 2023 |
||||||||||||||||||||||||
Fair value hierarchy |
Total fair value |
Fair value hierarchy |
Total fair value |
|||||||||||||||||||||||
Level 1 |
Level 2 |
Level 3 |
Level 1 |
Level 2 |
Level 3 |
|||||||||||||||||||||
In millions of COP | ||||||||||||||||||||||||||
Investment securities |
||||||||||||||||||||||||||
Negotiable and pledged financial assets |
||||||||||||||||||||||||||
Treasury securities issued by the Colombian Government - TES |
10,329,620 |
961,960 |
- |
11,291,580 |
4,089,072 |
324,985 |
- |
4,414,057 |
||||||||||||||||||
Mortgage-backed securities (TIPS) |
- |
79,665 |
63,280 |
142,945 |
- |
10,214 |
74,087 |
84,301 |
||||||||||||||||||
Bonds |
1,844,920 |
227,742 |
44,062 |
2,116,724 |
1,757,573 |
230,566 |
14,284 |
2,002,423 |
||||||||||||||||||
Other financial investment assets |
- |
315,575 |
- |
315,575 |
- |
441,687 |
- |
441,687 |
||||||||||||||||||
Total negotiable securities and pledged financial assets |
12,174,540 |
1,584,942 |
107,342 |
13,866,824 |
5,846,645 |
1,007,452 |
88,371 |
6,942,468 |
||||||||||||||||||
Available for sale |
||||||||||||||||||||||||||
Solidarity Securities issued by the Colombian Government (TDS) |
- |
- |
2,648,355 |
2,648,355 |
- |
- |
2,664,295 |
2,664,295 |
||||||||||||||||||
Bonds |
- |
51,275 |
81,784 |
133,059 |
- |
- |
- |
- |
||||||||||||||||||
Other public debt |
- |
- |
545,399 |
545,399 |
- |
547,130 |
- |
547,130 |
||||||||||||||||||
Total available for sale |
- |
51,275 |
3,275,538 |
3,326,813 |
- |
547,130 |
2,664,295 |
3,211,425 |
||||||||||||||||||
Total debt securities |
12,174,540 |
1,636,217 |
3,382,880 |
17,193,637 |
5,846,645 |
1,554,582 |
2,752,666 |
10,153,893 |
||||||||||||||||||
Equity securities |
||||||||||||||||||||||||||
Equity securities at fair value |
11,080 |
23,707 |
402,510 |
437,297 |
29,719 |
2,701 |
140,815 |
173,235 |
||||||||||||||||||
Total equity securities |
11,080 |
23,707 |
402,510 |
437,297 |
29,719 |
2,701 |
140,815 |
173,235 |
||||||||||||||||||
Derivative financial instruments |
||||||||||||||||||||||||||
Forward |
||||||||||||||||||||||||||
Exchange rate |
- |
608,625 |
465,512 |
1,074,137 |
- |
3,307,711 |
1,069,966 |
4,377,677 |
||||||||||||||||||
Securities |
- |
298 |
51,347 |
51,645 |
- |
151 |
2,863 |
3,014 |
||||||||||||||||||
Total forward |
- |
608,923 |
516,859 |
1,125,782 |
- |
3,307,862 |
1,072,829 |
4,380,691 |
||||||||||||||||||
Swaps |
||||||||||||||||||||||||||
Exchange rate |
- |
1,200,777 |
262,479 |
1,463,256 |
- |
1,066,916 |
237,422 |
1,304,338 |
||||||||||||||||||
Interest rate |
105,560 |
111,966 |
15,493 |
233,019 |
130,792 |
173,912 |
15,621 |
320,325 |
||||||||||||||||||
Total swaps |
105,560 |
1,312,743 |
277,972 |
1,696,275 |
130,792 |
1,240,828 |
253,043 |
1,624,663 |
||||||||||||||||||
Options |
||||||||||||||||||||||||||
Exchange rate |
161 |
36,206 |
66,010 |
102,377 |
7 |
136,978 |
73,603 |
210,588 |
||||||||||||||||||
Total options |
161 |
36,206 |
66,010 |
102,377 |
7 |
136,978 |
73,603 |
210,588 |
||||||||||||||||||
Total derivative financial instruments |
105,721 |
1,957,872 |
860,841 |
2,924,434 |
130,799 |
4,685,668 |
1,399,475 |
6,215,942 |
||||||||||||||||||
Investment property |
||||||||||||||||||||||||||
Buildings |
- |
- |
846,853 |
846,853 |
- |
- |
574,550 |
574,550 |
||||||||||||||||||
Total investment properties |
- |
- |
846,853 |
846,853 |
- |
- |
574,550 |
574,550 |
||||||||||||||||||
Total |
12,291,341 |
3,617,796 |
5,493,084 |
21,402,221 |
6,007,163 |
6,242,951 |
4,867,506 |
17,117,620 |
||||||||||||||||||
LIABILITIES | ||||||||||||||||||||||||||
| Type of instrument | December 31, 2024 |
December 31, 2023 |
||||||||||||||||||||||||
| Fair value hierarchy | Total fair value | Fair value hierarchy | Total fair value | |||||||||||||||||||||||
| Level 1 | Level 2 | Level 3 | Level 1 | Level 2 | Level 3 | |||||||||||||||||||||
| In millions of COP | ||||||||||||||||||||||||||
Derivative financial instruments |
||||||||||||||||||||||||||
| Forward | ||||||||||||||||||||||||||
| Exchange rate | - | 876,502 | 87,033 | 963,535 | - | 4,454,755 | 67,825 | 4,522,580 | ||||||||||||||||||
| Securities | - | 89 | 1,278 | 1,367 | - | 8,629 | 1,852 | 10,481 | ||||||||||||||||||
| Total forward | - | 876,591 | 88,311 | 964,902 | - | 4,463,384 | 69,677 | 4,533,061 | ||||||||||||||||||
| Swaps | ||||||||||||||||||||||||||
| Exchange rate | - | 1,264,594 | 67,838 | 1,332,432 | - | 1,388,113 | 102,973 | 1,491,086 | ||||||||||||||||||
| Interest rate | 102,701 | 157,276 | 27,646 | 287,623 | 126,728 | 304,981 | 11,078 | 442,787 | ||||||||||||||||||
| Total swaps | 102,701 | 1,421,870 | 95,484 | 1,620,055 | 126,728 | 1,693,094 | 114,051 | 1,933,873 | ||||||||||||||||||
| Options | ||||||||||||||||||||||||||
| Exchange rate | 421 | 82,061 | - | 82,482 | 19 | 232,568 | - | 232,587 | ||||||||||||||||||
| Total options | 421 | 82,061 | - | 82,482 | 19 | 232,568 | - | 232,587 | ||||||||||||||||||
| Total derivative financial instruments | 103,122 | 2,380,522 | 183,795 | 2,667,439 | 126,747 | 6,389,046 | 183,728 | 6,699,521 | ||||||||||||||||||
| Total financial liabilities | 103,122 | 2,380,522 | 183,795 | 2,667,439 | 126,747 | 6,389,046 | 183,728 | 6,699,521 | ||||||||||||||||||
ASSETS | ||||||||||||||||||||||||||
| Type of instrument | December 31, 2024 |
December 31, 2023 |
||||||||||||||||||||||||
| Fair value hierarchy | Total fair value | Fair value hierarchy | Fair value hierarchy | |||||||||||||||||||||||
| Level 1 | Level 2 | Level 3 | Level 1 | Level 2 | Level 3 | |||||||||||||||||||||
| In millions of COP | ||||||||||||||||||||||||||
| Investments to maturity | ||||||||||||||||||||||||||
| Agricultural Development Securities issued by the Colombian Government (TDA) | - | - | 3,326,903 | 3,326,903 | - | - | 3,075,873 | 3,075,873 | ||||||||||||||||||
| Mortgage-backed securities (TIPs) | - | - | - | - | - | - | - | - | ||||||||||||||||||
| Bonds | - | 46,272 | 722,095 | 768,367 | - | 279,483 | 55,112 | 334,595 | ||||||||||||||||||
| Total held to maturity investments | - | 46,272 | 4,048,998 | 4,095,270 | - | 279,483 | 3,130,985 | 3,410,468 | ||||||||||||||||||
| Equity securities | - | - | 17,126 | 17,126 | - | - | 14,889 | 14,889 | ||||||||||||||||||
| Loan portfolio and leasing operations, net | - | - | 185,329,424 | 185,329,424 | - | - | 171,005,705 | 171,005,705 | ||||||||||||||||||
| Total | - | 46,272 | 189,395,548 | 189,441,820 | - | 279,483 | 174,151,579 | 174,431,062 | ||||||||||||||||||
LIABILITIES | ||||||||||||||||||||||||||
| Type of instrument | December 31, 2024 |
December 31, 2023 |
||||||||||||||||||||||||
| Fair value hierarchy | Total fair value | Fair value hierarchy | Fair value hierarchy | |||||||||||||||||||||||
| Level 1 | Level 2 | Level 3 | Level 2 | Level 2 | Level 3 | |||||||||||||||||||||
| In millions of COP | ||||||||||||||||||||||||||
| Deposits by customers | - | 60,972,074 | 125,134,584 | 186,106,658 | - | 60,274,969 | 111,123,052 | 171,398,021 | ||||||||||||||||||
| Repurchase agreements and other similar secured borrowing | - | - | 628,483 | 628,483 | - | - | 263,751 | 263,751 | ||||||||||||||||||
| Borrowings from other financial institutions | - | - | 10,557,864 | 10,557,864 | - | - | 12,000,269 | 12,000,269 | ||||||||||||||||||
| Debt instruments in issue | 5,802,976 | 968,406 | 1,235,128 | 8,006,510 | 6,629,731 | 2,583,290 | 1,706,592 | 10,919,613 | ||||||||||||||||||
| Preferred shares | - | - | 407,174 | 407,174 | - | - | 394,550 | 394,550 | ||||||||||||||||||
| Total | 5,802,976 | 61,940,480 | 137,963,233 | 205,706,689 | 6,629,731 | 62,858,259 | 125,488,214 | 194,976,204 | ||||||||||||||||||
| December 31, 2024 | December 31, 2023 | |||||||||||||||||||||||||
| Fair value hierarchy | Total fair value | Fair value hierarchy | Total fair value | |||||||||||||||||||||||
| Level 1 | Level 2 | Level 3 | Level 1 | Level 2 | Level 3 | |||||||||||||||||||||
| In millions of COP | ||||||||||||||||||||||||||
| Real estate different from residential properties | - | - | 1,659 | 1,659 | - | - | 3,142 | 3,142 | ||||||||||||||||||
| Real estate for residential purposes | - | - | 28 | 28 | - | - | 3,188 | 3,188 | ||||||||||||||||||
| Movable property | - | - | 4,037 | 4,037 | - | - | 7,182 | 7,182 | ||||||||||||||||||
| Total | - | - | 5,724 | 5,724 | - | - | 13,512 | 13,512 | ||||||||||||||||||
|
Balance,
January 1,
2024
|
Included
in
earnings
|
OCI | Purchases | Settlement | Prepaids | Reclassifications |
Transfers
in to
level 3
|
Transfers
in to
level 3
|
Balance December 31, 2024 | |||||||||||||||||||||||
| In millions of COP | ||||||||||||||||||||||||||||||||
| Assets | ||||||||||||||||||||||||||||||||
| Debt securities | ||||||||||||||||||||||||||||||||
| Investments negotiable | ||||||||||||||||||||||||||||||||
| Mortgage backed securities (TIPs) | 74,087 | (920) | - | - | (7,515) | - | - | 3,195 | (5,567) | 63,280 | ||||||||||||||||||||||
| Bonds | 14,284 | 520 | - | 12,814 | - | - | - | 16,444 | - | 44,062 | ||||||||||||||||||||||
| Total negotiable investments | 88,371 | (400) | - | 12,814 | (7,515) | - | - | 19,639 | (5,567) | 107,342 | ||||||||||||||||||||||
| Available for- ale investments | ||||||||||||||||||||||||||||||||
| Solidarity Securities issued by the Colombian Government (TDS) | 2,664,295 | - | - | 2,648,355 | (2,664,295) | - | - | - | - | 2,648,355 | ||||||||||||||||||||||
| Bonds | - | - | - | 81,784 | - | - | - | - | - | 81,784 | ||||||||||||||||||||||
| Other public debt | - | - | - | 41,369 | - | - | - | 504,030 | - | 545,399 | ||||||||||||||||||||||
| Total available for sale investments | 2,664,295 | - | - | 2,771,508 | (2,664,295) | - | - | 504,030 | - | 3,275,538 | ||||||||||||||||||||||
| Total debt securities | 2,752,666 | (400) | - | 2,784,322 | (2,671,810) | - | - | 523,669 | (5,567) | 3,382,880 | ||||||||||||||||||||||
| Derivative financial instruments | ||||||||||||||||||||||||||||||||
| Exchange rate | 1,380,991 | (45,871) | - | 590,691 | (1,190,120) | - | (11,487) | 155,582 | (85,785) | 794,001 | ||||||||||||||||||||||
| Interest rate | 15,621 | (2,591) | - | 6,910 | (3,606) | - | (139) | 3,909 | (4,611) | 15,493 | ||||||||||||||||||||||
| Securities | 2,863 | - | - | 51,347 | (2,863) | - | - | - | - | 51,347 | ||||||||||||||||||||||
| Total derivative financial instruments | 1,399,475 | (48,462) | - | 648,948 | (1,196,589) | - | (11,626) | 159,491 | (90,396) | 860,841 | ||||||||||||||||||||||
| Equity securities at fair value | 140,815 | 44,851 | 2,975 | 232,387 | - | (18,516) | - | - | (2) | 402,510 | ||||||||||||||||||||||
| Investment property | 574,550 | 68,536 | - | 203,767 | - | - | - | - | - | 846,853 | ||||||||||||||||||||||
| Total assets | 4,867,506 | 64,525 | 2,975 | 3,869,424 | (3,868,399) | (18,516) | (11,626) | 683,160 | (95,965) | 5,493,084 | ||||||||||||||||||||||
| Liabilities | ||||||||||||||||||||||||||||||||
| Derivatives | ||||||||||||||||||||||||||||||||
| Exchange rate | 170,798 | 48,127 | - | 114,412 | (95,051) | - | (11,487) | 3,193 | (75,121) | 154,871 | ||||||||||||||||||||||
| Interest rate | 11,078 | (50) | - | 206 | (4,595) | - | (137) | 27,432 | (6,288) | 27,646 | ||||||||||||||||||||||
| Securities | 1,852 | - | - | 1,278 | (1,852) | - | - | - | - | 1,278 | ||||||||||||||||||||||
| Total derivatives | 183,728 | 48,077 | - | 115,896 | (101,498) | - | (11,624) | 30,625 | (81,409) | 183,795 | ||||||||||||||||||||||
| Total liabilities | 183,728 | 48,077 | - | 115,896 | (101,498) | - | (11,624) | 30,625 | (81,409) | 183,795 | ||||||||||||||||||||||
|
Balance,
January 1,
2023
|
Included
in
earnings
|
OCI | Purchases | Settlement | Prepaids | Reclassifications (1) |
Transfers
in to
level 3
|
Transfers
in to
level 3
|
Balance December 31, 2023 | |||||||||||||||||||||||
| In millions of COP | ||||||||||||||||||||||||||||||||
| Assets | ||||||||||||||||||||||||||||||||
| Debt securities | ||||||||||||||||||||||||||||||||
| Investments negotiable | ||||||||||||||||||||||||||||||||
| Mortgage backed securities (TIPs) | 2,928 | (5,534) | - | 848 | (2,343) | - | 77,773 | 415 | 74,087 | |||||||||||||||||||||||
| Bonds | - | - | - | - | - | - | - | 14,284 | - | 14,284 | ||||||||||||||||||||||
| Total negotiable investments | 2,928 | (5,534) | - | 848 | (2,343) | - | 77,773 | 14,699 | - | 88,371 | ||||||||||||||||||||||
| Available for- ale investments | ||||||||||||||||||||||||||||||||
| Solidarity Securities issued by the Colombian Government (TDS) | - | - | - | - | - | - | - | 2,664,295 | - | 2,664,295 | ||||||||||||||||||||||
| total available for sale investments | - | - | - | - | - | - | - | 2,664,295 | - | 2,664,295 | ||||||||||||||||||||||
| Total debt securities | 2,928 | (5,534) | - | 848 | (2,343) | - | 77,773 | 2,678,994 | - | 2,752,666 | ||||||||||||||||||||||
| Derivative financial instruments | ||||||||||||||||||||||||||||||||
| Exchange rate | 1,158,532 | (60,699) | - | 1,291,408 | (804,780) | - | (13,559) | 46,459 | (236,370) | 1,380,991 | ||||||||||||||||||||||
| Interest rate | 29,170 | (10,693) | - | 6,957 | (4,593) | - | (39) | 525 | (5,706) | 15,621 | ||||||||||||||||||||||
| Securities | 105 | - | - | 2,863 | (105) | - | - | - | - | 2,863 | ||||||||||||||||||||||
| Total derivative financial instruments | 1,187,807 | (71,392) | - | 1,301,228 | (809,478) | - | (13,598) | 46,984 | (242,076) | 1,399,475 | ||||||||||||||||||||||
| Equity securities at fair value | 148,169 | - | 20,055 | - | (18,453) | (8,956) | - | - | - | 140,815 | ||||||||||||||||||||||
| Investment property | 449,253 | 27,818 | - | 97,479 | - | - | - | - | - | 574,550 | ||||||||||||||||||||||
| Total assets | 1,788,157 | (49,108) | 20,055 | 1,399,555 | (830,274) | (8,956) | 64,175 | 2,725,978 | (242,076) | 4,867,506 | ||||||||||||||||||||||
| Liabilities | ||||||||||||||||||||||||||||||||
| Derivatives | ||||||||||||||||||||||||||||||||
| Exchange rate | 348,027 | 15,345 | - | 164,179 | (329,858) | - | (13,559) | 4,330 | (17,666) | 170,798 | ||||||||||||||||||||||
| Interest rate | 51,662 | (6,296) | - | 3,629 | (41,002) | - | (39) | 3,734 | (610) | 11,078 | ||||||||||||||||||||||
| Securities | - | - | - | 1,852 | - | - | - | - | - | 1,852 | ||||||||||||||||||||||
| Total derivatives | 399,689 | 9,049 | - | 169,660 | (370,860) | - | (13,598) | 8,064 | (18,276) | 183,728 | ||||||||||||||||||||||
| Total assets | 399,689 | 9,049 | - | 169,660 | (370,860) | - | (13,598) | 8,064 | (18,276) | 183,728 | ||||||||||||||||||||||
| Financial instrument | Fair Value |
Valuation
technique
|
Significant
unobservable input
|
Range of
inputs
|
Weighted
average
|
Sensitivity
100
basis point
increase
|
Sensitivity
100
basis point
decrease
|
||||||||||||||||
| Securities issued by other financial institutions | |||||||||||||||||||||||
| TIPS | 63,280 | Discounted cash flow | Margin (1) |
0% a 10.66% | 3.61% | 61,474 | 65,164 | ||||||||||||||||
Amortization table (2) |
NA | NA | 65,081 | - | |||||||||||||||||||
Amortization table (2) |
NA | NA | 60,732 | - | |||||||||||||||||||
| Solidarity Securities issued by the Colombian Government (TDS) | 2,648,355 | Discounted cash flow | Margin (1) |
1.18%% a 1.18% | 1.18% | 2,639,349 | 2,660,301 | ||||||||||||||||
| Bonuses | 167,215 | Discounted cash flow | Margin (1) |
0% a 5.25% | 2.10% | 164,781 | 172,140 | ||||||||||||||||
| Other bonuses | 504,030 | Discounted cash flow | Margin (1) |
1.25% a 1.25% | 1.25% | 467,145 | 536,285 | ||||||||||||||||
| Equity securities | |||||||||||||||||||||||
| Equity securities | 402,510 | Price-based | Price | NA | NA | NA | NA | ||||||||||||||||
| Derivative financial instruments, net | |||||||||||||||||||||||
| Options | 66,010 | Discounted cash flow | Counterparties COP (USD) (3) |
0.12% a 34.75% | 0.50% | 65,512 | 66,242 | ||||||||||||||||
| Forward | 428,548 | Discounted cash flow | Counterparties COP (USD) (3) |
0% a 20.80% | 4.98% | 427,979 | 429,124 | ||||||||||||||||
| Swaps | 182,488 | Discounted cash flow | Counterparties COP (USD) (3) |
0% a 56.14% | 4.03% | 166,650 | 204,677 | ||||||||||||||||
| Financial instrument | Fair Value |
Valuation
technique
|
Significant
unobservable input
|
Range of
inputs
|
Weighted
average
|
Sensitivity
100
basis point
increase
|
Sensitivity
100
basis point
decrease
|
||||||||||||||||
| Securities issued by other financial institutions | |||||||||||||||||||||||
| TIPS | 74,087 | Discounted cash flow | Margin (1) |
2.06% a 10.73% | 5.48% | 70,982 | 75,852 | ||||||||||||||||
Amortization table (2) |
NA | NA | 130,792 | - | |||||||||||||||||||
| Solidarity Securities issued by the Colombian Government (TDS) | 2,664,295 | Discounted cash flow | Margin (1) |
0% a 1.18% | 1.17% | 2,658,010 | 2,679,372 | ||||||||||||||||
| Bonuses | 14,284 | Discounted cash flow | Margin (1) |
3.49% a 3.49% | 3.49% | 13,700 | 14,912 | ||||||||||||||||
| Equity securities | |||||||||||||||||||||||
| Equity securities | 140,815 | Price-based | Price | NA | NA | NA | NA | ||||||||||||||||
| Derivative financial instruments, net | |||||||||||||||||||||||
| Options | 73,603 | Discounted cash flow | Counterparties COP (USD) (3) |
0.13 % a 33.77% | 0.57% | 73,048 | 73,870 | ||||||||||||||||
| Forward | 1,003,152 | Discounted cash flow | Counterparties COP (USD) (3) |
0% a 50.58% | 7.22% | 1,000,729 | 1,005,592 | ||||||||||||||||
| Swaps | 138,992 | Discounted cash flow | Counterparties COP (USD) (3) |
0% a 63.39% | 5.86% | 139,451 | 138,577 | ||||||||||||||||
| Methodology | Valuation technique | Significant unobservable input | Description of sensitivity | ||||||||
|
Sales Comparison Approach - SCA
The process by which an indication of value is obtained for the properties under analysis by comparing them with similar properties that can be considered comparable to those under analysis, that have been recently sold (ideally) or that are on offer, identifying the appropriate units of comparison and making the necessary adjustments to make them comparable to those under appraisal, based on market-derived comparables.
|
Comparable Prices |
The weighted average rates used in the income capitalization methodology for the third quarter of 2024 are:
•Direct capitalization: initial rate 8.14%
•Discounted cash flow: discount rate: 12,35%, terminal rate: 8,28%.
The same weighted rates for the fourth quarter of 2024 are:
•Direct capitalization: initial rate 8,13%.
•Discounted cash flow: discount rate: 12,27% terminal rate: 8,29%.
The ratio between monthly gross rent and the value of the properties managed directly by the FIC (rental rate) considering the differences in locations and individual factors between properties and on a weighted basis was 0.86% at the end of the third quarter of 2024 and 0.88% at the end of the fourth quarter of 2024.
|
An increase (Light, normal, considerable, significant) in the capitalization rate used would generate a decrease (significant, considerable, normal, light) in the fair value of the asset, and vice versa.
An increase (Light, normal, considerable, significant) in the leases used in the valuation would generate a (significant, light, considerable) increase in the fair value of the asset, and vice versa.
|
||||||||
|
Income Approach
In this methodology the appraiser analyzes the capacity of a property to generate future benefits, which are brought to present value as an indication of value.
|
Direct Capitalization
Discounted Cash Flows
|
||||||||||
|
Cost approach
A set of procedures by which an indication of the Market Value of the Full Property Right is obtained by estimating the cost of constructing, reproducing or replacing the property being appraised, including a reasonable profit, deducting depreciation from the total cost and adding the value of the land separately.
|
Replacement cost | ||||||||||
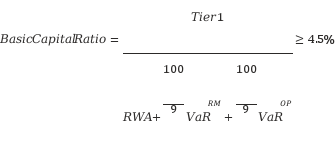

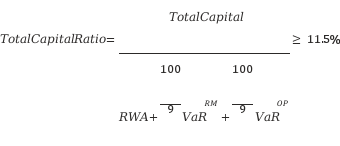
Technical Capital | ||||||||
BANCOLOMBIA SA |
December 31, 2024 |
December 31, 2023 |
||||||
Deductions Ordinary Basic Equity Net |
34,262,695 |
30,509,621 |
||||||
Additional Basic Equity |
- |
- |
||||||
Additional Equity |
5,521,257 |
5,536,933 |
||||||
Technical Equity Deductions |
- |
- |
||||||
Technical Equity |
39,783,951 |
36,046,554 |
||||||
Total Assets Weighted by Level of Credit Risk |
171,067,751 |
165,206,920 |
||||||
Total Market Risk |
16,478,209 |
10,730,322 |
||||||
Total Operational Risk |
26,985,742 |
23,426,846 |
||||||
Leverage Value |
274,218,726 |
257,345,483 |
||||||
Capital ratio |
12.49% |
11.86% |
||||||
Basic solvency ratio |
15.97% |
15.30% |
||||||
Combined buffer |
11.47% |
10.80% |
||||||
Additional Basic Solvency Ratio |
15.97% |
15.30% |
||||||
Total Solvency Ratio |
18.54% |
18.08% |
||||||
Credit Risk | ||
| In millions of Colombian pesos | December 31, 2024 | December 31, 2023 | ||||||
| Credit portfolio and financial leasing operations | 191,927,705 | 182,921,469 | ||||||
| Debt securities | 21,310,688 | 13,577,158 | ||||||
Equity investments (1) |
445,356 | 180,744 | ||||||
Derivatives (2) |
917,173 | 1,791,164 | ||||||
| Subtotal maximum credit risk exposure | 214,600,922 | 198,470,535 | ||||||
| Financial guarantees | 7,812,238 | 8,570,464 | ||||||
| Total maximum credit risk exposure | 222,413,160 | 207,040,999 | ||||||
Risk Level |
Description |
||||
A – Normal Risk |
Loans and financial lease operations that have an excellent payment behavior. The debtor's financial statements and cash flows forecast, as well as other available financial information, it allows inferring an adequate payment capacity. |
||||
B - Acceptable Risk |
Loans and financial lease transactions, even though they have an acceptable payment behavior, present some weakness that could potentially temporarily or permanently affect the debtor's ability to pay. |
||||
C - Appreciable Risk |
Loans and financial lease operations that present deficiencies in the debtor's payment capacity or in its cash flow forecast, which could affect the normal payment of the obligation. |
||||
D – Significant Risk |
Loans and financial lease transactions that have the same deficiencies than category "C", for a longer period, therefore its payment probability is low. |
||||
E – Uncollectible |
Loans and financial lease obligations in this category are considered uncollectible. |
||||
| December 31, 2024 | December 31, 2023 | |||||||||||||
| In millions of COP | ||||||||||||||
| Risk Level | In Millions of COP | Amount % |
In Millions of COP | Amount % |
||||||||||
| A – Normal Risk | 173,994,888 | 91% | 167,528,602 | 92% | ||||||||||
| B – Acceptable Risk | 3,460,917 | 2% | 3,485,959 | 2% | ||||||||||
C – Appreciable Risk |
3,144,840 | 2% | 2,152,771 | 1% | ||||||||||
| D – Significant Risk | 4,803,267 | 3% | 4,205,323 | 2% | ||||||||||
| E – Uncollectible | 6,523,793 | 3% | 5,548,814 | 3% | ||||||||||
| Total | 191,927,705 | 100% | 182,921,469 | 100% | ||||||||||
| Watch List | ||||||||||||||
| In millions of COP | ||||||||||||||
| Risk Level | Amount | % | Allowance | |||||||||||
| Level 1 – Low Risk | 11,128,412 | 0.80% | 89,178 | |||||||||||
| Level 2 – Medium Risk | 3,471,001 | 9.39% | 325,842 | |||||||||||
| Level 3 – High Risk | 2,716,725 | 56.15% | 1,525,474 | |||||||||||
| Level 4 – High Risk | 4,059,415 | 69.45% | 2,819,124 | |||||||||||
| Total | 21,375,553 | 22.27% | 4,759,618 | |||||||||||
| Watch List | |||||||||||
| In millions of COP | |||||||||||
| Risk Level | Amount | % | Allowance | ||||||||
| Level 1 – Low Risk | 12,292,358 | 0.81% | 99,252 | ||||||||
| Level 2 – Medium Risk | 2,131,768 | 7.64% | 162,766 | ||||||||
| Level 3 – High Risk | 1,928,851 | 49.21% | 949,254 | ||||||||
| Level 4 – High Risk | 3,589,466 | 71.60% | 2,569,887 | ||||||||
| Total | 19,942,443 | 18.96% | 3,781,159 | ||||||||
| Nature of the Guarantee | Value Covered by Guarantee | |||||||||||||||||||
| Commercial | Consumer | Mortgage | Small business loans | Financial Leasing | Total | |||||||||||||||
| In millions of COP | ||||||||||||||||||||
| Real Estate and Residential Properties | 10,484,908 | 515,931 | 22,124,987 | 2,600 | 128,293 | 33,256,719 | ||||||||||||||
| Properties Given in Real Estate Leasing | - | - | - | - | 15,810,680 | 15,810,680 | ||||||||||||||
| Properties Given in Non-Real Estate Leasing | - | 31 | - | - | 8,867,539 | 8,867,570 | ||||||||||||||
| Standby Letters of Credit | 1,521,903 | - | - | - | - | 1,521,903 | ||||||||||||||
| Guarantee Fund | 3,653,582 | 37 | - | 251,828 | 45,703 | 3,951,150 | ||||||||||||||
| Collection Rights | 6,558,731 | 34 | - | - | 80,729 | 6,639,494 | ||||||||||||||
| Other Collaterals (Pledges) | 1,932,363 | 3,969,318 | - | 24 | 3,855 | 5,905,560 | ||||||||||||||
| Unsecured (Overdraft Balance) | 78,672,084 | 32,645,100 | 3,038,211 | 401,898 | 1,217,336 | 115,974,629 | ||||||||||||||
| Total Loan Portfolio and Financial Leasing | 102,823,571 | 37,130,451 | 25,163,198 | 656,350 | 26,154,135 | 191,927,705 | ||||||||||||||
| Nature of the Guarantee | Value Covered by Guarantee | |||||||||||||||||||
| Commercial | Consumer | Mortgage | Small business loans | Financial Leasing | Total | |||||||||||||||
| In millions of COP | ||||||||||||||||||||
| Real Estate and Residential Properties | 10,367,215 | 563,856 | 19,550,039 | 4,999 | 162,364 | 30,648,474 | ||||||||||||||
| Properties Given in Real Estate Leasing | - | - | - | - | 15,786,804 | 15,786,802 | ||||||||||||||
| Properties Given in Non-Real Estate Leasing | - | 26 | - | - | 9,387,871 | 9,387,897 | ||||||||||||||
| Standby Letters of Credit | 1,046,563 | - | - | - | 45 | 1,046,608 | ||||||||||||||
| Guarantee Fund | 4,011,873 | 191 | - | 52,212 | 60,490 | 4,124,766 | ||||||||||||||
| Collection Rights | 6,269,408 | 18 | - | - | 33,518 | 6,302,944 | ||||||||||||||
| Other Collaterals (Pledges) | 1,653,431 | 3,812,053 | - | 77 | 25,007 | 5,490,568 | ||||||||||||||
| Unsecured (Overdraft Balance) | 72,266,332 | 34,486,369 | 2,290,219 | 490,389 | 600,100 | 110,133,410 | ||||||||||||||
| Total Loan Portfolio and Financial Leasing | 95,614,822 | 38,862,513 | 21,840,258 | 547,677 | 26,056,199 | 182,921,469 | ||||||||||||||
| Maturation | 1 year o less | From 1 to 5 years | From 5 to 10 years | More than 10 years | Total | ||||||||||||
| In millions of COP | |||||||||||||||||
| Commercial | 28,810,198 | 56,936,943 | 16,455,858 | 620,572 | 102,823,571 | ||||||||||||
| Consumption | 1,286,194 | 31,948,291 | 3,755,342 | 140,624 | 37,130,451 | ||||||||||||
| Mortgage | 34,787 | 1,661,104 | 4,541,722 | 18,925,585 | 25,163,198 | ||||||||||||
| Small business loans | 37,514 | 611,789 | 6,974 | 73 | 656,350 | ||||||||||||
| Financial leasing | 2,484,265 | 11,403,859 | 7,394,775 | 4,871,236 | 26,154,135 | ||||||||||||
| Total | 32,652,958 | 102,561,986 | 32,154,671 | 24,558,090 | 191,927,705 | ||||||||||||
| Maturation | 1 year o less | From 1 to 5 years | From 5 to 10 years | More than 10 years | Total | ||||||||||||
| In millions of COP | |||||||||||||||||
| Commercial | 28,741,018 | 52,321,953 | 13,715,948 | 835,903 | 95,614,822 | ||||||||||||
| Consumption | 1,933,889 | 33,080,576 | 3,820,686 | 27,362 | 38,862,513 | ||||||||||||
| Mortgage | 29,035 | 1,515,918 | 4,183,643 | 16,111,662 | 21,840,258 | ||||||||||||
| Small business loans | 52,708 | 484,864 | 10,024 | 81 | 547,677 | ||||||||||||
| Financial leasing | 2,618,280 | 10,736,771 | 8,075,399 | 4,625,749 | 26,056,199 | ||||||||||||
| Total | 33,374,930 | 98,140,082 | 29,805,700 | 21,600,757 | 182,921,469 | ||||||||||||
| Expiration days | ||||||||||||||||||||
| Period | 0 - 30 days |
31 - 90
days
|
91 - 120
days
|
121 - 360
days
|
Más de 360
days
|
Total | ||||||||||||||
| In millions of COP | ||||||||||||||||||||
| Commercial | 98,948,269 | 435,644 | 261,689 | 1,237,735 | 1,940,234 | 102,823,571 | ||||||||||||||
| Consumption | 34,070,598 | 1,215,039 | 429,235 | 1,253,258 | 162,321 | 37,130,451 | ||||||||||||||
| Mortgage | 23,754,127 | 510,838 | 136,023 | 414,029 | 348,181 | 25,163,198 | ||||||||||||||
| Small business loans | 604,112 | 17,278 | 7,117 | 23,807 | 4,036 | 656,350 | ||||||||||||||
| Financial leasing | 25,200,063 | 247,583 | 57,394 | 269,882 | 379,213 | 26,154,135 | ||||||||||||||
| Total | 182,577,169 | 2,426,382 | 891,458 | 3,198,711 | 2,833,985 | 191,927,705 | ||||||||||||||
| Expiration days | ||||||||||||||||||||
| Period | 0 - 30 days |
31 - 90
days
|
91 - 120
days
|
121 - 360
days
|
Más de 360
days
|
Total | ||||||||||||||
| In millions of COP | ||||||||||||||||||||
| Commercial | 92,422,930 | 358,041 | 173,983 | 1,498,621 | 1,161,247 | 95,614,822 | ||||||||||||||
| Consumption | 35,016,614 | 1,699,931 | 596,199 | 1,475,954 | 73,815 | 38,862,513 | ||||||||||||||
| Mortgage | 20,585,728 | 572,902 | 94,333 | 316,851 | 270,444 | 21,840,258 | ||||||||||||||
| Small business loans | 466,692 | 30,322 | 11,089 | 36,941 | 2,633 | 547,677 | ||||||||||||||
| Financial leasing | 25,212,587 | 251,600 | 56,146 | 195,133 | 340,733 | 26,056,199 | ||||||||||||||
| Total | 173,704,551 | 2,912,796 | 931,750 | 3,523,500 | 1,848,872 | 182,921,469 | ||||||||||||||
| Composition | December 31, 2024 | December 31, 2023 | ||||||
| In millions of COP | ||||||||
| Commercial | 102,823,571 | 95,614,822 | ||||||
| Corporate | 51,465,403 | 46,056,170 | ||||||
| Pyme | 13,331,823 | 13,264,333 | ||||||
| Other | 38,026,345 | 36,294,319 | ||||||
| Consumption | 37,130,451 | 38,862,513 | ||||||
| Credit Card | 7,743,666 | 7,902,173 | ||||||
| Vehicle | 4,397,615 | 4,431,696 | ||||||
| Payroll loans | 4,680,235 | 4,567,328 | ||||||
| Other | 20,308,935 | 21,961,316 | ||||||
| Mortgage | 25,163,198 | 21,840,258 | ||||||
| VIS | 9,920,821 | 7,992,579 | ||||||
| No VIS | 15,242,377 | 13,847,679 | ||||||
| Small business loans | 656,350 | 547,677 | ||||||
| Financial leasing | 26,154,135 | 26,056,199 | ||||||
| Total gross credit portfolio and financial leasing operations | 191,927,705 | 182,921,469 | ||||||
| Total deterioration | (13,829,166) | (12,892,352) | ||||||
| Total Loan Portfolio and net Financial Leasing | 178,098,539 | 170,029,117 | ||||||
| Economic Sector | Loans | Provision | Total, net | |||||||||||||||||||||||||||||
Capital |
Interest and/or financial component | Other items | Capital | Interest and/or financial component | Other items | |||||||||||||||||||||||||||
| In millions of COP | ||||||||||||||||||||||||||||||||
| Agriculture, forestry, fishing and hunting | 6,172,992 | 111,839 | 218,690 | 492,571 | 31,211 | 14,687 | 5,965,052 | |||||||||||||||||||||||||
| Customer portfolio for natural person | 59,919,891 | 673,649 | 553,646 |
5,673,167 | 149,810 | 58,976 | 55,265,233 | |||||||||||||||||||||||||
| Commerce, restaurants and hotels | 20,737,173 | 262,407 | 196,473 | 1,734,186 | 86,469 | 30,370 | 19,345,028 | |||||||||||||||||||||||||
| Construction and civil works | 13,509,454 | 300,365 | 96,554 | 1,547,237 | 144,993 | 26,980 | 12,187,163 | |||||||||||||||||||||||||
| Electricity, gas and water | 13,076,543 | 197,055 | 15,374 | 302,760 | 8,585 | 304 | 12,977,323 | |||||||||||||||||||||||||
| Exploitation of mines and quarries | 3,588,656 | 33,111 | 3,251 | 123,097 | 1,896 | 720 | 3,499,305 | |||||||||||||||||||||||||
| Government | 8,083,245 | 111,663 | 24,077 | 97,297 | 1,587 | 427 | 8,119,674 | |||||||||||||||||||||||||
| Manufacturing | 11,630,300 | 172,571 | 623,609 | 726,637 | 32,846 | 15,516 | 11,651,481 | |||||||||||||||||||||||||
| Paper, wood and cardboard | 1,346,864 | 19,533 | 98,406 | 54,473 | 2,898 | 2,393 | 1,405,039 | |||||||||||||||||||||||||
| Plastics | 1,444,102 | 14,001 | 59,816 | 51,686 | 1657 | 1,817 | 1,462,759 | |||||||||||||||||||||||||
| Chemical production | 543,139 | 6,295 | 3,988 | 25,483 | 1,337 | 256 | 526,346 | |||||||||||||||||||||||||
| Social and personal communal services | 8,452,677 | 99,921 | 322,871 | 567,351 | 17,972 | 10,723 | 8,279,423 | |||||||||||||||||||||||||
| Professional advisory services and business services | 7,543,405 | 91,727 | 103,716 | 574,031 | 23,992 | 11,895 | 7,128,930 | |||||||||||||||||||||||||
| Financial services, real estate, business | 19,618,895 | 190,881 | 380,409 | 394,020 | 16,539 | 14,662 | 19,764,964 | |||||||||||||||||||||||||
| Textile | 1,690,302 | 18,723 | 39,140 | 174,601 | 6,030 | 3,263 | 1,564,271 | |||||||||||||||||||||||||
| Transport and communications | 9,300,313 | 112,343 | 113,650 | 547,467 | 13,109 | 9,182 | 8,956,548 | |||||||||||||||||||||||||
| Total | 186,657,951 | 2,416,084 | 2,853,670 | 13,086,064 | 540,931 | 202,171 | 178,098,539 | |||||||||||||||||||||||||
| Economic Sector | Loans | Provision | Total, net | |||||||||||||||||||||||||||||
Capital |
Interest and/or financial component | Other items | Capital | Interest and/or financial component | Other items | |||||||||||||||||||||||||||
| In millions of COP | ||||||||||||||||||||||||||||||||
| Agriculture, forestry, fishing and hunting | 6,072,106 | 127,878 | 196,145 | 407,931 | 19,565 | 10,532 | 5,958,101 | |||||||||||||||||||||||||
| Customer portfolio for natural person | 57,428,453 | 820,820 | 202,054 |
5,929,537 | 167,815 | 46,959 | 52,307,016 | |||||||||||||||||||||||||
| Commerce, restaurants and hotels | 21,114,766 | 311,416 | 156,400 | 1,416,761 | 65,724 | 24,089 | 20,076,008 | |||||||||||||||||||||||||
| Construction and civil works | 15,395,250 | 394,429 | 98,553 | 1,357,966 | 70,472 | 25,778 | 14,434,016 | |||||||||||||||||||||||||
| Electricity, gas and water | 11,553,630 | 214,982 | 73,064 | 263,090 | 7,483 | 980 | 11,570,123 | |||||||||||||||||||||||||
| Exploitation of mines and quarries | 3,660,308 | 43,327 | 25,670 | 153,154 | 921 | 738 | 3,574,492 | |||||||||||||||||||||||||
| Government | 5,890,945 | 113,309 | 20,513 | 71,829 | 1,750 | 499 | 5,950,689 | |||||||||||||||||||||||||
| Manufacturing | 10,796,348 | 202,989 | 677,977 | 454,876 | 17,148 | 14,230 | 11,191,060 | |||||||||||||||||||||||||
| Paper, wood and cardboard | 1,143,023 | 14,878 | 16,978 | 41,411 | 2,090 | 875 | 1,130,503 | |||||||||||||||||||||||||
| Plastics | 1,304,004 | 17,062 | 53,315 | 30,348 | 694 | 1,054 | 1,342,285 | |||||||||||||||||||||||||
| Chemical production | 456,178 | 8,928 | 24,779 | 25,445 | 1,563 | 490 | 462,387 | |||||||||||||||||||||||||
| Social and personal communal services | 8,906,994 | 134,171 | 191,884 | 495,875 | 20,105 | 7,188 | 8,709,881 | |||||||||||||||||||||||||
| Professional advisory services and business services | 7,616,205 | 115,893 | 148,570 | 503,129 | 22,186 | 10,519 | 7,344,834 | |||||||||||||||||||||||||
| Financial services, real estate, business | 17,719,745 | 249,928 | 664,698 | 362,578 | 4,063 | 34,009 | 18,233,721 | |||||||||||||||||||||||||
| Textile | 1,651,758 | 26,641 | 48,196 | 192,638 | 9,370 | 4,678 | 1,519,909 | |||||||||||||||||||||||||
| Transport and communications | 6,654,758 | 83,943 | 77,608 | 569,707 | 10,259 | 12,251 | 6,224,092 | |||||||||||||||||||||||||
| Total | 177,364,471 | 2,880,594 | 2,676,404 | 12,276,275 | 421,208 | 194,869 | 170,029,117 | |||||||||||||||||||||||||
| December 31, 2024 | December 31, 2023 | |||||||
| Country | Stake | Stake | ||||||
| Colombia | 98.92% | 98.94% | ||||||
| Guatemala | 0.55% | 0.52% | ||||||
| Costa Rica | 0.0% | 0.0% | ||||||
| Perú | 0.08% | 0.07% | ||||||
| Panamá | 0.37% | 0.38% | ||||||
| Other countries | 0.09% | 0.09% | ||||||
| Total | 100% | 100% | ||||||
| Risk category | Loans current and without deterioration | Loans in default and without impairment | Current loans with some type of deterioration | Delinquent and impaired loans | Total | ||||||||||||
| A – Normal risk | 173,568,608 | 245,348 | 155,631 | 25,301 | 173,994,888 | ||||||||||||
| B – Acceptable risk | 2,332,015 | 740,142 | 154,796 | 233,964 | 3,460,917 | ||||||||||||
| C – Appreciable risk | 947,737 | 313,438 | 1,416,306 | 467,359 | 3,144,840 | ||||||||||||
| D – Significant risk | 568,371 | 185,290 | 804,941 | 3,244,665 | 4,803,267 | ||||||||||||
| E – Unrecoverable risk | 860,080 | 242,971 | 1,768,683 | 3,652,059 | 6,523,793 | ||||||||||||
| Total | 178,276,811 | 1,727,189 | 4,300,357 | 7,623,348 | 191,927,705 | ||||||||||||
| Risk category | Loans current and without deterioration | Loans in default and without impairment | Current loans with some type of deterioration | Delinquent and impaired loans | Total | ||||||||||||
| A – Normal risk | 166,991,585 | 329,182 | 173,146 | 34,689 | 167,528,602 | ||||||||||||
| B – Acceptable risk | 1,496,642 | 1,099,717 | 674,566 | 215,034 | 3,485,959 | ||||||||||||
| C – Appreciable risk | 646,264 | 498,747 | 543,146 | 464,614 | 2,152,771 | ||||||||||||
| D – Significant risk | 273,871 | 186,735 | 721,782 | 3,022,935 | 4,205,323 | ||||||||||||
| E – Unrecoverable risk | 387,455 | 159,790 | 1,796,095 | 3,205,474 | 5,548,814 | ||||||||||||
| Total | 169,795,817 | 2,274,171 | 3,908,735 | 6,942,746 | 182,921,469 | ||||||||||||
| Maximum Exposure to Credit Risk | Debt Instruments | Equity | Derivatives* | |||||||||||||||||
| December 31, 2024 | December 31, 2023 | December 31, 2024 | December 31, 2023 | December 31, 2024 | December 31, 2023 | |||||||||||||||
| In millions of COP | ||||||||||||||||||||
| Low Risk | 21,200,354 | 13,428,125 | 131,798 | 126,955 | 825,215 | 1,678,202 | ||||||||||||||
| Medium Risk | 107,402 | 146,155 | - | - | 1,782 | 316 | ||||||||||||||
| Hihg Risk | 2,932 | 2,879 | - | - | 3,739 | 17,327 | ||||||||||||||
| Without Rating | - | - | 313,558 | 53,788 | 86,437 | 95,319 | ||||||||||||||
| Total | 21,310,688 | 13,577,159 | 445,356 | 180,743 | 917,173 | 1,791,164 | ||||||||||||||
|
Note: A negative value corresponds to positions with a negative valuation.
| ||||||||||||||||||||
| Maximum Exposure to Credit Risk | Maximum Exposure | Collateral | Net Exposure | ||||||||||||||||||||
| December 31, 2024 | December 31, 2023 | December 31, 2024 | December 31, 2023 | December 31, 2024 | December 31, 2023 | ||||||||||||||||||
| In Millions of COP | |||||||||||||||||||||||
| Debt Instruments | 21,310,688 | 13,577,159 | (1,156,623) | (1,287,392) | 20,154,065 | 12,289,767 | |||||||||||||||||
| Derivatives | 917,173 | 1,791,164 | 589,098 | 698,663 | 328,075 | 1,092,502 | |||||||||||||||||
| Equity | 445,356 | 180,743 | - | - | 445,356 | 180,743 | |||||||||||||||||
| Total | 22,673,217 | 15,549,066 | (1,745,721) | (588,729) | 20,927,496 | 13,563,012 | |||||||||||||||||
|
Note: In December of 2023 derivative collateral received from counterparties was COP 698,663 and in December of 2024 derivative collateral received from counterparties was COP 589,098. In debt instruments the collateral corresponds to Repo, Simultaneous or TTvs transactions.
|
|||||||||||||||||||||||
| Maximum Exposure to Credit Risk | Exposure | Impairment | Final Exposure | ||||||||||||||||||||
| December 31, 2024 | December 31, 2023 | December 31, 2024 | December 31, 2023 | December 31, 2024 | December 31, 2023 | ||||||||||||||||||
| In millions of COP | |||||||||||||||||||||||
| Held for trading | 13,866,824 | 6,942,468 | - | - | 13,866,824 | 6,942,468 | |||||||||||||||||
| Available-for-sale | 3,326,813 | 3,211,425 | 3,395 | 3,208 | 3,323,418 | 3,208,217 | |||||||||||||||||
| Held-to-maturity | 4,117,051 | 3,423,265 | 8,511 | 8,985 | 4,108,540 | 3,414,280 | |||||||||||||||||
| Total | 21,310,688 | 13,577,158 | 11,906 | 12,193 | 21,298,782 | 13,564,965 | |||||||||||||||||
| Maximum Exposure to Credit Risk | Exposure | Impairment | Final Exposure | |||||||||||||||||
| December 31, 2024 | December 31, 2023 | December 31, 2024 | December 31, 2023 | December 31, 2024 | December 31, 2023 | |||||||||||||||
| In millions of COP | ||||||||||||||||||||
| Fair Value through profit or loss. | 279,966 | 2,701 | - | - | 279,966 | 2,701 | ||||||||||||||
| Equity Value through other comprehensive income. | 8,059 | 7,508 | - | - | 8,059 | 7,508 | ||||||||||||||
| Equity Value through other comprehensive income. | 157,331 | 170,534 | - | - | 157,331 | 170,534 | ||||||||||||||
| Total | 445,356 | 180,743 | - | - | 445,356 | 180,743 | ||||||||||||||
| Maximum Exposure to Credit Risk | Debt Instruments | Equity | Derivatives | |||||||||||||||||
| December 31, 2024 | December 31, 2023 | December 31, 2024 | December 31, 2023 | December 31, 2024 | December 31, 2023 | |||||||||||||||
| In millions of COP | ||||||||||||||||||||
| Sector Concentration | ||||||||||||||||||||
| Corporate | 1,484,877 | 1,025,184 | 23,530 | 36,816 | 359,546 | 947,891 | ||||||||||||||
| Financial | 4,142,512 | 3,821,860 | 143,572 | 141,226 | 309,248 | 840,694 | ||||||||||||||
| Government | 15,683,299 | 8,730,115 | - | - | - | - | ||||||||||||||
| Funds ETF | - | - | 278,254 | 2,701 | 248,379 | 2,579 | ||||||||||||||
| Total | 21,310,688 | 13,577,159 | 445,356 | 180,743 | 917,173 | 1,791,164 | ||||||||||||||
| Concentration by Region | ||||||||||||||||||||
| North America | 1,467,673 | 1,424,466 | - | - | 130,081 | 313,114 | ||||||||||||||
| Latin America | 19,843,015 | 12,152,693 | 167,102 | 178,042 | 423,979 | 1,005,914 | ||||||||||||||
| Europe | - | - | - | - | 140,442 | 469,557 | ||||||||||||||
| Others (Includes Funds and ETF) | - | - | 278,254 | 2,701 | 222,671 | 2,579 | ||||||||||||||
| Total | 21,310,688 | 13,577,159 | 445,356 | 180,743 | 917,173 | 1,791,164 | ||||||||||||||
| Maximum Exposure to Credit Risk | |||||||||||||||||
| In millions of COP | |||||||||||||||||
| Rating Risk | Rating Scale* | December 31, 2024 | December 31, 2023 | ||||||||||||||
| Low Risk | Sovereign Risk | 14,192,240 | 62.6% | 7,305,648 | 46.9% | ||||||||||||
| Low Risk | AAA | 7,241,893 | 31.9% | 6,639,565 | 42.7% | ||||||||||||
| Low Risk | AA+ | 196,918 | 0.9% | 283,336 | 1.8% | ||||||||||||
| Low Risk | AA | 107,982 | 0.5% | 201,229 | 1.3% | ||||||||||||
| Low Risk | AA- | 29,360 | 0.1% | 168,942 | 1.1% | ||||||||||||
| Low Risk | A+ | 123,794 | 0.5% | 148,392 | 1.0% | ||||||||||||
| Low Risk | A | 33,982 | 0.1% | 122,090 | 0.8% | ||||||||||||
| Low Risk | A- | 127,925 | 0.6% | 149,047 | 1.0% | ||||||||||||
| Low Risk | BBB+ | 67,966 | 0.3% | 199,422 | 1.3% | ||||||||||||
| Low Risk | BBB | 17,999 | 0.1% | 12,778 | 0.1% | ||||||||||||
| Low Risk | BBB- | 17,309 | 0.1% | 2,832 | 0.0% | ||||||||||||
| Medium Risk | BB+ | 107,759 | 0.5% | 141,311 | 0.9% | ||||||||||||
| Medium Risk | BB | 1,426 | 0.0% | 4,381 | 0.0% | ||||||||||||
| Medium Risk | BB- | - | 0.0% | 780 | 0.0% | ||||||||||||
| Hihg Risk | B+ | 3,410 | 0.0% | 2,895 | 0.0% | ||||||||||||
| Hihg Risk | B- | 2,352 | 0.0% | 1,445 | 0.0% | ||||||||||||
| Hihg Risk | CCC+ | 677 | 0.0% | 13,659 | 0.1% | ||||||||||||
| Hihg Risk | CCC | - | 0.0% | - | 0.0% | ||||||||||||
| Hihg Risk | C | 213 | 0.0% | 2,063 | 0.0% | ||||||||||||
| Hihg Risk | D | 18 | 0.0% | 144 | 0.0% | ||||||||||||
| Without Rating | SC | 399,994 | 1.8% | 149,107 | 1.0% | ||||||||||||
| Total | 22,673,217 | 100.0% | 15,549,066 | 100.0% | |||||||||||||
Market Risk | ||
Zone |
Band | Modified Duration | Changes in Interest Rates (bps) | |||||||||||||||||
| Lower Limit | Upper Limit | Moneda Legal | URV | Lower Limit | ||||||||||||||||
| Zone 1 | 1 | 0 | 0.08 | 274 | 274 | 100 | ||||||||||||||
| 2 | 0.08 | 0.25 | 268 | 274 | 100 | |||||||||||||||
| 3 | 0.25 | 0.5 | 259 | 274 | 100 | |||||||||||||||
| 4 | 0.5 | 1 | 233 | 274 | 100 | |||||||||||||||
| Zone 2 | 5 | 1 | 1.9 | 222 | 250 | 90 | ||||||||||||||
| 6 | 1.9 | 2.8 | 222 | 250 | 80 | |||||||||||||||
| 7 | 2.8 | 3.6 | 211 | 220 | 75 | |||||||||||||||
| Zone 3 | 8 | 3.6 | 4.3 | 211 | 220 | 75 | ||||||||||||||
| 9 | 4.3 | 5.7 | 172 | 200 | 70 | |||||||||||||||
| 10 | 5.7 | 7.3 | 162 | 170 | 65 | |||||||||||||||
| 11 | 7.3 | 9.3 | 162 | 170 | 60 | |||||||||||||||
| 12 | 9.3 | 10.6 | 162 | 170 | 60 | |||||||||||||||
| 13 | 10.6 | 12 | 162 | 170 | 60 | |||||||||||||||
| 14 | 12 | 20 | 162 | 170 | 60 | |||||||||||||||
| 15 | 20 | 162 | 170 | 60 | ||||||||||||||||
| Currency | Sensitivity Factor | ||||
| United States Dollar | 12.49% | ||||
| Euro | 11.00% | ||||
| Other currencies | 13.02% | ||||
| Equity and Fund Risk | 14.70% | ||||
| Risk factors |
December 31, 2024
In millions of Colombian pesos
|
|||||||||||||
| End of Period | Average | Maximum | Minimum | |||||||||||
| Interest rate | 413,000 | 405,330 | 452,682 | 351,696 | ||||||||||
| Exchange rate | 615,479 | 404,782 | 615,479 | 234,652 | ||||||||||
| Stock price | 14,996 | 15,638 | 26,578 | 11,674 | ||||||||||
| Collective investment funds | 439,564 | 417,525 | 439,564 | 401,821 | ||||||||||
| Total VaR | 1,483,039 | 1,243,275 | ||||||||||||
| Risk factors |
December 31, 2023
In millions of Colombian pesos
|
|||||||||||||
| End of Period | Average | Maximum | Minimum | |||||||||||
| Interest rate | 334,375 | 352,633 | 484,964 | 308,204 | ||||||||||
| Exchange rate | 203,244 | 128,096 | 239,366 | 42,283 | ||||||||||
| Stock price | 25,951 | 20,880 | 25,951 | 17,313 | ||||||||||
| Collective investment funds | 402,159 | 396,851 | 412,474 | 370,716 | ||||||||||
| VaR Total | 965,729 | 898,460 | ||||||||||||
| Currency (c) | Parallel (+/-) | ||||
| COP | 400 | ||||
| UVR | 200 | ||||
| USD | 200 | ||||
| Positions | December 31, 2024 | ||||
| In millions of COP | |||||
| Sensitivity of the asset | 5,047,412 | ||||
| Sensitivity of liabilities | 3,989,352 | ||||
| NII sensitivity (NII Delta) | 1,058,060 | ||||
| Currency (c) | Parallel | Short | Long | ||||||||
| COP | 400 | 500 | 300 | ||||||||
| UVR | 200 | 300 | 100 | ||||||||
| USD | 200 | 300 | 150 | ||||||||
| Positions | December 31, 2024 | ||||
| In millions of COP | |||||
| Sensitivity of the asset | 6,848,837 | ||||
| Sensitivity of liabilities | 4,985,977 | ||||
| Sensitivity EVE (Delta EVE) | 1,862,860 | ||||
Liquidity Risk | ||
|
The Vicepresidency of Risks, through the liquidity and interest rate risk area, is responsible
for proposing the minimum amount of the liquidity reserve, the liquidity portfolio policies,
defining premises and metrics to model the behavior of the cash flows, propose and monitor
liquidity limits consistent with the Bank's risk appetite, simulate stress scenarios, evaluate and
report the risks inherent to new products and operations; and report the reports required by
internal decision-making bodies, as well as by regulatory entities. All the above activities are
verified and evaluated by the area of audit.
Measures to control liquidity risk include the maintenance of an investment portfolio with the
purpose of having a liquidity reserve, and the definition of early warnings and liquidity limits,
which allow the Bank's level of exposure to be proactively evaluated.
The methodologies used to control liquidity risk include liquidity gaps and stress scenarios, sensitivity analysis, early liquidity alerts, among others. Regulatory models are applied, in which contractual expirations are used; and internal models in which cash flows are adjusted through the implementation of different indicators, which seek to reflect a more real behavior of cash flows.
As a complementary measure, stress scenarios are carried out, with the aim of identifying the
critical aspects in potential crises and defining the most appropriate management measures.
The scenarios consider the additional liquidity needs that could arise in the event of different
extreme, although possible, events; and that may affect the different balance sheet items in
different ways, such as the degree of renewal of term deposits, withdrawal of deposits, among
others.
The policies, limits, processes, methodologies and tools for evaluating exposure to liquidity
risk are periodically validated, in order to establish their relevance and functionality, and make
the necessary adjustments. The liquidity and interest rate risk area prepares daily, weekly and
monthly reports to monitor the evolution of the levels of exposure to liquidity risk and the
established limits and alerts, and support the decision-making process.
The Bank has a liquidity contingency plan to face critical events, which is tested annually.
a.Liquidity Risk Management
| ||
| Liquidity Coverage Ratio | December 31, 2024 | December 31, 2023 | ||||||
| In millions of COP | ||||||||
| Net cash outflows into 30 days** | 18,811,459 | 10,179,043 | ||||||
| Liquid Assets | 35,329,433 | 28,612,973 | ||||||
| Liquidity coverage ratio* | 187.80% | 281.10% |
||||||
Liquid Assets (1) |
December 31, 2024 | December 31, 2023 | ||||||
| In millions of COP | ||||||||
High quality liquid assets(2) |
||||||||
| Cash | 12,463,277 | 12,314,552 | ||||||
| High quality liquid securities | 20,622,441 | 14,197,252 | ||||||
Other Liquid Assets(3) |
||||||||
| Other securities | 2,243,715 | 2,101,169 | ||||||
| Total Liquid Assets | 35,329,433 | 28,612,973 | ||||||
| Financial Assets | 0-30 days | 31 days -1 year | 1-3 years | 3-5 years | More than 5 years | ||||||||||||
| December 31, 2024 | In millions of COP | ||||||||||||||||
| Cash and balances with central bank | 13,292,127 | - | - | - | - | ||||||||||||
| Interbank borrowings - Repurchase agreements | 5,697,440 | - | - | - | - | ||||||||||||
| Financial assets investments | 995,155 | 7,699,148 | 8,727,586 | 2,430,000 | 5,325,958 | ||||||||||||
| Loans and advances to customers | 8,128,320 | 65,765,834 | 78,036,549 | 46,330,763 | 78,012,086 | ||||||||||||
| Derivative financial instruments | 8,676,006 | 4,685,855 | 1,694,141 | 743,790 | 836,395 | ||||||||||||
| Total financial assets | 36,789,048 | 78,150,837 | 88,458,276 | 49,504,553 | 84,174,439 | ||||||||||||
| Financial Assets | 0-30 days | 31 days -1 year | 1-3 years | 3-5 years | More than 5 years | ||||||||||||
| December 31, 2023 | In millions of COP | ||||||||||||||||
| Cash and balances with central bank | 12,863,332 | - | - | - | - | ||||||||||||
| Interbank borrowings - Repurchase agreements | 11,485,003 | - | - | - | - | ||||||||||||
| Financial assets investments | 1,225,370 | 7,508,962 | 2,763,994 | 1,031,008 | 2,763,672 | ||||||||||||
| Loans and advances to customers | 9,299,459 | 67,075,512 | 76,991,280 | 44,292,725 | 73,095,556 | ||||||||||||
| Derivative financial instruments | 3,779,140 | 12,521,300 | 4,131,390 | 1,690,432 | 1,395,199 | ||||||||||||
| Total financial assets | 38,652,304 | 87,105,774 | 83,886,664 | 47,014,165 | 77,254,427 | ||||||||||||
| Financial Liabilities | 0-30 days | 31 days -1 year | 1-3 years | 3-5 years | More than 5 years | ||||||||||||
| December 31, 2024 | In millions of COP | ||||||||||||||||
| Demand deposit from customers | 115,768,639 | - | - | - | - | ||||||||||||
| Time deposits from customers | 11,309,077 | 35,826,396 | 8,349,029 | 3,583,268 | 15,246,849 | ||||||||||||
| Interbank deposits-Repurchase agreements | 646,806 | - | - | - | - | ||||||||||||
| Borrowings from other financial institutions | 148,800 | 4,123,676 | 4,830,763 | 865,447 | 1,205,849 | ||||||||||||
| Debt securities in issue | 40,491 | 759,393 | 4,581,252 | 1,131,868 | 5,761,272 | ||||||||||||
| Preferred Shares | - | 57,701 | 115,403 | 115,403 | 295,697 | ||||||||||||
| Derivative financial instruments | 8,444,434 | 4,517,066 | 1,559,856 | 763,789 | 754,418 | ||||||||||||
| Total financial liabilities | 136,358,247 | 45,284,232 | 19,436,303 | 6,459,775 | 23,264,085 | ||||||||||||
| Financial Liabilities | 0-30 days | 31 days -1 year | 1-3 years | 3-5 years | More than 5 years | ||||||||||||
| December 31, 2023 | In millions of COP | ||||||||||||||||
| Demand deposit from customers | 104,112,202 | - | - | - | - | ||||||||||||
| Time deposits from customers | 9,530,808 | 33,349,972 | 11,476,688 | 4,809,582 | 18,199,529 | ||||||||||||
| Interbank deposits-Repurchase agreements | 263,751 | - | - | - | - | ||||||||||||
| Borrowings from other financial institutions | 300,957 | 3,322,380 | 7,182,852 | 1,538,962 | 1,915,030 | ||||||||||||
| Debt securities in issue | 101,782 | 2,755,303 | 3,890,387 | 4,307,752 | 3,507,202 | ||||||||||||
| Preferred Shares | - | 57,701 | 115,403 | 115,403 | 295,697 | ||||||||||||
| Derivative financial instruments | 3,220,567 | 13,098,241 | 4,135,676 | 1,678,780 | 1,473,116 | ||||||||||||
| Total financial liabilities | 117,530,067 | 52,583,597 | 26,801,006 | 12,450,479 | 25,390,574 | ||||||||||||
December 31, 2024 |
0 – 30 days | 31 days – 1 Year | 1 - 3 Years | 3 - 5 Years | More than 5 years | ||||||||||||
| In millions of COP | |||||||||||||||||
| Financial guarantees | 522,590 | 4,656,286 | 1,894,900 | 135,821 | 602,640 | ||||||||||||
December 31, 2023 |
0 – 30 days | 31 days – 1 Year | 1 - 3 Years | 3 - 5 Years | More than 5 years | ||||||||||||
| In millions of COP | |||||||||||||||||
| Financial guarantees | 628,556 | 5,844,015 | 1,185,076 | 440,092 | 472,725 | ||||||||||||
|
Net Stable Funding Ratio
In millions of Colombian pesos
| ||||||||
| Item | December 31, 2024 | December 31, 2023 | ||||||
| Funding stable available (FED) | 205,786,903 | 192,571,288 | ||||||
| Funding stable Required (FER) | 168,405,514 | 158,734,448 | ||||||
| Net Stable Funding Ratio | 122.20% | 121.32% | ||||||
Operational Risk | ||
|
The Bank manages operational risk with the main objective of understanding and taking advantage of opportunities to generate profits, while reducing losses by knowing and attacking threats.
This management is framed in the main stages of risk administration such as risk identification, measurement, control and management. The Bank has the permanent identification and updating of the risks to which it is exposed.
The Bank closes the year 2024 with operating losses equivalent to COP 314.2 billion, representing a 19% increase in accumulated net economic losses compared to the previous year (COP 263.8 billion). This is due to the increase in external fraud events, customer impersonation, mainly in payment methods and digital channels, representing 82% of fraud losses; and technological failures that generated losses due to wrong balances in favor of clients that could not be recovered.
It should be noted that exposure to cybersecurity risk has remained at adequate levels, thanks to the measures that have been adopted in terms of controls, monitoring and mitigation actions to adjust to environmental threats.
Interest Rate Benchmark Reform
| ||
December 31, 2023 | |||||
| In millions of COP | |||||
USD LIBOR1 |
|||||
| Assets | |||||
Loans |
- | ||||
Derivatives |
41,818 | ||||
| Total Assets | 41,818 | ||||
| Liabilities | |||||
Loans |
323 | ||||
| Total Liabilities | 323 | ||||