

UNITED STATES
SECURITIES AND EXCHANGE COMMISSION
Washington D.C. 20549
FORM 6-K
REPORT OF FOREIGN PRIVATE ISSUER
PURSUANT TO RULE 13a-16 OR 15d-16 OF
THE SECURITIES EXCHANGE ACT OF 1934
For the month of April 2024
Commission File Number 001-32535
Bancolombia S.A.
(Translation of registrant’s name into English)
Cra. 48 # 26-85
Medellín, Colombia
(Address of principal executive offices)
Indicate by check mark whether the registrant files or will file annual reports under cover of Form 20-F or Form 40-F.
Form 20-F þ Form 40-F ◻
Indicate by check mark if the registrant is submitting the Form 6-K in paper as permitted by Regulation S-T Rule 101(b)(1):___
Indicate by check mark if the registrant is submitting the Form 6-K in paper as permitted by Regulation S-T Rule 101(b)(2):___
Indicate by check mark whether the registrant by furnishing the information contained in this form is also thereby furnishing the information to the Commission pursuant to Rule 12g3-2(b) under the Securities Exchange Act of 1934.
Yes ◻ No þ
If “Yes” is marked, indicate below the file number assigned to the registrant in connection with Rule 12g3-2(b): 82- .
EXHIBIT INDEX
|
Exhibit Number |
|
Description |
1
SIGNATURE
Pursuant to the requirements of the Securities Exchange Act of 1934, the registrant has duly caused this report to be signed on its behalf by the undersigned, thereunto duly authorized.
|
BANCOLOMBIA S.A. |
|
Date April 9, 2024 |
By: |
/s/ JOSE HUMBERTO ACOSTA MARTIN. |
|
Name: |
Jose Humberto Acosta Martin. |
|
Title: |
Vice President of Finance |
April 9, 2024
Medellín
Contacts |
|
|
|
Julian Mora Gomez |
Jose Humberto Acosta |
Catalina Tobon Rivera |
|
Corporate VP |
Financial VP |
IR Director |
|
Tel.: (57 601) 4042436 |
Tel.: (57 601) 4885934 |
Tel: (57 601) 4485950 |
|
2

2023 REGULAR FISCAL YEAR-END REPORT
BANCOLOMBIA S.A.

CARRERA 48 # 26-85, MEDELLÍN, COLOMBIA
*The issuer's outstanding securities can be found in the Our Shareholders section.
The issuer's legal representative certifies that the provided information covers all material aspects of the company.

1
Contents
2
3
4
In this report, we cover the key topics of our management in 2023. We report on the main achievements aligned with the strategy and the goals to be met.
In the final segment, we present the Global Reporting Initiative (GRI) content index, the economic, environmental, and social indicators that contribute to the compilation of a sustainability report. We also present the Sustainability Accounting Standards Board (SASB) indicator index to estimate structured reporting of these indicators in this first year.
This document has been prepared per the Core option of the GRI Standards. We will continue to use this methodology to deliver a management report increasingly tailored to different stakeholders and to continue learning in the process. This report was verified by a third party who reviewed its content adaptation to the Global Reporting Initiative's Sustainability Reporting Standard (GRI Standard).
Likewise, we demonstrate our commitment to sustainability by showcasing our efforts in voluntarily managing the 10 Global Compact Principles, our contribution to the fulfillment of the Sustainable Development Goals (SDGs), the commitments of the Paris Agreement, and participation in frameworks such as the Dow Jones Sustainability Index (DJSI), Equator Principles, United Nations Environmental Program - Financial Initiative (UNEP FI), Carbon Disclosure Project (CDP), Principles for Responsible Investment (PRI), Principles for Responsible Banking, Partnership for Carbon Accounting Financials (PCAF), Net Zero Banking Alliance (NZBA), Task Force on Climate-Related Financial Disclosure (TCFD), the Global Investors for Sustainable Development (GISD) Alliance, and the Glasgow Financial Alliance for NetZero (GFANZ), among others.
We promote sustainable development to achieve the well-being of ALL.
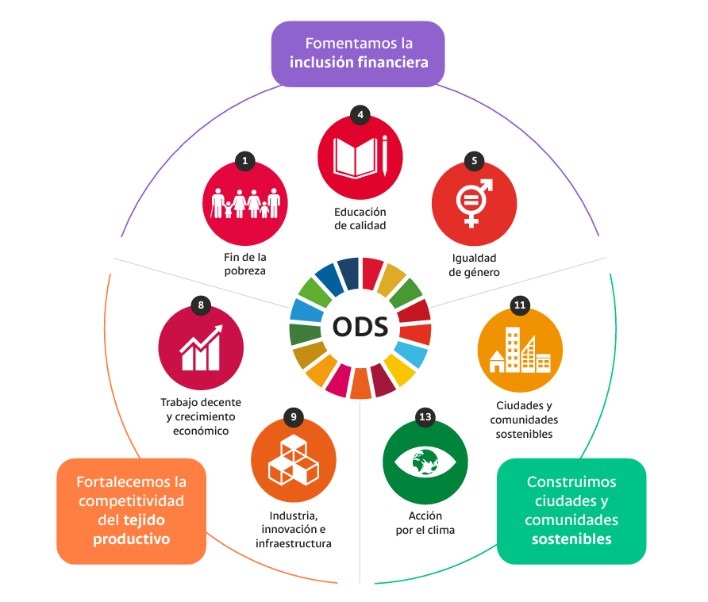
We have selected three strategic approaches that align with the United Nations SDGs. We believe they will help us achieve our purpose and measure our outcomes.
5
We enhance the competitiveness of the production network
Quality education
Gender equality
Sustainable cities and communities
Climate action
Industry, innovation, and infrastructure
SDGs
Decent work and economic growth
No poverty
We develop sustainable cities and communities
We promote financial inclusion
| I. | ABOUT GRUPO BANCOLOMBIA |
Grupo Bancolombia aims to promote sustainable development for the well-being of all.
This technology roadmap serves as a guide for over 30,000 employees within our organization. Our purpose is to positively influence the economy, society, and environment in all our endeavors. We uphold a culture of ethics and integrity to achieve this goal.
For nearly 150 years, we have evolved and grown continuously. This has led us to become what we are today: a group present in Colombia, Panama, Guatemala, and El Salvador. In these countries, we work daily to strengthen the productive network, develop sustainable cities and communities, and promote financial inclusion.
This is made possible thanks to a broad range of financial and non-financial solutions and the largest physical and digital network that provides services to over 30 million individuals and companies. They rely on us in an easy, timely, reliable, and close way, and we always strive to ensure financial well-being.
With our banking activity (accounts, deposits, transactional services, consumer, commercial, and housing credits, microcredits, and our A la Mano and Nequi platforms), leasing, renting, stock brokerage, trust, investment banking, and capital market solutions, we meet the needs of households and businesses. We also promote initiatives that foster growth, competitiveness, and quality of life in the countries where we operate.
6
In Colombia, we serve individuals and companies with our solutions through brands like Bancolombia, Plink, Wompi, Nequi, Sufi, and Renting. We also operate in Panama as Banistmo, Guatemala as BAM, and El Salvador as Banco Agrícola.
We understand that financial services are just one aspect of people's and businesses' needs. That is why we are expanding our capabilities in collaboration with other players to become a platform that provides comprehensive solutions and ensure that our products and services are integrated into third-party platforms.
Our shares have been listed on the Colombian capital market since 1981 and on the New York Stock Exchange (NYSE) since 1995. This ensures continuous access to both local and international capital markets, as well as ongoing enhancement of our corporate governance practices.
According to the Company Monitor on Corporate Reputation (MERCO), our company has been acknowledged as having the best reputation, corporate governance, and ability to attract and retain talent in the country for several years.
Our commitment extends beyond our borders. We are aligned with the United Nations Sustainable Development Goals and collaborate with global stakeholders to find solutions to the environmental and social challenges facing the world.
In short, this is the path we have chosen to grow beyond profitability. We aim for our impact on the economy to result in a better quality of life in our societies. Similarly, our long-term vision is to build a future of well-being for ALL.
At Grupo Bancolombia, we promote sustainable development to achieve the well-being of ALL. Every day, we evolve to address the economic, environmental, and social challenges we face by aligning ourselves with a global agenda framed by the 17 Sustainable Development Goals of the UN.
Our 149 years of solidity and experience enable us to be the financial ally of over 30 million customers, including individuals, independent workers, small and medium-sized enterprises (SMEs), companies, and corporations. We offer them a wide range of products and services through which we materialize our purpose of creating well-being. Beyond financial alternatives, we proactively provide comprehensive solutions to our customers' everyday needs.
This evolution is part of our action plan to address the challenges of an ever-changing environment. Our purpose guides our strategic priorities. This vision of success seeks to ensure our sustainability as an organization while positively impacting the well-being of society.
Our strategic objectives stem from the premises that we develop below:
Achieving the Well-Being of All
We provide services that generate well-being and development in the communities where we operate. We want to be the ally that enables them to seize opportunities and better manage their resources in their day-to-day lives. To achieve this, we strengthen the competitiveness of companies (the country's productive network). We promote financial inclusion so that more individuals and companies can integrate and contribute to economic development. Additionally, we offer solutions that contribute to the construction of more sustainable cities and communities.
7
In this way, we contribute to making the planet increasingly cleaner.
Achieving Customer Loyalty and Preference
We are a customer-focused organization. We stand out by providing reliable, approachable, timely, and user-friendly experiences for our customers. We want to earn their loyalty by being their top choice for recommendation ahead of other competitors. To achieve this, we prioritize enhancing service delivery by increasing speed and minimizing obstacles. We also advocate for adopting digital solutions to streamline their processes and enhance efficiency. We endeavor to offer a range of improved options for managing their finances, providing solutions that meet their everyday needs.
Maintaining Financial Stability through Responsible Growth
We manage risk prudently by ensuring stability (credit risk + liquidity), anticipating moderate economic growth, and maintaining good performance in our portfolio deterioration. We leverage our growth by enabling pre-approvals, instant responses, and personalized offers from our financial and non-financial portfolio tailored to our customers' needs. We prioritize our efficiency by proactively managing the organization's expenses and focusing on becoming increasingly productive.
Building Culture and Talent to Foster Competitiveness
We have a team of over 34,000 employees across the four countries. Every day, they rise to work within a strong culture driven by dynamism, ethics, and integrity. Our employees focus on customers and sustainable growth. They always strive to achieve extraordinary performance. Our talent is one of our core assets. Accordingly, we ensure their well-being and professional development. We aim to recruit and retain top talent in the market. We instill the principles that define our distinctive culture within our staff. Furthermore, we continuously enhance inclusivity, equity, simply, approachability, and empathy toward our customers' diverse realities and expectations.
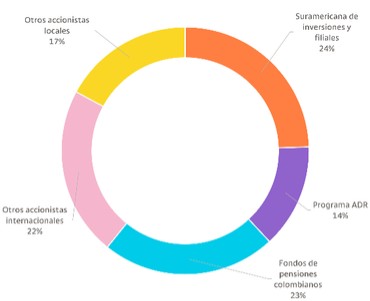
Suramericana de Inversiones and Subsidiaries 24%
Other local shareholders 17%
|
Common |
Preferred |
Total |
Suramericana de Inversiones and Subsidiaries |
46.2% |
0.0% |
24.5% |
ADR program |
0.0% |
28.9% |
13.6% |
Colombian Pension Funds* |
20.5% |
25.2% |
22.7% |
Other International Shareholders |
21.4% |
23.0% |
22.1% |
Other Local Shareholders |
11.9% |
23.0% |
17.1% |
ADR Program 14%
Colombian Pension Funds 23%
Other international shareholders 22%
*Private Funding
8
Asset Type |
Common Shares |
Preferred Shares |
Trading System |
Stock Exchange |
Stock Exchange |
Stock Exchange |
Colombian Stock Exchange (BVC) |
Colombian Stock Exchange (BVC) |
Outstanding Shares (12/31/2023) |
509,704,584 |
452,122,416 |
Number of Shareholders |
16,640 |
25,552 |
Amount Issued |
509,704,584 |
452,122,416 |
Amount Placed |
509,704,584 |
452,122,416 |
Bancolombia has a Level III ADR listed on the New York Stock Exchange. Each ADR is equivalent to four preferred shares.
Type of Shares |
Number of Outstanding Shares |
Number of Shareholders Owning a Type of Shares |
Percentage of Participation in Share Capital for Each Type of Share |
Common |
509,704,584 |
13,988 |
52.99% |
Preferred |
452,122,416 |
22,900 |
47.01% |
Total |
961,827,000 |
39,540* |
100% |
*2,652 shareholders have common and preferred shares.
Board of Directors

9
Vice President of Legal Affairs and Secretary General
Vice President of Risk Management
Vice President of Products
Vice President of Business
Vice President of Finance
Corporate Vice President
Vice President of Corporate Services
Vice President of Internal Audit
Vice President of Innovation and Sustainability
Bam President
Bancoagrícola President
Banistmo President
Grupo Bancolombia President

| ● | According to the MERCO, Bancolombia remains the financial institution with the best capacity to attract, develop, and retain talent in the country. This recognition demonstrates its effort to promote quality of life and well-being among its more than 23,000 employees. |
| ● | Bancolombia is the only Colombian financial institution that ranked in the top 5% of the best banks in the S&P Sustainability Yearbook. This ranking distinguishes companies in each sector with the greatest strengths in this area. |
| ● | According to the MERCO, Bancolombia has been recognized as the company with the best reputation in the country for the ninth time for its performance beyond financial metrics and drive towards sustainable development for the well-being of all. |
| ● | Juan Carlos Mora and Cristina Arrastía were listed in Bloomberg's ranking of the 500 most influential people in Latin America and the Caribbean for 2023. |
| ● | The Economic, Sectorial, and Market Research team consolidated its leadership by receiving eight awards in 11 categories at the AIE awards from the Colombian Stock Exchange. |
10
| ● | The Board of Directors of Bancolombia is among the best in the country according to KPMG’s Board Leadership Center. |
| ● | Bancolombia has solidified its position as the most sustainable bank in Colombia according to the Dow Jones Sustainability Index (DJSI). This index measures the performance of leading companies worldwide in environmental, social, and corporate governance (ESG) issues. |
| ● | According to the MERCO, Bancolombia is the Colombian company with the highest environmental, social, and corporate governance responsibility. |
| ● | Global Finance recognized Grupo Bancolombia Capital as the Best Investment Banking in Colombia and El Salvador. It also highlighted it as one of the most innovative organizations in designing financial solutions with ESG criteria. |
| ● | Best bank for small and medium-sized enterprises in Colombia, according to the Euromoney Awards for Excellence 2023. |
| ● | BAM was recognized as Guatemala's top bank in the 2023 Summa Magazine ranking of diverse, equitable, and inclusive companies in Central America and the Dominican Republic. |
| ● | The QR Code received the Platinum Award in Colombia in the Financial Inclusion Category at Fintech Americas 2023. |
| ● | Bancolombia was named Bank of the Year 2023, according to Latin Finance. |
| ● | With Bancolombia a La Mano and Crédito a La Mano, Bancolombia won in the 'Digital Transformation' category at the Acercando La Banca a Los Colombianos awards presented by Asobancaria. |
Communication with our Stakeholders
We implement communication and engagement strategies with our different stakeholders to identify how we are generating shared value through the most relevant economic, social, and environmental actions. To learn more, click here and go to the Communication with our Stakeholders section.
| II. | MAINTAINING FINANCIAL STABILITY THROUGH RESPONSIBLE GROWTH |
Main Trends in the Region (LAC)
In 2023, Latin America's major economies faced a combination of challenges and opportunities that shaped their performance. Economic uncertainty, political changes, and external factors influenced the region's growth, estimated at 2.3% (compared to 4.1% in 2022) according to the International Monetary Fund (IMF). It occurred amidst a widespread backdrop of slowdown, persistent inflation, and restrictive financial conditions.
The global economic landscape was a key factor. The region relies heavily on international trade. Fluctuations in global demand and commodity prices hit export-driven economies.
11
While some countries benefited from increased demand for commodities, others faced challenges due to market volatility.
Trade agreements also played a key role. The region engaged in negotiations to strengthen existing trade partnerships and explore new opportunities. This action was aimed at improving market access, reducing trade barriers, and fostering economic cooperation. In this regard, it is worth highlighting the favorable performance of economies such as Brazil (estimated GDP growth of 3.1% for 2023), Mexico (3.2%), and Panama (4%). These economies have capitalized on opportunities (near-shoring, friend-shoring) amidst global fragmentation to attract investment and energize various productive sectors.
Inflation captured the world's attention. Some countries experienced persistent inflationary pressures driven by high commodity prices and wages. This affected consumers' purchasing power and weakened demand. While in certain nations the deflationary process accelerated during the second half of 2023, even allowing their central banks to start cutting interest rates (Brazil, Chile, Peru, and Colombia towards the end of the year), the inflationary challenge is still ahead. Likewise, its drag has impacted growth.
Finally, political dynamics played a crucial role in shaping economic policies. Several countries in the region experienced elections or political transitions in 2023. These led to adjustments in economic strategies. The level of political stability influenced investor trust, the ability to implement revitalization policies, and consequently, economic growth. This trend is observable in countries such as Argentina (-2.5% expected contraction in 2023), Chile (-0.5%), Peru (1.1%), and Ecuador (1.4%).
While some countries grappled with uncertainties, others demonstrated resilience and adaptability. This was achieved by leveraging innovation and sustainable practices to attain positive economic outcomes. The region's performance underscored the importance of comprehensive policies addressing various economic, social, and environmental aspects to foster long-term growth and stability.
Colombia
A look at recent economic history reflects the progress made in the normalization of growth in the post-pandemic era. This is accompanied by a persistent behavior of inflation. Indeed, the Colombian economy contracted as a result of the pandemic in 2020 (-7.3%). It then rebounded in 2021 with a historic expansion (11%). The slowdown in 2023 leaves the economy with low growth (0.6%). However, it is still amidst high inflation (9.6%) and high interest rates.
Given the restrictive financial conditions, it was expected that 2023 would be a year of slowdown and normalization for the Colombian economy. Even so, the slow decline in inflation, driven by high prices of regulated goods, will entail a cautious monetary policy stance amid the downturn in the economic cycle. Returning to inflation levels within the tolerance range of the Bank of the Republic (2%-4%) and the targeted potential growth (3%-3.5%) will take more time and prudence. Nevertheless, the economy is heading in that direction.
12
As a result, the most affected sectors were those most sensitive to the challenging combination of high prices and rates, such as construction (-6%), manufacturing (-3.7%), and commerce (-2.1%), in real terms. Construction activity represents the backbone of investment in the country. However, this sector faces a landscape where major national infrastructure projects are not on the horizon, given the short-term focus of public spending on social programs. Similarly, the sharp decline in home sales would continue to exert downward pressure on the sector's activity.
The lingering effects of the economic slowdown and persistent inflation have also begun to exert pressure on the labor market. National unemployment increased to 9.9% in October and could return to double digits in the coming months. This is despite the public sector's push, which has been instrumental in increasing the number of employed individuals in 2023.
Finally, the economic slowdown will also put pressure on public finances, especially given the government's stance on increasing expenditure. This will mainly be directed towards strengthening social policies, particularly cash transfer programs and subsidies.
El Salvador
In the first half of 2023, El Salvador’s economy was driven by public consumption, public and private investment, and the dynamism of the public administration and construction sectors. According to the Central Reserve Bank of El Salvador, increased security in the country has benefited tourism and investment decisions. This has also driven tourism and commerce construction alongside public projects in road infrastructure, sports venues, and private investments in residential sectors. In this scenario, El Salvador's GDP recorded a solid progress in the second quarter of the year (3%). This came after the modest figure of 0.8% in the first quarter of 2023.
Regarding prices, El Salvador reached its inflation peak in June 2022 with a record of 7.8% annually. Since then, it has decelerated to close 2023 at an annual rate of 1.2%. This result is attributed to the reduced dynamics of food prices but faces upward risks in the coming months due to the intensity of the El Niño phenomenon and rising fuel prices. We anticipate that El Salvador's inflation will reach 1.9% by the end of 2024.
A significant driver of the economy, particularly household consumption, is remittances. They account for about 24% of GDP, making El Salvador the third most dependent country in Latin America on them. They even contribute more income than exports. In 2023, the total remittances received exceeded USD 8,181 million (+4.6% annually).
Guatemala
During the first two quarters of 2023, the GDP expanded by 3.7% and 3.8%, respectively. Similar to El Salvador, the resilience of the labor market in the U.S. has allowed Guatemala to benefit from the strength in remittance inflows as they represent around 16% of GDP and drive household spending. In the latter half of the year, activity was impacted by political uncertainty and recent social unrest. As a result, it grew by 3.5% in the full year of 2023.
13
In February, inflation peaked at 9.9% annually. Since reaching that peak, it has rapidly declined. By June, it returned to the target range (3%-5%). However, upward pressure from fuel prices and protests resulting from social unrest were evident during September and October. Consequently, the Bank of Guatemala has taken actions, resulting in nine increases that brought the interest rate to 5%. This level has remained stable since April 2023.
Panama
Panama's economic activity expanded by 9.3% in the first quarter of the year and 8.2% in the second. These results highlight the strength of production driven by the good performance of commerce and construction. We expect growth to be around 6.9% in 2023 and to decelerate to levels close to its potential in 2024 (around 4%). The construction sector will be the driving force due to public works projects such as the Panama City Metro, a bridge over the Panama Canal, and the construction of a gas power plant. However, the impact of the El Niño phenomenon is one of the main risks to the activity as it could restrict Canal operations.
At the same time, Panama's inflation situation has been somewhat less challenging as it peaked in June 2023 at a rate of 5.2% annually. Nevertheless, it underwent a rapid process of disinflation as a result of the government's freezing of fuel and food prices.
At the same time, various spending pressures and low tax collection would hinder the consolidation of public finances. Under this context, different rating agencies have recently downgraded the country's sovereign rating and the outlook has been revised due to weak tax collection, high dependence on Canal revenues, increased public spending, and the then likely cessation of mine operations.
2024 Economic Outlook
The outlook for 2024 is framed amidst anticipated risks, albeit with lagged effects, and a backdrop of high uncertainty. The global economy is expected to enter a soft landing phase in which inflation decreases without implying a significant slowdown in the economy. Indeed, in its latest edition of the World Economic Outlook (WEO), the IMF forecasts that Latin America will grow by 2.3% in 2024. This reflects its stagnation compared to the previous year.
In 2024, the spotlight will be on the shift in the monetary policy stance of developed economies. This process will unfold cautiously due to the resilience of economic activity and the labor market. Uncertainty about the effects of "higher rates for longer" is also expected to persist.
Furthermore, the gradual process of disinflation would persist, leading to gradual cuts in the policy rate. However, managing the risks of upward price pressures will remain crucial. The prolonged conflicts (Ukraine-Russia, Israel-Hamas) could intermittently drive up international oil prices. Meanwhile, the effects of the El Niño phenomenon will be felt in international trade, agricultural production, and the rise in food and energy prices.
14
Colombia
There are good reasons to believe that the economy may be nearing the end of the most challenging part of the cycle. It's also plausible to anticipate that in 2024, a slow recovery process may begin as inflation subsides and rate cuts persist. However, underlying factors such as investment lag and credit contraction suggest that there will be limitations to returning to potential economic growth levels in the medium term. Consequently, our GDP growth estimate for 2024 is 0.9%.
We anticipate that the most significant macro environments will continue to set the tone. Secondary activities (manufacturing and construction) and trade would continue to deteriorate due to lower private consumption and weak economic growth. Likewise, the primary sector (agriculture and mining) would face challenges from El Niño and regulatory uncertainty (such as in the mining, health, and public services sectors). Meanwhile, service-related activities and those tied to public spending would remain dynamic.
At the same time, the process of moderation in prices will continue. We anticipate that inflation would close around 5.9% by the end of 2024. In the medium term, we believe it will reach the upper limit of the issuer's tolerance range (2%-4%) by mid-2026. This means that the path for the Colombian economy to reach the 3% inflation target will be challenging and prolonged.
Given this context, we expect the rate-cut cycle that commenced in December 2023 with an initial 25 basis points reduction to potentially pick up pace throughout 2024, as inflation continues its path towards the target. Having this in mind, we anticipate that 2024 could end with a monetary policy rate close to 9%.
El Salvador
It is expected that in the coming months, a period of slowdown will begin as the construction boom moderates, household consumption weakens due to tight global financial conditions, persistent high inflation, declining remittance inflows, slower growth among trading partners, and the increasing impact of the El Niño phenomenon. Given this backdrop, we anticipate that the economy will experience moderate growth in 2024 (1.9%) as the delayed effects of the strong monetary tightening cycle become evident and the US economy slows down. Going forward, the economy would recover and grow in the medium term around potential (2.2%).
Guatemala
Regarding Guatemala, we anticipate a slight slowdown in GDP growth in 2024 due to weakening private consumption. This slowdown is because remittances, mostly from the U.S., would decrease as a result of tightening labor market conditions in that country. Therefore, Guatemala's economic growth is projected to be 3.3% in 2024, also supported by stability in the price trend (inflation expected within the range set by the Bank of Guatemala of 3-5%). The primary evident risk is political instability and governance due to the current political and social situation. Now, we expect the elected government to implement measures to increase tax revenues and combat corruption.
15
Panama
Panama's growth outlook remains positive for 2024. It will be bolstered by economic diversification and increased public investment related to the implementation of different public infrastructure projects. While Panama's economy could be significantly impacted by a strong El Niño phenomenon and its implications, particularly on the operation of the Panama Canal, it is estimated to grow by 4% in 2024.
The economy faces a significant downside risk due to the suspension of operations at the Cobre Panama mine. Coupled with the deterioration of the fiscal deficit and debt, it would hinder the country's fiscal consolidation. This could jeopardize its investment grade status and further complicate the management of external and fiscal deficits. Specifically, the fiscal deficit, economic slowdown, and electoral spending pressures would prevent the government from achieving the balance goal for the next year. Furthermore, low tax collection would also be a short-term challenge and another hurdle against achieving the fiscal target.
GDP Growth in Latin America (Annual Variation %) | ||||
Country |
2021 |
2022 |
2023 |
2024 |
Latin America* |
7.2% |
3.8% |
2.1% |
1.6% |
Peru* |
13.4% |
2.7% |
0.3% |
2.3% |
Mexico* |
5.7% |
3.9% |
3.2% |
2.1% |
Chile* |
11.7% |
2.4% |
-0.2% |
1.8% |
Brazil* |
5.0% |
2.9% |
2.9% |
1.5% |
Colombia |
11.0% |
7.3% |
1.2% |
0.9% |
Panama |
15.8% |
10.8% |
5.4% |
4.3% |
Costa Rica* |
7.9% |
4.6% |
4.3% |
3.4% |
Guatemala |
8.0% |
4.1% |
3.1% |
3.3% |
Honduras* |
12.5% |
4.0% |
3.0% |
3.0% |
Nicaragua* |
10.3% |
3.8% |
3.3% |
2.8% |
El Salvador |
11.2% |
2.6% |
2.3% |
1.9% |
Source: Grupo Bancolombia, FocusEconomics. *Focus Economics Forecasts.
Impact of Economic and Monetary Policies on Bancolombia's Results
Bancolombia's operational results are affected by macroeconomic factors, primarily in Colombia but also in the other countries where the Group operates. The key variables include GDP growth, interest rates, inflation, and exchange rates, mainly the USD to COP exchange rate. The trends of these variables for Colombia in 2023 are summarized below.
Economic Activity
Colombia's real GDP growth in 2023 was 0.6% annually. Thus, 2023 was a period of marked weakening of Colombia's economic dynamics, following a period of high GDP growth in 2022 (of 7.3% per annum).
16
This sharp drop in GDP growth has been part of a cycle in which Banco de la República significantly increased the policy interest rate to address inflationary pressures. Consequently, high-interest rates began to strain household and corporate budgets. It led to a decrease in both consumption and investment capacity. Similarly, public investment budget execution was also low.
The growth of the key components of GDP in 2023, at constant prices, was as follows: fixed investment decreased 8.9%, total consumption grew 1.1%, imports decreased 14.7%, and exports increased 3.1%.
The sectors that experienced the most dynamic growth in the first three quarters of 2023 (compared to the same period in 7.9) were arts, entertainment, and recreational activities along with other service-related activities (demonstrated an annual growth of 7.0%), financial and insurance activities (3.9%), and the macro environment encompassing public administration, defense, health, and education (4.0%).
Monetary Policy Interest Rate
As of December 31, 2023, the reference interest rate set by the Bank of the Republic stood at 13.00%. This followed a 125 basis points increase during the first half of the year and a 25 basis points reduction in December. Thus, the year concluded with a signal indicating the beginning of the phase of interest rate cuts in monetary policy.
Despite the initial rate cut, the stance of monetary policy remains highly contractionary. The Central Bank has considerable leeway to continue with the interest rate-cutting process while maintaining the contractionary stance of the policy. This will allow inflation to continue approaching its target throughout 2024.
Inflation
The annual consumer inflation (measured by CPI) stood at 9.28% at the end of 2023. It is significantly lower than the 13.12% recorded in 2022. In 2023, inflation was driven up by transportation (with a 15.42% annual increase), restaurant and hotel services (a 13.22% increase), and alcoholic beverages and tobacco (an 11.95% increase). Conversely, prices for information and communication services (with an annual increase of 0.12%), food and non-alcoholic beverages (a 5.00% increase), and clothing and footwear (a 5.23% increase) experienced the least growth.
In the latter part of 2023, annual inflation consistently exhibited a slow downward trend. This pattern is anticipated to persist throughout 2024 and underscores the likelihood of the policy interest rate continuing to decrease, albeit at an equally slow pace.
Exchange Type
The Colombian peso appreciated by 20.54% against the US dollar during 2023. The USD to COP exchange rate closed the year at COP 3,822.05. This contrasts with the 20.82% depreciation experienced by the pair in 2022, which resulted in a year-end closing of COP 4,810.20. Therefore, 2023 marked a year of recovery for the Colombian peso following the setbacks experienced in 2022. Several indicators of institutional strength, along with positive economic outcomes such as a reduction in the checking account deficit and the beginning of the inflation normalization process, would be the primary factors driving the currency's strengthening.
17
Outlooks
The future dynamics of the Colombian economy, the financial sector at large, and Bancolombia in particular are expected to be influenced by the following factors:
Positive Factors for the Colombian Economy in the Medium Term |
Challenges for the Colombian Economy in the Medium Term |
|---|---|
|
Rapid economic recovery from the recession caused by the pandemic. The country is expected to maintain responsible fiscal and monetary policies amidst a stable political environment. Colombia's stable democracy, division of power, and checks and balances underpin the predictability of policy measures and economic pragmatism. A significant decrease in the checking account deficit to 3%-4% of GDP in 2023 from 6.3% in 2022 will help mitigate short-term external vulnerabilities. The Bank of the Republic continues to adhere to its institutional tradition of targeting inflation and allowing the currency to float freely. The country’s ample international reserves help mitigate external vulnerabilities arising from the checking account deficit. Despite a decrease, this deficit remains relatively high compared to peer countries. |
Private investment remains low, which will limit medium-term economic growth. The potentially persistent low investor trust could impact private investment and pose risks to the expectation that GDP growth will return to its potential level, which is slightly above 3% in the coming years. A low medium-term potential growth could lead to challenges for public finances or increased external vulnerabilities. Colombia is exposed to the adverse effects of climate change, especially flooding. With over 80% of its population and economic activity concentrated in roughly 20% of its territory, the country is vulnerable to natural disasters. In terms of revenue, public finances could be affected if commodity prices decline in international markets. The country is exposed to significant volatility in terms of international trade due to its dependence on hydrocarbons. A low level of trade openness and a commodity-dependent export base implies high vulnerability to price shocks. Increased social spending will widen the fiscal deficit in 2024. The risk of civil unrest will remain high throughout the forecast period of 2024-2028. It reflects deep divisions within Colombian society. Likewise, the fragmentation in Congress will hinder rapid progress in addressing issues such as poverty and low-quality education. |
18
Trends, Events, or Uncertainties that Could Materially Impact the Issuer's Operations, Financial Position, or Changes to its Financial Situation
2023 faced a macroeconomic environment marked by rising interest rates and increasing inflation. Despite these challenges, Grupo Bancolombia maintained its margin due to its portfolio composition and the prudent management of funding resources, focusing on market liquidity.
During the same period, high inflation affected the cost of credit by hampering Colombians' ability to meet their financial obligations. This situation led to an increase in provisioning expenses, ultimately impacting the Group's profitability. Similarly, high levels of inflation also impacted operating expenses and put downward pressure on profits.
In 2024, we expect a more restrictive monetary policy as long as inflation keeps decreasing. This might prompt higher lending across various channels, contingent upon a risk appetite that depends on people's borrowing capacity in a year where unemployment rates could face pressure.
The interest rate cuts are expected to lead to a decrease in the net interest margin. Combined with operating expenses largely influenced by inflation, which is still expected to remain outside the target range set by the Bank of the Republic, this could create additional pressure on the financial results.
Grupo Bancolombia Consolidated Results
GRUPO BANCOLOMBIA |
|
|
|
|
|
CONSOLIDATED FINANCIAL STATEMENTS |
|
|
|
|
|
|
|
|
|
|
|
RESULTS AND BALANCE |
|
|
|
|
|
(Closing figures in millions of COP) |
December |
2023 vs. 2022 |
|||
2023 |
2022 |
2021 |
Var $ |
Var % |
|
Operating Income |
48,316,872 |
35,456,762 |
23,780,034 |
12,860,110 |
36.27% |
Net Operating Result |
8,147,526 |
9,744,786 |
5,984,012 |
-1,597,260 |
-16.39% |
Net Profit (Attributable to Shareholders) |
6,116,936 |
6,783,490 |
4,086,795 |
-666,554 |
-9.83% |
Total Assets |
342,928,809 |
352,814,733 |
289,855,048 |
-9,885,924 |
-2.80% |
Net Loan Portfolio and Financial Leasing |
237,728,544 |
254,444,099 |
204,459,001 |
-16,715,555 |
-6.57% |
Net Investments |
28,671,798 |
30,855,773 |
32,009,860 |
-2,183,975 |
-7.08% |
Total Liabilities |
303,879,080 |
312,817,182 |
255,929,590 |
-8,938,102 |
-2.86% |
19
Deposits |
247,941,180 |
250,992,323 |
210,390,848 |
-3,051,143 |
-1.22% |
Equity |
39,049,729 |
39,997,551 |
33,925,458 |
-947,822 |
-2.37% |
20
|
|
|
|
|||
PERFORMANCE AND PROFITABILITY |
|
|
|
|
|
|
|
|
|
|
|
|
2023 |
2022 |
2021 |
|
|
Net Interest Margin |
6.99% |
6.80% |
5.09% |
||
Financial Efficiency |
45.33% |
44.58% |
52.16% |
||
Operational Efficiency |
3.77% |
3.45% |
3.43% |
||
Return on Average Assets |
1.78% |
2.15% |
1.53% |
||
Return On Average Equity |
16.14% |
19.80% |
14.03% |
||
Portfolio Quality |
5.01%* |
3.24% |
4.05% |
||
Total Coverage Overdue Portfolio |
120.04%* |
168.73% |
166.29% |
|
|
Basic Solvency Ratio |
11.42% |
10.37% |
11.92% |
||
Total Solvency Ratio |
13.40% |
12.79% |
15.49% |
||
|
|
|
|
|
|
Accounting accounts parameterization per the Board of Directors report and press release. |
|||||
* This indicator is calculated using the equity balance of the portfolio.
At Grupo Bancolombia, we firmly believe that sustainable success stems from responsible, committed management focused on the well-being of all.
Our total assets closed at COP 342,928,809 million at the end of 2023, marking a decrease of COP 9,885,924 million (-2.8%) compared to the previous year. This decline was mainly attributable to the total net portfolio, which decreased by COP 16,715,555 million, partially offset by an increase of COP 6,829,631 million in other assets.
Considering that the exchange rate shifted from COP 4,810 at the end of 2022 to COP 3,822 at the end of 2023, the foreign currency balances on the Financial Position Statement were affected by a 20.5% appreciation of the peso against the dollar. This appreciation resulted in a decrease of COP 20,050,974 million in the gross loan portfolio, affecting the commercial portfolio by COP 11,950,164 million, the consumer portfolio by COP 4,174,125 million, and the housing segment by COP 3,774,178 million.
21
Deposits also decreased by COP 20,874,006 million. Specifically, time deposits fell by COP 10,222,525 million, while savings and checking accounts decreased by COP 6,700,798 million and COP 3,950,683 million, respectively. Other sources of financing were also reduced by this effect, such as bonds by COP 2,731,686 million and financial obligations by COP 2,368,378 million.
Without the peso appreciation, the gross portfolio grew by COP 4,078,882 million (1.5%). The commercial portfolio increased by COP 2,281,521 million (1.3%), primarily driven by the corporate segment. Likewise, the housing portfolio had an increase of COP 2,653,214 million (7.1%). This was the modality with the most dynamic growth. Also, the consumption pattern decreased by COP 825,005 million (1.4%).
Provisions for portfolio balance and financial leasing increased by COP 743,463 million and closed the year at COP 16,223,103 million. This increase was due to the deterioration of customers in the individual portfolio who were over 90 days in arrears and significant defaults from customers in the construction sector. Meanwhile, the portfolio’s capital coverage over 90 days closed at 183.5%. This underscores the strength we have in dealing with potential future deteriorations.
Throughout the year, other assets experienced an increase of COP 6,829,631 million (6.9%). This growth was primarily driven by increases in cash and cash equivalents by COP 8,154,318 million, trading derivatives by COP 1,291,033 million, and net investment properties by COP 715,853 million. All of this is offset by decreases in commercial credit by COP 1,949,495 and in net investments by COP 2,183,975 million (8.1%), primarily affected by exchange rate variations.
2023 ended with total liabilities for Grupo Bancolombia of COP 303,879,080 million. It represents an annual decrease of COP 8,938,102 million (2.9%).
Excluding the impact of exchange rate fluctuations, customer deposits increased by COP 16,692,013 million (6.8%) to reach a year-end total of COP 247,941,180 million. This result reflects the confidence of our customers in our organization's management of resources. Those with the greatest variation were time deposits, which increased by COP 21,770,974 million (25%). They accounted for 41% of total deposits, offset by a decrease in savings and checking accounts, by COP 3,163,254 million (2.7%) and COP 1,915,706 million (4.7%), respectively.
Bonds ended 2023 with a balance of COP 14,663,576 million, showing a decrease unaffected by the depreciation of the dollar against the peso by COP 2,180,726 million (11.1%). This aligns with the maturities occurring during the year, which were covered with internal resources. This reflects an appropriate management of the organization's liquidity. Furthermore, loans with institutions without this exchange rate effect had maturities that left a decrease of COP 1,675,875 million (8.5%).
Despite generating profits during 2023, the equity attributable to shareholders decreased by COP 999,391 million (2.6%). It ended the year at COP 38,089,512 million due to the restatement of the financial statements of foreign subsidiaries in our consolidated financial statements by COP 3,787,835 million and dividends declared in March 2023 amounting to COP 3,401,020 million. The equity's share of the balance sheet structure ended 2023 with a participation of 11.11% compared to 11.08% in 2022, allowing for a marginal reduction in asset leverage.
22
Solvency levels remained above the regulatory requirements, ending with a basic solvency ratio of 11.42%. This figure increased by 105 bps compared to the 10.37% reported in 2022. The increase is mainly attributed to the impact of Risk-Weighted Assets (RWA), earnings for the fiscal year, and the appreciation of the peso against the dollar.
We closed 2023 with a net profit attributable to shareholders of COP 6,116,936 million. This figure recorded an annual decrease of COP 666,554 million (9.8%). It can be explained as follows.
The net interest income grew by COP 2,023,387 million (11.0%). This is mainly attributed to the portfolio income, which increased by COP 10,457,294 million. It is a result of the increase in the monetary policy rate of the Bank of the Republic of Colombia and the Banking Benchmark (IBR). The financial expense increased by COP 8,225,825 million (97.4%). This rise aligns with the execution of the asset and liability management strategy. We observed an increase in the cost of funds associated with high deposit rates, product of the economic cycle. Net commissions grew by COP 203,238 million (5.4%), primarily driven by the net revenues generated from the customers' transactions when using our payment methods.
The portfolio provision and net leasing expense increased by COP 3,740,126 million (96.8%). This increase is attributed to higher allocations for impairment in the portfolio of natural persons. The situation mainly arose in BAM and Bancolombia’s unsecured consumer products, housing at Banistmo, and the portfolio of SMEs and Independent Businesses at Bancolombia.
Operating expenses increased by COP 2,054,542 million (18.9%). Within these, labor costs rose by COP 932,578 million primarily due to salary increases and actuarial calculations, which were significantly impacted by the behavior of TES discount rates. General expenses increased by COP 1,121,964 million. The most notable factors were local tax expenses (due to changes brought about by the tax reform in the industry and commerce tax), expenses associated with asset impairment, maintenance and repairs related to the Renting business, and fees for projects aimed at business evolution and transformation. In addition to a 16.9% increase in operating income before provisions, the above led to a deterioration in financial efficiency of 75 basis points, closing at 45.33%.
The income tax provision closed the year at COP 1,932,555 million. This represented a contribution to the national revenue for the country's development.
Consequently, we achieved a return on assets indicator of 1.78% and a return on equity attributable to shareholders of 16.14%. There was a deterioration compared to the figures recorded at the end of 2022 by 37 bps and 366 bps, respectively.
Bancolombia, a Commercial Bank
BANCOLOMBIA |
|
|
|
|
|
Commercial Bank |
|
|
|
|
|
UNCONSOLIDATED SUBSIDIARIES FINANCIAL RESULTS |
|
|
|
|
|
23
|
|
|
|
|
|
RESULTS AND BALANCE |
|
|
|
|
|
(Closing figures in millions of COP) |
|
|
|
2023 vs. 2022 |
|
2023 |
2022 |
2021 |
Var $ |
Var % |
|
Operating Income |
39,713,228 |
28,162,548 |
18,334,487 |
11,550,680 |
41.01% |
Net Operating Income (Operating Profit) |
7,662,543 |
9,090,560 |
5,243,413 |
-1,428,017 |
-15.71% |
Net Profit |
5,979,730 |
6,932,965 |
4,149,704 |
-953,235 |
-13.75% |
Total Assets |
251,590,338 |
243,175,544 |
206,914,719 |
8,414,794 |
3.46% |
Net Loan Portfolio |
170,029,117 |
168,203,995 |
139,105,688 |
1,825,122 |
1.09% |
Net Investments |
38,808,445 |
43,150,832 |
41,719,426 |
-4,342,387 |
-10.06% |
Total Liabilities |
214,508,670 |
204,433,764 |
175,147,270 |
10,074,906 |
4.93% |
Deposits |
170,231,400 |
156,480,283 |
138,702,086 |
13,751,117 |
8.79% |
Equity |
37,081,668 |
38,741,780 |
31,767,449 |
-1,660,112 |
-4.29% |
|
|
|
|
|
|
PERFORMANCE AND PROFITABILITY |
|
|
|
|
|
|
|
|
|
|
|
|
2023 |
2022 |
2021 |
|
|
Net Interest Margin |
7.93% |
7.94% |
5.55% |
||
Financial Efficiency |
37.90% |
37.85% |
45.67% |
||
Operational Efficiency |
3.55% |
3.26% |
3.26% |
||
Return on Average Assets |
2.42% |
3.08% |
2.12% |
||
Return on Average Equity |
15.77% |
19.67% |
14.42% |
||
Portfolio Quality |
4.95% |
3.35% |
4.19% |
||
Total Coverage Overdue Portfolio |
146.77% |
187.57% |
186.72% |
||
Basic Solvency Ratio |
15.30% |
14.70% |
16.18% |
||
Total Solvency Ratio |
18.08% |
18.29% |
21.01% |
||
|
|
|
|
|
|
MARKET |
|
|
|
|
|
(Figures as of December 31) |
|
|
|
2023 vs. 2022 |
|
2023 |
2022 |
2021 |
Var $ |
Var % |
|
24
Weighted Average Share Price |
38,293 |
33,431 |
-38,293 |
-100.00% |
|
Market Capitalization (in millions) |
36,831,152 |
32,154,666 |
-36,831,152 |
-100.00% |
|
Number of Outstanding Shares |
961,827,000 |
961,827,000 |
961,827,000 |
- |
0.00% |
Intrinsic Value |
38,553 |
40,279 |
33,028 |
-1,726 |
-4.29% |
Earnings Per Share-Unit |
6,217 |
7,208 |
4,314 |
-991 |
-13.75% |
|
|||||
Accounting accounts parameterization per the Board of Directors report and press release. |
|||||
Amidst 2023, marked by high inflation in the Colombian economy and a contractionary monetary policy rate, Bancolombia experienced a 3.46% growth in assets. This represents COP 8,414,794 million more compared to the end of 2022.
This variation was mainly leveraged by the gross portfolio, which grew by 1.92% during the year (COP 3,448,890 million). Additionally, the balance of cash and cash equivalents stood at COP 24,348,860 million at year-end, given the Bank's liquidity conditions.
The performance of portfolio balances was largely represented by the commercial segment, which grew by 4.01% (COP 3,685,879 million). Consumer loans decreased 4.94% (COP 2,021,414 million), due to a lower demand for credit. The housing portfolio grew 10.86% (COP 2,139,181 million). The financial services and natural resources sectors were the main drivers of this growth, especially in the commercial mode.
Investments in subsidiaries, associates, and joint ventures decreased by 16.56%, equivalent to COP 4,970,915 million. This outcome is attributed to investments in foreign subsidiaries and the currency revaluation effect caused by the exchange rate fluctuation, which shifted from COP 4,810 at the end of 2022 to COP 3,822 at the end of 2023.
The growth of COP 1,623,768 million in the portfolio provision balance indicates increased credit risk. This reflects a deterioration in portfolio quality with an increase in the non-performing loan ratio, which reached 4.95%.
The company ended the year 2023 with a total liability balance of COP 214,508,670 million, which is COP 10,074,906 million higher than the 2022 year-end figure. This behavior was primarily driven by time deposits, which grew by COP 16,599,660 million, reflecting higher profitability rates. The performance of virtual investment was notable, closing at COP 10,100,000 million in 2023. This represented an increase of COP 9,700,000 million compared to the previous year.
On the contrary, demand accounts experienced a downward trend: savings accounts decreased by COP -1,939,013 million and checking accounts by COP -2,132,066 million. This indicates a shift in funding structure. CDs gained 745 basis points of total deposit share, while savings and checking accounts lost share. This implies an increase in the cost of liabilities. The decrease in bonds is due to a restatement effect, along with bond maturities in pesos totaling around COP 612,522 million and a bond buyback operation of senior bonds maturing in 2025 for approximately USD 468 million conducted in August 2023.
25
In equity, Bancolombia decreased COP 1,660,112 million. This is primarily due to the exchange rate difference from investments in affiliates and subsidiaries due to the decrease in the Representative Market Exchange Rate (TRM) and lower net profit in the period.
In line with the increasing trend of the gross portfolio, the net interest income grew by 8.97%, equivalent to COP 1,273,799 million. This increase was primarily due to the revenue generation from the commercial portfolio. This favorable trend was offset by the deterioration of the portfolio. It led to an increase in provisions expense of COP 3,759,401 million. Consequently, interest income and valuation of financial instruments after provisions showed an annual decrease of COP 2,485,602 million.
Income from equity method amounted to COP 2,040,133 million. It represented an increase of COP 73,335 million compared to the balance in 2022. This was due to higher profits from subsidiary investments.
Net income before provisions grew by 19.44% compared to a 19.64% increase in operational expenses. This represents a 6 basis points deterioration in the efficiency indicator, which stood at 37.91%. Thus, pre-tax profit amounted to COP 7,662,543 million. It reflects a decrease of COP -1,428,017 million compared to the previous year.
As a result, Bancolombia ultimately closed 2023 with a net profit of COP 5,979,730 million. This amount represents an annual decrease of 13.75%, equivalent to COP 953,235 million. This leads to a decrease in the profitability of equity, which decreased by -389 basis points, standing at 15.77%.
Material Changes related to the Issuer's Liquidity and Solvency Position
Liquid Assets
One of the Bank’s main guidelines is to maintain a strong liquidity position. Therefore, the Asset and Liability Management (ALM) Committee has established a minimum level of liquid assets based on the financing needs of the parent company and each subsidiary. The objective is to ensure, as far as possible, that there will always be sufficient liquidity to meet its liabilities as they mature. This is both in normal conditions and stress scenarios without incurring significant losses or risking damage to the Bank's reputation.
As mentioned earlier, the Bank aims to maintain the optimal level of liquid assets to ensure not only smooth operation under normal conditions but also to operate under stress scenarios in the markets. In 2023, the Bank maintained a solid liquidity position with high levels of liquidity during the second half of the year.
The following table shows the distribution of liquid assets in the last two years:
Liquid assets (1) |
|
December 31, 2023 |
|
December 31, 2022 |
High-quality liquid assets* |
|
|
|
|
26
Cash |
|
25,273,317 |
|
26,299,990 |
High-quality liquid marketable securities |
|
19,951,771 |
|
17,739,501 |
Other liquid assets |
|
|
|
|
Other marketable securities** |
|
5,455,735 |
|
4,019,688 |
Total liquid assets |
|
50,680,823 |
|
48,059,179 |
27
Cash and liquid assets are those assets readily accepted as collateral by central banks in Colombia and other jurisdictions for monetary expansion or contraction operations. Liquid assets are adjusted by a reduction. They include cash, repos held for trading, and investments held for trading in stocks listed on the Colombian Stock Exchange, units of investment funds, or other debt trading instruments.
*High-quality liquid assets: Cash and shares that are eligible for reportable or repo operations, in addition to those liquid assets that the Central Bank receives for its monetary expansion and contraction operations described in Paragraph 3.1.1 of the Foreign Regulatory Circular DODM-142 of Bank of the Republic.
**Other marketable securities: Securities issued by financial and corporate entities.
As of December 31, 2023, liquid assets grew by COP 2,621,000 million primarily due to the increase in high-quality liquid securities. This change stems from increased deposits and excess liquidity managed through the treasury portfolio with purchases of liquid securities.
The Bank measures liquid assets on a daily basis and compares the result with a target set by the Risk Committee. Under this rule, daily liquid assets must be equal to or greater than the target. In case the limit is not reached, there is a period of five days to increase liquidity levels.
Cash is important to ensure branch and ATM operations. The Bank's expansion throughout Colombia requires significant levels of cash, and cash levels are monitored on a daily basis to minimize opportunity costs. In addition, cash is considered in the mandatory bank reserve established by the Central Bank.
Marketable securities comprising liquid assets are reviewed by the ALM Committee considering the Bank's liquidity objective. Although available-for-sale and held-to-maturity debt securities cannot be sold, they can be pledged as collateral in repurchase agreements. Some of them are mandatory investments that can be sent to the Central Bank as collateral.
The Financial Superintendence of Colombia (SFC) requires financial institutions to have liquid assets greater than the contractual one-month accumulated liquidity gap. This contractual gap reflects the maturity of current asset and liability positions and does not reflect projections of future operations. The maturity of the loan portfolio for this purpose is affected by the historical default indicator and the maturity of deposits is modeled in accordance with regulation.
The Bank's management believes that the current level of liquidity is adequate and seeks to maintain its strong deposit base and access to alternative sources of funding, such as loans from domestic and international development and commercial banks, repurchase agreements, bond issuances, overnight funds, and Central Bank funds, considering market conditions, interest rates and the desired maturity profile of liabilities.
Financing Structure
As of December 31, 2023, the Bank's liabilities reached COP 303,879,000 million, a 2.86% decrease compared to December 31, 2022. Liabilities in COP increased by 10.46%, while liabilities in USD decreased by 20.64%. This change is mainly due to the increase in time deposits in COP, offset by a decrease in savings and checking accounts in COP, financial obligations, and debt securities in USD. However, while USD liabilities decreased by 20.64%, this reduction was affected by the appreciation of the USD to COP exchange rate (20.54% in 2023).
28
|
As of December 31 |
|
|
2023 |
2022 |
|
In millions of COP |
|
Total financing |
|
|
In COP |
197,575,174 |
178,861,272 |
In USD |
106,303,906 |
133,955,910 |
Total liabilities |
303,879,080 |
312,817,182 |
In 2023, the Bank's deposits amounted to COP 247,941,000 million at the year-end, a decrease of COP 3,051,000 million, or 1.22%, compared to 2022. Deposits in COP increased by 9.18%, primarily due to the rise in time deposits. In contrast, deposits in USD decreased by 17.25% due to the reduction in savings accounts and the effect of exchange rate fluctuations. The ratio between deposits and total assets was 72.3%. This represented an increase of 116 basis points compared to 2022.
|
|
As of December 31 |
||
|
|
2023 |
|
2022 |
|
|
In millions of COP |
||
Total deposits |
|
247,941,180 |
|
250,992,323 |
The following table shows checking accounts, savings accounts, and time deposits as a percentage of the Bank's total liabilities for 2023 and 2022:
|
2023 |
|
2022 |
|
Check deposits |
11.6 |
% |
12.9 |
% |
Fixed-term deposits |
32.5 |
% |
27.9 |
% |
Savings deposits |
35.8 |
% |
37.8 |
% |
Other deposits |
1.7 |
% |
1.5 |
% |
Percentage of total liabilities |
81.6 |
% |
80.1 |
% |
29
The Bank's main sources of funding are deposits. They are mainly composed of checking accounts, time deposits, and savings accounts. During 2023, term deposits played a key role in the balance sheet financial structure. High inflation led the Bank of the Republic to maintain a contractionary monetary policy. Consequently, there was lower demand for liquidity and credit, prompting investors to rebalance their portfolios towards higher-yield investments. As a result, the cost of funds was negatively affected due to high interest rates. Additionally, the increase in time deposits was offset by the reduction in demand deposits.
Deposits as a percentage of the Bank's total liabilities in 2023 were 81.6%. This percentage increased compared to the 80.1% of total liabilities at the end of the 2022 fiscal year.
The ratio between net portfolio and deposits (including loans from other institutions) was 90.19% at the end of 2023. This figure decreased from 94.00% compared to 2022. This change is mainly explained by the decrease in net loans and advances to customers. These decreased from COP 254,444,000 million in 2022 to COP 237,728,000 in 2023. The reduction was less compared to the variation in deposits (the reduction was COP 7,095,000 million, reaching a total of COP 263,589,000 million in 2023).
|
|
As of December 31 |
|
||
|
|
2023 |
|
2022 |
|
Net Portfolio / Deposits |
|
90.19 |
% |
94.00 |
% |
The Bank also finances its operations with loans from financial institutions. However, the primary source of funding during 2023 was time deposits as interest rates remained high and liquidity demand was lower. Moreover, time deposits and loans with financial institutions are indexed to different market rates and indices such as the IBR (an overnight reference interest rate of the Colombian money market liquidity reflecting the price at which banks are willing to lend or borrow funds in the financial market), DTF, IPC1, LIBOR, and SOFR.
Furthermore, compliance with the CFEN in 2023, increased inflation, high-interest rates, and local and international political uncertainty generated additional pressures on the cost of short and long-term financing operations.
Outstanding Debt Instruments
In 2023, Bancolombia issued USD 50.5 million in bonds, while Bancolombia Panamá, Bancolombia Puerto Rico, and Banistmo issued bonds amounting to USD 41.9 million, USD 69.6 million, and USD 122.2 million, respectively. However, a prepayment of USD 468 million in senior bonds was executed during 2023. Consequently, the carrying amount of the issued obligations decreased by COP 4,912,000 million.
As of December 31, 2023, the total aggregate principal amount outstanding of bonds issued by the Bank was COP 14,663 million.
The following table shows the maturity profile of the Bank's debt securities in issue:
2024 |
2025 |
2026 |
2027 |
2028 |
2029 and beyond |
Total |
30
In millions of COP | |||||||
Bonds issued |
3,368,076 |
2,424,364 |
675,502 |
5,019,584 |
0 |
3,176,050 |
14,663,576 |
The following table outlines the components of the Bank's liabilities for fiscal years 2023 and 2022:
|
|
As of December |
|||
|
2023 |
% of total financing |
2022 |
% of total financing |
|
|
In millions of COP, except percentages |
||||
Checking accounts |
|
||||
In COP |
19,712,279 |
6.50% |
21,583,536 |
6.90% |
|
In USD |
15,280,787 |
5.10% |
19,225,320 |
6.00% |
|
Total |
34,993,066 |
11.60% |
40,808,856 |
12.90% |
|
Fixed-term deposits |
|||||
In COP |
59,146,972 |
19.50% |
42,493,753 |
13.60% |
|
In USD |
39,539,544 |
13.00% |
44,644,314 |
14.30% |
|
Total |
98,686,516 |
32.50% |
87,138,067 |
27.90% |
|
Savings accounts |
|||||
In COP |
83,053,422 |
27.30% |
84,542,389 |
27.00% |
|
In USD |
25,917,912 |
8.50% |
33,901,211 |
10.80% |
|
Total |
108,971,334 |
35.80% |
118,443,600 |
37.80% |
|
Other deposits |
|||||
In COP |
4,336,318 |
1.40% |
3,645,007 |
1.20% |
|
In USD |
953,946 |
0.30% |
956,793 |
0.30% |
|
Total |
5,290,264 |
1.70% |
4,601,800 |
1.50% |
|
Interbank deposits |
|||||
In COP |
0 |
0.00% |
0 |
0.00% |
|
In USD |
606,141 |
0.20% |
902,132 |
0.30% |
|
Total |
606,141 |
0.20% |
902,132 |
0.30% |
|
Derivative financial instrument-Liabilities |
|||||
In COP |
6,635,034 |
2.20% |
4,696,545 |
1.50% |
|
In USD |
75,330 |
0.00% |
40,909 |
0.00% |
|
31
Total |
6,710,364 |
2.20% |
4,737,454 |
1.50% |
|
Borrowings from other financial institutions (1) |
|||||
In COP |
6,488,331 |
2.10% |
4,877,928 |
1.60% |
|
In USD |
9,160,275 |
3.00% |
14,814,710 |
4.70% |
|
Total |
15,648,606 |
5.10% |
19,692,638 |
6.30% |
|
Bonds issued |
|||||
In COP |
4,097,729 |
1.30% |
4,708,588 |
1.50% |
|
In USD |
10,565,847 |
3.50% |
14,867,400 |
4.80% |
|
Total |
14,663,576 |
4.80% |
19,575,988 |
6.30% |
|
Repurchase agreements and other similar secured borrowings |
|||||
In COP |
308,711 |
0.10% |
167,774 |
0.10% |
|
In USD |
161,584 |
0.10% |
21,278 |
0.00% |
|
Total |
470,295 |
0.20% |
189,052 |
0.10% |
|
Leases |
|||||
In COP |
1,107,405 |
0.40% |
967,902 |
0.30% |
|
In USD |
666,205 |
0.20% |
932,366 |
0.30% |
|
Total |
1,773,610 |
0.60% |
1,900,268 |
0.60% |
|
Other liabilities |
|||||
In COP |
12,688,973 |
4.20% |
11,177,850 |
3.60% |
|
In USD |
3,376,335 |
1.10% |
3,649,477 |
1.20% |
|
Total |
16,065,308 |
5.30% |
14,827,327 |
4.80% |
|
Total financing |
|||||
In COP |
197,575,174 |
65.00% |
178,861,272 |
57.30% |
|
In USD |
106,303,906 |
35.00% |
133,955,910 |
42.70% |
|
Total liabilities |
303,879,080 |
100% |
312,817,182 |
100% |
|
(1) Includes borrowings from commercial banks and other non-financial entities.
32
Consolidated Cash Flow Statement
The following table displays the net cash provided by operating activities, net cash used in investing activities, and net cash used in financing activities for the years ended December 31, 2023, 2022, and 2021:
|
2023 |
2022 |
2021 |
In millions of COP |
|||
Operational activities |
19,153,084 |
6,339,438 |
6,095,305 |
Investment activities |
(159,689) |
(4,654,502) |
(650,486) |
Financing activities |
(5,430,672) |
853,436 |
(6,809,972) |
Increase (decrease) in cash and cash equivalents |
13,562,723 |
2,538,372 |
(1,365,153) |
Operational Activities
In 2023, operating activities generated a positive net cash flow due to the increase of COP 17,025,000 million in customer deposits, compared to an increase of COP 23,214,000 million in 2022, and COP 34,702,000 million in interest received, compared to COP 23,603,000 million in 2022.
The increase in loans and advances to customers and financial institutions was COP 10,554,000 million, compared to COP 37,593,000 million and COP 24,057,000 million in 2022 and 2021, respectively. Interest payments resulted in a cash outflow of COP 15,978,000 million in 2023, COP 7,508,000 million in 2022, and COP 4,410,000 million in 2021. The net change in the value of investment securities recognized at fair value through profit or loss was negative at COP 1,988,000 million in 2023. This compares to 2022 when the net change was COP 6,321,000 million.
Investment Activities
In 2023, the Bank purchased debt securities at amortized cost for COP 3,629,000 million, COP 4,915,000 million in 2022, and COP 3,722,000 million in 2021. The maturity of debt securities at amortized cost contributed COP 4,738,000 million in 2023, COP 4,260,000 million in 2022, and COP 2,984,000 million in 2021.
Investment activities related to debt instruments at fair value through OCI provided net cash of COP 1,415,000 million during 2023 and COP 235,000 million during 2022. Investment activities associated with equity securities and interests in associates utilized net cash of COP 106,000 million during 2023, whereas in 2022 it used COP 56,000 million. Investment activities related to purchases and sales of property, equipment, and investment properties utilized net cash of COP 2,226,000 million, compared to COP 3,117,000 million used during 2022 and COP 1,632,000 million in 2021.
33
Financing Activities
The proceeds from loans to other financial institutions contributed COP 9,855,000 million in 2023, COP 14,374,000 million in 2022, and COP 4,182,000 million in 2021. The issuance of outstanding debt securities provided COP 1,781,000 million in 2023, COP 2,138 million in 2022, and COP 1,387,000 million in 2021.
The repayment of loans used COP 9,921,000 million in 2023, compared to COP 5,874,000 million used in 2022 and COP 8,447,000 million used in 2021. Similarly, debt securities payments in issuance utilized COP 3,928,000 million during 2023, COP 6,699,000 million during 2022, and COP 1,871,000 million during 2021.
Cash was also used to pay dividends of COP 3,298,000 million to shareholders. In 2022 and 2021, this amount was COP 2,310,000 million and COP 467,000 million, respectively.
The decrease in repurchase agreements and other similar secured loans provided cash of COP 304,000 million, compared to the COP 579,000 million used in 2022 and COP 1,457,000 million in 2021.
Capital Solvency
The Bank and its subsidiaries comply with the capital solvency requirements in their respective operating countries.
The equity attributable to Bancolombia's owners amounted to COP 38,090,000 million as of December 31, 2023, which is 2.56% lower than the COP 39,089,000 million recorded as of December 31, 2022. This decrease is mainly explained by the appreciation of the Colombian peso against the US dollar and the lower net income generated during the period.
The Bank’s consolidated capital solvency ratio was 13.40% as of December 31, 2023, higher than the 12.79% in 2022.
The Bank's capital solvency ratio exceeded the requirements of the Colombian government and the Superintendence of Finance by 440 basis points above the minimum 9% required by the Colombian regulator. The core capital ratio (Tier 1) was 11.42 % and the tangible capital ratio, which is equal to the ratio of the difference between net equity and goodwill and intangible assets over tangible assets, was 8.66 % at the end of 2023. For a complete description of the Bank's capital adequacy requirements, see Item 4. "Information about the Company - B. Business Overview - B.8 - Supervision and Regulation".
The following table provides information on the Bank's consolidated capital solvency as of December 31, 2023, and 2022:
|
GRUPO BANCOLOMBIA |
|
|
December 31, 2023 |
December 31, 2022 |
Ordinary Basic Equity |
39,704,541 |
40,652,350 |
Share |
480,914 |
480,914 |
Premium in the Issue of Shares |
5,441,658 |
5,441,658 |
34
Translation Adjustment in Financial Statements |
|
|
Legal Reserve |
14,541,561 |
14,534,766 |
Voluntary Reserves |
7,250,712 |
3,162,401 |
Minority Interest |
960,217 |
908,648 |
ORI Profit/Loss |
4,065,182 |
7,749,234 |
Profit for the Fiscal Year |
6,116,936 |
6,783,490 |
Profit from Previous Fiscal Years |
847,362 |
1,591,239 |
PBO Deductions |
-8,919,345 |
-11,001,874 |
Capital Investments |
|
|
Losses from Previous Fiscal Years |
-79,587 |
-79,577 |
Goodwill |
-7,818,125 |
-9,836,661 |
PPE Revaluation |
-350,061 |
-351,871 |
Intangible |
-671,572 |
-602,531 |
Net Deferred Income Tax |
0 |
-131,233 |
Net PBO |
30,785,197 |
29,650,476 |
Minority Interest |
- |
- |
Hybrid Bonds |
4,283,448 |
6,109,531 |
Old Style Bonds |
678,797 |
794,881 |
Other PA Accounts |
0 |
0 |
General Provisions |
375,902 |
12,759 |
Additional Equity |
5,338,147 |
6,917,171 |
Deductions of Technical Equity |
-10,687 |
-16,136 |
|
36,112,657 |
36,551,511 |
Capital Ratios |
|
|
Tier I |
11.42% |
10.37% |
Tier II |
1.98% |
2.41% |
Assets weighted by level of credit risk including market risk and operational risk |
269,591,211 |
285,878,639 |
Total Solvency Ratio |
13.40% |
12.79% |
35
(1)Technical capital is the sum of core and additional capital.
(2)Capital solvency is calculated by dividing technical capital by risk-weighted assets.
Seasonality in Deposits
Historically, the bank has experienced a certain seasonality in its demand deposits. It has had low levels of liquidity during the first months of the year and high levels of liquidity at the end of the year. This behavior is mainly explained by the increase in liquidity due to the monetary expansion operations carried out by the Bank of the Republic and the National Government injecting liquidity to the market in response to the greater dynamics in the economic activity and the high transaction rate.
In 2023, inflation remained above the target range, prompting the Central Bank to maintain high interest rates. This resulted in reduced liquidity preference, credit operations, and an increase in investments in time deposits. While demand deposits decreased over the year, the last quarter witnessed significant growth in savings and checking accounts.
However, we believe that the seasonality in deposits does not have a significant impact on the operation of the business, as the excess/shortage of liquidity is managed through the treasury portfolio.
Throughout 2023, the performance of Bancolombia's common and preferred shares closely mirrored the movement of the COLCAP index.
Bancolombia's common stock concluded 2023 with a yearly variation of -22%. It experienced devaluation throughout the year, hitting a low of COP 27,200 on September 06, 2023, and reaching a peak of COP 44,000 on January 11, 2023. All of this aligns with the positive trend observed at the end of 2022.
The preferred stock had an annual variation of -11%, reflecting a trend similar to the market (COLCAP -7% annually). It reached its peak at COP 35,490 on January 31, 2023. Subsequently, the price declined to a minimum of COP 25,100 with some recovery in the last quarter to close 2023 at approximately COP 29,920.
Bancolombia Common and Preferred Price Evolution vs. COLCAP
36
12/30/2022
01/06/2023
01/13/2023
01/20/2023
01/27/2023
02/03/2023
02/10/2023
02/17/2023
02/24/2023
03/03/2023
03/10/2023
03/17/2023
03/24/2023
03/31/2023
04/07/2023
04/14/2023
04/21/2023
04/28/2023
05/05/2023
05/12/2023
05/19/2023
05/26/2023
06/02/2023
06/09/2023
06/16/2023
06/23/2023
06/30/2023
07/07/2023
07/14/2023
07/21/2023
07/28/2023
08/04/2023
08/11/2023
08/18/2023
08/25/2023
09/01/2023
09/08/2023
09/15/2023
09/22/2023
09/29/2023
10/06/2023
10/13/2023
10/20/2023
10/27/2023
11/03/2023
11/10/2023
11/17/2023
11/24/2023
12/01/2023
12/08/2023
12/15/2023
12/22/2023
12/29/2023
COLCAP
Local Preferential Price
Ordinary Price
1,400
1,350
1,300
1,250
1,200
1,150
1,100
1,050
1,000
44,000
42,000
40,000
38,000
36,000
34,000
32,000
30,000
28,000
26,000
24,000
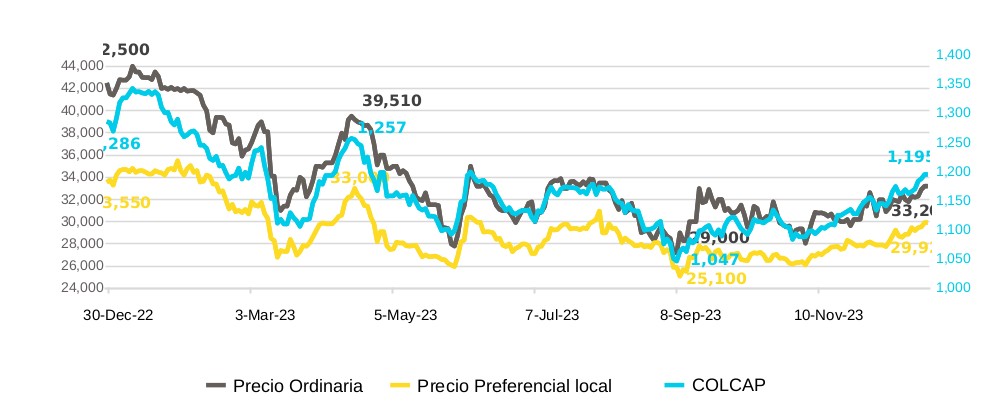
12/30/2022
01/06/2023
01/13/2023
01/20/2023
01/27/2023
02/03/2023
02/10/2023
02/17/2023
02/24/2023
03/03/2023
03/10/2023
03/17/2023
03/24/2023
03/31/2023
04/07/2023
04/14/2023
04/21/2023
04/28/2023
05/05/2023
05/12/2023
05/19/2023
05/26/2023
06/02/2023
06/09/2023
06/16/2023
06/23/2023
06/30/2023
07/07/2023
07/14/2023
07/21/2023
07/28/2023
08/04/2023
08/11/2023
08/18/2023
08/25/2023
09/01/2023
09/08/2023
09/15/2023
09/22/2023
09/29/2023
10/06/2023
10/13/2023
10/20/2023
10/27/2023
11/03/2023
11/10/2023
11/17/2023
11/24/2023
12/01/2023
12/08/2023
12/15/2023
12/22/2023
12/29/2023
At the end of 2023, the price of Bancolombia's ADR increased 8% compared to the end of 2022. This is largely attributed to the Colombian peso's stronger performance against the US dollar, experiencing an appreciation of 21% annually. During 2023, the ADR reached a peak of USD 31.00 and a low of USD 22.26. A noticeable upward trend was observed since the last quarter of the year.
Bancolombia ADR vs. Representative Market Rate (TRM) Price Evolution
TRM - COP
5,000
4,800
4,600
4,400
4,200
4,000
3,800
3,600
ADR Price
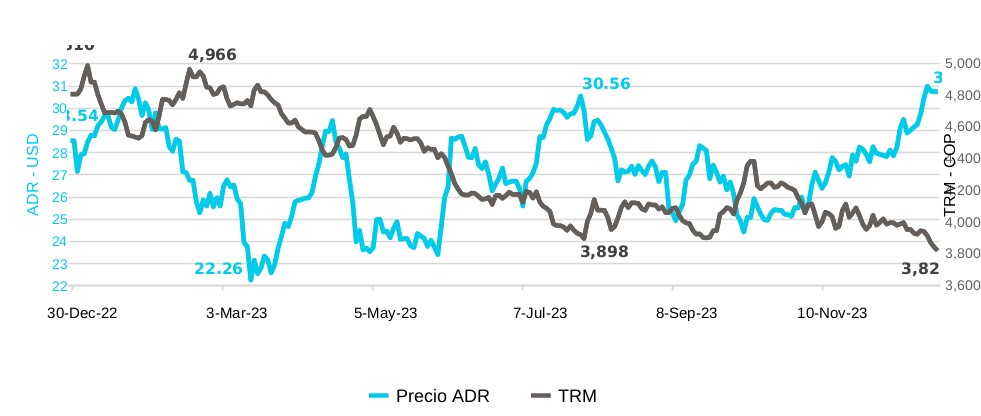
Bancolombia, TRM, and COLCAP Price Variation
Date |
ADR |
Common |
Preferred |
TRM |
COLCAP |
12/30/22 |
28.54 |
42,500 |
33,550 |
4,810 |
1,286 |
12/29/23 |
30.77 |
33,200 |
29,920 |
3,822 |
1,195 |
Var % |
8% |
-22% |
-11% |
-21% |
-7% |
General Local Market Information
37
Type |
Nemo |
Registration Date |
Outstanding Shares |
Market Capitalization |
Common |
BCOLOMBIA |
07-01-1945 |
509,704,584 |
16,922,192.19 |
Preferred |
PFBCOLOM |
07-26-1995 |
452,122,416 |
13,527,502.69 |
Nemo |
Average Daily Price |
Maximum Price |
Maximum Price Date |
Minimum Price |
Minimum Price Date |
BCOLOMBIA |
33,927 |
44,000 |
01-11-2023 |
26,700 |
09-06-2023 |
PFBCOLOM |
29,221 |
35,690 |
02-01-2023 |
25,010 |
09-08-2023 |
Operations |
Nemo |
Operation Number |
Operation number |
BCOLOMBIA |
57,054 |
Operation number |
PFBCOLOM |
151,444 |
Average daily operations |
BCOLOMBIA |
236 |
Average daily operations |
PFBCOLOM |
626 |
Trading volume in Bancolombia's common and preferred shares peaked in February. The trading activity during the first quarter of 2023 was the highest. However, there was a decline in common shares, while preferred shares maintained volumes close to COP 250,000 million. There was a resurgence in trading activity observed in September and December. On average, the monthly trading volume for Bancolombia's common shares in 2023 was COP 119,000 million. The volume of preferred shares was 2.3 times higher than that observed in common shares.
Monthly Volume of Bancolombia's Common and Preferred Shares
Dec-23
Nov-23
Oct-23
Sep-23
Aug-23
Jul-23
Jun-23
May-23
Apr-23
Mar-23
Feb-23
Dec-23
Apr-23
Jan-23
Preferred Shares Volume
Common Shares Volume
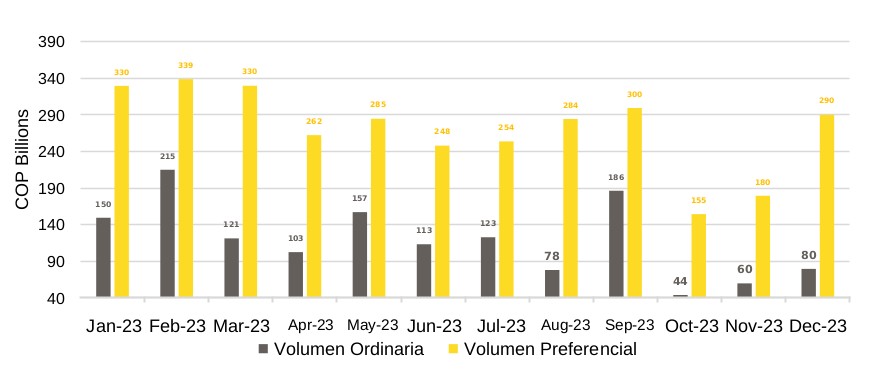
In 2023, there was a debt management event for Bancolombia in the international market. In July, we conducted a repurchase operation for the ordinary bonds maturing on January 29, 2025. The face value was USD 950 million with a 3% coupon rate. The purpose of this transaction was to prepare for the maturity of this bond and capitalize on the available market opportunity by conducting this operation. The total amount collected was USD 467,966 million, which corresponds to 49.26% of the bond's face value.
38
This amount exceeded the initial offering of USD 370 million by 1.26 times.
Tiers of Grupo Bancolombia Bonds in USD
(December 29, 2023)
Bond |
Amount |
Yield |
Price L |
G-Spread |
Subordinates | ||||
BCOLO SUB 27 |
USD 750 million |
7.176% |
99.512 |
311 |
BCOLO SUB 29 |
USD 550 million |
8.518% |
91.815 |
759 |
Common | ||||
BCOLO SR 25 |
USD 482 million |
6.215 |
96.899 |
130 |
BANISTMSR 27 |
USD 400 million |
7.147% |
91.095 |
315 |
Analyzing the average variations in credit spreads of Grupo Bancolombia bonds during 2023, we observe that Banistmo 2027 bonds experienced a 44 basis points (bps) increase in their credit spread. Additionally, Bancolombia 2029 and 2025 bonds saw a slight rise of 4 and 2 bps, respectively. Meanwhile, the 2027 bond experienced a decrease of 15 basis points in its credit spread.
Bancolombia Bond Credit Spreads
Nov-30
Oct-31
Sep-30
Jul-31
Jun-30
May-31
Apr-30
Mar-31
Feb-28
Jan-30
Dec-30
Aug-31
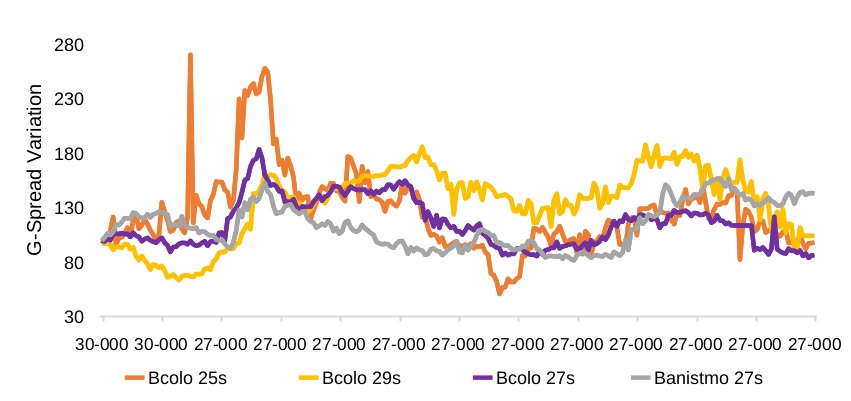
39
General Local Primary Market Information
Primary Nemo |
Secondary Nemo |
Date of Issue |
Expiration Date |
Term (Years) |
Bond Type |
Reference Rate |
Issue Date |
Currency |
Amount Issued (COP Millions) |
BBCB19B15 |
3/4/09 |
3/4/24 |
19.73 |
SUBORDINATED BONDS |
CPI |
6.9 |
COP |
209,000 |
|
BBCB209D15 |
7/27/11 |
7/27/26 |
15 |
ORDINARY BONDS |
CPI |
4.6 |
COP |
248,030 |
|
BBCB319D15 |
11/2/11 |
11/2/26 |
15.01 |
ORDINARY BONDS |
CPI |
4.62 |
COP |
224,050 |
|
BBCB319D12 |
11/2/11 |
11/2/23 |
12.01 |
ORDINARY BONDS |
CPI |
4.45 |
COP |
115,828 |
|
BLGC3119D1 |
4/18/12 |
4/18/24 |
12.01 |
ORDINARY BONDS |
CPI |
4.5 |
COP |
192,916 |
|
BLGC149D10 |
7/23/14 |
7/23/24 |
10 |
ORDINARY BONDS |
CPI |
4.25 |
COP |
178,750 |
|
BBCB149D15 |
9/24/14 |
9/24/29 |
15 |
SUBORDINATED BONDS |
CPI |
4.65 |
COP |
360,000 |
|
BBCB149D10 |
9/24/14 |
9/24/24 |
10 |
SUBORDINATED BONDS |
CPI |
4.29 |
COP |
373,752 |
|
BBCB149D20 |
9/24/14 |
9/24/34 |
20 |
SUBORDINATED BONDS |
CPI |
4.79 |
COP |
254,500 |
|
BLGC659C10 |
3/18/15 |
3/18/25 |
10 |
ORDINARY BONDS |
CPI |
4 |
COP |
91,884 |
|
BVBCB11895 |
BVBCB1189C05 |
7/18/18 |
7/18/23 |
5 |
ORDINARY BONDS |
CPI |
2.95 |
COP |
146,694 |
BSBCB219C5 |
BSBCB2219C05 |
9/16/21 |
9/16/26 |
5 |
ORDINARY BONDS |
CPI |
2.47 |
COP |
183,797 |
BSBCB219C1 |
BSBCB2219C12 |
9/16/21 |
9/16/33 |
12.01 |
ORDINARY BONDS |
CPI |
3.69 |
COP |
251,500 |
BSBCB2218E |
BSBCB2218E03 |
9/16/21 |
9/16/24 |
3 |
ORDINARY BONDS |
IB1 |
1.3 |
COP |
164,703 |
Capital Investments and Divestments
As Bancolombia Group, we invested in 2023 COP 699,953 million, including investments in digital evolution and technology assets (COP 520,219 million) and the development of channels and fixed assets (COP 179,735 million).
For 2024, we anticipate investing approximately COP 772,956 million, representing a 10.4% annual variation. Investment remains relatively stable. This is partly due to last year's expectations when we anticipated a stabilization in fixed asset investment. Nevertheless, we continue with a high investment focus on technology and digital development, cybersecurity enhancement, and cloud migration. We also anticipate investing in channels and tools to diversify the digital offering. Additionally, we plan to invest in data analytics, reinforce machines to support processing in non-productive environments, and evolve the ERP system.
BANCOLOMBIA S.A. ANNOUNCES PROFIT DISTRIBUTION PLAN
The Board of Directors of Bancolombia S.A. presents for the consideration of the upcoming Ordinary General Shareholders' Meeting in March a profit distribution project that considers the following aspects:
(i)Bancolombia will continue to maintain an adequate capital structure and an optimal level of solvency to meet the expected growth of the business, maintaining prudential standards above regulatory levels.
40
(ii)Business projections in 2024 are based on moderate asset growth, stability in overall business performance, and a return on equity substantially above projected inflation for Colombia.
Based on the foregoing, the Board of Directors will submit to the consideration of the shareholders the profit distribution project described below:
(i)The payment of an annual dividend of COP 3,536 per share, payable in 4 quarterly installments of COP 884 per share and quarter, on the following dates: April 01, July 02, October 01, 2024, and January 02, 2025. Dividends for consideration by the Meeting will be recognized for both outstanding common and preferred shares.
(ii)The constitution of an occasional reserve for the patrimonial strengthening and future growth of the entity for COP 2.61 trillion.
(iii)An occasional reserve available to the Board of Directors for donations to social benefit projects for COP 33,000 million.
The following is the proposed profit distribution that the Board of Directors will present for approval at the Meeting:
|
2023 Gross Profit |
7,662,543,704,125.73 |
|
Provisions for income and deferred tax |
(1,682,813,409,504.38) |
|
|
2023 Net Profit |
|
5,979,730,294,621.35 |
Plus retained earnings recognized in the opening balance and that were actually made during 2023. |
|
1,810,389,243.96 |
Plus release of provisional resources to pay preferred shares dividends. |
|
57,701,443,512.78 |
Total Distribution |
|
6,039,242,127,378.09 |
|
Provisions for equity strengthening and future growth. |
2,605,221,855,378.09 |
|
|
To pay a dividend corresponding to 509,704,584 common shares and 452,122,416 non-voting preferred shares. These were subscribed and paid as of December 31, 2023, at a rate of COP 3536 each. They are payable as follows: COP 884 per share and quarter on the following dates: April 01, July 02, October 01, 2024, and January 02, 2025. |
3,401,020,272,000.00 |
|
41
A discretionary reserve available to the Board of Directors for donations to social benefit projects. |
33,000,000,000.00 |
|
EQUAL AMOUNTS |
6,039,242,127,378.09 |
6,039,242,127,378.09 |
|
|
|
Figures expressed in Colombian pesos (COP)
The ex-dividend period will be between the first business day of dividends payment of the corresponding shares and the preceding 4 business days as follows:
Ex-dividend period start (*) |
Ex-dividend period end (*) |
March 21, 2024 |
April 01, 2024 |
June 25, 2024 |
July 02, 2024 |
September 25, 2024 |
October 01, 2024 |
December 26, 2024 |
January 02, 2025 |
(*) The ex-dividend period dates will be subject to adjustments as determined by the Colombian Stock Exchange.
As an issuer in the capital markets, we are committed to upholding the highest standards of financial disclosure and engaging with our shareholders. Our objective is to foster a close relationship that allows us to effectively communicate the impact of our strategy.
Our specialized channels for maintaining contact with the markets include the Bancolombia Shareholder Service Center and the Investor Relations Department. This is how we address the needs of our shareholders and keep them informed about the business outlook and developments.
Throughout 2023, we participated in 15 international in-person events and virtual capital market panels. We interacted with several institutional funds investing in Bancolombia. Thanks to virtual platforms, we also increased the number of meetings with investors, investment analysts, and risk rating agencies. They closely follow Bancolombia and its subsidiaries' performance, perceiving our company as an appealing investment option.
42
Four earnings conferences are held to keep our investor community informed. We report on progress in implementing our strategy, business results, and prospects. We participated in various forums as presenters. We addressed concerns and communicated key messages, such as the organization's digital transformation and sustainability efforts.
In 2023, Bancolombia consolidated its status as an IR Recognition issuer. This recognition is granted by the Colombian Stock Exchange (bvc) to companies that adhere to the best practices in information disclosure and investor relations.
Milestones, Initiatives, and Achievements
The financial sector is one of the main drivers of our countries' economies. This is achieved through the support we provide to natural persons, companies across all sectors of the economy, and the public sector. We aim to implement initiatives that foster growth, competitiveness, and well-being for all.
Committed to this role, Bancolombia aims to strike a balance between the necessary growth to provide robust support to our customers and create value for all our stakeholders, and the prudent management of our operations. This encompasses leveraging income, managing portfolios, controlling expenses, and enhancing efficiency.
We provide responsible lending
Portfolio (In millions of COP) |
Dec-22 |
Dec-23* |
Variation |
Persons |
53,300,745 |
56,715,804 |
6.41% |
Independents |
5,558,652 |
6,014,995 |
8.21% |
SMEs |
19,268,644 |
19,602,536 |
1.73% |
Companies |
13,357,190 |
14,050,924 |
5.19% |
Corporate |
73,176,521 |
84,203,423 |
15.07% |
TOTAL |
164,661,752 |
180,587,682 |
9.67% |
*Figures as of December 31
Portfolio by type (in COP millions) |
Dec-22 |
Dec-23* |
Variation |
Consumption |
24,417,461 |
24,073,115 |
-1.41% |
Commercial |
63,911,070 |
72,934,697 |
14.12% |
Leasing |
17,033,460 |
18,291,754 |
7.39% |
Housing |
20,392,588 |
22,876,594 |
12.18% |
*Preliminary data as of December 31
In 2023, we faced significant challenges in growing our portfolio. This was attributed to factors such as high interest rates and reduced purchasing power for families driven by inflation.
In that scenario, we maintained our strategy of pursuing healthy origination for individuals and independents using analytical models. Through this approach, we disbursed COP 7,800,000 million to over 664,000 financially sound customers. Similarly, we extended assistance to over 48,000 individuals through instruments like order of payments.
43
Portfolio containment and recovery was also a challenge. We promote initiatives with customers in good standing, with early delinquencies or with deteriorated balances. We improve reachability, payment incentives, and digital collections.
In terms of corporate business, 2023 was a challenging year, with several factors anticipating a more complex and volatile market landscape. However, we continue to accompany our customers in their needs.
Regarding the commercial portfolio (which represents 63.8% of the total), over 70% of the placements were new credits for over 2,000 companies. They now see us as their ally and reference for their short and long-term needs. This comes alongside effective risk management, with a stable non-performing loan ratio throughout the second half.
In Guatemala, we have also strengthened our value proposition across various segments to continue supporting our customers in their needs while fostering healthy growth. This includes an increase in placements and retention across various credit modalities, as well as a 53% rise in Bancaseguros placements.
Capital Management and Efficiency
We made progress in optimizing the Grupo Bancolombia’s capital structure. To achieve this, we designed a capital utilization methodology that prioritizes equity. It has enabled us to increase dividend payouts and maintain a solvency ratio above 10.5%, thereby contributing to profitability and meeting regulatory and business requirements.
Amidst the current environment, we achieved effective liquidity management. We optimized the Net Interest Margin performance and interest rate risk through our asset and liability management.
From Treasury, we achieved outstanding revenue performance: in 2023, we reached 32.5% of the annual revenue budget and achieved net earnings excluding CD of COP 785,300 million. With customers across various segments, we highlight a 47% increase in hedging revenues (COP 155,000 million). Additionally, we have created avenues for market updates and risk management strategy discussions.
In the Capital Markets arena, we secured approval and negotiated the first working capital credit with Deutsche Bank. This marks the first of its kind for a financial institution worldwide. We also successfully completed a buyback operation for a portion of the senior bonds maturing in January 2025, with a face value of USD 950 million. The transaction was closed at USD 468 million (1.26 times the original offer amount). The transaction leveraged the subsidiaries' dividend availability and a favorable market window, resulting in savings of USD 17 million on the repurchase price and USD 14 million in interest expenses.
Regarding efficiency initiatives, we highlight several efforts. One of them is the corporate EFITÓN. Its purpose is to drive the implementation of initiatives that improve efficiency and productivity, which in 2023 generated efficiency savings of COP 832,181 million.
44
At the same time, efficiencies, increased speed, precision, and future vision were achieved by leveraging analytics and digital evolution in financial practice. With the models developed using cross-analytical capabilities, annual efficiencies of COP 29,406 million were generated in contract optimization, cash storage management, analysis of customer financial behavior, and disclosure of information to shareholders and external parties.
In line with this, we evolved the service model of the finance function to better align with the business, anticipate solutions, and align strategy with financial objectives. This model has enhanced capacity to address challenges and support the business in its initiatives from inception, guiding strategic alternatives for the future.
Furthermore, we optimized processes in financial closing and quarterly result generation. This enables us to analyze and disclose information promptly (within the first 9 days of the following month).
Meanwhile, we continued to implement automation. With over 1,614 digital enablers and automation services in 426 processes across the organization, we achieved efficiencies totaling COP 9,826 million and reduced operational risk by over COP 38,817 million. Thanks to this evolution, we generated economic benefits equivalent to COP 128,472 million by avoiding expenses through the effective use of technology.
All of these efforts have been accompanied by a redefinition of the financial role. This has been facilitated by evolving the vision of success within the function, modernizing the operating model, and implementing a knowledge management strategy and talent mindset in finance.
Venture Capital Investment
Since 2018, Bancolombia Ventures, the Corporate Venture Capital (CVC) arm of the Grupo Bancolombia, has been in operation. It aims to invest in startups with high growth potential aligned with the bank's business strategy.
Since then, it has completed 46 transactions involving 32 companies. Notable transactions include alternative loans with investments such as Agricapital and Blup (a smart inventory financing solution), venture capital funds like Veronorte and Anthemis, and Consumer/Wealthtech companies, including Trii, Quipu, and N1CO.
Bancolombia Ventures also manages the impact investment fund of the Fundación Bancolombia. Through this fund, 12 transactions have been completed involving 9 companies, such as SunColombia, Páramo Snacks, and Urbania. It has made an impact on individuals in rural Colombia, reaching 32 out of the country's 33 departments.
In 2023, 20 investments totaling USD 17.8 million were made in startups. This brings the committed capital and impact portfolio to USD 49.2 million.
We also launched our Startup Management Office to strengthen the relationship between Bancolombia and key startups supporting the organization's focus strategies. This promotes experimentation to reduce uncertainty and enhance decision-making in structuring alliances and investments, maximizing outcomes for both parties.
We mapped out relationships with over 110 startups over the past four years. Through these partnerships, we have leveraged strategic capabilities including customer insights, customer experience, financial inclusion, banking aggregation, risk models, and access to non-customers.
45
We have also supported 13 startups in connecting with the bank, taking a comprehensive approach to strengthen their financial capabilities and address areas of weakness.
Miami Operation
Bancolombia Capital Miami began its operations in the United States in August 2022 and has since consolidated its operation. The entity currently manages USD 450 million across its two broker-dealer and investment adviser businesses. Through them, customers can access products traded in public markets and funds with various investment strategies in stocks and bonds across many sectors and countries in both public and private markets.
This year, we secured the first Multilateral Organization (Professional Investor) to invest funds in two of our Collective Investment Funds for Liquidity through a local custodian (Trust Entity). This opened doors to foreign professional investors interested in efficiently managing their liquidity and investment opportunities for medium and long-term goals.
Sustainable Funding
At Grupo Bancolombia, we have been consolidating a sustainable finance strategy to offer individuals and businesses solutions for harmonious relationships with the environment and the community.
Therefore, we aim to promote company projects that enable a transition to a low-carbon economy and contribute to closing social gaps and/or access to health or drinking water through the issuance of green, social, sustainable, and sustainability-linked bonds. We have also taken the message to the stock market that investments can generate social and environmental value.
Additionally, we continue to achieve milestones in accessing financing from international banks with a sustainability-linked loan worth USD 100 million received during 2023. Combined with two similar operations in 2022, this brings our total to USD 350 million in such credits. The resources are used for working capital and trade. They include commitments to financing goals for sustainable initiatives, women in leadership positions, and reducing carbon emissions.
To date, we have issued 6 bond issues for a total amount of COP 2,700,000 million and we have supported financed renewable energy, sustainable construction, women entrepreneur empowerment, social infrastructure, circular economy, and access to affordable housing initiatives. We are also committed to increase access to financing for unbanked and underserved low-income people and to achieve a reduction in financed CO2 emissions.
These bond issuances were conducted in Colombia and Panama. They had both domestic and international buyers, including the International Finance Corporation (IFC), the Inter-American Development Bank (IDB), and investors from the primary market. In accordance with the established Green, Social, Sustainable & Sustainability-Linked Bond Principles by the ICMA, we hereby provide the status of the 6 issuances as of December 31, 2023.
First Issuance: 2016 Bancolombia Green Bond
46
From the first issuance in 2016, 60% of the financed projects consist of small hydroelectric plants operating at the water's edge without dams, with capacities less than 20MW, and solar power plants. The other 40% are sustainable construction projects. This bond matured in December 2023.
| • | Disbursements for COP 350,000 million |
| • | 14 projects in 5 departments and 9 municipalities of Colombia |
| • | Average disbursement per operation: COP 35,320 million |
| • | Average term per operation: 9.4 years |
| • | Balance of the projects assigned as of the close of 2023: COP 361,253 million |
| • | Impact of the projects financed by the green bond: electricity generation from renewable sources, CO2 emissions, and sustainable construction areas. |
Second Issuance: 2018 Bancolombia Green Bond
On July 18, 2018, we conducted a second green bond issuance totaling COP 300,000 million in 2 series: Series 1 amounted to COP 153,306 million, maturing in July 2021, and Series 2 amounted to COP 146,694 million, maturing in July 2023. 23% of the projects financed with this issuance correspond to sustainable construction projects. The remaining 77% are renewable energy projects. 100% of the resources have been allocated and disbursed.
Data from the second issuance - Series 2, as of July 18, 2023:
| • | Disbursements for COP 146,694 million |
| • | 6 projects in 4 departments and 5 municipalities of Colombia |
| • | Average disbursement per operation: COP 31,268 million |
| • | Average term per operation: 6.2 years |
| • | Balance of the projects assigned as of the close of 2023: COP 154,092 million |
| • | Impact of projects financed by the green bond: electricity generation from renewable sources, avoided CO2 emissions, and sustainable construction areas. |
Third Issuance: 2019 Bancolombia Sustainable Bond
On July 19, 2019, we conducted the first issuance sustainable bond issuance for COP 657,000 million. This was fully acquired by the IDB and marked the third issuance with sustainable characteristics. 98% of the funds are allocated to green projects focused on sustainable construction, cleaner production, and energy efficiency. The remaining 2% corresponds to social projects focused on public housing. 100% of the resources have been allocated and disbursed.
| • | Disbursements for COP 657,000 million |
| • | 13 projects in 4 departments |
| • | 11 green projects and 2 social projects |
| • | Average disbursement per operation: COP 62,418 million |
| • | Balance of the projects assigned as of the close of 2023: COP 665,457 million |
| • | Average term per operation: 8.5 years |
47
Sustainable Development Goals to which we contribute with this issuance: SDG 11: Sustainable cities and communities, SDG 9: Industry, innovation, and infrastructure, SDG 7: Affordable and clean energy, SDG 6: Clean water and sanitation, SDG 4: Quality education and SDG 3: Good health and well-being.
Fourth Issuance: Bancolombia Sustainable Bond
On September 16, 2021, we executed the second sustainable bond issuance for COP 600,000 million in the Colombian primary market. 78% of the resources correspond to green projects focused on renewable energy, sustainable construction, and circular economy. The remaining 22% corresponds to social projects focused on affordable housing, social infrastructure, and women's empowerment. 100% of the resources have been allocated and disbursed.
| • | Disbursements for COP 600,000 million. |
| • | 118 projects nationwide |
| • | 18 green projects and 100 social projects |
| • | Average disbursement per operation: COP 6,616 million |
| • | Balance of the projects assigned as of the close of 2023: COP 613,778 million. |
| • | Average term per operation: 6.1 years |
Sustainable Development Goals to which we contribute with this issuance: SDG 1: No poverty, SDG 3: Good health and well-being, SDG 5: Gender equality, SDG 7: Affordable and clean energy, SDG 8: Decent work and economic growth, SDG 9: Industry, innovation, and infrastructure, SDG 10: Reduced inequalities, SDG 11: Sustainable cities and communities; SDG 12: Responsible consumption and production and SDG 13: Climate action.
Fifth Issuance: Bond Tied to Sustainable Performance
In October 2022, we were the first financial institution in Latin America to issue a sustainability-linked bond for COP 640,000 million with a 5-year term, acquired by the IDB, IDB Invest, and the Latin American Green Bond Fund (LAGreen). Under this operation, the conditions are linked to achieving two objectives by 2025 aligned with our purpose: 1) To increase financing for unbanked or underserved individuals with low incomes and 2) To reduce CO2-intensive emissions financed (tons of CO2e per COP million) per portfolio. The results achieved by the end of 2023 and their assurance are directly disclosed on our website.
Additionally, this issuance has a specific framework aligned with the 2020 Sustainability-linked Bonds Principles (SLBP) of the ICMA (International Capital Market Association), certified by Sustainalytics as an independent third party, and the local regulations applicable to these instruments.
First Issuance: Banistmo Gender Social Bond
In August 2019, Banistmo, our subsidiary in Panama, issued the first gender-focused social bond in Latin America for USD 50 million. It was structured and underwritten by IDB Invest and aligned with its female economic empowerment strategy and its commitments to the Gender Parity Initiative, the Seal of Equality, and UN Women's Empowerment Principles.
48
100% of the resources are to enable access to financing for SMEs led by women and commercial loans to women-owned small businesses, focused on the trade, services, and agribusiness sectors.
In August 2021, 100% of the resources were allocated and disbursed, benefiting 311 SMEs led by women.
Sustainable Development Goals to which we contribute with this issuance: SDG 5: Gender equality, SDG 8: Decent work and economic growth and SDG 9: Industry, innovation, and infrastructure.
This bond continued in force during 2023.
Loans Tied to Sustainable Performance
Below are the results as of the end of 2023 for the indicators we committed to through the sustainability-linked loans totaling USD 350 million from international banks:
| • | Disbursements made through our sustainable credit line: COP 4,761,046 million (target: COP 4,755,000 million) |
| • | Percentage of women in leadership positions (Colombia): 40% (target: 43%). |
| • | Absolute CO2 emissions, scope 1+2, from operations in Colombia, Panama, El Salvador, and Guatemala (measured in thousands of tons of CO2e): 3.62 (target: 6.4) |
Responsible Investment
At Grupo Bancolombia, we are committed to implementing best practices in responsible investing. We recognize that Environmental, Social, and Corporate Governance (ESG) criteria are essential for fulfilling our fiduciary duty.
Since our 2014 adherence to the Principles for Responsible Investment (PRI), supported by the United Nations, we have challenged ourselves to incorporate these criteria as a fundamental and integral element in all our investment processes. On this journey, and with the experience and knowledge acquired, we have deepened the integration of sustainability in our products and service offerings, our recommendations to the market, and our own position. In 2023, we reached the following milestones:
| ● | As part of our business ambition to mobilize at least COP 500,000,000 million through financial services in purpose-associated activities by 2030, our Asset Management division reached over COP 8,980,000 million in assets under management with ESG criteria by the end of 2023. This figure represents 33% of the total resources subject to these criteria and signifies a growth of over COP 5,000,000 million compared to the previous year. |
| ● | We joined the Net Zero Asset Managers initiative by committing to align our investment portfolios with net-zero carbon scenarios by 2050. To achieve this, we measured our investments' indirect carbon footprint using the PCAF methodology and set science-based targets validated by the Science Based Targets Initiative (SBTi). We commit to aligning scope 1 and 2 emissions of our asset management investment portfolio to 1.5°C by 2040 and 2.0°C including scope 3, using 2021 as the base year. |
49
| ● | Due to the region’s lack of information and ESG ratings, we continue applying our proprietary ESG assessment models under international standards. As of 2023, we internally rated 39 local issuers and expanded our coverage of ESG ratings to ensure responsible decisions aligned with our policies. |
| ● | We developed and published our Policy for Exercising Political Rights under Environmental, Social, and Corporate Governance (ESG) standards. This policy outlines the ESG criteria we consider when exercising voting rights at shareholders’ meetings. It is an integral part of our Responsible Investment Policy. |
| ● | We built tools to perform sustainability analysis for assets that lacked an evaluation methodology, such as green, social, and sustainable bond issuances and securitizations. |
This chapter includes the eco-efficiency management implemented in 2023 and describes the results obtained in Grupo Bancolombia's operations in Colombia, Panama, El Salvador, and Guatemala. It also includes information on our Renting and Transportempo business.
In our direct operation we use natural resources such as energy, water, paper, among others, which requires a conscious management to reduce our impact and a commitment to define a strategy to reduce consumption consistent with our corporate purpose. For this purpose, we carry out permanent monitoring aligned with reduction goals.
From 2010 to 2020, we surpassed our targets. To reinforce our commitment, we set higher goals by establishing a new baseline in 2019. In 2023, expenditures generally increased as the bank resumed normal operations. Compared to 2019, we are still on a downward trend in terms of meeting our 2030 targets.
50
81% of our consumption is renewable as of 2023.
Scope 1+2 (Ton CO2e/year) Emissions from fuel and electricity consumption.
We decreased by -38% compared to 2022.
We increased by 102% compared to 2022.
We increased by 3% compared to 2022.
Renewable energy (kWh)
Waste for final disposal (tons).
Scope 3 (Ton CO2e/year) Emissions from paper ream consumption, air travel, and reverse logistics.
Target
Target
Target
Target
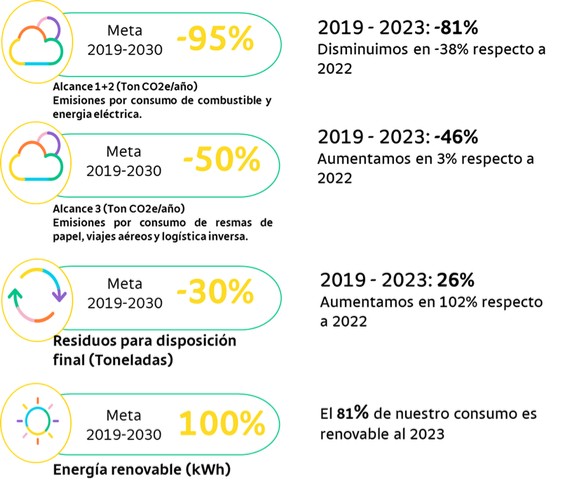
Environmental Management System
Describes the framework, structures, principles and guidelines for planning, organizing, executing, monitoring, controlling and ensuring the continuous improvement of our environmental performance. This is achieved through the prevention, control, and minimization of the environmental impacts of the operation in all the territories where we operate and by complying with the current environmental regulations that apply to us.
We continue to focus our efforts on identifying opportunities for improvement and strengths of our actions. This allows us to continually improve the indicators of our mission axes in eco-efficiency, Environmental and Social Risk Analysis (ESRA), sustainable business, and climate change strategy.
Compliance with Current Environmental Laws and Regulations as a Framework for Bancolombia's Actions
In 2023, compliance with regulations and the commitments we have made in sustainability protocols and adhesions have remained among our priorities. We kept our environmental and social legal matrix periodically updated and managed, making the respective mandatory annual reports in the corresponding platforms.
GRI 301 Materials
At Grupo Bancolombia, we have undertaken several actions to redesign our processes and digitize and reduce paper consumption.
GRI 301-1
51
Non-renewable materials used:
Not applicable: Given the bank's activities, non-renewable materials are not used in the provision of services.
Renewable materials used: We only quantify paper usage within this category.
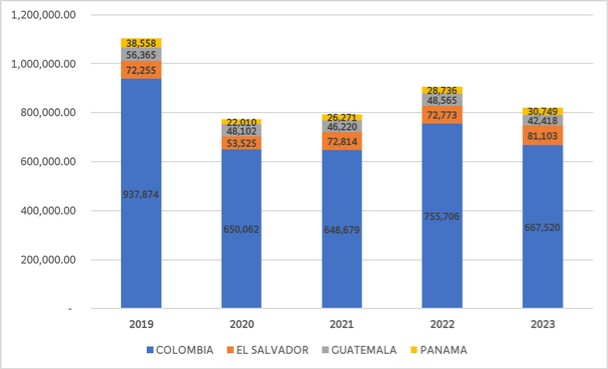
In 2023, our paper consumption totaled 822 tons. This represents an improvement in consumption compared to 2022, with a reduction of 9.3%. Compared to 2019, there was a reduction in consumption of 283 tons, representing a 26% decrease.
GRI 302 Energy Management
Energy (kWh)
Target

Through our Energy Model, we achieved a 0.06% reduction in energy consumption compared to 2022. Compared to 2019, we achieved an 18% reduction. This amounts to a reduction of 69,798,179.8 MJh.
GRI 302-1, GRI 302-3, GRI 302-4
Renewable resource
Year |
Self-generated renewable energy (MJh) |
Purchased renewable energy (MJh) |
Grid energy (MJh) |
TOTAL RENEWABLE ENERGY (MJh) |
2019 |
749,271.6 |
- |
391,259,345.1 |
392,008,616.7 |
2020 |
2,373,534.0 |
233,052,698.7 |
94,854,516.4 |
330,280,749.1 |
2021 |
3,140,652.0 |
237,697,266.6 |
75,157,991.8 |
315,995,910.3 |
2022 |
2,791,925.8 |
263,015,500.5 |
58,164,778.3 |
323,972,204.5 |
2023 |
3,139,497.9 |
257,700,705 |
60,161,718.5 |
321,001,922 |
52
Non-renewable resource
Year |
DIESEL or ACPM (MJh) |
B2 (MJh) |
B10 (MJh) |
Gasoline E10 (MJh) |
TOTAL NON-RENEWABLE ENERGY (MJh) |
2019 |
1,372,943.1 |
749,160.0 |
4,424,283.0 |
0.0 |
6,546,386.1 |
2020 |
993,822.2 |
1,068,531.3 |
4,370,940.0 |
4,111.6 |
6,437,405.1 |
2021 |
1,178,200.2 |
1,251,720.0 |
2,682,270.0 |
0.0 |
5,112,190.2 |
2022 |
1,113,937.8 |
1,067,373.0 |
2,814,111.0 |
0.0 |
4,995,421.8 |
2023 |
2,133,430 |
1,412,095.8 |
3,960,654 |
248,722.2 |
7,754,902 |
Total energy and energy intensity (Renewable + Non-Renewable)
Each year, we aim to reduce energy consumption. The following table illustrates the changes since the baseline year. We calculate energy intensity based on the number of employees and suppliers remaining on the premises.
YEAR |
TOTAL ENERGY CONSUMPTION (MJh) |
YEAR-TO-YEAR VARIATION (MJh) |
YEAR-TO-YEAR VARIATION (%) |
ENERGY/EMPLOYEE (MJh/employee) |
YEAR-TO-YEAR VARIATION (%) |
2019 |
398,555,002.8 |
|
-4.0% |
7,477.6 |
-8.5% |
2020 |
336,718,154.2 |
-61,836,848.6 |
-15.5% |
6,079.5 |
-19% |
2021 |
321,108,100.5 |
-15,610,053.7 |
-4.6% |
5,388.8 |
-11% |
2022 |
328,967,626.3 |
7,859,525.8 |
2.4% |
5,400.1 |
0.2% |
2023 |
328,756,823 |
-210,803 |
-0.1% |
5,595 |
4% |
Achievement of the Energy Consumption Target
|
ENERGY (MJh) |
2023 target compared to 2019 |
Achievement of 2023 target compared to 2019 |
2023 |
328,756,823 |
-8% |
-18% |
Remarks:
| ● | To calculate energy intensity, we consider the total energy consumed within the organization (renewable electricity: purchased, self-generated and from the grid, and non-renewable: fuels), along with the number of direct group employees plus suppliers. |
| ● | Currently, there is no steam, cooling, or heating consumption. |
| ● | Currently, we do not sell energy. |
| ● | Units are converted according to the Technical Regulation and Legal Metrology of the SIC. |
Energy Efficiency
Based on constant monitoring of energy consumption in branches and buildings, we continued with the implementation and research of energy efficiency strategies to identify and intervene in deviations that could alter the achievement of our goals. Thus, we have strengthened our strategies at the corporate level, integrating the actions we implement in each of the countries where we operate.
53
| ● | We integrated buildings into Building Manager Systems (BMS) for decision making and preventive management for energy and water efficiency, consumption control, and indoor personnel comfort. |
Renewable Energy
Renewable energy (kWh)
Target

We remain committed to using 100% renewable energy in our operations by 2030. In 2023, 81% of our energy consumption was renewable, aligning with our climate commitments in each country:
| • | Colombia: 100% |
| • | Panama: 100% |
| • | Guatemala: 22% |
Self-generated non-conventional renewable energy: we continue to explore implementation projects based on the analysis of our infrastructure.
| • | Colombia: Our main building, General Management, has 1,960 panels, an installed power of 700 kWp, which generated 694 MWh in 2023, equivalent to 1.2% of the building's energy consumption. Additionally, our La Palmas and Torre Oriente branches generated an additional 56.6 MWh. This allows for a total annual generation of 750.6 MWh. |
| • | El Salvador: Our data center generated 121.4 MWh. |
GRI 305 Emissions
Climate change is a growing challenge. Therefore, Bancolombia is committed to defining concrete actions to actively contribute to mitigation and compensation from our direct operations and move towards a low-carbon economy.
In 2020, we redefined our science-based target for Scopes 1 and 2, aligned with a 1.5°C scenario. We also committed to reduce our direct emissions by 73% by 2024 compared to 2019 emissions, and to achieve carbon neutrality in the countries where we operate by 2030. The definition of this target was based on the science-based methodology (SBTi - Science Base Targets Initiative).
Currently, we implement energy efficiency strategies and utilize renewable energy in 100% of our facilities. This includes the installation of photovoltaic systems in Colombia and El Salvador, as well as the purchase of 100% renewable energy certificates (REC) in Colombia and Panama, and 22% in Guatemala. We have also planted over 170,000 trees with the Fundación Natura, estimated to capture 2,727 tons of CO2e.
We calculate our carbon footprint using the GHG Protocol methodology.
GRI 305-1, GRI 305-2
54
Scope 1+2 (Tons of CO2e per year)
Target
Direct emissions stem from our consumption of fossil fuels in emergency power generation plants at our branches, company vehicle usage in Guatemala and El Salvador, and indirect emissions associated with purchased electricity for our operations. The calculation includes CO2 as a greenhouse gas because other gases do not contribute significantly when calculating.
In 2023, our market-based Scope 1 + 2 emissions decreased by 38% compared to 2022. We emitted 3,619 tons of CO2e per year and achieved an 81% reduction compared to 2019.
During 2023, we updated fuel emission factors for fuels and electricity across countries.
YEAR |
SCOPE 1 (TonCO2e) |
SCOPE 2 (TonCO2e) |
SCOPE 1+2 (TonCO2e) |
2023 target compared to 2019 |
Achievement of 2023 target compared to 2019 |
||
Location Based |
Market Based |
Location Based |
Market Based |
||||
2023 |
546,74 |
14,721 |
3,072.74 |
15,267.4 |
3,619.48 |
-38% |
-81% |
Market-Based emissions correspond to the purchase of renewable energy, which accounts for 100% in Colombia and Panama, and 22% in Guatemala.
Biogenic emissions: For Colombia, where B2 and B10 biodiesel is used, the corresponding percentage is calculated as biogenic emissions.
YEAR |
Biogenic Emissions (Ton CO2e) |
2023 |
21.28 |
GRI 305-3
Scope 3 (Tons of CO2e per year)
Target
Emissions associated with our paper consumption, business air travel, and logistic processes at our branches and buildings in Colombia. We will discuss our financed issues in detail in a later chapter. The calculation includes CO2 as a greenhouse gas because other gases do not contribute significantly when calculating.
In 2023, our Scope 3 emissions increased by 3% compared to 2022, totaling 1,688 tons of CO2e per year. This rise is primarily due to increased corporate-level travel. Compared to 2019, a 46% reduction was achieved.
55
YEAR |
SCOPE 3 (Ton CO2e) |
2023 target compared to 2019 |
Achievement of 2023 target compared to 2019 |
2023 |
1,688 |
-20% |
-46% |
Biogenic emissions: This doesn't apply as we lack the necessary information for this calculation.
TOTAL CARBON FOOTPRINT
Due to the purchase of renewable energy certificates, we calculate our footprint based on location and market:
Grupo Bancolombia Market-Based Scope 1+2+3 Emissions (Tons of CO2e)
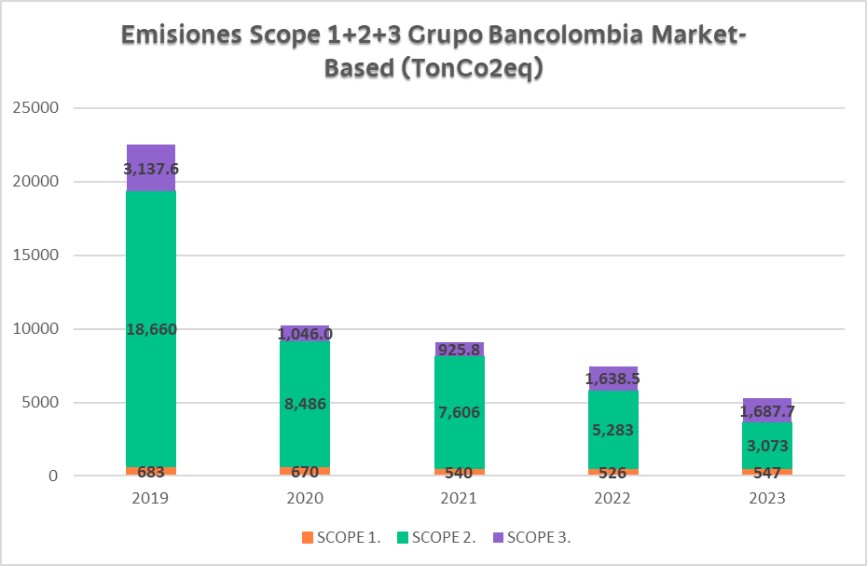
In 2023, we aimed to reduce emissions associated with the supply delivery process to our Colombian branches. Through collaboration between supplier OFIX and our logistics and distribution department, we successfully cut emissions from 12.6 to 11 tons of CO2e per year compared to 2022.
GRI 305-4, GRI 305-5
Generated Emissions and Emission Intensity
Here are the changes in emissions since the baseline year, along with the calculated emission intensity based on employees and suppliers. In Scope 1 we generated an increase in emissions of 21 Ton CO2e, for Scope 2 we achieved a reduction of 6,127 Ton CO2e location based, and 2,210 Ton CO2e market based, and in Scope 3, we increased emissions by 49 Ton CO2e with respect to 2022.
56
By 2023, a reduction in total emissions of 2,141 Ton CO2e was achieved compared to 2022. Compared to the 2019 baseline, a reduction of 8,133 location based and 15,724 market based was achieved for scope 1+2. In Scope 3, 1,450 Ton CO2e were reduced.
Year |
Scope 1 (Ton CO2e) |
Scope 2 (Ton CO2e) |
Scope 1+2 (Ton CO2e) |
Scope 3 (Ton CO2e) |
Total (Ton CO2e) |
Variation |
Total/Employee (TonCO2e/employee) |
Variation |
||||||
Location Based |
Market Based |
Location Based |
Market Based |
Location Based |
Market Based |
Location Based |
Market Based |
Location Based |
Market Based |
Location Based |
Market Based |
|||
2019 |
683 |
22,717 |
18,660 |
23,400 |
19,343 |
3,138 |
26,537 |
22,481 |
-9% |
-23% |
0.50 |
0.42 |
-13% |
-26% |
2020 |
670 |
19,128 |
8,486 |
19,798 |
9,157 |
1,046 |
20,844 |
10,203 |
-21% |
-55% |
0.38 |
0.18 |
-24% |
-56% |
2021 |
540 |
19,998 |
7,606 |
20,538 |
8,146 |
926 |
21,464 |
9,072 |
3% |
-11% |
0.36 |
0.15 |
-4% |
-17% |
2022 |
526 |
20,848 |
5,283 |
21,374 |
5,809 |
1,638 |
23,012 |
7,448 |
7% |
-18% |
0.38 |
0.12 |
5% |
-20% |
2023 |
546.7 |
14,721 |
3,073 |
15,267 |
3,619 |
1,688 |
16,955 |
5,307 |
-26% |
-29% |
0.29 |
0.09 |
-24% |
-26% |
Year |
Scope 1+2 (Ton CO2e) |
Total/Employee (TonCO2e/employee) |
Scope 3 (Ton CO2e) |
Total/Employee (TonCO2e/employee) |
||
Location Based |
Market Based |
Location Based |
Market Based |
|||
2019 |
23,400 |
19,343 |
0.44 |
0.36 |
3,138 |
0.06 |
2020 |
19,798 |
9,157 |
0.36 |
0.17 |
1,046 |
0.02 |
2021 |
20,538 |
8,146 |
0.34 |
0.14 |
926 |
0.02 |
2022 |
21,374 |
5,809 |
0.35 |
0.10 |
1,638 |
0.03 |
2023 |
15,267 |
3,619 |
0.26 |
0.06 |
1,688 |
0.03 |
REMARKS:
| • | The emission factors were sourced from: |
Scope 2
Colombia: It is sourced from the XM annual report.
Panama: It is sourced from local government reports.
El Salvador: It is sourced from the Low Carbon Power website.
Guatemala: It is sourced from local government reports.
Scope 1
It is sourced from the UPME calculator and IPCC 2006 for gasoline in Guatemala.
Scope 3
Paper
It is data provided by the paper supplier.
Travel
It is data provided by airlines and shared by travel agencies in Colombia and Panama. For Guatemala and El Salvador, it is re-extracted from the EPA Simplified GHG Emissions Calculator (U.S. Environmental Protection Agency).
| • | The calculation is done using the operational control approach. |
Business Travel
57
To offset the impact of the carbon footprint generated by our travel, we continued with the implementation of the internal carbon tax for business travel. In 2023, we generated internal revenue of COP 284,188,383, which we invested in energy efficiency initiatives to reduce energy consumption and the purchase of renewable energy certificates (REC).
CO2e EMISSIONS (TONS)
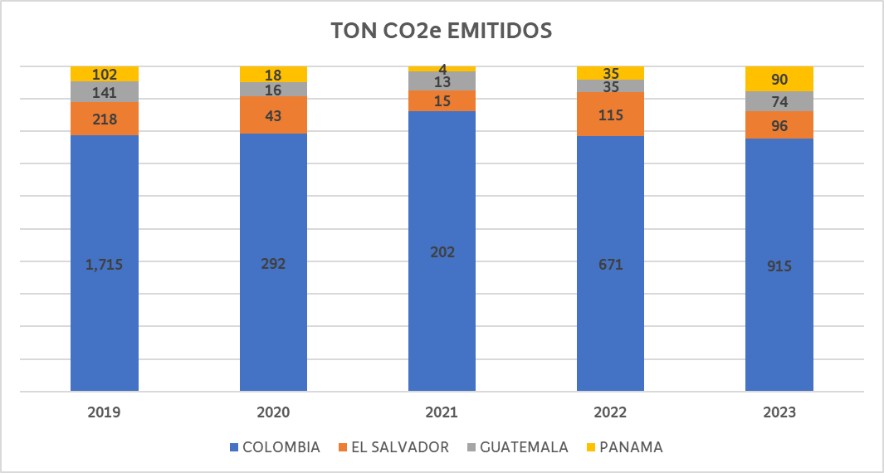
GRI 306 Waste
Waste for final disposal (tons)
Target
In 2023, we managed a total of 2,532 tons of waste. This represents a 102% increase in the amount of waste disposed of compared to 2022, due to a mass disposal of stored items. Compared to 2019, there was a 26% increase. This poses a challenge for 2024.
We calculate ordinary waste using the PPC. For 2023, the data updated from 1.71 to 2.07, resulting in an increased value.
GRI 306-2, GRI 306-3, GRI 306-4, GRI 306-5
In this section, we outline the waste generated during Grupo Bancolombia's operations. They are differentiated between those disposed of by a third party and those also utilized by third parties. All this information is validated through certificates confirming final disposal or utilization, as applicable.
The managed waste includes recyclables (paper, plastic, glass, PET, cardboard, scrap), special waste, WEEE, and hazardous waste.
WASTE NOT INTENDED FOR OFF-SITE DISPOSAL (TONS) | |||||
HAZARDOUS WASTE |
2019 |
2020 |
2021 |
2022 |
2023 |
58
Reuse/recycling |
0 |
0 |
4.45 |
0 |
3.09 |
Other type of classification |
0 |
0 |
0 |
0 |
|
TOTAL |
0 |
0 |
4.45 |
0 |
3.09 |
NON-HAZARDOUS WASTE |
2019 |
2020 |
2021 |
2022 |
2023 |
Reuse/recycling |
1,184.33 |
2,428.08 |
883.68 |
887.94 |
1,138 |
Other type of classification |
0 |
|
|||
TOTAL |
1,184.33 |
2,428.08 |
883.68 |
887.94 |
1,138 |
WASTE INTENDED FOR OFF-SITE DISPOSAL |
|
||||
HAZARDOUS WASTE |
2019 |
2020 |
2021 |
2022 |
2023 |
Waste incinerated with energy recovery |
12.45 |
6.96 |
0.11 |
0.7 |
0.11 |
Waste incinerated without energy recovery |
0.12 |
0.07 |
3.14 |
5.2 |
1.90 |
Landfill waste |
0 |
0 |
0 |
0 |
0 |
Waste disposed of in other ways (cells) |
0 |
0 |
1.07 |
1.93 |
1.10 |
TOTAL |
12.56 |
7.03 |
4.32 |
7.82 |
3.11 |
NON-HAZARDOUS WASTE |
2019 |
2020 |
2021 |
2022 |
2023 |
Waste incinerated with energy recovery |
0 |
0 |
0 |
0 |
0 |
Waste incinerated without energy recovery |
0 |
0 |
0 |
0 |
0 |
Landfill waste |
1,090.31 |
581.49 |
682.74 |
681 |
1,387 |
Waste disposed of in other ways (cells) |
0 |
0 |
0 |
0 |
0 |
TOTAL |
1,090.31 |
581.49 |
682.74 |
681.00 |
1,387 |
TOTAL WASTE |
2,287 |
3,017 |
1,575 |
1,577 |
2,532 |
Recycling % |
52% |
80% |
56% |
56% |
45% |
YEAR |
Waste not intended for off-site disposal (Ton) |
Waste intended for off-site disposal (Ton) |
2023 |
1,141 |
1,390 |
YEAR |
Waste for final disposal (Tons) |
2023 target compared to 2019 |
Achievement of 2023 target compared to 2019 |
2023 |
1,390 |
-12 |
26% |
During the supply delivery to branches in Colombia, we implement reverse logistics to collect waste from them and reduce contact frequency during supply deliveries. Our participation increased from 52% in 2022 to 62% in 2023, covering 506 branches nationwide. Consequently, 24,000 kilograms of waste were collected, achieving a 100% material recovery rate.
59
Breakdown by Type of Total Environmental Expenditures and Investments
Environmental Investments |
Costs (COP) |
Investments in energy and water management systems, replacement of equipment, and facilities’ adaptations |
13,144,131,061 |
Waste management |
893,671,478 |
PCB project |
12,179,492 |
TOTAL |
14,049,982,031 |
Circular Economy in Our Operation
During 2023, we implemented several strategies, including:
| • | We eliminated plastic cups in our buildings, replacing them with compostable cups in necessary areas and branches. We also launched a campaign to promote a culture of responsible consumption among employees. |
| • | We partnered with the Ellen MacArthur Foundation to drive and promote the transition to a circular economy in Colombia and the region. With this, we become the first company in Latin America to partner with the Foundation and have a presence in North America, Europe, and Asia. |
Similarly, our assessment with Circulytics yielded a C- rating, unchanged from the previous year.
To better utilize waste generated in our operations, we implemented different initiatives for reintegrating them into new production processes. We intervene in our waste management from the eco-design of our portfolio of physical products and the acquisition of our inputs through the implementation of sustainability criteria in our supply chain to reduce the amount of waste from the design stage. The wastes generated in our operation are classified by type for use, donation, treatment, and/or final disposal. All our management aims to promote the waste circularity.
Sustainable Construction at Headquarters
We integrate sustainability criteria in an asset life cycle framework, so that each stage is aligned with our eco-efficiency goals under design and sustainable criteria. This resulted in the consolidation of a best practices manual under LEED and EDGE standards.
We migrated our operations from administrative headquarters with traditional construction to buildings certified in sustainable construction in Bogotá and Barranquilla. In the case of Bogotá, our North Headquarters building has LEED Gold certification in Core & Shell.
In addition, these headquarters are certified in sustainable construction:
60
•Torre Oriente Building in Medellín, Colombia, under EDGE Certification. It is the first of its kind to obtain this certification with the following results:
Reduced Energy Consumption in Materials
Water Savings
Energy Savings
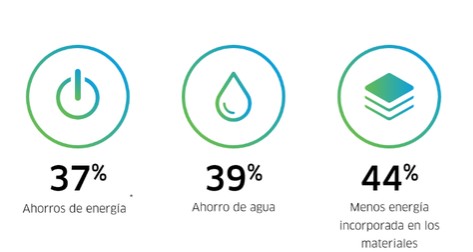
https://edgebuildings.com/project-studies/bancolombia-punto-clave/?lang=es
| • | Headquarters and the SOHO branch in Panama City, under LEED Gold certification. |
Sustainable Supply Chain
Having suppliers and partners committed to sustainability and focused on a higher purpose allows organizations to maximize the generation of value and well-being for all.
Therefore, Grupo Bancolombia has defined and implemented different actions over the years that integrate sustainability into different stages of the procurement process. This sustainability integration begins with defining the required need, procuring and contracting products and services that are environmentally friendly and produced or generated under socially fair conditions, conducting annual sustainability assessments, and supporting the development of offers that incorporate sustainability criteria. It creates value for us and other customer companies and reinforces a sustainable supply ecosystem.
| • | We updated our Sustainable Procurement Policy to more clearly outline the bank's commitment to sustainable purchases, leveraging circular economy principles, risk management, and ESG criteria. We also included a commitment for suppliers to implement circular economy strategies. This policy serves as a key tool for implementing and developing sustainability in the supply chain. |
| • | We conducted a sustainability risk assessment using supply taxonomy to prioritize families based on risk levels. The assessment identified 16 families as high risk, 19 as medium risk, and 106 as low risk. |
| • | In 2023, we assessed the sustainability commitments made by 50 suppliers to ensure compliance. |
To learn more about our eco-efficiency initiatives, visit our website https://www.grupobancolombia.com/sostenibilidad/enfoque-sostenible/ecobanco/ecoeficiencia-operacional Building trust among different company stakeholders fosters economic development and well-being, as per the Edelman Trust Barometer.
61
The Bank as a Trusted Provider
The UN has just joined this statement. It defines 2024 as the year to rebuild the trust that eroded in 2023 due to economic uncertainty, polarization, and the truth crisis.
Building trust among all our stakeholders has been central to Grupo Bancolombia's purpose implementation. We prioritize understanding our stakeholders' expectations and bridging gaps to strengthen trust in the countries where we operate. Trust forms the foundation for strong social relationships.
Trust fosters empathetic and genuine decisions, connects people around shared interests, and uncovers new relationship opportunities, leading to favorable behaviors for organizations and the company.
We Begin by Understanding our Stakeholders' Expectations
Aligned with this, we employ a comprehensive strategy to oversee Grupo Bancolombia's reputation by taking a sensitive approach to the environment and understanding stakeholder expectations.
In addition to external indices and rankings, we conduct our own study in partnership with KPMG Spain to better grasp stakeholder expectations and their perceptions of us from emotional, rational, and behavioral standpoints.
Thanks to our management efforts, stakeholders rated their trust levels in us highly in 2023. We achieved an 80% rating for our Individual and Company customers, 97.4% for suppliers, and 100% for employees (all on a scale of 0% to 100%). This success motivates us to further cultivate enduring relationships.
When assessing our performance, the general public (individual and company customers) rates us at 5.15/7, emphasizing our leadership and financial strength. Suppliers rate us at 6/7, highlighting our commitment to good governance, ethics, and integrity. Meanwhile, employees rate us at 6.4/7, emphasizing integrity, financial stability, and sustainable development for overall well-being.
Thus, the average rating across stakeholder groups is 5.7 out of 7. Indeed, we attained ratings exceeding 5 in all operating countries. It solidifies Grupo Bancolombia's robust reputation.
According to the MERCO, we also hold the top position as the company with the best reputation in Colombia, leading in ESG focus, and ranking second in talent attraction and retention reputation.
We Employ a Reputation Impact Risk Management Model
We recognize that trust erosion arises from diverse factors (traditional or financial and non-financial), such as market, liquidity, and credit risks, misinformation, political risk, ethics, and transparency. Therefore, we assess and address these risks' impact on reputation through a model to monitor exposure and make proactive decisions. We consider the balance between business profitability and reputation strength.
62
Our integrated reputation management approach prioritizes being trusted providers as a strategic step to fortify long-term relationships and foster a society guided by integrity, empathy, and an optimistic vision. That allows the construction of a future of well-being for all.
Countries and regions progress economically and socially through revenue generated from taxes, fees, and contributions. Hence, it is vital for Grupo Bancolombia to uphold transparent fiscal policies and committed corporate governance in every country of operation. We strive to generate sustainable tax impacts at the corporate level, aligning with the macroeconomic strategies of governments across different regions.
As a regional agent, Grupo Bancolombia has a presence in 11 countries and operates in 4. We fulfill our responsibilities as taxpayers in a responsible and timely manner and understand that we must pay management taxes in the location of our operations.
At Grupo Bancolombia, we promote fiscal sustainability in countries to support projects that foster well-being and community development. Therefore, it is crucial to fulfill tax obligations promptly and fairly to ensure that resources reach central and local governments promptly, thereby reinforcing the national tax framework.
Grupo Bancolombia consistently reviews and analyzes the impacts of tax regulations (including laws, decrees, doctrines, and jurisprudence) issued by the National Government in each region where it operates to ensure compliance with tax regulations obligations.
The following chart shows Grupo Bancolombia's participation in the public finances of the 4 countries where operations are focused for fiscal year 2023:
Taxes recorded by region | |
Region |
Taxes recorded* |
Colombia |
3,062,502 |
El Salvador |
226,384 |
Guatemala |
4,779 |
Panama |
154,244 |
TOTAL |
3,447,907 |
*All amounts are expressed in COP | |
Panama 4.5%
Guatemala 0.1%
El Salvador 6.6%
Colombia 88.8%
Panama
Total Tax Contribution by Country
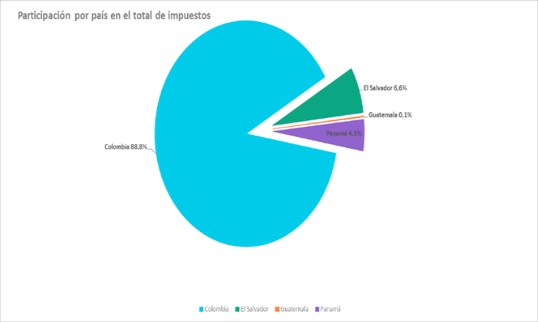
63
Our Corporate Governance Issues
Grupo Bancolombia recognizes corporate governance as an essential element for its sustainability and for obtaining the results outlined in the short, medium, and long term. Thus, applying the best industry standards promotes responsible decision-making, the continuous strengthening of the control environment, comprehensive risk management, and continuous and transparent communication with its Stakeholders.
The share capital of Bancolombia S.A. is made up of ordinary and preferred shares. On one side, ordinary shares grant their holder the right to participate in the deliberations of the Shareholders' General Meeting, to vote, and to receive a proportional share of the profits declared. On the other side, preferred shares grant the right to receive, at the time and in the manner approved by the General Meeting, a minimum preferential dividend based on the profits of the previous fiscal year. As a general rule and except for specific decisions identified in the corporate bylaws, preferred shares do not grant voting rights to their holders.
The Bank has an authorized capital of COP 700,000,000,000.00, and a subscribed and paid-in capital of COP 480,913,500,000.00, represented in 961,827,000 subscribed and paid shares. As of December 31, 2023, the total number of shareholders was 39,540 and 22,900 shareholders hold only preferred shares.
The following is the distribution of share capital and the identity of our significant shareholders as of December 31, 2023:
Type of shares |
Number of Outstanding Shares |
Number of shareholders owning a type of shares |
Percentage of participation in share capital for each type of share |
Ordinary |
509,704,584 |
13,988 |
52.99% |
Preferred |
452,122,416 |
22,900 |
47.01% |
Total |
961,827,000 |
39,540* |
100% |
*2,652 shareholders have common and preferred shares.
To date, Bancolombia S.A. is unaware of real beneficiaries with a percentage greater than 10% in the entity's share capital.
Name |
% of Ord. Share Participation |
% of Pref. Share Participation |
% of Total Participation |
Grupo de Inversiones Suramericana S.A. |
46.11% |
0.00% |
24.43% |
Fondo Bancolombia ADR Program |
0.00% |
28.85% |
13.56% |
Fondo de Pensiones Obligatorias Porvenir Moderado |
8.29% |
2.33% |
5.49% |
Fondo de Pensiones Obligatorias Protección Moderado |
5.48% |
4.71% |
5.12% |
Fondo Bursátil iShares MSCI Colcap |
3.64% |
7.27% |
5.34% |
64
.
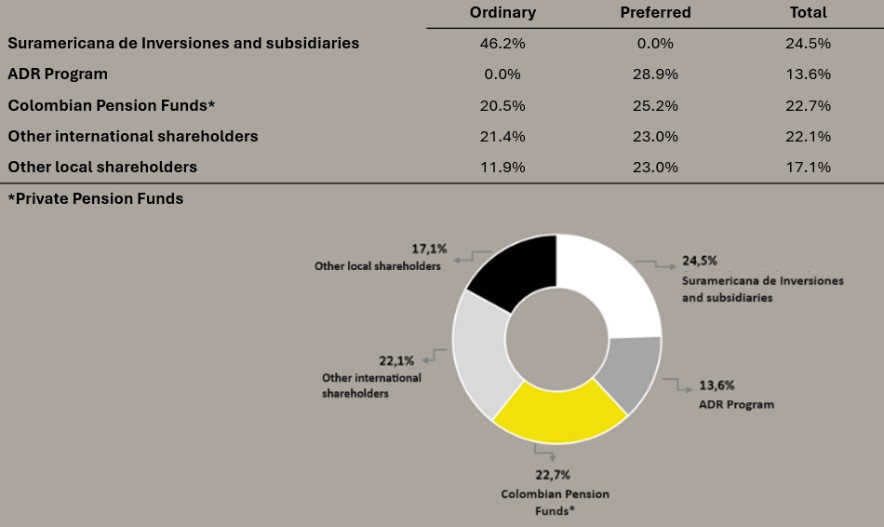
Bancolombia is unaware of any agreements between our shareholders concerning business management, alignment in voting, or similar matters. We do not have shares in reserve.
In accordance with our Good Governance Code, the Directors, and Administrators of Bancolombia S.A. may, directly or through an intermediary, sell or acquire shares of the Bank while they are in the exercise of their positions, as long as they involve operations unrelated to speculation and have authorization from the Board of Directors. In any case, the trading of shares may not be for speculation purposes, and the administrators may not carry out the operation during January, April, July, and October of each year and during the first ten calendar days of the remaining months, nor in the period that elapses between the moment in which the administrators become aware of a relevant operation or business that the entity is going to carry out and the moment in which they are disclosed to the market.
For the purposes of monitoring and effective compliance with the adopted procedure, our Good Governance Code establishes the requirements that must be met for the sale or purchase of shares by the administrators, which can be consulted on our website at the following link:
https://www.grupobancolombia.com/wcm/connect/www.grupobancolombia.com15880/ab4b162f-8256-46c9-9d29-f28d91e69df5/control-de-enajenacion-de-acciones-del-banco-por-administradores.pdf.pdf?MOD=AJPERES&CVID=nYk7CJl.
In the case of Directors and members of Senior Management, the authorization of the Board is promptly informed to the market through the relevant information mechanism.
As of December 31, 2023, the members of the Board of Directors and Senior Management held the following shares in the company:
65
Shareholder Name |
Total Preferred Shares |
Participation % |
Juan David Escobar Franco |
88 |
0.00% |
Gonzalo Alberto Pérez Rojas |
10 |
0.00% |
Bank employees receive 30% of their variable compensation in units of a fund that invests exclusively in company shares and is managed by Protección. Likewise, as the shareholders agree, the Directors receive 30% of their remuneration through this fund.
Communication with our Shareholders
Maintaining open and transparent communication with its shareholders and guaranteeing their access to complete, clear, and timely information is essential for Grupo Bancolombia. For this reason, we have a corporate website (in Spanish and English) in which we publish, in addition to our financial information, the business structure, the composition of the governing bodies, the corporate strategy, environmental, social, and human capital management of the Group, information of our administrators and main shareholders, and our most relevant corporate documents, among other information of interest.
Through the Shareholder Service Center managed by Fiduciaria Bancolombia, we attend to our shareholders' queries and concerns throughout the year. During 2023, 26,440 shareholder requests were answered, mainly related to tax certificates, news on the payment of dividends, general and historical certificates, blocking or unblocking, deposit certificates, and a total of 530 calls and 109 visits.
Our Investor Relations Office manages a live transmission channel for the quarterly results presentations, in which participants can send questions in real time. The recordings and presentations in these channels are available to the market on our corporate website. Additionally, our shareholders may request specialized audits on specific topics in the terms provided for this purpose in our Good Governance Code. Likewise, our management team holds periodic meetings of an informative nature with investors, analysts, and risk rating agencies in Colombia and abroad to present the progress and performance of Grupo Bancolombia’s businesses. Thus achieving enriching spaces for dialogue for all parties.
In accordance with current Colombian regulations and the guidelines established by the Securities and Exchange Commission (SEC), through the relevant information mechanism provided by the Colombian Financial Superintendency and through 6K reports, we reveal to the market relevant and material events that are important to our investors. Our relevant information was also provided to the public on our corporate website in both Spanish and English, at the following link:
https://www.grupobancolombia.com/relacion-inversionistas/informacion-interes/informacion-relevante.
During 2023, Bancolombia S.A. published 27 market-relevant information with the prior approval of the Disclosure Committee, a body that reports directly to the Audit Committee and is in charge of verifying that the information published is accurate, clear, and timely. The rating agencies transmitted 3 additional relevant information announcing ratings of our issued securities and our company as a securities issuer.
The ordinary meeting of the 2023 Shareholders' General Meeting was called one calendar month in advance. The call was published in two widely circulated newspapers and was transmitted as relevant information in both Colombia and the United States. Within the legal term, that is, 15 business days before the meeting, the information pertinent to the General Meeting was made available to our shareholders and the general public on our corporate website.
66
Likewise, within the same term, our shareholders had access to the documents on the right of inspection at our main domicile.
The Board of Directors stipulated measures aimed at ensuring equitable treatment of all Bancolombia shareholders, directed at the legal representatives, administrators, and other servants of Bancolombia and Fiduciaria Bancolombia S.A. Among these measures are, among others, publishing relevant information and made available to our shareholders on our corporate website, refrain from promoting the granting of power of attorney in blank, receive power of attorney where the name of the representative is not clearly defined, admit power of attorney as valid without fulfilling the legal requirements, suggest the name of proxies and recommend voting for or against any proposition.
2023 Shareholders' General Meeting
At the ordinary meeting of the 2023 Shareholders' General Meeting, 436,748,837 ordinary shares were duly represented, equivalent to 85.68% of the ordinary and outstanding shares.
At said meeting, the Management Report, the Audit Committee report, the separate and consolidated Financial Statements, the Decisions of the Statutory Auditor, the Profit Sharing Project, the election of the Financial Consumer Ombudsman for the period 2023-2025, the election of the Board of Directors for the period 2023-2025, and the remuneration of the Board of Directors were presented for consideration by the shareholders.
Regarding the Profit Sharing Project, the Shareholders' General Meeting approved the payment of an annual dividend of COP 3,536 per ordinary or preferred share, payable in four quarterly installments of COP 884 per share and quarter, on the following dates: April 3, July 4, October 2, 2023. and January 2, 2024.
As the main and alternate Financial Consumer Ombudsman for the period between April 2023 and March 2025, the Shareholders' General Meeting approved the election of Maria Adelayda Calle Correa and Ana Cristina Velásquez Cruz, respectively. The election took into account the candidates' professional career, experience, and specialized knowledge in the financial sector, as well as the analysis of their service proposal in light of the size of the Bank, the number of financial consumers, products, services, and operations, the average volume of complaints and claims, the available channels and in general, compliance with the duties assigned by Notice 013 of the Colombian Financial Superintendency. Likewise, the proposal to implement improvements to serve consumers in an agile and innovative way was taken into consideration, leveraging analytics, process automation, and digital developments.
Within the framework of the election process for the Board of Directors for the period between April 2023 and March 2025, the Shareholders' General Meeting re-elected the Directors who had been holding said position. They were identified in the Board of Directors section of this report.
Within the process of electing the Board, only one single plan, presented by the shareholder Grupo de Inversiones Suramericana S.A., was received. Pursuant to the procedure established in the Code of Good Governance, once the list of the candidates to join the Board of Directors was received, the Good Governance Committee, prior to the General Meeting, evaluated compliance with the selection criteria defined in the Good Governance Code and carried out an analysis of the suitability, experience and professional profile of each of the candidates, and the non-existence of inabilities and incompatibilities regarding these. The report received by the General Secretary and the conclusions of the evaluation carried out by the Good Governance Committee were made available to the shareholders before the Shareholders' Meeting.
67
In the evaluation carried out by the Good Governance Committee, the academic and professional career of the candidates, their personal qualities, their analytical and managerial skills, their competencies, their knowledge of the industry, financial, risk, legal, commercial, economic or strategic aspects, their contribution to the management of Bancolombia S.A., and their complementarity and diversity were taken into account. Besides, the aptitude to take office before the Colombian Financial Superintendence and the availability of each candidate to attend, at least, 80% of the total meetings, review the material in advance, and be part of trainings offered by the Bank were taken into account.
In general terms, the Good Governance Committee concluded that the candidates included in the list presented are upright professionals and have high ethical standards and good reputation. Additionally, they have top-level academic preparation, knowledge, and a professional career that allows them to direct the Grupo Bancolombia to its purpose. They have experience in risk management and sustainability, as well as a global and strategic vision of business. They meet the conditions contemplated in the Good Governance Code to be considered independent (as applicable) and are not immersed in disabilities or incompatibilities. In the same way, they present high complementarity and diversity among themselves in technical strengths, academic and professional experience, both nationally and internationally, in fields relevant to the administration of Grupo and the adequate management of its risks and businesses. The evaluation of the Good Governance Committee regarding each of the candidates can be consulted on our website at the following link:
https://www.grupobancolombia.com/wcm/connect/www.grupobancolombia.com15880/d8b72b85-d9f4-4d75-a660-ae6557524085/Evaluacion_Proposicion_Junta_Directiva.pdf?MOD=AJPERES&CVID=orMbWW6.
Out of the seven re-elected candidates, five meet the requirements of the Good Government Code to be considered independent members. These requirements, as well as the causes of inability or incompatibility, are distinguished in Section 3.1 of the Good Government Code.
The 2023 Shareholders' General Meeting also approved the update of the remuneration of the Board of Directors, with the understanding that to attract and maintain suitable professional Directors, who have the necessary skills to perform their functions, assume their responsibilities, and continue generating value in compliance with the strategic objectives of the Grupo Bancolombia, it is essential to keep the value of fees updated in a global economic context of inflation. Accordingly, the amount of the monthly fees of the Board of Directors and for participation in the Support Committees was set for the Directors residing in Colombia in the sum of twelve million one hundred seventy-four thousand Colombian pesos (COP 12,174,000), and for Directors residing abroad of three thousand one hundred ninety-five dollars (USD 3,195), plus two hundred sixty-six dollars (USD 266) of travel expenses per day of travel. The fees are paid 70% in cash and 30% through a contribution to the Fondo Institucional SVA, whose only investment is shares of the Bank and is subject to a two-year contribution term, starting from the respective contribution.
Details of the proposals approved by the shareholders at the Shareholders' General Meeting can be found on our corporate website.
68
Following what was reported to the market by Grupo de Inversiones Suramericana S.A. on August 31, 2023, Gonzalo Alberto Pérez Rojas, president of said company and member of the Board of Directors of Bancolombia S.A., presented his resignation to the Board of Directors of said company after turning 65 years old—under the rules of the Good Governance Code of Bancolombia S.A. The Board of Directors accepted the resignation and asked him to remain in office until April 30, 2024.
Board of Directors Structure
We seek to maintain a healthy diversity in the composition of our board of directors, fostering a mix of experience and innovative perspectives. Thus, our Board of Directors comprises 71% Independent Directors, 29% foreign Directors, and 29% female participation. 100% of our Directors are over 50 years of age. The average tenure period of Directors is 7.8 years, as follows:
| • | Luis Fernando Restrepo Echavarría: Independent member of the Board of Directors since 2016. He is currently the President of the Board. |
| • | Andrés Felipe Mejia Cardona has been an independent member of the Board of Directors since 2016. |
| • | Sylvia Escovar Gómez has been an independent member of the Board of Directors since 2020. |
| • | Arturo Condo Tamayo is an independent member of Ecuadorian nationality who has belonged to the Board of Directors since 2016. Expert in ESG and cybersecurity issues. |
| • | Silvina Vatnick is an independent member of Argentinian nationality who has belonged to our Board of Directors since 2021. Financial Expert. |
| • | Gonzalo Alberto Pérez Rojas has been an equity member of the Board of Directors since 2004. |
| • | Juan David Escobar Franco has been an equity member of the Board of Directors since 2020. |
All of our Directors have a recognized reputation, decision-making capabilities, and analytical skills. They have the necessary competencies to perform their duties and assume their responsibilities as Directors of a systemic entity such as Bancolombia. Their knowledge and specialties allow them to comprehensively measure and evaluate risks, as well as contribute to the financial, internal control, technological, commercial, economic, and legal aspects of Grupo Bancolombia. None of our Directors are employees of Bancolombia or its subsidiaries, nor are they members of the Boards of Directors of the latter.
The professional profiles of our Directors, their academic and professional career, and their participation in administrative bodies of other companies can be consulted on our institutional website at the following link, in the tab corresponding to the Board of Directors: https://www.grupobancolombia.com/corporativo/gobierno-corporativo/junta-directiva-alta-gerencia.
In response to the suggestion of the Directors in the annual evaluation of the Board of Directors, Jorge Noguera was appointed as advisor to the Board on matters related to technology and cybersecurity. The advice includes the participation of the advisor in the meetings of the Board of Directors and Committees in the agenda items that address issues associated with technology and cybersecurity or on demand when required by the President of the Board or the respective Committee.
*When this section refers to Independent or Equity Directors, we refer to the definitions contemplated in the current Colombian regulations and the Good Governance Code.
69
Operation in 2023
In accordance with the provisions of our statutes, the Board of Directors has sufficient powers to order the execution or signing of any act or contract included within the corporate purpose and to adopt the necessary decisions so Bancolombia fulfills its purposes. In carrying out its responsibilities, the Board of Directors especially has among its functions the definition of the general, financial, and risk policies, as well as the strategic objectives of the Bank and the Grupo Bancolombia. Furthermore, it is the body in charge of setting the general regime of salaries and extralegal benefits. It is the one that defines the general structure of the Bank, approves the creation of the Vice Presidencies, and appoints the legal representatives of the Bank. It supervises the effectiveness of the internal control system and risk and legal compliance systems and presents the required reports on such matters to the Shareholders' General Meeting. It appoints the members of the Support Committees and approves the Codes of Good Governance and Ethics and the Manuals through which the procedures are documented to manage the risks to which the Bank is exposed adequately. Lastly, it serves as an advisory body to the President of the Bank and promotes respect and equitable treatment of all shareholders and other investors in securities, among others.
The Operating Regulations of the Board of Directors are incorporated into the Good Governance Code, which can be consulted in English and Spanish on our institutional website at the following link:https://www.grupobancolombia.com/corporativo/gobierno-corporativo/documentos-de-interes
Among other functions carried out during 2023, in its capacity as the highest management and administration body, the Board of Directors:
| • | Recommended to the Shareholders' General Meeting the appointment of the Financial Consumer Ombudsman, after evaluating the proposal presented. |
| • | Approved the annual calendar of its ordinary sessions. |
| • | Defined the company's general policies and strategic objectives and monitored the actions undertaken to achieve them. |
| • | Approved the Integrated Risk Management System (SIAR), the Cybersecurity Policies, the Technology Plan, and updates to the SARLAFT Manual and the Code of Ethics, among others. |
| • | Monitored the proper functioning of the control, risk monitoring, and compliance systems, making recommendations for their continuous strengthening. |
| • | Through the Risk Committee, monitored the different risks of the risk map. |
| • | Promoted the integrity of accounting, product, financial consumer service, and information systems. |
| • | Monitored the financial results of the Bank and Grupo Bancolombia. |
| • | Established the general regime of salaries and social benefits. |
| • | Authorized the acquisition of shares in affiliates and subsidiaries. |
| • | Carried out appointments of administrators and Senior Management members. |
| • | Approved the Clawback Policy, as described below. |
On April 25, 2023, the Board re-elected Luis Fernando Restrepo Echavarría as its President and Gonzalo Alberto Pérez Rojas as Vice President. Likewise, the Board re-elected the members of the Board Support Committees.
In compliance with the entrusted functions, the President of the Board ensured the efficiency and best performance of the Board and guided the conversations with the purpose of ensuring the participation of the Directors and the relevance and conduct of the debates.
70
In the same way, together with the General Secretary and the Good Governance Committee, he managed the annual evaluation process of the Board of Directors and its Support Committees and led the process of defining the annual thematic agenda of the Board. This thematic agenda included the recommendations of the Directors, the Good Governance Committee, the President, and the Administration, responding to the functions and responsibilities of the Board of Directors with a strategic, business, and risk focus.
In 2023, the Board of Directors held 12 ordinary meetings and one extraordinary meeting, with an average attendance of 98%. The average attendance at Board meetings by each Director is as follows:
| • | Luis Fernando Restrepo Echavarría: 100% |
| • | Andrés Felipe Mejia Cardona: 100% |
| • | Sylvia Escovar Gómez: 100% |
| • | Arturo Condo Tamayo: 92% |
| • | Silvina Vatnick: 100% |
| • | Gonzalo Alberto Pérez Rojas: 92% |
| • | Juan David Escobar Franco: 100% |
The General Secretariat reflected in the minutes of the Board of Directors, the development of the sessions, and the decision-making processes. Moreover, it ensured compliance with the corporate governance procedures and rules, following the provisions of the Bylaws and other corporate documents.
In 2023, the total amount paid to the Directors for their participation in the Board and the different Support Committees amounted to two billion three hundred six million sixty-five thousand eight hundred thirty-three Colombian pesos and 15 cents (COP 2,306,065,833.15). For travel expenses, the sum amounted to eighty million six hundred forty-five thousand eight hundred seventy-five Colombian pesos (COP 80,645,875).
Access to Information
The timely delivery of information is essential for our Directors to participate in sessions and make informed decisions actively. Bancolombia uses a web-based tool with exclusive access for Directors. Through that tool, Bancolombia provides them with the material that will be presented to the Board of Directors for its evaluation and prior analysis at least 4 days in advance. In addition to guaranteeing timely access to information for Directors, this tool protects the confidentiality of the information.
Support Committees of the Board of Directors
The Board of Directors of Bancolombia has four Support Committees. Each Committee has a President and an Internal Regulation that regulates its composition, the frequency of its meetings, and its functions. The Presidents of each Committee submit a report to the Board of Directors on the issues addressed, the decisions made, and the decisions they recommend accepting by the Board.
Good Governance Committee
The Good Governance Committee of Bancolombia is made up of three independent members of the Board of Directors and is permanently attended by the President of Bancolombia. It acts as Secretary of the Committee, the Legal Vice President, and the General Secretary of Bancolombia. The main purpose of this Committee is to support the Board of Directors in the fulfillment of its functions related to corporate governance, approve the ESG strategy, and review its compliance.
71
During 2023, the Committee reviewed the results of the 2022 Board of Directors evaluation and made suggestions for the better functioning of the Board. Likewise, as mentioned before, for the election of the members of the Board of Directors carried out by the 2023 General Meeting, the Committee evaluated compliance with the selection criteria defined in the Good Governance Code and analyzed the suitability, experience, and professional profile of each of the candidates, and the non-existence of disabilities and incompatibilities regarding them. In terms of sustainability, the Committee learned about the materiality results, approved the Bank's ESG strategy and objectives, monitored the performance of the KPIs and OKRs, and learned about the DEI strategy, among others.
During 2023, the Committee met four times in response to the needs of the company, with an average attendance of 100%, as follows:
| • | Luis Fernando Restrepo Echavarría, independent director and President of the Committee: 100% |
| • | Sylvia Escovar Gómez, independent director: 100% |
| • | Arturo Condo Tamayo, independent director: 100% |
Starting in 2024, the Committee will meet once every quarter and in additional sessions if the environment requires it.
Risk Committee
Bancolombia's Risk Committee is made up of two independent members and one equity member of the Board of Directors. The President and Vice President of Risks of Bancolombia permanently attend this Committee. Jorge Noguera, external advisor to the Board of Directors, attends as a guest when the topics to be discussed at the meeting include technological or cyber risk issues.
The Committee meets monthly, and its main objective is to support the Board of Directors in the approval, monitoring, and control of policies, guidelines, and strategies for risk management. Additionally, it supports the Board of Directors in understanding the risks assumed, the capital required to support them, and monitoring the risk appetite; oversees risk management methodology, procedures, and tools; periodically analyzes the reports presented by Senior Management on risk exposure, as well as substantial changes in exposure, compliance with the tolerance level and the mitigation and management measures adopted by Bancolombia; and monitors the organization's risk map. The Risk Committee actively participates in the discussion, management, and supervision of risks related to cybersecurity and sustainability.
During 2023, the Committee supported the Board of Directors in the approval, monitoring, and control of policies, guidelines, and strategies for risk management. Simultaneously, it monitored the different indicators and risk behavior of the company's risk map once a month.
During the year, the Committee met in 12 ordinary meetings and two extraordinary ones, with an average attendance of 95%, as follows:
| • | Andrés Felipe Mejía Cardona, independent director and President of the Committee: 92% |
| • | Silvina Vatnick, independent director: 100% |
| • | Juan David Escobar Franco, equity director: 92% |
72
Audit Committee
Bancolombia’s Audit Committee is made up of three independent members of the Board of Directors, one of them being the financial expert and another the cybersecurity expert. This Committee is attended by the Vice President of Internal Audit of Bancolombia, the Statutory Audit Office, the external advisor of the Audit Committee, Luis Alberto Zuleta, and, when the topics to be discussed include technological or cybersecurity matters, Jorge Noguera, external advisor of the Board of Directors.
The Committee meets monthly, and its main objective is to serve as support to the Board of Directors in supervising the effectiveness of the internal control system of Bancolombia S.A., in particular, and of the Grupo Bancolombia, in general, as well as in its improvement. During 2023, the Committee supervised the integrity of the financial statements, the financial reporting process, and the internal accounting and financial control systems and monitored progress in the work plan of the Internal Audit and the Statutory Audit Office and in closing gaps. It also monitored the different programs managed by the Vice Presidency of Compliance, including SARLAFT, Ethics, FATCA, Data Protection, Anti-Fraud, and Regulatory Compliance. It examined channel availability indicators and plans for their restoration. It recommended to the Board the approval of the Information Security Policy and the Strategic Technology Plan and approved 20F—the Annual Plan and the Internal Audit Quality Assurance and Improvement Policy.
During the year, the Audit Committee met in 12 ordinary meetings and three extraordinary ones, with an average attendance of 100%, as follows:
| • | Arturo Condo Tamayo, independent director, President of the Committee, and cybersecurity expert: 100% |
| • | Silvina Vatnick, independent director and financial expert: 100% |
| • | Andrés Felipe Mejía Cardona, independent director: 100% |
Appointment, Compensation, and Development Committee:
The Appointment, Compensation, and Development Committee is made up of two independent members and one equity member of the Board of Directors. The Committee is attended by the President of the Bank, the Corporate Vice President of Talent and Culture, and the Compensation and Benefits Manager, who acts as Secretary of the Committee.
The main task of the Appointment, Compensation, and Development Committee is to support the Board of Directors in determining the policies and provisions for the selection, appointment, hiring, and remuneration of Senior Management and all matters related to Grupo Bancolombia’s remuneration model. Among its main functions are proposing to the Board of Directors the succession and remuneration policy of the Senior Management of Grupo Bancolombia; supervising compliance with the appointment, remuneration, and succession policies of the Grupo’s key executives; periodically reviewing the Senior Management remuneration programs and proposing, when appropriate, updates to them; and presenting to the Board of Directors proposals for corporate human management policies that are within its competence.
During 2023, the Committee met seven times in response to the needs of the company, with an average attendance of 95%, as follows:
| • | Luis Fernando Restrepo Echavarría, independent director and President of the Committee: 100% |
73
| • | Gonzalo Alberto Pérez Rojas, equity director: 86% |
| • | Sylvia Escovar Gómez: 100% |
Taking into account the applicable regulation and the best market practices and seeking to maintain the competitiveness of the company, the Committee reviewed the compensation models of Grupo Bancolombia, including the compensation model and salaries of the management team and the compensation model of commercial teams. Likewise, it approved and recommended to the Board of Directors the approval of the Clawback Policy, which addresses the new regulations of the SEC and the New York Stock Exchange (NYSE).
The policy regulates the process of recovery by Bancolombia S.A. of incentive-based compensation recognized in excess to executives in the event of a restatement of financial statements due to material non-compliance with financial reporting requirements under securities market law. The approved policy can be consulted on our corporate webpage at the following link:
https://www.grupobancolombia.com/wcm/connect/www.grupobancolombia.com15880/b4d29a8c-d48b-40c5-95cb-bb057b6bdd7c/Politica_Clawback.pdf?MOD=AJPERES&CVID=oPZO8fC
For the proper implementation of the Policy, Bancolombia signed an amendment to the employment contract with the members of Senior Management, among other servants, through which they accepted and embraced the Policy.
Evaluation of the Board of Directors and its Support Committees
In accordance with the provisions of the Good Governance Code, the Bank's Board of Directors annually carries out an evaluation of its management and that of its Support Committees. These evaluations alternate between internal and external. In this way, in January 2023, a self-evaluation of 2022 management was carried out. And, between December 2023 and February 2024, the external advisor, Governance Consultants, evaluated the Board management during 2023.
The results of the 2022 Board self-evaluation were assessed by the Good Governance Committee and the Board of Directors and were taken into account during 2023 for the improvement of the governing body. The openness to dialogue, cohesion and integrity, diversity, experience, knowledge, and commitment of its members, the broad perspective of the Group, its alignment with the purpose and values of the Grupo, the annual strategic planning, the independence of the administration, good coordination and logistics, programming of the annual agenda, and the contributions and reports of the committees were highlighted. The Directors recommended a greater social and political context, training in digital banking and cybersecurity, and an increase in how often or in length these Support Committee meetings occur.
The annual thematic agenda of the Board of Directors for 2023 was based on the recommendations of the Directors and the needs of the company. In nine meetings of the Board of Directors, the political, social, or economic outlook of the countries in which the Grupo has a presence was presented. Among other topics, the Directors were contextualized about the legislative initiatives, the political, social, and economic environment, and the plans of the elected governments, as well as their potential impacts, challenges, and opportunities. Besides, political, economic, and market analysts, who are recognized nationally and internationally, participated in the Board. Likewise, the meetings of the Support Committees were increased, especially the Audit Committee ones.
74
As specified below, multiple talks and training were held during the year on megatrends, behavioral sciences, sustainability, technology, digital banking, cybersecurity, and geopolitical risks. Moreover, as noted above, Jorge Noguera was appointed as an advisor to the Board of Directors on matters related to technology and cybersecurity.
By the above-mentioned, during December 2023 and February 2024, the external advisor, Governance Consultants, carried out an external evaluation of the Board of Directors. In this process, 50 factors were evaluated, related to six dimensions: (i) structure and conformation, (ii) agenda and strategic focuses, (iii) fulfillment of responsibilities, (iv) operability, (v) Support Committees, and (vi) dynamics of equipment. A methodology that included conducting interviews and completing a questionnaire by members of the Board and Senior Management was used.
In general terms, according to the Governance Consultants report, the results of the evaluation “reflect an effective government body, with good performance that adds value to Bancolombia. The average rating of the different dimensions evaluated is 9.3/10, both from the perspective of the members of the Board of Directors (JD) and the Senior Management team (AG).” In the same way, the report highlights that the Board has an “adequate diversity and complementarity of knowledge,” and that it “operates effectively (the information is sufficient and appropriate, the format of the meetings is appropriate, the role of the President is positively recognized, and the role of the Secretary receives outstanding ratings).” In addition to the above, “a work dynamic based on trust and the ability to work as a team” and “an adequate committee structure to respond to the needs of the Bank” is recognized.
The report also establishes that “one of the greatest challenges for the governance system of an entity with the size, complexity and regulatory burden of Bancolombia is to be able to establish the appropriate level of monitoring of past results and the level of involvement regarding the strategic vision and the future.” In this way, the need to “achieve a balance between monitoring results and the prospective vision of business” is highlighted. Also, it is noted the “expectation of better time management in meetings to comply with the entire agenda.”
The Good Governance Committee and the Board of Directors were informed of the evaluation results in February 2024. Hence, from the annual agendas of the Board and the Committees, measures have been taken to achieve the indicated balance and to guarantee better time management in meetings.
Board of Directors Training
In the development of our administrators' training activities, Directors attended the Directors' Meeting organized by Bancolombia in 2023. This meeting is held every two years and brings together the Board members of all the entities belonging to Grupo Bancolombia. At the event, Directors learned about the evolution of foreign banks and Grupo's new businesses and participated in talks on megatrends, reputation, behavioral sciences applied to financial decisions, challenges and opportunities of the Integration of Stock Exchanges, and economic context.
Likewise, Directors received training in technology, digital banking, and cybersecurity from the IE Business School of Madrid. This certification consisted of eight sessions (five virtual and three in-person), with a total of 30 hours, and covered cybersecurity governance, the transformation of banking to 2030, cyber risks, and code and financial consumer, employee, and organizational data protection.
75
Equally, the Risk Committee participated in a talk with Amazon Web Services about the resilience of its infrastructure and geopolitical risks.
Bancolombia's Senior Management is in charge of executing and developing the strategy, as well as achieving the company's medium and long-term objectives. Senior Management includes the President of Bancolombia S.A. and the Vice Presidents, who report directly to him. During 2023, the following people made up Senior Management:
| • | Juan Carlos Mora Uribe, President. The Government and direct administration of the Bank are in charge of the President, who has a vision of comprehensive governance of all the Grupo Bancolombia Companies at a national and international level, with clear lines of reporting and assignment of responsibilities. The President of the Bank, with the support of his Senior Management team, is the one who directs the goals and objectives of each of the businesses and validates the strategic execution and plans, ensuring that they are integrated within the context of Grupo. |
| • | María Cristina Arrastía Uribe. She held the position of Business Vice President until November 30, after her retirement after reaching retirement age. |
| • | Mauricio Rosillo Rojas. He served as Corporate Vice President until November 30, and as of December 1, 2023, he serves as Business Vice President. The main function of the Business Vice President is to propose, implement, and control strategies that aim to generate value for the businesses of the Bank and its subsidiaries. Likewise, he is the one who defines the value propositions within the universal banking reference framework to consolidate and increase Grupo Bancolombia’s leadership in the market. |
| • | Julián Mora Gómez. He has been appointed as Corporate Vice President since December 1, 2023. The Corporate Vice President directs and guides the reputation and communications, human resources management, compliance, and financial teams, guaranteeing business sustainability and profitability. |
| • | Jaime Alberto Villegas Gutiérrez, Vice President of Corporate Services. His function is to provide corporate administrative, technology, operations services, and project support required by the business units to fulfill the promises made to clients, ensuring the normal development of Grupo Bancolombia’s activities in Colombia and abroad. |
| • | Rodrigo Prieto Uribe, Vice President of Risks. His function is to design and propose to the Board of Directors the Risk Appetite Framework, the SIAR policies, the general exposure and concentration limits, the Risk Governance structure, and the strategies to manage risks, capital, and liquidity. He also controls that the policies contemplated in the SIAR are appropriate to manage risks and are in line with the profile and appetite of the company. |
| • | Cipriano López González, Vice President of Innovation. This Vice Presidency directs the formulation and implementation of innovation strategies, alliances, digital transformation, and analytical capabilities in all regions where Grupo Bancolombia is present, seeking new sources of value generation for the company's Stakeholders. |
| • | José Mauricio Rodríguez Ríos, Vice President of Audit. His main function is to evaluate the effectiveness of the internal control system, compliance with the accounting and financial policy, the quality of the systems established to guarantee compliance with applicable regulations, and the analysis of the organizational structure of the organization, proposing solutions to address identified improvement opportunities. |
76
| • | Claudia Echavarría Uribe, Legal Vice President and General Secretary, who has reported directly to the Presidency since December 1, 2023. From this position, he leads the General Secretary’s Office and legal strategy of Grupo Bancolombia, identifying, managing, and mitigating the legal risk implicit in the development of the company's activities. |
The professional profiles, academic training, and professional experience of the members of Senior Management can be consulted on our corporate website at the following link, in the tab corresponding to Senior Management: https://www.grupobancolombia.com/corporativo/gobierno-corporativo/junta-directiva-alta-gerencia
Bancolombia has a compensation strategy for the management team that is permanently controlled through external expert firms. These firms accompany the analysis of global compensation trends and the evaluation of salary competitiveness according to the responsibilities of the executives of a systemic organization like Bancolombia. This compensation strategy is made up of fixed and variable compensation. Variable compensation, with its short- and long-term components, seeks to stimulate the fulfillment of the company's goals, reward with the generation of value, align the interests of the management team with the interests of the shareholders, and recognize and encourage high performance of the management team in consistency with the organizational strategy.
During 2023, the Board of Directors, through the Appointment, Compensation, and Development Committee, and based on market references, comprehensively reviewed the compensation model of the management team, especially the variable component, including its indicators, challenges, and maximum limit.
The variable remuneration policy is based on the generation of added value. There is room for the payment of bonuses when organizational results in terms of profits exceed the value of the cost of capital. Besides, the model measures compliance with strategic planning goals, which must be aligned with the strategic direction defined by the Board of Directors. Long-term results are promoted. For this purpose, short- and long-term (triennial [3 years]) management measurement indicators are considered. The long-term component considers the financial indicator (SVA Holding), the sustainability indicator (Dow Jones Sustainability Index), and the loyalty indicator (competitive NPS). In line with the aforementioned, a compensation cap has been established. A maximum of eight salaries per year for the President and seven for Corporate Vice Presidents per bonus. 30% of the remuneration translates into participation in the Fondo Institucional de Pensión Voluntaria SVA, which is represented in Bancolombia shares. According to the regulations of the fund, the employee can only withdraw their contributions after a minimum term of permanence of three years. The philosophy of this mechanism is that employees feel ownership of the organization and are committed to sustainable results.
Note 28, 'transactions with related parties' of the consolidated financial statements (note 27 of the separate financial statements), contains details of labor payments made to Senior Management.
The withdrawal of resources from the Fondo SVA by the Bank's administrators must undergo an authorization procedure before the Board of Directors. The authorization granted to the members of Senior Management is revealed to the market through the relevant information mechanism. Taking the above into account, the Board of Directors authorized, during 2023, SVA withdrawal transactions of 11 administrators, including María Cristina Arrastia Uribe, then Vice President of Business, which was promptly reported to the market by the Bank.
77
Upon recommendation of the Audit Committee and the Board of Directors, the Shareholders' General Meeting appointed PwC Contadores y Auditores S.A.S. as Statutory Auditor for the period between April 2022 and March 2024 at its ordinary meeting in 2022. Regarding fees, the General Meeting approved the annual amount of COP 12,943 million for Colombian companies and USD 1.87 million for foreign subsidiaries, with an increase equivalent to the Consumer Price Index (CPI) for 2023 for each country. Likewise, when unforeseen circumstances made it necessary, the administration, approved by the Audit Committee, was authorized to make payments for additional services provided by PwC associated with tax audit and SOX function. These payments did not exceed ten percent (10%) of the total annual value authorized by the General Meeting.
The accrued fees billed under the heading audit fees for professional services rendered for the audit of its financial statements and for services normally rendered to Bancolombia in connection with statutory or regulatory filings or engagements amounted to COP 20,251 and COP 19,274 million audited by PwC Contadores y Auditores S.A.S. and by the member firms of the PwC network located in Panama, El Salvador, Guatemala, and Puerto Rico that are auditors of the Group's components for the years 2023 and 2022, respectively.
Additionally, the amount of unbilled fees as of December 31, 2023, and 2022 for the tax audit performed by PwC Contadores y Auditores S.A.S. and auditors of the Group's components is approximately COP 6,008 and COP 4,034 million, respectively.
Operations with Related Parties – Economic Group Report
We offer our customers, including our related parties, access to our financial products and services as a financial services provider. Therefore, we enter into agreements and alliances under the needs and evolution of the business.
Our commercial and business relationships with related parties are entered into at market prices and in Grupo Bancolombia's best interest. Although such transactions are not conflictive, managers may face dilemmas in decision-making. Hence, Grupo Bancolombia employees and managers shall exercise prudence when dealing with an actual or apparent conflict of interest, following the internal policies and guidelines set for this purpose. These policies are included in our Code of Good Governance and our Code of Ethics and Conduct, which can be consulted on our website.
Our Code of Good Governance considers as related parties the companies subject to Bancolombia's supervision, our members of the Board of Directors and Senior Management, including their spouses and children, the companies in which our members of the Board of Directors and Senior Management have an investment of more than 10%, the entities that make up the Sura Bancolombia Financial Conglomerate, and other shareholders of Bancolombia with a stake in our share capital of more than 10%. In addition, such a document contains policies based on which transactions with related parties are classified according to their recurrence and materiality. These policies allow adequate standards of identification, disclosure, evaluation, and, in some cases, approval to be applied to those operations that, due to their materiality, require greater attention from a corporate governance perspective.
Specifically, transactions with entities belonging to the Sura Bancolombia Financial Conglomerate were executed based on the best interest of each of the parties to obtain better conditions for their own business, under the premise of not jeopardizing the companies’ ability to meet their obligations to third parties.
78
The Board of Directors monitored the treasury operations performed with our related economic parties every month, following the market risk classification. These transactions were carried out under market conditions and in compliance with the procedures established for such purposes.
In addition, according to the Organic Statute of the Financial System, certain credit operations, including those of administrators and their relatives, require the approval of the Board of Directors, except for the vote of the respective Director, if applicable. With that in mind, for 2023, after verifying compliance with debt and risk concentration limits, four credit quotas were submitted to the consideration of the Board of Directors. Their approval implied the abstention of the respective Director and was unanimously authorized by the other members of the Board of Directors.
Bancolombia disclosed its transactions with related parties in note 28 of the consolidated financial statements and within note 27 of the standalone financial statements.
Bancolombia promotes the execution of agreements and contracts between the companies that are part of Grupo Bancolombia. Considering that consumer relationships of products and services reflect the parties' interest in obtaining the best conditions for their benefit, none of the transactions entered between Bancolombia and its affiliates or subsidiaries were performed under the exclusive interest of the parent company. In the ordinary course of our business, we enter into such active and passive operations, leasing contracts, correspondents’ office, network use, and, in general, the provision of financial services, following the current legal provisions and the postulates contained in the Good Government Code.
In compliance with the provisions of Article 29 of Law 222 of 1995, the most important operations carried out during the fiscal year 2023 are listed below, detailing their type of operation, conditions, and effects on the company:
Renting S.A.S. and Subsidiaries
At the end of the year, the main active transactions with this company were a credit portfolio for COP 156,001 million and fundraising through savings and checking accounts for COP 43,637 million. These operations generated interest income for Bancolombia S.A. of COP 245 million and interest income of COP 28,547 million. In addition to the above, Bancolombia had commission expenses of COP 12,408 million.
Banca de Inversión Bancolombia S.A.
Bancolombia S.A. raised funds through checking and savings accounts with Banca de Inversión for COP 284,627 million at the end of the year. These liability transactions involved interest expenses of COP 14,810 million.
Bancolombia Panamá S.A.
Bancolombia S.A. recorded active deposit transactions in correspondent banks for COP 80,885 million and liabilities transactions corresponding to deposits for COP 81,148 million at the end of the year. In 2023, Bancolombia S.A. made loans with Bancolombia Panamá, which, as of December 31, amounted to COP 4,095,108 million.
79
The above operations generated interest expenses for Bancolombia of COP 305,253 million. At the end of 2023, Bancolombia recorded expenses in interbank transactions for COP 6,971 million. In addition, the entity recorded net incomes of COP 18 million in cash and derivative transactions.
Bancolombia Puerto Rico International Inc.
At the end of the year, the main asset transactions with this company corresponded to deposits in correspondent banks for COP 37,720 million, and the main liability transactions were due to financial obligations for COP 429,671 million and deposits for COP 50,754 million.
Liability transactions involved interest expenses of COP 35,547 million.
Inversiones CFNS S.A.S.
At the end of the year, Bancolombia S.A. made transactions with Inversiones CFNS for a credit portfolio of COP 30,564 million and fundraising through checking and savings accounts for COP 10,178 million.
These operations generated portfolio interest income of COP 564 million and interest expenses of COP 1,213 million.
Banistmo S.A.
As of December 2023, Bancolombia S.A. registered with Banistmo S.A. active operations in banks for COP 2,463 million and a credit portfolio for COP 399,741 million. It also recorded deposit liabilities transactions for COP 220 million and derivative operations for COP 2,973 million.
At the end of the year, Bancolombia S.A. presented interest income of COP 23,980 million and other income of COP 9,707 million. Derivatives operations generated income of COP 1,993 million and expenses of COP 5,664 million for Bancolombia S.A.
Fondo de Capital Privado Fondo Inmobiliario Colombia
As of December 2023, Bancolombia S.A. had a credit portfolio of COP 692,510 million. In addition, it made fundraising operations through savings accounts for COP 17,353 million.
At the end of the year, Bancolombia S.A. recorded a portfolio interest income of COP 92,262 million and a leasing interest income of COP 10,377 million. The deposits generated an interest expense of COP 600 for Bancolombia S.A.
Grupo Agromercantil Holding
As of December 2023, Bancolombia registered a credit portfolio of COP 76,984 million and deposits in checking accounts for COP 3,909 million with the Grupo Agromercantil Holding Conglomerate. At the end of the year, Bancolombia S.A. presented a portfolio interest income of COP 5,147 million.
Nequi S.A. Compañía de Financiamiento
At year's end, Bancolombia S.A. presented fundraising operations through checking and savings accounts for COP 96,355 million. These liability transactions involved interest expenses for COP 13,830 million.
Other transactions
80
Bancolombia S.A. at year-end raised funds through checking and savings accounts with Fiduciaria Bancolombia and Valores Bancolombia, which at year-end 2023 totaled COP 275,396 million and COP 27,394 million, respectively. These liability operations implied interest expenses and other concepts for Bancolombia S.A., which totaled COP 11,587 million and COP 1,555 million, respectively.
At the end of the year, Bancolombia S.A. recorded liability deposit transactions with Wompi for COP 42,496 million, generated interest expenses of COP 1,219 million, and net commission expenses of COP 292 million.
Bancolombia S.A. presented with Bancoagrícola and subsidiaries liability deposit transactions for COP 2,479 million and net income in derivative operations for COP 1,638 million.
Company’s Legal Status
Our activities and transactions were performed within the applicable legal framework. As of December 31, 2023, as a limited company and bank establishment supervised by the Colombian Financial Superintendency, we complied with the applicable current regulations and the going concern hypothesis. Likewise, we complied with the provisions applicable to issuers of securities in Colombia and the United States. We also adequately and fully complied with the legal requirements of bank reserve, own position, minimum capital, solvency ratio, and mandatory investments.
The results of our businesses are duly reflected in the financial statements. The relevant issues that occurred during the year were duly disclosed to the market through the information mechanisms authorized by the Colombian Financial Superintendence and the Securities and Exchange Commission of the United States (SEC). To date, we have not been notified, nor are we aware of legal proceedings that could jeopardize our operations. However, the main contingencies arising from ongoing legal proceedings are disclosed in note 22 of standalone financial statements and in note 21.2 contingent liabilities of consolidated financial statements.
During the year, we maintained constant communication with supervisors, responding to their requirements and requests. Likewise, we permanently monitored regulatory modifications and current regulatory projects to understand and anticipate their impact on our operations.
On the other hand, we complied with the provisions established by the Colombian Financial Superintendency in the Basic Legal Circular regarding the security and quality of transactional information, as well as with our policies and procedures related to information management. This is to guarantee the protection of consumer information, its integrity, and availability through different channels.
In accordance with the provisions of Act 1676 of 2013, we have complied with the duties that we have for the receipt and payment of invoices issued to us. In this sense and to facilitate the free circulation and payment of these, we adopt measures to guarantee that invoices undergo due processing for timely payment, and that invoice discount operations are attended to with due diligence, among others.
We inform our shareholders that Bancolombia complies with the regulations on intellectual property and copyright in developing our corporate purpose. We own the rights above and have due authorization to execute them through contracts signed with the owners or its authorized distributors of intellectual property rights and/or copyright.
81
As of December 31, 2023, and after the closing, we are not aware of any pending claims from authorities or third parties involving possible intellectual property or copyright violations.
Our Bancolombia brand (nominative, mixed, and figurative) and other relevant brands are duly registered with the competent entity. Currently, Bancolombia has 199 registered trademarks, 10 trademarks in process, 15 commercial slogans granted, 4 commercial trademarks in deposit, and 6 commercial names granted in Colombia. Otherwise, abroad, it has 288 registered trademarks, 69 trademarks in process, 4 commercial slogans granted, and 3 commercial names granted. We highlight the following brands with strategic relevance for the company: Grupo Bancolombia, Grupo Bancolombia Capital, Bancolombia, Nequi, Wompi, and Plink, as well as other prominent brands whose owners are other entities of Grupo Bancolombia: Banistmo, Banco Agrícola and BAM.
In the execution of some of our mission processes, we leverage third-party software licenses under the On-Premise modality. The most relevant are the following: (i) Core, deposits, trade, mortgage, collections, and Nequi; (ii) Core factoring; (iii) Transactional switch for electronic channels; (iv) Communication of branches with the Bank's core application; (v) Transactions on financial instruments (foreign currency, derivatives, fixed income, and liquidity) in real-time; (vi) Reception, transmission, and validation of messages in SWIFT format to and from abroad; (vii) Administration for tax management of AFC accounts; (viii) Receipt of third-party payments by collection companies through bank channels; (ix) Suite of financial products for treasury management; (x) Check signature endorsement and capture; (xi) Landing Zone; (xii) Dynamic key or double authentication factor; (xiii) Robotic automation of processes; (xiv) CRM "Customer Relationship Management"; (xv) Queue manager in branches; and (xvi) Legal reporting.
It should be noted that in the use of these licenses, Bancolombia is exposed to internal and external fraud risks, cyber and information security, operational resilience, business continuity, and technological failures, which are described in the section Relevant Risks. In total, during 2023, 213 suppliers were analyzed, whose total residual exposure is COP 302,000 million; 86% of the risks are tolerable level, 11% moderate level, and 3% critical level. As a result of these risks, 77 action plans were generated that are focused on closing gaps related to the sending of sensitive data to third parties.
Also, we inform that Bancolombia has the following franchises in its operation of the payment methods business (i) Credit cards: Visa, Mastercard, and American Express; (ii) Debit cards: Mastercard; and (iii) Prepaid Cards: Visa.
In operation with the franchises, Bancolombia is exposed to risks of business interruption, external fraud due to information leakage, and errors in centralized compensation for franchises. For these risks, the entity has implemented the following controls: (i) technology business continuity strategies, (ii) information encryption, (iii) secure connections, (iv) international card security certificate, (v) accounting reconciliations, and (vi) reasonableness of amounts payable. In addition, the following certifications are available: MasterCard SOC1, Visa SSAE18 / ISAE3402 and American Express SOC1.
Anti-Money Laundering and Anti-Terrorist Financing Risk Management System (SARLAFT)
In 2023, we deployed actions to adequately manage the Money Laundering and Terrorist Financing (LAFT) risk and prevent the materialization of legal, operational, reputational, or contagion risks associated with these behaviors with a risk-based approach.
82
The following are some of the most important activities carried out during the year:
| • | We evolved the methodology based on the LAFT risk profile and the risk scores of Grupo Bancolombia for the identification of threats and vulnerabilities, seeking greater alignment with the strategy and purpose of the Company. |
| • | We constantly study new trends and monitor the evolution of international conflicts, to anticipate the construction of controls, and design and implementation of policies and processes. |
| • | We deployed the strategy for attending to electoral campaigns, which included strengthening the process of detecting and investigating alerts. |
| • | We support the Company's teams in the implementation of different initiatives to ensure adequate administration and management of the LAFT risk in different products and channels. |
| • | We lead the adoption of SARLAFT regulatory changes and articulate, together with the other impacted areas, the adjustments in the respective processes. |
| • | We transformed the detection strategy in order to achieve comprehensive risk coverage and avoid the generation of excessive alerts. We also implemented new detection schemes using control panels and work schemes focused on each risk. |
| • | We consolidated and stabilized the strategy for investigating alerts by work cells, seeking to manage team capacity more efficiently, achieve greater specialization by risk modality and source of alerts, and address escalated events promptly. |
Thereon, at Bancolombia, we are committed to the evolution of our LAFT Risk Management System, aimed at preventing and mitigating the materialization of these risks and enabling responsible and safe businesses for our customers and Company.
Internal Control System Report
| I. | Administration Report – Certification |
As a result of the activities and evaluations performed by the Administration in its first, second, and third lines, we can conclude that the Internal Control System (hereinafter ICS) and the procedures for control and disclosure of the financial information of Grupo Bancolombia as of December 31, 2023, operated satisfactorily.
In line with the evolution process and dynamics of the business units, our ICS continues to evolve with best practices and recommendations by improving controls and their execution and seeking to provide and maintain the highest possible security and quality in our transactions, information, and disclosure. Employees know the ICS and the different programs that develop or complement it at the various levels and units of the company. The ICS is immersed in operations and periodically reviewed to ensure continuous improvement, with all the elements being duly supported.
Regarding the opinion of the ICS, in compliance with the SOX Act, the administration continuously evaluates and assesses control issues with opportunities for improvement to determine their materiality and define possible action plans if they are relevant to internal control. For observations, weaknesses, and deficiencies observed, remediation plans are undertaken, monitored, and supervised.
83
The administration has the economic and human resources necessary for the proper implementation and operation of the ICS. During 2023, efforts were made to consolidate the internal control function so that the company is increasingly better prepared for the challenges that may arise in the development of its processes, can achieve its objectives, and can adequately manage its internal control. The following developed actions stand out:
| • | Construction of the good practices guide for the preparation of documents. This guide seeks to homologate and standardize the different types of documents prepared in the organization. |
| • | Creation of Internal Control policies and Internal Control over Financial Reporting policies, and updating of Controls, Single Account Statement (EUC), and Segregation of Duties Policies. |
| • | Redesign of the Internal Control Board. |
| • | Creation and structuring of the SOX and Internal Control Committee. |
| • | Design and deployment of the internal control awareness and communication strategy. |
| • | Diagnosis and support for the implementation of External Circular 008 issued by the Colombian Financial Superintendency. |
| • | Creation of the Internal Control Framework. |
Our ICS has policies and procedures consistent with the size and complexity of the business and has been structured to comply with the standards and best practices of the Committee of Sponsoring Organizations of the Treadway Commission (COSO) in its 2013 version.
It is important to mention that, during 2023, there were no remarks by supervisory bodies or sanctions on the entity's ICS.
The general status and main actions developed during the period evaluated for each of the elements of the ICS are presented below.
| a. | Control Environment |
Bancolombia's Board of Directors leads the strategic planning process based on a competitive environment diagnosis, trends, and Grupo’s capabilities to achieve its objectives. The latter seeks to make our purpose, "to promote sustainable development for the well-being of all", reality and to respond to the growing challenges that the environment brings us.
We are committed to promoting responsible and sustainable business. Therefore, we operate under the law and aspire to the highest standards of ethics, integrity, and anti-corruption. We know that the existence of an adequate control environment comes not only from the application of regulations but also from the appropriation of our Movimiento B program as an expression of our culture, and of the six (6) traits that drive us: integrity, sustainable growth, human beings, clients, dynamism, and extraordinary performance. These traits define our culture as a company and motivate and guide our actions.
We have made efforts to strengthen the culture of disclosure and ethical reasoning regarding conflicts of interest, related parties, participation in Boards of Directors and third-party committees, access to privileged information, external activities, gifts and invitations, sponsorships, and gratuitous bailment. We have also promoted trust in the Ethics Line through the promotion of the Whistleblower Protection Policy through awareness-raising activities throughout the organization and targeted at prioritized groups.
84
During 2023, within the framework of the ICS, we worked on strengthening the company's control environment from the compliance, talent and culture, and self-control and certification (AYC) fronts, as detailed below.
The Compliance Vice-Presidency continued to strengthen the compliance programs to supervise and control the risks of Ethics and Conduct, SARLAFT, Anticorruption, Personal Data Protection, Consumer Protection, penalties, FATCA/CRS, Behavioral Risk in Money Markets, Unfair Competition, and Regulatory Compliance. Likewise, the Anti-Fraud Program Strategy and the prioritization of activities against the risk of misappropriation of assets were established. The strengthening of the Anti-Fraud Program framework continued concerning the coordination/articulation role of the Compliance Vice Presidency. The following activities were also conducted:
| • | To promote the duty of disclosure and support for employees, we provided ongoing advice and guidance on ethical dilemmas and resolved general doubts about the guidelines of the Code of Ethics and Conduct. |
| • | Ethical Reasoning Tools were created for the receipt of gifts and invitations, participation in politics, related parties, and external activities, which seek to provide autonomy and empowerment to individuals to make informed and ethical decisions and to assist in these decision-making processes. In addition, we evolved tools for the inadvertent use of privileged information and participation in boards of directors and third-party committees to maintain the traceability of employees' actions in these tools. |
| • | We performed mass campaigns to reinforce the identification and disclosure of situations that generate conflicts of interest, to provide guidelines on employee participation in the policy, and to encourage employees to report such situations through the promotion of the Ethics Hotline and the Whistleblower Protection Policy. Moreover, we created and screened a communication piece to customers in branches to discourage the offering of tips to the sales teams. |
| • | Training and sensitization of different administrative and commercial teams of the company on the guidelines of the Code of Ethics and Conduct and the promotion of the Ethical Reasoning Tools were carried out, achieving a significant increase in the number of consultations and disclosures of possible conflicts of interest by employees. We also held an awareness-raising session with suppliers and partners to share best practices in integrity and cybersecurity. |
| • | We developed a conversation methodology for leaders to foster and institutionalize spaces for open conversations about ethical dilemmas based on psychological safety, listening, and care. |
| • | As a macro sensitization strategy, we leverage the elements and tools provided by the behavioral sciences to nurture diagnosis, measurement, and intervention mechanisms in the company. |
| • | From the anti-corruption front, we conducted an awareness-raising and dissemination of the new Anti-Corruption Policy. These spaces were carried out with the prioritized areas of the organization, and a dynamic methodology was used in which hypothetical cases related to the day-to-day issues of the teams were studied. |
Also, from this perspective, we developed an Ethical Reasoning Tool for users to manage the risks associated with the provision of sponsorships. This tool presents the main risk factors that users must take into account and the main steps and validations that must be carried out before submitting sponsorships.
85
Further, we developed awareness-raising and dissemination spaces for the tool and designed a mechanism to measure its effectiveness.
| • | As for the Ethics Committee, the topics discussed provided guidelines on ethics, conduct, and integrity and positions on highly complex ethical dilemmas. We also participated in the Audit Committee, presenting progress and relevant information on the Anti-Fraud Program. |
| • | A mandatory training plan for employees on internal control and compliance issues is updated annually. Topics related to Ethics, Anti-Fraud, Anti-Corruption, SOX Act, Anti-Money Laundering, and data protection are included in this plan. In 2023, the results obtained were highly satisfactory, achieving 99,8% compliance. |
| • | Year after year, the Ethics Line has become the channel for reporting breaches of the Code of Ethics and Conduct or the policies that complement it by employees, suppliers, and customers of Grupo Bancolombia. All reports and complaints received followed the corresponding process for their investigation. Additionally, investigations were conducted due to alerts detected by the areas responsible for ensuring compliance with the Code of Ethics and Conduct, the Anti-Fraud Program Policies, and the Zero-Tolerance standard for Fraud. When investigations determined that any of our employees failed to comply with the provisions, policies, or ethical standards required by Grupo Bancolombia, either actively or by omission, respective sanctions or disciplinary measures were imposed in accordance with provisions of the Internal Labor Regulations and applicable regulations. |
In addition to internal sanctions, Grupo Bancolombia initiated the corresponding civil or criminal actions deemed viable and appropriate.
Seeking excellence in talent management in the organization in connection with the Internal Control System, the Vice-Presidency of Talent and Culture implemented the following strategies:
| • | We are making progress in building an enriching work environment that fosters personal and professional development, as well as the well-being of our employees, while strengthening our employer brand to attract, empower, and retain the best talent with key knowledge. To achieve this, we have renewed our value proposition, focusing on three essential pillars: development, connection, and enjoyment, which form the basis of the work experience in our organization. |
| • | We focus on the evolution of talent and culture processes aligned with the sustainability of Banca en Movimiento. We accompanied the operation of the 59 Continuous Value Teams, achieving more than 85% compliance with its objectives and key results. In addition, we established a capacity management strategy that will guide our actions through 2024. |
| • | We make a significant investment in the development of our employees through multiple programs designed according to the strategic needs of the business and the best practices of the environment. The objective is to contribute to the evolution of the employees, helping them to reach their best version and meet the proposed goals. |
| • | To enrich the employee experience, we use tools such as "Y tú que dices" to gather their opinions. We also perform detailed demographic analyses of their trajectory in the organization, identifying areas to highlight and opportunities for improvement. This data allowed us to create a three-year strategic plan to intervene and improve the talent experience comprehensively. |
86
| • | We develop actions to maintain a solid and constantly evolving culture, together with the strategy and dynamics of the organizational ecosystem, to promote good performance and well-being. Practices such as MovimientoB, LíderB, and Tiempo de Enfoque, among others, summon employees through various collective actions to materialize the experience of our purpose. |
| • | We have a Social Dialogue model characterized by the promotion of respectful spaces for conversation, which reflects our firm determination to achieve a balance between the well-being of our employees and the sustainability of the company. |
| • | We made progress in strengthening the model of governance of employee information and data protection to ensure the proper management of internal information based on the policy and manual of data processing. |
Finally, the following activities were carried out by the areas in charge of coordinating Self-Control and Certification (AYC) actions:
| • | A total of 754 processes were certified, which led to close 1,691 commitments for continuous improvement. Furthermore, 150 controls at branches were certified. A total of 42 findings were managed and closed with the process holders. A 100% completion rate of self-evaluation was achieved by commercial advisors, service advisors, senior executives, managers, assistant managers, and supernumeraries. Likewise, 70% of the managers were certified in the services provided to suppliers, 224 contract managers responded to the Supplier Certification, and 195 improvement commitments were generated. |
| b. | Risk Assessment and Control Activities |
Grupo Bancolombia has a risk and control management framework that allows it to preserve the efficacy, efficiency, and effectiveness of its management and operational capacity; and prevent, avoid, or minimize the probability of events that may affect the operation or compliance with the objectives and/or the costs or damages caused associated with the materialization of these events.
87
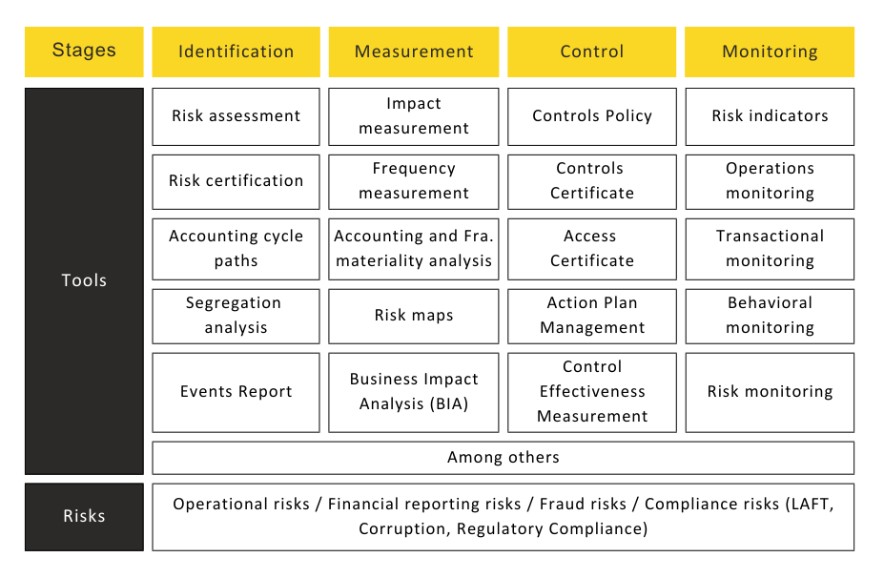
This framework promotes a risk management culture through self-control, self-management, and self-regulation. It includes the identification of the different risks to which the organization is exposed and the definition of roles and responsibilities of the different lines and areas of the company concerning these risks. These roles and responsibilities are aligned with the provisions of the SOX Law and the Chapter of the Basic Legal Circular - C.E. 029 regarding the Internal Control System, ensuring its compliance.
In June and December 2023, External Circular (EC) 018 issued by the Colombian Financial Superintendency in September 2021 on the "Comprehensive Risk Management System (SIAR)" came into force. This Circular allows the entity to have a global vision of the risks to which it is exposed, including governance guidelines, the definition of the risk appetite framework, and the aggregation of data and reporting.
During the year, the risk committee periodically monitored the appetite, tolerance, and capacity limits approved by the Board of Directors. Similarly, it implemented a control board to monitor the main risks to which the entity is exposed, such as credit, market, liquidity, operational, capital, and concentration risk, as applicable, and also introduced an action framework, which indicates the process when exceeding the defined limits.
Adequate structuring in the three lines and their proper functioning avoids gaps and unnecessary duplication of efforts and provides greater possibilities for achieving adequate risk management through interaction between the business and support units and the control and prevention units. It facilitates the achievement of organizational objectives and provides reasonable assurance to the various stakeholders on the control of risks and the entity’s sustainability.
In a joint effort between the different lines (business units, the risk and control systems of the second line, and the assurance function of the third line), measures have been reviewed and implemented to increase the company's resilience and its capacity to adapt to supervening events that may affect the way it provides its services.
88
Business and support units are constantly improving and implementing new controls to maintain their effectiveness and efficiency to mitigate risks and ensure the achievement of operational, compliance, and information objectives.
For risks that significantly expose the company and for which management decides on their mitigation, action or remediation plans are undertaken and executed within reasonable timeframes according to their complexity and scope.
In addition, the following measures were undertaken by the different risk management or control systems to improve the management, treatment, prevention, and control of risks:
| • | Controls and validations on the quality and recording of operational risk loss events were reinforced. |
| • | Operational risk losses were included in the calculation of regulatory solvency. |
| • | New functionalities were implemented in the GRC application (application for governance, risk, and control management) associated with the analysis of segregation rules and IPE (information processed by the entity). |
| • | Improvements were made to the operational risk assessment methods. |
| • | Third-party risk management processes were strengthened, integrating different risk programs to have a comprehensive view of them. |
| • | A structured risk analysis process was implemented for product modifications or new product launches, seeking better assurance and supervision of second-line and support functions. |
| • | The behavioral risk analysis associated with the products offered was implemented. |
| • | A workflow was implemented to ensure the follow-up and observation of validation milestones against model risk. |
| • | A new tool was implemented to manage the EUC (End User Computing) inventory, and the risk-based criticality assessment was improved. |
| • | The internal reclassification process of vulnerabilities was improved, allowing them to adjust their score to the information and context of each asset. This process was focused on remediation management of the most critical ones for the organization. |
| • | The vulnerability scanning frequency was increased from 3 to 4 times per year. |
| • | The analysis of the controls that operate over technology to mitigate cyber risk was improved. |
Additionally, Grupo Bancolombia, aware of the importance of the role of its employees in the proper management of risk, implemented training and culture strategies so that the company would have people aware of and trained on the subject.
It is important to highlight the role of Senior Management and the Board of Directors, who, throughout the year, actively participated in the approval, follow-up, and control of the company's risk management policies, methodologies, tools, guidelines, and strategies.
| c. | Information and communication |
Grupo Bancolombia ensures that clear and timely information is available to its employees and other stakeholders. Therefore, information administration and management policies are part of the training programs that all employees must complete.
89
These guidelines and definitions are aligned with the ICS and are constantly being improved.
Likewise, Grupo Bancolombia relies on the Information Security Management System (ISMS), which contains cybersecurity and information security policies based on international reference frameworks. In turn, Grupo Bancolombia has a cybersecurity strategy that is implemented through programs that include, among others, the design, implementation, dissemination, education, awareness, and maintenance of controls and mechanisms to manage cyber and information security risk.
The main purpose of the strategy and the ISMS is to safeguard the confidentiality, integrity, and data availability of customers, employees, shareholders, other stakeholders, and strategic or business information. It also seeks to have a controlled environment in interactions with allies and related third parties.
In addition, the company has an appropriate control environment for its processes and applications to ensure that the information managed, stored, or processed complies with security, integrity, confidentiality, availability, quality, and backup criteria. Grupo Bancolombia manages its platforms, applications, and the information handled therein according to Control Objectives for Information and Related Technologies (COBIT) standards.
Grupo Bancolombia continues to consolidate the methodology for identifying and classifying the use of information assets, including those shared with suppliers, to implement protection mechanisms according to their level of criticality.
As a good practice, the company performs an internal security assessment to identify opportunities for improvement and strengthen the implementation of processes and frameworks to prevent information leakage, adequate corporate strategy, process evolution, controls and technologies for the protection of information assets, as well as the incident and threat management with international standards.
During 2023, the deployment and strengthening of the ICS culture were leveraged through internal communication channels, where there was information related to the Code of Ethics and Conduct and the Anti-Fraud Program. Similarly, through internal communication campaigns, employees were dissuaded from engaging in improper practices and invited to seek assistance from established support channels if they found themselves in situations at risk of fraud. We worked on strengthening the analysis of segregation of duties, self-management of risk in End User Computing (EUC), and cybersecurity risk management.
Additionally, in 2023, the Data Protection Management System (DPMS) was strengthened and implemented as follows:
| • | The scope of support for the implementation of the personal data program was expanded to other businesses and subsidiaries, such as Nequi, Wompi, Negocios Digitales, Fundación Bancolombia, Wenia, and Renting. |
| • | We continue with the Privacy by Design methodology management and socialization to provide self-management tools on data protection issues for initiatives, projects, and alliances, among others. |
| • | Privacy impact assessments were carried out, leveraging the Privacy by Design Methodology to manage risk in the protection of personal data in various strategic business initiatives within the company. |
90
| • | The information domains of employees and suppliers were managed within the Data Protection Management System. |
| • | We continue with the management of data protection risk in third parties through the evaluation of the control environment for third parties’ data protection from the Supplier Management Model. |
| • | We continue managing the maturity model of the Data Protection Risk Methodology (Identification, Measurement, and Control) in synergy with the Compliance Risk Methodologies Management and the Non-Financial Risk Methodologies Management. |
| • | The Personal Data Protection Policy was updated for Bancolombia and Fiduciaria Bancolombia. |
| • | Institutional and customer requirements were met in a timely manner. |
| • | We studied different bills and decrees with an impact on data protection and Habeas Data programs, aiming to anticipate them. |
| • | We made reports and updates to the National Database Registry (NDR), administered by the Superintendency of Industry and Commerce (SIC). |
| • | The scope of the strategy for culture and training in personal data protection was expanded to vice presidencies and areas that, due to their relationship with data processing, are considered a priority. |
| • | We settled workgroups led by the Personal Data Protection and Habeas Data knowledge area, with a special focus on consent management in response to the regulatory evolution of Open Banking, Open Finance, and Open Data. |
Additionally, the Personal Data Protection and Habeas Data Knowledge Area initiated the structuring of a Habeas Data program in compliance with Article 19 (Demonstrated Responsibility) of Law 2557 of 2021.
As part of the communication strategies, the entity defined risk management as an essential part of the company's culture, reinforcing the roles and responsibilities under the Three Lines Model and the Internal Control significance through the campaign "Dale la vuelta al riesgo" ("Turning risk around"). The objective of this campaign was to raise awareness of risk management and control among all employees, making them aware of their role within the model and their commitment to active risk management.
Besides, SOX and Internal Control Corporate Management carried out a deployment in different areas of the company to explain through different forums the updates of the Three Lines Model and the responsibilities of the areas according to the new definitions of the Model. This facilitated the generation of synergies, an integrated vision of risk management, and organizational coherence.
Below is the Three Lines Model defined for Grupo Bancolombia, which encompasses the most relevant principles and functions of each line:
91
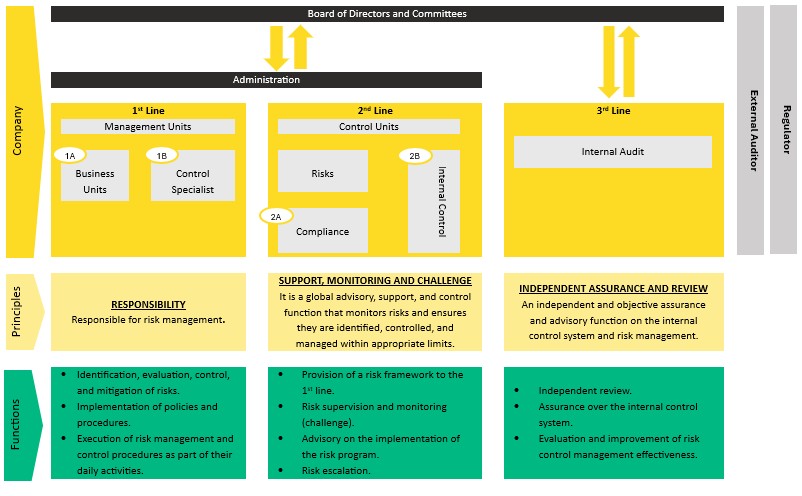
Three Lines Model defined for Grupo Bancolombia.
Regarding information disclosure to the market, the Disclosure Committee is responsible for supervising the timeliness, sufficiency, and clarity of the information disclosed by Bancolombia to its investors.
| d. | Monitoring |
The Internal Audit, as a third line, is in charge of improving and protecting the company’s value by providing assurance, consulting, and risk-based analysis. It is the area responsible for evaluating the internal control system. It allows the Board of Directors, the Audit Committee, and other Board and Senior Management Support Committees to exercise their supervisory role and validate the proper functioning of the ICS in the company.
Internal Audit Report
From Internal Audit, as a third line, independently and objectively, we improve and protect the company’s value by providing assurance, advice, and risk-based analysis. We have the necessary resources to perform our function without limitations or conflicts.
In the development of the Internal Audit work, current regulations and standards, internal policies defined by the Board of Directors, the Audit Committee, and other internal provisions were taken into account, as well as the standards for the professional practice of internal auditing defined by The Institute of Internal Auditors (IIA), who certified the area's processes until 2027.
In line with the evolution and dynamics of the business and supporting the achievement of the organization's strategic objectives, we provide Internal Audit services corporately for all geographies, generating trust among our stakeholders through a comprehensive approach to relevant processes.
Among the executed activities during 2023, we highlight:
92
| • | We audit the following processes, among other ones: |
| - | Ecosystem, product, and channel development and operation. |
| - | Risk management systems and business continuity. |
| - | Credit cycles and portfolio impairment risk methodologies. |
| - | The life cycle of technology solutions, infrastructure and IT continuity, cybersecurity, and corporate security. |
| - | Processes for money laundering precaution and customer knowledge and linkage. |
| - | Treasury operations, processes of the investment areas, and the stockbroker and its subsidiary Bancolombia Capital in Miami. |
| - | The sustainability strategy with works execution for ESG risk management, compliance with Circular 031, indicators associated with the company's strategy, and monitoring of the Dow Jones index. |
| - | Fiduciary products of Leasing, Sufi, and Nequi, and the activities developed in other subsidiaries like Renting, Wompi, Wenia, and Banca de Inversión with its capital investments. |
| - | Financial, accounting, and tax management, strategic allies, fraud management, superior customer experience, and mandatory compliance issues required by control entities. |
| • | We performed a face-to-face and centralized testing tour at branches, banking correspondents, and independent offices. |
| • | We monitored the closing of gaps identified by various external control entities such as the Colombian Financial Superintendency and the Statutory Auditor. |
The Audit Committee and management have been periodically informed of the results of the evaluations. These stakeholders have accepted the recommendations and are formulating and implementing action plans to ensure adequate risk management.
Finally, based on the consolidation of the results of the Internal Audit evaluations, considering the five components and 17 principles of the COSO model, we can conclude that the internal control system is adequate and operates reasonably in the company.
Audit Committee Report
During 2023, the Audit Committee supported the Board of Directors in overseeing the effectiveness and proper functioning of Bancolombia S.A. and Grupo Bancolombia's internal control system. The Committee incorporated into its functions new regulatory requirements defined by External Circular 008 of the Colombian Financial Superintendency. This strengthened the accountability process of the different areas or lines of defense and provided ongoing monitoring of the five components of the integrated internal control framework (COSO): control environment, risk management, control activities, information and communication, tracking, and monitoring.
Among the activities carried out by the Committee, the following stand out:
| • | It verified controls in the preparation of the financial and accounting information of Bancolombia S.A. on a separate and consolidated basis, as well as in its presentation and revelation while ensuring the fulfillment of the current provisions and the achievement of financial performance goals defined by the entity. |
93
| • | It evaluated the financial information disclosed to the market in 2023, including the 20F report submitted with the 2022 fiscal year, ensuring its transparency, reliability, and integrity. |
| • | It studied the reports presented by the Statutory Auditor and the Internal Audit on the evaluation of the effectiveness of the internal control system, duly following up on the management of the Administration in the implementation of the action plans and the respective closing of gaps. |
| • | It reviewed the management of risks by the administration through an accountability process with key executives and by holding private meetings with the President, the Internal Auditor, and the External Auditor. |
| • | It approved and monitored the execution of the Internal Audit and External Audit work plan, ensuring their autonomy, objectivity, and independence. |
| • | It approved the assurance and quality improvement policy of the Internal Audit and its budget. Moreover, it successfully assessed the work performed by the Internal Auditor in 2023. |
| • | It accompanied the implementation of Circular 008 on Internal Control of the Colombian Financial Superintendency. |
| • | It presented to the Shareholders’ Meeting, through the Board of Directors, the candidate to hold the position of statutory auditor for the period 2024-2026, after analyzing the alternatives in aspects such as services offered, costs and fees, experience and knowledge of the sector. |
| • | It analyzed the cybersecurity strategy, the policy approval that makes it viable, and the strategic technology plan with its technological developments for the short, medium, and long term. |
| • | It evaluated the operation, implementation, and strengthening of the programs managed by the Vice Presidency of Compliance, including the Anticorruption, SARLAFT, and Financial Consumer Protection programs. In particular, in the area of ethics and integrity, it supervised the evolution of the program and the ethical culture in business, the zero-tolerance fraud program, and the functioning of the Ethics Line. |
Based on the results of the works carried out by the Committee and the results of the audits by the Statutory Auditor and Internal Auditor, the Committee declares that no material deficiencies were detected that could affect the internal control system, nor the financial statements and management report.
The Committee considers that Grupo Bancolombia has an adequate internal control system in compliance with the policies and regulations in force for the correct preparation, presentation, and disclosure of the financial statements for the consideration of the Shareholders' Meeting. Therefore, the Committee recommends that the consolidated financial statements and notes, as of December 31, 2023, be submitted to the shareholders for approval, being duly audited and without exceptions.
This report was made by the Audit Committee of Bancolombia S.A. for its presentation by the Board of Directors to the Shareholders' General Meeting.
SAC Report
Bancolombia has a Consumer Service System (CSS) that is constituted by the following elements to protect the financial consumer:
94
1. Policies, procedures, and controls adopted by the Bank to ensure the proper protection of financial consumers, fostering an environment of attention and respect.
2. Financial education campaigns for consumers on different operations, services, markets, and types of activity of supervised entities, as well as the different mechanisms for protecting their rights.
3. Training for employees on offering, advising, and providing services or products to financial consumers.
4. Mechanisms that promote compliance with the principles, obligations, and rights established in the corresponding regulations.
5. Mechanisms to provide adequate information within legal terms.
6. Procedure to attend petitions, complaints, or claims.
7. Mechanism that creates statistics on types of complaints to identify improvement opportunities and corrective actions.
Bancolombia always behaves under the principle of due diligence, proper management of conflicts of interest, and transparency, ensuring the delivery of accurate, sufficient, and timely information at all times.
Align with the purpose of “Promoting sustainable development to achieve well-being for all,” Bancolombia S.A. permanently takes actions aimed at protecting the rights of the financial consumer and the adequate management and function of the Customer Service System (CSS). In this regard, the Compliance Vice Presidency, in its role as coordinator of the Financial Consumer Protection Program, supports Senior Management and the Board of Directors by providing knowledge and skills to consolidate an environment of due care, fair treatment, protection, respect, and proper provision of services to clients and users.
During 2023, efforts on this subject were mainly focused on four targets:
| • | To properly introduce the act of reporting through the app Smartsupervision to guarantee truthful and high-quality information. |
| • | To satisfactorily manage the behavioral risk. |
| • | To financially educate our financial consumers. |
| • | To establish the new Financial Consumer Ombudsman's Office. |
For the Bank, it is fundamental to know, understand, and introduce improvement actions about CSS. The Financial Consumer Ombudsman Office, the Statutory Audit Office, labor unions, and the Colombian Financial Superintendency are strategic allies with whom we work collaboratively to provide correct, efficient, and timely assistance to consumers, resulting in a superior experience.
In 2023, the main economies of Latin America faced economic uncertainty, political changes, and external elements that affected their growth trajectory. To meet the new challenges, in 2023, the Corporate Risk Vice Presidency developed initiatives and/or projects to leverage the organization's strategy, among which the following stand out:
| ● | Consolidation of teams that have a cross-functional role in managing the risks to which Grupo Bancolombia is exposed, including the Corporate Non-Financial Risks Management |
95
| and the Integral Risk Management Directorate. The Corporate Non-Financial Risks Management Directorate served as the team responsible for evolving the management of non-financial risks, with a priority on ESG risks and establishing their policies, models, frameworks, and measurement indicators. Additionally, the Integral Risk Management Directorate advanced in implementing maturity models for different risks, structuring a new methodology for risk mapping, updating appetite limits, and managing capital and analytics as fundamental pillars for the consolidation and advancement of risk management. |
| ● | The update of the Risk Manual in accordance with the External Circular 018 of 2021 issued by the Colombian Financial Superintendency regarding the Comprehensive Risk Management System (SIAR), which entered into force on June 01, 2023. |
| ● | Compliance with the instructions contained in numeral 10 of Part II of Chapter XXXI of the SIAR, related to the aggregation of risk data and reporting, and the implementation plan for the management of Interest Rate Risk in the Bank Book (IRRBB), considering the testing period and the effective date of the applicable instructions. |
| ● | During 2023, they worked on hardening the internal control function from the Directorate of Non-Financial Risk so that Grupo Bancolombia can adequately face the challenges that arise in the development of the different operations. To achieve this, the Corporate Risk Vice Presidency developed an Internal Control Policy, aligned with the COSO model, defined measurement indicators, and deployed a sensitization and communication strategy, leading the Company to a higher level of maturity in the culture of internal control management. |
| ● | For the end of 2023, a working framework was developed for the management of ESG risks; first evaluations on climate change, physical, and transition risks were made; and the objective physical risk model was constructed to advance towards the implementation of mass evaluations. |
| ● | To strengthen and adapt the process of counterparty credit risk management to international standards, progress was made in implementing the application for managing this risk in the derivatives portfolio. |
| ● | A work plan was established to comply with External Circular 025 of the Colombian Financial Superintendency of November 2022, which was focused on adjusting internal methodologies for interest rate risk in the banking book (Economic Value of Equity) and developing behavioral option models. |
| ● | To strengthen the value proposition for our clients, the Vice Presidency enhanced the approval processes for alternative investments, Fund houses, and ETFs, which improved response times and investment opportunities. |
The Risk Vice Presidency continued to develop the communication campaign “Dale la vuelta al riesgo” as part of our cultural strategy, aimed at reinforcing the importance of understanding the economic context when making credit decisions, knowing the customer in-depth, and refining re-banking processes.
Likewise, we raised awareness among employees about the relevance of credit risk for Grupo Bancolombia and showcased the evolution in creating models and tools and using analytics to mitigate risks and provide better service to our clients. Additionally, emphasis was placed on the importance of the control environment and how each employee, within their role, can contribute to its compliance.
96
Following the Movimiento B program, we implemented strategies to strengthen our leaders' and employees' soft skills, prioritizing empowerment as a feature of the culture to be developed in the Vice Presidency and strengthening the knowledge and analytical skills of the teams, among others. The above is aligned with the strategy's fundamental pillars and the objectives of developing human talent with skills for today and the future.
In the Corporate Risk Vice Presidency, we have highly qualified human talent to manage, integrally and adequately, the different risks to which the organization is exposed. Following the human talent development objectives, we met the training plan defined in accordance with the knowledge maps. In 2023, the compliance percentage of the Vice Presidency mandatory plan was 99.45%.
Regarding the corporate governance model, it is worth mentioning that this model grants the Corporate Vice President of Risks direct authority over risk management, ensuring through the risk framework the independence among the areas involved in their management, the existence of committees, and the hierarchical structure.
On the other side, the Board of Directors knew and approved the resources quoted in External Circular 018 of 2021 of the Colombian Financial Superintendency and the government structure associated with risk management. To comply with its monitoring functions, the Board had the support of the Risk Committee, as the entity in charge of accompanying it in the approval, tracking, and control of policies, methodologies, tools, guidelines, and strategies for the identification, measurement, control, and risk mitigation, with the periodicity established in the standard.
Below is a summary of risk management in Grupo Bancolombia during 2023:
The dynamic of Grupo Bancolombia's portfolio was influenced by the global economic slowdown and high inflation levels in all the regions where the Grupo operates, coupled with uncertainty in the political and social environment and the appreciation of the Colombian peso against the American dollar, which mainly impacted Colombia. As a consequence, important deteriorations in portfolios were observed, especially in natural person portfolios, consumption, and mortgage ones. This triggered early interventions in the origination, follow-up, and collection policies of the most impaired portfolios, intending to improve the risk profiles of new businesses, resulting in a decrease in disbursements.
In this sense, we maintained proactive credit risk management during 2023 by monitoring and accompanying customers and portfolios, evaluating conditions and particular requests of each one of them, as well as developing methodologies, tools, and models that optimize debt collection.
Among the activities developed to continue optimizing the risk management of the entire credit cycle, we highlight the following:
Origination
Taking into account the performance of the economy and in line with a more controlled risk appetite, conservative lending policies were implemented, primarily in natural person portfolios. These policies are supported by enhanced predictive models with a tighter risk profile of customers and responsiveness, reducing reaction times to changes in the environment.
97
In addition, improvements in the physical and automatic processes, the implementation of new controls, and the generation of early alerts allowed a portfolio placement focused on more favorable profiles.
About sectoral risk management, we unified the risk vision in the different economic sectors, managing to participate in the market with better strategies and using methodologies and tools to carry out more comprehensive management.
With the sectoral components of credit risk management, we understood cycles and anticipated better decisions, managed and prevented current and potential portfolio risk, modeled future scenarios, and optimized risk models, including sectorial impact. For this purpose, we have ratings, policies, and sector diagnostic templates, which helped us to focus origination according to appetite.
Follow-up
For 2023, the monitoring stage was the central focus of the cycle. We concentrated on credit cycle strategies with early and integrated decisions at all stages, supported by predictive analytical models.
We continued developing new monitoring processes and models with corporate scope, starting with Colombia.
These processes and models will enable proactive and timely customer management through tools like the Special Risk Management Tool (HERA), which is aimed at facilitating cross-functional credit cycle management and ensuring a comprehensive view of the portfolio and customers. Along with the countries, we successfully designed and planned the construction of data models for information from different stages of the credit cycle, aiming to provide the required information to models and tools and support decision-making regarding the portfolio.
Besides, we made progress in behavioral models, alerts, and early estimation of variables, which include not only traditional information but also alternative and sector information. Likewise, we have evolved the monitoring processes, making them more agile and timely for the portfolio, guarantees, covenants, and advances.
Predictive analytical models with traditional and alternative information enable us to improve the quality of customer qualification and have a broader coverage of customers qualified automatically, avoiding subjective judgments and achieving greater agility and timeliness in the process. This makes it possible to take early action, aligned with strategic decisions at all stages of the credit cycle.
Models are monitored and updated periodically and are under permanent study for their continuous evolution and open to new relevant variables that improve their prediction and disaggregation into increasingly specialized segments.
In this sense, we have early warning models that allow us to identify possible deviations from the projection of portfolio composition and sectoral analyses to manage portfolios affected by macroeconomic variables and other situations. The aforementioned enables us to generate reports that alert us about the most affected economic sectors and allows us to evaluate the most representative companies in each of them.
98
We also monitor the concentration risk in the loan portfolio, as events involving one or several of the largest economic groups could adversely and significantly affect the operating results and financial position of Grupo Bancolombia. The monitoring and management of this concentration is highly relevant and is carried out not only to comply with applicable regulations but also to achieve strategic management.
As of December 31, 2023, the total outstanding amount of Grupo Bancolombia's 20 largest economic groups, on a consolidated basis, represented 13.4% of its loan portfolio. No individual exposure represented more than 1.5% of said portfolio.
Recovery
To recognize the changes in the customer’s risk situation in all segments and sections, we maintain proactive management and an early collection for the portfolio in line with macroeconomic changes.
In 2023, the progress and strengthening of collection models and pre-approved creation, along with an increased digitization of the process and the implementation of alternative strategies with payment incentives and behavioral economics, enabled self-management and allowed us to achieve significant results for the year. In addition, through experimentation, we have developed new recovery schemes that focus on customer rebanking, initially in Colombia.
We evolved our collection model through an online channel, generating easy contact and adjusting announcements and guidelines for offering payment options. The purpose of this is to generate greater closeness with our customers through simplicity, active listening, and accompaniment. As a consequence of those strategies, through online collection channels, we have reached around 960,000 potential customers and achieved an updating of contact data for 380,000 customers in Colombia. Similarly, we offered pre-approved alternatives in Panama for close to 30,000 customers.
In addition, within the estimates of the portfolio provisions, the value of the collateral is considered as backing for the operations and its mitigation, considering that its physical and market characteristics are reflected in a fair value. Given that external elements such as market conditions, macroeconomic, environmental, and political conditions can impact the value of personal and real collateral supporting Grupo's portfolio. Such elements were considered in the valuation of collaterals, a process carried out by external and independent entities from Grupo that have the experience and suitability required by regulatory authorities.
For impaired portfolios, this valuation is conducted no less than once a year.
Grupo Bancolombia Results
Grupo Bancolombia Portfolio Balance
Figures in trillions of Colombian pesos
99
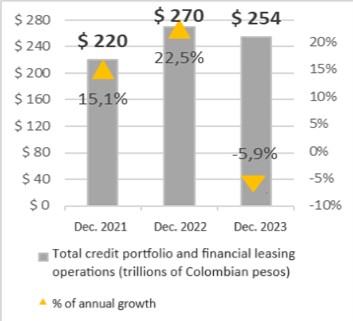
The gross portfolio balance of Grupo Bancolombia in Colombian pesos recorded a decrease of 5.9% for the closing of December 2023 compared to the same month of the previous year. This decrease is mainly attributed to the appreciation of the Colombian peso against the American dollar during the analysis period, which impacted the re-expression in COP of Grupo's foreign currency portfolio and the contraction in consumer and microcredit modalities primarily for Bancolombia. Additionally, the reduction in the commercial portfolio of Banco Agrícola, Banistmo, and Bam was added to the above, mainly derived from the global economic slowdown.
Remarks: Total exposure information IFRS (International Financial Reporting Standard) 9.
It includes figures from Bancolombia, Panama, Puerto Rico, Banistmo, Banco Agrícola and BAM.
The consolidated 30-day ICV defaulting index showed an increase, reaching 5.39% for December 2023, compared to 3.55% recorded in the same month of the year 2022. This increase was associated with macroeconomic effects that impacted both natural persons and legal entities, such as high levels of inflation, interest rates, and economic slowdown in most sectors. During the period, various strategies were developed throughout the credit cycle, which allowed the implementation of advanced and coherent actions tailored to the reality of customers and their environment. This is intended to contain deterioration and place them in better risk profiles.
Similarly, the 90-day overdue portfolio balance increased by 48.1% between comparable periods, generating a direct impact on the 90-day overdue portfolio indicator, which closed at 3.69% compared to 2.49% in the same period of the previous year.
The annual cost of credit for the closing of 2023 was 2.8%, which was 82% higher than the 1.6% recorded in the previous year, primarily due to increased expenditure in the natural persons and SME banking portfolio.
Bancolombia
100
Bancolombia Portfolio Balance
Figures in trillions of Colombian pesos
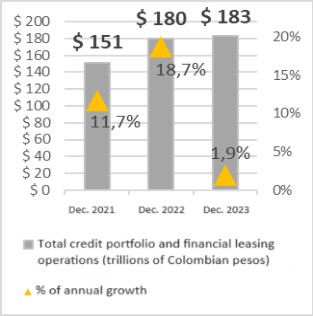
At the end of 2023, Bancolombia closed with a 1.92% growth in the portfolio compared to the previous year. This behavior was mainly explained by decreases in the annual portfolio of Natural Persons, SMEs, and Corporate segments, driven by lower disbursement dynamics and higher cancellations in the legal entities segment.
Remarks: Total exposure information IFRS (International Financial Reporting Standard) 9.
The 30-day past-due loan portfolio indicator closed December 2023 at 5.0%, which represented a growth compared to the 3.6% at the end of December 2022, largely explained by the macroeconomic situation the country is going through. The segment most affected is the individuals one. In order to avoid future rollovers and effectively manage the portfolio, we continue to develop various follow-up strategies, along with comprehensive customer support through customized solutions. In the other segments, we also make a proactive follow-up to anticipate the materialization of risks.
The overdue portfolio coverage decreased during the period, ending at 130.9% at the close of December 2023 compared to 166.7% in the same period of 2022.
In 2023, the accumulated provision expenses amounted to COP 6.5 trillion, representing a 117.3% growth compared to the previous year. This resulted in a credit cost for 2023 of 3.57% higher than the 1.8% recorded in the previous year. This growth is driven by the behavior of consumption due to a greater deterioration of the portfolio compared to 2022 and a challenging macroeconomic environment that affected the performance of the portfolios.
Other companies (1)
For the end of 2023, Banistmo experienced a decrease of 22.15% in the portfolio balance in Colombian pesos against the previous year. This change was due to currency effects, given the revaluation of the Colombian peso against the American dollar, accompanied by a decrease in the portfolio in its original currency (USD) in the commercial category and a slight growth in the consumer and housing categories.
The 30-day overdue portfolio indicator stood at 8.5% at year-end 2023, compared to 3.9% in 2022. Total overdue portfolio coverage ended at 60.4% compared to the 137.8% reported in the previous year. The impact on these indicators was primarily due to the deterioration of a significant customer in the real estate sector, which has the backing of real estate collateral that reduces the provision value. Additionally, it was due to the deterioration of the housing portfolio caused by the termination of reduced payment agreements and the normalization of mortgage payments, particularly among long-standing customers affected by macroeconomic impacts such as unemployment and inflation.
(1) The information exposed for the Grupo companies, other than Bancolombia S.A., includes the restatement of figures from U.S. dollars to Colombian pesos under the IFRS standard. During the period from December 2022 to December 2023, the Colombian peso devalued 20.5% against the U.S. dollar.
101
The strategies used for proactive management that fulfill the customers' needs were the following: implementation of origination strategies focused on better risk profiles for natural persons, customer knowledge using both internal and external information, and the activation of new recovery processes.
In Bancoagricola, the balance of the portfolio in Colombian pesos ended 2023 with a decrease of 18.97%, mainly explained by the effect of COP revaluation against the American dollar and the decrease in the commercial and housing portfolios, which, compared to a moderate growth in the consumer portfolio in its original currency (USD), was not sufficient to counteract this effect. The positive dynamic on the consumption portfolio was due to an expansion strategy on natural person customers with better risk profiles.
The 30-day overdue portfolio indicator for the end of the year was placed at 2.5% against 2.2% for 2022. For companies, the explanation is the deterioration of specific customers belonging to the textile sector. For natural persons and SMEs, origination strategies implemented were highlighted. Regarding coverage, it closed at 146.6% in December 2023, compared to 178.7% in the same period of the previous year.
For its part, Bam experienced a decrease of 18.73% in the portfolio in Colombian pesos at the end of 2023 compared to the quantity of 2022. This decrease was due to the previously mentioned Colombian peso revaluation against the American dollar and a moderate growth in the consumer and housing portfolios. The better dynamism observed in natural person banking is highlighted as a response to growth strategies in this segment.
The 30-day overdue portfolio indicator was 3.6% against 2.8% of the year-end 2022, driven by the growth of past-due balances in the natural person portfolio, specifically in consumption products. This is a consequence of the impact of political, social, and economic situations faced by the country during the year. Coverage of the 30-day overdue portfolio ended at 145.6% in December 2023, compared to 160.7% in December 2022.
In Bancolombia Panamá, the portfolio balance in Colombian pesos showed a decrease of 25.17% compared to the previous year due to partial and total payments from corporate clients and the impact of the Colombian peso's appreciation against the American dollar during the period under review. The 30-day overdue portfolio indicator stood at 0.22% at the end of 2023, compared to 0.02% in 2022, explained by the deterioration of customers in Colombia, who were affected by the country's macroeconomic effects.
Regarding Bancolombia Puerto Rico, the portfolio balance in Colombian pesos experienced a decrease of 8.22% compared to the previous year, explained by the revaluation of the Colombian peso against the American dollar, contrasting with a 15.5% growth in the portfolio in its original currency (USD). This is due to the expansion strategy implemented during the year. The overdue portfolio closed at 0.15% in December 2023, compared to 3.91% in December 2022, an improvement mainly explained by the sale of a significant customer portfolio in the agricultural sector and the write-off of a customer in the commercial sector.
COUNTRY RISK
During 2023, the Country Risk management framework was implemented for the financial companies of Grupo Bancolombia, subject to the application of the SIAR. This risk refers to the possibility that an entity may incur losses due to financial operations abroad as a result of a deterioration in the economic and/or socio-political conditions of the country receiving these operations, either due to limitations on currency transfers or factors not attributable to the commercial and financial condition of the receiving country.
102
This definition includes the sovereign risk (SR) and transfer risk (TR), among others.
At Grupo Bancolombia, we have guidelines, processes, and methodologies that allow us to periodically assess the country risk to which the Company is exposed in its capital investments. Capital investments are understood as those made in jurisdictions other than Colombia, which have a high individual or aggregate economic materiality by country and are intended to be permanent.
The country risk management includes the risk identification, measurement, control, and monitoring stages to which the entity is exposed. For such management, the business plan, the type of operations carried out, their materiality, their current and future vocation, and the characteristics of the country receiving the investment are also considered. Equally, the management is supported by methodologies and processes that are used in country risk management and are developed by the Vice Presidency of Risks and approved by the Board of Directors.
The definition of capital investment appetite considers the country risk assessment as defined in the SIAR, and aims to ensure compliance with solvency and liquidity indicators, in line with the strength and financial health of the Bank.
For 2023, there were no alerts in any investment, nor were adjustments made for deteriorating investments that could affect or impair the Bank’s financial strength.
Market risk refers to the possibility of incurring losses as a result of changes in stock prices, interest rates, exchange rates and other indicators whose values are fixed in a public market. It also refers to the probability of unexpected changes in net interest income and economic equity value as a result of a change in market interest rates.
In Grupo Bancolombia, market risks are identified, measured, monitored, controlled and communicated with the purpose of adopting timely decisions for the adequate mitigation of these, and to generate greater added value for shareholders. The guidelines, policies and methodologies for market risk management are approved by the Board of Directors, thus ensuring consistency and unity in the risk appetite among the different entities of Grupo Bancolombia.
Grupo Bancolombia
| a. | Instruments for trading purposes |
Instruments for trading purposes in Grupo Bancolombia include fixed income, variable income, foreign currency and derivative products, whose management is aimed to maintain an investment portfolio to support liquidity and meet the needs of our customers, while maintaining a controlled risk profile.
The relevant risk factors for instruments held for trading purposes are interest rate risk, exchange rate risk and share price risk.
| ● | Interest rate risk arises from unexpected changes in interest rates that may adversely affect the value of a financial instrument. It mainly affects debt securities and derivatives. |
103
| ● | Exchange rate risk refers to changes in the exchange rate of one currency against another and affects foreign currency positions. A long position in a foreign currency other than the local currency may result in losses if that currency depreciates against the local currency. |
| ● | Finally, equity price risk arises from adverse movements in market prices or expectations of future dividends that affect positions in shares, equity indices or derivatives with equity underlyings. |
All these market risks can be partially or fully mitigated with derivatives such as options, futures, forwards and swaps, relative value strategies and by taking non-directional positions.
For the management and control of market risks of trading activities in the Grupo Bancolombia, two Value at Risk methodologies are used: the standard methodology established by the SFC and the internal methodology by weighted historical simulation. These methodologies measure the maximum probable loss that a portfolio could have over a time horizon and with a level of confidence.
The internal methodology by weighted historical simulation uses a confidence level of 99%, a holding period of 10 days and a time window of one year or 250 daily data, obtained historically from the VaR calculation reference date. The standard methodology established by Chapter XXXI of the Basic Accounting and Financial Circular (CBCF, by its Spanish acronym) of the Financial Superintendence of Colombia (SFC, by its Spanish acronym) is based on the model recommended by the Basel Committee on Banking Supervision's 2005 Amendment to the Capital Accord to Incorporate Market Risk. This methodology is used to report market risk exposure to the SFC and to measure the capital requirements of Grupo Bancolombia.
In addition, extreme scenario measurements or stress tests are performed to estimate potential losses that do not occur with a high frequency but are possible, replicating past crises or simulating hypothetical events. Likewise, Expected Shortfall estimates are also made to measure the expected value of potential loss greater than the level set by the VaR. Unlike VaR, Expected Shortfall has the advantage of capturing the risk of large losses with low probability (tail risk). Likewise, adjustment tests or back testing are carried out to determine how accurate the loss forecasts are in relation to reality. The results of these tests lead to adjustments to the VaR models, if necessary.
To manage and control the market risk of trading activities, Grupo Bancolombia has a hierarchical structure of VaR limits that ensures that risk is not concentrated in certain asset classes and maximizes the diversification effect of portfolios. These limits are defined by company, product or risk-taking responsibilities. Loss alerts, stop losses and sensitivity limits are also managed, especially in derivative portfolios. The limits are approved by the Board of Directors, taking into account the size of the assets, the complexity and volatility of the markets, and the risk appetite. These are monitored daily, and their excesses or non-compliance are reported to the Board of Directors and the Risk Committee.
In 2023, market risk exposure measured with the SFC's standard methodology ranged between COP 815,373 million and COP 1,204,500 million, with an average exposure of COP 959,832 million. The total exposure, at the end of the year, registered an increase driven by the exchange rate factor that registered a greater exposure to the US dollar, followed by an increase in exposure to share prices and a decrease in exposure in collective portfolios. This effect was generated by the redistribution of exposure by risk factor of the Colombia Real Estate Fund, after a detailed analysis of the composition of its portfolio.
104
It is important to highlight that this redistribution did not generate an impact on the total risk since the volatility of both factors is the same.
Meanwhile, the interest rate risk factor presented an increase in its exposure, generated by a higher exposure in Colombian public debt securities in Bancolombia's book, partially offset by a lower exposure in foreign debt securities in all the Entities.
The total variation of market risk and its risk factors, under the standard methodology of the SFC, is shown below:
December 2023 | ||||||||
In millions of Colombian pesos | ||||||||
Factor |
End of the year |
Average |
Maximum |
Minimum |
||||
Interest Rate |
405,467 |
418,472 |
542,464 |
383,914 |
||||
Exchange Rate |
332,662 |
185,624 |
374,407 |
51,410 |
||||
Share Price |
342,024 |
332,443 |
347,539 |
312,136 |
||||
Collective Portfolios |
15,847 |
23,292 |
27,923 |
15,847 |
||||
Total VaR |
1,096,000 |
959,832 |
1,204,500 |
815,373 |
||||
December 2022 | ||||||||
In millions of Colombian pesos | ||||||||
Factor |
End of the year |
Average |
Maximum |
Minimum |
||||
Interest Rate |
340,107 |
381,094 |
410,605 |
340,107 |
||||
Exchange Rate |
78,165 |
118,620 |
201,927 |
78,165 |
||||
Share Price |
85,345 |
98,401 |
105,263 |
85,345 |
||||
Collective Portfolios |
387,952 |
294,468 |
387,952 |
225,401 |
||||
Total VaR |
891,569 |
892,583 |
1,059,312 |
783,367 |
||||
Grupo Bancolombia maintains non-trading instruments such as loans, time deposits, checking and savings accounts, which are recorded in the Banking Book. The market risk management of the Banking Book is focused on increasing the economic value of equity, contributing to the generation of recurring profits with a controlled risk profile.
The relevant risk factor of the Banking Book positions is interest rate risk, understood as the probability of unexpected changes in net interest income as a result of a change in market interest rates. Changes in interest rates affect the Bank's income due to differences in the repricing of assets and liabilities.
Another risk factor affecting the banking book positions is the equity price risk of the investments held by Investment Banking, as a Financial Corporation, directly and through its affiliated companies, in structural equity investments. Exchange rate exposures that arise in the Banking Book are transferred to the Treasury Book.
105
For the management and control of market risks of activities other than trading activities, Grupo Bancolombia has a comprehensive approach, consisting of a short-term view, measuring the sensitivity of the net interest margin over a one-year horizon, and a long-term vision, estimating the impact on the economic value of equity through different scenarios. Levels of alerts are also defined to monitor and control the interest rate risk of the positions in the Banking Book, which are periodically reported to Senior Management.
Market risk management of positions in the Banking Book is carried out in a decentralized and independent manner in each of the Grupo Bancolombia's banking entities. This management is carried out by the Asset and Liability Management areas, of the Financial Vice-Presidency, through derivative instruments such as exchange rate and interest rate swaps, mainly.
In general, Grupo Bancolombia has a positive sensitivity to increases in interest rates for the total financial margin. In relation to the sensitivity of the economic value (Market Value of Equity, MVE), the general positioning of the balance sheet was such that the average duration of the assets was slightly lower than that of the liabilities.
During 2023, a decrease in the sensitivity of the net interest margin of - COP 7,287 was observed due to the reduction in the sensitivity in dollars as a result of the decrease in the fixed-rate portfolio and the increase in fixed-term certificates of deposit (CD). Likewise, the duration mismatch in the Grupo Bancolombia's balance sheet did not present significant changes.
The following is a comparison of the interest rate risk sensitivity in legal currency (pesos), for Grupo Bancolombia, between December 31, 2023, and December 31, 2022:
Legal currency |
December 31, 2023 |
December 31, 2022 |
In millions of Colombian pesos | ||
Asset sensitivity to 100 bps |
1,152,782 |
1,060,949 |
Liability sensitivity at 100 bps |
595,749 |
545,911 |
Sensitivity of net interest margin to 100 bps |
557,033 |
515,038 |
Likewise, the sensitivity to interest rate risk in foreign currency (dollars) for Grupo Bancolombia as of December 31, 2023, and December 31, 2022, is shown:
Foreign currency |
December 31, 2023 |
December 31, 2022 |
In thousands of USD | ||
Asset sensitivity to 100 bps |
75,052 |
84,883 |
Liability sensitivity at 100 bps |
74,800 |
71,737 |
Sensitivity of net interest margin to 100 bps |
252 |
13,146 |
A positive net sensitivity denotes a greater sensitivity of assets than liabilities and implies that an increase in interest rates will positively affect Grupo Bancolombia's net interest margin. A negative sensitivity denotes a greater sensitivity of liabilities than assets and implies that an increase in interest rates will negatively affect the net interest margin. In case of a decrease in interest rates, the behavior of the net interest margin would be the opposite of that described above.
To calculate the sensitivity of the net interest margin based on the term at repricing, the following assumptions were taken into account: (a) only the contractual conditions of the current transactions were considered, (b) the sensitivity of the balance sheet at a fixed rate was based on amounts that mature in a period of less than one year under the assumption that these will be placed again at market rates; and (c) changes in the interest rate were presented immediately and in parallel in the asset and liability yield curves.
106
The price risk sensitivity of the structural shares is presented below:
The market value of these positions presented a negative variation of 27.4%, going from COP 56,607 at the end of 2022, to COP 41,096 at the end of 2023, mainly as a consequence of the devaluation of the shares of the company ENKA.
When considering a negative impact of 14.70% on the value of structural actions as of December 2023, a devaluation of COP 6,041 occurred.
December 31, 2023 |
December 31, 2022 |
|
Amount |
41,096 |
56,607 |
Delta |
14.70% |
14.70% |
Sensitivity |
6,041 |
8,321 |
Bancolombia
Market risk management in Bancolombia is the same as that described above for Grupo Bancolombia.
The results of this risk metric for the Bank are described below:
Contractual Maturity Flows Projections
During 2023, fundraising was concentrated on stable funding. In this way, the maturity mismatch between assets and liabilities did not present significant variations compared to the previous year.
Assets - 2023
Assets |
0-30 days |
31 days-1 year |
1-3 years |
3-5 years |
More than 5 years |
December 31, 2023 |
|
In millions of Colombian pesos |
|||
Available |
12,863,332 |
- |
- |
- |
- |
Asset liquidity transactions |
11,485,003 |
- |
- |
- |
- |
Investments |
1,225,370 |
7,508,962 |
2,763,994 |
1,031,008 |
2,763,672 |
Loan portfolio |
9,299,459 |
67,075,512 |
76,991,280 |
44,292,725 |
73,095,556 |
Derivative financial assets |
3,779,140 |
12,521,300 |
4,131,390 |
1,690,432 |
1,395,199 |
Total Assets |
38,652,304 |
87,105,774 |
83,886,664 |
47,014,165 |
77,254,427 |
Liabilities – 2023
107
Liabilities |
0-30 days |
31 days-1 year |
1-3 years |
3-5 years |
More than 5 years |
December 31, 2023 |
|
In millions of Colombian pesos |
|||
Deposit accounts |
104,112,202 |
- |
- |
- |
- |
Time deposits |
9,530,808 |
33,349,972 |
11,476,688 |
4,809,582 |
18,199,529 |
Liability liquidity transactions |
263,751 |
- |
- |
- |
- |
Bank loans |
300,957 |
3,322,380 |
7,182,852 |
1,538,962 |
1,915,030 |
Outstanding investment securities |
101,782 |
2,755,303 |
3,890,387 |
4,307,752 |
3,507,202 |
Preferred shares |
- |
57,701 |
115,403 |
115,403 |
295,697 |
Derivative financial liabilities |
3,220,567 |
13,098,241 |
4,135,676 |
1,678,780 |
1,473,116 |
Total Liabilities |
117,530,068 |
52,583,598 |
26,801,007 |
12,450,479 |
25,390,575 |
Position by Indexation
During 2023, more than 60% of the Bank's portfolio was concentrated in variable rates, while on the liabilities side, on average, the variable rate share was 40%. Likewise, the balance sheet was characterized by a significant increase in fixed-rate indexations, Reference Banking Indicator (IBR, by its Spanish acronym) and Consumer Price Index (CPI), considering the Bank's asset and liability management strategy in accordance with the growth of the portfolio and the evolution of market rates.
Fair Value of Assets and Liabilities
The fair value of each of Bancolombia's balance sheet positions is presented below:
December 31, 2023 |
December 31, 2022 |
|||
Book value |
Fair value |
Book value |
Fair value |
|
In millions of Colombian pesos | ||||
Assets | ||||
Debt securities, marketable investments and pledged financial assets (1) |
6,942,468 |
6,942,468 |
6,916,719 |
6,916,719 |
Debt securities, available-for-sale investments (1) |
3,211,425 |
3,211,425 |
2,590,622 |
2,590,622 |
Debt securities, held-to-maturity investments, net (1) |
3,423,265 |
3,410,468 |
3,450,225 |
3,382,219 |
Equity instruments (1) |
180,744 |
188,124 |
171,808 |
171,111 |
Hedging instruments (1) |
6,215,942 |
6,215,942 |
4,860,893 |
4,860,893 |
Loan portfolio and financial leasing operations (2) |
170,029,117 |
170,672,034 |
168,203,995 |
163,844,450 |
Investment properties (3) |
574,550 |
574,550 |
449,253 |
449,253 |
Total assets |
190,577,511 |
191,215,011 |
186,643,515 |
182,215,267 |
Liabilities | ||||
108
Customer deposits(4) |
170,231,400 |
171,398,021 |
156,480,283 |
155,160,442 |
Interbank (5) |
- |
- |
482,766 |
482,766 |
Repos (5) |
263,751 |
263,751 |
156,174 |
156,174 |
Hedging instruments (1) |
6,699,521 |
6,699,521 |
4,717,408 |
4,717,408 |
Financial obligations (6) |
12,000,269 |
12,000,269 |
14,161,087 |
14,161,087 |
Debt securities issued (7) |
10,958,823 |
10,919,613 |
15,209,620 |
14,632,729 |
Preferred shares (8) |
584,204 |
394,550 |
584,204 |
350,978 |
Total liabilities |
200,737,968 |
201,675,725 |
191,791,542 |
189,661,584 |
a.Instruments for trading purposes
The instruments for trading purposes for Bancolombia include fixed income, variable income, foreign currency and derivative products, whose management is aimed at maintaining an investment portfolio to support liquidity and meet the needs of our clients, maintaining a profile of controlled risks.
For the management and control of market risks in Bancolombia, the same methodologies set out above for Grupo Bancolombia are considered and a hierarchical structure of own limits with which the Bank's exposure is managed.
In 2023, market risk exposure measured with the SFC's standard methodology ranged between COP 752,644 million and COP 1,153,304 million, with an average exposure of COP 898,460 million. Total exposure registered an increase, mainly due to the increase in the exchange rate factor given the higher exposure to the US dollar, followed by the interest rate factor driven, particularly, by the increase of the portfolio in Colombian government and private debt securities. Meanwhile, the collective portfolios factor increased due to the valuation of investments.
The total variation in market risk, as well as that of its risk factors under the SFC's standard methodology is shown below:
December 2023 | ||||||||
In millions of Colombian pesos | ||||||||
Factor |
End of the year |
Average |
Maximum |
Minimum |
||||
Interest Rate |
334,375 |
352,633 |
484,964 |
308,204 |
||||
Exchange Rate |
203,244 |
128,096 |
239,366 |
42,283 |
||||
Share Price |
25,951 |
20,880 |
25,951 |
17,313 |
||||
Collective Portfolios |
402,159 |
396,851 |
412,474 |
370,716 |
||||
Total VaR |
965,729 |
898,460 |
1,153,304 |
752,644 |
||||
December 2022 | ||||||||
In millions of Colombian pesos | ||||||||
Factor |
End of the year |
Average |
Maximum |
Minimum |
||||
Interest Rate |
255,623 |
297,926 |
335,382 |
255,623 |
||||
Exchange Rate |
34,907 |
77,647 |
160,751 |
34,907 |
||||
Share Price |
17,247 |
25,615 |
30,477 |
17,247 |
||||
Collective Portfolios |
368,227 |
273,485 |
368,227 |
201,599 |
||||
109
Total VaR |
676,004 |
674,673 |
841,538 |
559,381 |
||||
| b. | Instruments for purposes other than trading |
For the management and control of market risks, Bancolombia uses the same methodologies described above for Grupo Bancolombia. The results of the sensitivity of the net interest margin are presented below:
Sensitivity to interest rate risk in the banking book
Legal Currency Positions |
December 31, 2023 |
December 31, 2022 |
In millions of Colombian pesos |
||
Asset sensitivity to 100 bps |
1,157,142 |
1,066,923 |
Liability sensitivity at 100 bps |
592,423 |
550,596 |
Sensitivity of net interest margin to 100 bps |
564,719 |
516,327 |
Foreign Currency Positions |
December 31, 2023 |
December 31, 2022 |
In millions of USD |
||
Asset sensitivity to 100 bps |
8,211 |
13,282 |
Liability sensitivity at 100 bps |
15,335 |
11,980 |
Sensitivity of net interest margin to 100 bps |
(7,124) |
1,302 |
In a scenario of increasing interest rates, a positive net sensitivity would imply a higher asset sensitivity and, therefore, a favorable impact on the net interest margin. A negative sensitivity denotes a greater sensitivity of the liability and therefore a negative impact on the net interest margin. In the case of an interest rate fall, the behavior of the net interest margin would be opposite to that mentioned.
The sensitivity of the net interest margin on legal currency positions given positive and parallel variations in interest rates of 100 basis points was COP 564,719. The variation in the sensitivity of the net interest margin between December 2022 and December 2023 occurred due to the increase in the balance of the variable rate portfolio, compensated by the increase in the balance of the CDs.
Likewise, the sensitivity of the net interest margin for positions in foreign currency was USD – 7,124 at 100 basis points. The change in this sensitivity compared to December 2022 corresponded to the decrease in the active portfolio and the increase in the balance of the rate-sensitive liability portfolio.
Assumptions and limitations
To calculate the sensitivity of the net interest margin, from the term to the reprice, the following assumptions were taken into account: (a) only the contractual conditions of the current operations are considered, (b) the sensitivity of the balance at a fixed rate considers amounts that mature in a period of less than one year under the assumption that these will be placed again at market rates; and (c) changes in the interest rate are presented immediately and in parallel in the asset and liability yield curves.
110
Liquidity risk is understood as the inability to fully and timely meet payment obligations on the corresponding dates due to insufficient liquid resources and/or the need to assume excessive funding costs. Situations such as a downgrade in the credit ratings of the Bank and its subsidiaries would increase the cost of funds and hinder its ability to attract deposits or roll over maturing debt.
For Grupo Bancolombia, liquidity prevails over any growth and profitability objective. Liquidity management, along with capital management, have always been a fundamental pillar of its business strategy to support the strength of the balance sheet. Grupo Bancolombia's liquidity management model promotes the autonomy of subsidiaries, which must be self-sufficient in their financing structure. Each subsidiary is responsible for meeting the liquidity needs of its current and future activities, within a management coordination framework at the Grupo level. The metrics used to control liquidity risk are developed around common and homogeneous concepts, but the analysis and adaptation is performed by each subsidiary.
Measures to control liquidity risk include the maintenance of an investment portfolio to ensure a liquidity reserve and the definition of early warnings and liquidity limits to proactively assess the Grupo's exposure level.
The methodologies used to control liquidity risk include liquidity gaps and stress scenarios. Liquidity gaps measure cash flow mismatches of assets, liabilities and off-balance sheet positions, separately for legal and foreign currencies. Regulators' models are applied, in which contractual maturities and internal models are used, in which cash flows are adjusted through the implementation of different indicators, in order to reflect a more realistic behavior of cash flows.
Structural liquidity is also measured by monitoring the available stable funding and its coverage against the required stable funding. For this purpose, we use the regulatory models and the standards established by the Basel Committee on Banking Supervision regarding the NSFR, adjusting it according to the stability characteristics of our deposits.
The policies, limits, processes, methodologies and tools for the evaluation of liquidity risk exposure are periodically validated to establish their relevance and functionality, and to adjust them as necessary. The market and liquidity risk areas prepare daily, weekly and monthly reports for Senior Management, with the purpose of monitoring the evolution of the levels of exposure to liquidity risk, the established limits and alerts, and support the decision-making process.
Liquidity risk exposure
In 2023, a comfortable liquidity position was maintained in Grupo Bancolombia with 30-day liquidity coverage at the end of December of 259.07% in legal currency, and 866.37% in foreign currency. By the end of the year, the liquid assets in legal currency of Grupo Bancolombia amounted to COP 26.8 billion, and in foreign currency to USD 6,226 million.
To estimate liquidity risk, a liquidity coverage ratio is calculated to ensure that liquid assets held are sufficient to cover potential net cash outflows within 30 days. This indicator allows Grupo Bancolombia to meet its liquidity coverage for the next month. The following is the result of the liquidity coverage indicator for Grupo Bancolombia:
Liquidity coverage ratio |
December 31, 2023 |
December 31, 2022 |
In millions of Colombian pesos | ||
30-day liquidity requirement |
13,752,496 |
18,227,019 |
111
Liquid assets |
50,680,823 |
48,059,179 |
Liquidity ratio* |
368.52% |
263.67% |
*The minimum level of the liquidity ratio required by law is 100%.
30-day liquidity requirement: 30-day contractual maturities of assets (portfolio, liquidity transactions, non-liquid investments, derivatives) minus contractual maturities of liabilities (time deposits, liability liquidity transactions, bonds, liability portfolio, derivatives) minus non-contractual maturities of deposit accounts.
Liquid assets: liquid assets are considered to be those that are easily realized and form part of the entity's portfolio or those that have been received as collateral in asset transactions in the money market, that have not been subsequently used in liability transactions in the money market and do not have any mobility restrictions. The following are considered liquid assets: cash, shares in open collective investment funds with no permanence agreement, shares registered in a stock exchange in Colombia that are eligible for repo or repurchase agreements, and marketable and available-for-sale investments in fixed-income securities.
Bancolombia
Liquidity risk management continued to be carried out through an internal liquidity gap projection model for both real and stressed situations. The regulatory indicators, such as the Liquidity Risk Index (LRI), the Individual and Consolidated Short-Term Exposure Index (IECPI-IECPC, by its Spanish acronym) and the Net Stable Funding Ratio (NSFR), presented results that showed comfortable liquidity levels for compliance with internal and regulatory limits.
Liquidity simulations were performed under different scenarios to guarantee comfortable liquidity levels, consistent with the dynamic growth of the portfolio and 100% compliance with the NSFR. Liquidity levels remained stable due to the lower dynamism in portfolio disbursements.
Short-term liquidity risk exposure
To estimate short-term liquidity risk, a liquidity coverage ratio (LCR) is calculated, corresponding to the ratio between liquid assets and its net liquidity requirements for a 30-calendar day period. This indicator shows the liquidity coverage for the next month.
The net liquidity requirement is calculated based on the flow of contractual maturities of assets and the flow of contractual and non-contractual maturities of liabilities, as defined in current regulations.
The liquidity coverage result for the Bank is presented below:
Liquidity coverage ratio |
December 31, 2023 |
December 31, 2022 |
In millions of Colombian pesos |
||
30-day liquidity requirement |
10,179,043 |
13,950,866 |
Liquid assets |
28,612,973 |
25,508,367 |
Liquidity ratio |
281.10% |
182.80% |
112
The liquidity indicator stood at 281.10% at the end of December 2023, which represents an increase of 98%, due to the increase in the level of Liquid Assets, the growth in deposit accounts and the reduction in the 30-day liquidity requirement due to the higher projection of income flows from liquidity operations.
The following table shows the Bank's liquid assets:
Liquid assets (1) |
December 31, 2023 |
December 31, 2022 |
In millions of Colombian pesos |
||
Highly liquid assets |
||
Available |
12,314,552 |
12,688,194 |
High-quality securities |
14,197,252 |
12,388,168 |
Other liquid assets |
|
|
Other securities |
2,101,169 |
432,005 |
Total liquid assets |
28,612,973 |
25,508,367 |
| (1) | The high liquidity characteristic is possessed by the available, in all cases, and those liquid assets received by the Bank of the Republic for its monetary expansion and contraction operations. Liquid assets are adjusted for market liquidity and foreign exchange risk. |
High-quality securities are considered as available and shares that are eligible for repo or repo transactions, for those entities that are in the group of OMOs Placement Agents (OPA), those securities received by the Bank of the Republic for its monetary expansion and contraction operations described in numeral 3.1.1 of the External Regulatory Circular DODM-142 of the Bank of the Republic or otherwise (if it is not an OPA) only those securities that are mandatory listed in the market maker program.
Other liquid assets: liquid assets that do not meet the quality characteristic are included in this item.
Long-term liquidity risk exposure
The Net Stable Funding Ratio (NSFR) indicator corresponds to the ratio between required stable funding and available stable funding and seeks to limit excessive dependence on unstable sources of funding for strategic assets that are often illiquid.
The following are the results of the NSFR at the end of 2023 and 2022:
Net Stable Funding Ratio | ||
CATEGORY |
December 31, 2023 |
December 31, 2022 |
Available Stable Funding (ASF) |
192,571.29 |
184,410.28 |
113
Required Stable Funding (RSF) |
158,734.45 |
170,264.63 |
NSFR |
121.32% |
108.31% |
The indicator has remained above adequate levels, maintaining an appropriate structure in the required stable funding and available stable funding. This highlights the strategy of capturing long-term CDs, the increase in equity and the increase in the weightings of the deposit accounts in the segments of Supervised Entities and Collective Investment Funds (CIFs) without permanence covenant, from 0% to 25% in accordance with the new NSFR regulation through Circular 013 of 2023, added to the redistribution of the balances of the portfolio decreasing the required stable funding.
The main objective of Grupo Bancolombia in the management of operating risk is to achieve the understanding and exploitation of opportunities, to generate benefits, while reducing losses by knowing and mitigating threats. This management is framed within the main stages of risk management: risk identification, measurement, control and management.
The identification and updating of the risks to which Grupo Bancolombia's entities are exposed in their operations is permanent. Through the development of human talent, the identification and management of risk is promoted in a collaborative manner. All employees contribute to the identification, achieving greater coverage and timeliness in risk management.
Regarding the implementation of External Circular 018 of 2021 issued by the SFC, the main regulatory changes for operating risk include the reinforcement of the incorporation of regulatory capital requirements for operating risk and the inclusion of greater management of third-party risks.
Bancolombia
The total operating risk profile of Bancolombia, at the end of 2023, shows a composition by risk criticality levels, as follows:
| ● | Tolerable assessment (low risks): 88%. |
| ● | Moderate rating (medium risks): 8%. |
| ● | Critical rating (high risks): 2%. |
| ● | Very critical rating (very high risks): 2%. |
The latter group recognizes risks at higher thresholds, in terms of individual appetite, defined for each of Grupo Bancolombia's companies.
Bancolombia constantly updates the risks according to the behavior of each business and the changes in the processes, which generates variations in them, year by year.
The residual exposure, i.e., the exposure after considering the mitigating effect of the controls, is represented as follows:
| ● | 66% in risks of process failures. |
| ● | 25% in the categories of internal and external fraud. |
| ● | 5% in unsuitable business practices. |
| ● | 4% in other categories. |
114
Bancolombia closes 2023 with operating losses equivalent to COP 276,103 million, representing an increase of 43% in accumulated net economic losses with respect to the previous year. This is mainly due to technological failures in production outputs in different products and channels, which generated losses due to erroneous balances in favor of customers that could not be recovered. In addition, it was caused by the provision of a first instance court order issued by the Departmental Comptroller's Office of Cundinamarca against Bancolombia, derived from an alleged fiscal detriment in disbursements under the financial leasing modality in the construction of a water treatment plant in the Municipality of Chía, which if confirmed would materialize an operating loss for the entity. It was also due to the increase in external fraud events, as a result of the intensive use of social engineering techniques by criminals.
It should be noted that exposure to cybersecurity risk has remained at adequate levels, thanks to the measures we have adopted in terms of controls, monitoring and mitigation, to address the threats in the environment.
Consolidated Operating Risk Status
Operational Risk by Criticality
Tolerable
Moderate
Critical
Very Critical
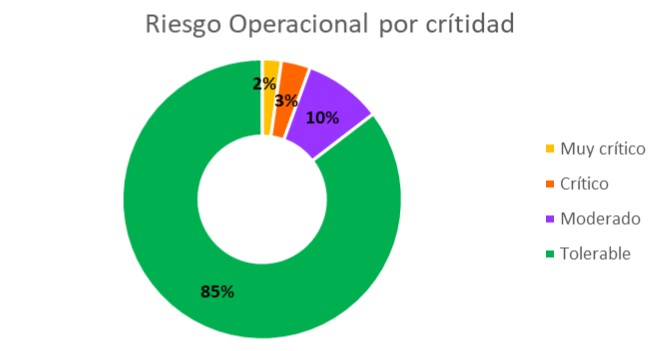
The total operating risk profile of Grupo Bancolombia, at the end of 2023, shows a composition by risk criticality levels, as follows:
| ● | Tolerable assessment (low risks): 85%. |
| ● | Moderate rating (medium risks): 10%. |
| ● | Critical rating (high risks): 3%. |
| ● | Very critical rating (very high risks): 2%. |
The latter group recognizes risks at higher thresholds, in terms of individual appetite, defined for each of Grupo Bancolombia's companies.
As mentioned for Bancolombia, the Grupo constantly updates its risks in accordance with the behavior of each business and changes in processes, which generates variations in risks from year to year.
115
The residual exposure, i.e., after considering the mitigating effect of the controls, is represented as follows:
| ● | 62% in risks of process failures. |
| ● | 18% in the internal fraud categories. |
| ● | 9% in the external fraud category. |
| ● | 5% in unsuitable business practices. |
| ● | 1% represented in the other categories. |
Process failures
Operating Risk by Risk Category
Other categories
External fraud
Internal fraud
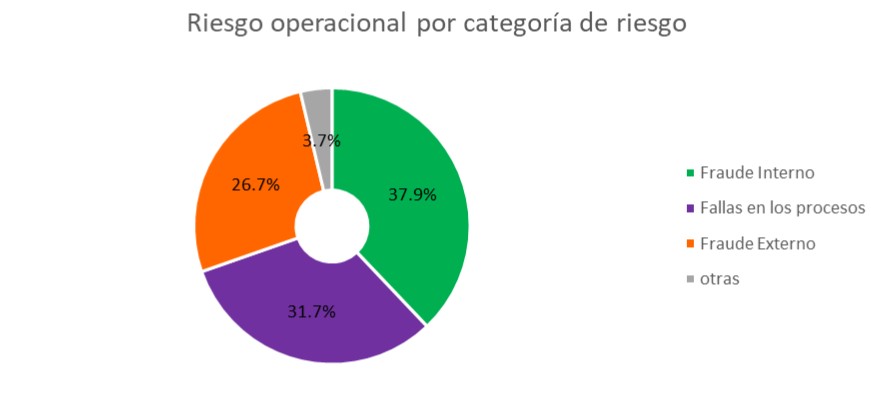
Losses due to operating risk increased by 16% compared to those recorded in 2022, due to the increase in external fraud in virtual channels and means of payment. 65% of the losses were generated by external fraud events, 20% by process failures, 14% by technological failures and the remaining 1% is made up of the other operating risk categories.
Other categories
Technological failures
Process failures
External fraud
Materiality by Category
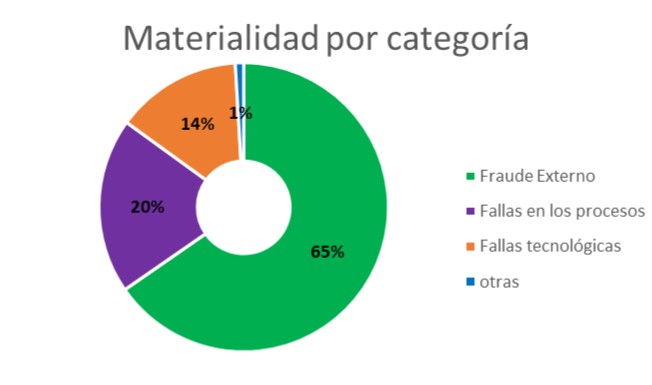
Operating Risk Management Achievements
116
1.Coverage of the risk profile is maintained at high levels, ensuring that changes in Grupo Bancolombia's processes, products, channels, IT components and services are evaluated and managed in a timely manner, in order to provide a higher level of assurance in the achievement of the organization's operational objectives.
2.We performed 213 risk evaluations to suppliers, requested by the Statutory Auditor's Office and the Board of Directors.
3.We achieved efficiencies in the relaxation of controls in eight initiatives, without affecting the organization's control environment.
4.We executed action plans and key initiatives for the main risks identified, achieving a decrease in operating risk exposure.
5.We participate in 100% of key business transformation initiatives, conducting risk assessments and advising on the definition of controls and action plans.
Cyber Risk Management
In 2023, we continued to consolidate technology and cybersecurity risk management, with the objective of protecting critical information assets and leveraging the Grupo Bancolombia's strategy. In this regard, we made progress in the identification and management of cybersecurity risks in suppliers, and in technological components and COBIT processes. Likewise, we followed up on the management and closure of high and critical vulnerabilities in different technological platforms, compliance with Baselines, and migration to the cloud, and we provided support to the secure development cycle and evolution in the maturity of cyber risk indicators.
We conducted more than 271 "Technological and Cybernetic Risk Assessments" on components (central platforms, transactional channels, controls), suppliers and processes, achieving a profile identification of 100% for critical suppliers, and 92% for processes and components. In addition, we achieved 100% compliance in 80 ethical hacking analyses as input for the analyses. Therefore, with the implementation of the different action plans, we achieved a high level of risk mitigation.
As achievements, we highlight that, during 2023, we had a 95% coverage of the technology inventory allowing the identification and management of vulnerabilities. We also built a dashboard with the measurement of controls with new baselines and performed IT and cybersecurity risk management in the organization's key transformation initiatives.
Business Continuity Management
By 2023, business continuity management focused on strengthening the operational resilience of Grupo Bancolombia, highlighting the following achievements:
| ● | We executed seven drills to train the reaction of the "Crisis Management Team" and validate the functionality of the response protocols. One of the most important exercises was the national crisis cybersecurity drill in conjunction with Asobancaria and the SFC. |
| ● | We defined three new protocols with their continuity strategies for the "Crisis Table", which establish the premises for a timely and adequate response to the materialization of disruptive events for the business. |
| ● | We had twenty-seven training sessions, fifteen of them with the members of the main and alternate "Crisis Management Team", training them on how to prepare for events and decision making. |
117
| ● | We evaluated thirty-six critical Business Impact Analysis (BIA) suppliers with joint testing of their strategies to respond to major failure scenarios. |
| ● | We achieved 98% compliance with the continuity tests for the process, technology, infrastructure and people fronts. |
As has been pointed out throughout this report, during 2023 the world experienced greater volatility in the price of financial assets, geopolitical conflicts and extreme weather events, thus configuring a complex economic scenario with strong inflationary pressures and high interest rates, which leaves many lessons and challenges. For this reason, Grupo Bancolombia works to constantly improve its policies and processes aimed at recognizing and mitigating the relevant risks to which it is exposed.
The Corporate Risk Vice-Presidency updates the Risk Map on an annual basis, and once it is approved by Senior Management, it becomes an input for the strategic planning of each of the Grupo Bancolombia's Vice-Presidencies. Likewise, the Risk Committee periodically monitors the risks included in the Map.
This tool allows the organization to identify, at an early stage, the most important sources of risk in the short term, with a holistic view of the local and international context, the development of the business and the organization's future objectives. In turn, it allows the organization to define action plans to control the identified risks.
Definition and allocation of strategic activities to mitigate the potential impacts of the selected risks and take advantage of environmental opportunities.
| ● | Definition of action plans for the management of identified risks. |
| ● | Dissemination to strengthen the risk culture. |
| ● | Follow-up scheme Map + Strategy. |
Comprehensive view of risks to select the most critical ones and determine their connectivity and potential impact on the entire organization. Requires constant dialogue with the governing bodies.
| ● | Development of the preliminary risk profile. |
| ● | Application of the survey. |
| ● | Information and data analysis. |
| ● | Validation and quantification of risks. |
Permanent observation and understanding of megatrends as global forces that impact people and organizations at different levels.
| ● | Megatrend analysis: CRForum, WEF, Swiss Re. |
| ● | Senior Management perception and perspectives. |
Connection with the STRATEGY
Selecting Risks
HOLISTIC VIEW
Identifying Risks
MEGATRENDS
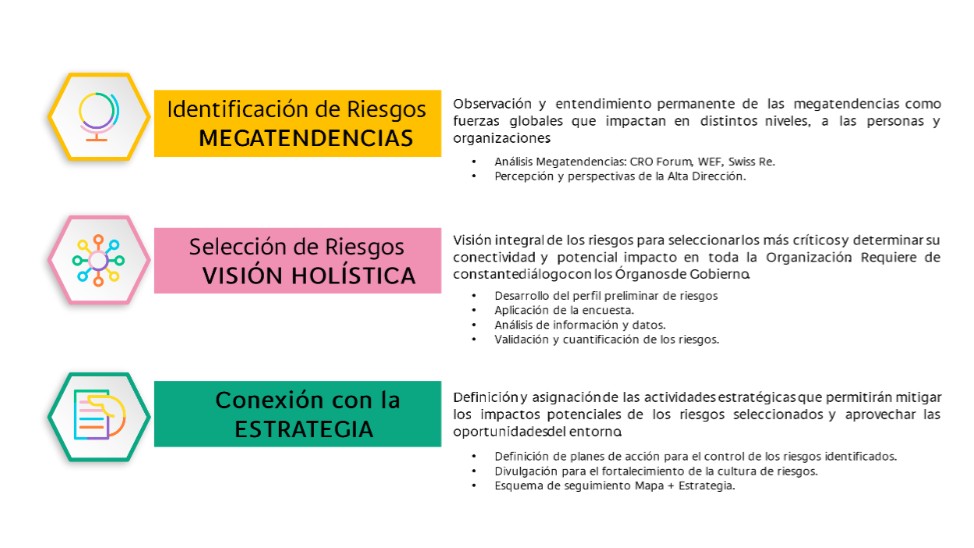
Description of the Risk Map construction methodology.
The tool focuses on identifying relatively new risk factors in the market, business or region that could have a strong impact on the financial condition of Grupo Bancolombia, directly or through its interrelation with other traditional risk factors, such as market risk, liquidity, credit, operational, among others.
118
Currently, the Risk Map has three risk categories: Business, Operational and Emerging, like this:
12. Inadequate response to market changes
6. AML/ATF and corruption
10. Third-party risk
9. Operational resilience, business continuity and technical failures
8. Political risk
5. Internal and external fraud
7. Regulatory and legal uncertainty
4. ESG risks
2. Cyber and information security
3. Model risk
1. Economic and sectoral environment
11. Human talent risk
BUSINESS
EMERGING
OPERATIONAL
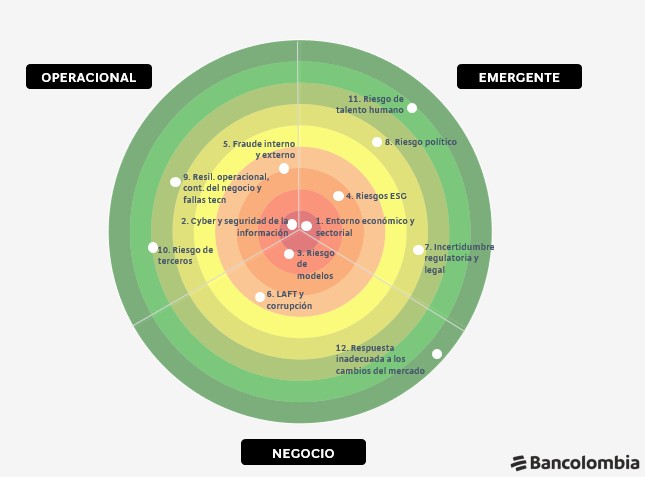
Risk Map 2023 – Grupo Bancolombia
The graphic scale of the risk map is represented by a heat radar, where the criticality of the risk is evident to the extent that its quantification represents a greater impact in terms of unexpected loss. Since the map is composed, for the most part, of emerging risks, there are no valuation standards and the methodologies used are usually adjusted depending on the evolution of the business or the risk.
The risk map construction process consists of validating, with the operating risk teams, the relevant risk categories in the events or processes within the organization. These are also verified with other areas that carry out evaluations of risk factors other than traditional ones, in the development of the comprehensive risk management of the Grupo Bancolombia Managements. Finally, references are made in high-level academic studies and assumptions and internal models are formulated to determine, in the best way, what the impact would be, in monetary terms, if the risk event materializes.
The risks that make up the Grupo Bancolombia's Risk Map are described below:
119
a.Economic and industry environment and supply chain disruption
On the macroeconomic front, one of the main risks is related to the higher-than-usual volatility in the prices of the main financial assets. During the last quarter of 2023, there was a strong reversal in the dynamics of capital flows to emerging economies.
The year 2023 ended in the midst of a trend of appreciation of riskier financial assets, given the incorporation of the expectation of the beginning of the process of interest rate cuts by the monetary authority in the United States during the first half of 2024. This dynamic, completely opposite to the one that prevailed during most of the third quarter of last year, highlights the reactivity and volatility that continues to be present in the markets and that may continue to be a characteristic of international macro-financial behavior in 2024.
The weakening phase of the global cycle is usually accompanied by exacerbated volatility, compounded by the pressures produced by geopolitical tensions and military conflicts in Ukraine and the Middle East. These situations can affect investor confidence and the prices of the main raw materials, particularly oil.
However, during the latter part of 2023, the evolution of the global economy and markets was not significantly affected by these geopolitical elements, insofar as events did not differ substantially from what was foreseeable. However, the persistence of conflicts implies an inherent potential risk, since the escalation of the confrontation in the Middle East could lead to the involvement of other countries and affect the functioning of logistics chains or raw material markets.
At the level of the countries where Bancolombia has a significant presence, during the last quarter of 2023, there were events that could soon result in the materialization of some adverse risks.
In Colombia, 2024's outlook for public finances deteriorated in light of the court order that struck down the non-deductibility of bonuses from the mining sector in corporate income tax. This fact, together with the highly uncertain revenues expected by the Government (due to judicial litigation and the efficiency of the Directorate of National Taxes and Customs - DIAN tax administration), has led to the consideration of the need for a new tax reform, and the Autonomous Committee of the Fiscal Rule has issued publications highlighting the risk of non-compliance with the fiscal rule in 2024.
Thus, the potential tax reform would add to a busy first half of the year, in terms of the passage of major reforms through Congress. On this front, during the last part of 2023, the health system reform was approved in the second debate. Meanwhile, the labor and pension reforms did not make significant progress and the context has become challenging for the government to achieve their passage without making significant concessions on the proposed elements. Thus, the likelihood of a profound economic impact from the approval of these reforms in their original versions has been reduced.
Likewise, in Guatemala, the main macroeconomic risk arises from the uncertainty as to whether the President will be able to remain in power for the entire period of government, due to errors in the constitution of the political party of which he is a member. Decisions contrary to the President could trigger large-scale social mobilizations that could have a profound impact on the functioning of the country's economy during the first part of 2024, implying a greater risk.
120
Meanwhile, Panama is mainly facing the risk of a sudden stoppage of the operation of the Cobre Panama mine, due to disputes over the contract between the government and the management company. This will have a strong impact on the country's external balance, as copper is the main export commodity, and on fiscal revenues, in a context of a cut in Panama's risk rating by some agencies, due to doubts about the expected fiscal management for the coming years. In addition, the effects of the "El Niño" climate phenomenon will continue to be relevant for the operation of the Panama Canal during the first half of 2024, after a second half of 2023 in which it began operating with some restrictions.
Finally, no new events of relevance to the macroeconomic situation have materialized in El Salvador. The country continues to face the challenge of not being able to access the international financial market as a source of resources. Likewise, the relationship with the International Monetary Fund continues to be not very fluid. The great challenge for the short and medium term will continue to be fiscal management, while the outlook for 2024 will be determined by the presidential elections in which Nayib Bukele was reelected.
Thus, considering the different macroeconomic scenarios in the models for calculating provisions, Grupo Bancolombia maintains its active management of credit risk and performs a constant analysis and sectorial monitoring of the identification of potentially affected customers. This is done by periodically reviewing, in the different forums, the evolution of the individual situation of the customers, and granting alternatives that allow accompanying them in the development of their businesses and the management of the aforementioned context.
b.Cyber and Information Security
Grupo Bancolombia is based on the pillars of information security, confidentiality, integrity and availability, seeking to ensure their applicability through the three-line model, which includes a synchronized process for managing operational, technological and cybersecurity risks.
The management of these risks includes, among others, the analysis of those situations potentially related to the technological infrastructure, the access or use of technology that affects the development of business processes or the entity's risk management, and the assessment of the impact generated for the Organization by adverse events on the security attributes of information assets in cyberspace.
In 2023, we made progress in securing and improving the control environment for all elements of the business that support technology, cybersecurity, business operations, and supplier, risk and audit management.
c. Model Risk
Analytical models are tools that help Grupo Bancolombia manage financial risks and other processes in an objective, automated and efficient manner. However, these models may also fail or not reflect reality, which is known as model risk.
Model risk arises when the analytical models used to measure, value or manage financial risks are not appropriate, accurate or reliable. This risk may adversely affect the Bank, causing economic losses, reputational damage or non-compliance with internal or external limits.
121
Grupo Bancolombia uses internal models to quantify and manage credit risk, market risk, operating risk, liquidity risk and other organizational processes. In order to control the risk of using analytical models, it has a model risk management framework that covers the identification, classification, development, independent validation, approval, performance monitoring and auditing of models. This framework is aligned with regulatory and supervisory requirements.
In addition, Grupo Bancolombia has an independent risk management model validation area, which is responsible for verifying the design, implementation, operation and updating of the models, following minimum development standards and best practices. This team applies consistent and rigorous criteria and methodologies to verify the models. The results and conclusions of these activities are reported periodically to the Technical Risk Committee.
Finally, we recognize that models have limitations, uncertainties and assumptions, and may have errors or biases. Therefore, we evaluate the impacts of using them in different processes, and action plans are established to mitigate this risk.
d.ESG Risk
During 2023, Grupo Bancolombia strengthened its commitment to ESG risks and climate change, making progress in their management. Through the issuance of the ESG Risk Circular, the management of these risks was standardized at the corporate level and guidelines and criteria were established for the identification, evaluation and management of environmental, social and governance risks associated with Grupo Bancolombia's operations and activities.
The ESG Risk Circular consists of three main chapters:
1.Environmental and Social Risk Analysis - ESRA.
2.Controversial Issues in Business.
3.Industries susceptible to Climate Change.
In a complementary manner and within this management, Grupo Bancolombia designed a management framework for environmental risks, including climate risks (A), social risks (S) and governance risks (G). Each of these frameworks establishes a governance scheme leveraged on a structure that accompanies the organization's strategy and sustainability purpose.
This strategy frames risk management in financing, through the Environmental and Social Risk Analysis (ESRA) and studies for the identification, prioritization and attention to Physical and Transition Risks associated with Climate Change, both in financing and fixed assets. We also take into account the risks associated with the supply chain and third-party risks, as well as those related to guarantees and dations in payment.
In line with the Grupo Bancolombia's commitment to climate change, we manage physical and transition risks through the identification and prioritization of economic sectors that generate high levels of greenhouse gases, seeking to accompany clients in their transition to renewable energies.
122
Strategies definition
Exposure measurement
Vulnerability assessment
Prioritization due to climatic conditions
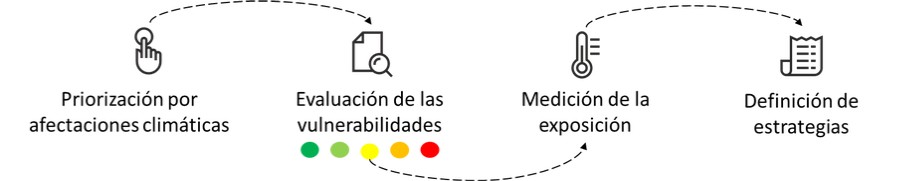
During 2023, we prioritized those sectors that are vulnerable to physical and transitional risks across our subsidiaries, adopting an approach that addresses the needs of geographies and the varying impacts that climate change has on each.
Based on this prioritization, Grupo Bancolombia has implemented an objective model for the management of physical risks linked to climate change. This model facilitates large-scale assessments for our clients, thus enabling the definition of mitigation and adaptation strategies for a larger number of clients and increasing the coverage of the analyses performed.
Regarding transition risk management, we initiated a process to improve the existing methodology in Grupo Bancolombia. The objective is to obtain results comparable to those obtained in the physical risk assessment model.
In order to manage the physical risk of the Grupo Bancolombia's facilities, we analyzed the different climatic vulnerabilities according to their geographic location and, in this way, we implemented strategies that preserve the operational continuity of processes, products and channels.
In addition to the declared management, we periodically monitored the following risk categories present in the aforementioned management frameworks. This follow-up allows us to measure the impact at the business level and develop prevention mechanisms to minimize it, through training, process improvement, monitoring and verification of procedures with clients and operations that guarantee the adequate execution and application of our internal policies.
These risk categories are:
Business Conduct Codes: relationship or linkage of employees or third parties with any corruption scandal, bribery or anti-competitive practices.
Sustainable Finance: income foregone as a result of a decrease in loan placement due to the migration of potential clients to other financial institutions that have a more attractive offer or strategy in ESG terms.
Decarbonization and Climate Strategy: impacts on the operation, portfolio and portfolio due to events that favor climate change.
Industries critical to climate change: during 2023, we developed a dashboard to monitor the portfolio of GHG-intensive industries declared in the ESG Risk Circular.
Human capital development and talent retention and attraction: inefficiencies in human management practices and policies related to hiring, performance evaluation, incentives, etc. of employees.
Financial Inclusion: income foregone due to the non-placement of products for citizens who are not yet banked.
123
Biodiversity: Grupo Bancolombia has initiated a thorough study of the risks associated with biodiversity, particularly those defined by the Taskforce on Nature-related Financial Disclosures (TNFD), in order to begin the proper management of these risks and their inclusion within the aforementioned frameworks.
The Bank designs strategies to mitigate each of these risks, improving their social and environmental impact.
e.Internal and External Fraud
The financial sector is particularly susceptible to different types of fraud, since its activity involves the execution of multiple processes aimed at ensuring that customers and users can carry out monetary transactions.
In order to identify fraud risks, Grupo Bancolombia uses methodologies for the analysis of operating risk, which allow it to monitor the processes, products and channels through which services are provided to customers and users of each of the entities that make up the Organization.
By 2023, we evidenced an increase in external fraud cases associated with social engineering, which impacted the banking ecosystem. In order to mitigate the occurrence of these events, we implemented controls and culture campaigns on the safe use of products and channels.
The Grupo Bancolombia's management of these risks involved establishing controls, closing gaps, monitoring internal processes and employee behavior. All this is done in order to mitigate the materialization of internal fraud. With regard to customers and users, we developed strategies for authentication, identity validation, transactional monitoring, culture and education on the secure use of the different products and channels, with which Grupo Bancolombia seeks to mitigate fraud in its different modalities.
f.AML/ATF and Corruption
The risks of money laundering, financing of terrorism and corruption refer to the possibility of loss or damage that the Organization may suffer due to its propensity to be used directly, or through its operations, as an instrument for criminal purposes or for the concealment of assets derived from illicit activities.
Grupo Bancolombia, acting consistently with its purpose of promoting sustainable development for the well-being of all, is committed to the prevention and mitigation of AML/ATF risk and corruption. In this sense, the Organization is constantly working on the evolution of methodologies, models and tools for the identification, measurement, control and monitoring of these risks, in line with the Grupo Bancolombia's internal and external context.
The following are the main initiatives that we carried out in 2023, with the aim of ensuring an adequate management and control environment against AML/ATF risks and corruption:
| ● | Implementation of AML/ATF risk matrices for Bancolombia, Valores Bancolombia, Fiduciaria Bancolombia and Bancolombia Investment Banking. |
| ● | Execution, maintenance or evolution of regulatory scores, including high-risk customers, suppliers, charges and SCOVIC; and adoption of other important scores, such as those of international jurisdictions, national jurisdictions, remittance companies and correspondent banks. |
124
| ● | Together with the SFC, analysis of the internal and external environment and understanding of new types of crime, including smuggling through distortion of imports and exports, risks in the real estate and notary sector. |
| ● | Evolution of foreign trade processes, in order to adequately manage the AML/ATF risks associated with this type of operations. |
| ● | Modification of the processes of linking and updating clients for the collection of information on Politically Exposed Persons (PEPs) and their related parties, as well as the final beneficiaries of legal entities and unincorporated structures. |
| ● | Creation of an interdisciplinary "Working Group" to implement the cash limit policy for withdrawals per customer. This is done considering that cash continues to be a frequently used payment instrument by customers and users. |
In addition, Grupo Bancolombia has been working on the process of identifying and updating the threats and vulnerabilities associated with the materialization of AML/ATF and corruption risks. With this, we seek to implement controls that mitigate these risks from different fronts (customers, channels, products, employees and jurisdictions) and to carry out constant monitoring that allows us to recognize emerging risks.
Regulatory and legal uncertainty and political instability
Both in Colombia and in the jurisdictions in which the Bank operates, banking regulations, and/or their interpretation by official authorities, have a material effect on the Bank's business and operations. Banking regulations can change frequently, which may have an adverse effect on the Bank's business.
In August 2022, Colombia transitioned to a new government with a political agenda that could affect the financial sector and impact capital-intensive industries. In addition, the increasing trend of raising financial consumer protection standards by regulatory authorities and high courts could result in additional operating costs and reduced bank revenues.
Although the Colombian government's flagship projects (health care, pension and labor reforms) continue to go through Congress, the main risks for the financial sector could derive from provisions adopted by other entities, as would be the case of a possible intervention in interest rates or fees. The foregoing could limit the ability of the Organization's activities to manage credit risks.
In this line, it should be noted that the SFC has submitted to public consultation the regulation related to the implementation of the regime for the internal assessment process of capital adequacy and liquidity and regulations regarding stress tests. The Bank could face a potential financial impact in the event of a misalignment between the regulations issued by the SFC and the Basel Committee on Banking Supervision standards, as this could result in higher capital adequacy and liquidity requirements at the system level.
g.Operational resilience, business continuity and technology failures
Given the constant evolution of the Grupo Bancolombia's businesses, services and processes, and the objective of being aligned with the evolution of the market, the Organization is exposed to situations that may affect the provision of services to customers or users, whether due to failures in processes, technology or situations generated by suppliers.
125
Grupo Bancolombia identifies its risks and determines the probability of an adverse situation materializing in each of its processes, channels, products, suppliers and services, which may result in affecting their availability. Based on these analyses, we design strategies to prevent or minimize the negative impact. As part of this approach, we identify the organization's critical processes to implement contingency measures, business continuity and disaster recovery plans that allow operations to continue and ensure that customers are not affected.
During 2023, we designed new crisis protocols that guarantee business continuity in the face of adverse situations, for which more than 90% of the cases designed for this purpose were tested.
h.Third Party Risk
During 2023, Grupo Bancolombia guaranteed third-party risk management, based on the identification of those critical suppliers for the Organization that, according to the service they provide, may generate a situation that may negatively impact the provision of services and/or the offering of products to its customers or users. We did this with the objective of generating mitigation plans.
For the analysis of these third parties, we have integrated multidisciplinary teams, made up of members from different areas of the organization such as sustainability, personal data protection, cybersecurity, talent and culture, business continuity, operating risk, among others. The objective is to understand the third party's management life cycle in its entirety and to guarantee that during the time of a contractual relationship with the third party, all events that may affect the Grupo Bancolombia entities are monitored and managed appropriately.
i.Human Resources Risk
Creativity and innovation, change flexibility and adaptability are required attributes for business performance. Technological advances and digital positioning create challenges related to strategies and business models for product development and service delivery. Specialized knowledge is required in areas related to data analytics, quantification and information security.
To evaluate the degree of exposure or possibilities of risk materialization, the Vice-Presidency of Human Resources has defined strategic and predictive indicators to periodically measure and monitor key aspects in the strategic management of talent in the organization. Among these key aspects are: (i) Talent loyalty: employee turnover, attraction and development; (ii) Movimiento B and Líder B: evolution and adoption of cultural traits and leaders' responsibilities; and (iii) Employee well-being: employees' perception of their harmony between personal, social and work life.
Additionally, indicators that reflect the management and identification of possible gaps in terms of talent risk are periodically considered, detailing employee turnover (discriminated by talent pool), performance appraisal, average salary per position level, learning curve, and seniority (reflecting job stability).
In order to respond to the challenges and trends of the current scenario, the Bank manages talent risk through the design of strategies that enable the culture and welfare that attracts, develops and retains talent to achieve the expected results, seeking to ensure a profitable and sustainable operation over time.
126
In line with this, the Bank's strategic objectives include talent management, and the teams in charge of managing this risk seek to develop safe work environments, attract talent, implement loyalty strategies (professional development and incentives) and strengthen labor relations. We are convinced that an adequate management of talent has an impact on the development of new products and services and allows the organization to achieve competitive advantages. For more information on these strategies, please refer to the Chapter "Developing Culture and Talent for Competitiveness".
j. Inadequate response to market changes
Grupo Bancolombia operates in a highly competitive environment and senior management anticipates increased competition in the jurisdictions in which it operates.
One of the main reasons for this has been the intensification of mergers and acquisitions in the financial services sector, which has generated larger, better capitalized and more geographically diversified companies, which in turn are able to offer a wider range of financial products and services at more competitive prices.
Likewise, the expansion of fintech and other digital native players may represent a competitive risk as some of them have outstanding technological capabilities that give them flexibility and speed for the development of new financial and non-financial solutions. Similarly, unregulated financial intermediaries (known as "shadow banking system"), which serve an unbanked or underbanked population group, should also be permanently monitored.
The ability of the different entities that make up Grupo Bancolombia to maintain their competitive position depends mainly on (i) their ability to meet the needs of new customers through the development of new products and services, (ii) the ability to deepen their current customer base through cross-selling and offering more tailored services (iii) the ability to continue with the digital and technological transformation to support growth and (iv) the ability to attract and retain human talent with the skills and knowledge that enable the development of its strategy. Failure to properly implement these focuses could negatively affect the business.
Finally, the Organization's efforts to offer new products and services may not be successful if product or market opportunities develop more slowly than expected or if the profitability of opportunities is affected by competitive pressures.
In order to respond to the challenges posed by a dynamic and challenging competitive environment, and to the imperative need to continue evolving its business model and technological capabilities, Grupo Bancolombia has set the following priorities within its strategy:
| ● | To evolve the Personas App into a Super App. |
| ● | To evolve the Sucursal Virtual Personas and Sucursal Virtual Negocios. |
| ● | To increase the portfolio of functionalities of the business channels in the Business Connections. |
| ● | To evolve the content site and digital sales. |
| ● | To evolve the Bancolombia A La Mano App. |
| ● | To develop "Hyperpersonalization" as a way to deepen customer loyalty. |
| ● | To develop the Banking as a Service (BaaS) business model, transforming the required transversal capabilities at the business, technology, experience, process and commercial levels. |
127
| ● | Open Data: enable the processes, technology and governance to develop Grupo Bancolombia's information marketing strategy. |
| ● | To modernize technological applications leveraged in the migration to the cloud. |
| ● | To evolve the platform and technological architecture, through the creation of pre-built devices that enable the development of business bets. |
| ● | To redesign the authentication and monitoring model. |
| ● | To implement a strategy for the adoption of capabilities based on Generative Artificial Intelligence. |
| ● | To evolve the integration practices used in Grupo Bancolombia (Event Driven Architecture, APIs and Files). |
Profitability and sustainable growth are fundamental premises of Grupo Bancolombia's risk-based capital management. For this reason, we have developed policies, procedures and methodologies to make decisions based on the risk-return relationship of each of the operations carried out in our business development. Thus, our risk assessment is present from the definition of prices, through profitability measurements, to our employees' variable remuneration.
Our management of allocated capital seeks to guarantee coverage of unexpected losses from the different types of risks to which the balance sheet is exposed, constantly monitoring and managing allocated capital in contrast with regulatory methodologies, for each Grupo Bancolombia entity.
From a regulatory standpoint, Grupo Bancolombia calculates its capital requirements in accordance with Decree 2555 of 2010 and Chapter 13-16 of the Basic Accounting and Financial Circular, which is aligned with the Basel III standard model. During 2023, Grupo Bancolombia maintained basic solvency levels above 9.5%, higher than the regulatory minimum including buffers, which stands at 6%.
The capital requirements include the local systemic importance buffer that Grupo Bancolombia must comply with, corresponding to 1% of the risk-weighted assets, covered with the best quality capital (Basic Ordinary Equity or Tier 1). At the local level, Bancolombia is the most important entity in the financial system, according to the calculations made by the SFC; however, at the international level, we are not part of the list of entities with global systemic importance (G-SIB).
Environmental and Social Risk Analysis
In Grupo Bancolombia we are committed to sustainability in our processes and products, so we adhere to the following agreements: the Equator Principles of the World Bank, the United Nations Environment Programme Finance Initiative (UNEP-FI), the Dow Jones Sustainability Index, the Partnership for Carbon Accounting Financials (PCAF), who integrates the standards defined by the International Finance Corporation (IFC) and others that may be applicable. With the above, we seek to promote sustainable economic development and contribute, as a financial stakeholder, in the mitigation of the effects of climate change, promoting mitigation actions with support decisions in the financing of industries that are intensive in greenhouse gas emissions.
Regarding Environmental and Social Risk Analysis, Bancolombia manages its internal processes and policies aligned with the fourth version of the Equator Principles and its entire application framework. These policies include the description of those activities that require Environmental and Social Risk Analysis, environmental risk studies for the receipt of guarantees, dations in payment and assets delivered via leasing, preventing risks associated with environmental liabilities in real estate where activities sensitive to environmental impacts are developed.
128
The Analysis includes the evaluation of Physical risks and Transition risks associated with Climate Change, Biodiversity, Human Rights, both in project finance and ordinary operations, corporate loans, bridge loans and financial advisory services, in the business units of Corporate Banking, Business Banking, SME Banking, Investment Banking and Leasing operations.
The criteria and parameters for risk categorization and the structuring of environmental and social covenants are applied for each analysis using the tools generated by the Equator Principles and the IFC Performance Standards, adjusted to the needs of the local regulations, the countries and the region.
2023 Management
During the year, in the four banks that make up Grupo Bancolombia, 130 credit transactions were evaluated through the Socio-environmental Risk Analysis process, covering a total portfolio of USD 3,287,572,923, distributed in the Corporate, Business and SME segments.
Specifically, the amounts covered are distributed as follows: Bancolombia, USD 2,760,260,867; Banistmo, USD 106,123,056; BAM USD 142,209,000 and Bancoagrícola, USD 278,980,000.
Corporate Management
During 2023, the Corporate ESG Risk Circular was consolidated and implemented. This includes, among other aspects, the management and corporate governance model of the Environmental and Social Risk Analysis process, which applies the criteria of the fourth version of the Equator Principles. This Circular determines the criteria and standards that must be validated in each of the countries through local socio-environmental risk analysis circulars, adjusted to the dynamics and regulations of each region.
Likewise, and in accordance with the provisions of the Circular, the controls required at each step of the process are currently defined in order to ensure that the teams involved carry out their corresponding activities in an orderly and timely manner.
As part of the analysis process, we consolidated the tool that integrates the evaluation of environmental and social risks transversally to the four banks that make up Grupo Bancolombia, which allows us to follow up and monitor each credit transaction, its result, risk level, economic sector, segment, among others. This tool is managed by corporate governance and applied by each subsidiary. With the application of the tool, we also seek to improve the efficiency of the process, reducing the time of risk analysis, with the objective of increasing the client base to be evaluated.
Therefore, we maintain risk analyses associated with climate change in projects that have the potential to generate significant greenhouse gas emissions and we inquire about the result of the calculation of their annual carbon footprint. Likewise, we consult on climate mitigation and adaptation measures and the compensation measures defined for their control.
ESRA to Project Finance
Statistics on Project Finance and corporate loans linked to projects
129
Among the 130 transactions evaluated in Grupo Bancolombia with favorable results during 2023, 13 correspond to Project Finance or corporate loans linked to projects developed in Colombia, Guatemala and El Salvador (Latin America) and of which the following report is made:
SECTOR AND PROJECT |
CATEGORY |
ANALYSIS DATE |
COUNTRY |
REVIEW |
|
Third party |
Internal |
||||
ENERGY | |||||
Construction and operation of a photovoltaic power plant |
B |
05/18/2023 |
Colombia |
G-ADVISORY |
|
Construction and operation of a photovoltaic power plant |
B |
06/23/2023 |
El Salvador |
|
. |
Construction and operation of a photovoltaic power plant |
B |
10/30/2023 |
El Salvador |
|
. |
Construction and operation of a photovoltaic power plant |
B |
12/29/2023 |
El Salvador |
|
. |
INFRASTRUCTURE | |||||
Installation and operation of communication towers |
B |
01/11/2023 |
Colombia |
|
. |
Installation and operation of communication towers |
B |
01/17/2023 |
Colombia |
|
. |
Construction and operation of road infrastructure |
. |
02/27/2023 |
Colombia |
ARUP |
|
Road construction, operation and maintenance* |
. |
08/24/2023 |
Colombia |
ARUP |
|
AGRIBUSINESS | |||||
Construction and operation of a palm oil extraction plant |
B |
09/22/2023 |
Guatemala |
|
. |
OIL AND GAS | |||||
Fuel storage terminal |
B |
09/25/2023 |
El Salvador |
|
. |
CONSTRUCTION AND REAL ESTATE | |||||
Construction and operation of a Logistics Center |
B |
02/17/2023 |
Colombia |
|
. |
Construction of warehouses |
B |
04/17/2023 |
Guatemala |
|
. |
Construction and expansion of a shopping center |
B |
08/10/2023 |
Guatemala |
|
. |
* Business loan. Previously also evaluated as a project
To learn more about ESRA and the corporate balance sheet in each of the subsidiaries, please visit:
https://www.grupobancolombia.com/wcm/connect/www.grupobancolombia.com15880/9f48e573-5a42-49ef-bb7e-8138b64ef609/Informe_Anual_de_Gesti%C3%B3n_ARAS_2022.pdf?MOD=AJPERES&CVID=oxOoDuo
| III. | WELL-BEING FOR ALL |
130
The well-being of all is the main objective we seek at Bancolombia when we work to promote sustainable development through three main fronts: strengthening the productive fabric of the countries in which we operate, building sustainable cities and communities, and deepening financial inclusion.
Our actions are not isolated: we are aligned with a global agenda that seeks to meet the United Nations Sustainable Development Goals (SDGs). These goals aim to promote well-being, protect the planet and improve the quality of life for all people.
To achieve the Sustainable Development Goals (SDGs), it is critical for the financial sector to make a strong commitment. Recognizing the interconnectedness between these goals and how impacting one can affect the others; we have identified seven areas where we can have greater influence through our strategy:
Promoting financial inclusion |
NO POVERTY  |
Through our inclusion initiatives, we bring financial services to underprivileged sectors in order to generate financial well-being and improve their quality of life. |
|
QUALITY EDUCATION  |
We generate knowledge and support strategies for our clients, employees and the community in general to make better financial decisions. We provide educational loans so that more people can access quality education. From our Fundación (Foundation) we provide higher education scholarships to rural youth from vulnerable populations so that they can fulfill their dream of studying and becoming professionals who will transform their territories. |
|
|
GENDER EQUALITY  |
We continue with our Diversity, Equity and Inclusion strategy, in which we work for gender equity covering female employees, suppliers, investors, customers and the community in general. We have made progress in the formalization and structure of this strategy, integrating the Bancolombia Diversa project (gender identity and sexual orientation) under the same focus, and updating the governance model. |
|
Strengthening the production network |
 |
DECENT WORK AND ECONOMIC GROWTH We finance SMEs and entrepreneurs and accompany them in their growth so that their productivity and employment generation increase and have a positive impact on the economy. We are committed to agriculture and rural areas with a value proposition that boosts the growth of this economic sector. We generate quality employment directly and indirectly through our value chain. |
|
INDUSTRY, INNOVATION AND INFRASTRUCTURE  |
We contribute to the technological reconversion of our industries, helping them to become more productive and efficient. We promote sustainable industrialization through our sustainable credit line that supports companies seeking to increase their positive impact on the environment and society. We support major infrastructure works to build a better country. |
131
Building more sustainable cities and communities |
SUSTAINABLE CITIES AND COMMUNITIES  |
We support access to housing through innovative solutions that go beyond financing. We promote sustainable mobility from financial and non-financial solutions aligned with market trends. |
|
CLIMATE ACTION  |
Climate change is at the core of our strategy; therefore, we have a zero net emissions strategy and support our clients in reducing their impact through a comprehensive financial and non-financial product offer. |
As Grupo Bancolombia we have the ambition to mobilize resources for initiatives aimed at materializing our purpose and contributing to the SDGs through our financial activity.
In Colombia, we are committed to mobilizing at least COP 500,000,000 million through financial services by 2030, which will be oriented towards various issues, mainly the strengthening of agriculture, SMEs, technological reconversion of companies, low-carbon mobility, access to housing, decarbonization of the economy, financial inclusion and women's entrepreneurship.
In 2023 alone, we disbursed COP 37,900,000 million which represents 24.1% of our ambition.
In Panama, we have a commitment to mobilize USD 17,342 million by 2030, and at the end of 2023 disbursements amounted to USD 1,664.29 million, representing 64% of all Banistmo disbursements. We allocated USD 1,227.9 million to strengthening the production network, USD 276.4 million to sustainable cities and communities, and USD 159.9 million to financial inclusion.
In Guatemala, through Bam, our ambition amounts to USD 8,176.6 million and in 2023 we surpassed the goal set for the year, with an accumulated USD 1,632.42 million in disbursements. We granted USD 1.160 million to strengthen the production network, USD 371 million to sustainable cities and communities, and USD 102 million to financial inclusion.
In El Salvador, Bancoagrícola's ambition is USD 18,126.6 million, and between 2021 and 2023 we have mobilized at least USD 5,033.1 million, which represents an advance of 28%. In 2023 we disbursed USD 1,344.15 million on the three fronts of the purpose, of which USD 806.35 million were aimed at strengthening the production network, USD 102.18 million for sustainable cities and communities, and USD 435.61 million for financial inclusion.
Details of our business ambitions aligned with the Sustainable Development Goals can be found here:
https://www.bancolombia.com/wps/wcm/connect/b7b07ab2-95f1-4369-b579-6f5e4608f089/nuestras+ambiciones+de+negocio+alineadas+con+los+ODS%281%29.pdf?MOD=AJPERES&CVID=ntg22fX
Strengthening the Production Network
Well-being in an economy is achieved when the financial sector drives initiatives that generate, on the one hand, growth, diversification, employment and opportunities for all its inhabitants, and, on the other hand, are environmentally and socially responsible.
132
At Grupo Bancolombia we are proud to be the ally of more than 19 million people, more than 710,000 SMEs and companies in Colombia and Central America, as well as more than 2 million independent workers, who together are the ones who drive the economy of our countries.
We support all of them with the financial services they need according to their activities, productive cycle and particular needs, understanding the conditions of each sector and the economies in which we operate.
SMEs as a Driving Force of the Economy
Strengthening SMEs is a direct boost to the dynamism of our countries' economies. An example of this is Colombia, where these companies account for around 80% of employment and 40% of GDP.
Understanding this reality, at Grupo Bancolombia we have focused on approaching these companies so that they can access solutions that allow them to leverage their businesses, with a value proposition that facilitates the management of their activities from the beginning to the end.
We evolved our customer service models by leveraging our physical and digital solutions. From our network of offices, they will be able to find solutions that allow them to increase their sales, such as QR and Wompi, the possibility of accessing the services they need in just one call, and an offer of banking solutions as a service, so that they can offer the financial services they require to their customers, such as the digital wallet and Compra y Paga después (Buy and Pay Later).
In 2023 we granted more than COP 16,208,000 million to SMEs operating in Colombia through the loans they need for working capital and investment. Meanwhile, in Central America we provided credit support to more than 4,504 SMEs with disbursements of USD 477 million.
We also supported SMEs and companies in the financing of assets through Financial Leasing and Operating Leasing for more than COP 2,048,000 million, which also include energy renovation solutions and assets with energy efficiencies that contribute to the environment.
In a complex economic environment, we actively accompany SME clients and companies in good standing or with low levels of delinquency, with strategies to alleviate their cash flows to avoid a possible deterioration, with solutions for operations for more than COP 202,000 million.
In addition, we want to recognize SMEs that implement good practices in ESG issues, so we are bringing the benefits of sustainable financing closer to this segment through increased training to our commercial force, and by strengthening relationships with trades and chambers of commerce in the country.
In Guatemala, SMEs are also a priority. In the last year we disbursed more than USD 94 million in credit to this segment and, as part of these operations, we supported SMEs with female leadership with more than 220 credits representing USD 12.7 million disbursed.
As part of this, we created two new specialized and exclusive financing products to meet the needs of micro, small and medium-size companies in the commercial sector. With this initiative we have not only been able to deepen our current clients and attract new ones, but we have also achieved USD 1.12 million in placements and reduced the credit process by 33 days.
Meanwhile, through Bancoagrícola in El Salvador, we supported SMEs, agroindustrial companies and exporters with disbursements of more than USD 704.5 million, which have been key to strengthening the country's production network.
133
In addition, we exceeded 2 million independent customers in Colombia, with whom we have worked to understand their needs in a comprehensive manner in order to strengthen our offerings for them. In 2023, we supported them with more than COP 4,320,057 million in credits. Likewise, more than 44,000 customers have savings and investment products such as CDs and virtual investments: 61% more than a year ago.
As an organization we worked with 24,793 suppliers, to whom we paid COP 7,300,000 million in 2023 with an average payment period of 15 days. With this we build society and contribute to the production network of the country. In addition, we have supported 217 suppliers with the Integrated Supplier Risk Management Model, articulating Cybersecurity, Operational Risk, Personal Data Protection and SOX capabilities.
In order to continue supporting the countryside so that it becomes a scenario of greater development opportunities for the country and its inhabitants, at Bancolombia we are expanding our offer to this sector, where we have more than 243,500 clients.
In 2023 we disbursed COP 10,500,000 million in loans for a wide range of sectors such as livestock, coffee, poultry, avocado, rice, flowers, among many others. This represents an increase of 20% compared to 2022, where loans to small producers grew 54%. In this line, we remain Finagro's main underwriter, with a 30% share.
This has been possible thanks to a range of credit options that can be adapted in terms of amount, terms and frequency of payment, including its own credit lines, credits with Finagro benefits, revolving quotas for short-term needs such as the purchase of inputs, payment of labor, among others, and even a specific credit card for this sector. More recently, we implemented a pilot to provide free parametric agricultural insurance to 1,000 clients with credits already disbursed.
Last year we launched the integrator credit, which allows businesses that are part of the value chain of large companies to have faster access to the resources of their accounts receivable, while large agribusiness companies obtain better financing conditions (on average 200 basis points less than in a traditional credit) in a very important item of their liabilities. At year-end, COP 130,000 million was disbursed to support more than 2,300 small and medium-sized producers.
With our Productive Linkages strategy, we are able to use the information provided by medium and large companies (pivots) to approach small businesses that are part of their production chains so that they can access savings and credit products. In agriculture, today we have 83 pivots with disbursements of COP 93,000 million.
In line with Colombia's environmental commitments and the challenges faced by the agricultural sector, which is responsible for 21.6% of greenhouse gas emissions, we have a Agro-Sustainable and Sustainable Livestock financing portfolio. This portfolio is designed to accompany companies in their transition to sustainability, reducing their emissions, adapting to the impacts of climate change and increasing productivity through more efficient land use and the conservation of non-agricultural areas.
The Agro-Sustainable line applies to independent clients and companies in all links of the agricultural value chain (producers, processors, marketers, support services and rural activities), which today meet the profile to access financing on Finagro terms and seek to implement investments with a positive environmental impact, framed within the policies established by the bank.
134
This financing has lines for working capital for companies with environmental and agro-sustainability seals endorsed by the bank. In 2023 we disbursed COP 331,211 million.
The Sustainable Livestock line leverages livestock systems that implement environmentally friendly practices, respecting forest areas, water bodies, among other investments that generate productivity efficiencies such as: increase in the animal load per hectare, optimization of pasture rotation times, increase in the number of trees per hectare, among other indicators. In 2023 we financed projects for COP 7,714.3 million for the development of sustainable livestock investments that generated positive environmental impacts such as: 6,850 hectares for sustainable livestock, establishment of 410 dispersed trees and live fences, establishment of 30 hectares in silvopastoral systems, 17 kilometers in livestock aqueducts, 125 hectares in forage banks and the release of 20 hectares for conservation.
With support from the Partnerships For Forests (P4F) program, we designed the Technical Assistance Manual for sustainable livestock. We continue to maintain the agreements with Fedegán and GANSO as allies for the provision of the technical assistance services required. We also began integrating the criteria for monitoring deforestation and respect for the agricultural frontier into the monitoring process for sustainable livestock credits.
More mechanisms to access assets
We consolidated our Rental and Use portfolio with real estate valued at COP 1,630,000 million, of which COP 387,000 million are sustainable assets.
In addition, in technology leasing contracts, we mobilized business for COP 220,000 million, 37% more than a year ago, which maintains us as the most relevant player in the market for leasing this type of assets.
In addition, we made Bancolombia the first bank in the country to finance real estate assets through trust rights under financial leasing, with the closing of three deals worth COP 89,000 million.
Sustainable Financing (GRI FS8)
With sustainable financing we confirmed our commitment to encourage and promote the implementation of ESG (Environmental, Social, Governance) criteria in our clients and to generate a greater impact on our portfolio with differentiated products.
The objectives of sustainable financing are: i) that the projects generate efficiencies for our clients, allowing them to use fewer resources and improving their operating model, and ii) to generate a quantifiable environmental benefit.
We do this through sustainable lines, which offer our clients better rates for the development of investment projects in assets and for working capital needs, with the objective of promoting the use of clean technologies, renewable energies, application of circular economy, efficient use of energy, clean fuels, reduction of waste, emissions and spills, sustainable construction, projects related to blue economy, among others. The business lines through which we finance these focuses are banking (ordinary portfolio) and leasing.
Sustainable line for companies certified as sustainable
135
Sustainability permeates all of a company's operations, which is why we promote a line that accompanies the financing needs through working capital for companies that meet the framework and criteria of the highest standards of sustainability certifications at a global and national level.
The sustainable seals endorsed include certifications for agricultural companies, comprehensive certifications such as Certified B Companies, High Impact Entrepreneurships (HIEs) classified as sustainable, companies committed to gender equity (Equipares Seal). We currently have a list of 21 sustainable certifications in different sectors accepted for the use of the sustainable line for the working capital focus.
Diamond Level
High Performing and Certified Level
Preferred and Strategic Supplier Level
Marketers
Producers and processors
Silver and gold
Livestock
Committed and responsible
Essence and excellence
In 2023 we incorporated these new seals:
| • | Aquaculture Stewardship Council- ACS International |
| • | Leather Working Group |
| • | Icontec's Sustainability Seal, essence and excellence levels |
| • | Porkcolombia |
| • | Sustainable Palm Oil |
| • | Diamond level Sustainability Seal for Poultry |
Through this line we have financed COP 186,625 million in legal currency and USD 117 million in foreign currency.
This is how we contribute to the country's environmental goal from the Línea Sostenible (Sustainable Line) financing with the 2023 disbursements
Savings |
Amount |
Unit |
Electrical energy saved |
22,262,282 |
MWh/year |
Renewable energy generation (PCH - Photovoltaic) |
143,853 |
MWh/year |
Power generation from biowaste and agro-industrial waste |
1.1 |
MWh/year |
136
Water saved |
385,256 |
m3/year |
Treated water |
8,687,261 |
m3/year |
Recirculated water |
166,831 |
m3/year |
CO2 emissions avoided |
282,321,455 |
CO2 tons/year |
Recycled waste |
413,542 |
Tons/year |
Waste avoided |
93,793 |
Tons/year |
Sustainable built area |
814,296 |
m2 |
In total, in 2023 we disbursed COP 4,761,046 million in legal currency and USD 117 million in foreign currency, which materialize projects in different economic sectors to fulfill our purpose as an organization.
For High Impact Entrepreneurs (HIEs) that have a relevant contribution to the achievement of the SDG goals through the development of their social purpose and the products and services they offer to the market, we achieved placements for COP 10,000 million.
In the support we provide to entrepreneurs, we emphasize women entrepreneurs, and together with the Department of Equity and Inclusion, we participate in the business rounds of Emprender Mujer, where we listen to the different proposals of women entrepreneurs to identify how we can support their business ideas and give them feedback on their business models.
For clients in the Government segment, we have a special focus that allows us to analyze projects related to the development plans of municipalities and territorial entities, promoting the implementation of sustainability criteria in public works. We closed 2023 with sustainable disbursements of COP 28,767 million, representing 7% of total placements in this segment.
Credit Tied to Sustainable Indicators
It supports companies that are taking action in their transition to a low-carbon economy, incorporating sustainability into their strategy and seeking to achieve better standards. To the extent that they demonstrate compliance with ESG objectives established at the beginning of the operation, they will be eligible for an improvement in the interest rate of the credit.
In addition to this, the credit seeks to encourage companies to set challenging goals that are relevant to their sector, aligned with international standards and verifiable by an expert third party, and that are measured periodically to verify compliance with the work plan.
In 2023 this exercise allowed us to strengthen the relationship with different clients by socializing their performance and proposing good practices that can be implemented according to an international framework that promotes best practices in each ESG component, using the materiality of each company as the main input.
Since the creation of this line, we have disbursed COP 2,600,000 million in 8 operations.
Sustainable Line in Foreign Currency
We developed this proposal aimed at companies whose operations are in dollars, with the objective of recognizing sustainable practices in agriculture and other sectors, such as international trade, through the rate. With this foreign currency line, we support them in financing their production chains, various working capital needs and sustainable projects. In 2023, we disbursed USD 117 million in 82 operations.
137
In addition to our own Sustainable Financing products, we promote special rediscount credit lines for special periods and subject to the availability of resources, which also reflect investments in efficiency and environmental benefits:
In COP |
|
2022 |
2023 |
Own resources |
Sustainable Line (Housing Leasing) |
372,014,392,342 |
37,737,287,985 (housing leasing disbursements) |
Leasing, Rental and Use |
62,000,000,000 |
4,147,329,101. |
|
Sufi Third-party channels (Electric mobility) |
246,380,000,000 |
350,469,168,875 |
|
Local Development Banks |
Rediscount (Bancóldex, Findeter, Finagro) Bank and Leasing |
3,146,319,672 |
34,000,000,000 |
Sustainable Cities and Communities
In the midst of a complex year for the real estate and construction sector, we assisted more than 37,000 people with new loans for home ownership, with disbursements of more than COP 4,700,000 million, which increased the portfolio balance in this segment by 8.9%, reaching COP 26,780,000 million. Thus, we have already helped more than 255,000 households to purchase a home.
Under the sustainable line for the purchase of housing, with which we offer better financing rates for projects that are part of certified constructions and are financed by Bancolombia, we disbursed more than COP 1,200,000 million, benefiting 1,980 people.
In 2023 we developed the Tasa Techo (Ceiling Rate) strategy, with which we accompany Public Housing homebuyers and the sector with a maximum annual effective rate of 14%, in times of high volatility and uncertainty in rates. With this, we have supported more than 3,132 families with disbursements of COP 237,736 million.
We also channeled more than 15,000 Mi Casa Ya subsidies to 6,556 families, achieving a 30% share of the total.
Another of the key fronts is the promotion of the construction sector, to which we granted COP 3,600,000 million last year for 500 projects that translate into the construction of 81,711 homes in Colombia.
Tu360 Inmobiliario's platform has allowed us to support this sector from other angles. It is not only a showcase to support marketing (where today there are more than 900 projects on display), but also facilitates the study for the financing of builders and homebuyers, allows to manage and consult the payments received for down payments, and provides market information on areas of interest, demographic characteristics and the profile of the potential buyer.
138
In addition, and understanding the interest of buying housing for other uses such as investment, mixed use or tourist housing, we developed a financing solution in Colombian pesos for 20 years.
In El Salvador, as part of the sustainable development loan portfolio, we placed USD 17.7 million for the construction of housing projects and USD 38.3 million in mortgage loans.
Sustainable Construction (Sustainable Business Management GRI FS8)
Financing and promoting sustainable construction is essential for the development of sustainable cities and communities (SDG 11). For this reason, we continue to support our clients to guide them in the selection of the appropriate certification for their projects and to have them accredited as Sustainable Construction: EDGE, LEED, CASA Colombia or HQE.
Through the focus on sustainable construction in 2023, we disbursed COP 1,200,000 million in certified projects. In turn, with the housing leasing business line, we were able to obtain business from 44 properties certified in sustainable construction for a total area of 4,000 m2, with savings in the construction phase in energy of 15.1 MWH/year, and 530 m3/year in water resources, avoiding the emission of 378 tons of CO2.
In the meantime, we closed an alliance with SUMAC, a multinational company with more than 20 years of experience in the market and a member of the US Green Building Council. With this alliance we offer our professional construction client’s advice to certify their projects and a discount on SUMAC's fees for the implementation of the certification.
In Guatemala, Bam also provides credit for sustainable construction that also includes expert advice on the subject, positioning of the client as a precursor of sustainability, preferential rates, among others. In 2023 we disbursed USD 53.44 million under this line, bringing Bam's total to 12 projects aligned with sustainable construction.
Of the 27 4G projects that have financial closure in the country, Bancolombia participates in 15 of them (52%), with a financing for COP 6,100,000 million.
The fiduciary manages 33 road concessions worth COP 51,200,000 million, totaling nearly 7,200 km, benefiting 58 municipalities and generating more than 230,000 jobs. We are a reference for our participation in the structuring and administration of sophisticated financial closings that include the management of international issues and structured financial products such as derivatives. In 2023 we participated in 3 new concessions with a value of COP 6,970,000 million and 6 financial closings for a value of COP 11,210,000 million, ensuring the transparency and efficiency of resources to contribute to the economic and social development of the country.
139
Regarding fifth generation (5G) contracts, during 2023 we achieved the financial closure of Malla Vial del Valle del Cauca - Accesos Cali Palmira, in which Bancolombia has a 45% participation, which will represent a financing of COP 677,000 million, to be disbursed over the next 5 years. With this project we expect to generate 40,000 direct, indirect and induced jobs, and we estimate that it will benefit 3.3 million inhabitants of 12 municipalities in Valle del Cauca and 5 municipalities in Cauca, through the 315 kilometers of roads that will be intervened.
We also accompanied the structuring and financial closing of Ruta al Sur, a project extending 480 km between Huila, Cauca and Putumayo to connect cargo and passenger transportation to and from Ecuador and reduce the travel time between Bogotá and Quito from 26 to 20 hours. We will finance this project with COP 800,000 million, 28.5% of the total.
La Cuenta del Mar (Sea Account)
The oceans are fundamental for what they represent for the environment, people's quality of life and global productive activity. For this reason, at Bancolombia we reaffirmed our commitment to sustainable development by creating the Cuenta del Mar.
This initiative involves the creation of a new category in our sustainable financing line called Economía Azul Sostenible (Sustainable Blue Economy), where we seek to promote projects, for COP 1,000,000 million by 2030, that contribute to social and economic growth in coastal areas, protecting marine ecosystems.
It also seeks the protection and restoration of mangrove forests in Colombia and El Salvador, as well as the conservation of the Panama Canal watershed and the protection of sea turtles in Guatemala.
Through our financial activity, we support companies that are part of the country's entire energy chain to guarantee energy supply and transition. Some examples are:
In 2023, we supported renewable energy projects with the sustainable line for COP 400,000 million, and COP 419,000 million for energy efficiency projects, with which 5,720,921 tons of CO2 emissions were avoided.
We disbursed more than COP 280,000 million in solar energy projects, distributed in five projects that are in the construction stage and have an installed capacity of 300 megawatts. This installed capacity is equivalent to 45% of the total solar projects currently in operation in the country. With this energy financed in 2023, approximately 410,000 Colombian homes will be supplied.
We supported the electric power generation sector by financing its working capital needs, mainly for the purchase of fuels in five of the main thermoelectric generation plants in Colombia for COP 274,000 million, contributing to the sector's anticipation and preparation for the “El Niño” climate phenomenon.
The Parque Solar Caracolí in Malambo (Atlántico), one of the projects awarded in the third non-conventional renewable energy auction held by the Ministry of Mines, had Bancolombia as structurer, sole financier and partner in other financial services. Through the green line, this project has a loan of COP 126,000 million, of which we have already disbursed COP 73,000 million.
Through Leasing, we supported the financing of the largest rice husk-based energy generation plant in Colombia for the client Diana Corporación, for a value of COP 90,000 million.
140
From Investment Banking we provided advice on the sale of renewable energy assets. An example of this was advising Celsia on the sale of 100% of its stake in the portfolio of renewable energy generation assets in Central America, with a total installed capacity of 188 MW. The transaction for USD 194 million in equity value was the most important of its kind in recent years in Central America, and will provide Celsia with resources for its strategy, while the buyer (Enfragen) will be able to position itself among the main players in the sector in Panama.
From the fiduciary, we continue to enable business in the non-conventional renewable energy sector through fiduciary guarantee and payment source schemes with financing from national and international sources. In 2023, we enabled an energy structure that provides sustainable energy for 35 MW in new businesses, reaching 364 MW in the managed businesses.
In order to diversify the portfolio of products available to customers who wish to access assets that generate renewable energy, we developed the leasing of solar solutions. We achieved an operation with Laurel, a vehicle whose investors are Inversiones CFNS and Celsia, whose purpose is to lease solar solutions to industrial and commercial users in different areas of Colombia.
With this same product we accompanied the Guamo (9.0 MW) and Numbana (9.9 MW) solar farms, located in the department of Tolima. With the entry into operation of these projects we contributed to the reduction of 7,000 tons of CO2 per year and with the supply of energy to nearly 15,000 homes.
We are strategic allies of the government and the education sector to materialize the development plans of the territorial entities. The portfolio balance of these clients grew almost 67% with respect to the previous year, amounting to COP 4,210,000 million.
At a time of transition of new governors of territorial entities, we accompany the candidates with knowledge transfer under the concept of “Conscious Governments”. We also generated points of contact with the incoming administrations in order to build bridges to jointly build their development plan for the next 4 years, focused on building sustainable and digital territories for the well-being of all.
We participated with COP 1,000,000 million in the financing of the development plan of the District of Bogotá, positioning ourselves as one of the client's leading banks to support the objectives of the four-year term, including projects such as the San Cristóbal cable and works related to the Bogotá Metro. Of this amount, we disbursed COP 200,000 million under the sustainable line and COP 800,000 million in the ordinary portfolio.
Continuing with Bogotá, as financial allies of Transmilenio S.A., Bancolombia participated as an anchor investor in its securitization, providing resources for COP 500,000 million. Likewise, we placed the first tranches of the Securitization of the Nation's Future Budgets of the Patrimonio Autónomo Troncales Alimentadoras de la Primera Línea del Metro de Bogotá D.C. for COP 871,200 million. These tranches are associated with a total issue of COP 2,990,000 million (the largest in the local market), structured by Banca de Inversión Bancolombia, which will allow Transmilenio to develop the shuttle service trunk lines of the first line of the Bogotá Metro, impacting more than 2 million inhabitants who will see an improvement in their quality of life due to shorter travel times and reduced transportation costs.
In line with our purpose of contributing to the sustainable development of the communities, from our Network Government segment we accompany numerous Colombian municipalities, among which we highlight:
141
| ● | The Municipality of Soacha, with the financing of COP 87,200 million for the construction and adaptation of schools -impacting around 60,000 young people-, for the construction and adaptation of parks that will bring integral development to more than 200,000 people, and finally for the paving of the municipality's main roads. |
| ● | In an operation carried out through Finagro, we granted more than COP 10,722 million to the municipality of Anapoima (Cundinamarca) for the paving of rural roads to facilitate the transportation of agricultural products, as well as for sewage and the construction of the new marketplace. |
| ● | We disbursed more than COP 11,000 million for the improvement of the urban road network in Pasto, which will benefit 84% of the community living in the urban area of the city. |
| ● | We provided COP 4,000 million in financing to the municipality of Ramiriquí (Boyacá) to connect the rural community to the public natural gas service, which will give people access to a fuel with lower cost and environmental impact, while natural gas can be used for agricultural and livestock activities. |
| ● | We supported the department of Boyacá in the structuring and implementation of the Vehicle Tax Collection, with which more than 160,000 taxpayers in the department have channels and national coverage for the payment of their vehicle tax. |
| ● | We supported the first sustainable project in Urabá by financing the municipality of Apartadó (Antioquia) with COP 7,500 million from our sustainable line, for the construction of cycling infrastructure, as well as the reconstruction and expansion of roads and the bridge that connects the center of the municipality with the road to Turbo and al Mar. |
We seek to encourage sustainable mobility aligned with the energy transition proposed as a country strategy, and to contribute to economic development by understanding transportation as a determining factor.
In this transition, vehicles dedicated to Natural Gas Vehicles are relevant and are therefore included in the sustainable line, from which we have mobilized COP 1,500,000 million in financing for this segment.
Renting Colombia continues to support differentiating connections that impact our clients from a sustainable point of view, allowing them to reinforce their own corporate strategies towards a positive path to preserve and correct the impacts that our environment has today. In 2023 we supported more than 20 clients who bet on sustainable investment in their fleets, with financing for more than COP 70,000 million in electric, hybrid and NGV vehicles.
Contributing to our decarbonization goals, we supported the people segment with the sustainable line through our subsidiary SUFI. During the year we mobilized more than COP 350,469 million in financing for sustainable vehicles.
With Muverang, our challenge to transform the way the world moves, by the end of 2023 we managed to put 1,272 electric vehicles on the road in 6 cities in the country (Bogotá, Bucaramanga, Cali, Medellín, Pereira and Barranquilla). In business contracts, we assisted 29 companies that put nearly 220 vehicles on the road, with the greatest participation in 2-wheeled vehicles. Furthermore, under the monthly subscription scheme aimed at individuals, we reached 1,834 subscriptions, serving 1,400 new customers and getting closer to our ambition to democratize electric mobility in the country.
142
Revenues were COP 8,221 million, an increase of 49% compared to 2022.
In our Tu360Movilidad platform, we integrated our partners' vehicle offerings, means of transportation and Grupo Bancolombia's financial products to accompany people in all their mobility-related needs. This included more than 77 partner showcases, solutions such as Renting, Localiza, Muverang, Flypass, license renewal assistance and all-risk insurance. Thus, in 2023 we helped more than 3,000 people to access the vehicle they need, with disbursements of approximately COP 120,000 million.
We are also there to meet the needs of public mobility. For this reason, we made the fare collection of the Medellín Metro more efficient, with more than 13 million recharges for more than COP 212,600 million; we worked with 45 cab fleets that incorporated digital tools so that Bancolombia customers can pay for services through the QR Code, through which more than COP 18,000 million have been mobilized, which in turn helps us to bring financial inclusion to a community of more than 55,000 cab drivers.
In addition, we made available to dealers a credit line that allows them to access an inventory of electric, hybrid and gas-powered vehicles at a more competitive rate. This line, through which we have disbursed more than COP 177,000 million, complements Bancolombia Factoring's offer of solutions to help companies manage their working capital.
Our strategy on this front continues its path of consolidation, with the ambition to promote, articulate and mobilize economic actors in the transition to the Circular Economy, seeking to build economic and environmental resilience, thus contributing to the well-being of businesses, society and the environment.
The strategy is based on 5 pillars: Financing and Investment, Measurement and Data, Communication and Influence, Circular Economy within Bancolombia and Strategic Collaboration.
In May 2023, Bancolombia joined the Ellen MacArthur Foundation network to mobilize and promote the transition to the circular economy in Colombia and the region. With this, we become the first company in Latin America to partner with the Foundation and have a presence in North America, Europe, and Asia.
In the second half of the year, the first "Circulatón" was launched to recognize and highlight solutions and projects based on circular economy concepts that impact and evolve different processes in society. A total of 282 applications were received, of which 33 teams advanced to the second phase and 3 winners were finally selected.
In 2023 we financed COP 542,693 million in circular economy projects for clients in different segments: corporate, business, SMEs, independent and government. The projects financed generated impacts in areas such as reduction of water consumption and management, increase in the useful life of production parts and technology, reduction of waste in production processes, among others.
Through our Leasing, Rental and Use business line, we have technology leasing financing that works under a circular economy scheme where the useful life of technology equipment is extended in order to reincorporate them into the market and ensure proper final disposal as Waste from Electrical and Electronic Equipment (WEEE) when necessary.
143
As owners of the equipment, we are responsible for the final disposal, in this case we seek a second use through repowering processes and put it at the service of the customer. In case this process is not possible, we take care of its adequate treatment as electronic waste.
In this way, we have achieved placements for a value of COP 97,098 million and promoted 181 clients in the incorporation of a circular economy model in their organization, for a total of 2,441 recycled and 22,987 used equipment sold, achieving energy savings of 54,494 MW/hour.
Financial Implications and Other Risks and Opportunities of Climate Change GRI 201-2
We define and implement sustainability policies as part of our corporate strategy, which are linked to our climate strategy.
These are the Climate Change Policy, Responsible Investment Policy, Sustainable Procurement Policy and the Corporate ESG Risk Circular which incorporates the Environmental and Social Risk Analysis Policy, the Climate Change Sensitive Industries Policy and the Controversial Issues Policy.
As part of our external strategy actions, we developed an engagement process with 25 customers relevant to our financed emissions reduction strategy.
Details of climate policies, strategy, metrics and targets can be found in the TCFD chapter of our Regulatory Report.
Our internal actions include the management of Scope 1, 2 and 3 emissions (except for financed emissions) and the resources collected through the internal carbon tax. Details of these actions can be found in the Ecoefficiency chapter, which includes information on renewable energy generation and energy efficiency indicators, among others.
Climate Change Financing and Actions in 2023
We recognize that climate change poses new risks and opportunities, with strategic and financial implications for our businesses and those of our customers and other stakeholders. Therefore, we ratify our commitment to implement actions to mitigate and adapt to the adverse effects of climate change through our Climate Change Management Strategy.
In terms of climate change, 2023 was a very active year for financial institutions, given the relevance in the run-up to the United Nations Climate Change Conference (COP 28) and the objective of reviewing progress in complying with the Paris Agreement.
In 2023 we met the following milestones in the initiatives in which we participate:
| • | Net-Zero Banking Alliance - NZBA: we made progress in defining the transition plans for the sectors in which we have defined goals: cement, energy, oil and gas. |
| • | We also initiated the validation process of our climate targets defined under the Science Based Targets Initiative standard. |
| • | During its participation in COP28 in Dubai, the world's most relevant event on climate change issues, Bancolombia reiterated its commitment to mobilize more resources for key energy transition projects and promoted conversations around collective solutions and scaled financing models to unlock the country's transformative potential to achieve a low-carbon, climate-resilient and inclusive economy for all. |
Climate commitment
144
Our commitment is to disburse COP 40,000,000 million by the year 2030, to finance projects for technological reconversion, low-emission mobility, sustainable construction, renewable energy and sustainable livestock.
|
Business with Purpose: Climate Commitment Goals and Compliance | ||||
Year |
Goal (COP million) |
Disbursements (COP millions) |
Compliance |
|
2023 |
4,070,000 |
5,510,000 |
135% |
|
For details on governance, strategy, risk management, and climate metrics and targets, please refer to the TCFD chapter of the regulatory report.
Biodiversity
As a member of the Equator Principles, Bancolombia has incorporated biodiversity-related issues into its decision-making since 2008. In this regard, some of the actions we have taken are the Environmental and Social Risk Assessment for projects and credits in activities with an impact on biodiversity established in our ESRA Policy. Likewise, our Controversial Issues Policy defines the activities that will not be financed due to their high impact on marine and terrestrial ecosystems, and the conditions for financing and investment in economic sectors with high environmental and social impact.
To learn more about our ESG risk policy please visit: https://www.grupobancolombia.com/wcm/connect/www.grupobancolombia.com15880/b9141ff1-1710-4c05-80e0-65fd0c6351e6/Circular_de_Corporativa_de_Riesgos_ESG.pdf?MOD=AJPERES&CVID=oyyjjTI
Since 2021 we are strengthening our biodiversity strategy, where the first step is aimed at measuring and managing our impact on forests. For this reason, we participated in the CDP Forest pilot, reporting on how we are managing these impacts from the risks and opportunities for our financing strategy in the sectors prioritized by the initiative: oil palm, timber, soybeans, livestock and rubber. Likewise, with CDP's support we will have the first analysis of our portfolio to identify impacts on forests.
We also recognize that deforestation is a risk that contributes to climate change and biodiversity loss. As a signatory to the Financial Sector Commitment on Eliminating Commodity Driven Deforestation (FSDA), we are committed to assessing our exposure to deforestation, deepening our commitments on this issue and establishing and disclosing meaningful information, our objectives and progress towards them.
During 2023 we evaluated our exposure to the prioritized sectors as a first step in assessing this risk:
Area |
TOTAL (COP million) |
Palm oil |
330,291 |
Livestock |
932,170 |
Wood |
61,639 |
145
Pulp and paper |
120,525 |
Soybeans* |
52,816 |
TOTAL |
1,497,442 |
*Includes other cereals (except rice).
In the climate commitment process with our clients, we have included biodiversity and deforestation issues, and we intend to deepen and expand these commitments in the coming years. In the group of 25 clients with whom we carry out climate engagement in 2023, we reviewed biodiversity and deforestation issues with 1 client from the livestock sector, 1 from the timber sector and 1 from the palm oil sector.
We want more people to access not only financial products, but also to the benefits that the use of different services provides them in their daily activities. In that sense, while we develop a more contextual offer according to the needs and expectations of different types of population, we also work for the financial well-being of everyone.
A Decade of Bancolombia A La Mano
From being a tool to include Colombians from the most remote areas who mainly dealt in cash, it has expanded to become a digital wallet for the entire country.
Today it not only offers transfers, cardless withdrawals, balance inquiries and bill payments, but it is a low-amount deposit with its own App that is present in people's daily lives, and that allows people to top up the cell phone balance and mass transportation cards, to buying online, receiving money orders from abroad, paying public services and using the QR Code to buy in more than 1 million stores in 1,100 municipalities in Colombia.
In 2023, the 6.36 million users of Bancolombia A La Mano made more than 417 million monetary transactions, which represent more than COP 74,000,000 million mobilized, 17% more compared to 2022.
It is also an instrument to promote access to financing. The A La Mano Credit is a low-amount, 100% digital, immediate and secure pre-approved loan that helps build credit history.
In 2023 we delivered 164,314 credits for a value of COP 190,593 million, which for almost 42,000 people became their first formal credit.
GRI FS7 Indicator
Dec-23 |
|
Number of Bancolombia A La Mano clients |
6,364,050 |
Total balance in BALM (millions of COP) |
970,584 |
Number of Loans Granted |
164,314 |
146
Amount of Credits Granted (millions of COP) |
190,593 |
Portfolio Balance (millions of COP) |
103,583 |
Family Remittances:
We continue to support financial inclusion in the country by facilitating the receipt of money transfers from abroad to more than 2.6 million beneficiaries in Colombia who receive support from their families or people who are building a future for when they can return to the country or to have investments and remain connected to their country of origin:
| ● | We disbursed USD 6,619,813,679 in family remittances through the different channels in 2023 and achieved a percentage of family remittances disbursed with credit to accounts of 91.24%. |
| ● | We had an 18.8% growth in commissions compared to 2022, reaching COP 203,727,252,227 for the year. |
Through Nequi, we help people improve their relationship with money, empowering them to achieve what they want with it. There are already 18.6 million people who see Nequi as an alternative for using money in their daily lives, with an ever-increasing range of services.
We continue to revolutionize digital payments. In 2023 we introduced the new functionality of contactless payment in terminals through our Nequi-Visa Card, with which we want people to carry everything on their cell phones and to make the use of digital means of payment, without the need for cash, a daily occurrence. With this, we also expanded the possibilities of use of the Nequi Card, thus reaching more businesses and increasing its adoption.
Thanks to the extension of digital payment methods, we have also fostered the development of the informal economy, the one that happens in the streets, in the neighborhoods, in the marketplaces, and in rural areas, which boosts the local economy. At Nequi, we have made significant efforts to provide merchants and entrepreneurs with access to their products and services. Of the total number of Nequi users, 15% belong to this segment of the economy where, of the total amount of money that enters Nequi in a month, 47% comes from this category.
Our loans are key for financial inclusion and for our users to achieve their dreams. This year we disbursed more than COP 127,000 million in credit, through 71,889 Propulsor loans for COP 118,000 million and 68,446 Salvavidas loans for COP 9,040 million. 55% of the loans were granted to individuals with no credit experience.
Some of the novelties in 2023 were that we increased the term and maximum amount of the Propulsor loan from 24 months and up to COP 5 million to 36 months and up to COP 10 million; and we lowered the interest rate of the Salvavidas loan from 43.7% to 28.07% effective annual interest rate (equivalent to 25% nominal annual interest rate).
We also introduced new non-financial services and ventured into the world of insurance. With Segurísimo we offer a personal accident insurance policy that can be customized with additional coverages that users can choose, according to their needs.
147
In Panama we migrated the core to provide our more than 152,000 customers with a much more stable and available app.
Likewise, in order to get closer to more people and strengthen our offer, we were at the Comic Con, where we were able to interact with an important niche of clients with the Nequi Visa Digital card, and we closed an alliance with the Pedidos Ya platform, which contributes to Nequi's promise to its clients to live in their day-to-day lives.
Inclusion with a Gender Perspective
We continue to strengthen the value proposition for women clients and in this way promote gender equality in the country. In Colombia we have more than 9 million women clients, whom we accompany in their personal and professional needs. In 2023 we granted them more than COP 3,500,000 million in disbursements through different lines of credit. We also offer them solutions for managing liquidity and growing their assets: There are already more than 267,000 women with products such as CD and virtual investment, which represents an increase of 58% compared to 2022.
In El Salvador we disbursed USD 359 million in loans that mostly seek to contribute to the economic empowerment of women in the country. Additionally, with the ES Líder platform, 40 Bancoagrícola clients who are business owners have received non-financial training that creates and reinforces leadership skills and strengthens their businesses.
In line with regulations, we adjusted the productive credit line with a special rate of 31.89% effective annual percentage rate for the country's micro-entrepreneurs. In addition, we offered them the possibility of accessing a personalized financial education program at no cost, which could generate an additional rate discount.
In this line of productive credit, we have disbursed COP 370,000 million to more than 23,000 people, of which 44.6% was disbursed to women microentrepreneurs and, of the total number of beneficiaries, 30.41% took the Elévate program.
With this line of credit, we participated in the Popular Economy line promoted by the Government, in which we accompanied more than 320 people with disbursements of more than COP 600 million in 2023.
Education and Financial Well-Being
As an organization, we understand well-being as a state in which a feeling of tranquility, satisfaction and progress is experienced and the ability for each person to have the conditions they consider necessary to achieve it. To the extent that a person has a better relationship with their money, they will be able to live with more security, freedom and a greater sense of well-being, which leads us to work from the financial well-being of people and businesses.
Financial education is the vehicle we have chosen to promote the financial wellbeing of our employees, customers, clients, users and the community in general, with the objective of guiding and raising awareness about the responsible use of money, contributing to the development of skills that allow people and businesses to achieve their own goals and make informed decisions at every stage of their economic life cycle.
We present the results of the Grupo Bancolombia's Financial Education and Wellness strategy for 2023 with its employees, customers and the community in general, with the objective of developing financial competencies so that they can better manage their money, make better decisions and progress.
148
Financial Well-Being Indicator
In 2023, we evolved the indicator to a more sophisticated one that would allow us to have a more comprehensive view of customers and incorporate new variables in the measurement. In this sense, the new version of the indicator is fed by 30 transactional variables, which are grouped into seven dimensions:
1. Savings and/or investment: We identify the individual's level of savings over income, its frequency and how long the savings could cover monthly expenses in the absence of income.
2. Planning: We observe how much the person uses the services (automatic debits, programmed transfers) and tools (Día a Día) offered by the bank for money management, in addition to observing how volatile spending is between periods.
3. Protection: We relate it to the insurability that the person has in order to generate tranquility by foreseeing situations that may affect his economic stability.
4. Expense: We observe the relationship between expenses vs. income, if the person has the capacity to cover all his expenses for the month and still has money available.
5. Debt Ratio: We identify the debt-to-income ratio and its adequacy, credit card management and payment behavior.
6. Equity: We evaluate financial solvency by identifying debt over equity.
7. Financial sophistication: we relate how much use is made of digital channels and possession of financial products that help manage money.
Based on the transactional information of these dimensions and according to the customer's life cycle, customers can obtain a score ranging from 0 to 100 points, which places them on one of the following scales:
149
This customer is severely financially stressed, in an unhealthy position. This customer is likely to delay payments on obligations or resort to high-cost credit.
Although this client's financial situation is not critical, facing an adverse event or making the wrong decisions can lead this person to a state of financial stress.
This customer has opportunities to improve his/her financial well-being. Positive events and good decisions will take him/her to a better level.
This customer has control over his finances. Although the customer is doing very well, he/she must continue to behave well in order to maintain his/her well-being and be able to cope with unexpected negative shocks.
Good >50 to 80
Stressed 0 to 30
Unstable >30 to 50
Very Good >80 to 100
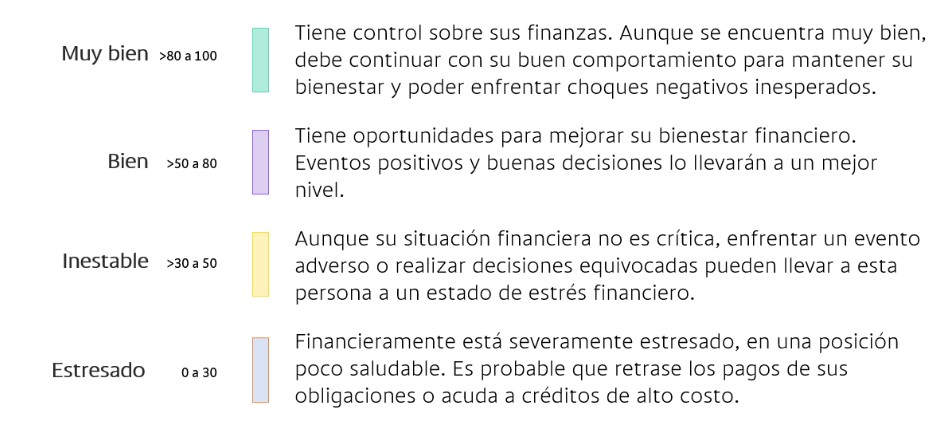
We defined as a goal for 2023 to improve the financial well-being of clients by 5.9%, which meant moving from a baseline of 32.4 points to 34.3 points (according to the previous scale). At the end of December, the consolidated result obtained was 32.7 points for the personal, plus, preferred, independent, social and employee segments that are part of the indicator, which independently obtained the following results:
| • | Personal: 32.0 points |
| • | Plus: 40.2 points |
| • | Preferential: 51.1 points |
| • | Independent: 37.3 points |
| • | Social: 26.9 points |
| • | Employees: 67.0 points |
Accordingly, the result obtained places compliance below the projected (34.3 points), reflecting the situation of the economy and customers, especially in the Social and Personal segments, which showed a decrease in the variables of savings, expenses, debt and planning. Since these two segments account for the largest number of customers (11 million of the 14 million for which the indicator is measured), the effect is seen to a greater extent in the overall results.
Although during July there was a slight improvement for all segments, mainly associated with the bonus issue, it stabilized in the following months despite the implementation of some financial education actions. Therefore, in 2024 we will continue to work for the well-being of customers and strengthen the strategy based on analytics and dimensions of greater opportunity for improvement for the segments.
Financial education
Financial Education is a responsibility that we assume with employees, customers, clients, users and the community in general, with the objective of guiding and generating awareness on the responsible use of money, contributing to the development of competencies that allow people and businesses to make informed decisions at each stage of their economic life cycle.
150
To this end, we materialize the different initiatives for these relationship audiences in such a way that they are contextual, pertinent and in line with the strategy. These are some of the results of 2023:
| - | # of initiatives: 211 |
| - | Total budget: COP 11,998 million. |
| - | Scope: 118,618,797 People/Companies/Views/Likes/Replays, distributed as follows: |
| - | # People/Companies: 147,166,0622 |
| - | #Views/Likes/Replays: 39,452,735 |
The following is a breakdown for Colombia by semester and subsidiary:
# Initiatives |
# Participants/Scope |
Budget |
||||||
TIN |
Semester 1 |
Semester 2 |
Semester 1 |
Semester 2 |
Semester 1 |
Semester 2 |
||
|
# People/ Companies |
#Views/Likes/ |
# People/ Companies |
#Views/Likes/ |
|||||
Bancolombia |
53 |
71 |
61,882,978 |
481,616 |
82,146,025 |
129,332 |
COP 3,502,554,090 |
COP 7,316,125,363 |
Valores |
15 |
9 |
404,609 |
0 |
2,277 |
0 |
COP 0 |
COP 0 |
Fiduciaria (Fiduciary) |
13 |
17 |
2,140 |
18 |
2,956 |
0 |
COP 14,000,000 |
COP 0 |
Banca de Inversión (Investment Banking) |
1 |
1 |
13 |
0 |
22 |
0 |
COP 300,000,000 |
COP 393,810,703 |
Sufi |
2 |
2 |
344,000 |
0 |
164,000 |
0 |
COP 12,000,000 |
COP 12,000,000 |
Nequi |
7 |
2 |
2,206,174 |
5,974,380 |
0 |
32,867,389 |
COP 133,768,084 |
COP 203,960,274 |
Transversal actions (with impact on several TINs) |
8 |
10 |
6,325 |
0 |
4,543 |
0 |
COP 0 |
COP 110,033,000 |
Total per semester |
99 |
112 |
64,846,239 |
6,456,014 |
82,319,823 |
32,996,721 |
COP 3,962,322,174 |
COP 8,035,929,340 |
Total annual |
211 |
COP 11,998,251,514 |
||||||
Financial education was delivered both in person and virtually through the implementation of programs, mass activities, talks/webinars, advisory services, workshops, seminars and courses focused on different topics of interest (savings, investment, security, responsible indebtedness, personal and business finances, financial products, equity, among others). These strategies made it possible to direct strategic efforts and segment audiences to strengthen clients' competencies and help them fulfill their dreams.
The data for Central America are as follows:
|
Panama |
Guatemala |
El Salvador |
2 Most of the actions implemented were massive, i.e., they were aimed at a large number of people who did not always participate only once, so that the same person can be counted several times in different activities.
151
Number of initiatives |
6 |
2 |
10 |
Investment |
USD 68,054 |
USD 196,419.23 |
USD 197,830.96 |
Scope |
4,415,785 people |
7,555,299 people* |
3.6 million people |
*For Guatemala, impacted users are not unique users, as they may be the same user, but impacted in a different month.
Financial Education Seal
The Financial Education Seal is an initiative of the Financial Superintendence of Colombia that emerged in 2022 and seeks to recognize the relevance, quality and suitability of the contents of the programs, campaigns or activities of supervised entities and associations in the sector. Applications are made through its Platform in one of the following categories:
| • | Capacity management: It establishes the institutional capacities that entities must develop to demonstrate their ability to implement information, content and materials for economic and financial education to financial consumers and other stakeholders. |
| • | Initiatives in the territory: It incorporates evaluation criteria related to institutional capacities in the territory. |
| • | MSMEs Initiative: It identifies institutional strategies to facilitate access to financial education services for MSMEs. |
Each of these categories contains certification levels that refer to the degree of maturity in the implementation of the initiatives. For the "Capacity Management" category there is Level 1, 2 and 3, for the "MSMEs Initiative" category there is Level 1 and 2, and for the "Territorial Initiatives" category there is a single level. Once the Seal is obtained at one of these levels, it is valid for two years (2) for programs and activities and one year (1) for campaigns.
Since its creation, the Sustainability and Wellness Center of Excellence, as leader of the Financial Education and Wellness strategy, has accompanied various teams of the Grupo Bancolombia and its subsidiaries in the definition of programs, initiatives or campaigns to apply for, verifying that the evidence meets the criteria and ensuring that the information is complete and of high quality, which has allowed us to position the organization as a leader before the Financial Superintendence3:
3 Information taken from Sellos de Educación (Education Seals) | Home (superfinanciera.gov.co)
152
COMMUNITY
ENTITIES
Tuya
90
Bancolombia
168
Banagrario
118
The following entities received the SFC Seal of Financial Education certification and stand out for their active participation in the proposed categories.
Hall of Fame
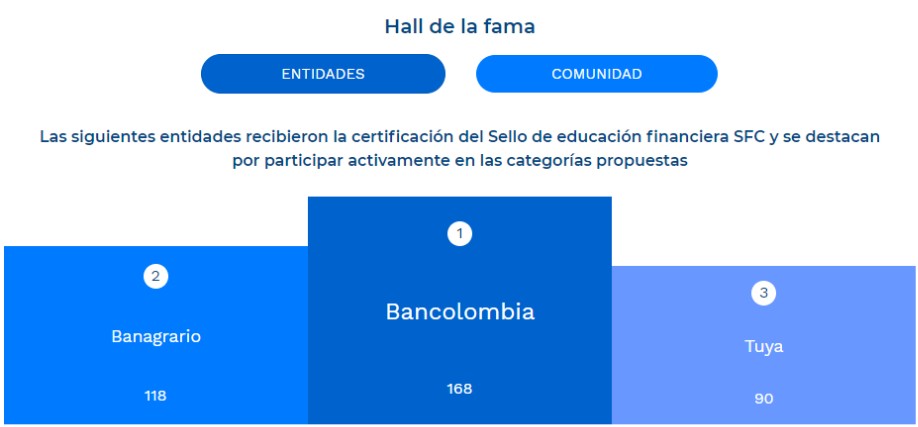
To date, Bancolombia has submitted 13 applications, of which 11 have already obtained the Seal and 2 more initiatives are pending approval, as follows:
TIN |
Postulated program |
Category |
Status |
|---|---|---|---|
Fundación Bancolombia |
Cuentas sin Cuento |
Capacity Management |
Seal awarded Level 1 and 2 |
Bancolombia |
Elévate - EVC personas e Independientes |
MSMEs Initiative |
Seal awarded Level 1 and 2 |
Bancolombia |
Día a día - EVC Bienestar Financiero |
Capacity Management |
Seal awarded |
Bancolombia |
A la mano te enseña- Bancolombia A La Mano |
Capacity Management |
Seal awarded Level 1 and 2 |
Bancolombia |
Sueños a la Mano - Bancolombia A La Mano |
Capacity Management |
Seal awarded Level 1 |
Bancolombia |
FinancieraMente - Brand |
Capacity Management |
Seal awarded Level 1 |
Bancolombia |
Bus Escuela - Brand |
Initiative in the territory |
Seal awarded Level 1 |
Fiduciaria (Fiduciary) |
Invernews |
Capacity Management |
Seal awarded Level 1 |
Valores |
Telegram |
Capacity Management |
Seal awarded Level 1 |
Nequi |
Educación Financiera Nequi |
Capacity Management |
Seal awarded Level 1 |
The Seal of Financial Education is awarded to each program, campaign or initiative independently, therefore, each of the teams of Grupo Bancolombia and its subsidiaries must apply for their initiatives. In this sense, we will continue to work on the processes of applying for quality initiatives and continue advancing in the levels to reach the maximum granted by the Financial Superintendence of Colombia.
In 2023 we advanced in our objectives of being the laboratory of social innovation and the platform for impact connections between the capabilities of the Grupo Bancolombia, the ecosystem and our local and international allies, to develop an impact management that contributes to the transformation of the Colombian countryside.
153
Our programs are leveraged on our theory of change, inspired by the generation of well-being in rural communities, and through the pillars: education and impact talent, strengthening business and territory, financing and business development. These programs achieved coverage in the 32 departments of the country with a focus on making rural areas a prosperous, equitable, profitable and innovative territory, which becomes an engine of sustainable development in Colombia.
One of our focuses for the year was to deepen our understanding of the gaps and patterns that generate inequality and hinder access to education, which is why we structured a Financial Education strategy aimed at helping to transform rural areas. Through the Cuentas sin Cuento program, we strengthened the financial knowledge and skills of more than 14,500 beneficiaries, twice as many as in 2022. Of these, 70% are from rural areas and we focused on two populations: young people, because of their role and potential for social mobility in the countryside (40% of the total), and women, who traditionally have larger gaps than men in rural areas (60% of the total).
We implemented two pilots to generate a financial education offer that meets the needs of rural youth. Through technological mechanisms proven in Latin America, we reached more than 1,900 young people from rural educational institutions who learned the basics of financial management, savings, entrepreneurship and investment opportunities.
Corporate Volunteer Work
Its purpose is to channel the social and voluntary actions of the Grupo Bancolombia's employees, strengthening our greatest asset: human talent. In 2023, more than 500 volunteers worked with communities throughout the country in projects such as mentoring for En-Campo entrepreneurship, young scholarship holders of the Foundation, Emprende Mujer, EAFIT's "Tejeduría" project, financial education workshops, and the mentoring marathon for rural grassroots organizations, among others.
Education for productive insertion
Through the articulation with 26 partner universities of our Scholarship Program, we supported 456 rural youth from 28 departments, facilitating their access and permanence in post-secondary education (mainly university) and accompanying them with mentoring and complementary training in financial education and employability, so that they can strengthen their skills in a comprehensive manner.
We also strengthened our participation in different alliances aimed at the development of quality, access and permanence of education in Colombia through:
| - | The Escuela Nueva (New School) and Universidad en el Campo (University in the Countryside) model that guarantees access and permanence for children, young people and teachers in dispersed rural areas in the departments of Antioquia, Risaralda and Caldas from elementary school to post-secondary education. |
| - | We began our alliance with Fundación Corona and Enseña por Colombia to strengthen the Socio-Occupational Guidance Model focused on Urabá and Atlántico, accompanying 3,704 young people in grades 10 and 11, and 32 teachers from 29 educational institutions with tools for better decision making and to facilitate permanence throughout their educational trajectory. |
| - | We strengthened our support to the Fundación Empresarios por la Educación and facilitated, together with the polling firm Cifras y Conceptos, the expansion of the scope of |
154
| the Education Opinion Survey, in order to better understand the perception of the educational community in rural areas. |
Business Strengthening
In the fourth version of En-Campo, we accompanied 120 businesses with an impact on rural areas in strengthening their business model. Of these, 71 continued their process through mentoring with experts from Grupo Bancolombia and allies to solve specific challenges in their businesses. Finally, COP 1,705 million will be invested with impact financing mechanisms for 8 businesses to promote their models, increasing the well-being, competitiveness and sustainability of the Colombian countryside.
We also supported the business development of 44 associative companies through the Potencia program in alliance with IC Fundación, Fundación Aurelio Llano and Rabobank Foundation. During this process, companies were able to identify and strengthen their areas of improvement, as well as establish plans to access financing.
In alliance with FOLU and Fundación Nutresa, we accompanied 10 organizations to promote regeneration in Antioquia, Valle, Cauca and Quindío. During this accompaniment, the organizations strengthened their organizational capacities and were able to access an incentive fund with a total of COP 170 million to apply for projects that strengthened their territories and empowered young people and women through regeneration.
Through "Alianza Soluciones" together with Comfama, Fundación Nutresa, Sodexo and Fundación Sura, we accompanied the strengthening and connections of 45 enterprises nationwide led by people in the peace process as a commitment to build social network.
In alliance with Fundación Nutresa and Corporación Biosuroeste, led by Comfama in the "Conectores de Progreso" program, we were able to accompany 41 families from Támesis and Valparaíso in the training and certification of agroecological practices so that they can be applied to their productive projects, contributing to the regeneration of southwestern Antioquia.
From the strengthening of the production network, we accompanied 25 coffee growers from Dabeiba, Antioquia through the Specialty Coffee Program led by the Coffee Cluster and the Medellín Chamber of Commerce for Antioquia. In these spaces, coffee growers learned about technical processes allowing them to access the specialty coffee market.
We also supported five (5) associations (coffee, milk, panela) in the village of San José de Urama in Dabeiba, Antioquia through Alianza para el Desarrollo (Alliance for Development), which is made up of 20 business and family foundations. With this advisory service, the organizations gained access to leadership training, training in production processes and networking spaces. In addition, together with Proantioquia, we made progress in strengthening the Agroprogreso Cooperative, located in the Llanogrande district of Dabeiba, made up of 110 peace signatories, through technical support to their productive and social projects as a commitment to collective reincorporation in the Taparales property.
155
Impact Investment
The environmental and social impact in rural areas was the focus of our impact investment management, through different instruments that allowed us to support their growth, not only with capital investments but also with accompaniment in the resolution of business challenges and in the scalability of the expected impact. We currently have an impact investment fund whose committed investments in businesses with an impact on rural areas exceed COP 22,000 million, made up of businesses from different sectors (Fintech, rural tourism, agribusiness, technology, renewable energies, among others).
We have also ventured into other innovative instruments for impact financing, such as the CREO Payment for Results Bond, in which we acted as investors, generating more than 1,000 jobs with a retention rate of more than 70%, with an audience made up of 80% women. Mechanisms such as this will allow us to scale the impact with revolving resources, achieving greater precision in the execution of resources aimed at addressing the country's challenges.
On the financing front, during the year we placed more than 3,100 loans in rural areas through our allies, thereby helping agricultural producers' associations, rural women and youth, and businesses in different sectors throughout the country to access capital.
Our Responsibility Transcends Borders
Transcending in people's lives and working for the transformation of the communities in which we operate were the pillars on which we worked at Banco Agrícola in El Salvador, Banistmo in Panama, and Bam in Guatemala.
El Salvador
Donations and disbursements of Bancoagrícola’s main social programs (January to December 2023)
LINE |
PROGRAM |
BENEFICIARIES |
TOTAL INVESTMENT (USD) |
|
|
||
QUALITY OF LIFE |
FESA "Lindo del Fútbol" 2023 |
2,900 |
USD 241,484.06 |
|
|
||
|
1,877,142 average reaches in Radio and TV; for social networks the average reach for the year was 3,760,533. |
USD 197,830.96 |
|
|
|||
Banco de la TELETÓN support for the Asociación Teletón Pro- Rehabilitación - FUNTER 2023 |
8,000 |
USD 80,250.00 |
|
|
|||
CONSOLIDATED TOTAL |
3 programs |
USD 519,565.02 |
|
|
|||
156
Panama
LINE |
PROGRAM |
BENEFICIARIES |
TOTAL INVESTMENT (USD) |
|||
Education |
Nacer Aprendiendo - United Way (Early Childhood) |
1,900 |
45,000 |
|
|
|
Educación financiera para jóvenes (Financial education for young people) - Asociación Bancaria de Panamá |
340 |
5,000 |
|
|
||
Financial Education and Entrepreneurship for children, youth and women - Junior Achievement Panama |
1,501 |
40,754.83 |
|
|
||
Comprehensive care, educational quality and infrastructure at Escuela Maria Ossa de Amador - Glasswing Foundation |
1,495 |
72,650 |
|
|
|
|
Impulsa - mentoring program for women entrepreneurs - Glasswing Foundation |
80 |
70,000 |
|
|
|
|
Environment |
Sea Turtle Conservation Program - Fundación Tortuguías |
1,712 |
35,600 |
|
|
|
Environmental conservation and community support in the Panama Canal watershed - Fundación Natura |
2,000 |
44,700 |
|
|
|
|
CONSOLIDATED TOTAL |
7 programs |
313,704.83 |
|
|
Guatemala
LINE |
PROGRAM |
BENEFICIARIES |
TOTAL INVESTMENT |
|
|
|
Support to communities |
Fighting chronic malnutrition - Partnership with United Way |
150 families - 5 communities |
USD 31,250.00 |
|
|
|
In-Pactamos |
15 SMEs - 45 mentors |
USD 37,158.5 |
|
|
||
Strengthening the education of Guatemalan children and youth - Partnership with Funsepa |
6,453 adolescents, boys and girls - 253 teachers |
USD 125,000.00 |
|
|
||
Financial education |
Annual campaign |
5,765,808 people |
USD 46,419.23 |
|
|
|
157
|
Content Hub |
1,789,491 people |
USD 150,000 |
|
|
|
Environmental care |
La Cuenta del Mar - Marine Conservation Center |
10,000 turtles per year - 5 beaches - 6 communities |
USD 38,000.00 |
|
|
|
CONSOLIDATED TOTAL |
6 programs |
USD 427,827.73 |
|
|
We Promote Conscious Leadership
In our company, we are committed to improving people's lives by building a prosperous economy and a healthy environment and contributing to social well-being. Our strategy is to contribute to the development of the territories where we operate, articulating actors and sectors with an offer of products and services so that our clients and allies become more sustainable and achieve a positive impact on their communities.
We were invited once again to participate in the evaluation of the Dow Jones Sustainability Index, which has been in the market for more than 20 years, and which we joined in 2012. In 2023, we scored 78 points out of 100, which reaffirms our commitment to working towards sustainability.
Additionally, in recognition of a work that for years has been a priority in environmental, social and corporate governance issues, Bancolombia was the only Colombian financial institution to be ranked in the 5% of the best banks in the S&P Global Sustainability Yearbook of February 2023, which highlights companies with best sustainability practices.
We base our sustainability strategy on the best national and international standards, for this, we have an international agenda of protocols and voluntary adhesions to be aligned with the best practices globally, generate commitments and disclose results to our stakeholders and the international community.
| • | Business Ambition for 1.5 |
| • | B Team |
| • | CDP |
| • | Climate Action 100+ |
| • | Climate Finance Leadership Initiative (CFLI) |
| • | Finance Sector Deforestation Action (FSDA) |
| • | Glasgow Financial Alliance for Net Zero (GFANZ) |
| • | Global Investors for Sustainable Development (GISD) |
| • | Global Reporting Initiative (GRI) |
| • | Dow Jones Sustainability Index |
| • | Net Zero Banking Alliance (NZBA) |
| • | Net Zero Asset Managers Initiative (NZAM) |
| • | UN Women |
| • | Partnership for Carbon Accounting Financials (PCAF) |
| • | Principles for Responsible Banking |
| • | Equator Principles |
| • | Principles for Responsible Investment |
| • | United Nations Environment Program - Finance Initiative (UNEPFI) |
158
| • | Green Protocol |
| • | Science Based Targets Initiative (SBTi) |
| • | Sustainability Accounting Standards Board (SASB) |
| • | Task Force on Climate-Related Financial Disclosure (TCFD) |
Details of our participation in these initiatives can be found here: https://www.grupobancolombia.com/sostenibilidad/enfoque-sostenible/protocolos-y-adhesiones
Sustainability Ratings
The world's main indexes constantly monitor the companies' performance in environmental, social, economic and corporate governance terms, and Grupo Bancolombia is included in many of them, motivating us to improve our sustainability practices:
Sustainability Index |
2022 |
2023 |
Dow Jones Sustainability Index |
85 points out of 100 Included in the Global index |
78 points out of 100 Included in the Global index |
CDP |
A- |
B |
MSCI ESG Research |
YY |
YY |
Moody's formerly Vigeo |
52 robust |
57 "Robust" |
PRI (investments) |
Investment & Stewarship Policy: 68 Direct-Listed equity – Passive fundamental: 47 Direct-Listed equity Voting: 34 Direct-Fixed income SSA: 39 Direct-Fixed income Corporate: 39 |
Policy Governance and Strategy: 74 Direct - Listed equity - Active fundamental: 42 Direct - Fixed income - SSA: 42 Direct - Fixed income - Corporate: 42 Confidence building measures: 40 |
Sustainalytics (ESG Risk rating) |
19.4 |
17.8 which positions us positively at "Low Risk". |
IR recognition |
96.3% |
98.3% |
ESG Trends (Environmental, Social and Governance)
To identify trends that impact the industries in our value chain in environmental, social and governance issues, we have developed an identification and evaluation methodology to monitor them and incorporate them into our ESG, strategic, commercial and risk management. The trends identified and prioritized for 2022 and 2023 are Circular Economy, climate change and biodiversity.
We continue to be the main financial ally for the Banco2 program, a payment scheme for environmental services, which currently protects 124,104 hectares of strategic ecosystems in Colombia and has 6,360 farming families, 13 Afro-descendant communities and 46 indigenous communities. These communities benefit by receiving payments through our Ahorro A la Mano platform, which has no handling charges for beneficiaries and allows up to 2 free withdrawals per month.
159
The program currently has 10 environmental authorities involved.
| IV. | ACHIEVING CUSTOMER LOYALTY AND PREFERENCE |
Those of us who work at Bancolombia are committed to providing the countries in which we operate, businesses and people with solutions for their financial needs. Our products and services are designed in a personalized way to offer each client a solution that allows them to make use of their money, as well as their savings, credit and investment needs according to their stage of life. The same happens with businesses of all sizes, which have seen us as their ally for the transactions they require in their activity, investing, managing their treasury and selling more.
Hence the importance of continuing to work to provide reliable, close, timely and easy experiences that have a direct impact on their well-being.
We Work to Accompany People in all their Day-to-day Needs
By channeling an important part of the system's resources, we have the opportunity to build links between all the parties involved: people, businesses, companies and governments, covering all segments and sectors of the country.
Colombia
In the case of Colombia, we processed around 68% of all payment, transfer and money transfer transactions in the country, and more than 39% of all funds moved through the system, according to the Superintendence of Finance. In fact, in 2023 we were present in 2,852 million monetary transactions (19% more than in 2022), representing more than COP 3,034,000,000,000 million mobilized.
This means that every minute we process nearly 12,000 monetary transactions associated with payments, collection, transfers, deposits, Bancolombia Button (Botón Bancolombia), QR, checks and cash transportation. We achieve this by making available to everyone a wide variety of alternatives for moving their money.
The Bancolombia QR Code continues to gain ground, as it offers a means of payment other than cash and makes it easier for businesses to sell both physically and digitally. It is already used by more than 3.8 million people and has mobilized more than 137 million transactions, which have digitized more than COP 9,200,000 million of operations that were previously done in cash.
In 2023 Colombia took a significant step forward with the launch of the Interoperable QR, which allows merchants that have the Bancolombia QR to accept payments from other banks and digital wallets in real time, and also allows users of the Personas App and Bancolombia A La Mano to make payments at the QR points of other banks. More than 252,000 merchants nationwide have this new interoperable QR and more than 1.3 million transactions have been made, for more than COP 104,000 million. We hope that the more than 1.3 million businesses that have the traditional Bancolombia QR will request this new alternative to continue facilitating cashless transfers in an easy and secure way, giving people more control to manage their money.
160
So that more people and businesses can pay or receive payments online, whether on a website or on social media, the Bancolombia Button is a simple and secure alternative. This payment option was used by 3.5 million people in 2023, who made more than 29 million transactions and mobilized more than COP 4,600,000 million in transactions and is now also available for A La Mano users and pensioners.
We are the partner of some 356,000 merchants to accept their payments on a daily basis. We have been in more than 500 million operations that represent sales for these businesses for more than COP 72,100,000 million, resources that are one of the levers of the economy. In the last year we grew 20% in amounts and our share of the acquisition business reached 38%.
Wompi, which was created 4 years ago to simplify money management and boost the digital growth of businesses, is used as the payment gateway for more than 12,500 merchants, who made more than 59 million transactions for COP 11,500,000 million, an invoicing that almost doubles that of 2022.
Since January 2022, Wompi has been operating independently from Bancolombia and today has more than 15% market share, making it a relevant and recognized player in the industry, which is continuously evolving to accompany businesses in their different moments and types of sales.
We recently launched a sales App in Wompi to make it easier for our merchants to receive face-to-face payments with different payment methods such as Nequi and QR, thus consolidating Bancolombia's payment ecosystem. We hope that with this solution it will be possible to receive payments with contactless cards and that through the app merchants will be able to send money based on the payments they receive.
Moreover, our nearly 15 million debit cards are present in people's daily lives as a secure and easy-to-use solution. With these cards, users made purchases for more than COP 55,300,000 million, 12.4% more than in 2022.
Likewise, more than 2.1 million people have Bancolombia credit cards, with which they make payments, finance their purchases and access benefits according to their needs. Invoicing with the 2.8 million cards in the market reached COP 34,500,000 million in 2023 (14% more than in 2022) through more than 120 million transactions, and the portfolio balance reached COP 9,000,000 million.
Our digital wallets (Apple, Google, Garmin, Fitbit) continue to consolidate in the market. In 2023, more than 450,000 of our customers used this means to make their payments easily and securely, with an invoicing of COP 2,600,000 million (160% more than in 2022) in 45 million transactions, with which they already have a 5% share in the invoicing of Bancolombia payment methods.
As part of being present at different moments of life, we launched the Comprehensive Cancer Insurance with a 100% digital proposal to accompany our clients with an economic indemnity in case of detection of any type of cancer. Its value proposition is modularity, since the value of the insurance depends on the age of the client and the insured value they choose (COP 10 million to COP 100 million). In addition, thinking about the integral well-being of our clients, we included additional free benefits, focused on nutrition, health and education.
161
We have seen how the barrier to take digital products continues to be overcome, as people are more open to self-management and choose the channel, they find most convenient. With our digital value proposition, we achieved that 59% of our sales are digital, which meant that more than 5.3 million financial products were managed through this channel.
Digital adoption and use |
Dec-20 |
Dec-21 |
Dec-22 |
Dec-23 |
% of Digital Adoption |
62.97% |
68.16% |
70.97% |
72.08% |
Active digital customers |
7,511,937 |
8,901,420 |
10,106,292 |
10,658,615 |
% digital use |
83.57% |
85.10% |
88.79% |
86.64% |
Among individuals and self-employed workers alone, we already have 8.3 million active digital customers, who made more than 104 million transactions in the App and the Sucursal Virtual Personas, for an amount of COP 35,600,000 million (84% of the total amount transacted in digital channels).
These solutions are also a tool to facilitate the operational processes and business management of SMEs and enterprises. 64.9% of SME customers and 84.5% of companies have adopted our digital channels, more than 35,000 SMEs joined the use of the App (half of them did their operations in physical channels) and in 2023 more than 207 million transactions were made through the App and the Virtual Branch for these two segments.
Likewise, our digital channels make it easier for corporations to manage their production cycles, bringing them closer to their customers, employees, suppliers and other relationship groups through specialized solutions for this segment. These companies make more than 390 million transactions each month on average and are increasingly using payment methods such as Bancolombia Button, QR and Wompi.
El Salvador
At Bancoagrícola we also strengthened our digital strategy to achieve greater adoption among Salvadorans. More than 500,000 people already use digital channels in their daily transactions, which represents 34.39% of the bank's active customers.
This, in turn, has facilitated the process of accessing consumer credit. In fact, more than USD 123.7 million have been disbursed through digital channels, representing about 30% of the amount placed in consumer products.
Guatemala
In Guatemala we partnered with Paggo, a Fintech provider of a much more versatile, innovative and accessible Points of Sale (POS) for micro and small businesses since it does not require a contract or monthly fees, offers a competitive commission per transaction, affiliation in 10 minutes, delivery in 24 hours, and access to payment link generation and free QR. With this, we provide a value alternative for our customers and have achieved invoicing of USD 1.2 million.
162
Models that Enable New Ways of Providing Financial Services
The way we interact with our clients is based on a comprehensive understanding of their needs. Therefore, this year we continue to evolve our value proposition based on Ecosystems to provide solutions that consider the lifetime of customers and their contexts to the financial and non-financial needs of the market. In this evolution we rely on three models:
| 1. | Banking as a Platform (BaaP) where we orchestrate financial and non-financial services, with our own and third-party solutions, in our own channels, and we achieve this through different solutions: |
Tu360Compras, the Marketplace in which more than 24,725 people (Bancolombia customers and non-customers) purchased products in categories such as technology, electrical appliances and home appliances, at a competitive price and with different financing alternatives from Bancolombia. In total, we generated an invoicing of more than COP 57,602 million.
Tu360Inmobiliario, where we have provided 16,000 people with real estate financing approvals for a value of COP 1,600,000 million, which have materialized in disbursements of more than COP 420,000 million in mortgage loans and housing leasing, thus allowing 3,080 families to have access to a home of their own. Customers and non-customers have the possibility of obtaining credit or leasing approval in a matter of minutes, generating an easy, digital and timely experience. It is also the showcase for more than 900 housing projects, accompanying builders throughout the country, for which we have leveraged disbursements of close to COP 1,000,000 million. In addition, through alliances with PropTech, we have given our clients the possibility of acquiring real estate with real estate and financial advice from a single front, making the purchase of housing a more agile and simple process.
Tu360Movilidad, which has received visits from 3.5 million users reflected in 5.7 million sessions, to whom we connect with more than 77 showcases of our partners and more than 7 solutions of use, including Renting Persona Natural, Localiza, Muverang, Flypass, assistance in license renewal and all-risk insurance, disbursing approximately COP 120,000 million in credits for their vehicles with the help of Sufi.
In Mis Aliados we have more than 700 active independents and have provided more than 32,000 services for more than COP 1,400 million in categories such as home, pets, people, group classes, among others.
Plink continues to improve the information it provides to its more than 8,200 users in terms of transactional behavior, general market knowledge, average transactions, knowledge of its customers, among others, so that retailers can develop strategies to attract more customers and improve their sales.
2.Banking as a Service, where third parties and strategic allies can leverage our channels to increase their sales and achieve market objectives:
The digital wallet, which is exposed to third parties as a service to be incorporated into their own platforms and experiences, has managed to mobilize more than COP 5,000 million with consumers such as Monet - a fintech focused on income advancement - and Puntos Colombia - the country's largest loyalty program.
163
Likewise, “Compra y paga después Bancolombia” (Buy and pay later Bancolombia") is positioned as an alternative to buy in installments. This product allows making online purchases and deferring them to 4 installments with no monthly interest charge, with a commission for the buyer and another for the merchant. At the end of the year, approximately 1,000 loans had been placed, with average amounts of COP 270,000, starting from a base of close to 3 million clients with a pre-calculated limit. The objective is for it to be a mechanism for financial inclusion and sustainable growth, as it is a financing option for people who are not subject to credit under traditional policies and who can start their credit life with low amounts and easy experiences.
With QR Bancolombia we are fulfilling our purpose of digitizing cash, becoming the largest non-acquiring network in the country and a means of acceptance that contributes to the banking and formalization of businesses.
3.Open Banking, where we are generating value exchange through the exposure or consumption of APIs that facilitate access to information, algorithms, technology and infrastructure:
We developed an Open Data strategy to better understand the reality of users in credit risk models and their personalization, as well as in the promotion of their financial well-being. Día a Día, the Bancolombia App functionality is already used by more than 2,467,000 people, with more than 222,000 active users per month, whom we help to better understand how they manage their money (including cash), starting with automatically categorizing their income and expenses, managing their budget by setting savings goals and defining ceilings for each item, in order to achieve their objectives.
As part of this, we periodically send more than two million customers a closing report on their personal finances in order to support them in their financial well-being. In fact, we have evolved the organization's Financial Well-Being measurement model, which this year became an ESG indicator (see more details in the Well-Being chapter).
With the launch of Tus Bancos, we are the first bank in the country to develop an Open Banking functionality in Colombia, in which 2,681 customers have already linked their accounts from any of the 6 banks we have available so far (representing 47% of the market) to consolidate in their Bancolombia App the management of their personal finances.
Promoting sustainability as a business strategy
We support our clients in the SME, business and corporate segments in the incorporation of ESG best practices through a digital platform and the advice of an expert team.
In this way, our customers can access to contents and methodological tools that allow them:
| • | To understand sustainability as a business strategy, fundamental for the sustainability and competitiveness of its economic activity. |
| • | To define its sustainability strategy according to the material issues identified in the Environmental, Social and Corporate Governance dimensions. |
| • | To understand the circular economy, measure the company's level of circularity and access methodological tools to define its circular economy strategy. |
| • | To create synchronous consulting spaces with experts in the area of sustainability. |
We have accompanied more than 50 clients in their business transformation.
164
In addition, we provide support to our clients in their green, social and sustainable bond issuance processes, leveraged by our experience with this type of issuance. In 2023 we accompanied Finanzauto S.A. BIC in the structuring for the issuance of a sustainable bond for COP 61,660 million for the financing of clean transportation projects, replacement of fossil fuel use, sustainable infrastructure and construction, and generation of employment for the population in vulnerable conditions.
Engagement in our sustainable management
Grupo Bancolombia, seeking to maximize the positive impact of its sustainability practices, has created spaces for open communication on relevant ESG issues with its clients/investors in order to contribute to their strategy in aspects such as dual materiality, transparency, climate change, biodiversity and international best practices that can have a direct impact on the protection of the environment, society and the business environment.
These spaces have been implemented in two ways:
| • | In a personalized manner by attending to the opportunities of each of our clients and/or investors in terms of the ESG pillars. |
| • | In a massive way in events in which different interest groups intervene in favor of sustainable financing. |
The following is a detail of the Engagements made by each line of business to stakeholders.
Engagement Strategy |
No. of Engagements |
ESG Assessment Issuers |
2 issuers |
Sustainability as a Service* |
482 customers |
Climate change |
25 customers |
*Sustainability as a Service refers to personalized and massive knowledge spaces with clients where different topics are developed: sustainable financing, circular economy, corporate governance, ESG assessments, among others.
Focusing on the safety of our customers and stakeholders, we continue to invest and strengthen our strategy and governance to maintain the highest safety standards in the organization, based on the alignment of corporate safety policies, standards, definitions, regulations and best practices.
From the digital evolution, we continue to enable business and the adoption of new technologies from controls, with a portfolio coverage level of 85% and a security controls adoption level of 97%.
We conduct hackathons, challenges and partnerships with educational institutions that allow us to identify, attract and train new talent to reduce the knowledge gap in cybersecurity. We do this with the intention of encouraging the new generations in the importance of information protection and to harvest, in the short term, a research seedbed of talents with specialized knowledge.
From the culture front, we developed six cybersecurity drills, security training and continuous Phishing and Ransomware exercises, reaching, on several occasions, 30,000 employees, delivering preventive recommendations against possible attacks and the importance of reporting cases through the official channel of suspicious mail.
165
We have managed to get the employees of Bancolombia and subsidiaries, Nequi, Wompi and other countries such as Salvador, Guatemala and Panama, to participate in training actions that allow the design of technologies, processes and practices to protect networks, computers, programs or data, from attacks, damage or unauthorized access to increase the knowledge and expertise of the talent that allows us to ensure the protection of our customers and employees and to be at the forefront.
We created specialized analytical models that optimize fraud prevention and allowed us to avoid COP 299,000 million in materialization losses (111% more than the previous year), thanks to the effective personalization of limits and transactional experiences.
In addition, we developed training strategies for fraud prevention. We reached more than 15 million people, with multimedia content generating more than 140,000 clicks and inviting our customers to ask themselves what the safest decision is when faced with the different situations that arise when using the bank's channels and products.
With the Bus Escuela we reached more than 3,000 users nationwide and impacted 3 million customers with safety videos on branch screens.
We complemented this strategy with a campaign to share how fraud occurs and what should be done to prevent it. The actions of this campaign impacted more than 4.5 million people on average per month, and the content such as videos, images and posts published on different digital platforms reached 45,000 impressions.
Technology Infrastructure
| ● | Thanks to the migration of more applications to the cloud, we have achieved efficiencies of COP 95,500 million, and on average we are generating an average savings of 45% per application supported in the cloud. We have also managed to reduce by 79 hours on average the first release to production of solutions implemented in the cloud and the decrease from 48 to 2 hours in the time to enable workspaces in the cloud. |
| ● | Furthermore, by implementing operational excellence strategies in the AWS cloud, such as consumption adjustments, automation and reengineering, we achieved savings of more than COP 800 million. We ensured the resilience of our critical processes by executing 237 IT Continuity Exercises and achieved a reduction in response times between branches and services on AWS. |
| ● | Our software development process allowed us to automate more than 7,200 end-to-end testing scenarios to ensure the quality of our systems, find vulnerabilities and address findings to make our systems more resilient to failures. |
| ● | We increased the computing capacity by 30% of the physical infrastructure of the Core Banking ecosystem to guarantee future transactional demand and its sustainability. |
| ● | We link and train talents in advance. In 2023 we hired 120 Software Engineers to reduce the knowledge curve and contribute to gender diversity; we implemented "team profiles", a methodology that defines the distribution of expertise of the Technology teams according to the responsibility and complexity of each Center of Excellence, increasing productivity and technical quality. |
166
We Support our Customers with Innovation
We structured the Sustainable Bancolombia Innovation Model, with which we provide our clients with innovation and sustainability capabilities, so that through methodologies and tools they can solve a challenge with an impact on organizations and society.
This accompaniment is carried out in a hybrid scheme (face-to-face and/or virtual) and has a platform that includes tools, activities and illustrative examples for the companies.
More than 180 people from different companies participated in this program, solving challenges related to internal efficiencies, circular economy, social and environmental impact, governance, among others.
We are convinced of the importance of creating relationships that generate value for all our clients, and of the responsibility to be consistent in our actions so that they reflect our ability to serve and support the achievement of their projects. This relationship is built by being present when they need us, which is achieved by acting with impeccability, ensuring high levels of availability in channels and services, constantly evolving our processes and products, strengthening our technological capabilities and connecting from agile models to deliver experiences that are more valued.
We develop and strengthen the Customer Experience as an organizational capacity that allows us to connect collaborators and allies so that each contact with the customer is a superior experience, based on listening to them empathetically to know their needs, what they expect to be different and what they value in their experience, in order to generate more people-centered solutions, manage their requirements with greater timeliness and satisfy their needs in an impeccable manner.
In order to be people-centered, we have a defined target experience, and in 2023 we ratified the continuity of the attributes that allow us to deliver a superior experience (being Close, Reliable, Timely and Easy), accompanied by an organizational mobilization that generated close to 114,000 interactions with our employees and allies, allowing us to achieve the following advances:
We launched the Promotorex Service Model, a new content program to train some 10,500 employees in the People and SME business in tangible behaviors that materialize the attributes of our superior target experience, through the development of content inspired by the Disney service culture.
The customer experience is the result of the sum of the interactions of all the teams and partners of the organization; therefore, we have a strategy to ensure the vision and management of the experience through training, consulting, personalized support, immersions and design in action. We mobilized more than 13,000 people and 100 allied companies.
We multiplied our capacity to listen to customers, which allowed us to ensure data-driven decision making and experience management. In addition, to more easily drill down into our voice-of-customer findings, we developed sophisticated, predictive analytical models that make it easier to understand customer feedback across all metrics and improve the experience.
We also enhanced the experience design skills by deepening our understanding of accessibility and inclusion guidelines and definitions, which have allowed us to take a more holistic view of the needs of all our users with permanent or temporary disabilities. Thanks to this we have been able to develop increasingly inclusive experiences for all our customers and employees, and together with the Diversity, Equity and Inclusion team we are prioritizing accessibility, to get ahead of Colombian regulations where from 2024 all digital assets must be accessible.
167
Moreover, taking care of our customers in moments of high impact is also part of that superior experience. For this reason, we created strategies to react with greater timeliness and effectiveness in situations of affectation. In a challenging context, we listened to the customer's pains and the barriers they have to catch up with payments and evolved the collection management, which includes communication with close, friendly and empathetic language, as well as a digital model that allows to improve the experience.
NPS Accumulated Relational Colombia73.72%Compliance: 120%2022: 72.94%+0.78%
Compliance does not apply
Informative: not weighted in NPS Colombia
Compliance 120%
Compliance 120%
Compliance
120%
Compliance
89.9%
Goal 100%
58.50%
Goal 100%
58.1%
Goal 100%
87% to 88%
Goal 100%
86% to 87%
Corporate
Companies
Independents
SMEs
Individuals
Seg focus: Preferential + Plus
Seg focus: Plus, Large, Medium
Detractors
Detractors
Detractors
Detractors
Passives
Passives
Passives
Passives
Promoters
Promoters
Promoters
Promoters
Detractors
Passives
Promoters
91.2%
88.6%
53.5%
58.6%
57.3%
NPS Accum
NPS Accum
NPS Accum
NPS Accum
NPS Accum
NPS Accum
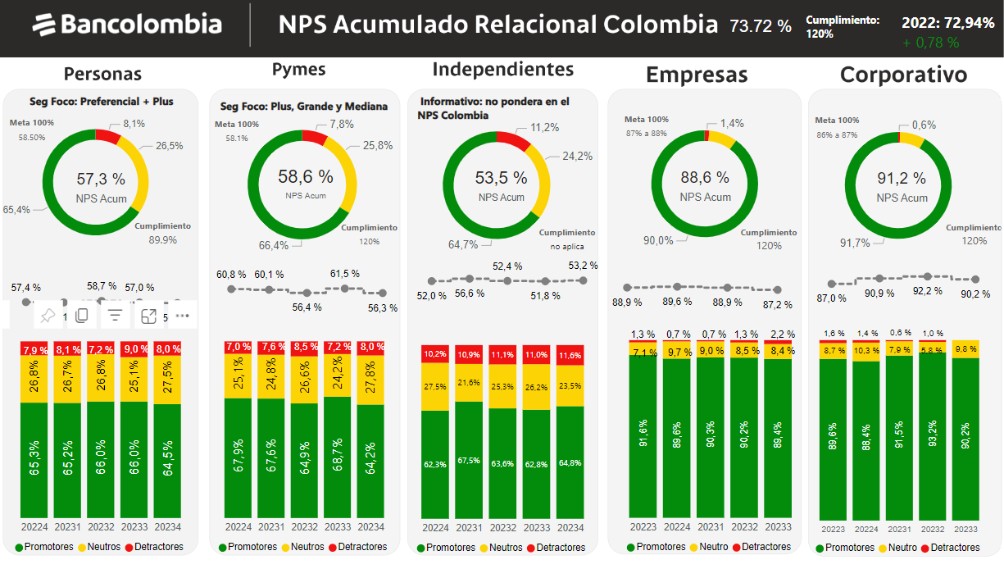
We Are Where Our Customers Need Us
During the year, 95.22% of Bancolombia's transactions were made through electronic distribution channels. In addition, we reported a sales force of approximately 14,400 employees.
Companies and branches as of December 2023
Company* |
Branches 2023 |
Branches 2022 |
Branches 2021 |
|---|---|---|---|
Bancolombia S.A. (Colombia) |
578 |
583 |
620 |
Bancolombia Panamá |
1 |
1 |
1 |
Bancolombia S.A. Panamá Branch |
1 |
1 |
1 |
Renting Colombia |
63 |
65 |
46 |
Valores Bancolombia |
19 |
19 |
17 |
Valores Banistmo |
1 |
1 |
1 |
168
Company* |
Branches 2023 |
Branches 2022 |
Branches 2021 |
|---|---|---|---|
Banca de Inversión (Investment Banking) |
2 |
2 |
2 |
Fiduciaria Bancolombia |
8 |
7 |
7 |
Bancolombia Puerto Rico International Inc. |
1 |
1 |
1 |
SUFI |
2 |
2 |
2 |
Inversiones CFNS S.A.S. |
2 |
2 |
2 |
Banco Agrícola |
59 |
90 |
93 |
Arrendadora Financiera S.A. |
1 |
1 |
1 |
Valores Banagrícola, S.A. de C.V. |
1 |
1 |
1 |
Transportempo S.A.S. |
0 |
1 |
1 |
Banistmo |
39 |
39 |
39 |
Financomer |
4 |
4 |
4 |
BAM (Guatemala) |
155 |
157 |
156 |
Bancolombia Capital Holding LLC (Miami) |
1 |
1 |
0 |
Total |
938 |
978 |
995 |
* For some companies their head office is considered a branch office.
Correspondent Banks
We reported 35,423 banking correspondents including 28,468 in Colombia, 618 in Panama, 5,386 in Guatemala and 951 in El Salvador.
Mobile Service Points “MSP”
Sales advisors who periodically visit small towns offering our product portfolio. As of December, we reported 523 (494 in Colombia, 11 in Guatemala and 18 in El Salvador).
Kiosks
They provide some after-sales services, and we have 498 (210 in El Salvador and 288 in Colombia).
ATMs
We have a network of 6,076 ATMs, including 5,170 in Colombia, 572 in El Salvador and 334 in Panama.
| V. | BUILDING CULTURE AND TALENT TO FOSTER COMPETITIVENESS |
At Grupo Bancolombia we understand that people are our most valuable asset: our employees, their dreams and their growth is what drives us.
169
So, in 2023, we went a step further to create an enriching work environment that contributes to their well-being and development, with the goal of being the place where talent chooses to grow and thrive. Together we seek to achieve our higher purpose of promoting sustainable development for the well-being of all.
On this path, and to respond to the challenges of the current labor reality, we renew the value proposition to employees so that each one can say with pride and commitment: “Bancolombia is the best place to work!” This is how we defined three pillars that make up the work experience in the organization: development, connection and enjoyment, through which we strengthen our employer brand to attract, empower and retain the best talent, in an environment that enhances their development in a framework of respect, equity and inclusion, where all people feel free to be who they want to be.
Development for the Personal and Professional Growth of Our Employees
Knowledge is a valuable resource that is created from preparation, collaborative construction, experimentation, continuous improvement and interaction with others. In our work environment, we make organizational purpose the inspiration that motivates us to take on challenges, to try new ways of doing things, to learn from mistakes and empower ourselves to conceive high-impact projects that generate exceptional results. Following this premise, we implemented different strategies to mobilize the comprehensive development of skills that encompass being, knowing and doing to evolve and become the best version.
In line with our vision, during 2023 we invested in the development of our employees through multiple programs designed according to the strategic needs of the business and best practices. The objective is to contribute to the evolution of our employees, helping them to achieve their best version and meet the proposed goals.
One of the key pillars of this initiative is the Plan Carrera (Career Plan), an organizational growth model that has evolved away from the prioritization of positions and hierarchies in order to empower employees to project their career to grow in the short, medium and long term through their contribution to organizational objectives, the reflection of expected behaviors, expertise in their role and the generation of value in the organization. Currently, 3,197 talents, whose roles apply, participate in this program. As part of the benefits, they have received significant investment of more than COP 10,400 million.
Similarly, this year we invested COP 1,167 million in the development of our talent pool in all countries to contribute to their personal and professional development, and thus anticipate the needs and challenges of the future through the comprehensive preparation of the talents that will take on the leadership of the organization. In each talent pool, we achieve outstanding results in terms of their loyalty:
High Potential Talents: 96.9% of loyalty rate
Key Talents: 98.5% of loyalty rate
Specialized Talents: 94.6% of loyalty rate
On a more general spectrum, the organization's employees received more than 1,129,000 hours of training, with a total value of COP 16,748,324,252. We highlight that 85% of our leaders acquired new knowledge and strengthened their skills through our Leadership Institute, and nearly 9,000 employees were part of our schools.
170
Likewise, 99% of our employees successfully completed their annual virtual training plan, dedicating an average of 43 hours to their professional development.
These academic programs are built together with high-level national and foreign institutions and the participation of our employees, to take advantage of internal knowledge and experience in specific topics, thus facilitating coverage and efficiency.
Likewise, we encourage reflections so that our employees find the connection that exists between their daily actions and decisions and the materialization of a purpose that positively impacts the environment, the organization and society.
There are other initiatives that contributed to the training, development, growth and personal, professional, social and economic well-being of employees, which have allowed us to strengthen our employer brand and consolidate our position as one of the leading companies to work for in the country and attract and retain employees with key skills, as well as emerging professionals in strategic areas such as technology, cybersecurity, design, analytics and artificial intelligence. Among these, in Colombia, the following stand out:
IT Generation: This program aims to attract people with knowledge and interest in technology, anticipating the demands for talent in this area. Additionally, we seek to close the gaps in female participation in masculinized areas, promoting the inclusion of women in the technological field, with a goal of hiring 25% of women in said program, which closed at 35%, exceeding expectations.
Open House Bancolombia: with the purpose of consolidating ourselves as the main option in the minds and hearts of young Colombians in terms of employment, we inaugurated the third edition of Open House Bancolombia. This event, held in a hybrid manner, included talks designed for senior managers and expert leaders to share their knowledge with the future of talent in our country. In total there were 15 conferences, which impacted 9,550 people.
Talento B is a program that brings together young people who are passionate about strategic topics such as: data science, cybersecurity, experience design and technology, through participation in real projects and challenges of the organization, in order to prepare future Bancolombia experts. This year, 62 young people entered the program in the junior stage, 37 advanced to the senior stage and 67% of the Talento B who completed the program in 2023 were promoted to specialized positions in the organization.
Bank Design: We want to maintain our position as an organization desired by specialized design talent. With this in mind, we convened professionals from all over the country in experience design, interfaces and research, who demonstrated their skills in tackling a challenge focused on accessibility for senior citizens.
Mujeres tech (Tech Women): is a strategy aimed at promoting job opportunities for women in technology. This initiative involves a network of female ambassadors from the vice-presidency of Technology Services, who are responsible for disseminating the organization's purpose and mobilizing knowledge to inspire and collaborate with new generations. These female ambassadors will receive training, including workshops and courses to improve their communication skills, and will be rewarded based on their participation. To date, 9 Tech Women have participated in various activities such as webinars, talks and events, among others.
Experiencia Bancolombia (Bancolombia Experience): Under this program we received 503 students from schools and universities in Medellín, to connect them with our culture, and challenge their knowledge in solving a business challenge, on trending topics.
171
DataFest: our first analytics fair, which became an enriching learning and knowledge experience in which more than 244 people, members of DataBank (our analytics community) and university students participated, obtaining a satisfaction indicator of 9.5 out of 10 and a Net Promoter Score (NPS) of 85.
In addition, the team of the Vice-Presidency of Talent and Culture evolved their ways of working and participated in a development program to become agile, contextual and daring professionals at the service of organizational purpose and strategy, an evolution that also seeks to incorporate analytical knowledge and cutting-edge practices for decision making centered on knowledge and talent experience.
Making Things Happen Through Connection
Connection is essential to maintain an inspiring work environment that encourages the creation of enriching relationships within a framework of respect.
During 2023, we focused our efforts on fostering collaboration, diversity and trust in our work environment. To enhance our employees' experience, we actively listen to their opinions through tools such as “Y tú qué dices” (What you think). This provides us with the opportunity to identify the areas in which we excel positively and those in which we can make improvements within our work environment.
In addition, we conducted a demographic analysis of our workforce using data that our employees voluntarily provide. We also undertook an analysis of their journey within the organization, from their onboarding process to the end of their career, and developed a three-year strategic plan to intervene and improve their experience.
As part of the strengthening of the Contigo (With You) System, aimed at addressing complaints related to workplace violence, sexual misconduct and discrimination, the bank has implemented a Human Rights remediation protocol. Through this protocol, various mechanisms are provided for stakeholders to report any infringement of human rights, discriminatory behavior or other improper acts. The ethics hotline and the coexistence committee are key channels for receiving complaints, in accordance with Colombian and Panamanian regulations.
Although there were no direct cases of human rights violations resulting from the bank's operations in 2023, the Contigo System managed cases in which related third parties violated human rights through inappropriate sexual behavior towards employees, implementing immediate action and reparation plans. The reparation measures included hours of psychological first aid, legal advice, reporting to authorities, administrative and disciplinary actions, application of the Methodological Route for employee care in real time, additional clauses in contracts with allies, and advice to allies on the preparation of their protocols. We investigate all cases under strict parameters of neutrality and confidentiality.
We have also intervened and automated talent selection, feedback, and onboarding processes through artificial intelligence platforms and the delivery of test result reports including resources for their interpretation, all while working collaboratively with strategic areas of the organization to ensure a comprehensive approach to improving the experience of our employees and seeking to provide the organization with increasingly transparent selection processes towards inclusion, strengthening ourselves as a bias-free and stereotype-free organization.
172
Advancement in the Consolidation of our Culture
In the third year since the declaration of our culture that defines the traits and behaviors that identify us, as well as the actions that we do not tolerate within the organization through MovimientoB (Movement B) and LíderB (Leader B), we have reaffirmed the experience of these values by our employees, as evidenced by the results of our "Y tú qué dices" study:
| • | All of MovimientoB's traits and LíderB's responsibilities have experienced a growth in their assessment, surpassing 9 out of 10 possible points, which demonstrates the appropriation of the culture and the generation of connection and belonging. |
| • | Integrity and Being Human are the most prominent traits in Movimiento B, which define the way in which we at Bancolombia relate and make decisions, highlighting the importance of creating close relationships based on trust, diversity, equity and collaboration, and promoting our consistent and transparent actions. |
| • | In LíderB, the commitment of leaders to purpose and strategy stands out as the best-rated responsibility, underscoring our focus on achieving organizational purpose. |
The challenge we face in this cultural journey is turning dynamism into the key to facing changes, maintaining a balance between operational excellence and speed in delivering solutions to the customer to ensure an extraordinary experience.
Finally, we are no strangers to the main challenges worldwide regarding leadership. Facing the new environments of the working world, facilitating people's development is one of the most challenging responsibilities and will occupy LíderB's work agenda in the coming years.
Enjoyment and Harmony as a Fundamental Part of Life
We firmly believe that each employee is a valuable human being with dreams, aspirations, and individual needs that, when part of a healthy work environment where collaboration, trust and cohesion among teams are promoted, they become more productive, creative and committed to their goals. Their happiness and satisfaction are reflected in their job performance and the positive impact they can have on society.
To achieve this, we strive to create an environment where each employee feels listened to, respected, and valued, and where outstanding performance and well-being go hand in hand, seeking harmony among the different dimensions of wellness. This is how the #ElegimosElBienestar (#WeChooseWellness) strategy was born, where we understand that well-being is an individual decision with a collective impact that we make on a daily basis, a conscious choice that transcends the limits of the company to converge in the individual conscience of each employee.
Based on the opportunities offered by new ways of working, we have launched the "A Tiempo" (On Time) strategy, an initiative that provides experiences, recommendations and spaces aimed at optimizing time management in the work environment. Our main goal is to make well-being a reality by promoting self-care and a harmonious balance between work and personal life, providing inclusive and segmented options for administrative and commercial areas.
In 2023, we succeeded in developing a diversified offer that provides over 19,000 employees, both administrative and commercial, with various options and practices to enhance their time management experience. We also coordinated, without affecting the customer experience, the possibility for over 6,300 employees from 400 branches nationwide to enjoy Friday afternoons off, have a smoother return after their vacations, or have time off on their birthdays.
173
Thus, "A Tiempo" empowers our employees to make consistent decisions, fostering shared responsibility and allowing greater flexibility in time management, which, in turn, contributes to well-being, exceptional performance, and increased productivity.
Similarly, as a contribution to the care economy and the well-being of new employee families, the “Creando Vínculos” (Creating Bonds) program was born, combining different flexible work schemes to facilitate parents spending the majority of their time with their children during their first year of life. To date, close to 70 employees are enjoying this benefit.
In addition to this, other achievements of the year were:
| • | 11,204 employees are part of flexible work schemes, representing 80% of administrative employees, in a context where flexibility, trust, and well-being are our premises to attract and develop the talent our organization needs to achieve its purpose. |
| • | Recognizing the efforts of 550 outstanding employees in Being an Example 2023, as well as promoting spaces for people and their families to enjoy, such as the five-year anniversary celebrations, national family parties, Employee Week, and Adventure Challenge 2023. |
| • | In the countries where we operate, we provide benefits to our employees and their families, including credits, savings programs, insurance, psychological support, financial advice, among many more personal development activities, with an investment of over USD 346 million, covering all employees. |
BMovers Community to Boost Well-being
We stay at the forefront, driven by behavioral sciences and in collaboration with our community of 209 employees, we continue to promote culture and well-being. This year, through the “Hackea tu cerebro y elige el bienestar” (Hack Your Brain and Choose Well-being) initiative, we have shared knowledge with over 8,000 employees about how our brain works to develop habits and make decisions that promote the relationship between well-being and exceptional performance.
Among our achievements are:
| • | The participation of 8,064 employees in Colombia, whom we have guided in forming habits related to time management, contributing to well-being and exceptional performance. |
| • | Generating efficiencies of over COP 320 million by leveraging internal talent through the BMovers community. |
| • | Banco Agrícola: 16 Bmovers impacting over 400 leaders in the LíderB Boot Camp. |
| • | BAM: 20 Bmovers impacting 400 leaders in the LíderB Boot Camp. |
| • | Banistmo: 19 Bmovers impacting 93% of employees in the “Juntos por la Ruta 16” (Together for Route 16) workshops. |
Dialogue to Build From What Unites Us
We have a Social Dialogue model characterized by promoting respectful conversation spaces, reflecting our firm determination to achieve a balance between our employees' well-being and the organization's sustainability.
Thanks to this approach, we have managed to negotiate our collective agreement at the direct settlement stage, where respect for differences and trust played a fundamental role.
174
These values allowed us to ensure a solid balance between our employees' well-being and the Bank's sustainability.
The most outstanding milestones of this agreement are as follows:
| • | Validity of 3 years, covering the period 2023-2026. |
| • | Salary increase: A 14.5% increase during the first year, followed by an increase equivalent to the variation of the CPI+2.3 percentage points in the second year and an increase of CPI+2.5% in the third year. |
| • | Health: We have improved the health policy, increasing coverage by 12.5%. |
| • | Education: Increase in the value of the aid so that employees, their spouses, and their children can access education programs to continue developing their skills and knowledge for the new demands of the current world. |
| • | Housing: We have increased the second credit fund by a percentage equivalent to the salary increase for each conventional year and have allocated additional resources for the approval of pending second housing loans that meet the conditions. |
In the regulatory field, several initiatives stand out, such as reducing the workweek to 42 hours starting January 1, 2025, surpassing the current Colombian regulation of 47 hours per week. An explicit commitment is established regarding work disconnection during rest periods, recognizing the importance of maintaining a healthy balance between work and personal life. Likewise, a specific approach is adopted for the assignment of work forms, with a formal commitment to shared responsibility of men and women in care responsibilities. We reaffirm our commitment to employee well-being and our zero-tolerance stance on any conduct that violates dignity.
These agreements apply to about 12,000 employees with operational positions and business lines.
Diversity, Equity, and Inclusion
At Bancolombia, we are convinced that development is only sustainable if it is also inclusive and generates well-being opportunities for all people, without distinction. Therefore, in 2023, we consolidated a diversity, equity, and inclusion strategy that we have been working on for over 5 years to contribute to building a world with fewer labels, where each person can freely identify and promote their life project, without limits imposed by stereotypes.
This strategy, led by a DEI directorate created in 2022 which reports to the Presidency to mobilize all necessary resources and capacities within and outside the organization, has three prioritized approaches so far: gender equity and empowerment of women, inclusion of sexual diversity, and accessibility for people with disabilities. However, there are still many challenges for other populations, such as ethnic groups, migrants, youth, and the elderly, that we also want to recognize and work on in the future, in line with our corporate policy of Diversity, Equity, and Inclusion.
In 2023, our DEI strategy received the Aequales certification, a recognition that only 9 other Colombian companies have. They, like Bancolombia, are transforming their policies and processes with gender equity and diversity criteria. Among the initiatives highlighted by the certification is the DEI Community that we created with our suppliers and allies to exchange knowledge and best practices on these topics.
The Aequales certification also recognizes the efforts we made during the last year to consolidate a gender-focused value proposition for our more than 9 million female customers in Colombia.
175
At Bancolombia, we not only have differential credit products for women, such as “Agro para Todas” (Agro for All Women) and the ordinary loan line for women-led companies, through which we disbursed over COP 400,000 million in 2023, but also training strategies and other non-financial solutions that allow us to continue strengthening our relationship with them.
For example, more than 3,200 women benefited from “Elévate” (Reach New Heights), our financial training platform for entrepreneurs and micro-business owners, and more than 340 were part of “Emprender Mujer” (Entrepreneur Woman), a business training program on business, impact, and leadership: 150 in cities such as Medellín, Cali, and Barranquilla, and 190 in 22 municipalities in Antioquia.
Our goal is to continue building capacities in women, especially those with their own businesses, and facilitating their access to credit. To achieve this, we need to strengthen alliances that allow us to better understand their needs and reach new market sectors. Therefore, in 2023, we participated in Project Germina, along with Comfama, USAID, Agricapital, ImpactHub, and MET Community, to provide loans to over 400 rural women entrepreneurs and micro-businesswomen in Antioquia.
We know that the resources we put into women's hands multiply as well-being opportunities for their surroundings. With this premise, we not only focus on entrepreneurship but also on formal employment, to contribute to the autonomy and economic empowerment of more women in Colombia. This year, we also renewed our alliance with the Juanfe Foundation, an organization that works to break the cycles of poverty of vulnerable teenage mothers, under which over 600 women in Medellín accessed technical and professional training for employment.
This gender-focused business value proposition also requires us to mobilize other companies to be part of the change. Therefore, in 2023, we launched a credit line tied to the Equipares certification, a seal awarded by the UNDP and the National Government to organizations that implement the best gender equity practices in Colombia. The line has an economic incentive, with an interest rate 100 basis points below the rate for traditional ordinary portfolios. This year we disbursed COP 4,200,000 million to certified companies.
In the same line, with the aim of strengthening an increasingly inclusive supply chain, we joined Sourcing2Equal, an initiative of the International Finance Corporation (IFC) that seeks to generate business between small and medium-sized enterprises led by women and large companies in Colombia.
With the She Is Foundation, we continue to work to connect women, from a young age, with science, technology, engineering, and mathematics, areas of knowledge where future professional development opportunities are concentrated. 100 girls from different regions of the country were part of She Is Astronaut, participating for 4 months in a virtual STEM training program, and another 35 experienced a scientific immersion at the NASA Space Center in Houston, Texas.
In 2023, we joined the Chamber to continue working for the financial inclusion of the LGBTIQ+ population and other historically discriminated social groups. In partnership with this organization and with ImpactHub, we conducted the first entrepreneurship boot camp in the country aimed at sexually diverse people who have their own businesses, in which 30 entrepreneurs from different cities participated.
Human Rights "Promote, Respect, and Remedy"
(Operations subject to human rights impact assessments or reviews)
176
At Bancolombia Group, we consider it essential to promote, respect, and effectively address issues related to human rights. Since 2013, we have established a public declaration committed to Human Rights, which is based on the Universal Declaration of Human Rights supported by the UN, as well as the Guiding Principles on Business and Human Rights, endorsed by the UN Human Rights Council. This declaration is complemented by voluntary commitments, such as the Equator Principles, Principles for Responsible Investment, and the Carbon Disclosure Project. These commitments encompass climate protection, combating corruption, managing water resources, and promoting peace, among other relevant aspects.
Over the years, we have strengthened our responsible and sustainable business conduct by implementing new strategies and policies that positively impact our employees, customers, suppliers, and society as a whole. This action has been fundamental to prevent and mitigate adverse effects on human rights directly related to our operations. Among our most prominent policies are the Mitigation and Remediation Protocol, the Responsible Corporate Investment Policy, the Diversity, Equity, and Inclusion Policy, as well as the Policy to promote healthy coexistence and gender equity. Additionally, we have aligned our labor practices with the Sustainable Development Goals (SDGs) and implemented human rights due diligence processes, among other significant initiatives.
At the center of our approach is the preservation of the intrinsic value of human dignity. Therefore, we strongly reject all forms of discrimination, human trafficking, forced labor, or child labor. We actively commit to promoting wage equality, freedom of association, and collective bargaining in all our interactions with significant groups.
Our Human Rights policy is based on four fundamental pillars:
1. Human Rights in Business.
2. Human Rights in the Supply Chain.
3. Human Rights with our Employees.
4. Human Rights in society.
For more details on the actions carried out in each pillar, we invite you to consult the 2023 Human Rights Report of Bancolombia Group through the following link:
https://www.grupobancolombia.com/wcm/connect/www.grupobancolombia.com15880/958e664e-0139-42b1-85b7-377f08e493e7/Informe+DDHH+Grupo+Bancolombia+2022..pdf?MOD=AJPERES&CVID=oGkw1CW
TALENT MANAGEMENT
| a. | DISTRIBUTION OF EMPLOYEES BY COMPANY AND COUNTRY |
Bancolombia, domestic subsidiaries, and foreign subsidiaries | |
Country |
No. of Employees |
Bancolombia (Colombia) |
23,693 |
Banco Agrícola (El Salvador) |
2,953 |
177
Banistmo (Panama) |
2,432 |
||
OffShore |
161 |
||
BAM (Guatemala) |
3,706 |
||
Other Bancolombia Group companies | |||
|
Other Bancolombia Group Companies: *Number of employees: Renting, Transportempo S.A.S., Nequi, Wenia, Valores Simesa, among others. |
1,811 |
||
Other types of non-direct contracts |
|
|
|
|
External-Service contract |
29,803 |
||
Interns/trainees |
902 |
||
|
|||
Subtotal Employees |
32,945 |
||
Other companies |
1,811 |
||
Total Employees |
34,756 |
||
*For the figures presented below, we consider the number of direct employees by Bancolombia with domestic subsidiaries and their foreign subsidiaries, i.e., 32,945 employees.
Indicator |
2022 |
2023 |
Variation (%) |
Numerical Variation |
Number |
Number |
|||
Number of Employees |
31,159 |
32,945 |
5.42% |
1,786 |
| b. | GRI 405-1 DEMOGRAPHICS |
We acknowledge demographic diversity and generational shifts, seeking greater flexibility in all organizational development processes and the inclusion of gender, knowledge, and different capabilities.
Indicator |
2022 |
2023 |
|||
Number |
% |
Number |
% |
||
Gender |
Women |
18,818 |
60% |
19,700 |
60% |
Men |
12,341 |
40% |
13,245 |
40% |
|
178
Age |
Employees under 30 years old |
9,164 |
29% |
9,743 |
30% |
Employees aged 30 - 50 years old |
19,526 |
63% |
20,669 |
63% |
|
Employees over 50 years old |
2,469 |
8% |
2,533 |
8% |
|
Seniority |
Employees with less than 3 years of service |
7,902 |
25% |
10,271 |
31% |
Employees with 3-10 years of service |
10,599 |
34% |
9,508 |
29% |
|
Employees with more than 10 years of service |
12,658 |
41% |
13,166 |
40% |
|
Diversity |
Number and % of women in leadership roles |
2,083 |
52% |
1,955 |
52% |
Number of women in junior roles |
1,601 |
55% |
1,763 |
53% |
|
Number and % of women in senior management |
205 |
42% |
192 |
40% |
|
Number and % of women in commercial roles |
1,208 |
58% |
1,165 |
58% |
|
Number and % of women in STEM (Science, Technology, Engineering, and Mathematics) roles |
2,835 |
44% |
3,542 |
40% |
|
Number of minority employees (people with disabilities, ethnic minorities, Afro-descendants, etc.) |
146 |
1% |
248 |
1% |
*The data includes Banco and domestic subsidiaries, Banistmo, Bancolombia Panamá, Bancolombia Puerto Rico, Banco Agrícola, and BAM.
*The Senior Management category includes senior management through to the presidency.
*STEM employees have been identified through their academic background.
Women in Leadership Positions - Colombia | ||
Classification |
2023 |
|
Number of employees |
Participation |
|
Female |
145 |
40.2% |
Male |
216 |
59.8% |
Grand Total |
361 |
100.0% |
179
| c. | New Employee Rates. d. |
Indicator |
2022 |
2023 |
||
Events |
% / rate |
Events |
% / rate |
|
|
|
|||
Total Hires |
4,768 |
15% |
4,686 |
14% |
Female Hires |
2,527 |
53% |
2,571 |
55% |
Male Hires |
2,241 |
47% |
2,115 |
45% |
Employee Hires under 30 years old |
3,296 |
69% |
3,143 |
67% |
Employee Hires aged 30 - 50 years old |
1,448 |
30% |
1,517 |
32% |
Employee Hires over 50 years old |
24 |
1% |
26 |
1% |
Hires at Bancolombia |
2,837 |
13% |
2,731 |
12% |
Hires at Banistmo |
470 |
20% |
446 |
18% |
Hires OffShore |
12 |
7.90% |
22 |
14% |
Hires at Banco Agrícola |
532 |
18% |
517 |
18% |
Hires at BAM |
917 |
26% |
970 |
26% |
*The data includes Bancolombia and domestic subsidiaries, Banistmo, Banco Agrícola, Bancolombia Puerto Rico/Bancolombia Panamá (OffShore), and BAM.
| d. | GRI 401-1 TURNOVER (PARTICIPATION) DUE TO EMPLOYEE DEPARTURES |
Indicator |
2022 |
2023 |
||
Events |
Turnover % |
Events |
Turnover % |
|
Total Departures |
3,586 |
12% |
2,910 |
9% |
Female Departures |
1,887 |
53% |
1,678 |
58% |
Male Departures |
1,699 |
47% |
1,232 |
42% |
Employee Departures under 30 years old |
1,335 |
37% |
1,168 |
40% |
180
Employee Departures aged 30 - 50 years old |
1,897 |
53% |
1,430 |
49% |
Employee Departures over 50 years old |
354 |
10% |
312 |
11% |
Voluntary Departures |
1,787 |
50% |
1,452 |
50% |
Departures without just cause (dismissals) |
231 |
6% |
257 |
9% |
Departures by mutual agreement |
1,031 |
29% |
626 |
22% |
Departures with just cause |
123 |
3% |
122 |
4% |
Departures due to retirement/pension |
63 |
2% |
55 |
2% |
Departures during probation period |
45 |
1% |
44 |
2% |
Departures due to death |
18 |
1% |
15 |
1% |
Departures due to contract termination |
286 |
8% |
331 |
11% |
Departures - pension due to disability |
1 |
0% |
0 |
0% |
Departures due to other reasons |
2 |
0% |
8 |
0% |
*The data includes Bancolombia and domestic subsidiaries, Banistmo, Banco Agrícola, Bancolombia Puerto Rico/Bancolombia Panamá (OffShore), and BAM.
Representative Turnover Indicator |
2023 |
|
Events |
Turnover % |
|
Turnover Bancolombia Departures |
1,370 |
5.8% |
Turnover Banistmo Departures |
306 |
12.6% |
Turnover OffShore Departures |
13 |
8.1% |
GRI 401-1 TURNOVER DUE TO EMPLOYEE DEPARTURES
Indicator |
2022 |
2023 |
||
Events |
Turnover % |
Events |
Turnover % |
|
Voluntary Departures |
1,787 |
5.70% |
1,452 |
4.41% |
Departures without just cause (dismissals) |
231 |
0.70% |
257 |
0.78% |
Departures by mutual agreement |
1,031 |
3.30% |
626 |
1.90% |
Departures with just cause |
123 |
0.40% |
122 |
0.37% |
Departures due to retirement/pension |
63 |
0.20% |
55 |
0.17% |
Departures during probation period |
45 |
0.10% |
44 |
0.13% |
Departures due to death |
18 |
0.10% |
15 |
0.05% |
Departures due to contract termination |
286 |
0.10% |
331 |
1.00% |
Departures - pension due to disability |
1 |
0.00% |
0 |
0.00% |
Departures due to other reasons |
2 |
0.00% |
8 |
0.02% |
181
*The data includes Bancolombia and domestic subsidiaries, Banistmo, Banco Agrícola, Bancolombia Puerto Rico/Bancolombia Panamá (OffShore), and BAM.
| e. | GRI 401-1 PROMOTIONS AT GRUPO BANCOLOMBIA |
Indicator |
2022 |
2023 |
||
Events |
Promotion Rate |
Events |
Promotion Rate |
|
Total Promotions |
6,037 |
19% |
4,093 |
12% |
Female Promotions |
3,422 |
57% |
2,300 |
56% |
Male Promotions |
2,615 |
43% |
1,793 |
44% |
*The data includes Bancolombia and domestic subsidiaries, Banistmo, Banco Agrícola, Bancolombia Puerto Rico/Bancolombia Panamá (OffShore), and BAM.
| f. | GRI 405-2 SALARY REMUNERATION BY GENDER AND AGE RANGES |
With the aim of aligning with UN Women's international standards, and based on internal decisions stemming from the confidentiality of figures in public reports, salary equity data is adjusted at the Senior Management level by eliminating President positions or those reporting directly to them with high strategic impact. The calculation is also adjusted by job valuation level with Korn Ferry methodology in line with the ILO principle that equal work deserves equal pay. For this same reason, and additionally due to distortions in the wage gap because of the exchange rate, a single average and median salary for women and men respectively that averages all banks and Offshore offices is not published.
Bancolombia – Colombia 2023 (Figures in COP) | ||||
Hierarchical Level |
Gender |
Population Percentage |
Average Monthly Salary |
% Below Men |
Senior Management |
Female |
40% |
19,187,110 |
2.18% |
Male |
60% |
20,820,116 |
||
Mid-Level Strategic |
Female |
55% |
9,116,748 |
3.99% |
Male |
45% |
9,583,151 |
||
Professional |
Female |
54% |
5,011,414 |
0.29% |
Male |
46% |
5,140,476 |
||
182
Operational |
Female |
69% |
3,457,890 |
0.98% |
Male |
31% |
3,529,151 |
Banistmo 2023 (Figures in USD) | ||||
Hierarchical Level |
Gender |
Population Percentage |
Average Monthly Salary |
% Below Men |
Senior Management |
Female |
50% |
9,875 |
4.34% |
Male |
50% |
10,455 |
||
Mid-Level Strategic |
Female |
62% |
4,138 |
5.77% |
Male |
38% |
4,452 |
||
Professional |
Female |
57% |
1,870 |
9.07% |
Male |
43% |
2,101 |
||
Operational |
Female |
77% |
937 |
1.14% |
Male |
23% |
968 |
||
OffShore 2023 (Figures in USD) | ||||
Hierarchical Level |
Gender |
Population Percentage |
Average Monthly Salary |
% Below Men |
Senior Management |
Female |
50% |
12,544 |
-9.32% |
Male |
50% |
12,339 |
||
Mid-Level Strategic |
Female |
59% |
4,374 |
-3.70% |
Male |
41% |
3,617 |
||
Professional |
Female |
68% |
2,146 |
2.36% |
Male |
32% |
2,174 |
||
Operational |
Female |
70% |
1,015 |
10.44% |
Male |
30% |
1,163 |
||
Banco Agrícola 2023 (Figures in USD) |
183
Hierarchical Level |
Gender |
Population Percentage |
Average Monthly Salary |
% Below Men |
Senior Management |
Female |
39% |
6,563 |
7.73% |
Male |
61% |
7,583 |
||
Mid-Level Strategic |
Female |
51% |
2,680 |
3.03% |
Male |
49% |
2,909 |
||
Professional |
Female |
50% |
1,278 |
1.62% |
Male |
50% |
1,341 |
||
Operational |
Female |
59% |
580 |
0.29% |
Male |
41% |
578 |
BAM 2023 (Figures in USD) | ||||
Hierarchical Level |
Gender |
Population Percentage |
Average Monthly Salary |
% Below Men |
Senior Management |
Female |
27% |
11,695 |
-10.58% |
Male |
73% |
10,032 |
||
Mid-Level Strategic |
Female |
34% |
3,974 |
0.68% |
Male |
66% |
3,444 |
||
Professional |
Female |
46% |
1,323 |
3.69% |
Male |
54% |
1,412 |
||
Operational |
Female |
58% |
519 |
0.38% |
Male |
42% |
523 |
||
| g. | Talent Education h. |
Indicator |
2023 |
Leaders trained in the Instituto de Liderazgo (Leadership Institute) program* |
5572 managers, 96% of the total managers. |
New trained managers* |
618 managers, 84% of new managers. |
Total training hours |
1451376 |
Average training hours per employee |
43 hours/employee |
Average virtual training hours per employee |
|
35 hours/employee |
184
Average face-to-face training hours per employee |
|
8 hours/employee |
|
Average hours of training per male employee |
|
42 hours/employee |
|
Average hours of training per female employee |
44 hours/employee |
Indicator |
2023 |
Average hours of training per employee managers |
71 |
Average hours of training per non-managers employee |
39 |
Average investment in training per person* |
USD 175 |
Fellows |
30 employees |
*Data includes domestic Bank and Subsidiaries, Banistmo, Off shore (Bancolombia Panamá/ Bancolombia Puerto Rico), Banco Agrícola and BAM.
**The classification of managers includes Senior and Mid-Level Strategic Management. Non-managers include Professionals, Operatives, and Trainees.
Compliance with Anti-Corruption Training 2023 | ||||
Employees |
Approved |
In progress |
Grand Total |
Compliance % |
Bancolombia Panamá |
123 |
0 |
123 |
100.00% |
Banistmo |
1,852 |
3 |
1,855 |
99.84% |
Banco Agromercantil de Guatemala (BAM) |
2,943 |
13 |
2,956 |
99.56% |
Banco Agrícola |
2,408 |
14 |
2,422 |
99.42% |
Bancolombia |
18,227 |
15 |
18,242 |
99.92% |
Puerto Rico |
7 |
0 |
7 |
100.00% |
Grand Total |
25,560 |
45 |
25,605 |
99.82% |
Managers |
Approved |
In progress |
Grand Total |
Compliance % |
Bancolombia Panamá |
28 |
0 |
28 |
100.00% |
Banistmo |
378 |
0 |
378 |
100.00% |
Banco Agromercantil de Guatemala (BAM) |
647 |
4 |
651 |
99.39% |
Banco Agrícola |
425 |
2 |
427 |
99.53% |
185
Bancolombia |
2,488 |
1 |
2489 |
99.96% |
Puerto Rico |
1 |
0 |
1 |
100.00% |
Grand Total |
3,967 |
7 |
3,974 |
99.82% |
Anti-Fraud Training Compliance 2023 | ||||
Employees |
Approved |
In progress |
Grand Total |
Compliance % |
Bancolombia Panamá |
123 |
0 |
123 |
100.00% |
Banistmo |
1,852 |
3 |
1,855 |
99.84% |
Banco Agromercantil de Guatemala (BAM) |
2,946 |
10 |
2,956 |
99.66% |
Banco Agrícola |
2,408 |
14 |
2,422 |
99.42% |
Bancolombia |
18,229 |
13 |
18,242 |
99.93% |
Puerto Rico |
7 |
0 |
7 |
100.00% |
Grand Total |
25,565 |
40 |
25,605 |
99.84% |
Managers |
Approved |
In progress |
Grand Total |
Compliance % |
Bancolombia Panamá |
28 |
0 |
28 |
100.00% |
Banistmo |
378 |
0 |
378 |
100.00% |
Banco Agromercantil de Guatemala (BAM) |
647 |
4 |
651 |
99.39% |
Banco Agrícola |
425 |
2 |
427 |
99.53% |
Bancolombia |
2,488 |
1 |
2,489 |
99.96% |
Puerto Rico |
1 |
0 |
1 |
100.00% |
Grand Total |
3,967 |
7 |
3,974 |
99.82% |
Compliance with Cybersecurity Training 2023 | ||||
Employees |
Approved |
In progress |
Grand Total |
Compliance % |
Bancolombia Panamá |
123 |
0 |
123 |
100.00% |
Banistmo |
1,852 |
3 |
1,855 |
99.84% |
Banco Agromercantil de Guatemala (BAM) |
2,948 |
8 |
2,956 |
99.73% |
Banco Agrícola |
2,411 |
11 |
2,422 |
99.55% |
Bancolombia |
18,231 |
11 |
18,242 |
99.94% |
Puerto Rico |
7 |
0 |
7 |
100.00% |
186
Grand Total |
25,572 |
33 |
25,605 |
99.87% |
Managers |
Approved |
In progress |
Grand Total |
Compliance % |
Bancolombia Panamá |
28 |
0 |
28 |
100.00% |
Banistmo |
378 |
0 |
378 |
100.00% |
Banco Agromercantil de Guatemala (BAM) |
647 |
4 |
651 |
99.39% |
Banco Agrícola |
427 |
|
427 |
100.00% |
Bancolombia |
2,488 |
1 |
2,489 |
99.96% |
Puerto Rico |
1 |
0 |
1 |
100.00% |
Grand Total |
3,969 |
5 |
3,974 |
99.87% |
Compliance with Code of Ethics Training | ||||
Employees |
Approved |
In progress |
Grand Total |
Compliance % |
Bancolombia Panamá |
123 |
0 |
123 |
100.00% |
Banistmo |
1,852 |
3 |
1,855 |
99.84% |
Banco Agromercantil de Guatemala (BAM) |
2,949 |
7 |
2,956 |
99.76% |
Banco Agrícola |
2,416 |
6 |
2,422 |
99.75% |
Bancolombia |
18,235 |
7 |
18,242 |
99.96% |
Puerto Rico |
7 |
0 |
7 |
100.00% |
Grand Total |
25,582 |
23 |
25,605 |
99.91% |
Managers |
Approved |
In progress |
Grand Total |
Compliance % |
Bancolombia Panamá |
28 |
0 |
28 |
100.00% |
Banistmo |
378 |
0 |
378 |
100.00% |
Banco Agromercantil de Guatemala (BAM) |
649 |
2 |
651 |
99.69% |
Banco Agrícola |
426 |
1 |
427 |
99.77% |
Bancolombia |
2,489 |
0 |
2,489 |
100.00% |
Puerto Rico |
1 |
0 |
1 |
100.00% |
Grand Total |
3,971 |
3 |
3,974 |
99.92% |
Compliance with DEI Training 2023 | ||||
Employees |
Approved |
In progress |
Grand Total |
Compliance % |
187
Bancolombia Panamá |
123 |
0 |
123 |
100.00% |
Banistmo |
1,852 |
3 |
1,855 |
99.84% |
Banco Agromercantil de Guatemala (BAM) |
2,919 |
37 |
2,956 |
98.75% |
Banco Agrícola |
2,412 |
10 |
2,422 |
99.59% |
Bancolombia |
18,232 |
10 |
18,242 |
99.95% |
Puerto Rico |
7 |
0 |
7 |
100.00% |
Grand Total |
25,545 |
60 |
25,605 |
99.77% |
Managers |
Approved |
In progress |
Grand Total |
Compliance % |
Bancolombia Panamá |
28 |
0 |
28 |
100.00% |
Banistmo |
378 |
0 |
378 |
100.00% |
Banco Agromercantil de Guatemala (BAM) |
640 |
11 |
651 |
98.31% |
Banco Agrícola |
426 |
1 |
427 |
99.77% |
Bancolombia |
2,488 |
1 |
2,489 |
99.96% |
Puerto Rico |
1 |
0 |
1 |
100.00% |
Grand Total |
3,961 |
13 |
3,974 |
99.67% |
Compliance with Occupational Health and Safety Risk Management Training 2023 | ||||
Employees |
Approved |
In progress |
Grand Total |
Compliance % |
Bancolombia |
18,225 |
17 |
18,242 |
99.91% |
Grand Total |
18,225 |
17 |
18,242 |
99.91% |
Managers |
Approved |
In progress |
Grand Total |
Compliance % |
Bancolombia |
2,487 |
2 |
2,489 |
99.92% |
Grand Total |
2,487 |
2 |
2,489 |
99.92% |
Compliance with Personal Data Protection Training 2023 | ||||
Employees |
Approved |
In progress |
Grand Total |
Compliance % |
Banistmo |
1,852 |
3 |
1.855 |
99.84% |
Banco Agromercantil de Guatemala (BAM) |
2,943 |
13 |
2.956 |
99.56% |
Bancolombia |
18,230 |
12 |
18.242 |
99.93% |
Grand Total |
23,025 |
28 |
23.053 |
99.88% |
Managers |
Approved |
In progress |
Grand Total |
Compliance % |
188
Banistmo |
378 |
0 |
378 |
100.00% |
Banco Agromercantil de Guatemala (BAM) |
647 |
4 |
651 |
99.39% |
Bancolombia |
2,488 |
1 |
2,489 |
99.96% |
Grand Total |
3,513 |
5 |
3,518 |
99.86% |
Compliance with SAC Training 2023 | ||||
Employees |
Approved |
In progress |
Grand Total |
Compliance % |
Bancolombia |
18,233 |
9 |
18,242 |
99.95% |
Grand Total |
18,233 |
9 |
18,242 |
99.95% |
Managers |
Approved |
In progress |
Grand Total |
Compliance % |
Bancolombia |
2,488 |
1 |
2,489 |
99.96% |
Grand Total |
2,488 |
1 |
2,489 |
99.96% |
Compliance with SARLAFT Training 2023 | ||||
Employees |
Approved |
In progress |
Grand Total |
Compliance % |
Bancolombia Panamá |
123 |
0 |
123 |
100.00% |
Banistmo |
1,852 |
3 |
1,855 |
99.84% |
Banco Agromercantil de Guatemala (BAM) |
2,936 |
20 |
2,956 |
99.32% |
Banco Agrícola |
2,408 |
14 |
2,422 |
99.42% |
Bancolombia |
18,224 |
18 |
18,242 |
99.90% |
Puerto Rico |
7 |
0 |
7 |
100.00% |
Grand Total |
25,550 |
55 |
25,605 |
99.79% |
Managers |
Approved |
In progress |
Grand Total |
Compliance % |
Bancolombia Panamá |
28 |
0 |
28 |
100.00% |
Banistmo |
378 |
0 |
378 |
100.00% |
Banco Agromercantil de Guatemala (BAM) |
646 |
5 |
651 |
99.23% |
Banco Agrícola |
424 |
3 |
427 |
99.30% |
Bancolombia |
2,487 |
2 |
2,489 |
99.92% |
Puerto Rico |
1 |
0 |
1 |
100.00% |
Grand Total |
3,964 |
10 |
3,974 |
99.75% |
189
Compliance with SARO Training 2023 | ||||
Employees |
Approved |
In progress |
Grand Total |
Compliance % |
Bancolombia Panamá |
123 |
0 |
123 |
100.00% |
Banistmo |
1,852 |
3 |
1,855 |
99.84% |
Banco Agromercantil de Guatemala (BAM) |
2,939 |
17 |
2,956 |
99.42% |
Banco Agrícola |
2,408 |
14 |
2,422 |
99.42% |
Bancolombia |
18,226 |
16 |
18,242 |
99.91% |
Puerto Rico |
7 |
0 |
7 |
100.00% |
Grand Total |
25,555 |
50 |
25,605 |
99.80% |
Managers |
Approved |
In progress |
Grand Total |
Compliance % |
Bancolombia Panamá |
28 |
0 |
28 |
100.00% |
Banistmo |
378 |
0 |
378 |
100.00% |
Banco Agromercantil de Guatemala (BAM) |
647 |
4 |
651 |
99.39% |
Banco Agrícola |
424 |
3 |
427 |
99.30% |
Bancolombia |
2,487 |
2 |
2,489 |
99.92% |
Puerto Rico |
1 |
0 |
1 |
100.00% |
Grand Total |
3,965 |
9 |
3,974 |
99.77% |
Compliance with Information Security Training 2023 | ||||
Employees |
Approved |
In progress |
Grand Total |
Compliance % |
Bancolombia Panamá |
123 |
0 |
123 |
100.00% |
Banistmo |
1852 |
3 |
1855 |
99.84% |
Banco Agromercantil de Guatemala (BAM) |
2943 |
13 |
2956 |
99.56% |
Banco Agrícola |
2408 |
14 |
2422 |
99.42% |
Bancolombia |
18,229 |
13 |
18,242 |
99.93% |
Puerto Rico |
7 |
0 |
7 |
100.00% |
Grand Total |
25,562 |
43 |
25,605 |
99.83% |
Managers |
Approved |
In progress |
Grand Total |
Compliance % |
Bancolombia Panamá |
28 |
0 |
28 |
100.00% |
Banistmo |
378 |
0 |
378 |
100.00% |
190
Banco Agromercantil de Guatemala (BAM) |
647 |
4 |
651 |
99.39% |
Banco Agrícola |
424 |
3 |
427 |
99.30% |
Bancolombia |
2,488 |
1 |
2,489 |
99.96% |
Puerto Rico |
1 |
0 |
1 |
100.00% |
Grand Total |
3,966 |
8 |
3,974 |
99.80% |
Compliance with Sustainability Training 2023 | ||||
Employees |
Approved |
In progress |
Grand Total |
Compliance % |
Bancolombia Panamá |
123 |
0 |
123 |
100.00% |
Banistmo |
1,852 |
3 |
1,855 |
99.84% |
Banco Agromercantil de Guatemala (BAM) |
2,948 |
8 |
2,956 |
99.73% |
Banco Agrícola |
2,412 |
10 |
2,422 |
99.59% |
Bancolombia |
18,234 |
8 |
18,242 |
99.96% |
Puerto Rico |
7 |
0 |
7 |
100.00% |
Grand Total |
25,576 |
29 |
25,605 |
99.89% |
Managers |
Approved |
In progress |
Grand Total |
Compliance % |
Bancolombia Panamá |
28 |
0 |
28 |
100.00% |
Banistmo |
378 |
0 |
378 |
100.00% |
Banco Agromercantil de Guatemala (BAM) |
648 |
3 |
651 |
99.54% |
Banco Agrícola |
426 |
1 |
427 |
99.77% |
Bancolombia |
2,488 |
1 |
2,489 |
99.96% |
Puerto Rico |
1 |
0 |
1 |
100.00% |
Grand Total |
3,969 |
5 |
3,974 |
99.87% |
Compliance with SOX Training 2023 | ||||
Employees |
Approved |
In progress |
Grand Total |
Compliance % |
Bancolombia Panamá |
123 |
0 |
123 |
100.00% |
Banistmo |
1,852 |
3 |
1,855 |
99.84% |
Banco Agromercantil de Guatemala (BAM) |
2,940 |
16 |
2,956 |
99.46% |
191
Banco Agrícola |
2,408 |
14 |
2,422 |
99.42% |
Bancolombia |
18,226 |
16 |
18,242 |
99.91% |
Puerto Rico |
7 |
0 |
7 |
100.00% |
Grand Total |
25,556 |
49 |
25,605 |
99.81% |
Managers |
Approved |
In progress |
Grand Total |
Compliance % |
Bancolombia Panamá |
28 |
0 |
28 |
100.00% |
Banistmo |
378 |
0 |
378 |
100.00% |
Banco Agromercantil de Guatemala (BAM) |
647 |
4 |
651 |
99.39% |
Banco Agrícola |
424 |
3 |
427 |
99.30% |
Bancolombia |
2,487 |
2 |
2,489 |
99.92% |
Puerto Rico |
1 |
0 |
1 |
100.00% |
Grand Total |
3,965 |
9 |
3,974 |
99.77% |
Compliance with Employee Knowledge Training 2023 | ||||
Employees |
Approved |
In progress |
Grand Total |
Compliance % |
Bancolombia Panamá |
28 |
0 |
28 |
100.00% |
Banistmo |
378 |
0 |
378 |
100.00% |
Banco Agromercantil de Guatemala (BAM) |
648 |
3 |
651 |
99.54% |
Banco Agrícola |
426 |
1 |
427 |
99.77% |
Bancolombia |
2,488 |
1 |
2,489 |
99.96% |
Puerto Rico |
1 |
0 |
1 |
100.00% |
Grand Total |
3,969 |
5 |
3,974 |
99.87% |
| h. | GRI 404-3 PERFORMANCE EVALUATION |
The target group of employees to be evaluated was 33,829*.
Indicator |
2022 |
2023 |
||
Number |
% |
Number |
% |
|
Employees with performance appraisal* |
29,388 |
99% |
31,845 |
100% |
Women with performance appraisal* |
17,845 |
99% |
19,082 |
100% |
Men with performance appraisal* |
11,543 |
99% |
12,763 |
100% |
192
Employees with performance appraisal by Labor Category |
Women |
Men |
Total |
% by Labor Category |
Senior Management |
189 |
284 |
473 |
1.5% |
Mid-Level Strategic |
1,749 |
1,532 |
3,281 |
10.3% |
Professional |
6,620 |
5,821 |
12,441 |
39.1% |
Operational |
10,524 |
5,126 |
15,650 |
49.1% |
Percentage by gender |
60% |
40% |
31,845 |
100.0% |
*This data includes the target audience (33,829), and employees who were exempted due to extended absences or union permits (1,984).
*The data includes Banco and domestic subsidiaries, Banistmo, Bancolombia Panamá, Bancolombia Puerto Rico, Bancolombia Capital, Banco Agrícola, and BAM.
**For Bancolombia and its domestic subsidiaries, the 360 competence assessment is implemented, which allows for a comprehensive performance view, obtaining feedback not only from our leader but also from our colleagues and leaders of their team, making the assessment more transparent and objective, generating value for employee development. For Banistmo, Bancolombia Panama, Bancolombia Capital, Banco Agrícola, and BAM, a partial percentage of the population participated in a pilot program.
**Top-down performance appraisal (Leader-to-Employee Assessment).
| i. | GRI 401-2 WELL-BEING |
Bancolombia and Domestic Subsidiaries (Figures in COP) | |
Investment in Quality of Life programs |
15,346,902,142 |
Number of Quality of Life activities developed |
31,946 |
Number of wellness activities developed |
944 |
Number of activities developed for the employee's health |
7,797 |
Number of activities developed in human security |
23,205 |
Number of employees and their families participating in Quality of Life programs |
165,525 |
Banistmo (Figures in USD) | |
Investment in Quality of Life programs |
USD 420,510 |
Number of Quality of Life activities developed |
391 |
Number of wellness activities developed |
222 |
Number of activities developed for the employee's health |
76 |
193
Number of activities developed in human security |
93 |
Number of employees and their families participating in Quality of Life programs |
47,525 |
OffShore (Bancolombia Panamá and Puerto Rico – Figures in USD) | |
Investment in Quality of Life programs |
USD 125,928 |
Number of Quality of Life activities developed |
473 |
Number of wellness activities developed |
386 |
Number of activities developed for the employee's health |
87 |
Number of activities developed in human security |
0 |
Number of employees and their families participating in Quality of Life programs |
14,572 |
Banco Agrícola (El Salvador – Figures in USD) | |
Investment in Quality of Life programs |
USD 345,541 |
Number of Quality of Life activities developed |
97 |
Number of wellness activities developed |
40 |
Number of activities developed for the employee's health |
24 |
Number of activities developed in human security |
33 |
Number of employees and their families participating in Quality of Life programs |
17,857 |
BAM (Guatemala – Figures in USD) | |
Investment in Quality of Life programs |
USD 3,912,965 |
Number of Quality of Life activities developed |
21 |
Number of wellness activities developed |
14 |
Number of activities developed for the employee's health |
5 |
Number of activities developed in human security |
2 |
Number of employees and their families participating in Quality of Life programs |
5,054 |
| j. | Loans for Employees. l. |
Bancolombia and Domestic Subsidiaries (Figures in COP) | ||||
|
2022 |
2023 |
||
194
Loans disbursed |
Values |
# Credits |
Values |
# Credits |
Disbursed loan amounts |
716,213,402,675 |
7,434 |
520,678,081,198 |
6,686 |
Education loans |
2,232,345,149 |
149 |
4,048,686,372 |
194 |
Housing loans |
594,617,525,817 |
1,969 |
402,235,370,364 |
1,824 |
Other |
119,363,531,709 |
5,225 |
114,394,024,462 |
4,668 |
Banistmo (Figures in USD) | ||||
2022 |
2023 |
|||
Loans disbursed |
Values |
# Credits |
Values |
# Credits |
Disbursed loan amounts |
USD 29,174,124 |
1,254 |
USD 28,619,851.65 |
1,095 |
Education loans |
USD 0 |
0 |
USD 0 |
0 |
Housing loans |
USD 14,577,109 |
123 |
USD 12,116,150.43 |
118 |
Other |
USD 14,597,014 |
1,131 |
USD 16,503,701.22 |
977 |
Banco Agrícola (Figures in USD) | ||||
2022 |
2023 |
|||
Loans disbursed |
Values |
# Credits |
Values |
# Credits |
Disbursed loan amounts |
USD 13,956,627.27 |
1,606 |
USD 14,974,592.59 |
1,626 |
Education loans |
USD 19,000.00 |
1 |
USD 0 |
0 |
Housing loans |
USD 3,284,598.25 |
77 |
USD 1,031,969.31 |
57 |
Other |
USD 10,653,029.02 |
1,528 |
USD 13,942,623.28 |
1,569 |
BAM (Figures in USD) | ||||
2022 |
2023 |
|||
Loans disbursed |
Values |
# Credits |
Values |
# Credits |
Disbursed loan amounts |
USD 12,438,139 |
1,120 |
USD 110,141,241.55 |
1,048 |
Education loans |
USD 94,562.14 |
13 |
USD 3,346,370.02 |
40 |
Housing loans |
USD 2,827,624 |
311 |
USD 43,184,687.61 |
433 |
Other |
USD 9,515,953 |
796 |
USD 63,610,183.92 |
575 |
| k. | GRI 401-2 INSURANCE FOR EMPLOYEES |
195
Bancolombia Colombia 2023 (Figures in COP) | ||||
|
Organizational Investment |
Employee Contributions |
Employees Benefited |
Family Members Benefited |
Investment / Organizational Contribution |
58,174,212,616.00 |
64,872,324,656.00 |
22,906 |
13,560 |
Health |
44,118,930,036.00 |
42,341,361,514.00 |
13,294 |
12,588 |
Group life (employer) |
6,308,951,219.00 |
0 |
24,567 |
0 |
Personal accidents (employer) |
779,844,986.00 |
0 |
24,567 |
0 |
Other |
6,966,486,375.00 |
22,530,963,142.00 |
9,612 |
0 |
Banistmo (Figures in USD) | ||||
|
Organizational Investment |
Employee Contributions |
Employees Benefited |
Family Members Benefited |
Investment / Organizational Contribution |
USD 3,536,655.96 |
USD 386,760.41 |
27,886 |
19,638 |
Health |
USD 3,229,440.00 |
USD 386,760.41 |
27,886 |
19,638 |
Group life (employer) |
USD 307,215.96 |
USD 0 |
27,886 |
0 |
Other |
USD 0 |
USD 0 |
0 |
0 |
Banco Agrícola (Figures in USD) | ||||
|
Organizational Investment |
Employee Contributions |
Employees Benefited |
Family Members Benefited |
Investment / Organizational Contribution |
USD 5,439,702.22 |
USD 0 |
2,953 |
1,328 |
Health |
USD 5,133,947.43 |
USD 0 |
2,953 |
0 |
Group life (employer) |
USD 266,235.11 |
USD 0 |
2,953 |
0 |
Other |
USD 39,519.68 |
USD 0 |
0 |
0 |
Off Shore (Bancolombia Panamá and Puerto Rico - Figures in USD) | ||||
|
Organizational Investment |
Employee Contributions |
Employees Benefited |
Family Members Benefited |
Investment / Organizational Contribution |
USD 319,469.43 |
USD 21,058.20 |
166 |
147 |
196
Health |
USD 285,286.31 |
USD 21,058.20 |
166 |
147 |
Group life (employer) |
USD 34,183.12 |
USD 0 |
166 |
0 |
Other |
USD 0 |
USD 0 |
0 |
0 |
BAM (Figures in USD) | ||||
|
Organizational Investment |
Employee Contributions |
Employees Benefited |
Family Members Benefited |
Investment / Organizational Contribution |
USD 18,320,282.26 |
USD 10,237,896.26 |
3,043 |
2,548 |
Health |
USD 14,738,123.04 |
USD 10,237,896.26 |
3,043 |
2,548 |
Group life (employer) |
USD 3,582,159.22 |
USD 0 |
4,382 |
0 |
Other |
USD 0 |
USD 0 |
0 |
0 |
| l. | GRI 401-2 ORGANIZATIONAL SAVINGS PROGRAMS |
Bancolombia (Figures in millions of COP) | ||
|
2022 |
2023 |
Investment / Organizational Contribution |
9,727,906,770 |
12,839,749,561.00 |
Employee Contribution |
19,455,813,540 |
25,679,499,144.00 |
Total, savings |
29,183,720,310 |
38,519,248,705.00 |
Employees Benefited |
12,544 |
13,544 |
Banistmo (Figures in USD) | ||
|
2022 |
2023 |
Investment / Organizational Contribution |
USD 762,291.75 |
USD 877,395.02 |
Employee Contribution |
USD 901,645.86 |
USD 991,063.41 |
Total Savings |
USD 1,663,937.61 |
USD 1,868,458.43 |
Employees Benefited |
1,234 |
1,354 |
Bancolombia Puerto Rico 2019 (Figures in USD) |
197
|
2022 |
2023 |
Investment / Organizational Contribution |
|
USD 12,343.75 |
Employee Contribution |
|
USD 25,162.50 |
Total Savings |
|
USD 37,506.25 |
Employees Benefited |
|
6 |
| m. | GRI 403-2 ABSENTEEISM FIGURES (% TIME LOST) |
Common Illness |
2020 |
2021 |
2022 |
2023 |
Bancolombia (Colombia) |
1.43% |
1.81% |
1.99% |
1.89% |
Banistmo |
0.78% |
0.97% |
0.95% |
0.61% |
Banco Agrícola |
1.21% |
2.10% |
1.79% |
3.48% |
OffShore (Bancolombia Panamá and Puerto Rico) |
0.61% |
0.37% |
0.08% |
0.59% |
Banco Agromercantil de Guatemala (BAM) |
0.22% |
0.54% |
0.41% |
0.27% |
Suppliers |
1.86% |
1.81% |
1.53% |
0.90% |
Occupational Disease and Accident | ||||
Bancolombia (Colombia) |
0.01% |
0.02% |
0.03% |
0.03% |
Banistmo |
0.22% |
0.00% |
0.00% |
0.00% |
Banco Agrícola |
0.05% |
0.08% |
0.08% |
0.01% |
OffShore (Bancolombia Panamá and Puerto Rico) |
0.52% |
0.00% |
0.00% |
0.00% |
Banco Agromercantil de Guatemala (BAM) |
0.27% |
0.24% |
0.35% |
0.00% |
Suppliers |
0.02% |
0,02% |
0.01% |
0.01% |
Maternity/Paternity Leave | ||||
Bancolombia (Colombia) |
0.80% |
0.87% |
0.80% |
0.75% |
Banistmo |
2.41% |
2.44% |
1.01% |
0.71% |
Banco Agrícola |
1.07% |
0.79% |
0.69% |
1.34% |
OffShore (Bancolombia Panamá and Puerto Rico) |
1.33% |
0.57% |
0.70% |
0.67% |
Banco Agromercantil de Guatemala (BAM) |
0.76% |
0.91% |
0.98% |
0.70% |
Suppliers |
0.24% |
0,18% |
0.22% |
0.15% |
Other Permissions |
|
|||
Bancolombia (Colombia) |
0.6% |
0.65% |
0,70% |
1.02% |
Banistmo |
0% |
0.00% |
0.00% |
0.51% |
Banco Agrícola |
0.15% |
0.06% |
0.01% |
0.24% |
OffShore (Bancolombia Panamá and Puerto Rico) |
0.11% |
0.00% |
0.00% |
0.00% |
Banco Agromercantil de Guatemala (BAM) |
0.02% |
0.35% |
0.29% |
0.87% |
Suppliers |
Does not apply |
Does not apply |
0.03% |
0.02% |
198
*Other permissions include topics such as: Union, educational, unpaid or family leave, among others, which translates into additional time for employees.
*In addition, we have different ways of working that contribute to employee flexibility, allowing for a balance between personal and professional life. In numbers, this is evidenced by the 11,204 employees we have under flexible work schemes, representing 80% of our administrative employees. Besides, employees gave us a rating of 9.8 out of 10 for this experience.
| N. | GRI 403-9 AND 403-10 INDICATOR: |
Bancolombia | |
Indicator 403-9 |
Response 2023 |
a. Female Employees: | |
i. The number of deaths resulting from a work related injury. |
0 |
i. The rate of deaths resulting from a work related injury. |
0 |
ii. Number of workplace injuries with major consequences (fatalities not included). |
9 |
ii. Rate of workplace injuries with major consequences (not including deaths). |
0.07 |
iii. Number of recordable workplace injuries. |
354 |
iii. Rate of recordable workplace injuries. |
2.69 |
iv. Main types of workplace injuries. |
Blow, bruise, or crush injury Psychological trauma Sprain, strain, muscle tear, hernia or laceration |
v. The number of hours worked. |
26,281,144 |
b. Male Employees: | |
i. The number of deaths resulting from a work related injury. |
0 |
i. The rate of deaths resulting from a work related injury. |
0 |
ii. Number of workplace injuries with major consequences (fatalities not included). |
3 |
ii. Rate of workplace injuries with major consequences (not including deaths). |
0.04 |
iii. Number of recordable workplace injuries. |
115 |
iii. Rate of recordable workplace injuries. |
1.36 |
199
iv. Most frequent types of workplace injuries. |
Psychological trauma Blow, bruise, or crush injury Wound |
v. The number of hours worked. |
16,881,224 |
c. Suppliers | |
i. The number of deaths resulting from a work related injury. |
0 |
i. The rate of deaths resulting from a work related injury. |
0 |
ii. Number of workplace injuries with major consequences (fatalities not included). |
3 |
ii. Rate of workplace injuries with major consequences (not including deaths). |
0.01 |
iii. Number of recordable workplace injuries. |
51 |
iii. Rate of recordable workplace injuries. |
0.22 |
iv. Most frequent types of workplace injuries. |
Blow, bruise, or crush injury, wounds, sprains, strains Multiple injuries |
v. The number of hours worked. |
45,585,264 |
Bancolombia | |
Indicator 403-10 |
Response 2023 |
a. Female Employees: | |
i. The number of deaths resulting from an occupational disease or illness. |
0 |
ii. Number of cases of recordable occupational diseases and illnesses. |
11 |
iii. Main types of occupational diseases and illnesses. |
Carpal Tunnel Syndrome, Epicondylitis |
b. Male Employees: | |
i. The number of deaths resulting from an occupational disease or illness. |
0 |
ii. Number of cases of recordable occupational diseases and illnesses. |
13 |
iii. Main types of occupational diseases and illnesses. |
Carpal Tunnel Syndrome, Anxiety Disorders |
Banistmo | |
Indicator 403-9 |
Response 2023 |
a. Female Employees: | |
200
i. The number of deaths resulting from a work related injury. |
0 |
i. The rate of deaths resulting from a work related injury. |
0 |
ii. Number of workplace injuries with major consequences (fatalities not included). |
0 |
ii. Rate of workplace injuries with major consequences (not including deaths). |
0 |
iii. Number of recordable workplace injuries. |
2 |
iii. Rate of recordable workplace injuries. |
0.12 |
iv. Main types of workplace injuries. |
Fracture, sprain |
v. The number of hours worked. |
3,276,166,027 |
b. Male Employees: | |
i. The number of deaths resulting from a work related injury. |
0 |
i. The rate of deaths resulting from a work related injury. |
0 |
ii. Number of workplace injuries with major consequences (fatalities not included). |
0 |
ii. Rate of workplace injuries with major consequences (not including deaths). |
0 |
iii. Number of recordable workplace injuries. |
3 |
iii. Rate of recordable workplace injuries. |
0.32 |
iv. Most frequent types of workplace injuries. |
Sprain, Trauma, Bruise |
v. The number of hours worked. |
1,865,976,585 |
Banistmo | |
Indicator 403-10 |
Response 2023 |
a. Female Employees: | |
i. The number of deaths resulting from an occupational disease or illness. |
0 |
ii. Number of cases of recordable occupational diseases and illnesses. |
0 |
iii. Main types of occupational diseases and illnesses. |
N/A |
201
b. Male Employees: | |
i. The number of deaths resulting from an occupational disease or illness. |
0 |
ii. Number of cases of recordable occupational diseases and illnesses. |
0 |
iii. Main types of occupational diseases and illnesses. |
N/A |
Banco Agromercantil de Guatemala (BAM) | |
Indicator 403-9 |
Response 2023 |
a. Female Employees: | |
i. The number of deaths resulting from a work related injury. |
0 |
i. The rate of deaths resulting from a work related injury. |
0 |
ii. Number of workplace injuries with major consequences (fatalities not included). |
0 |
ii. Rate of workplace injuries with major consequences (not including deaths). |
0 |
iii. Number of recordable workplace injuries. |
1 |
iii. Rate of recordable workplace injuries. |
0.06 |
iv. Main types of workplace injuries. |
Slight cut |
v. The number of hours worked. |
3,385,280 |
b. Male Employees: | |
i. The number of deaths resulting from a work related injury. |
0 |
i. The rate of deaths resulting from a work related injury. |
0 |
ii. Number of workplace injuries with major consequences (fatalities not included). |
0 |
ii. Rate of workplace injuries with major consequences (not including deaths). |
0 |
iii. Number of recordable workplace injuries. |
0 |
iii. Rate of recordable workplace injuries. |
0 |
202
iv. Most frequent types of workplace injuries. |
N/A |
v. The number of hours worked. |
3,198,016 |
c. Suppliers | |
i. The number of deaths resulting from a work related injury. |
0 |
i. The rate of deaths resulting from a work related injury. |
0 |
ii. Number of workplace injuries with major consequences (fatalities not included). |
0 |
ii. Rate of workplace injuries with major consequences (not including deaths). |
0 |
iii. Number of recordable workplace injuries. |
1 |
iii. Rate of recordable workplace injuries. |
0.15 |
iv. Most frequent types of workplace injuries. |
Sprain |
v. The number of hours worked. |
1,335,890 |
Banco Agromercantil de Guatemala (BAM) | |
Indicator 403-10 |
Response 2023 |
a. Female Employees: | |
i. The number of deaths resulting from an occupational disease or illness. |
0 |
ii. Number of cases of recordable occupational diseases and illnesses. |
0 |
iii. Main types of occupational diseases and illnesses. |
N/A |
b. Male Employees: | |
i. The number of deaths resulting from an occupational disease or illness. |
0 |
ii. Number of cases of recordable occupational diseases and illnesses. |
0 |
iii. Main types of occupational diseases and illnesses. |
N/A |
Banco Agrícola | |
Indicator 403-9 |
Response 2023 |
a. Female Employees: | |
203
i. The number of deaths resulting from a work related injury. |
0 |
i. The rate of deaths resulting from a work related injury. |
0 |
ii. Number of workplace injuries with major consequences (fatalities not included). |
2 |
ii. Rate of workplace injuries with major consequences (not including deaths). |
0.14 |
iii. Number of recordable workplace injuries. |
2 |
iii. Rate of recordable workplace injuries. |
0.14 |
iv. Main types of workplace injuries. |
Trauma |
v. The number of hours worked. |
2,773,632 |
b. Male Employees: | |
i. The number of deaths resulting from a work related injury. |
0 |
i. The rate of deaths resulting from a work related injury. |
0 |
ii. Number of workplace injuries with major consequences (fatalities not included). |
1 |
ii. Rate of workplace injuries with major consequences (not including deaths). |
0.08 |
iii. Number of recordable workplace injuries. |
1 |
iii. Rate of recordable workplace injuries. |
0.08 |
iv. Most frequent types of workplace injuries. |
Trauma |
v. The number of hours worked. |
2,479,864 |
Banco Agrícola | |
Indicator 403-10 |
Response 2023 |
a. Female Employees: | |
i. Number of deaths resulting from an occupational disease or illness. |
0 |
ii. Number of cases of recordable occupational diseases and illnesses. |
0 |
iii. Main types of occupational diseases and illnesses. |
N/A |
204
b. Male Employees: | |
i. Number of deaths resulting from an occupational disease or illness. |
0 |
ii. Number of cases of recordable occupational diseases and illnesses. |
0 |
iii. Main types of occupational diseases and illnesses. |
N/A |
Work-related hazards at the corporate level that pose a risk of injury due to workplace accidents with significant consequences are outlined below:
Corporate | |
Indicator 403-9 |
Response 2023 |
c. Work-related hazards posing a risk of injury due to workplace accidents with significant consequences, indicating: | |
i. How these hazards are determined. |
Through analysis and investigation conducted via the risk and hazard matrix of each subsidiary. |
ii. Which of these hazards have caused or contributed to causing workplace injuries with significant consequences during the reporting period. |
The main hazards of each subsidiary are listed: Bancolombia: •Falls of persons •Steps, bumps, or blows •Exposure or contact with harmful substances, radiation, or splashes BAM: •Falls of persons Banco Agrícola (Salvador Work accidents base 2023 - Risk) •Falls of persons •Bumps Banistmo •Falls of persons Bancolombia Panamá •No reported events Bancolombia Puerto Rico •No reported events |
iii. Measures taken or planned to eliminate such hazards and minimize risks through the control hierarchy. |
Administrative controls: demarcation, reinforcement of good practices, generation of standards and injuries learned. |
d. Whether the rates have been calculated per 200,000 or per 1,000,000 hours worked. |
200,000 |
205
e. Whether any workers have been excluded from this Content, including the type of worker and the reason for exclusion. |
All subsidiaries are taken into account except Bancolombia Puerto Rico, since it does not have a risk and hazard measurement system. |
f. Any contextual information necessary to understand how the data has been collected, as well as any standards, methodologies or assumptions used. |
Through the capture of employee reports to the Bank and the respective reports of each subsidiary where the information on alleged occupational accidents is recorded and the respective management is carried out. This information is used to generate the different risk prevention and control actions, as well as to monitor the health of the people affected. |
Corporate | |
Indicator 403-10 |
Response 2023 |
c. Work-related hazards posing a risk of illness and disease, including: | |
i. How these hazards have been determined; |
Through analysis and investigation conducted via the risk and hazard matrix of each subsidiary. |
ii. Which of these hazards have caused or contributed to occupational illnesses and diseases during the reporting period; |
o
Dynamic load
o
Prolonged postures
o
Maintained postures
|
iii. Measures taken or planned to eliminate these hazards and minimize risks through the hierarchy of control. |
Administrative Controls: such as marking, reinforcement of best practices, standards generation, and Lessons Learned. The respective follow-up is carried out for each reported illness. |
d. If there are workers excluded from this content, including those who have |
This criterion is disclosed for Bancolombia and Banco Agrícola |
e. Any necessary contextual information to understand how the data has been collected, such as standards, methodologies, or assumptions used. |
Through the collection of employee reports to the bank and the respective reports of each subsidiary where information on occupational diseases is recorded, and the respective management is carried out, with this information, different prevention and control actions of the risks are generated, as well as follow-up on the health of the affected individuals. |
206
For more information on the figures presented in the previous report, please click on the following link where you will find policy guidelines, demographics, benefits, employee metrics, among other relevant topics:
https://www.grupobancolombia.com/sostenibilidad/enfoque-sostenible/banco-incluyente
A la Mano: A La Mano is a Bancolombia digital platform that, through an app that does not consume cellular data, offers different financial services. It allows customers to create a 100% digital account from which they can make payments, transfers, recharges, receive remittances and even credit.
ADR: American Depositary Shares, or the bank's securities listed on the New York Stock Exchange. An ADR represents four preferred shares.
Asset Management: portfolio management.
ESG: Environmental, Social and Corporate Governance.
ESRA: Environmental and Social Risk Analysis.
ATM: Automated Teller Machine.
BAM: Banco Agromercantil de Guatemala S.A.
IDB: Inter-American Development Bank.
CDT: Certificate of Time Deposit, by its Spanish acronym.
NSFR: Net Stable Funding Ratio, an indicator of the Superintendency of Finance to limit dependence on unstable sources of financing.
COLCAP: benchmark index of the Colombian Stock Exchange.
COP: Colombian pesos.
Dian: Directorate of National Taxes and Customs, Colombia's tax authority.
DJSI: Dow Jones Sustainability Index.
TD: Average interest rate paid by financial entities for 90-day deposits.
Circular economy: Model that allows a better and more efficient use of materials, based on redesigning, rethinking, reducing, reusing, repairing and recycling, thus reducing the waste of resources.
Ecosystems: Model in which different stakeholders come together to solve people's comprehensive needs, of which financial services are only a part.
ETF: Exchanged-Traded Fund, a group of assets traded on the stock exchange.
PEF: Private equity funds, vehicles for investing capital in unlisted public companies.
Finagro: Fund for the financing of the agricultural sector, a mixed economy company that acts as a development bank for the agricultural sector.
GRI: Global Reporting Initiative, a standard for sustainability reporting.
207
GFANZ: Glasgow Financial Alliance for Net Zero, a group of financial institutions from around the world committed to mobilizing more resources towards the decarbonization of the economy.
IFC: International Finance Corporation.
Order of Payment: A credit modality in which the borrower authorizes deduction from their salary or pension for the installment amount.
Mi Casa Ya: subsidy program for the purchase of new low-income housing.
Nequi: financial platform that accompanies users in their daily lives with financial and non-financial services from third parties. As a 100% digital solution, Nequi complements its offer with functionalities that go beyond savings and money management.
NYSE: New York Stock Exchange.
SDGs: Sustainable Development Goals
Pivots: large and medium-sized companies in the agroindustrial sector from which we approach small businesses within their productive chains, the essence of the Productive Linkages strategy.
Plink: Bancolombia's data analysis tool with which businesses can obtain key information to design strategies aimed at increasing their sales.
SAC: Financial Consumer Service System.
SASB: Sustainability Accounting Standards Board.
SARLAFT: Anti-Money Laundering and Anti-Terrorist Financing Risk Management System, by its Spanish acronym.
SFC: Financial Superintendence of Colombia, financial supervisor and regulator.
SMMLV: Current Legal Minimum Monthly Wage, by its Spanish acronym.
TRM: Representative Market Rate, price of the dollar in the Colombian market, which varies daily, by its Spanish acronym.
Tu360: A Bancolombia Group platform that seeks to connect supply and demand for mobility, real estate, business and shopping solutions, and also provides users with financing.
USD: United States dollars.
RVU: Real Value Units, an indicator related to the behavior of inflation that is used to calculate the cost of certain housing loans.
4G Roads: Concession program for the construction and operation of highways in Colombia.
VIS: Social Interest Housing, houses and/or apartments with a maximum value of 150 minimum monthly wages.
Wompi: A Bancolombia Group company that provides payment gateway services to individuals, small and large companies to offer their customers a wide range of payment alternatives for the sale of their products.
208
| III. | DISCLOSURE OF INFORMATION ON SOCIAL AND ENVIRONMENTAL ISSUES, INCLUDING THOSE RELATED TO CLIMATE CHANGE |
Full Task Force For Climate Related Financial Disclosures (TCFD) Report
| 1. | Corporate Governance of Climate Change |
Governance Model for Environmental, Social and Governance Aspects - Corporate ESG4
We acknowledge that we have a fundamental role as a socio-environmental actor and the capacity to engage various stakeholders around sustainability issues to propose solutions and mobilize the necessary actions, generating a positive impact in the countries where we operate. This commitment is articulated through a governance model within the Bancolombia Group that ensures the adoption and compliance of decisions regarding Sustainability, materializing our purpose of promoting sustainable development for the well-being for all.
ESG Corporate Governance Structure:
The following are the instances of ESG decision-making and management carried out during 2023:

Board of
Directors

Risk Committee
Audit Committee
Good Governance Committee

Sustainability Committee
Executive Committee
Decision-making agencies
Agencies and Corporate Scope Responsibilities
Agency |
Management during 2023 |
Sessions executed in 2023 |
4 The construction and collection of ESG information reported in this chapter has undergone a process of assurance and reliability within the Bank during 2023, with a scheme that seeks to establish an additional control over the accuracy of the information disclosed here. Therefore, information that did not undergo such assurance process is not included in this report.
209
Board of Directors |
●
Defined the organization's priorities and general guidelines for ESG strategies and policies.
●
Reviewed the ESG strategy and long-term objectives of the organization
|
1 |
|
Good Governance Committee |
●
Approved the ESG strategy following the guidelines of the Board of Directors.
●
Followed up on compliance with the ESG strategy.
●
Gave recommendations on ESG disclosures.
|
2 |
Risk Committee |
●
Reviewed, in advance, the ESG risk policies and methodologies submitted for consideration and approval by the Board of Directors.
|
2 |
Audit Committee |
●
Monitored the implementation plan of Circular 031 of the SFC on disclosure of social and environmental matters, including climate-related issues.
●
Learned about identified ESG gaps and action plans to close them.
|
2 |
Sustainability Committee |
●
Monitored the implementation of and compliance with the ESG strategy.
●
Led the implementation of the ESG operating model, monitoring industry best practices.
|
2 |
In addition to the various sessions held in the senior management committees, each Vice Presidency of the Bank has been assigned roles and responsibilities to deploy our sustainability strategy. This assignment of roles refers to the expected participation of each area, whether leading, supporting, providing training, or observing actions for the execution of the defined strategy.
Corporate Policies Related to Climate Change5
As part of our guidelines on climate change, we have the following policies:
ESG Risk Policy
Our ESG risk policy consolidates governance frameworks, scope, guidelines, responsibilities, and control schemes regarding:
| ● | Environmental and Social Risk Analysis: It aims to carry out our commitment to responsible and sustainable financing within credit and leasing operations by assessing the socio-environmental risks and impacts that may materialize and prevent their impact on credit. It verifies compliance with the Equator Principles, IFC Performance Standards, as well as compliance with current national environmental regulations. |
| ● | Controversial Business Topics: It stablishes activities that will not be financed and financing or investment conditions for sectors with a high environmental and social impact. It applies to financing and investment operations in all segments of Bancolombia's business lines. |
| ● | Critical Climate Change Industries: It provides credit risk management guidelines for industries with a high climate impact, especially supporting the transition to a low-carbon economy for sectors such as cement, energy, steel, transportation, and livestock, aiming to minimize exposure by 2030 in coal production and marketing sectors and the complete elimination of coal-based energy generation by no later than 2040. |
5 Our policies are available on our website at: https://www.grupobancolombia.com/sostenibilidad/enfoque-sostenible/modelo/politica-sostenibilidad Its objective is to identify and manage risks and opportunities related to climate change, allowing us to develop the necessary actions to align the business strategy with the goals established by the United Nations Framework Convention on Climate Change (UNFCCC), particularly the Paris Agreement.
210
Climate Change Policy in Financing and Investment
This policy covers our entire operation in the countries where we are present, focusing on economic sectors most vulnerable to climate change and those with the highest impact in terms of greenhouse gas emissions (GHG).
Sustainable Procurement Policy
This is a key tool for implementing and developing sustainability in Bancolombia's supply chain. Particularly, our sustainable procurement policy defines the following objectives:
| ● | Mitigate Climate Change through responsible consumption, with products and services that generate a lower carbon footprint. |
| ● | Promote climate change and circular economy strategies in our Supply Chain. |
| ● | Responsible Investment Policy |
This includes the integration of ESG criteria into investment decision-making. As part of the environmental analysis of issuers and their respective engagement, segmented analyses involving the guidelines of our sensitive industries policy are incorporated. Likewise, proxy voting policy includes voting criteria focused on environmental management and climate change.
Impact of Climate Change Management on the Variable Compensation Model
Climate-related risk management is part of the variable compensation model for the Senior Management Team of Bancolombia Group, namely, the President (CEO) and Corporate Vice Presidents.
This scheme defines short and long-term variable remuneration incentives, which include climate change goals and indicators.
| a) | In the long term, participation in Dow Jones Sustainability Index is included as an indicator, for which the evaluation includes decarbonization strategy through metrics such as: |
| ● | Definition of Net-Zero targets for financed emissions |
| ● | Emission intensity of financing and investment portfolios |
| ● | Corporate policies for the coal sector |
| ● | Corporate policies for unconventional hydrocarbons |
| b) | The short-term scheme establishes strategic financing and performance indicators: |
| ● | Disbursements for activities that contribute to the decarbonization goals of our corporate purpose: Renewable energy, technological conversion, low-emission mobility, sustainable construction, sustainable livestock, among others. |
| ● | Climate commitment: Targets for reducing financed emissions (Scope 3), emissions avoided thanks to financing, reduction of operational emissions (Scopes 1, 2, and 3). |
| 2. | Climate Change Strategy |
211
In our strategy, we aim to contribute to the development of the territories where we operate by bringing together actors and sectors with a range of products and services, enabling our customers and partners to become increasingly sustainable and positively impact their communities.
We were once again invited to participate in the Dow Jones Sustainability Index evaluation, which has been in the market for over 20 years, and to which we have been contributing since 2012. In 2023, we remained among the 27 banks worldwide included in the Dow Jones Sustainability Index.
In the assessment of our decarbonization strategy by the Dow Jones Sustainability Index, our rating improved compared to the previous year, maintaining our position in the top quartile globally. We continue to advance our interest in having a management model that encompasses international best practices: better disclosure of our goals (short-term, medium-term, Net-zero), disclosing the sectoral composition in our assets under management, deadlines, and other aspects related to our policies for excluding coal and unconventional oil and gas resources.
We base our sustainability strategy on the best national and international standards. To achieve this, we have an international agenda of protocols and voluntary commitments that allow us to align with global best practices, make commitments, and disclose results to our stakeholders and the international community.
Additionally, as part of our climate change performance, we have relied on the Carbon Disclosure Project (CDP) as a valuable tool to measure our management. For the year 2023, our result was B.
Internal and External Actions:
Our strategy aligns with our goal of achieving a net-zero emissions portfolio by 2050 and aligning our financing and investment portfolios with a 1.5°C climate scenario.
Internal Actions
Standards and memberships: We actively participate in international initiatives to stay at the forefront of material aspects and to be leaders in our industry. More information is available on page 167 of our Management Report.
Climate change governance: It integrates the strategy, identification, and assessment of risks, definition of corporate policies for credit and investment guiding actions, pricing definition, appetite, and exposure, as well as the development of new financial and non-financial products.
Legislation and regulatory compliance: We comply with regulatory requirements on climate disclosure in the geographies where we operate6.
| ● | External Actions |
| a) | Vulnerable sectors: We identify the sectors most vulnerable to the impacts of climate change and design products and services aimed at adaptation and increasing resilience. |
| b) | High-impact sectors: We implement differential financing actions to promote the transition of emission-intensive industries, define sectors for exclusion and |
6 Disclosure under the TCFD standard follows the rules of the Financial Superintendence of Colombia.
212
| divestment, set limits and attention thresholds, and accompany our customers with knowledge for the definition and implementation of their own climate change strategies, guided by national commitments and the international climate agenda for the development of an orderly and fair transition. |
Strategic Levers
Our actions are based on five strategic levers in relevant action fronts for our customers:
| a) | Providing information and advice: We provide updated information to our customers on international climate agenda developments, accompany them in measuring their emissions and defining alternatives for decarbonizing their operations and value chains. |
Engagement strategy outcome with customers:
During 2023, we continued to develop the climate engagement process with 25 corporate customers relevant to our financed emissions, in sectors such as Oil and Gas, cement, food, agriculture, manufacturing, construction, validating the information of their emission inventory, their reduction targets, and alignment with science-based goals or 1.5°C scenarios, the assessment of physical and transition risks, and their needs for transition support.
Out of these 25 customers, 22 have measured their corporate emission inventories, 5 have science-based or 1.5°C-aligned goals, and 12 are in the process of defining them or improving their measurement processes to make this definition.
Science-based goals
8 No
5 Yes
12 are considering it
Measure emissions
3 No
22 Yes
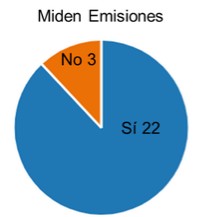
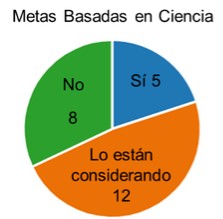
Additionally, 18 of these 25 customers have already initiated some process of assessment and management of physical climate risk.
During 2024, we will monitor the engagements undertaken and initiate new engagements with other relevant customers for the calculation of financed emissions.
Additionally, we conducted visits to 9 customers in the coal sector, producers of thermal coal, metallurgical, and coke, as a first step in the just transition process for this sector, in which we have declared a commitment to a progressive elimination of financing.
213
| c) | Climate resilience: We incorporate adaptation activities and nature-based solutions into our taxonomy for sustainable financing. Through La Cuenta del Mar, in 2023, we sponsored activities for the conservation of mangrove areas in Colombia and El Salvador, the conservation of the Panama Canal watershed, and the conservation of sea turtles in Guatemala. Additionally, we commit to financing sustainable blue economy projects for COP 1 trillion by 2030. |
| d) | Reduction of financed emissions: |
With sustainable financing, we reaffirm the commitment to incorporate ESG variables into the offer we provide to our customers from all areas. Thus, we support them to make sustainable investments such as technological conversion, projects that generate environmental benefits, and resource optimization (less water, energy, and fuel consumption, or that generate less waste), and to establish challenging sustainability objectives.
Definition of sensitive climate change industries and exposure at the end of the reporting year
Sector |
Exposure of the 2023 portfolio* |
Coal mining |
0.02% |
Other mining |
0.24% |
Coal-based electricity |
0.36% |
Electricity from other sources |
4.97% |
Cement |
0.34% |
Oil and gas |
1.14% |
Steel |
0.14% |
Livestock |
0.36% |
Transport |
2.47% |
*Measured as the proportion of the commercial portfolio capital balance by sector with respect to the total credit portfolio balance of Bancolombia S.A.
| e) | Financing sustainable value chains |
Our green financing includes providers of sustainable technologies that contribute to the transition, as well as different actors in the supply chains. For example, for sustainable mobility, we developed a special factoring product for vehicle brands and dealerships that provides special benefits for financing in this link of the chain.
For details on the ESG financing achieved in 2023, see the SUSTAINABLE FINANCING (GRI FS8) section of the Well-Being For All chapter.
| 3. | Climate Risk Management |
214
At Bancolombia, we remain committed to managing ESG risks, including those related to climate. True to our strategy, we continue working to strengthen our risk management system in environmental and social aspects that support our sustainability purpose.
We have designed various tools to assist us in ESG analyses of our customer operations, investment portfolios, and the bank's own physical facilities. This includes implementing the ESG Risk Policy and evaluating the physical risks associated with our facilities and those that may affect our customers.
Moreover, in asset and wealth management areas, we have developed specific tools to enhance our practices. These initiatives encompass policies aligned with the Principles for Responsible Investment (PRI), identification and measurement of sectors highly sensitive to climate risk, continuous research on best practices, and the promotion of impact investments.


Risk Management Framework

Identification
Measurement
Control
Monitoring
The description of the progress we have made in ESG risk management will be framed within the cycle: identification, measurement, control, and monitoring; stages that will describe the tools with which we have managed all stages of risk management, both in our credit portfolio and in our investment business and facilities.
Identification
We complement our risk management system with the construction of the Risk Map, presented annually in the bank's management report. In this map, we consolidate relevant information that complements the management of traditional risks with information on emerging risks. This map is nourished by a compilation of trends and the knowledge of various experts analyzing future challenges for the organization regarding risks.
This process is carried out annually to keep the evaluation updated and adjust our strategy with the most significant risks. The results consistently highlight the relevance of climate change as a key risk since 2021.
The results of the Risk Map drive strategic planning, proactively integrating climate change with traditional risks. This approach strengthens our climate resilience and prepares us for opportunities in a changing business environment.
215
Climate change risks are classified into two categories: physical risks and transition risks. Physical risk is the possibility of our organization incurring losses due to the materialization of climate threats. On the other hand, transition risks are related to losses derived from transitioning to a low-carbon economy, which may involve changes in regulation, technology, and the market, necessitating adaptation and mitigation measures.
Measurement
We measure climate risks through scenario generation, analysis of climate threats, and incorporation of their aspects into traditional financial risks to leverage their management in the organization.
In order to direct our efforts to sectors most impacted by climate change, we have developed a methodology to determine which sectors to begin analyzing physical and transition risks. This process is based on guidelines provided by UNEP-FI, allowing us to evaluate both risks comprehensively and aligned with international best practices.
The following chart illustrates the sectors and their exposure for climate risk analysis.
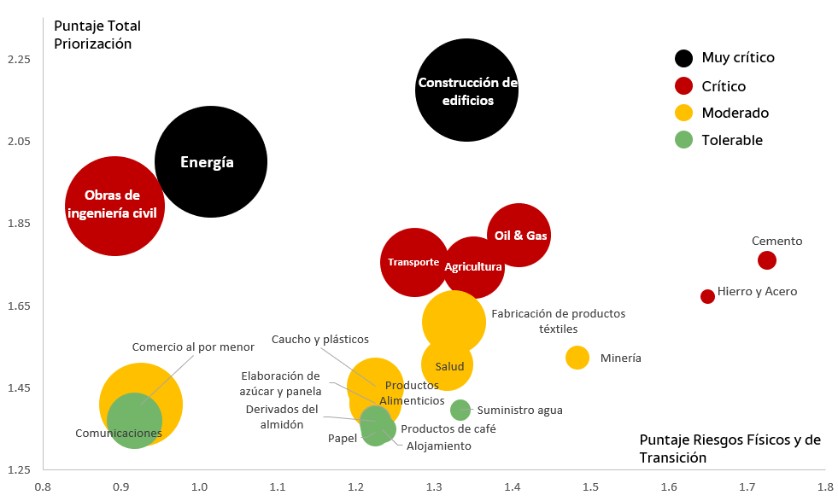
Total Prioritization Score
Construction of buildings
Energy
Civil engineering works
Oil & Gas
Agriculture Transport
Textile product manufacturing
Retail trade
Rubber and plastics
Sugar and panela processing
Starch derivatives
Mining
Communications
Paper
Health
Food Products
Coffee products
Accommodation
Water supply
Cement
Iron and steel
Physical and Transition Risks Score


Very critical
Critical
Moderate
Tolerable
Source: Author’s own research 7
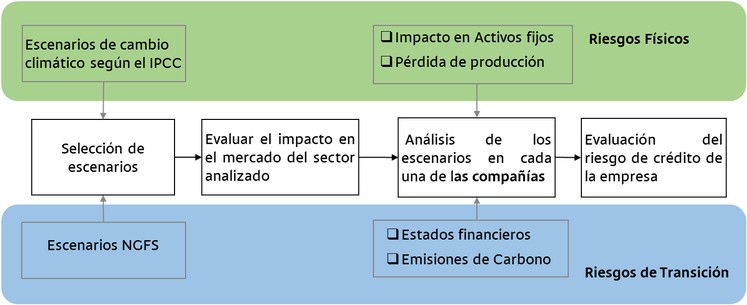
Climate Change Scenarios according to the IPCC
| ● | Impact on fixed assets |
| ● | Loss of production |
Physical risks
Scenario selection
Assessing the impact on the market of the analyzed sector
Scenario analysis in each of the companies
Evaluation of the company's credit risk
NGFS scenarios
| ● | Financial statements |
| ● | Carbon emissions |
Transition risks
7 In this graph, the X-axis represents the score obtained for physical and transition risks. The Y-axis represents the total score, which includes the result for both climate risks and a score according to the credit exposure of the sector in the bank. The size of the circle determines the weight of participation in the sector's exposure in relation to its risk category.
216
Evaluation of Climate Risks
Our methodology for climate risk analysis independently measures the impact of physical risks and transition risks on the financial statements of our customers to assess the individual impact of each of these factors on key variables influencing credit risk.
Regarding physical risks, climate hazards are projected using representative pathways of greenhouse gas concentrations proposed by the Intergovernmental Panel on Climate Change (IPCC). These scenarios are used to project different climate threats and evaluate the loss of asset value and/or production losses due to the materialization of any of these hazards.
We have progressed in defining an automatic model that allows us to evaluate the financial impacts of physical risks on customers more efficiently. During 2023, we analyzed the threats of cyclones, floods, forest fires and increased precipitation in which we were able to evaluate 28.42% of customers and 63.74% of the exposure of the SME, Business, Corporate and Construction segments8.
To evaluate transition risks, we use scenarios suggested by the Network for Greening the Financial System (NGFS9) embraced by the Bank, which describe the projection of carbon prices under different scenarios of measures adoption necessary to mitigate climate change. These scenarios entail increased expenses and/or decreased income due to transitioning to a low-carbon economy.
The following chart provides a general overview of the evaluation models for physical risks and transition risks:
We continue to advance in achieving a higher level of maturity in the methodologies applied for risk management to facilitate advice and support to our customers in their transition to a low-carbon economy.
Environmental and Social Risk Analysis - ESRA
The purpose of the Environmental and Social Risk Analysis (ESRA) is to ensure responsible and sustainable financing within credit and leasing operations, through the assessment of socio-environmental risks and impacts that may materialize, thus preventing their repercussion on credit affectation.
Since 2010, the ESRA process has been implemented at Bancolombia and is incorporated into the business units of Corporate Banking, Business Banking, SME Banking, Investment
8 The reported data on the progress of the physical risk methodology was calculated with information as of November 2023.
9 For more details on the scenarios proposed by NGFS visit the link: NGFS Scenarios Portal Banking, and leasing operations.
217
Additionally, environmental risk studies are conducted for properties offered as collateral or as payment in kind.
In 2023, an intervention was carried out in the environmental and social risk analysis process, aiming for efficiency, control, and quality. The results of the portfolio evaluated through the ESRA process in Colombia total COP 11,000,000 million distributed across 99 operations. The infrastructure and energy sectors concentrated the highest number of operations and assessed exposure.
ESG Portfolio Metrics
In ESG Risk Management for the Asset Management business, we have established various metrics, such as the Internal ESG Issuer Rating Model, Quota Granting Model, Identification and Measurement of Sensitive Industries, applied to portfolios that have adopted ESG criteria.
For granting quotas in portfolios, we use the ESG Rating of the issuer under internal methodology or MSCI, or MSCI Industrial Intensity Methodology, to filter and segment against the issuer.
Last year, a marking was developed that will allow us to identify, starting its implementation in 2024, that ESG portfolios are not intensive in Climate Change Sensitive Industries. These industries are differentiated from others by allocating Economic Activities (ISIC) and/or Global Industry Classification Standards (GICS) of the issuers defined in the "ESG Risk Notice".
Physical Risks in Own Facilities
To ensure the continuity of the services we offer, we have conducted an evaluation of the physical risks affecting our own facilities, including branches, ATMs, and buildings. This analysis focuses on understanding the accumulated vulnerability to various hazards and natural disasters, considering factors such as geographic location and exposure to climate vulnerabilities.
Floods
Strong winds
Heavy rainfall
Earthquakes
Volcano eruptions
Hurricanes
Lightning strikes
Landslides
Forest fires
Drought
Hazards
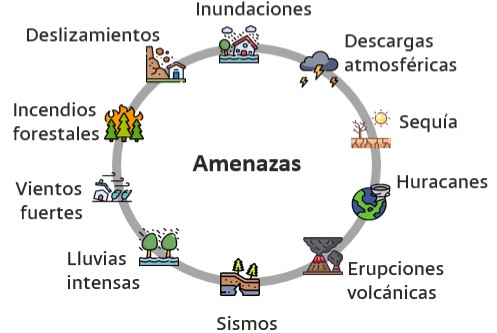
Source: Author’s own research
By understanding the joint vulnerability of our facilities to these climate threats, we strengthen our capacity to implement mitigation and adaptation strategies that preserve Bancolombia's operational continuity.
218
The result of this evaluation highlights the most critical locations, emphasizing the need to execute mitigation plans promptly.
Control
Bancolombia Group's ESG Risk Notice provides guidelines for treating sectors with high incidence of climate change, focusing on customers and investment portfolios.
In the area of customers, the ESRA chapter establishes minimum guidelines for carrying out the process, empowering analysts to request covenants and rigorously monitor those customers with deficiencies in socio-environmental management.
Additionally, supported by the chapter on industries sensitive to climate change, we monitor the commercial portfolio, as defined in the strategy section of this document.
For investment portfolios, Bancolombia employs various tools to monitor sensitive industries, compliance with minimum ESG by issuer, and ESG metrics per portfolio.
Regarding physical facilities, there are action plans that address the particular needs of each of the hazards and natural disasters described above, which include the following:
| ● | Emergency support equipment, such as electrical plants and water tanks |
| ● | Stand-alone backup equipment |
| ● | Installation of specialized equipment for evacuation. |
| ● | Detection systems |
| ● | Extinguishing system |
| ● | Fire protection nets |
| ● | Among others. |
Monitoring
In the monitoring process, at Bancolombia, we provide comprehensive support to both customers and issuers, conducting regular reviews of the Bank's own facilities to improve ESG and Climate Risk management.
For customers, this monitoring covers crucial aspects such as decarbonization goals, climate change analysis, and associated risk management. This advice extends to the teamwork we do with our customers to effectively address challenges and opportunities related to climate change, facilitating a transition to a low-carbon economy and resilience to climate hazards.
For issuers, the engagement process has created an enabling space for the exchange of knowledge and discussion of best practices in the implementation of ESG criteria, achieving significant improvement in public information disclosure, greater access to relevant data, and improved risk management. Additionally, this allows us to constantly monitor issuers that are increasing or decreasing their ESG Rating, directly affecting compliance with ESG portfolio limits policies and Bancolombia's ESG Asset Under Management (AUM) global target and the metrics of the position presented to Senior Management.
219
Likewise, the business continuity area in collaboration with the fixed assets area, monitor physical facilities, improving their environment and generating reports of possible events, in such a way that risks they may face are identified, assessed, and mitigated promptly.
Throughout 2024, we will persist in incorporating the impacts of climate change into the various business units of the Bank. Specifically, in the area of the commercial portfolio, we will advance in consolidating the objective model for physical risk assessment, whose approach has allowed us to transition from personalized customer analysis to mass scope. Additionally, we will initiate the development of the objective assessment model for transition risks, with the aim of achieving results comparable to those achieved for physical risks presented in the measurement section of this document.
| 4. | Metrics and Goals |
Purpose-driven Businesses
We have committed to financing COP 500,000,000 million by 2030 to mobilize our purpose of Promoting Sustainable Development for the Well-being for All. This equals twice the level of the organization's total assets, aimed at strengthening agriculture, SMEs, technological conversion, low-emission mobility, access to housing, financial inclusion, and female entrepreneurship. In 2023, we achieved disbursements of COP 37,900,000 million.
Climate Commitment
| ● | Disbursement and Compliance |
Our commitment is to disburse COP 40,000,000 million by 2030 for financing projects related to technological conversion, low-emission mobility, sustainable construction, renewable energy, and sustainable livestock.
|
Purpose-driven Businesses: Climate Commitment Goals and Compliance | |||
2023 Goal (COP Bn) |
2023 Disbursements (COP Bn) |
2023 Compliance |
|
4.07 |
5.51 |
135% |
|
Greenhouse Gas Emissions Inventory (GHG). Scope 1, 2, and 3, including category 15 emissions financed by the portfolio.
| ● | Our Direct Impact: |
Scope 1 and 2, scope 3 categories 1 and 6 (Bancolombia Group).
We commit to defining concrete actions to actively contribute to mitigation and compensation from our direct operation and move towards a low-carbon economy.
In 2020, we redefined our science-based targets for scopes 1 and 2, aligned with a 1.5°C scenario, aiming to reduce our direct emissions by 95% by 2030. The definition of this target was based on the science-based methodology (SBTi - Science Base Targets Initiative).
We achieved a 38% reduction in our Scope 1 + 2 emissions in 2023 compared to 2022, emitting 3,619.5 Ton CO2e/year, an 81% reduction compared to 2019.
220
Regarding scope 3 categories 1 and 6, we increased emissions by 3% compared to 2022, emitting 1,688 Ton CO2e/year, due to increased corporate travel. Compared to 2019, we achieved a 46% reduction.
For details on our management of scopes 1, 2, and 3 in categories other than category 15 of financed emissions (GRI 305), our goals and performance in eco-efficiency, please see the Eco-efficiency section, Chapter Maintaining Financial Stability, page 147 of our Management Report.
| ● | Scope 3, Category 15 |
Total commercial portfolio financed emissions10.
Year |
Financed Emissions - commercial credit portfolio MtCO2*. |
2022 |
4.0 |
*it includes Scope 1 and 2 for all sectors, and Scope 3 for the fossil fuel sectors (Mining, coal, oil and gas, petroleum derivatives).
The financed emissions have been calculated using the PCAF methodology for financial institutions for the commercial loan portfolio (Business Loans and Unlisted Equity). This result includes customers in the corporate, business and SME segments.
The calculation was based on the version of the PCAF emissions factors database updated as of September 2023, and information on emissions reported by customers publicly or obtained by Bancolombia through commercial management and the climate engagement process.
For this metric, we report the result for 2022, since a fundamental input for the calculation is the reporting of emissions by our customers, especially those that represent a higher percentage of our total financed emissions. As of the date of publication of this report, we only have disclosed emissions information for the year 2022, which is understandable as emissions reports for 2023 will be disclosed by our customers in the course of 2024.
Intensity of emissions for Cement and Energy sector loan portfolios.
In 2022, we defined emission intensity goals for our financing portfolios in the Cement and Energy sectors, aligned with a 1.5°C scenario, according to the Sectoral Decarbonization Approach methodology of SBTi.
Sector |
2022 Result |
2030 Goal |
Cement |
0.63 tCO2/t |
0.52 tCO2/t |
Energy - Commercial Portfolio |
0.09 tCO2/MWh |
0.06 tCO2/MWh |
Energy - Project Finance* |
Only renewable energy |
Only renewable energy |
10 The information corresponding to the financed emissions of the commercial portfolio reported herein corresponds to the 2022 emissions, due to the fact that the reports of our customers' emissions available to us, as of the date of presentation of this report, have a cutoff date of December 31, 2022.
221
* Since in the base year we only had renewable generation projects financed through Project Finance, a maintenance goal was defined according to SBTi guidelines, where we commit to continue financing only renewable projects under this mechanism.
Net Zero Banking Alliance
We have sectoral transition plans for the energy, cement, oil and gas sectors, and other sectors.
Sustainable Financing:
For details on ESG financing metrics and objectives, compliance with our purpose goals, and the results of the sustainable funding strategy, please SUSTAINABLE FINANCING (GRI FS8) and Sustainable Funding sections.
Responsible Investment
At Bancolombia Group, we are committed to implementing best practices in responsible investment and acknowledge that Environmental, Social, and Corporate Governance (ESG) criteria are fundamental to fulfilling our fiduciary duty.
We have adhered to the Principles for Responsible Investment and Net Zero Asset Managers initiative.
For details of our investment management aligned with our climate strategy, please refer to the Responsible Investing section of the Maintaining financial stability chapter.
The Sustainability Accounting Standards Board (SASB) disclosure standards identify sustainability-related risks and opportunities that may impact financial statements and provide guidance to companies across various industries on material topics for disclosure, aiding decision-making.
For Bancolombia, the SASB disclosure guidelines applicable to our businesses and disclosed in this report include: Commercial Banks, Mortgage Financing, Asset Management and Custody Activities, and Investment Banking and Brokerage.
We present the development of each of the four guidelines with disclosure of relevant ESG issues for operations in Colombia, as of the end of 202311:
| 1. | Commercial Banking |
Disclosure topic |
Accounting Parameter |
Code |
Response |
11 Work is underway on the development of new updates to the known guidelines during 2023, with implementation planned for January 2025. The current version corresponds to the 2018 version, developed in this report.
222
Data security |
(1) Number of data breaches, (2) percentage involving Personally Identifiable Information (PII), (3) number of affected account holders |
FN-CB-230a.1 |
In 2023, Bancolombia experienced no cybersecurity and information security incidents associated with data leakage. |
Description of the approach to identify and address data security risks |
FN-CB-230a.2 |
Within the Bancolombia Cybersecurity Governance, the Information Security Management System (ISMS) is implemented to manage the Organization's information security through policies, standards, baselines, methodologies, governance frameworks, and maturity models, subject to annual continuous improvement cycles and shared with employees and third parties having labor and commercial relationships with the Organization. Our processes adhere to international information security standards, in addition to the most relevant national and international regulations. The ISMS is managed through governance frameworks, maturity models, policies, standards, and the Cybersecurity Committee. More information is available in the Commitment to Cybersecurity section of our Management Report. |
|
|
Inclusion and Financial Capability Generation |
(1) Number and (2) amount of outstanding loans qualified for programs designed to promote small businesses and community development |
FN-CB-240a.1 |
The products included in this indicator are Crédito a la Manot and active microcredits as of the end of 2023. Number Amount (COP millions) 202,159 574,566 Information on Financial Inclusion is available in the Well-being for All chapter of our Management Report. The information related to this indicator in the Consolidated Financial Statements is available in NOTE 6. NET CUSTOMER LOAN PORTFOLIO. |
(1) Number and (2) amount of overdue and unproductive loans qualified for programs designed to promote small businesses and community development |
FN-CB-240a.2 |
The products included in this indicator correspond to Crédito a la Mano and microcredit. The reported information refers to credits with overdue periods exceeding 30 days as of the end of 2023. Number Amount (COP millions) 34,680 89,275 The information related to this indicator in the Consolidated Financial Statements is available in NOTE 6. NET CUSTOMER LOAN PORTFOLIO. |
|
Number of retail checking accounts provided at no cost to previously unbanked or underbanked customers |
FN-CB-240a.3 |
During the year, 1,133,758 no-cost accounts were generated. The number of active deposits at the end of 2023 was 6,364,050. The information reported in this indicator corresponds to deposits made through Bancolombia a la Mano. More information on this product is available in the Wellness for All chapter of our Management Report. |
|
|
Number of participants in financial education initiatives for |
FN-CB-240a.4 |
As of the date, the total number of participants covered by our financial education initiatives has not been fully identified. However, various initiatives for this concept have been |
223
unbanked, underbanked, or underserved customers |
developed during the year, which can be referenced in the Financial Education section of the chapter "Well-being for All" of our Management Report. |
||
|
Incorporation of environmental, social, and governance factors in credit analysis |
Commercial and industrial credit exposure, by sector |
FN-CB-410a.1 |
The information reported below corresponds to the 10 sectors with the highest exposure of commercial portfolio. The classification of the sectors is based on the ISIC code (International Standard Industrial Classification). Sector Credit exposure (COP millions) Electric power generation 8,157,761 Trusts, funds and similar financial entities 8,068,166 Construction of residential buildings 7,217,864 Construction of roads and railways 5,282,920 Executive activities of public administration 4,549,671 Retail trade 4,233,366 Other activities related to the stock market 3,945,735 Real estate activities carried out with own or leased property 2,680,251 Pipeline transportation 2,034,441 Wired telecommunications activities 1,775,630 Information related to the portfolio in the Consolidated Financial Statements is available in NOTE 6. NET CUSTOMER LOAN PORTFOLIO. |
Description of the approach to incorporate environmental, social, and corporate governance (ESG) factors in credit analysis |
FN-CB-410a.2 |
For the assessment of environmental and social risks, we apply the standards defined by the World Bank's Equator Principles and the International Finance Corporation's Performance Standards – IFC, through their Environmental, Health and Safety Guidelines for credit and leasing operations falling within the categories and amounts defined in our Environmental and Social Risk Analysis policy. Furthermore, Bancolombia adheres to Asobancaria's Green Protocol12, committing, among other things, the commitment to "consider in the credit and investment risk analysis; the environmental, social, and climate change impacts and costs generated in the activities and projects to be financed" (Asobancaria, 2022). Additionally, credit risk areas will determine the sectoral scope for socio-environmental studies of operations that, due to their characteristics, do not fall within the scope of the Equator Principles and IFC performance standards. Our Task Force for Climate Related Financial Disclosure (TCFD) report includes annual management of our Environmental and Social Risk Analysis report, available on page 227 of this report. |
|
|
Business Ethics |
Total amount of monetary losses resulting from legal proceedings related to fraud, insider trading, antitrust, unfair competition, market manipulation, malpractice, or other financial industry laws or regulations |
FN-CB-510a.1 |
Bancolombia reports no monetary losses resulting from litigation associated with unethical business conduct by the entity. Our business ethics and corporate governance practices can be found in the Our Corporate Governance Matters section of our Management Report. Bancolombia reports no monetary losses resulting from litigation associated with insider trading. Bancolombia reports no monetary losses resulting from litigation associated with violations of antitrust provisions. |
12 The Green Protocol is a voluntary inter-institutional agreement signed between the National Government and the Colombian financial sector. (Asobancaria, Protocol document, effective 2022-2027).
224
|
Bancolombia reports no monetary losses resulting from litigation associated with anti-competitive practices. Bancolombia reports no monetary losses as a result of litigation associated with market manipulation. Bancolombia reports monetary losses incurred in 2023 amounting to COP 3,083 million resulting from settlement agreements or jurisdictional decisions arising from the scope and interpretation of laws or contracts related to the financial industry and frauds affecting Bank customers. For more information on Bancolombia's material litigations and entities with which financial statements are consolidated, please refer to NOTE 21. PROVISIONS AND CONTINGENT LIABILITIES of the consolidated financial statements. |
|||
Description of policies and procedures for reporting irregularities |
FN-CB-510a.2 |
At Bancolombia Group, we have based all our actions on the development of ethical principles that are collected in our Code of Ethics and Conduct in coherence with our organizational culture and our principles of corporate governance. Our control environment includes an Ethics Committee with members of the Bank's senior management, an Ethics Line for reporting irregularities, our Code of Ethics and Conduct, as well as policies and complementary documents, such as anti-corruption and anti-fraud policies and tax policy. More information can be found in the Our Corporate Governance Matters section of our Management Report. From management, based on solid corporate values and ethical principles that include a zero-tolerance policy for fraud, we have a program aimed at managing internal fraud risk. This program is responsible for identification and management, reporting to the relevant committees to comply with our zero-tolerance policy for fraud. Regarding external fraud, these are identified through transactional monitoring using tools containing analytics, machine learning, and artificial intelligence. Additionally, frauds are identified through customer reports through the customer service hotlines. Fraud cases are managed by an expert team, which evaluates the events and determines necessary corrective actions. |
|
|
Systemic Risk Management |
Score in the evaluation of global systemically important bank (G-SIB), by category |
FN-CB-550a.1 |
Bancolombia is not currently part of the evaluation of global systemically important banks (G-SIB). |
Description of the approach to incorporate results of mandatory and voluntary stress tests in capital adequacy planning, long-term corporate strategy, and other business activities |
FN-CB-550a.2 |
In the design, implementation, and validation of stress tests, different internal areas participate, which develop forecasts according to their objectives and analyses. Both assumptions, methodologies, and results are reviewed and approved by the leaders of each management. Assumptions, methodologies and results are reviewed and approved by the leaders of each management. These reviews include meetings with the corresponding leaders, whose approval allows the presentation of stress tests to the Risk Committee and the Board of Directors. The Board of Directors and senior management have a high degree of participation, as they approve the performance of stress tests, provide instructions, |
225
|
observations, and make their respective evaluations of the results. In the event of a stress scenario materializing, the organization has mitigating actions that would begin according to financial planning and the conditions or triggers of the crisis to be faced: For each mitigating action, there is a clear and detailed process describing the protocols to be followed for their implementation. |
|||
Activity parameters |
(1) Number and (2) value of checking and savings accounts by segment: (a) personal and (b) small businesses |
FN-CB-000.A |
Savings and checking accounts, by segment, outstanding at the end of 2023: Personal SMEs Number 11,811,204 691,555 Amount (COP millions) 16,116,642 18,590,160 Information related to this indicator in the Consolidated Financial Statements is available in NOTE 15. CUSTOMER DEPOSITS. |
(1) Number and (2) value of loans by segment: (a) personal, (b) small businesses, and (c) corporate |
FN-CB-000.B |
Below is the information on active loans by segment at the end of 2023: Personal SMEs Corporate Number 11,252 125,094 5,561 Amount (COP millions) 474,365 12,084,210 56,781,330 The information related to this indicator in the Consolidated Financial Statements is available in NOTE 6. NET CUSTOMER LOAN PORTFOLIO. |
Topic |
Accounting Parameter |
Code |
Response |
|
Loan Practices |
(1) Number and (2) value of residential mortgages of the following types: (a) hybrid or option adjustable-rate mortgages (ARMs), (b) with prepayment penalties, (c) higher-rate mortgages, (d) total, with FICO scores above or below 660 |
FN-MF-270a.1 |
Considering that current Colombian legislation does not include these types of classifications for mortgage loans, we do not have available information with the required characteristics of the standard. Information related to mortgage portfolio in the Consolidated Financial Statements is available in NOTE 6. NET CUSTOMER LOAN PORTFOLIO. |
(1) Number and (2) value of (a) modifications to residential mortgages, (b) foreclosures, and (c) short sales or deed-in-lieu of foreclosure, according to FICO scores above or below 660 |
FN-MF-270a.2 |
Considering that current Colombian legislation does not include these types of classifications for mortgage loans, we do not have available information with the required characteristics of the standard. |
|
Total amount of monetary losses resulting from legal proceedings related to |
FN-MF-270a.3 |
Bancolombia does not report monetary losses resulting from litigation associated solely with |
226
communications to customers or loan originator compensation |
communications with customers or compensation of mortgage loan originators. However, in the ordinary course of business, Bancolombia incurred losses in litigation of COP 3,083 million due to settlement agreements or jurisdictional decisions derived from the scope and interpretation of laws or contracts related to the financial industry (see Business Ethics section report). This amount may include, among other things, litigation associated with mortgage loans. For more information on Bancolombia's material litigations and entities with which financial statements are consolidated, please refer to NOTE 21. PROVISIONS AND CONTINGENT LIABILITIES of the consolidated financial statements. |
||
|
Description of the remuneration structure of loan originators |
FN-MF-270.a.4 |
At Bancolombia Group, we understand that employees constitute the differentiating and determining factor in the sustainability of the business. Therefore, we have defined a compensation strategy that seeks the appropriate balance between monetary compensation and non-economic compensation, taking into account the employee in all their dimensions, needs, and motivations. This strategy consists of four pillars: ●Fixed compensation: Equivalent to the legal and extralegal monetary compensation that the organization provides to the employee for the provision of their service.
●Benefits: programs and services that contribute to human and social well-being and strengthen organizational culture.
●Emotional compensation: optimal living conditions, where work dynamics combine perfectly with the needs of employees.
●Variable compensation: bonuses paid to employees determined by organizational results and team performance. The variable compensation model for commercial teams also considers variables related to business growth and profitability, as well as those related to customer experience.
|
|
|
Discriminatory loan |
(1)Number, (2) value, and (3) weighted average
ratio of loan-to-value (LTV) of mortgages granted to (a) minority borrowers and (b) all other borrowers, according to FICO scores above or below 660 |
FN-MF-270b.1 |
Considering that current Colombian legislation does not include these types of classifications for mortgage loans, we do not have available information with the required characteristics of the standard. However, we support our customers in their goals of accessing decent housing. More information is available in our Well-being for All chapter of our Management Report. |
Total amount of monetary losses as a result of legal proceedings related to discriminatory mortgage loans |
FN-MF-270b.2 |
Bancolombia does not report monetary losses as a result of litigation associated with discriminatory mortgage loans. |
227
|
|
|||
|
Description of the policies and procedures to ensure nondiscriminatory mortgage origination |
FN-MF-270b.3 |
Within the framework of our equity, diversity, and inclusion policy, we seek to promote respect, value differences, and ensure that all people have access to the Bank's solutions equitably and without distinction. We have internal protocols for commercial teams to ensure the attention of customers with disabilities and sexually diverse customers, aiming for Bancolombia employees to relate with respect and empathy to any person, regardless of their condition, preferences, and tastes, contributing to an equitable environment and greater well-being opportunities for all. Our Mortgage and Home Leasing origination policies are aimed at correctly selecting credit subjects through objective variables that measure our customers' payment capacity and potential default risk. At no time do we include variables or policies that contain discriminatory elements to make our financing approval decisions. |
|
|
Environmental risk impact of mortgaged properties |
(1) Number and (2) value of mortgage loans in 100-year flood zones |
FN-MF-450a.1 |
Currently, we do not have available information in the conditions required by the standard; we are working towards its disclosure in upcoming reports. |
(1) Expected total loss and (2) loss given default (LGD) attributable to mortgage loan default and delinquency caused by climate-related natural disasters, by geographic region |
FN-MF-450a.2 |
Currently, we do not have available information in the conditions required by the standard; we are working towards its disclosure in upcoming reports. |
|
Description of how climate change and other environmental risks are incorporated into mortgage origination and underwriting |
FN-MF-450a.3 |
At Bancolombia Group, we establish different guidelines to comply with the guarantees and securities used as collateral for customers with credit obligations, including mortgages. With this, we seek compliance with the regulations associated with guarantees and ensure that the collateral is within the organization's defined appetite, including issues related to reputational risk and environmental risk, among others. Regarding the environmental management of the collateral, the following management is detailed: ●Assessment of guarantees: we have environmental guidelines to verify assets considering potential and permitted land use and the identification of possible environmental impacts, to establish asset management based on Colombian and international technical standards. Likewise, we seek to identify risks and classify them in the appraisal, against the activities and uses in the properties that could affect the environment and its sustainability, based on criteria of suitability, admissibility, and favorability of the properties. During 2023, new tools were incorporated to discriminate more accurately the areas affected by environmental risks and determine their impact on the total asset to facilitate decision-making in this type of property, and multi-temporal analyzes were carried out to identify components of assets
|
228
|
affected by floods, mass movements, fires, among others.
●We have a Notice on Environmental and Social Risk Analysis: for real estate and construction projects that have certain characteristics, such as location, type of impacted community, risk areas, among others, where environmental and social risk analysis is carried out to issue an environmental concept on the project.
|
|||
Activity parameters |
(1) Number and (2) value of mortgages opened by category: (a) residential and (b) commercial |
FN-MF-000.A |
The following is the number and value of mortgage loans originated during the year: Category Number Value (millions) Residential 36,678 4,154,306 Commercial 3,149 3,709,647 The residential portfolio corresponds to financing for the three categories of housing: acquisition, construction, and remodeling. The commercial portfolio refers to construction and non-residential housing, aimed at the construction and purchase of commercial properties. The information related to this indicator in the Consolidated Financial Statements is available in NOTE 6. NET CUSTOMER LOAN PORTFOLIO. |
(1) Number and (2) value of mortgages acquired by category: (a) residential and (b) commercial |
FN-MF-000.B |
Currently, the breakdown as required by the standard is not available; we are working on its disclosure in upcoming reports. |
Disclosure topic |
Accounting Parameter |
Code |
Response |
|
Transparent Information and Fair Advice for Customers |
(1) Number and (2) percentage of employees covered with a history of investigations related to investments, consumer claims, private civil litigation, or other regulatory proceedings |
FN-AC-270a.1 |
During 2023, there were no cases that led to the investigation of employees of the Vice-Presidency of Asset Management for events affecting the market and resulting in infringement. The information contained in this point corresponds to the number of Asset Management Vice Presidency employees with investigations for events that may affect the market during the reporting period. Consumer claims, private civil litigation, or other regulatory proceedings are not included. |
|
Total amount of monetary losses resulting from legal proceedings related to marketing and commercialization of the Company’s products and communication of information related to financial products to new and existing customers |
FN-AC-270a.2 |
Asset Management Bancolombia Group (Fiduciaria Bancolombia S.A. and Valores Bancolombia S.A.) does not report monetary losses resulting from litigation associated with marketing and communication of information related to financial products to new and existing customers. |
|
Description of the approach to inform customers about products and services. |
FN-AC-270a.3 |
|
229
|
The regulation applicable to the offering of securities market products in Colombia requires that customers receive advice from their securities market intermediaries. Consulting activity includes (i) investor classification and profiling, (ii) product classification and profiling, (iii) convenience analysis, (iv) provision of professional recommendations, (v) delivery of information, and (vi) rules applicable to product distribution. Therefore, our customers receive professional advice from their account managers, which is duly documented in verifiable media. Therefore, the offering of products is made in accordance with the convenience analysis between the customer's profile and the product profile, and materializes through a professional recommendation that also includes disclosures on risks, conflicts of interest, among others. |
|||
|
Diversity and inclusion among employees |
Percentage representation of genders and racial/ethnic groups in (1) executive management, (2) non-executive management, (3) professionals, and (4) all other employees |
FN-AC-330a.1 |
The percentage representation of gender for the Asset Management Vice Presidency is reported below. Currently, the percentage representation of racial/ethnic groups as indicated by the standard is not available. Position/Gender Female Male Executive Management 25% 75% Non-Executive Management 33% 67% Professionals 9% 91% Other Employees 0% 0% The reported information in different positions, according to internal classification, corresponds to: ●Executive Management: senior management positions
●Non-Executive Management: mid-level strategic positions
●Professionals: professional positions
●Other Employees: operational positions
We are working on building information on racial/ethnic group representation for disclosure in upcoming reports. |
|
Incorporation of Environmental,, Social, and Corporate Governance Factors into Investment Consulting and |
Amount of assets under management, by asset class, employing (1) integration of environmental, social, and corporate governance (ESG) issues, (2) thematic investing in sustainability investment, and (3) screening |
FN-AC-410a.1 |
Our responsible investment strategy has a combined approach that includes the integration of ESG criteria and screening in investment decision-making. Currently, we do not have a thematic investment strategy in our Asset Management portfolios. However, investments are made in assets such as green, social, and/or sustainable bonds. The value of Asset Management's assets under management (AUM) incorporating ESG criteria and screening is reported below: Asset Type AUM ESG (in millions) Fixed Income 5,755,191 Equity 689,586 Cash Positions 2,458,773 Other Investments 82,380 Total 8,985,931 Information related to this indicator in the Consolidated Financial Statements is available in NOTE 24. UNCONSOLIDATED STRUCTURED ENTITIES. |
|
Description of the approach to incorporate environmental, social, and corporate governance (ESG) factors into investment or wealth management processes and strategies |
FN-AC-410a.2 |
Environmental, social, and governance (ESG) factors are becoming much more relevant in organizations worldwide, as their management allows balancing organizational objectives with the expectations of their stakeholders. For us at Asset Management Bancolombia Group, the inclusion of sustainability in investment decisions seeks at all times to integrate a series of additional factors into traditional analysis, with the aim of achieving better risk management and generating sustainable benefits in the long term, consistent with our duty of advice. We are aware that there is no single way to implement ESG strategies in the investment process, which is why both the inclusion of positive and negative filters, the integration of ESG factors in the investment process, and voting based on policies defined by the Bancolombia Group are considered. In the implementation of the strategy, we will strive to make investment decisions on assets with the best ESG performance when conditions regarding factors such as: asset type, market risks, estimated returns, liquidity, maturity dates, credit quality of the issuer, etc., are similar, comparable, and do not detract from the portfolio's financial performance. Since 2014, we have been signatories to the Principles for Responsible Investment (PRI). Therefore, these principles are part of our investment decision-making and the implementation of best practices in our policies and processes for incorporating ESG criteria. |
|
Description of policies and procedures for proxy voting and intervention in investee companies |
FN-AC-410a.3 |
In line with good practices in responsible investment, Bancolombia Group has a proxy voting policy for investment processes that is part of the Group's Investment Policy. At Asset Management Bancolombia Group we adjust the Investment Management Manual in exercising political rights in third-party investment vehicles. The included guidelines promote the incorporation of ESG issues in companies in which we have a stake through votes that promote, among others, good corporate governance, disclosure of ESG issues, and management of climate risks. |
230
|
|
232
Management |
|||
|
Business Ethics |
Total amount of monetary losses resulting from legal proceedings related to fraud, insider trading, antitrust, unfair competition, market manipulation, malpractice, or other industry-related laws or regulations |
FN-AC-510a.1 |
Asset Management Bancolombia Group (Fiduciaria Bancolombia S.A. and Valores Bancolombia S.A.) does not report monetary losses resulting from litigation associated with the entity's behavior against business ethics. Asset Management Bancolombia Group (Fiduciaria Bancolombia S.A. and Valores Bancolombia S.A.) does not report monetary losses resulting from litigation associated with insider trading. Asset Management Bancolombia Group (Fiduciaria Bancolombia S.A. and Valores Bancolombia S.A.) does not report monetary losses resulting from litigation associated with antitrust provisions. Asset Management Bancolombia Group (Fiduciaria Bancolombia S.A. and Valores Bancolombia S.A.) does not report monetary losses resulting from litigation associated with anticompetitive practices. Asset Management Bancolombia Group (Fiduciaria Bancolombia S.A. and Valores Bancolombia S.A.) does not report monetary losses resulting from litigation associated with market manipulation. |
|
Description of the policies and procedures for reporting irregularities |
FN-AC-510a.2 |
At Bancolombia Group, we have based all our actions on the development of ethical principles that are collected in our Code of Ethics and Conduct in coherence with our organizational culture and our principles of corporate governance. Our control environment includes an Ethics Committee with members of the Bank's senior management, an Ethics Line for reporting irregularities, our Code of Ethics and Conduct, as well as policies and complementary documents, such as anti-corruption and anti-fraud policies and tax policy. More information can be found in the Our Corporate Governance Matters section of our Management Report. |
|
Activity parameters |
(1) Total registered assets and (2) total unregistered managed assets (AUM) |
FN-AC-000.A |
Below is the total value of assets under management by Asset Management, which at the close of 2023 amounted to COP 30,048,144 (figure in millions). Information related to this indicator in the Consolidated Financial Statements is available in NOTE 24. UNCONSOLIDATED STRUCTURED ENTITIES. |
Total assets under custody and supervision |
FN-AC-000.B |
13 The information reported in the Investment Banking and Brokerage Guide corresponds to Bancolombia's Investment Banking activity.
231
Disclosure topic |
Accounting Parameter |
Code |
Response |
|
Diversity and inclusion among employees |
Percentage representation of genders and racial/ethnic groups in (1) executive management, (2) non-executive management, (3) professionals, and (4) all other employees |
FN-IB-330a.1 |
The percentage representation of gender for Bancolombia's Investment Banking is reported below. Currently, the percentage representation of racial/ethnic groups as indicated by the standard is not available. Position/Gender Female Male Executive Management 32% 68% Non-Executive Management 44% 56% Professionals 38% 63% Other employees 100% 0% The reported information in different positions, according to internal classification, corresponds to: ●
Executive Management: senior management positions
●
Non-Executive Management: mid-level strategic positions
●
Professionals: professional positions
●
Other Employees: operational positions
We are working on building information on racial/ethnic group representation for disclosure in upcoming reports. |
|
Integration of environmental, social and corporate governance factors in investment banking and brokerage activities. |
Income from transactions of (1) underwriting, (2) consulting, and (3) securitization incorporating the integration of environmental, social, and corporate governance (ESG) factors, by industry |
FN-IB-410a.1 |
Transaction type Income Value (COP millions) Consulting 16,601 Securitization 91 The reported value corresponds to the commissions generated by the mentioned transactions incorporating ESG criteria. Underwriting transactions correspond to credit structuring and syndications; consulting transactions correspond to advice on mergers and acquisitions, equity investments, and special situations; securitization transactions correspond to capital market operations carried out by Investment Banking. No income from underwriting ESG transaction commissions was reported for 2023. Information related to this indicator in the Consolidated Financial Statements is available in NOTE 25. OPERATING INCOME and NOTE 3. OPERATING SEGMENTS |
(1) Number and (2) total value of investments and loans incorporating the integration of environmental, social, and |
FN-IB-410a.2 |
Aligned with the ESG rating methodology developed by Bancolombia Group, the assessment of the |
233
corporate governance (ESG) factors, by industry |
investments held by Bancolombia Investment Banking in its portfolio has been carried out through analyses such as ESG ratings and identification of related themes. Regarding information on loans, these are not conducted through Bancolombia Investment Banking. To date, assessments have been made for investments incorporating the integration of environmental and social factors for 27% of the investments held by Bancolombia Investment Banking in its portfolio. The number of investments categorized with good ESG performance as of the end of 2023 was 5, representing COP 377,032 million. For investments made indirectly by Bancolombia Investment Banking, assessments are in process for inclusion in future disclosures. Information related to this indicator in the Consolidated Financial Statements is available in NOTE 5. INVESTMENT AND DERIVATIVE FINANCIAL INSTRUMENTS. |
||
Description of the approach to incorporate environmental, social, and corporate governance (ESG) factors into investment banking and brokerage activities |
FN-IB-410a.3 |
The incorporation of ESG criteria is present in the different activities carried out through Bancolombia Investment Banking. Within our Investment Banking practices (underwriting, consulting, and securitization), we integrate ESG criteria as follows: ●
Equator Principles and IFC Performance Standards for applicable projects.
●
Customer knowledge and due diligence: under the Money Laundering and Terrorism Financing Risk Management System (SARLAFT), policies, procedures, methodologies and tools have been created for the identification, measurement, control and monitoring of money laundering and terrorist financing risks.
●
Support and engagement in the structuring of specific-purpose and general-purpose bonds: We possess proven capacities and methodologies in structuring ESG debt instruments to provide comprehensive support in the pre-certification process of emissions. This process includes methodological guidance and the structuring of the issuance framework, identifying applicable projects, the life cycle of bond structuring concerning sustainability, sector materiality, key indicators, suggestions for calibrating each indicator, among others.
●
ESG valuation in investment and/or divestment processes carried out through Bancolombia Investment Banking using its equity: ESG valuations of both the sector and the company are taken into account in the investment decision-making process, as well as in the monitoring of investments.
|
|
Business ethics |
Total amount of monetary losses resulting from legal proceedings related to fraud, insider trading, antitrust, unfair |
FN-IB-510a.1 |
Bancolombia Investment Banking does not report monetary losses resulting from litigation associated with the entity's behavior against business ethics. Bancolombia Investment Banking does not report monetary losses resulting from litigation associated with insider trading. Bancolombia Investment Banking does not report monetary losses resulting from litigation associated with antitrust provisions. Bancolombia Investment Banking does not report monetary losses resulting from litigation associated with anticompetitive practices. Bancolombia Investment Banking does not report monetary losses resulting from litigation associated with market manipulation. |
234
competition, market manipulation, malpractice, or other financial industry laws or regulations |
|||
Description of policies and procedures for reporting irregularities |
FN-IB-510a.2 |
At Bancolombia Group, we have based all our actions on the development of ethical principles that are collected in our Code of Ethics and Conduct in coherence with our organizational culture and our principles of corporate governance. Our control environment includes an Ethics Committee with members of the Bank's senior management, an Ethics Line for reporting irregularities, our Code of Ethics and Conduct, as well as policies and complementary documents, such as anti-corruption and anti-fraud policies and tax policy. Further information is available on the Our Corporate Governance Matters section of our Management Report. From management, based on solid corporate values and ethical principles that include a zero-tolerance policy for fraud, we have a program aimed at managing internal fraud risk. This program is responsible for identification and management, reporting to the relevant committees to comply with our zero-tolerance policy for fraud. Regarding external fraud, these are identified through transactional monitoring using tools containing analytics, machine learning, and artificial intelligence. Additionally, frauds are identified through customer reports through the customer service hotlines. Fraud cases are managed by an expert team, which evaluates the events and determines necessary corrective actions. |
|
Professional Integrity |
(1) Number and (2) percentage of employees covered with a history of investigations related to investments, consumer claims, private civil litigation, or other regulatory proceedings |
FN-IB-510b.1 |
Considering that Bancolombia Investment Banking, under its operating model, does not engage in capital market consulting activities and therefore does not have employees subject to submitting FINRA forms as indicated by the SASB guidance, no information is reported on this aspect. |
Number of mediation and arbitration cases related to professional integrity, including due diligence |
FN-IB-510b.2 |
We are working to disclose this information in the detail required by the standard in upcoming reports. However, Bancolombia Investment Banking does |
235
not report monetary losses as a result of litigation associated with professional integrity. |
|||
Total amount of monetary losses as a result of legal proceedings related to professional integrity, including due diligence |
FN-IB-510b.3 |
Bancolombia Investment Banking does not report monetary losses as a result of litigation associated with professional integrity. |
|
Description of the approach to ensure professional integrity, including due diligence |
FN-IB-510b.4 |
At Bancolombia Group, we have based all our actions on the development of ethical principles that are collected in our Code of Ethics and Conduct in coherence with our organizational culture and our principles of corporate governance. Our control environment includes an Ethics Committee with members of the Bank's senior management, an Ethics Line for reporting irregularities, our Code of Ethics and Conduct, as well as policies and complementary documents, such as anti-corruption and anti-fraud policies and tax policy. Further information is available on the Our Corporate Governance Matters section of our Management Report. |
|
|
Systemic Risk Management |
Score in the evaluation of global systemically important bank (G-SIB), by category |
FN-IB-550a.1 |
n/a Bancolombia Investment Banking is currently not part of the global systemically important bank evaluation. |
Description of the approach for incorporating the results of mandatory and voluntary stress tests into capital adequacy planning, long-term corporate strategy, and other business activities |
FN-IB-550a.2 |
In the design, implementation, and validation of stress tests, different internal areas participate, which develop forecasts according to their objectives and analyses. Both assumptions, methodologies, and results are reviewed and approved by the leaders of each management. Assumptions, methodologies and results are reviewed and approved by the leaders of each management. These reviews include meetings with managers, directors and vice presidents, the approval of which allows the stress tests to be presented to the Risk Committee and the Board of Directors. The Board of Directors and senior management have a high degree of participation, as they approve the performance of stress tests, provide instructions, observations, and make their respective evaluations of the results. In the event of a stress test materializing, the organization has mitigating actions that would be initiated according to the financial planning and the conditions or triggers of the crisis to be faced. For each mitigating action, there is a clear and detailed process describing the protocols to be followed for their implementation. |
|
|
2-7 Employee Incentives and Risk Taking |
Percentage of total compensation that is variable for material risk takers (MRT) |
FN-IB-550b.1 |
Variable compensation corresponds to 44% of total remuneration. The reported value covers all Investment Banking employees, who are considered material risk takers. Information related to this indicator in the Consolidated Financial Statements is available in NOTE 19. EMPLOYEE BENEFITS and NOTE 28. TRANSACTIONS WITH RELATED PARTIES |
Percentage of variable remuneration for material risk takers (MRT) subject to penalty or recovery clauses |
FN-IB-550b.2 |
Currently, penalty or recovery clauses are not applied once remuneration is generated. However, when a person is terminated for just cause, they forfeit the variable remuneration benefit. |
236
|
Analysis of policies related to the supervision, control and validation of operators' prices for level 3C assets and liabilities |
FN-IB-550b.3 |
Bancolombia Investment Banking has an investment portfolio composed of companies from various economic sectors. Within the management performed for the portfolio is the valuation of the companies that make up the portfolio. For this process, Bancolombia Investment Banking mainly uses three methodologies: market value of assets if listed, discounted cash flow valuation, and valuation by multiples. Within the controls and validation mechanisms, meetings are held to review valuation assumptions, results, and their consistency with previous periods. The team participating in the valuation process has the same variable remuneration scheme as Bancolombia Investment Banking. It is worth noting that the pricing of assets impacting Bancolombia Investment Banking's variable remuneration scheme is in the hands of an external team of this society. |
Activity parameters |
(1) Number and (2) value of (a) underwriting transactions, (b) consulting and (c) securitization transactions |
FN-IB-000.A |
Transaction type Amount (COP millions) Underwriting 31,341 Consulting 22,799 Securitization 1,748 The reported value corresponds to the commissions generated by the mentioned transactions. Underwriting transactions correspond to credit structuring and syndications; consulting transactions correspond to advice on mergers and acquisitions, equity investments, and special situations; securitization transactions correspond to capital market operations carried out by Investment Banking. Information related to this indicator in the Consolidated Financial Statements is available in NOTE 25. OPERATING INCOME and NOTE 3. OPERATING SEGMENTS |
(1) Number and (2) value of investments and property loans by sector |
FN-IB-000.B |
As of the end of 2023, the number of investments made by Bancolombia Investment Banking using its equity was 22, for a value of COP 1,382,895 million. These investments were distributed among the financial, real estate, industry and commerce, mobility, innovation, and ventures sectors. Regarding loan information, Bancolombia Investment Banking does not engage in active credit operations. Information related to this indicator in the Consolidated Financial Statements is available in NOTE 5. INVESTMENT AND DERIVATIVE FINANCIAL INSTRUMENTS |
|
(1) Number and (2) value of market-making transactions in (a) fixed income, (b) equities, (c) currencies, (d) derivatives, and (e) commodities |
FN-IB-000.C |
Since Bancolombia Investment Banking does not operate as a market maker, no information is reported on this aspect. |
237
| IV. | INFORMATION REPORTED IN OTHER JURISDICTIONS |
Description of the Colombian Financial System
In recent years, the Colombian banking system has expanded due to mergers and acquisitions in the sector. In 2013, Bancolombia continued its internationalization process by acquiring HSBC's banking and insurance operations in Panama for USD 2,234 billion. Additionally, Bancolombia Panama acquired 40% of Agromercantil Group's common shares for USD 217 million. In the same year, Grupo Aval acquired 100% of the Guatemalan financial group Reformador (the transaction was valued at USD 411 million) and acquired BBVA Panamá for USD 490 million. Moreover, some competitors began operations in Colombia: Itaú BBA entered the market with an investment bank, as did BNP Paribas, CrediCorp acquired Correval (a local securities firm); BTG Pactual, a Brazilian securities firm, acquired Bolsa y Renta; Banco Santander re-entered the Colombian market with a bank, and the Chilean company Larrain Vial started operations with a securities agency.
In 2014, new entities entered the banking system, such as the financing company Hipotecaria, specialized in mortgage loans, which began operations in March 2014. Additionally, in June, CorpBanca completed the acquisition of Helm Bank, maintaining the CorpBanca brand. That same year, GNB Sudameris Bank acquired 99.9% of HSBC Colombia's capital and began operating under the GBN Colombia brand, while an agreement was signed to operate in Paraguay, Peru, and Uruguay. In 2015, the Chilean CorpBanca merged with Brazil's Itaú, and Bancolombia sold 50% of its shares in Tuya S.A. to Colombia's Éxito group. At the end of 2015, Bancolombia also acquired an additional 20% stake in the Agromercantil group, increasing its total stake to 60%.
Some banks underwent transformations over time. One example is Serfinanza, which, until January 2019, was a financing company and in February of that year began operating as the 26th bank in the financial system. Additionally, in 2020, four financing companies underwent changes in their share structures: in January, Credifinanciera acquired Procredit Bank, renaming it Banco Credifinanciera; in April, Coltefinanciera acquired the rights and obligations of Multibank, which ceased to act as a bank; Leasing Bancoldex merged with ArcoBancoldex in August, and Pagos Internacional was acquired by W Bank in November.
Additionally, in 2021, Lulo Bank began operating as the first digital bank, and by the end of that year, BTG Pactual transitioned from operating as a securities house to becoming the leading bank. Finally, in 2022, Banco Unión, formerly known as "Giros y Finanzas," transitioned from being a commercial financing company to operating as the 29th bank in the financial system.
As of December 31, 2023, according to the SFC, the main participants in the financial system are 29 commercial banks (18 private local banks, 10 foreign banks, 1 local state-owned bank), 5 financial corporations, and 17 financing companies. Additionally, trust companies, cooperatives, insurance companies, insurance brokers and securities intermediaries, special state-owned institutions, and compensation payments and pension funds also participate in the Colombian financial system.
Market Evolution and Credit Institutions in 2023
In 2015, Colombian financial institutions began reporting their consolidated financial results under the IFRS framework; however, in the case of credit institutions (banks, financial corporations, financing companies, and 38 financial cooperatives), the SFC has allowed the presentation of independent financial statements under the Colombian banking GAAP basis, according to decree 1851 of August 2013, which regulates law 1314 of 2009.
238
The following information includes figures under Colombian banking GAAP regulation, as reported by Colombian credit institutions to the SFC.
The growth of Colombian credit institutions' placements was 2.4% in 2023 compared to 16.9% in 2022. Commercial loan portfolio grew by 3.0% in 2023, compared to 16.7% the previous year; consumer loans decreased by -1.6% in 2023, compared to 18.3% in 2022; mortgage loans increased by 7.3% in 2023, less than in 2022 (14.6%), and microloans grew by 11.6% in 2023, compared to 14.6% in 2022.
The level of past-due loans of credit institutions as a percentage of the total loan portfolio increased from 3.67% in December 2022 to 5.20% in November 2023. Additionally, coverage measured by the preventive estimation index for credit risk (overdue 30 days) ended 2023 at 119.41%, compared to 159.94% at the end of 2022.
As of November 2023, loan portfolios represented 62.82% of assets, a lower proportion than the 63.97% of the previous year. Investments and derivative transactions as a percentage of total assets decreased from 21.15% at the end of 2022 to 20.93% at the end of 2023. Deposits increased their share of liabilities from 70.61% in 2022 to 73.46% in 2023.
At the same cut-off, credit institutions recorded COP 1,010,000,000 million in total assets, representing a 3.9% increase compared to the previous year. Based on the total assets of Colombian credit institutions, banks have a market share of 94.84%, followed by financial corporations with 3.0%, financing companies with 1.67%, and financial cooperatives with 0.49%.
The solvency ratio (Tier 1 + Tier 2) of credit institutions was 17.40% in November 2023 (including banks, financial corporations, financing companies, and financial cooperatives), which is above the minimum legal requirement of 9% with the enactment of Decree 1477 of 2018.
Bancolombia and its Competitors
The following table shows the comparison between the key indicators of profitability, solvency and loan portfolio quality of Bancolombia and its main unconsolidated competitors based on IFRS information applicable under Colombian regulations and published by the SFC.
|
|
|
|
|
|
|
|
|
|
|
|
|
|
|
|
|
|
|
|
|
|
|
|
|
|
|
|
|
|
|
|
Portfolio Quality |
|
Coverage |
|
|
|
|
|
||||
|
|
ROE (1) |
|
ROA (2) |
|
|
|
|
|
Solvency Level |
|
||||||||||
|
|
Nov- 2023 |
|
Dec- 2022 |
|
Nov- 2023 |
|
Dec- 2022 |
|
Nov- 2023 |
|
Dec- 2022 |
|
Nov- 2023 |
|
Dec- 2022 |
|
Nov- 2023 |
|
Dec- 2022 |
|
Bancolombia(3) |
|
15.3 |
% |
17.9 |
% |
2.3 |
% |
2.8 |
% |
4.8 |
% |
3.2 |
% |
144.1 |
% |
192.1 |
% |
18.0 |
% |
18.3 |
% |
Banco de Bogotá |
|
7.4 |
% |
15.0 |
% |
0.9 |
% |
2.0 |
% |
4.6 |
% |
3.7 |
% |
123.3 |
% |
168.0 |
% |
16.0 |
% |
17.0 |
% |
Davivienda |
|
0.4 |
% |
7.9 |
% |
0.1 |
% |
0.8 |
% |
7.4 |
% |
4.8 |
% |
90.2 |
% |
128.9 |
% |
16.2 |
% |
19.9 |
% |
BBVA |
|
4.5 |
% |
15.1 |
% |
0.3 |
% |
0.9 |
% |
3.9 |
% |
2.7 |
% |
128.1 |
% |
187.9 |
% |
12.7 |
% |
13.3 |
% |
B. de Occidente |
|
7.7 |
% |
10.6 |
% |
0.6 |
% |
0.9 |
% |
4.0 |
% |
3.0 |
% |
128.2 |
% |
167.9 |
% |
11.6 |
% |
12.4 |
% |
Itaú Corpbanca |
|
1 |
.0% |
1.8 |
% |
0.1 |
% |
0.2 |
% |
4.6 |
% |
3.7 |
% |
127.4 |
% |
154.6 |
% |
14.5 |
% |
15.8 |
% |
Scotiabank Colpatria |
|
-12.6 |
% |
5.3 |
% |
-0.9 |
% |
0.4 |
% |
5.0 |
% |
3.7 |
% |
117.5 |
% |
124.9 |
% |
11.4 |
% |
11.5 |
% |
Source: SFC
Data for 2023 is as of November, being the most recent cut-off at the time of this report.
(1)ROE is Return on Average Equity.
239
(2)ROA is Return on Average Assets.
The following tables illustrate Bancolombia's market share and its main competitors on a non-consolidated basis regarding various key products based on figures published by the SFC for 2022 and 2023.
Net Portfolio – Market Share (%) |
|
2023 |
|
2022 |
|
Bancolombia |
|
26.8 |
% |
26.8 |
% |
Davivienda |
|
15.9 |
% |
16.7 |
% |
Banco de Bogotá |
|
12.3 |
% |
11.4 |
% |
BBVA |
|
11.3 |
% |
10.9 |
% |
Banco de Occidente |
|
7.0 |
% |
6.5 |
% |
Scotiabank Colpatria |
|
4.7 |
% |
5.3 |
% |
Itaú Corpbanca |
|
3.0 |
% |
3.2 |
% |
Other |
|
19.0 |
% |
19.2 |
% |
Source: Ratios calculated by Bancolombia with data from the SFC.
Current Account - Market Share (%) |
|
2023 |
|
2022 |
|
Bancolombia |
|
25.5 |
% |
27.8 |
% |
Banco de Bogotá |
|
17.9 |
% |
19.3 |
% |
Davivienda |
|
14.7 |
% |
11.9 |
% |
BBVA |
|
10.5 |
% |
11.2 |
% |
Banco de Occidente |
|
7.6 |
% |
8.2 |
% |
Itaú Corpbanca |
|
2.3 |
% |
2.6 |
% |
Scotiabank Colpatria |
|
2.5 |
% |
2.5 |
% |
Other |
|
19.0 |
% |
16.5 |
% |
Source: Ratios calculated by Bancolombia with data from the SFC.
Time Deposits - Share (%) |
|
2023 |
|
2022 |
|
Bancolombia |
|
22.8 |
% |
21.5 |
% |
Davivienda |
|
17.0 |
% |
15.4 |
% |
BBVA |
|
13.4 |
% |
13.8 |
% |
Banco de Bogotá |
|
12.4 |
% |
11.8 |
% |
Banco de Occidente |
|
5.4 |
% |
5.1 |
% |
Scotiabank Colpatria |
|
5.6 |
% |
6.6 |
% |
Itaú Corpbanca |
|
3.4 |
% |
3.6 |
% |
Other |
|
20.0 |
% |
22.2 |
% |
Source: Ratios calculated by Bancolombia with data from the SFC.
240
Savings Account - Share (%) |
|
2023 |
|
2022 |
|
Bancolombia |
|
28.6 |
% |
29.1 |
% |
Davivienda |
|
13.9 |
% |
15.3 |
% |
BBVA |
|
11.1 |
% |
10.1 |
% |
Banco de Bogotá |
|
9.9 |
% |
10.0 |
% |
Banco de Occidente |
|
8.7 |
% |
7.2 |
% |
Scotiabank Colpatria |
|
4.1 |
% |
5.6 |
% |
Itaú Corpbanca |
|
2.2 |
% |
2.1 |
% |
Other |
|
21.5 |
% |
20.6 |
% |
Source: Ratios calculated by Bancolombia with data from the SFC.
Banco Agrícola and its Competitors
In 2023, Banco Agrícola continued to lead the Salvadoran Financial System, closing in first position in assets, loans, deposits, equity, and profits. The information presented in the following tables related to Banco Agrícola and its competitors independently was prepared based on information published by the Superintendence of the Financial System (SSF)* in accordance with applicable accounting standards in El Salvador.
*Until 2022, the source used was the Salvadoran Banking Association (ABANSA). However, starting in 2023, with the aim of providing a more comprehensive view of the Salvadoran Financial System and showing more accurate data, a change of source was made to the Superintendence of the Financial System (SSF).
The following table shows the market share for the most important institutions in El Salvador's financial system as of December 2023.
|
|
Assets |
Equity |
Loans |
Deposits |
Profit |
Banco Agrícola |
24.2% |
25.6% |
24.8% |
24.4% |
38.5% |
Cuscatlán |
17.1% |
17.5% |
17.9% |
17.1% |
16.1% |
Davivienda |
13.2% |
14.1% |
14.4% |
13.6% |
10.5% |
BAC |
14.2% |
13.5% |
15.3% |
14.6% |
13.0% |
Mortgage |
9.7% |
7.5% |
6.6% |
9.9% |
6.7% |
Promérica |
5.9% |
5.0% |
6.1% |
6.1% |
2.6% |
Other |
15.7% |
16.8% |
15.0% |
14.3% |
12.6% |
Banistmo and its Competitors
Banistmo, a leading company in Panama, is the second largest bank in the country with a 9.4% market share by loans. The following table illustrates the market share of the main institutions of the Panamanian financial system as of November 30, 2023.
MARKET SHARE |
241
|
Assets |
Capital |
Loans |
Deposits |
Profit |
Banistmo |
8.1% |
8.2% |
9.4% |
10.1% |
5.0% |
Banco General |
13.5% |
12.6% |
13.6% |
19.9% |
26.0% |
Global Bank |
6.6% |
3.9% |
7.5% |
7.3% |
1.3% |
Banesco |
3.8% |
2.8% |
4.3% |
5.6% |
1.6% |
BAC |
8.5% |
23.4% |
5.9% |
8.8% |
26.6% |
Others |
59.5% |
49.1% |
59.3% |
48.3% |
39.5% |
|
|
|
|
|
|
Source: figures published by the SBP (Superintendency of Banks of Panama).
BAM and its Competitors
BAM is the fifth largest bank in the Guatemalan banking system, measured by total assets, deposits and stockholders' equity, and the third in terms of net portfolio.
As of December 31, 2023, the Superintendence of Banks of Guatemala (SIB) has 18 banking institutions under its supervision and inspection. The information presented in the following tables was prepared in accordance with Guatemalan banking regulations, as reported to the SIB (Superintendence of Banks of Guatemala).
242
Market Share |
|
|
|
|
|
|
Assets |
Shareholders' Equity |
Net Portfolio |
Deposits |
Profits |
Banco Industrial |
29.2% |
23.6% |
29.0% |
27.6% |
28.4% |
Banrural |
20.7% |
23.1% |
15.6% |
22.2% |
28.2% |
Banco G&T Continental |
12.3% |
11.7% |
11.0% |
12.5% |
11.1% |
BAC-Reformador |
8.6% |
7.6% |
10.5% |
8.8% |
4.8% |
Banco Agromercantil |
8.2% |
7.3% |
10.5% |
7.9% |
2.8% |
Bantrab |
7.8% |
11.5% |
8.5% |
8.0% |
9.4% |
Banco Promerica |
5.2% |
5.5% |
6.8% |
4.9% |
6.5% |
Other* |
8.0% |
9.7% |
8.1% |
8.1% |
8.8% |
*Other. It includes the following Banks: Internacional, Crédito Hipotecario Nacional, Ficohsa, Azteca, Inmobiliario, De Antigua, Vivibanco, Citibank, N.A. de Guatemala, Inv, Credicorp, and Nexa.
Source: Superintendence of Banks of Guatemala (SIB).
As a consequence of restrictive financial conditions, 2023 marked a period of deceleration for the economies in which Bancolombia operates. Consolidated-level revenues were adversely impacted over the past year mainly due to the deterioration in the credit cycle. Net interest and investment income decreased by 11.31% in 2023. Although the net interest margin increased due to higher average interest rates, adverse asset quality conditions implied higher provision expenses and were the primary factor explaining lower net profit for shareholders. The evolution of the portfolio and recovery in the credit cycle will be key factors for the bank's future performance. Below is a brief discussion of recent trends in business and economics.
Portfolio Performance
The gross portfolio of loans and financial leases (i.e., before provisions for credit risks and financial leases) reached 253,952,000 million Colombian pesos, decreasing by 5.92% year-on-year. The appreciation of the Colombian peso against the US dollar was 20.54%, explaining the contraction in the balance when considering that 30.54% of the total portfolio is denominated in foreign currency. Excluding the exchange rate effect, the balance would have increased by 0.99%.
Unlike 2022, all geographies where Bancolombia is present reported a very low annual increase in their portfolio or even a contraction in the case of Banistmo, following a lower risk appetite by the bank and weak demand from customers. When expressed in local currency, the consumer portfolio decreased by 8.38%, the commercial portfolio by 5.63%, mortgages by 3.00%, and microloans by 13.80%.
The portfolio at Bancolombia S.A. expanded by 1.11% during 2023, contracting in real terms. The deceleration compared to 2022 is the result of a more restrictive origination policy due to growing concerns about asset quality and the deterioration of customers' repayment capabilities. The consumer loan book showed the most pronounced variation, decreasing by 1.55%, consistent with a shift in the policy for disbursing pre-approved loans. The Colombian economy experienced significant deceleration during the year, as high inflation rates, caused by the resurgence of pent-up consumption during the pandemic, were followed by contractionary monetary and fiscal policies.
243
The portfolio at Banco Agrícola grew by 1.98% in dollars during 2023. Consumer and commercial placements performed similarly, growing at a slower pace compared to the previous year, although maintaining their market share in the country. The Salvadoran economy has moderated its growth pace over the last year despite its resilience to the current global slowdown context. It is expected that in the coming months, growth will further slow down due to still-high inflation, decreasing remittance volumes, and lesser expansion from trading partners.
Banistmo's portfolio decreased by 2.02% annually in dollars. Panama was the most affected nation by the pandemic in Central America, and the recovery is still visible with high growth rates over the last 3 years. In 2023, trade and construction were key drivers of the economy. The performance of Banistmo's loan portfolio has been impacted by an increasingly competitive environment in the banking industry with narrowing yields. The bank has prioritized improving its margins, considering segments with better risk profiles. The expansion of commercial loans should pick up pace in 2024 as companies anticipate interest rate reductions to increase their debt levels.
Banco Agromercantil grew its portfolio by 2.29% with a mixed dynamic segment by segment. Similar to 2022, the consumer and housing portfolio showed the highest growth while the commercial portfolio decreased. The bank has continued with a strategy of rearranging its portfolio mix where consumer lending has gained share within the total balance. The Guatemalan economy recorded dynamic activity in the first half of 2023, with remittances being a significant driver of household spending. In the second half of the year, there has been a slowdown, largely attributed to political uncertainty and recent social unrest.
The portfolio denominated in foreign currency decreased by 3.03% during 2023. The performance of the book in Bancolombia's international banking operation in Panama, Puerto Rico, the dollar-denominated portfolio in Colombia, and Banistmo's operation essentially drove the contraction of the dollar-denominated portfolio at the consolidated level. A better backdrop in the global economy, lower interest rates and stronger domestic demand should drive credit growth at a faster pace in 2024 across the board in both local and foreign currencies for the bank.
Net Interest Margin and Valuation
Most of the bank's loan book is tied to variable rates, and the pace of repricing of our assets tends to be faster than that of the bank's liabilities.
The annualized net interest margin at the consolidated level was 6.99% for 2023, increasing compared to the 6.80% reported in 2022.
Interest income increased due to better performance in the credit business. As a year ago, the financial margin with customers progressively increased as reference rates continued their upward trend and remained high throughout the year, while the Central Bank of Colombia implemented its contractionary monetary policy since 2021, which concluded at the end of 2023.
Bancolombia has experienced steady expansion in interest income during this cycle despite the slow loan origination dynamics over the past twelve months. While the bank has redistributed its share in the loan portfolio in recent years with a heavier weight of consumer loans within the total balance, in 2023 this segment contracted as a conservative approach to reduce its risk appetite amid a deteriorating credit cycle.
244
In the same direction as rate hikes, the interest paid on interest-bearing liabilities grew during the year ending December 31, 2023. It is worth noting that the magnitude of the increase in interest expenses was much lower than the increase in reference rates due to the low sensitivity of a large part of the bank's liabilities.
During the past year, there was a continuous shift in the funding mix, as was the case in 2022, as customers demanded higher yields in an environment of high interest rates. Time deposits accounted for 32.5% of total liabilities in 2023, up from 27.9% the previous year. Considering a better liquidity position and low portfolio growth in 2024, stabilization is expected in the capture of more expensive deposits. Customer deposits represent 81.6% of the bank's liabilities, offering a stable and cost-competitive source of funding.
Cost of Credit
For 2023, the cost of credit was 2.84% of the average portfolio, increasing from the 1.56% recorded in 2022. This increase was largely explained by the deterioration of the credit cycle, driving the formation of overdue portfolio in all segments, albeit to a greater extent in the consumer portfolio. The operation in Colombia represented the largest provision expense at the consolidated level. 2024 should be a year of transition towards better asset quality metrics, as financial conditions are expected to improve with a positive impact on the bank's risk cost. Bancolombia maintains a strong balance sheet backed by an adequate level of on-balance sheet reserves for credit risks, reporting a coverage ratio of overdue portfolio (overdue by 30 days) of 120% as of December 2023.
General Discussion of Changes in Results for 2023 versus 2022
During the past year, Bancolombia maintained its strong competitive position and wide range of financial services amid a challenging global economic environment in the various regions where the group operates. 2023 was marked by a global economic slowdown, high levels of inflation, weak domestic demand, and credit contraction. High interest rates significantly affected customers' borrowing capacity in the financial system, deteriorating asset quality indicators and discouraging new originations across different portfolio segments.
Furthermore, after a sharp depreciation in 2022, the Colombian peso experienced a strong rebound during 2023, closing at COP 3,822.05 per dollar, an appreciation of 20.54%.
Net income attributable to Bancolombia shareholders amounted to COP 6,117,000 million (COP 6,420 per share, both ordinary and preferred, and USD 6.72 per ADR), representing a 9.83% reduction from COP 6,783,000 million in net income attributable to Bancolombia shareholders for the 2022 fiscal year.
Bancolombia's return on average equity for 2023 was 16.14%, compared to 19.80% in 2022.
The net interest income and valuation margin increased in 2023, reaching 6.99% for the year, compared to 6.80% in 2022.
Provisions for credit risk totaled COP 7,462,000 million for 2023, a 96.79% increase over COP 3,792,000 million in 2022. Due to more challenging financial conditions for customers, annual growth in this area is mainly explained by the performance of the individual portfolio in Colombia, which experienced significant expansion in 2022. In this sense, the banking industry experienced significant deterioration to a greater extent during the first half of 2023.
245
During the latter half of the year, provision expenses for the group decreased as new originations indicated improved customer payment behavior.
The customer loan portfolio decreased by 5.92% in the year, a result strongly correlated with the high appreciation of the Colombian peso against the US dollar and the currency conversion re-expression of balances from foreign subsidiaries. Excluding the exchange rate effect, annual growth would have been 1.51%.
Similarly, reduced credit demand related to high interest rates, as well as the bank's stricter origination policies, resulted in fewer originations during the year. Unlike previous years when the consumer portfolio had shown sustained growth trends, its balance contracted in 2023 due to reduced risk appetite in this credit cycle segment. The mortgage portfolio grew in all geographies, while the commercial modality gained market share in the portfolio mix, primarily due to a higher balance in Colombia. The total loan portfolio denominated in COP grew by 4.21%, while the USD-denominated portfolio decreased by 22.95% (-3.03% when calculated in USD) in the year.
Balance provisions represented 6.02% of the total portfolio and 120.04% of the 30-day past due portfolio (excluding accrued interest) at the end of 2023, compared to 5.47% of the total portfolio and 168.73% of the 30-day past due portfolio (excluding accrued interest) at December 31, 2022. The bank expects these provisions to provide adequate coverage for expected credit losses.
During the past year, Bancolombia maintained its strong competitive position and wide range of financial services amid a challenging global economic environment in the various regions where the group operates. 2023 was marked by a global economic slowdown, high levels of inflation, weak domestic demand, and credit contraction. High interest rates significantly affected customers' borrowing capacity in the financial system, deteriorating asset quality indicators and discouraging new originations across different portfolio segments.
Furthermore, after a sharp depreciation in 2022, the Colombian peso experienced a strong rebound during 2023, closing at COP 3,822.05 per dollar, an appreciation of 20.54%.
Net income attributable to Bancolombia shareholders amounted to COP 6,117,000 million (COP 6,420 per share, both ordinary and preferred, and USD 6.72 per ADR), representing a 9.83% reduction from COP 6,783,000 million in net income attributable to Bancolombia shareholders for the 2022 fiscal year.
Bancolombia's return on average equity for 2023 was 16.14%, compared to 19.80% in 2022.
The net interest income and valuation margin increased in 2023, reaching 6.99% for the year, compared to 6.80% in 2022.
Provisions for credit risk totaled COP 7,462,000 million for 2023, a 96.79% increase over COP 3,792,000 million in 2022. Due to more challenging financial conditions for customers, annual growth in this area is mainly explained by the performance of the individual portfolio in Colombia, which experienced significant expansion in 2022. In this sense, the banking industry experienced significant deterioration to a greater extent during the first half of 2023. During the latter half of the year, provision expenses for the group decreased as new originations indicated improved customer payment behavior.
246
The customer loan portfolio decreased by 5.92% in the year, a result strongly correlated with the high appreciation of the Colombian peso against the US dollar and the currency conversion re-expression of balances from foreign subsidiaries. Excluding the exchange rate effect, growth would have been 0.99% annually.
Similarly, reduced credit demand related to high interest rates, as well as the bank's stricter origination policies, resulted in fewer originations during the year. Unlike previous years when the consumer portfolio had shown sustained growth trends, its balance contracted in 2023 due to reduced risk appetite in this credit cycle segment. The mortgage portfolio grew in all geographies, while the commercial modality gained market share in the portfolio mix, primarily due to a higher balance in Colombia. The total loan portfolio denominated in COP grew by 4.21%, while the USD-denominated portfolio decreased by 22.95% (-3.03% when calculated in USD) in the year.
Balance provisions represented 6.02% of the total portfolio and 120.04% of the 30-day past due portfolio (excluding accrued interest) at the end of 2023, compared to 5.47% of the total portfolio and 168.73% of the 30-day past due portfolio (excluding accrued interest) at December 31, 2022. The bank expects these provisions to provide adequate coverage for expected credit losses.
Capital solvency was 13.40% (basic solvency of 11.42%), higher than the 12.79% (basic solvency of 10.37%) reported at the close of 2022, mainly due to lower loan growth and the appreciation of the Colombian peso against the US dollar, which impacted the balance of risk-weighted assets and lower intangible deductions.
Customer deposits decreased by 1.22% during 2023, while the net loan to deposit ratio was 95.9% at the end of the year, compared to 101.4% at December 31, 2022.
Net Interest Margin and Income from Valuation of Financial Instruments Before Provision for Portfolio Deterioration, Off-Balance Sheet Commitments, and Other Financial Instruments
During 2023, Banco Central de Colombia continued its contractionary monetary policy stance to control inflation and raised the reference interest rate by an additional 125 percentage points during the year, closing at 13.25%, a 20-year high. Likewise, the Federal Reserve of the United States raised the reference rate by 100 basis points to 5.25%-5.50% in the same period.
Interest income, which includes interest from loan portfolios and financial leasing operations, interbank funds sold, and interest and valuation of financial instruments, amounted to COP 37,046,000 million, 38.25% higher than the COP 26,796,000 million in 2022, mainly driven by price rather than volume, due to higher market rates that trigger repricing. This occurs because most of the loan portfolio is at variable rates and, therefore, assets tend to reprice quickly when interest rates rise.
However, the slower pace of interest income growth compared to the previous year is due to the 5.92% contraction in the loan portfolio, which, in turn, has a triple explanation; first, weaker credit demand across all segments caused by high interest rates; second, reduced risk appetite given the increased loan delinquency, and third, the strong appreciation of the COP during the period, which reduced the volume of the loan portfolio and the contribution of interest income from dollar-denominated loans to the consolidated book.
247
In fact, the consumer portfolio, which provides higher risk-adjusted returns, saw the largest decline with a year-on-year contraction of 8.38% due to the bank's reduced risk appetite, impacting income generation overall.
As a result, the average nominal interest rate for loans and leasing operations was 13.4%, compared to 10.2% in 2022.
Interest expenses amounted to COP 16.668 trillion, a year-on-year increase of 97.43%, mainly driven by the growth of time deposits that outpaced the growth of all other deposit sources, as customers prioritized products with higher returns. Accordingly, interest paid on cost-bearing liabilities rose to 5.9% from 3.2% recorded in 2022.
Interest on debt instruments measured by the total effective interest method amounted to COP 1,029,000 million in 2023, 74.83% higher than in 2022, mainly due to higher market rates. In contrast, the total valuation of financial instruments was COP 579,000 million, a 57.53% decrease from 2022, attributable to higher market rates at which the portfolio was discounted.
As a result, net interest and valuation income for 2023 was COP 20,378,000 million, an 11.02% increase from COP 18,354,000 million in 2022. This represents a net margin and valuation of 6.99%, increasing by almost 20 basis points compared to the 6.80% recorded in 2022. Despite the loan portfolio contraction and increased interest expenses on deposits due to higher market rates, income generation grew, albeit at a slower pace compared to 2022, mainly due to changes in loan and financial leasing pricing, interbank funds sold, and investment instrument interest in the portfolio.
Commissions
For 2023, gross commission income was COP 7,081,000 million, 11.15% higher than COP 6,371,000 million in 2022. The main source of commission income during the period was associated with the debit and credit card line, including the acquiring business, and card acceptance fees from different issuers. Revenue from this division grew by 10.46% year on year, mainly due to high transaction volume that increased revenue from interbank exchange fees generated by higher domestic and international manual and electronic purchases.
Banking services made a significant contribution to the increase in commissions, largely due to Bancolombia S.A.'s operations, associated, among other factors, with higher revenue from digital banking. Bancaseguros reported an increase during the last year due to good performance in policy renewals, as well as higher revenue from voluntary and mandatory insurance. Lastly, the payments and collections line reported a significant annual contribution due to increased demand for services such as individual customer bill collection.
Fee and commission expense was COP 3,097,000 million in 2023, 19.58% higher than the COP 2,590,000 million in 2022. This increase is mainly due to higher payments in data processing in banking services and higher royalties to credit and debit card franchises due to increased transaction volume. At the same time, sales through outsourced channels and collection services also contributed to the growth in fee expenses. Finally, during the year, there was higher spending on banking correspondents due to the higher number of transactions received and the opening of new service points.
Other Operating Income
248
For 2023, total other operating income was COP 3,980,000 million, 93.80% higher than COP 2,053,000 million in 2022. Currency exchange hedging operations reported in other operating income resulted in a net positive effect due to exchange rate volatility.
Operating lease income totaled COP 1,771,000 million in 2023, a 29.97% increase over 2022. The improved performance is the result of incremental demand in vehicle leasing and subleasing operations at Bancolombia S.A. and Renting Colombia, and higher rental income from real estate leases.
Operating Expenses
For 2023, operating expenses totaled COP 12,942,000 million, 18.87% higher than COP 10,888,000 million in 2022.
Salaries and benefits to employees totaled COP 4,410,000 million in 2023, 22.70% higher than in 2022. The result is mainly derived from annual salary increases, as well as updates to actuarial valuations of certain employee benefits resulting in higher expenses for the period. On the other hand, bonuses increased by 14.18% annually based on a performance-based model for generated profitability.
Other administrative and general expenses totaled COP 5,034,000 million in 2023, 10.40% higher than in 2022. This is due to: (i) higher expenses for local taxes due to changes introduced by the 2022 tax reform regarding the industry and commerce tax, (ii) an increase in the vehicle rental division resulting in higher expenses associated with asset impairment and maintenance, and (iii) the continued expansion of projects for business evolution and transformation.
Depreciation and amortization totaled COP 1,125,000 million in 2023, 14.71% higher than in 2022. This increase is largely related to the increase in operating leases and the higher depreciation of recognized assets.
As a result of changes in expenses and income, Bancolombia's financial efficiency cost-income ratio for 2023 was 45.33%, an increase compared to 44.58% in 2022.
Provisions and Portfolio Quality Expenses
For 2023, net provisions for portfolio deterioration totaled COP 7,462,000 million (or 2.8% of the average portfolio), representing an increase of 96.79% over COP 3,792,000 million (or 1.6% of the average portfolio) in 2022.
Macroeconomic factors such as high interest rates and economic slowdown have influenced portfolio deterioration in the various regions where the bank operates. The significant increase in credit costs for 2023 was mainly explained by the rollover of customers in the consumer segment and most notably in unsecured loans.
Net portfolio write-offs totaled COP 6,720,000 million in 2023, 9.01% more than COP 6,165,000 million in 2022.
The acceleration in the volume of write-offs is due to the increase in harvests of portfolios that reached the required delinquency deadlines and whose recovery probabilities were very low. In 2023, significant progress has been made in collection processes and restructuring alternatives that have prevented further deterioration in the payment of overdue obligations in customers with high delinquency indices. Net write-offs have two important characteristics: first, they reduce the portfolio balance and, second, they help reduce overdue portfolio ratios.
249
Past due loans amounted to COP 13,700,000 million as of December 31, 2023, 43.04% higher than COP 9,578,000 million as of December 31, 2022.
The past due loan ratio (loans overdue more than 30 days divided by total loans) was 5.39% as of December 31, 2023, up from 3.55% as of December 31, 2022. Despite the implementation of effective measures for the recovery of past due loans and the high write-offs made during the period, the increase in delinquency rates reflects the high deterioration experienced during 2023, mainly in Colombia, associated with the factors described above.
Income Tax Expenses
Income tax expense for the fiscal year 2023 amounted to COP 1,933,000 million, 29.68% less than COP 2,748,000 million in 2022. The effective tax rate for 2023 was 23.72%.
The explanation for the lower effective tax rate derives from two factors; first, tax benefits in Colombia related to the mortgage portfolio for social housing and investments in productive fixed assets, and second, the higher contribution to consolidated results from foreign subsidiaries with lower statutory rates, which also resulted in a lower tax balance. Additionally, tax benefits from overseas operations are associated with tax-exempt income from returns on securities issued by the Governments of Guatemala, El Salvador, and Panama.
For additional details, please refer to Note 12 of the Consolidated Financial Statements.
RESULTS BY OPERATING SEGMENTS
The Bank manages its business through 9 main operating segments: Banking Colombia, Banking El Salvador, Banking Panama, Banking Guatemala, Fiduciary, Investment Banking, Brokerage, International Banking and All Others.
The segment information in this Annual Report reflects the reporting structure as of the presentation date according to the segment information in Note 3. Operating Segments to the Consolidated Financial Statements
Banking Colombia
|
|
For the year ended on December 31, |
|
||||||||
|
|
|
|
|
|
|
|
Variance |
|
Variance |
|
|
|
2023 |
|
2022 |
|
2021 |
|
2023-2022 |
|
2022-2021 |
|
|
|
In millions of Colombian pesos |
|
||||||||
Total interest income and valuation of financial instruments |
|
29,230,060 |
|
20,727,335 |
|
11,498,013 |
|
41.02 |
% |
80.27 |
% |
Total interest on loan portfolio and financial leasing transactions |
|
28,366,678 |
|
19,263,960 |
|
11,118,035 |
|
47.25 |
% |
73.27 |
% |
Total debt securities |
|
937,090 |
|
1,361,299 |
|
399,517 |
|
(31.16) |
% |
240.74 |
% |
Derivatives, net |
|
(167,887) |
|
108,255 |
|
17,263 |
|
(255.08) |
% |
527.09 |
% |
Total liquidity transactions, net |
|
94,179 |
|
(6,179) |
|
(36,802) |
|
(1,624.18) |
% |
(83.21) |
% |
Interest expense |
|
(13,464,980) |
|
(6,333,834) |
|
(2,666,843) |
|
112.59 |
% |
137.50 |
% |
250
Net interest margin and valuation of financial instruments before allowance for impairment, off-balance sheet commitments and other financial instruments. |
|
15,765,080 |
|
14,393,501 |
|
8,831,170 |
|
9.53 |
% |
62.99 |
% |
Total provisions for credit risk impairment, net |
|
(6,480,377) |
|
(2,971,599) |
|
(2,122,515) |
|
118.08 |
% |
40.00 |
% |
Net interest income and valuation of financial instruments after provisions and impairments |
|
9,284,703 |
|
11,421,902 |
|
6,708,655 |
|
(18.71) |
% |
70.26 |
% |
(Expenses) Income from transactions with other operating segments of the Bank |
|
(187,467) |
|
(32,163) |
|
18,458 |
|
482.87 |
% |
(274.25) |
% |
Commission income |
|
5,252,099 |
|
4,684,563 |
|
3,841,472 |
|
12.12 |
% |
21.95 |
% |
Commission expenses |
|
(2,522,927) |
|
(2,099,585) |
|
(1,524,691) |
|
20.16 |
% |
37.71 |
% |
Total net commission income |
|
2,729,172 |
|
2,584,978 |
|
2,316,781 |
|
5.58 |
% |
11.58 |
% |
Other operational income (expenses) (1) |
|
1,575,845 |
|
(72,994) |
|
653,968 |
|
(2,258.87) |
% |
(111.16) |
% |
Dividends and other net income from equity interests |
|
17,613 |
|
(8,058) |
|
93,769 |
|
(318.58) |
% |
(108.59) |
% |
Total net income |
|
13,419,866 |
|
13,893,665 |
|
9,791,631 |
|
(3.41) |
% |
41.89 |
% |
Operating expenses(2) |
|
(8,022,042) |
|
(6,600,686) |
|
(5,550,033) |
|
21.53 |
% |
18.93 |
% |
Amortization, depreciation, and impairment |
|
(744,346) |
|
(613,807) |
|
(529,662) |
|
21.27 |
% |
15.89 |
% |
Total operating expenses |
|
(8,766,388) |
|
(7,214,493) |
|
(6,079,695) |
|
21.51 |
% |
18.67 |
% |
Profit before income tax |
|
4,653,478 |
|
6,679,172 |
|
3,711,936 |
|
(30.33) |
% |
79.94 |
% |
Segment assets |
|
254,367,378 |
|
247,113,605 |
|
209,948,788 |
|
2.94 |
% |
17.70 |
% |
Segment liabilities |
|
216,200,157 |
|
207,293,246 |
|
177,198,960 |
|
4.30 |
% |
16.98 |
% |
It includes derivatives, net exchange rate, operating leases, and gains on asset sales.
Includes salaries and employee benefits, other general and administrative expenses and taxes other than income taxes.
In 2023, profit before income tax for Colombian Banking decreased by 30.33% to COP 4,653,000 million from COP 6,679,000 million in 2022 for the reasons described below.
Total interest and valuation income increased by 41.02% to COP 29,230,000 million, mainly due to the growth in interest income from loan and financial leasing operations by 47.25% as a result of the performance of the loan portfolio, which grew by 2.09%, and the increases in the reference interest rate of the Central Bank, which also boosted the margin given the bank's asset-sensitive condition. This increase was mainly reflected in interest income from commercial, consumer and mortgage loans.
Total interest expenses increased by 112.59% to COP 13,465,000 million from COP 6,334,000 million, explained by an increase in time deposits in line with the increase in the Central Bank's reference rate in 2023. The net interest margin and valuation of financial instruments reflected a 9.53% increase to COP 15,765,000 million.
The total charge for credit impairment, net, increased by 118.08% to COP 6,480,000 million from COP 2,972,000 million. This variation is mainly due to the increase in credit deterioration in the consumer portfolio and additional charges for macroeconomic variables estimated in risk models.
Total net commissions increased by 5.58% to COP 2,729,000 million, mainly driven by the performance in acceptances and bank guarantees, which increased by 24.09%, banking services by 23.41%, bancassurance by 13.46%, credit and debit cards by 9.71%, and payments-collections by 11.52% (digital channels).
251
These increases were offset by fees and commission expenses, which increased by 20.16% compared to the previous year.
Other operational incomes increased significantly to COP 1,576,000 million, mainly due to the exchange difference result and higher income generated by exchange rate derivatives explained by higher levels of volatility in the foreign exchange market in line with the uncertainty related to political risk and macroeconomic variables worldwide.
Dividends and net income from equity investments increased to COP 18,000 million from COP 8,000 million loss in 2022, mainly explained by income from advantageous purchases in the acquisition of autonomous equity, offset by lower dividend income and by equity method of associates and joint ventures, as a result of macroeconomic conditions that generated lower profits.
Total operating expenses increased by 21.51% to COP 8,766,000 million, mainly due to an increase in administrative and general expenses, highlighting the increase in taxes other than income tax, as well as an increase in salaries and benefits to employees.
Assets attributable to Colombian Banking grew by 2.94% during the year, mainly driven by the increase in cash and balances at the central bank and the growth of the loan portfolio, highlighting the performance of the commercial and mortgage portfolio.
Finally, liabilities attributable to Banking Colombia grew 4.30% in 2023, driven by an increase in deposits, leveraged by time deposits.
Banking El Salvador
|
|
For the year ended on December 31, |
|
||||||||
|
|
|
|
|
|
|
|
Variance |
|
Variance |
|
|
|
2023 |
|
2022 |
|
2021 |
|
2023-2022 |
|
2022-2021 |
|
|
|
In millions of Colombian pesos |
|
||||||||
Total interest income and valuation of financial instruments |
|
1,773,140 |
|
1,527,860 |
|
1,193,824 |
|
16.05 |
% |
27.98 |
% |
Total interest on loan portfolio and financial leasing transactions |
|
1,524,765 |
|
1,293,556 |
|
1,072,718 |
|
17.87 |
% |
20.59 |
% |
Total debt securities |
|
236,350 |
|
170,423 |
|
105,035 |
|
38.68 |
% |
62.25 |
% |
Derivatives, net |
|
11,187 |
|
63,494 |
|
15,345 |
|
(82.38) |
% |
313.78 |
% |
Total liquidity transactions, net |
|
838 |
|
387 |
|
726 |
|
116.54 |
% |
(46.69) |
% |
Interest expense |
|
(464,851) |
|
(297,839) |
|
(240,144) |
|
56.07 |
% |
24.03 |
% |
Net interest margin and valuation of financial instruments before allowance for impairment, off-balance sheet commitments and other financial instruments. |
|
1,308,289 |
|
1,230,021 |
|
953,680 |
|
6.36 |
% |
28.98 |
% |
Total (provisions) recovery for credit risk impairment, net |
|
(154,938) |
|
(102,710) |
|
4,271 |
|
50.85 |
% |
(2,504.82) |
% |
Net interest income and valuation of financial instruments after provisions and impairments |
|
1,153,351 |
|
1,127,311 |
|
957,951 |
|
2.31 |
% |
17.68 |
% |
(Expenses) Income from transactions with other operating segments of the Bank |
|
(17,844) |
|
(7,371) |
|
7 |
|
142.08 |
% |
(105,400.00) |
% |
252
Commission income |
|
479,568 |
|
444,177 |
|
359,724 |
|
7.97 |
% |
23.48 |
% |
Commission expenses |
|
(188,972) |
|
(170,563) |
|
(116,600) |
|
10.79 |
% |
46.28 |
% |
Total net commission income |
|
290,596 |
|
273,614 |
|
243,124 |
|
6.21 |
% |
12.54 |
% |
Other operating income (1) |
|
51,656 |
|
19,685 |
|
9,712 |
|
162.41 |
% |
102.69 |
% |
Dividends and other net income from equity interests |
|
10,982 |
|
5,340 |
|
2,760 |
|
105.66 |
% |
93.48 |
% |
Total net income |
|
1,488,741 |
|
1,418,579 |
|
1,213,554 |
|
4.95 |
% |
16.89 |
% |
Operating expenses(2) |
|
(668,105) |
|
(639,748) |
|
(549,782) |
|
4.43 |
% |
16.36 |
% |
Amortization, depreciation and impairment |
|
(131,921) |
|
(106,601) |
|
(81,201) |
|
23.75 |
% |
31.28 |
% |
Total operating expenses |
|
(800,026) |
|
(746,349) |
|
(630,983) |
|
7.19 |
% |
18.28 |
% |
Profit before income tax |
|
688,715 |
|
672,230 |
|
582,571 |
|
2.45 |
% |
15.39 |
% |
Segment assets |
|
21,608,586 |
|
26,696,524 |
|
20,980,061 |
|
(19.06) |
% |
27.25 |
% |
Segment liabilities |
|
19,220,367 |
|
23,738,984 |
|
18,416,563 |
|
(19.03) |
% |
28.90 |
% |
It includes derivatives, net exchange rate, operating leases, and gains on asset sales.
Includes salaries and employee benefits, other general and administrative expenses and taxes other than income taxes.
In 2023, Banking El Salvador's profit before tax increased 2.45% to COP 689,000 million for the reasons described below.
The financial statements in Colombian pesos are affected by the appreciation of the COP against the USD, which reached 20.5% in the last year.
Total interest and valuation expressed in COP increased 16.05% to COP 1,773,000 million (14.13% when expressed in USD) mainly due to higher interest income earned on the commercial portfolio. Likewise, interest expenses grow mainly due to credits with financial institutions and time deposits.
On the other hand, the loan book in COP decreased by 18.97% due to the revaluation effect of the peso against the dollar and increased by 1.98% in USD, mainly driven by the consumer portfolio, which grew by 6.20% expressed in USD. Deposits grew by 1.75%, mainly driven by time deposits and savings accounts. Similarly, bonds also increased to strengthen the liability structure.
Total net charges for credit deterioration increased by 50.85% to COP 155,000 million from COP 103,000 million in 2022, mainly due to the consumer portfolio.
Total net fees and commissions increased by 6.21% to COP 291,000 million despite fee and commission expenses growing by 10.79% due to higher transaction fees charged in banking services.
Total operating expenses increased by 7.19% to COP 800,000 million, mainly due to salaries and benefits to employees.
Assets attributable to Banking El Salvador grew 19,06% during the year, driven mainly by portfolio growth and the exchange rate depreciation that impacted the portfolio in U.S. dollars.
Banking Panama:
253
|
|
For the year ended on December 31, |
|
||||||||
|
|
|
|
|
|
|
|
Variance |
Variance |
|
|
|
|
2023 |
2022 |
2021 |
2023-2022 |
|
2022-2021 |
|
|||
|
|
In millions of Colombian pesos |
|
||||||||
Total interest income and valuation of financial instruments |
|
2,826,559 |
|
2,364,820 |
|
1,963,509 |
|
19.53 |
% |
20.44 |
% |
Total interest on loan portfolio and financial leasing transactions |
|
2,415,234 |
|
2,154,151 |
|
1,791,476 |
|
12.12 |
% |
20.24 |
% |
Total debt securities |
|
301,167 |
|
161,974 |
|
156,377 |
|
85.94 |
% |
3.58 |
% |
Derivatives, net |
|
817 |
|
(1,026) |
|
1,860 |
|
(179.63) |
% |
(155.16) |
% |
Total liquidity transactions, net |
|
109,341 |
|
49,721 |
|
13,796 |
|
119.91 |
% |
260.40 |
% |
Interest expense |
|
(1,238,112) |
|
(910,937) |
|
(796,396) |
|
35.92 |
% |
14.38 |
% |
Net interest margin and valuation of financial instruments before allowance for impairment, off-balance sheet commitments and other financial instruments. |
|
1,588,447 |
|
1,453,883 |
|
1,167,113 |
|
9.26 |
% |
24.57 |
% |
Total provisions for credit risk impairment, net |
|
(270,501) |
|
(545,012) |
|
(323,216) |
|
(50.37) |
% |
68.62 |
% |
Net interest income and valuation of financial instruments after provisions and impairments |
|
1,317,946 |
|
908,871 |
|
843,897 |
|
45.01 |
% |
7.70 |
% |
Expenses from transactions with other operating segments of the Bank |
|
(34,105) |
|
(25,022) |
|
(10,089) |
|
36.30 |
% |
148.01 |
% |
Commission income |
|
532,930 |
|
446,583 |
|
351,603 |
|
19.34 |
% |
27.01 |
% |
Commission expenses |
|
(258,897) |
|
(210,004) |
|
(151,906) |
|
23.28 |
% |
38.25 |
% |
Total net commission income |
|
274,033 |
|
236,579 |
|
199,697 |
|
15.83 |
% |
18.47 |
% |
Other operating income (1) |
|
36,939 |
|
51,494 |
|
19,101 |
|
(28.27) |
% |
169.59 |
% |
Dividends and other net income from equity interests |
|
13,498 |
|
9,655 |
|
4,387 |
|
39.80 |
% |
120.08 |
% |
Total net income |
|
1,608,311 |
|
1,181,577 |
|
1,056,993 |
|
36.12 |
% |
11.79 |
% |
Operating expenses(2) |
|
(909,843) |
|
(797,091) |
|
(700,226) |
|
14.15 |
% |
13.83 |
% |
Amortization, depreciation and impairment |
|
(107,716) |
|
(110,293) |
|
(104,493) |
|
(2.34) |
% |
5.55 |
% |
Total operating expenses |
|
(1,017,559) |
|
(907,384) |
|
(804,719) |
|
12.14 |
% |
12.76 |
% |
Profit before income tax |
|
590,752 |
|
274,193 |
|
252,274 |
|
115.45 |
% |
8.69 |
% |
Segment assets |
|
40,740,495 |
|
52,445,934 |
|
40,561,211 |
|
(22.32) |
% |
29.30 |
% |
Segment liabilities |
|
36,315,750 |
|
47,081,613 |
|
36,231,139 |
|
(22.87) |
% |
29.95 |
% |
It includes derivatives, net exchange rate, operating leases, and gains on asset sales.
Includes salaries and employee benefits, other general and administrative expenses and taxes other than income taxes.
In 2023, the profit before taxes of Banking Panama increased by 115.45% to COP 591,000 million, from COP 274,000 million in 2022 for the reasons described below.
The financial statements in Colombian pesos are affected by the appreciation of the COP against the USD, which reached 20.5% in the last year.
254
Total interest and valuations increased by 19.53% to COP 2,827,000 billion; however, measured in USD, they rose by 17.62%, mainly due to the growth in interest income generated from commercial and mortgage loans, and from the valuation of investments in debt securities. The loan book in dollars decreased by 2.02%, mainly due to the decrease in the commercial loan balance.
The total net charge for credit impairment decreased by 50.37% to COP 270,000 million, compared to COP 545,000 million in 2022. This variation is mainly explained by lower provision charges and higher recoveries from written-off loans.
Total net commissions increased by 15.83% to COP 274,000 million, driven mainly by higher revenues generated by acquisition services, ATM commissions, and insurance banking; despite an increase in banking services expenses.
Total operating expenses increased by 12.14% due to increases in salaries, bonuses, and administrative expenses.
Assets attributable to Banking Panamá increased 22.32% during the year, mainly due to the depreciation of the exchange rate, which impacted loans in USD.
Banking Guatemala
|
|
For the year ended on December 31, |
|
||||||||
|
|
|
|
|
|
|
|
Variance |
Variance |
|
|
|
|
2023 |
|
2022 |
|
2021 |
|
2023-2022 |
|
2022-2021 |
|
|
|
In millions of Colombian pesos |
|
||||||||
Total interest income and valuation of financial instruments |
|
1,795,543 |
|
1,537,801 |
|
1,178,615 |
|
16.76 |
% |
30.48 |
% |
Total interest on loan portfolio and financial leasing transactions |
|
1,726,821 |
|
1,509,143 |
|
1,109,804 |
|
14.42 |
% |
35.98 |
% |
Total debt securities |
|
60,534 |
|
27,089 |
|
67,772 |
|
123.46 |
% |
(60.03) |
% |
Total liquidity transactions, net |
|
8,188 |
|
1,569 |
|
1,039 |
|
421.86 |
% |
51.01 |
% |
Interest expense |
|
(731,886) |
|
(528,459) |
|
(397,138) |
|
38.49 |
% |
33.07 |
% |
Net interest margin and valuation of financial instruments before allowance for impairment, off-balance sheet commitments and other financial instruments. |
|
1,063,657 |
|
1,009,342 |
|
781,477 |
|
5.38 |
% |
29.16 |
% |
Total (provisions) recovery for credit risk impairment, net |
|
(499,368) |
|
(168,834) |
|
35,841 |
|
195.77 |
% |
(571.06) |
% |
Net interest income and valuation of financial instruments after provisions and impairments |
|
564,289 |
|
840,508 |
|
817,318 |
|
(32.86) |
% |
2.84 |
% |
Expenses from transactions with other operating segments of the Bank |
|
(76,054) |
|
(45,526) |
|
(26,324) |
|
67.06 |
% |
72.94 |
% |
Commission income |
|
223,200 |
|
218,554 |
|
159,908 |
|
2.13 |
% |
36.67 |
% |
Commission expenses |
|
(89,405) |
|
(91,424) |
|
(50,144) |
|
(2.21) |
% |
82.32 |
% |
Total net commission income |
|
133,795 |
|
127,130 |
|
109,764 |
|
5.24 |
% |
15.82 |
% |
Other operating income (1) |
|
130,757 |
|
129,403 |
|
82,855 |
|
1.05 |
% |
56.18 |
% |
Dividends and other net income from equity interests |
|
1,827 |
|
828 |
|
658 |
|
120.65 |
% |
25.84 |
% |
255
Total net income |
|
754,614 |
|
1,052,343 |
|
984,271 |
|
(28.29) |
% |
6.92 |
% |
Operating expenses(2) |
|
(620,928) |
|
(577,497) |
|
(464,199) |
|
7.52 |
% |
24.41 |
% |
Amortization, depreciation and impairment |
|
(55,243) |
|
(54,999) |
|
(102,991) |
|
0.44 |
% |
(46.60) |
% |
Total operating expenses |
|
(676,171) |
|
(632,496) |
|
(567,190) |
|
6.91 |
% |
11.51 |
% |
Profit before income tax |
|
78,443 |
|
419,847 |
|
417,081 |
|
(81.32) |
% |
0.66 |
% |
Segment assets |
|
21,377,205 |
|
26,143,629 |
|
19,510,688 |
|
(18.23) |
% |
34.00 |
% |
Segment liabilities |
|
19,469,075 |
|
23,635,998 |
|
17,763,659 |
|
(17.63) |
% |
33.06 |
% |
It includes derivatives, net exchange rate, operating leases, and gains on asset sales.
Includes salaries and employee benefits, other general and administrative expenses and taxes other than income taxes.
In 2023, the profit before taxes of Banking Guatemala decreased to COP 78,000 million from a profit of COP 420,000 million in 2022 for the reasons described below.
The financial statements in Colombian pesos were affected by the depreciation of the COP against the USD, which reached 20.5% during the last year.
Total interest and valuations increased by COP 16.76%, to COP 1,795,000 million, and increased 14.66% in USD, due to a better performance of the loan portfolio driven mainly by the consumer portfolio. The loan portfolio expressed in USD grew by 2.29%, primarily propelled by a 7.77% increase in consumer loans and a 14.57% increase in mortgages.
The total net credit impairment charge increased by 195.77% to COP 499,000 million, from COP 169,000 million in 2022, due to higher provisions in the consumer portfolio and lower provision reversals compared to 2022.
Total net commissions increased by 5.24% to COP 134,000 million mainly due to the growth of electronic service commissions and ATM commissions leveraged by the reduction in commission expenses for sales and services.
Total operating expenses increased by 6.91% to COP 676,000 million, mainly due to increases in salaries and administrative expenses for maintenance.
Assets attributable to Banking Guatemala in COP decreased by 18.23% (increased by 2.91% expressed in USD) during the year, mainly explained by the appreciation of the exchange rate that impacted loans expressed in US dollars.
Fiduciary:
|
|
For the year ended on December 31, |
|
||||||||
|
|
|
|
|
|
|
|
Variance |
|
Variance |
|
|
|
2023 |
|
2022 |
|
2021 |
|
2023-2022 |
|
2022-2021 |
|
|
|
In millions of Colombian pesos |
|
||||||||
Total interest income and valuation of financial instruments |
|
47 |
|
72 |
|
46 |
|
(34.72) |
% |
56.52 |
% |
Total interest on loan portfolio and financial leasing transactions |
|
47 |
|
72 |
|
46 |
|
(34.72) |
% |
56.52 |
% |
Interest expense |
|
(179) |
|
(150) |
|
(167) |
|
19.33 |
% |
(10.18) |
% |
Net interest margin and valuation of financial instruments before allowance for impairment, off-balance sheet commitments and other financial instruments. |
|
(132) |
|
(78) |
|
(121) |
|
69.23 |
% |
(35.54) |
% |
256
Total provisions for credit risk impairment, net |
|
(2,893) |
|
(796) |
|
(4,595) |
|
263.44 |
% |
(82.68) |
% |
Net interest income and valuation of financial instruments after provisions and impairments |
|
(3,025) |
|
(874) |
|
(4,716) |
|
246.11 |
% |
(81.47) |
% |
Expenses from transactions with other operating segments of the Bank |
|
(16,518) |
|
(12,658) |
|
(26,584) |
|
30.49 |
% |
(52.38) |
% |
Commission income |
|
361,965 |
|
318,869 |
|
347,878 |
|
13.52 |
% |
(8.34) |
% |
Commission expenses |
|
(4,244) |
|
(3,668) |
|
(3,881) |
|
15.70 |
% |
(5.49) |
% |
Total net commission income |
|
357,721 |
|
315,201 |
|
343,997 |
|
13.49 |
% |
(8.37) |
% |
Other operating income (1) |
|
14,107 |
|
14,897 |
|
12,702 |
|
(5.30) |
% |
17.28 |
% |
Dividends and other net income from equity interests |
|
33,275 |
|
2,164 |
|
28,201 |
|
1,437.66 |
% |
(92.33) |
% |
Total net income |
|
385,560 |
|
318,730 |
|
353,600 |
|
20.97 |
% |
(9.86) |
% |
Operating expenses(2) |
|
(177,626) |
|
(153,377) |
|
(129,923) |
|
15.81 |
% |
18.05 |
% |
Amortization, depreciation and impairment |
|
(2,218) |
|
(1,630) |
|
(1,548) |
|
36.07 |
% |
5.30 |
% |
Total operating expenses |
|
(179,844) |
|
(155,007) |
|
(131,471) |
|
16.02 |
% |
17.90 |
% |
Profit before income tax |
|
205,716 |
|
163,723 |
|
222,129 |
|
25.65 |
% |
(26.29) |
% |
Segment assets |
|
658,547 |
|
603,486 |
|
638,280 |
|
9.12 |
% |
(5.45) |
% |
Segment liabilities |
|
138,171 |
|
126,307 |
|
108,254 |
|
9.39 |
% |
16.68 |
% |
It includes net exchange rate, operating leases, and gains on asset sales.
Includes salaries and employee benefits, other general and administrative expenses and taxes other than income taxes.
In 2023, the fiduciary segment's profit before tax increased by 25.65% to COP 206,000 million from COP 164,000 million in 2022, for the reasons described below:
Total net commissions increased by 13.49% to COP 358,000 million, mainly driven by an increase in commissions from collective investment funds. The total net operating result rose by 20.97% to COP 386,000 million compared to 2022.
Total operating expenses increased by 16.02% to COP 180,000 million, mainly explained by an increase in salaries and employee benefits by 27.9% to COP 29,000 million.
Assets attributable to the Fiduciary segment grew by 9.12% during 2023 to COP 659,000 million, due to the performance of investments in associates and the purchase of investment certificates.
Liabilities increased by 9.39% to COP 138,000 million, due to growth in liabilities for employee benefits and taxes.
Investment Banking:
|
|
For the year ended on December 31, |
|
||||||||||
|
|
|
|
|
|
|
|
Variance |
|
Variance |
|
||
|
|
2023 |
|
2022 |
|
2021 |
|
2023-2022 |
|
2022-2021 |
|
||
|
|
In millions of Colombian pesos |
|
||||||||||
Total interest income and valuation of financial instruments |
|
6 |
|
4 |
|
— |
|
50.00 |
% |
100.00 |
% |
||
Total debt securities |
|
6 |
|
4 |
|
— |
|
50.00 |
% |
100.00 |
% |
||
257
Interest expense |
|
(1) |
|
(4) |
|
(7) |
|
(75.00) |
% |
(42.86) |
% |
||
Net interest margin and valuation of financial instruments before allowance for impairment, off-balance sheet commitments and other financial instruments. |
|
5 |
|
— |
|
(7) |
|
100.00 |
% |
(100.00) |
% |
||
Total provisions for credit risk impairment, net |
|
(380) |
|
(924) |
|
(55) |
|
(58.87) |
% |
1,580.00 |
% |
||
Net interest income and valuation of financial instruments after provisions and impairments |
|
(375) |
|
(924) |
|
(62) |
|
(59.42) |
% |
1,390.32 |
% |
||
Income from transactions with other operating segments of the Bank |
|
13,949 |
|
3,404 |
|
3,576 |
|
309.78 |
% |
(4.81) |
% |
||
Commission income |
|
55,917 |
|
86,232 |
|
79,531 |
|
(35.16) |
% |
8.43 |
% |
||
Commission expenses |
|
(238) |
|
(269) |
|
(49) |
|
(11.52) |
% |
448.98 |
% |
||
Total net commission income |
|
55,679 |
|
85,963 |
|
79,482 |
|
(35.23) |
% |
8.15 |
% |
||
Other (expense) operating income (1) |
|
(1,011) |
|
671 |
|
879 |
|
(250.67) |
% |
(23.66) |
% |
||
Dividends and other net income from equity interests |
|
(98,512) |
|
8,760 |
|
(232) |
|
(1,224.57) |
% |
(3,875.86) |
% |
||
Total net income |
|
(30,270) |
|
97,874 |
|
83,643 |
|
(130.93) |
% |
17.01 |
% |
||
Operating expenses(2) |
|
(49,759) |
|
(47,997) |
|
(34,905) |
|
3.67 |
% |
37.51 |
% |
||
Amortization, depreciation and impairment |
|
(208) |
|
(232) |
|
(206) |
|
(10.34) |
% |
12.62 |
% |
||
Total operating expenses |
|
(49,967) |
|
(48,229) |
|
(35,111) |
|
3.60 |
% |
37.36 |
% |
||
Profit before income tax |
|
(80,237) |
|
49,645 |
|
48,532 |
|
(261.62) |
% |
2.29 |
% |
||
Segment assets |
|
1,719,824 |
|
2,116,143 |
|
2,039,204 |
|
(18.73) |
% |
3.77 |
% |
||
Segment liabilities |
|
51,841 |
|
80,162 |
|
55,743 |
|
(35.33) |
% |
43.81 |
% |
||
It includes derivatives, net exchange rate, operating leases, and gains on asset sales.
Includes salaries and employee benefits, other general and administrative expenses and taxes other than income taxes.
In 2023, the Investment Banking segment's profit before tax decreased by 261.62% to COP (80,000) million from COP 49,600 million in 2022, for the reasons described below:
Total net commissions decreased by 35.23% to COP 56,000 million due to lower commissions in structured financing, financial consulting services, and securities structuring.
Dividends received and the share of profits from investments by equity method reported a decrease by COP (99,000) million from COP 9,000 million in 2022, due to lower net profit from equity investments. The total net operating result decreased by 130.93% to COP (30,000) million from COP 98,000 million in 2022.
Total operating expenses increased by 3.60% to COP 50,000 million. The increase is largely due to increases in administrative expenses and a slight decrease in salaries and employee benefits.
Assets attributable to Investment Banking decreased by 18.73% to COP 1,720,000 million, mainly explained by the decrease in associated investments and joint ventures.
Liabilities attributable to the Investment Banking segment increased by 35.33% during 2023 to COP 52,000,000 million, due to an increase in liabilities for employee benefits and taxes.
258
Brokerage
|
|
For the year ended on December 31, 2022 |
|
||||||||
|
|
|
|
|
|
|
|
Variance |
|
Variance |
|
|
|
2023 |
|
2022 |
|
2021 |
|
2023-2022 |
|
2022-2021 |
|
|
|
In millions of Colombian pesos |
|
||||||||
Total interest income and valuation of financial instruments |
|
45,875 |
|
12,996 |
|
12,277 |
|
252.99 |
% |
5.86 |
% |
Total interest on loan portfolio and financial leasing transactions |
|
5,076 |
|
511 |
|
28 |
|
893.35 |
% |
1,725.00 |
% |
Total debt securities |
|
36,538 |
|
20,024 |
|
12,540 |
|
82.47 |
% |
59.68 |
% |
Derivatives, net |
|
(1,747) |
|
658 |
|
(832) |
|
(365.50) |
% |
(179.09) |
% |
Total liquidity transactions, net |
|
6,008 |
|
(8,197) |
|
541 |
|
(173.30) |
% |
(1,615.16) |
% |
Interest expense |
|
(222) |
|
(104) |
|
(73) |
|
113.46 |
% |
42.47 |
% |
Net interest margin and valuation of financial instruments before allowance for impairment, off-balance sheet commitments and other financial instruments. |
|
45,653 |
|
12,892 |
|
12,204 |
|
254.12 |
% |
5.64 |
% |
Total recovery (provisions) for credit risk impairment, net |
|
106 |
|
3,133 |
|
(116) |
|
(96.62) |
% |
(2,800.86) |
% |
Net interest income and valuation of financial instruments after provisions and impairments |
|
45,759 |
|
16,025 |
|
12,088 |
|
185.55 |
% |
32.57 |
% |
Income from transactions with other operating segments of the Bank |
|
68,617 |
|
53,229 |
|
59,995 |
|
28.91 |
% |
(11.28) |
% |
Commission income |
|
103,985 |
|
111,366 |
|
117,282 |
|
(6.63) |
% |
(5.04) |
% |
Commission expenses |
|
(8,645) |
|
(6,160) |
|
(4,135) |
|
40.34 |
% |
48.97 |
% |
Total net commission income |
|
95,340 |
|
105,206 |
|
113,147 |
|
(9.38) |
% |
(7.02) |
% |
Other (expense) operational income (1) |
|
4,737 |
|
13,575 |
|
(6,075) |
|
(65.10) |
% |
(323.46) |
% |
Dividends and other net income from equity interests |
|
6,416 |
|
(4,314) |
|
2,177 |
|
(248.73) |
% |
(298.16) |
% |
Total net income |
|
220,869 |
|
183,721 |
|
181,332 |
|
20.22 |
% |
1.32 |
% |
Operating expenses(2) |
|
(186,212) |
|
(153,317) |
|
(119,265) |
|
21.46 |
% |
28.55 |
% |
Amortization, depreciation and impairment |
|
(2,950) |
|
(1,754) |
|
(1,896) |
|
68.19 |
% |
(7.49) |
% |
Total operating expenses |
|
(189,162) |
|
(155,071) |
|
(121,161) |
|
21.98 |
% |
27.99 |
% |
Profit before income tax |
|
31,707 |
|
28,650 |
|
60,171 |
|
10.67 |
% |
(52.39) |
% |
Segment assets |
|
351,694 |
|
326,047 |
|
371,278 |
|
7.87 |
% |
(12.18) |
% |
Segment liabilities |
|
121,423 |
|
106,115 |
|
125,176 |
|
14.43 |
% |
(15.23) |
% |
It includes derivatives, net exchange rate, operating leases, and gains on asset sales.
Includes salaries and employee benefits, other general and administrative expenses and taxes other than income taxes.
In 2023, the brokerage segment's profit before tax increased by 10.67% to COP 32,000 million from COP 29,000 million in 2022, for the reasons described below.
Total interest and valuation surged by 252.99% to COP 46,000 million, primarily due to an 82.47% increase in the valuation of debt investments.
259
Total net commissions decreased by 9.38% to COP 95,000 million, mainly attributed to a decrease of COP 7,000 million in brokerage commission revenues due to reduced market operations and COP 4,000 million in investment funds due to lower volumes managed in securities and private equity funds. Total net operating income grew by 20.22% compared to 2022.
Total operating expenses increased by 21.98% to COP 189,000 million from COP 155,000 million in 2022, mainly driven by a 12.49% rise to COP 97,000 million in salaries, employee benefits, and severance pay.
Assets attributable to the Stockbrokerage segment increased by 7.87%, primarily due to an increase in the capital investment portfolio. Liabilities attributable to the brokerage segment decreased 14.43% in 2023 to COP 121,000,000 million, due to a reduction in liabilities for money market operations.
International Banking
|
|
For the year ended on December 31, |
|
||||||||
|
|
|
|
|
|
|
|
Variance |
|
Variance |
|
|
|
2023 |
|
2022 |
|
2021 |
|
2023-2022 |
|
2022-2021 |
|
|
|
In millions of Colombian pesos |
|
||||||||
Total interest income and valuation of financial instruments |
|
1,112,171 |
|
512,417 |
|
251,135 |
|
117.04 |
% |
104.04 |
% |
Total interest on loan portfolio and financial leasing transactions |
|
940,091 |
|
446,028 |
|
215,529 |
|
110.77 |
% |
106.95 |
% |
Total debt securities |
|
85,091 |
|
48,722 |
|
35,739 |
|
74.65 |
% |
36.33 |
% |
Derivatives, net |
|
(188) |
|
— |
|
1 |
|
100.00 |
% |
(100.00) |
% |
Total liquidity transactions |
|
87,177 |
|
17,667 |
|
(134) |
|
393.45 |
% |
(13,284.33) |
% |
Interest expense |
|
(596,039) |
|
(271,280) |
|
(198,012) |
|
119.71 |
% |
37.00 |
% |
Net interest margin and valuation of financial instruments before allowance for impairment, off-balance sheet commitments and other financial instruments. |
|
516,132 |
|
241,137 |
|
53,123 |
|
114.04 |
% |
353.92 |
% |
Total recovery for credit risk impairment, net |
|
4,164 |
|
25,029 |
|
14,995 |
|
(83.36) |
% |
66.92 |
% |
Net interest income and valuation of financial instruments after provisions and impairments |
|
520,296 |
|
266,166 |
|
68,118 |
|
95.48 |
% |
290.74 |
% |
Income from transactions with other operating segments of the Bank |
|
415,508 |
|
212,049 |
|
81,997 |
|
95.95 |
% |
158.61 |
% |
Commission income |
|
47,228 |
|
42,021 |
|
33,309 |
|
12.39 |
% |
26.16 |
% |
Commission expenses |
|
(11,042) |
|
(8,025) |
|
(6,556) |
|
37.60 |
% |
22.41 |
% |
Total net commission income |
|
36,186 |
|
33,996 |
|
26,753 |
|
6.44 |
% |
27.07 |
% |
Other operating income (1) |
|
16,794 |
|
9,954 |
|
11,109 |
|
68.72 |
% |
(10.40) |
% |
Dividends and other net income from equity interests |
|
37 |
|
35 |
|
20 |
|
5.71 |
% |
75.00 |
% |
Total net income |
|
988,821 |
|
522,200 |
|
187,997 |
|
89.36 |
% |
177.77 |
% |
260
Operating expenses(2) |
|
(89,219) |
|
(79,814) |
|
(61,191) |
|
11.78 |
% |
30.43 |
% |
Amortization, depreciation and impairment |
|
(4,259) |
|
(2,626) |
|
(1,993) |
|
62.19 |
% |
31.76 |
% |
Total operating expenses |
|
(93,478) |
|
(82,440) |
|
(63,184) |
|
13.39 |
% |
30.48 |
% |
Profit before income tax |
|
895,343 |
|
439,760 |
|
124,813 |
|
103.60 |
% |
252.34 |
% |
Segment assets |
|
30,199,897 |
|
35,131,458 |
|
24,074,957 |
|
(14.04) |
% |
45.93 |
% |
Segment liabilities |
|
20,734,521 |
|
23,216,118 |
|
15,568,638 |
|
(10.69) |
% |
49.12 |
% |
It includes derivatives, net exchange rate, operating leases, and gains on asset sales.
Includes salaries and employee benefits, other general and administrative expenses and taxes other than income taxes.
In 2023, the International Banking segment's profit before tax increased by 103.60% to COP 895,000 million from COP 440,000 million in 2022 for the reasons described below.
The financial statements in Colombian pesos are affected by the appreciation of the COP against the USD, which reached 20.5% in the last year. Despite this, total interest and valuations increased in COP terms by 117.04% to COP 1,112,000 million from COP 512,000 million in 2022, mainly due to increased interest income from corporate customer loans, interbank funds, and debt securities investments.
The total recovery for credit impairment decreased by 83.36% to COP (4,000) million from COP (25,000) million in 2022, mainly due to a lower volume of provision reversals resulting from a reduced loan portfolio balance and lower asset quality.
Total net commissions increased by 6.44% to COP 36,000 million, mainly due to a higher transaction volume resulting from an increase in the number of customers in recent years. Commission expenses increased due to higher professional fees for correspondent banking with other entities in the group.
Total operating expenses increased by 13.39% to COP 93,000 million due to investments in digital transformation and automation of operational capabilities.
Assets attributable to the International Banking segment increased by 14.04%, to COP 30,200,000 million, mainly due to the growth of the portfolio and the depreciation of the exchange rate, which impacted loans in U.S. dollars.
All other segments:
|
|
For the year ended on December 31, |
|
||||||||
|
|
|
|
|
|
|
|
Variance |
|
Variance |
|
|
|
2023 |
2022 |
2021 |
2023-2022 |
|
2022-2021 |
|
|||
|
|
In millions of Colombian pesos |
|
||||||||
Total interest income and valuation of financial instruments |
|
262,758 |
|
113,642 |
|
37,898 |
|
131.22 |
% |
199.86 |
% |
Total interest on loan portfolio and financial leasing transactions |
|
262,075 |
|
116,072 |
|
36,226 |
|
125.79 |
% |
220.41 |
% |
Total debt securities |
|
683 |
|
(2,447) |
|
632 |
|
(127.91) |
% |
(487.18) |
% |
261
Total liquidity transactions |
|
— |
|
17 |
|
1,040 |
|
(100.00) |
% |
(98.37) |
% |
Interest expense |
|
(172,025) |
|
(99,863) |
|
(52,776) |
|
72.26 |
% |
89.22 |
% |
Net interest margin and valuation of financial instruments before allowance for impairment, off-balance sheet commitments and other financial instruments. |
|
90,733 |
|
13,779 |
|
(14,878) |
|
558.49 |
% |
(192.61) |
% |
Total provisions for credit risk impairment, net |
|
(57,399) |
|
(29,984) |
|
(17,836) |
|
91.43 |
% |
68.11 |
% |
Net interest income and valuation of financial instruments after provisions and impairments |
|
33,334 |
|
(16,205) |
|
(32,714) |
|
(305.70) |
% |
(50.46) |
% |
Expenses from transactions with other operating segments of the Bank |
|
(166,086) |
|
(145,942) |
|
(101,036) |
|
13.80 |
% |
44.45 |
% |
Commission income |
|
23,986 |
|
18,161 |
|
3,097 |
|
32.07 |
% |
486.41 |
% |
Commission expenses |
|
(12,910) |
|
(468) |
|
(2,721) |
|
2,658.55 |
% |
(82.80) |
% |
Total net commission income |
|
11,076 |
|
17,693 |
|
376 |
|
(37.40) |
% |
4,605.59 |
% |
Other operating income (1) |
|
2,149,826 |
|
1,886,750 |
|
1,238,893 |
|
13.94 |
% |
52.29 |
% |
Dividends and other net income from equity interests |
|
225,049 |
|
221,444 |
|
196,604 |
|
1.63 |
% |
12.63 |
% |
Total net income |
|
2,253,199 |
|
1,963,740 |
|
1,302,123 |
|
14.74 |
% |
50.81 |
% |
Operating expenses(2) |
|
(1,093,592) |
|
(857,541) |
|
(633,171) |
|
27.53 |
% |
35.44 |
% |
Amortization, depreciation and impairment |
|
(75,998) |
|
(88,633) |
|
(95,773) |
|
(14.26) |
% |
(7.46) |
% |
Total operating expenses |
|
(1,169,590) |
|
(946,174) |
|
(728,944) |
|
23.61 |
% |
29.80 |
% |
Profit before income tax |
|
1,083,609 |
|
1,017,566 |
|
573,179 |
|
6.49 |
% |
77.53 |
% |
Segment assets |
|
10,224,734 |
|
9,222,529 |
|
7,117,110 |
|
10.87 |
% |
29.58 |
% |
Segment liabilities |
|
4,874,547 |
|
4,320,836 |
|
3,037,853 |
|
12.81 |
% |
42.23 |
% |
It includes derivatives, net exchange rate, operating leases, and gains on asset sales.
Includes salaries and employee benefits, other general and administrative expenses and taxes other than income taxes.
In 2023, the pre-tax profit of other segments grew by 6.49% to COP 1,084,000 million, for the reasons described below.
The total interest from loan portfolios and financial leasing operations increased by 125.79%, associated with the rise in leasing fees.
Other operating revenues grew by 13.94% to COP 2,150,000 million, associated with the increase in operational leasing fees from Renting Colombia.
Dividends and net income from equity investments increased by 1.63% to COP 225,000 million in 2023 due to the better performance of the real estate asset portfolio.
Operating expenses increased by 27.53%, primarily due to administrative and general expenses such as maintenance, losses from accidents, depreciation, among others.
Assets of other segments increased by 10.87%, reaching COP 10,200,000 million.
Selected Statistical Information
The following information should be read together with the Consolidated Financial Statements, as well as with section 5, "Analysis and operational and financial perspectives." This information has been prepared from the Bank's financial records, which are prepared in accordance with IFRS issued by the IASB and the corresponding interpretations issued by the IFRS Interpretations Committee.
262
The selected consolidated statistical information corresponds to the Bank, including all Subsidiaries over which Bancolombia has control.
Distribution of assets, liabilities and equity; interest rates and differential interest rate
The average balances for each of the years ended December 31, 2023, 2022, and 2021 have been calculated as the arithmetic mean of the last 13 monthly balances under IFRS. In addition, interest rate subtotals are based on the weighted average of local and foreign assets and liabilities.
Averages of the Consolidated Statement of Financial Position
The following table presents information for the years ended December 31, 2023 and 2022 on: (i) the average of all assets and liabilities of Bancolombia Group, (ii) the value of interest received and paid, and (iii) the nominal interest rates resulting from interest on average assets and liabilities:
Statement of average financial position and interest income received from average assets, as of December 31, (1) | ||||||
|
2023 |
2022 |
||||
|
In millions of Colombian pesos (except percentages) |
|||||
|
Average |
Interest included in income |
Average interest / assets |
Average |
Interest included in income |
Average interest / assets |
ASSET |
|
|||||
Interest-earning assets |
|
|||||
Interbank |
|
|
|
|
|
|
Local activities |
91,258 |
10,028 |
10.99% |
56,945 |
5,063 |
8.89% |
Foreign activities |
2,981,291 |
187,279 |
6.28% |
2,367,478 |
56,899 |
2.40% |
Total |
3,072,549 |
197,307 |
6.42% |
2,424,423 |
61,962 |
2.56% |
Repos |
||||||
Local activities |
2,676,670 |
292,971 |
10.95% |
1,086,449 |
77,664 |
7.15% |
Foreign activities |
73,920 |
11,777 |
15.93% |
122,943 |
8,044 |
6.54% |
Total |
2,750,590 |
304,748 |
11.08% |
1,209,392 |
85,708 |
7.09% |
Debt securities(2) |
||||||
Local activities |
10,599,721 |
1,376,246 |
12.98% |
11,990,844 |
512,492 |
4.27% |
Foreign activities |
16,826,459 |
281,213 |
1.67% |
14,742,929 |
1,274,596 |
8.65% |
Total |
27,426,180 |
1,657,459 |
6.04% |
26,733,773 |
1,787,088 |
6.68% |
Customer loan portfolio |
||||||
Local activities |
172,515,187 |
27,947,473 |
16.20% |
155,827,942 |
18,914,965 |
12.14% |
Foreign activities |
89,986,484 |
7,293,314 |
8.10% |
87,318,297 |
5,868,528 |
6.72% |
Total |
262,501,671 |
35,240,787 |
13.42% |
243,146,239 |
24,783,493 |
10.19% |
Total interest-earning assets |
||||||
263
Local activities |
185,882,836 |
29,626,718 |
15.94% |
168,962,180 |
19,510,184 |
11.55% |
Foreign activities |
109,868,154 |
7,773,583 |
7.08% |
104,551,647 |
7,208,067 |
6.89% |
Total |
295,750,990 |
37,400,301 |
12.65% |
273,513,827 |
26,718,251 |
9.77% |
Total non-interest-earning assets |
||||||
Local activities |
23,428,476 |
— |
— |
19,302,722 |
— |
— |
Foreign activities(3) |
24,158,685 |
— |
— |
22,495,964 |
— |
— |
Total |
47,587,161 |
— |
— |
41,798,686 |
— |
— |
Total assets |
||||||
Local activities |
209,311,312 |
29,626,718 |
14.15% |
188,264,902 |
19,510,184 |
10.36% |
Foreign activities(3) |
134,026,839 |
7,773,583 |
5.80% |
127,047,611 |
7,208,067 |
5.67% |
Total assets |
343,338,151 |
37,400,301 |
10.89% |
315,312,513 |
26,718,251 |
8.47% |
(1) The average assets of Bancolombia Group have been calculated based on the last 13 months of the balance sheet under IFRS.
(2) Tax-exempt income from debt securities has not been calculated on a tax-equivalent basis because the effect of such calculation is not significant.
(3)The percentage of the total average assets attributable to foreign activities was 39.0%, 40.3%, and 38.6%, respectively, for the years ended December 31, 2023, 2022, and 2021.
Statement of average financial position and interest expense paid on average liabilities, as of December 31,(1) | ||||||
|
2023 |
2022 |
||||
|
In millions of Colombian pesos (except percentages) |
|||||
|
Average |
Interest included in income |
Average interest / liabilities(2) |
Average |
Interest included in income |
Average interest / liabilities(2) |
LIABILITIES AND STOCKHOLDERS’ EQUITY |
|
|||||
Interest-bearing liabilities |
|
|
|
|
|
|
Checking accounts |
|
|||||
Local activities |
22,001,228 |
22,131 |
0.10% |
25,899,835 |
25,944 |
0.10% |
Foreign activities |
18,432,636 |
68,657 |
0.37% |
18,344,263 |
49,633 |
0.27% |
Total |
40,433,864 |
90,788 |
0.22% |
44,244,098 |
75,577 |
0.17% |
Savings accounts |
||||||
Local activities |
79,151,508 |
3,463,957 |
4.38% |
80,939,114 |
1,936,283 |
2.39% |
Foreign activities |
29,694,615 |
395,108 |
1.33% |
29,911,479 |
346,288 |
1.16% |
Total |
108,846,123 |
3,859,065 |
3.55% |
110,850,593 |
2,282,571 |
2.06% |
Time deposits |
||||||
Local activities |
54,810,787 |
7,586,429 |
13.84% |
30,895,060 |
2,615,941 |
8.47% |
Foreign activities |
42,637,064 |
1,787,234 |
4.19% |
38,508,868 |
1,167,591 |
3.03% |
Total |
97,447,851 |
9,373,663 |
9.62% |
69,403,928 |
3,783,532 |
5.45% |
264
Repos |
||||||
Local activities |
968,917 |
160,766 |
16.59% |
1,617,857 |
165,440 |
10.23% |
Foreign activities |
54,757 |
6,968 |
12.73% |
87,737 |
4,678 |
5.33% |
Total |
1,023,674 |
167,734 |
16.39% |
1,705,594 |
170,118 |
9.97% |
Financial obligations(2) |
||||||
Local activities |
5,645,529 |
798,977 |
14.15% |
4,691,668 |
390,970 |
8.33% |
Foreign activities |
11,769,294 |
860,019 |
7.31% |
8,874,224 |
372,747 |
4.20% |
Total |
17,414,823 |
1,658,996 |
9.53% |
13,565,892 |
763,717 |
5.63% |
Interbank(2)(3) |
||||||
Local activities |
71,595 |
11,260 |
15.73% |
78,105 |
5,288 |
6.77% |
Foreign activities |
723,898 |
19,280 |
2.66% |
706,734 |
6,087 |
0.86% |
Total |
795,493 |
30,540 |
3.84% |
784,839 |
11,375 |
1.45% |
Debt securities issued |
||||||
Local activities |
4,602,387 |
895,296 |
19.45% |
4,237,757 |
740,063 |
17.46% |
Foreign activities |
12,856,710 |
531,319 |
4.13% |
16,259,152 |
588,448 |
3.62% |
Total |
17,459,097 |
1,426,615 |
8.17% |
20,496,909 |
1,328,511 |
6.48% |
Lease liabilities |
||||||
Local activities |
987,982 |
71,808 |
7.27% |
967,289 |
64,611 |
6.68% |
Foreign activities |
802,540 |
42,007 |
5.23% |
843,771 |
46,738 |
5.54% |
Total |
1,790,522 |
113,815 |
6.36% |
1,811,060 |
111,349 |
6.15% |
Total interest-bearing liabilities |
||||||
Local activities |
168,239,933 |
13,010,624 |
7.73% |
149,326,685 |
5,944,540 |
3.98% |
Foreign activities |
116,971,514 |
3,710,592 |
3.17% |
113,536,228 |
2,582,210 |
2.27% |
Total |
285,211,447 |
16,721,216 |
5.86% |
262,862,913 |
8,526,750 |
3.24% |
Total non-interest-bearing liabilities |
||||||
Local activities |
15,982,833 |
— |
— |
13,675,803 |
— |
— |
Foreign activities |
3,298,036 |
— |
— |
3,087,785 |
— |
— |
Total |
19,280,869 |
— |
— |
16,763,588 |
— |
— |
Shareholders' equity |
||||||
Local activities |
29,371,732 |
— |
— |
26,739,788 |
— |
— |
Foreign activities |
9,474,103 |
— |
— |
8,946,224 |
— |
— |
Total |
38,845,835 |
— |
— |
35,686,012 |
— |
— |
Total Shareholders' Liabilities and Equity(4) |
||||||
Local activities |
213,594,498 |
13,010,624 |
6.09% |
189,742,276 |
5,944,540 |
3.13% |
Foreign activities(4) |
129,743,653 |
3,710,592 |
2.86% |
125,570,237 |
2,582,210 |
2.06% |
Total |
343,338,151 |
16,721,216 |
4.87% |
315,312,513 |
8,526,750 |
2.70% |
265
(1) The average liabilities and shareholders' equity of Bancolombia Group have been calculated based on the last 13 months of the balance sheet under IFRS.
(2) Includes both short-term and long-term obligations.
(3) Includes obligations with banks located outside Colombia.
(4) The percentage of total average liabilities attributable to foreign activities was 39.5%, 41.7%, and 40.2%, respectively, for the years ended December 31, 2023, 2022, and 2021.
Changes in Net Interest Income: Volume and Rate Analysis
The following table allocates, for domestic and foreign activities, the changes in net interest income of Bancolombia Group to changes in average volume, changes in nominal rates and the net variation caused by changes in both average volume and nominal rate for the year ended December 31, 2023 compared to the year ended December 31, 2022. Volume and rate changes have been calculated based on movements in average balances for the period and changes in nominal interest rates on average earning assets and average earning liabilities. Net changes attributable to changes in both volume and interest rate have been allocated to the change due to changes in volume.
December 31, 2023 - December 31, 2022 |
||||
|---|---|---|---|---|
Increases (decreases) due to changes in: | ||||
|
Volume |
Rate |
Net change |
|
Interest-earning assets |
|
|
||
Interbank |
|
|||
Local activities |
3,568 |
1,397 |
4,965 |
|
Foreign activities |
18,047 |
112,333 |
130,380 |
|
Total |
21,615 |
113,730 |
135,345 |
|
Repos |
||||
Local activities |
157,978 |
57,329 |
215,307 |
|
Foreign activities |
(1,436) |
5,169 |
3,733 |
|
Total |
156,542 |
62,498 |
219,040 |
|
Debt securities(1) |
|
|||
Local activities |
(52,143) |
915,897 |
863,754 |
|
Foreign activities |
210,995 |
(1,204,378) |
(993,383) |
|
Total |
158,852 |
(288,481) |
(129,629) |
|
Customer loan portfolio, net |
|
|||
Local activities |
2,189,882 |
6,842,626 |
9,032,508 |
|
Foreign activities |
184,097 |
1,240,689 |
1,424,786 |
|
Total |
2,373,979 |
8,083,315 |
10,457,294 |
|
Total interest-earning assets |
|
|||
Local activities |
2,299,285 |
7,817,249 |
10,116,534 |
|
Foreign activities |
411,703 |
153,813 |
565,516 |
|
266
December 31, 2023 - December 31, 2022 |
||||
|---|---|---|---|---|
Increases (decreases) due to changes in: | ||||
|
Volume |
Rate |
Net change |
|
Total |
2,710,988 |
7,971,062 |
10,682,050 |
|
Interest-bearing liabilities |
||||
Checking accounts |
||||
Local activities |
(3,922) |
109 |
(3,813) |
|
Foreign activities |
240 |
18,784 |
19,024 |
|
Total |
(3,682) |
18,893 |
15,211 |
|
Savings accounts |
||||
Local activities |
(41,794) |
1,569,468 |
1,527,674 |
|
Foreign activities |
(2,493) |
51,313 |
48,820 |
|
Total |
(44,287) |
1,620,781 |
1,576,494 |
|
Time deposits |
||||
Local activities |
2,731,191 |
2,239,297 |
4,970,488 |
|
Foreign activities |
135,648 |
483,995 |
619,643 |
|
Total |
2,866,839 |
2,723,292 |
5,590,131 |
|
Repos |
||||
Local activities |
8,465 |
(13,139) |
(4,674) |
|
Foreign activities |
(852) |
3,142 |
2,290 |
|
Total |
7,613 |
(9,997) |
(2,384) |
|
Financial Obligations |
||||
Local activities |
92,004 |
316,003 |
408,007 |
|
Foreign activities |
149,132 |
338,140 |
487,272 |
|
Total |
241,136 |
654,143 |
895,279 |
|
Interbank |
||||
Local activities |
(401) |
6,373 |
5,972 |
|
Foreign activities |
152 |
13,041 |
13,193 |
|
Total |
(249) |
19,414 |
19,165 |
|
December 31, 2023 - December 31, 2022 |
|||
|---|---|---|---|
Increases (decreases) due to changes in: | |||
|
Volume |
Rate |
Net change |
Debt securities issued |
|||
Local activities |
66,798 |
88,435 |
155,233 |
Foreign activities |
(177,384) |
120,255 |
(57,129) |
Total |
(110,586) |
208,690 |
98,104 |
Lease liabilities |
|||
Local activities |
1,407 |
5,790 |
7,197 |
267
December 31, 2023 - December 31, 2022 |
|||
|---|---|---|---|
Increases (decreases) due to changes in: | |||
|
Volume |
Rate |
Net change |
Foreign activities |
(2,225) |
(2,506) |
(4,731) |
Total |
(818) |
3,284 |
2,466 |
Total interest-bearing liabilities |
|||
Local activities |
2,853,748 |
4,212,336 |
7,066,084 |
Foreign activities |
102,218 |
1,026,164 |
1,128,382 |
Total |
2,955,966 |
5,238,500 |
8,194,466 |
(1) Tax-exempt income from debt securities has not been calculated on a tax-equivalent basis because the effect of such calculation is not significant.
Interest-earning assets: net interest margin and interest margin
The following table presents the levels of average interest-earning assets and net interest income of Bancolombia Group, the comparative net interest margin and the interest margin obtained for the years ended December 31, 2023 and 2022, respectively:
Yields on interest-earning assets | ||
|
As of December 31, |
|
|
2023 |
2022 |
In millions of Colombian pesos (Except percentages) | ||
Interest-earning assets |
||
Local activities |
185,882,836 |
168,962,180 |
Foreign activities |
109,868,154 |
104,551,647 |
Total |
295,750,990 |
273,513,827 |
Net interest income(1) |
|
|
Local activities |
16,616,094 |
13,565,644 |
Foreign activities |
4,062,991 |
4,625,857 |
Total |
20,679,085 |
18,191,501 |
Average yield on interest-earning assets |
|
|
Local activities |
15.94% |
11.55% |
Foreign activities |
7.08% |
6.89% |
Total |
12.65% |
9.77% |
Net Interest Margin(2) |
|
|
Local activities |
8.94% |
8.03% |
Foreign activities |
3.70% |
4.42% |
Total |
6.99% |
6.65% |
Interest margin(3) |
|
|
Local activities |
8.21% |
7.57% |
Foreign activities |
3.90% |
4.62% |
268
Total |
6.78% |
6.52% |
(1)Net interest income is portfolio interest income minus interest received and includes interest received on investments.
(2)Net interest margin is net interest income divided by average total interest-earning assets.
(3)The interest margin is the difference between the average rate on interest-earning assets and the average rate on interest-bearing liabilities.
269
Report of Independent Registered Public Accounting Firm
To the Board of Directors and Shareholders of Bancolombia S. A.
Opinions on the Financial Statements and Internal Control over Financial Reporting
We have audited the accompanying consolidated statement of financial position of Bancolombia S.A. and its subsidiaries (the “Bank”) as of December 31, 2023 and 2022, and the related consolidated statements of income, comprehensive income, changes in equity and cash flows for each of the three years in the period ended December 31, 2023, including the related notes (collectively referred to as the “consolidated financial statements”). We also have audited the Bank's internal control over financial reporting as of December 31, 2023, based on criteria established in Internal Control - Integrated Framework (2013) issued by the Committee of Sponsoring Organizations of the Treadway Commission (COSO).
In our opinion, the consolidated financial statements referred to above present fairly, in all material respects, the financial position of the Bank as of December 31, 2023 and 2022, and the results of its operations and its cash flows for each of the three years in the period ended December 31, 2023 in conformity with International Financial Reporting Standards as issued by the International Accounting Standards Board. Also in our opinion, the Bank maintained, in all material respects, effective internal control over financial reporting as of December 31, 2023, based on criteria established in Internal Control - Integrated Framework (2013) issued by the COSO.
Basis for Opinions
The Bank's management is responsible for these consolidated financial statements, for maintaining effective internal control over financial reporting, and for its assessment of the effectiveness of internal control over financial reporting, included in Management’s Report on Internal Control Over Financial Reporting appearing under Item 15. Our responsibility is to express opinions on the Bank’s consolidated financial statements and on the Bank's internal control over financial reporting based on our audits. We are a public accounting firm registered with the Public Company Accounting Oversight Board (United States) (PCAOB) and are required to be independent with respect to the Bank in accordance with the U.S. federal securities laws and the applicable rules and regulations of the Securities and Exchange Commission and the PCAOB.
We conducted our audits in accordance with the standards of the PCAOB. Those standards require that we plan and perform the audits to obtain reasonable assurance about whether the consolidated financial statements are free of material misstatement, whether due to error or fraud, and whether effective internal control over financial reporting was maintained in all material respects.
Our audits of the consolidated financial statements included performing procedures to assess the risks of material misstatement of the consolidated financial statements, whether due to error or fraud, and performing procedures that respond to those risks. Such procedures included examining, on a test basis, evidence regarding the amounts and disclosures in the consolidated financial statements. Our audits also included evaluating the accounting principles used and significant estimates made by management, as well as evaluating the overall presentation of the consolidated financial statements. Our audit of internal control over financial reporting included obtaining an understanding of internal control over financial reporting, assessing
PwC Contadores y Auditores S.A.S., Calle 7 Sur No. 42-70, Torre 2, Piso 11, Edificio Forum, Medellín, Colombia. |
Tel: (60-4) 6040606, www.pwc.com/co |
© 2023 PricewaterhouseCoopers. PwC se refiere a las Firmas colombianas que hacen parte de la red global de PricewaterhouseCoopers International Limited, cada una de las cuales es una entidad legal separada e independiente. Todos los derechos reservados. |
F-2
the risk that a material weakness exists, and testing and evaluating the design and operating effectiveness of internal control based on the assessed risk. Our audits also included performing such other procedures as we considered necessary in the circumstances. We believe that our audits provide a reasonable basis for our opinions.
Report of Independent Registered Public Accounting Firm
Definition and Limitations of Internal Control over Financial Reporting
A company’s internal control over financial reporting is a process designed to provide reasonable assurance regarding the reliability of financial reporting and the preparation of financial statements for external purposes in accordance with generally accepted accounting principles. A company’s internal control over financial reporting includes those policies and procedures that (i) pertain to the maintenance of records that, in reasonable detail, accurately and fairly reflect the transactions and dispositions of the assets of the company; (ii) provide reasonable assurance that transactions are recorded as necessary to permit preparation of financial statements in accordance with generally accepted accounting principles, and that receipts and expenditures of the company are being made only in accordance with authorizations of management and directors of the company; and (iii) provide reasonable assurance regarding prevention or timely detection of unauthorized acquisition, use, or disposition of the company’s assets that could have a material effect on the financial statements.
Because of its inherent limitations, internal control over financial reporting may not prevent or detect misstatements. Also, projections of any evaluation of effectiveness to future periods are subject to the risk that controls may become inadequate because of changes in conditions, or that the degree of compliance with the policies or procedures may deteriorate.
Critical Audit Matters
The critical audit matters communicated below are matters arising from the current period audit of the consolidated financial statements that were communicated or required to be communicated to the audit committee and that (i) relate to accounts or disclosures that are material to the consolidated financial statements and (ii) involved our especially challenging, subjective, or complex judgments. The communication of critical audit matters does not alter in any way our opinion on the consolidated financial statements, taken as a whole, and we are not, by communicating the critical audit matters below, providing separate opinions on the critical audit matters or on the accounts or disclosures to which they relate.
Allowance for loans, advances and lease losses
As described in Notes 2 (section D.4.1.2.1 and E.1), 6 and 30 to the consolidated financial statements, management assesses the adequacy of the allowance for loan losses based on evaluations of the loan portfolio utilizing objective and subjective criteria. As of December 31, 2023, the allowance for loan losses was COP$16,223,103 million on total loans of COP$253,951,647 million. As disclosed by management, expected credit losses are calculated using both individual and collective models and methodologies. These are based on significant assumptions and judgements that consider
historical credit data, the current situation of the borrower and reasonable and proper forecasts of future economic conditions. Collective models include parameters such as the probability of default at 12 months, probability of default throughout the lifetime of the obligation (when the loan is classified as stage 2), loss given default, and exposure at default. These models also incorporate a prospective approach that includes assumptions of future macroeconomic
PwC Contadores y Auditores S.A.S., Calle 7 Sur No. 42-70, Torre 2, Piso 11, Edificio Forum, Medellín, Colombia. |
Tel: (60-4) 6040606, www.pwc.com/co |
© 2023 PricewaterhouseCoopers. PwC se refiere a las Firmas colombianas que hacen parte de la red global de PricewaterhouseCoopers International Limited, cada una de las cuales es una entidad legal separada e independiente. Todos los derechos reservados. |
F-3
conditions in plausible future scenarios. In addition, for loans individually assessed in stage 3, the Bank will evaluate significant defaulted loans. This evaluation will consider the debt profile of each debtor, the fair value of guarantees
granted, information on credit behavior and the expected future cash flows from the client.
Report of Independent Registered Public Accounting Firm
The principal considerations for our determination that performing procedures relating to the Bank’s allowance for loans, advances and lease losses is a critical audit matter are, (i) the significant judgment used by management in determining the expected credit losses, in particular the assumptions used in determining: probability of default at 12 months, probability of default throughout the lifetime of the obligation, loss given default, exposure at default with the inclusion of the forward-looking basis that includes assumptions of future macroeconomic conditions in plausible future scenarios. In addition, for loans individually assessed in Stage 3 analysis of the debt profile of each debtor, information on the credit behavior, the future cash flows expected from the client and the fair value of guarantees granted, which in turn led to a high degree of auditor judgment, subjectivity and effort in performing procedures and in evaluating audit evidence obtained relating to these significant assumptions, and (ii) the audit effort involved the use of professionals with specialized skill and knowledge to assist in performing procedures and evaluating the audit evidence obtained.
Addressing the matter involved performing procedures and evaluating audit evidence in connection with forming the overall opinion on the consolidated financial statements. These procedures included testing the effectiveness of controls relating to the Bank’s allowance for loans, advances and leasing losses estimation process, which included controls over the data, models and assumptions used in the estimation process. These procedures also included, among others: testing management’s process for estimating the allowance for loan, advances and lease losses by (i) evaluating the appropriateness of the models utilized for the estimation of the expected loss parameters and the reasonableness of the significant assumptions, such as default at 12 months and lifetime, loss given default and exposure at default with the inclusion of the forward-looking basis that include assumptions of future macroeconomic conditions in plausible future scenarios, and evaluating the adjustments, (ii) testing the completeness and accuracy of the data used in the estimate and the mathematical accuracy of the impairment calculation for the credit portfolios; and (iii) evaluating individual credit files to determine the reasonableness of management’s estimation of the future cash flows expected from the client and the fair value of guarantees granted, estimated by management in the impairment for the credit portfolios. The procedures included the use of professionals with specialized skill and knowledge to assist in evaluating the appropriateness of the models utilized by management, methodologies and the reasonableness of the assumptions used in the credit loss estimates.
Goodwill Impairment Assessment
As described in Notes 2 (section D.13) and 9.2 to the consolidated financial statements, the Bank’s consolidated goodwill balance was COP$7.818.125 million as of December 31, 2023. The Bank evaluates at the end of each period whether there is any indication that on a stand-alone basis non-financial assets and cash-generating units are impaired. If
some indication of impairment does exist, the Bank estimates the recoverable amount of the assets and the loss by impairment, the impairment loss is recognized for the amount by which the carrying amount of the cash generating unit exceeds its recoverable amount. Regardless of whether impairment indicators exist, impairment of goodwill is assessed annually, or more frequently if events or changes in circumstances indicate that it may be impaired. The recoverable amount of non-financial assets or cash-generating units is the higher of its fair value less costs of disposal and its value in use, where fair value is determined by Management by reference to market value, if available, by pricing models, or with the assistance of a valuation specialist. While value in use requires Management to make significant assumptions and use estimates to forecast cash flow for periods that are beyond the normal requirements of management reporting; and assess the appropriate discount rate and growth rate.
PwC Contadores y Auditores S.A.S., Calle 7 Sur No. 42-70, Torre 2, Piso 11, Edificio Forum, Medellín, Colombia. |
Tel: (60-4) 6040606, www.pwc.com/co |
© 2023 PricewaterhouseCoopers. PwC se refiere a las Firmas colombianas que hacen parte de la red global de PricewaterhouseCoopers International Limited, cada una de las cuales es una entidad legal separada e independiente. Todos los derechos reservados. |
F-4
The principal considerations for our determination that performing procedures relating to the goodwill impairment assessment of all reporting units is a critical audit matter are the significant judgment by management when developing the recoverable amount measurement of the cash generating units. This in turn led to a high degree of auditor judgment, subjectivity, and effort in performing procedures to evaluate management’s cash flow projections and significant assumptions, related to discount rate and growth rate, and other assumptions commonly used to determine the recoverable value of the goodwill. In addition, the audit effort involved the use of professionals with specialized skill and knowledge to assist in performing procedures and evaluating the audit evidence obtained.
Addressing the matter involved performing procedures and evaluating audit evidence in connection with forming the overall opinion on the financial statements. These procedures included testing the effectiveness of controls relating to management’s goodwill impairment assessment, including controls over the valuation of the Bank’s cash generating units. These procedures also included, among others, testing management’s process for developing the recoverable amount estimate; evaluating the appropriateness of the discounted cash flow model; testing the completeness, accuracy and relevance of underlying data used in the model; and evaluating the assumptions used by management were reasonable considering: (i) the current and past performance of the cash generating unit, (ii) the consistency with external market and industry data, (iii) whether these assumptions were consistent with evidence obtained in other areas of the audit and other assumptions used to determine the recoverable value of the goodwill. Professionals with specialized skill and knowledge were used to assist in the evaluation of the appropriateness of the Bank’s discounted cash flow model and the reasonableness of certain significant assumptions, relating to the discount rate and growth rate.

/s/ PwC Contadores y Auditores S. A. S.
Medellín, Colombia
March 26, 2024
We have served as the Company’s auditor since 2020.
PwC Contadores y Auditores S.A.S., Calle 7 Sur No. 42-70, Torre 2, Piso 11, Edificio Forum, Medellín, Colombia. |
Tel: (60-4) 6040606, www.pwc.com/co |
© 2023 PricewaterhouseCoopers. PwC se refiere a las Firmas colombianas que hacen parte de la red global de PricewaterhouseCoopers International Limited, cada una de las cuales es una entidad legal separada e independiente. Todos los derechos reservados. |
F-5
CONSOLIDATED STATEMENT OF FINANCIAL POSITION
BANCOLOMBIA S.A. AND ITS SUBSIDIARIES
As of December 31, 2023 and 2022
(Stated in millions of Colombian pesos)
|
|
Note |
|
December 31, 2023 |
|
December 31, 2022 |
ASSETS |
|
|
|
|
|
|
Cash and cash equivalents |
|
4 |
|
39,799,609 |
|
31,645,291 |
Financial assets investments |
|
5.1 |
|
25,674,195 |
|
27,940,140 |
Derivative financial instruments |
|
5.2 |
|
6,252,270 |
|
4,961,237 |
Financial assets investments and derivative financial instruments |
|
|
|
31,926,465 |
|
32,901,377 |
Loans and advances to customers |
|
|
|
253,951,647 |
|
269,923,739 |
Allowance for loans, advances and lease losses |
|
|
|
(16,223,103) |
|
(15,479,640) |
Loans and advances to customers, net |
|
6 |
|
237,728,544 |
|
254,444,099 |
Assets held for sale and inventories, net |
|
13 |
|
906,753 |
|
608,449 |
Investment in associates and joint ventures |
|
8 |
|
2,997,603 |
|
2,915,633 |
Investment properties |
|
11 |
|
4,709,911 |
|
3,994,058 |
Premises and equipment, net |
|
10 |
|
6,522,534 |
|
6,727,066 |
Right-of-use assets, lease |
|
7.2 |
|
1,634,045 |
|
1,827,108 |
Goodwill and intangible assets, net |
|
9 |
|
8,489,697 |
|
10,439,192 |
Deferred tax, net |
|
12.5 |
|
685,612 |
|
764,594 |
Other assets, net |
|
14 |
|
7,528,036 |
|
6,547,866 |
TOTAL ASSETS |
|
|
|
342,928,809 |
|
352,814,733 |
LIABILITIES AND EQUITY |
|
|
|
|
|
|
LIABILITIES |
|
|
|
|
|
|
Deposits by customers |
|
15 |
|
247,941,180 |
|
250,992,323 |
Interbank deposits and repurchase agreements and other similar secured borrowing |
|
16 |
|
1,076,436 |
|
1,091,184 |
Derivative financial instruments |
|
5.2 |
|
6,710,364 |
|
4,737,454 |
Borrowings from other financial institutions |
|
17 |
|
15,648,606 |
|
19,692,638 |
Debt instruments in issue |
|
18 |
|
14,663,576 |
|
19,575,988 |
Lease liabilities |
|
7.2 |
|
1,773,610 |
|
1,900,268 |
Preferred shares |
|
|
|
584,204 |
|
584,204 |
Current tax |
|
|
|
164,339 |
|
965,180 |
Deferred tax, net |
|
12.5 |
|
1,785,230 |
|
633,361 |
Employee benefit plans |
|
19 |
|
882,954 |
|
765,371 |
Other liabilities |
|
20 |
|
12,648,581 |
|
11,879,211 |
TOTAL LIABILITIES |
|
|
|
303,879,080 |
|
312,817,182 |
EQUITY |
|
|
|
|
|
|
Share capital |
|
22 |
|
480,914 |
|
480,914 |
Additional paid-in-capital |
|
|
|
4,857,454 |
|
4,857,454 |
Appropriated reserves |
|
23 |
|
20,044,769 |
|
15,930,665 |
Retained earnings |
|
|
|
2,515,278 |
|
3,278,164 |
Net income attributable to equity holders of the Parent Company |
|
|
|
6,116,936 |
|
6,783,490 |
Accumulated other comprehensive income, net of tax |
|
|
|
4,074,161 |
|
7,758,216 |
SHAREHOLDERS’ EQUITY ATTRIBUTABLE TO THE OWNERS OF THE PARENT COMPANY |
|
|
|
38,089,512 |
|
39,088,903 |
Non-controlling interest |
|
|
|
960,217 |
|
908,648 |
TOTAL EQUITY |
|
|
|
39,049,729 |
|
39,997,551 |
TOTAL LIABILITIES AND EQUITY |
|
|
|
342,928,809 |
|
352,814,733 |
The accompanying notes form an integral part of these Consolidated Financial Statements.
F-6
CONSOLIDATED STATEMENT OF INCOME
BANCOLOMBIA S.A. AND ITS SUBSIDIARIES
For the years ended December 31, 2023, 2022 and 2021
(Stated in millions of Colombian pesos, except EPS stated in units of pesos)
|
|
Note |
|
2023 |
|
2022 |
|
2021 |
Interest on loans and financial leases |
|
|
|
|
|
|
|
|
Commercial |
|
|
|
17,277,481 |
|
10,950,463 |
|
6,073,718 |
Consumer |
|
|
|
10,062,092 |
|
7,821,758 |
|
5,362,194 |
Small business loans |
|
|
|
169,301 |
|
172,384 |
|
135,914 |
Mortgage |
|
|
|
3,852,725 |
|
3,377,432 |
|
2,331,971 |
Financial leases |
|
|
|
3,879,188 |
|
2,461,456 |
|
1,440,493 |
Total interest income on loans and financial leases |
|
|
|
35,240,787 |
|
24,783,493 |
|
15,344,290 |
Interest on debt instruments using the effective interest method |
|
25.1 |
|
1,029,377 |
|
588,792 |
|
311,488 |
Total Interest on financial instruments using the effective interest method |
|
|
|
36,270,164 |
|
25,372,285 |
|
15,655,778 |
Interest income on overnight and market funds |
|
|
|
197,307 |
|
61,962 |
|
9,413 |
Interest and valuation on financial instruments |
|
25.1 |
|
578,688 |
|
1,362,700 |
|
470,554 |
Total interest and valuation on financial instruments |
|
|
|
37,046,159 |
|
26,796,947 |
|
16,135,745 |
Interest expenses |
|
25.2 |
|
(16,668,295) |
|
(8,442,470) |
|
(4,351,556) |
Net interest margin and valuation on financial instruments before impairment on loans and financial leases, off balance sheet credit instruments and other financial instruments |
|
|
|
20,377,864 |
|
18,354,477 |
|
11,784,189 |
Credit impairment charges on loans, advances and financial leases, net |
|
6 |
|
(7,461,479) |
|
(3,721,353) |
|
(2,521,178) |
Credit (impairment) recovery for other financial instruments |
|
5.1 - 21.1 |
|
(107) |
|
(70,344) |
|
100,648 |
Total credit impairment charges, net |
|
|
|
(7,461,586) |
|
(3,791,697) |
|
(2,420,530) |
Net interest margin and valuation on financial instruments after impairment on loans and financial leases and off balance sheet credit instruments and other financial instruments |
|
|
|
12,916,278 |
|
14,562,780 |
|
9,363,659 |
Fees and commissions income |
|
25.3 |
|
7,080,878 |
|
6,370,526 |
|
5,293,804 |
Fees and commissions expenses |
|
25.3 |
|
(3,097,280) |
|
(2,590,166) |
|
(1,860,683) |
Total fees and commissions, net |
|
|
|
3,983,598 |
|
3,780,360 |
|
3,433,121 |
Other operating income |
|
25.4 |
|
3,979,650 |
|
2,053,435 |
|
2,022,141 |
Dividends and net income on equity investments |
|
25.5 |
|
210,185 |
|
235,854 |
|
328,344 |
Total operating income, net |
|
|
|
21,089,711 |
|
20,632,429 |
|
15,147,265 |
Operating expenses |
|
|
|
|
|
|
|
|
Salaries and employee benefits |
|
26.1 |
|
(5,350,234) |
|
(4,417,656) |
|
(3,782,596) |
Other administrative and general expenses |
|
26.2 |
|
(5,033,944) |
|
(4,559,900) |
|
(3,740,506) |
Taxes other than income tax |
|
26.2 |
|
(1,433,148) |
|
(929,512) |
|
(719,593) |
Impairment, depreciation and amortization |
|
26.3 |
|
(1,124,859) |
|
(980,575) |
|
(920,558) |
Total operating expenses |
|
|
|
(12,942,185) |
|
(10,887,643) |
|
(9,163,253) |
Profit before income tax |
|
|
|
8,147,526 |
|
9,744,786 |
|
5,984,012 |
Income tax |
|
12.3 |
|
(1,932,555) |
|
(2,748,421) |
|
(1,776,225) |
Net income |
|
|
|
6,214,971 |
|
6,996,365 |
|
4,207,787 |
Net income attributable to equity holders of the Parent Company |
|
|
|
6,116,936 |
|
6,783,490 |
|
4,086,795 |
Non-controlling interest |
|
|
|
98,035 |
|
212,875 |
|
120,992 |
Basic and diluted earnings per share to common shareholders, stated in units of pesos |
|
27 |
|
6,420 |
|
7,113 |
|
4,309 |
The accompanying notes form an integral part of these Consolidated Financial Statements.
F-7
CONSOLIDATED STATEMENT OF COMPREHENSIVE INCOME
BANCOLOMBIA S.A. AND ITS SUBSIDIARIES
For the years ended December 31, 2023, 2022 and 2021
(Stated in millions of Colombian pesos)
|
|
Note |
|
2023 |
|
2022 |
|
2021 |
Net income |
|
|
|
6,214,971 |
|
6,996,365 |
|
4,207,787 |
Other comprehensive income/(loss) that will not be reclassified to net income |
|
|
|
|
|
|
|
|
Remeasurement income related to defined benefit liability |
|
|
|
(44,594) |
|
69,249 |
|
7,444 |
Income tax |
|
12.4 |
|
13,234 |
|
(25,090) |
|
(1,791) |
Net of tax amount |
|
|
|
(31,360) |
|
44,159 |
|
5,653 |
Investments in equity instruments measured at fair value through other comprehensive income (FVTOCI) |
|
|
|
|
|
|
|
|
Unrealized gain |
|
|
|
11,144 |
|
33,354 |
|
3,994 |
Income tax |
|
12.4 |
|
(246) |
|
(1,282) |
|
48,153 |
Net of tax amount |
|
|
|
10,898 |
|
32,072 |
|
52,147 |
Gains on asset revaluation |
|
|
|
|
|
|
|
|
Income tax |
|
12.4 |
|
- |
|
(71) |
|
(142) |
Net of tax amount |
|
|
|
- |
|
(71) |
|
(142) |
Total other comprehensive income that will not be reclassified to net income, net of tax |
|
|
|
(20,462) |
|
76,160 |
|
57,658 |
Other comprehensive income/(loss) that may be reclassified to net income |
|
|
|
|
|
|
|
|
Investments in debt instruments measured at fair value through other comprehensive income (FVTOCI) |
|
|
|
|
|
|
|
|
(Loss)/Gain on investments recycled to profit or loss upon disposal |
|
|
|
(8,679) |
|
15,250 |
|
34,440 |
Unrealized gain/(loss) |
|
|
|
119,225 |
|
(182,729) |
|
(101,544) |
Unrealized (loss)/gain for fair value hedging |
|
|
|
- |
|
(3,647) |
|
6,285 |
Changes in loss allowance for credit losses |
|
|
|
3,741 |
|
(1,259) |
|
(233) |
Income tax |
|
|
|
(21,023) |
|
7,843 |
|
9,527 |
Net of tax amount |
|
|
|
93,264 |
|
(164,542) |
|
(51,525) |
Foreign currency translation adjustments: |
|
|
|
|
|
|
|
|
Exchange differences arising on translating the foreign operations |
|
|
|
(4,963,913) |
|
4,064,795 |
|
2,513,742 |
Gain / (Loss) on net investment hedge in foreign operations |
|
|
|
1,948,833 |
|
(1,833,087) |
|
(1,207,052) |
Income tax |
|
12.4 |
|
(772,755) |
|
746,232 |
|
493,346 |
Net of tax amount(1) |
|
|
|
(3,787,835) |
|
2,977,940 |
|
1,800,036 |
Unrealized (loss)/gain on investments in associates and joint ventures using equity method |
|
|
|
(2,225) |
|
(1,929) |
|
2,913 |
Income tax |
|
12.4 |
|
2,223 |
|
(1,221) |
|
(982) |
Net of tax amount |
|
|
|
(2) |
|
(3,150) |
|
1,931 |
Total other comprehensive income that may be reclassified to net income, net of tax |
|
|
|
(3,694,573) |
|
2,810,248 |
|
1,750,442 |
Other comprehensive income, attributable to the owners of the Parent Company, net of tax |
|
|
|
(3,715,035) |
|
2,886,408 |
|
1,808,100 |
Other comprehensive income, attributable to the Non-controlling interest |
|
|
|
(5,222) |
|
3,441 |
|
6,540 |
Total comprehensive income attributable to: |
|
|
|
2,494,714 |
|
9,886,214 |
|
6,022,427 |
Equity holders of the Parent Company |
|
|
|
2,401,901 |
|
9,669,898 |
|
5,894,895 |
Non-controlling interest |
|
|
|
92,813 |
|
216,316 |
|
127,532 |
| (1) | In 2023, there was a 20.54% revaluation of the Colombian peso against the U.S. dollar and in 2022 there was 20.82% devaluation. |
The accompanying notes form an integral part of these Consolidated Financial Statements.
F-8
CONSOLIDATED STATEMENT OF CHANGES IN EQUITY
BANCOLOMBIA S.A. AND ITS SUBSIDIARIES
For the years ended December 31, 2023, 2022 and 2021
(Stated in millions of Colombian pesos, except per share amounts stated in units of pesos)
|
|
|
|
|
|
|
|
|
|
|
|
|
|
|
|
|
|
|
|
|
|
|
|
|
|
|
|
|
|
|
Attributable to owners of Parent Company |
|
|
|
|
||||||||||||||||||||||
|
|
|
|
|
|
|
|
Accumulated other comprehensive income |
|
|
|
|
|
|
|
|
|
|
||||||||||
|
|
|
|
|
|
|
|
|
|
|
|
Debt |
|
|
|
|
|
|
|
|
|
|
|
Attributable |
|
|
|
|
|
|
Share |
|
Additional |
|
Appropiated |
|
|
|
Equity |
|
instruments |
|
|
|
|
|
|
|
|
|
|
|
to owners |
|
Non- |
|
|
|
|
Capital |
|
Paid in |
|
Reserves |
|
Translation |
|
Securities |
|
at fair value |
|
Revaluation |
|
|
|
Employee |
|
Retained |
|
Net |
|
of Parent |
|
Controlling |
|
Total |
|
|
(Note 22) |
|
capital |
|
(Note 23) |
|
adjustment |
|
through OCI |
|
through OCI |
|
of assets |
|
Associates |
|
Benefits |
|
earnings |
|
Income |
|
Company |
|
interest |
|
equity |
Balance as of January 1, 2023 |
|
480,914 |
|
4,857,454 |
|
15,930,665 |
|
7,762,214 |
|
152,028 |
|
(160,570) |
|
2,137 |
|
11,522 |
|
(9,115) |
|
3,278,164 |
|
6,783,490 |
|
39,088,903 |
|
908,648 |
|
39,997,551 |
Transfer to profit from previous years |
|
- |
|
- |
|
- |
|
- |
|
- |
|
- |
|
- |
|
- |
|
- |
|
6,783,490 |
|
(6,783,490) |
|
- |
|
- |
|
- |
Dividend payment corresponding to 509,704,584 common shares and 452,122,416 preferred shares without voting rights, subscribed and paid as of December 31, 2022, at a rate of COP 3,536 per share. |
|
- |
|
- |
|
- |
|
- |
|
- |
|
- |
|
- |
|
- |
|
- |
|
(3,343,319) |
|
- |
|
(3,343,319) |
|
- |
|
(3,343,319) |
Other reserves |
|
- |
|
- |
|
4,114,104 |
|
- |
|
- |
|
- |
|
- |
|
- |
|
- |
|
(4,149,684) |
|
- |
|
(35,580) |
|
- |
|
(35,580) |
Realization of retained earnings(1) |
|
- |
|
- |
|
- |
|
- |
|
30,980 |
|
- |
|
- |
|
- |
|
- |
|
(30,980) |
|
- |
|
- |
|
- |
|
- |
Others |
|
- |
|
- |
|
- |
|
- |
|
- |
|
- |
|
- |
|
- |
|
- |
|
(22,393) |
|
- |
|
(22,393) |
|
- |
|
(22,393) |
Non-controlling interest |
|
- |
|
- |
|
- |
|
- |
|
- |
|
- |
|
- |
|
- |
|
- |
|
- |
|
- |
|
- |
|
(41,244) |
|
(41,244) |
Net Income |
|
- |
|
- |
|
- |
|
- |
|
- |
|
- |
|
- |
|
- |
|
- |
|
- |
|
6,116,936 |
|
6,116,936 |
|
98,035 |
|
6,214,971 |
Other comprehensive income |
|
- |
|
- |
|
- |
|
(3,787,835) |
|
10,898 |
|
93,264 |
|
- |
|
(2) |
|
(31,360) |
|
- |
|
- |
|
(3,715,035) |
|
(5,222) |
|
(3,720,257) |
Balance as of December 31, 2023 |
|
480,914 |
|
4,857,454 |
|
20,044,769 |
|
3,974,379 |
|
193,906 |
|
(67,306) |
|
2,137 |
|
11,520 |
|
(40,475) |
|
2,515,278 |
|
6,116,936 |
|
38,089,512 |
|
960,217 |
|
39,049,729 |
| (1) | Corresponds mainly to the exchange of shares from Bolsa de Valores de Colombia for shares of the Holding Bursátil Regional in Chile. The Holding Bursátil Regional was constituted as of the integration of the Colombia, Peru and Chile Stock Exchanges in November 2023. See Note 5.1. Financial assets investments. |
The accompanying notes form an integral part of these Consolidated Financial Statements.
F-9
CONSOLIDATED STATEMENT OF CHANGES IN EQUITY
BANCOLOMBIA S.A. AND ITS SUBSIDIARIES
For the years ended December 31, 2023, 2022 and 2021
(Stated in millions of Colombian pesos, except per share amounts stated in units of pesos)
|
|
|
|
|
|
|
|
|
|
|
|
|
|
|
|
|
|
|
|
|
|
|
|
|
|
|
|
|
|
|
Attributable to owners of Parent Company |
|
|
|
|
||||||||||||||||||||||
|
|
|
|
|
|
|
|
Accumulated other comprehensive income |
|
|
|
|
|
|
|
|
|
|
||||||||||
|
|
|
|
|
|
|
|
|
|
|
|
Debt |
|
|
|
|
|
|
|
|
|
|
|
Attributable |
|
|
|
|
|
|
Share |
|
Additional |
|
Appropiated |
|
|
|
Equity |
|
instruments |
|
|
|
|
|
|
|
|
|
|
|
to owners |
|
Non- |
|
|
|
|
Capital |
|
Paid in |
|
Reserves |
|
Translation |
|
Securities |
|
at fair value |
|
Revaluation |
|
|
|
Employee |
|
Retained |
|
Net |
|
of Parent |
|
Controlling |
|
Total |
|
|
(Note 22) |
|
capital |
|
(Note 23) |
|
adjustment |
|
through OCI |
|
through OCI |
|
of assets |
|
Associates |
|
Benefits |
|
earnings |
|
Income |
|
Company |
|
interest |
|
equity |
Balance as of January 1, 2022 |
|
480,914 |
|
4,857,454 |
|
14,661,007 |
|
4,784,274 |
|
135,364 |
|
3,972 |
|
2,208 |
|
13,874 |
|
(65,303) |
|
3,273,788 |
|
4,086,795 |
|
32,234,347 |
|
1,691,111 |
|
33,925,458 |
Transfer to profit from previous years |
|
- |
|
- |
|
- |
|
- |
|
- |
|
- |
|
- |
|
- |
|
- |
|
4,086,795 |
|
(4,086,795) |
|
- |
|
- |
|
- |
Dividend payment corresponding to 509,704,584 common shares and 452,122,416 preferred shares without voting rights, subscribed and paid as of December 31, 2021, at a rate of COP 3,120 per share. |
|
- |
|
- |
|
- |
|
- |
|
- |
|
- |
|
- |
|
- |
|
- |
|
(2,943,199) |
|
- |
|
(2,943,199) |
|
- |
|
(2,943,199) |
Other reserves |
|
- |
|
- |
|
1,269,658 |
|
- |
|
- |
|
- |
|
- |
|
- |
|
- |
|
(1,299,084) |
|
- |
|
(29,426) |
|
- |
|
(29,426) |
Realization of retained earnings(1)(2) |
|
- |
|
- |
|
- |
|
- |
|
(15,408) |
|
- |
|
- |
|
798 |
|
12,029 |
|
2,581 |
|
- |
|
- |
|
- |
|
- |
Others |
|
- |
|
- |
|
- |
|
- |
|
- |
|
- |
|
- |
|
- |
|
- |
|
11,776 |
|
- |
|
11,776 |
|
- |
|
11,776 |
Acquisition Non-controlling interest (3) |
|
- |
|
- |
|
- |
|
- |
|
- |
|
- |
|
- |
|
- |
|
- |
|
145,507 |
|
- |
|
145,507 |
|
(961,588) |
|
(816,081) |
Non-controlling interest |
|
- |
|
- |
|
- |
|
- |
|
- |
|
- |
|
- |
|
- |
|
- |
|
- |
|
- |
|
|
|
(37,191) |
|
(37,191) |
Net Income |
|
- |
|
- |
|
- |
|
- |
|
- |
|
- |
|
- |
|
- |
|
- |
|
- |
|
6,783,490 |
|
6,783,490 |
|
212,875 |
|
6,996,365 |
Other comprehensive income |
|
- |
|
- |
|
- |
|
2,977,940 |
|
32,072 |
|
(164,542) |
|
(71) |
|
(3,150) |
|
44,159 |
|
- |
|
- |
|
2,886,408 |
|
3,441 |
|
2,889,849 |
Balance as of December 31, 2022 |
|
480,914 |
|
4,857,454 |
|
15,930,665 |
|
7,762,214 |
|
152,028 |
|
(160,570) |
|
2,137 |
|
11,522 |
|
(9,115) |
|
3,278,164 |
|
6,783,490 |
|
39,088,903 |
|
908,648 |
|
39,997,551 |
(1)Mainly corresponds to partial payments of asset-backed securities investments.
(2)Corresponds to termination to the Pension Premium Plan. For further information see Note 19.3 Retirement Pension Premium Plan and Executive Pension Plan Premium.
(3)During the third trimester of 2022, the Parent Company increased its participation percentage in FCP Fondo Inmobiliario Colombia. As of December 31, 2022, the Parent Company’s’ participation in said the private equity fund increased to 80.47%. For further information see Note 1 Reporting Entity.
The accompanying notes form an integral part of these Consolidated Financial Statements.
F-10
CONSOLIDATED STATEMENT OF CHANGES IN EQUITY
BANCOLOMBIA S.A. AND ITS SUBSIDIARIES
For the years ended December 31, 2023, 2022 and 2021
(Stated in millions of Colombian pesos, except per share amounts stated in units of pesos)
|
|
|
|
|
|
|
|
|
|
|
|
|
|
|
|
|
|
|
|
|
|
|
|
|
|
|
|
|
|
|
Attributable to owners of Parent Company |
|
|
|
|
||||||||||||||||||||||
|
|
|
|
|
|
|
|
Accumulated other comprehensive income |
|
|
|
|
|
|
|
|
|
|
||||||||||
|
|
|
|
|
|
|
|
|
|
|
|
Debt |
|
|
|
|
|
|
|
|
|
|
|
Attributable |
|
|
|
|
|
|
Share |
|
Additional |
|
Appropiated |
|
|
|
Equity |
|
instruments |
|
|
|
|
|
|
|
|
|
|
|
to owners |
|
Non- |
|
|
|
|
Capital |
|
Paid in |
|
Reserves |
|
Translation |
|
Securities |
|
at fair value |
|
Revaluation |
|
|
|
Employee |
|
Retained |
|
Net |
|
of Parent |
|
Controlling |
|
Total |
|
|
(Note 22) |
|
capital |
|
(Note 23) |
|
adjustment |
|
through OCI |
|
through OCI |
|
of assets |
|
Associates |
|
Benefits |
|
earnings |
|
Income |
|
Company |
|
interest |
|
equity |
Balance as of January 1, 2021 |
|
480,914 |
|
4,857,454 |
|
13,830,604 |
|
2,984,238 |
|
205,942 |
|
55,497 |
|
2,350 |
|
11,943 |
|
(70,956) |
|
3,911,249 |
|
275,994 |
|
26,545,229 |
|
1,569,984 |
|
28,115,213 |
Transfer to profit from previous years |
|
- |
|
- |
|
- |
|
- |
|
- |
|
- |
|
- |
|
- |
|
- |
|
275,994 |
|
(275,994) |
|
- |
|
- |
|
- |
Dividend payment corresponding to 509,704,584 common shares and 452,122,416 preferred shares without voting rights, subscribed and paid as of December 31, 2020, at a rate of COP 260 per share. |
|
- |
|
- |
|
- |
|
- |
|
- |
|
- |
|
- |
|
- |
|
- |
|
(192,374) |
|
- |
|
(192,374) |
|
- |
|
(192,374) |
Other reserves |
|
- |
|
- |
|
830,403 |
|
- |
|
- |
|
- |
|
- |
|
- |
|
- |
|
(836,554) |
|
- |
|
(6,151) |
|
- |
|
(6,151) |
Realization of retained earnings(1) |
|
- |
|
- |
|
- |
|
- |
|
(122,725) |
|
- |
|
- |
|
- |
|
- |
|
122,725 |
|
- |
|
- |
|
- |
|
- |
Others |
|
- |
|
- |
|
- |
|
- |
|
- |
|
- |
|
- |
|
- |
|
- |
|
(7,252) |
|
- |
|
(7,252) |
|
- |
|
(7,252) |
Non-controlling interest |
|
- |
|
- |
|
- |
|
- |
|
- |
|
- |
|
- |
|
- |
|
- |
|
- |
|
- |
|
- |
|
(6,405) |
|
(6,405) |
Net Income |
|
- |
|
- |
|
- |
|
- |
|
- |
|
- |
|
- |
|
- |
|
- |
|
- |
|
4,086,795 |
|
4,086,795 |
|
120,992 |
|
4,207,787 |
Other comprehensive income |
|
- |
|
- |
|
- |
|
1,800,036 |
|
52,147 |
|
(51,525) |
|
(142) |
|
1,931 |
|
5,653 |
|
- |
|
- |
|
1,808,100 |
|
6,540 |
|
1,814,640 |
Balance as of December 31, 2021 |
|
480,914 |
|
4,857,454 |
|
14,661,007 |
|
4,784,274 |
|
135,364 |
|
3,972 |
|
2,208 |
|
13,874 |
|
(65,303) |
|
3,273,788 |
|
4,086,795 |
|
32,234,347 |
|
1,691,111 |
|
33,925,458 |
| (1) | Mainly corresponds to partial payments of asset-backed securities investments. |
The accompanying notes form an integral part of these Consolidated Financial Statements.
F-11
CONSOLIDATED STATEMENT OF CASH FLOW
BANCOLOMBIA S.A. AND ITS SUBSIDIARIES
For the years ended December 31, 2023, 2022 and 2021
(Stated in millions of Colombian pesos)
|
|
NOTE |
|
2023 |
|
2022 |
|
2021 |
Net income |
|
|
|
6,214,971 |
|
6,996,365 |
|
4,207,787 |
Adjustments to reconcile net income to net cash provided by operating activities: |
|
|
|
|
|
|
|
|
Depreciation and amortization |
|
26.3 |
|
1,082,838 |
|
949,448 |
|
855,167 |
Other assets impairment |
|
26.3 |
|
42,021 |
|
31,127 |
|
65,391 |
Impairment of investments in associates and joint ventures |
|
8 - 25.5 |
|
108,175 |
|
9,633 |
|
1,733 |
Equity method |
|
8 - 25.5 |
|
(113,115) |
|
(219,105) |
|
(199,652) |
Credit impairment charges on loans and advances and financial leases |
|
6 |
|
7,461,479 |
|
3,721,353 |
|
2,521,178 |
Credit impairment (recovery) charges on off balance sheet credit and other financial instruments(1) |
|
5.1 - 21.1 |
|
107 |
|
70,344 |
|
(100,648) |
Gain on sales of assets held for sale and inventories |
|
25.4 |
|
(170,910) |
|
(171,482) |
|
(227,445) |
Valuation gain on investment securities |
|
|
|
(1,680,403) |
|
(1,786,416) |
|
(790,063) |
Loss upon disposal of investment in subsidiary, associates and joint ventures(2) |
|
25.5 |
|
- |
|
41,434 |
|
- |
Valuation gain on derivative financial instruments |
|
|
|
(180,246) |
|
(68,055) |
|
(319,524) |
Income tax |
|
12.3 |
|
1,932,555 |
|
2,748,421 |
|
1,776,225 |
Bonuses and short-term benefits |
|
|
|
734,916 |
|
640,458 |
|
526,273 |
Dividends |
|
25.5 |
|
(127,427) |
|
(59,072) |
|
(108,079) |
Investment property valuation |
|
25.4 |
|
(197,526) |
|
(236,617) |
|
(67,762) |
Effect of exchange rate changes(3) |
|
|
|
(245,915) |
|
(224,788) |
|
507,449 |
Other non-cash items |
|
|
|
74,905 |
|
22,632 |
|
(29,076) |
Net interest |
|
|
|
(18,572,492) |
|
(16,341,023) |
|
(10,992,734) |
Change in operating assets and liabilities: |
|
|
|
|
|
|
|
|
Decrease in derivative financial instruments |
|
|
|
859,961 |
|
348,554 |
|
245,064 |
(Increase) Decrease in accounts receivable |
|
|
|
(525,550) |
|
515,052 |
|
(489,266) |
Increase in loans and advances to customers |
|
|
|
(10,554,946) |
|
(37,593,875) |
|
(24,057,389) |
Increase in other assets |
|
|
|
(1,151,822) |
|
(724,769) |
|
(278,776) |
Increase in accounts payable |
|
|
|
945,923 |
|
2,719,586 |
|
1,271,347 |
(Increase) Decrease in other liabilities |
|
|
|
245,593 |
|
(127,044) |
|
(296,865) |
Increase in deposits by customers |
|
|
|
17,025,357 |
|
23,214,318 |
|
19,290,140 |
(Decrease) Increase in estimated liabilities and provisions |
|
|
|
(40,602) |
|
(31,945) |
|
21,629 |
Net changes in investment securities recognized at fair value through profit or loss |
|
|
|
(1,988,166) |
|
6,321,440 |
|
1,834,085 |
Proceeds from sales of assets held for sale and inventories |
|
|
|
1,060,642 |
|
778,328 |
|
735,788 |
Recovery of charged-off loans |
|
6 |
|
770,934 |
|
674,966 |
|
565,436 |
Income tax paid |
|
|
|
(2,737,511) |
|
(2,057,388) |
|
(1,441,413) |
Dividend received |
|
|
|
155,676 |
|
81,899 |
|
90,822 |
Interest received |
|
|
|
34,702,410 |
|
23,603,725 |
|
15,896,674 |
Interest paid |
|
|
|
(15,978,748) |
|
(7,508,066) |
|
(4,410,742) |
Net cash provided by operating activities |
|
|
|
19,153,084 |
|
6,339,438 |
|
6,602,754 |
Cash flows from investment activities: |
|
|
|
|
|
|
|
|
Purchases of debt instruments at amortized cost |
|
|
|
(3,629,543) |
|
(4,915,717) |
|
(3,722,124) |
Proceeds from maturities of debt instruments at amortized cost |
|
|
|
4,738,686 |
|
4,260,063 |
|
2,984,260 |
Purchases of debt instruments at fair value through OCI |
|
|
|
(7,837,997) |
|
(6,562,334) |
|
(8,850,491) |
Proceeds from debt instruments at fair value through OCI |
|
|
|
9,253,538 |
|
6,797,420 |
|
10,699,010 |
Purchases of equity instruments at fair value through OCI and interests in associates and joint ventures |
|
|
|
(122,910) |
|
(255,129) |
|
(44,915) |
Proceeds from equity instruments at fair value through OCI and interests in associates and joint ventures |
|
|
|
16,804 |
|
198,807 |
|
69,448 |
Consideration paid to non-controlling interests(4) |
|
|
|
- |
|
(816,081) |
|
- |
Purchases of premises and equipment and investment properties |
|
|
|
(2,412,123) |
|
(3,538,855) |
|
(2,185,800) |
Acquisition of subsidiaries |
|
|
|
- |
|
799 |
|
(9,178) |
Proceeds from sales of premises and equipment and investment properties |
|
|
|
185,324 |
|
421,729 |
|
553,652 |
Purchase of other long-term assets |
|
|
|
(351,468) |
|
(245,204) |
|
(144,348) |
Net cash used in investing activities |
|
|
|
(159,689) |
|
(4,654,502) |
|
(650,486) |
Cash flows from financing activities: |
|
|
|
|
|
|
|
|
Increase (Decrease) in repurchase agreements and other similar secured borrowing |
|
|
|
304,846 |
|
(579,488) |
|
(1,457,203) |
Proceeds from borrowings from other financial institutions |
|
|
|
9,855,033 |
|
14,374,110 |
|
4,182,658 |
Repayment of borrowings from other financial institutions |
|
|
|
(9,921,582) |
|
(5,874,833) |
|
(8,447,238) |
Payment of lease liability |
|
|
|
(182,596) |
|
(157,402) |
|
(136,797) |
Placement of debt instruments in issue(5) |
|
|
|
1,781,728 |
|
2,138,125 |
|
1,387,401 |
Payment of debt instruments in issue |
|
|
|
(3,928,673) |
|
(6,699,219) |
|
(1,871,576) |
Dividends paid |
|
|
|
(3,298,183) |
|
(2,310,666) |
|
(467,217) |
Transactions with non-controlling interests |
|
|
|
(41,245) |
|
(37,191) |
|
- |
Net cash (used) provided in financing activities(6) |
|
|
|
(5,430,672) |
|
853,436 |
|
(6,809,972) |
Effect of exchange rate changes on cash and cash equivalents(3) |
|
|
|
(5,408,405) |
|
3,777,073 |
|
2,486,401 |
Increase (Decrease) in cash and cash equivalents |
|
|
|
13,562,723 |
|
2,538,372 |
|
(857,704) |
Cash and cash equivalents at beginning of year |
|
4 |
|
31,645,291 |
|
25,329,846 |
|
23,701,149 |
Cash and cash equivalents at end of year |
|
4 |
|
39,799,609 |
|
31,645,291 |
|
25,329,846 |
F-12
| (1) | The decrease is mainly due to the financial guarantees and loan commitments. |
| (2) | In 2022, was registered the spin-off of Protección S.A. and the creation of Asulado Seguros de Vida S.A., were registered; the Bank sold its interest in Asulado Seguros de Vida S.A. to SURA Asset Management S.A., to comply with the authorized investment regime. |
| (3) | For further information, see Note 2.A.2. |
| (4) | During the third trimester of 2022, the Parent Company increased its participation percentage in FCP Fondo Inmobiliario Colombia. As of December 31, 2022, the participation in said private equity fund increased to 80.47%. For further information see Note 1 Reporting Entity. |
| (5) | For further information, see Note 18 Debt instruments in issues. |
| (6) | For further information about the reconciliation of the balances of liabilities from financing activities, see Note 29 Liabilities from financing activities. |
During the years ended December 31, 2023, 2022 and 2021, the Bank entered into non-cash operating and investing activities related to restructured loans and returned properties that were transferred to assets held for sale and inventories amounting to COP 1,361,465, COP 889,752 and COP 672,586, respectively. Additionally, in 2021, the Bank received loans and advances to customers and assets held for sale as payment by residual rights amounting to COP 75,664, which are not reflected in the consolidated statement of cash flows.
The accompanying notes form an integral part of these Consolidated Financial Statements.
NOTE 1. REPORTING ENTITY
Bancolombia S.A., hereinafter the Parent Company, is a credit establishment, listed on the Colombia Stock Exchange (BVC) as well as on the New York Stock Exchange (NYSE), since 1981 and 1995, respectively. The Parent Company's main location is in Medellin (Colombia), main address Carrera 48 # 26-85, Avenida Los Industriales, and was originally constituted under the name Banco Industrial Colombiano (BIC) according to public deed number 388, date January 24, 1945, from the First Notary's Office of Medellin, authorized by the Superintendence of Finance of Colombia (“SFC”). On April 3, 1998, by means of public deed No. 633, BIC merged with Bank of Colombia S.A., and the resulting organization of that merger was named Bancolombia S.A.
The Parent Company bylaws are found in the public deed numer 1441, dated May 6, 2022, at the 20th Notary´s Office of Medellín.
Bancolombia S.A.’s business purpose is to carry out all operations, transactions, acts and services inherent to the banking business. The Parent Company may, by itself or through its subsidiaries, own interests in other corporations, wherever authorized by law, according to all terms and requirements, limits or conditions established therein.
The duration of the Parent Company contemplated in the bylaws is until December 8, 2044, but it can be dissolved or renewed before the conclusion of that period. The operating license was authorized definitively by the SFC according to Resolution number 3140 on September 24, 1993.
The Parent Company and its subsidiaries include the following operating segments: United States, Banking Colombia, Banking Panama, Banking El Salvador, Banking Guatemala, Trust, Investment banking, Brokerage, International Banking and Others. The activities carried out by each operating segment of the Bank are described in Note 3 Operating segments.
The Parent Company, through its subsidiaries, has banking operations and an international presence in United States, Puerto Rico, Panama, Guatemala, and El Salvador. On May 25, 2022 and April 15, 2022, respectively, the regulatory authorizations and licenses were obtained for the operation as a broker-dealer and as an investment adviser (registered investment adviser) in the United States, through its subsidiaries Bancolombia Capital Holdings USA LLC, Bancolombia Capital LLC, and Bancolombia Capital Advisers LLC, which were incorporated in September 2021.
On June 4, 2021, the Parent signed an agreement for the assignment of the fiduciary rights of the PA FAI Calle 77 trust, subject to condition. Fulfilled the condition on March 1, 2022, the Parent Company was established as trustor of PA FAI Calle 77, owner of a property used for housing rental. The amount paid by the Parent Company was COP 56,968. The main purpose of the trust is to carry out the development, administration, management and operation of the project, on the aforementioned property in the city of Bogotá. For further information, see Note 9.3 Business combination.
The operations in Barbados through Mercom Bank Ltd. are in the process of being gradually wound down. The winding down of the operations will continue as the compromises related to assets and liabilities come to term, the assets, liabilities and contracts were transferred to other companies which are also part of the Bank. The company Transportempo S.A.S. is winding down since May 2023.
F-13
On December 14, 2021, the Parent Company´s Board of Directors authorized the legal separation of the Nequi business, the digital platform of the Bank. The Financial Superintendence of Colombia (Superintendencia Financiera de Colombia) through Resolution 0843 of July 6, 2022, later modified by the Resolution 0955 of July 27, 2022, authorized the establishment of Nequi S.A. Compañía de Financiamiento. The legal separation resulted in the creation and commercial registration of a new corporation through which Nequi will operate as a 100% digital credit establishment. Nequi must obtain an authorization certificate or operating permit, accredited by the Financial Superintendence of Colombia in order to operate. Activities for this process are in progress. In September 2022, the company NEQUI S.A. was created with a capitalization of COP 150,000 distributed mainly in Banca de Inversión Bancolombia S.A. Corporación Financiera with a participation percentage of 94.99% and Inversiones CFNS S.A.S. of 5.01%.
On July 22, 2022, through the subsidiary, Sistemas de Inversiones y Negocios S.A. SINESA, the company Wenia LTD, a digital corporate vehicle whose purpose is the provision of technology services, was incorporated in Bermuda. By private document of October 18, 2022, Wenia LTD as the sole shareholder, registered on November 22, 2022, in the Chamber of Commerce of Colombia, the company of a commercial nature called Wenia S.A.S., whose purpose is, among others, the creation and implementation of operating systems and software applications
During the third quarter of 2022, the Bank increased its participation in the FCP Fondo Inmobiliario Colombia, which facilitates speed in decision-making in matters of governance and strategy. To date, the participation in the private equity fund amounts to 80.47%.
The effect on shareholders' equity (amounts in millions of COP) is as follows:
Consideration paid to non-controlling interests |
|
816,081 |
|
Carrying amount of non-controlling interests acquired |
|
961,588 |
|
Excess of consideration paid recognized in the transactions with non-controlling interests reserve within equity |
|
145,507 |
|
Additionally, the operations in Cayman Islands through Bancolombia Cayman were in the process of dismantling, for which, on November 22, 2023, the Cayman Islands Monetary Authority approved the surrender the banking license pursuant to Section 20(1)(a) of the Banks and Trust Companies Law (2021 Revision) (the "BTCA"), therefore, the banking license has been cancelled as of such date. The company is in liquidation.
As of December 31, 2023, the Bank has 34,756 employees, 35,431 banking correspondents, 6,080 ATMs and operates through 831 offices.
For more information on the Bank’s subsidiaries, see Note 2.C.1. Subsidiaries.
NOTE 2. MATERIAL ACCOUNTING POLICIES
| A. | Basis for preparation of the consolidated financial statements |
The consolidated financial statements of the Bank are prepared in accordance with the International Financial Reporting Standards (hereinafter, “IFRS”) issued by the International Accounting Standards Board (hereinafter, “IASB”), as well as the interpretations issued by the International Financial Reporting Interpretations Committee (hereinafter, “IFRS-IC”).
The preparation of consolidated financial statements in conformity with IFRS requires the use of accounting estimates which, by definition, will seldom equal the actual results. Therefore, the estimates and assumptions are constantly reviewed. Any revision is recognized in the same period if it affects the reviewed period; or in the reviewed period and future periods if it affects all the current and future periods.
F-14
| 1. | Preparation of the consolidated financial statements under going concern basis |
Management has assessed the Bank’s ability to continue as a going concern and confirms that the Bank has adequate liquidity and solvency to continue operating the business for the foreseeable future, which is at least, but is not limited to, 12 months from the end of the reporting period. Based on the Bank's liquidity position at the date of authorization of the consolidated financial statements, Management maintains a reasonable expectation that it has adequate liquidity and solvency to continue in operation for at least the next 12 months and that the going concern basis of accounting remains appropriate.
The consolidated financial statements were prepared on a going concern basis and do not include any adjustments to the reported carrying amounts and classification of assets, liabilities and expenses that might otherwise be required if the going concern basis were not correct.
Assets and liabilities are measured at cost or amortized cost, except for some financial assets and liabilities and investment properties that are measured at fair value. Financial assets and liabilities measured at fair value comprise those classified as assets and liabilities at fair value through profit or loss, debt instruments and equity securities measured at fair value through other comprehensive income (“OCI”) and derivative instruments. Likewise, the carrying value of assets and liabilities recognized as a fair value hedge are adjusted for changes in fair value attributable to the hedged risk. Almost all investments in associates and joint ventures are measured using the equity method.
The consolidated financial statements are stated in Colombian pesos (“COP”) and figures are stated in millions or billions (when indicated), except earnings per share, diluted earnings per share and the exchange rate, which are stated in units of Colombian pesos, while other currencies (dollars, euro, pounds, etc.) are stated in thousands.
The Parent Company’s financial statements, which have been prepared in accordance with “Normas de Contabilidad e Información Financiera” (“NCIF”) applicable to separate financial statements, are those that serve as the basis for the distribution of dividends and other appropriations by the shareholders.
The separate financial statements are those presented by the Parent Company in which the entity recognizes and measures the impairment of credit risk through allowances for loans losses, the classification and measurement of certain financial instruments (such as debt securities and equity instruments) and the recognition of provisions for foreclosed assets, in accordance with the accounting required by the SFC, which differ in certain accounting principles from IFRS that are used in the consolidated financial statements.
2.Revised presentation of Statement of Cash Flow
In preparing the consolidated statement of cash flow as of December 31, 2023, the Company identified an error in the classification of the amount relating to the exchange difference of operating activities in the consolidated statement of cash flow for the years ended December 31, 2022 and 2021, that was included in the line “Effect of exchange rate changes on cash and cash equivalents”. The Company has made adjustments to the prior periods amounts presented in these financial statements accordingly. The Management evaluated the error in the classification and determined that the related impacts were not material.
The revisions to the consolidated statement of cash flow as of December 31, 2022 and 2021, are summarized in the following table:
|
|
December 31, 2022 |
|
Adjustments |
|
December 31, 2022 |
|
|
(As previously reported) |
|
|
|
(As revised) |
|
|
In millions of COP |
||||
Adjustments to reconcile net income to net cash provided by operating activities: |
|
|
|
|
|
|
Effect of exchange rate changes |
|
- |
|
(224,788) |
|
(224,788) |
Net cash provided by operating activities |
|
6,564,226 |
|
(224,788) |
|
6,339,438 |
Effect of exchange rate changes on cash and cash equivalents |
|
3,552,285 |
|
224,788 |
|
3,777,073 |
Increase (Decrease) in cash and cash equivalents |
|
2,763,160 |
|
(224,788) |
|
2,538,372 |
F-15
Cash and cash equivalents at beginning of year |
|
25,329,846 |
|
- |
|
25,329,846 |
Cash and cash equivalents at end of year |
|
31,645,291 |
|
- |
|
31,645,291 |
|
|
December 31, 2021 |
|
Adjustments |
|
December 31, 2021 |
|
|
(As previously reported) |
|
|
|
(As revised) |
|
|
In millions of COP |
||||
Adjustments to reconcile net income to net cash provided by operating activities: |
|
|
|
|
|
|
Effect of exchange rate changes |
|
- |
|
507,449 |
|
507,449 |
Net cash provided by operating activities |
|
6,095,305 |
|
507,449 |
|
6,602,754 |
Effect of exchange rate changes on cash and cash equivalents |
|
2,993,850 |
|
(507,449) |
|
2,486,401 |
Increase (Decrease) in cash and cash equivalents |
|
(1,365,153) |
|
507,449 |
|
(857,704) |
Cash and cash equivalents at beginning of year |
|
23,701,149 |
|
- |
|
23,701,149 |
Cash and cash equivalents at end of year |
|
25,329,846 |
|
- |
|
25,329,846 |
| B. | Presentation of the consolidated financial statements |
The Bank presents the consolidated statement of financial position ordered by liquidity and the consolidated statement of income is prepared based on the nature of expenses. Revenues and expenses are not offset unless such treatment is permitted or required by an accounting standard or interpretation and described in the Bank's policies.
The consolidated statement of comprehensive income presents net income and items of OCI classified by nature and grouped into those that will not be reclassified subsequently to profit or loss and those that will be reclassified when specific conditions are met. The Bank discloses the amount of income tax relating to each item of OCI.
The consolidated statement of cash flows was prepared using the indirect method, whereby net income is adjusted for the effects of transactions of a non-cash nature, changes during the period in operating assets and liabilities, and items of income or expense associated with investing or financing cash flows.
| C. | Consolidation |
| 1. | Subsidiaries |
The consolidated financial statements include the financial statements of Bancolombia S.A. and its subsidiaries as of December 31, 2023 and 2022. The Parent Company consolidates the financial results of the entities over which it exerts control.
The Parent Company has the following subsidiaries making up the Bank´s organizational structure, which is currently registered as a corporate group:
|
|
|
|
|
|
PROPORTION OF |
|
PROPORTION OF |
|
PROPORTION OF |
|
|
|
JURISDICTION |
|
|
|
OWNERSHIP |
|
OWNERSHIP |
|
OWNERSHIP |
|
ENTITY |
|
OF |
|
BUSINESS |
|
INTEREST AND |
|
INTEREST AND |
|
INTEREST AND |
|
|
|
INCORPORATION |
|
|
|
VOTING POWER |
|
VOTING POWER |
|
VOTING POWER |
|
|
|
|
|
|
|
HELD BY THE |
|
HELD BY THE |
|
HELD BY THE |
|
|
|
|
|
|
|
BANK 2023 |
|
BANK 2022 |
|
BANK 2021 |
|
Fiduciaria Bancolombia S.A. Sociedad Fiduciaria |
|
Colombia |
|
Trust |
|
98.81 |
% |
98.81 |
% |
98.81 |
% |
Banca de Inversión Bancolombia S.A. Corporación Financiera |
|
Colombia |
|
Investment banking |
|
100.00 |
% |
100.00 |
% |
100.00 |
% |
Valores Bancolombia S.A. Comisionista de Bolsa |
|
Colombia |
|
Securities brokerage |
|
100.00 |
% |
100.00 |
% |
100.00 |
% |
WOMPI S.A.S. (before “VLIPCO S.A.S.”)(1) |
|
Colombia |
|
Technology services provider |
|
100.00 |
% |
99.98 |
% |
94.77 |
% |
Renting Colombia S.A.S. |
|
Colombia |
|
Operating leasing |
|
100.00 |
% |
100.00 |
% |
100.00 |
% |
Transportempo S.A.S. “En Liquidación” |
|
Colombia |
|
Transportation |
|
100.00 |
% |
100.00 |
% |
100.00 |
% |
Inversiones CFNS S.A.S. |
|
Colombia |
|
Investments |
|
99.94 |
% |
99.94 |
% |
99.94 |
% |
Negocios Digitales Colombia S.A.S. (before “Pasarela Colombia S.A.S.”) |
|
Colombia |
|
Payment solutions |
|
100.00 |
% |
100.00 |
% |
100.00 |
% |
Fondo de Capital Privado Fondo Inmobiliario Colombia(2) |
|
Colombia |
|
Real estate investment fund |
|
80.47 |
% |
80.47 |
% |
49.96 |
% |
P.A. Inmuebles CEM(2) |
|
Colombia |
|
Mercantil trust |
|
80.47 |
% |
80.47 |
% |
49.96 |
% |
P.A. Calle 92 FIC-11(2) |
|
Colombia |
|
Mercantil trust |
|
52.31 |
% |
52.31 |
% |
32.47 |
% |
P.A. FIC Edificio Corfinsura(2) |
|
Colombia |
|
Mercantil trust |
|
80.47 |
% |
80.47 |
% |
49.96 |
% |
P.A. FIC-A5(2) |
|
Colombia |
|
Mercantil trust |
|
80.47 |
% |
80.47 |
% |
49.96 |
% |
P.A. FIC Inmuebles(2) |
|
Colombia |
|
Mercantil trust |
|
80.47 |
% |
80.47 |
% |
49.96 |
% |
P.A. FIC Clínica de Prado(2) |
|
Colombia |
|
Mercantil trust |
|
62.00 |
% |
62.00 |
% |
38.49 |
% |
P.A. FIC A6(2) |
|
Colombia |
|
Mercantil trust |
|
80.47 |
% |
80.47 |
% |
49.96 |
% |
P.A. Central Point(2) |
|
Colombia |
|
Mercantil trust |
|
60.35 |
% |
60.35 |
% |
37.47 |
% |
F-16
Fideicomiso Irrevocable de Garantía, Fuente de Pago y Administración Inmobiliaria Polaris(2) |
|
Colombia |
|
Mercantil trust |
|
80.47 |
% |
80.47 |
% |
49.96 |
% |
P.A. Fideicomiso Twins Bay(2) |
|
Colombia |
|
Mercantil trust |
|
80.47 |
% |
80.47 |
% |
49.96 |
% |
Fideicomiso Lote Av San Martín(2) |
|
Colombia |
|
Mercantil trust |
|
80.47 |
% |
80.47 |
% |
49.96 |
% |
P.A. Fideicomiso Lote 30(2) |
|
Colombia |
|
Mercantil trust |
|
80.47 |
% |
80.47 |
% |
49.96 |
% |
Fideicomiso Fondo Inmobiliario Bancolombia(2) |
|
Colombia |
|
Mercantil trust |
|
80.47 |
% |
80.47 |
% |
17.54 |
% |
P.A. Florencia Ferrara(2)(3) |
|
Colombia |
|
Mercantil trust |
|
44.26 |
% |
44.26 |
% |
- |
|
P.A. Flor Morado Plaza(3) |
|
Colombia |
|
Mercantil trust |
|
80.47 |
% |
80.47 |
% |
- |
|
P.A. Galería la 33(4) |
|
Colombia |
|
Mercantil trust |
|
80.47 |
% |
- |
|
- |
|
Valores Simesa S.A.(5) |
|
Colombia |
|
Investments |
|
64.93 |
% |
66.33 |
% |
66.82 |
% |
Fideicomiso Lote Distrito Vera B1B2(5) |
|
Colombia |
|
Mercantil trust |
|
64.61 |
% |
66.00 |
% |
66.49 |
% |
Fideicomiso Lote Distrito Vera B3B4(5) |
|
Colombia |
|
Mercantil trust |
|
64.61 |
% |
66.00 |
% |
66.49 |
% |
Fideicomiso Lote B6 Ciudad del Rio(6) |
|
Colombia |
|
Mercantil trust |
|
- |
|
66.00 |
% |
- |
|
P.A. FAI CALLE 77(7) |
|
Colombia |
|
Real estate investment fund |
|
98.00 |
% |
98.00 |
% |
- |
|
P.A. NOMAD SALITRE(8) |
|
Colombia |
|
Real estate investment fund |
|
98.00 |
% |
98.00 |
% |
- |
|
P.A. NOMAD CENTRAL-2(9) |
|
Colombia |
|
Real estate investment fund |
|
98.00 |
% |
- |
|
- |
|
P.A. CALLE 84 (2)(9) |
|
Colombia |
|
Real estate investment fund |
|
98.00 |
% |
- |
|
- |
|
P.A. CALLE 84 (3)(9) |
|
Colombia |
|
Real estate investment fund |
|
98.00 |
% |
- |
|
- |
|
P.A. MERCURIO(10) |
|
Colombia |
|
Real estate investment fund |
|
100.00 |
% |
100.00 |
% |
- |
|
Wenia S.A.S.(11) |
|
Colombia |
|
Technology services |
|
100.00 |
% |
100.00 |
% |
- |
|
P.A. Wenia(11) |
|
Colombia |
|
Mercantil trust |
|
100.00 |
% |
- |
|
- |
|
Nequi S.A. Compañía de Financiamiento(12) |
|
Colombia |
|
Financial services |
|
100.00 |
% |
100.00 |
% |
- |
|
Bancolombia Panamá S.A. |
|
Panama |
|
Banking |
|
100.00 |
% |
100.00 |
% |
100.00 |
% |
Sistemas de Inversiones y Negocios S.A. Sinesa |
|
Panama |
|
Investments |
|
100.00 |
% |
100.00 |
% |
100.00 |
% |
Banagrícola S.A. |
|
Panama |
|
Investments |
|
99.17 |
% |
99.17 |
% |
99.17 |
% |
Banistmo S.A. |
|
Panama |
|
Banking |
|
100.00 |
% |
100.00 |
% |
100.00 |
% |
Banistmo Investment Corporation S.A. |
|
Panama |
|
Trust |
|
100.00 |
% |
100.00 |
% |
100.00 |
% |
Leasing Banistmo S.A. |
|
Panama |
|
Leasing |
|
100.00 |
% |
100.00 |
% |
100.00 |
% |
Valores Banistmo S.A. |
|
Panama |
|
Securities brokerage |
|
100.00 |
% |
100.00 |
% |
100.00 |
% |
Banistmo Panamá Fondo de Inversión S.A.(13) |
|
Panama |
|
Holding |
|
100.00 |
% |
100.00 |
% |
100.00 |
% |
Suvalor Renta Fija Internacional Corto Plazo S.A.(14) |
|
Panama |
|
Collective investment fund |
|
- |
|
- |
|
100.00 |
% |
Fondo Renta Sostenible Global S.A.(14) |
|
Panama |
|
Collective investment fund |
|
- |
|
- |
|
100.00 |
% |
Banistmo Capital Markets Group Inc.(13) |
|
Panama |
|
Purchase and sale of securities |
|
100.00 |
% |
100.00 |
% |
100.00 |
% |
Anavi Investment Corporation S.A.(13) |
|
Panama |
|
Real estate |
|
100.00 |
% |
100.00 |
% |
100.00 |
% |
Desarrollo de Oriente S.A.(13) |
|
Panama |
|
Real estate |
|
100.00 |
% |
100.00 |
% |
100.00 |
% |
Steens Enterprises S.A.(13) |
|
Panama |
|
Portfolio holder |
|
100.00 |
% |
100.00 |
% |
100.00 |
% |
Ordway Holdings S.A.(13) |
|
Panama |
|
Real estate broker |
|
100.00 |
% |
100.00 |
% |
100.00 |
% |
Grupo Agromercantil Holding S.A. |
|
Panama |
|
Holding |
|
100.00 |
% |
100.00 |
% |
100.00 |
% |
Banco Agromercantil de Guatemala S.A. |
|
Guatemala |
|
Banking |
|
99.68 |
% |
99.68 |
% |
99.66 |
% |
Seguros Agromercantil de Guatemala S.A. |
|
Guatemala |
|
Insurance agency |
|
79.92 |
% |
79.92 |
% |
79.92 |
% |
Financiera Agromercantil S.A. |
|
Guatemala |
|
Financial services |
|
100.00 |
% |
100.00 |
% |
100.00 |
% |
Agrovalores S.A. |
|
Guatemala |
|
Securities brokerage |
|
100.00 |
% |
100.00 |
% |
100.00 |
% |
Arrendadora Agromercantil S.A. |
|
Guatemala |
|
Operating Leasing |
|
100.00 |
% |
100.00 |
% |
100.00 |
% |
Agencia de Seguros y Fianzas Agromercantil S.A.(15) |
|
Guatemala |
|
Insurance agency |
|
- |
|
100.00 |
% |
100.00 |
% |
Asistencia y Ajustes S.A. |
|
Guatemala |
|
Roadside and medical assistance services |
|
100.00 |
% |
100.00 |
% |
100.00 |
% |
Serproba S.A. |
|
Guatemala |
|
Maintenance and remodeling services |
|
100.00 |
% |
100.00 |
% |
100.00 |
% |
Servicios de Formalización S.A. |
|
Guatemala |
|
Loans formalization |
|
100.00 |
% |
100.00 |
% |
100.00 |
% |
Conserjeria, Mantenimiento y Mensajería S.A. “En Liquidación” |
|
Guatemala |
|
Maintenance services |
|
100.00 |
% |
100.00 |
% |
100.00 |
% |
Mercom Bank Ltd.(16) |
|
Barbados |
|
Banking |
|
99.68 |
% |
99.68 |
% |
99.66 |
% |
New Alma Enterprises Ltd. |
|
Bahamas |
|
Investments |
|
99.68 |
% |
99.68 |
% |
99.66 |
% |
Bancolombia Puerto Rico Internacional Inc. |
|
Puerto Rico |
|
Banking |
|
100.00 |
% |
100.00 |
% |
100.00 |
% |
Bancolombia Cayman S.A.(17) |
|
Cayman Islands |
|
Banking |
|
100.00 |
% |
100.00 |
% |
100.00 |
% |
Banco Agrícola S.A. |
|
El Salvador |
|
Banking |
|
97.36 |
% |
97.36 |
% |
97.36 |
% |
Arrendadora Financiera S.A. Arfinsa |
|
El Salvador |
|
Leasing |
|
97.37 |
% |
97.37 |
% |
97.37 |
% |
Credibac S.A. de C.V. |
|
El Salvador |
|
Credit card services |
|
97.36 |
% |
97.36 |
% |
97.36 |
% |
Valores Banagrícola S.A. de C.V. |
|
El Salvador |
|
Securities brokerage |
|
98.89 |
% |
98.89 |
% |
98.89 |
% |
Inversiones Financieras Banco Agrícola S.A. IFBA |
|
El Salvador |
|
Investments |
|
98.89 |
% |
98.89 |
% |
98.89 |
% |
Gestora de Fondos de Inversión Banagrícola S.A. |
|
El Salvador |
|
Administers investment funds |
|
98.89 |
% |
98.89 |
% |
98.89 |
% |
Bagrícola Costa Rica S.A. |
|
Costa Rica |
|
Outsourcing |
|
99.17 |
% |
99.17 |
% |
99.17 |
% |
Bancolombia Capital Holdings USA LLC(18) |
|
United States |
|
Holding |
|
100.00 |
% |
100.00 |
% |
100.00 |
% |
Bancolombia Capital Adviser LLC(18) |
|
United States |
|
Investment advisor |
|
100.00 |
% |
100.00 |
% |
100.00 |
% |
Bancolombia Capital LLC(18) |
|
United States |
|
Securities brokerage |
|
100.00 |
% |
100.00 |
% |
100.00 |
% |
Wenia Ltd.(11) |
|
Bermuda |
|
Technology services |
|
100.00 |
% |
100.00 |
% |
- |
|
| (1) | During 2022 and 2023, the Bank, through its subsidiary Banca de Inversión S.A., purchased remaining shares from minority investors. |
| (2) | During 2022, the Bank increased its participation in FCP Fondo Inmobiliario Colombia, to strengthen governance and strategy decisions. For further information, see Note 1. Reporting entity. |
| (3) | Companies consolidated by Fondo de Capital Privado FCP Fondo Inmobiliario Colombia since April 2022 and December 2022. |
| (4) | Company consolidated by Fondo de Capital Privado FCP Fondo Inmobiliario Colombia since March 2023. |
| (5) | The decrease in the shareholding is due to the repurchase of outstanding stock carried out by Valores Simesa S.A. during 2023 and 2022. |
F-17
| (6) | During 2023, the trust rights were transferred by Valores Simesa S.A. |
| (7) | On March 1, 2022, the Parent Company was established as trustor of P.A. FAI Calle 77, owner of a property that will be used for rental housing. For further information, see Note 1. Reporting entity and Note 9.3. Business combination. |
| (8) | On April 4, 2022, the Parent Company was appointed as trustor of 100% of the trust rights of Patrimonio Autonomo Nomad Salitre, whose main purpose is to develop a multifamily project. |
| (9) | During February and April 2023, the Parent Company was established as trustor of P.A. Nomad Central-2, P.A. Calle 84 (2) and P.A. Calle 84 (3), through a management mercantil trust agreement. |
| (10) | On July 8, 2022, Bancolombia S.A. acquired control of Fidecomiso P.A. Mercurio, through a management mercantil trust agreement. |
| (11) | On July 22, 2022, the Bank, through the subsidiary Sistemas de Inversiones y Negocios S.A. Sinesa, established the company Wenia Ltd. in Bermuda, a digital corporate vehicle whose purpose is to provide technology services. On November 22, 2022, Wenia Ltd. established the company called Wenia S.A.S., whose purpose is the creation and implementation of operating systems and software applications. On May 17, 2023, Wenia S.A.S. was established as trustor of the trust rights of P.A. Wenia. For further information, see Note 1. Reporting entity. |
| (12) | On December 14, 2021, the Board of Directors of the Parent Company authorized the legal separation of the business of Nequi, a Bank’s digital platform that offers financial services. The Superintendencia Financiera de Colombia, with Resolution 0843 of July 6, 2022, as amended by Resolution 0955 of July 27, 2022, authorized the incorporation of Nequi S.A. Compañía de Financiamiento. The legal separation resulted in the creation and commercial registration of a new corporation supervised by the Superintendencia Financiera de Colombia through which Nequi will operate as a 100.00% digital credit establishment. For further information, see Note 1. Reporting entity. |
| (13) | Investments in non-operational stage. |
| (14) | Companies not consolidated by Banistmo S.A. as of November 2022, due to non-compliance with consolidation requirements established in IFRS 10. |
| (15) | Company liquidated as of June 2023. |
| (16) | On September 30, 2021, Mercom Bank Ltd. shareholders authorized the beginning of an organized and gradual process to transfer of the assets and liabilities of Mercom Bank Ltd., to Banco Agromercantil de Guatemala S.A. or other companies of the Bancolombia Group. For further information, see Note 1. Reporting entity. |
| (17) | On October 5, 2020, the Board of Directors of Bancolombia Panamá (parent company of Bancolombia Cayman), authorized the decision to wind-down the business and operations of its subsidiary in Cayman. For further information, see Note 1. Reporting entity. |
| (18) | Companies created by Valores Bancolombia S.A. Comisionista de Bolsa in October 2021. For further information, see Note 1. Reporting entity. |
When necessary, adjustments are made to the accounting principles in the financial statements of subsidiaries to bring their accounting policies into line with the Bank’s accounting policies, in order to prepare consolidated financial statements using uniform accounting policies.
All intragroup assets and liabilities, equity, income, expenses and cash flows relating to transactions between members of the Bank are eliminated in full on consolidation.
Non-controlling interests in controlled entities are presented in profit or loss and equity separately from the Parent Company’s shareholders equity and profit or loss. When the Bank loses control over a subsidiary, any residual interest remaining on the Bank’s balances is measured at fair value; gains or losses arising from this measurement are recognized in net income.
The loan and financial leases originated by Banistmo and Bancolombia Panama are subject to prudential regulation in Panama by the Superintendencia de Bancos de Panamá (“SBP”) requiring the maintenance of minimum reserves as a countercyclical capital buffer. For the years ended as of December 31, 2023 and 2022, the reserves recognized amounted to COP 835,527 and COP 1,036,919. The establishment of these reserves restricts the ability of the aforementioned subsidiaries to pay dividends to Bancolombia S.A., the ultimate parent, except in the event of liquidation.
F-18
| 2. | Transactions between entities under common control |
Combinations of entities under common control refer to those transactions in which all the combining entities are under the control of the Bank both before and after the combination, and that control is not transitory.
The assets and liabilities recognized as a result of transactions between entities under common control are recognized at the carrying value of the acquirer’s financial statements. The Bank presents the net assets received prospectively from the date of the transfer.
| 3. | Fund’s administration |
The Bank manages assets held in mutual funds and other forms of investment. Assets managed by the Bank’s subsidiaries and owned by third parties are not included in the consolidated financial statements unless control exists as structured entities.
The Bank consolidates the following funds:
|
|
|
|
% of ownership |
|
% of ownership |
|
% of ownership |
|
Assets managed |
||
Name |
|
Country |
|
interest held by |
|
interest held by |
|
interest held by |
|
December 31, |
|
December 31, |
|
|
|
|
the Bank, 2023 |
|
the Bank, 2022 |
|
the Bank, 2021 |
|
2023 |
|
2022 |
Fondo de Capital Privado Fondo Inmobiliario Colombia(1) |
|
Colombia |
|
80.47 |
% |
80.47 |
% |
49.96 |
% |
5,503,022 |
|
5,023,316 |
Fideicomiso Lote Distrito Vera B1B2(2) |
|
Colombia |
|
64.61 |
% |
66.00 |
% |
66.49 |
% |
25,073 |
|
55,733 |
Fideicomiso Lote Distrito Vera B3B4(2) |
|
Colombia |
|
64.61 |
% |
66.00 |
% |
66.49 |
% |
56,295 |
|
53,558 |
Fideicomiso Lote B6 Ciudad del Rio(3) |
|
Colombia |
|
- |
|
66.00 |
% |
- |
|
- |
|
66,150 |
Banistmo Panamá Fondo de Inversión S.A.(4) |
|
Panama |
|
100.00 |
% |
100.00 |
% |
100.00 |
% |
132,496 |
|
243,268 |
| (1) | It includes the amounts of certain equity instruments that are controlled through the subsidiary Fondo de Capital Privado Fondo Inmobiliario Colombia, they meet the definition of control in accordance with IFRS 10. For further information, see Note 2.C. Consolidation. Also, during 2022, the Bank increased its participation in FCP Fondo Inmobiliario Colombia, which facilitates speed in decision-making in matters of government and strategy. For further information, see Note 1. Reporting entity. |
| (2) | The decrease in equity interest is due to the repurchase by the subsidiary Valores Simesa S.A. (parent company of Lote Distrito Vera B1B2, Lote Distrito Vera B3B4 and Lote B6 Ciudad del Rio), during 2023 and 2022. For further information, see Note 2.C. Consolidation. |
| (3) | During 2023, the trust rights were transferred by Valores Simesa S.A. |
| (4) | Investment in non-operational stage. For further information, see Note 2.C. Consolidation. |
For all these funds, the Bank participated in the design of the structured entity, makes operating and financial decisions on behalf of the funds, and is exposed to variable returns such as dividends or returns paid in quarterly installments.
Commissions earned by the management of funds that are not consolidated are included in the consolidated statement of income as “Fees and commissions income”.
| 4. | Non-controlling interest |
Non-controlling interests in the net assets of consolidated subsidiaries are presented separately within the Bank’s equity. Similarly, net income and other comprehensive income are also attributed to non-controlling interest and equity holders of the Parent Company. In a business combination, the amount of non-controlling interest may be initially measured either at fair value or at the non-controlling interest’s proportionate share of the acquirer’s identifiable net assets. The option for recognition is made on an investment-by-investment basis.
Any purchase or sale of shares in subsidiaries that does not imply a loss or gain of control is directly recognized in equity.
F-19
4.1. Significant non-controlling interest
FCP Fondo Inmobiliario Colombia
During the third quarter of 2022, the Bank increased its participation in the FCP Fondo Inmobiliario Colombia by 30.51% to have greater control over the governance and strategy decisions making in this investment. The participation in this private equity fund amounted to 80.47% as of December 31, 2022. With this transaction, FCP Fondo Inmobiliario Colombia is no longer considered a significant non-controlling interest for the Bank and its subsidiaries. Therefore, in accordance with IFRS 10, changes in the parent’s ownership interest in the subsidiary are considered as equity transactions.
During 2023, returns were not delivered to the non-controlling interest. During 2022, returns were delivered to the non-controlling interest in quarterly installments due to the nature of its business, which mainly comprises a long- term investment in real estate which is considered a low-risk portfolio. The return delivered amounted to COP 41,219 as of December 31, 2022.
The following table summarizes the net income and cash flows as of December 31, 2021 related to the FCP Fondo Inmobiliario Colombia:
|
|
|
|
|
|
Year-Ended 2021 |
|
|
In millions of COP |
||||
Condensed statement of income |
|
|
|
|
|
|
Income |
|
|
|
|
|
|
Valuation of investment properties |
|
|
|
|
|
85,148 |
Valuation of trust rights |
|
|
|
|
|
- |
Rents |
|
|
|
|
|
187,194 |
Profits of equity method investees |
|
|
|
|
|
105,439 |
Other income |
|
|
|
|
|
92,298 |
Total Income |
|
|
|
|
|
470,079 |
Expenses |
|
|
|
|
|
|
Interest on loans |
|
|
|
|
|
(73,201) |
Other administrative and general expenses |
|
|
|
|
|
(212,385) |
Total Expenses |
|
|
|
|
|
(285,586) |
Net Income |
|
|
|
|
|
184,493 |
Condensed cash flow (1) |
|
|
|
|
|
|
Net cash used in operating activities |
|
|
|
|
|
(34,442) |
Net cash provided by financing activities |
|
|
|
|
|
21,882 |
Cash and cash equivalents at beginning of year |
|
|
|
|
|
63,368 |
Cash and cash equivalents at end of year |
|
|
|
|
|
50,808 |
| (1) | Statement of cash flow corresponds to the FCP Fondo Inmobiliario Colombia without equity securities consolidated cash flow. |
The information above represents the amounts before inter-company eliminations.
As of December 31, 2023, 2022 and 2021, the accumulated non-controlling interest of the FCP Fondo Inmobiliario Colombia amounted to COP 663,713, COP 605,611 and COP 1,369,084, respectively and the profit allocated to non-controlling interest amounted to COP 58,102, COP 71,354 and COP 92,353, respectively.
| D. | Material Accounting Policies |
The material accounting policies used by the Bank in the preparation of its consolidated financial statements are detailed below:
F-20
| 1. | Functional currency, transactions and balances in foreign currency |
The functional and presentation currency of the Bank´s consolidated financial statements is the Colombian peso. Therefore, all balances and transactions denominated in currencies other than the Colombian peso are considered as foreign currency, which are translated into the functional currency using the exchange rates at the dates of the transactions.
Foreign exchange gains and losses resulting from the settlement of the transactions and from the translation of monetary assets and liabilities denominated in foreign currencies at period end are generally recognized in net income. They are deferred in equity (other comprehensive income) if they relate to qualifying cash flow hedges and qualifying net investment hedges or are attributable to part of the net investment in a foreign operation.
Non-monetary items that are measured at cost are held at the exchange rate at the transaction date, while those which are measured at fair value in a foreign currency are translated using the exchange rates at the date when the fair value was determined. When a gain or loss on a non-monetary item is recognized in the consolidated statement of comprehensive income, any exchange component of that gain or loss is recognized in other comprehensive income. Conversely, when a gain or loss on a non-monetary item is recognized in net income, any exchange component of that gain or loss shall be recognized in net income.
The Bank translated the results and financial position of foreign subsidiaries a functional currency as follows:
| ● | Assets and liabilities for each statement of financial position presented are translated at the closing rate at the date of that consolidated statement of financial position; |
| ● | Income and expenses for each statement of income and statement of comprehensive income is translated at average exchange rates for the period; and |
| ● | All resulting of such translations are recognized in other comprehensive income in the caption “Translation adjustment”. |
When a foreign operation is sold, the associated exchange differences are reclassified to net income, as part of the gain or loss on sale.
Goodwill and fair value adjustments arising on the acquisition of a foreign operation are treated as assets and liabilities of the foreign operation and translated at the closing exchange rate.
The table below sets forth the exchange rate used by the Bank and its subsidiaries to convert consolidated statement of financial position accounts and transactions in U.S. dollar into Colombian pesos:
|
|
December 31, 2023 |
|
December 31, 2022 |
|
December 31, 2021 |
Year-end exchange rate |
|
3,822.05 |
|
4,810.20 |
|
3,981.16 |
Average rate for the period ended at |
|
4,330.14 |
|
4,257.12 |
|
3,747.24 |
| 2. | Cash and cash equivalents |
The Bank considers cash and cash equivalents to include cash and balances at banks and the Central Bank, interbank assets and reverse repurchase agreements and other similar secured lending that have original maturities up to 90 days, as shown in Note 4. Cash and cash equivalents.
| 3. | Business combinations and goodwill |
Business combinations are those transactions where an acquirer obtains control of a business (e.g., an acquisition or merger).
Business combinations are accounted for using the acquisition method as follows: a) identifiable acquired assets, liabilities and contingent liabilities assumed in the acquisition are recognized at fair value at the date of acquisition; b) acquisition costs are recognized in the consolidated statement of income as expenses in the periods in which the costs are incurred and the services are received; and c) goodwill is recognized as an asset in the consolidated statement of financial position or a gain from a bargain purchase.
F-21
The consideration transferred for the acquisition of a subsidiary is the fair value of the assets transferred, the liabilities incurred to the former owners of the acquiree, and the equity interests issued by the Bank (if any).
Goodwill is measured as the excess of the sum of the consideration transferred, the value of any non-controlled interest and, when applicable, the fair value of any previous equity interest in the acquired entity, over the net fair value of the acquired assets, liabilities or contingent liabilities assumed at the date of acquisition.
For each business combination, at the date of acquisition, the Bank measures the non-controlling interest by the proportional share of the identifiable assets acquired, as well as liabilities and contingent liabilities assumed by the acquired company, or by their fair value.
Any contingent consideration in a business combination is classified as a liability or as equity and is recognized at fair value at the date of acquisition, the liability is remeasured at subsequent reporting dates in accordance with IAS 37 Provisions, contingent liabilities and contingent assets, and the consideration classified as equity is not remeasured at subsequent reporting dates and its subsequent settlement is accounted for within equity.
The goodwill acquired in a business combination is allocated, at the date of acquisition, to the Bank's cash-generating units (or group of cash generating units) which are expected to benefit from the combination, regardless of whether other assets or liabilities of the acquiree are assigned to those units or group of units.
For business combinations achieved in stages, any previous equity interest held by the Bank in the acquiree is remeasured at its fair value at the date of acquisition and any resulting gain (or loss) is reported in the consolidated statement of income or other comprehensive income, as appropriate. Amounts related to such investments previously recognized in other comprehensive income that must be recycled through net income are reclassified to the consolidated statement of income, as if such investment had been sold. When the associate had other comprehensive income, which was not reclassified to profit or loss, the amounts were reclassified within equity to “Retained earnings” once the investment was sold.
On March 1, 2022, the Bank completed the acquisition of the PA FAI Calle 77 Trust, which constituted a business combination. For further details of this transaction, see Note 9.3. Business combination.
| 4. | Financial instruments |
A financial instrument is a contract that gives rise to a financial asset of one entity and a financial liability or equity instrument of another entity.
| 4.1. | Financial assets |
Financial assets are recognized in the consolidated statement of financial position when the Bank becomes party to the contractual provisions of the instrument. This includes regular way purchases and sales, which are those purchases and sales of financial assets that require the delivery of assets within the time frame established by regulation or convention in the marketplace. The Bank uses settlement date accounting for regular way contracts when recording financial asset transactions.
At initial recognition, the Bank measures financial assets at fair value plus, in the case of a financial asset that is not measured at fair value through profit or loss, the transaction costs directly attributable to the acquisition of the financial assets. Transaction costs of financial assets subsequently measured at fair value with changes in profit or loss are recognized as expenses in the income statement. After initial recognition, for financial assets measured at amortized cost and investments in debt securities subsequently measured at fair value with changes in other comprehensive income, an allowance for expected credit losses (“ECL”) is recognized.
F-22
The Bank classifies its financial assets considering the business model and the characteristics of contractual cash flows (cash flows that consist solely of payments of principal and interest on the principal amount outstanding at specified dates – “SPPI”) in accordance with the following categories of subsequent measurement:
| ● | Amortized cost, measured at cost using the effective interest rate method, excluding future credit losses, and considering transaction costs and premiums granted, less commissions and discounts received that are included in the calculation of the effective interest rate. |
| ● | Fair value through other comprehensive income (“FVOCI”), measured using fair value, variations in the fair value of the investment are recognized in other comprehensive income, except for impairment losses or recoveries, interest income, and gains or losses on foreign exchange, which are recognized in the income statement. |
| ● | Fair value through profit or loss (“FVTPL”), measured using fair value, variations in the fair value are recognized in the income statement. |
The classification based on the business model reflects how the Bank manages financial assets and how it determines whether cash flows from the asset will come from obtaining contractual cash flows, selling the instrument, or both. If the objective is to obtain contractual cash flows, the assets are subsequently measured at amortized cost; if the objective is to obtain contractual cash flows and selling financial assets, the assets are subsequently measured at FVOCI. A financial asset shall be measured at FVTPL unless it is measured at amortized cost or at FVTORI.
The Bank measures equity instruments at FVTPL. Likewise, the Bank has made an irrevocable choice to present subsequent changes in the fair value of some equity instrument investments that are not held for trading in other comprehensive income; dividends from such investments are recognized in the income statement when the right to receive payment is established.
Accumulated gains or losses in other comprehensive income at the time of derecognition of a financial asset are reclassified from equity to the income statement, except for investments in equity instruments for which the Bank has made the irrevocable choice to present subsequent changes in fair value in other comprehensive income; for these, reclassification is made to the "retained earnings" line.
Expected credit losses are calculated using both individual and collective models and methodologies. These are based on significant assumptions and judgements that consider historical credit data, the current situation of the borrower and reasonable and proper forecasts of future economic conditions. Collective models include parameters such as the probability of default at 12 months, probability of default throughout the lifetime of the obligation (when the loan is classified as stage 2), loss given default, and exposure at default. These models also incorporate a prospective approach that includes assumptions of future macroeconomic conditions in plausible future scenarios. In addition, for loans individually assessed in stage 3, the Bank will evaluate significant defaulted loans. This evaluation will consider the debt profile of each debtor, the fair value of guarantees granted, information on credit behavior and the expected future cash flows from the client.
At the end of each period, the Bank assesses the impairment model based on the expected loss of a financial asset or a group of them, measured at amortized cost. The impairment loss will be measured from “day 1” after its initial recognition. The model is structured in three stages in which the financial asset can be categorized, from its initial recognition. This categorization considers the degree of credit risk, and the circumstances that produce a significant increase in it, as described below:
F-23
| ● | Stage 1: Financial instruments that have not experienced a significant increase in credit risk since their initial recognition, or that have low credit risk at the reporting date. |
| ● | Stage 2: Financial instruments that have experienced a significant increase in credit risk since their initial recognition (unless they have low credit risk at the reporting date), but do not have objective evidence of impairment. |
| ● | Stage 3: Financial assets that have objective evidence of impairment (“OEI”) at the reporting date. |
For each of the stages, an expected credit loss (“ECL”) is calculated. This calculation takes into account both current and future conditions, the behavior of the portfolio and various associated macroeconomic conditions.
| ● | For stage 1, a 12-month ECL is calculated. This represents the expected credit losses that could occur from default events within 12 months after the reporting date. |
| ● | For stage 2 and 3, a Lifetime ECL is calculated. This represents the expected credit losses that could occur from all possible default events over the expected life of the financial instrument. |
Significant increase in risk
To determine whether an asset has experienced a significant increase in risk since its initial recognition, and is therefore classified as Stage 2, the Bank performs an assessment of both quantitative and qualitative factors and reviews. For each portfolio, the Bank reviews the rebuttable presumption of more than 30 days overdue in payment. The Bank determines whether the credit risk of financial instruments has increased significantly since their initial recognition as follows:
Quantitative criteria
| ● | Clients who are 90 or more days past due. |
| ● | Lifetime PD assessment: The Bank has determined that the most suitable quantitative way to establish the significant increase in credit risk is by comparing the residual lifetime PD at the initial recognition and the current lifetime PD. To measure this difference, two thresholds are defined: |
| ◾ | Absolute threshold: This is the absolute difference between the current lifetime PD and the residual lifetime PD at initial recognition. A positive absolute variation beyond this threshold indicates an increase in the instrument’s risk. |
| ◾ | Relative threshold: This is a percentage variation between the value of the current lifetime PD and the residual lifetime PD at initial recognition. A positive percentage variation beyond this threshold indicates an increase in the instrument’s risk. |
If the PD comparison surpasses one threshold but not the other, it is not considered a significant increase in the instrument’s risk.
If the instrument does not exceed the threshold, other qualitative criteria are assessed. These can identify a significant increase in credit risk even when the obligation is nearing expiration. The criteria are as follows:
Qualitative criteria
| ● | Assets restructured due to risk, where the client is experiencing financial difficulties, are classified in stage 2, until the instrument is canceled, cured, or transferred to stage 3 because it meets the definition of default. |
| ● | Customers who are no longer in default (stage 3) remain in stage 2 for a period of 12 months. |
| ● | Clients on the watch list with a medium risk level. |
| ● | The Bank also reviews every six months to see if there are collective criteria for the migration of a group of clients to stage 2. For example, if a significant change has occurred from the commencement of a specific product or geographic region, or the occurrence of industry events, regulatory changes, market changes or any other significant event impacting the generation of future cash flow of the customer's operation. |
F-24
Refutable presumption of more than 30 days of default
The Bank has reviewed for each portfolio the presumption of a significant increase in 30 days past due and finds historical evidence that there is a relationship between this presumption and default.
Definition of default
To determine whether an asset is in default, and thus classified as stage 3, the Bank conducts an assessment of both quantitative and qualitative factors. It also reviews the rebuttable presumption of more than 90 days overdue in payment for each portfolio.
The Bank applies the following criteria to ascertain if there is a breach:
Quantitative criteria
| ● | Clients with an active portfolio and who have at least one instrument written off in the modality. |
| ● | Clients who are 90 or more days past due. |
Qualitative criteria
| ● | Clients in special states of restructuring, business reorganization or insolvency agreements. |
| ● | Clients on the watchlist a high-risk level. |
| ● | The Bank also aligns all products of the same client to stage 3 when at least one of its obligations is in default. |
Refutable presumption of default beyond 90 days
The Bank has conducted a review of the default presumption after 90 days past due for each portfolio. Historical evidence indicates a high probability of loss at 90 days. However, this presumption has been refuted for Banistmo’s mortgage portfolio. The rationale for this refutation is the historical evidence that demonstrates the default typically occurs at 120 days.
Collective methodology for measuring expected credit losses
The collective quantification of expected credit losses is conducted based on the stage classification, the homogeneous groups defined within each portfolio type and the client’s risk level.
Homogeneous groups are segmented by client type; for individuals, they are grouped by product, and for companies, they are grouped by industry segments defined by the client’s sales level.
Likewise, the risk level is assigned by customer type. For individuals, the risk is assessed using a behavioral scoring model for consumer products and a separate scoring model for housing products. The purpose of these models is to rank customers according to risk, allowing for more effective monitoring. The rating is based on historical behavior, transactional information, and customer product information. The consumer portfolio rating system is evaluated using various advanced statistical methodologies. These models allow the inclusion of a greater number of variables related to the customer, providing a more precise rating that aligns with the risk level.
For companies, risk levels are assessed using an internal rating model that incorporates both qualitative and quantitative variables as financial indicators. Clients are ranked on a scale from 1 to 19. This process also takes into account regional qualification programs, local market factors, and the client’s market knowledge.
In Colombia, for SME and Corporate portfolio, the risk level is estimated based on models that allow assigning an internal rating to a client considering their economic sector and in accordance with multiple variables. These include: financial information, transactional data, sectoral data, qualitative variables, and behavior. These models aim to achieve greater assertiveness in classifying the risk level of the Bank’s clients, greater discrimination and precision, the use of non-traditional information, and interpretability, with the goal of achieving a deep understanding of the client.
F-25
These methodologies play a fundamental role in the evaluation and monitoring of credit risk.
To estimate the expected credit losses (“ECL”) under the collective methodology, the following formula is used:
ECL = Probability of Default * Loss Given Default * Exposure at Default
The factors are estimated using statistical models developed from internal historical information of the entity and then adjusted with forward-looking information as described below:
| o | PD 12 months: The estimated probability of occurrence of a default in the next 12 months of the instrument’s life as of the date of analysis. The Bank defines the use of PD 12 months for current portfolio that does not present a significant increase in credit risk or any impairment evidence (portfolio classified in stage 1). To estimate the probability of default for 12 months, the Bank uses traditional techniques such as logistic regression, modeling the behavior of the portfolio by level of risk for each of the segments. |
| o | Lifetime PD: The estimated probability of occurrence of a default over the remaining life of an instrument, being dependent on the conditions of the product and the level of risk. The Bank defines the use of lifetime PD for portfolio with a significant increase in credit risk (portfolio classified in stage 2). The Bank estimates this factor using survival models which propose a statistical analysis to quantify the survival rate of a portfolio for a given period. One of the advantages of the methodology is the inclusion of prepaid models. |
| o | PD stage 3: The customers evaluated by the collective methodology in stage 3 have an associated probability of default of 100.00%. |
For revolving products and those with available borrowing that is likely to be used in its entirety, the Exposure at Default (“EAD”) estimate considers the use of the CCF (credit conversion factor), in order to find a relationship corresponding to the used and unused component of the instrument. To estimate the expected credit losses (“ECL”), a component of probability of becoming loan is included.
To estimate the lifetime expected credit loss, the exposed balance is projected annually, considering the discount of contractual payments agreed with the client for each year. Cash flows are discounted at the effective interest rate or an approximation of it.
F-26
Forward-looking information incorporated in the ECL models
To incorporate the prospective information to the factors defined for the estimation of the expected loss, the Bank uses methodologies that correlate the historical behavior of the portfolio with certain economic variables. The Bank uses projections based on three macro scenarios (base, pessimistic and optimistic); each scenario has a plausible probability of occurrence to evaluate the best estimate of the expected loss under possible future economic conditions.
To make the projections, the Corporate Economic Research team has defined a process for the generation of estimates under two perspectives: thematic and analytical.
As a result, projections are obtained for the economic variables of interest, which are formulated monthly in a time horizon that includes the current year and five subsequent years. After five years, given the technical difficulties and the high uncertainty, the projection of the economic variables for the total remaining useful life of each instrument corresponds to the value of the last projection.
The Bank considers that a five year projection horizon continues to be reasonable and that maintaining the fifth-year estimate for subsequent periods is a good approximation. This is based on the natural behavior of any statistical or econometric exercise of variable projection, in which the series tend towards a reversion to the mean or, in this case, to the long-term trend or equilibrium level. Then, in subsequent periods they remain there once the macroeconomic projections reach that steady state and only the materialization of a shock (unpredictable, so it is not possible to project when it will happen) would cause a deviation.
It is reasonable to think that in a period of 5 years, the macroeconomic variables projection would already be at a level very close to their equilibrium, since historically the maximum periods of consecutive deviation above or below the long-term trend (more or less 0.25 standard deviations of the variable) of the economic cycle (from the series of annual economic growth in the period 1972-2023) has been precisely a period of 5 years.
Economic scenario weightings
To incorporate not only a perspective, but also to recognize the uncertainty surrounding the short and medium-term economic context that the country will experience, the projection work incorporates three scenarios: base, optimistic and pessimistic.
It is intended that each perspective contain reasonable expectations and that each has a relevant level of probability associated with it. The scenarios are weighted as follows:
|
Optimistic |
Base |
Pessimistic |
|||||||||
Country |
2023 |
2022 |
2023 |
2022 |
2023 |
2022 |
||||||
Colombia |
15.00 |
% |
15.00 |
% |
50.00 |
% |
45.00 |
% |
35.00 |
% |
40.00 |
% |
Panama |
20.00 |
% |
15.00 |
% |
50.00 |
% |
55.00 |
% |
30.00 |
% |
30.00 |
% |
El Salvador |
20.00 |
% |
15.00 |
% |
55.00 |
% |
55.00 |
% |
25.00 |
% |
30.00 |
% |
Guatemala |
20.00 |
% |
15.00 |
% |
55.00 |
% |
55.00 |
% |
25.00 |
% |
30.00 |
% |
F-27
The following is a comparison of the main macroeconomic variable projected in each country, "GDP growth", used to estimate ECL as of December 31, 2023 and 2022:
As of December 31, 2023 | ||||||||||||
|
|
|
Colombia |
|
|
|
|
|
Panama |
|
|
|
Cutoff |
Optimistic |
Base |
Pessimistic |
Optimistic |
Base |
Pessimistic |
||||||
2023 |
1.64 |
% |
1.16 |
% |
0.68 |
% |
7.92 |
% |
5.95 |
% |
3.99 |
% |
2024 |
2.37 |
% |
0.87 |
% |
(0.63) |
% |
6.68 |
% |
4.00 |
% |
1.33 |
% |
2025 |
4.47 |
% |
2.60 |
% |
0.73 |
% |
7.17 |
% |
4.20 |
% |
1.23 |
% |
As of December 31, 2023 | ||||||||||||
|
|
|
Guatemala |
|
|
|
|
|
El Salvador |
|
|
|
Cutoff |
Optimistic |
Base |
Pessimistic |
Optimistic |
Base |
Pessimistic |
||||||
2023 |
3.69 |
% |
3.12 |
% |
2.55 |
% |
2.75 |
% |
2.25 |
% |
1.74 |
% |
2024 |
4.33 |
% |
3.26 |
% |
2.19 |
% |
3.32 |
% |
1.90 |
% |
0.49 |
% |
2025 |
4.61 |
% |
3.38 |
% |
2.15 |
% |
3.76 |
% |
2.08 |
% |
0.41 |
% |
As of December 31, 2022 | ||||||||||||
|
|
|
Colombia |
|
|
|
|
|
Panama |
|
|
|
Cutoff |
Optimistic |
Base |
Pessimistic |
Optimistic |
Base |
Pessimistic |
||||||
2022 |
8.11 |
% |
7.76 |
% |
6.98 |
% |
8.84 |
% |
8.19 |
% |
7.53 |
% |
2023 |
2.01 |
% |
0.93 |
% |
(0.78) |
% |
5.62 |
% |
3.96 |
% |
2.31 |
% |
2024 |
3.68 |
% |
2.50 |
% |
0.36 |
% |
5.70 |
% |
3.71 |
% |
1.73 |
% |
As of December 31, 2022 | ||||||||||||
|
|
|
Guatemala |
|
|
|
|
|
El Salvador |
|
|
|
Cutoff |
Optimistic |
Base |
Pessimistic |
Optimistic |
Base |
Pessimistic |
||||||
2022 |
4.35 |
% |
3.40 |
% |
2.45 |
% |
3.78 |
% |
2.62 |
% |
1.47 |
% |
2023 |
4.19 |
% |
2.72 |
% |
1.25 |
% |
3.52 |
% |
1.65 |
% |
(0.23) |
% |
2024 |
4.59 |
% |
3.00 |
% |
1.40 |
% |
3.94 |
% |
1.96 |
% |
(0.03) |
% |
Special methodologies applied in stage 3
Collateral methodology
For defaulted loans (stage 3), when it is determined that the fundamental source of collection is a mortgage guarantee or a leased asset, the amount of the loss is estimated as the balance owed minus the weighted net present value of the market value of the collateral, estimated through appraisals with an age no longer than one year, minus the costs of obtaining, maintaining and selling the collateral, and affected by several macroeconomic scenarios with an expected probability of occurrence that result in a weighted expected loss.
Individual methodology
The Bank will individually evaluate defaulted loans (stage 3) greater than COP 20,000 or USD 5 for foreign subsidiaries, analyzing the debt profile of each debtor, the guarantees granted and information on the credit behavior of the client and of the sector. Significant financial assets are considered in default when, based on current or past information and events, it is probable that the entity will not be able to recover all the amounts described in the original contract, including the interest and commissions agreed to in the contract. When a significant financial asset has been identified as being in default, the amount of the loss is measured as the balance due minus the weighted net present value of the expected future cash flows under two minimum macroeconomic scenarios with an expected probability of occurrence.
Customers classified as individual methodology will be evaluated at least twice a year and, additionally, each time a relevant event occurs that reflects in significant changes in their level of risk and that leads to a change in the scenarios previously analyzed. The relevant events can be:
| ● | Significant changes in the value of the guarantee, |
| ● | Expected or adverse changes in the business, |
| ● | Potentially shocking regulatory changes for the business, |
F-28
| ● | Changes they make in their commercial and operational dynamics, and |
| ● | Significant amount of payments made by the client. |
To establish the future cash flows expected from the client, two approaches are presented, which may be via cash flow generation or via execution of some type of guarantee or liquidation of assets, that is, “Going Concern” or “Gone Concern” approach.
Approach via cash flow: This refers to an analysis under the premise of "Going concern", that is, it is assumed that the payment of the obligation will be made through the client's cash flow. The expected NPV calculation with a cash flow approach includes:
| ● | Financial projections of the client. |
| ● | Debt simulator. |
| ● | Expected NPV calculation. |
Approach via guarantee recovery: This refers to the "Gone concern", that is, it is assumed that the payment of the obligation will be given through the execution of guarantees, liquidation of assets, the execution of personal guarantees and adjudication of assets through judicial processes. The calculation of the NPV with guarantee approach includes:
| ● | Analysis of the guarantee. |
| ● | Future value of the guarantee. |
| ● | NPV calculation. |
| ● | Recovery times. |
Future cash flows are estimated based on two scenarios (base and alternative) that can be affected by the aforementioned variables.
4.1.2.2. Impairment of investments measured at fair value with changes in other comprehensive income
At the end of each period, the Bank evaluates the impairment model based on the expected loss of a financial asset or a group of assets that are measured at fair value with changes in other comprehensive income, where the impairment loss will be measured from "day 1" after its initial recognition.
Investments are classified in stages according to the risk level (rating), as follows:
Stage 1:
| ● | Investments rated at investment grade. |
| ● | Investments rated at speculation grade, if: |
| o | The current external rating is maintained or improved against the rating granted on the date of purchase. |
| o | If there is a rating deterioration, the deterioration is lower than the number of notches that signify a significant increase in risk. |
Stage 2:
| ● | Investments that pass from an investment grade rating to speculation level. |
| ● | If there is a rating deterioration, the deterioration is a number of notches that signify a significant increase in risk. |
Stage 3:
| ● | Investments that are classified as default. |
F-29
Significant increase in risk
Investments classified in stage 2 include those instruments that meet the corporate definition of a significant increase in risk.
To establish whether a security has a significant increase in risk since the initial recognition, an assessment of the deterioration of the rating in the current date is made against the rating granted at the time of purchase; according to the origin classification there may be an increase with 1, 2 or 3 notches, as shown in the following table:
|
|
SIGNIFICANT INCREASE |
EXTERNAL RATING ORIGIN |
|
IN RISK |
Ba1/BB+ |
|
3 Notches |
Ba2/BB |
|
3 Notches |
Ba3/BB- |
|
3 Notches |
B1/B+ |
|
2 Notches |
B2/B |
|
2 Notches |
B3/B- |
|
1 Notch |
Caa/CCC |
|
1 Notch |
Measurement of expected losses:
Impairment: [Amortized Cost or Market Position (Exposure)] * PD (Probability of default) * LGD (Loss given default)
| ● | All instruments classified in stage 1 will be assigned a default probability for 12 months. |
| ● | All instruments classified in stage 2 will be assigned a probability of default for the life of the instrument. |
| ● | All instruments classified in stage 3 will be assigned a default probability of 100.00%. |
To estimate the impairment of the instruments if the issue has an external rating, provision is made with the PD (Probability of default) of the external rating agency; if it does not have an external rating, it is determined from the internal rating model and the default probability of the portfolio.
In all cases, the LGD (Loss Given Default) is the parameter calculated by the external rating agency for the investment portfolio at the closure of December 2023 it corresponds to 64.90%.
| 4.1.3. | Derecognition of financial assets |
| 4.1.3.1. | Derecognition of financial assets not resulting from modifications |
Financial assets are derecognized when the rights to receive cash flows from the financial assets have expired or have been transferred, and the Bank has transferred substantially all the risks and rewards of ownership, or when the Bank neither transfers nor retains substantially all of the risks and rewards of ownership but it does not retain control of the financial asset.
When the Bank retains the contractual rights to receive cash flows from the financial asset, but assumes a contractual obligation to pay those cash flows to other entities, it shall treat the transaction as a transfer that results in derecognition if:
| ● | It has no obligation to pay any amounts to the other entities unless it collects equivalent amounts from the assets; |
| ● | It is prohibited from selling or pledging the assets; and |
| ● | It has an obligation to remit without material delay any cash flows it receives from the assets. |
F-30
| 4.1.3.2. | Modifications |
In modifications for commercial or market reasons, an assessment is made as to whether the modification is substantial; that is, whether the changes in the terms of the contract differ substantially from the original contract, based on the analysis of qualitative variables (inclusion of returns based on profit sharing, guarantees, other collateral, or credit enhancements that significantly affect the credit risk profile associated with the loan, changes in currency and/or obligor) and, in some cases, a quantitative assessment. When the modifications result in derecognition, the renegotiated contract is a new loan, subject to the classification and measurement requirements established by IFRS 9.
Similarly, the costs and commissions associated with the financial asset are derecognized. Modifications that do not result in derecognition are understood as non-substantial modifications, the carrying amount will be recalculated as the present value of the modified contractual cash flows discounted at the original interest rate, recognizing the effect of the modification in the margin net interest in the statement consolidated of income. Likewise, costs and commissions are adjusted and amortized over the remaining life of the modified asset.
Contractual modifications of financial assets may be carried out due to restructurings and/or renegotiations for credit risk due to the borrower's financial difficulties are evaluated as a non-substantial modification and therefore does not lead to derecognition. When a financial asset is restructured, the difference between the original contractual cash flow and the new cash flow of the restructured asset discounted at the original effective interest rate is recognized as a gain or loss in the statement consolidated of income as “Interest income on loan and financial leases”, the costs and fees are deferred and will be amortized by the remaining life of the modified asset.
| 4.1.3.3. | Written-Off loan portfolio |
Loans are written off when the Bank concludes there is no realistic expectation of recovery of the loans and receivables balances from a client or third party, i.e., there is no possibility of recovery due to the debtor's lack of ability or willingness to pay or in the absence of open guarantees granted by the debtor. In general, this characteristic will be fulfilled when the following delinquency conditions are present:
|
|
Length of delinquency (days) |
|||
Type |
Collateral |
Grupo Agromercantil Holding S.A. |
Banistmo S.A. |
Banco Agrícola S.A. |
Bancolombia S.A. |
|
Without collateral |
|
|
180 |
|
Commercial |
With collateral |
N/A(1) |
360 |
360 |
360 |
|
Without collateral |
180 |
180 |
180 |
|
Consumer |
With collateral |
540 for vehicles collateral |
1,080 for mortgage collateral |
720 for mortgage collateral |
180 |
|
Without collateral |
|
180 |
|
|
Small Business Loan |
With collateral |
N/A(1) |
1,080 for mortgage collateral |
180 |
180 |
Mortgage |
With collateral |
1,440 |
1,080 |
720 |
N/A(1) |
(1) Not dependent on the length of delinquency but on the reasons underlying a loan's non-recoverability.
Among the reasons underlying a loan's non-recoverability are the estimated recovery time of the obligation, the probable recovery percentage given the existence or lack of collateral and the inability to locate the client. When default conditions are present, it is initially necessary to evaluate whether the collateral that supports the loan generates a reasonable expectation of recovery; if so, the necessary steps are taken to realize on the collateral prior to writing-off the loan. In cases where the collateral net fair value indicates that there are no reasonable expectations of recovery, loans are written-off in the consolidated financial statements.
F-31
| 4.2. | Financial liabilities |
At initial recognition, the Bank measures its financial liabilities at fair value. The transaction costs that are directly attributable to the financial liability are deducted from its fair value if the instruments are subsequently recognized at amortized cost or will be recognized in the consolidated statement of income if the liabilities are measured at fair value.
| 4.2.1. | Classification and Measurement of Financial Liabilities |
Financial liabilities are classified and subsequently measured as follows:
| ● | Amortized cost, measured at cost using the effective interest rate method. |
| ● | Fair value through profit or loss (“FVTPL”), measured using fair value, with variations in value recognized in the income statement. |
| ● | Irrevocably designated at fair value through profit or loss, measured using fair value, with variations in value recognized in the income statement. The effect of changes in own credit risk is presented in other comprehensive income. |
| 4.2.2. | Derecognition of Financial Liabilities |
The Bank derecognizes a financial liability from the consolidated statement of financial position when it is extinguished; that is, when the contractual obligation has been paid or settled or has expired.
Debt Exchange
The Bank assesses whether instruments subject to debt exchange are substantially different from each other, considering qualitative aspects such as currencies, maturities, interest rates, subordination terms, regulatory framework, among others, and quantitative aspects, in which the present value of discounted cash flows under the conditions of the new instruments (including any net commission paid minus any commission received) using the original effective interest rate to calculate the discount differs by at least 10 percent from the present value of discounted cash flows remaining from the original financial liability.
When it is concluded that the instruments subject to debt exchange are not substantially different (based on the analysis of qualitative variables such as currency or issuance market changes, and in some cases a quantitative evaluation), the transaction is recognized as a modification of debt, and in this case, the amortized cost of the modified liability is adjusted to the present value of estimated contractual cash flows discounted at the original effective interest rate of the financial instrument, and the gain or loss is recognized immediately in the income statement. Incremental costs and commissions adjust the carrying amount of the liability and are amortized over the remaining life of the modified liability, following its subsequent measurement at amortized cost. In debt exchanges that are considered substantially different, derecognition is recognized in the income statement, and a new financial liability is recognized.
| 4.3. | Day one profit adjustment |
In situations where the fair value of a financial asset acquired or financial liability assumed at initial recognition differs from the transaction price, the Bank shall recognize a gain or loss directly in the consolidated statement of income if the fair value is supported by Level 1 inputs or is based on a valuation technique that uses only observable market data. In all other circumstances, the Bank defers the Day one gain or loss and recognizes it in the consolidated statement of income over the course of the transaction period.
| 4.4. | Compound instruments |
The Bank recognizes compound financial instruments that contain both liability and equity components separately. Therefore, for initial measurement, the liability component is the fair value of a similar liability which doesn´t have an equity component (determined by discounting future cash flows using the market rate at the date of the issuance). The difference between the fair value of the liability component and the fair value of the compound financial instrument, considered as a whole, is the residual value assigned to the equity component.
F-32
After initial recognition, the liability component of a compound financial instrument is measured at amortized cost using the effective interest method. The equity component of a compound financial instrument is not re-measured subsequent to initial recognition. The liability component corresponds to the preferred dividend related to 1% of the subscription price, which is the payment of the minimum dividend on the preferred shares for each period. For further information, see Note 22. Share capital.
| 4.5. | Financial guarantee contracts and loan commitments |
The Bank issues financial guarantees and loan commitments. Loan commitments are those agreements under which the Bank has an irrevocable obligation to grant the loan. The financial guarantee contracts issued by the Bank are contracts that require the issuer to make specified payments to reimburse the holder for a loss it incurs because a specified debtor fails to make payment when due to accordance with the original or modified terms of a debt instrument.
Both financial guarantee contracts and loan commitments are initially recognized as liabilities at fair value, which is normally the fee received, adjusted for the directly attributable transaction costs incurred. Subsequently, liabilities are measured at the higher of the provision amount measured according to IFRS 9, and the amount initially recognized, less the accumulated amortization recognized according to IFRS 15 Revenue from contracts with customers.
Income derived from guarantees is recognized as “commission income” in the consolidated statement of income over the term of the contract, in accordance with the method and frequency of commission’s payments.
| 4.6. | Derivatives financial instruments |
A financial derivative is an instrument whose value changes in response to changes in a variable or index, such as an interest rate, exchange rate, the price of a financial instrument, a credit rating or a credit index. This instrument requires no initial payment or is lower in comparison to other financial instruments with a similar response to changes in market conditions and is generally settled at a future date.
The Bank recognizes its derivative financial instruments at fair value, based on the prices and valuation methodologies provided by the official pricing service provider (Precia); this includes counterparty credit-risk adjustments applied to derivatives when the Bank's position is a derivative asset, and the Bank's credit risk when the position is a liability on a derivative. For further information, see Note 30. Fair value of assets and liabilities, section d. Credit valuation adjustment.
Derivatives are recognized and measured at fair value through profit or loss unless such derivatives are designated as cash flow hedges or hedges of a net investment in a foreign operation. In those cases, the effective portion of changes in the fair value of the derivatives are recognized in other comprehensive income. All derivatives are carried as assets when fair value is positive and as liabilities when fair value is negative. Gains and losses arising from changes in the fair value of derivatives, which are not in hedging relationships, are recognized in the consolidated statement of income under the "valuation on financial instruments" item, and gains and losses from the valuation of foreign exchange derivatives are included in the "Other Operating Income" item.
| 4.7. | Hedge accounting |
The Bank designates and documents hedge accounting at inception in accordance with the requirements of IFRS 9 Financial Instruments. When the hedging relationship is considered to be highly effective, the changes in value of the hedging derivative are accounted for according to their classification, as fair value hedges, cash flow hedges and hedges of net investment in foreign operations, as set out in the paragraph below.
The Bank assesses at the inception of the hedge and on a monthly basis during the life of the instrument, whether the hedge used in the transaction is expected to be aligned with the hedge effectiveness requirement (prospective effectiveness):
| ● | Economic relationship between the hedging instrument and the hedged item. |
| ● | The effect of credit risk does not predominate over the value of the economic relationship. |
| ● | Designated hedge ratio is consistent with risk management strategy. |
F-33
The Bank discontinues the hedge accounting when the hedging relationship no longer meets the criteria provided for hedge effectiveness or when the hedging instrument expires or is sold, terminated or exercised. Consequently, the item no longer complies with the hedge accounting conditions or the hedging relationship no longer complies with the risk management objective.
Before the establishment of hedge accounting, the Bank documents the relationship between hedged items and hedging instruments, as well as its risk management objectives and hedging strategies, which are approved by the Risk Management Committee as the body designated by the Board of Directors.
Hedge relationships are classified and accounted for in the following ways:
Fair value hedges
Fair value hedges are designated to protect against the exposure to changes in the fair value of recognized assets or liabilities or unrecognized firm commitments.
Changes in the fair value of derivatives that are designated and qualify as hedging instruments in fair value hedges are recognized in the consolidated statement of income as interest and valuation on financial instruments. The change in fair value of the hedged item attributable to the hedged risk is included as part of the carrying value of the hedged item, and it is also recognized in the aforementioned item of the consolidated statement of income.
For fair value hedges that are related to items accounted for at amortized cost, the adjustments to the carrying value are amortized through the consolidated statement of income during the remaining term until their expiry. The amortization of the effective interest rate shall begin as long as there is an adjustment to the carrying value of the hedged item and shall begin no later than when the hedged item ceases to be adjusted for changes in its fair value attributable to the risk being hedged.
If the hedged item is derecognized, the non-amortized fair value is recognized immediately in the consolidated statement of income.
For the items hedged at amortized cost, the difference between the carrying value of the item hedged at the termination of the hedge and the nominal value are amortized using the effective rate method during the time beyond the original terms of the hedge.
When an unrecognized firm commitment is designated as a hedged item, the subsequent cumulative change in the fair value of the firm commitment attributable to the hedged risk is recognized as an asset or liability with corresponding gain or loss recognized in net income.
Cash flow hedges
Cash flows hedges are used mainly to manage the exposure to variability related to the cash flow attributable to a specific risk associated with an asset or liability recognized on the consolidated statement of financial position or to a highly probable forecast transaction.
The portion of the gain or loss on the hedging instrument that is determined to be an effective hedge is recognized in other comprehensive income. The ineffective portion of the gain or loss on the hedging instrument is recognized in the consolidated statement of income.
If the hedging instrument expires or is sold, terminated or exercised, without replacement or rollover into another hedging instrument, or if the hedging designation no longer meets the criteria provided for the hedge effectiveness requirements after any subsequent rebalancing adjustment, any accumulated gain or loss previously recognized in OCI remains in OCI, until the planned operation or the firm commitment affects the result.
F-34
When a forecasted transaction is no longer expected to occur, the gain or loss accumulated in equity is recognized immediately in net income.
Hedges of a net investment in a foreign operation
In accordance with IFRS 9 and IFRIC 16 Hedges of a net investment in a foreign operation, the Bank has decided to apply the hedge accounting of the foreign currency risk arising from currency translation of consolidated financial statements and goodwill of its net investment in Banistmo, designating as a hedging instrument of certain debt securities issued by the Parent Company and financial liabilities. The hedge accounting requires that the Bank accounts for the gain or loss derived from the foreign exchange differences related to the debt securities that are determined to be an effective hedge is recognized in other comprehensive income, as is the currency translation adjustment of the Banistmo operation into the presentation currency as required by IAS 21 Effects of changes in foreign exchange rates as detailed in 1. Functional currency, transactions and balances in foreign currency.
| 5. | Investments in associates and joint arrangements |
| 5.1. | Investments in associates and joint ventures |
An associate is an entity over which the Bank has significant influence. Significant influence is the power to participate in the financial and operating policy decisions of the investee but does not have control or joint control to make those policies decisions.
A joint venture is an entity that the Bank controls jointly with other participants, where the parties maintain a contractual agreement that establishes joint control over the relevant activities of the entity (which only exists when decisions about those activities require unanimous consent of the parties sharing control) and the parties have rights to the net assets of the joint arrangement.
The Bank's investments in associates and joint ventures are initially recorded at cost and their results, assets and liabilities are subsequently included in the consolidated financial statements using the equity method, except when the investment, or a portion thereof, is classified as held for sale, in which case it is accounted for in accordance with IFRS 5 Non-current assets held for sale and discontinued operations.
When an investment in an associate or joint venture is held by, or is held indirectly through, an entity that is a venture capital organization, or a mutual fund, unit trust or similar entities, and such investment is measured at fair value through profit or loss in that entity, the Bank may elect to measure investments in those associates and joint ventures at fair value through profit or loss in the consolidated financial statements. This election is applied on an investment-by-investment basis.
At the acquisition date, the excess of the acquisition cost of the associate or joint venture shares exceeding the Bank´s share of the net fair value of identifiable assets and liabilities of the investee is recognized as goodwill and is included in the carrying amount of the investment and it is not amortized. Any excess of the Bank’s share of the net fair value of the investee’s identifiable assets and liabilities over the cost of the investment is included as income in the determination of the Bank’s share of the associate or joint venture’s profit or loss in the period in which the investment is acquired. When necessary, the entire carrying amount of the investment (including goodwill) is tested for impairment in accordance with IAS 36 Impairment of assets. Impairment losses are recognized in accordance with the policy for impairment of assets, cash-generating units and goodwill (see section 12. Impairment of assets, cash-generating units and goodwill, of this note).
If the Bank's share of losses of an associate or joint venture exceeds the Bank's interest in that associate or joint venture (which includes any long-term interests that, in substance, form part of the Bank's net investment in the associate or joint venture), the Bank discontinues recognition its share of further losses. Additional, losses are recognized only to the extent that the Bank has incurred legal or constructive obligations or made payments on behalf of the associate or joint venture.
When the equity method is applicable, adjustments are considered in order to adopt uniform accounting policies of the associate or joint venture with the Bank.
F-35
The portion that corresponds to the Bank for changes in the investee´s other comprehensive income items is recognized in the consolidated statement of comprehensive income as “Unrealized gain/loss on investments in associates and joint ventures using equity method” and gains or losses of the associate or joint venture are recognized in the consolidated statement of income as “Dividends and net income on equity investments”, in accordance with the Bank's participation. Gains and losses resulting from transactions between the Bank and its associate or joint venture are recognized in the Bank´s consolidated financial statements only to the extent of the unrelated investor´s interest in the associate or joint venture. The equity method is applied from the acquisition date until the significant influence or joint control over the entity is lost. When the significant influence on the associate or the joint venture is lost, the Bank measures and recognizes any residual investment that remains at its fair value. The difference between the associate or joint venture carrying value (taking into account the relevant items of other comprehensive income), the fair value of the retained residual investment and any proceeds from disposing of a partial interest in the associate or joint venture, is recognized in the consolidated statement of income. The currency translation adjustments recognized in equity are reclassified to net income at the moment of disposal.
The unrealized gain or loss of an associate or joint venture is presented in the consolidated statement of comprehensive income, net of tax. Changes in the investment´s participation that arise from changes in other comprehensive income of an associate or joint venture are recognized directly in the investor’s statement of comprehensive income.
The dividends received from the associate or joint venture reduce the investment carrying value.
For further information, please see Note 8. Investments in associates and joint ventures.
| 5.2. | Joint operations |
A joint operation is a joint arrangement whereby the parties that have joint control of the arrangement have rights to the assets, and obligations for the liabilities, relating to the arrangement.
The Bank recognizes and measures assets, liabilities, revenues, and expenses in relation to its interest in joint operations in accordance with the applicable IFRS for the particular assets, liabilities, revenues and expenses.
When the Bank acquires an interest in a joint operation in which the activity constitutes a business, as defined in IFRS 3, or when an existing business is contributed to the joint operation on its formation by one of the parties that participate in the joint operation, the Bank will apply all of the principles of IFRS 3. In this case, the Bank recognizes goodwill in the event that consideration transferred exceeds the net of the acquisition date amounts of the identifiable assets acquired and the liabilities assumed.
When the Bank transacts with a joint operation in which the Parent Company or its subsidiaries is a joint operator (such as a sale or contribution of assets), the Bank is considered to be conducting the transaction with the other parties to the joint operation, and gains and losses resulting from the transactions are recognized in the Bank’s consolidated financial statements only to the extent of other parties’ interests in the joint operation.
| 6. | Leases |
| 6.1. | The Bank as lessee |
The Bank assesses whether a contract is or contains a lease at the inception of the contract and recognizes a right-of-use asset representing its right to use the leased asset and a lease liability representing its obligation to make lease payments. The Bank elected to apply the recognition exemptions for short-term leases (leases of 12 months or less and without a purchase option) and leases where the underlying asset is of low value. Lease payments related to these exemptions will be recognized as an expense in profit or loss on a straight-line basis over the term of the lease.
Both the right-of-use asset and the lease liability are measured at the present value of the lease payments that have not been paid at that date. Lease payments are discounted using the lessee’s incremental borrowing rate. In addition, the right-of-use asset includes: 1) the amount of the initial measurement of the lease liability, 2) lease payments or costs incurred by the lessee made before or after the commencement date, less lease incentives received, and 3) an estimate of the costs to be incurred to dismantle the underlying asset, restore the site on which it is located or restore the underlying asset to the condition required by the lease.
F-36
Subsequently, the Bank measures the right-of-use asset at cost less any accumulated depreciation and any accumulated impairment losses and adjusted for any remeasurement of the lease liability. The Bank measures the lease liability by increasing the carrying amount to reflect interest on the lease liability, reducing the carrying amount to reflect the lease payments made, and remeasuring the carrying amount to reflect any new expectation or lease modifications. Each lease payment has been allocated between the liability and interest expenses. The accrued interest on the lease liability for each period over the lease term will be the amount that produces a constant periodic rate of interest (incremental borrowing rate) on the remaining balance of the liability.
| 6.2. | The Bank as lessor |
The lease agreements entered into by the Bank are classified at the initial recognition as financial or operating leases.
A lease is classified as a finance lease when substantially all the risks and rewards incidental to ownership of the asset are transferred to the lessee and are recognized at a value equal to the net investment in the lease, corresponding to the sum of the minimum lease payments receivable and any unguaranteed residual value, discounted at the interest rate implicit in the lease. Otherwise, it is classified as an operating lease, recognizing and measuring the assets under the principles of property and equipment or investment property, in which case income and depreciation of property and equipment are recognized on a straight-line basis over the life of the asset. Contingent lease payments are recognized as revenue in the period in which they are received.
If during the lease term, the lessor and the lessee decide to modify the initial conditions, and the agreed changes result in a different classification, then the modified agreement will be considered a new lease with new clauses that will lead to the classification of a financial or operating lease, as appropriate.
The Bank uses the following indicia of transfer of risk and rewards incidental to ownership to the asset; if one of them is met, lease is classified as a finance lease:
| ● | The agreement indicates that the lessee has the option to purchase the asset at a price that is expected to be equal to or less than 10% of the fair value of the asset, upon termination of the lease. |
| ● | The term of the lease covers most of the economic life of the asset, even when the lease does not transfer the ownership of the underlying asset to the lessee at the end of the lease term, i.e., when the minimum lease term represents 75% or more of the economic life of the leased asset. |
| ● | At the inception of the lease, the present value of the minimum lease payments amounts to at least 90% of the fair value of the leased asset. |
| ● | The leased assets are of such a specialized nature that only the lessee has the possibility of using them without making significant modifications. |
| 7. | Premises and equipment and depreciation |
Premises and equipment include tangible items that are held for use, for rental to others, or for administrative purposes and are expected to be used for more than one period.
Items of premises and equipment are expressed at cost less accumulated depreciation and impairment losses. Depreciation is calculated using the straight-line method, in order to derecognize the depreciable amount of premises and equipment over the estimated useful lives of the assets. The depreciable amount is the cost of an asset less its residual value. The estimated useful lives for each asset group are:
F-37
Asset group |
|
Useful life range |
Buildings |
|
10 to 75 years |
Furniture and fixtures |
|
3 to 20 years |
Computer equipment |
|
3 to 20 years |
Equipment and machinery |
|
2 to 40 years |
Vehicles |
|
3 to 10 years |
The asset’s residual values and useful lives are reviewed, and adjusted if appropriate, at the end of each reporting period. When there is a significant change, the depreciation and the charge to the consolidated statement of income are adjusted based on the new estimation.
The Bank assesses at the end of each year whether there is any indication of external or internal reduction in the asset’s recoverable value. If there is any indication of impairment, the Bank estimates the recoverable amount of the assets and then recognizes the impairment loss in the consolidated statement of income. For further information, see section 12. Impairment of non-financial assets, cash-generating units and goodwill in this note.
Maintenance expenses of the premises and equipment are recognized as an expense in the period in which they are incurred and are registered in the consolidated statement of income as “Other administrative and general expenses”.
Gains and losses in sales of premises and equipment are registered in the consolidated statement of income as “Other operating income”.
| 8. | Investment properties |
The investment properties are measured initially at cost, including the transaction costs. The carrying value includes the cost of replacement or substitution of a part of an investment property at the time the cost is incurred, if the cost meets the recognition criteria; and it excludes the daily maintenance costs of the investment property which are included in the consolidated statement of income as “Other administrative and general expenses”.
After the initial recognition, the investment properties are measured at fair value which reflects the market conditions at the consolidated statement of financial position date and are valued by Management with the support of external experts using valuation techniques based on comparable prices, direct capitalization, discounted cash flows and replacement cost. The gains and losses that arise from changes in the fair values of investment properties are included in the consolidated statement of income as “Other operating income”.
Transfers of an asset to or from the investment properties are only made when there is a change in its use. For a transfer from an investment property to premises and equipment, the cost taken into account for its subsequent accounting is the fair value at the time of the change in use. If a premise and equipment becomes an investment property, it will be accounted for at its fair value.
| 9. | Intangible assets |
Intangible assets are identifiable, non-monetary assets without physical appearance, separately acquired or internally generated by the Bank that are measured initially at cost and subsequently at cost less any accumulated amortization and any accumulated impairment loss. Intangible assets acquired in business combinations are recognized at fair value at the date of acquisition.
Intangible assets with finite useful lives (ranging from 1 to 10 years) are amortized using the straight-line method over their estimated useful lives and assessed at the end of the period for impairment. The amortization period and the amortization method for intangible assets with a finite useful life are reviewed at least annually. The expected changes in the useful life or in the pattern of consumption of the future economic benefits of the asset are recognized when the amortization period or method has changed, as appropriate, and they are treated as changes in the accounting estimates. The amortization expense of intangible assets with finite useful lives is recognized in the consolidated statement of income.
F-38
The Bank’s intangible assets comprise mainly intangibles of finite useful life, such as licenses, software and computer applications, customer relationships and trademarks (See Note 9. Goodwill and intangible assets, net). Intangibles of indefinite useful life include Goodwill.
When intangible assets with finite useful life are written-off, the expected future economic benefits period is reduced to increase the amount of amortization, resulting in the derecognition of the intangible asset in a shorter period than initially estimated.
Intangible assets with indefinite useful lives are not subject to amortization but are periodically tested to identify any impairment, either individually or at the cash-generating unit level. The assessment of the indefinite life is reviewed annually to determine if it continues being supportable. In the event that the assessment was not valid, the change from indefinite useful life to finite useful life is recognized prospectively. Intangible assets with an indefinite useful life correspond to goodwill.
| 9.1. | Internally generated intangible assets |
The costs of internally generated intangible assets are recognized as intangible assets if they have been incurred in the development stage and meet the recognition criteria; if so, such assets are presented in the consolidated statement of financial position at cost less accumulated amortization and accumulated impairment losses (see section 12. Impairment of non-financial assets, cash-generating units and goodwill in this note). Other expenditures are recorded as expenses in the consolidated statement of income.
Amortization of the asset begins when development is complete and the asset is available for use. Intangible assets are amortized using the straight-line method over their estimated useful lives and assessed at the end of the period for impairment.
| 10. | Inventories |
Inventories of assets or returned property are those assets arising from an early termination of a finance or operating lease or those on which the lease has been terminated, and they are expected to be sold in the normal course of business, which are controlled by the Bank and are expected to obtain future economic benefit.
The inventory of returned property is recognized as an asset from the date on which the Bank assumes the risks and benefits thereof. Assets arising from operating leases are initially measured at cost, which is the carrying amount less accumulated depreciation and impairment, if any. Assets returned property financial leasing operations are recognized at the lower of their book value plus sanitation costs and its net realizable value. When the book value is greater than the net realizable value, an adjustment is recognized under the caption "Provision for impairment of loan portfolio and financial leasing operations, net" in the consolidated income statement.
Inventories are measured at the lower of cost and net realizable value. Net realizable value ("NRV") is the estimated selling price in the normal course of business, less the estimated costs necessary to make the sale. The cost of inventories is assigned by using specific identification of their individual costs.
The Bank revises the NRV of its inventories at least annually, or when market conditions so require; the adjustment of the decrease in value is recognized directly in income. Adjustments to the NRV are recognized under the caption "Amortization, depreciation and impairment" in the consolidated statement of income, up to the value initially recognized.
| 10.1 | . Digital assets |
The Bank chooses as an accounting policy to recognize digital assets held to be sold in the normal course of its operations as inventories. Digital assets are measured at fair value less costs of sale. If there is no active market, the fair value of the digital asset will be zero given the low probability of its realization.
Changes in fair value are recognized in the consolidated statement of income for the period in which such changes occur.
F-39
The exchange differences of the digital asset in foreign currency are recognized within the valuation process inherent to the fair value model.
| 11. | Digital assets and liabilities held in custody for customers |
The Bank safeguards crypto assets for customers in digital wallets and cryptographic keys are required to access digital assets on the Bank's platform. The Bank safeguards these assets and/or keys and is required to protect them from loss, theft, or other misuse.
The Bank recognizes customer's digital assets initially and subsequently at fair value. At the same time, the Bank recognizes the obligation to safeguard the customer's digital asset as a liability. The liability should be measured at the same amount as the corresponding asset at fair value.
Any loss, theft or other misuse that impacts the measurement of customer cryptoassets is recognized in profit or loss in the period in which it occurs.
| 12. | Assets held for sale and discontinued operations |
The Bank classifies non-current assets or disposal groups held for sale if their carrying value will be recovered through a sale transaction, rather than through continuing use. These assets are measured at the lower of their carrying value and their fair value less costs to sell and they are not depreciated nor amortized from the date of their classification. Additionally, if any indications of impairment exist, impairment losses are recognized for the difference between the carrying and the fair value less costs to sell as “Impairment, depreciation and amortization” in the consolidated statement of income. Gains and losses in the sale of assets held for sale are recognized in the consolidated statement of income as “Other operating income” or “Other administrative and general expenses”.
The held for sale condition is met if the assets or groups of assets are available, in their current condition, for immediate sale or the sale transaction is highly probable and is expected to be completed within the year following the date of classification. In the Bank, the assets held under this classification correspond to foreclosed assets. If the sale of the asset does not take place within the planned period, the assets are reclassified to "Other assets, net" in the consolidated statement of financial position.
A discontinued operation is a component of an entity that has been disposed of, or is classified as held for sale, and represents a separate major line of business or a geographical area of operations, is part of a single coordinated and individual plan to dispose of a separate major line of business or geographical area of operations, or is a subsidiary acquired exclusively with a view to resale. The results of a discontinued operation are presented separately from those of continuing operations in the consolidated statement of income on a comparative basis.
| 13. | Impairment of non-financial assets and cash-generating units and goodwill |
The Bank evaluates at the end of each period whether there is any indication that on a stand-alone basis non-financial assets and cash-generating units are impaired. If some indication of impairment does exist, the Bank estimates the recoverable amount of the assets and the loss by impairment, the impairment loss is recognized for the amount by which the carrying amount of the cash generating unit exceeds its recoverable amount. Regardless of whether impairment indicators exist, impairment of goodwill is assessed annually, or more frequently if events or changes in circumstances indicate that it may be impaired.
The recoverable amount of non-financial assets or cash-generating units is the higher of its fair value less costs of disposal and its value in use, where fair value is determined by Management by reference to market value, if available, by pricing models, or with the assistance of a valuation specialist. While value in use requires Management to make significant assumptions and use estimates to forecast cash flow for periods that are beyond the normal requirements of management reporting; and assess the appropriate discount rate and growth rate.
F-40
If an asset does not generate cash flows that are independent from the rest of the assets or group of assets, the recoverable amount is determined by the cash-generating unit to which the asset belongs.
The amount of impairment losses recognized in net income during the period are included in the consolidated statement of income as “Impairment, depreciation and amortization”. Except for impairment loss recognized for goodwill, impairment losses are subject to reversal, the increased carrying amount of an asset other than goodwill attributable to a reversal of an impairment loss shall not exceed the carrying amount that would have been determined (net of amortization or depreciation) had no impairment loss been recognized for the asset in prior years.
| 14. | Other assets |
The Bank presents as other assets, among other things, (a) the expenses paid in advance incurred in the development of its business, in order to receive future services, which are amortized during the period in which services are received or the costs or expenses are recorded and (b) foreclosed assets that do not comply with the requirements to be recognized as assets held for sale and where there are no plans to use them in the supply of services or for administrative purposes.
Foreclosed assets are initially recognized at the lower of net amount of the charged-off financial assets to which the foreclosed assets relate and net realizable value of the foreclosed asset (the net realizable value will be the estimated selling price of the asset or its awarding value, less the estimated costs necessary to carry out its sale), pending obtaining a plan for its commercialization. If net amount of the charged-off financial assets is greater than net realizable value of the foreclosed asset, an adjustment for impairment of credit risk of the financial asset is recorded in the results for the period.
There is evidence of impairment when these group of assets remain in the consolidated statement of financial position for a period of time exceeding one year from the reception date, without buyer having been found, despite the Bank’s ongoing efforts to sell them (even adjusting the selling price).
Foreclosed assets are subsequently assessed to determine whether an impairment lost must be recognized. In the case of events that arise that are beyond the control of the Bank and that make remote the realization of these assets, they are identified as "non-tradable”, and a complete impairment is carried out.
| 15. | Derecognition of non-financial assets |
The Bank's non-financial assets are derecognized either on disposal or when they are permanently withdrawn from use and no future economic benefits are expected. The difference between the value obtained on disposal and the carrying amount is recognized in the consolidated statement of income.
| 16. | Employee benefits |
| 16.1. | Short term benefits |
The Bank grants to its employees short-term benefits such as bonuses based on added value to clients and the Bank’s results, salaries, accrued performance costs and social security that are expected to be wholly settled within 12 months. Expenses related to these benefits are recognized over the period in which the employees provide the services to which the payments relate. For further information, see Note 19. Employee benefit plans.
| 16.2. | Other long-term employee benefits |
The Bank grants to its employees seniority bonuses as long-term employee benefits whose payment is not expected within the 12 months following the end of the annual period in which the employees have rendered their services. The cost of long-term employee benefits is allocated across the period from the time the employee was hired by the Bank and the expected date of obtaining the benefit. These benefits are projected up to the date of payment and are discounted through the projected unit credit method.
F-41
| 16.3. | Pensions and other post-employment benefits |
The Bank makes monthly contributions to pension funds, due to legal requirements and it has no legal obligation to pay further contributions.
The Bank recognizes contributions in the consolidated statement of income once the contribution is accrued. Any contributions unpaid at the consolidated statement of financial position date are included as a liability.
These are post-employment benefit plans in which the Bank has the legal or constructive obligation to take responsibility for the payments of benefits that have been agreed, for example, severance obligation, retirement pension premium plan and senior management pension plan premium and pension plan. The Bank makes an actuarial valuation based on the projected unit credit method and a risk-free rate which reflects current market assessments of the time value of money in each country (interest rate of treasury bonds [“TES”], representative of the nation's public debt), related to the characteristics and the benefit flows weighted average, to discount such obligation.
| 17. | Provisions, contingent liabilities and contingent assets |
Provisions
Provisions are recognized when the Bank has a present obligation (legal or constructive) as a result of a past event, where it is probable that an outflow of resources embodying economic benefits will be required to settle the obligation, and a reliable estimate of the obligation's value can be made.
The corresponding expense for any provision is presented in the consolidated statement of income, net of all expected reimbursement. The increase in the provision due to the time value of money is recognized as a financial expense.
The amounts recognized in the consolidated statement of financial position, correspond mainly to:
| I. | Judicial proceedings |
Judicial provisions refer to pending legal proceedings on employment matters, ordinary lawsuits, class actions suit, civil actions within criminal prosecutions and executive proceedings against the Bank.
| II. | Onerous contracts |
For the Bank, an onerous contract is a contract in which the unavoidable costs of meeting the obligations under the contract exceeds the economic benefits expected to be received under it.
| III. | Loan commitments |
In order to meet the needs of its customers, the Bank issues loan commitments, letters of credit and bank guarantees. Loan commitments are those approved irrevocable loans, in which, despite having acquired a commitment to grant them, due to the contract or agreement or for any other reason they are still pending disbursement.
| IV. | Financial guarantees |
The Bank issues bank guarantees on behalf of its customers. A bank guarantee represents an irrevocable commitment pursuant to which the Bank will cover, up to the maximum amount guaranteed, a breach of the client's contractual obligations to third parties for a certain period of time. These are commitments issued by the Bank to guarantee the performance of a customer to a third party and are mainly issued to guarantee agreements established between parties from the energy sector, hydrocarbons sector, private sector and public procurement contracts.
F-42
The Bank expects most of those guarantees provided to expire before they are used.
The events or circumstances that would require the Bank to perform under a guarantee are determined by the type of guarantee, as outlined below:
Guarantees for the energy sector
The Bank is responsible before the guarantee’s beneficiary in the following situations:
| ● | Lack of energy supply due to low availability from the generating company (the guaranteed entity). |
| ● | Non-compliance with the contract signed by the guaranteed entity. |
| ● | Non-compliance with the payment for energy supply. |
| ● | Non-compliance with the construction and operating of power plants. |
| ● | Non-compliance with the construction and operating of transmission lines. |
Guarantees for the hydrocarbons sector
The Bank is responsible before the guarantee’s beneficiary in the following situations:
| ● | Non-compliance with the contractual obligations in the Minimum Exploration Program. |
| ● | Non-compliance with the contractual obligations in the Additional Exploratory Program. |
| ● | Non-compliance with the contractual obligations in the Post Exploratory Program. |
| ● | Non-compliance with the Technical Evaluation obligations. |
Guarantees for public procurement
The Bank must pay a state entity up to the amount guaranteed for the breach by the contractor of the contractual or legal obligations agreed.
Commitment issued by the Bank to guarantee the performance of a customer from the private sector
The Bank must pay the third party if there is any breach of what has been agreed upon or due to the economic insolvency of the client.
Contingent liabilities
Possible obligations that arise from past events and whose existence will be confirmed only by the occurrence or non-occurrence of one or more uncertain future events, not wholly within the control of the Bank, or present obligations that arise from past events but are not recognized because it is not probable that an outflow of resources embodying economic benefits will be required to settle the obligations or the amount of the obligations cannot be measured with sufficient reliability, are not recognized in the consolidated statement of financial position, but instead are disclosed as contingent liabilities, unless the possibility of an outflow of resources embodying economic benefits is remote, in which case no disclosure is required.
Contingent assets
Possible assets that arise from past events whose existence will be confirmed only by the occurrence or non-occurrence of one or more uncertain future events, not wholly within the control of the Bank, are not recognized in the consolidated statement of financial position; instead, these are disclosed as contingent assets where an inflow of economic benefits is probable. When the realization of income is virtually certain, then the related asset is not a contingent asset and its recognition is appropriate.
F-43
| 18. | Revenue recognition |
The Bank recognizes revenue from ordinary activities, which represent the transfer of goods or services committed with customers in exchange for an amount that reflects the consideration to which the entity expects to be entitled. For performance obligations where none of the conditions for revenue recognition over time are met, the Bank satisfies the performance obligation at a point in time, at which the customer obtains control of the promised services.
Revenue is measured based on the consideration specified in the contract with the customer, and excludes amounts received on behalf of third parties when the Bank is an agent. The Bank recognizes revenue when it transfers control over a good or service to a customer. Revenue is presented net of reimbursements and discounts and after eliminating inter-group sales. The Bank evaluates its revenue categories based on specific criteria to determine whether it acts as principal or agent. Revenue is recognized to the extent that it is probable that economic benefits will flow to the Bank and it is possible to reliably measure the related revenues and costs.
When the Bank fulfills a performance obligation through the delivery of promised goods or services to customer, it creates a contractual asset for the consideration amount obtained with the performance. The Bank recognizes the contractual assets as current assets, as they are expected to be realized within the normal operating cycle.
The costs of contracts eligible for capitalization as incremental costs when obtaining a contract are recognized as a contractual asset. Contractual costs are capitalized when incurred if the Bank expects to recover those costs. Contractual costs constitute non-current assets to the extent that the Bank expects to receive the economic benefits of those assets in a period greater than twelve months. The contractual costs are amortized systematically and consistently with the transfer of the services to the customer once the corresponding revenue has been recognized. The capitalized contractual costs are impaired if the customer withdraws or if the carrying amount of the asset exceeds the projection of the discounted cash flows that are related to the contract.
Interest income comprises income of financial assets at amortized cost or at fair value through other comprehensive income. Interest income is recognized using the effective interest rate method, the computation takes into account all the contractual conditions of the financial instrument (for example, prepayment options) and includes incremental fees and commissions (for example, certain loan commitment fees) or expenses that are directly attributed to the instrument and are an integral part of the effective interest rate, without taking account future credit losses.
Valuation income relates to debt securities at fair value, where gains and losses arising from changes in fair value are included in the consolidated statement of income as “Interest and valuation on financial instruments”.
Fees and services commissions are recognized as the right to consideration is obtained through the exchange of goods or services that the entity has transferred to a customer. Therefore, the Bank recognizes some fees as revenue over time, such as income from commissions and asset management, custody and other administration and advisory commissions. While other fees are recognized as revenue at a point in time of completion of the underlying transaction, like commissions arising from the negotiation or participation in the negotiation of a transaction for a third party, such as the acquisition of shares or other securities or the purchase or sale of businesses. In addition, the Bank maintains a credit card loyalty program to provide incentives to its customers. The program allows customers to purchase goods and services, based on the exchange of awards points, which are awarded based on purchases using the Bank's credit cards and the fulfillment of certain conditions established in such program. The redemption of points for prizes is carried out by a third party. Therefore, the expenses of the Bank's commitments with its clients arising from this program are recognized as a lower value of the fees and commission income, considering the total number of points that can be redeemed over the accumulated prizes and the probability of redemptions.
Dividend revenue of investments that are not associates or joint ventures are recognized when the right to payment of the Bank is established, which is generally when the shareholders declare the dividend. These are included in the consolidated statement of income as “Dividends and net income on equity investments”.
F-44
| 19. | Income tax |
Income tax includes current tax and deferred tax. The current tax is the income tax payable with respect to the profit for the fiscal year, which arises in profit or other comprehensive income. A provision is made for current tax considering the tax bases and tax rates enacted in each of the jurisdictions where the Bank is located, at the date of preparation of the consolidated financial statements.
The Bank recognizes, when appropriate, deferred tax assets and liabilities by estimating the future tax effects attributable to differences between book values of assets, liabilities and their tax bases. Deferred tax assets and liabilities are measured based on the tax rate that, in accordance with the valid tax laws in each country where the Bank has operations, must be applied in the year in which the deferred tax assets and liabilities are expected to be realized or settled. The future effects of changes in tax laws or tax rates are recognized in the deferred taxes as from the date of publication of the law providing for such changes.
Tax bases for deferred tax must be calculated by factoring in the definition of IAS 12 Income tax and the value of the assets and liabilities that will be realized or settled in the future according to the valid tax laws of each of the countries where the Bank has operations.
Deferred tax liabilities due to deductible temporary differences associated with investments in subsidiary and associated entities or shares in joint ventures, are recognized, except when the Bank is able to control the period in which the deductible temporary difference is reverted, and it is likely that the temporary difference will not be reverted in the foreseeable future.
Deferred tax assets, identified with temporary differences, are only recognized if it is considered likely that the Bank will have sufficient taxable income in the future that allows it to be recovered based on the stand-alone entity expected cash flow forecast for the next three years.
Tax credit from fiscal losses and surplus amounts from the presumptive income on the net income are recognized as a deferred asset, provided that it is likely that the Bank will generate future net income to allow their offset.
The deferred tax is recorded as debit or credit according to the result of each of the companies that form the Bank, and for the purpose of disclosure on the consolidated statement of financial position it is disclosed as net.
The deferred income tax expense is recognized in the consolidated statement of income under the heading “Income tax”, except when referring to amounts directly recognized in OCI (Other Comprehensive Income).
Regulatory changes in tax laws and in tax rates are recognized in the consolidated statement of income under the heading “Income Tax” in the period when such rule becomes enforceable. Interest and fines are recognized in the consolidated statement of income under the other administrative and general expenses or in the caption "Income tax" of the consolidated income statement, when applicable.
The Bank periodically assesses the tax positions adopted in tax returns, and, according to the results of the tax audits conducted by the tax authorities, determines possible tax outcomes provided it has a present obligation and it is more likely than not that the Bank will have to dispose of the economic resources to cancel the obligation, and the Bank can make an accurate estimate of the amount of the obligation.
For further information about deferred tax considerations derived from the last Colombian tax reform (Law 2277 of 2022), see Note 12. Income tax.
Transfer pricing policy
The Bank has as a general policy that each of its companies be responsible for their income, costs and expenses independently.
F-45
The policy takes into account the regulation for the Parent Company provided for in the Organic Statute of the Financial System (article 119, numeral 4) which in relation to the autonomy of the subsidiaries states that: The activity of the subsidiaries of entities subject to the control and supervision of the SFC must be carried out in conditions of independence and administrative autonomy, so that they have sufficient decision-making capacity to carry out the operations that constitute their object.
The Bank recognizes arm’s length operations with foreign economic links. These operations are documented and reported to the tax Administration according to the last evaluation date corresponding to the previous year.
E. Use of estimates and judgments
The preparation of consolidated financial statements requires Bank's Management to make judgments, estimates and assumptions that affect the application of accounting policies and the reported amounts of assets, liabilities, income and expenses.
The estimates and underlying assumptions are reviewed on an ongoing basis. Revisions to accounting estimates are recognized in the period in which the estimate is revised if the revision affects only that period, or in the period of the revision and future periods if the revision affects both current and future periods.
Judgments or changes in assumptions are disclosed in the notes to the consolidated financial statements. Management bases its estimates and judgments on historical experience and on various other factors that are believed to be reasonable under current circumstances. Actual results may differ from these estimates if assumptions and conditions change.
The significant accounting estimates that the Bank uses in preparing its consolidated financial statements are detailed below:
| 1. | Credit risk impairment |
As disclosed by Management and described in section D. Material Accounting Policies, paragraph 4.1.2. Impairment of financial assets at amortized cost or at fair value through other comprehensive income ‘FVTOCI’, expected credit losses are calculated using individual and collective models and methodologies based on assumptions and judgement considering historical credit data, current borrower situation and reasonable and supportable forecasts of future economic conditions. Collective models include parameters of probability of default at 12 months, probability of default throughout the lifetime of the obligation, loss given default, and exposure at default with the inclusion of the prospective approach that include assumptions of future macroeconomic conditions in plausible future scenarios. In addition, for loans individually assessed in stage 3, the Bank will evaluate defaulted significant loans, analyzing the debt profile of each debtor, the fair value of guarantees granted, information on credit behavior and the future cash flows expected from the client.
The estimation of impairment charges is a critical accounting policy because of the significance of this line item, the sensitivity of the charges to changes in assumptions about future events (behavior of the expected macroeconomic variables), weighting of macroeconomic scenarios and other somewhat subjective judgments that are incorporated in the individual credit loss models.
Some relevant assumptions must be made to operate the mathematical models behind the expected credit loss assessment. Assumptions are constructed from historical data to consider whether a customer has a significant increase in risk or is in default; these are reviewed by expert panels. Other assumptions such as future economic conditions, the simulation of reasonable future economic scenarios and the likelihood of those scenarios have a high impact on lifetime default probability models. These scenarios are determined and leveraged by the Direction of Economic Research.
The main factors considered in collective estimations of credit losses are the definition of significant increase in credit risk, definition of default, collateral values, loan maturity and macroeconomic forecast of variables such as unemployment, GDP, interest rates, among others. It is also important to consider any other variable that could influence a client´s willingness to pay.
F-46
In addition, individual credit loss models consider assumptions on how the financial performance and future cash flow of a client could be affected, the client’s expected future operational and commercial activity, the capacity to generate sufficient cash to pay debt obligations and trends and regulatory changes in the economic sector in which the client operates, changes in the collateral value, weighting of the scenarios used, as well as other internal or external factors. For further information, see Note 6. Loans and advances to customers, net and Risk management.
Given the inherent uncertainties and the high level of subjectivity involved in the assessment of three following factors, it is possible that the outcomes in the next financial year could differ from the expectations on which Management’s estimates are based:
| ● | Exposure at default: The exposed balance of assets to the current capital balance, interest, and receivable accounts. In the case of products whose nature is revolving and that have an available borrowing that is susceptible to be used in its entirety according to loan contracts subscribed with clients, this parameter includes an estimation of the use of those products after the client’s default. |
| ● | Probability of default (“PD”): This is the probability that the debtor fails to fulfill their obligations of capital and/or interest payment over a period of 12 months. This is linked to the rating/scoring of each debtor/operation. |
| ● | Loss given default (“LGD”): This is defined as the economic impairment that the entity would incur in the event of any instance of default. This depends mainly upon the characteristics of the debtor and upon the valuation of guarantees or collateral associated with the operation. |
Impairment loss models and methodologies, and the related assumptions, are assessed by the Bank’s Chief Risk Officer (“CRO”) on a regular basis, using robust validation procedures in order to assure a reasonable coverage of effective losses. This process enables Management to periodically determine whether assumptions and models used to measure credit risk impairment should be adjusted to achieve more precise estimations. Internal controls, data governance standards and approval processes, have been implemented by the Bank to make estimations more accurate. As of December 31, 2023, there has been an improvement in the methodology used to calculate impairment, as shown below:
| ● | LGD: A methodological change has been made to the selection of the defaulting client's recovery, which more closely reflects the client's payment behavior. |
| ● | New rating models have been developed to improve the risk classification of customers in the individual (in Colombia and Panama) and corporate (in Colombia) portfolios. |
| ● | Enhancements have been made to the threshold model to identify a significant increase in risk from the point of origin, which allows for greater accuracy in classifying customers into stage 2 with a high probability of default. |
| ● | The probability of default (“PD”) models currently incorporate data through February 2020 (pre-pandemic). When performing analyses to incorporate new information, difficulties are encountered in modeling and obtaining good precision and discrimination metrics due to the irregular behavior of the variables included in the estimates. These variables include macroeconomic factors such as the country’s low economic growth, high interest rates, and high unemployment, in addition to the behavior of default rates. These rates represent recoveries that are not real but have been given by the provision of financial relief and then a high level of default as a result of the economic situation that has had a negative impact on the credit portfolio. Therefore, the Bank’s Management has decided not to incorporate recent data into the PD models. However, an overlay has been created for those portfolios that have recent payment delinquencies above the historical average. |
The net effect of the above is the constitution of provisions of COP 11,071 as of December 31, 2023.
| 2. | Impairment testing of cash generating units (“CGU”), including goodwill |
The Bank tests goodwill recognized upon business combinations for impairment at least annually. The impairment test for goodwill involves estimates and significant judgments, including the identification of cash generating units and the allocation of goodwill based on the expectations of which operating segments of the Bank will benefit from the acquisition. The fair value of the acquired companies is sensitive to changes in the valuation models’ assumptions. Adverse changes in any of the factors underlying these assumptions could lead the Bank to record a goodwill impairment charge. Management believes that the assumptions and estimates used are reasonable and supportable in the existing market environment and commensurate with the risk profile of the assets valued. See Note 9. Goodwill and intangible assets, net, for further information related to carrying amount, valuation methodologies, key assumptions, sensitivities and the allocation of goodwill.
F-47
| 3. | Recognition of digital assets |
Currently, there is no specific definitive guidance in IFRS or alternative accounting frameworks to account for the recognition of digital assets held by the Bank, as well as the custody of digital assets held for customers, so management has exercised significant judgment in determining the appropriate accounting treatment.
The Bank has considered that it acts in the quality of a commodity trader, as defined in IAS 2, Inventories, by characterizing certain of its holdings as inventories, or more specifically, digital assets. The business model for digital assets will be to sell them in the near future and generate a profit from fluctuations in price or dealer margin. So, inventories held by commodity broker-dealers are measured at fair value less costs to sale. When such inventories are measured on that basis, changes in value are recognized in profit or loss in the period.
With respect to the custody of digital assets held by customers, the Bank recognizes a liability for the obligation to safeguard user's assets and recognizes an associated asset for the cryptographic assets safeguarded. Both the liability and the asset must be measured initially and subsequently at the fair value of the crypto assets being safeguarded.
In the event that the IASB issues final guidance, the Bank may be required to modify its accounting policies, which could have a significant effect on the Bank's consolidated financial statements.
| 4. | Deferred tax |
Deferred tax assets and liabilities are recorded on deductible or levied temporary differences originating between tax and accounting bases, taking into account the tax rules applicable in each country where the Bank has operations. Due to the changing conditions of the political, social and economic environment, the constant amendments to tax legislation and the permanent changes in the tax principles and changes in interpretations by tax authorities determining the tax bases for the deferred tax items involves difficult judgments including estimates of future gains, offsets or tax deductions. Accordingly, the determination of the deferred tax is considered a critical accounting policy.
For more information relating to the nature of deferred tax assets and liabilities recognized by the Bank, please see Note 12. Income tax.
| 5. | Provisions and contingent liabilities |
The Bank is subject to contingent liabilities, including those arising from judicial, regulatory and arbitration proceedings, tax and other claims arising from the conduct of the Bank’s business activities. These contingencies are evaluated based on Management’s best estimates and provisions are established for legal and other claims by assessing the likelihood of the loss actually occurring as probable, possible or remote. Contingences are provisioned and recorded when all the information available indicates that it is probable that an outflow of resources embodying economic benefits will be required to settle the obligation before the consolidated statement of financial position date and the amounts may be reasonably estimated. The Bank engages internal and external experts in assessing probability and in estimating timing, nature and amount of outflows that may result from past events.
Provisions are determined by Management’s best estimate of the expenditure required to settle the present obligation at the end of the reporting period, which estimate is discounted using a risk-free rate which reflects current market assessments of the time value of money in each country, which for Colombia is the interest rate on treasury bonds “TES”.
Throughout the life of a contingency, the Bank may learn of additional information that can affect assessments regarding probability or the estimates of amounts involved; changes in these assessments can lead to changes in recorded provisions.
The Bank considers the estimates used to determine the provisions for contingent liabilities critical estimates because the probability of their occurrence and the amounts that the Bank may be required to pay are based on the Bank’s judgment and those of its internal and external experts, which will not necessarily coincide with the future outcome of the proceedings.
F-48
For further information regarding legal proceedings and contingencies and their carrying amounts, see Note 21. Provisions and contingent liabilities.
| 6. | Fair value of assets and liabilities |
The fair value of the Bank's assets and liabilities is determined at the date of the consolidated statement of financial position. The Bank's fair value measurement process considers the characteristics of the asset or liability in the same way that market participants would take them into account when pricing the asset or liability at the measurement date; the estimate takes into account inputs from valuation techniques used to measure fair value.
To increase consistency and comparability in fair value measurements and related disclosures, the Bank specifies different levels of inputs that may be used to measure the fair value of financial instruments, as follows:
Level 1: Assets and liabilities are classified as Level 1 if there are observable inputs that reflect quoted prices (unadjusted) for identical assets or liabilities in active markets. An active market is one in which transactions occur with sufficient volume and frequency to provide pricing information on an ongoing basis. Instruments are valued by reference to unadjusted quoted prices for identical assets or liabilities in active markets where the quoted price is readily available, and the price represents actual and regularly occurring market transactions.
Level 2: Assets and liabilities are classified as Level 2 if in the absence of a market price for a specific financial instrument, its fair value is estimated using models whose input data are observable for recent transactions of identical or similar instruments.
Level 3: Assets and liabilities are classified as level 3 if unobservable input data were used in the measurement of fair value that are supported by little or no market activity and that are significant to the fair value of these assets or liabilities. The fair value of Level 3 financial assets and liabilities is determined using pricing models, discounted cash flow methodologies or similar techniques.
Transfers into or out of Level 3 are made if the significant inputs used in the financial models measuring the fair values of the assets and liabilities became unobservable or observable, respectively, in the current marketplace. All transfers between the aforementioned levels are assumed to occur at the end of the reporting period.
The measurement of the fair value of financial instruments generally involves a higher degree of complexity and requires the application of judgments especially when the models use unobservable inputs (level 3) based on the assumptions that would be used in the market to determine the price for assets or liabilities. Determination of these assumptions includes consideration of market conditions and liquidity levels. Changes in the market conditions, such as reduced liquidity in the capital markets or changes in secondary market activities, may reduce the availability and reliability of quoted prices or observable data used to determine fair value.
When developing fair value measurements, the Bank maximizes the use of observable inputs and minimizes the use of unobservable inputs in measuring fair value. Additionally, the Bank uses third-party pricing services to obtain fair values, which are used to either record the price of an instrument or to corroborate internally developed prices. Third-party price validation procedures are performed over the reasonableness of the fair value measurements. For further details regarding carrying amount and sensitivity disclosures, please see Note 30. Fair value of assets and liabilities.
| 7. | Measurement of employee benefits |
The measurement of post-employment benefit obligations and long-term employee benefits takes into account a range of inputs and it is dependent upon a series of assumptions of future events. The projected unit credit method is used to determine the present value of the obligation for the defined benefits and its associated cost. Future measurements of obligations may differ to those presented in the consolidated financial statements, among others, due to changes in economic and demographic assumptions and significant events. The actuarial valuation methodology of the post-employment and long-term benefit plans include typified discount rates by each benefit plan, with the objective of presenting more relevant information on the value of these plans in the consolidated financial statements.
F-49
For further information, see Note 19. Employee benefit plans.
| 8. | Transaction price determination |
With respect to contracts with the Bank’s customers, for the determination of the transaction price, the Bank allocates to each one of the performance obligations under the contract the price which represents the value expected to be received in respect of each such performance obligation based on its relative stand-alone selling price. Such price is determined based on the cost of each service, related tax and associated risks to the operation and inherent to the transaction, plus the margin expected to be received for the services, considering in each case the market price for the service, the conditions agreed with the customer and the customer’s segment. The Bank has fixed and variable prices considering the characteristics of each service, future events, discounts, returns and other variables that may influence the selling price. No significant financing components are factored in the determination of the selling price. For further information, see Note 25. Operating income.
| 9. | Leases |
The measurement of the right-of-use asset and of the lease liabilities requires a series of judgments, among which are the determination of the term of the lease and the rate used in discounting the cash flows. The term of the lease is defined according to the historical information of the contracts and the period over which an asset is expected to be economically usable, which involves a high degree of uncertainty due to the use of relevant information about past events. In the Bank’s case, the weighted average lessee’s incremental borrowing rate was used to discount the cash flows associated with the leasing contracts. The Bank performs analysis taking into account the currency, lease term, economic environment and class of underlying assets, as to determine the weighted average lessee’s incremental borrowing rate. For further information, see Note 7. Leases.
| 10. | Uncertainty over income tax treatments |
In the process of determining the current and deferred tax for periods subject to review by the tax authority, the applicable rules have been applied and interpretations have been made to take positions, on which different interpretations could arise from those made by the entity. Due to the complexity of the tax system, the continuous modifications of the fiscal rules, the accounting changes with implications in the tax bases and in general the legal instability of the country, at any time the tax authority could have different criteria from the Bank. Therefore, a dispute or inspection by the tax authority on a specific tax treatment may affect the deferred or current tax asset or liability bank´s accounting, in accordance with the requirements of IAS 12.
Management and its advisors believe that their decisions concerning the estimates and judgments made in each fiscal period are in accordance with those required by the current tax regulations, and therefore have not considered it necessary to recognize any additional provisions to those indicated in Note 12. Income tax.
Amendments to IAS 8 Accounting Policies, Changes in Accounting Estimates and Errors. Definition of Accounting Estimates: In February 2021, the Board issued Definition of Accounting Estimates, which amended IAS 8. The amendments introduced the definition of accounting estimates in paragraph 5 and included other amendments to IAS 8 to help entities distinguish changes in accounting estimates from changes in accounting policies.
The amendment to IAS 8 is effective for annual periods beginning on or after January 1, 2023, and early application is permitted.
F-50
The Bank early applied this amendment as of January 1, 2022, with no impact on the Bank's consolidated financial statements and disclosures, due to the new definition of accounting estimates being in accordance with that which the Bank currently applies and discloses.
Amendments to IAS 1 Presentation of Financial Statements and IFRS Practice Statement 2 Making Materiality Judgements. Disclosure of Accounting Policies: In February 2021 the Board amended IAS 1 and IFRS Practice Statement 2 Making Materiality Judgements, to replace the term "significant" with "material", to require an entity to disclose its material accounting policy information rather than its significant accounting policies. Therefore, accounting policy information may be considered material when that information is considered together with other information in a complete set of financial statements. In the Board’s view, accounting policy information is expected to be material if its disclosure was needed for primary users to understand information provided about material transactions, other events or conditions in the financial statements. These amendments are effective for annual periods beginning on or after January 1, 2023, and early application is permitted.
The Bank applied this amendment for the annual consolidated financial statements and disclosures beginning on or after January 1, 2023. For further information, see section D. Material Accounting Policies in this note.
Amendments to IAS 12 Income Taxes. Deferred Tax related to Assets and Liabilities arising from a Single Transaction: In May 2021, the Board issued Deferred Tax related to Assets and Liabilities arising from a Single Transaction. The amendments narrowed the scope of the recognition exemption in paragraphs 15 and 24 of IAS 12 (recognition exemption) so that it no longer applies to transactions that, on initial recognition, give rise to equal taxable and deductible temporary differences.
This amendment is effective for annual periods beginning on or after January 1, 2023, and early application is permitted.
This amendment was assessed by Management without evidencing an impact on the Bank's consolidated financial statements and disclosures because no exemptions are currently applied for the recognition of deferred taxes arising from a single transaction.
Amendments to IAS 12 Income Taxes - International Tax Reform—Pillar Two Model Rules: In May 2023, the IASB amended IAS 12 Income Taxes to give companies temporary relief from accounting for deferred taxes arising from the Organisation for Economic Co-operation and Development’s (“OECD”) international tax reform.
The OECD published the Pillar Two model rules in December 2021 to ensure that large multinational companies would be subject to a minimum 15.00% tax rate. More than 135 countries and jurisdictions representing more than 90.00% of global GDP have agreed to the Pillar Two model rules.
The amendments introduce:
| - | A temporary exception—to the accounting for deferred taxes arising from jurisdictions implementing the global tax rules. This will help to ensure consistency in the financial statements while easing into the implementation of the rules; and |
| - | Targeted disclosure requirements—to help investors better understand a company’s exposure to income taxes arising from the reform, particularly before legislation implementing the rules is in effect. |
Companies can benefit from the temporary exception immediately but are required to provide the disclosures for annual reporting periods beginning on or after January 1, 2023.
This amendment has been assessed by Management with no evidence of an impact on the Bank's consolidated financial statements and disclosures, due the OECD’s Pillar Two model rules has not yet been implemented in Colombia and in the countries in which the Bank has a presence.
New Standard IFRS 17 Insurance Contracts and amendments to IFRS 17: IFRS 17, issued in May 2017 to replace IFRS 4 Insurance Contracts, applies to insurance contracts, including reinsurance contracts, issued by an entity with
F-51
specified exceptions; reinsurance contracts held by an entity; and investment contracts with discretionary participation features issued by an entity that issues insurance contracts.
The new rules will affect the financial statements and key performance indicators of all entities that issue insurance contracts or investment contracts with discretionary participation features.
Targeted amendments made in July 2020 aimed to ease the implementation of the standard by reducing implementation costs and making it easier for entities to explain the results from applying IFRS 17 to investors and others. The amendments also deferred the application date of IFRS 17 to 1 January 2023.
Further amendments made in December 2021 added a transition option that permits an entity to apply an optional classification overlay in the comparative period(s) presented on initial application of IFRS 17. The classification overlay applies to all financial assets, including those held in respect of activities not connected to contracts within the scope of IFRS 17. It allows those assets to be classified in the comparative period(s) in a way that aligns with how the entity expects those assets to be classified on initial application of IFRS 9. The classification can be applied on an instrument-by-instrument basis.
This standard is effective for annual periods beginning on or after January 1, 2023, and early application is permitted for entities that apply IFRS 9 Financial Instruments before the date of initial application of IFRS 17.
The Bank applied this amendment for the annual consolidated financial statements and disclosures beginning on or after January 1, 2023. For further information, see Note 32. Impacts on application of new standards.
Amendments to IAS 1 Presentation of Financial Statements: On January 23, 2020, the IASB issued amendments to IAS 1 to clarify the requirements for classifying liabilities as current or non-current. More specifically:
- The amendments specify that the conditions which exist at the end of the reporting period of an obligation are those which will be used to determine if a right to defer settlement of a liability exists.
- Management expectations about events after the balance sheet date, for example on whether a covenant will be breached, or whether early settlement will take place, are not relevant.
- The amendments clarify the situations that are considered settlement of a liability.
Additionally, on October 30, 2022, the IASB issued an amendment to IAS 1 to improve the disclosures an entity provides when its right to defer settlement of a liability for at least twelve months is subject to compliance with covenants, and how this impacts the classification of that liability as current or non-current.
The amendments to IAS 1 are required to be applied for annual periods beginning on or after January 1, 2024. The amendments must be applied retrospectively, in accordance with IAS 8. Early application is permitted.
Management concluded that this amendment has no impact on the preparation of the consolidated financial statements, because the Bank presents the consolidated statement of financial position ordered by liquidity, according to the business nature.
Amendments to IFRS 16 Leases- Lease liability in a sale and leaseback: In September 2022, the Board amended IFRS 16 to add subsequent measurement requirements for sale and leaseback transactions that meet the requirements of IFRS 15 to be accounted as a sale. The amendments require a seller-lessee to subsequently measure lease liabilities arising from a subsequent lease such that it does not recognize any amount of gain or loss that relates to the right-of-use that it retains.
This amendment is effective for annual periods beginning on or after January 1, 2024, and early application is permitted.
This amendment has been assessed by Management with no evidence of an impact on the Bank's consolidated financial statements and disclosures, due the new requirements are in line with what the Bank has applied and disclosed.
F-52
NOTE 3. OPERATING SEGMENTS
Operating segments are defined as components of an entity about which separate financial information is available and that is evaluated regularly by the chief operating decision maker (CODM) in deciding how to allocate resources and assessing performance; the CODM is comprised of the Bank’s President (CEO) and Financial Vicepresident (CFO). The segment information has been prepared following the Bank’s accounting policies and has been presented consistently with the internal reports provided to the CODM.
The CODM uses a variety of information and key financial data on a segment basis to assess the performance and make decisions regarding the investment and allocation of resources, such as:
| ● | Net interest margin (Net margin on financial instruments divided by average interest-earning assets). |
| ● | Return on average total assets (Net income divided by average total assets). |
| ● | Return on average stockholders’ equity. |
| ● | Efficiency ratio (Operating expenses as a percentage of interest, fees, services and other operating income). |
| ● | Asset quality and loan coverage ratios. |
The Bank has the following segments: Banking Colombia, Banking Panama, Banking El Salvador, Banking Guatemala, Trust, Investment Banking, Brokerage, International Banking and All other segments. The factors used to identify the Bank’s reportable segments are the nature of the products and services provided by the subsidiaries and the geographical locations where the subsidiaries are domiciled, in line with the CODM’s operating decisions related to the results of each segment.
The Bank’s operating segments are comprised as follows:
•Banking Colombia
This segment provides retail and corporate banking products and services to individuals, companies and national and local governments in Colombia. The Bank’s strategy in Colombia is to grow with these clients based on value added and long-term relationships. In order to offer specialized services to individuals toguarantee quality service and promote business growth and country development.
In order to offer specialized services to individuals, small and medium-sized enterprises (SMEs) and large companies, the individual sales force classifies its target customers as: Personal, Plus and Corporate. The Bank´s corporate and government sales force targets and specializes in companies with more than COP 100,000 million in revenue in twelve economic sectors: agribusiness, commerce, manufacturing of supplies and materials, consumer goods, financial services, health, education, construction, government, infrastructure, real estate, and natural resources.
On December 14 of 2021, the Parent Company´s Board of Directors authorized the legal separation of the Nequi business, the digital platform of the Bank. The Financial Superintendence of Colombia (Superintendencia Financiera de Colombia) through Resolution 0843 of July 6, 2022, later modified by the Resolution 0955 of July 27, 2022, authorized the establishment of Nequi S.A. Compañía de Financiamiento. The legal separation resulted in the creation and commercial registration of a new corporation through which Nequi will operate as a 100% digital credit establishment. Nequi must obtain an authorization certificate or operating permit, accredited by the Financial Superintendence of Colombia in order to operate. For further information, see Note 1. Reporting Entity.
This segment is responsible for managing the Bank operations with its own portfolio, liquidity and distribution of treasury products and services to its customers in Colombia.
F-53
•Banking Panama
This segment provides retail and commercial banking products and services to individuals and companies in Panama and includes all the operations of Banistmo S.A. and its subsidiaries, which are managed and monitored by the CODM on a consolidated basis. Banking Panama also includes operations of the following operational stage subsidiaries: Banistmo Investment Corporation S.A., Leasing Banistmo S.A. y Valores Banistmo S.A.; and of the following non-operational subsidiaries: Banistmo Panamá Fondo de Inversión S.A., Banistmo Capital Markets Group Inc., Anavi Investment Corporation S.A., Desarrollo de Oriente S.A., Steens Enterprises S.A. and Ordway Holdings S.A.
This segment is also responsible for the management of Banistmo’s proprietary trading activities, liquidity and distribution of treasury products and services to its client base in Panama.
•Banking El Salvador
This segment provides retail and commercial banking products and services to individuals, companies and national and local governments in El Salvador through Banco Agrícola S.A. Banking El Salvador also includes operations of the following subsidiaries: Banagrícola S.A, Inversiones Financieras Banco Agrícola S.A. IFBA, Bagrícola Costa Rica S.A., Gestora de Fondos de Inversión Banagricola, S.A, Valores Banagrícola S.A. de C.V., Credibac S.A. de C.V. and Arrendadora Financiera S.A. Arfinsa.
This segment is also responsible for the management of Banco Agrícola’s proprietary trading activities, liquidity and distribution of treasury products and services to its client base in El Salvador.
•Banking Guatemala
This segment provides retail and commercial banking and insurance products and services to individuals, companies and national and local governments in Guatemala through Banco Agromercantil de Guatemala S.A., Banking Guatemala also includes operations of the following subsidiaries: Seguros Agromercantil S.A., Financiera Agromercantil S.A., Agrovalores S.A., Arrendadora Agromercantil S.A., Asistencia y Ajustes S.A., Serproba S.A., Servicios de Formalización S.A., Conserjería, Mantenimiento y Mensajería S.A.(company in liquidation), New Alma Enterprises LTD. On June 29, 2023, Agencia de Seguros y Fianzas Agromercantil S.A.S. was wound up. The Mercom Bank Ltd is in the process of gradually winding down its operations. For further information, see Note 1. Reporting Entity.
This segment is also responsible for the management of Banco Agromercantil’s proprietary trading activities, liquidity and distribution of treasury products and services to its client base in Guatemala.
•Trust
This segment provides trust and asset management services to clients in Colombia through Fiduciaria Bancolombia S.A. Sociedad Fiduciaria.
The main products offered by this segment include money market accounts, mutual and pension funds, private equity funds, payment trust, custody services and corporate trust.
•Investment banking
This segment provides corporate and project financial advisory services, underwriting, capital markets services and private equity management through Banca de Inversión Bancolombia S.A. Corporación Financiera. Its customers include private and publicly-held corporations as well as government institutions.
F-54
•Brokerage
This segment provides brokerage, investment advisory and private banking services to individuals and institutions through Valores Bancolombia S.A. Comisionista de Bolsa. It sells and distributes equities, futures, foreign currencies, fixed income securities, mutual funds and structured products.
This segments also includes the operations of Bancolombia Capital Holdings USA LLC, Bancolombia Capital LLC and Bancolombia Capital Advisers LLC, to provide broker-dealer and investment advisor services in the United States. For further information, see Note 1. Reporting entity.
•International Banking
This segment provides a complete line of international banking services to Colombian and foreign customers through Bancolombia Panamá S.A., Bancolombia Cayman S.A. (company in liquidation), and Bancolombia Puerto Rico International, Inc. It offers loans to private sector companies, trade financing, leases financing and financing for industrial projects, as well as a complete portfolio of cash management products, such as checking accounts, international collections and payments. Through these subsidiaries, the Bank also offers investment opportunities in U.S. dollars, savings and checking accounts, time deposits, and investment funds to its high net worth clients and private banking customers.
The Board of Directors of Bancolombia Panamá (Parent Company of Bancolombia Cayman), decided to wind down the business and operations of its subsidiary in Cayman. For further information, see Note 1. Reporting entity.
•All other segments
This segment provides financial and operating lease activities, including leasing services to clients in Colombia. Bancolombia offers these services mainly through the following Subsidiaries: Renting Colombia S.A.S. and Transportempo S.A.S. (company in liquidation). Additionally, through the FCP Fondo Inmobiliario Colombia, the Bank provides real estate service.
This segment also includes results from the operations of investment vehicles of the Bank: Valores Simesa S.A., Negocios Digitales Colombia S.A.S., Inversiones CFNS S.A.S., Sistema de Inversiones y Negocios S.A. Sinesa and the technology services company Wompi S.A.S.
From 2022, this segment includes the operations developed by the trusts P.A. FAI CALLE 77, P.A. Nomad Salitre and P.A. Mercurio, from 2023 it includes P.A. Nomad Central, P.A. Calle 84 (2) and P.A. Calle 84 (3).
In addition, includes Wenia LTD, a company formed by the subsidiary, Sistemas de Inversiones y Negocios S.A. SINESA, in Bermuda. The company is a corporate vehicle for the creation and implementation of operating systems and software applications. Additionally, it includes Wenia S.A.S. which since December 2023 began to consolidate the Wenia P.A. For further information, see Note 1. Reporting Entity.
In accordance with IFRS 8, the figures reported in "all other segments" combine the information on operating segments that did not meet the quantitative thresholds defined by this same standard, i.e., the absolute individual amount of their reported results is, in absolute terms, less than 10 percent of the combined results of all segments and their assets represent less than 10 percent of the combined assets of all operating segments of the Bank.
Financial performance by operating segment:
The CODM reviews the performance of the Bank using the following financial information by operating segment:
F-55
|
|
|
|
|
|
|
|
|
|
|
|
|
|
|
|
|
|
|
|
|
|
|
For the year ended December 31, 2023 |
||||||||||||||||||
|
|
Banking |
|
Banking |
|
Banking El |
|
Banking |
|
|
|
Investment |
|
|
|
International |
|
All other |
|
Total |
|
|
Colombia |
|
Panama |
|
Salvador |
|
Guatemala |
|
Trust |
|
banking |
|
Brokerage |
|
Banking |
|
segments |
|
segments |
In millions of COP | ||||||||||||||||||||
Total interest and valuation on financial instruments |
|
29,230,060 |
|
2,826,559 |
|
1,773,140 |
|
1,795,543 |
|
47 |
|
6 |
|
45,875 |
|
1,112,171 |
|
262,758 |
|
37,046,159 |
Interest income on loans and financial leases |
|
28,366,678 |
|
2,415,234 |
|
1,524,765 |
|
1,726,821 |
|
47 |
|
- |
|
5,076 |
|
940,091 |
|
262,075 |
|
35,240,787 |
Total debt investments |
|
937,090 |
|
301,167 |
|
236,350 |
|
60,534 |
|
- |
|
6 |
|
36,538 |
|
85,091 |
|
683 |
|
1,657,459 |
Derivatives |
|
(167,887) |
|
817 |
|
11,187 |
|
- |
|
- |
|
- |
|
(1,747) |
|
(188) |
|
- |
|
(157,818) |
Total liquidity operations |
|
94,179 |
|
109,341 |
|
838 |
|
8,188 |
|
- |
|
- |
|
6,008 |
|
87,177 |
|
- |
|
305,731 |
Interest expenses |
|
(13,464,980) |
|
(1,238,112) |
|
(464,851) |
|
(731,886) |
|
(179) |
|
(1) |
|
(222) |
|
(596,039) |
|
(172,025) |
|
(16,668,295) |
Net interest margin and valuation on financial instruments before impairment on loans and financial leases, off balance sheet credit instruments and other financial instruments |
|
15,765,080 |
|
1,588,447 |
|
1,308,289 |
|
1,063,657 |
|
(132) |
|
5 |
|
45,653 |
|
516,132 |
|
90,733 |
|
20,377,864 |
Total credit impairment charges, net |
|
(6,480,377) |
|
(270,501) |
|
(154,938) |
|
(499,368) |
|
(2,893) |
|
(380) |
|
106 |
|
4,164 |
|
(57,399) |
|
(7,461,586) |
Net interest margin and valuation on financial instruments after impairment on loans and financial leases, off balance sheet credit instruments and other financial instruments |
|
9,284,703 |
|
1,317,946 |
|
1,153,351 |
|
564,289 |
|
(3,025) |
|
(375) |
|
45,759 |
|
520,296 |
|
33,334 |
|
12,916,278 |
(Expenses) Revenues from transactions the operating segments of the Bank |
|
(187,467) |
|
(34,105) |
|
(17,844) |
|
(76,054) |
|
(16,518) |
|
13,949 |
|
68,617 |
|
415,508 |
|
(166,086) |
|
- |
Fees and commissions income(1) |
|
5,252,099 |
|
532,930 |
|
479,568 |
|
223,200 |
|
361,965 |
|
55,917 |
|
103,985 |
|
47,228 |
|
23,986 |
|
7,080,878 |
Fees and commissions expenses |
|
(2,522,927) |
|
(258,897) |
|
(188,972) |
|
(89,405) |
|
(4,244) |
|
(238) |
|
(8,645) |
|
(11,042) |
|
(12,910) |
|
(3,097,280) |
Total fees and commissions, net |
|
2,729,172 |
|
274,033 |
|
290,596 |
|
133,795 |
|
357,721 |
|
55,679 |
|
95,340 |
|
36,186 |
|
11,076 |
|
3,983,598 |
Other operating income (Expenses) |
|
1,575,845 |
|
36,939 |
|
51,656 |
|
130,757 |
|
14,107 |
|
(1,011) |
|
4,737 |
|
16,794 |
|
2,149,826 |
|
3,979,650 |
Dividends and net income on equity investments |
|
17,613 |
|
13,498 |
|
10,982 |
|
1,827 |
|
33,275 |
|
(98,512) |
|
6,416 |
|
37 |
|
225,049 |
|
210,185 |
Total operating income, net |
|
13,419,866 |
|
1,608,311 |
|
1,488,741 |
|
754,614 |
|
385,560 |
|
(30,270) |
|
220,869 |
|
988,821 |
|
2,253,199 |
|
21,089,711 |
Operating expenses(2) |
|
(8,022,042) |
|
(909,843) |
|
(668,105) |
|
(620,928) |
|
(177,626) |
|
(49,759) |
|
(186,212) |
|
(89,219) |
|
(1,093,592) |
|
(11,817,326) |
Impairment, depreciation and amortization |
|
(744,346) |
|
(107,716) |
|
(131,921) |
|
(55,243) |
|
(2,218) |
|
(208) |
|
(2,950) |
|
(4,259) |
|
(75,998) |
|
(1,124,859) |
Total operating expenses |
|
(8,766,388) |
|
(1,017,559) |
|
(800,026) |
|
(676,171) |
|
(179,844) |
|
(49,967) |
|
(189,162) |
|
(93,478) |
|
(1,169,590) |
|
(12,942,185) |
Profit before income tax |
|
4,653,478 |
|
590,752 |
|
688,715 |
|
78,443 |
|
205,716 |
|
(80,237) |
|
31,707 |
|
895,343 |
|
1,083,609 |
|
8,147,526 |
| (1) | For further information about income from contracts with customers, see Note 25.3 Fees and commissions. |
| (2) | Includes salaries and employee benefits, other administration and general expenses and taxes other than income tax. |
|
|
For the year ended December 31, 2022 |
||||||||||||||||||
|
|
Banking |
|
Banking |
|
Banking El |
|
Banking |
|
|
|
Investment |
|
|
|
International |
|
All other |
|
Total |
|
|
Colombia |
|
Panama |
|
Salvador |
|
Guatemala |
|
Trust |
|
banking |
|
Brokerage |
|
Banking |
|
segments |
|
segments |
In millions of COP | ||||||||||||||||||||
Total interest and valuation on financial instruments |
|
20,727,335 |
|
2,364,820 |
|
1,527,860 |
|
1,537,801 |
|
72 |
|
4 |
|
12,996 |
|
512,417 |
|
113,642 |
|
26,796,947 |
Interest income on loans and financial leases |
|
19,263,960 |
|
2,154,151 |
|
1,293,556 |
|
1,509,143 |
|
72 |
|
- |
|
511 |
|
446,028 |
|
116,072 |
|
24,783,493 |
Total debt investments |
|
1,361,299 |
|
161,974 |
|
170,423 |
|
27,089 |
|
- |
|
4 |
|
20,024 |
|
48,722 |
|
(2,447) |
|
1,787,088 |
Derivatives |
|
108,255 |
|
(1,026) |
|
63,494 |
|
- |
|
- |
|
- |
|
658 |
|
- |
|
- |
|
171,381 |
Total liquidity operations |
|
(6,179) |
|
49,721 |
|
387 |
|
1,569 |
|
- |
|
- |
|
(8,197) |
|
17,667 |
|
17 |
|
54,985 |
Interest expenses |
|
(6,333,834) |
|
(910,937) |
|
(297,839) |
|
(528,459) |
|
(150) |
|
(4) |
|
(104) |
|
(271,280) |
|
(99,863) |
|
(8,442,470) |
Net interest margin and valuation on financial instruments before impairment on loans and financial leases, off balance sheet credit instruments and other financial instruments |
|
14,393,501 |
|
1,453,883 |
|
1,230,021 |
|
1,009,342 |
|
(78) |
|
- |
|
12,892 |
|
241,137 |
|
13,779 |
|
18,354,477 |
Total credit impairment charges, net |
|
(2,971,599) |
|
(545,012) |
|
(102,710) |
|
(168,834) |
|
(796) |
|
(924) |
|
3,133 |
|
25,029 |
|
(29,984) |
|
(3,791,697) |
Net interest margin and valuation on financial instruments after impairment on loans and financial leases, off balance sheet credit instruments and other financial instruments |
|
11,421,902 |
|
908,871 |
|
1,127,311 |
|
840,508 |
|
(874) |
|
(924) |
|
16,025 |
|
266,166 |
|
(16,205) |
|
14,562,780 |
Revenues (Expenses) from transactions the operating segments of the Bank |
|
(32,163) |
|
(25,022) |
|
(7,371) |
|
(45,526) |
|
(12,658) |
|
3,404 |
|
53,229 |
|
212,049 |
|
(145,942) |
|
- |
Fees and commissions income(1) |
|
4,684,563 |
|
446,583 |
|
444,177 |
|
218,554 |
|
318,869 |
|
86,232 |
|
111,366 |
|
42,021 |
|
18,161 |
|
6,370,526 |
Fees and commissions expenses |
|
(2,099,585) |
|
(210,004) |
|
(170,563) |
|
(91,424) |
|
(3,668) |
|
(269) |
|
(6,160) |
|
(8,025) |
|
(468) |
|
(2,590,166) |
Total fees and commissions, net |
|
2,584,978 |
|
236,579 |
|
273,614 |
|
127,130 |
|
315,201 |
|
85,963 |
|
105,206 |
|
33,996 |
|
17,693 |
|
3,780,360 |
Other operating income (Expenses) |
|
(72,994) |
|
51,494 |
|
19,685 |
|
129,403 |
|
14,897 |
|
671 |
|
13,575 |
|
9,954 |
|
1,886,750 |
|
2,053,435 |
Dividends and net income on equity investments |
|
(8,058) |
|
9,655 |
|
5,340 |
|
828 |
|
2,164 |
|
8,760 |
|
(4,314) |
|
35 |
|
221,444 |
|
235,854 |
Total operating income, net |
|
13,893,665 |
|
1,181,577 |
|
1,418,579 |
|
1,052,343 |
|
318,730 |
|
97,874 |
|
183,721 |
|
522,200 |
|
1,963,740 |
|
20,632,429 |
Operating expenses(2) |
|
(6,600,686) |
|
(797,091) |
|
(639,748) |
|
(577,497) |
|
(153,377) |
|
(47,997) |
|
(153,317) |
|
(79,814) |
|
(857,541) |
|
(9,907,068) |
Impairment, depreciation and amortization |
|
(613,807) |
|
(110,293) |
|
(106,601) |
|
(54,999) |
|
(1,630) |
|
(232) |
|
(1,754) |
|
(2,626) |
|
(88,633) |
|
(980,575) |
Total operating expenses |
|
(7,214,493) |
|
(907,384) |
|
(746,349) |
|
(632,496) |
|
(155,007) |
|
(48,229) |
|
(155,071) |
|
(82,440) |
|
(946,174) |
|
(10,887,643) |
Profit before income tax |
|
6,679,172 |
|
274,193 |
|
672,230 |
|
419,847 |
|
163,723 |
|
49,645 |
|
28,650 |
|
439,760 |
|
1,017,566 |
|
9,744,786 |
| (1) | For further information about income from contracts with customers, see Note 25.3 Fees and commissions. |
| (2) | Includes salaries and employee benefits, other administration and general expenses and taxes other than income tax. |
F-56
|
|
For the year ended December 31, 2021 |
||||||||||||||||||||||
|
|
Banking |
|
Banking |
|
Banking El |
|
Banking |
|
|
|
Investment |
|
|
|
International |
|
All other |
|
Total before |
|
Adjustments for |
|
Total after |
|
|
Colombia |
|
Panama |
|
Salvador |
|
Guatemala |
|
Trust |
|
Banking |
|
Brokerage |
|
Banking |
|
segments |
|
eliminations |
|
consolidation |
|
eliminations |
In millions of COP | ||||||||||||||||||||||||
Total interest and valuation on financial instruments |
|
11,498,013 |
|
1,963,509 |
|
1,193,824 |
|
1,178,615 |
|
46 |
|
- |
|
12,277 |
|
251,135 |
|
37,898 |
|
16,135,317 |
|
428 |
|
16,135,745 |
Interest income on loans and financial leases |
|
11,118,035 |
|
1,791,476 |
|
1,072,718 |
|
1,109,804 |
|
46 |
|
- |
|
28 |
|
215,529 |
|
36,226 |
|
15,343,862 |
|
428 |
|
15,344,290 |
Total debt investments |
|
399,517 |
|
156,377 |
|
105,035 |
|
67,772 |
|
- |
|
- |
|
12,540 |
|
35,739 |
|
632 |
|
777,612 |
|
- |
|
777,612 |
Derivatives |
|
17,263 |
|
1,860 |
|
15,345 |
|
- |
|
- |
|
- |
|
(832) |
|
1 |
|
- |
|
33,637 |
|
- |
|
33,637 |
Total liquidity operations |
|
(36,802) |
|
13,796 |
|
726 |
|
1,039 |
|
- |
|
- |
|
541 |
|
(134) |
|
1,040 |
|
(19,794) |
|
- |
|
(19,794) |
Interest expenses |
|
(2,666,843) |
|
(796,396) |
|
(240,144) |
|
(397,138) |
|
(167) |
|
(7) |
|
(73) |
|
(198,012) |
|
(52,776) |
|
(4,351,556) |
|
- |
|
(4,351,556) |
Net interest margin and valuation on financial instruments before impairment on loans and financial leases, off balance sheet credit instruments and other financial instruments |
|
8,831,170 |
|
1,167,113 |
|
953,680 |
|
781,477 |
|
(121) |
|
(7) |
|
12,204 |
|
53,123 |
|
(14,878) |
|
11,783,761 |
|
428 |
|
11,784,189 |
Total credit impairment charges, net |
|
(2,122,515) |
|
(323,216) |
|
4,271 |
|
35,841 |
|
(4,595) |
|
(55) |
|
(116) |
|
14,995 |
|
(17,836) |
|
(2,413,226) |
|
(7,304) |
|
(2,420,530) |
Net interest margin and valuation on financial instruments after impairment on loans and financial leases, off balance sheet credit instruments and other financial instruments |
|
6,708,655 |
|
843,897 |
|
957,951 |
|
817,318 |
|
(4,716) |
|
(62) |
|
12,088 |
|
68,118 |
|
(32,714) |
|
9,370,535 |
|
(6,876) |
|
9,363,659 |
Revenues (Expenses) from transactions the operating segments of the Bank |
|
18,458 |
|
(10,089) |
|
7 |
|
(26,324) |
|
(26,584) |
|
3,576 |
|
59,995 |
|
81,997 |
|
(101,036) |
|
- |
|
- |
|
- |
Fees and commission income(1) |
|
3,841,472 |
|
351,603 |
|
359,724 |
|
159,908 |
|
347,878 |
|
79,531 |
|
117,282 |
|
33,309 |
|
3,097 |
|
5,293,804 |
|
- |
|
5,293,804 |
Fees and commission expenses |
|
(1,524,691) |
|
(151,906) |
|
(116,600) |
|
(50,144) |
|
(3,881) |
|
(49) |
|
(4,135) |
|
(6,556) |
|
(2,721) |
|
(1,860,683) |
|
- |
|
(1,860,683) |
Total fees and commission income, net |
|
2,316,781 |
|
199,697 |
|
243,124 |
|
109,764 |
|
343,997 |
|
79,482 |
|
113,147 |
|
26,753 |
|
376 |
|
3,433,121 |
|
- |
|
3,433,121 |
Other operating income (Expenses) |
|
653,968 |
|
19,101 |
|
9,712 |
|
82,855 |
|
12,702 |
|
879 |
|
(6,075) |
|
11,109 |
|
1,238,893 |
|
2,023,144 |
|
(1,003) |
|
2,022,141 |
Dividends and net income on equity investments |
|
93,769 |
|
4,387 |
|
2,760 |
|
658 |
|
28,201 |
|
(232) |
|
2,177 |
|
20 |
|
196,604 |
|
328,344 |
|
- |
|
328,344 |
Total operating income, net |
|
9,791,631 |
|
1,056,993 |
|
1,213,554 |
|
984,271 |
|
353,600 |
|
83,643 |
|
181,332 |
|
187,997 |
|
1,302,123 |
|
15,155,144 |
|
(7,879) |
|
15,147,265 |
Operating expenses(2) |
|
(5,550,033) |
|
(700,226) |
|
(549,782) |
|
(464,199) |
|
(129,923) |
|
(34,905) |
|
(119,265) |
|
(61,191) |
|
(633,171) |
|
(8,242,695) |
|
- |
|
(8,242,695) |
Impairment, depreciation and amortization |
|
(529,662) |
|
(104,493) |
|
(81,201) |
|
(102,991) |
|
(1,548) |
|
(206) |
|
(1,896) |
|
(1,993) |
|
(95,773) |
|
(919,763) |
|
(795) |
|
(920,558) |
Total operating expenses |
|
(6,079,695) |
|
(804,719) |
|
(630,983) |
|
(567,190) |
|
(131,471) |
|
(35,111) |
|
(121,161) |
|
(63,184) |
|
(728,944) |
|
(9,162,458) |
|
(795) |
|
(9,163,253) |
Profit (Loss) before income tax |
|
3,711,936 |
|
252,274 |
|
582,571 |
|
417,081 |
|
222,129 |
|
48,532 |
|
60,171 |
|
124,813 |
|
573,179 |
|
5,992,686 |
|
(8,674) |
|
5,984,012 |
| (1) | For further information about income from contracts with customers, see Note 25.3 Fees and commissions. |
| (2) | Includes salaries and employee benefits, other administration and general expenses and taxes other than income tax. |
The following table presents financial information of the total assets and liabilities by operating segment:
|
|
|
|
|
|
|
|
|
|
|
|
|
|
|
|
|
|
|
|
|
|
|
|
|
As of December 31, 2023 | ||||||||||||||||||||||||
In millions of COP | ||||||||||||||||||||||||
|
|
|
|
|
|
|
|
|
|
|
|
|
|
|
|
|
|
|
|
|
|
Adjustments |
|
|
|
|
Banking |
|
Banking |
|
Banking El |
|
Banking |
|
|
|
Investment |
|
|
|
International |
|
Allother |
|
Total before |
|
for |
|
Total after |
|
|
Colombia |
|
Panama |
|
Salvador |
|
Guatemala |
|
Trust |
|
banking |
|
Brokerage |
|
Banking |
|
segments |
|
eliminations |
|
consolidation |
|
eliminations |
Total assets |
|
254,367,378 |
|
40,740,495 |
|
21,608,586 |
|
21,377,205 |
|
658,547 |
|
1,719,824 |
|
351,694 |
|
30,199,897 |
|
10,224,734 |
|
381,248,360 |
|
(38,319,551) |
|
342,928,809 |
Total liabilities |
|
216,200,157 |
|
36,315,750 |
|
19,220,367 |
|
19,469,075 |
|
138,171 |
|
51,841 |
|
121,423 |
|
20,734,521 |
|
4,874,547 |
|
317,125,852 |
|
(13,246,772) |
|
303,879,080 |
As of December 31, 2022 | ||||||||||||||||||||||||
In millions of COP | ||||||||||||||||||||||||
|
|
|
|
|
|
|
|
|
|
|
|
|
|
|
|
|
|
|
|
|
|
Adjustments |
|
|
|
|
Banking |
|
Banking |
|
Banking El |
|
Banking |
|
|
|
Investment |
|
|
|
International |
|
Allother |
|
Total before |
|
for |
|
Total after |
|
|
Colombia |
|
Panama |
|
Salvador |
|
Guatemala |
|
Trust |
|
banking |
|
Brokerage |
|
Banking |
|
segments |
|
eliminations |
|
consolidation |
|
eliminations |
Total assets |
|
247,113,605 |
|
52,445,934 |
|
26,696,524 |
|
26,143,629 |
|
603,486 |
|
2,116,143 |
|
326,047 |
|
35,131,458 |
|
9,222,529 |
|
399,799,355 |
|
(46,984,622) |
|
352,814,733 |
Total liabilities |
|
207,293,246 |
|
47,081,613 |
|
23,738,984 |
|
23,635,997 |
|
126,307 |
|
80,162 |
|
106,115 |
|
23,216,118 |
|
4,320,836 |
|
329,599,378 |
|
(16,782,196) |
|
312,817,182 |
The following table presents financial information of the investments in associates and joint ventures by operating segment:
As of December 31, 2023(1) | ||||||||||||
|
|
Banking |
|
Banking El |
|
|
|
Investment |
|
All other |
|
|
|
|
Colombia |
|
Salvador |
|
Trust |
|
banking |
|
segments |
|
Total |
In millions of COP | ||||||||||||
Investments in associates and joint ventures |
|
332,862 |
|
21,292 |
|
285,838 |
|
617,982 |
|
1,739,629 |
|
2,997,603 |
Equity method |
|
(52,183) |
|
2,730 |
|
30,043 |
|
4,398 |
|
128,127 |
|
113,115 |
| (1) | As of December 31, 2023, Banking Panama, Banking Guatemala, Brokerage and International Banking did not have investments in associates and joint ventures. |
F-57
As of December 31, 2022(1) | ||||||||||||
|
|
Banking |
|
Banking El |
|
|
|
Investment |
|
All other |
|
|
|
|
Colombia |
|
Salvador |
|
Trust |
|
banking |
|
segments |
|
Total |
In millions of COP | ||||||||||||
Investments in associates and joint ventures |
|
337,024 |
|
28,029 |
|
256,720 |
|
700,936 |
|
1,592,924 |
|
2,915,633 |
Equity method |
|
2,588 |
|
3,617 |
|
22,522 |
|
3,857 |
|
186,521 |
|
219,105 |
| (1) | As of December 31, 2022, Banking Panama, Banking Guatemala, Brokerage and International Banking did not have investments in associates and joint ventures. |
For additional information related to investment in associates and joint ventures, see Note 8 Investments in associates and joint ventures.
Information about products and services
The Bank does not report revenues from external customers for each product and service or each group of similar products and services, because the information is not available and the cost to develop it is excessive.
Geographic information
The following summarizes the Bank’s total interest and valuation and long-lived assets attributable to Colombia and other foreign countries based on the country where the Interest and valuation was originated:
|
|
2023 |
|
2022 |
|
2021 |
||||||
Geographic information |
|
Interest and |
|
Long-lived |
|
Interest and |
|
Long-lived |
|
Interest and |
|
Long-lived |
|
|
valuation(1) |
|
assets(2) |
|
valuation(1) |
|
assets(2) |
|
valuation(1) |
|
assets(2) |
In millions of COP | ||||||||||||
Colombia |
|
29,812,448 |
|
13,466,457 |
|
20,977,845 |
|
12,666,847 |
|
11,605,829 |
|
9,413,340 |
Panama |
|
4,234,542 |
|
877,407 |
|
3,023,461 |
|
1,042,824 |
|
2,251,653 |
|
838,278 |
El Salvador |
|
1,774,165 |
|
547,357 |
|
1,528,264 |
|
636,071 |
|
1,194,026 |
|
434,212 |
Guatemala |
|
1,795,597 |
|
361,840 |
|
1,537,811 |
|
445,288 |
|
1,178,619 |
|
347,084 |
United States of America |
|
55 |
|
4,805 |
|
- |
|
7,504 |
|
- |
|
- |
Bermuda |
|
184 |
|
3,434 |
|
2 |
|
- |
|
- |
|
- |
Puerto Rico |
|
149,541 |
|
1,297 |
|
64,709 |
|
2,328 |
|
49,662 |
|
1,644 |
Total |
|
37,766,532 |
|
15,262,597 |
|
27,132,092 |
|
14,800,862 |
|
16,279,789 |
|
11,034,558 |
Eliminations and adjustment |
|
(720,373) |
|
7,000,343 |
|
(335,145) |
|
8,795,011 |
|
(144,044) |
|
7,655,610 |
Total, net |
|
37,046,159 |
|
22,262,940 |
|
26,796,947 |
|
23,595,873 |
|
16,135,745 |
|
18,690,168 |
| (1) | Includes interest and valuation on financial instruments. |
| (2) | Includes assets held for sale, premises and equipment, net, investment property, right-of-use assets, goodwill and intangible assets, net. |
NOTE 4. CASH AND CASH EQUIVALENTS
For purposes of the consolidated statement of cash flow and the consolidated statement of financial position, the following assets are considered as cash and cash equivalents:
F-58
|
|
December 31, 2023 |
|
December 31, 2022 |
In millions of COP | ||||
Cash and balances at central bank |
|
|
|
|
Cash |
|
8,830,305 |
|
8,854,169 |
Due from central banks(1) |
|
11,248,230 |
|
9,602,209 |
Due from other private financial entities |
|
7,607,921 |
|
5,881,022 |
Checks on hold |
|
214,004 |
|
289,924 |
Remittances of domestic negotiated checks in transit |
|
74,524 |
|
93,844 |
Total cash and due from banks |
|
27,974,984 |
|
24,721,168 |
Money market transactions |
|
|
|
|
Interbank borrowings |
|
3,983,699 |
|
4,050,407 |
Reverse repurchase agreements and other similar secured loans |
|
7,840,926 |
|
2,873,716 |
Total money market transactions |
|
11,824,625 |
|
6,924,123 |
Total cash and cash equivalents |
|
39,799,609 |
|
31,645,291 |
| (1) | According to External Resolution No. 20 of 2020 of Banco de la República, which amends External Resolution No. 5 of 2008 issued by the Colombian Central Bank, the Parent Company must maintain, the equivalent of 8% of the deposits mentioned in Article 1, paragraph (a), and the equivalent of 3.5% of its customer’s deposits with a maturity of less than 18 months (paragraph b), as ordinary reserve, represented in deposits at the Central Bank or as cash in hand. In addition, according to Resolution Number 177 of 2002 issued by the Guatemala Monetary Board, Grupo Agromercantil Holding through its subsidiary Banco Agromercantil de Guatemala must maintain the equivalent of 14.60% of its customer’s deposits daily balances as a legal banking reserve, represented in unrestricted deposits at the Bank of Guatemala. Additionally, circular SBP-DR-0045-2023 dated July 25, 2023, communicates the decision of the Superintendency of Banks of Panama to maintain the percentage established in the General Resolution of the Board of Directors SBP-GJD-0003-2014 dated January 28, 2014, which sets at 30.00% the minimum legal liquidity rate that Panamanian banks must maintain. Finally, in accordance with temporary rule NPBT-11, which is effective from September 27, 2023, to March 26, 2024, Banco Agrícola must maintain an equivalent average daily amount of its deposits and debt instruments in issue as a liquidity reserve between 1.00% and 16.00% represented in unrestricted deposits or debt instruments in issue by El Salvador Central Bank. Once the complete term established, the bank continues with the Technical Norm (NRP-28), issued by the Central Bank, where the Bank must maintain an equivalent amount between 1.00% and 18.00%, which has been in effect since 23 June 2021. |
As of December 31, 2023 and 2022, there is restricted cash amounting to COP 1,082,611 and COP 752,099, respectively, included in other assets on the Consolidated Statement of Financial Position, which represents margin deposits pledged as collateral for derivative contracts traded through Colombian clearing houses. See Note 14. Other assets, net.
NOTE 5. FINANCIAL ASSETS INVESTMENTS AND DERIVATIVES
5.1 Financial assets investments
The Bank’s securities portfolios at fair value through profit or loss, other comprehensive income and at amortized cost are listed below, as of December 31, 2023 and 2022:
F-59
As of December 31, 2023
|
|
Measurement methodology |
|
|
||||
Financial assets investments |
|
Fair value through |
|
Fair value through other |
|
Amortized |
|
Total carrying |
|
|
profit or loss |
|
comprehensive income, net |
|
cost, net |
|
value, net |
In millions of COP | ||||||||
Securities issued by foreign governments |
|
6,274,400 |
|
2,437,996 |
|
537,831 |
|
9,250,227 |
Securities issued by the Colombian Government |
|
4,725,605 |
|
2,725,722 |
|
68,624 |
|
7,519,951 |
Corporate bonds |
|
237,234 |
|
611,153 |
|
2,559,336 |
|
3,407,723 |
Securities issued by government entities |
|
84,990 |
|
- |
|
3,129,501 |
|
3,214,491 |
Securities issued by other financial institutions(1)(2) |
|
774,178 |
|
373,306 |
|
552,790 |
|
1,700,274 |
Total debt instruments |
|
12,096,407 |
|
6,148,177 |
|
6,848,082 |
|
25,092,666 |
Total equity securities |
|
98,853 |
|
444,357 |
|
|
|
543,210 |
Total other instruments financial(3) |
|
38,319 |
|
|
|
|
|
38,319 |
Total financial assets investments |
|
|
|
|
|
|
|
25,674,195 |
| (1) | Includes mortgage-backed securities (TIPS) measured at fair value through profit or loss amounting to COP 84,301. For further information on TIPS’ fair value measurement see Note 30. Fair value of assets and liabilities. |
| (2) | At December 31, the Bank has recognized in the Consolidated Statement of Comprehensive Income COP 93,264 related to debt instruments at fair value through OCI. |
| (3) | Corresponds to convertible notes or agreements for the future purchase of shares, Simple Agreement for Future Equity “SAFE”, by Inversiones CFNS S.A.S., Sistema de Inversiones y Negocios, S.A. and Banagrícola S.A |
As of December 31, 2022
|
Measurement methodology |
|
|
|||||
Financial assets investments |
|
Fair value through |
|
Fair value through other |
|
Amortized |
|
Total carrying |
|
|
profit or loss |
|
comprehensive income, net |
|
cost, net |
|
value, net |
In millions of COP | ||||||||
Securities issued by foreign governments |
|
5,967,856 |
|
4,694,369 |
|
755,282 |
|
11,417,507 |
Securities issued by the Colombian Government |
|
4,260,230 |
|
2,590,622 |
|
206,950 |
|
7,057,802 |
Corporate bonds |
|
121,527 |
|
123,327 |
|
3,680,260 |
|
3,925,114 |
Securities issued by government entities |
|
79,035 |
|
- |
|
3,059,550 |
|
3,138,585 |
Securities issued by other financial institutions(1)(2) |
|
610,618 |
|
569,357 |
|
634,318 |
|
1,814,293 |
Total debt instruments |
|
11,039,266 |
|
7,977,675 |
|
8,336,360 |
|
27,353,301 |
Total equity securities |
|
102,274 |
|
442,394 |
|
|
|
544,668 |
Total other instruments financial(3) |
|
42,171 |
|
|
|
|
|
42,171 |
Total financial assets investments |
|
|
|
|
|
|
|
27,940,140 |
| (1) | Includes mortgage-backed securities (TIPS) measured at fair value through profit or loss amounting to COP 91,204. For further information on TIPS’ fair value measurement see Note 30. Fair value of assets and liabilities. |
| (2) | At December 31, 2022, the Bank has recognized in the Consolidated Statement of Comprehensive Income COP (164,542) related to debt instruments at fair value through OCI. |
| (3) | Corresponds to convertible notes or agreements for the future purchase of shares, Simple Agreement for Future Equity “SAFE”, by Inversiones CFNS S.A.S. and Sistema de Inversiones y Negocios, S.A. In 2022 were revealed as debt instruments and equity securities. |
F-60
The following tables set forth the debt instruments portfolio by maturity:
As of December 31, 2023
|
|
Less than 1 |
|
Between 1 and 3 |
|
Between 3 and 5 |
|
Greater than 5 |
|
|
|
|
year |
|
years |
|
years |
|
years |
|
Total |
In millions of COP | ||||||||||
Securities at fair value through profit or loss |
|
|
|
|
|
|
|
|
|
|
Securities issued by foreign governments |
|
4,864,121 |
|
513,546 |
|
283,020 |
|
613,713 |
|
6,274,400 |
Securities issued by the Colombian Government |
|
390,307 |
|
2,759,392 |
|
491,867 |
|
1,084,039 |
|
4,725,605 |
Securities issued by other financial institutions |
|
312,749 |
|
236,597 |
|
89,526 |
|
135,306 |
|
774,178 |
Corporate bonds |
|
39,361 |
|
40,930 |
|
28,624 |
|
128,319 |
|
237,234 |
Securities issued by government entities |
|
48,893 |
|
33,601 |
|
2,496 |
|
- |
|
84,990 |
Subtotal |
|
5,655,431 |
|
3,584,066 |
|
895,533 |
|
1,961,377 |
|
12,096,407 |
Fair value through other comprehensive income |
|
|
|
|
|
|
|
|
|
|
Securities issued by the Colombian Government |
|
2,672,090 |
|
53,632 |
|
- |
|
- |
|
2,725,722 |
Securities issued by foreign governments |
|
1,346,171 |
|
598,014 |
|
355,927 |
|
137,884 |
|
2,437,996 |
Corporate bonds |
|
549 |
|
- |
|
63,474 |
|
547,130 |
|
611,153 |
Securities issued by other financial institutions |
|
149,124 |
|
154,659 |
|
- |
|
69,523 |
|
373,306 |
Subtotal |
|
4,167,934 |
|
806,305 |
|
419,401 |
|
754,537 |
|
6,148,177 |
Securities at amortized cost |
|
|
|
|
|
|
|
|
|
|
Securities issued by government entities |
|
3,078,744 |
|
- |
|
- |
|
50,757 |
|
3,129,501 |
Corporate bonds |
|
229,811 |
|
46,925 |
|
322,314 |
|
1,960,286 |
|
2,559,336 |
Securities issued by other financial institutions |
|
103,414 |
|
106,681 |
|
46,969 |
|
295,726 |
|
552,790 |
Securities issued by foreign governments |
|
188,651 |
|
189,744 |
|
56,703 |
|
102,733 |
|
537,831 |
Securities issued by the Colombian Government |
|
39,046 |
|
- |
|
7,350 |
|
22,228 |
|
68,624 |
Subtotal |
|
3,639,666 |
|
343,350 |
|
433,336 |
|
2,431,730 |
|
6,848,082 |
Total debt instruments |
|
13,463,031 |
|
4,733,721 |
|
1,748,270 |
|
5,147,644 |
|
25,092,666 |
As of December 31, 2022
|
|
Less than 1 |
|
Between 1 and 3 |
|
Between 3 and 5 |
|
Greater than 5 |
|
|
|
|
year |
|
years |
|
years |
|
years |
|
Total |
In millions of COP | ||||||||||
Securities at fair value through profit or loss |
|
|
|
|
|
|
|
|
|
|
Securities issued by foreign governments |
|
5,187,871 |
|
100,436 |
|
367,120 |
|
312,429 |
|
5,967,856 |
Securities issued by the Colombian Government |
|
1,639,518 |
|
866,241 |
|
472,955 |
|
1,281,516 |
|
4,260,230 |
Securities issued by other financial institutions |
|
198,255 |
|
287,933 |
|
52,592 |
|
71,838 |
|
610,618 |
Corporate bonds |
|
46,638 |
|
32,989 |
|
19,228 |
|
22,672 |
|
121,527 |
Securities issued by government entities |
|
23,763 |
|
45,921 |
|
5,757 |
|
3,594 |
|
79,035 |
Subtotal |
|
7,096,045 |
|
1,333,520 |
|
917,652 |
|
1,692,049 |
|
11,039,266 |
Fair value through other comprehensive income |
|
|
|
|
|
|
|
|
|
|
Securities issued by foreign governments |
|
2,930,125 |
|
878,199 |
|
694,837 |
|
191,208 |
|
4,694,369 |
Securities issued by the Colombian Government |
|
2,590,622 |
|
- |
|
- |
|
- |
|
2,590,622 |
Securities issued by other financial institutions |
|
148,925 |
|
316,099 |
|
- |
|
104,333 |
|
569,357 |
Corporate bonds |
|
- |
|
- |
|
- |
|
123,327 |
|
123,327 |
Subtotal |
|
5,669,672 |
|
1,194,298 |
|
694,837 |
|
418,868 |
|
7,977,675 |
Securities at amortized cost |
|
|
|
|
|
|
|
|
|
|
Corporate bonds |
|
250,583 |
|
423,154 |
|
755,067 |
|
2,251,456 |
|
3,680,260 |
Securities issued by government entities |
|
3,008,521 |
|
- |
|
- |
|
51,029 |
|
3,059,550 |
Securities issued by foreign governments |
|
16,676 |
|
431,662 |
|
116,919 |
|
190,025 |
|
755,282 |
Securities issued by other financial institutions |
|
79,800 |
|
191,690 |
|
48,701 |
|
314,127 |
|
634,318 |
Securities issued by the Colombian Government |
|
- |
|
170,314 |
|
9,139 |
|
27,497 |
|
206,950 |
Subtotal |
|
3,355,580 |
|
1,216,820 |
|
929,826 |
|
2,834,134 |
|
8,336,360 |
Total debt instruments |
|
16,121,297 |
|
3,744,638 |
|
2,542,315 |
|
4,945,051 |
|
27,353,301 |
For further information related to disclosures of the fair value of securities, please see Note 30 Fair value of assets and liabilities.
The Bank has recognized in the consolidated statement of comprehensive income COP 10,898 in 2023, COP 32,072 in 2022 and COP 52,147 in 2021 related to equity securities and trust funds at fair value through OCI. See Consolidated Statement of Comprehensive Income.
F-61
Equity securities that are measured at fair value through OCI are considered strategic for the Bank and, thus, there is no intention to sell them in the foreseeable future and that is the main reason for using this presentation alternative.
The following table details the equity instruments designated at fair value through OCI analyzed by listing status:
|
|
Carrying amount |
||
Equity securities |
|
December 31, 2023 |
|
December 31, 2022 |
In millions of COP | ||||
Securities at fair value through OCI: |
|
|
|
|
Equity securities listed in Colombia(1) |
|
2 |
|
40,878 |
Equity securities listed in foreign countries(1) |
|
78,787 |
|
8,038 |
Equity securities unlisted: |
|
|
|
|
Telered S.A. |
|
164,981 |
|
207,562 |
Asociación Gremial de Instituciones Financieras Credibanco S.A. |
|
110,786 |
|
98,492 |
Transacciones y Transferencias, S. A. |
|
17,346 |
|
16,890 |
Compañía de Procesamiento de Medios de Pago Guatemala (Bahamas), S. A. |
|
16,333 |
|
21,727 |
Cámara de Riesgo Central de Contraparte de Colombia S.A. |
|
14,998 |
|
6,038 |
Derecho Fiduciario Inmobiliaria Cadenalco |
|
4,449 |
|
4,003 |
Others |
|
36,675 |
|
38,766 |
Total equity securities at fair value through OCI |
|
444,357 |
|
442,394 |
| (1) | In November 2023, the integration of the stock exchanges of Colombia, Chile, and Peru was perfected, resulting in the creation of the Regional Stock Holding. As a result of this integration, 5,992,160 shares of the Bolsa de Valores de Colombia S.A. were delisted for COP 56,146, and 3,606,223 shares were recognized in the Regional Stock Holding for COP 78,139, this transaction generated an income in results of COP 21,993, see Note 25.5. Dividends and net income on equity investments. The Bank retains 134 shares that were not included in this transaction, valued at COP |
During 2023, 2022 and 2021, no impairment loss was recognized on equity securities. Dividends received from equity investments at fair value through OCI held as of December 31, 2023, 2022 and 2021 amounted to COP 18,464, COP 16,842 and COP 12,665, respectively. See Note 25.5 Dividends and net income on equity investments.
Equity investments do not have a specific maturity date; therefore, they are not included in the maturity detail.
The detail of the securities pledged as collateral as of December 31, 2023 and 2022 is as follows:
As of December 31, 2023
Pledged financial assets |
|
Term |
|
Security pledged |
|
Carrying amount |
In millions of COP | ||||||
Investments pledged as collateral in money market |
|
|
|
|
|
|
Securities issued by foreign governments |
|
Up to 3 months |
|
Time deposits |
|
120,477 |
Securities issued by foreign governments |
|
Between 3 and 6 months |
|
Time deposits |
|
94,582 |
Securities issued by other financial institutions |
|
Up to 3 months |
|
Time deposits |
|
5,443 |
Securities issued by other financial institutions |
|
Between 6 and 12 months |
|
Time deposits |
|
2,179 |
Securities issued by other financial institutions |
|
Greater than 12 months |
|
Time deposits |
|
25,938 |
Securities issued by other financial institutions |
|
Greater than 12 months |
|
Bonds |
|
6,687 |
Corporate bonds |
|
Up to 3 months |
|
Bonds |
|
4,570 |
Subtotal investments pledged as collateral in money market |
|
|
|
|
|
259,876 |
Investments pledged as collateral in derivative operations |
|
|
|
|
|
|
Securities issued by the Colombian Government |
|
Up to 3 months |
|
TES - Treasury instruments |
|
39,257 |
Securities issued by the Colombian Government |
|
Between 6 and 12 months |
|
TES - Treasury instruments |
|
7,821 |
Securities issued by the Colombian Government |
|
Greater than 12 months |
|
TES - Treasury instruments |
|
1,244,190 |
Securities issued by foreign governments |
|
Between 3 and 6 months |
|
Foreign issueds |
|
1,875 |
Subtotal investments pledged as collateral in derivative operations |
|
|
|
|
|
1,293,143 |
Total securities pledged as collateral |
|
|
|
|
|
1,553,019 |
F-62
As of December 31, 2022
Pledged financial assets |
|
Term |
|
Security pledged |
|
Carrying amount |
In millions of COP | ||||||
Investments pledged as collateral in money market |
|
|
|
|
|
|
Corporate bonds |
|
Between 3 and 6 months |
|
Bonds |
|
5,101 |
Securities issued by other financial institutions |
|
Greater than 12 months |
|
Bonds |
|
1,861 |
Securities issued by other financial institutions |
|
Greater than 12 months |
|
Time deposits |
|
2,171 |
Securities issued by the Colombian Government |
|
Up to 3 months |
|
TES - Treasury instruments |
|
23,764 |
Securities issued by the Colombian Government |
|
Greater than 12 months |
|
TES - Treasury instruments |
|
30,383 |
Securities issued by foreign governments |
|
Greater than 12 months |
|
Bonds |
|
212,249 |
Subtotal investments pledged as collateral in money market |
|
|
|
|
|
275,529 |
Investments pledged as collateral in derivative operations |
|
|
|
|
|
|
Securities issued by the Colombian Government |
|
Up to 3 months |
|
TES - Treasury instruments |
|
320,252 |
Securities issued by the Colombian Government |
|
Between 3 and 6 months |
|
TES - Treasury instruments |
|
38,083 |
Securities issued by the Colombian Government |
|
Greater than 12 months |
|
TES - Treasury instruments |
|
215,250 |
Subtotal investments pledged as collateral in derivative operations |
|
|
|
|
|
573,585 |
Total securities pledged as collateral |
|
|
|
|
|
849,114 |
The following table shows the breakdown of the changes in the gross carrying amount of the debt securities at fair value through other comprehensive income and amortized cost, in order to explain their significance to the changes in the loss allowance for the same portfolio as discussed above:
As of December 31, 2023
Debt instruments portfolio measure at fair value through OCI and amortized cost |
|
Stage 1 |
|
Stage 2 |
|
Stage 3 |
|
Total |
In millions of COP | ||||||||
Gross carrying amount as at 1 January 2023 |
|
15,973,144 |
|
340,891 |
|
- |
|
16,314,035 |
Transfer from stage 1 to stage 3(1) |
|
(30,784) |
|
- |
|
30,784 |
|
- |
Transfer from stage 2 to stage 1(1) |
|
6,627 |
|
(6,627) |
|
- |
|
- |
Sales and maturities |
|
(9,792,950) |
|
- |
|
- |
|
(9,792,950) |
Purchases |
|
7,701,763 |
|
- |
|
- |
|
7,701,763 |
Valuation and payments |
|
84,609 |
|
(66,959) |
|
- |
|
17,650 |
Foreign Exchange |
|
(1,182,067) |
|
(62,172) |
|
- |
|
(1,244,239) |
Gross carrying amount as at 31 December 2023 |
|
12,760,342 |
|
205,133 |
|
30,784 |
|
12,996,259 |
(1)Stage transfer in corporate bonds by Banistmo S.A. y Filiales.
As of December 31, 2022
Debt instruments portfolio measure at fair value through OCI and amortized cost |
|
Stage 1 |
|
Stage 2 |
|
Total |
In millions of COP | ||||||
Gross carrying amount as at 1 January 2022 |
|
13,545,514 |
|
227,167 |
|
13,772,681 |
Transfer from stage 1 to stage 2(1) |
|
(23,017) |
|
23,017 |
|
- |
Transfer from stage 2 to stage 1(2) |
|
129,403 |
|
(129,403) |
|
- |
Change in measure(3) |
|
(110,061) |
|
- |
|
(110,061) |
Sales and maturities |
|
(8,056,827) |
|
(96,382) |
|
(8,153,209) |
Purchases |
|
9,814,484 |
|
286,278 |
|
10,100,762 |
Valuation and payments |
|
(381,921) |
|
2,979 |
|
(378,942) |
Foreign Exchange |
|
1,055,569 |
|
27,235 |
|
1,082,804 |
Gross carrying amount as at 31 December 2022 |
|
15,973,144 |
|
340,891 |
|
16,314,035 |
| (1) | Stage transfer in corporate bonds by Banistmo S.A. y Filiales and Banagrícola S.A. y Filiales. |
| (2) | Stage transfer in securities issued by the Guatemalan government and corporate bonds by Bancolombia Panamá S.A. and Bancolombia Puerto Rico Internacional, Inc. |
| (3) | Mercom Bank Ltd., a Grupo Agromercantil Holding S.A. subsidiary, is in the process of being gradually wound down; the measurement of the portfolio of securities issued by the government of Guatemala was changed from amortized cost to fair value through profit or loss. |
F-63
The following shows provisions detail for the debt instruments portfolio using the expected credit losses model:
As of December 31, 2023
Concept |
|
Stage 1 |
|
Stage 2 |
|
Stage 3 |
|
Total |
In millions of COP | ||||||||
Securities at amortized cost |
|
6,612,165 |
|
205,133 |
|
30,784 |
|
6,848,082 |
Carrying amount |
|
6,642,104 |
|
217,046 |
|
44,735 |
|
6,903,885 |
Loss allowance |
|
(29,939) |
|
(11,913) |
|
(13,951) |
|
(55,803) |
Securities at fair value through other comprehensive income(1) |
|
6,148,177 |
|
- |
|
- |
|
6,148,177 |
Total debt instruments portfolio measure at fair value through OCI and amortized cost |
|
12,760,342 |
|
205,133 |
|
30,784 |
|
12,996,259 |
| (1) | Loss allowance of investments at fair value through OCI corresponds to COP (5,562) classified in stage 1. The increase in relation to 2022 is due to the acquisition of instruments for COP 3,760. |
As of December 31, 2022
Concept |
|
Stage 1 |
|
Stage 2 |
|
Total |
In millions of COP | ||||||
Securities at amortized cost |
|
7,995,469 |
|
340,891 |
|
8,336,360 |
Carrying amount |
|
8,025,350 |
|
375,911 |
|
8,401,261 |
Loss allowance |
|
(29,881) |
|
(35,020) |
|
(64,901) |
Securities at fair value through other comprehensive income(1) |
|
7,977,675 |
|
- |
|
7,977,675 |
Total debt instruments portfolio measure at fair value through OCI and amortized cost |
|
15,973,144 |
|
340,891 |
|
16,314,035 |
| (1) | Loss allowance of investments at fair value through OCI corresponds to COP (2,288) classified in stage 1. |
The following table sets forth the changes in the allowance for debt instruments measured at amortized cost and fair value through other comprehensive income:
As of December 31, 2023
Concept |
|
Stage 1 |
|
Stage 2 |
|
Stage 3 |
|
Total |
In millions of COP | ||||||||
Loss allowance of January 1, 2023 |
|
29,881 |
|
35,020 |
|
- |
|
64,901 |
Transfer from stage 1 to stage 3(1) |
|
(13,951) |
|
- |
|
13,951 |
|
- |
Transfer from stage 2 to stage 1(1) |
|
129 |
|
(129) |
|
- |
|
- |
Sales and maturities |
|
(9,459) |
|
- |
|
- |
|
(9,459) |
New debt instruments purchased(2) |
|
10,497 |
|
- |
|
- |
|
10,497 |
Net provisions recognised during the period(3) |
|
19,030 |
|
(17,882) |
|
- |
|
1,148 |
Foreign Exchange(4) |
|
(6,188) |
|
(5,096) |
|
- |
|
(11,284) |
Loss allowance of December 31, 2023 |
|
29,939 |
|
11,913 |
|
13,951 |
|
55,803 |
(1)Stage transfer in corporate bonds by Banistmo S.A. y Filiales.
(2)Impairment is mainly in securities issued by government entities and corporate bonds by Bancolombia S.A. and Banistmo S.A. y Filiales.
(3)The increase in stage 1 is mostly due to a higher value of impairment loss in corporate bonds by Banistmo S.A. y Filiales and provision recovery in stage 2 is mostly in securities issued by foreign governments by Banagrícola S.A. y Filiales.
(4)The decrease is due to the variation in the market representative rate during the year 2023.
F-64
As of December 31, 2022
Concept |
|
Stage 1 |
|
Stage 2 |
|
Total |
In millions of COP | ||||||
Loss allowance of January 1, 2022 |
|
17,690 |
|
6,989 |
|
24,679 |
Transfer from stage 1 to stage 2(1) |
|
(3,808) |
|
3,808 |
|
- |
Transfer from stage 2 to stage 1(2) |
|
526 |
|
(526) |
|
- |
Change in measure(3) |
|
(213) |
|
- |
|
(213) |
Sales and maturities |
|
(6,097) |
|
(1,170) |
|
(7,267) |
New debt instruments purchased(4) |
|
16,104 |
|
28,795 |
|
44,899 |
Net provisions recognised during the period |
|
3,482 |
|
(4,088) |
|
(606) |
Foreign Exchange |
|
2,197 |
|
1,212 |
|
3,409 |
Loss allowance of December 31, 2022 |
|
29,881 |
|
35,020 |
|
64,901 |
(1)Stage transfer in corporate bonds by Banistmo S.A. y Filiales and Banagrícola S.A. y Filiales.
(2)Stage transfer in securities issued by the Guatemalan government and corporate bonds by Bancolombia Panamá S.A. and Bancolombia Puerto Rico Internacional, Inc.
(3)Mercom Bank Ltd., a Grupo Agromercantil Holding S.A. subsidiary, is in the process of being gradually wound down; the measurement of the portfolio of securities issued by the government of Guatemala was changed from amortized cost to fair value through profit or loss.
(4)Impairment is mainly in securities issued by the government of Salvador and corporate bonds.
As of December 31, 2021
Concept |
|
Stage 1 |
|
Stage 2 |
|
Total |
In millions of COP | ||||||
Loss allowance of January 1, 2021 |
|
34,500 |
|
4,626 |
|
39,126 |
Transfer from stage 1 to stage 2(1) |
|
(1,670) |
|
1,670 |
|
- |
Sales and maturities |
|
(6,137) |
|
- |
|
(6,137) |
New debt instruments purchased |
|
10,273 |
|
- |
|
10,273 |
Net provisions recognised during the period |
|
(23,809) |
|
(46) |
|
(23,855) |
Foreign Exchange |
|
4,533 |
|
739 |
|
5,272 |
Loss allowance of December 31, 2021 |
|
17,690 |
|
6,989 |
|
24,679 |
| (1) | Stage transfer in corporate bonds by Banistmo S.A. y Filiales and Bancolombia Panamá S.A. |
5.2 Derivative financial instruments
The Bank derivative activities do not give rise to significant open positions in portfolios of derivatives. The Bank enters into derivative transactions to facilitate customer business, for hedging purposes and arbitrage activities, such as forwards, options or swaps where the underlying are exchange rates, interest rates and securities.
A swap agreement is a contract between two parties to exchange cash flows based on specified underlying notional amounts, assets and/or indices. Financial futures and forward settlement contracts are agreements to buy or sell a quantity of a financial instrument (including another derivative financial instrument), index, currency or commodity at a predetermined rate or price during a period or at a date in the future. Futures and option contracts are standardized agreements for future delivery, traded on exchanges that typically act as a platform.
For further information related to the objectives, policies and processes for managing the Bank’s risk, please see Risk Management.
F-65
The following table sets forth the carrying values of the Bank’s derivatives by type of risk as of December 31, 2023 and 2022:
Derivatives |
|
December 31, 2023 |
|
December 31, 2022 |
In millions of COP | ||||
Forwards |
|
|
|
|
Assets |
|
|
|
|
Foreign exchange contracts |
|
4,381,906 |
|
1,573,952 |
Equity contracts |
|
3,015 |
|
5,519 |
Subtotal assets |
|
4,384,921 |
|
1,579,471 |
Liabilities |
|
|
|
|
Foreign exchange contracts |
|
4,526,353 |
|
1,711,644 |
Equity contracts |
|
10,481 |
|
7,203 |
Subtotal liabilities |
|
4,536,834 |
|
1,718,847 |
Total forwards |
|
(151,913) |
|
(139,376) |
Swaps |
|
|
|
|
Assets |
|
|
|
|
Foreign exchange contracts |
|
1,304,337 |
|
2,394,832 |
Interest rate contracts |
|
352,424 |
|
865,627 |
Subtotal assets |
|
1,656,761 |
|
3,260,459 |
Liabilities |
|
|
|
|
Foreign exchange contracts |
|
1,491,086 |
|
1,917,397 |
Interest rate contracts |
|
449,857 |
|
1,008,302 |
Subtotal liabilities |
|
1,940,943 |
|
2,925,699 |
Total swaps |
|
(284,182) |
|
334,760 |
Options |
|
|
|
|
Assets |
|
|
|
|
Foreign exchange contracts |
|
210,588 |
|
121,307 |
Subtotal assets |
|
210,588 |
|
121,307 |
Liabilities |
|
|
|
|
Foreign exchange contracts |
|
232,587 |
|
92,908 |
Subtotal liabilities |
|
232,587 |
|
92,908 |
Total options |
|
(21,999) |
|
28,399 |
Derivative assets |
|
6,252,270 |
|
4,961,237 |
Derivative liabilities |
|
6,710,364 |
|
4,737,454 |
The following table sets forth the remaining contractual life of the derivatives portfolio:
As of December 31, 2023
|
|
Forwards |
|
Swaps |
|
Options |
|
Total |
In millions of COP | ||||||||
Assets |
|
4,384,921 |
|
1,656,761 |
|
210,588 |
|
6,252,270 |
Less than 1 year |
|
4,235,981 |
|
642,305 |
|
135,559 |
|
5,013,845 |
Between 1 and 3 years |
|
147,826 |
|
517,314 |
|
75,029 |
|
740,169 |
Greater than 3 years |
|
1,114 |
|
497,142 |
|
- |
|
498,256 |
Liabilities |
|
4,536,834 |
|
1,940,943 |
|
232,587 |
|
6,710,364 |
Less than 1 year |
|
4,419,918 |
|
419,251 |
|
152,285 |
|
4,991,454 |
Between 1 and 3 years |
|
116,916 |
|
979,130 |
|
80,302 |
|
1,176,348 |
Greater than 3 years |
|
- |
|
542,562 |
|
- |
|
542,562 |
F-66
As of December 31, 2022
|
|
Forwards |
|
Swaps |
|
Options |
|
Total |
In millions of COP | ||||||||
Assets |
|
1,579,471 |
|
3,260,459 |
|
121,307 |
|
4,961,237 |
Less than 1 year |
|
1,432,022 |
|
860,281 |
|
108,319 |
|
2,400,622 |
Between 1 and 3 years |
|
147,449 |
|
1,241,252 |
|
12,988 |
|
1,401,689 |
Greater than 3 years |
|
- |
|
1,158,926 |
|
- |
|
1,158,926 |
Liabilities |
|
1,718,847 |
|
2,925,699 |
|
92,908 |
|
4,737,454 |
Less than 1 year |
|
1,642,706 |
|
501,368 |
|
80,854 |
|
2,224,928 |
Between 1 and 3 years |
|
76,141 |
|
1,092,480 |
|
12,054 |
|
1,180,675 |
Greater than 3 years |
|
- |
|
1,331,851 |
|
- |
|
1,331,851 |
Collateral for derivatives
The table below presents the collateral amounts posted under derivatives contracts as of December 31, 2023 and 2022:
|
|
December 31, 2023 |
|
December 31, 2022 |
In millions of COP | ||||
Collateral granted |
|
2,326,977 |
|
1,143,266 |
Collateral received |
|
795,628 |
|
655,176 |
Day one gains or (losses)
If an asset has been acquired or a liability has been assumed in a market transaction, it could be assumed that the transaction price is the fair value of the asset or liability. However, the fair value of the financial asset or liability at the time of initial recognition may be different from the transaction price, because the fair value includes variables in its valuation technique that include market information, such as interest rate yield curves, currencies rates, indicators, default factors among others. When the values are not equal, the asset or liability must be measured at fair value and the difference between the transaction price and the fair value must be recognized as follows:
| ● | If fair value is evidenced by Level 1 inputs or is based on a valuation technique that uses only observable market data, the Group must recognize the difference as a gain or loss on initial recognition directly in the income statement. |
| ● | In all other circumstances, the entire day 1 gain or loss is deferred and is recognized in the income statement over the life of the transaction. |
The table below presents the unrecognised gains or (losses) for derivatives trading at the initial moment, due to use of valuation techniques for which not all inputs were observable market data:
As of December 31, 2023
|
|
Forward |
|
Swaps |
|
Options |
|
Total |
In millions of COP | ||||||||
Balance at January 1, 2023 |
|
61,724 |
|
16,580 |
|
39,714 |
|
118,018 |
New trades |
|
1,159,069 |
|
(26,905) |
|
195,456 |
|
1,327,620 |
Amortization |
|
(1,176,173) |
|
4,166 |
|
(148,299) |
|
(1,320,306) |
Sale or transfer |
|
(8,331) |
|
(7,471) |
|
(23,803) |
|
(39,605) |
Balance at December 31, 2023 |
|
36,289 |
|
(13,630) |
|
63,068 |
|
85,727 |
F-67
As of December 31, 2022
|
|
Forward |
|
Swaps |
|
Opciones |
|
Total |
In millions of COP | ||||||||
Balance at January 1, 2022 |
|
16,918 |
|
27,894 |
|
26,675 |
|
71,487 |
New trades |
|
315,395 |
|
11,937 |
|
164,460 |
|
491,792 |
Amortization |
|
(265,268) |
|
(18,723) |
|
(113,705) |
|
(397,696) |
Sale or transfer |
|
(5,321) |
|
(4,528) |
|
(37,716) |
|
(47,565) |
Balance at December 31, 2022 |
|
61,724 |
|
16,580 |
|
39,714 |
|
118,018 |
Hedges of a net asset in a foreign operation
The Bank has designated debt instruments in issue and financing with correspondent banks for USD 1,592,034 in 2023 and USD 2,060,000 in 2022 as hedge accounting for an equivalent amount of the net assets of its investment in Banistmo. The purpose of this operation is to protect the Bank from the foreign exchange rate risk (USD/COP) of a portion of the net assets in the subsidiary Banistmo S.A., a company domicilied in Panama, which has a different functional currency from that of the Group. In August 2023 and December 2022, the Bank discontinued USD 467,966 and USD 140,000 from the hedging relationship, respectively.
The following is the detail of the hedging instruments of the net foreign investment:
As of December 31, 2023
Debt securities issued designated as a hedging instrument | ||||||||
In thousands of USD | ||||||||
|
|
|
|
|
|
|
|
Designated capital as |
Opening date |
|
Expiration date |
|
Rate |
|
Principal balance |
|
a hedged instrument |
18/10/2017 |
|
18/10/2027 |
|
7.03 |
% |
750,000 |
|
360,000 |
18/12/2019 |
|
18/12/2029 |
|
4.68 |
% |
436,516 |
|
436,516 |
18/12/2019 |
|
18/12/2029 |
|
4.68 |
% |
85,710 |
|
85,710 |
18/12/2019 |
|
18/12/2029 |
|
4.68 |
% |
27,774 |
|
27,774 |
29/01/2020 |
|
29/01/2025 |
|
3.02 |
% |
482,034 |
|
482,034 |
Total debt securities issued |
|
|
|
1,782,034 |
|
1,392,034 |
||
Financing with Correspondent Banks designated as a hedging instrument | ||||||||
31/03/2022 |
|
17/03/2025 |
|
6.06 |
% |
150,000 |
|
150,000 |
7/09/2022 |
|
5/09/2025 |
|
6.36 |
% |
50,000 |
|
50,000 |
Total financing with Correspondent Banks |
|
200,000 |
|
200,000 |
||||
Total |
|
|
|
|
|
1,982,034 |
|
1,592,034 |
As of December 31, 2022
Debt securities issued designated as a hedging instrument | ||||||||
In thousands of USD | ||||||||
|
|
|
|
|
|
|
|
Designated capital as |
Opening date |
|
Expiration date |
|
Rate |
|
Principal balance |
|
a hedged instrument |
18/10/2017 |
|
18/10/2027 |
|
7.03 |
% |
750,000 |
|
360,000 |
18/12/2019 |
|
18/12/2029 |
|
4.68 |
% |
436,516 |
|
436,516 |
18/12/2019 |
|
18/12/2029 |
|
4.68 |
% |
85,710 |
|
85,710 |
18/12/2019 |
|
18/12/2029 |
|
4.68 |
% |
27,774 |
|
27,774 |
29/01/2020 |
|
29/01/2025 |
|
3.02 |
% |
598,032 |
|
598,032 |
29/01/2020 |
|
29/01/2025 |
|
3.02 |
% |
351,968 |
|
351,968 |
Total debt securities issued |
|
|
|
2,250,000 |
|
1,860,000 |
||
Financing with Correspondent Banks designated as a hedging instrument | ||||||||
F-68
31/03/2022 |
|
17/03/2025 |
|
6.06 |
% |
150,000 |
|
150,000 |
7/09/2022 |
|
5/09/2025 |
|
6.36 |
% |
50,000 |
|
50,000 |
Total financing with Correspondent Banks |
|
200,000 |
|
200,000 |
||||
Total |
|
|
|
|
|
2,450,000 |
|
2,060,000 |
Measurement of effectiveness and ineffectiveness
A hedge is considered effective if, at the beginning of the period and subsequent periods, changes in fair value or cash flows attributable to the hedge risk during the period for which the hedge has been designated.
The Bank has documented the effectiveness tests of the hedge.The hedge is considered effective, since the critical terms and risks of the obligations that serve as a hedging instrument are identical to those of the primary hedged position. Hedged effectiveness is measured on a before income tax.
Gains or losses on the conversion of Banistmo’s financial statements are recognized in Consolidated Statements of Comprehensive Income. Consequently, the exchange difference related to the conversion of debt securities issued and financing with Correspondent banks is recognized directly in OCI, as a result of the revaluation of the peso against the dollar, the adjustment recognized in Consolidated Statements of Comprehensive Income amounted to COP 1,948,833, COP (1,833,087) and COP (1,207,052), for the years ended at December 31, 2023, 2022 and 2021, respectively.
For further information see note 17. Borrowings from other financial institusions, note 18. Debt instruments in issue and Consolidated Statement of Comprehensive Income.
Offsetting of derivatives
The Bank enters into International Swaps and Derivatives Association (ISDA) master netting agreements or similar agreements with substantially all of the Bank’s derivative counterparties. Where legally enforceable, and depending on the Bank’s intention, these master netting agreements give the Bank, in the event of default by the counterparty, the right to liquidate securities and cash equivalents held as collateral and to offset receivables and payables with the same counterparty.
F-69
The table below presents derivative instruments subject to enforceable master netting agreements and other similar agreements but not offset in the statement of financial position as of December 31, 2023 and 2022 by derivative and by risk:
As of December 31, 2023
|
|
Derivatives Assets |
|
Derivatives Liabilities |
In millions of COP | ||||
Over-the-counter |
|
|
|
|
Foreign exchange contracts |
|
|
|
|
Forwards |
|
4,381,906 |
|
4,526,353 |
Swaps |
|
1,304,337 |
|
1,491,086 |
Options |
|
210,588 |
|
232,587 |
Interest rate contracts |
|
|
|
|
Swaps |
|
352,424 |
|
449,857 |
Equity contracts |
|
|
|
|
Forwards |
|
3,015 |
|
10,481 |
Gross derivative assets/liabilities |
|
6,252,270 |
|
6,710,364 |
Offseting of derivates |
|
- |
|
- |
Derivative financial instruments in statement of financial position |
|
6,252,270 |
|
6,710,364 |
Master netting agreements |
|
(6,215,727) |
|
(5,548,746) |
Collateral received/paid |
|
(36,543) |
|
(1,161,618) |
Total derivative financial instruments assetss/ liabilities before collateral and Master netting agreements |
|
- |
|
- |
As of December 31, 2022
|
|
Derivatives Assets |
|
Derivatives Liabilities |
In millions of COP | ||||
Over-the-counter |
|
|
|
|
Foreign exchange contracts |
|
|
|
|
Forwards |
|
1,573,952 |
|
1,711,644 |
Swaps |
|
2,394,832 |
|
1,917,397 |
Options |
|
121,307 |
|
92,908 |
Interest rate contracts |
|
|
|
|
Swaps |
|
865,627 |
|
1,008,302 |
Equity contracts |
|
|
|
|
Forwards |
|
5,519 |
|
7,203 |
Gross derivative assets/liabilities |
|
4,961,237 |
|
4,737,454 |
Offseting of derivates |
|
- |
|
- |
Derivative financial instruments in statement of financial position |
|
4,961,237 |
|
4,737,454 |
Master netting agreements |
|
(4,369,178) |
|
(4,578,461) |
Collateral received/paid |
|
(592,059) |
|
(158,993) |
Total derivative financial instruments assetss/ liabilities before collateral and Master netting agreements |
|
- |
|
- |
For further information about offsetting of other financial assets and liabilities see Note 16. Interbank deposits and repurchase agreements and other similar secured borrowing.
F-70
NOTE 6. LOANS AND ADVANCES TO CUSTOMERS, NET
Loans and financial leasing operating portfolio
The following is the composition of the loans and financial leasing operations portfolio, net as of December 31, 2023 and 2022:
Composition |
|
December 31, 2023 |
|
December 31, 2022 |
In millions of COP | ||||
Commercial |
|
134,687,396 |
|
143,537,853 |
Consumer |
|
54,591,769 |
|
59,588,721 |
Mortgage |
|
36,250,408 |
|
37,371,373 |
Financial Leases(1) |
|
27,277,057 |
|
28,097,716 |
Small Business Loans |
|
1,145,017 |
|
1,328,076 |
Total gross loans and advances to customers(2) |
|
253,951,647 |
|
269,923,739 |
Total allowance |
|
(16,223,103) |
|
(15,479,640) |
Total Net loans and advances to customers |
|
237,728,544 |
|
254,444,099 |
| (1) | See note 7.1 Lessor. |
| (2) | The operations in Colombia and Banistmo in Panama contributed to the portfolio contraction. In addition, in 2023 the Colombian peso revalued 20.54% against the US dollar. |
Allowance for loans losses
The following table sets forth the changes in the allowance for loans and advances and lease losses as of December 31, 2023, 2022 and 2021:
As of December 31, 2023
|
|
|
|
|
|
|
|
|
|
Small |
|
|
Concept |
|
Commercial |
|
Consumer |
|
Mortgage |
|
Financial |
|
business |
|
Total |
|
|
|
|
|
|
|
|
Leases |
|
loans |
|
|
In millions of COP | ||||||||||||
Balance at beginning of period January 1, 2023 |
|
7,270,305 |
|
6,047,135 |
|
1,024,091 |
|
1,013,074 |
|
125,035 |
|
15,479,640 |
Loan sales(1) |
|
(829,547) |
|
- |
|
- |
|
- |
|
- |
|
(829,547) |
Recovery of charged - off loans |
|
93,251 |
|
548,655 |
|
64,573 |
|
61,749 |
|
2,706 |
|
770,934 |
Credit impairment charges on loans, advances and financial leases, net |
|
756,174 |
|
6,313,453 |
|
104,417 |
|
167,904 |
|
119,531 |
|
7,461,479 |
Adjusted stage 3(2) |
|
427,283 |
|
509,668 |
|
33,465 |
|
67,288 |
|
11,201 |
|
1,048,905 |
Charges-off |
|
(970,685) |
|
(5,261,966) |
|
(128,532) |
|
(277,904) |
|
(81,276) |
|
(6,720,363) |
Translation adjustment |
|
(456,515) |
|
(439,907) |
|
(74,808) |
|
(7,536) |
|
(9,179) |
|
(987,945) |
Balance at December 31, 2023 |
|
6,290,266 |
|
7,717,038 |
|
1,023,206 |
|
1,024,575 |
|
168,018 |
|
16,223,103 |
| (1) | Corresponds to the release of loan allowances related to portfolio sales. |
| (2) | Recognized as a reduction to Interest Income on loans and financial leases in Consolidated Statement of Income, in accordance with IFRS 9. |
The charges-off still subject to enforcement activity.
F-71
As of December 31, 2022
|
|
|
|
|
|
|
|
|
|
Small |
|
|
Concept |
|
Commercial |
|
Consumer |
|
Mortgage |
|
Financial |
|
business |
|
Total |
|
|
|
|
|
|
|
|
Leases |
|
loans |
|
|
In millions of COP | ||||||||||||
Balance at beginning of period January 1, 2022 |
|
7,813,023 |
|
5,305,267 |
|
1,061,058 |
|
1,521,067 |
|
164,067 |
|
15,864,482 |
Loan sales(1) |
|
(225,226) |
|
- |
|
- |
|
- |
|
- |
|
(225,226) |
Recovery of charged - off loans |
|
188,018 |
|
385,011 |
|
28,690 |
|
72,056 |
|
1,191 |
|
674,966 |
Credit impairment charges on loans, advances and financial leases, net |
|
502,577 |
|
3,447,515 |
|
183,436 |
|
(461,665) |
|
49,490 |
|
3,721,353 |
Adjusted stage 3(2) |
|
323,196 |
|
279,843 |
|
38,769 |
|
48,836 |
|
11,989 |
|
702,633 |
Charges-off |
|
(1,742,895) |
|
(3,788,517) |
|
(345,991) |
|
(176,407) |
|
(111,092) |
|
(6,164,902) |
Translation adjustment |
|
411,612 |
|
418,016 |
|
58,129 |
|
9,187 |
|
9,390 |
|
906,334 |
Balance at December 31, 2022 |
|
7,270,305 |
|
6,047,135 |
|
1,024,091 |
|
1,013,074 |
|
125,035 |
|
15,479,640 |
| (1) | Corresponds to the release of loan allowances related to portfolio sales. |
| (2) | Recognized as a reduction to Interest Income on loans and financial leases in Consolidated Statement of Income, in accordance with IFRS 9. |
The charges-off still subject to enforcement activity.
As of December 31, 2021
|
|
|
|
|
|
|
|
|
|
Small |
|
|
Concept |
|
Commercial |
|
Consumer |
|
Mortgage |
|
Financial |
|
business |
|
Total |
|
|
|
|
|
|
|
|
Leases |
|
loans |
|
|
In millions of COP | ||||||||||||
Balance at beginning of period January 1, 2021 |
|
7,673,720 |
|
5,753,430 |
|
992,515 |
|
1,996,033 |
|
200,345 |
|
16,616,043 |
Loan sales(1) |
|
(27,817) |
|
- |
|
- |
|
- |
|
- |
|
(27,817) |
Recovery of charged - off loans |
|
125,208 |
|
349,125 |
|
26,660 |
|
61,303 |
|
3,140 |
|
565,436 |
Credit impairment charges on loans, advances and financial leases, net |
|
198,619 |
|
2,268,595 |
|
68,809 |
|
(34,678) |
|
19,833 |
|
2,521,178 |
Adjusted stage 3(2) |
|
216,330 |
|
288,214 |
|
49,893 |
|
40,747 |
|
12,550 |
|
607,734 |
Charges-off |
|
(674,248) |
|
(3,618,009) |
|
(110,408) |
|
(554,701) |
|
(79,065) |
|
(5,036,431) |
Translation adjustment |
|
301,211 |
|
263,912 |
|
33,589 |
|
12,363 |
|
7,264 |
|
618,339 |
Balance at December 31, 2021 |
|
7,813,023 |
|
5,305,267 |
|
1,061,058 |
|
1,521,067 |
|
164,067 |
|
15,864,482 |
| (1) | Corresponds to the release of loan allowances related to portfolio sales. |
| (2) | Recognized as a reduction to Interest Income on loans and financial leases in Consolidated Statement of Income, in accordance with IFRS 9. |
The charges-off still subject to enforcement activity.
The following table presents information about the nature and effects of changes in the contractual cash flows of the loan portfolio that did not result in derecognition and the effect of these changes on the measurement of expected credit losses.
Changes in the contractual cash flows of the loan portfolio that did not result in derecognition |
|
|
|
|
In millions of COP | ||||
|
|
2023 |
|
2022 |
Loan portfolio modified during the period |
|
|
|
|
Amortized cost before modification |
|
7,566,692 |
|
5,524,962 |
Net gain or loss on changes |
|
(182,023) |
|
(78,790) |
F-72
Loan portfolio modified since initial recognition |
|
|
|
|
Gross carrying value of the previously modified loan portfolio for which the allowance for losses has been changed from the asset's life to the expected credit losses for 12 months. |
|
393,789 |
|
164,423 |
Impact of movements in the value of the portfolio and loss allowance by Stage
Variation December 2023 vs December 2022
Stage 1 (12-month expected credit losses)
Stage 1 exposure decreased by COP 14,397,167 and the loss allowance increased by COP 820,111. The decrease in the portfolio at this stage is mainly due to the restatement of the dollar loans into colombian pesos due to a lower in the market representative rate and a slow disbursement dynamic of the consumer portfolio compared to the previous period. The increase in the loss allowance is due to the impact of a less favorable economic outlook, where there is lower economic growth and a high trend of interest rates throughout the year.
Stage 2 (Lifetime expected credit losses)
The exposure in Stage 2 decreased by COP 2,613,778 and the loss allowance decreased by COP 608,427. The decrease in exposure is due to the migration of loans with delinquency over 90 days to Stage 3, and the level of new overdue portfolio being lower than the previous period. The decrease of loss allowance is in accordance with the decrease in exposure.
Stage 3 (Lifetime expected credit losses)
The exposure in Stage 3 increased by COP 1,038,853, and the loss allowance increased by COP 531,779. The variation in exposure and loss allowance in this Stage is mainly due to clients of the consumer portfolio reaching a delinquency height over 90 days and the impairment of significant clients from the construction sector.
The following explains the significant changes in the loans and the allowance for loan losses by category during the periods ended on December 31, 2023 and 2022 as a result of applying the expected credit loss model according to IFRS 9:
As of December 31, 2023
Commercial
|
|
Stage1 |
Stage2 |
Stage3 |
Total |
|||||||||||
|
|
Gross |
|
|
|
Gross |
|
|
|
Gross |
|
|
|
Gross |
|
|
|
|
carrying |
|
Allowance |
|
carrying |
|
Allowance |
|
carrying |
|
Allowance |
|
carrying |
|
Allowance |
In millions of COP | ||||||||||||||||
Balance at January 1, 2023 |
|
126,530,862 |
|
(665,259) |
|
8,062,435 |
|
(751,728) |
|
8,944,556 |
|
(5,853,318) |
|
143,537,853 |
|
(7,270,305) |
Transfers of financial instruments: |
|
(1,248,210) |
|
(73,788) |
|
(565,802) |
|
157,677 |
|
1,814,012 |
|
(83,889) |
|
- |
|
- |
Transfers from stage 1 to stage 2 |
|
(1,286,292) |
|
24,362 |
|
1,286,292 |
|
(24,362) |
|
- |
|
- |
|
- |
|
- |
Transfers from stage 1 to stage 3 |
|
(900,645) |
|
26,071 |
|
- |
|
- |
|
900,645 |
|
(26,071) |
|
- |
|
- |
Transfers from stage 2 to stage 1 |
|
931,660 |
|
(118,403) |
|
(931,660) |
|
118,403 |
|
- |
|
- |
|
- |
|
- |
Transfers from stage 2 to stage 3 |
|
- |
|
- |
|
(1,081,128) |
|
139,257 |
|
1,081,128 |
|
(139,257) |
|
- |
|
- |
Transfers from stage 3 to stage 1 |
|
7,067 |
|
(5,818) |
|
- |
|
- |
|
(7,067) |
|
5,818 |
|
- |
|
- |
Transfers from stage 3 to stage 2 |
|
- |
|
- |
|
160,694 |
|
(75,621) |
|
(160,694) |
|
75,621 |
|
- |
|
- |
Remeasurement arising from transfer of stage |
|
(172,134) |
|
98,684 |
|
(190,275) |
|
(7,563) |
|
(153,574) |
|
(1,140,608) |
|
(515,983) |
|
(1,049,487) |
Remeasurement from remaining in the stage |
|
(10,087,837) |
|
69,038 |
|
(444,057) |
|
97,791 |
|
(135,588) |
|
(159,438) |
|
(10,667,482) |
|
7,391 |
Remeasurement due to changes in economics factors |
|
- |
|
(14,781) |
|
- |
|
(19,968) |
|
- |
|
7,515 |
|
- |
|
(27,234) |
Remeasurement due to changes in model inputs |
|
- |
|
- |
|
- |
|
- |
|
- |
|
- |
|
- |
|
- |
Remeasurement due to methodological changes |
|
- |
|
19,001 |
|
- |
|
53,533 |
|
- |
|
25,299 |
|
- |
|
97,833 |
New financial assets purchased/originated(1) |
|
60,154,305 |
|
(302,169) |
|
1,192,219 |
|
(143,442) |
|
1,296,765 |
|
(725,298) |
|
62,643,289 |
|
(1,170,909) |
Financial assets that have been derecognized |
|
(45,206,464) |
|
181,931 |
|
(1,519,892) |
|
121,596 |
|
(1,715,530) |
|
1,391,718 |
|
(48,441,886) |
|
1,695,245 |
Charges-off |
|
(19,285) |
|
973 |
|
(81,528) |
|
17,475 |
|
(869,872) |
|
952,237 |
|
(970,685) |
|
970,685 |
F-73
Foreign Exchange and other movements |
|
(9,177,310) |
|
48,275 |
|
(999,563) |
|
49,159 |
|
(720,837) |
|
359,081 |
|
(10,897,710) |
|
456,515 |
Balance at December 31, 2023 |
|
120,773,927 |
|
(638,095) |
|
5,453,537 |
|
(425,470) |
|
8,459,932 |
|
(5,226,701) |
|
134,687,396 |
|
(6,290,266) |
| (1) | Includes financial assets purchased, originated and restructured. |
Consumer
|
|
Stage1 |
Stage2 |
Stage3 |
Total |
|||||||||||
|
|
Gross |
|
|
|
Gross |
|
|
|
Gross |
|
|
|
Gross |
|
|
|
|
carrying |
|
Allowance |
|
carrying |
|
Allowance |
|
carrying |
|
Allowance |
|
carrying |
|
Allowance |
In millions of COP | ||||||||||||||||
Balance at January 1, 2023 |
|
51,510,943 |
|
(1,823,841) |
|
5,288,921 |
|
(1,868,882) |
|
2,788,857 |
|
(2,354,412) |
|
59,588,721 |
|
(6,047,135) |
Transfers of financial instruments: |
|
(2,366,645) |
|
(213,509) |
|
299,377 |
|
313,735 |
|
2,067,268 |
|
(100,226) |
|
- |
|
- |
Transfers from stage 1 to stage 2 |
|
(1,890,263) |
|
116,262 |
|
1,890,263 |
|
(116,262) |
|
- |
|
- |
|
- |
|
- |
Transfers from stage 1 to stage 3 |
|
(1,805,932) |
|
124,706 |
|
- |
|
- |
|
1,805,932 |
|
(124,706) |
|
- |
|
- |
Transfers from stage 2 to stage 1 |
|
1,252,391 |
|
(381,036) |
|
(1,252,391) |
|
381,036 |
|
- |
|
- |
|
- |
|
- |
Transfers from stage 2 to stage 3 |
|
- |
|
- |
|
(547,962) |
|
230,723 |
|
547,962 |
|
(230,723) |
|
- |
|
- |
Transfers from stage 3 to stage 1 |
|
77,159 |
|
(73,441) |
|
- |
|
- |
|
(77,159) |
|
73,441 |
|
- |
|
- |
Transfers from stage 3 to stage 2 |
|
- |
|
- |
|
209,467 |
|
(181,762) |
|
(209,467) |
|
181,762 |
|
- |
|
- |
Remeasurement arising from transfer of stage |
|
(176,080) |
|
281,499 |
|
(103,802) |
|
(541,174) |
|
990,976 |
|
(4,445,663) |
|
711,094 |
|
(4,705,338) |
Remeasurement from remaining in the stage |
|
(4,024,103) |
|
(79,073) |
|
(162,497) |
|
(79,505) |
|
278,004 |
|
(493,421) |
|
(3,908,596) |
|
(651,999) |
Remeasurement due to changes in economics factors |
|
- |
|
(242,317) |
|
- |
|
(32,244) |
|
- |
|
989 |
|
- |
|
(273,572) |
Remeasurement due to changes in model inputs |
|
- |
|
- |
|
- |
|
- |
|
- |
|
- |
|
- |
|
- |
Remeasurement due to methodological changes |
|
- |
|
(423,782) |
|
- |
|
252,110 |
|
- |
|
19,805 |
|
- |
|
(151,867) |
New financial assets purchased/originated(1) |
|
15,350,895 |
|
(866,684) |
|
1,429,142 |
|
(584,910) |
|
1,275,594 |
|
(1,053,814) |
|
18,055,631 |
|
(2,505,408) |
Financial assets that have been derecognized |
|
(9,643,264) |
|
349,930 |
|
(858,742) |
|
315,991 |
|
(294,422) |
|
250,487 |
|
(10,796,428) |
|
916,408 |
Charges-off |
|
(1,299,715) |
|
231,387 |
|
(1,129,877) |
|
542,312 |
|
(2,832,374) |
|
4,488,267 |
|
(5,261,966) |
|
5,261,966 |
Foreign Exchange and other movements |
|
(3,291,416) |
|
114,156 |
|
(355,455) |
|
98,062 |
|
(149,816) |
|
227,689 |
|
(3,796,687) |
|
439,907 |
Balance at December 31, 2023 |
|
46,060,615 |
|
(2,672,234) |
|
4,407,067 |
|
(1,584,505) |
|
4,124,087 |
|
(3,460,299) |
|
54,591,769 |
|
(7,717,038) |
| (1) | Includes financial assets purchased, originated and restructured. |
Financial Leases
|
|
Stage1 |
Stage2 |
Stage3 |
Total |
|||||||||||
|
|
Gross |
|
|
|
Gross |
|
|
|
Gross |
|
|
|
Gross |
|
|
|
|
carrying |
|
Allowance |
|
carrying |
|
Allowance |
|
carrying |
|
Allowance |
|
carrying |
|
Allowance |
In millions of COP | ||||||||||||||||
Balance at January 1, 2023 |
|
23,566,544 |
|
(151,328) |
|
3,172,285 |
|
(238,920) |
|
1,358,887 |
|
(622,826) |
|
28,097,716 |
|
(1,013,074) |
Transfers of financial instruments: |
|
(33,774) |
|
(56,552) |
|
(337,901) |
|
74,010 |
|
371,675 |
|
(17,458) |
|
- |
|
- |
Transfers from stage 1 to stage 2 |
|
(886,398) |
|
15,837 |
|
886,398 |
|
(15,837) |
|
- |
|
- |
|
- |
|
- |
Transfers from stage 1 to stage 3 |
|
(214,258) |
|
6,202 |
|
- |
|
- |
|
214,258 |
|
(6,202) |
|
- |
|
- |
Transfers from stage 2 to stage 1 |
|
1,065,222 |
|
(77,927) |
|
(1,065,222) |
|
77,927 |
|
- |
|
- |
|
- |
|
- |
Transfers from stage 2 to stage 3 |
|
- |
|
- |
|
(211,221) |
|
26,291 |
|
211,221 |
|
(26,291) |
|
- |
|
- |
Transfers from stage 3 to stage 1 |
|
1,660 |
|
(664) |
|
- |
|
- |
|
(1,660) |
|
664 |
|
- |
|
- |
Transfers from stage 3 to stage 2 |
|
- |
|
- |
|
52,144 |
|
(14,371) |
|
(52,144) |
|
14,371 |
|
- |
|
- |
Remeasurement arising from transfer of stage |
|
(67,839) |
|
66,879 |
|
(66,232) |
|
(43,021) |
|
38,500 |
|
(275,772) |
|
(95,571) |
|
(251,914) |
Remeasurement from remaining in the stage |
|
(1,719,440) |
|
7,812 |
|
(84,050) |
|
27,024 |
|
(16,635) |
|
(44,480) |
|
(1,820,125) |
|
(9,644) |
Remeasurement due to changes in economics factors |
|
- |
|
(2,286) |
|
- |
|
(4,103) |
|
- |
|
8,419 |
|
- |
|
2,030 |
Remeasurement due to changes in model inputs |
|
- |
|
- |
|
- |
|
- |
|
- |
|
- |
|
- |
|
- |
Remeasurement due to methodological changes |
|
- |
|
(1,756) |
|
- |
|
(5,150) |
|
- |
|
8,486 |
|
- |
|
1,580 |
New financial assets purchased/originated(1) |
|
2,926,745 |
|
(21,654) |
|
915,316 |
|
(57,704) |
|
67,467 |
|
(45,494) |
|
3,909,528 |
|
(124,852) |
Financial assets that have been derecognized |
|
(1,780,980) |
|
11,596 |
|
(264,866) |
|
12,186 |
|
(129,570) |
|
62,077 |
|
(2,175,416) |
|
85,859 |
Charges-off |
|
(863) |
|
29 |
|
(25,471) |
|
27,464 |
|
(251,570) |
|
250,411 |
|
(277,904) |
|
277,904 |
Foreign Exchange and other movements |
|
(337,265) |
|
1,831 |
|
(15,981) |
|
1,573 |
|
(7,925) |
|
4,132 |
|
(361,171) |
|
7,536 |
Balance at December 31, 2023 |
|
22,553,128 |
|
(145,429) |
|
3,293,100 |
|
(206,641) |
|
1,430,829 |
|
(672,505) |
|
27,277,057 |
|
(1,024,575) |
| (1) | Includes financial assets purchased, originated and restructured. |
F-74
Mortgage
|
|
Stage1 |
Stage2 |
Stage3 |
Total |
|||||||||||
|
|
Gross |
|
|
|
Gross |
|
|
|
Gross |
|
|
|
Gross |
|
|
|
|
carrying |
|
Allowance |
|
carrying |
|
Allowance |
|
carrying |
|
Allowance |
|
carrying |
|
Allowance |
In millions of COP | ||||||||||||||||
Balance at January 1, 2023 |
|
34,067,734 |
|
(206,800) |
|
1,997,270 |
|
(256,275) |
|
1,306,369 |
|
(561,016) |
|
37,371,373 |
|
(1,024,091) |
Transfers of financial instruments: |
|
(1,226,789) |
|
(46,563) |
|
838,151 |
|
32,285 |
|
388,638 |
|
14,278 |
|
- |
|
- |
Transfers from stage 1 to stage 2 |
|
(1,419,929) |
|
20,379 |
|
1,419,929 |
|
(20,379) |
|
- |
|
- |
|
- |
|
- |
Transfers from stage 1 to stage 3 |
|
(330,417) |
|
7,821 |
|
- |
|
- |
|
330,417 |
|
(7,821) |
|
- |
|
- |
Transfers from stage 2 to stage 1 |
|
523,311 |
|
(74,687) |
|
(523,311) |
|
74,687 |
|
- |
|
- |
|
- |
|
- |
Transfers from stage 2 to stage 3 |
|
- |
|
- |
|
(306,993) |
|
52,110 |
|
306,993 |
|
(52,110) |
|
- |
|
- |
Transfers from stage 3 to stage 1 |
|
246 |
|
(76) |
|
- |
|
- |
|
(246) |
|
76 |
|
- |
|
- |
Transfers from stage 3 to stage 2 |
|
- |
|
- |
|
248,526 |
|
(74,133) |
|
(248,526) |
|
74,133 |
|
- |
|
- |
Remeasurement arising from transfer of stage |
|
(18,655) |
|
45,186 |
|
(8,302) |
|
(84,371) |
|
63,442 |
|
(154,335) |
|
36,485 |
|
(193,520) |
Remeasurement from remaining in the stage |
|
(1,240,204) |
|
(6,873) |
|
(12,416) |
|
(5,955) |
|
(20,842) |
|
(125,459) |
|
(1,273,462) |
|
(138,287) |
Remeasurement due to changes in economics factors |
|
- |
|
(8,108) |
|
- |
|
(1,386) |
|
- |
|
- |
|
- |
|
(9,494) |
Remeasurement due to changes in model inputs |
|
- |
|
- |
|
- |
|
- |
|
- |
|
- |
|
- |
|
- |
Remeasurement due to methodological changes |
|
- |
|
54,756 |
|
- |
|
17,730 |
|
- |
|
58,972 |
|
- |
|
131,458 |
New financial assets purchased/originated(1) |
|
5,361,515 |
|
(36,938) |
|
102,552 |
|
(19,513) |
|
37,864 |
|
(11,435) |
|
5,501,931 |
|
(67,886) |
Financial assets that have been derecognized |
|
(1,428,077) |
|
11,130 |
|
(69,961) |
|
10,885 |
|
(106,100) |
|
53,259 |
|
(1,604,138) |
|
75,274 |
Charges-off |
|
(2,088) |
|
8 |
|
(2,446) |
|
497 |
|
(123,998) |
|
128,027 |
|
(128,532) |
|
128,532 |
Foreign Exchange and other movements |
|
(3,302,788) |
|
9,287 |
|
(216,194) |
|
21,182 |
|
(134,267) |
|
44,339 |
|
(3,653,249) |
|
74,808 |
Balance at December 31, 2023 |
|
32,210,648 |
|
(184,915) |
|
2,628,654 |
|
(284,921) |
|
1,411,106 |
|
(553,370) |
|
36,250,408 |
|
(1,023,206) |
| (1) | Includes financial assets purchased, originated and restructured. |
Small business loans
|
|
Stage1 |
Stage2 |
Stage3 |
Total |
|||||||||||
|
|
Gross |
|
|
|
Gross |
|
|
|
Gross |
|
|
|
Gross |
|
|
|
|
carrying |
|
Allowance |
|
carrying |
|
Allowance |
|
carrying |
|
Allowance |
|
carrying |
|
Allowance |
In millions of COP | ||||||||||||||||
Balance at January 1, 2023 |
|
1,093,973 |
|
(28,564) |
|
135,528 |
|
(29,024) |
|
98,575 |
|
(67,447) |
|
1,328,076 |
|
(125,035) |
Transfers of financial instruments: |
|
(210,552) |
|
3,957 |
|
155,467 |
|
(680) |
|
55,085 |
|
(3,277) |
|
- |
|
- |
Transfers from stage 1 to stage 2 |
|
(177,024) |
|
4,932 |
|
177,024 |
|
(4,932) |
|
- |
|
- |
|
- |
|
- |
Transfers from stage 1 to stage 3 |
|
(46,849) |
|
2,745 |
|
- |
|
- |
|
46,849 |
|
(2,745) |
|
- |
|
- |
Transfers from stage 2 to stage 1 |
|
13,169 |
|
(3,625) |
|
(13,169) |
|
3,625 |
|
- |
|
- |
|
- |
|
- |
Transfers from stage 2 to stage 3 |
|
- |
|
- |
|
(17,243) |
|
5,043 |
|
17,243 |
|
(5,043) |
|
- |
|
- |
Transfers from stage 3 to stage 1 |
|
152 |
|
(95) |
|
- |
|
- |
|
(152) |
|
95 |
|
- |
|
- |
Transfers from stage 3 to stage 2 |
|
- |
|
- |
|
8,855 |
|
(4,416) |
|
(8,855) |
|
4,416 |
|
- |
|
- |
Remeasurement arising from transfer of stage |
|
(2,939) |
|
2,268 |
|
(4,798) |
|
(5,519) |
|
(8,155) |
|
(58,743) |
|
(15,892) |
|
(61,994) |
Remeasurement from remaining in the stage |
|
(133,210) |
|
5,932 |
|
(9,475) |
|
(7,767) |
|
(94) |
|
(9,821) |
|
(142,779) |
|
(11,656) |
Remeasurement due to changes in economics factors |
|
- |
|
(3,185) |
|
- |
|
(882) |
|
- |
|
24 |
|
- |
|
(4,043) |
Remeasurement due to changes in model inputs |
|
- |
|
- |
|
- |
|
- |
|
- |
|
- |
|
- |
|
- |
Remeasurement due to methodological changes |
|
- |
|
(14,202) |
|
- |
|
3,792 |
|
- |
|
2,808 |
|
- |
|
(7,602) |
New financial assets purchased/originated(1) |
|
395,777 |
|
(29,237) |
|
31,394 |
|
(8,643) |
|
32,093 |
|
(28,378) |
|
459,264 |
|
(66,258) |
Financial assets that have been derecognized |
|
(220,594) |
|
5,021 |
|
(13,738) |
|
3,545 |
|
(12,904) |
|
9,549 |
|
(247,236) |
|
18,115 |
Charges-off |
|
(17,840) |
|
1,787 |
|
(17,376) |
|
7,174 |
|
(46,060) |
|
72,315 |
|
(81,276) |
|
81,276 |
Foreign Exchange and other movements |
|
(130,044) |
|
993 |
|
(16,699) |
|
3,139 |
|
(8,397) |
|
5,047 |
|
(155,140) |
|
9,179 |
Balance at December 31, 2023 |
|
774,571 |
|
(55,230) |
|
260,303 |
|
(34,865) |
|
110,143 |
|
(77,923) |
|
1,145,017 |
|
(168,018) |
| (1) | Includes financial assets purchased, originated and restructured. |
Variation December 2022 vs December 2021
Stage 1 (12-month expected credit losses)
The exposure value in stage 1 increased by COP 51,669,823 and the loss allowance increased by COP 420,975. The growth of the portfolio at this stage is mainly due to newly granted loans and clients demonstrating good payment behavior post-pandemic, returning to Stage 1. The increase in the loss allowance is primarily due to a more unfavorable macroeconomic expectation where the provision is impacted by lower economic growth and a trend of high interest rates.
F-75
Stage 2 (Lifetime expected credit losses)
The exposure value in stage 2 decreased by COP 643,314 and the loss allowance also decreased by COP 178,706. The decrease in exposure is mainly explained by specific loan migrations from Stage 2 to Stage 1 of clients in the agro-industrial sector for a value of COP 658,486, customers transitioning out of medium risk monitoring due to exhibiting improved credit performance, and clients who conclude their financial relief due to COVID-19 and exhibit favorable payment behavior, transitioning to Stage 1. The loss allowance decrease is mainly due to the migration of clients between stages and the movement of the loss allowance from debtors ending their financial relief.
Stage 3 (Lifetime expected credit losses)
The exposure at default in stage 3 decreased by COP 1,426,253 and the loss allowance decreased by COP 627,111. The variation in exposure is mainly due to a higher level of write-offs (going off balance sheet) and clients leaving AEC (Special Client Administration Watchlist) level 3 due to better sector performance. The decrease of loss allowance is in accordance with the decrease in exposure.
As of December 31, 2022
Commercial
|
|
Stage1 |
Stage2 |
Stage3 |
Total |
|||||||||||
|
|
Gross |
|
|
|
Gross |
|
|
|
Gross |
|
|
|
Gross |
|
|
|
|
carrying |
|
Allowance |
|
carrying |
|
Allowance |
|
carrying |
|
Allowance |
|
carrying |
|
Allowance |
In millions of COP | ||||||||||||||||
Balance at January 1, 2022 |
|
97,000,580 |
|
(745,898) |
|
8,335,781 |
|
(917,747) |
|
9,575,482 |
|
(6,149,378) |
|
114,911,843 |
|
(7,813,023) |
Transfers of financial instruments: |
|
(1,000,903) |
|
(55,842) |
|
164,928 |
|
(58,355) |
|
835,975 |
|
114,197 |
|
- |
|
- |
Transfers from stage 1 to stage 2 |
|
(1,826,599) |
|
40,086 |
|
1,826,599 |
|
(40,086) |
|
- |
|
- |
|
- |
|
- |
Transfers from stage 1 to stage 3 |
|
(495,556) |
|
24,385 |
|
- |
|
- |
|
495,556 |
|
(24,385) |
|
- |
|
- |
Transfers from stage 2 to stage 1 |
|
1,318,572 |
|
(115,364) |
|
(1,318,572) |
|
115,364 |
|
- |
|
- |
|
- |
|
- |
Transfers from stage 2 to stage 3 |
|
- |
|
- |
|
(791,245) |
|
85,224 |
|
791,245 |
|
(85,224) |
|
- |
|
- |
Transfers from stage 3 to stage 1 |
|
2,680 |
|
(4,949) |
|
- |
|
- |
|
(2,680) |
|
4,949 |
|
- |
|
- |
Transfers from stage 3 to stage 2 |
|
- |
|
- |
|
448,146 |
|
(218,857) |
|
(448,146) |
|
218,857 |
|
- |
|
- |
Remeasurement arising from transfer of stage |
|
(418,622) |
|
102,555 |
|
(288,452) |
|
(3,163) |
|
(200,663) |
|
(692,420) |
|
(907,737) |
|
(593,028) |
Remeasurement from remaining in the stage |
|
(8,259,356) |
|
121,886 |
|
(250,538) |
|
53,997 |
|
67,232 |
|
(563,580) |
|
(8,442,662) |
|
(387,697) |
Remeasurement due to changes in economics factors |
|
- |
|
(37,926) |
|
- |
|
157,149 |
|
- |
|
(7,695) |
|
- |
|
111,528 |
Remeasurement due to changes in model inputs |
|
- |
|
- |
|
- |
|
- |
|
- |
|
- |
|
- |
|
- |
Remeasurement due to methodological changes |
|
- |
|
98,728 |
|
- |
|
92,122 |
|
- |
|
53,754 |
|
- |
|
244,604 |
New financial assets purchased/originated(1) |
|
71,027,870 |
|
(323,336) |
|
1,638,849 |
|
(256,104) |
|
1,671,567 |
|
(1,147,222) |
|
74,338,286 |
|
(1,726,662) |
Financial assets that have been derecognized |
|
(38,422,512) |
|
190,804 |
|
(2,625,441) |
|
208,049 |
|
(1,966,963) |
|
1,163,837 |
|
(43,014,916) |
|
1,562,690 |
Charges-off |
|
(19,378) |
|
1,330 |
|
(48,003) |
|
26,417 |
|
(1,675,514) |
|
1,715,148 |
|
(1,742,895) |
|
1,742,895 |
Foreign Exchange and other movements |
|
6,623,183 |
|
(17,560) |
|
1,135,311 |
|
(54,093) |
|
637,440 |
|
(339,959) |
|
8,395,934 |
|
(411,612) |
Balance at December 31, 2022 |
|
126,530,862 |
|
(665,259) |
|
8,062,435 |
|
(751,728) |
|
8,944,556 |
|
(5,853,318) |
|
143,537,853 |
|
(7,270,305) |
| (1) | Includes financial assets purchased, originated and restructured. |
F-76
Consumer
|
|
Stage1 |
Stage2 |
Stage3 |
Total |
|||||||||||
|
|
Gross |
|
|
|
Gross |
|
|
|
Gross |
|
|
|
Gross |
|
|
|
|
carrying |
|
Allowance |
|
carrying |
|
Allowance |
|
carrying |
|
Allowance |
|
carrying |
|
Allowance |
In millions of COP | ||||||||||||||||
Balance at January 1, 2022 |
|
41,773,555 |
|
(1,402,277) |
|
3,927,387 |
|
(1,800,518) |
|
2,662,098 |
|
(2,102,472) |
|
48,363,040 |
|
(5,305,267) |
Transfers of financial instruments: |
|
(2,023,245) |
|
(175,533) |
|
937,915 |
|
147,486 |
|
1,085,330 |
|
28,047 |
|
- |
|
- |
Transfers from stage 1 to stage 2 |
|
(2,205,274) |
|
126,781 |
|
2,205,274 |
|
(126,781) |
|
- |
|
- |
|
- |
|
- |
Transfers from stage 1 to stage 3 |
|
(981,411) |
|
64,937 |
|
- |
|
- |
|
981,411 |
|
(64,937) |
|
- |
|
- |
Transfers from stage 2 to stage 1 |
|
1,086,524 |
|
(298,371) |
|
(1,086,524) |
|
298,371 |
|
- |
|
- |
|
- |
|
- |
Transfers from stage 2 to stage 3 |
|
- |
|
- |
|
(379,978) |
|
129,687 |
|
379,978 |
|
(129,687) |
|
- |
|
- |
Transfers from stage 3 to stage 1 |
|
76,916 |
|
(68,880) |
|
- |
|
- |
|
(76,916) |
|
68,880 |
|
- |
|
- |
Transfers from stage 3 to stage 2 |
|
- |
|
- |
|
199,143 |
|
(153,791) |
|
(199,143) |
|
153,791 |
|
- |
|
- |
Remeasurement arising from transfer of stage |
|
(206,572) |
|
336,478 |
|
(191,232) |
|
(135,684) |
|
511,818 |
|
(2,497,603) |
|
114,014 |
|
(2,296,809) |
Remeasurement from remaining in the stage |
|
(3,215,778) |
|
(89,383) |
|
(38,099) |
|
(206,202) |
|
(268,082) |
|
93,183 |
|
(3,521,959) |
|
(202,402) |
Remeasurement due to changes in economics factors |
|
- |
|
39,672 |
|
- |
|
241,992 |
|
- |
|
(2,512) |
|
- |
|
279,152 |
Remeasurement due to changes in model inputs |
|
- |
|
- |
|
- |
|
- |
|
- |
|
- |
|
- |
|
- |
Remeasurement due to methodological changes |
|
- |
|
23,381 |
|
- |
|
(78,241) |
|
- |
|
785 |
|
- |
|
(54,075) |
New financial assets purchased/originated(1) |
|
23,609,797 |
|
(987,792) |
|
1,919,811 |
|
(715,751) |
|
943,121 |
|
(759,058) |
|
26,472,729 |
|
(2,462,601) |
Financial assets that have been derecognized |
|
(10,128,838) |
|
286,762 |
|
(668,543) |
|
215,579 |
|
(149,520) |
|
122,025 |
|
(10,946,901) |
|
624,366 |
Charges-off |
|
(698,744) |
|
233,953 |
|
(916,801) |
|
615,728 |
|
(2,172,972) |
|
2,938,836 |
|
(3,788,517) |
|
3,788,517 |
Foreign Exchange and other movements |
|
2,400,768 |
|
(89,102) |
|
318,483 |
|
(153,271) |
|
177,064 |
|
(175,643) |
|
2,896,315 |
|
(418,016) |
Balance at December 31, 2022 |
|
51,510,943 |
|
(1,823,841) |
|
5,288,921 |
|
(1,868,882) |
|
2,788,857 |
|
(2,354,412) |
|
59,588,721 |
|
(6,047,135) |
| (1) | Includes financial assets purchased, originated and restructured. |
Financial leases
|
|
Stage1 |
Stage2 |
Stage3 |
Total |
|||||||||||
|
|
Gross |
|
|
|
Gross |
|
|
|
Gross |
|
|
|
Gross |
|
|
|
|
carrying |
|
Allowance |
|
carrying |
|
Allowance |
|
carrying |
|
Allowance |
|
carrying |
|
Allowance |
In millions of COP | ||||||||||||||||
Balance at January 1, 2022 |
|
19,927,472 |
|
(142,954) |
|
3,198,182 |
|
(314,149) |
|
1,993,974 |
|
(1,063,964) |
|
25,119,628 |
|
(1,521,067) |
Transfers of financial instruments: |
|
59,490 |
|
(79,666) |
|
(118,703) |
|
57,312 |
|
59,213 |
|
22,354 |
|
- |
|
- |
Transfers from stage 1 to stage 2 |
|
(626,697) |
|
16,913 |
|
626,697 |
|
(16,913) |
|
- |
|
- |
|
- |
|
- |
Transfers from stage 1 to stage 3 |
|
(102,499) |
|
3,810 |
|
- |
|
- |
|
102,499 |
|
(3,810) |
|
- |
|
- |
Transfers from stage 2 to stage 1 |
|
779,795 |
|
(98,964) |
|
(779,795) |
|
98,964 |
|
- |
|
- |
|
- |
|
- |
Transfers from stage 2 to stage 3 |
|
- |
|
- |
|
(143,173) |
|
19,624 |
|
143,173 |
|
(19,624) |
|
- |
|
- |
Transfers from stage 3 to stage 1 |
|
8,891 |
|
(1,425) |
|
- |
|
- |
|
(8,891) |
|
1,425 |
|
- |
|
- |
Transfers from stage 3 to stage 2 |
|
- |
|
- |
|
177,568 |
|
(44,363) |
|
(177,568) |
|
44,363 |
|
- |
|
- |
Remeasurement arising from transfer of stage |
|
(74,495) |
|
86,331 |
|
(23,270) |
|
(22,332) |
|
46,660 |
|
(164,292) |
|
(51,105) |
|
(100,293) |
Remeasurement from remaining in the stage |
|
(1,380,295) |
|
10,504 |
|
(74,988) |
|
49,130 |
|
(38,739) |
|
2,788 |
|
(1,494,022) |
|
62,422 |
Remeasurement due to changes in economics factors |
|
- |
|
(14,991) |
|
- |
|
1,612 |
|
- |
|
(8,667) |
|
- |
|
(22,046) |
Remeasurement due to changes in model inputs |
|
- |
|
- |
|
- |
|
- |
|
- |
|
- |
|
- |
|
- |
Remeasurement due to methodological changes |
|
- |
|
19,160 |
|
- |
|
(19,451) |
|
- |
|
(9,455) |
|
- |
|
(9,746) |
New financial assets purchased/originated(1) |
|
5,358,579 |
|
(38,976) |
|
587,957 |
|
(35,776) |
|
33,567 |
|
(17,606) |
|
5,980,103 |
|
(92,358) |
Financial assets that have been derecognized |
|
(1,362,963) |
|
10,976 |
|
(399,179) |
|
28,647 |
|
(585,828) |
|
463,171 |
|
(2,347,970) |
|
502,794 |
Charges-off |
|
(264) |
|
4 |
|
(19,361) |
|
19,127 |
|
(156,782) |
|
157,276 |
|
(176,407) |
|
176,407 |
Foreign Exchange and other movements |
|
1,039,020 |
|
(1,716) |
|
21,647 |
|
(3,040) |
|
6,822 |
|
(4,431) |
|
1,067,489 |
|
(9,187) |
Balance at December 31, 2022 |
|
23,566,544 |
|
(151,328) |
|
3,172,285 |
|
(238,920) |
|
1,358,887 |
|
(622,826) |
|
28,097,716 |
|
(1,013,074) |
| (1) | Includes financial assets purchased, originated and restructured. |
F-77
Mortgage
|
|
Stage1 |
Stage2 |
Stage3 |
Total |
|||||||||||
|
|
Gross |
|
|
|
Gross |
|
|
|
Gross |
|
|
|
Gross |
|
|
|
|
carrying |
|
Allowance |
|
carrying |
|
Allowance |
|
carrying |
|
Allowance |
|
carrying |
|
Allowance |
In millions of COP | ||||||||||||||||
Balance at January 1, 2022 |
|
25,447,635 |
|
(140,843) |
|
3,654,710 |
|
(260,867) |
|
1,544,442 |
|
(659,348) |
|
30,646,787 |
|
(1,061,058) |
Transfers of financial instruments: |
|
2,074,437 |
|
(61,050) |
|
(2,522,248) |
|
30,734 |
|
447,811 |
|
30,316 |
|
- |
|
- |
Transfers from stage 1 to stage 2 |
|
(745,136) |
|
15,839 |
|
745,136 |
|
(15,839) |
|
- |
|
- |
|
- |
|
- |
Transfers from stage 1 to stage 3 |
|
(207,362) |
|
4,437 |
|
- |
|
- |
|
207,362 |
|
(4,437) |
|
- |
|
- |
Transfers from stage 2 to stage 1 |
|
3,021,745 |
|
(80,567) |
|
(3,021,745) |
|
80,567 |
|
- |
|
- |
|
- |
|
- |
Transfers from stage 2 to stage 3 |
|
- |
|
- |
|
(445,019) |
|
31,802 |
|
445,019 |
|
(31,802) |
|
- |
|
- |
Transfers from stage 3 to stage 1 |
|
5,190 |
|
(759) |
|
- |
|
- |
|
(5,190) |
|
759 |
|
- |
|
- |
Transfers from stage 3 to stage 2 |
|
- |
|
- |
|
199,380 |
|
(65,796) |
|
(199,380) |
|
65,796 |
|
- |
|
- |
Remeasurement arising from transfer of stage |
|
(34,494) |
|
69,980 |
|
(26,095) |
|
(40,822) |
|
105,748 |
|
(309,941) |
|
45,159 |
|
(280,783) |
Remeasurement from remaining in the stage |
|
(1,265,193) |
|
(611) |
|
406,332 |
|
(924) |
|
(448,715) |
|
(14,146) |
|
(1,307,576) |
|
(15,681) |
Remeasurement due to changes in economics factors |
|
- |
|
(21,123) |
|
- |
|
54,802 |
|
- |
|
32 |
|
- |
|
33,711 |
Remeasurement due to changes in model inputs |
|
- |
|
- |
|
- |
|
- |
|
- |
|
- |
|
- |
|
- |
Remeasurement due to methodological changes |
|
- |
|
(11,559) |
|
- |
|
(22,449) |
|
- |
|
(2,081) |
|
- |
|
(36,089) |
New financial assets purchased/originated(1) |
|
7,407,685 |
|
(46,935) |
|
74,121 |
|
(15,026) |
|
23,675 |
|
(9,646) |
|
7,505,481 |
|
(71,607) |
Financial assets that have been derecognized |
|
(1,772,230) |
|
11,975 |
|
(146,498) |
|
11,697 |
|
(173,986) |
|
95,882 |
|
(2,092,714) |
|
119,554 |
Charges-off |
|
(3,449) |
|
283 |
|
(1,206) |
|
1,174 |
|
(341,336) |
|
344,534 |
|
(345,991) |
|
345,991 |
Foreign Exchange and other movements |
|
2,213,343 |
|
(6,917) |
|
558,154 |
|
(14,594) |
|
148,730 |
|
(36,618) |
|
2,920,227 |
|
(58,129) |
Balance at December 31, 2022 |
|
34,067,734 |
|
(206,800) |
|
1,997,270 |
|
(256,275) |
|
1,306,369 |
|
(561,016) |
|
37,371,373 |
|
(1,024,091) |
| (1) | Includes financial assets purchased, originated and restructured. |
Small business loans
|
|
Stage1 |
Stage2 |
Stage3 |
Total |
|||||||||||
|
|
Gross |
|
|
|
Gross |
|
|
|
Gross |
|
|
|
Gross |
|
|
|
|
carrying |
|
Allowance |
|
carrying |
|
Allowance |
|
carrying |
|
Allowance |
|
carrying |
|
Allowance |
In millions of COP | ||||||||||||||||
Balance at January 1, 2022 |
|
950,991 |
|
(22,845) |
|
183,693 |
|
(30,255) |
|
147,501 |
|
(110,967) |
|
1,282,185 |
|
(164,067) |
Transfers of financial instruments: |
|
(70,809) |
|
(1,260) |
|
17,756 |
|
3,557 |
|
53,053 |
|
(2,297) |
|
- |
|
- |
Transfers from stage 1 to stage 2 |
|
(68,581) |
|
2,098 |
|
68,581 |
|
(2,098) |
|
- |
|
- |
|
- |
|
- |
Transfers from stage 1 to stage 3 |
|
(44,815) |
|
1,960 |
|
- |
|
- |
|
44,815 |
|
(1,960) |
|
- |
|
- |
Transfers from stage 2 to stage 1 |
|
38,613 |
|
(4,608) |
|
(38,613) |
|
4,608 |
|
- |
|
- |
|
- |
|
- |
Transfers from stage 2 to stage 3 |
|
- |
|
- |
|
(18,528) |
|
3,684 |
|
18,528 |
|
(3,684) |
|
- |
|
- |
Transfers from stage 3 to stage 1 |
|
3,974 |
|
(710) |
|
- |
|
- |
|
(3,974) |
|
710 |
|
- |
|
- |
Transfers from stage 3 to stage 2 |
|
- |
|
- |
|
6,316 |
|
(2,637) |
|
(6,316) |
|
2,637 |
|
- |
|
- |
Remeasurement arising from transfer of stage |
|
(4,527) |
|
4,802 |
|
(8,173) |
|
(4,465) |
|
(9,736) |
|
(52,103) |
|
(22,436) |
|
(51,766) |
Remeasurement from remaining in the stage |
|
(42,292) |
|
(505) |
|
(89,440) |
|
1,278 |
|
(14,946) |
|
2,472 |
|
(146,678) |
|
3,245 |
Remeasurement due to changes in economics factors |
|
- |
|
(435) |
|
- |
|
3,752 |
|
- |
|
(71) |
|
- |
|
3,246 |
Remeasurement due to changes in model inputs |
|
- |
|
- |
|
- |
|
- |
|
- |
|
- |
|
- |
|
- |
Remeasurement due to methodological changes |
|
- |
|
49 |
|
- |
|
(448) |
|
- |
|
(1,704) |
|
- |
|
(2,103) |
New financial assets purchased/originated(1) |
|
463,403 |
|
(14,534) |
|
42,588 |
|
(10,982) |
|
24,050 |
|
(19,183) |
|
530,041 |
|
(44,699) |
Financial assets that have been derecognized |
|
(279,820) |
|
4,489 |
|
(21,195) |
|
3,584 |
|
(31,532) |
|
21,334 |
|
(332,547) |
|
29,407 |
Charges-off |
|
(12,781) |
|
2,895 |
|
(16,004) |
|
6,857 |
|
(82,307) |
|
101,340 |
|
(111,092) |
|
111,092 |
Foreign Exchange and other movements |
|
89,808 |
|
(1,220) |
|
26,303 |
|
(1,902) |
|
12,492 |
|
(6,268) |
|
128,603 |
|
(9,390) |
Balance at December 31, 2022 |
|
1,093,973 |
|
(28,564) |
|
135,528 |
|
(29,024) |
|
98,575 |
|
(67,447) |
|
1,328,076 |
|
(125,035) |
| (1) | Includes financial assets purchased, originated and restructured. |
F-78
NOTE 7. LEASES
7.1. Lessor
Finance leases
The Bank has entered into lease agreements as the lessor. These lease arrangements involve machinery and equipment, computer equipment, vehicles and furniture and fixtures, and their terms range between one and ten years, as follows:
As of December 31, 2023
Period |
|
Gross investment in finance |
|
Present value of minimum |
In millions of COP | ||||
Less than 1 year |
|
1,481,313 |
|
1,257,859 |
Between 1 and 5 years |
|
10,967,173 |
|
8,338,151 |
Greater than 5 years |
|
34,066,937 |
|
17,681,047 |
Total gross investment in finance lease receivable/ present value of minimum payments |
|
46,515,423 |
|
27,277,057 |
Less: Future financial income(1) |
|
(19,238,366) |
|
- |
Present value of payments receivable(2) |
|
27,277,057 |
|
27,277,057 |
Minimum non-collectable payments impairment |
|
(1,024,575) |
|
(1,024,575) |
Total |
|
26,252,482 |
|
26,252,482 |
As of December 31, 2022
Period |
|
Gross investment in finance |
|
Present value of minimum |
In millions of COP | ||||
Less than 1 year |
|
634,388 |
|
612,012 |
Between 1 and 5 years |
|
10,579,102 |
|
8,286,322 |
Greater than 5 years |
|
34,118,764 |
|
19,199,382 |
Total gross investment in finance lease receivable/ present value of minimum payments |
|
45,332,254 |
|
28,097,716 |
Less: Future financial income(1) |
|
(17,234,538) |
|
- |
Present value of payments receivable(2) |
|
28,097,716 |
|
28,097,716 |
Minimum non-collectable payments impairment |
|
(972,743) |
|
(972,743) |
Total |
|
27,124,973 |
|
27,124,973 |
F-79
Unsecured residual value(*)
The following table sets the unsecured residual values by type of asset as of December 31, 2023 and 2022:
Type of asset |
|
December 31, 2023 |
|
December 31, 2022 |
In millions of COP | ||||
Technological equipment |
|
49,990 |
|
47,922 |
Vehicles |
|
14,243 |
|
24,187 |
Machinery and equipment |
|
11,930 |
|
13,124 |
Furniture and fixtures |
|
12 |
|
28 |
Other assets |
|
1,417 |
|
1,541 |
Total |
|
77,592 |
|
86,802 |
(*) The unsecured residual value is the part of the residual value of the leased asset, whose realization is not secured or is secured by a third party related to the lessor.
Amounts recognized as income for extensions
At the end of the reporting period, the following entries are recognized as income corresponding to contract extensions or automatic time extension of financial leasing contracts:
Type of asset |
|
December 31, 2023 |
|
December 31, 2022 |
In millions of COP | ||||
Technological equipment |
|
20,717 |
|
30,075 |
Buildings |
|
8,088 |
|
3,905 |
Machinery and equipment |
|
532 |
|
498 |
Vehicles |
|
102 |
|
206 |
Furniture and fixtures |
|
- |
|
1 |
Total |
|
29,439 |
|
34,685 |
As of December 31, 2023, 2022 and 2021, financial leases income amounted to COP 3,879,188, COP 2,461,456, and COP 1,440,493, respectively.
Operating leases
Certain of the Bank’s subsidiaries lease assets to third parties under non-cancellable operating lease arrangements. Assets provided through operating leases are recorded as premises and equipment. The terms established for these agreements range from one to ten years.
The following table presents the information of minimum payments by lease to be received:
|
|
December 31, 2023 |
|
December 31, 2022 |
|
In millions of COP | |||||
Less than 1 year |
|
259,277 |
|
501,738 |
|
Between 1 and 5 years |
|
524,293 |
|
783,663 |
|
Greater than 5 years |
|
60,619 |
|
423,459 |
|
Total(1) |
|
844,189 |
|
1,708,860 |
|
(1) During 2023, Renting S.A.S. have subleased their vehicles under financial leases, therefore operational placements through own resources and the number of operational vehicles have decreased.
As of December 31, 2023 and 2022, the operating lease income amounted to COP 833,244 and COP 649,693, respectively. Additionally, the Bank recognized other services related to the lease for COP 660,442 and COP 541,436, respectively.
F-80
Risk management associated with leases
The Bank, acting as a lessor of operating leases, has a comprehensive asset management model for those assets classified as property, plant and equipment. This model includes an impairment test that evaluates indicators that impact the assets, which is carried out annually. The test evaluates both external indicators (economic, environmental, and legal), and internal ones (insurance, maintenance and used market sales). Likewise, the calculation of residuals was updated to reflect the effect of the new macroeconomic conditions. Moreover, the Bank performs a detailed review process at the time of return of the asset by the lessees in order to guarantee their operating conditions. Additionally, the Bank employs experts apart from the sales team, who constantly monitor the conditions of the second-hand market, and carry out back-testing in order to determine the consistency of the residual value model, and periodically review the results together with key managers. All the above is complemented by agreements with suppliers, which allow the exchange of information, knowledge and, in some cases, the structuring of residual risk mitigation mechanisms.
In order to manage the risks associated with the assets, the Bank also employs an insurance department, and engages an international broker and insurance companies. They all serve as support to design and define the strategies for the different types of protection that cover the lessor's risks, assets and customers.
Additionally, in Renting Colombia's vehicle rental business, assets are managed with the goal of preserving commercial value through necessary maintenance, which avoids deterioration beyond that generated by regular use. Service indicators with suppliers are periodically reviewed in order to ensure their quality and compliance with the expected levels. Safe mobility strategies are also defined based on the permanent analysis of the road safety indicators. These strategies aim at ensuring the status and useful life of the asset.
7.2. Lessee
The Bank has entered into lease agreements as a lessee. These arrangements involve offices, branches and administrative offices as well as certain Computer equipment. As of December 31, 2023 and 2022, the rollforward of right-of-use assets was as follows:
F-81
As of December 31, 2023
|
|
|
|
Roll - forward |
|
|
||||||||||
Right-of-use assets |
|
Balance at |
|
Acquisitions |
|
Additions |
|
Expenses |
|
Disposals |
|
Revaluation(2) |
|
Effect of changes |
|
Balance at |
In millions of COP | ||||||||||||||||
Buildings |
|
|
|
|
|
|
|
|
|
|
|
|
|
|
|
|
Cost |
|
2,319,471 |
|
67,049 |
|
11,861 |
|
- |
|
(75,701) |
|
218,592 |
|
(238,350) |
|
2,302,922 |
Accumulated depreciation |
|
(637,615) |
|
- |
|
- |
|
(198,156) |
|
41,560 |
|
- |
|
87,425 |
|
(706,786) |
Furniture and fixtures |
|
|
|
|
|
|
|
|
|
|
|
|
|
|
|
|
Cost |
|
4,449 |
|
620 |
|
- |
|
- |
|
(1,783) |
|
- |
|
(524) |
|
2,762 |
Accumulated depreciation |
|
(4,291) |
|
- |
|
- |
|
(548) |
|
1,708 |
|
- |
|
524 |
|
(2,607) |
Computer equipment |
|
|
|
|
|
|
|
|
|
|
|
|
|
|
|
|
Cost |
|
95,240 |
|
7,965 |
|
- |
|
- |
|
(30,650) |
|
(2,773) |
|
(11,713) |
|
58,069 |
Accumulated depreciation |
|
(53,757) |
|
- |
|
- |
|
(17,043) |
|
29,864 |
|
- |
|
6,000 |
|
(34,936) |
Vehicles |
|
|
|
|
|
|
|
|
|
|
|
|
|
|
|
|
Cost |
|
136,560 |
|
418,773 |
|
- |
|
- |
|
(539,293) |
|
4,419 |
|
(704) |
|
19,755 |
Accumulated depreciation |
|
(32,949) |
|
- |
|
- |
|
(13,918) |
|
41,128 |
|
- |
|
605 |
|
(5,134) |
Total right-of-use assets – cost |
|
2,555,720 |
|
494,407 |
|
11,861 |
|
- |
|
(647,427) |
|
220,238 |
|
(251,291) |
|
2,383,508 |
Total right-of-use assets - accumulated depreciation |
|
(728,612) |
|
- |
|
- |
|
(229,665) |
|
114,260 |
|
- |
|
94,554 |
|
(749,463) |
Total right-of-use assets, net |
|
1,827,108 |
|
494,407 |
|
11,861 |
|
(229,665) |
|
(533,167) |
|
220,238 |
|
(156,737) |
|
1,634,045 |
| (1) | See Note 26.3 Impairment, depreciation and amortization. |
| (2) | The variation corresponds mainly to changes in the estimated term of buildings lease liabilities. |
F-82
As of December 31, 2022
|
|
|
|
Roll - forward |
|
|
||||||||||
Right-of-use assets |
|
Balance at |
|
Acquisitions |
|
Additions |
|
Expenses |
|
Disposals |
|
Revaluation |
|
Effect of changes |
|
Balance at |
In millions of COP | ||||||||||||||||
Buildings |
|
|
|
|
|
|
|
|
|
|
|
|
|
|
|
|
Cost |
|
2,015,154 |
|
66,738 |
|
8,746 |
|
- |
|
(55,759) |
|
83,387 |
|
201,205 |
|
2,319,471 |
Accumulated depreciation |
|
(431,147) |
|
- |
|
- |
|
(175,538) |
|
31,276 |
|
- |
|
(62,206) |
|
(637,615) |
Furniture and fixtures |
|
|
|
|
|
|
|
|
|
|
|
|
|
|
|
|
Cost |
|
3,972 |
|
- |
|
- |
|
- |
|
- |
|
37 |
|
440 |
|
4,449 |
Accumulated depreciation |
|
(2,821) |
|
- |
|
- |
|
(1,066) |
|
- |
|
- |
|
(404) |
|
(4,291) |
Computer equipment |
|
|
|
|
|
|
|
|
|
|
|
|
|
|
|
|
Cost |
|
87,357 |
|
2,603 |
|
- |
|
- |
|
(985) |
|
(2,659) |
|
8,924 |
|
95,240 |
Accumulated depreciation |
|
(32,538) |
|
- |
|
- |
|
(18,717) |
|
826 |
|
- |
|
(3,328) |
|
(53,757) |
Vehicles |
|
|
|
|
|
|
|
|
|
|
|
|
|
|
|
|
Cost |
|
72,369 |
|
99,041 |
|
- |
|
- |
|
(70,207) |
|
34,776 |
|
581 |
|
136,560 |
Accumulated depreciation |
|
(16,481) |
|
- |
|
- |
|
(17,540) |
|
1,558 |
|
- |
|
(486) |
|
(32,949) |
Total right-of-use assets – cost |
|
2,178,852 |
|
168,382 |
|
8,746 |
|
- |
|
(126,951) |
|
115,541 |
|
211,150 |
|
2,555,720 |
Total right-of-use assets - accumulated depreciation |
|
(482,987) |
|
- |
|
- |
|
(212,861) |
|
33,660 |
|
- |
|
(66,424) |
|
(728,612) |
Total right-of-use assets, net |
|
1,695,865 |
|
168,382 |
|
8,746 |
|
(212,861) |
|
(93,291) |
|
115,541 |
|
144,726 |
|
1,827,108 |
| (1) | See Note 26.3 Impairment, depreciation and amortization. |
The following table sets forth the changes in lease liabilities as of December 31, 2023 and 2022:
As of December 31, 2023
Concept |
|
Total |
In millions of COP | ||
Balance at January 01, 2023 |
|
1,900,268 |
(+) New contracts |
|
75,345 |
(+/-) Reassessment of the lease liability(1) |
|
161,787 |
(-) Payments |
|
(305,413) |
(+) Accrued Interest(2) |
|
123,175 |
(+/-) Effect of changes in foreign exchange rate(3) |
|
(181,552) |
Balance at December 31, 2023 |
|
1,773,610 |
| (1) | The variation corresponds mainly to changes in the estimated term of buildings lease liabilities. |
F-83
| (2) | The difference of COP 9,360 with the interest expensive on lease liabilities recognized in the Consolidated Statement Income corresponds to the expense accrued for the difference between the book value of the right-of-use asset and the lease liability at the time of early termination of contracts |
| (3) | The variation is due to the decrease in the market representative rate from COP 4,810.20 colombian pesos in December 2022 to COP 3,822.05 colombian pesos in December 2023. |
As of December 31, 2022
Concept |
|
Total |
In millions of COP | ||
Balance at January 01, 2022 |
|
1,819,077 |
(+) New contracts |
|
68,201 |
(+/-) Reassessment of the lease liability |
|
12,131 |
(-) Payments |
|
(285,920) |
(+) Accrued Interest(1) |
|
123,510 |
(+/-) Effect of changes in foreign exchange rate |
|
163,269 |
Balance at December 31, 2022 |
|
1,900,268 |
| (1) | The difference of COP 12,161 with the interest expensive on lease liabilities recognized in the Consolidated Statement Income corresponds to the expense accrued for the difference between the book value of the right-of-use asset and the lease liability at the time of early termination of contracts. |
The following table shows maturity analysis of lease liabilities as of December 31, 2023 and 2022:
As of December 31, 2023
Type of assets |
|
Maturity less than 1 year |
|
Maturity between 1 and 3 years |
|
Maturity between 3 and 5 years |
|
Maturity more than 5 years |
|
Total lease liabilities |
In millions of COP | ||||||||||
|
|
|
|
|
|
|
|
|
|
|
Buildings |
|
17,345 |
|
58,438 |
|
230,397 |
|
1,441,288 |
|
1,747,468 |
Vehicles |
|
125 |
|
245 |
|
- |
|
- |
|
370 |
Computer equipment |
|
2,733 |
|
14,124 |
|
7,524 |
|
1,391 |
|
25,772 |
Total lease liabilities |
|
20,203 |
|
72,807 |
|
237,921 |
|
1,442,679 |
|
1,773,610 |
As of December 31, 2022
Type of assets |
|
Maturity less than 1 year |
|
Maturity between 1 and 3 years |
|
Maturity between 3 and 5 years |
|
Maturity more than 5 years |
|
Total lease liabilities |
In millions of COP | ||||||||||
|
|
|
|
|
|
|
|
|
|
|
Buildings |
|
10,502 |
|
43,545 |
|
82,647 |
|
1,716,968 |
|
1,853,662 |
Vehicles |
|
83 |
|
300 |
|
183 |
|
- |
|
566 |
Computer equipment |
|
3,052 |
|
17,775 |
|
14,650 |
|
10,563 |
|
46,040 |
Total lease liabilities |
|
13,637 |
|
61,620 |
|
97,480 |
|
1,727,531 |
|
1,900,268 |
The following table shows the weighted average rates and average useful life of right-of-use assets as of December 31, 2023 and 2022:
F-84
As of December 31, 2023
Right-of-use assets |
|
Weighted average life |
|
Weighted average |
|
Weighted average discount |
|
Buildings |
|
209 |
|
99 |
|
6.67 |
% |
Computer equipment |
|
73 |
|
31 |
|
8.36 |
% |
Vehicles |
|
51 |
|
22 |
|
9.81 |
% |
As of December 31, 2022
Right-of-use assets |
|
Weighted average life |
|
Weighted average |
|
Weighted average discount |
|
Buildings |
|
195 |
|
97 |
|
5.75 |
% |
Computer equipment |
|
75 |
|
35 |
|
8.65 |
% |
Vehicles |
|
48 |
|
35 |
|
10.24 |
% |
The following table shows the detail of leases in the Consolidated Statement of Income as of December 31, 2023 and 2022:
As of December 31, 2023
Right-of-use assets |
|
Financial interest(1) |
|
Expenses |
|
Effect of changes in foreign exchange rate |
|
Short-term leases |
|
Leases for which the underlying asset is of low value |
|
Variable payments |
|
In millions of COP | |||||||||||||
Buildings |
|
109,800 |
|
198,156 |
|
62 |
|
983 |
|
235 |
|
7,577 |
|
Vehicles |
|
40 |
|
13,918 |
|
- |
|
51 |
|
- |
|
- |
|
Computer equipment |
|
3,907 |
|
17,043 |
|
- |
|
- |
|
6,545 |
|
- |
|
Furniture and fixtures |
|
68 |
|
548 |
|
- |
|
904 |
|
432 |
|
- |
|
Total |
|
113,815 |
|
229,665 |
|
62 |
|
1,938 |
|
7,212 |
|
7,577 |
|
| (1) | Includes the expense generated by the difference between the carrying amount of the asset for the right to use and the liability for leasing at the time of the early termination of lease contracts by COP 9,360, see Note 25.2 Interest expenses. |
| (2) | See Note 26.3 Impairment, depreciation and amortization. |
As of December 31, 2022
Right-of-use assets |
|
Financial interest(1) |
|
Expenses |
|
Effect of changes in foreign exchange rate |
|
Short-term leases |
|
Leases for which the underlying asset is of low value |
|
Variable payments |
|
In millions of COP | |||||||||||||
Buildings |
|
107,002 |
|
175,538 |
|
416 |
|
872 |
|
208 |
|
6,048 |
|
Vehicles |
|
13 |
|
17,540 |
|
- |
|
394 |
|
55 |
|
- |
|
Computer equipment |
|
4,289 |
|
18,717 |
|
- |
|
- |
|
8,649 |
|
- |
|
Furniture and fixtures |
|
45 |
|
1,066 |
|
- |
|
1,015 |
|
2,685 |
|
- |
|
Total |
|
111,349 |
|
212,861 |
|
416 |
|
2,281 |
|
11,597 |
|
6,048 |
|
| (1) | Includes the expense generated by the difference between the carrying amount of the asset for the right to use and the liability for leasing at the time of the early termination of lease contracts by COP 12,161, see Note 25.2 Interest expenses. |
| (2) | See Note 26.3 Impairment, depreciation and amortization. |
F-85
The following table contains the minimum payments lease liabilities as of December 31, 2023 and 2022:
As of December 31, 2023
Type of assets |
|
Maturity less than 1 year |
|
Maturity between 1 and 3 years |
|
Maturity between 3 and 5 years |
|
Maturity more than 5 years |
|
Total minimum payments lease liabilities |
In millions of COP | ||||||||||
|
|
|
|
|
|
|
|
|
|
|
Buildings |
|
21,050 |
|
73,316 |
|
301,470 |
|
2,074,687 |
|
2,470,523 |
Vehicles |
|
193 |
|
206 |
|
- |
|
- |
|
399 |
Computer equipment |
|
2,964 |
|
16,263 |
|
1,550 |
|
8,323 |
|
29,100 |
Total minimum payments lease liabilities |
|
24,207 |
|
89,785 |
|
303,020 |
|
2,083,010 |
|
2,500,022 |
As of December 31, 2022
Type of assets |
|
Maturity less than 1 year |
|
Maturity between 1 and 3 years |
|
Maturity between 3 and 5 years |
|
Maturity more than 5 years |
|
Total minimum payments lease liabilities |
In millions of COP | ||||||||||
|
|
|
|
|
|
|
|
|
|
|
Buildings |
|
13,492 |
|
52,100 |
|
110,495 |
|
2,427,607 |
|
2,603,694 |
Vehicles |
|
84 |
|
330 |
|
229 |
|
256 |
|
899 |
Computer equipment |
|
3,117 |
|
19,266 |
|
19,875 |
|
14,292 |
|
56,550 |
Total minimum payments lease liabilities |
|
16,693 |
|
71,696 |
|
130,599 |
|
2,442,155 |
|
2,661,143 |
NOTE 8. INVESTMENTS IN ASSOCIATES AND JOINT VENTURES
The following table presents information regarding the Bank’s investments in associates and joint ventures:
Composition |
|
December 31, 2023 |
|
December 31, 2022 |
In millions of COP | ||||
Investments in associates(1) |
|
2,526,073 |
|
2,300,450 |
Investments in joint ventures(2) |
|
471,530 |
|
615,183 |
Total associates and joint ventures |
|
2,997,603 |
|
2,915,633 |
| (1) | As of December 31, 2023 and 2022, the amount includes investments in associates at fair value for COP 1,670,782 and COP 1,532,156, respectively, and investments in associates at equity method value for COP 855,291 and COP 768,294 respectively. See Note 30. Fair value of assets and liabilities. |
| (2) | All investments in joint ventures are accounted for using the equity method. |
The following are the investments in associates that the Bank holds as of December 31, 2023 and 2022:
|
|
|
|
|
|
December 31, 2023 |
|
December 31, 2022 |
|
||||
Company name |
|
Main activity |
|
Country |
|
% of Ownership |
|
Carrying |
|
% of Ownership |
|
Carrying |
|
|
|
|
|
|
|
interest |
|
amount |
|
interest |
|
amount |
|
In millions of COP | |||||||||||||
P.A Viva Malls |
|
Development and operation of commercial spaces |
|
Colombia |
|
49.00 |
% |
1,661,679 |
|
49.00 |
% |
1,530,459 |
|
Protección S.A. |
|
Administration of pension funds and severances |
|
Colombia |
|
20.58 |
% |
594,105 |
* |
20.58 |
% |
533,584 |
|
F-86
P.A El Bosque |
|
Real estate ecosystems |
|
Colombia |
|
14.11 |
% |
57,120 |
* |
14.11 |
% |
40,231 |
* |
Titularizadora Colombiana S.A. Hitos. |
|
Mortgage portfolio securities |
|
Colombia |
|
26.98 |
% |
37,950 |
* |
26.98 |
% |
35,756 |
* |
Redeban Multicolor S.A. |
|
Network data transmission services |
|
Colombia |
|
20.36 |
% |
35,735 |
* |
20.36 |
% |
31,876 |
* |
P.A El Otoño |
|
Real estate ecosystems |
|
Colombia |
|
16.30 |
% |
33,442 |
* |
16.30 |
% |
23,960 |
* |
ACH Colombia S.A. |
|
Electronic transfer services |
|
Colombia |
|
19.94 |
% |
21,952 |
* |
19.94 |
% |
19,005 |
* |
Gestoría Externa de Portafolios S.A. |
|
Investment management service |
|
Colombia |
|
49.31 |
% |
11,278 |
* |
- |
|
- |
|
Servicio Salvadoreño de Protección, S. A. de C.V. |
|
Custodial services and transfer of monetary types |
|
El Salvador |
|
25.00 |
% |
10,223 |
* |
25.00 |
% |
14,497 |
* |
Servicios Financieros, S.A. de C.V. |
|
Processing of financial transactions and electronic payment methods |
|
El Salvador |
|
49.78 |
% |
9,514 |
* |
49.78 |
% |
11,392 |
* |
P.A Madrid II |
|
Real estate ecosystems |
|
Colombia |
|
20.00 |
% |
9,208 |
* |
20.00 |
% |
9,126 |
* |
P.A Distrito Vera |
|
Real estate ecosystems |
|
Colombia |
|
33.33 |
% |
9,103 |
|
33.33 |
% |
1,697 |
* |
P.A Boreal |
|
Real estate ecosystems |
|
Colombia |
|
20.00 |
% |
7,579 |
* |
20.00 |
% |
7,477 |
|
P.A La Felicidad |
|
Real estate ecosystems |
|
Colombia |
|
20.00 |
% |
6,938 |
* |
20.00 |
% |
9,798 |
* |
Internacional Ejecutiva de Aviación S.A.S. |
|
Aircraft and aircraft travel service |
|
Colombia |
|
25.00 |
% |
6,093 |
* |
25.00 |
% |
6,455 |
|
Reintegra S.A.S. |
|
Collections and recovery of portfolio |
|
Colombia |
|
46.00 |
% |
5,864 |
* |
46.00 |
% |
11,211 |
* |
P.A Mirador de la Ciénaga. |
|
Real estate ecosystems |
|
Colombia |
|
13.00 |
% |
4,518 |
* |
13.00 |
% |
3,329 |
* |
ACH de El Salvador, S. A. de C.V. |
|
Electronic transfer services |
|
El Salvador |
|
25.00 |
% |
1,554 |
* |
25.00 |
% |
2,140 |
* |
Agricapital S.A.S.(1) |
|
Financial services |
|
Colombia |
|
10.79 |
% |
1,262 |
* |
10.21 |
% |
1,408 |
* |
Servicios de Identidad Digital S.A.S. |
|
Digital services |
|
Colombia |
|
33.33 |
% |
956 |
|
33.33 |
% |
7,049 |
|
Total, investments in associates |
|
|
|
|
|
2,526,073 |
|
|
|
2,300,450 |
|
||
| (1) | In 2023, the ownership interest is increased due to capitalization through Bancolombia S.A. |
(*) For the purposes of applying the equity method of accounting, financial statements as of November 30, 2023 and 2022 have been used. However, the Bank does not consider that any adjustments have to be made since no significant transactions took place between that date and December 31, 2023 and 2022.
The following table sets forth the changes in the carrying amount of associates of the Bank as of December 31, 2023 and 2022:
|
|
December 31, 2023 |
December 31, 2022 |
|||||||||||||
|
In millions of COP |
|||||||||||||||
|
|
P.A Viva Malls |
|
Protección S.A. |
|
Others |
|
Total |
|
P.A Viva Malls |
|
Protección S.A. |
|
Others |
|
Total |
Balance at January 1, |
|
1,530,459 |
|
533,584 |
|
236,407 |
|
2,300,450 |
|
1,355,688 |
|
630,821 |
|
151,647 |
|
2,138,156 |
Equity method - Gain(1) |
|
128,028 |
|
62,442 |
|
40,234 |
|
230,704 |
|
189,132 |
|
46,812 |
|
29,941 |
|
265,885 |
OCI (Equity method) |
|
- |
|
(1,921) |
|
(1,039) |
|
(2,960) |
|
- |
|
3,137 |
|
2,227 |
|
5,364 |
OCI (Translation adjustment) |
|
- |
|
- |
|
(5,674) |
|
(5,674) |
|
- |
|
- |
|
4,466 |
|
4,466 |
Purchase / capitalizations |
|
3,192 |
|
- |
|
35,561 |
|
38,753 |
|
- |
|
61,728 |
|
74,634 |
|
136,362 |
Sells or refund of contributions(2) |
|
- |
|
- |
|
(6,428) |
|
(6,428) |
|
(14,361) |
|
(208,914) |
|
(6,155) |
|
(229,430) |
Impairment loss(3) |
|
- |
|
- |
|
(2,017) |
|
(2,017) |
|
- |
|
- |
|
(2,656) |
|
(2,656) |
Dividends |
|
- |
|
- |
|
(28,249) |
|
(28,249) |
|
- |
|
- |
|
(28,005) |
|
(28,005) |
Others |
|
- |
|
- |
|
1,494 |
|
1,494 |
|
- |
|
- |
|
10,308 |
|
10,308 |
Balance at December 31, |
|
1,661,679 |
|
594,105 |
|
270,289 |
|
2,526,073 |
|
1,530,459 |
|
533,584 |
|
236,407 |
|
2,300,450 |
| (1) | For further information see Note 25.5. Dividends and net income on equity investments. |
| (2) | In December 2022, was registered the spin-off of Protección S.A. and the creation of the company Asulado Seguros de Vida S.A., of which the Bank sold its participation to SURA Asset Management S.A., in order to comply with the authorized investment regime. For further information, see Note 25.5. Dividends and net income on equity investments. |
| (3) | For 2023 and 2022, the Bank management performed a valuation, to establish the recoverable amount based in value in use of Reintegra S.A.S., which amounted to COP 5,750 and COP 8,735, respectively, with a 21.5% discount rate. As a result of the valuation, the recoverables amounts of the investment were lower than the carrying amount of each year, for this, the Bank recorded an impairment in the Consolidated Statement of Income for COP 2,017 for 2023 and COP 7,688 for 2022. In addition, in 2022 the Bank management also performed a valuation, to establish the recoverable amount of Internacional Ejecutiva de Aviación S.A.S. based in fair value (Level 3) less sales costs using a methodology based on the commercial appraisal of the entity's assets, which amounted to COP 10,359. As a result of the valuation, the recoverable amount of the investment was higher than the carrying amount, for this, the Bank recognised a recovery of the impairment losses in the Consolidated Statement of Income for COP 5,032. For further information see Note 25.5. Dividends and net income on equity investments. |
F-87
The following is additional information regarding the Bank’s most significant associates as of December 31, 2023 and 2022:
As of December 31, 2023
|
|
|
|
|
|
|
|
Income from |
|
|
|
|
Assets |
|
Liabilities |
|
OCI |
|
ordinary activities |
|
Profits |
Company name |
|
(unaudited) |
|
(unaudited) |
|
(unaudited) |
|
(unaudited) |
|
(unaudited) |
In millions of COP | ||||||||||
P.A Viva Malls |
|
3,492,834 |
|
101,653 |
|
- |
|
849,928 |
|
327,838 |
Protección S.A. |
|
2,955,547 |
|
666,280 |
|
80,088 |
|
1,597,171 |
|
303,460 |
As of December 31, 2022
|
|
|
|
|
|
|
|
Income from |
|
|
|
|
Assets |
|
Liabilities |
|
OCI |
|
ordinary activities |
|
Profits |
Company name |
|
(unaudited) |
|
(unaudited) |
|
(unaudited) |
|
(unaudited) |
|
(unaudited) |
In millions of COP | ||||||||||
P.A Viva Malls |
|
3,152,529 |
|
19,705 |
|
- |
|
689,794 |
|
418,410 |
Protección S.A. |
|
2,619,197 |
|
624,052 |
|
89,419 |
|
2,993,740 |
|
227,514 |
The dividends received from the associate at fair value P.A Viva Malls for the year ended December 31, 2023 and 2022 are COP 104,623 and COP 35,905, respectively. These are included in the line Dividends and net income on equity investments in the Consolidated Statement of Income.
The following are the joint ventures that the Bank holds as of December 31, 2023 and 2022:
|
|
|
|
|
|
December 31, 2023 |
|
December 31, 2022 |
|
||||
Company name |
|
Main activity |
|
Country |
|
% of Ownership |
|
Carrying |
|
% of Ownership |
|
Carrying |
|
|
|
|
|
|
|
interest |
|
amount |
|
interest |
|
amount |
|
In millions of COP | |||||||||||||
Compañía de Financiamiento TUYA S.A.(1) |
|
Financing Services |
|
Colombia |
|
50.00 |
% |
410,324 |
|
50.00 |
% |
564,998 |
|
P.A Laurel |
|
Renewable energies |
|
Colombia |
|
50.00 |
% |
27,364 |
* |
50.00 |
% |
22,150 |
|
Puntos Colombia S.A.S. |
|
Administration of the customers loyalty |
|
Colombia |
|
50.00 |
% |
10,922 |
* |
50.00 |
% |
11,514 |
|
Fondo de Capital Privado Ruta del Sol compartimento A |
|
Investment in infrastructure projects |
|
Colombia |
|
25.90 |
% |
10,588 |
* |
25.90 |
% |
10,159 |
|
Ecosistemas Digitales de Negocio S.A.S. |
|
Digital electronic billing services |
|
Colombia |
|
50.00 |
% |
6,293 |
* |
50.00 |
% |
3,832 |
|
P.A Muverang |
|
Sustainable mobility services |
|
Colombia |
|
33.33 |
% |
2,684 |
|
33.33 |
% |
2,351 |
|
P.A Blup |
|
Inventory finance and comprehensive logistics operation |
|
Colombia |
|
50.00 |
% |
3,313 |
|
50.00 |
% |
179 |
* |
P.A. Finsocial |
|
Purchase and sale of loans and receivables |
|
Colombia |
|
50.00 |
% |
42 |
* |
- |
|
- |
|
P.A Reintegra(2) |
|
Collections and recovery of portfolio |
|
Colombia |
|
46.00 |
% |
- |
* |
46.00 |
% |
- |
* |
Avicapital(3) |
|
Purchase and sale of loans and receivables |
|
Colombia |
|
50.00 |
% |
- |
|
- |
|
- |
|
Total investments in joint venture |
|
|
|
|
|
471,530 |
|
|
|
615,183 |
|
||
| (1) | See table the changes in the carrying amount of joint ventures of the Bank as of December 31, 2023 and 2022 |
| (2) | In 2023 and 2022, the carrying amount at the end of the year is zero, because the amount of downstream transactions between Bancolombia S.A. and P.A Reintegra made during these years. |
| (3) | The value of the investment in the company is COP 0, due to the recognition of the company's losses up to its recoverable value. |
(*) For the purposes of applying the equity method of accounting, financial statements as of November 30, 2023 and 2022 have been used. However, the Bank does not consider that any adjustments have to be made since no significant transactions took place between these dates and December 31, 2023 and 2022.
The following table sets forth the changes in the carrying amount of joint ventures of the Bank as of December 31, 2023 and 2022:
F-88
|
December 31, 2023 |
December 31, 2022 |
||||||||||
|
In millions of COP |
|||||||||||
|
|
Compañía de |
|
|
|
|
|
Compañía de |
|
|
|
|
|
|
financiamiento |
|
Others |
|
Total |
|
financiamiento |
|
Others |
|
Total |
|
|
TUYA S.A. |
|
|
|
|
|
TUYA S.A. |
|
|
|
|
Balance at January 1, |
|
564,998 |
|
50,185 |
|
615,183 |
|
546,633 |
|
35,770 |
|
582,403 |
Equity method - (Loss) / Gain(1) |
|
(110,600) |
|
(6,989) |
|
(117,589) |
|
(36,635) |
|
(10,145) |
|
(46,780) |
Purchase / capitalizations |
|
62,500 |
|
17,890 |
|
80,390 |
|
55,000 |
|
31,524 |
|
86,524 |
Sells or refund of contributions |
|
- |
|
(296) |
|
(296) |
|
- |
|
(10) |
|
(10) |
(Impairment loss) / Recovery(2) |
|
(106,574) |
|
416 |
|
(106,158) |
|
- |
|
(6,977) |
|
(6,977) |
Others |
|
- |
|
- |
|
- |
|
- |
|
23 |
|
23 |
Balance at December 31, |
|
410,324 |
|
61,206 |
|
471,530 |
|
564,998 |
|
50,185 |
|
615,183 |
| (1) | For further information see Note 25.5. Dividends and net income on equity investments. |
| (2) | During the year 2023, the impairment loss relates mainly to the fact that the Bank's management requested a valuation of joint venture Tuya S.A. to establish the recoverable amount based in value in use of the previously mentioned joint ventures, which amounted to COP 425,494 with a 13.1% - 20.3% discount rate. As a result of the valuation, the recoverable amount on investment was lower than the carrying amount, therefore, the Bank recorded an impairment in the Consolidated Statement of Income for COP 106,574. Additionally, for 2023, the Bank management performed a valuation, to establish the recoverable amount based in value in use of Fondo de Capital Privado Ruta del Sol compartimento A, which amounted to COP 2,742, with a 36.03% discount rate. As a result of the valuation, the recoverable amount of the investment was higher than the carrying amount, for this, the Bank recognised a recovery of the impairment losses for COP 416. See Note 25.5. Dividends and net income on equity investments. |
The following is additional information regarding the Bank’s most significant joint ventures as of December 31, 2023 and 2022:
As of December 31, 2023
|
|
|
|
|
|
Income from |
|
|
|
|
|
Assets |
|
Liabilities |
|
ordinary activities |
|
Loss |
|
Company name |
|
(unaudited) |
(1) |
(unaudited) |
|
(unaudited) |
|
(unaudited) |
(2) |
In millons of COP | |||||||||
Compañía de financiamiento TUYA S.A. |
|
3,827,631 |
|
3,313,741 |
|
2,205,538 |
|
221,199 |
|
| (1) | Includes cash and cash equivalents for COP 223,625. |
| (2) | Includes interest and valuation income for COP 1,142,715, credit impairment charges, net for COP 949,125, interest expenses for COP 502,501, depreciation and amortization for COP 38,491 and income tax revenue for COP 131,265. |
As of December 31, 2022
|
|
|
|
|
|
Income from |
|
|
|
|
|
Assets |
|
Liabilities |
|
ordinary activities |
|
Loss |
|
Company name |
|
(unaudited) |
(1) |
(unaudited) |
|
(unaudited) |
|
(unaudited) |
(2) |
In millons of COP | |||||||||
Compañía de financiamiento TUYA S.A. |
|
5,101,346 |
|
4,491,257 |
|
1,973,131 |
|
73,266 |
|
| (1) | Includes cash and cash equivalents for COP 523,835. |
| (2) | Includes interest and valuation income for COP 1,001,631, interest expenses for COP 304,114, depreciation and amortization for COP 32,122 and income tax revenue for COP 7,907. |
The accumulated other comprehensive income before tax of investments in associates and joint ventures as of December 31, 2023 and 2022, corresponds to COP 4,751 and COP 13,385, respectively.
As of December 31, 2023 and 2022, there are no restrictions on the ability of the associates and joint ventures to transfer funds to the Bank in the form of cash dividends. In the same way, there are no contingent liabilities incurred by the Bank regarding its interests in the aforementioned joint ventures and associates.
F-89
NOTE 9. GOODWILL AND INTANGIBLE ASSETS, NET
Intangibles assets and goodwill net are as follows:
|
|
December 31, 2023 |
|
December 31, 2022 |
In millions of COP | ||||
Goodwill |
|
7,818,125 |
|
9,836,661 |
Intangible assets |
|
671,572 |
|
602,531 |
Total intangible assets and goodwill, net |
|
8,489,697 |
|
10,439,192 |
9.1. Intangible assets
The following table sets forth the Bank’s intangible assets as of December 31, 2023 and 2022, including the reconciliation of initial and final balances of the cost and accrued amortization:
As of December 31, 2023
|
|
|
|
Licenses, software |
|
|
|
|
Cost |
|
Trademarks |
|
and computer |
|
Client |
|
Total |
|
|
|
|
applications |
|
relationships |
|
|
In millions of COP | ||||||||
Balance at January 1, 2023 |
|
28,438 |
|
1,361,258 |
|
554,558 |
|
1,944,254 |
Acquisitions |
|
- |
|
352,248 |
|
- |
|
352,248 |
Write off |
|
- |
|
(119,482) |
|
- |
|
(119,482) |
Foreign currency translation adjustment |
|
(5,842) |
|
(184,188) |
|
(113,922) |
|
(303,952) |
Balance at December 31, 2023 |
|
22,596 |
|
1,409,836 |
|
440,636 |
|
1,873,068 |
|
|
|
|
Licenses, software |
|
|
|
|
Amortization |
|
Trademarks |
|
and computer |
|
Client |
|
Total |
|
|
|
|
applications |
|
relationships |
|
|
In millions of COP | ||||||||
Balance at January 1, 2023 |
|
28,437 |
|
765,339 |
|
547,947 |
|
1,341,723 |
Write off |
|
- |
|
(119,482) |
|
- |
|
(119,482) |
Amortization expense(1) |
|
- |
|
210,333 |
|
1,984 |
|
212,317 |
Foreign currency translation adjustment |
|
(5,841) |
|
(114,425) |
|
(112,796) |
|
(233,062) |
Balance at December 31, 2023 |
|
22,596 |
|
741,765 |
|
437,135 |
|
1,201,496 |
|
|
|
|
|
|
|
|
|
Intangible assets at December 31, 2023, net |
|
- |
|
668,071 |
|
3,501 |
|
671,572 |
| (1) | See Note 26.3. Impairment, depreciation and amortization. |
As of December 31, 2022
|
|
|
|
Licenses, software |
|
|
|
|
Cost |
|
Trademarks |
|
and computer |
|
Client |
|
Total |
|
|
|
|
applications |
|
relationships |
|
|
In millions of COP | ||||||||
Balance at January 1, 2022 |
|
23,537 |
|
997,609 |
|
458,980 |
|
1,480,126 |
Acquisitions |
|
- |
|
245,204 |
|
- |
|
245,204 |
Write off |
|
- |
|
(43,991) |
|
- |
|
(43,991) |
Transfers from premises and equipment |
|
- |
|
30,068 |
|
- |
|
30,068 |
Foreign currency translation adjustment |
|
4,901 |
|
132,368 |
|
95,578 |
|
232,847 |
Balance at December 31, 2022 |
|
28,438 |
|
1,361,258 |
|
554,558 |
|
1,944,254 |
F-90
|
|
|
|
Licenses, software |
|
|
|
|
Amortization |
|
Trademarks |
|
and computer |
|
Client |
|
Total |
|
|
|
|
applications |
|
relationships |
|
|
In millions of COP | ||||||||
Balance at January 1, 2022 |
|
20,174 |
|
523,055 |
|
451,271 |
|
994,500 |
Write off |
|
- |
|
(41,148) |
|
- |
|
(41,148) |
Amortization expense(1) |
|
3,595 |
|
170,004 |
|
2,392 |
|
175,991 |
Transfers from premises and equipment |
|
- |
|
28,940 |
|
- |
|
28,940 |
Foreign currency translation adjustment |
|
4,668 |
|
84,488 |
|
94,284 |
|
183,440 |
Balance at December 31, 2022 |
|
28,437 |
|
765,339 |
|
547,947 |
|
1,341,723 |
|
|
|
|
|
|
|
|
|
Intangible assets at December 31, 2022, net |
|
1 |
|
595,919 |
|
6,611 |
|
602,531 |
| (1) | See Note 26.3. Impairment, depreciation and amortization. |
As of December 31, 2023 and 2022, the assessment made by the Bank indicates there is no evidence of impairment of intangible assets.
As of December 31, 2023 and 2022, the Bank does not have intangible assets with restricted ownership, intangible assets pledged as collateral or contractual agreements for the acquisition of this class of assets.
Research and development costs
During the period ended at December 31, 2023, 2022 and 2021, the Bank incurred in research and development expenditures on non-capitalized intangible assets for COP 64,363, COP 40,229 and COP 11,882, respectively, recognized in the Consolidated Statement of Income. These costs were the result of the analysis design and implementation of the transformation projects, the most representative of which were: Core Nequi Renewal (Colombia) and core transformation in Banistmo S.A. The expenses were recorded mainly as fees in the line ‘Other administrative and general expenses’ of the Consolidated Statement of Income.
Intangibles which did not meet the criteria to be recognized as assets
During the period ended December 31, 2023, 2022 and 2021, the Bank recognized in the Consolidated Statement of Income the amount of COP 1,026, COP 49,079 and COP 10,046, respectively, related to expenditures which were not recognized as intangible assets. These expenses were not recorded as assets due to the lack of characterists to be reliably identifiable, and those assets do not support critical processes to be recognized as intangible assets.
9.2 Goodwill
The following table sets forth an analysis of the activity in the goodwill account:
|
|
December 31, 2023 |
|
December 31, 2022 |
In millions of COP | ||||
Balance at beginning of the year, net |
|
9,836,661 |
|
8,143,146 |
Effect of change in foreign exchange rate(1) |
|
(2,018,536) |
|
1,693,515 |
Balance at end of the year, net |
|
7,818,125 |
|
9,836,661 |
| (1) | The market representative rate at the end of December 31, 2023 is COP 3,822.05 colombian pesos and 2022 is COP 4,810.20 colombian pesos. See Note 2.D.1. Functional currency, transactions and balances in foreign currency. |
The Bank tests goodwill recognized as a result of business combinations for impairment at least annually using a process that begins with an estimation of the recoverable amount of a group of cash-generation units equal to the operating segment. Recoverable amount is determined by management by reference to market value, if available, by pricing models, or with the assistance of a valuation specialist. Determination of recoverable amount requires management to make assumptions and use estimates to forecast cash flow for periods that are beyond the normal requirements of management reporting; the assessment of the appropriate discount rate; estimation of the recoverable amount of cash-generation units; and the valuation of the separable assets of each business whose goodwill is being reviewed.
F-91
The key assumptions used by management in determining the recoverable amount as of December 31, 2023 and 2022 are:
As of December 31, 2023
|
|
|
|
|
|
Discount Rate |
(1) |
Growth rate |
(2) |
Goodwill |
Operating segment |
|
Valuation Methodology |
|
Key Assumptions |
|
(real) |
|
(real) |
|
2023 |
In millions of COP | ||||||||||
Banking Panama |
|
Discounted Cash flow |
|
5 years plan |
|
10.90 |
% |
4.50 |
% |
5,837,310 |
Banking |
|
|
|
|
|
17.10 |
% |
|
|
|
El Salvador |
|
Discounted Cash flow |
|
5 years plan |
|
and 15.50 |
%(3) |
3.70 |
% |
1,078,105 |
Banking Guatemala |
|
Discounted Cash flow |
|
5 years plan |
|
12.30 |
% |
4.80 |
% |
892,050 |
|
|
|
|
Multiples EV/ Revenue |
|
Does not |
|
Does not |
|
|
Others Segments |
|
Comparable multiples |
|
and EV/EBITDA |
|
apply |
|
apply |
|
10,660 |
Total |
|
|
|
|
|
|
|
|
|
7,818,125 |
| (1) | The discount rate is the return that would be expected for an investment that generates cash flows similar to those that are expected to be obtained from the use of the CGU. CAPM methodology was used as a basis to determine this rate. |
| (2) | This rate is equivalent to the nominal or real growth of the economy in Guatemala, Panama and El Salvador, which is considered an important driver for the growth of the banking industry. |
| (3) | Corresponds to the discount rate used for the short and long term, respectively. |
As of December 31, 2022
|
|
|
|
|
|
Discount Rate |
(1) |
Growth rate |
(2) |
Goodwill |
Operating segment |
|
Valuation Methodology |
|
Key Assumptions |
|
(real) |
|
(real) |
|
2022 |
In millions of COP | ||||||||||
Banking Panama |
|
Discounted Cash flow |
|
5 years plan |
|
10.90 |
% |
5.30 |
% |
7,346,484 |
Banking |
|
|
|
|
|
20.10 |
% |
|
|
|
El Salvador |
|
Discounted Cash flow |
|
5 years plan |
|
and 16.10 |
%(3) |
3.90 |
% |
1,356,837 |
Banking Guatemala |
|
Discounted Cash flow |
|
5 years plan |
|
13.00 |
% |
4.90 |
% |
1,122,680 |
|
|
|
|
Multiples EV/ Revenue |
|
Does not |
|
Does not |
|
|
Others Segments |
|
Comparable multiples |
|
and EV/EBITDA |
|
apply |
|
apply |
|
10,660 |
Total |
|
|
|
|
|
|
|
|
|
9,836,661 |
| (1) | The discount rate is the return that would be expected for an investment that generates cash flows similar to those that are expected to be obtained from the use of the CGU. CAPM methodology was used as a basis to determine this rate. |
| (2) | This rate is equivalent to the nominal or real growth of the economy in Guatemala, Panama and El Salvador, which is considered an important driver for the growth of the banking industry. |
| (3) | Corresponds to the discount rate used for the short and long term, respectively. |
In 2023 and 2022, the Bank tested the aforementioned goodwill for impairment purposes at the following operating segment levels: Banking Panama, Banking El Salvador and Banking Guatemala. Each operating segment represents a group of cash generating units. Evaluating the goodwill impairment at an operating segment level ensures the alignment with the approach used by the CODM to make decisions about resources to be allocated to the segments and assess its performance. After the valuation, it was determined that there is no impairment loss for any of the cash-generating units mentioned above during 2023 and 2022.
Sensitivity analysis:
In order to assess the impact of changes in certain significant inputs such as the discount rate and the growth rate in the operating segments’ recoverable amount, the Bank undertook a sensitivity analysis of these inputs through alternative scenarios.
F-92
The tables below present the estimated recoverable amount of each operating segment obtained as a result of sensitivity analysis for the discount rate and growth rate in basis points (bips):
As of December 31, 2023
Banking Panama
|
+50 bips |
Discount rate |
-50 bips |
|||
Growth rate |
|
11.40% |
|
10.90% |
|
10.40% |
4.50% |
|
10,826,278 |
|
11,721,608 |
|
12,770,528 |
|
|
|
|
|
|
|
|
-50 bips |
Growth rate |
+50 bips |
|||
Discount rate |
|
4.00% |
|
4.50% |
|
5.00% |
10.90% |
|
11,224,673 |
|
11,721,608 |
|
12,302,770 |
Banking El Salvador
|
+100 bips |
Discount rate |
-100 bips |
|||
|
|
18.10% |
|
17.10% |
|
16.10% |
Growth rate |
|
16.50% |
|
15.50% |
|
14.50% |
3.70% |
|
3,909,551 |
|
4,241,177 |
|
4,634,962 |
|
|
|
|
|
|
|
|
-50 bips |
Growth rate |
+50 bips |
|||
Discount rate |
|
3.20% |
|
3.70% |
|
4.20% |
17.10% and 15.50% |
|
4,182,324 |
|
4,241,177 |
|
4,305,238 |
Banking Guatemala
|
+50 bips |
Discount rate |
-50 bips |
|||
Growth rate |
|
12.80% |
|
12.30% |
|
11.80% |
4.80% |
|
3,903,356 |
|
4,224,256 |
|
4,592,449 |
|
|
|
|
|
|
|
|
-50 bips |
Growth rate |
+50 bips |
|||
Discount rate |
|
4.30% |
|
4.80% |
|
5.30% |
12.30% |
|
4,090,025 |
|
4,224,256 |
|
4,377,661 |
As of December 31, 2022
Banking Panama
|
+50 bips |
Discount rate |
-50 bips |
|||
Growth rate |
|
11.40% |
|
10.90% |
|
10.40% |
5.30% |
|
12,851,974 |
|
14,049,526 |
|
15,483,841 |
|
|
|
|
|
|
|
|
-50 bips |
Growth rate |
+50 bips |
|||
Discount rate |
|
4.80% |
|
5.30% |
|
5.80% |
10.90% |
|
13,351,970 |
|
14,049,526 |
|
14,883,860 |
F-93
Banking El Salvador
|
+100 bips |
Discount rate |
-100 bips |
|||
|
|
21.10% |
|
20.10% |
|
19.10% |
Growth rate |
|
17.10% |
|
16.10% |
|
15.10% |
3.90% |
|
4,543,466 |
|
4,913,975 |
|
5,351,507 |
|
|
|
|
|
|
|
|
-50 bips |
Growth rate |
+50 bips |
|||
Discount rate |
|
3.40% |
|
3.90% |
|
4.40% |
20.10% and 16.10% |
|
4,851,416 |
|
4,913,975 |
|
4,981,886 |
Banking Guatemala
|
+50 bips |
Discount rate |
-50 bips |
|||
Growth rate |
|
13.50% |
|
13.00% |
|
12.50% |
4.90% |
|
4,854,108 |
|
5,225,546 |
|
5,647,675 |
|
|
|
|
|
|
|
|
-50 bips |
Growth rate |
+50 bips |
|||
Discount rate |
|
4.40% |
|
4.90% |
|
5.40% |
13.00% |
|
5,070,100 |
|
5,225,546 |
|
5,401,451 |
The Bank considers goodwill as an asset with indefinite useful life.
9.3 Business combination
For 2023 there were no business combinations, for 2022 and 2021 the business combinations effected by the Bank are below:
P.A. FAI CALLE 77
On June 4, 2021, Bancolombia S.A. entered into an agreement with CCLA Colombia S.A.S. for the conditional assignment of the fiduciary rights of the Trust named P.A. FAI Calle 77, which owns the Nomad 77 Building located in the city of Bogotá (Colombia), which is the first project built for Multifamily rental housing in Colombia. Bancolombia S.A. concluded that it has control over the P.A. FAI Calle 77 given that it has exposures, or rights, to variable returns from its involvement in the investee and also has the ability to use its power to affect returns from the rental housing activity, through its participation in executive committees, and has the capacity to direct the activity that most significantly affects returns of all business – namely, approval rights over the disposal of the real estate projects.
The transaction was completed on March 1, 2022, upon Bancolombia S.A. obtaining the registration that qualifies it as a lessor of real estate for urban housing from the “Secretaría de Habitat” of Bogota. This registration was the condition to which the transfer of the fiduciary rights were subject. The Bank also obtained control of the P.A. FAI Calle 77 Trust on March 1, 2022, and has an equity interest of 98.00%. This acquisition reflects the Bank's objective to evolve its value proposition based on the current needs of the market, seeking to provide a differential service in rental housing.
The consideration paid by Bancolombia S.A. was COP 56,968, which consisted of a cash advance of COP 29,025 on June 9, 2021 and settlement of an active financial leasing operation with the sellers for COP 27,943.
The acquisition of the P.A. FAI Calle 77 Trust was accounted for in accordance with the acquisition method of IFRS 3. The purchase price was assigned to the assets and liabilities acquired, based on their estimated fair values at the acquisition date.
The Bank opted to measure the non-controlling interest in the acquiree of 2.00% at fair value, which amounted to COP 1,166 at the date of acquisition.
F-94
The estimate of the fair value of the assets acquired and liabilities assumed was based on information available as of March 1, 2022. The Bank believes that this information provides a reasonable basis for determining fair values:
|
|
In millions of COP |
Purchase Price Allocation |
|
|
Pruchase price on June 9, 2021 |
|
56,968 |
Non-controlling interest at fair value |
|
1,166 |
TOTAL |
|
58,134 |
|
|
|
Fair value of net assets acquired |
|
|
ASSETS |
|
|
Cash and cash equivalents |
|
799 |
Accounts receivable |
|
299 |
Premises and equipment, net |
|
3 |
Investments property |
|
60,850 |
Other assets |
|
78 |
Total Assets |
|
62,029 |
|
|
|
LIABILITIES |
|
|
Accounts payable |
|
1,080 |
Deferred tax |
|
283 |
Other liabilities |
|
99 |
Total Liabilities |
|
1,462 |
Fair value of net assets acquired |
|
60,567 |
|
|
|
Gain from a bargain purchase |
|
2,433 |
The acquisition of P.A. FAI Calle 77 Trust resulted in the recognition of a gain from a bargain purchase of COP 2,433, which was recognized in “Dividends and net income on equity investments” line item of the Consolidated Statement of Income. The amount of the identifiable net assets of the acquiree exceeds the fair value of the consideration transferred, plus the fair value of the non-controlling interest therein, due to the fact that the price was agreed 9 months before the efective transfer of control of the business, reflecting a valuation of the assets.
Acquisition-related cost
In connection with the acquisition, the Bank incurred costs which are recorded in the "Other administrative and general expenses" line item of the Consolidated Statement of Income.
WOMPI S.A.S. (before “Vlipco S.A.S.”)
On November 10, 2021, Bancolombia S.A. entered into a stock purchase agreement, pursuant to which Bancolombia S.A. agreed to purchase an additional 47.37% stake in the capital stock of the Colombian company, Wompi S.A.S. Wompi S.A.S. provides technology services to financial companies and qualifies as a business as defined in IFRS 3.
At the acquisition date, the Bank owned 91,838 shares of Wompi S.A.S. that represented 47.40% of the total capital stock of the company, classified as an investment in joint venture.
The transaction was completed on November 30, 2021, upon receipt of required regulatory approvals from the Superintendencia of Industry and Commerce, and as a result Bancolombia S.A. obtained control of Wompi S.A.S. The consideration paid by Bancolombia S.A. was COP 9,474, in cash.
The acquisition of Wompi S.A.S. in stages was accounted for under the acquisition method, in accordance with IFRS 3. Accordingly, the Bank has remeasured its previously held equity interest in Wompi S.A.S. at its acquisition-date fair value and recognized the resulting gain or loss and equity method adjustment.
F-95
The purchase price was preliminarily allocated to the acquired assets and liabilities based on their estimated fair values at the acquisition date, as summarized in the following table. The goodwill of COP 10,660 is calculated as the purchase premium after adjusting for the fair value of net assets acquired, and reflects the value expected from the synergies from combining Wompi’s technology services with the Bank’s financial services, as well as the opportunity to increase its national and international operations in the payments gateway market, that do not qualify for a separate recognition as intangible assets. The goodwill has been allocated to the segment Other Segments. None of the goodwill is expected to be deductible for income tax purposes.
The Bank has elected to measure the non-controlling interests of 5.23% in the acquiree at fair value, the amount at the acquisition date was COP 1,047.
For this acquisition, the estimated fair value of assets acquired and liabilities assumed are based on the information available at November 30, 2021. The Bank believes that this information provides a reasonable basis for determining fair values.
|
|
In millions of COP |
Wompi S.A.S Purchase Price Allocation |
|
|
Pruchase price on November 30, 2021 |
|
9,474 |
Fair value of previously held invesment |
|
9,479 |
Non-controlling interest at fair value |
|
1,047 |
TOTAL |
|
20,000 |
|
|
|
Book value of net assets acquired |
|
|
ASSETS |
|
|
Cash and cash equivalents |
|
296 |
Accounts receivable |
|
241 |
Taxes receivable |
|
433 |
Premises and equipment, net |
|
22 |
Other assets |
|
32 |
Total Assets |
|
1,024 |
|
|
|
LIABILITIES |
|
|
Short-term borrowings |
|
37 |
Accounts payable |
|
45 |
Taxes liabilities |
|
78 |
Employee benefit plans |
|
106 |
Total Liabilities |
|
266 |
Net assets at book value |
|
758 |
|
|
|
Wompi S.A.S intangibles assets recognized at the acquisition date: |
|
|
Software(1) |
|
13,196 |
Deferred tax |
|
(4,614) |
Fair value of net assets acquired |
|
9,340 |
|
|
|
Goodwill |
|
10,660 |
| (1) | The fair value of the intangible assets includes a software development that supports the operation of the Wompi S.A.S. payment gateway, with a fair value of COP 13,196. |
Acquisition-related cost
In connection with the acquisition of Wompi S.A.S., the Bank incurred costs which are recorded in the ‘Other administrative and general expenses’ line item of the Consolidated Statement of Income. The transaction costs were immaterial.
F-96
Previously held interest
Prior to control being obtained, the Bank accounted for its investment in Wompi S.A.S. using the equity method, due to the fact that the Bank had joint control of Wompi S.A.S. and, accordingly, it was classified as a joint venture. The previous shareholding was 47.40%.
Date and nature of investment |
|
Share in equity |
|
Investment recorded as an joint venture(1) |
|
47.40 |
% |
November 2021 – acquisition of 47.37%, control obtained |
|
47.37 |
% |
Total at December 31, 2021 |
|
94.77 |
% |
| (1) | Investment made since July 2019, the participation percentage was 48.91% at initial recognition. |
At the date of obtaining control (the acquisition date), the Bank remeasured the previously held equity interest to fair value and recognized revenue amounting to COP 5,197 in the Consolidated Statement of Income as “Dividends and net income on equity investments” (See Note 25.5. Dividends and net income on equity investments).
NOTE 10. PREMISES AND EQUIPMENT, NET
As of December 31, 2023 and 2022, the premises and equipment, net consisted of the following:
As of December 31, 2023
Premises and equipment for own use
|
|
|
Roll - forward |
|
|
|||||||||
|
|
Balance at |
|
|
|
|
|
|
|
|
|
Effect of |
|
Balance at |
Premises and equipment for own use |
|
January 1, |
|
|
|
Expenses |
|
|
|
Assets |
|
changes in |
|
December 31, |
|
|
2023 |
|
Additions |
|
depreciation and |
|
Disposals |
|
classified as held |
|
foreign |
|
2023 |
|
|
|
|
|
|
impairment(1) |
|
|
|
for sale and |
|
exchange |
|
|
|
|
|
|
|
|
|
|
|
|
other assets |
|
rate |
|
|
In millions of COP | ||||||||||||||
Land |
|
|
|
|
|
|
|
|
|
|
|
|
|
|
Cost |
|
605,713 |
|
3,750 |
|
- |
|
(3,738) |
|
(39,665) |
|
(48,655) |
|
517,405 |
Construction in progress |
|
|
|
|
|
|
|
|
|
|
|
|
|
|
Cost |
|
51,839 |
|
46,846 |
|
- |
|
- |
|
- |
|
(15,052) |
|
83,633 |
Buildings |
|
|
|
|
|
|
|
|
|
|
|
|
|
|
Cost |
|
1,878,689 |
|
25,644 |
|
- |
|
(30,968) |
|
18,311 |
|
(151,671) |
|
1,740,005 |
Accumulated depreciation |
|
(535,550) |
|
- |
|
(38,565) |
|
10,828 |
|
(11,916) |
|
82,007 |
|
(493,196) |
Accumulated impairment |
|
- |
|
- |
|
(153) |
|
153 |
|
- |
|
- |
|
- |
Furniture and fixtures |
|
|
|
|
|
|
|
|
|
|
|
|
|
|
Cost |
|
709,894 |
|
57,565 |
|
- |
|
(29,474) |
|
(6,522) |
|
(53,325) |
|
678,138 |
Accumulated depreciation |
|
(432,992) |
|
- |
|
(44,238) |
|
25,956 |
|
- |
|
35,757 |
|
(415,517) |
Accumulated impairment |
|
- |
|
- |
|
(797) |
|
797 |
|
- |
|
- |
|
- |
Computer equipment |
|
|
|
|
|
|
|
|
|
|
|
|
|
|
Cost |
|
1,007,230 |
|
129,012 |
|
- |
|
(91,096) |
|
2,416 |
|
(73,129) |
|
974,433 |
Accumulated depreciation |
|
(595,991) |
|
- |
|
(114,887) |
|
73,226 |
|
(4,100) |
|
49,316 |
|
(592,436) |
Accumulated impairment |
|
- |
|
- |
|
(1,507) |
|
1,507 |
|
- |
|
|
|
- |
Vehicles |
|
|
|
|
|
|
|
|
|
|
|
|
|
|
Cost |
|
31,713 |
|
9,967 |
|
- |
|
(6,709) |
|
2,489 |
|
(3,480) |
|
33,980 |
Accumulated depreciation |
|
(19,506) |
|
- |
|
(5,331) |
|
5,650 |
|
(14) |
|
1,895 |
|
(17,306) |
Leasehold improvements |
|
|
|
|
|
|
|
|
|
|
|
|
|
|
Cost |
|
9,661 |
|
26,950 |
|
- |
|
- |
|
(19,436) |
|
(538) |
|
16,637 |
Accumulated depreciation |
|
(627) |
|
- |
|
(25) |
|
- |
|
- |
|
130 |
|
(522) |
Total premises and equipment for own use - cost |
|
4,294,739 |
|
299,734 |
|
- |
|
(161,985) |
|
(42,407) |
|
(345,850) |
|
4,044,231 |
Total premises and equipment - accumulated depreciation |
|
(1,584,666) |
|
- |
|
(203,046) |
|
115,660 |
|
(16,030) |
|
169,105 |
|
(1,518,977) |
Total premises and equipment - accumulated impairment |
|
- |
|
- |
|
(2,457) |
|
2,457 |
|
- |
|
- |
|
- |
Total premises and equipment for own use, net |
|
2,710,073 |
|
299,734 |
|
(205,503) |
|
(43,868) |
|
(58,437) |
|
(176,745) |
|
2,525,254 |
(1) See Note 26.3. Impairment, depreciation and amortization.
F-97
Premises and equipment in operating leases
|
|
|
Roll - forward |
|
|
|||||||||
|
|
Balance at |
|
|
|
|
|
|
|
|
|
Effect of |
|
Balance at |
Premises and equipment in operating leases |
|
January 1, |
|
|
|
Expenses |
|
|
|
Assets |
|
changes in |
|
December 31, |
|
|
2023 |
|
Additions |
|
depreciation and |
|
Disposals |
|
classified as held |
|
foreign |
|
2023 |
|
|
|
|
|
|
impairment(1) |
|
|
|
for sale and |
|
exchange |
|
|
|
|
|
|
|
|
|
|
|
|
other assets |
|
rate |
|
|
In millions of COP | ||||||||||||||
Furniture and fixtures |
|
|
|
|
|
|
|
|
|
|
|
|
|
|
Cost |
|
2,091 |
|
- |
|
- |
|
- |
|
- |
|
- |
|
2,091 |
Accumulated depreciation |
|
(360) |
|
- |
|
(254) |
|
- |
|
- |
|
- |
|
(614) |
Computer equipment |
|
|
|
|
|
|
|
|
|
|
|
|
|
|
Cost |
|
150,969 |
|
66,833 |
|
- |
|
(4,463) |
|
14,822 |
|
- |
|
228,161 |
Accumulated depreciation |
|
(66,577) |
|
- |
|
(49,364) |
|
3,855 |
|
16,448 |
|
- |
|
(95,638) |
Vehicles |
|
|
|
|
|
|
|
|
|
|
|
|
|
|
Cost |
|
4,718,405 |
|
1,156,419 |
|
- |
|
(79,280) |
|
(1,007,899) |
|
- |
|
4,787,645 |
Accumulated depreciation |
|
(787,535) |
|
- |
|
(383,712) |
|
18,181 |
|
228,701 |
|
- |
|
(924,365) |
Accumulated impairment |
|
- |
|
- |
|
(2,023) |
|
2,023 |
|
- |
|
- |
|
- |
Total premises and equipment in operating leases - cost |
|
4,871,465 |
|
1,223,252 |
|
- |
|
(83,743) |
|
(993,077) |
|
- |
|
5,017,897 |
Total premises and equipment - accumulated depreciation |
|
(854,472) |
|
- |
|
(433,330) |
|
22,036 |
|
245,149 |
|
- |
|
(1,020,617) |
Total premises and equipment - accumulated impairment |
|
- |
|
- |
|
(2,023) |
|
2,023 |
|
- |
|
- |
|
- |
Total premises and equipment in operating leases, net |
|
4,016,993 |
|
1,223,252 |
|
(435,353) |
|
(59,684) |
|
(747,928) |
|
- |
|
3,997,280 |
(1) See Note 26.3. Impairment, depreciation and amortization.
Premises and equipment total
|
|
|
Roll - forward |
|
|
|||||||||
|
|
Balance at |
|
|
|
|
|
|
|
|
|
Effect of |
|
Balance at |
Premises and equipment total |
|
January 1, |
|
|
|
Expenses |
|
|
|
Assets |
|
changes in |
|
December 31, |
|
|
2023 |
|
Additions |
|
depreciation and |
|
Disposals |
|
classified as held |
|
foreign |
|
2023 |
|
|
|
|
|
|
impairment(1) |
|
|
|
for sale and |
|
exchange |
|
|
|
|
|
|
|
|
|
|
|
|
other assets |
|
rate |
|
|
In millions of COP | ||||||||||||||
Total premises and equipment - cost |
|
9,166,204 |
|
1,522,986 |
|
- |
|
(245,728) |
|
(1,035,484) |
|
(345,850) |
|
9,062,128 |
Total premises and equipment - accumulated depreciation |
|
(2,439,138) |
|
- |
|
(636,376) |
|
137,696 |
|
229,119 |
|
169,105 |
|
(2,539,594) |
Total premises and equipment - accumulated impairment |
|
- |
|
- |
|
(4,480) |
|
4,480 |
|
- |
|
- |
|
- |
Total premises and equipment, net |
|
6,727,066 |
|
1,522,986 |
|
(640,856) |
|
(103,552) |
|
(806,365) |
|
(176,745) |
|
6,522,534 |
(1) See Note 26.3. Impairment, depreciation and amortization.
As of December 31, 2022
Premises and equipment for own use
|
|
|
Roll - forward |
|
|
|||||||||
|
|
Balance at |
|
|
|
|
|
|
|
|
|
Effect of |
|
Balance at |
Premises and equipment for own use |
|
January 1, |
|
|
|
Expenses |
|
|
|
Assets |
|
changes in |
|
December 31, |
|
|
2022 |
|
Additions |
|
depreciation and |
|
Disposals |
|
classified as held |
|
foreign |
|
2022 |
|
|
|
|
|
|
impairment(1) |
|
|
|
for sale and |
|
exchange |
|
|
|
|
|
|
|
|
|
|
|
|
other assets |
|
rate |
|
|
In millions of COP | ||||||||||||||
Land |
|
|
|
|
|
|
|
|
|
|
|
|
|
|
Cost |
|
551,484 |
|
34,151 |
|
- |
|
(3,773) |
|
(17,068) |
|
40,919 |
|
605,713 |
Construction in progress |
|
|
|
|
|
|
|
|
|
|
|
|
|
|
Cost |
|
37,040 |
|
24,643 |
|
- |
|
(17,714) |
|
- |
|
7,870 |
|
51,839 |
Accumulated impairment |
|
- |
|
- |
|
(3,536) |
|
3,536 |
|
- |
|
- |
|
- |
Buildings |
|
|
|
|
|
|
|
|
|
|
|
|
|
|
Cost |
|
1,795,240 |
|
20,789 |
|
- |
|
(18,844) |
|
(43,379) |
|
124,883 |
|
1,878,689 |
Accumulated depreciation |
|
(458,784) |
|
- |
|
(37,604) |
|
14,939 |
|
13,878 |
|
(67,979) |
|
(535,550) |
Furniture and fixtures |
|
|
|
|
|
|
|
|
|
|
|
|
|
|
Cost |
|
662,385 |
|
46,390 |
|
- |
|
(42,540) |
|
- |
|
43,659 |
|
709,894 |
Accumulated depreciation |
|
(388,005) |
|
- |
|
(44,958) |
|
29,759 |
|
- |
|
(29,788) |
|
(432,992) |
Computer equipment |
|
|
|
|
|
|
|
|
|
|
|
|
|
|
Cost |
|
881,056 |
|
191,122 |
|
- |
|
(125,436) |
|
- |
|
60,488 |
|
1,007,230 |
Accumulated depreciation |
|
(545,954) |
|
- |
|
(114,099) |
|
106,367 |
|
- |
|
(42,305) |
|
(595,991) |
Vehicles |
|
|
|
|
|
|
|
|
|
|
|
|
|
|
Cost |
|
42,366 |
|
5,253 |
|
- |
|
(18,361) |
|
(163) |
|
2,618 |
|
31,713 |
Accumulated depreciation |
|
(18,233) |
|
- |
|
(4,484) |
|
4,721 |
|
64 |
|
(1,574) |
|
(19,506) |
Leasehold improvements |
|
|
|
|
|
|
|
|
|
|
|
|
|
|
Cost |
|
5,307 |
|
32,144 |
|
- |
|
(1,058) |
|
(27,075) |
|
343 |
|
9,661 |
Accumulated depreciation |
|
(510) |
|
- |
|
(32) |
|
16 |
|
- |
|
(101) |
|
(627) |
Total premises and equipment for own use - cost |
|
3,974,878 |
|
354,492 |
|
- |
|
(227,726) |
|
(87,685) |
|
280,780 |
|
4,294,739 |
Total premises and equipment - accumulated depreciation |
|
(1,411,486) |
|
- |
|
(201,177) |
|
155,802 |
|
13,942 |
|
(141,747) |
|
(1,584,666) |
F-98
Total premises and equipment - accumulated impairment |
|
- |
|
- |
|
(3,536) |
|
3,536 |
|
- |
|
- |
|
- |
Total premises and equipment for own use, net |
|
2,563,392 |
|
354,492 |
|
(204,713) |
|
(68,388) |
|
(73,743) |
|
139,033 |
|
2,710,073 |
(1) See Note 26.3. Impairment, depreciation and amortization.
Premises and equipment in operating leases
|
|
|
Roll - forward |
|
|
|||||||||
|
|
Balance at |
|
|
|
|
|
|
|
|
|
Effect of |
|
Balance at |
Premises and equipment in operating leases |
|
January 1, |
|
|
|
Expenses |
|
|
|
Assets |
|
changes in |
|
December 31, |
|
|
2022 |
|
Additions |
|
depreciation and |
|
Disposals |
|
classified as held |
|
foreign |
|
2022 |
|
|
|
|
|
|
impairment(1) |
|
|
|
for sale and |
|
exchange |
|
|
|
|
|
|
|
|
|
|
|
|
other assets |
|
rate |
|
|
In millions of COP | ||||||||||||||
Furniture and fixtures |
|
|
|
|
|
|
|
|
|
|
|
|
|
|
Cost |
|
2,091 |
|
- |
|
- |
|
- |
|
- |
|
- |
|
2,091 |
Accumulated depreciation |
|
(106) |
|
- |
|
(254) |
|
- |
|
- |
|
- |
|
(360) |
Computer equipment |
|
|
|
|
|
|
|
|
|
|
|
|
|
|
Cost |
|
121,071 |
|
45,690 |
|
- |
|
(6,001) |
|
(9,791) |
|
- |
|
150,969 |
Accumulated depreciation |
|
(46,884) |
|
- |
|
(32,482) |
|
4,618 |
|
8,171 |
|
- |
|
(66,577) |
Vehicles |
|
|
|
|
|
|
|
|
|
|
|
|
|
|
Cost |
|
3,113,511 |
|
2,265,250 |
|
- |
|
(36,539) |
|
(623,817) |
|
- |
|
4,718,405 |
Accumulated depreciation |
|
(652,423) |
|
- |
|
(326,683) |
|
2,700 |
|
188,871 |
|
- |
|
(787,535) |
Total premises and equipment in operating leases - cost |
|
3,236,673 |
|
2,310,940 |
|
- |
|
(42,540) |
|
(633,608) |
|
- |
|
4,871,465 |
Total premises and equipment - accumulated depreciation |
|
(699,413) |
|
- |
|
(359,419) |
|
7,318 |
|
197,042 |
|
- |
|
(854,472) |
Total premises and equipment in operating leases, net |
|
2,537,260 |
|
2,310,940 |
|
(359,419) |
|
(35,222) |
|
(436,566) |
|
- |
|
4,016,993 |
| (1) | See Note 26.3. Impairment, depreciation and amortization. |
Premises and equipment total
|
|
|
Roll - forward |
|
|
|||||||||
|
|
Balance at |
|
|
|
|
|
|
|
|
|
Effect of |
|
Balance at |
Premises and equipment total |
|
January 1, |
|
|
|
Expenses |
|
|
|
Assets |
|
changes in |
|
December 31, |
|
|
2022 |
|
Additions |
|
depreciation and |
|
Disposals |
|
classified as held |
|
foreign |
|
2022 |
|
|
|
|
|
|
impairment(1) |
|
|
|
for sale and |
|
exchange |
|
|
|
|
|
|
|
|
|
|
|
|
other assets |
|
rate |
|
|
In millions of COP | ||||||||||||||
Total premises and equipment - cost |
|
7,211,551 |
|
2,665,432 |
|
- |
|
(270,266) |
|
(721,293) |
|
280,780 |
|
9,166,204 |
Total premises and equipment - accumulated depreciation |
|
(2,110,899) |
|
- |
|
(560,596) |
|
163,120 |
|
210,984 |
|
(141,747) |
|
(2,439,138) |
Total premises and equipment - accumulated impairment |
|
- |
|
- |
|
(3,536) |
|
3,536 |
|
- |
|
- |
|
- |
Total premises and equipment, net |
|
5,100,652 |
|
2,665,432 |
|
(564,132) |
|
(103,610) |
|
(510,309) |
|
139,033 |
|
6,727,066 |
| (1) | See Note 26.3. Impairment, depreciation and amortization. |
As of December 31, 2023 and 2022, there were contractual commitments for the purchase of premises and equipment of COP 4,025 and COP 3,816, respectively. As of December 31, 2023 and 2022, there was no premises and equipment pledged as collateral, or with ownership restrictions. Additionally, the assessment made by the Bank indicates there is no evidence of impairment of its premises and equipment.
As of December 31, 2023 and 2022, the amount of fully depreciated premises and equipment that is still in use is COP 673,376 and COP 714,734, respectively, mainly comprised of computer equipment, furniture and fixtures and office equipment. The temporarily idle premises and equipment amounted to COP 79,644 in 2023 and COP 75,473 in 2022.
F-99
NOTE 11. INVESTMENT PROPERTIES
The table below sets forth the reconciliation between the initial balance account and the balance at the end of the period, at fair value:
|
|
December 31, 2023 |
|
December 31, 2022 |
In millions of COP | ||||
Balance at the beginning of the year |
|
3,994,058 |
|
3,132,220 |
Acquisitions |
|
294,569 |
|
731,600 |
Subsequent expenditure recognised as an asset |
|
170,920 |
|
66,745 |
Sales/Write-offs |
|
(21,194) |
|
(233,974) |
Acquisitions through business combination(1) |
|
- |
|
60,850 |
Amount reclassified from premises and equipment(2) |
|
39,096 |
|
- |
Gains on valuation(3) |
|
232,462 |
|
236,617 |
Balance at the end of the period(4) |
|
4,709,911 |
|
3,994,058 |
| (1) | In 2022 corresponds to PA FAI Calle 77. See Note 9.3. Business combination. |
| (2) | In 2023, the amount relates properties from FCP Fondo Inmobiliario Colombia that were reclassified from premises and equipment to investment property, because they are held for obtaining profits and capital appreciation. |
| (3) | The difference with the line Investment property valuation included in Other operating income corresponds to gains recognized in acquisitions. See Note 25.4. Other operating income - Investment property valuation and Others. |
| (4) | Between December 31, 2023 and 2022, there were no transfers in and out of Level 3 fair value hierarchy related with investment properties. See Note 30. Fair value of assets and liabilities. |
The valuation adjustments recorded by the Bank related to its investment properties are detailed below:
As of December 31, 2023
|
|
Balance at the |
|
|
|
|
|
Amount |
|
Adjusted fair |
Type of asset |
|
beginning of the |
|
Appraisals |
|
Net increase(1)(2) |
|
reclassified from |
|
value at the end |
|
|
year |
|
|
|
|
|
premises and equipment(3) |
|
of the year |
In millions of COP | ||||||||||
Buildings |
|
3,870,706 |
|
194,608 |
|
280,107 |
|
39,096 |
|
4,384,517 |
Lands |
|
123,352 |
|
37,854 |
|
164,188 |
|
- |
|
325,394 |
Total |
|
3,994,058 |
|
232,462 |
|
444,295 |
|
39,096 |
|
4,709,911 |
| (1) | The increase in buildings corresponds mainly in Bancolombia for the purchase for COP 80,954, FCP Fondo Inmobiliario Colombia for COP 91,182, in addition to subsequent expenditure for investment properties under construction for COP 71,023. |
| (2) | The increase in lands corresponds mainly to the entry of NOMAD CENTRAL, P.A CALLE 84 (2) and P.A CALLE 84 (3) for COP 92,585 and the subsequent expenditure for COP 71,354. |
| (3) | The amount reclassified from premises and equipment corresponds properties from FCP Fondo Inmobiliario Colombia that were transfers to investment property, because they are held for obtaining profits and capital appreciation. |
As of December 31, 2022
|
|
Balance at the |
|
|
|
|
|
Acquisitions |
|
Adjusted fair |
|
Type of asset |
|
beginning of the |
|
Appraisals |
|
Net increase |
|
from business |
|
value at the end |
|
|
|
year |
|
|
|
(decrease) (1)(2) |
|
combination(3) |
|
of the year |
|
In millions of COP |
|
||||||||||
Buildings |
|
2,949,720 |
|
239,823 |
|
620,313 |
|
60,850 |
|
3,870,706 |
|
Lands |
|
182,500 |
|
(3,206) |
|
(55,942) |
|
- |
|
123,352 |
|
Total |
|
3,132,220 |
|
236,617 |
|
564,371 |
|
60,850 |
|
3,994,058 |
|
| (1) | The net increase in buildings corresponds mainly to increases in P.A. MERCURIO for COP 249,492, FCP Fondo Inmobiliario Colombia for COP 242,274, Bancolombia S.A. for COP 221,834 and sales made by FCP Fondo Inmobiliario Colombia for COP 147,483. |
F-100
| (2) | The decrease in lands corresponds mainly to the sale of land by Valores Simesa S.A. |
| (3) | For more information on acquisitions from business combinations, See Note 9.3. Business. |
Amounts recognized in the statement of income for the period.
The table sets forth the main income recorded by the Bank related to its investment properties:
|
|
December 31, 2023 |
|
December 31, 2022 |
|
December 31, 2021 |
|
|
In millions of COP |
||||
Income from rentals |
|
228,325 |
|
157,511 |
|
139,021 |
Operating expenses due to: |
|
|
|
|
|
|
Investment properties that generated income through rentals |
|
28,813 |
|
21,267 |
|
15,331 |
Investment properties that did not generate income through rentals |
|
10,378 |
|
19,021 |
|
10,050 |
Currently, there are no restrictions on the use or income derived from the buildings or lands that the Bank has as investment property.
The fair value of the Bank’s investment properties for the year ending at December 31, 2023 and 2022, has been recorded according to the assessment made by independent external consulting companies that have the appropriate capacity and experience in performing those assessments. The appraisers are either approved by the Property Market Auctions of Colombia or foreign appraisers, who are required to provide a second signature by a Colombia appraiser accredited by the Property Market Auctions.
Fair value appraisals are carried out in accordance with IFRS 13. The reports made by the external consulting company contain the description of the valuation methodologies used, and key assumptions such as: discount rates, calculation of applied expenses and income approach, among others. The fair value of the investment properties is based on the comparative market approach, which reflects the prices of recent transactions with similar characteristics. Upon determining the fair value of these investment properties, the greater and best use of these investment properties is their present use. For further information about measurement techniques and inputs used by consulting companies, see Note 30 Fair Value of assets and liabilities.
As of December 31, 2023 and 2022, the Bank does not have investment properties held under financial leases.
NOTE 12. INCOME TAX
The income tax is recognized in each of the countries where the Bank has operations, in accordance with the tax regulations in force in each of the jurisdictions.
12.1 Components recognized in the income statement:
|
|
December 31, |
|
December 31, |
|
December 31, |
|
|
2023 |
|
2022 |
|
2021 |
In millions of Colombian pesos | ||||||
Current tax(1) |
|
|
|
|
|
|
Fiscal term |
|
(1,779,538) |
|
(2,644,173) |
|
(1,321,400) |
Prior fiscal terms |
|
46,791 |
|
39,137 |
|
71,932 |
Total current tax |
|
(1,732,747) |
|
(2,605,036) |
|
(1,249,468) |
Deferred tax |
|
|
|
|
|
|
Fiscal term |
|
(282,012) |
|
(80,663) |
|
(530,926) |
Adjustments for consolidation purposes |
|
82,204 |
|
(62,722) |
|
4,169 |
Total deferred tax |
|
(199,808) |
|
(143,385) |
|
(526,757) |
Total income tax(2) |
|
(1,932,555) |
|
(2,748,421) |
|
(1,776,225) |
| (1) | The nominal income tax rate used in Colombia for the years 2023 and 2022 is 35%, and for the year 2021 it was 31%. The Colombian financial institutions of the Group liquidated some additional points in the income tax of 5% for the years 2023 and 2022, and 3% for the year 2021. |
F-101
| (2) | See table 12.3 Reconciliation of the effective tax rate. |
12.2 Legal regulatory changes
Principal changes introduced by the tax reform of 2022:
The Colombian Congress enacted Law 2277 of 2022 on 13th of December 2022, which became effective January 1, 2023. The most significant measures this norm are outlined below:
The Corporate Income Tax rate (CIT) continues at 35%; however, the surcharge applicable to financial entities from 2023 to 2027 increased by 5%. This surcharge is applicable when the financial entities have a taxable income equal to, or higher than 120.000 tax units (UVT).
Certain non-taxable incomes, special deductions, exempt incomes, and tax credits will be limited to 3% of the taxpayer´s net income before deductions.
For the fiscal year 2023 onwards, Industry and Trade Tax (ITT) will not be creditable against the Corporate Income Tax. Therefore, ITT only will be eligible as a deduction.
A minimum effective tax rate of 15% was introduced for Colombian corporations. This rate must be calculated by dividing the due tax (with certain adjustments) over the book profits (with certain adjustments).
Profits derived from the sale of shares listed on the Colombian Stock Exchange will be treated as non-taxable income if: i) a single shareholder owns them, and ii) they are not more than 3% of the total outstanding shares listed by the entity in the taxable year.
The distribution of profits in shares will be taxable for CIT matters.
Payments falling into the following categories i) social club memberships, ii) personal payments to shareholders and their relatives, and iii) labor expenses of home support personnel, among others, will not be deductible for CIT purposes.
Donations to research, technological developments, and innovation will not be deductible.
Dividend tax rate increases as follows:
Dividend tax |
|
Rate |
|
Foreign entities |
|
From 10% to 20% |
|
Colombian corporations |
|
From 7,5% to 10% |
|
Capital gains tax increases from 10% to 15%.
A temporary reduction in penalties and interest of 60% will be applied upon the fulfillment of certain requirements
The tax determination will be made through electronic invoicing when the taxpayer has not filed their income tax returns.
Penalty for not sending information to the Tax Office is reduced to 7500 tax units (UVT).
In-kind payments made by an entity to third parties for the acquisition of goods or provision of services will be deemed as taxable income for the entity’s employees, their spouses, their relatives, and any other person with the title of the beneficiary of the payment.
Other Countries:
The income tax rate in the other countries where the Group has a presence amounts to 25% in Guatemala and Panama and 30% in El Salvador.
F-102
12.3 Reconciliation of the effective tax rate
The reconciliation between total income tax expenses calculated at the current nominal tax rate and the tax expense recognized in the income statement for the periods ended December 31, 2023, 2022 and 2021 is detailed below:
|
|
December 31, |
|
December 31, |
|
December 31, |
Reconciliation of the tax rate |
|
2023 |
|
2022 |
|
2021 |
In millions of Colombian pesos | ||||||
Accounting profit |
|
8,147,526 |
|
9,744,786 |
|
5,984,012 |
Applicable tax with nominal rate(1) |
|
(3,259,011) |
|
(3,703,019) |
|
(2,034,564) |
Non-deductible expenses to determine taxable profit (loss) |
|
(478,901) |
|
(425,458) |
|
(260,546) |
Accounting and non-tax expense (income) to determine taxable profit (loss) |
|
667,744 |
|
978,468 |
|
767,857 |
Differences in accounting bases(2) |
|
(106,648) |
|
(19,448) |
|
(32,714) |
Fiscal and non-accounting expense (income) to determine taxable profit (loss) |
|
(652,607) |
|
(470,063) |
|
(285,191) |
Ordinary activities income exempt from taxation |
|
1,563,793 |
|
832,822 |
|
412,495 |
Ordinary activities income not constituting income or occasional tax gain |
|
67,132 |
|
120,513 |
|
98,870 |
Tax deductions |
|
156,543 |
|
374,233 |
|
226,064 |
Goodwill Depreciation |
|
2,478 |
|
461 |
|
200,617 |
Tax depreciation surplus |
|
223,901 |
|
162,111 |
|
140,384 |
Untaxed recoveries |
|
(64,516) |
|
(40,559) |
|
(84,692) |
Tax rate effect in other countries |
|
(121,597) |
|
(319,825) |
|
(384,669) |
Prior fiscal terms |
|
46,791 |
|
39,137 |
|
71,932 |
Other effects of the tax rate by reconciliation between accounting profit and tax expense (income) |
|
22,343 |
|
(277,794) |
|
(612,068) |
Total income tax |
|
(1,932,555) |
|
(2,748,421) |
|
(1,776,225) |
| (1) | The nominal income tax rate used in Colombia for the years 2023 and 2022 is 35%, and for the year 2021 it was 31%. The Colombian financial institutions of the Group liquidated some additional points in the income tax of 5% for the years 2023 and 2022, and 3% for the year 2021. |
| (2) | Difference between the technical accounting frameworks in force in Colombia and the full International Financial Reporting Standards (IFRS). |
12.4 Components recognized in Other Comprehensive Income (OCI)
See Consolidated Statement of Comprehensive Income
December 31, 2023 | ||||||
In millions of Colombian pesos | ||||||
|
|
Amounts before taxes |
|
Deferred tax |
|
Net taxes |
Remeasurement income related to defined benefit liability |
|
(44,594) |
|
13,234 |
|
(31,360) |
Unrealized gain Investments in equity instruments measured at fair value through other comprehensive income (FVTOCI) |
|
11,144 |
|
(246) |
|
10,898 |
Unrealized loss Investments in debt instruments measured at fair value through other comprehensive income (FVTOCI) |
|
114,287 |
|
(21,023) |
|
93,264 |
Loss on net investment hedge in foreign operations |
|
1,948,833 |
|
(772,755) |
|
1,176,078 |
Exchange differences arising on translating the foreign operations. |
|
(4,963,913) |
|
- |
|
(4,963,913) |
Unrealized loss on investments in associates and joint ventures using equity method |
|
(2,225) |
|
2,223 |
|
(2) |
Net |
|
(2,936,468) |
|
(778,567) |
|
(3,715,035) |
F-103
See Consolidated Statement of Comprehensive Income
December 31, 2022 | ||||||
In millions of Colombian pesos | ||||||
|
|
Amounts before taxes |
|
Deferred tax |
|
Net taxes |
Remeasurement income related to defined benefit liability |
|
69,249 |
|
(25,090) |
|
44,159 |
Unrealized loss Investments in equity instruments measured at fair value through other comprehensive income (FVTOCI) |
|
33,354 |
|
(1,282) |
|
32,072 |
Gains due to asset revaluation |
|
- |
|
(71) |
|
(71) |
Unrealized gain Investments in debt instruments measured at fair value through other comprehensive income (FVTOCI) |
|
(172,385) |
|
7,843 |
|
(164,542) |
Loss on net investment hedge in foreign operations |
|
(1,833,087) |
|
746,232 |
|
(1,086,855) |
Exchange differences arising on translating the foreign operations. |
|
4,064,795 |
|
- |
|
4,064,795 |
Unrealized gains on investments in associates and joint ventures using equity method |
|
(1,929) |
|
(1,221) |
|
(3,150) |
Net |
|
2,159,997 |
|
726,411 |
|
2,886,408 |
See Consolidated Statement of Comprehensive Income
December 31, 2021 | ||||||
In millions of Colombian pesos | ||||||
|
|
Amounts before taxes |
|
Deferred tax |
|
Net taxes |
Remeasurement expense related to defined benefit liability |
|
7,444 |
|
(1,791) |
|
5,653 |
Unrealized gain Investments in equity instruments measured at fair value through other comprehensive income (FVTOCI)(1) |
|
3,994 |
|
48,153 |
|
52,147 |
Gains due to asset revaluation |
|
- |
|
(142) |
|
(142) |
Unrealized gain Investments in debt instruments measured at fair value through other comprehensive income (FVTOCI) |
|
(61,052) |
|
9,527 |
|
(51,525) |
Loss on net investment hedge in foreign operations |
|
(1,207,052) |
|
493,346 |
|
(713,706) |
Exchange differences arising on translating the foreign operations. |
|
2,513,742 |
|
- |
|
2,513,742 |
Unrealized gains on investments in associates and joint ventures using equity method |
|
2,913 |
|
(982) |
|
1,931 |
Net |
|
1,259,989 |
|
548,111 |
|
1,808,100 |
| (1) | Includes income tax to partial payments of asset-backed securities transferred to retained earnings and reclassification of income tax on investments in associates that were transferred from retained earnings to OCI. |
12.5 Deferred tax
In accordance with its financial projections, the companies from the Bank’s expects in the future to generate enough liquid income to offset the items recorded as deductible deferred tax. These estimates start from the financial projections that were prepared considering information from the Bank’s economic research records, the expected economic environment for the next five years. The main indicators on which the models are based are GDP growth, loans growth and interest rates. In addition to these elements, the long-term Group's strategy is taken into account.
The deferred tax asset and liability for each of the concepts that generated taxable or deductible temporary differences for the period ending December 31, 2023 are detailed below:
F-104
|
|
|
|
Effect on |
|
|
|
|
|
|
|
|
|
Adjustments for |
|
|
|
|
December 31, |
|
Income |
|
Effect on |
|
Effect on |
|
Tax Made(2) |
|
Foreign |
|
consolidation |
|
December 31, |
|
|
2022 |
|
Statement |
|
OCI |
|
Equity(1) |
|
|
|
Exchange |
|
purposes |
|
2023 |
In millions of Colombian pesos | ||||||||||||||||
Asset Deferred Tax: |
|
|
|
|
|
|
|
|
|
|
|
|
|
|
|
|
Property and equipment |
|
11,071 |
|
(1,494) |
|
- |
|
- |
|
- |
|
(2,082) |
|
(1,513) |
|
5,982 |
Employee Benefits |
|
218,263 |
|
34,648 |
|
13,234 |
|
- |
|
- |
|
(6,739) |
|
- |
|
259,406 |
Deterioration assessment |
|
602,289 |
|
1,666 |
|
- |
|
- |
|
- |
|
(136,367) |
|
(51,136) |
|
416,452 |
Investments evaluation |
|
5,591 |
|
(231) |
|
(165) |
|
- |
|
- |
|
(134) |
|
- |
|
5,061 |
Derivatives Valuation |
|
8,457 |
|
221,735 |
|
- |
|
- |
|
- |
|
- |
|
4,875 |
|
235,067 |
Tax credits settlement |
|
18,186 |
|
16,754 |
|
- |
|
- |
|
- |
|
- |
|
- |
|
34,940 |
Financial Obligations |
|
663,095 |
|
(663,095) |
|
- |
|
- |
|
- |
|
- |
|
- |
|
- |
Insurance operations |
|
- |
|
(633) |
|
- |
|
13,952 |
|
- |
|
- |
|
- |
|
13,319 |
Net investment coverage in operations abroad |
|
1,530,074 |
|
(91,043) |
|
(772,755) |
|
- |
|
(137,838) |
|
- |
|
- |
|
528,438 |
Other deductions |
|
446,451 |
|
(191,575) |
|
- |
|
- |
|
- |
|
(13,241) |
|
- |
|
241,635 |
implementation adjustment |
|
410,477 |
|
925 |
|
- |
|
- |
|
- |
|
(35,186) |
|
- |
|
376,216 |
Total Asset Deferred Tax (3) |
|
3,913,954 |
|
(672,343) |
|
(759,686) |
|
13,952 |
|
(137,838) |
|
(193,749) |
|
(47,774) |
|
2,116,516 |
Liability Deferred Tax: |
|
|
|
|
|
|
|
|
|
|
|
|
|
|
|
|
Property and equipment |
|
(310,845) |
|
32,867 |
|
- |
|
- |
|
- |
|
4,549 |
|
128,441 |
|
(144,988) |
Deterioration assessment |
|
(549,435) |
|
437,539 |
|
- |
|
- |
|
- |
|
1,333 |
|
(2,828) |
|
(113,391) |
Participatory titles evaluation |
|
(154,094) |
|
(200,138) |
|
(21,104) |
|
- |
|
- |
|
(1,205) |
|
6,732 |
|
(369,809) |
Derivatives evaluation |
|
(20,466) |
|
8,585 |
|
- |
|
- |
|
- |
|
4,203 |
|
(2,367) |
|
(10,045) |
Lease restatement |
|
(258,954) |
|
43,543 |
|
- |
|
- |
|
- |
|
- |
|
- |
|
(215,411) |
Investments in associates. Adjustment for equity method |
|
(241,748) |
|
168,671 |
|
2,223 |
|
- |
|
- |
|
(8,730) |
|
- |
|
(79,584) |
Financial Obligations |
|
(1,248) |
|
(178,955) |
|
- |
|
- |
|
- |
|
256 |
|
- |
|
(179,947) |
Goodwill |
|
(1,576,519) |
|
644 |
|
- |
|
- |
|
- |
|
1,909 |
|
- |
|
(1,573,966) |
Insurance operations |
|
- |
|
189 |
|
- |
|
(14,138) |
|
- |
|
- |
|
- |
|
(13,949) |
Properties received in payment |
|
(162,681) |
|
11,016 |
|
- |
|
- |
|
- |
|
3,203 |
|
- |
|
(148,462) |
Other deductions |
|
(506,706) |
|
66,370 |
|
- |
|
- |
|
- |
|
73,779 |
|
- |
|
(366,557) |
implementation adjustment |
|
(25) |
|
- |
|
- |
|
- |
|
- |
|
- |
|
- |
|
(25) |
Total Liability Deferred Tax (3) |
|
(3,782,721) |
|
390,331 |
|
(18,881) |
|
(14,138) |
|
- |
|
79,297 |
|
129,978 |
|
(3,216,134) |
Net Deferred Tax |
|
131,233 |
|
(282,012) |
|
(778,567) |
|
(186) |
|
(137,838) |
|
(114,452) |
|
82,204 |
|
(1,099,618) |
| (1) | Application of IFRS 17 Insurance Contracts in Guatemala. |
| (2) | Current tax that arose from the exchange difference due to the liquidation of the bonds that was associated as a hedging instrument. |
| (3) | The values revealed in the Consolidated Statement of Financial Position correspond to the sum of the net deferred tax per company. |
12.6 Amount of temporary differences in subsidiaries, branches, associates over which deferred tax was not recognized is
In accordance with IAS 12, no deferred tax credit was recorded, because management can control the future moment in which such differences are reversed and this is not expected to occur in the foreseeable future.
|
|
December 31, 2023 |
|
December 31, 2022 |
In millions of Colombian pesos | ||||
Temporary differences |
|
|
|
|
Local Subsidiaries |
|
(1,378,775) |
|
(1,966,594) |
Foreign Subsidiaries |
|
(17,696,145) |
|
(22,854,744) |
F-105
12.7 Tax credits
For the 2023 period, a deferred tax asset was recognized since the Group companies will have future taxable profits in which they can charge this temporary difference.
The following is the detail of the fiscal losses and presumptive income excesses over net income in the Group's entities, which have not been used, as of December 31, 2023.
|
|
|
|
Deferred tax |
Company |
|
Base |
|
recognized asset |
In millions of Colombian pesos | ||||
Renting Colombia S.A.S. |
|
39,037 |
|
12,883 |
Nequi S.A., Compañía de Financiamiento |
|
63,018 |
|
22,057 |
Total |
|
102,055 |
|
34,940 |
12.8 Dividends
12.8.1 Dividend Payment
If the parent company or any of its subsidiaries were to distribute dividends, they would be subject to the tax regulations of each of the countries in which they are decreed and distributed. In the case of Colombian companies, dividends will be subject to the application of Articles 48 and 49 of the Tax Statute and consequently will be subject to withholding at source at the established rates, in accordance with the tax characteristics of each shareholder.
12.8.2 Dividends received from Subsidiary Companies
Considering the historical tax status of the dividends received by the Bank from its affiliates and national subsidiaries, it is expected that in the future dividends will be received on the basis of non-income tax. They will not be subject to withholding tax, taking into account that the Bank, its affiliates and national subsidiaries belong to the same business group.
12.9 Tax contingent liabilities and assets
In the determination of the effective current and deferred taxes subject to review by the tax authority, the relevant regulations have been applied in accordance with the interpretations made by the Group Bancolombia.
In Colombia due to the complexity of the tax system, ongoing amendments to the tax regulations, accounting changes with implications on tax bases and in general the legal instability of the country, the tax authority may at any time have different criteria than that of the Bank. Consequently, a dispute or inspection by the tax authority on a tax treatment may affect the Bank accounting of assets or liabilities for deferred or current taxes, in accordance with the requirements of IAS 12. However, based on the criteria established in the interpretation of IFRIC 23, the Bank did not recognize uncertain tax positions in its financial statements.
F-106
NOTE 13. ASSETS HELD FOR SALE AND INVENTORIES, NET
The breakdown of inventories and assets held for sale, net of the Bank is as follows:
Assets held for sale and inventories |
|
December 31, 2023 |
|
December 31, 2022 |
In millions of COP | ||||
Inventories, net |
|
747,302 |
|
513,032 |
Assets held for sale, net |
|
159,451 |
|
95,417 |
Total assets held for sale and inventories, net |
|
906,753 |
|
608,449 |
13.1. Inventories
Due to the nature of the financial services provided by some subsidiaries of the Bank, assets provided through operating or financial leases to third parties that do not exercise the purchase option or that do not have a purchase option, are recorded as inventories once the agreement expires, considering that in the course of the ordinary activities performed by such subsidiaries, those assets are routinely sold.
The Bank’s inventories at December 31, 2023 and 2022, are summarized as follows:
Inventories |
|
December 31, 2023 |
|
December 31, 2022 |
In millions of COP | ||||
Lands and buildings |
|
275,808 |
|
285,076 |
Vehicles(1) |
|
469,949 |
|
220,522 |
Machinery and others |
|
38,310 |
|
33,091 |
Total inventory cost |
|
784,067 |
|
538,689 |
Impairment |
|
(36,765) |
|
(25,658) |
Total inventories, net |
|
747,302 |
|
513,031 |
(1) The increase is mainly due to the restitution of assets.
Impairment is recognized based on market price fluctuation due to the fact that the fair value is determined by the offering price less cost to sell.
There are no inventories pledged as collateral for liabilities as of December 31, 2023 and 2022.
13.2. Assets held for sale
The assets recognized by the Bank as assets held for sale correspond to machinery, equipment, motor vehicles and technology, among others that have been received as foreclosed assets.
These assets are subject to a current plan for their sale, which contains the details of the selling price allocation and the advertising and marketing plan. Furthermore, the plan specifies the conditions to proceed with the selling process.
F-107
The total balance of assets held for sale, by operating segment, are detailed below:
As of December 31, 2023
|
|
Banking |
|
Banking |
|
Banking |
|
Banking |
|
|
Assets held for sale |
|
Colombia |
|
Panama |
|
El Salvador |
|
Guatemala |
|
Total |
In millions of COP | ||||||||||
Machinery and equipment |
|
9,238 |
|
2,464 |
|
- |
|
- |
|
11,702 |
Cost |
|
9,300 |
|
2,473 |
|
- |
|
- |
|
11,773 |
Impairment |
|
(62) |
|
(9) |
|
- |
|
- |
|
(71) |
Real estate for residential purposes |
|
6,191 |
|
104,934 |
|
3,091 |
|
3,260 |
|
117,476 |
Cost |
|
6,191 |
|
106,642 |
|
3,148 |
|
4,060 |
|
120,041 |
Impairment |
|
- |
|
(1,708) |
|
(57) |
|
(800) |
|
(2,565) |
Real estate different from residential properties |
|
5,406 |
|
24,867 |
|
- |
|
- |
|
30,273 |
Cost |
|
5,947 |
|
24,980 |
|
- |
|
- |
|
30,927 |
Impairment |
|
(541) |
|
(113) |
|
- |
|
- |
|
(654) |
Total assets held for sale - cost |
|
21,438 |
|
134,095 |
|
3,148 |
|
4,060 |
|
162,741 |
Total assets held for sale - impairment |
|
(603) |
|
(1,830) |
|
(57) |
|
(800) |
|
(3,290) |
Total assets held for sale(1) |
|
20,835 |
|
132,265 |
|
3,091 |
|
3,260 |
|
159,451 |
| (1) | For 2023 there are no assets related to investments held for sale. |
As of December 31, 2022
|
|
Banking |
|
Banking |
|
Banking |
|
Banking |
|
|
Assets held for sale |
|
Colombia |
|
Panama |
|
El Salvador |
|
Guatemala |
|
Total |
In millions of COP | ||||||||||
Machinery and equipment |
|
5,090 |
|
4,828 |
|
- |
|
- |
|
9,918 |
Cost |
|
5,160 |
|
4,870 |
|
- |
|
- |
|
10,030 |
Impairment |
|
(70) |
|
(42) |
|
- |
|
- |
|
(112) |
Real estate for residential purposes |
|
7,928 |
|
52,331 |
|
1,559 |
|
1,465 |
|
63,283 |
Cost |
|
7,967 |
|
54,181 |
|
1,616 |
|
1,880 |
|
65,644 |
Impairment |
|
(39) |
|
(1,850) |
|
(57) |
|
(415) |
|
(2,361) |
Real estate different from residential properties |
|
10,868 |
|
11,348 |
|
- |
|
- |
|
22,216 |
Cost |
|
11,178 |
|
11,348 |
|
- |
|
- |
|
22,526 |
Impairment |
|
(310) |
|
- |
|
- |
|
- |
|
(310) |
Total assets held for sale - cost |
|
24,305 |
|
70,399 |
|
1,616 |
|
1,880 |
|
98,200 |
Total assets held for sale - impairment |
|
(419) |
|
(1,892) |
|
(57) |
|
(415) |
|
(2,783) |
Total assets held for sale(1) |
|
23,886 |
|
68,507 |
|
1,559 |
|
1,465 |
|
95,417 |
| (1) | For 2022 there are no assets related to investments held for sale. |
Impairment losses are recognized for the difference between the carrying and recoverable amount of the asset.
F-108
NOTE 14. OTHER ASSETS, NET
As of December 31, 2023 and 2022 the Bank’s other assets, net consist of:
Other Assets, net |
|
December 31, 2023 |
|
December 31, 2022 |
In millions of COP | ||||
Tax advance(1) |
|
1,461,816 |
|
1,298,400 |
Other receivables(2) |
|
1,193,294 |
|
1,158,447 |
Assets pledged as collateral (cash)(3) |
|
1,082,611 |
|
752,099 |
Marketable and non-marketable for sale assets(4) |
|
890,653 |
|
978,319 |
Prepaid expenses |
|
713,505 |
|
576,742 |
Receivables related to abandoned accounts(5) |
|
403,432 |
|
439,994 |
Accounts receivable from contracts with customers(6) |
|
259,516 |
|
192,029 |
Receivable Sales of goods and service |
|
254,607 |
|
260,674 |
Commission for letters of credit |
|
207,327 |
|
70,249 |
Operating leases |
|
201,302 |
|
172,216 |
Balance in credit card clearing house |
|
185,164 |
|
142,331 |
Debtors |
|
85,698 |
|
21,646 |
Others |
|
595,799 |
|
488,640 |
Total other assets |
|
7,534,724 |
|
6,551,786 |
Allowance others |
|
(6,688) |
|
(3,920) |
Total other assets, net |
|
7,528,036 |
|
6,547,866 |
| (1) | Mainly due to increase balance in favor of income tax advance. |
| (2) | Other accounts receivable are mainly associated with outstanding items with networks, accounts receivable from derivatives and cash transactions, among others. |
| (3) | Variation generated by growth in current operations with international counterparts. |
| (4) | Decrease generated mainly in foreign subsidiaries due to the variation of the market representative rate, for December 2022 was COP 4,810.20 colombian pesos and for December 2023 is COP 3,822.05 colombian pesos. |
| (5) | Corresponds to the application of Law 1777 of February 1, 2016, where established that entities holding balances in savings or checking accounts that are considered abandoned, must transfer these resources to the special fund created and administered by ICETEX for the granting of study credits and credits to promote the quality of Higher Education Institutions. |
| (6) | Corresponds to accounts receivable from commissions, see Note 25.3.1. Income from commissions and other services, in the detail of accounts receivable and liabilities from contracts. |
NOTE 15. DEPOSITS BY CUSTOMERS
The detail of the deposits as of December 31, 2023 and 2022 is as follows:
Deposits |
|
December 31, 2023 |
|
December 31, 2022 |
In millions of COP |
|
|
|
|
Saving accounts(1)(2) |
|
108,971,334 |
|
118,443,600 |
Time deposits(2) |
|
98,686,516 |
|
87,138,067 |
Checking accounts(2) |
|
34,993,066 |
|
40,808,856 |
Other deposits(1) |
|
5,290,264 |
|
4,601,800 |
Total deposits by customers |
|
247,941,180 |
|
250,992,323 |
(1) As of December 31, 2023 and 2022 includes Nequi Deposits by COP 2,924,906 and COP 1,724,123, respectively.
(2) The variation in time deposits is mainly due to the increase in interest rates, which has led to a greater preference for fixed income instruments and a decrease in savings and checking accounts.
F-109
The following table details the time deposits issued by the Bank:
As of December 31, 2023
Time deposits |
|
Effective interest rate |
|
December 31, 2023 |
||||
Modality |
|
Minimum |
|
Maximum |
|
Carrying Value |
|
Fair value(1) |
In millions of COP | ||||||||
Less than 6 months |
|
0.10 |
% |
15.52 |
% |
17,641,158 |
|
17,494,878 |
Between 6 months and 12 months |
|
0.50 |
% |
17.32 |
% |
18,422,400 |
|
18,314,065 |
Between 12 months and 18 months |
|
0.85 |
% |
20.52 |
% |
17,523,847 |
|
17,647,508 |
Greater than 18 months |
|
0.01 |
% |
20.86 |
% |
45,099,111 |
|
46,629,404 |
Total time deposits |
|
|
|
|
|
98,686,516 |
|
100,085,855 |
(1) See Note 30. Fair value of assets and liabilities.
As of December 31, 2022
Time deposits |
|
Effective interest rate |
|
December 31, 2022 |
||||
Modality |
|
Minimum |
|
Maximum |
|
Carrying Value |
|
Fair value(1) |
In millions of COP | ||||||||
Less than 6 months |
|
0.10 |
% |
16.57 |
% |
16,922,753 |
|
16,900,555 |
Between 6 months and 12 months |
|
0.50 |
% |
17.41 |
% |
14,279,083 |
|
14,234,825 |
Between 12 months and 18 months |
|
0.50 |
% |
19.51 |
% |
13,692,773 |
|
13,571,248 |
Greater than 18 months |
|
0.40 |
% |
22.10 |
% |
42,243,458 |
|
40,942,920 |
Total time deposits |
|
|
|
|
|
87,138,067 |
|
85,649,548 |
(1) See Note 30. Fair value of assets and liabilities.
The detail of time deposits issued by the Bank by maturity is as follows:
As of December 31, 2023
December 31, 2023 | ||||
Period |
|
Carrying value |
|
Fair value(1) |
In millions of COP | ||||
Less than 1 year |
|
71,178,788 |
|
71,315,171 |
Between 1 and 3 years |
|
13,715,792 |
|
13,949,647 |
Between 3 and 5 years |
|
3,197,528 |
|
3,256,102 |
Greater than 5 years |
|
10,594,408 |
|
11,564,935 |
Total |
|
98,686,516 |
|
100,085,855 |
(1) See Note 30. Fair value of assets and liabilities.
As of December 31, 2022
December 31, 2022 | ||||
Period |
|
Carrying value |
|
Fair value(1) |
In millions of COP | ||||
Less than 1 year |
|
60,256,684 |
|
60,113,046 |
Between 1 and 3 years |
|
14,930,613 |
|
14,621,696 |
Between 3 and 5 years |
|
4,318,988 |
|
4,017,350 |
Greater than 5 years |
|
7,631,782 |
|
6,897,456 |
Total |
|
87,138,067 |
|
85,649,548 |
(1) See Note 30. Fair value of assets and liabilities.
F-110
NOTE 16. INTERBANK DEPOSITS AND REPURCHASE AGREEMENTS AND OTHER SIMILAR SECURED BORROWING
The following table sets forth information regarding the money market operations recognized as liabilities in Consolidated Statement of Financial Position:
Interbank and repurchase agreements and other similar secured borrowing |
|
December 31, 2023 |
|
December 31, 2022 |
In millions of COP | ||||
Interbank Deposits |
|
|
|
|
Interbank liabilities |
|
606,141 |
|
902,132 |
Total interbank |
|
606,141 |
|
902,132 |
Repurchase agreements and other similar secured borrowing |
|
|
|
|
Short selling operations |
|
273,791 |
|
125,682 |
Temporary transfer of securities |
|
44,888 |
|
63,370 |
Repurchase agreements |
|
151,616 |
|
- |
Total Repurchase agreements and other similar secured borrowing(1) |
|
470,295 |
|
189,052 |
Total money market transactions |
|
1,076,436 |
|
1,091,184 |
| (1) | Total repo liabilities have maturities of less than 30 days. |
Offsetting of Repurchase and Resale Agreements
For the Bank and its Colombian subsidiaries, substantially all repurchase and resale activities are transacted under legally enforceable repurchase agreements that give the Bank, in the event of default by the counterparty, the right to liquidate securities held with the same counterparty.
The Bank does not offset repurchase and resale transactions with the same counterparty in the consolidated statement of financial position.
The table below presents repurchases and resale transactions included in the consolidated statement of financial position at December 31, 2023 and 2022:
As of December 31, 2023
|
|
|
|
|
|
Net balance |
|
|
|
|
|
|
Assets / |
|
Amounts offset in |
|
presented in the |
|
Financial |
|
Assets / |
|
|
liabilities gross |
|
the statement of |
|
statement of financial |
|
instruments as |
|
liabilities |
|
|
|
|
financial position |
|
position |
|
collaterals |
|
net |
In millions of COP | ||||||||||
Securities purchased under resale agreements(1) |
|
7,850,516 |
|
- |
|
7,850,516 |
|
(7,850,516) |
|
- |
Securities sold under repurchase agreements |
|
(470,295) |
|
- |
|
(470,295) |
|
470,295 |
|
- |
Total repurchase and resale agreements |
|
7,380,221 |
|
- |
|
7,380,221 |
|
(7,380,221) |
|
- |
| (1) | The amount includes those presented as cash and cash equivalents for COP 7,840,926 and those presented as other assets for COP 9,590. |
F-111
As of December 31, 2022
|
|
|
|
|
|
Net balance |
|
|
|
|
|
|
Assets / |
|
Amounts offset in |
|
presented in the |
|
Financial |
|
Assets / |
|
|
liabilities gross |
|
the statement of |
|
statement of financial |
|
instruments as |
|
liabilities |
|
|
|
|
financial position |
|
position |
|
collaterals |
|
net |
In millions of COP | ||||||||||
Securities purchased under resale agreements(1) |
|
2,880,987 |
|
- |
|
2,880,987 |
|
(2,880,987) |
|
- |
Securities sold under repurchase agreements |
|
(189,052) |
|
- |
|
(189,052) |
|
189,052 |
|
- |
Total repurchase and resale agreements |
|
2,691,935 |
|
- |
|
2,691,935 |
|
(2,691,935) |
|
- |
| (1) | The amount includes those presented as cash and cash equivalents for COP 2,873,716 and those presented as other assets for COP 7,271. |
For further information about offsetting of other financial assets and liabilities see Note 5 Financial assets investments and derivatives.
NOTE 17. BORROWINGS FROM OTHER FINANCIAL INSTITUTIONS
As of December 31, 2023 and 2022, the composition of the borrowings from other financial institutions measured at amortized cost is the following:
Borrowings from other financial institutions |
|
December 31, 2023 |
|
December 31, 2022 |
In millions of COP | ||||
Obligations granted by foreign banks(1) |
|
9,139,834 |
|
14,774,220 |
Obligations granted by domestic banks(2) |
|
6,508,772 |
|
4,918,418 |
Total borrowings from other financial institutions |
|
15,648,606 |
|
19,692,638 |
(1) The variation is mainly due to the cancellation of obligations and the decrease of the market representative rate at the end of December 31, 2023 it was COP 3,822.05 colombian pesos and December 31, 2022 it was COP 4,810.20 colombian pesos.
(2)The increase is due to higher loan openings by Bancolombia S.A mainly in rediscount lines with Finagro, Bancoldex and Findeter.
Obligations granted by foreign banks
As of December 31, 2023
Financial entity |
|
Rate Minimum |
|
Rate Maximum |
|
December 31, 2023 |
In millions of COP | ||||||
Financing with Correspondent Banks and Multilateral Entities(1) |
|
1.21 |
% |
10.06 |
% |
8,566,580 |
Banco Interamericano de Desarrollo (BID) |
|
9.50 |
% |
10.64 |
% |
532,899 |
Banco Latinoamericano de Comercio Exterior (Bladex) |
|
6.91 |
% |
6.91 |
% |
40,355 |
Total |
|
|
|
|
|
9,139,834 |
(1)At Bancolombia S.A. USD 200 million were designated as coverage of net investment abroad. See Note 5.2 Derivative financial instruments- Hedges of a net asset in a foreign operation.
As of December 31, 2022
Financial entity |
|
Rate Minimum |
|
Rate Maximum |
|
December 31, 2022 |
In millions of COP | ||||||
Financing with Correspondent Banks and Multilateral Entities |
|
0.97 |
% |
9.51 |
% |
13,816,270 |
Banco Interamericano de Desarrollo (BID) |
|
8.62 |
% |
8.74 |
% |
670,043 |
Banco Latinoamericano de Comercio Exterior (Bladex) |
|
2.89 |
% |
6.60 |
% |
287,907 |
Total |
|
|
|
|
|
14,774,220 |
F-112
The maturities of the financial obligations with foreign entities as of December 31, 2023 and 2022 are the following:
Foreign |
|
December 31, 2023 |
|
December 31, 2022 |
In millions of COP | ||||
Amount expected to be settled: |
|
|
|
|
No more than twelve months after the reporting period |
|
3,813,504 |
|
8,825,089 |
More than twelve months after the reporting period |
|
5,326,330 |
|
5,949,131 |
Total |
|
9,139,834 |
|
14,774,220 |
Obligations granted by domestic banks
As of December 31, 2023
|
|
Rate |
|
Rate |
|
|
Financial entity |
|
Minimum |
|
Maximum |
|
December 31, 2023 |
In millions of COP | ||||||
Financiera de desarrollo territorial (Findeter) |
|
8.15 |
% |
20.85 |
% |
2,530,570 |
Fondo para el financiamiento del sector agropecuario (Finagro) |
|
8.37 |
% |
15.88 |
% |
1,509,594 |
Banco de comercio exterior de Colombia (Bancoldex) |
|
2.17 |
% |
21.46 |
% |
1,404,873 |
Other private financial entities |
|
12.88 |
% |
16.67 |
% |
1,063,735 |
Total |
|
|
|
|
|
6,508,772 |
As of December 31, 2022
|
|
Rate |
|
Rate |
|
|
Financial entity |
|
Minimum |
|
Maximum |
|
December 31, 2022 |
In millions of COP | ||||||
Financiera de desarrollo territorial (Findeter) |
|
7.22 |
% |
18.77 |
% |
2,047,506 |
Fondo para el financiamiento del sector agropecuario (Finagro) |
|
3.40 |
% |
15.70 |
% |
931,018 |
Banco de comercio exterior de Colombia (Bancoldex) |
|
2.15 |
% |
19.15 |
% |
902,036 |
Other private financial entities |
|
11.35 |
% |
15.75 |
% |
1,037,858 |
Total |
|
|
|
|
|
4,918,418 |
The maturities of financial obligations with domestic banks as of December 31, 2023 and 2022, are as follows:
Domestic |
|
December 31, 2023 |
|
December 31, 2022 |
In millions of COP | ||||
Amount expected to be settled: |
|
|
|
|
No more than twelve months after the reporting period |
|
767,470 |
|
500,500 |
More than twelve months after the reporting period |
|
5,741,302 |
|
4,417,918 |
Total |
|
6,508,772 |
|
4,918,418 |
F-113
As of December 31, 2023 and 2022, there were some financial covenants, mainly regarding capital adequacy ratios, past due loans and allowances, linked to some of the aforementioned outstanding credit facilities. None of these covenants had been breached nor were the related obligations past due.
NOTE 18. DEBT INSTRUMENTS IN ISSUE
Duly authorized by the authority in each country bonds have been issued as follows:
As of December 31, 2023
Issuer |
|
Currency |
|
Face value(1) |
|
Balance COP |
|
Rate Range |
||
Bancolombia S.A. |
|
Local |
|
COP |
|
4,029,882 |
|
4,097,727 |
|
12.87%-21.06% |
Bancolombia S.A.(2)(3) |
|
Foreign |
|
USD |
|
1,832,534 |
|
6,861,098 |
|
3.02%-7.03% |
Banistmo S.A.(4) |
|
Foreign |
|
USD |
|
679,395 |
|
2,626,235 |
|
3.00%-6.25% |
Banco Agrícola S.A.(5) |
|
Foreign |
|
USD |
|
162,700 |
|
623,568 |
|
5.58%-7.57% |
Bancolombia Puerto Rico Internacional Inc. |
|
Foreign |
|
USD |
|
69,648 |
|
276,451 |
|
5.05%-5.50% |
Bancolombia Panamá S.A. |
|
Foreign |
|
USD |
|
44,924 |
|
176,376 |
|
4.70%-6.10% |
Grupo Agromercantil Holding S.A. |
|
Foreign |
|
USD |
|
555 |
|
2,121 |
|
0.25%-7.25% |
Total debt instruments in issue |
|
|
|
|
|
|
|
14,663,576 |
|
|
(1) Face value is in US dollar for foreign currency bonds.
(2)The variation is due to repurchase in Bancolombia S.A. of USD 467,966 of senior bonds maturing in 2025 and the decrease in the market representative rate at the end of December 31, 2023 it was COP 3,822.05 colombian pesos and December 31, 2022 it was COP 4,810.20 colombian pesos.
(3)USD 1,392,034 was designated as hedge of net asset in a foreign operation. See Note 5.2. Derivative financial instruments- Hedges of a net asset in a foreign operation.
(4) See Note 18.2. Issue of Banistmo S.A. ordinary bonds.
(5) See Note 18.3. Issue of Banco Agrícola S.A. ordinary bonds.
As of December 31, 2022
Issuer |
|
Currency |
|
Face value(1) |
|
Balance COP |
|
Rate Range |
||
Bancolombia S.A. |
|
Local |
|
COP |
|
4,642,404 |
|
4,708,586 |
|
13.06%-17.92% |
Bancolombia S.A.(2)(3) |
|
Foreign |
|
USD |
|
2,256,397 |
|
10,501,036 |
|
3.02%-7.03% |
Banistmo S.A.(4) |
|
Foreign |
|
USD |
|
687,913 |
|
3,344,759 |
|
1.80%-5.00% |
Banco Agrícola S.A.(5) |
|
Foreign |
|
USD |
|
125,640 |
|
603,865 |
|
5.45%-6.41% |
Bancolombia Puerto Rico Internacional Inc. |
|
Foreign |
|
USD |
|
14,876 |
|
72,240 |
|
3.30%-3.65% |
Bancolombia Panamá S.A. |
|
Foreign |
|
USD |
|
70,881 |
|
342,793 |
|
1.50%-5.65% |
Grupo Agromercantil Holding S.A. |
|
Foreign |
|
USD |
|
563 |
|
2,709 |
|
0.25%-7.25% |
Total debt instruments in issue |
|
|
|
|
|
|
|
19,575,988 |
|
|
(1)Face value is in US dollar for foreign currency bonds.
(2)USD 1,860,000 was designated as hedge of net asset in a foreign operation. See Note 5.2. Derivative financial instruments- Hedges of a net asset in a foreign operation.
(3) See Note 18.1. Issue of Bancolombia S.A. sustainable ordinary bonds.
(4) See Note 18.2. Issue of Banistmo S.A. ordinary bonds.
(5) See Note 18.3. Issue of Banco Agrícola S.A. ordinary bonds.
F-114
The following table shows the detail of the bonds classified by currency, term and type of issue:
As of December 31, 2023
|
|
Less than |
|
Between |
|
Between |
|
|
|
|
Issuer |
|
1 year |
|
1 and 3 years |
|
3 and 5 years |
|
Greater than 5 years |
|
Total amortized cost |
In millions of COP | ||||||||||
Local currency |
|
|
|
|
|
|
|
|
|
|
Subordinated bonds(1) |
|
- |
|
- |
|
- |
|
1,236,385 |
|
1,236,385 |
Ordinary bonds |
|
- |
|
- |
|
165,589 |
|
2,695,753 |
|
2,861,342 |
Foreign currency |
|
|
|
|
|
|
|
|
|
|
Subordinated bonds(1) |
|
- |
|
- |
|
- |
|
4,822,273 |
|
4,822,273 |
Ordinary bonds |
|
106,707 |
|
1,375,723 |
|
137,613 |
|
4,123,533 |
|
5,743,576 |
Total |
|
106,707 |
|
1,375,723 |
|
303,202 |
|
12,877,944 |
|
14,663,576 |
| (1) | In the event of default of the Bank, the subordinated bonds, will be subordinated to the claims of depositors and all other creditors of the issuer, other than creditors whose claims rank equally with, or are junior to, the claims of the holders of the subordinated liabilities. |
As of December 31, 2022
Issuer |
|
Less than |
|
Between |
|
Between |
|
|
|
|
|
|
1 year |
|
1 to 3 years |
|
3 to 5 years |
|
Greater than 5 years |
|
Total amortized cost |
In millions of COP | ||||||||||
Local currency |
|
|
|
|
|
|
|
|
|
|
Subordinated bonds(1) |
|
- |
|
- |
|
- |
|
1,225,276 |
|
1,225,276 |
Ordinary bonds |
|
- |
|
- |
|
165,495 |
|
3,317,815 |
|
3,483,310 |
Foreign currency |
|
|
|
|
|
|
|
|
|
|
Subordinated bonds(1) |
|
- |
|
- |
|
- |
|
6,026,739 |
|
6,026,739 |
Ordinary bonds |
|
402,714 |
|
609,437 |
|
619,232 |
|
7,209,280 |
|
8,840,663 |
Total |
|
402,714 |
|
609,437 |
|
784,727 |
|
17,779,110 |
|
19,575,988 |
(1)In the event of default of the Bank, the subordinated bonds, will be subordinated to the claims of depositors and all other creditors of the issuer, other than creditors whose claims rank equally with, or are junior to, the claims of the holders of the subordinated liabilities.
18.1. Issue of Bancolombia S.A. sustainable ordinary bonds.
On October 25, 2022 Bancolombia S.A. issued the first bond linked to sustainability for COP 640,000, with commitments to promoting financial inclusion and decarbonizing loans. The issuance, was signed by the BID, BID Invest and LAGreen, has a term of 5 years and includes sustainability goals, such as a commitment to grant financing for more than 1.5 million unbanked or low-income people by 2025, and to reduce CO2 emissions by 35.6% in its financed loans compared to 2021, all as part of the Bank’s sustainability strategy.
18.2. Issue of Banistmo S.A. ordinary bonds.
Banistmo S.A., a subsidiary of the Bank issued in 2023 bonds under the Revolving Bond Program, totaling USD 58,062 with a term of 1 year each and rates between 6% and 6.25%. For the year 2022, it issued a bond under the Revolving Bond Program worth USD 72,682 with a term of 2 years and a rate of 4.50%.
18.3. Issue of Banco Agrícola S.A. ordinary bonds.
Banco Agrícola a subsidiary of the Bank issued ordinary bonds in 2023 for USD 77,700 with rates from 6.68% to 7.25% and terms from 1.5 years to 8 years. For the year 2022, the issues were USD 23,600 with rates from 5.25% to 6.68% with terms from 2 years to 5 years.
F-115
For information related to the disclosures of fair value of the debt securities in issue, see Note 30. Fair value of assets and liabilities.
The following is a schedule of the debt instruments in issue by maturity:
Issuer |
|
December 31, 2023 |
|
December 31, 2022 |
In millions of COP | ||||
Amount expected to be settled: |
|
|
|
|
No more than twelve months after the reporting period |
|
3,368,076 |
|
1,898,469 |
More than twelve months after the reporting period |
|
11,295,500 |
|
17,677,519 |
Total |
|
14,663,576 |
|
19,575,988 |
As of December 31, 2023 and 2022, there were no financial covenants linked to the aforementioned securities in issue, except for some financial covenants related to the Banistmo S.A. social gender private placement bond. None of these covenants had been breached nor were the related obligations past due.
NOTE 19. EMPLOYEE BENEFIT PLANS
The following table shows liabilities relating to post-employment benefit and long-term benefit plans:
|
|
December 31, |
|
December 31, |
Employee benefit plans |
|
2023 |
|
2022 |
In millions of COP | ||||
19.1 Defined benefit pension plan |
|
132,854 |
|
131,255 |
19.2 Severance obligation |
|
14,360 |
|
15,446 |
19.3 Retirement Pension Premium Plan and Executive Pension Plan Premium |
|
195,295 |
|
176,816 |
19.4 Other long term benefits |
|
543,210 |
|
446,473 |
Total Post-employment and long-term benefit plans |
|
885,719 |
|
769,990 |
Fair value Plan assets |
|
2,765 |
|
4,619 |
Total Unfunded Post-employment and long-term benefit plans |
|
882,954 |
|
765,371 |
These benefits include all types of payments that the Bank provides to its employees. The recognition of liabilities related to post-employment and long-term employee benefit plans is based on actuarial computations which involve judgments and assumptions made by management (with the assistance of external actuaries) related to the future macroeconomic and employee demographic factors, among others, which will not necessarily coincide with the future outcome of such factors.
Post-employment benefits
19.1 Defined benefit pension plan
Colombia
Under Colombian law, employee pension obligations are managed as a defined contribution plan since 1990. The Bank’s legal retirement benefit obligation as of December 31, 2023 and 2022 relates to retired employees who rendered services to the Bank before the current regulations took effect. Under this unfunded plan, benefits are based on length of service and level of compensation. As of December 2023, 498 participants were covered by this plan, and as of December 31,2022, 522 participants.
For purposes of the projected assessment of the pension plan obligation, in the absence of an extensive market for high-quality corporate debt, the sovereign bond curve of the Colombian government is used, with maturity similar to the residual life of the obligation of the projected benefit.
F-116
The net cost of pensions is accounted for in the Consolidated Statement of Income as “salaries and employee benefits”, and includes the interest costs and cost of current service.
Defined benefit pension plan |
|
2023 |
|
2022 |
In millions of COP | ||||
Present value of the obligation as of January 1 |
|
95,081 |
|
110,018 |
Interest cost |
|
11,409 |
|
9,459 |
Benefits paid |
|
(12,237) |
|
(11,439) |
Net actuarial loss / (gain) due to changes in assumptions |
|
7,025 |
|
(11,321) |
Net actuarial loss / (gain) due to plan experience |
|
500 |
|
(1,636) |
Defined obligation, unfunded as of December 31 |
|
101,778 |
|
95,081 |
Panama
The Chase Manhattan Bank Corporation, N.A. (formerly “HSBC Bank Panama”, later merged with Banistmo S.A. in 2000) offered a defined benefit pension plan based on the average salaries paid during the 120 most recent months prior to the employee's retirement date and the years of employment service. The right to this plan was obtained after 10 years of service with the organization. This individual plan covered a certain group of employees who were hired by Chase Manhattan Bank Corporation, N.A. and it was not extended to employees of HSBC Bank Panama, now Banistmo S.A.
As of December 31, 2023, and 2022, there were 37 participants (10 participants with deferred benefits and 27 participants receiving benefits), and 42 participants (15 participants with deferred benefits and 27 participants receiving benefits), respectively.
Defined benefit pension plan |
|
2023 |
|
2022 |
In millions of COP | ||||
Present value of the obligation as of January 1 |
|
5,296 |
|
6,025 |
Interest cost |
|
312 |
|
229 |
Benefits paid from plan assets |
|
(1,088) |
|
(332) |
Net actuarial gain due to changes in assumptions |
|
(174) |
|
(1,360) |
Net actuarial gain due to plan experience |
|
(361) |
|
(293) |
Foreign currency translation effect |
|
(934) |
|
1,027 |
Defined obligation, funded as of December 31 |
|
3,051 |
|
5,296 |
The Bank, through its subsidiary Banistmo, has established a plan with assets to secure benefits promised by Banistmo to the employees entitled to participate in the Pension Plan for former Chase employees under the terms described above and to comply with Panama labor code, which specifies the terms of securing the payments to be made in the event of an employee’s termination (voluntary or involuntary) or upon retirement (termination indemnity plan).
Banistmo’s pension and post-retirement plan assets consider investments in fixed-term deposits and cash and due from banks, in order to reduce the investment risk. The plan assets are managed by a trustee (third party). Likewise, the assets allocation is periodically reviewed by Banistmo and, when necessary, adjusted according to the investment strategy. The plan's investment assets are measured at fair value using significant, unobservable market data and, therefore, are classified as Level 3.
The expected return on assets assumption represents the long term rate of return based on analysis of historical returns, historical asset class volatilities and the fund’s past experience.
The following table details the change in plan assets:
Banistmo’s Plan assets |
|
2023 |
|
2022 |
In millions of COP | ||||
Fair value of assets as of January 1 |
|
4,619 |
|
4,127 |
Interest income on plan assets |
|
80 |
|
30 |
F-117
Benefits paid |
|
(1,105) |
|
(355) |
Foreign currency translation effect |
|
(829) |
|
817 |
Fair value assets as of December 31 |
|
2,765 |
|
4,619 |
Guatemala
Banco Agromercantil Guatemala S.A. has established a retirement pension plan for its employees. Under this plan, the employees are entitled to receive a lifetime payment of 50% of their monthly nominal wage, if they are 70 years old and have 30 years of service, or if they are 65 years old and have 40 years of service. On the other hand, employees are entitled to receive a lifetime payment of 70% of their monthly nominal wage, if they are 70 years old and have 40 years of service, or they are 65 years old and have 45 years of service.
Defined benefit pension plan |
|
2023 |
|
2022 |
In millions of COP | ||||
Present value of the obligation as of January 1 |
|
30,878 |
|
52,773 |
Current cost of service |
|
878 |
|
2,457 |
Interest cost |
|
2,757 |
|
3,375 |
Past service cost(1) |
|
(4,821) |
|
- |
Benefits paid |
|
(1,764) |
|
(1,709) |
Net actuarial loss / (gain) due to changes in assumptions(2) |
|
5,544 |
|
(30,093) |
Net actuarial loss / (gain) due to plan experience |
|
1,272 |
|
(2,122) |
Foreign currency translation effect |
|
(6,719) |
|
6,197 |
Defined obligation, unfunded as of December 31 |
|
28,025 |
|
30,878 |
(1)Corresponds to the change in the computable age of the benefit, modified in the year 2023.
(2)The loss for the year 2023 was mainly due to the decrease in the discount rate from 10.20% in 2022 to 9.00% in 2023.
19.2 Severance obligation
Colombia
Under Colombian labor regulations, employees hired before 1990 are entitled to receive severance in an amount equal to one month’s salary for each year of service. This benefit accumulates and is paid to the employees upon their termination or retirement from the Bank, calculated based on the employees’ last salary base; however, employees may request advances against this benefit at any time. In 1990, the Colombian government revised its labor regulations for new employees to permit companies, subject to the approval of the employees, to transfer this severance obligation annually to private pension funds (this scheme of employee benefits is known as the current severance obligation).
As of December 2023 and 2022, 114 and 152 participants, respectively, were covered by this plan.
The balances recognized in the Consolidated Statement of Financial Position are listed below:
Severance obligation |
|
2023 |
|
2022 |
In millions of COP | ||||
Present value of the obligation as of January 1 |
|
15,446 |
|
18,429 |
Current cost of service |
|
357 |
|
409 |
Interest cost |
|
1,566 |
|
1,250 |
Benefits paid |
|
(6,594) |
|
(5,113) |
Net actuarial loss due to changes in assumptions |
|
888 |
|
1,806 |
Net actuarial loss / (gain) due to plan experience |
|
2,697 |
|
(1,335) |
Defined obligation, unfunded as of December 31 |
|
14,360 |
|
15,446 |
F-118
19.3 Retirement Pension Premium Plan and Executive Pension Plan Premium
Colombia
Under Colombian labor regulations, employers and employees are entitled to negotiate private agreements. The Bank’s employees and its subsidiaries Valores Bancolombia S.A. Comisionista de Bolsa, Banca de Inversión Bancolombia S.A. Corporación Financiera and Fiduciaria Bancolombia S.A. Sociedad Fiduciaria participate in a defined benefit plan according to which they are entitled to receive, on the date of their retirement, a single payment.
Until 2022 and as a key talent retention strategy, the Parent Company offered certain senior management executives a plan under the defined benefit modality, according to which the people covered by this plan were entitled to receive a single payment based on the years of service provided to the organization and thus contribute to closing the pension gap. In December 2022 this benefit ended and as a consequence:
| (i) | The obligations for the Parent company derived from the defined benefit plan ceased, as well as the rights for those who were part of it. |
| (ii) | The resources of the asset plan that supported the defined benefit plan were transferred to the accounts of the beneficiaries in the private pension fund, subject to permanence until the termination of the employment relationship (See line "consolidation of contributions" in the movement of the present value of the obligation, disclosed below in this same section); |
| (iii) | The pension gap closing program for executives is unified under the defined contribution modality. |
El Salvador
By means of Decree 592 of 2013, under Salvadorian labor regulations, employees are entitled to receive 15 days of salary for each year of service. This benefit is payable upon retirement, resignation, unjustified dismissal, death and disability. As of December 31, 2023, and 2022, there were 2,927 and 2,844 participants respectively, covered by the plan.
Until 2022 and as a key talent retention strategy, Banagrícola S.A. offered certain senior management executives a plan under the defined benefit modality, according to which the people covered by this plan were entitled to receive a single payment based on the years of service provided to the organization and thus contribute to closing the pension gap. In December 2022 this benefit ended and as a consequence:
| (i) | The obligations of the entity derived from the defined benefit plan ceased, as well as the rights for those who were part of it (See line "consolidation of contributions" in the movement of the present value of the obligation, disclosed below in this same section). |
| (ii) | The value caused by this benefit will be transferred to a fiduciary or similar vehicle, under which the executive pension plan will be administered on behalf of the beneficiaries, subject to permanence until the termination of the employment relationship. |
Guatemala
Banco Agromercantil Guatemala S.A. has established a defined benefit plan for its employees. Under this plan, the employees are entitled to receive a one-off payment based on the number of years of service to the organization in the event of waiver before retirement. As of December 31, 2023, and 2022, there were 3,733 and 3,504 participants respectively, covered by the plan.
F-119
Panama
Banistmo S.A established a retirement benefit plan for its senior management executives. Under this plan, the executives are entitled to receive a one-off payment on their retirement date, death or disability based on the number of years of service to the organization.
Until 2022 and as a key talent retention strategy, Banistmo S.A. offered certain senior management executives a plan under the defined benefit modality, according to which the people covered by this plan were entitled to receive a single payment based on the years of service provided to the organization and thus contribute to closing the pension gap. In December 2022 this benefit ended and as a consequence:
| (i) | The obligations of the entity derived from the defined benefit plan ceased, as well as the rights for those who were part of it (See line "consolidation of contributions" in the movement of the present value of the obligation, disclosed below in this same section). |
| (ii) | The value caused by this benefit will be transferred to a fiduciary or similar vehicle, under which the executive pension plan will be administered on behalf of the beneficiaries, subject to permanence until the termination of the employment relationship. |
The annual change of the present value of the obligations of defined benefit plans is as follows:
Retirement Pension Premium Plan |
|
2023 |
|
2022 |
In millions of COP | ||||
Present value of the obligation as of January 1 |
|
176,816 |
|
219,496 |
Current service cost |
|
18,427 |
|
20,794 |
Interest cost |
|
17,338 |
|
15,371 |
Benefits paid |
|
(18,889) |
|
(19,487) |
Consolidation of contributions |
|
- |
|
(43,199) |
Net actuarial gain due to changes in assumptions(1) |
|
(565) |
|
(39,817) |
Net actuarial loss due to plan experience |
|
24,238 |
|
6,487 |
Foreign currency translation effect(2) |
|
(22,070) |
|
17,171 |
Defined obligation, unfunded as of December 31 |
|
195,295 |
|
176,816 |
(1)In the case of the plan in Guatemala, in 2022 the discount rate increased from 5.40% to 9.30%, generating an actuarial gain of COP 13,476, while in 2023 there was an actuarial loss of COP 2,772, mainly due to a higher than expected real salary growth and the decrease in the discount rate from 9.30% to 8.50%. In addition, Bancolombia S.A. presented a lower gain due to the decrease in the nominal discount rate (14.25% in 2022 to 11.75% in 2023) together with the change in the nominal inflation rate (7.30% in 2022 to 6.35% in 2023).
(2)Corresponds to Banagrícola S.A. y Filiales and Banco Agromercantil de Guatemala S.A. given higher devaluation between COP to USD currencies.
Asset plan
To support the Executive Pension Plan Premium, Bancolombia S.A. had established an asset plan managed by a Private Pension Fund. The plan's investment assets are measured at fair value using significant, unobservable market data and, therefore, are classified as Level 3. In 2022, this benefit was terminated and, as a consequence, the passive obligation of the Executive Pension Plan Premium ceased at the end of the year. The resources of the asset plan that backed this benefit were transferred to the accounts of the beneficiaries in the private pension fund, subject to the permanence of the employment relationship.
The plan assets’ fair value as of December 31, 2022 is as follow:
Bancolombia’s Plan assets |
|
2022 |
In millions of COP | ||
Fair value of assets as of January 1 |
|
30,121 |
F-120
Employee contributions |
|
6,614 |
Interest income on plan assets |
|
2,329 |
Return on plan assets greater/(less) than discount rate |
|
(4,245) |
Benefits paid |
|
(34,819) |
Fair value assets at the end of the year |
|
- |
19.4 Other long term benefits
In addition to legal benefits and the aforementioned post-employment benefits, the Bank grants to its employees other benefits based on the employees’ seniority. For the periods ended December 31, 2023 and December 31, 2022, the reconciliation of the other long term benefits is set below:
Other long term benefits |
|
2023 |
|
2022 |
In millions of COP | ||||
Present value of the obligation as of January 1 |
|
446,473 |
|
465,744 |
Current service cost |
|
48,790 |
|
24,106 |
Interest cost |
|
54,878 |
|
39,973 |
Benefits paid |
|
(55,257) |
|
(44,601) |
Net actuarial loss / (gain) due to changes in assumptions(1) |
|
38,497 |
|
(47,997) |
Net actuarial loss due to plan experience |
|
18,721 |
|
2,369 |
Foreign currency translation effect |
|
(8,892) |
|
6,879 |
Defined obligation, unfunded as of December 31 |
|
543,210 |
|
446,473 |
(1)In the case of Bancolombia S.A., in 2023 the discount rate decreased from 14.00% to 11.75% and the nominal inflation rate from 7.30% to 6.35%, generating an actuarial loss of COP 33,545, while in 2022 the discount rate increased from 8.00% to 14.00%, producing an actuarial gain of COP 33,143.
Defined contribution plans
The expense recognized in the line “Salaries and employee benefits” of the Consolidated Statement of Income for defined contribution plans, for current severance regimen and pension benefits, is as follows:
Defined contribution plans |
|
2023 |
|
2022 |
In millions of COP | ||||
Pension |
|
286,621 |
|
231,676 |
Current severance regimen |
|
82,963 |
|
63,802 |
Total |
|
369,584 |
|
295,478 |
The economic assumptions used in the determination of the present value of the defined benefit plans, in nominal terms, are as follows:
Colombia
Main projected assumptions |
|
December 31, 2023 |
|
December 31, 2022 |
|
Discount rate |
|
11.75 |
% |
14.25 |
% |
Rate of wage increase |
|
8.85 |
% |
9.80 |
% |
Projected inflation |
|
6.35 |
% |
7.30 |
% |
Rate of pension increase |
|
6.35 |
% |
7.30 |
% |
Bancolombia Panamá
Main projected assumptions |
|
December 31, 2023 |
|
December 31, 2022 |
|
Discount rate |
|
7.00 |
% |
6.50 |
% |
Rate of wage increase |
|
2.00 |
% |
2.00 |
% |
Projected inflation |
|
2.00 |
% |
2.00 |
% |
F-121
Banistmo
Main projected assumptions |
|
December 31, 2023 |
|
December 31, 2022 |
|
Discount rate |
|
7.60 |
% |
6.90 |
% |
Expected long-term rate of return on plan assets |
|
2.20 |
% |
0.70 |
% |
El Salvador
Main projected assumptions |
|
December 31, 2023 |
|
December 31, 2022 |
|
Discount rate |
|
6.20 |
% |
5.80 |
% |
Rate of wage increase |
|
2.50 |
% |
2.50 |
% |
Projected inflation |
|
1.50 |
% |
1.50 |
% |
Guatemala
Main projected assumptions |
|
December 31, 2023 |
|
December 31, 2022 |
|
Discount rate |
|
9.00 |
% |
10.20 |
% |
Rate of wage increase |
|
5.00 |
% |
5.00 |
% |
Projected inflation |
|
4.00 |
% |
4.00 |
% |
In 2023, assumptions regarding future longevity have been based on mortality tables, which reflect average ages of mortality from 20-60 years. The rate used to discount the obligation of the defined benefit plan to reflect the duration of the labor liabilities as of December 2023 corresponds to the yield of sovereign bonds of each country where the plan is established, either Colombia, Panama, Guatemala and El Salvador, as applicable, since the market transactions of these countries involving corporate bonds of high quality have no high levels of activity. The assumption of the rate of inflation is based on the long term projection of the Central Bank of Colombia, Panama, Guatemala and El Salvador.
The nature of the risks related to the obligations aforementioned are summarized below:
Investment risk |
The present value of the obligation for the defined benefits plan is calculated using a discount rate determined with reference to high quality sovereign yields of each country. Currently, the plan includes investment in financial instruments that are not vulnerable to market risks |
Interest rate risks |
A reduction of the bond interest rates will increase the obligation of the plan |
Longevity risk |
The present value of the obligation of the defined benefit plan is calculated with reference to the highest estimate of the mortality of participants during their time of employment. An increase in the life expectancy of the participants will increase the plan obligation |
Salary risk |
The present value of the obligation of the benefit plan is calculated with reference to the future salaries of the participants. As such, an increase in the participants’ wages will increase the obligation of the plan |
F-122
Estimated payment of future benefits
The payments of benefits, which reflect future service rendered, are considered to be paid as follows:
Years |
|
Pension Benefits |
|
Other benefits |
In millions of COP | ||||
2024 |
|
15,217 |
|
90,557 |
2025 |
|
15,296 |
|
83,744 |
2026 |
|
15,443 |
|
98,699 |
2027 |
|
15,388 |
|
89,188 |
2028 |
|
15,357 |
|
98,452 |
2029 a 2033 |
|
71,711 |
|
483,520 |
Sensitivity analysis
In presenting the sensitivity analysis, the present value of the defined benefit obligation has been calculated using the projected unit credit method at the end of the reporting period, which is the same method used to calculate the defined benefit obligation (DBO) recognized in the Statement of Financial Position. Obligations and expenses will change in the future as a result of future changes in the methods of projection and assumption, participant information, plan provisions and regulations, or as resulting from future gains and losses.
There were no changes in the methods and assumptions used in preparing the sensitivity analyses from prior years.
Colombia
Defined benefit pension plan
Assumption |
|
Value |
|
(Increase/Decrease) |
|
Effect on DBO |
In millions of COP | ||||||
Discount rate |
|
12.25 |
% |
0.50% increase |
|
(2,899) |
Discount rate |
|
11.25 |
% |
0.50% decrease |
|
3,071 |
Salary increases |
|
6.85 |
% |
0.50% increase |
|
3,436 |
Salary decreases |
|
5.85 |
% |
0.50% decrease |
|
(3,264) |
Mortality Table |
|
RV-08 ("Rentistas Validos") |
|
One year increase in life expectancy |
|
4,229 |
Retirement Pension Premium Plan
Assumption |
|
Value |
|
(Increase/Decrease) |
|
Effect on DBO |
In millions of COP | ||||||
Discount rate |
|
12.25 |
% |
0.50% increase |
|
(5,412) |
Discount rate |
|
11.25 |
% |
0.50% decrease |
|
5,894 |
Salary increases |
|
9.35 |
% |
0.50% increase |
|
6,058 |
Salary decreases |
|
8.35 |
% |
0.50% decrease |
|
(5,602) |
Severance obligation
Assumption |
|
Value |
|
(Increase/Decrease) |
|
Effect on DBO |
In millions of COP | ||||||
Discount rate |
|
11.75 |
% |
0.50% increase |
|
(177) |
Discount rate |
|
10.75 |
% |
0.50% decrease |
|
182 |
Salary increases |
|
9.35 |
% |
0.50% increase |
|
410 |
Salary decreases |
|
8.35 |
% |
0.50% decrease |
|
(402) |
F-123
Panama
Defined benefit pension plan
Assumption |
|
Value |
|
(Increase/Decrease) |
|
Effect on DBO |
In millions of COP | ||||||
Discount rate |
|
8.10 |
% |
0.50% increase |
|
(102) |
Discount rate |
|
7.10 |
% |
0.50% decrease |
|
108 |
Mortality Table |
|
RP-2000 |
|
One year increase in life expectancy |
|
86 |
Guatemala
Defined Benefit Pension Plan
Assumption |
|
Value |
|
(Increase/Decrease) |
|
Effect on DBO |
In millions of COP | ||||||
Discount rate |
|
9.50 |
% |
0.50% increase |
|
(2,226) |
Discount rate |
|
8.50 |
% |
0.50% decrease |
|
2,546 |
Salary increases |
|
5.50 |
% |
0.50% increase |
|
1,653 |
Salary decreases |
|
4.50 |
% |
0.50% decrease |
|
(1,482) |
Mortality Table |
|
RP-2000 |
|
One year increase in life expectancy |
|
784 |
Retirement Pension Premium Plan
Assumption |
|
Value |
|
(Increase/Decrease) |
|
Effect on DBO |
In millions of COP | ||||||
Discount rate |
|
9.00 |
% |
0.50% increase |
|
(1,461) |
Discount rate |
|
8.00 |
% |
0.50% decrease |
|
1,537 |
Salary increases |
|
5.50 |
% |
0.50% increase |
|
1,582 |
Salary decreases |
|
4.50 |
% |
0.50% decrease |
|
(1,515) |
El Salvador
Retirement Pension Premium Plan
Assumption |
|
Value |
|
(Increase/Decrease) |
|
Effect on DBO |
In millions of COP | ||||||
Discount rate |
|
6.70 |
% |
0.50% increase |
|
(724) |
Discount rate |
|
5.70 |
% |
0.50% decrease |
|
778 |
Salary increases |
|
3.00 |
% |
0.50% increase |
|
134 |
Salary decreases |
|
2.00 |
% |
0.50% decrease |
|
(183) |
Other long term benefits
Colombia
Assumption |
|
Value |
|
(Increase/Decrease) |
|
Effect on DBO |
In millions of COP | ||||||
Discount rate |
|
12.25 |
% |
0.50% increase |
|
(14,948) |
Discount rate |
|
11.25 |
% |
0.50% decrease |
|
15,879 |
Salary increases |
|
9.35 |
% |
0.50% increase |
|
16,208 |
Salary decreases |
|
8.35 |
% |
0.50% decrease |
|
(14,405) |
F-124
Guatemala
Assumption |
|
Value |
|
(Increase/Decrease) |
|
Effect on DBO |
In millions of COP | ||||||
Discount rate |
|
9.10 |
% |
0.50% increase |
|
(892) |
Discount rate |
|
8.10 |
% |
0.50% decrease |
|
952 |
Salary increases |
|
5.50 |
% |
0.50% increase |
|
981 |
Salary decreases |
|
4.50 |
% |
0.50% decrease |
|
(926) |
El Salvador
Assumption |
|
Value |
|
(Increase/Decrease) |
|
Effect on DBO |
In millions of COP | ||||||
Discount rate |
|
6.70 |
% |
0.50% increase |
|
(132) |
Discount rate |
|
5.70 |
% |
0.50% decrease |
|
140 |
Bonuses and short-term benefits
Short-term employment benefit plans recognized in the Consolidated Statement of Financial Position in the line “other liabilities” consist of the following:
|
|
December 31, |
|
December 31, |
Other employment benefit plans |
|
2023 |
|
2022 |
In millions of COP | ||||
Current severance obligation |
|
95,732 |
|
73,475 |
Bonuses and short-term benefits(1) |
|
734,916 |
|
640,458 |
Other employment benefit plans |
|
830,648 |
|
713,933 |
| (1) | The increases between December 31, 2023 and 2022, corresponds to the bonuses related to employees’ variable compensation. See Note 20 Other Liabilities. |
NOTE 20. OTHER LIABILITIES
Other liabilities consist of the following:
Other liabilities |
|
December 31, 2023 |
|
December 31, 2022 |
In millions of COP | ||||
Payables |
|
4,746,323 |
|
3,629,433 |
Suppliers(1) |
|
1,653,424 |
|
2,333,289 |
Advances to obligations |
|
1,199,509 |
|
1,082,447 |
Dividends(2) |
|
870,846 |
|
769,181 |
Collection services |
|
820,393 |
|
1,032,613 |
Deposits delivered as security(3) |
|
795,628 |
|
655,176 |
Bonuses and short-term benefits(4) |
|
734,916 |
|
640,458 |
Security contributions |
|
524,741 |
|
473,247 |
Provisions(5) |
|
401,111 |
|
417,242 |
Salaries and other labor obligations(6) |
|
396,734 |
|
359,673 |
Deferred interests |
|
217,507 |
|
96,939 |
Advances in leasing operations and loans |
|
186,547 |
|
282,173 |
Liabilities from contracts with customers(7) |
|
60,128 |
|
56,856 |
Other |
|
40,774 |
|
50,484 |
Total |
|
12,648,581 |
|
11,879,211 |
| (1) | The decrease corresponds mainly to cancellations of supplier invoices for purchases and imports of leasing assets. |
| (2) | This relates to the last installment pending payment January 2, 2024. See Consolidated Statement of Changes in Equity, distribution of dividends. |
F-125
| (3) | The variation is generated by the valuation of current operations with international counterparties. For more information See Note 5.2. Derivative financial instruments. |
| (4) | For further information, see Note 19. Employee benefit plans (Bonuses and short-term benefits). |
| (5) | See Note 21. Provisions and contingent liabilities. |
| (6) | For more information related to other employee benefits, see Note 19. Employee benefits. |
| (7) | See Note 25.3. Fees and commissions. |
NOTE 21. PROVISIONS AND CONTINGENT LIABILITIES
21.1. Provisions
The following tables show the detail of the provisions at December 31, 2023 and 2022:
As of December 31, 2023
|
|
|
|
|
|
|
|
|
|
|
|
|
|
|
Judicial |
|
Administrative |
|
Financial |
|
Loan |
|
Onerous |
|
|
|
|
proceedings |
|
proceedings(1) |
|
guarantees(2) |
|
commitments |
|
contracts(3) |
|
Total |
In millions of COP | ||||||||||||
Balance at January 1, 2023 |
|
47,577 |
|
84,997 |
|
16,501 |
|
265,405 |
|
2,762 |
|
417,242 |
Net provisions recognized during the period |
|
19,427 |
|
11,248 |
|
(14,139) |
|
4,394 |
|
538 |
|
21,468 |
Provisions used during the period |
|
(10,666) |
|
(3,865) |
|
- |
|
- |
|
- |
|
(14,531) |
Translation adjustment |
|
(1,395) |
|
- |
|
(124) |
|
(17,418) |
|
- |
|
(18,937) |
Effect of discounted cash flows |
|
(4,131) |
|
- |
|
- |
|
- |
|
- |
|
(4,131) |
Final balance at December 31, 2023 |
|
50,812 |
|
92,380 |
|
2,238 |
|
252,381 |
|
3,300 |
|
401,111 |
| (1) | Mainly includes environmental remediation of the Santa Elena property, see Note 21.2. Contingent Liabilities; Judicial Proceesing current and proceedings in administrative litigation regarding the discussion of the difference in income tax criteria according to the applicable tax law for COP 14,920. |
| (2) | The balance corresponds mainly to financial guarantees in Bancolombia S.A. and its decrease is due to the cancellation of operations |
| (3) | Onerous contracts corresponds to Renting Colombia S.A.S. |
As of December 31, 2022
|
|
Judicial |
|
Administrative |
|
Financial |
|
Loan |
|
Onerous |
|
|
|
|
proceedings |
|
proceedings(1) |
|
guarantees(2) |
|
commitments |
|
contracts(3) |
|
Total |
In millions of COP | ||||||||||||
Balance at January 1, 2022 |
|
35,815 |
|
15,340 |
|
31,111 |
|
204,655 |
|
1,096 |
|
288,017 |
Net provisions recognized during the period |
|
18,958 |
|
92,739 |
|
(14,716) |
|
48,727 |
|
1,666 |
|
147,374 |
Provisions used during the period |
|
(8,863) |
|
(23,082) |
|
- |
|
- |
|
- |
|
(31,945) |
Translation adjustment |
|
(1,733) |
|
- |
|
106 |
|
12,023 |
|
- |
|
10,396 |
Effect of discounted cash flows |
|
3,400 |
|
- |
|
- |
|
- |
|
- |
|
3,400 |
Final balance at December 31, 2022 |
|
47,577 |
|
84,997 |
|
16,501 |
|
265,405 |
|
2,762 |
|
417,242 |
| (1) | Mainly includes environmental remediation of the Santa Elena property, see Note 21.2. Contingent Liabilities; and proceedings in administrative litigation regarding the discussion of the difference in income tax criteria according to the applicable tax law for COP 14,002. |
| (2) | The balance corresponds mainly to financial guarantees in Bancolombia S.A. |
| (3) | Onerous contracts corresponds to Renting Colombia S.A.S. |
F-126
The following table shows the changes in the provision for financial guarantees and loan commitments during period at December 31, 2023 and 2022 with the expected credit loss model:
|
|
Stage 1 |
|
Stage 2 |
|
Stage 3 |
|
TOTAL |
Balance at January 1, 2023 |
|
140,574 |
|
82,615 |
|
58,717 |
|
281,906 |
Transfers |
|
34,443 |
|
(23,490) |
|
(10,953) |
|
- |
Transfer to stage 1 |
|
33,530 |
|
(24,858) |
|
(8,672) |
|
- |
Transfer to stage 2 |
|
2,384 |
|
4,992 |
|
(7,376) |
|
- |
Transfer to stage 3 |
|
(1,471) |
|
(3,624) |
|
5,095 |
|
- |
Provisions recognized during the period |
|
56,254 |
|
11,515 |
|
9,928 |
|
77,697 |
Provisions reversed during the period |
|
(60,779) |
|
(20,306) |
|
(6,357) |
|
(87,442) |
Translation adjustment |
|
(12,155) |
|
(5,276) |
|
(111) |
|
(17,542) |
Balance at December 31, 2023 |
|
158,337 |
|
45,058 |
|
51,224 |
|
254,619 |
|
|
Stage1 |
|
Stage2 |
|
Stage3 |
|
TOTAL |
Balance at January 1, 2022 |
|
104,204 |
|
59,825 |
|
71,737 |
|
235,766 |
Transfers |
|
24,198 |
|
1,873 |
|
(26,071) |
|
- |
Transfer to stage 1 |
|
25,578 |
|
(17,581) |
|
(7,997) |
|
- |
Transfer to stage 2 |
|
119 |
|
21,547 |
|
(21,666) |
|
- |
Transfer to stage 3 |
|
(1,499) |
|
(2,093) |
|
3,592 |
|
- |
Provisions recognized during the period |
|
60,707 |
|
22,636 |
|
8,149 |
|
91,492 |
Provisions reversed during the period |
|
(55,730) |
|
(6,559) |
|
4,808 |
|
(57,481) |
Translation adjustment |
|
7,195 |
|
4,840 |
|
94 |
|
12,129 |
Balance at December 31, 2022 |
|
140,574 |
|
82,615 |
|
58,717 |
|
281,906 |
Judicial proceedings
Judicial provisions refer to pending legal proceedings on employment matters, ordinary lawsuits, class actions suits, civil actions within criminal prosecutions and executive proceedings against the Bank. In the opinion of management, after receiving pertinent legal advice, the payments estimated to be made in connection with these proceedings will not generate significant losses in addition to the provisions recognized as of December 31, 2023 and 2022. In addition, the Bank does not expect to obtain any reimbursement from judicial proceedings raised against it and, therefore, has not recognized any assets for that purpose, see Note 21.2 Contingent liabilities.
Onerous contracts
For the Bank, an onerous contract is a contract in which the unavoidable costs of meeting the obligations under the contract exceed the economic benefits expected to be received under it.
Financial guarantees
As of December 31, 2023
Maturity |
|
Financial Guarantees |
In millions of COP | ||
Guarantees under 1 month |
|
826,699 |
Guarantees greater than 1 month and up to 3 months |
|
3,778,824 |
Guarantees greater than 3 months and up to 1 years |
|
5,609,521 |
Guarantees greater than 1 year and up to 3 years(1) |
|
1,489,899 |
Guarantees greater than 3 years and up to 5 years |
|
450,875 |
Guarantees greater than 5 years |
|
535,380 |
Total |
|
12,691,198 |
| (1) | The decrease with respect to the previous year is mainly due to the cancellation of operations with the following economic sectors: energy, private, among others. |
F-127
As of December 31, 2022
Maturity |
|
Financial Guarantees |
In millions of COP | ||
Guarantees under 1 month |
|
757,658 |
Guarantees greater than 1 month and up to 3 months |
|
1,286,137 |
Guarantees greater than 3 months and up to 1 years |
|
5,695,172 |
Guarantees greater than 1 year and up to 3 years |
|
3,660,806 |
Guarantees greater than 3 years and up to 5 years |
|
134,611 |
Guarantees greater than 5 years |
|
90,530 |
Total |
|
11,624,914 |
The total amount outstanding is the maximum potential payments which represent a “worse-case scenario”, and does not reflect expected results.
Loan commitments
As of December 31, 2023
Maturity |
|
Loan commitments |
In millions of COP | ||
Commitments under 1 month |
|
687,405 |
Commitments greater than 1 month and up to 3 months |
|
11,373 |
Commitments greater than 3 months and up to 1 years |
|
4,205,833 |
Commitments greater than 1 year and up to 3 years |
|
2,269,280 |
Commitments greater than 3 years and up to 5 years |
|
3,411,570 |
Commitments greater than 5 years |
|
648,153 |
Total |
|
11,233,614 |
As of December 31, 2022
Maturity |
|
Loan commitments |
In millions of COP | ||
Commitments under 1 month |
|
745,606 |
Commitments greater than 1 month and up to 3 months |
|
1,028,896 |
Commitments greater than 3 months and up to 1 years |
|
1,271,666 |
Commitments greater than 1 year and up to 3 years |
|
5,308,195 |
Commitments greater than 3 years and up to 5 years |
|
6,683,599 |
Commitments greater than 5 years |
|
827,797 |
Total |
|
15,865,759 |
21.2. Contingent liabilities
Contingencies due to judicial or administrative proceedings/litigations in which Bancolombia and the entities with which financial statements are consolidated as of December 31, 2023, and that represent a contingency superior to USD 6,585 are listed as follows.
Some of the proceedings in which the claims are inferior and that were revelated in prior periods will be kept to provide information about its evolution.
F-128
BANCOLOMBIA S.A.
Neos Group S.A.S. (in reorganization) and Inversiones Davanic S.A.S.
On November 3, 2022, Bancolombia was informed of a lawsuit in which the plaintiff contends that a loan agreement is in place between the parties, rather than a lease. The plaintiffs also requested that the purchase and sale agreement be rescinded on the basis that the price of the property was lower than its fair price.
The plaintiffs seek COP 65,000. The likelihood of recovering this amount is considered to be remote because the parties always intended to celebrate a lease and not a different type of contract. On December 7, 2022, Bancolombia issued an answer to the lawsuit. As of December 31, 2023, the proceeding is pending a response to the lawsuit from the other defendant. Bancolombia has not recorded a provision for this matter.
Constitutional Public Interest Action - Carlos Julio Aguilar and other
In this proceeding, a constitutional public interest action was filed, in which the plaintiffs allege that due to the restructuring of Departamento del Valle´s financial obligations and its Performance Plan, the collective rights of the public administration and the public funds of the Departamento del Valle were breached. According to the Bank's defense arguments, the agreement was made in accordance with the law.
As of December 31, 2023, the procedure is pending a first instance judgment. The contingency is deemed to be possible. Bancolombia has not recorded a provision for this matter.
Contraloría Departamental de Cundinamarca v. GEHS, Bancolombia and other natural persons
The development of the Water Treatment Plant PTAR Chía I Delicias Sur from Municipio de Chía, Colombia, was outlined in a lease agreement signed on September 28, 2015. The price agreed was COP 19,000. The object of the agreement was the financing of the Project, as well as the optimization, design, and construction of the Water Treatment Plant PTAR Chía I Delicias Sur.
As of December 31, 2018, Bancolombia had anticipated certain payments to the Supplier of the Project. The Municipio de Chía´s Mayor Office, has claimed that irregularities have been found during the execution of the Project. Because of these allegations, the Contraloría de Cundinamarca began a proceeding of Fiscal Responsibility against GEHS Global Environment and Health Solutions de Colombia (Supplier), Guillermo Varela Romero, Rafael Antonio Ballesteros Gómez, Luís Alejandro Prieto González (Municipio de Chía´s former Mayor and employees of the municipal administration), and Bancolombia S.A., on the basis of the alleged loss.
Bancolombia has alleged in its defense, among other arguments, that the Bank fully complied with its contractual obligations and that it is not responsible for the loss of the Municipality's resources.
On November 3, 2023, the Contraloría de Cundinamarca at first instance held responsible five individuals, including Bancolombia, for an amount of COP 7,649. Bancolombia filed a motion for reconsideration, and alternatively, an appeal against the decision. These proceedings are pending resolution.
As of December 31, 2023, taking into account these recent developments and further analysis, Bancolombia considers the contingency as possible, therefore has established a provision of COP 7,149. This amount corresponds to the judgment amount, deducting the value to be assumed by the insurance companies involved in the proceeding.
Remediation Plan for Santa Elena´s property
In 1987, Bancolombia (formerly Bank of Colombia) received a property located in Municipio de Cartagena, Colombia from the National Federation of Algodoneros. After the settlement was signed, soil contamination from pesticides and herbicides was found on the property. Bancolombia initiated a civil responsibility judicial procedure against the Federation alleging environmental contamination.
F-129
On November 13, 2015, the final judgment was issued, and it was decided that the National Federation of Algodoneros was liable for environmental damages and that Bancolombia was not.
Despite not being liable for environmental damages, Bancolombia is subject to decontamination requirements with respect to the property. Bancolombia has carried out over the years various activities aimed at containing the environmental impact, as well as the social management of the communities neighboring the lot. These activities include, among others, the confinement of contaminating material, installation of monitoring wells, and execution of plans to reduce contamination levels.
Currently, these plans have the approval of the Autoridad Nacional de Licencias Ambientales de Colombia (ANLA) and their execution is divided into 3 stages: Stage 1, Stage 2 and Stage 3. Bancolombia appealed the administrative act issued by the ANLA on the basis of technical issues for the execution of Stage 3, and it is pending resolution.
As of December 31, 2023, Bancolombia is progressing in the activities outlined in the plans to reduce contamination levels approved by ANLA, which include the monitoring of soils and waters in the area (Stage 1), monitoring of floors and walls in the warehouses (Stage 2), social management plan with the communities in the influence area of the remediation plan, emergency plan, hazardous waste management plan and biotic environment protection plan.
It is expected to complete the execution of the plans within 36 months, this timeframe may be adjusted based on new analyses or requirements from the authorities. As of December 31, 2023, Bancolombia has established a provision of COP 74,770 for the accomplishment of the remaining activities.
Fredy Alberto Lara Borja
On December 13, 2023, Bancolombia was notified of a lawsuit filed by a former employee of the liquidated company Aluminio Reynolds Santo Domingo S.A, seeking the absolute nullity of the purchase agreement between Leasing Bancolombia and Bancolombia S.A. for two properties signed in 2011. Leasing Bancolombia acquired those properties through a purchase agreement with the company Armarcas E.U, which had received them as a payment from Sociedad Aluminio Reynolds Santo Domingo S.A. The plaintiff requested that the properties be returned to Aluminios Reynolds Santo Domingo´s estate so they can be used as payment of the labor liabilities of the company. The value of the claim is COP 103,943.
Bancolombia filed an appeal against the court´s order admitting the lawsuit arguing, among other reasons, non-compliance of legal requirements and lack of jurisdiction. As of December 31, 2023, it is pending resolution. The contingency is deemed to be remote. Bancolombia has not recorded a provision for this matter.
FIDUCIARIA BANCOLOMBIA
Quinta Sur S.A.S.
In March 2022, Fiduciaria Bancolombia was notified of a lawsuit filed by Quinta Sur S.A.S. (in liquidation). According to the lawsuit, Quinta Sur seeks to be indemnified for damages as a result of the failure to transfer the resources to the plaintiff for the beginning of a housing construction project, under the terms agreed in the trust agreement.
Fiduciaria Bancolombia alleges that it has complied with the law and the contract, arguing that the property on which the housing project was to be constructed did not fulfill the contractual requirements. The plaintiff seeks COP 128,000.
On August 24, 2023, a favorable judgment was issued for Fiduciaria Bancolombia. As of December 31, 2023, the proceeding is pending the resolution of the appeal filed by the plaintiff. The contingency is deemed to be possible. Fiduciaria Bancolombia has not recorded provision for this matter.
F-130
BANISTMO
Constructora Tymsa S.A.
In October 2021, Banistmo and Banistmo Investment were notified of a lawsuit in which the plaintiff alleged fraudulent acts involving the sale of the plaintiff´s property. Constructora Tymsa alleges that the signatures and fingerprints in the public instrument of purchase, sale and in the mortgage in favor of Banistmo are false.
The plaintiff seeks USD 10,000, in addition to interests, costs and expenses. Banistmo and Banistmo Investment allege they are not liable for any intentional or negligent conduct in relation to the alleged fraudulent sale of the property. As of December 31, 2023, the proceeding is pending resolution of three incidents, including the lack of jurisdiction incident filed by the bank. The contingency is deemed to be possible. Banistmo has not recorded a provision for this matter.
Five Star Production Inc., Global Men Health Foundation, Ingrid Perscky and Others
In April 2022, Banistmo was notified of a lawsuit filed by Five Star Production Inc., Global Men Health Foundation, Ingrid Perscky and others for USD 5,000.
The lawsuit was filed on the basis of a dispute between Ingrid Perscky and Jose Barbero (who used to be husband and wife) for the distribution of their assets. In 2017, Ms. Perscky, who had an authorized signature, ordered the cancelation of a fixed term deposit from Five Star and instructed that those funds be transferred to 3 accounts that belonged to persons related to her (for example, her children). Mr. Barbero contacted Banistmo and tried to reverse the instructions, however as it was not possible, Mr. Barbero filed criminal complaints against Ms. Perscky.
Banistmo has complied with banking law and has handled the information´s confidentiality according to the law and the contract. The plaintiffs seek compensation for material and moral damages, alleging that Banistmo breached confidentiality and banking secret in detriment of the plaintiffs.
As of December 31, 2023, the evidentiary stage is pending. The contingency is deemed to be remote. Banistmo has not recorded a provision for this matter.
Deniss Rafael Pérez Perozo, Carlos Pérez Leal and others
Promotora Terramar (client of Banistmo, formerly HSBC Panamá) was paid USD 299, through Visa gift cards issued by a foreign bank. This payment was received as a partial payment of 2 apartments located in Panamá City.
The Credit Card Securities and Fraud Prevention department of the HSBC bank detected an irregular activity by Promotora Terramar on June 3, 2008, when a monitoring alert was activated due to the high number of cards with the same BIN and bank. Therefore, pursuant to the Business Establishments Affiliate Agreement, HSBC held funds from Promotora Terramar´s accounts. Nevertheless, after further investigations the money was refunded.
On October 2013, the plaintiffs filed a claim for compensation of the material and moral damages caused, which according to their valuation, amounts to USD 5,252,000. Banistmo alleges it has complied with the contractual terms outlined in the Affiliate Agreement and the statute of limitations deadline has lapsed, among other defenses.
As of December 31, 2023, commencement of the evidentiary stage is pending. The contingency is deemed to be remote. Banistmo has not recorded a provision for this matter.
DD&C, Carlos Pérez Leal and Others
In October 2022, Banistmo received a communication announcing the filing of a legal action in the Tribunal of First Instance of Kaloum in the Republic of Guinea. This action was initiated by Inversiones DD&C, Carlos Perez Leal and other natural persons against the Central Bank of the Republic of Guinea (“BCRG”) and five international banks, including Banistmo. The action seeks compensation for damages derived from alleged fraud involving six international transfers for a total USD 1,900 that Inversiones DD&C, who was a client of Banistmo at the time, ordered to be made to a bank account at the BCRG.
F-131
The parties who initiated the action are seeking USD 28,100 in “dommages matériels” (which are damages for alleged economic loss), as well as additional amounts in “dommages moraux” (which are damages for alleged non-economic loss, including alleged psychological suffering and moral anguish).
On May 22, 2023, a favorable first instance judgment was issued for Banistmo. The plaintiff filed an appeal against the decision. As of December 31, 2023, the proceeding is pending the scheduling of a date to conclude the appeal hearing.
The contingency is deemed to be remote. Banistmo has not recorded a provision for this matter.
BANCO AGRÍCOLA
Dirección General de Impuestos Internos of El Salvador
The authority on taxes of El Salvador (DGII), in accordance with the resolution of October 2018, determined that Banco Agrícola failed to pay and declare income taxes related to fiscal year 2014 for a total of USD 11,116 and related penalties.
In 2021, the appeal presented by Banco Agrícola was decided. The Tribunal de Apelaciones de los Impuestos Internos y Aduanas (TAII) modified the Resolution issued by DGII, adjusted the rental tax to USD 6,341 and revoked the sanction.
Banco Agrícola filed a lawsuit before the Contentious Administrative Tribunal seeking to overrule DGII´s and TAII´s previous decisions in relation to the tax’s payment. As of December 31, 2023, the initial hearing date is pending.
The contingency is deemed to be remote. Banco Agrícola has not recorded a provision for this matter.
ARRENDADORA FINANCIERA S.A.
Cordal filed a lawsuit against Arrendadora Financiera, seeking compensation for USD 6,454. According to the lawsuit, Cordal was the owner of a current account in Arrendadora Financiera (formerly Banco Capital S.A.) and it alleged that it´s funds were irregularly transferred to third parties. Arrendadora Financiera alleges Cordal´s account was liquidated before the acquisition of Banco Capital S.A. and, therefore, no funds were transferred.
As of December 31, 2023, the proceeding is at the evidentiary stage. The contingency is deemed to be remote. Arrendadora Financiera has not recorded a provision for this matter. A former employee of the plaintiff was convicted of aggravated theft in connection with the facts of this lawsuit.
BANCO AGROMERCANTIL
Bapa Holdings Corp.
On September 20, 2022, a lawsuit against Banco Agromercantil was filed by Bapa Holdings Corp. The plaintiff alleges it invested USD 7,000 through a participation agreement with North Shore Development Company (NDSC) for the development of a housing project that was going to be built in a property, which was security for a loan given by Banco Agromercantil to NDSC, located in Roatan Island, Honduras. Bapa claims BAM caused damages due to its failure to provide information about NDSC´s financial situation and going through with the sale of the credit.
On October 24, 2022, BAM responded to the claim and filed exceptions alleging that it has no commercial relationship with Bapa, and the statute of limitations deadline expired. As of December 31, 2023, the court is pending a ruling on the exceptions to the lawsuit.
The contingency is deemed to be remote. Banco Agromercantil has not recorded a provision for this matter.
F-132
Superintendencia de Administración Tributaria (SAT)
The Superintendencia de Administración Tributaria (SAT) de Guatemala ordered a tax adjustment in the fiscal year 2014 of Banco Agromercantil´s rental tax declaration, duly paid by BAM, for a value of USD 13,583 (including tax and sanction). Banco Agromercantil initiated legal proceedings against the decision adopted by de SAT, pleading that the tax discounts applied by the Bank were appropriate.
As a result of the agreement with SAT, BAM made a payment of USD 770 for taxes and penalties. As of December 31, 2023, the suspension of the case is still pending.
NOTE 22. SHARE CAPITAL
The subscribed and paid-in capital is the following:
Share capital |
|
December 31, 2023 |
|
December 31, 2022 |
Authorized shares |
|
1,400,000,000 |
|
1,400,000,000 |
Subscribed and paid-in shares: |
|
|
|
|
Ordinary shares with a nominal value of COP 500 pesos |
|
509,704,584 |
|
509,704,584 |
Preferred shares with dividend without voting rights with nominal value of COP 500 pesos |
|
452,122,416 |
|
452,122,416 |
Total subscribed and paid-in shares |
|
961,827,000 |
|
961,827,000 |
Subscribed and paid capital (nominal value, in millions of COP) |
|
480,914 |
|
480,914 |
Dividends declared
The declaration, amount and payment of dividends are based on Bancolombia S.A.’s unconsolidated net income. Dividends must be approved at the ordinary general shareholders' meeting upon the recommendation of the Board of Directors. Under the Colombian Commercial Code, after payment of income taxes and appropriation of legal and other reserves, and after setting off losses from prior fiscal years, Bancolombia must distribute to its stockholders at least 50% of its annual net income or 70% of its annual net income if the total amount of reserves exceeds its outstanding capital, unless such minimum percentages are waived by an affirmative vote of the holders of at least 78% of the shares present at the stockholders’ meeting. Such dividend distribution must be made to all stockholders, in cash or in issued stock of Bancolombia, as may be determined by the stockholders, and within a year from the date of the annual general ordinary stockholders' meeting in which the dividend was declared.
The payment of dividends must be made in cash during the year following the applicable date for the annual general ordinary stockholders' meeting. If the payment is made in the Bank’s own equity securities instead of cash, that must be approved by 80% of the outstanding common shareholders and 80% of the outstanding preferred shares.
The annual net profits of Bancolombia must be applied as follows: (i) first, an amount equal to 10% of Bancolombia’s net profits to a legal reserve until such reserve is equal to at least 50% of the Bank’s paid-in capital; (ii) second, to the payment of the minimum dividend on the preferred shares; and (iii) third, as may be determined in the ordinary annual general ordinary stockholders' meeting by the vote of the holders of a majority of the shares entitled to vote.
F-133
Dividends declared with respect to |
|
Cash dividends per share |
net income earned in: |
|
(Stated in COP) |
2023 |
|
3,536 |
2022 |
|
3,536 |
2021 |
|
3,120 |
2020 |
|
260 |
2019 |
|
1,638 |
Common shares
The holders of common shares are entitled to vote on any matter subject to approval at an annual general ordinary stockholders' meeting. Within 15 calendar days prior to such meeting, such holders are entitled to inspect the books and records of the Company.
Also, the holders of common shares will receive a proportion of the profits subject to the provisions of law, statutes and established at general shareholders’ meeting. The dividend received by holders of common shares may not be higher than the dividend assigned to preferred shares.
Preferred shares
Holders of preferred shares are entitled to receive dividends based on the net profits of the preceding fiscal year, after deducting losses affecting the capital and once the amount that shall be legally set apart for the legal reserve has been deducted, but before creating or accruing for any other reserve, of a non-cumulative minimum preferred dividend equal to one percent (1%) yearly of the subscription price of the preferred share, provided this dividend is higher than the dividend assigned to common shares. If this is not the case, the dividend shall be increased to an amount that is equal to the per share dividend on the common shares.
Payment of the preferred dividend shall be made at the time and in the manner established in the general shareholders’ meeting and with the priority indicated by Colombian law.
Any dividend in shares requires the approval of 80% or more of the shares present at a shareholders’ meeting, which will include 80% or more of the outstanding preferred shares. In the event of absence of such holders of preferred shares, a stock dividend only has can be payable to the holders of common shares that aprove this payment.
Reserved Shares
Stocks that are available between maximum authorized shares and paid-in shares. The Bank has not reserved shares.
NOTE 23. APPROPRIATED RESERVES
As of December 31, 2023 and 2022, the appropriated retained earnings consist of the following:
Concept |
|
December 31, 2023 |
|
December 31, 2022 |
In millions of COP | ||||
Appropriation of net income(1)(2) |
|
12,794,057 |
|
12,768,264 |
Others(3) |
|
7,250,712 |
|
3,162,401 |
Total Appropiated reserves |
|
20,044,769 |
|
15,930,665 |
| (1) | The legal reserve fulfills two objetives: to increase and maintain the company's capital and to absorb economic losses. Based on the aforementioned, this amount shall not be distributed in dividends to the stockholders. |
F-134
| (2) | As of December 31, 2023 and December 31, 2022 includes reclassification of unclaimed dividends under Article 85 of the Bancolombia S.A Bylaws for COP 557 and COP 574, respectively. |
| (3) | At Bancolombia S.A, the creation of an occasional reserve for equity strengthening and future growth continues, which was approved at the General Shareholders Meeting. |
NOTE 24. UNCONSOLIDATED STRUCTURED ENTITIES
Nature and risks associated with the Bank’s interests in unconsolidated structured entities
The term "unconsolidated structured entities" refers to all structured entities that are not controlled by the Bank. The Bank manages transactions with unconsolidated structured entities in the normal course of business to facilitate customer transactions and for specific investment opportunities.
The table below shows the total assets of unconsolidated structured entities in which the Bank had an interest at the reporting date and its maximum exposure to loss in relation to those interests.
As of December 31, 2023
|
|
Securitizations |
|
The Bank’s managed funds |
|
Total |
In millions of COP | ||||||
Total assets of the entities |
|
1,028,501 |
|
159,609,365 |
|
160,637,866 |
The Bank’s interest-assets |
|
|
|
|
|
|
Investments at fair value through profit or loss |
|
80,436 |
|
- |
|
80,436 |
Investments at fair value through other comprehensive income |
|
22,149 |
|
- |
|
22,149 |
Loans and advances to customers |
|
- |
|
7,997,406 |
|
7,997,406 |
Total assets in relation to the Bank’s interests in the unconsolidated structured entities |
|
102,585 |
|
7,997,406 |
|
8,099,991 |
The Bank’s maximum exposure |
|
102,585 |
|
7,997,406 |
|
8,099,991 |
Fees income |
|
3,763 |
|
474,136 |
|
477,899 |
As of December 31, 2022
|
|
Securitizations |
|
The Bank’s managed funds |
|
Total |
In millions of COP | ||||||
Total assets of the entities |
|
1,198,421 |
|
149,688,085 |
|
150,886,506 |
The Bank’s interest-assets |
|
|
|
|
|
|
Investments at fair value through profit or loss |
|
87,048 |
|
- |
|
87,048 |
Investments at fair value through other comprehensive income |
|
26,936 |
|
- |
|
26,936 |
Loans and advances to customers |
|
- |
|
6,116,373 |
|
6,116,373 |
Total assets in relation to the Bank’s interests in the unconsolidated structured entities |
|
113,984 |
|
6,116,373 |
|
6,230,357 |
The Bank’s maximum exposure |
|
113,984 |
|
6,116,373 |
|
6,230,357 |
Fees income |
|
4,532 |
|
435,177 |
|
439,709 |
Securitizations
The Bank invests in asset-backed securities issued by securitization entities for which underlying assets are mortgages originated by financial institutions. The Bank does not have a significant exposure to sub-prime securities. The asset-backed securities are denominated in local market TIPS and accounted for as investment at fair value through profit or loss and residual rights accounted for as investment at fair value through other comprehensive income. These asset-backed securities have different maturities and are generally classified by credit ratings.
F-135
The Bank does not expect significant changes in those ratings. Also, the Bank retains beneficial interests in the form of servicing fees on the securitized mortgages.
The Bank’s managed funds
The Bank’s managed funds are derived from the following type of business lines: related trusts, mutual funds sold to individuals, corporate trusts, escrow accounts, private equity funds, and delegated tailor-made mandates from third parties. Generally, the revenues correspond to the fees received from the management of resources that are invested in several instruments and management of properties and premises related to real estate projects in progress.
Likewise, the Bank receives fees for management assets pledged as collateral for clients’ commitments and obligations, and fees from management of resources of government agencies and entities.
On the other hand, there is not an additional exposure to loss, such as funding commitments with regards to the Bank’s involvement with those entities.
NOTE 25. OPERATING INCOME
25.1. Interest and valuation on financial instruments
The following table sets forth the detail of interest and valuation on financial asset instruments for the years ended December 31, 2023, 2022 and 2021:
|
|
2023 |
|
2022 |
|
2021 |
In millions of COP | ||||||
Interest on debt instruments using the effective interest method(1) |
|
1,029,377 |
|
588,792 |
|
311,488 |
Interest and valuation on financial instruments |
|
|
|
|
|
|
Debt investments(2) |
|
628,082 |
|
1,198,296 |
|
466,124 |
Repos |
|
137,014 |
|
(84,410) |
|
(56,555) |
Spot transactions |
|
(28,590) |
|
77,433 |
|
27,348 |
Derivatives |
|
(157,818) |
|
171,381 |
|
33,637 |
Total valuation on financial instruments |
|
578,688 |
|
1,362,700 |
|
470,554 |
Total Interest and valuation on financial instruments |
|
1,608,065 |
|
1,951,492 |
|
782,042 |
(1)The increase is mainly presented in Bancolombia S.A., due to higher profits in the valuation of TDA (Títulos de Desarrollo Agropecuario).
(2) In 2023 the decrease is mainly presented in Bancolombia S.A., due to a lower volume and lower valuation in the portfolio of securities issued by foreign governments (United States Treasury Bonds), which are directly related to the variations in the exchange rate, offset by an increase in the valuation of fixed rate TES.
25.2. Interest expenses
The following table sets forth the detail of interest on financial liability instruments for the years ended December 31, 2023, 2022 and 2021:
|
|
2023 |
|
2022 |
|
2021 |
In millions of COP | ||||||
Deposits(1) |
|
13,323,516 |
|
6,141,680 |
|
2,814,505 |
Borrowing costs(1) |
|
1,658,996 |
|
763,717 |
|
293,949 |
Debt instruments in issue |
|
1,426,615 |
|
1,328,511 |
|
1,053,441 |
Lease liabilities(2) |
|
113,815 |
|
111,349 |
|
111,556 |
Preferred shares |
|
57,701 |
|
57,701 |
|
57,701 |
Overnight funds |
|
30,540 |
|
11,375 |
|
3,870 |
Other interest (expense) |
|
57,112 |
|
28,137 |
|
16,534 |
F-136
Total interest expenses |
|
16,668,295 |
|
8,442,470 |
|
4,351,556 |
(1)The intervention rate issued by the Banco de la República de Colombia for the period of 2023 started at 12.00% and closed at 13.00%, for 2022 it started at 3.00% and closed at 12.00% and for 2021 it started at 1.75% and closed at 3.00%. This has an impact on the rates of deposits and financial obligations in addition, there was an increase of time deposits.
(2) See Note 7.2. Lessee.
Net interest income is defined as interest on loan portfolio and financial leasing operations, interest on debt instruments measured by the effective interest method and interest expense amounts to COP 19,601,869 COP 16,929,815 and COP 11,304,222 for the years ended in December 31, 2023, 2022 and 2021, respectively.
25.3. Fees and commissions
The Bank has elected to present the income from contracts with customers as an element in a line named “Fees and commissions income” in the consolidated statement of income separated from the other income sources.
The information contained in this section about the fees and commission’s income presents information on the nature, amount, timing and uncertainty of the income from ordinary activities which arise from a contract with a customer under the regulatory framework of IFRS 15 Revenue from Ordinary activities from Contracts with Customers.
In the following table, the description of the main activities through which the Bank generates revenue from contracts with customers is presented:
Fees and Commissions |
Description |
Banking services |
Banking Services are related to commissions from the use of digital physical channels or once the customer makes a transaction. The performance obligation is fulfilled once the payment is delivered to its beneficiary and the proof of receipt of the payment is sent, in that moment, the collection of the commission charged to the customer is generated, which is a fixed amount. The commitment is satisfied during the entire validity of the contract with the customer. The Bank acts as principal. |
Credit and debit card fees |
In debit card product contracts, it is identified that the price assigned to the services promised by the Bank to the customers is fixed. Given that no financing component exists, it is established on the basis of the national and international interbank rate. Additionally, the product charges to the customers commissions for handling fees, at a determined time and with a fixed rate. For Credit Cards, the commissions are the handling fees and depend on the card franchise. The commitment is satisfied in so far that the customer has capacity available on the card. Other revenue received by the (issuer) credit card product, is advance commission; this revenue is the charge generated each time the customer makes a national or international advance, at owned or non-owned ATMs, or through a physical branch. The exchange bank fee is a revenue for the Issuing Bank of the credit card for the services provided to the business for the transaction effected at the point of sale. The commission is accrued and collected immediately at the establishment and has a fixed amount. In the credit cards product there is a customer loyalty program, in which points are awarded for each transaction made by the customer in a retail establishment. The program is administrated by a third party who assumes the inventory and claims risks, for which it acts as agent. The Bank, recognized it as a lower value of the revenue from the exchange bank fee. The rights and obligations of each party in respect of the goods and services for transfer are clearly identified, the payment terms are explicit, and it is probable, that is, it takes into consideration the capacity of the customer and the intention of having to pay the consideration at termination to those entitled to change the transferred goods or services. The revenue is recognized at a point in time: the Bank satisfies the performance obligation when the “control” of the goods or services was transferred to the customers. |
F-137
Deposits |
Deposits are related to the services generated from the offices network of the Bank once a customer makes a transaction. The Bank generally commits to maintain active channels for the products that the customer has with the Bank, with the purpose of making payments and transfers, sending statements and making transactions in general. The commissions are deducted from the deposit account, and they are incurred at a point in time. The Bank acts as principal. |
Electronic services and ATMs |
Revenue received from electronic services and ATMs arises through the provision of services so that the customers may make required transactions, and which are enabled by the Bank. These include online and real-time payments by the customers of the Bank holding a checking or savings accounts, with a debit or credit card for the products and services that the customer offers. Each transaction has a single price, for a single service. The provision of collection services or other different services provided by the Bank, through electronic equipment, generates consideration chargeable to the customer established contractually by the Bank as a fee. The Bank acts as principal and the revenue is recognized at a point in time. |
Brokerage |
Brokerage is a group of services for the negotiation and administration of operations for purchasing fixed revenue securities, equities and operations with derivatives in its own name, but on the account of others. The performance obligations are fulfilled at a point in time when the commission agent in making its best effort can execute the business entrusted by the customer in the best conditions. The performance obligations are considered satisfied once the service stipulated in the contract is fulfilled, as consideration fixed, or variable payments are agreed, depending on the service. The Bank acts generally as principle and in some special cases as agent. |
Remittance |
Revenue for remittance is received as consideration for the commitment established by the Bank to pay remittances sent by the remitting companies to the beneficiaries of the same. The commitment is satisfied at a point in time to the extent that the remittance is paid to the beneficiary. The price is fixed, but may vary in accordance to the transferred amount, due to the operation being dependent on the volume of operations generated and the transaction type. There is no component of financing, nor the right to receive consideration dependent on the occurrence or not of a future event. |
Acceptances, Guarantees and Standby Letters of Credit |
Banking Service from acceptances, guarantees and standby letters of credit which are not part of the portfolio of the Bank. There exist different performance obligations; the satisfaction of performance obligations occurs when the service is given to the customer. The consideration in these types of contracts may include fixed amounts, variable amounts, or both, and the Bank acts as principal. The revenue is recognized at a point in time. |
Trust |
Revenue related to Trust are received from the administration of the customer resources in the business of investment trusts, property trusts, management trusts, guarantee trusts, for the resources of the general social security system, Collective portfolios and Private Equity Funds (PEF). The commitments are established in contracts independently and in an explicit manner, and the services provided by the Bank are not inter-related between the contracts. The performance obligation corresponds to performing the best management in terms of the services to be provided in relation to trust characteristics, thus fixed and variable prices are established depending on the complexity of the business, similarly, revenues are recognized throughout or at a determined time. In all the established businesses it acts as principal. |
Placement of Securities |
Valores Bancolombia makes available its commercial strength for the deposit, reinvestment of resources through financial instruments to the issuing company. It receives a payment for deposits made. The commitment of the contract is satisfied to the extent that the resources requested by the issuer are obtained through the distribution desks of Valores Bancolombia. The collection is made monthly. It is established that Valores Bancolombia may undertake collection of these commissions at the end of the month through a collection account charged to the issuer, acting as principal. |
F-138
Bancassurance |
The bank receives a commission for collecting insurance premiums at a given time and for allowing the use of its network to sell insurance from different insurance companies over time. The Bank in these bancassurance contracts acts as agent (intermediary between the customer and the insurance company), since it is the insurance company which assumes the risks, and which handles the complaints and claims of the customers inherent in each insurance. Therefore, the insurance company acts as principal before the customer. The prices agreed in bancassurance are defined as a percentage on the value of the policy premiums. The payment shall be tied to the premiums collected, sold or taken for the case of employees’ insurance. The aforementioned then means that the price is variable, since, the revenue will depend on the quantity of policies or calculations made by the insurance companies. |
Collections |
The Bank acting as principal, commits to collect outstanding invoices receivable by the collecting customers through the different channels offered by the bank, send the information of the collections made and credit the money to the savings or checking account defined by the collecting customer. The commitment is satisfied at a point in time to the extent that the money is collected by the different channels, the information of the said collections is delivered appropriately, and the resources are credited in real-time to the account agreed with the customer. For the service, the Bank receives a fixed payment, which is received for each transaction once the contract is in effect. |
Services |
These are the maintenance services performed on the fleet owned by the customers, these services are performed on demand, and the value of the service cost is invoiced plus an intermediation margin. The collection is made by the amount of expense invoiced by the provider plus an intermediation percentage, which ranges between 5% and 10% depending on the customer. The contract is written, is based on a framework contract which is held between the customers which contains the general terms of negotiation and the payment terms are generally 30 days after generating the invoice. The revenue is recognized when the service is provided. There is no financing nor sanctions for early cancellations. To view the details of the balance, refer to line ‘Logistics services’ in Note 25.4 Other operational Income. |
Gains on sale of assets |
These are the revenue from the sale of assets, where the sale value is higher than the book value recorded in the accounts, the difference representing the gains. The recognition of the revenue is at a point in time once the sale is realized. The Bank acts as principal in this type of transaction and the transaction price is determined by the market value of the asset being sold. To view the details of the balance, refer to line ‘Gain on sale of assets’ in Note 25.4 Other operational Income. |
F-139
Investment Banking |
Investment Banking offers to customer’s financial advisory services in the structuring of businesses in accordance with the needs of each one of them. The advisory services consist in realizing a financial structuring of a credit or bond in which the Investment Bank offers the elements so that the company decides the best option for structuring the instrument. In the financial advisory contract, a best efforts clause is included. The promises given to the customers are established in the contracts independently and explicitly. The services provided by the Invesment Bank are not interrelated between the contracts, correspond to the independent advice agreed and do not include additional services in the commission agreed with the customer. The advisory services offered in each one of the contracts are identifiable separately from the other performance commitments that the Investment Bank may have with the customers. The Investment Bank does not have a standard contract for the provision of advisory services, given than each contract is tailored to the customer’s needs. The transaction price is defined at the start of the contract and is assigned to each service provided independently. The price contains a fixed and a variable portion which is provided in the contracts. The variation depends on the placement amount for the case of a financial structuring contract and coordination of the issuance and conditions of the same. In these operations Banca de Inversion Bancolombia provides advice to the customers and the price shall depend at times on the success and amount of the operation. In the contracts subject to evaluation there are no incremental costs associated with the satisfaction of the commitments of the Bank with the customers provided for. In the contracts signed with the customers, a penalty clause is established in case of a customer withdrawing from continuing with the provision of the services established in the commercial offer. The penalty shall be recognized in the financial statements once the Investment Bank is notified on the withdrawal under the concept of charges for early termination of the contract. |
The Bank presents the information on revenue from contracts with customers in accordance with its operating segments defined earlier in Note 3. Operating Segments for each of the principal services offered.
The following table shows the balances categorized by nature and by segment of revenue from ordinary activities from contracts with customers, for further information about composition of Bank’ segments see Note 3. Operating segments:
As of December 31, 2023
|
|
|
|
|
|
|
|
|
|
|
|
|
|
|
|
|
|
|
|
|
|
|
|
|
|
|
|
|
|
|
|
|
|
|
|
|
|
|
|
|
|
|
|
|
|
|
|
|
|
|
|
|
|
|
|
|
|
|
|
|
|
|
|
Banking |
|
|
Banking |
|
|
Banking El |
|
|
Banking |
|
|
|
|
|
Investment |
|
|
|
|
|
International |
|
|
All Other |
|
|
Total |
|
|
|
Colombia |
|
|
Panama |
|
|
Salvador |
|
|
Guatemala |
|
|
Trust |
|
|
Banking |
|
|
Brokerage |
|
|
Banking |
|
|
Segments |
|
|
|
|
|
|
|
|
|
|
|
|
|
|
|
|
|
|
|
|
|
|
|
|
|
|
|
|
|
|
|
|
|
|
|
Revenue from contracts with customers |
|
In millions of COP |
||||||||||||||||||||||||||||
Fees and Commissions income |
|
|
|
|
|
|
|
|
|
|
|
|
|
|
|
|
|
|
|
|
|
|
|
|
|
|
|
|
|
|
Credit and debit card fees and commercial estabilshments |
|
2,467,174 |
|
|
272,380 |
|
|
233,049 |
|
|
95,833 |
|
|
- |
|
|
- |
|
|
- |
|
|
1,992 |
|
|
- |
|
|
3,070,428 |
|
Bancassurance |
|
924,280 |
|
|
72,705 |
|
|
77 |
|
|
- |
|
|
104 |
|
|
29 |
|
|
126 |
|
|
- |
|
|
- |
|
|
997,321 |
|
Banking services |
|
593,729 |
|
|
110,271 |
|
|
157,386 |
|
|
68,857 |
|
|
- |
|
|
- |
|
|
- |
|
|
37,746 |
|
|
23,574 |
|
|
991,563 |
|
Payment and collections |
|
950,167 |
|
|
15,236 |
|
|
- |
|
|
- |
|
|
- |
|
|
- |
|
|
- |
|
|
- |
|
|
- |
|
|
965,403 |
|
Fiduciary Activities and Securities |
|
- |
|
|
20,233 |
|
|
6,399 |
|
|
851 |
|
|
361,632 |
|
|
- |
|
|
74,377 |
|
|
54 |
|
|
- |
|
|
463,546 |
|
Acceptances, Guarantees and Standby Letters of Credit |
|
72,335 |
|
|
25,159 |
|
|
5,211 |
|
|
3,173 |
|
|
- |
|
|
- |
|
|
- |
|
|
1,803 |
|
|
- |
|
|
107,681 |
|
Investment banking |
|
- |
|
|
980 |
|
|
1,225 |
|
|
- |
|
|
- |
|
|
55,888 |
|
|
10,728 |
|
|
- |
|
|
- |
|
|
68,821 |
|
Brokerage |
|
- |
|
|
15,568 |
|
|
- |
|
|
- |
|
|
- |
|
|
- |
|
|
11,140 |
|
|
- |
|
|
- |
|
|
26,708 |
|
Others |
|
244,414 |
|
|
398 |
|
|
76,221 |
|
|
54,486 |
|
|
229 |
|
|
- |
|
|
7,614 |
|
|
5,633 |
|
|
412 |
|
|
389,407 |
|
Total revenue of contracts with customers |
|
5,252,099 |
|
|
532,930 |
|
|
479,568 |
|
|
223,200 |
|
|
361,965 |
|
|
55,917 |
|
|
103,985 |
|
|
47,228 |
|
|
23,986 |
|
|
7,080,878 |
|
As of December 31, 2022
|
|
|
|
|
|
|
|
|
|
|
|
|
|
|
|
|
|
|
|
|
|
|
|
|
|
|
|
|
|
|
|
|
|
|
|
|
|
|
|
|
|
|
|
|
|
|
|
|
|
|
|
|
|
|
|
|
|
|
|
|
|
|
|
Banking |
|
|
Banking |
|
|
Banking El |
|
|
Banking |
|
|
|
|
|
Investment |
|
|
|
|
|
International |
|
|
All Other |
|
|
Total |
|
|
|
Colombia |
|
|
Panama |
|
|
Salvador |
|
|
Guatemala |
|
|
Trust |
|
|
Banking |
|
|
Brokerage |
|
|
Banking |
|
|
Segments |
|
|
|
|
|
|
|
|
|
|
|
|
|
|
|
|
|
|
|
|
|
|
|
|
|
|
|
|
|
|
|
|
|
|
|
Revenue from contracts with customers |
|
In millions of COP |
||||||||||||||||||||||||||||
Fees and Commissions income |
|
|
|
|
|
|
|
|
|
|
|
|
|
|
|
|
|
|
|
|
|
|
|
|
|
|
|
|
|
|
Credit and debit card fees and commercial estabilshments |
|
2,248,727 |
|
|
232,637 |
|
|
216,977 |
|
|
79,551 |
|
|
- |
|
|
- |
|
|
- |
|
|
1,868 |
|
|
- |
|
|
2,779,760 |
|
Bancassurance |
|
814,653 |
|
|
57,858 |
|
|
97 |
|
|
- |
|
|
29 |
|
|
8 |
|
|
32 |
|
|
- |
|
|
- |
|
|
872,677 |
|
Banking services |
|
481,103 |
|
|
91,938 |
|
|
142,047 |
|
|
78,264 |
|
|
- |
|
|
- |
|
|
- |
|
|
31,277 |
|
|
12,732 |
|
|
837,361 |
|
F-140
Payment and collections |
|
851,983 |
|
|
13,975 |
|
|
- |
|
|
- |
|
|
- |
|
|
- |
|
|
- |
|
|
- |
|
|
- |
|
|
865,958 |
|
Fiduciary Activities and Securities |
|
- |
|
|
18,975 |
|
|
6,522 |
|
|
803 |
|
|
318,840 |
|
|
- |
|
|
78,509 |
|
|
53 |
|
|
- |
|
|
423,702 |
|
Acceptances, Guarantees and Standby Letters of Credit |
|
58,293 |
|
|
18,382 |
|
|
10,081 |
|
|
3,774 |
|
|
- |
|
|
- |
|
|
- |
|
|
828 |
|
|
- |
|
|
91,358 |
|
Investment banking |
|
- |
|
|
550 |
|
|
1,482 |
|
|
- |
|
|
- |
|
|
86,224 |
|
|
15,667 |
|
|
- |
|
|
- |
|
|
103,923 |
|
Brokerage |
|
- |
|
|
11,888 |
|
|
- |
|
|
- |
|
|
- |
|
|
- |
|
|
15,960 |
|
|
- |
|
|
- |
|
|
27,848 |
|
Others |
|
229,804 |
|
|
380 |
|
|
66,971 |
|
|
56,162 |
|
|
- |
|
|
- |
|
|
1,198 |
|
|
7,995 |
|
|
5,429 |
|
|
367,939 |
|
Total revenue of contracts with customers |
|
4,684,563 |
|
|
446,583 |
|
|
444,177 |
|
|
218,554 |
|
|
318,869 |
|
|
86,232 |
|
|
111,366 |
|
|
42,021 |
|
|
18,161 |
|
|
6,370,526 |
|
As of December 31, 2021
|
|
|
|
|
|
|
|
|
|
|
|
|
|
|
|
|
|
|
|
|
|
|
|
|
|
|
|
|
|
|
|
|
|
|
|
|
|
|
|
|
|
|
|
|
|
|
|
|
|
|
|
|
|
|
|
|
|
|
|
|
|
|
|
Banking |
|
|
Banking |
|
|
Banking El |
|
|
Banking |
|
|
|
|
|
Investment |
|
|
|
|
|
International |
|
|
All Other |
|
|
Total |
|
|
|
Colombia |
|
|
Panama |
|
|
Salvador |
|
|
Guatemala |
|
|
Trust |
|
|
Banking |
|
|
Brokerage |
|
|
Banking |
|
|
Segments |
|
|
|
|
|
|
|
|
|
|
|
|
|
|
|
|
|
|
|
|
|
|
|
|
|
|
|
|
|
|
|
|
|
|
|
Revenue from contracts with customers |
|
In millions of COP |
||||||||||||||||||||||||||||
Fees and Commissions income |
|
|
|
|
|
|
|
|
|
|
|
|
|
|
|
|
|
|
|
|
|
|
|
|
|
|
|
|
|
|
Credit and debit card fees and commercial estabilshments |
|
1,830,128 |
|
|
174,226 |
|
|
168,273 |
|
|
61,831 |
|
|
- |
|
|
- |
|
|
- |
|
|
1,663 |
|
|
- |
|
|
2,236,121 |
|
Bancassurance |
|
636,632 |
|
|
49,730 |
|
|
129 |
|
|
- |
|
|
40 |
|
|
10 |
|
|
51 |
|
|
- |
|
|
- |
|
|
686,592 |
|
Banking services |
|
414,870 |
|
|
69,379 |
|
|
118,532 |
|
|
56,548 |
|
|
- |
|
|
- |
|
|
- |
|
|
22,902 |
|
|
- |
|
|
682,231 |
|
Payment and collections |
|
723,297 |
|
|
10,064 |
|
|
- |
|
|
- |
|
|
- |
|
|
- |
|
|
- |
|
|
- |
|
|
- |
|
|
733,361 |
|
Fiduciary Activities and Securities |
|
- |
|
|
17,420 |
|
|
6,567 |
|
|
704 |
|
|
347,838 |
|
|
- |
|
|
90,548 |
|
|
46 |
|
|
- |
|
|
463,123 |
|
Acceptances, Guarantees and Standby Letters of Credit |
|
43,863 |
|
|
16,125 |
|
|
6,928 |
|
|
3,716 |
|
|
- |
|
|
- |
|
|
- |
|
|
1,917 |
|
|
- |
|
|
72,549 |
|
Investment banking |
|
- |
|
|
1,998 |
|
|
1,353 |
|
|
- |
|
|
- |
|
|
79,521 |
|
|
11,481 |
|
|
- |
|
|
- |
|
|
94,353 |
|
Brokerage |
|
- |
|
|
12,661 |
|
|
- |
|
|
- |
|
|
- |
|
|
- |
|
|
14,193 |
|
|
- |
|
|
- |
|
|
26,854 |
|
Others |
|
192,682 |
|
|
- |
|
|
57,942 |
|
|
37,109 |
|
|
- |
|
|
- |
|
|
1,009 |
|
|
6,781 |
|
|
3,097 |
|
|
298,620 |
|
Total revenue of contracts with customers |
|
3,841,472 |
|
|
351,603 |
|
|
359,724 |
|
|
159,908 |
|
|
347,878 |
|
|
79,531 |
|
|
117,282 |
|
|
33,309 |
|
|
3,097 |
|
|
5,293,804 |
|
For the determination of the transaction price, the Bank assigns to each one of the services the amount which represents the value expected to be received as consideration for each independent commitment, which is based on the relative price of independent sale. The price that the Bank determines for each performance obligation is done by defining the cost of each service, related tax and associated risks to the operation and inherent to the transaction plus the margin expected to be received in each one of the services, taking as references the market prices and conditions, as well as the segmentation of the customer.
In the transactions evaluated in the contracts, changes in the price of the transaction are not identified.
Contract assets with customers
The Bank receives payments from customers based on the provision of the service, in accordance to that established in the contracts. When the Bank incurs costs for providing the service prior to the invoicing, and if these are directly related with a contract, they improve the resources of the entity and are expected to recuperate, these costs correspond to a contract asset. Currently, the Group does not have assets related to contracts with customers.
As a practical expedient, the Bank recognizes the incremental costs of obtaining a contract as an expense when the amortization period of the asset is one year or less.
Contract liabilities with customers
The contract liabilities constitute the obligation of the Bank to transfer the services to a customer, for which the Group has received a payment on the part of the final customer or if the amount is due before the execution of the contract. They also include deferred income related to services that shall be delivered or provided in the future, which will be invoiced to the customer in advance, but which are still not due.
F-141
The following table shows the detail of accounts receivable, and contract liabilities balances as at December 31, 2023, 2022 and 2021:
|
|
2023 |
|
2022 |
|
2021 |
|
|
In millions of COP |
||||
Accounts receivable from contracts with customers(1) |
|
259,516 |
|
192,029 |
|
182,672 |
Liabilities from contracts with customers(2)(3)(4) |
|
60,128 |
|
56,856 |
|
55,025 |
(1) Allowances for receivables from customers are COP 21,591, COP 15,330 and COP 16,537 for the year 2023, 2022 and 2021, respectively.
(2) Contract liabilities are mainly related to commissions received from customers when the Bank issues financial guarantees. They are recognized as income during the term of the contract, according to the form and frequency of payment of the commissions. The weighted-average expected period for income recognition as of December 31, 2023 was 1.3 years, as of December 31, 2022, 1.6 years and as of December 31, 2021 was 1.3 years.
(3) During the years 2023 and 2022, income was recognized for COP 55,179 and COP 45,656 respectively from the liability of contracts with clients at the beginning of the period.
(4) See Note 20. Other liabilities.
The contract liabilities increased COP 3,272 in 2023 and COP 1,831 in 2022. The changes in contract liabilities are due to performance circumscribed in the contract.
Fees and Commissions Expenses
Fees and Commissions Expenses |
|
2023 |
|
2022 |
|
2021 |
|
|
In millions of COP |
||||
Banking services |
|
1,483,701 |
|
1,242,590 |
|
798,729 |
Sales, collections and other services |
|
851,784 |
|
708,803 |
|
619,715 |
Correspondent banking |
|
504,227 |
|
406,567 |
|
307,308 |
Payments and collections |
|
41,904 |
|
34,720 |
|
26,897 |
Others |
|
215,664 |
|
197,486 |
|
108,034 |
Total expenses for commissions |
|
3,097,280 |
|
2,590,166 |
|
1,860,683 |
25.4. Other operating income
The following table sets forth the detail of other operating income net for the years ended December 31, 2023, 2022 and 2021:
Other operating income |
|
2023 |
|
2022 |
|
2021 |
|
|
In millions of COP |
||||
Leases and related services(1) |
|
1,771,016 |
|
1,362,677 |
|
936,574 |
Net foreign exchange and Derivatives Foreign exchange contracts(2) |
|
1,215,064 |
|
(373,045) |
|
296,534 |
Investment property valuation(3) |
|
197,526 |
|
236,617 |
|
67,762 |
Gains on sale of assets |
|
170,910 |
|
171,482 |
|
227,445 |
Logistics services |
|
136,118 |
|
165,738 |
|
140,451 |
Insurance(4) |
|
86,330 |
|
92,294 |
|
54,833 |
Other reversals |
|
67,617 |
|
64,467 |
|
56,381 |
Penalties for failure to contracts |
|
13,855 |
|
6,833 |
|
15,680 |
Others |
|
321,214 |
|
326,372 |
|
226,481 |
Total Other operating income |
|
3,979,650 |
|
2,053,435 |
|
2,022,141 |
(1)Corresponds to operating leases for COP 833,244, COP 649,693 and COP 412,286, other related leasing services for COP 660,442, COP 541,436 and COP 375,275 (see Note 7.1 lessor), property leases for COP 228,325, COP 157,511 and COP 139,021 (see Note 11. Investment properties) and other assets for COP 49,005, COP 14,037, COP 9,992 for the years ended December 31, 2023, 2022 and 2021 respectively.
(2) Corresponds to the management of assets and liabilities in foreign currencies and the volatility of the U.S. dollar.
(3) In 2022 increased in properties and variation in fair value due to improved market conditions at the reporting date.
F-142
(4)Corresponds to income from insurance operations of Seguros Agromercantil S.A., subsidiary domiciled in Guatemala. In 2023, it includes the effect of the adoption of IFRS 17 Insurance Contract. See Note 32. Impacts on the application of new standards.
25.5. Dividends and net income on equity investments
The following table sets forth the detail of dividends received, and share of profits of equity method investees for the years ended December 31, 2023, 2022 and 2021:
Dividends and net income on equity investments |
|
2023 |
|
2022 |
|
2021 |
|
|
In millions of COP |
||||
Dividends(1) |
|
127,427 |
|
59,072 |
|
108,079 |
Equity method(2) |
|
113,115 |
|
219,105 |
|
199,652 |
Equity investments and other financial instruments(3) |
|
22,944 |
|
(672) |
|
7,253 |
(Losses) Gains on sale of investments in associates(4) |
|
- |
|
(34,451) |
|
9,896 |
Impairment of investments in associates and joint ventures(5) |
|
(108,175) |
|
(9,633) |
|
(1,733) |
Others(6) |
|
54,874 |
|
2,433 |
|
5,197 |
Total dividends received, and share of profits of equity method investees |
|
210,185 |
|
235,854 |
|
328,344 |
| (1) | As of December 31, 2023, 2022 and 2021, includes dividends received from equity investments at fair value through profit or loss for COP 768, COP 6,209 and COP 40,188, the decrease is the result of lower dividends on the preferred share of Tuya S.A and investments derecognised for COP 341, COP 116 and COP 251, respectively, dividends from equity investments at fair value through OCI for COP 18,464, COP 16,842 and COP 12,665, respectively and investments derecognised for COP 3,231 in 2023. Additionally, includes returns received of the associate at fair value P.A. Viva Malls for COP 104,623, COP 35,905, and COP 50,208, respectively. For further information, see Note 8. Investments in associates and joint ventures. |
| (2) | Corresponds to income from equity method of investments in associates as of December 31, 2023, 2022 and 2021 for COP 230,704, COP 265,885 and COP 179,032 (includes valuation of investments in associates at fair value), respectively, and joint ventures for COP (117,589), COP (46,780) and COP 20,620, respectively. For further information, see Note 8. Investments in associates and joint ventures. |
| (3) | For 2023, the increase is explained by the effect of the exchange of shares from Bolsa de Valores de Colombia for shares of the Holding Bursátil Regional in Chile. The Holding Bursátil Regional was constituted as of the integration of the Colombia, Perú and Chile Stock Exchanges in November 2023. For more information see Note 5.1. Financial assets investments. |
| (4) | In December 2022, was registered the spin-off of Protección S.A. and the creation of the company Asulado Seguros de Vida S.A., of which the Bank sold its participation to SURA Asset Management S.A., to comply with the authorized investment regime, and a loss of COP (41,434) was recognized, see Note 8 Investments in associates and joint ventures. Additionally, as a result of the sale in 2019 of the investments in the associates Avefarma S.A.S, Glassfarma Tech S.A.S. and Panamerican Pharmaceutical Holding Inc., COP 6,983 was received as contingent payment. For 2021, COP 9,896 had been received. |
| (5) | Corresponds to the impairment of associates and joint ventures, for 2023 in Compañía de Financiamiento TUYA S.A. recognized in the Investment Banking segment for COP 106,574, Reintegra S.A.S. for COP 2,017 and recovery of impairment in Fondo de Capital Privado Ruta del Sol compartimento A for COP 416 for impairment recorded in 2022, both recognized in the segment Others. For 2022, the impairment corresponds to Reintegra S.A.S for COP 7,688, Fondo de Capital Privado Ruta del Sol compartimiento A for COP 6,514 and Viliv S.A.S. (in liquidation) for COP 463, recognized in Others segments, offset by the recovery of impairment of the associate Internacional Ejecutiva de Aviación S.A.S for COP 5,032, impairment recognized in 2021 in the Investment Banking segment. For further information, see Note 8. Investments in associates and joint ventures. |
| (6) | For 2023, corresponds to gains recognized in acquisitions of P.A. Calle 84 (2) and P.A. Calle 84 (3) for COP 31,117 and P.A. Nomad Central for COP 23,757 from a bargain purchase. In 2022, this income corresponded to P.A. Fai Calle 77. For 2022, corresponds to gains recognized in acquisition of P.A. FAI Calle 77 from a bargain purchase. In 2021, corresponds to gains recognized by the Bank as the difference between book value and fair value of Wompi S.A.S. (before Vlipco S.A.S.) previous to its acquisition date, the transaction was completed in November 2021. For further information, see Note 9.3. Business combination. |
F-143
NOTE 26. OPERATING EXPENSES
26.1. Salaries and employee benefit
The detail for salaries and employee benefits for the years ended December 31, 2023, 2022 and 2021 is as follows:
Salaries and employee benefit |
|
2023 |
|
2022 |
|
2021 |
In millions of COP |
|
|
|
|
|
|
Salaries(1) |
|
2,286,471 |
|
1,897,710 |
|
1,648,872 |
Bonuses(2) |
|
940,292 |
|
823,517 |
|
714,353 |
Private premium(3) |
|
651,048 |
|
423,261 |
|
384,056 |
Social security contributions |
|
546,434 |
|
447,017 |
|
355,166 |
Indemnization payment |
|
179,916 |
|
189,643 |
|
137,453 |
Other benefits(4) |
|
746,073 |
|
636,508 |
|
542,696 |
Total Salaries and employee benefit |
|
5,350,234 |
|
4,417,656 |
|
3,782,596 |
| (1) | This is mainly explained by salary increases indexed to inflation. |
| (2) | Corresponds mainly to bonuses for employees in accordance with the variable compensation model of the Bank. |
| (3) | The increase corresponds to a higher provision due to a decrease in the nominal rate and the inflation rate. |
| (4) | Includes vacations, severance and interest on severance, pension and employee benefits, mainly policy benefits, training and recreation. |
26.2. Other administrative and general expenses
The detail for administrative and general expenses for the years ended December 31, 2023, 2022 and 2021 is as follows:
Other administrative and general expenses |
|
2023 |
|
2022 |
|
2021 |
|
|
In millions of COP |
|
|
|
|
Fees(1) |
|
943,781 |
|
864,520 |
|
758,986 |
Maintenance and repairs(2) |
|
900,251 |
|
757,861 |
|
592,493 |
Insurance(3) |
|
738,786 |
|
640,753 |
|
495,146 |
Data processing(4) |
|
473,059 |
|
362,621 |
|
363,105 |
Frauds and claims(5) |
|
346,899 |
|
258,834 |
|
182,916 |
Transport |
|
233,856 |
|
232,471 |
|
198,828 |
Advertising |
|
175,690 |
|
185,122 |
|
153,066 |
Cleaning and security services |
|
129,460 |
|
117,966 |
|
111,717 |
Public services |
|
125,433 |
|
119,949 |
|
149,029 |
Contributions and affiliations |
|
109,038 |
|
116,118 |
|
101,727 |
Communications |
|
74,685 |
|
72,501 |
|
71,861 |
Properties improvements and installation |
|
66,438 |
|
70,845 |
|
64,554 |
Useful and stationery |
|
57,061 |
|
55,045 |
|
53,476 |
Disputes, fines and sanctions(6) |
|
43,499 |
|
63,519 |
|
13,106 |
Real estate management |
|
33,637 |
|
30,216 |
|
28,962 |
Travel expenses |
|
31,813 |
|
25,600 |
|
10,713 |
Publications and subscriptions |
|
22,574 |
|
20,644 |
|
17,775 |
Storage services |
|
16,321 |
|
15,013 |
|
14,666 |
Legal expenses |
|
14,136 |
|
10,573 |
|
6,834 |
Others |
|
497,527 |
|
539,729 |
|
351,546 |
Total other administrative and general expenses(7) |
|
5,033,944 |
|
4,559,900 |
|
3,740,506 |
Taxes other than income tax(8) |
|
1,433,148 |
|
929,512 |
|
719,593 |
| (1) | Increase generated mainly by digital transformation fees. |
| (2) | Increase is caused mainly by vehicle maintenance for COP 85,247 and computer equipment maintenance for COP 46,626. |
| (3) | The increase is mainly generated by Fogafin deposit insurance due to an increase in the volume of time deposits. |
F-144
| (4) | In 2023, the increase generated mainly by license maintenance services, electronic data processing and technology services. |
| (5) | The increase is generated mainly in virtual transactions and cards frauds. |
| (6) | The amount for the year 2022 includes the following events: Banagrícola and subsidiaries by USD 4,000 due to out-of-court closing of contingency and in Banistmo and subsidiaries by USD 2,500 due to judgment against. |
| (7) | As of December 31, 2021, the Consolidated Statement of Income disclosed the line "Other expenses" for COP 218,586. Considering the nature of the operations contained in this caption, the Bank decided to reclassify this item in the Consolidated Statement of Income as of December 31, 2023, 2022 and 2021 in the line "Other administrative and general expenses". For comparative purposes, figure disclosed in 2021 in the line "Other administrative and general expenses" for COP 3,521,920 were modified to COP 3,740,506. |
| (8) | The increase mainly generates in industry and commerce taxes, value added tax (IVA) and Tax on Financial Movements (GMF). |
26.3. Impairment, depreciation and amortization
The detail for Impairment, depreciation and amortization for the years ended December 31, 2023, 2022 and 2021 is as follows:
Impairment, depreciation and amortization |
|
2023 |
|
2022 |
|
2021 |
|
|
In millions of COP |
|
|
|
|
Depreciation of premises and equipment(1) |
|
636,376 |
|
560,596 |
|
466,179 |
Depreciation of right-of-use assets(2) |
|
229,665 |
|
212,861 |
|
190,819 |
Amortization of intangible assets(3) |
|
212,317 |
|
175,991 |
|
198,169 |
Impairment of other assets, net(4)(5) |
|
46,501 |
|
31,127 |
|
65,391 |
Total impairment, depreciation and amortization |
|
1,124,859 |
|
980,575 |
|
920,558 |
(1)See Note 10 Premises and equipment, net.
(2)See Note 7.2 Lessee.
(3)See Note 9 Goodwill and intangibles assets, net.
(4) Includes value for impairment of property and equipment for COP 4,480 in 2023 and COP 3,536 in 2022.
(5)The detail of the impairment of other assets net by operating segments for the years ended December 31, 2023, 2022 and 2021 is presented in the table below:
Impairment (recovery) of other assets, net |
|
2023 |
|
2022 |
|
2021 |
|
|
In millions of COP |
|
|
|
|
Banking Colombia |
|
45,122 |
|
24,187 |
|
38,632 |
Banking Panama |
|
5,290 |
|
12,599 |
|
17,962 |
Banking Guatemala |
|
8,929 |
|
12,101 |
|
7,554 |
All other segments |
|
4,713 |
|
1,803 |
|
848 |
International Banking |
|
1,730 |
|
314 |
|
- |
Banking El Salvador(1) |
|
(19,283) |
|
(19,877) |
|
395 |
Total(2) |
|
46,501 |
|
31,127 |
|
65,391 |
(1)Corresponds mainly to the Net realizable value (NRV) and higher sales generated in 2022 compared to 2021.
(2)The variation in 2023 with respect to 2022 is mainly to the Net realizable value (NRV).
During 2023, 2022 and 2021, no significant cybersecurity breaches materialized, according to the data security policies established by Management.
NOTE 27. EARNING PER SHARE (‘EPS’)
Basic EPS is calculated by reducing the income from continuing operations by the amount of dividends declared in the current period for each class of stock and by the contractual amount of dividends that must be paid for the current period, considering the allocation of remaining earnings to common stock and participating securities to the extent that each security may share in earnings as if all of the earnings for the period had been distributed.
F-145
EPS is determined by dividing the total earnings allocated to each security by the weighted average number of common shares outstanding.
Diluted EPS assumes the issuance of common shares for all dilutive potential common shares outstanding during the reporting period. The Bank had no dilutive potential common shares as of December 31, 2023, 2022 and 2021.
The following table summarizes information related to the computation of basic EPS for the years ended December 31, 2023, 2022 and 2021 (in millions of pesos, except per share data):
|
|
2023 |
|
2022 |
|
2021 |
Income from continuing operations before attribution of non-controlling interests |
|
6,214,971 |
|
6,996,365 |
|
4,207,787 |
Less: Non-controlling interests from continuing operations |
|
98,035 |
|
212,875 |
|
120,992 |
Net income from controlling interest |
|
6,116,936 |
|
6,783,490 |
|
4,086,795 |
Less: Preferred dividends declared |
|
1,541,003 |
|
1,352,921 |
|
59,851 |
Less: Allocation of undistributed earnings to preferred stockholders |
|
1,303,784 |
|
1,805,191 |
|
1,830,636 |
Net income allocated to common shareholders for basic and diluted EPS |
|
3,272,149 |
|
3,625,378 |
|
2,196,308 |
Weighted average number of common shares outstanding used in basic EPS calculation (In millions) |
|
510 |
|
510 |
|
510 |
Basic and diluted earnings per share to common shareholders |
|
6,420 |
|
7,113 |
|
4,309 |
Basic and diluted earnings per share from continuing operations |
|
6,420 |
|
7,113 |
|
4,309 |
NOTE 28. RELATED PARTY TRANSACTIONS
IAS 24 Related Party Disclosures requires that an entity discloses:
| (a) | Transactions with its related parties; and |
| (b) | Relationships between a parent and its subsidiaries irrespective of whether there have been transactions between them. |
Under IAS 24, an entity must disclose transactions with its related parties, outstanding balances, including commitments, recognized in the consolidated and separate financial statements of a parent or investors with joint control or significant influence over, an investee presented in accordance with IFRS 10 Consolidated Financial Statements.
Under this standard parties are considered to be related if one party has the ability to control the other party or exercise significant influence over the other party in making financial or operational decisions, or one other party controls both. This definition applies to the Bank in the cases below:
| ● | Stockholders with ownership interest equal or higher than 20% of the Bank’s capital: |
| - | Grupo de Inversiones Suramericana S.A. |
| - | Fondo Bancolombia ADR Program. |
| ● | Members of Board of Directors and Senior Management, understood as the President and corporate Vice-presidents, as well as their close relatives (spouse and children) and the companies in which they have a participation of 10% or more of the Bank's capital. |
| ● | Associates and joint ventures for which Bancolombia S.A. or any of the subsidiaries of the Group provide commercial banking services and deposits. For these purposes, all companies in which Grupo Bancolombia has joint control or significant influence have been included. For more information see note 8. Investments in associates and joint control. |
Bancolombia S.A. or some of the subsidiaries of the Grupo Bancolombia provide banking and financial services to its related parties in order to satisfy their liquidity needs, and except for the intercompany merger agreement described below, these transactions are conducted on similar terms to third-party transactions and are not individually material. In the case of treasury operations, Bancolombia operates between its own position and its related parties through transactional channels or systems established for this purpose and under the conditions established by current regulations.
F-146
Between the Parent Company and its related parties, during the periods ending at December 31, 2023, 2022 and 2021, there were no:
| - | Loans that for its contractual terms do not represent a lending transaction. |
| - | Loans with interest rates different to those that are ordinarily paid or charged to third parties in similar conditions of term, risk, etc. |
| - | Operations whose characteristics differ from those carried out with third parties |
| - | Guarantees, pledges or commitments given or received in respect of the aforementioned transactions. |
As of December 31, 2023
|
|
Stockholders with an |
|
|
|
|
|
|
|
interest equal or |
|
|
Directors and |
|
Associates and |
|
|
higher than 20% of |
|
|
senior |
|
joint ventures |
|
|
the Bank's capital(1) |
|
|
management |
|
|
In millions of COP | |||||||
Assets |
|
|
|
|
|
|
|
Financial assets investments |
|
6,050 |
|
|
- |
|
54,001 |
Derivative financial instruments |
|
48,747 |
|
|
- |
|
7,297 |
Loans and advances to customers |
|
1,850,407 |
|
|
22,437 |
|
271,676 |
Allowance for loans, advances and lease losses |
|
(1,455) |
|
|
(50) |
|
(760) |
Investment in associates and joint ventures |
|
- |
|
|
- |
|
2,997,603 |
Other assets |
|
17,951 |
|
|
18 |
|
271,263 |
Total assets |
|
1,921,700 |
|
|
22,405 |
|
3,601,080 |
|
|
|
|
|
|
|
|
Liabilities |
|
|
|
|
|
|
|
Deposits by customers |
|
1,434,117 |
|
|
16,312 |
|
141,853 |
Derivative financial instruments |
|
14 |
|
|
209 |
|
1,068 |
Other liabilities |
|
23,070 |
|
|
59 |
|
70,387 |
Total liabilities |
|
1,457,201 |
|
|
16,580 |
|
213,308 |
|
|
|
|
|
|
|
|
Income |
|
|
|
|
|
|
|
Interest on loans and financial leases |
|
157,451 |
|
|
1,783 |
|
27,925 |
Valuation on financial instruments |
|
97 |
|
|
- |
|
11,998 |
Fees and commissions income |
|
744,000 |
|
|
98 |
|
14,647 |
Dividends and net income on equity investments(2) |
|
213 |
|
|
- |
|
109,563 |
Derivatives Foreign exchange contracts |
|
63,060 |
|
|
(218) |
|
27,174 |
Other operating income |
|
48,531 |
|
|
9 |
|
9,806 |
Net income |
|
1,013,352 |
|
|
1,672 |
|
201,113 |
|
|
|
|
|
|
|
|
Expenses |
|
|
|
|
|
|
|
Interest expenses |
|
181,085 |
|
|
1,038 |
|
8,261 |
Credit impairment charges, net |
|
(8,307) |
|
|
4 |
|
(1,193) |
Fees and commissions expenses |
|
590 |
|
|
- |
|
152,563 |
Employee benefits(3) |
|
89,199 |
|
|
93 |
|
- |
Other administrative and general expenses |
|
159,184 |
|
|
2,492 |
|
23,644 |
Total expenses |
|
421,751 |
|
|
3,627 |
|
183,275 |
| (1) | Includes Grupo Sura conglomerate. |
| (2) | Includes impairment of associates and joint ventures mainly in TUYA S.A. for COP 106,574. |
| (3) | In case of stockholders with an interest equal or higher than 20% of the Bank’s capital, includes the benefit provided to employees for insurance policies and for directors and senior management corresponds to the benefit of special credit rates for employees. |
F-147
As of December 31, 2022
|
|
Stockholders with an |
|
|
|
|
|
|
|
interest equal or |
|
|
Directors and |
|
Associates and |
|
|
higher than 20% of |
|
|
senior |
|
joint ventures |
|
|
the Bank's capital(1) |
|
|
management |
|
|
In millions of COP | |||||||
Assets |
|
|
|
|
|
|
|
Financial assets investments |
|
5,711 |
|
|
- |
|
51,991 |
Derivative financial instruments |
|
191 |
|
|
5 |
|
8 |
Loans and advances to customers |
|
947,150 |
|
|
28,935 |
|
342,896 |
Allowance for loans, advances and lease losses |
|
(9,746) |
|
|
(49) |
|
(3,470) |
Investment in associates and joint ventures |
|
- |
|
|
- |
|
2,915,633 |
Other assets(2) |
|
17,520 |
|
|
41 |
|
209,350 |
Total assets |
|
960,826 |
|
|
28,932 |
|
3,516,408 |
|
|
|
|
|
|
|
|
Liabilities |
|
|
|
|
|
|
|
Deposits by customers |
|
1,364,663 |
|
|
14,433 |
|
161,708 |
Derivative financial instruments |
|
23 |
|
|
- |
|
27,571 |
Other liabilities(2) |
|
26,803 |
|
|
56 |
|
54,017 |
Total liabilities |
|
1,391,489 |
|
|
14,489 |
|
243,296 |
|
|
|
|
|
|
|
|
Income |
|
|
|
|
|
|
|
Interest on loans and financial leases |
|
74,896 |
|
|
1,249 |
|
21,715 |
Valuation on financial instruments |
|
- |
|
|
- |
|
994 |
Fees and commissions income |
|
929,721 |
|
|
100 |
|
20,574 |
Dividends and net income on equity investments |
|
30 |
|
|
- |
|
224,602 |
Net foreign exchange and Derivatives Foreign exchange contracts |
|
(10,158) |
|
|
984 |
|
(30,484) |
Other operating income |
|
50,816 |
|
|
28 |
|
99,855 |
Net income |
|
1,045,305 |
|
|
2,361 |
|
337,256 |
|
|
|
|
|
|
|
|
Expenses |
|
|
|
|
|
|
|
Interest expenses |
|
112,403 |
|
|
301 |
|
8,483 |
Credit impairment charges, net |
|
10,171 |
|
|
50 |
|
(550) |
Fees and commissions expenses |
|
19 |
|
|
- |
|
180,951 |
Employee benefits(3) |
|
76,455 |
|
|
117 |
|
- |
Other administrative and general expenses |
|
161,367 |
|
|
2,056 |
|
30,792 |
Total expenses |
|
360,415 |
|
|
2,524 |
|
219,676 |
| (1) | Includes Grupo Sura conglomerate. |
| (2) | The values disclosed for Other assets and Other liabilities corresponding to Stockholders with an interest equal or higher than 20% as of December 31, 2022 were restated from COP 54,842 to COP 17,520 and from COP 163,385 to 26,803, respectively; this restatement has no effect on the Financial Statements and their notes, and it was also concluded that the revised figures were adjusted and disclosed on a comparative basis. |
| (3) | In case of stockholders with an interest equal or higher than 20% of the Bank’s capital, includes the benefit provided to employees for insurance policies and for directors and senior management corresponds to the benefit of special credit rates for employees. |
F-148
As of December 31, 2021
|
|
Stockholders with an |
|
|
|
|
|
|
|
interest equal or |
|
|
Directors and |
|
Associates and |
|
|
higher than 20% of |
|
|
senior |
|
joint ventures |
|
|
the Bank’s capital(1) |
|
|
management |
|
|
In millions of COP | |||||||
Assets |
|
|
|
|
|
|
|
Financial assets investments |
|
2,755 |
|
|
- |
|
9,635 |
Derivative financial instruments |
|
- |
|
|
25 |
|
- |
Loans and advances to customers |
|
937,190 |
|
|
17,821 |
|
234,956 |
Allowance for loans, advances and lease losses |
|
(3,028) |
|
|
(84) |
|
(5,360) |
Investment in associates and joint ventures |
|
- |
|
|
- |
|
2,720,559 |
Other assets |
|
7,644 |
|
|
913 |
|
172,636 |
Total assets |
|
944,561 |
|
|
18,675 |
|
3,132,426 |
|
|
|
|
|
|
|
|
Liabilities |
|
|
|
|
|
|
|
Deposits by customers |
|
2,101,846 |
|
|
8,175 |
|
194,864 |
Derivative financial instruments |
|
- |
|
|
6 |
|
8,565 |
Other liabilities |
|
1,120 |
|
|
368 |
|
36,596 |
Total liabilities |
|
2,102,966 |
|
|
8,549 |
|
240,025 |
|
|
|
|
|
|
|
|
Income |
|
|
|
|
|
|
|
Interest on loans and financial leases |
|
29,092 |
|
|
759 |
|
11,443 |
Valuation on financial instruments |
|
- |
|
|
- |
|
1,560 |
Fees and commissions income |
|
737,402 |
|
|
98 |
|
13,056 |
Dividends and net income on equity investments |
|
58 |
|
|
- |
|
289,423 |
Net foreign exchange and Derivatives Foreign exchange contracts |
|
(1,840) |
|
|
1,112 |
|
(9,966) |
Other operating income |
|
278 |
|
|
- |
|
55,524 |
Net income |
|
764,990 |
|
|
1,969 |
|
361,040 |
|
|
|
|
|
|
|
|
Expenses |
|
|
|
|
|
|
|
Interest expenses |
|
16,564 |
|
|
93 |
|
1,403 |
Credit impairment charges, net |
|
3,043 |
|
|
92 |
|
5,123 |
Fees and commissions expenses |
|
17 |
|
|
- |
|
130,950 |
Employee benefits(2) |
|
60,221 |
|
|
19 |
|
- |
Other administrative and general expenses |
|
14,148 |
|
|
1,724 |
|
32,071 |
Total expenses |
|
93,993 |
|
|
1,928 |
|
169,547 |
| (1) | Includes Grupo Sura conglomerate. |
| (2) | In case of stockholders with an interest equal or higher than 20% of the Bank’s capital, includes the benefit provided to employees for insurance policies and for directors and senior management corresponds to the benefit of special credit rates for employees. |
During the years ending December 31, 2023, 2022 and 2021, the Bank paid fees to the directors of COP 2,306, COP 1,937 and COP 1,655, respectively, as compensation for attending meetings of the Board and its Committees.
The payments to senior management in the same periods were COP 18,387, COP 15,776 and COP 10,487 for short-term retributions and COP 312, COP 552 and COP 604 for long-term retributions. In 2022, there was a consolidation of the contributions of the Senior Management Pension Plan for COP 36,962 (See Note 19.3 Retirement Pension Premium Plan), and there were payments for post-employment benefits of COP 827 in 2023, COP 642 in 2022 and 3,207 in 2021.
The Parent Company, which is also the ultimate parent company, is Bancolombia S.A. Transactions between companies included in consolidation, described in the significant accounting policies, see Note 2.C.1 Subsidiaries, meet the definition of related party transactions and were eliminated from the consolidated financial statements.
F-149
NOTE 29. LIABILITIES FROM FINANCING ACTIVITIES
The following table presents the reconciliation of the balances of liabilities from financing activities as of December 31, 2023 and 2022:
|
|
|
|
|
|
Non-cash changes |
|
|
||||
|
|
Balance as of |
|
|
|
Foreign |
|
|
|
|
|
|
|
|
January 1, 2023 |
|
Cash flows |
|
currency |
|
Interests |
|
Other |
|
Balance as of |
|
|
|
|
|
|
translation |
|
accrued |
|
movements |
|
December 31, 2023 |
|
|
|
|
|
|
adjustment |
|
|
|
|
|
|
|
|
In millions of COP |
||||||||||
Liabilities from financing activities |
|
|
|
|
|
|
|
|
|
|
|
|
Repurchase agreements and other similar secured borrowing |
|
189,052 |
|
304,846 |
|
(23,603) |
|
- |
|
- |
|
470,295 |
Borrowings from other financial institutions(1) |
|
19,692,638 |
|
(1,674,476) |
|
(4,029,947) |
|
1,658,996 |
|
1,395 |
|
15,648,606 |
Debt instruments in issue(1) |
|
19,575,988 |
|
(3,494,834) |
|
(2,844,193) |
|
1,426,615 |
|
- |
|
14,663,576 |
Preferred shares(2) |
|
584,204 |
|
(57,701) |
|
- |
|
57,701 |
|
- |
|
584,204 |
Total liabilities from financing activities |
|
40,041,882 |
|
(4,922,165) |
|
(6,897,743) |
|
3,143,312 |
|
1,395 |
|
31,366,681 |
| (1) | The cash flows disclosed in this table related with Borrowings from other financial institutions and Debt securities in issue include the interests paid during the year amounting to COP 1,607,927 and COP 1,347,889, respectively, which are classified as cash flows from operating activities in the Consolidated Statement of Cash Flow. |
| (2) | The cash flow amounting to COP 57,701 corresponds to the fixed minimum dividend paid to the preferred shares' holders and is included in the line "dividends paid" of the Consolidated Statement of Cash Flow, which includes the divideds paid during the year to both preferred and common shares holders. |
|
|
|
|
|
|
Non-cash changes |
|
|
||||
|
|
Balance as of |
|
|
|
Foreign |
|
|
|
|
|
|
|
|
January 1, 2022 |
|
Cash flows |
|
currency |
|
Interests |
|
Other |
|
Balance as of |
|
|
|
|
|
|
translation |
|
accrued |
|
movements |
|
December 31, 2022 |
|
|
|
|
|
|
adjustment |
|
|
|
|
|
|
|
|
In millions of COP |
||||||||||
Liabilities from financing activities |
|
|
|
|
|
|
|
|
|
|
|
|
Repurchase agreements and other similar secured borrowing |
|
763,325 |
|
(579,488) |
|
5,215 |
|
- |
|
- |
|
189,052 |
Borrowings from other financial institutions(1) |
|
8,551,558 |
|
7,963,253 |
|
2,404,567 |
|
763,717 |
|
9,543 |
|
19,692,638 |
Debt instruments in issue(1) |
|
21,093,864 |
|
(5,767,989) |
|
2,921,602 |
|
1,328,511 |
|
- |
|
19,575,988 |
Preferred shares(2) |
|
584,204 |
|
(57,701) |
|
- |
|
57,701 |
|
- |
|
584,204 |
Total liabilities from financing activities |
|
30,992,951 |
|
1,558,075 |
|
5,331,384 |
|
2,149,929 |
|
9,543 |
|
40,041,882 |
| (1) | The cash flows disclosed in this table related with Borrowings from other financial institutions and Debt securities in issue include the interests paid during the year amounting to COP 536,024 and COP 1,206,895, respectively, which are classified as cash flows from operating activities in the Consolidated Statement of Cash Flow. |
| (2) | The cash flow amounting to COP 57,701 corresponds to the fixed minimum dividend paid to the preferred shares' holders and is included in the line "dividends paid" of the Consolidated Statement of Cash Flow, which includes the divideds paid during the year to both preferred and common shares holders. |
F-150
NOTE 30. FAIR VALUE OF ASSETS AND LIABILITIES
The following table presents the carrying amount and the fair value of the assets and liabilities as of December 31, 2023 and 2022:
|
|
December 31, 2023 |
|
December 31, 2022 |
||||
|
|
Carrying |
|
Fair |
|
Carrying |
|
Fair |
|
|
amount |
|
Value |
|
amount |
|
Value |
In millions of COP | ||||||||
Assets |
|
|
|
|
|
|
|
|
Debt instruments at fair value through profit or loss |
|
12,096,407 |
|
12,096,407 |
|
11,039,266 |
|
11,039,266 |
Debt instruments at fair value through OCI |
|
6,148,177 |
|
6,148,177 |
|
7,977,675 |
|
7,977,675 |
Debt instruments at amortized cost |
|
6,848,082 |
|
6,840,867 |
|
8,336,360 |
|
8,246,876 |
Derivative financial instruments |
|
6,252,270 |
|
6,252,270 |
|
4,961,237 |
|
4,961,237 |
Equity securities at fair value |
|
543,210 |
|
543,210 |
|
544,668 |
|
544,668 |
Other financial instruments(1) |
|
38,319 |
|
38,319 |
|
42,171 |
|
42,171 |
Loans and advances to customers at amortized cost, net |
|
237,728,544 |
|
238,771,724 |
|
254,444,099 |
|
251,336,077 |
Investment property |
|
4,709,911 |
|
4,709,911 |
|
3,994,058 |
|
3,994,058 |
Investments in associates(2) |
|
1,670,782 |
|
1,670,782 |
|
1,532,156 |
|
1,532,156 |
Total |
|
276,035,702 |
|
277,071,667 |
|
292,871,690 |
|
289,674,184 |
Liabilities |
|
|
|
|
|
|
|
|
Deposits by customers |
|
247,941,180 |
|
249,340,519 |
|
250,992,323 |
|
249,503,805 |
Interbank deposits |
|
606,141 |
|
606,141 |
|
902,132 |
|
902,132 |
Repurchase agreements and other similar secured borrowing |
|
470,295 |
|
470,295 |
|
189,052 |
|
189,052 |
Derivative financial instruments |
|
6,710,364 |
|
6,710,364 |
|
4,737,454 |
|
4,737,454 |
Borrowings from other financial institutions |
|
15,648,606 |
|
15,648,606 |
|
19,692,638 |
|
19,692,638 |
Preferred shares |
|
584,204 |
|
394,550 |
|
584,204 |
|
350,978 |
Debt instruments in issue |
|
14,663,576 |
|
14,468,650 |
|
19,575,988 |
|
18,776,819 |
Total |
|
286,624,366 |
|
287,639,125 |
|
296,673,791 |
|
294,152,878 |
| (1) | For futher information see Note 5.1. Financial assets investments. |
| (2) | It corresponds to investments in associates P.A Viva Malls and Distrito Vera. See Note 8 Investments in associates and joint ventures. |
Fair value hierarchy
IFRS 13 establishes a fair value hierarchy of valuation techniques based on whether the inputs to those valuation techniques are observable or unobservable, that reflects the significance of inputs adopted in the measurement process. In accordance with IFRS the financial instruments are classified as follows:
Level 1: Observable inputs that reflect quoted prices (unadjusted) in active markets for identical assets or liabilities. An active market is a market in which transactions for the asset or liability being measured take place with sufficient frequency and volume to provide pricing information on an ongoing basis.
Level 2: Inputs other than quoted prices included in Level 1 that are observable for the asset or liability either directly or indirectly. Level 2 generally includes: (i) quoted prices for similar assets or liabilities in active markets; (ii) quoted prices for identical or similar assets or liabilities in markets that are not active, that is, markets in which there are few transactions for the asset or liability.
Level 3: Unobservable inputs that are supported by little or no market activity and that are significant to the fair value of the assets or liabilities. Level 3 assets and liabilities include financial instruments whose value is determined using pricing models, discounted cash flow methodologies, or similar techniques, as well as instruments for which the determination of fair value requires significant management judgment or estimation. This category generally includes certain retained residual interests in securitizations, asset-backed securities (ABS) and highly structured or long-term derivative contracts where independent pricing information was not able to be obtained for a significant portion of the underlying assets.
F-151
Valuation process for fair value measurements
The valuation to fair value prices is performed using prices, methodologies and inputs provided by the official pricing services provider (Precia) to the Bank.
All methodologies and procedures developed by the pricing services provider are supervised by the Financial Superintendence of Colombia, which has not objected to them.
On a daily basis, the back-office Service Valuation Officer (SVO) verifies the valuation of investments, and the Credit and Financial Risk Manager area reports the results of the portfolio’s valuation.
Fair value measurement
Assets and liabilities
a. Debt instruments
The Bank assigns prices to those debt investments, using the prices provided by the official pricing services provider (Precia) and assigns the appropriate level according to the procedure described above. For securities not traded or over-the-counter such as certain bonds issued by other financial institutions, the Bank generally determines fair value utilizing internal valuation and standard techniques. These techniques include determination of expected future cash flows which are discounted using curves of the applicable currencies and the Colombian consumer price index (interest rate in this case), modified by the credit risk and liquidity risk. The interest rate is generally computed using observable market data and reference yield curves derived from quoted interest in appropriate time bandings, which match the timings of the cash flows and maturities of the instruments.
b. Equity securities and other financial instruments
The Bank performs the market price valuation of its investments in variable income using the prices provided by the official pricing services provider (Precia) and classifies those investments according to the procedure described above (Hierarchy of fair value section). Likewise, the fair value of unlisted equity securities and other financial instruments is based on an assessment of each individual investment using methodologies that include publicly-traded comparables derived by multiplying a key performance metric (e.g., earnings before interest, taxes, depreciation and amortization) of the portfolio company by the relevant valuation multiple observed for comparable companies, acquisition comparables, and if necessary considered, are subject to appropriate discounts for lack of liquidity or marketability. Interests in investment funds, trusts and collective portfolios are valued using the investment unit value determined by the fund management company. For investment funds where the underlying assets are investment properties, the investment unit value depends on the investment properties value, determined as described below in “i. Investment property”.
c. Derivative financial instruments
The Bank holds positions in standardized derivatives, such as futures over local stocks, and over the market representative rate. These instruments are evaluated according to the information provided by Precia, which perfectly matches the information provided by the Central Counterparty Clearing House – CCP.
Additionally, the Bank holds positions in Over The Counter (OTC) derivatives, which in the absence of prices, are valued using the inputs and methodologies provided by the pricing services provider, which have the no objection of the SFC.
The key inputs depend upon the type of derivative and the nature of the underlying instrument and include interest rate yield curves, foreign exchange rates, the spot price of the underlying volatility, credit curves and correlation of such inputs.
F-152
d. Credit valuation adjustment
The Bank measures the effects of the credit risk of its counterparties and its own creditworthiness in determining fair value of the swap, option and forward derivatives.
Counterparty credit-risk adjustments are applied to derivatives when the Bank’s position is a derivative asset and the Bank’s credit risk is incorporated when the position is a derivative liability. The Bank attempts to mitigate credit risk to third parties which are international banks by entering into master netting agreements. The agreements allow to offset or bring net amounts that are liabilities, derivates from transactions carried out by the different agreements. Master netting agreements take different forms and may allow payments to be made under a variety of other master agreements or other negotiation agreements between the same parties; some may have a monthly basis and others only apply at the time the agreements are terminated.
When assessing the impact of credit exposure, only the net counterparty exposure is considered at risk, due to the offsetting of certain same-counterparty positions and the application of cash and other collateral.
The Bank generally calculates the asset’s credit risk adjustment for derivatives transacted with international financial institutions by incorporating indicative credit related pricing that is generally observable in the market (Credit Default Swaps, “CDS”). The credit-risk adjustment for derivatives transacted with non-public counterparties is calculated by incorporating unobservable credit data derived from internal credit qualifications to the financial institutions and corporate companies located in Colombia. The Bank also considers its own creditworthiness when determining the fair value of an instrument, including OTC derivative instruments if the Bank believes market participants would take that into account when transacting the respective instrument. The approach to measuring the impact of the Bank’s credit risk on an instrument transacted with international financial institutions is done using the asset swap curve calculated for subordinated bonds issued by the Bank in foreign currency. For derivatives transacted with local financial institutions, the Bank calculates the credit risk adjustment by incorporating credit risk data provided by rating agencies and released in the Colombian financial market.
e. Impaired loans measured at fair value
The Bank measured certain impaired loans based on the fair value of the associated collateral less costs to sell. The fair values were determined as follows using external and internal valuation techniques or third party experts, depending on the type of underlying asset.
For vehicles under leasing arrangements, the Bank uses an internal valuation model based on price curves for each type of vehicle. Such curves show the expected price of the vehicle at different points in time based on the initial price and projection of economic variables such as inflation, devaluation and customs. The prices modelled in the curves are compared every six months with market information for the same or similar vehicles and in the case of significant deviation; the curve is adjusted to reflect the market conditions.
Other vehicles are measured using matrix pricing from a third party. This matrix is used by most of the market participants and is updated monthly. The matrix is developed from values provided by several price providers for identical or similar vehicles and considers brand, characteristics of the vehicles, and manufacturing date among other variables to determine the prices.
For real estate assets, a third-party qualified appraiser is used. The methodologies vary depending on the date of the last appraisal available for the property (the appraisal is estimated based on either of three approaches: cost, sales comparison and income approach, and is required every three years). When the property has been valued in the last 12 months and the market conditions have not shown significant changes, the most recent valuation is considered the fair value of the property.
For all other cases (for example, appraisals older than 12 months) the value of the property is updated by adjusting the value in the last appraisal for weighted factors such as location, type and characteristics of the property, size, structural conditions and the expected sales prices, among others.
F-153
The factors are determined based on current market information gathered from several external real estate specialists.For all other cases (for example, appraisals older than 12 months) the value of the property is updated by adjusting the value in the last appraisal for weighted factors such as location, type and characteristics of the property, size, structural conditions and the expected sales prices, among others. The factors are determined based on current market information gathered from several external real estate specialists.
f. Assets held for sale measured at fair value less cost of sale
The Bank measures certain impaired foreclosed assets and premises and equipment held for sale based on fair value less costs to sell. The fair values were determined using external and internal valuation techniques, depending on the type of underlying asset. Those assets are comprised mainly of real estate properties for which the appraisal is conducted by experts considering factors such as the location, type and characteristics of the property, size, physical conditions and expected selling costs, among others. Likewise, in some cases the fair value is estimated considering comparable prices or promises of sale and offering prices from auctions process.
g. Mortgage-backed securities (“TIPS”) and Asset-Backed securities
The Bank invests in asset-backed securities for which underlying assets are mortgages and earnings under contracts issued by financial institutions and corporations, respectively. The Bank does not have a significant exposure to sub-prime securities. The asset-backed securities are denominated in local market TIPS and are classified as fair value through profit or loss. These asset-backed securities have different maturities and are generally classified by credit ratings.
TIPS are part of the Bank portfolio and its fair value is measured with published price by the official pricing services provider. These securities are leveled by margin and are assigned level 2 or 3 based on the Precia information.
Residual TIPS have their fair value measured using the discounted flow method, taking into account the amortization tables of the Titularizadora Colombiana, the betas in COP and UVR of Precia (used to construct the curves) and the margins; when they are residual TIPS of subordinated issues, a liquidity premium is applied. These securities are assigned level 3.
h. Investments in associates measured at fair value
The Bank recognizes its investments in P.A Viva Malls and P.A Distrito Vera as an associate at fair value. The estimated amount is provided by the fund manager as the variation of the units according to the units owned by the FCP Fondo Inmobiliario Colombia. The associate’s assets are comprised of investment properties which are measured using the following techniques: comparable prices, discounted cash flows, replacement cost and direct capitalization. For further information about techniques methodologies and inputs used by the external party see “Quantitative Information about Level 3 Fair Value Measurements”.
i. Investment property
The Bank’s investment property is valued by external experts, who use valuation techniques based on comparable prices, direct capitalization, discounted cash flows and replacement costs.
Assets and liabilities measured at fair value on a recurring basis
The following table presents for each of the fair-value hierarchy levels the Bank’s assets and liabilities that are measured at fair value on a recurring basis at December 31, 2023 and 2022:
F-154
Financial Assets | ||||||||||||||||
|
|
December 31, 2023 |
|
December 31, 2022 |
||||||||||||
Type of instrument |
|
Fair value hierarchy |
|
Total fair |
|
Fair value hierarchy |
|
Total fair |
||||||||
|
|
Level 1 |
|
Level 2 |
|
Level 3 |
|
value |
|
Level 1 |
|
Level 2 |
|
Level 3 |
|
value |
In millions of COP | ||||||||||||||||
Investment securities |
|
|
|
|
|
|
|
|
|
|
|
|
|
|
|
|
Debt instruments at fair value through profit or loss |
|
|
|
|
|
|
|
|
|
|
|
|
|
|
|
|
Securities issued by the Colombian Government |
|
4,363,135 |
|
362,470 |
|
- |
|
4,725,605 |
|
3,960,211 |
|
300,019 |
|
- |
|
4,260,230 |
Securities issued or secured by government entities |
|
- |
|
84,990 |
|
- |
|
84,990 |
|
13,075 |
|
65,960 |
|
- |
|
79,035 |
Securities issued by other financial institutions |
|
41,003 |
|
654,446 |
|
78,729 |
|
774,178 |
|
77,944 |
|
451,285 |
|
81,389 |
|
610,618 |
Securities issued by foreign governments |
|
3,621,960 |
|
2,652,440 |
|
- |
|
6,274,400 |
|
3,136,636 |
|
2,831,220 |
|
- |
|
5,967,856 |
Corporate bonds |
|
125,010 |
|
97,940 |
|
14,284 |
|
237,234 |
|
17,299 |
|
104,228 |
|
- |
|
121,527 |
Total debt instruments at fair value through profit or loss |
|
8,151,108 |
|
3,852,286 |
|
93,013 |
|
12,096,407 |
|
7,205,165 |
|
3,752,712 |
|
81,389 |
|
11,039,266 |
Debt instruments at fair value through OCI |
|
|
|
|
|
|
|
|
|
|
|
|
|
|
|
|
Securities issued by the Colombian Government |
|
61,427 |
|
- |
|
2,664,295 |
|
2,725,722 |
|
- |
|
2,590,622 |
|
- |
|
2,590,622 |
Securities issued by other financial institutions |
|
224,049 |
|
149,257 |
|
- |
|
373,306 |
|
465,025 |
|
104,332 |
|
- |
|
569,357 |
Securities issued by foreign governments |
|
1,675,193 |
|
762,803 |
|
- |
|
2,437,996 |
|
4,045,118 |
|
649,251 |
|
- |
|
4,694,369 |
Corporate bonds |
|
63,475 |
|
547,678 |
|
- |
|
611,153 |
|
- |
|
123,327 |
|
- |
|
123,327 |
Total debt instruments at fair value through OCI |
|
2,024,144 |
|
1,459,738 |
|
2,664,295 |
|
6,148,177 |
|
4,510,143 |
|
3,467,532 |
|
- |
|
7,977,675 |
Total debt instruments |
|
10,175,252 |
|
5,312,024 |
|
2,757,308 |
|
18,244,584 |
|
11,715,308 |
|
7,220,244 |
|
81,389 |
|
19,016,941 |
Equity securities |
|
|
|
|
|
|
|
|
|
|
|
|
|
|
|
|
Equity securities |
|
89,128 |
|
69,400 |
|
384,682 |
|
543,210 |
|
30,884 |
|
51,531 |
|
462,253 |
|
544,668 |
Total equity securities |
|
89,128 |
|
69,400 |
|
384,682 |
|
543,210 |
|
30,884 |
|
51,531 |
|
462,253 |
|
544,668 |
Other financial assets |
|
|
|
|
|
|
|
|
|
|
|
|
|
|
|
|
Other financial assets |
|
- |
|
- |
|
38,319 |
|
38,319 |
|
- |
|
- |
|
42,171 |
|
42,171 |
Total other financial assets |
|
- |
|
- |
|
38,319 |
|
38,319 |
|
- |
|
- |
|
42,171 |
|
42,171 |
Derivative financial instruments |
|
|
|
|
|
|
|
|
|
|
|
|
|
|
|
|
Forwards |
|
|
|
|
|
|
|
|
|
|
|
|
|
|
|
|
Foreign exchange contracts |
|
- |
|
3,308,258 |
|
1,073,648 |
|
4,381,906 |
|
- |
|
982,212 |
|
591,740 |
|
1,573,952 |
Equity contracts |
|
- |
|
152 |
|
2,863 |
|
3,015 |
|
- |
|
5,414 |
|
105 |
|
5,519 |
Total forwards |
|
- |
|
3,308,410 |
|
1,076,511 |
|
4,384,921 |
|
- |
|
987,626 |
|
591,845 |
|
1,579,471 |
Swaps |
|
|
|
|
|
|
|
|
|
|
|
|
|
|
|
|
Foreign exchange contracts |
|
- |
|
1,066,915 |
|
237,422 |
|
1,304,337 |
|
- |
|
1,940,303 |
|
454,529 |
|
2,394,832 |
Interest rate contracts |
|
130,792 |
|
206,011 |
|
15,621 |
|
352,424 |
|
266,708 |
|
569,749 |
|
29,170 |
|
865,627 |
Total swaps |
|
130,792 |
|
1,272,926 |
|
253,043 |
|
1,656,761 |
|
266,708 |
|
2,510,052 |
|
483,699 |
|
3,260,459 |
Options |
|
|
|
|
|
|
|
|
|
|
|
|
|
|
|
|
Foreign exchange contracts |
|
6 |
|
136,979 |
|
73,603 |
|
210,588 |
|
- |
|
4,240 |
|
117,067 |
|
121,307 |
Total options |
|
6 |
|
136,979 |
|
73,603 |
|
210,588 |
|
- |
|
4,240 |
|
117,067 |
|
121,307 |
Total derivative financial instruments |
|
130,798 |
|
4,718,315 |
|
1,403,157 |
|
6,252,270 |
|
266,708 |
|
3,501,918 |
|
1,192,611 |
|
4,961,237 |
Investment properties |
|
|
|
|
|
|
|
|
|
|
|
|
|
|
|
|
Lands |
|
- |
|
- |
|
325,394 |
|
325,394 |
|
- |
|
- |
|
123,352 |
|
123,352 |
Buildings |
|
- |
|
- |
|
4,384,517 |
|
4,384,517 |
|
- |
|
- |
|
3,870,706 |
|
3,870,706 |
Total investment properties |
|
- |
|
- |
|
4,709,911 |
|
4,709,911 |
|
- |
|
- |
|
3,994,058 |
|
3,994,058 |
Investment in associates at fair value |
|
|
|
|
|
|
|
|
|
|
|
|
|
|
|
|
Investment in associates at fair value |
|
- |
|
- |
|
1,670,782 |
|
1,670,782 |
|
- |
|
- |
|
1,532,156 |
|
1,532,156 |
Total investment in associates at fair value |
|
- |
|
- |
|
1,670,782 |
|
1,670,782 |
|
- |
|
- |
|
1,532,156 |
|
1,532,156 |
Total |
|
10,395,178 |
|
10,099,739 |
|
10,964,159 |
|
31,459,076 |
|
12,012,900 |
|
10,773,693 |
|
7,304,638 |
|
30,091,231 |
F-155
Financial liabilities | ||||||||||||||||
|
|
December 31, 2023 |
|
December 31, 2022 |
||||||||||||
Type of instrument |
|
Fair value hierarchy |
|
Total fair |
|
Fair value hierarchy |
|
Total fair |
||||||||
|
|
Level 1 |
|
Level 2 |
|
Level 3 |
|
value |
|
Level 1 |
|
Level 2 |
|
Level 3 |
|
value |
In millions of COP | ||||||||||||||||
Derivative financial instruments |
|
|
|
|
|
|
|
|
|
|
|
|
|
|
|
|
Forwards |
|
|
|
|
|
|
|
|
|
|
|
|
|
|
|
|
Foreign exchange contracts |
|
- |
|
4,458,528 |
|
67,825 |
|
4,526,353 |
|
- |
|
1,523,795 |
|
187,849 |
|
1,711,644 |
Equity contracts |
|
- |
|
8,629 |
|
1,852 |
|
10,481 |
|
- |
|
7,203 |
|
- |
|
7,203 |
Total forwards |
|
- |
|
4,467,157 |
|
69,677 |
|
4,536,834 |
|
- |
|
1,530,998 |
|
187,849 |
|
1,718,847 |
Swaps |
|
|
|
|
|
|
|
|
|
|
|
|
|
|
|
|
Foreign exchange contracts |
|
- |
|
1,388,113 |
|
102,973 |
|
1,491,086 |
|
- |
|
1,757,219 |
|
160,178 |
|
1,917,397 |
Interest rate contracts |
|
126,728 |
|
312,051 |
|
11,078 |
|
449,857 |
|
227,847 |
|
728,793 |
|
51,662 |
|
1,008,302 |
Total swaps |
|
126,728 |
|
1,700,164 |
|
114,051 |
|
1,940,943 |
|
227,847 |
|
2,486,012 |
|
211,840 |
|
2,925,699 |
Options |
|
|
|
|
|
|
|
|
|
|
|
|
|
|
|
|
Foreign exchange contracts |
|
19 |
|
232,568 |
|
- |
|
232,587 |
|
- |
|
92,908 |
|
- |
|
92,908 |
Total options |
|
19 |
|
232,568 |
|
- |
|
232,587 |
|
- |
|
92,908 |
|
- |
|
92,908 |
Total derivative financial instruments |
|
126,747 |
|
6,399,889 |
|
183,728 |
|
6,710,364 |
|
227,847 |
|
4,109,918 |
|
399,689 |
|
4,737,454 |
Total |
|
126,747 |
|
6,399,889 |
|
183,728 |
|
6,710,364 |
|
227,847 |
|
4,109,918 |
|
399,689 |
|
4,737,454 |
Fair value of assets and liabilities that are not measured at fair value in the Statement of Financial Position
The following table presents for each of the fair-value hierarchy levels the Bank’s assets and liabilities that are not measured at fair value in the Statement of Financial Position, but for which the fair value is disclosed at December 31, 2023 and December 31, 2022:
Assets | ||||||||||||||||
|
|
December 31, 2023 |
|
December 31, 2022 |
||||||||||||
Type of instrument |
|
Fair value hierarchy |
|
Total fair |
|
Fair value hierarchy |
|
Total fair |
||||||||
|
|
Level 1 |
|
Level 2 |
|
Level 3 |
|
value |
|
Level 1 |
|
Level 2 |
|
Level 3 |
|
value |
In millions of COP | ||||||||||||||||
Debt instruments |
|
|
|
|
|
|
|
|
|
|
|
|
|
|
|
|
Securities issued by the Colombian Government |
|
67,514 |
|
- |
|
- |
|
67,514 |
|
197,749 |
|
- |
|
- |
|
197,749 |
Securities issued or secured by government entities |
|
- |
|
49,980 |
|
3,075,936 |
|
3,125,916 |
|
- |
|
3,041,314 |
|
- |
|
3,041,314 |
Securities issued by other financial institutions |
|
209,178 |
|
280,662 |
|
55,112 |
|
544,952 |
|
272,157 |
|
307,960 |
|
- |
|
580,117 |
Securities issued by foreign governments |
|
150,695 |
|
377,560 |
|
- |
|
528,255 |
|
248,735 |
|
517,661 |
|
- |
|
766,396 |
Corporate bonds |
|
774,624 |
|
12,620 |
|
1,786,986 |
|
2,574,230 |
|
1,183,046 |
|
37,977 |
|
2,440,277 |
|
3,661,300 |
Total – Debt instruments |
|
1,202,011 |
|
720,822 |
|
4,918,034 |
|
6,840,867 |
|
1,901,687 |
|
3,904,912 |
|
2,440,277 |
|
8,246,876 |
Loans and advances to customers, net |
|
- |
|
- |
|
238,771,724 |
|
238,771,724 |
|
- |
|
- |
|
251,336,077 |
|
251,336,077 |
Total |
|
1,202,011 |
|
720,822 |
|
243,689,758 |
|
245,612,591 |
|
1,901,687 |
|
3,904,912 |
|
253,776,354 |
|
259,582,953 |
Liabilities | ||||||||||||||||
|
|
December 31, 2023 |
|
December 31, 2022 |
||||||||||||
Type of instruments |
|
Fair value hierarchy |
|
Total fair |
|
Fair value hierarchy |
|
Total fair |
||||||||
|
|
Level 1 |
|
Level 2 |
|
Level 3 |
|
value |
|
Level 1 |
|
Level 2 |
|
Level 3 |
|
value |
In millions of COP | ||||||||||||||||
Deposits by customers |
|
- |
|
60,236,355 |
|
189,104,164 |
|
249,340,519 |
|
- |
|
40,990,191 |
|
208,513,614 |
|
249,503,805 |
Interbank deposits |
|
- |
|
- |
|
606,141 |
|
606,141 |
|
- |
|
- |
|
902,132 |
|
902,132 |
Repurchase agreements and other similar secured borrowing |
|
- |
|
- |
|
470,295 |
|
470,295 |
|
- |
|
- |
|
189,052 |
|
189,052 |
Borrowings from other financial institutions |
|
- |
|
- |
|
15,648,606 |
|
15,648,606 |
|
- |
|
- |
|
19,692,638 |
|
19,692,638 |
Debt instruments in issue(1) |
|
8,021,700 |
|
4,025,322 |
|
2,421,628 |
|
14,468,650 |
|
7,714,800 |
|
8,898,934 |
|
2,163,085 |
|
18,776,819 |
Preferred shares |
|
- |
|
- |
|
394,550 |
|
394,550 |
|
- |
|
- |
|
350,978 |
|
350,978 |
Total |
|
8,021,700 |
|
64,261,677 |
|
208,645,384 |
|
280,928,761 |
|
7,714,800 |
|
49,889,125 |
|
231,811,499 |
|
289,415,424 |
(1) The decrease in level 2 for the year 2023 corresponds to maturity of securities.
IFRS requires entities to disclose the fair value of financial instruments, both assets and liabilities recognized and not recognized in the statement of financial position, for which it is practicable to estimate fair value. Certain categories of assets and liabilities, however, are not eligible for fair value accounting. The financial instruments below are not measured at fair value on a recurring and nonrecurring basis:
F-156
Short-term financial instruments
Short-term financial instruments are valued at their carrying amounts included in the consolidated statement of financial position, which are reasonable estimates of fair value due to the relatively short period to maturity of the instruments. This approach was used for cash and cash equivalents, accrued interest receivable, customers’ acceptances, accounts receivable, accounts payable, accrued interest payable and bank acceptances outstanding.
Deposits from customers
The fair value of time deposits was estimated based on the discounted value of cash flows using the appropriate discount rate for the applicable maturity. Fair value of deposits with no contractual maturities represents the amount payable on demand as of the statement of financial position date.
Interbank deposits and repurchase agreements and other similar secured borrowings
Short-term interbank borrowings and repurchase agreements have been valued at their carrying amounts because of their relatively short-term nature. Long-term and domestic development bank borrowings have also been valued at their carrying amount because they bear interest at variable rates.
Borrowings from other financial institutions
The fair value of borrowings from other financial institutions were determined using discounted cash flow models. The cash flows projection of capital and interest was made according to the contractual terms, considering capital amortization and interest bearing. Subsequently, the cash flows were discounted using reference curves formed by the weighted average of the Bank’s deposit rates.
Debt instruments in issue
The fair value of debt instruments in issue, comprised of bonds issued by Bancolombia S.A. and its subsidiaries, was estimated substantially based on quoted market prices. The fair value of certain bonds which do not have a public trading market, were determined based on the discounted value of cash flows using the rates currently offered for bonds of similar remaining maturities and the Bank’s creditworthiness.
Preferred shares
In the valuation of the liability component of preferred shares related to the minimum dividend of 1% of the subscription price, the Bank uses the Gordon Model to price the obligation, taking into account its own credit risk, which is measured using the market spread based on observable inputs such as quoted prices of sovereign debt. The Gordon Model is commonly used to determine the intrinsic value of a stock based on a future series of dividends that are estimated by the Bank and growth at a constant rate considering the Bank’s own perspectives of the payout ratio.
Loans and advances to customers
Estimating the fair value of loans and advances to customers is considered an area of considerable uncertainty as there is no observable market. The loan portfolio is stratified into tranches and loans segments suchs as commercial, consumer, small business loans, mortgage and leasing. The fair value of loans and advances to customers and financial institutions is determined using a discounted cash flow methodology, considering each credit’s principal and interest projected cash flows to the prepayment date. The projected cash flows are discounted using reference curves according to the type of loan and its maturity date.
Items measured at fair value on a non-recurring basis
The Bank measures assets held for sale based on fair value less costs to sell. This category includes certain foreclosed assets and investments in associates held for sale. The fair values were determined using external and internal valuation techniques or third party experts, depending on the type of underlying asset.
F-157
The following breakdown sets forth the fair value hierarchy of those assets classified by type:
|
|
December 31, 2023 |
|
December 31, 2022 |
||||||||||||
|
|
Fair-value hierarchy |
|
Total fair |
|
Fair-value hierarchy |
|
Total fair |
||||||||
|
|
Level 1 |
|
Level 2 |
|
Level 3 |
|
value |
|
Level 1 |
|
Level 2 |
|
Level 3 |
|
value |
In millions of COP | ||||||||||||||||
Machinery and equipment |
|
- |
|
- |
|
11,702 |
|
11,702 |
|
- |
|
- |
|
9,918 |
|
9,918 |
Real estate for residential purposes |
|
- |
|
- |
|
117,476 |
|
117,476 |
|
- |
|
- |
|
63,283 |
|
63,283 |
Real estate different from residential properties |
|
- |
|
- |
|
30,273 |
|
30,273 |
|
- |
|
- |
|
22,216 |
|
22,216 |
Total |
|
- |
|
- |
|
159,451 |
|
159,451 |
|
- |
|
- |
|
95,417 |
|
95,417 |
F-158
Changes in level 3 fair-value category
The table below presents reconciliation for all assets and liabilities measured at fair value on a recurring basis using significant unobservable inputs during 2023 and 2022:
As of December 31, 2023
|
|
|
|
|
|
|
|
|
|
|
|
|
|
|
|
|
|
|
|
|
|
|
Balance, |
|
Included |
|
|
|
|
|
|
|
|
|
|
|
Transfers |
|
Transfers |
|
Balance, |
|
|
January 1, |
|
in |
|
OCI |
|
Purchases |
|
Settlement |
|
Reclassifications |
(1) |
Prepaids |
|
in to |
|
out of |
|
December 31, |
|
|
2023 |
|
earnings |
|
|
|
|
|
|
|
|
|
|
|
level 3 |
|
level 3 |
|
2023 |
In millions of COP | ||||||||||||||||||||
Assets |
|
|
|
|
|
|
|
|
|
|
|
|
|
|
|
|
|
|
|
|
Debt instruments at fair value though profit or loss |
|
|
|
|
|
|
|
|
|
|
|
|
|
|
|
|
|
|
|
|
Securities issued by the Colombian Government |
|
- |
|
(4,150) |
|
- |
|
4,150 |
|
- |
|
- |
|
- |
|
- |
|
- |
|
- |
Securities issued or secured by other financial entities |
|
81,389 |
|
12,869 |
|
- |
|
2,639 |
|
(12,767) |
|
- |
|
(9,613) |
|
4,212 |
|
- |
|
78,729 |
Corporate bonds |
|
- |
|
- |
|
- |
|
- |
|
- |
|
- |
|
- |
|
14,284 |
|
- |
|
14,284 |
Total |
|
81,389 |
|
8,719 |
|
- |
|
6,789 |
|
(12,767) |
|
- |
|
(9,613) |
|
18,496 |
|
- |
|
93,013 |
Debt instruments at fair value through OCI |
|
|
|
|
|
|
|
|
|
|
|
|
|
|
|
|
|
|
|
|
Securities issued by the Colombian Government |
|
- |
|
- |
|
173,648 |
|
2,490,647 |
|
- |
|
- |
|
- |
|
- |
|
- |
|
2,664,295 |
Total |
|
- |
|
- |
|
173,648 |
|
2,490,647 |
|
- |
|
- |
|
- |
|
- |
|
- |
|
2,664,295 |
Derivative financial instruments |
|
|
|
|
|
|
|
|
|
|
|
|
|
|
|
|
|
|
|
|
Foreign exchange contracts |
|
1,163,336 |
|
(60,699) |
|
- |
|
1,295,089 |
|
(812,275) |
|
(13,559) |
|
- |
|
46,459 |
|
(233,678) |
|
1,384,673 |
Interest rate contracts |
|
29,170 |
|
(10,694) |
|
- |
|
6,957 |
|
(4,593) |
|
(38) |
|
- |
|
525 |
|
(5,706) |
|
15,621 |
Equity contracts |
|
105 |
|
- |
|
- |
|
2,863 |
|
(105) |
|
- |
|
- |
|
- |
|
- |
|
2,863 |
Total |
|
1,192,611 |
|
(71,393) |
|
- |
|
1,304,909 |
|
(816,973) |
|
(13,597) |
|
- |
|
46,984 |
|
(239,384) |
|
1,403,157 |
Equity securities |
|
|
|
|
|
|
|
|
|
|
|
|
|
|
|
|
|
|
|
|
Equity securities |
|
462,253 |
|
(3,577) |
|
(8,087) |
|
6,740 |
|
(72,647) |
|
- |
|
- |
|
- |
|
- |
|
384,682 |
Total |
|
462,253 |
|
(3,577) |
|
(8,087) |
|
6,740 |
|
(72,647) |
|
- |
|
- |
|
- |
|
- |
|
384,682 |
Other financial instruments |
|
|
|
|
|
|
|
|
|
|
|
|
|
|
|
|
|
|
|
|
Other financial instruments |
|
42,171 |
|
(13,746) |
|
- |
|
9,894 |
|
- |
|
- |
|
- |
|
- |
|
- |
|
38,319 |
Total |
|
42,171 |
|
(13,746) |
|
- |
|
9,894 |
|
- |
|
- |
|
- |
|
- |
|
- |
|
38,319 |
Investment in associates |
|
|
|
|
|
|
|
|
|
|
|
|
|
|
|
|
|
|
|
|
PA Viva Malls |
|
1,530,459 |
|
128,028 |
|
- |
|
3,192 |
|
- |
|
- |
|
- |
|
- |
|
- |
|
1,661,679 |
PA Distrito Vera |
|
1,697 |
|
1,179 |
|
- |
|
6,227 |
|
- |
|
- |
|
- |
|
- |
|
- |
|
9,103 |
Total |
|
1,532,156 |
|
129,207 |
|
- |
|
9,419 |
|
- |
|
- |
|
- |
|
- |
|
- |
|
1,670,782 |
Total Assets |
|
3,310,580 |
|
49,210 |
|
165,561 |
|
3,828,398 |
|
(902,387) |
|
(13,597) |
|
(9,613) |
|
65,480 |
|
(239,384) |
|
6,254,248 |
Liabilities |
|
|
|
|
|
|
|
|
|
|
|
|
|
|
|
|
|
|
|
|
Derivative financial instruments |
|
|
|
|
|
|
|
|
|
|
|
|
|
|
|
|
|
|
|
|
Foreign exchange contracts |
|
348,027 |
|
15,346 |
|
- |
|
164,179 |
|
(329,858) |
|
(13,559) |
|
- |
|
4,330 |
|
(17,667) |
|
170,798 |
Interest rate contracts |
|
51,662 |
|
(6,297) |
|
- |
|
3,628 |
|
(41,002) |
|
(38) |
|
- |
|
3,734 |
|
(609) |
|
11,078 |
Equity contracts |
|
- |
|
- |
|
- |
|
1,852 |
|
- |
|
- |
|
- |
|
- |
|
- |
|
1,852 |
Total |
|
399,689 |
|
9,049 |
|
- |
|
169,659 |
|
(370,860) |
|
(13,597) |
|
- |
|
8,064 |
|
(18,276) |
|
183,728 |
Total liabilities |
|
399,689 |
|
9,049 |
|
- |
|
169,659 |
|
(370,860) |
|
(13,597) |
|
- |
|
8,064 |
|
(18,276) |
|
183,728 |
| (1) | From derivative assets to derivative liabilities classified in level 3 and vice versa. |
F-159
As of December 31, 2022
|
|
|
|
|
|
|
|
|
|
|
|
|
|
|
|
|
|
|
|
|
|
|
Balance, |
|
Included |
|
|
|
|
|
|
|
|
|
|
|
Transfers |
|
Transfers |
|
Balance, |
|
|
January 1, |
|
in |
|
OCI |
|
Purchases |
|
Settlement |
|
Reclassifications |
(1) |
Prepaids |
|
in to |
|
out of |
|
December 31, |
|
|
2022 |
|
earnings |
|
|
|
|
|
|
|
|
|
|
|
level 3 |
|
level 3 |
|
2022 |
In millions of COP | ||||||||||||||||||||
Assets |
|
|
|
|
|
|
|
|
|
|
|
|
|
|
|
|
|
|
|
|
Debt instruments at fair value though profit or loss |
|
|
|
|
|
|
|
|
|
|
|
|
|
|
|
|
|
|
|
|
Securities issued or secured by other financial entities |
|
113,058 |
|
11,700 |
|
- |
|
3,789 |
|
(20,031) |
|
- |
|
(19,181) |
|
10,863 |
|
(18,809) |
|
81,389 |
Total |
|
113,058 |
|
11,700 |
|
- |
|
3,789 |
|
(20,031) |
|
- |
|
(19,181) |
|
10,863 |
|
(18,809) |
|
81,389 |
Derivative financial instruments |
|
|
|
|
|
|
|
|
|
|
|
|
|
|
|
|
|
|
|
|
Foreign exchange contracts |
|
937,633 |
|
270,494 |
|
- |
|
607,659 |
|
(647,914) |
|
(777) |
|
- |
|
547 |
|
(4,306) |
|
1,163,336 |
Interest rate contracts |
|
46,393 |
|
19,887 |
|
- |
|
9,323 |
|
(8,986) |
|
(3,181) |
|
- |
|
49 |
|
(34,315) |
|
29,170 |
Equity contracts |
|
313 |
|
- |
|
- |
|
105 |
|
(313) |
|
- |
|
- |
|
- |
|
- |
|
105 |
Total |
|
984,339 |
|
290,381 |
|
- |
|
617,087 |
|
(657,213) |
|
(3,958) |
|
- |
|
596 |
|
(38,621) |
|
1,192,611 |
Equity securities |
|
|
|
|
|
|
|
|
|
|
|
|
|
|
|
|
|
|
|
|
Equity securities(2) |
|
335,006 |
|
(285) |
|
89,072 |
|
15,762 |
|
(18,848) |
|
- |
|
- |
|
41,856 |
|
(310) |
|
462,253 |
Total |
|
335,006 |
|
(285) |
|
89,072 |
|
15,762 |
|
(18,848) |
|
- |
|
- |
|
41,856 |
|
(310) |
|
462,253 |
Other financial instruments |
|
|
|
|
|
|
|
|
|
|
|
|
|
|
|
|
|
|
|
|
Other financial instruments |
|
- |
|
(3,851) |
|
- |
|
46,022 |
|
- |
|
- |
|
- |
|
- |
|
- |
|
42,171 |
Total |
|
- |
|
(3,851) |
|
- |
|
46,022 |
|
- |
|
- |
|
- |
|
- |
|
- |
|
42,171 |
Investment in associates |
|
|
|
|
|
|
|
|
|
|
|
|
|
|
|
|
|
|
|
|
PA Viva Malls |
|
1,355,688 |
|
189,132 |
|
- |
|
- |
|
(14,361) |
|
- |
|
- |
|
- |
|
- |
|
1,530,459 |
PA Distrito Vera |
|
2,680 |
|
(983) |
|
- |
|
- |
|
- |
|
- |
|
- |
|
- |
|
- |
|
1,697 |
Total |
|
1,358,368 |
|
188,149 |
|
- |
|
- |
|
(14,361) |
|
- |
|
- |
|
- |
|
- |
|
1,532,156 |
Total Assets |
|
2,790,771 |
|
486,094 |
|
89,072 |
|
682,660 |
|
(710,453) |
|
(3,958) |
|
(19,181) |
|
53,315 |
|
(57,740) |
|
3,310,580 |
Liabilities |
|
|
|
|
|
|
|
|
|
|
|
|
|
|
|
|
|
|
|
|
Derivative financial instruments |
|
|
|
|
|
|
|
|
|
|
|
|
|
|
|
|
|
|
|
|
Foreign exchange contracts |
|
232,444 |
|
88,743 |
|
- |
|
188,860 |
|
(157,374) |
|
(777) |
|
- |
|
- |
|
(3,869) |
|
348,027 |
Interest rate contracts |
|
4,312 |
|
24,825 |
|
- |
|
26,323 |
|
(332) |
|
(3,181) |
|
- |
|
396 |
|
(681) |
|
51,662 |
Total |
|
236,756 |
|
113,568 |
|
- |
|
215,183 |
|
(157,706) |
|
(3,958) |
|
- |
|
396 |
|
(4,550) |
|
399,689 |
Total liabilities |
|
236,756 |
|
113,568 |
|
- |
|
215,183 |
|
(157,706) |
|
(3,958) |
|
- |
|
396 |
|
(4,550) |
|
399,689 |
| (1) | From derivative assets to derivative liabilities classified in level 3 and vice versa. |
| (2) | Mainly in Banistmo S.A. of the Telered S.A. instrument, which also includes conversion adjustments. |
Level 3 fair value rollforward
The following were the significant level 3 transfers at December 31, 2023 and 2022:
As of December 31, 2023 and 2022, net transfers in Bancolombia S.A. for COP 257,660 and COP 43,171, respectively, from level 3 to level 2 of derivatives foreign exchange contracts and interest rate contracts, it was presented due to the transfer of the credit risk of the counterparty to the own credit risk. As of December 31, 2023, net transfers for COP 55,048, from level 2 to level 3 of the derivative foreign exchange contracts and interest rate contracts, it was presented due to the transfer of the credit risk from the Bank to the credit risk of the counterparty.
As of December 31, 2023 and 2022, unrealized gains and losses on debt instruments were COP 8,719 and COP 11,700; equity securities COP (3,577) and COP (285), respectively.
Transfers between level 1 and level 2 of the fair value hierarchy
The table below presents the transfers for all assets and liabilities measured at fair value on a recurring basis between level 1 and level 2 as of December 31, 2023 and 2022:
F-160
|
|
December 31, 2023 |
|
December 31, 2022 |
||||
|
|
Transfers level 1 |
|
Transfers level |
|
Transfers level |
|
Transfers level |
|
|
to level 2 |
|
2 to level 1 |
|
1 to level 2 |
|
2 to level 1 |
In millions of COP | ||||||||
Debt instruments at fair value though profit or loss |
|
|
|
|
|
|
|
|
Securities issued or secured by foreign government |
|
1,712 |
|
- |
|
- |
|
15,885 |
Securities issued or secured by government entities |
|
13,619.0 |
|
- |
|
- |
|
14,459 |
Corporate bonds |
|
- |
|
8,397 |
|
5,282 |
|
- |
Securities issued by the Colombian Government |
|
- |
|
- |
|
- |
|
5,103 |
Securities issued or secured by other financial entities |
|
1,848 |
|
- |
|
- |
|
- |
Total |
|
17,179 |
|
8,397 |
|
5,282 |
|
35,447 |
Debt instruments at fair value through OCI |
|
|
|
|
|
|
|
|
Securities issued or secured by foreign government |
|
572,800 |
|
- |
|
- |
|
950,235 |
Securities issued or secured by other financial entities |
|
64,944 |
|
- |
|
- |
|
- |
Corporate bonds |
|
- |
|
95,572 |
|
90,010 |
|
- |
Total |
|
637,744 |
|
95,572 |
|
90,010 |
|
950,235 |
Equity securities |
|
|
|
|
|
|
|
|
Equity securities |
|
13,740 |
|
7 |
|
- |
|
15,858 |
Total |
|
13,740 |
|
7 |
|
- |
|
15,858 |
As of December 31, 2023 and 2022, the Bank transferred securities from level 1 to level 2, because such securities had lower liquidity and lower trading in an active market.
As of December 31, 2022, the transfer of COP 950,235 from level 2 to 1, corresponds mainly to Banistmo S.A. for the Republic of Panama instrument.
All transfers are assumed to occur at the end of the reporting period.
Quantitative information about level 3 fair value measurements
The fair value of financial instruments is, in certain circumstances, measured using valuation techniques that incorporate assumptions that are not evidenced by prices from observable market transactions in the same instrument and are not based on observable market data. Changing one or more of the inputs to the valuation models to reasonably possible alternative assumptions would change the fair values and therefore a valuation adjustment would be recognized in profit or loss. Favorable and unfavorable changes are determined on the basis of changes in the value of the instrument as a result of varying the levels of the unobservable input as described in the table below.
The following table sets forth information about significant unobservable inputs related to the Bank’s material categories of level 3 financial assets and liabilities and the sensitivity of these fair values to reasonably possible alternative assumptions.
F-161
As of December 31, 2023
|
|
|
|
|
|
|
|
|
|
|
|
Sensitivity |
|
Sensitivity |
|
|
|
|
Valuation |
|
Significant |
|
Range of |
|
Weighted |
|
100 |
|
100 |
Financial instrument |
|
Fair Value |
|
technique |
|
unobservable input |
|
inputs |
|
average |
|
basis point |
|
basis point |
|
|
|
|
|
|
|
|
|
|
|
|
increase |
|
decrease |
In millions of COP | ||||||||||||||
Debt instruments |
|
|
|
|
|
|
|
|
|
|
|
|
|
|
Securities issued by other financial institutions |
|
|
|
|
|
|
|
|
|
|
|
|
|
|
|
|
|
|
|
|
Yield |
|
2.06% to 10.73 |
% |
5.48 |
% |
70,982 |
|
75,852 |
TIPS |
|
74,087 |
|
Discounted cash flow |
|
Prepayment Speed |
|
n/a |
|
n/a |
|
78,953 |
|
n/a |
|
|
|
|
|
|
Prepayment Speed |
|
n/a |
|
n/a |
|
73,271 |
|
n/a |
Time deposits |
|
4,642 |
|
Discounted cash flow |
|
Yield / Interest rate |
|
2.15% to 5.70 |
% |
3.78 |
% |
4,277 |
|
4,701 |
Total securities issued by other financial institutions |
|
78,729 |
|
|
|
|
|
|
|
|
|
|
|
|
Securities issued by the Colombian Government |
|
|
|
|
|
|
|
|
|
|
|
|
|
|
Bonds by government entities |
|
2,664,295 |
|
Discounted cash flow |
|
Yield |
|
0.00% to 1.18% |
|
1.17% |
|
2,658,010 |
|
2,679,372 |
Corporate bonds |
|
|
|
|
|
|
|
|
|
|
|
|
|
|
Corporate bonds |
|
14,284 |
|
Discounted cash flow |
|
Yield |
|
3.49% to 3.49% |
|
3.49% |
|
13,700 |
|
14,912 |
Total debt instruments |
|
2,757,308 |
|
|
|
|
|
|
|
|
|
|
|
|
Equity securities |
|
|
|
|
|
|
|
|
|
|
|
|
|
|
Equity securities |
|
384,682 |
|
Price-based |
|
Price |
|
n/a |
|
n/a |
|
n/a |
|
n/a |
Other financial instruments |
|
|
|
|
|
|
|
|
|
|
|
|
|
|
Other financial instruments |
|
38,319 |
|
Internal valuation methodology |
|
Internal valuation methodology |
|
n/a |
|
n/a |
|
n/a |
|
n/a |
Derivative financial instruments |
|
|
|
|
|
|
|
|
|
|
|
|
|
|
Forward |
|
1,006,834 |
|
Discounted cash flow |
|
Credit spread / Yield |
|
0.00% to 50.58 |
% |
7.22 |
% |
1,004,399 |
|
1,009,283 |
Swaps |
|
138,992 |
|
Discounted cash flow |
|
Credit spread |
|
0.00% to 63.39 |
% |
5.86 |
% |
139,451 |
|
138,577 |
Options |
|
73,603 |
|
Discounted cash flow |
|
Credit spread |
|
0.13% to 33.77 |
% |
0.57 |
% |
73,048 |
|
73,870 |
Total derivative financial instruments |
|
1,219,429 |
|
|
|
|
|
|
|
|
|
|
|
|
Investment in associates |
|
|
|
|
|
|
|
|
|
|
|
|
|
|
P.A Viva Malls |
|
1,661,679 |
|
Price-based |
|
Price |
|
n/a |
|
n/a |
|
n/a |
|
n/a |
P.A Distrito Vera |
|
9,103 |
|
Price-based |
|
Price |
|
n/a |
|
n/a |
|
n/a |
|
n/a |
Total investment in associates |
|
1,670,782 |
|
|
|
|
|
|
|
|
|
|
|
|
As of December 31, 2022
|
|
|
|
|
|
|
|
|
|
|
|
Sensitivity |
|
Sensitivity |
|
|
|
|
Valuation |
|
Significant |
|
Range of |
|
Weighted |
|
100 |
|
100 |
Financial instrument |
|
Fair Value |
|
technique |
|
unobservable input |
|
inputs |
|
average |
|
basis point |
|
basis point |
|
|
|
|
|
|
|
|
|
|
|
|
increase |
|
decrease |
In millions of COP | ||||||||||||||
Debt instruments |
|
|
|
|
|
|
|
|
|
|
|
|
|
|
Securities issued by other financial institutions |
|
|
|
|
|
|
|
|
|
|
|
|
|
|
TIPS |
|
76,014 |
|
Discounted cash flow |
|
Yield |
|
2.06% to 9.89 |
% |
4.93 |
% |
71,208 |
|
75,021 |
|
|
|
|
|
|
Prepayment Speed |
|
n/a |
|
n/a |
|
77,349 |
|
n/a |
Time deposits |
|
5,375 |
|
Discounted cash flow |
|
Interest rate |
|
4.10% to 5.20 |
% |
5.00 |
% |
5,033 |
|
5,438 |
Total debt instruments |
|
81,389 |
|
|
|
|
|
|
|
|
|
|
|
|
Equity securities |
|
|
|
|
|
|
|
|
|
|
|
|
|
|
Equity securities |
|
462,253 |
|
Price-based |
|
Price |
|
n/a |
|
n/a |
|
n/a |
|
n/a |
Other financial instruments |
|
|
|
|
|
|
|
|
|
|
|
|
|
|
Other financial instruments |
|
42,171 |
|
Internal valuation methodology |
|
Internal valuation methodology |
|
n/a |
|
n/a |
|
n/a |
|
n/a |
Derivative financial instruments |
|
|
|
|
|
|
|
|
|
|
|
|
|
|
Forward |
|
403,996 |
|
Discounted cash flow |
|
Credit spread / Yield |
|
0.00% to 59.47 |
% |
11.05 |
% |
405,806 |
|
410,413 |
Swaps |
|
271,859 |
|
Discounted cash flow |
|
Credit spread / Yield |
|
0.00% to 39.33 |
% |
7.85 |
% |
265,949 |
|
278,192 |
Options |
|
117,067 |
|
Discounted cash flow |
|
Credit spread |
|
0.10% to 36.40 |
% |
0.64 |
% |
116,182 |
|
117,636 |
Total derivative financial instruments |
|
792,922 |
|
|
|
|
|
|
|
|
|
|
|
|
Investment in associates |
|
|
|
|
|
|
|
|
|
|
|
|
|
|
P.A Viva Malls |
|
1,530,459 |
|
Price-based |
|
Price |
|
n/a |
|
n/a |
|
n/a |
|
n/a |
P.A Distrito Vera |
|
1,697 |
|
Price-based |
|
Price |
|
n/a |
|
n/a |
|
n/a |
|
n/a |
Total investment in associates |
|
1,532,156 |
|
|
|
|
|
|
|
|
|
|
|
|
F-162
The following table sets forth information about valuation techniques used in the measurement of the fair value investment properties of the Bank, the significant unobservable inputs and the respective sensivity:
Methodology |
Valuation technique |
Significant unobservable input |
Description of sensitivity |
|
Sales Comparison Approach - SCA The fair value assessment is based on the examination of prices at which similar properties in the same area recently sold. Since no two properties are identical the measurement valuation must take into account adjustments for the differences between the sold properties and those held by the Bank to earn rentals or for capital appreciation. |
Comparable prices |
The weighted average rates used in the capitalization methodology for revenues in the last quarter for 2023 are: • Direct capitalization: initial rate 8.07%. • Discounted cash flow: discount rate: 12.44%, terminal rate: 8.25%. The same weighted rates for the last quarter of 2022 were: • Direct capitalization: initial rate 7.86% • Discounted cash flow: discount rate: 11.62%, terminal rate: 8.06%. The ratio between monthly gross income and real estate value directly administered by the FIC (rental rate) considering the differences in placements and individual factors between properties and in a weighted way in the last quarter of 2023 are 0.82% and for December 31, 2022 was 0.61%. |
An increase (light, normal, considerable, significant) in the capitalization rate used would generate a decrease (significant, considerable, normal, light) in the fair value of the asset, and vice versa. An increase (light, normal, considerable, significant) in the leases used in the valuation would generate a (significant, light, considerable) increase in the fair value of the asset, and vice versa. |
|
Income Approach Used to estimate the fair value of the property by taking future net cash flows and discounting them at the capitalization rate. |
Direct capitalization Discounted cash flows |
||
|
Cost approach Used to estimate the fair value of the property considering the cost to replace or build a property at the same or equal conditions of the asset to be measured, deducting the accumulated depreciation charge and adding-up the amount of the land. |
Replacement cost |
There has been no change to the valuation technique during the year 2023 for each asset.
NOTE 31. SUBSEQUENT EVENTS
Approval of Consolidated Financial Statements
The consolidated financial statements were approved by the Board of Directors on XXX X, 2024.
NOTE 32. IMPACTS ON APPLICATION OF NEW STANDARDS
| a. | Accounting pronouncements applicable in 2023 |
IFRS 17, issued in May 2017 to replace IFRS 4 Insurance Contracts, applies to insurance contracts, including reinsurance contracts, issued by an entity with specified exceptions; reinsurance contracts held by an entity; and investment contracts with discretionary participation features issued by an entity that issues insurance contracts. An insurance contract is defined as “a contract under which one party (the issuer) accepts significant insurance risk from another party (the policyholder) by agreeing to compensate the policyholder if a specified uncertain future event (the insured event) adversely affects the policyholder” (IFRS 17).
The standard requires that estimates be remeasured in each reporting period. In the statement of financial position, contracts are measured using the following core components:
| • | Discounted probability-weighted cash flows, |
| • | An explicit risk adjustment, and |
| • | A Contractual Service Margin (“CSM”) representing the unearned profit of the contract which is recognised as revenue over the coverage period. |
F-163
IFRS 17 requires an entity to recognise profit from a group of insurance contracts over the period the entity provides services, and as the entity is released from risk. If a group of contracts is or becomes loss-making, the entity is required to recognise the loss immediately.
The portfolio of insurance contracts are detailed below:
Direct Insurance |
General Insurance |
Life Insurance |
|
Accident and Health |
|
Reinsurance |
General Insurance |
Life Insurance |
|
Accident and Health |
For the measurement of direct insurance and reinsurance portfolios, the Bank adopted the Premium Allocation Approach (“PAA”). Additionally, it considered:
a) Opting to defer cash flows for the acquisition of insurance for direct insurance and reinsurance portfolios. This process involves allocating to groups of related insurance contracts, which are amortized over the coverage period of the respective group.
b) Determining that the Bank’s direct insurance and reinsurance portfolios do not need to adjust the carrying amount of the Liability for Remaining Coverage (“LRC”) to reflect the time value of money and the financial effect, as premiums were measured under the PAA approach.
c) In cases where it is expected that direct insurance and reinsurance portfolios will pay claims over a period exceeding 12 months, the Bank will adjust the carrying amount of the Liability for Incurred Claims (“LIC”) to reflect the time value of money. Otherwise, no adjustment to the carrying amount is required.
d) Recognize in the income statement the financial income and expenses arising from direct insurance and reinsurance contracts, as well as the effect on the liability for incurred claims due to changes in discount rates.
On January 1, 2023, the Bank adopted IFRS 17. This involved the identification, recognition, and measurement of each group of insurance contracts and cash flows for the acquisition of insurance, and derecognized amounts that would not exist if this standard had always been applied. The resulting net difference was recognized in equity.
The effects on the consolidated statement of financial position as of January 1, 2023, are presented below:
Concept |
|
December 31, 2022 |
|
Adoption adjustment |
|
January 1, 2023 |
In millions of COP | ||||||
Insurance contracts asset(1) |
|
68,991 |
|
22,383 |
|
91,374 |
Insurance contracts liability(2) |
|
124,598 |
|
21,679 |
|
146,277 |
Retained earnings |
|
- |
|
704 |
|
704 |
| (1) | Included in the "Other assets, net" item in the consolidated statement of financial position. |
| (2) | Included in the "Other liabilities" item in the consolidated statement of financial position. |
RISK MANAGEMENT
The Bank’s comprehensive risk management is developed in compliance with current regulations and internal standards as defined by the Board of Directors, in relation to market, credit/ counterparty, liquidity and interest rate of the banking book, operational , business continuity, technological and cybersecurity risk, country risk, Risk Appetite Framework (MAR) and stress tests applicable. In accordance with the requirements of the External Circular (EC) 018 as of September 2021 about the “Comprehensive Risk Management System (SIAR)”, we work continues to comply with the instructions contained in numeral 10 of Part II of Chapter XXXI related to the aggregation of data on risks and reporting, which will become effective no later than December 31, 2023.
F-164
Morover, the Bank sent the “Implementation Plan” for the management of interest rate risk of the banking book (RTILB), considering the testing period and the enliquidity risktry into force of the applicable instructions.
To strengthen comprehensive risk management, the Bank has a Three Lines Model, with a cohesive and coordinated approach, in which its independence is guaranteed. Within the Corporate Governance Framework, the roles of the responsible areas in each line are defined, according to the level of responsibility in Bancolombia, in order to guarantee effective and efficient coordination among them for risk management (in its different stages) and internal control.
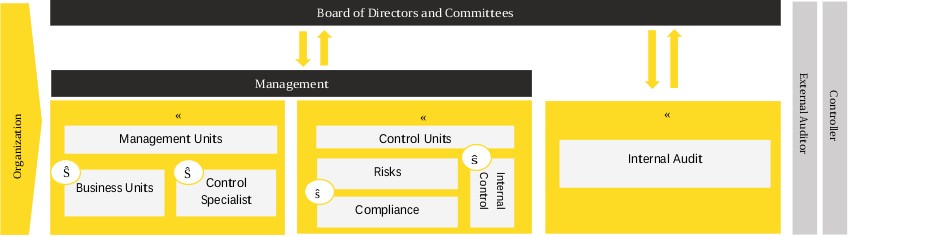
First line: owns the processes, products, services, channels, whose activities manage the risks that may contribute or impede the achievement of the Bank’s objectives. The first line owns the risk and defines the design and execution of the organization's controls to respond to those risks.
The 1st line is made up of 1A and 1B, highlighting the following characteristics:
| ● | Identification, evaluation, control and mitigation of risks. |
| ● | Definition of standards / Implementation of policies, standards and procedures. |
| ● | Execution of control and risk management procedures and activities as part of your daily activity. |
Second line: defines the risk and internal control framework, as well as the policies and guidelines for the 1st line to manage risks. It is a global advisory, support and control function that monitors that risks are identified, controlled and managed within appropriate limits.
The 2nd line is made up of 2A and 2B, highlighting the following characteristics and differences:
| ● | Provision of a risk and internal control framework. |
| ● | Escalation of new risks. |
| ● | Advice and support. |
Third line: made up of Internal Audit. It is an independent and objective assurance and advisory function on the internal control system and risk management, highlighting the following characteristics:
| ● | Independent review. |
| ● | Assurance on the Internal Control System. |
F-165
| ● | Evaluation and improvement in the effectiveness of management in risk control. |
Credit risk
Credit risk is the risk of an economic loss to the Bank due to a non-fulfillment of financial obligations by a customer or counterparty and arises principally from the decline on borrower´s creditworthiness or changes in the business climate. Credit risk is the single largest risk for the Bank's business; the Bank manages its exposure to credit risk.
The information below contains the maximum exposure to credit risk for the periods ending December 31, 2023 and December 31, 2022:
December 31, 2023
Maximum exposure to credit risk - Financial instruments subject to impairment | ||||||||
In millions of COP | ||||||||
|
|
Stage 1 |
|
Stage 2 |
|
Stage 3 |
|
Total |
Loans and Advances |
|
222,372,889 |
|
16,042,661 |
|
15,536,097 |
|
253,951,647 |
Commercial |
|
120,773,927 |
|
5,453,537 |
|
8,459,932 |
|
134,687,396 |
Consumer |
|
46,060,615 |
|
4,407,067 |
|
4,124,087 |
|
54,591,769 |
Mortgage |
|
32,210,648 |
|
2,628,654 |
|
1,411,106 |
|
36,250,408 |
Small Business Loans |
|
774,571 |
|
260,303 |
|
110,143 |
|
1,145,017 |
Financial Leases |
|
22,553,128 |
|
3,293,100 |
|
1,430,829 |
|
27,277,057 |
Off-Balance Sheet Exposures |
|
39,266,370 |
|
154,567 |
|
157,801 |
|
39,578,738 |
Financial Guarantees |
|
12,533,868 |
|
26,889 |
|
130,441 |
|
12,691,198 |
Loan Commitments |
|
26,732,502 |
|
127,678 |
|
27,360 |
|
26,887,540 |
Loss Allowance |
|
(3,854,240) |
|
(2,581,460) |
|
(10,042,022) |
|
(16,477,722) |
Total |
|
257,785,019 |
|
13,615,768 |
|
5,651,876 |
|
277,052,663 |
December 31, 2022
Maximum exposure to credit risk - Financial instruments subject to impairment | ||||||||
In millions of COP | ||||||||
|
|
Stage 1 |
|
Stage 2 |
|
Stage 3 |
|
Total |
Loans and Advances |
|
236,770,056 |
|
18,656,439 |
|
14,497,244 |
|
269,923,739 |
Commercial |
|
126,530,862 |
|
8,062,435 |
|
8,944,556 |
|
143,537,853 |
Consumer |
|
51,510,943 |
|
5,288,921 |
|
2,788,857 |
|
59,588,721 |
Mortgage |
|
34,067,734 |
|
1,997,270 |
|
1,306,369 |
|
37,371,373 |
Small Business Loans |
|
1,093,973 |
|
135,528 |
|
98,575 |
|
1,328,076 |
Financial Leases |
|
23,566,544 |
|
3,172,285 |
|
1,358,887 |
|
28,097,716 |
Off-Balance Sheet Exposures |
|
39,476,630 |
|
338,136 |
|
50,829 |
|
39,865,595 |
Financial Guarantees |
|
11,399,726 |
|
202,240 |
|
22,948 |
|
11,624,914 |
Loan Commitments * |
|
28,076,904 |
|
135,896 |
|
27,881 |
|
28,240,681 |
Loss Allowance |
|
(3,017,368) |
|
(3,227,440) |
|
(9,516,738) |
|
(15,761,546) |
Total |
|
273,229,318 |
|
15,767,135 |
|
5,031,335 |
|
294,027,788 |
*The informational disclosed value of loan commitments has been updated.
Other Financial Instruments
Maximum Exposure to Credit Risk - Other Financial Instruments | ||||||||||||
|
|
Maximum Exposure |
|
Collateral * |
|
Net Exposure |
||||||
|
|
2023 |
|
2022 |
|
2023 |
|
2022 |
|
2023 |
|
2022 |
Maximum Exposure to Credit Risk |
|
|
|
|
|
|
|
|
|
|
|
|
Debt instruments |
|
25,148,469 |
|
27,418,197 |
|
(1,407,484) |
|
(741,197) |
|
23,740,985 |
|
26,677,000 |
F-166
Derivatives ** |
|
1,824,750 |
|
9,189,488 |
|
(698,662) |
|
(138,416) |
|
1,126,088 |
|
9,051,072 |
Equity |
|
543,210 |
|
544668 |
|
- |
|
- |
|
543,210 |
|
544,668 |
Other financial instruments |
|
38,319 |
|
42171 |
|
- |
|
- |
|
38,319 |
|
42,171 |
Total |
|
27,554,748 |
|
37,194,524 |
|
(2,106,146) |
|
(879,613) |
|
25,448,602 |
|
36,314,911 |
Maximum exposure to credit risk of the loans and advances refers to the carrying amount at the end of the period. It does not take into account any collateral received or any other credit risk mitigants.
Maximum exposure to credit risk of financial guarantees and loan commitments corresponds to the total amount guaranteed at the end of the period. It does not take into account any collateral received or any other credit risk mitigants.
Maximum exposure to derivatives refers to the fair value at the end of the period, without considering any guarantee received or any other credit risk mitigants.
Maximum exposure to credit risk of debt instruments and equity securities refers to the carrying amount at the end of the period without considering any guarantee received.
Country Risk
In addition, for the Bank's financial companies, which are subject to the application of the Comprehensive Risk Management System (SIAR), the framework for the management of country risk is included, which refers to the possibility of an entity incurring losses as a result of financial operations abroad due to adverse economic and/or political conditions in the country receiving those operations, either because of restrictions on the transfer of foreign exchange or because of factors not attributable to the commercial and financial condition of the country receiving those operations. This definition includes, but is not limited to, sovereign risk (SR) and transfer risk (TR) associated with such factors.
The framework has guidelines, processes and methodologies that evaluate periodically the country risk to which it is exposed in its Equity Investments, such as equity investments, those that are executed in jurisdictions different from Colombia that could have a high economic materiality, individually or aggregated by country, and whose purpose is to remain in the country.
Country risk management includes different stages to identificate, measure, control and monitor the risk to which the entity is being exposed. For this management, the business plan, type of operations, their materiality, current and future vocation, as well as the characteristics of the country in which the investment is made. Additionally, it is supported by methodologies and processes used in the management of country risk, developed by the Vice President of Risk and approved by the Board of Directors.
The definition of investment appetite takes into account the assessment of country risk as defined in the SIAR and must ensure compliance with solvency and liquidity indicators, seeking to be consistent with the strength and financial health of the entity.
At the end of 2023, there were no alerts on any investments, nor were any adjustments made for deterioration in investments that could affect or deteriorate the Bank's financial strength.
a. Credit Risk Management - Loans and Advances
Management of credit risk is carried out through all the credit life cycle. These estages are defined in the following way:
| ● | Origination: Knowing the borrower, payment capacity analysis, payment behavior and credit approval and structure. |
| ● | Monitoring: Knowing the borrower’s situation during the life of the credit. |
| ● | Recovery: Collection management during the different stages of the same credit. |
F-167
In order to support the credit origination processes, the Bank develops models, methodologies and analytic techniques based on statistical information or criteria from experts, which differentiate the risk levels of potential borrowers in order to support the decision-making process.
In 2023, the dynamics of the Bank’s portfolio were affected by the global economic slowdown and high inflation rates in all the regions where the Bank is present.This, in addition to the uncertainty in the political and social environment and the appreciation of the peso against the dollar, which mainly affected Colombia, had a significant impact on the performance of the portfolio, leaving significant impairments as a result, in particular in the individual portfolios of natural persons., both consumer and mortgage. This led to early interventions in the origination, monitoring and collection policies of portfolios with greater deterioration, with the aim of improving the risk profile of new business, resulting in a reduction in payouts. about that, proactive credit risk management was maintained through the monitoring and follow-up of customers and portfolios, the evaluation of the conditions and specific requirements of each one, as well as the development of methods, tools and models to optimize collection..
Monitoring and reviewing the credit portfolio continues to be a key factor in identifying and applying strategies at different stages of the credit cycle, which has generated the development of new processes and models with traditional, alternative and sectorial information, allowing the management of customers in a timely manner, through local and transversal tools in the countries where the Bank is present, behavioral models and early warning systems, which allow the identification of possible deviations in the projection of portfolio composition.
Risk management during the credit life cycle is developed through the fulfillment of the policies, procedures and methodologies stipulated in the “Comprehensive Risk Management System (SIAR)”, )”, which include the general criteria for evaluating, measuring, assuming, monitoring, controlling and hedging credit risk. In addition, Management has developed process and methodology manuals that specify the policies and procedures for the different products and segments served by the organization in accordance with the strategy approved by the Board of Directors for monitoring and controlling such risk.
The Credit Risk Administration System also contains general criteria to evaluate, classify, measure and mitigate credit risk. In addition, the credit risk department has developed methodologies and manuals that specify the policies and procedures for different products and segments managed by the Bank.
To maintain credit quality and manage the risk arising from its lending activities, the Bank has established general loan policies, including the following:
| ● | Credit exposure limits: Contains guidelines with regards to the establishment of credit exposure limits. This is set as a result of legal requirements and according to the Bank’s internal guidelines. |
| ● | Origination policies: These policies aim to acquire ample and sufficient knowledge of the characteristics of potential borrowers and to select them properly. The risk level of the individual and legal entities is determined using rating and scoring models which define cut-off points that are applied in the process of issuing credit. These models use information such as the credit history of the borrower, sociodemographic particularities, the type of business the borrower engages in, the borrower’s ability to repay the loan, and information received from the credit risk bureaus. In addition, sectorial and macroeconomic behavior is taken into account. Loan applications, depending on their amount and risk level, are presented for approval at the level of management authority required. |
| ● | Collaterals policies: For the purpose of mitigating risk associated with non-fulfillment of obligations agreed upon by the borrower, the Bank has established policies for the valuation of collateral received as well as for the determination of the maximum loan amount that can be granted against the value of the collateral. |
| ● | Allowance policies: The objective of this policy is to fulfill legal requirements and the Bank’s business policies. In addition, this policy is meant to provide the guidelines to analyze the client’s status and take the necessary actions in order to mitigate credit risk to which the Bank is exposed. For further information, please see Note 2. |
F-168
| ● | Monitoring policies: Contains various monitoring procedures, portfolio reports and policies for the purpose of overseeing, in an adequate and timely manner, the evolution of credit risk. These procedures include a continuous process of classification and reassessment of credit operations and they maintain consistency with the policies implemented for granting loans. |
| ● | Portfolio recovery policies: Through these policies, the Bank aims to establish those mechanisms that allow it to anticipate the action to be taken in the event of possible delays and minimize the impact resulting from non-fulfillment of payment or delays by the borrower. Additionally, the aspects established in this policy delimit what the Bank has defined as collection management and that make it possible to obtain information to improve the origination policies and the allowances for loans and advances and lease losses models. The established actions are combined with strategies to adjust to the economy, market and costumer conditions, allowing the Bank to offer alternatives tailored to each case, such as payment deals, foreclosed assets, cession agreements, modifications, restructuring, and so on. |
The Risk Corporate Vice Presidency is in charge of defining and documenting the specific characteristics of the models, methodologies and analytics techniques, as well as the parameters, variables and the cut-off points that are applied in the process of issuing credit, according to market and product conditions, as well as the appetite framework approved by the board of directors. Those models, methodologies and analytic techniques can incorporate different kinds of variables such as social demographic, qualitative issues, internal and external behavior, product parameters, etc. In addition, as defined for regulatory basis, Risk Corporate Vice Presidency performs back testing to these models and methodologies in order to evaluate their effectiveness, reporting their results to the board of directors.
The Risk Corporate Vice Presidency establishes through internal guidelines the scoring or cut-off points required in the different process of issuing credit. In the same way, this Vice Presidency can adjust parameters to give a different score considering relevant qualitative and quantitative information, such as customer´s sector, financial indicators, historical payment behavior, etc. Moreover, on a monthly basis, large part of the portfolio is rated considering the established internal models for the purpose of evaluating the credit risk of each borrower and constitutes the required allowance for loans and advances and lease losses.
In addition to the evaluation and qualification of the portfolio, the monthly allowance for loans and advances and lease losses serves to measure the present condition of the portfolio and the methodologies used for its calculation serve as a tool to evaluate risk, be it in a collective or individual manner. Collective evaluation of the portfolio applies the following parameters for measuring risk: probability of default (PD), loss given default (LGD) and exposure at default (EAD). For further details please see Note 2 Significant Accounting Policies, section 7.4.5 Impairment of financial assets at amortized cost.
An individual’s risk evaluation is made in respect of consumers classified in stage 3 with significant exposure and corporate clients classified in stage 2 who were previously in stage 3. The analysis is based on the projection of the individual client cash flow, parameters such as recovery rates estimated by models that include financial, behavioral information, collaterals and qualitative variables, which serve as elements to measure risk and define allowances for loans, advances and lease losses for each borrower.
Periodically backtesting must be performed on the allowances for loans and advances and lease losses models for the purpose of maintaining suitable hedge levels in accordance with the Bank’s risk appetite.
The Bank is continuously monitoring the concentration of risk groups, as well as carrying out a daily control of the exposure to different economic groups, evaluating the legal limits of indebtedness in order to fulfill the norms established about the concentration limits.
The Bank performs international references determined by the rankings of external risks that allow the analysis of concentration levels in different geographic areas. On the other hand, at the legal level, the Bank is governed by the concepts and methodologies established by the external norms regarding the construction, administration and control of the concentration of economic groups.
F-169
The following classifications are established for the analysis of concentration:
| ● | By country: Based on the country where the loans were originated. |
| ● | By sector: According to the sectorial sub-segmentation defined by the Bank based mainly on the code CIIU1. |
| ● | By categories: According to the portfolio category of each agreement (commercial, financial leases, consumer loans, small business loans and mortgages). |
| ● | By economic group: According to the characteristics of economic groups as established by regulations. |
| ● | By maturity: According to the remaining term to loan maturity. |
| ● | By past due days: This concentration evaluates loans that are more than one month overdue. |
1 CIIU: International Standard Industrial Classification of All Economic Activities.
b. Credit Quality Analysis - Loans and Financial Leases
Rating System for Credit Risk Management
The principal aim of this rating system is to determine the risk profile of the borrower, which is obtained through a rating.
The rating for corporate loans is assigned principally based on the analysis of the interrelation of both qualitative and quantitative elements that can affect the fulfillment of the financial commitments acquired by a borrower. Information from financial statements, profit and loss statements, historical payment behavior both with the Bank and with other entities, and qualitative information on variables that are not explicit in the financial statements are taken into account, as well as client transactional information such as alternative variables. The rating model is applied at the origination of the loan and is updated by a central qualification office to undertake a periodical evaluation of the loan portfolio.
In the case of a retail customer, granting and behavior scoring models are used in order to identify the level of risk associated with the borrower. These models include information such as personal details, financial information and transactional, historical behavior, the total number of credit products and external information from credit bureaus.
Description of Loans and Financial Leases
In order to evaluate and manage credit risk, the credits and financial leasing operations have been classified as:
· Commercial and Financial Leases:
Loans granted to individuals or companies in order to carry out organized economic activities and are not classified as small business loans.
The borrowers in this portfolio are mainly made up of companies, segmented in homogenous groups that are constituted according to size, annual sales or main activity. The following variables are part of this classification:
F-170
Segment |
Incomes/Sales |
Corporate |
Companies with consolidated annual sales by economic group >= COP 100,000 M. Banistmo places borrowers with annual sales >= USD 10 M. Banco Agrícola and BAM place borrowers with annual sales >= USD 25 M. |
Business |
Companies with consolidated annual sales by economic group > = COP 13,000 M and < COP 100,000 M. For Banco Agricola borrowers with annual sales >= USD 7 MM y < USD 25 MM and BAM, with annual sales >= USD 5 M and < USD 25 M. |
Commercial |
For BAM, companies with annual sales >= USD 2 M y < USD 5 M. |
Business Construction |
Constructors who dedicate themselves professionally to the construction of buildings to be sold or rented as their main activity, with consolidated annual sales by economic group >= COP 58,000 M and <= COP 200,000 M or commercial size > = $15,000 M and < $70,000 MM, or project size >= $500,000 M and < $2,200 billion |
Corporate Construction |
Constructors who dedicate themselves to the construction of buildings to be sold or rented as their main activity, with consolidated annual sales by economic group > COP 200,000 M or commercial size > = $70,000 M or project size >= $2,200 billion |
|
SME Construction |
Constructors who dedicate themselves professionally to the construction of buildings to be sold or rented as their main activity with consolidated annual sales by economic group >= COP 380 M and <= COP 58,000 M or commercial size < $715,000 M or project size < $500,000 M. |
Institutional Financing |
Financial sector institutions. |
Government |
Municipalities, districts, departments with their respective decentralized organizations and entities at the national level with incomes >= COP 20,000 M. |
SME |
Annual sales < COP 13,000 M, with a classification between small, medium, large and plus except for Banistmo which places borrowers < USD 10 M in annual sales. For Banco Agrícola, borrowers with annual sales < USD 7 M and BAM, borrowers with annual sales < USD 2 M. |
· Consumer:
Loans and advances, regardless of amount, granted to individuals for the purchase of consumer goods or to pay for non-commercial or business services. These loans are classified as follows:
Classification | |
Vehicles |
Credits granted for the acquisition of vehicles and motorcycles. The vehicle financed is used as collateral for the loan. |
Credit cards |
Revolving credit limits for the acquisition of consumer goods, utilized by means of a plastic card, a virtual card or a token in digital wallets. |
Payroll loans |
It is a credit line attached to an authorized individual payroll and pension amount. |
Other loans |
Loans granted for the acquisition of consumer goods other than vehicles and Payroll loans Credit cards are not included in this segment. |
The counterparties in this portfolio are mainly individuals, segmented in homogenous groups, which are formed according to their size, which is calculated by their monthly income.
· Mortgage:
These are loans, regardless of amount, granted to individuals for the purchase of a new or used house, commercial real estate or construction of a home. These loans include loans denominated in local units or local currency that are guaranteed by a senior mortgage on the property and that are financed with a total repayment term of 5 to 30 years.
The counterparties in the mortgage portfolio are mainly made up of individuals segmented in homogenous groups, which are formed according to their size, which is calculated by their monthly income.
F-171
· Small Business Loans:
These are issued for the purpose of encouraging the activities of small business and are subject to the following requirements in Colombia: (i) their indebtedness with all entities cannot exceed 120 minimum wages (excluding mortgage obligations for housing financing); (ii) the client's total assets, excluding mortgage assets, are less than 500 minimum wages.
The borrowers in this portfolio are mainly individuals, segmented in homogenous groups, which are formed according to their commercial size, which is calculated by their monthly income.
Analysis of the behavior and impairment of the loan portfolio and financial lease operations
As of December 31, 2023, the Bank’s total loan portfolio, valued in Colombian pesos, registered an decrease of 5.9% compared to December 2022, driven by to the appreciation of the peso against the dollar during the analysis period, which affected the re-expression in pesos of the foreign currency portfolio of the Bank and the contraction in consumer and small business loans, mainly for Bancolombia, added to the reduction in the commercial portfolio of Banco Agricola, Banistmo and BAM, a fact attributable to a greater extent to the global economic slowdown. The 30-day past due loan ratio (consolidated) reaching at 5.39% in December 2023 compared to 3.55% in December 2022, associated with macroeconomic effects that affect both natural person and legal entity, such as high levels of inflation, interest rates and slowdown in most sectors. During the period, different strategies were developed throughout the credit cycle, which allowed the implementation of anticipated and coherent actions to the reality of customers and their environment, in order to limit the deterioration and place them in better risk profiles.
| ● | Commercial loans and financial leases amounted to COP 161,964 billion, which represented a decrease of 5.6% compared to 2022. The 30-day past due loan ratio was 3.50% compared to 2.39% as of December 2022. |
| ● | Consumer loans amounted to COP 54,592 billion, which represented a decrease of 8.4% compared to 2022. The 30-day past due loan ratio was 9.48% compared to 5.82% as of December 2022. |
| ● | Mortgage loans totaled to COP 36,250 billion, which represented a decrease of 3.0% compared to 2022. The 30-day past due loan ratio was 7.52% compared to 4.95% as of December 2022. |
| ● | Small Business loans ended at COP 1,145 billion, which represented a decrease of 13.8% with respect to 2022. The 30-day past due loan ratio was 12.17% compared to 11.48% as of December 2022. |
In order to monitor credit risk associated with clients, the Bank has established regular meetings conducted by the AEC Committee to identify events that can lead to a reduction in borrowers’ ability to pay. Generally, clients with good credit behavior could be included in the watch list in case of detecting any event that can lead to future financial difficulties to repay their loans; for instance, internal factors such as the economic activity and sector, financial weakness, impacts of macroeconomic conditions, changes in corporate governance and other situations that could affect clients’ business. The amount and allowance of clients included in the described watch list, as of December 31, 2023 and December 2022 is shown below:
December 2023:
Watch List december 31, 2023 | ||||||
In millions of COP | ||||||
Risk Level |
|
Amount |
|
% |
|
Allowance |
Level 1 – Low Risk |
|
14,358,838 |
|
1.02 |
% |
146,014 |
Level 2 – Medium Risk |
|
4,744,341 |
|
7.38 |
% |
349,972 |
Level 3 – High Risk |
|
2,886,649 |
|
53.31 |
% |
1,538,882 |
Level 4 – High Risk |
|
5,239,356 |
|
73.24 |
% |
3,837,196 |
Total |
|
27,229,184 |
|
21.57 |
% |
5,872,064 |
F-172
December 2022:
Watch List december 31, 2022 | ||||||
In millions of COP | ||||||
Risk Level |
|
Amount |
|
% |
|
Allowance |
Level 1 – Low Risk |
|
10,467,361 |
|
1.50 |
% |
157,131 |
Level 2 – Medium Risk |
|
7,408,528 |
|
9.36 |
% |
693,260 |
Level 3 – High Risk |
|
2,265,069 |
|
52.04 |
% |
1,178,800 |
Level 4 – High Risk |
|
6,442,895 |
|
82.16 |
% |
5,293,593 |
Total |
|
26,583,853 |
|
27.55 |
% |
7,322,784 |
Loans and Financial Leases Collateral
The Bank obtains collateral for loans and leases in order to mitigate credit risk by foreclosing the collateral when the borrower cannot fully repay the loan or lease. Collateral is considered in the determination of the allowance for loans and advances and lease losses when it complies with the following conditions:
| ● | Its fair value was established according to technical and objective criteria. |
| ● | The Bank is granted a preference to obtain the payment of the obligation, becoming an effective legal mechanism over it. |
| ● | Its performance is reasonably possible. |
The Bank has defined the criteria for collateral enforceability, which are established according to the classification of the loan portfolio. In addition, the Bank has set guidelines to value collateral and the frequency of such valuations, as well as those guidelines related to the legalization, registry and maintenance of the collateral. Likewise, the Bank has defined the criteria for insurability, custody and the necessary procedures for their cancellation.
The update of the fair value of mortgages and vehicles collaterals for the loan portfolio is made at least once a year. The methodology used to estimate the fair value of the properties is applied by external and independent entities. Updating the fair value of the vehicles is done through guides and valid values commonly used as reference to set the value of a vehicle. The fair value of real state and vehicles are classified in levels 2 and 3 depending on the observability and significance of the inputs used in the valuation techniques according to the hierarchy established by IFRS 13.
To determine the suitability of appraiser’s selection, there are internal guidelines to be fulfilled related to independence, professional certification, reputation and experience. In a similar way, to validate the appraisal´s suitability, the bank has defined guidelines based on current regulations which are related to methodologies, report quality and commercial value.
F-173
During the reporting period, the Bank’s collateral policies have not changed significantly in relation to the way collateral is held and its overall quality.
The following table shows loans and financial leases, classified in commercial, consumer, mortgage, financial leases and small business loans, and disaggregated by type of collateral:
December 31, 2023 | ||||||||||||
Amount Covered by Collateral | ||||||||||||
In Millions of COP | ||||||||||||
|
|
|
|
|
|
|
|
Financial |
|
Small |
|
|
Nature of the Collateral |
|
Commercial |
|
Consumer |
|
Mortgage |
|
Leasing |
|
Business |
|
Total |
Real Estate and Residential |
|
23,368,950 |
|
1,693,007 |
|
34,253,140 |
|
10 |
|
319,038 |
|
59,634,145 |
Goods Given in Real Estate Leasing |
|
- |
|
- |
|
189 |
|
17,104,180 |
|
- |
|
17,104,369 |
Goods Given in Leasing Other Than Real Estate |
|
- |
|
26 |
|
- |
|
8,580,543 |
|
- |
|
8,580,569 |
Stand by Letters of Credit |
|
1,052,764 |
|
- |
|
- |
|
- |
|
- |
|
1,052,764 |
Security Deposits |
|
447,306 |
|
370,286 |
|
- |
|
- |
|
103,013 |
|
920,605 |
Guarantee Fund |
|
4,012,115 |
|
191 |
|
- |
|
60,242 |
|
52,222 |
|
4,124,770 |
Sovereign of the Nation |
|
- |
|
- |
|
- |
|
- |
|
- |
|
- |
Collection Rights |
|
6,673,320 |
|
57,306 |
|
- |
|
- |
|
420 |
|
6,731,046 |
Other Collateral (Pledges) |
|
2,957,482 |
|
7,286,581 |
|
39,432 |
|
- |
|
2,499 |
|
10,285,994 |
Without Guarantee (Uncovered Balance) |
|
96,175,459 |
|
45,184,372 |
|
1,957,647 |
|
1,532,082 |
|
667,825 |
|
145,517,385 |
Total loans and financial leases |
|
134,687,396 |
|
54,591,769 |
|
36,250,408 |
|
27,277,057 |
|
1,145,017 |
|
253,951,647 |
December 31, 2022 | ||||||||||||
Amount Covered by Collateral | ||||||||||||
In Millions of COP | ||||||||||||
|
|
|
|
|
|
|
|
Financial |
|
Small |
|
|
Nature of the Collateral |
|
Commercial |
|
Consumer |
|
Mortgage |
|
Leasing |
|
Business |
|
Total |
Real Estate and Residential |
|
28,426,583 |
|
2,094,966 |
|
34,941,415 |
|
13 |
|
494,198 |
|
65,957,175 |
Goods Given in Real Estate Leasing |
|
- |
|
- |
|
193 |
|
17,031,277 |
|
- |
|
17,031,470 |
Goods Given in Leasing Other Than Real Estate |
|
- |
|
39 |
|
- |
|
7,975,353 |
|
- |
|
7,975,392 |
Stand by Letters of Credit |
|
604,309 |
|
- |
|
- |
|
- |
|
3,375 |
|
607,684 |
Security Deposits |
|
450,157 |
|
464,940 |
|
- |
|
- |
|
133,112 |
|
1,048,209 |
Guarantee Fund |
|
4,976,395 |
|
1,168 |
|
- |
|
77,695 |
|
132,290 |
|
5,187,548 |
Sovereign of the Nation |
|
- |
|
- |
|
- |
|
- |
|
- |
|
- |
Collection Rights |
|
6,048,311 |
|
54,112 |
|
- |
|
- |
|
437 |
|
6,102,860 |
Other Collateral (Pledges) |
|
3,382,334 |
|
7,963,563 |
|
57,360 |
|
- |
|
3,696 |
|
11,406,953 |
Without Guarantee (Uncovered Balance) |
|
99,649,764 |
|
49,009,933 |
|
2,372,405 |
|
3,013,378 |
|
560,968 |
|
154,606,448 |
Total loans and financial leases |
|
143,537,853 |
|
59,588,721 |
|
37,371,373 |
|
28,097,716 |
|
1,328,076 |
|
269,923,739 |
The Bank closely monitors financial assets that are classified in Stage 3, to the point that a specific methodology for calculating expected credit losses is applied using a sophisticated approach named “ECL model under collateral Methodology”, which considers components like the forecasts of future collateral valuations, including expected sale discounts; time to realization of collateral, cure rates, external costs of realization of collateral, among others; as a consequence of the higher likelihood that the bank will take possession of these collaterals in order to mitigate potential credit losses.
F-174
The Financial assets that are classified in Stage 3 and are evaluated under this methodology are shown below:
December 31, 2023 | ||||||||
In Millions of COP | ||||||||
Classification |
|
Amount |
|
Allowance |
|
Total |
|
Fair Value of Collateral |
Commercial |
|
700,120 |
|
274,641 |
|
425,479 |
|
1,176,130 |
Consumer |
|
|
|
|
|
|
|
|
Mortgage |
|
383,878 |
|
94,260 |
|
289,618 |
|
331,738 |
Small Business Loans |
|
|
|
|
|
|
|
|
Financial Leases |
|
699,803 |
|
383,127 |
|
316,676 |
|
1,263,274 |
Total credit assets |
|
1,783,801 |
|
752,028 |
|
1,031,773 |
|
2,771,142 |
December 31, 2022 | ||||||||
In Millions of COP | ||||||||
Classification |
|
Amount |
|
Allowance |
|
Total |
|
Fair Value of Collateral |
Commercial |
|
653,619 |
|
317,950 |
|
335,669 |
|
1,185,888 |
Consumer |
|
|
|
|
|
|
|
|
Mortgage |
|
350,380 |
|
82,378 |
|
268,002 |
|
406,990 |
Small Business Loans |
|
|
|
|
|
|
|
|
Financial Leases |
|
669,804 |
|
267,200 |
|
402,604 |
|
1,083,968 |
Total credit assets |
|
1,673,803 |
|
667,528 |
|
1,006,275 |
|
2,676,846 |
A portion of the Bank’s financial assets originated by the mortgage and commercial business has sufficiently low ‘loan to value’ (LTV) ratios, which results in no loss allowance being recognized in accordance with The Bank’s expected credit loss model. The carrying amount of such financial assets is COP 206,871 as at December 31, 2022 and COP 204,268 as at 31 December 2021.
Foreclosed assets and other credit mitigants
Assets received in lieu of payment (foreclosed assets) are recognized on the statement of financial position when current possession of the asset takes place.
Foreclosed assets such as immovable and movable property, equity securities and other financial assets, are received based on a commercial valuation, and their net realizable value is given by a specialized team.
During the years ended December 31, 2023 and 2022, the Bank entered into non-cash operating and investing activities related to restructured loans and returned properties that were transferred to assets held for sale and inventories amounting to COP 1,361,465 and COP 889,752, respectively.
The Bank classifies foreclosed assets after acknowledgment of the exchange operation according to the intention of use, as follows:
| ● | Non-current assets held for sale. |
| ● | Other marketable assets. |
| ● | Other non-marketable assets. |
| ● | Inventories. |
Collateral classified as non-current assets held for sale are those expected to be sold in the following 12 months. When there are market restrictions that do not allow their realization in less than 12 months and this period is extended, retroactive depreciation must be charged to results and the asset value will be reduced by the depreciation value.
Foreclosed assets classified as non-current assets held for sale are those expected to be sold in the following 12 months. The non-current assets held for sale that cease to comply with the guidelines of immediately sell, must be classified as “Other marketable assets” and if it’s necessary, their book value would be adjusted.
F-175
c. Risk Concentration – Loans and Advances
The analysis of credit risk concentration is done by monitoring the portfolio by groups such as: loan categories, maturity, past due days, economic sector, country and economic group, as shown here:
● Loans concentration by category
The composition of the credit portfolio in commercial, consumer, mortgage, financial leases and small business loans categories for the periods ending on December 31, 2023 and December 31, 2022, it is as follows:
Composition |
|
December 31, 2023 |
|
December 31, 2022 |
In millions of COP | ||||
Commercial |
|
134,687,396 |
|
143,537,853 |
Corporate |
|
69,843,654 |
|
79,766,203 |
SME |
|
14,200,557 |
|
15,864,828 |
Others |
|
50,643,185 |
|
47,906,822 |
Consumer |
|
54,591,769 |
|
59,588,721 |
Credit card |
|
11,207,731 |
|
11,388,043 |
Vehicle |
|
5,409,226 |
|
5,173,235 |
Payroll loans |
|
9,461,889 |
|
10,838,679 |
Others |
|
28,512,923 |
|
32,188,764 |
Mortgage |
|
36,250,408 |
|
37,371,373 |
VIS2 |
|
12,997,624 |
|
12,318,512 |
Non- VIS |
|
23,252,784 |
|
25,052,861 |
Financial Leases |
|
27,277,057 |
|
28,097,716 |
Small Business Loans |
|
1,145,017 |
|
1,328,076 |
Loans and advances to customers and financial institutions |
|
253,951,647 |
|
269,923,739 |
Allowance for loans and advances and lease losses |
|
(16,223,103) |
|
(15,479,640) |
Total net loan and financial leases |
|
237,728,544 |
|
254,444,099 |
· Concentration of loan by maturity
The following table shows the ranges of maturity for the credit loans and financial leases, according for the remaining term for the completion of the contract of loans and financial leases at the end of December 2023 and December 2022:
December 31, 2023 | ||||||||||
|
|
|
|
Between 1 and 5 |
|
Between 5 and 15 |
|
Greater Than 15 |
|
|
Maturity |
|
Less Than 1 Year |
|
Years |
|
Years |
|
Years |
|
Total |
In millions of COP | ||||||||||
Commercial |
|
40,601,345 |
|
57,828,301 |
|
35,936,869 |
|
320,881 |
|
134,687,396 |
Corporate |
|
22,360,108 |
|
27,329,312 |
|
19,970,727 |
|
183,507 |
|
69,843,654 |
SME |
|
4,486,326 |
|
7,497,307 |
|
2,200,274 |
|
16,650 |
|
14,200,557 |
Others |
|
13,754,911 |
|
23,001,682 |
|
13,765,868 |
|
120,724 |
|
50,643,185 |
Consumer |
|
1,289,150 |
|
26,549,043 |
|
26,086,537 |
|
667,039 |
|
54,591,769 |
Credit card |
|
417,390 |
|
1,755,518 |
|
9,034,823 |
|
- |
|
11,207,731 |
Vehicle |
|
55,295 |
|
2,982,439 |
|
2,371,163 |
|
329 |
|
5,409,226 |
Order of payment |
|
57,211 |
|
1,872,546 |
|
7,061,605 |
|
470,527 |
|
9,461,889 |
Others |
|
759,254 |
|
19,938,540 |
|
7,618,946 |
|
196,183 |
|
28,512,923 |
Mortgage |
|
75,189 |
|
1,005,831 |
|
9,601,783 |
|
25,567,605 |
|
36,250,408 |
VIS |
|
23,303 |
|
264,232 |
|
2,157,322 |
|
10,552,767 |
|
12,997,624 |
Non-VIS |
|
51,886 |
|
741,599 |
|
7,444,461 |
|
15,014,838 |
|
23,252,784 |
Financial Leases |
|
1,639,218 |
|
9,165,622 |
|
12,939,908 |
|
3,532,309 |
|
27,277,057 |
Small business loans |
|
208,429 |
|
737,255 |
|
194,581 |
|
4,752 |
|
1,145,017 |
Total gross loans and financial leases |
|
43,813,331 |
|
95,286,052 |
|
84,759,678 |
|
30,092,586 |
|
253,951,647 |
F-176
December 31, 2022 | ||||||||||
|
|
|
|
Between 1 and 5 |
|
Between 5 and 15 |
|
Greater Than 15 |
|
|
Maturity |
|
Less Than 1 Year |
|
Years |
|
Years |
|
Years |
|
Total |
In millions of COP | ||||||||||
Commercial |
|
41,624,418 |
|
63,696,431 |
|
38,127,660 |
|
89,344 |
|
143,537,853 |
Corporate |
|
22,737,806 |
|
32,474,514 |
|
24,547,720 |
|
6,163 |
|
79,766,203 |
SME |
|
4,715,405 |
|
9,011,823 |
|
2,110,855 |
|
26,745 |
|
15,864,828 |
Others |
|
14,171,207 |
|
22,210,094 |
|
11,469,085 |
|
56,436 |
|
47,906,822 |
Consumer |
|
1,276,398 |
|
36,662,101 |
|
20,790,945 |
|
859,277 |
|
59,588,721 |
Credit card |
|
341,644 |
|
9,658,986 |
|
1,387,413 |
|
- |
|
11,388,043 |
Vehicle |
|
56,869 |
|
2,453,692 |
|
2,662,171 |
|
503 |
|
5,173,235 |
Order of payment |
|
53,455 |
|
1,955,842 |
|
8,274,849 |
|
554,533 |
|
10,838,679 |
Others |
|
824,430 |
|
22,593,581 |
|
8,466,512 |
|
304,241 |
|
32,188,764 |
Mortgage |
|
65,252 |
|
1,017,950 |
|
10,018,853 |
|
26,269,318 |
|
37,371,373 |
VIS |
|
16,905 |
|
246,203 |
|
1,934,490 |
|
10,120,914 |
|
12,318,512 |
Non-VIS |
|
48,347 |
|
771,747 |
|
8,084,363 |
|
16,148,404 |
|
25,052,861 |
Financial Leases |
|
2,215,774 |
|
8,560,553 |
|
13,798,615 |
|
3,522,774 |
|
28,097,716 |
Small business loans |
|
199,488 |
|
834,176 |
|
282,515 |
|
11,897 |
|
1,328,076 |
Total gross loans and financial leases |
|
45,381,330 |
|
110,771,211 |
|
83,018,588 |
|
30,752,610 |
|
269,923,739 |
2 VIS: Social Interest Homes, corresponds to mortgage loans granted by the financial institutions of amounts less than 135 minimum wages.
· Concentration by past due days
The following table shows the loans and financial leases according to past due days for the periods ending on December 31, 2023 and December 31, 2022. Loans or financial leases are considered past due if it is more than one month overdue (i.e. 31 days):
December 31, 2023 | ||||||||||||
Past-due | ||||||||||||
|
|
|
|
|
|
|
|
|
|
More Than 360 |
|
|
Period |
|
0 - 30 Days |
|
31 - 90 Days |
|
91 - 120 Days |
|
121 - 360 Days |
|
Days |
|
Total |
In millions of COP | ||||||||||||
Commercial |
|
129,866,971 |
|
500,794 |
|
205,141 |
|
1,777,620 |
|
2,336,870 |
|
134,687,396 |
Consumer |
|
49,418,431 |
|
2,244,017 |
|
794,005 |
|
1,994,748 |
|
140,568 |
|
54,591,769 |
Mortgage |
|
33,524,034 |
|
1,290,817 |
|
212,433 |
|
599,351 |
|
623,773 |
|
36,250,408 |
Financial Leases |
|
26,436,493 |
|
247,124 |
|
56,434 |
|
196,578 |
|
340,428 |
|
27,277,057 |
Small Business Loans |
|
1,005,725 |
|
50,138 |
|
14,859 |
|
58,244 |
|
16,051 |
|
1,145,017 |
Total |
|
240,251,654 |
|
4,332,890 |
|
1,282,872 |
|
4,626,541 |
|
3,457,690 |
|
253,951,647 |
December 31, 2022 | ||||||||||||
Past-due | ||||||||||||
|
|
|
|
|
|
|
|
|
|
More Than 360 |
|
|
Period |
|
0 - 30 Days |
|
31 - 90 Days |
|
91 - 120 Days |
|
121 - 360 Days |
|
Days |
|
Total |
In millions of COP | ||||||||||||
Commercial |
|
140,277,356 |
|
427,127 |
|
140,582 |
|
604,363 |
|
2,088,425 |
|
143,537,853 |
Consumer |
|
56,121,232 |
|
1,578,302 |
|
521,407 |
|
1,201,421 |
|
166,359 |
|
59,588,721 |
Mortgage |
|
35,520,689 |
|
578,116 |
|
144,580 |
|
524,619 |
|
603,369 |
|
37,371,373 |
Financial Leases |
|
27,250,876 |
|
205,639 |
|
53,469 |
|
117,808 |
|
469,924 |
|
28,097,716 |
Small Business Loans |
|
1,175,668 |
|
66,979 |
|
15,262 |
|
54,439 |
|
15,728 |
|
1,328,076 |
Total |
|
260,345,821 |
|
2,856,163 |
|
875,300 |
|
2,502,650 |
|
3,343,805 |
|
269,923,739 |
F-177
· Concentration of loans by economic sector
The following table contains the detail of the portfolio of loans and financial leases by main economic activity of the borrower for the periods ending on December 31, 2023 and December 31, 2022:
December 31, 2023 | ||||||
Economic sector |
|
Loans and advances |
||||
|
|
Local |
|
Foreign |
|
Total |
|
|
In millions of COP |
||||
Agriculture |
|
5,162,973 |
|
2,488,789 |
|
7,651,762 |
Petroleum and Mining Products |
|
1,846,238 |
|
234,523 |
|
2,080,761 |
Food, Beverages and Tobacco |
|
9,147,936 |
|
888,429 |
|
10,036,365 |
Chemical Production |
|
4,299,308 |
|
25,409 |
|
4,324,717 |
Government |
|
8,369,707 |
|
887,448 |
|
9,257,155 |
Construction |
|
16,202,035 |
|
5,561,782 |
|
21,763,817 |
Commerce and Tourism |
|
23,803,830 |
|
11,068,049 |
|
34,871,879 |
Transport and Communications |
|
9,574,318 |
|
351,176 |
|
9,925,494 |
Public Services |
|
11,758,265 |
|
1,286,561 |
|
13,044,826 |
Consumer Services |
|
59,032,642 |
|
32,965,565 |
|
91,998,207 |
Commercial Services |
|
27,474,593 |
|
7,217,591 |
|
34,692,184 |
Other Industries and Manufactured Products |
|
8,679,684 |
|
5,624,796 |
|
14,304,480 |
Total |
|
185,351,529 |
|
68,600,118 |
|
253,951,647 |
December 31, 2022 | ||||||
Economic sector |
|
Loans and advances |
||||
|
|
Local |
|
Foreign |
|
Total |
|
|
In millions of COP |
||||
Agriculture |
|
4,822,190 |
|
3,306,216 |
|
8,128,406 |
Petroleum and Mining Products |
|
751,401 |
|
144,373 |
|
895,774 |
Food, Beverages and Tobacco |
|
9,725,211 |
|
1,213,217 |
|
10,938,428 |
Chemical Production |
|
5,029,722 |
|
31,773 |
|
5,061,495 |
Government |
|
6,826,772 |
|
4,707 |
|
6,831,479 |
Construction |
|
17,828,783 |
|
8,066,352 |
|
25,895,135 |
Commerce and Tourism |
|
24,841,275 |
|
13,691,154 |
|
38,532,429 |
Transport and Communications |
|
10,345,263 |
|
724,740 |
|
11,070,003 |
Public Services |
|
10,121,410 |
|
1,684,858 |
|
11,806,268 |
Consumer Services |
|
59,437,125 |
|
39,168,939 |
|
98,606,064 |
Commercial Services |
|
24,688,401 |
|
10,195,601 |
|
34,884,002 |
Other Industries and Manufactured Products |
|
9,748,529 |
|
7,525,727 |
|
17,274,256 |
Total |
|
184,166,082 |
|
85,757,657 |
|
269,923,739 |
F-178
· Credit concentration by country
The following information shows the concentration of the loans and financial leases by country in which the Bank are located as of December 31, 2023 and December 31, 2022:
December 31, 2023 |
|
||||||||
|
|
|
|
|
|
Allowance for loans and |
|
|
|
Country |
|
Loans and advances |
|
% Participation |
|
advances and lease losses |
|
% Participation |
|
Colombia |
|
181,951,462 |
|
71.65 |
% |
(13,133,577) |
|
80.96 |
% |
Panama |
|
38,599,152 |
|
15.20 |
% |
(1,645,802) |
|
10.14 |
% |
El Salvador |
|
15,373,156 |
|
6.05 |
% |
(552,236) |
|
3.40 |
% |
Guatemala |
|
16,958,954 |
|
6.68 |
% |
(887,518) |
|
5.47 |
% |
Puerto Rico |
|
1,068,923 |
|
0.42 |
% |
(3,970) |
|
0.02 |
% |
Other Countries |
|
- |
|
0.00 |
% |
- |
|
0.00 |
% |
Total |
|
253,951,647 |
|
100.00 |
% |
(16,223,103) |
|
100.00 |
% |
December 31, 2022 |
|
||||||||
|
|
|
|
|
|
Allowance for loans and |
|
|
|
Country |
|
Loans and advances |
|
% Participation |
|
advances and lease losses |
|
% Participation |
|
Colombia |
|
178,168,073 |
|
66.01 |
% |
(11,505,443) |
|
74.33 |
% |
Panama |
|
50,813,521 |
|
18.83 |
% |
(2,223,118) |
|
14.36 |
% |
El Salvador |
|
18,971,871 |
|
7.03 |
% |
(729,238) |
|
4.71 |
% |
Guatemala |
|
20,866,364 |
|
7.73 |
% |
(950,068) |
|
6.14 |
% |
Puerto Rico |
|
1,103,910 |
|
0.41 |
% |
(71,773) |
|
0.46 |
% |
Other Countries |
|
- |
|
0.00 |
% |
- |
|
0.00 |
% |
Total |
|
269,923,739 |
|
100.00 |
% |
(15,479,640) |
|
100.00 |
% |
· Credit concentration by economic group
As of December 31, 2023 and 2022, concentration of the 20 largest economic groups amounted to COP 34,134,547 M and COP 33,413,138 M, respectively. This exposure corresponds to all credit active operations of these groups.
d. Credit quality – Loans and Advances
The following information about credit quality of the borrower for the periods ending December 31, 2023 and December 31, 2022:
December 31 2023 | ||||||||
Classification |
|
Stage 1 |
|
Stage 2 |
|
Stage 3 |
|
Total |
|
|
In millions of COP |
||||||
Commercial |
|
120,773,927 |
|
5,453,537 |
|
8,459,932 |
|
134,687,396 |
Consumer |
|
46,060,615 |
|
4,407,067 |
|
4,124,087 |
|
54,591,769 |
Mortgage |
|
32,210,648 |
|
2,628,654 |
|
1,411,106 |
|
36,250,408 |
Small Business Loans |
|
774,571 |
|
260,303 |
|
110,143 |
|
1,145,017 |
Financial Leases |
|
22,553,128 |
|
3,293,100 |
|
1,430,829 |
|
27,277,057 |
Loans and Advances |
|
222,372,889 |
|
16,042,661 |
|
15,536,097 |
|
253,951,647 |
F-179
December 31 2022 | ||||||||
Classification |
|
Stage 1 |
|
Stage 2 |
|
Stage 3 |
|
Total |
|
|
In millions of COP |
||||||
Commercial |
|
126,530,862 |
|
8,062,435 |
|
8,944,556 |
|
143,537,853 |
Consumer |
|
51,510,943 |
|
5,288,921 |
|
2,788,857 |
|
59,588,721 |
Mortgage |
|
34,067,734 |
|
1,997,270 |
|
1,306,369 |
|
37,371,373 |
Small Business Loans |
|
1,093,973 |
|
135,528 |
|
98,575 |
|
1,328,076 |
Financial Leases |
|
23,566,544 |
|
3,172,285 |
|
1,358,887 |
|
28,097,716 |
Loans and Advances |
|
236,770,056 |
|
18,656,439 |
|
14,497,244 |
|
269,923,739 |
In order to determine the expected credit loss, the Bank considers the economic conditions and performance of the borrower’s industry, the analysis of payments behavior, events that could negatively affect the borrower’s ability to pay, among others factors.
The expected credit loss is determined either by a collective or individual evaluation according to the amount and characteristics of the loan. For further details please see Note 2 Significant Accounting Policies, section 7.4.5 Impairment of financial assets at amortized cost or at fair value through other comprehensive income “FVOCI”.
Impairment loan portfolio analyzed by individual evaluation at COP 5.7 billion, which represented 2.3% of the total portfolio of the Bank.
The table below shows Stage 3 loans and advances according to their type of evaluation for the periods ending December 31, 2023 and December 31, 2022:
December 31 2023 | ||||||||
Impairment |
|
Individual Evaluation |
|
Collective Evaluation |
||||
|
|
Carrying Amount |
|
ECL |
|
Carrying Amount |
|
ECL |
In millions of COP | ||||||||
Commercial |
|
5,198,384 |
|
2,825,357 |
|
3,261,548 |
|
2,401,344 |
Consumer |
|
- |
|
- |
|
4,124,087 |
|
3,460,299 |
Mortgage |
|
- |
|
- |
|
1,411,106 |
|
553,370 |
Financial Leases |
|
562,716 |
|
315,979 |
|
868,113 |
|
356,526 |
Small Business Loan |
|
- |
|
- |
|
110,143 |
|
77,923 |
Total |
|
5,761,100 |
|
3,141,336 |
|
9,774,997 |
|
6,849,462 |
December 31 2022 | ||||||||
Impairment |
|
Individual Evaluation |
|
Collective Evaluation |
||||
|
|
Carrying Amount |
|
ECL |
|
Carrying Amount |
|
ECL |
In millions of COP | ||||||||
Commercial |
|
5,990,389 |
|
3,650,680 |
|
2,954,167 |
|
2,202,638 |
Consumer |
|
- |
|
- |
|
2,788,857 |
|
2,354,412 |
Mortgage |
|
- |
|
- |
|
1,306,369 |
|
561,016 |
Financial Leases |
|
554,698 |
|
276,392 |
|
804,189 |
|
346,434 |
Small Business Loan |
|
- |
|
- |
|
98,575 |
|
67,447 |
Total |
|
6,545,087 |
|
3,927,072 |
|
7,952,157 |
|
5,531,947 |
Sensitivity analysis
The variables with the greatest influence for each country on the expected credit loss (ECL) assessment for the loan portfolio and financial leasing are:
F-180
Colombia:
•GDP growth: due to the impact on the performance of companies and the valuation of collaterals;
•Interest rates: because of its direct impact on the obligations’ repayment.
Panama:
•GDP growth: due to the impact on the performance of companies and the valuation of collaterals;
•Consumer price index: due to its significant impact on the clients’ repayment capacity.
El Salvador:
•GDP growth: due to the impact on the performance of companies and the valuation of collaterals;
•Consumer price index: due to its significant impact on the clients’ repayment capacity.
Guatemala:
•GDP growth: due to the impact on the performance of companies and the valuation of collaterals;
•Interest rates: because of its direct impact on the obligations’ repayment.
The change in the expected credit losses (ECL) at 31 of December 2023, as a result of a possible positive or negative 1% (100 basis points) change in those variables were assessed based on the assumptions used to calculate the ECL for each of the scenarios: base, optimistic and pessimistic, as following:
|
|
|
|
Fiscal Budget Balance – Current account deficit – Inflation – Interest Rate |
||||
|
|
|
|
In Millions of COP |
||||
|
|
|
|
[+1%] |
|
Unchanged |
|
[-1%] |
|
|
[+1%] |
|
73,940 |
|
-141,718 |
|
-344,396 |
|
|
|
|
|
|
|
|
|
GDP Growth |
|
Unchanged |
|
215,658 |
|
- |
|
-202,678 |
|
|
|
|
|
|
|
|
|
|
|
[-1%] |
|
389,759 |
|
174,101 |
|
-28,576 |
The Bank has estimated the impact on the expected credit loss (ECL) assuming the forward-looking scenarios (e.g. optimistic and pessimistic) were weighted 100% instead of applying scenario probability weights across the two scenarios. The table below shows the impact on the expected credit loss (ECL) for each methodology:
|
|
2023 |
|
2022 |
|
||||
As of 31 December |
|
Optimistic |
|
Pessimistic |
|
Optimistic |
|
Pessimistic |
|
In millions of COP | |||||||||
Collective methodology |
|
(437,294) |
|
343,209 |
|
(306,602) |
|
277,296 |
|
Collateral methodology |
|
(149,983) |
|
137,172 |
|
(150,312) |
|
115,074 |
|
Individual methodology* |
|
(240,474) |
|
605,152 |
|
(825,111) |
|
817,330 |
|
Total |
|
(827,751) |
|
1,085,533 |
|
(1,282,025) |
|
1,209,700 |
|
F-181
*For individual methodology, the applied scenarios are the base in the optimistic scenario and the alternative in the pessimistic scenario with a weighting of 100% each.
e. Credit Risk Management – Other Financial Instruments:
Each one of the positions that make up the portfolio complies with the policies and limits that seek to diminish credit risk exposure. Those policies are, among others:
| ● | Term Limits: The Credit Committee evaluates and reviews the result of the authorized model for the different counterparties according to quantitative and qualitative variables, allowing it to establish the maximum term to which the Bank wishes to have exposure.. |
| ● | Credit Limits: Approved limits under the model and with authorization from the Credit Committee, as well as the exposure, are monitored in line or batch, in such a way as to mitigate the occurrence of excesses and, in the event that there is a need for them, applies to the current attribution system.. |
| ● | Counterparty Limits: These limits, derived from the credit limits or from allocation models and are verified by the Front Office prior to the close of operations. |
| ● | Master Agreement: These bilateral agreements describe the handling of operations between the counterparties in accordance with good international practices and that limit the legal and financial risk under the occurrence of events of default (failure to pay or delivery). Mitigation mechanisms, procedures to be carried out in the case of these events of default, special conditions by type of operation and that are applied to OTC derivatives, Repos and other securities financing transactions, are all agreed upon. |
| ● | Margin Agreements: For OTC derivatives operations and other securities financing transactions, agreements that regulate the administration of guarantees, haircuts, adjustment periods, minimum transfer amounts, etc., and that limit risk for a period of time (one day, one week, etc.), are established for counterparties involved in the operation. |
| ● | Counterparty Alerts: There are financial, qualitative and market indicators that allow the Bank to establish damages to the credit quality of an issuer or counterparty. |
f. Credit Quality Analysis - investment financial instruments:
In order to evaluate the credit quality of a counterparty or issuer (to determine a risk level or profile), the Bank relies on two rating systems: an external one and an internal one, both of which allow to identify a degree of risk differentiated by segment and country and to apply the policies that have been established for issuers or counterparties with different levels of risk, in order to limit the impact on liquidity and/or the income statement of the Bank.
External credit rating system is divided by the type of rating applied to each instrument or issuer; in this way the geographic location, the term and the type of instrument allow the assignment of a rating according to the methodology that each examining agency uses.
Internal credit rating system: the “ratings or risk profiles” scale is created with a range of levels that go from low risk to high risk (this can be reported in numerical or alphanumerical scales), where the rating model is sustained by the implementation and analysis of qualitative and quantitative variables at sector level, which according to the relative analysis of each variable, determine credit quality; in this way the internal credit rating system aims to establish adequate margin in decision-making regarding the management of financial instruments.
F-182
Credit Quality Analysis of the Bank
|
|
Debt instruments |
|
Equity |
|
Other financial instruments(1) |
|
Derivatives(2) |
||||||||
|
|
2023 |
|
2022 |
|
2023 |
|
2022 |
|
2023 |
|
2022 |
|
2023 |
|
2022 |
Maximum Exposure to Credit Risk |
|
|
|
|
|
|
|
|
|
|
|
|
|
|
|
|
Low Risk |
|
21,078,496 |
|
21,851,178 |
|
220,967 |
|
222,843 |
|
21,976 |
|
12,821 |
|
1,711,788 |
|
9,119,402 |
Medium Risk |
|
827,469 |
|
2,090,039 |
|
17,354 |
|
19,074 |
|
- |
|
- |
|
316 |
|
14,464 |
High Risk |
|
3,242,504 |
|
3,476,980 |
|
587 |
|
13,728 |
|
2,966 |
|
- |
|
17,327 |
|
55,622 |
Without Rating |
|
- |
|
- |
|
304,302 |
|
289,023 |
|
13,377 |
|
29,350 |
|
95,319 |
|
- |
Total |
|
25,148,469 |
|
27,418,197 |
|
543,210 |
|
544,668 |
- |
38,319 |
- |
42,171 |
|
1,824,750 |
|
9,189,488 |
| (1) | Corresponds to SAFE "Simple Agreement for Future Equity", in Inversiones CFNS S.A.S., Sistema de Inversiones y Negocios, S.A. and Banagrícola S.A (For 2023). For the year 2022 were revealed as debt securities and equity. |
| (2) | For derivatives transactions counterparty risk is disclosed as long as the valuation is positive. |
In accordance with the criteria and considerations specified in the internal rating allocation and external credit rating systems methodologies, the following schemes of relation can be established, according to credit quality given to each one of the qualification scales:
Low Risk: All investment grade positions (from AAA to BBB-), as well as those issuers that according to the information available (financial statements, relevant information, external ratings, CDS, among others) reflect adequate credit quality.
Medium Risk: All speculative grade positions (from BB+ to BB-), as well as those issuers that according to the available information (Financial statements, relevant information, external qualifications, CDS, among others) reflect weaknesses that could affect their financial situation in the medium term.
High Risk: All positions of speculative grade (from B+ to D), as well as those issuers that according to the information available (Financial statements, relevant information, external qualifications, CDS, among others) reflect a high probability of default of financial obligations or that already have failed to fulfill them.
· Financial credit quality of other financial instruments that are not in default nor impaired in value
Debt instruments: 100% of the debt instruments are not in default.
Equity: The positions do not represent significant risks.
Derivatives: 99.9% of the credit exposure does not present incidences of material default. The remaining percentage corresponds to default events at the end of the period.
· Maximum exposure level to the credit risk given:
|
|
Maximum Exposure |
|
Collateral* |
|
Net Exposure |
||||||
|
|
2023 |
|
2022 |
|
2023 |
|
2022 |
|
2023 |
|
2022 |
Maximum Exposure to Credit Risk |
|
|
|
|
|
|
|
|
|
|
|
|
Debt instruments |
|
25,148,469 |
|
27,418,197 |
|
(1,407,484) |
|
(741,197) |
|
23,740,985 |
|
26,677,000 |
Derivatives ** |
|
1,824,750 |
|
9,189,488 |
|
(698,662) |
|
(138,416) |
|
1,126,088 |
|
9,051,072 |
Equity |
|
543,210 |
|
544,668 |
|
- |
|
- |
|
543,210 |
|
544,668 |
Other financial instruments |
|
38,319 |
|
42,171 |
|
- |
|
- |
|
38,319 |
|
42,171 |
Total |
|
27,554,748 |
|
37,194,524 |
|
(2,106,146) |
|
(879,613) |
|
25,448,602 |
|
36,314,911 |
| ● | Analysis of the maturity of other financial instruments past due but not impaired |
| - | Debt instruments: Portfolio does not present past due nor impaired assets. |
| - | Equity: Portfolio does not present impaired assets. |
| - | Derivatives: The past due assets are not material. |
F-183
| ● | The information corresponding to the individual evaluation of impairment at the end of the period for other financial instruments, is detailed as follows: |
Debt instruments
|
|
Exposure |
|
Impairment |
|
Final Exposure |
||||||
|
|
2023 |
|
2022 |
|
2023 |
|
2022 |
|
2023 |
|
2022 |
Maximum Exposure to Credit Risk |
|
|
|
|
|
|
|
|
|
|
|
|
Fair Value |
|
18,244,584 |
|
19,016,935 |
|
5,562 |
|
2,286 |
|
18,239,022 |
|
19,014,648 |
Amortized Cost |
|
6,903,885 |
|
8,401,262 |
|
55,803 |
|
64,903 |
|
6,848,082 |
|
8,336,360 |
Total |
|
25,148,469 |
|
27,418,197 |
|
61,365 |
|
67,189 |
|
25,087,104 |
|
27,351,008 |
Equity
|
|
Exposure |
|
Impairment |
|
Final Exposure |
||||||
|
|
2023 |
|
2022 |
|
2023 |
|
2022 |
|
2023 |
|
2022 |
Maximum Exposure to Credit Risk |
|
|
|
|
|
|
|
|
|
|
|
|
Fair Value through profit or loss |
|
98,853 |
|
90,538 |
|
- |
|
- |
|
98,853 |
|
90,538 |
Fair Value through OCI |
|
444,357 |
|
454,130 |
|
- |
|
- |
|
444,357 |
|
454,130 |
Total |
|
543,210 |
|
544,668 |
|
- |
|
- |
|
543,210 |
|
544,668 |
Collateral- investment financial instruments:
Level of collateral: respect to the type of asset or operation, a collateral level is determined according to the policies defined for each product and the market where the operation is carried out.
Assets held as collateral in organized markets: the only assets that can be received as collateral are those defined by the central counterparties, the stock market where the operation is negotiated, those assets that are settled separately in different contracts or documents, which can be managed by each organization and must comply with the investment policies defined by the Bank, taking into account the credit limit for each type of asset or operation received or delivered, which collateral received are the best credit quality and liquidity.
Assets received as bilateral collateral between counterparties: the collateral accepted in international OTC derivative operations is agreed on bilaterally in the Credit Support Annex (CSA)1 and with fulfillment in cash in dollars and managed by Citibank N.A.. This company acts on behalf of Bancolombia for making international margin calls and providing a better management of the collateral.
Collateral adjustments for margin agreements: the adjustments will be determined by the criteria applied by both the external and internal regulations in effect, and at the same time, mitigation standards are maintained so that the operation fulfills the liquidity and solidity criteria for settlement. Among the main characteristics by product or market, we have:
| - | With respect to the derivative operations, these are carried out daily, with threshold levels of zero for the majority of counterparties, which reduces the exposure to a term that does not exceed 10 days, according to Basel. |
| - | For buy-sell backs, repos and other securities financing transactions, daily monitoring is done in order to establish the need to adjust the collateral in such a way that these are applied in as little time as possible, according to the contracts or market conditions. |
1 A Credit Support Annex (CSA) provides credit protection by setting forth the rules governing the mutual posting of collateral. CSAs are used in documenting collateral arrangements between two parties that trade privately negotiated (over-the-counter) derivative securities. The trade is documented under a standard contract called a master agreement, developed by the International Swaps and Derivatives Association (ISDA).
F-184
| - | For all international counterparties, margin agreements that limit exposure to the maximum and with a daily adjustment period are celebrated. These margin agreements are celebrated under ISDA(International Swaps and Derivatives Association)2 and GMRA (Global Master Repurchase Agreement)3 both for OTC derivatives and securities financing transactions. |
| - | For every local counterparty, the local framework agreement is signed (agreement developed by the industry) and the mitigating actions to apply in each operation are agreed upon, whether for margin agreements, re-couponing, early termination, among others. |
| - | For repos, buy-sell backs and other securities financing transactions, these are agreed upon by organized markets that in general implicate complying with haircut or additional collateral rules. |
| - | The central counterparty carries out daily control and monitoring processes in order to comply with the rules imposed by these organizations in such a way that we are always making daily adjustments at the demanded collateral level. |
|
|
Collateral* |
|
Main type of collateral |
||||
|
|
2023 |
|
2022 |
|
2023 |
|
2022 |
Maximum Exposure to Credit Risk |
|
|
|
|
|
|
|
|
Debt Securities |
|
(1,407,483) |
|
(741,197) |
|
Government bonds (TES) |
|
Government bonds (TES) |
Derivatives |
|
(698,663) |
|
(138,416) |
|
Cash |
|
Cash |
Equity |
|
- |
|
- |
|
|
|
|
Total |
|
(2,106,146) |
|
(879,613) |
|
|
|
|
* Collateral Held (-) and Collateral Pledged (+).
g. Credit risk concentration - other financial instruments:
According to the regulations, the Bank must control on a daily basis the risk of positions of the Bank’s companies where the same issuer or counterparty stands, below the legal limits.
By the same way, the positions of the Bank are verified in respect of the authorized risk levels in each country in order to guarantee the alerts and positions limits, that are considered outside of the Bank risk appetite.
Privately negotiated (over-the-counter) derivative securities. The trade is documented under a standard contract called a master agreement, developed by the International Swaps and Derivatives Association (ISDA).
2 ISDA: Organization of participants in the OTC derivatives markets. Its main objective is to establish a reference framework through standard contracts for OTC derivatives trading.
3 GMRA: It is a model legal agreement designed for parties transacting repos and is published by the International Capital Market Association (ICMA).
F-185
|
|
Debt instruments |
|
Equity |
|
Other financial instruments(1) |
Derivatives(2) |
||||||||
|
|
2023 |
|
2022 |
|
2023 |
|
2022 |
|
2023 |
|
2022 |
2023 |
|
2022 |
Maximum Exposure to Credit Risk |
|
|
|
|
|
|
|
|
|
|
|
|
|
|
|
Sector Concentration |
|
|
|
|
|
|
|
|
|
|
|
|
|
|
|
Corporate |
|
3,675,913 |
|
4,197,844 |
|
279,396 |
|
329,249 |
|
23,887 |
|
42,171 |
951,573 |
|
1,403,527 |
Financial |
|
4,626,294 |
|
5,268,337 |
|
211,037 |
|
199,760 |
|
14,432 |
|
- |
870,598 |
|
7,096,094 |
Government |
|
16,827,596 |
|
17,924,261 |
|
- |
|
- |
|
- |
|
- |
- |
|
- |
Funds ETF |
|
18,666 |
|
27,755 |
|
52,777 |
|
15,659 |
|
- |
|
- |
2,579 |
|
689,867 |
Total |
|
25,148,469 |
|
27,418,197 |
|
543,210 |
|
544,668 |
|
38,319 |
|
42,171 |
1,824,750 |
|
9,189,488 |
Concentration by Region |
|
|
|
|
|
|
|
|
|
|
|
|
|
|
|
North America |
|
4,666,195 |
|
5,686,298 |
|
197 |
|
125 |
|
- |
|
- |
344,639 |
|
3,285,822 |
Latin America |
|
20,440,893 |
|
20,004,790 |
|
529,033 |
|
473,259 |
|
38,319 |
|
29,187 |
1,009,595 |
|
2,102,995 |
Europe |
|
41,381 |
|
- |
|
- |
|
- |
|
- |
|
12984 |
467,937 |
|
3117284 |
Others (Includes Funds and ETF) |
|
- |
|
1,727,109 |
|
13,980 |
|
71,284 |
|
- |
|
- |
2,579 |
|
683,387 |
Total |
|
25,148,469 |
|
27,418,197 |
|
543,210 |
|
544,668 |
|
38,319 |
|
42,171 |
1,824,750 |
|
9,189,488 |
(1) |
Corresponds to SAFE "Simple Agreement for Future Equity", in Inversiones CFNS S.A.S., Sistema de Inversiones y Negocios, S.A. and Banagrícola S.A (For 2023). For the year 2022 were revealed as debt securities and equity. |
(2) For derivatives transactions counterparty risk is disclosed as long as the valuation is positive.
Risk exposure by credit rating
|
|
Other financial instruments |
||
|
|
2023 |
|
2022 |
Maximum Exposure to Credit Risk |
|
|
|
|
Sovereign Risk |
|
7,520,002 |
|
7,025,658 |
AAA |
|
9,613,353 |
|
14,570,753 |
AA+ |
|
2,934,561 |
|
1,448,837 |
AA |
|
761,139 |
|
723,019 |
AA- |
|
285,253 |
|
794,748 |
A+ |
|
763,754 |
|
3,549,222 |
A |
|
465,025 |
|
516,950 |
A- |
|
396,755 |
|
1,628,479 |
BBB+ |
|
604,672 |
|
1,395,620 |
BBB |
|
243,820 |
|
1,027,745 |
BBB- |
|
1,808,396 |
|
1,332,161 |
Other |
|
1,745,020 |
|
2,862,959 |
Not rated |
|
412,998 |
|
318,373 |
Total |
|
27,554,748 |
|
37,194,524 |
Note: * Internal homologation
At the end of the year, the Bank’s positions are not in excess of the concentration limit, according to the applicable laws.
Relevant facts
In 2023 inflation rate decreased to 9.28% vs 13.12% in December 2022, Banco de la República de Colombia (Central bank) placed rates at the end of December 2023 up to 13% vs 12% in December 2022, this condition maintains the devaluation of portfolios as its main consequence. According to the economic expectations survey, inflation rate would be located in the range of 5.2% - 5.7% by the end of December 2024 and whether the restrictive monetary stance continues, stress in the financial system will be maintained, generating possible devaluations in some sectors in Economy.
F-186
In the International fixed income international market, there was a change in the monetary expansion posture with an increase in the interest rate by the Federal Reserve from 4.05% in December 2022 to 5.50% in July 2023, which was maintained until December 2023, an CPI control measure that closed at 3.4% for the US. The changes in monetary policy, the global economic recession and the resurgence of geopolitical tensions, deepen the risks of devaluation in some markets or the opportunities for appreciation in others.
The Colombian stock market closed December 2023 with an annual devaluation of (-7.07%), explained by several factors, among which are the uncertainty due to political tensions corresponding to the pension, health and energy reforms, in addition to the increase in the prices of products and the behavior of supply, which further drive the country's inflation rate upwards, with which, risks could materialize for the companies in this market until these effects are contained.
The international market closed by December with annual appreciation in the S&P 500 of (+24.23%) and in the Euro Stoxx 50 with annual appreciation of (+19.19%), however, fears of a possible economic recession continue, which as a consequence will affect the financial indicators of the companies in these markets, added to the volatility caused by the increase in military conflicts worldwide.
Negotiation of the different derivative products as of 2023 increased vs 2022 due to increase in the negotiation of interest rate futures (+24.7%) and currency futures (+12.8%) as a consequence of a higher uncertainty regarding the behavior of the monetary policy rate and the behavior of the exchange rate. The USD/COP closed December at COP 3,822.05 with an annual appreciation of (+20.54%) for the Colombian peso.
Concerning of a possible economic recession due to current global inflationary landscape, along with the rise in interest rates and geopolitical tensions, it is possible that records in these macroeconomic variables will be reached, influencing further devaluation of securities in the short and medium term; however, the central banks' measures are expected to contain these macroeconomic effects that continue to negatively impact the markets.
Market risk
Market risk refers to the risk of losses in the Bank’s treasury book due to changes in equity prices, interest rates, foreign-exchange rates and other indicators whose values are set in a public market. It also refers to the probability of unexpected changes in net interest income and equity economic value of equity as a result of a change in market interest rates.
Market risk stems from the following activities at the Bank:
| a) | Trading: includes purchase - sale and positioning mainly in fixed income securities, equities, currencies and derivatives, as well as the financial services provided to customers, such as brokerage. Trading instruments are recorded in the treasury book and are managed by the Treasury Division which is also responsible for the aggregated management of exchange rate exposures arising from the banking book and treasury book. |
Market risk can also arise from the crypto market fluctuations that affect our crypto assets portafolio held in reserve to facilitate our clients activitivies of Wenia, our digital asset company in Bermudas, which is the only company in Grupo Bancolombia authorized to take this kind of assets, according to our internal policies.
b) Balance sheet management: refers to the assets and liabilities management, due to mismatches in maturities and repricing of them. The Assets Liability Management Division is responsible for the balance sheet management, preserving the stability of the financial margin and the economic value of equity, maintaining adequate levels of liquidity and solvency. Non-trading instruments are recorded in the Bank’s banking book (the “Banking Book”), which includes primarily loans, time deposits, checking accounts and savings accounts.
In the Bank, the market risks are identified, measured, monitored, controlled and reported in order to support the decision-making process for their mitigation, and to create greater shareholder value added.
The guidelines, policies and methodologies for market risks management are approved by the Board of Directors, thus guaranteeing the congruence and consistency in the risk appetite among subsidiaries. Each country has a local Market and Liquidity Risk Management Office that applies at an individual level the principles of the Bank´s Market Risks Management Strategy.
F-187
The Board of Directors and senior management have formalized the policies, procedures, strategies and rules of action for market risk administration in its “Market Risk Manual”. This manual defines the roles and responsibilities within each subdivision of the Bank and their interaction to ensure adequate market risk administration.
The Bank´s Market and Liquidity Risks Management Office, responsible for monitoring and permanently controlling compliance with the limits established, is set up with clear independence from the trading and businesses units, ensuring enforcement authority. This independent control function is complemented by regular reviews conducted by the Internal Audit.
The Bank’s Market and Liquidity Risks Management Office is responsible for: (a) identifying, measuring, monitoring, and controlling the market risk inherent in the Bank’s businesses: (b) the Bank’s exposure under stress scenarios and confirming compliance with the Bank’s risk management policies: (c) designing the methodologies for valuation of the market value of certain securities and financial instruments: (d) reporting to senior management and the Board of Directors any violation of the Bank’s risk management policies: (e) reporting to the senior management on a daily basis the levels of market risk associated with the trading instruments recorded in its treasury book, and (f) proposing policies to the Board of Directors and to senior management that ensure the maintenance of predetermined risk levels. The Bank has also implemented an approval process for new products across each of its subdivisions. This process is designed to ensure that each subdivision is prepared to incorporate the new product into its procedures, that every risk is considered before the product is incorporated and that approval is obtained from the Board of Directors before the new product can be sold.
Market risks arising from trading instruments are measured at the Bank using two different Value at Risk (VaR) methodologies: the standard methodology required by the SFC, and the internal methodology of historical simulation. The standard methodology is established by “Chapter XXXI of the Basic Accounting Circular”, based on the model recommended by the Amendment to the Capital Accord to Incorporate Market Risks of Basel Committee, and is reflected in the Bank’s Capital Adequacy (Solvency) ratio. The internal methodology of weighted historical simulation uses a confidence level of 99%, a holding period of 10 days, and a time frame of one year or at least 250 days from the reference date of the VaR calculation is used, for digital assets the internal methodology uses a holding period of 3 days and a time frame of 4 years, using a multivariate GARCH family model. The standard methodology is used to report the market risk exposure to the Financial Superintendency and is also used to measure the capital requirements for the Bank, therefore the analysis below is based on information obtained from this model.
The Bank’s VaR limits structure for trading activities, is sufficiently granular to conduct an effective control of the various types of market risk factors on which an exposure is held. It ensures that the market risk is not concentrated in certain asset classes and maximizes the portfolio diversification effect. These limits are defined by companies, products or by risk takers. The majority of the limits are based on the maximum VaR values to which a certain portfolio can be exposed, nevertheless, loss triggers, stop loss and sensitivity warning levels are also set, especially in the derivatives portfolios. The limits are approved by the Board of Directors, and set based on factors such as tolerance for losses, capital resources and market´s complexity and volatility. They are monitored daily, and their excesses or violations are reported to the Board of Directors and the Risk Committee.
In order to capture the tail risks, the Expected Shortfall is estimated, with a confidence interval of 97.5%, which corresponds to the expected value of the losses that are greater than or equal to the VaR.Additional measurements such as stress tests are performed, to identify extreme unusual situations that could cause severe losses. Stress simulations include historical events and hypothetical scenarios. Back testing or model validation techniques through comparison of predicted and actual loss level are applied on a regular basis to analyze and contrast the accuracy of the VaR calculation methodology in order to confirm its reliability, and make adjustments to the models if necessary.
Within the control and monitoring processes of market risks, reports are elaborated on a daily and monthly basis. They include an analysis of the most relevant risk measures and allow for monitoring the exposure levels to market risks and to the legal and internal limits established for each one of the levels of the Bank. These reports are taken as an input for the decision-making process in the different Committees and management of the Bank.
F-188
For management and control of the market risks of activities other than trading, the Bank uses a comprehensive approach, with a short-term vision, measuring the sensitivity of the net interest margin over a one-year horizon, and a long-term vision, estimating the impact on the economic value of equity through different scenarios. Additionally, triggers are defined for monitoring and controling exposure to the interest rate risk of the banking book positions, which are periodically reported to Senior Management..
The market risk management of the positions in the banking book is carried out in a decentralized and independent manner in each of the banking entities of the Bank, by the Asset and Liability Management areas, in the Finance Department.
Market Risk Management
The following section describes the market risks to which the Bank is exposed and the tools and methodologies used to measure these risks as of December 31, 2023. The Bank faces market risk as a consequence of its lending, trading and investments businesses.
The Bank uses VaR calculation to limit its exposure to the market risk of its Treasury Book. The Board of Directors is responsible for establishing the maximum VaR based on its assessment of the appropriate level of risk for Bancolombia. The Risks Committee is responsible for establishing the maximum VaR for each company and the Propietary Trading Risks Committee is responsible for establishing the maximum VaR by type of investment. These limits are supervised on a daily basis by the Market Risk Management Office.
For managing the interest rate risk from banking activities, the Bank analyzes the interest rate mismatches between its interest earning assets and its interest bearing liabilities and estimates the impact on the net interest income and the economic value of equity. In addition, the foreign currency exchange rate exposures arising from the banking book are provided to the Treasury Division where these positions are aggregated and managed.
a. Measurement of market risk of trading instruments
The Bank currently measures the treasury book exposure to market risk (including OTC derivatives positions) as well as the currency risk exposure of the banking book, which is provided to the Treasury Division, using a VaR methodology established in accordance with “Chapter XXXI of the Basic Accounting Circular”, issued by the SFC.
The VaR methodology established by “Chapter XXXI of the Basic Accounting Circular” is based on the model recommended by the Amendment to the Capital Accord to Incorporate Market Risks of Basel Committee, which focuses on the treasury book and excludes investments classified as amortized cost which are not being given as collateral and any other investment that comprises the banking book, such as non-trading positions excluding the currency the risk position stemming from investment in affiliated but not consolidated entities denominated in foreign currencies. In addition, the methodology aggregates all risks by the use of correlations, through an allocation system based on defined zones and bands, affected by given sensitivity factors.
The total market risk for the Bank is calculated by the arithmetical aggregation of the VaR calculated for each subsidiary. The aggregated VaR is reflected in the Bank’s Capital Adequacy (Solvency) ratio, in accordance with Decree 2555 de 2010.
For purposes of VaR calculations, a risk exposure category is any market variable that is able to influence potential changes in the portfolio value. Taking into account a given risk exposure, the VaR model assesses the maximum loss not exceeded, over a given period of time. The fluctuations in the portfolio’s VaR depend on volatility, modified duration and positions changes relating to the different instruments that are subject to market risk.
The relevant risk exposure categories for which VaR is computed by the Bank according to “Chapter XXXI, Appendix VI of the Basic Accounting Circular” are: (i) interest rate risks relating to local currency, foreign currency and UVR; (ii) currency risk; (iii) stock price risk; (iv) fund risk. and (v) credit default swaps risk.
F-189
· Interest Rate Risk (Treasury Book)
The interest rate risk is the probability of decrease in the market value of the position due to fluctuations in market interest rates. The Bank calculates the interest rate risk for positions in local currency, foreign currency and UVR separately; in accordance with Chapter XXXI of the Basic Accounting Circular issued by the SFC.
In the first instance, the interest rate risk exposure is determined by the sensitivity calculation for the net position of each instrument. This sensitivity is calculated as the net present value (NPV) of each instrument, its corresponding modified duration and the estimated variation of interest rates. The possible variations in the interest rates are established by the SFC according to the historical behavior of these variables in the markets, and they are a function of the duration and currency, as seen in the following table:
|
|
|
|
Modified Duration |
|
Changes in Interest Rates (bps) |
||||||
Zone |
|
Band |
|
Lower Limit |
|
Upper Limit |
|
Legal Currency |
|
UVR |
|
Foreign Currency |
|
|
1 |
|
0 |
|
0.08 |
|
274 |
|
274 |
|
100 |
Zone 1 |
|
2 |
|
0.08 |
|
0.25 |
|
268 |
|
274 |
|
100 |
|
|
3 |
|
0.25 |
|
0.5 |
|
259 |
|
274 |
|
100 |
|
|
4 |
|
0.5 |
|
1 |
|
233 |
|
274 |
|
100 |
|
|
5 |
|
1 |
|
1.9 |
|
222 |
|
250 |
|
90 |
Zone 2 |
|
6 |
|
1.9 |
|
2.8 |
|
222 |
|
250 |
|
80 |
|
|
7 |
|
2.8 |
|
3.6 |
|
211 |
|
220 |
|
75 |
|
|
8 |
|
3.6 |
|
4.3 |
|
211 |
|
220 |
|
75 |
|
|
9 |
|
4.3 |
|
5.7 |
|
172 |
|
200 |
|
70 |
|
|
10 |
|
5.7 |
|
7.3 |
|
162 |
|
170 |
|
65 |
Zone 3 |
|
11 |
|
7.3 |
|
9.3 |
|
162 |
|
170 |
|
60 |
|
|
12 |
|
9.3 |
|
10.6 |
|
162 |
|
170 |
|
60 |
|
|
13 |
|
10.6 |
|
12 |
|
162 |
|
170 |
|
60 |
|
|
14 |
|
12 |
|
20 |
|
162 |
|
170 |
|
60 |
|
|
15 |
|
20 |
|
|
|
162 |
|
170 |
|
60 |
Once the sensitivity factor is calculated for each position, the modified duration is then used to classify each position within its corresponding band. A net sensitivity is then calculated for each band, by determining the difference between the sum of all long-positions and the sum of all short-positions. Then a net position is calculated for each zone (which consists of a series of bands) determined by the SFC. The final step is to make adjustments within each band, across bands and within each zone, which results in a final number that is the interest rate risk VaR by currency. Each adjustment is performed following the guidelines established by the SFC.
The Bank’s exposure to interest risk primarily arises from investments in Colombian government’s treasury bonds (TES).
· Currency (Treasury and Banking Book), Equity (Treasury Book) and Fund (Treasury Book) Risk
The VaR model uses a sensitivity factor to calculate the probability of loss due to fluctuations in the price of stocks, funds and currencies in which the Bank maintains a position. As previously indicated, the methodology used in these financial statements to measure such risk consists of computing VaR, which is derived by multiplying the position by the maximum probable variation in the price of such positions (“∆p”). The (“∆p”) is determined by the SFC, as shown in the following table:
Currency |
|
Sensitivity Factor |
|
United States Dollar |
|
12.49 |
% |
Euro |
|
11.00 |
% |
Other currencies |
|
13.02 |
% |
Equity and Fund Risk |
|
14.70 |
% |
F-190
The SFC according to historical market performance establishes the interest rate’s fluctuations and the sensitivity factors for currency, equity and fund risk used in the model.
· Total Market Risk VaR
The total market risk VaR is calculated as the algebraic sum of the interest rate risk, the currency risk, the stock price risk, fund risk and the credit default swaps risk which are calculated as the algebraic sum of the Parent Company and each of its subsidiaries’ exposure to these risks. Currently, the Bank not present exposure to credit default swaps risk.
The total market risk VaR had a 22.9% increase, from COP 891,569 in December 31, 2022 to COP 1,096,000 as of December 31, 2023. This increase was highlighted by the currency risk VaR, driven by an increase in exposure to the US Dollar for Bancolombia's book. The interest rate risk arise as a result of the increase in the position in Colombian government’s treasury bonds (TES). The equity risk VaR registered a higer risk level and the fund risk VaR registered a lower risk level driven by the detailed risk analysis of the Fund Colombia Inmobiliario that generated a reassign of the market risk factors exposure. This change does not imply an impact on the Bank’s exposure as the sensitivity factors are the same.
The following table presents the total change in market risk and other risk factors.
December 2023 | ||||||||
In millions of COP | ||||||||
Factor |
|
December 31 |
|
Average |
|
Maximum |
|
Minimum |
Interest Rate Risk VaR |
|
405,467 |
|
418,472 |
|
542,464 |
|
383,914 |
Foreign Exchange Rate Risk VaR |
|
332,662 |
|
185,624 |
|
374,407 |
|
51,410 |
Equity Risk VaR |
|
342,024 |
|
332,443 |
|
347,539 |
|
312,136 |
Fund Risk VaR |
|
15,847 |
|
23,292 |
|
27,923 |
|
15,847 |
Total Value at Risk |
|
1,096,000 |
|
959,831 |
|
|
|
|
December 2022 | ||||||||
In millions of COP | ||||||||
Factor |
|
December 31 |
|
Average |
|
Maximum |
|
Minimum |
Interest Rate Risk VaR |
|
340,107 |
|
381,094 |
|
410,605 |
|
340,107 |
Foreign Exchange Rate Risk VaR |
|
78,165 |
|
118,620 |
|
201,927 |
|
78,165 |
Equity Risk VaR |
|
85,345 |
|
98,401 |
|
105,263 |
|
85,345 |
Fund Risk VaR |
|
387,952 |
|
294,468 |
|
387,952 |
|
225,401 |
Total Value at Risk |
|
891,569 |
|
892,583 |
|
|
|
|
· Assumptions and Limitations of VaR Models
Although VaR models represent a recognized tool for risk management, they have inherent limitations, including reliance on historical data that may not be indicative of future market conditions or trading patterns. Accordingly, VaR models should not be viewed as predictive of future results. The Bank may incur losses that could be materially in excess of the amounts indicated by the models on a particular trading day or over a period of time, and there have been instances when results have fallen outside the values generated by the Bank’s VaR models. A VaR model does not calculate the greatest possible loss. The results of these models and analysis thereof are subject to the reasonable judgment of the Bank’s risk management personnel.
· The Bank’s results could adversely affected with high inflation rate
High level of inflation increases interest rates and reduces the market value of the Bank´s debt instruments and increases the market risk in general. Inflation also impacts the real interest rate. When the inflation rate is higher than the nominal interest rate, negative real interest rates discourage saving and the greater variability increases uncertainty and risk, not only in the loan market but also in the stock market.
F-191
b. Non-trading instruments market risk measurement
The banking book’s relevant risk exposure is interest rate risk, which is the probability of unexpected changes in net interest income or in the economic value of equity as a result of a change in market interest rates. Changes in interest rates affect the Bank’s earnings because of timing differences on the repricing of the assets and liabilities. The Bank manages the interest rate risk arising from banking activities in non-trading instruments by analyzing the interest rate mismatches between its interest earning assets and its interest bearing liabilities, and estimates the impact on the net interest income and the economic value of equity. The foreign currency exchange rate exposures arising from the banking book are provided to the Treasury Division where these positions are aggregated and managed.
· Interest Risk Exposure (Banking Book)
The Bank has performed a sensitivity analysis of market risk sensitive instruments estimating the impact on the net interest income of each position in the Banking Book, using a repricing model and assuming positive parallel shifts of 100 basis points (bps).
The table 1 provides information about Bancolombia’s interest rate sensitivity for the statement of financial position items comprising the Banking Book.
Table 1. Sensitivity to Interest Rate Risk of the Banking Book
The chart below provides information about Bancolombia’s interest rate risk sensitivity in local currency (COP) at December 31, 2023 and December 31, 2022:
|
|
December 31, 2023 |
|
December 31, 2022 |
In millions of COP | ||||
Assets sensitivity 100 bps |
|
1,152,782 |
|
1,060,949 |
Liabilities sensitivity 100 bps |
|
595,749 |
|
545,911 |
Net interest income sensitivity 100 bps |
|
557,033 |
|
515,038 |
The chart below provides information about Bancolombia’s interest rate risk sensitivity in foreign currency (US dollars) at December 31, 2023 and December 31, 2022:
|
|
December 31, 2023 |
|
December 31, 2022 |
In millions of USD | ||||
Assets sensitivity 100 bps |
|
75,052 |
|
84,883 |
Liabilities sensitivity 100 bps |
|
74,800 |
|
71,737 |
Net interest income sensitivity 100 bps |
|
252 |
|
13,146 |
A positive net sensitivity denotes a higher sensitivity of assets than of liabilities and implies that a rise in interest rates will positively affect the Bank´s net interest income. A negative sensitivity denotes a higher sensitivity of liabilities than of assets and implies that a rise in interest rates will negatively affect the Bank´s net interest income. In the event of a decrease in interest rates, the impacts on net interest income would be opposite to those described above.
Total Exposure:
The net interest income sensitivity in local currency for the banking book instruments, entered for other than trading purposes with positive parallel shifts of 100 basis points was COP 557,033. The variation in the sensitivity of the net interest margin between December 2022 and December 2023 is due to the increase in the floating loans compensated by the increase in the fixed time deposits.
F-192
On the other hand, the sensitivity to the net interest margin in foreign currency, assuming the same parallel shift of 100 basis points, presented a decrease between December 2023 and December 31, 2022, due to the reduction in fixed rate loans and and the increase in fixed rate time deposits.
•Assumptions and Limitations
Net interest income sensitivity analysis is based on the repricing model and considers the following key assumptions: (a) does not consider prepayments, new operations, defaults, etc., (b); the fixed rate instruments sensitivity, includes the amounts with maturity lower than one year and assumes these will be disbursed at market interest rates and (c) changes in interest rate occur immediately and parallel in the yield curves from assets and liabilities for different maturities.
• Structural equity risk exposure (Banking Book)
Bancolombia’s investment banking affiliate, in its role of financial corporation, holds, directly and through its affiliated companies, structural equity investments. These positions are maintained mostly in the industrial and financial sectors. The market value of those investments decreased by 27.4% during the year, from COP 56,607 million as of December 31, 2022 to COP 41,096 million as of December 31, 2023, mainly, as a result of the reduction in the market value of the investments in Enka Shares.
The structural equity positions are exposed to market risk. Sensitivity calculations are made for those positions:
|
|
December 31, 2023 |
|
December 31, 2022 |
|
Fair Value |
|
41,096 |
|
56,607 |
|
Delta |
|
14.70 |
% |
14.70 |
% |
Sensitivity |
|
6,041 |
|
8,321 |
|
A negative impact of 14.7%, applied to the market value, produces a decrease of COP 6 billion in the structural equity investments market value, from COP 41 billion to COP 35 billion.
Liquidity risk
Liquidity risk is defined as the inability of a financial firm to meet its debt obligations without incurring unacceptably large losses. Thus, funding liquidity risk is the risk that a firm will not be able to meet its current and future cash flow and collateral needs, both expected and unexpected, without materially affecting its daily operations or overall financial condition. The Bank is sensitive to funding liquidity risk since debt maturity transformation is one of its key business areas.
At the Bank, liquidity prevails over any objective of growth or revenue. Managing liquidity has always been a fundamental pillar of its business strategy, together with capital, in supporting its statement of financial position.
The Bank’s liquidity management model promotes the autonomy of subsidiaries, which must be self-sufficient in their structural funding. Each subsidiary is responsible for meeting the liquidity needs of its current and future activity, within a framework of management coordination at the Bank level. The metrics used to control liquidity risk are developed based on common and homogeneous concepts, but analysis and adaptation are made by each subsidiary.
In line with best governance practices, the Bank has established a clear division of function between executing liquidity management, responsibility of the Asset and Liability Division, and their monitoring and control, responsibility of the Market and Liquidity Risks Management Office.
The different authorities of senior management define the policies and guidelines for managing liquidity risk. These authorities are the Board of Directors, the Risk Committee, and senior management of the Parent Company, which set the risk appetite and define the financial strategy. The ALCO committees (Asset and liability committee) define the objective positioning of liquidity and the strategies that ensure the funding needs derived from businesses. The ALM division (Asset and liability management) and the Market and Liquidity Risks Management Office support the mentioned committees, which elaborate analysis and management proposals, and control compliance with the limits established.
F-193
Liquidity Risks Management Office is responsible for proposing the minimum amount of the liquidity reserve, the policies of the liquidity portfolio, defining premises and metrics in order to model the behaviour of the cash flows, proposing and monitoring liquidity limits in line with the Bank's risk appetite, simulating stress scenarios, evaluating and reporting the risks inherent to new products and operations; and submitting the reports required by the internal authorities for decision-making, as well as by regulators. All of the above activities are verified and evaluated by the Internal Audit.
The measures to control liquidity risk include maintaining a portfolio of highly liquid assets, and the definition of triggers and liquidity limits, which enable evaluating the level of exposure of each one of the entities in a proactive way.
The methodologies used to control liquidity risk include the liquidity gaps and stress scenarios. The liquidity gaps measure the mismatches of assets, liabilities and off-balance sheet position´s cash flows, separately for local currency and foreign currency. Regulatory metrics are also applied, in which the contractual maturities are used; and internal models in which the cash flows are adjusted by different ratios, to reflect a more accurate behaviour.
Periodically, a validation of the policies, limits, processes, methodologies and tools to evaluate liquidity risk exposure is performed, in order to establish its pertinence and functionality, and to carry out the necessary adjustments. The Market and Liquidity Risks Management Office elaborate reports daily, weekly and monthly basis in order to monitor the exposure levels and the limits and triggers set up, and to support the decision-making process.
Each subsidiary has its own liquidity contingency plan, which is tested annually. These contingency plans procure the optimization of different funding sources, including obtaining additional funding from the Parent Company.
Liquidity risk management
The Bank’s Board of Directors sets the strategy for managing liquidity risk and delegates responsibility for oversight of the implementation of this policy to ALCO committee that approves the Bank’s liquidity policies and procedures. The Treasury Division manages the Bank’s liquidity position on a day-to-day basis and reviews daily reports covering the liquidity position. A summary report, including any exceptions and remedial action taken, is submitted regularly to Risk Committee and ALCO committees.
a. Liquidity risk exposure:
In order to estimate liquidity risk, the Bank measures a liquidity coverage ratio to ensure holding liquid assets sufficient to cover potential net cash outflows over 30 days. This indicator allows the Bank to meet liquidity coverage for the next month. The liquidity coverage ratio is presented as follows:
Liquidity Coverage Ratio |
|
December 31, 2023 |
|
December 31, 2022 |
|
Net cash outflows into 30 days |
|
13,752,496 |
|
18,227,019 |
|
Liquid Assets |
|
50,680,823 |
|
48,059,179 |
|
Liquidity coverage ratio ** |
|
368.52 |
% |
263.67 |
% |
* The minimum level required of the liquidity coverage ratio by the legal norm is 100%.
b. Liquid Assets
One of the main guidelines of the Bank is to maintain a solid liquidity position, therefore, the ALCO Committee, has established a minimum level of liquid assets, based on the funding needs of each subsidiary, to ensure, as far as possible, that it will always have sufficient liquidity to meet its liabilities when they are due, under both normal and stressed conditions, without incurring unacceptable losses or risking damage to the Bank’s reputation.
F-194
The following table shows the liquid assets held by Bank:
Liquid Assets(1) |
|
December 31, 2023 |
|
December 31, 2022 |
High quality liquid assets* |
|
|
|
|
Cash |
|
25,273,317 |
|
26,299,990 |
High quality liquid securities |
|
19,951,771 |
|
17,739,501 |
Other Liquid Assets |
|
|
|
|
Other securities** |
|
5,455,735 |
|
4,019,688 |
Total Liquid Assets |
|
50,680,823 |
|
48,059,179 |
| (1) | Cash and those liquid assets received by the Central Bank for its operations expansion and monetary contraction are the assets with highest liquidity. Liquid assets are adjusted by a haircut. The following are considered as liquid assets: cash, repos held for trading and investments held for trading in listed shares in Colombia’s stock exchange, in investment funds units or in other trading debt instruments. |
* High-quality liquid assets: cash and shares that are eligible to be reportable or repo operations, in addition to those liquid assets that the Central Bank receives for its monetary expansion and contraction operations described in paragraph 3.1.1 of the Foreign Regulatory Circular DODM-142 of the Bank of the Republic.
** Other Securities: Securities issued by financial and corporate entities.
c. Contractual maturities of financial assets
The tables below set out the remaining contractual maturities of principal and interest balances of the Bank’s financial assets:
Contractual maturities of financial assets December 31, 2023
Financial Assets |
|
0 – 30 days |
|
31 days – 1 Year |
|
1 - 3 Years |
|
3 - 5 Years |
|
More than 5 years |
Cash and balances with central bank |
|
24,461,384 |
|
|
|
|
|
|
|
|
Interbank borrowings - Repurchase agreements |
|
14,497,024 |
|
452,847 |
|
|
|
|
|
|
Financial assets investments |
|
2,467,493 |
|
12,311,055 |
|
5,462,198 |
|
2,597,787 |
|
5,525,545 |
Loans and advances to customers |
|
12,474,473 |
|
90,653,852 |
|
96,770,268 |
|
57,038,679 |
|
104,103,871 |
Derivative financial instruments |
|
3,922,735 |
|
12,977,266 |
|
4,141,896 |
|
1,699,943 |
|
1,405,850 |
Total financial assets |
|
57,823,109 |
|
116,395,020 |
|
106,374,362 |
|
61,336,409 |
|
111,035,266 |
Contractual maturities of financial assets December 31, 2022
Financial Assets |
|
0 – 30 days |
|
31 days – 1 Year |
|
1 - 3 Years |
|
3 - 5 Years |
|
More than 5 years |
Cash and balances with central bank |
|
24,721,168 |
|
- |
|
- |
|
- |
|
- |
Interbank borrowings - Repurchase agreements |
|
6,354,954 |
|
1,369,698 |
|
- |
|
- |
|
- |
Financial assets investments |
|
5,191,479 |
|
10,620,793 |
|
4,595,406 |
|
2,715,738 |
|
3,788,041 |
Loans and advances to customers |
|
11,980,037 |
|
80,781,681 |
|
95,394,236 |
|
60,072,303 |
|
108,373,306 |
Derivative financial instruments |
|
1,486,797 |
|
5,636,620 |
|
3,413,710 |
|
1,481,485 |
|
1,348,645 |
Total financial assets |
|
49,734,435 |
|
98,408,792 |
|
103,403,352 |
|
64,269,526 |
|
113,509,992 |
F-195
d. Contractual maturities of financial liabilities
The tables below set out the remaining contractual maturities of principal and interest balances of the Bank’s financial liabilities:
Contractual maturities of financial liabilities December 31, 2023:
Financial Liabilities |
|
0 – 30 days |
|
31 days – 1 Year |
|
1 - 3 Years |
|
3 - 5 Years |
|
More than 5 years |
Demand deposit from customers |
|
143,307,149 |
|
|
|
|
|
|
|
|
Time deposits from customers |
|
15,107,203 |
|
57,588,430 |
|
17,737,464 |
|
6,671,911 |
|
18,331,091 |
Interbank deposits-Repurchase agreements |
|
809,027 |
|
242,810 |
|
23,431 |
|
|
|
|
Borrowings from other financial institutions |
|
763,580 |
|
5,604,327 |
|
6,651,228 |
|
2,403,786 |
|
2,661,657 |
Debt securities in issue |
|
124,055 |
|
3,913,687 |
|
4,363,593 |
|
6,023,469 |
|
3,836,353 |
Preferred Shares |
|
|
|
57,701 |
|
115,403 |
|
115,403 |
|
295,697 |
Derivative financial instruments |
|
3,337,039 |
|
13,511,532 |
|
4,146,259 |
|
1,688,473 |
|
1,484,149 |
Total financial liabilities |
|
163,448,053 |
|
80,918,487 |
|
33,037,378 |
|
16,903,042 |
|
26,608,947 |
Contractual maturities of financial liabilities December 31, 2022:
Financial Liabilities |
|
0 – 30 days |
|
31 days – 1 Year |
|
1 - 3 Years |
|
3 - 5 Years |
|
More than 5 years |
Demand deposit from customers |
|
158,943,073 |
|
- |
|
- |
|
- |
|
- |
Time deposits from customers |
|
9,814,980 |
|
47,401,947 |
|
18,441,478 |
|
7,318,807 |
|
17,384,283 |
Interbank deposits-Repurchase agreements |
|
921,917 |
|
158,179 |
|
- |
|
- |
|
- |
Borrowings from other financial institutions |
|
1,601,799 |
|
12,736,576 |
|
10,673,653 |
|
4,325,218 |
|
2,479,635 |
Debt securities in issue |
|
807,242 |
|
2,117,609 |
|
9,501,683 |
|
8,220,719 |
|
1,472,558 |
Preferred Shares |
|
62,083 |
|
374,780 |
|
540,358 |
|
136,414 |
|
322,982 |
Derivative financial instruments |
|
1,488,518 |
|
5,167,852 |
|
2,579,407 |
|
1,501,967 |
|
1,417,894 |
Total financial liabilities |
|
173,639,612 |
|
67,956,943 |
|
41,736,579 |
|
21,503,125 |
|
23,077,352 |
The expected cash flows for some financial assets and liabilities may vary significantly from their contractual maturity. The main differences are the following:
| ● | The demand deposits historically have maintained a tendency to remain stable. |
| ● | The mortgages loans, in spite of having contractual maturity between 15 and 30 years, its average life is less than these terms. |
e. Financial guarantees
The tables below set out the remaining contractual maturities of the Bank’s financial guarantees
December 31, 2023 |
|
0 – 30 days |
|
31 days – 1 Year |
|
1 - 3 Years |
|
3 - 5 Years |
|
More than 5 years |
In millions of COP | ||||||||||
Financial guarantees |
|
826,699 |
|
9,388,345 |
|
1,489,899 |
|
450,875 |
|
535,380 |
December 31, 2022 |
|
0 – 30 days |
|
31 days – 1 Year |
|
1 - 3 Years |
|
3 - 5 Years |
|
More than 5 years |
In millions of COP | ||||||||||
Financial guarantees |
|
757,658 |
|
6,981,309 |
|
3,660,806 |
|
134,611 |
|
90,530 |
Interest Rate Benchmark Reform
As part of the LIBOR benchmark reform that is being implemented since 2017 by the Financial Conduct Authority of the UK, in March of the present year, it was announced that the publication of LIBOR on a representative basis will cease for the one-week and two-month USD LIBOR settings immediately after December 31, 2021, and the remaining USD LIBOR settings immediately after June 30, 2023.
F-196
The Bank has taken the necessary measures to identify and implement the action plans required to address de discontinuation process of the LIBOR rate. The replacement of th LIBOR rate in USD with the SOFR rate was approved by the Asset and Liability Management (ALM) Committee and the Risk Committee of the Board of Directors. The development of products indexed to the new reference rate (SOFR) has commenced.
The following tables provide a breakdown by currency and nature of financial instruments exposed to the LIBOR rate for the periods ending in December 2022 and December 2023:
December 31, 2022 | |||
In millions of COP | |||
|
|
USD LIBOR1 |
|
Assets |
|
|
|
Loans |
|
12,448,204 |
|
Bonds |
|
693,302 |
|
Derivatives |
|
(1,784,991) |
|
Total Assets |
|
11,356,515 |
|
Liabilities |
|
|
|
Loans |
|
2,209,628 |
|
Term deposits |
|
11,458 |
|
Total Liabilities |
|
2,221,086 |
|
1Cessation date: USD LIBOR 06/30/23. Portfolio balances and market value of derivative transactions outstanding at December 30, 2021.
December 31, 2023 | |||
In millions of COP | |||
|
|
USD LIBOR1 |
|
Assets |
|
|
|
Loans |
|
66,351 |
|
Bonds |
|
|
|
Derivatives |
|
|
|
Total Assets |
|
66,351 |
|
Liabilities |
|
|
|
Loans |
|
323 |
|
Term deposits |
|
6,750 |
|
Total Liabilities |
|
7,073 |
|
1Cessation date: USD LIBOR 06/30/23. Portfolio balances and market value of derivative transactions outstanding at December 31, 2023.
Risk
Any failure by market participants, such as the Bank, and regulators to successfully introduce benchmark rates to replace LIBOR and implement effective transitional arrangements to address the discontinuation of LIBOR could result in disruption of the financial and capital markets. In addition, the transition process to an alternative reference rate could impact the Bank’s business, financial condition or result of operations, as a result of:
•An adverse impact in pricing, liquidity, value, return and trading for a broad array of financial products, loans and derivatives that are included in the Bank’s financial assets and liabilities.
•Extensive changes to internal processes and documentation that contain references to LIBOR or use formulas that depend on LIBOR.
F-197
•The transition and development of appropriate systems and models to effectively transition the Bank’s risk management processes from LIBOR -based products to those based on one or more alternative reference rates in a timely manner; and
•An increase in prepayments of LIBOR -linked loans by the Bank’s clients.
From January 2022, products indexed to the SOFR rate began to be offered, additionally it was defined not to carry new operations indexed to the LIBOR rate. In turn, as an organization, we will continue to focus during 2024 on the transition process of operations that are indexed to LIBOR.
Capital management
The Capital Management function oversees Shareholders’ equity and Bancolombia’s capital structure, aiming for value generation through businesses related to financial activities and investments.
The goal is to have the enough capital to cover unexpected losses, and develope the business plan. To do so, the Capital and Corporate Investments area oversees Bancolombia’s capital ratios and uses several mechanisms to optimize such ratios according to forecasted business conditions.
The monitoring of corporate investments and shareholders’ equity, as well as different components of assets and associated risks, is executed for internal and external purposes. The results are presented to the Board of Directors and some support committees to make sure that all risks are properly managed and within risks appetite, guidelines, and regulation.
Bancolombia’s management has the goal of maintaining the balance between an adequate capital allocation and value generation for shareholders. This way, business opportunities can be financed with internal funding or capital markets resources.
Bancolombia’s lending and deposit-taking activities are supervisor by the Superintendencia Financiera de Colombia, and that implies complying with Decree 1477 of 2018.
This decree standardized the definitions of regulatory capital according to Basel III standards. It also updated the risk adjusted capital consumption of assets and added capital buffers. New capital measures will be implemented from the current 4.5% basic solvency level and the 9% total solvency level.
Additionally, Bancolombia conducts stress test to estimate how the bank’s balance sheet, results and ratios during adverse scenarios. None of the stress test runs implies reaching solvency ratios below regulatory levels and therefore, we consider that capital levels are optimal at the end of 2023.
Between 2021 and 2024, after the complete implementation of the new capital standards, a minimum basic capital of 6% and a total capital ratio of 11.5% will be required, according to the following formulas::
The following table indicates Bancolombia’ s capital ratios for 2023 according to the new regulation implemented in Colombia:
F-198
Technical Capital |
|
Asof |
|
||
|
|
December 31, 2023 |
|
December 31, 2022 |
|
In millions of COP | |||||
Primary capital |
|
39,704,542 |
|
40,652,350 |
|
Share Capital |
|
480,914 |
|
480,914 |
|
Additional paid-in capital |
|
4,857,454 |
|
4,857,454 |
|
Preferred shares |
|
584,204 |
|
584,204 |
|
Legal reserve |
|
14,541,561 |
|
14,534,766 |
|
Occasional reserves |
|
7,250,712 |
|
3,162,401 |
|
Non-controlling interest |
|
960,217 |
|
908,648 |
|
Other comprehensive income |
|
4,065,182 |
|
7,749,234 |
|
Net income attributable to equity holders of the Parent Company |
|
6,116,936 |
|
6,783,490 |
|
Retained earnings |
|
847,362 |
|
1,591,239 |
|
Less: |
|
(8,919,345) |
|
(11,001,874) |
|
Prior-year losses |
|
(79,587) |
|
(79,577) |
|
Intangibles assets |
|
(7,818,125) |
|
(9,836,661) |
|
Revaluation property, plant and equipment |
|
(350,061) |
|
(351,871) |
|
Other intangibles |
|
(671,572) |
|
(602,531) |
|
Deferred net income tax |
|
- |
|
(131,234) |
|
Primary capital (Tier I) |
|
30,785,197 |
|
29,650,476 |
|
Hybrid bonds |
|
4,283,448 |
|
6,109,531 |
|
Subordinated bonds |
|
678,797 |
|
794,881 |
|
General provisions |
|
375,902 |
|
12,759 |
|
Computed secondary capital (Tier II) |
|
5,338,147 |
|
6,917,171 |
|
Less: |
|
(10,687) |
|
(16,136) |
|
Technical capital |
|
36,112,657 |
|
36,551,511 |
|
Capital Ratios |
|
|
|
|
|
Primary capital to risk-weighted assets (Tier I) |
|
11.42 |
% |
10.37 |
% |
Secondary capital to risk-weighted assets (Tier II) |
|
1.98 |
% |
2.41 |
% |
Risk-weighted assets including market risk and operational risk |
|
269,591,211 |
|
285,878,639 |
|
Technical capital to risk-weighted assets |
|
13.40 |
% |
12.79 |
% |
Calculations based on the new definitions of Decree 1477 of 2018.
F-199
|
|
 |
|
|
|
SEPARATE FINANCIAL STATEMENTS 2023 Y 2022 |
SEPARATE STATEMENT OF FINANCIAL POSITION
BANCOLOMBIA S.A.
As of December 31, 2023 and 2022
(Stated in millions of Colombian pesos)
|
Note |
December 31, 2023 |
December 31, 2022 |
ASSETS |
|
|
|
Cash and cash equivalents |
3 |
24,348,860 |
16,233,804 |
Financial assets investments, net |
4.1 |
13,757,902 |
13,129,374 |
Derivative financial instruments |
4.2 |
6,215,942 |
4,860,893 |
Financial assets investments, net and derivative financial instruments |
19,973,844 |
17,990,267 |
|
Loans and advances to customers |
182,921,469 |
179,472,579 |
|
Allowance for loans, advances and lease losses |
(12,892,352) |
(11,268,584) |
|
Cartera de créditos y operaciones de leasing financiero, neto |
5 |
170,029,117 |
168,203,995 |
Assets held for sale and inventories, net |
13 |
459,328 |
248,001 |
Investment in subsidiaries |
7 |
24,751,945 |
29,718,697 |
Investment in associates and joint ventures |
8 |
298,598 |
302,761 |
Premises and equipment, net |
10 |
5,446,056 |
5,282,430 |
Investment properties |
11 |
574,550 |
449,253 |
Right of use asset under lease agreements |
6.2.1 |
1,228,649 |
1,116,653 |
Intangible assets, net |
9 |
345,553 |
277,065 |
Deferred tax, net |
12.5 |
- |
151,340 |
Other assets, net |
14 |
4,133,838 |
3,201,278 |
TOTAL ASSETS |
|
251,590,338 |
243,175,544 |
LIABILITIES AND EQUITY |
|
||
LIABILITIES |
|
|
|
Deposits by customers |
15 |
170,231,400 |
156,480,283 |
Interbank deposits and repurchase agreements and other similar secured borrowing |
16 |
263,751 |
638,940 |
Derivative financial instruments |
4.2 |
6,699,521 |
4,717,408 |
Borrowings from other financial institutions |
17 |
12,000,269 |
14,161,087 |
Debt instruments in issue |
18 |
10,958,823 |
15,209,620 |
lease contracts liabilities, net |
6.2.2 |
1,352,302 |
1,252,263 |
Preferred shares |
19 |
584,204 |
584,204 |
Current tax |
1,520 |
697,373 |
|
Deferred tax, net |
12.5 |
1,113,359 |
- |
Employee benefit plans |
20 |
684,439 |
556,513 |
Other liabilities |
21, 22 |
10,619,082 |
10,136,073 |
TOTAL LIABILITIES |
|
214,508,670 |
204,433,764 |
EQUITY |
|
|
|
Share capital |
23 |
480,914 |
480,914 |
Additional paid-in-capital |
4,837,497 |
4,837,497 |
|
Appropriated reserves |
24 |
20,292,454 |
16,733,917 |
Retained earnings |
5,935,658 |
6,931,037 |
|
Accumulated other comprehensive income, net of tax |
5,535,145 |
9,758,415 |
|
TOTAL EQUITY |
|
37,081,668 |
38,741,780 |
TOTAL LIABILITIES AND EQUITY |
|
251,590,338 |
243,175,544 |
The accompanying notes form an integral part of these separate financial statements.
SEPARATE STATEMENT OF INCOME
BANCOLOMBIA S.A.
For the years ended December 31, 2023 and 2022
(Stated in millions of Colombian pesos)
Note |
|
2023 |
2022 |
|
Interest on loans and financial leases |
|
|
|
|
Commercial |
|
|
13,496,215 |
7,891,866 |
Consumer |
|
|
8,138,830 |
6,287,886 |
Small business loans |
|
|
142,804 |
150,887 |
Mortgage |
|
|
2,916,180 |
2,515,454 |
Financial leases |
|
|
3,623,476 |
2,396,276 |
Total interest income on loans and financial leases |
|
|
28,317,505 |
19,242,369 |
Interest income on overnight and market funds |
|
|
10,404 |
7,827 |
Interest and valuation on financial instruments |
25.1 |
|
837,862 |
1,449,187 |
Other interest income |
|
|
198,822 |
50,232 |
Total interest and valuation on financial instruments |
|
|
29,364,593 |
20,749,615 |
Interest expenses |
25.2 |
|
(13,887,154) |
(6,545,975) |
Net interest margin and valuation on financial instruments before impairment on loans and financial leases, off balance sheet credit instruments and other financial instruments |
|
|
15,477,439 |
14,203,640 |
Credit impairment charges on loans, advances and financial leases, net |
5 |
|
(6,723,335) |
(2,956,483) |
Credit (impairment) recovery for other financial instruments |
|
|
(8,858) |
(16,309) |
Total credit impairment charges, net |
|
|
(6,732,193) |
(2,972,792) |
Net interest margin and valuation on financial instruments after impairment on loans and financial leases and off balance sheet credit instruments and other financial instruments |
|
|
8,742,529 |
11,230,848 |
Fees and commissions income |
25.3.1 |
|
5,333,049 |
4,717,944 |
Fees and commissions expenses |
25.3.2 |
|
(2,641,905) |
(2,206,616) |
Total fees and commissions, net |
|
|
2,691,144 |
2,511,328 |
Other operating income, net |
25.4 |
|
2,903,331 |
779,278 |
Equity method |
7, 8, 25.5 |
|
2,040,133 |
1,966,798 |
Dividend income |
25.5 |
|
4,482 |
7,777 |
Valuation and gains on sale of equity investments |
25.5 |
|
67,640 |
(58,864) |
Total income, net |
|
|
16,451,976 |
16,437,165 |
Operating expenses |
|
|
|
|
Salaries and employee benefits |
26.1 |
|
(3,504,950) |
(2,910,394) |
Other administrative and general expenses |
26.2 |
|
(3,201,592) |
(2,904,201) |
Taxes other than income tax |
26.2 |
|
(1,183,244) |
(731,389) |
Impairment, depreciation and amortization |
26.3 |
|
(899,647) |
(800,621) |
Total operating expenses |
|
|
(8,789,433) |
(7,346,605) |
Profit before income tax |
|
|
7,662,543 |
9,090,560 |
Income tax |
12 |
|
(1,682,813) |
(2,157,595) |
Net income |
|
|
5,979,730 |
6,932,965 |
The accompanying notes form an integral part of these separate financial statements.
SEPARATE STATEMENT OF COMPREHENSIVE INCOME
BANCOLOMBIA S.A.
For the years ended December 31, 2023 and 2022
(Stated in millions of Colombian pesos)
|
Note |
2023 |
2022 |
Net income |
|
5,979,730 |
6,932,965 |
Other comprehensive income/(loss) that will not be reclassified to net income |
|
|
|
Remeasurement (loss)/income related to defined benefit liability |
20.1 |
(24,291) |
36,927 |
Income tax |
12.4 |
9,061 |
(17,937) |
Gains on asset revaluation |
|
- |
- |
Income tax |
12.4 |
- |
(71) |
Net of tax amount |
|
(15,230) |
18,919 |
Other comprehensive income/(loss) that may be reclassified to net income |
|
|
|
Net gain (loss) on valuation of financial instruments (1) |
4.1 |
68,819 |
(28,984) |
Income tax |
12.4 |
(19,335) |
5,472 |
Net of tax amount |
|
49,484 |
(23,512) |
Foreign currency translation adjustments |
|
|
|
Exchange differences |
7 |
(5,791,932) |
3,738,815 |
Hedge of net investment in foreign operations |
7 |
1,948,833 |
(1,833,087) |
Income tax |
12.4 |
(772,755) |
746,232 |
Net of tax amount (2) |
|
(4,615,854) |
2,651,960 |
Superávit por participación patrimonial |
|
|
|
Unrealized gain/(loss) on investments in subsidiaries using equity method |
7 |
359,968 |
378,470 |
Gain/(loss) on valuation of investments in associates and joint ventures (3) (4) |
8 |
172 |
(8,695) |
Income tax |
12.4 |
- |
924 |
Net of tax amount |
|
360,140 |
370,699 |
Total other comprehensive income that may be reclassified to net income |
|
(4,206,230) |
2,999,147 |
Total other comprehensive income, net of tax |
|
(4,221,460) |
3,018,066 |
Total comprehensive income |
|
1,758,270 |
9,951,031 |
The accompanying notes form an integral part of these separate financial statements.
| (1) | The net effect as of december 31, 2023, corresponds to realization of OCI equity investments for COP (8,608) reclassified to income for the period, valuation of equity investments for COP 19,082, debt securities for COP 52,063 and realization as a result of the derecognition of interest in BVC for COP 6,282. The net effect as of dicember 31, 2022 is due to realization of OCI equity investments for COP (15,122) reclassified to income for the period, valuation of equity investments for COP 4,320 and debt securities COP (18,182). |
| (2) | In 2023, mainly due to revaluation of the Colombian peso against the U.S. dollar amounting to 20.54%. |
| (3) | The net effect ad of December 31, 2023 relates to valuation, while as of December 21, 2022 relates to valuation for COP 1,812 andrealizarion of OCI in the derecognition of interests in Protección for COP (10,507). |
| (4) | For further information see Note 2. Material Accounting policies, section C 4.1Investments in associates and joint ventures and Note 8. in associates and joint ventures. |
SEPARATE STATEMENT OF CHANGES IN EQUITY
BANCOLOMBIA S.A.
For the years ended December 31, 2023 and 2022
(Stated in millions of Colombian pesos, except per share amounts stated in units of pesos)
|
|
|
|
Accumulated other comprehensive income |
|
|
||||||||||||
Note |
Share capital |
Additional paid in capital |
Appropriated reserves |
Financial instruments |
Adjustments on first-time application of IFRS |
Revaluation of assets |
Employee benefits |
Equity method surplus (1) |
Total other comprehensive income, net |
Retained earnings |
Total equity |
||||||
Balance as of January 1, 2023 |
|
480,914 |
4,837,497 |
16,733,917 |
123,805 |
2,557,668 |
2, 137 |
(535) |
7,075,340 |
9,758,415 |
6,931,037 |
38,741,780 |
|||||
Dividend payment corresponding to 509,704,584 common shares and 452,122,416 preferred shares without voting rights, subscribed and paid as of December 31, 2022, at a rate of COP 3,536 per share, payable as follows: COP 884 per share quarterly, on the following dates: April 3, July 4, October 2, 2023 and January 2, 2024. |
|
- |
- |
- |
- |
- |
- |
- |
- |
- |
(3,343,319) |
(3,343,319) |
|||||
Reserve for equity strengthening and future growth. |
|
- |
- |
3,557,980 |
- |
- |
- |
- |
- |
- |
(3,557,980) |
- |
|||||
Reserve for social benefit projects and donations. |
|
- |
- |
- |
- |
- |
- |
- |
- |
- |
(33,000) |
(33,000) |
|||||
Reclassification of unclaimed dividends in accordance with Article 85 of the Bank's bylaws to reserves. |
|
- |
- |
557 |
- |
- |
- |
- |
- |
- |
- |
557 |
|||||
Realization of retained earnings. |
|
- |
- |
- |
- |
(1,810) |
- |
- |
- |
(1,810) |
1,810 |
- |
|||||
Equity method from participation in subsidiaries, associates and joint ventures. |
|
- |
- |
- |
- |
- |
- |
- |
- |
- |
(42,620) |
(42,620) |
|||||
Net income |
|
- |
- |
- |
- |
- |
- |
- |
- |
- |
5,979,730 |
5,979,730 |
|||||
Other comprehensive income |
12.4 |
- |
- |
- |
49,484 (2) |
- |
- |
(15,230) |
(4,255,714) |
(4,221,460) |
- |
(4,221,460) |
|||||
Equity as of December 31, 2023 |
|
480,914 |
4,837,497 |
20,292,454 |
173,289 |
2,555,858 |
2,137 |
(15,765) |
2,819,626 |
5,535,145 |
5,935,658 |
37,081,668 |
|||||
The accompanying notes form an integral part of these separate financial statements.
| (1) | The balance as of December 31, 2023 includes recognition of the equity method on investments in subsidiaries for COP 6,519,385, equity method of investments in associates for COP (2,223), hedging of foreign investments for COP (4,403,782) and deferred tax for COP 706,246. |
| (2) | The balance as of December, 2023 includes OCI related to valuation of equity investments for COP 19,082, realization of OCI for COP (8,608), valuation of debt securities for COP 52,063, realization of OCI as a result of the derecognition of interest in BVC for COP 6,282 and deferred tax for COP (19,335). |
NOTE 1. REPORTING ENTITY
Bancolombia S.A., hereinafter the Bank, is a credit establishment, listed on the Colombia Stock Exchange (BVC) as well as on the New York Stock Exchange (NYSE), since 1981 and 1995, respectively. The Bank main location is in Medellín (Colombia), main address Carrera 48 # 26-85, Avenida Los Industriales, and was originally constituted under the name Banco Industrial Colombiano (BIC) according to public deed number 388, date January 24, 1945, from the First Notary's Office of Medellin, authorized by the Superintendence of Finance of Colombia (“SFC”). On April 3, 1998, by means of public deed No. 633, BIC merged with Bank of Colombia S.A., and the resulting organization of that merger was named Bancolombia S.A.
The Bank bylaws are found in the public deed number 1441, dated May 6, 2022, at the 20th Notary´s Office of Medellín.
Bancolombia S.A. business purpose is to carry out all operations, transactions, acts and services inherent to the banking business. The Bank may, by itself or through its subsidiaries, own interests in other corporations, wherever authorized by law, according to all terms and requirements, limits or conditions established therein.
The duration contemplated in the bylaws is until December 8, 2044, but it may be dissolved or renewed before the end of that period. The operating license was definitively authorized by the SFC according to Resolution number 3140 of September 24, 1993.
The Bank, through its subsidiaries, has banking operations and international presence in United States, Puerto Rico, Panamá Guatemala and El Salvador. On May 25, 2022 and April 15, 2022, respectively, the Bank obtained the regulatory authorizations and licenses to operate as a broker-dealer and as a registered investment adviser in the United States, through its subsidiaries Bancolombia Capital Holdings USA LLC, Bancolombia Capital LLC, and Bancolombia Capital Advisers LLC, which were incorporated in September 2021.
On June 4, 2021, the Bank signed an agreement for the assignment of the fiduciary rights of the PA FAI Calle 77 trust, subject to condition. Fulfilled the condition on March 1, 2022, the Bank was established as trustor of PA FAI Calle 77, owner of a property that will be used for mortgage rental. The consdieration paid by the Bank was COP 56,968. The main purpose of the trust is to carry out the development, administration, management and operation of the project, on the aforementioned property in the city of Bogotá.
Operations in Barbados through Mercom Bank Ltd. are in the process of being dismantled to the extent that the instruments or obligations related to the assets and liabilities of said entity come due contractually. Its assets, liabilities and contracts were transferred to other companies that are also part of the Bancolombia Group. The operations of Transportempo S.A.S. They have been in liquidation since May 2023.
Additionally, operations in the Cayman Islands through Bancolombia Cayman were in the process of dismantling, for which on November 22, 2023 the Cayman Islands Monetary Authority approved the delivery of the banking license in accordance with Section 20(1). (a) of the Banking and Trust Companies Act (2021 Revision) (the BTCA), therefore, the banking license has been canceled with effect from that date. The company is in liquidation.
On December 14, 2021, the Bank's Board of Directors authorized the legal separation of the Nequi business, the digital platform of Grupo Bancolombia which offers financial services.
The Financial Superintendence of Colombia, through Resolution 0843 of July 6, 2022, modified by the Resolution 0955 of July 27, 2022, authorized the constitution of Nequi S.A. Financial Company. The legal separation implied the creation and commercial registration of a new corporation supervised by the Financial Superintendence of Colombia through which Nequi will operate completely as a digital bank (compañía de financiamiento). In order to be able to operate, compliance with all the activities required to obtain the authorization certificate or operating permit must be accredited to the Financial Superintendence of Colombia. On September 2022 the company NEQUI S.A.S. was created with a capitalization of COP 150,000 distributed mainly between Banca de Inversión Bancolombia S.A. with a participation of 94.99% and Inversiones CFNS S.A.S. with 5.01%.
On July 22, 2022, through the subsidiary, Sistemas de Inversiones y Negocios S.A. SINESA, the company Wenia LTD was incorporated in Bermuda, a corporate vehicle whose purpose is to provide technology services. By private document dated October 18, 2022, Wenia LTD as the sole shareholder, registered on November 22, 2022 with the Chamber of Commerce, the commercial company called Wenia S.A.S., whose purpose, among others, is the creation and implementation of operating systems and software applications.
On June 27, 2023, the Bank's Board of Directors evaluated a change in the professional management of the Private Capital Fund Fondo Inmobiliario Colombia and approved the constitution of a new company that arose from a joint venture entered into with Patria Investments to provide said services. On August 28, the company Gestoría Externa de Portafolios S.A. was established, with a capital of one million pesos, 100% owned by the Bancolombia Group. This entity issued shares for an approximate value of COP 19,000, and on November 1, 2023, Patria subscribed 51% of the shares of this company. Said company, Patria Asset Management S.A. (formerly Gestoría Externa de Portafolios S.A.), has as its main corporate purpose the provision of professional management services and external management of collective investment vehicles including collective investment funds and private equity funds in Colombia under the terms of part 3 of the Decree 2555 of 2010, without this constituting the performance of regulated activities exclusive to the entities supervised by the Financial Superintendence of Colombia.
As of december 31, 2023, the Bank has 22,559 employees, operates through 28,468 banking correspondents, 4,582 ATM’s, 578 offices and 494 mobile service points in Colombian territory.
The Bank has the following subsidiaries making up the Bank´s organizational structure, which is currently registered as a corporate group:
|
|
|
|
|
|
PROPORTION OF |
|
PROPORTION OF |
|
|
|
|
JURISDICTION |
|
|
|
OWNERSHIP |
|
OWNERSHIP |
|
|
ENTITY |
|
OF |
|
BUSINESS |
|
INTEREST AND |
|
INTEREST AND |
|
|
|
|
INCORPORATION |
|
|
|
VOTING POWER |
|
VOTING POWER |
|
|
|
|
|
|
|
|
HELD BY THE |
|
HELD BY THE |
|
|
|
|
|
|
|
|
BANK 2023 |
|
BANK 2022 |
|
|
Fiduciaria Bancolombia S.A. Sociedad Fiduciaria |
|
Colombia |
|
Trust |
|
98.81 |
% |
98.81 |
% |
|
Banca de Inversión Bancolombia S.A. Corporación Financiera |
|
Colombia |
|
Investment banking |
|
100.00 |
% |
100.00 |
% |
|
Valores Bancolombia S.A. Comisionista de Bolsa |
|
Colombia |
|
Securities brokerage |
|
100.00 |
% |
100.00 |
% |
|
WOMPI S.A.S. (before “VLIPCO S.A.S.”)(1) |
|
Colombia |
|
Technology services provider |
|
100.00 |
% |
99.98 |
% |
|
Renting Colombia S.A.S. |
|
Colombia |
|
Operating leasing |
|
100.00 |
% |
100.00 |
% |
|
Transportempo S.A.S. "Into liquidation" |
|
Colombia |
|
Transportation |
|
100.00 |
% |
100.00 |
% |
|
Inversiones CFNS S.A.S. |
|
Colombia |
|
Investments |
|
99.94 |
% |
99.94 |
% |
|
Negocios Digitales Colombia S.A.S. (before “Pasarela Colombia S.A.S.”) |
|
Colombia |
|
Payment solutions |
|
100.00 |
% |
100.00 |
% |
|
Fondo de Capital Privado Fondo Inmobiliario Colombia |
|
Colombia |
|
Real estate investment fund |
|
80.47 |
% |
80.47 |
% |
|
P.A. Inmuebles CEM |
|
Colombia |
|
Mercantil trust |
|
80.47 |
% |
80.47 |
% |
|
P.A. Calle 92 FIC-11 |
|
Colombia |
|
Mercantil trust |
|
52.31 |
% |
52.31 |
% |
|
P.A. FIC Edificio Corfinsura |
|
Colombia |
|
Mercantil trust |
|
80.47 |
% |
80.47 |
% |
|
P.A. FIC-A5 |
|
Colombia |
|
Mercantil trust |
|
80.47 |
% |
80.47 |
% |
|
P.A. FIC Inmuebles |
|
Colombia |
|
Mercantil trust |
|
80.47 |
% |
80.47 |
% |
|
P.A. FIC Clínica de Prado |
|
Colombia |
|
Mercantil trust |
|
62.00 |
% |
62.00 |
% |
|
P.A. FIC A6 |
|
Colombia |
|
Mercantil trust |
|
80.47 |
% |
80.47 |
% |
|
P.A. Central Point |
|
Colombia |
|
Mercantil trust |
|
60.35 |
% |
60.35 |
% |
|
Fideicomiso Irrevocable de Garantía, Fuente de Pago y Administración Inmobiliaria Polaris |
|
Colombia |
|
Mercantil trust |
|
80.47 |
% |
80.47 |
% |
|
P.A. Fideicomiso Twins Bay |
|
Colombia |
|
Mercantil trust |
|
80.47 |
% |
80.47 |
% |
|
Fideicomiso Lote Av San Martín |
|
Colombia |
|
Mercantil trust |
|
80.47 |
% |
80.47 |
% |
|
P.A. Fideicomiso Lote 30 |
|
Colombia |
|
Mercantil trust |
|
80.47 |
% |
80.47 |
% |
|
Fideicomiso Fondo Inmobiliario Bancolombia |
|
Colombia |
|
Mercantil trust |
|
80.47 |
% |
80.47 |
% |
|
P.A. Florencia Ferrara |
|
Colombia |
|
Mercantil trust |
|
44.26 |
% |
44.26 |
% |
|
P.A. Flor Morado Plaza |
|
Colombia |
|
Mercantil trust |
|
80.47 |
% |
80.47 |
% |
|
P.A. Galería la 33(2) |
|
Colombia |
|
Mercantil trust |
|
80.47 |
% |
- |
|
|
Valores Simesa S.A.(3) |
|
Colombia |
|
Investments |
|
64.93 |
% |
66.33 |
% |
|
Fideicomiso Lote Distrito Vera B1B2(3) |
|
Colombia |
|
Mercantil trust |
|
64.61 |
% |
66.00 |
% |
|
Fideicomiso Lote Distrito Vera B3B4(3) |
|
Colombia |
|
Mercantil trust |
|
64.61 |
% |
66.00 |
% |
|
Fideicomiso Lote B6 Ciudad del Rio(4) |
|
Colombia |
|
Mercantil trust |
|
- |
|
66.00 |
% |
|
P.A. FAI CALLE 77 |
|
Colombia |
|
Real estate investment fund |
|
98.00 |
% |
98.00 |
% |
|
P.A. NOMAD SALITRE |
|
Colombia |
|
Real estate investment fund |
|
98.00 |
% |
98.00 |
% |
|
P.A. NOMAD CENTRAL-2(5) |
|
Colombia |
|
Real estate investment fund |
|
98.00 |
% |
- |
|
|
P.A. CALLE 84 (2)(5) |
|
Colombia |
|
Real estate investment fund |
|
98.00 |
% |
- |
|
|
P.A. CALLE 84 (3)(5) |
|
Colombia |
|
Real estate investment fund |
|
98.00 |
% |
- |
|
|
P.A. MERCURIO |
|
Colombia |
|
Real estate investment fund |
|
100.00 |
% |
100.00 |
% |
|
Wenia S.A.S. |
|
Colombia |
|
Technology services |
|
100.00 |
% |
100.00 |
% |
|
P.A. Wenia(6) |
|
Colombia |
|
Mercantil trust |
|
100.00 |
% |
- |
|
|
Wenia Ltd. |
|
Bermuda |
|
Technology services |
|
100.00 |
% |
100.00 |
|
|
Nequi S.A. Compañía de Financiamiento |
|
Colombia |
|
Financial services |
|
100.00 |
% |
100.00 |
% |
|
Bancolombia Panamá S.A. |
|
Panama |
|
Banking |
|
100.00 |
% |
100.00 |
% |
|
Sistemas de Inversiones y Negocios S.A. Sinesa |
|
Panama |
|
Investments |
|
100.00 |
% |
100.00 |
% |
|
Banagrícola S.A. |
|
Panama |
|
Investments |
|
99.17 |
% |
99.17 |
% |
|
Banistmo S.A. |
|
Panama |
|
Banking |
|
100.00 |
% |
100.00 |
% |
|
Banistmo Investment Corporation S.A. |
|
Panama |
|
Trust |
|
100.00 |
% |
100.00 |
% |
|
Leasing Banistmo S.A. |
|
Panama |
|
Leasing |
|
100.00 |
% |
100.00 |
% |
|
Valores Banistmo S.A. |
|
Panama |
|
Securities brokerage |
|
100.00 |
% |
100.00 |
% |
|
Banistmo Panamá Fondo de Inversión S.A.(7) |
|
Panama |
|
Holding |
|
100.00 |
% |
100.00 |
% |
|
Banistmo Capital Markets Group Inc.(7) |
|
Panama |
|
Purchase and sale of securities |
|
100.00 |
% |
100.00 |
% |
|
Anavi Investment Corporation S.A.(7) |
|
Panama |
|
Real estate |
|
100.00 |
% |
100.00 |
% |
|
Desarrollo de Oriente S.A.(7) |
|
Panama |
|
Real estate |
|
100.00 |
% |
100.00 |
% |
|
Steens Enterprises S.A.(7) |
|
Panama |
|
Portfolio holder |
|
100.00 |
% |
100.00 |
% |
|
Ordway Holdings S.A.(7) |
|
Panama |
|
Real estate broker |
|
100.00 |
% |
100.00 |
% |
|
Grupo Agromercantil Holding S.A. |
|
Panama |
|
Holding |
|
100.00 |
% |
100.00 |
% |
|
Banco Agromercantil de Guatemala S.A. |
|
Guatemala |
|
Banking |
|
99.68 |
% |
99.68 |
% |
|
Seguros Agromercantil de Guatemala S.A. |
|
Guatemala |
|
Insurance agency |
|
79.92 |
% |
79.92 |
% |
|
Financiera Agromercantil S.A. |
|
Guatemala |
|
Financial services |
|
100.00 |
% |
100.00 |
% |
|
Agrovalores S.A. |
|
Guatemala |
|
Securities brokerage |
|
100.00 |
% |
100.00 |
% |
|
Arrendadora Agromercantil S.A. |
|
Guatemala |
|
Operating Leasing |
|
100.00 |
% |
100.00 |
% |
|
Agencia de Seguros y Fianzas Agromercantil S.A.(8) |
|
Guatemala |
|
Insurance agency |
|
- |
|
100.00 |
% |
|
Asistencia y Ajustes S.A. |
|
Guatemala |
|
Roadside and medical assistance services |
|
100.00 |
% |
100.00 |
% |
|
Serproba S.A. |
|
Guatemala |
|
Maintenance and remodelling services |
|
100.00 |
% |
100.00 |
% |
|
Servicios de Formalización S.A. |
|
Guatemala |
|
Loans formalization |
|
100.00 |
% |
100.00 |
% |
|
Conserjeria, Mantenimiento y Mensajería S.A. "Into liquidation" |
|
Guatemala |
|
Maintenance services |
|
100.00 |
% |
100.00 |
% |
|
Mercom Bank Ltd.(9) |
|
Barbados |
|
Banking |
|
99.68 |
% |
99.68 |
% |
|
New Alma Enterprises Ltd. |
|
Bahamas |
|
Investments |
|
99.68 |
% |
99.68 |
% |
|
Bancolombia Puerto Rico Internacional Inc. |
|
Puerto Rico |
|
Banking |
|
100.00 |
% |
100.00 |
% |
|
Bancolombia Cayman S.A.(10) |
|
Cayman Islands |
|
Banking |
|
100.00 |
% |
100.00 |
% |
|
Banco Agrícola S.A. |
|
El Salvador |
|
Banking |
|
97.36 |
% |
97.36 |
% |
|
Arrendadora Financiera S.A. Arfinsa |
|
El Salvador |
|
Leasing |
|
97.37 |
% |
97.37 |
% |
|
Credibac S.A. de C.V. |
|
El Salvador |
|
Credit card services |
|
97.36 |
% |
97.36 |
% |
|
Valores Banagrícola S.A. de C.V. |
|
El Salvador |
|
Securities brokerage |
|
98.89 |
% |
98.89 |
% |
|
Inversiones Financieras Banco Agrícola S.A. IFBA |
|
El Salvador |
|
Investments |
|
98.89 |
% |
98.89 |
% |
|
Gestora de Fondos de Inversión Banagrícola S.A. |
|
El Salvador |
|
Administers investment funds |
|
98.89 |
% |
98.89 |
% |
|
Bagrícola Costa Rica S.A. |
|
Costa Rica |
|
Outsourcing |
|
99.17 |
% |
99.17 |
% |
|
Bancolombia Capital Holdings USA LLC |
|
United States |
|
Holding |
|
100.00 |
% |
100.00 |
% |
|
Bancolombia Capital Adviser LLC |
|
United States |
|
Investment advisor |
|
100.00 |
% |
100.00 |
% |
|
Bancolombia Capital LLC |
|
United States |
|
Securities brokerage |
|
100.00 |
% |
100.00 |
% |
|
| (1) | During 2022 and 2023, the Bank, through its subsidiary Banca de Inversión S.A., increased its participation through the purchase of shares from minority. |
| (2) | Company consolidated by Fondo de Capital Privado FCP Fondo Inmobiliario Colombia since March 2023. |
| (3) | The decrease in the shareholding is due to the repurchase of outstanding stock carried out by Valores Simesa S.A. during 2023 and 2022. |
| (4) | During 2023, the trust rights were transferred by Valores Simesa S.A.. |
| (5) | During February and April 2023, the Bank was established as trustor of P.A. Nomad Central-2, P.A. Calle 84 (2) and P.A. Calle 84 (3), through a management mercantil trust agreement |
| (6) | On May 17, 2023, Wenia S.A.S. was established as trustor of the trust rights of P.A. Wenia. |
| (7) | Investments in non-operational stage. |
| (8) | Company liquidated as of June 2023. |
| (9) | On September 30, 2021, Mercom Bank Ltd. shareholders authorized the beginning of an organized and gradual process to transfer of the assets and liabilities of Mercom Bank Ltd., to Banco Agromercantil de Guatemala S.A. or other companies of the Bank. |
SEPARATE STATEMENT OF CHANGES IN EQUITY
BANCOLOMBIA S.A.
For the years ended December 31, 2023 and 2022 and
(Stated in millions of Colombian pesos, except per share amounts stated in units of pesos)
|
|
|
|
Accumulated other comprehensive income |
|
|
||||||||||||||
Note |
Share capital |
Additional paid in capital |
Appropriated reserves |
Financial instruments |
Adjustments on first-time application of IFRS |
Revaluation of assets |
Employee benefits |
Equity method surplus (1) |
Total other comprehensive income, net |
Retained earnings |
Total equity |
||||||||
Equity as of January 1, 2022 |
|
480,914 |
4,837,497 |
15,017,742 |
147,317 |
2,559,001 |
2,208 |
(31,554) |
4,052,681 |
6,729,653 |
4,701,643 |
31,767,449 |
|||||||
Dividend corresponding to 509,704,584 common shares and 452,122,416 preferred shares without voting rights, subscribed and paid as of December 31, 2021, at COP 3,120 per share, payable as follows: COP 780 per share quarterly, on the following dates: April 1, July 1, October 6, 2022 and January 2, 2023. |
|
- |
- |
- |
- |
- |
- |
- |
- |
- |
(2,943,199) |
(2,943,199) |
|||||||
Reserve for equity strengthening and future growth. |
|
- |
- |
1,715,601 |
- |
- |
- |
- |
- |
- |
(1,715,601) |
- |
|||||||
Reserve for social benefit projects and occasional donations. |
|
- |
- |
- |
- |
- |
- |
- |
- |
- |
(30,000) |
(30,000) |
|||||||
Reclassification of unclaimed dividends in accordance with Article 85 of the Bank's bylaws to reserves. |
|
- |
- |
574 |
- |
- |
- |
- |
- |
- |
- |
574 |
|||||||
Realization of retained earnings. |
|
- |
- |
- |
- |
(1,333) |
- |
12,029 |
- |
10,696 |
(10,696) |
- |
|||||||
Equity method from subsidiaries, associated and joint ventures. |
|
- |
- |
- |
- |
- |
- |
- |
- |
- |
(4,075) |
(4,075) |
|||||||
Net income |
|
- |
- |
- |
- |
- |
- |
- |
- |
- |
6,932,965 |
6,932,965 |
|||||||
Other comprehensive income |
12.4 |
- |
- |
- |
(23,512) (2) |
- |
(71) |
18,990 |
3,022,659 |
3,018,066 |
- |
3,018,066 |
|||||||
Equity as of December 31, 2022 |
|
480,914 |
4,837,497 |
16,733,917 |
123,805 |
2,557,668 |
2, 137 |
(535) |
7,075,340 |
9,758,415 |
6,931,037 |
38,741,780 |
|||||||
The accompanying notes form an integral part of these separate financial statements.
| (1) | The balance as of December 31, 2022 includes recognition of the equity method on investments in subsidiaries for COP 11,951,349, equity method of investments in associates for COP (2,395), hedging of foreign investments for COP (6,352,614) and deferred tax for COP 1,479,000. |
| (2) | The balance as of December 31, 2022 includes OCI for financial instruments for COP 4,320, realization of OCI on equity securities for COP (15,122), OCI debt securities for COP (18,182) and deferred tax for COP 5,472. |
SEPARATE STATEMENT OF CASH FLOW
BANCOLOMBIA S.A.
For the years ended December 31, 2023 and 2022
(Stated in millions of Colombian pesos)
|
Note |
2023 |
2022 |
|
Net income |
5,979,730 |
6,932,965 |
||
Adjustments to reconcile net income to net cash provided by operating activities: |
|
|
||
Depreciation, amortization and impairment |
26.3 |
899,647 |
800,621 |
|
Equity method |
25.5 |
(2,040,133) |
(1,966,798) |
|
Investment recovery |
4.1 |
(7,381) |
(14,253) |
|
Credit impairment charges on loans and financial leases, net |
5 |
6,723,335 |
2,956,483 |
|
Other assets impairment |
16,239 |
30,562 |
||
Net interest income |
(14,679,270) |
(12,797,868) |
||
(Gain) loss on sale of equity assets |
25.5 |
(9,553) |
58,984 |
|
Gain on sale of portfolio and other assets |
25.4 |
(271,834) |
(56,682) |
|
Gain on sale of property and equipment |
25.4 |
(107,390) |
(82,569) |
|
Gain on repositioning of inventories and sale of assets held for sale |
25.4 |
(140,668) |
(222,332) |
|
Gain on valuation of financial instruments at fair value - Debt instruments |
25.1 |
(622,737) |
(1,204,565) |
|
Gain on valuation of financial instruments at amortized cost |
25.1 |
(299,236) |
(150,044) |
|
(Gain) loss on valuation of equity instruments |
|
(58,086) |
(120) |
|
Loss (gain) on valuation of spot transactions |
25.1 |
48,373 |
(73,385) |
|
(Gain) loss on derivative financial instruments |
|
(171,022) |
8,187 |
|
Gain on valuation of investment property |
11, 25.4 |
(27,818) |
(11,190) |
|
Other provisions |
|
29,568 |
90,148 |
|
Bonds and short-term benefits |
|
553,823 |
483,691 |
|
Other non-cash items |
872 |
(1,314) |
||
Preferred shares dividend expense |
25.2 |
57,701 |
57,701 |
|
Dividends on equity investments |
25.5 |
(4,482) |
(7,777) |
|
Effect of exchange rate changes |
(251,857) |
246,969 |
||
Income tax expense (2) |
12 |
1,682,813 |
2,157,595 |
|
Change in operating assets and liabilities: |
|
|
||
Decrease (Increase) Financial instruments measured at fair value through profit and loss |
394,688 |
6,070,278 |
||
Increase Loan portfolio and financial leasing operations |
(8,499,818) |
(29,605,881) |
||
Increase Other accounts receivable |
(319,730) |
(220,821) |
||
Decrease Derivatives |
797,574 |
327,816 |
||
Increase Other assets |
(814,622) |
310,633 |
||
Increase Deposits |
13,012,343 |
17,156,730 |
||
(Decrease) Increase in accounts payable |
619,969 |
2,638,875 |
||
Increase in other liabilities and provisions |
(291,028) |
243,883 |
||
Interest received |
26,877,239 |
17,247,380 |
||
Received dividends |
1,861,195 |
967,319 |
||
Proceeds from sale of assets held for sale and inventories |
|
714,668 |
482,999 |
|
Recovery of charged-off receivables account |
5 |
428,298 |
443,588 |
|
Interest paid |
(13,005,427) |
(5,595,530) |
||
Income tax paid |
|
(2,358,248) |
(1,631,421) |
|
Net cash provided by (used in) operating activities |
16,717,735 |
5,576,919 |
||
Cash flows from investment activities |
|
|
||
Investments Purchase: |
(3,927,726) |
(4,445,617) |
||
Investments at amortized cost |
(3,111,805) |
(3,263,097) |
||
Financial instruments measured at fair value through OCI - Debt securities |
(500,235) |
- |
||
Investments in subsidiaries |
(250,655) |
(1,087,902) |
||
Investments in associates and joint ventures |
(65,031) |
(94,618) |
||
Investments sale: |
3,600,551 |
3,432,373 |
||
Financial instruments measured at fair value through OCI - Debt securities |
|
223,199 |
61,917 |
|
Financial instruments measured at fair value through OCI – Equity investment |
|
8,956 |
16,056 |
|
Investments at amortized cost |
3,367,609 |
3,076,492 |
||
Investments in subsidiaries |
787 |
18,953 |
||
Investments in associates and joint ventures |
|
- |
258,955 |
|
Acquisition of property and equipment |
|
(1,353,713) |
(2,305,163) |
|
Acquisition of investment property |
11 |
(97,479) |
(221,834) |
|
Proceeds from sale of property and equipment |
|
170,304 |
114,797 |
|
Acquisition of intangible assets |
(129,764) |
(68,853) |
||
Net cash used in investing activities |
(1,737,827) |
(3,494,297) |
||
Cash flows from Financial activities: |
|
|
||
(Decrease) Increase Interbank |
|
(482,766) |
482,766 |
|
Increase in monetary and related market operations |
|
107,576 |
(502,379) |
|
Opening of financial obligations |
|
4,147,659 |
5,596,628 |
|
Cancellation of financial obligations |
|
(4,249,291) |
(1,995,941) |
|
Lease liabilities |
|
(118,385) |
(104,866) |
|
Issuance of debt securities |
|
277,506 |
688,814 |
|
Cancellation of debt securities |
|
(2,672,528) |
(3,295,205) |
|
Dividends paid |
(3,298,183) |
(2,310,666) |
||
Net cash (used in) provided by Financial activities |
(6,288,412) |
(1,110,849) |
||
(Decrease) / Increase in cash and cash equivalents, before the effect of exchange rate changes |
8,691,496 |
971,773 |
||
Effect of exchange rate variations on cash and cash equivalents |
(576,440) |
508,865 |
||
Increase in cash and cash equivalents |
8,115,056 |
1,480,638 |
||
Cash and cash equivalents at the beginning of the period |
3 |
16,233,804 |
14,753,166 |
|
Cash and cash equivalents at the end of the period |
3 |
24,348,860 |
16,233,804 |
|
The accompanying notes form an integral part of these separate financial statements.
1
The statement of cash flows includes the following non-cash transactions, which were not reflected in the separate statement of cash flows:
| a) | Restructured loans that were transferred to foreclosed assets as of December 2023 for COP 947,534 and as of December 2022 for COP 545,619. |
| b) | Reclasification from Held-to-maturity to negotiable investments for COP 77,774, for further information, see Note 4. Financial assets investments, net and derivatives. |
| c) | Recognition of interests in Holding Bursatil Regional for COP 25,682 and derecognition of interests in Bolsa de Valores de Colombia for COP 18,453, as a result of the regional integration of the stock exchanges. See note 4.1 in Equity instruments measured at fair value through OCI. |
2
SEPARATE FINANCIAL STATEMENTS NOTES
BANCOLOMBIA S.A.
NOTA 2. MATERIAL ACCOUNTING POLICIES
| A. | Basis for preparation of the financial statements |
The financial statements of the Bank are prepared in accordance with standards accounting and Financial Reporting Standards accepted in Colombia, based on the International Financial Reporting Standards (hereinafter, “IFRS”) issued by the International Accounting Standards Board (hereinafter, “IASB”), as well as the interpretations issued by the International Financial Reporting Interpretations Committee (hereinafter, IFRS-IC), in accordance with the Regulatory Technical Framework issued through the single regulatory decree 2420 of 2015 and its amendments, by the Ministry of Finance and Public Credit and Commerce Industry and Tourism.
This framework exempts the application of IAS 39 and IFRS 9, only with respect to the loan portfolio and its impairment and the classification and valuation of investments, which are recognised, classified and measured in accordance with the provisions of the Superintendencia Financiera de Colombia (“SFC”) contained in Chapter I and II of Circular Externa 100 of 1995, and IFRS 5 for the determination of impairment of foreclosed assets, which are impaired in accordance with the provisions of the SFC. See Note 2. Material Accounting Policies, paragraph C., items 5 and 14. The above provisions are considered Accounting and Financial Reporting Standards accepted in Colombia (NCIF).
Preparation of the separate financial statements undergoing concern basis
Management has assessed the Bank’s ability to continue as a going concern and confirms that the Bank has adequate liquidity and solvency to continue operating the business for the foreseeable future, which is at least, but is not limited to, 12 months from the end of the reporting period. Based on the Bank's liquidity position at the date of authorization of the financial statements, Management maintains a reasonable expectation that it has adequate liquidity and solvency to continue in operation for at least the next 12 months and that the going concern basis of accounting remains appropriate.
The financial statements were prepared on a going concern basis and do not include any adjustments to the reported carrying amounts and classification of assets, liabilities and expenses that might otherwise be required if the going concern basis were not correct.
Assets and liabilities are measured at cost or amortized cost, except for some financial assets and liabilities and investment properties that are measured at fair value. Financial assets and liabilities measured at fair value comprise those classified as assets and liabilities at fair value through profit or loss, debt instruments and equity securities measured at fair value through other comprehensive income (“OCI”) and derivative instruments. Investments in associates and joint ventures are measured using the equity method.
The financial statements are stated in Colombian pesos (“COP”) and figures are stated in millions or billions (when indicated), except earnings per share, diluted earnings per share and the exchange rate, which are stated in units of Colombian pesos, while other currencies (dollars, euro, pounds, etc.) are stated in thousands.
3
In accordance with Colombian law, the Bank is required to prepare separate financial statements, which have been prepared in accordance with the Marco Técnico Normative indicated above. The separate financial statements are those that serve as the basis for the regulatory compliance, distribution of dividends and other appropriations by the shareholders.
| B. | Presentation of the financial statements |
The Bank presents the statement of financial position ordered by liquidity and the statement of income is prepared based on the nature of expenses. Revenues and expenses are not offset unless such treatment is permitted or required by an accounting standard or interpretation and described in the Bank's policies.
The statement of comprehensive income presents net income and items of OCI classified by nature and grouped into those that will not be reclassified subsequently to profit or loss and those that will be reclassified when specific conditions are met. The Bank discloses the amount of income tax relating to each item of OCI.
The statement of cash flows was prepared using the indirect method, whereby net income is adjusted for the effects of transactions of a non-cash nature, changes during the period in operating assets and liabilities, and items of income or expense associated with investing or financing cash flows.
| C. | Material Accounting Policies |
The material accounting policies that the Bank uses in preparing its financial statements are detailed below:
| 1. | Functional currency, transactions and balances in foreign currencies |
The functional and presentation currency of the Bank´s financial statements is the Colombian peso. Therefore, all balances and transactions denominated in currencies other than the Colombian peso are considered as foreign currency, which are translated into the functional currency using the exchange rates at the dates of the transactions.
Foreign exchange gains and losses resulting from the settlement of the transactions and from the translation of monetary assets and liabilities denominated in foreign currencies at period end are generally recognized in net income. They are deferred in equity (other comprehensive income) if they relate to qualifying cash flow hedges and qualifying net investment hedges or are attributable to part of the net investment in a foreign operation.
Non-monetary items that are measured at cost are held at the exchange rate at the transaction date, while those which are measured at fair value in a foreign currency are translated using the exchange rates at the date when the fair value was determined. When a gain or loss on a non-monetary item is recognized in the statement of comprehensive income, any exchange component of that gain or loss is recognized in other comprehensive income. Conversely, when a gain or loss on a non-monetary item is recognized in net income, any exchange component of that gain or loss shall be recognized in net income.
The table below sets forth the exchange rate used by the Bank to convert transactions in U.S. dollar into Colombian pesos:
4
|
December 31, 2023 |
December 31, 2022 |
Year-end exchange rate |
3,822.05 |
4,810.20 |
| 2. | Cash and cash equivalents |
The Bank considers cash and cash equivalents to include cash and balances at banks and the Central Bank, interbank assets and reverse repurchase agreements and other similar secured lending that have original maturities up to 90 days, as shown in Note 3. Cash and cash equivalents.
| 3. | Financial instruments |
A financial instrument is a contract that gives rise to a financial asset of one entity and a financial liability or equity instrument of another entity.
Pursuant to Decree 2420 of December 2015 - Sole Regulatory Decree of the Accounting, Financial Reporting and Information Assurance Standards established exceptions for the separate financial statements of credit institutions. This exempted those entities from applying IFRS 9 in relation to the classification and valuation of investments. The SFC was also empowered to issue instructions regarding these exceptions to IFRS, as well as to dictate the procedures for compliance with the prudential regime, outlined in External Circular 034. This circular amends Chapter I - "Classification, valuation and accounting of investments for individual or separate financial statements" of the of the Colombian Basic Accounting and Financial Circular (CBCF). As an entity subject to SFC supervision and classified within Group 1, the Bank adheres to the following investment classification policies:
3.1 Financial assets
3.1.1. Classification and measurement
In accordance with the provisions of the SFC, investments in debt securities are classified as trading, available-for-sale and held-to-maturity.
Trading securities
Securities, specifically debt securities, and any other investments acquired primarily to realize short-term profits from price fluctuations are classified as trading securities.
The difference between their current and previous fair values known as unrealized gains or losses, is recognized in the current period's income statement, impacting the overall results.
Accrued interest on these securities is recorded as an increase in their carrying value, while its subsequent collection is recorded as a decrease. This reflects the principle of matching income and expenses for the period.
Available for sale
5
This category encompasses securities, debt securities, and other investments that are neither classified as trading (marketable) nor held-to-maturity. Their classification as available-for-sale signifies the investor's intent and ability to hold them, evidenced by factors like legal rights, contractual obligations, financial resources, and operational capacity.
The change in the present value of callable yields is recognized in income statement accounts, while the difference between the fair value and the amortized cost at each reporting is recorded in other comprehensive income.
Accrued callable yields are to be maintained as an increase in the value of the investment. Consequently, the collection of such yields is to be accounted for as a decrease in the value of the investment.
When available-for-sale investments are sold, unrealized gains or losses recorded in OCI, are to be recognized as income or expense in the period of sale.
Held to maturity
This refers to those debt securities and, in general, any type of investment for which the investor has the purpose and legal, contractual, financial, and operating capacity to hold them until their maturity or redemption term. The purpose of maintaining the investment corresponds to the positive and unequivocal intention of not selling the security or value.
The updating of the present value of this class of investment is to be recorded as an increase in the value of the investment, affecting the results for the period.
Accrued callable yields are recorded as an increase in the value of the investment. Consequently, the collection of such yields is to be accounted for as a decrease in the value of the investment.
3.1.2. Valuation
The valuation of investments has as its fundamental objective the calculation and disclosure of the fair value or exchange price at which an investment may be traded on a given date, as follows:
Local currency and UVR debt securities
Valuation of debt securities is performed daily, whit results recorded whit the same frequency.
The Bank determines the market value of trading and available for sale debt securities using the daily published prices provided by a pricing provider selected by the Bank and authorized by the SFC to perform this function. Debt securities held to maturity and securities for which no published price exists on a given date are valued exponentially using the internal rate of return calculated at the time of purchase and recalculated at events determined by the SFC.
If the value or security is denominated in UVR, the value determined in accordance with the above is converted to Colombian pesos using the current UVR (Unidad de Valor Real) published by the Banco de la República for the date.
Foreign currency debt securities
6
The present value or market value of the respective security in its currency is determined, using the procedure established in the previous numeral based on prices published by the pricing provider selected by the Bank and authorized by the SFC to perform this function. In the absence of these, those determined in international markets published by Bloomberg are used, or, finally, exponentially based on the internal rate of return calculated at the time of purchase and recalculated in the events determined by the SFC.
If the security is denominated in a currency other than the United States dollar, the value determined in accordance with the previous paragraph is converted into dollars based on the foreign exchange conversion rates authorized by the SFC.
The value thus obtained must be re-expressed in Colombian pesos using the representative market rate (TRM) calculated on the day of the valuation and certified by the SFC or by the value of the unit in force for the same day, as appropriate.
3.1.3. Reclassification of investments
The Bank may reclassify an investment from available-for-sale to trading or held-to-maturity, when it recomposes the significant activities of its business due to changes in the market or in its risk appetite, when a risk contemplated in the investment management of its business model materializes, when it loses its parent or controlling status, if this event involves the decision to sell the investment or the main purpose of obtaining profits from short-term fluctuations from that date.
When available-for-sale investments are reclassified to trading investments, the valuation and accounting rules for the latter are observed. As a result, unrealized gains or losses must be recognized and maintained in OCI as unrealized gains or losses on the date of reclassification, until the sale of the corresponding investment is made.
3.1.4 Provisions or losses due to credit risk rating
Negotiable debt securities available for sale that do not have fair exchange prices, as well as securities classified as held to maturity, have their price adjusted on each valuation date, based on a credit risk rating. as indicated below.
The securities or securities of internal or external public debt issued or guaranteed by the nation, those issued by the Bank of the Republic and those issued or guaranteed by the Financial Institutions Guarantee Fund -FOGAFIN are not subject to this adjustment.
Securities or titles of issues or issuers that have external credit risk ratings
The securities or securities that have credit risk ratings granted by external rating agencies recognized by the SFC, or the securities or debt securities issued by entities that are evaluated by these rating agencies, their book value cannot exceed the following percentages of its nominal value, net of amortizations carried out up to the valuation date:
Long-Term Rating |
Maximum% |
Short-Term Rating |
Maximum% |
BB+, BB, BB- |
Ninety (90) |
3 |
Ninety (90) |
B+, B, B- |
Seventy (70) |
4 |
Fifty (50) |
CCC |
Fifty (50) |
5 y 6 |
Zero (0) |
DD, EE |
Zero (0) |
7
In investments classified as held to maturity and for which a fair exchange price can be established, the provision corresponds to the difference between their amortized book cost and said price.
Securities or titles of issues or issuers without external rating for credit risk
These securities or titles are evaluated and qualified in accordance with the methodology defined by the Bank. The maximum value defined by the SFC for which these investments are recorded according to their qualification is:
Category |
Maximum recorded value % (1) |
Investment characteristics |
|---|---|---|
B Acceptable risk, higher than normal |
eighty (80) |
They present uncertainty factors that could affect the ability to continue to adequately comply with debt services and weaknesses that may affect their financial situation. |
C Appreciable risk |
Sixty (60) |
They have a high or medium probability of non-compliance with the timely payment of capital and interest and deficiencies in their financial situation that compromise the recovery of the investment. |
D Significant risk |
Forty (40) |
They present non-compliance with the terms agreed in the title and accentuated deficiencies in their financial situation, so that the probability of recovering the investment is highly doubtful. |
E Bad |
Zero (0) |
It is estimated to be uncollectible. |
3.1.5 Other financial instruments
Classification and measurement
For investments in companies that do not have a market value provided by a price provider, their fair value will be recognized by subsequent variations in the issuer's equity according to the percentage of participation.
Financial instruments at fair value through profit or loss
They are all those equity investments in which the Bank does not have control or significant influence and that have been acquired with the purpose of selling in the short term and/or reflecting the effects of the change in the market value in the result of the year.
Its valuation is determined by price providers authorized by the SFC.
Financial instruments at fair value with changes in other comprehensive income
They are all those equity investments in which the Bank does not have control or significant influence and that have been acquired with the purpose of strategic maintenance in the long term. The fair value of these investments will be determined by price providers authorized by the SFC.
When the price provider does not have a valuation methodology for these investments, the Bank must affect the value of the investment in the corresponding percentage of participation, on the subsequent variations in the assets of the respective issuer.
8
The Bank may irrevocably choose at the initial moment to carry changes in market value to the other comprehensive income account in equity.
3.1.6 Credit portfolio, financial leasing operations and provisions for credit risk
In accordance with Decree 2420 of 2015, preparers of financial information subject to the supervision of the SFC who are part of group 1 were exempted from the application of IFRS 9 Financial Instruments to credit portfolio operations and their impairment, maintaining the provisions of Chapter II of the CBCF (External Circular 100 of 1995).
The Bank grants loans in the commercial, consumer, mortgage and small business segments, as indicated below, in the forms of ordinary loans, financial leasing operations, factoring, among others.
The loans granted are recorded at their net nominal value of the payments received from customers, except for portfolio purchases that are recorded at their acquisition cost and those granted in foreign currency that are recorded at the exchange rate representative of the market in force at the time. day of disbursement. Accumulated interest is recorded as accounts receivable and advance interest is recorded as a deferred credit to liabilities.
Financial leasing operations are recorded as a credit portfolio for the book value of the asset leased to clients and are subsequently amortized with the payment of fees in the part that corresponds to the payment of the principal balance.
Classification of credits
The structure of the loan portfolio and financial leasing operations are classified as:
living place
They are those that, regardless of their amount, are granted to natural persons, intended for the acquisition of new or used mortgage, or the construction of individual mortgage and comply with the terms of Law 546 of 1999, among them: being denominated in UVR or in legal currency, be guaranteed with a first degree mortgage on the property being financed and the repayment period must be between 5 and 30 years maximum.
Consumer
They are those that, regardless of their amount, are granted to natural persons to finance the acquisition of consumer goods or the payment of services for non-commercial or business purposes, other than those granted under the small business modality.
Small business
Small business are credits constituted by active credit operations referred to in Article 39 of Law 590 of 2000, or the regulations that modify, replace or add to it, as well as those carried out with microenterprises in which the main source of payment of the obligation comes from income derived from its activity.
The debtor's debt balance may not exceed one hundred and twenty (120) legal monthly minimum wages in force at the time of approval of the respective active credit operation. The debt balance is understood to be the amount of current obligations owed by the corresponding microenterprise with the financial sector and other sectors, which are found in the records of the data bank operators consulted by the respective creditor, excluding mortgage loans for mortgage financing and adding the value of the new obligation.
9
Commercial
All those granted to natural or legal persons for the development of organized economic activities, other than those granted under the modality of small business, are classified as commercial.
Commissions and accounts receivable derived from active credit operations are classified in the modality that corresponds to each of the credits.

3.1.6.1 Evaluation, rating, and provisions for credit risks
The Bank follows chapter XXXI of External Circular 100 of 1995, which establishes the guidelines for credit risk management, through the Integral Risk Management System (SIAR), which comprises the policies, processes, models, provisions, and control mechanisms that allow financial entities to identify, measure and adequately mitigate credit risk.
The Bank evaluates the risk of its loan portfolio on a monthly basis, taking into account the seasonality of the obligations, as well as the level of risk associated with the debtor, the latter at least every six months in May and November of each year, evaluating other risk factors of each debtor, mainly related to its payment capacity and generation of cash flows to cover the debt, according to the agreed conditions.
In addition, it is mandatory to immediately evaluate the credit risk of loans in default after they have been restructured.
The Bank rates and provisions the loan portfolio and financial leasing operations as follows:
General provisions
The Bank constitutes a general provision only for the mortgage and small business modalities, which do not have reference models, of at least one percent (1%) of the total amount of the gross loan portfolio of the two modalities.
General Provision External Circular 026 of 2022
Based on the provisions of external circular 026 of 2022, and to mitigate the impact of the possible materialization of credit risk in an environment of economic slowdown and persistent inflation, the Bank recognized an additional Consumer provision in the statement of income for an amount equivalent to the expense for macroeconomic variables and an expense for the possible use of contingent quotas, based on internal IFRS9 expected loss models. This provision was approved by the board of directors in December of 2022 and will vary according to the internal analysis performed, which will be reported monthly to the risk committee.
December 31, 2022 |
December 31, 2023 |
10
Additional Consumer AMP C026 of 2022 |
353,159 |
353,159 |
Individual provisioning
For the commercial and consumer portfolio categories, the Bank's portfolio provisioning rating is established by taking into account the reference models established by the Superintendency through Annex I, Chapter XXXI of the SFC's External Circular 100 of 1995. The mortgage and small business portfolio modalities do not have an associated reference model, therefore their provision is made based on the height of delinquency, as established in Annex II of the circular. The individual loan portfolio provision under the reference models is established as the sum of two individual components, defined as follows:
Pro-cyclical individual component (CIP): Corresponds to the portion of the individual allowance of the loan portfolio that reflects the credit risk of each debtor, at present.
Individual counter-cyclical component (CIC): Corresponds to the portion of the individual allowance for loan portfolio that reflects possible changes in the credit risk of debtors at times when the impairment of such assets increases. This portion is constituted to reduce the impact on the statement of income when such a situation arises. The internal or reference models must consider and calculate this component based on available information reflecting such changes.
To calculate these components of the individual provision, the Superintendency has defined in the aforementioned reference models the matrices "A" and "B" for estimating the probability of default associated with periods of growth and economic stability, which are indicated below.
In no case may the individual counter-cyclical component of each obligation be less than zero, nor may it exceed the value of the expected loss calculated with matrix B; likewise, the sum of these two components may not exceed the value of the exposure.
To determine the methodology to be applied for the calculation of these components, the entities must evaluate on a monthly basis the indicators established by the Superintendency (related to impairment, efficiency, loan portfolio growth and the entity's financial situation), which once calculated will determine the methodology for calculating the components of the individual loan portfolio provisions.
The estimate of the expected loss or individual allowance under the reference models is determined by the following formula:
EXPECTED LOSS = [Asset exposure at default] x [Probability of default] x [Loss given default].
Consumer
EXPECTED LOSS = [Asset exposure at default] x [Probability of default] x [Loss given default] x [Loss given default] x [Forward adjustment] x [K].
Where each of the components is defined as follows:
11
- Probability of default (PI)
Corresponds to the probability that in the 12 months following the closing date of the financial statements the debtors of a given portfolio will default (in accordance with the cases described in paragraph 2.3.1 of Chapter XXXI, External Circular 100 of 1995). The probability of default is established in accordance with matrices issued by the SFC as indicated below.
- Exposure of the asset at default
Corresponds to the value exposed by the Bank to the debtor, consisting of the current balance of principal, interest, interest accounts receivable and other accounts receivable.
Adjustment for Term
It is the value of the term adjustment which is calculated as follows and is applied for the consumer portfolio. Where the Remaining term corresponds to the number of months remaining against the agreed term of the loan at the date of calculation of the expected loss. In case the agreed term or the remaining term is less than 72, AP will be equal to 1. For the Credit Card and Revolving segments, AP will be equal to 1.For loans originated, disbursed, restructured, or acquired before December 1, 2016, AP will be equal to one (1).Loans originated, disbursed, restructured, or acquired on or after December 1, 2016, should calculate the expected loss by applying the resulting allowance for loan losses (AP).
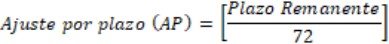
- K
This is the adjustment factor that seeks to recognize the risk associated with the increase in the leverage level of debtors with terms greater than 72 months. This factor will not be applicable to loans granted to pensioners, nor to the Credit Card and Revolving segments. This factor will be applied to loans disbursed as of January 1, 2023. The value of variable K will be assigned according to the following expression:
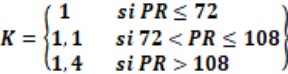
- Loss given default (PDI)
It is defined as the economic impairment that the debtor would incur in the event that any of the default situations referred to in paragraph 2.3.1 of Chapter XXXI, External Circular 100 of 1995 materializes, namely, commercial loans that are in arrears for more than 150 days, consumer loans that are in arrears for more than 90 days, mortgage loans that are in arrears for more than 180 days and small business that are in arrears for more than 30 days.
The PDI for debtors classified in the default category will gradually increase according to the number of days elapsed after classification in that category.
12
Accordingly, the application of the reference and provisioning models are made as follows:
- Commercial portfolio
Initially, the following classifications are made, and the following variables derived from the portfolio segmentation are taken into account:
Classification of the commercial portfolio by asset level | |
Company size |
Level of assets in SMMLV |
Large companies |
More than 15,000 |
Medium-sized companies |
Between 5,000 and 15,000 |
Small companies |
Less than 5,000 |
SMMLV: Minimum Monthly Legal Minimum Wage in force | |
Classification of the commercial portfolio by credit risk level | |
|---|---|
Category |
Blackberry height (days) |
Category AA |
Between 0 and 29 |
Category A |
Between 30 and 59 |
Category BB |
Between 60 and 89 |
Category B |
Between 90 and 119 |
Category CC |
Between 120 and 149 |
Noncompliance |
More than 150 |
In addition to the minimum delinquency conditions for the classification of the commercial portfolio, the Bank evaluates other risk factors every six months in May and November in order to assign a rating to each debtor. This risk evaluation is based on information related to the historical behavior of the debt, particular characteristics of the debtors, guarantees backing the obligations, credit behavior with other entities, sectoral variables, payment capacity and financial information up to one year old, among others. In the evaluation of loans to territorial entities, in addition to the aspects that apply to other debtors, the conditions established in Law 358 of 1997 and 617 of 2000 must be taken into account.
The probability of default (PI) is assigned taking into account the following matrices established by the SFC, according to the type of portfolio.
MATRIX A | ||||
|---|---|---|---|---|
Rating |
Large company |
Medium-sized company |
Small business |
Individuals |
AA |
1.53% |
1.51% |
4.18% |
5.27% |
A |
2.24% |
2.40% |
5.30% |
6.39% |
BB |
9.55% |
11.65% |
18.56% |
18.72% |
B |
12.24% |
14.64% |
22.73% |
22.00% |
CC |
19.77% |
23.09% |
32.50% |
32.21% |
Noncompliance |
100% |
100% |
100% |
100% |
MATRIX B | ||||
Rating |
Large company |
Medium-sized company |
Small business |
Individuals |
AA |
2.19% |
4.19% |
7.52% |
8.22% |
A |
3.54% |
6.32% |
8.64% |
9.41% |
BB |
14.13% |
18.49% |
20.26% |
22.36% |
B |
15.22% |
21.45% |
24.15% |
25.81% |
CC |
23.35% |
26.70% |
33.57% |
37.01% |
13
Noncompliance |
100% |
100% |
100% |
100% |
The PDI by type of guarantee is as follows:
As a prudent measure and based on the portfolio recovery experience established for clients, the Bank uses the following matrix for the SME commercial portfolio, which allows an earlier recognition of the increase in PDI, using the minimum number of days established by the Superintendency and not the maximum number of days within the range of time allowed by the Superintendency. The commercial portfolio of Corporate and Government Banking uses the PDI given by the Superintendency.
MRC | |||||
|---|---|---|---|---|---|
Code |
Warranty Type |
SEG.PDI SFC |
SEG.PDI Policy |
||
A-B-C-G-1-2-3-7-8 |
4-5-6-9-M-S |
||||
Days Noncompliance |
PDI |
Days Noncompliance |
PDI |
||
16 |
Assets leased other than real estate |
0-360 |
45% |
0 |
45% |
361-720 |
80% |
1-720 |
80% |
||
>720 |
100% |
>720 |
100% |
||
17 |
Assets leased under real estate leases |
0-540 |
35% |
0-540 |
35% |
541-1080 |
70% |
541-1080 |
70% |
||
>1080 |
100% |
>1080 |
100% |
||
6-11-1 |
Commercial and residential real estate |
0 - 540 |
40% |
0 |
40% |
541 - 1080 |
70% |
>=1- 90 |
60% |
||
>1080 |
100% |
91-210 |
80% |
||
|
>210 |
100% |
|||
A-B |
Eligible financial collateral: FNG, FAG |
0-99999 |
12% |
0-359 |
12% |
360-539 |
70% |
||||
>=540 |
100% |
||||
4-12-13 |
Sovereign nation, Letters of Credit, Deposits Guarantee |
0-99999 |
0% |
0-99999 |
0% |
9-10 |
Collection rights |
0-360 |
45% |
0 |
45% |
361-720 |
80% |
>=1- 90 |
60% |
||
>720 |
100% |
91-210 |
80% |
||
|
>210 |
100% |
|||
5 |
Ineligible collateral |
0-270 |
55% |
0 |
55% |
271-520 |
70% |
>0 |
100% |
||
>520 |
100% |
|
|||
|
No Warranty |
0-210 |
55% |
0 |
55% |
211-420 |
80% |
>0 |
100% |
||
>420 |
100% |
|
|||
2-3-7-8 |
Other collateral |
0-360 |
50% |
0 |
50% |
361-720 |
80% |
>=1- 89 |
90% |
||
>720 |
100% |
>89 |
100% |
||
Ratings of Individually analyzed client
The individual provision analysis methodology applies when a client has a significant exposure (greater than COP 20,000) and any of the following conditions:
14
| ● | The client is in default equal to or greater than 90 days. |
| ● | Clients who present at least one written-off instrument. |
| ● | Clients in special states of corporate restructuring or reorganization and insolvency law agreements. |
| ● | Clients on internal watch list with high risk level. |
For these clients, the Bank carries out an individual analysis of their risk situation and establishes the percentage of provision required under an expected loss model similar to the credit risk model under the IFRS9 framework, based on the estimation of the Net Present Value (NPV).) of the expected credit flows.
The estimated provision percentages for each client are reviewed monthly and according to the following ranges, the client's rating will be approved under the SFC standard.
The table is obtained from the average provision level of the last 12 months, taking as reference the corporate and business segments that have the greatest participation in individual VPN clients. As of December 31, 2023, the portfolio that presented an adjustment in its rating, given the previously mentioned criteria, amounts to COP 3,270,244 with a provision of COP 2,341,886
Commercial portfolio | ||
MRC Ratings |
Approved Ratings |
Corporate Business |
A |
B |
0% <6.4% |
BB |
B |
>=6.4% <7.9% |
B |
C |
>=7.9% <11.0% |
CC |
C |
>=11.0% <53.6% |
Default |
D - E |
>=53.6% |
The rating deteriorations, and therefore provisions, are based on the fact that the reference models establish minimum parameters that must be complemented with analysis of risk factors, capacity to generate future flows that, if insufficient, must be recognized in the statement of financial situation.
The client's rating will be the one with the highest risk between the one approved according to the percentage of provision of the individual analysis and the legal one assigned, in accordance with Chapter XXXI of External Circular 100 of 1995 of the Superintendency, Annex 1 “Commercial Portfolio Reference Model”
To keep the level of provision in both segments approved, the provision must be calculated during closing according to the FULL IFRS level and compared with the COLGAAP/SUPER MODIFIED provision and if the difference between both segments is a greater than $10,000 MM (for client or group) then an Additional individual provision is made.
- Consumer portfolio
15
Initially, the Bank classifies the portfolio credit, like this:
Classification of the consumer portfolio by segment | |
General - automobile |
Credits for acquisition of automobile. |
Credit cards |
Revolving credit for the acquisition of consumer goods that is used through a plastic card. |
General - others |
Credits for the acquisition of consumer goods other than automobile. Credit cards are not included in this segment. |
The rating of the consumer portfolio is carried out by credit risk category. For this purpose, the criteria for assigning the rating vary according to the segments described above and is determined by the following formula:
“Z” variable, is calculated using the following variables:
| ● | Height of arrears at the time of calculation of the provision. |
| ● | Maximum height of arrears in the last 3 years. |
| ● | Height of arrears in the last 3 quarter (quarters are March, June, September, December). |
| ● | If the customer has another consumer credit in the Bank, that has another segment of the credit that is evaluated. |
| ● | Warranty type. |
| ● | Prepaid od the credit card. |
According to the score calculated in the previous point, the rating is assigned by credit risk categories based on the following table, taking into account that the lower the score, the better the rating per risk category is obtained:
Score |
General – automobiles |
Credit card |
General – others |
|---|---|---|---|
AA |
0,2484 |
0,3735 |
0,3767 |
A |
0,6842 |
0,6703 |
0,8205 |
BB |
0,81507 |
0,9382 |
0,89 |
B |
0,94941 |
0,9902 |
0,9971 |
CC |
1 |
1 |
1 |
I |
1 |
1 |
1 |
Probability of default (PI):
It is assigned taking into account the following matrices according to the type of portfolio:
MATRIX A | |||
|---|---|---|---|
Rating |
General - automobiles |
Credit card |
General - other |
AA |
0.97% |
1.58% |
2.10% |
A |
3.12% |
5.35% |
3.88% |
BB |
7.48% |
9.53% |
12.68% |
B |
15.76% |
14.17% |
14.16% |
CC |
31.01% |
17.06% |
22.57% |
Non-compliance |
100% |
100% |
100% |
16
MATRIX B | |||
|---|---|---|---|
Rating |
General - automobiles |
Credit card |
General - other |
AA |
2.75% |
3.36% |
3.88% |
A |
4.91% |
7.13% |
5.67% |
BB |
16.53% |
18.57% |
21.72% |
B |
24.80% |
23.21% |
23.20% |
CC |
44.84% |
30.89% |
36.40% |
Non-compliance |
100% |
100% |
100% |
The Bank uses matrix B to assign the probability of default.
PDI is assigned by collateral type according to the following:
As a measure of prudence and based on the portfolio recovery experience established for the Bank's clients, the following matrix is used, which allows an earlier recognition of the increase in PDI, using the minimum number of days established by the SFC and not the maximum number of days within the time range allowed by the SFC.
MRCO | |||||
|---|---|---|---|---|---|
Code |
Warranty Type |
SEG.PDI SFC |
SEG.PDI Policy |
||
|
A-B-C-G-1-2-3-7-8-4-5-6-9-M-S |
||||
Days Noncompliance |
PDI |
Days Noncompliance |
PDI |
||
16 |
Assets leased other than real estate |
0-270 |
45% |
0 |
45% |
271-540 |
70% |
1-540 |
80% |
||
>540 |
100% |
>540 |
100% |
||
17 |
Assets leased under real estate leases |
0-360 |
35% |
0-360 |
35% |
360-720 |
70% |
361-720 |
70% |
||
>720 |
100% |
>720 |
100% |
||
6-11-1 |
Commercial and residential real estate |
0-360 |
40% |
0 |
40% |
360-720 |
70% |
>0-29 |
80% |
||
>720 |
100% |
30-89 |
90% |
||
|
>89 |
100% |
|||
A-B |
Eligible financial collateral: FNG, FAG |
0-99999 |
12% |
0-359 |
12% |
360-539 |
70% |
||||
>539 |
100% |
||||
4-12-13 |
Sovereign nation, Letters of Credit, Deposits Guarantee |
0-99999 |
0% |
0-99999 |
0% |
|
Collection rights |
0-360 |
45% |
0 |
45% |
9-10 |
361-720 |
80% |
>=1-29 |
80% |
|
|
>720 |
100% |
30-89 |
90% |
|
|
|
|
>89 |
100% |
|
5 |
Ineligible collateral |
0-210 |
60% |
0 |
75% |
211-420 |
70% |
>=1 - 89 |
90% |
||
>420 |
100% |
>=90 |
100% |
||
|
Ineligible collateral (Payroll Loans) |
<30/06/2018 <30/06/2018 |
60% 45% |
< 30/06/2018 |
60% |
>30/06/2018 |
45% |
||||
|
No warranty |
0-30 |
75% |
0 |
75% |
|
31-90 |
85% |
>=1 - 89 |
90% |
|
|
>90 |
100% |
>=90 |
100% |
|
|
Other collateral |
0-270 |
50% |
0 |
50% |
2-3-7-8 |
271-540 |
70% |
>=1-29 |
85% |
|
|
>540 |
100% |
30-89 |
90% |
|
|
|
|
>=90 |
100% |
|
17
As of July 1, 2018, a change in the PDI is made for the payroll loans in accordance with Circular 013 issued by the SFC. Additionally, in accordance with Circular 026 issued by the same entity, which is in force as from 2017, the constitution of an additional individual provision, of a temporary nature, is made to those entities whose balance sheets have reported gross consumer portfolio balances for at least the last twenty-five (25) months and whose parameter "α" is greater than zero (α > 0); ); for December 31, 2023 the balance provision generated by this parameter amounts to COP 123,088, which is estimated on a capital balance of COP 38,075,787.
For these purposes, "α" is understood as the 6-month moving average of the semiannual variation of the real annual growth rate of the past-due consumer portfolio.
- Mortgage portfolio
To constitute individual provisions for the mortgage portfolio, the following classifications are made+ and the following variables are taken into account:
Score by credit risk level | |
|---|---|
Score |
Height of arrears (month) |
“A” Normal |
Until 2 |
“B” Acceptable |
More than 2 - until 5 |
“C” Appreciable |
More than 5 - until 12 |
“D” Significant |
More than 12 - until 18 |
“E” Bad |
More than 18 |
The Bank maintains at all times provisions of not less than the percentages indicated below, calculated on the outstanding balance:
Ranking |
Capital |
Interest and other items |
|
On guaranteed portion |
Unsecured portion |
||
"A" Normal |
1% |
1% |
1% |
"B" Acceptable |
3.2% |
100% |
100% |
"C" Appreciated |
50% |
100% |
100% |
"D" Significant |
75% |
100% |
100% |
"E" Uncollectible |
100% |
100% |
100% |
- Small business portfolio
To constitute individual provisions for the small business portfolio, the following classifications are made, and the following variables are taken into account.
Score by credit risk level | |
|---|---|
Score |
Height of arrears (month) |
“A” Normal |
Until 1 month |
“B” Acceptable |
More than 1 - until 2 |
“C” Appreciable |
More than 2 - until 3 |
“D” Significant |
More than 3 y until 4 |
“E” Bad |
More than 4 |
18
The Bank must always maintain provisions of not less than the percentages indicated below, calculated on the outstanding balance:
Ranking |
Capital |
|
|
|---|---|---|---|
On guaranteed portion |
Unsecured portion |
Interest and other items |
|
"A" Normal |
1% |
1% |
1% |
"B" Acceptable |
2.20% |
3.20% |
100% |
"C" Appreciated |
60% |
60% |
100% |
"D" Significant |
100% |
100% |
100% |
"E" Uncollectible |
100% |
100% |
100% |
Homologation of qualifications
To standardize the risk ratings in the debt reports and in the recording in the financial statements with the ratings of the commercial portfolio reference model (MRC) and consumer portfolio reference model (MRCO), the following table is applied:
Grouped category |
Report category |
|
|---|---|---|
Commercial |
Consumer |
|
A |
AA |
AA |
|
A with height of arrears between 0 and 30 days |
|
B |
A |
A with more than 30 days of height of arrears |
BB |
BB |
|
C |
B |
B |
CC |
CC |
|
C |
C |
|
D |
D |
D |
E |
E |
E |
Alignment rules
When the Bank qualifies any of a debtor's credits into risk categories B, C, D or E, it takes the other credits of the same type of the same debtor to the highest risk category, unless shows to the Superintendency the existence of sufficient reasons for its classification in a lower risk category
Financial entities linked to the Bank under the terms of articles 260 to 262 of the Commercial Code, which refer to subordination and control, must give the same score that the Bank gives, unless reasons are demonstrated to the Superintendency to keep them in a lower risk category.
The Superintendency may order reclassifications of the categories assigned by financial institutions. Likewise, it may order portfolio reclassifications for an economic sector, geographic area, or for a debtor or group of debtors, whose obligations must be accumulated according to the rules of individual debt quotas.
Provisions at 100% interest and other items
19
A 100% provision for interest and other items will be made when the obligation meets the following conditions:
| ● | Bonds rated CC, C, and I (Risk Rating). |
| ● | Obligations whose causation counter is greater than 1 and whose overdue days are greater than zero. |
| ● | Obligations more than one day overdue: |
CREDIT MODE |
ARREARS IN EXCESS OF |
Commercial |
3 months |
Consumer |
2 months |
Mortgage |
2 months |
Small business |
1 month |
This provision must be constituted in any of the four portfolio classifications that are currently managed: Commercial (under MRC), Consumer (under MRCO), Small business and Mortgage (low indebtedness).
Effect of Guarantees on Provisions
For the calculation of individual provisions, guarantees back just the capital portion of the loans. In consequence, all current loans that are backed by a guarantee considered admissible and adequate must be provisioned using the following guidelines:
Commercial and Consumption
For the calculation of provisions of the commercial and Consumer loan´ books that are covered by a guarantee considered adequate, up to 100% of its value can be used to mitigate the loan portfolio´s risk. According to the guidelines of the reference models mentioned in the numerals 5.7.2.2., the bank must segregate the exposure covered by the adequate guarantee and the remaining part of the exposure, assigning the corresponding LGD to each part according to the classification of the guarantee associated to the transactions.
A guarantee is considered adequate if it complies with the following criteria:
| ● | It has a value established using technical and objective criteria. |
| ● | It offers the bank an efficient judicial support to repay the guaranteed obligation, and t gives the bank a reasonable recovery timeframe. |
Likewise, it will be considered adequate any guarantee that is designated as such by the Superintendencia Financiera de Colombia (SFC).
Mortgages
Similarly, for the calculation of provisions of the mortgages´ loan book, all guarantees considered adequate will be used up to 100% of its value to mitigate the portfolio´s risk.
20
The value of the household properties received as guarantees will be updated according to the guidelines of chapter XXXI of the Circular Externa 100 de 1995, following these conditions:
Properties located in Bogota D.C.: the bank will apply yearly readjustment values to the current value of the guarantee according to the Índice de Valoración Inmobiliaria Urbana y Rural (IVIUR) published by Bogota D.C.´s government for the tax year and corresponding residential status.
Properties located in main and intermediate cities different than Bogotá D.C.: the bank will apply yearly readjustment values to the current value of the guarantee according to the Índice de Valoración Predial (IVP) published by the Colombian National Department of Statistics (DIAN) for the corresponding city.
Properties located in places different than the ones mentioned above: the bank will apply yearly readjustment values according to the national Índice de Valoración Predial (IVP)
The value of all properties different than households received as guarantees will be set hiring a commercial appraisal that must have an issuance date less than 12 months before disbursement or through a valuation process done by experts on the subject. This value will be updated according to the guidelines of chapter XXXI of the Circular Externa 100 de 1995, following these conditions:
| ● | Properties located in Bogota D.C.: the bank will apply yearly readjustment values to the current value of the guarantee according to the Índice de Valoración Inmobiliaria Urbana y Rural (IVIUR) published by Bogota D.C.´s government for the tax year and the corresponding property´s classification. |
| ● | Properties located outside of Bogotá D.C.: the initial appraisal or valuation will have a three-year validity. Once this period ends a new commercial appraisal must be hired or a new valuation process by experts must be done. |
Small business
For the provision calculation of small business´s loan book, the bank will use the difference between the unpaid value of the debt and 70% of the value of the guarantee, applying a haircut percentage according to the definitions of Annex 2 of chapter XXXI of the Circular Externa 100 of 1995 issued by the Superintendencia Financiera de Colombia (SFC).
3.1.7 Suspension of interest accrual
Mortgage loans will cease to accrue interest when the loan is two months in arrears. For consumer and commercial loans, interest payments will cease every 3 months, and for small business loans, interest payments will cease after 1 month, in accordance with Article 2.3.1.1 of Chapter II of Circular Externa 100 of 1995 from the SFC.
The Bank has established as a policy that, for loans of any type other than mortgage or commercial constructor (which is 60 days), loans that are more than 30 days past due will cease to accrue interest in the income statement and their registration will be made in off-balance sheet control accounts, until their collection is not effectively collected. Loans that enter arrears and that have ever ceased to accrue interest, correction monetary, UVR, exchange adjustments, rents, and income from other concepts, will cease to accrue interest from the first day in arrears.
21
Before the suspension, interest is accrued in accordance with the aforementioned policies for each type of loan. At the time of suspension, interest ceases to be provisioned in balance sheet accounts and is recognized in contingent accounts. When an obligation has suspended interest, current interest accrued is provisioned at 100%.
3.1.8 Derecognition of financial assets
Financial assets are derecognized when the rights to receive cash flows from the financial assets have expired or have been transferred, and the Bank has transferred substantially all the risks and rewards of ownership, or when the Bank neither transfers nor retains substantially all of the risks and rewards of ownership but it does not retain control of the financial asset.
When the Bank retains the contractual rights to receive cash flows from the financial asset, but assumes a contractual obligation to pay those cash flows to other entities, it shall treat the transaction as a transfer that results in derecognition if:
| ● | It has no obligation to pay any amounts to the other entities unless it collects equivalent amounts from the assets. |
| ● | It is prohibited from selling or pledging the assets; and |
| ● | It has an obligation to remit without material delay any cash flows it receives from the assets. |
3.1.8.1 Modifications and restructurings
As of November 1, 2017, the Bank adopted the guidelines set forth in Circular Externa 026, as amended by Circular Externa 016 in July 2019, which sets forth the requirements for making changes to the initially agreed terms of loans. This defines two typologies: modifications and restructurings; it also establishes the requirements to be classified in one or the other according to the payment habit and financial viability. Likewise, it provides guidelines for establishing the rating in case of a possible default.
Loan Modifications
Loan modifications are changes to the contractual terms due to financial difficulties of the borrower or for other commercial reasons that give rise to the modification, allowing the customer to adequately attend to their obligation in the event of a real or potential deterioration of their payment capacity. The modification may bring about changes in all or some of the conditions of the operation, such as term, rate, amortization plan, among others.
For a customer to be subject to modification, they must meet the following:
| - | Financial viability: A comprehensive risk and payment capacity analysis must be carried out, considering all of the customer's operations. |
| - | Payment habit: According to the loan type, the maximum arrears during the last 6 months may not exceed: |
22
• For small business and consumer 60 days in arrears.
• For commercial and mortgage 90 days in arrears.
In addition, the modification policies must define at least the following:
| - | Tracking to remove marking as a modified portfolio in accordance with what is defined in Circular 026 of the SFC. |
| - | Tracking of 30 days of arrears to change the status of the loan to restructured in accordance with the definition in Circular 026 of the SFC. |
| - | Mechanism to inform the costumer of the new conditions and implications of falling into arrears. |
| - | The bodies within the entity that will analyze and make the decisions to approve the modifications, their responsibilities, and attributions. |
Monitoring of modifications:
Modified loans will enter a monitoring period, which consists of monitoring the correct payment of principal and interest in an uninterrupted manner. This period will be based on the type of loan as follows:
| - | 9 months for small business. |
| - | 12 months for consumer, commercial and mortgage. |
If during this period the modified obligation reaches a delay equal to or greater than 30 days, it will be marked as restructured.
Restructured loans
Restructured loans are an alternative for carrying out an adequate debt collection management in cases where the conditions established in Circular 026 of SFC for being modified are not met. It should be understood as an exceptional resource to regularize the behavior of the loan portfolio, instrumented through the celebration and/or execution of any legal transaction, which has the purpose of modifying the originally agreed conditions in order to allow the debtor to properly attend to their obligation in the event of a real or potential deterioration of their ability to pay. Restructured loans are carried out by modifying the contractual terms, rates, and payment terms. In all cases, at the time of restructuring, the initial obligation's guarantees are retained, at a minimum, and if possible, the Bank's position is improved by obtaining new guarantees and/or endorsements that support the obligations.
The policies for the restructuring of loans must define at least the following:
| a. | The requirements and criteria for a debtor to be eligible for restructuring, which must be in line with the entity's risk tolerance levels and business plan. |
| b. | The mechanisms that will be implemented for the identification and monitoring of restructured operations, including the risk rating of the same. |
| c. | The bodies within the entity that will analyze and make restructuring approval decisions, their responsibilities, and attributions, as well as their level of independence from the areas responsible for granting loans. |
23
| d. | The consequences of non-compliance with restructuring policies. |
| e. | The mechanisms through which the consumer will be informed of the conditions for accessing a restructuring. |
In the implementation of the restructuring, assets can be received in satisfaction of debt to cancel partial or total obligations in its favor, as well as discounts on interest or other concepts such as commissions, and if necessary on capital, to customers, either because the guarantees or sources of payment do not have coverage over the total debts or because the formula for an arrangement reached with the customer does not allow for the full recovery of the debts. In each negotiation, the client's conditions are reviewed to determine whether the commercial relationship will be maintained in the future, and if so, to define the conditions for restoring said commercial relationship after a certain period of time.
Prior to restructurings, an analysis of the client's projected payment capacity or cash flow is conducted to meet the proposed restructuring plan.
Restructurings are classified as follows:
• Private agreement
These are agreements agreed with the client, after a negotiation between the two parties, without the client having resorted to any special regime contemplated in the law.
• Agreements regulated by Law
These agreements are the result of the client resorting to an agreement under the Law of restructuring or business reorganization and insolvency (Insolvency Process).
Monitoring of restructured loans:
Restructured loans will enter a monitoring period, which consists of monitoring the correct payment of principal and interest on an uninterrupted basis. This period will depend on the type of loan as follows:
| - | 12 months for small business. |
| - | 24 months for consumer, commercial and mortgage. |
If during this period the restructured obligation reaches a default equal to or greater than 30 days for small business, 60 days for Consumer and commercial, and 90 days for mortgage, it will be classified as in default.
3.1.9 Write-off loan portfolio
Loans are written off when the Bank concludes there is no realistic expectation of recovery of the loans and receivables balances from a client or third party, i.e., there is no possibility of recovery due to the debtor's lack of ability or willingness to pay or in the absence of open guarantees granted by the debtor. In general, this characteristic will be fulfilled when the following delinquency conditions are present:
24
Consumer |
180 days |
Commercial: |
360 days |
Small Business loan: |
180 days |
Mortgage: |
N/A 1 |
Accounts receivable from bank employees: |
360 days |
| (1) | Not dependent on the length of delinquency but on the reasons underlying a loan's non-recoverability. |
Among the reasons underlying a loan's non-recoverability are the estimated recovery time of the obligation, the probable recovery percentage given the existence or lack of collateral and the inability to locate the client. When default conditions are present, it is initially necessary to evaluate whether the collateral that supports the loan generates a reasonable expectation of recovery; if so, the necessary steps are taken to realize on the collateral prior to writing-off the loan. In cases where the collateral net fair value indicates that there are no reasonable expectations of recovery, loans are written-off in the financial statements.
3.2 Financial liabilities
At initial recognition, the Bank measures its financial liabilities at fair value. The transaction costs that are directly attributable to the financial liability are deducted from its fair value if the instruments are subsequently recognized at amortized cost or will be recognized in the statement of income if the liabilities are measured at fair value.
| 3.2.1 | Classification and Measurement of Financial Liabilities |
Financial liabilities are classified and subsequently measured as follows:
| ● | Amortized cost, measured at cost using the effective interest rate method. |
| ● | Fair value through profit or loss (“FVTPL”), measured using fair value, with variations in value recognized in the income statement. |
Irrevocably designated at fair value through profit or loss, measured using fair value, with variations in value recognized in the income statement. The effect of changes in own credit risk is presented in other comprehensive income.
| 3.2.2 | Derecognition of Financial Liabilities |
The Bank derecognizes a financial liability from the statement of financial position when it is extinguished; that is, when the contractual obligation has been paid or settled or has expired.
Debt Exchange
The Bank assesses whether instruments subject to debt exchange are substantially different from each other, considering qualitative aspects such as currencies, maturities, interest rates, subordination terms, regulatory framework, among others, and quantitative aspects, in which the present value of discounted cash flows under the conditions of the new instruments (including any net commission paid minus any commission received) using the original effective interest rate to calculate the discount differs by at least 10 percent from the present value of discounted cash flows remaining from the original financial liability.
25
When it is concluded that the instruments subject to debt exchange are not substantially different (based on the analysis of qualitative variables such as currency or issuance market changes, and in some cases a quantitative evaluation), the transaction is recognized as a modification of debt, and in this case, the amortized cost of the modified liability is adjusted to the present value of estimated contractual cash flows discounted at the original effective interest rate of the financial instrument, and the gain or loss is recognized immediately in the income statement. Incremental costs and commissions adjust the carrying amount of the liability and are amortized over the remaining life of the modified liability, following its subsequent measurement at amortized cost. In debt exchanges that are considered substantially different, derecognition is recognized in the income statement, and a new financial liability is recognized.
| 3.3 | Day one profit adjustment |
In situations where the fair value of a financial asset acquired or financial liability assumed at initial recognition differs from the transaction price, the Bank shall recognize a gain or loss directly in the statement of income if the fair value is supported by Level 1 inputs or is based on a valuation technique that uses only observable market data. In all other circumstances, the Bank defers the Day one gain or loss and recognizes it in the statement of income over the course of the transaction period.
| 3.4 | Compound instruments |
The Bank recognizes compound financial instruments that contain both liability and equity components separately. Therefore, for initial measurement, the liability component is the fair value of a similar liability which doesn´t have an equity component (determined by discounting future cash flows using the market rate at the date of the issuance). The difference between the fair value of the liability component and the fair value of the compound financial instrument, considered as a whole, is the residual value assigned to the equity component. After initial recognition, the liability component of a compound financial instrument is measured at amortized cost using the effective interest method. The equity component of a compound financial instrument is not re-measured subsequent to initial recognition. The liability component corresponds to the preferred dividend related to 1% of the subscription price, which is the payment of the minimum dividend on the preferred shares for each period.
| 3.5 | Financial guarantee contracts and loan commitments |
The Bank issues financial guarantees and loan commitments. Loan commitments are those agreements under which the Bank has an irrevocable obligation to grant the loan. The financial guarantee contracts issued by the Bank are contracts that require the issuer to make specified payments to reimburse the holder for a loss it incurs because a specified debtor fails to make payment when due to accordance with the original or modified terms of a debt instrument.
Both financial guarantee contracts and loan commitments are initially recognized as liabilities at fair value, which is normally the fee received, adjusted for the directly attributable transaction costs incurred. Subsequently, liabilities are measured at the higher of the provision amount measured according to IFRS 9, and the amount initially recognized, less the accumulated amortization recognized according to IFRS 15 Revenue from contracts with customers.
26
Income derived from guarantees is recognized as “commission income” in the statement of income over the term of the contract, in accordance with the method and frequency of commission’s payments.
| 3.6 | Derivatives financial instruments |
A financial derivative is an instrument whose value changes in response to changes in a variable or index, such as an interest rate, exchange rate, the price of a financial instrument, a credit rating or a credit index. This instrument requires no initial payment or is lower in comparison to other financial instruments with a similar response to changes in market conditions and is generally settled at a future date.
The Bank recognizes its derivative financial instruments at fair value, based on the prices and valuation methodologies provided by the official pricing service provider (Precia); this includes counterparty credit-risk adjustments applied to derivatives when the Bank's position is a derivative asset, and the Bank's credit risk when the position is a liability on a derivative. For further information, see Note 29. Fair value of assets and liabilities, section d. Credit valuation adjustment.
Derivatives are recognized and measured at fair value through profit or loss unless such derivatives are designated as cash flow hedges or hedges of a net investment in a foreign operation. In those cases, the effective portion of changes in the fair value of the derivatives are recognized in other comprehensive income. All derivatives are carried as assets when fair value is positive and as liabilities when fair value is negative. Gains and losses arising from changes in the fair value of derivatives, which are not in hedging relationships, are recognized in the statement of income under the "valuation on financial instruments" item, and gains and losses from the valuation of foreign exchange derivatives are included in the "Other Operating Income" item.
| 3.7 | Hedge accounting |
The Bank designates and documents hedge accounting at inception in accordance with the requirements of IFRS 9 Financial Instruments. When the hedging relationship is considered to be highly effective, the changes in value of the hedging derivative are accounted for according to their classification, as fair value hedges, cash flow hedges and hedges of net investment in foreign operations, as set out in the paragraph below.
The Bank assesses at the inception of the hedge and on a monthly basis during the life of the instrument, whether the hedge used in the transaction is expected to be aligned with the hedge effectiveness requirement (prospective effectiveness):
| ● | Economic relationship between the hedging instrument and the hedged item. |
| ● | The effect of credit risk does not predominate over the value of the economic relationship. |
| ● | Designated hedge ratio is consistent with risk management strategy. |
The Bank discontinues the hedge accounting when the hedging relationship no longer meets the criteria provided for hedge effectiveness or when the hedging instrument expires or is sold, terminated or exercised.
Consequently, the item no longer complies with the hedge accounting conditions or the hedging relationship no longer complies with the risk management objective.
27
Before the establishment of hedge accounting, the Bank documents the relationship between hedged items and hedging instruments, as well as its risk management objectives and hedging strategies, which are approved by the Risk Management Committee as the body designated by the Board of Directors.
Hedge relationships are classified and accounted for in the following ways:
Fair value hedges
Fair value hedges are designated to protect against the exposure to changes in the fair value of recognized assets or liabilities or unrecognized firm commitments.
Changes in the fair value of derivatives that are designated and qualify as hedging instruments in fair value hedges are recognized in the statement of income as interest and valuation on financial instruments. The change in fair value of the hedged item attributable to the hedged risk is included as part of the carrying value of the hedged item, and it is also recognized in the aforementioned item of the statement of income.
For fair value hedges that are related to items accounted for at amortized cost, the adjustments to the carrying value are amortized through the statement of income during the remaining term until their expiry. The amortization of the effective interest rate shall begin as long as there is an adjustment to the carrying value of the hedged item and shall begin no later than when the hedged item ceases to be adjusted for changes in its fair value attributable to the risk being hedged.
If the hedged item is derecognized, the non-amortized fair value is recognized immediately in the statement of income.
For the items hedged at amortized cost, the difference between the carrying value of the item hedged at the termination of the hedge and the nominal value are amortized using the effective rate method during the time beyond the original terms of the hedge.
When an unrecognized firm commitment is designated as a hedged item, the subsequent cumulative change in the fair value of the firm commitment attributable to the hedged risk is recognized as an asset or liability with corresponding gain or loss recognized in net income.
Cash flow hedges
Cash flows hedges are used mainly to manage the exposure to variability related to the cash flow attributable to a specific risk associated with an asset or liability recognized on the statement of financial position or to a highly probable forecast transaction.
The portion of the gain or loss on the hedging instrument that is determined to be an effective hedge is recognized in other comprehensive income. The ineffective portion of the gain or loss on the hedging instrument is recognized in the statement of income.
If the hedging instrument expires or is sold, terminated or exercised, without replacement or rollover into another hedging instrument, or if the hedging designation no longer meets the criteria provided for the hedge effectiveness requirements after any subsequent rebalancing adjustment, any accumulated gain or loss previously recognized in OCI remains in OCI, until the planned operation or the firm commitment affects the result.
28
When a forecasted transaction is no longer expected to occur, the gain or loss accumulated in equity is recognized immediately in net income.
Hedges of a net investment in a foreign operation
In accordance with IFRS 9 and IFRIC 16 Hedges of a net investment in a foreign operation, the Bank has decided to apply the hedge accounting of the foreign currency risk arising from currency translation of financial statements and goodwill of its net investment in Banistmo, designating as a hedging instrument of certain debt securities issued by the Parent Company and financial liabilities. The hedge accounting requires that the Bank accounts for the gain or loss derived from the foreign exchange differences related to the debt securities that are determined to be an effective hedge is recognized in other comprehensive income, as is the currency translation adjustment of the Banistmo operation into the presentation currency as required by IAS 21 Effects of changes in foreign exchange rates as detailed in 2. Transactions and balances in foreign currency.
| 4 | Investments in subsidiaries |
A subsidiary is an entity in which the Bank holds rights that give it the ability to direct the relevant activities, provided that it meets the following elements:
| - | Power over the investee that gives it the present ability to direct the relevant activities that significantly affect its performance. |
| - | Exposure or right to variable returns arising from its involvement in the investee. |
| - | Ability to use its power over the investee to influence the amounts of returns of the investor. |
Investments in subsidiaries must be valued in such a way that in the books of the Bank they are recognized by the equity method, in accordance with the SFC regulations according to Circular Externa 034 of December 9, 2014.
Under the equity method, the investment is initially recorded at cost, and is adjusted with the changes in the Bank's participation in the net assets of the subsidiary after the acquisition date, less any loss in value of the investment. When there are indications of impairment, the carrying amount of the investment will be evaluated in accordance with IAS 36 Impairment of Assets, as a single asset. Impairment losses are recognized in results when the carrying amount exceeds the recoverable amount, determined as the greater of the fair value less costs to sell and the value in use of the subsidiary.
Cash dividends received from the subsidiary are recognized by reducing the carrying amount of the investment.
| 4.1 | Investments in associates and joint ventures |
An associate is an entity over which the Bank has significant influence. Significant influence is the power to participate in the financial and operating policy decisions of the investee but does not have control or joint control to make those policies decisions.
A joint venture is an entity that the Bank controls jointly with other participants, where the parties maintain a contractual agreement that establishes joint control over the relevant activities of the entity (which only exists when decisions about those activities require unanimous consent of the parties sharing control) and the parties have rights to the net assets of the joint arrangement.
29
The Bank's investments in associates and joint ventures are initially recorded at cost and their results, assets and liabilities are subsequently included in the financial statements using the equity method, except when the investment, or a portion thereof, is classified as held for sale, in which case it is accounted for in accordance with IFRS 5 Non-current assets held for sale and discontinued operations.
When an investment in an associate or joint venture is held by, or is held indirectly through, an entity that is a venture capital organization, or a mutual fund, unit trust or similar entities, and such investment is measured at fair value through profit or loss in that entity, the Bank may elect to measure investments in those associates and joint ventures at fair value through profit or loss in the financial statements. This election is applied on an investment-by-investment basis.
At the acquisition date, the excess of the acquisition cost of the associate or joint venture shares exceeding the Bank´s share of the net fair value of identifiable assets and liabilities of the investee is recognized as goodwill and is included in the carrying amount of the investment and it is not amortized. Any excess of the Bank’s share of the net fair value of the investee’s identifiable assets and liabilities over the cost of the investment is included as income in the determination of the Bank’s share of the associate or joint venture’s profit or loss in the period in which the investment is acquired. When necessary, the entire carrying amount of the investment (including goodwill) is tested for impairment in accordance with IAS 36 Impairment of assets. Impairment losses are recognized in accordance with the policy for impairment of assets, cash-generating units and goodwill (see section 11. Impairment of assets, cash-generating units and goodwill, of this note).
If the Bank's share of losses of an associate or joint venture exceeds the Bank's interest in that associate or joint venture (which includes any long-term interests that, in substance, form part of the Bank's net investment in the associate or joint venture), the Bank discontinues recognition its share of further losses. Additional, losses are recognized only to the extent that the Bank has incurred legal or constructive obligations or made payments on behalf of the associate or joint venture.
When the equity method is applicable, adjustments are considered in order to adopt uniform accounting policies of the associate or joint venture with the Bank. The portion that corresponds to the Bank for changes in the investee´s other comprehensive income items is recognized in the statement of comprehensive income as “Unrealized gain/loss on investments in associates and joint ventures using equity method” and gains or losses of the associate or joint venture are recognized in the statement of income as “Dividends and net income on equity investments”, in accordance with the Bank's participation. Gains and losses resulting from transactions between the Bank and its associate or joint venture are recognized in the Bank´s financial statements only to the extent of the unrelated investor´s interest in the associate or joint venture. The equity method is applied from the acquisition date until the significant influence or joint control over the entity is lost. When the significant influence on the associate or the joint venture is lost, the Bank measures and recognizes any residual investment that remains at its fair value. The difference between the associate or joint venture carrying value (taking into account the relevant items of other comprehensive income), the fair value of the retained residual investment and any proceeds from disposing of a partial interest in the associate or joint venture, is recognized in the statement of income. The currency translation adjustments recognized in equity are reclassified to net income at the moment of disposal.
30
The unrealized gain or loss of an associate or joint venture is presented in the statement of comprehensive income, net of tax. Changes in the investment´s participation that arise from changes in other comprehensive income of an associate or joint venture are recognized directly in the investor’s statement of comprehensive income.
The dividends received from the associate or joint venture reduce the investment carrying value.
For further information, please see Note 8. Investments in associates and joint ventures.
4.2 Joint operations
A joint operation is a joint arrangement whereby the parties that have joint control of the arrangement have rights to the assets, and obligations for the liabilities, relating to the arrangement.
The Bank recognizes and measures assets, liabilities, revenues, and expenses in relation to its interest in joint operations in accordance with the applicable IFRS for the particular assets, liabilities, revenues and expenses.
When the Bank acquires an interest in a joint operation in which the activity constitutes a business, as defined in IFRS 3, or when an existing business is contributed to the joint operation on its formation by one of the parties that participate in the joint operation, the Bank will apply all of the principles of IFRS 3. In this case, the Bank recognizes goodwill in the event that consideration transferred exceeds the net of the acquisition date amounts of the identifiable assets acquired and the liabilities assumed.
When the Bank transacts with a joint operation in which the Parent Company or its subsidiaries is a joint operator (such as a sale or contribution of assets), the Bank is considered to be conducting the transaction with the other parties to the joint operation, and gains and losses resulting from the transactions are recognized in the Bank’s financial statements only to the extent of other parties’ interests in the joint operation
| 5 | Leases |
| 5.1 | The Bank as lessee |
The Bank assesses whether a contract is or contains a lease at the inception of the contract and recognizes a right-of-use asset representing its right to use the leased asset and a lease liability representing its obligation to make lease payments. The Bank elected to apply the recognition exemptions for short-term leases (leases of 12 months or less and without a purchase option) and leases where the underlying asset is of low value. Lease payments related to these exemptions will be recognized as an expense in profit or loss on a straight-line basis over the term of the lease.
Both the right-of-use asset and the lease liability are measured at the present value of the lease payments that have not been paid at that date. Lease payments are discounted using the lessee’s incremental borrowing rate. In addition, the right-of-use asset includes: 1) the amount of the initial measurement of the lease liability, 2) lease payments or costs incurred by the lessee made before or after the commencement date, less lease incentives received, and 3) an estimate of the costs to be incurred to dismantle the underlying asset, restore the site on which it is located or restore the underlying asset to the condition required by the lease.
31
Subsequently, the Bank measures the right-of-use asset at cost less any accumulated depreciation and any accumulated impairment losses and adjusted for any remeasurement of the lease liability. The Bank measures the lease liability by increasing the carrying amount to reflect interest on the lease liability, reducing the carrying amount to reflect the lease payments made, and remeasuring the carrying amount to reflect any new expectation or lease modifications. Each lease payment has been allocated between the liability and interest expenses. The accrued interest on the lease liability for each period over the lease term will be the amount that produces a constant periodic rate of interest (incremental borrowing rate) on the remaining balance of the liability.
| 5.2 | The Bank as lessor |
The lease agreements entered into by the Bank are classified at the initial recognition as financial or operating leases.
A lease is classified as a finance lease when substantially all the risks and rewards incidental to ownership of the asset are transferred to the lessee and are recognized at a value equal to the net investment in the lease, corresponding to the sum of the minimum lease payments receivable and any unguaranteed residual value, discounted at the interest rate implicit in the lease. Otherwise, it is classified as an operating lease, recognizing and measuring the assets under the principles of property and equipment or investment property, in which case income and depreciation of property and equipment are recognized on a straight-line basis over the life of the asset. Contingent lease payments are recognized as revenue in the period in which they are received.
If during the lease term, the lessor and the lessee decide to modify the initial conditions, and the agreed changes result in a different classification, then the modified agreement will be considered a new lease with new clauses that will lead to the classification of a financial or operating lease, as appropriate.
The Bank uses the following indicia of transfer of risk and rewards incidental to ownership to the asset; if one of them is met, lease is classified as a finance lease:
| - | The agreement indicates that the lessee has the option to purchase the asset at a price that is expected to be equal to or less than 10% of the fair value of the asset, upon termination of the lease. |
| - | The term of the lease covers most of the economic life of the asset, even when the lease does not transfer the ownership of the underlying asset to the lessee at the end of the lease term, i.e., when the minimum lease term represents 75% or more of the economic life of the leased asset. |
| - | At the inception of the lease, the present value of the minimum lease payments amounts to at least 90% of the fair value of the leased asset. |
| - | The leased assets are of such a specialized nature that only the lessee has the possibility of using them without making significant modifications. |
| 6 | Premises and equipment and depreciation |
Premises and equipment include tangible items that are held for use, for rental to others, or for administrative purposes and are expected to be used for more than one period.
Items of premises and equipment are expressed at cost less accumulated depreciation and impairment losses. Depreciation is calculated using the straight-line method, in order to derecognize the depreciable amount of premises and equipment over the estimated useful lives of the assets.
32
The depreciable amount is the cost of an asset less its residual value. The estimated useful lives for each asset are:
Asset Bank |
Useful life range |
Buildings |
10 to 75 years |
Furniture and fixtures |
3 to 20 years |
Computer equipment |
3 to 20 years |
Equipment and machinery |
2 to 40 years |
Vehicles |
3 to 10 years |
The asset’s residual values and useful lives are reviewed, and adjusted if appropriate, at the end of each reporting period. When there is a significant change, the depreciation and the charge to the statement of income are adjusted based on the new estimation.
The Bank assesses at the end of each year whether there is any indication of external or internal reduction in the asset’s recoverable value. If there is any indication of impairment, the Bank estimates the recoverable amount of the assets and then recognizes the impairment loss in the statement of income. For further information, see section 11. Impairment of non-financial assets, cash-generating units and goodwill in this note.
Maintenance expenses of the premises and equipment are recognized as an expense in the period in which they are incurred and are registered in the statement of income as “Other administrative and general expenses”.
Gains and losses in sales of premises and equipment are registered in the statement of income as “Other operating income”.
7. Investment properties
The investment properties are measured initially at cost, including the transaction costs. The carrying value includes the cost of replacement or substitution of a part of an investment property at the time the cost is incurred, if the cost meets the recognition criteria; and it excludes the daily maintenance costs of the investment property which are included in the statement of income as “Other administrative and general expenses”.
After the initial recognition, the investment properties are measured at fair value which reflects the market conditions at the statement of financial position date and are valued by Management with the support of external experts using valuation techniques based on comparable prices, direct capitalization, discounted cash flows and replacement cost. The gains and losses that arise from changes in the fair values of investment properties are included in the statement of income as “Other operating income”.
Transfers of an asset to or from the investment properties are only made when there is a change in its use. For a transfer from an investment property to premises and equipment, the cost taken into account for its subsequent accounting is the fair value at the time of the change in use. If a premise and equipment become an investment property, it will be accounted for at its fair value.
| 8. | Intangible assets |
Intangible assets are identifiable, non-monetary assets without physical appearance, separately acquired or internally generated by the Bank that are measured initially at cost and subsequently at cost less any accumulated amortization and any accumulated impairment loss.
33
Intangible assets acquired in business combinations are recognized at fair value at the date of acquisition.
Intangible assets with finite useful lives (ranging from 1 to 10 years) are amortized using the straight-line method over their estimated useful lives and assessed at the end of the period for impairment. The amortization period and the amortization method for intangible assets with a finite useful life are reviewed at least annually. The expected changes in the useful life or in the pattern of consumption of the future economic benefits of the asset are recognized when the amortization period or method has changed, as appropriate, and they are treated as changes in the accounting estimates. The amortization expense of intangible assets with finite useful lives is recognized in the statement of income.
The Bank’s intangible assets comprise mainly intangibles of finite useful life, such as licenses, software and computer applications, customer relationships and trademarks (See Note 9. Goodwill and intangible assets, net). Intangibles of indefinite useful life include Goodwill.
When intangible assets with finite useful life are written-off, the expected future economic benefits period is reduced to increase the amount of amortization, resulting in the derecognition of the intangible asset in a shorter period than initially estimated.
Intangible assets with indefinite useful lives are not subject to amortization but are periodically tested to identify any impairment, either individually or at the cash-generating unit level. The assessment of the indefinite life is reviewed annually to determine if it continues being supportable. In the event that the assessment was not valid, the change from indefinite useful life to finite useful life is recognized prospectively. Intangible assets with an indefinite useful life correspond to goodwill.
Internally generated intangible assets
The costs of internally generated intangible assets are recognized as intangible assets if they have been incurred in the development stage and meet the recognition criteria; if so, such assets are presented in the statement of financial position at cost less accumulated amortization and accumulated impairment losses (see section 11. Impairment of non-financial assets, cash-generating units and goodwill in this note). Other expenditures are recorded as expenses in the statement of income.
Amortization of the asset begins when development is complete and the asset is available for use. Intangible assets are amortized using the straight-line method over their estimated useful lives and assessed at the end of the period for impairment.
| 9. | Inventories |
Inventories of assets or returned property are those assets arising from an early termination of a finance or operating lease or those on which the lease has been terminated, and they are expected to be sold in the normal course of business, which are controlled by the Bank and are expected to obtain future economic benefit.
The inventory of returned property is recognized as an asset from the date on which the Bank assumes the risks and benefits thereof. Assets arising from operating leases are initially measured at cost, which is the carrying amount less accumulated depreciation and impairment, if any. Assets returned property financial leasing operations are recognized at the lower of their book value plus sanitation costs and its net realizable value. When the book value is greater than the net realizable value, an adjustment is recognized under the caption "Provision for impairment of loan portfolio and financial leasing operations, net" in the income statement.
34
Inventories are measured at the lower of cost and net realizable value. Net realizable value ("NRV") is the estimated selling price in the normal course of business, less the estimated costs necessary to make the sale. The cost of inventories is assigned by using specific identification of their individual costs.
The Bank revises the NRV of its inventories at least annually, or when market conditions so require; the adjustment of the decrease in value is recognized directly in income. Adjustments to the NRV are recognized under the caption "Amortization, depreciation and impairment" in the statement of income, up to the value initially recognized.
Inventory Provision
With the issuance of Circular Externa 036 of December 12, 2014, preparers of financial information subject to the supervision of the SFC must provide for goods received in satisfaction of debt or returned from financial lease contracts, regardless of their accounting classification, in accordance with the instructions established in Chapter III of the CBCF.
To determine the provisions in accordance with Circular Externa 036 of 2014 for assets from financial lease operations, the Bank has established certain parameters according to the asset class:
| - | Real estate: A provision is established with a charge to results in monthly installments in the first year of receipt of the asset, an amount equivalent to 40% of its value of receipt, which must be increased in monthly installments within the second year by an additional 40% to reach 80% of the acquisition cost of the asset. The remaining 20% will be provided for in the following year. |
| - | Vehicles: A provision is established with a charge to results in monthly installments in the first year of receipt of the asset, an amount equivalent to 35% of its value of receipt, which must be increased in monthly installments within the second year by an additional 35% to reach 70% of the acquisition cost of the asset. The remaining 30% will be provided for in the following year. |
| - | Movable assets: By Bank policy, all movable assets, machinery and computer equipment are provided for 100% at the time of receipt of the asset. |
| - | Trust rights: Trust rights whose underlying assets are marketable real estate, a provision is established with a charge to results in monthly installments in the first year of receipt of the asset, an amount equivalent to 40% of its value of receipt, which must be increased in monthly installments within the second year by an additional 40% to reach 80% of the acquisition cost of the asset. The remaining 20% will be provided for in the following year. |
Inventories that enter with restrictions on commercialization, regardless of their classification, are provided for 100%.
| 10. | Assets held for sale and discontinued operations. |
The Bank classifies non-current assets or disposal groups held for sale if their carrying value will be recovered through a sale transaction, rather than through continuing use. These assets are measured at the lower of their carrying value and their fair value less costs to sell and they are not depreciated nor amortized from the date of their classification. Additionally, if any indications of impairment exist, impairment losses are recognized for the difference between the carrying and the fair value less costs to sell as “Impairment, depreciation and amortization” in the statement of income.
35
The held for sale condition is met if the assets or groups of assets are available, in their current condition, for immediate sale or the sale transaction is highly probable and is expected to be completed within the year following the date of classification. In the Bank, the assets held under this classification correspond to foreclosed assets. If the sale of the asset does not take place within the planned period, the assets are reclassified to "Other assets, net" in the statement of financial position.
A discontinued operation is a component of an entity that has been disposed of, or is classified as held for sale, and represents a separate major line of business or a geographical area of operations, is part of a single coordinated and individual plan to dispose of a separate major line of business or geographical area of operations, or is a subsidiary acquired exclusively with a view to resale. The results of a discontinued operation are presented separately from those of continuing operations in the statement of income on a comparative basis.
| 11. | Impairment of non-financial assets and cash-generating units and goodwill |
The Bank evaluates at the end of each period whether there is any indication that on a stand-alone basis non-financial assets and cash-generating units are impaired. If some indication of impairment does exist, the Bank estimates the recoverable amount of the assets and the loss by impairment, the impairment loss is recognized for the amount by which the carrying amount of the cash generating unit exceeds its recoverable amount. Regardless of whether impairment indicators exist, impairment of goodwill is assessed annually, or more frequently if events or changes in circumstances indicate that it may be impaired.
The recoverable amount of non-financial assets or cash-generating units is the higher of its fair value less costs of disposal and its value in use, where fair value is determined by Management by reference to market value, if available, by pricing models, or with the assistance of a valuation specialist. While value in use requires Management to make assumptions and use estimates to forecast cash flow for periods that are beyond the normal requirements of management reporting; and assess the appropriate discount rate and growth rate.
If an asset does not generate cash flows that are independent from the rest of the assets or group of assets, the recoverable amount is determined by the cash-generating unit to which the asset belongs.
The amount of impairment losses recognized in net income during the period are included in the statement of income as “Impairment, depreciation and amortization”. Except for impairment loss recognized for goodwill, impairment losses are subject to reversal, the increased carrying amount of an asset other than goodwill attributable to a reversal of an impairment loss shall not exceed the carrying amount that would have been determined (net of amortization or depreciation) had no impairment loss been recognized for the asset in prior years.
| 12. | Other assets |
The Bank presents as other assets, among other things, (a) the expenses paid in advance incurred in the development of its business, in order to receive future services, which are amortized during the period in which services are received or the costs or expenses are recorded and (b) foreclosed assets that do not comply with the requirements to be recognized as assets held for sale and where there are no plans to use them in the supply of services or for administrative purposes.
36
Foreclosed assets are initially recognized at the lower of net amount of the charged-off financial assets to which the foreclosed assets relate and net realizable value of the foreclosed asset (the net realizable value will be the estimated selling price of the asset or its awarding value, less the estimated costs necessary to carry out its sale), pending obtaining a plan for its commercialization. If net amount of the charged-off financial assets is greater than net realizable value of the foreclosed asset, an adjustment for impairment of credit risk of the financial asset is recorded in the results for the period.
There is evidence of impairment when these group of assets remain in the statement of financial position for a period of time exceeding one year from the reception date, without buyer having been found, despite the Bank’s ongoing efforts to sell them (even adjusting the selling price).
Foreclosed assets are subsequently assessed to determine whether an impairment lost must be recognized. In the case of events that arise that are beyond the control of the Bank and that make remote the realization of these assets, they are identified as "non-tradable”, and a complete impairment is carried out.
Provision of other assets
With the issuance of External Circular 036 of December 12, 2014, preparers of financial information subject to the supervision of the SFC must provision for assets received in payment or returned, regardless of their accounting classification, in accordance with the instructions established in chapter III of the CBCF. To determine provisions, the Bank has established certain parameters depending on the asset class: Real estate: A provision is made against results in monthly rates in the first year of receipt of the property, a provision equivalent to 40% of its reception value, which must be increased in monthly rates within the second year by an additional 40%. until reaching 80% of the acquisition cost of the good received in payment. The remaining 20% will be provisioned in the following year. Vehicles: A provision is made against results in monthly rates in the first year of receipt of the good, a provision equivalent to 35% of its reception value, which must be increased in monthly rates within the second year by an additional 35% up to reach 70% of the acquisition cost of the good. The remaining 30% will be provisioned in the following year. Personal property: By Bank policy, all personal property, machinery, computer equipment and rights in trusts that do not contain real estate are 100% provisioned at the time of receipt of the property. Rights in trusts: Rights in trusts whose underlying assets are marketable real estate, a provision is constituted charged to results in monthly aliquots in the first year of receipt of the asset, a provision equivalent to 40% of its reception value, which must be increased in monthly aliquots within the second year by an additional 40% until reaching 80% of the acquisition cost of the good. The remaining 20% will be provisioned in the following year Assets that enter with marketing restrictions, regardless of their classification, are provisioned at 100%.
| 13. | Derecognition of non-financial assets |
The Bank's non-financial assets are derecognized either on disposal or when they are permanently withdrawn from use and no future economic benefits are expected. The difference between the value obtained on disposal and the carrying amount is recognized in the statement of income.
37
| 14. | Employee benefits |
13.1 Short term benefits
The Bank grants to its employees short-term benefits such as bonuses based on added value to clients and the Bank’s results, salaries, accrued performance costs and social security that are expected to be wholly settled within 12 months. Expenses related to these benefits are recognized over the period in which the employees provide the services to which the payments relate. For further information, see Note 20. Employee benefit plans.
13.2 Other long-term employee benefits
The Bank grants to its employees seniority bonuses as long-term employee benefits whose payment is not expected within the 12 months following the end of the annual period in which the employees have rendered their services. The cost of long-term employee benefits is allocated across the period from the time the employee was hired by the Bank and the expected date of obtaining the benefit. These benefits are projected up to the date of payment and are discounted through the projected unit credit method.
13.3 Pensions and other post-employment benefits
The Bank makes monthly contributions to pension funds, due to legal requirements and it has no legal obligation to pay further contributions.
The Bank recognizes contributions in the statement of income once the contribution is accrued. Any contributions unpaid at the statement of financial position date are included as a liability.
These are post-employment benefit plans in which the Bank has the legal or constructive obligation to take responsibility for the payments of benefits that have been agreed, for example, severance obligation, retirement pension premium plan and senior management pension plan premium and pension plan. The Bank makes an actuarial valuation based on the projected unit credit method and a risk-free rate which reflects current market assessments of the time value of money in each country (interest rate of treasury bonds [“TES”], representative of the nation's public debt), related to the characteristics and the benefit flows weighted average, to discount such obligation.
| 15. | Provisions, contingent liabilities and contingent assets |
Provisions
Provisions are recognized when the Bank has a present obligation (legal or constructive) as a result of a past event, where it is probable that an outflow of resources embodying economic benefits will be required to settle the obligation, and a reliable estimate of the obligation's value can be made.
Provisions are determined by management's best estimate of the disbursements required to settle the present obligation and are discounted using the risk-free rate (TES) (national risk securities issued by the Ministry of Finance and Public Credit).
38
The corresponding expense for any provision is presented in the statement of income, net of all expected reimbursement. The increase in the provision due to the time value of money is recognized as a financial expense.
The amounts recognized in the statement of financial position, correspond mainly to:
| I. | Judicial proceedings |
Judicial provisions refer to pending legal proceedings on employment matters, ordinary lawsuits, class actions suit, civil actions within criminal prosecutions and executive proceedings against the Bank.
| II. | Onerous contracts |
For the Bank, an onerous contract is a contract in which the unavoidable costs of meeting the obligations under the contract exceeds the economic benefits expected to be received under it.
| III. | Loan commitments |
In order to meet the needs of its customers, the Bank issues loan commitments, letters of credit and bank guarantees. Loan commitments are those approved irrevocable loans, in which, despite having acquired a commitment to grant them, due to the contract or agreement or for any other reason they are still pending disbursement.
| IV. | Financial guarantees |
The Bank issues bank guarantees on behalf of its customers. A bank guarantee represents an irrevocable commitment pursuant to which the Bank will cover, up to the maximum amount guaranteed, a breach of the client's contractual obligations to third parties for a certain period of time. These are commitments issued by the Bank to guarantee the performance of a customer to a third party and are mainly issued to guarantee agreements established between parties from the energy sector, hydrocarbons sector, private sector and public procurement contracts. The Bank expects most of those guarantees provided to expire before they are used.
The events or circumstances that would require the Bank to perform under a guarantee are determined by the type of guarantee, as outlined below:
Guarantees for the energy sector
The Bank is responsible before the guarantee’s beneficiary in the following situations:
| ● | Lack of energy supply due to low availability from the generating company (the guaranteed entity). |
| ● | Non-compliance with the contract signed by the guaranteed entity. |
| ● | Non-compliance with the payment for energy supply. |
| ● | Non-compliance with the construction and operating of power plants. |
| ● | Non-compliance with the construction and operating of transmission lines. |
Guarantees for the hydrocarbons sector
The Bank is responsible before the guarantee’s beneficiary in the following situations:
| ● | Non-compliance with the contractual obligations in the Minimum Exploration Program. |
| ● | Non-compliance with the contractual obligations in the Additional Exploratory Program. |
39
| ● | Non-compliance with the contractual obligations in the Post Exploratory Program. |
| ● | Non-compliance with the Technical Evaluation obligations. |
Guarantees for public procurement
The Bank must pay a state entity up to the amount guaranteed for the breach by the contractor of the contractual or legal obligations agreed.
Commitment issued by the Bank to guarantee the performance of a customer from the private sector
The Bank must pay the third party if there is any breach of what has been agreed upon or due to the economic insolvency of the client.
Contingent liabilities
Possible obligations that arise from past events and whose existence will be confirmed only by the occurrence or non-occurrence of one or more uncertain future events, not wholly within the control of the Bank, or present obligations that arise from past events but are not recognized because it is not probable that an outflow of resources embodying economic benefits will be required to settle the obligations or the amount of the obligations cannot be measured with sufficient reliability, are not recognized in the statement of financial position, but instead are disclosed as contingent liabilities, unless the possibility of an outflow of resources embodying economic benefits is remote, in which case no disclosure is required.
Contingent assets
Possible assets that arise from past events whose existence will be confirmed only by the occurrence or non-occurrence of one or more uncertain future events, not wholly within the control of the Bank, are not recognized in the statement of financial position; instead, these are disclosed as contingent assets where an inflow of economic benefits is probable. When the realization of income is virtually certain, then the related asset is not a contingent asset, and its recognition is appropriate.
| 16. | Revenue recognition |
The Bank recognizes revenue from ordinary activities, which represent the transfer of goods or services committed with customers in exchange for an amount that reflects the consideration to which the entity expects to be entitled. For performance obligations where none of the conditions for revenue recognition over time are met, the Bank satisfies the performance obligation at a point in time, at which the customer obtains control of the promised services.
Revenue is measured based on the consideration specified in the contract with the customer, and excludes amounts received on behalf of third parties when the Bank is an agent. The Bank recognizes revenue when it transfers control over a good or service to a customer. Revenue is presented net of reimbursements and discounts and after eliminating inter-group sales. The Bank evaluates its revenue categories based on specific criteria to determine whether it acts as principal or agent. Revenue is recognized to the extent that it is probable that economic benefits will flow to the Bank, and it is possible to reliably measure the related revenues and costs.
When the Bank fulfills a performance obligation through the delivery of promised goods or services to customer, it creates a contractual asset for the consideration amount obtained with the performance. The Bank recognizes the contractual assets as current assets, as they are expected to be realized within the normal operating cycle.
40
The costs of contracts eligible for capitalization as incremental costs when obtaining a contract are recognized as a contractual asset. Contractual costs are capitalized when incurred if the Bank expects to recover those costs. Contractual costs constitute non-current assets to the extent that the Bank expects to receive the economic benefits of those assets in a period greater than twelve months. The contractual costs are amortized systematically and consistently with the transfer of the services to the customer once the corresponding revenue has been recognized. The capitalized contractual costs are impaired if the customer withdraws or if the carrying amount of the asset exceeds the projection of the discounted cash flows that are related to the contract.
Interest income comprises income of financial assets at amortized cost or at fair value through other comprehensive income. Interest income is recognized using the effective interest rate method, the computation takes into account all the contractual conditions of the financial instrument (for example, prepayment options) and includes incremental fees and commissions (for example, certain loan commitment fees) or expenses that are directly attributed to the instrument and are an integral part of the effective interest rate, without taking account future credit losses.
Valuation income relates to debt securities at fair value, where gains and losses arising from changes in fair value are included in the statement of income as “Interest and valuation on financial instruments”.
Fees and services commissions are recognized as the right to consideration is obtained through the exchange of goods or services that the entity has transferred to a customer. Therefore, the Bank recognizes some fees as revenue over time, such as income from commissions and asset management, custody and other administration and advisory commissions. While other fees are recognized as revenue at a point in time of completion of the underlying transaction, like commissions arising from the negotiation or participation in the negotiation of a transaction for a third party, such as the acquisition of shares or other securities or the purchase or sale of businesses. In addition, the Bank maintains a credit card loyalty program to provide incentives to its customers. The program allows customers to purchase goods and services, based on the exchange of awards points, which are awarded based on purchases using the Bank's credit cards and the fulfillment of certain conditions established in such program. The redemption of points for prizes is carried out by a third party. Therefore, the expenses of the Bank's commitments with its clients arising from this program are recognized as a lower value of the fees and commission income, considering the total number of points that can be redeemed over the accumulated prizes and the probability of redemptions.
Dividend revenue of investments that are not associates or joint ventures are recognized when the right to payment of the Bank is established, which is generally when the shareholders declare the dividend. These are included in the statement of income as “Dividends and net income on equity investments”.
| 17. | Income tax |
Income tax includes current tax and deferred tax. The current tax is the income tax payable with respect to the profit for the fiscal year, which arises in profit or other comprehensive income. A provision is made for current tax considering the tax bases and tax rates enacted in each of the jurisdictions where the Bank is located, at the date of preparation of the financial statements.
41
The Bank recognizes, when appropriate, deferred tax assets and liabilities by estimating the future tax effects attributable to differences between book values of assets, liabilities and their tax bases. Deferred tax assets and liabilities are measured based on the tax rate that, in accordance with the valid tax laws in each country where the Bank has operations, must be applied in the year in which the deferred tax assets and liabilities are expected to be realized or settled. The future effects of changes in tax laws or tax rates are recognized in the deferred taxes as from the date of publication of the law providing for such changes.
Tax bases for deferred tax must be calculated by factoring in the definition of IAS 12 Income tax and the value of the assets and liabilities that will be realized or settled in the future according to the valid tax laws of each of the countries where the Bank has operations.
Deferred tax liabilities due to deductible temporary differences associated with investments in subsidiary and associated entities or shares in joint ventures, are recognized, except when the Bank is able to control the period in which the deductible temporary difference is reverted, and it is likely that the temporary difference will not be reverted in the foreseeable future.
Deferred tax assets, identified with temporary differences, are only recognized if it is considered likely that the Bank will have sufficient taxable income in the future that allows it to be recovered based on the stand-alone entity expected cash flow forecast for the next three years.
Tax credit from fiscal losses and surplus amounts from the presumptive income on the net income are recognized as a deferred asset, provided that it is likely that the Bank will generate future net income to allow their offset.
The deferred tax is recorded as debit or credit according to the result of each of the companies that form the Bank, and for the purpose of disclosure on the statement of financial position it is disclosed as net.
The deferred income tax expense is recognized in the statement of income under the heading “Income tax”, except when referring to amounts directly recognized in OCI (Other Comprehensive Income).
Regulatory changes in tax laws and in tax rates are recognized in the statement of income under the heading “Income Tax” in the period when such rule becomes enforceable. Interest and fines are recognized in the statement of income under the other administrative and general expenses or in the caption "Income tax" of the income statement, when applicable.
The Bank periodically assesses the tax positions adopted in tax returns, and, according to the results of the tax audits conducted by the tax authorities, determines possible tax outcomes provided it has a present obligation and it is more likely than not that the Bank will have to dispose of the economic resources to cancel the obligation, and the Bank can make an accurate estimate of the amount of the obligation.
For further information about deferred tax considerations derived from the last Colombian tax reform (Law 2277 of 2022), see Note 12. Income tax.
Transfer pricing policy
The Bank has as a general policy that each of its companies be responsible for their income, costs and expenses independently.
42
The policy takes into account the regulation for the Parent Company provided for in the Organic Statute of the Financial System (article 119, numeral 4) which in relation to the autonomy of the subsidiaries states that: The activity of the subsidiaries of entities subject to the control and supervision of the SFC must be carried out in conditions of independence and administrative autonomy, so that they have sufficient decision-making capacity to carry out the operations that constitute their object.
The Bank recognizes arm’s length operations with foreign economic links. These operations are documented and reported to the tax Administration according to the last evaluation date corresponding to the previous year.
| D. | Use of estimates and judgments |
The preparation of financial statements requires Bank's Management to make judgments, estimates and assumptions that affect the application of accounting policies and the reported amounts of assets, liabilities, income, and expenses.
The estimates and underlying assumptions are reviewed on an ongoing basis. Revisions to accounting estimates are recognized in the period in which the estimate is revised if the revision affects only that period, or in the period of the revision and future periods if the revision affects both current and future periods.
Judgments or changes in assumptions are disclosed in the notes to the financial statements. Management bases its estimates and judgments on historical experience and on various other factors that are believed to be reasonable under current circumstances. Actual results may differ from these estimates if assumptions and conditions change.
The material accounting estimates that the Bank uses in preparing its financial statements are detailed below.
| 1. | Impairment of financial instruments for credit risk |
This estimate is measured and accounted for in accordance with SFC regulations. Credit risk impairment is recognized at the balance sheet date as an expected loss in the loan portfolio. The determination of the provision for loan losses requires management to use appropriate criteria for the estimates, including, among others, the loan portfolio rating, which depends on the ability of customers to pay, and the estimate of the fair value of the underlying collateral or of the cash flows that are expected to be received.
The estimation of impairment charges is a critical accounting policy due to the importance of this item, the sensitivity of the charges to changes in assumptions about future events (effects of macroeconomic variables on the possible default of debtors) and other judgments that are incorporated in the individual credit loss models. Additionally, these estimates are considered as critical criteria because:
| (i) | They are highly susceptible to change from period to period. |
| (ii) | The assumptions for the valuation of potential expected losses, related to the portfolio classified as in default, are based on current performance experience and are higher than the parameters given by the SFC. In addition to the criteria of delinquency height objectives, they require qualitative evaluations on the ability to generate future flows that allow the loan to be recovered or, otherwise, estimate a deterioration that implies the registration of a provision on the non-recoverable amount. |
43
| (iii) | The customer rating allows for a classification based on the credit risk they present, which is assigned taking into account an evaluation of financial, transactional, historical behavior of internal and external payments, among others. |
| (iv) | Any significant difference between the estimated losses (reflected in the provisions) and the actual losses, will require the Bank to make provisions that, if significantly different, could have a material impact on the Bank's financial results. |
For more information on risk management, please see Note 32.
Impairment evaluation of the loan portfolio:
Circular 026 of 2022
Based on the provisions of external circular 026 of November 2022 issued by the SFC, and in order to mitigate the impact of the possible materialization of credit risk in an environment of economic slowdown and persistent inflation, the Bank recognized an additional Consumer provision in the statement of income for an amount equivalent to the expense for macroeconomic variables and an expense for the possible use of contingent quotas, based on internal expected loss models.
This provision was recognized at the end of December 31, 2023, and amounts to COP 353.159
Additional Individual Provisions
n individual review of significant customers with impairment is performed to determine if they need an additional individual provision, based on their risk. At the end of December 2023 this provision amounts to $370.0696 MM.
| 2. | Deferred tax |
Deferred tax assets and liabilities are recorded on deductible or levied temporary differences originating between tax and accounting bases, taking into account the tax rules applicable in each country where the Bank has operations. Due to the changing conditions of the political, social and economic environment, the constant amendments to tax legislation and the permanent changes in the tax principles and changes in interpretations by tax authorities determining the tax bases for the deferred tax items involves difficult judgments including estimates of future gains, offsets or tax deductions. Accordingly, the determination of the deferred tax is considered a critical accounting policy.
For more information relating to the nature of deferred tax assets and liabilities recognized by the Bank, please see Note 12. Income tax.
| 3. | Provisions and contingent liabilities |
The Bank is subject to contingent liabilities, including those arising from judicial, regulatory and arbitration proceedings, tax and other claims arising from the conduct of the Bank’s business activities. These contingencies are evaluated based on Management’s best estimates and provisions are established for legal and other claims by assessing the likelihood of the loss occurring as probable, possible or remote. Contingences are provisioned and recorded when all the information available indicates that it is probable that an outflow of resources embodying economic benefits will be required to settle the obligation before the statement of financial position date and the amounts may be reasonably estimated.
44
The Bank engages internal and external experts in assessing probability and in estimating timing, nature and amount of outflows that may result from past events.
Provisions are determined by Management’s best estimate of the expenditure required to settle the present obligation at the end of the reporting period, which estimate is discounted using a risk-free rate which reflects current market assessments of the time value of money in each country, which for Colombia is the interest rate on treasury bonds “TES”.
Throughout the life of a contingency, the Bank may learn of additional information that can affect assessments regarding probability or the estimates of amounts involved; changes in these assessments can lead to changes in recorded provisions.
The Bank considers the estimates used to determine the provisions for contingent liabilities critical estimates because the probability of their occurrence and the amounts that the Bank may be required to pay are based on the Bank’s judgment and those of its internal and external experts, which will not necessarily coincide with the future outcome of the proceedings. For further information regarding legal proceedings and contingencies and their carrying amounts, see Note 22. Provisions and contingent liabilities.
| 4. | Fair value of assets and liabilities |
The fair value of the Bank's assets and liabilities is determined at the date of the statement of financial position. The Bank's fair value measurement process considers the characteristics of the asset or liability in the same way that market participants would take them into account when pricing the asset or liability at the measurement date; the estimate takes into account inputs from valuation techniques used to measure fair value.
To increase consistency and comparability in fair value measurements and related disclosures, the Bank specifies different levels of inputs that may be used to measure the fair value of financial instruments, as follows:
Level 1: Assets and liabilities are classified as Level 1 if there are observable inputs that reflect quoted prices (unadjusted) for identical assets or liabilities in active markets. An active market is one in which transactions occur with sufficient volume and frequency to provide pricing information on an ongoing basis. Instruments are valued by reference to unadjusted quoted prices for identical assets or liabilities in active markets where the quoted price is readily available, and the price represents actual and regularly occurring market transactions.
Level 2: Assets and liabilities are classified as Level 2 if in the absence of a market price for a specific financial instrument, its fair value is estimated using models whose input data are observable for recent transactions of identical or similar instruments.
Level 3: Assets and liabilities are classified as level 3 if unobservable input data were used in the measurement of fair value that are supported by little or no market activity and that are significant to the fair value of these assets or liabilities. The fair value of Level 3 financial assets and liabilities is determined using pricing models, discounted cash flow methodologies or similar techniques.
Transfers into or out of Level 3 are made if the significant inputs used in the financial models measuring the fair values of the assets and liabilities became unobservable or observable, respectively, in the current marketplace.
45
All transfers between the aforementioned levels are assumed to occur at the end of the reporting period.
The measurement of the fair value of financial instruments generally involves a higher degree of complexity and requires the application of judgments especially when the models use unobservable inputs (level 3) based on the assumptions that would be used in the market to determine the price for assets or liabilities. Determination of these assumptions includes consideration of market conditions and liquidity levels. Changes in the market conditions, such as reduced liquidity in the capital markets or changes in secondary market activities, may reduce the availability and reliability of quoted prices or observable data used to determine fair value.
When developing fair value measurements, the Bank maximizes the use of observable inputs and minimizes the use of unobservable inputs in measuring fair value. Additionally, the Bank uses third-party pricing services to obtain fair values, which are used to either record the price of an instrument or to corroborate internally developed prices. Third-party price validation procedures are performed over the reasonableness of the fair value measurements. For further details regarding carrying amount and sensitivity disclosures, please see Note 29. Fair value of assets and liabilities.
| 5. | Measurement of employee benefits |
The measurement of post-employment benefit obligations and long-term employee benefits takes into account a range of inputs and it is dependent upon a series of assumptions of future events. The projected unit credit method is used to determine the present value of the obligation for the defined benefits and its associated cost. Future measurements of obligations may differ to those presented in the financial statements, among others, due to changes in economic and demographic assumptions and significant events. The actuarial valuation methodology of the post-employment and long-term benefit plans include typified discount rates by each benefit plan, with the objective of presenting more relevant information on the value of these plans in the financial statements. For further information, see Note 20. Employee benefit plans.
| 6. | Transaction price determination |
With respect to contracts with the Bank’s customers, for the determination of the transaction price, the Bank allocates to each one of the performance obligations under the contract the price which represents the value expected to be received in respect of each such performance obligation based on its relative stand-alone selling price. Such price is determined based on the cost of each service, related tax and associated risks to the operation and inherent to the transaction, plus the margin expected to be received for the services, considering in each case the market price for the service, the conditions agreed with the customer and the customer’s segment. The bank has fixed and variable prices considering the characteristics of each service, future events, discounts, returns and other variables that may influence the selling price. No significant financing components are factored in the determination of the selling price.
| 7. | Leases |
The measurement of the right-of-use asset and of the lease liabilities requires a series of judgments, among which are the determination of the term of the lease and the rate used in discounting the cash flows. The term of the lease is defined according to the historical information of the contracts and the period over which an asset is expected to be economically usable, which involves a high degree of uncertainty due to the use of relevant information about past events.
46
In the Bank’s case, the weighted average lessee’s incremental borrowing rate was used to discount the cash flows associated with the leasing contracts. The Bank performs analysis taking into account the currency, lease term, economic environment and class of underlying assets, as to determine the weighted average lessee’s incremental borrowing rate.
| 8. | Uncertainty over income tax treatments |
In the process of determining the current and deferred tax for periods subject to review by the tax authority, the applicable rules have been applied and interpretations have been made to take positions, on which different interpretations could arise from those made by the entity. Due to the complexity of the tax system, the continuous modifications of the fiscal rules, the accounting changes with implications in the tax bases and in general the legal instability of the country, at any time the tax authority could have different criteria from the Bank. Therefore, a dispute or inspection by the tax authority on a specific tax treatment may affect the deferred or current tax asset or liability bank´s accounting, in accordance with the requirements of IAS 12.
Management and its advisors believe that their decisions concerning the estimates and judgments made in each fiscal period are in accordance with those required by the current tax regulations, and therefore have not considered it necessary to recognize any additional provisions to those indicated in Note 12. Income tax.
| 9. | Impairment evaluation of the loan portfolio |
Circular 026 of 2022
Based on the provisions of external circular 026 of November 2022 issued by the SFC, and in order to mitigate the impact of the possible materialization of credit risk in an environment of economic slowdown and persistent inflation, the Bank recognized an additional consumption provision in the statement of income for an amount equivalent to the expense for macroeconomic variables and an expense for the possible use of contingent quotas, based on internal expected loss models.
This provision was recognized at the end of December 31, 2023, and amounts to COP 353,159, for the end of December 2023 there has been no change.
| E. | Recently issued accounting pronouncements |
| a) | Accounting pronouncements applicable in 2023 |
Amendments to IAS 8 Accounting Policies, Changes in Accounting Estimates and Errors. Definition of Accounting Estimates: In February 2021, the Board issued Definition of Accounting Estimates, which amended IAS 8. The amendments introduced the definition of accounting estimates in paragraph 5 and included other amendments to IAS 8 to help entities distinguish changes in accounting estimates from changes in accounting policies. The amendment to IAS 8 is effective for annual periods beginning on or after January 1, 2023, and early application is permitted.
47
The Bank early applied this amendment as of January 1, 2022, with no impact on the Bank's financial statements and disclosures, due to the new definition of accounting estimates being in accordance with that which the Bank currently applies and discloses.
Amendments to IAS 1 Presentation of Financial Statements and IFRS Practice Statement 2 Making Materiality Judgements. Disclosure of Accounting Policies: In February 2021 the Board amended IAS 1 and IFRS Practice Statement 2 Making Materiality Judgements, to replace the term "significant" with "material", to require an entity to disclose its material accounting policy information rather than its significant accounting policies. Therefore, accounting policy information may be considered material when that information is considered together with other information in a complete set of financial statements. In the Board’s view, accounting policy information is expected to be material if its disclosure was needed for primary users to understand information provided about material transactions, other events or conditions in the financial statements. These amendments are effective for annual periods beginning on or after January 1, 2023, and early application is permitted.
The Bank applied this amendment for the annual financial statements and disclosures beginning on or after January 1, 2023. For further information, see section D. Material Accounting Policies in this note.
Amendments to IAS 12 Income Taxes. Deferred Tax related to Assets and Liabilities arising from a Single Transaction: In May 2021, the Board issued Deferred Tax related to Assets and Liabilities arising from a Single Transaction. The amendments narrowed the scope of the recognition exemption in paragraphs 15 and 24 of IAS 12 (recognition exemption) so that it no longer applies to transactions that, on initial recognition, give rise to equal taxable and deductible temporary differences.
This amendment is effective for annual periods beginning on or after January 1, 2023, and early application is permitted.
This amendment was assessed by Management without evidencing an impact on the Bank's financial statements and disclosures because no exemptions are currently applied for the recognition of deferred taxes arising from a single transaction.
Amendments to IAS 12 Income Taxes - International Tax Reform—Pillar Two Model Rules: In May 2023, the IASB amended IAS 12 Income Taxes to give companies temporary relief from accounting for deferred taxes arising from the Organization for Economic Co-operation and Development’s (“OECD”) international tax reform.
The OECD published the Pillar Two model rules in December 2021 to ensure that large multinational companies would be subject to a minimum 15.00% tax rate. More than 135 countries and jurisdictions representing more than 90.00% of global GDP have agreed to the Pillar Two model rules.
The amendments introduce:
| - | A temporary exception—to the accounting for deferred taxes arising from jurisdictions implementing the global tax rules. This will help to ensure consistency in the financial statements while easing into the implementation of the rules; and |
| - | Targeted disclosure requirements—to help investors better understand a company’s exposure to income taxes arising from the reform, particularly before legislation implementing the rules is in effect. |
48
Companies can benefit from the temporary exception immediately but are required to provide the disclosures for annual reporting periods beginning on or after January 1, 2023.
This amendment has been assessed by Management with no evidence of an impact on the Bank's financial statements and disclosures, due the OECD’s Pillar Two model rules has not yet been implemented in Colombia and in the countries in which the Bank has a presence.
| b) | Recently issued accounting pronouncements applicable in future periods |
Amendments to IAS 1 Presentation of Financial Statements: On January 23, 2020, the IASB issued amendments to IAS 1 to clarify the requirements for classifying liabilities as current or non-current. More specifically:
- The amendments specify that the conditions which exist at the end of the reporting period of an obligation are those which will be used to determine if a right to defer settlement of a liability exists.
- Management expectations about events after the balance sheet date, for example on whether a covenant will be breached, or whether early settlement will take place, are not relevant.
- The amendments clarify the situations that are considered settlement of a liability.
Additionally, on October 30, 2022, the IASB issued an amendment to IAS 1 to improve the disclosures an entity provides when its right to defer settlement of a liability for at least twelve months is subject to compliance with covenants, and how this impacts the classification of that liability as current or non-current.
The amendments to IAS 1 are required to be applied for annual periods beginning on or after January 1, 2024. The amendments must be applied retrospectively, in accordance with IAS 8. Early application is permitted.
Management concluded that this amendment has no impact on the preparation of the financial statements, because the Bank presents the statement of financial position ordered by liquidity, according to the business nature.
Amendments to IFRS 16 Leases- Lease liability in a sale and leaseback: In September 2022, the Board amended IFRS 16 to add subsequent measurement requirements for sale and leaseback transactions that meet the requirements of IFRS 15 to be accounted as a sale. The amendments require a seller-lessee to subsequently measure lease liabilities arising from a subsequent lease such that it does not recognize any amount of gain or loss that relates to the right-of-use that it retains.
This amendment is effective for annual periods beginning on or after January 1, 2024, and early application is permitted.
This amendment has been assessed by Management with no evidence of an impact on the Bank's financial statements and disclosures, due the new requirements are in line with what the Bank has applied and disclosed.
NOTE 3. CASH AND CASH EQUIVALENTS
For purposes of the statement of cash flow and the statement of financial position, the following assets are considered as cash and cash equivalents:
49
|
December 31, 2023 |
December 31, 2022 |
|---|---|---|
In millions of COP | ||
Cash |
|
|
Cash |
6,846,978 |
6,622,778 |
Deposits from Colombian Central Bank (1)(2) |
7,318,665 |
4,919,951 |
Deposits from banks and other private financial institutions |
2,203,471 |
1,518,190 |
Checks on hold |
7,508 |
5,010 |
Remittances of domestic negotiated checks in transit |
309 |
412 |
Total cash |
16,376,931 |
13,066,341 |
Monetary market transactions |
|
|
Reverse repurchase agreements |
7,792,496 |
2,816,948 |
Interbank borrowings |
179,433 |
350,515 |
Total monetary market transactions |
7,971,929 |
3,167,463 |
Total cash and cash equivalents |
24,348,860 |
16,233,804 |
(1)According to External Resolution No. 20 of 2020 of Colombian Central Bank, which amends External Resolution No. 5 of 2008 issued by the Colombian Central Bank, the Bank must maintain the equivalent of 8% of the deposits mentioned in Article 1, paragraph (a), and the equivalent of 3.5% of its customers’ deposits with a maturity of less than 18 months paragraph (b) as ordinary reserve, represented in deposits at the Central Bank or as cash in hand.
(2)The variation corresponds mainly to interest-bearing deposits of COP $3.5B opened in December 2023.
(3)The increase corresponds to higher repo transactions carried out through the Cámara de Riesgo Central de Contraparte for COP 7.6B in December 2023.
As of December 31, 2023 and 2022, there is restricted cash amounting to COP 1.010.562 and COP 648,364 respectively, included in other assets on the statement of financial position, which represents margin deposits pledged as collateral for derivative contracts traded through Colombian clearing houses. See Note 14. Other assets, net.
NOTE 4. FINANCIAL ASSETS INVESTMENTS, NET AND DERIVATIVES
The Bank's portfolio investment in financial instruments and derivatives as of December 31, 2023 and December 31, 2022, is described below:
Financial assets investments |
December 31, 2023 |
December 31, 2022 |
In millions of COP | ||
Investments in debt securities |
|
|
Negotiable investments (1) |
5,655,077 |
6,315,428 |
Available-for-sale investments(2) |
3,211,425 |
2,590,622 |
Held-to-maturity investments (3) |
3,423,265 |
3,457,606 |
Provision (2) |
- |
(7,381) |
Subtotal debt securities, net (4) |
12,289,767 |
12,356,275 |
Pledged financial assets (4) |
1,287,391 |
601,291 |
Total debt securities |
13,577,158 |
12,957,566 |
Total equity securities (4) |
180,744 |
171,808 |
Total investment financial assets, net |
13,757,902 |
13,129,374 |
|
|
|
Total derivative assets (5) |
6,215,942 |
4,860,893 |
|
|
|
Total derivative liabilities (5) |
(6,699,521) |
(4,717,408) |
| (1) | As of December 31, 2023, there is a decrease in the portfolio of COP 660,351, mainly in foreign securities for COP 727,778. |
| (2) | As of December 31, 2023, there is a increase in the portfolio of COP 620,803, mainly for the acquisition of bonds issued by Transmilenio and guaranteed by the nation for COP 500,235 in August. |
| (3) | As of December 31, 2023, previous SFC authorization, COP 77,774 mortgage-backed securities (“TIPS”) operations were reclassified to the negotiable investments. The effect on the period results of the reclassification was COP 4,569, which corresponds to the recovery of impairment for COP 2,326 and the valuation effect for COP 2,243. |
| (4) | See Note 4.1. Financial assets investments, net. |
| (5) | See Note 4.2. Derivative financial instruments. |
50
4.1. Financial assets investments, net
The detail of the financial investment assets is as follows:
As of December 31, 2023
Debt securities |
Measurement methodology |
Total carrying amount |
||
|---|---|---|---|---|
Held for trading |
Available-for-sale investments |
Held-to-maturity investments |
||
In millions of COP | ||||
Treasury securities issued by the Colombian Government - TES |
3,126,666 |
- |
- |
3,126,666 |
Bonds |
2,002,423 |
- |
336,794 |
2,339,217 |
Agricultural Development Securities issued by the Colombian Government (TDA) |
- |
- |
3,086,471 |
3,086,471 |
Solidarity Securities issued by the Colombian Government (TDS) |
- - |
2,664,295 547,130 |
- - |
2,664,295 547,130 |
Other public debt |
441,687 |
- |
- |
441,687 |
Other financial investment assets |
84,301 |
- |
- |
84,301 |
Total debt securities |
5,655,077 |
3,211,425 |
3,423,265 |
12,289,767 |
As of December 31, 2022
Debt securities |
Measurement methodology |
Total carrying amount |
||
|---|---|---|---|---|
Held for trading |
Available-for-sale investments |
Held-to-maturity investments |
||
In millions of COP | ||||
Treasury securities issued by the Colombian Government - TES |
3,341,820 |
- |
- |
3,341,820 |
Bonds |
2,708,070 |
- |
352,662 |
3,060,732 |
Agricultural Development Securities issued by the Colombian Government (TDA) |
- |
- |
3,014,354 |
3,014,354 |
Solidarity Securities issued by the Colombian Government (TDS) |
- |
2,590,622 |
- |
2,590,622 |
Other public debt |
249,045 |
- |
- |
249,045 |
Other financial investment assets |
16,493 |
- |
90,590 |
107,083 |
Provision |
- |
- |
(7,381) |
(7,381) |
Total debt securities |
6,315,428 |
2,590,622 |
3,450,225 |
12,356,275 |
The following table shows the detail of debt securities maturity:
As of December 31, 2023
Debt securities |
Less than 1 year |
Between 1 and 3 years |
Between 3 and 5 years |
Greater than 5 years |
Total |
|
In millions of COP | ||||||
Negotiable investments | ||||||
Treasury securities issued by the Colombian Government - TES |
301,849 |
1,757,746 |
365,919 |
701,152 |
3,126,666 |
|
Bonds |
1,540,796 |
101,294 |
42,733 |
317,600 |
2,002,423 |
|
Other financial investment assets |
160,177 |
146,411 |
72,981 |
62,118 |
441,687 |
|
Mortgage- backed securities |
848 |
2,559 |
10,651 |
70,243 |
84,301 |
|
Subtotal negotiable investments |
2,003,670 |
2,008,010 |
492,284 |
1,151,113 |
5,655,077 |
|
51
Available-for-sale investments | ||||||
Solidarity Securities issued by the Colombian Government (TDS) |
2,664,295 |
- |
- |
- |
2,664,295 |
|
Other public debt |
- |
- |
- |
547,130 |
547,130 |
|
Subtotal available-for-sale investments |
2,664,295 |
- |
- |
547,130 |
3,211,425 |
|
Held-to-maturity investments | ||||||
Agricultural Development Securities issued by the Colombian Government (TDA) |
3,086,471 |
- |
- |
- |
3,086,471 |
|
Bonds |
- |
- |
- |
336,794 |
336,794 |
|
Mortgage-backed securities |
3,086,471 |
- |
- |
336,794 |
3,423,265 |
|
Subtotal held-to-maturity investments |
7,754,436 |
2,008,010 |
492,284 |
2,035,037 |
12,289,767 |
|
As of December 31, 2022
Debt securities |
Less than 1 year |
Between 1 and 3 years |
Between 3 and 5 years |
Greater than 5 years |
Total |
|
In millions of COP | ||||||
Negotiable investments | ||||||
Treasury securities issued by the Colombian Government - TES |
1,223,555 |
646,214 |
472,955 |
999,096 |
3,341,820 |
|
Bonds |
2,298,617 |
132,020 |
7,138 |
270,295 |
2,708,070 |
|
Other financial investment assets |
68,919 |
152,722 |
27,404 |
- |
249,045 |
|
Mortgage-backed securities |
- |
3,321 |
1,733 |
11,439 |
16,493 |
|
Subtotal negotiable investments |
3,591,091 |
934,277 |
509,230 |
1,280,830 |
6,315,428 |
|
Available-for-sale investments | ||||||
Solidarity Securities issued by the Colombian Government (TDS) |
2,590,622 |
- |
- |
- |
2,590,622 |
|
Subtotal available-for-sale investments |
2,590,622 |
- |
- |
- |
2,590,622 |
|
Held-to-maturity investments | ||||||
Agricultural Development Securities issued by the Colombian Government (TDA) |
3,014,354 |
- |
- |
- |
3,014,354 |
|
Bonds |
- |
- |
- |
352,662 |
352,662 |
|
Mortgage-backed securities |
- |
- |
15,387 |
75,203 |
90,590 |
|
Provision |
- |
- |
- |
(7,381) |
(7,381) |
|
Subtotal held-to-maturity investments (1) |
3,006,973 |
- |
15,387 |
427,865 |
3,450,225 |
|
Total debt securities |
9,188,686 |
934,277 |
524,617 |
1,708,695 |
12,356,275 |
|
(1) Held-to-maturity investments as of december 31, 2023 have an impairment for COP (7,381), the net carrying amount of the investment is COP 3,450,225.
For more information related to fair value disclosures of investments classified as held-to-maturity, see Note 29 Fair value of assets and liabilities.
The net effect in the statement of comprehensive income corresponding to the debt securities is COP 52,063 for 2023 and COP (18,182) for 2022. See separate statement of comprehensive income – profit Net loss on valuation of financial instruments.
These assets have no restrictions or limitations as of December 31, 2023 and December 31, 2022, except for the securities pledged as collateral for Reverse repurchase agreements and derivatives indicated below:
As of December 31, 2023
Pledged financial assets |
Term |
Security type |
Carrying amount |
In millions of COP | |||
Securities issued by the Colombian government | |||
Investments pledged as collateral in transactions with reverse repurchase agreements |
Up to 1 month |
Treasury securities |
810,101 |
52
Investments pledged as collateral in transactions with derivatives |
Between 1 and 3 months |
Treasury securities |
477,290 |
Total securities issued by the Colombian government |
|
|
1,287,391 |
Total pledged financial assets |
1,287,391 |
||
As of December 31, 2022
Pledged financial assets |
Term |
Security type |
Carrying amount |
In millions of COP | |||
Securities issued by the Colombian government | |||
Investments pledged as collateral in transactions with reverse repurchase agreements |
Up to 1 month |
Treasury securities |
30,383 |
Investments pledged as collateral in transactions with derivatives |
Between 1 and 3 months |
Treasury securities |
570,908 |
Total securities issued by the Colombian government |
|
|
601,291 |
Total pledged financial assets |
601,291 |
||
The following table ilustrates the movement in provisions for investments in debt securities:
|
December 31, 2023 |
December 31, 2022 |
|---|---|---|
In millions of COP | ||
Initial balance |
7,381 |
21,634 |
(+) Provision charged to expense |
- |
1,441 |
(-) Provision recovery(1) |
7,381 |
15,694 |
Final balance |
- |
7,381 |
| (1) | As of December 31, 2023, the securities held by Titularizadora Colombiana S.A. Hitos were reclassified to the negotiable investments to be measured at fair value. |
As of December 31, 2023 and 2022, provisions for investments in debt securities are as follows:
Provision for securities held-to-maturity | ||||
In millions of COP | ||||
Issuer |
Description |
Risk category |
December 31, 2023 |
December 31, 2022 |
Titularizadora Colombiana S.A Hitos |
TIP U2 UVR C 2032 8.50% 9/11/32 |
B- |
- |
1,823 |
Titularizadora Colombiana S.A Hitos |
TIP N16 COP C 2032 15% 6/12/32 |
BB- |
- |
994 |
Titularizadora Colombiana S.A Hitos |
TIP N16 COP MZ 2032 12.5% 6/12/32 |
BB+ |
- |
932 |
Titularizadora Colombiana S.A Hitos |
TIP U3 UVR C 2033 8.4991% 25/7/33 |
BB |
- |
691 |
Titularizadora Colombiana S.A Hitos |
TIP N18 COP B 2034 10.5% 4/4/34 |
A |
- |
605 |
Titularizadora Colombiana S.A Hitos |
TIP N18 COP C 2034 16% 4/4/34 |
BB- |
- |
599 |
Titularizadora Colombiana S.A Hitos |
TIP N18 COP MZ 2034 12.5% 4/4/34 |
BB+ |
- |
520 |
Titularizadora Colombiana S.A Hitos |
TIP N19 COP B 2034 9.5% 23/5/34 |
BBB+ |
- |
334 |
53
Titularizadora Colombiana S.A Hitos |
TIP N19 COP MZ 2034 13% 23/5/34 |
B+ |
- |
267 |
||
Titularizadora Colombiana S.A Hitos |
TIP N19 COP C 2034 15% 23/5/34 |
CCC |
- |
232 |
||
Titularizadora Colombiana S.A Hitos |
TIP U4 UVR C 2034 9.0% 15/8/34 |
BB+ |
- |
161 |
||
Titularizadora Colombiana S.A Hitos |
TIP N20 COP MZ 2034 12.6% 4/10/34 |
B+ |
- |
116 |
||
Titularizadora Colombiana S.A Hitos |
TIP N20 COP C 2034 14.4% 4/10/34 |
B- |
- |
107 |
||
Total Provision for securities held-to-maturity |
- |
7,381 |
|
|
||
The detail of investments in equity securities is as follows:
Equity financial securities |
December 31, 2023 |
December 31, 2022 |
In millions of COP | ||
Investments at fair value through OCI (1) |
170,534 |
153,673 |
Financial assets measured at changes in equity through OCI |
7,509 |
7,014 |
Investments at fair value through income statement (2) |
2,701 |
11,121 |
Total equity financial securities |
180,744 |
171,808 |
| (1) | The detail of this investments is presented in the table “ Equity instruments measured at fair value through OCI”. |
| (2) | The category of Investments at fair value through income statement includes the Preferred shares of Compañía de Financiamiento TUYA S.A., for a value of less than COP 1, Renta Fija Plus and Renta Fija Plazo trusts, which were acquired in 2022 for COP 11,000, in July 2023, capital contributions of COP 30,500 were made and in December a derecognition of COP 42,132 was made. |
Equity instruments measured at fair value through OCI
Investments at fair value through OCI |
Carrying amount |
|
December 31, 2023 |
December 31, 2022 |
|
In millions of COP | ||
Residual rights (1) |
25,579 |
31,916 |
Asociación Gremial de Instituciones Financieras Credibanco S.A. |
110,785 |
98,493 |
Bolsa de Valores de Colombia S.A. (2) |
2 |
13,757 |
Derecho Fiduciario Inmobiliaria Cadenalco |
4,449 |
4,003 |
Total investments at fair value through OCI |
170,534 |
153,673 |
| (1) | For payments received from residual rights as of December 31, 2023, COP (8,608) were made from the OCI and as of December 31, 2022, COP (15,122) were made and transferred to income. |
| (2) | In November 2023, the integration of the Chilean, Colombian and Peruvian Stock Exchanges was completed, resulting in the creation of the Regional Stock Exchange Holding Company. As a result of this integration, 1,969,399 shares of the Bolsa de Valores de Colombia S.A. were derecognized for COP 18,453 and 1,185,231 shares were recognized in the Regional Holding Company for COP 25,682. Additionally, the accumulated loss in the Other comprehensive income for COP 6,282 was reclassified to the result for the period. The bank holds 133 shares in Bolsa de Valores de Colombia wich were not included in the transaction. |
Investments in equity securities which are measured at fair value through OCI are considered strategic for the Bank and, therefore, there is no intention to sell them in the foreseeable future. That is the reason why this alternative is used for its presentation.
54
The net effect of valuation in the statement of comprehensive income corresponding to equity investment financial securities is COP 19,082 of 2023 and COP 4,320 for 2022. See separate statement of comprehensive income - net loss on valuation of financial instruments.
Dividends on equity securities through OCI recognized as of December 31, 2023 and 2022 amount to COP 4,482 and COP 7,777, respectively. See Note 25.5. Equity investment income.
As of December 31, 2023 and 2022 there were no impairment losses on equity securities. These investments do not have a maturity date, therefore, they are not included in the maturity detail.
4.2. Derivative financial instruments
The Bank derivative activities do not give rise to significant open positions in portfolios of derivatives. The Bank enters into derivative transactions to facilitate customer business, for hedging purposes and arbitrage activities, such as forwards, options, or swaps where the underlying are exchange rates, interest rates, and securities.
A swap agreement is a contract between two parties to exchange cash flows based on specified underlying notional amounts, assets, and/or indexes. Financial futures and forward settlement contracts are agreements to buy or sell a quantity of a financial instrument (including another derivative financial instrument), index, currency or commodity at a predetermined rate or price during a period or at a date in the future. Futures and option contracts are standardized agreements for future delivery, traded on exchanges that typically act as a platform.
For further information related to the objectives, policies, and processes for managing the Bank’s risk, please see item Risk Management.
The following table presents the Bank's derivatives by type of risk as of December 31, 2023 and 2022:
Derivatives |
December 31, 2023 |
December 31, 2022 |
In millions of COP | ||
Forwards |
|
|
Assets |
|
|
Foreign currencies |
4,377,677 |
1,568,062 |
Securities |
3,014 |
5,519 |
Subtotal assets |
4,380,691 |
1,573,581 |
Liabilities |
|
|
Foreign currencies |
(4,522,580) |
(1,707,199) |
Securities |
(10,481) |
(7,204) |
Subtotal Liabilities |
(4,533,061) |
(1,714,403) |
55
Total forwards |
(152,370) |
(140,822) |
Swaps | ||
Assets |
|
|
Foreign currencies |
1,304,338 |
2,394,832 |
Interest rate |
320,325 |
771,173 |
Subtotal assets |
1,624,663 |
3,166,005 |
Liabilities |
|
|
Foreign currencies |
(1,491,086) |
(1,917,397) |
Interest rate |
(442,787) |
(992,700) |
Subtotal liabilities |
(1,933,873) |
(2,910,097) |
Total swaps |
(309,210) |
255,908 |
Options |
|
|
Assets |
|
|
Foreign currencies |
210,588 |
121,307 |
Subtotal assets |
210,588 |
121,307 |
Liabilities |
|
|
Foreign currencies |
(232,587) |
(92,908) |
Subtotal liabilities |
(232,587) |
(92,908) |
Total options |
(21,999) |
28,399 |
Derivative assets |
6,215,942 |
4,860,893 |
Derivative liabilities |
(6,699,521) |
(4,717,408) |
The table below details the amount of derivatives net by maturity:
As of December 31, 2023
Forward |
Swaps |
Options |
Total |
|
|---|---|---|---|---|
Assets |
4,380,691 |
1,624,663 |
210,588 |
6,215,942 |
Less than 1 year |
4,231,752 |
611,487 |
135,559 |
4,978,798 |
Between 1 and 3 years |
147,826 |
517,205 |
75,029 |
740,060 |
More than 3 years |
1,113 |
495,971 |
- |
497,084 |
Liabilities |
(4,533,061) |
(1,933,873) |
(232,587) |
(6,699,521) |
Less than 1 year |
(4,416,129) |
(414,233) |
(152,284) |
(4,982,646) |
Between 1 and 3 years |
(116,932) |
(979,130) |
(80,303) |
(1,176,365) |
More than 3 years |
- |
(540,510) |
- |
(540,510) |
As of December 31, 2022
Forward |
Swaps |
Options |
Total |
|
|---|---|---|---|---|
Assets |
1,573,581 |
3,166,005 |
121,307 |
4,860,893 |
Less than 1 year |
1,426,455 |
860,281 |
108,319 |
2,395,055 |
Between 1 and 3 years |
147,126 |
1,149,154 |
12,988 |
1,309,268 |
More than 3 years |
- |
1,156,570 |
- |
1,156,570 |
Liabilities |
(1,714,403) |
(2,910,097) |
(92,908) |
(4,717,408) |
Less than 1 year |
(1,638,262) |
(500,583) |
(80,854) |
(2,219,699) |
Between 1 and 3 years |
(76,141) |
(1,079,278) |
(12,054) |
(1,167,473) |
More than 3 years |
- |
(1,330,236) |
- |
(1,330,236) |
Derivatives' guarantee
The following table presents the cash and securities collateral for derivatives as of December 31, 2023 and 2022:
|
December 31, 2023 |
December 31, 2022 |
56
In millions of COP | ||
Guarantees delivered |
2,297,681 |
1,097,501 |
Guarantees received |
(787,640) |
(639,207) |
Day one gains or losses
If an asset has been acquired or a liability has been assumed in a market transaction, it could be assumed that the transaction price is the fair value of the asset or liability. However, the fair value of the financial asset or liability at the time of initial recognition may be different from the transaction price, because the fair value includes variables in its valuation technique that include market information, such as interest rate yield curves, currencies rates, indicators, default factors among others. When the values are not equal, the asset or liability must be measured at fair value and the difference between the transaction price and the fair value must be recognized as follows:
| ● | If fair value is evidenced by Level 1 inputs or is based on a valuation technique that uses only observable market data, the Group must recognize the difference as a gain or loss on initial recognition directly in the income statement. |
| ● | In all other circumstances, the entire day 1 gain or loss is deferred and is recognized in the income statement over the life of the transaction. |
The table below presents the unrecognised gains or (losses) for derivatives trading at the initial moment, due to use of valuation techniques for which not all inputs were observable market data:
As of December 31, 2023
|
Forward |
Swaps |
Opciones |
Total |
In millions of COP | ||||
Balance at January 1, 2023 |
61,724 |
16,580 |
39,714 |
118,018 |
New trades |
1,159,069 |
(26,905) |
195,456 |
1,327,620 |
Amortization |
(1,176,173) |
4,166 |
(148,299) |
(1,320,306) |
Sale or transfer |
(8,331) |
(7,471) |
(23,803) |
(39,605) |
Balance at December 31, 2023 |
36,289 |
(13,630) |
63,068 |
85,727 |
As of December 31, 2022
|
Forward |
Swaps |
Opciones |
Total |
In millions of COP | ||||
Balance at January 1, 2022 |
16,918 |
27,894 |
26,675 |
71,487 |
New trades |
315,395 |
11,937 |
164,460 |
491,792 |
Amortization |
(265,268) |
(18,723) |
(113,705) |
(397,696) |
Sale or transfer |
(5,321) |
(4,528) |
(37,716) |
(47,565) |
Balance at December 31, 2022 |
61,724 |
16,580 |
39,714 |
118,018 |
57
Offsetting of derivatives
The Bank enters into International Swaps and Derivatives Association (ISDA) master netting agreements or similar agreements with substantially all of the Bank’s derivative counterparties.
Where legally enforceable, and depending on the Bank’s intention, these master netting agreements give the Bank, in the event of default by the counterparty, the right to liquidate securities and cash equivalents held as collateral and to offset receivables and payables with the same counterparty.
The table below presents derivative instruments subject to enforceable master netting agreements and other similar agreements but not offset in the statement of financial position as of December 31, 2023 and 2022 by derivative and by risk:
As of December 31, 2023
Derivados activos |
Derivados pasivos |
|
In millions of COP | ||
Over-the-counter | ||
Foreign exchange contracts |
|
|
Swaps |
1,304,338 |
(1,491,086) |
Forwards |
4,377,677 |
(4,522,580) |
Options |
210,588 |
(232,587) |
Interest rate contracts |
|
|
Swaps |
320,325 |
(442,787) |
Securities contracts |
|
|
Forwards |
3,014 |
(10,481) |
Gross derivative |
6,215,942 |
(6,699,521) |
Master netting agreements |
(6,190,847) |
5,377,895 |
Collateral received/paid |
(25,095) |
1,321,626 |
Total derivative financial instruments assetss/ liabilities after collateral and Master netting agreements |
- |
- |
As of December 31, 2022
Derivados activos |
Derivados pasivos |
|
In millions of COP | ||
Over-the-counter | ||
Foreign exchange contracts |
|
|
Swaps |
2,394,832 |
(1,917,397) |
Forwards |
1,568,062 |
(1,707,199) |
Options |
121,307 |
(92,908) |
Interest rate contracts |
|
|
Swaps |
771,173 |
(992,700) |
Securities contracts |
|
|
Forwards |
5,519 |
(7,204) |
Gross derivative |
4,860,893 |
(4,717,408) |
Master netting agreements |
(4,185,320) |
4,245,662 |
Collateral received/paid |
(639,207) |
471,746 |
Total derivative financial instruments assetss/ liabilities after collateral and Master netting agreements |
36,366 |
- |
NOTE 5. LOANS AND ADVANCES TO CUSTOMERS, NET
The following is the composition of the loans and leasing operations portfolio, net as of December 31, 2023 and 2022:
58
Composition |
December 31, 2023 |
December 31, 2022 |
In millions of COP | ||
Commercial |
95,614,822 |
91,928,943 |
Consumer |
38,862,513 |
40,883,927 |
Leasing (1) |
26,056,199 |
26,393,149 |
Mortgage |
21,840,258 |
19,701,077 |
Small business loans |
547,677 |
565,483 |
Total loan portfolio and financial leasing operations |
182,921,469 |
179,472,579 |
|
Total provision for loan portfolio and leasing operations impairment (2) |
(12,892,352) |
(11,268,584) |
Total loan portfolio and leasing operations, net |
170,029,117 |
168,203,995 |
| (1) | See note 6. Leases. |
| (2) | Includes general provision for loan portfolio and leasing operations, in accordance with SFC regulations, see Note 2. accounting policies, literal C, section 3.1.6.1., general provision. |
Provision concept |
December 31, 2023 |
December 31, 2022 |
In millions of COP | ||
General provision (Circular 026, 2022) |
353,159 |
353,159 |
General provision Small business loans and Mortgage (Circular 100, 1995) |
221,529 |
200,366 |
General capital provision (Circular 022, 2020) |
- |
66,366 |
General interest provision (Circular 022, 2020) |
- |
2,293 |
Total general provision |
574,688 |
622,184 |
| (1) | This concept remains the same, given that there have been no significant variations in the provision of consumption quotas or in the macroeconomic expectation for the current year. |
Loans and leasing operations portfolio By risk category
As of December 31, 2023 and 2022, the loan portfolio and leasing operations are distributed in the following risk categories:
As of December 31, 2023
Commercial |
Loans |
Provision |
Other items |
||||
|---|---|---|---|---|---|---|---|
Category |
Capital |
Interest and/or financial component |
Other items |
Capital |
Interest and/or financial component |
Other items |
|
In millions of COP | |||||||
A – Normal risk |
87,655,242 |
1,502,565 |
16,158 |
1,232,376 |
24,530 |
578 |
87,916,481 |
B – Acceptable risk |
1,300,166 |
74,543 |
1,854 |
197,071 |
8,079 |
392 |
1,171,021 |
C – Appreciable risk |
631,082 |
12,217 |
1,564 |
156,946 |
9,861 |
1,385 |
476,671 |
D – Significant risk |
1,779,007 |
43,394 |
11,537 |
1,223,780 |
43,394 |
11,523 |
555,241 |
E – Unrecoverable risk |
2,550,668 |
28,750 |
6,075 |
2,142,931 |
28,750 |
5,931 |
407,881 |
Total |
93,916,165 |
1,661,469 |
37,188 |
4,953,104 |
114,614 |
19,809 |
90,527,295 |
Consumer |
Loans |
Provision |
Total net |
||||
|---|---|---|---|---|---|---|---|
Category |
Capital |
Interest and/or financial component |
Other items |
Capital |
Interest and/or financial component |
Other items |
|
In millions of COP | |||||||
A – Normal risk |
32,413,615 |
517,717 |
64,264 |
1,372,121 |
21,829 |
3,139 |
31,598,507 |
B – Acceptable risk |
1,062,168 |
35,307 |
5,318 |
127,120 |
11,640 |
2,299 |
961,734 |
C – Appreciable risk |
898,748 |
29,112 |
5,546 |
193,193 |
22,939 |
4,826 |
712,448 |
D – Significant risk |
1,511,693 |
52,257 |
11,365 |
1,448,226 |
52,257 |
11,350 |
63,482 |
E – Unrecoverable risk |
2,173,238 |
64,509 |
17,656 |
2,108,782 |
64,509 |
17,496 |
64,616 |
59
Consumer |
Loans |
Provision |
Total net |
||||
|---|---|---|---|---|---|---|---|
Category |
Capital |
Interest and/or financial component |
Other items |
Capital |
Interest and/or financial component |
Other items |
|
In millions of COP | |||||||
Total |
38,059,462 |
698,902 |
104,149 |
5,249,442 |
173,174 |
39,110 |
33,400,787 |
Leasing |
Loans |
Provision |
Total net |
|||||
|---|---|---|---|---|---|---|---|---|
Category |
Capital |
Interest and/or financial component |
Other items |
Capital |
Interest and/or financial component |
Other items |
||
In millions of COP | ||||||||
A – Normal risk |
21,592,066 |
175,325 |
2,404,759 |
435,169 |
3,829 |
37,879 |
23,695,273 |
|
B – Acceptable risk |
538,105 |
7,852 |
12,592 |
25,701 |
565 |
907 |
531,376 |
|
C – Appreciable risk |
328,825 |
4,816 |
16,995 |
27,587 |
3,234 |
12,688 |
307,127 |
|
D – Significant risk |
430,928 |
35,678 |
55,351 |
224,699 |
35,664 |
42,956 |
218,638 |
|
E – Unrecoverable risk |
346,214 |
73,062 |
33,631 |
326,783 |
72,005 |
33,320 |
20,799 |
|
Total |
23,236,138 |
296,733 |
2,523,328 |
1,039,939 |
115,297 |
127,750 |
24,773,213 |
|
Mortgage |
Loans |
Provision |
Total net |
||||
|---|---|---|---|---|---|---|---|
Category |
Capital |
Interest and/or financial component |
Other items |
Capital |
Interest and/or financial component |
Other items |
|
In Millions of COP | |||||||
A – Normal risk |
20,535,984 |
200,004 |
2,549 |
421,655 |
2,073 |
26 |
20,314,783 |
B – Acceptable risk |
424,654 |
4,934 |
654 |
34,213 |
4,934 |
654 |
390,441 |
C – Appreciable risk |
210,292 |
921 |
866 |
110,781 |
921 |
866 |
99,511 |
D – Significant risk |
249,828 |
2,383 |
1,076 |
188,885 |
2,383 |
1,076 |
60,943 |
E – Unrecoverable risk |
198,883 |
3,279 |
3,951 |
198,883 |
3,279 |
3,951 |
- |
Total |
21,619,641 |
211,521 |
9,096 |
954,417 |
13,590 |
6,573 |
20,865,678 |
Small business loans |
Loans |
Provision |
Total net |
||||
|---|---|---|---|---|---|---|---|
Category |
Capital |
Interest and/or financial component |
Other items |
Capital |
Interest and/or financial component |
Other items |
|
In millions of COP | |||||||
A – Normal risk |
439,705 |
7,609 |
1,040 |
9,739 |
173 |
29 |
438,413 |
B – Acceptable risk |
16,911 |
774 |
127 |
644 |
774 |
127 |
16,267 |
C – Appreciable risk |
11,175 |
503 |
109 |
6,858 |
503 |
109 |
4,317 |
D – Significant risk |
19,715 |
867 |
244 |
19,257 |
867 |
243 |
459 |
E – Unrecoverable risk |
45,559 |
2,216 |
1,123 |
42,875 |
2,216 |
1,119 |
2,688 |
Total |
533,065 |
11,969 |
2,643 |
79,373 |
4,533 |
1,627 |
462,144 |
Total loans |
Loans |
Provision |
Total Net |
|||||
Category |
Capital |
Interest and/or financial component |
Other items |
Capital |
Interest and/or financial component |
Other items |
||
In millions of COP | ||||||||
A – Normal risk |
162,636,612 |
2,403,220 |
2,488,770 |
3,471,060 |
52,434 |
41,651 |
163,963,457 |
|
B – Acceptable risk |
3,342,004 |
123,410 |
20,545 |
384,749 |
25,992 |
4,379 |
3,070,839 |
|
C – Appreciable risk |
2,080,122 |
47,569 |
25,080 |
495,365 |
37,458 |
19,874 |
1,600,074 |
|
D – Significant risk |
3,991,171 |
134,579 |
79,573 |
3,104,847 |
134,565 |
67,148 |
898,763 |
|
E – Unrecoverable risk |
5,314,562 |
171,816 |
62,436 |
4,820,254 |
170,759 |
61,817 |
495,984 |
|
Total |
177,364,471 |
2,880,594 |
2,676,404 |
12,276,275 |
421,208 |
194,869 |
170,029,117 |
|
As of December 31, 2022
Commercial |
Loans |
Provision |
Total net |
||||
|---|---|---|---|---|---|---|---|
Category |
Capital |
Interest and/or financial component |
Other items |
Capital |
Interest and/or financial component |
Other items |
|
In millions of COP | |||||||
A – Normal risk |
84,539,907 |
1,195,434 |
14,450 |
1,223,332 |
20,185 |
660 |
84,505,614 |
B – Acceptable risk |
1,025,676 |
24,107 |
1,949 |
49,509 |
3,768 |
440 |
998,015 |
C – Appreciable risk |
481,071 |
5,028 |
1,585 |
59,275 |
2,915 |
1,306 |
424,188 |
60
Commercial |
Loans |
Provision |
Total net |
||||
|---|---|---|---|---|---|---|---|
Category |
Capital |
Interest and/or financial component |
Other items |
Capital |
Interest and/or financial component |
Other items |
|
In millions of COP | |||||||
D – Significant risk |
1,092,208 |
21,742 |
10,236 |
697,915 |
21,742 |
10,225 |
394,304 |
E – Unrecoverable risk |
3,480,725 |
28,866 |
5,959 |
2,908,190 |
28,866 |
5,832 |
572,662 |
Total |
90,619,587 |
1,275,177 |
34,179 |
4,938,221 |
77,476 |
18,463 |
86,894,783 |
Consumer |
Loans |
Provision |
Total net |
||||
|---|---|---|---|---|---|---|---|
Category |
Capital |
Interest and/or financial component |
Other items |
Capital |
Interest and/or financial component |
Other items |
|
In millions of COP | |||||||
A – Normal risk |
36,364,084 |
495,949 |
68,983 |
1,510,773 |
20,001 |
3,044 |
35,395,198 |
B – Acceptable risk |
896,948 |
24,440 |
4,129 |
102,683 |
6,630 |
1,386 |
814,818 |
C – Appreciable risk |
662,595 |
18,706 |
3,734 |
137,633 |
14,352 |
3,168 |
529,882 |
D – Significant risk |
995,508 |
25,408 |
6,921 |
955,341 |
25,408 |
6,916 |
40,172 |
E – Unrecoverable risk |
1,274,346 |
32,040 |
10,136 |
1,239,644 |
32,040 |
10,079 |
34,759 |
Total |
40,193,481 |
596,543 |
93,903 |
3,946,074 |
98,431 |
24,593 |
36,814,829 |
Leasing |
Loans |
Provision |
Total net |
|||||
|---|---|---|---|---|---|---|---|---|
Category |
Capital |
Interest and/or financial component |
Other items |
Capital |
Interest and/or financial component |
Other items |
||
In millions of COP | ||||||||
A – Normal risk |
20,867,142 |
157,827 |
3,683,805 |
378,379 |
3,444 |
59,531 |
24,267,420 |
|
B – Acceptable risk |
454,833 |
6,222 |
38,428 |
21,698 |
401 |
2,861 |
474,523 |
|
C – Appreciable risk |
232,176 |
4,429 |
7,674 |
19,378 |
3,112 |
5,874 |
215,915 |
|
D – Significant risk |
320,915 |
23,384 |
17,578 |
176,570 |
23,373 |
17,578 |
144,356 |
|
E – Unrecoverable risk |
389,726 |
73,212 |
115,798 |
377,464 |
73,125 |
115,798 |
12,349 |
|
Total |
22,264,792 |
265,074 |
3,863,283 |
973,489 |
103,455 |
201,642 |
25,114,563 |
|
Mortgage |
Loans |
Provision |
Total net |
||||
|---|---|---|---|---|---|---|---|
Category |
Capital |
Interest and/or financial component |
Other items |
Capital |
Interest and/or financial component |
Other items |
|
In millions of COP | |||||||
A – Normal risk |
18,747,967 |
199,999 |
1,826 |
382,983 |
2,662 |
18 |
18,564,129 |
B – Acceptable risk |
253,748 |
2,085 |
362 |
17,717 |
2,085 |
362 |
236,031 |
C – Appreciable risk |
109,225 |
540 |
523 |
57,866 |
540 |
523 |
51,359 |
D – Significant risk |
150,950 |
1,313 |
608 |
114,656 |
1,313 |
608 |
36,294 |
E – Unrecoverable risk |
224,506 |
2,670 |
4,755 |
224,506 |
2,670 |
4,755 |
- |
Total |
19,486,396 |
206,607 |
8,074 |
797,728 |
9,270 |
6,266 |
18,887,813 |
Small business loans |
Loans |
Provision |
Total net |
||||
|---|---|---|---|---|---|---|---|
Category |
Capital |
Interest and/or financial component |
Other items |
Capital |
Interest and/or financial component |
Other items |
|
In millions of COP | |||||||
A – Normal risk |
471,357 |
9,214 |
863 |
10,644 |
339 |
32 |
470,419 |
B – Acceptable risk |
16,693 |
830 |
128 |
577 |
830 |
128 |
16,116 |
C – Appreciable risk |
9,266 |
410 |
107 |
5,702 |
410 |
106 |
3,565 |
D – Significant risk |
14,845 |
659 |
210 |
14,490 |
659 |
210 |
355 |
E – Unrecoverable risk |
37,801 |
1,963 |
1,137 |
36,251 |
1,963 |
1,135 |
1,552 |
Total |
549,962 |
13,076 |
2,445 |
67,664 |
4,201 |
1,611 |
492,007 |
Total loans |
Loans |
Provision |
Total net |
|||||
Category |
Capital |
Interest and/or financial component |
Other items |
Capital |
Interest and/or financial component |
Other items |
||
In millions of COP | ||||||||
A – Normal risk |
160,990,457 |
2,058,423 |
3,769,927 |
3,506,111 |
46,631 |
63,285 |
163,202,780 |
|
B – Acceptable risk |
2,647,898 |
57,684 |
44,996 |
192,184 |
13,714 |
5,177 |
2,539,503 |
|
C – Appreciable risk |
1,494,333 |
29,113 |
13,623 |
279,854 |
21,329 |
10,977 |
1,224,909 |
|
61
D – Significant risk |
2,574,426 |
72,506 |
35,553 |
1,958,972 |
72,495 |
35,537 |
615,481 |
E – Unrecoverable risk |
5,407,104 |
138,751 |
137,785 |
4,786,055 |
138,664 |
137,599 |
621,322 |
Total |
173,114,218 |
2,356,477 |
4,001,884 |
10,723,176 |
292,833 |
252,575 |
168,203,995 |
By geographic location
As of December 31, 2023 and 2022, the following is the detail of the loan portfolio and leasing operations according to the zone where the loan was created:
As of December 31, 2023
|
Location |
Loans |
Provision |
Total net |
||||
|---|---|---|---|---|---|---|---|
Capital |
Interest and/or financial component |
Other items |
Capital |
Interest and/or financial component |
Other items |
||
In millions of COP | |||||||
Antioquia |
62,217,145 |
979,180 |
1,008,386 |
4,334,701 |
106,060 |
54,155 |
59,709,795 |
Bogotá y Sabana |
56,091,415 |
982,157 |
1,128,678 |
3,079,839 |
153,992 |
60,403 |
54,908,016 |
Centro |
14,886,930 |
246,096 |
118,041 |
1,296,201 |
45,362 |
15,414 |
13,894,090 |
Norte |
19,324,428 |
309,431 |
262,998 |
1,512,356 |
55,796 |
45,406 |
18,283,299 |
Sur |
21,843,035 |
319,516 |
158,301 |
1,891,575 |
50,028 |
19,491 |
20,359,758 |
Panamá |
3,001,518 |
44,214 |
- |
161,603 |
9,970 |
- |
2,874,159 |
Total |
177,364,471 |
2,880,594 |
2,676,404 |
12,276,275 |
421,208 |
194,869 |
170,029,117 |
As of December 31, 2022
|
Location |
Loans |
Provision |
Total net |
||||
|---|---|---|---|---|---|---|---|
Capital |
Interest and/or financial component |
Other items |
Capital |
Interest and/or financial component |
Other items |
||
In millions of COP | |||||||
Antioquia |
58,417,695 |
714,611 |
1,662,212 |
3,308,012 |
73,360 |
51,800 |
57,361,346 |
Bogotá y Sabana |
56,839,351 |
864,432 |
1,510,207 |
3,371,518 |
119,415 |
58,300 |
55,664,757 |
Centro |
14,692,254 |
215,860 |
219,647 |
1,033,532 |
30,224 |
15,946 |
14,048,059 |
Norte |
17,762,799 |
245,426 |
415,400 |
1,220,047 |
33,879 |
111,260 |
17,058,439 |
Sur |
21,861,747 |
281,890 |
194,418 |
1,670,202 |
34,641 |
15,269 |
20,617,943 |
Panamá |
3,540,372 |
34,258 |
- |
119,865 |
1,314 |
- |
3,453,451 |
Total |
173,114,218 |
2,356,477 |
4,001,884 |
10,723,176 |
292,833 |
252,575 |
168,203,995 |
By monetary units
The following is the loan and lease portfolio according to the monetary unit in which the loan is created as of December 31, 2023 and 2022:
As of December 31, 2023
|
Monetary units |
|
||
|---|---|---|---|---|
Category |
Legal Currency |
Foreign Currency |
UVR |
Total |
In millions of COP | ||||
Commercial |
84,690,072 |
5,233,176 |
5,691,574 |
95,614,822 |
Consumer |
38,189,099 |
673,414 |
- |
38,862,513 |
Leasing |
25,937,719 |
118,480 |
- |
26,056,199 |
Mortgage |
16,919,390 |
- |
4,920,868 |
21,840,258 |
Small business loans |
547,677 |
- |
- |
547,677 |
Total |
166,283,957 |
6,025,070 |
10,612,442 |
182,921,469 |
62
As of December 31, 2022
|
Monetary units |
|
||
|---|---|---|---|---|
Category |
Legal Currency |
Foreign Currency |
UVR |
Total |
In millions of COP | ||||
Commercial |
78,208,393 |
8,541,659 |
5,178,891 |
91,928,943 |
Consumer |
40,123,026 |
760,901 |
- |
40,883,927 |
Leasing |
25,961,725 |
431,424 |
- |
26,393,149 |
Mortgage |
16,067,286 |
- |
3,633,791 |
19,701,077 |
Small business loans |
565,483 |
- |
- |
565,483 |
Total |
160,925,913 |
9,733,984 |
8,812,682 |
179,472,579 |
Restructured loan portfolio and leasing operations
By type of restructuring:
As of December 31, 2023
Type |
Loans |
Provision |
Total net |
||||
Capital |
Interest and/or financial component |
Other items |
Capital |
Interest and/or financial component |
Other items |
||
In millions of COP | |||||||
Law 550 and/or 1116 |
1,288,215 |
16,174 |
10,686 |
928,120 |
15,885 |
10,585 |
360,485 |
Restructuring due to conciliations with clients |
4,021,739 |
135,538 |
51,892 |
2,658,408 |
114,820 |
48,199 |
1,387,742 |
Total |
5,309,954 |
151,712 |
62,578 |
3,586,528 |
130,705 |
58,784 |
1,748,227 |
As of December 31, 2022
Type |
Loans |
Provision |
Total net |
||||
Capital |
Interest and/or financial component |
Other items |
Capital |
Interest and/or financial component |
Other items |
||
In millions of COP | |||||||
Law 550 and/or 1116 |
1,297,102 |
17,911 |
9,362 |
945,587 |
17,814 |
9,274 |
351,700 |
Restructuring due to conciliations with clients |
3,103,122 |
76,629 |
26,982 |
1,961,835 |
56,117 |
23,562 |
1,165,219 |
Total |
4,400,224 |
94,540 |
36,344 |
2,907,422 |
73,931 |
32,836 |
1,516,919 |
Loans restructured by rating
As of December 31, 2023
Rating |
Loans |
Provision |
Total net |
||||
Capital |
Interest and/or |
Other items |
Capital |
Interest and/or |
Other items |
||
63
financial component |
financial component |
||||||
In millions of COP | |||||||
A – Normal risk |
439,339 |
14,899 |
1,480 |
20,388 |
3,284 |
551 |
431,495 |
B – Acceptable risk |
381,691 |
14,956 |
2,617 |
47,690 |
8,489 |
888 |
342,197 |
C – Appreciable risk |
395,430 |
9,180 |
12,291 |
78,466 |
6,295 |
11,416 |
320,724 |
D – Significant risk |
1,121,405 |
37,991 |
14,992 |
898,684 |
37,982 |
14,980 |
222,742 |
E – Unrecoverable risk |
2,972,089 |
74,686 |
31,198 |
2,541,300 |
74,655 |
30,949 |
431,069 |
Total |
5,309,954 |
151,712 |
62,578 |
3,586,528 |
130,705 |
58,784 |
1,748,227 |
As of December 31, 2022
Rating |
Loans |
Provision |
Total net |
||||
Capital |
Interest and/or financial component |
Other items |
Capital |
Interest and/or financial component |
Other items |
||
In millions of COP | |||||||
A – Normal risk |
468,645 |
15,568 |
2,434 |
17,646 |
1,706 |
505 |
466,790 |
B – Acceptable risk |
286,719 |
8,513 |
2,082 |
29,052 |
3,596 |
478 |
264,188 |
C – Appreciable risk |
251,161 |
6,039 |
1,888 |
50,157 |
4,187 |
1,768 |
202,976 |
D – Significant risk |
743,537 |
20,393 |
10,732 |
531,257 |
17,327 |
8,706 |
217,372 |
E – Unrecoverable risk |
2,650,162 |
44,027 |
19,208 |
2,279,310 |
47,115 |
21,379 |
365,593 |
Total |
4,400,224 |
94,540 |
36,344 |
2,907,422 |
73,931 |
32,836 |
1,516,919 |
Loans restructured by geographic location
As of December 31, 2023
Location |
Loans |
Provision |
Total net |
||||
Capital |
Interest and/or financial component |
Other items |
Capital |
Interest and/or financial component |
Other items |
||
In millions of COP | |||||||
Antioquia |
1,344,322 |
42,394 |
19,127 |
891,364 |
36,652 |
18,576 |
459,251 |
Bogotá y Sabana |
1,454,189 |
53,477 |
17,491 |
917,580 |
47,328 |
15,801 |
544,448 |
Centro |
626,267 |
15,105 |
4,399 |
405,743 |
12,106 |
3,987 |
223,935 |
Norte |
796,059 |
19,349 |
10,028 |
533,914 |
16,833 |
9,490 |
265,199 |
Sur |
1,089,117 |
21,387 |
11,533 |
837,927 |
17,786 |
10,930 |
255,394 |
Total |
5,309,954 |
151,712 |
62,578 |
3,586,528 |
130,705 |
58,784 |
1,748,227 |
As of December 31, 2022
Location |
Loans |
Provision |
Total net |
||||
Capital |
Interest and/or financial component |
Other items |
Capital |
Interest and/or financial component |
Other items |
||
In millions of COP | |||||||
Antioquia |
910,049 |
22,936 |
8,429 |
572,809 |
16,975 |
7,765 |
343,865 |
Bogotá y Sabana |
1,444,813 |
36,500 |
12,587 |
883,381 |
30,569 |
11,062 |
568,888 |
Centro |
447,751 |
9,503 |
3,309 |
275,396 |
6,817 |
3,037 |
175,313 |
Norte |
664,018 |
13,495 |
8,818 |
452,770 |
10,534 |
8,381 |
214,646 |
Sur |
933,593 |
12,106 |
3,201 |
723,066 |
9,036 |
2,591 |
214,207 |
Total |
4,400,224 |
94,540 |
36,344 |
2,907,422 |
73,931 |
32,836 |
1,516,919 |
Loans restructured by economic sector
64
As of December 31, 2023
Sector |
Loans |
Provision |
Total net |
||||
Capital |
Interest and/or financial component |
Other items |
Capital |
Interest and/or financial component |
Other items |
||
In millions of COP | |||||||
Agriculture, forestry, fishing and hunting |
158,148 |
4,786 |
1,956 |
101,439 |
4,005 |
1,823 |
57,623 |
Customer portfolio for natural person |
2,505,994 |
84,824 |
15,823 |
1,732,561 |
70,237 |
14,284 |
789,559 |
Commerce, restaurants and hotels |
841,391 |
19,019 |
7,595 |
553,552 |
17,361 |
6,991 |
290,101 |
Manufacturing |
1,149,875 |
31,250 |
25,370 |
734,136 |
28,322 |
24,375 |
419,662 |
Social and personal communal services |
239,834 |
6,623 |
2,457 |
146,518 |
6,161 |
2,010 |
94,225 |
Financial services, real estate, business |
12,950 |
575 |
129 |
8,529 |
544 |
127 |
4,454 |
Transport and communications |
401,762 |
4,635 |
9,248 |
309,793 |
4,075 |
9,174 |
92,603 |
Total |
5,309,954 |
151,712 |
62,578 |
3,586,528 |
130,705 |
58,784 |
1,748,227 |
As of December 31, 2022
Sector |
Loans |
Provision |
Total net |
||||
Capital |
Interest and/or financial component |
Other items |
Capital |
Interest and/or financial component |
Other items |
||
In millions of COP | |||||||
Agriculture, forestry, fishing and hunting |
166,379 |
2,797 |
1,843 |
103,013 |
2,169 |
1,726 |
64,111 |
Customer portfolio for natural person |
1,508,807 |
42,681 |
7,919 |
913,856 |
28,423 |
6,632 |
610,496 |
Commerce, restaurants and hotels |
744,008 |
15,452 |
6,176 |
469,772 |
13,654 |
4,790 |
277,420 |
Manufacturing |
1,095,885 |
25,998 |
12,849 |
777,542 |
22,951 |
12,354 |
321,885 |
Social and personal communal services |
232,350 |
5,247 |
2,106 |
144,106 |
4,669 |
1,918 |
89,010 |
Financial services, real estate, business |
6,618 |
184 |
27 |
4,172 |
146 |
26 |
2,485 |
Transport and communications |
646,177 |
2,181 |
5,424 |
494,961 |
1,919 |
5,390 |
151,512 |
Total |
4,400,224 |
94,540 |
36,344 |
2,907,422 |
73,931 |
32,836 |
1,516,919 |
Provision for impairment of loan portfolio and leasing operations
The tables below display the rollforward of the allowance for loans and leasing operations losses as of December 31, 2023 and 2022:
As of December 31, 2023
65
Loans |
Commercial |
Consumer |
Leasing |
Mortgage |
Small business loans |
Total |
|---|---|---|---|---|---|---|
In millions of COP | ||||||
(+) Balance at December 31, 2022 |
5,034,160 |
4,069,098 |
1,278,586 |
813,264 |
73,476 |
11,268,584 |
(+) Charged-off-loan recovery |
47,591 |
285,768 |
59,732 |
33,410 |
1,797 |
428,298 |
(+) Impairment of loan portfolio and leasing operations, net (1) |
1,362,636 |
4,891,574 |
194,354 |
201,287 |
73,484 |
6,723,335 |
(-) Period charges-off |
621,663 |
3,784,714 |
249,686 |
73,381 |
63,224 |
4,792,668 |
(-) Sold portfolio provisions(2) |
735,197 |
- |
- |
- |
- |
735,197 |
Balance at December 31, 2023 |
5,087,527 |
5,461,726 |
1,282,986 |
974,580 |
85,533 |
12,892,352 |
| (1) | Includes exchange difference of COP 36,551. |
| (2) | Charged-off-loans are still in recovery management. |
Al 31 de diciembre de 2022
Loans |
Commercial |
Consumer |
Leasing |
Mortgage |
Small business loans |
Total |
|---|---|---|---|---|---|---|
In millions of COP | ||||||
(+) Balance at December 31, 2021 |
5,619,324 |
3,507,642 |
1,642,714 |
916,658 |
105,112 |
11,791,450 |
(+) Charged-off-loan recovery |
159,174 |
193,382 |
69,481 |
21,527 |
25 |
443,589 |
(+) Impairment of loan portfolio and leasing operations, net |
619,770 |
2,543,311 |
(285,761) |
38,456 |
40,707 |
2,956,483 |
(-) Period charges-off (1) |
1,109,508 |
2,175,237 |
147,848 |
163,377 |
72,368 |
3,668,338 |
(-) Sold portfolio provisions |
267,637 |
- |
- |
- |
- |
267,637 |
(+) Exchange difference, net |
13,037 |
- |
- |
- |
- |
13,037 |
Balance at December 31, 2022 |
5,034,160 |
4,069,098 |
1,278,586 |
813,264 |
73,476 |
11,268,584 |
| (1) | Charged-off-loans are still in recovery management. |
Portfolio and leasing operations write-off
The following table shows the portfolio and leasing operations write-off as of December 31, 2023 and 2022:
As of December 31, 2023
Loans |
Capital |
Interest and/or financial component |
Other items |
Total |
In millions of COP | ||||
Commercial |
579,463 |
28,893 |
13,307 |
621,663 |
Consumer |
3,590,857 |
124,065 |
69,792 |
3,784,714 |
Leasing |
168,045 |
54,331 |
27,310 |
249,686 |
Mortgage |
57,466 |
14,713 |
1,202 |
73,381 |
Small business loans |
57,132 |
4,057 |
2,035 |
63,224 |
Total |
4,452,963 |
226,059 |
113,646 |
4,792,668 |
As of December 31, 2022
Loans |
Capital |
Interest and/or financial component |
Other items |
Total |
In millions of COP | ||||
Commercial |
1,054,555 |
44,595 |
10,358 |
1,109,508 |
Consumer |
2,054,481 |
78,587 |
42,169 |
2,175,237 |
Leasing |
83,031 |
56,726 |
8,091 |
147,848 |
Mortgage |
138,697 |
19,107 |
5,573 |
163,377 |
66
Small business loans |
61,895 |
6,547 |
3,926 |
72,368 |
Total |
3,392,659 |
205,562 |
70,117 |
3,668,338 |
Sales of loans portfolio
The following table shows the purchases and sales of the loan portfolio and leasing operations as of December 31, 2023 and 2022:
As of December 31, 2023
Loan sales | ||
In million of COP | ||
Entity name |
Sale price (1) |
% of the loan sold |
Transición Express SAS. |
243,363 |
100% |
Cerberus South American Investments. |
22,157 |
100% |
CI RAM Inversiones BVI de Colombia S.A.S. |
4,063 |
100% |
SKEMA Promotora S.A. |
2,251 |
100% |
| (1) | See Note 25.4. Other operating income,net – Profit on portfolio sales,net COP 271,834. |
As of December 31, 2022
Loan sales | ||
In million of COP | ||
Entity name |
Sale price (1) |
% of the loan sold |
Merrill Lynch Credit Products |
55,596 |
100% |
| (1) | See Note 25.4. Other operating income,net – Profit on portfolio sales,net COP 56,682. |
NOTE 6. LEASES
6.1 Lessor
Finance leases
The Bank has entered into leases as lessor. These leases relate to machinery and equipment, computer equipment, vehicles and furniture and fixtures, and their terms range from one to thirty years, as detailed below:
As of December 31, 2023
Period |
Gross investment |
Present value of minimum payments |
In millions of COP | ||
Less than 1 year |
966,212 |
777,995 |
Between 1 and 3 years |
4,189,482 |
2,695,144 |
Between 3 and 5 years |
6,384,736 |
3,861,606 |
Más de 5 años |
34,029,393 |
18,721,454 |
Total gross investment/ present value of minimum payments |
45,569,823 |
26,056,199 |
Future financial income (1) |
(19,513,624) |
- |
Present value of payments receivable (2) |
26,056,199 |
26,056,199 |
Minimum non-collectable payments impairment |
(1,282,986) |
(1,282,986) |
Total |
24,773,213 |
24,773,213 |
| (1) | Future financial income: Total Gross Investment - Total Present Value of minimum payments. |
67
| (2) | See Note 5 Loans And Advances to customers,net. |
As of December 31, 2022
Period |
Gross investment |
Present value of minimum payments |
In millions of COP | ||
Less than 1 year |
598,735 |
528,046 |
Between 1 and 3 years |
3,488,857 |
2,381,538 |
Between 3 and 5 years |
6,268,149 |
4,251,095 |
Más de 5 años |
33,293,994 |
19,232,470 |
Total gross investment/ present value of minimum payments |
43,649,735 |
26,393,149 |
Future financial income (1) |
(17,256,586) |
- |
Present value of payments receivable (2) |
26,393,149 |
26,393,149 |
Minimum non-collectable payments impairment |
(1,278,586) |
(1,278,586) |
Total |
25,114,563 |
25,114,563 |
| (1) | Future financial income: Total Gross Investment - Total Present Value of minimum payments. |
| (2) | See Note 5 Loans And Advances to customers,net. |
Unsecured residual value (*)
At the end of the reported period,the residual values not guaranteed by the assets tha are under financial leasing are:
Type of asset |
December 31, 2023 |
December 31, 2022 |
In millions of COP | ||
|
Vehicles Technological equipment Machinery and equipment |
99,874 49,457 3,031 |
25,283 47,270 1,486 |
Total |
152,362 |
74,039 |
(*) The unsecured residual value is the part of the residual value of the leased asset, whose realization is not secured or is secured by a third party related to the lessor.
Amounts recognized as income for extensions
At the end of the reporting period, the following entries are recognized as income corresponding to contract extensions or automatic time extension of financial leasing contracts:
Type of asset |
December 31, 2023 |
December 31, 2022 |
In millions of COP | ||
Technological equipment |
20,717 |
30,905 |
Buildings |
8,088 |
3,905 |
Machinery and equipment |
532 |
497 |
Vehicles |
102 |
205 |
Total |
29,439 |
34,682 |
Amounts recognized as income from finance leases
The Bank has recognized income from financial leasing operations as of December 31, 2023 and 2022 for COP 3,623,476 and COP 2,396,276, respectively.
Gross investment growth: Increase in finance leases during the period
68
The following information corresponds to the gross investment growth in finance leases during the current period:
Diciembre 31, 2023 |
Diciembre 31, 2022 |
|
In millions of COP |
|
|
Gross investment in finance leases |
7,352,215 |
9,270,824 |
Unearned income |
(3,159,541) |
(4,086,220) |
Written off leases |
(1,363,613) |
(1,876,098) |
Total |
2,829,061 |
3,308,506 |
Operating leases
The Bank leases assets to third parties under operating leases. Assets leased under operating leases are recorded as premises and equipment. The terms established for these agreements range from six months to ten years.
The following table presents the information of minimum payments by lease to be received:
Period |
December 31, 2023 (1) |
December 31, 2022 |
||
In millions of COP | ||||
Less than 1 year |
116,193 |
76,156 |
||
Between 1 and 3 years |
945,825 |
677,148 |
||
Between 3 and 5 years |
1,124,074 |
567,172 |
||
Más de 5 años |
398,645 |
330,949 |
||
Total |
2,584,737 |
1,651,425 |
||
| (1) | The increment is mainly due to activations of vehicle contracts. |
Amounts recognized as income from operating leases
The Bank has recognized income from operating leases as of December 31, 2023 and 2022 for COP 999,207 and COP 567,315 respectively, see Note 25.4. Other operating income, net.
Risk management as lessor
The Bank offers leasing services, acting as lessor, has a comprehensive risk assessment model for those assets classified as property, plant and equipment. The model includes the impairment test performed annually for this type of assets, where external (economic and legal) and internal (insurance, maintenance, sales) indicators that impact the assets and their environment are evaluated. The lessor carries out a detailed review process at the time the asset is returned by the lessees to ensure its operating conditions and determine the necessary adjustments. Additionally, the bank has the participation of experts, independent of the sales force, who permanently monitor the market conditions of pre-owned assets, performing retrospective tests of the consistency of the variables involved in the estimation of residual value (commercial value minus sales costs) and periodically reviewing the results of the model with key executives All of the above, complemented by agreements with suppliers for the exchange of information, knowledge and in some cases, structuring the residual risk mitigation mechanisms.
In order to manage the risks associated with the assets, the Bank also employs an insurance department, and engages an international broker and insurance companies. They all serve as support to design and define the strategies for the different types of protection that cover the lessor's risks, assets and customers.
69
6.2. Lessee
The Bank has entered into lease agreements as a lessee. These arrangements involve offices, branches and administrative offices as well as certain Computer equipment.
6.2.1. Right-of-use assets under lease, net
As of December 31, 2023 and 2022, the rollforward of right-of-use assets was as follows:
As of December 31, 2023
Right-of-use assets |
Balance at January 01, 2023 |
|
Roll - forward |
Balance at December 31, 2023 |
||||||
Acquisitions (1) |
Additions (2) |
Depreciation expense (3) |
Impairment expense (3) |
Disposals (4) |
Revaluation (5) |
|||||
|
In millions of COP |
|||||||||
Buildings |
|
|||||||||
Cost |
1,476,159 |
37,443 |
19,436 |
- |
- |
(42,578) |
205,731 |
1,696,191 |
||
Accumulated depreciation |
(367,891) |
- |
- |
(129,221) |
- |
25,842 |
- |
(471,270) |
||
Impairment |
- |
- |
- |
- |
(489) |
489 |
- |
- |
||
Computer equipment |
|
|
||||||||
Cost |
32,734 |
- |
- |
- |
- |
(28,478) |
(3,681) |
575 |
||
Accumulated depreciation |
(24,518) |
- |
- |
(3,706) |
- |
27,849 |
- |
(375) |
||
Vehicles |
|
|
||||||||
Cost |
1,260 |
3,853 |
- |
- |
- |
- |
522 |
5,635 |
||
Accumulated depreciation |
(1,091) |
- |
- |
(1,016) |
- |
- |
- |
(2,107) |
||
Total cost |
1,510,153 |
41,296 |
19,436 |
- |
- |
(71,056) |
202,572 |
1,702,401 |
||
Total accumulated depreciation |
(393,500) |
- |
- |
(133,943) |
- |
53,691 |
- |
(473,752) |
||
Total impairment |
- |
- |
- |
- |
(489) |
489 |
- |
- |
||
Total right-of-use assets, net |
1,116,653 |
41,296 |
19,436 |
(133,943) |
(489) |
(16,876) |
202,572 |
1,228,649 |
||
As of December 31, 2022
Right-of-use assets |
Balance at January 01, 2022 |
|
Roll - forward |
Balance at December 31, 2022 |
||||||
Acquisitions (1) |
Additions (2) |
Depreciation expense (3) |
Impairment expense (3) |
Disposals (4) |
Revaluation |
|||||
|
In millions of COP |
|||||||||
Buildings |
|
|||||||||
Cost |
1,387,248 |
26,321 |
27,075 |
- |
- |
(51,059) |
86,574 |
1,476,159 |
||
Accumulated depreciation |
(282,367) |
- |
- |
(114,092) |
- |
28,568 |
- |
(367,891) |
||
Impairment |
- |
- |
- |
- |
(513) |
513 |
- |
- |
||
Computer equipment |
|
|
||||||||
Cost |
34,963 |
- |
- |
- |
- |
(199) |
(2,030) |
32,734 |
||
Accumulated depreciation |
(16,791) |
- |
- |
(7,926) |
- |
199 |
- |
(24,518) |
||
Vehicles |
|
|
||||||||
70
Cost |
1,079 |
- |
- |
- |
- |
- |
181 |
1,260 |
||
Accumulated depreciation |
(955) |
- |
- |
(136) |
- |
- |
- |
(1,091) |
||
Total cost |
1,423,290 |
26,321 |
27,075 |
- |
- |
(51,258) |
84,725 |
1,510,153 |
||
Total accumulated depreciation |
(300,113) |
- |
- |
(122,154) |
- |
28,767 |
- |
(393,500) |
||
Total impairment |
- |
- |
- |
- |
(513) |
513 |
- |
- |
||
Total right-of-use assets, net |
1,123,177 |
26,321 |
27,075 |
(122,154) |
(513) |
(21,978) |
84,725 |
1,116,653 |
||
| (1) | The main acquisitions for properties are due to: Plaza Fabricato Branch for COP 3,093, branch in Puerta del Norte 2 Shopping Center for COP 2,938, La Serrezuela Branch for COP 2,802. |
| (2) | The main aditions for the properties correspond to: FIC48 (Sede Medellín) for COP 14,421 and Plaza Fabricato branch for COP 2,420. |
| (3) | See Note 26.3. Amortization, depreciation y impairment. |
| (4) | The main disposals are related to Olaya Herrera business Center for COP 15,892, San Martin Torre Central building for COP 14,540, Pablo Tobón Uribe Hospital for COP 3,367 and Banca Colombia Rosales Branch for COP 3,324. |
| (5) | The main contract modifications for properties of fee and rate corresponds to: Building 9211 (Bogotá North Headquarters) for COP 10,599, Torre Barranquilla Building (Barranquilla Headquarters) for COP 7,710 and Hotel Estelar Barranquilla branch for COP 2,893. |
6.2.2. Lease liabilities, net
The changes in lease liabilities, net, during the year are presented below:
As of December 31, 2023
Concept |
Total |
In millions of COP | |
Balance at January 01, 2023 |
1,252,263 |
(+) New contracts |
41,132 |
(+) Reassessment of the lease liability (1) |
175,809 |
(-) Made-payments amortization |
218,112 |
(+)Accrued Interest |
101,210 |
Saldo a diciembre 31, 2023 |
1,352,302 |
| (1) | The increase is mainly due to changes in the estimate of the term of contracts for the properties that led to an adjustment of $84,703. |
As of December 31, 2022
Concept |
Total |
In millions of COP | |
Balance at January 01, 2022 |
1,278,568 |
(+) New contracts |
26,175 |
(+) Reassessment of the lease liability |
52,186 |
(-) Made-payments amortization |
200,042 |
(+)Accrued Interest |
95,376 |
Saldo a diciembre 31, 2022 |
1,252,263 |
The following table shows maturity analysis of lease liabilities as of December 31, 2023 and 2022:
As of December 31, 2023
Type of assets |
Maturity less than 1 year |
Maturity between 1 and 3 years |
Maturity between 3 and 5 years |
Maturity more than 5 years |
Total lease liabilities, net |
71
In millions of COP | |||||
Buildings |
7,837 |
27,130 |
225,727 |
1,087,682 |
1,348,376 |
Vehicles |
94 |
- |
3,634 |
- |
3,728 |
Computer equipment (1) |
198 |
- |
- |
- |
198 |
Total pasivos por arrendamiento, neto |
8,129 |
27,130 |
229,361 |
1,087,682 |
1,352,302 |
(1) As of December 31, 2023 the contract with Axity Colombia SAS was canceled.
As of December 31, 2022
Type of assets |
Maturity less than 1 year |
Maturity between 1 and 3 years |
Maturity between 3 and 5 years |
Maturity more than 5 years |
Total lease liabilities, net |
In millions of COP | |||||
Buildings |
10,764 |
18,785 |
51,956 |
1,160,816 |
1,242,321 |
Vehicles |
83 |
- |
- |
- |
83 |
Computer equipment |
1,477 |
8,382 |
- |
- |
9,859 |
Total pasivos por arrendamiento, neto |
12,324 |
27,167 |
51,956 |
1,160,816 |
1,252,263 |
The following table shows the weighted average rates and average useful life of right-of-use assets as of December 31, 2023 and 2022:
As of December 31, 2023
Type of assets |
Weighted average life (months) |
Weighted average remaining lease terms (months) |
Weighted average discount rates |
Buildings |
259 |
140 |
8.77% |
Vehicles (1) |
62 |
47 |
18.34% |
Computer equipment |
35 |
11 |
6.22% |
(1) The increase in the weighted average of the discount rate is due to the inception of 16 new vehicle contracts.
As of December 31, 2022
Type of assets |
Weighted average life (months) |
Weighted average remaining lease terms (months) |
Weighted average discount rates |
Buildings |
248 |
140 |
8.20% |
Vehicles |
47 |
4 |
5.82% |
Computer equipment |
56 |
12 |
5.75% |
Reconocimiento en estado de resultados:
The following table shows the detail of leases in the Statement of Income as of December 31, 2023 and 2022:
As of December 31, 2023
Type of assets |
Financial interest(1) |
Depreciation expenses (2) |
Impairment expenses (2) |
Short-term leases |
Low-cost leasing (3) |
Early termination fine expense (4) |
In millions of COP | ||||||
Buildings |
89,368 |
129,221 |
489 |
- |
- |
1,281 |
Vehicles |
567 |
1,016 |
- |
121 |
- |
- |
Computer equipment |
737 |
3,706 |
- |
- |
- |
- |
Furniture and fixtures |
- |
- |
- |
- |
- |
- |
Total |
90,672 |
133,943 |
489 |
121 |
- |
1,281 |
72
| (1) | Interest expense: The balance includes the expense generated by the difference between the carrying value of the right-of-use asset and the lease liability at the time of early termination of lease contracts for COP (10,538). See Note 25.2. Interest expenses. |
| (2) | See Note 26.3. Amortization, depreciation and impairment. |
| (3) | There is not low cost leases contract effects in the reporting period |
| (4) | Corresponds to sanctions for terminating the contract before the agreed date. |
As of December 31, 2022
Type of assets |
Financial interest (1) |
Depreciation expenses (2) |
Impairment expenses (2) |
Short-term leases |
Low-cost leasing |
Early termination fine expense |
In millions of COP | ||||||
Buildings |
85,818 |
114,092 |
513 |
41 |
6 |
32 |
Vehicles |
7 |
136 |
- |
93 |
- |
- |
Computer equipment |
671 |
7,926 |
- |
- |
- |
- |
Furniture and fixtures |
- |
- |
- |
- |
2,291 |
- |
Total |
86,496 |
122,154 |
513 |
134 |
2,297 |
32 |
| (1) | Interest expense: The balance includes the expense generated by the difference between the carrying value of the right-of-use asset and the lease liability at the time of early termination of lease contracts for COP (8,880). See Note 25.2. Interest expenses. |
| (2) | See Note 26.3. Amortization, depreciation and impairment). |
Sublease:
The sublease income from real estate, received as of December 31, 2023 was COP 3,326 and as of December 31, 2022 was COP 199.
NOTE 7. INVESTMENT IN SUBSIDIARIES
The detail of investments in subsidiaries as of December 31, 2023 and 2022 is as below:
|
December 31, 2023 |
December 31, 2022 |
|||||
|
In millions of COP |
||||||
Company name |
Main activity |
Country |
% of ownership |
Investment value |
% of ownership |
Investment value |
|
Banistmo S.A. (1) |
Financial services |
Panamá |
100% |
9,920,304 |
100% |
12,640,048 |
|
Bancolombia Panamá S.A. (1) |
Financial services |
Panamá |
100% |
8,838,482 |
100% |
11,221,104 |
|
FCP Inmobliario Colombia S.A. |
Real estate services |
Colombia |
80.43% |
2,733,074 |
80.43% |
2,493,826 |
|
Banca de Inversión Bancolombia S.A. Corporación Financiera |
Financial services |
Colombia |
94.90% |
1,394,710 |
94.90% |
1,744,834 |
|
Bancolombia Puerto Rico Internacional Inc. (1) |
Financial services |
Puerto Rico |
100.% |
580,423 |
100.00% |
636,656 |
|
Fiduciaria Bancolombia S.A. Sociedad Fiduciaria. |
Financial trust services |
Colombia |
94.97% |
490,721 |
94.97% |
449,696 |
|
P.A MERCURIO (2) |
Real estate services |
Colombia |
99.99% |
279,491 |
100% |
254,601 |
|
Valores Bancolombia S.A. Comisionista de Bolsa. |
Trade-broker dealer |
Colombia |
93.61% |
213,275 |
93.61% |
200,611 |
|
P.A NOMAD CENTRAL (3) |
Real estate services |
Colombia |
98.00% |
101,260 |
- |
- |
|
P.A NOMAD CABRERA(4) |
Real estate services |
Colombia |
98.00% |
99,109 |
- |
- |
|
P.A. FAI CALLE 77 (NOMAD77) (3) |
Real estate services |
Colombia |
98.00% |
57,306 |
98.00% |
56,660 |
|
P.A. SALITRE (4) |
Real estate services |
Colombia |
98.00% |
43,790 |
98.00% |
20,661 |
|
Total investment in subsidiaries |
|
24,751,945 |
|
29,718,697 |
|||
73
| (1) | Decrease in the carrying value of investments mainly due to the effect of foreign exchange differences. |
| (2) | As of December 31, 2022, the Bank made purchase and capital contributions for COP 249,492 and for December 2023 for COP 8,503. The equity method income recognized for this investment was COP 17,058 and for restitution of contributions was COP (671). |
| (3) | As of December 2023, the Bank made a purchase of COP 64,680 and capital contributions of COP 41,340. The equity method income recognized for this investment was COP (4,760). |
| (4) | As of December 2023, the Bank made a purchase of COP 85,507 and capital contributions of COP 19,110. The equity method income recognized for this investment was COP (5,508). |
| (5) | As of December 2022, the bank acquired the P.A. FAI CALLE 77 for COP 56,968 and subsequent capitalizations for COP 5,179; in 2023, capital contributions were made for COP 3,585. The equity method income recognized for this investment was COP (2,809), for retained earnings was COP (14) and for restitution of contributions was COP (116). |
| (6) | As of December 31, 2022 the Bank made a purchase for COP 21,560 and for September 2023 made capital contributions for COP 27,930. The equity method income recognized for this investment was COP (4,798) and in retained earnings was COP 2. |
The following tables sets forth the changes of the Bank's subsidiary investments as of December 31, 2023 and December 31, 2022:
December 31, 2023 | |||||||||
|
Banistmo S.A. |
Bancolombia Panamá S.A. |
FCP Fondo Inmobiliario Colombia. |
Banca de Inversión Bancolombia S.A. Corporación Financiera. |
Bancolombia Puerto |
Fiduciaria Bancolombia S.A. Sociedad Fiduciaria. |
Valores Bancolombia S.A. Comisionista de Bolsa. |
Others |
Total |
In millions of COP | |||||||||
Initial balance |
12,640,048 |
11,221,104 |
2,493,826 |
1,744,834 |
636,656 |
449,696 |
200,611 |
331,922 |
29,718,697 |
Equity method through income statement. ((1) |
485,132 |
1,431,958 |
239,248 |
(294,003)(1) |
84,465 |
132,456 |
13,878 |
(817) |
2,092,317 |
OCI (Equity method) (2) |
81,970 |
240,162 |
- |
22,718 |
11,362 |
2,192 |
1,564 |
- |
359,968 |
OCI (Translation adjustment) (2) |
(2,991,741) |
(2,648,131) |
- |
- |
(152,060) |
- |
- |
- |
(5,791,932) |
Purchase / capitalizations |
- |
- |
- |
- |
- |
- |
- |
250,655 |
250,655 |
Dividends |
(285,530) |
(1,406,611) |
- |
(54,427) |
- |
(91,467) |
- |
- |
(1,838,035) |
Restitution of contributions |
- |
- |
- |
- |
- |
- |
- |
(787) |
(787) |
Profit for previous years |
(9,575) |
- |
- |
(24,412) |
- |
(2,156) |
(2,778) |
(17) |
(38,938) |
Final balance |
9,920,304 |
8,838,482 |
2,733,074 |
1,394,710 |
580,423 |
490,721 |
213,275 |
580,956 |
24,751,945 |
| (1) | Corresponds mainly to impairment caused by investment banking on the Tuya S.A. investment as of December 2023.. |
| (2) | See Note 25.5. Income from equity investments. |
| (3) | Corresponds to other comprehensive income recognized as equity method as of December 31, 2023, See Separate Statement of Comprehensive Income. |
December 31, 2022 | |||||||||
|
Banistmo S.A. |
Bancolombia Panamá S.A. |
FCP Fondo Inmobiliario Colombia. |
Banca de Inversión Bancolombia S.A. Corporación Financiera. |
Bancolombia Puerto |
Fiduciaria Bancolombia S.A. Sociedad Fiduciaria. |
Valores Bancolombia S.A. Comisionista de Bolsa. |
Others |
Total |
In millions of COP | |||||||||
Initial balance |
10,351,826 |
8,763,060 |
1,364,315 |
1,694,992 |
494,504 |
499,885 |
228,497 |
18,953 |
23,416,032 |
Equity method through income statement. ((1) |
232,496 |
1,156,417 |
313,431 |
127,332 |
34,672 |
91,467 |
10,345 |
(1,949) |
1,964,211 |
OCI (Equity method) (2) |
153,790 |
248,686 |
- |
(30,861) |
11,006 |
(3,378) |
(774) |
1 |
378,470 |
OCI (Translation adjustment) (2) |
1,906,773 |
1,735,568 |
- |
- |
96,474 |
- |
- |
- |
3,738,815 |
Purchase / capitalizations |
- |
- |
816,080 |
- |
- |
- |
- |
333,093 |
1,149,173 |
Sells |
- |
- |
- |
- |
- |
- |
- |
(18,176) |
(18,176) |
Dividends |
- |
(682,627) |
- |
(46,790) |
- |
(138,278) |
(37,457) |
- |
(905,152) |
Profit for previous years |
(4,837) |
- |
- |
161 |
- |
- |
- |
- |
(4,676) |
Final balance |
12,640,048 |
11,221,104 |
2,493,826 |
1,744,834 |
636,656 |
449,696 |
200,611 |
331,922 |
29,718,697 |
The following is the supplementary information of the Bank's most significant subsidiaries as of December 31, 2023 and 2022 without eliminations:
74
As of December 31, 2023
Company name |
Assets |
Liabilities |
Income from ordinary activities |
Gain / (Loss) |
In millions of COP | ||||
Banistmo S.A. |
40,740,495 |
36,315,750 |
4,551,651 |
485,132 |
Bancolombia Panamá S.A. |
27,550,302 |
18,711,820 |
2,116,383 |
1,431,958 |
FCP Fondo Inmobiliario Colombia |
5,503,022 |
1,905,773 |
889,683 |
297,475 |
Banca de Inversión Bancolombia S.A. Corporación Financiera(1) |
1,719,824 |
52,784 |
150,732 |
(309,804) |
The financial statements as of December 31, 2023 have been used for the purpose of applying the equity method for the subsidiaries.
As of December 31, 2022
Company name |
Assets |
Liabilities |
Income from ordinary activities |
Gain / (Loss) |
In millions of COP | ||||
Banistmo S.A. |
52,445,934 |
47,081,614 |
3,918,578 |
232,496 |
Bancolombia Panamá S.A. |
32,499,048 |
21,277,944 |
1,566,322 |
1,156,417 |
FCP Fondo Inmobiliario Colombia |
5,023,316 |
1,729,798 |
745,768 |
365,336 |
Banca de Inversión Bancolombia S.A. Corporación Financiera(1) |
2,116,144 |
80,162 |
247,830 |
134,175 |
The financial statements as of December 31, 2022 have been used for the purpose of applying the equity method for the subsidiaries.
As of December 31, 2023 and 2022 there are no restrictions or limitations on the ability of subsidiaries to transfer funds to the Bank in the form of dividends and other capital distributions.
Hedge of a net investment in a foreign operation
The Bank uses hedge accounting for net investments in foreign operations with non-derivative instruments and has designated USD 1,592,034 in debt securities issued and borrowings from international banks as hedging instruments. The purpose of this operation is to protect the Bank from the exchange rate risk (USD/COP) of a portion of the net investment in Banistmo S.A., a company domiciled in Panama City and whose financial statements are denominated in US dollars.
Banistmo S.A. |
December 31, 2023 |
December 31, 2022 |
|
In Thousands of USD |
|||
Investment portion covered in the hedging relationship(1) |
1,592,034 |
2,060,000 |
|
Investment Portion uncovered |
1,004,000 |
567,759 |
|
Total investment in Banistmo S.A |
2,596,034 |
2,627,759 |
|
75
| (1) | In August 2023 and December 2022, the Bank discontinued from the hedging relationship USD 467,966 and USD 140,000, respectively. The cumulative effects of the exchange difference previously recognized are maintained in other comprehensive income. |
The following is a detail of the hedging instruments of the net investment in the net foreign investment:
As of December 31, 2023
Debt securities issued in thousands of U.S. dollars, designated as hedging instruments | ||||
Opening date |
Due date (1) |
E.A rate |
Capital balance |
Capital designated as hedging instrument |
18/10/2017 |
18/10/2027 |
7.03% |
750,000 |
360,000 |
18/12/2019 |
18/12/2029 |
4.68% |
550,000 |
550,000 |
29/01/2020 |
29/01/2025 |
3.02% |
482,034 |
482,034 |
|
|
|
1,782,034 |
1,392,034 |
Borrwings from international banks in thousands of U.S. dollars, designated as hedging instruments | ||||
31/03/2022 |
17/03/2025 |
6.06% |
150,000 |
150,000 |
07/09/2022 |
05/09/2025 |
6.36% |
50,000 |
50,000 |
|
|
|
200,000 |
200,000 |
Total debt securities issued and loans with correspondent banks |
1,982,034 |
1,592,034 |
||
As of December 31, 2022
Debt securities issued in thousands of U.S. dollars, designated as hedging instruments | ||||
Opening date |
Due date (1) |
E.A rate |
Capital balance |
Capital designated as hedging instrument |
18/10/2017 |
18/10/2027 |
7.03% |
750,000 |
360,000 |
18/12/2019 |
18/12/2029 |
4.68% |
550,000 |
550,000 |
29/01/2020 |
29/01/2025 |
3.02% |
950,000 |
950,000 |
|
|
|
2,250,000 |
1,860,000 |
Borrwings from international banks in thousands of U.S. dollars, designated as hedging instruments | ||||
31/03/2022 |
17/03/2025 |
6.06% |
150,000 |
150,000 |
07/09/2022 |
05/09/2025 |
6.36% |
50,000 |
50,000 |
|
|
|
200,000 |
200,000 |
Total debt securities issued and loans with correspondent banks |
2,450,000 |
2,060,000 |
||
For further information related to obligations with correspondent banks and debt securities issued, see Note 17 Financial obligations and Note 18 Debt securities issued.
Measuring effectiveness and ineffectiveness
A hedge is considered effective if, at the beginning of the period and in subsequent periods, the changes in fair value or cash flows attributable to the hedged risk during the period for which the hedge has been designated are offset.
The Bank has documented the evidence of effectiveness of the hedge of the net foreign investment based on the portion of the net investment hedged at the beginning of the hedging relationship amounting to USD 1,592,034. The hedge is considered perfectly effective, since the critical terms and risks of the obligations that serve as hedging instruments are identical to those of the primary hedged position.
76
The effectiveness of the hedge is measured on a before taxes.
Gains or losses on translation of Banistmo's financial statements are recognized in other comprehensive income (OCI). Consequently, the exchange difference related to the translation of debt securities issued and borrowings from international banks is recognized directly in OCI. The foreign currency translation adjustment corresponding to hedging instruments as of December 31, 2023 was COP 1,948,833 and as of December 31, 2022 was COP (1,833,087) See Separate Statement of Comprehensive Income - Hedge of net investment in foreign operations.
NOTE 8. INVESTMENTS IN ASSOCIATES AND JOINT VENTURES
The following table summarizes the balance sheet balances of investments in associates and joint ventures as of December 31, 2023 and December 31, 2022:
Composition |
December 31,2023 |
December 31,2022 |
|
In millions of COP |
|
Investments in associates |
117,682 |
112,901 |
Investments in joint ventures |
180,916 |
189,860 |
Total |
298,598 |
302,761 |
The following tables present the Bank's investments in associates as of December 31, 2023 and December 31, 2022:
Company name |
Main activity |
Country |
% of Ownership interest |
Investment |
% of Ownership interest |
Investment |
December 31,2023 |
December 31,2022 |
|||||
Titularizadora Colombiana S.A. Hitos |
Mortgage portfolio securities |
Colombia |
26.98% |
37,950 |
26.98% |
35,756 |
Redeban Multicolor S.A. |
Network data transmission services |
Colombia |
20.36% |
35,735 |
20.36% |
31,876 |
ACH Colombia S.A. |
Electronic transfer services |
Colombia |
19.94% |
21,952 |
19.94% |
19,005 |
Protección S.A. |
Administration of pension funds and severances |
Colombia |
0.69% |
19,827 |
0.69% |
17,807 |
Agricapital S.A.S |
Financial services |
Colombia |
10.79% |
1,262 |
10.21% |
1,408 |
Servicios de Identidad Digital S.A.S.(2) |
Digital services |
Colombia |
33.33% |
956 |
33.33% |
7,049 |
Total, investments in associates |
|
|
117,682 |
|
112,901 |
|
The following tables present the changes in the Bank's investments in associates as of December 31, 2023 and December 31, 2022:
Diciembre 31, 2023 | |||||||
|
Titularizadora |
Redeban |
ACH |
Protección S.A. |
Agricapital S.A.S |
Servicios de Identidad Digital S.A.S |
Total |
In millions of COP | |||||||
Initial balance |
35,756 |
31,876 |
19,005 |
17,807 |
1,408 |
7,049 |
112,901 |
77
Equity method through income statement.(1) |
2,119 |
4,021 |
21,624 |
2,084 |
(243) |
(10,345) |
19,260 |
OCI (Equity method) (2) |
398 |
(162) |
- |
(64) |
- |
- |
172 |
Purchase / capitalizations |
- |
- |
- |
- |
97 |
2,434 |
2,531 |
Sells / restitution of contributions |
- |
- |
- |
- |
- |
- |
- |
Dividends |
- |
- |
(18,677) |
- |
- |
- |
(18,677) |
Profit for previous years |
(323) |
- |
- |
- |
- |
1,818 |
1,495 |
Final balance |
37,950 |
35,735 |
21,952 |
19,827 |
1,262 |
956 |
117,682 |
Diciembre 31, 2022 | |||||||
|
Titularizadora |
Redeban |
ACH |
Protección S.A. |
Agricapital S.A.S |
Servicios de Identidad Digital S.A.S |
Total |
In millions of COP | |||||||
Initial balance |
34,241 |
26,046 |
18,854 |
327,315 |
1,191 |
4,566 |
412,213 |
Equity method through income statement.(1) |
1,587 |
6,652 |
18,620 |
1,038 |
(105) |
(4,784) |
23,008 |
OCI (Equity method) (2) |
(72) |
114 |
- |
1,770 |
- |
- |
1,812 |
Purchase / capitalizations |
- |
- |
- |
32,029 |
322 |
7,267 |
39,618 |
Sells / restitution of contributions |
- |
- |
- |
(344,345) |
- |
- |
(344,345) |
Dividends |
- |
(936) |
(19,069) |
- |
- |
- |
(20,005) |
Profit for previous years |
- |
- |
600 |
- |
- |
- |
600 |
Final balance |
35,756 |
31,876 |
19,005 |
17,807 |
1,408 |
7,049 |
112,901 |
| (1) | See Note 25.5. Income from equity investments. |
| (2) | See separate statement of comprehensive income. |
The following are the joint ventures that the Bank holds as of December 31, 2023 and 2022:
Company name |
Main activity |
Country |
% of Ownership interest |
Investment |
% of Ownership interest |
Investment |
|---|---|---|---|---|---|---|
December 31,2023 |
December 31,2022 |
|||||
Compañía de Financiamiento TUYA S.A. |
Financial services |
Colombia |
35.17% |
180,916 |
30.82% |
189,860 |
Total investments in joint venture. In millions of COP |
|
|
180,916 |
|
189,860 |
|
The following table sets forth the changes in the carrying amount of joint ventures of the Bank as of December 31, 2023 and 2022:
|
December 31, 2023 |
December 31, 2022 |
Compañía de financiamiento TUYA S.A. | ||
In millions of COP | ||
Saldo inicio del periodo |
189,860 |
155,281 |
Equity method through income statement(1) |
(71,444) |
(20,421) |
Purchase / capitalizations |
62,500 |
55,000 |
Final balance |
180,916 |
189,860 |
| (1) | See Note 25.5. Income from equity investments. |
The following is additional information regarding the Bank’s most significant associates and joint ventures as of December 31, 2023 and 2022:
78
As of December 31, 2023
Company name |
Classification |
Assets |
Liabilities |
Income from ordinary activities |
Profit / (Loss) |
|
|
In millons of COP |
|||||
Protección S.A. |
Associates |
2,955,547 |
666,280 |
1,597,171 |
303,460 |
|
Titularizadora Colombiana S.A. Hitos |
Associates |
233,582 |
96,975 |
38,599 |
7,268 |
|
Compañía de financiamiento TUYA S.A. |
joint ventures |
3,827,631 |
3,313,741 |
2,205,537 |
(221,199) |
|
For the purpose of applying the equity method for associates and joint ventures, the financial statements as of December 31, 2023 for Compañía de financiamiento TUYA S.A. and the financial statements as of November 30, 2023 for Protección S.A. and Titularizadora Colombiana S.A. Milestones have been used.
As of December 31, 2023 and December 31, 2022 there are no restrictions or limitations on the ability of subsidiaries to transfer funds to the Bank in the form of dividends and other capital distributions.
As of December 31, 2022
Company name |
Classification |
Assets |
Liabilities |
Income from ordinary activities |
Profit / (Loss) |
|
|
In millons of COP |
|||||
Protección S.A. |
Associates |
2,619,197 |
624,052 |
2,993,740 |
227,514 |
|
Titularizadora Colombiana S.A. Hitos |
Associates |
138,350 |
9,874 |
28,236 |
5,065 |
|
Compañía de financiamiento TUYA S.A. |
joint ventures |
5,101,347 |
4,491,257 |
1,973,132 |
(73,266) |
|
To apply the equity method for associates and joint ventures, the financial statements as of December 31, 2022 have been used.
NOTE 9. INTANGIBLE ASSETS, NET
The following table sets forth the Bank’s intangible assets as of December 31, 2023 and 2022, including the reconciliation of initial and final balances of the cost and accrued amortization:
Licenses, software and computer applications |
79
Cost |
December 31, 2023 |
December 31, 2022 |
In millions of COP | ||
Initial balance |
488,817 |
446,049 |
Acquisitions (1) |
129,692 |
68,951 |
Write off (2) |
(2,692) |
(26,183) |
Final balance |
615,817 |
488,817 |
| (1) | Corresponds to the inception of license contracts for technological updating. |
| (2) | As of December 31, 2022, mainly due to the derecognition of licenses, as follow: Banking Correspondent Administrative Module for COP 8,996, Kofax License for COP 4,835 and AFI License for COP 4,223. |
Licenses, software and computer applications | ||
Amortization |
December 31, 2023 |
December 31, 2023 |
In millions of COP | ||
Initial balance |
(211,752) |
(185,956) |
Amortization expense (1) |
(61,204) |
(51,979) |
Write off (2) |
2,692 |
26,183 |
Final balance |
(270,264) |
(211,752) |
Net |
345,553 |
277,065 |
| (1) | See Note 26.3 Impairment, depreciation and amortization. |
| (2) | As of December 31, 2022 are mainly due to the derecognition of licenses, as follows: Banking Correspondent Administrative Module for COP 8,996, Kofax License for COP 4,835 y AFI License for COP 4,223. |
As of December 31, 2023 and 2022, the Bank does not have intangible assets with restricted ownership, intangible assets pledged as collateral or contractual agreements for the acquisition of this class of assets.
Research and development costs related to software development
During the period ended at December 31, 2023 and 2022, the Bank incurred costs that are directly related to software development in the amounts of COP 2,615 and COP 9,353, respectively. These costs were the result of the analysis design and implementation of the transformation projects, the most representative of which were: Core Nequi Renewal (Colombia). The expenses were recorded mainly as fees in the line “Other administrative and general expenses”.
Fully amortized intangible assets
The Bank has intangible assets that have reached their useful life but are still in use; these assets correspond mainly to licenses and fees required to carry out banking activities. During the period ended December 31, 2023 and 2022 the cost of these assets was COP 16,508; ivo Firs Data SW MerchanT Portal as the most significant for COP 14,104 and COP 771, respectively.
Intangibles which did not meet the criteria to be recognized as assets
During the period ended December 31, 2023 and 2022, the Bank recognized in the statement of income the amount of COP 903 and COP 709, respectively, related to expenditures which were not recognized as intangible assets. These expenses were not recorded as assets due to the lack of characterists to be reliably identifiable, control over the resource and future economic benefits are expected to flow to the entity.
As of December 31, 2023 and 2022, the Bank's assessment shows that there is no impairment of its intangible assets. Therefore, it is not necessary to make a formal estimate of the recoverable amount for these assets.
80
NOTE 10. PREMISES AND EQUIPMENT, NET
As of December 31, 2023 and 2022, the premises and equipment, net consisted of the following:
Composition |
Diciembre 31,2023 |
Diciembre 31,2022 |
In millions of COP | ||
Premises and equipment for own use |
1,757,039 |
1,777,622 |
Premises and equipment in operating leases |
3,689,017 |
3,504,808 |
Total premises and equipment, net |
5,446,056 |
5,282,430 |
As of December 31, 2023
|
Premises and equipment for own use |
Balance at January 1, 2023 |
Roll - forward |
Balance at December 31, 2023 |
|||||
Additions (1) |
Expenses depreciation |
Expenses impairment(2) |
Written off (3) |
Movements(4) |
||||
|
In millions of COP |
|||||||
Land |
|
|
|
|
|
|
|
|
Cost |
308,934 |
3,266 |
- |
- |
(422) |
- |
311,778 |
|
Construction in progress |
|
|
|
|
|
|
|
|
Costo |
2,114 |
5,576 |
- |
- |
- |
- |
7,690 |
|
Impairment |
- |
- |
- |
- |
- |
- |
- |
|
Buildings |
|
|
|
|
|
|
|
|
Cost |
1,102,310 |
19,079 |
- |
- |
(19,203) |
146 |
1,102,332 |
|
Accumulated depreciation |
(137,652) |
- |
(21,293) |
- |
(10) |
(42) |
(158,997) |
|
Furniture and fixtures |
|
|
|
|
|
|
|
|
Cost |
343,946 |
29,519 |
- |
- |
(6,931) |
256 |
366,790 |
|
Accumulated depreciation |
(178,187) |
- |
(27,414) |
- |
5,420 |
(256) |
(200,437) |
|
Impairment |
- |
- |
- |
(305) |
305 |
- |
- |
|
Computer equipment |
|
|
|
|
|
|
|
|
Cost |
652,224 |
64,355 |
- |
- |
(59,262) |
4,100 |
661,417 |
|
Accumulated depreciation |
(353,259) |
- |
(79,479) |
- |
57,364 |
(4,100) |
(379,474) |
|
Impairment |
- |
- |
- |
(1,147) |
1,147 |
- |
- |
|
Vehicles |
|
|
|
|
|
|
|
|
Cost |
14,161 |
5,545 |
- |
- |
(2,989) |
- |
16,717 |
|
Accumulated depreciation |
(9,395) |
- |
(2,629) |
- |
2,748 |
- |
(9,276) |
|
Machinery |
|
|
|
|
|
|
|
|
Cost |
95,113 |
2,000 |
- |
- |
(5,096) |
(256) |
91,761 |
|
Accumulated depreciation |
(70,174) |
- |
(3,060) |
- |
4,715 |
256 |
(68,263) |
|
Impairment |
- |
- |
- |
(304) |
304 |
- |
- |
|
Leasehold improvements |
|
|
|
|
|
|
|
|
Cost |
7,487 |
26,950 |
- |
- |
- |
(19,436) |
15,001 |
|
Accumulated depreciation |
- |
- |
- |
- |
- |
- |
- |
|
Total cost |
2,526,289 |
156,290 |
- |
- |
(93,903) |
(15,190) |
2,573,486 |
|
Total accumulated depreciation |
(748,667) |
- |
(133,875) |
- |
70,237 |
(4,142) |
(816,447) |
|
Total accumulated impairment, net |
- |
- |
- |
(1,756) |
1,756 |
- |
- |
|
Total premises and equipment for own use, net |
1,777,622 |
156,290 |
(133,875) |
(1,756) |
(21,910) |
(19,332) |
1,757,039 |
|
81
| (1) | Buildings, mainly: Mercurio Plaza Branch for COP 7,781, Armenia Centro branch for COP 3,806 and Montería branch for COP 2,030. |
Furniture and fixtures, mainly: Condensing unit for COP 6,668, Handling unit for COP 3,624 and Modular System for COP 2,695.
Computer equipment, mainly: Laptops for COP 23,143, ATMs for COP 22,945 and kiosks for COP 3,669.
| (2) | Impairments are related to the process applied for obsolescence, accidents and others, which results in the derecognition of the asset. |
| (3) | Buildings: Explained by the legalization of advances, mainly in branches. |
Computer equipment, mainly due to obsolescence of ATMs.
| (4) | Right-of-use assets for completion of improvements and activation of contracts; The main transfers correspond to: Unicentro Medellin Branch for COP 1,784, Central Mayorista branch for COP 1,604 and Pitalito branch for COP 1,591. |
Premises and equipment in operating leases |
Balance at January 1, 2023 |
Roll - forward |
Balance at December 31, 2023 |
|||||
Additions(1) |
Expenses depreciation(2) |
Expenses impairment |
Written off |
Movements(3) |
||||
|
In millions of COP |
|||||||
Furniture and fixtures |
|
|
|
|
|
|
|
|
82
Cost |
2,091 |
- |
- |
- |
- |
- |
2,091 |
|
Accumulated depreciation |
(360) |
- |
(254) |
- |
- |
- |
(614) |
|
Vehicles |
|
|
|
|
|
|
|
|
Cost |
3,896,727 |
1,146,580 |
- |
- |
(67,686) |
(748,350) |
4,227,271 |
|
Accumulated depreciation |
(478,042) |
- |
(350,362) |
- |
13,485 |
142,665 |
(672,254) |
|
Computer equipment |
|
|
|
|
|
|
|
|
Cost |
150,969 |
66,833 |
- |
- |
(4,463) |
14,822 |
228,161 |
|
Accumulated depreciation |
(66,577) |
- |
(49,364) |
- |
3,855 |
16,448 |
(95,638) |
|
Total cost |
4,049,787 |
1,213,413 |
- |
- |
(72,149) |
(733,528) |
4,457,523 |
|
Total accumulated depreciation |
(544,979) |
- |
(399,980) |
- |
17,340 |
159,113 |
(768,506) |
|
Total premises and equipment in operating leases, net |
3,504,808 |
1,213,413 |
(399,980) |
- |
(54,809) |
(574,415) |
3,689,017 |
|
|
|
|
|
|
|
|
|
|
Total premises and equipment - cost |
6,576,076 |
1,369,703 |
- |
- |
(166,052) |
(748,718) |
7,031,009 |
|
Total premises and equipment - accumulated depreciation |
(1,293,646) |
- |
(533,855) |
- |
87,577 |
154,971 |
(1,584,953) |
|
Total premises and equipment -impairment |
- |
- |
- |
(1,756) |
1,756 |
- |
- |
|
Total premises and equipment, net |
5,282,430 |
1,369,703 |
(533,855) |
(1,756) |
(76,719) |
(593,747) |
5,446,056 |
|
| (1) | Purchase of vehicles to include in operating lease contracts mainly with Renting Colombia S.A.S. |
| (2) | See Note 26.3. Amortization, depreciation and impairment. |
| (3) | Vehicles, corresponds mainly to transfers of assets that ended the lease contract and were reclassified to the inventories. |
Computer equipment, corresponds to: Income as a result of transferring cost and depreciation from financial leasing for COP 36,866 and (2,618), reclassifications to inventories for COP (22,043) and 19,065.
As of December 31, 2022
|
Premises and equipment for own use |
Balance at January 1, 2022 |
Roll - forward |
Balance at December 31, 2022 |
|||||
|
|
Additions(1) |
Expenses depreciation |
Expenses impairment (2) |
Written off |
Movement in right-of-use assets(3) |
|
|
|
In millions of COP |
|||||||
Land |
|
|
|
|
|
|
|
|
Cost |
323,451 |
2,961 |
- |
- |
(410) |
(17,068) |
308,934 |
|
Construction in progress |
|
|
|
|
|
|
|
|
Costo |
4,936 |
2,981 |
- |
- |
(5,803) |
- |
2,114 |
|
Impairment |
- |
- |
- |
(3,536) |
3,536 |
- |
- |
|
Buildings |
|
|
|
|
|
|
|
|
Cost |
1,136,346 |
13,734 |
- |
- |
(4,391) |
(43,379) |
1,102,310 |
|
Accumulated depreciation |
(129,439) |
- |
(22,455) |
- |
364 |
13,878 |
(137,652) |
|
Furniture and fixtures |
|
|
|
|
|
|
|
|
Cost |
343,830 |
16,811 |
- |
- |
(16,695) |
- |
343,946 |
|
Accumulated depreciation |
(163,404) |
- |
(26,644) |
- |
11,861 |
- |
(178,187) |
|
Impairment |
- |
- |
- |
(1,600) |
1,600 |
- |
- |
|
Computer equipment |
|
|
|
|
|
|
|
|
Cost |
556,676 |
127,267 |
- |
- |
(31,719) |
- |
652,224 |
|
Accumulated depreciation |
(303,495) |
- |
(79,382) |
- |
29,618 |
- |
(353,259) |
|
Impairment |
- |
- |
- |
(1,090) |
1,090 |
- |
- |
|
Vehicles |
|
|
|
|
|
|
|
|
Cost |
14,097 |
2,183 |
- |
- |
(2,119) |
- |
14,161 |
|
Accumulated depreciation |
(9,012) |
- |
(2,382) |
- |
1,999 |
- |
(9,395) |
|
Machinery |
|
|
|
|
|
|
|
|
Cost |
103,812 |
945 |
- |
- |
(9,644) |
- |
95,113 |
|
83
Accumulated depreciation |
(75,650) |
- |
(3,436) |
- |
8,912 |
- |
(70,174) |
|
Impairment |
- |
- |
- |
(370) |
370 |
- |
- |
|
Leasehold improvements |
|
|
|
|
|
|
|
|
Cost |
2,699 |
32,144 |
- |
- |
(281) |
(27,075) |
7,487 |
|
Accumulated depreciation |
- |
- |
- |
- |
- |
- |
- |
|
Total cost |
2,485,847 |
199,026 |
- |
- |
(71,062) |
(87,522) |
2,526,289 |
|
Total accumulated depreciation |
(681,000) |
- |
(134,299) |
- |
52,754 |
13,878 |
(748,667) |
|
Total accumulated impairment, net |
- |
- |
- |
(5,550) |
5,550 |
- |
- |
|
Total premises and equipment for own use, net |
1,804,847 |
199,026 |
(134,299) |
(5,550) |
(12,758) |
(73,644) |
1,777,622 |
|
| (1) | Buildings, mainly: Los Molinos Branch for COP 2,908, Banca Colombia Rosales Branch for COP $2,735 and Unicentro Villavicencio Branch for COP 2,548. |
Computer equipment, mainly: Electronic ATMs for COP 65,061 and laptops for COP 30,494.Leasehold improvements, mainly: Medellín FIC48 headquarters for COP 14,462 and Plaza Fabricato branch for COP 2,374.
| (2) | Impairments are related to the process applied for obsolescence, accidents and others, which results in the derecognition of the asset. |
| (3) | Land and buildings, 31 properties are transferred to the category of other marketable assets, mainly Medellín Center Headquarters with a cost of COP 12,080 and La 14 Building for COP 8,940. |
Right-of-use assets for completion of improvements and activation of contracts; The main transfers correspond to: Medellín FIC48 headquarters and Plaza Fabricato branch.
Premises and equipment in operating leases |
Balance at January 1, 2022 |
Roll - forward |
Balance at December 31, 2022 |
||||
Additions(1) |
Expenses depreciation(2) |
Expenses impairment |
Written off |
Movement in right-of-use assets |
|||
|
In millions of COP |
||||||
Machinery and equipment |
|
|
|
|
|
|
|
Cost |
2,091 |
- |
- |
- |
- |
- |
2,091 |
Accumulated depreciation |
(106) |
- |
(254) |
- |
- |
|
(360) |
Vehicles |
|
|
|
|
|
- |
|
Cost |
2,220,427 |
2,060,532 |
- |
- |
(384,232) |
- |
3,896,727 |
Accumulated depreciation |
(283,936) |
- |
(274,113) |
|
80,007 |
|
(478,042) |
Computer equipment |
|
|
|
|
|
- |
|
Cost |
121,071 |
45,605 |
- |
- |
(15,707) |
- |
150,969 |
Accumulated depreciation |
(46,884) |
- |
(32,482) |
- |
12,789 |
- |
(66,577) |
Total cost |
2,343,589 |
2,106,137 |
- |
- |
(399,939) |
- |
4,049,787 |
Total accumulated depreciation |
(330,926) |
- |
(306,849) |
- |
92,796 |
- |
(544,979) |
Total premises and equipment in operating leases, net |
2,012,663 |
2,106,137 |
(306,849) |
- |
(307,143) |
|
3,504,808 |
|
|
|
|
|
|
|
|
Total premises and equipment – cost |
4,829,436 |
2,305,163 |
- |
- |
(471,001) |
(87,522) |
6,576,076 |
Total premises and equipment - accumulated depreciation |
(1,011,926) |
- |
(441,148) |
- |
145,550 |
13,878 |
(1,293,646) |
Total premises and equipment -impairment |
- |
- |
- |
(5,550) |
5,550 |
- |
- |
Total premises and equipment, net |
3,817,510 |
2,305,163 |
(441,148) |
(5,550) |
(319,901) |
(73,644) |
5,282,430 |
84
| (1) | Purchase of vehicles to include in operating lease contracts mainly with Renting Colombia S.A.S. |
Purchases computer equipment to include in operating lease contracts mainly with Sociedad de Comercialización Internacional Girdle & Lingerie SAS, Seguros Comerciales Bolivar SA and KPMG Advisory Tax & Legal SAS
| (2) | See Note 26.3. Amortization, depreciation and impairment. |
As of December 31, 2023, there are contractual commitments for the acquisition of properties and equipment for COP 4,025, mainly for Zona Colaborativa Project for headquarter in Cali and the construction of a facility in the Cañaveral Shopping Center. As of December 31, 2022, there are contractual commitments for the acquisition of properties and equipment for COP 3,816, mainly for the construction of a store in the Cañaveral Shopping Center..
As of December 31, 2023 and 2022, the Bank has no property and equipment with restricted title, nor guarantees of debts and contractual commitments for the fulfillment of obligations.
As of December 31, 2023 and 2022, the Bank's assessment indicates that there is no evidence of impairment of the Cash Generating Unit. Therefore, it is not considered necessary to make a formal estimate of the recoverable amount for these assets.
As of December 31, 2023 and 2022, the value of the property and equipment that is fully depreciated and in use is COP 251,896 and COP 218,228, respectively, and corresponds mainly to computer equipment, fixtures and accessories and machinery.
NOTE 11. INVESTMENT PROPERTIES
The Bank recognizes lands and buildings as investment property which hold for rental or capital appreciation purposes, rather than for use or sale in the ordinary course of business.
The table below sets forth the reconciliation between the initial balance account and the balance at the end of the period, at fair value:
|
December 31, 2023 |
December 31, 2022 |
In millions of COP | ||
Balance at the beginning of the year |
449,253 |
216,229 |
Acquisitions (1) |
97,479 |
221,834 |
Gains on valuation (2) |
27,818 |
11,190 |
Saldo al final del período (3) |
574,550 |
449,253 |
| (1) | As of December 2023, mainly due to the acquisition of the LATAM Building for COP 80,954 and as of December 2022, mainly due to the acquisition of the Amadeus Building for COP 127,964 and the C75 Building for COP 84,128. |
| (2) | Mainly due to the valuation of the Amadeus Building for COP 17,709 and Bodegas Quality COP 7,655. See Note 25.4 Other Operating Income, net. |
See Note 29. Fair value of assets and liabilities
The valuation adjustments recorded by the Bank related to its investment properties are detailed below:
As of December 31, 2023
Type of asset |
Balance at the beginning of the year |
Appraisal update |
Net increase (decrease) in investment properties |
Transfer of assets due to change of use |
Adjusted fair value |
|
In millions of COP |
||||
85
Real Estate |
449,253 |
27,818 |
97,479 |
- |
574,550 |
Total |
449,253 |
27,818 |
97,479 |
- |
574,550 |
As of December 31, 2022
Type of asset |
Balance at the beginning of the year |
Appraisal update |
Net increase (decrease) in investment properties |
Transfer of assets due to change of use |
Adjusted fair value |
|
In millions of COP |
|
|||||
Real Estate |
216,229 |
11,190 |
221,834 |
- |
449,253 |
|
Total |
216,229 |
11,190 |
221,834 |
- |
449,253 |
|
Amounts recognized in the statement of income for the period
The following table shows the main revenues and expenses recorded by the Bank in connection with its investment properties:
December 31, 2023 |
December 31, 2022 |
||
In millions of COP | |||
Income from rentals (1) |
40,371 |
15,699 |
|
Administration and other expenses |
(5,338) |
(5,832) |
|
| (1) | Mainly due to income from the Amadeus Building for COP 12,573, Bodegas Quality COP 10,123 and Building C75 COP 6,955. |
Currently, there are no restrictions on the use or income derived from the buildings or lands that the Bank has as investment property.
The fair value of the Bank’s investment properties for the year ending at December 31, 2023 and 2022, has been recorded according to the assessment made by independent external consulting companies that have the appropriate capacity and experience in performing those assessments. Appraisers are listed in the Open Register of Appraisers by means of a certificate of registration, sanctions and registration of appraisers' information issued by the Recognized Self-Regulatory Entity, which will be valid for 30 days from its date of issuance.
Fair value appraisals are carried out in accordance with IFRS 13. The reports made by the external consulting company contain the description of the valuation methodologies used, and key assumptions. The fair value of the investment properties is based on the comparative market approach, which reflects the prices of recent transactions with similar characteristics. Upon determining the fair value of these investment properties, the greater and best use of these investment properties is their present use. For further information about measurement techniques and inputs used by consulting companies, see Note 29. Fair Value of assets and liabilities.
As of December 31, 2023 and 2022, the Bank does not have investment properties held under financial leases.
NOTE 12. INCOME TAX
The Income tax is recognized in accordance with current tax regulations.
86
12.1. Components recognized in the separate Income statement
The following chart provides a detailed breakdown of the total income tax for the periods ended December 31, 2023 and 2022
|
December 31, 2023 |
December 31, 2022 |
In millions of COP | ||
Current tax |
|
|
Fiscal term (1) |
(1,382,864) |
(2,248,552) |
Vigencia fiscal sucursal exterior |
(1,520) |
(2,693) |
Prior fiscal terms |
45,403 |
44,478 |
Total current tax |
(1,338,981) |
(2,206,767) |
Deferred tax |
|
|
Fiscal term (2) |
(343,832) |
49,172 |
Total deferred tax |
(343,832) |
49,172 |
Total income tax |
(1,682,813) |
(2,157,595) |
| (1) | The nominal current tax rate for the year 2023 is 40%, for the year 2022 it was 38%. The variation corresponds to lower pre-tax profit in the year 2023, the increase in equity method, and tax-exempt income. |
| (2) | The variation corresponds to the effect on deferred tax due to the tax reform (Law 2277 of 2022) and changes in the representative market rate. |
12.2. Principal changes introduced by the tax reform of 2022
The Colombian Congress enacted Law 2277 of 2022 on 13th of December 2022, which became effective January 1, 2023. The most significant measures this norm are outlined below:
The Corporate Income Tax rate (CIT) continues at 35%; however, the surcharge applicable to financial entities and brokerage entities from 2023 to 2027 increased by 5%. This surcharge is applicable when the financial entities have a taxable income equal to, or higher than 120.000 tax units (UVT).
Certain non-taxable incomes, special deductions, exempt incomes, and tax credits will be limited to 3% of the taxpayer´s net income before deductions.
For the fiscal year 2023 onwards, Industry and Trade Tax (ITT) will not be creditable against the Corporate Income Tax. Therefore, ITT only will be eligible as a deduction.
A minimum effective tax rate of 15% was introduced for Colombian corporations based on financial profitability. If the minimum effective tax rate is lower than 15%, it should be adjusted to achieve the 15%.
Colombian corporations whose financial statements are subject to consolidation in Colombia must follow a special and different procedure from taxpayers who do not consolidate their financial statements, to determine the minimum effective tax rate, due to, if the consolidated tax rate is less than 15%, the additional tax will be allocated according to the profits greater than 0 of each consolidating taxpayer.
87
Profits derived from the sale of shares listed on the Colombian Stock Exchange will be treated as non-taxable income if: i) a single shareholder owns them, and ii) they are not more than 3% of the total outstanding shares listed by the entity in the taxable year.
The distribution of profits in shares will be taxable for CIT matters.
Payments falling into the following categories i) social club memberships, ii) personal payments to shareholders and their relatives, and iii) labor expenses of home support personnel, among others, will not be deductible for CIT purposes.
Donations to research, technological developments, and innovation will not be deductible. People who make investments in projects classified as investment, technological development or innovation are allowed to deduct from their income tax liability 30% of the value invested in said projects in the taxable period in which the investment was made.
Dividend tax rate increases as follows: |
|
|
|
Dividend tax |
|
Rate |
|
Foreign shareholders |
|
From 10% to 20% |
|
Colombian corporations |
|
From 7,5% to 10% |
|
Capital gains tax increases from 10% to 15%.
A temporary reduction in penalties and interest of 60% will be applied upon the fulfillment of certain requirements
The tax determination will be made through electronic invoicing when the taxpayer has not filed their income tax returns.
Penalty for not sending information to the Tax Office is reduced to 7500 tax units (UVT).
In-kind payments made by an entity to third parties for the acquisition of goods or provision of services will be deemed as taxable income for the entity’s employees, their spouses, their relatives, and any other person with the title of the beneficiary of the payment.
12.3. Reconciliation of the effective tax rate
The detailed reconciliation between the total income tax expenses calculated at the current nominal tax rate and the recognized fiscal expense in the income statement for the first nine months of 2022 and 2023, and for a three-month period from July 1st to September 30th of 2022 and 2023 is as follows:
In millions of COP | ||
|---|---|---|
Reconciliation of the tax rate |
December 31, 2023 |
December 31, 2022 |
Accounting profit |
7,662,543 |
9,090,560 |
88
In millions of COP | ||
|---|---|---|
Reconciliation of the tax rate |
December 31, 2023 |
December 31, 2022 |
Applicable tax with nominal rate(1) |
(3,065,017) |
(3,454,413) |
Non-deductible expenses to determine taxable profit (loss) |
(144,351) |
(125,824) |
Accounting and non-tax expense (income) to determine taxable profit (loss) |
908,189 |
794,287 |
Fiscal and non-accounting expense (income) to determine taxable profit (loss) |
(689,101) |
(424,833) |
Ordinary activities income exempt from taxation |
1,011,561 |
506,143 |
Ordinary activities income not constituting income or occasional tax gain |
61,553 |
103,966 |
Tax deductions |
163,886 |
302,891 |
Tax depreciation surplus |
211,839 |
148,703 |
Untaxed recoveries |
(64,522) |
(40,558) |
Prior fiscal terms |
45,403 |
44,478 |
Other effects of the tax rate by reconciliation between accounting profit and tax expense (income) (2) |
(122,253) |
(12,435) |
Total income tax |
(1,682,813) |
(2,157,595) |
(1) The variation is due to the decrease in pre-tax profit and the change in the tax rate. For the year 2023, it is 40%, while for the year 2022, it was 38%.
(2) The variation is generated by deferred tax.
12.4. Components recognized in the separate Other Comprehensive Income (OCI).
|
December 31, 2023 |
||
|
In millions of COP |
||
|
Amounts before taxes |
Deferred tax |
Net taxes |
Remeasurement loss related to defined benefit liability |
(24,291) |
9,061 |
(15,230) |
Net gain on financial instruments measured at fair value. |
68,819 |
(19,335) |
49,484 |
Exchange differences |
(5,791,932) |
- |
(5,791,932) |
Unrealized gain/(loss) on investments in subsidiaries using equity method |
359,968 |
- |
359,968 |
Net gain on valuation of investments in associates and joint ventures. |
172 |
- |
172 |
Gain on net investment hedge in foreign operations |
1,948,833 |
(772,755) |
1,176,078 |
Net |
(3,438,431) |
(783,029) |
(4,221,460) |
|
December 31, 2022 |
||
|
In millions of COP |
||
|
Amounts before taxes |
Deferred tax |
Net taxes |
89
|
Remeasurement income related to defined benefit liability. |
36,927 |
(17,937) |
18,990 |
|
Net loss from financial instruments measured at fair value. |
(28,984) |
5,472 |
(23,512) |
Exchange differences |
3,738,815 |
- |
3,738,815 |
Unrealized gain/(loss) on investments in subsidiaries using equity method |
378,470 |
- |
378,470 |
Losses in equity method for associates and joint ventures |
(8,695) |
924 |
(7,771) |
Gains on asset revaluation |
- |
(71) |
(71) |
Net loss from hedge of net investment in foreign operations. |
(1,833,087) |
746,232 |
(1,086,855) |
Net |
2,283,446 |
734,620 |
3,018,066 |
12.5. Deferred tax
According to the financial projections, it is expected to generate enough liquid income to offset the items recorded as deductible deferred tax. These estimates start from the financial projections that were prepared considering information from the Bancolombia Group's economic research records, the expected economic environment for the next five years. The main indicators on which the models are based are GDP growth, loans growth and interest rates. In addition to these elements, the long-term Group's strategy is taken into account.
December 31, 2022 |
Effect on Income Statement |
Effect on OCI |
Realized tax |
December 31, 2023 |
||||
|
In millions of COP |
|||||||
Asset Deferred Tax: |
|
|
|
|
|
|||
Employee Benefits |
172,174 |
33,191 |
9,061 |
- |
214,426 |
|||
Deterioration assessment |
- |
253,299 |
- |
- |
253,299 |
|||
Financial Obligations |
649,828 |
(649,828) |
- |
- |
- |
|||
Derivatives Valuation |
8,457 |
221,735 |
- |
- |
230,192 |
|||
Net investment coverage in operations abroad |
1,530,072 |
(91,043) |
(772,755) |
(137,838) (1) |
528,436 |
|||
Properties received in payment |
83,212 |
3,318 |
- |
- |
86,530 |
|||
Other deductions |
190,979 |
(75,812) |
- |
- |
115,167 |
|||
implementation adjustment |
90,895 |
- |
- |
- |
90,895 |
|||
Total Asset Deferred Tax |
2,725,617 |
(305,140) |
(763,694) |
(137,838) |
1,518,945 |
|||
Liability Deferred Tax: |
|
|
|
|
|
|||
Property and equipment |
(142,199) |
108,057 |
- |
- |
(34,142) |
|||
Lease restatement |
(312,842) |
(102,127) |
- |
- |
(414,969) |
|||
Deterioration assessment |
(211,487) |
211,487 |
- |
- |
- |
|||
Valuation of equity instruments |
(277,787) |
(57,834) |
(19,335) |
- |
(354,956) |
|||
Financial Obligations |
- |
(192,530) |
- |
- |
(192,530) |
|||
90
Goodwill |
(1,567,225) |
- |
- |
- |
(1,567,225) |
|||
Other deductions |
(62,737) |
(5,745) |
- |
- |
(68,482) |
|||
Total Liability Deferred Tax |
(2,574,277) |
(38,692) |
(19,335) |
- |
(2,632,304) |
|||
Net Deferred Tax |
151,340 |
(343,832) |
(783,029) |
(137,838) |
(1,113,359) |
|||
(1) Current tax arising from the exchange difference on the settlement of the bonds that was associated as a hedging instrument
12.6. Amount of temporary differences in subsidiaries, branches, associates over which deferred tax was not recognized is:
In accordance with IAS 12, no deferred tax credit was recorded, because management can control the future moment in which such differences are reversed and this is not expected to occur in the foreseeable future.
December 31, 2023 |
December 31, 2022 |
|
In millions of COP | ||
Temporary differences |
|
|
Local Subsidiaries |
(868,405) |
(1,164,839) |
Foreign Subsidiaries |
(17,696,145) |
(22,854,744) |
12.7. Dividends
12.7.1 Dividend Payment
Dividends to be distributed by the Bank will be subject to the application of section 48 and 49 of the Colombian Tax Code, and consequently, they will be subject to a withholding tax established by the norm. This is in accordance with the tax characteristics of each shareholder.
12.7.2 Dividends received from Colombian Subsidiary Companies
Considering the historical tax status of the dividends received by the Bank from its affiliates and national subsidiaries, it is expected that in the future dividends will be received on the basis of non-income tax. They will not be subject to withholding tax, taking into account that the Bank, its affiliates and national subsidiaries belong to the same business group.
12.8. Tax contingent liabilities and assets
In the determination of the effective current and deferred taxes subject to review by the tax authority, the relevant regulations have been applied in accordance with the interpretations made by the Bancolombia Group.
In Colombia, due to the complexity of the tax system, ongoing amendments to the tax regulations, accounting changes with implications on tax bases and in general the legal instability of the country, the tax administration's judgment may differ from that applied by Bancolombia at any time.
91
Consequently, a dispute or inspection by the tax authority on a tax treatment may affect accounting of assets or liabilities for deferred or current taxes, in accordance with the requirements of IAS 12. However.
based on the criteria established in the interpretation of IFRIC 23, Bancolombia did not recognize uncertain tax positions in its financial statements.
12.9. Transfer Pricing System
The Bank recognizes transactions between related parties by applying the arm's length principle. These transactions are documented and reported to the Colombian tax administration. For the current fiscal year, adjustments are expected in transfer pricing matters, which were included in the calculation of the income tax provision at the end of the year.
NOTE 13. ASSETS HELD FOR SALE AND INVENTORIES, NET
The detail of assets held for sale and inventories, net as of December 31, 2023 and 2022 is as follows:
Assets held for sale and inventories |
December 31, 2023 |
December 31, 2022 |
|
In millions of COP | |||
Inventories, net (1) |
445,816 |
232,163 |
|
Assets held for sale, net (2) |
13,512 |
15,838 |
|
Total assets held for sale and inventories, net |
459,328 |
248,001 |
|
| (1) | See 13.1. Inventories, net. |
| (2) | See 13.2. Assets held for sale, net. |
For more information on marketable and non-marketable assets, see Note 14. Other assets, net.
13.1. Inventories, net
When goods delivered under operating or financial leases to third parties that do not exercise the purchase option or do not have a purchase option, they are recorded as inventories once the contract expires, considering that in the course of the ordinary activities carried out by the Bank, such goods are routinely sold.
The Bank’s inventories at December 31, 2023 and 2022, are summarized as follows:
Inventories |
December 31, 2023 |
December 31, 2022 |
|
In millions of COP | |||
Lands and buildings(1) |
275,808 |
285,076 |
|
Vehicles(2) |
379,928 |
155,285 |
|
Computer equipment(2) |
15,824 |
9,704 |
|
Machinery and equipment |
7,906 |
7,343 |
|
Other assets |
625 |
574 |
|
Subtotal, inventaries |
680,091 |
457,982 |
|
Deterioro (2) |
(234,275) |
(225,819) |
|
92
Total inventaries, net |
445,816 |
232,163 |
|
| (1) | The decrease is mainly due to sales during 2023. |
| (2) | The increase corresponds to transfers to inventories of assets after maturity of lease contracts. In vehicles, it is related to contracts with Renting. In computer equipment associated with contracts with Axity Colombia SAS, Caja de Compensacion Familiar Comfandi and Colsof SAS. |
There are no inventories pledged as collateral for liabilities as of December 31, 2023 and 2022.
The impairment recognized in the income statement as of December 31, 2023 and 2022 was COP 90,315 and COP 75,247, respectively. See Note 26.3. Amortization, depreciation and impairment, subscript (2).
13.2. Assets held for sale, net
The Bank's assets held for sale, net, composition is as follows:
Assets held for sale |
December 31, 2023 |
December 31, 2022 |
In millions of COP | ||
Real estate different from residential properties (1) |
5,947 |
11,178 |
Real estate for residential purposes |
6,191 |
7,967 |
Real estate (2) |
9,299 |
5,160 |
Total assets held for sale |
21,437 |
24,305 |
Impairment |
(7,925) |
(8,467) |
Total assets held for sale, net |
13,512 |
15,838 |
| (1) | The decrease corresponds mainly to reclassification to the category Other marketable assets for not carrying out the sale within one year. The decrease is mainly due to higher sales made during the year. |
| (2) | The increase is mainly due to higher reclassification of furniture and fixtures and lower sales during the year. |
The assets recognized by the Bank as held for sale correspond to real estate different from residential properties, real estate for residential purposes and personal property such as machinery, equipment, automobiles, technology, among others.
The assets held for sale held by the Bank have a strategy plan according to the type of asset in order to dynamize and maximize the commercialization that in turn allows the improvement of sales in optimal times for the organization.
The impairment recognized in the income statement as of December 31, 2023 and 2022 amounted to COP 10,987 and COP 14,398, respectively. See Note 26.3. Amortization, depreciation and impairment, subscript (2).
Assets held for sale and inventory costs incurred are recognized as an expense during the year, for COP 39,779, for administration, maintenance, utilities, real estate, fees, etc
NOTE 14. OTHER ASSETS, NET
As of December 31, 2023 and 2022 the Bank’s other assets, net consist of:
December 31, 2023 |
December 31, 2022 |
|
|---|---|---|
In millions of COP | ||
Balance in favorable income tax |
1,184,129 |
953,615 |
Assets pledged as collateral (cash) (1) |
1,010,562 |
648,364 |
Other accounts receivable (2) |
776,813 |
606,109 |
Receivables related to abandoned accounts (3) |
403,432 |
439,994 |
93
December 31, 2023 |
December 31, 2022 |
|
|---|---|---|
Accounts receivable from contracts with customers (4) |
169,182 |
127,984 |
Prepaid expenses (5) |
161,018 |
121,491 |
Marketable and non-marketable assets, net (6) |
88,976 |
80,052 |
Operating leasing fee, net |
66,614 |
49,245 |
Payments on customers account |
31,861 |
31,288 |
Receivable Sales of goods and service |
13,906 |
27,968 |
Other |
304,818 |
169,866 |
Subtotal other assets |
4,211,311 |
3,255,976 |
Impairment of accounts receivable |
(47,113) |
(33,839) |
Impairment of assets from customer contracts |
(23,681) |
(16,948) |
Impairment of other assets |
(6,679) |
(3,911) |
Subtotal other assets impairment |
(77,473) |
(54,698) |
Total other assets, net |
4,133,838 |
3,201,278 |
| (1) | The variation is generated by the valuation of current operations with international counterparties.see Note 3. Cash and Cash equivalents. |
| (2) | Other accounts receivable are mainly associated with import factoring, correspondent banking items, accounts receivable from derivatives, debt securities and treasury operations, TIPS interest, among others. |
| (3) | Corresponds to the application of Law 1777 of February 1, 2016, where it is established that entities that maintain balances in savings or checking accounts that are considered abandoned, must transfer these resources to the special fund created and administered by ICETEX for the granting of study credits and credits to promote the quality of Higher Education Institutions. |
| (4) | Corresponds to accounts receivable from commissions, see Note 25.3.1. Income from commissions and other services, in the detail of balances of accounts receivable and liabilities from contracts. |
| (5) | The following is a detail of prepaid expenses: |
|
December 31, 2023 |
December 31, 2022 |
|---|---|---|
In millions of COP | ||
License renewal (*) |
129,663 |
88,256 |
Insurance |
21,819 |
24,794 |
Contract advances |
4,089 |
3,291 |
Other |
5,447 |
5,150 |
Total |
161,018 |
121,491 |
(*) Corresponds to expenses paid in advance for licenses and support of applications and updates thereof.
| (6) | The following is a detail of Marketable and non-marketable assets, net, for assent type. |
|
December 31, 2023 |
December 31, 2022 |
|---|---|---|
In millions of COP | ||
Assent Type |
|
|
Real estate different from residential properties |
471,141 |
494,854 |
Real estate for residential purposes |
45,291 |
56,090 |
Machinery, fixtures and fittings and others |
32,474 |
40,781 |
Trust |
33,878 |
38,614 |
Vehicles |
3,657 |
732 |
Shares |
373 |
373 |
Total |
586,814 |
631,444 |
Impairment |
(497,838) |
(551,392) |
Total marketable and non-marketable, net |
88,976 |
80,052 |
The impairment recognized in the income statement as of December 31, 2023 and 2022 was COP 67,098 and COP 89,632, respectively. See Note 26.3. Amortization, depreciation and impairment, subscript (2).
NOTE 15. DEPOSITS BY CUSTOMERS
The detail of the deposits as of December 31, 2023 and 2022 is as follows:
94
|
December 31, 2023 |
December 31, 2022 |
In millions of COP | ||
Saving accounts |
83,841,543 |
85,780,556 |
Time deposits(1) |
61,106,144 |
44,506,484 |
Checking accounts |
20,270,659 |
22,402,725 |
Other deposits |
5,013,054 |
3,790,518 |
Total (2) |
170,231,400 |
156,480,283 |
| (1) | The increase in term deposits is mainly due to the increase in interest rates, which have generated an appetite for fixed income instruments due to the comparative advantage in rates compared to other types of investments. |
| (2) | As of December 31, 2023 and 2022, Nequi deposits are included for COP 2,924,906 and COP 1,724,123, respectively. |
The following table details the time deposits issued by the Bank:
Time deposits |
Effective interest rate |
December 31, 2023 |
|
|---|---|---|---|
Modality |
Minimum |
Maximum |
Carrying Value |
Less than 6 months |
0.10% |
15.52% |
14,755,244 |
Between 6 months and 12 months |
5.15% |
16.89% |
9,022,876 |
Between 12 months and 18 months |
5.30% |
20.56% |
12,595,855 |
Greater than 18 months |
1.85% |
20.86% |
24,732,169 |
Total |
61,106,144 |
||
Time deposits |
Effective interest rate |
December 31, 2022 |
|
|---|---|---|---|
Modality |
Minimum |
Maximum |
Carrying Value |
Less than 6 months |
0.10% |
17.04% |
13,414,344 |
Between 6 months and 12 months |
1.60% |
17.41% |
4,001,794 |
Between 12 months and 18 months |
1.25% |
19.63% |
8,684,034 |
Greater than 18 months |
1.50% |
22.10% |
18,406,312 |
Total |
44.506,484 |
||
| (1) | The intervention interest rate issued by Banco de la República went from 3.00% at the beginning of 2022, to 13.00% on December 31, 2023. This has an impact on the rates of CDT deposit operations. |
The detail of Time deposits issued by the Bank by maturity is as follows:
|
December 31, 2023 |
December 31, 2022 |
In millions of COP | ||
Less than 1 year |
41,575,609 |
28,829,132 |
Between 1 and 3 years |
7,404,119 |
6,208,346 |
Between 3 and 5 years |
1,533,206 |
1,837,225 |
Greater than 5 years |
10,593,210 |
7,631,781 |
Total |
61,106,144 |
44,506,484 |
NOTE 16. INTERBANK DEPOSITS AND REPURCHASE AGREEMENTS
The following table sets forth information regarding the money market operations recognized as liabilities in Statement of Financial Position:
December 31, 2023 |
December 31, 2022 |
|
Interbank Deposits |
|
|
Interbank liabilities |
- |
482,766 |
Total interbank |
- |
482,766 |
Repurchase agreements and other similar secured borrowing |
|
|
Temporary transfer of securities |
- |
30,492 |
Short selling operations |
263,751 |
125,682 |
Total Repurchase agreements (1) |
263,751 |
156,174 |
Total interbank deposits and repurchase agreements |
263,751 |
638,940 |
95
| (1) | Total repo liabilities have maturities of less than 30 days. |
Offsetting of Repurchase and Resale Agreements
For the Bank substantially all repurchase and resale activities are transacted under legally enforceable repurchase agreements that give the Bank, in the event of default by the counterparty, the right to liquidate securities held with the same counterparty.
The Bank does not offset repurchase and resale transactions with the same counterparty in the statement of financial position.
The table below presents repurchases and resale transactions included in the statement of financial position at December 31, 2023 and 2022:
December 31, 2023 | |||
In millions of COP | |||
|
Assets / liabilities gross |
Financial instruments as collaterals |
Assets / liabilities net |
Securities purchased under resale agreements(1) |
7,792,496 |
(7,792,496) |
- |
Securities sold under repurchase agreements |
(263,751) |
263,751 |
- |
Total repurchase and resale agreements |
7,528,745 |
(7,528,745) |
- |
December 31, 2022 | |||
In millions of COP | |||
|
Assets / liabilities gross |
Financial instruments as collaterals |
Assets / liabilities net |
Securities purchased under resale agreements(1) |
2,816,948 |
(2,816,948) |
- |
Securities sold under repurchase agreements |
(156,175) |
156,175 |
- |
Total repurchase and resale agreements |
2,660,773 |
(2,660,773) |
- |
| (1) | See Note 3. Cash and cash equivalents. |
NOTE 17. BORROWINGS FROM OTHER FINANCIAL INSTITUTIONS
As of December 31, 2023 and 2022, the composition of the borrowings from other financial institutions measured at amortized cost is the following:
December 31, 2023 |
December 31, 2022 |
|
In millions of COP | ||
Obligations granted by foreign banks (1) |
6,555,231 |
10,280,527 |
Obligations granted by domestic banks |
5,445,038 |
3,880,560 |
Total |
12,000,269 |
14,161,087 |
(1) Increase mainly due to the opening of more obligations and the variation of the TRM from COP 4,810.20 in 2022 to COP 3,822.05 in 2023.
Obligations granted by foreign banks
Financial entity |
Rate Minimum |
Rate Maximum |
December 31, 2023 |
In millions of COP | |||
Financing with Correspondent Banks (1) |
1.21% |
8.87% |
6,555,231 |
Total |
|
|
6,555,231 |
96
(1) Of the obligations with correspondent banks, USD 200,000 were designated as coverage of the net assets of a foreign bussiness. See Note 7. Investment in subsidiaries.
Financial entity |
Rate Minimum |
Rate Maximum |
December 31, 2022 |
In millions of COP | |||
Financing with Correspondent Banks |
0.97% |
7.93% |
10,280,527 |
Total |
|
|
10,280,527 |
The contractual maturities of financial obligations with foreign entities are as follows:
December 31, 2023 |
December 31, 2022 |
|
In millions of COP | ||
Short term (less than 1 year) |
1,742,300 |
5,292,484 |
Long term (more than 1 year) |
4,812,931 |
4,988,043 |
Total |
6,555,231 |
10,280,527 |
Obligations granted by domestic Banks
Financial entity |
Rate Minimum (1) |
Rate Maximum (1) |
December 31, 2023 |
|
In millions of COP | ||||
Financiera de desarrollo territorial (Findeter) |
8.15% |
20.85% |
2,530,570 |
|
Fondo para el financiamiento del sector agropecuario (Finagro) |
8.37% |
15.88% |
1,509,595 |
|
Banco de comercio exterior de Colombia (Bancoldex) |
2.17% |
21.46% |
1,404,873 |
|
Total |
|
|
5,445,038 |
|
Financial entity |
Rate Minimum (1) |
Rate Maximum (1) |
December 31, 2022 |
|
In millions of COP | ||||
Financiera de desarrollo territorial (Findeter) |
7.22% |
18.77% |
2,047,506 |
|
Fondo para el financiamiento del sector agropecuario (Finagro) |
3.40% |
15.70% |
931,018 |
|
Banco de comercio exterior de Colombia (Bancoldex) |
2.15% |
19.15% |
902,036 |
|
Total |
|
|
3,880,560 |
|
(1) The intervention rate issued by the Colombian Central Bank increased from 3.00% in 2022 to 13.00% in 2022, which has an impact on the operation rates of financial obligations.
The maturities of financial obligations with domestic banks as of December 31, 2023 and 2022, are as follows:
December 31, 2023 |
December 31, 2022 |
|
In millions of COP | ||
Short term (less than 1 year) |
213,557 |
273,806 |
Long term (more than 1 year) |
5,231,481 |
3,606,754 |
Total |
5,445,038 |
3,880,560 |
As of December 31, 2023 and 2022, there were some financial covenants, mainly regarding capital adequacy ratios, past due loans and allowances. None of these covenants had been breached nor were the related obligations past due.
NOTE 18. DEBT INSTRUMENTS IN ISSUE
The Bank, duly authorized by the SFC, has issued bonds as shown in the following table:
97
December 31, 2023 | ||||
|
Amount Issued |
Carrying balance |
E.A. Rate Range |
|
Securities issued in foreign currency (1) |
USD |
1,832,534 |
6,861,097 |
3.02% -7.03% |
Securities issued in local currency |
COP |
4,029,882 |
4,097,726 |
12.87% -21.06% |
Total |
|
|
10,958,823 |
|
December 31, 2022 | ||||
|
Amount Issued |
Carrying balance |
E.A. Rate Range |
|
Securities issued in foreign currency (1) |
USD |
2,256,397 |
10,501,034 |
3.02% -7.03% |
Securities issued in local currency |
COP |
4,642,404 |
4,708,586 |
13.06% -17.92% |
Total |
|
|
15,209,620 |
|
(1) As of august 2023, USD 467,966 of bonds were redeemed early. For debt securities issued in foreign currency, USD 1,392,034 thousand were designated as a hedge of net investment abroad at December 31, 2023, and USD 1,860,000 thousand at December 31, 2022, See Note 7. Investments in subsidiaries.
The following is the detail of debt securities issued in foreign currency, as of December 31, 2023 and 2022:
December 31, 2023 | ||||||
Issuance date |
Maturity date |
Currency |
Payment method (*) |
Amount issued (in thousands of USD) |
Carrying balance (in millions of COP) |
EIR (1) |
October 18, 2017 |
October 18, 2027 |
USD |
SD |
750,000 |
2,810,736 |
7.03% |
December 18, 2019 |
December 18, 2029 |
USD |
SD |
550,000 |
2,011,536 |
4.68% |
January 29, 2020 |
January 29, 2025 |
USD |
SD |
482,034 |
1,835,514 |
3.02% |
January 13, 2023 |
January 26, 2024 |
USD |
M |
4,000 |
16,176 |
6.00% |
January 26, 2020 |
July 26, 2024 |
USD |
M |
25,000 |
100,944 |
6.05% |
January 26, 2023 |
January 26, 2024 |
USD |
M |
4,000 |
16,144 |
6.00% |
March 9, 2023 |
March 8, 2024 |
USD |
M |
3,000 |
12,025 |
6.00% |
March 14, 2023 |
March 14, 2024 |
USD |
M |
11,500 |
46,059 |
6.00% |
March 29, 2023 |
April 2, 2024 |
USD |
M |
3,000 |
11,963 |
5.70% |
Total |
|
|
|
1,832,534 |
6,861,097 |
|
December 31, 2022 | ||||||
Issuance date |
Maturity date |
Currency |
Payment method (*) |
Amount issued (in thousands of USD) |
Carrying balance (in millions of COP) |
EIR (1) |
October 18, 2017 |
October 18, 2027 |
USD |
SD |
750,000 |
3,511,306 |
7.03% |
December 18, 2019 |
December 18, 2029 |
USD |
SD |
550,000 |
2,515,433 |
4.68% |
January 29, 2020 |
January 29, 2020 |
USD |
SD |
950,000 |
4,442,493 |
3.02% |
July 7, 2020 (1) |
July 7 de 2023 |
USD |
SD |
1,650 |
8,725 |
4.00% |
September 29, 2022 (1) |
September 29 de 2023 |
USD |
M |
2,000 |
9,742 |
4.90% |
October 27, 2022(1) |
April 27 de 2023 |
USD |
M |
1,456 |
7,065 |
4.85% |
October 28, 2022(1) |
October 27 de 2023 |
USD |
M |
1,291 |
6,270 |
5.40% |
Total |
|
|
|
2,256,397 |
10,501,034 |
|
* SD: Semester due. M: At maturity
| (1) | Bonds issued by the Panama branch office. |
The following is the detail of debt securities issued in local currency, as of December 31, 2023 and 2022:
December 31, 2023 | ||||||
Issuance date |
Maturity date |
Currency |
Payment method (*) |
Amount issued (in thousands of USD) |
Carrying balance (in millions of COP) |
E.A rate (1) |
98
March 4, 2009 |
March 4, 2024 |
COP |
YD |
209,000 |
245,539 |
21.06% |
July 27, 2011 |
July 27, 2026 |
COP |
QD |
248,030 |
254,852 |
16.10% |
November 2, 2011 |
November 2, 2023 |
COP |
QD |
224,050 |
229,659 |
16.12% |
April 18, 2012 |
April 18, 2024 |
COP |
QD |
192,916 |
198,906 |
15.98% |
July 23, 2014 |
July 23, 2024 |
COP |
QD |
178,750 |
183,844 |
15.71% |
September 24, 2014 |
September 24, 2034 |
COP |
QD |
254,500 |
255,152 |
15.43% |
September 24, 2014 |
September 24, 2029 |
COP |
QD |
360,000 |
360,945 |
15.27% |
September 24, 2014 |
September 24, 2024 |
COP |
QD |
373,752 |
374,749 |
14.88% |
March 18, 2015 |
March 18, 2025 |
COP |
QD |
91,884 |
92,333 |
14.56% |
July 19, 2019 |
July 19, 2024 |
COP |
MD |
657,000 |
659,796 |
14.72% |
September 16, 2021 |
September 16, 2033 |
COP |
QD |
251,500 |
252,719 |
14.21% |
September 16, 2021 |
September 16, 2026 |
COP |
QD |
183,797 |
184,646 |
12.87% |
September 16, 2021 |
September 16, 2024 |
COP |
MD |
164,703 |
165,589 |
14.39% |
October 25, 2022 |
October 25 de 2027 |
COP |
MD |
640,000 |
638,997 |
16.01% |
Total |
|
|
|
4,029,882 |
4,097,726 |
|
December 31, 2022 | ||||||
Issuance date |
Maturity date |
Currency |
Payment method (*) |
Amount issued (in thousands of USD) |
Carrying balance (in millions of COP) |
E.A rate (1) |
March 4, 2009 |
March 4, 2024 |
COP |
YD |
209,000 |
233,846 |
14.32% |
July 27, 2011 |
July 27, 2026 |
COP |
QD |
248,030 |
255,040 |
16.57% |
November 2, 2011 |
November 2, 2023 |
COP |
QD |
115,828 |
118,775 |
16.40% |
November 2, 2011 |
November 2, 2026 |
COP |
QD |
224,050 |
229,814 |
16.59% |
April 18, 2012 |
April 18, 2024 |
COP |
QD |
192,916 |
199,072 |
16.45% |
July 23, 2014 |
July 23, 2024 |
COP |
QD |
178,750 |
183,988 |
16.18% |
September 24, 2014 |
September 24, 2034 |
COP |
QD |
254,500 |
255,304 |
17.92% |
September 24, 2014 |
September 24, 2024 |
COP |
QD |
373,752 |
374,971 |
17.36% |
September 24, 2014 |
September 24, 2029 |
COP |
QD |
360,000 |
361,156 |
17.76% |
March 18, 2015 |
March 18, 2025 |
COP |
QD |
91,884 |
92,420 |
17.03% |
December 5, 2016 |
December 5, 2023 |
COP |
MD |
350,000 |
352,729 |
13.71% |
July 18, 2018 |
July 18, 2023 |
COP |
QD |
146,694 |
150,854 |
14.73% |
July 19, 2019 |
July 19, 2024 |
COP |
MD |
657,000 |
658,883 |
13.41% |
September 16, 2021(2) |
September 16, 2024 |
COP |
MD |
164,703 |
165,495 |
13.06% |
September 16, 2021(2) |
September 16, 2026 |
COP |
QD |
183,797 |
184,812 |
15.31% |
September 16, 2021(2) |
September 16, 2033 |
COP |
QD |
251,500 |
252,982 |
16.68% |
October 25, 2022 |
October 25 de 2027 |
COP |
MD |
640,000 |
638,445 |
15.00% |
Total |
|
|
|
4,642,404 |
4,708,586 |
|
* MD: Month due. QD: Quarterly due. YD: Year due.
| (1) | Each of these issuances has different nominal rates; therefore, the effective rates presented herein correspond to the calculation made with each of the rates for each outstanding issuance. The form of payment varies according to the conditions established in each issuance; there are no real guarantees granted to third parties. |
| (2) | See Sustainable bond issuance. |
99
The following table shows the detail of the bonds classified by currency, term and type of issue:
As of December 31, 2023
Less than 1 year |
Between 1 and 3 years |
Between 3 and 5 years |
Greater than 5 years |
Total amortized cost |
|
In millions of COP | |||||
Local currency | |||||
Ordinary bonds |
- |
- |
165,589 |
2,695,751 |
2,861,340 |
Subordinated bonds (1) |
- |
- |
- |
1,236,385 |
1,236,385 |
Foreign currency | |||||
Ordinary bonds |
28,169 |
175,142 |
- |
1,835,514 |
2,038,825 |
Subordinated bonds (1) |
- |
- |
- |
4,822,273 |
4,822,273 |
Total |
28,169 |
175,142 |
165,589 |
10,589,923 |
10,958,823 |
| (1) | In the event of default of the Bank, the subordinated bonds, will be subordinated to the claims of depositors and all other creditors of the Bank, other than creditors whose claims rank equally with, or are junior to, the claims of the holders of the subordinated liabilities. |
As of December 31, 2022
Less than 1 year |
Between 1 and 3 years |
Between 3 and 5 years |
Greater than 5 years |
Total amortized cost |
|
In millions of COP | |||||
Local currency | |||||
Ordinary bonds |
- |
- |
165,495 |
3,317,815 |
3,483,310 |
Subordinated bonds (1) |
- |
- |
- |
1,225,276 |
1,225,276 |
Foreign currency | |||||
Ordinary bonds |
23,077 |
8,725 |
- |
4,442,493 |
4,474,295 |
Subordinated bonds (1) |
- |
- |
- |
6,026,739 |
6,026,739 |
Total |
23,077 |
8,725 |
165,495 |
15,012,323 |
15,209,620 |
| (1) | In the event of default of the Bank, the subordinated bonds, will be subordinated to the claims of depositors and all other creditors of the Bank, other than creditors whose claims rank equally with, or are junior to, the claims of the holders of the subordinated liabilities. |
Sustainable bond issuance
On October 25, 2022 the Bank issued the first bond linked to sustainability for COP 640,000, with commits to promoting financial inclusion and decarbonizing loans. The issuance, was signed by the BID, BID Invest and LAGreen, has a term of 5 years and includes sustainability goals, including commits to grant financing for more than 1.5 million unbanked or low-income people by 2025, and reduce CO2 emissions by 35.6% in its financed loans compared to 2021, all as part of its sustainability strategy.
For more information related to the fair value disclosures of debt securities issued, see Note 29. Fair value of assets and liabilities.
The following is a schedule of the debt instruments in issue by maturity:
December 31, 2023 |
December 31, 2022 |
|
In millions of COP | ||
Short term (less than 1 year) |
2,031,732 |
654,160 |
Long term (more than 1 year) |
8,927,091 |
14,555,460 |
Total |
10,958,823 |
15,209,620 |
100
As of December 31, 2023 and 2022, there were no financial covenants related to the aforementioned securities.
NOTE 19. PREFERRED SHARES
The Bank recognizes as a financial liability the obligation to pay in cash a preferred dividend to the holders of its preferred shares.
Details of the preferred stock liability as of December 31, 2023 and 2022 are described below:
|
December 31, 2023 |
December 31, 2022 |
In millions of COP | ||
Initial balance - minimum dividend on preferred shares |
584,204 |
584,204 |
Interest expense on preferred shares |
57,701 |
57,701 |
Payment of dividends declared during the period |
(57,701) |
(57,701) |
Total |
584,204 |
584,204 |
See detail in Note 23. Share Capital.
NOTE 20. EMPLOYEE BENEFIT PLANS
The following table shows liabilities relating to post-employment benefit and long-term benefit plans:
Concept |
December 31, 2023 |
December 31, 2022 |
|
|---|---|---|---|
In millions of COP | |||
Post-employment benefits(1) (2) |
|||
Defined benefit pension plan |
101,778 |
95,081 |
|
Retirement Pension Premium Plan and Executive Pension Plan Premium (1) |
100,158 |
72,365 |
|
Severance obligation under the previous regime |
14,360 |
15,446 |
|
Total post-employment |
216,296 |
182,892 |
|
Long-term benefits (1) (3) |
|
||
Seniority bonus |
468,143 |
373,621 |
|
Total long-term benefits |
468,143 |
373,621 |
|
Total |
684,439 |
556,513 |
|
| (1) | Ver 20.1. Annual change of the present value of the obligations of defined benefit. |
| (2) | Ver 20.2. Post-employment benefit. |
| (3) | Ver 20.3. Long-term benefits. |
These benefits include all types of payments that the Bank provides to its employees. The recognition of liabilities related to post-employment and long-term employee benefit plans is based on actuarial computations which involve judgments and assumptions made by management (with the assistance of external actuaries) related to the future macroeconomic and employee demographic factors, among others, which will not necessarily coincide with the future outcome of such factors.
20.1. Present value of defined benefit plan obligations in the statement of financial position
The annual changes in the present value of the defined benefit plan obligations in the statement of financial position are as follows:
101
|
Defined benefit pension plan |
Pension bonus |
Executive pension plan, net (1) |
Severance indemnities previous regime |
Seniority bonus |
In millions of COP | |||||
Initial balance as of January 1, 2022 |
110,018 |
87,728 |
3,236 |
18,428 |
391,806 |
Cost per current service |
- |
6,134 |
1,213 |
409 |
15,392 |
Interest cost |
9,459 |
8,372 |
404 |
1,250 |
35,489 |
Actuarial gain, net income |
- |
- |
- |
- |
(31,964) |
Actuarial gain, other comprehensive income |
(12,954) |
(28,350) |
3,905 |
472 |
- |
Employer contributions |
- |
- |
(6,614) |
- |
- |
Payments |
(11,442) |
(1,519) |
- |
(5,113) |
(37,102) |
Consolidation of contributions, net |
- |
- |
(2,144) |
- |
- |
Saldo final a diciembre 31, 2022 |
95,081 |
72,365 |
- |
15,446 |
373,621 |
Cost per current service |
- |
6,146 |
- |
357 |
41,786 |
Interest cost |
11,408 |
10,077 |
- |
1,566 |
47,693 |
Actuarial gain, net income |
- |
- |
- |
- |
51,752 |
Actuarial gain, other comprehensive income |
7,525 |
13,181 |
- |
3,585 |
- |
Payments |
(12,236) |
(1,611) |
- |
(6,594) |
(46,709) |
Final balance at December 31, 2023 |
101,778 |
100,158 |
- |
14,360 |
468,143 |
| (1) | See 20.2. Post-employment benefit - Retirement Pension Premium Plan and Executive Pension Plan Premium. |
20.2. Post-employment benefit
Defined benefit pension plan
In accordance with Colombian law, employee pension obligations have been managed as a defined contribution plan since 1990. The Bank's legal obligation for retirement benefits at December 31, 2023 and 2022 corresponds to retired employees who rendered their services to the Bank prior to the entry into force of the current regulations. Under this open-ended plan, benefits are based on length of service and level of remuneration. As of December 31, 2023 and 2022, 498 and 522 participants, respectively, were covered by this plan.
For purposes of the projected valuation of the pension plan obligation, in the absence of a large market for high quality corporate debt, the Colombian government sovereign bond curve, rated as sovereign by one of the three major risk rating agencies, with a maturity similar to the remaining life of the projected benefit obligation, is used. The net pension cost is recorded in the Income Statement as "salaries and employee benefits".
Retirement Pension Premium Plan and Executive Pension Plan Premium
Under Colombian labor law, employees and employers have the right to negotiate private agreements. The Bank's employees participate in defined benefit plans under which they may receive a payment upon retirement.
Until 2022 and as a key talent retention strategy, the Bank offered certain senior executives a defined benefit plan, under which the individuals covered by this plan were entitled to receive a single payment at the date of their retirement based on the years of service rendered to the organization and thus contribute to closing the pension gap. In December 2022 this benefit was terminated and as a consequence:
| (i) | The obligations for the Bank derived from the defined benefit plan ceased, as well as the rights for those who were part of it. |
102
| (ii) | The resources of the plan assets that supported the defined benefit plan were transferred to the beneficiaries' accounts in the private pension fund, subject to permanence until the termination of the labor relationship (See line "consolidation of contributions" in the movement of the present value of the obligation, disclosed below in this same section); |
| (iii) | The program for closing the pension gap for executives is unified under the defined contribution modality. |
Asset plan
To support the Executive Pension Plan Premium, the Bank had established an asset plan managed by a Private Pension Fund. The plan's investment assets are measured at fair value using significant, unobservable market data and, therefore, are classified as Level 3. In 2022, this benefit was terminated and, as a consequence, the passive obligation of the Executive Pension Plan Premium ceased at the end of the year. The resources of the asset plan that backed this benefit were transferred to the accounts of the beneficiaries in the private pension fund, subject to the permanence of the employment relationship.
The reconciliation of the fair value of the executive pension bonus asset plan is detailed below:
Fair value of plan assets |
December 31, 2023 |
December 31, 2022 |
|
In millions of COP | |||
Initial balance |
- |
30,121 |
|
Employee contributions |
- |
6,614 |
|
Interest income on plan assets |
- |
2,329 |
|
Return on plan assets greater/(less) than discount rate |
- |
(4,245) |
|
Consolidation of contributions |
- |
(34,819) |
|
Final balance |
- |
- |
|
Severance obligation under the previous regime
In accordance with Colombian labor regulations, employees hired before 1990 are entitled to receive a severance benefit equivalent to one month's salary for each year of service. This benefit accrues and is paid to employees at the time of termination or retirement from the Bank, calculated on the basis of the employee's last base salary; however, employees may request advances of this benefit at any time. In 1990, the Colombian government revised labor regulations for new employees to allow companies, subject to employee approval, to transfer this severance obligation annually to private pension and census funds independent of the employer. As of December 31, 2023 and 2022, 114 and 152 participants, respectively, were covered by this plan.
20.3. Long-term benefit
Seniority bonuses
In addition to the legal benefits and post-employment benefits mentioned above, the Bank provides its employees with additional benefits based on their length of service.
20.4. Assumptions
103
The Bank main actuarial assumptions
The assumptions used to determine the cost for the defined benefit pension plan, pension premium bonus, executive pension bonus, severance payments under the previous regime and seniority premium are as follows:
Defined contribution plans
Main actuarial assumptions |
December 31, 2023 |
December 31, 2022 |
Nominal discount rate |
11.75% |
14.00% |
Rate of salary increase |
6.35% |
7.30% |
Annual inflation rate |
6.35% |
7.30% |
Pension bonus:
Main actuarial assumptions |
December 31, 2023 |
December 31, 2022 |
Nominal discount rate |
11.75% |
14.25% |
Rate of salary increase |
8.85% |
9.80% |
Annual inflation rate |
6.35% |
7.30% |
Executive Pension Plan Premium, net:
Main actuarial assumptions |
December 31, 2023 |
December 31, 2022 |
Nominal discount rate |
NA |
13.75% |
Rate of salary increase |
NA |
9.80% |
Annual inflation rate |
NA |
7.30% |
Severance obligation under the previous regime:
Main actuarial assumptions |
Diciembre 31, 2022 |
Diciembre 31, 2021 |
Nominal discount rate |
11.25% |
13.25% |
Rate of salary increase |
8.85% |
9.80% |
Annual inflation rate |
6.35% |
7.30% |
Seniority bonuses:
Main actuarial assumptions |
December 31, 2023 |
December 31, 2022 |
Nominal discount rate |
11.75% |
14.00% |
Rate of salary increase |
8.85% |
9.80% |
Annual inflation rate |
6.35% |
7.30% |
In 2022, the mortality assumption used in the preparation of the valuation of the liability is table RV-08 ("Valid Annuitants"). The discount rate used to bring to present value the obligation of the defined benefit plans to reflect the duration of the labor liability as of December 2023 corresponds to the curve of the sovereign of Colombia. The inflation rate assumption is based on the long-term projection of the Central Bank of Colombia.
Interest rate risks |
A decrease in the rate of return on government bonds implies a decrease in the discount rate which in turn will increase the obligation of the plans. The same applies in reverse when the rate of return increases. |
Longevity risk |
The present value of the defined benefit plan liability is calculated using the mortality tables recommended by the national government. An increase in the life expectancy of the participants will also increase the liability. |
Salary risk |
The present value of the benefit plans' obligation includes the Bank's long-term salary increase expectation. As such, an increase in participants' salaries beyond what is forecasted will increase the obligation of the plans. |
104
20.5. Estimated payment of future benefits
The payments of benefits, which reflect future service rendered, are considered to be paid as follows:
Año |
Defined benefit pension plan |
Pension premium plan |
Severance obligation previous regime |
Seniority bonuses |
|---|---|---|---|---|
In millions of COP | ||||
2024 |
13,265 |
6,207 |
4,946 |
54,685 |
2025 |
13,491 |
4,232 |
1,453 |
52,540 |
2026 |
13,606 |
5,116 |
2,737 |
64,688 |
2027 |
13,612 |
5,365 |
1,272 |
56,800 |
2028 |
13,516 |
6,970 |
1,142 |
63,863 |
2029 a 2033 |
63,043 |
44,240 |
5,893 |
305,121 |
20.6. Sensitivity analysis
The defined benefit obligation (DBO) was calculated using the projected unit credit method. The obligations and expenses will change in the future as a result of future changes in actuarial methods and assumptions, participant information, plan provisions and regulation, or as a result of future gains and losses.
Defined benefit pension plan |
(Increase/Decrease) |
Effect on DBO |
||
|
In millions of COP |
|||
Discount rate |
12.25% |
0.50% increase |
(2,899) |
|
Discount rate |
11.25% |
0.50% decrease |
3,071 |
|
Pension increase rate |
6.85% |
0.50% increase |
3,436 |
|
Pension increase rate |
5.85% |
0.50% decrease |
(3,264) |
|
Mortality table |
|
One year increase in life expectancy. |
4,229 |
|
Pension bonus |
(Increase/Decrease) |
Effect on DBO |
|||
|
In millions of COP |
||||
Discount rate |
12.25% |
0.50% increase |
(5,221) |
||
Discount rate |
11.25% |
0.50% decrease |
5,687 |
||
Rate of Salary Increase |
9.35% |
0.50% increase |
5,843 |
||
Rate of Salary Increase |
8.35% |
0.50% decrease |
(5,403) |
||
Severance previous regime |
(Increase/Decrease) |
Effect on DBO |
|||
|
In millions of COP |
||||
Discount rate |
11.75% |
0.50% increase |
(177) |
||
Discount rate |
10.75% |
0.50% decrease |
182 |
||
Rate of Salary Increase |
9.35% |
0.50% increase |
410 |
||
Rate of Salary Increase |
8.35% |
0.50% decrease |
(402) |
||
Seniority bonuses |
(Increase/Decrease) |
Effect on DBO |
|||
|
In millions of COP |
||||
Discount rate |
12.25% |
0.50% increase |
(13,833) |
||
Discount rate |
11.25% |
0.50% decrease |
14,695 |
||
Rate of Salary Increase |
9.35% |
0.50% increase |
15,001 |
||
Rate of Salary Increase |
8.35% |
0.50% decrease |
(14,238) |
||
20.7. Disclosures under Decree 2131 of December 2016
105
On December 22, 2016 the Ministry of Commerce, Industry and Tourism, issued Decree 2131, whereby:
Requires financial information preparers to disclose in the notes to their financial statements, the calculation of pension liabilities under their charge in accordance with the parameters established in Decree 1625 of 2016; reporting the variables used and the differences with the calculation made under IAS 19.
The following table shows the differences in the calculation of the defined benefit pension plan, between IAS 19 and Decree 1625 of December 2016, for the year 2023:
Liabilities calculation |
IAS 19 (1) |
Decree 1625 of December 2016 |
In millions of COP | ||
Defined benefit pension plan |
101,778 |
97,265 |
| (1) | Value taken for the update of the pension liability. |
Assumptions |
IAS 19 (1) |
Decree 1625 of December 2016 |
Discount rate |
11.75% |
13.92% |
Pension increase rate |
6.35% |
8.70% |
Annual inflation rate |
6.35% |
8.70% |
20.8. Defined contribution plans
The expense of the defined contribution plans for severance, current plan and pension are as follows:
Plan |
December 31, 2023 |
December 31, 2022 |
In millions of COP | ||
Pension |
227,315 |
188,235 |
Severance obligations current regime |
82,963 |
63,802 |
20.9. Short-term benefits
The detail of short-term benefit plans recognized in the Bank's statement of financial position is as follows. See Note 21. Other liabilities:
December 31, 2023 |
December 31, 2022 |
|
In millions of COP | ||
Bonuses and benefit plans (1) |
520,342 |
447,218 |
Salaries and labor obligations (2) |
315,038 |
269,726 |
Other benefits and short-term bonuses |
835,380 |
716,944 |
| (1) | The increase corresponds mainly to bonuses for the Bank's employees, in accordance with the variable compensation model of the Bancolombia Group. |
| (2) | Includes legal and extra-legal vacations. |
NOTE 21. OTHER LIABILITIES
Other liabilities consist of the following:
December 31, 2023 |
December 31, 2022 |
|||
|---|---|---|---|---|
In millions of COP | ||||
Payables |
4,126,706 |
3,021,567 |
||
Suppliers (1) |
1,437,329 |
2,134,243 |
||
Dividends (2) |
863,629 |
761,349 |
||
Deposits delivered as security |
787,640 |
639,206 |
||
106
December 31, 2023 |
December 31, 2022 |
|||
|---|---|---|---|---|
Collection services |
764,080 |
915,865 |
||
Deferred income |
532,668 |
647,773 |
||
Bonuses and short-term benefits (3) |
520,342 |
447,218 |
||
Withholdings and labor contributions |
452,164 |
404,456 |
||
Surplus to be applied |
414,509 |
386,173 |
||
Salaries and other labor obligations(3) |
315,038 |
269,726 |
||
Advances in leasing operations |
186,547 |
282,173 |
||
Provisions (4) |
130,081 |
129,981 |
||
Liabilities from contracts with customers(5) |
41,730 |
47,355 |
||
Credits for factoring operations |
26,056 |
29,534 |
||
Others |
20,563 |
19,454 |
||
Total |
10,619,082 |
10,136,073 |
||
| (1) | The decrease corresponds mainly to the payment of supplier invoices for purchases and imports of leasing assets. |
| (2) | Corresponds to the last installment pending payment on January 2, 2024. See Statement of changes in equity, distribution of dividends. |
| (3) | For more information related to other employee benefits, see Note 20.9 Short-term benefits. |
| (4) | See Note 22. Provisions and contingent liabilities. |
| (5) | See Note 25.3.1. Income from commissions and other services, in the detail of accounts receivable and contract liabilities. |
NOTE 22. PROVISIONS AND CONTINGENT LIABILITIES
22.1. Provisions
The following tables show the detail of the provisions:
As of December 31, 2023
|
Judicial proceedings |
Administrative proceedings(1) |
Financial guarantees and letters of credit (2) |
Loan commitments (3) |
Total provisions |
|
|
In millions of COP |
|||||
Balance at January 1, 2023 |
15,524 |
84,997 |
15,797 |
13,663 |
129,981 |
|
Additional provisions recognized during the period |
24,644 |
11,535 |
- |
1,722 |
37,901 |
|
Provisions used during the period |
(4,613) |
(3,865) |
- |
- |
(8,478) |
|
Provisions reversed during the period |
(5,706) |
(287) |
(13,966) |
(8,746) |
(28,705) |
|
Effect of discounted cash flows |
(618) |
- |
- |
- |
(618) |
|
Final balance at December 31, 2023 |
29,231 |
92,380 |
1,831 |
6,639 |
130,081 |
|
| (1) | Mainly includes environmental remediation of the Santa Elena property, see Note 22.2. Current legal proceedings; and proceedings in administrative litigation regarding the discussion of the difference in income tax criteria according to the applicable tax law for COP 14,920. |
| (2) | Mainly related to financial guarantees and its decrease is due to cancellation of operations. |
| (3) | The reversed provisions are due to the decrease in credit commitments. |
As of December 31, 2022
|
Judicial proceedings |
Administrative proceedings(1) |
Financial guarantees and letters of credit (2) |
Loan commitments (3) |
Total provisions |
|
|
In millions of COP |
|||||
Balance at January 1, 2022 |
19,862 |
15,332 |
30,752 |
1,824 |
67,770 |
|
Additional provisions recognized during the period |
9,100 |
94,004 |
3,649 |
11,844 |
118,597 |
|
107
Provisions used during the period |
(4,855) |
(23,082) |
- |
- |
(27,937) |
|
Provisions reversed during the period |
(8,452) |
(1,257) |
(18,604) |
(5) |
(28,318) |
|
Effect of discounted cash flows |
(131) |
- |
- |
- |
(131) |
|
Final balance at December 31, 2022 |
15,524 |
84,997 |
15,797 |
13,663 |
129,981 |
|
(1) Mainly includes environmental remediation of the Santa Elena property, see Note 22.2. Current legal proceedings; and proceedings in administrative litigation regarding the discussion of the difference in income tax criteria according to the applicable tax law for COP 14,002.
(2) The balance corresponds mainly to financial guarantees.
(3) The provision is due to the increase in credit commitments.
Judicial proceedings
Judicial provisions refer to pending legal proceedings on employment matters, ordinary lawsuits, class actions suits, civil actions within criminal prosecutions and executive proceedings against the Bank. In the opinion of management, after receiving pertinent legal advice, the payments estimated to be made in connection with these proceedings will not generate significant losses in addition to the provisions recognized as of December 31, 2023 and 2022.
In addition, the Bank does not expect to obtain any reimbursement from judicial proceedings raised against it and, therefore, has not recognized any assets for that purpose, see Note 22.2 Contingent liabilities.
Financial guarantees, letters of credit and credit commitments
In order to meet customers' needs, the Bank issues credit commitments, letters of credit and bank guarantees.
| - | Financial guarantees |
The Bank grants bank guarantees on behalf of customers. A bank guarantee represents an irrevocable commitment that the Bank will cover monetarily up to the maximum guaranteed amount, the nonperformance of the customer's contractual obligations to third parties for a specified period of time. These guarantees are issued mainly to back commitments established between parties in the energy sector, hydrocarbon sector, private sector and public works contracts. The provisions amount to COP 1,831 and COP 15,797 as of December 31, 2023 and 2022, respectively.
The events or circumstances that will require the Bank to meet the backed obligations are:
Guarantees for the energy sector
The Bank is responsible before the guarantee’s beneficiary in the following situations:
-
Lack of energy supply due to low availability from the generating company (the guaranteed entity)
| |
-
Non-compliance with the contract signed by the guaranteed entity
|
|
-
Non-compliance with the payment for energy supply
|
|
-
Non-compliance with the construction and operating of power plants
| |
-
Non-compliance with the construction and operating of transmission lines
| |
Guarantees for the hydrocarbons sector
The Bank is responsible before the guarantee’s beneficiary in the following situations:
108
| - | Non-compliance with the contractual obligations in the Minimum Exploration Program. |
| - | Non-compliance with the contractual obligations in the Additional Exploratory Program. |
| - | Non-compliance with the contractual obligations in the Post Exploratory Program. |
| - | Non-compliance with the Technical Evaluation obligations. |
Guarantees for public procurement
The Bank must pay a state entity up to the amount guaranteed for the breach by the contractor of the contractual or legal obligations agreed.
Private guarantees
These are those issued by the Bank for its customers on a private contract for goods and services in favor of a third party. The Bank must pay the third party what is established in the contract in the event of any breach of the agreement or in the event of the customer's economic insolvency.
| ● | Letters of credit |
It is a payment method used for the fulfillment of commercial obligations, exports and imports. It becomes a payment commitment, assumed by a bank (issuer or issuer), in favor of a third party (beneficiary), acting at the request and with instructions from a client (originator) using the services of a correspondent abroad (advisor/confirming). The provision as of December 31, 2023 and 2022 is worth less than COP 1.
Import letter of credit
They are issued by the Bank where it undertakes to pay in favor of a third party (exporter) acting under instructions from the client (importer) an international trade operation.
Provided that the required documents constitute a compliant presentation, the issuing bank is irrevocably bound to honor the obligation from the moment it issues the letter of credit.
Export Letter of Credit
It is issued by a bank abroad at the request of an importing client in favor of an exporting client in Colombia; in this case when Bancolombia acts as confirming bank, provided that the required documents constitute a compliant presentation it is irrevocably bound to honor the payment obligation from the moment the confirmation is added to the letter of credit.
| ● | Loan commitments |
Loan commitments are irrevocable business entered into with customers, where conditions are agreed from the time of signing the credit agreement until the maximum term of availability, such conditions must be respected and maintained for disbursements made during the entire term.
Both loan commitments and financial guarantee contracts are initially recognized as a liability at fair value, adjusted for transaction costs directly attributable to the issuance of the guarantee, if any. Generally, the fair value at initial recognition is equal to the value of the commission received at the time the product is opened.
109
Subsequently, the liability is measured at the higher of the amount of the provision calculated in accordance with IFRS 9 Impairment and the amount initially recognized less, when applicable, the accumulated amortization recognized in accordance with IFRS 15 Revenue from contracts with customers. Provisions amount to COP 6,639 and COP 13,663 as of December 31, 2023 and 2022, respectively.
The detail of guarantees and letters of credit is as follows:
As of December 31, 2023
Ranges |
Private guarantees and letters of credit |
|
In millions of COP | ||
Guarantees less than 1 month |
628,556 |
|
Warranties greater than 1 month and up to 3 months |
1,048,867 |
|
Warranties greater than 3 months and up to 1 year |
4,795,148 |
|
Warranties longer than 1 year and up to 5 years (1) |
1,625,168 |
|
Warranties longer than 5 years |
472,725 |
|
Total |
8,570,464 |
|
| (1) | The decrease compared to the previous year is mainly due to the cancellation of operations, with the following economic sectors: Energy, private, among others. |
As of December 31, 2022
Ranges |
Private guarantees and letters of credit |
|
In millions of COP | ||
Guarantees less than 1 month |
385,607 |
|
Warranties greater than 1 month and up to 3 months |
794,798 |
|
Warranties greater than 3 months and up to 1 year |
4,677,881 |
|
Warranties longer than 1 year and up to 5 years (1) |
3,514,328 |
|
Warranties longer than 5 years (2) |
9,600 |
|
Total |
9,382,214 |
|
(1) Mainly due to the opening of operations with the following economic sectors: private, energy, financial, among others.
(2) Mainly due to the change in the duration of a guarantee in the private sector.
The maximum balance payable on guarantees represents the nominal balance COP 8,570,464 for 2023 and COP 9,382,214 for 2022.
The following table shows the maximum exposure of financial guarantees and letters of credit to credit risk and provisioning according to the Bank's internal credit rating system, the 12-month Basel PD range and the year-end stage rating.
As of December 31, 2023
Level |
PD range |
Stage 1 |
Stage 2 |
Stage 3 |
Total |
||||
Exposure |
Provision |
Exposure |
Provision |
Exposure |
Provision |
Exposure |
Provision |
||
In millions of COP | |||||||||
Normal Risk |
0% - 3.11% |
8,405,750 |
1 |
1,321 |
- |
- |
- |
8,407,071 |
1 |
Acceptable Risk |
> 3.11% - 11.15% |
32,466 |
- |
733 |
- |
- |
- |
33,199 |
- |
Appreciable Risk |
> 11.15% - 72.75% |
1,783 |
- |
- |
- |
- |
- |
1,783 |
- |
Significant Risk |
> 72.75% - 89.89% |
- |
- |
- |
- |
- |
- |
- |
- |
Bad Risk |
> 89.89% - 100% |
- |
- |
- |
- |
128,411 |
1,830 |
128,411 |
1,830 |
Total |
8,439,999 |
1 |
2,054 |
- |
128,411 |
1,830 |
8,570,464 |
1.831 |
|
110
As of December 31, 2022
Level |
PD range |
Stage 1 |
Stage 2 |
Stage 3 |
Total |
||||
Exposure |
Provision |
Exposure |
Provision |
Exposure |
Provision |
Exposure |
Provision |
||
In millions of COP | |||||||||
Normal Risk |
0% - 3.11% |
9,147,269 |
1 |
11,968 |
- |
- |
- |
9,159,237 |
1 |
Acceptable Risk |
> 3.11% - 11.15% |
42,247 |
- |
163,394 |
- |
- |
- |
205,641 |
- |
Appreciable Risk |
> 11.15% - 72.75% |
1,309 |
- |
168 |
- |
- |
- |
1,477 |
- |
Significant Risk |
> 72.75% - 89.89% |
- |
- |
- |
- |
- |
- |
- |
- |
Bad Risk |
> 89.89% - 100% |
- |
- |
- |
- |
15,859 |
15,796 |
15,859 |
15,796 |
Total |
9,190,825 |
1 |
175,530 |
- |
15,859 |
15,796 |
9,382,214 |
15,797 |
|
The following table shows the changes in the provision for financial guarantees and letters of credit:
|
Stage 1 |
Stage 2 |
Stage 3 |
Total |
Balance at January, 2023 |
1 |
- |
15,796 |
15,797 |
Transfers |
- |
- |
- |
- |
Transfer to stage 1 |
- |
- |
- |
- |
Transfer to stage 2 |
- |
- |
- |
- |
Transfer to stage 3 |
- |
- |
- |
- |
Provisions recognized during the period |
- |
- |
- |
- |
Provisions reversed during the period |
- |
- |
(13,966) |
(13,966) |
Translation adjustment |
- |
- |
- |
- |
Balance at December 31, 2023 |
1 |
- |
1,830 |
1,831 |
|
|
|
|
|
|
Stage 1 |
Stage 2 |
Stage 3 |
Total |
Balance at January 1, 2022 |
2 |
- |
30,750 |
30,752 |
Transfers: |
- |
13,870 |
(13,870) |
- |
Transfer to stage 1 |
- |
- |
- |
- |
Transfer to stage 2 |
- |
13,870 |
(13,870) |
- |
Transfer to stage 3 |
- |
- |
- |
- |
Provisions recognized during the period |
3,649 |
- |
- |
3,649 |
Provisions reversed during the period |
(3,650) |
(13,870) |
(1,084) |
(18,604) |
Translation adjustment |
- |
- |
- |
- |
Balance at December 31, 2022 |
1 |
- |
15,796 |
15,797 |
The following table shows the maturity loan commitments:
As of December 31, 2023
Maturity |
Loan Commitments |
|
In million of COP | ||
Commitments under 1 month |
664,667 |
|
Commitments greater than 1 month and up to 3 months |
5,227 |
|
Commitments greater than 3 months and up to 1 years |
1,022,171 |
|
Commitments greater than 1 year and up to 3 years |
4,109,339 |
|
Commitments greater than 3 years and up to 5 years |
609,196 |
|
Total |
6,410,600 |
|
As of December 31, 2022
111
Maturity |
Loan Commitments |
|
In million of COP | ||
Commitments under 1 month |
721,295 |
|
Commitments greater than 1 month and up to 3 months |
1,017,541 |
|
Commitments greater than 3 months and up to 1 years |
1,071,771 |
|
Commitments greater than 1 year and up to 3 years |
6,989,297 |
|
Commitments greater than 3 years and up to 5 years |
788,691 |
|
Total |
10,588,595 |
|
The following table shos the changes in provision for loan commitments:
|
Stage 1 |
Stage 2 |
Stage 3 |
Total |
Balance at January 1, 2022 |
12,663 |
- |
1,000 |
13,663 |
Transfers: |
- |
- |
- |
- |
Transfer to stage 1 |
- |
- |
- |
- |
Transfer to stage 2 |
- |
- |
- |
- |
Transfer to stage 3 |
- |
- |
- |
- |
Provisions recognized during the period |
1,722 |
- |
- |
1,722 |
Provisions reversed during the period |
(7,746) |
- |
(1,000) |
(8,746) |
Balance at December 31, 2023 |
6,639 |
- |
- |
6,639 |
|
Stage 1 |
Stage 2 |
Stage 3 |
Total |
Balance at January 1, 2022 |
1,824 |
- |
- |
1,824 |
Transfers: |
- |
- |
- |
- |
Transfer to stage 1 |
- |
- |
- |
- |
Transfer to stage 2 |
- |
- |
- |
- |
Transfer to stage 3 |
- |
- |
- |
- |
Provisions recognized during the period |
10,844 |
- |
1,000 |
11,844 |
Provisions reversed during the period |
(5) |
- |
- |
(5) |
Balance at December 31, 2023 |
12,663 |
- |
1,000 |
13,663 |
22.2. Contingent liabilities
Current legal proceedings
As of December 31, 2023, there are labor, ordinary civil, commercial, mortgage, class actions, civil actions and other proceedings brought by administrative authorities against the Bank with claims of approximately COP 415,890, with a total provision of COP 29,231, mainly for commercial lawsuits for COP 19,875 and labor lawsuits for COP 9,357.
The following is a list of the Bank's contingencies for judicial or administrative litigation at the end of December 31, 2023, which represent a contingency of more than COP 28,516.
Some processes with claims for lower amounts and which were disclosed in previous periods, are retained for the reader to have information on their evolution.
Neos Group S.A.S. (in reorganization) and Inversiones Davanic S.A.S.
On November 3, 2022, Bancolombia was notified of a lawsuit requesting a declaration that there was a mutual or money loan contract between the parties and not a real estate leasing contract. Subsidiarily, the plaintiffs requested to declare the purchase and sale contract rescinded due to enormous damage, considering that the price of the property agreed in said contract is lower than its fair price.
112
The claims of the lawsuit are for COP 65,000. The contingency is classified as remote because the will of the contracting parties was always directed to the conclusion of the leasing contract and not another contract. On December 7, 2022, Bancolombia responded to the lawsuit.
As of December 31, 2023, the process continues pending the response to the lawsuit by another defendant. The process does not required a provision.
Constitutional Public Interest Action - Carlos Julio Aguilar and other
Related to a Popular Action in which the plaintiff considers that with the restructuring of the financial obligations of the Department of Valle and the performance plan signed by it, the collective rights of public morality and the assets of the Department were allegedly violated. The Bank proposed as exceptions that the restructuring was carried out with full respect for legal limits.
As of December 31, 2023, the procedure is pending a first instance ruling. This process is classified as eventual. Does not present provision.
Fiscal Responsibility Proceeding – Contraloría Departamental de Cundinamarca v. GEHS, Bancolombia and other natural persons
The development of the Water Treatment Plant PTAR Chía I Delicias Sur from Municipio de Chía, Colombia, was outlined in a lease agreement signed on September 28, 2015. The price agreed was COP 19,000. The object of the agreement was the financing of the Project, as well as the optimization, design, and construction of the Water Treatment Plant PTAR Chía I Delicias Sur.
As of December 31, 2018, the contract was in the advance payment stage (with payment of interest on the disbursements made to the supplier). The Mayor of the Municipality of Chía has denounced the irregularities that he has found in the execution of the aforementioned project and as a consequence of the aforementioned irregularities detected, the Comptroller's Office of Cundinamarca initiated a Fiscal Responsibility process for an alleged property detriment against GEHS Global Environment and Health Solutions de Colombia (supplier), Guillermo Varela Romero, Rafael Antonio Ballesteros Gómez, Luís Alejandro Prieto González (former municipal mayor and other officials of that administration) and Bancolombia S.A. In its defense, the Bank has explained compliance with the leasing contract, that it does not have the status of fiscal manager and that the damage claimed is attributable to the act of a third party.
On November 3, 2023, the Departmental Comptroller's Office of Cundinamarca in the first instance declared fiscal liability in charge of five (5) people, including Bancolombia, for an amount that amounts to COP 7,649. Against the decision of the Comptroller's Office, Bancolombia filed an appeal for reconsideration and an appeal, and the appeal is pending.
As of December 31, 2023, the process is classified as probable and led a provisioned for COP 7,149, which corresponds to the amount of the ruling, discounting the value that must be assumed by the insurance companies involved in the process.
Remediation Plan for Santa Elena’s property In 1987, Bancolombia (formerly Bank of Colombia) received a property located in Municipio de Cartagena, Colombia from the National Federation of Algodoneros.
113
After the settlement was signed, soil contamination from pesticides and herbicides was found on the property. Bancolombia initiated a civil responsibility judicial procedure against the Federation alleging environmental contamination. On November 13, 2015, the final judgement was issued, and it was decided that the National Federation of Algodoneros was liable for environmental damages and that Bancolombia was not liable.
The Bank, despite not being responsible for the damage and in compliance with legal and contractual provisions, has assumed binding commitments aimed at contracting and paying for the decontamination of the property. By virtue of such commitments, The Bank has carried out different containment and decontamination processes over the years and currently has approval from the National Environmental License Authority ANLA for the execution of the remediation plan divided into three stages: Stage I, Stage II and Stage III. In relation to Stage III, an appeal presented by the bank is ongoing, with the objective of clarifying technical parameters required by the Authority.
As of December 31, 2023, Bancolombia advances the activities of the work plans and programs approved by the ANLA, among which the monitoring of soil and water in the area delimited as Stage I, monitoring of floors and walls of warehouses Stage stand out. II, social management plan with the communities in the area of influence of the remediation plan, emergency and contingency plan, hazardous waste management plan and biotic environment protection plan.
The estimated schedule is 36 months, which will be adjusted according to the results of the analyzes carried out, as well as the supervening requirements of the authorities. As of December 31, 2023, there is a provision of COP 74,770 to attend to the execution of the pending activities of the plan.
Verbal Simulation Process of Fredy Alberto Lara Borja
On December 13, 2023, Bancolombia was notified of the lawsuit filed by a former employee of the liquidated company Aluminio Reynolds Santo Domingo S.A., which seeks to declare the absolute nullity of the contract for the sale of two properties entered into between Leasing Bancolombia and Bancolombia. S.A. carried out in 2011. Previously, Leasing Bancolombia acquired the properties through a sale concluded with the company Armarcas E.U, who received them as a contribution in kind from the Society Aluminio Reynolds Santo Domingo S.A. The plaintiff requests that the properties return to the assets of Aluminios Reynolds Santo Domingo and be used to pay the labor debts of the aforementioned company.
The demand amounts to COP 103,943. Bancolombia filed an appeal against the order admissing the lawsuit, arguing, among others, the lack of compliance with the legal requirements of the lawsuit and lack of jurisdiction. As of December 31, 2023, the appeal was pending resolution. The contingency is classified as remote. The process does not present a provision.
NOTE 23. SHARE CAPITAL
The subscribed and paid-in capital is the following:
|
December 31, 2023 |
December 31, 2022 |
114
Authorized shares |
1,400,000,000 |
1,400,000,000 |
Subscribed and paid-in shares: |
|
|
Ordinary shares with a nominal value of COP 500 |
509,704,584 |
509,704,584 |
Preferred shares with dividend without voting rights with nominal value of COP 500. |
452,122,416 |
452,122,416 |
Total acciones |
961,827,000 |
961,827,000 |
Subscribed and paid capital (nominal value, in millions of COP) |
480,914 |
480,914 |
Authorized shares (nominal value, in millions of COP) |
700,000 |
700,000 |
Distribution and payment of dividends
Dividends must be approved at the ordinary general shareholders' meeting upon the recommendation of the Board of Directors. Except in the events indicated below, this approval corresponds to a simple majority of the shares represented at the Meeting.
In accordance with the legal regime applicable to the Bank, when the sum of the legal, statutory or occasional reserve exceeds one hundred percent (100%) of the subscribed capital, the corporation must distribute seventy percent (70%) of the net profits, unless the shareholders with a majority of seventy-eight percent (78%) of the shares represented at the meeting approve a different distribution amount. In the event of not obtaining the favorable vote of this number of shareholders, at least fifty percent (50%) of the net profits must be distributed.
The payment of dividends must be made in cash during the year following the applicable date for the annual general ordinary stockholders' meeting. . If the payment is made in the Bank’s own equity securities instead of cash, that must be approved by 80% of the outstanding common shareholders and 80% of the outstanding preferred shares.
The annual net profits of Bancolombia must be applied as follows: (i) first, an amount equal to 10% of Bancolombia’s net profits to a legal reserve until such reserve is equal to at least 50% of the Bank’s paid-in capital; (ii) second, to the payment of the minimum dividend on the preferred shares; and (iii) third, as may be determined in the ordinary annual general ordinary stockholders' meeting by the vote of the holders of a majority of the shares entitled to vote.
|
Dividends declared with respect to net income earned in: |
Cash dividends per share |
In millions of COP | |
2022 |
3,536 |
2021 |
3,120 |
2020 |
260 |
2019 |
1,638 |
2018 |
1,092 |
Common shares
The holders of common shares are entitled to vote on any matter subject to approval at an annual general ordinary stockholders' meeting. Within 15 calendar days prior to such meeting, such holders are entitled to inspect the books and records of the Company.
Also, the holders of common shares will receive a proportion of the profits subject to the provisions of law, statutes and established at general shareholders’ meeting. The dividend received by holders of common shares may not be higher than the dividend assigned to preferred shares.
115
Preferred shares with no voting rights
The holders of preferred shares are entitled to receive dividends based on the net profits of the previous year, after deducting the losses affecting the capital and after deducting the amount legally allocated to the legal reserve, but before creating or accruing any other reserve.
The minimum non-cumulative preferred dividend equal to one percent (1%) per annum of the subscription price of the preferred share, provided that this dividend is higher than the dividend assigned to the common shares. Otherwise, the dividend will be increased up to an amount equal to the dividend per share of common stock.
The payment of the preferred dividend will be made at the time and in the manner established by the general shareholders' meeting and with the priority established by Colombian law.
Any stock dividend requires the approval of 80% or more of the shares present at a shareholders' meeting, which shall include 80% or more of the outstanding preferred shares. In the absence of such holders of preferred stock, a stock dividend may only be payable to holders of common stock who approve such payment.
Reserved Shares
Stocks that are available between maximum authorized shares and paid-in shares. The Bank has not reserved shares.
NOTE 24. APPROPRIATED RESERVES
As of December 31, 2023 and 2022, the appropriated retained earnings consist of the following:
December 31, 2023 |
December 31, 2022 |
|
In millions of COP | ||
Appropriation of net income (1) (2) |
14,208,314 |
14,207,757 |
Occasional reserve (3) |
6,084,140 |
2,526,160 |
Total Appropiated reserves |
20,292,454 |
16,733,917 |
| (1) | In compliance with Article 452 of the Commercial Code of the Republic of Colombia, which establishes that corporations shall constitute a legal reserve amounting to at least fifty percent of the subscribed capital, formed with ten percent of the net profits of each fiscal year. The constitution of such reserve will be mandatory until it reaches fifty percent of the subscribed capital. (1)The legal reserve fulfills two objetives: to increase and maintain the company's capital and to absorb economic losses. Based on the aforementioned, this amount shall not be distributed in dividends to the stockholders. |
| (2) | Includes reclassification of unclaimed dividends under Article 85 of the Bank's Bylaws for COP 557 and COP 574, respectively. |
| (3) | On March 17, 2023, the Bank established a reserve for equity strengthening and future growth, which was approved at the General Shareholders Meeting. |
NOTE 25. OPERATING INCOME
25.1. Interest and valuation on financial instruments
The following table sets forth the detail of interest and valuation on financial asset instruments for the years ended December 31, 2023 and 2022:
116
December 31, 2023 |
December 31, 2022 |
|
|---|---|---|
In millions of COP | ||
Debt securities held to maturity |
299,236 |
150,044 |
Interest on debt securities through OCI |
291,705 |
154,794 |
Total interest on debt instruments measured by the effective interest method |
590,941 |
304,838 |
Net income from activities measured at fair value through income statement |
|
|
Debt securities (1) |
331,032 |
1,049,771 |
Derivatives |
(167,887) |
108,255 |
Cash operations |
(48,373) |
73,385 |
Monetary market operations |
132,149 |
(87,062) |
Total activities measured at fair value through income statement, net |
246,921 |
1,144,349 |
Total interest and valuation of investments |
837,862 |
1,449,187 |
| (1) | Decrease in the foreign currency portfolio, mainly in treasury bonds due to its direct relationship with the fluctuation of the dollar in 2023 with an accumulated drop of COP 988.15 for each dollar compared to December 2022. |
25.2. Interest expenses
The following table sets forth the detail of interest on financial liability instruments for the years ended December 31, 2023 and 2022:
Interest expenses |
December 31, 2023 |
December 31, 2022 |
|---|---|---|
In millions of COP | ||
Deposits (1) |
(11,232,123) |
(4,652,366) |
Debt securities issued (bonds) |
(1,241,398) |
(1,120,202) |
Financial obligations (1) |
(1,190,779) |
(588,322) |
Lease liabilities(2) |
(90,672) |
(86,496) |
Preferred share |
(57,701) |
(57,701) |
Interbank deposits purchased |
(17,413) |
(12,830) |
Other interest |
(57,068) |
(28,058) |
Total interest expenses |
(13,887,154) |
(6,545,975) |
| (1) | The intervention rate issued by the Bank of the Republic went from 3.00% in 2022 to 13.00% in 2023, this has an impact on the rates of deposit operations and on financial obligation operations. |
| (2) | Note 6.2.2. Lease liability, net. |
The net interest income defined as: Interest on credit portfolio and financial leasing operations, interest on debt instruments measured by the effective interest method and interest expense amounts to COP 15,021,294 y COP 13,001,232 as of December 31, 2023 and 2022, respectively.
25.3. Fees and commissions
25.3.1. Income from fees and commissions
The Bank has elected to present the income from contracts with customers as an element in a line named “Fees and commissions income” in the consolidated statement of income separated from the other income sources.
The information contained in this section about the fees and commission’s income presents information on the nature, amount, timing and uncertainty of the income from ordinary activities which arise from a contract with a customer under the regulatory framework of IFRS 15 Revenue from Ordinary activities from Contracts with Customers.
117
In the following table, the description of the main activities through which the Bank generates revenue from contracts with customers is presented:
Fees and Commissions |
Description |
|---|---|
Debit and credit cards fees |
In debit card product contracts, it is identified that the price assigned to the services promised by the Bank to the customers is fixed, given that no financing component exists, it is established on the basis of the national and international interbank rate, additionally, the product charges to the customers commissions for handling fees, at a determined time and with a fixed rate. For Credit Cards, the commissions are the handling fees and depend on the card franchise. The commitment is satisfied in so far that the customer has capacity available on the card. Other revenue received by the (issuer) credit card product, is advance commission; this revenue is the charge generated each time the customer makes a national or international advance, at owned or non-owned ATMs, or through a physical branch. The exchange bank fee is a revenue for the Issuing Bank of the credit card for the services provided to the business for the transaction effected at the point of sale, the commission is accrued and collected immediately at the establishment and has a fixed amount. In the credit cards product there is a customer loyalty program, in which points are awarded for each transaction made by the customer in a retail establishment. The program is administrated by a third party who assumes the inventory and claims risks, for which it acts as agent. The Bank, recognized it as a lower value of the revenue from the exchange bank fee. The rights and obligations of each party in respect of the goods and services for transfer are clearly identified, the payment terms are explicit, and it is probable, that is, it takes into consideration the capacity of the customer and the intention of having to pay the consideration at termination to those entitled to change the transferred goods or services. The revenue is recognized at a point in time: the Bank satisfies the performance obligation when the “control” of the goods or services was transferred to the customers. |
Bancassurance |
The Bank receives a commission for collecting insurance premiums at a given time and for allowing the use of its network to sell insurance from different insurance companies over time. The Bank in these bancassurance contracts acts as agent (intermediary between the customer and the insurance company), since it is the insurance company which assumes the risks, and which handles the complaints and claims of the customers inherent in each insurance. Therefore, the insurance company acts as principal before the customer. The prices agreed in bancassurance are defined as a percentage on the value of the policy premiums. The payment shall be tied to the premiums collected, sold or taken for the case of employees’ insurance. The aforementioned then means that the price is variable, since, the revenue will depend on the quantity of policies or calculations made by the insurance companies. |
Payments |
Service inwhich the Bank's customers can automatically perform whereby transactional channels, banking transactions for payroll payments, cancellation of invoices and credits, to beneficiaries of the Bank, as well as other financial entities affiliated to Automated Clearing House ACH, the commitment is satisfied once the Bank performs the transaction. The rate stipulated for this commission is variable, the income is recognized at a given time and acts as principal. |
Collections |
The Bank acting as principal, commits to collect outstanding invoices receivable by the collecting customers through the different channels offered by the bank, send the information of the collections made and credit the money to the savings or checking account defined by the collecting customer. The commitment is satisfied at a point in time to the extent that the money is collected by the different channels, the information of the said collections is delivered appropriately, and the resources are credited in real-time to the account agreed with the customer. For the service, the Bank receives a fixed payment, which is received for each transaction once the contract is in effect. |
Electronic services and ATMs |
Revenue received from electronic services and ATMs arises through the provision of services so that the customers may make required transactions, and which are enabled by the Bank. These include online and real-time payments by the customers of the Bank holding a checking or savings accounts, with a debit |
118
Fees and Commissions |
Description |
|---|---|
or credit card for the products and services that the customer offers. Each transaction has a single price, for a single service. The provision of collection services or other different services provided by the Bank, through electronic equipment, generates consideration chargeable to the customer established contractually by the Bank as a fee. The Bank acts as principal and the revenue is recognized at a point in time. |
|
Banking services |
Banking Services are related to commissions from the use of digital physical channels or once the customer makes a transaction. The performance obligation is fulfilled once the payment is delivered to its beneficiary and the proof of receipt of the payment is sent, in that moment, the collection of the commission charged to the customer is generated, which is a fixed amount. The commitment is satisfied during the entire validity of the contract with the customer. The Bank acts as principal. |
Letters of credit |
Banking service corresponding to a documentary credit in which the Bank acquires the commitment to guarantee the fulfillment of financial, commercial or service obligations to a supplier of the contracting party, called beneficiary, in import or export operations through a correspondent bank. The consideration in this type of contract may include fixed amounts, variable amounts, or both, and is acted as principal. |
Acceptances, guarantees and standby letters of credit |
Bank service of acceptances, guarantees and standby letters of credit that are not part of the Bank's portfolio. There are different performance obligations; the satisfaction of performance obligations occurs when the service is rendered to the customer. The consideration in these types of contracts may include fixed amounts, variable amounts, or both, and the Bank acts as principal. Revenue is recognized at a point in time. |
Checks |
Service through which the Bank offers its customers alternatives to avoid the risk of mobilizing cash, through the sale of domestic checks that can be exchanged in any place where the Bank has a presence. The consideration in this type of contract is fixed, the income is recognized at a determined time and acts as principal. |
Deposits |
Deposits are related to the services generated from the offices network of the Bank once a customer makes a transaction. The Bank generally commits to maintain active channels for the products that the customer has with the Bank, with the purpose of making payments and transfers, sending statements and making transactions in general. The commissions are deducted from the deposit account, and they are incurred at a point in time. The Bank acts as principal. |
Gains on sale of assets |
These are the revenue from the sale of assets, where the sale value is higher than the book value recorded in the accounts, the difference representing the gains. The recognition of the revenue is at a point in time once the sale is realized. The Bank acts as principal in this type of transaction and the transaction price is determined by the market value of the asset being sold. For a detail of the balance see Note 25.4. Other operating income, net |
The following table represents in detail and categorized by nature the commissions and other services for the years ended December 31, 2023 and 2022:
Income from fees and commissions:
Ingreso por comisiones y otros servicios |
December 31, 2023 |
December 31, 2022 |
|---|---|---|
In millions of COP | ||
Debit and credit cards and affiliated establishments (1) |
2,534,776 |
2,277,221 |
Bancassurance (2) |
924,280 |
815,141 |
Collections |
499,425 |
435,959 |
Payment |
450,742 |
416,024 |
Electronic services and ATMs (3) |
411,300 |
332,548 |
Acceptances, guarantees and Standby Letters of Credit and commissions for operations in foreign currencies |
195,538 |
179,771 |
Banking services |
169,495 |
127,468 |
Placements |
56,339 |
49,513 |
Cheks |
20,248 |
22,917 |
Others (4) |
70,906 |
61,382 |
119
Ingreso por comisiones y otros servicios |
December 31, 2023 |
December 31, 2022 |
|---|---|---|
In millions of COP | ||
Ingresos por comisiones y otros servicios |
5,333,049 |
4,717,944 |
| (1) | Increase generated by greater transactionality during the year 2023. |
| (2) | Increase generated by greater collections and increase in sales made for this concept. |
| (3) | Increase generated in digital banking commission and dynamic currency exchange. Likewise, there is greater transactionality mainly at ATMs due to an increase in customer withdrawals from other entities and foreign users. |
| (4) | Mainly includes income from structuring commissions and reimbursement of fees. |
For the determination of the transaction price, the Bank assigns to each one of the services the amount which represents the value expected to be received as consideration for each independent commitment, which is based on the relative price of independent sale. The price that the Bank determines for each performance obligation is done by defining the cost of each service, related tax and associated risks to the operation and inherent to the transaction plus the margin expected to be received in each one of the services, taking as references the market prices and conditions, as well as the segmentation of the customer.
In the transactions evaluated in the contracts, changes in the price of the transaction are not identified.
Contract assets with customers
The Bank receives payments from customers based on the provision of the service, in accordance to that established in the contracts. When the Bank incurs costs for providing the service prior to the invoicing, and if these are directly related with a contract, they improve the resources of the entity and are expected to recuperate, these costs correspond to a contract asset. As a practical measure, the Bank recognizes as an expense the incremental costs of obtaining a contract when the amortization period of the asset is equal to or less than one year.
Contract liabilities with customers
The contract liabilities constitute the obligation of the Bank to transfer the services to a customer, for which the Bank has received a payment on the part of the final customer or if the amount is due before the execution of the contract. They also include deferred income related to services that shall be delivered or provided in the future, which will be invoiced to the customer in advance, but which are still not due.
The following table shows the detail of accounts receivable, and contract liabilities balances as at December 31, 2023 and 2022:
December 31, 2023 |
December 31, 2022 |
|
In millions of COP | ||
Accounts receivable from contracts with clients (1) |
169,182 |
127,984 |
Liabilities from contracts with clients (2) |
41,730 |
47,355 |
| (1) | An impairment of COP 23,681 and COP 16,948 is calculated on these accounts receivable as of December 31, 2023 and 2022, respectively. |
| (2) | See Note 21. Other liabilities. |
25.3.2. Fees and Commissions Expenses
Fees and Commissions Expenses |
December 31, 2023 |
December 31, 2022 |
In millions of COP | ||
Banking services (1) |
(901,112) |
(758,100) |
Sales, collections and other services (2) |
(891,791) |
(758,922) |
Correspondent banking (3) |
(504,227) |
(406,567) |
120
ACH y PSE services (1) |
(136,939) |
(112,718) |
Placements |
(63,970) |
(58,340) |
Payments and collections |
(41,904) |
(34,720) |
Other |
(101,962) |
(77,249) |
Total expenses for fees and commissions |
(2,641,905) |
(2,206,616) |
Total income for fees and commissions, net |
2,691,144 |
2,511,328 |
| (1) | The increase is due to higher transactions as of December de 2023. |
| (2) | Increase caused by greater demand in customer service via telephone channel (contact center services), and greater collection management due to an increase in the overdue portfolio. |
| (3) | The increase is due to higher transactions and the opening of new banking correspondents during 2023. |
25.4. Other operating income, net
The following table sets forth the detail of other operating income net for the years ended December 31, 2023 and 2022:
|
December 31, 2023 |
December 31, 2022 |
|
In millions of COP | |||
Exchange difference and foreign exchange derivatives net |
1,159,575 |
(423,765) |
|
Operating leases (1) |
999,207 |
567,315 |
|
Profit on portfolio sale (2) |
271,834 |
56,682 |
|
Gain on sale of assets held for sale and inventories |
140,668 |
222,332 |
|
Gain on sale of assets held for sale (leasing) |
101,862 |
83,229 |
|
Recoveries |
59,898 |
59,876 |
|
Leases |
57,754 |
60,126 |
|
Investment property valuation (3) |
27,818 |
11,190 |
|
Gain on sale of property and equipment (4) |
5,527 |
(660) |
|
Profit on sale of assets – Financial leasing |
4,572 |
10,718 |
|
Penalties for noncompliance with leasing contracts |
2,411 |
1,613 |
|
Other |
72,205 |
130,622 |
|
Total other operating income, net |
2,903,331 |
779,278 |
|
| (1) | Increase generated by the activations of operational leasing contracts, carried out during the year 2023, see note. 6.1 The Bank as lessor. |
| (2) | Higher profits are presented on portfolio sales in 2023, see Note 5. Loan portfolio and financial leasing operations, net. |
| (3) | Mainly due to the valuation of the Amadeus Building for COP 17,709 and Bodegas Quality COP 7,655, see Note 11. Investment Properties. |
| (4) | In 2023, a profit is generated on the sale of real estate, mainly Multicentro Payment Center, Edificio Santillana Medellín, Plaza Caicedo, Edificio La 14, Morato, among others, and in 2022, a loss is generated from the sale of cash validator machines. |
25.5. Equity investment income
The following table sets forth the detail of equity investment income for the years ended December 31, 2023 and 2022:
|
December 31, 2023 |
December 31, 2022 |
In millions of COP | ||
Equity method (1) (2) |
2,040,133 |
1,966,798 |
Valuation and sale of equity investments (3) |
67,640 |
(58,864) |
Dividends (4) |
4,482 |
7,777 |
Total Ingresos por inversiones patrimoniales |
2,112,255 |
1,915,711 |
| (1) | For more information related to the equity method, see Note 7. Investments in Subsidiaries and Note 8. Investments in Associates and Joint Ventures. |
| (2) | The balance includes the equity method as of December 31, 2023, of subsidiary investments for COP 2,092,317, by associates COP 19,260 and joint ventures COP (71,444) and as of December 31, 2022, of subsidiary investments for COP 1,964,211, by associates COP 23,008 and joint ventures COP (20,421). |
| (3) | As of December 31, 2023, includes income recognized in the acquisition of the autonomous assets NOMAD CABRERA and NOMAD CENTRAL for COP 31,118 and COP 23,756, respectively; profit in fixed income valuation for COP 3,212; residual realization product for COP 8,608; profit in BVC as a result of exchange of shares with Chilean Holding for COP |
121
| 7,228 and realization of ORI of BVC for COP (6,282). As of December 31, 2022, COP 15,122 were made from ORI corresponding to payments received from residual rights; COP 10,506 ORI realization in sale of Protection; COP 777 profit due to derecognition of Vlipco S.A.S investment; COP 120 profit in fixed income valuation; COP 83,808 loss on sale of investment in Protección S.A. and COP 1,581 loss in the spin-off of Protección S.A. (Asulado Life Insurance S.A.). |
| (4) | Correspond to other equity instruments with changes in OCI, see Note 4.1. Financial investment instruments, net. Dividends received from equity instruments as of December 31, 2023 correspond to Bolsa de Valores de Colombia S.A. COP 1,720, Guild Association of Financial Institutions Credibanco S.A. COP 1,765, Central Counterpart Risk Chamber of Colombia S.A. COP 520, Latin American Foreign Trade Bank, S.A. Bladex COP 306 and Tecnibanca S.A.- Servibanca S.A. COP 171. As of December 31, 2022, they correspond to: Compañía de Financiamiento TUYA S.A. COP 5,178; Colombia Stock Exchange S.A. COP 1,156; Guild Association of Financial Institutions Credibanco S.A. COP 679; Central Counterpart Risk Chamber of Colombia S.A. COP 340; Banco Latinoamericano de Comercio Exterior S.A. Bladex COP 299 and Tecnibanca S.A.- Servibanca S.A. COP 125. |
NOTE 26. OPERATING EXPENSES
The following is the composition of employee benefits for the years, as of December 31, 2023 and 2022:
26.1. Salaries and employee benefit
The detail for salaries and employee benefits for the years ended December 31, 2023 and 2022:
Salaries and employee benefit |
December 31, 2023 |
December 31, 2022 |
||
In millions of COP | ||||
Salarie (1) |
1,316,292 |
1,093,832 |
||
Bonuses (2) |
603,095 |
536,795 |
||
Private premium (3) |
566,181 |
370,274 |
||
Social security contributions (3) |
419,843 |
347,760 |
||
Defined benefit severance obligation and interest |
141,795 |
116,481 |
||
Indemnization payment |
134,526 |
176,398 |
||
vacation expenses |
98,368 |
78,902 |
||
Pension plan |
11,408 |
9,459 |
||
Others (4) |
213,442 |
180,493 |
||
Total salaries and employee benefit |
3,504,950 |
2,910,394 |
||
| (1) | Corresponds mainly to salary increase for employees of the bylaws and employees who belong to the Collective Bargaining Agreement. |
| (2) | Corresponds mainly to bonifications for bank employees regarding the Bancolombia Group compensation variable model. |
| (3) | Increment in 2023, is due to the fact that this concepts are affected by wage increment because they are wage constituents. |
| (4) | Includes other benefits to the employees, like financial support for insurances policies, education and leisure activities |
26.2. Other administrative and general expenses
The detail for administrative and general expenses for the years ended December 31, 2023 and 2022:
Other administrative and general expenses |
December 31, 2023 |
December 31, 2022 |
In millions of COP | ||
Fees (1) |
663,492 |
616,832 |
Insurance (2) |
499,754 |
431,713 |
Maintenance and repairs |
404,924 |
358,119 |
Data processing |
358,349 |
293,524 |
Fraud and claims |
297,405 |
207,321 |
Transport |
183,343 |
185,042 |
Advertising |
110,183 |
123,959 |
|
Communications Cleaning and surveillance services |
74,685 71,568 |
72,501 66,293 |
Cleaning and security services |
69,251 |
65,612 |
122
Contributions and affiliations |
61,185 |
50,920 |
Adaptation and Installation |
59,112 |
61,709 |
Useful and stationery |
36,159 |
37,450 |
Real estate management |
33,637 |
30,216 |
Disputes, fines and sanctions |
27,572 |
23,167 |
Travel expenses |
20,808 |
17,260 |
Warehouse service |
16,321 |
15,013 |
Tax fee inspection and External audit |
12,067 |
10,777 |
Transactional services |
10,627 |
8,866 |
Minor furniture and fixtures |
9,480 |
9,362 |
Legal expenses |
4,814 |
3,099 |
Temporary services |
4,218 |
4,328 |
Publishing and subscriptions |
3,838 |
3,117 |
Exchange processing |
3,209 |
3,322 |
Other (3) |
165,591 |
204,679 |
Total other administrative and general expenses |
3,201,592 |
2,904,201 |
Taxes other than income tax (4) |
1,183,244 |
731,389 |
| (1) | Increment mainly due to tax fee of digital transformation. |
| (2) | The increment is principally generated by Fogafin insurance deposit, mainly due to increase in deposits volume. |
| (3) | In 2022 was constituted a provision for sanitation of batch in Santa Elena in Cartagena for COP 68,726 and 2023 provision for Ambiental remediation for COP 9,829 of the same asset. See note.22 Provisions and contingent liabilities. |
| (4) | The increment is generated mainly due to industry and commerce taxes COP 325,473, IVA for COP 62,702 and Tax on financial transactions for COP 59,409, among others. |
26.3. Impairment, depreciation and amortization
The detail for Impairment, depreciation and amortization for the years ended December 31, 2023 and 2022:
Impairment, depreciation and amortization |
December 31, 2023 |
December 31, 2022 |
In millions of COP | ||
Depreciation of premises and equipment (1) |
533,855 |
441,148 |
Impairment of negotiable assets and inventories, net (2) |
168,400 |
179,277 |
Depreciation of right-of-use assets, on lease (3) |
133,943 |
122,154 |
Amortization of intangible assets (4) |
61,204 |
51,979 |
Impairment of premises and equipment (1) |
1,756 |
5,550 |
Impairment of right-of-use assets, on lease (3) |
489 |
513 |
Total amortización, depreciación y deterioro |
899,647 |
800,621 |
| (1) | Ver Note 10. Premises and equipment,net. |
| (2) | Ver Note 13.1. Inventories,net COP 90,315 y COP 75,247; Nota 13.2. Assets held for sale,net COP 10,987 y COP 14,398 y Nota 14 Other assets,net COP 67,098 y COP 89,632. |
| (3) | Ver Nota 6.2.1. Right-of use assets under lease,net. |
| (4) | Ver Nota 9. Intangible assets,net. |
NOTE 27. RELATED PARTY TRANSACTIONS
IAS 24 Related Party Disclosures requires that an entity discloses:
| (a) | Transactions with its related parties; and |
| (b) | Relationships between a parent and its subsidiaries irrespective of whether there have been transactions between them. |
Under IAS 24, an entity must disclose transactions with its related parties, outstanding balances, including commitments, recognized in the consolidated and separate financial statements of a parent or investors with joint control or significant influence over, an investee presented in accordance with IFRS 10 Consolidated Financial Statements.
123
Under this standard parties are considered to be related if one party has the ability to control the other party or exercise significant influence over the other party in making financial or operational decisions, or one other party controls both. This definition applies to the Bank in the cases below:
| ● | Shareholders who individually own more than 20% of the Bank's capital, i.e., Grupo de Inversiones Suramericana S.A. |
| ● | Members of Board of Directors and Senior Management, understood as the President and corporate Vice-presidents, as well as their close relatives (spouse and children) and the companies in which they have a participation of 10% or more of the Bank's capital. |
| ● | Associates and joint ventures, for which the Bank provides commercial banking and deposit services. For these purposes, companies in which the Bank has significant influence (in all cases it has between 20% and 50% equity interest) have been included. |
The Bank provide banking and financial services to its related parties in order to satisfy their liquidity needs, and except for the intercompany merger agreement described below, these transactions are conducted on similar terms to third-party transactions and are not individually material. In the case of treasury operations, the Bank operates between its own position and its related parties through transactional channels or systems established for this purpose and under the conditions established by current regulations.
Between the Bank and its related parties, during the periods ending at December 31, 2023, 2022 and 2021, there were no:
| - | Loans that imply for the borrower an obligation that does not correspond to the essence or nature of the loan contract. |
| - | Loans with interest rates different from those that are ordinarily paid or charged to third parties under similar conditions of term, risk, etc. |
| - | Operations whose characteristics differ from those carried out with third parties. |
| - | No guarantees, promises and commitments were given or received with respect to the transactions carried out, which do not correspond to ordinary guarantees in the course of customer - Bank relations. |
As of December 31, 2023
Stockholders with an interest equal or higher than 20% of the Bank's capital (1) |
Associates and joint ventures |
Directly controlled subsidiaries |
Indirectly controlled subsidiaries |
Directors and senior management |
|
In millions of COP | |||||
Assets |
|
|
|
|
|
Cash and cash equivalents |
- |
- |
121,069 |
- |
- |
Financial investment instruments, net |
- |
50,270 |
- |
- |
- |
124
Investments in associates and joint ventures |
- |
298,598 |
- |
- |
- |
Derivative financial instruments |
48,747 |
7,297 |
- |
225 |
- |
Investments in subsidiaries |
- |
- |
24,751,945 |
- |
- |
Loans and receivables and financial leasing operations |
1,850,296 |
125,253 |
1,092,075 |
325,904 |
22,428 |
Provision for impairment of loans and receivables and financial leasing operations |
(1,456) |
(479) |
(623) |
(533) |
(50) |
Right-of-use lease assets, net |
- |
- |
322,068 |
- |
- |
Other assets |
13,572 |
268,647 |
3,579 |
4,389 |
9 |
Total assets |
1,911,159 |
749,586 |
26,290,113 |
329,985 |
22,387 |
Liabilities |
|
|
|
|
|
Customer deposits |
1,212,866 |
141,714 |
795,782 |
216,799 |
10,220 |
Derivative financial instruments |
14 |
1,068 |
2,973 |
323 |
209 |
Financial obligations |
- |
- |
4,524,872 |
- |
- |
Lease liabilities, net |
- |
- |
389,536 |
- |
- |
Other liabilities |
2,629 |
66,310 |
10,518 |
10,888 |
59 |
Total liabilities |
1,215,509 |
209,092 |
5,723,681 |
228,010 |
11,488 |
Income |
|
|
|
|
|
Interest on loans and financial leases |
156,519 |
15,743 |
155,119 |
52,939 |
1,778 |
Valuation on financial instruments |
- |
11,919 |
- |
- |
- |
Fees and commissions income |
740, 880 |
5,918 |
- |
- |
70 |
Dividends and net income on equity investments |
- |
(52,184) |
2,092,317 |
- |
- |
Net foreign exchange and Derivatives Foreign exchange contracts |
63,059 |
27,174 |
- |
- |
(218) |
Other operating income |
7,191 |
2,307 |
30,176 |
7,868 |
- |
Total Income |
967,649 |
10,877 |
2,277,612 |
60,807 |
1,630 |
Expenses |
|
|
|
|
|
Interest expenses |
177,999 |
8,186 |
446,875 |
19,422 |
909 |
Credit impairment charges, net |
(8,343) |
(1,936) |
- |
- |
4 |
Fees and commissions expenses |
590 |
144,585 |
- |
- |
- |
Employee benefits |
82,515 |
- |
- |
- |
93 |
Other administrative and general expenses |
13,423 |
23,883 |
2,840 |
21,837 |
2,415 |
Total expenses |
266,184 |
174,718 |
449,715 |
41,259 |
3,421 |
| (1) | Includes Grupo Sura conglomerate. |
| (2) | Includes the benefit provided to employees for insurance policies. |
As of December 31, 2023 and 2022, fees were paid to Directors for COP 2,306 and COP 1,937 respectively, for attendance to Board of Directors and Support Committees meeting.
Payments to senior management in the same periods were COP 18,387 and COP 15,776 respectively. Short-term remuneration was COP 312 and COP 552 for long-term remuneration.
125
In 2023 post-employment benefits was COP 827. In 2022 the executive pension bonus plan contributions were consolidated for COP 36,962 (See Note 20.2 Bonification bonus pension plan and bonification executive pension plan). Post-employment benefits presented payments of COP 642
As of December 31, 2022
Stockholders with an interest equal or higher than 20% of the Bank's capital (1) |
Associates and joint ventures |
Directly controlled subsidiaries |
Indirectly controlled subsidiaries |
Directors and senior management |
|
In millions of COP | |||||
Assets |
|
|
|
|
|
Cash and cash equivalents |
- |
- |
125,462 |
- |
- |
Financial investment instruments, net |
- |
49,801 |
- |
- |
- |
Investments in associates and joint ventures |
- |
302,761 |
- |
- |
- |
Derivative financial instruments |
191 |
8 |
4,092 |
602 |
5 |
Investments in subsidiaries |
- |
- |
29,718,697 |
- |
- |
Loans and receivables and financial leasing operations |
947,064 |
166,994 |
1,342,361 |
321,965 |
23,224 |
Provision for impairment of loans and receivables and financial leasing operations |
(9,745) |
(2,012) |
(6,864) |
(4,860) |
(48) |
Right-of-use lease assets, net |
- |
- |
311,704 |
- |
- |
Other assets |
13,002 |
156,091 |
28,287 |
- |
2 |
Total assets |
950,512 |
673,643 |
31,523,739 |
317,707 |
23,183 |
Liabilities |
|
|
|
|
|
Customer deposits |
1,173,803 |
154,051 |
1,716,425 |
277,784 |
8,531 |
Derivative financial instruments |
23 |
27,571 |
- |
1,771 |
- |
Financial obligations |
- |
- |
5,450,116 |
- |
- |
Lease liabilities, net |
- |
- |
373,521 |
- |
- |
Other liabilities |
1,062 |
48,762 |
48,866 |
8,249 |
56 |
Total liabilities |
1,174,888 |
230,384 |
7,588,928 |
287,804 |
8,587 |
Income |
|
|
|
|
|
Interest on loans and financial leases (2) |
74,611 |
9,003 |
135,565 |
33,345 |
1,208 |
Valuation on financial instruments |
- |
994 |
- |
- |
- |
Fees and commissions income (2) |
926,258 |
5,227 |
- |
- |
76 |
Dividends and net income on equity investments |
- |
2,587 |
1,964,211 |
- |
- |
Net foreign exchange and Derivatives Foreign exchange contracts |
(10,157) |
(30,484) |
- |
- |
984 |
Other operating income (3) |
4,741 |
97,980 |
1,379 |
2,564 |
- |
Total Income |
995,453 |
85,307 |
2,101,155 |
35,909 |
2,268 |
126
Expenses |
|
|
|
|
|
Interest expenses |
110,260 |
8,476 |
254,205 |
10,328 |
266 |
Credit impairment charges, net |
10,171 |
3,191 |
- |
- |
50 |
Fees and commissions expenses |
19 |
180,951 |
- |
- |
- |
Employee benefits (4) |
71,522 |
- |
- |
- |
117 |
Other administrative and general expenses |
12,119 |
30,750 |
1,810 |
7,271 |
1,937 |
Total expenses |
204,091 |
223,368 |
256,015 |
17,599 |
2,370 |
| (1) | Includes Grupo Sura conglomerate. |
| (2) | Loans and advances revealed interest values and leasing operations corresponding to a share equal or greater than 20% by 31 of December of 2022 were updated for better presentation, going from COP 889,752 to COP 74,611, the variation is compensated through incomes for commissions and other services. Financial status and respective notes are not affected by this update, besides it was concluded that the reviewed values were adjusted and distributed in a comparative manner. |
| (3) | This balance includes the sale of written-off loans between the Bank and P.A. Reintegra for COP 94,198. |
| (4) | Includes the benefit provided to employees for insurance policies |
NOTE 28. LIABILITIES FROM FINANCING ACTIVITIES
The following table presents the reconciliation of the balances of liabilities from financing activities as of December 31, 2023:
|
Balance as of January 1, 2023 |
Cash flows |
Non-cash changes |
Balance as of December 31, 2023 |
|||
|
Foreign currency translation adjustment |
Interests accrued |
Other movements |
||||
In Million of COP | ||||||
Liabilities from financing activities |
||||||
Debt instruments in issue |
14,161,087 |
(1,258,270) |
(2,093,327) |
1,190,779 |
- |
12,000,269 |
Borrowings from other financial institutions |
15,209,620 |
(3,576,255) |
(1,915,939) |
1,144,718 |
96,679 |
10,958,823 |
Interbank and repurchase agreements |
584,204 |
(57,701) |
- |
- |
57,701 |
584,204 |
Preferred shares |
638,940 |
(375,189) |
- |
- |
|
263,751 |
Total liabilities from financing activities |
30,593,851 |
(5,267,415) |
(4,009,266) |
2,335,497 |
154,380 |
23,807,047 |
NOTE 29. FAIR VALUE OF ASSETS AND LIABILITIES
The characteristics of the asset or liability are considered in determining fair value in the same manner as market participants would consider in pricing the asset or the liability at the measurement date.
Valuation process for fair value measurements
The valuation to fair value prices is performed using prices, methodologies and inputs provided by the official pricing services provider (Precia) to the Bank.
All methodologies and procedures developed by the pricing services provider are supervised by the SFC, which has its authorization.
127
The following table shows the carrying value and fair value of assets and liabilities as of December 31, 2023 and December 31, 2022:
128
December 31, 2023 |
December 31, 2022 |
|||
Carrying value |
Fair value |
Carrying value |
Fair value |
|
In millions of COP | ||||
Assets | ||||
Debt securities negotiable investments and pledged financial assets (1) |
6,942,468 |
6,942,468 |
6,916,719 |
6,916,719 |
Debt securities available for sale investments (1) |
3,211,425 |
3,211,425 |
2,590,622 |
2,590,622 |
Debt securities held to maturity investments, net (1) |
3,423,265 |
3,410,468 |
3,450,225 |
3,382,219 |
Equity instruments (1) |
180,744 |
188,124 |
171,808 |
171,111 |
Derivative financial instruments (1) |
6,215,942 |
6,215,942 |
4,860,893 |
4,860,893 |
Loans and leasing transactions (2) |
170,029,117 |
170,672,034 |
168,203,995 |
163,844,450 |
Investment property |
574,550 |
574,550 |
449,253 |
449,253 |
Total assets |
190,577,511 |
191,215,011 |
186,643,515 |
182,215,267 |
Liabilities | ||||
Deposits by customers (3) |
170,231,400 |
171,398,021 |
156,480,283 |
155,160,442 |
Interbank deposits |
- |
- |
482,766 |
482,766 |
Repurchase agreements and other similar secured borrowing |
263,751 |
263,751 |
156,174 |
156,174 |
Derivative financial instruments (1) |
6,699,521 |
6,699,521 |
4,717,408 |
4,717,408 |
Borrowings from other financial institutions (4) |
12,000,269 |
12,000,269 |
14,161,087 |
14,161,087 |
Debt instruments in issue (5) |
10,958,823 |
10,919,613 |
15,209,620 |
14,632,729 |
Preferred shares |
584,204 |
394,550 |
584,204 |
350,978 |
Total liabilities |
200,737,968 |
201,675,725 |
191,791,542 |
189,661,584 |
| (1) | See Note 4.1 Financial assets investments, net. |
| (2) | See Note 5. Loans and advances to customers, net. |
| (3) | See Note 9. Deposits by customers. |
| (4) | See Note 10. Borrowings from other financial institutions. |
| (5) | See Note 11. Debt instruments in issue. |
Fair value measurement
Assets and liabilities
a. Debt instruments
The Bank assigns prices to these debt investments, using the prices provided by the official pricing service provider (Precia) and assigns the appropriate level according to the procedure described at the beginning of this note. For securities not traded or over-the-counter such as certain bonds issued by other financial institutions, the Bank generally determines fair value utilizing internal valuation and standard techniques. These techniques include determination of expected future cash flows which are discounted using curves of the applicable currencies and the Colombian consumer price index (interest rate in this case), modified by the credit risk and liquidity risk. The interest rate is generally computed using observable market data and reference yield curves derived from quoted interest in appropriate time bandings, which match the timings of the cash flows and maturities of the instruments.
b. Equity securities
The Bank performs the market price valuation of its investments in variable income using the prices provided by the official pricing services provider (Precia) and classifies those investments according to the procedure described at the beginning of this note. Likewise, in order to determine the fair value of unquoted equity securities, the Bank affects the value of the investment in the corresponding percentage of participation, to the subsequent variations of the respective issuer's equity.
129
Holdings in mutual funds, trusts and collective portfolios are valued taking into account the value of the holding as calculated by the management company.
c. Derivative financial instruments
The Bank holds positions in standardized derivatives, such as futures over local stocks, and over the representative exchange rate. These instruments are evaluated according to the information provided by Precia, which perfectly matches the information provided by the Central Counterparty Clearing House – CCP.
Additionally, the Bank holds positions in Over The Counter (OTC) derivatives, which in the absence of prices, are valued using the inputs and methodologies provided by the pricing services provider, which have the no objection of the Financial Superintendence of Colombia.
The key inputs depend upon the type of derivative and the nature of the underlying instrument and include interest rate yield curves, foreign exchange rates, the spot price of the underlying volatility, credit curves and correlation of such inputs.
d. Credit valuation adjustment
The Bank measures the effects of the credit risk of its counterparties and its own creditworthiness in determining fair value of the swap, option and forward derivatives.
Counterparty credit-risk adjustments are applied to derivatives when the Bank’s position is a derivative asset and the Bank’s credit risk is incorporated when the position is a derivative liability. The Bank attempts to mitigate credit risk to third parties which are international banks by entering into master netting agreements. The agreements allow to offset or bring net amounts that are liabilities, derivates from transactions carried out by the different agreements. Master netting agreements take different forms and may allow payments to be made under a variety of other master agreements or other negotiation agreements between the same parties, some may have a monthly basis and others only apply at the time the agreements are terminated.
When assessing the impact of credit exposure, only the net counterparty exposure is considered at risk, due to the offsetting of certain same-counterparty positions and the application of cash and other collateral.
The Bank generally calculates the asset’s credit risk adjustment for derivatives transacted with international financial institutions by incorporating indicative credit related pricing that is generally observable in the market (Credit Default Swaps, “CDS”). The credit-risk adjustment for derivatives transacted with non-public counterparties is calculated by incorporating unobservable credit data derived from internal credit qualifications to the financial institutions and corporate companies located in Colombia. The Bank also considers its own creditworthiness when determining the fair value of an instrument, including OTC derivative instruments if the Bank believes market participants would take that into account when transacting the respective instrument.
The approach to measuring the impact of the Bank’s credit risk on an instrument transacted with international financial institutions is done using the asset swap curve calculated for subordinated bonds issued by the Bank in foreign currency.
130
For derivatives transacted with local financial institutions, the Bank calculates the credit risk adjustment by incorporating credit risk data provided by rating agencies and released in the Colombian financial market.
e. Impaired loans measured at fair value
The Bank measured certain impaired loans based on the fair value of the associated collateral less costs to sell. The fair values were determined as follows using external and internal valuation techniques or third party experts, depending on the type of underlying asset.
For vehicles under leasing arrangements, the Bank uses an internal valuation model based on price curves for each type of vehicle. Such curves show the expected price of the vehicle at different points in time based on the initial price and projection of economic variables such as inflation, devaluation and customs. The prices modelled in the curves are compared every six months with market information for the same or similar vehicles and in the case of significant deviation; the curve is adjusted to reflect the market conditions.
Other vehicles are measured using matrix pricing from a third party. This matrix is used by most of the market participants and is updated monthly. The matrix is developed from values provided by several price providers for identical or similar vehicles and considers brand, characteristics of the vehicles, and manufacturing date among other variables to determine the prices.
For real estate assets, a third-party qualified appraiser is used. The methodologies vary depending on the date of the last appraisal available for the property (the appraisal is estimated based on either of three approaches: cost, sales comparison and income approach, and is required every three years). When the property has been valued in the last 12 months and the market conditions have not shown significant changes, the most recent valuation is considered the fair value of the property.
For all other cases (for example, appraisals older than 12 months) the value of the property is updated by adjusting the value in the last appraisal for weighted factors such as location, type and characteristics of the property, size, structural conditions and the expected sales prices, among others. The factors are determined based on current market information gathered from several external real estate specialists.
f. Assets held for sale measured at fair value less cost of sale
The Bank measures certain impaired foreclosed assets and premises and equipment held for sale based on fair value less costs to sell. The fair values were determined using external and internal valuation techniques, depending on the type of underlying asset. Those assets are comprised mainly of real estate properties for which the appraisal is conducted by experts considering factors such as the location, type and characteristics of the property, size, physical conditions and expected selling costs, among others. Likewise, in some cases the fair value is estimated considering comparable prices or promises of sale and offering prices from auctions process.
g. Mortgage backed securities (“TIPS”) and Asset-Backed securities
The Bank invests in asset-backed securities for which underlying assets are mortgages and earnings under contracts issued by financial institutions and corporations, respectively. The Bank does not have a significant exposure to sub-prime securities. The asset-backed securities are denominated in local market TIPS and are classified as fair value through profit or loss.
131
These asset-backed securities have different maturities and are generally classified by credit ratings.
TIPS are part of the Bank portfolio and its fair value is measured with published price by the official pricing services provider. These securities are leveled by margin and are assigned level 2 or 3 based on the Precia information.
Residual TIPS have their fair value measured using the discounted flow method, taking into account the amortization tables of the Titularizadora Colombiana, the betas in COP and UVR of Precia (used to construct the curves) and the margins; when they are residual TIPS of subordinated issues, a liquidity premium is applied. These securities are assigned level 3.
h. Investment property
The Bank’s investment property is valued by external experts, who use valuation techniques based on comparable prices, direct capitalization, discounted cash flows and replacement costs.
Fair value hierarchy
IFRS 13 establishes a fair value hierarchy of valuation techniques based on whether the inputs to those valuation techniques are observable or unobservable, that reflects the significance of inputs adopted in the measurement process. In accordance with IFRS the financial instruments are classified as follows:
Level 1: Observable inputs that reflect quoted prices (unadjusted) in active markets for identical assets or liabilities. An active market is a market in which transactions for the asset or liability being measured take place with sufficient frequency and volume to provide pricing information on an ongoing basis.
Level 2: Inputs other than quoted prices included in Level 1 that are observable for the asset or liability either directly or indirectly. Level 2 generally includes: (i) quoted prices for similar assets or liabilities in active markets; (ii) quoted prices for identical or similar assets or liabilities in markets that are not active, that is, markets in which there are few transactions for the asset or liability.
Level 3: Unobservable inputs that are supported by little or no market activity and that are significant to the fair value of the assets or liabilities. Level 3 assets and liabilities include financial instruments whose value is determined using pricing models, discounted cash flow methodologies, or similar techniques, as well as instruments for which the determination of fair value requires significant management judgment or estimation.
This category generally includes certain retained residual interests in securitizations, asset-backed securities (ABS) and highly structured or long-term derivative contracts where independent pricing information was not able to be obtained for a significant portion of the underlying assets.
132
133
Assets and liabilities measured at fair value on a recurring basis
The following table presents assets and liabilities by fair value hierarchy that are measured on a recurring basis at December 31, 2023 and December 31, 2022:
ASSETS | ||||||||||||
Type of instrument |
December 31, 2023 |
December 31, 2022 |
||||||||||
Fair value hierarchy |
Total fair value |
Fair value hierarchy |
Total fair value |
|||||||||
Level 1 |
Level 2 |
Level 3 |
Level 1 |
Level 2 |
Level 3 |
|||||||
In millions of COP | ||||||||||||
Investment securities |
|
|||||||||||
Negotiable and pledged financial assets |
|
|||||||||||
Treasury securities issued by the Colombian Government - TES |
4,089,072 |
324,985 |
- |
4,414,057 |
3,672,521 |
270,590 |
- |
3,943,111 |
||||
Mortgage-backed securities (TIPs) |
- |
10,214 |
74,087 |
84,301 |
- |
13,565 |
2,928 |
16,493 |
||||
Bonds |
1,757,573 |
230,566 |
14,284 |
2,002,423 |
2,493,310 |
214,760 |
- |
2,708,070 |
||||
Other financial investment assets |
- |
441,687 |
- |
441,687 |
- |
249,045 |
- |
249,045 |
||||
Total negotiable securities and pledged financial assets |
5,846,645 |
1,007,452 |
88,371 |
6,942,468 |
6,165,831 |
747,960 |
2,928 |
6,916,719 |
||||
Available for sale |
|
|||||||||||
Solidarity Securities issued by the Colombian Government (TDS) |
- |
- |
2,664,295 |
2,664,295 |
- |
2,590,622 |
- |
2,590,622 |
||||
Other public debt |
- |
547,130 |
- |
547,130 |
|
|
|
|
||||
Total available for sale |
- |
547,130 |
2,664,295 |
3,211,425 |
- |
2,590,622 |
- |
2,590,622 |
||||
Total debt securities |
5,846,645 |
1,554,582 |
2,752,666 |
10,153,893 |
6,165,831 |
3,338,582 |
2,928 |
9,507,341 |
||||
Equity securitie |
|
|||||||||||
Equity securities at fair value |
29,719 |
2,701 |
140,815 |
173,235 |
5,505 |
11,120 |
148,169 |
164,794 |
||||
Total equity securities |
29,719 |
2,701 |
140,815 |
173,235 |
5,505 |
11,120 |
148,169 |
164,794 |
||||
Forward |
|
|||||||||||
Exchange rate |
- |
3,307,711 |
1,069,966 |
4,377,677 |
- |
981,126 |
586,936 |
1,568,062 |
||||
Securities |
- |
151 |
2,863 |
3,014 |
- |
5,414 |
105 |
5,519 |
||||
Total forward |
- |
3,307,862 |
1,072,829 |
4,380,691 |
- |
986,540 |
587,041 |
1,573,581 |
||||
Swaps |
|
|||||||||||
Exchange rate |
- |
1,066,916 |
237,422 |
1,304,338 |
- |
1,940,303 |
454,529 |
2,394,832 |
||||
Interest rate |
130,792 |
173,912 |
15,621 |
320,325 |
266,708 |
475,295 |
29,170 |
771,173 |
||||
Total swaps |
130,792 |
1,240,828 |
253,043 |
1,624,663 |
266,708 |
2,415,598 |
483,699 |
3,166,005 |
||||
Options |
|
|||||||||||
Exchange rate |
7 |
136,978 |
73,603 |
210,588 |
- |
4,240 |
117,067 |
121,307 |
||||
Total options |
7 |
136,978 |
73,603 |
210,588 |
- |
4,240 |
117,067 |
121,307 |
||||
Total derivative financial instruments |
130,799 |
4,685,668 |
|
6,215,942 |
266,708 |
3,406,378 |
1,187,807 |
4,860,893 |
||||
134
1,399,475 |
||||||||||||
Investment property |
|
|||||||||||
Buildings |
- |
- |
574,550 |
574,550 |
- |
- |
449,253 |
449,253 |
||||
Total investment properties |
- |
- |
574,550 |
574,550 |
- |
- |
449,253 |
449,253 |
||||
Total |
6,007,163 |
6,242,951 |
4,867,506 |
17,117,620 |
6,438,044 |
6,756,080 |
1,788,157 |
14,982,281 |
||||
LIABILITIES | ||||||||||||
Type of instrument |
December 31, 2023 |
December 31, 2022 |
||||||||||
Fair value hierarchy |
Total fair value |
Fair value hierarchy |
Total fair value |
|||||||||
Level 1 |
Level 2 |
Level 3 |
Level 1 |
Level 2 |
Level 3 |
|||||||
In millions of COP | ||||||||||||
Financial liabilities |
|
|||||||||||
Forward |
|
|||||||||||
Exchange rate |
- |
4,454,755 |
67,825 |
4,522,580 |
- |
1,519,350 |
187,849 |
1,707,199 |
||||
Securities |
- |
8,629 |
1,852 |
10,481 |
- |
7,204 |
- |
7,204 |
||||
Total forward |
- |
4,463,384 |
69,677 |
4,533,061 |
- |
1,526,554 |
187,849 |
1,714,403 |
||||
Swaps |
|
|||||||||||
Exchange rate |
- |
1,388,113 |
102,973 |
1,491,086 |
- |
1,757,219 |
160,178 |
1,917,397 |
||||
Interest rate |
126,728 |
304,981 |
11,078 |
442,787 |
227,847 |
713,191 |
51,662 |
992,700 |
||||
Total swaps |
126,728 |
1,693,094 |
114,051 |
1,933,873 |
227,847 |
2,470,410 |
211,840 |
2,910,097 |
||||
Options |
|
|||||||||||
Exchange rate |
19 |
232,568 |
- |
232,587 |
- |
92,908 |
- |
92,908 |
||||
Total options |
19 |
232,568 |
- |
232,587 |
- |
92,908 |
- |
92,908 |
||||
Total derivative financial instruments |
126,747 |
6,389,046 |
183,728 |
6,699,521 |
227,847 |
4,089,872 |
399,689 |
4,717,408 |
||||
Total financial liabilities |
126,747 |
6,389,046 |
183,728 |
6,699,521 |
227,847 |
4,089,872 |
399,689 |
4,717,408 |
||||
135
Fair value of assets and liabilities that are not measured at fair value in the statement of financial position
The following table presents for each level of the fair value hierarchy the Bank's assets and liabilities that are not measured at fair value in the statement of financial position, however, the fair value as of December 31, 2023 and December 31, 2022 is disclosed:
ASSETS | ||||||||
Type of instrument |
December 31, 2023 |
December 31, 2022 |
||||||
Fair value hierarchy |
Total fair value |
Jerarquía de valoración |
Fair value hierarchy |
|||||
Level 1 |
Level 2 |
Level 3 |
Level 1 |
Level 2 |
Level 3 |
|||
In millions of COP | ||||||||
Investments to maturity |
||||||||
Agricultural Development Securities issued by the Colombian Government (TDA) |
- |
- |
3,075,873 |
3,075,873 |
- |
2,999,284 |
- |
2,999,284 |
Mortgage-backed securities (TIPs) |
- |
- |
- |
- |
- |
1,626 |
78,307 |
79,933 |
Other financial investment instruments |
- |
279,483 |
55,112 |
334,595 |
- |
303,002 |
- |
303,002 |
Total held to maturity investments |
- |
279,483 |
3,130,985 |
3,410,468 |
- |
3,303,912 |
78,307 |
3,382,219 |
Equity securities |
- |
- |
14,889 |
14,889 |
- |
- |
6,317 |
6,317 |
|
Loan portfolio and leasing operations, net Total |
- |
- |
170,672,034 |
170,672,034 |
- |
- |
163,844,450 |
163,844,450 |
Total |
- |
279,483 |
173,817,908 |
174,097,391 |
- |
3,303,912 |
163,929,074 |
167,232,986 |
LIABILITIES | ||||||||
Type of instrument |
December 31, 2023 |
December 31, 2022 |
||||||
Fair value hierarchy |
Total fair value |
Jerarquía de valoración |
Fair value hierarchy |
|||||
Level 1 |
Level 2 |
Level 3 |
Level 2 |
Level 2 |
Level 3 |
|||
In millions of COP | ||||||||
Deposits by customers |
- |
60,274,969 |
111,123,052 |
171,398,021 |
- |
41,263,268 |
113,897,174 |
155,160,442 |
Interbank deposits |
- |
- |
- |
- |
- |
- |
482,766 |
482,766 |
Repurchase agreements and other similar secured borrowing |
- |
- |
263,751 |
263,751 |
- |
- |
156,174 |
156,174 |
Borrowings from other financial institutions |
- |
- |
12,000,269 |
12,000,269 |
- |
- |
14,161,087 |
14,161,087 |
Debt instruments in issue |
6,629,731 |
2,583,290 |
1,706,592 |
10,919,613 |
5,943,324 |
7,356,640 |
1,332,765 |
14,632,729 |
Preferred shares |
- |
- |
394,550 |
394,550 |
- |
- |
350,978 |
350,978 |
Total |
6,629,731 |
62,858,259 |
125,488,214 |
194,976,204 |
5,943,324 |
48,619,908 |
130,380,944 |
184,944,176 |
136
IFRS requires entities to disclose the fair value of financial instruments, both assets and liabilities recognized and not recognized in the statement of financial position, for which it is practicable to estimate fair value. Certain categories of assets and liabilities, however, are not eligible for fair value accounting.
The financial instruments below are not measured at fair value on a recurring and nonrecurring basis:
Short-term financial instruments
Short-term financial instruments are valued at their carrying amounts included in the consolidated statement of financial position, which are reasonable estimates of fair value due to the relatively short period to maturity of the instruments. This approach was used for cash and cash equivalents, accrued interest receivable, customers’ acceptances, accounts receivable, accounts payable, accrued interest payable and bank acceptances outstanding.
Deposits from customers
The fair value of time deposits was estimated based on the discounted value of cash flows using the appropriate discount rate for the applicable maturity. Fair value of deposits with no contractual maturities represents the amount payable on demand as of the statement of financial position date.
Interbank deposits and repurchase agreements and other similar secured borrowings
Short-term interbank borrowings and repurchase agreements have been valued at their carrying amounts because of their relatively short-term nature. Long-term and domestic development bank borrowings have also been valued at their carrying amount because they bear interest at variable rates.
Borrowings from other financial institutions
The fair value of borrowings from other financial institutions were determined using discounted cash flow models. The cash flows projection of capital and interest was made according to the contractual terms, considering capital amortization and interest bearing. Subsequently, the cash flows were discounted using reference curves formed by the weighted average of the Bank’s deposit rates.
Debt instruments in issue
The fair value of debt instruments in issue, comprised of bonds issued by Bancolombia S.A. and its subsidiaries, was estimated substantially based on quoted market prices. The fair value of certain bonds which do not have a public trading market, were determined based on the discounted value of cash flows using the rates currently offered for bonds of similar remaining maturities and the Bank’s creditworthiness.
Preferred shares
In the valuation of the liability component of preferred shares related to the minimum dividend of 1% of the subscription price, the Bank uses the Gordon Model to price the obligation, taking into account its own credit risk, which is measured using the market spread based on observable inputs such as quoted prices of sovereign debt.
137
The Gordon Model is commonly used to determine the intrinsic value of a stock based on a future series of dividends that are estimated by the Bank and growth at a constant rate considering the Bank’s own perspectives of the payout ratio.
Loans and advances to customers
Estimating the fair value of loans and advances to customers is considered an area of considerable uncertainty as there is no observable market. The loan portfolio is stratified into tranches and loans segments suchs as commercial, consumer, small business loans, mortgage and leasing. The fair value of loans and advances to customers and financial institutions is determined using a discounted cash flow methodology, considering each credit’s principal and interest projected cash flows to the prepayment date. The projected cash flows are discounted using reference curves according to the type of loan and its maturity date.
Items measured at fair value on a non-recurring basis
The Bank measures assets held for sale based on fair value less costs to sell. This category includes certain foreclosed assets and investments in associates held for sale. The fair values were determined using external and internal valuation techniques or third party experts, depending on the type of underlying asset. The following breakdown sets forth the fair value hierarchy of those assets classified by type:
|
December 31, 2023 |
December 31, 2022 |
||||||
Fair value hierarchy |
Total fair value |
Fair value hierarchy |
Total fair value |
|||||
Level 1 |
Level 2 |
Level 1 |
Level 1 |
Level 2 |
Level 3 |
|||
|
In millions of COP |
|||||||
Real estate different from residential properties |
- |
- |
3,142 |
3,142 |
- |
- |
6,841 |
6,841 |
Real estate for residential purposes |
- |
- |
3,188 |
3,188 |
- |
- |
4,801 |
4,801 |
Movable property |
- |
- |
7,182 |
7,182 |
- |
- |
4,196 |
4,196 |
Total |
- |
- |
13,512 |
13,512 |
- |
- |
15,838 |
15,838 |
Changes in level 3 fair-value category
The table below presents reconciliation for assets and liabilities measured at fair value, on a recurring basis using significant unobservable inputs as of December 31, 2023 and December 31, 2022:
138
As of December 31, 2023
|
Balance, January 1, 2023 |
Included in earnings |
OCI |
Purchases |
Settlement |
Prepaids |
Reclassifications (1) |
Transfers in to level 3 |
Transfers in to level 3 |
Balance September 30, 2023 |
|
In millions of COP | ||||||||||
Assets | ||||||||||
Debt securities | ||||||||||
Investments negotiable | ||||||||||
Mortgage backed securities (TIPs) |
2,928 |
(5,534) |
- |
848 |
(2,343) |
- |
77,773 |
415 |
74,087 |
|
Bonds |
- |
- |
- |
- |
- |
- |
- |
14,284 |
- |
14,284 |
Total negotiable investments |
2,928 |
(5,534) |
- |
848 |
(2,343) |
- |
77,773 |
14,699 |
- |
88,371 |
Available for- ale investments |
- |
- |
- |
- |
- |
- |
- |
- |
- |
|
Solidarity Securities issued by the Colombian Government (TDS) |
- |
- |
- |
- |
- |
- |
- |
2,664,295 |
- |
2,664,295 |
total available for sale investments |
- |
- |
- |
- |
- |
- |
- |
2,664,295 |
- |
2,664,295 |
Total debt securities |
2,928 |
(5,534) |
- |
848 |
(2,343) |
- |
77,773 |
2,678,994 |
- |
2,752,666 |
Derivative financial instruments | ||||||||||
Exchange rate |
1,158,532 |
(60,699) |
- |
1,291,408 |
(804,780) |
- |
(13,559) |
46,459 |
(236,370) |
1,380,991 |
Interest rate |
29,170 |
(10,693) |
- |
6,957 |
(4,593) |
- |
(39) |
525 |
(5,706) |
15,621 |
Securities |
105 |
- |
- |
2,863 |
(105) |
- |
- |
- |
- |
2,863 |
Total derivative financial instruments |
1,187,807 |
(71,392) |
- |
1,301,228 |
(809,478) |
- |
(13,598) |
46,984 |
(242,076) |
1,399,475 |
Equity securities at fair value |
148,169 |
- |
20,055 |
- |
(18,453) |
(8,956) |
- |
- |
- |
140,815 |
Investment property |
449,253 |
27,818 |
- |
97,479 |
- |
- |
- |
- |
- |
574,550 |
Total assets |
1,788,157 |
(56,795) |
20,055 |
1,399,555 |
(835,421) |
(8,956) |
75,020 |
2,727,967 |
(242,076) |
4,867,506 |
Liabilities | ||||||||||
Derivatives | ||||||||||
Exchange rate |
348,027 |
15,345 |
- |
164,179 |
(329,858) |
- |
(13,559) |
4,330 |
(17,666) |
170,798 |
Interest rate |
51,662 |
(6,296) |
- |
3,629 |
(41,002) |
- |
(39) |
3,734 |
(610) |
11,078 |
Securities |
- |
- |
- |
1,852 |
- |
- |
- |
- |
- |
1,852 |
Total derivatives |
399,689 |
9,049 |
- |
169,660 |
(370,860) |
- |
(13,598) |
8,064 |
(18,276) |
183,728 |
Total assets |
399,689 |
9,049 |
- |
169,660 |
(370,860) |
- |
(13,598) |
8,064 |
(18,276) |
183,728 |
139
As of December 31, 2022
|
Balance, January 1, 2022 |
Included in earnings |
OCI |
Purchases |
Settlement |
Prepaids |
Reclassifications (1) |
Transfers in to level 3 |
Transfers in to level 3 |
Balance september 30, 2022 |
|
In millions of COP | ||||||||||
Assets | ||||||||||
Debt securities | ||||||||||
Investments negotiable | ||||||||||
Mortgage backed securities (TIPs) |
17,810 |
2,928 |
- |
- |
(4) |
- |
- |
- |
(17,806) |
2,928 |
Bonds |
10,076 |
- |
- |
- |
(10,076) |
- |
- |
- |
- |
- |
Total negotiable investments |
27,886 |
2,928 |
- |
- |
(10,080) |
- |
- |
- |
(17,806) |
2,928 |
Total debt securities |
27,886 |
2,928 |
- |
- |
(10,080) |
- |
- |
- |
(17,806) |
2,928 |
Derivative financial instruments | ||||||||||
Exchange rate |
936,711 |
269,712 |
- |
603,714 |
(647,069) |
- |
(777) |
547 |
(4,306) |
1,158,532 |
Interest rate |
41,773 |
19,888 |
- |
9,323 |
(4,367) |
- |
(3,181) |
50 |
(34,316) |
29,170 |
Securities |
313 |
- |
- |
105 |
(313) |
- |
- |
- |
- |
105 |
Total derivative financial instruments |
978,797 |
289,600 |
- |
613,142 |
(651,749) |
- |
(3,958) |
597 |
(38,622) |
1,187,807 |
Equity securities at fair value |
141,942 |
- |
2,834 |
- |
- |
(16,056) |
- |
19,449 |
- |
148,169 |
Investment property |
216,229 |
11,190 |
- |
221,834 |
- |
- |
- |
- |
- |
449,253 |
Total assets |
1,364,854 |
303,718 |
2,834 |
834,976 |
(661,829) |
(16,056) |
(3,958) |
20,046 |
(56,428) |
1,788,157 |
Liabilities | ||||||||||
Derivatives | ||||||||||
Exchange rate |
232,400 |
88,744 |
- |
188,860 |
(157,332) |
- |
(777) |
- |
(3,868) |
348,027 |
Interest rate |
4,312 |
24,825 |
- |
26,323 |
(332) |
- |
(3,181) |
396 |
(681) |
51,662 |
Securities |
236,712 |
113,569 |
- |
215,183 |
(157,664) |
- |
(3,958) |
396 |
(4,549) |
399,689 |
Total derivatives |
236,712 |
113,569 |
- |
215,183 |
(157,664) |
- |
(3,958) |
396 |
(4,549) |
399,689 |
| (1) | Reclassifications during the period are presented by the valuation of derivatives, where the Bank records its derivatives as assets when the fair value is positive and liabilities when the fair value is negative. In addition, as of December 31, 2023, COP 90,589 of TIPS operations were reclassified, with the prior authorization of the SFC, from the classification to maturity to the classification of marketable investments. |
140
Level 3 fair value – transfers
The following were the significant level 3 transfers at December 31, 2023:
Transfers between Level 1 and Level 2 to Level 3:
Transfer of COP 2,678,994 in 2023 of Solidarity Securities - TDS, Mortgage Securities - TIPS and Bonds to level 3. For December 2023, the securities do not mark to price, the margin is updated and the marking days are greater than 365, therefore their current level is 3.
Transfer of COP 38,920 in 2023 of the exchange rate and interest rate derivative contracts to level 3. This is mainly related to a transfer of the Company's own credit risk to the counterparty's credit risk.
Transfers between Level 3 and Level 1 and 2:
Transfer of COP (223,800) of the exchange rate and interest rate derivative contracts from Level 3 to Level 2, mainly related to a transfer of the counterparty's credit risk to the Company's own credit risk.
Transfers between Level 2 and Level 1 of the Fair Value hierarchy
As of December 31, 2023, the Bank transferred securities from level 1 to level 2 for COP 13,619 as these securities increased their liquidity and were traded more frequently in an active market
All transfers are assumed to have occurred at the end of the reporting period.
Quantitative Information about Level 3 Fair Value measurements
The fair value of financial instruments is, in certain circumstances, measured using valuation techniques that incorporate assumptions that are not evidenced by prices from observable market transactions in the same instrument and are not based on observable market data.
Changing one or more of the inputs to the valuation models to reasonably possible alternative assumptions would change the fair values and therefore a valuation adjustment would be recognized through income statement. Favorable and unfavorable changes are determined on the basis of changes in the value of the instrument as a result of varying the levels of the unobservable input.
The following table sets forth information about significant unobservable inputs related to the Bank’s material categories of level 3 financial assets and liabilities and the sensitivity of these fair values to reasonably possible alternative assumptions.
As of December 31, 2023
Financial instrument |
Fair Value |
Valuation technique |
Significant unobservable input |
Range of inputs |
Weighted average |
Sensitivity 100 basis point increase |
Sensitivity 100 basis point decrease |
141
Securities issued by other financial institutions | |||||||
TIPS |
74,087 |
Discounted cash flow |
Margin (1) |
2.06% a 10.73% |
5.48% |
70,982 |
75,852 |
Amortization table (2) |
NA |
NA |
152,224 |
- |
|||
Solidarity Securities issued by the Colombian Government (TDS) |
2,664,295 |
Discounted cash flow |
Margin (1) |
0% a 1.18% |
1.17% |
2,658,010 |
2,679,372 |
Bunuses |
14,283 |
Discounted cash flow |
Margin (1) |
3.49% a 3.49% |
3.49% |
13,700 |
14,912 |
Equity securities | |||||||
Equity securities |
140,815 |
Price-based |
Price |
NA |
NA |
NA |
NA |
Derivative financial instruments, net | |||||||
Options |
73,603 |
Discounted cash flow |
Counterparties COP (USD) (4) |
0.13 % a 33.77% |
0.57% |
73,048 |
73,870 |
Forward |
1,003,152 |
Discounted cash flow |
Counterparties COP (USD) (4) |
0% a 50.58% |
7.22% |
1,000,729 |
1,005,592 |
Swaps |
138,992 |
Discounted cash flow |
Counterparties COP (USD) (4) |
0% a 63.39% |
5.86% |
139,451 |
138,577 |
As of December 31, 2022
Financial instrument |
Fair Value |
Valuation technique |
Significant unobservable input |
Range of inputs |
Weighted average |
Sensitivity 100 basis point increase |
Sensitivity 100 basis point decrease |
Debt securities negotiable investments | |||||||
TIPS |
2,928 |
Discounted cash flow |
Margin (1) |
205.93% a 1073.71% |
513.38% |
76,195 |
80,486 |
Amortization table (2) |
NA |
NA |
157,615 |
- |
|||
Equity securities | |||||||
Equity securities |
148,169 |
Price-based |
Price |
NA |
NA |
NA |
NA |
Derivative financial instruments, net | |||||||
Options |
117,067 |
Discounted cash flow |
Counterparties COP (USD) (4) |
0,10% a 36,40% |
0,64% |
116,181 |
117,636 |
Forward |
399,192 |
Discounted cash flow |
Counterparties COP (USD) (4) |
0% a 59,17% |
11,05% |
396,970 |
401,456 |
Swaps |
271,859 |
Discounted cash flow |
Counterparties COP (USD) (4) |
0% a 39,33% |
7,85% |
265,949 |
278,192 |
| (1) | Margin: The margin reflects the risks not incorporated in the reference rate, such as the credit risk, and is that value which, compounded with the reference rate, results in the discount rate with which the price of the security in the operation is obtained. |
| (2) | Amortization table (Applies to TIPS): It is based on the cash flows generated monthly by the Colombian Securitization Company, which incorporate, among other assumptions, the default and prepayment indicators, which correspond to inputs that are not observable in the market, but are developed under statistical techniques and based on the history of mortgage loans in Colombia. |
| (3) | Liquidity effect: Corresponds to the difference in nominal monthly maturity terms of the face rate of the subordinated issue with respect to the most liquid face rate of the same issue. |
| (4) | Recovery rate and counterparties COP (USD): These refer to the recovery rates and the probabilities of default of the counterparties, which are used in the estimation of the CVA/DVA adjustment in the measurement of the fair value of the OTC derivative instruments. |
142
The following table presents the valuation techniques used in measuring the fair value of the Bank's investment properties, the most significant unobservable inputs and the respective sensitivity:
Methodology |
Valuation technique |
Significant unobservable input |
Description of sensitivity |
|---|---|---|---|
|
Sales Comparison Approach - SCA The process by which an indication of value is obtained for the properties under analysis by comparing them with similar properties that can be considered comparable to those under analysis, that have been recently sold (ideally) or that are on offer, identifying the appropriate units of comparison and making the necessary adjustments to make them comparable to those under appraisal, based on market-derived comparables. |
Comparable Prices |
The weighted average rates used in the income capitalization methodology for the fourth quarter of 2023 are: Direct capitalization: initial rate 8.05% Discounted cash flow: discount rate: 12,32*%, terminal rate: 8,23%. The same weighted rates for the third quarter of 2023 are: Direct capitalization: initial rate 8,07% Discounted cash flow: discount rate: 12,44% terminal rate: 8,25%. The ratio between monthly gross rent and the value of the properties managed directly by the FIC (rental rate) considering the differences in locations and individual factors between properties and on a weighted basis was 0.80% at the end of the first quarter of 2023 and 0.82% at the end of the second quarter of 2023. |
An increase (Light, normal, considerable, significant) in the capitalization rate used would generate a decrease (significant, considerable, normal, light) in the fair value of the asset, and vice versa. An increase (Light, normal, considerable, significant) in the leases used in the valuation would generate a (significant, light, considerable) increase in the fair value of the asset, and vice versa. |
|
Income Approach In this methodology the appraiser analyzes the capacity of a property to generate future benefits, which are brought to present value as an indication of value. |
Direct Capitalization Discounted Cash Flows |
||
|
Cost approach A set of procedures by which an indication of the Market Value of the Full Property Right is obtained by estimating the cost of constructing, reproducing or replacing the property being appraised, including a reasonable profit, deducting depreciation from the total cost and adding the value of the land separately. |
Replacement cost |
There has been no change to the valuation technique during the year 2023 for each asset.
NOTA 30. CAPITAL MANAGEMENT
143
The Capital Management function oversees Shareholders’equity and Bancolombia’s capital structure, aiming for value generation through businesses related to financial activities and investments.
The goal is to have the enough capital to cover unexpected losses, and develope the business plan. To do so, the Capital and Corporate Investments area oversees Bancolombia’s capital ratios and uses several mechanisms to optimize such ratios according to forecasted business conditions.
The monitoring of corporate investments and shareholders’ equity, as well as different components of assets and associated risks, is executed for internal and external purposes. The results are presented to the Board of Directors and some support committees to make sure that all risks are properly managed and within risks appetite, guidelines, and regulation.
The Bank´s management has the goal of maintaining the balance between an adequate capital allocation and value generation for shareholders. This way, business opportunities can be financed with internal funding or capital markets resources.
Bancolombia’s lending and deposit-taking activities are supervisor by the Superintendencia Financiera de Colombia, and that implies complying with Decree 1477 of 2018.
This decree standardized the definitions of regulatory capital according to Basel III standards. It also updated the risk adjusted capital consumption of assets and added capital buffers. New capital measures will be implemented from the current 4.5% basic solvency level and the 9% total solvency level.
Additionally, Bancolombia conducts stress test to estimate how the bank’s balance sheet, results and ratios during adverse scenarios. None of the stress tests involve reaching solvency ratios below regulatory levels; therefore, we consider the organization's capital levels to be optimal at this time.
Between 2021 and 2024, after the complete implementation of the new capital standards, a minimum basic capital of 6% and a total capital ratio of 11.5% will be required, according to the following formulas:
Management directs its efforts towards equity strength, maintaining solvency indicators above the regulatory requirements. In accordance with the provisions of paragraph 5 of External Circular 025 of 2020, the Bank applied the international standards of the Basel Committee on Banking Supervision (known as Basel III), for the calculation of the solvency and technical equity ratio, obtaining the following results for the year 2021:
Technical Capital | ||
BANCOLOMBIA SA |
December 31, 2023 |
December 31, 2022 |
144
Deductions Ordinary Basic Equity Net |
30,509,621 |
30,942,419 |
Additional Basic Equity |
- |
- |
Additional Equity |
5,536,933 |
7,538,047 |
Technical Equity Deductions |
- |
- |
Technical Equity |
36,046,554 |
38,480,466 |
Total Assets Weighted by Level of Credit Risk |
165,206,920 |
182,292,327 |
Total Market Risk |
10,730,322 |
7,588,383 |
Total Operational Risk |
23,426,846 |
20,545,009 |
Leverage Value |
257,345,483 |
269,903,372 |
Capital ratio |
11,86% |
11,46% |
Basic solvency ratio |
15,30% |
14,70% |
Combined buffer |
10,80% |
10,20% |
Additional Basic Solvency Ratio |
15,30% |
14,70% |
Total Solvency Ratio |
18,08% |
18,29% |
Calculations based on the new definitions of Decree 1477 of 2018.
NOTE 31. SUBSEQUENT EVENTS
The financial statements of Bancolombia S.A. for the year ended December 31, 2023 were approved by the Board of Directors for issuance on February 20, 2024.
RISK MANAGEMENT
The Bank's comprehensive risk management is developed in compliance with current regulations and internal standards defined by the Board of Directors, in relation to credit and/or counterparty, market, liquidity and operational risk, among others.
Given the entry into force on June 1, 2023 of External Circular 018 (EC) issued by the SFC in September 2021 on the “Comprehensive Risk Management System (SIAR)”, the update of the Risk Manuals is highlighted in accordance with the named regulations; furthermore, during the year we worked on compliance with the instructions contained in paragraph 10 of Part II of Chapter XXXI related to the aggregation of risk data and reports presentations, which it came into effect on December 31, 2023. Moreover, the “Implementation Plan” for the management of interest rate risk of the banking book (RTILB) was sent, considering the testing period and the entry into force of the applicable instructions.
The Board of Directors knows and approves the resources referred to in CE 018, and the Bank's governance structure associated with risk management, and has the support of the Risk Committee to carry out its supervisory functions. as the body in charge of accompanying the Board in the approval, monitoring and control of policies, methodologies, tools, guidelines and strategies for the identification, measurement, control and mitigation of risks.
On the other hand, aware of the importance of human talent to promote a risk culture, the Corporate Risk Vice Presidency has highly qualified human talent to comprehensively and adequately manage the different risks to which the organization is exposed, to achieve this. has accomplished with the training plan in accordance with the defined knowledge maps, which it focus on the development of competencies required to fulfill their responsibilities.
145
Credit Risk
Credit risk is the probability that the entity will incur losses due to i) non-compliance with the financial obligations taken by the counterparty, issuer or debtor, ii) deterioration due to the decrease in their risk rating, iii) the reduction of profits and remunerations and iv) the benefits delivered in restructuring and recovery costs.
The information included below presents the maximum exposure to credit risk as of December 31, 2022 and 2023:
In millions of COP |
December 31, 2023 |
December 31, 2022 |
Credit portfolio and financial leasing operations |
182,921,469 |
179,472,579 |
Debt securities |
13,577,158 |
12,964,947 |
Equity investments (1) |
180,744 |
171,808 |
Derivatives (2) |
1,791,164 |
1,407,297 |
Subtotal maximum credit risk exposure |
198,470,535 |
194,016,631 |
Financial guarantees |
8,570,464 |
9,382,214 |
Total maximum credit risk exposure |
207,040,999 |
203,398,845 |
(1) For equity investments, the book value to be disclosed corresponds to the Other financial instruments.
(2) For derivative transactions, counterparty risk is revealed as long as the valuation is positive. Therefore, the value described here differs from the book value.
The maximum exposure to credit risk of the financial leasing portfolio and operations corresponds to its carrying amount at the end of the period without considering any guarantee received or other credit improvements.
The maximum exposure to credit risk of financial guarantees corresponds to the total balance granted at the end of the period, which is why it does not reflect the expected results.
The maximum exposure to credit risk of derivatives corresponds to the market value (mark to market) at the end of the period without considering any guarantee received or other credit improvements.
The maximum exposure to credit risk of debt securities and equity investments corresponds to their book amount at the end of the period without considering any guarantee received or other credit improvements.
Credit Risk Management – loan portfolio and Leasing operations
Risk management in the cycles of the different types of credit operations, it develops by complying with the policies, procedures and methodologies stipulated in the Credit Risk Management System, which also contains the general criteria for evaluating, qualifying, assuming, controlling and covering the mentioned risk. In addition, the administration has developed process and method manuals that specify the policies and procedures for the different products and segments served by the entity, and realize the strategy approved by the Board of Directors for the monitoring and control of credit risk.
In accordance with the above, part of the credit risk management policies are those stipulated for the credit exposure limit, credit origination, guarantees and securities, provisions, and portfolio monitoring and collections.
146
Below is a brief description of the mentioned policies:
| ● | Credit Exposure Limit Policy: contains the guidelines regarding the establishment of credit exposure limits and levels. Is set in compliance with legal requirements and in accordance with the entity's internal guidelines. |
| ● | Credit origination Policy: with this policy, the broad and sufficient knowledge of the characteristics of potential clients, the proper selection of these and the optimal granting levels consistent with their capacities is sought. |
| ● | Guarantees Policy: this policy specifies the guarantees provided by the clients to the entity, the characteristics, and criteria to accept and evaluate them to mitigate the risk associated with the non-compliance of the agreed upon obligations. |
| ● | Provisions Policy: this policy underlines the compliance of legal guidelines, what is stipulated by the Bank and the analysis of clients regarding the actions which must be taken, to cover the risk of losses due to credit exposure. |
| ● | Monitoring Policy*: It contains all the following activities that the bank use to monitoring the customer with their information, the purpose of this is review the correct evolution of credit risk. These activities require an specific classification process of credits operations and are consistent with the policies implemented for new credits. |
* Follow-up: Knowledge of the client's situation during the life of the credit.
| ● | Portfolio recovery policy**: through the definition of this policy, the Bank's objective is to establish those mechanisms that allow it to anticipate possible delays and carry out the recovery of the portfolio, that is, to minimize the impacts that result from late or non-compliance with payments, Additionally, this policy define all the activities and aspects that the bank has been considered as customer reconciliation management to make it possible to obtain information and create with this some models to make the necessary estimates for monitoring and estimating losses. |
**Recovery: Collection management during the different stages of the same.
The Bank's credit risk management is carried out in all processes of the credit cycle, these processes are framed as follows:
| ● | Credit origination: customer knowledge, payment capacity analysis, sectoral analysis, payment behavior and credit structuring. |
| ● | Behavior: knowledge of the client's situation during the credit life. |
| ● | Recovery: collection during the different stages. |
Scoring and rating models based on statistical information or expert criteria are used to support credit origination processes. This allows a differentiation of the risk level of potential clients to support decision making.
147
The Vice Presidency of Risks defines and documents the characteristics of the models that are used in the process of credit origination. Also, defines parameters, variables and the cut-off points that applied in each model. At least every six months, the Vice Presidency of Risks must do the backtesting1 of the scoring and rating models, used in the credit origination process to validate their effectiveness. Additionally, monthly the entire credit portfolio must be rated with the reference models and days past due, in order to assess the credit risk of each debtor and the allocation of bank provisions.
In addition to the evaluation and qualification of the portfolio, monthly provisions serve as a measure of the current condition of the portfolio, the parameters for their calculation are found in chapter 2 of Circular 100 of 1995 of the Financial Superintendence of Colombia, where define two matrices (A and B) for assigning the probability of default of the commercial and retail portfolio, a calculation that is made taking into account the rating, and in the commercial portfolio, the value of the client's assets, and in that of consumption, the historical behavior of the client's payments. For the remaining modalities, the portfolio is classified by risk level and then the provision percentage is calculated according to the days past due.
In order to guarantee compliance with the regulations established with respect to individual credit and concentration limits, the Bank carries out continuous monitoring of the concentration of risk groups, as well as daily control of the exposures of the different risk groups, evaluating the legal limits of indebtedness.
Additionally, there are internal concentration limits for the following classifications:
| ● | Concentration analysis by country: the country risk for a client will be the one where the econimic activity of the client take place to generate the resources to pay the credit obligation.. |
| ● | Sector concentration analysis: carried out through the economic sector defined by the international ISIC code2 |
| ● | Concentration analysis by modality: refers to the portfolio modality of each agreement (commercial, retail, Small business loans and mortgage credit). |
The Bank has models based on the optimization of risk and profitability, to determine the different levels of concentration of portfolios, also based on international references determined with external risk rating agencies that allow the analysis of concentration levels in different geographies.
Country Risk
In addition, the comprehensive risk management system (SIAR) includes the country risk management framework, which refers to the possibility of a company incurring losses as a
1 Statistical procedure used to validate the quality and accuracy of a model, by comparing actual results and risk measures generated by the models
2 ISIC: International Standard Industrial Classification of all economic activities.
148
result of financial operations abroad due to adverse economic and/or socio-political conditions in the country receiving those operations, either because of restrictions on the transfer of foreign exchange or because of factors not attributable to the commercial and financial condition of the country receiving those operations. This definition includes, but is not limited to, sovereign risk (SR) and transfer risk (TR) associated with such factors.
The Group has guidelines, processes and methodologies that periodically evaluate the country risk to which it is exposed in its equity investments, such as those made in jurisdictions other than Colombia that could have a high economic materiality, individually or aggregated by country, and whose purpose is to remain in the country.
Country risk management includes different stages to identify, measure, control and monitor the risk to which the Group is exposed. This management also takes into account the business plan, the nature of the operations, their materiality, the current and future vocation, as well as the characteristics of the country in which the investment is made. Additionally,is supported by methodologies and processes used in the management of country risk, developed by the Vice President of Risk and approved by the Board of Directors, which delegates this function to the Risk Committee.
At December 2023, The Group has declared that it will not invest in countries with an "E" rating and that any decision to invest capital for country risk must ensure compliance with solvency and liquidity indicators, seeking to be consistent with the strength and financial health of the entity. During this period, there were no alerts on any investments, nor were there any adjustments to the value of investments that could affect or deteriorate the Bank's financial strength.
| a. | Credit Quality Analysis - loans and Financial Leases portfolio |
Credit risk rating system
Its main goal is to determine the client’s credit risk profile, which is given by the result of a rating.
The institutional or legal entities portfolio rating is performed through a Rating model, based on the analysis of quantitative and qualitative variables, which could affect the payment of the financial commitments acquired by a client. This model is performed in the early stage of the credit process, it is updated every six months and includes credit risk variables, which could be summarized in the customer's financial performance measured from financial figures and payment capacity, payment behavior with the Bank and with other entities, and qualitative variables that are not explicit in the financial statements.
For the retail portfolio there is a rating model based on a score, which contains the last 12 months behavior variables, such as overdue, product counts, changes in the initial credit conditions, among others, gathering all this information the rating model gives a score, which will be categorized by a credit risk level, to identify the level of risk associated with the client.
149
For the Bank, the following credit risk levels have been determined to group customers according to their payment behavior:
Risk Level |
Description |
A – Normal Risk |
Loans and financial lease operations that have an excellent payment behavior. The debtor's financial statements and cash flows forecast, as well as other available financial information, it allows inferring an adequate payment capacity. |
B - Acceptable Risk |
Loans and financial lease transactions, even though they have an acceptable payment behavior, present some weakness that could potentially temporarily or permanently affect the debtor's ability to pay. |
C - Appreciable Risk |
Loans and financial lease operations that present deficiencies in the debtor's payment capacity or in its cash flow forecast, which could affect the normal payment of the obligation. |
D – Significant Risk |
Loans and financial lease transactions that have the same deficiencies than category "C", for a longer period, therefore its payment probability is low. |
E – Uncollectible |
Loans and financial lease obligations in this category are considered uncollectible. |
The Bank’s loan and financial lease portfolio distribution by the end of the period, according to the credit risk levels mentioned above, is shown below:
December 31, 2023 |
Decembere 31, 2022 |
|||
In Million of COP | ||||
Risk Level |
In Millions of COP |
Amount |
In Millions of COP |
Amount |
A – Normal Risk |
167,528,602 |
92% |
166,818,807 |
93% |
B – Acceptable Risk |
3,485,959 |
2% |
2,750,578 |
2% |
C – Appreciable Risk |
2,152,771 |
1% |
1,537,069 |
1% |
D – Significant Risk |
4,205,323 |
2% |
2,682,485 |
1% |
E – Uncollectible |
5,548,814 |
3% |
5,683,640 |
3% |
Total |
182,921,469 |
100% |
179,472,579 |
100% |
Additional provisions
External Circular 026 of 2022
150
Based on what is described in the EC 026 of november 29, 2022, and with the purpose of mitigating the impact of credit risk in an environment of economic deceleration and persistent inflation, the Bank recognized an additional provision to consumer loans in the income statement for a value equivalent to the expense explained by macroeconomic variables and the possible use of contingent lines of credit, based on the internal ECL models.
Said provision was recognized at the end of december 31, 2022, for a value of COP 353,159 and remains without any variations as of december 31, 2023, since there were no significant changes in the provision of the consumer credit lines nor in the expected macroeconomic environment this year.
For the period of december 31, 2023, the estimations and decisions made by Management did not change the Bank’s accounting guidelines, in comparison with those applied in the separated income statements for december 31, 2022.
Portfolio monitoring
| ● | Retail and SME Banking: |
At the end of December 2023, the total balance of the banking system for the Personal and SME portfolios decreased by 2.1% compared to the end of December 2022, this decrease is explained by a lower dynamic in disbursements and a higher cancellation in the SME segment. As for the non-performing loans portfolio, there was an increase of 42.2% compared to the same period, leaving with an NPL of 7.4%, 230 bps above the NPL of December of the previous year, which is explained to a great extent by the macroeconomic situation that the country is going through. The segment that has been most affected is the personal segment, given that its share in the increase of the past due portfolio is 73%, therefore, to avoid future deterioration and to contain the portfolio, we continue to develop different follow-up strategies, as well as an integral accompaniment to the clients through customized solutions. Likewise, in the other segments we continue to monitor proactively to anticipate the materialization of risks.
| ● | Corporate banking: |
By the end of December 2023, the Corporate Business has maintained its trend in the portfolio loans, up 7.34% over the end of previous year (December 2022). Which is partly explained by the 10.48% increase in the dynamics of the amount of disbursements made by corporate business clients. Additionally, the credit quality has deteriorated, the past-due 30 days closed at 1.93% of the portfolio at the end of December 2023, which represents an increase of 0.57 basis point respect to the end of December 2022.
It is also important to highlight that the coverage of past- due loans with provisions remains with healthy margins, as it is higher than 230% by the end of December 2023.
Monitoring sectoral alerts, macroeconomic changes and political environment
During the third quarter of 2023, the different monitoring and collection strategies continued to be executed in each of the segments, in order to anticipate future risks and impacts on the portfolio through a comprehensive analysis of the economic sectors in which the bank participates.
151
These strategies take into account macroeconomic, sectorial, financial and transactional variables.
In the retail segments, we have been managing the portfolio as a result of the current environment, such as the substantial increases in inflation and interest rates, implementing containment strategies that allow us to anticipate risk and achieve a greater recovery of the NPL portfolio.
On the other hand, in the SME segment, multiple evaluations were carried out on the portfolio that could be impacted by a variety of sectoral alerts, such as the increase in interest rates. Additionally, through the various monitoring and collection strategies in each segment, we have been able to anticipate risk and provide the client with solutions according to their situation.
Description of the credit portfolio and financial leasing operations portfolio
In order to carry out the evaluation and management of credit risk, credits and financial leasing operations have been classified into commercial and financial leasing (see Note 2-E.5.6.1.4), consumption (see Note 2-E ..5.6.1.2), mortgage (see Note 2-E. 5.6.1.1) and Small business loans (see Note 2-E.5.6.1.3).
Analysis of the behavior and deterioration of the loan portfolio and financial leasing operations
At the end of December 2023, the Bank's portfolio registered a growth of 1.92% compared to 2022. Below are the general aspects for each portfolio type:
| ● | The commercial portfolio including Financial Leasing as of December 2023 stood at COP 121.6 billion, registering an increase of 2.83% compared to 2022, explained by a lower growth dynamic in the last year. |
| ● | 93.3% of the gross balance of the loan portfolio in this modality corresponds to a portfolio classified as normal credit risk. |
| ● | The consumer portfolio closed at COP 38.8 billion with a decrease of -4.94% compared to the previous year, a situation that is due to the country's economy during the year. |
| ● | 85.17% of the portfolio is classified as normal credit risk. |
| ● | In Small business loans, the portfolio stood at COP 547,678 million, registering a decrease of -3.15% compared to 2022. |
Regarding exposure to credit risk in this modality, 82.49% of the gross balance corresponds to normal credit risk.
152
| ● | At the end of 2023, the mortgage portfolio closed at COP 21.8 billion, presenting a growth of 10.86% compared to the previous year. |
94.99% of the portfolio is classified as normal credit risk.
The exposure registered in the watch list at the end of December 2023 and 2022 is consolidated with the Financial Leasing portfolio.
As 31 december of 2023
Watch List - December 2023 | |||
Million COP | |||
Risk Level |
Amount |
% |
Allowance |
Level 1 – Low Risk |
12,292,358 |
0.81% |
99,252 |
Level 2 – Medium Risk |
2,131,768 |
7.64% |
162,766 |
Level 3 – High Risk |
1,928,851 |
49.21% |
949,254 |
Level 4 – High Risk |
3,589,466 |
71.60% |
2,569,887 |
Total |
19,942,443 |
18.96% |
3,781,159 |
As 31 december of 2022
Watch List - December 2023 | |||
Million COP | |||
Risk Level |
Risk Level |
Risk Level |
Risk Level |
Level 1 – Low Risk |
7,378,026 |
1.35% |
99,503 |
Level 2 – Medium Risk |
3,250,214 |
11.27% |
366,296 |
Level 3 – High Risk |
833,935 |
44.69% |
372,673 |
Level 4 – High Risk |
4,392,501 |
77.04% |
3,383,851 |
Total |
15,854,676 |
26.63% |
4,222,323 |
Loan Portfolio Guarantees and Financial Leasing Operations
Guarantees refer to the collateral provided by clients that enable the organization to mitigate credit risk by serving as an alternative source for the payment of loans granted in events of client default. These are considered admissible and suitable when they meet the following conditions:
| ● | Their economic value is sufficient to cover the amount of the obligation they support according to technical and objective criteria. |
| ● | They grant the entity a preference or a better right to obtain payment of the obligation, constituting an effective backup. |
| ● | A reasonable and effective guarantee that can be executed rapidly. |
153
| ● | They are a source of payment that sufficiently addresses the obligation upon the organization's request. |
| ● | Guarantees provided by the National Government that have certified budget appropriation and approved by the competent authority. |
The Bank has developed criteria for the requirement of guarantees, which are established according to the modalities of the loan portfolio. Likewise, it has set the coverages by type of guarantees and the necessary aspects in their maintenance, such as their legalization and registration, the performance of appraisals by experts with objective criteria, the obligation to insure those assets that are susceptible to loss or deterioration, the exercise of their custody and the necessary procedures for their cancellation.
The information included in the table reveals the nature of the guarantees and the balances covered by them for the loan portfolio and financial leasing operations classified in the modalities of commercial, consumer, Small business loans, mortgage, and financial leasing.
As of December 31, 2023
Nature of the Guarantee |
Value Covered by Guarantee |
|||||
|---|---|---|---|---|---|---|
Commercial |
Consumer |
Mortgage |
Small business loans |
Financial Leasing |
Total |
|
In Millions of COP | ||||||
Real Estate and Residential Properties |
10,367,215 |
563,856 |
19,550,039 |
4,999 |
162,364 |
30,648,473 |
Properties Given in Real Estate Leasing |
- |
- |
- |
- |
15,786,804 |
15,786,804 |
Properties Given in Non-Real Estate Leasing |
- |
26 |
- |
- |
9,387,871 |
9,387,897 |
Standby Letters of Credit |
1,046,563 |
- |
- |
- |
45 |
1,046,608 |
Guarantee Fund |
4,011,873 |
191 |
- |
52,212 |
60,490 |
4,124,766 |
Collection Rights |
6,269,408 |
18 |
- |
- |
33,518 |
6,302,944 |
Other Collaterals (Pledges) |
1,653,431 |
3,812,053 |
- |
77 |
25,007 |
5,490,568 |
Unsecured (Overdraft Balance) |
72,266,332 |
34,486,369 |
2,290,219 |
490,389 |
600,100 |
110,133,409 |
Total Loan Portfolio and Financial Leasing |
95,614,822 |
38,862,513 |
21,840,258 |
547,677 |
26,056,199 |
182,921,469 |
As of December 31, 2022
154
Nature of the Guarantee |
Value Covered by Guarantee |
|||||
|---|---|---|---|---|---|---|
Commercial |
Consumer |
Mortgage |
Small business loans |
Financial Leasing |
Total |
|
In Millions of COP | ||||||
Real Estate and Residential Properties |
10,569,733 |
646,882 |
17,161,364 |
8,975 |
174,049 |
28,561,003 |
Properties Given in Real Estate Leasing |
- |
- |
- |
- |
15,702,541 |
15,702,541 |
Properties Given in Non-Real Estate Leasing |
- |
38 |
- |
- |
7,571,019 |
7,571,057 |
Standby Letters of Credit |
588,969 |
- |
- |
- |
2,189 |
591,158 |
Guarantee Fund |
4,976,659 |
1,168 |
- |
132,293 |
77,697 |
5,187,817 |
Collection Rights |
5,550,437 |
5 |
- |
- |
196,877 |
5,747,319 |
Other Collaterals (Pledges) |
1,899,687 |
3,654,777 |
- |
176 |
46,486 |
5,601,126 |
Unsecured (Overdraft Balance) |
68,343,458 |
36,581,057 |
2,539,713 |
424,039 |
2,622,291 |
110,510,558 |
Total Loan Portfolio and Financial Leasing |
91,928,943 |
40,883,927 |
19,701,077 |
565,483 |
26,393,149 |
179,472,579 |
The Execution of Guarantees
Guarantees are recognized in the income statement when effective possession of the asset is held.
The guarantees represented in real estate or movable goods is received based on a commercial appraisal, and those transfers, such as shares or participations, are received based on market value.
As of December 31, 2023 and 2022, the guarantees that were taken possession during the period totaled COP 270,680 and COP 212,849, respectively.
The Bank classifies the guarantees after the exchange operation according to the intended use, as follows:
| ● | Assets held for sale. |
| ● | Other marketable assets. |
| ● | Other non-marketable assets. |
| ● | Financial instruments (investments). |
| ● | Property and equipment. |
| ● | Inventories. |
The guarantees classified as assets held for sale are those expected to be sold within the next 12 months. When market restrictions prevent their execution in less than 12 months and this period is extended, retroactive depreciation must be performed to decrease the net assets value.
155
c. Credit risk concentration of loan portfolio and financial leasing operations
The Bank performs its credit risk concentration analysis by monitoring the portfolio by groupings such as: maturity, age of default, rating, modality, sector and country as shown below:
| ● | Concentration of credits due to maturation |
The following table shows the maturation ranges, understood as the remaining term for the termination of the contract of the credit portfolio and financial leasing operations at the end of the year 2023, where it can be seen that the highest concentration (54%) is found in the portfolio with a maturity of 1 to 5 years:
December 31, 2023
Maturation |
1 year o less |
From 1 to 5 years |
From 5 to 10 years |
More than 10 years |
Total |
|---|---|---|---|---|---|
In millions of COP | |||||
Commercial |
28,741,018 |
52,321,953 |
13,715,948 |
835,903 |
95,614,822 |
Consumption |
1,933,889 |
33,080,576 |
3,820,686 |
27,362 |
38,862,513 |
Mortgage |
29,035 |
1,515,918 |
4,183,643 |
16,111,662 |
21,840,258 |
Small business loans |
52,708 |
484,864 |
10,024 |
81 |
547,677 |
Financial leasing |
2,618,280 |
10,736,771 |
8,075,399 |
4,625,749 |
26,056,199 |
Total |
33,374,930 |
98,140,082 |
29,805,700 |
21,600,757 |
182,921,469 |
December 31, 2022
Maturation |
1 year o less |
From 1 to 5 years |
From 5 to 10 years |
More than 10 years |
Total |
|---|---|---|---|---|---|
In millions of COP | |||||
Commercial |
25,413,971 |
51,925,036 |
13,900,174 |
689,762 |
91,928,943 |
Consumption |
875,632 |
36,114,027 |
3,879,641 |
14,627 |
40,883,927 |
Mortgage |
27,011 |
1,467,582 |
3,900,820 |
14,305,664 |
19,701,077 |
Small business loans |
43,258 |
508,900 |
13,283 |
42 |
565,483 |
Financial leasing |
2,939,644 |
9,681,008 |
9,182,467 |
4,590,030 |
26,393,149 |
Total |
29,299,516 |
99,696,553 |
30,876,385 |
19,600,125 |
179,472,579 |
| ● | Concentration of credits by age of default |
The details of the credits are shown below according to the days due, with overdue credits understood as those credits that are from the 31st day of maturity onwards. It is highlighted that 96.9% of the portfolio is concentrated in the range 0 to 30 days:
December 31, 2023
156
Expiration days | ||||||
|---|---|---|---|---|---|---|
Period |
0 - 30 days |
31 - 90 days |
91 - 120 days |
121 - 360 days |
Más de 360 days |
Total |
In millions of COP | ||||||
Commercial |
92,422,930 |
358,041 |
173,983 |
1,498,621 |
1,161,247 |
95,614,822 |
Consumption |
35,016,614 |
1,699,931 |
596,199 |
1,475,954 |
73,815 |
38,862,513 |
Mortgage |
20,585,728 |
572,902 |
94,333 |
316,851 |
270,444 |
21,840,258 |
Small business loans |
466,692 |
30,322 |
11,089 |
36,941 |
2,633 |
547,677 |
Financial leasing |
25,212,587 |
251,600 |
56,146 |
195,133 |
340,733 |
26,056,199 |
Total |
173,704,551 |
2,912,796 |
931,750 |
3,523,500 |
1,848,872 |
182,921,469 |
December 31, 2022
Expiration days | ||||||
|---|---|---|---|---|---|---|
Period |
0 - 30 días |
31 - 90 días |
91 - 120 días |
121 - 360 días |
Más de 360 días |
Total |
In millions of COP | ||||||
Commercial |
89,737,219 |
335,879 |
121,253 |
442,863 |
1,291,729 |
91,928,943 |
Consumption |
38,445,567 |
1,166,585 |
369,526 |
816,942 |
85,307 |
40,883,927 |
Mortgage |
18,832,662 |
369,175 |
72,083 |
166,337 |
260,820 |
19,701,077 |
Small business loans |
497,188 |
25,266 |
9,389 |
29,777 |
3,863 |
565,483 |
Financial leasing |
25,552,762 |
203,170 |
53,877 |
116,188 |
467,152 |
26,393,149 |
Total |
173,065,398 |
2,100,075 |
626,128 |
1,572,107 |
2,108,871 |
179,472,579 |
| ● | Concentration of credits by modality |
The composition of the credit portfolio in the commercial, consumption, Small business loans, Mortgage and financial leasing modalities for the period ending in December 2023 is as follows:
Composition |
December 31, 2023 |
December 31, 2022 |
In millions of COP | ||
Commercial |
95,614,822 |
91,928,943 |
Corporate |
46,056,170 |
46,537,845 |
Pyme |
13,264,333 |
13,510,052 |
Other |
36,294,319 |
31,881,046 |
Consumption |
38,862,513 |
40,883,927 |
Credit Card |
7,902,173 |
7,934,831 |
Vehicle |
4,431,696 |
4,039,955 |
Payroll loans |
4,567,328 |
4,592,663 |
Other |
21,961,316 |
24,316,478 |
Mortgage |
21,840,258 |
19,701,077 |
VIS |
7,992,579 |
6,505,237 |
No VIS |
13,847,679 |
13,195,840 |
Small business loans |
547,677 |
565,483 |
Financial leasing |
26,056,199 |
26,393,149 |
Total gross credit portfolio and financial leasing operations |
182,921,469 |
179,472,579 |
Total deterioration |
(12,892,352) |
(11,268,584) |
Total Loan Portfolio and net Financial Leasing |
170,029,117 |
168,203,995 |
157
| ● | Concentration of credits by economic sector |
The following is the detail of the credit portfolio by the debtor's main economic activity for the period ending in December 2023 and 2022:
As of December 31, 2023
Economic Sector |
Loans |
Provision |
Total, net |
|||||||
Capital |
Interest and/or financial component |
Other items |
Capital |
Interest and/or financial component |
Other items |
|||||
In millions of COP | ||||||||||
Agriculture, forestry, fishing and hunting |
6,072,106 |
127,878 |
196,145 |
407,931 |
19,565 |
10,532 |
5,958,101 |
|||
Customer portfolio for natural person |
57,428,453 |
820,820 |
202,054 |
5,929,537 |
167,815 |
46,959 |
52,307,016 |
|||
Commerce, restaurants and hotels |
21,114,766 |
311,416 |
156,400 |
1,416,761 |
65,724 |
24,089 |
20,076,008 |
|||
Construction and civil works |
15,395,250 |
394,429 |
98,553 |
1,357,966 |
70,472 |
25,778 |
14,434,016 |
|||
Electricity, gas and water |
11,553,630 |
214,982 |
73,064 |
263,090 |
7,483 |
980 |
11,570,123 |
|||
Exploitation of mines and quarries |
3,660,308 |
43,327 |
25,670 |
153,154 |
921 |
738 |
3,574,492 |
|||
Government |
5,890,945 |
113,309 |
20,513 |
71,829 |
1,750 |
499 |
5,950,689 |
|||
Manufacturing |
10,796,348 |
202,989 |
677,977 |
454,876 |
17,148 |
14,230 |
11,191,060 |
|||
Paper, wood and cardboard |
1,143,023 |
14,878 |
16,978 |
41,411 |
2,090 |
875 |
1,130,503 |
|||
Plastics |
1,304,004 |
17,062 |
53,315 |
30,348 |
694 |
1,054 |
1,342,285 |
|||
Chemical production |
456,178 |
8,928 |
24,779 |
25,445 |
1,563 |
490 |
462,387 |
|||
Social and personal communal services |
8,906,994 |
134,171 |
191,884 |
495,875 |
20,105 |
7,188 |
8,709,881 |
|||
Professional advisory services and business services |
7,616,205 |
115,893 |
148,570 |
503,129 |
22,186 |
10,519 |
7,344,834 |
|||
Financial services, real estate, business |
17,719,745 |
249,928 |
664,698 |
362,578 |
4,063 |
34,009 |
18,233,721 |
|||
Textile |
1,651,758 |
26,641 |
48,196 |
192,638 |
9,370 |
4,678 |
1,519,909 |
|||
Transport and communications |
6,654,758 |
83,943 |
77,608 |
569,707 |
10,259 |
12,251 |
6,224,092 |
|||
Total |
177,364,471 |
2,880,594 |
2,676,404 |
12,276,275 |
421,208 |
194,869 |
170,029,117 |
|||
As of December 31, 2022
Economic Sector |
Loans |
Provision |
Total, net |
||||
Capital |
Interest and/or financial component |
Other items |
Capital |
Interest and/or financial component |
Other items |
||
In millions of COP | |||||||
Agriculture, forestry, fishing and hunting |
5,898,769 |
110,058 |
137,468 |
465,205 |
16,740 |
8,066 |
5,656,284 |
Customer portfolio for natural person |
57,605,123 |
722,576 |
273,313 |
4,354,838 |
97,188 |
36,701 |
54,112,285 |
Commerce, restaurants and hotels |
21,100,533 |
243,817 |
348,672 |
1,267,192 |
41,350 |
23,331 |
20,361,149 |
Construction and civil works |
16,912,028 |
280,663 |
241,829 |
1,163,263 |
54,104 |
108,908 |
16,108,245 |
Electricity, gas and water |
9,951,204 |
177,148 |
171,817 |
272,126 |
8,242 |
3,734 |
10,016,067 |
Exploitation of mines and quarries |
2,084,462 |
31,727 |
15,936 |
114,148 |
2,173 |
1,274 |
2,014,530 |
158
Government |
4,312,076 |
56,726 |
26,514 |
59,893 |
1,232 |
616 |
4,333,575 |
Manufacturing |
11,589,636 |
174,538 |
568,633 |
451,668 |
16,014 |
12,152 |
11,852,973 |
Paper, wood and cardboard |
1,342,488 |
16,775 |
67,238 |
44,490 |
3,058 |
2,440 |
1,376,513 |
Plastics |
1,572,717 |
17,708 |
81,737 |
35,747 |
854 |
1,326 |
1,634,235 |
Chemical production |
660,448 |
9,051 |
132,597 |
32,813 |
1,279 |
1,546 |
766,458 |
Social and personal communal services |
9,180,490 |
119,993 |
224,235 |
520,388 |
15,232 |
7,779 |
8,981,319 |
Professional advisory services and business services |
6,813,262 |
92,692 |
539,897 |
408,682 |
17,488 |
14,382 |
7,005,299 |
Financial services, real estate, business |
14,480,490 |
206,667 |
776,716 |
203,050 |
4,420 |
10,966 |
15,245,437 |
Textile |
2,086,545 |
25,331 |
95,603 |
125,062 |
6,528 |
6,940 |
2,068,949 |
Transport and communications |
7,523,947 |
71,007 |
299,679 |
1,204,611 |
6,931 |
12,414 |
6,670,677 |
Total |
173,114,218 |
2,356,477 |
4,001,884 |
10,723,176 |
292,833 |
252,575 |
168,203,995 |
| ● | Credit concentration by risk country |
The information included below corresponds to the concentration of the credit portfolio and financial leasing operations, detailing the participation that the countries in which the Bank's clients are located have with respect to the total credit portfolio:
|
December 31, 2023 |
December 31, 2022 |
Country |
Stake |
Stake |
Colombia |
98,94% |
98.5% |
Guatemala |
0,52% |
0.7% |
Costa Rica |
0,00% |
0.00% |
Perú |
0,07% |
0.10% |
Panamá |
0,38% |
0.63% |
Other countries |
0,09% |
0.07% |
Total |
100% |
100% |
The information for current, delinquent or impaired financial assets is presented below:
As of December 31, 2023
Risk category |
Loans current and without deterioration |
Loans in default and without impairment |
Current loans with some type of deterioration |
Delinquent and impaired loans |
Total |
|---|---|---|---|---|---|
A – Normal risk |
166,991,585 |
329,182 |
173,146 |
34,689 |
167,528,602 |
B – Acceptable risk |
1,496,642 |
1,099,717 |
674,566 |
215,034 |
3,485,959 |
C – Appreciable risk |
646,264 |
498,747 |
543,146 |
464,614 |
2,152,771 |
D – Significant risk |
273,871 |
186,735 |
721,782 |
3,022,935 |
4,205,323 |
E – Unrecoverable risk |
387,455 |
159,790 |
1,796,095 |
3,205,474 |
5,548,814 |
Total |
169,795,817 |
2,274,171 |
3,908,735 |
6,942,746 |
182,921,469 |
159
As of December 31, 2022
Risk category |
Loans current and without deterioration |
Loans in default and without impairment |
Current loans with some type of deterioration |
Delinquent and impaired loans |
Total |
|---|---|---|---|---|---|
A – Normal risk |
166,327,756 |
213,230 |
265,364 |
12,457 |
166,818,807 |
B – Acceptable risk |
1,422,423 |
869,303 |
338,236 |
120,616 |
2,750,578 |
C – Appreciable risk |
477,621 |
371,753 |
392,378 |
295,317 |
1,537,069 |
D – Significant risk |
253,448 |
96,511 |
575,410 |
1,757,116 |
2,682,485 |
E – Unrecoverable risk |
299,454 |
88,576 |
2,713,308 |
2,582,302 |
5,683,640 |
Total |
168,780,702 |
1,639,373 |
4,284,696 |
4,767,808 |
179,472,579 |
To estimate the deterioration of the Bank's loan portfolio and financial leasing operations, the economic conditions and trends of the client's industry, the analysis of payments made against the contractual conditions, events that may negatively affect the client's payment capacity, among others.
The portfolio quality indicators show a variation compared to the previous year, since the overdue coverage (Total Capital Provision / Overdue Portfolio Capital Balance) at the end of the year amounts to 139.76%, compared to 178.49% in 2022. Regarding The provision levels (Total Capital Provision/Total Portfolio) at the end of the year amount to 6.92% and 6.19% in 2022. The variation in the coverage level is due to the high deterioration observed in 2023, which generates an increase in the overdue greater than the balance sheet provision, which directly impacts the level of provision where there is an increase in the portfolio and the difference from the A rating compared to the year 2022, with a greater impact on consumption, associated with economic dynamics.
The evaluation of clients is carried out monthly based on the days of default at the end of each month, in order to assess the credit risk of each debtor, in accordance with what is established by the Financial Superintendency. Additionally, in the months of May and November, clients are reviewed in the Portfolio Rating process, in accordance with the provisions of the SIAR manual, Credit Risk Management Framework (Chapter 4).
| e. | Credit Risk Management – investment financial instruments |
Each one of the positions that make up the portfolio complies with the policies and limits that seek to diminish credit risk exposure. Those policies are, among others:
| ● | Term Limits: each borrower is evaluated by the Risk Committee, in which the result of the authorized model for this type of borrower is reviewed (quantitative and |
160
| qualitative variables), which allows the Committee to establish the maximum term for which the Bank wishes to have exposure. |
| ● | Credit Limits: limits approved under the model and with authorization from the Risk Committee, as well as the exposure, are monitored in line or batch, in such a way that the presentation of excesses is mitigated. |
| ● | Counterparty Limits: these limits, derived from the credit limits or from allocation models and are verified by the Front Office prior to the close of operations. |
| ● | Master Agreement: these bilateral agreements describe the handling of operations between the counterparties in accordance with good international practices and that limit the legal and financial risk under the occurrence of events of default (failure to pay or delivery). Mitigation mechanisms, procedures to be carried out in the case of these events of default, special conditions by type of operation and that are applied to OTC derivatives, Repos and other securities financing transactions, are all agreed upon. |
| ● | Margin Agreements: for OTC derivatives operations and other securities financing transactions, agreements that regulate the administration of guarantees, haircuts, adjustment periods, minimum transfer amounts, etc., and that limit risk for a period of time (one day, one week, etc.), are established for counterparties involved in the operation. |
| ● | Counterparty Alerts: there are financial, qualitative and market indicators that allow the Bank to establish damages to the credit quality of an issuer or counterparty. |
| f. | Credit Quality Analysis - Other Financial Instruments: |
In order to evaluate the credit quality of a counterparty or issuer (to determine a risk level or profile), the Bank relies on two rating systems: an external one and an internal one, both of which allow to identify a degree of risk differentiated by segment and country and to apply the policies that have been established for issuers or counterparties with different levels of risk, in order to limit the impact on liquidity and/or the income statement of the Bank.
External credit rating system: is divided by the type of rating applied to each instrument or issuer; in this way the geographic location, the term and the type of instrument allow the assignment of a rating according to the methodology that each examining agency uses.
Internal credit rating system: the “ratings or risk profiles” scale is created with a range of levels that go from low risk to high risk (this can be reported in numerical or alphanumerical scales), where the rating model is sustained by the implementation and analysis of qualitative and quantitative variables at sector level, which according to the relative analysis of each variable, determine credit quality; in this way the internal credit rating system aims to establish adequate margin in decision-making regarding the management of financial instruments.
| ● | Credit Quality Analysis of the Bank |
161
Maximum Exposure to Credit Risk |
Debt Instruments |
Equity |
Derivatives* |
|||
December 31, 2023 |
December 31, 2022 |
December 31, 2023 |
Diciembre 31, 2022 |
December 31, 2023 |
December 31, 2022 |
|
In millions of COP | ||||||
Low Risk |
13,428,125 |
12,950,114 |
126,955 |
117,754 |
1,678,202 |
1,398,716 |
Medium Risk |
146,155 |
8,131 |
- |
- |
316 |
4,522 |
Hihg Risk |
2,879 |
6,702 |
- |
- |
17,327 |
4,059 |
Without Rating |
- |
- |
53,788 |
54,054 |
95,319 |
- |
Total |
13,577,159 |
12,964,947 |
180,743 |
171,808 |
1,791,164 |
1,407,297 |
|
Note: A negative value corresponds to positions with a negative valuation. | ||||||
In accordance with the criteria and considerations specified in the internal rating allocation and external credit rating systems methodologies, the following schemes of relation can be established, according to credit quality given to each one of the qualification scales:
Low Risk: all investment grade positions (from AAA to BBB-), as well as those issuers that according to the information available (financial statements, relevant information, external ratings, CDS, among others) reflect adequate credit quality.
Medium Risk: all speculative grade positions (from BB+ to BB-), as well as those issuers that according to the available information (Financial statements, relevant information, external qualifications, CDS, among others) reflect weaknesses that could affect their financial situation in the medium term.
High Risk: all positions of speculative grade (from B+ to D), as well as those issuers that according to the information available (Financial statements, relevant information, external qualifications, CDS, among others) reflect a high probability of default of financial obligations or that already have failed to fulfill them.
| ● | Financial credit quality of other financial instruments that are not in default nor impaired in value |
| - | Debt instruments: 100% of the debt instruments are not in default. |
| - | Equity: the positions do not represent significant risks. |
| - | Derivatives: 99.9% of the credit exposure does not present incidences of material default. The remaining percentage corresponds to default events at the end of the period. |
| ● | Maximum exposure level to the credit risk given: |
Maximum Exposure to Credit Risk |
Maximum Exposure |
Collateral |
Net Exposure |
||||
December 31, 2023 |
December 31, 2022 |
December 31, 2023 |
Diciembre 31, 2022 |
December 31, 2023 |
December 31, 2022 |
||
In Millions of COP | |||||||
162
Debt Instruments |
13,577,159 |
12,964,947 |
(1,287,392) |
(601,291) |
12,289,767 |
12,363,656 |
|
Derivatives |
1,791,164 |
1,407,297 |
698,663 |
569,251 |
1,092,502 |
838,045 |
|
Equity |
180,743 |
171,808 |
- |
- |
180,743 |
171,808 |
|
Total |
15,549,066 |
14,544,052 |
(588,729) |
(32,040) |
13,563,012 |
13,373,509 |
|
|
Note: In derivatives, negative collateral are received from counterparties and positive collateral are delivered to counterparties. In debt instruments the collateral corresponds to Repo, Simultaneous or TTvs transactions. | |||||||
| ● | Analysis of the maturity of other financial instruments past due but not impaired |
| - | Debt instruments: portfolio does not present past due nor impaired assets. |
| - | Equity: portfolio does not present impaired assets. |
| - | Derivatives: the past due assets are not material. |
| ● | The information corresponding to the individual evaluation of impairment at the end of the period for other financial instruments, is detailed as follows: |
Debt instruments
Maximum Exposure to Credit Risk |
Exposure |
Impairment |
Final Exposure |
||||
Diciembre 31, 2023 |
Diciembre 31, 2022 |
Diciembre 31, 2023 |
Diciembre 31, 2022 |
Diciembre 31, 2023 |
Diciembre 31, 2022 |
||
In Millions of COP | |||||||
Held for trading |
6,942,468 |
6,916,719 |
- |
- |
6,942,468 |
6,916,719 |
|
Available-for-sale |
3,211,425 |
2,590,622 |
3,208 |
762 |
3,208,217 |
2,589,860 |
|
Held-to-maturity |
3,423,265 |
3,457,606 |
8,985 |
7,045 |
3,414,280 |
3,450,561 |
|
Total |
13,577,158 |
12,964,947 |
12,193 |
7,807 |
13,564,965 |
12,957,140 |
|
Equity
Maximum Exposure to Credit Risk |
Exposure |
Impairment |
Final Exposure |
|||
Diciembre 31, 2023 |
Diciembre 31, 2022 |
Diciembre 31, 2023 |
Diciembre 31, 2022 |
Diciembre 31, 2023 |
Diciembre 31, 2022 |
|
In Millions of COP | ||||||
Fair Value through profit or loss. |
2,701 |
11,121 |
- |
- |
2,701 |
11,121 |
Equity Value through other comprehensive income. |
7,508 |
7,014 |
- |
- |
7,508 |
7,014 |
Equity Value through other comprehensive income. |
170,534 |
153,673 |
- |
- |
170,534 |
153,673 |
Total |
180,743 |
171,808 |
- |
- |
180,743 |
171,808 |
163
Collateral- other financial instruments:
Level of collateral: respect to the type of asset or operation, a collateral level is determined according to the policies defined for each product and the market where the operation is carried out.
Assets held as collateral in organized markets: the only assets that can be received as collateral are those defined by the central counterparties, the stock market where the operation is negotiated, those assets that are settled separately in different contracts or documents, which can be managed by each organization and must comply with the investment policies defined by the Bank, taking into account the credit limit for each type of asset or operation received or delivered, which collateral received are the best credit quality and liquidity.
Assets received as bilateral collateral between counterparties: the collateral accepted in international OTC derivative operations is agreed on bilaterally in the Credit Support Annex (CSA) 1 and with fulfillment in cash in dollars and managed by Citibank N.A. This company acts on behalf of Bancolombia for making international margin calls and providing a better management of the collateral.
Collateral adjustments for margin agreements: the adjustments will be determined by the criteria applied by both the external and internal regulations in effect, and at the same time, mitigation standards are maintained so that the operation fulfills the liquidity and solidity criteria for settlement. Among the main characteristics by product or market, we have:
-With respect to the derivative operations, these are carried out daily, with threshold levels of zero for the majority of counterparties, which reduces the exposure to a term that does not exceed 10 days, according to Basel.
-For buy-sell backs, repos and other securities financing transactions, daily monitoring is done in order to establish the need to adjust the collateral in such a way that these are applied in as little time as possible, according to the contracts or market conditions.
-For all international counterparties, margin agreements that limit exposure to the maximum and with a daily adjustment period are celebrated. These margin agreements are celebrated
1 A Credit Support Annex (CSA) provides credit protection by setting forth the rules governing the mutual posting of collateral. CSAs are used in documenting collateral arrangements between two parties that trade privately negotiated (over the counter) derivative securities. The trade is documented under a standard contract called a master agreement, developed by the International Swaps and Derivatives Association (ISDA).
164
under ISDA(International Swaps and Derivatives Association)1 and GMRA (Global Master Repurchase Agreement)2 both for OTC derivatives and securities financing transactions.
-For every local counterparty, the local framework agreement is signed (agreement developed by the industry) and the mitigating actions to apply in each operation are agreed upon, whether for margin agreements, re-couponing, early termination, among others.
-For repos, buy-sell backs and other securities financing transactions, these are agreed upon by organized markets that in general implicate complying with haircut or additional collateral rules.
-The central counterparty carries out daily control and monitoring processes in order to comply with the rules imposed by these organizations in such a way that we are always making daily adjustments at the demanded collateral level.
g. Credit risk concentration - other financial instruments:
According to the regulations, the Bank must control on a daily basis the risk of positions of the Bank’s companies where the same issuer or counterparty stands, below the legal limits.
By the same way, the positions of the Bank are verified in respect of the authorized risk levels in each country in order to guarantee the alerts and positions limits, that are considered outside of the Bank risk appetite.
| ● | Risk exposure by economic sector and risk region: |
Maximum Exposure to Credit Risk |
Debt Instruments |
Equity |
Derivatives |
|||
Diciembre 31, 2023 |
Diciembre 31, 2022 |
Diciembre 31, 2023 |
Diciembre 31, 2022 |
Diciembre 31, 2023 |
Diciembre 31, 2022 |
|
In millions of COP | ||||||
Sector Concentration |
||||||
Corporate |
1,025,184 |
393,357 |
36,816 |
42,934 |
947,891 |
397,405 |
Financial |
3,821,860 |
3,557,622 |
141,226 |
117,753 |
840,694 |
828,303 |
Government |
8,730,115 |
9,013,968 |
- |
- |
- |
- |
Funds ETF |
- |
- |
2,701 |
11,121 |
2,579 |
181,589 |
Total |
13,577,159 |
12,964,947 |
180,743 |
171,808 |
1,791,164 |
1,407,297 |
Concentration by Region |
|
|
|
|
|
|
North America |
1,424,466 |
2,228,198 |
- |
- |
313,114 |
308,427 |
Latin America |
12,152,693 |
10,736,749 |
178,042 |
139,892 |
1,005,914 |
602,843 |
Europe |
- |
- |
- |
- |
469,557 |
315,806 |
Others (Includes Funds and ETF) |
- |
- |
2,701 |
31,916 |
2,579 |
180,221 |
Total |
13,577,159 |
12,964,947 |
180,743 |
171,808 |
1,791,164 |
1,407,297 |
1 ISDA: Organization of participants in the OTC derivatives markets. Its main objective is to establish a reference framework through standard contracts for OTC derivatives trading.
2 GMRA: It is a model legal agreement designed for parties transacting repos and is published by the International Capital Market Association (ICMA).
165
| ● | Risk exposure by credit rating: |
Maximum Exposure to Credit Risk | |||||
In Millions of COP | |||||
Rating Risk |
Rating Scale* |
December 31, 2023 |
December 31, 2022 |
||
Low Risk |
Sovereign Risk |
7,305,648 |
46.9% |
6,785,772 |
46.8% |
Low Risk |
AAA |
6,639,565 |
42.7% |
6,752,475 |
46.4% |
Low Risk |
AA+ |
283,336 |
1.8% |
138,330 |
1.0% |
Low Risk |
AA |
201,229 |
1.3% |
44,615 |
0.3% |
Low Risk |
AA- |
168,942 |
1.1% |
45,263 |
0.3% |
Low Risk |
A+ |
148,392 |
1.0% |
215,623 |
1.5% |
Low Risk |
A |
122,090 |
0.8% |
62,586 |
0.4% |
Low Risk |
A- |
149,047 |
1.0% |
186,971 |
1.3% |
Low Risk |
BBB+ |
199,422 |
1.3% |
147,031 |
1.0% |
Low Risk |
BBB |
12,778 |
0.1% |
72,193 |
0.5% |
Low Risk |
BBB- |
2,832 |
0.0% |
2,650 |
0.0% |
Medium Risk |
BB+ |
141,311 |
0.9% |
20,759 |
0.1% |
Medium Risk |
BB |
4,381 |
0.0% |
3,597 |
0.0% |
Medium Risk |
BB- |
780 |
0.0% |
1,372 |
0.0% |
Hihg Risk |
B+ |
2,895 |
0.0% |
2,954 |
0.0% |
Hihg Risk |
B- |
1,445 |
0.0% |
2,771 |
0.0% |
Hihg Risk |
CCC+ |
13,659 |
0.1% |
- |
0.0% |
Hihg Risk |
CCC |
- |
0.0% |
994 |
0.0% |
Hihg Risk |
C |
2,063 |
0.0% |
22 |
0.0% |
Hihg Risk |
D |
144 |
0.0% |
4,020 |
0.0% |
Without Rating |
SC |
149,107 |
1.0% |
54,054 |
0.4% |
Total |
|
15,549,066 |
100.0% |
14,544,052 |
100.0% |
Note: * Internal homologation
At the end of the year, Bank’s positions are not in excess of the concentration limit, according to the applicable laws.
Relevant facts
In 2023 inflation rate decreased to 9.28% vs 13.12% in December 2022, Banco de la República de Colombia (Central bank) placed rates at the end of December 2023 up to 13% vs 12% in December 2022, this condition maintains the devaluation of portfolios as its main consequence. According to the economic expectations survey, inflation rate would be located in the range of 5.2% - 5.7% by the end of December 2024 and whether the restrictive monetary stance continues, stress in the financial system will be maintained, generating possibledevaluations in some sectors in Economy.
In the International fixed income international market, there was a change in the monetary expansion posture with an increase in the interest rate by the Federal Reserve from 4.05% in December 2022 to 5.50% in July 2023, which was maintained until December 2023, an CPI control measure that closed at 3.4% for the US. The changes in monetary policy, the global economic recession and the resurgence of geopolitical tensions, deepen the risks of devaluation in some markets or the opportunities for appreciation in others.
166
The Colombian stock market closed December 2023 with an annual devaluation of (-7.07%), explained by several factors, among which are the uncertainty due to political tensions corresponding to the pension, health and energy reforms, in addition to the increase in the prices of products and the behavior of supply, which further drive the country's inflation rate upwards, with which, risks could materialize for the companies in this market until these effects are contained.
The international market closed by December with annual appreciation in the S&P 500 of (+24.23%) and in the Euro Stoxx 50 with annual appreciation of (+19.19%), however, fears of a possible economic recession continue, which as a consequence will affect the financial indicators of the companies in these markets, added to the volatility caused by the increase in military conflicts worldwide.
Negotiation of the different derivative products as of 2023 increased vs 2022 due to increase in the negotiation of interest rate futures (+24.7%) and currency futures (+12.8%) as a consequence of a higher uncertainty regarding the behavior of the monetary policy rate and the behavior of the exchange rate. The USD/COP closed December at $3,822.05 with an annual appreciation of (+20.54%) for the Colombian peso.
Concerning of a possible economic recession due to current global inflationary landscape, along with the rise in interest rates and geopolitical tensions, it is possible that records in these macroeconomic variables will be reached, influencing further devaluation of securities in the short and medium term; however, the central banks' measures are expected to contain these macroeconomic effects that continue to negatively impact the markets.
Market Risk
Market risk refers to the risk of losses in the Bank’s treasury book due to changes in equity prices, interest rates, foreign-exchange rates and other indicators whose values are set in a public market. It also refers to the probability of unexpected changes in net interest income and equity economic value of equity as a result of a change in market interest rates.
Market risk stems from the following activities at the Bank:
| 1. | Trading: includes purchase - sale and positioning mainly in fixed income securities, equities, currencies and derivatives, as well as the financial services provided to customers, such as brokerage. Trading instruments are recorded in the treasury book and are managed by the Treasury Division which is also responsible for the aggregated management of exchange rate exposures arising from the banking book and treasury book. |
167
| 2. | Balance sheet management: refers to the assets and liabilities management, due to mismatches in maturities and repricing of them. The Assets Liability Management Division is responsible for the balance sheet management, preserving the stability of the financial margin and the equity economic value of equity, maintaining adequate levels of liquidity and solvency. Non-trading instruments are recorded in the Bank’s banking book (the “Banking Book”), which includes primarily loans, time deposits, checking accounts and savings accounts. |
In the Bank, the market risks are identified, measured, monitored, controlled and reported in order to support the decision-making process for their mitigation, and to create greater shareholder value added.
The guidelines, policies and methodologies for market risks management are approved by the Board of Directors, thus guaranteeing the congruence and consistency in the risk appetite among subsidiaries. Each country has a local Market and Liquidity Risk Management Office that applies at an individual level the principles of the Bank´s Market Risks Management Strategy. The Board of Directors and senior management have formalized the policies, procedures, strategies and rules of action for market risk administration in its “Market Risk Manual”. This manual defines the roles and responsibilities within each subdivision of the Bank and their interaction to ensure adequate market risk administration.
The Bank´s Market and Liquidity Risks Management Office, responsible for monitoring and permanently controlling compliance with the limits established, is set up with clear independence from the trading and businesses units, ensuring enforcement authority. This independent control function is complemented by regular reviews conducted by the Internal Audit.
The Bank’s Market and Liquidity Risks Management Office is responsible for: (a) identifying, measuring, monitoring, and controlling the market risk inherent in the Bank’s businesses: (b) the Bank’s exposure under stress scenarios and confirming compliance with the Bank’s risk management policies: (c) designing the methodologies for valuation of the market value of certain securities and financial instruments: (d) reporting to senior management and the Board of Directors any violation of the Bank’s risk management policies: (e) reporting to the senior management on a daily basis the levels of market risk associated with the trading instruments recorded in its treasury book, and (f) proposing policies to the Board of Directors and to senior management that ensure the maintenance of predetermined risk levels. The Bank has also implemented an approval process for new products across each of its subdivisions. This process is designed to ensure that each subdivision is prepared to incorporate the new product into its procedures, that every risk is considered before the product is incorporated and that approval is obtained from the Board of Directors before the new product can be sold.
Market risks arising from trading instruments are measured at the Bank using two different Value at Risk (VaR) methodologies: the standard methodology required by the SFC, and the internal methodology of historical simulation. The standard methodology is established by “Chapter XXXI of the Basic Accounting Circular”, based on the model recommended by the Amendment to the Capital Accord to Incorporate Market Risks of Basel Committee, and is reflected in the Bank’s Capital Adequacy (Solvency) ratio.
168
The internal methodology of weighted historical simulation uses a confidence level of 99%, a holding period of 10 days, and a time frame of one year or at least 250 days from the reference date of the VaR calculation is used, obtained from the reference date of calculating the VaR; for digital assets the internal methodology uses a holding period of 3 days and a time frame of 4 years, using a multivariate GARCH family model. The standard methodology is used to report the market risk exposure to the Financial Superintendency and is also used to measure the capital requirements for the Bank, therefore the analysis below is based on information obtained from this model.
The Bank’s VaR limits structure for trading activities, is sufficiently granular to conduct an effective control of the various types of market risk factors on which an exposure is held. It ensures that the market risk is not concentrated in certain asset classes and maximizes the portfolio diversification effect. These limits are defined by companies, products or by risk takers. The majority of the limits are based on the maximum VaR values to which a certain portfolio can be exposed, nevertheless, loss triggers, stop loss and sensitivity warning levels are also set, especially in the derivatives portfolios. The limits are approved by the Board of Directors, and set based on factors such as tolerance for losses, capital resources and market´s complexity and volatility. They are monitored daily, and their excesses or violations are reported to the Board of Directors and the Risk Committee.
Within the control and monitoring processes of market risks, reports are elaborated on a daily and monthly basis. They include an analysis of the most relevant risk measures and allow for monitoring the exposure levels to market risks and to the legal and internal limits established for each one of the levels of the Bank. These reports are taken as an input for the decision-making process in the different Committees and management of the Bank.
2023, a year characterized by showing a consistent trend of moderation on inflation and a weakening of local economic growth followed by a reduction in the vulnerability of external economic impacts and a more favorable international context; pressured to present mixed movements in the stock markets and in the fixed income markets. These movements resulted in the generation of positive results, accompanied on some occasions by certain alerts in the Bank’s book, increases in market risk exposure, which led to the adjustment of the portfolios to continue with the attention of customer trades.
Despite the volatility presented in the markets and the movements that were recorded within the investment portfolio to comply with the limits established by the Board of Directors, the Treasury recorded good performance in its management.
Market Risk Management
The following section describes the market risks to which the Bank is exposed and the tools and methodologies used to measure these risks as of December 31, 2023.
169
The Bank maintains trading instruments in its assets which are recorded in the treasury book and include, among others, fixed income instruments and derivatives, futures on bonds and exchange rates, as well as OTC plain vanilla derivatives (currency and securities forwards, interest rate swaps, exchange rate swaps, European and Asian options). Likewise, the Bank maintains instruments not intended for trading which are recorded in the banking book and mainly include loans, fixed-term deposits, savings accounts, current accounts, and investments to hold until maturity.
The Bank uses VaR calculation to limit its exposure to the market risk of its Treasury Book. The Board of Directors is responsible for establishing the maximum VaR based on its assessment of the appropriate level of risk for Bancolombia.
For managing the interest rate risk from banking activities, the Bank analyses the interest rate mismatches between its interest earning assets and its interest bearing liabilities and estimates the impact on the net interest income and the equity economic value of equity. In addition, the foreign currency exchange rate exposures arising from the banking book are provided to the Treasury Division where these positions are aggregated and managed.
| a. | Measurement of market risk of trading instruments |
The Bank currently measures the treasury book exposure to market risk (including OTC derivatives positions) as well as the currency risk exposure of the banking book, which is provided to the Treasury Division, using a VaR methodology established in accordance with “Chapter XXXI of the Basic Accounting Circular”, issued by the SFC.
The VaR methodology established by “Chapter XXXI of the Basic Accounting Circular” is based on the model recommended by the Amendment to the Capital Accord to Incorporate Market Risks of Basel Committee of 2005, which focuses on the treasury book and excludes investments classified as amortized cost which are not being given as collateral and any other investment that comprises the banking book, such as non-trading positions excluding the currency the risk position stemming from investment in affiliated but not consolidated entities denominated in foreign currencies. In addition, the methodology aggregates all risks by the use of correlations, through an allocation system based on defined zones and bands, affected by given sensitivity factors.
The total market risk for the Bank is calculated by the arithmetical aggregation of the VaR calculated for each subsidiary. The aggregated VaR is reflected in the Bank’s Capital Adequacy (Solvency) ratio, in accordance with Decree 1771 of 2012.
For purposes of VaR calculations, a risk exposure category is any market variable that is able to influence potential changes in the portfolio value. Taking into account a given risk exposure, the VaR model assesses the maximum loss not exceeded, over a given period of time. The fluctuations in the portfolio’s VaR depend on volatility, modified duration and positions changes relating to the different instruments that are subject to market risk.
The relevant risk exposure categories for which VaR is computed by the Bank according to “Chapter XXXI, Appendix VI of the Basic Accounting Circular” are: (i) interest rate risks relating to local currency, foreign currency and UVR; (ii) currency risk; (iii) stock price risk; (iv) fund risk.
170
and (v) credit default swaps risk (CDS).
Interest Rate Risk (Treasury Book)
The interest rate risk is the probability of decrease in the market value of the position due to fluctuations in market interest rates. The Bank calculates the interest rate risk for positions in local currency, foreign currency and UVR separately; in accordance with Chapter XXXI of the Basic Accounting Circular issued by the SFC. In the first instance, the interest rate risk exposure is determined by the sensitivity calculation for the net position of each instrument. This sensitivity is calculated as the net present value (NPV) of each instrument, its corresponding modified duration and the estimated variation of interest rates. The possible variations in the interest rates are established by the SFC according to the historical behavior of these variables in the markets, and they are a function of the duration and currency, as seen in the following table:
Zone |
Band |
Modified Duration |
Changes in Interest Rates (bps) |
|||
Lower Limit |
Upper Limit |
Moneda Legal |
URV |
Lower Limit |
||
Zone 1 |
1 |
0 |
0.08 |
274 |
274 |
100 |
2 |
0.08 |
0.25 |
268 |
274 |
100 |
|
3 |
0.25 |
0.5 |
259 |
274 |
100 |
|
4 |
0.5 |
1 |
233 |
274 |
100 |
|
Zone 2 |
5 |
1 |
1.9 |
222 |
250 |
90 |
6 |
1.9 |
2.8 |
222 |
250 |
80 |
|
7 |
2.8 |
3.6 |
211 |
220 |
75 |
|
Zone 3 |
8 |
3.6 |
4.3 |
211 |
220 |
75 |
9 |
4.3 |
5.7 |
172 |
200 |
70 |
|
10 |
5.7 |
7.3 |
162 |
170 |
65 |
|
11 |
7.3 |
9.3 |
162 |
170 |
60 |
|
12 |
9.3 |
10.6 |
162 |
170 |
60 |
|
13 |
10.6 |
12 |
162 |
170 |
60 |
|
14 |
12 |
20 |
162 |
170 |
60 |
|
15 |
20 |
162 |
170 |
60 |
||
Once the sensitivity for each net position has been calculated, they are grouped into the zones and bands observed in the previous table using the modified duration of each investment. This procedure allows calculating a net sensitivity for each band and zone understood as the difference between the sensitivities associated with long positions (positive sensitivities) versus the sensitivities of short positions (negative sensitivities) of the instruments that make up each of the bands or zones.
However, when performing the direct sum of net sensitivities (positive and negative) for each of the bands and zones, it would be allowing the compensation of interest rate risk exposures between instruments that are clearly different, although these instruments share the same currency, they have differential exposures in relation to movements in interest rate curves for different terms. Therefore, interest rate risk cannot be compensated, at least in total, between different instruments, especially from the point of view of their duration.
171
To incorporate this fact into the measurement of interest rate risk, the calculation of a sensitivity adjustment charge has been implemented, which represents a portion of sensitivity that cannot be compensated between different instruments, bands, or zones. The adjustment factors show an increasing behaviour as instruments whose duration differs to a greater extent are compensated.
It is important to highlight that both changes in interest rates and adjustment factors can be modified by the SFC when it so provides, to adequately reflect the sensitivity of each of the positions exposed to interest rate risk.
The Bank’s exposure to interest risk primarily arises from investments in Colombian government’s treasury bonds (TES), and other instruments issued by the Colombian government, recorded in the Bank’s treasury book.
| ● | Currency (Treasury and Banking Book), Equity (Treasury Book) and Fund (Treasury Book) Risk |
The VaR model uses a sensitivity factor to calculate the probability of loss due to fluctuations in the price of stocks, funds and currencies in which the Bank maintains a position. As previously indicated, the methodology used in these financial statements to measure such risk consists of computing VaR, which is derived by multiplying the position by the maximum probable variation in the price of such positions (“∆p”). The (“∆p”) is determined by the SFC, as shown in the following table:
Currency |
Sensitivity Factor |
United States Dollar |
12.49% |
Euro |
11.00% |
Other currencies |
13.02% |
Equity and Fund Risk |
14.70% |
The SFC according to historical market performance establishes the interest rate’s fluctuations and the sensitivity factors for currency, equity and fund risk used in the model.
| ● | Total market risk |
The total market risk VaR is calculated as the algebraic sum of the interest rate risk, the currency risk, the stock price risk, fund risk and the credit default swaps risk which are calculated as the algebraic sum of the Parent Company and each of its subsidiaries’ exposure to these risks. Currently, the Bank not present exposure to credit default swaps risk.
The total market risk VaR had an increase of 42.9%, rising from COP 676,004 in December 2022 to COP 965,729 in December 2023. Increase explained by the exposure to different market risk factors. The risk factor leading the increment is the exchange rate factor increased due to higher exposure to the US dollar. Followed by the interest rate, driven by the increase in the portfolio of Colombian Government public debt and private debt.
172
On the other hand, the collective investment fund risk factor due to appreciation in investments.
Despite the current situation and market volatility, the Bank's Regulatory VaR has remained stable without significant variations.
The following table presents the total change in market risk and other risk factors:
Risk factors |
December 31, 2023 |
|||
End of Period |
Average |
Maximum |
Minimum |
|
Interest rate |
334,375 |
352,633 |
484,964 |
308,204 |
Exchange rate |
203,244 |
128,096 |
239,366 |
42,283 |
Stock price |
25,951 |
20,880 |
25,951 |
17,313 |
Collective investment funds |
402,159 |
396,851 |
412,474 |
370,716 |
Total VaR |
965,729 |
898,460 |
1,153,304 |
752,644 |
Risk factors |
December 31, 2022 |
|||
End of Period |
Average |
Maximum |
Minimum |
|
Interest rate |
255,623 |
297,926 |
335,382 |
255,623 |
Exchange rate |
34,907 |
77,647 |
160,751 |
34,907 |
Stock price |
17,247 |
25,615 |
30,477 |
17,247 |
Collective investment funds |
368,227 |
273,485 |
368,227 |
201,599 |
VaR Total |
676,004 |
674,673 |
841,538 |
559,381 |
| ● | Assumptions and Limitations of VaR Models |
Although VaR models represent a recognized tool for risk management, they have inherent limitations, including reliance on historical data that may not be indicative of future market conditions or trading patterns. Accordingly, VaR models should not be viewed as predictive of future results. The Bank may incur losses that could be materially in excess of the amounts indicated by the models on a particular trading day or over a period of time, and there have been instances when results have fallen outside the values generated by the Bank’s VaR models. A VaR model does not calculate the greatest possible loss. The results of these models and analysis thereof are subject to the reasonable judgment of the Bank’s risk management personnel.
| b. | Market risk measurement of banking book instruments |
Interest rate risk is understood as the possibility of incurring losses due to a decrease in the economic value of assets or a reduction in the net interest margin, as a consequence of changes in interest rates. The impact of these variations could be reflected in the financial margin and, consequently, in equity due to the risks inherent in active and passive transactions, as well as in the administration of the resources that the Bank manages day to day.
173
Interest rate risk management consists of monitoring and controlling these possible impacts, seeking to maximize the risk/profitability relationship of the banking book. All the guidelines established for its management are defined in the interest rate risk manual, which is reviewed by the Board of Directors annually.
The approval, monitoring and control of the methodologies, policies, guidelines and strategies for the administration of interest rate risks, including the assignment of powers and setting action limits for the different areas, is the responsibility of the Risk Committee.
The methodologies used by the Bank to control interest rate risk in banking book activities are interest rate gap analysis, sensitivity to hypothetical changes in market rates and measurement of the VaR of the banking book. In the analysis of interest rate gaps, the accumulated exposure due to cash flows is evaluated, for each of the interest rate types to which the balance sheet is exposed, in order to monitor the management of balances, rates and repricing terms. In the sensitivity analyzes the modified duration and repricing criterion is used, assuming positive parallel changes in interest rates, which seeks to measure the risk implicit in the net interest margin. In the VaR calculation, the maximum devaluation of the economic value of the assets is measured over a horizon of one year and with a confidence level of 99% in the event of adverse movements in the interest rates of assets and liabilities.
On the other hand, the GAP Committee supports the Board of Directors and the Presidency in the definition, monitoring and control of general policies on the management of assets and liabilities, and the assumption of liquidity risks, interest rate risks and exchange rate risks to which Bank is exposed.
| ● | Exposure to Interest Rate Risk (Banking Book) |
For managing the interest rate risk from banking activities, the Bank analyzes the interest rate mismatches between its interest earning assets and its interest bearing liabilities, and estimates the impact on the net interest income, using a repricing model and assuming a positive parallel shift of 100 basis point (bps) . The repricing criterion refers to the remaining term for the rate of an indexed operation to be adjusted according to its market benchmark.
The table 1 shows this sensitivity for positions in both legal and foreign currency.
Table 1. Sensitivity to Interest Rate Risk of the Banking Book
Legal Currency Positions |
|
December 31, 2023 |
December 31, 2022 |
|
In millions of COP |
||
Assets sensitivity 100 bps |
|
1,157,142 |
1,066,923 |
Liabilities sensitivity 100 bps |
|
592,423 |
550,596 |
Net interest income sensitivity 100 bps |
|
564,719 |
516,327 |
174
Foreign Currency Positions |
December 31,2023 |
December 31, 2022 |
In thousand of USD |
||
Assets sensitivity 100 bps |
8,211 |
13,282 |
Liabilities sensitivity 100 bps |
15,335 |
11,980 |
Net interest income sensitivity 100 bps |
(7,124) |
1,302 |
A positive net sensitivity denotes a higher sensitivity of assets than of liabilities and implies that a rise in interest rates will positively affect the Bank´s net interest income. A negative sensitivity denotes a higher sensitivity of liabilities than of assets and implies that a rise in interest rates will negatively affect the Bank´s net interest income. In the event of a decrease in interest rates, the impacts on net interest income would be opposite to those described above.
| ● | Total Exposure |
The net interest income sensitivity in local currency for the banking book instruments, entered for other than trading purposes with positive parallel shifts of 100 basis points was COP 564,719. The variation in the sensitivity of the net interest margin between December 2022 and December 2023 is presented due to the increase in the floating loans compensated by the increase in the time deposits.
On the other hand, the net interest income sensitivity in foreign currency for the banking book instruments, entered for other than trading purposes with positive parallel shifts of 100 basis points was USD – 7,124. The change in this sensitivity compared to December 2022 corresponds to the decrease in the floating loans and the increase in passive loans.
| ● | Assumptions and limitations |
To calculate a sensitivity of the net interest margin from the term to the reprice, some significant assumptions were considered: (a) only the contractual conditions of the current operations are considered, (b) the sensitivity of the balance to a fixed rate considers the amounts that mature in a period of less than one year under the assumption that these will be placed again at market rates; and (c) changes in the interest rate appear immediately and in parallel in the asset and liability yield curves.
Liquidity Risk
Liquidity risk is understood as the inability to comply fully and in a timely manner with payment obligations on the corresponding dates, due to insufficient liquid resources and/or
the need to assume excessive funding costs.
For the Bank, liquidity prevails over any growth and profitability objectives. Liquidity management has always been a fundamental pillar of its business strategy, which supports its balance sheet strength along with capital.
In line with best governance practices, the Bank has established a clear division between the execution of the financial management strategy, responsibility of the asset and liability
175
management area; and its monitoring and control, responsibility of the liquidity and interest
rate risk area.
The policies and guidelines for liquidity risk management are defined by the different Senior
Management levels. These bodies are made up of the Board of Directors, the Risk Committee,
and the Bank's Senior Management, and are guided by the definition of the risk appetite and
therefore the definition of the financial strategy to follow. The decision-making process is
carried out through the GAP Committee (asset and liability management committee), which
to carry out its functions is supported by the GAP Management and the liquidity and interest
rate risk area, which present the analyzes and management proposals, and control compliance with the established limits.
The Vicepresidency of Risks, through the liquidity and interest rate risk area, is responsible
for proposing the minimum amount of the liquidity reserve, the liquidity portfolio policies,
defining premises and metrics to model the behavior of the cash flows, propose and monitor
liquidity limits consistent with the Bank's risk appetite, simulate stress scenarios, evaluate and
report the risks inherent to new products and operations; and report the reports required by
internal decision-making bodies, as well as by regulatory entities. All the above activities are
verified and evaluated by the area of audit.
Measures to control liquidity risk include the maintenance of an investment portfolio with the
purpose of having a liquidity reserve, and the definition of early warnings and liquidity limits,
which allow the Bank's level of exposure to be proactively evaluated.
The methodologies used to control liquidity risk include liquidity gaps and stress scenarios.
Liquidity gaps measure mismatches in the cash flows of assets, liabilities and off-balance sheet positions, separately for legal currency and foreign currency. Regulatory models are applied, in which contractual expirations are used; and internal models in which cash flows are adjusted through the implementation of different indicators, which seek to reflect a more
real behavior of cash flows.
As a complementary measure, stress scenarios are carried out, with the aim of identifying the
critical aspects in potential crises and defining the most appropriate management measures.
The scenarios consider the additional liquidity needs that could arise in the event of different
extreme, although possible, events; and that may affect the different balance sheet items in
different ways, such as the degree of renewal of term deposits, withdrawal of deposits, among
others.
The policies, limits, processes, methodologies and tools for evaluating exposure to liquidity risk are periodically validated, in order to establish their relevance and functionality, and make
176
the necessary adjustments. The liquidity and interest rate risk area prepares daily, weekly and
monthly reports to monitor the evolution of the levels of exposure to liquidity risk and the
established limits and alerts, and support the decision-making process.
The Bank has a liquidity contingency plan to face critical events, which is tested annually.
| a. | Liquidity Risk Management |
Liquidity risk is defined as the risk of not being able to efficiently and timely meet expected and unexpected payment obligations, current and future, without affecting the course of daily operations or the financial condition of the entity. This risk manifests itself in the lack of available liquid assets and/or in the need to assume unusual funding costs.
Liquidity risk management seeks to support financial management and support the Bank's liquidity management process on a day-to-day basis, providing sufficient information to know the degree of exposure that exists to illiquidity events. To do this, measurements are obtained that allow Senior Management to make decisions to correct situations in which high exposures to liquidity risk are evident, both in legal currency and in foreign currency.
The guidelines and policies for managing liquidity risk are defined by the different levels of Senior Management. These bodies are made up of the Board of Directors and different specialized Committees, which are guided by the definition of the risk appetite and the definition of the financial strategy to follow.
The management of liquidity risk in the Bank is carried out by a risk area, independent of the treasury negotiation, deposits and placement areas, which is responsible for the identification, measurement, monitoring and control of risks. There are policies and different methodologies that allow establishing limits and defining early warnings of liquidity risk.
Stress scenarios are periodically simulated to ensure that there is sufficient time to generate the funds necessary to operate under adverse market conditions. Likewise, daily reports are prepared for Senior Management in which the evolution of exposure to liquidity risk is monitored, as well as the degree of use of the limits and levels of established alerts.
| ● | Liquidity Risk Exposure: |
To estimate liquidity risk, a liquidity coverage indicator (IRL) is calculated that corresponds to the relationship between liquid assets and their net liquidity requirements for a horizon of 30 calendar days. This indicator allows you to know the liquidity coverage you have for the next month.
177
The net liquidity requirement is calculated from the flow of contractual maturities of the asset and the flow of contractual and non-contractual maturities of the liability, as defined in Chapter XXXI, of the CBCF of the SFC.
Below are the results of liquidity coverage for the Bank:
Liquidity Coverage Ratio |
December 31, 2023 |
December 31, 2022 |
In millions of COP |
||
Net cash outflows into 30 days** |
10,179,043 |
13,950,866 |
Liquid Assets |
28,612,973 |
25,508,367 |
Liquidity coverage ratio* |
281.10% |
182.80% |
* The minimum level required of the liquidity coverage ratio by the legal norm is 100%.
** Net cash outflows into 30 days: 30-day contractual maturities of the asset (portfolio, liquidity operations, investments that are not liquid assets, derivatives) less contractual maturities of the liability (term deposits, passive liquidity operations, bonds, passive portfolio, derivatives) less non-contractual maturities of deposit accounts.
The liquidity indicator was located at 281.10% at the end of December 2023, which represents an increase of 98%, due to the increase in the level of Liquid Assets given the grow in the deposit accounts and the reduction in the net cash outflows due to the higher projection of income flows from interbank operations.
| ● | Liquid Assets |
One of the main guidelines of the Bank is to maintain a solid liquidity position, therefore, the ALCO Committee, has established a minimum level of liquid assets, based on the funding needs of each subsidiary, to ensure, as far as possible, that it will always have sufficient liquidity to meet its liabilities when they are due, under both normal and stressed conditions, without incurring unacceptable losses or risking damage to the Bank’s reputation.
The following table shows the liquid assets held by Bank:
Liquid Assets (1) |
December 31, 2023 |
December 31, 2022 |
In millions of COP |
||
High quality liquid assets(2) |
|
|
Cash |
12,314,552 |
12,688,194 |
High quality liquid securities |
14,197,252 |
12,388,168 |
Other Liquid Assets(3) |
|
|
Other securities |
2,101,169 |
432,005 |
Total Liquid Assets |
28,612,973 |
25,508,367 |
| (1) | Liquid assets: Liquid assets will be considered those that are easily realized that form part of the entity's portfolio or those that have been received as collateral in active operations in the money market, and that have not been subsequently used in passive operations in the monetary market and do not have any mobility restrictions. The following are considered liquid assets: available assets, shares in open collective investment funds without a permanence agreement, shares registered on the Colombian stock exchange that are eligible to be subject to repo or repo operations, and negotiable investments available for sale. sale of fixed income securities. |
| (2) | High quality liquid securities are considered to be those available and the shares that are eligible to be subject to repo or repo operations, additionally for those entities that are in the group of OMAS Placement Agents (ACO) those liquid assets that receive the Banco de la República for its monetary expansion and contraction operations described in section |
178
| 3.1.1 of the External Regulatory Circular DODM-142 of the Banco de la República or otherwise (if it is not ACO) only those securities that are mandatory listing in the market maker program. |
| (3) | Other Liquid Assets: Liquid assets that do not meet the quality characteristic are those included in this item. |
| ● | Contractual maturities of financial assets and liabilities |
Below are the contractual maturities of capital and interest of the Bank's financial assets:
Contractual expirations of the asset 2023
Financial Assets |
0-30 days |
31 days -1 year |
1-3 years |
3-5 years |
More than 5 years |
December 31, 2023 |
|
In millions of COP |
|||
Cash and balances with central bank |
12,863,332 |
- |
- |
- |
- |
Interbank borrowings - Repurchase agreements |
11,485,003 |
- |
- |
- |
- |
Financial assets investments |
1,225,370 |
7,508,962 |
2,763,994 |
1,031,008 |
2,763,672 |
Loans and advances to customers |
9,299,459 |
67,075,512 |
76,991,280 |
44,292,725 |
73,095,556 |
Derivative financial instruments |
3,779,140 |
12,521,300 |
4,131,390 |
1,690,432 |
1,395,199 |
Total financial assets |
38,652,304 |
87,105,774 |
83,886,664 |
47,014,165 |
77,254,427 |
Contractual expirations of the asset 2022
Financial Assets |
0-30 days |
31 days -1 year |
1-3 years |
3-5 years |
More than 5 years |
December 31, 2022 |
|
In millions of COP |
|||
Cash and balances with central bank |
13,066,341 |
- |
- |
- |
- |
Interbank borrowings - Repurchase agreements |
3,051,244 |
144,650 |
- |
- |
- |
Financial assets investments |
4,679,203 |
4,073,432 |
571,109 |
244,203 |
829,657 |
Loans and advances to customers |
5,995,746 |
47,575,876 |
69,218,922 |
39,348,756 |
69,726,182 |
Derivative financial instruments |
1,304,577 |
5,232,058 |
2,967,407 |
1,460,148 |
1,321,259 |
Total financial assets |
28,097,111 |
57,026,016 |
72,757,438 |
41,053,107 |
71,877,098 |
Below are the contractual maturities of capital and interest of the Bank’s liabilities:
Contractual maturities of liabilities 2023
Financial Liabilities |
0-30 days |
31 days -1 year |
1-3 years |
3-5 years |
More than 5 years |
December 31, 2023 |
|
In millions of COP |
|||
Demand deposit from customers |
104,112,202 |
- |
- |
- |
- |
Time deposits from customers |
9,530,808 |
33,349,972 |
11,476,688 |
4,809,582 |
18,199,529 |
Interbank deposits-Repurchase agreements |
263,751 |
- |
- |
- |
- |
179
Borrowings from other financial institutions |
300,957 |
3,322,380 |
7,182,852 |
1,538,962 |
1,915,030 |
Debt securities in issue |
101,782 |
2,755,303 |
3,890,387 |
4,307,752 |
3,507,202 |
Preferred Shares |
- |
57,701 |
115,403 |
115,403 |
295,697 |
Derivative financial instruments |
3,220,567 |
13,098,241 |
4,135,676 |
1,678,780 |
1,473,116 |
Total financial liabilities |
117,530,067 |
52,583,597 |
26,801,006 |
12,450,479 |
25,390,574 |
Contractual maturities of liabilities 2022
Financial Liabilities |
0-30 days |
31 days -1 year |
1-3 years |
3-5 years |
More than 5 years |
December 31, 2023 |
|
In millions of COP |
|||
Demand deposit from customers |
108,183,281 |
- |
- |
- |
- |
Time deposits from customers |
5,988,853 |
26,171,943 |
10,067,623 |
4,827,600 |
17,380,378 |
Interbank deposits-Repurchase agreements |
134,892 |
- |
- |
- |
- |
Borrowings from other financial institutions |
458,821 |
6,132,794 |
4,794,998 |
2,524,470 |
1,281,159 |
Debt securities in issue |
139,773 |
1,671,669 |
8,191,089 |
6,102,209 |
1,472,558 |
Preferred Shares |
- |
57,701 |
115,403 |
115,403 |
295,697 |
Derivative financial instruments |
1,333,943 |
5,161,912 |
2,578,447 |
1,501,967 |
1,417,894 |
Total financial liabilities |
116,239,563 |
39,138,318 |
25,747,560 |
15,071,649 |
21,847,686 |
The expected cash flows for some financial assets and liabilities may vary significantly from their contractual maturity. The main differences are the following:
| • | The demand deposits historically have maintained a tendency to remain stable. |
| • | The mortgages loans, in spite of having contractual maturity between 15 and 20 years, its average life is less than these terms. |
| • | Time deposits have maintained an average renewal level of 51%. |
| ● | Financial guarantees |
Below are the financial guarantees:
December 31, 2023 |
0 – 30 days |
31 days – 1 Year |
1 - 3 Years |
3 - 5 Years |
More than 5 years |
|
|
In millions of COP |
|||
Financial guarantees |
628,556 |
5,844,015 |
1,185,076 |
440,092 |
472,725 |
December 31, 2022 |
0 – 30 days |
31 days – 1 Year |
1 - 3 Years |
3 - 5 Years |
More than 5 years |
|
|
In millions of COP |
|||
Financial guarantees |
385,607 |
5,472,678 |
3,395,077 |
119,251 |
9,601 |
180
| ● | Net Stable Funding Ratio |
The Net Stable Funding Ratio indicator seeks to limit excessive dependence on unstable sources of financing for strategic assets that are often illiquid. It also seeks for entities to maintain a stable funding profile in relation to their assets. The Net Stable Funding Ratio (CFEN) is a ratio between the stable funding required and the stable funding available.
The following are the results of the Net Stable Funding Ratio between december 2022 and 2023:
Net Stable Funding Ratio | ||
Item |
December 31, 2023 |
December 31, 2022 |
Funding stable available (FED) |
192,571.29 |
184,410.28 |
Funding stable Required (FER) |
158,734.45 |
170,264.63 |
Net Stable Funding Ratio |
121.32% |
108.31% |
The indicator has remained at adequate levels, maintaining an appropriate structure in the stable funding required and the stable funding available, highlighting the long-term CDTs fundraising strategy, the increase in equity and the grow in the weightings of the Supervised Entities and FIC's Without Permanence Agreement’s deposit accounts, going from 0% to 25% regarding the new CFEN regulation due to “Circular 013 de 2023” added to the redistribution of loans in different segments considered in the indicator, reducing the stable funding required.
Operational Risk
The Bank manages operational risk with the main objective of understanding and taking advantage of opportunities to generate profits, while reducing losses by knowing and attacking threats.
This management is framed in the main stages of risk administration such as risk identification, measurement, control and management. The Bank has the permanent identification and updating of the risks to which it is exposed.
Operating losses increased by 43% in 2023 compared to the previous year, mainly due to a series of events of technological failures in passing on to production in different chanels and products, resulting in credit balance for clients that was not able to retrieve. Additionally, a ruling was presented against Bancolombia by the Comptroller's Office for a fiscal responsibility process due to non-compliance with the execution of a water treatment plant in the municipality of Chia, whose import process was generated in 2015 under the financial leasing modality. On the other hand, external fraud events increased as a result of the intensive use of social engineering techniques by criminals.
It should be noted that exposure to cybersecurity risk has remained at adequate levels, thanks to the measures that have been adopted in terms of controls, monitoring and mitigation actions to adjust to environmental threats.
181
Interest Rate Benchmark Reform
As part of the LIBOR benchmark reform that is being implemented since 2017 by the Financial Conduct Authority of the UK, it was announced that the publication of LIBOR on a representative basis will cease for the one-week and two-month USD LIBOR settings immediately after December 31, 2022, and the remaining USD LIBOR settings immediately after June 30, 2023.
Bancolombia has taken the necessary measures to identify and implement the action plans required to address de discontinuation process of the LIBOR rate. The replacement of the LIBOR rate in USD with the SOFR rate was approved by the Asset and Liability Management (ALM) Committee and the Risk Committee of the Board of Directors. The development of products indexed to the new reference rate (SOFR) has commenced.
The following tables provide a breakdown by currency and nature of financial instruments exposed to the LIBOR rate for the periods ending in December 2022 and December 2023:
December 31, 2023 | |
In millions of COP | |
|
USD LIBOR1 |
Assets |
|
Loans |
- |
Derivatives |
41,818 |
Total Assets |
41,818 |
Liabilities |
|
Loans |
323 |
Total Liabilities |
323 |
1 Cessation date: USD LIBOR June 30,2023. Portfolio balances and market value of derivative transactions outstanding at December 31, 2023.
December 31, 2022 | |
In millions of COP | |
|
USD LIBOR1 |
Assets |
|
Loans |
1,194,044 |
Derivatives |
(1,866,067) |
Total Assets |
672,023 |
Liabilities |
|
Loans |
37,180 |
Total Liabilities |
37,180 |
1 Cessation date: USD LIBOR June 30, 2023. Portfolio balances and market value of derivative transactions outstanding at December 31, 2022.
Risk
182
Any failure by market participants, such as the Bank, and regulators to successfully introduce benchmark rates to replace LIBOR and implement effective transitional arrangements to address the discontinuation of LIBOR could result in disruption of the financial and capital markets. In addition, the transition process to an alternative reference rate could impact the Bank’s business, financial condition or result of operations, as a result of:
| ● | An adverse impact in pricing, liquidity, value, return and trading for a broad array of financial products, loans and derivatives that are included in the Bank’s financial assets and liabilities. |
| ● | Extensive changes to internal processes and documentation that contain references to LIBOR or use formulas that depend on LIBOR. |
| ● | Disputes, litigation or other actions with counterparties regarding the interpretation and enforceability of provisions in LIBOR -based products such as fallback language or other related provisions. |
| ● | The transition and development of appropriate systems and models to effectively transition the Bank’s risk management processes from LIBOR -based products to those based on one or more alternative reference rates in a timely manner; and |
| ● | An increase in prepayments of LIBOR -linked loans by the Bank’s clients. |
From January 2022, products indexed to the SOFR rate began to be offered, additionally it was defined not to carry new operations indexed to the LIBOR rate. In turn, as an organization, we will continue to focus, during 2024, on the transition process of operations that are indexed to LIBOR.
183