| ☐ | Written communications pursuant to Rule 425 under the Securities Act (17 CFR 230.425) | ||||
| ☐ | Soliciting material pursuant to Rule 14a-12 under the Exchange Act (17 CFR 240.14a-12) | ||||
| ☐ | Pre-commencement communications pursuant to Rule 14d-2(b) under the Exchange Act (17 CFR 240.14d-2(b)) | ||||
| ☐ | Pre-commencement communications pursuant to Rule 13e-4(c) under the Exchange Act (17 CFR 240.13e-4(c)) | ||||
| Title of each class | Trading Symbol(s) | Name of each exchange on which registered | ||||||||||||
| Common Stock, par value $0.001 per share | EWBC | The Nasdaq Global Select Market | ||||||||||||
| Press Release, dated July 23, 2024. | |||||
| Presentation Materials, dated July 23, 2024. | |||||
| 104 | Cover Page Interactive Data (formatted in Inline XBRL). | ||||
| EAST WEST BANCORP, INC. | |||||||||||
| Date: July 23, 2024 | By: | /s/ Christopher J. Del Moral-Niles | |||||||||
| Christopher J. Del Moral-Niles | |||||||||||
| Executive Vice President and Chief Financial Officer | |||||||||||
 |
East West Bancorp, Inc. | ||||
| 135 N. Los Robles Ave., 7th Fl. | |||||
| Pasadena, CA 91101 | |||||
| Tel. 626.768.6000 | |||||
NEWS RELEASE |
|||||||||||
| FOR INVESTOR INQUIRIES, CONTACT: | |||||
Christopher Del Moral-Niles, CFA |
Adrienne Atkinson |
||||
Chief Financial Officer |
Director of Investor Relations | ||||
T: (626) 768-6860 |
T: (626) 788-7536 |
||||
E: chris.delmoralniles@eastwestbank.com |
E: adrienne.atkinson@eastwestbank.com |
||||
| Three Months Ended | Quarter-over-Quarter Change |
||||||||||||||||||||||||||||
| ($ in millions, except per share data) | June 30, 2024 | March 31, 2024 | $ | % | |||||||||||||||||||||||||
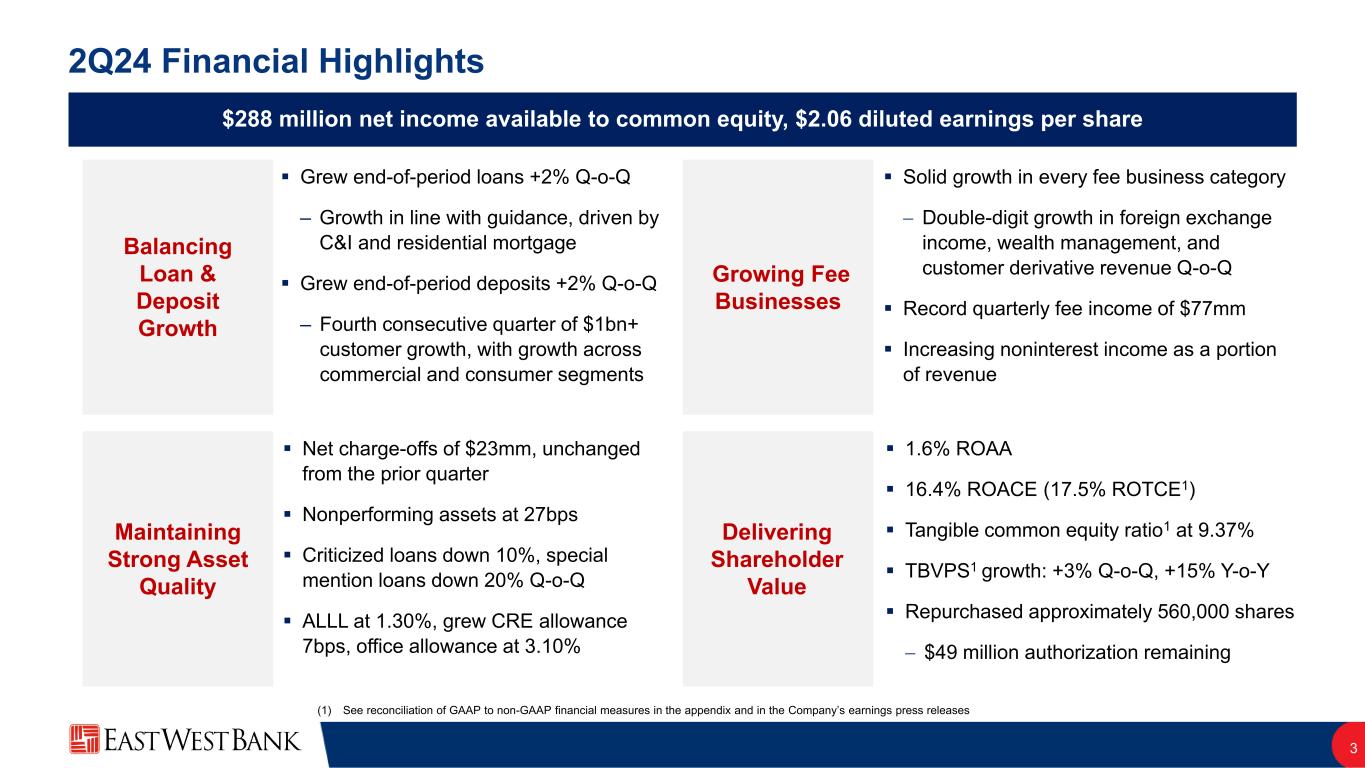
| Revenue | $638 | $644 | $(6) | (1)% | |||||||||||||||||||||||||
Pre-tax, Pre-provision Income2 |
401 | 397 | 4 | 1 | |||||||||||||||||||||||||
| Net Income | 288 | 285 | 3 | 1 | |||||||||||||||||||||||||
| Diluted Earnings per Share | $2.06 | $2.03 | $0.03 | 1 | |||||||||||||||||||||||||
| Book Value per Share | $52.06 | $50.48 | $1.58 | 3 | |||||||||||||||||||||||||
Tangible Book Value per Share1 |
$48.65 | $47.09 | $1.56 | 3% | |||||||||||||||||||||||||
| Return on Average Common Equity | 16.36% | 16.40% | -4 bps | — | |||||||||||||||||||||||||
Return on Average Tangible Common Equity1 |
17.54% | 17.60% | -6 bps | — | |||||||||||||||||||||||||
Tangible Common Equity Ratio1 |
9.37% | 9.31% | 6 bps | — | |||||||||||||||||||||||||
| Total Assets | $72,468 | $70,876 | $1,592 | 2% | |||||||||||||||||||||||||
1 Return on average tangible common equity, tangible book value per share, and tangible common equity ratio are non-GAAP financial measures. See reconciliation of GAAP to non-GAAP measures in Table 13. | |||||||||||
|
2 Pre-tax, pre-provision income is a non-GAAP financial measure. See reconciliation of GAAP to non-GAAP financial measures in Table 12.
| |||||||||||
3 Tangible book value per share and tangible common equity ratio are non-GAAP financial measures. See reconciliation of GAAP to non-GAAP measures in Table 13. | ||||||||||||||
4 Fee income includes deposit account and lending fees, foreign exchange income, wealth management fees, and customer derivative revenue. Refer to Table 3 for additional fee and noninterest income information. | |||||||||||
5 In November 2023, the FDIC approved a final rule to implement a special deposit insurance assessment to recover estimated losses to the Deposit Insurance Fund arising from the protection of uninsured depositors following the receiverships of failed institutions in the spring of 2023. In March 2024, the FDIC updated the loss estimate to $22.5 billion. As losses to the DIF are estimates, the FDIC may periodically adjust the amount, resulting in longer or shorter assessment periods, and/or additional special assessments. | |||||||||||
6 Adjusted noninterest expense and adjusted efficiency ratio are non-GAAP financial measures. See reconciliation of GAAP to non-GAAP measures in Table 12. | |||||||||||
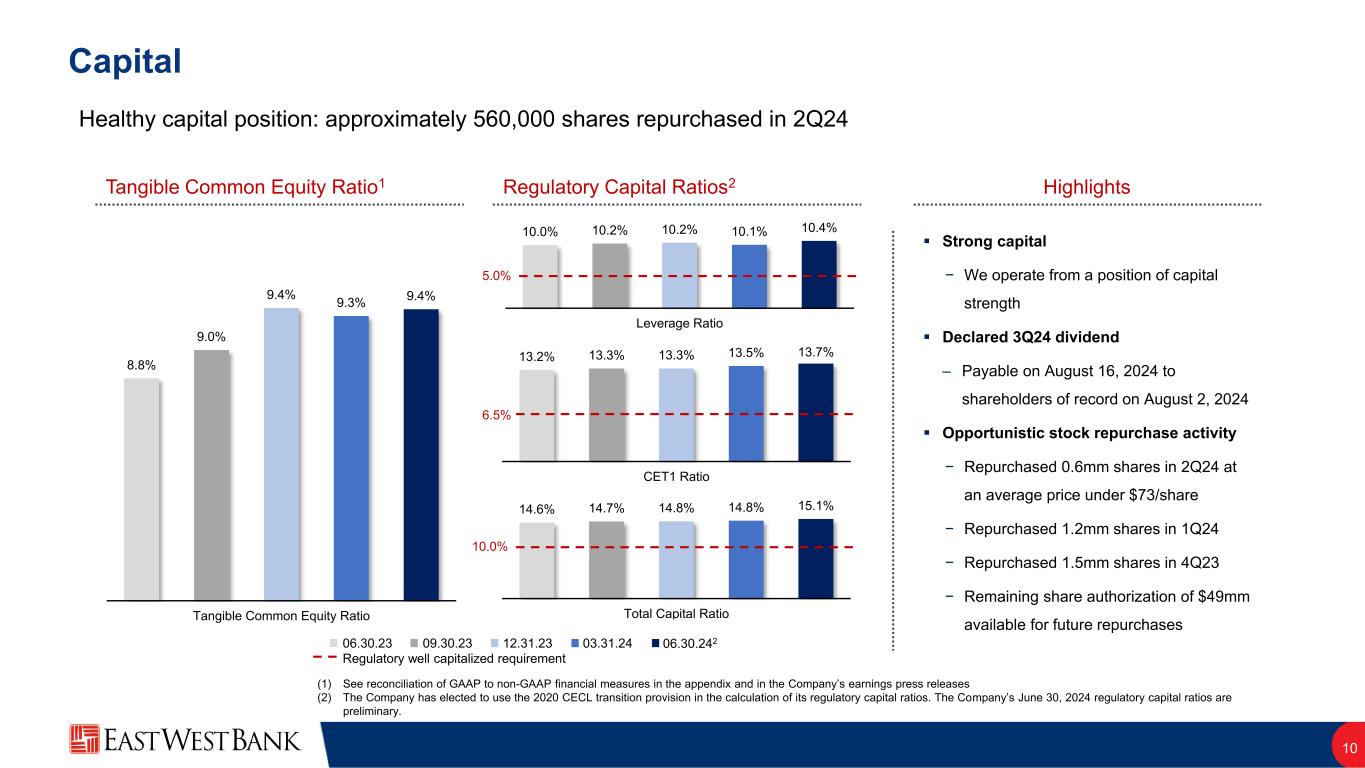
| EWBC Capital | |||||||||||||||||||||||||||||
| ($ in millions) | June 30, 2024 (a) |
March 31, 2024 (a) |
June 30, 2023 (a) |
||||||||||||||||||||||||||
Risk-Weighted Assets (“RWA”) (b) |
$53,967 | $53,448 | $51,696 | ||||||||||||||||||||||||||
| Risk-based capital ratios: | |||||||||||||||||||||||||||||
| Total capital ratio | 15.05% | 14.84% | 14.60% | ||||||||||||||||||||||||||
| CET1 capital ratio | 13.74% | 13.53% | 13.17% | ||||||||||||||||||||||||||
| Tier 1 capital ratio | 13.74% | 13.53% | 13.17% | ||||||||||||||||||||||||||
| Leverage ratio | 10.36% | 10.05% | 10.03% | ||||||||||||||||||||||||||
Tangible common equity ratio (c) |
9.37% | 9.31% | 8.80% | ||||||||||||||||||||||||||
| EAST WEST BANCORP, INC. AND SUBSIDIARIES | |||||||||||||||||||||||||||||||||||||||||
| CONDENSED CONSOLIDATED BALANCE SHEET | |||||||||||||||||||||||||||||||||||||||||
| ($ and shares in thousands, except per share data) | |||||||||||||||||||||||||||||||||||||||||
| (unaudited) | |||||||||||||||||||||||||||||||||||||||||
| Table 1 | |||||||||||||||||||||||||||||||||||||||||
|
June 30, 2024
% or Basis Point Change
|
|||||||||||||||||||||||||||||||||||||||||
| June 30, 2024 | March 31, 2024 | June 30, 2023 | Qtr-o-Qtr | Yr-o-Yr | |||||||||||||||||||||||||||||||||||||
| Assets | |||||||||||||||||||||||||||||||||||||||||
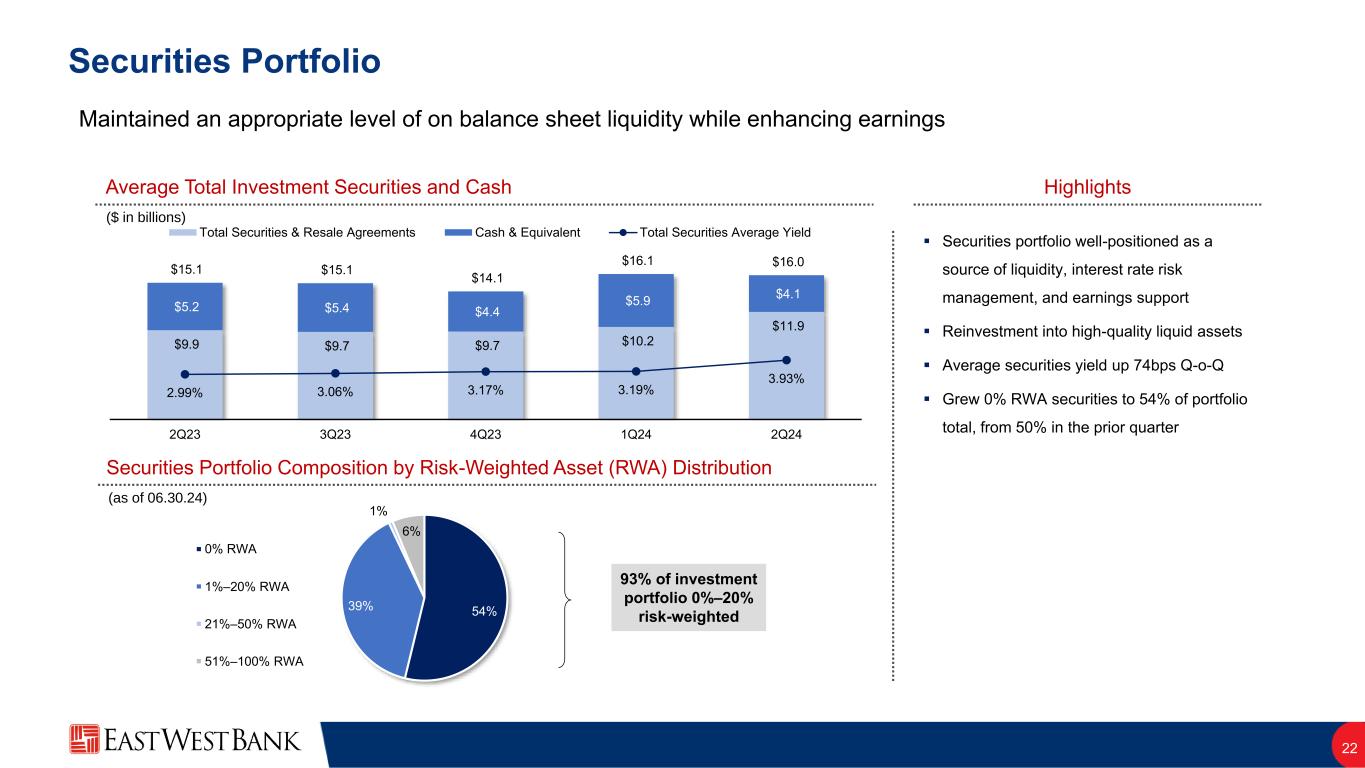
| Cash and cash equivalents | $ | 4,365,691 | $ | 4,210,801 | $ | 6,377,887 | 3.7 | % | (31.5) | % | |||||||||||||||||||||||||||||||
| Interest-bearing deposits with banks | 24,530 | 24,593 | 17,169 | (0.3) | 42.9 | ||||||||||||||||||||||||||||||||||||
| Securities purchased under resale agreements (“resale agreements”) | 485,000 | 485,000 | 635,000 | — | (23.6) | ||||||||||||||||||||||||||||||||||||
Available-for-sale (“AFS”) debt securities (amortized cost of $9,644,377, $9,131,953 and $6,820,569) |
8,923,528 | 8,400,468 | 5,987,258 | 6.2 | 49.0 | ||||||||||||||||||||||||||||||||||||
Held-to-maturity (“HTM”) debt securities, at amortized cost (fair value of $2,405,227, $2,414,478 and $2,440,484) |
2,938,250 | 2,948,642 | 2,975,933 | (0.4) | (1.3) | ||||||||||||||||||||||||||||||||||||
| Loans held-for-sale (“HFS”) | 18,909 | 13,280 | 2,830 | 42.4 | 568.2 | ||||||||||||||||||||||||||||||||||||
Loans held-for-investment (“HFI”) (net of allowance for loan losses of $683,794, $670,280 and $635,400) |
52,084,115 | 51,322,224 | 49,192,964 | 1.5 | 5.9 | ||||||||||||||||||||||||||||||||||||
Affordable housing partnership, tax credit and Community Reinvestment Act (“CRA”) investments, net |
956,428 | 933,187 | 815,471 | 2.5 | 17.3 | ||||||||||||||||||||||||||||||||||||
| Goodwill | 465,697 | 465,697 | 465,697 | — | — | ||||||||||||||||||||||||||||||||||||
| Operating lease right-of-use assets | 81,941 | 87,535 | 100,500 | (6.4) | (18.5) | ||||||||||||||||||||||||||||||||||||
| Other assets | 2,124,183 | 1,984,243 | 1,961,972 | 7.1 | 8.3 | ||||||||||||||||||||||||||||||||||||
| Total assets | $ | 72,468,272 | $ | 70,875,670 | $ | 68,532,681 | 2.2 | % | 5.7 | % | |||||||||||||||||||||||||||||||
| Liabilities and Stockholders’ Equity | |||||||||||||||||||||||||||||||||||||||||
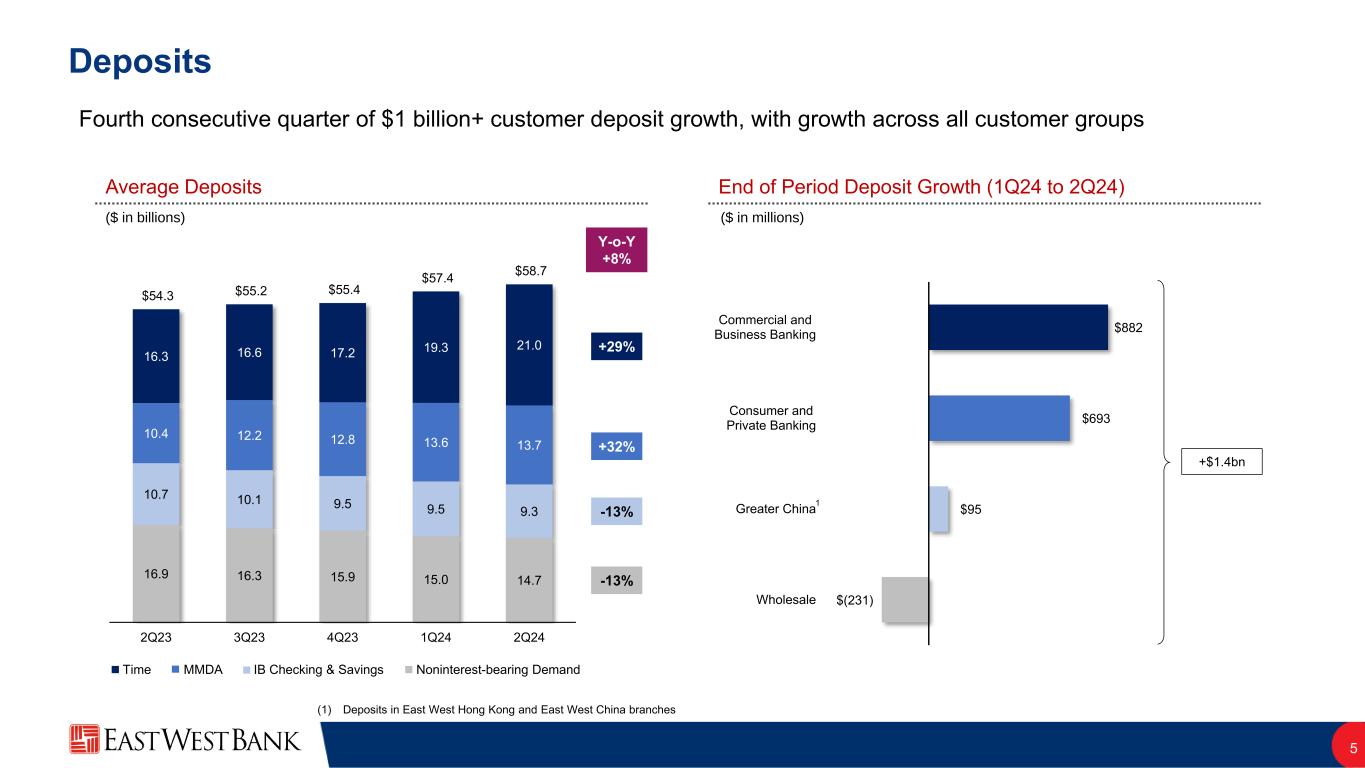
| Deposits | $ | 59,999,785 | $ | 58,560,624 | $ | 55,658,786 | 2.5 | % | 7.8 | % | |||||||||||||||||||||||||||||||
| Short-term borrowings | — | 19,173 | — | (100.0) | — | ||||||||||||||||||||||||||||||||||||
| Bank Term Funding Program (“BTFP”) borrowings | — | — | 4,500,000 | — | (100.0) | ||||||||||||||||||||||||||||||||||||
Federal Home Loan Bank (“FHLB”) advances |
3,500,000 | 3,500,000 | — | — | 100.0 | ||||||||||||||||||||||||||||||||||||
| Long-term debt and finance lease liabilities | 36,141 | 36,428 | 152,951 | (0.8) | (76.4) | ||||||||||||||||||||||||||||||||||||
| Operating lease liabilities | 89,644 | 95,643 | 110,383 | (6.3) | (18.8) | ||||||||||||||||||||||||||||||||||||
| Accrued expenses and other liabilities | 1,627,588 | 1,640,570 | 1,648,864 | (0.8) | (1.3) | ||||||||||||||||||||||||||||||||||||
| Total liabilities | 65,253,158 | 63,852,438 | 62,070,984 | 2.2 | 5.1 | ||||||||||||||||||||||||||||||||||||
| Stockholders’ equity | 7,215,114 | 7,023,232 | 6,461,697 | 2.7 | 11.7 | ||||||||||||||||||||||||||||||||||||
| Total liabilities and stockholders’ equity | $ | 72,468,272 | $ | 70,875,670 | $ | 68,532,681 | 2.2 | % | 5.7 | % | |||||||||||||||||||||||||||||||
| Book value per share | $ | 52.06 | $ | 50.48 | $ | 45.67 | 3.1 | % | 14.0 | % | |||||||||||||||||||||||||||||||
Tangible book value (1) per share |
$ | 48.65 | $ | 47.09 | $ | 42.33 | 3.3 | 14.9 | |||||||||||||||||||||||||||||||||
| Number of common shares at period-end | 138,604 | 139,121 | 141,484 | (0.4) | (2.0) | ||||||||||||||||||||||||||||||||||||
| Total stockholders’ equity to assets ratio | 9.96 | % | 9.91 | % | 9.43 | % | 5 | bps | 53 | bps | |||||||||||||||||||||||||||||||
Tangible common equity (“TCE”) ratio (1) |
9.37 | % | 9.31 | % | 8.80 | % | 6 | bps | 57 | bps | |||||||||||||||||||||||||||||||
| EAST WEST BANCORP, INC. AND SUBSIDIARIES | |||||||||||||||||||||||||||||||||||
| TOTAL LOANS AND DEPOSITS DETAIL | |||||||||||||||||||||||||||||||||||
| ($ in thousands) | |||||||||||||||||||||||||||||||||||
| (unaudited) | |||||||||||||||||||||||||||||||||||
| Table 2 | |||||||||||||||||||||||||||||||||||
|
June 30, 2024
% Change
|
|||||||||||||||||||||||||||||||||||
| June 30, 2024 | March 31, 2024 | June 30, 2023 | Qtr-o-Qtr | Yr-o-Yr | |||||||||||||||||||||||||||||||
| Loans: | |||||||||||||||||||||||||||||||||||
Commercial: |
|||||||||||||||||||||||||||||||||||
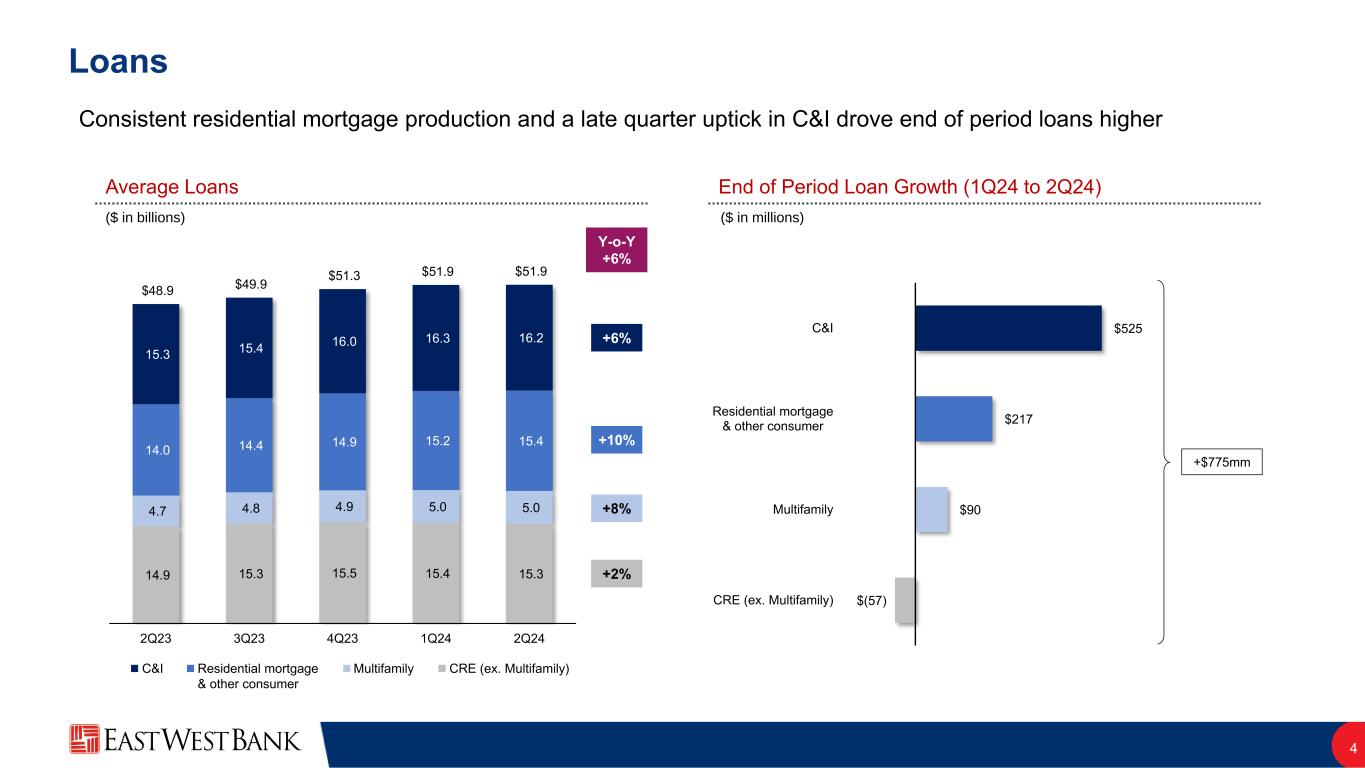
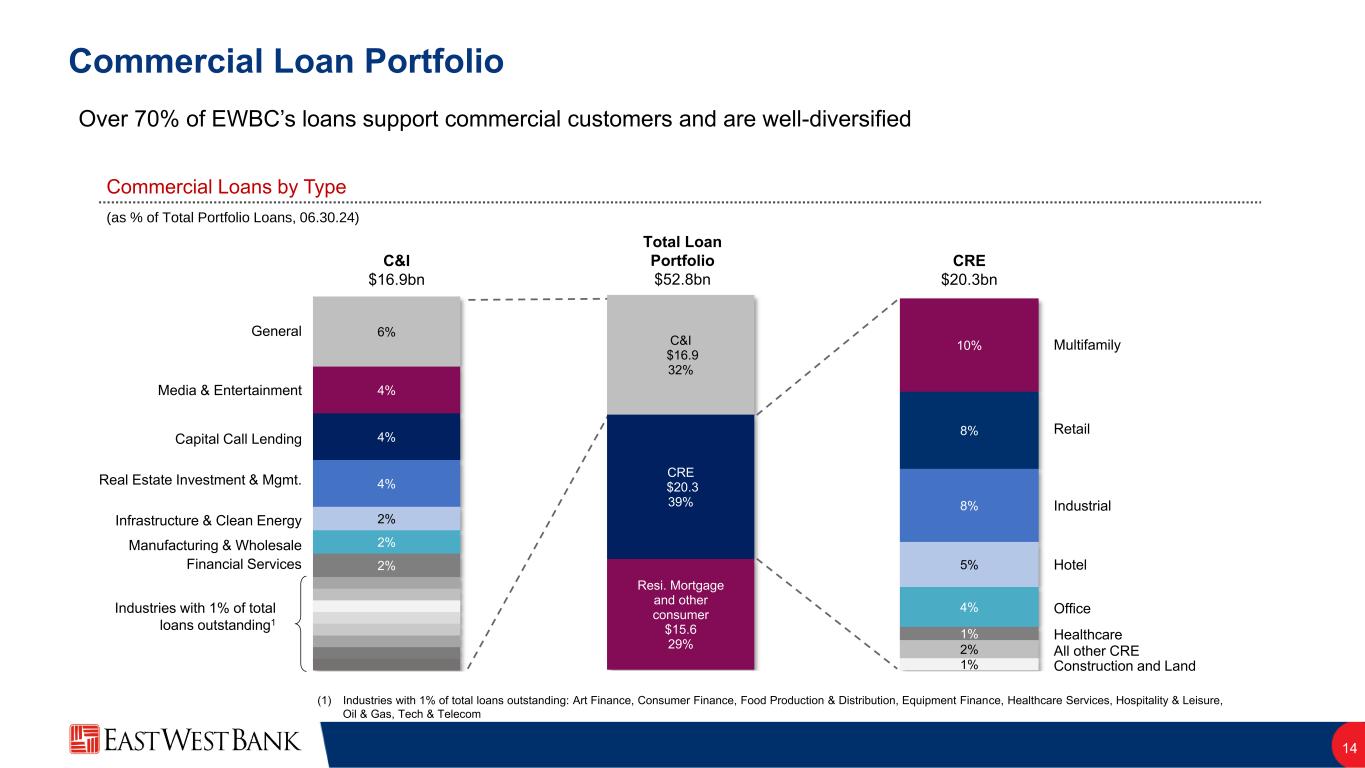
| Commercial and industrial (“C&I”) | $ | 16,875,009 | $ | 16,350,191 | $ | 15,670,084 | 3.2 | % | 7.7 | % | |||||||||||||||||||||||||
Commercial real estate (“CRE”): |
|||||||||||||||||||||||||||||||||||
CRE |
14,562,595 | 14,609,655 | 14,373,385 | (0.3) | 1.3 | ||||||||||||||||||||||||||||||
Multifamily residential |
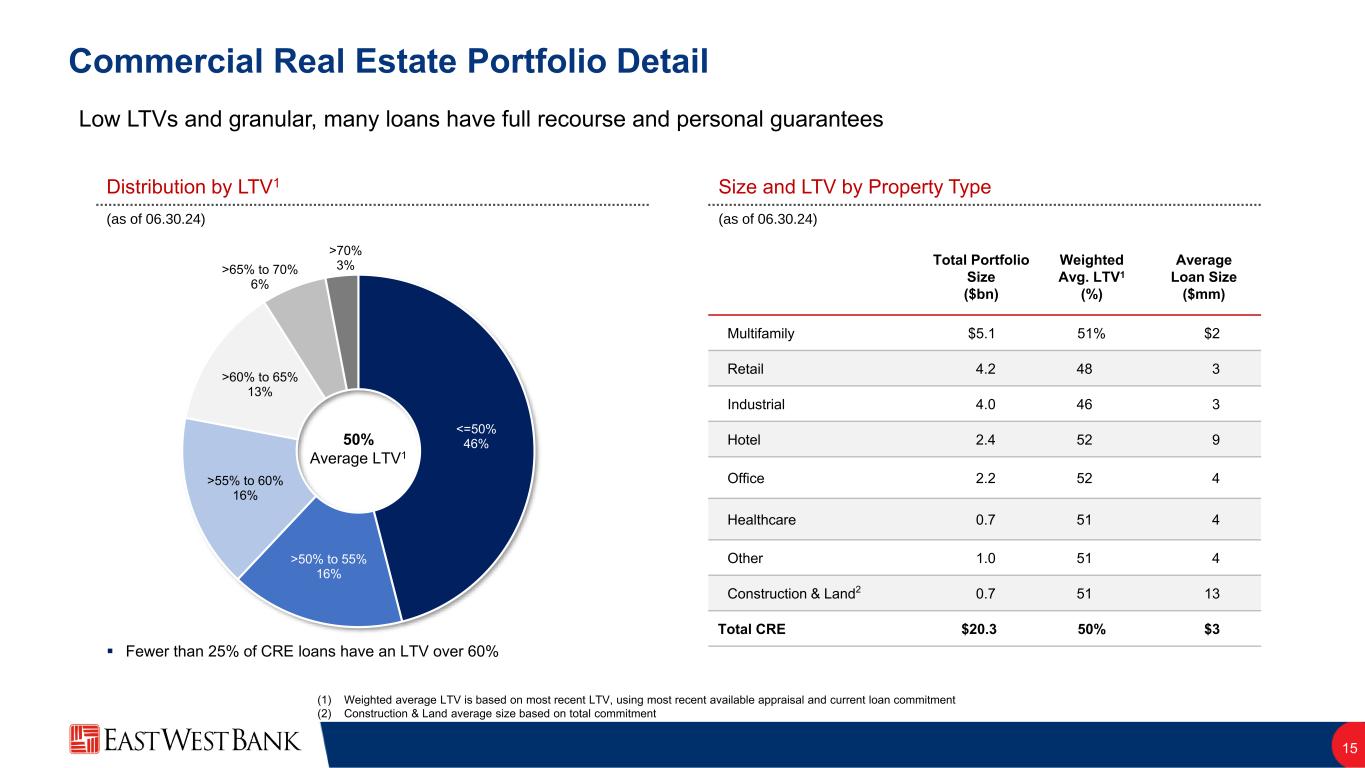
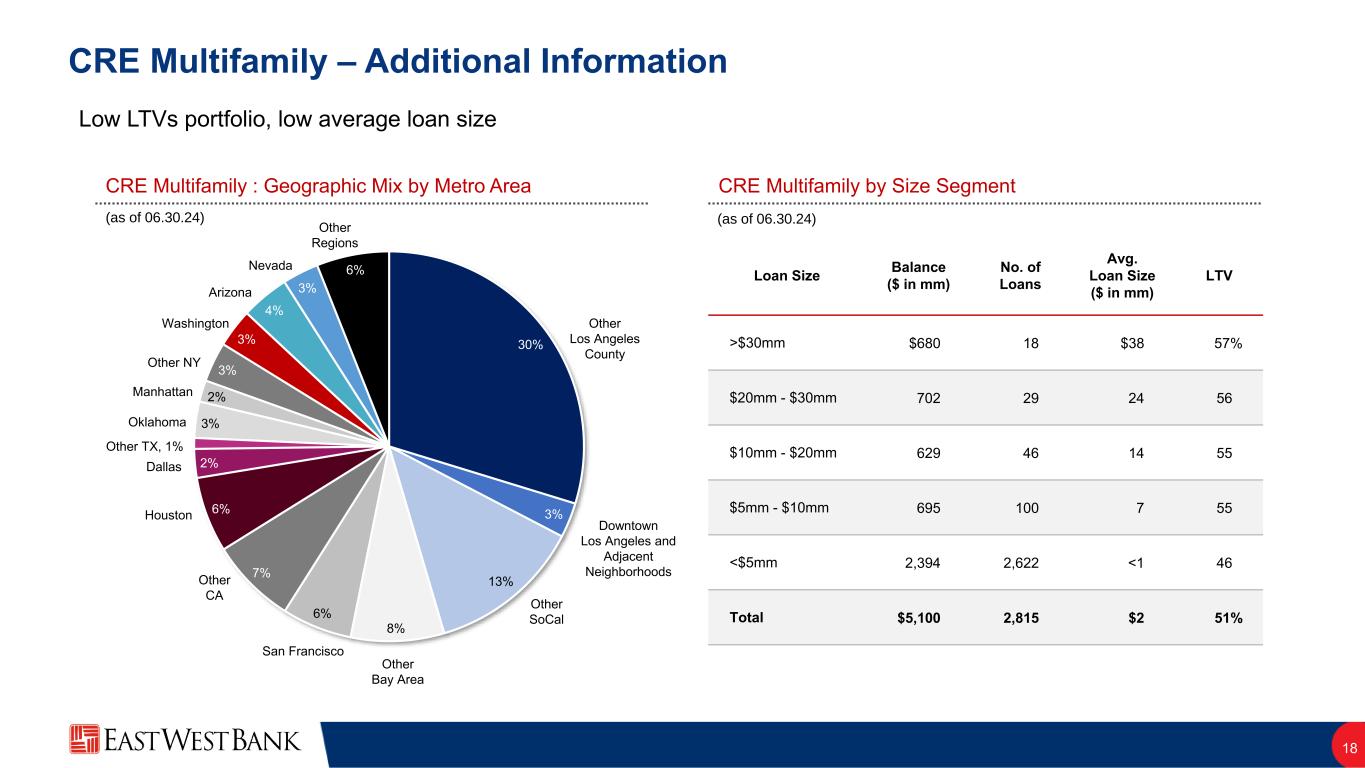
5,100,210 | 5,010,245 | 4,764,180 | 1.8 | 7.1 | ||||||||||||||||||||||||||||||
Construction and land |
664,793 | 673,939 | 781,068 | (1.4) | (14.9) | ||||||||||||||||||||||||||||||
Total CRE |
20,327,598 | 20,293,839 | 19,918,633 | 0.2 | 2.1 | ||||||||||||||||||||||||||||||
Consumer: |
|||||||||||||||||||||||||||||||||||
Residential mortgage: |
|||||||||||||||||||||||||||||||||||
Single-family residential |
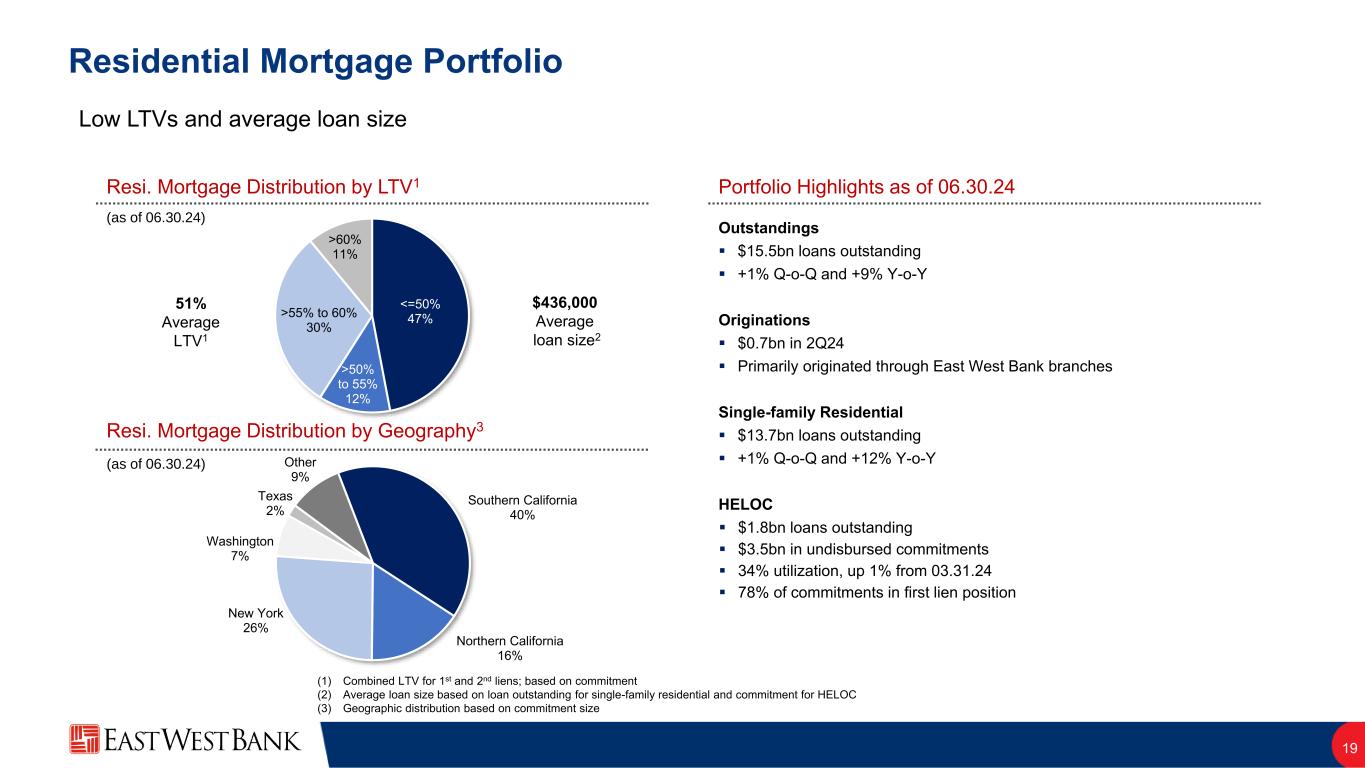
13,747,769 | 13,563,738 | 12,308,613 | 1.4 | 11.7 | ||||||||||||||||||||||||||||||
| Home equity lines of credit (“HELOCs”) | 1,761,379 | 1,731,233 | 1,862,928 | 1.7 | (5.5) | ||||||||||||||||||||||||||||||
Total residential mortgage |
15,509,148 | 15,294,971 | 14,171,541 | 1.4 | 9.4 | ||||||||||||||||||||||||||||||
Other consumer |
56,154 | 53,503 | 68,106 | 5.0 | (17.5) | ||||||||||||||||||||||||||||||
Total loans HFI (1) |
52,767,909 | 51,992,504 | 49,828,364 | 1.5 | 5.9 | ||||||||||||||||||||||||||||||
Loans HFS |
18,909 | 13,280 | 2,830 | 42.4 | 568.2 | ||||||||||||||||||||||||||||||
Total loans (1) |
52,786,818 | 52,005,784 | 49,831,194 | 1.5 | 5.9 | ||||||||||||||||||||||||||||||
| Allowance for loan losses | (683,794) | (670,280) | (635,400) | 2.0 | 7.6 | ||||||||||||||||||||||||||||||
Net loans (1) |
$ | 52,103,024 | $ | 51,335,504 | $ | 49,195,794 | 1.5 | % | 5.9 | % | |||||||||||||||||||||||||
Deposits: |
|||||||||||||||||||||||||||||||||||
Noninterest-bearing demand |
$ | 14,922,741 | $ | 14,798,927 | $ | 16,741,099 | 0.8 | % | (10.9) | % | |||||||||||||||||||||||||
Interest-bearing checking |
7,758,081 | 7,570,427 | 8,348,587 | 2.5 | (7.1) | ||||||||||||||||||||||||||||||
Money market |
13,775,908 | 13,585,597 | 11,486,473 | 1.4 | 19.9 | ||||||||||||||||||||||||||||||
Savings |
1,772,368 | 1,834,393 | 2,102,850 | (3.4) | (15.7) | ||||||||||||||||||||||||||||||
Time deposits |
21,770,687 | 20,771,280 | 16,979,777 | 4.8 | 28.2 | ||||||||||||||||||||||||||||||
Total deposits |
$ | 59,999,785 | $ | 58,560,624 | $ | 55,658,786 | 2.5 | % | 7.8 | % | |||||||||||||||||||||||||
| Deposits by type: | |||||||||||||||||||||||||||||||||||
Commercial and business banking |
$ | 33,572,624 | $ | 32,690,771 | $ | 31,240,428 | 2.7 | % | 7.5 | % | |||||||||||||||||||||||||
Consumer and private banking |
21,236,669 | 20,543,473 | 17,960,113 | 3.4 | 18.2 | ||||||||||||||||||||||||||||||
Greater China (2) |
3,376,971 | 3,282,218 | 2,833,531 | 2.9 | 19.2 | ||||||||||||||||||||||||||||||
| Wholesale | 1,813,521 | 2,044,162 | 3,624,714 | (11.3) | (50.0) | ||||||||||||||||||||||||||||||
Total deposits |
$ | 59,999,785 | $ | 58,560,624 | $ | 55,658,786 | 2.5 | % | 7.8 | % | |||||||||||||||||||||||||
Loan-to-deposit ratio |
88 | % | 89 | % | 90 | % | (1.1) | % | (2.2) | % | |||||||||||||||||||||||||
| EAST WEST BANCORP, INC. AND SUBSIDIARIES | |||||||||||||||||||||||||||||||||||
| CONDENSED CONSOLIDATED STATEMENT OF INCOME | |||||||||||||||||||||||||||||||||||
| ($ and shares in thousands, except per share data) | |||||||||||||||||||||||||||||||||||
| (unaudited) | |||||||||||||||||||||||||||||||||||
| Table 3 | |||||||||||||||||||||||||||||||||||
| Three Months Ended |
June 30, 2024
% Change
|
||||||||||||||||||||||||||||||||||
| June 30, 2024 | March 31, 2024 | June 30, 2023 | Qtr-o-Qtr | Yr-o-Yr | |||||||||||||||||||||||||||||||
| Interest and dividend income | $ | 1,034,414 | $ | 1,023,617 | $ | 906,134 | 1.1% | 14.2% | |||||||||||||||||||||||||||
Interest expense |
481,185 | 458,478 | 339,388 | 5.0 | 41.8 | ||||||||||||||||||||||||||||||
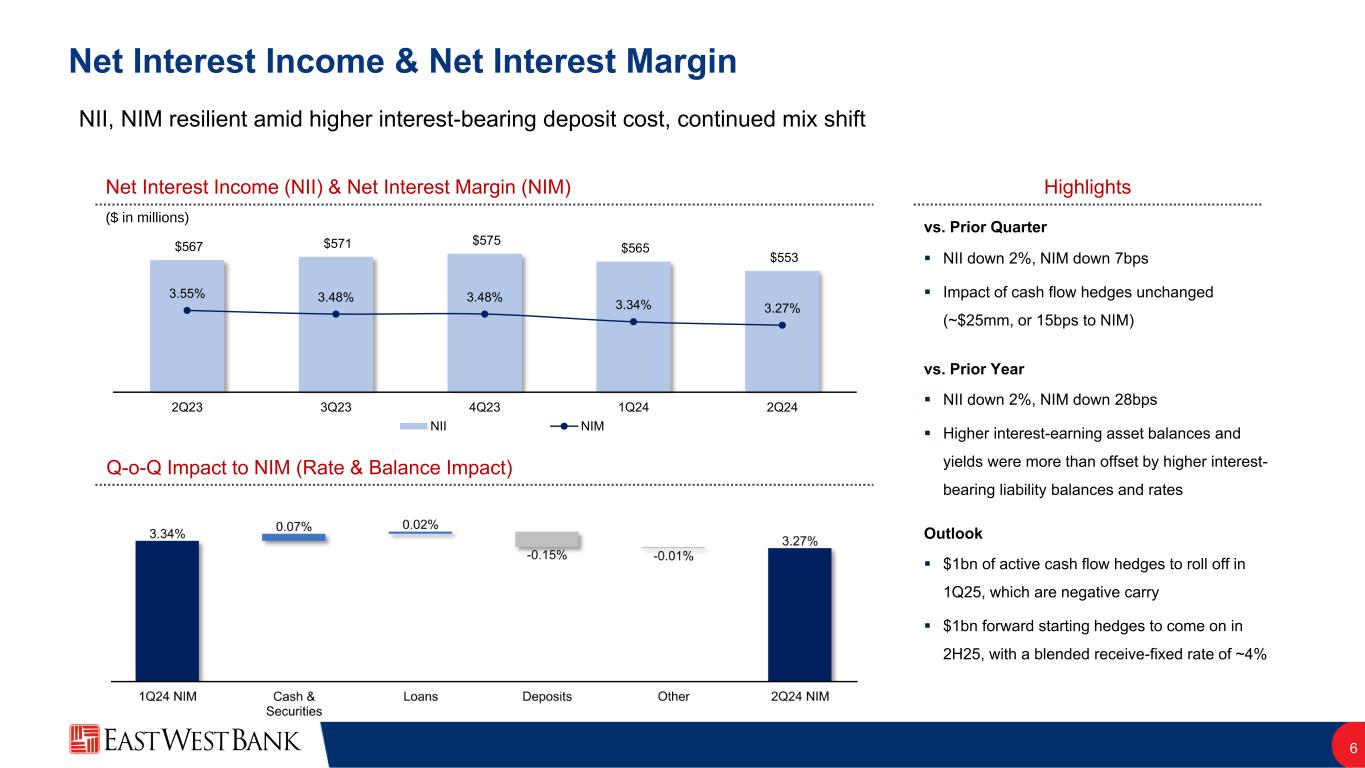
| Net interest income before provision for credit losses | 553,229 | 565,139 | 566,746 | (2.1) | (2.4) | ||||||||||||||||||||||||||||||
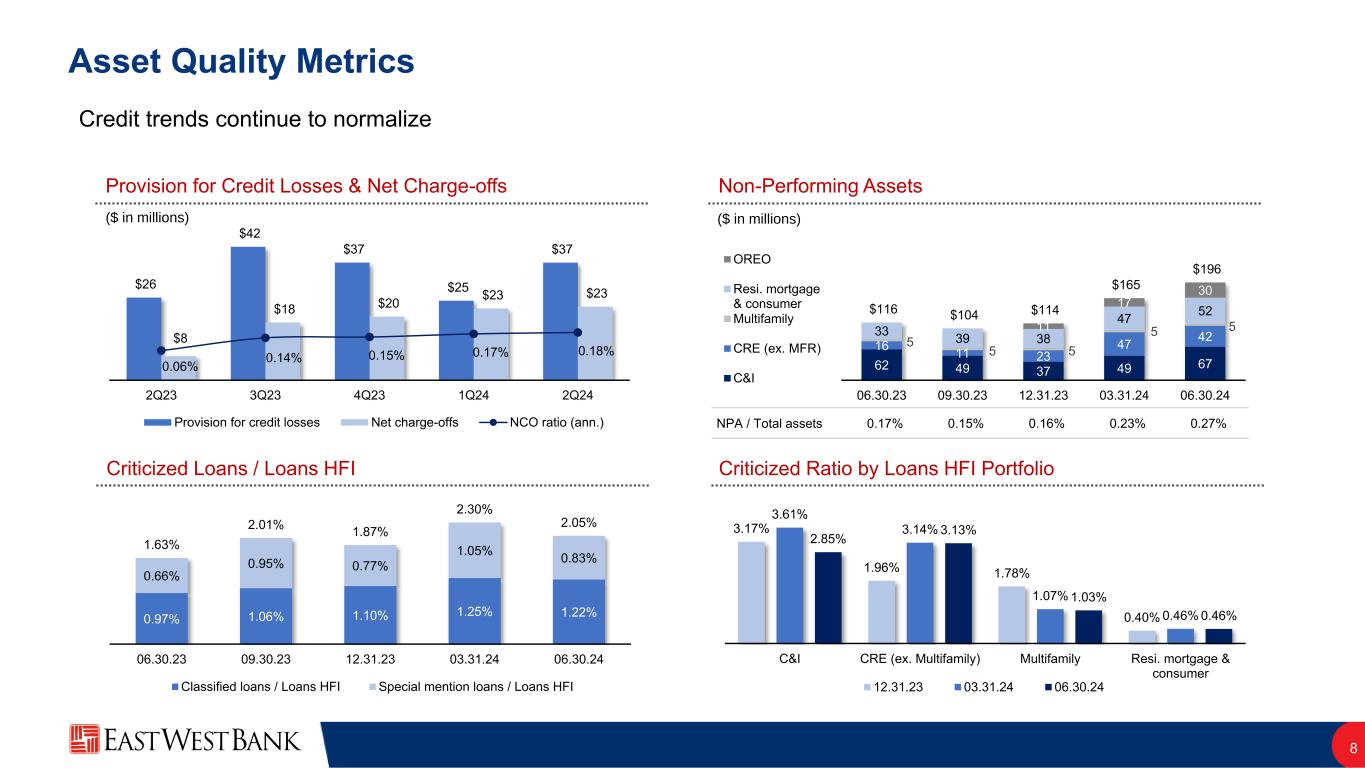
| Provision for credit losses | 37,000 | 25,000 | 26,000 | 48.0 | 42.3 | ||||||||||||||||||||||||||||||
| Net interest income after provision for credit losses | 516,229 | 540,139 | 540,746 | (4.4) | (4.5) | ||||||||||||||||||||||||||||||
Noninterest income: |
|||||||||||||||||||||||||||||||||||
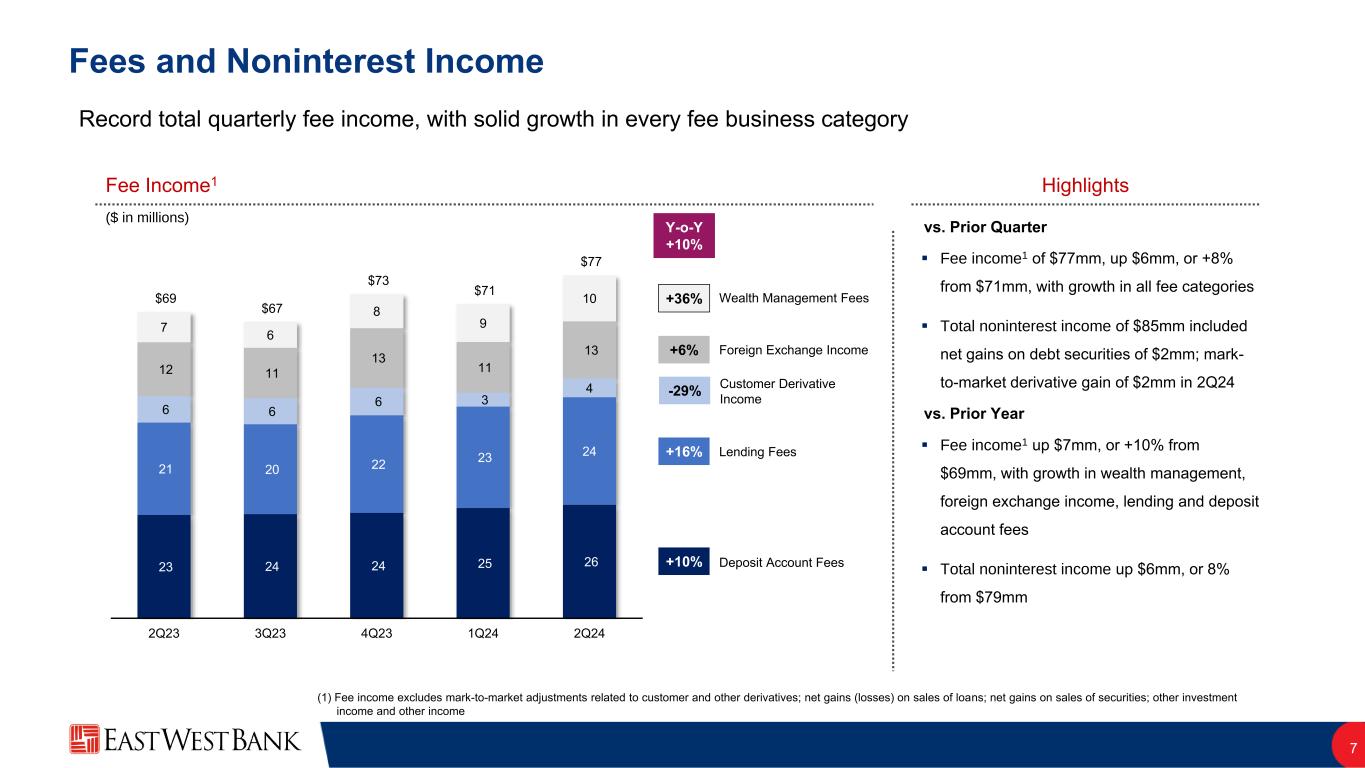
| Deposit account fees | 25,649 | 24,948 | 23,369 | 2.8% | 9.8% | ||||||||||||||||||||||||||||||
| Lending fees | 24,340 | 22,925 | 20,901 | 6.2 | 16.5 | ||||||||||||||||||||||||||||||
| Foreign exchange income | 12,924 | 11,469 | 12,167 | 12.7 | 6.2 | ||||||||||||||||||||||||||||||
| Wealth management fees | 9,478 | 8,637 | 6,944 | 9.7 | 36.5 | ||||||||||||||||||||||||||||||
| Customer derivative revenue | 4,230 | 3,137 | 5,979 | 34.8 | (29.3) | ||||||||||||||||||||||||||||||
| Total fee income | 76,621 | 71,116 | 69,360 | 7.7 | 10.5 | ||||||||||||||||||||||||||||||
Mark-to-market and credit valuation adjustments |
1,534 | 613 | 1,394 | 150.2 | 10.0 | ||||||||||||||||||||||||||||||
Net gains (losses) on sales of loans |
56 | (41) | (7) | NM | NM | ||||||||||||||||||||||||||||||
Net gains on AFS debt securities |
1,785 | 49 | — | NM | 100.0 | ||||||||||||||||||||||||||||||
| Other investment income | 586 | 2,815 | 4,003 | (79.2) | (85.4) | ||||||||||||||||||||||||||||||
| Other income | 4,091 | 4,436 | 3,881 | (7.8) | 5.4 | ||||||||||||||||||||||||||||||
| Total noninterest income | 84,673 | 78,988 | 78,631 | 7.2% | 7.7% | ||||||||||||||||||||||||||||||
| Noninterest expense: | |||||||||||||||||||||||||||||||||||
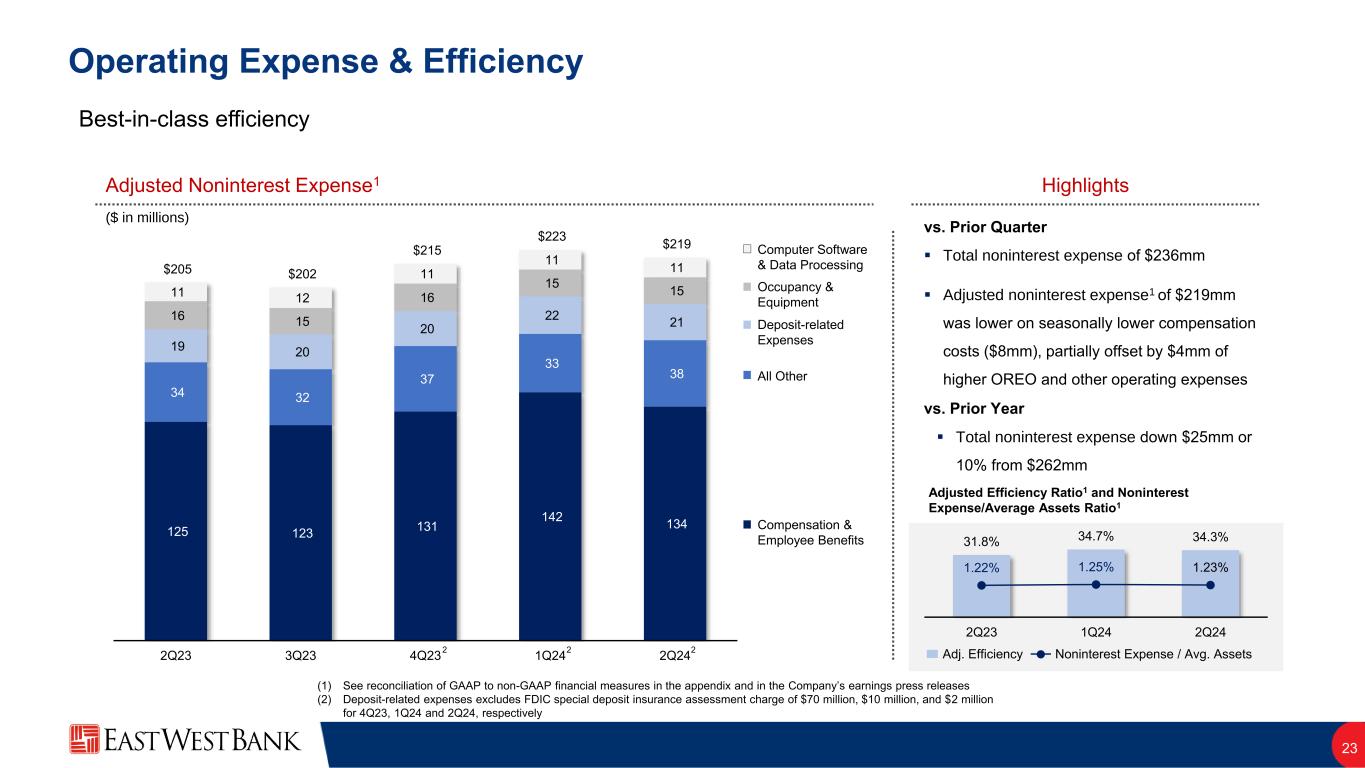
| Compensation and employee benefits | 133,588 | 141,812 | 124,937 | (5.8)% | 6.9% | ||||||||||||||||||||||||||||||
| Occupancy and equipment expense | 15,031 | 15,230 | 16,088 | (1.3) | (6.6) | ||||||||||||||||||||||||||||||
| Deposit insurance premiums and regulatory assessments | 10,708 | 19,649 | 8,262 | (45.5) | 29.6 | ||||||||||||||||||||||||||||||
| Deposit account expense | 12,050 | 12,188 | 10,559 | (1.1) | 14.1 | ||||||||||||||||||||||||||||||
| Computer software and data processing expenses | 11,392 | 11,344 | 10,692 | 0.4 | 6.5 | ||||||||||||||||||||||||||||||
| Other operating expense | 37,613 | 33,445 | 35,337 | 12.5 | 6.4 | ||||||||||||||||||||||||||||||
| Amortization of tax credit and CRA investments | 16,052 | 13,207 | 55,914 | 21.5 | (71.3) | ||||||||||||||||||||||||||||||
| Total noninterest expense | 236,434 | 246,875 | 261,789 | (4.2)% | (9.7)% | ||||||||||||||||||||||||||||||
Income before income taxes |
364,468 | 372,252 | 357,588 | (2.1) | 1.9 | ||||||||||||||||||||||||||||||
Income tax expense |
76,238 | 87,177 | 45,557 | (12.5) | 67.3 | ||||||||||||||||||||||||||||||
Net income |
$ | 288,230 | $ | 285,075 | $ | 312,031 | 1.1% | (7.6)% | |||||||||||||||||||||||||||
Earnings per share (“EPS”) |
|||||||||||||||||||||||||||||||||||
- Basic |
$ | 2.07 | $ | 2.04 | $ | 2.21 | 1.4% | (6.0)% | |||||||||||||||||||||||||||
- Diluted |
$ | 2.06 | $ | 2.03 | $ | 2.20 | 1.4 | (6.3) | |||||||||||||||||||||||||||
Weighted-average number of shares outstanding |
|||||||||||||||||||||||||||||||||||
- Basic |
138,980 | 139,409 | 141,468 | (0.3)% | (1.8)% | ||||||||||||||||||||||||||||||
- Diluted |
139,801 | 140,261 | 141,876 | (0.3) | (1.5) | ||||||||||||||||||||||||||||||
| EAST WEST BANCORP, INC. AND SUBSIDIARIES | |||||||||||||||||||||||
| CONDENSED CONSOLIDATED STATEMENT OF INCOME | |||||||||||||||||||||||
| ($ and shares in thousands, except per share data) | |||||||||||||||||||||||
| (unaudited) | |||||||||||||||||||||||
| Table 4 | |||||||||||||||||||||||
| Six Months Ended |
June 30, 2024
% Change
|
||||||||||||||||||||||
| June 30, 2024 | June 30, 2023 | Yr-o-Yr | |||||||||||||||||||||
| Interest and dividend income | $ | 2,058,031 | $ | 1,741,640 | 18.2% | ||||||||||||||||||
Interest expense |
939,663 | 575,033 | 63.4 | ||||||||||||||||||||
| Net interest income before provision for credit losses | 1,118,368 | 1,166,607 | (4.1) | ||||||||||||||||||||
| Provision for credit losses | 62,000 | 46,000 | 34.8 | ||||||||||||||||||||
| Net interest income after provision for credit losses | 1,056,368 | 1,120,607 | (5.7) | ||||||||||||||||||||
| Noninterest income: | |||||||||||||||||||||||
| Deposit account fees | 50,597 | 46,423 | 9.0% | ||||||||||||||||||||
| Lending fees | 47,265 | 41,487 | 13.9 | ||||||||||||||||||||
| Foreign exchange income | 24,393 | 23,476 | 3.9 | ||||||||||||||||||||
| Wealth management fees | 18,115 | 13,291 | 36.3 | ||||||||||||||||||||
| Customer derivative income | 7,367 | 11,025 | (33.2) | ||||||||||||||||||||
| Total fee income | 147,737 | 135,702 | 8.9 | ||||||||||||||||||||
| Mark-to-market and credit valuation adjustments | 2,147 | (1,088) | NM | ||||||||||||||||||||
Net gains (losses) on sales of loans |
15 | (29) | NM | ||||||||||||||||||||
Net gains (losses) on AFS debt securities |
1,834 | (10,000) | NM | ||||||||||||||||||||
| Other investment income | 3,401 | 5,924 | (42.6) | ||||||||||||||||||||
| Other income | 8,527 | 8,100 | 5.3 | ||||||||||||||||||||
| Total noninterest income | 163,661 | 138,609 | 18.1% | ||||||||||||||||||||
| Noninterest expense | |||||||||||||||||||||||
| Compensation and employee benefits | 275,400 | 254,591 | 8.2% | ||||||||||||||||||||
| Occupancy and equipment expense | 30,261 | 31,675 | (4.5) | ||||||||||||||||||||
| Deposit insurance premiums and regulatory assessments | 30,357 | 16,172 | 87.7 | ||||||||||||||||||||
| Deposit account expense | 24,238 | 20,168 | 20.2 | ||||||||||||||||||||
| Computer software and data processing expenses | 22,736 | 21,399 | 6.2 | ||||||||||||||||||||
Other operating expense (1) |
71,058 | 70,207 | 1.2 | ||||||||||||||||||||
| Amortization of tax credit and CRA investments | 29,259 | 66,024 | (55.7) | ||||||||||||||||||||
| Total noninterest expense | 483,309 | 480,236 | 0.6% | ||||||||||||||||||||
Income before income taxes |
736,720 | 778,980 | (5.4) | ||||||||||||||||||||
Income tax expense |
163,415 | 144,510 | 13.1 | ||||||||||||||||||||
Net income |
$ | 573,305 | $ | 634,470 | (9.6)% | ||||||||||||||||||
| EPS | |||||||||||||||||||||||
- Basic |
$ | 4.12 | $ | 4.49 | (8.3)% | ||||||||||||||||||
- Diluted |
$ | 4.09 | $ | 4.47 | (8.4) | ||||||||||||||||||
Weighted-average number of shares outstanding |
|||||||||||||||||||||||
- Basic |
139,195 | 141,291 | (1.5)% | ||||||||||||||||||||
- Diluted |
140,047 | 141,910 | (1.3) | ||||||||||||||||||||
| EAST WEST BANCORP, INC. AND SUBSIDIARIES | |||||||||||||||||||||||||||||||||||||||||||||||||||||
| SELECTED AVERAGE BALANCES | |||||||||||||||||||||||||||||||||||||||||||||||||||||
| ($ in thousands) | |||||||||||||||||||||||||||||||||||||||||||||||||||||
| (unaudited) | |||||||||||||||||||||||||||||||||||||||||||||||||||||
| Table 5 | |||||||||||||||||||||||||||||||||||||||||||||||||||||
| Three Months Ended |
June 30, 2024
% Change
|
Six Months Ended |
June 30, 2024
% Change
|
||||||||||||||||||||||||||||||||||||||||||||||||||
| June 30, 2024 | March 31, 2024 | June 30, 2023 | Qtr-o-Qtr | Yr-o-Yr | June 30, 2024 | June 30, 2023 | Yr-o-Yr | ||||||||||||||||||||||||||||||||||||||||||||||
Loans: |
|||||||||||||||||||||||||||||||||||||||||||||||||||||
Commercial: |
|||||||||||||||||||||||||||||||||||||||||||||||||||||
| C&I | $ | 16,209,659 | $ | 16,251,622 | $ | 15,244,826 | (0.3) | % | 6.3 | % | $ | 16,230,641 | $ | 15,322,480 | 5.9 | % | |||||||||||||||||||||||||||||||||||||
| CRE: | |||||||||||||||||||||||||||||||||||||||||||||||||||||
| CRE | 14,561,886 | 14,725,440 | 14,130,811 | (1.1) | 3.1 | 14,643,663 | 14,032,331 | 4.4 | |||||||||||||||||||||||||||||||||||||||||||||
| Multifamily residential | 5,039,249 | 5,033,143 | 4,685,786 | 0.1 | 7.5 | 5,036,196 | 4,643,177 | 8.5 | |||||||||||||||||||||||||||||||||||||||||||||
| Construction and land | 669,681 | 655,001 | 782,541 | 2.2 | (14.4) | 662,341 | 729,091 | (9.2) | |||||||||||||||||||||||||||||||||||||||||||||
Total CRE |
20,270,816 | 20,413,584 | 19,599,138 | (0.7) | 3.4 | 20,342,200 | 19,404,599 | 4.8 | |||||||||||||||||||||||||||||||||||||||||||||
Consumer: |
|||||||||||||||||||||||||||||||||||||||||||||||||||||
Residential mortgage: |
|||||||||||||||||||||||||||||||||||||||||||||||||||||
| Single-family residential | 13,636,389 | 13,477,057 | 12,014,513 | 1.2 | 13.5 | 13,556,723 | 11,717,644 | 15.7 | |||||||||||||||||||||||||||||||||||||||||||||
HELOCs |
1,750,469 | 1,725,288 | 1,928,208 | 1.5 | (9.2) | 1,737,878 | 1,989,154 | (12.6) | |||||||||||||||||||||||||||||||||||||||||||||
| Total residential mortgage | 15,386,858 | 15,202,345 | 13,942,721 | 1.2 | 10.4 | 15,294,601 | 13,706,798 | 11.6 | |||||||||||||||||||||||||||||||||||||||||||||
Other consumer |
51,455 | 57,289 | 65,035 | (10.2) | (20.9) | 54,372 | 68,840 | (21.0) | |||||||||||||||||||||||||||||||||||||||||||||
Total loans (1) |
$ | 51,918,788 | $ | 51,924,840 | $ | 48,851,720 | 0.0 | % | 6.3 | % | $ | 51,921,814 | $ | 48,502,717 | 7.0 | % | |||||||||||||||||||||||||||||||||||||
Interest-earning assets |
$ | 68,050,050 | $ | 68,122,045 | $ | 64,061,569 | (0.1) | % | 6.2 | % | $ | 68,086,048 | $ | 62,779,673 | 8.5 | % | |||||||||||||||||||||||||||||||||||||
Total assets |
$ | 71,189,200 | $ | 71,678,396 | $ | 67,497,367 | (0.7) | % | 5.5 | % | $ | 71,433,798 | $ | 66,312,070 | 7.7 | % | |||||||||||||||||||||||||||||||||||||
| Deposits: | |||||||||||||||||||||||||||||||||||||||||||||||||||||
Noninterest-bearing demand |
$ | 14,664,789 | $ | 14,954,953 | $ | 16,926,937 | (1.9) | % | (13.4) | % | $ | 14,809,871 | $ | 18,310,770 | (19.1) | % | |||||||||||||||||||||||||||||||||||||
Interest-bearing checking |
7,467,801 | 7,695,429 | 8,434,655 | (3.0) | (11.5) | 7,581,615 | 7,469,621 | 1.5 | |||||||||||||||||||||||||||||||||||||||||||||
Money market |
13,724,230 | 13,636,210 | 10,433,839 | 0.6 | 31.5 | 13,680,220 | 10,844,992 | 26.1 | |||||||||||||||||||||||||||||||||||||||||||||
Savings |
1,795,242 | 1,809,568 | 2,200,124 | (0.8) | (18.4) | 1,802,405 | 2,317,702 | (22.2) | |||||||||||||||||||||||||||||||||||||||||||||
Time deposits |
21,028,737 | 19,346,243 | 16,289,320 | 8.7 | 29.1 | 20,187,490 | 15,674,457 | 28.8 | |||||||||||||||||||||||||||||||||||||||||||||
Total deposits |
$ | 58,680,799 | $ | 57,442,403 | $ | 54,284,875 | 2.2 | % | 8.1 | % | $ | 58,061,601 | $ | 54,617,542 | 6.3 | % | |||||||||||||||||||||||||||||||||||||
| EAST WEST BANCORP, INC. AND SUBSIDIARIES | |||||||||||||||||||||||||||||||||||||||||
| QUARTER-TO-DATE AVERAGE BALANCES, YIELDS AND RATES | |||||||||||||||||||||||||||||||||||||||||
| ($ in thousands) | |||||||||||||||||||||||||||||||||||||||||
| (unaudited) | |||||||||||||||||||||||||||||||||||||||||
| Table 6 | |||||||||||||||||||||||||||||||||||||||||
| Three Months Ended | |||||||||||||||||||||||||||||||||||||||||
| June 30, 2024 | March 31, 2024 | ||||||||||||||||||||||||||||||||||||||||
| Average | Average | Average | Average | ||||||||||||||||||||||||||||||||||||||
| Balance | Interest | Yield/Rate (1) |
Balance | Interest | Yield/Rate (1) |
||||||||||||||||||||||||||||||||||||
Assets |
|||||||||||||||||||||||||||||||||||||||||
Interest-earning assets: |
|||||||||||||||||||||||||||||||||||||||||
Interest-bearing cash and deposits with banks |
$ | 4,058,515 | $ | 49,406 | 4.90 | % | $ | 5,861,517 | $ | 74,382 | 5.10 | % | |||||||||||||||||||||||||||||
| Resale agreements | 485,000 | 1,885 | 1.56 | % | 725,659 | 6,115 | 3.39 | % | |||||||||||||||||||||||||||||||||
Debt securities: |
|||||||||||||||||||||||||||||||||||||||||
| AFS debt securities | 8,481,948 | 99,242 | 4.71 | % | 6,566,368 | 62,858 | 3.85 | % | |||||||||||||||||||||||||||||||||
| HTM debt securities | 2,941,150 | 12,490 | 1.71 | % | 2,950,686 | 12,534 | 1.71 | % | |||||||||||||||||||||||||||||||||
Total debt securities |
11,423,098 | 111,732 | 3.93 | % | 9,517,054 | 75,392 | 3.19 | % | |||||||||||||||||||||||||||||||||
Loans: |
|||||||||||||||||||||||||||||||||||||||||
C&I |
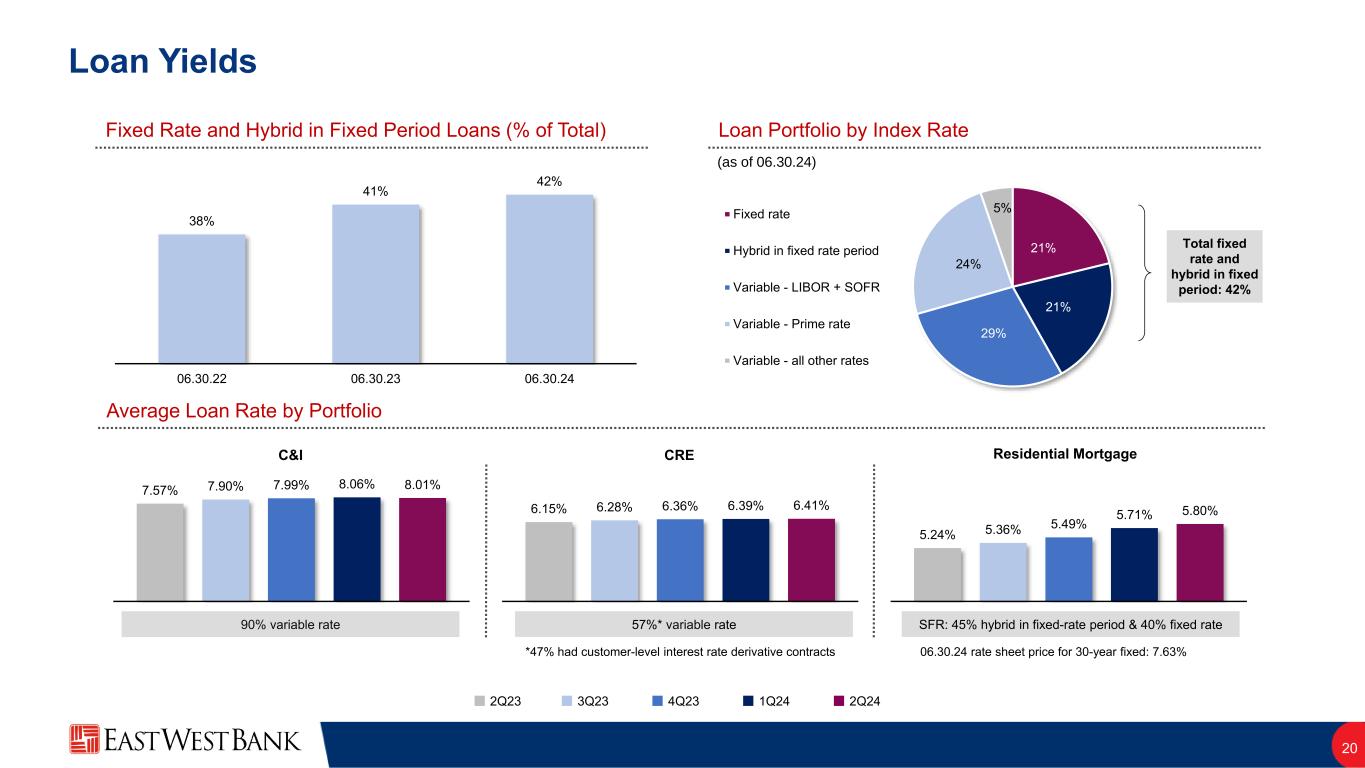
16,209,659 | 322,648 | 8.01 | % | 16,251,622 | 325,810 | 8.06 | % | |||||||||||||||||||||||||||||||||
CRE |
20,270,816 | 323,106 | 6.41 | % | 20,413,584 | 324,087 | 6.39 | % | |||||||||||||||||||||||||||||||||
Residential mortgage |
15,386,858 | 221,966 | 5.80 | % | 15,202,345 | 215,674 | 5.71 | % | |||||||||||||||||||||||||||||||||
Other consumer |
51,455 | 721 | 5.64 | % | 57,289 | 818 | 5.74 | % | |||||||||||||||||||||||||||||||||
Total loans (2) |
51,918,788 | 868,441 | 6.73 | % | 51,924,840 | 866,389 | 6.71 | % | |||||||||||||||||||||||||||||||||
FHLB and FRB stock |
164,649 | 2,950 | 7.21 | % | 92,975 | 1,339 | 5.79 | % | |||||||||||||||||||||||||||||||||
Total interest-earning assets |
$ | 68,050,050 | $ | 1,034,414 | 6.11 | % | $ | 68,122,045 | $ | 1,023,617 | 6.04 | % | |||||||||||||||||||||||||||||
Noninterest-earning assets: |
|||||||||||||||||||||||||||||||||||||||||
Cash and due from banks |
468,374 | 445,767 | |||||||||||||||||||||||||||||||||||||||
| Allowance for loan losses | (675,346) | (679,116) | |||||||||||||||||||||||||||||||||||||||
Other assets |
3,346,122 | 3,789,700 | |||||||||||||||||||||||||||||||||||||||
Total assets |
$ | 71,189,200 | $ | 71,678,396 | |||||||||||||||||||||||||||||||||||||
| Liabilities and Stockholders’ Equity | |||||||||||||||||||||||||||||||||||||||||
Interest-bearing liabilities: |
|||||||||||||||||||||||||||||||||||||||||
Checking deposits |
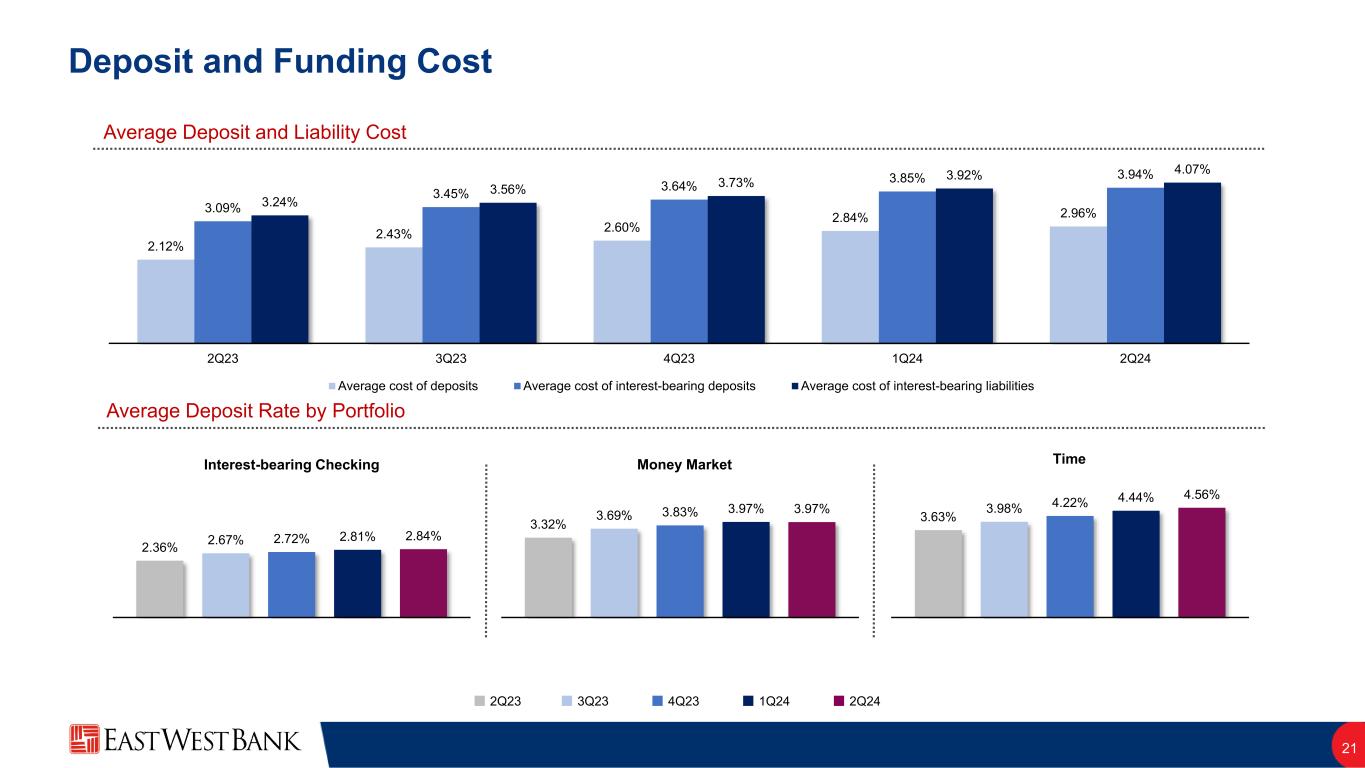
$ | 7,467,801 | $ | 52,680 | 2.84 | % | $ | 7,695,429 | $ | 53,821 | 2.81 | % | |||||||||||||||||||||||||||||
Money market deposits |
13,724,230 | 135,405 | 3.97 | % | 13,636,210 | 134,661 | 3.97 | % | |||||||||||||||||||||||||||||||||
Savings deposits |
1,795,242 | 5,004 | 1.12 | % | 1,809,568 | 4,120 | 0.92 | % | |||||||||||||||||||||||||||||||||
Time deposits |
21,028,737 | 238,393 | 4.56 | % | 19,346,243 | 213,597 | 4.44 | % | |||||||||||||||||||||||||||||||||
BTFP, short-term borrowings and federal funds purchased |
2,889 | 32 | 4.45 | % | 3,864,525 | 42,106 | 4.38 | % | |||||||||||||||||||||||||||||||||
| Assets sold under repurchase agreements (“repurchase agreements”) | 4,104 | 58 | 5.68 | % | 2,549 | 35 | 5.52 | % | |||||||||||||||||||||||||||||||||
FHLB advances |
3,500,001 | 48,840 | 5.61 | % | 554,946 | 7,739 | 5.61 | % | |||||||||||||||||||||||||||||||||
Long-term debt and finance lease liabilities |
36,335 | 773 | 8.56 | % | 125,818 | 2,399 | 7.67 | % | |||||||||||||||||||||||||||||||||
Total interest-bearing liabilities |
$ | 47,559,339 | $ | 481,185 | 4.07 | % | $ | 47,035,288 | $ | 458,478 | 3.92 | % | |||||||||||||||||||||||||||||
Noninterest-bearing liabilities and stockholders’ equity: |
|||||||||||||||||||||||||||||||||||||||||
Demand deposits |
14,664,789 | 14,954,953 | |||||||||||||||||||||||||||||||||||||||
Accrued expenses and other liabilities |
1,877,572 | 2,695,597 | |||||||||||||||||||||||||||||||||||||||
Stockholders’ equity |
7,087,500 | 6,992,558 | |||||||||||||||||||||||||||||||||||||||
Total liabilities and stockholders’ equity |
$ | 71,189,200 | $ | 71,678,396 | |||||||||||||||||||||||||||||||||||||
Interest rate spread |
2.04 | % | 2.12 | % | |||||||||||||||||||||||||||||||||||||
| Net interest income and net interest margin | $ | 553,229 | 3.27 | % | $ | 565,139 | 3.34 | % | |||||||||||||||||||||||||||||||||
| EAST WEST BANCORP, INC. AND SUBSIDIARIES | |||||||||||||||||||||||||||||||||||||||||
| QUARTER-TO-DATE AVERAGE BALANCES, YIELDS AND RATES | |||||||||||||||||||||||||||||||||||||||||
| ($ in thousands) | |||||||||||||||||||||||||||||||||||||||||
| (unaudited) | |||||||||||||||||||||||||||||||||||||||||
| Table 7 | |||||||||||||||||||||||||||||||||||||||||
| Three Months Ended | |||||||||||||||||||||||||||||||||||||||||
| June 30, 2024 | June 30, 2023 | ||||||||||||||||||||||||||||||||||||||||
| Average | Average | Average | Average | ||||||||||||||||||||||||||||||||||||||
| Balance | Interest | Yield/Rate (1) |
Balance | Interest | Yield/Rate (1) |
||||||||||||||||||||||||||||||||||||
Assets |
|||||||||||||||||||||||||||||||||||||||||
Interest-earning assets: |
|||||||||||||||||||||||||||||||||||||||||
Interest-bearing cash and deposits with banks |
$ | 4,058,515 | $ | 49,406 | 4.90 | % | $ | 5,247,755 | $ | 60,995 | 4.66 | % | |||||||||||||||||||||||||||||
Assets purchased under resale agreements (2) |
485,000 | 1,885 | 1.56 | % | 641,939 | 3,969 | 2.48 | % | |||||||||||||||||||||||||||||||||
| Debt securities: | |||||||||||||||||||||||||||||||||||||||||
| AFS debt securities | 8,481,948 | 99,242 | 4.71 | % | 6,257,397 | 56,292 | 3.61 | % | |||||||||||||||||||||||||||||||||
| HTM debt securities | 2,941,150 | 12,490 | 1.71 | % | 2,983,780 | 12,678 | 1.70 | % | |||||||||||||||||||||||||||||||||
Total debt securities |
11,423,098 | 111,732 | 3.93 | % | 9,241,177 | 68,970 | 2.99 | % | |||||||||||||||||||||||||||||||||
Loans: |
|||||||||||||||||||||||||||||||||||||||||
C&I |
16,209,659 | 322,648 | 8.01 | % | 15,244,826 | 287,799 | 7.57 | % | |||||||||||||||||||||||||||||||||
CRE |
20,270,816 | 323,106 | 6.41 | % | 19,599,138 | 300,721 | 6.15 | % | |||||||||||||||||||||||||||||||||
Residential mortgage |
15,386,858 | 221,966 | 5.80 | % | 13,942,721 | 182,035 | 5.24 | % | |||||||||||||||||||||||||||||||||
Other consumer |
51,455 | 721 | 5.64 | % | 65,035 | 709 | 4.37 | % | |||||||||||||||||||||||||||||||||
Total loans (3) |
51,918,788 | 868,441 | 6.73 | % | 48,851,720 | 771,264 | 6.33 | % | |||||||||||||||||||||||||||||||||
FHLB and FRB stock |
164,649 | 2,950 | 7.21 | % | 78,978 | 936 | 4.75 | % | |||||||||||||||||||||||||||||||||
Total interest-earning assets |
$ | 68,050,050 | $ | 1,034,414 | 6.11 | % | $ | 64,061,569 | $ | 906,134 | 5.67 | % | |||||||||||||||||||||||||||||
Noninterest-earning assets: |
|||||||||||||||||||||||||||||||||||||||||
Cash and due from banks |
468,374 | 569,227 | |||||||||||||||||||||||||||||||||||||||
| Allowance for loan losses | (675,346) | (619,868) | |||||||||||||||||||||||||||||||||||||||
Other assets |
3,346,122 | 3,486,439 | |||||||||||||||||||||||||||||||||||||||
Total assets |
$ | 71,189,200 | $ | 67,497,367 | |||||||||||||||||||||||||||||||||||||
Liabilities and Stockholders’ Equity |
|||||||||||||||||||||||||||||||||||||||||
Interest-bearing liabilities: |
|||||||||||||||||||||||||||||||||||||||||
Checking deposits |
$ | 7,467,801 | $ | 52,680 | 2.84 | % | $ | 8,434,655 | $ | 49,571 | 2.36 | % | |||||||||||||||||||||||||||||
Money market deposits |
13,724,230 | 135,405 | 3.97 | % | 10,433,839 | 86,419 | 3.32 | % | |||||||||||||||||||||||||||||||||
Savings deposits |
1,795,242 | 5,004 | 1.12 | % | 2,200,124 | 3,963 | 0.72 | % | |||||||||||||||||||||||||||||||||
Time deposits |
21,028,737 | 238,393 | 4.56 | % | 16,289,320 | 147,524 | 3.63 | % | |||||||||||||||||||||||||||||||||
BTFP, short-term borrowings and federal funds purchased |
2,889 | 32 | 4.45 | % | 4,500,566 | 49,032 | 4.37 | % | |||||||||||||||||||||||||||||||||
| Repurchase agreements | 4,104 | 58 | 5.68 | % | 15,579 | 211 | 5.43 | % | |||||||||||||||||||||||||||||||||
FHLB advances |
3,500,001 | 48,840 | 5.61 | % | 1 | — | — | % | |||||||||||||||||||||||||||||||||
Long-term debt and finance lease liabilities |
36,335 | 773 | 8.56 | % | 152,760 | 2,668 | 7.01 | % | |||||||||||||||||||||||||||||||||
Total interest-bearing liabilities |
$ | 47,559,339 | $ | 481,185 | 4.07 | % | $ | 42,026,844 | $ | 339,388 | 3.24 | % | |||||||||||||||||||||||||||||
Noninterest-bearing liabilities and stockholders’ equity: |
|||||||||||||||||||||||||||||||||||||||||
Demand deposits |
14,664,789 | 16,926,937 | |||||||||||||||||||||||||||||||||||||||
Accrued expenses and other liabilities |
1,877,572 | 2,102,590 | |||||||||||||||||||||||||||||||||||||||
Stockholders’ equity |
7,087,500 | 6,440,996 | |||||||||||||||||||||||||||||||||||||||
Total liabilities and stockholders’ equity |
$ | 71,189,200 | $ | 67,497,367 | |||||||||||||||||||||||||||||||||||||
Interest rate spread |
2.04 | % | 2.43 | % | |||||||||||||||||||||||||||||||||||||
Net interest income and net interest margin |
$ | 553,229 | 3.27 | % | $ | 566,746 | 3.55 | % | |||||||||||||||||||||||||||||||||
| EAST WEST BANCORP, INC. AND SUBSIDIARIES | |||||||||||||||||||||||||||||||||||||||||
| YEAR-TO-DATE AVERAGE BALANCES, YIELDS AND RATES | |||||||||||||||||||||||||||||||||||||||||
| ($ in thousands) | |||||||||||||||||||||||||||||||||||||||||
| (unaudited) | |||||||||||||||||||||||||||||||||||||||||
| Table 8 | |||||||||||||||||||||||||||||||||||||||||
| Six Months Ended | |||||||||||||||||||||||||||||||||||||||||
| June 30, 2024 | June 30, 2023 | ||||||||||||||||||||||||||||||||||||||||
| Average | Average | Average | Average | ||||||||||||||||||||||||||||||||||||||
| Balance | Interest | Yield/Rate (1) |
Balance | Interest | Yield/Rate (1) |
||||||||||||||||||||||||||||||||||||
Assets |
|||||||||||||||||||||||||||||||||||||||||
Interest-earning assets: |
|||||||||||||||||||||||||||||||||||||||||
Interest-bearing cash and deposits with banks |
$ | 4,960,016 | $ | 123,788 | 5.02 | % | $ | 4,353,658 | $ | 96,642 | 4.48 | % | |||||||||||||||||||||||||||||
Assets purchased under resale agreements (2) |
605,330 | 8,000 | 2.66 | % | 665,229 | 8,472 | 2.57 | % | |||||||||||||||||||||||||||||||||
| Debt securities: | |||||||||||||||||||||||||||||||||||||||||
| AFS debt securities | 7,524,158 | 162,100 | 4.33 | % | 6,183,522 | 109,489 | 3.57 | % | |||||||||||||||||||||||||||||||||
| HTM debt securities | 2,945,918 | 25,024 | 1.71 | % | 2,989,695 | 25,412 | 1.71 | % | |||||||||||||||||||||||||||||||||
| Total debt securities | 10,470,076 | 187,124 | 3.59 | % | 9,173,217 | 134,901 | 2.97 | % | |||||||||||||||||||||||||||||||||
Loans: |
|||||||||||||||||||||||||||||||||||||||||
C&I |
16,230,641 | 648,458 | 8.03 | % | 15,322,480 | 563,372 | 7.41 | % | |||||||||||||||||||||||||||||||||
CRE |
20,342,200 | 647,193 | 6.40 | % | 19,404,599 | 583,185 | 6.06 | % | |||||||||||||||||||||||||||||||||
Residential mortgage |
15,294,601 | 437,640 | 5.75 | % | 13,706,798 | 351,529 | 5.17 | % | |||||||||||||||||||||||||||||||||
Other consumer |
54,372 | 1,539 | 5.69 | % | 68,840 | 1,564 | 4.58 | % | |||||||||||||||||||||||||||||||||
Total loans (3) |
51,921,814 | 1,734,830 | 6.72 | % | 48,502,717 | 1,499,650 | 6.24 | % | |||||||||||||||||||||||||||||||||
FHLB and FRB stock |
128,812 | 4,289 | 6.70 | % | 84,852 | 1,975 | 4.69 | % | |||||||||||||||||||||||||||||||||
Total interest-earning assets |
$ | 68,086,048 | $ | 2,058,031 | 6.08 | % | $ | 62,779,673 | $ | 1,741,640 | 5.59 | % | |||||||||||||||||||||||||||||
Noninterest-earning assets: |
|||||||||||||||||||||||||||||||||||||||||
Cash and due from banks |
457,070 | 595,022 | |||||||||||||||||||||||||||||||||||||||
Allowance for loan losses |
(677,231) | (611,358) | |||||||||||||||||||||||||||||||||||||||
Other assets |
3,567,911 | 3,548,733 | |||||||||||||||||||||||||||||||||||||||
Total assets |
$ | 71,433,798 | $ | 66,312,070 | |||||||||||||||||||||||||||||||||||||
Liabilities and Stockholders’ Equity |
|||||||||||||||||||||||||||||||||||||||||
Interest-bearing liabilities: |
|||||||||||||||||||||||||||||||||||||||||
Checking deposits |
$ | 7,581,615 | $ | 106,501 | 2.82 | % | $ | 7,469,621 | $ | 72,745 | 1.96 | % | |||||||||||||||||||||||||||||
Money market deposits |
13,680,220 | 270,066 | 3.97 | % | 10,844,992 | 162,521 | 3.02 | % | |||||||||||||||||||||||||||||||||
Savings deposits |
1,802,405 | 9,124 | 1.02 | % | 2,317,702 | 7,632 | 0.66 | % | |||||||||||||||||||||||||||||||||
Time deposits |
20,187,490 | 451,990 | 4.50 | % | 15,674,457 | 261,373 | 3.36 | % | |||||||||||||||||||||||||||||||||
BTFP, short-term borrowings and federal funds purchased |
1,933,707 | 42,138 | 4.38 | % | 2,666,249 | 57,857 | 4.38 | % | |||||||||||||||||||||||||||||||||
FHLB advances |
2,027,474 | 56,579 | 5.61 | % | 248,619 | 6,430 | 5.22 | % | |||||||||||||||||||||||||||||||||
| Repurchase agreements | 3,327 | 93 | 5.62 | % | 60,931 | 1,263 | 4.18 | % | |||||||||||||||||||||||||||||||||
Long-term debt and finance lease liabilities |
81,076 | 3,172 | 7.87 | % | 152,591 | 5,212 | 6.89 | % | |||||||||||||||||||||||||||||||||
Total interest-bearing liabilities |
$ | 47,297,314 | $ | 939,663 | 4.00 | % | $ | 39,435,162 | $ | 575,033 | 2.94 | % | |||||||||||||||||||||||||||||
Noninterest-bearing liabilities and stockholders’ equity: |
|||||||||||||||||||||||||||||||||||||||||
Demand deposits |
14,809,871 | 18,310,770 | |||||||||||||||||||||||||||||||||||||||
Accrued expenses and other liabilities |
2,286,584 | 2,253,266 | |||||||||||||||||||||||||||||||||||||||
Stockholders’ equity |
7,040,029 | 6,312,872 | |||||||||||||||||||||||||||||||||||||||
Total liabilities and stockholders’ equity |
$ | 71,433,798 | $ | 66,312,070 | |||||||||||||||||||||||||||||||||||||
Interest rate spread |
2.08 | % | 2.65 | % | |||||||||||||||||||||||||||||||||||||
Net interest income and net interest margin |
$ | 1,118,368 | 3.30 | % | $ | 1,166,607 | 3.75 | % | |||||||||||||||||||||||||||||||||
| EAST WEST BANCORP, INC. AND SUBSIDIARIES | ||||||||||||||||||||||||||||||||||||||
| SELECTED RATIOS | ||||||||||||||||||||||||||||||||||||||
| (unaudited) | ||||||||||||||||||||||||||||||||||||||
| Table 9 | ||||||||||||||||||||||||||||||||||||||
Three Months Ended (1) |
June 30, 2024
Basis Point Change
|
|||||||||||||||||||||||||||||||||||||
| June 30, 2024 |
March 31, 2024 |
June 30, 2023 |
Qtr-o-Qtr | Yr-o-Yr | ||||||||||||||||||||||||||||||||||
Return on average assets |
1.63 | % | 1.60 | % | 1.85 | % | 3 | bps | (22) | bps | ||||||||||||||||||||||||||||
Adjusted return on average assets (2) |
1.64 | % | 1.64 | % | 1.85 | % | — | (21) | ||||||||||||||||||||||||||||||
| Return on average common equity | 16.36 | % | 16.40 | % | 19.43 | % | (4) | (307) | ||||||||||||||||||||||||||||||
Adjusted return on average common equity (2) |
16.43 | % | 16.81 | % | 19.43 | % | (38) | (300) | ||||||||||||||||||||||||||||||
Return on average TCE (3) |
17.54 | % | 17.60 | % | 21.01 | % | (6) | (347) | ||||||||||||||||||||||||||||||
Adjusted return on average TCE (3) |
17.62 | % | 18.05 | % | 21.01 | % | (43) | (339) | ||||||||||||||||||||||||||||||
Interest rate spread |
2.04 | % | 2.12 | % | 2.43 | % | (8) | (39) | ||||||||||||||||||||||||||||||
Net interest margin |
3.27 | % | 3.34 | % | 3.55 | % | (7) | (28) | ||||||||||||||||||||||||||||||
Average loan yield |
6.73 | % | 6.71 | % | 6.33 | % | 2 | 40 | ||||||||||||||||||||||||||||||
Yield on average interest-earning assets |
6.11 | % | 6.04 | % | 5.67 | % | 7 | 44 | ||||||||||||||||||||||||||||||
Average cost of interest-bearing deposits |
3.94 | % | 3.85 | % | 3.09 | % | 9 | 85 | ||||||||||||||||||||||||||||||
Average cost of deposits |
2.96 | % | 2.84 | % | 2.12 | % | 12 | 84 | ||||||||||||||||||||||||||||||
Average cost of funds |
3.11 | % | 2.97 | % | 2.31 | % | 14 | 80 | ||||||||||||||||||||||||||||||
Adjusted noninterest expense/average assets (4) |
1.23 | % | 1.25 | % | 1.22 | % | (2) | 1 | ||||||||||||||||||||||||||||||
Efficiency ratio |
37.06 | % | 38.33 | % | 40.56 | % | (127) | (350) | ||||||||||||||||||||||||||||||
Adjusted efficiency ratio (4) |
34.25 | % | 34.68 | % | 31.83 | % | (43) | bps | 242 | bps | ||||||||||||||||||||||||||||
Six Months Ended (1) |
June 30, 2024 Basis Point Change |
|||||||||||||||||||||||||||||||||||||
| June 30, 2024 |
June 30, 2023 |
Yr-o-Yr | ||||||||||||||||||||||||||||||||||||
Return on average assets |
1.61 | % | 1.93 | % | (32) | bps | ||||||||||||||||||||||||||||||||
Adjusted return on average assets (2) |
1.64 | % | 1.95 | % | (31) | |||||||||||||||||||||||||||||||||
| Return on average common equity | 16.38 | % | 20.27 | % | (389) | |||||||||||||||||||||||||||||||||
Adjusted return on average common equity (2) |
16.62 | % | 20.49 | % | (387) | |||||||||||||||||||||||||||||||||
Return on average TCE (3) |
17.57 | % | 21.95 | % | (438) | |||||||||||||||||||||||||||||||||
Adjusted return on average TCE (3) |
17.83 | % | 22.19 | % | (436) | |||||||||||||||||||||||||||||||||
Interest rate spread |
2.08 | % | 2.65 | % | (57) | |||||||||||||||||||||||||||||||||
Net interest margin |
3.30 | % | 3.75 | % | (45) | |||||||||||||||||||||||||||||||||
Average loan yield |
6.72 | % | 6.24 | % | 48 | |||||||||||||||||||||||||||||||||
Yield on average interest-earning assets |
6.08 | % | 5.59 | % | 49 | |||||||||||||||||||||||||||||||||
Average cost of interest-bearing deposits |
3.89 | % | 2.80 | % | 109 | |||||||||||||||||||||||||||||||||
Average cost of deposits |
2.90 | % | 1.86 | % | 104 | |||||||||||||||||||||||||||||||||
Average cost of funds |
3.04 | % | 2.01 | % | 103 | |||||||||||||||||||||||||||||||||
Adjusted noninterest expense/average assets (4) |
1.24 | % | 1.25 | % | (1) | |||||||||||||||||||||||||||||||||
Efficiency ratio |
37.70 | % | 36.79 | % | 91 | |||||||||||||||||||||||||||||||||
Adjusted efficiency ratio (4) |
34.47 | % | 31.13 | % | 334 | bps | ||||||||||||||||||||||||||||||||
| EAST WEST BANCORP, INC. AND SUBSIDIARIES | |||||||||||||||||||||||||||||||||||||||||||||||||||||
| ALLOWANCE FOR LOAN LOSSES & OFF-BALANCE SHEET CREDIT EXPOSURES | |||||||||||||||||||||||||||||||||||||||||||||||||||||
| ($ in thousands) | |||||||||||||||||||||||||||||||||||||||||||||||||||||
| (unaudited) | |||||||||||||||||||||||||||||||||||||||||||||||||||||
| Table 10 | |||||||||||||||||||||||||||||||||||||||||||||||||||||
| Three Months Ended June 30, 2024 | |||||||||||||||||||||||||||||||||||||||||||||||||||||
| Commercial | Consumer | ||||||||||||||||||||||||||||||||||||||||||||||||||||
| CRE | Residential Mortgage | ||||||||||||||||||||||||||||||||||||||||||||||||||||
| ($ in thousands) | C&I | CRE | Multi-Family Residential | Construction and Land | Single-Family Residential | HELOCs | Other Consumer | Total | |||||||||||||||||||||||||||||||||||||||||||||
Allowance for loan losses, March 31, 2024 |
$ | 373,631 | $ | 187,460 | $ | 37,418 | $ | 10,819 | $ | 55,922 | $ | 3,563 | $ | 1,467 | $ | 670,280 | |||||||||||||||||||||||||||||||||||||
Provision for (reversal of) credit losses on loans |
(a) | 17,783 | 18,287 | 2,628 | 4,422 | (6,366) | (232) | 240 | 36,762 | ||||||||||||||||||||||||||||||||||||||||||||
| Gross charge-offs | (13,134) | (11,103) | — | (920) | (35) | — | (130) | (25,322) | |||||||||||||||||||||||||||||||||||||||||||||
| Gross recoveries | 1,817 | 150 | 208 | 1 | 2 | 9 | — | 2,187 | |||||||||||||||||||||||||||||||||||||||||||||
| Total net (charge-offs) recoveries | (11,317) | (10,953) | 208 | (919) | (33) | 9 | (130) | (23,135) | |||||||||||||||||||||||||||||||||||||||||||||
| Foreign currency translation adjustment | (113) | — | — | — | — | — | — | (113) | |||||||||||||||||||||||||||||||||||||||||||||
Allowance for loan losses, June 30, 2024 |
$ | 379,984 | $ | 194,794 | $ | 40,254 | $ | 14,322 | $ | 49,523 | $ | 3,340 | $ | 1,577 | $ | 683,794 | |||||||||||||||||||||||||||||||||||||
| Three Months Ended March 31, 2024 | |||||||||||||||||||||||||||||||||||||||||||||||||||||
| Commercial | Consumer | ||||||||||||||||||||||||||||||||||||||||||||||||||||
| CRE | Residential Mortgage | ||||||||||||||||||||||||||||||||||||||||||||||||||||
| ($ in thousands) | C&I | CRE | Multi-Family Residential | Construction and Land | Single-Family Residential | HELOCs | Other Consumer | Total | |||||||||||||||||||||||||||||||||||||||||||||
Allowance for loan losses, December 31, 2023 |
$ | 392,685 | $ | 170,592 | $ | 34,375 | $ | 10,469 | $ | 55,018 | $ | 3,947 | $ | 1,657 | $ | 668,743 | |||||||||||||||||||||||||||||||||||||
| Provision for (reversal of) credit losses on loans | (a) | 275 | 19,132 | 3,032 | 1,381 | 899 | (432) | (132) | 24,155 | ||||||||||||||||||||||||||||||||||||||||||||
| Gross charge-offs | (20,998) | (2,398) | (6) | (1,224) | — | — | (58) | (24,684) | |||||||||||||||||||||||||||||||||||||||||||||
| Gross recoveries | 1,710 | 134 | 17 | 193 | 5 | 48 | — | 2,107 | |||||||||||||||||||||||||||||||||||||||||||||
| Total net (charge-offs) recoveries | (19,288) | (2,264) | 11 | (1,031) | 5 | 48 | (58) | (22,577) | |||||||||||||||||||||||||||||||||||||||||||||
| Foreign currency translation adjustment | (41) | — | — | — | — | — | — | (41) | |||||||||||||||||||||||||||||||||||||||||||||
Allowance for loan losses, March 31, 2024 |
$ | 373,631 | $ | 187,460 | $ | 37,418 | $ | 10,819 | $ | 55,922 | $ | 3,563 | $ | 1,467 | $ | 670,280 | |||||||||||||||||||||||||||||||||||||
| Three Months Ended June 30, 2023 | |||||||||||||||||||||||||||||||||||||||||||||||||||||
| Commercial | Consumer | ||||||||||||||||||||||||||||||||||||||||||||||||||||
| CRE | Residential Mortgage | ||||||||||||||||||||||||||||||||||||||||||||||||||||
| ($ in thousands) | C&I | CRE | Multi-Family Residential | Construction and Land | Single-Family Residential | HELOCs | Other Consumer | Total | |||||||||||||||||||||||||||||||||||||||||||||
Allowance for loan losses, March 31, 2023 |
$ | 376,325 | $ | 155,067 | $ | 24,526 | $ | 9,322 | $ | 48,007 | $ | 4,971 | $ | 1,675 | $ | 619,893 | |||||||||||||||||||||||||||||||||||||
| Provision for (reversal of) credit losses on loans | (a) | 5,259 | 15,685 | (1,604) | 1,995 | 3,501 | (444) | (367) | 24,025 | ||||||||||||||||||||||||||||||||||||||||||||
| Gross charge-offs | (7,335) | (2,366) | — | — | — | (6) | (48) | (9,755) | |||||||||||||||||||||||||||||||||||||||||||||
| Gross recoveries | 2,065 | 119 | 16 | 8 | 5 | 5 | — | 2,218 | |||||||||||||||||||||||||||||||||||||||||||||
| Total net (charge-offs) recoveries | (5,270) | (2,247) | 16 | 8 | 5 | (1) | (48) | (7,537) | |||||||||||||||||||||||||||||||||||||||||||||
| Foreign currency translation adjustment | (981) | — | — | — | — | — | — | (981) | |||||||||||||||||||||||||||||||||||||||||||||
Allowance for loan losses, June 30, 2023 |
$ | 375,333 | $ | 168,505 | $ | 22,938 | $ | 11,325 | $ | 51,513 | $ | 4,526 | $ | 1,260 | $ | 635,400 | |||||||||||||||||||||||||||||||||||||
| EAST WEST BANCORP, INC. AND SUBSIDIARIES | |||||||||||||||||||||||||||||||||||||||||||||||||||||
| ALLOWANCE FOR LOAN LOSSES & OFF-BALANCE-SHEET CREDIT EXPOSURES | |||||||||||||||||||||||||||||||||||||||||||||||||||||
| ($ in thousands) | |||||||||||||||||||||||||||||||||||||||||||||||||||||
| (unaudited) | |||||||||||||||||||||||||||||||||||||||||||||||||||||
| Table 10 (continued) | |||||||||||||||||||||||||||||||||||||||||||||||||||||
| Six Months Ended June 30, 2024 | |||||||||||||||||||||||||||||||||||||||||||||||||||||
| Commercial | Consumer | ||||||||||||||||||||||||||||||||||||||||||||||||||||
| CRE | Residential Mortgage | ||||||||||||||||||||||||||||||||||||||||||||||||||||
| ($ in thousands) | C&I | CRE | Multi-Family Residential | Construction and Land | Single-Family Residential | HELOCs | Other Consumer | Total | |||||||||||||||||||||||||||||||||||||||||||||
Allowance for loan losses, January 1, 2024 |
$ | 392,685 | $ | 170,592 | $ | 34,375 | $ | 10,469 | $ | 55,018 | $ | 3,947 | $ | 1,657 | $ | 668,743 | |||||||||||||||||||||||||||||||||||||
Provision for (reversal of) credit losses on loans |
(a) | 18,058 | 37,419 | 5,660 | 5,803 | (5,467) | (664) | 108 | 60,917 | ||||||||||||||||||||||||||||||||||||||||||||
| Gross charge-offs | (34,132) | (13,501) | (6) | (2,144) | (35) | — | (188) | (50,006) | |||||||||||||||||||||||||||||||||||||||||||||
| Gross recoveries | 3,527 | 284 | 225 | 194 | 7 | 57 | — | 4,294 | |||||||||||||||||||||||||||||||||||||||||||||
| Total net (charge-offs) recoveries | (30,605) | (13,217) | 219 | (1,950) | (28) | 57 | (188) | (45,712) | |||||||||||||||||||||||||||||||||||||||||||||
| Foreign currency translation adjustment | (154) | — | — | — | — | — | — | (154) | |||||||||||||||||||||||||||||||||||||||||||||
Allowance for loan losses, June 30, 2024 |
$ | 379,984 | $ | 194,794 | $ | 40,254 | $ | 14,322 | $ | 49,523 | $ | 3,340 | $ | 1,577 | $ | 683,794 | |||||||||||||||||||||||||||||||||||||
| Six Months Ended June 30, 2023 | |||||||||||||||||||||||||||||||||||||||||||||||||||||
| Commercial | Consumer | ||||||||||||||||||||||||||||||||||||||||||||||||||||
| CRE | Residential Mortgage | ||||||||||||||||||||||||||||||||||||||||||||||||||||
| ($ in thousands) | C&I | CRE | Multi-Family Residential | Construction and Land | Single-Family Residential | HELOCs | Other Consumer | Total | |||||||||||||||||||||||||||||||||||||||||||||
Allowance for loan losses, December 31, 2022 |
$ | 371,700 | $ | 149,864 | $ | 23,373 | $ | 9,109 | $ | 35,564 | $ | 4,475 | $ | 1,560 | $ | 595,645 | |||||||||||||||||||||||||||||||||||||
Impact of ASU 2022-02 adoption |
5,683 | 337 | 6 | — | 1 | 1 | — | 6,028 | |||||||||||||||||||||||||||||||||||||||||||||
Allowance for loan losses, January 1, 2023 |
$ | 377,383 | 150,201 | 23,379 | 9,109 | 35,565 | 4,476 | $ | 1,560 | $ | 601,673 | ||||||||||||||||||||||||||||||||||||||||||
| Provision for (reversal of) credit losses on loans | (a) | 4,581 | 20,361 | (469) | 2,205 | 15,943 | 136 | (212) | 42,545 | ||||||||||||||||||||||||||||||||||||||||||||
| Gross charge-offs | (9,235) | (2,372) | — | — | — | (97) | (88) | (11,792) | |||||||||||||||||||||||||||||||||||||||||||||
| Gross recoveries | 3,276 | 315 | 28 | 11 | 5 | 11 | — | 3,646 | |||||||||||||||||||||||||||||||||||||||||||||
| Total net (charge-offs) recoveries | (5,959) | (2,057) | 28 | 11 | 5 | (86) | (88) | (8,146) | |||||||||||||||||||||||||||||||||||||||||||||
| Foreign currency translation adjustment | (672) | — | — | — | — | — | — | (672) | |||||||||||||||||||||||||||||||||||||||||||||
Allowance for loan losses, June 30, 2023 |
$ | 375,333 | $ | 168,505 | $ | 22,938 | $ | 11,325 | $ | 51,513 | $ | 4,526 | $ | 1,260 | $ | 635,400 | |||||||||||||||||||||||||||||||||||||
| Three Months Ended | Six Months Ended | ||||||||||||||||||||||||||||||||||
| ($ in thousands) | June 30, 2024 |
March 31, 2024 |
June 30, 2023 |
June 30, 2024 |
June 30, 2023 |
||||||||||||||||||||||||||||||
| Unfunded Credit Facilities | |||||||||||||||||||||||||||||||||||
Allowance for unfunded credit commitments, beginning of period (1) |
$ | 38,544 | $ | 37,699 | $ | 27,741 | $ | 37,699 | $ | 26,264 | |||||||||||||||||||||||||
Provision for credit losses on unfunded credit commitments |
(b) | 238 | 845 | 1,975 | 1,083 | 3,455 | |||||||||||||||||||||||||||||
| Foreign currency translation adjustment | 1 | — | 12 | 1 | 9 | ||||||||||||||||||||||||||||||
Allowance for unfunded credit commitments, end of period (1) |
$ | 38,783 | $ | 38,544 | $ | 29,728 | $ | 38,783 | $ | 29,728 | |||||||||||||||||||||||||
| Provision for credit losses | (a)+(b) | $ | 37,000 | $ | 25,000 | $ | 26,000 | $ | 62,000 | $ | 46,000 | ||||||||||||||||||||||||
| EAST WEST BANCORP, INC. AND SUBSIDIARIES | |||||||||||||||||||||||
|
CRITICIZED LOANS, NONPERFORMING ASSETS, CREDIT QUALITY RATIOS AND
COMPOSITION OF ALLOWANCE BY PORTFOLIO
|
|||||||||||||||||||||||
| ($ in thousands) | |||||||||||||||||||||||
| (unaudited) | |||||||||||||||||||||||
| Table 11 | |||||||||||||||||||||||
| Criticized Loans | June 30, 2024 | March 31, 2024 | June 30, 2023 | ||||||||||||||||||||
| Special mention loans | $ | 435,679 | $ | 543,573 | $ | 330,741 | |||||||||||||||||
| Classified loans | 644,564 | 651,485 | 481,051 | ||||||||||||||||||||
Total criticized loans (1) |
$ | 1,080,243 | $ | 1,195,058 | $ | 811,792 | |||||||||||||||||
Nonperforming Assets |
June 30, 2024 | March 31, 2024 | June 30, 2023 | ||||||||||||||||||||
| Nonaccrual loans: | |||||||||||||||||||||||
| Commercial: | |||||||||||||||||||||||
| C&I | $ | 66,960 | $ | 48,962 | $ | 61,879 | |||||||||||||||||
| Total CRE | 47,203 | 51,888 | 20,598 | ||||||||||||||||||||
| Consumer: | |||||||||||||||||||||||
| Total residential mortgage | 51,514 | 47,167 | 33,032 | ||||||||||||||||||||
| Other consumer | 205 | 162 | 24 | ||||||||||||||||||||
| Total nonaccrual loans | 165,882 | 148,179 | 115,533 | ||||||||||||||||||||
| Other real estate owned, net | 30,400 | 16,692 | — | ||||||||||||||||||||
| Total nonperforming assets | $ | 196,282 | $ | 164,871 | $ | 115,533 | |||||||||||||||||
| Credit Quality Ratios | June 30, 2024 | March 31, 2024 | June 30, 2023 | ||||||||||||||||||||
| Annualized quarterly net charge-offs to average loans HFI | 0.18 | % | 0.17 | % | 0.06 | % | |||||||||||||||||
| Special mention loans to loans HFI | 0.83 | % | 1.05 | % | 0.66 | % | |||||||||||||||||
| Classified loans to loans HFI | 1.22 | % | 1.25 | % | 0.97 | % | |||||||||||||||||
| Criticized loans to loans HFI | 2.05 | % | 2.30 | % | 1.63 | % | |||||||||||||||||
| Nonperforming assets to total assets | 0.27 | % | 0.23 | % | 0.17 | % | |||||||||||||||||
| Nonaccrual loans to loans HFI | 0.31 | % | 0.29 | % | 0.23 | % | |||||||||||||||||
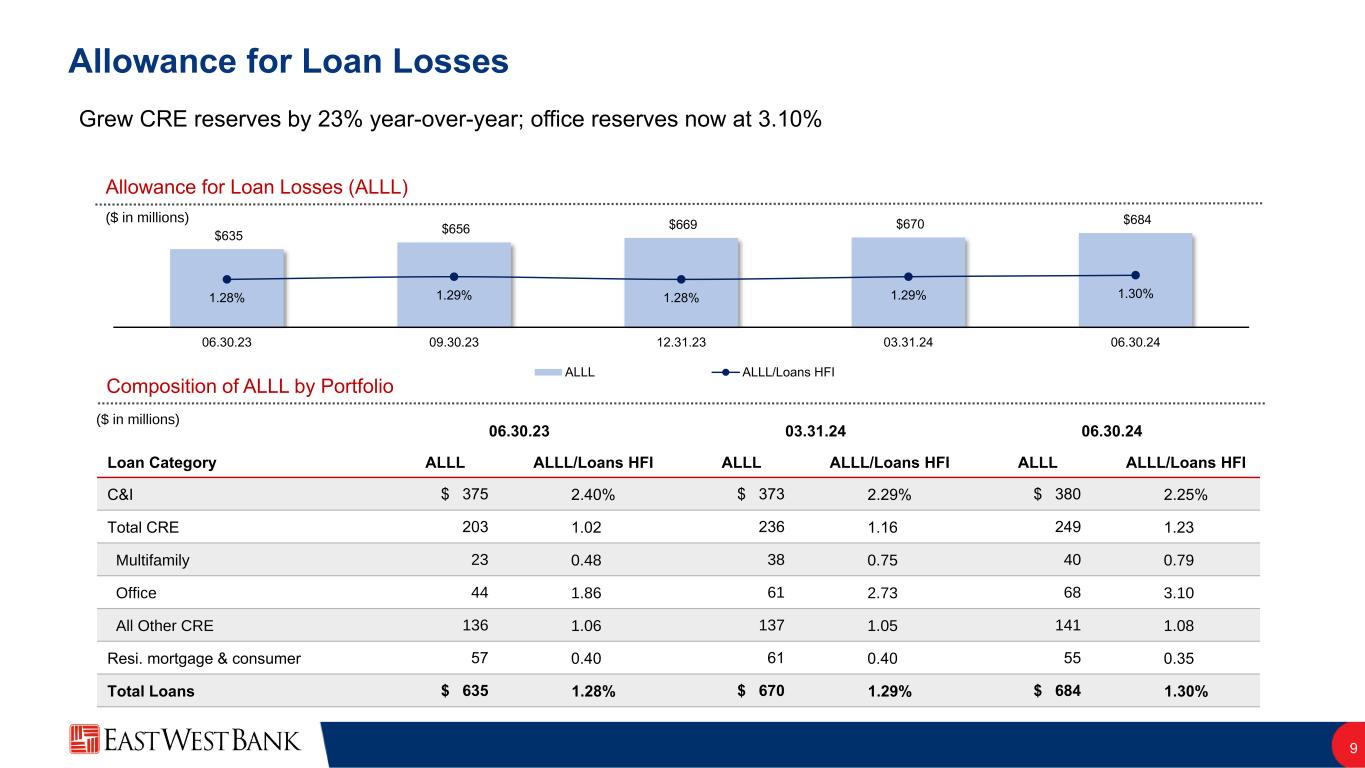
| Allowance for loan losses to loans HFI | 1.30 | % | 1.29 | % | 1.28 | % | |||||||||||||||||
Composition of Allowance (“ALLL”) by Portfolio |
June 30, 2024 | March 31, 2024 | June 30, 2023 | ||||||||||||||||||||||||||||||||||||||
Loan Category |
ALLL |
ALLL/
Loans HFI
|
ALLL |
ALLL/
Loans HFI
|
ALLL |
ALLL/
Loans HFI
|
|||||||||||||||||||||||||||||||||||
C&I |
$ | 379,984 | 2.25 | % | $ | 373,631 | 2.29 | % | $ | 375,333 | 2.40 | % | |||||||||||||||||||||||||||||
Total CRE |
249,370 | 1.23 | 235,697 | 1.16 | 202,768 | 1.02 | |||||||||||||||||||||||||||||||||||
Multifamily |
40,254 | 0.79 | 37,418 | 0.75 | 22,938 | 0.48 | |||||||||||||||||||||||||||||||||||
Office |
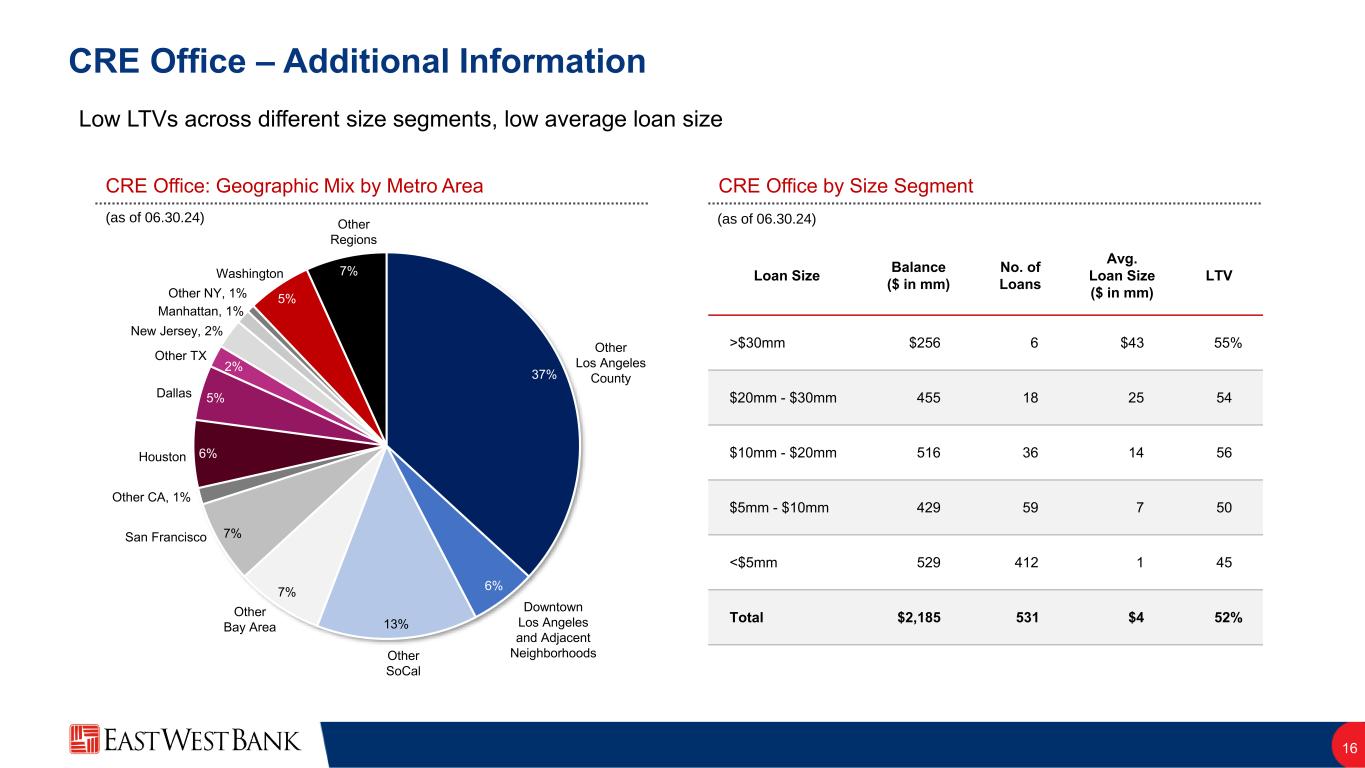
67,772 | 3.10 | 61,271 | 2.73 | 43,680 | 1.86 | |||||||||||||||||||||||||||||||||||
All other CRE |
141,344 | 1.08 | 137,008 | 1.05 | 136,150 | 1.06 | |||||||||||||||||||||||||||||||||||
Residential mortgage & consumer |
54,440 | 0.35 | 60,952 | 0.40 | 57,299 | 0.40 | |||||||||||||||||||||||||||||||||||
Total loans |
$ | 683,794 | 1.30 | % | $ | 670,280 | 1.29 | % | $ | 635,400 | 1.28 | % | |||||||||||||||||||||||||||||
| EAST WEST BANCORP, INC. AND SUBSIDIARIES | ||||||||||||||||||||||||||||||||||||||
| GAAP TO NON-GAAP RECONCILIATION | ||||||||||||||||||||||||||||||||||||||
| ($ in thousands) | ||||||||||||||||||||||||||||||||||||||
| (unaudited) | ||||||||||||||||||||||||||||||||||||||
| Table 12 | ||||||||||||||||||||||||||||||||||||||
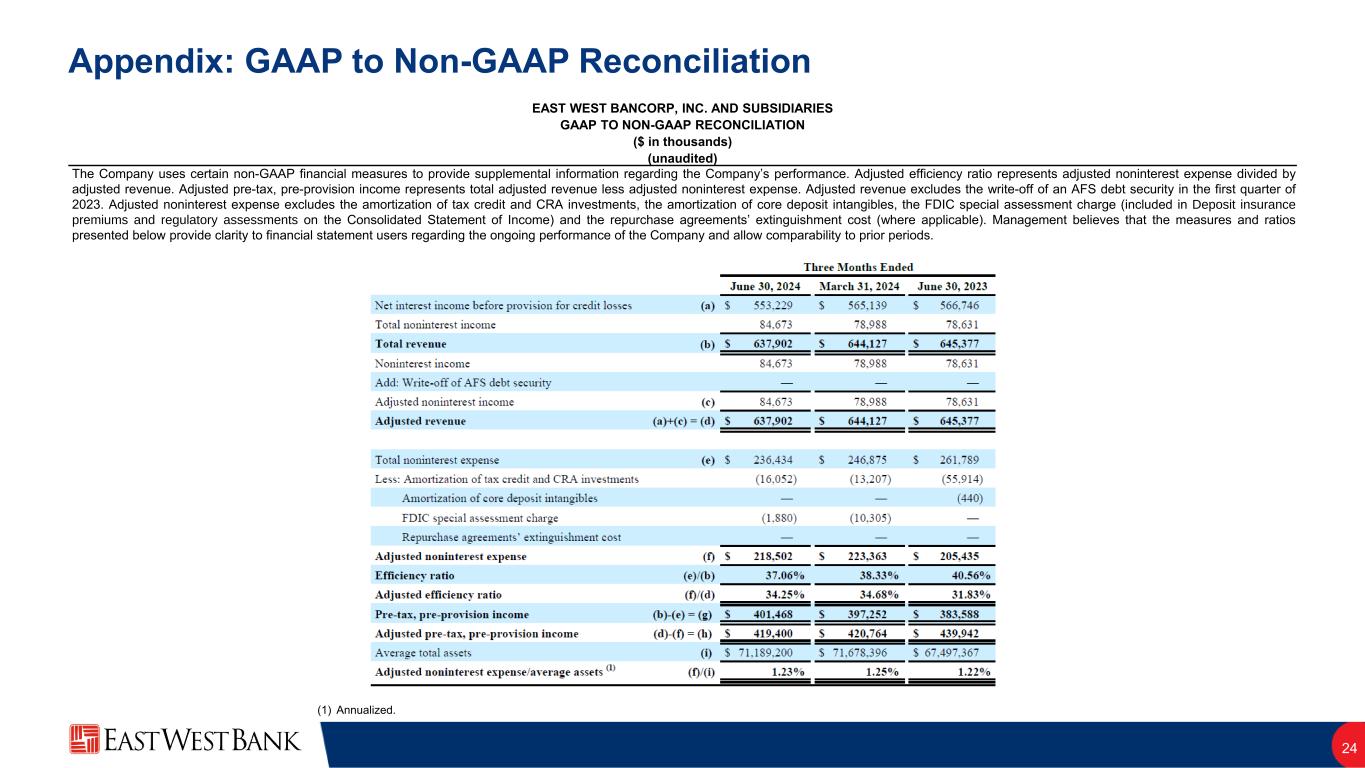
The Company uses certain non-GAAP financial measures to provide supplemental information regarding the Company’s performance. Adjusted efficiency ratio represents adjusted noninterest expense divided by adjusted revenue. Adjusted pre-tax, pre-provision income represents total adjusted revenue less adjusted noninterest expense. Adjusted revenue excludes the write-off of an AFS debt security in the first quarter of 2023. Adjusted noninterest expense excludes the amortization of tax credit and CRA investments, the amortization of core deposit intangibles, the FDIC special assessment charge (included in Deposit insurance premiums and regulatory assessments on the Consolidated Statement of Income) and the repurchase agreements’ extinguishment cost (where applicable). Management believes that the measures and ratios presented below provide clarity to financial statement users regarding the ongoing performance of the Company and allow comparability to prior periods. | ||||||||||||||||||||||||||||||||||||||
| Three Months Ended | Six Months Ended | |||||||||||||||||||||||||||||||||||||
| June 30, 2024 | March 31, 2024 | June 30, 2023 | June 30, 2024 | June 30, 2023 | ||||||||||||||||||||||||||||||||||
| Net interest income before provision for credit losses | (a) | $ | 553,229 | $ | 565,139 | $ | 566,746 | $ | 1,118,368 | $ | 1,166,607 | |||||||||||||||||||||||||||
| Total noninterest income | 84,673 | 78,988 | 78,631 | 163,661 | 138,609 | |||||||||||||||||||||||||||||||||
| Total revenue | (b) | $ | 637,902 | $ | 644,127 | $ | 645,377 | $ | 1,282,029 | $ | 1,305,216 | |||||||||||||||||||||||||||
| Noninterest income | 84,673 | 78,988 | 78,631 | 163,661 | 138,609 | |||||||||||||||||||||||||||||||||
Add: Write-off of AFS debt security |
— | — | — | — | 10,000 | |||||||||||||||||||||||||||||||||
| Adjusted noninterest income | (c) | 84,673 | 78,988 | 78,631 | 163,661 | 148,609 | ||||||||||||||||||||||||||||||||
| Adjusted revenue | (a)+(c) = (d) | $ | 637,902 | $ | 644,127 | $ | 645,377 | $ | 1,282,029 | $ | 1,315,216 | |||||||||||||||||||||||||||
| Total noninterest expense | (e) | $ | 236,434 | $ | 246,875 | $ | 261,789 | 483,309 | $ | 480,236 | ||||||||||||||||||||||||||||
Less: Amortization of tax credit and CRA investments |
(16,052) | (13,207) | (55,914) | (29,259) | (66,024) | |||||||||||||||||||||||||||||||||
| Amortization of core deposit intangibles | — | — | (440) | — | (881) | |||||||||||||||||||||||||||||||||
FDIC special assessment charge |
(1,880) | (10,305) | — | (12,185) | — | |||||||||||||||||||||||||||||||||
| Repurchase agreements’ extinguishment cost | — | — | — | — | (3,872) | |||||||||||||||||||||||||||||||||
| Adjusted noninterest expense | (f) | $ | 218,502 | $ | 223,363 | $ | 205,435 | $ | 441,865 | $ | 409,459 | |||||||||||||||||||||||||||
| Efficiency ratio | (e)/(b) | 37.06 | % | 38.33 | % | 40.56 | % | 37.70 | % | 36.79 | % | |||||||||||||||||||||||||||
| Adjusted efficiency ratio | (f)/(d) | 34.25 | % | 34.68 | % | 31.83 | % | 34.47 | % | 31.13 | % | |||||||||||||||||||||||||||
Pre-tax, pre-provision income |
(b)-(e) = (g) |
$ | 401,468 | $ | 397,252 | $ | 383,588 | $ | 798,720 | $ | 824,980 | |||||||||||||||||||||||||||
| Adjusted pre-tax, pre-provision income | (d)-(f) = (h) |
$ | 419,400 | $ | 420,764 | $ | 439,942 | $ | 840,164 | $ | 905,757 | |||||||||||||||||||||||||||
| Average total assets | (i) |
$ | 71,189,200 | $ | 71,678,396 | $ | 67,497,367 | $ | 71,433,798 | $ | 66,312,070 | |||||||||||||||||||||||||||
Adjusted noninterest expense/average assets (1) |
(f)/(i) | 1.23 | % | 1.25 | % | 1.22 | % | 1.24 | % | 1.25 | % | |||||||||||||||||||||||||||
| EAST WEST BANCORP, INC. AND SUBSIDIARIES | ||||||||||||||||||||||||||
| GAAP TO NON-GAAP RECONCILIATION | ||||||||||||||||||||||||||
| ($ in thousands) | ||||||||||||||||||||||||||
| (unaudited) | ||||||||||||||||||||||||||
| Table 13 | ||||||||||||||||||||||||||
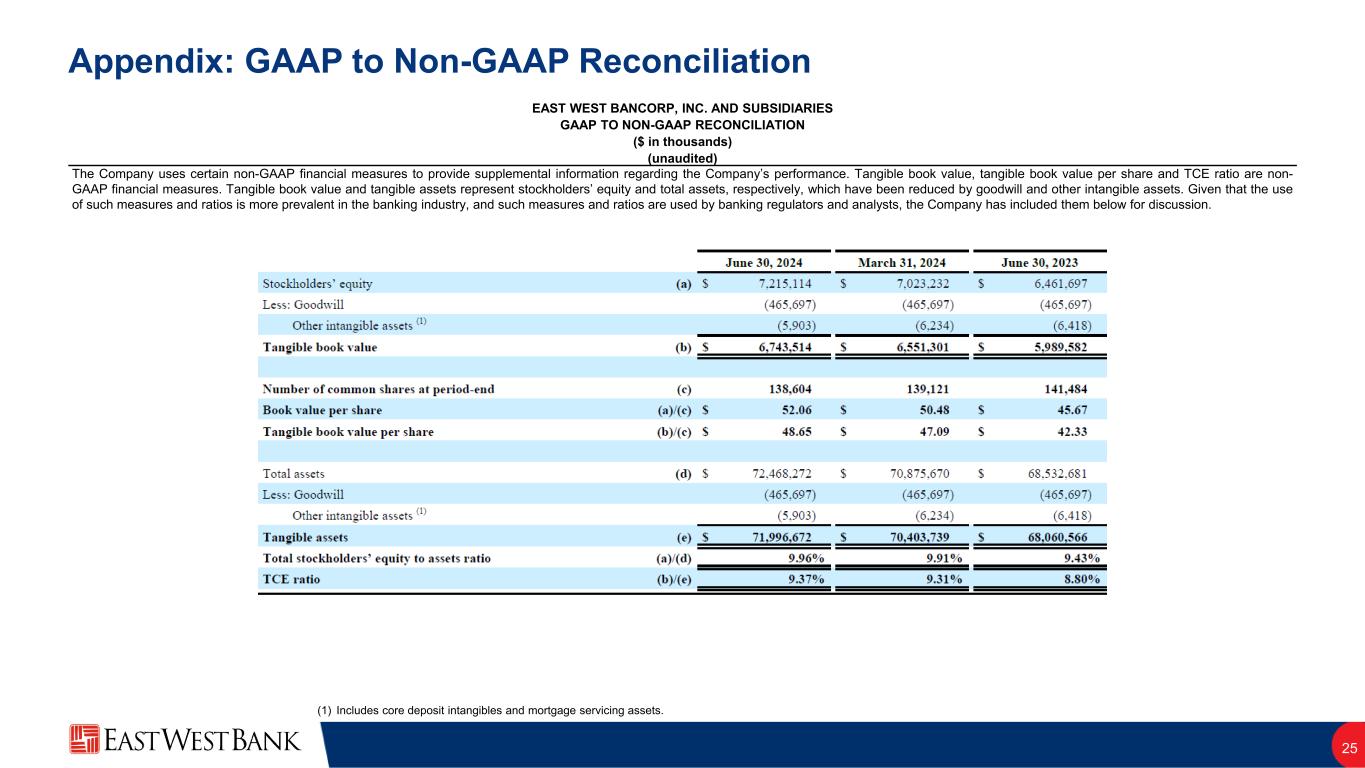
| The Company uses certain non-GAAP financial measures to provide supplemental information regarding the Company’s performance. Tangible book value, tangible book value per share and TCE ratio are non-GAAP financial measures. Tangible book value and tangible assets represent stockholders’ equity and total assets, respectively, which have been reduced by goodwill and other intangible assets. Given that the use of such measures and ratios is more prevalent in the banking industry, and such measures and ratios are used by banking regulators and analysts, the Company has included them below for discussion. | ||||||||||||||||||||||||||
| June 30, 2024 | March 31, 2024 | June 30, 2023 | ||||||||||||||||||||||||
| Stockholders’ equity | (a) | $ | 7,215,114 | $ | 7,023,232 | $ | 6,461,697 | |||||||||||||||||||
| Less: Goodwill | (465,697) | (465,697) | (465,697) | |||||||||||||||||||||||
Other intangible assets (1) |
(5,903) | (6,234) | (6,418) | |||||||||||||||||||||||
| Tangible book value | (b) | $ | 6,743,514 | $ | 6,551,301 | $ | 5,989,582 | |||||||||||||||||||
| Number of common shares at period-end | (c) | 138,604 | 139,121 | 141,484 | ||||||||||||||||||||||
| Book value per share | (a)/(c) | $ | 52.06 | $ | 50.48 | $ | 45.67 | |||||||||||||||||||
| Tangible book value per share | (b)/(c) | $ | 48.65 | $ | 47.09 | $ | 42.33 | |||||||||||||||||||
| Total assets | (d) | $ | 72,468,272 | $ | 70,875,670 | $ | 68,532,681 | |||||||||||||||||||
| Less: Goodwill | (465,697) | (465,697) | (465,697) | |||||||||||||||||||||||
Other intangible assets (1) |
(5,903) | (6,234) | (6,418) | |||||||||||||||||||||||
| Tangible assets | (e) | $ | 71,996,672 | $ | 70,403,739 | $ | 68,060,566 | |||||||||||||||||||
| Total stockholders’ equity to assets ratio | (a)/(d) | 9.96 | % | 9.91 | % | 9.43 | % | |||||||||||||||||||
| TCE ratio | (b)/(e) | 9.37 | % | 9.31 | % | 8.80 | % | |||||||||||||||||||
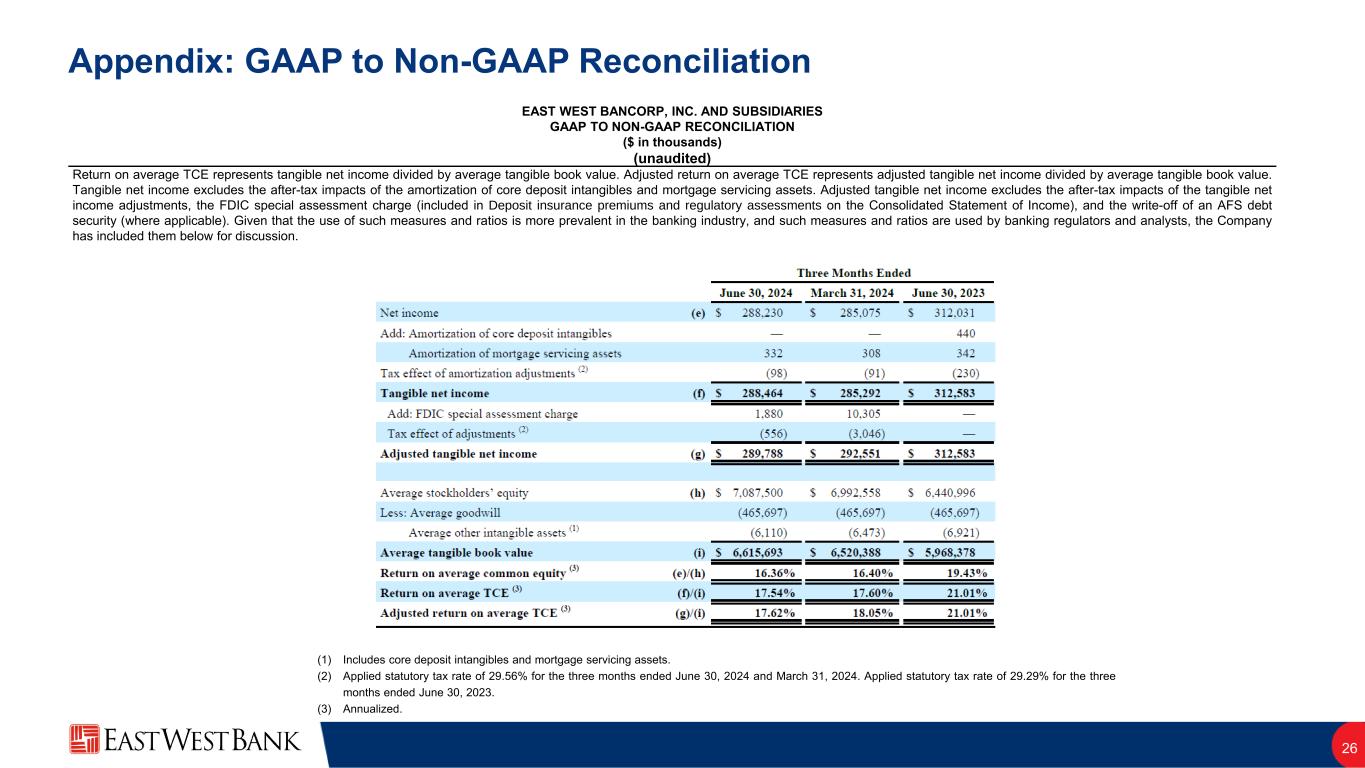
Return on average TCE represents tangible net income divided by average tangible book value. Adjusted return on average TCE represents adjusted tangible net income divided by average tangible book value. Tangible net income excludes the after-tax impacts of the amortization of core deposit intangibles and mortgage servicing assets. Adjusted tangible net income excludes the after-tax impacts of the tangible net income adjustments, the FDIC special assessment charge (included in Deposit insurance premiums and regulatory assessments on the Consolidated Statement of Income), and the write-off of an AFS debt security (where applicable). Given that the use of such measures and ratios is more prevalent in the banking industry, and such measures and ratios are used by banking regulators and analysts, the Company has included them below for discussion. | ||||||||||||||||||||||||||||||||||||||
| Three Months Ended | Six Months Ended | |||||||||||||||||||||||||||||||||||||
| June 30, 2024 | March 31, 2024 | June 30, 2023 | June 30, 2024 | June 30, 2023 | ||||||||||||||||||||||||||||||||||
| Net income | (e) | $ | 288,230 | $ | 285,075 | $ | 312,031 | $ | 573,305 | $ | 634,470 | |||||||||||||||||||||||||||
| Add: Amortization of core deposit intangibles | — | — | 440 | — | 881 | |||||||||||||||||||||||||||||||||
Amortization of mortgage servicing assets |
332 | 308 | 342 | 640 | 698 | |||||||||||||||||||||||||||||||||
Tax effect of amortization adjustments (2) |
(98) | (91) | (230) | (189) | (463) | |||||||||||||||||||||||||||||||||
| Tangible net income | (f) | $ | 288,464 | $ | 285,292 | $ | 312,583 | $ | 573,756 | $ | 635,586 | |||||||||||||||||||||||||||
| Add: FDIC special assessment charge | 1,880 | 10,305 | — | 12,185 | — | |||||||||||||||||||||||||||||||||
Add: Write-off of AFS debt security |
— | — | — | — | 10,000 | |||||||||||||||||||||||||||||||||
Tax effect of adjustments (2) |
(556) | (3,046) | — | (3,602) | (2,929) | |||||||||||||||||||||||||||||||||
| Adjusted tangible net income | (g) | $ | 289,788 | $ | 292,551 | $ | 312,583 | $ | 582,339 | $ | 642,657 | |||||||||||||||||||||||||||
| Average stockholders’ equity | (h) | $ | 7,087,500 | $ | 6,992,558 | $ | 6,440,996 | $ | 7,040,029 | $ | 6,312,872 | |||||||||||||||||||||||||||
| Less: Average goodwill | (465,697) | (465,697) | (465,697) | (465,697) | (465,697) | |||||||||||||||||||||||||||||||||
Average other intangible assets (1) |
(6,110) | (6,473) | (6,921) | (6,292) | (7,306) | |||||||||||||||||||||||||||||||||
| Average tangible book value | (i) | $ | 6,615,693 | $ | 6,520,388 | $ | 5,968,378 | $ | 6,568,040 | $ | 5,839,869 | |||||||||||||||||||||||||||
Return on average common equity (3) |
(e)/(h) | 16.36 | % | 16.40 | % | 19.43 | % | 16.38 | % | 20.27 | % | |||||||||||||||||||||||||||
Return on average TCE (3) |
(f)/(i) | 17.54 | % | 17.60 | % | 21.01 | % | 17.57 | % | 21.95 | % | |||||||||||||||||||||||||||
Adjusted return on average TCE (3) |
(g)/(i) | 17.62 | % | 18.05 | % | 21.01 | % | 17.83 | % | 22.19 | % | |||||||||||||||||||||||||||
| EAST WEST BANCORP, INC. AND SUBSIDIARIES | ||||||||||||||||||||||||||||||||||||||
| GAAP TO NON-GAAP RECONCILIATION | ||||||||||||||||||||||||||||||||||||||
| ($ and shares in thousands, except for per share data) | ||||||||||||||||||||||||||||||||||||||
| (unaudited) | ||||||||||||||||||||||||||||||||||||||
| Table 14 | ||||||||||||||||||||||||||||||||||||||
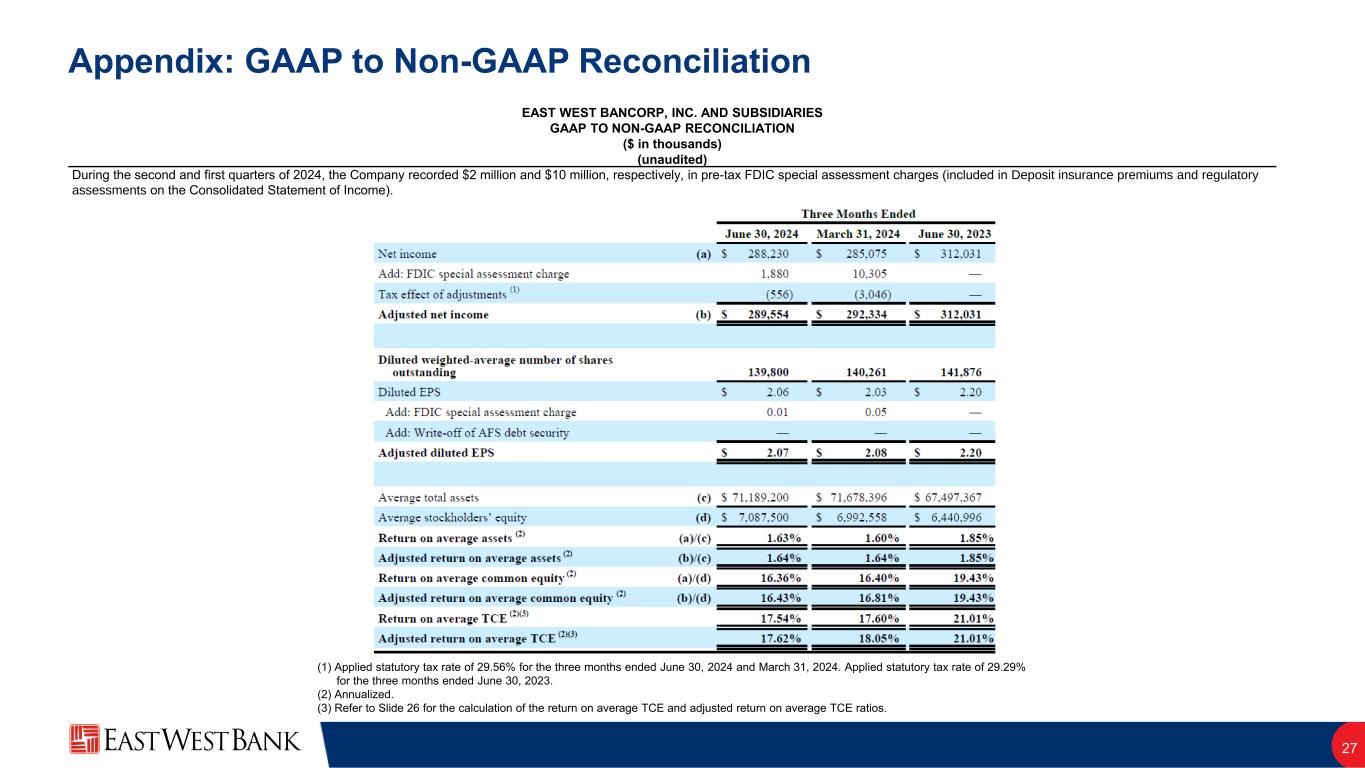
During the second and first quarters of 2024, the Company recorded $2 million and $10 million, respectively, in pre-tax FDIC special assessment charges (included in Deposit insurance premiums and regulatory assessments on the Consolidated Statement of Income). During the first quarter of 2023, the Company recorded a $10 million pre-tax impairment write-off of an AFS debt security. | ||||||||||||||||||||||||||||||||||||||
| Three Months Ended | Six Months Ended |
|||||||||||||||||||||||||||||||||||||
| June 30, 2024 | March 31, 2024 | June 30, 2023 | June 30, 2024 | June 30, 2023 | ||||||||||||||||||||||||||||||||||
Net income |
(a) | $ | 288,230 | $ | 285,075 | $ | 312,031 | $ | 573,305 | $ | 634,470 | |||||||||||||||||||||||||||
Add: FDIC special assessment charge |
1,880 | 10,305 | — | 12,185 | — | |||||||||||||||||||||||||||||||||
Add: Write-off of AFS debt security |
— | — | — | — | 10,000 | |||||||||||||||||||||||||||||||||
Tax effect of adjustments (1) |
(556) | (3,046) | — | (3,602) | (2,929) | |||||||||||||||||||||||||||||||||
Adjusted net income |
(b) | $ | 289,554 | $ | 292,334 | $ | 312,031 | $ | 581,888 | $ | 641,541 | |||||||||||||||||||||||||||
| Diluted weighted-average number of shares outstanding | 139,801 | 140,261 | 141,876 | 140,047 | 141,910 | |||||||||||||||||||||||||||||||||
Diluted EPS |
$ | 2.06 | $ | 2.03 | $ | 2.20 | $ | 4.09 | $ | 4.47 | ||||||||||||||||||||||||||||
Add: FDIC special assessment charge |
0.01 | 0.05 | — | 0.06 | — | |||||||||||||||||||||||||||||||||
Add: Write-off of AFS debt security |
— | — | — | — | 0.05 | |||||||||||||||||||||||||||||||||
Adjusted diluted EPS |
$ | 2.07 | $ | 2.08 | $ | 2.20 | $ | 4.15 | $ | 4.52 | ||||||||||||||||||||||||||||
Average total assets |
(c) | $ | 71,189,200 | $ | 71,678,396 | $ | 67,497,367 | $ | 71,433,798 | $ | 66,312,070 | |||||||||||||||||||||||||||
Average stockholders’ equity |
(d) | $ | 7,087,500 | $ | 6,992,558 | $ | 6,440,996 | $ | 7,040,029 | $ | 6,312,872 | |||||||||||||||||||||||||||
Return on average assets (2) |
(a)/(c) | 1.63 | % | 1.60 | % | 1.85 | % | 1.61 | % | 1.93 | % | |||||||||||||||||||||||||||
Adjusted return on average assets (2) |
(b)/(c) | 1.64 | % | 1.64 | % | 1.85 | % | 1.64 | % | 1.95 | % | |||||||||||||||||||||||||||
Return on average common equity (2) |
(a)/(d) | 16.36 | % | 16.40 | % | 19.43 | % | 16.38 | % | 20.27 | % | |||||||||||||||||||||||||||
Adjusted return on average common equity (2) |
(b)/(d) | 16.43 | % | 16.81 | % | 19.43 | % | 16.62 | % | 20.49 | % | |||||||||||||||||||||||||||
Return on average TCE (2)(3) |
17.54 | % | 17.60 | % | 21.01 | % | 17.57 | % | 21.95 | % | ||||||||||||||||||||||||||||
Adjusted return on average TCE (2)(3) |
17.62 | % | 18.05 | % | 21.01 | % | 17.83 | % | 22.19 | % | ||||||||||||||||||||||||||||
