000106915712/312024Q1falsehttp://www.eastwestbank.com/20240331#Lendingfeeshttp://fasb.org/us-gaap/2023#OtherAssetshttp://fasb.org/us-gaap/2023#AccruedLiabilitiesAndOtherLiabilitieshttp://fasb.org/us-gaap/2023#OtherAssetshttp://fasb.org/us-gaap/2023#AccruedLiabilitiesAndOtherLiabilitiesxbrli:sharesiso4217:USDiso4217:USDxbrli:sharesewbc:trustxbrli:pureewbc:securityutr:Boeutr:MMBTUewbc:companyewbc:Contractutr:Qewbc:segment00010691572024-01-012024-03-3100010691572024-04-3000010691572024-03-3100010691572023-12-3100010691572023-01-012023-03-310001069157us-gaap:CommonStockMember2022-12-310001069157us-gaap:CommonStockIncludingAdditionalPaidInCapitalMember2022-12-310001069157us-gaap:RetainedEarningsMember2022-12-310001069157us-gaap:TreasuryStockCommonMember2022-12-310001069157us-gaap:AccumulatedOtherComprehensiveIncomeMember2022-12-3100010691572022-12-310001069157srt:CumulativeEffectPeriodOfAdoptionAdjustmentMemberus-gaap:AccountingStandardsUpdate202202Memberus-gaap:RetainedEarningsMember2022-12-310001069157srt:CumulativeEffectPeriodOfAdoptionAdjustmentMemberus-gaap:AccountingStandardsUpdate202202Member2022-12-310001069157us-gaap:RetainedEarningsMember2023-01-012023-03-310001069157us-gaap:AccumulatedOtherComprehensiveIncomeMember2023-01-012023-03-310001069157us-gaap:CommonStockMember2023-01-012023-03-310001069157us-gaap:CommonStockIncludingAdditionalPaidInCapitalMember2023-01-012023-03-310001069157ewbc:StockCompensationPlansAndAgreementsVariousPlansAndAgreementsMemberus-gaap:CommonStockMember2023-01-012023-03-310001069157ewbc:StockCompensationPlansAndAgreementsVariousPlansAndAgreementsMemberus-gaap:TreasuryStockCommonMember2023-01-012023-03-310001069157ewbc:StockCompensationPlansAndAgreementsVariousPlansAndAgreementsMember2023-01-012023-03-310001069157us-gaap:CommonStockMember2023-03-310001069157us-gaap:CommonStockIncludingAdditionalPaidInCapitalMember2023-03-310001069157us-gaap:RetainedEarningsMember2023-03-310001069157us-gaap:TreasuryStockCommonMember2023-03-310001069157us-gaap:AccumulatedOtherComprehensiveIncomeMember2023-03-3100010691572023-03-310001069157us-gaap:CommonStockMember2023-12-310001069157us-gaap:CommonStockIncludingAdditionalPaidInCapitalMember2023-12-310001069157us-gaap:RetainedEarningsMember2023-12-310001069157us-gaap:TreasuryStockCommonMember2023-12-310001069157us-gaap:AccumulatedOtherComprehensiveIncomeMember2023-12-310001069157srt:CumulativeEffectPeriodOfAdoptionAdjustmentMemberewbc:AccountingStandardsUpdate202302Memberus-gaap:RetainedEarningsMember2023-12-310001069157srt:CumulativeEffectPeriodOfAdoptionAdjustmentMemberewbc:AccountingStandardsUpdate202302Member2023-12-310001069157us-gaap:RetainedEarningsMember2024-01-012024-03-310001069157us-gaap:AccumulatedOtherComprehensiveIncomeMember2024-01-012024-03-310001069157us-gaap:CommonStockMember2024-01-012024-03-310001069157us-gaap:CommonStockIncludingAdditionalPaidInCapitalMember2024-01-012024-03-310001069157ewbc:StockCompensationPlansAndAgreementsVariousPlansAndAgreementsMemberus-gaap:CommonStockMember2024-01-012024-03-310001069157ewbc:StockCompensationPlansAndAgreementsVariousPlansAndAgreementsMemberus-gaap:TreasuryStockCommonMember2024-01-012024-03-310001069157ewbc:StockCompensationPlansAndAgreementsVariousPlansAndAgreementsMember2024-01-012024-03-310001069157us-gaap:CommonStockMemberewbc:StockRepurchasePlanMember2024-01-012024-03-310001069157ewbc:StockRepurchasePlanMemberus-gaap:TreasuryStockCommonMember2024-01-012024-03-310001069157ewbc:StockRepurchasePlanMember2024-01-012024-03-310001069157us-gaap:CommonStockMember2024-03-310001069157us-gaap:CommonStockIncludingAdditionalPaidInCapitalMember2024-03-310001069157us-gaap:RetainedEarningsMember2024-03-310001069157us-gaap:TreasuryStockCommonMember2024-03-310001069157us-gaap:AccumulatedOtherComprehensiveIncomeMember2024-03-310001069157ewbc:AccountingStandardsUpdate202302Member2024-01-010001069157ewbc:RayliantGlobalAdvisorsLimitedMember2023-09-300001069157ewbc:RayliantGlobalAdvisorsLimitedMember2023-07-012023-09-300001069157ewbc:PerformanceBasedRestrictedStockUnitsMembersrt:MinimumMemberewbc:RayliantGlobalAdvisorsLimitedMember2023-07-012023-09-300001069157ewbc:PerformanceBasedRestrictedStockUnitsMembersrt:MaximumMemberewbc:RayliantGlobalAdvisorsLimitedMember2023-07-012023-09-300001069157us-gaap:USTreasurySecuritiesMemberus-gaap:FairValueMeasurementsRecurringMemberus-gaap:FairValueInputsLevel1Member2024-03-310001069157us-gaap:FairValueInputsLevel2Memberus-gaap:USTreasurySecuritiesMemberus-gaap:FairValueMeasurementsRecurringMember2024-03-310001069157us-gaap:FairValueInputsLevel3Memberus-gaap:USTreasurySecuritiesMemberus-gaap:FairValueMeasurementsRecurringMember2024-03-310001069157us-gaap:USTreasurySecuritiesMemberus-gaap:FairValueMeasurementsRecurringMember2024-03-310001069157us-gaap:USGovernmentSponsoredEnterprisesDebtSecuritiesMemberus-gaap:FairValueMeasurementsRecurringMemberus-gaap:FairValueInputsLevel1Member2024-03-310001069157us-gaap:FairValueInputsLevel2Memberus-gaap:USGovernmentSponsoredEnterprisesDebtSecuritiesMemberus-gaap:FairValueMeasurementsRecurringMember2024-03-310001069157us-gaap:FairValueInputsLevel3Memberus-gaap:USGovernmentSponsoredEnterprisesDebtSecuritiesMemberus-gaap:FairValueMeasurementsRecurringMember2024-03-310001069157us-gaap:USGovernmentSponsoredEnterprisesDebtSecuritiesMemberus-gaap:FairValueMeasurementsRecurringMember2024-03-310001069157ewbc:CommercialMortgageBackedSecuritiesIssuedByUSGovernmentAgenciesAndGovernmentSponsoredEnterpriseMemberus-gaap:FairValueMeasurementsRecurringMemberus-gaap:FairValueInputsLevel1Member2024-03-310001069157us-gaap:FairValueInputsLevel2Memberewbc:CommercialMortgageBackedSecuritiesIssuedByUSGovernmentAgenciesAndGovernmentSponsoredEnterpriseMemberus-gaap:FairValueMeasurementsRecurringMember2024-03-310001069157ewbc:CommercialMortgageBackedSecuritiesIssuedByUSGovernmentAgenciesAndGovernmentSponsoredEnterpriseMemberus-gaap:FairValueInputsLevel3Memberus-gaap:FairValueMeasurementsRecurringMember2024-03-310001069157ewbc:CommercialMortgageBackedSecuritiesIssuedByUSGovernmentAgenciesAndGovernmentSponsoredEnterpriseMemberus-gaap:FairValueMeasurementsRecurringMember2024-03-310001069157us-gaap:FairValueMeasurementsRecurringMemberus-gaap:FairValueInputsLevel1Memberewbc:ResidentialMortgageBackedSecuritiesIssuedByUSGovernmentAgenciesAndGovernmentSponsoredEnterpriseMember2024-03-310001069157us-gaap:FairValueInputsLevel2Memberus-gaap:FairValueMeasurementsRecurringMemberewbc:ResidentialMortgageBackedSecuritiesIssuedByUSGovernmentAgenciesAndGovernmentSponsoredEnterpriseMember2024-03-310001069157us-gaap:FairValueInputsLevel3Memberus-gaap:FairValueMeasurementsRecurringMemberewbc:ResidentialMortgageBackedSecuritiesIssuedByUSGovernmentAgenciesAndGovernmentSponsoredEnterpriseMember2024-03-310001069157us-gaap:FairValueMeasurementsRecurringMemberewbc:ResidentialMortgageBackedSecuritiesIssuedByUSGovernmentAgenciesAndGovernmentSponsoredEnterpriseMember2024-03-310001069157us-gaap:USStatesAndPoliticalSubdivisionsMemberus-gaap:FairValueMeasurementsRecurringMemberus-gaap:FairValueInputsLevel1Member2024-03-310001069157us-gaap:FairValueInputsLevel2Memberus-gaap:USStatesAndPoliticalSubdivisionsMemberus-gaap:FairValueMeasurementsRecurringMember2024-03-310001069157us-gaap:FairValueInputsLevel3Memberus-gaap:USStatesAndPoliticalSubdivisionsMemberus-gaap:FairValueMeasurementsRecurringMember2024-03-310001069157us-gaap:USStatesAndPoliticalSubdivisionsMemberus-gaap:FairValueMeasurementsRecurringMember2024-03-310001069157us-gaap:CommercialMortgageBackedSecuritiesMemberus-gaap:FairValueMeasurementsRecurringMemberus-gaap:FairValueInputsLevel1Member2024-03-310001069157us-gaap:FairValueInputsLevel2Memberus-gaap:CommercialMortgageBackedSecuritiesMemberus-gaap:FairValueMeasurementsRecurringMember2024-03-310001069157us-gaap:CommercialMortgageBackedSecuritiesMemberus-gaap:FairValueInputsLevel3Memberus-gaap:FairValueMeasurementsRecurringMember2024-03-310001069157us-gaap:CommercialMortgageBackedSecuritiesMemberus-gaap:FairValueMeasurementsRecurringMember2024-03-310001069157us-gaap:ResidentialMortgageBackedSecuritiesMemberus-gaap:FairValueMeasurementsRecurringMemberus-gaap:FairValueInputsLevel1Member2024-03-310001069157us-gaap:FairValueInputsLevel2Memberus-gaap:ResidentialMortgageBackedSecuritiesMemberus-gaap:FairValueMeasurementsRecurringMember2024-03-310001069157us-gaap:FairValueInputsLevel3Memberus-gaap:ResidentialMortgageBackedSecuritiesMemberus-gaap:FairValueMeasurementsRecurringMember2024-03-310001069157us-gaap:ResidentialMortgageBackedSecuritiesMemberus-gaap:FairValueMeasurementsRecurringMember2024-03-310001069157us-gaap:FairValueMeasurementsRecurringMemberus-gaap:FairValueInputsLevel1Memberus-gaap:CorporateDebtSecuritiesMember2024-03-310001069157us-gaap:FairValueInputsLevel2Memberus-gaap:FairValueMeasurementsRecurringMemberus-gaap:CorporateDebtSecuritiesMember2024-03-310001069157us-gaap:FairValueInputsLevel3Memberus-gaap:FairValueMeasurementsRecurringMemberus-gaap:CorporateDebtSecuritiesMember2024-03-310001069157us-gaap:FairValueMeasurementsRecurringMemberus-gaap:CorporateDebtSecuritiesMember2024-03-310001069157ewbc:ForeignGovernmentBondsMemberus-gaap:FairValueMeasurementsRecurringMemberus-gaap:FairValueInputsLevel1Member2024-03-310001069157us-gaap:FairValueInputsLevel2Memberewbc:ForeignGovernmentBondsMemberus-gaap:FairValueMeasurementsRecurringMember2024-03-310001069157us-gaap:FairValueInputsLevel3Memberewbc:ForeignGovernmentBondsMemberus-gaap:FairValueMeasurementsRecurringMember2024-03-310001069157ewbc:ForeignGovernmentBondsMemberus-gaap:FairValueMeasurementsRecurringMember2024-03-310001069157us-gaap:AssetBackedSecuritiesMemberus-gaap:FairValueMeasurementsRecurringMemberus-gaap:FairValueInputsLevel1Member2024-03-310001069157us-gaap:FairValueInputsLevel2Memberus-gaap:AssetBackedSecuritiesMemberus-gaap:FairValueMeasurementsRecurringMember2024-03-310001069157us-gaap:AssetBackedSecuritiesMemberus-gaap:FairValueInputsLevel3Memberus-gaap:FairValueMeasurementsRecurringMember2024-03-310001069157us-gaap:AssetBackedSecuritiesMemberus-gaap:FairValueMeasurementsRecurringMember2024-03-310001069157us-gaap:CollateralizedLoanObligationsMemberus-gaap:FairValueMeasurementsRecurringMemberus-gaap:FairValueInputsLevel1Member2024-03-310001069157us-gaap:FairValueInputsLevel2Memberus-gaap:CollateralizedLoanObligationsMemberus-gaap:FairValueMeasurementsRecurringMember2024-03-310001069157us-gaap:CollateralizedLoanObligationsMemberus-gaap:FairValueInputsLevel3Memberus-gaap:FairValueMeasurementsRecurringMember2024-03-310001069157us-gaap:CollateralizedLoanObligationsMemberus-gaap:FairValueMeasurementsRecurringMember2024-03-310001069157us-gaap:FairValueMeasurementsRecurringMemberus-gaap:FairValueInputsLevel1Member2024-03-310001069157us-gaap:FairValueInputsLevel2Memberus-gaap:FairValueMeasurementsRecurringMember2024-03-310001069157us-gaap:FairValueInputsLevel3Memberus-gaap:FairValueMeasurementsRecurringMember2024-03-310001069157us-gaap:FairValueMeasurementsRecurringMember2024-03-310001069157us-gaap:InterestRateContractMemberus-gaap:FairValueMeasurementsRecurringMemberus-gaap:FairValueInputsLevel1Member2024-03-310001069157us-gaap:FairValueInputsLevel2Memberus-gaap:InterestRateContractMemberus-gaap:FairValueMeasurementsRecurringMember2024-03-310001069157us-gaap:InterestRateContractMemberus-gaap:FairValueInputsLevel3Memberus-gaap:FairValueMeasurementsRecurringMember2024-03-310001069157us-gaap:InterestRateContractMemberus-gaap:FairValueMeasurementsRecurringMember2024-03-310001069157us-gaap:ForeignExchangeContractMemberus-gaap:FairValueMeasurementsRecurringMemberus-gaap:FairValueInputsLevel1Member2024-03-310001069157us-gaap:FairValueInputsLevel2Memberus-gaap:ForeignExchangeContractMemberus-gaap:FairValueMeasurementsRecurringMember2024-03-310001069157us-gaap:FairValueInputsLevel3Memberus-gaap:ForeignExchangeContractMemberus-gaap:FairValueMeasurementsRecurringMember2024-03-310001069157us-gaap:ForeignExchangeContractMemberus-gaap:FairValueMeasurementsRecurringMember2024-03-310001069157us-gaap:EquityContractMemberus-gaap:FairValueMeasurementsRecurringMemberus-gaap:FairValueInputsLevel1Member2024-03-310001069157us-gaap:FairValueInputsLevel2Memberus-gaap:EquityContractMemberus-gaap:FairValueMeasurementsRecurringMember2024-03-310001069157us-gaap:FairValueInputsLevel3Memberus-gaap:EquityContractMemberus-gaap:FairValueMeasurementsRecurringMember2024-03-310001069157us-gaap:EquityContractMemberus-gaap:FairValueMeasurementsRecurringMember2024-03-310001069157us-gaap:CommodityContractMemberus-gaap:FairValueMeasurementsRecurringMemberus-gaap:FairValueInputsLevel1Member2024-03-310001069157us-gaap:FairValueInputsLevel2Memberus-gaap:CommodityContractMemberus-gaap:FairValueMeasurementsRecurringMember2024-03-310001069157us-gaap:CommodityContractMemberus-gaap:FairValueInputsLevel3Memberus-gaap:FairValueMeasurementsRecurringMember2024-03-310001069157us-gaap:CommodityContractMemberus-gaap:FairValueMeasurementsRecurringMember2024-03-310001069157us-gaap:CreditRiskContractMemberus-gaap:FairValueMeasurementsRecurringMemberus-gaap:FairValueInputsLevel1Member2024-03-310001069157us-gaap:FairValueInputsLevel2Memberus-gaap:CreditRiskContractMemberus-gaap:FairValueMeasurementsRecurringMember2024-03-310001069157us-gaap:CreditRiskContractMemberus-gaap:FairValueInputsLevel3Memberus-gaap:FairValueMeasurementsRecurringMember2024-03-310001069157us-gaap:CreditRiskContractMemberus-gaap:FairValueMeasurementsRecurringMember2024-03-310001069157us-gaap:USTreasurySecuritiesMemberus-gaap:FairValueMeasurementsRecurringMemberus-gaap:FairValueInputsLevel1Member2023-12-310001069157us-gaap:FairValueInputsLevel2Memberus-gaap:USTreasurySecuritiesMemberus-gaap:FairValueMeasurementsRecurringMember2023-12-310001069157us-gaap:FairValueInputsLevel3Memberus-gaap:USTreasurySecuritiesMemberus-gaap:FairValueMeasurementsRecurringMember2023-12-310001069157us-gaap:USTreasurySecuritiesMemberus-gaap:FairValueMeasurementsRecurringMember2023-12-310001069157us-gaap:USGovernmentSponsoredEnterprisesDebtSecuritiesMemberus-gaap:FairValueMeasurementsRecurringMemberus-gaap:FairValueInputsLevel1Member2023-12-310001069157us-gaap:FairValueInputsLevel2Memberus-gaap:USGovernmentSponsoredEnterprisesDebtSecuritiesMemberus-gaap:FairValueMeasurementsRecurringMember2023-12-310001069157us-gaap:FairValueInputsLevel3Memberus-gaap:USGovernmentSponsoredEnterprisesDebtSecuritiesMemberus-gaap:FairValueMeasurementsRecurringMember2023-12-310001069157us-gaap:USGovernmentSponsoredEnterprisesDebtSecuritiesMemberus-gaap:FairValueMeasurementsRecurringMember2023-12-310001069157ewbc:CommercialMortgageBackedSecuritiesIssuedByUSGovernmentAgenciesAndGovernmentSponsoredEnterpriseMemberus-gaap:FairValueMeasurementsRecurringMemberus-gaap:FairValueInputsLevel1Member2023-12-310001069157us-gaap:FairValueInputsLevel2Memberewbc:CommercialMortgageBackedSecuritiesIssuedByUSGovernmentAgenciesAndGovernmentSponsoredEnterpriseMemberus-gaap:FairValueMeasurementsRecurringMember2023-12-310001069157ewbc:CommercialMortgageBackedSecuritiesIssuedByUSGovernmentAgenciesAndGovernmentSponsoredEnterpriseMemberus-gaap:FairValueInputsLevel3Memberus-gaap:FairValueMeasurementsRecurringMember2023-12-310001069157ewbc:CommercialMortgageBackedSecuritiesIssuedByUSGovernmentAgenciesAndGovernmentSponsoredEnterpriseMemberus-gaap:FairValueMeasurementsRecurringMember2023-12-310001069157us-gaap:FairValueMeasurementsRecurringMemberus-gaap:FairValueInputsLevel1Memberewbc:ResidentialMortgageBackedSecuritiesIssuedByUSGovernmentAgenciesAndGovernmentSponsoredEnterpriseMember2023-12-310001069157us-gaap:FairValueInputsLevel2Memberus-gaap:FairValueMeasurementsRecurringMemberewbc:ResidentialMortgageBackedSecuritiesIssuedByUSGovernmentAgenciesAndGovernmentSponsoredEnterpriseMember2023-12-310001069157us-gaap:FairValueInputsLevel3Memberus-gaap:FairValueMeasurementsRecurringMemberewbc:ResidentialMortgageBackedSecuritiesIssuedByUSGovernmentAgenciesAndGovernmentSponsoredEnterpriseMember2023-12-310001069157us-gaap:FairValueMeasurementsRecurringMemberewbc:ResidentialMortgageBackedSecuritiesIssuedByUSGovernmentAgenciesAndGovernmentSponsoredEnterpriseMember2023-12-310001069157us-gaap:USStatesAndPoliticalSubdivisionsMemberus-gaap:FairValueMeasurementsRecurringMemberus-gaap:FairValueInputsLevel1Member2023-12-310001069157us-gaap:FairValueInputsLevel2Memberus-gaap:USStatesAndPoliticalSubdivisionsMemberus-gaap:FairValueMeasurementsRecurringMember2023-12-310001069157us-gaap:FairValueInputsLevel3Memberus-gaap:USStatesAndPoliticalSubdivisionsMemberus-gaap:FairValueMeasurementsRecurringMember2023-12-310001069157us-gaap:USStatesAndPoliticalSubdivisionsMemberus-gaap:FairValueMeasurementsRecurringMember2023-12-310001069157us-gaap:CommercialMortgageBackedSecuritiesMemberus-gaap:FairValueMeasurementsRecurringMemberus-gaap:FairValueInputsLevel1Member2023-12-310001069157us-gaap:FairValueInputsLevel2Memberus-gaap:CommercialMortgageBackedSecuritiesMemberus-gaap:FairValueMeasurementsRecurringMember2023-12-310001069157us-gaap:CommercialMortgageBackedSecuritiesMemberus-gaap:FairValueInputsLevel3Memberus-gaap:FairValueMeasurementsRecurringMember2023-12-310001069157us-gaap:CommercialMortgageBackedSecuritiesMemberus-gaap:FairValueMeasurementsRecurringMember2023-12-310001069157us-gaap:ResidentialMortgageBackedSecuritiesMemberus-gaap:FairValueMeasurementsRecurringMemberus-gaap:FairValueInputsLevel1Member2023-12-310001069157us-gaap:FairValueInputsLevel2Memberus-gaap:ResidentialMortgageBackedSecuritiesMemberus-gaap:FairValueMeasurementsRecurringMember2023-12-310001069157us-gaap:FairValueInputsLevel3Memberus-gaap:ResidentialMortgageBackedSecuritiesMemberus-gaap:FairValueMeasurementsRecurringMember2023-12-310001069157us-gaap:ResidentialMortgageBackedSecuritiesMemberus-gaap:FairValueMeasurementsRecurringMember2023-12-310001069157us-gaap:FairValueMeasurementsRecurringMemberus-gaap:FairValueInputsLevel1Memberus-gaap:CorporateDebtSecuritiesMember2023-12-310001069157us-gaap:FairValueInputsLevel2Memberus-gaap:FairValueMeasurementsRecurringMemberus-gaap:CorporateDebtSecuritiesMember2023-12-310001069157us-gaap:FairValueInputsLevel3Memberus-gaap:FairValueMeasurementsRecurringMemberus-gaap:CorporateDebtSecuritiesMember2023-12-310001069157us-gaap:FairValueMeasurementsRecurringMemberus-gaap:CorporateDebtSecuritiesMember2023-12-310001069157ewbc:ForeignGovernmentBondsMemberus-gaap:FairValueMeasurementsRecurringMemberus-gaap:FairValueInputsLevel1Member2023-12-310001069157us-gaap:FairValueInputsLevel2Memberewbc:ForeignGovernmentBondsMemberus-gaap:FairValueMeasurementsRecurringMember2023-12-310001069157us-gaap:FairValueInputsLevel3Memberewbc:ForeignGovernmentBondsMemberus-gaap:FairValueMeasurementsRecurringMember2023-12-310001069157ewbc:ForeignGovernmentBondsMemberus-gaap:FairValueMeasurementsRecurringMember2023-12-310001069157us-gaap:AssetBackedSecuritiesMemberus-gaap:FairValueMeasurementsRecurringMemberus-gaap:FairValueInputsLevel1Member2023-12-310001069157us-gaap:FairValueInputsLevel2Memberus-gaap:AssetBackedSecuritiesMemberus-gaap:FairValueMeasurementsRecurringMember2023-12-310001069157us-gaap:AssetBackedSecuritiesMemberus-gaap:FairValueInputsLevel3Memberus-gaap:FairValueMeasurementsRecurringMember2023-12-310001069157us-gaap:AssetBackedSecuritiesMemberus-gaap:FairValueMeasurementsRecurringMember2023-12-310001069157us-gaap:CollateralizedLoanObligationsMemberus-gaap:FairValueMeasurementsRecurringMemberus-gaap:FairValueInputsLevel1Member2023-12-310001069157us-gaap:FairValueInputsLevel2Memberus-gaap:CollateralizedLoanObligationsMemberus-gaap:FairValueMeasurementsRecurringMember2023-12-310001069157us-gaap:CollateralizedLoanObligationsMemberus-gaap:FairValueInputsLevel3Memberus-gaap:FairValueMeasurementsRecurringMember2023-12-310001069157us-gaap:CollateralizedLoanObligationsMemberus-gaap:FairValueMeasurementsRecurringMember2023-12-310001069157us-gaap:FairValueMeasurementsRecurringMemberus-gaap:FairValueInputsLevel1Member2023-12-310001069157us-gaap:FairValueInputsLevel2Memberus-gaap:FairValueMeasurementsRecurringMember2023-12-310001069157us-gaap:FairValueInputsLevel3Memberus-gaap:FairValueMeasurementsRecurringMember2023-12-310001069157us-gaap:FairValueMeasurementsRecurringMember2023-12-310001069157us-gaap:InterestRateContractMemberus-gaap:FairValueMeasurementsRecurringMemberus-gaap:FairValueInputsLevel1Member2023-12-310001069157us-gaap:FairValueInputsLevel2Memberus-gaap:InterestRateContractMemberus-gaap:FairValueMeasurementsRecurringMember2023-12-310001069157us-gaap:InterestRateContractMemberus-gaap:FairValueInputsLevel3Memberus-gaap:FairValueMeasurementsRecurringMember2023-12-310001069157us-gaap:InterestRateContractMemberus-gaap:FairValueMeasurementsRecurringMember2023-12-310001069157us-gaap:ForeignExchangeContractMemberus-gaap:FairValueMeasurementsRecurringMemberus-gaap:FairValueInputsLevel1Member2023-12-310001069157us-gaap:FairValueInputsLevel2Memberus-gaap:ForeignExchangeContractMemberus-gaap:FairValueMeasurementsRecurringMember2023-12-310001069157us-gaap:FairValueInputsLevel3Memberus-gaap:ForeignExchangeContractMemberus-gaap:FairValueMeasurementsRecurringMember2023-12-310001069157us-gaap:ForeignExchangeContractMemberus-gaap:FairValueMeasurementsRecurringMember2023-12-310001069157us-gaap:CreditRiskContractMemberus-gaap:FairValueMeasurementsRecurringMemberus-gaap:FairValueInputsLevel1Member2023-12-310001069157us-gaap:FairValueInputsLevel2Memberus-gaap:CreditRiskContractMemberus-gaap:FairValueMeasurementsRecurringMember2023-12-310001069157us-gaap:CreditRiskContractMemberus-gaap:FairValueInputsLevel3Memberus-gaap:FairValueMeasurementsRecurringMember2023-12-310001069157us-gaap:CreditRiskContractMemberus-gaap:FairValueMeasurementsRecurringMember2023-12-310001069157us-gaap:EquityContractMemberus-gaap:FairValueMeasurementsRecurringMemberus-gaap:FairValueInputsLevel1Member2023-12-310001069157us-gaap:FairValueInputsLevel2Memberus-gaap:EquityContractMemberus-gaap:FairValueMeasurementsRecurringMember2023-12-310001069157us-gaap:FairValueInputsLevel3Memberus-gaap:EquityContractMemberus-gaap:FairValueMeasurementsRecurringMember2023-12-310001069157us-gaap:EquityContractMemberus-gaap:FairValueMeasurementsRecurringMember2023-12-310001069157us-gaap:CommodityContractMemberus-gaap:FairValueMeasurementsRecurringMemberus-gaap:FairValueInputsLevel1Member2023-12-310001069157us-gaap:FairValueInputsLevel2Memberus-gaap:CommodityContractMemberus-gaap:FairValueMeasurementsRecurringMember2023-12-310001069157us-gaap:CommodityContractMemberus-gaap:FairValueInputsLevel3Memberus-gaap:FairValueMeasurementsRecurringMember2023-12-310001069157us-gaap:CommodityContractMemberus-gaap:FairValueMeasurementsRecurringMember2023-12-310001069157us-gaap:GovernmentNationalMortgageAssociationGnmaInsuredLoansMember2024-03-310001069157us-gaap:GovernmentNationalMortgageAssociationGnmaInsuredLoansMember2023-12-310001069157us-gaap:FairValueInputsLevel3Memberus-gaap:EquityContractMemberus-gaap:FairValueMeasurementsRecurringMember2022-12-310001069157us-gaap:FairValueInputsLevel3Memberus-gaap:EquityContractMemberus-gaap:FairValueMeasurementsRecurringMember2024-01-012024-03-310001069157us-gaap:FairValueInputsLevel3Memberus-gaap:EquityContractMemberus-gaap:FairValueMeasurementsRecurringMember2023-01-012023-03-310001069157us-gaap:FairValueInputsLevel3Memberus-gaap:EquityContractMemberus-gaap:FairValueMeasurementsRecurringMember2023-03-310001069157ewbc:BlackScholesOptionPricingModelMembersrt:MinimumMemberus-gaap:EquityContractMemberus-gaap:FairValueInputsLevel3Memberus-gaap:MeasurementInputPriceVolatilityMemberus-gaap:FairValueMeasurementsRecurringMember2024-03-310001069157ewbc:BlackScholesOptionPricingModelMemberus-gaap:EquityContractMemberus-gaap:FairValueInputsLevel3Membersrt:MaximumMemberus-gaap:MeasurementInputPriceVolatilityMemberus-gaap:FairValueMeasurementsRecurringMember2024-03-310001069157ewbc:BlackScholesOptionPricingModelMemberus-gaap:EquityContractMemberus-gaap:FairValueInputsLevel3Membersrt:WeightedAverageMemberus-gaap:MeasurementInputPriceVolatilityMemberus-gaap:FairValueMeasurementsRecurringMember2024-03-310001069157us-gaap:MeasurementInputDiscountForLackOfMarketabilityMemberus-gaap:FairValueInputsLevel3Memberus-gaap:EquityContractMemberus-gaap:FairValueMeasurementsRecurringMember2024-03-310001069157us-gaap:MeasurementInputDiscountForLackOfMarketabilityMemberus-gaap:EquityContractMemberus-gaap:FairValueInputsLevel3Membersrt:WeightedAverageMemberus-gaap:FairValueMeasurementsRecurringMember2024-03-310001069157ewbc:PayoutDesignatedBasedOnOperatingRevenueAndOperatingEBITDAOfInvesteeMemberus-gaap:FairValueInputsLevel3Memberus-gaap:EquityContractMemberus-gaap:FairValueMeasurementsRecurringMember2024-03-310001069157ewbc:PayoutDesignatedBasedOnOperatingRevenueAndOperatingEBITDAOfInvesteeMemberus-gaap:EquityContractMemberus-gaap:FairValueInputsLevel3Membersrt:WeightedAverageMemberus-gaap:FairValueMeasurementsRecurringMember2024-03-310001069157ewbc:BlackScholesOptionPricingModelMembersrt:MinimumMemberus-gaap:EquityContractMemberus-gaap:FairValueInputsLevel3Memberus-gaap:MeasurementInputPriceVolatilityMemberus-gaap:FairValueMeasurementsRecurringMember2023-12-310001069157ewbc:BlackScholesOptionPricingModelMemberus-gaap:EquityContractMemberus-gaap:FairValueInputsLevel3Membersrt:MaximumMemberus-gaap:MeasurementInputPriceVolatilityMemberus-gaap:FairValueMeasurementsRecurringMember2023-12-310001069157ewbc:BlackScholesOptionPricingModelMemberus-gaap:EquityContractMemberus-gaap:FairValueInputsLevel3Membersrt:WeightedAverageMemberus-gaap:MeasurementInputPriceVolatilityMemberus-gaap:FairValueMeasurementsRecurringMember2023-12-310001069157us-gaap:MeasurementInputDiscountForLackOfMarketabilityMemberus-gaap:FairValueInputsLevel3Memberus-gaap:EquityContractMemberus-gaap:FairValueMeasurementsRecurringMember2023-12-310001069157us-gaap:MeasurementInputDiscountForLackOfMarketabilityMemberus-gaap:EquityContractMemberus-gaap:FairValueInputsLevel3Membersrt:WeightedAverageMemberus-gaap:FairValueMeasurementsRecurringMember2023-12-310001069157ewbc:PayoutDesignatedBasedOnOperatingRevenueAndOperatingEBITDAOfInvesteeMemberus-gaap:FairValueInputsLevel3Memberus-gaap:EquityContractMemberus-gaap:FairValueMeasurementsRecurringMember2023-12-310001069157ewbc:PayoutDesignatedBasedOnOperatingRevenueAndOperatingEBITDAOfInvesteeMemberus-gaap:EquityContractMemberus-gaap:FairValueInputsLevel3Membersrt:WeightedAverageMemberus-gaap:FairValueMeasurementsRecurringMember2023-12-310001069157us-gaap:FairValueMeasurementsNonrecurringMemberewbc:CommercialAndIndustrialLoanMemberus-gaap:CommercialPortfolioSegmentMemberus-gaap:FairValueInputsLevel1Member2024-03-310001069157us-gaap:FairValueInputsLevel2Memberus-gaap:FairValueMeasurementsNonrecurringMemberewbc:CommercialAndIndustrialLoanMemberus-gaap:CommercialPortfolioSegmentMember2024-03-310001069157us-gaap:FairValueInputsLevel3Memberus-gaap:FairValueMeasurementsNonrecurringMemberewbc:CommercialAndIndustrialLoanMemberus-gaap:CommercialPortfolioSegmentMember2024-03-310001069157us-gaap:FairValueMeasurementsNonrecurringMemberewbc:CommercialAndIndustrialLoanMemberus-gaap:CommercialPortfolioSegmentMember2024-03-310001069157us-gaap:CommercialRealEstateMemberus-gaap:FairValueMeasurementsNonrecurringMemberus-gaap:CommercialPortfolioSegmentMemberus-gaap:FairValueInputsLevel1Member2024-03-310001069157us-gaap:FairValueInputsLevel2Memberus-gaap:CommercialRealEstateMemberus-gaap:FairValueMeasurementsNonrecurringMemberus-gaap:CommercialPortfolioSegmentMember2024-03-310001069157us-gaap:CommercialRealEstateMemberus-gaap:FairValueInputsLevel3Memberus-gaap:FairValueMeasurementsNonrecurringMemberus-gaap:CommercialPortfolioSegmentMember2024-03-310001069157us-gaap:CommercialRealEstateMemberus-gaap:FairValueMeasurementsNonrecurringMemberus-gaap:CommercialPortfolioSegmentMember2024-03-310001069157us-gaap:FairValueMeasurementsNonrecurringMemberus-gaap:CommercialPortfolioSegmentMemberewbc:ConstructionAndLandLoanMemberus-gaap:FairValueInputsLevel1Member2024-03-310001069157us-gaap:FairValueInputsLevel2Memberus-gaap:FairValueMeasurementsNonrecurringMemberus-gaap:CommercialPortfolioSegmentMemberewbc:ConstructionAndLandLoanMember2024-03-310001069157us-gaap:FairValueInputsLevel3Memberus-gaap:FairValueMeasurementsNonrecurringMemberus-gaap:CommercialPortfolioSegmentMemberewbc:ConstructionAndLandLoanMember2024-03-310001069157us-gaap:FairValueMeasurementsNonrecurringMemberus-gaap:CommercialPortfolioSegmentMemberewbc:ConstructionAndLandLoanMember2024-03-310001069157us-gaap:FairValueMeasurementsNonrecurringMemberus-gaap:CommercialPortfolioSegmentMemberus-gaap:FairValueInputsLevel1Member2024-03-310001069157us-gaap:FairValueInputsLevel2Memberus-gaap:FairValueMeasurementsNonrecurringMemberus-gaap:CommercialPortfolioSegmentMember2024-03-310001069157us-gaap:FairValueInputsLevel3Memberus-gaap:FairValueMeasurementsNonrecurringMemberus-gaap:CommercialPortfolioSegmentMember2024-03-310001069157us-gaap:FairValueMeasurementsNonrecurringMemberus-gaap:CommercialPortfolioSegmentMember2024-03-310001069157us-gaap:ConsumerPortfolioSegmentMemberus-gaap:FairValueMeasurementsNonrecurringMemberewbc:SingleFamilyResidentialMemberus-gaap:FairValueInputsLevel1Member2024-03-310001069157us-gaap:FairValueInputsLevel2Memberus-gaap:ConsumerPortfolioSegmentMemberus-gaap:FairValueMeasurementsNonrecurringMemberewbc:SingleFamilyResidentialMember2024-03-310001069157us-gaap:ConsumerPortfolioSegmentMemberus-gaap:FairValueInputsLevel3Memberus-gaap:FairValueMeasurementsNonrecurringMemberewbc:SingleFamilyResidentialMember2024-03-310001069157us-gaap:ConsumerPortfolioSegmentMemberus-gaap:FairValueMeasurementsNonrecurringMemberewbc:SingleFamilyResidentialMember2024-03-310001069157us-gaap:ConsumerPortfolioSegmentMemberus-gaap:FairValueMeasurementsNonrecurringMemberus-gaap:FairValueInputsLevel1Member2024-03-310001069157us-gaap:FairValueInputsLevel2Memberus-gaap:ConsumerPortfolioSegmentMemberus-gaap:FairValueMeasurementsNonrecurringMember2024-03-310001069157us-gaap:ConsumerPortfolioSegmentMemberus-gaap:FairValueInputsLevel3Memberus-gaap:FairValueMeasurementsNonrecurringMember2024-03-310001069157us-gaap:ConsumerPortfolioSegmentMemberus-gaap:FairValueMeasurementsNonrecurringMember2024-03-310001069157us-gaap:FairValueMeasurementsNonrecurringMemberus-gaap:FairValueInputsLevel1Member2024-03-310001069157us-gaap:FairValueInputsLevel2Memberus-gaap:FairValueMeasurementsNonrecurringMember2024-03-310001069157us-gaap:FairValueMeasurementsNonrecurringMemberus-gaap:FairValueInputsLevel3Member2024-03-310001069157us-gaap:FairValueMeasurementsNonrecurringMember2024-03-310001069157us-gaap:FairValueMeasurementsNonrecurringMemberewbc:CommercialAndIndustrialLoanMemberus-gaap:CommercialPortfolioSegmentMemberus-gaap:FairValueInputsLevel1Member2023-12-310001069157us-gaap:FairValueInputsLevel2Memberus-gaap:FairValueMeasurementsNonrecurringMemberewbc:CommercialAndIndustrialLoanMemberus-gaap:CommercialPortfolioSegmentMember2023-12-310001069157us-gaap:FairValueInputsLevel3Memberus-gaap:FairValueMeasurementsNonrecurringMemberewbc:CommercialAndIndustrialLoanMemberus-gaap:CommercialPortfolioSegmentMember2023-12-310001069157us-gaap:FairValueMeasurementsNonrecurringMemberewbc:CommercialAndIndustrialLoanMemberus-gaap:CommercialPortfolioSegmentMember2023-12-310001069157us-gaap:CommercialRealEstateMemberus-gaap:FairValueMeasurementsNonrecurringMemberus-gaap:CommercialPortfolioSegmentMemberus-gaap:FairValueInputsLevel1Member2023-12-310001069157us-gaap:FairValueInputsLevel2Memberus-gaap:CommercialRealEstateMemberus-gaap:FairValueMeasurementsNonrecurringMemberus-gaap:CommercialPortfolioSegmentMember2023-12-310001069157us-gaap:CommercialRealEstateMemberus-gaap:FairValueInputsLevel3Memberus-gaap:FairValueMeasurementsNonrecurringMemberus-gaap:CommercialPortfolioSegmentMember2023-12-310001069157us-gaap:CommercialRealEstateMemberus-gaap:FairValueMeasurementsNonrecurringMemberus-gaap:CommercialPortfolioSegmentMember2023-12-310001069157us-gaap:FairValueMeasurementsNonrecurringMemberus-gaap:CommercialPortfolioSegmentMemberus-gaap:FairValueInputsLevel1Member2023-12-310001069157us-gaap:FairValueInputsLevel2Memberus-gaap:FairValueMeasurementsNonrecurringMemberus-gaap:CommercialPortfolioSegmentMember2023-12-310001069157us-gaap:FairValueInputsLevel3Memberus-gaap:FairValueMeasurementsNonrecurringMemberus-gaap:CommercialPortfolioSegmentMember2023-12-310001069157us-gaap:FairValueMeasurementsNonrecurringMemberus-gaap:CommercialPortfolioSegmentMember2023-12-310001069157us-gaap:ConsumerPortfolioSegmentMemberus-gaap:FairValueMeasurementsNonrecurringMemberus-gaap:HomeEquityMemberus-gaap:FairValueInputsLevel1Member2023-12-310001069157us-gaap:FairValueInputsLevel2Memberus-gaap:ConsumerPortfolioSegmentMemberus-gaap:FairValueMeasurementsNonrecurringMemberus-gaap:HomeEquityMember2023-12-310001069157us-gaap:ConsumerPortfolioSegmentMemberus-gaap:FairValueInputsLevel3Memberus-gaap:FairValueMeasurementsNonrecurringMemberus-gaap:HomeEquityMember2023-12-310001069157us-gaap:ConsumerPortfolioSegmentMemberus-gaap:FairValueMeasurementsNonrecurringMemberus-gaap:HomeEquityMember2023-12-310001069157us-gaap:ConsumerPortfolioSegmentMemberus-gaap:FairValueMeasurementsNonrecurringMemberus-gaap:FairValueInputsLevel1Member2023-12-310001069157us-gaap:FairValueInputsLevel2Memberus-gaap:ConsumerPortfolioSegmentMemberus-gaap:FairValueMeasurementsNonrecurringMember2023-12-310001069157us-gaap:ConsumerPortfolioSegmentMemberus-gaap:FairValueInputsLevel3Memberus-gaap:FairValueMeasurementsNonrecurringMember2023-12-310001069157us-gaap:ConsumerPortfolioSegmentMemberus-gaap:FairValueMeasurementsNonrecurringMember2023-12-310001069157us-gaap:FairValueMeasurementsNonrecurringMemberus-gaap:FairValueInputsLevel1Member2023-12-310001069157us-gaap:FairValueInputsLevel2Memberus-gaap:FairValueMeasurementsNonrecurringMember2023-12-310001069157us-gaap:FairValueMeasurementsNonrecurringMemberus-gaap:FairValueInputsLevel3Member2023-12-310001069157us-gaap:FairValueMeasurementsNonrecurringMember2023-12-310001069157us-gaap:FairValueMeasurementsNonrecurringMemberewbc:InvestmentsInTaxCreditAndOtherInvestmentsNetMemberus-gaap:FairValueInputsLevel1Member2023-12-310001069157us-gaap:FairValueInputsLevel2Memberus-gaap:FairValueMeasurementsNonrecurringMemberewbc:InvestmentsInTaxCreditAndOtherInvestmentsNetMember2023-12-310001069157us-gaap:FairValueInputsLevel3Memberus-gaap:FairValueMeasurementsNonrecurringMemberewbc:InvestmentsInTaxCreditAndOtherInvestmentsNetMember2023-12-310001069157us-gaap:FairValueMeasurementsNonrecurringMemberewbc:InvestmentsInTaxCreditAndOtherInvestmentsNetMember2023-12-310001069157us-gaap:FairValueMeasurementsNonrecurringMemberewbc:CommercialAndIndustrialLoanMemberus-gaap:LoansReceivableMemberus-gaap:CommercialPortfolioSegmentMember2024-01-012024-03-310001069157us-gaap:FairValueMeasurementsNonrecurringMemberewbc:CommercialAndIndustrialLoanMemberus-gaap:LoansReceivableMemberus-gaap:CommercialPortfolioSegmentMember2023-01-012023-03-310001069157us-gaap:CommercialRealEstateMemberus-gaap:FairValueMeasurementsNonrecurringMemberus-gaap:LoansReceivableMemberus-gaap:CommercialPortfolioSegmentMember2024-01-012024-03-310001069157us-gaap:CommercialRealEstateMemberus-gaap:FairValueMeasurementsNonrecurringMemberus-gaap:LoansReceivableMemberus-gaap:CommercialPortfolioSegmentMember2023-01-012023-03-310001069157us-gaap:FairValueMeasurementsNonrecurringMemberus-gaap:LoansReceivableMemberus-gaap:CommercialPortfolioSegmentMemberewbc:ConstructionAndLandLoanMember2024-01-012024-03-310001069157us-gaap:FairValueMeasurementsNonrecurringMemberus-gaap:LoansReceivableMemberus-gaap:CommercialPortfolioSegmentMemberewbc:ConstructionAndLandLoanMember2023-01-012023-03-310001069157us-gaap:FairValueMeasurementsNonrecurringMemberus-gaap:LoansReceivableMemberus-gaap:CommercialPortfolioSegmentMember2024-01-012024-03-310001069157us-gaap:FairValueMeasurementsNonrecurringMemberus-gaap:LoansReceivableMemberus-gaap:CommercialPortfolioSegmentMember2023-01-012023-03-310001069157us-gaap:ConsumerPortfolioSegmentMemberus-gaap:FairValueMeasurementsNonrecurringMemberewbc:SingleFamilyResidentialMemberus-gaap:LoansReceivableMember2024-01-012024-03-310001069157us-gaap:ConsumerPortfolioSegmentMemberus-gaap:FairValueMeasurementsNonrecurringMemberewbc:SingleFamilyResidentialMemberus-gaap:LoansReceivableMember2023-01-012023-03-310001069157us-gaap:ConsumerPortfolioSegmentMemberus-gaap:FairValueMeasurementsNonrecurringMemberus-gaap:LoansReceivableMember2024-01-012024-03-310001069157us-gaap:ConsumerPortfolioSegmentMemberus-gaap:FairValueMeasurementsNonrecurringMemberus-gaap:LoansReceivableMember2023-01-012023-03-310001069157us-gaap:FairValueMeasurementsNonrecurringMemberus-gaap:LoansReceivableMember2024-01-012024-03-310001069157us-gaap:FairValueMeasurementsNonrecurringMemberus-gaap:LoansReceivableMember2023-01-012023-03-310001069157us-gaap:FairValueMeasurementsNonrecurringMemberewbc:InvestmentsInTaxCreditAndOtherInvestmentsNetMember2024-01-012024-03-310001069157us-gaap:FairValueMeasurementsNonrecurringMemberewbc:InvestmentsInTaxCreditAndOtherInvestmentsNetMember2023-01-012023-03-310001069157us-gaap:FairValueInputsLevel3Memberus-gaap:FairValueMeasurementsNonrecurringMemberewbc:ValuationTechniqueFairValueOfCollateralDiscountMember2024-03-310001069157srt:MinimumMemberus-gaap:FairValueInputsLevel3Memberus-gaap:FairValueMeasurementsNonrecurringMemberewbc:ValuationTechniqueFairValueOfCollateralDiscountMemberus-gaap:MeasurementInputDiscountRateMember2024-03-310001069157us-gaap:FairValueInputsLevel3Memberus-gaap:FairValueMeasurementsNonrecurringMemberewbc:ValuationTechniqueFairValueOfCollateralDiscountMembersrt:WeightedAverageMemberus-gaap:MeasurementInputDiscountRateMember2024-03-310001069157ewbc:ValuationTechniqueFairValueOfCollateralContractValueMemberus-gaap:FairValueInputsLevel3Memberus-gaap:FairValueMeasurementsNonrecurringMember2024-03-310001069157us-gaap:FairValueInputsLevel3Memberus-gaap:FairValueMeasurementsNonrecurringMemberewbc:ValuationTechniqueFairValueOfValuationTechniqueFairValueOfPropertySellingCostMember2024-03-310001069157us-gaap:FairValueInputsLevel3Memberus-gaap:FairValueMeasurementsNonrecurringMemberewbc:ValuationTechniqueFairValueOfValuationTechniqueFairValueOfPropertySellingCostMemberus-gaap:MeasurementInputCostToSellMember2024-03-310001069157us-gaap:FairValueInputsLevel3Memberus-gaap:FairValueMeasurementsNonrecurringMembersrt:WeightedAverageMemberewbc:ValuationTechniqueFairValueOfValuationTechniqueFairValueOfPropertySellingCostMemberus-gaap:MeasurementInputCostToSellMember2024-03-310001069157us-gaap:FairValueInputsLevel3Memberus-gaap:FairValueMeasurementsNonrecurringMemberewbc:ValuationTechniqueFairValueOfCollateralDiscountMember2023-12-310001069157srt:MinimumMemberus-gaap:FairValueInputsLevel3Memberus-gaap:FairValueMeasurementsNonrecurringMemberewbc:ValuationTechniqueFairValueOfCollateralDiscountMemberus-gaap:MeasurementInputDiscountRateMember2023-12-310001069157us-gaap:FairValueInputsLevel3Memberus-gaap:FairValueMeasurementsNonrecurringMemberewbc:ValuationTechniqueFairValueOfCollateralDiscountMembersrt:MaximumMemberus-gaap:MeasurementInputDiscountRateMember2023-12-310001069157us-gaap:FairValueInputsLevel3Memberus-gaap:FairValueMeasurementsNonrecurringMemberewbc:ValuationTechniqueFairValueOfCollateralDiscountMembersrt:WeightedAverageMemberus-gaap:MeasurementInputDiscountRateMember2023-12-310001069157ewbc:ValuationTechniqueFairValueOfCollateralContractValueMemberus-gaap:FairValueInputsLevel3Memberus-gaap:FairValueMeasurementsNonrecurringMember2023-12-310001069157us-gaap:FairValueInputsLevel3Memberus-gaap:FairValueMeasurementsNonrecurringMemberewbc:ValuationTechniqueFairValueOfValuationTechniqueFairValueOfPropertySellingCostMember2023-12-310001069157us-gaap:FairValueInputsLevel3Memberus-gaap:FairValueMeasurementsNonrecurringMemberewbc:ValuationTechniqueFairValueOfValuationTechniqueFairValueOfPropertySellingCostMemberus-gaap:MeasurementInputCostToSellMember2023-12-310001069157us-gaap:FairValueInputsLevel3Memberus-gaap:FairValueMeasurementsNonrecurringMembersrt:WeightedAverageMemberewbc:ValuationTechniqueFairValueOfValuationTechniqueFairValueOfPropertySellingCostMemberus-gaap:MeasurementInputCostToSellMember2023-12-310001069157us-gaap:FairValueInputsLevel3Memberus-gaap:FairValueMeasurementsNonrecurringMemberewbc:ValuationTechniqueIndividualAnalysisMemberewbc:InvestmentsInTaxCreditAndOtherInvestmentsNetMember2023-12-310001069157us-gaap:CarryingReportedAmountFairValueDisclosureMember2024-03-310001069157us-gaap:EstimateOfFairValueFairValueDisclosureMemberus-gaap:FairValueInputsLevel1Member2024-03-310001069157us-gaap:FairValueInputsLevel2Memberus-gaap:EstimateOfFairValueFairValueDisclosureMember2024-03-310001069157us-gaap:FairValueInputsLevel3Memberus-gaap:EstimateOfFairValueFairValueDisclosureMember2024-03-310001069157us-gaap:EstimateOfFairValueFairValueDisclosureMember2024-03-310001069157us-gaap:CarryingReportedAmountFairValueDisclosureMember2023-12-310001069157us-gaap:EstimateOfFairValueFairValueDisclosureMemberus-gaap:FairValueInputsLevel1Member2023-12-310001069157us-gaap:FairValueInputsLevel2Memberus-gaap:EstimateOfFairValueFairValueDisclosureMember2023-12-310001069157us-gaap:FairValueInputsLevel3Memberus-gaap:EstimateOfFairValueFairValueDisclosureMember2023-12-310001069157us-gaap:EstimateOfFairValueFairValueDisclosureMember2023-12-310001069157us-gaap:USTreasurySecuritiesMember2024-03-310001069157us-gaap:USGovernmentSponsoredEnterprisesDebtSecuritiesMember2024-03-310001069157ewbc:CommercialMortgageBackedSecuritiesIssuedByUSGovernmentAgenciesAndGovernmentSponsoredEnterpriseMember2024-03-310001069157ewbc:ResidentialMortgageBackedSecuritiesIssuedByUSGovernmentAgenciesAndGovernmentSponsoredEnterpriseMember2024-03-310001069157us-gaap:USStatesAndPoliticalSubdivisionsMember2024-03-310001069157us-gaap:CommercialMortgageBackedSecuritiesMember2024-03-310001069157us-gaap:ResidentialMortgageBackedSecuritiesMember2024-03-310001069157us-gaap:CorporateDebtSecuritiesMember2024-03-310001069157ewbc:ForeignGovernmentBondsMember2024-03-310001069157us-gaap:AssetBackedSecuritiesMember2024-03-310001069157us-gaap:CollateralizedLoanObligationsMember2024-03-310001069157us-gaap:USTreasurySecuritiesMember2023-12-310001069157us-gaap:USGovernmentSponsoredEnterprisesDebtSecuritiesMember2023-12-310001069157ewbc:CommercialMortgageBackedSecuritiesIssuedByUSGovernmentAgenciesAndGovernmentSponsoredEnterpriseMember2023-12-310001069157ewbc:ResidentialMortgageBackedSecuritiesIssuedByUSGovernmentAgenciesAndGovernmentSponsoredEnterpriseMember2023-12-310001069157us-gaap:USStatesAndPoliticalSubdivisionsMember2023-12-310001069157us-gaap:CommercialMortgageBackedSecuritiesMember2023-12-310001069157us-gaap:ResidentialMortgageBackedSecuritiesMember2023-12-310001069157us-gaap:CorporateDebtSecuritiesMember2023-12-310001069157ewbc:ForeignGovernmentBondsMember2023-12-310001069157us-gaap:AssetBackedSecuritiesMember2023-12-310001069157us-gaap:CollateralizedLoanObligationsMember2023-12-310001069157ewbc:MortgageBackedSecuritiesIssuedByUSGovernmentAgenciesAndGovernmentSponsoredEnterpriseMember2024-03-310001069157ewbc:NonAgencyMortgageBackedSecuritiesMember2024-03-310001069157ewbc:MortgageBackedSecuritiesIssuedByUSGovernmentAgenciesAndGovernmentSponsoredEnterpriseMember2023-12-310001069157ewbc:NonAgencyMortgageBackedSecuritiesMember2023-12-310001069157us-gaap:AssetPledgedAsCollateralMember2024-03-310001069157us-gaap:AssetPledgedAsCollateralMember2023-12-310001069157ewbc:LondonClearingHouseChicagoMercantileExchangeMemberus-gaap:InterestRateContractMemberus-gaap:NondesignatedMember2024-03-310001069157ewbc:LondonClearingHouseChicagoMercantileExchangeMemberus-gaap:InterestRateContractMemberus-gaap:NondesignatedMember2023-12-310001069157us-gaap:InterestRateContractMemberus-gaap:DesignatedAsHedgingInstrumentMemberus-gaap:CashFlowHedgingMember2024-03-310001069157us-gaap:InterestRateContractMemberus-gaap:DesignatedAsHedgingInstrumentMemberus-gaap:CashFlowHedgingMember2023-12-310001069157us-gaap:NetInvestmentHedgingMemberus-gaap:DesignatedAsHedgingInstrumentMemberus-gaap:ForeignExchangeContractMember2024-03-310001069157us-gaap:NetInvestmentHedgingMemberus-gaap:DesignatedAsHedgingInstrumentMemberus-gaap:ForeignExchangeContractMember2023-12-310001069157us-gaap:DesignatedAsHedgingInstrumentMember2024-03-310001069157us-gaap:DesignatedAsHedgingInstrumentMember2023-12-310001069157us-gaap:InterestRateContractMemberus-gaap:NondesignatedMember2024-03-310001069157us-gaap:InterestRateContractMemberus-gaap:NondesignatedMember2023-12-310001069157us-gaap:CommodityContractMemberus-gaap:NondesignatedMember2024-03-310001069157us-gaap:CommodityContractMemberus-gaap:NondesignatedMember2023-12-310001069157us-gaap:NondesignatedMemberus-gaap:ForeignExchangeContractMember2024-03-310001069157us-gaap:NondesignatedMemberus-gaap:ForeignExchangeContractMember2023-12-310001069157us-gaap:CreditRiskContractMemberus-gaap:NondesignatedMember2024-03-310001069157us-gaap:CreditRiskContractMemberus-gaap:NondesignatedMember2023-12-310001069157us-gaap:NondesignatedMemberus-gaap:EquityContractMember2024-03-310001069157us-gaap:NondesignatedMemberus-gaap:EquityContractMember2023-12-310001069157us-gaap:NondesignatedMember2024-03-310001069157us-gaap:NondesignatedMember2023-12-310001069157srt:CrudeOilMember2024-01-012024-03-310001069157srt:NaturalGasReservesMember2024-01-012024-03-310001069157srt:CrudeOilMember2023-01-012023-12-310001069157srt:NaturalGasReservesMember2023-01-012023-12-310001069157us-gaap:NondesignatedMemberewbc:EquityPrivateCompaniesMember2024-03-310001069157us-gaap:NondesignatedMemberewbc:EquityPrivateCompaniesMember2023-12-310001069157ewbc:EquityPublicCompaniesMemberus-gaap:NondesignatedMember2024-03-310001069157ewbc:EquityPublicCompaniesMemberus-gaap:NondesignatedMember2023-12-310001069157ewbc:PerformanceBasedRestrictedStockSettledinStockMemberewbc:RayliantGlobalAdvisorsLimitedMember2024-03-310001069157us-gaap:InterestRateContractMemberus-gaap:DesignatedAsHedgingInstrumentMemberus-gaap:CashFlowHedgingMemberewbc:CommercialBankingMember2024-03-310001069157us-gaap:InterestRateContractMemberus-gaap:DesignatedAsHedgingInstrumentMemberus-gaap:CashFlowHedgingMember2024-01-012024-03-310001069157us-gaap:InterestRateContractMemberus-gaap:DesignatedAsHedgingInstrumentMemberus-gaap:CashFlowHedgingMember2023-01-012023-03-310001069157us-gaap:InterestRateContractMemberus-gaap:DesignatedAsHedgingInstrumentMemberus-gaap:InterestExpenseMemberus-gaap:CashFlowHedgingMember2024-01-012024-03-310001069157us-gaap:InterestRateContractMemberus-gaap:DesignatedAsHedgingInstrumentMemberus-gaap:InterestExpenseMemberus-gaap:CashFlowHedgingMember2023-01-012023-03-310001069157us-gaap:InterestIncomeMemberus-gaap:InterestRateContractMemberus-gaap:DesignatedAsHedgingInstrumentMemberus-gaap:CashFlowHedgingMember2024-01-012024-03-310001069157us-gaap:InterestIncomeMemberus-gaap:InterestRateContractMemberus-gaap:DesignatedAsHedgingInstrumentMemberus-gaap:CashFlowHedgingMember2023-01-012023-03-310001069157us-gaap:InterestRateContractMemberus-gaap:DesignatedAsHedgingInstrumentMemberewbc:NoninterestIncomeMemberus-gaap:CashFlowHedgingMember2024-01-012024-03-310001069157us-gaap:InterestRateContractMemberus-gaap:DesignatedAsHedgingInstrumentMemberewbc:NoninterestIncomeMemberus-gaap:CashFlowHedgingMember2023-01-012023-03-310001069157us-gaap:NetInvestmentHedgingMemberus-gaap:DesignatedAsHedgingInstrumentMemberus-gaap:ForeignExchangeContractMember2024-01-012024-03-310001069157us-gaap:NetInvestmentHedgingMemberus-gaap:DesignatedAsHedgingInstrumentMemberus-gaap:ForeignExchangeContractMember2023-01-012023-03-310001069157us-gaap:NondesignatedMemberus-gaap:ForeignExchangeContractMembersrt:MaximumMember2024-01-012024-03-310001069157us-gaap:NondesignatedMemberus-gaap:ForeignExchangeContractMembersrt:MaximumMember2023-01-012023-12-310001069157us-gaap:InterestRateContractMemberus-gaap:SwapMemberus-gaap:NotDesignatedAsHedgingInstrumentTradingMember2024-03-310001069157us-gaap:InterestRateContractMemberus-gaap:SwapMemberus-gaap:NotDesignatedAsHedgingInstrumentTradingMember2023-12-310001069157ewbc:WrittenOptionMemberus-gaap:InterestRateContractMemberus-gaap:NotDesignatedAsHedgingInstrumentTradingMember2024-03-310001069157ewbc:WrittenOptionMemberus-gaap:InterestRateContractMemberus-gaap:NotDesignatedAsHedgingInstrumentTradingMember2023-12-310001069157ewbc:CollarsandCorridorsMemberus-gaap:InterestRateContractMemberus-gaap:NotDesignatedAsHedgingInstrumentTradingMember2024-03-310001069157ewbc:CollarsandCorridorsMemberus-gaap:InterestRateContractMemberus-gaap:NotDesignatedAsHedgingInstrumentTradingMember2023-12-310001069157us-gaap:InterestRateContractMemberus-gaap:NotDesignatedAsHedgingInstrumentTradingMember2024-03-310001069157us-gaap:InterestRateContractMemberus-gaap:NotDesignatedAsHedgingInstrumentTradingMember2023-12-310001069157ewbc:ForwardAndSpotMemberus-gaap:ForeignExchangeContractMemberus-gaap:NotDesignatedAsHedgingInstrumentTradingMember2024-03-310001069157ewbc:ForwardAndSpotMemberus-gaap:ForeignExchangeContractMemberus-gaap:NotDesignatedAsHedgingInstrumentTradingMember2023-12-310001069157us-gaap:ForeignExchangeContractMemberus-gaap:SwapMemberus-gaap:NotDesignatedAsHedgingInstrumentTradingMember2024-03-310001069157us-gaap:ForeignExchangeContractMemberus-gaap:SwapMemberus-gaap:NotDesignatedAsHedgingInstrumentTradingMember2023-12-310001069157us-gaap:ForeignExchangeContractMemberewbc:PurchasedOptionsMemberus-gaap:NotDesignatedAsHedgingInstrumentTradingMember2024-03-310001069157us-gaap:ForeignExchangeContractMemberewbc:PurchasedOptionsMemberus-gaap:NotDesignatedAsHedgingInstrumentTradingMember2023-12-310001069157us-gaap:ForeignExchangeContractMemberus-gaap:NotDesignatedAsHedgingInstrumentTradingMember2024-03-310001069157us-gaap:ForeignExchangeContractMemberus-gaap:NotDesignatedAsHedgingInstrumentTradingMember2023-12-310001069157us-gaap:NotDesignatedAsHedgingInstrumentTradingMember2024-03-310001069157us-gaap:NotDesignatedAsHedgingInstrumentTradingMember2023-12-310001069157us-gaap:InterestRateContractMemberus-gaap:NotDesignatedAsHedgingInstrumentEconomicHedgeMemberus-gaap:SwapMember2024-03-310001069157us-gaap:InterestRateContractMemberus-gaap:NotDesignatedAsHedgingInstrumentEconomicHedgeMemberus-gaap:SwapMember2023-12-310001069157us-gaap:InterestRateContractMemberewbc:PurchasedOptionsMemberus-gaap:NotDesignatedAsHedgingInstrumentEconomicHedgeMember2024-03-310001069157us-gaap:InterestRateContractMemberewbc:PurchasedOptionsMemberus-gaap:NotDesignatedAsHedgingInstrumentEconomicHedgeMember2023-12-310001069157ewbc:CollarsandCorridorsMemberus-gaap:InterestRateContractMemberus-gaap:NotDesignatedAsHedgingInstrumentEconomicHedgeMember2024-03-310001069157ewbc:CollarsandCorridorsMemberus-gaap:InterestRateContractMemberus-gaap:NotDesignatedAsHedgingInstrumentEconomicHedgeMember2023-12-310001069157us-gaap:InterestRateContractMemberus-gaap:NotDesignatedAsHedgingInstrumentEconomicHedgeMember2024-03-310001069157us-gaap:InterestRateContractMemberus-gaap:NotDesignatedAsHedgingInstrumentEconomicHedgeMember2023-12-310001069157ewbc:ForwardAndSpotMemberus-gaap:ForeignExchangeContractMemberus-gaap:NotDesignatedAsHedgingInstrumentEconomicHedgeMember2024-03-310001069157ewbc:ForwardAndSpotMemberus-gaap:ForeignExchangeContractMemberus-gaap:NotDesignatedAsHedgingInstrumentEconomicHedgeMember2023-12-310001069157us-gaap:ForeignExchangeContractMemberus-gaap:NotDesignatedAsHedgingInstrumentEconomicHedgeMemberus-gaap:SwapMember2024-03-310001069157us-gaap:ForeignExchangeContractMemberus-gaap:NotDesignatedAsHedgingInstrumentEconomicHedgeMemberus-gaap:SwapMember2023-12-310001069157ewbc:WrittenOptionMemberus-gaap:ForeignExchangeContractMemberus-gaap:NotDesignatedAsHedgingInstrumentEconomicHedgeMember2024-03-310001069157ewbc:WrittenOptionMemberus-gaap:ForeignExchangeContractMemberus-gaap:NotDesignatedAsHedgingInstrumentEconomicHedgeMember2023-12-310001069157us-gaap:ForeignExchangeContractMemberus-gaap:NotDesignatedAsHedgingInstrumentEconomicHedgeMember2024-03-310001069157us-gaap:ForeignExchangeContractMemberus-gaap:NotDesignatedAsHedgingInstrumentEconomicHedgeMember2023-12-310001069157us-gaap:NotDesignatedAsHedgingInstrumentEconomicHedgeMember2024-03-310001069157us-gaap:NotDesignatedAsHedgingInstrumentEconomicHedgeMember2023-12-310001069157srt:CrudeOilMemberus-gaap:CommodityContractMemberus-gaap:SwapMemberus-gaap:NotDesignatedAsHedgingInstrumentTradingMember2024-01-012024-03-310001069157srt:CrudeOilMemberus-gaap:CommodityContractMemberus-gaap:SwapMemberus-gaap:NotDesignatedAsHedgingInstrumentTradingMember2024-03-310001069157srt:CrudeOilMemberus-gaap:CommodityContractMemberus-gaap:SwapMemberus-gaap:NotDesignatedAsHedgingInstrumentTradingMember2023-01-012023-12-310001069157srt:CrudeOilMemberus-gaap:CommodityContractMemberus-gaap:SwapMemberus-gaap:NotDesignatedAsHedgingInstrumentTradingMember2023-12-310001069157srt:CrudeOilMemberus-gaap:CommodityContractMemberus-gaap:NotDesignatedAsHedgingInstrumentTradingMemberewbc:CollarsMember2024-01-012024-03-310001069157srt:CrudeOilMemberus-gaap:CommodityContractMemberus-gaap:NotDesignatedAsHedgingInstrumentTradingMemberewbc:CollarsMember2024-03-310001069157srt:CrudeOilMemberus-gaap:CommodityContractMemberus-gaap:NotDesignatedAsHedgingInstrumentTradingMemberewbc:CollarsMember2023-01-012023-12-310001069157srt:CrudeOilMemberus-gaap:CommodityContractMemberus-gaap:NotDesignatedAsHedgingInstrumentTradingMemberewbc:CollarsMember2023-12-310001069157srt:CrudeOilMemberus-gaap:CommodityContractMemberus-gaap:NotDesignatedAsHedgingInstrumentTradingMember2024-01-012024-03-310001069157srt:CrudeOilMemberus-gaap:CommodityContractMemberus-gaap:NotDesignatedAsHedgingInstrumentTradingMember2024-03-310001069157srt:CrudeOilMemberus-gaap:CommodityContractMemberus-gaap:NotDesignatedAsHedgingInstrumentTradingMember2023-01-012023-12-310001069157srt:CrudeOilMemberus-gaap:CommodityContractMemberus-gaap:NotDesignatedAsHedgingInstrumentTradingMember2023-12-310001069157srt:NaturalGasReservesMemberus-gaap:CommodityContractMemberus-gaap:SwapMemberus-gaap:NotDesignatedAsHedgingInstrumentTradingMember2024-01-012024-03-310001069157srt:NaturalGasReservesMemberus-gaap:CommodityContractMemberus-gaap:SwapMemberus-gaap:NotDesignatedAsHedgingInstrumentTradingMember2024-03-310001069157srt:NaturalGasReservesMemberus-gaap:CommodityContractMemberus-gaap:SwapMemberus-gaap:NotDesignatedAsHedgingInstrumentTradingMember2023-01-012023-12-310001069157srt:NaturalGasReservesMemberus-gaap:CommodityContractMemberus-gaap:SwapMemberus-gaap:NotDesignatedAsHedgingInstrumentTradingMember2023-12-310001069157srt:NaturalGasReservesMemberus-gaap:CommodityContractMemberus-gaap:NotDesignatedAsHedgingInstrumentTradingMemberewbc:CollarsMember2024-01-012024-03-310001069157srt:NaturalGasReservesMemberus-gaap:CommodityContractMemberus-gaap:NotDesignatedAsHedgingInstrumentTradingMemberewbc:CollarsMember2024-03-310001069157srt:NaturalGasReservesMemberus-gaap:CommodityContractMemberus-gaap:NotDesignatedAsHedgingInstrumentTradingMemberewbc:CollarsMember2023-01-012023-12-310001069157srt:NaturalGasReservesMemberus-gaap:CommodityContractMemberus-gaap:NotDesignatedAsHedgingInstrumentTradingMemberewbc:CollarsMember2023-12-310001069157srt:NaturalGasReservesMemberus-gaap:CommodityContractMemberewbc:WrittenOptionMemberus-gaap:NotDesignatedAsHedgingInstrumentTradingMember2024-01-012024-03-310001069157srt:NaturalGasReservesMemberus-gaap:CommodityContractMemberewbc:WrittenOptionMemberus-gaap:NotDesignatedAsHedgingInstrumentTradingMember2024-03-310001069157srt:NaturalGasReservesMemberus-gaap:CommodityContractMemberewbc:WrittenOptionMemberus-gaap:NotDesignatedAsHedgingInstrumentTradingMember2023-01-012023-12-310001069157srt:NaturalGasReservesMemberus-gaap:CommodityContractMemberewbc:WrittenOptionMemberus-gaap:NotDesignatedAsHedgingInstrumentTradingMember2023-12-310001069157srt:NaturalGasReservesMemberus-gaap:CommodityContractMemberus-gaap:NotDesignatedAsHedgingInstrumentTradingMember2024-01-012024-03-310001069157srt:NaturalGasReservesMemberus-gaap:CommodityContractMemberus-gaap:NotDesignatedAsHedgingInstrumentTradingMember2024-03-310001069157srt:NaturalGasReservesMemberus-gaap:CommodityContractMemberus-gaap:NotDesignatedAsHedgingInstrumentTradingMember2023-01-012023-12-310001069157srt:NaturalGasReservesMemberus-gaap:CommodityContractMemberus-gaap:NotDesignatedAsHedgingInstrumentTradingMember2023-12-310001069157us-gaap:CommodityContractMemberus-gaap:NotDesignatedAsHedgingInstrumentTradingMember2024-03-310001069157us-gaap:CommodityContractMemberus-gaap:NotDesignatedAsHedgingInstrumentTradingMember2023-12-310001069157srt:CrudeOilMemberus-gaap:CommodityContractMemberus-gaap:NotDesignatedAsHedgingInstrumentEconomicHedgeMemberus-gaap:SwapMember2024-01-012024-03-310001069157srt:CrudeOilMemberus-gaap:CommodityContractMemberus-gaap:NotDesignatedAsHedgingInstrumentEconomicHedgeMemberus-gaap:SwapMember2024-03-310001069157srt:CrudeOilMemberus-gaap:CommodityContractMemberus-gaap:NotDesignatedAsHedgingInstrumentEconomicHedgeMemberus-gaap:SwapMember2023-01-012023-12-310001069157srt:CrudeOilMemberus-gaap:CommodityContractMemberus-gaap:NotDesignatedAsHedgingInstrumentEconomicHedgeMemberus-gaap:SwapMember2023-12-310001069157srt:CrudeOilMemberus-gaap:CommodityContractMemberus-gaap:NotDesignatedAsHedgingInstrumentEconomicHedgeMemberewbc:CollarsMember2024-01-012024-03-310001069157srt:CrudeOilMemberus-gaap:CommodityContractMemberus-gaap:NotDesignatedAsHedgingInstrumentEconomicHedgeMemberewbc:CollarsMember2024-03-310001069157srt:CrudeOilMemberus-gaap:CommodityContractMemberus-gaap:NotDesignatedAsHedgingInstrumentEconomicHedgeMemberewbc:CollarsMember2023-01-012023-12-310001069157srt:CrudeOilMemberus-gaap:CommodityContractMemberus-gaap:NotDesignatedAsHedgingInstrumentEconomicHedgeMemberewbc:CollarsMember2023-12-310001069157srt:CrudeOilMemberus-gaap:CommodityContractMemberus-gaap:NotDesignatedAsHedgingInstrumentEconomicHedgeMember2024-01-012024-03-310001069157srt:CrudeOilMemberus-gaap:CommodityContractMemberus-gaap:NotDesignatedAsHedgingInstrumentEconomicHedgeMember2024-03-310001069157srt:CrudeOilMemberus-gaap:CommodityContractMemberus-gaap:NotDesignatedAsHedgingInstrumentEconomicHedgeMember2023-01-012023-12-310001069157srt:CrudeOilMemberus-gaap:CommodityContractMemberus-gaap:NotDesignatedAsHedgingInstrumentEconomicHedgeMember2023-12-310001069157srt:NaturalGasReservesMemberus-gaap:CommodityContractMemberus-gaap:NotDesignatedAsHedgingInstrumentEconomicHedgeMemberus-gaap:SwapMember2024-01-012024-03-310001069157srt:NaturalGasReservesMemberus-gaap:CommodityContractMemberus-gaap:NotDesignatedAsHedgingInstrumentEconomicHedgeMemberus-gaap:SwapMember2024-03-310001069157srt:NaturalGasReservesMemberus-gaap:CommodityContractMemberus-gaap:NotDesignatedAsHedgingInstrumentEconomicHedgeMemberus-gaap:SwapMember2023-01-012023-12-310001069157srt:NaturalGasReservesMemberus-gaap:CommodityContractMemberus-gaap:NotDesignatedAsHedgingInstrumentEconomicHedgeMemberus-gaap:SwapMember2023-12-310001069157srt:NaturalGasReservesMemberus-gaap:CommodityContractMemberus-gaap:NotDesignatedAsHedgingInstrumentEconomicHedgeMemberewbc:CollarsMember2024-01-012024-03-310001069157srt:NaturalGasReservesMemberus-gaap:CommodityContractMemberus-gaap:NotDesignatedAsHedgingInstrumentEconomicHedgeMemberewbc:CollarsMember2024-03-310001069157srt:NaturalGasReservesMemberus-gaap:CommodityContractMemberus-gaap:NotDesignatedAsHedgingInstrumentEconomicHedgeMemberewbc:CollarsMember2023-01-012023-12-310001069157srt:NaturalGasReservesMemberus-gaap:CommodityContractMemberus-gaap:NotDesignatedAsHedgingInstrumentEconomicHedgeMemberewbc:CollarsMember2023-12-310001069157srt:NaturalGasReservesMemberus-gaap:CommodityContractMemberewbc:PurchasedOptionsMemberus-gaap:NotDesignatedAsHedgingInstrumentEconomicHedgeMember2024-01-012024-03-310001069157srt:NaturalGasReservesMemberus-gaap:CommodityContractMemberewbc:PurchasedOptionsMemberus-gaap:NotDesignatedAsHedgingInstrumentEconomicHedgeMember2024-03-310001069157srt:NaturalGasReservesMemberus-gaap:CommodityContractMemberewbc:PurchasedOptionsMemberus-gaap:NotDesignatedAsHedgingInstrumentEconomicHedgeMember2023-01-012023-12-310001069157srt:NaturalGasReservesMemberus-gaap:CommodityContractMemberewbc:PurchasedOptionsMemberus-gaap:NotDesignatedAsHedgingInstrumentEconomicHedgeMember2023-12-310001069157srt:NaturalGasReservesMemberus-gaap:CommodityContractMemberus-gaap:NotDesignatedAsHedgingInstrumentEconomicHedgeMember2024-01-012024-03-310001069157srt:NaturalGasReservesMemberus-gaap:CommodityContractMemberus-gaap:NotDesignatedAsHedgingInstrumentEconomicHedgeMember2024-03-310001069157srt:NaturalGasReservesMemberus-gaap:CommodityContractMemberus-gaap:NotDesignatedAsHedgingInstrumentEconomicHedgeMember2023-01-012023-12-310001069157srt:NaturalGasReservesMemberus-gaap:CommodityContractMemberus-gaap:NotDesignatedAsHedgingInstrumentEconomicHedgeMember2023-12-310001069157us-gaap:CommodityContractMemberus-gaap:NotDesignatedAsHedgingInstrumentEconomicHedgeMember2024-03-310001069157us-gaap:CommodityContractMemberus-gaap:NotDesignatedAsHedgingInstrumentEconomicHedgeMember2023-12-310001069157us-gaap:CreditRiskContractMemberus-gaap:NondesignatedMemberus-gaap:ShortMember2024-01-012024-03-310001069157us-gaap:CreditRiskContractMemberus-gaap:NondesignatedMemberus-gaap:ShortMember2023-01-012023-12-310001069157us-gaap:CreditRiskContractMemberus-gaap:NondesignatedMemberus-gaap:ShortMember2024-03-310001069157us-gaap:CreditRiskContractMemberus-gaap:NondesignatedMemberus-gaap:ShortMember2023-12-310001069157us-gaap:CreditRiskContractMemberus-gaap:NondesignatedMemberus-gaap:LongMember2024-03-310001069157us-gaap:CreditRiskContractMemberus-gaap:NondesignatedMemberus-gaap:LongMember2023-12-310001069157us-gaap:InterestRateContractMemberus-gaap:NondesignatedMemberewbc:CustomerDerivativeIncomeMember2024-01-012024-03-310001069157us-gaap:InterestRateContractMemberus-gaap:NondesignatedMemberewbc:CustomerDerivativeIncomeMember2023-01-012023-03-310001069157us-gaap:NondesignatedMemberus-gaap:ForeignExchangeContractMemberus-gaap:ForeignCurrencyGainLossMember2024-01-012024-03-310001069157us-gaap:NondesignatedMemberus-gaap:ForeignExchangeContractMemberus-gaap:ForeignCurrencyGainLossMember2023-01-012023-03-310001069157us-gaap:CreditRiskContractMemberus-gaap:NondesignatedMemberewbc:CustomerDerivativeIncomeMember2024-01-012024-03-310001069157us-gaap:CreditRiskContractMemberus-gaap:NondesignatedMemberewbc:CustomerDerivativeIncomeMember2023-01-012023-03-310001069157us-gaap:NondesignatedMemberus-gaap:EquityContractMemberewbc:LendingfeesMember2024-01-012024-03-310001069157us-gaap:NondesignatedMemberus-gaap:EquityContractMemberewbc:LendingfeesMember2023-01-012023-03-310001069157us-gaap:CommodityContractMemberus-gaap:NondesignatedMemberewbc:CustomerDerivativeIncomeMember2024-01-012024-03-310001069157us-gaap:CommodityContractMemberus-gaap:NondesignatedMemberewbc:CustomerDerivativeIncomeMember2023-01-012023-03-310001069157us-gaap:NondesignatedMember2024-01-012024-03-310001069157us-gaap:NondesignatedMember2023-01-012023-03-310001069157ewbc:CreditRiskRelatedContingentFeaturesMember2024-03-310001069157ewbc:CreditRiskRelatedContingentFeaturesMember2023-12-310001069157ewbc:CommercialAndIndustrialLoanMemberus-gaap:CommercialPortfolioSegmentMember2024-03-310001069157ewbc:CommercialAndIndustrialLoanMemberus-gaap:CommercialPortfolioSegmentMember2023-12-310001069157us-gaap:CommercialRealEstateMemberus-gaap:CommercialPortfolioSegmentMember2024-03-310001069157us-gaap:CommercialRealEstateMemberus-gaap:CommercialPortfolioSegmentMember2023-12-310001069157us-gaap:RealEstateLoanMemberus-gaap:CommercialPortfolioSegmentMembersrt:MultifamilyMember2024-03-310001069157us-gaap:RealEstateLoanMemberus-gaap:CommercialPortfolioSegmentMembersrt:MultifamilyMember2023-12-310001069157ewbc:ConstructionAndLandLoanMemberus-gaap:CommercialPortfolioSegmentMember2024-03-310001069157ewbc:ConstructionAndLandLoanMemberus-gaap:CommercialPortfolioSegmentMember2023-12-310001069157us-gaap:CommercialPortfolioSegmentMemberewbc:TotalCommercialRealEstateMember2024-03-310001069157us-gaap:CommercialPortfolioSegmentMemberewbc:TotalCommercialRealEstateMember2023-12-310001069157us-gaap:CommercialPortfolioSegmentMember2024-03-310001069157us-gaap:CommercialPortfolioSegmentMember2023-12-310001069157us-gaap:RealEstateLoanMemberus-gaap:ConsumerPortfolioSegmentMembersrt:SingleFamilyMember2024-03-310001069157us-gaap:RealEstateLoanMemberus-gaap:ConsumerPortfolioSegmentMembersrt:SingleFamilyMember2023-12-310001069157us-gaap:ConsumerPortfolioSegmentMemberus-gaap:HomeEquityMember2024-03-310001069157us-gaap:ConsumerPortfolioSegmentMemberus-gaap:HomeEquityMember2023-12-310001069157ewbc:TotalResidentialMortgageMemberus-gaap:ConsumerPortfolioSegmentMember2024-03-310001069157ewbc:TotalResidentialMortgageMemberus-gaap:ConsumerPortfolioSegmentMember2023-12-310001069157us-gaap:ConsumerPortfolioSegmentMemberewbc:OtherConsumerMember2024-03-310001069157us-gaap:ConsumerPortfolioSegmentMemberewbc:OtherConsumerMember2023-12-310001069157us-gaap:ConsumerPortfolioSegmentMember2024-03-310001069157us-gaap:ConsumerPortfolioSegmentMember2023-12-310001069157us-gaap:PassMemberewbc:CommercialAndIndustrialLoanMemberus-gaap:CommercialPortfolioSegmentMember2024-03-310001069157ewbc:CommercialAndIndustrialLoanMemberus-gaap:CommercialPortfolioSegmentMemberewbc:CriticizedAccrualMember2024-03-310001069157ewbc:CommercialAndIndustrialLoanMemberus-gaap:CommercialPortfolioSegmentMemberewbc:CriticizedNonaccrualMember2024-03-310001069157ewbc:GrossWriteoffMemberewbc:CommercialAndIndustrialLoanMemberus-gaap:CommercialPortfolioSegmentMember2024-01-012024-03-310001069157us-gaap:CommercialRealEstateMemberus-gaap:PassMemberus-gaap:CommercialPortfolioSegmentMember2024-03-310001069157us-gaap:CommercialRealEstateMemberus-gaap:CommercialPortfolioSegmentMemberewbc:CriticizedAccrualMember2024-03-310001069157us-gaap:CommercialRealEstateMemberus-gaap:CommercialPortfolioSegmentMemberewbc:CriticizedNonaccrualMember2024-03-310001069157us-gaap:CommercialRealEstateMemberewbc:GrossWriteoffMemberus-gaap:CommercialPortfolioSegmentMember2024-01-012024-03-310001069157us-gaap:RealEstateLoanMemberus-gaap:PassMemberus-gaap:CommercialPortfolioSegmentMembersrt:MultifamilyMember2024-03-310001069157us-gaap:RealEstateLoanMemberus-gaap:CommercialPortfolioSegmentMemberewbc:CriticizedAccrualMembersrt:MultifamilyMember2024-03-310001069157us-gaap:RealEstateLoanMemberus-gaap:CommercialPortfolioSegmentMemberewbc:CriticizedNonaccrualMembersrt:MultifamilyMember2024-03-310001069157us-gaap:RealEstateLoanMemberewbc:GrossWriteoffMemberus-gaap:CommercialPortfolioSegmentMembersrt:MultifamilyMember2024-01-012024-03-310001069157us-gaap:PassMemberus-gaap:CommercialPortfolioSegmentMemberewbc:ConstructionAndLandLoanMember2024-03-310001069157us-gaap:CommercialPortfolioSegmentMemberewbc:ConstructionAndLandLoanMemberewbc:CriticizedAccrualMember2024-03-310001069157us-gaap:CommercialPortfolioSegmentMemberewbc:ConstructionAndLandLoanMemberewbc:CriticizedNonaccrualMember2024-03-310001069157ewbc:GrossWriteoffMemberus-gaap:CommercialPortfolioSegmentMemberewbc:ConstructionAndLandLoanMember2024-01-012024-03-310001069157ewbc:GrossWriteoffMemberus-gaap:CommercialPortfolioSegmentMemberewbc:TotalCommercialRealEstateMember2024-01-012024-03-310001069157ewbc:GrossWriteoffMemberus-gaap:CommercialPortfolioSegmentMember2024-01-012024-03-310001069157us-gaap:RealEstateLoanMemberus-gaap:ConsumerPortfolioSegmentMemberus-gaap:PassMembersrt:SingleFamilyMember2024-03-310001069157us-gaap:RealEstateLoanMemberus-gaap:ConsumerPortfolioSegmentMembersrt:SingleFamilyMemberewbc:CriticizedAccrualMember2024-03-310001069157us-gaap:RealEstateLoanMemberus-gaap:ConsumerPortfolioSegmentMembersrt:SingleFamilyMemberewbc:CriticizedNonaccrualMember2024-03-310001069157us-gaap:ConsumerPortfolioSegmentMemberus-gaap:PassMemberus-gaap:HomeEquityMember2024-03-310001069157us-gaap:ConsumerPortfolioSegmentMemberus-gaap:HomeEquityMemberewbc:CriticizedAccrualMember2024-03-310001069157us-gaap:ConsumerPortfolioSegmentMemberewbc:CriticizedNonaccrualMemberus-gaap:HomeEquityMember2024-03-310001069157us-gaap:ConsumerPortfolioSegmentMemberus-gaap:PassMemberewbc:OtherConsumerMember2024-03-310001069157us-gaap:ConsumerPortfolioSegmentMemberewbc:OtherConsumerMemberewbc:CriticizedAccrualMember2024-03-310001069157us-gaap:ConsumerPortfolioSegmentMemberewbc:OtherConsumerMemberewbc:CriticizedNonaccrualMember2024-03-310001069157us-gaap:ConsumerPortfolioSegmentMemberewbc:GrossWriteoffMemberewbc:OtherConsumerMember2024-01-012024-03-310001069157us-gaap:ConsumerPortfolioSegmentMemberewbc:GrossWriteoffMember2024-01-012024-03-310001069157us-gaap:PassMember2024-03-310001069157ewbc:CriticizedAccrualMember2024-03-310001069157ewbc:CriticizedNonaccrualMember2024-03-310001069157ewbc:GrossWriteoffMember2024-01-012024-03-310001069157us-gaap:PassMemberewbc:CommercialAndIndustrialLoanMemberus-gaap:CommercialPortfolioSegmentMember2023-12-310001069157ewbc:CommercialAndIndustrialLoanMemberus-gaap:CommercialPortfolioSegmentMemberewbc:CriticizedAccrualMember2023-12-310001069157ewbc:CommercialAndIndustrialLoanMemberus-gaap:CommercialPortfolioSegmentMemberewbc:CriticizedNonaccrualMember2023-12-310001069157ewbc:GrossWriteoffMemberewbc:CommercialAndIndustrialLoanMemberus-gaap:CommercialPortfolioSegmentMember2023-01-012023-12-310001069157us-gaap:CommercialRealEstateMemberus-gaap:PassMemberus-gaap:CommercialPortfolioSegmentMember2023-12-310001069157us-gaap:CommercialRealEstateMemberus-gaap:CommercialPortfolioSegmentMemberewbc:CriticizedAccrualMember2023-12-310001069157us-gaap:CommercialRealEstateMemberus-gaap:CommercialPortfolioSegmentMemberewbc:CriticizedNonaccrualMember2023-12-310001069157us-gaap:CommercialRealEstateMemberewbc:GrossWriteoffMemberus-gaap:CommercialPortfolioSegmentMember2023-01-012023-12-310001069157us-gaap:RealEstateLoanMemberus-gaap:PassMemberus-gaap:CommercialPortfolioSegmentMembersrt:MultifamilyMember2023-12-310001069157us-gaap:RealEstateLoanMemberus-gaap:CommercialPortfolioSegmentMemberewbc:CriticizedAccrualMembersrt:MultifamilyMember2023-12-310001069157us-gaap:RealEstateLoanMemberus-gaap:CommercialPortfolioSegmentMemberewbc:CriticizedNonaccrualMembersrt:MultifamilyMember2023-12-310001069157us-gaap:RealEstateLoanMemberewbc:GrossWriteoffMemberus-gaap:CommercialPortfolioSegmentMembersrt:MultifamilyMember2023-01-012023-12-310001069157us-gaap:PassMemberus-gaap:CommercialPortfolioSegmentMemberewbc:ConstructionAndLandLoanMember2023-12-310001069157ewbc:GrossWriteoffMemberus-gaap:CommercialPortfolioSegmentMemberewbc:TotalCommercialRealEstateMember2023-01-012023-12-310001069157ewbc:GrossWriteoffMemberus-gaap:CommercialPortfolioSegmentMember2023-01-012023-12-310001069157us-gaap:RealEstateLoanMemberus-gaap:ConsumerPortfolioSegmentMemberus-gaap:PassMembersrt:SingleFamilyMember2023-12-310001069157us-gaap:RealEstateLoanMemberus-gaap:ConsumerPortfolioSegmentMembersrt:SingleFamilyMemberewbc:CriticizedAccrualMember2023-12-310001069157us-gaap:RealEstateLoanMemberus-gaap:ConsumerPortfolioSegmentMembersrt:SingleFamilyMemberewbc:CriticizedNonaccrualMember2023-12-310001069157us-gaap:ConsumerPortfolioSegmentMemberus-gaap:PassMemberus-gaap:HomeEquityMember2023-12-310001069157us-gaap:ConsumerPortfolioSegmentMemberus-gaap:HomeEquityMemberewbc:CriticizedAccrualMember2023-12-310001069157us-gaap:ConsumerPortfolioSegmentMemberewbc:CriticizedNonaccrualMemberus-gaap:HomeEquityMember2023-12-310001069157us-gaap:ConsumerPortfolioSegmentMemberewbc:GrossWriteoffMemberus-gaap:HomeEquityMember2023-01-012023-12-310001069157ewbc:TotalResidentialMortgageMemberus-gaap:ConsumerPortfolioSegmentMemberewbc:GrossWriteoffMember2023-01-012023-12-310001069157us-gaap:ConsumerPortfolioSegmentMemberus-gaap:PassMemberewbc:OtherConsumerMember2023-12-310001069157us-gaap:ConsumerPortfolioSegmentMemberewbc:OtherConsumerMemberewbc:CriticizedNonaccrualMember2023-12-310001069157us-gaap:ConsumerPortfolioSegmentMemberewbc:GrossWriteoffMember2023-01-012023-12-310001069157us-gaap:PassMember2023-12-310001069157ewbc:CriticizedAccrualMember2023-12-310001069157ewbc:CriticizedNonaccrualMember2023-12-310001069157ewbc:GrossWriteoffMember2023-01-012023-12-310001069157us-gaap:CommercialPortfolioSegmentMember2024-01-012024-03-310001069157us-gaap:CommercialPortfolioSegmentMember2023-01-012023-03-310001069157us-gaap:ConsumerLoanMember2024-01-012024-03-310001069157us-gaap:ConsumerLoanMember2023-01-012023-03-310001069157us-gaap:PassMemberus-gaap:FederalHousingAdministrationLoanMember2024-03-310001069157us-gaap:PassMemberus-gaap:FederalHousingAdministrationLoanMember2023-12-310001069157ewbc:CommercialAndIndustrialLoanMemberus-gaap:CommercialPortfolioSegmentMemberus-gaap:FinancialAssetNotPastDueMember2024-03-310001069157us-gaap:FinancingReceivables30To59DaysPastDueMemberewbc:CommercialAndIndustrialLoanMemberus-gaap:CommercialPortfolioSegmentMember2024-03-310001069157us-gaap:FinancingReceivables60To89DaysPastDueMemberewbc:CommercialAndIndustrialLoanMemberus-gaap:CommercialPortfolioSegmentMember2024-03-310001069157us-gaap:FinancialAssetPastDueMemberewbc:CommercialAndIndustrialLoanMemberus-gaap:CommercialPortfolioSegmentMember2024-03-310001069157ewbc:CommercialAndIndustrialLoanMemberus-gaap:CommercialPortfolioSegmentMemberus-gaap:NonperformingFinancingReceivableMember2024-03-310001069157us-gaap:CommercialRealEstateMemberus-gaap:CommercialPortfolioSegmentMemberus-gaap:FinancialAssetNotPastDueMember2024-03-310001069157us-gaap:CommercialRealEstateMemberus-gaap:FinancingReceivables30To59DaysPastDueMemberus-gaap:CommercialPortfolioSegmentMember2024-03-310001069157us-gaap:CommercialRealEstateMemberus-gaap:FinancingReceivables60To89DaysPastDueMemberus-gaap:CommercialPortfolioSegmentMember2024-03-310001069157us-gaap:CommercialRealEstateMemberus-gaap:FinancialAssetPastDueMemberus-gaap:CommercialPortfolioSegmentMember2024-03-310001069157us-gaap:CommercialRealEstateMemberus-gaap:CommercialPortfolioSegmentMemberus-gaap:NonperformingFinancingReceivableMember2024-03-310001069157us-gaap:RealEstateLoanMemberus-gaap:CommercialPortfolioSegmentMemberus-gaap:FinancialAssetNotPastDueMembersrt:MultifamilyMember2024-03-310001069157us-gaap:FinancingReceivables30To59DaysPastDueMemberus-gaap:RealEstateLoanMemberus-gaap:CommercialPortfolioSegmentMembersrt:MultifamilyMember2024-03-310001069157us-gaap:RealEstateLoanMemberus-gaap:FinancingReceivables60To89DaysPastDueMemberus-gaap:CommercialPortfolioSegmentMembersrt:MultifamilyMember2024-03-310001069157us-gaap:RealEstateLoanMemberus-gaap:FinancialAssetPastDueMemberus-gaap:CommercialPortfolioSegmentMembersrt:MultifamilyMember2024-03-310001069157us-gaap:RealEstateLoanMemberus-gaap:CommercialPortfolioSegmentMemberus-gaap:NonperformingFinancingReceivableMembersrt:MultifamilyMember2024-03-310001069157us-gaap:CommercialPortfolioSegmentMemberewbc:ConstructionAndLandLoanMemberus-gaap:FinancialAssetNotPastDueMember2024-03-310001069157us-gaap:FinancingReceivables30To59DaysPastDueMemberus-gaap:CommercialPortfolioSegmentMemberewbc:ConstructionAndLandLoanMember2024-03-310001069157us-gaap:FinancingReceivables60To89DaysPastDueMemberus-gaap:CommercialPortfolioSegmentMemberewbc:ConstructionAndLandLoanMember2024-03-310001069157us-gaap:FinancialAssetPastDueMemberus-gaap:CommercialPortfolioSegmentMemberewbc:ConstructionAndLandLoanMember2024-03-310001069157us-gaap:CommercialPortfolioSegmentMemberewbc:ConstructionAndLandLoanMemberus-gaap:NonperformingFinancingReceivableMember2024-03-310001069157us-gaap:CommercialPortfolioSegmentMemberus-gaap:FinancialAssetNotPastDueMemberewbc:TotalCommercialRealEstateMember2024-03-310001069157us-gaap:FinancingReceivables30To59DaysPastDueMemberus-gaap:CommercialPortfolioSegmentMemberewbc:TotalCommercialRealEstateMember2024-03-310001069157us-gaap:FinancingReceivables60To89DaysPastDueMemberus-gaap:CommercialPortfolioSegmentMemberewbc:TotalCommercialRealEstateMember2024-03-310001069157us-gaap:FinancialAssetPastDueMemberus-gaap:CommercialPortfolioSegmentMemberewbc:TotalCommercialRealEstateMember2024-03-310001069157us-gaap:CommercialPortfolioSegmentMemberus-gaap:NonperformingFinancingReceivableMemberewbc:TotalCommercialRealEstateMember2024-03-310001069157us-gaap:CommercialPortfolioSegmentMemberus-gaap:FinancialAssetNotPastDueMember2024-03-310001069157us-gaap:FinancingReceivables30To59DaysPastDueMemberus-gaap:CommercialPortfolioSegmentMember2024-03-310001069157us-gaap:FinancingReceivables60To89DaysPastDueMemberus-gaap:CommercialPortfolioSegmentMember2024-03-310001069157us-gaap:FinancialAssetPastDueMemberus-gaap:CommercialPortfolioSegmentMember2024-03-310001069157us-gaap:CommercialPortfolioSegmentMemberus-gaap:NonperformingFinancingReceivableMember2024-03-310001069157us-gaap:RealEstateLoanMemberus-gaap:ConsumerPortfolioSegmentMembersrt:SingleFamilyMemberus-gaap:FinancialAssetNotPastDueMember2024-03-310001069157us-gaap:FinancingReceivables30To59DaysPastDueMemberus-gaap:RealEstateLoanMemberus-gaap:ConsumerPortfolioSegmentMembersrt:SingleFamilyMember2024-03-310001069157us-gaap:RealEstateLoanMemberus-gaap:ConsumerPortfolioSegmentMemberus-gaap:FinancingReceivables60To89DaysPastDueMembersrt:SingleFamilyMember2024-03-310001069157us-gaap:RealEstateLoanMemberus-gaap:ConsumerPortfolioSegmentMemberus-gaap:FinancialAssetPastDueMembersrt:SingleFamilyMember2024-03-310001069157us-gaap:RealEstateLoanMemberus-gaap:ConsumerPortfolioSegmentMembersrt:SingleFamilyMemberus-gaap:NonperformingFinancingReceivableMember2024-03-310001069157us-gaap:ConsumerPortfolioSegmentMemberus-gaap:FinancialAssetNotPastDueMemberus-gaap:HomeEquityMember2024-03-310001069157us-gaap:FinancingReceivables30To59DaysPastDueMemberus-gaap:ConsumerPortfolioSegmentMemberus-gaap:HomeEquityMember2024-03-310001069157us-gaap:ConsumerPortfolioSegmentMemberus-gaap:FinancingReceivables60To89DaysPastDueMemberus-gaap:HomeEquityMember2024-03-310001069157us-gaap:ConsumerPortfolioSegmentMemberus-gaap:FinancialAssetPastDueMemberus-gaap:HomeEquityMember2024-03-310001069157us-gaap:ConsumerPortfolioSegmentMemberus-gaap:NonperformingFinancingReceivableMemberus-gaap:HomeEquityMember2024-03-310001069157ewbc:TotalResidentialMortgageMemberus-gaap:ConsumerPortfolioSegmentMemberus-gaap:FinancialAssetNotPastDueMember2024-03-310001069157us-gaap:FinancingReceivables30To59DaysPastDueMemberewbc:TotalResidentialMortgageMemberus-gaap:ConsumerPortfolioSegmentMember2024-03-310001069157ewbc:TotalResidentialMortgageMemberus-gaap:ConsumerPortfolioSegmentMemberus-gaap:FinancingReceivables60To89DaysPastDueMember2024-03-310001069157ewbc:TotalResidentialMortgageMemberus-gaap:ConsumerPortfolioSegmentMemberus-gaap:FinancialAssetPastDueMember2024-03-310001069157ewbc:TotalResidentialMortgageMemberus-gaap:ConsumerPortfolioSegmentMemberus-gaap:NonperformingFinancingReceivableMember2024-03-310001069157us-gaap:ConsumerPortfolioSegmentMemberewbc:OtherConsumerMemberus-gaap:FinancialAssetNotPastDueMember2024-03-310001069157us-gaap:FinancingReceivables30To59DaysPastDueMemberus-gaap:ConsumerPortfolioSegmentMemberewbc:OtherConsumerMember2024-03-310001069157us-gaap:ConsumerPortfolioSegmentMemberus-gaap:FinancingReceivables60To89DaysPastDueMemberewbc:OtherConsumerMember2024-03-310001069157us-gaap:ConsumerPortfolioSegmentMemberus-gaap:FinancialAssetPastDueMemberewbc:OtherConsumerMember2024-03-310001069157us-gaap:ConsumerPortfolioSegmentMemberewbc:OtherConsumerMemberus-gaap:NonperformingFinancingReceivableMember2024-03-310001069157us-gaap:ConsumerPortfolioSegmentMemberus-gaap:FinancialAssetNotPastDueMember2024-03-310001069157us-gaap:FinancingReceivables30To59DaysPastDueMemberus-gaap:ConsumerPortfolioSegmentMember2024-03-310001069157us-gaap:ConsumerPortfolioSegmentMemberus-gaap:FinancingReceivables60To89DaysPastDueMember2024-03-310001069157us-gaap:ConsumerPortfolioSegmentMemberus-gaap:FinancialAssetPastDueMember2024-03-310001069157us-gaap:ConsumerPortfolioSegmentMemberus-gaap:NonperformingFinancingReceivableMember2024-03-310001069157us-gaap:FinancialAssetNotPastDueMember2024-03-310001069157us-gaap:FinancingReceivables30To59DaysPastDueMember2024-03-310001069157us-gaap:FinancingReceivables60To89DaysPastDueMember2024-03-310001069157us-gaap:FinancialAssetPastDueMember2024-03-310001069157us-gaap:NonperformingFinancingReceivableMember2024-03-310001069157ewbc:CommercialAndIndustrialLoanMemberus-gaap:CommercialPortfolioSegmentMemberus-gaap:FinancialAssetNotPastDueMember2023-12-310001069157us-gaap:FinancingReceivables30To59DaysPastDueMemberewbc:CommercialAndIndustrialLoanMemberus-gaap:CommercialPortfolioSegmentMember2023-12-310001069157us-gaap:FinancingReceivables60To89DaysPastDueMemberewbc:CommercialAndIndustrialLoanMemberus-gaap:CommercialPortfolioSegmentMember2023-12-310001069157us-gaap:FinancialAssetPastDueMemberewbc:CommercialAndIndustrialLoanMemberus-gaap:CommercialPortfolioSegmentMember2023-12-310001069157ewbc:CommercialAndIndustrialLoanMemberus-gaap:CommercialPortfolioSegmentMemberus-gaap:NonperformingFinancingReceivableMember2023-12-310001069157us-gaap:CommercialRealEstateMemberus-gaap:CommercialPortfolioSegmentMemberus-gaap:FinancialAssetNotPastDueMember2023-12-310001069157us-gaap:CommercialRealEstateMemberus-gaap:FinancingReceivables30To59DaysPastDueMemberus-gaap:CommercialPortfolioSegmentMember2023-12-310001069157us-gaap:CommercialRealEstateMemberus-gaap:FinancingReceivables60To89DaysPastDueMemberus-gaap:CommercialPortfolioSegmentMember2023-12-310001069157us-gaap:CommercialRealEstateMemberus-gaap:FinancialAssetPastDueMemberus-gaap:CommercialPortfolioSegmentMember2023-12-310001069157us-gaap:CommercialRealEstateMemberus-gaap:CommercialPortfolioSegmentMemberus-gaap:NonperformingFinancingReceivableMember2023-12-310001069157us-gaap:RealEstateLoanMemberus-gaap:CommercialPortfolioSegmentMemberus-gaap:FinancialAssetNotPastDueMembersrt:MultifamilyMember2023-12-310001069157us-gaap:FinancingReceivables30To59DaysPastDueMemberus-gaap:RealEstateLoanMemberus-gaap:CommercialPortfolioSegmentMembersrt:MultifamilyMember2023-12-310001069157us-gaap:RealEstateLoanMemberus-gaap:FinancingReceivables60To89DaysPastDueMemberus-gaap:CommercialPortfolioSegmentMembersrt:MultifamilyMember2023-12-310001069157us-gaap:RealEstateLoanMemberus-gaap:FinancialAssetPastDueMemberus-gaap:CommercialPortfolioSegmentMembersrt:MultifamilyMember2023-12-310001069157us-gaap:RealEstateLoanMemberus-gaap:CommercialPortfolioSegmentMemberus-gaap:NonperformingFinancingReceivableMembersrt:MultifamilyMember2023-12-310001069157us-gaap:CommercialPortfolioSegmentMemberewbc:ConstructionAndLandLoanMemberus-gaap:FinancialAssetNotPastDueMember2023-12-310001069157us-gaap:FinancingReceivables30To59DaysPastDueMemberus-gaap:CommercialPortfolioSegmentMemberewbc:ConstructionAndLandLoanMember2023-12-310001069157us-gaap:FinancingReceivables60To89DaysPastDueMemberus-gaap:CommercialPortfolioSegmentMemberewbc:ConstructionAndLandLoanMember2023-12-310001069157us-gaap:FinancialAssetPastDueMemberus-gaap:CommercialPortfolioSegmentMemberewbc:ConstructionAndLandLoanMember2023-12-310001069157us-gaap:CommercialPortfolioSegmentMemberewbc:ConstructionAndLandLoanMemberus-gaap:NonperformingFinancingReceivableMember2023-12-310001069157us-gaap:CommercialPortfolioSegmentMemberus-gaap:FinancialAssetNotPastDueMemberewbc:TotalCommercialRealEstateMember2023-12-310001069157us-gaap:FinancingReceivables30To59DaysPastDueMemberus-gaap:CommercialPortfolioSegmentMemberewbc:TotalCommercialRealEstateMember2023-12-310001069157us-gaap:FinancingReceivables60To89DaysPastDueMemberus-gaap:CommercialPortfolioSegmentMemberewbc:TotalCommercialRealEstateMember2023-12-310001069157us-gaap:FinancialAssetPastDueMemberus-gaap:CommercialPortfolioSegmentMemberewbc:TotalCommercialRealEstateMember2023-12-310001069157us-gaap:CommercialPortfolioSegmentMemberus-gaap:NonperformingFinancingReceivableMemberewbc:TotalCommercialRealEstateMember2023-12-310001069157us-gaap:CommercialPortfolioSegmentMemberus-gaap:FinancialAssetNotPastDueMember2023-12-310001069157us-gaap:FinancingReceivables30To59DaysPastDueMemberus-gaap:CommercialPortfolioSegmentMember2023-12-310001069157us-gaap:FinancingReceivables60To89DaysPastDueMemberus-gaap:CommercialPortfolioSegmentMember2023-12-310001069157us-gaap:FinancialAssetPastDueMemberus-gaap:CommercialPortfolioSegmentMember2023-12-310001069157us-gaap:CommercialPortfolioSegmentMemberus-gaap:NonperformingFinancingReceivableMember2023-12-310001069157us-gaap:RealEstateLoanMemberus-gaap:ConsumerPortfolioSegmentMembersrt:SingleFamilyMemberus-gaap:FinancialAssetNotPastDueMember2023-12-310001069157us-gaap:FinancingReceivables30To59DaysPastDueMemberus-gaap:RealEstateLoanMemberus-gaap:ConsumerPortfolioSegmentMembersrt:SingleFamilyMember2023-12-310001069157us-gaap:RealEstateLoanMemberus-gaap:ConsumerPortfolioSegmentMemberus-gaap:FinancingReceivables60To89DaysPastDueMembersrt:SingleFamilyMember2023-12-310001069157us-gaap:RealEstateLoanMemberus-gaap:ConsumerPortfolioSegmentMemberus-gaap:FinancialAssetPastDueMembersrt:SingleFamilyMember2023-12-310001069157us-gaap:RealEstateLoanMemberus-gaap:ConsumerPortfolioSegmentMembersrt:SingleFamilyMemberus-gaap:NonperformingFinancingReceivableMember2023-12-310001069157us-gaap:ConsumerPortfolioSegmentMemberus-gaap:FinancialAssetNotPastDueMemberus-gaap:HomeEquityMember2023-12-310001069157us-gaap:FinancingReceivables30To59DaysPastDueMemberus-gaap:ConsumerPortfolioSegmentMemberus-gaap:HomeEquityMember2023-12-310001069157us-gaap:ConsumerPortfolioSegmentMemberus-gaap:FinancingReceivables60To89DaysPastDueMemberus-gaap:HomeEquityMember2023-12-310001069157us-gaap:ConsumerPortfolioSegmentMemberus-gaap:FinancialAssetPastDueMemberus-gaap:HomeEquityMember2023-12-310001069157us-gaap:ConsumerPortfolioSegmentMemberus-gaap:NonperformingFinancingReceivableMemberus-gaap:HomeEquityMember2023-12-310001069157ewbc:TotalResidentialMortgageMemberus-gaap:ConsumerPortfolioSegmentMemberus-gaap:FinancialAssetNotPastDueMember2023-12-310001069157us-gaap:FinancingReceivables30To59DaysPastDueMemberewbc:TotalResidentialMortgageMemberus-gaap:ConsumerPortfolioSegmentMember2023-12-310001069157ewbc:TotalResidentialMortgageMemberus-gaap:ConsumerPortfolioSegmentMemberus-gaap:FinancingReceivables60To89DaysPastDueMember2023-12-310001069157ewbc:TotalResidentialMortgageMemberus-gaap:ConsumerPortfolioSegmentMemberus-gaap:FinancialAssetPastDueMember2023-12-310001069157ewbc:TotalResidentialMortgageMemberus-gaap:ConsumerPortfolioSegmentMemberus-gaap:NonperformingFinancingReceivableMember2023-12-310001069157us-gaap:ConsumerPortfolioSegmentMemberewbc:OtherConsumerMemberus-gaap:FinancialAssetNotPastDueMember2023-12-310001069157us-gaap:FinancingReceivables30To59DaysPastDueMemberus-gaap:ConsumerPortfolioSegmentMemberewbc:OtherConsumerMember2023-12-310001069157us-gaap:ConsumerPortfolioSegmentMemberus-gaap:FinancingReceivables60To89DaysPastDueMemberewbc:OtherConsumerMember2023-12-310001069157us-gaap:ConsumerPortfolioSegmentMemberus-gaap:FinancialAssetPastDueMemberewbc:OtherConsumerMember2023-12-310001069157us-gaap:ConsumerPortfolioSegmentMemberewbc:OtherConsumerMemberus-gaap:NonperformingFinancingReceivableMember2023-12-310001069157us-gaap:ConsumerPortfolioSegmentMemberus-gaap:FinancialAssetNotPastDueMember2023-12-310001069157us-gaap:FinancingReceivables30To59DaysPastDueMemberus-gaap:ConsumerPortfolioSegmentMember2023-12-310001069157us-gaap:ConsumerPortfolioSegmentMemberus-gaap:FinancingReceivables60To89DaysPastDueMember2023-12-310001069157us-gaap:ConsumerPortfolioSegmentMemberus-gaap:FinancialAssetPastDueMember2023-12-310001069157us-gaap:ConsumerPortfolioSegmentMemberus-gaap:NonperformingFinancingReceivableMember2023-12-310001069157us-gaap:FinancialAssetNotPastDueMember2023-12-310001069157us-gaap:FinancingReceivables30To59DaysPastDueMember2023-12-310001069157us-gaap:FinancingReceivables60To89DaysPastDueMember2023-12-310001069157us-gaap:FinancialAssetPastDueMember2023-12-310001069157us-gaap:NonperformingFinancingReceivableMember2023-12-310001069157us-gaap:ResidentialRealEstateMember2023-12-310001069157us-gaap:ResidentialRealEstateMember2024-03-310001069157us-gaap:ExtendedMaturityMemberewbc:CommercialAndIndustrialLoanMemberus-gaap:CommercialPortfolioSegmentMember2024-01-012024-03-310001069157us-gaap:PaymentDeferralMemberewbc:CommercialAndIndustrialLoanMemberus-gaap:CommercialPortfolioSegmentMember2024-01-012024-03-310001069157ewbc:RateReductionAndPaymentDelayMemberewbc:CommercialAndIndustrialLoanMemberus-gaap:CommercialPortfolioSegmentMember2024-01-012024-03-310001069157ewbc:CommercialAndIndustrialLoanMemberus-gaap:CommercialPortfolioSegmentMember2024-01-012024-03-310001069157us-gaap:CommercialRealEstateMemberus-gaap:ExtendedMaturityMemberus-gaap:CommercialPortfolioSegmentMember2024-01-012024-03-310001069157us-gaap:CommercialRealEstateMemberus-gaap:PaymentDeferralMemberus-gaap:CommercialPortfolioSegmentMember2024-01-012024-03-310001069157us-gaap:CommercialRealEstateMemberewbc:RateReductionAndPaymentDelayMemberus-gaap:CommercialPortfolioSegmentMember2024-01-012024-03-310001069157us-gaap:CommercialRealEstateMemberus-gaap:CommercialPortfolioSegmentMember2024-01-012024-03-310001069157us-gaap:ExtendedMaturityMemberus-gaap:CommercialPortfolioSegmentMember2024-01-012024-03-310001069157us-gaap:PaymentDeferralMemberus-gaap:CommercialPortfolioSegmentMember2024-01-012024-03-310001069157ewbc:RateReductionAndPaymentDelayMemberus-gaap:CommercialPortfolioSegmentMember2024-01-012024-03-310001069157us-gaap:RealEstateLoanMemberus-gaap:ConsumerPortfolioSegmentMemberus-gaap:ExtendedMaturityMembersrt:SingleFamilyMember2024-01-012024-03-310001069157us-gaap:RealEstateLoanMemberus-gaap:ConsumerPortfolioSegmentMemberus-gaap:PaymentDeferralMembersrt:SingleFamilyMember2024-01-012024-03-310001069157us-gaap:RealEstateLoanMemberus-gaap:ConsumerPortfolioSegmentMemberewbc:RateReductionAndPaymentDelayMembersrt:SingleFamilyMember2024-01-012024-03-310001069157us-gaap:RealEstateLoanMemberus-gaap:ConsumerPortfolioSegmentMembersrt:SingleFamilyMember2024-01-012024-03-310001069157us-gaap:ConsumerPortfolioSegmentMemberus-gaap:ExtendedMaturityMemberus-gaap:HomeEquityMember2024-01-012024-03-310001069157us-gaap:ConsumerPortfolioSegmentMemberus-gaap:PaymentDeferralMemberus-gaap:HomeEquityMember2024-01-012024-03-310001069157us-gaap:ConsumerPortfolioSegmentMemberewbc:RateReductionAndPaymentDelayMemberus-gaap:HomeEquityMember2024-01-012024-03-310001069157us-gaap:ConsumerPortfolioSegmentMemberus-gaap:HomeEquityMember2024-01-012024-03-310001069157us-gaap:ConsumerPortfolioSegmentMemberus-gaap:ExtendedMaturityMember2024-01-012024-03-310001069157us-gaap:ConsumerPortfolioSegmentMemberus-gaap:PaymentDeferralMember2024-01-012024-03-310001069157us-gaap:ConsumerPortfolioSegmentMemberewbc:RateReductionAndPaymentDelayMember2024-01-012024-03-310001069157us-gaap:ConsumerPortfolioSegmentMember2024-01-012024-03-310001069157us-gaap:ExtendedMaturityMember2024-01-012024-03-310001069157us-gaap:PaymentDeferralMember2024-01-012024-03-310001069157ewbc:RateReductionAndPaymentDelayMember2024-01-012024-03-310001069157us-gaap:ExtendedMaturityMemberewbc:CommercialAndIndustrialLoanMemberus-gaap:CommercialPortfolioSegmentMember2023-01-012023-03-310001069157us-gaap:PaymentDeferralMemberewbc:CommercialAndIndustrialLoanMemberus-gaap:CommercialPortfolioSegmentMember2023-01-012023-03-310001069157ewbc:RateReductionAndPaymentDelayMemberewbc:CommercialAndIndustrialLoanMemberus-gaap:CommercialPortfolioSegmentMember2023-01-012023-03-310001069157ewbc:CommercialAndIndustrialLoanMemberus-gaap:CommercialPortfolioSegmentMember2023-01-012023-03-310001069157us-gaap:CommercialRealEstateMemberus-gaap:ExtendedMaturityMemberus-gaap:CommercialPortfolioSegmentMember2023-01-012023-03-310001069157us-gaap:CommercialRealEstateMemberus-gaap:PaymentDeferralMemberus-gaap:CommercialPortfolioSegmentMember2023-01-012023-03-310001069157us-gaap:CommercialRealEstateMemberewbc:RateReductionAndPaymentDelayMemberus-gaap:CommercialPortfolioSegmentMember2023-01-012023-03-310001069157us-gaap:CommercialRealEstateMemberus-gaap:CommercialPortfolioSegmentMember2023-01-012023-03-310001069157us-gaap:ExtendedMaturityMemberus-gaap:CommercialPortfolioSegmentMember2023-01-012023-03-310001069157us-gaap:PaymentDeferralMemberus-gaap:CommercialPortfolioSegmentMember2023-01-012023-03-310001069157ewbc:RateReductionAndPaymentDelayMemberus-gaap:CommercialPortfolioSegmentMember2023-01-012023-03-310001069157us-gaap:ConsumerPortfolioSegmentMemberus-gaap:ExtendedMaturityMemberus-gaap:HomeEquityMember2023-01-012023-03-310001069157us-gaap:ConsumerPortfolioSegmentMemberus-gaap:PaymentDeferralMemberus-gaap:HomeEquityMember2023-01-012023-03-310001069157us-gaap:ConsumerPortfolioSegmentMemberewbc:RateReductionAndPaymentDelayMemberus-gaap:HomeEquityMember2023-01-012023-03-310001069157us-gaap:ConsumerPortfolioSegmentMemberus-gaap:HomeEquityMember2023-01-012023-03-310001069157us-gaap:ConsumerPortfolioSegmentMemberus-gaap:ExtendedMaturityMember2023-01-012023-03-310001069157us-gaap:ConsumerPortfolioSegmentMemberus-gaap:PaymentDeferralMember2023-01-012023-03-310001069157us-gaap:ConsumerPortfolioSegmentMemberewbc:RateReductionAndPaymentDelayMember2023-01-012023-03-310001069157us-gaap:ConsumerPortfolioSegmentMember2023-01-012023-03-310001069157us-gaap:ExtendedMaturityMember2023-01-012023-03-310001069157us-gaap:PaymentDeferralMember2023-01-012023-03-310001069157ewbc:RateReductionAndPaymentDelayMember2023-01-012023-03-310001069157us-gaap:InterestRateBelowMarketReductionMemberus-gaap:CommercialRealEstateMemberus-gaap:CommercialPortfolioSegmentMember2024-01-012024-03-310001069157us-gaap:InterestRateBelowMarketReductionMemberus-gaap:RealEstateLoanMemberus-gaap:ConsumerPortfolioSegmentMembersrt:SingleFamilyMember2024-01-012024-03-310001069157us-gaap:InterestRateBelowMarketReductionMemberus-gaap:ConsumerPortfolioSegmentMemberus-gaap:HomeEquityMember2024-01-012024-03-310001069157us-gaap:InterestRateBelowMarketReductionMemberus-gaap:ConsumerPortfolioSegmentMemberus-gaap:HomeEquityMember2023-01-012023-03-310001069157ewbc:FinancingReceivables30To89DaysPastDueMemberewbc:CommercialAndIndustrialLoanMemberus-gaap:CommercialPortfolioSegmentMember2024-03-310001069157us-gaap:FinancingReceivablesEqualToGreaterThan90DaysPastDueMemberewbc:CommercialAndIndustrialLoanMemberus-gaap:CommercialPortfolioSegmentMember2024-03-310001069157us-gaap:CommercialRealEstateMemberewbc:FinancingReceivables30To89DaysPastDueMemberus-gaap:CommercialPortfolioSegmentMember2024-03-310001069157us-gaap:CommercialRealEstateMemberus-gaap:FinancingReceivablesEqualToGreaterThan90DaysPastDueMemberus-gaap:CommercialPortfolioSegmentMember2024-03-310001069157ewbc:FinancingReceivables30To89DaysPastDueMemberus-gaap:CommercialPortfolioSegmentMember2024-03-310001069157us-gaap:FinancingReceivablesEqualToGreaterThan90DaysPastDueMemberus-gaap:CommercialPortfolioSegmentMember2024-03-310001069157us-gaap:RealEstateLoanMemberus-gaap:ConsumerPortfolioSegmentMemberewbc:FinancingReceivables30To89DaysPastDueMembersrt:SingleFamilyMember2024-03-310001069157us-gaap:RealEstateLoanMemberus-gaap:ConsumerPortfolioSegmentMemberus-gaap:FinancingReceivablesEqualToGreaterThan90DaysPastDueMembersrt:SingleFamilyMember2024-03-310001069157us-gaap:ConsumerPortfolioSegmentMemberewbc:FinancingReceivables30To89DaysPastDueMemberus-gaap:HomeEquityMember2024-03-310001069157us-gaap:ConsumerPortfolioSegmentMemberus-gaap:FinancingReceivablesEqualToGreaterThan90DaysPastDueMemberus-gaap:HomeEquityMember2024-03-310001069157us-gaap:ConsumerPortfolioSegmentMemberewbc:FinancingReceivables30To89DaysPastDueMember2024-03-310001069157us-gaap:ConsumerPortfolioSegmentMemberus-gaap:FinancingReceivablesEqualToGreaterThan90DaysPastDueMember2024-03-310001069157ewbc:FinancingReceivables30To89DaysPastDueMember2024-03-310001069157us-gaap:FinancingReceivablesEqualToGreaterThan90DaysPastDueMember2024-03-310001069157ewbc:CommercialAndIndustrialLoanMemberus-gaap:CommercialPortfolioSegmentMemberus-gaap:FinancialAssetNotPastDueMember2023-03-310001069157ewbc:FinancingReceivables30To89DaysPastDueMemberewbc:CommercialAndIndustrialLoanMemberus-gaap:CommercialPortfolioSegmentMember2023-03-310001069157us-gaap:FinancingReceivablesEqualToGreaterThan90DaysPastDueMemberewbc:CommercialAndIndustrialLoanMemberus-gaap:CommercialPortfolioSegmentMember2023-03-310001069157ewbc:CommercialAndIndustrialLoanMemberus-gaap:CommercialPortfolioSegmentMember2023-03-310001069157us-gaap:CommercialRealEstateMemberus-gaap:CommercialPortfolioSegmentMemberus-gaap:FinancialAssetNotPastDueMember2023-03-310001069157us-gaap:CommercialRealEstateMemberewbc:FinancingReceivables30To89DaysPastDueMemberus-gaap:CommercialPortfolioSegmentMember2023-03-310001069157us-gaap:CommercialRealEstateMemberus-gaap:FinancingReceivablesEqualToGreaterThan90DaysPastDueMemberus-gaap:CommercialPortfolioSegmentMember2023-03-310001069157us-gaap:CommercialRealEstateMemberus-gaap:CommercialPortfolioSegmentMember2023-03-310001069157us-gaap:CommercialPortfolioSegmentMemberus-gaap:FinancialAssetNotPastDueMember2023-03-310001069157ewbc:FinancingReceivables30To89DaysPastDueMemberus-gaap:CommercialPortfolioSegmentMember2023-03-310001069157us-gaap:FinancingReceivablesEqualToGreaterThan90DaysPastDueMemberus-gaap:CommercialPortfolioSegmentMember2023-03-310001069157us-gaap:CommercialPortfolioSegmentMember2023-03-310001069157us-gaap:ConsumerPortfolioSegmentMemberus-gaap:FinancialAssetNotPastDueMemberus-gaap:HomeEquityMember2023-03-310001069157us-gaap:ConsumerPortfolioSegmentMemberewbc:FinancingReceivables30To89DaysPastDueMemberus-gaap:HomeEquityMember2023-03-310001069157us-gaap:ConsumerPortfolioSegmentMemberus-gaap:FinancingReceivablesEqualToGreaterThan90DaysPastDueMemberus-gaap:HomeEquityMember2023-03-310001069157us-gaap:ConsumerPortfolioSegmentMemberus-gaap:HomeEquityMember2023-03-310001069157us-gaap:ConsumerPortfolioSegmentMemberus-gaap:FinancialAssetNotPastDueMember2023-03-310001069157us-gaap:ConsumerPortfolioSegmentMemberewbc:FinancingReceivables30To89DaysPastDueMember2023-03-310001069157us-gaap:ConsumerPortfolioSegmentMemberus-gaap:FinancingReceivablesEqualToGreaterThan90DaysPastDueMember2023-03-310001069157us-gaap:ConsumerPortfolioSegmentMember2023-03-310001069157us-gaap:FinancialAssetNotPastDueMember2023-03-310001069157ewbc:FinancingReceivables30To89DaysPastDueMember2023-03-310001069157us-gaap:FinancingReceivablesEqualToGreaterThan90DaysPastDueMember2023-03-310001069157ewbc:CommercialAndIndustrialLoanMember2023-06-300001069157ewbc:CommercialAndIndustrialLoanMember2023-09-300001069157us-gaap:RealEstateLoanMemberus-gaap:CommercialPortfolioSegmentMembersrt:MultifamilyMember2024-01-012024-03-310001069157ewbc:ConstructionAndLandLoanMemberus-gaap:CommercialPortfolioSegmentMember2024-01-012024-03-310001069157us-gaap:ConsumerPortfolioSegmentMemberewbc:OtherConsumerMember2024-01-012024-03-310001069157ewbc:CommercialAndIndustrialLoanMemberus-gaap:CommercialPortfolioSegmentMember2022-12-310001069157us-gaap:CommercialRealEstateMemberus-gaap:CommercialPortfolioSegmentMember2022-12-310001069157us-gaap:RealEstateLoanMemberus-gaap:CommercialPortfolioSegmentMembersrt:MultifamilyMember2022-12-310001069157ewbc:ConstructionAndLandLoanMemberus-gaap:CommercialPortfolioSegmentMember2022-12-310001069157us-gaap:RealEstateLoanMemberus-gaap:ConsumerPortfolioSegmentMembersrt:SingleFamilyMember2022-12-310001069157us-gaap:ConsumerPortfolioSegmentMemberus-gaap:HomeEquityMember2022-12-310001069157us-gaap:ConsumerPortfolioSegmentMemberewbc:OtherConsumerMember2022-12-310001069157us-gaap:AccountingStandardsUpdate202202Memberewbc:CommercialAndIndustrialLoanMemberus-gaap:CommercialPortfolioSegmentMember2022-12-310001069157us-gaap:CommercialRealEstateMemberus-gaap:AccountingStandardsUpdate202202Memberus-gaap:CommercialPortfolioSegmentMember2022-12-310001069157us-gaap:RealEstateLoanMemberus-gaap:AccountingStandardsUpdate202202Memberus-gaap:CommercialPortfolioSegmentMembersrt:MultifamilyMember2022-12-310001069157us-gaap:AccountingStandardsUpdate202202Memberus-gaap:CommercialPortfolioSegmentMemberewbc:ConstructionAndLandLoanMember2022-12-310001069157us-gaap:RealEstateLoanMemberus-gaap:ConsumerPortfolioSegmentMemberus-gaap:AccountingStandardsUpdate202202Membersrt:SingleFamilyMember2022-12-310001069157us-gaap:ConsumerPortfolioSegmentMemberus-gaap:AccountingStandardsUpdate202202Memberus-gaap:HomeEquityMember2022-12-310001069157us-gaap:ConsumerPortfolioSegmentMemberus-gaap:AccountingStandardsUpdate202202Memberewbc:OtherConsumerMember2022-12-310001069157us-gaap:AccountingStandardsUpdate202202Member2022-12-310001069157ewbc:CommercialAndIndustrialLoanMemberus-gaap:CommercialPortfolioSegmentMember2023-01-010001069157us-gaap:CommercialRealEstateMemberus-gaap:CommercialPortfolioSegmentMember2023-01-010001069157us-gaap:RealEstateLoanMemberus-gaap:CommercialPortfolioSegmentMembersrt:MultifamilyMember2023-01-010001069157ewbc:ConstructionAndLandLoanMemberus-gaap:CommercialPortfolioSegmentMember2023-01-010001069157us-gaap:RealEstateLoanMemberus-gaap:ConsumerPortfolioSegmentMembersrt:SingleFamilyMember2023-01-010001069157us-gaap:ConsumerPortfolioSegmentMemberus-gaap:HomeEquityMember2023-01-010001069157us-gaap:ConsumerPortfolioSegmentMemberewbc:OtherConsumerMember2023-01-0100010691572023-01-010001069157us-gaap:RealEstateLoanMemberus-gaap:CommercialPortfolioSegmentMembersrt:MultifamilyMember2023-01-012023-03-310001069157ewbc:ConstructionAndLandLoanMemberus-gaap:CommercialPortfolioSegmentMember2023-01-012023-03-310001069157us-gaap:RealEstateLoanMemberus-gaap:ConsumerPortfolioSegmentMembersrt:SingleFamilyMember2023-01-012023-03-310001069157us-gaap:ConsumerPortfolioSegmentMemberewbc:OtherConsumerMember2023-01-012023-03-310001069157us-gaap:RealEstateLoanMemberus-gaap:CommercialPortfolioSegmentMembersrt:MultifamilyMember2023-03-310001069157ewbc:ConstructionAndLandLoanMemberus-gaap:CommercialPortfolioSegmentMember2023-03-310001069157us-gaap:RealEstateLoanMemberus-gaap:ConsumerPortfolioSegmentMembersrt:SingleFamilyMember2023-03-310001069157us-gaap:ConsumerPortfolioSegmentMemberewbc:OtherConsumerMember2023-03-310001069157us-gaap:UnfundedLoanCommitmentMember2023-12-310001069157us-gaap:UnfundedLoanCommitmentMember2022-12-310001069157us-gaap:UnfundedLoanCommitmentMember2024-01-012024-03-310001069157us-gaap:UnfundedLoanCommitmentMember2023-01-012023-03-310001069157us-gaap:UnfundedLoanCommitmentMember2024-03-310001069157us-gaap:UnfundedLoanCommitmentMember2023-03-310001069157ewbc:LoansReceivableOriginatedMember2024-01-012024-03-310001069157ewbc:LoansReceivableOriginatedMember2023-01-012023-03-310001069157ewbc:LoansSoldInSecondaryMarketMemberewbc:LoansReceivablePurchasedMember2024-01-012024-03-310001069157ewbc:LoansSoldInSecondaryMarketMemberewbc:LoansReceivablePurchasedMember2023-01-012023-03-310001069157ewbc:InvestmentsInTaxCreditAndOtherInvestmentsNetAndOtherAssetsMember2024-03-310001069157ewbc:InvestmentsInTaxCreditAndOtherInvestmentsNetAndOtherAssetsMember2023-12-3100010691572023-01-012023-12-310001069157ewbc:RayliantGlobalAdvisorsLimitedMember2024-03-310001069157srt:MinimumMember2024-03-310001069157srt:MaximumMember2024-03-310001069157ewbc:BankTermFundingProgramMember2024-03-310001069157ewbc:BankTermFundingProgramMember2023-12-310001069157us-gaap:JuniorSubordinatedDebtMembersrt:ParentCompanyMember2024-03-310001069157us-gaap:JuniorSubordinatedDebtMembersrt:ParentCompanyMember2023-12-310001069157us-gaap:JuniorSubordinatedDebtMember2024-01-012024-03-310001069157us-gaap:LoanOriginationCommitmentsMember2024-03-310001069157us-gaap:LoanOriginationCommitmentsMember2023-12-310001069157us-gaap:LetterOfCreditMember2024-03-310001069157us-gaap:LetterOfCreditMember2023-12-310001069157us-gaap:CommitmentsToExtendCreditMember2024-03-310001069157us-gaap:CommitmentsToExtendCreditMember2023-12-310001069157us-gaap:StandbyLettersOfCreditMember2024-03-310001069157ewbc:CommercialLettersOfCreditMember2024-03-310001069157us-gaap:StandbyLettersOfCreditMember2023-12-310001069157ewbc:CommercialLettersOfCreditMember2023-12-310001069157us-gaap:GuaranteeObligationsMemberewbc:SingleFamilyResidentialMemberewbc:LoansSoldorSecuritizedWithRecourseMember2024-03-310001069157us-gaap:GuaranteeObligationsMemberewbc:SingleFamilyResidentialMemberewbc:LoansSoldorSecuritizedWithRecourseMember2023-12-310001069157ewbc:MultifamilyResidentialMemberus-gaap:GuaranteeObligationsMemberewbc:LoansSoldorSecuritizedWithRecourseMember2024-03-310001069157ewbc:MultifamilyResidentialMemberus-gaap:GuaranteeObligationsMemberewbc:LoansSoldorSecuritizedWithRecourseMember2023-12-310001069157us-gaap:GuaranteeObligationsMemberewbc:LoansSoldorSecuritizedWithRecourseMember2024-03-310001069157us-gaap:GuaranteeObligationsMemberewbc:LoansSoldorSecuritizedWithRecourseMember2023-12-310001069157us-gaap:GuaranteeObligationsMemberewbc:SingleFamilyResidentialAndMultiFamilyResidentialMemberewbc:LoansSoldorSecuritizedWithRecourseMember2023-12-310001069157us-gaap:GuaranteeObligationsMemberewbc:SingleFamilyResidentialAndMultiFamilyResidentialMemberewbc:LoansSoldorSecuritizedWithRecourseMember2024-03-310001069157ewbc:TwoThousandAndTwentyOneStockIncentivePlanMember2023-12-310001069157ewbc:TwoThousandAndTwentyOneStockIncentivePlanMember2024-03-310001069157us-gaap:RestrictedStockUnitsRSUMemberewbc:CliffVestingMember2024-01-012024-03-310001069157srt:MinimumMemberewbc:PerformanceBasedRestrictedStockSettledinStockMember2024-01-012024-03-310001069157srt:MaximumMemberewbc:PerformanceBasedRestrictedStockSettledinStockMember2024-01-012024-03-310001069157ewbc:PerformanceBasedRestrictedStockSettledinStockMemberewbc:CliffVestingMember2024-01-012024-03-310001069157ewbc:TimeBasedRestrictedStockSettledinStockMember2023-12-310001069157ewbc:PerformanceBasedRestrictedStockSettledinStockMember2023-12-310001069157ewbc:TimeBasedRestrictedStockSettledinStockMember2024-01-012024-03-310001069157ewbc:PerformanceBasedRestrictedStockSettledinStockMember2024-01-012024-03-310001069157ewbc:TimeBasedRestrictedStockSettledinStockMember2024-03-310001069157ewbc:PerformanceBasedRestrictedStockSettledinStockMember2024-03-310001069157us-gaap:RestrictedStockUnitsRSUMember2024-01-012024-03-310001069157us-gaap:RestrictedStockUnitsRSUMember2023-01-012023-03-3100010691572020-12-310001069157us-gaap:AccumulatedNetUnrealizedInvestmentGainLossMember2022-12-310001069157us-gaap:AccumulatedGainLossNetCashFlowHedgeParentMember2022-12-310001069157us-gaap:AccumulatedTranslationAdjustmentMember2022-12-310001069157us-gaap:AccumulatedNetUnrealizedInvestmentGainLossMember2023-01-012023-03-310001069157us-gaap:AccumulatedGainLossNetCashFlowHedgeParentMember2023-01-012023-03-310001069157us-gaap:AccumulatedTranslationAdjustmentMember2023-01-012023-03-310001069157us-gaap:AccumulatedNetUnrealizedInvestmentGainLossMember2023-03-310001069157us-gaap:AccumulatedGainLossNetCashFlowHedgeParentMember2023-03-310001069157us-gaap:AccumulatedTranslationAdjustmentMember2023-03-310001069157us-gaap:AccumulatedNetUnrealizedInvestmentGainLossMember2023-12-310001069157us-gaap:AccumulatedGainLossNetCashFlowHedgeParentMember2023-12-310001069157us-gaap:AccumulatedTranslationAdjustmentMember2023-12-310001069157us-gaap:AccumulatedNetUnrealizedInvestmentGainLossMember2024-01-012024-03-310001069157us-gaap:AccumulatedGainLossNetCashFlowHedgeParentMember2024-01-012024-03-310001069157us-gaap:AccumulatedTranslationAdjustmentMember2024-01-012024-03-310001069157us-gaap:AccumulatedNetUnrealizedInvestmentGainLossMember2024-03-310001069157us-gaap:AccumulatedGainLossNetCashFlowHedgeParentMember2024-03-310001069157us-gaap:AccumulatedTranslationAdjustmentMember2024-03-310001069157ewbc:ConsumerandBusinessBankingMember2024-01-012024-03-310001069157ewbc:CommercialBankingMember2024-01-012024-03-310001069157us-gaap:AllOtherSegmentsMember2024-01-012024-03-310001069157ewbc:ConsumerandBusinessBankingMember2024-03-310001069157ewbc:CommercialBankingMember2024-03-310001069157us-gaap:AllOtherSegmentsMember2024-03-310001069157ewbc:ConsumerandBusinessBankingMember2023-01-012023-03-310001069157ewbc:CommercialBankingMember2023-01-012023-03-310001069157us-gaap:AllOtherSegmentsMember2023-01-012023-03-310001069157ewbc:ConsumerandBusinessBankingMember2023-03-310001069157ewbc:CommercialBankingMember2023-03-310001069157us-gaap:AllOtherSegmentsMember2023-03-31
UNITED STATES
SECURITIES AND EXCHANGE COMMISSION
Washington, D.C. 20549
FORM 10-Q
☒ QUARTERLY REPORT PURSUANT TO SECTION 13 OR 15(d) OF
THE SECURITIES EXCHANGE ACT OF 1934
For the quarterly period ended March 31, 2024
or
☐ TRANSITION REPORT PURSUANT TO SECTION 13 OR 15(d) OF
THE SECURITIES EXCHANGE ACT OF 1934
For the transition period from to
Commission file number 000-24939
EAST WEST BANCORP, INC.
(Exact name of registrant as specified in its charter)
Delaware
(State or other jurisdiction of incorporation or organization)
95-4703316
(I.R.S. Employer Identification No.)
135 North Los Robles Ave., 7th Floor, Pasadena, California 91101
(Address of principal executive offices) (Zip Code)
Registrant’s telephone number, including area code:
(626) 768-6000
Securities registered pursuant to Section 12(b) of the Act:
|
|
|
|
|
|
|
|
|
|
|
|
|
|
|
|
|
|
|
|
|
Title of each class |
|
Trading
Symbol(s) |
|
Name of each exchange
on which registered |
|
|
Common Stock, par value $0.001 per share |
|
EWBC |
|
The Nasdaq Global Select Market |
|
Indicate by check mark whether the registrant (1) has filed all reports required to be filed by Section 13 or 15(d) of the Securities Exchange Act of 1934 during the preceding 12 months (or for such shorter period that the registrant was required to file such reports), and (2) has been subject to such filing requirements for the past 90 days.
Yes ☒ No ☐
Indicate by check mark whether the registrant has submitted electronically every Interactive Data File required to be submitted pursuant to Rule 405 of Regulation S-T (§232.405 of this chapter) during the preceding 12 months (or for such shorter period that the registrant was required to submit such files).
Yes ☒ No ☐
Indicate by check mark whether the registrant is a large accelerated filer, an accelerated filer, a non-accelerated filer, a smaller reporting company, or an emerging growth company. See the definitions of “large accelerated filer,” “accelerated filer,” “smaller reporting company,” and “emerging growth company” in Rule 12b-2 of the Exchange Act.
|
|
|
|
|
|
|
|
|
|
|
|
|
|
|
| Large accelerated filer |
☒ |
|
Accelerated filer |
☐ |
| Non-accelerated filer |
☐ |
|
Smaller reporting company |
☐ |
|
|
Emerging growth company |
☐ |
If an emerging growth company, indicate by check mark if the registrant has elected not to use the extended transition period for complying with any new or revised financial accounting standards provided pursuant to Section 13(a) of the Exchange Act. ☐
Indicate by check mark whether the registrant is a shell company (as defined in Rule 12b-2 of the Exchange Act).
Yes ☐ No ☒
Number of shares outstanding of the issuer’s common stock on the latest practicable date: 139,143,317 shares as of April 30, 2024.
TABLE OF CONTENTS
Forward-Looking Statements
Certain matters discussed in this Quarterly Report on Form 10-Q (this “Form 10-Q”) contain “forward-looking statements” that are intended to be covered by the safe harbor for such statements provided by the Private Securities Litigation Reform Act of 1995. East West Bancorp, Inc. (referred to herein on an unconsolidated basis as “East West” and on a consolidated basis as the “Company,” “we,” “us,” “our” or “EWBC”) may make forward-looking statements in other documents that it files with, or furnishes to, the United States (“U.S.”) Securities and Exchange Commission (“SEC”) and management may make forward-looking statements to analysts, investors, media members and others. Forward-looking statements are those that do not relate to historical facts and that are based on current assumptions, beliefs, estimates, expectations and projections, many of which, by their nature, are inherently uncertain and beyond the Company’s control. Forward-looking statements may relate to various matters, including the Company’s financial condition, results of operations, plans, objectives, future performance, business or industry, and usually can be identified by the use of forward-looking words, such as “anticipates,” “assumes,” “believes,” “can,” “continues,” “could,” “estimates,” “expects,” “forecasts,” “goal,” “intends,” “likely,” “may,” “might,” “objective,” “plans,” “potential,” “projects,” “remains,” “should,” “target,” “trend,” “will,” “would,” or similar expressions or variations thereof, and the negative thereof, but these terms are not the exclusive means of identifying such statements. You should not place undue reliance on forward-looking statements, as they are subject to risks and uncertainties, including, but not limited to, those described below. When considering these forward-looking statements, you should keep in mind these risks and uncertainties, as well as any cautionary statements the Company may make.
There are various important factors that could cause future results to differ materially from historical performance and any forward-looking statements. Factors that might cause such differences, include, but are not limited to:
•changes in the global economy, including an economic slowdown, capital or financial market disruption, supply chain disruption, level of inflation, interest rate environment, residential and commercial property prices, employment levels, rate of growth and general business conditions, which could result in, among other things, reduced demand for loans, reduced availability of funding or increased funding costs, declines in asset values and/or recognition of allowance for credit losses;
•changes in local, regional and global business, economic and political conditions and geopolitical events, such as political unrest, wars and acts of terrorism;
•the soundness of other financial institutions and the impacts related to or resulting from bank failures and other economic and industry volatility, including potential increased regulatory requirements, Federal Deposit Insurance Corporation (“FDIC”) insurance premiums and assessments, deposit withdrawals, or other adverse consequences of negative market perceptions of the banking industry or us;
•changes in laws or the regulatory environment, including regulatory reform initiatives and policies of the U.S. Department of the Treasury, the Board of Governors of the Federal Reserve System (“Federal Reserve”), the FDIC, the SEC, the Consumer Financial Protection Bureau (“CFPB”), the California Department of Financial Protection and Innovation — Division of Financial Institutions, the People’s Bank of China, China’s National Administration of Financial Regulation, the Hong Kong Monetary Authority, the Hong Kong Securities and Futures Commission, and the Monetary Authority of Singapore;
•changes and effects thereof in trade, monetary and fiscal policies and laws, including the ongoing trade, economic and political disputes between the U.S. and the People’s Republic of China and the monetary policies of the Federal Reserve;
•changes in the commercial and consumer real estate markets;
•changes in consumer or commercial spending, savings and borrowing habits, and patterns and behaviors;
•the impact from changes to income tax laws and regulations, federal spending and economic stimulus programs;
•the impact of any future U.S. federal government shutdown and uncertainty regarding the U.S. federal government’s debt limit and credit rating;
•the Company’s ability to compete effectively against financial institutions and other entities, including as a result of emerging technologies;
•the success and timing of the Company’s business strategies;
•the Company’s ability to retain key officers and employees;
•the impact on the Company’s funding costs, net interest income and net interest margin from changes in key variable market interest rates, competition, regulatory requirements and the Company’s product mix;
•changes in the Company’s costs of operation, compliance and expansion;
•the Company’s ability to adopt and successfully integrate new initiatives or technologies into its business in a strategic manner;
•the impact of communications or technology disruption, failure in, or breach of, the Company’s operational or security systems or infrastructure, or those of third-party vendors with which the Company does business, including as a result of cyber-attacks, and other similar matters which could result in, among other things, confidential, proprietary, or personally identifiable information being disclosed or misused, and materially impact the Company’s ability to provide services to its clients;
•the adequacy of the Company’s risk management framework, disclosure controls and procedures and internal control over financial reporting;
•future credit quality and performance, including the Company’s expectations regarding future credit losses and allowance levels;
•the impact of adverse changes to the Company’s credit ratings from major credit rating agencies;
•the impact of adverse judgments or settlements in litigation and other proceedings;
•the impact of political developments, pandemics, wars, civil unrest, terrorism or other hostilities that may disrupt or increase volatility in securities or otherwise affect business and economic conditions on the Company and its customers;
•heightened regulatory and governmental oversight and scrutiny of the Company’s business practices, including dealings with consumers;
•the impact of reputational risk from negative publicity, fines, penalties and other negative consequences from regulatory violations, legal actions and the Company’s interactions with business partners, counterparties, service providers and other third parties;
•the impact of regulatory investigations, regulatory agreements, supervisory criticisms, and enforcement actions;
•changes in accounting standards as may be required by the Financial Accounting Standards Board (“FASB”) or other regulatory agencies and their impact on the Company’s critical accounting policies and assumptions;
•the Company’s capital requirements and its ability to generate capital internally or raise capital on favorable terms;
•the impact on the Company’s liquidity due to changes in the Company’s ability to receive dividends from its subsidiaries;
•any strategic acquisitions or divestitures and the introduction of new or expanded products and services;
•changes in the equity and debt securities markets;
•fluctuations in the Company’s stock price;
•fluctuations in foreign currency exchange rates;
•the impact of increased focus on social, environmental and sustainability matters, which may affect the operations of the Company and its customers and the economy more broadly; and
•the impact of climate change, natural or man-made disasters or calamities, such as wildfires, droughts, hurricanes, flooding and earthquakes or other events that may directly or indirectly result in a negative impact on the financial performance of the Company and its customers.
For a more detailed discussion of some of the factors that might cause such differences, see the Company’s Annual Report on Form 10-K for the year ended December 31, 2023, filed with the SEC on February 29, 2024 (the “Company’s 2023 Form 10-K”) under the heading Item 1A. Risk Factors. You should treat forward-looking statements as speaking only as of the date they are made and based only on information then actually known to the Company. The Company does not undertake, and specifically disclaims, any obligation to update or revise any forward-looking statements to reflect the occurrence of events or circumstances after the date of such statements except as required by law.
PART I — FINANCIAL INFORMATION
ITEM 1. CONSOLIDATED FINANCIAL STATEMENTS
EAST WEST BANCORP, INC. AND SUBSIDIARIES
CONSOLIDATED BALANCE SHEETS
($ in thousands, except shares)
(Unaudited)
|
|
|
|
|
|
|
|
|
|
|
|
|
|
|
|
|
|
March 31,
2024 |
|
December 31,
2023 |
|
|
|
|
|
| ASSETS |
|
|
|
|
| Cash and due from banks |
|
$ |
382,484 |
|
|
$ |
444,793 |
|
| Interest-bearing cash with banks |
|
3,828,317 |
|
|
4,170,191 |
|
| Cash and cash equivalents |
|
4,210,801 |
|
|
4,614,984 |
|
| Interest-bearing deposits with banks |
|
24,593 |
|
|
10,498 |
|
Securities purchased under resale agreements (“resale agreements”) |
|
485,000 |
|
|
785,000 |
|
| Securities: |
|
|
|
|
Available-for-sale (“AFS”) debt securities, at fair value (amortized cost of $9,131,953 and $6,916,491) |
|
8,400,468 |
|
|
6,188,337 |
|
Held-to-maturity (“HTM”) debt securities, at amortized cost (fair value of $2,414,478 and $2,453,971) |
|
2,948,642 |
|
|
2,956,040 |
|
|
|
|
|
|
| Loans held-for-sale |
|
13,280 |
|
|
116 |
|
Loans held-for-investment (net of allowance for loan losses of $670,280 and $668,743) |
|
51,322,224 |
|
|
51,542,039 |
|
Affordable housing partnership, tax credit and Community Reinvestment Act (“CRA”) investments, net |
|
933,187 |
|
|
905,036 |
|
|
|
|
|
|
Premises and equipment (net of accumulated depreciation of $159,760 and $157,622) |
|
83,989 |
|
|
86,370 |
|
| Goodwill |
|
465,697 |
|
|
465,697 |
|
| Operating lease right-of-use assets |
|
87,535 |
|
|
94,024 |
|
| Other assets |
|
1,900,254 |
|
|
1,964,743 |
|
| TOTAL |
|
$ |
70,875,670 |
|
|
$ |
69,612,884 |
|
| LIABILITIES |
|
|
|
|
| Deposits: |
|
|
|
|
| Noninterest-bearing |
|
$ |
14,798,927 |
|
|
$ |
15,539,872 |
|
| Interest-bearing |
|
43,761,697 |
|
|
40,552,566 |
|
| Total deposits |
|
58,560,624 |
|
|
56,092,438 |
|
| Short-term borrowings |
|
19,173 |
|
|
— |
|
Bank Term Funding Program (“BTFP”) borrowings |
|
— |
|
|
4,500,000 |
|
|
|
|
|
|
| Federal Home Loan Bank (“FHLB”) advances |
|
3,500,000 |
|
|
— |
|
|
|
|
|
|
| Long-term debt and finance lease liabilities |
|
36,428 |
|
|
153,011 |
|
| Operating lease liabilities |
|
95,643 |
|
|
102,353 |
|
| Accrued expenses and other liabilities |
|
1,640,570 |
|
|
1,814,248 |
|
| Total liabilities |
|
63,852,438 |
|
|
62,662,050 |
|
| COMMITMENTS AND CONTINGENCIES (Note 11) |
|
|
|
|
| STOCKHOLDERS’ EQUITY |
|
|
|
|
Common stock, $0.001 par value, 200,000,000 shares authorized; 169,835,469 and 169,372,230 shares issued |
|
170 |
|
|
169 |
|
| Additional paid-in capital |
|
1,993,806 |
|
|
1,980,818 |
|
| Retained earnings |
|
6,662,919 |
|
|
6,465,230 |
|
Treasury stock, at cost 30,714,307 and 29,344,863 shares |
|
(970,930) |
|
|
(874,787) |
|
| Accumulated other comprehensive loss (“AOCI”), net of tax |
|
(662,733) |
|
|
(620,596) |
|
| Total stockholders’ equity |
|
7,023,232 |
|
|
6,950,834 |
|
| TOTAL |
|
$ |
70,875,670 |
|
|
$ |
69,612,884 |
|
|
See accompanying Notes to Consolidated Financial Statements.
5
EAST WEST BANCORP, INC. AND SUBSIDIARIES
CONSOLIDATED STATEMENT OF INCOME
($ and shares in thousands, except per share data)
(Unaudited)
|
|
|
|
|
|
|
|
|
|
|
|
|
|
|
|
|
|
|
|
|
|
|
|
|
|
Three Months Ended March 31, |
|
|
|
|
|
|
2024 |
|
2023 |
|
|
|
|
|
|
|
|
| INTEREST AND DIVIDEND INCOME |
|
|
|
|
|
|
|
|
|
|
|
|
| Loans receivable, including fees |
|
$ |
866,389 |
|
|
$ |
728,386 |
|
|
|
|
|
|
|
|
|
| Debt securities |
|
75,392 |
|
|
65,931 |
|
|
|
|
|
|
|
|
|
|
|
|
|
|
|
|
|
|
|
|
|
|
| Resale agreements |
|
6,115 |
|
|
4,503 |
|
|
|
|
|
|
|
|
|
| Restricted equity securities |
|
1,339 |
|
|
1,039 |
|
|
|
|
|
|
|
|
|
| Interest-bearing cash and deposits with banks |
|
74,382 |
|
|
35,647 |
|
|
|
|
|
|
|
|
|
| Total interest and dividend income |
|
1,023,617 |
|
|
835,506 |
|
|
|
|
|
|
|
|
|
| INTEREST EXPENSE |
|
|
|
|
|
|
|
|
|
|
|
|
| Deposits |
|
406,199 |
|
|
216,794 |
|
|
|
|
|
|
|
|
|
| Federal funds purchased and other short-term borrowings |
|
42,106 |
|
|
8,825 |
|
|
|
|
|
|
|
|
|
FHLB advances |
|
7,739 |
|
|
6,430 |
|
|
|
|
|
|
|
|
|
Securities sold under repurchase agreements (“repurchase agreements”) |
|
35 |
|
|
1,052 |
|
|
|
|
|
|
|
|
|
| Long-term debt and finance lease liabilities |
|
2,399 |
|
|
2,544 |
|
|
|
|
|
|
|
|
|
| Total interest expense |
|
458,478 |
|
|
235,645 |
|
|
|
|
|
|
|
|
|
| Net interest income before provision for credit losses |
|
565,139 |
|
|
599,861 |
|
|
|
|
|
|
|
|
|
| Provision for credit losses |
|
25,000 |
|
|
20,000 |
|
|
|
|
|
|
|
|
|
| Net interest income after provision for credit losses |
|
540,139 |
|
|
579,861 |
|
|
|
|
|
|
|
|
|
| NONINTEREST INCOME |
|
|
|
|
|
|
|
|
|
|
|
|
| Deposit account fees |
|
24,948 |
|
|
23,054 |
|
|
|
|
|
|
|
|
|
| Lending fees |
|
22,925 |
|
|
20,586 |
|
|
|
|
|
|
|
|
|
| Foreign exchange income |
|
11,469 |
|
|
11,309 |
|
|
|
|
|
|
|
|
|
| Wealth management fees |
|
8,592 |
|
|
6,304 |
|
|
|
|
|
|
|
|
|
| Customer derivative income |
|
3,750 |
|
|
2,564 |
|
|
|
|
|
|
|
|
|
|
|
|
|
|
|
|
|
|
|
|
|
|
|
|
|
|
|
|
|
|
|
|
|
|
|
Net losses on sales of loans |
|
(41) |
|
|
(22) |
|
|
|
|
|
|
|
|
|
| Net gains (losses) on AFS debt securities |
|
49 |
|
|
(10,000) |
|
|
|
|
|
|
|
|
|
|
|
|
|
|
|
|
|
|
|
|
|
|
|
|
|
|
|
|
|
|
|
|
|
|
|
|
|
|
|
|
|
|
|
|
|
|
|
|
| Other investment income |
|
2,815 |
|
|
1,921 |
|
|
|
|
|
|
|
|
|
| Other income |
|
4,481 |
|
|
4,262 |
|
|
|
|
|
|
|
|
|
| Total noninterest income |
|
78,988 |
|
|
59,978 |
|
|
|
|
|
|
|
|
|
| NONINTEREST EXPENSE |
|
|
|
|
|
|
|
|
|
|
|
|
| Compensation and employee benefits |
|
141,812 |
|
|
129,654 |
|
|
|
|
|
|
|
|
|
| Occupancy and equipment expense |
|
15,230 |
|
|
15,587 |
|
|
|
|
|
|
|
|
|
| Deposit insurance premiums and regulatory assessments |
|
19,649 |
|
|
7,910 |
|
|
|
|
|
|
|
|
|
| Deposit account expense |
|
12,188 |
|
|
9,609 |
|
|
|
|
|
|
|
|
|
| Computer software and data processing expenses |
|
11,344 |
|
|
10,707 |
|
|
|
|
|
|
|
|
|
|
|
|
|
|
|
|
|
|
|
|
|
|
|
|
|
|
|
|
|
|
|
|
|
|
|
| Other operating expense |
|
33,445 |
|
|
34,870 |
|
|
|
|
|
|
|
|
|
Amortization of tax credit and CRA investments |
|
13,207 |
|
|
10,110 |
|
|
|
|
|
|
|
|
|
|
|
|
|
|
|
|
|
|
|
|
|
|
| Total noninterest expense |
|
246,875 |
|
|
218,447 |
|
|
|
|
|
|
|
|
|
| INCOME BEFORE INCOME TAXES |
|
372,252 |
|
|
421,392 |
|
|
|
|
|
|
|
|
|
| INCOME TAX EXPENSE |
|
87,177 |
|
|
98,953 |
|
|
|
|
|
|
|
|
|
| NET INCOME |
|
$ |
285,075 |
|
|
$ |
322,439 |
|
|
|
|
|
|
|
|
|
| EARNINGS PER SHARE (“EPS”) |
|
|
|
|
|
|
|
|
|
|
|
|
| BASIC |
|
$ |
2.04 |
|
|
$ |
2.28 |
|
|
|
|
|
|
|
|
|
| DILUTED |
|
$ |
2.03 |
|
|
$ |
2.27 |
|
|
|
|
|
|
|
|
|
| WEIGHTED-AVERAGE NUMBER OF SHARES OUTSTANDING |
|
|
|
|
|
|
|
|
|
|
|
|
| BASIC |
|
139,409 |
|
|
141,112 |
|
|
|
|
|
|
|
|
|
| DILUTED |
|
140,261 |
|
|
141,913 |
|
|
|
|
|
|
|
|
|
|
See accompanying Notes to Consolidated Financial Statements.
6
EAST WEST BANCORP, INC. AND SUBSIDIARIES
CONSOLIDATED STATEMENT OF COMPREHENSIVE INCOME
($ in thousands)
(Unaudited)
|
|
|
|
|
|
|
|
|
|
|
|
|
|
|
|
|
|
|
|
|
|
|
|
|
|
|
|
|
|
|
|
Three Months Ended March 31, |
|
|
|
|
|
|
|
|
|
|
2024 |
|
2023 |
|
|
|
|
|
|
|
|
|
|
|
|
|
|
| Net income |
|
$ |
285,075 |
|
|
$ |
322,439 |
|
|
|
|
|
|
|
|
|
|
|
|
|
|
|
| Other comprehensive (loss) income, net of tax: |
|
|
|
|
|
|
|
|
|
|
|
|
|
|
|
|
|
|
| Net changes in unrealized (losses) gains on AFS debt securities |
|
(2,317) |
|
|
51,319 |
|
|
|
|
|
|
|
|
|
|
|
|
|
|
|
|
|
|
|
|
|
|
|
|
|
|
|
|
|
|
|
|
|
|
Amortization of unrealized losses on debt securities transferred from AFS to HTM |
|
2,688 |
|
|
2,762 |
|
|
|
|
|
|
|
|
|
|
|
|
|
|
|
| Net changes in unrealized (losses) gains on cash flow hedges |
|
(46,330) |
|
|
28,613 |
|
|
|
|
|
|
|
|
|
|
|
|
|
|
|
| Foreign currency translation adjustments |
|
3,822 |
|
|
2,941 |
|
|
|
|
|
|
|
|
|
|
|
|
|
|
|
| Other comprehensive (loss) income |
|
(42,137) |
|
|
85,635 |
|
|
|
|
|
|
|
|
|
|
|
|
|
|
|
COMPREHENSIVE INCOME |
|
$ |
242,938 |
|
|
$ |
408,074 |
|
|
|
|
|
|
|
|
|
|
|
|
|
|
|
|
See accompanying Notes to Consolidated Financial Statements.
7
EAST WEST BANCORP, INC. AND SUBSIDIARIES
CONSOLIDATED STATEMENT OF CHANGES IN STOCKHOLDERS’ EQUITY
($ in thousands, except shares and per share data)
(Unaudited)
|
|
|
|
|
|
|
|
|
|
|
|
|
|
|
|
|
|
|
|
|
|
|
|
|
|
|
|
|
|
|
|
|
|
|
|
|
|
|
|
|
|
Common Stock and Additional Paid-in Capital |
|
|
|
|
|
|
|
|
|
|
Shares |
|
Amount |
|
Retained Earnings |
|
Treasury Stock |
|
AOCI, Net of Tax |
|
Total Stockholders’ Equity |
| BALANCE, JANUARY 1, 2023 |
|
140,947,846 |
|
|
$ |
1,936,557 |
|
|
$ |
5,582,546 |
|
|
$ |
(768,862) |
|
|
$ |
(765,629) |
|
|
$ |
5,984,612 |
|
Cumulative-effect of a change in accounting principle (1) |
|
— |
|
|
— |
|
|
(4,262) |
|
|
— |
|
|
— |
|
|
(4,262) |
|
| Net income |
|
— |
|
|
— |
|
|
322,439 |
|
|
— |
|
|
— |
|
|
322,439 |
|
| Other comprehensive income |
|
— |
|
|
— |
|
|
— |
|
|
— |
|
|
85,635 |
|
|
85,635 |
|
| Issuance of common stock pursuant to various stock compensation plans and agreements |
|
740,722 |
|
|
11,130 |
|
|
— |
|
|
— |
|
|
— |
|
|
11,130 |
|
| Repurchase of common stock pursuant to various stock compensation plans and agreements |
|
(292,768) |
|
|
— |
|
|
— |
|
|
(21,791) |
|
|
— |
|
|
(21,791) |
|
|
|
|
|
|
|
|
|
|
|
|
|
|
Cash dividends on common stock ($0.48 per share) |
|
— |
|
|
— |
|
|
(68,432) |
|
|
— |
|
|
— |
|
|
(68,432) |
|
| BALANCE, MARCH 31, 2023 |
|
141,395,800 |
|
|
$ |
1,947,687 |
|
|
$ |
5,832,291 |
|
|
$ |
(790,653) |
|
|
$ |
(679,994) |
|
|
$ |
6,309,331 |
|
| BALANCE, JANUARY 1, 2024 |
|
140,027,367 |
|
|
$ |
1,980,987 |
|
|
$ |
6,465,230 |
|
|
$ |
(874,787) |
|
|
$ |
(620,596) |
|
|
$ |
6,950,834 |
|
Cumulative-effect of a change in accounting principle (2) |
|
— |
|
|
— |
|
|
(9,482) |
|
|
— |
|
|
— |
|
|
(9,482) |
|
| Net income |
|
— |
|
|
— |
|
|
285,075 |
|
|
— |
|
|
— |
|
|
285,075 |
|
| Other comprehensive loss |
|
— |
|
|
— |
|
|
— |
|
|
— |
|
|
(42,137) |
|
|
(42,137) |
|
| Issuance of common stock pursuant to various stock compensation plans and agreements |
|
463,239 |
|
|
12,989 |
|
|
— |
|
|
— |
|
|
— |
|
|
12,989 |
|
| Repurchase of common stock pursuant to various stock compensation plans and agreements |
|
(187,593) |
|
|
— |
|
|
— |
|
|
(13,702) |
|
|
— |
|
|
(13,702) |
|
Repurchase of common stock pursuant to the stock repurchase program |
|
(1,181,851) |
|
|
— |
|
|
— |
|
|
(82,441) |
|
|
— |
|
|
(82,441) |
|
Cash dividends on common stock ($0.55 per share) |
|
— |
|
|
— |
|
|
(77,904) |
|
|
— |
|
|
— |
|
|
(77,904) |
|
| BALANCE, MARCH 31, 2024 |
|
139,121,162 |
|
|
$ |
1,993,976 |
|
|
$ |
6,662,919 |
|
|
$ |
(970,930) |
|
|
$ |
(662,733) |
|
|
$ |
7,023,232 |
|
|
|
|
|
|
|
|
|
|
|
|
|
|
(1)Represents the change in the Company’s allowance for loan losses as a result of the adoption of Accounting Standards Update (“ASU”) 2022-02, Financial Instruments - Credit Losses (Topic 326): Troubled Debt Restructurings and the Vintage Disclosures on January 1, 2023.
(2)Represents the impact of the adoption of ASU 2023-02, Investments - Equity Method and Joint Ventures (Topic 323): Accounting for Investments in Tax Credit Structures Using the Proportional Amortization Method on January 1, 2024. Refer to Note 2 — Current Accounting Developments and Summary of Significant Accounting Policies in this Form 10-Q for additional information.
See accompanying Notes to Consolidated Financial Statements.
8
EAST WEST BANCORP, INC. AND SUBSIDIARIES
CONSOLIDATED STATEMENT OF CASH FLOWS
($ in thousands)
(Unaudited)
|
|
|
|
|
|
|
|
|
|
|
|
|
|
|
|
|
|
|
|
Three Months Ended March 31, |
|
|
|
|
2024 |
|
2023 |
|
|
| CASH FLOWS FROM OPERATING ACTIVITIES |
|
|
|
|
|
|
| Net income |
|
$ |
285,075 |
|
|
$ |
322,439 |
|
|
|
| Adjustments to reconcile net income to net cash provided by operating activities: |
|
|
|
|
|
|
| Provision for credit losses |
|
25,000 |
|
|
20,000 |
|
|
|
| Depreciation and amortization |
|
50,998 |
|
|
32,567 |
|
|
|
Amortization of premiums (accretion of discount), net |
|
648 |
|
|
(4,497) |
|
|
|
| Stock compensation costs |
|
12,988 |
|
|
11,075 |
|
|
|
Deferred income tax (benefit) expense |
|
(6,905) |
|
|
609 |
|
|
|
Net losses on sales of loans |
|
41 |
|
|
22 |
|
|
|
Net (gains) losses on AFS debt securities |
|
(49) |
|
|
10,000 |
|
|
|
|
|
|
|
|
|
|
|
|
|
|
|
|
|
|
|
|
|
|
|
|
|
|
|
|
|
|
|
| Loans held-for-sale: |
|
|
|
|
|
|
| Originations and purchases |
|
(850) |
|
|
— |
|
|
|
| Proceeds from sales and paydowns/payoffs of loans originally classified as held-for-sale |
|
992 |
|
|
— |
|
|
|
|
|
|
|
|
|
|
|
|
|
|
|
|
|
Distributions received from equity method investees |
|
978 |
|
|
1,718 |
|
|
|
| Net change in accrued interest receivable and other assets |
|
75,815 |
|
|
(75,163) |
|
|
|
| Net change in accrued expenses and other liabilities |
|
(177,732) |
|
|
(93,948) |
|
|
|
| Other operating activities, net |
|
(760) |
|
|
(1,921) |
|
|
|
| Total adjustments |
|
(18,836) |
|
|
(99,538) |
|
|
|
| Net cash provided by operating activities |
|
266,239 |
|
|
222,901 |
|
|
|
| CASH FLOWS FROM INVESTING ACTIVITIES |
|
|
|
|
|
|
Net (increase) decrease in: |
|
|
|
|
|
|
Affordable housing partnership, tax credit and CRA investments |
|
(106,536) |
|
|
(27,358) |
|
|
|
| Interest-bearing deposits with banks |
|
(14,252) |
|
|
128,772 |
|
|
|
Assets purchased under resale agreements: |
|
|
|
|
|
|
| Proceeds from paydowns and maturities |
|
300,000 |
|
|
150,629 |
|
|
|
| Purchases |
|
— |
|
|
(12,725) |
|
|
|
| AFS debt securities: |
|
|
|
|
|
|
| Proceeds from sales |
|
537,195 |
|
|
— |
|
|
|
| Proceeds from repayments, maturities and redemptions |
|
577,750 |
|
|
321,913 |
|
|
|
| Purchases |
|
(3,337,121) |
|
|
(532,758) |
|
|
|
| HTM debt securities: |
|
|
|
|
|
|
| Proceeds from repayments, maturities and redemptions |
|
11,270 |
|
|
12,387 |
|
|
|
|
|
|
|
|
|
|
| Loans held-for-investment: |
|
|
|
|
|
|
| Proceeds from sales of loans originally classified as held-for-investment |
|
241,907 |
|
|
179,237 |
|
|
|
| Purchases |
|
(108,174) |
|
|
(155,016) |
|
|
|
| Other changes in loans held-for-investment, net |
|
110,120 |
|
|
(695,646) |
|
|
|
|
|
|
|
|
|
|
|
|
|
|
|
|
|
|
|
|
|
|
|
|
Redemption of trust preferred securities |
|
3,558 |
|
|
— |
|
|
|
|
|
|
|
|
|
|
| Proceeds from sales of other real estate owned (“OREO”) and other foreclosed assets |
|
— |
|
|
1,976 |
|
|
|
|
|
|
|
|
|
|
Distributions received from equity method investees |
|
847 |
|
|
2,244 |
|
|
|
Purchases of FHLB stock |
|
(84,294) |
|
|
— |
|
|
|
| Other investing activities, net |
|
(3,846) |
|
|
(6,501) |
|
|
|
| Net cash used in investing activities |
|
(1,871,576) |
|
|
(632,846) |
|
|
|
|
|
|
|
|
|
|
|
|
|
|
|
|
|
|
|
|
|
|
|
|
|
|
|
|
|
|
|
|
|
|
|
|
|
|
|
|
|
|
|
|
|
|
|
|
|
|
|
|
|
|
|
|
|
|
|
|
|
|
|
|
|
|
|
|
|
|
|
|
|
|
|
|
|
|
|
|
|
|
|
|
|
|
|
|
|
|
|
|
|
|
|
|
|
|
|
|
|
|
|
|
|
|
|
|
|
|
|
|
|
|
|
|
|
|
|
|
|
|
|
|
|
|
|
|
|
|
|
|
|
|
|
|
|
|
|
|
|
|
|
|
|
|
|
|
|
|
|
|
|
|
|
|
|
|
|
|
|
|
|
|
|
|
|
|
|
|
|
|
|
|
|
|
|
|
See accompanying Notes to Consolidated Financial Statements.
9
EAST WEST BANCORP, INC. AND SUBSIDIARIES
CONSOLIDATED STATEMENT OF CASH FLOWS
($ in thousands)
(Unaudited)
(Continued)
|
|
|
|
|
|
|
|
|
|
|
|
|
|
|
|
|
|
|
|
Three Months Ended March 31, |
|
|
|
|
2024 |
|
2023 |
|
|
|
|
|
|
|
|
|
|
|
|
|
|
|
|
|
|
|
|
|
|
|
|
|
|
|
|
|
|
|
|
|
|
|
|
|
|
|
|
|
|
|
|
|
|
|
|
|
|
|
|
|
|
|
|
|
|
|
|
|
|
|
|
|
|
|
|
|
|
|
|
|
|
|
|
|
|
|
|
|
|
|
|
|
|
|
|
|
|
|
|
|
|
|
|
|
|
|
|
|
|
|
|
|
|
|
|
|
|
|
|
|
|
|
|
|
|
|
|
|
|
|
|
|
|
|
|
|
|
|
|
|
|
|
|
|
|
|
|
|
|
|
|
|
|
|
|
|
|
|
|
|
|
|
|
|
|
|
|
|
|
|
|
|
|
|
|
|
|
|
|
|
|
|
|
|
|
|
|
|
|
|
|
|
|
|
|
|
|
|
|
|
|
|
|
|
|
|
|
|
|
|
|
|
|
|
|
|
|
|
|
|
|
|
|
|
|
|
|
|
|
|
|
|
|
|
|
|
|
|
|
|
|
|
|
|
|
|
|
|
|
|
|
|
|
|
|
|
|
|
|
|
|
|
|
|
|
|
|
|
|
|
|
|
|
|
|
|
|
|
|
|
|
|
|
|
|
|
|
|
|
|
|
|
|
|
|
|
|
|
|
|
|
|
|
|
|
|
|
|
|
|
|
|
|
|
|
|
|
|
|
|
|
|
|
|
|
|
|
|
|
|
|
|
|
|
|
|
|
|
|
|
|
|
|
|
|
|
|
|
|
|
|
|
|
|
|
|
|
|
|
|
|
|
|
|
|
|
| CASH FLOWS FROM FINANCING ACTIVITIES |
|
|
|
|
|
|
| Net change in deposits |
|
2,475,059 |
|
|
(1,246,189) |
|
|
|
| Net change in short-term borrowings |
|
(4,480,827) |
|
|
4,500,017 |
|
|
|
|
|
|
|
|
|
|
| FHLB advances: |
|
|
|
|
|
|
| Proceeds |
|
3,500,000 |
|
|
6,000,000 |
|
|
|
| Repayment |
|
— |
|
|
(6,000,000) |
|
|
|
| Repurchase agreements: |
|
|
|
|
|
|
|
|
|
|
|
|
|
Repayment |
|
— |
|
|
(300,000) |
|
|
|
Extinguishment cost |
|
— |
|
|
(3,872) |
|
|
|
| Long-term debt and lease liabilities: |
|
|
|
|
|
|
|
|
|
|
|
|
|
Repayment of junior subordinated debt and lease liabilities |
|
(116,798) |
|
|
(203) |
|
|
|
| Common stock: |
|
|
|
|
|
|
|
|
|
|
|
|
|
| Stock tendered for payment of withholding taxes |
|
(13,702) |
|
|
(21,791) |
|
|
|
Repurchase of common stocks pursuant to the stock repurchase program |
|
(82,441) |
|
|
— |
|
|
|
| Cash dividends paid |
|
(79,304) |
|
|
(70,776) |
|
|
|
| Net cash provided by financing activities |
|
1,201,987 |
|
|
2,857,186 |
|
|
|
| Effect of exchange rate changes on cash and cash equivalents |
|
(833) |
|
|
5,169 |
|
|
|
NET (DECREASE) INCREASE IN CASH AND CASH EQUIVALENTS |
|
(404,183) |
|
|
2,452,410 |
|
|
|
| CASH AND CASH EQUIVALENTS, BEGINNING OF PERIOD |
|
4,614,984 |
|
|
3,481,784 |
|
|
|
| CASH AND CASH EQUIVALENTS, END OF PERIOD |
|
$ |
4,210,801 |
|
|
$ |
5,934,194 |
|
|
|
|
|
|
|
|
|
|
SUPPLEMENTAL CASH FLOW INFORMATION: |
|
|
|
|
|
|
| Cash paid during the period for: |
|
|
|
|
|
|
| Interest |
|
$ |
600,438 |
|
|
$ |
227,504 |
|
|
|
| Income taxes, net |
|
$ |
38,619 |
|
|
$ |
— |
|
|
|
| Noncash investing and financing activities: |
|
|
|
|
|
|
|
|
|
|
|
|
|
|
|
|
|
|
|
|
| Loans transferred from held-for-investment to held-for-sale |
|
$ |
199,974 |
|
|
$ |
160,476 |
|
|
|
|
|
|
|
|
|
|
|
|
|
|
|
|
|
|
|
|
|
|
|
|
|
|
|
|
|
|
|
Loans transferred to OREO and other foreclosed assets |
|
$ |
5,551 |
|
|
$ |
— |
|
|
|
|
|
|
|
|
|
|
See accompanying Notes to Consolidated Financial Statements.
10
EAST WEST BANCORP, INC. AND SUBSIDIARIES
NOTES TO CONSOLIDATED FINANCIAL STATEMENTS
(Unaudited)
Note 1 — Basis of Presentation
East West Bancorp, Inc. is a registered bank holding company that offers a full range of banking services to individuals and businesses through its subsidiary bank, East West Bank and its subsidiaries (“East West Bank” or the “Bank”). The unaudited interim Consolidated Financial Statements in this Form 10-Q include the accounts of East West, East West Bank and East West’s subsidiaries. Intercompany transactions and accounts have been eliminated in consolidation. As of March 31, 2024, East West also has one wholly-owned subsidiary that is a statutory business trust (the “Trust”). In accordance with FASB Accounting Standards Codification (“ASC”) Topic 810, Consolidation, the Trust is not included on the Consolidated Financial Statements.
The unaudited interim Consolidated Financial Statements are presented in accordance with U.S. Generally Accepted Accounting Principles (“GAAP”), applicable guidelines prescribed by regulatory authorities and general practices in the banking industry. While the unaudited interim Consolidated Financial Statements reflect all adjustments that, in the opinion of management, are necessary for fair presentation, they primarily serve to update the most recently filed annual report on Form 10-K, and may not include all the information and notes necessary to constitute a complete set of financial statements. Accordingly, they should be read in conjunction with the audited Consolidated Financial Statements and notes thereto included in the Company’s 2023 Form 10-K.
The preparation of the Consolidated Financial Statements in conformity with U.S. GAAP requires management to make estimates and assumptions that affect the reported amounts of assets and liabilities as of the date of the Consolidated Financial Statements, income and expenses during the reporting periods, and the related disclosures. Although our estimates consider current conditions and how we expect them to change in the future, it is reasonably possible that actual results could be materially different from those estimates. Hence, the current period’s results of operations are not necessarily indicative of results that may be expected for any future interim period or for the year as a whole. Certain items on the Consolidated Financial Statements and notes for the prior periods have been reclassified to conform to the current presentation. Events subsequent to the Consolidated Balance Sheet date have been evaluated through the date the Consolidated Financial Statements are issued for inclusion in the accompanying Consolidated Financial Statements.
Note 2 — Current Accounting Developments and Summary of Significant Accounting Policies
Accounting Pronouncements Adopted in 2024
|
|
|
|
|
|
|
|
|
|
|
|
| Standard |
Required Date of Adoption |
Description |
Effect on Financial Statements |
|
|
|
|
|
|
|
|
|
|
|
|
|
ASU 2023-02, Investments — Equity Method and Joint Ventures (Topic 323): Accounting for Investments in Tax Credit Structures Using the Proportional Amortization Method
|
January 1, 2024 |
ASU 2023-02 expands the scope of the proportional amortization method (“PAM”) to equity tax credit investment programs if certain conditions are met. Previously, PAM could only be used for investments in low-income housing tax credit structures. Under this guidance, companies are able to elect, on a tax credit program-by-tax credit program basis, to apply PAM to all equity investments meeting the criteria in ASC 323-740-25-1.
The amendments in this guidance must be applied on a modified retrospective or a retrospective basis.
|
The Company adopted ASU 2023-02 on January 1, 2024, for all tax credit investments under a modified retrospective basis. The impact of the adoption decreased opening retained earnings on January 1, 2024 by $9 million. |
The following standards were adopted on January 1, 2024, but they did not have a material impact on the Company’s Consolidated Financial Statements:
•ASU 2023-01, Leases (Topic 842): Common Control Arrangements
•ASU 2022-03, Fair Value Measurement (Topic 820) Fair Value Measurement of Equity Securities Subject to Contractual Sale Restrictions
Significant Accounting Policies Update
Income Taxes — The Company has elected to apply PAM to qualifying affordable housing partnership, new markets, historic, production and renewable energy tax credit investments. Under PAM, the Company amortizes the initial cost of the investment in proportion to the income tax credits and other income tax benefits received, and recognizes the amortization in Income tax expense on the Consolidated Statement of Income.
Note 3 — Fair Value Measurement and Fair Value of Financial Instruments
Under applicable accounting standards, the Company measures a portion of its assets and liabilities at fair value. These assets and liabilities are predominantly recorded at fair value on a recurring basis. From time to time, certain assets and liabilities are measured at fair value on a nonrecurring basis; that is, they are subject to fair value adjustments only as required through the application of an accounting method such as lower of cost or fair value or write-down of individual assets. The Company categorizes its assets and liabilities into three levels based on the established fair value hierarchy and conducts a review of fair value hierarchy classifications on a quarterly basis. For more information regarding the fair value hierarchy and how the Company measures fair value, see Note 1 — Summary of Significant Accounting Policies — Significant Accounting Policies — Fair Value to the Consolidated Financial Statements in the Company’s 2023 Form 10-K.
Assets and Liabilities Measured at Fair Value on a Recurring Basis
The following section describes the valuation methodologies used by the Company to measure financial assets and liabilities on a recurring basis, as well as the general classification of these instruments within the fair value hierarchy.
Available-for-Sale Debt Securities — The fair value of AFS debt securities is generally determined by independent external pricing service providers who have experience in valuing these securities or by taking the average quoted market prices obtained from independent external brokers. The valuations provided by the third-party pricing service providers are based on observable market inputs, which include benchmark yields, reported trades, issuer spreads, benchmark securities, bids, offers, prepayment expectations and reference data obtained from market research publications. Inputs used by the third-party pricing service providers in valuing collateralized mortgage obligations and other securitization structures also include newly issued data, monthly payment information, whole loan collateral performance, tranche evaluation and “To Be Announced” prices. In valuing securities issued by state and political subdivisions, inputs used by third-party pricing service providers also include material event notices. The valuations provided by the brokers incorporate information from their trading desks, research and other market data.
On a monthly basis, the Company validates the valuations provided by third-party pricing service providers to ensure that the fair value determination is consistent with the applicable accounting guidance and the financial instruments are properly classified in the fair value hierarchy. To perform this validation, the Company evaluates the fair values of securities by comparing the fair values provided by the third-party pricing service providers to prices from other available independent sources for the same securities. When significant variances in prices are identified, the Company further compares inputs used by different sources to ascertain the reliability of these sources. On a quarterly basis, the Company reviews the valuation inputs and methodology furnished by third-party pricing service providers for each security category. On an annual basis, the Company assesses the reasonableness of broker pricing by reviewing the related pricing methodologies. This review includes corroborating pricing with market data, performing pricing input reviews under current market-related conditions, and investigating security pricing by instrument as needed.
When a quoted price in an active market exists for the identical security, this price is used to determine the fair value and the AFS debt security is classified as Level 1. Level 1 AFS debt securities consist of U.S. Treasury securities. When pricing is unavailable from third-party pricing service providers for certain securities, the Company requests market quotes from various independent external brokers and utilizes the average quoted market prices. In addition, the Company obtains market quotes from other official published sources. As these valuations are based on observable inputs in the current marketplace, they are classified as Level 2.
Equity Securities — Equity securities consisted of mutual funds as of both March 31, 2024 and December 31, 2023. The Company invested in these mutual funds for CRA purposes. The Company uses net asset value (“NAV”) information to determine the fair value of these equity securities. When NAV is available periodically and the equity securities can be put back to the transfer agents at the publicly available NAV, the fair value of the equity securities is classified as Level 1. When NAV is available periodically, but the equity securities may not be readily marketable at its periodic NAV in the secondary market, the fair value of these equity securities is classified as Level 2.
Interest Rate Contracts — Interest rate contracts consist of interest rate swaps and options. The fair value of the interest rate swaps is determined using the market standard methodology of netting the discounted future fixed cash payments (or receipts) and the discounted expected variable cash receipts (or payments). The fair value of the interest rate options, which consist of floors and caps, is determined using the market standard methodology of discounting the future expected cash receipts that will occur if variable interest rates fall below (rise above) the strike rate of the floors (caps). In addition, to comply with the provisions of ASC 820, Fair Value Measurement, the Company incorporates credit valuation adjustments to appropriately reflect both its own and the respective counterparty’s nonperformance risk in the fair value measurements of its derivatives. The credit valuation adjustments associated with the Company’s derivatives utilize model-derived credit spreads, which are Level 3 inputs. Considering the observable nature of all other significant inputs utilized, the Company classifies these derivative instruments as Level 2.
Foreign Exchange Contracts — The fair value of foreign exchange contracts is determined at each reporting period based on changes in the foreign exchange rates. These are over-the-counter contracts where quoted market prices are not readily available. Valuation is measured using conventional valuation methodologies with observable market data. Due to the short-term nature of the majority of these contracts, the counterparties’ credit risks are considered nominal and result in no adjustments to the valuation of the foreign exchange contracts. Due to the observable nature of the inputs used in deriving the fair value of these contracts, the valuation of foreign exchange contracts is classified as Level 2. In addition, the Bank managed its foreign currency exposure in the net investment in its China subsidiary, East West Bank (China) Limited, a non-U.S. dollar (“USD”) functional currency subsidiary, with foreign currency non-deliverable forward contracts. These foreign currency non-deliverable forward contracts were designated as net investment hedges. The fair value of foreign currency non-deliverable forward contracts is determined by comparing the contracted foreign exchange rate to the current market foreign exchange rate. Key inputs of the current market exchange rate include the spot and forward rates of the contractual currencies. Foreign exchange forward curves are used to determine which forward rate pertains to a specific maturity. Due to the observable nature of the inputs used in deriving the estimated fair value, these instruments are classified as Level 2.
Credit Contracts — Credit contracts utilized by the Company are comprised of credit risk participation agreements (“RPAs”) entered into by the Company with institutional counterparties. The fair value of the RPAs is calculated by determining the total expected asset or liability exposure of the derivatives to the borrowers and applying the borrowers’ credit spread to that exposure. Total expected exposure incorporates both the current and potential future exposure of the derivatives, derived from using observable inputs, such as yield curves and volatilities. Due to the observable nature of all other significant inputs used in deriving the estimated fair value, credit contracts are classified as Level 2.
Equity Contracts — Equity contracts consist of warrants to purchase common or preferred stock of public and private companies, and any liability-classified contingently issuable shares of the Company. The fair value of the warrants is based on the Black-Scholes option pricing model. For warrants from public companies, the model uses the underlying stock price, stated strike price, warrant expiration date, risk-free interest rate based on a duration-matched U.S. Treasury rate, and market-observable company-specific equity volatility as inputs to value the warrants. Due to the observable nature of the inputs used in deriving the estimated fair value, warrants from public companies are classified as Level 2. For warrants from private companies, the model uses inputs such as the offering price observed in the most recent round of funding, stated strike price, warrant expiration date, risk-free interest rate based on duration-matched U.S. Treasury rate and equity volatility. The Company applies proxy volatilities based on the industry sectors of the private companies. The model values are then adjusted for a general lack of liquidity due to the private nature of the underlying companies. Since both equity volatility and liquidity discount assumptions are subject to management’s judgment, measurement uncertainty is inherent in the valuation of private company warrants. Due to the unobservable nature of the equity volatility and liquidity discount assumptions used in deriving the estimated fair value, warrants from private companies are classified as Level 3. On a quarterly basis, the changes in the fair value of warrants from private companies are reviewed for reasonableness, and a measurement of uncertainty analysis on the equity volatility and liquidity discount assumptions is performed.
In connection with the Company’s acquisition of a 49.99% equity interest in Rayliant Global Advisors Limited (“Rayliant”) during the third quarter of 2023, the Company granted 349,138 shares of performance-based restricted stock units (“RSUs”) as part of its consideration, in addition to $95 million in cash. The vesting of these equity contracts on September 1, 2028, is contingent on Rayliant meeting certain financial performance targets during the performance period. The fair value of liability-classified equity contracts varies based on the operating revenue and operating EBITDA of Rayliant to be achieved during the future performance period, and these performance-based RSUs are expected to vest into a variable number of the Company’s common stock, ranging from 20% to 200% of the target performance-based RSUs granted. Due to the unobservable nature of the input assumptions, these equity contracts are classified as Level 3. For additional information on the equity contracts, refer to Note 6 — Derivatives to the Consolidated Financial Statements in this Form 10-Q.
Commodity Contracts — Commodity contracts consist of swaps and options referencing commodity products. The fair value of the commodity option contracts is determined using the Black-Scholes model and assumptions that include expectations of future commodity price and volatility. The future commodity contract price is derived from observable inputs such as the market price of the commodity. Commodity swaps are structured as an exchange of fixed cash flows for floating cash flows. The fair value of the commodity swaps is determined using the market standard methodology of netting the discounted future fixed cash payments (or receipts) and the discounted expected variable cash receipts (or payments) based on the market prices of the commodity. The fixed cash flows are predetermined based on the known volumes and fixed price as specified in the swap agreement. The floating cash flows are correlated with the change of forward commodity prices, which is derived from market corroborated futures settlement prices. As a result, the Company classifies these derivative instruments as Level 2 due to the observable nature of the significant inputs utilized.
The following tables present financial assets and liabilities that are measured at fair value on a recurring basis as of March 31, 2024 and December 31, 2023:
|
|
|
|
|
|
|
|
|
|
|
|
|
|
|
|
|
|
|
|
|
|
|
|
|
|
|
|
|
|
Assets and Liabilities Measured at Fair Value on a Recurring Basis
as of March 31, 2024 |
| ($ in thousands) |
|
Level 1 |
|
Level 2 |
|
Level 3 |
|
Total
Fair Value |
| AFS debt securities: |
|
|
|
|
|
|
|
|
| U.S. Treasury securities |
|
$ |
621,094 |
|
|
$ |
— |
|
|
$ |
— |
|
|
$ |
621,094 |
|
| U.S. government agency and U.S. government-sponsored enterprise debt securities |
|
— |
|
|
360,802 |
|
|
— |
|
|
360,802 |
|
U.S. government agency and U.S. government-sponsored enterprise mortgage-backed securities (1): |
|
|
|
|
|
|
|
|
| Commercial mortgage-backed securities |
|
— |
|
|
455,619 |
|
|
— |
|
|
455,619 |
|
| Residential mortgage-backed securities |
|
— |
|
|
4,992,399 |
|
|
— |
|
|
4,992,399 |
|
| Municipal securities |
|
— |
|
|
258,495 |
|
|
— |
|
|
258,495 |
|
| Non-agency mortgage-backed securities: |
|
|
|
|
|
|
|
|
| Commercial mortgage-backed securities |
|
— |
|
|
333,996 |
|
|
— |
|
|
333,996 |
|
| Residential mortgage-backed securities |
|
— |
|
|
519,657 |
|
|
— |
|
|
519,657 |
|
| Corporate debt securities |
|
— |
|
|
502,647 |
|
|
— |
|
|
502,647 |
|
| Foreign government bonds |
|
— |
|
|
227,196 |
|
|
— |
|
|
227,196 |
|
| Asset-backed securities |
|
— |
|
|
40,712 |
|
|
— |
|
|
40,712 |
|
| Collateralized loan obligations (“CLOs”) |
|
— |
|
|
87,851 |
|
|
— |
|
|
87,851 |
|
Total AFS debt securities |
|
$ |
621,094 |
|
|
$ |
7,779,374 |
|
|
$ |
— |
|
|
$ |
8,400,468 |
|
|
|
|
|
|
|
|
|
|
Affordable housing partnership, tax credit and CRA investments, net: |
|
|
|
|
|
|
|
|
| Equity securities |
|
$ |
20,402 |
|
|
$ |
4,137 |
|
|
$ |
— |
|
|
$ |
24,539 |
|
Total affordable housing partnership, tax credit and CRA investments, net |
|
$ |
20,402 |
|
|
$ |
4,137 |
|
|
$ |
— |
|
|
$ |
24,539 |
|
|
|
|
|
|
|
|
|
|
| Derivative assets: |
|
|
|
|
|
|
|
|
| Interest rate contracts |
|
$ |
— |
|
|
$ |
484,794 |
|
|
$ |
— |
|
|
$ |
484,794 |
|
| Foreign exchange contracts |
|
— |
|
|
60,499 |
|
|
— |
|
|
60,499 |
|
|
|
|
|
|
|
|
|
|
| Equity contracts |
|
— |
|
|
— |
|
|
330 |
|
|
330 |
|
| Commodity contracts |
|
— |
|
|
76,615 |
|
|
— |
|
|
76,615 |
|
| Gross derivative assets |
|
$ |
— |
|
|
$ |
621,908 |
|
|
$ |
330 |
|
|
$ |
622,238 |
|
Netting adjustments (2) |
|
$ |
— |
|
|
$ |
(489,262) |
|
|
$ |
— |
|
|
$ |
(489,262) |
|
| Net derivative assets |
|
$ |
— |
|
|
$ |
132,646 |
|
|
$ |
330 |
|
|
$ |
132,976 |
|
|
|
|
|
|
|
|
|
|
| Derivative liabilities: |
|
|
|
|
|
|
|
|
| Interest rate contracts |
|
$ |
— |
|
|
$ |
518,330 |
|
|
$ |
— |
|
|
$ |
518,330 |
|
| Foreign exchange contracts |
|
— |
|
|
53,153 |
|
|
— |
|
|
53,153 |
|
Equity contracts (3) |
|
— |
|
|
— |
|
|
15,119 |
|
|
15,119 |
|
| Credit contracts |
|
— |
|
|
16 |
|
|
— |
|
|
16 |
|
| Commodity contracts |
|
— |
|
|
106,930 |
|
|
— |
|
|
106,930 |
|
| Gross derivative liabilities |
|
$ |
— |
|
|
$ |
678,429 |
|
|
$ |
15,119 |
|
|
$ |
693,548 |
|
Netting adjustments (2) |
|
$ |
— |
|
|
$ |
(134,963) |
|
|
$ |
— |
|
|
$ |
(134,963) |
|
| Net derivative liabilities |
|
$ |
— |
|
|
$ |
543,466 |
|
|
$ |
15,119 |
|
|
$ |
558,585 |
|
|
|
|
|
|
|
|
|
|
|
|
|
|
|
|
|
|
|
|
|
|
|
|
|
|
|
|
|
|
|
|
Assets and Liabilities Measured at Fair Value on a Recurring Basis
as of December 31, 2023 |
| ($ in thousands) |
|
Level 1 |
|
Level 2 |
|
Level 3 |
|
Total
Fair Value |
| AFS debt securities: |
|
|
|
|
|
|
|
|
| U.S. Treasury securities |
|
$ |
1,060,375 |
|
|
$ |
— |
|
|
$ |
— |
|
|
$ |
1,060,375 |
|
| U.S. government agency and U.S. government-sponsored enterprise debt securities |
|
— |
|
|
364,446 |
|
|
— |
|
|
364,446 |
|
U.S. government agency and U.S. government-sponsored enterprise mortgage-backed securities (1): |
|
|
|
|
|
|
|
|
| Commercial mortgage-backed securities |
|
— |
|
|
468,259 |
|
|
— |
|
|
468,259 |
|
| Residential mortgage-backed securities |
|
— |
|
|
1,727,594 |
|
|
— |
|
|
1,727,594 |
|
| Municipal securities |
|
— |
|
|
261,016 |
|
|
— |
|
|
261,016 |
|
| Non-agency mortgage-backed securities: |
|
|
|
|
|
|
|
|
| Commercial mortgage-backed securities |
|
— |
|
|
367,516 |
|
|
— |
|
|
367,516 |
|
| Residential mortgage-backed securities |
|
— |
|
|
553,671 |
|
|
— |
|
|
553,671 |
|
| Corporate debt securities |
|
— |
|
|
502,425 |
|
|
— |
|
|
502,425 |
|
| Foreign government bonds |
|
— |
|
|
227,874 |
|
|
— |
|
|
227,874 |
|
| Asset-backed securities |
|
— |
|
|
42,300 |
|
|
— |
|
|
42,300 |
|
| CLOs |
|
— |
|
|
612,861 |
|
|
— |
|
|
612,861 |
|
Total AFS debt securities |
|
$ |
1,060,375 |
|
|
$ |
5,127,962 |
|
|
$ |
— |
|
|
$ |
6,188,337 |
|
|
|
|
|
|
|
|
|
|
Affordable housing partnership, tax credit and CRA investments, net: |
|
|
|
|
|
|
|
|
| Equity securities |
|
$ |
20,509 |
|
|
$ |
4,150 |
|
|
$ |
— |
|
|
$ |
24,659 |
|
Affordable housing partnership, tax credit and CRA investments, net |
|
$ |
20,509 |
|
|
$ |
4,150 |
|
|
$ |
— |
|
|
$ |
24,659 |
|
|
|
|
|
|
|
|
|
|
| Derivative assets: |
|
|
|
|
|
|
|
|
| Interest rate contracts |
|
$ |
— |
|
|
$ |
473,907 |
|
|
$ |
— |
|
|
$ |
473,907 |
|
| Foreign exchange contracts |
|
— |
|
|
57,072 |
|
|
— |
|
|
57,072 |
|
| Credit contracts |
|
— |
|
|
1 |
|
|
— |
|
|
1 |
|
| Equity contracts |
|
— |
|
|
— |
|
|
336 |
|
|
336 |
|
| Commodity contracts |
|
— |
|
|
79,604 |
|
|
— |
|
|
79,604 |
|
| Gross derivative assets |
|
$ |
— |
|
|
$ |
610,584 |
|
|
$ |
336 |
|
|
$ |
610,920 |
|
Netting adjustments (2) |
|
$ |
— |
|
|
$ |
(312,792) |
|
|
$ |
— |
|
|
$ |
(312,792) |
|
| Net derivative assets |
|
$ |
— |
|
|
$ |
297,792 |
|
|
$ |
336 |
|
|
$ |
298,128 |
|
|
|
|
|
|
|
|
|
|
| Derivative liabilities: |
|
|
|
|
|
|
|
|
| Interest rate contracts |
|
$ |
— |
|
|
$ |
433,936 |
|
|
$ |
— |
|
|
$ |
433,936 |
|
| Foreign exchange contracts |
|
— |
|
|
42,564 |
|
|
— |
|
|
42,564 |
|
Equity contracts (3) |
|
— |
|
|
— |
|
|
15,119 |
|
|
15,119 |
|
| Credit contracts |
|
— |
|
|
25 |
|
|
— |
|
|
25 |
|
| Commodity contracts |
|
— |
|
|
121,670 |
|
|
— |
|
|
121,670 |
|
| Gross derivative liabilities |
|
$ |
— |
|
|
$ |
598,195 |
|
|
$ |
15,119 |
|
|
$ |
613,314 |
|
Netting adjustments (2) |
|
$ |
— |
|
|
$ |
(76,170) |
|
|
$ |
— |
|
|
$ |
(76,170) |
|
| Net derivative liabilities |
|
$ |
— |
|
|
$ |
522,025 |
|
|
$ |
15,119 |
|
|
$ |
537,144 |
|
|
(1)Includes Government National Mortgage Association (“GNMA”) AFS debt securities totaling $4.4 billion and $1.2 billion of fair value as of March 31, 2024 and December 31, 2023, respectively.
(2)Represents the balance sheet netting of derivative assets and liabilities and related cash collateral under master netting agreements or similar agreements. See Note 6 — Derivatives to the Consolidated Financial Statements in this Form 10-Q for additional information.
(3)Equity contracts classified as derivative liabilities consist of performance-based RSUs granted as part of EWBC’s consideration in its investment in Rayliant.
For the three months ended March 31, 2024 and 2023, Level 3 fair value measurements that were measured on a recurring basis consisted of warrant equity contracts issued by private companies and liability-classified contingently issuable shares of the Company. The following table provides a reconciliation of the beginning and ending balances of these equity contracts for the three months ended March 31, 2024 and 2023:
|
|
|
|
|
|
|
|
|
|
|
|
|
|
|
|
|
|
|
|
|
|
|
|
|
|
Three Months Ended March 31, |
|
|
|
|
| ($ in thousands) |
|
2024 |
|
2023 |
|
|
|
|
|
|
|
|
| Derivative assets: |
|
|
|
|
|
|
|
|
|
|
|
|
| Equity contracts |
|
|
|
|
|
|
|
|
|
|
|
|
| Beginning balance |
|
$ |
336 |
|
|
$ |
323 |
|
|
|
|
|
|
|
|
|
|
|
|
|
|
|
|
|
|
|
|
|
|
Total losses included in earnings (1) |
|
(6) |
|
|
(46) |
|
|
|
|
|
|
|
|
|
|
|
|
|
|
|
|
|
|
|
|
|
|
|
|
|
|
|
|
|
|
|
|
|
|
|
|
|
|
|
|
|
|
|
|
|
|
|
|
|
|
|
|
|
|
|
|
|
|
|
|
|
|
|
|
|
|
|
|
|
|
|
|
|
|
|
|
|
|
|
|
|
|
|
|
|
|
|
|
|
|
|
|
|
|
|
|
|
|
|
|
|
|
|
|
|
|
|
|
|
|
|
|
|
|
|
|
|
|
|
|
|
|
|
|
|
|
| Ending balance |
|
$ |
330 |
|
|
$ |
277 |
|
|
|
|
|
|
|
|
|
Derivative liabilities: |
|
|
|
|
|
|
|
|
|
|
|
|
Equity contracts (2) |
|
|
|
|
|
|
|
|
|
|
|
|
| Beginning balance |
|
$ |
15,119 |
|
|
$ |
— |
|
|
|
|
|
|
|
|
|
Total gains (losses) included in earnings |
|
— |
|
|
— |
|
|
|
|
|
|
|
|
|
|
|
|
|
|
|
|
|
|
|
|
|
|
| Ending balance |
|
$ |
15,119 |
|
|
$ |
— |
|
|
|
|
|
|
|
|
|
|
|
|
|
|
|
|
|
|
|
|
|
|
|
|
|
|
|
|
|
|
|
|
|
|
|
|
|
|
|
|
|
|
|
|
|
|
|
|
|
|
|
|
|
|
|
|
|
|
|
|
|
|
|
|
|
|
|
|
|
|
|
|
|
|
|
|
|
|
|
|
|
|
|
|
|
|
|
|
|
|
|
|
|
|
|
|
|
|
|
|
|
|
|
|
|
|
|
|
|
|
|
|
|
|
(1)Includes unrealized losses recorded in Lending fees on the Consolidated Statement of Income.
(2)Equity contracts classified as derivative liabilities consist of performance-based RSUs granted as part of EWBC’s consideration in its investment in Rayliant.
The following table presents quantitative information about the significant unobservable inputs used in the valuation of Level 3 fair value measurements as of March 31, 2024 and December 31, 2023. The significant unobservable inputs presented in the table below are those that the Company considers significant to the fair value of the Level 3 assets. The Company considers unobservable inputs to be significant if, by their exclusion, the fair value of the Level 3 assets would be impacted by a predetermined percentage change.
|
|
|
|
|
|
|
|
|
|
|
|
|
|
|
|
|
|
|
|
|
|
|
|
|
|
|
|
|
|
|
|
|
|
|
|
|
|
| ($ in thousands) |
|
Fair Value Measurements (Level 3) |
|
Valuation Technique |
|
Unobservable Inputs |
|
Range of Inputs |
|
Weighted-Average of Inputs |
|
| March 31, 2024 |
|
|
|
|
|
|
|
|
|
|
|
| Derivative assets: |
|
|
|
|
|
|
|
|
|
|
|
| Equity contracts |
|
$ |
330 |
|
|
Black-Scholes option pricing model |
|
Equity volatility |
|
39% — 50% |
|
46 |
% |
(1) |
|
|
|
|
|
|
Liquidity discount |
|
47% |
|
47 |
% |
|
Derivative liabilities: |
|
|
|
|
|
|
|
|
|
|
|
Equity contracts (2) |
|
$ |
15,119 |
|
|
Internal model |
|
Payout % designated based on operating revenue and operating EBITDA of investee |
|
84% |
|
84 |
% |
|
| December 31, 2023 |
|
|
|
|
|
|
|
|
|
|
|
| Derivative assets: |
|
|
|
|
|
|
|
|
|
|
|
| Equity contracts |
|
$ |
336 |
|
|
Black-Scholes option pricing model |
|
Equity volatility |
|
37% — 48% |
|
45 |
% |
(1) |
|
|
|
|
|
|
Liquidity discount |
|
47% |
|
47 |
% |
|
Derivative liabilities: |
|
|
|
|
|
|
|
|
|
|
|
Equity contracts (2) |
|
$ |
15,119 |
|
|
Internal model |
|
Payout % designated based on operating revenue and operating EBITDA of investee |
|
84% |
|
84 |
% |
|
|
|
(1)Weighted-average of inputs is calculated based on the fair value of equity contracts as of both March 31, 2024 and December 31, 2023.
(2)Equity contracts classified as derivative liabilities consist of performance-based RSUs granted as part of EWBC’s consideration in its investment in Rayliant.
Assets and Liabilities Measured at Fair Value on a Nonrecurring Basis
Assets measured at fair value on a nonrecurring basis include certain individually evaluated loans held-for-investment, affordable housing partnership, tax credit and CRA investments, OREO, loans held-for-sale, and other nonperforming assets. Nonrecurring fair value adjustments result from the impairment on certain individually evaluated loans held-for-investment and affordable housing partnership, tax credit and CRA investments, from the write-downs of OREO and other nonperforming assets, or from the application of lower of cost or fair value on loans held-for-sale.
Individually Evaluated Loans Held-for-Investment — Individually evaluated loans held-for-investment are classified as Level 3 assets. The following two methods are used to derive the fair value of individually evaluated loans held-for-investment:
•Discounted cash flow valuation techniques consist of developing an expected stream of cash flows over the life of the loans, and then calculating the present value of the loans by discounting the expected cash flows at a designated discount rate.
•When the repayment of an individually evaluated loan is dependent on the sale of the collateral, the fair value of the loan is determined based on the fair value of the underlying collateral, which may take the form of real estate, inventory, equipment, contracts or guarantees. The fair value of the underlying collateral is generally based on third-party appraisals, or an internal valuation if a third-party appraisal is not required by regulations, or is unavailable. An internal valuation utilizes one or more valuation techniques such as the income, market and/or cost approaches.
Affordable Housing Partnership, Tax Credit and CRA Investments, Net — The Company conducts due diligence on its affordable housing partnership, tax credit and CRA investments prior to the initial investment date and through the placed-in-service date. After these investments are either acquired or placed into service, the Company continues its periodic monitoring process to ensure book values are realizable and that there is no significant tax credit recapture risk. This monitoring process includes reviewing the investment entity’s quarterly financial statements and annual tax returns, the annual financial statements of the guarantor (if any) and a comparison of the actual performance of the investment against the financial projections prepared at the time the investment was made. The Company assesses its tax credit and other investments for possible other-than-temporary impairment on an annual basis or when events or circumstances suggest that the carrying amount of the investments may not be realizable. These circumstances can include, but are not limited to the following factors:
•expected future cash flows that are less than the carrying amount of the investment;
•changes in the economic, market or technological environment that could adversely affect the investee’s operations;
•the potential for tax credit recapture; and
•other factors that raise doubt about the investee’s ability to continue as a going concern, such as negative cash flows from operations and the continuing prospects of the underlying operations of the investment.
All available information is considered in assessing whether a decline in value is other-than-temporary. Generally, none of the aforementioned factors are individually conclusive and the relative importance placed on individual facts may vary depending on the situation. In accordance with ASC 323-10-35-32, Investments — Equity Method and Joint Ventures, an impairment charge would only be recognized in earnings for a decline in value that is determined to be other-than-temporary.
Other Real Estate Owned — The Company’s OREO represents properties acquired through foreclosure, or through full or partial satisfaction of loans held-for-investment such as an acceptance of a deed-in-lieu of foreclosure. These OREO properties are recorded at estimated fair value less the costs to sell at the time of foreclosure or at the lower of cost or estimated fair value less the costs to sell subsequent to acquisition. On a monthly basis, the current fair market value of each OREO property is reviewed to ensure that the current carrying value is appropriate. OREO properties are classified as Level 3.
Loans Held-for-Sale — Loans held-for-investment subsequently transferred to held-for-sale are recorded at the lower of cost or fair value upon transfer. Loans held-for-sale may be measured at fair value on a nonrecurring basis when fair value is less than cost. Fair value is generally determined based on available market data for similar loans and therefore, loans held-for-sale are classified as Level 2.
Other Nonperforming Assets — Other nonperforming assets are recorded at fair value upon transfer from loans to foreclosed assets. Subsequently, foreclosed assets are recorded at the lower of carrying value or fair value. Fair value is based on independent market prices, appraised values of the collateral or management’s estimated recovery of the foreclosed asset. The Company records an impairment when the foreclosed asset’s fair value declines below its carrying value. The fair value measurement of other nonperforming assets is classified within one of the three levels in a valuation hierarchy based upon the observability of inputs to the valuation as of the measurement date.
The following tables present the carrying amounts of assets that were still held and had fair value adjustments measured on a nonrecurring basis as of March 31, 2024 and December 31, 2023:
|
|
|
|
|
|
|
|
|
|
|
|
|
|
|
|
|
|
|
|
|
|
|
|
|
|
|
|
|
|
Assets Measured at Fair Value on a Nonrecurring Basis
as of March 31, 2024 |
| ($ in thousands) |
|
Level 1 |
|
Level 2 |
|
Level 3 |
|
Fair Value Measurements |
| Loans held-for-investment: |
|
|
|
|
|
|
|
|
| Commercial: |
|
|
|
|
|
|
|
|
| Commercial and industrial (“C&I”) |
|
$ |
— |
|
|
$ |
— |
|
|
$ |
25,914 |
|
|
$ |
25,914 |
|
| Commercial real estate (“CRE”): |
|
|
|
|
|
|
|
|
| CRE |
|
— |
|
|
— |
|
|
10,028 |
|
|
10,028 |
|
|
|
|
|
|
|
|
|
|
| Construction and land |
|
— |
|
|
— |
|
|
12,236 |
|
|
12,236 |
|
|
|
|
|
|
|
|
|
|
| Total commercial |
|
— |
|
|
— |
|
|
48,178 |
|
|
48,178 |
|
| Consumer: |
|
|
|
|
|
|
|
|
| Residential mortgage: |
|
|
|
|
|
|
|
|
| Single-family residential |
|
— |
|
|
— |
|
|
116 |
|
|
116 |
|
|
|
|
|
|
|
|
|
|
|
|
|
|
|
|
|
|
|
|
|
|
|
|
|
|
|
|
| Total consumer |
|
— |
|
|
— |
|
|
116 |
|
|
116 |
|
| Total loans held-for-investment |
|
$ |
— |
|
|
$ |
— |
|
|
$ |
48,294 |
|
|
$ |
48,294 |
|
|
|
|
|
|
|
|
|
|
|
|
|
|
|
|
|
|
|
|
|
|
|
|
|
|
|
|
|
|
|
|
|
|
|
|
|
|
|
|
|
|
|
|
|
|
|
|
|
|
|
|
|
|
|
|
|
|
|
|
|
|
|
|
|
|
|
Assets Measured at Fair Value on a Nonrecurring Basis
as of December 31, 2023 |
| ($ in thousands) |
|
Level 1 |
|
Level 2 |
|
Level 3 |
|
Fair Value Measurements |
| Loans held-for-investment: |
|
|
|
|
|
|
|
|
| Commercial: |
|
|
|
|
|
|
|
|
| C&I |
|
$ |
— |
|
|
$ |
— |
|
|
$ |
22,035 |
|
|
$ |
22,035 |
|
| CRE: |
|
|
|
|
|
|
|
|
| CRE |
|
— |
|
|
— |
|
|
22,653 |
|
|
22,653 |
|
|
|
|
|
|
|
|
|
|
|
|
|
|
|
|
|
|
|
|
|
|
|
|
|
|
|
|
| Total commercial |
|
— |
|
|
— |
|
|
44,688 |
|
|
44,688 |
|
| Consumer: |
|
|
|
|
|
|
|
|
| Residential mortgage: |
|
|
|
|
|
|
|
|
|
|
|
|
|
|
|
|
|
Home equity lines of credit (“HELOCs”) |
|
— |
|
|
— |
|
|
1,204 |
|
|
1,204 |
|
|
|
|
|
|
|
|
|
|
|
|
|
|
|
|
|
|
|
| Total consumer |
|
— |
|
|
— |
|
|
1,204 |
|
|
1,204 |
|
| Total loans held-for-investment |
|
$ |
— |
|
|
$ |
— |
|
|
$ |
45,892 |
|
|
$ |
45,892 |
|
Affordable housing partnership, tax credit and CRA investments, net |
|
$ |
— |
|
|
$ |
— |
|
|
$ |
868 |
|
|
$ |
868 |
|
|
|
|
|
|
|
|
|
|
|
|
|
|
|
|
|
|
|
The following table presents the (decrease) increase in the fair value of certain assets held at the end of the respective reporting periods, for which a nonrecurring fair value adjustment was recognized for the three months ended March 31, 2024 and 2023:
|
|
|
|
|
|
|
|
|
|
|
|
|
|
|
|
|
|
|
|
|
|
|
|
|
|
Three Months Ended March 31, |
|
|
|
|
| ($ in thousands) |
|
2024 |
|
2023 |
|
|
|
|
|
|
|
|
| Loans held-for-investment: |
|
|
|
|
|
|
|
|
|
|
|
|
| Commercial: |
|
|
|
|
|
|
|
|
|
|
|
|
| C&I |
|
$ |
(12,843) |
|
|
$ |
(1,255) |
|
|
|
|
|
|
|
|
|
| CRE: |
|
|
|
|
|
|
|
|
|
|
|
|
| CRE |
|
(2,006) |
|
|
— |
|
|
|
|
|
|
|
|
|
|
|
|
|
|
|
|
|
|
|
|
|
|
| Construction and land |
|
(1,224) |
|
|
— |
|
|
|
|
|
|
|
|
|
|
|
|
|
|
|
|
|
|
|
|
|
|
| Total commercial |
|
(16,073) |
|
|
(1,255) |
|
|
|
|
|
|
|
|
|
| Consumer: |
|
|
|
|
|
|
|
|
|
|
|
|
| Residential mortgage: |
|
|
|
|
|
|
|
|
|
|
|
|
| Single-family residential |
|
(1,384) |
|
|
— |
|
|
|
|
|
|
|
|
|
|
|
|
|
|
|
|
|
|
|
|
|
|
|
|
|
|
|
|
|
|
|
|
|
|
|
|
|
|
|
|
|
|
|
|
|
|
|
|
| Total consumer |
|
(1,384) |
|
|
— |
|
|
|
|
|
|
|
|
|
| Total loans held-for-investment |
|
$ |
(17,457) |
|
|
$ |
(1,255) |
|
|
|
|
|
|
|
|
|
|
|
|
|
|
|
|
|
|
|
|
|
|
Affordable housing partnership, tax credit and CRA investments, net |
|
$ |
— |
|
|
$ |
174 |
|
|
|
|
|
|
|
|
|
|
|
|
|
|
|
|
|
|
|
|
|
|
|
|
|
|
|
|
|
|
|
|
|
|
|
|
|
|
|
|
|
|
|
|
|
|
|
|
|
|
|
|
|
|
|
|
|
|
|
|
|
The following table presents the quantitative information about the significant unobservable inputs used in the valuation of Level 3 fair value measurements that are measured on a nonrecurring basis as of March 31, 2024 and December 31, 2023:
|
|
|
|
|
|
|
|
|
|
|
|
|
|
|
|
|
|
|
|
|
|
|
|
|
|
|
|
|
|
|
|
|
|
|
|
|
|
| ($ in thousands) |
|
Fair Value Measurements (Level 3) |
|
Valuation Techniques |
|
Unobservable Inputs |
|
Range of Inputs |
|
Weighted-Average of Inputs |
|
| March 31, 2024 |
|
|
|
|
|
|
|
|
|
|
|
|
|
|
|
|
|
|
|
|
|
|
|
| Loans held-for-investment |
|
$ |
6,917 |
|
|
Fair value of collateral |
|
Discount |
|
20% |
|
20% |
|
|
|
$ |
8,471 |
|
|
Fair value of collateral |
|
Contract value |
|
NM |
|
NM |
|
|
|
$ |
32,906 |
|
|
Fair value of property |
|
Selling cost |
|
8% |
|
8% |
|
|
|
|
|
|
|
|
|
|
|
|
|
|
|
|
|
|
|
|
|
|
|
|
|
|
|
|
|
|
|
|
|
|
|
|
|
|
|
|
|
|
|
|
|
|
|
|
|
| December 31, 2023 |
|
|
|
|
|
|
|
|
|
|
|
|
|
|
|
|
|
|
|
|
|
|
|
|
|
|
|
|
|
|
|
|
|
|
|
| Loans held-for-investment |
|
$ |
16,328 |
|
|
Fair value of collateral |
|
Discount |
|
15% — 75% |
|
45% |
(1) |
|
|
$ |
3,009 |
|
|
Fair value of collateral |
|
Contract value |
|
NM |
|
NM |
|
|
|
$ |
26,555 |
|
|
Fair value of property |
|
Selling cost |
|
8% |
|
8% |
|
Affordable housing partnership, tax credit and CRA investments, net |
|
$ |
868 |
|
|
Individual analysis of each investment |
|
Expected future tax benefits and distributions |
|
NM |
|
NM |
|
|
|
|
|
|
|
|
|
|
|
|
|
|
|
|
|
|
|
|
|
|
|
|
|
|
|
NM — Not meaningful.
(1)Weighted-average of inputs is based on the relative fair value of the respective assets as of December 31, 2023.
Disclosures about the Fair Value of Financial Instruments
The following tables present the fair value estimates for financial instruments as of March 31, 2024 and December 31, 2023, excluding financial instruments recorded at fair value on a recurring basis as they are included in the tables presented elsewhere in this Note. The carrying amounts in the following tables are recorded on the Consolidated Balance Sheet under the indicated captions, except for accrued interest receivable, restricted equity securities, at cost, and mortgage servicing rights that are included in Other assets, and accrued interest payable which is included in Accrued expenses and other liabilities. These financial instruments are measured on an amortized cost basis on the Company’s Consolidated Balance Sheet.
|
|
|
|
|
|
|
|
|
|
|
|
|
|
|
|
|
|
|
|
|
|
|
|
|
|
|
|
|
|
|
|
|
|
|
|
March 31, 2024 |
| ($ in thousands) |
|
Carrying Amount |
|
Level 1 |
|
Level 2 |
|
Level 3 |
|
Estimated Fair Value |
| Financial assets: |
|
|
|
|
|
|
|
|
|
|
| Cash and cash equivalents |
|
$ |
4,210,801 |
|
|
$ |
4,210,801 |
|
|
$ |
— |
|
|
$ |
— |
|
|
$ |
4,210,801 |
|
| Interest-bearing deposits with banks |
|
$ |
24,593 |
|
|
$ |
— |
|
|
$ |
24,593 |
|
|
$ |
— |
|
|
$ |
24,593 |
|
| Resale agreements |
|
$ |
485,000 |
|
|
$ |
— |
|
|
$ |
391,403 |
|
|
$ |
— |
|
|
$ |
391,403 |
|
| HTM debt securities |
|
$ |
2,948,642 |
|
|
$ |
485,400 |
|
|
$ |
1,929,078 |
|
|
$ |
— |
|
|
$ |
2,414,478 |
|
| Restricted equity securities, at cost |
|
$ |
164,402 |
|
|
$ |
— |
|
|
$ |
164,402 |
|
|
$ |
— |
|
|
$ |
164,402 |
|
| Loans held-for-sale |
|
$ |
13,280 |
|
|
$ |
— |
|
|
$ |
13,280 |
|
|
$ |
— |
|
|
$ |
13,280 |
|
| Loans held-for-investment, net |
|
$ |
51,322,224 |
|
|
$ |
— |
|
|
$ |
— |
|
|
$ |
49,849,727 |
|
|
$ |
49,849,727 |
|
| Mortgage servicing rights |
|
$ |
6,234 |
|
|
$ |
— |
|
|
$ |
— |
|
|
$ |
10,787 |
|
|
$ |
10,787 |
|
| Accrued interest receivable |
|
$ |
336,428 |
|
|
$ |
— |
|
|
$ |
336,428 |
|
|
$ |
— |
|
|
$ |
336,428 |
|
| Financial liabilities: |
|
|
|
|
|
|
|
|
|
|
| Demand, checking, savings and money market deposits |
|
$ |
37,789,344 |
|
|
$ |
— |
|
|
$ |
37,789,344 |
|
|
$ |
— |
|
|
$ |
37,789,344 |
|
| Time deposits |
|
$ |
20,771,280 |
|
|
$ |
— |
|
|
$ |
20,715,628 |
|
|
$ |
— |
|
|
$ |
20,715,628 |
|
| Short-term borrowings |
|
$ |
19,173 |
|
|
$ |
— |
|
|
$ |
19,173 |
|
|
$ |
— |
|
|
$ |
19,173 |
|
|
|
|
|
|
|
|
|
|
|
|
| FHLB advances |
|
$ |
3,500,000 |
|
|
$ |
— |
|
|
$ |
3,500,000 |
|
|
$ |
— |
|
|
$ |
3,500,000 |
|
|
|
|
|
|
|
|
|
|
|
|
| Long-term debt |
|
$ |
31,768 |
|
|
$ |
— |
|
|
$ |
30,201 |
|
|
$ |
— |
|
|
$ |
30,201 |
|
| Accrued interest payable |
|
$ |
63,470 |
|
|
$ |
— |
|
|
$ |
63,470 |
|
|
$ |
— |
|
|
$ |
63,470 |
|
|
|
|
|
|
|
|
|
|
|
|
|
|
|
|
|
|
|
|
|
|
|
|
|
|
|
|
|
|
|
|
|
|
|
|
|
|
December 31, 2023 |
| ($ in thousands) |
|
Carrying Amount |
|
Level 1 |
|
Level 2 |
|
Level 3 |
|
Estimated Fair Value |
| Financial assets: |
|
|
|
|
|
|
|
|
|
|
| Cash and cash equivalents |
|
$ |
4,614,984 |
|
|
$ |
4,614,984 |
|
|
$ |
— |
|
|
$ |
— |
|
|
$ |
4,614,984 |
|
| Interest-bearing deposits with banks |
|
$ |
10,498 |
|
|
$ |
— |
|
|
$ |
10,498 |
|
|
$ |
— |
|
|
$ |
10,498 |
|
| Resale agreements |
|
$ |
785,000 |
|
|
$ |
— |
|
|
$ |
699,056 |
|
|
$ |
— |
|
|
$ |
699,056 |
|
| HTM debt securities |
|
$ |
2,956,040 |
|
|
$ |
488,551 |
|
|
$ |
1,965,420 |
|
|
$ |
— |
|
|
$ |
2,453,971 |
|
| Restricted equity securities, at cost |
|
$ |
79,811 |
|
|
$ |
— |
|
|
$ |
79,811 |
|
|
$ |
— |
|
|
$ |
79,811 |
|
| Loans held-for-sale |
|
$ |
116 |
|
|
$ |
— |
|
|
$ |
116 |
|
|
$ |
— |
|
|
$ |
116 |
|
| Loans held-for-investment, net |
|
$ |
51,542,039 |
|
|
$ |
— |
|
|
$ |
— |
|
|
$ |
50,256,565 |
|
|
$ |
50,256,565 |
|
|
|
|
|
|
|
|
|
|
|
|
| Mortgage servicing rights |
|
$ |
6,602 |
|
|
$ |
— |
|
|
$ |
— |
|
|
$ |
9,470 |
|
|
$ |
9,470 |
|
| Accrued interest receivable |
|
$ |
331,490 |
|
|
$ |
— |
|
|
$ |
331,490 |
|
|
$ |
— |
|
|
$ |
331,490 |
|
| Financial liabilities: |
|
|
|
|
|
|
|
|
|
|
|
|
|
|
|
|
|
|
|
|
|
| Demand, checking, savings and money market deposits |
|
$ |
38,048,974 |
|
|
$ |
— |
|
|
$ |
38,048,974 |
|
|
$ |
— |
|
|
$ |
38,048,974 |
|
| Time deposits |
|
$ |
18,043,464 |
|
|
$ |
— |
|
|
$ |
18,004,951 |
|
|
$ |
— |
|
|
$ |
18,004,951 |
|
|
|
|
|
|
|
|
|
|
|
|
|
|
|
|
|
|
|
|
|
|
|
BTFP borrowings |
|
$ |
4,500,000 |
|
|
$ |
— |
|
|
$ |
4,500,000 |
|
|
$ |
— |
|
|
$ |
4,500,000 |
|
| Long-term debt |
|
$ |
148,249 |
|
|
$ |
— |
|
|
$ |
150,896 |
|
|
$ |
— |
|
|
$ |
150,896 |
|
| Accrued interest payable |
|
$ |
205,430 |
|
|
$ |
— |
|
|
$ |
205,430 |
|
|
$ |
— |
|
|
$ |
205,430 |
|
|
Note 4 — Securities Purchased under Resale Agreements
The Company’s resale agreements expose it to credit risk from both the counterparties and the underlying collateral. The Company manages credit exposure from certain transactions by entering into master netting agreements and collateral arrangements with the counterparties. The relevant agreements allow for an efficient closeout of the transaction, liquidation and set-off of collateral against the net amount owed by the counterparty following a default. It is the Company’s policy to take possession, where possible, of the assets underlying resale agreements. As a result of the Company’s credit risk mitigation practices with respect to resale agreements as described above, the Company did not hold any reserves for credit impairment with respect to these agreements as of both March 31, 2024 and December 31, 2023.
Securities Purchased under Resale Agreements — Total securities purchased under resale agreements were $485 million and $785 million as of March 31, 2024 and December 31, 2023, respectively. The weighted-average yields were 3.39% and 2.50% for the three months ended March 31, 2024 and 2023, respectively.
Balance Sheet Offsetting
The Company’s resale and repurchase agreements are transacted under legally enforceable master netting agreements that, in the event of default by the counterparty, provide the Company the right to liquidate securities held and to offset receivables and payables with the same counterparty. The Company nets resale and repurchase transactions with the same counterparty on the Consolidated Balance Sheet when it has a legally enforceable master netting agreement and the transactions are eligible for netting under ASC 210-20-45-11, Balance Sheet Offsetting Repurchase and Reverse Repurchase Agreements. Collateral received includes securities and loans that are not recognized on the Consolidated Balance Sheet. Collateral pledged consists of securities that are not netted on the Consolidated Balance Sheet against the related collateralized liability. Securities received or pledged as collateral in resale and repurchase agreements with other financial institutions may also be sold or re-pledged by the secured party, and are usually delivered to and held by the third-party trustees.
The following table presents the resale agreements included on the Consolidated Balance Sheet as of March 31, 2024 and December 31, 2023:
|
|
|
|
|
|
|
|
|
|
|
|
|
|
|
|
|
|
|
|
|
|
|
|
|
|
|
|
|
|
|
|
|
|
|
|
|
|
|
|
|
|
|
|
|
|
|
|
|
|
|
|
|
|
|
|
|
|
|
|
|
Gross Amounts of Recognized Assets |
|
Gross Amounts Offset on the Consolidated Balance Sheet |
|
Net Amounts of Assets Presented on the Consolidated Balance Sheet |
|
Gross Amounts Not Offset on the Consolidated Balance Sheet |
|
|
($ in thousands) |
|
|
|
|
Collateral Received (1) |
|
Net Amount |
Resale agreements as of March 31, 2024 |
|
$ |
485,000 |
|
|
$ |
— |
|
|
$ |
485,000 |
|
|
$ |
(404,004) |
|
|
$ |
80,996 |
|
|
|
|
|
|
|
|
|
|
|
|
Resale agreements as of December 31, 2023 |
|
$ |
785,000 |
|
|
$ |
— |
|
|
$ |
785,000 |
|
|
$ |
(715,358) |
|
|
$ |
69,642 |
|
|
|
|
|
|
|
|
|
|
|
|
|
|
|
|
|
|
|
|
|
|
|
|
|
|
|
|
|
|
|
|
|
|
|
|
|
(1)Represents the fair value of assets the Company has received under resale agreements, limited for table presentation purposes to the amount of the recognized asset due from each counterparty. The application of collateral cannot reduce the net position below zero. Therefore, excess collateral, if any, is not reflected above.
In addition to the amounts included in the table above, the Company also has balance sheet netting related to derivatives. Refer to Note 6 — Derivatives to the Consolidated Financial Statements in this Form 10-Q for additional information.
Note 5 — Securities
The following tables present the amortized cost, gross unrealized gains and losses and fair value by major categories of AFS and HTM debt securities as of March 31, 2024 and December 31, 2023:
|
|
|
|
|
|
|
|
|
|
|
|
|
|
|
|
|
|
|
|
|
|
|
|
|
|
|
|
|
|
|
|
March 31, 2024 |
| ($ in thousands) |
|
Amortized Cost (1) |
|
|
|
Gross Unrealized Gains |
|
Gross Unrealized Losses |
|
Fair Value |
| AFS debt securities: |
|
|
|
|
|
|
|
|
|
|
| U.S. Treasury securities |
|
$ |
676,290 |
|
|
|
|
$ |
— |
|
|
$ |
(55,196) |
|
|
$ |
621,094 |
|
| U.S. government agency and U.S. government-sponsored enterprise debt securities |
|
410,676 |
|
|
|
|
— |
|
|
(49,874) |
|
|
360,802 |
|
U.S. government agency and U.S. government-sponsored enterprise mortgage-backed securities (2): |
|
|
|
|
|
|
|
|
|
|
| Commercial mortgage-backed securities |
|
513,159 |
|
|
|
|
129 |
|
|
(57,669) |
|
|
455,619 |
|
| Residential mortgage-backed securities |
|
5,229,549 |
|
|
|
|
4,212 |
|
|
(241,362) |
|
|
4,992,399 |
|
| Municipal securities |
|
296,360 |
|
|
|
|
47 |
|
|
(37,912) |
|
|
258,495 |
|
| Non-agency mortgage-backed securities: |
|
|
|
|
|
|
|
|
|
|
| Commercial mortgage-backed securities |
|
373,834 |
|
|
|
|
— |
|
|
(39,838) |
|
|
333,996 |
|
| Residential mortgage-backed securities |
|
609,705 |
|
|
|
|
— |
|
|
(90,048) |
|
|
519,657 |
|
| Corporate debt securities |
|
653,501 |
|
|
|
|
— |
|
|
(150,854) |
|
|
502,647 |
|
| Foreign government bonds |
|
238,592 |
|
|
|
|
605 |
|
|
(12,001) |
|
|
227,196 |
|
| Asset-backed securities |
|
41,287 |
|
|
|
|
— |
|
|
(575) |
|
|
40,712 |
|
| CLOs |
|
89,000 |
|
|
|
|
— |
|
|
(1,149) |
|
|
87,851 |
|
| Total AFS debt securities |
|
9,131,953 |
|
|
|
|
4,993 |
|
|
(736,478) |
|
|
8,400,468 |
|
| HTM debt securities: |
|
|
|
|
|
|
|
|
|
|
| U.S. Treasury securities |
|
530,921 |
|
|
|
|
— |
|
|
(45,521) |
|
|
485,400 |
|
| U.S. government agency and U.S. government-sponsored enterprise debt securities |
|
1,002,697 |
|
|
|
|
— |
|
|
(196,898) |
|
|
805,799 |
|
U.S. government agency and U.S. government-sponsored enterprise mortgage-backed securities (3): |
|
|
|
|
|
|
|
|
|
|
| Commercial mortgage-backed securities |
|
491,842 |
|
|
|
|
— |
|
|
(93,850) |
|
|
397,992 |
|
| Residential mortgage-backed securities |
|
734,577 |
|
|
|
|
— |
|
|
(153,299) |
|
|
581,278 |
|
| Municipal securities |
|
188,605 |
|
|
|
|
— |
|
|
(44,596) |
|
|
144,009 |
|
| Total HTM debt securities |
|
2,948,642 |
|
|
|
|
— |
|
|
(534,164) |
|
|
2,414,478 |
|
| Total debt securities |
|
$ |
12,080,595 |
|
|
|
|
$ |
4,993 |
|
|
$ |
(1,270,642) |
|
|
$ |
10,814,946 |
|
|
|
|
|
|
|
|
|
|
|
|
|
|
|
|
|
|
|
|
|
|
|
|
|
|
|
|
|
|
|
|
|
|
December 31, 2023 |
| ($ in thousands) |
|
Amortized Cost (1) |
|
|
|
Gross Unrealized Gains |
|
Gross Unrealized Losses |
|
Fair Value |
| AFS debt securities: |
|
|
|
|
|
|
|
|
|
|
| U.S. Treasury securities |
|
$ |
1,112,587 |
|
|
|
|
$ |
101 |
|
|
$ |
(52,313) |
|
|
$ |
1,060,375 |
|
| U.S. government agency and U.S. government-sponsored enterprise debt securities |
|
412,086 |
|
|
|
|
— |
|
|
(47,640) |
|
|
364,446 |
|
U.S. government agency and U.S. government-sponsored enterprise mortgage-backed securities (2): |
|
|
|
|
|
|
|
|
|
|
| Commercial mortgage-backed securities |
|
531,377 |
|
|
|
|
158 |
|
|
(63,276) |
|
|
468,259 |
|
| Residential mortgage-backed securities |
|
1,956,927 |
|
|
|
|
380 |
|
|
(229,713) |
|
|
1,727,594 |
|
| Municipal securities |
|
297,283 |
|
|
|
|
75 |
|
|
(36,342) |
|
|
261,016 |
|
| Non-agency mortgage-backed securities: |
|
|
|
|
|
|
|
|
|
|
| Commercial mortgage-backed securities |
|
409,578 |
|
|
|
|
— |
|
|
(42,062) |
|
|
367,516 |
|
| Residential mortgage-backed securities |
|
643,335 |
|
|
|
|
— |
|
|
(89,664) |
|
|
553,671 |
|
| Corporate debt securities |
|
653,501 |
|
|
|
|
— |
|
|
(151,076) |
|
|
502,425 |
|
| Foreign government bonds |
|
239,333 |
|
|
|
|
69 |
|
|
(11,528) |
|
|
227,874 |
|
| Asset-backed securities |
|
43,234 |
|
|
|
|
— |
|
|
(934) |
|
|
42,300 |
|
| CLOs |
|
617,250 |
|
|
|
|
— |
|
|
(4,389) |
|
|
612,861 |
|
| Total AFS debt securities |
|
6,916,491 |
|
|
|
|
783 |
|
|
(728,937) |
|
|
6,188,337 |
|
| HTM debt securities: |
|
|
|
|
|
|
|
|
|
|
| U.S. Treasury securities |
|
529,548 |
|
|
|
|
— |
|
|
(40,997) |
|
|
488,551 |
|
| U.S. government agency and U.S. government-sponsored enterprise debt securities |
|
1,001,836 |
|
|
|
|
— |
|
|
(186,904) |
|
|
814,932 |
|
U.S. government agency and U.S. government-sponsored enterprise mortgage-backed securities (3): |
|
|
|
|
|
|
|
|
|
|
| Commercial mortgage-backed securities |
|
493,348 |
|
|
|
|
— |
|
|
(88,968) |
|
|
404,380 |
|
| Residential mortgage-backed securities |
|
742,436 |
|
|
|
|
— |
|
|
(142,119) |
|
|
600,317 |
|
| Municipal securities |
|
188,872 |
|
|
|
|
— |
|
|
(43,081) |
|
|
145,791 |
|
| Total HTM debt securities |
|
2,956,040 |
|
|
|
|
— |
|
|
(502,069) |
|
|
2,453,971 |
|
| Total debt securities |
|
$ |
9,872,531 |
|
|
|
|
$ |
783 |
|
|
$ |
(1,231,006) |
|
|
$ |
8,642,308 |
|
|
|
|
|
|
|
|
|
|
|
|
|
|
|
|
|
|
|
|
|
|
|
(1)Amortized cost excludes accrued interest receivables which are presented within Other assets on the Consolidated Balance Sheet. As of March 31, 2024 and December 31, 2023, the accrued interest receivables were $40 million and $44 million, respectively. For the Company’s accounting policy related to debt securities’ accrued interest receivables, see Note 1 — Summary of Significant Accounting Policies — Significant Accounting Policies — Allowance for Credit Losses on Available-for-Sale Debt Securities and Allowance for Credit Losses on Held-to-Maturity Debt Securities to the Consolidated Financial Statements in the Company’s 2023 Form 10-K.
(2)Includes GNMA AFS debt securities totaling $4.5 billion of amortized cost and $4.4 billion of fair value as of March 31, 2024, and $1.3 billion of amortized cost and $1.2 billion of fair value as of December 31, 2023.
(3)Includes GNMA HTM debt securities totaling $91 million of amortized cost and $73 million of fair value as of March 31, 2024, and $92 million of amortized cost and $75 million of fair value of as of December 31, 2023.
Unrealized Losses of Available-for-Sale Debt Securities
The following tables present the fair value and the associated gross unrealized losses of the Company’s AFS debt securities, aggregated by investment category and the length of time that the securities have been in a continuous unrealized loss position as of March 31, 2024 and December 31, 2023.
|
|
|
|
|
|
|
|
|
|
|
|
|
|
|
|
|
|
|
|
|
|
|
|
|
|
|
|
|
|
|
|
|
|
|
|
|
|
|
|
|
|
March 31, 2024 |
|
|
Less Than 12 Months |
|
12 Months or More |
|
Total |
| ($ in thousands) |
|
Fair Value |
|
Gross Unrealized Losses |
|
Fair Value |
|
Gross Unrealized Losses |
|
Fair Value |
|
Gross Unrealized Losses |
| AFS debt securities: |
|
|
|
|
|
|
|
|
|
|
|
|
| U.S. Treasury securities |
|
$ |
— |
|
|
$ |
— |
|
|
$ |
621,094 |
|
|
$ |
(55,196) |
|
|
$ |
621,094 |
|
|
$ |
(55,196) |
|
| U.S. government agency and U.S. government sponsored enterprise debt securities |
|
— |
|
|
— |
|
|
360,802 |
|
|
(49,874) |
|
|
360,802 |
|
|
(49,874) |
|
| U.S. government agency and U.S. government-sponsored enterprise mortgage-backed securities: |
|
|
|
|
|
|
|
|
|
|
|
|
| Commercial mortgage-backed securities |
|
— |
|
|
— |
|
|
450,965 |
|
|
(57,669) |
|
|
450,965 |
|
|
(57,669) |
|
| Residential mortgage-backed securities |
|
1,577,361 |
|
|
(4,504) |
|
|
1,642,455 |
|
|
(236,858) |
|
|
3,219,816 |
|
|
(241,362) |
|
| Municipal securities |
|
4,189 |
|
|
(6) |
|
|
252,268 |
|
|
(37,906) |
|
|
256,457 |
|
|
(37,912) |
|
| Non-agency mortgage-backed securities: |
|
|
|
|
|
|
|
|
|
|
|
|
| Commercial mortgage-backed securities |
|
— |
|
|
— |
|
|
333,996 |
|
|
(39,838) |
|
|
333,996 |
|
|
(39,838) |
|
| Residential mortgage-backed securities |
|
— |
|
|
— |
|
|
519,657 |
|
|
(90,048) |
|
|
519,657 |
|
|
(90,048) |
|
| Corporate debt securities |
|
— |
|
|
— |
|
|
502,647 |
|
|
(150,854) |
|
|
502,647 |
|
|
(150,854) |
|
| Foreign government bonds |
|
18,567 |
|
|
(61) |
|
|
88,060 |
|
|
(11,940) |
|
|
106,627 |
|
|
(12,001) |
|
| Asset-backed securities |
|
— |
|
|
— |
|
|
40,712 |
|
|
(575) |
|
|
40,712 |
|
|
(575) |
|
| CLOs |
|
— |
|
|
— |
|
|
87,851 |
|
|
(1,149) |
|
|
87,851 |
|
|
(1,149) |
|
| Total AFS debt securities |
|
$ |
1,600,117 |
|
|
$ |
(4,571) |
|
|
$ |
4,900,507 |
|
|
$ |
(731,907) |
|
|
$ |
6,500,624 |
|
|
$ |
(736,478) |
|
|
|
|
|
|
|
|
|
|
|
|
|
|
|
|
|
|
|
|
|
|
|
|
|
|
|
|
|
|
|
|
|
|
|
|
|
|
|
|
|
|
|
|
December 31, 2023 |
|
|
Less Than 12 Months |
|
12 Months or More |
|
Total |
| ($ in thousands) |
|
Fair Value |
|
Gross Unrealized Losses |
|
Fair Value |
|
Gross Unrealized Losses |
|
Fair Value |
|
Gross Unrealized Losses |
| AFS debt securities: |
|
|
|
|
|
|
|
|
|
|
|
|
| U.S. Treasury securities |
|
$ |
— |
|
|
$ |
— |
|
|
$ |
623,978 |
|
|
$ |
(52,313) |
|
|
$ |
623,978 |
|
|
$ |
(52,313) |
|
| U.S. government agency and U.S. government-sponsored enterprise debt securities |
|
— |
|
|
— |
|
|
364,446 |
|
|
(47,640) |
|
|
364,446 |
|
|
(47,640) |
|
| U.S. government agency and U.S. government-sponsored enterprise mortgage-backed securities: |
|
|
|
|
|
|
|
|
|
|
|
|
| Commercial mortgage-backed securities |
|
— |
|
|
— |
|
|
463,572 |
|
|
(63,276) |
|
|
463,572 |
|
|
(63,276) |
|
| Residential mortgage-backed securities |
|
9,402 |
|
|
(558) |
|
|
1,661,112 |
|
|
(229,155) |
|
|
1,670,514 |
|
|
(229,713) |
|
| Municipal securities |
|
2,825 |
|
|
(15) |
|
|
254,773 |
|
|
(36,327) |
|
|
257,598 |
|
|
(36,342) |
|
| Non-agency mortgage-backed securities: |
|
|
|
|
|
|
|
|
|
|
|
|
| Commercial mortgage-backed securities |
|
2,742 |
|
|
(4) |
|
|
364,774 |
|
|
(42,058) |
|
|
367,516 |
|
|
(42,062) |
|
| Residential mortgage-backed securities |
|
— |
|
|
— |
|
|
553,671 |
|
|
(89,664) |
|
|
553,671 |
|
|
(89,664) |
|
| Corporate debt securities |
|
— |
|
|
— |
|
|
502,425 |
|
|
(151,076) |
|
|
502,425 |
|
|
(151,076) |
|
| Foreign government bonds |
|
110,955 |
|
|
(144) |
|
|
88,616 |
|
|
(11,384) |
|
|
199,571 |
|
|
(11,528) |
|
| Asset-backed securities |
|
— |
|
|
— |
|
|
42,300 |
|
|
(934) |
|
|
42,300 |
|
|
(934) |
|
| CLOs |
|
— |
|
|
— |
|
|
612,861 |
|
|
(4,389) |
|
|
612,861 |
|
|
(4,389) |
|
| Total AFS debt securities |
|
$ |
125,924 |
|
|
$ |
(721) |
|
|
$ |
5,532,528 |
|
|
$ |
(728,216) |
|
|
$ |
5,658,452 |
|
|
$ |
(728,937) |
|
|
As of March 31, 2024, the Company had 560 AFS debt securities in a gross unrealized loss position with no credit impairment, primarily consisting of 288 U.S. government agency and U.S. government-sponsored enterprise mortgage-backed securities, 66 corporate debt securities, and 95 non-agency mortgage-backed securities. In comparison, as of December 31, 2023, the Company had 547 AFS debt securities in a gross unrealized loss position with no credit impairment, primarily consisting of 255 U.S. government agency and U.S. government-sponsored enterprise mortgage-backed securities, 66 corporate debt securities, and 99 non-agency mortgage-backed securities.
Allowance for Credit Losses on Available-for-Sale Debt Securities
The Company evaluates each AFS debt security where the fair value declines below amortized cost. For a discussion of the factors and criteria the Company uses in analyzing securities for impairment related to credit losses, see Note 1 — Summary of Significant Accounting Policies — Significant Accounting Policies — Allowance for Credit Losses on Available-for-Sale Debt Securities to the Consolidated Financial Statements in the Company’s 2023 Form 10-K.
The gross unrealized losses presented in the preceding tables were primarily attributable to interest rate movement and the widening of liquidity and/or credit spreads. U.S. Treasury, U.S. government agency, U.S. government-sponsored agency, and U.S. government-sponsored enterprise debt and mortgage-backed securities are issued, guaranteed, or otherwise supported by the U.S. government and have a zero credit loss assumption. The remaining securities that were in an unrealized loss position as of March 31, 2024 were mainly comprised of the following:
•Corporate debt securities — The market value decline as of March 31, 2024 was primarily due to interest rate movement and spread widening. A portion of the corporate debt securities is comprised of subordinated debt securities issued by U.S. banks. Despite the reduction of the market value of these securities after the banking sector disruption in 2023, these securities are nearly all rated investment grade by nationally recognized statistical rating organizations (“NRSROs”) or issued by well-capitalized financial institutions with strong profitability. The contractual payments from these corporate debt securities have been and are expected to be received on time. The Company will continue to monitor the market developments in the banking sector and the credit performance of these securities.
•Non-agency mortgage-backed securities — The market value decline as of March 31, 2024 was primarily due to interest rate movement and spread widening. Since these securities are rated investment grade by NRSROs, or have high priority in the cash flow waterfall within the securitization structure, and the contractual payments have historically been on time, the Company believes the risk of credit losses on these securities is low.
As of both March 31, 2024 and December 31, 2023, the Company intended to hold the AFS debt securities with unrealized losses through the anticipated recovery period and it was more-likely-than-not that the Company would not have to sell these securities before the recovery of their amortized cost. The issuers of these securities have not, to the Company’s knowledge, established any cause for default on these securities. As a result, the Company expects to recover the entire amortized cost basis of these securities. Accordingly, there was no allowance for credit losses provided against these securities as of both March 31, 2024 and December 31, 2023. In addition, there was no provision for credit losses recognized for the three months ended March 31, 2024 and 2023.
Allowance for Credit Losses on Held-to-Maturity Debt Securities
The Company separately evaluates its HTM debt securities for any credit losses using an expected loss model, similar to the methodology used for loans. For additional information on the Company’s credit loss methodology, refer to Note 1 — Summary of Significant Accounting Policies — Significant Accounting Policies — Allowance for Credit Losses on Held-to-Maturity Debt Securities to the Consolidated Financial Statements in the Company’s 2023 Form 10-K.
The Company monitors the credit quality of the HTM debt securities using external credit ratings. As of March 31, 2024, all HTM securities were rated investment grade by NRSROs and issued, guaranteed, or supported by U.S. government entities and agencies. Accordingly, the Company applied a zero credit loss assumption and no allowance for credit losses was recorded as of both March 31, 2024 and December 31, 2023. Overall, the Company believes that the credit support levels of the debt securities are strong, and based on current assessments and macroeconomic forecasts, expects that full contractual cash flows will be received.
Realized Gains and Losses
The following table presents the gross realized gains from the sales and impairment write-off of AFS debt securities and the related tax expense (benefit) included in earnings for the three months ended March 31, 2024 and 2023:
|
|
|
|
|
|
|
|
|
|
|
|
|
|
|
|
|
|
|
|
|
|
|
|
|
|
Three Months Ended March 31, |
|
|
|
|
| ($ in thousands) |
|
2024 |
|
2023 |
|
|
|
|
|
|
|
|
|
|
|
|
|
|
|
|
|
|
|
|
|
Gross realized gains from sales |
|
$ |
49 |
|
|
$ |
— |
|
|
|
|
|
|
|
|
|
Impairment write-off (1) |
|
$ |
— |
|
|
$ |
(10,000) |
|
|
|
|
|
|
|
|
|
Related tax expense (benefit) |
|
$ |
14 |
|
|
$ |
(2,956) |
|
|
|
|
|
|
|
|
|
|
(1)During the first quarter of 2023, the Company recognized a $10 million impairment write-off on a subordinated debt security as a component of noninterest income in the Company’s Consolidated Statement of Income.
Interest Income
The following table presents the composition of interest income on debt securities for the three months ended March 31, 2024 and 2023:
|
|
|
|
|
|
|
|
|
|
|
|
|
|
|
|
|
|
|
|
|
|
|
|
|
|
Three Months Ended March 31, |
|
|
|
|
| ($ in thousands) |
|
2024 |
|
2023 |
|
|
|
|
|
|
|
|
|
|
|
|
|
|
|
|
|
|
|
|
|
| Taxable interest |
|
$ |
70,328 |
|
|
$ |
61,049 |
|
|
|
|
|
|
|
|
|
| Nontaxable interest |
|
5,064 |
|
|
4,882 |
|
|
|
|
|
|
|
|
|
| Total interest income on debt securities |
|
$ |
75,392 |
|
|
$ |
65,931 |
|
|
|
|
|
|
|
|
|
|
Contractual Maturities of Available-for-Sale and Held-to-Maturity Debt Securities
The following tables present the contractual maturities, amortized cost, fair value and weighted-average yields of AFS and HTM debt securities as of March 31, 2024. Expected maturities will differ from contractual maturities on certain securities as the issuers and borrowers of the underlying collateral may have the right to call or prepay obligations with or without prepayment penalties.
|
|
|
|
|
|
|
|
|
|
|
|
|
|
|
|
|
|
|
|
|
|
|
|
|
|
|
|
|
|
|
|
|
|
| ($ in thousands) |
|
Within One Year |
|
After One Year through Five Years |
|
After Five Years through Ten Years |
|
After Ten Years |
|
Total |
| AFS debt securities: |
|
|
|
|
|
|
|
|
|
|
| U.S. Treasury securities |
|
|
|
|
|
|
|
|
|
|
| Amortized cost |
|
$ |
34,901 |
|
|
$ |
641,389 |
|
|
$ |
— |
|
|
$ |
— |
|
|
$ |
676,290 |
|
| Fair value |
|
33,920 |
|
|
587,174 |
|
|
— |
|
|
— |
|
|
621,094 |
|
Weighted-average yield (1) |
|
1.83 |
% |
|
1.17 |
% |
|
— |
% |
|
— |
% |
|
1.20 |
% |
| U.S. government agency and U.S. government-sponsored enterprise debt securities |
|
|
|
|
|
|
|
|
|
|
| Amortized cost |
|
51,238 |
|
|
94,159 |
|
|
127,833 |
|
|
137,446 |
|
|
410,676 |
|
| Fair value |
|
51,163 |
|
|
90,935 |
|
|
106,727 |
|
|
111,977 |
|
|
360,802 |
|
Weighted-average yield (1) |
|
4.94 |
% |
|
3.16 |
% |
|
1.60 |
% |
|
2.33 |
% |
|
2.62 |
% |
| U.S. government agency and U.S. government-sponsored enterprise mortgage-backed securities |
|
|
|
|
|
|
|
|
|
|
| Amortized cost |
|
3,219 |
|
|
36,135 |
|
|
137,555 |
|
|
5,565,799 |
|
|
5,742,708 |
|
| Fair value |
|
3,130 |
|
|
34,513 |
|
|
125,890 |
|
|
5,284,485 |
|
|
5,448,018 |
|
Weighted-average yield (1) (2) |
|
2.68 |
% |
|
3.15 |
% |
|
2.73 |
% |
|
5.32 |
% |
|
5.24 |
% |
| Municipal securities |
|
|
|
|
|
|
|
|
|
|
| Amortized cost |
|
2,240 |
|
|
34,998 |
|
|
9,621 |
|
|
249,501 |
|
|
296,360 |
|
| Fair value |
|
2,219 |
|
|
32,747 |
|
|
8,885 |
|
|
214,644 |
|
|
258,495 |
|
Weighted-average yield (1) (2) |
|
3.39 |
% |
|
2.23 |
% |
|
3.22 |
% |
|
2.23 |
% |
|
2.27 |
% |
| Non-agency mortgage-backed securities |
|
|
|
|
|
|
|
|
|
|
| Amortized cost |
|
82,941 |
|
|
46,116 |
|
|
— |
|
|
854,482 |
|
|
983,539 |
|
| Fair value |
|
82,055 |
|
|
45,322 |
|
|
— |
|
|
726,276 |
|
|
853,653 |
|
Weighted-average yield (1) |
|
3.67 |
% |
|
3.70 |
% |
|
— |
% |
|
2.54 |
% |
|
2.69 |
% |
| Corporate debt securities |
|
|
|
|
|
|
|
|
|
|
| Amortized cost |
|
— |
|
|
— |
|
|
349,501 |
|
|
304,000 |
|
|
653,501 |
|
| Fair value |
|
— |
|
|
— |
|
|
294,845 |
|
|
207,802 |
|
|
502,647 |
|
Weighted-average yield (1) |
|
— |
% |
|
— |
% |
|
3.50 |
% |
|
1.97 |
% |
|
2.79 |
% |
| Foreign government bonds |
|
|
|
|
|
|
|
|
|
|
| Amortized cost |
|
32,724 |
|
|
105,868 |
|
|
50,000 |
|
|
50,000 |
|
|
238,592 |
|
| Fair value |
|
32,665 |
|
|
106,471 |
|
|
49,640 |
|
|
38,420 |
|
|
227,196 |
|
Weighted-average yield (1) |
|
3.01 |
% |
|
2.28 |
% |
|
5.72 |
% |
|
1.50 |
% |
|
2.94 |
% |
| Asset-backed securities |
|
|
|
|
|
|
|
|
|
|
| Amortized cost |
|
— |
|
|
— |
|
|
— |
|
|
41,287 |
|
|
41,287 |
|
| Fair value |
|
— |
|
|
— |
|
|
— |
|
|
40,712 |
|
|
40,712 |
|
Weighted-average yield (1) |
|
— |
% |
|
— |
% |
|
— |
% |
|
6.06 |
% |
|
6.06 |
% |
| CLOs |
|
|
|
|
|
|
|
|
|
|
| Amortized cost |
|
— |
|
|
— |
|
|
69,000 |
|
|
20,000 |
|
|
89,000 |
|
| Fair value |
|
— |
|
|
— |
|
|
67,924 |
|
|
19,927 |
|
|
87,851 |
|
Weighted-average yield (1) |
|
— |
% |
|
— |
% |
|
7.10 |
% |
|
6.84 |
% |
|
7.04 |
% |
| Total AFS debt securities |
|
|
|
|
|
|
|
|
|
|
| Amortized cost |
|
$ |
207,263 |
|
|
$ |
958,665 |
|
|
$ |
743,510 |
|
|
$ |
7,222,515 |
|
|
$ |
9,131,953 |
|
| Fair value |
|
$ |
205,152 |
|
|
$ |
897,162 |
|
|
$ |
653,911 |
|
|
$ |
6,644,243 |
|
|
$ |
8,400,468 |
|
Weighted-average yield (1) |
|
3.55 |
% |
|
1.72 |
% |
|
3.51 |
% |
|
4.67 |
% |
|
4.24 |
% |
|
|
|
|
|
|
|
|
|
|
|
|
|
|
|
|
|
|
|
|
|
|
|
|
|
|
|
|
|
|
|
|
|
|
|
| ($ in thousands) |
|
Within One Year |
|
After One Year through Five Years |
|
After Five Years through Ten Years |
|
After Ten Years |
|
Total |
| HTM debt securities: |
|
|
|
|
|
|
|
|
|
|
| U.S. Treasury securities |
|
|
|
|
|
|
|
|
|
|
| Amortized cost |
|
$ |
— |
|
$ |
530,921 |
|
$ |
— |
|
$ |
— |
|
$ |
530,921 |
| Fair value |
|
— |
|
485,400 |
|
— |
|
— |
|
485,400 |
Weighted-average yield (1) |
|
— |
% |
|
1.05 |
% |
|
— |
% |
|
— |
% |
|
1.05 |
% |
| U.S. government agency and U.S. government-sponsored enterprise debt securities |
|
|
|
|
|
|
|
|
|
|
| Amortized cost |
|
— |
|
— |
|
343,666 |
|
659,031 |
|
1,002,697 |
| Fair value |
|
— |
|
— |
|
291,586 |
|
514,213 |
|
805,799 |
Weighted-average yield (1) |
|
— |
% |
|
— |
% |
|
1.90 |
% |
|
1.89 |
% |
|
1.90 |
% |
| U.S. government agency and U.S. government-sponsored enterprise mortgage-backed securities |
|
|
|
|
|
|
|
|
|
|
| Amortized cost |
|
— |
|
4,852 |
|
94,536 |
|
1,127,031 |
|
1,226,419 |
| Fair value |
|
— |
|
4,401 |
|
79,571 |
|
895,298 |
|
979,270 |
Weighted-average yield (1) (2) |
|
— |
% |
|
1.40 |
% |
|
1.59 |
% |
|
1.69 |
% |
|
1.68 |
% |
| Municipal securities |
|
|
|
|
|
|
|
|
|
|
| Amortized cost |
|
— |
|
— |
|
— |
|
188,605 |
|
188,605 |
| Fair value |
|
— |
|
— |
|
— |
|
144,009 |
|
144,009 |
Weighted-average yield (1) (2) |
|
— |
% |
|
— |
% |
|
— |
% |
|
1.99 |
% |
|
1.99 |
% |
| Total HTM debt securities |
|
|
|
|
|
|
|
|
|
|
| Amortized cost |
|
$ |
— |
|
$ |
535,773 |
|
$ |
438,202 |
|
$ |
1,974,667 |
|
$ |
2,948,642 |
| Fair value |
|
$ |
— |
|
$ |
489,801 |
|
$ |
371,157 |
|
$ |
1,553,520 |
|
$ |
2,414,478 |
Weighted-average yield (1) |
|
— |
% |
|
1.05 |
% |
|
1.83 |
% |
|
1.79 |
% |
|
1.66 |
% |
|
(1)Weighted-average yields are computed based on amortized cost balances.
(2)Yields on tax-exempt securities are not presented on a tax-equivalent basis.
As of March 31, 2024 and December 31, 2023, AFS and HTM debt securities with carrying values of $5.8 billion and $7.0 billion, respectively, were pledged to secure borrowings, public deposits and for other purposes required or permitted by law.
Restricted Equity Securities
The following table presents the restricted equity securities included in Other assets on the Consolidated Balance Sheet as of March 31, 2024 and December 31, 2023:
|
|
|
|
|
|
|
|
|
|
|
|
|
|
|
|
| ($ in thousands) |
|
March 31, 2024 |
|
December 31, 2023 |
Federal Reserve Bank of San Francisco (“FRBSF”) stock |
|
$ |
62,858 |
|
|
$ |
62,561 |
|
| FHLB stock |
|
101,544 |
|
|
17,250 |
|
| Total restricted equity securities |
|
$ |
164,402 |
|
|
$ |
79,811 |
|
|
Note 6 — Derivatives
The Company uses derivative instruments to manage exposure to market risk, primarily interest rate and foreign currency risks, as well as to assist customers with their risk management objectives. The Company’s goal is to manage interest rate sensitivity and volatility to mitigate the effect of interest rate changes on earnings or capital. The Company also uses foreign exchange contracts to manage the foreign exchange rate risk associated with certain foreign currency-denominated assets and liabilities, as well as the Bank’s investment in East West Bank (China) Limited. The Company recognizes all derivatives on the Consolidated Balance Sheet at fair value. While the Company designates certain derivatives as hedging instruments in a qualifying hedge accounting relationship, other derivatives serve as economic hedges. For additional information on the Company’s derivatives and hedging activities, see Note 1 — Summary of Significant Accounting Policies — Significant Accounting Policies — Derivatives to the Consolidated Financial Statements of the Company’s 2023 Form 10-K.
The following table presents the notional amounts and fair values of the Company’s derivatives as of March 31, 2024 and December 31, 2023. Certain derivative contracts are cleared though central clearing organizations where variation margin is applied daily as settlement to the fair values of the contracts. The fair values are presented on a gross basis prior to the application of bilateral collateral and master netting agreements, but after the application of variation margin payments as settlement to fair values of contracts cleared through central clearing organizations. Applying variation margin payments as settlement to the fair values of derivative contracts cleared through the London Clearing House (“LCH”) and the Chicago Mercantile Exchange (“CME”) resulted in reductions in the derivative asset and liability fair values by $41 million and $47 million, respectively, as of March 31, 2024. In comparison, applying variation margin payments as settlement to LCH- and CME-cleared derivative transactions resulted in reductions in both the derivative asset and liability fair values by $43 million as of December 31, 2023. Total derivative asset and liability fair values are adjusted to reflect the effects of legally enforceable master netting agreements and cash collateral received or paid. The resulting net derivative asset and liability fair values are included in Other assets and Accrued expenses and other liabilities, respectively, on the Consolidated Balance Sheet.
|
|
|
|
|
|
|
|
|
|
|
|
|
|
|
|
|
|
|
|
|
|
|
|
|
|
|
|
|
|
|
|
|
|
|
|
|
|
|
|
|
|
|
|
|
|
|
March 31, 2024 |
|
December 31, 2023 |
|
|
|
|
|
|
Fair Value |
|
|
|
Fair Value |
|
|
| ($ in thousands) |
|
Notional Amount |
|
Assets |
|
Liabilities |
|
Notional Amount |
|
Assets |
|
Liabilities |
|
|
Derivatives designated as hedging instruments: |
|
|
|
|
|
|
|
|
|
|
|
|
|
|
|
|
|
|
|
|
|
|
|
|
|
|
|
|
|
|
|
|
|
|
|
|
|
|
|
|
|
|
|
|
Cash flow hedges: |
|
|
|
|
|
|
|
|
|
|
|
|
|
|
Interest rate contracts |
|
$ |
5,250,000 |
|
|
$ |
15,707 |
|
|
$ |
49,616 |
|
|
$ |
5,250,000 |
|
|
$ |
50,421 |
|
|
$ |
13,124 |
|
|
|
Net investment hedges: |
|
|
|
|
|
|
|
|
|
|
|
|
|
|
Foreign exchange contracts |
|
— |
|
|
— |
|
|
— |
|
|
81,480 |
|
|
3,394 |
|
|
— |
|
|
|
Total derivatives designated as hedging instruments |
|
$ |
5,250,000 |
|
|
$ |
15,707 |
|
|
$ |
49,616 |
|
|
$ |
5,331,480 |
|
|
$ |
53,815 |
|
|
$ |
13,124 |
|
|
|
Derivatives not designated as hedging instruments: |
|
|
|
|
|
|
|
|
|
|
|
|
|
|
Interest rate contracts |
|
$ |
16,910,462 |
|
|
$ |
469,087 |
|
|
$ |
468,714 |
|
|
$ |
17,387,909 |
|
|
$ |
423,486 |
|
|
$ |
420,812 |
|
|
|
Commodity contracts (1) |
|
— |
|
|
76,615 |
|
|
106,930 |
|
|
— |
|
|
79,604 |
|
|
121,670 |
|
|
|
| Foreign exchange contracts |
|
4,898,429 |
|
|
60,499 |
|
|
53,153 |
|
|
5,827,149 |
|
|
53,678 |
|
|
42,564 |
|
|
|
Credit contracts (2) |
|
118,144 |
|
|
— |
|
|
16 |
|
|
118,391 |
|
|
1 |
|
|
25 |
|
|
|
Equity contracts |
|
— |
|
|
330 |
|
(3) |
15,119 |
|
(4) |
— |
|
|
336 |
|
(3) |
15,119 |
|
(4) |
|
| Total derivatives not designated as hedging instruments |
|
$ |
21,927,035 |
|
|
$ |
606,531 |
|
|
$ |
643,932 |
|
|
$ |
23,333,449 |
|
|
$ |
557,105 |
|
|
$ |
600,190 |
|
|
|
| Gross derivative assets/liabilities |
|
|
|
$ |
622,238 |
|
|
$ |
693,548 |
|
|
|
|
$ |
610,920 |
|
|
$ |
613,314 |
|
|
|
| Less: Master netting agreements |
|
|
|
(132,555) |
|
|
(132,555) |
|
|
|
|
(75,534) |
|
|
(75,534) |
|
|
|
| Less: Cash collateral received |
|
|
|
(356,707) |
|
|
(2,408) |
|
|
|
|
(237,258) |
|
|
(636) |
|
|
|
| Net derivative assets/liabilities |
|
|
|
$ |
132,976 |
|
|
$ |
558,585 |
|
|
|
|
$ |
298,128 |
|
|
$ |
537,144 |
|
|
|
|
|
|
(1)The notional amount of the Company’s commodity contracts totaled 18,468 thousand barrels of crude oil and 350,942 thousand units of natural gas, measured in million British thermal units (“MMBTUs”) as of March 31, 2024. In comparison, the notional amount of the Company’s commodity contracts totaled 18,631 thousand barrels of crude oil and 328,844 thousand MMBTUs of natural gas as of December 31, 2023.
(2)The notional amount of the credit contracts reflects the Company’s pro-rata share of the underlying derivative instruments in RPAs.
(3)The Company held warrant equity contracts in 11 private companies and one public company as of both March 31, 2024 and December 31, 2023.
(4)Equity contracts classified as derivative liabilities consist of 349,138 performance-based RSUs granted as part of EWBC’s consideration in its investment in Rayliant.
Derivatives Designated as Hedging Instruments
Cash Flow Hedges — The Company uses interest rate swaps to hedge the variability in interest amount received on certain floating-rate commercial loans, or paid on certain floating-rate borrowings due to changes in contractually specified interest rates. As of March 31, 2024, interest rate contracts in notional amounts of $5.3 billion were designated as cash flow hedges to convert certain variable-rate loans from floating-rate payments to fixed-rate payments. Gains and losses on the hedging derivative instruments are recognized in AOCI and reclassified to earnings in the same period the hedged cash flows impact earnings and within the same income statement line item as the hedged cash flows. Considering the interest rates, yield curve and notional amount as of March 31, 2024, the Company expects to reclassify an estimated $50 million of after-tax net losses on derivative instruments designated as cash flow hedges from AOCI into earnings during the next 12 months.
The following table presents the pre-tax changes in AOCI from cash flow hedges for the three months ended March 31, 2024 and 2023. The after-tax impact of cash flow hedges on AOCI is shown in Note 14 — Accumulated Other Comprehensive Income (Loss) to the Consolidated Financial Statements in this Form-10-Q.
|
|
|
|
|
|
|
|
|
|
|
|
|
|
|
|
|
|
|
|
|
|
|
|
Three Months Ended March 31, |
|
|
| ($ in thousands) |
|
2024 |
|
2023 |
|
|
|
|
(Losses) gains recognized in AOCI: |
|
|
|
|
|
|
|
|
| Interest rate contracts |
|
$ |
(90,376) |
|
|
$ |
29,843 |
|
|
|
|
|
|
|
|
|
|
|
|
|
|
|
|
|
|
|
|
|
|
|
(Losses) gains reclassified from AOCI into earnings: |
|
|
|
|
|
|
|
|
| Interest expense (for cash flow hedges on borrowings) |
|
$ |
— |
|
|
$ |
696 |
|
|
|
|
|
| Interest and dividend income (for cash flow hedges on loans) |
|
(24,605) |
|
|
(12,954) |
|
|
|
|
|
| Noninterest income |
|
— |
|
|
1,614 |
|
(1) |
|
|
|
| Total |
|
$ |
(24,605) |
|
|
$ |
(10,644) |
|
|
|
|
|
|
(1)Represents the amounts in AOCI reclassified into earnings as a result that the forecasted cash flows were no longer probable to occur.
Net Investment Hedges — The Company enters into foreign currency forward contracts to hedge a portion of the Bank’s investment in East West Bank (China) Limited, a non-USD functional currency subsidiary in China. The hedging instruments designated as net investment hedges were used to hedge against the risk of adverse changes in the foreign currency exchange rate of the Chinese Renminbi (“RMB”). The net investment hedge in place as of December 31, 2023 expired during the three months ended March 31, 2024. The following table presents the pre-tax gains or losses recognized in AOCI on net investment hedges for the three months ended March 31, 2024 and 2023:
|
|
|
|
|
|
|
|
|
|
|
|
|
|
|
|
|
|
|
|
|
|
Three Months Ended March 31, |
|
|
| ($ in thousands) |
|
2024 |
|
2023 |
|
|
|
|
Gains (losses) recognized in AOCI |
|
$ |
586 |
|
|
$ |
(1,076) |
|
|
|
|
|
|
|
|
|
|
|
|
|
|
|
Derivatives Not Designated as Hedging Instruments
Customer-Related Positions and Economic Hedge Derivatives — The Company enters into interest rate, commodity, and foreign exchange derivatives at the request of its customers and generally enters into offsetting derivative contracts with third-party financial institutions to mitigate the inherent market risk. The Company also utilizes foreign exchange contracts to mitigate the effect of currency fluctuations on certain foreign currency-denominated on-balance sheet assets and liabilities, primarily foreign currency denominated deposits that it offers to its customers. A majority of the foreign exchange contracts had original maturities of one year or less as of both March 31, 2024 and December 31, 2023.
The following table presents the notional amounts and the gross fair values of the interest rate and foreign exchange derivatives entered into with customers and with third-party financial institutions as economic hedges to customers’ positions as of March 31, 2024 and December 31, 2023:
|
|
|
|
|
|
|
|
|
|
|
|
|
|
|
|
|
|
|
|
|
|
|
|
|
|
|
|
|
|
|
|
|
|
|
|
|
|
|
|
|
|
|
|
|
|
|
|
|
|
March 31, 2024 |
|
December 31, 2023 |
|
|
|
|
|
|
|
|
Fair Value |
|
|
|
Fair Value |
|
|
|
|
| ($ in thousands) |
|
Notional Amount |
|
Assets |
|
Liabilities |
|
Notional Amount |
|
Assets |
|
Liabilities |
|
|
|
|
| Customer-related positions: |
|
|
|
|
|
|
|
|
|
|
|
|
|
|
|
|
| Interest rate contracts: |
|
|
|
|
|
|
|
|
|
|
|
|
|
|
|
|
| Swaps |
|
$ |
6,874,132 |
|
|
$ |
9,521 |
|
|
$ |
442,960 |
|
|
$ |
6,835,822 |
|
|
$ |
25,649 |
|
|
$ |
377,388 |
|
|
|
|
|
| Written options |
|
1,287,121 |
|
|
— |
|
|
11,909 |
|
|
1,522,531 |
|
|
— |
|
|
12,756 |
|
|
|
|
|
| Collars and corridors |
|
281,117 |
|
|
130 |
|
|
3,371 |
|
|
322,732 |
|
|
440 |
|
|
4,481 |
|
|
|
|
|
| Subtotal |
|
8,442,370 |
|
|
9,651 |
|
|
458,240 |
|
|
8,681,085 |
|
|
26,089 |
|
|
394,625 |
|
|
|
|
|
| Foreign exchange contracts: |
|
|
|
|
|
|
|
|
|
|
|
|
|
|
|
|
| Forwards and spot |
|
643,298 |
|
|
4,124 |
|
|
7,548 |
|
|
956,618 |
|
|
9,466 |
|
|
6,756 |
|
|
|
|
|
| Swaps |
|
1,577,082 |
|
|
19,020 |
|
|
24,839 |
|
|
1,588,491 |
|
|
5,801 |
|
|
18,118 |
|
|
|
|
|
Purchased options |
|
129,000 |
|
|
2,580 |
|
|
— |
|
|
136,000 |
|
|
1,839 |
|
|
— |
|
|
|
|
|
| Subtotal |
|
2,349,380 |
|
|
25,724 |
|
|
32,387 |
|
|
2,681,109 |
|
|
17,106 |
|
|
24,874 |
|
|
|
|
|
| Total |
|
$ |
10,791,750 |
|
|
$ |
35,375 |
|
|
$ |
490,627 |
|
|
$ |
11,362,194 |
|
|
$ |
43,195 |
|
|
$ |
419,499 |
|
|
|
|
|
Economic hedges: |
|
|
|
|
|
|
|
|
|
|
|
|
|
|
|
|
| Interest rate contracts: |
|
|
|
|
|
|
|
|
|
|
|
|
|
|
|
|
| Swaps |
|
$ |
6,899,692 |
|
|
$ |
444,094 |
|
|
$ |
10,337 |
|
|
$ |
6,861,561 |
|
|
$ |
380,123 |
|
|
$ |
25,731 |
|
|
|
|
|
| Purchased options |
|
1,287,283 |
|
|
11,962 |
|
|
— |
|
|
1,522,531 |
|
|
12,783 |
|
|
— |
|
|
|
|
|
|
|
|
|
|
|
|
|
|
|
|
|
|
|
|
|
|
| Collars and corridors |
|
281,117 |
|
|
3,380 |
|
|
137 |
|
|
322,732 |
|
|
4,491 |
|
|
456 |
|
|
|
|
|
| Subtotal |
|
8,468,092 |
|
|
459,436 |
|
|
10,474 |
|
|
8,706,824 |
|
|
397,397 |
|
|
26,187 |
|
|
|
|
|
| Foreign exchange contracts: |
|
|
|
|
|
|
|
|
|
|
|
|
|
|
|
|
| Forwards and spot |
|
33,003 |
|
|
42 |
|
|
18 |
|
|
148,003 |
|
|
292 |
|
|
94 |
|
|
|
|
|
| Swaps |
|
2,387,046 |
|
|
34,733 |
|
|
18,168 |
|
|
2,862,037 |
|
|
36,280 |
|
|
15,757 |
|
|
|
|
|
Written options |
|
129,000 |
|
|
— |
|
|
2,580 |
|
|
136,000 |
|
|
— |
|
|
1,839 |
|
|
|
|
|
| Subtotal |
|
2,549,049 |
|
|
34,775 |
|
|
20,766 |
|
|
3,146,040 |
|
|
36,572 |
|
|
17,690 |
|
|
|
|
|
| Total |
|
$ |
11,017,141 |
|
|
$ |
494,211 |
|
|
$ |
31,240 |
|
|
$ |
11,852,864 |
|
|
$ |
433,969 |
|
|
$ |
43,877 |
|
|
|
|
|
|
|
|
|
|
The Company enters into energy commodity contracts with its customers in the oil and gas sector, which allow them to hedge against the risk of fluctuation in energy commodity prices. Offsetting contracts entered with third-party financial institutions are used as economic hedges to manage the Company’s exposure on its customer-related positions. The following table presents the notional amounts in units and the gross fair values of the commodity derivatives issued for customer-related positions and economic hedges as of March 31, 2024 and December 31, 2023:
|
|
|
|
|
|
|
|
|
|
|
|
|
|
|
|
|
|
|
|
|
|
|
|
|
|
|
|
|
|
|
|
|
|
|
|
|
|
|
|
|
|
|
|
|
|
|
|
|
|
|
|
|
|
|
|
|
|
|
|
|
|
March 31, 2024 |
|
December 31, 2023 |
|
|
|
|
|
|
|
|
|
|
Fair Value |
|
|
|
|
|
Fair Value |
|
|
|
|
| ($ and unit in thousands) |
|
Notional Units |
|
Assets |
|
Liabilities |
|
Notional Units |
|
Assets |
|
Liabilities |
|
|
|
|
| Customer-related positions: |
|
|
|
|
|
|
|
|
|
|
|
|
|
|
|
|
|
|
|
|
| Commodity contracts: |
|
|
|
|
|
|
|
|
|
|
|
|
|
|
|
|
|
|
|
|
| Crude oil: |
|
|
|
|
|
|
|
|
|
|
|
|
|
|
|
|
|
|
|
|
| Swaps |
|
3,608 |
|
|
Barrels |
|
$ |
15,370 |
|
|
$ |
685 |
|
|
3,277 |
|
|
Barrels |
|
$ |
3,735 |
|
|
$ |
15,445 |
|
|
|
|
|
| Collars |
|
5,576 |
|
|
Barrels |
|
11,901 |
|
|
115 |
|
|
5,966 |
|
|
Barrels |
|
1,820 |
|
|
5,103 |
|
|
|
|
|
|
|
|
|
|
|
|
|
|
|
|
|
|
|
|
|
|
|
|
|
|
| Subtotal |
|
9,184 |
|
|
Barrels |
|
27,271 |
|
|
800 |
|
|
9,243 |
|
|
Barrels |
|
5,555 |
|
|
20,548 |
|
|
|
|
|
| Natural gas: |
|
|
|
|
|
|
|
|
|
|
|
|
|
|
|
|
|
|
|
|
| Swaps |
|
127,102 |
|
|
MMBTUs |
|
1,420 |
|
|
70,028 |
|
|
118,325 |
|
|
MMBTUs |
|
438 |
|
|
73,793 |
|
|
|
|
|
| Collars |
|
47,953 |
|
|
MMBTUs |
|
672 |
|
|
17,107 |
|
|
45,854 |
|
|
MMBTUs |
|
21 |
|
|
20,400 |
|
|
|
|
|
| Written options |
|
1,976 |
|
|
MMBTUs |
|
132 |
|
|
33 |
|
|
1,874 |
|
|
MMBTUs |
|
— |
|
|
233 |
|
|
|
|
|
| Subtotal |
|
177,031 |
|
|
MMBTUs |
|
2,224 |
|
|
87,168 |
|
|
166,053 |
|
|
MMBTUs |
|
459 |
|
|
94,426 |
|
|
|
|
|
| Total |
|
|
|
|
|
$ |
29,495 |
|
|
$ |
87,968 |
|
|
|
|
|
|
$ |
6,014 |
|
|
$ |
114,974 |
|
|
|
|
|
Economic hedges: |
|
|
|
|
|
|
|
|
|
|
|
|
|
|
|
|
|
|
|
|
| Commodity contracts: |
|
|
|
|
|
|
|
|
|
|
|
|
|
|
|
|
|
|
|
|
| Crude oil: |
|
|
|
|
|
|
|
|
|
|
|
|
|
|
|
|
|
|
|
|
| Swaps |
|
3,708 |
|
|
Barrels |
|
$ |
1,788 |
|
|
$ |
12,997 |
|
|
3,422 |
|
|
Barrels |
|
$ |
9,166 |
|
|
$ |
4,924 |
|
|
|
|
|
| Collars |
|
5,576 |
|
|
Barrels |
|
1 |
|
|
4,902 |
|
|
5,966 |
|
|
Barrels |
|
1,685 |
|
|
1,467 |
|
|
|
|
|
|
|
|
|
|
|
|
|
|
|
|
|
|
|
|
|
|
|
|
|
|
| Subtotal |
|
9,284 |
|
|
Barrels |
|
1,789 |
|
|
17,899 |
|
|
9,388 |
|
|
Barrels |
|
10,851 |
|
|
6,391 |
|
|
|
|
|
| Natural gas: |
|
|
|
|
|
|
|
|
|
|
|
|
|
|
|
|
|
|
|
|
| Swaps |
|
124,582 |
|
|
MMBTUs |
|
37,170 |
|
|
629 |
|
|
116,463 |
|
|
MMBTUs |
|
49,941 |
|
|
305 |
|
|
|
|
|
| Collars |
|
47,353 |
|
|
MMBTUs |
|
8,120 |
|
|
318 |
|
|
44,454 |
|
|
MMBTUs |
|
12,565 |
|
|
— |
|
|
|
|
|
| Purchased options |
|
1,976 |
|
|
MMBTUs |
|
41 |
|
|
116 |
|
|
1,874 |
|
|
MMBTUs |
|
233 |
|
|
— |
|
|
|
|
|
| Subtotal |
|
173,911 |
|
|
MMBTUs |
|
45,331 |
|
|
1,063 |
|
|
162,791 |
|
|
MMBTUs |
|
62,739 |
|
|
305 |
|
|
|
|
|
| Total |
|
|
|
|
|
$ |
47,120 |
|
|
$ |
18,962 |
|
|
|
|
|
|
$ |
73,590 |
|
|
$ |
6,696 |
|
|
|
|
|
|
|
|
|
|
Credit Contracts — The Company periodically enters into credit RPAs with institutional counterparties to manage the credit exposure of the interest rate contracts associated with syndication loans. Under the RPAs, a portion of the credit exposure is transferred from one party (the purchaser of credit protection) to another party (the seller of credit protection). The seller of credit protection is required to make payments to the purchaser of credit protection if the underlying borrower defaults on the related interest rate contract. The Company may enter into protection sold or protection purchased RPAs. Credit risk on RPAs is managed by monitoring the credit worthiness of the borrowers and the institutional counterparties, which is a part of the Company’s normal credit review and monitoring process. All referenced entities of the protection sold RPAs were investment grade and the weighted-average remaining maturity was 2.6 years and 2.8 years as of March 31, 2024 and December 31, 2023, respectively. Assuming the underlying borrowers referenced in the interest rate contracts defaulted, the maximum exposure in the protection sold RPAs would be $82 thousand and $177 thousand as of March 31, 2024 and December 31, 2023, respectively.
As of both March 31, 2024 and December 31, 2023, the Company had one outstanding protection purchased RPA with notional amount of $25 million and minimal fair value.
Equity Contracts — As part of the loan origination process, the Company may obtain warrants to purchase the preferred and/or common stock of the borrowers’ companies, which are mainly in the technology and life sciences sectors. Warrants grant the Company the right to buy a certain class of the underlying company’s equity at a certain price before expiration. In connection with the Company’s investment in Rayliant during the third quarter of 2023, the Company granted performance-based RSUs as part of its consideration. The vesting of these equity contracts is contingent on Rayliant meeting certain financial performance targets during the future performance period. For additional information on these equity contracts, refer to Note 3 — Fair Value Measurement and Fair Value of Financial Instruments to the Consolidated Financial Statements in this Form 10-Q.
The following table presents the net gains (losses) recognized on the Company’s Consolidated Statement of Income related to derivatives not designated as hedging instruments for the three months ended March 31, 2024 and 2023:
|
|
|
|
|
|
|
|
|
|
|
|
|
|
|
|
|
|
|
|
|
|
|
|
|
|
|
|
|
|
Three Months Ended March 31, |
|
|
| ($ in thousands) |
|
Classification on Consolidated Statement of Income |
|
2024 |
|
2023 |
|
|
|
|
| Derivatives not designated as hedging instruments: |
|
|
|
|
|
|
|
|
|
|
| Interest rate contracts |
|
Customer derivative income |
|
$ |
484 |
|
|
$ |
(2,484) |
|
|
|
|
|
| Foreign exchange contracts |
|
Foreign exchange income |
|
12,780 |
|
|
10,442 |
|
|
|
|
|
| Credit contracts |
|
Customer derivative income |
|
(5) |
|
|
(5) |
|
|
|
|
|
Equity contracts - warrants |
|
Lending fees |
|
(6) |
|
|
(45) |
|
|
|
|
|
|
|
|
|
|
|
|
|
|
|
|
| Commodity contracts |
|
Customer derivative income |
|
134 |
|
|
6 |
|
|
|
|
|
| Net gains |
|
|
|
$ |
13,387 |
|
|
$ |
7,914 |
|
|
|
|
|
|
Credit-Risk-Related Contingent Features — Certain of the Company’s over-the-counter derivative contracts contain early termination provisions that require the Company to settle any outstanding balances upon the occurrence of a specified credit-risk-related event. Such an event primarily relates to a downgrade of the credit rating of East West Bank to below investment grade. As of March 31, 2024, the aggregate fair value amounts of all derivative instruments with credit risk-related contingent features that were in a net liability position totaled $2 million, for which $2 million collateral was posted to cover these positions. In comparison, as of December 31, 2023, the aggregate fair value amounts of all derivative instruments with credit risk-related contingent features that were in a net liability position totaled $9 thousand, for which no collateral was posted to cover these positions. In the event that the credit rating of East West Bank had been downgraded to below investment grade, the Company would have been required to post minimal additional collateral as of both March 31, 2024 and December 31, 2023.
Offsetting of Derivatives
The following tables present the gross derivative fair values, the balance sheet netting adjustments, and the resulting net fair values recorded on the Consolidated Balance Sheet, as well as the cash and noncash collateral associated with master netting arrangements. The gross amounts of derivative assets and liabilities are presented after the application of variation margin payments as settlements to the fair values of contracts cleared through central clearing organizations, where applicable. The collateral amounts in the following tables are limited to the outstanding balances of the related asset or liability. Therefore, instances of over-collateralization are not shown:
|
|
|
|
|
|
|
|
|
|
|
|
|
|
|
|
|
|
|
|
|
|
|
|
|
|
|
|
|
|
|
|
|
|
|
|
|
|
|
|
| ($ in thousands) |
|
As of March 31, 2024 |
|
|
|
|
|
|
|
|
|
|
|
|
|
Gross Amounts Recognized (1) |
|
Gross Amounts Offset on the Consolidated Balance Sheet |
|
Net Amounts Presented on the Consolidated Balance Sheet |
|
Gross Amounts Not Offset on the Consolidated Balance Sheet |
|
Net Amount |
|
|
|
Master Netting Arrangements |
|
Cash Collateral Received (3) |
|
|
Security Collateral Received (5) |
|
| Derivative assets |
|
$ |
622,238 |
|
|
$ |
(132,555) |
|
|
$ |
(356,707) |
|
|
$ |
132,976 |
|
|
$ |
(99,877) |
|
|
$ |
33,099 |
|
|
|
|
|
|
|
|
|
|
|
|
|
|
|
|
Gross Amounts Recognized (2) |
|
Gross Amounts Offset on the Consolidated Balance Sheet |
|
Net Amounts Presented on the Consolidated Balance Sheet |
|
Gross Amounts Not Offset on the Consolidated Balance Sheet |
|
Net Amount |
|
|
|
Master Netting Arrangements |
|
Cash Collateral Pledged (4) |
|
|
Security Collateral Pledged (5) |
|
| Derivative liabilities |
|
$ |
693,548 |
|
|
$ |
(132,555) |
|
|
$ |
(2,408) |
|
|
$ |
558,585 |
|
|
$ |
— |
|
|
$ |
558,585 |
|
|
|
|
|
|
|
|
|
|
|
|
|
|
|
|
|
|
|
|
|
|
|
|
|
|
|
|
|
|
|
|
|
|
|
|
|
|
|
|
|
|
| ($ in thousands) |
|
As of December 31, 2023 |
|
|
|
|
|
|
|
|
|
|
|
|
|
Gross Amounts Recognized (1) |
|
Gross Amounts Offset on the Consolidated Balance Sheet |
|
Net Amounts Presented on the Consolidated Balance Sheet |
|
Gross Amounts Not Offset on the Consolidated Balance Sheet |
|
Net Amount |
|
|
|
Master Netting Arrangements |
|
Cash Collateral Received (3) |
|
|
Security Collateral Received (5) |
|
| Derivative assets |
|
$ |
610,920 |
|
|
$ |
(75,534) |
|
|
$ |
(237,258) |
|
|
$ |
298,128 |
|
|
$ |
(246,259) |
|
|
$ |
51,869 |
|
|
|
|
|
|
|
|
|
|
|
|
|
|
|
|
Gross Amounts Recognized (2) |
|
Gross Amounts Offset on the Consolidated Balance Sheet |
|
Net Amounts Presented on the Consolidated Balance Sheet |
|
Gross Amounts Not Offset on the Consolidated Balance Sheet |
|
Net Amount |
|
|
|
Master Netting Arrangements |
|
Cash Collateral Pledged (4) |
|
|
Security Collateral Pledged (5) |
|
| Derivative liabilities |
|
$ |
613,314 |
|
|
$ |
(75,534) |
|
|
$ |
(636) |
|
|
$ |
537,144 |
|
|
$ |
— |
|
|
$ |
537,144 |
|
|
(1)Includes $2 million and $3 million of gross fair value assets with counterparties that were not subject to enforceable master netting arrangements or similar agreements as of March 31, 2024 and December 31, 2023, respectively.
(2)Includes $17 million and $16 million of gross fair value liabilities with counterparties that were not subject to enforceable master netting arrangements or similar agreements as of March 31, 2024 and December 31, 2023, respectively.
(3)Gross cash collateral received under master netting arrangements or similar agreements was $362 million and $244 million as of March 31, 2024 and December 31, 2023, respectively. Of the gross cash collateral received, $357 million and $237 million were used to offset derivative assets as of March 31, 2024 and December 31, 2023, respectively.
(4)Gross cash collateral pledged under master netting arrangements or similar agreements was $3 million and $1 million as of March 31, 2024 and December 31, 2023, respectively. Of the gross cash collateral pledged, $2 million and $1 million were used to offset derivative liabilities as of March 31, 2024 and December 31, 2023, respectively.
(5)Represents the fair value of security collateral received or pledged limited to derivative assets or liabilities that are subject to enforceable master netting arrangements or similar agreements. U.S. GAAP does not permit the netting of noncash collateral on the Consolidated Balance Sheet but requires the disclosure of such amounts.
In addition to the amounts included in the tables above, the Company has balance sheet netting related to resale agreements. Refer to Note 4 — Securities Purchased under Resale Agreements to the Consolidated Financial Statements in this Form 10-Q for additional information. Refer to Note 3 — Fair Value Measurement and Fair Value of Financial Instruments to the Consolidated Financial Statements in this Form 10-Q for fair value measurement disclosures on derivatives.
Note 7 — Loans Receivable and Allowance for Credit Losses
The following table presents the composition of the Company’s loans held-for-investment outstanding as of March 31, 2024 and December 31, 2023:
|
|
|
|
|
|
|
|
|
|
|
|
|
|
|
|
| ($ in thousands) |
|
March 31, 2024 |
|
December 31, 2023 |
| Commercial: |
|
|
|
|
| C&I |
|
$ |
16,350,191 |
|
|
$ |
16,581,079 |
|
| CRE: |
|
|
|
|
| CRE |
|
14,609,655 |
|
|
14,777,081 |
|
| Multifamily residential |
|
5,010,245 |
|
|
5,023,163 |
|
| Construction and land |
|
673,939 |
|
|
663,868 |
|
| Total CRE |
|
20,293,839 |
|
|
20,464,112 |
|
| Total commercial |
|
36,644,030 |
|
|
37,045,191 |
|
| Consumer: |
|
|
|
|
| Residential mortgage: |
|
|
|
|
| Single-family residential |
|
13,563,738 |
|
|
13,383,060 |
|
| HELOCs |
|
1,731,233 |
|
|
1,722,204 |
|
| Total residential mortgage |
|
15,294,971 |
|
|
15,105,264 |
|
| Other consumer |
|
53,503 |
|
|
60,327 |
|
| Total consumer |
|
15,348,474 |
|
|
15,165,591 |
|
Total loans held-for-investment (1) |
|
$ |
51,992,504 |
|
|
$ |
52,210,782 |
|
| Allowance for loan losses |
|
(670,280) |
|
|
(668,743) |
|
Loans held-for-investment, net (1) |
|
$ |
51,322,224 |
|
|
$ |
51,542,039 |
|
|
(1)Includes $63 million and $71 million of net deferred loan fees and net unamortized premiums as of March 31, 2024 and December 31, 2023, respectively.
Accrued interest receivable on loans held-for-investment was $268 million and $267 million as of March 31, 2024 and December 31, 2023, respectively, and was included in Other assets on the Consolidated Balance Sheet. The interest income reversed was insignificant for both the three months ended March 31, 2024 and 2023. For the Company’s accounting policy on accrued interest receivable related to loans held-for-investment, see Note 1 — Summary of Significant Accounting Policies — Significant Accounting Policies — Loans Held-for-Investment to the Consolidated Financial Statements of the Company’s 2023 Form 10-K. The Company also has loans held-for-sale. For the Company’s accounting policy on loans held-for-sale, refer to Note 1 — Summary of Significant Accounting Policies — Significant Accounting Policies — Loans Held-for-Sale to the Consolidated Financial Statements in the Company’s 2023 Form 10-K.
The Company’s FRBSF and FHLB borrowings are primarily secured by loans held-for-investment. Loans held-for-investment totaling $37.1 billion and $37.2 billion, respectively, were pledged to secure borrowings and provide additional borrowing capacity as of March 31, 2024 and December 31, 2023.
Credit Quality Indicators
All loans are subject to the Company’s credit review and monitoring process. For the commercial loan portfolio, loans are risk rated based on an analysis of the borrower’s current payment performance or delinquency, repayment sources, financial and liquidity factors, including industry and geographic considerations. For the consumer loan portfolio, payment performance or delinquency is typically the driving indicator for risk ratings.
The Company utilizes internal credit risk ratings to assign each individual loan a risk rating of 1 through 10:
•Pass — loans risk rated 1 through 5 are assigned an internal risk rating category of “Pass.” Loans risk rated 1 are typically loans fully secured by cash. Pass loans have sufficient sources of repayment to repay the loan in full, in accordance with all terms and conditions.
•Special mention — loans assigned a risk rating of 6 have potential weaknesses that warrant closer attention by management; these are assigned an internal risk rating category of “Special Mention.”
•Substandard — loans assigned a risk rating of 7 or 8 have well-defined weaknesses that may jeopardize the full and timely repayment of the loan; these are assigned an internal risk rating category of “Substandard.”
•Doubtful — loans assigned a risk rating of 9 have insufficient sources of repayment and a high probability of loss; these are assigned an internal risk rating category of “Doubtful.”
•Loss — loans assigned a risk rating of 10 are uncollectible and of such little value that they are no longer considered bankable assets; these are assigned an internal risk rating category of “Loss.”
Loan exposures categorized as criticized consist of special mention, substandard, doubtful and loss categories. The Company reviews the internal risk ratings of its loan portfolio on a regular basis, and adjusts the ratings based on changes in the borrowers’ financial status and the collectability of the loans.
The following tables summarize the Company’s loans held-for-investment and year-to-date gross write-offs by loan portfolio segments, internal risk ratings and vintage year as of the periods presented. The vintage year is the year of loan origination, renewal or major modification. Revolving loans that are converted to term loans presented in the tables below are excluded from term loans by vintage year columns.
|
|
|
|
|
|
|
|
|
|
|
|
|
|
|
|
|
|
|
|
|
|
|
|
|
|
|
|
|
|
|
|
|
|
|
|
|
|
|
|
|
|
|
|
|
|
|
|
|
|
|
|
|
|
|
|
|
|
|
|
|
|
|
|
March 31, 2024 |
|
|
|
|
|
|
|
|
|
|
|
|
|
|
|
|
|
|
|
|
|
|
|
|
|
|
|
|
|
|
|
|
|
|
|
|
|
|
|
|
|
|
|
|
|
|
Term Loans by Origination Year |
|
|
|
|
|
|
|
|
|
|
|
|
|
|
|
|
|
|
|
| ($ in thousands) |
|
2024 |
|
2023 |
|
2022 |
|
2021 |
|
2020 |
|
Prior |
|
Revolving Loans |
|
Revolving Loans Converted to Term Loans (1) |
|
Total |
|
|
| Commercial: |
|
|
|
|
|
|
|
|
|
|
|
|
|
|
|
|
|
|
|
|
| C&I: |
|
|
|
|
|
|
|
|
|
|
|
|
|
|
|
|
|
|
|
|
| Pass |
|
$ |
494,511 |
|
|
$ |
2,181,627 |
|
|
$ |
1,390,042 |
|
|
$ |
1,162,380 |
|
|
$ |
290,790 |
|
|
$ |
357,396 |
|
|
$ |
9,858,874 |
|
|
$ |
23,801 |
|
|
$ |
15,759,421 |
|
|
|
| Criticized (accrual) |
|
15 |
|
|
80,137 |
|
|
146,122 |
|
|
126,563 |
|
|
8,378 |
|
|
61,936 |
|
|
118,657 |
|
|
— |
|
|
541,808 |
|
|
|
| Criticized (nonaccrual) |
|
— |
|
|
15,676 |
|
|
10,179 |
|
|
631 |
|
|
4,193 |
|
|
17,313 |
|
|
970 |
|
|
— |
|
|
48,962 |
|
|
|
|
|
|
|
|
|
|
|
|
|
|
|
|
|
|
|
|
|
|
|
|
|
|
|
|
|
|
|
|
|
|
|
|
|
|
|
|
|
|
|
|
|
| Total C&I |
|
494,526 |
|
|
2,277,440 |
|
|
1,546,343 |
|
|
1,289,574 |
|
|
303,361 |
|
|
436,645 |
|
|
9,978,501 |
|
|
23,801 |
|
|
16,350,191 |
|
|
|
|
|
|
|
|
|
|
|
|
|
|
|
|
|
|
|
|
|
|
|
|
Gross write-offs for the three months ended March 31, 2024 (2) |
|
— |
|
|
221 |
|
|
11,550 |
|
|
3,047 |
|
|
488 |
|
|
1,528 |
|
|
(56) |
|
(3) |
— |
|
|
16,778 |
|
|
|
|
|
|
|
|
|
|
|
|
|
|
|
|
|
|
|
|
|
|
|
|
| CRE: |
|
|
|
|
|
|
|
|
|
|
|
|
|
|
|
|
|
|
|
|
|
|
|
|
|
|
|
|
|
|
|
|
|
|
|
|
|
|
|
|
|
| Pass |
|
310,715 |
|
|
2,415,104 |
|
|
3,940,346 |
|
|
2,125,414 |
|
|
1,412,088 |
|
|
3,815,741 |
|
|
90,300 |
|
|
48,880 |
|
|
14,158,588 |
|
|
|
| Criticized (accrual) |
|
— |
|
|
66,187 |
|
|
54,141 |
|
|
26,402 |
|
|
53,926 |
|
|
200,610 |
|
|
— |
|
|
14,795 |
|
|
416,061 |
|
|
|
| Criticized (nonaccrual) |
|
— |
|
|
1,750 |
|
|
— |
|
|
— |
|
|
— |
|
|
33,256 |
|
|
— |
|
|
— |
|
|
35,006 |
|
|
|
|
|
|
|
|
|
|
|
|
|
|
|
|
|
|
|
|
|
|
|
|
|
|
|
|
|
|
|
|
|
|
|
|
|
|
|
|
|
|
|
|
|
| Subtotal CRE |
|
310,715 |
|
|
2,483,041 |
|
|
3,994,487 |
|
|
2,151,816 |
|
|
1,466,014 |
|
|
4,049,607 |
|
|
90,300 |
|
|
63,675 |
|
|
14,609,655 |
|
|
|
|
|
|
|
|
|
|
|
|
|
|
|
|
|
|
|
|
|
|
|
|
Gross write-offs for the three months ended March 31, 2024 |
|
— |
|
|
— |
|
|
— |
|
|
— |
|
|
— |
|
|
2,398 |
|
|
— |
|
|
— |
|
|
2,398 |
|
|
|
|
|
|
|
|
|
|
|
|
|
|
|
|
|
|
|
|
|
|
|
|
| Multifamily residential: |
|
|
|
|
|
|
|
|
|
|
|
|
|
|
|
|
|
|
|
|
| Pass |
|
43,746 |
|
|
652,947 |
|
|
1,482,963 |
|
|
794,023 |
|
|
645,391 |
|
|
1,329,341 |
|
|
6,831 |
|
|
1,275 |
|
|
4,956,517 |
|
|
|
| Criticized (accrual) |
|
— |
|
|
13,939 |
|
|
— |
|
|
31,882 |
|
|
— |
|
|
3,261 |
|
|
— |
|
|
— |
|
|
49,082 |
|
|
|
| Criticized (nonaccrual) |
|
— |
|
|
— |
|
|
— |
|
|
— |
|
|
— |
|
|
4,646 |
|
|
— |
|
|
— |
|
|
4,646 |
|
|
|
|
|
|
|
|
|
|
|
|
|
|
|
|
|
|
|
|
|
|
|
|
|
|
|
|
|
|
|
|
|
|
|
|
|
|
|
|
|
|
|
|
|
| Subtotal multifamily residential |
|
43,746 |
|
|
666,886 |
|
|
1,482,963 |
|
|
825,905 |
|
|
645,391 |
|
|
1,337,248 |
|
|
6,831 |
|
|
1,275 |
|
|
5,010,245 |
|
|
|
|
|
|
|
|
|
|
|
|
|
|
|
|
|
|
|
|
|
|
|
|
| Gross write-offs for the three months ended March 31, 2024 |
|
— |
|
|
— |
|
|
— |
|
|
— |
|
|
— |
|
|
6 |
|
|
— |
|
|
— |
|
|
6 |
|
|
|
|
|
|
|
|
|
|
|
|
|
|
|
|
|
|
|
|
|
|
|
|
| Construction and land: |
|
|
|
|
|
|
|
|
|
|
|
|
|
|
|
|
|
|
|
|
| Pass |
|
2,980 |
|
|
266,224 |
|
|
234,093 |
|
|
124,830 |
|
|
1,603 |
|
|
6,290 |
|
|
8,795 |
|
|
— |
|
|
644,815 |
|
|
|
| Criticized (accrual) |
|
— |
|
|
— |
|
|
16,888 |
|
|
— |
|
|
— |
|
|
— |
|
|
— |
|
|
— |
|
|
16,888 |
|
|
|
| Criticized (nonaccrual) |
|
— |
|
|
— |
|
|
12,236 |
|
|
— |
|
|
— |
|
|
— |
|
|
— |
|
|
— |
|
|
12,236 |
|
|
|
| Subtotal construction and land |
|
2,980 |
|
|
266,224 |
|
|
263,217 |
|
|
124,830 |
|
|
1,603 |
|
|
6,290 |
|
|
8,795 |
|
|
— |
|
|
673,939 |
|
|
|
|
|
|
|
|
|
|
|
|
|
|
|
|
|
|
|
|
|
|
|
|
| Gross write-offs for the three months ended March 31, 2024 |
|
— |
|
|
— |
|
|
1,224 |
|
|
— |
|
|
— |
|
|
— |
|
|
— |
|
|
— |
|
|
1,224 |
|
|
|
|
|
|
|
|
|
|
|
|
|
|
|
|
|
|
|
|
|
|
|
|
| Total CRE |
|
357,441 |
|
|
3,416,151 |
|
|
5,740,667 |
|
|
3,102,551 |
|
|
2,113,008 |
|
|
5,393,145 |
|
|
105,926 |
|
|
64,950 |
|
|
20,293,839 |
|
|
|
|
|
|
|
|
|
|
|
|
|
|
|
|
|
|
|
|
|
|
|
|
Total CRE gross write-offs for the three months ended March 31, 2024 |
|
— |
|
|
— |
|
|
1,224 |
|
|
— |
|
|
— |
|
|
2,404 |
|
|
— |
|
|
— |
|
|
3,628 |
|
|
|
|
|
|
|
|
|
|
|
|
|
|
|
|
|
|
|
|
|
|
|
|
| Total commercial |
|
$ |
851,967 |
|
|
$ |
5,693,591 |
|
|
$ |
7,287,010 |
|
|
$ |
4,392,125 |
|
|
$ |
2,416,369 |
|
|
$ |
5,829,790 |
|
|
$ |
10,084,427 |
|
|
$ |
88,751 |
|
|
$ |
36,644,030 |
|
|
|
|
|
|
|
|
|
|
|
|
|
|
|
|
|
|
|
|
|
|
|
|
Total commercial gross write-offs for the three months ended March 31, 2024 (2) |
|
$ |
— |
|
|
$ |
221 |
|
|
$ |
12,774 |
|
|
$ |
3,047 |
|
|
$ |
488 |
|
|
$ |
3,932 |
|
|
$ |
(56) |
|
(3) |
$ |
— |
|
|
$ |
20,406 |
|
|
|
|
|
|
|
|
|
|
|
|
|
|
|
|
|
|
|
|
|
|
|
|
|
|
|
|
|
|
|
|
|
|
|
|
|
|
|
|
|
|
|
|
|
|
|
|
|
|
|
|
|
|
|
|
|
|
|
|
|
|
|
|
|
|
|
|
|
|
|
|
|
|
|
|
|
|
|
|
|
|
|
|
|
|
|
|
|
|
|
|
|
|
|
|
|
|
|
|
|
|
|
|
|
|
|
March 31, 2024 |
|
|
|
|
|
|
|
|
|
|
|
|
|
|
|
|
|
|
|
|
|
|
|
|
|
|
|
|
|
|
|
|
|
|
|
|
|
|
|
|
|
|
|
|
|
|
Term Loans by Origination Year |
|
|
|
|
|
|
|
|
| ($ in thousands) |
|
2024 |
|
2023 |
|
2022 |
|
2021 |
|
2020 |
|
Prior |
|
Revolving Loans |
|
Revolving Loans Converted to Term Loans (1) |
|
Total |
|
|
| Consumer: |
|
|
|
|
|
|
|
|
|
|
|
|
|
|
|
|
|
|
|
|
| Residential mortgage: |
|
|
|
|
|
|
|
|
|
|
|
|
|
|
|
|
|
|
|
|
| Single-family residential: |
|
|
|
|
|
|
|
|
|
|
|
|
|
|
|
|
|
|
|
|
Pass (4) |
|
$ |
547,073 |
|
|
$ |
3,077,628 |
|
|
$ |
3,285,262 |
|
|
$ |
2,236,107 |
|
|
$ |
1,553,848 |
|
|
$ |
2,814,348 |
|
|
$ |
— |
|
|
$ |
— |
|
|
$ |
13,514,266 |
|
|
|
| Criticized (accrual) |
|
— |
|
|
3,196 |
|
|
— |
|
|
1,764 |
|
|
3,910 |
|
|
5,583 |
|
|
— |
|
|
— |
|
|
14,453 |
|
|
|
Criticized (nonaccrual) (4) |
|
— |
|
|
7,860 |
|
|
5,874 |
|
|
3,389 |
|
|
3,718 |
|
|
14,178 |
|
|
— |
|
|
— |
|
|
35,019 |
|
|
|
| Subtotal single-family residential mortgage |
|
547,073 |
|
|
3,088,684 |
|
|
3,291,136 |
|
|
2,241,260 |
|
|
1,561,476 |
|
|
2,834,109 |
|
|
— |
|
|
— |
|
|
13,563,738 |
|
|
|
|
|
|
|
|
|
|
|
|
|
|
|
|
|
|
|
|
|
|
|
|
|
|
|
|
|
|
|
|
|
|
|
|
|
|
|
|
|
|
|
|
|
| HELOCs: |
|
|
|
|
|
|
|
|
|
|
|
|
|
|
|
|
|
|
|
|
| Pass |
|
4,798 |
|
|
3,655 |
|
|
3,394 |
|
|
2,817 |
|
|
5,107 |
|
|
9,288 |
|
|
1,561,308 |
|
|
123,131 |
|
|
1,713,498 |
|
|
|
| Criticized (accrual) |
|
— |
|
|
808 |
|
|
2,435 |
|
|
360 |
|
|
— |
|
|
670 |
|
|
718 |
|
|
1,246 |
|
|
6,237 |
|
|
|
| Criticized (nonaccrual) |
|
— |
|
|
65 |
|
|
518 |
|
|
219 |
|
|
— |
|
|
5,906 |
|
|
— |
|
|
4,790 |
|
|
11,498 |
|
|
|
| Subtotal HELOCs |
|
4,798 |
|
|
4,528 |
|
|
6,347 |
|
|
3,396 |
|
|
5,107 |
|
|
15,864 |
|
|
1,562,026 |
|
|
129,167 |
|
|
1,731,233 |
|
|
|
|
|
|
|
|
|
|
|
|
|
|
|
|
|
|
|
|
|
|
|
|
|
|
|
|
|
|
|
|
|
|
|
|
|
|
|
|
|
|
|
|
|
| Total residential mortgage |
|
551,871 |
|
|
3,093,212 |
|
|
3,297,483 |
|
|
2,244,656 |
|
|
1,566,583 |
|
|
2,849,973 |
|
|
1,562,026 |
|
|
129,167 |
|
|
15,294,971 |
|
|
|
|
|
|
|
|
|
|
|
|
|
|
|
|
|
|
|
|
|
|
|
|
|
|
|
|
|
|
|
|
|
|
|
|
|
|
|
|
|
|
|
|
|
| Other consumer: |
|
|
|
|
|
|
|
|
|
|
|
|
|
|
|
|
|
|
|
|
| Pass |
|
2,132 |
|
|
632 |
|
|
18,101 |
|
|
134 |
|
|
— |
|
|
6,861 |
|
|
22,481 |
|
|
— |
|
|
50,341 |
|
|
|
| Criticized (accrual) |
|
— |
|
|
— |
|
|
— |
|
|
— |
|
|
— |
|
|
— |
|
|
3,000 |
|
|
— |
|
|
3,000 |
|
|
|
| Criticized (nonaccrual) |
|
— |
|
|
— |
|
|
— |
|
|
— |
|
|
— |
|
|
— |
|
|
162 |
|
|
— |
|
|
162 |
|
|
|
| Total other consumer |
|
2,132 |
|
|
632 |
|
|
18,101 |
|
|
134 |
|
|
— |
|
|
6,861 |
|
|
25,643 |
|
|
— |
|
|
53,503 |
|
|
|
Gross write-offs for the three months ended March 31, 2024 (2) |
|
— |
|
|
— |
|
|
— |
|
|
— |
|
|
— |
|
|
— |
|
|
2 |
|
|
— |
|
|
2 |
|
|
|
|
|
|
|
|
|
|
|
|
|
|
|
|
|
|
|
|
|
|
|
|
| Total consumer |
|
$ |
554,003 |
|
|
$ |
3,093,844 |
|
|
$ |
3,315,584 |
|
|
$ |
2,244,790 |
|
|
$ |
1,566,583 |
|
|
$ |
2,856,834 |
|
|
$ |
1,587,669 |
|
|
$ |
129,167 |
|
|
$ |
15,348,474 |
|
|
|
Total consumer gross write-offs for the three months ended March 31, 2024 (2) |
|
$ |
— |
|
|
$ |
— |
|
|
$ |
— |
|
|
$ |
— |
|
|
$ |
— |
|
|
$ |
— |
|
|
$ |
2 |
|
|
$ |
— |
|
|
$ |
2 |
|
|
|
|
|
|
|
|
|
|
|
|
|
|
|
|
|
|
|
|
|
|
|
|
| Total loans held-for-investment: |
|
|
|
|
|
|
|
|
|
|
|
|
|
|
|
|
|
|
|
|
| Pass |
|
$ |
1,405,955 |
|
|
$ |
8,597,817 |
|
|
$ |
10,354,201 |
|
|
$ |
6,445,705 |
|
|
$ |
3,908,827 |
|
|
$ |
8,339,265 |
|
|
$ |
11,548,589 |
|
|
$ |
197,087 |
|
|
$ |
50,797,446 |
|
|
|
| Criticized (accrual) |
|
15 |
|
|
164,267 |
|
|
219,586 |
|
|
186,971 |
|
|
66,214 |
|
|
272,060 |
|
|
122,375 |
|
|
16,041 |
|
|
1,047,529 |
|
|
|
| Criticized (nonaccrual) |
|
— |
|
|
25,351 |
|
|
28,807 |
|
|
4,239 |
|
|
7,911 |
|
|
75,299 |
|
|
1,132 |
|
|
4,790 |
|
|
147,529 |
|
|
|
|
|
|
|
|
|
|
|
|
|
|
|
|
|
|
|
|
|
|
|
|
|
|
|
|
|
|
|
|
|
|
|
|
|
|
|
|
|
|
|
|
|
|
|
|
|
|
|
|
|
|
|
|
|
|
|
|
|
|
|
|
|
|
| Total |
|
$ |
1,405,970 |
|
|
$ |
8,787,435 |
|
|
$ |
10,602,594 |
|
|
$ |
6,636,915 |
|
|
$ |
3,982,952 |
|
|
$ |
8,686,624 |
|
|
$ |
11,672,096 |
|
|
$ |
217,918 |
|
|
$ |
51,992,504 |
|
|
|
Total loans held-for-investment gross write-offs for the three months ended March 31, 2024 (2) |
|
$ |
— |
|
|
$ |
221 |
|
|
$ |
12,774 |
|
|
$ |
3,047 |
|
|
$ |
488 |
|
|
$ |
3,932 |
|
|
$ |
(54) |
|
(3) |
$ |
— |
|
|
$ |
20,408 |
|
|
|
|
|
|
|
|
|
|
|
|
|
|
|
|
|
|
|
|
|
|
|
|
|
|
|
|
|
|
|
|
|
|
|
|
|
|
|
|
|
|
|
|
|
|
|
|
|
|
|
|
|
|
|
|
|
|
|
|
|
|
|
|
|
|
December 31, 2023 |
|
|
|
|
|
|
|
|
|
|
|
|
|
|
|
|
|
|
|
|
|
|
|
|
|
|
|
|
|
|
|
|
|
|
|
|
|
|
|
|
Term Loans by Origination Year |
|
|
|
|
|
|
|
|
|
|
|
|
|
|
|
| ($ in thousands) |
|
2023 |
|
2022 |
|
2021 |
|
2020 |
|
2019 |
|
Prior |
|
Revolving Loans |
|
Revolving Loans Converted to Term Loans (1) |
|
Total |
| Commercial: |
|
|
|
|
|
|
|
|
|
|
|
|
|
|
|
|
|
|
| C&I: |
|
|
|
|
|
|
|
|
|
|
|
|
|
|
|
|
|
|
| Pass |
|
$ |
2,314,463 |
|
|
$ |
1,628,560 |
|
|
$ |
1,296,936 |
|
|
$ |
331,982 |
|
|
$ |
245,173 |
|
|
$ |
164,159 |
|
|
$ |
10,053,757 |
|
|
$ |
20,143 |
|
|
$ |
16,055,173 |
|
| Criticized (accrual) |
|
105,119 |
|
|
67,899 |
|
|
120,574 |
|
|
15,064 |
|
|
40,920 |
|
|
22,098 |
|
|
117,196 |
|
|
— |
|
|
488,870 |
|
| Criticized (nonaccrual) |
|
2,104 |
|
|
7,916 |
|
|
131 |
|
|
4,819 |
|
|
2,979 |
|
|
18,137 |
|
|
950 |
|
|
— |
|
|
37,036 |
|
|
|
|
|
|
|
|
|
|
|
|
|
|
|
|
|
|
|
|
|
|
|
|
|
|
|
|
|
|
|
|
|
|
|
|
|
|
|
| Total C&I |
|
2,421,686 |
|
|
1,704,375 |
|
|
1,417,641 |
|
|
351,865 |
|
|
289,072 |
|
|
204,394 |
|
|
10,171,903 |
|
|
20,143 |
|
|
16,581,079 |
|
Gross write-offs for the year ended December 31, 2023 (2) |
|
350 |
|
|
10,454 |
|
|
424 |
|
|
3,758 |
|
|
9,748 |
|
|
2,648 |
|
|
1,593 |
|
|
— |
|
|
28,975 |
|
|
|
|
|
|
|
|
|
|
|
|
|
|
|
|
|
|
|
|
| CRE: |
|
|
|
|
|
|
|
|
|
|
|
|
|
|
|
|
|
|
| Pass |
|
2,492,915 |
|
|
4,086,385 |
|
|
2,216,257 |
|
|
1,428,724 |
|
|
1,600,844 |
|
|
2,494,382 |
|
|
92,851 |
|
|
62,771 |
|
|
14,475,129 |
|
| Criticized (accrual) |
|
36,855 |
|
|
34,485 |
|
|
30,336 |
|
|
48,250 |
|
|
24,437 |
|
|
104,340 |
|
|
— |
|
|
— |
|
|
278,703 |
|
| Criticized (nonaccrual) |
|
— |
|
|
— |
|
|
— |
|
|
— |
|
|
444 |
|
|
22,805 |
|
|
— |
|
|
— |
|
|
23,249 |
|
|
|
|
|
|
|
|
|
|
|
|
|
|
|
|
|
|
|
|
|
|
|
|
|
|
|
|
|
|
|
|
|
|
|
|
|
|
|
| Subtotal CRE |
|
2,529,770 |
|
|
4,120,870 |
|
|
2,246,593 |
|
|
1,476,974 |
|
|
1,625,725 |
|
|
2,621,527 |
|
|
92,851 |
|
|
62,771 |
|
|
14,777,081 |
|
Gross write-offs for the year ended December 31, 2023 (2) |
|
— |
|
|
— |
|
|
— |
|
|
— |
|
|
— |
|
|
1,329 |
|
|
— |
|
|
— |
|
|
1,329 |
|
|
|
|
|
|
|
|
|
|
|
|
|
|
|
|
|
|
|
|
Multifamily residential: |
|
|
|
|
|
|
|
|
|
|
|
|
|
|
|
|
|
|
| Pass |
|
665,780 |
|
|
1,481,161 |
|
|
808,333 |
|
|
612,408 |
|
|
498,491 |
|
|
857,713 |
|
|
8,690 |
|
|
1,281 |
|
|
4,933,857 |
|
| Criticized (accrual) |
|
— |
|
|
3,356 |
|
|
54,614 |
|
|
— |
|
|
693 |
|
|
25,974 |
|
|
— |
|
|
— |
|
|
84,637 |
|
| Criticized (nonaccrual) |
|
— |
|
|
— |
|
|
— |
|
|
— |
|
|
— |
|
|
4,669 |
|
|
— |
|
|
— |
|
|
4,669 |
|
|
|
|
|
|
|
|
|
|
|
|
|
|
|
|
|
|
|
|
|
|
|
|
|
|
|
|
|
|
|
|
|
|
|
|
|
|
|
| Subtotal multifamily residential |
|
665,780 |
|
|
1,484,517 |
|
|
862,947 |
|
|
612,408 |
|
|
499,184 |
|
|
888,356 |
|
|
8,690 |
|
|
1,281 |
|
|
5,023,163 |
|
Gross write-offs for the year ended December 31, 2023 |
|
— |
|
|
— |
|
|
— |
|
|
— |
|
|
— |
|
|
3 |
|
|
— |
|
|
— |
|
|
3 |
|
|
|
|
|
|
|
|
|
|
|
|
|
|
|
|
|
|
|
|
| Construction and land: |
|
|
|
|
|
|
|
|
|
|
|
|
|
|
|
|
|
|
| Pass |
|
209,775 |
|
|
280,151 |
|
|
120,724 |
|
|
39,928 |
|
|
808 |
|
|
5,501 |
|
|
6,981 |
|
|
— |
|
|
663,868 |
|
|
|
|
|
|
|
|
|
|
|
|
|
|
|
|
|
|
|
|
|
|
|
|
|
|
|
|
|
|
|
|
|
|
|
|
|
|
|
| Subtotal construction and land |
|
209,775 |
|
|
280,151 |
|
|
120,724 |
|
|
39,928 |
|
|
808 |
|
|
5,501 |
|
|
6,981 |
|
|
— |
|
|
663,868 |
|
|
|
|
|
|
|
|
|
|
|
|
|
|
|
|
|
|
|
|
| Total CRE |
|
3,405,325 |
|
|
5,885,538 |
|
|
3,230,264 |
|
|
2,129,310 |
|
|
2,125,717 |
|
|
3,515,384 |
|
|
108,522 |
|
|
64,052 |
|
|
20,464,112 |
|
Total CRE gross write-offs for the year ended December 31, 2023 (2) |
|
— |
|
|
— |
|
|
— |
|
|
— |
|
|
— |
|
|
1,332 |
|
|
— |
|
|
— |
|
|
1,332 |
|
|
|
|
|
|
|
|
|
|
|
|
|
|
|
|
|
|
|
|
| Total commercial |
|
$ |
5,827,011 |
|
|
$ |
7,589,913 |
|
|
$ |
4,647,905 |
|
|
$ |
2,481,175 |
|
|
$ |
2,414,789 |
|
|
$ |
3,719,778 |
|
|
$ |
10,280,425 |
|
|
$ |
84,195 |
|
|
$ |
37,045,191 |
|
Total commercial gross write-offs for the year ended December 31, 2023 (2) |
|
350 |
|
|
10,454 |
|
|
424 |
|
|
3,758 |
|
|
9,748 |
|
|
3,980 |
|
|
1,593 |
|
|
— |
|
|
30,307 |
|
|
|
|
|
|
|
|
|
|
|
|
|
|
|
|
|
|
|
|
|
|
|
|
|
|
|
|
|
|
|
|
|
|
|
|
|
|
|
|
|
|
|
|
|
|
|
|
|
|
|
|
|
|
|
|
|
|
|
|
|
|
|
|
|
|
|
|
|
|
|
|
|
|
|
|
|
|
|
|
|
|
|
|
|
|
|
|
|
|
|
|
|
|
|
|
|
|
December 31, 2023 |
|
|
Term Loans by Origination Year |
|
|
|
|
|
|
| ($ in thousands) |
|
2023 |
|
2022 |
|
2021 |
|
2020 |
|
2019 |
|
Prior |
|
Revolving Loans |
|
Revolving Loans Converted to Term Loans (1) |
|
Total |
| Consumer: |
|
|
|
|
|
|
|
|
|
|
|
|
|
|
|
|
|
|
| Residential mortgage: |
|
|
|
|
|
|
|
|
|
|
|
|
|
|
|
|
|
|
| Single-family residential: |
|
|
|
|
|
|
|
|
|
|
|
|
|
|
|
|
|
|
Pass (4) |
|
$ |
3,188,830 |
|
|
$ |
3,340,789 |
|
|
$ |
2,279,802 |
|
|
$ |
1,594,525 |
|
|
$ |
980,686 |
|
|
$ |
1,959,974 |
|
|
$ |
— |
|
|
$ |
— |
|
|
$ |
13,344,606 |
|
| Criticized (accrual) |
|
2,680 |
|
|
4,471 |
|
|
566 |
|
|
1,440 |
|
|
1,503 |
|
|
4,167 |
|
|
— |
|
|
— |
|
|
14,827 |
|
Criticized (nonaccrual) (4) |
|
4,466 |
|
|
837 |
|
|
3,902 |
|
|
2,081 |
|
|
3,626 |
|
|
8,715 |
|
|
— |
|
|
— |
|
|
23,627 |
|
| Subtotal single-family residential mortgage |
|
3,195,976 |
|
|
3,346,097 |
|
|
2,284,270 |
|
|
1,598,046 |
|
|
985,815 |
|
|
1,972,856 |
|
|
— |
|
|
— |
|
|
13,383,060 |
|
|
|
|
|
|
|
|
|
|
|
|
|
|
|
|
|
|
|
|
| HELOCs: |
|
|
|
|
|
|
|
|
|
|
|
|
|
|
|
|
|
|
| Pass |
|
3,641 |
|
|
3,882 |
|
|
1,734 |
|
|
3,153 |
|
|
729 |
|
|
9,251 |
|
|
1,551,074 |
|
|
126,280 |
|
|
1,699,744 |
|
| Criticized (accrual) |
|
565 |
|
|
1,219 |
|
|
1,872 |
|
|
101 |
|
|
185 |
|
|
1,470 |
|
|
2,548 |
|
|
1,089 |
|
|
9,049 |
|
| Criticized (nonaccrual) |
|
815 |
|
|
856 |
|
|
413 |
|
|
72 |
|
|
584 |
|
|
6,863 |
|
|
279 |
|
|
3,529 |
|
|
13,411 |
|
| Subtotal HELOCs |
|
5,021 |
|
|
5,957 |
|
|
4,019 |
|
|
3,326 |
|
|
1,498 |
|
|
17,584 |
|
|
1,553,901 |
|
|
130,898 |
|
|
1,722,204 |
|
Gross write-offs for the year ended December 31, 2023 (2) |
|
— |
|
|
— |
|
|
— |
|
|
— |
|
|
— |
|
|
41 |
|
|
— |
|
|
6 |
|
|
47 |
|
|
|
|
|
|
|
|
|
|
|
|
|
|
|
|
|
|
|
|
| Total residential mortgage |
|
3,200,997 |
|
|
3,352,054 |
|
|
2,288,289 |
|
|
1,601,372 |
|
|
987,313 |
|
|
1,990,440 |
|
|
1,553,901 |
|
|
130,898 |
|
|
15,105,264 |
|
Total residential mortgage gross write-offs for the year ended December 31, 2023 (2) |
|
— |
|
|
— |
|
|
— |
|
|
— |
|
|
— |
|
|
41 |
|
|
— |
|
|
6 |
|
|
47 |
|
|
|
|
|
|
|
|
|
|
|
|
|
|
|
|
|
|
|
|
| Other consumer: |
|
|
|
|
|
|
|
|
|
|
|
|
|
|
|
|
|
|
| Pass |
|
2,286 |
|
|
18,098 |
|
|
135 |
|
|
— |
|
|
— |
|
|
13,244 |
|
|
26,432 |
|
|
— |
|
|
60,195 |
|
|
|
|
|
|
|
|
|
|
|
|
|
|
|
|
|
|
|
|
| Criticized (nonaccrual) |
|
— |
|
|
— |
|
|
— |
|
|
— |
|
|
— |
|
|
— |
|
|
132 |
|
|
— |
|
|
132 |
|
Total other consumer |
|
2,286 |
|
|
18,098 |
|
|
135 |
|
|
— |
|
|
— |
|
|
13,244 |
|
|
26,564 |
|
|
— |
|
|
60,327 |
|
|
|
|
|
|
|
|
|
|
|
|
|
|
|
|
|
|
|
|
|
|
|
|
|
|
|
|
|
|
|
|
|
|
|
|
|
|
|
| Total consumer |
|
$ |
3,203,283 |
|
|
$ |
3,370,152 |
|
|
$ |
2,288,424 |
|
|
$ |
1,601,372 |
|
|
$ |
987,313 |
|
|
$ |
2,003,684 |
|
|
$ |
1,580,465 |
|
|
$ |
130,898 |
|
|
$ |
15,165,591 |
|
Total consumer gross write-offs for the year ended December 31, 2023 (2) |
|
$ |
— |
|
|
$ |
— |
|
|
$ |
— |
|
|
$ |
— |
|
|
$ |
— |
|
|
$ |
41 |
|
|
$ |
— |
|
|
$ |
6 |
|
|
$ |
47 |
|
|
|
|
|
|
|
|
|
|
|
|
|
|
|
|
|
|
|
|
| Total by Risk Rating: |
|
|
|
|
|
|
|
|
|
|
|
|
|
|
|
|
|
|
| Pass |
|
$ |
8,877,690 |
|
|
$ |
10,839,026 |
|
|
$ |
6,723,921 |
|
|
$ |
4,010,720 |
|
|
$ |
3,326,731 |
|
|
$ |
5,504,224 |
|
|
$ |
11,739,785 |
|
|
$ |
210,475 |
|
|
$ |
51,232,572 |
|
| Criticized (accrual) |
|
145,219 |
|
|
111,430 |
|
|
207,962 |
|
|
64,855 |
|
|
67,738 |
|
|
158,049 |
|
|
119,744 |
|
|
1,089 |
|
|
876,086 |
|
| Criticized (nonaccrual) |
|
7,385 |
|
|
9,609 |
|
|
4,446 |
|
|
6,972 |
|
|
7,633 |
|
|
61,189 |
|
|
1,361 |
|
|
3,529 |
|
|
102,124 |
|
|
|
|
|
|
|
|
|
|
|
|
|
|
|
|
|
|
|
|
|
|
|
|
|
|
|
|
|
|
|
|
|
|
|
|
|
|
|
|
|
|
|
|
|
|
|
|
|
|
|
|
|
|
|
|
|
|
Total |
|
$ |
9,030,294 |
|
|
$ |
10,960,065 |
|
|
$ |
6,936,329 |
|
|
$ |
4,082,547 |
|
|
$ |
3,402,102 |
|
|
$ |
5,723,462 |
|
|
$ |
11,860,890 |
|
|
$ |
215,093 |
|
|
$ |
52,210,782 |
|
Total loans held-for-investment gross write-offs for the year ended December 31, 2023 (2) |
|
$ |
350 |
|
|
$ |
10,454 |
|
|
$ |
424 |
|
|
$ |
3,758 |
|
|
$ |
9,748 |
|
|
$ |
4,021 |
|
|
$ |
1,593 |
|
|
$ |
6 |
|
|
$ |
30,354 |
|
|
|
|
|
|
|
|
|
|
|
|
|
|
|
|
|
|
|
|
(1)$7 million and $12 million of total commercial loans, comprised of C&I and CRE revolving loans, converted to term loans during the three months ended March 31, 2024 and 2023, respectively. During the three months ended March 31, 2024 and 2023, respectively, $15 million and $5 million of total consumer loans, comprised of HELOCs, converted to term loans.
(2)Excludes gross write-offs associated with loans the Company sold or settled.
(3)Represents the remaining unamortized deferred loan fee related to a zero balance loan with no previous charge-offs.
(4)As of both March 31, 2024 and December 31, 2023, $1 million of nonaccrual loans whose payments were guaranteed by the Federal Housing Administration were classified with a “Pass” rating.
Nonaccrual and Past Due Loans
Loans that are 90 or more days past due are generally placed on nonaccrual status unless the loan is well-collateralized and in the process of collection. Loans that are less than 90 days past due but have identified deficiencies, such as when the full collection of principal or interest becomes uncertain, are also placed on nonaccrual status. The following tables present the aging analysis of loans held-for-investment as of March 31, 2024 and December 31, 2023:
|
|
|
|
|
|
|
|
|
|
|
|
|
|
|
|
|
|
|
|
|
|
|
|
|
|
|
|
|
|
|
|
|
|
|
|
|
|
|
|
|
|
|
|
|
|
|
|
|
|
March 31, 2024 |
| ($ in thousands) |
|
Current Accruing Loans |
|
Accruing Loans 30-59 Days Past Due |
|
Accruing Loans 60-89 Days Past Due |
|
|
|
|
|
Total Accruing Past Due Loans |
|
|
|
|
|
Total Nonaccrual Loans |
|
Total Loans |
| Commercial: |
|
|
|
|
|
|
|
|
|
|
|
|
|
|
|
|
|
|
|
|
| C&I |
|
$ |
16,281,903 |
|
|
$ |
4,559 |
|
|
$ |
14,767 |
|
|
|
|
|
|
$ |
19,326 |
|
|
|
|
|
|
$ |
48,962 |
|
|
$ |
16,350,191 |
|
| CRE: |
|
|
|
|
|
|
|
|
|
|
|
|
|
|
|
|
|
|
|
|
| CRE |
|
14,555,923 |
|
|
18,726 |
|
|
— |
|
|
|
|
|
|
18,726 |
|
|
|
|
|
|
35,006 |
|
|
14,609,655 |
|
| Multifamily residential |
|
5,005,231 |
|
|
368 |
|
|
— |
|
|
|
|
|
|
368 |
|
|
|
|
|
|
4,646 |
|
|
5,010,245 |
|
| Construction and land |
|
661,703 |
|
|
— |
|
|
— |
|
|
|
|
|
|
— |
|
|
|
|
|
|
12,236 |
|
|
673,939 |
|
| Total CRE |
|
20,222,857 |
|
|
19,094 |
|
|
— |
|
|
|
|
|
|
19,094 |
|
|
|
|
|
|
51,888 |
|
|
20,293,839 |
|
| Total commercial |
|
36,504,760 |
|
|
23,653 |
|
|
14,767 |
|
|
|
|
|
|
38,420 |
|
|
|
|
|
|
100,850 |
|
|
36,644,030 |
|
| Consumer: |
|
|
|
|
|
|
|
|
|
|
|
|
|
|
|
|
|
|
|
|
| Residential mortgage: |
|
|
|
|
|
|
|
|
|
|
|
|
|
|
|
|
|
|
|
|
| Single-family residential |
|
13,478,789 |
|
|
33,911 |
|
|
15,369 |
|
|
|
|
|
|
49,280 |
|
|
|
|
|
|
35,669 |
|
|
13,563,738 |
|
| HELOCs |
|
1,699,628 |
|
|
13,877 |
|
|
6,230 |
|
|
|
|
|
|
20,107 |
|
|
|
|
|
|
11,498 |
|
|
1,731,233 |
|
| Total residential mortgage |
|
15,178,417 |
|
|
47,788 |
|
|
21,599 |
|
|
|
|
|
|
69,387 |
|
|
|
|
|
|
47,167 |
|
|
15,294,971 |
|
| Other consumer |
|
53,224 |
|
|
60 |
|
|
57 |
|
|
|
|
|
|
117 |
|
|
|
|
|
|
162 |
|
|
53,503 |
|
| Total consumer |
|
15,231,641 |
|
|
47,848 |
|
|
21,656 |
|
|
|
|
|
|
69,504 |
|
|
|
|
|
|
47,329 |
|
|
15,348,474 |
|
| Total |
|
$ |
51,736,401 |
|
|
$ |
71,501 |
|
|
$ |
36,423 |
|
|
|
|
|
|
$ |
107,924 |
|
|
|
|
|
|
$ |
148,179 |
|
|
$ |
51,992,504 |
|
|
|
|
|
|
|
|
|
|
|
|
|
|
|
|
|
|
|
|
|
|
|
|
|
|
|
|
|
|
|
|
|
|
|
|
|
|
|
|
|
|
|
|
|
|
|
|
|
|
December 31, 2023 |
| ($ in thousands) |
|
Current Accruing Loans |
|
Accruing Loans 30-59 Days Past Due |
|
Accruing Loans 60-89 Days Past Due |
|
|
|
Total Accruing Past Due Loans |
|
|
|
|
|
Total Nonaccrual Loans |
|
Total Loans |
| Commercial: |
|
|
|
|
|
|
|
|
|
|
|
|
|
|
|
|
|
|
| C&I |
|
$ |
16,508,394 |
|
|
$ |
28,550 |
|
|
$ |
7,099 |
|
|
|
|
$ |
35,649 |
|
|
|
|
|
|
$ |
37,036 |
|
|
$ |
16,581,079 |
|
| CRE: |
|
|
|
|
|
|
|
|
|
|
|
|
|
|
|
|
|
|
| CRE |
|
14,750,315 |
|
|
1,719 |
|
|
1,798 |
|
|
|
|
3,517 |
|
|
|
|
|
|
23,249 |
|
|
14,777,081 |
|
| Multifamily residential |
|
5,017,897 |
|
|
597 |
|
|
— |
|
|
|
|
597 |
|
|
|
|
|
|
4,669 |
|
|
5,023,163 |
|
| Construction and land |
|
650,617 |
|
|
13,251 |
|
|
— |
|
|
|
|
13,251 |
|
|
|
|
|
|
— |
|
|
663,868 |
|
| Total CRE |
|
20,418,829 |
|
|
15,567 |
|
|
1,798 |
|
|
|
|
17,365 |
|
|
|
|
|
|
27,918 |
|
|
20,464,112 |
|
| Total commercial |
|
36,927,223 |
|
|
44,117 |
|
|
8,897 |
|
|
|
|
53,014 |
|
|
|
|
|
|
64,954 |
|
|
37,045,191 |
|
| Consumer: |
|
|
|
|
|
|
|
|
|
|
|
|
|
|
|
|
|
|
| Residential mortgage: |
|
|
|
|
|
|
|
|
|
|
|
|
|
|
|
|
|
|
| Single-family residential |
|
13,313,455 |
|
|
29,285 |
|
|
15,943 |
|
|
|
|
45,228 |
|
|
|
|
|
|
24,377 |
|
|
13,383,060 |
|
| HELOCs |
|
1,687,301 |
|
|
12,266 |
|
|
9,226 |
|
|
|
|
21,492 |
|
|
|
|
|
|
13,411 |
|
|
1,722,204 |
|
Total residential mortgage |
|
15,000,756 |
|
|
41,551 |
|
|
25,169 |
|
|
|
|
66,720 |
|
|
|
|
|
|
37,788 |
|
|
15,105,264 |
|
| Other consumer |
|
56,930 |
|
|
3,123 |
|
|
142 |
|
|
|
|
3,265 |
|
|
|
|
|
|
132 |
|
|
60,327 |
|
| Total consumer |
|
15,057,686 |
|
|
44,674 |
|
|
25,311 |
|
|
|
|
69,985 |
|
|
|
|
|
|
37,920 |
|
|
15,165,591 |
|
| Total |
|
$ |
51,984,909 |
|
|
$ |
88,791 |
|
|
$ |
34,208 |
|
|
|
|
$ |
122,999 |
|
|
|
|
|
|
$ |
102,874 |
|
|
$ |
52,210,782 |
|
|
The following table presents the amortized cost of loans on nonaccrual status for which there was no related allowance for loan losses as of both March 31, 2024 and December 31, 2023. Nonaccrual loans may not have an allowance for credit losses if the loan balances are well secured by collateral values and there is no loss expectation.
|
|
|
|
|
|
|
|
|
|
|
|
|
|
|
|
|
|
| ($ in thousands) |
|
|
March 31, 2024 |
|
|
December 31, 2023 |
|
|
|
|
|
|
|
| Commercial: |
|
|
|
|
|
|
| C&I |
|
|
$ |
40,617 |
|
|
|
$ |
33,089 |
|
|
|
|
|
|
|
|
| CRE |
|
|
34,431 |
|
|
|
22,653 |
|
| Multifamily residential |
|
|
4,235 |
|
|
|
4,235 |
|
| Construction and land |
|
|
12,236 |
|
|
|
— |
|
|
|
|
|
|
|
|
| Total commercial |
|
|
91,519 |
|
|
|
59,977 |
|
| Consumer: |
|
|
|
|
|
|
|
|
|
|
|
|
|
| Single-family residential |
|
|
15,380 |
|
|
|
4,852 |
|
| HELOCs |
|
|
6,287 |
|
|
|
7,256 |
|
|
|
|
|
|
|
|
|
|
|
|
|
|
|
| Total consumer |
|
|
21,667 |
|
|
|
12,108 |
|
| Total nonaccrual loans with no related allowance for loan losses |
|
|
$ |
113,186 |
|
|
|
$ |
72,085 |
|
|
Foreclosed Assets
The Company acquires assets from borrowers through loan restructurings, workouts, or foreclosures. Assets acquired may include real properties (e.g., real estate, land, and buildings) and commercial and personal properties. The Company recognizes foreclosed assets upon receiving assets in satisfaction of a loan (e.g., taking legal title or physical possession).
Foreclosed assets, consisting of OREO and other nonperforming assets, are included in Other assets on the Consolidated Balance Sheet. The Company had $17 million of foreclosed assets as of March 31, 2024, compared with $11 million as of December 31, 2023. The Company commences the foreclosure process on consumer mortgage loans after a borrower becomes more than 120 days delinquent in accordance with the CFPB guidelines. The carrying value of the consumer real estate loans that were in an active or suspended foreclosure process was $8 million as of both March 31, 2024 and December 31, 2023.
Loan Modifications to Borrowers Experiencing Financial Difficulty
As part of the Company’s loss mitigation efforts, the Company may agree to modify the contractual terms of a loan to assist borrowers experiencing financial difficulty. The Company negotiates loan modifications on a case-by-case basis to achieve mutually agreeable terms that maximize loan collectability and meet the borrower’s financial needs. The Company considers various factors to identify borrowers experiencing financial difficulty. The primary factor for consumer borrowers is delinquency status. For commercial loan borrowers, these factors include credit risk ratings, the probability of loan risk rating downgrades, and overall risk profile changes. The modification may include, but is not limited to, payment deferrals, interest rate reductions, term extensions, principal forgiveness, or a combination of such modifications. Commercial loan borrowers that require immaterial modifications such as insignificant interest rate changes, short-term extensions (90 days or less) from the original maturity date, or temporary waivers or extensions of financial covenants which would not constitute material credit actions, are generally not considered to be experiencing financial difficulty and are not included in the disclosure. Insignificant payment deferrals (three months or less in the last 12 months) are also not included in the disclosure.
The following tables present the amortized cost of loans that were modified during the three months ended March 31, 2024 and 2023 by loan class and modification type:
|
|
|
|
|
|
|
|
|
|
|
|
|
|
|
|
|
|
|
|
|
|
|
|
|
|
|
|
|
|
|
|
|
|
|
|
|
|
|
|
|
|
|
|
|
|
|
|
Three Months Ended March 31, 2024 |
|
|
Modification Type |
|
|
|
|
|
|
| ($ in thousands) |
|
Term Extension |
|
Payment Delay |
|
|
|
|
|
|
|
Combination: Rate Reduction/ Payment Delay |
|
Total |
|
Modification as a % of Loan Class |
|
|
|
|
|
|
| Commercial: |
|
|
|
|
|
|
|
|
|
|
|
|
|
|
|
|
|
|
|
|
|
|
| C&I |
|
$ |
4,013 |
|
|
$ |
22,155 |
|
|
|
|
|
|
|
|
$ |
— |
|
|
$ |
26,168 |
|
|
0.16 |
% |
|
|
|
|
|
|
|
|
|
|
|
|
|
|
|
|
|
|
|
|
|
|
|
|
|
|
|
|
|
| CRE |
|
24,488 |
|
|
— |
|
|
|
|
|
|
|
|
19,325 |
|
|
43,813 |
|
|
0.22 |
% |
|
|
|
|
|
|
|
|
|
|
|
|
|
|
|
|
|
|
|
|
|
|
|
|
|
|
|
|
|
|
|
|
|
|
|
|
|
|
|
|
|
|
|
|
|
|
|
|
|
|
|
|
|
|
|
|
|
|
|
|
|
|
|
|
|
|
|
|
|
|
|
|
|
|
|
| Total commercial |
|
28,501 |
|
|
22,155 |
|
|
|
|
|
|
|
|
19,325 |
|
|
69,981 |
|
|
|
|
|
|
|
|
|
| Consumer: |
|
|
|
|
|
|
|
|
|
|
|
|
|
|
|
|
|
|
|
|
|
|
|
|
|
|
|
|
|
|
|
|
|
|
|
|
|
|
|
|
|
|
|
|
|
| Single-family residential |
|
— |
|
|
3,996 |
|
|
|
|
|
|
|
|
— |
|
|
3,996 |
|
|
0.03 |
% |
|
|
|
|
|
|
| HELOCs |
|
— |
|
|
5,501 |
|
|
|
|
|
|
|
|
517 |
|
|
6,018 |
|
|
0.35 |
% |
|
|
|
|
|
|
|
|
|
|
|
|
|
|
|
|
|
|
|
|
|
|
|
|
|
|
|
|
|
|
|
|
|
|
|
|
|
|
|
|
|
|
|
|
|
|
|
|
|
|
|
|
|
|
|
|
|
|
|
|
|
|
|
|
|
|
|
|
|
|
|
|
|
|
|
|
|
|
|
|
|
|
|
|
|
|
|
|
|
|
|
|
|
|
|
|
|
|
| Total consumer |
|
— |
|
|
9,497 |
|
|
|
|
|
|
|
|
517 |
|
|
10,014 |
|
|
|
|
|
|
|
|
|
| Total |
|
$ |
28,501 |
|
|
$ |
31,652 |
|
|
|
|
|
|
|
|
$ |
19,842 |
|
|
$ |
79,995 |
|
|
|
|
|
|
|
|
|
|
|
|
|
|
|
|
|
|
|
|
|
|
|
|
|
|
|
|
|
|
|
|
|
|
|
|
|
|
|
|
|
|
|
|
|
|
|
|
|
|
|
|
|
|
|
|
Three Months Ended March 31, 2023 |
|
|
Modification Type |
|
|
|
|
| ($ in thousands) |
|
Term Extension |
|
Payment Delay |
|
|
|
|
|
|
|
Combination: Rate Reduction/ Payment Delay |
|
Total |
|
Modification as a % of Loan Class |
|
|
|
|
| Commercial: |
|
|
|
|
|
|
|
|
|
|
|
|
|
|
|
|
|
|
|
|
| C&I |
|
$ |
19,974 |
|
|
$ |
14,364 |
|
|
|
|
|
|
|
|
$ |
— |
|
|
$ |
34,338 |
|
|
0.22 |
% |
|
|
|
|
|
|
|
|
|
|
|
|
|
|
|
|
|
|
|
|
|
|
|
|
|
| CRE |
|
543 |
|
|
— |
|
|
|
|
|
|
|
|
— |
|
|
543 |
|
|
— |
% |
|
|
|
|
|
|
|
|
|
|
|
|
|
|
|
|
|
|
|
|
|
|
|
|
|
|
|
|
|
|
|
|
|
|
|
|
|
|
|
|
|
|
|
|
|
|
|
|
|
|
|
|
|
|
|
|
|
|
|
|
|
|
|
|
|
|
|
| Total commercial |
|
20,517 |
|
|
14,364 |
|
|
|
|
|
|
|
|
— |
|
|
34,881 |
|
|
|
|
|
|
|
| Consumer: |
|
|
|
|
|
|
|
|
|
|
|
|
|
|
|
|
|
|
|
|
|
|
|
|
|
|
|
|
|
|
|
|
|
|
|
|
|
|
|
|
|
|
|
|
|
|
|
|
|
|
|
|
|
|
|
|
|
|
|
|
|
|
| HELOCs |
|
738 |
|
|
— |
|
|
|
|
|
|
|
|
— |
|
|
738 |
|
|
0.04 |
% |
|
|
|
|
|
|
|
|
|
|
|
|
|
|
|
|
|
|
|
|
|
|
|
|
|
|
|
|
|
|
|
|
|
|
|
|
|
|
|
|
|
|
|
|
|
|
|
|
|
|
|
|
|
|
|
|
|
|
|
|
|
|
|
|
|
|
|
|
|
|
|
|
|
|
|
|
|
|
|
|
|
|
|
|
|
|
|
|
| Total consumer |
|
738 |
|
|
— |
|
|
|
|
|
|
|
|
— |
|
|
738 |
|
|
|
|
|
|
|
| Total |
|
$ |
21,255 |
|
|
$ |
14,364 |
|
|
|
|
|
|
|
|
$ |
— |
|
|
$ |
35,619 |
|
|
|
|
|
|
|
|
The following tables present the financial effects of the loan modifications for the three months ended March 31, 2024 and 2023 by loan class and modification type:
|
|
|
|
|
|
|
|
|
|
|
|
|
|
|
|
|
|
|
|
|
|
|
|
|
|
|
|
Financial Effects of Loan Modifications |
|
|
|
|
Three Months Ended March 31, 2024 |
|
|
|
|
|
| ($ in thousands) |
|
|
|
Weighted-Average Interest Rate Reduction |
|
Weighted-Average Term Extension
(in years) |
|
Weighted-Average Payment Delay
(in years) |
| Commercial: |
|
|
|
|
|
|
|
|
| C&I |
|
|
|
— |
|
|
1.8 |
|
1.7 |
|
|
|
|
|
|
|
|
|
| CRE |
|
|
|
2.75 |
% |
|
1.5 |
|
1.7 |
|
|
|
|
|
|
|
|
|
|
|
|
|
|
|
|
|
|
|
|
|
|
|
|
|
|
|
|
|
|
|
|
|
|
|
|
| Consumer: |
|
|
|
|
|
|
|
|
|
|
|
|
|
|
|
|
|
| Single-family residential |
|
|
|
— |
|
|
0.0 |
|
0.7 |
| HELOCs |
|
|
|
0.25 |
% |
|
0.0 |
|
3.2 |
|
|
|
|
|
|
|
|
|
|
|
|
|
|
|
|
|
|
|
|
|
|
|
|
|
|
|
|
|
|
|
|
|
|
|
|
|
|
|
|
|
|
|
|
|
|
|
|
|
|
|
|
|
|
|
|
|
|
|
|
|
|
|
|
|
|
|
|
|
|
|
|
|
|
|
|
|
|
|
|
|
|
|
|
|
|
|
|
|
|
|
|
|
|
|
|
|
|
|
|
|
|
|
|
|
|
|
|
|
|
|
|
|
|
|
|
|
|
|
|
|
|
|
|
|
|
|
|
|
|
|
|
|
Financial Effects of Loan Modifications |
|
|
|
|
|
|
|
|
|
|
|
|
|
|
|
|
|
|
Three Months Ended March 31, 2023 |
|
|
|
|
|
|
|
|
|
|
|
|
|
|
|
|
|
|
|
|
|
|
|
|
|
|
|
|
|
|
|
|
|
|
|
|
|
|
|
($ in thousands) |
|
|
|
Weighted-Average Interest Rate Reduction |
|
Weighted-Average Term Extension
(in years) |
|
Weighted-Average Payment Delay
(in years) |
|
|
|
|
|
|
|
|
|
|
|
|
|
|
|
|
|
|
|
|
Commercial: |
|
|
|
|
|
|
|
|
|
|
|
|
|
|
|
|
|
|
|
|
|
|
|
|
|
|
|
|
C&I |
|
|
|
— |
|
|
0.9 |
|
1.0 |
|
|
|
|
|
|
|
|
|
|
|
|
|
|
|
|
|
|
|
|
|
|
|
|
|
|
|
|
|
|
|
|
|
|
|
|
|
|
|
|
|
|
|
|
|
|
|
|
|
CRE |
|
|
|
— |
|
|
2.0 |
|
0.0 |
|
|
|
|
|
|
|
|
|
|
|
|
|
|
|
|
|
|
|
|
|
|
|
|
|
|
|
|
|
|
|
|
|
|
|
|
|
|
|
|
|
|
|
|
|
|
|
|
|
|
|
|
|
|
|
|
|
|
|
|
|
|
|
|
|
|
|
|
|
|
|
|
|
|
|
|
|
|
|
|
|
|
|
|
|
|
|
|
|
|
|
|
|
|
|
|
|
|
|
|
|
|
|
|
|
|
|
|
|
|
|
|
|
|
|
|
|
|
|
|
|
|
|
|
|
|
|
|
|
|
|
|
|
|
|
|
Consumer: |
|
|
|
|
|
|
|
|
|
|
|
|
|
|
|
|
|
|
|
|
|
|
|
|
|
|
|
|
|
|
|
|
|
|
|
|
|
|
|
|
|
|
|
|
|
|
|
|
|
|
|
|
|
|
|
|
|
|
|
|
|
|
|
|
|
|
|
|
|
|
|
|
|
|
|
|
|
|
|
|
|
|
|
|
|
|
HELOCs |
|
|
|
— |
|
|
14.8 |
|
0.0 |
|
|
|
|
|
|
|
|
|
|
|
|
|
|
|
|
|
|
|
|
|
|
|
|
|
|
|
|
|
|
|
|
|
|
|
|
|
|
|
|
|
|
|
|
|
|
|
|
|
|
|
|
|
|
|
|
|
|
|
|
|
|
|
|
|
|
|
|
|
|
|
|
|
|
|
|
|
|
|
|
|
|
|
|
|
|
|
|
|
|
|
|
|
|
|
|
|
|
|
|
|
|
|
|
|
|
|
|
|
|
|
|
|
|
|
|
|
|
|
|
|
|
|
|
|
|
|
|
|
|
|
|
|
|
|
|
|
|
|
|
|
|
|
|
|
|
|
|
|
|
|
|
|
|
|
|
|
|
|
|
|
|
|
|
|
|
|
|
|
|
|
|
|
|
|
|
|
|
|
|
|
|
|
|
|
|
|
|
|
|
|
|
|
|
|
|
|
|
|
|
|
|
|
|
|
A modified loan may become delinquent and result in a payment default (generally 90 days past due) subsequent to modification. The following table presents information on loans that defaulted during the three months ended March 31, 2024 that received modifications during the 12 months preceding payment default:
|
|
|
|
|
|
|
|
|
|
|
|
|
|
|
|
|
|
|
|
|
|
|
|
|
|
|
|
|
|
|
|
|
|
|
|
|
|
|
|
|
|
|
|
|
|
|
Loans Modified Subsequently Defaulted |
|
|
|
|
|
|
Three Months Ended March 31, 2024 |
|
|
|
| ($ in thousands) |
|
|
|
|
|
Term Extension |
|
Payment Delay |
|
Combination: Term Extension/ Payment Delay |
|
|
|
Total |
|
|
|
|
| Commercial: |
|
|
|
|
|
|
|
|
|
|
|
|
|
|
|
|
|
|
| C&I |
|
|
|
|
|
$ |
7,828 |
|
|
$ |
— |
|
|
— |
|
|
|
|
$ |
7,828 |
|
|
|
|
|
|
|
|
|
|
|
|
|
|
|
|
|
|
|
|
|
|
|
|
|
|
|
|
|
|
|
|
|
|
|
|
|
|
|
|
|
|
|
|
|
|
|
|
|
|
|
|
|
|
|
|
|
|
|
|
|
|
|
|
|
|
|
|
|
|
|
|
|
|
|
|
|
|
|
|
|
|
|
|
|
|
|
|
|
|
|
|
|
|
|
|
|
|
|
|
| Total commercial |
|
|
|
|
|
7,828 |
|
|
— |
|
|
— |
|
|
|
|
7,828 |
|
|
|
|
|
| Consumer: |
|
|
|
|
|
|
|
|
|
|
|
|
|
|
|
|
|
|
|
|
|
|
|
|
|
|
|
|
|
|
|
|
|
|
|
|
|
| Single-family residential |
|
|
|
|
|
— |
|
|
3,972 |
|
|
383 |
|
|
|
|
4,355 |
|
|
|
|
|
|
|
|
|
|
|
|
|
|
|
|
|
|
|
|
|
|
|
|
|
|
|
|
|
|
|
|
|
|
|
|
|
|
|
|
|
|
|
|
|
|
|
|
|
|
|
|
|
|
|
|
|
|
|
|
|
|
|
|
|
|
|
|
|
|
|
|
|
|
|
|
|
|
|
|
|
|
|
|
|
|
|
|
|
|
|
|
|
|
|
|
|
|
|
|
| Total consumer |
|
|
|
|
|
— |
|
|
3,972 |
|
|
383 |
|
|
|
|
4,355 |
|
|
|
|
|
| Total |
|
|
|
|
|
$ |
7,828 |
|
|
$ |
3,972 |
|
|
$ |
383 |
|
|
|
|
$ |
12,183 |
|
|
|
|
|
|
|
|
|
In comparison, there were no loans that received modifications, which subsequently defaulted during the three months ended March 31, 2023.
The Company closely monitors the performance of modified loans to borrowers experiencing financial difficulty to understand the effectiveness of its modification efforts. The following tables present the performance of loans that were modified in the twelve months ended March 31, 2024. For the comparative period, the amounts represent the performance of loans that were modified in the three months ended March 31, 2023, subsequent to the adoption of ASU 2022-02 on January 1, 2023:
|
|
|
|
|
|
|
|
|
|
|
|
|
|
|
|
|
|
|
|
|
|
|
|
|
|
|
|
|
|
|
|
|
|
|
|
|
|
|
|
|
|
|
|
Payment Performance as of March 31, 2024 |
| ($ in thousands) |
|
|
|
|
|
|
|
|
|
|
|
|
|
Current |
|
30 - 89 Days Past Due |
|
90+ Days Past Due |
|
Total |
| Commercial: |
|
|
|
|
|
|
|
|
|
|
|
|
|
|
|
|
|
|
|
|
| C&I |
|
|
|
|
|
|
|
|
|
|
|
|
|
$ |
75,193 |
|
|
$ |
— |
|
|
$ |
7,829 |
|
|
$ |
83,022 |
|
|
|
|
|
|
|
|
|
|
|
|
|
|
|
|
|
|
|
|
|
|
CRE |
|
|
|
|
|
|
|
|
|
|
|
|
|
76,028 |
|
|
— |
|
|
— |
|
|
76,028 |
|
|
|
|
|
|
|
|
|
|
|
|
|
|
|
|
|
|
|
|
|
|
|
|
|
|
|
|
|
|
|
|
|
|
|
|
|
|
|
|
|
|
|
|
|
|
|
|
|
|
|
|
|
|
|
|
|
|
|
|
|
|
|
|
| Total commercial |
|
|
|
|
|
|
|
|
|
|
|
|
|
151,221 |
|
|
— |
|
|
7,829 |
|
|
159,050 |
|
| Consumer: |
|
|
|
|
|
|
|
|
|
|
|
|
|
|
|
|
|
|
|
|
|
|
|
|
|
|
|
|
|
|
|
|
|
|
|
|
|
|
|
|
|
| Single-family residential |
|
|
|
|
|
|
|
|
|
|
|
|
|
8,455 |
|
|
4,239 |
|
|
5,075 |
|
|
17,769 |
|
| HELOCs |
|
|
|
|
|
|
|
|
|
|
|
|
|
6,994 |
|
|
2,536 |
|
|
— |
|
|
9,530 |
|
|
|
|
|
|
|
|
|
|
|
|
|
|
|
|
|
|
|
|
|
|
|
|
|
|
|
|
|
|
|
|
|
|
|
|
|
|
|
|
|
|
|
| Total consumer |
|
|
|
|
|
|
|
|
|
|
|
|
|
15,449 |
|
|
6,775 |
|
|
5,075 |
|
|
27,299 |
|
| Total |
|
|
|
|
|
|
|
|
|
|
|
|
|
$ |
166,670 |
|
|
$ |
6,775 |
|
|
$ |
12,904 |
|
|
$ |
186,349 |
|
|
|
|
|
|
|
|
|
|
|
|
|
|
|
|
|
|
|
|
|
|
|
|
|
|
|
|
|
|
|
|
|
|
|
|
|
|
|
|
|
|
|
|
|
|
|
|
|
|
|
|
|
|
|
|
|
|
|
|
|
|
|
|
|
|
Payment Performance as of March 31, 2023 |
| ($ in thousands) |
|
|
|
|
|
|
|
|
|
|
|
|
|
Current |
|
30 - 89 Days Past Due |
|
90+ Days Past Due |
|
Total |
| Commercial: |
|
|
|
|
|
|
|
|
|
|
|
|
|
|
|
|
|
|
|
|
| C&I |
|
|
|
|
|
|
|
|
|
|
|
|
|
$ |
27,393 |
|
|
$ |
6,945 |
|
|
$ |
— |
|
|
$ |
34,338 |
|
|
|
|
|
|
|
|
|
|
|
|
|
|
|
|
|
|
|
|
|
|
CRE |
|
|
|
|
|
|
|
|
|
|
|
|
|
543 |
|
|
— |
|
|
— |
|
|
543 |
|
|
|
|
|
|
|
|
|
|
|
|
|
|
|
|
|
|
|
|
|
|
|
|
|
|
|
|
|
|
|
|
|
|
|
|
|
|
|
|
|
|
|
|
|
|
|
|
|
|
|
|
|
|
|
|
|
|
|
|
|
|
|
|
| Total commercial |
|
|
|
|
|
|
|
|
|
|
|
|
|
27,936 |
|
|
6,945 |
|
|
— |
|
|
34,881 |
|
| Consumer: |
|
|
|
|
|
|
|
|
|
|
|
|
|
|
|
|
|
|
|
|
|
|
|
|
|
|
|
|
|
|
|
|
|
|
|
|
|
|
|
|
|
|
|
|
|
|
|
|
|
|
|
|
|
|
|
|
|
|
|
|
|
|
| HELOCs |
|
|
|
|
|
|
|
|
|
|
|
|
|
738 |
|
|
— |
|
|
— |
|
|
738 |
|
|
|
|
|
|
|
|
|
|
|
|
|
|
|
|
|
|
|
|
|
|
|
|
|
|
|
|
|
|
|
|
|
|
|
|
|
|
|
|
|
|
|
| Total consumer |
|
|
|
|
|
|
|
|
|
|
|
|
|
738 |
|
|
— |
|
|
— |
|
|
738 |
|
| Total |
|
|
|
|
|
|
|
|
|
|
|
|
|
$ |
28,674 |
|
|
$ |
6,945 |
|
|
$ |
— |
|
|
$ |
35,619 |
|
|
|
|
|
|
|
|
|
|
|
|
|
|
|
|
|
|
|
|
|
|
As of March 31, 2024 and December 31, 2023, commitments to lend additional funds to borrowers whose loans were modified were $10 million and $4 million, respectively.
Allowance for Credit Losses
The Company has a current expected credit losses framework for all financial assets measured at amortized cost and certain off-balance sheet credit exposures. The Company’s allowance for credit losses, which includes both the allowance for loan losses and the allowance for unfunded credit commitments, is calculated with the objective of maintaining a reserve sufficient to absorb losses inherent in our credit portfolios. The measurement of the allowance for credit losses is based on management’s best estimate of lifetime expected credit losses, periodic evaluation of the loan portfolio, lending-related commitments and other relevant factors.
The allowance for credit losses is deducted from the amortized cost basis of a financial asset or a group of financial assets so that the balance sheet reflects the net amount the Company expects to collect. Amortized cost is the principal balance outstanding, net of purchase premiums and discounts, deferred fees and costs, and escrow advances. Subsequent changes in expected credit losses are recognized in net income as a provision for, or a reversal of, credit loss expense.
The allowance for credit losses estimation involves procedures to consider the unique risk characteristics of the portfolio segments. The majority of the Company’s credit exposures that share risk characteristics with other similar exposures are collectively evaluated. The collectively evaluated loans include performing loans and unfunded credit commitments. If an exposure does not share risk characteristics with other exposures, the Company generally estimates expected credit losses on an individual basis.
Allowance for Collectively Evaluated Loans
The allowance for collectively evaluated loans consists of a quantitative component that assesses the different risk factors considered in our models and a qualitative component that considers risk factors external to the models. Each of these components are described below.
Quantitative Component — The Company applies quantitative methods to estimate loan losses by considering a variety of factors such as historical loss experience, the current credit quality of the portfolio, and an economic outlook over the life of the loan. The Company incorporates forward-looking information using macroeconomic scenarios which include variables that are considered key drivers of increases and decreases in credit losses. The Company utilizes a probability-weighted, multiple-scenario forecast approach. These scenarios may consist of a base forecast representing management's view of the most likely outcome, combined with downside or upside scenarios reflecting possible worsening or improving economic conditions. The quantitative models incorporate a probability-weighted calculation of these macroeconomic scenarios over a reasonable and supportable forecast period. If the life of the loans extends beyond the reasonable and supportable forecast period, the Company will consider historical experience or long-run macroeconomic trends over the remaining life of the loans to estimate the allowance for loan losses.
There were no changes to the reasonable and supportable forecast period, except to the C&I segment, and no changes to the reversion to the historical loss experience method for the three months ended March 31, 2024 and 2023. The reasonable and supportable forecast period for the C&I segment changed from 11 quarters to eight quarters due to model redevelopment during the third quarter of 2023.
The following table provides key credit risk characteristics and macroeconomic variables that the Company uses to estimate the expected credit losses by portfolio segment:
|
|
|
|
|
|
|
|
|
|
|
|
|
|
|
|
|
|
|
|
| Portfolio Segment |
|
Risk Characteristics |
|
Macroeconomic Variables |
| C&I |
|
Age percentage, size at origination, delinquency status, sector and risk rating |
|
Unemployment rate, Gross Domestic Product (“GDP”), and U.S. Treasury rates (1) |
| CRE, Multifamily residential, and Construction and land |
|
Delinquency status, maturity date, collateral value, property type, and geographic location |
|
Unemployment rate, GDP, and U.S. Treasury rates |
| Single-family residential and HELOCs |
|
FICO score, delinquency status, maturity date, collateral value, and geographic location |
|
Unemployment rate, GDP, and Home Price Indices |
| Other consumer |
|
Loss rate approach |
|
Immaterial (2) |
|
|
|
|
|
(1)Macroeconomic variables were updated due to model redevelopment.
(2)Macroeconomic variables are included in the qualitative estimate.
Quantitative Component — Allowance for Loan Losses for the Commercial Loan Portfolio
The Company’s C&I lifetime loss rate model estimates the loss rate expected over the life of a loan. This loss rate is applied to the amortized cost basis, excluding accrued interest receivable, to determine expected credit losses. The lifetime loss rate model’s reasonable and supportable period spans eight quarters, thereafter immediately reverting to the historical average loss rate, expressed through the loan-level lifetime loss rate.
To generate estimates of expected loss at the loan level for CRE, multifamily residential, and construction and land loans, projected probabilities of default (“PDs”) and loss given defaults (“LGDs”) are applied to the estimated exposure at default, considering the term and payment structure of the loan. The forecast of future economic conditions returns to long-run historical economic trends within the reasonable and supportable period.
To estimate the life of a loan under both models, the contractual term of the loan is adjusted for estimated prepayments based on historical prepayment experience.
Quantitative Component — Allowance for Loan Losses for the Consumer Loan Portfolio
For single-family residential and HELOC loans, projected PDs and LGDs are applied to the estimated exposure at default, considering the term and payment structure of the loan, to generate estimates of expected loss at the loan level. The forecast of future economic conditions returns to long-run historical economic trends after the reasonable and supportable period. To estimate the life of a loan for the single-family residential and HELOC loan portfolios, the contractual term of the loan is adjusted for estimated prepayments based on historical prepayment experience. For other consumer loans, the Company uses a loss rate approach.
Qualitative Component — The Company considers the following qualitative factors in the determination of the collectively evaluated allowance if these factors have not already been captured by the quantitative model. Such qualitative factors may include, but are not limited to:
•loan growth trends;
•the volume and severity of past due financial assets, and criticized or adversely classified financial assets;
•the Company’s lending policies and procedures, including changes in lending strategies, underwriting standards, collection, write-off and recovery practices;
•knowledge of a borrower’s operations;
•the quality of the Company’s credit review system;
•the experience, ability and depth of the Company’s management and associates;
•the effect of other external factors such as the regulatory and legal environments, or changes in technology;
•actual and expected changes in international, national, regional, and local economic and business conditions in which the Company operates; and
•risk factors in certain industry sectors not captured by the quantitative models.
The magnitude of the impact of these factors on the Company’s qualitative assessment of the allowance for credit losses changes from period to period according to changes made by management in its assessment of these factors. The extent to which these factors change may be dependent on whether they are already reflected in quantitative loss estimates during the current period and the extent to which changes in these factors diverge from period to period.
While the Company’s allowance methodologies strive to reflect all relevant credit risk factors, there continues to be uncertainty associated with, but not limited to, potential imprecision in the estimation process due to the inherent time lag of obtaining information and normal variations between expected and actual outcomes. The Company may hold additional qualitative reserves that are designed to provide coverage for losses attributable to such risk.
Allowance for Individually Evaluated Loans
When a loan no longer shares similar risk characteristics with other loans, such as in the case of certain nonaccrual loans, the Company estimates the allowance for loan losses on an individual loan basis. The allowance for loan losses for individually evaluated loans is measured as the difference between the recorded value of the loans and their fair value. For loans evaluated individually, the Company uses one of three different asset valuation measurement methods: (1) the fair value of collateral less costs to sell; (2) the present value of expected future cash flows; or (3) the loan's observable market price. If an individually evaluated loan is determined to be collateral dependent, the Company applies the fair value of the collateral less costs to sell method. If an individually evaluated loan is determined not to be collateral dependent, the Company uses the present value of future cash flows or the observable market value of the loan.
•Collateral-Dependent Loans — The allowance of a collateral-dependent loan is limited to the difference between the recorded value and fair value of the collateral less cost of disposal or sale. As of March 31, 2024, collateral-dependent commercial and consumer loans totaled $63 million and $23 million, respectively. In comparison, collateral-dependent commercial and consumer loans totaled $30 million and $12 million, respectively, as of December 31, 2023. The Company's collateral-dependent loans were secured by real estate. As of both March 31, 2024 and December 31, 2023, the collateral value of the properties securing the collateral-dependent loans, net of selling costs, exceeded the recorded value of the majority of the loans.
The following tables summarize the activity in the allowance for loan losses by portfolio segments for the three months ended March 31, 2024 and 2023:
|
|
|
|
|
|
|
|
|
|
|
|
|
|
|
|
|
|
|
|
|
|
|
|
|
|
|
|
|
|
|
|
|
|
|
|
|
|
|
|
|
|
|
|
|
|
|
|
|
|
|
|
|
|
Three Months Ended March 31, 2024 |
|
|
Commercial |
|
Consumer |
|
|
|
|
|
|
CRE |
|
Residential Mortgage |
|
|
|
|
| ($ in thousands) |
|
C&I |
|
CRE |
|
Multifamily Residential |
|
Construction and Land |
|
Single-Family Residential |
|
HELOCs |
|
Other Consumer |
|
Total |
| Allowance for loan losses, beginning of period |
|
$ |
392,685 |
|
|
$ |
170,592 |
|
|
$ |
34,375 |
|
|
$ |
10,469 |
|
|
$ |
55,018 |
|
|
$ |
3,947 |
|
|
$ |
1,657 |
|
|
$ |
668,743 |
|
Provision for (reversal of) credit losses on loans |
(a) |
275 |
|
|
18,939 |
|
|
3,032 |
|
|
1,574 |
|
|
899 |
|
|
(432) |
|
|
(132) |
|
|
24,155 |
|
| Gross charge-offs |
|
(20,998) |
|
|
(2,398) |
|
|
(6) |
|
|
(1,224) |
|
|
— |
|
|
— |
|
|
(58) |
|
|
(24,684) |
|
| Gross recoveries |
|
1,710 |
|
|
327 |
|
|
17 |
|
|
— |
|
|
5 |
|
|
48 |
|
|
— |
|
|
2,107 |
|
| Total net (charge-offs) recoveries |
|
(19,288) |
|
|
(2,071) |
|
|
11 |
|
|
(1,224) |
|
|
5 |
|
|
48 |
|
|
(58) |
|
|
(22,577) |
|
| Foreign currency translation adjustment |
|
(41) |
|
|
— |
|
|
— |
|
|
— |
|
|
— |
|
|
— |
|
|
— |
|
|
(41) |
|
| Allowance for loan losses, end of period |
|
$ |
373,631 |
|
|
$ |
187,460 |
|
|
$ |
37,418 |
|
|
$ |
10,819 |
|
|
$ |
55,922 |
|
|
$ |
3,563 |
|
|
$ |
1,467 |
|
|
$ |
670,280 |
|
|
|
|
|
|
|
|
|
|
|
|
|
|
|
|
|
|
|
|
|
|
|
|
|
|
|
|
|
|
|
|
|
|
|
|
|
|
|
|
|
|
|
|
|
|
|
|
|
|
|
|
|
|
|
|
|
|
|
|
|
|
|
|
|
|
|
|
|
|
|
|
|
|
|
|
|
|
|
|
|
|
|
|
|
|
|
|
|
|
|
|
|
|
|
|
|
|
|
|
|
|
|
|
|
|
|
|
|
|
|
|
|
|
|
|
|
|
|
|
|
|
|
|
|
|
|
|
|
|
|
|
|
|
|
|
|
|
|
|
|
|
|
|
|
|
|
|
|
|
|
|
|
|
|
|
|
Three Months Ended March 31, 2023 |
|
|
Commercial |
|
Consumer |
|
|
|
|
|
|
CRE |
|
Residential Mortgage |
|
|
|
|
| ($ in thousands) |
|
C&I |
|
CRE |
|
Multifamily Residential |
|
Construction and Land |
|
Single-Family Residential |
|
HELOCs |
|
Other Consumer |
|
Total |
| Allowance for loan losses, December 31, 2022 |
|
$ |
371,700 |
|
|
$ |
149,864 |
|
|
$ |
23,373 |
|
|
$ |
9,109 |
|
|
$ |
35,564 |
|
|
$ |
4,475 |
|
|
$ |
1,560 |
|
|
$ |
595,645 |
|
| Impact of ASU 2022-02 adoption |
|
5,683 |
|
|
337 |
|
|
6 |
|
|
— |
|
|
1 |
|
|
1 |
|
|
— |
|
|
6,028 |
|
| Allowance for loan losses, January 1, 2023 |
|
377,383 |
|
|
150,201 |
|
|
23,379 |
|
|
9,109 |
|
|
35,565 |
|
|
4,476 |
|
|
1,560 |
|
|
601,673 |
|
| (Reversal of) provision for credit losses on loans |
(a) |
(678) |
|
|
4,676 |
|
|
1,135 |
|
|
210 |
|
|
12,442 |
|
|
580 |
|
|
155 |
|
|
18,520 |
|
| Gross charge-offs |
|
(1,900) |
|
|
(6) |
|
|
— |
|
|
— |
|
|
— |
|
|
(91) |
|
|
(40) |
|
|
(2,037) |
|
| Gross recoveries |
|
1,211 |
|
|
196 |
|
|
12 |
|
|
3 |
|
|
— |
|
|
6 |
|
|
— |
|
|
1,428 |
|
| Total net (charge-offs) recoveries |
|
(689) |
|
|
190 |
|
|
12 |
|
|
3 |
|
|
— |
|
|
(85) |
|
|
(40) |
|
|
(609) |
|
| Foreign currency translation adjustment |
|
309 |
|
|
— |
|
|
— |
|
|
— |
|
|
— |
|
|
— |
|
|
— |
|
|
309 |
|
| Allowance for loan losses, end of period |
|
$ |
376,325 |
|
|
$ |
155,067 |
|
|
$ |
24,526 |
|
|
$ |
9,322 |
|
|
$ |
48,007 |
|
|
$ |
4,971 |
|
|
$ |
1,675 |
|
|
$ |
619,893 |
|
|
|
|
|
|
|
|
|
|
|
|
|
|
|
|
|
|
|
|
|
|
|
|
|
|
|
|
|
|
|
|
|
|
|
|
|
|
|
|
|
|
|
|
|
|
|
|
|
|
|
|
|
|
|
|
|
|
|
|
|
|
|
|
|
|
|
|
|
|
|
|
|
|
|
|
|
|
|
|
|
|
|
|
|
|
|
|
|
|
|
|
|
|
|
|
|
|
|
|
|
|
|
|
|
|
|
|
|
|
|
|
|
|
|
|
|
|
|
|
In addition to the allowance for loan losses, the Company maintains an allowance for unfunded credit commitments. The Company has three general areas for which it provides the allowance for unfunded credit commitments: (1) recourse obligations for loans sold, (2) letters of credit, and (3) unfunded lending commitments. The allowance for unfunded credit commitments is maintained at a level that management believes to be sufficient to absorb estimated expected credit losses related to unfunded credit facilities. See Note 11 — Commitments and Contingencies to the Consolidated Financial Statements in this Form 10-Q for additional information related to unfunded credit commitments. The following table summarizes the activities in the allowance for unfunded credit commitments for the three months ended March 31, 2024 and 2023:
|
|
|
|
|
|
|
|
|
|
|
|
|
|
|
|
|
|
|
|
|
|
|
|
|
|
|
|
|
|
|
|
|
|
Three Months Ended March 31, |
|
|
|
|
| ($ in thousands) |
|
2024 |
|
2023 |
|
|
|
|
|
|
|
|
| Unfunded credit facilities |
|
|
|
|
|
|
|
|
|
|
|
|
| Allowance for unfunded credit commitments, beginning of period |
|
$ |
37,699 |
|
|
$ |
26,264 |
|
|
|
|
|
|
|
|
|
|
|
|
|
|
|
|
|
|
|
|
|
|
Provision for credit losses on unfunded credit commitments |
(b) |
845 |
|
|
1,480 |
|
|
|
|
|
|
|
|
|
| Foreign currency translation adjustment |
|
— |
|
|
(3) |
|
|
|
|
|
|
|
|
|
| Allowance for unfunded credit commitments, end of period |
|
$ |
38,544 |
|
|
$ |
27,741 |
|
|
|
|
|
|
|
|
|
|
|
|
|
|
|
|
|
|
|
|
|
|
| Provision for credit losses |
(a) + (b) |
$ |
25,000 |
|
|
$ |
20,000 |
|
|
|
|
|
|
|
|
|
|
|
|
|
|
|
|
|
|
The allowance for credit losses was $709 million as of March 31, 2024, an increase of $3 million, compared with $706 million as of December 31, 2023. The slight increase in the allowance for credit losses was primarily driven by the Company’s qualitative risk assessment and economic forecasts that reflected continued caution regarding inflation, the high interest rate environment and the CRE market outlook, while recognizing negative loan growth.
The Company considers multiple economic scenarios to develop the estimate of the allowance for loan losses. The scenarios may consist of a baseline forecast representing management's view of the most likely outcome, and downside or upside scenarios that reflect possible worsening or improving economic conditions. As of March 31, 2024, the Company assigned the same weightings to its baseline, upside and downside scenarios as compared with December 31, 2023. The current baseline economic forecast continues to reflect key risks such as high inflation, high interest rates, concerns over global conflicts and oil prices. Compared to December 2023, the March 2024 baseline forecast for GDP growth and unemployment rate showed a slight improvement in the near term (full year 2024) while longer-term forecasts (2025 and beyond) slightly worsened for GDP growth. The downside scenario assumed the economy falls into recession in the second quarter of 2024 as a result of an extended federal shutdown, global and domestic political tensions, high inflation, and increased unemployment. The upside scenario assumed a more optimistic economic outlook for 2024, including stronger growth, stable financial market, and full employment starting in the second quarter of 2024.
Loan Transfers, Sales and Purchases
The Company’s primary business focus is on directly originated loans. The Company also purchases loans and participates in loan financing with other banks. In the normal course of doing business, the Company also provides other financial institutions with the ability to participate in commercial loans that it originates, by selling loans to such institutions. Purchased loans may be transferred from held-for-investment to held-for-sale, and write-downs to allowance for loan losses are recorded, when appropriate. The following tables provide information on the carrying value of loans transferred, sold and purchased for the held-for-investment portfolio, during the three months ended March 31, 2024 and 2023:
|
|
|
|
|
|
|
|
|
|
|
|
|
|
|
|
|
|
|
|
|
|
|
|
|
|
|
|
|
|
|
|
|
|
|
|
Three Months Ended March 31, 2024 |
|
|
Commercial |
|
Consumer |
|
|
|
|
|
|
|
|
|
|
|
|
Residential Mortgage |
|
|
|
|
|
|
| ($ in thousands) |
|
C&I |
|
|
|
|
|
|
|
Single-Family Residential |
|
|
|
|
|
Total |
Loans transferred from held-for-investment to held-for-sale (1) |
|
$ |
199,974 |
|
|
|
|
|
|
|
|
$ |
— |
|
|
|
|
|
|
$ |
199,974 |
|
|
|
|
|
|
|
|
|
|
|
|
|
|
|
|
|
|
Sales (2)(3) |
|
$ |
187,202 |
|
|
|
|
|
|
|
|
$ |
965 |
|
|
|
|
|
|
$ |
188,167 |
|
Purchases |
|
$ |
33,344 |
|
(4) |
|
|
|
|
|
|
$ |
74,736 |
|
|
|
|
|
|
$ |
108,080 |
|
|
|
|
|
|
|
|
|
|
|
|
|
|
|
|
|
|
|
|
|
|
|
|
|
|
|
|
|
|
|
|
|
|
|
|
|
|
|
|
Three Months Ended March 31, 2023 |
|
|
Commercial |
|
|
|
Consumer |
|
|
|
|
|
|
|
|
|
|
CRE |
|
|
|
Residential Mortgage |
|
|
|
|
|
|
| ($ in thousands) |
|
C&I |
|
CRE |
|
|
|
|
|
Single-Family Residential |
|
|
|
|
|
Total |
Loans transferred from held-for-investment to held-for-sale (1) |
|
$ |
156,876 |
|
|
$ |
3,600 |
|
|
|
|
|
|
$ |
— |
|
|
|
|
|
|
$ |
160,476 |
|
|
|
|
|
|
|
|
|
|
|
|
|
|
|
|
|
|
Sales (2)(3) |
|
$ |
175,932 |
|
|
$ |
3,600 |
|
|
|
|
|
|
$ |
— |
|
|
|
|
|
|
$ |
179,532 |
|
Purchases |
|
$ |
22,683 |
|
(4) |
$ |
— |
|
|
|
|
|
|
$ |
131,999 |
|
|
|
|
|
|
$ |
154,682 |
|
|
(1)Includes write-downs of $1 million and $273 thousand to the allowance for loan losses related to loans transferred from held-for-investment to held-for-sale for the three months ended March 31, 2024, and 2023, respectively.
(2)Includes originated loans sold of $92 million and $111 million for the three months ended March 31, 2024 and 2023, respectively. Originated loans sold consisted primarily of C&I loans for both periods.
(3)Includes $96 million and $69 million of purchased loans sold in the secondary market for the three months ended March 31, 2024 and 2023, respectively.
(4)C&I loan purchases were comprised primarily of syndicated C&I term loans.
Note 8 — Affordable Housing Partnership, Tax Credit and Community Reinvestment Act Investments, Net
The CRA encourages banks to meet the credit needs of their communities, particularly low- and moderate-income individuals and neighborhoods. The Company invests in certain affordable housing projects in the form of ownership interests in limited partnerships or limited liability companies that qualify for CRA consideration and tax credits. These entities are formed to develop and operate apartment complexes designed as high-quality affordable housing for lower income tenants throughout the U.S. To fully utilize the available tax credits, each of these entities must meet the affordable housing regulatory requirements for a 15-year minimum compliance period. The Company also invests in small business investment companies and new markets tax credit projects that qualify for CRA consideration, as well as eligible projects that qualify for production, historic and renewable energy tax credits. Investments in new markets tax credits promote development in low-income communities, investments in production and renewable energy tax credits help promote the development of renewable energy sources, and investments in historic tax credits promote the rehabilitation of historic buildings and economic revitalization of the surrounding areas.
The majority of affordable housing partnership, tax credit and CRA investments discussed above are variable interest entities where the Company is a limited partner in these investments, and an unrelated third party is typically the general partner or managing member who has control over the significant activities of these investments. While the Company’s interest in some of the investments may exceed 50% of the outstanding equity interests, the Company does not consolidate these investments due to the general partner’s or managing member’s ability to manage the entity, which is indicative of the general partner’s or managing member’s power over the entity. The Company’s maximum exposure to loss in connection with these partnerships consists of the unamortized investment balance and any tax credits claimed that may become subject to recapture.
The Company records its investments in qualifying affordable housing partnerships, net, using PAM. Following the adoption of ASU 2023-02 on January 1, 2024, the Company elects to account for its tax credit investments using PAM on a program-by-program basis if certain conditions are met. For the Company’s accounting policies on PAM, see Note 2 — Current Accounting Developments and Summary of Significant Accounting Policies — Significant Accounting Policies Update — Income Taxes to the Consolidated Financial Statements in this Form 10-Q. For discussion on the Company’s impairment evaluation and monitoring process of tax credit investments, refer to Note 3 — Fair Value Measurement and Fair Value of Financial Instruments — Affordable Housing Partnerships, Tax Credit and Community Reinvestment Act Investments, Net to the Consolidated Financial Statements in this Form 10-Q.
The following table presents the investments and unfunded commitments of the Company’s affordable housing partnership, tax credit, and CRA investments, net as of March 31, 2024 and December 31, 2023:
|
|
|
|
|
|
|
|
|
|
|
|
|
|
|
|
|
|
|
|
|
|
|
|
|
|
|
|
|
|
March 31, 2024 |
|
December 31, 2023 |
| ($ in thousands) |
|
Assets |
|
Liabilities - Unfunded Commitments (1) |
|
Assets |
|
Liabilities - Unfunded Commitments (1) |
|
|
|
|
|
|
|
|
|
PAM: |
|
|
|
|
|
|
|
|
Affordable housing partnership investments |
|
$ |
432,073 |
|
|
$ |
255,217 |
|
|
$ |
419,785 |
|
|
$ |
251,746 |
|
Tax credit and CRA investments |
|
228,901 |
|
|
117,022 |
|
|
— |
|
|
— |
|
Equity method of accounting and other: |
|
|
|
|
|
|
|
|
Tax credits and CRA investments |
|
272,213 |
|
|
147,147 |
|
|
485,251 |
|
|
298,990 |
|
| Total |
|
$ |
933,187 |
|
|
$ |
519,386 |
|
|
$ |
905,036 |
|
|
$ |
550,736 |
|
|
(1)Included in Accrued expenses and other liabilities on the Consolidated Balance Sheet.
The following table presents additional information related to the investments in affordable housing partnership, tax credit and CRA investments for the three months ended March 31, 2024 and 2023:
|
|
|
|
|
|
|
|
|
|
|
|
|
|
|
|
|
|
|
|
|
|
|
|
|
|
Three Months Ended March 31, |
|
|
|
| ($ in thousands) |
|
2024 |
|
2023 |
|
|
|
|
|
|
|
|
Tax credits and benefits(1): |
|
|
|
|
|
|
|
|
|
|
|
|
PAM: |
|
|
|
|
|
|
|
|
|
|
|
|
Affordable housing partnership investments |
|
$ |
18,419 |
|
|
$ |
16,094 |
|
|
|
|
|
|
|
|
|
Tax credit and CRA investments |
|
27,149 |
|
|
— |
|
|
|
|
|
|
|
|
|
Equity method of accounting and other: |
|
|
|
|
|
|
|
|
|
|
|
|
| Tax credit and CRA investments |
|
12,594 |
|
|
14,498 |
|
|
|
|
|
|
|
|
|
Total tax credits and benefits |
|
$ |
58,162 |
|
|
$ |
30,592 |
|
|
|
|
|
|
|
|
|
|
|
|
|
|
|
|
|
|
|
|
|
|
Amortization: |
|
|
|
|
|
|
|
|
|
|
|
|
PAM: |
|
|
|
|
|
|
|
|
|
|
|
|
Affordable housing partnership investments (2) |
|
$ |
13,869 |
|
|
$ |
12,666 |
|
|
|
|
|
|
|
|
|
Tax credit and CRA investments (3) |
|
23,301 |
|
|
— |
|
|
|
|
|
|
|
|
|
Equity method of accounting and other: |
|
|
|
|
|
|
|
|
|
|
|
|
Tax credit and CRA investments (4) |
|
13,207 |
|
|
10,110 |
|
|
|
|
|
|
|
|
|
Total amortization |
|
$ |
50,377 |
|
|
$ |
22,776 |
|
|
|
|
|
|
|
|
|
|
|
|
|
|
|
|
|
|
|
|
|
|
|
|
|
|
|
|
|
|
|
|
|
|
|
|
|
|
|
|
|
|
|
|
|
|
|
|
(1)Included in Income tax expense on the Consolidated Statement of Income for the three months ended March 31, 2024 and 2023.
(2)Amortization related to investments in qualified affordable housing partnerships under PAM was recorded in Income tax expense on the Consolidated Statement of Income for the three months ended March 31, 2024 and 2023.
(3)Due to the adoption of ASU 2023-02 on January 1, 2024, amortization related to qualifying tax credit investments under PAM was recorded in Income tax expense on the Consolidated Statement of Income for the three months ended March 31, 2024.
(4)Amortization related to tax credit and CRA investments was recognized in Amortization of tax credit and CRA investments as part of noninterest expense on the Consolidated Statement Income for the three months ended March 31, 2024 and 2023.
The Company also held equity securities without readily determinable fair values totaling $147 million and $146 million as of March 31, 2024 and December 31, 2023, respectively. Equity securities without readily determinable fair values are included in Other Assets and Affordable housing partnership, tax credit and CRA investments, net on the Consolidated Balance Sheet.
Note 9 — Goodwill
Total goodwill was $466 million as of both March 31, 2024 and December 31, 2023. The Company’s goodwill impairment test is performed annually, as of December 31, or more frequently as events occur or circumstances change that would more-likely-than-not reduce the fair value of a reporting unit below its carrying value. Based on the Company’s annual goodwill impairment test as of December 31, 2023, there was no impairment. Additional information pertaining to the Company’s accounting policy for goodwill is summarized in Note 1 — Summary of Significant Accounting Policies — Significant Accounting Policies — Goodwill to the Consolidated Financial Statements in the Company’s 2023 Form 10-K. The Company performed an analysis of goodwill during the first quarter of 2024 that consisted of a qualitative assessment to determine if it was more likely than not that the carrying values of each reporting unit exceeded their estimated fair values. The results of this analysis indicated that no impairment of goodwill existed as of March 31, 2024.
The Company has an equity method investment in Rayliant and its carrying value was $110 million as of March 31, 2024, of which $101 million was comprised of equity method goodwill. For additional information on this investment, Note 7 - Investments in Qualified Affordable Housing Partnerships, Tax Credit and Other Investments, Net and Variable Interest Entities to the Consolidated Financial Statements in the Company’s 2023 Form 10-K.
Note 10 — Short-Term Borrowings and Long-Term Debt
The following table presents details of the Company’s short-term and BTFP borrowings, FHLB advances, and long-term debt as of March 31, 2024 and December 31, 2023:
|
|
|
|
|
|
|
|
|
|
|
|
|
|
|
|
|
|
|
|
|
|
|
|
|
|
|
|
|
|
|
|
|
|
|
|
|
|
March 31, 2024 |
|
December 31, 2023 |
| ($ in thousands) |
|
|
|
Interest Rates |
|
Maturity Dates |
|
Amount |
|
Amount |
|
|
|
|
|
|
|
|
|
|
|
|
|
|
|
|
|
|
|
|
|
|
|
|
|
|
|
|
|
|
|
|
|
Bank |
|
|
|
|
|
|
|
|
|
|
Short-term borrowings |
|
|
|
4.75% — 4.83% |
|
April 2024 |
|
$ |
19,173 |
|
|
$ |
— |
|
BTFP borrowings |
|
|
|
4.37% |
|
3/19/2024 |
|
$ |
— |
|
|
$ |
4,500,000 |
|
FHLB advances (1) — floating (2) |
|
|
|
5.49% — 5.56% |
|
2024 — 2025 |
|
$ |
3,500,000 |
|
|
$ |
— |
|
Parent company |
|
|
|
|
|
|
|
|
|
|
Junior subordinated debt (3) — floating (2) |
|
|
|
7.14% |
|
12/15/2035 |
|
$ |
31,768 |
|
|
$ |
148,249 |
|
|
|
|
|
|
|
|
|
|
|
|
|
|
|
|
|
|
|
|
|
|
|
|
|
|
|
|
|
|
|
|
|
|
|
(1)The weighted-average interest rates for FHLB advances were 5.52% as of March 31, 2024.
(2)Floating interest rates are based on the Secured Overnight Financing Rate plus the established spread.
(3)The weighted-average interest rates for junior subordinated debt were 7.14% and 6.87% as of March 31, 2024 and December 31, 2023, respectively.
The Bank’s available borrowing capacity from FHLB advances totaled $7.6 billion as of March 31, 2024. The Bank’s available borrowing capacity from the FHLB is derived from its portfolio of loans that are pledged to the FHLB, reduced by any outstanding FHLB advances. As of March 31, 2024, all advances were secured by real estate loans.
During the first quarter of 2024, the Company redeemed approximately $117 million of junior subordinated debt and repaid $4.5 billion of BTFP borrowings upon maturity. For additional information on the BTFP and junior subordinated debt, refer to Note 10 — Short-Term Borrowings and Long-Term Debt to the Consolidated Financial Statements in the Company’s 2023 Form 10-K.
Note 11 — Commitments and Contingencies
Commitments to Extend Credit — In the normal course of business, the Company provides loan commitments and letters of credit to customers on predetermined terms. These outstanding commitments to extend credit are not reflected in the accompanying Consolidated Financial Statements. While the Company does not anticipate losses from these transactions, commitments to extend credit are included in determining the appropriate level of allowance for unfunded credit commitments.
The following table presents the Company’s credit-related commitments as of March 31, 2024 and December 31, 2023:
|
|
|
|
|
|
|
|
|
|
|
|
|
|
|
|
|
|
|
|
|
|
|
|
|
|
|
|
|
|
|
|
|
|
|
|
|
|
|
|
|
|
March 31, 2024 |
|
December 31, 2023 |
| ($ in thousands) |
|
Expire in One Year or Less |
|
Expire After One Year Through Three Years |
|
Expire After Three Years Through Five Years |
|
Expire After Five Years |
|
Total |
|
Total |
| Loan commitments |
|
$ |
4,794,033 |
|
|
$ |
3,622,191 |
|
|
$ |
799,699 |
|
|
$ |
151,877 |
|
|
$ |
9,367,800 |
|
|
$ |
9,141,447 |
|
Commercial letters of credit and standby letters of credit (“SBLCs”) |
|
1,025,797 |
|
|
434,373 |
|
|
143,006 |
|
|
1,140,456 |
|
|
2,743,632 |
|
|
2,610,761 |
|
| Total |
|
$ |
5,819,830 |
|
|
$ |
4,056,564 |
|
|
$ |
942,705 |
|
|
$ |
1,292,333 |
|
|
$ |
12,111,432 |
|
|
$ |
11,752,208 |
|
|
|
|
|
|
|
|
|
|
|
|
|
|
|
|
|
|
|
|
|
|
|
|
|
|
|
|
|
|
|
|
|
|
|
|
|
|
|
|
|
|
|
|
|
|
Loan commitments are agreements to lend to customers provided there are no violations of any conditions established in the agreement. Commitments generally have fixed expiration dates or other termination clauses and may require commitment fees. Since many of the commitments are expected to expire without being drawn upon, the total commitment amounts do not necessarily represent future funding requirements.
Commercial letters of credit are issued to facilitate domestic and foreign trade transactions, while SBLCs are generally contingent upon the failure of the customers to perform according to the terms of the underlying contract with the third party. As a result, the total contractual amounts do not necessarily represent future funding requirements. The Company’s historical experience is that SBLCs typically expire without being funded. Additionally, in many cases, the Company holds collateral in various forms against these SBLCs. As part of its risk management activities, the Company monitors the creditworthiness of customers in conjunction with its SBLC exposure. Customers are obligated to reimburse the Company for any payment made on the customers’ behalf. If the customers fail to pay, the Company would, as applicable, liquidate the collateral and/or offset existing accounts. As of March 31, 2024, total letters of credit of $2.7 billion consisted of SBLCs of $2.7 billion and commercial letters of credit of $26 million. In comparison, as of December 31, 2023, total letters of credit of $2.6 billion consisted of SBLCs of $2.6 billion and commercial letters of credit of $24 million. As of both March 31, 2024 and December 31, 2023, substantially all letters of credit were graded “Pass” using the Bank’s internal credit risk rating system.
The Company applies the same credit underwriting criteria to extend loans, commitments, and conditional obligations to customers. Each customer’s creditworthiness is evaluated on a case-by-case basis. Collateral and financial guarantees may be obtained based on management’s assessment of a customer’s credit risk. Collateral may include cash, accounts receivable, inventory, personal property, plant and equipment, and real estate property.
Estimated exposure to loss from these commitments is included in the allowance for unfunded credit commitments and amounted to $39 million and $38 million as of March 31, 2024 and December 31, 2023, respectively.
Guarantees — From time to time, the Company sells or securitizes single-family and multifamily residential loans with recourse in the ordinary course of business. The Company is obligated to repurchase up to the recourse component of the loans if the loans default. The following table presents the carrying amounts of loans sold or securitized with recourse and the maximum potential future payments as of March 31, 2024 and December 31, 2023:
|
|
|
|
|
|
|
|
|
|
|
|
|
|
|
|
|
|
|
|
|
|
|
|
|
|
|
|
|
|
|
|
|
|
|
|
|
|
|
|
|
|
|
|
|
|
|
|
|
|
|
|
|
|
|
|
|
|
|
|
|
|
|
|
|
|
|
|
|
|
|
|
Maximum Potential Future Payments |
|
Carrying Value |
|
|
|
|
|
|
|
|
|
|
March 31, 2024 |
|
December 31, 2023 |
|
March 31, 2024 |
|
December 31, 2023 |
|
|
|
|
|
|
|
|
| ($ in thousands) |
|
Expire in One Year or Less |
|
|
|
Expire After One Year Through Three Years |
|
Expire After Three Years Through Five Years |
|
Expire After Five Years |
|
Total |
|
Total |
|
Total |
|
Total |
|
|
|
|
|
|
|
|
| Single-family residential loans sold or securitized with recourse |
|
$ |
7 |
|
|
|
|
$ |
17 |
|
|
$ |
26 |
|
|
$ |
5,363 |
|
|
$ |
5,413 |
|
|
$ |
5,888 |
|
|
$ |
5,413 |
|
|
$ |
5,888 |
|
|
|
|
|
|
|
|
|
| Multifamily residential loans sold or securitized with recourse |
|
— |
|
|
|
|
— |
|
|
160 |
|
|
14,836 |
|
|
14,996 |
|
|
14,996 |
|
|
18,756 |
|
|
19,020 |
|
|
|
|
|
|
|
|
|
| Total |
|
$ |
7 |
|
|
|
|
$ |
17 |
|
|
$ |
186 |
|
|
$ |
20,199 |
|
|
$ |
20,409 |
|
|
$ |
20,884 |
|
|
$ |
24,169 |
|
|
$ |
24,908 |
|
|
|
|
|
|
|
|
|
|
|
|
|
|
|
|
|
|
|
|
|
|
|
|
|
|
|
|
|
|
|
|
|
|
|
|
|
|
|
|
|
|
|
|
|
|
|
|
|
|
|
|
|
|
|
|
|
|
|
|
|
|
|
|
|
|
|
|
|
|
|
|
|
|
|
|
|
|
|
|
|
|
|
|
|
|
|
|
|
|
|
|
|
|
|
|
|
|
|
|
|
|
|
|
|
|
|
|
|
|
|
|
The Company’s recourse reserve related to these guarantees is included in the allowance for unfunded credit commitments and totaled $40 thousand as of both March 31, 2024 and December 31, 2023. The allowance for unfunded credit commitments is included in Accrued expenses and other liabilities on the Consolidated Balance Sheet. The Company continues to experience minimal losses from the single-family and multifamily residential loan portfolios sold or securitized with recourse.
Litigation — The Company is a party to various legal actions arising in the ordinary course of its business. In accordance with ASC 450, Contingencies, the Company accrues reserves for outstanding lawsuits, claims and proceedings when a loss contingency is probable and can be reasonably estimated. The Company estimates the amount of loss contingencies using current available information from legal proceedings, advice from legal counsel and available insurance coverage. Due to the inherent subjectivity of the assessments and unpredictability of the outcomes of the legal proceedings, any amounts accrued or included in this aggregate amount may not represent the ultimate loss to the Company from the legal proceedings in question. Thus, the Company’s exposure and ultimate losses may be higher, and possibly significantly more, than the amounts accrued.
While it is impossible to ascertain the ultimate resolution or range of financial liability, based on information known to the Company as of March 31, 2024, the Company does not believe there are any pending legal proceedings to which the Company is a party that, individually or in the aggregate, would reasonably be expected to have a material adverse effect on the Company’s financial condition. In light of the inherent uncertainty in legal proceedings, however, there can be no assurance that the ultimate resolution will not exceed established reserves and it is possible that the outcome of a particular matter, or a combination of matters, may be material to the Company’s financial condition for a particular period, depending upon the size of the loss and the Company’s income for that particular period.
Note 12 — Stock Compensation Plans
Pursuant to the Company’s 2021 Stock Incentive Plan, as amended, the Company may issue stock, stock options, restricted stock, RSUs including performance-based RSUs, stock purchase warrants, stock appreciation rights, phantom stock and dividend equivalents to eligible employees, non-employee directors, consultants, and other service providers of East West and its subsidiaries. The Company has granted RSUs as its primary incentive awards. There were no outstanding awards other than RSUs as of both March 31, 2024 and December 31, 2023.
The following table presents a summary of the total share-based compensation expense and the related net tax benefits associated with the Company’s various employee share-based compensation plans for the three months ended March 31, 2024 and 2023:
|
|
|
|
|
|
|
|
|
|
|
|
|
|
|
|
|
|
|
|
|
|
|
|
|
|
|
|
Three Months Ended March 31, |
| ($ in thousands) |
|
|
|
|
|
|
|
2024 |
|
2023 |
| Stock compensation costs |
|
|
|
|
|
|
|
$ |
12,988 |
|
|
$ |
11,075 |
|
| Related net tax benefits for stock compensation plans |
|
|
|
|
|
|
|
$ |
783 |
|
|
$ |
8,290 |
|
|
Restricted Stock Units — RSUs are granted under the Company’s long-term incentive plan at no cost to the recipient. RSUs generally cliff vest after three years of continued employment from the date of the grant, and are authorized to settle in shares of the Company’s common stock. Dividends are accrued during the vesting period and paid at the time of vesting. While a portion of RSUs are time-based vesting awards, others vest subject to the attainment of additional specified performance goals, referred to as “performance-based RSUs.” Performance-based RSUs are granted annually upon approval by the Company’s Compensation and Management Development Committee based on the performance in the year prior to the grant date of the award. The number of awards that vest can range from zero percent to a maximum of 200% of the granted number of awards based on the Company’s achievement of specified performance criteria over a performance period of three years. For information on accounting on stock-based compensation plans, see Note 1 — Summary of Significant Accounting Policies — Significant Accounting Policies — Stock-Based Compensation to the Consolidated Financial Statements of the Company’s 2023 Form 10-K.
The following table presents a summary of the activities for the Company’s time- and performance-based RSUs that were settled in shares for the three months ended March 31, 2024. The number of performance-based RSUs stated below reflects the number of awards granted on the grant date.
|
|
|
|
|
|
|
|
|
|
|
|
|
|
|
|
|
|
|
|
|
|
|
|
|
|
|
|
|
|
|
|
|
|
|
|
|
|
|
|
|
|
|
|
|
|
|
|
|
|
|
|
|
|
|
|
|
|
Time-Based RSUs |
|
Performance-Based RSUs |
|
|
|
|
|
|
|
|
|
|
Shares |
|
Weighted-Average Grant Date Fair Value |
|
Shares |
|
Weighted-Average Grant Date Fair Value |
Outstanding, January 1, 2024 |
|
|
|
|
|
|
|
|
|
1,206,518 |
|
|
$ |
74.29 |
|
|
276,223 |
|
|
$ |
78.59 |
|
|
|
|
|
|
|
|
|
|
|
|
|
|
|
|
|
|
| Granted |
|
|
|
|
|
|
|
|
|
515,235 |
|
|
75.79 |
|
|
97,798 |
|
|
80.28 |
|
| Vested |
|
|
|
|
|
|
|
|
|
(299,381) |
|
|
71.68 |
|
|
(91,960) |
|
|
77.67 |
|
| Forfeited |
|
|
|
|
|
|
|
|
|
(12,163) |
|
|
75.24 |
|
|
— |
|
|
— |
|
Outstanding, March 31, 2024 |
|
|
|
|
|
|
|
|
|
1,410,209 |
|
|
$ |
75.39 |
|
|
282,061 |
|
|
$ |
79.48 |
|
|
As of March 31, 2024, there were $51 million of unrecognized compensation costs related to unvested time-based RSUs expected to be recognized over a weighted-average period of 2.3 years, and $25 million of unrecognized compensation costs related to unvested performance-based RSUs expected to be recognized over a weighted-average period of 2.3 years.
Note 13 — Stockholders’ Equity and Earnings Per Share
The following table presents the basic and diluted EPS calculations for the three months ended March 31, 2024 and 2023. For more information on the calculation of EPS, see Note 1 — Summary of Significant Accounting Policies — Significant Accounting Policies — Earnings Per Share to the Consolidated Financial Statements in the Company’s 2023 Form 10-K.
|
|
|
|
|
|
|
|
|
|
|
|
|
|
|
|
|
|
|
|
|
|
|
|
|
|
|
|
|
|
|
| ($ and shares in thousands, except per share data) |
|
|
|
Three months ended March 31, |
|
|
|
|
|
|
|
|
|
|
|
|
2024 |
|
2023 |
|
|
|
|
|
|
|
|
|
|
|
| Basic: |
|
|
|
|
|
|
|
|
|
|
|
|
|
|
|
|
|
|
|
| Net income |
|
|
|
|
|
$ |
285,075 |
|
|
$ |
322,439 |
|
|
|
|
|
|
|
|
|
|
|
|
| Weighted-average number of shares outstanding |
|
|
|
|
|
139,409 |
|
|
141,112 |
|
|
|
|
|
|
|
|
|
|
|
|
| Basic EPS |
|
|
|
|
|
$ |
2.04 |
|
|
$ |
2.28 |
|
|
|
|
|
|
|
|
|
|
|
|
| Diluted: |
|
|
|
|
|
|
|
|
|
|
|
|
|
|
|
|
|
|
|
| Net income |
|
|
|
|
|
$ |
285,075 |
|
|
$ |
322,439 |
|
|
|
|
|
|
|
|
|
|
|
|
|
|
|
|
|
|
|
|
|
|
|
|
|
|
|
|
|
|
|
|
| Weighted-average number of shares outstanding |
|
|
|
|
|
139,409 |
|
|
141,112 |
|
|
|
|
|
|
|
|
|
|
|
|
Add: Dilutive impact of unvested RSUs |
|
|
|
|
|
852 |
|
|
801 |
|
|
|
|
|
|
|
|
|
|
|
|
| Diluted weighted-average number of shares outstanding |
|
|
|
|
|
140,261 |
|
|
141,913 |
|
|
|
|
|
|
|
|
|
|
|
|
| Diluted EPS |
|
|
|
|
|
$ |
2.03 |
|
|
$ |
2.27 |
|
|
|
|
|
|
|
|
|
|
|
|
|
Approximately 170 thousand and 417 thousand weighted-average shares of anti-dilutive RSUs were excluded from the diluted EPS computations for the three months ended March 31, 2024 and 2023, respectively.
Stock Repurchase Program — In 2020, the Company’s Board of Directors authorized a stock repurchase program to buy back up to $500 million of the Company’s common stock. For the three months ended March 31, 2024, the Company repurchased 1,181,851 shares at an average price of $69.76 per share at $82 million. The Company did not repurchase any shares during the three months ended March 31, 2023. As of March 31, 2024, the Company had approximately $89 million available for repurchases under its stock repurchase program.
Note 14 — Accumulated Other Comprehensive Income (Loss)
The following table presents the changes in the components of AOCI balances for the three months ended March 31, 2024 and 2023:
|
|
|
|
|
|
|
|
|
|
|
|
|
|
|
|
|
|
|
|
|
|
|
|
|
|
|
|
| ($ in thousands) |
|
Debt Securities (1) |
|
Cash Flow Hedges |
|
Foreign Currency Translation Adjustments (2) |
|
Total |
| Balance, January 1, 2023 |
|
$ |
(694,815) |
|
|
$ |
(49,531) |
|
|
$ |
(21,283) |
|
|
$ |
(765,629) |
|
| Net unrealized gains arising during the period |
|
44,275 |
|
|
21,086 |
|
|
2,941 |
|
|
68,302 |
|
| Amounts reclassified from AOCI |
|
9,806 |
|
|
7,527 |
|
|
— |
|
|
17,333 |
|
| Changes, net of tax |
|
54,081 |
|
|
28,613 |
|
|
2,941 |
|
|
85,635 |
|
Balance, March 31, 2023 |
|
$ |
(640,734) |
|
|
$ |
(20,918) |
|
|
$ |
(18,342) |
|
|
$ |
(679,994) |
|
|
|
|
|
|
|
|
|
|
| Balance, January 1, 2024 |
|
$ |
(601,881) |
|
|
$ |
2,624 |
|
|
$ |
(21,339) |
|
|
$ |
(620,596) |
|
Net unrealized (losses) gains arising during the period |
|
(2,282) |
|
|
(63,662) |
|
|
3,822 |
|
|
(62,122) |
|
| Amounts reclassified from AOCI |
|
2,653 |
|
|
17,332 |
|
|
— |
|
|
19,985 |
|
| Changes, net of tax |
|
371 |
|
|
(46,330) |
|
|
3,822 |
|
|
(42,137) |
|
Balance, March 31, 2024 |
|
$ |
(601,510) |
|
|
$ |
(43,706) |
|
|
$ |
(17,517) |
|
|
$ |
(662,733) |
|
|
(1)Includes after-tax unamortized losses related to AFS debt securities that were transferred to HTM in 2022.
(2)Represents foreign currency translation adjustments related to the Company’s net investment in non-U.S. operations, including related hedges. The functional currency and reporting currency of the Company’s foreign subsidiary was RMB and USD, respectively.
The following table presents the components of other comprehensive income (loss), reclassifications to net income and the related tax effects for the three months ended March 31, 2024 and 2023:
|
|
|
|
|
|
|
|
|
|
|
|
|
|
|
|
|
|
|
|
|
|
|
|
|
|
|
|
|
|
|
|
|
|
|
|
|
|
|
|
|
|
Three Months Ended March 31, |
|
|
2024 |
|
2023 |
| ($ in thousands) |
|
Before-Tax |
|
Tax Effect |
|
Net-of-Tax |
|
Before-Tax |
|
Tax Effect |
|
Net-of-Tax |
| Debt securities: |
|
|
|
|
|
|
|
|
|
|
|
|
| Net unrealized (losses) gains on AFS debt securities arising during the period |
|
$ |
(3,282) |
|
|
$ |
1,000 |
|
|
$ |
(2,282) |
|
|
$ |
62,860 |
|
|
$ |
(18,585) |
|
|
$ |
44,275 |
|
| Reclassification adjustments: |
|
|
|
|
|
|
|
|
|
|
|
|
Net realized (gains) losses on AFS debt securities reclassified into net income (1) |
|
(49) |
|
|
14 |
|
|
(35) |
|
|
10,000 |
|
(2) |
(2,956) |
|
|
7,044 |
|
Amortization of unrealized losses on transferred debt securities (3) |
|
3,816 |
|
|
(1,128) |
|
|
2,688 |
|
|
3,921 |
|
|
(1,159) |
|
|
2,762 |
|
| Net change |
|
485 |
|
|
(114) |
|
|
371 |
|
|
76,781 |
|
|
(22,700) |
|
|
54,081 |
|
| Cash flow hedges: |
|
|
|
|
|
|
|
|
|
|
|
|
| Net unrealized (losses) gains arising during the period |
|
(90,376) |
|
|
26,714 |
|
|
(63,662) |
|
|
29,843 |
|
|
(8,757) |
|
|
21,086 |
|
Net realized losses reclassified into net income (4) |
|
24,605 |
|
|
(7,273) |
|
|
17,332 |
|
|
10,644 |
|
|
(3,117) |
|
|
7,527 |
|
| Net change |
|
(65,771) |
|
|
19,441 |
|
|
(46,330) |
|
|
40,487 |
|
|
(11,874) |
|
|
28,613 |
|
| Foreign currency translation adjustments, net of hedges: |
|
|
|
|
|
|
|
|
|
|
|
|
Net unrealized gains arising during the period |
|
3,995 |
|
|
(173) |
|
|
3,822 |
|
|
2,626 |
|
|
315 |
|
|
2,941 |
|
| Net change |
|
3,995 |
|
|
(173) |
|
|
3,822 |
|
|
2,626 |
|
|
315 |
|
|
2,941 |
|
| Other comprehensive (loss) income |
|
$ |
(61,291) |
|
|
$ |
19,154 |
|
|
$ |
(42,137) |
|
|
$ |
119,894 |
|
|
$ |
(34,259) |
|
|
$ |
85,635 |
|
|
(1)Pre-tax amounts were reported in Net gains (losses) on AFS debt securities on the Consolidated Statement of Income.
(2)Represents the loss related to an AFS debt security that was written off in the first quarter of 2023.
(3)Represents unrealized losses amortized over the remaining lives of securities that were transferred from the AFS to HTM portfolio in 2022.
(4)Pre-tax amounts related to cash flow hedges on variable rate loans and long-term borrowings, where applicable, were reported in Interest and dividend income and in Interest expense, respectively, on the Consolidated Statement of Income. In the first quarter of 2023, the pre-tax amount also included the terminated cash flow hedge where the forecasted cash flows were no longer probable to occur and was reported in Noninterest income on the Consolidated Statement of Income.
Note 15 — Business Segments
The Company organizes its operations into three reportable operating segments: (1) Consumer and Business Banking; (2) Commercial Banking; and (3) Other. These segments are defined by the type of customers served, and the related products and services provided. The segments reflect how financial information is currently evaluated by management. Operating segment results are based on the Company’s internal management reporting process, which reflects assignments and allocations of certain balance sheet and income statement items. The information presented is not indicative of how the segments would perform if they operated as independent entities.
The Consumer and Business Banking segment primarily provides financial products and services to consumer and commercial customers through the Company’s domestic branch network and digital banking platforms. This segment offers consumer and commercial deposits, mortgage and home equity loans, and other products and services. It also originates commercial loans for small- and medium-sized enterprises through the Company’s branch network. Other products and services provided by this segment include wealth management, treasury management, interest rate risk hedging and foreign exchange services.
The Commercial Banking segment primarily generates commercial loan and deposit products. Commercial loan products include CRE lending, construction financing, commercial business lending, working capital lines of credit, trade finance, letters of credit, affordable housing lending, asset-based lending, asset-backed finance, project finance and equipment financing. Commercial deposit products and other financial services include treasury management, foreign exchange services and interest rate and commodity risk hedging.
The remaining centralized functions, including the corporate treasury activities of the Company and eliminations of inter-segment amounts, have been aggregated and included in the Other segment, which provides broad administrative support to the two core segments, namely the Consumer and Business Banking and the Commercial Banking segments.
The Company utilizes an internal reporting process to measure the performance of the three operating segments within the Company. The internal reporting process derives operating segment results by utilizing allocation methodologies for revenues and expenses. Net interest income of each segment represents the difference between actual interest earned on assets and interest incurred on liabilities of the segment, adjusted for funding charges or credits through the Company’s internal funds transfer pricing (“FTP”) process. Noninterest income and noninterest expense directly attributable to a business segment are assigned to that segment. Indirect costs, including technology-related costs and corporate overhead, are allocated based on a segment’s estimated usage using factors including but not limited to, full-time equivalent employees, net interest income, and loan and deposit volume. Charge-offs are recorded to the segment directly associated with the respective loans charged off, and provision for credit losses is recorded to the segments based on the related loans for which allowances are evaluated. The Company’s internal reporting process utilizes a full-allocation methodology. Under this methodology, corporate and indirect expenses incurred by the Other segment are allocated to the Consumer and Business Banking and the Commercial Banking segments, except certain corporate treasury-related expenses and insignificant unallocated expenses.
The corporate treasury function within the Other segment is responsible for the Company’s liquidity and interest rate management, and the internal FTP process. The FTP process is formulated with the goal of encouraging loan and deposit growth that is consistent with the Company’s overall profitability objectives, as well as providing a reasonable and consistent basis for the measurement of its business segments’ net interest margins and profitability. The FTP process charges a cost to fund loans (“FTP charges for loans”) and allocates credits for funds provided from deposits (“FTP credits for deposits”) using internal FTP rates. FTP charges for loans are determined based on a matched cost of funds, which is tied to the pricing and term characteristics of the loans. FTP credits for deposits are based on matched funding credit rates, which are tied to the implied or stated maturity of the deposits. FTP credits for deposits reflect the long-term value generated by the deposits. The net spread between the total internal FTP charges and credits is recorded as part of net interest income in the Other segment. The FTP process transfers the corporate interest rate risk exposure to the treasury function within the Other segment, where such exposures are centrally managed. The Company’s internal FTP assumptions and methodologies are reviewed at least annually to ensure that the process is reflective of current market conditions.
The following tables present the operating results and other key financial measures for the individual operating segments as of and for the three months ended March 31, 2024 and 2023:
|
|
|
|
|
|
|
|
|
|
|
|
|
|
|
|
|
|
|
|
|
|
|
|
|
|
|
|
| ($ in thousands) |
|
Consumer and Business Banking |
|
Commercial Banking |
|
Other |
|
Total |
| Three Months Ended March 31, 2024 |
|
|
|
|
|
|
|
|
|
|
|
|
|
|
|
|
|
|
|
|
|
|
|
|
|
|
|
|
|
|
|
|
|
|
|
|
|
|
|
|
|
|
|
|
|
|
|
|
|
|
|
|
|
|
|
|
|
|
|
|
|
|
Net interest income before provision for credit losses |
|
$ |
291,764 |
|
|
$ |
260,349 |
|
|
$ |
13,026 |
|
|
$ |
565,139 |
|
| Provision for credit losses |
|
2,565 |
|
|
22,435 |
|
|
— |
|
|
25,000 |
|
| Noninterest income |
|
25,542 |
|
|
46,466 |
|
|
6,980 |
|
|
78,988 |
|
| Noninterest expense |
|
119,300 |
|
|
106,307 |
|
|
21,268 |
|
|
246,875 |
|
Segment income (loss) before income taxes |
|
195,441 |
|
|
178,073 |
|
|
(1,262) |
|
|
372,252 |
|
|
|
|
|
|
|
|
|
|
| Segment net income |
|
$ |
137,672 |
|
|
$ |
125,581 |
|
|
$ |
21,822 |
|
|
$ |
285,075 |
|
| As of March 31, 2024 |
|
|
|
|
|
|
|
|
|
|
|
|
|
|
|
|
|
| Segment assets |
|
$ |
19,629,076 |
|
|
$ |
35,049,899 |
|
|
$ |
16,196,695 |
|
|
$ |
70,875,670 |
|
|
|
|
|
|
|
|
|
|
|
|
|
|
|
|
|
|
|
|
|
|
|
|
|
|
|
|
|
|
| ($ in thousands) |
|
Consumer and Business Banking |
|
Commercial Banking |
|
Other |
|
Total |
| Three Months Ended March 31, 2023 |
|
|
|
|
|
|
|
|
|
|
|
|
|
|
|
|
|
|
|
|
|
|
|
|
|
|
|
|
|
|
|
|
|
|
|
|
|
|
|
|
|
|
|
|
|
|
|
|
|
|
|
|
|
|
|
|
|
|
|
|
|
|
Net interest income before provision for credit losses |
|
$ |
304,242 |
|
|
$ |
236,723 |
|
|
$ |
58,896 |
|
|
$ |
599,861 |
|
| Provision for credit losses |
|
15,012 |
|
|
4,988 |
|
|
— |
|
|
20,000 |
|
Noninterest income (loss) |
|
26,002 |
|
|
43,599 |
|
|
(9,623) |
|
|
59,978 |
|
| Noninterest expense |
|
113,823 |
|
|
87,248 |
|
|
17,376 |
|
|
218,447 |
|
| Segment income before income taxes |
|
201,409 |
|
|
188,086 |
|
|
31,897 |
|
|
421,392 |
|
|
|
|
|
|
|
|
|
|
| Segment net income |
|
$ |
142,247 |
|
|
$ |
134,457 |
|
|
$ |
45,735 |
|
|
$ |
322,439 |
|
| As of March 31, 2023 |
|
|
|
|
|
|
|
|
|
|
|
|
|
|
|
|
|
| Segment assets |
|
$ |
17,880,525 |
|
|
$ |
33,647,465 |
|
|
$ |
15,716,908 |
|
|
$ |
67,244,898 |
|
|
ITEM 2. MANAGEMENT’S DISCUSSION AND ANALYSIS OF FINANCIAL CONDITION AND RESULTS OF OPERATIONS
Overview
The following discussion provides information about the results of operations, financial condition, liquidity and capital resources of East West Bancorp, Inc. (referred to herein on an unconsolidated basis as “East West” and on a consolidated basis as the “Company,” “we” or “EWBC”) and its subsidiaries, including its subsidiary bank, East West Bank and its subsidiaries (referred to herein as “East West Bank” or the “Bank”). This information is intended to facilitate the understanding and assessment of significant changes and trends related to the Company’s results of operations and financial condition. This discussion and analysis should be read in conjunction with the Consolidated Financial Statements and the accompanying notes presented elsewhere in this Quarterly Report on Form 10-Q (this “Form 10-Q”), and the Company’s Annual Report on Form 10-K for the year ended December 31, 2023, filed with the United States (“U.S.”) Securities and Exchange Commission (“SEC”) on February 29, 2024 (the “Company’s 2023 Form 10-K”).
Organization and Strategy
East West is a bank holding company incorporated in Delaware on August 26, 1998, and is registered under the Bank Holding Company Act of 1956, as amended. The Company commenced business on December 30, 1998 when, pursuant to a reorganization, it acquired all of the voting stock of the Bank, which became its principal asset. The Bank is an independent commercial bank headquartered in California that focuses on the financial service needs of individuals and businesses that operate in both the U.S. and Asia. Through 120 locations in the U.S. and Asia, the Company provides a full range of consumer and commercial products and services through the following three business segments: (1) Consumer and Business Banking and (2) Commercial Banking, with the remaining operations recorded in (3) Other. The Company’s principal activity is lending to and accepting deposits from businesses and individuals. We are committed to enhancing long-term shareholder value by growing loans, deposits and revenue, improving profitability, and investing for the future while managing risks, expenses and capital. Our business model is built on customer loyalty and engagement, understanding our customers’ financial goals, and meeting our customers’ financial needs through our diverse products and services. We expect our relationship-focused business model to continue generating organic growth from existing customers and to expand our targeted customer bases. As of March 31, 2024, the Company had $70.9 billion in total assets and approximately 3,200 full-time equivalent employees. For additional information on our strategy, and the products and services provided by the Bank, see Item 1. Business — Strategy and Banking Services in the Company’s 2023 Form 10-K.
Current Developments
Economic Developments
Recent external data indicate that inflation has not progressed closer to the Board of Governors of the Federal Reserve System’s (“Federal Reserve”) 2% target. In response to the persistent inflation, the Federal Reserve has communicated the appropriateness of its current restrictive policy, which has lowered expectations of rate cuts by midyear 2024. The higher interest rate environment continues to negatively impact the market value of banking organizations’ investment securities, while the commercial real estate (“CRE”) market remains under pressure from tighter credit conditions and decreased demand. Factors such as the economic impacts of unrest, wars, and acts of terrorism could lead to higher oil prices and increased inflationary pressures, along with the likelihood that the Federal Reserve will cut interest rates slower than anticipated. The Company monitors changes in economic and industry conditions and their impacts on the Company’s business, customers, employees, communities and markets.
Further discussion of the potential impacts on the Company’s business due to the higher interest rate environment has been provided in Item 1A. — Risk Factors — Risks Related to Financial Matters in the Company’s 2023 Form 10-K.
Federal Deposit Insurance Corporation Special Assessment
In November 2023, the Federal Deposit Insurance Corporation (“FDIC”) approved a final rule to implement a special deposit insurance assessment to recover losses to the Deposit Insurance Fund (“DIF”) arising from the protection of uninsured depositors following the receiverships of failed institutions in the spring of 2023. Under the final rule, the assessment base for the special assessment is equal to an insured depository institution’s estimated uninsured deposits, reported for the quarter ended December 31, 2022, minus the first $5 billion in estimated uninsured deposits. The FDIC will collect the special assessment over eight quarterly assessment periods starting with the first quarter of 2024, at a quarterly rate of 3.36 basis points (“bps”). The Company recognized the entire assessment expense of approximately $70 million in the fourth quarter of 2023. However, depending on future adjustments to the DIF’s estimated loss, the FDIC retained the ability to cease collection early, extend the special assessment collection period, or impose a final shortfall special assessment.
As of the publication of the final rule, the FDIC estimated that losses to the DIF totaled $16.3 billion. In February 2024, the FDIC updated its estimate of the DIF’s losses to $20.4 billion before the $1.7 billion residual interest in the Silicon Valley Bridge Bank, N.A. receivership’s trust. In the first quarter of 2024, the Company updated its estimate to recognize an anticipated additional FDIC special assessment charge (“FDIC charge”) of $10 million, which represents the proportional increase in the FDIC’s estimated loss.
Climate Accountability
On March 6, 2024, the SEC adopted final rules requiring registrants to disclose certain climate-related information in registration statements and annual reports. The final rules include disclosures related to climate-related risks and risk management as well as the board and management’s governance of such risks. The rules also incorporate requirements to disclose the financial effects of certain severe weather events and other natural conditions in the audited financial statements. Larger registrants will also be required to disclose information about greenhouse gas emissions, to the extent material, which will be subject to a phased-in third-party assurance requirement.
On April 4, 2024, the SEC voluntarily stayed implementation of the rules pending the completion of judicial review of consolidated legal challenges to the rules by the United States Court of Appeals for the Eighth Circuit. The Company is evaluating the impact of the climate disclosure rules and monitoring the outcome of the litigation regarding their adoption.
Financial Review
|
|
|
|
|
|
|
|
|
|
|
|
|
|
|
|
|
|
|
|
|
|
|
|
|
|
|
|
|
|
|
|
|
|
|
|
|
|
|
|
|
|
Three Months Ended March 31, |
|
|
|
|
|
|
|
| ($ and shares in thousands, except per share, and ratio data) |
|
2024 |
|
|
|
2023 |
|
|
|
|
|
|
|
|
|
|
|
| Summary of operations: |
|
|
|
|
|
|
|
|
|
|
|
|
|
|
|
|
|
| Net interest income before provision for credit losses |
|
$ |
565,139 |
|
|
|
|
$ |
599,861 |
|
|
|
|
|
|
|
|
|
|
|
|
| Noninterest income |
|
78,988 |
|
|
|
|
59,978 |
|
|
|
|
|
|
|
|
|
|
|
|
| Total revenue |
|
644,127 |
|
|
|
|
659,839 |
|
|
|
|
|
|
|
|
|
|
|
|
| Provision for credit losses |
|
25,000 |
|
|
|
|
20,000 |
|
|
|
|
|
|
|
|
|
|
|
|
|
|
|
|
|
|
|
|
|
|
|
|
|
|
|
|
|
|
|
|
|
|
|
|
|
|
|
|
|
|
|
|
|
|
|
|
| Noninterest expense |
|
246,875 |
|
|
|
|
218,447 |
|
|
|
|
|
|
|
|
|
|
|
|
| Income before income taxes |
|
372,252 |
|
|
|
|
421,392 |
|
|
|
|
|
|
|
|
|
|
|
|
| Income tax expense |
|
87,177 |
|
|
|
|
98,953 |
|
|
|
|
|
|
|
|
|
|
|
|
|
|
|
|
|
|
|
|
|
|
|
|
|
|
|
|
|
|
| Net income |
|
$ |
285,075 |
|
|
|
|
$ |
322,439 |
|
|
|
|
|
|
|
|
|
|
|
|
|
|
|
|
|
|
|
|
|
|
|
|
|
|
|
|
|
|
| Per share: |
|
|
|
|
|
|
|
|
|
|
|
|
|
|
|
|
|
| Basic earnings |
|
$ |
2.04 |
|
|
|
|
$ |
2.28 |
|
|
|
|
|
|
|
|
|
|
|
|
| Diluted earnings |
|
$ |
2.03 |
|
|
|
|
$ |
2.27 |
|
|
|
|
|
|
|
|
|
|
|
|
Adjusted diluted earnings (1) |
|
$ |
2.08 |
|
|
|
|
$ |
2.32 |
|
|
|
|
|
|
|
|
|
|
|
|
| Dividends declared |
|
$ |
0.55 |
|
|
|
|
$ |
0.48 |
|
|
|
|
|
|
|
|
|
|
|
|
|
|
|
|
|
|
|
|
|
|
|
|
|
|
|
|
|
|
|
|
|
|
|
|
|
|
|
|
|
|
|
|
|
|
|
|
|
|
|
|
|
|
|
|
|
|
|
|
|
|
|
|
|
|
| Weighted-average number of shares outstanding: |
|
|
|
|
|
|
|
|
|
|
|
|
|
|
|
|
|
| Basic |
|
139,409 |
|
|
|
|
141,112 |
|
|
|
|
|
|
|
|
|
|
|
|
| Diluted |
|
140,261 |
|
|
|
|
141,913 |
|
|
|
|
|
|
|
|
|
|
|
|
|
|
|
|
|
|
|
|
|
|
|
|
|
|
|
|
|
|
|
|
|
|
|
|
|
|
|
|
|
|
|
|
|
|
|
|
| Performance metrics: |
|
|
|
|
|
|
|
|
|
|
|
|
|
|
|
|
|
| Return on average assets (“ROA”) |
|
1.60 |
% |
|
|
|
2.01 |
% |
|
|
|
|
|
|
|
|
|
|
|
| Return on average common equity (“ROE”) |
|
16.40 |
% |
|
|
|
21.15 |
% |
|
|
|
|
|
|
|
|
|
|
|
Return on average tangible common equity (“TCE”) (1) |
|
17.60 |
% |
|
|
|
22.94 |
% |
|
|
|
|
|
|
|
|
|
|
|
|
|
|
|
|
|
|
|
|
|
|
|
|
|
|
|
|
|
| Common dividend payout ratio |
|
27.33 |
% |
|
|
|
21.22 |
% |
|
|
|
|
|
|
|
|
|
|
|
| Net interest margin |
|
3.34 |
% |
|
|
|
3.96 |
% |
|
|
|
|
|
|
|
|
|
|
|
Efficiency ratio (2) |
|
38.33 |
% |
|
|
|
33.11 |
% |
|
|
|
|
|
|
|
|
|
|
|
Adjusted efficiency ratio (1) |
|
34.68 |
% |
|
|
|
30.46 |
% |
|
|
|
|
|
|
|
|
|
|
|
|
|
|
|
|
|
|
|
|
|
|
|
|
|
|
|
|
|
|
|
|
|
|
|
|
|
|
|
|
|
|
|
|
|
|
|
|
|
|
|
|
|
|
|
|
|
|
|
|
|
|
|
|
|
|
|
|
|
|
|
|
|
|
|
|
|
|
|
|
|
|
|
|
|
|
|
|
|
|
|
|
|
|
|
|
|
|
|
|
|
|
|
|
|
|
|
|
|
|
|
|
|
|
|
|
|
|
|
|
|
|
|
|
|
|
|
|
|
|
|
|
|
|
|
|
|
|
|
|
|
|
|
|
|
|
|
|
|
|
|
|
|
|
|
|
|
|
|
|
|
|
|
|
|
|
|
|
|
|
|
|
|
|
|
|
|
|
|
|
|
|
|
|
|
|
|
|
|
|
|
|
|
|
|
|
|
|
|
|
|
|
|
|
|
|
|
|
|
|
|
|
|
|
|
|
|
|
|
|
|
|
|
|
|
|
|
|
|
|
|
|
|
|
|
|
|
|
|
|
|
|
|
|
|
|
|
|
|
|
|
|
|
|
|
|
|
|
|
|
|
|
|
|
|
|
|
|
|
|
|
|
|
|
|
|
|
|
|
|
|
|
|
|
|
|
|
|
|
|
|
|
|
|
|
|
|
|
|
|
|
|
|
|
|
|
|
|
|
|
|
|
|
|
|
|
|
|
|
|
|
|
|
|
|
|
|
|
|
|
|
|
|
|
|
|
|
|
|
|
|
|
|
|
|
|
|
|
|
|
|
|
|
|
|
|
|
|
|
|
|
|
|
|
|
|
|
|
|
|
|
|
|
|
|
|
|
|
|
|
|
|
|
|
|
|
|
|
|
|
|
|
|
|
|
|
|
|
|
|
|
|
|
|
|
|
|
|
|
|
|
|
|
|
|
|
|
|
|
|
|
|
|
|
|
|
|
|
|
|
|
|
|
|
|
|
|
|
|
|
|
|
|
|
|
|
|
|
|
|
|
|
|
|
|
|
|
|
|
|
|
|
|
|
|
|
|
|
|
|
|
|
|
|
|
|
|
|
|
|
|
|
|
|
|
|
|
|
|
|
|
|
|
|
|
|
|
|
|
|
|
|
|
|
|
|
|
|
|
|
|
|
|
|
|
|
|
|
|
|
|
|
|
|
|
|
|
|
|
|
|
|
|
|
|
|
|
|
|
|
|
|
|
|
|
|
|
|
|
|
|
|
|
|
|
|
|
|
|
|
|
|
|
|
|
|
|
|
|
|
|
|
|
|
|
|
|
|
|
|
|
|
|
|
|
|
|
|
|
|
|
|
|
|
|
|
|
|
|
|
|
|
|
|
|
|
|
|
|
|
|
|
|
|
|
|
|
|
|
|
|
|
|
|
|
|
|
|
|
|
|
|
|
|
|
|
|
|
|
|
|
|
|
|
|
|
|
|
|
|
|
|
|
|
|
|
|
|
|
|
|
|
|
|
|
|
|
|
|
|
|
|
|
|
|
|
|
|
|
|
|
|
|
|
|
|
|
|
|
|
|
|
|
|
|
|
|
|
|
|
|
|
|
|
|
|
|
|
|
|
|
|
|
|
|
|
|
|
|
|
|
|
|
|
|
|
|
|
|
|
|
|
|
|
|
|
|
|
|
|
|
|
|
|
|
|
|
|
|
|
|
|
|
|
|
|
|
|
|
|
|
|
|
|
|
|
|
|
|
|
|
|
|
|
|
|
|
|
|
|
|
|
|
|
|
|
|
|
|
|
|
|
|
|
|
|
|
|
|
|
|
|
|
|
|
|
|
|
|
|
|
|
|
|
|
|
|
|
|
|
|
|
|
|
|
|
|
|
|
|
| At period end: |
|
March 31, 2024 |
|
December 31, 2023 |
| Total assets |
|
$ |
70,875,670 |
|
|
$ |
69,612,884 |
|
| Total loans |
|
$ |
52,005,784 |
|
|
$ |
52,210,898 |
|
| Total deposits |
|
$ |
58,560,624 |
|
|
$ |
56,092,438 |
|
| Common shares outstanding at period-end |
|
139,121 |
|
|
140,027 |
|
| Book value per share |
|
$ |
50.48 |
|
|
$ |
49.64 |
|
Tangible book value per share (1) |
|
$ |
47.09 |
|
|
$ |
46.27 |
|
|
(1)For additional information regarding the reconciliation of these non-U.S. Generally Accepted Accounting Principles (“GAAP”) financial measures, refer to Item 2. Management’s Discussion and Analysis of Financial Condition and Results of Operations (“MD&A”) — Reconciliation of GAAP to Non-GAAP Financial Measures in this Form 10-Q.
(2)Efficiency ratio is calculated as noninterest expense divided by total revenue.
The Company’s first quarter 2024 net income was $285 million, a decrease of $37 million or 12%, compared with first quarter 2023 net income of $322 million. The decrease was primarily due to lower net interest income and higher noninterest expense, partially offset by higher noninterest income and lower income tax expense during the quarter. Noteworthy items about the Company’s performance for the first quarter of 2024 included:
•Asset growth. Total assets reached $70.9 billion as of March 31, 2024, an increase of $1.3 billion or 2% from December 31, 2023, primarily driven by a $2.2 billion or 36% increase in available-for-sale (“AFS”) debt securities mainly funded by a $2.5 billion increase in deposits, partially offset by decreases in cash and cash equivalents and securities purchased under resale agreements (“resale agreements”).
•Deposit growth. Total deposits were $58.6 billion as of March 31, 2024, an increase of $2.5 billion or 4%, from $56.1 billion as of December 31, 2023, primarily reflecting an increase in customer deposits related to a successful branch-based certificates of deposit (“CD”) campaign for the Lunar New Year.
•Borrowings. Total borrowings and long-term debt decreased $1.1 billion to $3.6 billion as of March 31, 2024, compared with December 31, 2023. The net decrease was primarily driven by the $4.5 billion payoff of Bank Term Funding Program (“BTFP”) borrowings and the $117 million redemption of East West Capital Trust securities, partially offset by a $3.5 billion increase in Federal Home Loan Bank (“FHLB”) advances.
•Strong capital levels. Stockholders’ equity was $7.0 billion as of March 31, 2024, up 1% compared with December 31, 2023. Book value and tangible book value per share of $50.48 and $47.09, respectively, as of March 31, 2024, were both up 2% compared with December 31, 2023. Tangible book value per share is a non-GAAP financial measure. For additional details, see the reconciliation of non-GAAP financial measures presented under Item 2. MD&A - Reconciliation of GAAP to non-GAAP Financial Measures in this Form 10-Q.
•Net interest income and net interest margin. First quarter 2024 net interest income before provision for credit losses was $565 million, a decrease of $35 million or 6% from the first quarter of 2023. First quarter 2024 net interest margin of 3.34% was down 62 basis points (“bps”) year-over-year.
•Profitability ratios. First quarter 2024 ROA, ROE and the return on average TCE were 1.60%, 16.40% and 17.60%, respectively. Return on average TCE is a non-GAAP financial measure. For additional details, see the reconciliation of non-GAAP financial measures presented under Item 2. MD&A — Reconciliation of GAAP to Non-GAAP Financial Measures in this Form 10-Q.
Results of Operations
Net Interest Income
The Company’s primary source of revenue is net interest income, which is the interest income earned on interest-earning assets less interest expense paid on interest-bearing liabilities. Net interest margin is the ratio of net interest income to average interest-earning assets. Net interest income and net interest margin are impacted by several factors, including changes in average balances and the composition of interest-earning assets and funding sources, market interest rate fluctuations and the slope of the yield curve, repricing characteristics and maturity of interest-earning assets and interest-bearing liabilities, the volume of noninterest-bearing sources of funds and asset quality.
Net interest income and net interest margin for the first quarter of 2024 decreased year-over-year, which primarily reflected the higher cost of interest-bearing deposits, shifts in the deposit mix to time deposits and higher average balances of short-term and BTFP borrowings, partially offset by higher loan yields, loan growth and an increase in interest-bearing cash and deposits with banks. The changes in yields and rates reflected higher benchmark interest rates.
Average interest-earning assets were $68.1 billion for the first quarter of 2024, an increase of $6.6 billion or 11% from $61.5 billion for the first quarter of 2023. The increase in average interest-earning assets primarily reflected loan growth, and higher interest-bearing cash and deposits with banks.
The yield on average interest-earning assets for the first quarter of 2024 was 6.04%, an increase of 53 bps from 5.51% for the first quarter of 2023. The year-over-year increase in the yield on average interest-earning assets primarily resulted from higher benchmark interest rates.
The average loan yield for the first quarter of 2024 was 6.71%, an increase of 57 bps from 6.14% for the first quarter of 2023. The year-over-year increase in the average loan yield reflected the loan portfolio’s sensitivity to higher benchmark interest rates and loan growth. Approximately 57% and 59% of loans held-for-investment were variable-rate as of March 31, 2024 and 2023, respectively.
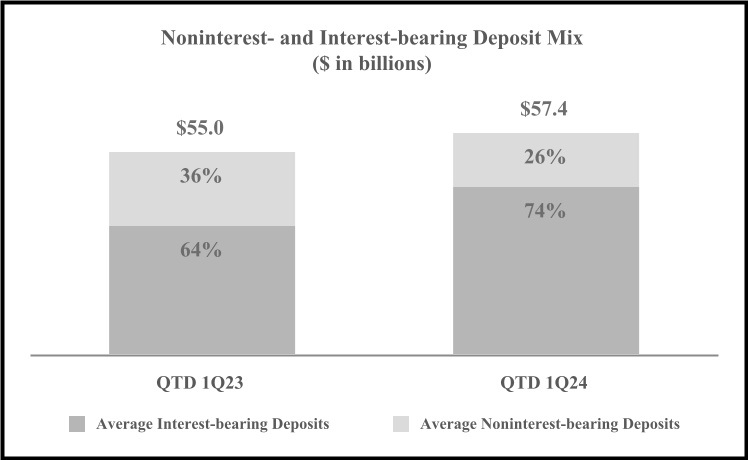
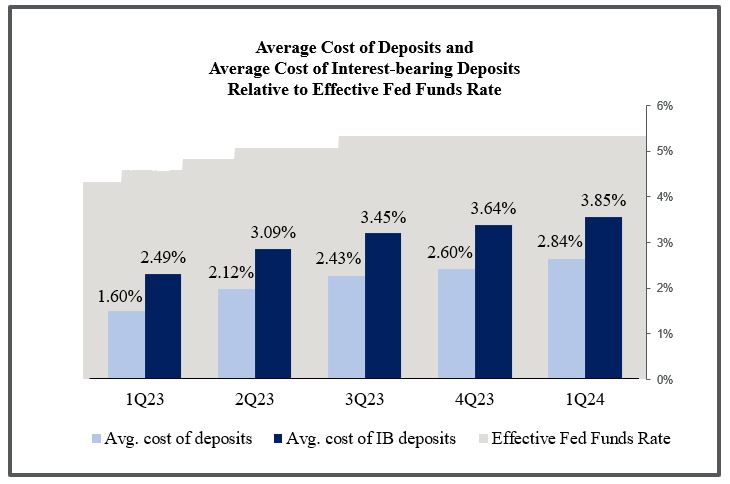
Deposits are an important source of funds and impact both net interest income and net interest margin. Average deposits were $57.4 billion for the first quarter of 2024, which increased $2.5 billion or 5% from $55.0 billion for the first quarter of 2023. Average noninterest-bearing deposits were $15.0 billion for the first quarter of 2024, a decrease of $4.7 billion or 24% from $19.7 billion for the first quarter of 2023, which reflected the deposit mix shift to time deposits. Average noninterest-bearing deposits made up 26% and 36% of average deposits for the first quarters of 2024 and 2023, respectively.
The average cost of deposits was 2.84% for the first quarter of 2024, a 124 bps increase from 1.60% for the first quarter of 2023. The average cost of interest-bearing deposits was 3.85% for the first quarter of 2024, a 136 bps increase from 2.49% for the first quarter of 2023. The year-over-year increase primarily reflected higher rates paid on time deposits, money market and checking deposits in response to the higher interest rate environment.
The average cost of funds calculation includes deposits, short-term and BTFP borrowings, FHLB advances, assets sold under repurchase agreements (“repurchase agreements”), and long-term debt. For the first quarter of 2024, the average cost of funds was 2.97%, a 128 bps increase from 1.69% for the first quarter of 2023. The year-over year increase was mainly driven by the increased cost of deposits discussed above.
The Company utilizes various tools to manage interest rate risk. Refer to the Interest Rate Risk Management section of Item 2. MD&A — Risk Management — Market Risk Management in this Form 10-Q.
The following table presents the interest spread, net interest margin, average balances, interest income and expense, and the average yield/rate by asset and liability component for the first quarters of 2024 and 2023:
|
|
|
|
|
|
|
|
|
|
|
|
|
|
|
|
|
|
|
|
|
|
|
|
|
|
|
|
|
|
|
|
|
|
|
|
|
|
|
|
|
|
Three Months Ended March 31, |
|
|
2024 |
|
2023 |
| ($ in thousands) |
|
Average Balance |
|
Interest |
|
Average Yield/
Rate (1)
|
|
Average Balance |
|
Interest |
|
Average Yield/
Rate (1)
|
| ASSETS |
|
|
|
|
|
|
|
|
|
|
|
|
| Interest-earning assets: |
|
|
|
|
|
|
|
|
|
|
|
|
| Interest-bearing cash and deposits with banks |
|
$ |
5,861,517 |
|
|
$ |
74,382 |
|
|
5.10 |
% |
|
$ |
3,449,626 |
|
|
$ |
35,647 |
|
|
4.19 |
% |
Assets purchased under resale agreements (2) |
|
725,659 |
|
|
6,115 |
|
|
3.39 |
% |
|
688,778 |
|
|
4,503 |
|
|
2.65 |
% |
Debt securities: |
|
|
|
|
|
|
|
|
|
|
|
|
AFS debt securities (3)(4) |
|
6,566,368 |
|
|
62,858 |
|
|
3.85 |
% |
|
6,108,825 |
|
|
53,197 |
|
|
3.53 |
% |
Held-to-maturity (“HTM”) debt securities (3) |
|
2,950,686 |
|
|
12,534 |
|
|
1.71 |
% |
|
2,995,677 |
|
|
12,734 |
|
|
1.72 |
% |
Total debt securities (3) |
|
9,517,054 |
|
|
75,392 |
|
|
3.19 |
% |
|
9,104,502 |
|
|
65,931 |
|
|
2.94 |
% |
| Loans: |
|
|
|
|
|
|
|
|
|
|
|
|
| C&I |
|
16,251,622 |
|
|
325,810 |
|
|
8.06 |
% |
|
15,400,996 |
|
|
275,573 |
|
|
7.26 |
% |
| CRE |
|
20,413,584 |
|
|
324,087 |
|
|
6.39 |
% |
|
19,207,899 |
|
|
282,464 |
|
|
5.96 |
% |
| Residential mortgage |
|
15,202,345 |
|
|
215,674 |
|
|
5.71 |
% |
|
13,468,255 |
|
|
169,494 |
|
|
5.10 |
% |
| Other consumer |
|
57,289 |
|
|
818 |
|
|
5.74 |
% |
|
72,687 |
|
|
855 |
|
|
4.77 |
% |
Total loans (5)(6) |
|
51,924,840 |
|
|
866,389 |
|
|
6.71 |
% |
|
48,149,837 |
|
|
728,386 |
|
|
6.14 |
% |
|
|
|
|
|
|
|
|
|
|
|
|
|
|
|
|
|
|
|
|
|
|
|
|
|
|
|
|
|
|
|
|
|
|
|
|
|
|
|
|
|
|
|
|
|
|
|
|
|
|
|
|
|
|
|
|
|
|
|
|
|
|
|
|
|
|
|
|
|
|
|
|
|
|
|
|
|
|
|
|
|
|
|
|
|
|
|
|
|
|
|
| Restricted equity securities |
|
92,975 |
|
|
1,339 |
|
|
5.79 |
% |
|
90,790 |
|
|
1,039 |
|
|
4.64 |
% |
| Total interest-earning assets |
|
$ |
68,122,045 |
|
|
$ |
1,023,617 |
|
|
6.04 |
% |
|
$ |
61,483,533 |
|
|
$ |
835,506 |
|
|
5.51 |
% |
|
|
|
|
|
|
|
|
|
|
|
|
|
| Noninterest-earning assets: |
|
|
|
|
|
|
|
|
|
|
|
|
| Cash and due from banks |
|
445,767 |
|
|
|
|
|
|
621,104 |
|
|
|
|
|
| Allowance for loan losses |
|
(679,116) |
|
|
|
|
|
|
(602,754) |
|
|
|
|
|
| Other assets |
|
3,789,700 |
|
|
|
|
|
|
3,611,721 |
|
|
|
|
|
| Total assets |
|
$ |
71,678,396 |
|
|
|
|
|
|
$ |
65,113,604 |
|
|
|
|
|
|
|
|
|
|
|
|
|
|
|
|
|
|
| LIABILITIES AND STOCKHOLDERS’ EQUITY |
|
|
|
|
|
|
|
|
|
|
|
|
| Interest-bearing liabilities: |
|
|
|
|
|
|
|
|
|
|
|
|
| Checking deposits |
|
$ |
7,695,429 |
|
|
$ |
53,821 |
|
|
2.81 |
% |
|
$ |
6,493,865 |
|
|
$ |
23,174 |
|
|
1.45 |
% |
| Money market deposits |
|
13,636,210 |
|
|
134,661 |
|
|
3.97 |
% |
|
11,260,715 |
|
|
76,102 |
|
|
2.74 |
% |
| Savings deposits |
|
1,809,568 |
|
|
4,120 |
|
|
0.92 |
% |
|
2,436,587 |
|
|
3,669 |
|
|
0.61 |
% |
| Time deposits |
|
19,346,243 |
|
|
213,597 |
|
|
4.44 |
% |
|
15,052,762 |
|
|
113,849 |
|
|
3.07 |
% |
| Short-term and BTFP borrowings |
|
3,864,525 |
|
|
42,106 |
|
|
4.38 |
% |
|
811,551 |
|
|
8,825 |
|
|
4.41 |
% |
| Repurchase agreements |
|
2,549 |
|
|
35 |
|
|
5.52 |
% |
|
106,785 |
|
|
1,052 |
|
|
4.00 |
% |
| FHLB advances |
|
554,946 |
|
|
7,739 |
|
|
5.61 |
% |
|
500,000 |
|
|
6,430 |
|
|
5.22 |
% |
| Long-term debt and finance lease liabilities |
|
125,818 |
|
|
2,399 |
|
|
7.67 |
% |
|
152,420 |
|
|
2,544 |
|
|
6.77 |
% |
| Total interest-bearing liabilities |
|
$ |
47,035,288 |
|
|
$ |
458,478 |
|
|
3.92 |
% |
|
$ |
36,814,685 |
|
|
$ |
235,645 |
|
|
2.60 |
% |
|
|
|
|
|
|
|
|
|
|
|
|
|
| Noninterest-bearing liabilities and stockholders’ equity: |
|
|
|
|
|
|
|
|
|
|
|
|
| Demand deposits |
|
14,954,953 |
|
|
|
|
|
|
19,709,980 |
|
|
|
|
|
| Accrued expenses and other liabilities |
|
2,695,597 |
|
|
|
|
|
|
2,405,615 |
|
|
|
|
|
| Stockholders’ equity |
|
6,992,558 |
|
|
|
|
|
|
6,183,324 |
|
|
|
|
|
| Total liabilities and stockholders’ equity |
|
$ |
71,678,396 |
|
|
|
|
|
|
$ |
65,113,604 |
|
|
|
|
|
|
|
|
|
|
|
|
|
|
|
|
|
|
| Interest rate spread |
|
|
|
|
|
2.12 |
% |
|
|
|
|
|
2.91 |
% |
| Net interest income and net interest margin |
|
|
|
$ |
565,139 |
|
|
3.34 |
% |
|
|
|
$ |
599,861 |
|
|
3.96 |
% |
|
(1)Annualized.
(2)Includes the average balances and interest income for securities and loans purchased under resale agreements for the first quarter of 2023.
(3)Yields on tax-exempt securities are not presented on a tax-equivalent basis.
(4)Includes the amortization of net premiums on AFS debt securities of $7 million and $9 million for the first quarters of 2024 and 2023, respectively.
(5)Average balances include nonperforming loans and loans held-for-sale.
(6)Loans include the accretion of net deferred loan fees and amortization of net premiums, which totaled $14 million for each of the first quarters of 2024 and 2023.
The following table summarizes the extent to which changes in (1) interest rates, and (2) volume of average interest-earning assets and average interest-bearing liabilities impacted the Company’s net interest income for the periods presented. The total change for each category of interest-earning assets and interest-bearing liabilities is segmented into changes attributable to variations in volume and yield/rate. Changes that are not solely due to either volume or yield/rate are allocated proportionally based on the absolute value of the change related to average volume and average yield/rate.
|
|
|
|
|
|
|
|
|
|
|
|
|
|
|
|
|
|
|
|
|
|
|
|
|
|
|
|
|
|
|
|
|
|
|
|
|
|
|
|
|
|
Three Months Ended March 31, |
|
|
|
|
|
|
|
|
|
|
|
|
2024 vs. 2023 |
|
|
|
|
|
|
|
|
|
|
Changes Due to |
|
|
|
|
|
|
|
|
|
|
|
|
| ($ in thousands) |
|
Total Change |
|
Volume |
|
Yield/Rate |
|
|
|
|
|
|
|
|
|
|
|
|
|
|
|
| Interest-earning assets: |
|
|
|
|
|
|
|
|
|
|
|
|
|
|
|
|
|
|
|
|
|
|
|
|
| Interest-bearing cash and deposits with banks |
|
$ |
38,735 |
|
|
$ |
29,533 |
|
|
$ |
9,202 |
|
|
|
|
|
|
|
|
|
|
|
|
|
|
|
|
|
|
|
Assets purchased under resale agreements (1) |
|
1,612 |
|
|
260 |
|
|
1,352 |
|
|
|
|
|
|
|
|
|
|
|
|
|
|
|
|
|
|
|
Debt securities: |
|
|
|
|
|
|
|
|
|
|
|
|
|
|
|
|
|
|
|
|
|
|
|
|
| AFS debt securities |
|
9,661 |
|
|
4,384 |
|
|
5,277 |
|
|
|
|
|
|
|
|
|
|
|
|
|
|
|
|
|
|
|
| HTM debt securities |
|
(200) |
|
|
(125) |
|
|
(75) |
|
|
|
|
|
|
|
|
|
|
|
|
|
|
|
|
|
|
|
Total debt securities |
|
9,461 |
|
|
4,259 |
|
|
5,202 |
|
|
|
|
|
|
|
|
|
|
|
|
|
|
|
|
|
|
|
| Loans: |
|
|
|
|
|
|
|
|
|
|
|
|
|
|
|
|
|
|
|
|
|
|
|
|
| C&I |
|
50,237 |
|
|
16,678 |
|
|
33,559 |
|
|
|
|
|
|
|
|
|
|
|
|
|
|
|
|
|
|
|
| CRE |
|
41,623 |
|
|
19,582 |
|
|
22,041 |
|
|
|
|
|
|
|
|
|
|
|
|
|
|
|
|
|
|
|
| Residential mortgage |
|
46,180 |
|
|
24,098 |
|
|
22,082 |
|
|
|
|
|
|
|
|
|
|
|
|
|
|
|
|
|
|
|
| Other consumer |
|
(37) |
|
|
(198) |
|
|
161 |
|
|
|
|
|
|
|
|
|
|
|
|
|
|
|
|
|
|
|
Total loans |
|
138,003 |
|
|
60,160 |
|
|
77,843 |
|
|
|
|
|
|
|
|
|
|
|
|
|
|
|
|
|
|
|
| Restricted equity securities |
|
300 |
|
|
27 |
|
|
273 |
|
|
|
|
|
|
|
|
|
|
|
|
|
|
|
|
|
|
|
| Total interest and dividend income |
|
$ |
188,111 |
|
|
$ |
94,239 |
|
|
$ |
93,872 |
|
|
|
|
|
|
|
|
|
|
|
|
|
|
|
|
|
|
|
| Interest-bearing liabilities: |
|
|
|
|
|
|
|
|
|
|
|
|
|
|
|
|
|
|
|
|
|
|
|
|
| Checking deposits |
|
$ |
30,647 |
|
|
$ |
5,024 |
|
|
$ |
25,623 |
|
|
|
|
|
|
|
|
|
|
|
|
|
|
|
|
|
|
|
| Money market deposits |
|
58,559 |
|
|
18,715 |
|
|
39,844 |
|
|
|
|
|
|
|
|
|
|
|
|
|
|
|
|
|
|
|
| Savings deposits |
|
451 |
|
|
(1,103) |
|
|
1,554 |
|
|
|
|
|
|
|
|
|
|
|
|
|
|
|
|
|
|
|
| Time deposits |
|
99,748 |
|
|
38,819 |
|
|
60,929 |
|
|
|
|
|
|
|
|
|
|
|
|
|
|
|
|
|
|
|
| Short-term and BTFP borrowings |
|
33,281 |
|
|
33,338 |
|
|
(57) |
|
|
|
|
|
|
|
|
|
|
|
|
|
|
|
|
|
|
|
| FHLB advances |
|
1,309 |
|
|
776 |
|
|
533 |
|
|
|
|
|
|
|
|
|
|
|
|
|
|
|
|
|
|
|
| Repurchase agreements |
|
(1,017) |
|
|
(1,314) |
|
|
297 |
|
|
|
|
|
|
|
|
|
|
|
|
|
|
|
|
|
|
|
| Long-term debt and finance lease liabilities |
|
(145) |
|
|
(469) |
|
|
324 |
|
|
|
|
|
|
|
|
|
|
|
|
|
|
|
|
|
|
|
| Total interest expense |
|
$ |
222,833 |
|
|
$ |
93,786 |
|
|
$ |
129,047 |
|
|
|
|
|
|
|
|
|
|
|
|
|
|
|
|
|
|
|
| Change in net interest income |
|
$ |
(34,722) |
|
|
$ |
453 |
|
|
$ |
(35,175) |
|
|
|
|
|
|
|
|
|
|
|
|
|
|
|
|
|
|
|
|
(1)Includes the impact of securities and loans purchased under resale agreements for the first quarter of 2023.
Noninterest Income
The following table presents the components of noninterest income for the first quarters of 2024 and 2023:
|
|
|
|
|
|
|
|
|
|
|
|
|
|
|
|
|
|
|
|
|
|
|
|
|
|
|
|
|
|
|
|
|
|
|
|
|
|
Three Months Ended March 31, |
|
|
|
|
|
|
|
|
|
|
|
|
|
|
|
|
|
|
|
|
|
|
|
|
|
| ($ in thousands) |
|
2024 |
|
2023 |
|
|
|
% Change |
|
|
|
|
|
|
|
|
|
|
|
|
Deposit account fees |
|
$ |
24,948 |
|
|
$ |
23,054 |
|
|
|
|
8% |
|
|
|
|
|
|
|
|
|
|
|
|
| Lending fees |
|
22,925 |
|
|
20,586 |
|
|
|
|
11% |
|
|
|
|
|
|
|
|
|
|
|
|
| Foreign exchange income |
|
11,469 |
|
|
11,309 |
|
|
|
|
1% |
|
|
|
|
|
|
|
|
|
|
|
|
| Wealth management fees |
|
8,592 |
|
|
6,304 |
|
|
|
|
36% |
|
|
|
|
|
|
|
|
|
|
|
|
| Customer derivative income |
|
3,750 |
|
|
2,564 |
|
|
|
|
46% |
|
|
|
|
|
|
|
|
|
|
|
|
Net losses on sales of loans |
|
(41) |
|
|
(22) |
|
|
|
|
(86)% |
|
|
|
|
|
|
|
|
|
|
|
|
Net gains (losses) on AFS debt securities |
|
49 |
|
|
(10,000) |
|
|
|
|
NM |
|
|
|
|
|
|
|
|
|
|
|
|
|
|
|
|
|
|
|
|
|
|
|
|
|
|
|
|
|
|
|
|
|
|
|
|
|
|
|
|
|
|
|
|
|
|
|
|
|
|
|
|
|
|
| Other investment income |
|
2,815 |
|
|
1,921 |
|
|
|
|
47% |
|
|
|
|
|
|
|
|
|
|
|
|
| Other income |
|
4,481 |
|
|
4,262 |
|
|
|
|
5% |
|
|
|
|
|
|
|
|
|
|
|
|
Total noninterest income |
|
$ |
78,988 |
|
|
$ |
59,978 |
|
|
|
|
32% |
|
|
|
|
|
|
|
|
|
|
|
|
|
NM — Not meaningful.
Noninterest income comprised 12% of total revenue for the first quarter of 2024, compared with 9% for the first quarter of 2023. Noninterest income for the first quarter of 2024 was $79 million, an increase of $19 million or 32%, compared with $60 million for the first quarter of 2023. The increase was primarily due to net gains on AFS debt securities and increases in lending, wealth management and deposit account fees.
Deposit account fees were $25 million for the first quarter of 2024, an increase of $2 million or 8%, compared with $23 million for the first quarter of 2023. The increase was primarily related to analysis charges, which reflected customer growth and fee increases.
Lending fees were $23 million for the first quarter of 2024, an increase of $2 million or 11%, compared with $21 million for the first quarter of 2023. The increase was primarily due to higher unused commitment and trade finance fees driven by an increase in customers.
Wealth management fees were $9 million for the first quarter of 2024, an increase of approximately $2 million or 36%, compared with $6 million for the first quarter of 2023. The increase reflected customer demand for higher-yielding products in response to the interest rate environment and potential rate cuts.
Net gains on AFS debt securities were $49 thousand for the first quarter of 2024. In comparison, net losses on AFS debt securities were $10 million for the first quarter of 2023 due to the write-off of an impaired subordinated AFS debt security.
Noninterest Expense
The following table presents the components of noninterest expense for the first quarters of 2024 and 2023:
|
|
|
|
|
|
|
|
|
|
|
|
|
|
|
|
|
|
|
|
|
|
|
|
|
|
|
|
|
|
|
|
|
|
|
|
|
|
Three Months Ended March 31, |
|
|
|
|
|
|
|
|
|
|
|
|
|
|
|
|
|
|
|
|
|
|
|
|
| ($ in thousands) |
|
2024 |
|
2023 |
|
|
|
% Change |
|
|
|
|
|
|
|
|
|
|
|
|
| Compensation and employee benefits |
|
$ |
141,812 |
|
|
$ |
129,654 |
|
|
|
|
9 |
% |
|
|
|
|
|
|
|
|
|
|
|
|
| Occupancy and equipment expense |
|
15,230 |
|
|
15,587 |
|
|
|
|
(2) |
% |
|
|
|
|
|
|
|
|
|
|
|
|
| Deposit insurance premiums and regulatory assessments |
|
19,649 |
|
|
7,910 |
|
|
|
|
148 |
% |
|
|
|
|
|
|
|
|
|
|
|
|
| Deposit account expense |
|
12,188 |
|
|
9,609 |
|
|
|
|
27 |
% |
|
|
|
|
|
|
|
|
|
|
|
|
|
|
|
|
|
|
|
|
|
|
|
|
|
|
|
|
|
|
|
|
|
Computer software and data processing expenses |
|
11,344 |
|
|
10,707 |
|
|
|
|
6 |
% |
|
|
|
|
|
|
|
|
|
|
|
|
|
|
|
|
|
|
|
|
|
|
|
|
|
|
|
|
|
|
|
|
|
|
|
|
|
|
|
|
|
|
|
|
|
|
|
|
|
|
|
|
|
|
| Other operating expense |
|
33,445 |
|
|
34,870 |
|
|
|
|
(4) |
% |
|
|
|
|
|
|
|
|
|
|
|
|
Amortization of tax credit and CRA investments |
|
13,207 |
|
|
10,110 |
|
|
|
|
31 |
% |
|
|
|
|
|
|
|
|
|
|
|
|
|
|
|
|
|
|
|
|
|
|
|
|
|
|
|
|
|
|
|
|
|
|
|
|
|
|
|
|
|
|
|
|
|
|
|
|
|
|
|
|
|
|
Total noninterest expense |
|
$ |
246,875 |
|
|
$ |
218,447 |
|
|
|
|
13 |
% |
|
|
|
|
|
|
|
|
|
|
|
|
|
First quarter 2024 noninterest expense was $247 million, an increase of $28 million or 13%, compared with $218 million for the first quarter of 2023. The increase was primarily due to increases in compensation and employee benefits and deposit insurance premiums and regulatory assessments.
Compensation and employee benefits were $142 million for the first quarter of 2024, an increase of $12 million or 9%, compared with $130 million for the first quarter of 2023. The increase was primarily driven by staffing growth and annual merit increases.
Deposit insurance premiums and regulatory assessments were $20 million for the first quarter of 2024, an increase of $12 million or 148%, compared with $8 million for the first quarter of 2023. The increase was primarily due to an additional $10 million FDIC charge. For additional information about the FDIC special assessment, refer to Item 2. MD&A — Overview — Current Developments in this Form 10-Q.
Income Taxes
|
|
|
|
|
|
|
|
|
|
|
|
|
|
|
|
|
|
|
|
|
|
|
|
|
|
|
|
|
|
|
|
|
|
|
|
|
|
|
|
|
|
Three Months Ended March 31, |
|
|
|
|
|
|
| ($ in thousands) |
|
2024 |
|
2023 |
|
% Change |
|
|
|
|
|
|
|
|
|
|
|
|
|
|
|
|
|
|
Income before income taxes |
|
$ |
372,252 |
|
|
$ |
421,392 |
|
|
(12) |
% |
|
|
|
|
|
|
|
|
|
|
|
|
|
|
|
|
|
|
| Income tax expense |
|
$ |
87,177 |
|
|
$ |
98,953 |
|
|
(12) |
% |
|
|
|
|
|
|
|
|
|
|
|
|
|
|
|
|
|
|
| Effective tax rate |
|
23.4 |
% |
|
23.5 |
% |
|
|
|
|
|
|
|
|
|
|
|
|
|
|
|
|
|
|
|
|
|
First quarter 2024 income tax expense was $87 million and the effective tax rate was 23.4%, compared with first quarter 2023 income tax expense of $99 million and an effective tax rate of 23.5%. The decrease in income tax expense for the first quarter of 2024 compared with the year-ago period was primarily due to lower pre-tax income.
Operating Segment Results
The Company organizes its operations into three reportable operating segments: (1) Consumer and Business Banking; (2) Commercial Banking; and (3) Other. These segments are defined by the type of customers served and the related products and services provided. For a description of the Company’s internal management reporting process, including the segment cost allocation methodology, see Note 15 — Business Segments to the Consolidated Financial Statements in this Form 10-Q.
Segment net interest income represents the difference between actual interest earned on assets and interest incurred on liabilities of the segment, adjusted for funding charges or credits through the Company’s internal funds transfer pricing process.
The following table presents the results by operating segment for the periods indicated:
|
|
|
|
|
|
|
|
|
|
|
|
|
|
|
|
|
|
|
|
|
|
|
|
|
|
|
|
|
|
|
|
|
|
|
|
|
|
|
|
|
|
Three Months Ended March 31, |
|
|
Consumer and Business Banking |
|
Commercial Banking |
|
Other |
| ($ in thousands) |
|
2024 |
|
2023 |
|
2024 |
|
2023 |
|
2024 |
|
2023 |
| Total revenue |
|
$ |
317,306 |
|
|
$ |
330,244 |
|
|
$ |
306,815 |
|
|
$ |
280,322 |
|
|
$ |
20,006 |
|
|
$ |
49,273 |
|
| Provision for credit losses |
|
2,565 |
|
|
15,012 |
|
|
22,435 |
|
|
4,988 |
|
|
— |
|
|
— |
|
|
|
|
|
|
|
|
|
|
|
|
|
|
|
|
|
|
|
|
|
|
|
|
|
|
|
|
|
|
|
|
|
|
|
|
|
|
|
|
|
|
|
|
|
|
|
|
|
|
|
|
|
|
|
|
|
|
|
|
|
|
|
|
|
|
|
|
|
|
|
|
|
|
|
|
|
|
|
|
|
|
|
|
|
|
|
|
|
|
|
|
|
|
|
|
|
|
|
|
|
|
|
|
|
|
|
|
|
|
|
|
|
|
|
|
|
|
|
|
|
|
|
|
|
|
|
|
|
|
|
|
|
|
|
|
|
|
|
|
|
|
|
|
|
|
|
|
|
|
|
|
|
|
|
|
|
|
|
|
|
|
|
|
|
|
|
|
|
|
|
|
|
|
|
|
|
|
|
|
|
|
|
|
|
|
|
|
|
|
|
|
|
|
|
|
|
|
|
|
|
|
|
|
|
|
|
|
|
|
|
|
|
|
|
|
|
|
|
|
|
|
|
|
|
|
|
|
|
|
|
|
|
|
|
|
|
|
|
|
|
|
|
|
|
|
|
|
|
|
|
|
|
|
|
|
|
|
|
|
|
|
|
|
|
|
|
|
|
|
|
|
|
|
|
|
|
|
|
|
|
|
|
|
|
|
|
|
|
|
|
|
|
|
|
|
|
|
|
|
| Noninterest expense |
|
119,300 |
|
|
113,823 |
|
|
106,307 |
|
|
87,248 |
|
|
21,268 |
|
|
17,376 |
|
Segment income (loss) before income taxes |
|
195,441 |
|
|
201,409 |
|
|
178,073 |
|
|
188,086 |
|
|
(1,262) |
|
|
31,897 |
|
|
|
|
|
|
|
|
|
|
|
|
|
|
| Segment net income |
|
$ |
137,672 |
|
|
$ |
142,247 |
|
|
$ |
125,581 |
|
|
$ |
134,457 |
|
|
$ |
21,822 |
|
|
$ |
45,735 |
|
|
Consumer and Business Banking
The Consumer and Business Banking segment primarily provides financial products and services to consumer and commercial customers through the Company’s domestic branch network and digital banking platform. This segment offers consumer and commercial deposits, mortgage and home equity loans, and other products and services. It also originates commercial loans for small- and medium-sized enterprises through the Company’s branch network. Other products and services provided by this segment include wealth management, treasury management, interest rate risk hedging and foreign exchange services.
The following table presents additional financial information for the Consumer and Business Banking segment for the periods indicated:
|
|
|
|
|
|
|
|
|
|
|
|
|
|
|
|
|
|
|
|
|
|
|
|
|
|
|
|
|
|
Three Months Ended March 31, |
|
|
|
|
|
|
Change from 2023 |
| ($ in thousands) |
|
2024 |
|
2023 |
|
$ |
|
% |
| Net interest income before provision for credit losses |
|
$ |
291,764 |
|
|
$ |
304,242 |
|
|
$ |
(12,478) |
|
|
(4) |
% |
| Noninterest income |
|
25,542 |
|
|
26,002 |
|
|
(460) |
|
|
(2) |
% |
| Total revenue |
|
317,306 |
|
|
330,244 |
|
|
(12,938) |
|
|
(4) |
% |
| Provision for credit losses |
|
2,565 |
|
|
15,012 |
|
|
(12,447) |
|
|
(83) |
% |
| Noninterest expense |
|
119,300 |
|
|
113,823 |
|
|
5,477 |
|
|
5 |
% |
| Segment income before income taxes |
|
195,441 |
|
|
201,409 |
|
|
(5,968) |
|
|
(3) |
% |
| Income tax expense |
|
57,769 |
|
|
59,162 |
|
|
(1,393) |
|
|
(2) |
% |
| Segment net income |
|
$ |
137,672 |
|
|
$ |
142,247 |
|
|
$ |
(4,575) |
|
|
(3) |
% |
| Average loans |
|
$ |
19,137,292 |
|
|
$ |
17,110,917 |
|
|
$ |
2,026,375 |
|
|
12 |
% |
| Average deposits |
|
$ |
33,786,818 |
|
|
$ |
33,848,051 |
|
|
$ |
(61,233) |
|
|
0 |
% |
|
Consumer and Business Banking segment net income decreased by $5 million or 3% year-over-year to $138 million for the first quarter of 2024. This decrease was primarily driven by a decrease in net interest income and an increase in noninterest expense, partially offset by a decrease in provision for credit losses. Net interest income before provision for credit losses decreased by $12 million or 4% year-over-year to $292 million for the first quarter of 2024. This decrease was primarily driven by a higher cost of interest-bearing deposits and continued deposit mix shift. Provision for credit losses decreased by $12 million or 83% year-over-year to $3 million for the first quarter of 2024. This decrease was primarily driven by the substantial residential mortgage loan growth from the Bridge To Home Ownership program that required higher provision for credit losses in the first quarter of 2023. Noninterest expense increased $5 million or 5% year-over-year to $119 million for the first quarter of 2024, primarily due to an increase in deposit insurance premiums and regulatory assessments largely resulting from the FDIC charge.
Commercial Banking
The Commercial Banking segment primarily generates commercial loan and deposit products. Commercial loan products include CRE lending, construction finance, commercial business lending, working capital lines of credit, trade finance, letters of credit, affordable housing lending, asset-based lending, asset-backed finance, project finance and equipment financing. Commercial deposit products and other financial services include treasury management, foreign exchange services, and interest rate and commodity risk hedging.
The following table presents additional financial information for the Commercial Banking segment for the periods indicated:
|
|
|
|
|
|
|
|
|
|
|
|
|
|
|
|
|
|
|
|
|
|
|
|
|
|
|
|
|
|
Three Months Ended March 31, |
|
|
|
|
|
|
Change from 2023 |
| ($ in thousands) |
|
2024 |
|
2023 |
|
$ |
|
% |
| Net interest income before provision for credit losses |
|
$ |
260,349 |
|
|
$ |
236,723 |
|
|
$ |
23,626 |
|
|
10 |
% |
| Noninterest income |
|
46,466 |
|
|
43,599 |
|
|
2,867 |
|
|
7 |
% |
| Total revenue |
|
306,815 |
|
|
280,322 |
|
|
26,493 |
|
|
9 |
% |
| Provision for credit losses |
|
22,435 |
|
|
4,988 |
|
|
17,447 |
|
|
350 |
% |
| Noninterest expense |
|
106,307 |
|
|
87,248 |
|
|
19,059 |
|
|
22 |
% |
| Segment income before income taxes |
|
178,073 |
|
|
188,086 |
|
|
(10,013) |
|
|
(5) |
% |
| Income tax expense |
|
52,492 |
|
|
53,629 |
|
|
(1,137) |
|
|
(2) |
% |
| Segment net income |
|
$ |
125,581 |
|
|
$ |
134,457 |
|
|
$ |
(8,876) |
|
|
(7) |
% |
| Average loans |
|
$ |
32,787,548 |
|
|
$ |
31,038,920 |
|
|
$ |
1,748,628 |
|
|
6 |
% |
| Average deposits |
|
$ |
21,054,189 |
|
|
$ |
17,282,964 |
|
|
$ |
3,771,225 |
|
|
22 |
% |
|
Commercial Banking segment net income decreased by $9 million or 7% year-over-year to $126 million for the first quarter of 2024. This decrease was due to higher noninterest expense and provision for credit losses, partially offset by higher net interest income. Net interest income before provision for credit losses increased $24 million or 10% year-over-year to $260 million for the first quarter of 2024. This increase was primarily due to higher loan interest income from commercial loan growth. Provision for credit losses increased $17 million or 350% year-over-year to $22 million for the first quarter of 2024, primarily driven by continued caution regarding the CRE market outlook. Noninterest expense increased $19 million or 22% year-over-year to $106 million for the first quarter of 2024, primarily due to higher compensation and employee benefits, deposit insurance premiums and regulatory assessments, and deposit account expense.
Other
Centralized functions, including the corporate treasury activities of the Company and eliminations of inter-segment amounts, have been aggregated and included in the Other segment, which provides broad administrative support to the two core segments, namely the Consumer and Business Banking and the Commercial Banking segments.
The following table presents additional financial information for the Other segment for the periods indicated:
|
|
|
|
|
|
|
|
|
|
|
|
|
|
|
|
|
|
|
|
|
|
|
|
|
|
|
|
|
|
Three Months Ended March 31, |
|
|
|
|
|
|
Change from 2023 |
| ($ in thousands) |
|
2024 |
|
2023 |
|
$ |
|
% |
Net interest income before provision for credit losses |
|
$ |
13,026 |
|
|
$ |
58,896 |
|
|
$ |
(45,870) |
|
|
(78) |
% |
Noninterest income (loss) |
|
6,980 |
|
|
(9,623) |
|
|
16,603 |
|
|
173 |
% |
| Total revenue |
|
20,006 |
|
|
49,273 |
|
|
(29,267) |
|
|
(59) |
% |
|
|
|
|
|
|
|
|
|
| Noninterest expense |
|
21,268 |
|
|
17,376 |
|
|
3,892 |
|
|
22 |
% |
Segment (loss) income before income taxes |
|
(1,262) |
|
|
31,897 |
|
|
(33,159) |
|
|
(104) |
% |
| Income tax benefit |
|
23,084 |
|
|
13,838 |
|
|
9,246 |
|
|
67 |
% |
| Segment net income |
|
$ |
21,822 |
|
|
$ |
45,735 |
|
|
$ |
(23,913) |
|
|
(52) |
% |
|
|
|
|
|
|
|
|
|
| Average deposits |
|
$ |
2,601,396 |
|
|
$ |
3,822,894 |
|
|
$ |
(1,221,498) |
|
|
(32) |
% |
|
The Other segment reported segment loss before income taxes of $1 million and segment net income of $22 million, reflecting an income tax benefit of $23 million for the first quarter of 2024. The decrease in segment net income was primarily driven by lower net interest income, partially offset by an increase in noninterest income. The $46 million decrease in net interest income before provision for credit losses was primarily driven by the higher cost of BTFP borrowings. Noninterest income increased by $17 million for the first quarter of 2024, mainly due to a $10 million write-off of an impaired AFS debt security during the first quarter of 2023 and an increase in foreign exchange income.
The income tax expense or benefit in the Other segment consists of the remaining unallocated income tax expense or benefit after allocating income tax expense to the two core segments, and reflects the impact of tax credit investment activity. Income tax expense is allocated to the Consumer and Business Banking and the Commercial Banking segments by applying statutory income tax rates to the segment income before income taxes. Tax credit investment amortization is allocated to the Other segment.
Balance Sheet Analysis
Debt Securities
The Company maintains a portfolio of high quality and liquid debt securities with a moderate duration profile. It closely manages the overall portfolio credit, interest rate and liquidity risks. The Company’s debt securities provide:
•interest income for earnings and yield enhancement;
•funding availability for needs arising during the normal course of business;
•the ability to execute interest rate risk management strategies in response to changes in economic or market conditions; and
•collateral to support pledging agreements as required and/or to enhance the Company’s borrowing capacity.
While the Company does not intend to sell its debt securities, it may sell AFS debt securities in response to changes in the balance sheet and related interest rate risk to meet liquidity, regulatory and strategic requirements.
The following table presents the distribution of the Company’s AFS and HTM debt securities portfolio as of March 31, 2024 and December 31, 2023, and by credit ratings as of March 31, 2024:
|
|
|
|
|
|
|
|
|
|
|
|
|
|
|
|
|
|
|
|
|
|
|
|
|
|
|
|
|
|
|
|
|
|
|
|
|
|
|
|
|
|
|
|
|
|
|
|
|
|
|
|
|
|
|
|
|
|
|
|
|
|
|
|
|
|
|
|
|
|
|
|
|
|
|
|
|
|
|
|
March 31, 2024 |
|
December 31, 2023 |
|
|
|
|
|
Ratings as of March 31, 2024 (1) |
|
| ($ in thousands) |
|
Amortized Cost |
|
Fair Value |
|
|
% of Fair Value |
|
Amortized Cost |
|
Fair Value |
|
|
% of Fair Value |
|
|
|
|
|
AAA/AA |
|
A |
|
BBB |
|
BB and Lower |
|
No Rating (2) |
|
| AFS debt securities: |
|
|
|
|
|
|
|
|
|
|
|
|
|
|
|
|
|
|
|
|
|
|
|
|
|
|
|
|
|
| U.S. Treasury securities |
|
$ |
676,290 |
|
|
$ |
621,094 |
|
|
|
7 |
% |
|
$ |
1,112,587 |
|
|
$ |
1,060,375 |
|
|
|
17 |
% |
|
|
|
|
|
100 |
% |
|
— |
% |
|
— |
% |
|
— |
% |
|
— |
% |
|
| U.S. government agency and U.S. government-sponsored enterprise debt securities |
|
410,676 |
|
|
360,802 |
|
|
|
4 |
% |
|
412,086 |
|
|
364,446 |
|
|
|
6 |
% |
|
|
|
|
|
100 |
% |
|
— |
% |
|
— |
% |
|
— |
% |
|
— |
% |
|
U.S. government agency and U.S. government-sponsored enterprise mortgage-backed securities (3) |
|
5,742,708 |
|
|
5,448,018 |
|
|
|
65 |
% |
|
2,488,304 |
|
|
2,195,853 |
|
|
|
35 |
% |
|
|
|
|
|
100 |
% |
|
— |
% |
|
— |
% |
|
— |
% |
|
— |
% |
|
| Municipal securities |
|
296,360 |
|
|
258,495 |
|
|
|
3 |
% |
|
297,283 |
|
|
261,016 |
|
|
|
4 |
% |
|
|
|
|
|
98 |
% |
|
— |
% |
|
— |
% |
|
— |
% |
|
2 |
% |
|
| Non-agency mortgage-backed securities |
|
983,539 |
|
|
853,653 |
|
|
|
10 |
% |
|
1,052,913 |
|
|
921,187 |
|
|
|
15 |
% |
|
|
|
|
|
86 |
% |
|
— |
% |
|
— |
% |
|
— |
% |
|
14 |
% |
|
| Corporate debt securities |
|
653,501 |
|
|
502,647 |
|
|
|
6 |
% |
|
653,501 |
|
|
502,425 |
|
|
|
8 |
% |
|
|
|
|
|
— |
% |
|
31 |
% |
|
66 |
% |
|
3 |
% |
|
— |
% |
|
| Foreign government bonds |
|
238,592 |
|
|
227,196 |
|
|
|
3 |
% |
|
239,333 |
|
|
227,874 |
|
|
|
4 |
% |
|
|
|
|
|
47 |
% |
|
53 |
% |
|
— |
% |
|
— |
% |
|
— |
% |
|
| Asset-backed securities |
|
41,287 |
|
|
40,712 |
|
|
|
1 |
% |
|
43,234 |
|
|
42,300 |
|
|
|
1 |
% |
|
|
|
|
|
100 |
% |
|
— |
% |
|
— |
% |
|
— |
% |
|
— |
% |
|
| Collateralized loan obligations |
|
89,000 |
|
|
87,851 |
|
|
|
1 |
% |
|
617,250 |
|
|
612,861 |
|
|
|
10 |
% |
|
|
|
|
|
72 |
% |
|
28 |
% |
|
— |
% |
|
— |
% |
|
— |
% |
|
| Total AFS debt securities |
|
$ |
9,131,953 |
|
|
$ |
8,400,468 |
|
|
|
100 |
% |
|
$ |
6,916,491 |
|
|
$ |
6,188,337 |
|
|
|
100 |
% |
|
|
|
|
|
91 |
% |
|
4 |
% |
|
4 |
% |
|
0 |
% |
|
1 |
% |
|
|
|
|
|
|
|
|
|
|
|
|
|
|
|
|
|
|
|
|
|
|
|
|
|
|
|
|
|
|
|
| HTM debt securities: |
|
|
|
|
|
|
|
|
|
|
|
|
|
|
|
|
|
|
|
|
|
|
|
|
|
|
|
|
|
| U.S. Treasury securities |
|
$ |
530,921 |
|
|
$ |
485,400 |
|
|
|
20 |
% |
|
$ |
529,548 |
|
|
$ |
488,551 |
|
|
|
20 |
% |
|
|
|
|
|
100 |
% |
|
— |
% |
|
— |
% |
|
— |
% |
|
— |
% |
|
| U.S. government agency and U.S. government-sponsored enterprise debt securities |
|
1,002,697 |
|
|
805,799 |
|
|
|
33 |
% |
|
1,001,836 |
|
|
814,932 |
|
|
|
33 |
% |
|
|
|
|
|
100 |
% |
|
— |
% |
|
— |
% |
|
— |
% |
|
— |
% |
|
U.S. government agency and U.S. government-sponsored enterprise mortgage-backed securities (4) |
|
1,226,419 |
|
|
979,270 |
|
|
|
41 |
% |
|
1,235,784 |
|
|
1,004,697 |
|
|
|
41 |
% |
|
|
|
|
|
100 |
% |
|
— |
% |
|
— |
% |
|
— |
% |
|
— |
% |
|
| Municipal securities |
|
188,605 |
|
|
144,009 |
|
|
|
6 |
% |
|
188,872 |
|
|
145,791 |
|
|
|
6 |
% |
|
|
|
|
|
100 |
% |
|
— |
% |
|
— |
% |
|
— |
% |
|
— |
% |
|
| Total HTM debt securities |
|
$ |
2,948,642 |
|
|
$ |
2,414,478 |
|
|
|
100 |
% |
|
$ |
2,956,040 |
|
|
$ |
2,453,971 |
|
|
|
100 |
% |
|
|
|
|
|
100 |
% |
|
— |
% |
|
— |
% |
|
— |
% |
|
— |
% |
|
| Total debt securities |
|
$ |
12,080,595 |
|
|
$ |
10,814,946 |
|
|
|
|
|
$ |
9,872,531 |
|
|
$ |
8,642,308 |
|
|
|
|
|
|
|
|
|
|
|
|
|
|
|
|
|
|
|
|
|
(1)Credit ratings express opinions about the credit quality of a debt security. The Company determines the credit rating of a security according to the lowest credit rating made available by nationally recognized statistical rating organizations (“NRSROs”). Debt securities rated investment grade, which are those with ratings similar to BBB- or above (as defined by NRSROs), are generally considered by the rating agencies and market participants to be low credit risk. Ratings percentages are allocated based on fair value.
(2)For debt securities not rated by NRSROs, the Company uses other factors which include but are not limited to the priority in collections within the securitization structure, and whether the contractual payments have historically been on time.
(3)Includes Government National Mortgage Association (“GNMA”) AFS debt securities totaling $4.5 billion of amortized cost and $4.4 billion of fair value as of March 31, 2024, and $1.3 billion of amortized cost and $1.2 billion of fair value as of December 31, 2023.
(4)Includes GNMA HTM debt securities totaling $91 million of amortized cost and $73 million of fair value as of March 31, 2024, and $92 million of amortized cost and $75 million of fair value of as of December 31, 2023.
As of March 31, 2024, the Company’s AFS and HTM debt securities portfolios had an effective duration (defined as the sensitivity of the value of the portfolio to interest rate changes) of 2.8 and 7.4, respectively, compared with 3.6 and 7.5, respectively, as of December 31, 2023. The decrease in the AFS effective duration was primarily due to the purchases of floating rate GNMA securities. The decrease in the HTM effective duration was due to the portfolio seasoning.
Available-for-Sale Debt Securities
The fair value of AFS debt securities totaled $8.4 billion as of March 31, 2024, an increase of $2.2 billion or 36% from $6.2 billion as of December 31, 2023. The increase was primarily due to the purchases of GNMA securities, which were mainly funded by an increase in deposits. The Company’s AFS debt securities are carried at fair value with non-credit related unrealized gains and losses, net of tax, reported in Other comprehensive income (loss) on the Consolidated Statement of Comprehensive Income. Pre-tax net unrealized losses on AFS debt securities were $731 million as of March 31, 2024, compared with $728 million as of December 31, 2023.
As of March 31, 2024 and December 31, 2023, 99% and 97%, respectively, of the carrying value of the AFS debt securities portfolio was rated investment grade by NRSROs. Of the AFS debt securities with gross unrealized losses, substantially all were rated investment grade as of both March 31, 2024 and December 31, 2023. There was no allowance for credit losses provided against the AFS debt securities as of each of March 31, 2024 and December 31, 2023. Additionally, there were no credit losses recognized in earnings for the first quarters of 2024 and 2023.
Held-to-Maturity Debt Securities
All HTM debt securities were issued, guaranteed, or supported by the U.S. government or government-sponsored enterprises. Accordingly, the Company applied a zero credit loss assumption for these securities and no allowance for credit loss was recorded as of both March 31, 2024 and December 31, 2023.
For additional information on AFS and HTM securities, see Note 1 — Summary of Significant Accounting Policies to the Consolidated Financial Statements in the Company’s 2023 Form 10-K and Note 3 — Fair Value Measurement and Fair Value of Financial Instruments and Note 5 — Securities to the Consolidated Financial Statements in this Form 10-Q.
Loan Portfolio
The Company offers a broad range of financial products designed to meet the credit needs of its borrowers. The Company’s loan portfolio segments include commercial loans, which consist of C&I, CRE, multifamily residential, and construction and land loans, as well as consumer loans, which consist of single-family residential, home equity lines of credit (“HELOCs”) and other consumer loans. Loans held-for-investment totaled $52.0 billion and $52.2 billion as of March 31, 2024 and December 31, 2023, respectively, and the composition of the loan portfolio as of March 31, 2024 was similar to the composition as of December 31, 2023.
The following table presents the composition of the Company’s total loan portfolio by loan type as of March 31, 2024 and December 31, 2023:
|
|
|
|
|
|
|
|
|
|
|
|
|
|
|
|
|
|
|
|
|
|
|
|
|
|
|
|
|
|
|
|
|
|
March 31, 2024 |
|
December 31, 2023 |
|
|
| ($ in thousands) |
|
Amount |
|
% |
|
Amount |
|
% |
|
|
|
|
| Commercial: |
|
|
|
|
|
|
|
|
|
|
|
|
C&I |
|
$ |
16,350,191 |
|
|
31 |
% |
|
$ |
16,581,079 |
|
|
32 |
% |
|
|
|
|
| CRE: |
|
|
|
|
|
|
|
|
|
|
|
|
| CRE |
|
14,609,655 |
|
|
28 |
% |
|
14,777,081 |
|
|
28 |
% |
|
|
|
|
| Multifamily residential |
|
5,010,245 |
|
|
10 |
% |
|
5,023,163 |
|
|
10 |
% |
|
|
|
|
| Construction and land |
|
673,939 |
|
|
1 |
% |
|
663,868 |
|
|
1 |
% |
|
|
|
|
| Total CRE |
|
20,293,839 |
|
|
39 |
% |
|
20,464,112 |
|
|
39 |
% |
|
|
|
|
| Total commercial |
|
36,644,030 |
|
|
70 |
% |
|
37,045,191 |
|
|
71 |
% |
|
|
|
|
| Consumer: |
|
|
|
|
|
|
|
|
|
|
|
|
| Residential mortgage: |
|
|
|
|
|
|
|
|
|
|
|
|
| Single-family residential |
|
13,563,738 |
|
|
26 |
% |
|
13,383,060 |
|
|
26 |
% |
|
|
|
|
| HELOCs |
|
1,731,233 |
|
|
4 |
% |
|
1,722,204 |
|
|
3 |
% |
|
|
|
|
| Total residential mortgage |
|
15,294,971 |
|
|
30 |
% |
|
15,105,264 |
|
|
29 |
% |
|
|
|
|
| Other consumer |
|
53,503 |
|
|
0 |
% |
|
60,327 |
|
|
0 |
% |
|
|
|
|
| Total consumer |
|
15,348,474 |
|
|
30 |
% |
|
15,165,591 |
|
|
29 |
% |
|
|
|
|
Total loans held-for-investment (1) |
|
51,992,504 |
|
|
100 |
% |
|
52,210,782 |
|
|
100 |
% |
|
|
|
|
Allowance for loan losses |
|
(670,280) |
|
|
|
|
(668,743) |
|
|
|
|
|
|
|
Loans held-for-sale (2) |
|
13,280 |
|
|
|
|
116 |
|
|
|
|
|
|
|
| Total loans, net |
|
$ |
51,335,504 |
|
|
|
|
$ |
51,542,155 |
|
|
|
|
|
|
|
|
(1)Includes $63 million and $71 million of net deferred loan fees and net unamortized premiums as of March 31, 2024 and December 31, 2023, respectively.
(2)Consists of C&I loans as of March 31, 2024 and a single family-residential loan as of December 31, 2023.
Commercial
The commercial loan portfolio comprised 70% and 71% of total loans as of March 31, 2024 and December 31, 2023, respectively. The Company actively monitors the commercial lending portfolio for credit risk and reviews credit exposures for sensitivity to changing economic conditions.
Commercial — Commercial and Industrial Loans. Total C&I loan commitments were $24.7 billion and $24.6 billion as of March 31, 2024 and December 31, 2023, respectively, with a utilization rate of 66% as of March 31, 2024, compared with 67% as of December 31, 2023. Total C&I loans were $16.4 billion as of March 31, 2024, a decrease of $231 million or 1% from $16.6 billion as of December 31, 2023. Total C&I loans made up 31% and 32% of total loans held-for-investment as of March 31, 2024 and December 31, 2023, respectively. The C&I loan portfolio includes loans and financing for businesses across a wide spectrum of industries. The Company offers a variety of C&I products, including commercial business lending, working capital lines of credit, trade finance, letters of credit, asset-based lending, asset-backed finance, project finance and equipment financing. Additionally, the Company has a portfolio of broadly syndicated C&I loans, which represent revolving or term loan facilities that are marketed and sold primarily to institutional investors. This portfolio totaled $502 million and $645 million as of March 31, 2024 and December 31, 2023, respectively. The majority of the C&I loans had variable interest rates as of both March 31, 2024 and December 31, 2023.
The C&I portfolio is well-diversified by industry. The Company monitors concentrations within the C&I loan portfolio by industry and customer exposure, and has exposure limits by industry and loan product. The following table presents the industry mix within the Company’s C&I loan portfolio as of March 31, 2024 and December 31, 2023:
|
|
|
|
|
|
|
|
|
|
|
|
|
|
|
|
|
|
|
|
|
|
|
|
|
|
|
|
|
|
|
|
|
|
|
|
|
|
|
|
|
|
|
|
|
|
March 31, 2024 |
|
|
|
December 31, 2023 (1) |
| ($ in thousands) |
|
Amount |
|
% |
|
($ in thousands) |
|
Amount |
|
% |
| Industry: |
|
|
|
|
|
Industry: |
|
|
|
|
| Real estate investment & management |
|
$ |
2,067,855 |
|
|
13 |
% |
|
Capital call lending |
|
$ |
2,171,367 |
|
|
13 |
% |
| Capital call lending |
|
1,944,730 |
|
|
12 |
% |
|
Real estate investment & management |
|
1,970,713 |
|
|
12 |
% |
| Media & entertainment |
|
1,801,303 |
|
|
11 |
% |
|
Media & entertainment |
|
1,891,199 |
|
|
11 |
% |
| Manufacturing & wholesale |
|
1,084,648 |
|
|
7 |
% |
|
Financial services |
|
1,136,731 |
|
|
7 |
% |
| Financial services |
|
1,041,937 |
|
|
6 |
% |
|
Manufacturing & wholesale |
|
1,110,544 |
|
|
7 |
% |
| Infrastructure & clean energy |
|
986,436 |
|
|
6 |
% |
|
Infrastructure & clean energy |
|
1,023,662 |
|
|
6 |
% |
| Food production & distribution |
|
686,035 |
|
|
4 |
% |
|
Tech & telecom |
|
729,922 |
|
|
4 |
% |
| Tech & telecom |
|
679,839 |
|
|
4 |
% |
|
Food production & distribution |
|
655,340 |
|
|
4 |
% |
| Consumer finance |
|
584,290 |
|
|
4 |
% |
|
Consumer finance |
|
586,468 |
|
|
4 |
% |
| Oil & gas |
|
581,122 |
|
|
3 |
% |
|
Hospitality & leisure |
|
576,328 |
|
|
3 |
% |
| Other |
|
4,891,996 |
|
|
30 |
% |
|
Other |
|
4,728,805 |
|
|
29 |
% |
| Total C&I |
|
$ |
16,350,191 |
|
|
100 |
% |
|
Total C&I |
|
$ |
16,581,079 |
|
|
100 |
% |
|
|
|
|
|
|
|
|
|
|
|
(1)Revised segmentation to conform with the current presentation.
Commercial — Total Commercial Real Estate Loans. Total CRE loans totaled $20.3 billion and $20.5 billion as of March 31, 2024 and December 31, 2023, respectively, and accounted for 39% of total loans held-for-investment as of both March 31, 2024 and December 31, 2023. The total CRE portfolio consists of CRE, multifamily residential, and construction and land loans, and affordable housing lending. The Company’s underwriting parameters for CRE loans are established in compliance with supervisory guidance, including property type, geography and loan-to-value (“LTV”). The consistency of the Company’s low LTV underwriting standards has historically resulted in lower credit losses.
The Company’s total CRE loan portfolio is well-diversified by property type with an average CRE loan size of $3 million as of both March 31, 2024 and December 31, 2023. The following table summarizes the Company’s total CRE loans by property type as of March 31, 2024 and December 31, 2023:
|
|
|
|
|
|
|
|
|
|
|
|
|
|
|
|
|
|
|
|
|
|
|
|
|
|
|
|
|
|
March 31, 2024 |
|
December 31, 2023 |
| ($ in thousands) |
|
Amount |
|
% |
|
Amount |
|
% |
| Property types: |
|
|
|
|
|
|
|
|
| Multifamily |
|
$ |
5,010,245 |
|
|
25 |
% |
|
$ |
5,023,164 |
|
|
25 |
% |
Retail (1) |
|
4,256,919 |
|
|
21 |
% |
|
4,297,569 |
|
|
21 |
% |
Industrial (1) |
|
4,028,488 |
|
|
20 |
% |
|
3,997,764 |
|
|
20 |
% |
Hotel (1) |
|
2,431,463 |
|
|
12 |
% |
|
2,446,504 |
|
|
12 |
% |
Office (1) |
|
2,245,781 |
|
|
11 |
% |
|
2,271,508 |
|
|
11 |
% |
Healthcare (1) |
|
724,422 |
|
|
4 |
% |
|
852,362 |
|
|
4 |
% |
| Construction and land |
|
673,939 |
|
|
3 |
% |
|
663,868 |
|
|
3 |
% |
Other (1) |
|
922,582 |
|
|
4 |
% |
|
911,373 |
|
|
4 |
% |
| Total CRE loans |
|
$ |
20,293,839 |
|
|
100 |
% |
|
$ |
20,464,112 |
|
|
100 |
% |
|
(1)Included in CRE loans, which is a subset of Total CRE loans.
The weighted-average LTV ratio of the total CRE loan portfolio was 50% as of both March 31, 2024 and December 31, 2023. Weighted average LTV is based on the most recent LTV, which is based on the latest available appraisal and current loan commitment. Approximately 91% of total CRE loans had an LTV ratio of 65% or lower as of both March 31, 2024 and December 31, 2023.
The following tables provide a summary of the Company’s CRE, multifamily residential, and construction and land loans by geography as of March 31, 2024 and December 31, 2023. The distribution of the total CRE loan portfolio largely reflects the Company’s geographical branch footprint, which is primarily concentrated in California.
|
|
|
|
|
|
|
|
|
|
|
|
|
|
|
|
|
|
|
|
|
|
|
|
|
|
|
|
|
|
|
|
|
|
|
|
|
|
|
|
|
|
|
|
|
|
|
|
|
|
|
|
|
|
March 31, 2024 |
| ($ in thousands) |
|
CRE |
|
% |
|
Multifamily Residential |
|
% |
|
Construction and Land |
|
% |
|
Total CRE |
|
% |
| Geographic markets: |
|
|
|
|
|
|
|
|
|
|
|
|
|
|
|
|
| Southern California |
|
$ |
7,545,016 |
|
|
51 |
% |
|
$ |
2,340,771 |
|
|
47 |
% |
|
$ |
264,824 |
|
|
39 |
% |
|
$ |
10,150,611 |
|
|
50 |
% |
| Northern California |
|
2,729,200 |
|
|
19 |
% |
|
1,059,018 |
|
|
21 |
% |
|
159,425 |
|
|
24 |
% |
|
3,947,643 |
|
|
19 |
% |
| California |
|
10,274,216 |
|
|
70 |
% |
|
3,399,789 |
|
|
68 |
% |
|
424,249 |
|
|
63 |
% |
|
14,098,254 |
|
|
69 |
% |
| Texas |
|
1,103,921 |
|
|
8 |
% |
|
443,215 |
|
|
9 |
% |
|
62,992 |
|
|
9 |
% |
|
1,610,128 |
|
|
8 |
% |
| New York |
|
703,714 |
|
|
5 |
% |
|
261,894 |
|
|
5 |
% |
|
43,406 |
|
|
6 |
% |
|
1,009,014 |
|
|
5 |
% |
| Washington |
|
492,470 |
|
|
3 |
% |
|
163,383 |
|
|
3 |
% |
|
10,380 |
|
|
2 |
% |
|
666,233 |
|
|
3 |
% |
| Arizona |
|
368,389 |
|
|
2 |
% |
|
148,591 |
|
|
3 |
% |
|
46,259 |
|
|
7 |
% |
|
563,239 |
|
|
3 |
% |
| Nevada |
|
256,218 |
|
|
2 |
% |
|
141,975 |
|
|
3 |
% |
|
11,244 |
|
|
2 |
% |
|
409,437 |
|
|
2 |
% |
| Other markets |
|
1,410,727 |
|
|
10 |
% |
|
451,398 |
|
|
9 |
% |
|
75,409 |
|
|
11 |
% |
|
1,937,534 |
|
|
10 |
% |
| Total loans |
|
$ |
14,609,655 |
|
|
100 |
% |
|
$ |
5,010,245 |
|
|
100 |
% |
|
$ |
673,939 |
|
|
100 |
% |
|
$ |
20,293,839 |
|
|
100 |
% |
|
|
|
|
|
|
|
|
|
|
|
|
|
|
|
|
|
|
|
|
|
|
|
|
|
|
|
|
|
|
|
|
|
|
|
|
|
|
|
|
|
|
|
|
|
|
|
|
|
|
|
|
|
|
|
December 31, 2023 |
| ($ in thousands) |
|
CRE |
|
% |
|
Multifamily Residential |
|
% |
|
Construction and Land |
|
% |
|
Total CRE |
|
% |
Geographic markets: |
|
|
|
|
|
|
|
|
|
|
|
|
|
|
|
|
Southern California |
|
$ |
7,604,053 |
|
|
51 |
% |
|
$ |
2,295,592 |
|
|
46 |
% |
|
$ |
294,879 |
|
|
44 |
% |
|
$ |
10,194,524 |
|
|
50 |
% |
Northern California |
|
2,737,635 |
|
|
19 |
% |
|
1,055,852 |
|
|
21 |
% |
|
147,031 |
|
|
22 |
% |
|
3,940,518 |
|
|
19 |
% |
| California |
|
10,341,688 |
|
|
70 |
% |
|
3,351,444 |
|
|
67 |
% |
|
441,910 |
|
|
66 |
% |
|
14,135,042 |
|
|
69 |
% |
| Texas |
|
1,122,428 |
|
|
8 |
% |
|
445,391 |
|
|
9 |
% |
|
41,768 |
|
|
6 |
% |
|
1,609,587 |
|
|
8 |
% |
| New York |
|
696,950 |
|
|
5 |
% |
|
287,961 |
|
|
6 |
% |
|
43,227 |
|
|
7 |
% |
|
1,028,138 |
|
|
5 |
% |
| Washington |
|
495,577 |
|
|
3 |
% |
|
173,367 |
|
|
3 |
% |
|
10,375 |
|
|
2 |
% |
|
679,319 |
|
|
3 |
% |
| Arizona |
|
355,047 |
|
|
2 |
% |
|
148,970 |
|
|
3 |
% |
|
38,897 |
|
|
6 |
% |
|
542,914 |
|
|
3 |
% |
| Nevada |
|
257,105 |
|
|
2 |
% |
|
142,133 |
|
|
3 |
% |
|
6,325 |
|
|
1 |
% |
|
405,563 |
|
|
2 |
% |
| Other markets |
|
1,508,286 |
|
|
10 |
% |
|
473,897 |
|
|
9 |
% |
|
81,366 |
|
|
12 |
% |
|
2,063,549 |
|
|
10 |
% |
| Total loans |
|
$ |
14,777,081 |
|
|
100 |
% |
|
$ |
5,023,163 |
|
|
100 |
% |
|
$ |
663,868 |
|
|
100 |
% |
|
$ |
20,464,112 |
|
|
100 |
% |
|
As of both March 31, 2024 and December 31, 2023, 69% of total CRE loans were concentrated in California. Changes in California’s economy and real estate values could have a significant impact on the collectability of these loans and the required level of allowance for loan losses. For additional information related to the higher degree of risk from a downturn in the California economic and real estate markets, see Item 1A. Risk Factors — Risks Related to Geopolitical Uncertainties to the Company’s 2023 Form 10-K.
Commercial — Commercial Real Estate Loans. The Company focuses on providing financing to experienced real estate investors and developers who have moderate levels of leverage, many of whom are long-time customers of the Bank. CRE loans totaled $14.6 billion as of March 31, 2024, compared with $14.8 billion as of December 31, 2023, and accounted for 28% of total loans held-for-investment as of both dates. Interest rates on CRE loans may be fixed, variable or hybrid. As of March 31, 2024, 57% of our CRE portfolio had variable rates, of which 52% had customer-level interest rate derivative contracts in place. These were hedging contracts offered by the Company to help our customers manage their interest rate risk while the Bank’s exposure remained variable rate. In comparison, as of December 31, 2023, 58% of our CRE portfolio had variable rates, of which 50% had customer-level interest rate derivative contracts in place. The Company seeks to underwrite loans with conservative standards for cash flows, debt service coverage and LTV.
Owner-occupied properties comprised 20% of the CRE loans as of both March 31, 2024 and December 31, 2023. The remainder were non-owner-occupied properties, where 50% or more of the debt service for the loan is typically provided by rental income from an unaffiliated third party.
Commercial — Multifamily Residential Loans. The multifamily residential loan portfolio is largely comprised of loans secured by residential properties with five or more units. Multifamily residential loans totaled $5.0 billion and accounted for 10% of total loans held-for-investment as of both March 31, 2024 and December 31, 2023. The Company offers a variety of first lien mortgages, including fixed- and variable-rate loans, as well as hybrid loans with interest rates that adjust annually after an initial fixed rate period of three to ten years. As of both March 31, 2024 and December 31, 2023, 48% of our multifamily residential portfolio had variable rates, of which 40% had customer-level interest rate derivative contracts in place. These were hedging contracts offered by the Company to help our customers manage their interest rate risk while the Bank’s own exposure remained variable rate.
Commercial — Construction and Land Loans. Construction and land loans provide financing for a portfolio of projects diversified by real estate property type. Construction and land loans totaled $674 million as of March 31, 2024, compared with $664 million as of December 31, 2023, and accounted for 1% of total loans held-for-investment as of both dates. Construction loan exposure was made up of $538 million in loans outstanding, plus $641 million in unfunded commitments as of March 31, 2024, compared with $526 million in loans outstanding, plus $672 million in unfunded commitments as of December 31, 2023. Land loans totaled $136 million as of March 31, 2024, compared with $138 million as of December 31, 2023.
Consumer
Residential mortgage loans are primarily originated through the Bank’s branch network. The average total residential loan size was $435 thousand and $436 thousand as of March 31, 2024 and December 31, 2023, respectively. The following tables summarize the Company’s single-family residential and HELOC loan portfolios by geography as of March 31, 2024 and December 31, 2023:
|
|
|
|
|
|
|
|
|
|
|
|
|
|
|
|
|
|
|
|
|
|
|
|
|
|
|
|
|
|
|
|
|
|
|
|
|
|
|
|
|
|
March 31, 2024 |
| ($ in thousands) |
|
Single-Family Residential |
|
% |
|
HELOCs |
|
% |
|
Total Residential Mortgage |
|
% |
| Geographic markets: |
|
|
|
|
|
|
|
|
|
|
|
|
| Southern California |
|
$ |
5,041,793 |
|
|
37 |
% |
|
$ |
812,239 |
|
|
47 |
% |
|
$ |
5,854,032 |
|
|
38 |
% |
| Northern California |
|
1,701,556 |
|
|
13 |
% |
|
372,302 |
|
|
21 |
% |
|
2,073,858 |
|
|
14 |
% |
| California |
|
6,743,349 |
|
|
50 |
% |
|
1,184,541 |
|
|
68 |
% |
|
7,927,890 |
|
|
52 |
% |
| New York |
|
4,396,997 |
|
|
33 |
% |
|
247,026 |
|
|
14 |
% |
|
4,644,023 |
|
|
30 |
% |
| Washington |
|
691,594 |
|
|
5 |
% |
|
182,112 |
|
|
11 |
% |
|
873,706 |
|
|
6 |
% |
| Massachusetts |
|
409,538 |
|
|
3 |
% |
|
65,516 |
|
|
4 |
% |
|
475,054 |
|
|
3 |
% |
| Georgia |
|
448,234 |
|
|
3 |
% |
|
18,879 |
|
|
1 |
% |
|
467,113 |
|
|
3 |
% |
Nevada |
|
422,840 |
|
|
3 |
% |
|
31,658 |
|
|
2 |
% |
|
454,498 |
|
|
3 |
% |
Texas |
|
435,538 |
|
|
3 |
% |
|
— |
|
|
— |
% |
|
435,538 |
|
|
3 |
% |
| Other markets |
|
15,648 |
|
|
0 |
% |
|
1,501 |
|
|
0 |
% |
|
17,149 |
|
|
0 |
% |
| Total |
|
$ |
13,563,738 |
|
|
100 |
% |
|
$ |
1,731,233 |
|
|
100 |
% |
|
$ |
15,294,971 |
|
|
100 |
% |
| Lien priority: |
|
|
|
|
|
|
|
|
|
|
|
|
| First mortgage |
|
$ |
13,563,738 |
|
|
100 |
% |
|
$ |
1,324,007 |
|
|
76 |
% |
|
$ |
14,887,745 |
|
|
97 |
% |
| Junior lien mortgage |
|
— |
|
|
— |
% |
|
407,226 |
|
|
24 |
% |
|
407,226 |
|
|
3 |
% |
| Total |
|
$ |
13,563,738 |
|
|
100 |
% |
|
$ |
1,731,233 |
|
|
100 |
% |
|
$ |
15,294,971 |
|
|
100 |
% |
|
|
|
|
|
|
|
|
|
|
|
|
|
|
|
|
|
|
|
|
|
|
|
|
|
|
|
|
|
|
|
|
|
|
|
|
|
|
|
|
|
|
|
December 31, 2023 |
| ($ in thousands) |
|
Single-Family Residential |
|
% |
|
HELOCs |
|
% |
|
Total Residential Mortgage |
|
% |
| Geographic markets: |
|
|
|
|
|
|
|
|
|
|
|
|
| Southern California |
|
$ |
4,990,848 |
|
|
37 |
% |
|
$ |
799,571 |
|
|
46 |
% |
|
$ |
5,790,419 |
|
|
38 |
% |
| Northern California |
|
1,650,905 |
|
|
13 |
% |
|
370,989 |
|
|
22 |
% |
|
2,021,894 |
|
|
13 |
% |
| California |
|
6,641,753 |
|
|
50 |
% |
|
1,170,560 |
|
|
68 |
% |
|
7,812,313 |
|
|
51 |
% |
| New York |
|
4,376,416 |
|
|
33 |
% |
|
247,202 |
|
|
14 |
% |
|
4,623,618 |
|
|
31 |
% |
| Washington |
|
696,028 |
|
|
5 |
% |
|
184,843 |
|
|
11 |
% |
|
880,871 |
|
|
6 |
% |
| Massachusetts |
|
391,666 |
|
|
3 |
% |
|
67,016 |
|
|
4 |
% |
|
458,682 |
|
|
3 |
% |
| Georgia |
|
432,258 |
|
|
3 |
% |
|
17,123 |
|
|
1 |
% |
|
449,381 |
|
|
3 |
% |
| Nevada |
|
404,837 |
|
|
3 |
% |
|
33,959 |
|
|
2 |
% |
|
438,796 |
|
|
3 |
% |
| Texas |
|
423,972 |
|
|
3 |
% |
|
— |
|
|
— |
% |
|
423,972 |
|
|
3 |
% |
| Other markets |
|
16,130 |
|
|
0 |
% |
|
1,501 |
|
|
0 |
% |
|
17,631 |
|
|
0 |
% |
| Total |
|
$ |
13,383,060 |
|
|
100 |
% |
|
$ |
1,722,204 |
|
|
100 |
% |
|
$ |
15,105,264 |
|
|
100 |
% |
| Lien priority: |
|
|
|
|
|
|
|
|
|
|
|
|
| First mortgage |
|
$ |
13,383,060 |
|
|
100 |
% |
|
$ |
1,331,509 |
|
|
77 |
% |
|
$ |
14,714,569 |
|
|
97 |
% |
| Junior lien mortgage |
|
— |
|
|
— |
% |
|
390,695 |
|
|
23 |
% |
|
390,695 |
|
|
3 |
% |
| Total |
|
$ |
13,383,060 |
|
|
100 |
% |
|
$ |
1,722,204 |
|
|
100 |
% |
|
$ |
15,105,264 |
|
|
100 |
% |
|
Consumer — Single-Family Residential Loans. Single-family residential loans totaled $13.6 billion as of March 31, 2024, compared with $13.4 billion as of December 31, 2023, and accounted for 26% of total loans held-for-investment as of both dates. The Company was in a first lien position for all of its single-family residential loans as of both March 31, 2024 and December 31, 2023. Many of these loans are reduced documentation loans, for which a substantial down payment is required, resulting in a low LTV ratio at origination, typically 65% or less. The weighted-average LTV ratio was 52% as of March 31, 2024 and 53% as of December 31, 2023. These loans have historically experienced low delinquency and loss rates. The Company offers a variety of single-family residential first lien mortgage loan programs, including fixed- and variable-rate loans, as well as hybrid loans with interest rates that adjust on a regular basis, typically annually, after an initial fixed rate period.
Consumer — Home Equity Lines of Credit. Total HELOC commitments were $5.2 billion, with a utilization rate of 33%, as of both March 31, 2024 and December 31, 2023. Substantially all of the Company’s unfunded HELOC commitments are unconditionally cancellable. HELOCs outstanding totaled $1.7 billion as of both March 31, 2024 and December 31, 2023, and accounted for 4% and 3% of total loans held-for-investment as of March 31, 2024 and December 31, 2023, respectively. The Company was in a first lien position for 76% and 77% of total outstanding HELOCs as of March 31, 2024 and December 31, 2023, respectively. The weighted-average LTV ratio was 48% on HELOC commitments as of both dates. Weighted-average LTV ratio represents the loan’s balance divided by the estimated current property value. Combined LTV ratios are used for junior lien home equity loans. Many of these loans are reduced documentation loans, resulting in a low LTV ratio at origination, typically 65% or less. As a result, these loans have historically experienced low delinquency and loss rates. Substantially all of the Company’s HELOCs were variable-rate loans as of both March 31, 2024 and December 31, 2023.
All originated commercial and consumer loans are subject to the Company’s conservative underwriting guidelines and loan origination standards. Management believes that the Company’s underwriting criteria and procedures adequately consider the unique risks associated with these products. The Company conducts a variety of quality control procedures and periodic audits, including the review of lending and legal requirements, to ensure that the Company is in compliance with these requirements.
Foreign Outstandings
The Company’s overseas offices, which include the branch in Hong Kong and the subsidiary bank in China, are subject to the general risks inherent in conducting business in foreign countries, such as regulatory, economic and political uncertainties. As such, the Company’s international operation risk exposure is largely concentrated in China and Hong Kong. In addition, the Company’s financial assets held in the Hong Kong branch and the subsidiary bank in China may be affected by fluctuations in currency exchange rates or other factors. The following table presents the major financial assets held in the Company’s overseas offices as of March 31, 2024 and December 31, 2023:
|
|
|
|
|
|
|
|
|
|
|
|
|
|
|
|
|
|
|
|
|
|
|
|
|
|
|
|
|
|
March 31, 2024 |
|
December 31, 2023 |
| ($ in thousands) |
|
Amount |
|
% of Total Consolidated Assets |
|
Amount |
|
% of Total Consolidated Assets |
| Hong Kong branch: |
|
|
|
|
|
|
|
|
| Cash and cash equivalents |
|
$ |
543,831 |
|
|
1 |
% |
|
$ |
631,487 |
|
|
1 |
% |
|
|
|
|
|
|
|
|
|
AFS debt securities (1) |
|
$ |
541,262 |
|
|
1 |
% |
|
$ |
546,495 |
|
|
1 |
% |
Loans held-for-investment (2) |
|
$ |
807,506 |
|
|
1 |
% |
|
$ |
934,734 |
|
|
1 |
% |
| Total assets |
|
$ |
1,897,761 |
|
|
3 |
% |
|
$ |
2,115,857 |
|
|
3 |
% |
| Subsidiary bank in China: |
|
|
|
|
|
|
|
|
| Cash and cash equivalents |
|
$ |
753,207 |
|
|
1 |
% |
|
$ |
719,058 |
|
|
1 |
% |
|
|
|
|
|
|
|
|
|
AFS debt securities (3) |
|
$ |
120,570 |
|
|
0 |
% |
|
$ |
120,167 |
|
|
0 |
% |
Loans held-for-investment (2) |
|
$ |
1,358,047 |
|
|
2 |
% |
|
$ |
1,328,383 |
|
|
2 |
% |
| Total assets |
|
$ |
2,240,428 |
|
|
3 |
% |
|
$ |
2,156,548 |
|
|
3 |
% |
|
(1)Comprised of U.S. government agency and U.S. government-sponsored enterprise mortgage-backed securities, U.S. Treasury securities, and foreign government bonds as of March 31, 2024; comprised of foreign government bonds and U.S. Treasury securities as of December 31, 2023.
(2)Primarily comprised of C&I loans as of both March 31, 2024 and December 31, 2023.
(3)Comprised of foreign government bonds as of both March 31, 2024 and December 31, 2023.
The following table presents the total revenue generated by the Company’s overseas offices for the first quarters of 2024 and 2023:
|
|
|
|
|
|
|
|
|
|
|
|
|
|
|
|
|
|
|
|
|
|
|
|
|
|
|
|
|
|
|
|
|
|
|
|
|
|
Three Months Ended March 31, |
|
|
|
|
2024 |
|
2023 |
|
|
|
|
| ($ in thousands) |
|
Amount |
|
% of Total Consolidated Revenue |
|
Amount |
|
% of Total Consolidated Revenue |
|
|
|
|
|
|
|
|
| Hong Kong Branch: |
|
|
|
|
|
|
|
|
|
|
|
|
|
|
|
|
| Total revenue |
|
$ |
18,093 |
|
|
3 |
% |
|
$ |
15,318 |
|
|
2 |
% |
|
|
|
|
|
|
|
|
| Subsidiary Bank in China: |
|
|
|
|
|
|
|
|
|
|
|
|
|
|
|
|
| Total revenue |
|
$ |
7,444 |
|
|
1 |
% |
|
$ |
7,885 |
|
|
1 |
% |
|
|
|
|
|
|
|
|
|
Capital
The Company maintains a strong capital base to support its anticipated asset growth, operating needs, and credit risks, and to ensure that the Company and the Bank are in compliance with all regulatory capital guidelines. The Company engages in regular capital planning processes on at least an annual basis to optimize the use of available capital and to appropriately plan for future capital needs, allocating capital to existing and future business activities. Furthermore, the Company conducts capital stress tests as part of its capital planning process. The stress tests enable the Company to assess the impact of adverse changes in the economy and interest rates on its capital base.
On March 3, 2020, the Company’s Board of Directors authorized the repurchase of $500 million of the Company’s common stock. During the first quarter of 2024, the Company repurchased $82 million of common stock or 1,181,851 shares at an average price of $69.76 per share. In comparison, the Company repurchased $82 million of common stock or 1,506,091 shares, at an average price of $54.56 per share in 2023. The total remaining available capital authorized for repurchase as of March 31, 2024 was $89 million.
The Company’s stockholders’ equity was $7.0 billion as of both March 31, 2024 and December 31, 2023, which increased $72 million or 1% during the first quarter of 2024. The increase in the Company’s stockholders’ equity was primarily due to $285 million of net income, partially offset by $82 million of common stock repurchases, $78 million of cash dividends declared, and $42 million of other comprehensive loss. For other factors that contributed to the changes in stockholders’ equity, refer to Item 1. Consolidated Financial Statements — Consolidated Statement of Changes in Stockholders’ Equity in this Form 10-Q.
Book value per share was $50.48 as of March 31, 2024, an increase of 2% from $49.64 per share as of December 31, 2023, a result of both the increase in the Company’s stockholders’ equity described above and a decrease in the Company’s common shares outstanding. Tangible book value per share was $47.09 as of March 31, 2024, compared with $46.27 as of December 31, 2023. For additional details, see the reconciliation of non-GAAP measures presented under Item 2. MD&A — Reconciliation of GAAP to Non-GAAP Financial Measures in this Form 10-Q.
The Company paid a quarterly common stock cash dividend of $0.55 and $0.48 per share during the first quarters of 2024 and 2023, respectively. In April 2024, the Company’s Board of Directors declared a second quarter 2024 cash dividend of $0.55 per share. The dividend is payable on May 17, 2024, to stockholders of record as of May 3, 2024.
Deposits and Other Sources of Funding
Deposits are the Company’s primary source of funding, the cost of which has a significant impact on the Company’s net interest income and net interest margin. Additional funding is provided by short- and long-term borrowings, and long-term debt. See Item 2. MD&A — Risk Management — Liquidity Risk Management — Liquidity in this Form 10-Q for a discussion of the Company’s liquidity management. The following table summarizes the Company’s sources of funds as of March 31, 2024 and December 31, 2023:
|
|
|
|
|
|
|
|
|
|
|
|
|
|
|
|
|
|
|
|
|
|
|
|
|
|
|
|
|
|
|
|
|
|
|
|
|
|
|
|
|
|
March 31, 2024 |
|
December 31, 2023 |
|
Change |
| ($ in thousands) |
|
Amount |
|
% |
|
Amount |
|
% |
|
$ |
|
% |
| Deposits: |
|
|
|
|
|
|
|
|
|
|
|
|
|
|
|
|
|
|
|
|
|
|
|
|
|
| Noninterest-bearing demand |
|
$ |
14,798,927 |
|
|
25 |
% |
|
$ |
15,539,872 |
|
|
28 |
% |
|
$ |
(740,945) |
|
|
(5) |
% |
| Interest-bearing checking |
|
7,570,427 |
|
|
13 |
% |
|
7,558,908 |
|
|
14 |
% |
|
11,519 |
|
|
0 |
% |
| Money market |
|
13,585,597 |
|
|
23 |
% |
|
13,108,727 |
|
|
23 |
% |
|
476,870 |
|
|
4 |
% |
| Savings |
|
1,834,393 |
|
|
3 |
% |
|
1,841,467 |
|
|
3 |
% |
|
(7,074) |
|
|
0 |
% |
|
|
|
|
|
|
|
|
|
|
|
|
|
|
|
|
|
|
|
|
|
|
|
|
|
|
|
|
|
|
|
|
|
|
|
|
|
|
|
|
|
|
|
|
|
|
|
|
|
|
|
|
| Time deposits |
|
20,771,280 |
|
|
36 |
% |
|
18,043,464 |
|
|
32 |
% |
|
2,727,816 |
|
|
15 |
% |
| Total deposits |
|
$ |
58,560,624 |
|
|
100 |
% |
|
$ |
56,092,438 |
|
|
100 |
% |
|
$ |
2,468,186 |
|
|
4 |
% |
|
|
|
|
|
|
|
|
|
|
|
|
|
|
|
|
|
|
|
|
|
|
|
|
|
|
|
|
|
|
|
|
|
|
|
|
|
|
|
|
|
|
|
|
|
|
|
|
|
|
|
|
|
|
|
|
|
|
|
|
|
|
|
|
|
| Other Funds: |
|
|
|
|
|
|
|
|
|
|
|
|
Short-term borrowings |
|
$ |
19,173 |
|
|
0 |
% |
|
$ |
— |
|
|
— |
% |
|
19,173 |
|
|
100 |
% |
BTFP borrowings |
|
— |
|
|
— |
% |
|
4,500,000 |
|
|
97 |
% |
|
(4,500,000) |
|
|
(100) |
% |
|
|
|
|
|
|
|
|
|
|
|
|
|
| FHLB advances |
|
3,500,000 |
|
|
99 |
% |
|
— |
|
|
— |
% |
|
3,500,000 |
|
|
100 |
% |
|
|
|
|
|
|
|
|
|
|
|
|
|
| Long-term debt |
|
31,768 |
|
|
1 |
% |
|
148,249 |
|
|
3 |
% |
|
(116,481) |
|
|
(79) |
% |
| Total other funds |
|
$ |
3,550,941 |
|
|
100 |
% |
|
$ |
4,648,249 |
|
|
100 |
% |
|
$ |
(1,097,308) |
|
|
(24) |
% |
| Total sources of funds |
|
$ |
62,111,565 |
|
|
|
|
$ |
60,740,687 |
|
|
|
|
$ |
1,370,878 |
|
|
2 |
% |
|
Deposits
The Company’s strategy is to grow and retain relationship-based deposits to provide a stable and low-cost source of funding and liquidity. Accordingly, the Company offers a wide variety of deposit products to meet the needs of its consumer and commercial customers. As a result, we believe our deposit base is seasoned, stable and well-diversified. The following chart presents the Company’s deposits by type as of March 31, 2024 and December 31, 2023.
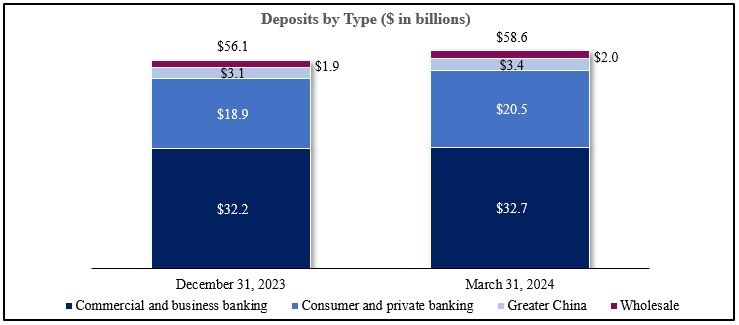
Total deposits were $58.6 billion as of March 31, 2024, an increase of $2.5 billion or 4% from $56.1 billion as of December 31, 2023. The increase in deposits was primarily driven by an increase in customer deposits. Time deposits comprised 36% and 32% of total deposits as of March 31, 2024 and December 31, 2023, respectively. Noninterest-bearing demand deposits comprised 25% and 28% of total deposits as of March 31, 2024 and December 31, 2023, respectively. The shift in deposit mix was primarily due to continued customer migration to higher yielding deposit products.
Uninsured deposits represent the portion of deposit accounts in U.S. offices that exceed the FDIC insurance limit. Management believes that presenting uninsured domestic deposits as reported on Schedule RC-OM item 2 of the Bank’s Call Report, with an adjustment to exclude collateralized and affiliate deposits provides a more accurate view of the deposits at risk, given that collateralized deposits are secured, and affiliate deposits are not customer-facing and are eliminated in consolidation.
The following table summarizes the Company’s uninsured domestic deposit balances reported on Schedule RC-OM item 2 of the Bank’s Call Report as of March 31, 2024 and December 31, 2023, after certain adjustments:
|
|
|
|
|
|
|
|
|
|
|
|
|
|
|
|
|
|
|
|
|
|
|
|
| ($ in thousands) |
|
|
March 31, 2024 |
|
December 31, 2023 |
| Uninsured deposits, per regulatory reporting requirements |
|
|
$ |
29,006,693 |
|
|
$ |
27,592,714 |
|
| Less: Collateralized deposits |
|
|
(5,258,927) |
|
|
(4,631,047) |
|
| Affiliate deposits |
|
|
(333,846) |
|
|
(491,992) |
|
| Uninsured deposits, excluding collateralized and affiliate deposits |
(a) |
|
$ |
23,413,920 |
|
|
$ |
22,469,675 |
|
|
|
|
|
|
|
| Total domestic deposits per Call Report |
(b) |
|
$ |
55,684,012 |
|
|
$ |
53,486,990 |
|
| Uninsured deposits, excluding collateralized and affiliate deposits, ratio |
(a) / (b) |
|
42 |
% |
|
42 |
% |
|
|
|
|
|
|
Additional information regarding the impact of deposits on net interest income, with a comparison of average deposit balances and rates, is provided in Item 2. MD&A — Results of Operations — Net Interest Income in this Form 10-Q. See also the discussion of the impact of deposits on liquidity in Item 2. MD&A — Liquidity Risk Management — Liquidity in this Form 10-Q.
Other Sources of Funding
Short-term borrowings totaled $19 million as of March 31, 2024. Refer to Note 10 — Short-Term Borrowings and Long-Term Debt to the Consolidated Financial Statements in this Form 10-Q for additional information on the short-term borrowings.
The Company had $4.5 billion of BTFP borrowings outstanding as of December 31, 2023. These borrowings were repaid upon maturity during the first quarter of 2024.
The Company had $3.5 billion of FHLB advances as of March 31, 2024, compared with no FHLB advances as of December 31, 2023. FHLB advances as of March 31, 2024 had floating interest rates of 5.49% to 5.56% with remaining maturities between six months and 1.5 years.
The Company uses long-term debt to provide funding to acquire interest-earning assets, and to enhance liquidity and regulatory capital adequacy. Long-term debt consists of junior subordinated debt, which qualifies as Tier 2 capital for regulatory capital purposes. During the first quarter of 2024, the Company redeemed approximately $117 million of junior subordinated debt. Refer to Note 10 — Short-Term Borrowings and Long-Term Debt to the Consolidated Financial Statements in this Form 10-Q for additional information on the junior subordinated debt.
Regulatory Capital and Ratios
The federal banking agencies have risk-based capital adequacy requirements intended to ensure that banking organizations maintain capital that is commensurate with the degree of risk associated with their operations. The Company and the Bank are each subject to these regulatory capital adequacy requirements. See Item 1. Business — Supervision and Regulation — Regulatory Capital Requirements and Regulatory Capital-Related Development in the Company’s 2023 Form 10-K for additional details.
The Company adopted Accounting Standards Update 2016-13 on January 1, 2020, which requires the measurement of the allowance for credit losses to be based on management’s best estimate of lifetime expected credit losses inherent in the Company’s relevant financial assets. The Company has elected the phase-in option provided by a final rule that delays an estimate of the current expected credit losses (“CECL”) effect on regulatory capital for two years and phases in the impact over three years. The rule permits certain banking organizations to exclude from regulatory capital the initial adoption impact of CECL, plus 25% of the cumulative changes in the allowance for credit losses under CECL for each period until December 31, 2021, followed by a three-year phase-out period in which the aggregate benefit is reduced by 25% in 2022, 50% in 2023 and 75% in 2024. Accordingly, our capital ratios as of March 31, 2024 reflect a delay of 25% of the estimated impact of CECL on regulatory capital.
The following table presents the Company’s and the Bank’s capital ratios as of March 31, 2024 and December 31, 2023 under the Basel III Capital Rules, and those required by regulatory agencies for capital adequacy and well-capitalized classification purposes:
|
|
|
|
|
|
|
|
|
|
|
|
|
|
|
|
|
|
|
|
|
|
|
|
|
|
|
|
|
|
|
|
|
|
|
|
|
|
|
|
|
|
|
|
|
|
|
|
|
|
Basel III Capital Rules |
|
|
|
|
March 31, 2024 |
|
December 31, 2023 |
|
|
|
|
|
|
|
|
|
|
Company |
|
Bank |
|
Company |
|
Bank |
|
Minimum Regulatory Requirements |
|
Minimum Regulatory Requirements including Capital Conservation Buffer |
|
Well-Capitalized Requirements |
|
|
| Risk-based capital ratios: |
|
|
|
|
|
|
|
|
|
|
|
|
|
|
|
|
Common Equity Tier 1 capital (1) |
|
13.5 |
% |
|
12.9 |
% |
|
13.3 |
% |
|
12.6 |
% |
|
4.5 |
% |
|
7.0 |
% |
|
6.5 |
% |
|
|
Tier 1 capital (2) |
|
13.5 |
% |
|
12.9 |
% |
|
13.3 |
% |
|
12.6 |
% |
|
6.0 |
% |
|
8.5 |
% |
|
8.0 |
% |
|
|
| Total capital |
|
14.8 |
% |
|
14.1 |
% |
|
14.8 |
% |
|
13.8 |
% |
|
8.0 |
% |
|
10.5 |
% |
|
10.0 |
% |
|
|
Tier 1 leverage (1) |
|
10.1 |
% |
|
9.6 |
% |
|
10.2 |
% |
|
9.6 |
% |
|
4.0 |
% |
|
4.0 |
% |
|
5.0 |
% |
|
|
|
(1)The Common Equity Tier 1 capital and Tier 1 leverage well-capitalized requirements apply only to the Bank since there is no Common Equity Tier 1 capital component or Tier 1 leverage ratio component in the definition of a well-capitalized bank holding company.
(2)The well-capitalized Tier 1 capital ratio requirements for the Company and the Bank are 6.0% and 8.0%, respectively.
The Company is committed to maintaining strong capital levels to assure its investors, customers and regulators that the Company and the Bank are financially sound. As of both March 31, 2024 and December 31, 2023, the Company and the Bank continued to exceed all “well-capitalized” capital requirements and the minimum capital requirements under the Basel III Capital Rules. Total risk-weighted assets were $53.4 billion as of March 31, 2024, a decrease of $217 million from $53.7 billion as of December 31, 2023.
Risk Management
Overview
In the normal course of business, the Company is exposed to a variety of risks, some of which are inherent to the financial services industry and others of which are more specific to the Company’s business. The Company operates under a Board-approved enterprise risk management (“ERM”) framework, which outlines the company-wide approach to risk management and oversight, and describes the structures and practices employed to manage the current and emerging risks inherent to the Company. The Company’s ERM program incorporates risk management throughout the organization in identifying, managing, monitoring, and reporting risks. It identifies the Company’s major risk categories as: credit, liquidity, capital, market, operational, compliance, legal, strategic, technology and reputational.
The Risk Oversight Committee (“ROC”) of the Board of Directors monitors the ERM program through such identified risk categories and provides oversight of the Company’s risk appetite and control environment. The ROC provides focused oversight of the Company’s identified enterprise risk categories on behalf of the full Board of Directors. Under the authority of the ROC, management committees apply targeted strategies to manage the risks to which the Company’s operations are exposed.
The Company’s ERM program is executed along the three lines of defense model, which provides for a consistent and standardized risk management control environment across the enterprise. The first line of defense is comprised of production, operational and support units. The second line of defense is comprised of various risk management and control functions charged with monitoring and managing specific major risk categories and/or risk subcategories. The third line of defense is comprised of the Internal Audit and Independent Asset Review (“IAR”) functions. Internal Audit reports to the Chief Audit Executive (“CAE”) who reports to the Board’s Audit Committee. Internal Audit provides assurance and evaluates the effectiveness of risk management, control, and governance processes as established by the Company. IAR serves as an internal loan review and independent credit risk monitoring function within the Bank that works under the direction of the CAE and reports to the Audit Committee. IAR provides management and the Audit Committee with an objective and independent assessment of the Bank’s credit profile and credit risk management processes. Further discussion and analysis of selected primary risk areas are discussed in the following subsections of Risk Management.
Credit Risk Management
Credit risk is the risk that a borrower or a counterparty will fail to perform according to the terms and conditions of a loan or investment and expose the Company to loss. Credit risk exists with many of the Company’s assets and exposures such as loans, debt securities and certain derivatives. The majority of the Company’s credit risk is associated with lending activities.
The ROC has primary oversight responsibility for the identified enterprise risk categories including credit risk. The ROC monitors management’s assessment of asset quality, credit risk trends, credit quality administration, underwriting standards, and portfolio credit risk management strategies and processes, such as diversification and liquidity, all of which enable management to control credit risk. At the management level, the Credit Risk Management Committee has primary oversight responsibility for credit risk. The Senior Credit Supervision function manages credit policy for the line of business transactional credit risk, assuring that all exposure is risk-rated according to the requirements of the credit risk rating policy. The Senior Credit Supervision function evaluates and reports the overall credit risk exposure to senior management and the ROC. Reporting directly to the Board’s Audit Committee, the IAR function provides additional support to the Company’s strong credit risk management culture by performing an independent and objective assessment of underwriting and documentation quality. A key focus of our credit risk management is adherence to a well-controlled underwriting and loan monitoring process.
The Company assesses the overall credit quality performance of the loans held-for-investment portfolio through an integrated analysis of specific performance ratios. This approach forms the basis of the discussion in the sections immediately following: Credit Quality, Nonperforming Assets and Allowance for Credit Losses.
Credit Quality
The Company utilizes a credit risk rating system to assist in monitoring credit quality. Loans are evaluated using the Company’s internal credit risk rating of 1 through 10. For more information on the Company’s credit quality indicators and internal credit risk ratings, refer to Note 7 — Loans Receivable and Allowance for Credit Losses to the Consolidated Financial Statements in this Form 10-Q.
The following table presents the Company’s criticized loans as of March 31, 2024 and December 31, 2023:
|
|
|
|
|
|
|
|
|
|
|
|
|
|
|
|
|
|
|
|
|
|
|
|
|
|
|
|
|
|
|
|
|
|
Change |
| ($ in thousands) |
|
March 31, 2024 |
|
December 31, 2023 |
|
$ |
|
% |
| Criticized loans: |
|
|
|
|
|
|
|
|
|
|
|
|
|
|
|
|
|
|
|
|
|
|
|
|
|
|
|
|
|
|
|
|
|
|
|
|
|
|
|
|
|
|
|
|
|
|
|
|
|
|
|
|
|
|
|
|
|
|
|
|
|
|
|
|
|
|
|
|
|
|
|
|
|
|
|
|
|
|
|
|
|
|
|
|
|
|
|
|
|
|
|
|
|
|
|
|
|
|
|
|
|
|
|
|
|
|
|
|
|
|
|
|
|
|
|
|
|
|
|
|
|
|
|
|
|
|
|
|
|
|
|
|
|
|
|
|
|
|
|
|
|
|
|
|
|
|
|
|
|
|
|
|
|
|
|
|
|
|
|
|
|
|
|
|
|
|
|
|
|
|
|
|
|
|
|
|
|
|
|
|
|
|
|
|
|
|
|
|
|
|
|
|
|
|
|
|
|
|
|
|
|
|
|
|
|
|
|
|
|
|
|
|
|
|
|
|
|
|
|
|
|
|
|
|
|
|
|
|
|
|
|
|
|
|
|
|
|
|
|
|
|
|
|
|
|
|
|
|
|
|
|
|
|
|
|
|
|
|
|
|
|
|
|
|
|
|
|
|
|
|
|
|
|
|
|
|
|
|
|
|
|
|
|
|
|
|
|
|
|
|
|
|
|
|
|
|
|
|
|
|
|
|
|
|
|
|
|
|
|
|
|
|
|
|
|
|
|
|
|
|
|
|
|
|
|
|
|
|
|
|
|
|
| Special mention loans |
|
$ |
543,573 |
|
|
$ |
404,241 |
|
|
$ |
139,332 |
|
|
34 |
% |
Classified loans (1) |
|
651,485 |
|
|
573,969 |
|
|
77,516 |
|
|
14 |
% |
Total criticized loans (2) |
|
$ |
1,195,058 |
|
|
$ |
978,210 |
|
|
$ |
216,848 |
|
|
22 |
% |
|
|
|
|
|
|
|
|
|
| Special mention loans to loans held-for-investment |
|
1.05 |
% |
|
0.77 |
% |
|
|
|
|
| Classified loans to loans held-for-investment |
|
1.25 |
% |
|
1.10 |
% |
|
|
|
|
| Criticized loans to loans held-for-investment |
|
2.30 |
% |
|
1.87 |
% |
|
|
|
|
|
(1)Consists of substandard, doubtful and loss categories.
(2)Excludes loans held-for-sale.
Criticized loans were $1.2 billion as of March 31, 2024, an increase of $217 million or 22%, compared with $978 million as of December 31, 2023. The increase was primarily driven by CRE and C&I loans.
Nonperforming Assets
Nonperforming assets are comprised of nonaccrual loans, other real estate owned (“OREO”) and other nonperforming assets. Other nonperforming assets and OREO are repossessed assets and properties, respectively, acquired through foreclosure, or through full or partial satisfaction of loans held-for-investment. Nonperforming assets were $165 million or 0.23% of total assets as of March 31, 2024, an increase of $51 million or 45%, compared with $114 million or 0.16% of total assets as of December 31, 2023.
The following table presents nonperforming assets information as of March 31, 2024 and December 31, 2023:
|
|
|
|
|
|
|
|
|
|
|
|
|
|
|
|
|
|
|
|
|
|
|
|
|
|
|
|
|
|
|
|
|
|
Change |
| ($ in thousands) |
|
March 31, 2024 |
|
December 31, 2023 |
|
$ |
|
% |
| Commercial: |
|
|
|
|
|
|
|
|
| C&I |
|
$ |
48,962 |
|
|
$ |
37,036 |
|
|
$ |
11,926 |
|
|
32 |
% |
| CRE: |
|
|
|
|
|
|
|
|
| CRE |
|
35,006 |
|
|
23,249 |
|
|
11,757 |
|
|
51 |
% |
| Multifamily residential |
|
4,646 |
|
|
4,669 |
|
|
(23) |
|
|
0 |
% |
| Construction and land |
|
12,236 |
|
|
— |
|
|
12,236 |
|
|
100 |
% |
| Total CRE |
|
51,888 |
|
|
27,918 |
|
|
23,970 |
|
|
86 |
% |
| Consumer: |
|
|
|
|
|
|
|
|
| Residential mortgage: |
|
|
|
|
|
|
|
|
| Single-family residential |
|
35,669 |
|
|
24,377 |
|
|
11,292 |
|
|
46 |
% |
| HELOCs |
|
11,498 |
|
|
13,411 |
|
|
(1,913) |
|
|
(14) |
% |
| Total residential mortgage |
|
47,167 |
|
|
37,788 |
|
|
9,379 |
|
|
25 |
% |
| Other consumer |
|
162 |
|
|
132 |
|
|
30 |
|
|
23 |
% |
| Total nonaccrual loans |
|
148,179 |
|
|
102,874 |
|
|
45,305 |
|
|
44 |
% |
| OREO, net |
|
16,692 |
|
|
11,141 |
|
|
5,551 |
|
|
50 |
% |
|
|
|
|
|
|
|
|
|
|
|
|
|
|
|
|
|
|
| Total nonperforming assets |
|
$ |
164,871 |
|
|
$ |
114,015 |
|
|
$ |
50,856 |
|
|
45 |
% |
Nonperforming assets to total assets |
|
0.23 |
% |
|
0.16 |
% |
|
|
|
|
Nonaccrual loans to loans held-for-investment |
|
0.29 |
% |
|
0.20 |
% |
|
|
|
|
| Allowance for loan losses to nonaccrual loans |
|
452.34 |
% |
|
650.06 |
% |
|
|
|
|
|
|
|
|
|
|
|
|
|
|
|
|
|
|
|
|
|
|
|
Loans are generally placed on nonaccrual status when they become 90 days past due or when the full collection of principal or interest becomes uncertain regardless of the length of past due status. Collectability is generally assessed based on economic and business conditions, the borrower’s financial condition, and the adequacy of collateral, if any. For additional details regarding the Company’s nonaccrual loan policy, see Note 1 — Summary of Significant Accounting Policies — Significant Accounting Policies — Loans Held-for-Investment to the Consolidated Financial Statements in the Company’s 2023 Form 10-K.
Nonaccrual loans were $148 million as of March 31, 2024, an increase of $45 million or 44% from $103 million as of December 31, 2023. This increase was predominantly due to increases in construction, C&I, CRE and single-family residential nonaccrual loans. As of March 31, 2024, $27 million or 18% of nonaccrual loans were less than 90 days delinquent. In comparison, $40 million or 39% of nonaccrual loans were less than 90 days delinquent as of December 31, 2023.
The following table presents the accruing loans past due by portfolio segment as of March 31, 2024 and December 31, 2023:
|
|
|
|
|
|
|
|
|
|
|
|
|
|
|
|
|
|
|
|
|
|
|
|
|
|
|
|
|
|
|
|
|
|
|
|
|
|
|
|
|
|
|
|
|
|
Total Accruing Past Due Loans (1) |
|
Change |
|
Percentage of Total Loans Outstanding |
| ($ in thousands) |
|
|
|
March 31,
2024 |
|
December 31,
2023 |
|
$ |
|
% |
|
March 31,
2024 |
|
December 31,
2023 |
Commercial: |
|
|
|
|
|
|
|
|
|
|
|
|
|
|
| C&I |
|
|
|
$ |
19,326 |
|
|
$ |
35,649 |
|
|
$ |
(16,323) |
|
|
(46) |
% |
|
0.12 |
% |
|
0.21 |
% |
| CRE: |
|
|
|
|
|
|
|
|
|
|
|
|
|
|
| CRE |
|
|
|
18,726 |
|
|
3,517 |
|
|
15,209 |
|
|
432 |
% |
|
0.13 |
% |
|
0.02 |
% |
Multifamily residential |
|
|
|
368 |
|
|
597 |
|
|
(229) |
|
|
(38) |
% |
|
0.01 |
% |
|
0.01 |
% |
Construction and land |
|
|
|
— |
|
|
13,251 |
|
|
(13,251) |
|
|
(100) |
% |
|
— |
% |
|
2.00 |
% |
Total CRE |
|
|
|
19,094 |
|
|
17,365 |
|
|
1,729 |
|
|
10 |
% |
|
0.09 |
% |
|
0.08 |
% |
Total commercial |
|
|
|
38,420 |
|
|
53,014 |
|
|
(14,594) |
|
|
(28) |
% |
|
0.10 |
% |
|
0.14 |
% |
| Consumer: |
|
|
|
|
|
|
|
|
|
|
|
|
|
|
Residential mortgage: |
|
|
|
|
|
|
|
|
|
|
|
|
|
|
Single-family residential |
|
|
|
49,280 |
|
|
45,228 |
|
|
4,052 |
|
|
9 |
% |
|
0.36 |
% |
|
0.34 |
% |
| HELOCs |
|
|
|
20,107 |
|
|
21,492 |
|
|
(1,385) |
|
|
(6) |
% |
|
1.16 |
% |
|
1.25 |
% |
Total residential mortgage |
|
|
|
69,387 |
|
|
66,720 |
|
|
2,667 |
|
|
4 |
% |
|
0.45 |
% |
|
0.44 |
% |
| Other consumer |
|
|
|
117 |
|
|
3,265 |
|
|
(3,148) |
|
|
(96) |
% |
|
0.22 |
% |
|
5.41 |
% |
Total consumer |
|
|
|
69,504 |
|
|
69,985 |
|
|
(481) |
|
|
(1) |
% |
|
0.45 |
% |
|
0.46 |
% |
Total |
|
|
|
$ |
107,924 |
|
|
$ |
122,999 |
|
|
$ |
(15,075) |
|
|
(12) |
% |
|
0.21 |
% |
|
0.24 |
% |
|
(1)There were no accruing loans past due 90 days or more as of both March 31, 2024 and December 31, 2023.
Allowance for Credit Losses
The Company maintains its allowance for credit losses at a level sufficient to provide appropriate reserves to absorb estimated future credit losses in accordance with GAAP. For additional information on the policies, methodologies and judgments used to determine the allowance for credit losses, see Item 7. MD&A — Critical Accounting Estimates and Item 8. Financial Statements — Note 1 — Summary of Significant Accounting Policies to the Consolidated Financial Statements in the Company’s 2023 Form 10-K, and Note 7 — Loans Receivable and Allowance for Credit Losses to the Consolidated Financial Statements in this Form 10-Q.
The following table presents an allocation of the allowance for loan losses by loan portfolio segments and unfunded credit commitments as of March 31, 2024 and December 31, 2023:
|
|
|
|
|
|
|
|
|
|
|
|
|
|
|
|
|
|
|
|
|
|
|
|
|
|
|
|
|
|
|
|
|
|
|
|
|
|
March 31, 2024 |
|
December 31, 2023 |
|
|
|
|
| ($ in thousands) |
|
Allowance Allocation |
|
% of Loan Type to Total Loans |
|
Allowance Allocation |
|
% of Loan Type to Total Loans |
|
|
|
|
| Allowance for loan losses |
|
|
|
|
|
|
|
|
|
|
|
|
| Commercial: |
|
|
|
|
|
|
|
|
|
|
|
|
| C&I |
|
$ |
373,631 |
|
|
32 |
% |
|
$ |
392,685 |
|
|
32 |
% |
|
|
|
|
| CRE: |
|
|
|
|
|
|
|
|
|
|
|
|
| CRE |
|
187,460 |
|
|
28 |
% |
|
170,592 |
|
|
28 |
% |
|
|
|
|
| Multifamily residential |
|
37,418 |
|
|
10 |
% |
|
34,375 |
|
|
10 |
% |
|
|
|
|
| Construction and land |
|
10,819 |
|
|
1 |
% |
|
10,469 |
|
|
1 |
% |
|
|
|
|
| Total CRE |
|
235,697 |
|
|
39 |
% |
|
215,436 |
|
|
39 |
% |
|
|
|
|
| Total commercial |
|
609,328 |
|
|
71 |
% |
|
608,121 |
|
|
71 |
% |
|
|
|
|
| Consumer: |
|
|
|
|
|
|
|
|
|
|
|
|
| Residential mortgage: |
|
|
|
|
|
|
|
|
|
|
|
|
| Single-family residential |
|
55,922 |
|
|
26 |
% |
|
55,018 |
|
|
26 |
% |
|
|
|
|
| HELOCs |
|
3,563 |
|
|
3 |
% |
|
3,947 |
|
|
3 |
% |
|
|
|
|
| Total residential mortgage |
|
59,485 |
|
|
29 |
% |
|
58,965 |
|
|
29 |
% |
|
|
|
|
| Other consumer |
|
1,467 |
|
|
0 |
% |
|
1,657 |
|
|
0 |
% |
|
|
|
|
| Total consumer |
|
60,952 |
|
|
29 |
% |
|
60,622 |
|
|
29 |
% |
|
|
|
|
| Total allowance for loan losses |
|
$ |
670,280 |
|
|
100 |
% |
|
$ |
668,743 |
|
|
100 |
% |
|
|
|
|
| Allowance for unfunded credit commitments |
|
$ |
38,544 |
|
|
|
|
$ |
37,699 |
|
|
|
|
|
|
|
| Total allowance for credit losses |
|
$ |
708,824 |
|
|
|
|
$ |
706,442 |
|
|
|
|
|
|
|
|
|
|
|
|
|
|
|
|
|
|
|
|
| Loans held-for-investment |
|
$ |
51,992,504 |
|
|
|
|
$ |
52,210,782 |
|
|
|
|
|
|
|
| Allowance for loan losses to loans held-for-investment |
|
1.29 |
% |
|
|
|
1.28 |
% |
|
|
|
|
|
|
|
|
|
|
|
|
|
|
|
|
|
|
|
|
|
Three Months Ended March 31, |
|
|
|
|
|
|
2024 |
|
2023 |
|
|
|
|
| Average loans held-for-investment |
|
$ |
51,924,317 |
|
|
$ |
48,144,120 |
|
|
|
|
|
|
|
|
|
|
|
|
|
|
|
|
|
|
Annualized net charge-offs to average loans held-for-investment |
|
0.17 |
% |
|
0.01 |
% |
|
|
|
|
|
|
|
|
|
First quarter of 2024 net charge-offs were $23 million, or annualized 0.17% of average loans held-for-investment, compared with net charge-offs of $1 million, or annualized 0.01% of average loans held-for-investment for the first quarter of 2023. The increase in net charge-offs was primarily driven by higher losses in the C&I portfolio.
Liquidity Risk Management
Liquidity
Liquidity risk arises from the Company’s inability to meet its customer deposit withdrawals and obligations to other counterparties as they come due, or to obtain adequate funding at a reasonable cost to meet those obligations. Liquidity risk also considers the stability of deposits. The objective of liquidity management is to manage the potential mismatch of asset and liability cash flows. Maintaining an adequate level of liquidity depends on the institution’s ability to efficiently meet both expected and unexpected cash flow and collateral needs without adversely affecting daily operations or the financial condition of the institution. To achieve this objective, the Company analyzes its liquidity risk, maintains readily available liquid assets, and utilizes diverse funding sources including its stable core deposit base.
The ROC has primary oversight responsibility over liquidity risk management. At the management level, the Company’s Asset/Liability Committee (“ALCO”) establishes the liquidity guidelines that govern the day-to-day active management of the Company’s liquidity position by requiring sufficient asset-based liquidity to cover potential funding requirements and avoid over-dependence on volatile, less reliable funding markets. These guidelines are established and monitored for both the Bank and East West on a stand-alone basis to ensure that the Company can serve as a source of strength for its subsidiaries. The ALCO regularly monitors the Company’s liquidity status and related management processes, and provides regular reports on the Company’s liquidity position relative to policy limits and guidelines to the Board of Directors. The liquidity management practices have been effective under normal operating and stressed market conditions.
The Company also maintains a Liquidity Contingency Plan that provides an early-warning methodology to detect liquidity problems and provide a timely response. The Liquidity Contingency Plan describes the procedures, roles and responsibilities, and communication protocols for managing any identified liquidity problem. Management monitors the early-warning indicators defined in the Liquidity Contingency Plan, which include metrics for measuring the Company’s internal liquidity status as well as company-specific and market-wide external factors. When early-warning signals are detected, the ALCO is informed, and the problem is evaluated for severity. The ALCO will determine the course of action and appropriate contingency funding sources, if any, that are needed.
Liquidity Risk — Liquidity Sources. The Company’s primary source of funding is from deposits, generated by its banking business, which we believe is a relatively stable and low-cost source of funding. Our loans are funded by deposits, which amounted to $58.6 billion as of March 31, 2024, compared with $56.1 billion as of December 31, 2023. The Company’s loan-to-deposit ratio was 89% as of March 31, 2024, compared with 93% as of December 31, 2023.
In addition to deposits, the Company has access to various sources of wholesale financing, including borrowing capacity with the FHLB and Federal Reserve Bank of San Francisco (“FRBSF”), unsecured federal funds lines of credit with various correspondent banks, and several master repurchase agreements with major brokerage companies to sustain an adequate liquid asset portfolio, meet daily cash demands and allow management flexibility to execute its business strategy. However, general financial market and economic conditions could impact our access and cost of external funding. Additionally, the Company’s access to capital markets is affected by the ratings received from various credit rating agencies.
Unencumbered loans and/or debt securities were pledged to the FHLB and the FRBSF discount window as collateral. The Company has established operational procedures to enable borrowing against these assets, including regular monitoring of the total pool of loans and debt securities eligible as collateral. Eligibility of collateral is defined in guidelines from the FHLB and FRBSF and is subject to change at their discretion. See Item 2 — MD&A — Balance Sheet Analysis — Deposits and Other Sources of Funding in this Form 10-Q for further details related to the Company’s funding sources. The Company believes its cash and cash equivalents, and available borrowing capacity described below provide sufficient liquidity above its expected cash needs.
The Company maintains its source of liquidity in the form of cash and cash equivalents and borrowing capacity with its eligible loans and debt securities as collateral. The following table presents the Company’s total cash and cash equivalents and collateralized borrowing capacity as of March 31, 2024 and December 31, 2023:
|
|
|
|
|
|
|
|
|
|
|
|
|
|
|
|
|
|
|
|
|
|
|
|
|
|
|
|
|
|
|
|
|
|
|
|
|
|
Change |
| ($ in thousands) |
|
March 31, 2024 |
|
December 31, 2023 |
|
$ |
|
% |
| Cash and cash equivalents |
|
$ |
4,210,801 |
|
|
$ |
4,614,984 |
|
|
$ |
(404,183) |
|
|
(9) |
% |
| Interest-bearing deposits with banks |
|
24,593 |
|
|
10,498 |
|
|
14,095 |
|
|
134 |
% |
|
|
|
|
|
|
|
|
|
Collateralized borrowing capacity: |
|
|
|
|
|
|
|
|
| FHLB |
|
7,617,334 |
|
|
12,373,002 |
|
|
(4,755,668) |
|
|
(38) |
% |
| FRBSF |
|
13,104,803 |
|
|
9,830,769 |
|
|
3,274,034 |
|
|
33 |
% |
| Unpledged available securities |
|
5,138,819 |
|
|
1,988,526 |
|
|
3,150,293 |
|
|
158 |
% |
|
|
|
|
|
|
|
|
|
|
|
|
|
|
|
|
|
|
|
|
|
|
|
|
|
|
|
|
|
|
|
|
|
|
|
|
|
|
|
|
|
|
|
|
|
|
|
|
|
|
|
|
|
|
|
|
|
|
|
|
|
|
|
|
|
|
|
|
|
|
|
|
|
|
|
|
|
|
|
|
|
|
|
|
|
|
|
|
|
|
|
|
|
|
|
|
|
|
|
|
|
|
|
|
|
|
|
|
| Total |
|
$ |
30,096,350 |
|
|
$ |
28,817,779 |
|
|
$ |
1,278,571 |
|
|
4 |
% |
|
|
|
|
|
The Company’s cash and cash equivalents and collateralized borrowing capacity totaled $30.1 billion as of March 31, 2024, compared with $28.8 billion as of December 31, 2023. The increase was primarily related to an increase in available borrowing capacity at the FRBSF due to the repayment of BTFP borrowings, and an increase in unpledged available securities. This increase was partially offset by a decrease in available borrowing capacity at the FHLB, primarily due to the increase in FHLB advances during the first quarter of 2024.
Liquidity Risk — Cash Requirements. In the ordinary course of business, the Company enters contractual obligations that require future cash payments, including funding for customer deposit withdrawals, repayments for short- and long-term borrowings, and other cash commitments. For additional information on these obligations, see Note 9 — Deposits to the Consolidated Financial Statements in the Company’s 2023 Form 10-K, and Note 8 — Affordable Housing Partnership, Tax Credit and Community Reinvestment Act Investments, Net and Note 10 — Short-Term Borrowings and Long-Term Debt to the Consolidated Financial Statements in this Form 10-Q. During the first quarter of 2024, the Company redeemed approximately $117 million of junior subordinated debt.
The Company also has off-balance sheet arrangements which represent transactions that are not recorded on the Consolidated Balance Sheet. The Company’s off-balance sheet arrangements include (1) commitments to extend credit, such as loan commitments, commercial letters of credit for foreign and domestic trade, standby letters of credit (“SBLCs”), and financial guarantees, to meet the financing needs of its customers, (2) future interest obligations related to customer deposits and the Company’s borrowings, and (3) transactions with unconsolidated entities that provide financing, liquidity, market risk or credit risk support to the Company, or engage in leasing, hedging or research and development services with the Company. Because many of these commitments are expected to expire without being drawn upon, the total commitment amounts do not necessarily represent future funding requirements. The Company does not expect the total commitment amounts as of March 31, 2024 to have a material current or future impact on the Company’s financial conditions or results of operations. Information about the Company’s loan commitments, commercial letters of credit and SBLCs is provided in Note 11 — Commitments and Contingencies to the Consolidated Financial Statements in this Form 10-Q.
The Consolidated Statement of Cash Flows summarizes the Company’s sources and uses of cash by type of activity for the first quarters of 2024 and 2023. Excess cash generated by operating and investing activities may be used to repay outstanding debt or invest in liquid assets.
Liquidity Risk — Liquidity for East West. In addition to bank level liquidity management, the Company manages liquidity at the parent company level for various operating needs including payment of dividends, repurchases of common stock, principal and interest payments on its borrowings, acquisitions and additional investments in its subsidiaries. East West’s primary source of liquidity is from cash dividends distributed by its subsidiary, East West Bank. The Bank is subject to various statutory and regulatory restrictions on its ability to pay dividends as discussed in Item 1. Business — Supervision and Regulation — Dividends and Other Transfers of Funds in the Company’s 2023 Form 10-K. East West held $287 million and $446 million in cash and cash equivalents as of March 31, 2024 and December 31, 2023, respectively. Management believes that East West has sufficient cash and cash equivalents to meet the projected cash obligations for the coming year.
Liquidity Risk — Liquidity Stress Testing. The Company utilizes liquidity stress analysis to determine the appropriate amounts of liquidity to maintain at the Company, foreign subsidiary and foreign branch to meet contractual and contingent cash outflows under a range of scenarios. Scenario analyses include assumptions about significant changes in key funding sources, market triggers, potential uses of funding and economic conditions in certain countries. In addition, Company specific events are incorporated into the stress testing. Liquidity stress tests are conducted to ascertain potential mismatches between liquidity sources and uses over various time horizons and under a variety of stressed conditions. Given the range of potential stresses, the Company maintains contingency funding plans on a consolidated basis and for individual entities.
As of March 31, 2024, the Company believes it has adequate liquidity resources to conduct operations and meet other needs in the ordinary course of business, and is not aware of any events that are reasonably likely to have a material adverse effect on its liquidity, capital resources or operations. Given the uncertain and rapidly changing market and economic conditions, the Company will continue to actively evaluate the impact on its business and financial position. For more details on how economic conditions may impact our liquidity, see Item 1A. Risk Factors in the Company’s 2023 Form 10-K.
Market Risk Management
Market risk refers to the risk of potential loss due to adverse movements in market risk factors, including interest rates, foreign exchange rates, commodity prices, and credit spreads. The Company is primarily exposed to interest rate risk through its core business activities of extending loans and acquiring deposits. There have been no significant changes in our risk management practices as described in Item 7. MD&A — Market Risk Management in the Company’s 2023 Form 10-K.
Interest Rate Risk Management
Interest rate risk is the risk that market fluctuations in interest rates can have a negative impact on the Company’s earnings and capital stemming from mismatches in the Company’s asset and liability cash flows primarily arising from customer-related activities such as lending and deposit-taking. The Company is subject to interest rate risk because:
•Assets and liabilities may mature or reprice at different times. If assets reprice faster than liabilities and interest rates are generally rising, earnings will initially increase;
•Assets and liabilities may reprice at the same time but by different amounts;
•Short- and long-term market interest rates may change by different amounts. For example, the shape of the yield curve may affect the yield of new loans and funding costs differently;
•The remaining maturity of various assets or liabilities may shorten or lengthen as interest rates change. For example, if long-term mortgage interest rates increase sharply, mortgage-related products may pay down at a slower rate than anticipated, which could impact portfolio income and valuation; or
•Interest rates may have a direct or indirect effect on loan demand, collateral values, mortgage origination volume, and the fair value of other financial instruments.
The ALCO coordinates the overall management of the Company’s interest rate risk, meets regularly to review the Company’s open market positions and establishes policies to monitor and limit exposure to market risk. Interest rate risk management is carried out primarily through strategies involving the Company’s loan portfolio, debt securities portfolio, available funding channels and capital market activities. In addition, the Company’s policies permit the use of derivative instruments to assist in managing interest rate risk.
We measure and monitor interest rate risk exposure through various risk management tools, which include a simulation model that performs interest rate sensitivity analyses under multiple interest rate scenarios against a baseline. The simulation model incorporates the market’s forward rate expectations and the Company’s earning assets and liabilities. The Company uses both a static balance sheet and a forward growth balance sheet to perform the interest rate sensitivity analyses. The simulated interest rate scenarios include an instantaneous non-parallel shift in the yield curve and a gradual non-parallel shift in the yield curve (“rate ramp”). In addition, the Company also performs simulations using other alternative interest rate scenarios, including various permutations of the yield curve flattening, steepening or inverting. The Company uses the results of these simulations to formulate and gauge strategies to achieve a desired risk profile within its capital and liquidity guidelines.
The net interest income simulation model is based on the maturity and repricing characteristics of the Company’s interest rate sensitive assets, liabilities, and related derivative contracts. This model also incorporates various assumptions, which management believes to be reasonable but that may have a significant impact on the results. These key assumptions include the timing and magnitude of changes in interest rates, the yield curve evolution and shape, the correlation between various interest rate indices, financial instruments’ future repricing characteristics and spread relative to benchmark rates, and the effect of interest rate floors and caps. The modeled results are highly sensitive to deposit decay and deposit beta assumptions, which we derive from a regression analysis of the Company’s historical deposit data.
Simulation results are highly dependent on modeled behaviors and input assumptions. To the extent that actual behaviors are different from the assumptions used in the models, there could be material changes to the interest rate sensitivity results. The key behavioral models impacting interest rate sensitivity simulations include deposit repricing, deposit balance forecasts, and mortgage prepayments. These models and assumptions are documented, supported, and periodically back-tested to assess the reasonableness and effectiveness. The Company also regularly monitors the sensitivity of the other important modeling assumptions, such as loan and security prepayments and early withdrawal on fixed-rate customer liabilities. The Company makes appropriate calibrations to the model as needed and continually validates the model, methodology and results. Changes to key model assumptions are reviewed by the ALCO. Scenario results do not reflect strategies that the management could employ to limit the impact of changing interest rate expectations. The simulation does not represent a forecast of the Company’s net interest income but is a tool utilized to assess the risk of the impact of changing market interest rates across a range of interest rate environments.
The Company employs a variety of quantitative and qualitative approaches to capture historical deposit repricing and balance behaviors. These historical observations are performed at a granular level based on key product characteristics, including distinctions for brokered, public, and large commercial deposits, which are then combined with forward-looking market expectations and the competitive landscape to generate the deposit repricing and balance forecasting models. The Company uses these deposit repricing models to forecast deposit interest expense. The repricing models provide sufficient granularity to reflect key behavioral differences across product and customer types. The deposit beta is a key parameter of the deposit rate forecast. The deposit beta defines the sensitivity of deposit rates to changes in the Effective Fed Funds Rate.
In March 2024, the Company assumed a weighted-average beta of 52% for total deposits, an increase of approximately 1.5% from December 31, 2023, which was due to deposit product mix changes as product level deposit beta assumptions were not updated. The Company updated the deposit mix assumptions in March of 2024 to assume that noninterest-bearing deposits would migrate to interest-bearing CDs. The updated assumptions reduced the proportion of noninterest-bearing deposits for the base case and decreasing interest rate scenarios, and reduced the repricing speed of the CD portfolio to better reflect its maturity profile.
As loan and security prepayment assumptions are key components of the Company’s model, the Company incorporates third-party vendor models to forecast prepayment behavior on mortgage loans and securities, which have mortgage loans as underlying collateral. These third-party vendor models have access to more comprehensive industry-level data which can capture specific borrower and collateral characteristics over a variety of interest rate cycles. The Company will periodically assess and adjust the vendor models when appropriate to include its own available observations and expectations. In 2023, the Company updated its version of the vendor prepayment model to better support the transition from London Interbank Offered Rate to Secured Overnight Financing Rate (“SOFR”) indexed loans and updated tuning factors to slow prepayment speeds on single-family residential mortgages to better align them with actual and expected prepayments.
Twelve-Month Net Interest Income Simulation
Net interest income simulation modeling measures interest rate risk through earnings volatility. The simulation projects the cash flow changes in interest rate sensitive assets and liabilities, expressed in terms of net interest income, over a specified time horizon for defined interest rate scenarios. Net interest income simulations provide insight into the impact of market rate changes on earnings, which help guide risk management decisions. The Company assesses interest rate risk by comparing the changes of net interest income in different interest rate scenarios.
The following table presents the Company’s net interest income sensitivity related to an instantaneous and sustained non-parallel shift in market interest rates by 100 and 200 bps as of March 31, 2024 and December 31, 2023, on a balance sheet assuming flat forward rates and flat loan and deposit growth on the date of analysis. The non-parallel shift scenarios were calibrated internally based on historical analysis.
|
|
|
|
|
|
|
|
|
|
|
|
|
|
|
|
|
|
|
|
|
|
Net Interest Income Volatility (1) |
|
|
| Change in Interest Rates (in bps) |
|
March 31, 2024 |
|
December 31, 2023 |
|
|
|
|
| +200 |
|
2.7 |
% |
|
1.3 |
% |
|
|
|
|
| +100 |
|
2.0 |
% |
|
1.2 |
% |
|
|
|
|
| -100 |
|
(3.2) |
% |
|
(1.8) |
% |
|
|
|
|
| -200 |
|
(6.6) |
% |
|
(4.1) |
% |
|
|
|
|
|
(1)The percentage change represents net interest income change over a 12-month period in a stable interest rate environment versus in the various interest rate scenarios.
The composition of the Company’s loan portfolio creates sensitivity to interest rate movements due to a mismatch of repricing behavior between the floating-rate loan portfolio and deposit products. In the table above, net interest income volatility expressed in relation to base-case net interest income increased as of March 31, 2024. This increase reflects updated deposit product mix assumptions, which better reflect the expected repricing profile of the CD portfolio and the amount of noninterest-bearing deposits for the shocked interest rate scenarios.
The Company also models scenarios based on gradual shifts in interest rates and assesses the corresponding impacts. These interest rate scenarios provide additional information to estimate the Company’s underlying interest rate risk. The rate ramp table below shows the net interest income volatility under a gradual non-parallel shift of the yield curve, in even monthly increments over the first 12 months, followed by rates held constant thereafter based on a flat balance sheet as of the date of the analysis.
|
|
|
|
|
|
|
|
|
|
|
|
|
|
|
|
|
|
Net Interest Income Volatility |
| Change in Interest Rates (in bps) |
|
March 31, 2024 |
|
December 31, 2023 |
| +200 Rate Ramp |
|
2.8 |
% |
|
0.8 |
% |
| +100 Rate Ramp |
|
1.6 |
% |
|
0.5 |
% |
| -100 Rate Ramp |
|
(1.8) |
% |
|
(0.6) |
% |
| -200 Rate Ramp |
|
(3.6) |
% |
|
(1.3) |
% |
|
As of March 31, 2024, the Company’s net interest income profile reflects an asset sensitive position, where assets reprice faster or more significantly than liabilities. Net interest income is expected to increase when interest rates rise as the Company has a large population of variable rate loans, primarily tied to Prime and Term SOFR indices. The Company’s interest income is sensitive to changes in short-term interest rates. As of March 31, 2024, the Company designated interest rate contracts with a notional amount of $5.3 billion as cash flow hedges, which reduced net interest income volatility by approximately 1.8% of the base net interest income for every 100 bps change in interest rate.
The Company’s deposit portfolio is primarily composed of non-maturity deposits, which are not directly tied to short-term interest rate indices, but are, nevertheless, sensitive to changes in short-term interest rates. The modeled results are highly sensitive to modeled behavior and assumptions. Actual net interest income results may deviate from the model’s net interest income due to earning asset growth variation and deposit mix changes based on customer preferences relative to the interest rate environment. During a period of declining interest rates, balance sheet growth could offset headwinds to net interest income from yield compression.
Economic Value of Equity at Risk
Economic value of equity (“EVE”) is a cash flow calculation that takes the present value of all asset cash flows and subtracts the present value of all liability cash flows. This calculation is used for asset/liability management and measures changes in the economic value of the bank’s assets and liabilities due to changes in interest rates.
The economic value approach provides a comparatively broader scope than the net interest income volatility approach since it represents the discounted present value of cash flows over the expected life of the instruments. Due to this longer horizon, EVE is useful to identify risks arising from repricing, prepayment and maturity gaps between assets and liabilities on the balance sheet, as well as from off-balance sheet derivative exposures, over their lifetime. This long-term economic perspective into the Company’s interest rate risk profile allows the Company to identify anticipated negative effects of interest rate fluctuations. However, the difference in time horizons can cause the EVE analysis to diverge from the shorter-term net interest income analysis presented above. Given the uncertainty of the magnitude, timing and direction of future interest rate movements, the shape of the yield curve, and potential changes to the balance sheet, actual results may vary from those predicted by the Company’s model.
The following table presents the Company’s EVE sensitivity related to an instantaneous non-parallel shift in market interest rates by 100 and 200 bps as of March 31, 2024 and December 31, 2023. The non-parallel shift scenarios were calibrated internally based on historical analysis.
|
|
|
|
|
|
|
|
|
|
|
|
|
|
|
|
|
|
|
|
|
|
EVE Volatility (1) |
| Change in Interest Rates (in bps) |
|
March 31, 2024 |
|
December 31, 2023 |
| +200 |
|
(10.4) |
% |
|
(10.3) |
% |
| +100 |
|
(4.9) |
% |
|
(5.4) |
% |
| -100 |
|
2.6 |
% |
|
3.0 |
% |
| -200 |
|
5.1 |
% |
|
6.0 |
% |
|
|
|
|
|
(1)The percentage change represents net portfolio value change of the Company in a stable interest rate environment versus in the various interest rate scenarios.
As of March 31, 2024, the Company’s EVE is expected to decrease when interest rates rise. The change in EVE sensitivity was due to changes in the structure of the balance sheet as well as changes in the underlying valuations and durations of assets and liabilities.
Derivatives
It is the Company’s policy not to speculate on the future direction of interest rates, foreign currency exchange rates and commodity prices. However, the Company periodically enters into derivative transactions in order to manage its exposure to market risk, primarily interest rate risk and foreign currency risk. The Company believes these derivative transactions, when properly structured and managed, provide a hedge against inherent risk in certain assets and liabilities or against risk in specific transactions. Hedging transactions may be implemented using a variety of derivative instruments such as swaps, forwards, options, and collars. The Company uses interest rate swaps to hedge the variability in interest received on certain floating-rate commercial loans and interest paid on certain floating-rate borrowings. Foreign exchange derivatives are used in net investment hedging strategies to mitigate the risk of changes in the U.S. dollar equivalent value of a designated monetary amount of the Company’s net investment in East West Bank (China) Limited. Prior to entering any hedge accounting activity, the Company analyzes the costs and benefits of the hedge in comparison to alternative strategies. The Company also repositions its hedging derivatives portfolio based on the current assessment of economic and financial conditions, including the interest rate and foreign currency environments, balance sheet composition and trends, and the relative mix of its cash and derivative positions.
In addition, the Company enters into derivative transactions in order to accommodate its customers with their business needs or to assist customers with their risk management objectives, such as managing exposure to fluctuations in interest rates, foreign currencies and commodity prices. To economically hedge against the derivative contracts entered into with the Company’s customers, the Company enters into offsetting derivative contracts with third-party financial institutions, some of which are cleared through central clearing organizations. The exposures from derivative transactions are collateralized by cash and/or eligible securities based on limits as set forth in the respective agreements between the Company and counterparty financial institutions. The fair value changes of the derivative contracts traded with third-party financial institutions are expected to be largely comparable to the fair value changes of the derivative transactions executed with customers throughout the terms of these contracts, except for the credit valuation adjustment component in the contracts and the spread variances between the customer derivatives and the offsetting financial counterparty positions. The Company also utilizes foreign exchange contracts that are not designated as hedging instruments to mitigate the economic effect of fluctuations in certain foreign currency on-balance sheet assets and liabilities, primarily foreign currency denominated deposits offered to its customers.
The Company is subject to credit risk associated with the counterparties to the derivative contracts. This counterparty credit risk is a multi-dimensional form of risk, affected by both the exposure and credit quality of the counterparty, both of which are sensitive to market-induced changes. The Company’s Credit Risk Management Committee provides oversight of credit risk and the Company has guidelines in place to manage counterparty concentration, tenor limits, and collateral. The Company manages the credit risk of its derivative positions by diversifying its positions among various counterparties, by entering into legally enforceable master netting agreements, and by requiring collateral arrangements, where possible. The Company may also transfer counterparty credit risk related to interest rate swaps to third-party financial institutions through the use of credit risk participation agreements. Certain derivative contracts are required to be cleared through central clearinghouses, to further mitigate counterparty credit risk, where variation margin is applied daily as settlement to the fair value of the derivative contracts. In addition, the Company incorporates credit value adjustments and other market standard methodologies to appropriately reflect the counterparty’s and the Company’s own nonperformance risk in the fair value measurement of its derivatives. As of March 31, 2024, the Company anticipates performance by its counterparties and has not incurred any related credit losses.
The following table summarizes certain information on derivative instruments designated as accounting hedges and utilized by the Company in its management of interest rate and foreign currency risks as of March 31, 2024 and December 31, 2023:
|
|
|
|
|
|
|
|
|
|
|
|
|
|
|
|
|
|
|
|
|
|
March 31, 2024 |
|
December 31, 2023 |
| ($ in thousands) |
|
Interest Rate Contracts Hedging Loans (1)(2)(3) |
|
|
|
Interest Rate Contracts Hedging Loans (1)(2)(3) |
|
|
| Cash flow hedges |
|
|
|
|
|
|
|
|
| Notional amount |
|
$ |
4,000,000 |
|
|
|
|
$ |
4,000,000 |
|
|
|
| Weighted average: |
|
|
|
|
|
|
|
|
| Receive rate |
|
4.95 |
% |
|
|
|
4.95 |
% |
|
|
| Pay rate |
|
7.31 |
% |
|
|
|
7.32 |
% |
|
|
| Remaining term (in months) |
|
32.8 |
|
|
|
|
35.8 |
|
|
|
|
|
|
|
|
|
|
|
|
|
|
|
|
|
|
|
|
|
| ($ in thousands) |
|
Foreign Exchange Contracts |
|
Foreign Exchange Contracts |
| Net investment hedges |
|
|
|
|
|
|
|
|
| Notional amount |
|
$ |
— |
|
|
|
|
$ |
81,480 |
|
|
Hedged percentage (4) |
|
— |
% |
|
|
|
44 |
% |
|
|
| Remaining term (in months) |
|
— |
|
|
|
|
2.7 |
|
|
|
|
NA — Not applicable.
(1)Represents receive-fixed/pay-floating interest rate swaps and excludes interest rate collars. Floating rates paid are based on SOFR or Prime.
(2)Excludes interest rate collars in total notional amount of $250 million as of both March 31, 2024 and December 31, 2023.
(3)Excludes forward-starting swaps in total notional amount of $1.0 billion not effective as of both March 31, 2024 and December 31, 2023.
(4)Represents percentage between the notional of outstanding foreign exchange contracts and the net RMB exposure from East West Bank (China) Limited. The Company does not have active net investment hedges as of March 31, 2024.
Additional information on the Company’s derivatives is presented in Note 1 — Summary of Significant Accounting Policies — Significant Accounting Policies — Derivatives to the Consolidated Financial Statements in the Company’s 2023 Form 10-K, Note 3 — Fair Value Measurement and Fair Value of Financial Instruments, and Note 6 — Derivatives to the Consolidated Financial Statements in this Form 10-Q.
Critical Accounting Policies and Estimates
The Company’s significant accounting policies are described in Note 1 — Summary of Significant Accounting Policies to the Consolidated Financial Statements in the Company’s 2023 Form 10-K. Certain of these policies include critical accounting estimates, which are subject to valuation assumptions, subjective or complex judgments about matters that are inherently uncertain, and it is likely that materially different amounts could be reported under different assumptions and conditions. The Company has procedures and processes in place to facilitate making these judgments. The following accounting policies are critical to the Company’s Consolidated Financial Statements:
•allowance for credit losses;
•fair value estimates;
•goodwill impairment; and
•income taxes.
For additional information on the Company’s critical accounting estimates involving significant judgments, see Item 7. MD&A — Critical Accounting Estimates in the Company’s 2023 Form 10-K.
Reconciliation of GAAP to Non-GAAP Financial Measures
To supplement the Company’s unaudited interim Consolidated Financial Statements presented in accordance with U.S. GAAP, the Company uses certain non-GAAP measures of financial performance. Non-GAAP financial measures are not prepared in accordance with, or as an alternative to U.S. GAAP. Generally, a non-GAAP financial measure is a numerical measure of a company’s performance that either excludes or includes amounts, or is subject to adjustments that have such an effect, that are not normally excluded or included in the most directly comparable financial measure that is calculated and presented in accordance with U.S. GAAP. The non-GAAP financial measures discussed in this Form 10-Q are return on average TCE, adjusted efficiency ratio, adjusted diluted EPS, and tangible book value per share. Certain additional non-GAAP financial measures that are components of the foregoing non-GAAP financial measures are also set forth and reconciled in the table below. The Company believes these non-GAAP financial measures, when taken together with the corresponding U.S. GAAP financial measures, provide meaningful supplemental information regarding its performance, and allow comparability to prior periods. These non-GAAP financial measures may be different from non-GAAP financial measures used by other companies, limiting their usefulness for comparison purposes.
The following tables present the reconciliations of U.S. GAAP to non-GAAP financial measures for the periods presented:
|
|
|
|
|
|
|
|
|
|
|
|
|
|
|
|
|
|
|
|
|
|
|
|
|
|
|
|
|
|
Three Months Ended March 31, |
|
|
| ($ in thousands) |
|
|
2024 |
|
2023 |
|
|
|
|
| Net income |
(a) |
|
$ |
285,075 |
|
|
$ |
322,439 |
|
|
|
|
|
| Add: Amortization of core deposit intangibles |
|
|
— |
|
|
441 |
|
|
|
|
|
| Amortization of mortgage servicing assets |
|
|
308 |
|
|
356 |
|
|
|
|
|
Tax effect of amortization adjustments (1) |
|
|
(91) |
|
|
(233) |
|
|
|
|
|
| Tangible net income (non-GAAP) |
(b) |
|
$ |
285,292 |
|
|
$ |
323,003 |
|
|
|
|
|
|
|
|
|
|
|
|
|
|
|
| Average stockholders’ equity |
(c) |
|
$ |
6,992,558 |
|
|
$ |
6,183,324 |
|
|
|
|
|
| Less: Average goodwill |
|
|
(465,697) |
|
|
(465,697) |
|
|
|
|
|
Average other intangible assets (2) |
|
|
(6,473) |
|
|
(7,696) |
|
|
|
|
|
| Average tangible book value (non-GAAP) |
(d) |
|
$ |
6,520,388 |
|
|
$ |
5,709,931 |
|
|
|
|
|
|
|
|
|
|
|
|
|
|
|
ROE (3) |
(a)/(c) |
|
16.40 |
% |
|
21.15 |
% |
|
|
|
|
Return on average TCE (3) (non-GAAP) |
(b)/(d) |
|
17.60 |
% |
|
22.94 |
% |
|
|
|
|
|
|
|
|
|
|
|
|
|
|
|
|
|
|
|
|
|
|
|
|
|
|
|
|
|
|
|
|
|
|
|
|
|
|
|
|
|
|
|
|
|
|
|
Three Months Ended March 31, |
|
|
| ($ in thousands) |
|
|
2024 |
|
2023 |
|
|
|
|
| Net interest income before provision for credit losses |
(a) |
|
$ |
565,139 |
|
|
$ |
599,861 |
|
|
|
|
|
| Total noninterest income |
|
|
78,988 |
|
|
59,978 |
|
|
|
|
|
| Total revenue |
(b) |
|
$ |
644,127 |
|
|
$ |
659,839 |
|
|
|
|
|
| Noninterest income |
|
|
78,988 |
|
|
59,978 |
|
|
|
|
|
Add: Net loss on AFS debt security (4) |
|
|
— |
|
|
10,000 |
|
|
|
|
|
| Adjusted noninterest income (non-GAAP) |
(c) |
|
78,988 |
|
|
69,978 |
|
|
|
|
|
| Adjusted revenue (non-GAAP) |
(a)+(c)=(d) |
|
$ |
644,127 |
|
|
$ |
669,839 |
|
|
|
|
|
|
|
|
|
|
|
|
|
|
|
Total noninterest expense |
(e) |
|
$ |
246,875 |
|
|
$ |
218,447 |
|
|
|
|
|
| Less: Amortization of tax credit and other investments |
|
|
(13,207) |
|
|
(10,110) |
|
|
|
|
|
| Amortization of core deposit intangibles |
|
|
— |
|
|
(441) |
|
|
|
|
|
FDIC charge (5) |
|
|
(10,305) |
|
|
— |
|
|
|
|
|
Repurchase agreements’ extinguishment cost (6) |
|
|
— |
|
|
(3,872) |
|
|
|
|
|
| Adjusted noninterest expense (non-GAAP) |
(f) |
|
$ |
223,363 |
|
|
$ |
204,024 |
|
|
|
|
|
|
|
|
|
|
|
|
|
|
|
| Efficiency ratio |
(e)/(b) |
|
38.33 |
% |
|
33.11 |
% |
|
|
|
|
| Adjusted efficiency ratio (non-GAAP) |
(f)/(d) |
|
34.68 |
% |
|
30.46 |
% |
|
|
|
|
|
|
|
|
|
|
|
|
|
|
|
|
|
|
|
|
|
|
|
|
|
|
|
|
|
|
|
|
|
|
|
Three Months Ended March 31, |
| ($ and shares in thousands, except per share data) |
|
|
|
|
|
|
2024 |
|
2023 |
| Net income |
(a) |
|
|
|
|
|
$ |
285,075 |
|
|
$ |
322,439 |
|
Add: FDIC charge (5) |
|
|
|
|
|
|
10,305 |
|
|
— |
|
Net loss on AFS debt security (4) |
|
|
|
|
|
|
— |
|
|
10,000 |
|
Tax effect of adjustment (1) |
|
|
|
|
|
|
(3,046) |
|
|
(2,929) |
|
| Adjusted net income (non-GAAP) |
(b) |
|
|
|
|
|
$ |
292,334 |
|
|
$ |
329,510 |
|
|
|
|
|
|
|
|
|
|
|
| Diluted weighted-average number of shares outstanding |
(c) |
|
|
|
|
|
$ |
140,261 |
|
|
$ |
141,913 |
|
| Diluted EPS |
(a)/(c) |
|
|
|
|
|
2.03 |
|
|
2.27 |
|
Add: FDIC charge (5) |
|
|
|
|
|
|
0.05 |
|
|
— |
|
Net loss on AFS debt security (4) |
|
|
|
|
|
|
— |
|
|
0.05 |
|
| Adjusted diluted EPS (non-GAAP) |
(b)/(c) |
|
|
|
|
|
$ |
2.08 |
|
|
$ |
2.32 |
|
|
|
|
|
|
|
|
|
|
|
|
|
|
|
|
|
|
|
|
|
(1)Applied statutory tax rate of 29.56% for the first quarter of 2024 and 29.29% for the first quarter of 2023.
(2)Includes core deposit intangibles and mortgage servicing assets.
(3)Annualized.
(4)Represents the net loss related to an AFS debt security that was written-off in the first quarter of 2023.
(5)During the first quarter of 2024, the Company recorded a $10 million pre-tax FDIC charge (included in Deposit insurance premiums and regulatory assessments on the Consolidated Statement of Income).
(6)The Company prepaid $300 million of repurchase agreements and incurred a debt extinguishment cost of $4 million in the first quarter of 2023.
|
|
|
|
|
|
|
|
|
|
|
|
|
|
|
|
|
|
|
|
|
|
|
| ($ and shares in thousands, except per share data) |
|
|
March 31, 2024 |
|
December 31, 2023 |
|
|
| Stockholders’ equity |
(a) |
|
$ |
7,023,232 |
|
|
$ |
6,950,834 |
|
|
|
Less: Goodwill |
|
|
(465,697) |
|
|
(465,697) |
|
|
|
Other intangible assets (1) |
|
|
(6,234) |
|
|
(6,602) |
|
|
|
| Tangible book value (non-GAAP) |
(b) |
|
$ |
6,551,301 |
|
|
$ |
6,478,535 |
|
|
|
|
|
|
|
|
|
|
|
|
|
|
|
|
|
|
|
|
|
|
|
|
|
|
|
|
|
|
|
|
|
|
|
|
|
|
|
|
|
|
|
|
|
|
|
|
|
|
|
|
|
|
|
|
|
|
|
|
|
|
|
|
|
|
|
|
|
|
|
|
|
|
|
| Number of common shares at period-end |
(c) |
|
139,121 |
|
|
140,027 |
|
|
|
| Book value per share |
(a)/(c) |
|
$ |
50.48 |
|
|
$ |
49.64 |
|
|
|
| Tangible book value per share (non-GAAP) |
(b)/(c) |
|
$ |
47.09 |
|
|
$ |
46.27 |
|
|
|
|
|
|
(1)Includes core deposit intangibles and mortgage servicing assets.
ITEM 3. QUANTITATIVE AND QUALITATIVE DISCLOSURES ABOUT MARKET RISK
For quantitative and qualitative disclosures regarding market risk in the Company’s portfolio, see Note 6 — Derivatives to the Consolidated Financial Statements in this Form 10-Q and Item 2. MD&A — Risk Management — Market Risk Management in this Form 10-Q.
ITEM 4. CONTROLS AND PROCEDURES
Disclosure Controls and Procedures
As of March 31, 2024, pursuant to Rule 13a-15(b) of the Securities Exchange Act of 1934, as amended (the “Exchange Act”), the Company conducted an evaluation, under the supervision and with the participation of the Company’s management, including the Chief Executive Officer and Chief Financial Officer, of the effectiveness of the Company’s disclosure controls and procedures (as defined in Rule 13a-15(e) of the Exchange Act). Based upon that evaluation, the Company’s Chief Executive Officer and Chief Financial Officer concluded that the Company’s disclosure controls and procedures were effective as of March 31, 2024.
The Company’s disclosure controls and procedures are designed to ensure that information required to be disclosed by the Company in the reports that the Company files or submits under the Exchange Act is recorded, processed, summarized, and reported within the time periods specified in the rules and forms of the SEC. The Company’s disclosure controls and procedures include, without limitation, controls and procedures designed to ensure that information required to be disclosed by the Company in the reports that the Company files under the Exchange Act is accumulated and communicated to the Company’s management, including the Chief Executive Officer and Chief Financial Officer, as appropriate, to allow timely decisions regarding required disclosure.
Change in Internal Control over Financial Reporting
There were no changes in the Company’s internal control over financial reporting (as defined in Rule 13a-15(f) of the Exchange Act) during the quarter ended March 31, 2024, that have materially affected or are reasonably likely to materially affect the Company’s internal control over financial reporting.
PART II — OTHER INFORMATION
ITEM 1. LEGAL PROCEEDINGS
See Note 11 — Commitments and Contingencies — Litigation to the Consolidated Financial Statements in Part I of this Form 10-Q, incorporated herein by reference.
ITEM 1A. RISK FACTORS
The Company’s 2023 Form 10-K contains disclosure regarding the risks and uncertainties related to the Company’s business under the heading Item 1A. Risk Factors. There have been no material changes to the Company’s risk factors as presented in the Company’s 2023 Form 10-K.
ITEM 2. UNREGISTERED SALES OF EQUITY SECURITIES AND USE OF PROCEEDS
Repurchases of Equity Securities by the Issuer and Affiliated Purchasers
The following table summarizes the Company’s common stock repurchase activity during the first quarter of 2024:
|
|
|
|
|
|
|
|
|
|
|
|
|
|
|
|
|
|
|
|
|
|
|
|
|
|
|
|
| Calendar Month |
|
Total Number of Shares Purchased (1) |
|
Average Price Paid per Share of Common Stock |
|
Total Number of Shares Purchased as Part of Publicly Announced Plans or Programs |
|
Approximate Dollar Value of Shares that May Yet Be Purchased Under the Plans or Programs (in millions) (2) |
| January |
|
— |
|
|
$ |
— |
|
|
— |
|
|
$ |
172 |
|
| February |
|
1,181,851 |
|
|
$ |
69.76 |
|
|
1,181,851 |
|
|
$ |
89 |
|
| March |
|
— |
|
|
$ |
— |
|
|
— |
|
|
$ |
89 |
|
| First quarter |
|
1,181,851 |
|
|
$ |
69.76 |
|
|
1,181,851 |
|
|
|
|
(1)Excludes the repurchase of common stock pursuant to various stock compensation plans and agreements.
(2)On March 3, 2020, the Company’s Board of Directors authorized, and the Company announced, a stock repurchase program under which the Company may repurchase up to $500 million of its common stock. The stock repurchase authorization has no expiration date.
ITEM 5. OTHER INFORMATION
During the three months ended March 31, 2024, none of the Company’s directors or Section 16 reporting officers adopted or terminated any Rule 10b5-1 trading arrangement or non-Rule 10b5-1 trading arrangement (as such terms are defined in Item 408 of the SEC’s Regulation S-K).
ITEM 6. EXHIBITS
The following exhibit index lists Exhibits filed, or in the case of Exhibits 32.1 and 32.2 furnished, with this report:
|
|
|
|
|
|
|
|
|
| Exhibit No. |
|
Exhibit Description |
|
|
|
| 3.1 |
|
|
|
|
|
| 3.1.1 |
|
|
|
|
|
| 3.1.2 |
|
|
|
|
|
| 3.1.3 |
|
|
|
|
|
| 3.1.4 |
|
|
|
|
|
| 3.1.5 |
|
|
|
|
|
| 3.1.6 |
|
|
|
|
|
| 3.2 |
|
|
|
|
|
| 10.1 |
|
|
|
|
|
| 10.2 |
|
|
|
|
|
|
|
|
|
|
|
|
|
|
|
|
|
|
|
|
|
|
|
|
|
|
|
|
|
|
|
|
|
|
|
| 31.1 |
|
|
|
|
|
| 31.2 |
|
|
|
|
|
| 32.1 |
|
|
|
|
|
| 32.2 |
|
|
|
|
|
| 101.INS |
|
The instance document does not appear in the interactive data file because its XBRL tags are embedded within the inline XBRL document. |
|
|
|
| 101.SCH |
|
Inline XBRL Taxonomy Extension Schema Document. Filed herewith. |
|
|
|
| 101.CAL |
|
Inline XBRL Taxonomy Extension Calculation Linkbase Document. Filed herewith. |
|
|
|
| 101.DEF |
|
Inline XBRL Taxonomy Extension Definition Linkbase Document. Filed herewith. |
|
|
|
| 101.LAB |
|
Inline XBRL Taxonomy Extension Label Linkbase Document. Filed herewith. |
|
|
|
| 101.PRE |
|
Inline XBRL Taxonomy Extension Presentation Linkbase Document. Filed herewith. |
|
|
|
| 104 |
|
Cover Page Interactive Data (formatted as Inline XBRL and contained in Exhibit 101 filed herewith). Filed herewith. |
|
|
|
|
|
|
|
|
GLOSSARY OF ACRONYMS
|
|
|
|
|
|
|
|
|
|
|
|
| AFS |
Available-for-sale |
HELOC |
Home equity lines of credit |
| ALCO |
Asset/Liability Committee |
HTM |
Held-to-maturity |
| AOCI |
Accumulated other comprehensive income |
IAR |
Independent Asset Review |
| ASC |
Accounting Standards Codification |
LCH |
London Clearing House |
| ASU |
Accounting Standards Update |
LGD |
Loss given default |
| BTFP |
Bank Term Funding Program |
LTV |
Loan-to-value |
| C&I |
Commercial and industrial |
MD&A |
Management’s Discussion and Analysis of Financial Condition and Results of Operations |
CD |
Certificate of deposit |
MMBTU |
Million British thermal unit |
| CECL |
Current expected credit losses |
NAV |
Net asset value |
| CFPB |
Consumer Financial Protection Bureau |
NRSRO |
Nationally recognized statistical rating organizations |
| CLO |
Collateralized loan obligations |
OREO |
Other real estate owned |
| CME |
Chicago Mercantile Exchange |
PAM |
Proportional amortization method |
| CRA |
Community Reinvestment Act |
PD |
Probability of default |
| CRE |
Commercial real estate |
RMB |
Chinese Renminbi |
| DIF |
Deposit Insurance Fund |
ROA |
Return on average assets |
| EPS |
Earnings per share |
ROC |
Risk Oversight Committee |
| ERM |
Enterprise risk management |
ROE |
Return on average common equity |
| EVE |
Economic value of equity |
RPA |
Credit risk participation agreement |
| FASB |
Financial Accounting Standards Board |
RSU |
Restricted stock unit |
| FDIC |
Federal Deposit Insurance Corporation |
SBLC |
Standby letters of credit |
| FHLB |
Federal Home Loan Bank |
SEC |
U.S. Securities and Exchange Commission |
| FRBSF |
Federal Reserve Bank of San Francisco |
SOFR |
Secured Overnight Financing Rate |
| FTP |
Funds transfer pricing |
TCE |
Tangible Common Equity |
| GAAP |
Generally Accepted Accounting Principles |
U.S. |
United States |
| GDP |
Gross Domestic Product |
USD |
U.S. dollar |
| GNMA |
Government National Mortgage Association |
|
|
SIGNATURE
Pursuant to the requirements of the Securities Exchange Act of 1934, the registrant has duly caused this report to be signed on its behalf by the undersigned thereunto duly authorized.
|
|
|
|
|
|
|
|
|
|
|
|
|
|
|
| Dated: |
May 9, 2024 |
|
|
|
|
|
|
EAST WEST BANCORP, INC.
(Registrant) |
|
|
|
|
|
By |
/s/ Christopher J. Del Moral-Niles |
|
|
|
|
Christopher J. Del Moral-Niles |
|
|
|
Executive Vice President and
Chief Financial Officer |
EX-10.1
2
ewbc10110q3312024.htm
EX-10.1
Document
Exhibit 10.1
AMENDMENT TO EMPLOYMENT AGREEMENT
This Amendment Agreement is dated as of March 5, 2024 (the "Amendment Effective Date") and amends that certain Employment Agreement dated as of June 25, 1998 (as amended from time to time, the "Employment Agreement") by and between East West Bancorp, Inc. ("Company") and Dominic Ng ("Employee").
The following terms and conditions of the Employment Agreement are hereby modified as of the Amendment Effective Date:
1.Section 3.1 (Term) of the Agreement is hereby modified in its entirety to read as follows:
This Agreement and employment under this Agreement shall terminate on March 5, 2027 unless extended by Company.
2.Except as expressly agreed to herein, the Employment Agreement shall remain in force and effect.
|
|
|
|
|
|
|
EAST WEST BANCORP, INC. |
|
/s/ GARY TEO |
|
Gary Teo |
|
Chief Human Resources Officer |
|
|
|
/s/ DOMINIC NG |
|
Employee: Dominic Ng |
EX-10.2
3
ewbc10210q3312024.htm
EX-10.2
Document
Exhibit 10.2
AMENDMENT TO EMPLOYMENT AGREEMENT
This Amendment Agreement is dated as of March 5, 2024 (the "Amendment Effective Date") and amends that certain Employment Agreement dated as of September 17, 1999 (as amended from time to time, the "Employment Agreement") by and between East West Bancorp, Inc. ("Company") and Douglas Krause ("Employee").
The following terms and conditions of the Employment Agreement are hereby modified as of the Amendment Effective Date:
1.Section 3.1 (Term) of the Agreement is hereby modified in its entirety to read as follows:
This Agreement and employment under this Agreement shall terminate on March 5, 2027 unless extended by Company.
2.Except as expressly agreed to herein, the Employment Agreement shall remain in force and effect.
|
|
|
|
|
|
|
EAST WEST BANCORP, INC. |
|
/s/ GARY TEO |
|
Gary Teo |
|
Chief Human Resources Officer |
|
|
|
/s/ DOUGLAS KRAUSE |
|
Employee: Douglas Krause |
EX-31.1
4
ewbc31110q3312024.htm
EX-31.1
Document
Exhibit 31.1
CERTIFICATION
CERTIFICATION PURSUANT TO SECTION 302
OF THE SARBANES-OXLEY ACT OF 2002
FOR THE CHIEF EXECUTIVE OFFICER
I, Dominic Ng, certify that:
1.I have reviewed this Quarterly Report on Form 10-Q of East West Bancorp, Inc. (the “registrant”);
2.Based on my knowledge, this report does not contain any untrue statement of a material fact or omit to state a material fact necessary to make the statements made, in light of the circumstances under which such statements were made, not misleading with respect to the period covered by this report;
3.Based on my knowledge, the financial statements, and other financial information included in this report, fairly present in all material respects the financial condition, results of operations and cash flows of the registrant as of, and for, the periods presented in this report;
4.The registrant’s other certifying officer and I are responsible for establishing and maintaining disclosure controls and procedures (as defined in Exchange Act Rules 13a-15(e) and 15d-15(e)) and internal control over financial reporting (as defined in Exchange Act Rules 13a-15(f) and 15d-15(f)) for the registrant and have:
a.Designed such disclosure controls and procedures, or caused such disclosure controls and procedures to be designed under our supervision, to ensure that material information relating to the registrant, including its consolidated subsidiaries, is made known to us by others within those entities, particularly during the period in which this report is being prepared;
b.Designed such internal control over financial reporting, or caused such internal control over financial reporting to be designed under our supervision, to provide reasonable assurance regarding the reliability of financial reporting and the preparation of financial statements for external purposes in accordance with generally accepted accounting principles;
c.Evaluated the effectiveness of the registrant’s disclosure controls and procedures and presented in this report our conclusions about the effectiveness of the disclosure controls and procedures, as of the end of the period covered by this report based on such evaluation; and
d.Disclosed in this report any change in the registrant’s internal control over financial reporting that occurred during the registrant’s most recent fiscal quarter (the registrant’s fourth fiscal quarter in the case of an annual report) that has materially affected, or is reasonably likely to materially affect, the registrant’s internal control over financial reporting; and
5.The registrant’s other certifying officer and I have disclosed, based on our most recent evaluation of internal control over financial reporting, to the registrant’s auditors and the audit committee of the registrant’s board of directors (or persons performing the equivalent functions):
a.All significant deficiencies and material weaknesses in the design or operation of internal control over financial reporting which are reasonably likely to adversely affect the registrant’s ability to record, process, summarize and report financial information; and
b.Any fraud, whether or not material, that involves management or other employees who have a significant role in the registrant’s internal control over financial reporting.
Date: May 9, 2024
|
|
|
|
|
|
| |
/s/ DOMINIC NG |
| |
Dominic Ng |
| |
Chief Executive Officer |
EX-31.2
5
ewbc31210q3312024.htm
EX-31.2
Document
Exhibit 31.2
CERTIFICATION
CERTIFICATION PURSUANT TO SECTION 302
OF THE SARBANES-OXLEY ACT OF 2002
FOR THE CHIEF FINANCIAL OFFICER
I, Christopher J. Del Moral-Niles, certify that:
1.I have reviewed this Quarterly Report on Form 10-Q of East West Bancorp, Inc. (the “registrant”);
2.Based on my knowledge, this report does not contain any untrue statement of a material fact or omit to state a material fact necessary to make the statements made, in light of the circumstances under which such statements were made, not misleading with respect to the period covered by this report;
3.Based on my knowledge, the financial statements, and other financial information included in this report, fairly present in all material respects the financial condition, results of operations and cash flows of the registrant as of, and for, the periods presented in this report;
4.The registrant’s other certifying officer and I are responsible for establishing and maintaining disclosure controls and procedures (as defined in Exchange Act Rules 13a-15(e) and 15d-15(e)) and internal control over financial reporting (as defined in Exchange Act Rules 13a-15(f) and 15d-15(f)) for the registrant and have:
a.Designed such disclosure controls and procedures, or caused such disclosure controls and procedures to be designed under our supervision, to ensure that material information relating to the registrant, including its consolidated subsidiaries, is made known to us by others within those entities, particularly during the period in which this report is being prepared;
b.Designed such internal control over financial reporting, or caused such internal control over financial reporting to be designed under our supervision, to provide reasonable assurance regarding the reliability of financial reporting and the preparation of financial statements for external purposes in accordance with generally accepted accounting principles;
c.Evaluated the effectiveness of the registrant’s disclosure controls and procedures and presented in this report our conclusions about the effectiveness of the disclosure controls and procedures, as of the end of the period covered by this report based on such evaluation; and
d.Disclosed in this report any change in the registrant’s internal control over financial reporting that occurred during the registrant’s most recent fiscal quarter (the registrant’s fourth fiscal quarter in the case of an annual report) that has materially affected, or is reasonably likely to materially affect, the registrant’s internal control over financial reporting; and
5.The registrant’s other certifying officer and I have disclosed, based on our most recent evaluation of internal control over financial reporting, to the registrant’s auditors and the audit committee of the registrant’s board of directors (or persons performing the equivalent functions):
a.All significant deficiencies and material weaknesses in the design or operation of internal control over financial reporting which are reasonably likely to adversely affect the registrant’s ability to record, process, summarize and report financial information; and
b.Any fraud, whether or not material, that involves management or other employees who have a significant role in the registrant’s internal control over financial reporting.
Date: May 9, 2024
|
|
|
|
|
|
| |
/s/ CHRISTOPHER J. DEL MORAL-NILES |
| |
Christopher J. Del Moral-Niles |
| |
Chief Financial Officer |
EX-32.1
6
ewbc32110q3312024.htm
EX-32.1
Document
Exhibit 32.1
CERTIFICATION
CERTIFICATION PURSUANT TO
18 U.S.C. SECTION 1350,
AS ADOPTED PURSUANT TO
SECTION 906 OF THE SARBANES-OXLEY ACT OF 2002
In connection with the Quarterly Report of East West Bancorp, Inc. (the “Company”) on Form 10-Q for the period ended March 31, 2024, as filed with the Securities and Exchange Commission on the date hereof (the “Report”), I, Dominic Ng, Chairman and Chief Executive Officer of the Company, certify, pursuant to 18 U.S.C. Section 1350, as adopted pursuant to Section 906 of the Sarbanes-Oxley Act of 2002, based on my knowledge that:
a.the Report fully complies with the requirements of Section 13(a) or 15(d) of the Securities Exchange Act of 1934; and
b.the information contained in the Report fairly presents, in all material respects, the financial condition and results of operations of the Company.
Date: May 9, 2024
|
|
|
|
|
|
| |
/s/ DOMINIC NG |
| |
Dominic Ng |
| |
Chief Executive Officer |
EX-32.2
7
ewbc32210q3312024.htm
EX-32.2
Document
Exhibit 32.2
CERTIFICATION
CERTIFICATION PURSUANT TO
18 U.S.C. SECTION 1350,
AS ADOPTED PURSUANT TO
SECTION 906 OF THE SARBANES-OXLEY ACT OF 2002
In connection with the Quarterly Report of East West Bancorp, Inc. (the “Company”) on Form 10-Q for the period ended March 31, 2024, as filed with the Securities and Exchange Commission on the date hereof (the “Report”), I, Christopher J. Del Moral-Niles, Executive Vice President and Chief Financial Officer of the Company, certify, pursuant to 18 U.S.C. Section 1350, as adopted pursuant to Section 906 of the Sarbanes-Oxley Act of 2002, based on my knowledge that:
a.the Report fully complies with the requirements of Section 13(a) or 15(d) of the Securities Exchange Act of 1934; and
b.the information contained in the Report fairly presents, in all material respects, the financial condition and results of operations of the Company.
Date: May 9, 2024
|
|
|
|
|
|
| |
/s/ CHRISTOPHER J. DEL MORAL-NILES |
| |
Christopher J. Del Moral-Niles |
| |
Chief Financial Officer |