Document
Exhibit 99.1
April 17, 2025
Fellow shareholders,
•We are off to a good start in 2025. In Q1, revenue and operating income grew 13% and 27% year over year, respectively. Both were ahead of our guidance due to slightly higher subscription and ad revenue and the timing of expenses.
•We’re executing on our 2025 priorities: improving our series and film offering and growing our ads business; further developing newer initiatives like live programming and games; and sustaining healthy revenue and profit growth.
◦We delivered a solid slate in Q1 with one series (Adolescence1) and three films (Back in Action2, Ad Vitam3 and Counterattack4) all breaking into our all-time most popular lists.
◦On April 1, we successfully launched our ad tech platform in the US and are on track to roll it out in our remaining ads countries in the coming months.
◦We’re building out our live offering with our Q1 launch of WWE RAW, which has been on our global Top 10 list every week. We also announced Taylor vs. Serrano 3, a historic women’s boxing rematch that will stream on July 11, and opted into a second NFL game for Christmas Day 2025.
◦Our revenue and profit growth outlook remains solid, with no change to our 2025 guidance forecast for revenue of $43.5-$44.5B and operating margin of 29%.
•We are working hard to improve and expand our entertainment offering with the goal to build the most valued entertainment company for members, creators and shareholders.
Our summary results, and forecast for Q2, are below.
|
|
|
|
|
|
|
|
|
|
|
|
|
|
|
|
|
|
|
|
|
| (in millions except per share data) |
Q1'24 |
Q2'24 |
Q3'24 |
Q4'24 |
Q1'25 |
Q2'25 Forecast |
| Revenue |
$ |
9,370 |
|
$ |
9,559 |
|
$ |
9,825 |
|
$ |
10,247 |
|
$ |
10,543 |
|
$ |
11,035 |
|
| Y/Y % Growth |
14.8 |
% |
16.8 |
% |
15.0 |
% |
16.0 |
% |
12.5 |
% |
15.4 |
% |
| Operating Income |
$ |
2,633 |
|
$ |
2,603 |
|
$ |
2,909 |
|
$ |
2,273 |
|
$ |
3,347 |
|
$ |
3,675 |
|
| Operating Margin |
28.1 |
% |
27.2 |
% |
29.6 |
% |
22.2 |
% |
31.7 |
% |
33.3 |
% |
| Net Income |
$ |
2,332 |
|
$ |
2,147 |
|
$ |
2,364 |
|
$ |
1,869 |
|
$ |
2,890 |
|
$ |
3,055 |
|
| Diluted EPS |
$ |
5.28 |
|
$ |
4.88 |
|
$ |
5.40 |
|
$ |
4.27 |
|
$ |
6.61 |
|
$ |
7.03 |
|
|
|
|
|
|
|
|
| Net cash provided by operating activities |
$ |
2,213 |
|
$ |
1,291 |
|
$ |
2,321 |
|
$ |
1,537 |
|
$ |
2,789 |
|
|
| Free Cash Flow |
$ |
2,137 |
|
$ |
1,213 |
|
$ |
2,194 |
|
$ |
1,378 |
|
$ |
2,661 |
|
|
| Shares (FD) |
441.7 |
|
439.7 |
|
437.9 |
|
437.8 |
|
437.0 |
|
|
|
|
|
|
|
|
|
|
__________________________________
1 https://www.netflix.com/tudum/top10/most-popular/tv
2 https://www.netflix.com/tudum/top10/most-popular
3 https://www.netflix.com/tudum/top10/most-popular/films-non-english
4 https://www.netflix.com/tudum/top10/most-popular/films-non-english
Q1 Results and Forecast
Revenue in Q1 grew 13% year over year, or 16% on a foreign exchange (F/X) neutral basis5, driven primarily by membership growth and higher pricing, partially offset by F/X, net of hedging. Revenue was modestly above our guidance due to slightly higher-than-forecasted subscription and ad revenue (which is still very small relative to subscription revenue). UCAN revenue grew 9% year over year vs. 15% in Q4’24 due to only a partial quarter impact from our price change, plan mix and the absence of advertising revenue from the Christmas Day NFL games. We expect UCAN revenue growth to reaccelerate in Q2.
Operating income totaled $3.3B, up 27% year over year, and operating margin was 32% vs 28% in Q1’24. Both were slightly above our forecast given the revenue upside and the timing of expense spending. As a result, EPS amounted to $6.61 vs. $5.28 last year (+25% year over year).
As a reminder, the guidance we provide is our actual internal forecast at the time we report and we strive for accuracy. Our primary financial metrics are revenue for growth and operating margin for profitability. Our goal is to sustain healthy revenue growth, expand operating margin and deliver growing free cash flow.
In Q2’25, we expect revenue growth of 15% (+17% F/X neutral) as we see the full quarter benefit from recent price changes and continued growth in membership and advertising revenue. We project operating margin of 33%, a ~6 percentage point year-over-year improvement.
We continue to forecast 2025 revenue of $43.5B-$44.5B, which assumes healthy member growth, higher subscription pricing and a rough doubling of our ad revenue, partially offset by F/X net of hedging. We’re still targeting a 29% operating margin for 2025 based on F/X rates as of January 1, 2025. There’s been no material change to our overall business outlook since our last earnings report, although at current F/X rates (with the recent weakness of the US dollar relative to most other currencies), we’re currently tracking above the mid-point of our 2025 revenue guidance range.
Content
We remain optimistic about our 2025 slate6 with a lineup that includes returning favorites, series finales, new discoveries and unexpected surprises designed to thrill our members. Already in Q1 we’ve delivered our third most popular English language series ever with Adolescence* (124M views7), a hit limited series from our UK team; our sixth most popular English language film ever with Back in Action* (146M views) starring Cameron Diaz and Jamie Foxx; our sixth most popular non-English language film, Ad Vitam (63M views) from France; and our tenth most popular non-English language film, Counterattack* (59M views) from Mexico.
__________________________________
5 Excluding the year over year effect of foreign exchange rate movements and the impact of hedging gains/losses realized as revenues. Assumes foreign exchange rates remained constant with foreign exchange rates from each of the corresponding months of the prior-year period.
6 https://www.youtube.com/watch?v=ch2xk-xekzI
7 A view is defined as hours viewed divided by runtime for each title. Views for a title are based on the first 91 days since the release of each episode (less than 91 days denoted with an asterisk and data is from launch date through April 13, 2025). We publish our top titles based on views each week at Netflix Top 108.
8 https://www.netflix.com/tudum/top10
We believe this steady drumbeat of must-see entertainment is what allows us to capture our members’ attention and, in return, delight them every time they visit Netflix. We do this across a variety of genres including in Q1 with action (The Night Agent S2*, 50M views), comedy (Running Point*, 36M views; Envious S2* from Argentina, 9M views) and true crime (American Murder: Gabby Petito*, 52M views); across languages including German (Cassandra*, 36M views), Portuguese (Sintonia S5*, 9M views), Korean (The Trauma Code: Heroes on Call*, 31M views; When Life Gives You Tangerines*, 23M views) and Swedish (The Åre Murders*, 29M views); and across formats such as anime (SAKAMOTO DAYS, 21M views), animated features (Plankton: The Movie*, 40M views) and documentaries (Gone Girls: The Long Island Serial Killer*, 17M views).
We also continue to test into new formats. This quarter we licensed four episodes of the toddler learning series Ms. Rachel* (29M views) which has consistently been in the global Top 10. We also debuted season 2 of Inside* (2M views), a reality show from the Sidemen.
To satisfy so many different tastes, we need a lot of movies and TV shows — and we need to make them great. This includes prestige thrillers like Zero Day* (55M views), starring Robert De Niro; feel-good films like The Life List* (67M views), featuring rising star Sofia Carson9 (Purple Hearts, Carry-On and the upcoming My Oxford Year); and best-in-class reality television like Love is Blind, our most popular dating franchise (season 8*, 12M views). Per Nielsen10, it’s the top unscripted streaming show of all time and top streaming original in terms of total appearances on the Nielsen Streaming Top 10. Love is Blind has now successfully spun off local versions11 of the show including in Brazil, Sweden, Mexico, UK, Habibi (Arabic), Argentina, Japan and Germany, with three more on the way from France, Poland and Italy.
We are investing in big, can’t miss special events. We now have WWE live events 52 weeks a year. We are pleased with the engagement to date as WWE tentpole shows like Royal Rumble and Elimination Chamber12, which we have outside the US, have drawn large audiences and impressive fandom13. Monday Night RAW has ranked in the Weekly Top 10 across 29 different countries and has maintained a spot on the Global Weekly Top 10 list every week since its debut, despite not yet launching in some major markets. As of April 1, Netflix has been the exclusive home for WWE in India, providing live streams with Hindi commentary throughout the year.
Our live event strategy is unchanged—we remain focused on breakthrough events that our audiences love and any rights or event deal we pursue has to make economic sense. A good example is our recently-announced Taylor vs. Serrano boxing rematch14 on July 11th. The November 2024 Taylor-Serrano fight on Netflix became the most-watched professional women’s sports event in US history. With the upcoming rematch, we're poised for another groundbreaking night that will further elevate the profile of women athletes. In addition, we’ve opted into a second game for Christmas 2025 when we’ll once again be the home of the NFL for Christmas Day. While our initial live efforts have primarily focused on the US, we expect to extend this strategy to other countries over time.
In Q2, new films include Nonnas starring Vince Vaughn, Tyler Perry's new drama Straw15 starring Taraji P. Henson, Bullet Train Explosion (Japan) and Havoc, an action thriller starring Tom Hardy and Forest Whitaker. Our new series include Forever16, a modern-day take on the classic Judy Blume novel; romantic comedy The Royals (India); The Four Seasons, a comedy starring Tina Fey, Steve Carell and
___________________________________
9 https://www.nytimes.com/2025/03/28/movies/sofia-carson-interview-the-life-list.html
10 https://deadline.com/2025/03/love-is-blind-ielsen-streaming-record-severance-milestone-1236352651/
11 https://www.netflix.com/tudum/articles/love-is-blind-international-release-date-news
12 https://x.com/WWE/status/1896044286149284062
13 https://mashable.com/article/john-cena-turns-heel-internet-reacts-wwe-elimination-chamber
14 https://www.netflix.com/tudum/articles/taylor-serrano-3-live-on-netflix
15 https://www.netflix.com/tudum/articles/straw-tyler-perry-taraji-p-henson-release-date-photos-news
16 https://www.youtube.com/watch?v=I9rnIxBjy4I
Colman Domingo; El Eternauta17 (Argentina); and Ransom Canyon, a romantic western. America’s Sweethearts: The Dallas Cowboys Cheerleaders, Black Mirror and Ginny & Georgia are all back for brand new seasons. And we have the series finales of the Emmy Award-winning adult animated series Big Mouth, and fan-favorite YOU.
The final season of the global cultural phenomenon, Squid Game, our most popular series ever, will debut on June 27, 2025. Alongside the new season will be an update to Squid Game: Unleashed, one of our biggest games to date, with new characters and games, and content specific to the new season. The Squid Game phenomenon lives on through a variety of consumer products, live experiences and planned spinoffs as well - Squid Game: The Experience18 continues to entertain fans in New York, Sydney and Seoul and is expanding to London in May.
Competition
We have a huge audience that’s estimated to be more than 700M people, with over two-thirds of them living outside the US. No entertainment company has ever programmed for so many tastes, cultures and languages. Consumers have so many amazing entertainment choices—our business remains intensely competitive. To grow around the world and to delight and satisfy such a large and diverse audience, our strategy is to continuously improve and expand our entertainment offering, starting with great shows and movies from across the globe which first and foremost appeal directly to local audiences because we believe they want to see authentic stories. We then make it easy for anyone, anywhere to watch them.
To do this well, it takes not just long-term commitment and focus, but teams on the ground that understand local tastes and cultures. We have offices around the world with local executives who have deep relationships with the creative and business communities. And we have invested in production infrastructure to create high quality series and films. We started building this muscle nearly a decade ago with Club de Cuervos from Mexico and we’re now producing in over 50 countries.
In 2019, we opened our offices in Mexico City. Nearly seven years later, series like The Accident, and films like the aforementioned Counterattack and Lucca’s World* (27M views), are entertaining our members in Mexico and beyond. Our Paris19 office opened in 2020 and now French shows such as Class Act and Family Business are very popular in France while others like Lupin have been global sensations (Lupin: Part 1 is No. 4 on our all-time non-English series list). It’s a model that takes time and hard work to replicate—a slate built on variety and quality around the world that, with a combination of best-in-class recommendations, great subtitles and dubbing, broad reach and intense fandom, make it possible for local stories from anywhere to be loved everywhere.
While the majority of our content spend and production infrastructure investment is in the US, we now also spend billions of dollars per year making programming abroad. And instead of just licensing local titles, we’re now making local shows and films in many countries, commissioned by our local executives, that keep our members happy. And our local slates are improving each year.
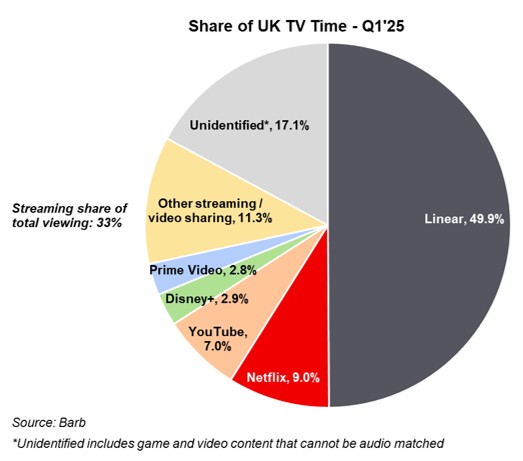
The UK is emblematic of our approach. We opened our first office in the UK in 2015 and have a substantial employee presence in the UK. Our strategy, driven by a dedicated team making shows and films for UK audiences, has delivered popular UK programming that’s fueling our growth, including Q1 shows Adolescence, Toxic Town* (14M views) and Missing You (53M views). As a result, our improving content offering and product/market fit helped grow our share of TV time in the UK to 9.0% in Q1’25 (+1.0 pt versus 8.0% in Q1’24), according to data from Barb, trailing only BBC and ITV, which had ~20%
___________________________________
17 https://www.youtube.com/watch?v=TqT4fDQQqCc
18 https://squidgameexperience.com/
19 https://about.netflix.com/en/news/netflix-opens-new-paris-office-and-increases-investment-in-france
and ~13% view share (this includes both their linear and streaming viewing), respectively. Additionally, Adolescence has become the first streaming show20 to top the UK’s weekly TV ratings.
And with our success and growth, we invest substantially in the local creative and business community. Since 2020, we’ve invested over $6B in the UK creative community and we operate a dedicated production hub, featuring 20 sound stages, workshops and office space at Shepperton Studios, five additional stages at Longcross Studios and three at Uxbridge. Over the past four years, we’ve worked with more than 50,000 cast and crew members, and expect to be in production with more than 100 productions in the UK this year.
Monetization
As we deliver more value to members, we refine our plans and pricing to improve monetization to drive investment in future service improvements. The recent pricing adjustments we made in large markets (including US, UK and Argentina) have performed in line with our expectations. Today, we’re adjusting prices in France, which was already factored into our 2025 guidance.
Our ads plan allows us to offer lower price points for consumers while creating an additional revenue and profit stream for our business. We continue to make progress building our ads business. We remain on track to reach sufficient scale with our member base in all ads countries in 2025, and we expect to continue to grow our ads membership from this strong base in the future.
___________________________________
20 https://www.bbc.com/news/articles/c62kyg00q71o
A key focus in 2025 is enhancing our capabilities for advertisers. We successfully rolled out the Netflix Ads Suite, our in-house first party ad tech platform, in the US on April 1st. In the coming months we will launch the Netflix Ads Suite in our remaining ads markets. We believe our ad tech platform is foundational to our long term ads strategy. Over time, it will enable us to offer better measurement, enhanced targeting, innovative ad formats and expanded programmatic capabilities. In Q1, we launched programmatic in EMEA, and now offer programmatic capability in UCAN, EMEA and LATAM, with a full APAC launch coming in Q2. Additionally, we continue to build out our infrastructure and invest in resources that will help to better serve our ads clients.
Cash Flow and Capital Structure
Our capital allocation approach is unchanged - we prioritize profitable growth by reinvesting in our business, maintaining ample liquidity, and returning excess cash (beyond several billion dollars of minimum cash and any used for selective M&A) to shareholders through share repurchases.
In Q1’25, net cash generated by operating activities was $2.8B vs. $2.2B in the prior year period. Free cash flow21 totaled $2.7B vs. $2.1B in Q1’24. We’re still forecasting full year 2025 free cash flow of about $8B. During the quarter, we paid down $800M of senior notes using proceeds from our 2024 refinancing and we repurchased 3.7M shares for $3.5B. We have $13.6B remaining under our existing share repurchase authorization. We ended the quarter with gross debt of $15.1B and cash and cash equivalents of $7.2B. In Q2, we have $1B of debt maturities, which we’ll pay down with proceeds from our investment grade bond deal last year, which are currently held in short-term investments.
Governance
As part of the natural evolution of our leadership structure and succession planning, Reed Hastings has transitioned from Executive Chairman to Chairman of the Board and a non-executive director. Separately, Tim Haley, our longest standing independent Director, has informed us that he will not stand for re-election. For more than 27 years, Tim has been on this journey with us and his counsel and leadership have been a much valued part of our success. We thank Tim for his long service and many contributions to the Netflix Board of Directors.
Reference
For quick reference, our past investor letters can be found here22.
___________________________________
21 Defined as cash provided by (used in) operating activities less purchases of property and equipment and change in other assets.
22 https://ir.netflix.net/financials/quarterly-earnings/default.aspx
Regional Breakdown
|
|
|
|
|
|
|
|
|
|
|
|
|
|
|
|
|
|
| (in millions) |
Q1'24 |
Q2'24 |
Q3'24 |
Q4'24 |
Q1'25 |
| UCAN: |
|
|
|
|
|
| Revenue |
$ |
4,224 |
|
$ |
4,296 |
|
$ |
4,322 |
|
$ |
4,517 |
|
$ |
4,617 |
|
| Y/Y % Growth |
17 |
% |
19 |
% |
16 |
% |
15 |
% |
9 |
% |
| F/X Neutral Y/Y % Growth |
17 |
% |
19 |
% |
16 |
% |
15 |
% |
9 |
% |
|
|
|
|
|
|
| EMEA: |
|
|
|
|
|
| Revenue |
$ |
2,958 |
|
$ |
3,008 |
|
$ |
3,133 |
|
$ |
3,288 |
|
$ |
3,405 |
|
| Y/Y % Growth |
17 |
% |
17 |
% |
16 |
% |
18 |
% |
15 |
% |
| F/X Neutral Y/Y % Growth |
17 |
% |
19 |
% |
17 |
% |
16 |
% |
16 |
% |
|
|
|
|
|
|
| LATAM: |
|
|
|
|
|
| Revenue |
$ |
1,165 |
|
$ |
1,204 |
|
$ |
1,241 |
|
$ |
1,230 |
|
$ |
1,262 |
|
| Y/Y % Growth |
9 |
% |
12 |
% |
9 |
% |
6 |
% |
8 |
% |
| F/X Neutral Y/Y % Growth |
31 |
% |
44 |
% |
46 |
% |
35 |
% |
27 |
% |
|
|
|
|
|
|
| APAC: |
|
|
|
|
|
| Revenue |
$ |
1,023 |
|
$ |
1,052 |
|
$ |
1,128 |
|
$ |
1,212 |
|
$ |
1,259 |
|
| Y/Y % Growth |
10 |
% |
14 |
% |
19 |
% |
26 |
% |
23 |
% |
| F/X Neutral Y/Y % Growth |
14 |
% |
19 |
% |
21 |
% |
24 |
% |
26 |
% |
F/X Neutral Operating Margin Disclosure
To provide additional transparency around our operating margin, we disclose each quarter our year-to-date (YTD) operating margin based on F/X rates at the beginning of each year. This will allow investors to see how our operating margin is tracking against our target (which was set in January of 2025 based on F/X rates at that time), absent intra-year fluctuations in F/X.
April 17, 2025 Earnings Interview, 1:45pm PT
Our live video interview will be on youtube/netflixir23 at 1:45pm PT today. Co-CEOs Greg Peters and Ted Sarandos, CFO Spence Neumann and VP of Finance/IR/Corporate Development Spencer Wang will all be on the video to answer questions submitted by sellside analysts.
|
|
|
|
|
|
IR Contact: |
PR Contact: |
| Lowell Singer |
Emily Feingold |
| VP, Investor Relations |
VP, Corporate Communications |
| 818 434-2141 |
323 287-0756 |
__________________________________
23 https://www.youtube.com/netflixir
Use of Non-GAAP Measures
This shareholder letter and its attachments include reference to the non-GAAP financial measures of F/X neutral revenue and adjusted operating profit and margin, free cash flow and net debt. Management believes that free cash flow is an important liquidity metric because it measures, during a given period, the amount of cash generated that is available to repay debt obligations, make strategic acquisitions and investments and for certain other activities like stock repurchases. Management believes that F/X neutral revenue and adjusted operating profit and margin allow investors to compare our projected results to our actual results absent year-over-year and intra-year currency fluctuations, respectively, and the impact of restructuring costs. Management believes net debt is a useful measure of the company's liquidity, capital structure, and leverage. However, these non-GAAP financial measures should be considered in addition to, not as a substitute for or superior to, net income, operating income (profit), operating margin, diluted earnings per share and net cash provided by (used in) operating activities, or other financial measures prepared in accordance with GAAP. Reconciliation to the GAAP equivalent of these non-GAAP measures are contained in tabular form on the attached unaudited financial statements and in the F/X neutral operating margin disclosure above. We are not able to reconcile forward-looking non-GAAP financial measures because we are unable to predict without unreasonable effort the exact amount or timing of the reconciling items, including property and equipment and change in other assets, and the impact of changes in currency exchange rates. The variability of these items could have a significant impact on our future GAAP financial results.
Forward-Looking Statements
This shareholder letter contains certain forward-looking statements within the meaning of the federal securities laws, including statements regarding our expected results for the fiscal quarter ending June 30, 2025 and fiscal year ending December 31, 2025; priorities for 2025; adoption and growth of streaming entertainment; growth strategy and outlook; market opportunity; competitive landscape and position; entertainment offerings, including TV shows, movies, games, and live programming; engagement; consumer products; live experiences; production infrastructure; slate strength; pricing and plans strategy; ad-supported tier and its prospects; advertising, including our ad-tech platform; product strategy; impact of foreign exchange rates; foreign currency exchange hedging program; stock repurchases; advertising revenue; revenue and revenue growth; membership growth; operating income, operating margin, net income, earnings per share, capital allocation, debt repayment and free cash flow. The forward-looking statements in this letter are subject to risks and uncertainties that could cause actual results and events to differ, including, without limitation: our ability to attract new members and engage and retain existing members; our ability to compete effectively, including for consumer engagement with different modes of entertainment; failing to improve the variety and quality of entertainment offerings; adoption of the ads plan and paid sharing; maintenance and expansion of device platforms for streaming; fluctuations in consumer usage of our service; service disruptions; production risks; macroeconomic conditions; content slate and timing of content releases. A detailed discussion of these and other risks and uncertainties that could cause actual results and events to differ materially from such forward-looking statements is included in our filings with the Securities and Exchange Commission, including our Annual Report on Form 10-K, filed with the Securities and Exchange Commission (“SEC”) on January 27, 2025. The Company provides internal forecast numbers. Investors should anticipate that actual performance will vary from these forecast numbers based on risks and uncertainties discussed above and in our Annual Report on Form 10-K. We undertake no obligation to update forward-looking statements to reflect events or circumstances occurring after the date of this shareholder letter.
Netflix, Inc.
Consolidated Statements of Operations
(unaudited)
(in thousands, except per share data)
|
|
|
|
|
|
|
|
|
|
|
|
|
|
|
|
|
|
|
|
|
|
|
Three Months Ended |
|
|
|
March 31,
2025 |
|
December 31,
2024 |
|
March 31,
2024 |
|
|
|
|
| Revenues |
$ |
10,542,801 |
|
|
$ |
10,246,513 |
|
|
$ |
9,370,440 |
|
|
|
|
|
Cost of revenues |
5,263,147 |
|
|
5,767,364 |
|
|
4,977,073 |
|
|
|
|
|
| Sales and marketing |
688,370 |
|
|
976,204 |
|
|
654,340 |
|
|
|
|
|
Technology and development |
822,823 |
|
|
776,505 |
|
|
702,473 |
|
|
|
|
|
General and administrative |
421,462 |
|
|
453,674 |
|
|
404,020 |
|
|
|
|
|
| Operating income |
3,346,999 |
|
|
2,272,766 |
|
|
2,632,534 |
|
|
|
|
|
| Other income (expense): |
|
|
|
|
|
|
|
|
|
| Interest expense |
(184,172) |
|
|
(192,603) |
|
|
(173,314) |
|
|
|
|
|
| Interest and other income (expense) |
50,899 |
|
|
54,105 |
|
|
155,359 |
|
|
|
|
|
| Income before income taxes |
3,213,726 |
|
|
2,134,268 |
|
|
2,614,579 |
|
|
|
|
|
| Provision for income taxes |
(323,375) |
|
|
(265,661) |
|
|
(282,370) |
|
|
|
|
|
| Net income |
$ |
2,890,351 |
|
|
$ |
1,868,607 |
|
|
$ |
2,332,209 |
|
|
|
|
|
| Earnings per share: |
|
|
|
|
|
|
|
|
|
| Basic |
$ |
6.76 |
|
|
$ |
4.37 |
|
|
$ |
5.40 |
|
|
|
|
|
| Diluted |
$ |
6.61 |
|
|
$ |
4.27 |
|
|
$ |
5.28 |
|
|
|
|
|
| Weighted-average shares of common stock outstanding: |
|
|
|
|
|
|
|
|
|
| Basic |
427,270 |
|
|
427,716 |
|
|
432,090 |
|
|
|
|
|
| Diluted |
436,962 |
|
|
437,786 |
|
|
441,654 |
|
|
|
|
|
Netflix, Inc.
Consolidated Balance Sheets
(in thousands)
|
|
|
|
|
|
|
|
|
|
|
|
|
|
|
As of |
|
|
March 31,
2025 |
|
December 31,
2024 |
|
|
(unaudited) |
|
|
| Assets |
|
|
|
|
| Current assets: |
|
|
|
|
| Cash and cash equivalents |
|
$ |
7,199,848 |
|
|
$ |
7,804,733 |
|
| Short-term investments |
|
1,171,142 |
|
|
1,779,006 |
|
| Other current assets |
|
3,326,642 |
|
|
3,516,640 |
|
| Total current assets |
|
11,697,632 |
|
|
13,100,379 |
|
| Content assets, net |
|
32,040,839 |
|
|
32,452,462 |
|
| Property and equipment, net |
|
1,644,346 |
|
|
1,593,756 |
|
| Other non-current assets |
|
6,704,827 |
|
|
6,483,777 |
|
| Total assets |
|
$ |
52,087,644 |
|
|
$ |
53,630,374 |
|
| Liabilities and Stockholders' Equity |
|
|
|
|
| Current liabilities: |
|
|
|
|
| Current content liabilities |
|
$ |
4,128,905 |
|
|
$ |
4,393,681 |
|
| Accounts payable |
|
614,489 |
|
|
899,909 |
|
| Accrued expenses and other liabilities |
|
2,359,518 |
|
|
2,156,544 |
|
| Deferred revenue |
|
1,609,726 |
|
|
1,520,813 |
|
| Short-term debt |
|
1,005,881 |
|
|
1,784,453 |
|
| Total current liabilities |
|
9,718,519 |
|
|
10,755,400 |
|
| Non-current content liabilities |
|
1,696,662 |
|
|
1,780,806 |
|
| Long-term debt |
|
14,011,037 |
|
|
13,798,351 |
|
| Other non-current liabilities |
|
2,633,353 |
|
|
2,552,250 |
|
| Total liabilities |
|
28,059,571 |
|
|
28,886,807 |
|
| Stockholders' equity: |
|
|
|
|
| Common stock |
|
6,677,469 |
|
|
6,252,126 |
|
| Treasury stock at cost |
|
(16,754,929) |
|
|
(13,171,638) |
|
| Accumulated other comprehensive income (loss) |
|
(85,735) |
|
|
362,162 |
|
| Retained earnings |
|
34,191,268 |
|
|
31,300,917 |
|
| Total stockholders' equity |
|
24,028,073 |
|
|
24,743,567 |
|
| Total liabilities and stockholders' equity |
|
$ |
52,087,644 |
|
|
$ |
53,630,374 |
|
|
|
|
|
|
| Supplemental Information |
|
|
|
|
| Total streaming content obligations* |
|
$ |
21,790,643 |
|
|
$ |
23,248,931 |
|
* Total streaming content obligations are comprised of content liabilities included in "Current content liabilities" and "Non-current content liabilities" on the Consolidated Balance Sheets and obligations that are not reflected on the Consolidated Balance Sheets as they did not yet meet the criteria for recognition.
Netflix, Inc.
Consolidated Statements of Cash Flows
(unaudited)
(in thousands)
|
|
|
|
|
|
|
|
|
|
|
|
|
|
|
|
|
|
|
|
|
|
|
Three Months Ended |
|
|
|
March 31,
2025 |
|
December 31,
2024 |
|
March 31,
2024 |
|
|
|
|
| Cash flows from operating activities: |
|
|
|
|
|
|
|
|
|
| Net income |
$ |
2,890,351 |
|
|
$ |
1,868,607 |
|
|
$ |
2,332,209 |
|
|
|
|
|
| Adjustments to reconcile net income to net cash provided by operating activities: |
|
|
|
|
|
|
|
|
|
| Additions to content assets |
(3,549,657) |
|
|
(4,429,402) |
|
|
(3,728,967) |
|
|
|
|
|
| Change in content liabilities |
(411,253) |
|
|
(139,537) |
|
|
(189,441) |
|
|
|
|
|
| Amortization of content assets |
3,823,112 |
|
|
4,161,501 |
|
|
3,670,805 |
|
|
|
|
|
| Depreciation and amortization of property, equipment and intangibles |
80,067 |
|
|
79,539 |
|
|
87,234 |
|
|
|
|
|
| Stock-based compensation expense |
71,977 |
|
|
61,827 |
|
|
76,345 |
|
|
|
|
|
| Foreign currency remeasurement loss (gain) on debt |
28,547 |
|
|
(52,855) |
|
|
(130,801) |
|
|
|
|
|
| Other non-cash items |
114,730 |
|
|
130,927 |
|
|
97,181 |
|
|
|
|
|
| Deferred income taxes |
(163,928) |
|
|
(73,252) |
|
|
(107,077) |
|
|
|
|
|
| Changes in operating assets and liabilities: |
|
|
|
|
|
|
|
|
|
| Other current assets |
(131,367) |
|
|
(41,866) |
|
|
38,049 |
|
|
|
|
|
| Accounts payable |
(276,426) |
|
|
255,379 |
|
|
(145,265) |
|
|
|
|
|
| Accrued expenses and other liabilities |
306,413 |
|
|
(124,591) |
|
|
251,782 |
|
|
|
|
|
| Deferred revenue |
88,913 |
|
|
7,765 |
|
|
26,515 |
|
|
|
|
|
| Other non-current assets and liabilities |
(82,280) |
|
|
(167,148) |
|
|
(66,047) |
|
|
|
|
|
| Net cash provided by operating activities |
2,789,199 |
|
|
1,536,894 |
|
|
2,212,522 |
|
|
|
|
|
| Cash flows from investing activities: |
|
|
|
|
|
|
|
|
|
| Purchases of property and equipment |
(128,277) |
|
|
(158,674) |
|
|
(75,714) |
|
|
|
|
|
|
|
|
|
|
|
|
|
|
|
|
|
|
|
|
|
|
|
|
|
|
|
|
|
|
|
|
|
|
|
|
|
|
|
|
|
|
|
|
|
| Purchases of investments |
(156,015) |
|
|
— |
|
|
— |
|
|
|
|
|
| Proceeds from maturities and sales of investments |
769,954 |
|
|
— |
|
|
— |
|
|
|
|
|
| Net cash provided by (used in) investing activities |
485,662 |
|
|
(158,674) |
|
|
(75,714) |
|
|
|
|
|
| Cash flows from financing activities: |
|
|
|
|
|
|
|
|
|
|
|
|
|
|
|
|
|
|
|
| Repayments of debt |
(800,000) |
|
|
— |
|
|
(400,000) |
|
|
|
|
|
| Proceeds from issuance of common stock |
351,602 |
|
|
302,012 |
|
|
268,881 |
|
|
|
|
|
| Repurchases of common stock |
(3,536,396) |
|
|
(963,748) |
|
|
(2,000,000) |
|
|
|
|
|
| Taxes paid related to net share settlement of equity awards |
(27,870) |
|
|
(2,553) |
|
|
(1,825) |
|
|
|
|
|
|
|
|
|
|
|
|
|
|
|
| Other financing activities |
(15,652) |
|
|
(14,409) |
|
|
— |
|
|
|
|
|
| Net cash used in financing activities |
(4,028,316) |
|
|
(678,698) |
|
|
(2,132,944) |
|
|
|
|
|
| Effect of exchange rate changes on cash, cash equivalents, and restricted cash |
150,146 |
|
|
(351,270) |
|
|
(95,790) |
|
|
|
|
|
| Net increase (decrease) in cash, cash equivalents, and restricted cash |
(603,309) |
|
|
348,252 |
|
|
(91,926) |
|
|
|
|
|
| Cash, cash equivalents and restricted cash at beginning of period |
7,807,337 |
|
|
7,459,085 |
|
|
7,118,515 |
|
|
|
|
|
| Cash, cash equivalents and restricted cash at end of period |
$ |
7,204,028 |
|
|
$ |
7,807,337 |
|
|
$ |
7,026,589 |
|
|
|
|
|
|
|
|
|
|
|
|
|
|
|
|
|
|
|
|
|
|
|
|
|
|
|
|
|
Three Months Ended |
|
|
|
March 31,
2025 |
|
December 31,
2024 |
|
March 31,
2024 |
|
|
|
|
| Non-GAAP free cash flow reconciliation: |
|
|
|
|
|
|
|
|
|
| Net cash provided by operating activities |
$ |
2,789,199 |
|
|
$ |
1,536,894 |
|
|
$ |
2,212,522 |
|
|
|
|
|
| Purchases of property and equipment |
(128,277) |
|
|
(158,674) |
|
|
(75,714) |
|
|
|
|
|
|
|
|
|
|
|
|
|
|
|
| Non-GAAP free cash flow |
$ |
2,660,922 |
|
|
$ |
1,378,220 |
|
|
$ |
2,136,808 |
|
|
|
|
|
Netflix, Inc.
Non-GAAP Information
(unaudited)
(in thousands, except percentages)
The tables below provide a non-GAAP reconciliation of reported and constant currency revenue growth by region for the quarters ended March 31, 2024, June 30, 2024, September 30, 2024, December 31, 2024, and March 31, 2025. The regions presented in the tables below include United States and Canada ("UCAN"), Europe, Middle East, and Africa ("EMEA"), Latin America ("LATAM"), and Asia-Pacific ("APAC").
|
|
|
|
|
|
|
|
|
|
|
|
|
|
|
|
|
|
|
|
|
|
|
|
|
|
|
|
|
|
|
|
|
|
|
|
|
|
|
|
|
|
|
|
|
|
|
|
|
|
|
|
|
|
|
|
|
|
|
Three Months Ended |
|
Three Months Ended |
|
Change |
|
|
March 31,
2024 |
|
March 31,
2023 |
|
Q1'24 vs. Q1'23 |
|
|
As Reported |
|
Constant Currency Adjustment |
|
Hedging (Gains) Losses Included in Revenues |
|
Constant Currency Revenues |
|
As Reported |
|
Hedging (Gains) Losses Included in Revenues |
|
Revenues
Less Hedging Impact |
|
Reported Change |
|
Constant Currency Change |
UCAN (1) |
|
$ |
4,224,315 |
|
|
$ |
(2,065) |
|
|
$ |
831 |
|
|
$ |
4,223,081 |
|
|
$ |
3,608,645 |
|
|
$ |
— |
|
|
$ |
3,608,645 |
|
|
17 |
% |
|
17 |
% |
| EMEA |
|
2,958,193 |
|
|
(16,034) |
|
|
4,687 |
|
|
2,946,846 |
|
|
2,517,641 |
|
|
— |
|
|
2,517,641 |
|
|
17 |
% |
|
17 |
% |
| LATAM |
|
1,165,008 |
|
|
232,742 |
|
|
6,266 |
|
|
1,404,016 |
|
|
1,070,192 |
|
|
— |
|
|
1,070,192 |
|
|
9 |
% |
|
31 |
% |
| APAC |
|
1,022,924 |
|
|
45,156 |
|
|
(543) |
|
|
1,067,537 |
|
|
933,523 |
|
|
— |
|
|
933,523 |
|
|
10 |
% |
|
14 |
% |
|
|
|
|
|
|
|
|
|
|
|
|
|
|
|
|
|
|
|
|
|
|
|
|
|
|
|
|
|
|
|
|
|
|
|
|
|
|
|
|
|
|
|
|
|
|
|
|
|
|
|
|
|
|
|
|
|
|
|
|
|
|
|
|
|
|
|
|
|
|
|
|
|
|
|
|
|
|
|
|
|
|
|
|
|
|
|
|
|
|
|
|
|
|
|
|
|
|
|
|
|
|
|
|
|
|
|
|
|
|
|
|
|
|
|
|
Three Months Ended |
|
Three Months Ended |
|
Change |
|
|
June 30,
2024 |
|
June 30,
2023 |
|
Q2'24 vs. Q2'23 |
|
|
As Reported |
|
Constant Currency Adjustment |
|
Hedging (Gains) Losses Included in Revenues |
|
Constant Currency Revenues |
|
As Reported |
|
Hedging (Gains) Losses Included in Revenues |
|
Revenues
Less Hedging Impact |
|
Reported Change |
|
Constant Currency Change |
UCAN (1) |
|
$ |
4,295,560 |
|
|
$ |
2,120 |
|
|
$ |
(3,183) |
|
|
$ |
4,294,497 |
|
|
$ |
3,599,448 |
|
|
$ |
— |
|
|
$ |
3,599,448 |
|
|
19 |
% |
|
19 |
% |
| EMEA |
|
3,007,772 |
|
|
61,838 |
|
|
(15,344) |
|
|
3,054,266 |
|
|
2,562,170 |
|
|
— |
|
|
2,562,170 |
|
|
17 |
% |
|
19 |
% |
| LATAM |
|
1,204,145 |
|
|
344,707 |
|
|
(1,759) |
|
|
1,547,093 |
|
|
1,077,435 |
|
|
— |
|
|
1,077,435 |
|
|
12 |
% |
|
44 |
% |
| APAC |
|
1,051,833 |
|
|
55,003 |
|
|
(13,015) |
|
|
1,093,821 |
|
|
919,273 |
|
|
— |
|
|
919,273 |
|
|
14 |
% |
|
19 |
% |
|
|
|
|
|
|
|
|
|
|
|
|
|
|
|
|
|
|
|
|
|
|
|
|
|
|
|
|
|
|
|
|
|
|
|
|
|
|
|
|
|
|
|
|
|
|
|
|
|
|
|
|
|
|
|
|
|
|
|
|
|
|
|
|
|
|
|
|
|
|
|
|
|
|
|
|
|
|
|
|
|
|
|
|
|
|
|
|
|
|
|
|
|
|
|
|
|
|
|
|
|
|
|
|
|
|
|
|
|
|
|
|
|
|
|
|
Three Months Ended |
|
Three Months Ended |
|
Change |
|
|
September 30,
2024 |
|
September 30,
2023 |
|
Q3'24 vs. Q3'23 |
|
|
As Reported |
|
Constant Currency Adjustment |
|
Hedging (Gains) Losses Included in Revenues |
|
Constant Currency Revenues |
|
As Reported |
|
Hedging (Gains) Losses Included in Revenues |
|
Revenues
Less Hedging Impact |
|
Reported Change |
|
Constant Currency Change |
UCAN (1) |
|
$ |
4,322,476 |
|
|
$ |
7,898 |
|
|
$ |
(3,265) |
|
|
$ |
4,327,109 |
|
|
$ |
3,735,133 |
|
|
$ |
— |
|
|
$ |
3,735,133 |
|
|
16 |
% |
|
16 |
% |
| EMEA |
|
3,133,466 |
|
|
31,454 |
|
|
(1,857) |
|
|
3,163,063 |
|
|
2,693,146 |
|
|
— |
|
|
2,693,146 |
|
|
16 |
% |
|
17 |
% |
| LATAM |
|
1,240,892 |
|
|
456,746 |
|
|
(34,654) |
|
|
1,662,984 |
|
|
1,142,811 |
|
|
— |
|
|
1,142,811 |
|
|
9 |
% |
|
46 |
% |
| APAC |
|
1,127,869 |
|
|
28,055 |
|
|
(8,408) |
|
|
1,147,516 |
|
|
948,216 |
|
|
— |
|
|
948,216 |
|
|
19 |
% |
|
21 |
% |
|
|
|
|
|
|
|
|
|
|
|
|
|
|
|
|
|
|
|
|
|
|
|
|
|
|
|
|
|
|
|
|
|
|
|
|
|
|
|
|
|
|
|
|
|
|
|
|
|
|
|
|
|
|
|
|
|
(1) Excludes DVD revenues in the prior year comparative periods of March 31, 2023, June 30, 2023, and September 30, 2023.
|
|
|
|
|
|
|
|
|
|
|
|
|
|
|
|
|
|
|
|
|
|
|
|
|
|
|
|
|
|
|
|
|
|
|
|
|
|
|
|
|
|
|
|
|
|
|
|
|
|
|
|
|
|
|
|
|
|
|
Three Months Ended |
|
Three Months Ended |
|
Change |
|
|
December 31,
2024 |
|
December 31,
2023 |
|
Q4'24 vs. Q4'23 |
|
|
As Reported |
|
Constant Currency Adjustment |
|
Hedging (Gains) Losses Included in Revenues |
|
Constant Currency Revenues |
|
As Reported |
|
Hedging (Gains) Losses Included in Revenues |
|
Revenues
Less Hedging Impact |
|
Reported Change |
|
Constant Currency Change |
| UCAN |
|
$ |
4,517,018 |
|
|
$ |
3,153 |
|
|
$ |
(5,564) |
|
|
$ |
4,514,607 |
|
|
$ |
3,930,557 |
|
|
$ |
— |
|
|
$ |
3,930,557 |
|
|
15 |
% |
|
15 |
% |
| EMEA |
|
3,287,604 |
|
|
(46,338) |
|
|
(12,789) |
|
|
3,228,477 |
|
|
2,783,530 |
|
|
— |
|
|
2,783,530 |
|
|
18 |
% |
|
16 |
% |
| LATAM |
|
1,229,771 |
|
|
356,709 |
|
|
(28,307) |
|
|
1,558,173 |
|
|
1,156,023 |
|
|
— |
|
|
1,156,023 |
|
|
6 |
% |
|
35 |
% |
| APAC |
|
1,212,120 |
|
|
(12,752) |
|
|
(7,107) |
|
|
1,192,261 |
|
|
962,715 |
|
|
— |
|
|
962,715 |
|
|
26 |
% |
|
24 |
% |
|
|
|
|
|
|
|
|
|
|
|
|
|
|
|
|
|
|
|
|
|
|
|
|
|
|
|
|
|
|
|
|
|
|
|
|
|
|
|
|
|
|
|
|
|
|
|
|
|
|
|
|
|
|
|
|
|
|
|
|
|
|
|
|
|
|
|
|
|
|
|
|
|
|
|
|
|
|
|
|
|
|
|
|
|
|
|
|
|
|
|
|
|
|
|
|
|
|
|
|
|
|
|
|
|
|
|
|
|
|
|
|
|
|
|
|
Three Months Ended |
|
Three Months Ended |
|
Change |
|
|
March 31,
2025 |
|
March 31,
2024 |
|
Q1'25 vs. Q1'24 |
|
|
As Reported |
|
Constant Currency Adjustment |
|
Hedging (Gains) Losses Included in Revenues |
|
Constant Currency Revenues |
|
As Reported |
|
Hedging (Gains) Losses Included in Revenues |
|
Revenues
Less Hedging Impact |
|
Reported Change |
|
Constant Currency Change |
| UCAN |
|
$ |
4,617,098 |
|
|
$ |
23,338 |
|
|
$ |
(14,552) |
|
|
$ |
4,625,884 |
|
|
$ |
4,224,315 |
|
|
$ |
831 |
|
|
$ |
4,225,146 |
|
|
9 |
% |
|
9 |
% |
| EMEA |
|
3,404,676 |
|
|
146,975 |
|
|
(105,225) |
|
|
3,446,426 |
|
|
2,958,193 |
|
|
4,687 |
|
|
2,962,880 |
|
|
15 |
% |
|
16 |
% |
| LATAM |
|
1,261,934 |
|
|
243,068 |
|
|
(13,936) |
|
|
1,491,066 |
|
|
1,165,008 |
|
|
6,266 |
|
|
1,171,274 |
|
|
8 |
% |
|
27 |
% |
| APAC |
|
1,259,093 |
|
|
62,243 |
|
|
(31,083) |
|
|
1,290,253 |
|
|
1,022,924 |
|
|
(543) |
|
|
1,022,381 |
|
|
23 |
% |
|
26 |
% |
| Total Revenues |
|
$ |
10,542,801 |
|
|
$ |
475,624 |
|
|
$ |
(164,796) |
|
|
$ |
10,853,629 |
|
|
$ |
9,370,440 |
|
|
$ |
11,241 |
|
|
$ |
9,381,681 |
|
|
13 |
% |
|
16 |
% |
|
|
|
|
|
|
|
|
|
|
|
|
|
|
|
|
|
|
|
|
|
|
|
|
|
|
|
|
|
|
|
|
|
|
|
|
|
|
|
|
|
|
|
|
|
|
|
|
|
|
|
As of |
|
|
March 31,
2025 |
|
|
| Non-GAAP Net Debt reconciliation: |
|
|
|
|
| Total debt |
|
$ |
15,016,918 |
|
|
|
| Add: Debt issuance costs and original issue discount |
|
66,682 |
|
|
|
| Less: Cash and cash equivalents |
|
(7,199,848) |
|
|
|
| Less: Short-term investments |
|
(1,171,142) |
|
|
|
| Net debt |
|
$ |
6,712,610 |
|
|
|