00010647282023FYfalsehttp://fasb.org/us-gaap/2023#AccountsPayableAndAccruedLiabilitiesCurrenthttp://fasb.org/us-gaap/2023#AccountsPayableAndAccruedLiabilitiesCurrenthttp://fasb.org/us-gaap/2023#LongTermDebtAndCapitalLeaseObligationshttp://fasb.org/us-gaap/2023#LongTermDebtAndCapitalLeaseObligations00010647282023-01-012023-12-3100010647282023-06-30iso4217:USD00010647282024-02-16xbrli:shares00010647282022-01-012022-12-3100010647282022-12-3100010647282021-12-3100010647282023-12-310001064728btu:AssetRetirementObligationsMember2023-12-310001064728btu:OtherObligationsMember2023-12-310001064728btu:AssetRetirementAndOtherObligationsMember2023-12-3100010647282023-10-012023-12-3100010647282021-01-012021-12-31iso4217:USDxbrli:shares0001064728us-gaap:PreferredStockMember2023-12-310001064728us-gaap:PreferredStockMember2022-12-310001064728btu:SeriesCommonStockMember2023-12-310001064728btu:SeriesCommonStockMember2022-12-3100010647282020-12-310001064728us-gaap:CommonStockMember2020-12-310001064728us-gaap:AdditionalPaidInCapitalMember2020-12-310001064728us-gaap:TreasuryStockCommonMember2020-12-310001064728us-gaap:RetainedEarningsMember2020-12-310001064728us-gaap:AccumulatedOtherComprehensiveIncomeMember2020-12-310001064728us-gaap:NoncontrollingInterestMember2020-12-310001064728us-gaap:RetainedEarningsMember2021-01-012021-12-310001064728us-gaap:NoncontrollingInterestMember2021-01-012021-12-310001064728us-gaap:AccumulatedOtherComprehensiveIncomeMember2021-01-012021-12-310001064728us-gaap:AdditionalPaidInCapitalMember2021-01-012021-12-310001064728us-gaap:CommonStockMember2021-01-012021-12-310001064728us-gaap:CommonStockMemberus-gaap:CommonStockMember2021-01-012021-12-310001064728us-gaap:AdditionalPaidInCapitalMemberus-gaap:CommonStockMember2021-01-012021-12-310001064728us-gaap:CommonStockMember2021-01-012021-12-310001064728us-gaap:TreasuryStockCommonMember2021-01-012021-12-310001064728us-gaap:CommonStockMember2021-12-310001064728us-gaap:AdditionalPaidInCapitalMember2021-12-310001064728us-gaap:TreasuryStockCommonMember2021-12-310001064728us-gaap:RetainedEarningsMember2021-12-310001064728us-gaap:AccumulatedOtherComprehensiveIncomeMember2021-12-310001064728us-gaap:NoncontrollingInterestMember2021-12-310001064728us-gaap:RetainedEarningsMember2022-01-012022-12-310001064728us-gaap:NoncontrollingInterestMember2022-01-012022-12-310001064728us-gaap:AccumulatedOtherComprehensiveIncomeMember2022-01-012022-12-310001064728us-gaap:AdditionalPaidInCapitalMember2022-01-012022-12-310001064728us-gaap:CommonStockMemberus-gaap:CommonStockMember2022-01-012022-12-310001064728us-gaap:AdditionalPaidInCapitalMemberus-gaap:CommonStockMember2022-01-012022-12-310001064728us-gaap:TreasuryStockCommonMember2022-01-012022-12-310001064728us-gaap:CommonStockMember2022-12-310001064728us-gaap:AdditionalPaidInCapitalMember2022-12-310001064728us-gaap:TreasuryStockCommonMember2022-12-310001064728us-gaap:RetainedEarningsMember2022-12-310001064728us-gaap:AccumulatedOtherComprehensiveIncomeMember2022-12-310001064728us-gaap:NoncontrollingInterestMember2022-12-310001064728us-gaap:RetainedEarningsMember2023-01-012023-12-310001064728us-gaap:NoncontrollingInterestMember2023-01-012023-12-310001064728us-gaap:AdditionalPaidInCapitalMember2023-01-012023-12-310001064728us-gaap:AccumulatedOtherComprehensiveIncomeMember2023-01-012023-12-310001064728us-gaap:TreasuryStockCommonMember2023-01-012023-12-310001064728us-gaap:CommonStockMember2023-12-310001064728us-gaap:AdditionalPaidInCapitalMember2023-12-310001064728us-gaap:TreasuryStockCommonMember2023-12-310001064728us-gaap:RetainedEarningsMember2023-12-310001064728us-gaap:AccumulatedOtherComprehensiveIncomeMember2023-12-310001064728us-gaap:NoncontrollingInterestMember2023-12-310001064728srt:MaximumMemberus-gaap:ProductiveLandMember2023-12-310001064728us-gaap:MachineryAndEquipmentMembersrt:MinimumMemberus-gaap:BuildingAndBuildingImprovementsMember2023-12-310001064728srt:MaximumMemberus-gaap:MachineryAndEquipmentMemberus-gaap:BuildingAndBuildingImprovementsMember2023-12-31xbrli:pure0001064728btu:MiddlemountMineMember2023-12-310001064728us-gaap:DomesticDestinationMemberbtu:ThermalCoalMemberbtu:SeaborneThermalMiningMember2023-01-012023-12-310001064728us-gaap:DomesticDestinationMemberbtu:ThermalCoalMemberbtu:SeaborneMetallurgicalMiningMember2023-01-012023-12-310001064728us-gaap:DomesticDestinationMemberbtu:PowderRiverBasinMiningMemberbtu:ThermalCoalMember2023-01-012023-12-310001064728us-gaap:DomesticDestinationMemberbtu:OtherUSThermalMiningMemberbtu:ThermalCoalMember2023-01-012023-12-310001064728us-gaap:DomesticDestinationMemberus-gaap:CorporateAndOtherMemberbtu:ThermalCoalMember2023-01-012023-12-310001064728us-gaap:DomesticDestinationMemberbtu:ThermalCoalMember2023-01-012023-12-310001064728us-gaap:GeographicDistributionForeignMemberbtu:ThermalCoalMemberbtu:SeaborneThermalMiningMember2023-01-012023-12-310001064728us-gaap:GeographicDistributionForeignMemberbtu:ThermalCoalMemberbtu:SeaborneMetallurgicalMiningMember2023-01-012023-12-310001064728us-gaap:GeographicDistributionForeignMemberbtu:PowderRiverBasinMiningMemberbtu:ThermalCoalMember2023-01-012023-12-310001064728us-gaap:GeographicDistributionForeignMemberbtu:OtherUSThermalMiningMemberbtu:ThermalCoalMember2023-01-012023-12-310001064728us-gaap:GeographicDistributionForeignMemberus-gaap:CorporateAndOtherMemberbtu:ThermalCoalMember2023-01-012023-12-310001064728us-gaap:GeographicDistributionForeignMemberbtu:ThermalCoalMember2023-01-012023-12-310001064728btu:ThermalCoalMemberbtu:SeaborneThermalMiningMember2023-01-012023-12-310001064728btu:ThermalCoalMemberbtu:SeaborneMetallurgicalMiningMember2023-01-012023-12-310001064728btu:PowderRiverBasinMiningMemberbtu:ThermalCoalMember2023-01-012023-12-310001064728btu:OtherUSThermalMiningMemberbtu:ThermalCoalMember2023-01-012023-12-310001064728us-gaap:CorporateAndOtherMemberbtu:ThermalCoalMember2023-01-012023-12-310001064728btu:ThermalCoalMember2023-01-012023-12-310001064728us-gaap:GeographicDistributionForeignMemberbtu:MetallurgicalCoalMemberbtu:SeaborneThermalMiningMember2023-01-012023-12-310001064728us-gaap:GeographicDistributionForeignMemberbtu:MetallurgicalCoalMemberbtu:SeaborneMetallurgicalMiningMember2023-01-012023-12-310001064728us-gaap:GeographicDistributionForeignMemberbtu:PowderRiverBasinMiningMemberbtu:MetallurgicalCoalMember2023-01-012023-12-310001064728us-gaap:GeographicDistributionForeignMemberbtu:OtherUSThermalMiningMemberbtu:MetallurgicalCoalMember2023-01-012023-12-310001064728us-gaap:GeographicDistributionForeignMemberbtu:MetallurgicalCoalMemberus-gaap:CorporateAndOtherMember2023-01-012023-12-310001064728us-gaap:GeographicDistributionForeignMemberbtu:MetallurgicalCoalMember2023-01-012023-12-310001064728btu:MetallurgicalCoalMemberbtu:SeaborneThermalMiningMember2023-01-012023-12-310001064728btu:MetallurgicalCoalMemberbtu:SeaborneMetallurgicalMiningMember2023-01-012023-12-310001064728btu:PowderRiverBasinMiningMemberbtu:MetallurgicalCoalMember2023-01-012023-12-310001064728btu:OtherUSThermalMiningMemberbtu:MetallurgicalCoalMember2023-01-012023-12-310001064728btu:MetallurgicalCoalMemberus-gaap:CorporateAndOtherMember2023-01-012023-12-310001064728btu:MetallurgicalCoalMember2023-01-012023-12-310001064728us-gaap:ProductAndServiceOtherMemberbtu:SeaborneThermalMiningMember2023-01-012023-12-310001064728us-gaap:ProductAndServiceOtherMemberbtu:SeaborneMetallurgicalMiningMember2023-01-012023-12-310001064728btu:PowderRiverBasinMiningMemberus-gaap:ProductAndServiceOtherMember2023-01-012023-12-310001064728btu:OtherUSThermalMiningMemberus-gaap:ProductAndServiceOtherMember2023-01-012023-12-310001064728us-gaap:CorporateAndOtherMemberus-gaap:ProductAndServiceOtherMember2023-01-012023-12-310001064728us-gaap:ProductAndServiceOtherMember2023-01-012023-12-310001064728btu:SeaborneThermalMiningMember2023-01-012023-12-310001064728btu:SeaborneMetallurgicalMiningMember2023-01-012023-12-310001064728btu:PowderRiverBasinMiningMember2023-01-012023-12-310001064728btu:OtherUSThermalMiningMember2023-01-012023-12-310001064728us-gaap:CorporateAndOtherMember2023-01-012023-12-310001064728us-gaap:DomesticDestinationMemberbtu:ThermalCoalMemberbtu:SeaborneThermalMiningMember2022-01-012022-12-310001064728us-gaap:DomesticDestinationMemberbtu:ThermalCoalMemberbtu:SeaborneMetallurgicalMiningMember2022-01-012022-12-310001064728us-gaap:DomesticDestinationMemberbtu:PowderRiverBasinMiningMemberbtu:ThermalCoalMember2022-01-012022-12-310001064728us-gaap:DomesticDestinationMemberbtu:OtherUSThermalMiningMemberbtu:ThermalCoalMember2022-01-012022-12-310001064728us-gaap:DomesticDestinationMemberus-gaap:CorporateAndOtherMemberbtu:ThermalCoalMember2022-01-012022-12-310001064728us-gaap:DomesticDestinationMemberbtu:ThermalCoalMember2022-01-012022-12-310001064728us-gaap:GeographicDistributionForeignMemberbtu:ThermalCoalMemberbtu:SeaborneThermalMiningMember2022-01-012022-12-310001064728us-gaap:GeographicDistributionForeignMemberbtu:ThermalCoalMemberbtu:SeaborneMetallurgicalMiningMember2022-01-012022-12-310001064728us-gaap:GeographicDistributionForeignMemberbtu:PowderRiverBasinMiningMemberbtu:ThermalCoalMember2022-01-012022-12-310001064728us-gaap:GeographicDistributionForeignMemberbtu:OtherUSThermalMiningMemberbtu:ThermalCoalMember2022-01-012022-12-310001064728us-gaap:GeographicDistributionForeignMemberus-gaap:CorporateAndOtherMemberbtu:ThermalCoalMember2022-01-012022-12-310001064728us-gaap:GeographicDistributionForeignMemberbtu:ThermalCoalMember2022-01-012022-12-310001064728btu:ThermalCoalMemberbtu:SeaborneThermalMiningMember2022-01-012022-12-310001064728btu:ThermalCoalMemberbtu:SeaborneMetallurgicalMiningMember2022-01-012022-12-310001064728btu:PowderRiverBasinMiningMemberbtu:ThermalCoalMember2022-01-012022-12-310001064728btu:OtherUSThermalMiningMemberbtu:ThermalCoalMember2022-01-012022-12-310001064728us-gaap:CorporateAndOtherMemberbtu:ThermalCoalMember2022-01-012022-12-310001064728btu:ThermalCoalMember2022-01-012022-12-310001064728us-gaap:GeographicDistributionForeignMemberbtu:MetallurgicalCoalMemberbtu:SeaborneThermalMiningMember2022-01-012022-12-310001064728us-gaap:GeographicDistributionForeignMemberbtu:MetallurgicalCoalMemberbtu:SeaborneMetallurgicalMiningMember2022-01-012022-12-310001064728us-gaap:GeographicDistributionForeignMemberbtu:PowderRiverBasinMiningMemberbtu:MetallurgicalCoalMember2022-01-012022-12-310001064728us-gaap:GeographicDistributionForeignMemberbtu:OtherUSThermalMiningMemberbtu:MetallurgicalCoalMember2022-01-012022-12-310001064728us-gaap:GeographicDistributionForeignMemberbtu:MetallurgicalCoalMemberus-gaap:CorporateAndOtherMember2022-01-012022-12-310001064728us-gaap:GeographicDistributionForeignMemberbtu:MetallurgicalCoalMember2022-01-012022-12-310001064728btu:MetallurgicalCoalMemberbtu:SeaborneThermalMiningMember2022-01-012022-12-310001064728btu:MetallurgicalCoalMemberbtu:SeaborneMetallurgicalMiningMember2022-01-012022-12-310001064728btu:PowderRiverBasinMiningMemberbtu:MetallurgicalCoalMember2022-01-012022-12-310001064728btu:OtherUSThermalMiningMemberbtu:MetallurgicalCoalMember2022-01-012022-12-310001064728btu:MetallurgicalCoalMemberus-gaap:CorporateAndOtherMember2022-01-012022-12-310001064728btu:MetallurgicalCoalMember2022-01-012022-12-310001064728us-gaap:ProductAndServiceOtherMemberbtu:SeaborneThermalMiningMember2022-01-012022-12-310001064728us-gaap:ProductAndServiceOtherMemberbtu:SeaborneMetallurgicalMiningMember2022-01-012022-12-310001064728btu:PowderRiverBasinMiningMemberus-gaap:ProductAndServiceOtherMember2022-01-012022-12-310001064728btu:OtherUSThermalMiningMemberus-gaap:ProductAndServiceOtherMember2022-01-012022-12-310001064728us-gaap:CorporateAndOtherMemberus-gaap:ProductAndServiceOtherMember2022-01-012022-12-310001064728us-gaap:ProductAndServiceOtherMember2022-01-012022-12-310001064728btu:SeaborneThermalMiningMember2022-01-012022-12-310001064728btu:SeaborneMetallurgicalMiningMember2022-01-012022-12-310001064728btu:PowderRiverBasinMiningMember2022-01-012022-12-310001064728btu:OtherUSThermalMiningMember2022-01-012022-12-310001064728us-gaap:CorporateAndOtherMember2022-01-012022-12-310001064728us-gaap:DomesticDestinationMemberbtu:ThermalCoalMemberbtu:SeaborneThermalMiningMember2021-01-012021-12-310001064728us-gaap:DomesticDestinationMemberbtu:ThermalCoalMemberbtu:SeaborneMetallurgicalMiningMember2021-01-012021-12-310001064728us-gaap:DomesticDestinationMemberbtu:PowderRiverBasinMiningMemberbtu:ThermalCoalMember2021-01-012021-12-310001064728us-gaap:DomesticDestinationMemberbtu:OtherUSThermalMiningMemberbtu:ThermalCoalMember2021-01-012021-12-310001064728us-gaap:DomesticDestinationMemberus-gaap:CorporateAndOtherMemberbtu:ThermalCoalMember2021-01-012021-12-310001064728us-gaap:DomesticDestinationMemberbtu:ThermalCoalMember2021-01-012021-12-310001064728us-gaap:GeographicDistributionForeignMemberbtu:ThermalCoalMemberbtu:SeaborneThermalMiningMember2021-01-012021-12-310001064728us-gaap:GeographicDistributionForeignMemberbtu:ThermalCoalMemberbtu:SeaborneMetallurgicalMiningMember2021-01-012021-12-310001064728us-gaap:GeographicDistributionForeignMemberbtu:PowderRiverBasinMiningMemberbtu:ThermalCoalMember2021-01-012021-12-310001064728us-gaap:GeographicDistributionForeignMemberbtu:OtherUSThermalMiningMemberbtu:ThermalCoalMember2021-01-012021-12-310001064728us-gaap:GeographicDistributionForeignMemberus-gaap:CorporateAndOtherMemberbtu:ThermalCoalMember2021-01-012021-12-310001064728us-gaap:GeographicDistributionForeignMemberbtu:ThermalCoalMember2021-01-012021-12-310001064728btu:ThermalCoalMemberbtu:SeaborneThermalMiningMember2021-01-012021-12-310001064728btu:ThermalCoalMemberbtu:SeaborneMetallurgicalMiningMember2021-01-012021-12-310001064728btu:PowderRiverBasinMiningMemberbtu:ThermalCoalMember2021-01-012021-12-310001064728btu:OtherUSThermalMiningMemberbtu:ThermalCoalMember2021-01-012021-12-310001064728us-gaap:CorporateAndOtherMemberbtu:ThermalCoalMember2021-01-012021-12-310001064728btu:ThermalCoalMember2021-01-012021-12-310001064728us-gaap:GeographicDistributionForeignMemberbtu:MetallurgicalCoalMemberbtu:SeaborneThermalMiningMember2021-01-012021-12-310001064728us-gaap:GeographicDistributionForeignMemberbtu:MetallurgicalCoalMemberbtu:SeaborneMetallurgicalMiningMember2021-01-012021-12-310001064728us-gaap:GeographicDistributionForeignMemberbtu:PowderRiverBasinMiningMemberbtu:MetallurgicalCoalMember2021-01-012021-12-310001064728us-gaap:GeographicDistributionForeignMemberbtu:OtherUSThermalMiningMemberbtu:MetallurgicalCoalMember2021-01-012021-12-310001064728us-gaap:GeographicDistributionForeignMemberbtu:MetallurgicalCoalMemberus-gaap:CorporateAndOtherMember2021-01-012021-12-310001064728us-gaap:GeographicDistributionForeignMemberbtu:MetallurgicalCoalMember2021-01-012021-12-310001064728btu:MetallurgicalCoalMemberbtu:SeaborneThermalMiningMember2021-01-012021-12-310001064728btu:MetallurgicalCoalMemberbtu:SeaborneMetallurgicalMiningMember2021-01-012021-12-310001064728btu:PowderRiverBasinMiningMemberbtu:MetallurgicalCoalMember2021-01-012021-12-310001064728btu:OtherUSThermalMiningMemberbtu:MetallurgicalCoalMember2021-01-012021-12-310001064728btu:MetallurgicalCoalMemberus-gaap:CorporateAndOtherMember2021-01-012021-12-310001064728btu:MetallurgicalCoalMember2021-01-012021-12-310001064728us-gaap:ProductAndServiceOtherMemberbtu:SeaborneThermalMiningMember2021-01-012021-12-310001064728us-gaap:ProductAndServiceOtherMemberbtu:SeaborneMetallurgicalMiningMember2021-01-012021-12-310001064728btu:PowderRiverBasinMiningMemberus-gaap:ProductAndServiceOtherMember2021-01-012021-12-310001064728btu:OtherUSThermalMiningMemberus-gaap:ProductAndServiceOtherMember2021-01-012021-12-310001064728us-gaap:CorporateAndOtherMemberus-gaap:ProductAndServiceOtherMember2021-01-012021-12-310001064728us-gaap:ProductAndServiceOtherMember2021-01-012021-12-310001064728btu:SeaborneThermalMiningMember2021-01-012021-12-310001064728btu:SeaborneMetallurgicalMiningMember2021-01-012021-12-310001064728btu:PowderRiverBasinMiningMember2021-01-012021-12-310001064728btu:OtherUSThermalMiningMember2021-01-012021-12-310001064728us-gaap:CorporateAndOtherMember2021-01-012021-12-310001064728us-gaap:CorporateAndOtherMemberbtu:CoalContractAndPhysicalCommodityPurchaseSaleContractsMemberus-gaap:DesignatedAsHedgingInstrumentMember2023-01-012023-12-310001064728us-gaap:CorporateAndOtherMemberbtu:CoalContractAndPhysicalCommodityPurchaseSaleContractsMemberus-gaap:DesignatedAsHedgingInstrumentMember2022-01-012022-12-310001064728us-gaap:CorporateAndOtherMemberbtu:CoalContractAndPhysicalCommodityPurchaseSaleContractsMemberus-gaap:DesignatedAsHedgingInstrumentMember2021-01-012021-12-310001064728us-gaap:CorporateAndOtherMemberbtu:PhysicalCommodityPurchaseSaleContractsMemberus-gaap:DesignatedAsHedgingInstrumentMember2023-01-012023-12-310001064728us-gaap:CorporateAndOtherMemberbtu:PhysicalCommodityPurchaseSaleContractsMemberus-gaap:DesignatedAsHedgingInstrumentMember2022-01-012022-12-310001064728us-gaap:CorporateAndOtherMemberbtu:PhysicalCommodityPurchaseSaleContractsMemberus-gaap:DesignatedAsHedgingInstrumentMember2021-01-012021-12-310001064728us-gaap:CoalContractMemberus-gaap:CorporateAndOtherMemberus-gaap:DesignatedAsHedgingInstrumentMember2023-01-012023-12-310001064728us-gaap:CoalContractMemberus-gaap:CorporateAndOtherMemberus-gaap:DesignatedAsHedgingInstrumentMember2022-01-012022-12-310001064728us-gaap:CoalContractMemberus-gaap:CorporateAndOtherMemberus-gaap:DesignatedAsHedgingInstrumentMember2021-01-012021-12-3100010647282021-01-012023-12-310001064728us-gaap:TradeAccountsReceivableMember2023-12-310001064728us-gaap:TradeAccountsReceivableMember2022-12-310001064728us-gaap:EquitySecuritiesMember2023-01-012023-12-310001064728us-gaap:LandMember2022-01-012022-12-310001064728us-gaap:EquitySecuritiesMember2022-01-012022-12-310001064728btu:MaterialAndSuppliesMember2023-12-310001064728btu:MaterialAndSuppliesMember2022-12-310001064728btu:MiddlemountMineMember2022-12-310001064728btu:MiddlemountMineMember2023-01-012023-12-310001064728btu:MiddlemountMineMember2022-01-012022-12-310001064728btu:MiddlemountMineMember2021-01-012021-12-310001064728btu:OtherEquityMethodInvestmentsMember2023-12-310001064728btu:OtherEquityMethodInvestmentsMember2022-12-310001064728btu:OtherEquityMethodInvestmentsMember2023-01-012023-12-310001064728btu:OtherEquityMethodInvestmentsMember2022-01-012022-12-310001064728btu:OtherEquityMethodInvestmentsMember2021-01-012021-12-310001064728btu:MiddlemountMineMember2023-01-012023-12-310001064728btu:MiddlemountMineMember2022-01-012022-12-310001064728btu:MiddlemountMineMember2021-01-012021-12-310001064728btu:MiddlemountMineMember2023-12-310001064728btu:MiddlemountMineMember2021-01-012021-12-310001064728btu:MiddlemountMineMember2023-01-012023-12-310001064728btu:MiddlemountMineMember2022-01-012022-12-310001064728btu:MiddlemountMineMember2021-01-012021-12-310001064728btu:MiddlemountMineMember2023-12-310001064728btu:MiddlemountMineMember2022-12-310001064728btu:R3RenewablesMember2023-12-310001064728btu:R3RenewablesMember2022-12-310001064728btu:DieselFuelHedgeContractsMember2023-12-31iso4217:AUD0001064728us-gaap:ForeignExchangeContractMember2023-12-310001064728srt:ScenarioForecastMembersrt:MinimumMemberus-gaap:ForeignExchangeContractMember2024-06-30iso4217:USDiso4217:AUD0001064728srt:ScenarioForecastMembersrt:MaximumMemberus-gaap:ForeignExchangeContractMember2024-06-300001064728us-gaap:ForeignExchangeContractMemberus-gaap:SubsequentEventMember2024-09-300001064728srt:ScenarioForecastMemberus-gaap:ForeignExchangeContractMember2024-09-300001064728btu:CoalDerivativeContractsRelatedToForecastedSalesMember2023-12-310001064728btu:PhysicalCommodityPurchaseSaleContractsMemberus-gaap:DesignatedAsHedgingInstrumentMember2023-01-012023-12-310001064728us-gaap:ForwardContractsMemberus-gaap:DesignatedAsHedgingInstrumentMember2023-10-012023-12-310001064728btu:PhysicalCommodityPurchaseSaleContractsMemberus-gaap:DesignatedAsHedgingInstrumentMember2022-01-012022-12-310001064728us-gaap:GainLossOnDerivativeInstrumentsMemberus-gaap:DesignatedAsHedgingInstrumentMember2022-10-012022-12-310001064728us-gaap:ForwardContractsMemberus-gaap:DesignatedAsHedgingInstrumentMember2022-10-012022-12-310001064728btu:PhysicalCommodityPurchaseSaleContractsMemberus-gaap:DesignatedAsHedgingInstrumentMember2021-01-012021-12-310001064728us-gaap:GainLossOnDerivativeInstrumentsMemberus-gaap:DesignatedAsHedgingInstrumentMember2021-10-012021-12-310001064728us-gaap:ForwardContractsMemberus-gaap:DesignatedAsHedgingInstrumentMember2021-01-012021-12-310001064728us-gaap:ForeignExchangeContractMemberus-gaap:DesignatedAsHedgingInstrumentMember2023-12-310001064728us-gaap:ForeignExchangeContractMemberus-gaap:DesignatedAsHedgingInstrumentMember2022-12-310001064728btu:PhysicalCommodityPurchaseSaleContractsMemberus-gaap:DesignatedAsHedgingInstrumentMember2023-12-310001064728btu:PhysicalCommodityPurchaseSaleContractsMemberus-gaap:DesignatedAsHedgingInstrumentMember2022-12-310001064728us-gaap:CoalContractMemberus-gaap:DesignatedAsHedgingInstrumentMember2023-12-310001064728us-gaap:CoalContractMemberus-gaap:DesignatedAsHedgingInstrumentMember2022-12-310001064728us-gaap:DesignatedAsHedgingInstrumentMember2023-12-310001064728us-gaap:DesignatedAsHedgingInstrumentMember2022-12-310001064728btu:NetAmountMemberus-gaap:DesignatedAsHedgingInstrumentMember2022-12-310001064728btu:CoalTradingMember2022-12-310001064728us-gaap:ForeignExchangeContractMemberus-gaap:DesignatedAsHedgingInstrumentMember2023-01-012023-12-310001064728us-gaap:CoalContractMemberus-gaap:DesignatedAsHedgingInstrumentMember2023-01-012023-12-310001064728us-gaap:DesignatedAsHedgingInstrumentMember2023-01-012023-12-310001064728us-gaap:ForeignExchangeContractMemberus-gaap:DesignatedAsHedgingInstrumentMember2022-01-012022-12-310001064728us-gaap:CoalContractMemberus-gaap:DesignatedAsHedgingInstrumentMember2022-01-012022-12-310001064728us-gaap:DesignatedAsHedgingInstrumentMember2022-01-012022-12-310001064728us-gaap:ForeignExchangeContractMemberus-gaap:DesignatedAsHedgingInstrumentMember2021-01-012021-12-310001064728us-gaap:CoalContractMemberus-gaap:DesignatedAsHedgingInstrumentMember2021-01-012021-12-310001064728us-gaap:DesignatedAsHedgingInstrumentMember2021-01-012021-12-310001064728us-gaap:FairValueInputsLevel1Memberus-gaap:FairValueMeasurementsRecurringMemberus-gaap:ForeignExchangeContractMember2023-12-310001064728us-gaap:FairValueInputsLevel2Memberus-gaap:FairValueMeasurementsRecurringMemberus-gaap:ForeignExchangeContractMember2023-12-310001064728us-gaap:FairValueInputsLevel3Memberus-gaap:FairValueMeasurementsRecurringMemberus-gaap:ForeignExchangeContractMember2023-12-310001064728us-gaap:FairValueMeasurementsRecurringMemberus-gaap:ForeignExchangeContractMember2023-12-310001064728btu:PhysicalCommodityPurchaseSaleContractsMemberus-gaap:FairValueInputsLevel1Memberus-gaap:FairValueMeasurementsRecurringMember2023-12-310001064728us-gaap:FairValueInputsLevel2Memberbtu:PhysicalCommodityPurchaseSaleContractsMemberus-gaap:FairValueMeasurementsRecurringMember2023-12-310001064728us-gaap:FairValueInputsLevel3Memberbtu:PhysicalCommodityPurchaseSaleContractsMemberus-gaap:FairValueMeasurementsRecurringMember2023-12-310001064728btu:PhysicalCommodityPurchaseSaleContractsMemberus-gaap:FairValueMeasurementsRecurringMember2023-12-310001064728us-gaap:CoalContractMemberus-gaap:FairValueInputsLevel1Memberus-gaap:FairValueMeasurementsRecurringMember2023-12-310001064728us-gaap:FairValueInputsLevel2Memberus-gaap:CoalContractMemberus-gaap:FairValueMeasurementsRecurringMember2023-12-310001064728us-gaap:FairValueInputsLevel3Memberus-gaap:CoalContractMemberus-gaap:FairValueMeasurementsRecurringMember2023-12-310001064728us-gaap:CoalContractMemberus-gaap:FairValueMeasurementsRecurringMember2023-12-310001064728us-gaap:EquitySecuritiesMemberus-gaap:FairValueInputsLevel1Memberus-gaap:FairValueMeasurementsRecurringMember2023-12-310001064728us-gaap:FairValueInputsLevel2Memberus-gaap:EquitySecuritiesMemberus-gaap:FairValueMeasurementsRecurringMember2023-12-310001064728us-gaap:FairValueInputsLevel3Memberus-gaap:EquitySecuritiesMemberus-gaap:FairValueMeasurementsRecurringMember2023-12-310001064728us-gaap:EquitySecuritiesMemberus-gaap:FairValueMeasurementsRecurringMember2023-12-310001064728us-gaap:FairValueInputsLevel1Memberus-gaap:FairValueMeasurementsRecurringMember2023-12-310001064728us-gaap:FairValueInputsLevel2Memberus-gaap:FairValueMeasurementsRecurringMember2023-12-310001064728us-gaap:FairValueInputsLevel3Memberus-gaap:FairValueMeasurementsRecurringMember2023-12-310001064728us-gaap:FairValueMeasurementsRecurringMember2023-12-310001064728us-gaap:FairValueInputsLevel1Memberus-gaap:FairValueMeasurementsRecurringMemberus-gaap:ForeignExchangeContractMember2022-12-310001064728us-gaap:FairValueInputsLevel2Memberus-gaap:FairValueMeasurementsRecurringMemberus-gaap:ForeignExchangeContractMember2022-12-310001064728us-gaap:FairValueInputsLevel3Memberus-gaap:FairValueMeasurementsRecurringMemberus-gaap:ForeignExchangeContractMember2022-12-310001064728us-gaap:FairValueMeasurementsRecurringMemberus-gaap:ForeignExchangeContractMember2022-12-310001064728btu:PhysicalCommodityPurchaseSaleContractsMemberus-gaap:FairValueInputsLevel1Memberus-gaap:FairValueMeasurementsRecurringMember2022-12-310001064728us-gaap:FairValueInputsLevel2Memberbtu:PhysicalCommodityPurchaseSaleContractsMemberus-gaap:FairValueMeasurementsRecurringMember2022-12-310001064728us-gaap:FairValueInputsLevel3Memberbtu:PhysicalCommodityPurchaseSaleContractsMemberus-gaap:FairValueMeasurementsRecurringMember2022-12-310001064728btu:PhysicalCommodityPurchaseSaleContractsMemberus-gaap:FairValueMeasurementsRecurringMember2022-12-310001064728us-gaap:CoalContractMemberus-gaap:FairValueInputsLevel1Memberus-gaap:FairValueMeasurementsRecurringMember2022-12-310001064728us-gaap:FairValueInputsLevel2Memberus-gaap:CoalContractMemberus-gaap:FairValueMeasurementsRecurringMember2022-12-310001064728us-gaap:FairValueInputsLevel3Memberus-gaap:CoalContractMemberus-gaap:FairValueMeasurementsRecurringMember2022-12-310001064728us-gaap:CoalContractMemberus-gaap:FairValueMeasurementsRecurringMember2022-12-310001064728us-gaap:EquitySecuritiesMemberus-gaap:FairValueInputsLevel1Memberus-gaap:FairValueMeasurementsRecurringMember2022-12-310001064728us-gaap:FairValueInputsLevel2Memberus-gaap:EquitySecuritiesMemberus-gaap:FairValueMeasurementsRecurringMember2022-12-310001064728us-gaap:FairValueInputsLevel3Memberus-gaap:EquitySecuritiesMemberus-gaap:FairValueMeasurementsRecurringMember2022-12-310001064728us-gaap:EquitySecuritiesMemberus-gaap:FairValueMeasurementsRecurringMember2022-12-310001064728us-gaap:FairValueInputsLevel1Memberus-gaap:FairValueMeasurementsRecurringMember2022-12-310001064728us-gaap:FairValueInputsLevel2Memberus-gaap:FairValueMeasurementsRecurringMember2022-12-310001064728us-gaap:FairValueInputsLevel3Memberus-gaap:FairValueMeasurementsRecurringMember2022-12-310001064728us-gaap:FairValueMeasurementsRecurringMember2022-12-310001064728us-gaap:CarryingReportedAmountFairValueDisclosureMember2023-12-310001064728us-gaap:CarryingReportedAmountFairValueDisclosureMember2022-12-310001064728us-gaap:EstimateOfFairValueFairValueDisclosureMember2023-12-310001064728us-gaap:EstimateOfFairValueFairValueDisclosureMember2022-12-310001064728btu:CoalTradingMember2021-12-310001064728btu:CoalTradingMember2020-12-310001064728btu:CoalTradingMember2023-01-012023-12-310001064728btu:CoalTradingMember2022-01-012022-12-310001064728btu:CoalTradingMember2021-01-012021-12-310001064728btu:CoalTradingMember2023-12-310001064728us-gaap:FairValueInputsLevel12And3Member2023-12-310001064728us-gaap:ProductiveLandMember2023-12-310001064728us-gaap:ProductiveLandMember2022-12-310001064728us-gaap:BuildingAndBuildingImprovementsMember2023-12-310001064728us-gaap:BuildingAndBuildingImprovementsMember2022-12-310001064728us-gaap:MachineryAndEquipmentMember2023-12-310001064728us-gaap:MachineryAndEquipmentMember2022-12-310001064728btu:MiscellaneousReceivablesMember2023-12-310001064728btu:MiscellaneousReceivablesMember2022-12-310001064728btu:CoalReservesHeldByFeeOwnershipMember2023-12-310001064728btu:CoalReservesHeldByFeeOwnershipMember2022-12-310001064728us-gaap:DomesticCountryMember2023-12-310001064728us-gaap:ForeignCountryMember2023-12-310001064728us-gaap:DomesticCountryMember2023-01-012023-12-310001064728us-gaap:DomesticCountryMember2022-01-012022-12-310001064728us-gaap:DomesticCountryMember2021-01-012021-12-310001064728us-gaap:StateAndLocalJurisdictionMember2023-01-012023-12-310001064728us-gaap:StateAndLocalJurisdictionMember2022-01-012022-12-310001064728us-gaap:StateAndLocalJurisdictionMember2021-01-012021-12-310001064728us-gaap:ForeignCountryMember2023-01-012023-12-310001064728us-gaap:ForeignCountryMember2022-01-012022-12-310001064728us-gaap:ForeignCountryMember2021-01-012021-12-310001064728us-gaap:SeniorNotesMemberbtu:A3250ConvertibleSeniorNotesDueMarch2028Member2023-12-310001064728us-gaap:SeniorNotesMemberbtu:A3250ConvertibleSeniorNotesDueMarch2028Member2022-12-310001064728us-gaap:SeniorNotesMemberbtu:A6.000SeniorSecuredNotesDue2022Member2022-01-012022-03-310001064728us-gaap:SeniorNotesMemberbtu:A8500SeniorSecuredNotesDue2024Member2022-01-012022-12-310001064728us-gaap:SeniorNotesMemberbtu:A8500SeniorSecuredNotesDue2024Member2022-03-310001064728us-gaap:SeniorNotesMemberbtu:LCAgreementMember2022-01-012022-12-310001064728btu:LCAgreementMember2022-01-012022-12-310001064728us-gaap:SeniorNotesMemberbtu:A6.375SeniorSecuredNotesDue2025Member2022-01-012022-12-310001064728btu:A6.375SeniorSecuredNotesDue2025Member2022-01-012022-12-310001064728btu:SeniorSecuredTermLoanDue2025Memberbtu:TermLoanMember2022-01-012022-12-310001064728btu:A10000SeniorSecuredNotesDueDecember2024AndSeniorSecuredTermLoanDue2024Member2022-01-012022-12-310001064728us-gaap:SeniorNotesMemberbtu:A1000SeniorSecuredNotesDue2024Member2022-01-012022-12-310001064728btu:SeniorSecuredTermLoanDue2024Memberbtu:TermLoanMember2022-01-012022-12-310001064728btu:SeniorSecuredTermLoanDue2024Memberbtu:TermLoanMember2022-12-310001064728us-gaap:SeniorNotesMemberbtu:A1000SeniorSecuredNotesDue2024Member2022-12-310001064728us-gaap:SeniorNotesMemberbtu:A10000SeniorSecuredNotesDueDecember2024AndSeniorSecuredTermLoanDue2024Member2022-01-012022-12-310001064728btu:SeniorNotesAndTermLoansMember2022-01-012022-12-310001064728us-gaap:SeniorNotesMemberbtu:A3250ConvertibleSeniorNotesDueMarch2028Member2022-03-010001064728us-gaap:SeniorNotesMemberbtu:A8500SeniorSecuredNotesDue2024Member2022-01-012022-03-310001064728us-gaap:SeniorNotesMemberbtu:A6.375SeniorSecuredNotesDue2025Member2022-01-012022-03-310001064728us-gaap:SeniorNotesMemberbtu:A3250ConvertibleSeniorNotesDueMarch2028Member2022-03-310001064728btu:A8500SeniorSecuredNotesDueDecember2024And6375SeniorSecuredNotesDueMarch2025Domain2022-01-012022-03-310001064728btu:A3250ConvertibleSeniorNotesDueMarch2028Member2023-10-012023-12-31btu:buyer0001064728us-gaap:SeniorNotesMemberbtu:A3250ConvertibleSeniorNotesDueMarch2028Member2023-10-012023-12-310001064728us-gaap:SeniorNotesMemberbtu:A3250ConvertibleSeniorNotesDueMarch2028Memberus-gaap:SubsequentEventMember2024-02-212024-02-210001064728us-gaap:SeniorNotesMemberbtu:A3250ConvertibleSeniorNotesDueMarch2028Memberus-gaap:SubsequentEventMember2025-03-010001064728us-gaap:SeniorNotesMembersrt:MinimumMemberbtu:A3250ConvertibleSeniorNotesDueMarch2028Member2023-10-012023-12-310001064728us-gaap:SeniorNotesMemberbtu:A3250ConvertibleSeniorNotesDueMarch2028Member2023-01-012023-12-310001064728us-gaap:SeniorNotesMemberbtu:A1000RevolvingCreditFacilityMaturing2025Member2022-03-070001064728btu:AtMarketIssuanceMemberus-gaap:CommonStockMember2022-03-072022-03-070001064728btu:A1000RevolvingCreditFacilityMaturing2025Member2022-03-310001064728btu:A1000RevolvingCreditFacilityMaturing2025Member2022-01-012022-03-310001064728btu:AtMarketIssuanceMemberbtu:A1000RevolvingCreditFacilityMaturing2025Memberus-gaap:CommonStockMember2022-01-012022-03-310001064728btu:IndebtednessMember2023-01-012023-12-310001064728btu:IndebtednessMember2022-01-012022-12-310001064728btu:IndebtednessMember2021-01-012021-12-310001064728us-gaap:RevolvingCreditFacilityMemberus-gaap:SubsequentEventMember2024-01-180001064728us-gaap:RevolvingCreditFacilityMembersrt:MinimumMemberus-gaap:SubsequentEventMember2024-01-182024-12-310001064728srt:MaximumMemberus-gaap:RevolvingCreditFacilityMemberus-gaap:SubsequentEventMember2024-01-182024-12-310001064728srt:MinimumMemberus-gaap:SubsequentEventMember2024-01-182024-12-310001064728srt:MaximumMemberus-gaap:SubsequentEventMember2024-01-182024-12-310001064728us-gaap:LongTermDebtMember2023-12-310001064728us-gaap:LongTermDebtMember2022-12-310001064728srt:MinimumMember2023-01-012023-12-310001064728srt:MaximumMember2023-01-012023-12-310001064728us-gaap:OtherPostretirementBenefitPlansDefinedBenefitMember2023-01-012023-12-310001064728us-gaap:OtherPostretirementBenefitPlansDefinedBenefitMember2022-01-012022-12-310001064728us-gaap:OtherPostretirementBenefitPlansDefinedBenefitMember2021-01-012021-12-310001064728us-gaap:OtherPostretirementBenefitPlansDefinedBenefitMember2023-12-310001064728us-gaap:OtherPostretirementBenefitPlansDefinedBenefitMember2022-12-310001064728us-gaap:OtherPostretirementBenefitPlansDefinedBenefitMember2021-12-310001064728btu:RetirementPlanAmendmentTwoMemberus-gaap:OtherPostretirementBenefitPlansDefinedBenefitMember2023-12-310001064728btu:RetirementPlanAmendmentTwoMemberus-gaap:OtherPostretirementBenefitPlansDefinedBenefitMember2022-12-310001064728btu:RetirementPlanAmendmentOneMemberus-gaap:OtherPostretirementBenefitPlansDefinedBenefitMember2023-12-310001064728btu:RetirementPlanAmendmentOneMemberus-gaap:OtherPostretirementBenefitPlansDefinedBenefitMember2022-12-310001064728btu:RetirementPlan2018AmendmentMemberus-gaap:OtherPostretirementBenefitPlansDefinedBenefitMember2023-12-310001064728btu:RetirementPlan2018AmendmentMemberus-gaap:OtherPostretirementBenefitPlansDefinedBenefitMember2022-12-310001064728srt:MaximumMemberus-gaap:OtherPostretirementBenefitPlansDefinedBenefitMember2023-01-012023-12-310001064728btu:PreMedicareMember2023-12-310001064728btu:PreMedicareMember2022-12-310001064728btu:PostMedicareMember2023-12-310001064728btu:PostMedicareMember2022-12-310001064728us-gaap:DefinedBenefitPlanEquitySecuritiesMember2023-12-310001064728us-gaap:FixedIncomeSecuritiesMember2023-12-310001064728us-gaap:EquitySecuritiesMemberus-gaap:FairValueInputsLevel1Memberus-gaap:OtherPostretirementBenefitPlansDefinedBenefitMember2023-12-310001064728us-gaap:FairValueInputsLevel2Memberus-gaap:EquitySecuritiesMemberus-gaap:OtherPostretirementBenefitPlansDefinedBenefitMember2023-12-310001064728us-gaap:FairValueInputsLevel3Memberus-gaap:EquitySecuritiesMemberus-gaap:OtherPostretirementBenefitPlansDefinedBenefitMember2023-12-310001064728us-gaap:EquitySecuritiesMemberus-gaap:OtherPostretirementBenefitPlansDefinedBenefitMember2023-12-310001064728btu:InternationalEquitySecuritiesMemberus-gaap:FairValueInputsLevel1Memberus-gaap:OtherPostretirementBenefitPlansDefinedBenefitMember2023-12-310001064728btu:InternationalEquitySecuritiesMemberus-gaap:FairValueInputsLevel2Memberus-gaap:OtherPostretirementBenefitPlansDefinedBenefitMember2023-12-310001064728btu:InternationalEquitySecuritiesMemberus-gaap:FairValueInputsLevel3Memberus-gaap:OtherPostretirementBenefitPlansDefinedBenefitMember2023-12-310001064728btu:InternationalEquitySecuritiesMemberus-gaap:OtherPostretirementBenefitPlansDefinedBenefitMember2023-12-310001064728us-gaap:FairValueInputsLevel1Memberus-gaap:CorporateDebtSecuritiesMemberus-gaap:OtherPostretirementBenefitPlansDefinedBenefitMember2023-12-310001064728us-gaap:FairValueInputsLevel2Memberus-gaap:CorporateDebtSecuritiesMemberus-gaap:OtherPostretirementBenefitPlansDefinedBenefitMember2023-12-310001064728us-gaap:FairValueInputsLevel3Memberus-gaap:CorporateDebtSecuritiesMemberus-gaap:OtherPostretirementBenefitPlansDefinedBenefitMember2023-12-310001064728us-gaap:CorporateDebtSecuritiesMemberus-gaap:OtherPostretirementBenefitPlansDefinedBenefitMember2023-12-310001064728us-gaap:USTreasuryAndGovernmentMemberus-gaap:FairValueInputsLevel1Memberus-gaap:OtherPostretirementBenefitPlansDefinedBenefitMember2023-12-310001064728us-gaap:FairValueInputsLevel2Memberus-gaap:USTreasuryAndGovernmentMemberus-gaap:OtherPostretirementBenefitPlansDefinedBenefitMember2023-12-310001064728us-gaap:FairValueInputsLevel3Memberus-gaap:USTreasuryAndGovernmentMemberus-gaap:OtherPostretirementBenefitPlansDefinedBenefitMember2023-12-310001064728us-gaap:USTreasuryAndGovernmentMemberus-gaap:OtherPostretirementBenefitPlansDefinedBenefitMember2023-12-310001064728us-gaap:FairValueInputsLevel1Memberus-gaap:MoneyMarketFundsMemberus-gaap:OtherPostretirementBenefitPlansDefinedBenefitMember2023-12-310001064728us-gaap:FairValueInputsLevel2Memberus-gaap:MoneyMarketFundsMemberus-gaap:OtherPostretirementBenefitPlansDefinedBenefitMember2023-12-310001064728us-gaap:FairValueInputsLevel3Memberus-gaap:MoneyMarketFundsMemberus-gaap:OtherPostretirementBenefitPlansDefinedBenefitMember2023-12-310001064728us-gaap:MoneyMarketFundsMemberus-gaap:OtherPostretirementBenefitPlansDefinedBenefitMember2023-12-310001064728us-gaap:FairValueInputsLevel1Memberus-gaap:OtherPostretirementBenefitPlansDefinedBenefitMember2023-12-310001064728us-gaap:FairValueInputsLevel2Memberus-gaap:OtherPostretirementBenefitPlansDefinedBenefitMember2023-12-310001064728us-gaap:FairValueInputsLevel3Memberus-gaap:OtherPostretirementBenefitPlansDefinedBenefitMember2023-12-310001064728us-gaap:EquitySecuritiesMemberus-gaap:FairValueInputsLevel1Memberus-gaap:OtherPostretirementBenefitPlansDefinedBenefitMember2022-12-310001064728us-gaap:FairValueInputsLevel2Memberus-gaap:EquitySecuritiesMemberus-gaap:OtherPostretirementBenefitPlansDefinedBenefitMember2022-12-310001064728us-gaap:FairValueInputsLevel3Memberus-gaap:EquitySecuritiesMemberus-gaap:OtherPostretirementBenefitPlansDefinedBenefitMember2022-12-310001064728us-gaap:EquitySecuritiesMemberus-gaap:OtherPostretirementBenefitPlansDefinedBenefitMember2022-12-310001064728btu:InternationalEquitySecuritiesMemberus-gaap:FairValueInputsLevel1Memberus-gaap:OtherPostretirementBenefitPlansDefinedBenefitMember2022-12-310001064728btu:InternationalEquitySecuritiesMemberus-gaap:FairValueInputsLevel2Memberus-gaap:OtherPostretirementBenefitPlansDefinedBenefitMember2022-12-310001064728btu:InternationalEquitySecuritiesMemberus-gaap:FairValueInputsLevel3Memberus-gaap:OtherPostretirementBenefitPlansDefinedBenefitMember2022-12-310001064728btu:InternationalEquitySecuritiesMemberus-gaap:OtherPostretirementBenefitPlansDefinedBenefitMember2022-12-310001064728us-gaap:FairValueInputsLevel1Memberus-gaap:CorporateDebtSecuritiesMemberus-gaap:OtherPostretirementBenefitPlansDefinedBenefitMember2022-12-310001064728us-gaap:FairValueInputsLevel2Memberus-gaap:CorporateDebtSecuritiesMemberus-gaap:OtherPostretirementBenefitPlansDefinedBenefitMember2022-12-310001064728us-gaap:FairValueInputsLevel3Memberus-gaap:CorporateDebtSecuritiesMemberus-gaap:OtherPostretirementBenefitPlansDefinedBenefitMember2022-12-310001064728us-gaap:CorporateDebtSecuritiesMemberus-gaap:OtherPostretirementBenefitPlansDefinedBenefitMember2022-12-310001064728us-gaap:USTreasuryAndGovernmentMemberus-gaap:FairValueInputsLevel1Memberus-gaap:OtherPostretirementBenefitPlansDefinedBenefitMember2022-12-310001064728us-gaap:FairValueInputsLevel2Memberus-gaap:USTreasuryAndGovernmentMemberus-gaap:OtherPostretirementBenefitPlansDefinedBenefitMember2022-12-310001064728us-gaap:FairValueInputsLevel3Memberus-gaap:USTreasuryAndGovernmentMemberus-gaap:OtherPostretirementBenefitPlansDefinedBenefitMember2022-12-310001064728us-gaap:USTreasuryAndGovernmentMemberus-gaap:OtherPostretirementBenefitPlansDefinedBenefitMember2022-12-310001064728us-gaap:FairValueInputsLevel1Memberus-gaap:MoneyMarketFundsMemberus-gaap:OtherPostretirementBenefitPlansDefinedBenefitMember2022-12-310001064728us-gaap:FairValueInputsLevel2Memberus-gaap:MoneyMarketFundsMemberus-gaap:OtherPostretirementBenefitPlansDefinedBenefitMember2022-12-310001064728us-gaap:FairValueInputsLevel3Memberus-gaap:MoneyMarketFundsMemberus-gaap:OtherPostretirementBenefitPlansDefinedBenefitMember2022-12-310001064728us-gaap:MoneyMarketFundsMemberus-gaap:OtherPostretirementBenefitPlansDefinedBenefitMember2022-12-310001064728us-gaap:FairValueInputsLevel1Memberus-gaap:OtherPostretirementBenefitPlansDefinedBenefitMember2022-12-310001064728us-gaap:FairValueInputsLevel2Memberus-gaap:OtherPostretirementBenefitPlansDefinedBenefitMember2022-12-310001064728us-gaap:FairValueInputsLevel3Memberus-gaap:OtherPostretirementBenefitPlansDefinedBenefitMember2022-12-3100010647282022-03-310001064728us-gaap:PensionPlansDefinedBenefitMember2023-01-012023-12-310001064728us-gaap:PensionPlansDefinedBenefitMember2022-01-012022-12-310001064728us-gaap:PensionPlansDefinedBenefitMember2021-01-012021-12-310001064728us-gaap:PensionPlansDefinedBenefitMember2022-12-310001064728us-gaap:PensionPlansDefinedBenefitMember2021-12-310001064728us-gaap:PensionPlansDefinedBenefitMember2023-12-310001064728btu:WesternPlanMember2023-01-012023-12-310001064728srt:ScenarioForecastMemberbtu:WesternPlanMember2024-01-012024-12-310001064728btu:PeabodyPlanMember2023-12-310001064728btu:PeabodyPlanMember2022-12-310001064728btu:WesternPlanMember2023-12-310001064728btu:WesternPlanMember2022-12-310001064728us-gaap:FixedIncomeInvestmentsMember2022-12-310001064728us-gaap:FixedIncomeInvestmentsMember2023-12-310001064728us-gaap:RealEstateMember2022-12-310001064728us-gaap:RealEstateMember2023-12-310001064728us-gaap:PensionPlansDefinedBenefitMemberus-gaap:FairValueInputsLevel1Memberus-gaap:CorporateDebtSecuritiesMember2023-12-310001064728us-gaap:FairValueInputsLevel2Memberus-gaap:PensionPlansDefinedBenefitMemberus-gaap:CorporateDebtSecuritiesMember2023-12-310001064728us-gaap:FairValueInputsLevel3Memberus-gaap:PensionPlansDefinedBenefitMemberus-gaap:CorporateDebtSecuritiesMember2023-12-310001064728us-gaap:PensionPlansDefinedBenefitMemberus-gaap:FairValueInputsLevel12And3Memberus-gaap:CorporateDebtSecuritiesMember2023-12-310001064728us-gaap:USTreasuryAndGovernmentMemberus-gaap:PensionPlansDefinedBenefitMemberus-gaap:FairValueInputsLevel1Member2023-12-310001064728us-gaap:FairValueInputsLevel2Memberus-gaap:USTreasuryAndGovernmentMemberus-gaap:PensionPlansDefinedBenefitMember2023-12-310001064728us-gaap:FairValueInputsLevel3Memberus-gaap:USTreasuryAndGovernmentMemberus-gaap:PensionPlansDefinedBenefitMember2023-12-310001064728us-gaap:USTreasuryAndGovernmentMemberus-gaap:PensionPlansDefinedBenefitMemberus-gaap:FairValueInputsLevel12And3Member2023-12-310001064728us-gaap:ForeignGovernmentDebtSecuritiesMemberus-gaap:PensionPlansDefinedBenefitMemberus-gaap:FairValueInputsLevel1Member2023-12-310001064728us-gaap:ForeignGovernmentDebtSecuritiesMemberus-gaap:FairValueInputsLevel2Memberus-gaap:PensionPlansDefinedBenefitMember2023-12-310001064728us-gaap:ForeignGovernmentDebtSecuritiesMemberus-gaap:FairValueInputsLevel3Memberus-gaap:PensionPlansDefinedBenefitMember2023-12-310001064728us-gaap:ForeignGovernmentDebtSecuritiesMemberus-gaap:PensionPlansDefinedBenefitMemberus-gaap:FairValueInputsLevel12And3Member2023-12-310001064728us-gaap:AssetBackedSecuritiesMemberus-gaap:PensionPlansDefinedBenefitMemberus-gaap:FairValueInputsLevel1Member2023-12-310001064728us-gaap:FairValueInputsLevel2Memberus-gaap:AssetBackedSecuritiesMemberus-gaap:PensionPlansDefinedBenefitMember2023-12-310001064728us-gaap:FairValueInputsLevel3Memberus-gaap:AssetBackedSecuritiesMemberus-gaap:PensionPlansDefinedBenefitMember2023-12-310001064728us-gaap:AssetBackedSecuritiesMemberus-gaap:PensionPlansDefinedBenefitMemberus-gaap:FairValueInputsLevel12And3Member2023-12-310001064728us-gaap:ShortTermInvestmentsMemberus-gaap:PensionPlansDefinedBenefitMemberus-gaap:FairValueInputsLevel1Member2023-12-310001064728us-gaap:ShortTermInvestmentsMemberus-gaap:FairValueInputsLevel2Memberus-gaap:PensionPlansDefinedBenefitMember2023-12-310001064728us-gaap:ShortTermInvestmentsMemberus-gaap:FairValueInputsLevel3Memberus-gaap:PensionPlansDefinedBenefitMember2023-12-310001064728us-gaap:ShortTermInvestmentsMemberus-gaap:PensionPlansDefinedBenefitMemberus-gaap:FairValueInputsLevel12And3Member2023-12-310001064728us-gaap:PensionPlansDefinedBenefitMemberus-gaap:FairValueInputsLevel1Member2023-12-310001064728us-gaap:FairValueInputsLevel2Memberus-gaap:PensionPlansDefinedBenefitMember2023-12-310001064728us-gaap:FairValueInputsLevel3Memberus-gaap:PensionPlansDefinedBenefitMember2023-12-310001064728us-gaap:PensionPlansDefinedBenefitMemberus-gaap:FairValueInputsLevel12And3Member2023-12-310001064728us-gaap:PrivateEquityFundsMemberus-gaap:PensionPlansDefinedBenefitMemberus-gaap:FairValueMeasuredAtNetAssetValuePerShareMember2023-12-310001064728us-gaap:PensionPlansDefinedBenefitMemberus-gaap:FairValueInputsLevel1Memberus-gaap:CorporateDebtSecuritiesMember2022-12-310001064728us-gaap:FairValueInputsLevel2Memberus-gaap:PensionPlansDefinedBenefitMemberus-gaap:CorporateDebtSecuritiesMember2022-12-310001064728us-gaap:FairValueInputsLevel3Memberus-gaap:PensionPlansDefinedBenefitMemberus-gaap:CorporateDebtSecuritiesMember2022-12-310001064728us-gaap:PensionPlansDefinedBenefitMemberus-gaap:FairValueInputsLevel12And3Memberus-gaap:CorporateDebtSecuritiesMember2022-12-310001064728us-gaap:USTreasuryAndGovernmentMemberus-gaap:PensionPlansDefinedBenefitMemberus-gaap:FairValueInputsLevel1Member2022-12-310001064728us-gaap:FairValueInputsLevel2Memberus-gaap:USTreasuryAndGovernmentMemberus-gaap:PensionPlansDefinedBenefitMember2022-12-310001064728us-gaap:FairValueInputsLevel3Memberus-gaap:USTreasuryAndGovernmentMemberus-gaap:PensionPlansDefinedBenefitMember2022-12-310001064728us-gaap:USTreasuryAndGovernmentMemberus-gaap:PensionPlansDefinedBenefitMemberus-gaap:FairValueInputsLevel12And3Member2022-12-310001064728us-gaap:ForeignGovernmentDebtSecuritiesMemberus-gaap:PensionPlansDefinedBenefitMemberus-gaap:FairValueInputsLevel1Member2022-12-310001064728us-gaap:ForeignGovernmentDebtSecuritiesMemberus-gaap:FairValueInputsLevel2Memberus-gaap:PensionPlansDefinedBenefitMember2022-12-310001064728us-gaap:ForeignGovernmentDebtSecuritiesMemberus-gaap:FairValueInputsLevel3Memberus-gaap:PensionPlansDefinedBenefitMember2022-12-310001064728us-gaap:ForeignGovernmentDebtSecuritiesMemberus-gaap:PensionPlansDefinedBenefitMemberus-gaap:FairValueInputsLevel12And3Member2022-12-310001064728us-gaap:AssetBackedSecuritiesMemberus-gaap:PensionPlansDefinedBenefitMemberus-gaap:FairValueInputsLevel1Member2022-12-310001064728us-gaap:FairValueInputsLevel2Memberus-gaap:AssetBackedSecuritiesMemberus-gaap:PensionPlansDefinedBenefitMember2022-12-310001064728us-gaap:FairValueInputsLevel3Memberus-gaap:AssetBackedSecuritiesMemberus-gaap:PensionPlansDefinedBenefitMember2022-12-310001064728us-gaap:AssetBackedSecuritiesMemberus-gaap:PensionPlansDefinedBenefitMemberus-gaap:FairValueInputsLevel12And3Member2022-12-310001064728us-gaap:ShortTermInvestmentsMemberus-gaap:PensionPlansDefinedBenefitMemberus-gaap:FairValueInputsLevel1Member2022-12-310001064728us-gaap:ShortTermInvestmentsMemberus-gaap:FairValueInputsLevel2Memberus-gaap:PensionPlansDefinedBenefitMember2022-12-310001064728us-gaap:ShortTermInvestmentsMemberus-gaap:FairValueInputsLevel3Memberus-gaap:PensionPlansDefinedBenefitMember2022-12-310001064728us-gaap:ShortTermInvestmentsMemberus-gaap:PensionPlansDefinedBenefitMemberus-gaap:FairValueInputsLevel12And3Member2022-12-310001064728us-gaap:PensionPlansDefinedBenefitMemberus-gaap:FairValueInputsLevel1Memberbtu:GroupAnnuityContractMember2022-12-310001064728us-gaap:FairValueInputsLevel2Memberus-gaap:PensionPlansDefinedBenefitMemberbtu:GroupAnnuityContractMember2022-12-310001064728us-gaap:FairValueInputsLevel3Memberus-gaap:PensionPlansDefinedBenefitMemberbtu:GroupAnnuityContractMember2022-12-310001064728us-gaap:PensionPlansDefinedBenefitMemberus-gaap:FairValueInputsLevel12And3Memberbtu:GroupAnnuityContractMember2022-12-310001064728us-gaap:PensionPlansDefinedBenefitMemberus-gaap:FairValueInputsLevel1Memberus-gaap:RealEstateInvestmentMember2022-12-310001064728us-gaap:FairValueInputsLevel2Memberus-gaap:PensionPlansDefinedBenefitMemberus-gaap:RealEstateInvestmentMember2022-12-310001064728us-gaap:FairValueInputsLevel3Memberus-gaap:PensionPlansDefinedBenefitMemberus-gaap:RealEstateInvestmentMember2022-12-310001064728us-gaap:PensionPlansDefinedBenefitMemberus-gaap:FairValueInputsLevel12And3Memberus-gaap:RealEstateInvestmentMember2022-12-310001064728us-gaap:PensionPlansDefinedBenefitMemberus-gaap:FairValueInputsLevel1Member2022-12-310001064728us-gaap:FairValueInputsLevel2Memberus-gaap:PensionPlansDefinedBenefitMember2022-12-310001064728us-gaap:FairValueInputsLevel3Memberus-gaap:PensionPlansDefinedBenefitMember2022-12-310001064728us-gaap:PensionPlansDefinedBenefitMemberus-gaap:FairValueInputsLevel12And3Member2022-12-310001064728us-gaap:PrivateEquityFundsMemberus-gaap:PensionPlansDefinedBenefitMemberus-gaap:FairValueMeasuredAtNetAssetValuePerShareMember2022-12-310001064728us-gaap:FairValueInputsLevel3Member2022-12-310001064728us-gaap:FairValueInputsLevel3Member2021-12-310001064728us-gaap:FairValueInputsLevel3Member2020-12-310001064728us-gaap:FairValueInputsLevel3Member2023-01-012023-12-310001064728us-gaap:FairValueInputsLevel3Member2022-01-012022-12-310001064728us-gaap:FairValueInputsLevel3Member2021-01-012021-12-310001064728us-gaap:FairValueInputsLevel3Member2023-12-31btu:numberOfPlan0001064728us-gaap:ForeignPlanMember2023-01-012023-12-310001064728us-gaap:ForeignPlanMember2022-01-012022-12-310001064728us-gaap:ForeignPlanMember2021-01-012021-12-310001064728us-gaap:CommonStockMember2023-12-31btu:numberOfVote0001064728btu:DebtForEquityExchangeMember2023-12-310001064728btu:DebtForEquityExchangeMember2022-12-310001064728btu:DebtForEquityExchangeMember2021-12-310001064728btu:AtMarketIssuanceMember2023-12-310001064728btu:AtMarketIssuanceMember2022-12-310001064728btu:AtMarketIssuanceMember2021-12-3100010647282017-08-0100010647282018-10-3000010647282017-04-022020-12-3100010647282017-04-022017-12-3100010647282023-04-170001064728us-gaap:SubsequentEventMember2024-01-012024-01-030001064728us-gaap:TreasuryStockCommonMember2023-01-012023-12-310001064728us-gaap:TreasuryStockCommonMember2022-01-012022-12-310001064728us-gaap:TreasuryStockCommonMember2021-01-012021-12-310001064728btu:A2017IncentivePlanMember2020-12-310001064728btu:DeferredStockUnitsMember2023-01-012023-12-310001064728us-gaap:RestrictedStockUnitsRSUMember2023-01-012023-12-310001064728us-gaap:RestrictedStockUnitsRSUMember2023-12-310001064728us-gaap:RestrictedStockUnitsRSUMember2022-12-310001064728us-gaap:RestrictedStockUnitsRSUMember2022-01-012022-12-310001064728us-gaap:RestrictedStockUnitsRSUMember2021-01-012021-12-310001064728btu:DividendEquivalentUnitsMember2023-12-310001064728btu:A2020PerformanceUnitsMember2023-01-012023-12-310001064728srt:MaximumMemberbtu:A2020PerformanceUnitsMember2023-01-012023-12-310001064728btu:A2023PerformanceUnitsMember2023-01-012023-12-310001064728srt:MaximumMemberbtu:A2023PerformanceUnitsMember2023-01-012023-12-310001064728us-gaap:PerformanceSharesMember2022-01-012022-12-310001064728us-gaap:PerformanceSharesMember2021-01-012021-12-310001064728us-gaap:PerformanceSharesMember2022-12-310001064728us-gaap:PerformanceSharesMember2023-01-012023-12-310001064728us-gaap:PerformanceSharesMember2023-12-310001064728btu:DividendEquivalentUnitsPerformanceSharesMember2023-12-310001064728btu:TransitionAgreementMember2021-01-012021-12-310001064728btu:WardsWellCoalDepositMember2023-10-252023-10-250001064728btu:NorthAntelopeRochelleMineMember2023-01-012023-12-310001064728btu:MaterialsAndSuppliesInventoriesMemberbtu:NorthAntelopeRochelleMineMember2023-01-012023-12-310001064728btu:BuildingsAndEquipmentMemberbtu:NorthAntelopeRochelleMineMember2023-01-012023-12-310001064728btu:IncrementalRepairCostsMemberbtu:NorthAntelopeRochelleMineMember2023-01-012023-12-310001064728btu:ShoalCreekMember2023-01-012023-12-310001064728btu:ShoalCreekMemberbtu:LongwallAndDevelopmentAndOtherCostsMember2023-01-012023-12-310001064728btu:ShoalCreekMemberbtu:EquipmentDeemedInoperableMember2023-01-012023-12-310001064728btu:MillenniumMineMember2023-01-012023-12-310001064728btu:WilkieCreekMineMember2023-01-012023-12-31btu:numberOfEmployeebtu:numberOfMine0001064728btu:RepresentedByOrganizedLaborUnionMemberbtu:KayentaMineMember2023-12-310001064728btu:RepresentedByOrganizedLaborUnionMemberbtu:ShoalCreekMember2023-12-310001064728btu:RepresentedByOrganizedLaborUnionMemberbtu:WilpinjongMineMember2023-12-310001064728btu:RepresentedByOrganizedLaborUnionMemberbtu:CoppabellaMineMember2023-12-310001064728btu:RepresentedByOrganizedLaborUnionMemberbtu:MoorvaleMineMember2023-12-310001064728btu:CenturionMineMemberbtu:RepresentedByOrganizedLaborUnionMember2023-12-310001064728btu:RepresentedByOrganizedLaborUnionMemberbtu:MetropolitanUndergroundMineMember2023-12-310001064728btu:RepresentedByOrganizedLaborUnionMemberbtu:MetropolitanPrepPlantMember2023-12-310001064728btu:RepresentedByOrganizedLaborUnionMemberbtu:WamboUndergroundMineMember2023-12-310001064728btu:RepresentedByOrganizedLaborUnionMemberbtu:WamboPrepPlantMember2023-12-310001064728srt:MaximumMember2023-04-140001064728us-gaap:SuretyBondMember2023-12-310001064728srt:MaximumMemberus-gaap:SuretyBondMember2023-12-310001064728us-gaap:SuretyBondMembersrt:MinimumMember2023-12-310001064728btu:SuretyTrustAccountMember2023-03-310001064728us-gaap:SuretyBondMember2023-01-012023-03-310001064728us-gaap:SuretyBondMember2023-03-3100010647282023-04-140001064728us-gaap:LetterOfCreditMember2023-02-032023-02-030001064728btu:AccountsReceivableSecuritizationProgramMember2023-02-130001064728btu:AccountsReceivableSecuritizationProgramMemberus-gaap:SecuredDebtMemberus-gaap:SecuredOvernightFinancingRateSofrOvernightIndexSwapRateMember2023-01-012023-12-310001064728btu:AccountsReceivableSecuritizationProgramMemberus-gaap:SecuredDebtMember2023-12-310001064728btu:AccountsReceivableSecuritizationProgramMemberus-gaap:SecuredDebtMember2023-12-310001064728btu:AccountsReceivableSecuritizationProgramMemberus-gaap:SecuredDebtMember2023-01-012023-12-310001064728btu:AccountsReceivableSecuritizationProgramMemberus-gaap:SecuredDebtMember2022-01-012022-12-310001064728btu:AccountsReceivableSecuritizationProgramMemberus-gaap:SecuredDebtMember2021-01-012021-12-310001064728us-gaap:LetterOfCreditMember2023-12-310001064728us-gaap:LetterOfCreditMembersrt:MaximumMember2023-12-310001064728btu:CollateralizedLetterOfCreditAgreementMember2023-12-310001064728btu:SuretyTrustAccountMember2023-12-310001064728btu:SuretyTrustAccountMember2022-12-310001064728btu:CollateralizedLettersOfCreditFundingMember2023-12-310001064728btu:CollateralizedLettersOfCreditFundingMember2022-12-310001064728btu:CashBackedBankGuaranteesMember2023-12-310001064728btu:CashBackedBankGuaranteesMember2022-12-310001064728btu:DepositsWithRegulatoryAuthoritiesMember2023-12-310001064728btu:DepositsWithRegulatoryAuthoritiesMember2022-12-310001064728btu:LCFacilityMember2023-12-310001064728btu:LCFacilityMember2022-12-310001064728btu:DepositsHeldOnBehalfOfSuretyMember2023-12-310001064728btu:DepositsHeldOnBehalfOfSuretyMember2022-12-310001064728btu:LCFacilityMember2022-12-310001064728btu:LCFacilityMember2023-04-140001064728us-gaap:CapitalAdditionsMember2023-12-310001064728btu:PatriotCoalCorporationMember2015-10-090001064728us-gaap:DisposalGroupDisposedOfByMeansOtherThanSaleNotDiscontinuedOperationsSpinoffMemberbtu:BlackLungOccupationalDiseaseLiabilityMemberbtu:PatriotCoalCorporationMember2007-12-310001064728btu:BlackLungOccupationalDiseaseLiabilityMemberus-gaap:DisposalGroupDisposedOfByMeansOtherThanSaleNotDiscontinuedOperationsMemberbtu:PatriotCoalCorporationMember2022-12-3100010647282023-08-080001064728btu:SeaborneMiningMember2023-12-310001064728btu:U.SThermalMiningMember2023-12-310001064728us-gaap:CorporateAndOtherMember2023-12-310001064728btu:SeaborneMiningMember2022-12-310001064728btu:U.SThermalMiningMember2022-12-310001064728us-gaap:CorporateAndOtherMember2022-12-310001064728btu:SeaborneMiningMember2021-12-310001064728btu:U.SThermalMiningMember2021-12-310001064728us-gaap:CorporateAndOtherMember2021-12-310001064728country:US2023-01-012023-12-310001064728country:US2022-01-012022-12-310001064728country:US2021-01-012021-12-310001064728country:JP2023-01-012023-12-310001064728country:JP2022-01-012022-12-310001064728country:JP2021-01-012021-12-310001064728country:CN2023-01-012023-12-310001064728country:CN2022-01-012022-12-310001064728country:CN2021-01-012021-12-310001064728country:AU2023-01-012023-12-310001064728country:AU2022-01-012022-12-310001064728country:AU2021-01-012021-12-310001064728country:TW2023-01-012023-12-310001064728country:TW2022-01-012022-12-310001064728country:TW2021-01-012021-12-310001064728country:BR2023-01-012023-12-310001064728country:BR2022-01-012022-12-310001064728country:BR2021-01-012021-12-310001064728country:VN2023-01-012023-12-310001064728country:VN2022-01-012022-12-310001064728country:VN2021-01-012021-12-310001064728country:ID2023-01-012023-12-310001064728country:ID2022-01-012022-12-310001064728country:ID2021-01-012021-12-310001064728country:FR2023-01-012023-12-310001064728country:FR2022-01-012022-12-310001064728country:FR2021-01-012021-12-310001064728country:IN2023-01-012023-12-310001064728country:IN2022-01-012022-12-310001064728country:IN2021-01-012021-12-310001064728country:DE2023-01-012023-12-310001064728country:DE2022-01-012022-12-310001064728country:DE2021-01-012021-12-310001064728country:BE2023-01-012023-12-310001064728country:BE2022-01-012022-12-310001064728country:BE2021-01-012021-12-310001064728country:KP2023-01-012023-12-310001064728country:KP2022-01-012022-12-310001064728country:KP2021-01-012021-12-310001064728country:CL2023-01-012023-12-310001064728country:CL2022-01-012022-12-310001064728country:CL2021-01-012021-12-310001064728btu:OtherRegionsMember2023-01-012023-12-310001064728btu:OtherRegionsMember2022-01-012022-12-310001064728btu:OtherRegionsMember2021-01-012021-12-310001064728btu:ReserveForMaterialsAndSuppliesMember2022-12-310001064728btu:ReserveForMaterialsAndSuppliesMember2023-01-012023-12-310001064728btu:ReserveForMaterialsAndSuppliesMember2023-12-310001064728us-gaap:ValuationAllowanceOfDeferredTaxAssetsMember2022-12-310001064728us-gaap:ValuationAllowanceOfDeferredTaxAssetsMember2023-01-012023-12-310001064728us-gaap:ValuationAllowanceOfDeferredTaxAssetsMember2023-12-310001064728btu:AdvanceRoyaltyRecoupmentReserveMember2021-12-310001064728btu:AdvanceRoyaltyRecoupmentReserveMember2022-01-012022-12-310001064728btu:AdvanceRoyaltyRecoupmentReserveMember2022-12-310001064728btu:ReserveForMaterialsAndSuppliesMember2021-12-310001064728btu:ReserveForMaterialsAndSuppliesMember2022-01-012022-12-310001064728us-gaap:ValuationAllowanceOfDeferredTaxAssetsMember2021-12-310001064728us-gaap:ValuationAllowanceOfDeferredTaxAssetsMember2022-01-012022-12-310001064728btu:AdvanceRoyaltyRecoupmentReserveMember2020-12-310001064728btu:AdvanceRoyaltyRecoupmentReserveMember2021-01-012021-12-310001064728btu:ReserveForMaterialsAndSuppliesMember2020-12-310001064728btu:ReserveForMaterialsAndSuppliesMember2021-01-012021-12-310001064728us-gaap:ValuationAllowanceOfDeferredTaxAssetsMember2020-12-310001064728us-gaap:ValuationAllowanceOfDeferredTaxAssetsMember2021-01-012021-12-31
UNITED STATES
SECURITIES AND EXCHANGE COMMISSION
Washington, D.C. 20549
_____________________________________________
FORM 10-K
(Mark One)
|
|
|
|
|
|
|
|
|
|
|
|
|
|
|
|
|
|
|
|
|
|
☑ |
ANNUAL REPORT PURSUANT TO SECTION 13 OR 15(d) OF THE
SECURITIES EXCHANGE ACT OF 1934 |
|
|
|
|
For the Fiscal Year Ended |
December 31, 2023 |
|
|
or
|
|
|
|
|
|
|
|
|
|
|
|
|
|
|
|
☐ |
TRANSITION REPORT PURSUANT TO SECTION 13 OR 15(d) OF THE
SECURITIES EXCHANGE ACT OF 1934 |
|
|
Commission File Number 1-16463
____________________________________________
PEABODY ENERGY CORPORATION
(Exact name of registrant as specified in its charter)
|
|
|
|
|
|
|
|
|
| Delaware |
|
13-4004153 |
| (State or other jurisdiction of incorporation or organization) |
|
(I.R.S. Employer Identification No.) |
|
|
|
|
|
|
|
|
|
|
|
|
|
|
|
|
|
|
|
|
|
|
701 Market Street, |
St. Louis, |
Missouri |
|
|
63101-1826 |
| (Address of principal executive offices) |
|
(Zip Code) |
(314) 342-3400
(Registrant’s telephone number, including area code)
Securities Registered Pursuant to Section 12(b) of the Act:
|
|
|
|
|
|
|
|
|
| Title of Each Class |
Trading Symbol(s) |
Name of Each Exchange on Which Registered |
| Common Stock, par value $0.01 per share |
BTU |
New York Stock Exchange |
Securities Registered Pursuant to Section 12(g) of the Act:
None
Indicate by check mark if the registrant is a well-known seasoned issuer, as defined in Rule 405 of the Securities Act. Yes ☑ No ☐
Indicate by check mark if the registrant is not required to file reports pursuant to Section 13 or Section 15(d) of the Act. Yes ☐ No ☑
Indicate by check mark whether the registrant (1) has filed all reports required to be filed by Section 13 or 15(d) of the Securities Exchange Act of 1934 during the preceding 12 months (or for such shorter period that the registrant was required to file such reports), and (2) has been subject to such filing requirements for the past 90 days. Yes ☑ No ☐
Indicate by check mark whether the registrant has submitted electronically every Interactive Data File required to be submitted pursuant to Rule 405 of Regulation S-T (§ 232.405 of this chapter) during the preceding 12 months (or for such shorter period that the registrant was required to submit such files). Yes ☑ No ☐
Indicate by check mark whether the registrant is a large accelerated filer, an accelerated filer, a non-accelerated filer, a smaller reporting company, or an emerging growth company. See the definitions of “large accelerated filer,” “accelerated filer,” “smaller reporting company,” and “emerging growth company” in Rule 12b-2 of the Exchange Act.
Large accelerated filer ☑ Accelerated filer ☐
Non-accelerated filer ☐ Smaller reporting company ☐
Emerging growth company ☐
If an emerging growth company, indicate by check mark if the registrant has elected not to use the extended transition period for complying with any new or revised financial accounting standards provided pursuant to Section 13(a) of the Exchange Act. ☐
Indicate by check mark whether the registrant has filed a report on and attestation to its management’s assessment of the effectiveness of its internal control over financial reporting under Section 404(b) of the Sarbanes-Oxley Act (15 U.S.C. 7262(b)) by the registered public accounting firm that prepared or issued its audit report. ☑
If securities are registered pursuant to Section 12(b) of the Act, indicate by check mark whether the financial statements of the registrant included in the filing reflect the correction of an error to previously issued financial statements. ☐
Indicate by check mark whether any of those error corrections are restatements that required a recovery analysis of incentive-based compensation received by any of the registrant’s executive officers during the relevant recovery period pursuant to §240.10D-1(b). ☐
Indicate by check mark whether the registrant is a shell company (as defined in Rule 12b-2 of the Exchange Act). Yes ☐ No ☑
Aggregate market value of the voting and non-voting common equity held by non-affiliates (stockholders who are not directors or executive officers) of the Registrant, calculated using the closing price on June 30, 2023: Common Stock, par value $0.01 per share, $2.5 billion.
Number of shares outstanding of each of the Registrant’s classes of Common Stock, as of February 16, 2024: Common Stock, par value $0.01 per share, 128,363,495 shares outstanding.
DOCUMENTS INCORPORATED BY REFERENCE
Portions of the Company’s Proxy Statement to be filed with the Securities and Exchange Commission in connection with the Company’s 2024 Annual Meeting of Shareholders (the Company’s 2024 Proxy Statement) are incorporated by reference into Part III hereof. Other documents incorporated by reference in this report are listed in the Exhibit Index of this Form 10-K.
CAUTIONARY NOTICE REGARDING FORWARD-LOOKING STATEMENTS
This report includes statements of the Company’s expectations, intentions, plans and beliefs that constitute “forward-looking statements” within the meaning of Section 27A of the Securities Act of 1933, as amended (the Securities Act), and Section 21E of the Securities Exchange Act of 1934, as amended (the Exchange Act), and are intended to come within the safe harbor protection provided by those sections. These statements relate to future events or the Company’s future financial performance. The Company uses words such as “anticipate,” “believe,” “expect,” “may,” “forecast,” “project,” “should,” “estimate,” “plan,” “outlook,” “target,” “likely,” “will,” “to be” or other similar words to identify forward-looking statements.
Without limiting the foregoing, all statements relating to the Company’s future operating results, anticipated capital expenditures, future cash flows and borrowings, and sources of funding are forward-looking statements and speak only as of the date of this report. These forward-looking statements are based on numerous assumptions that the Company believes are reasonable, but are subject to a wide range of uncertainties and business risks, and actual results may differ materially from those discussed in these statements. These factors include but are not limited to those described in Part I, Item 1A. “Risk Factors.” Such factors are difficult to accurately predict and may be beyond the Company’s control.
When considering these forward-looking statements, you should keep in mind the cautionary statements in this document and in the Company’s other Securities and Exchange Commission (SEC) filings. These forward-looking statements speak only as of the date on which such statements were made, and the Company undertakes no obligation to update these statements except as required by federal securities laws.
|
|
|
|
|
|
|
|
|
| Peabody Energy Corporation |
2023 Form 10-K |
i |
TABLE OF CONTENTS
|
|
|
|
|
|
|
|
|
| Peabody Energy Corporation |
2023 Form 10-K |
1 |
|
|
|
|
|
|
| Note: |
The words “Peabody” or “the Company” as used in this report, refer to Peabody Energy Corporation or its applicable subsidiary or subsidiaries. Unless otherwise noted herein, disclosures in this Annual Report on Form 10-K relate only to the Company’s continuing operations. |
|
When used in this filing, the term “ton” refers to short or net tons, equal to 2,000 pounds (907.18 kilograms), while “tonne” refers to metric tons, equal to 2,204.62 pounds (1,000 kilograms). |
PART I
Item 1. Business.
Overview
Peabody is a leading producer of metallurgical and thermal coal. At December 31, 2023, the Company owned interests in 17 active coal mining operations located in the United States (U.S.) and Australia, including a 50% equity interest in Middlemount Coal Pty Ltd. (Middlemount). In addition to its mining operations, the Company markets and brokers coal from other coal producers; trades coal and freight-related contracts; and, since 2022, is partnered in a joint venture with the intent of developing various sites, including certain reclaimed mining land held by the Company in the U.S., for utility-scale photovoltaic solar generation and battery storage.
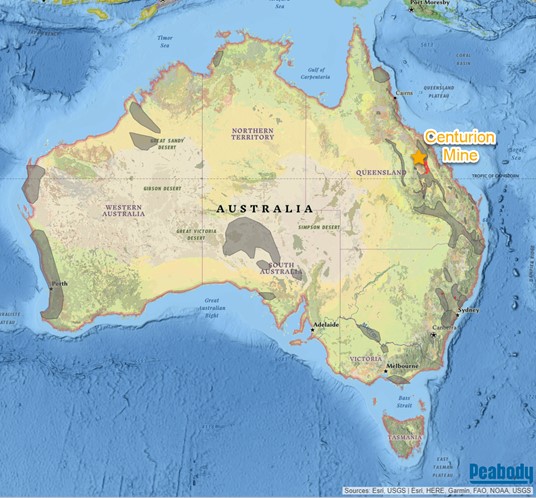
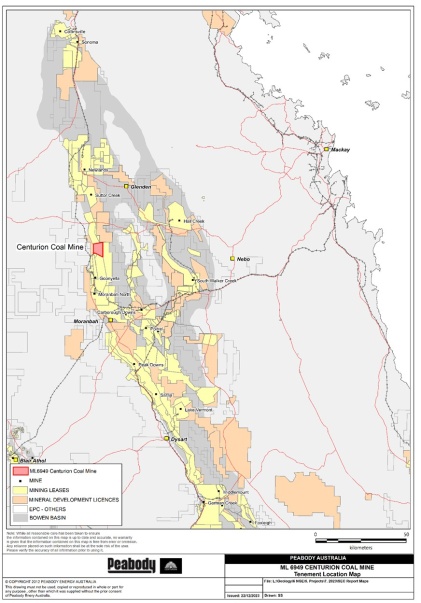
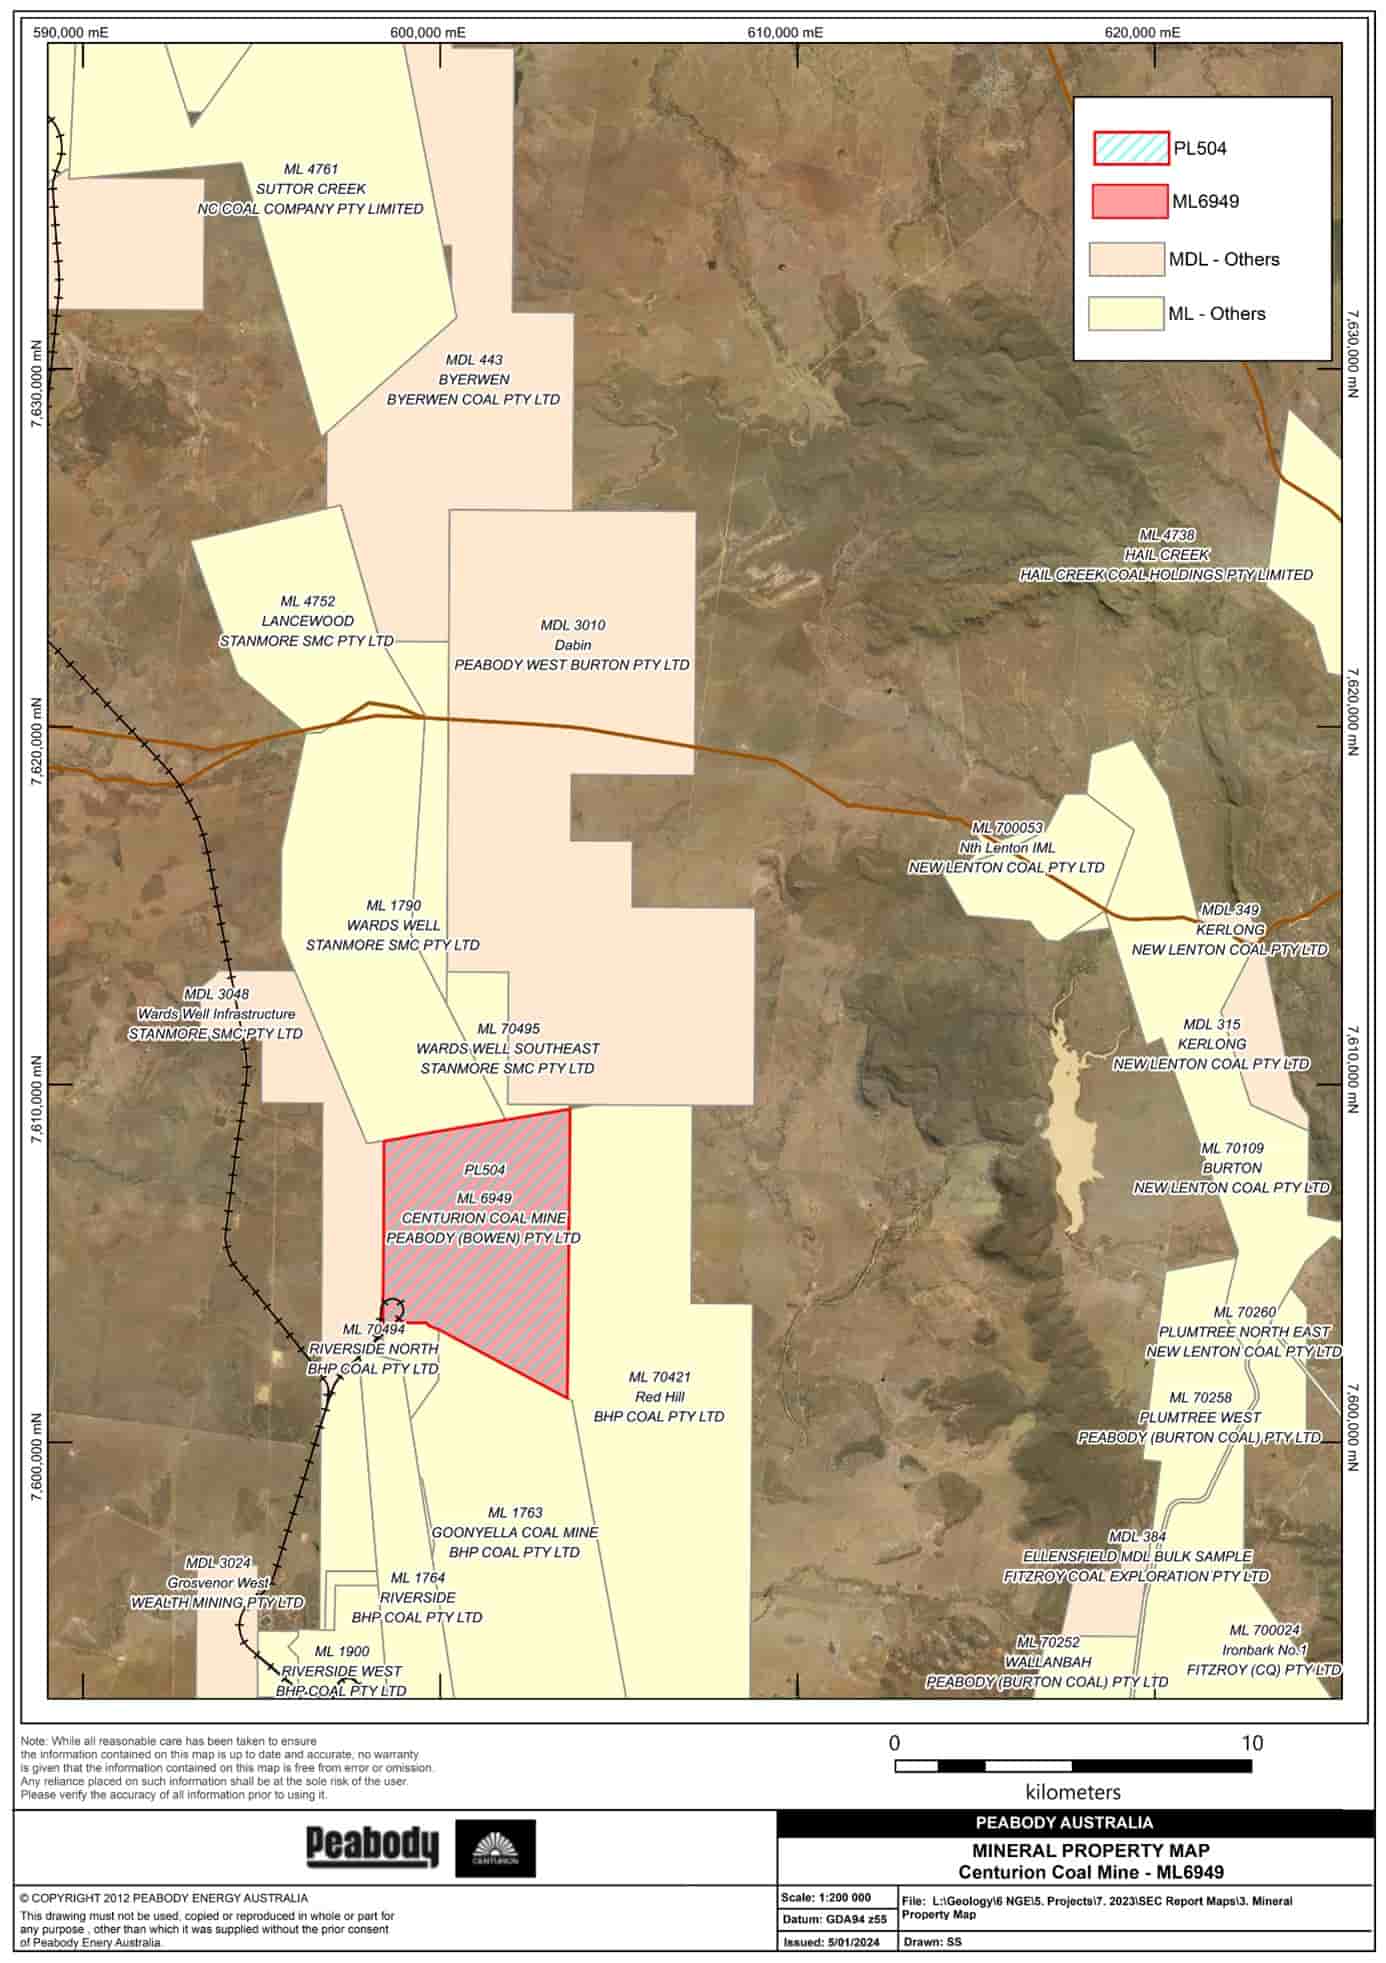
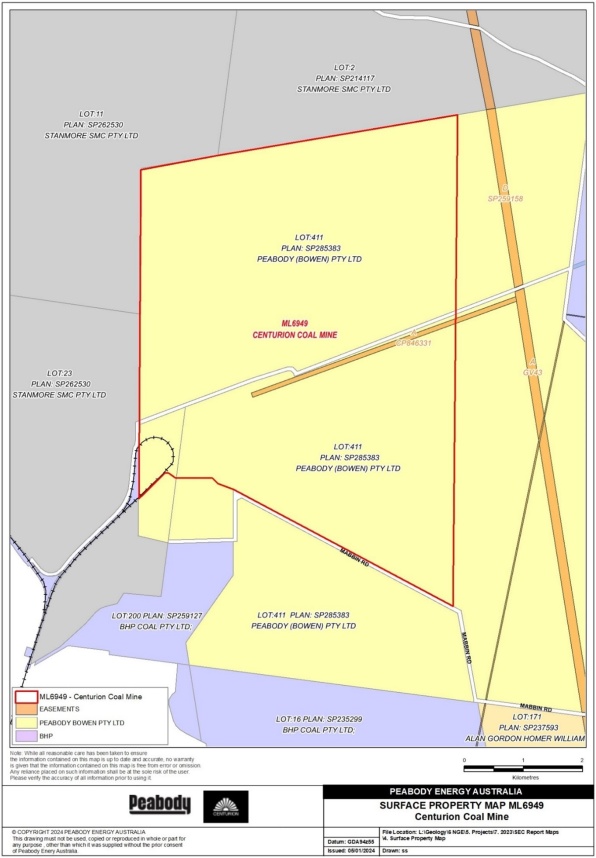
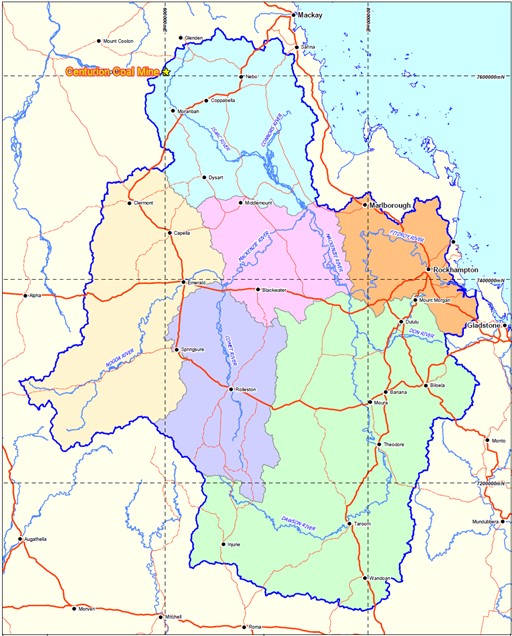
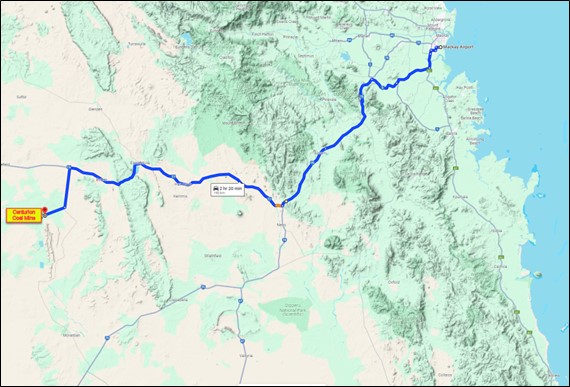
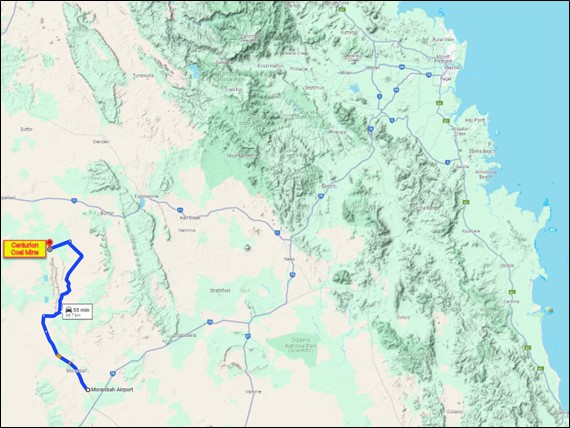
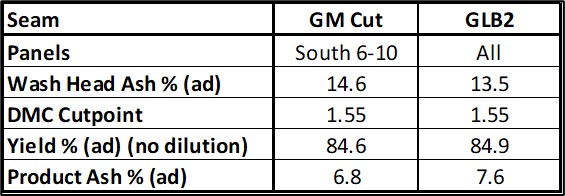
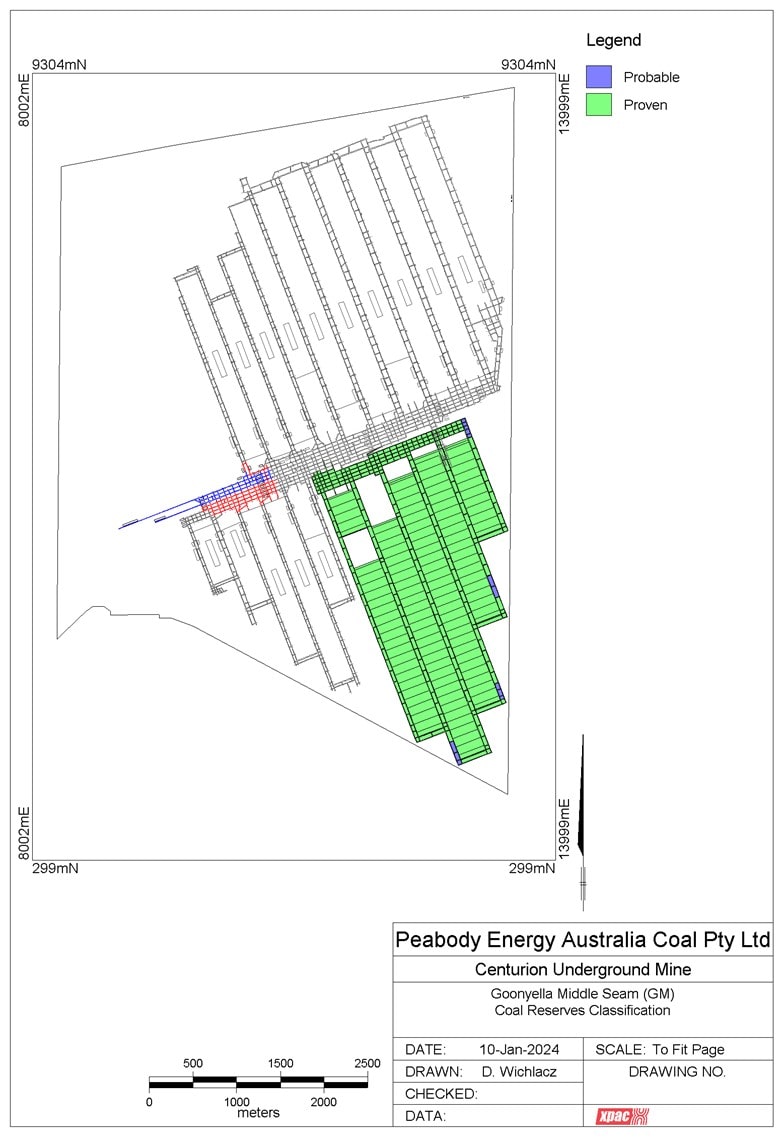
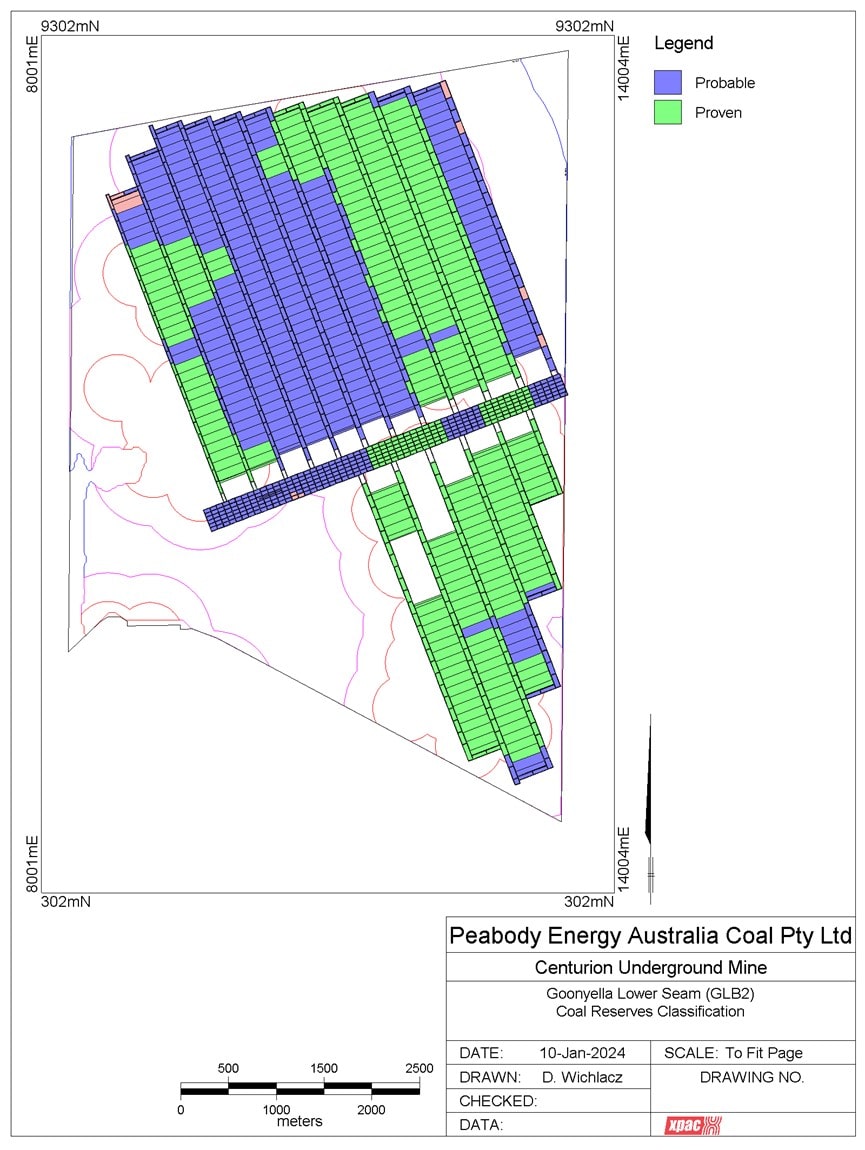
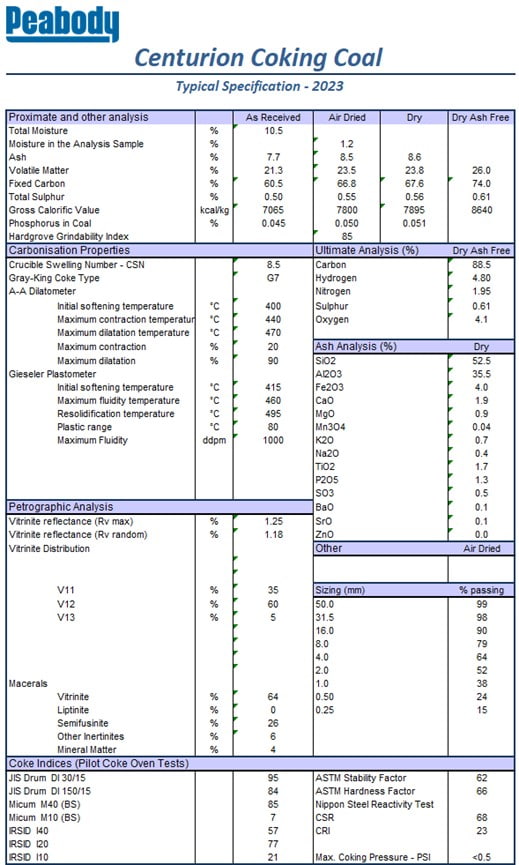
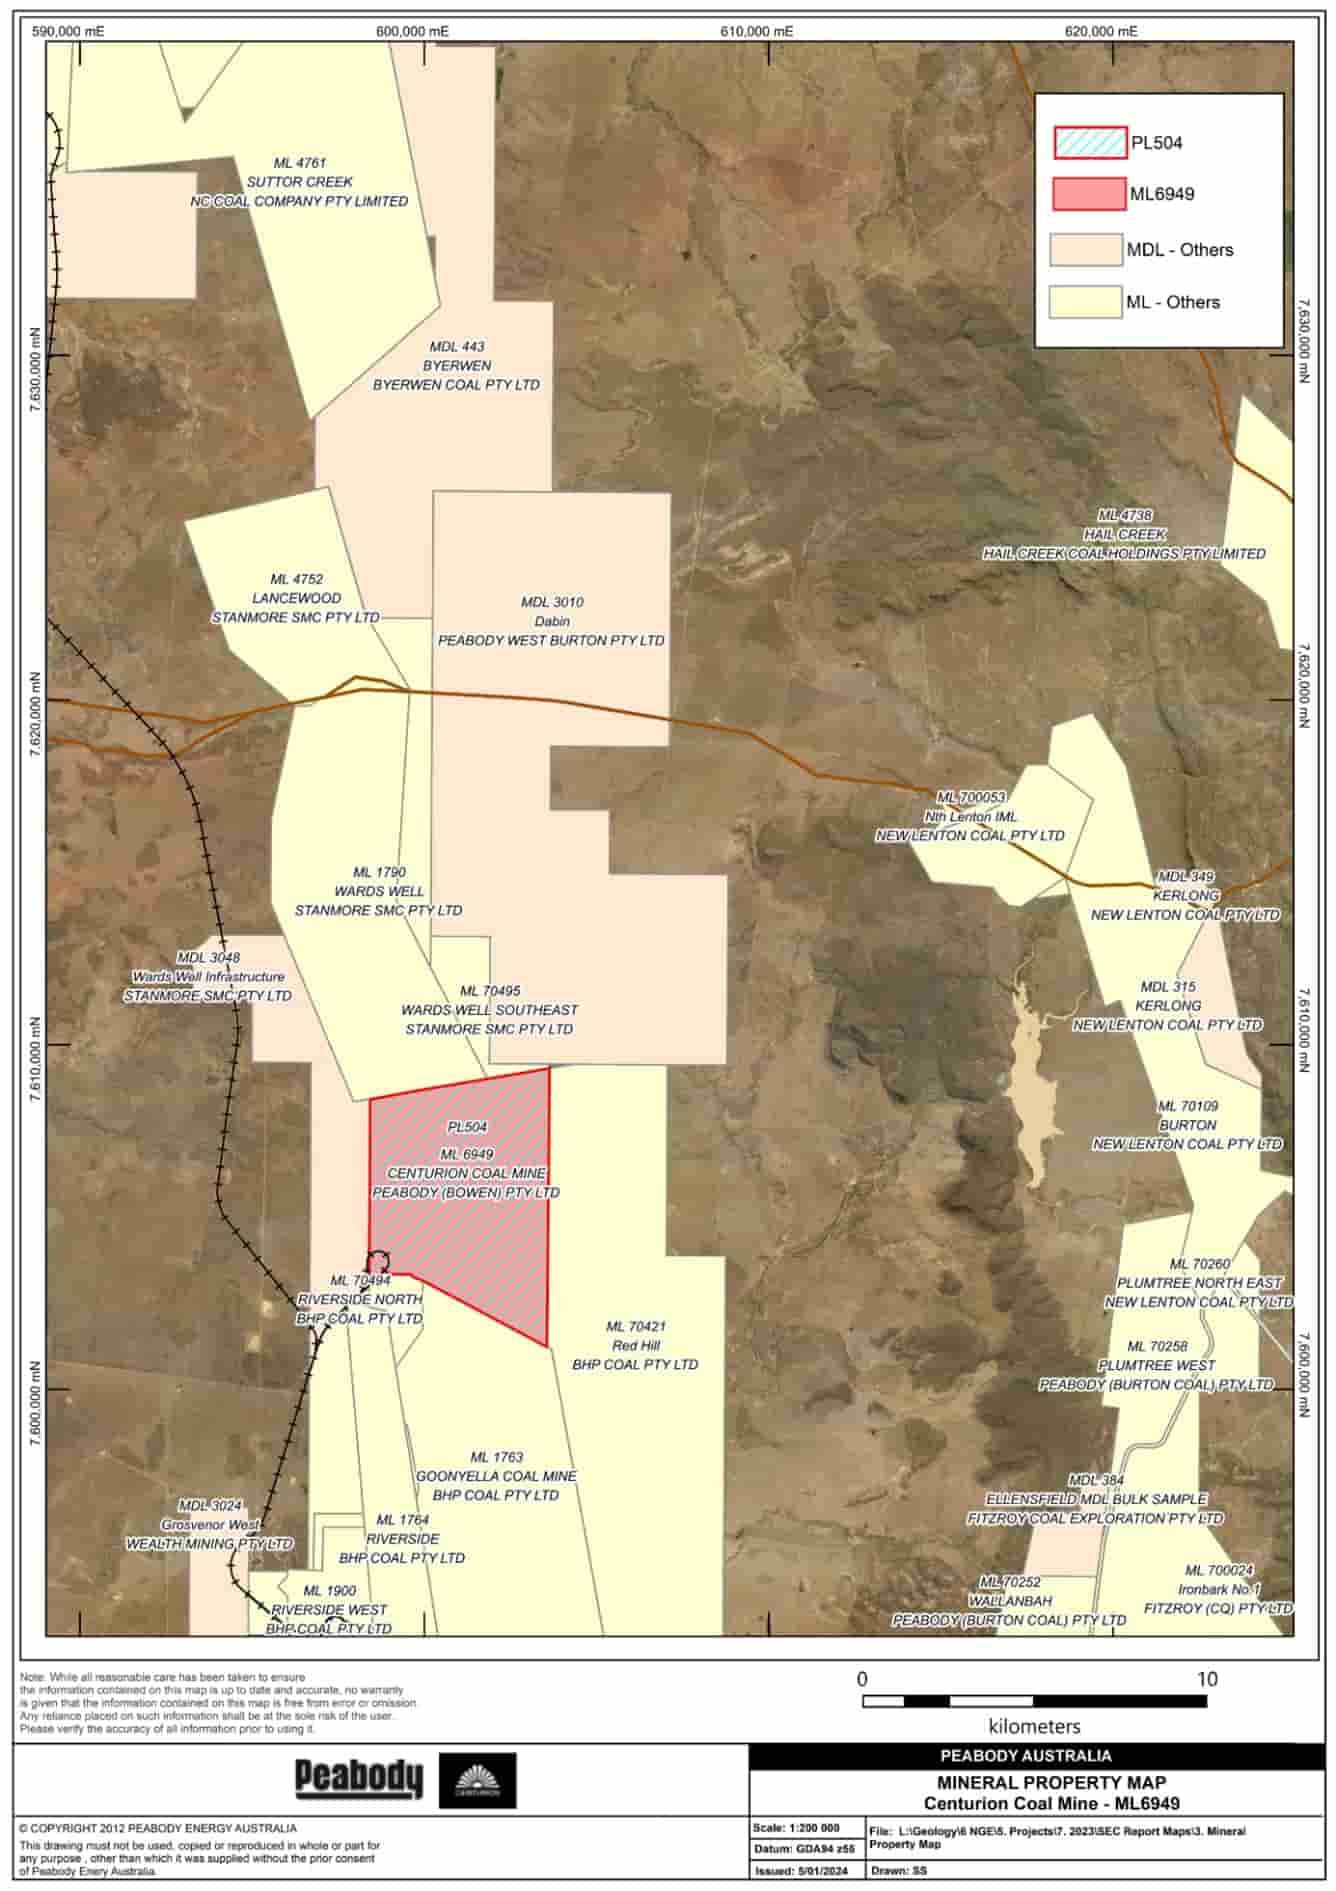
During 2023, Peabody advanced the redevelopment of its North Goonyella Mine in Australia. During the fourth quarter, the mine was renamed to Centurion Mine to reflect the next stage of redevelopment and the Company’s agreement to acquire an adjacent coal deposit. The first development coal from the Centurion Mine is anticipated in the second quarter of 2024.
Segment and Geographic Information
As of December 31, 2023, Peabody reports its results of operations primarily through the following reportable segments: Seaborne Thermal, Seaborne Metallurgical, Powder River Basin, Other U.S. Thermal and Corporate and Other. Refer to Part II, Item 7. “Management’s Discussion and Analysis of Financial Condition and Results of Operations” for additional information regarding the Company’s segments. Note 22. “Segment and Geographic Information” to the accompanying consolidated financial statements is incorporated herein by reference and also contains segment and geographic financial information.
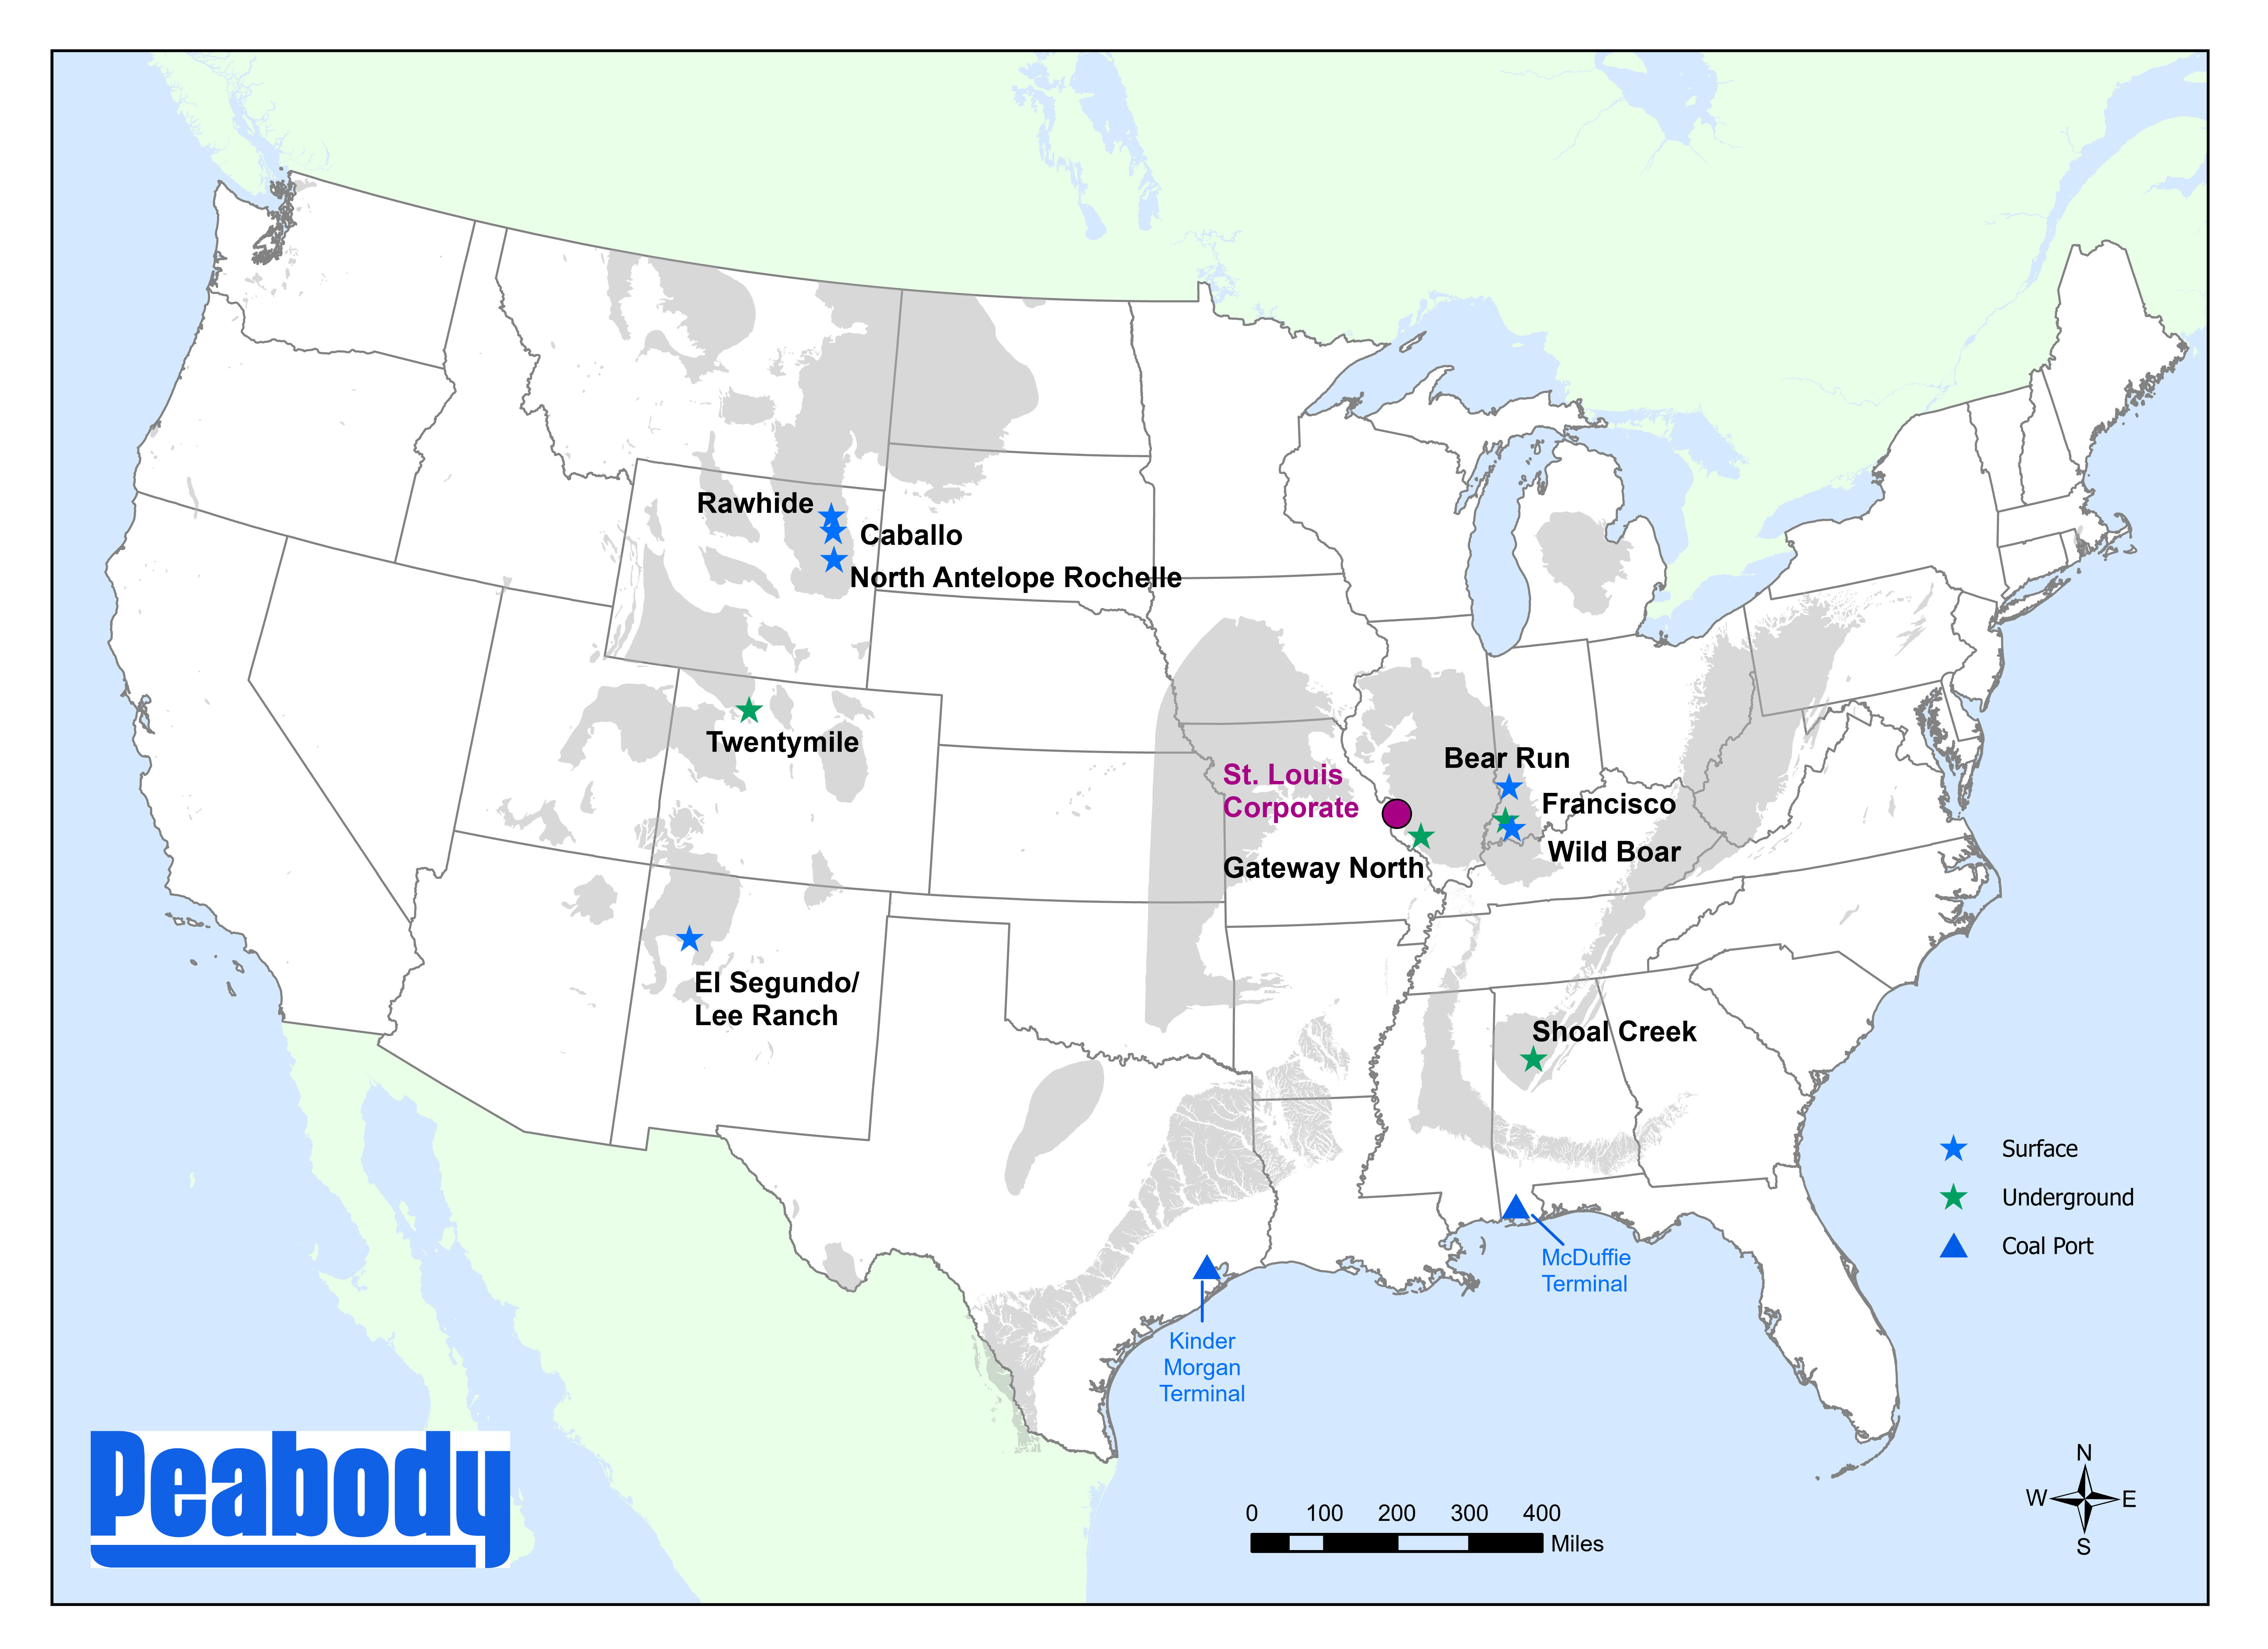
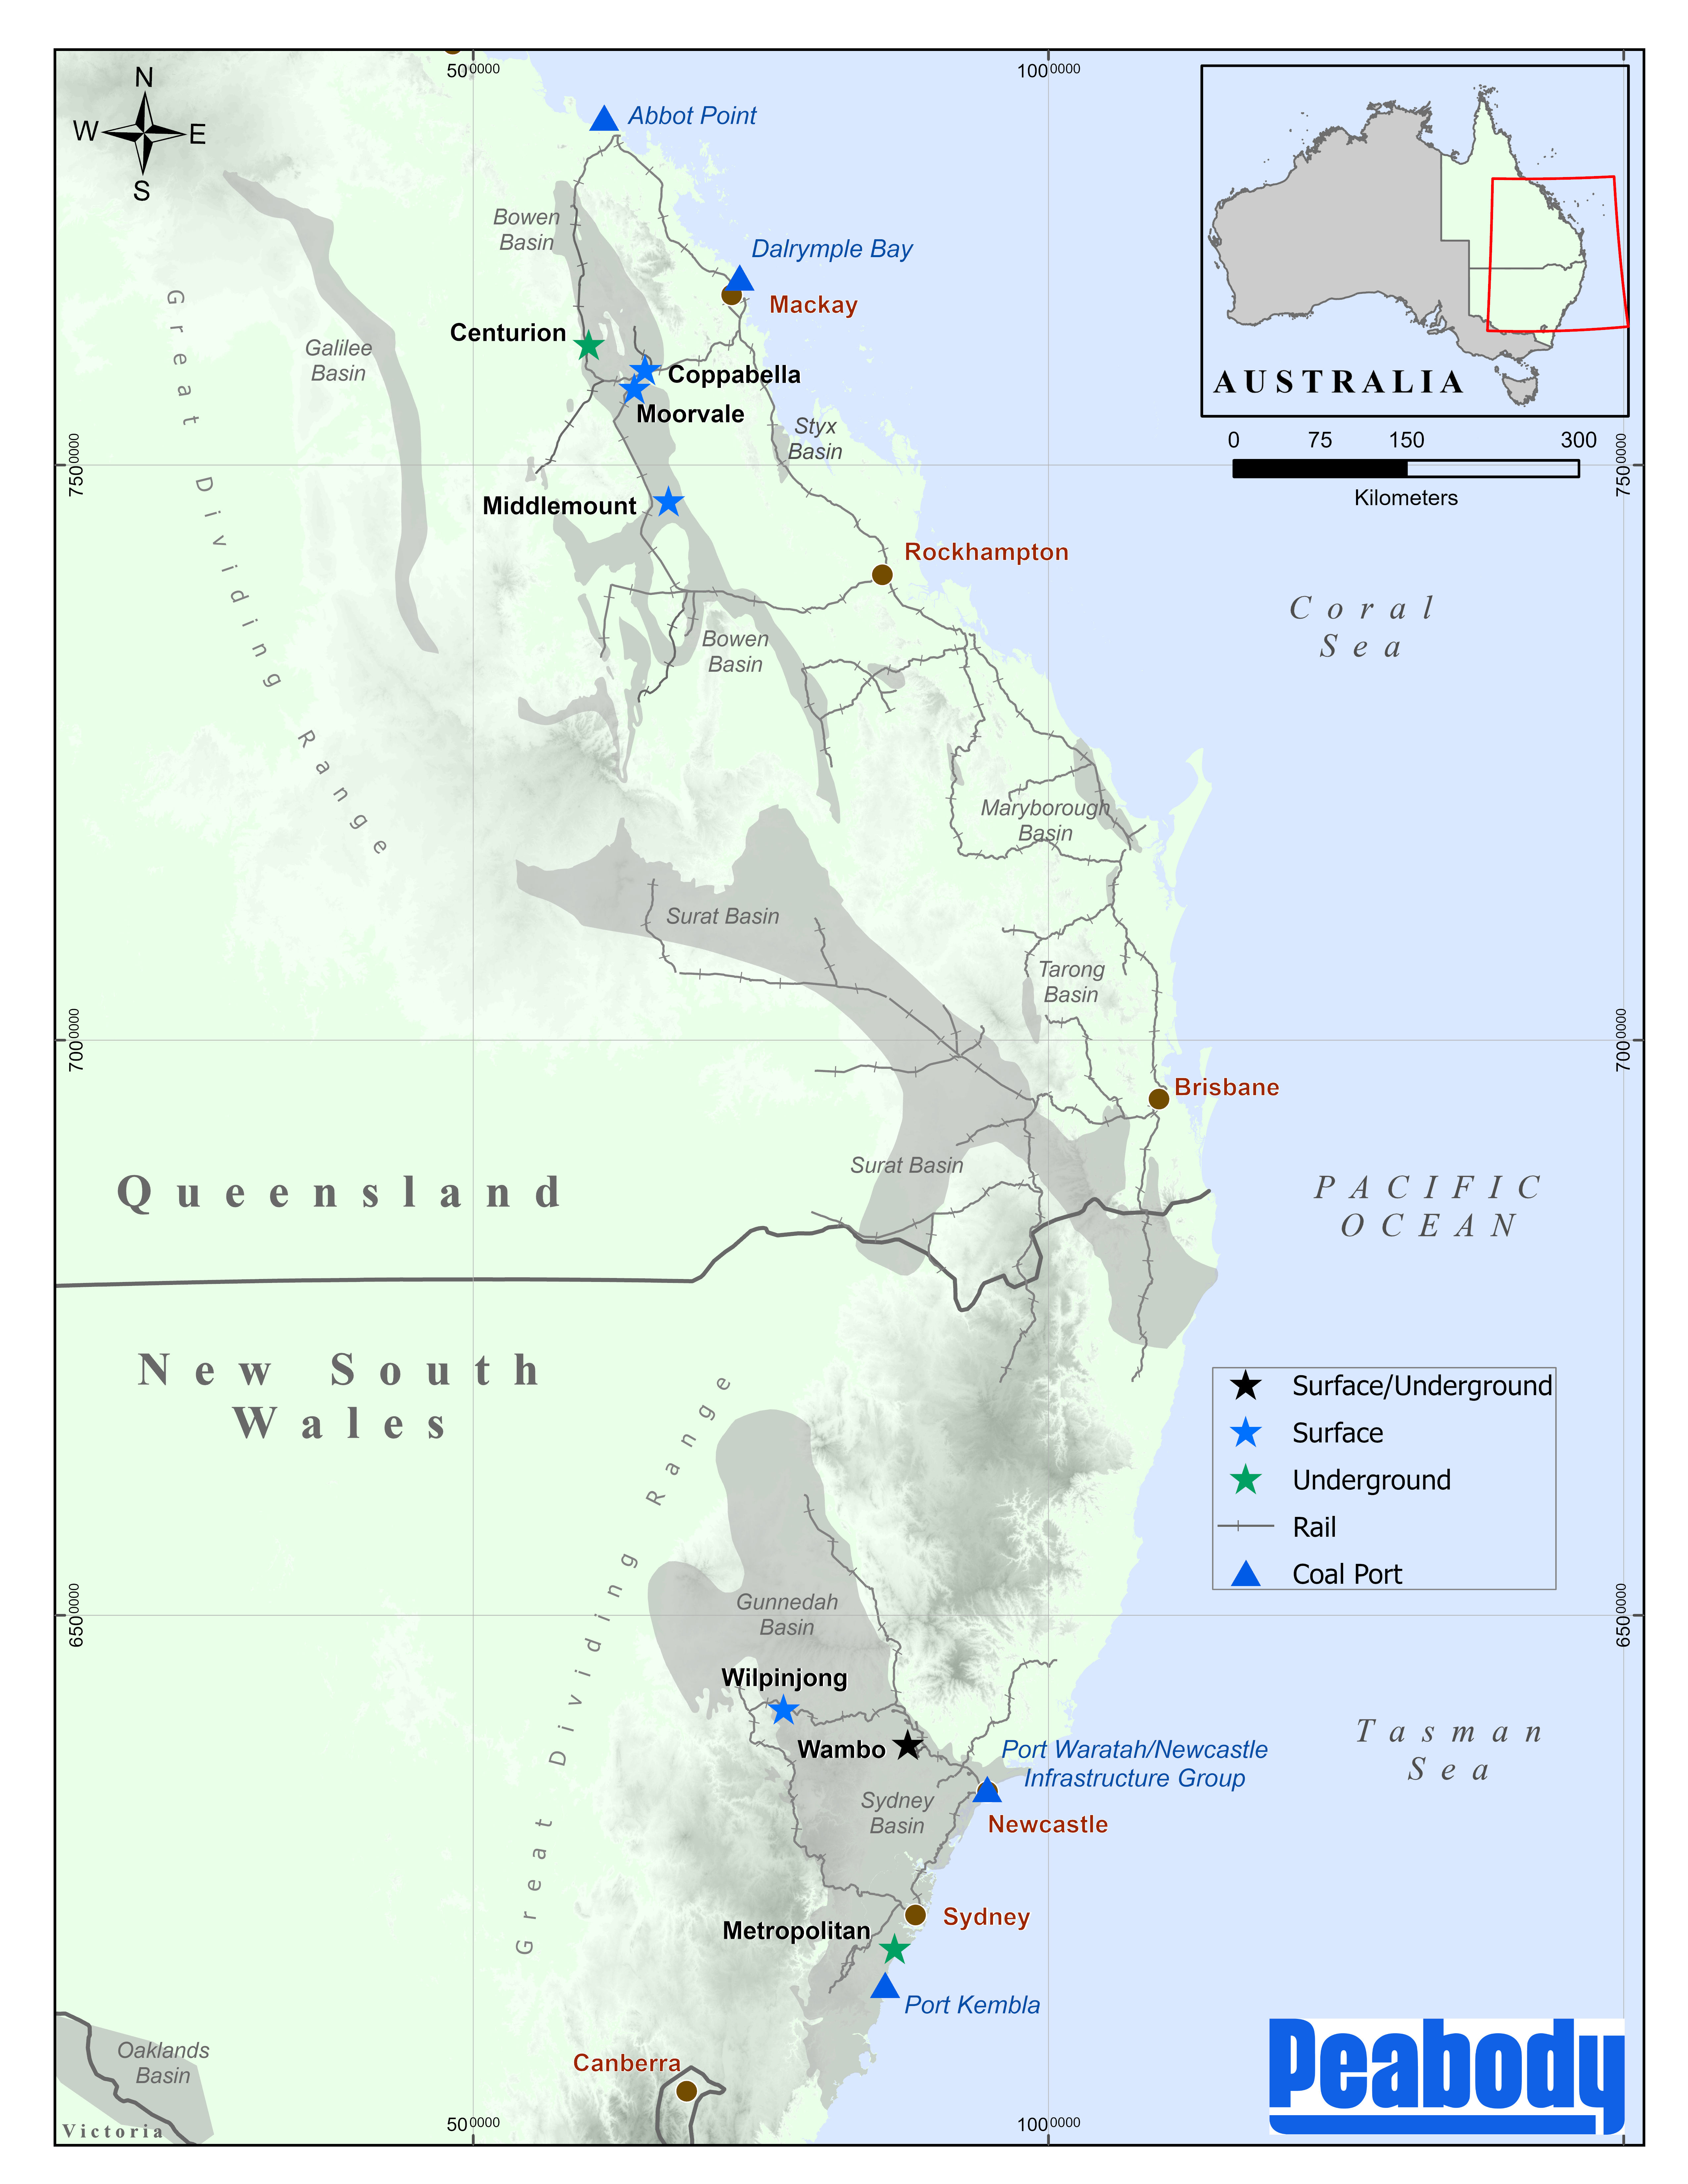
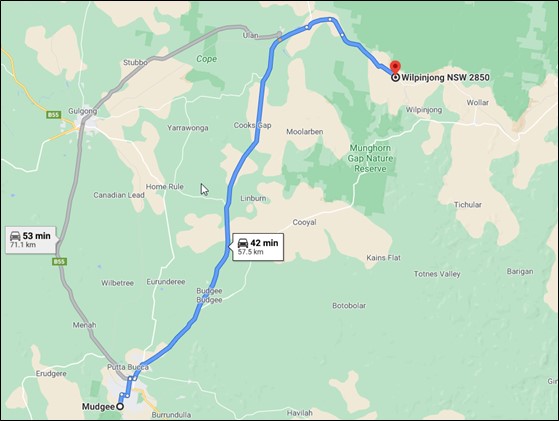
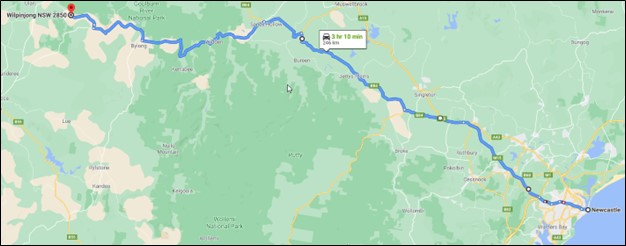
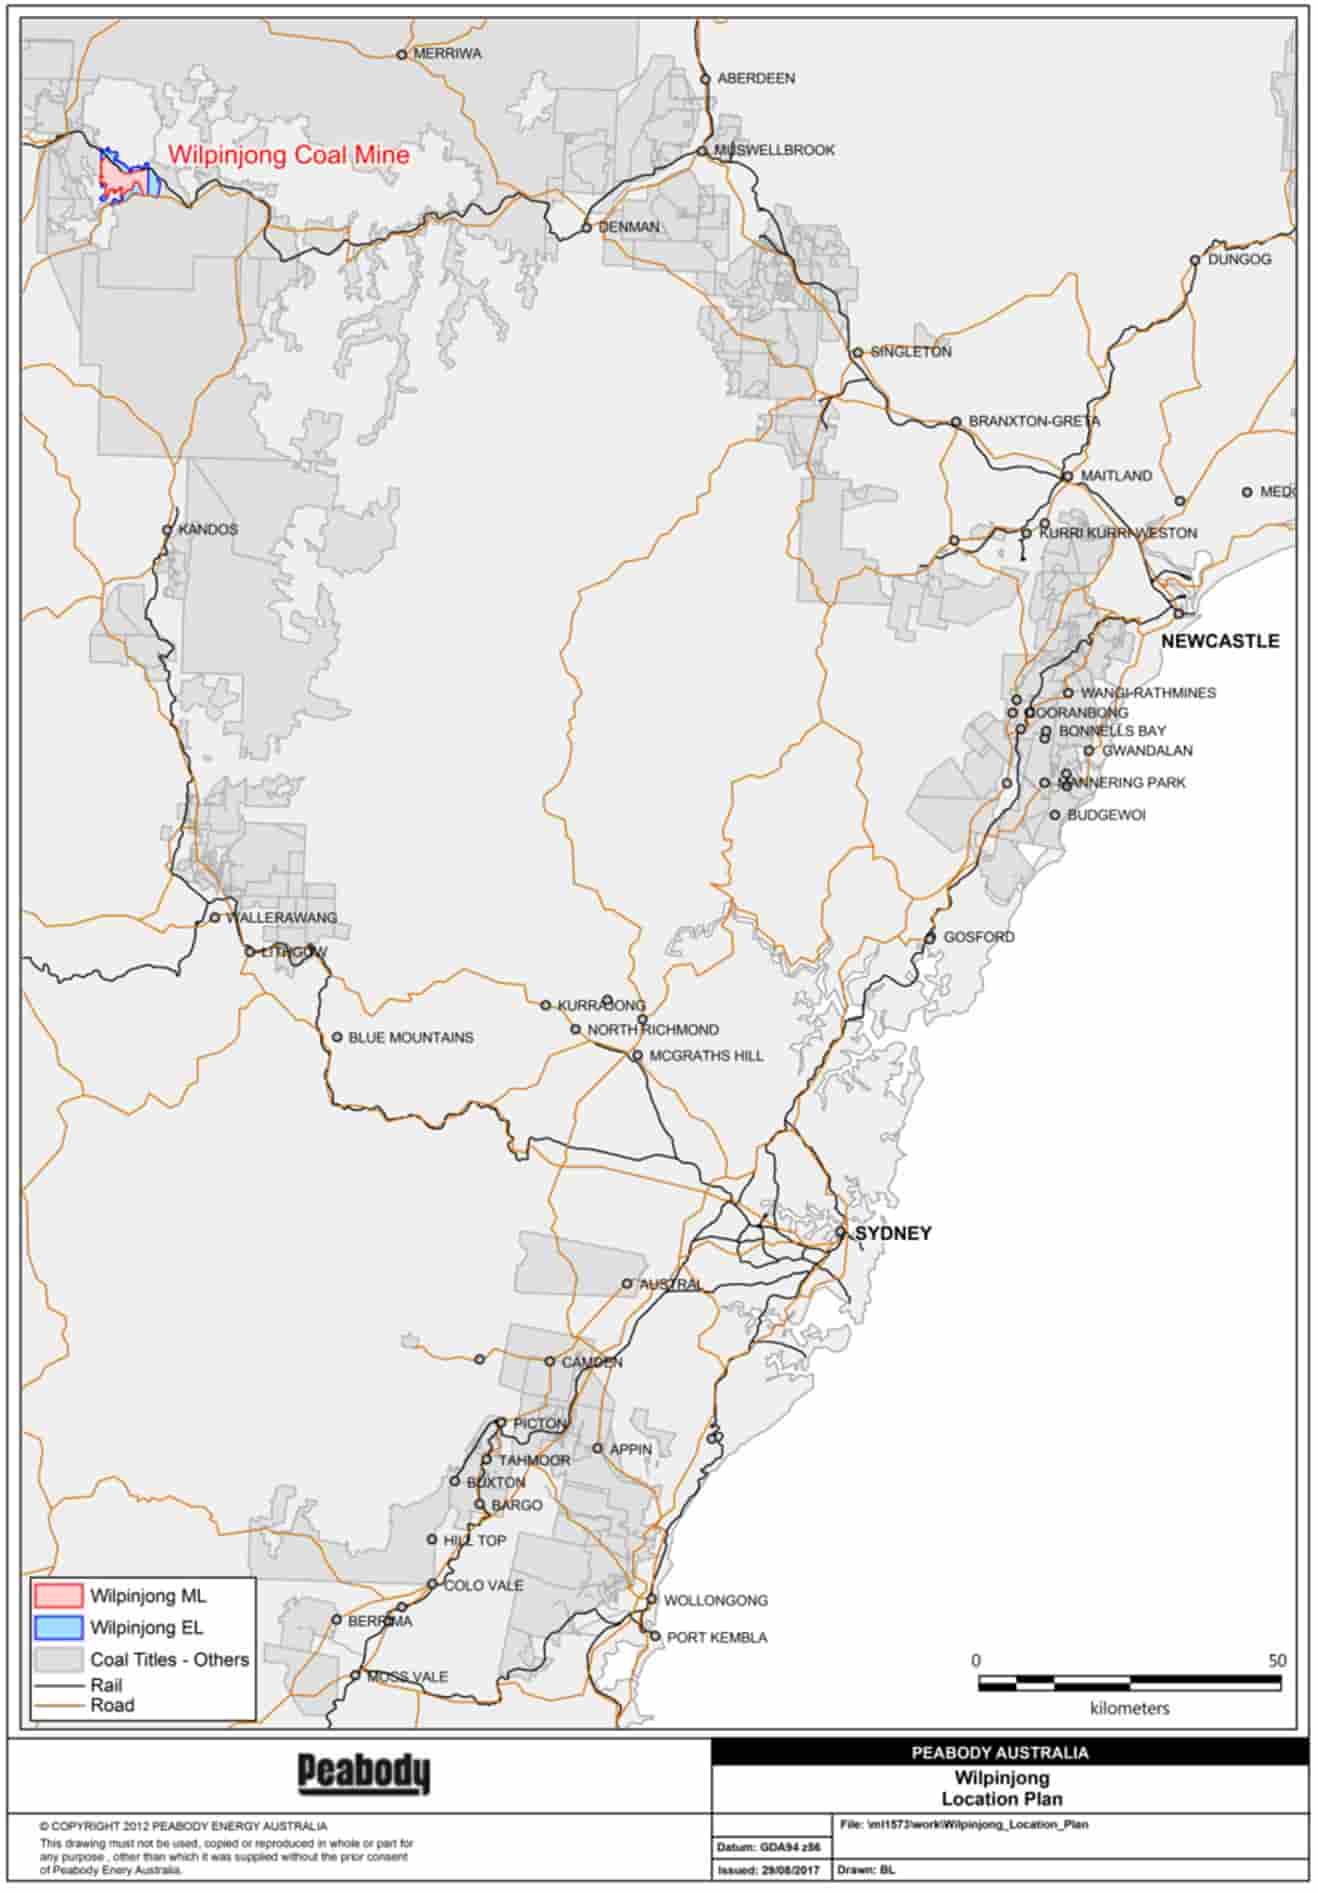
Mining Locations
The maps that follow display Peabody’s active and development mine locations as of December 31, 2023. Also shown are the primary ports that the Company uses for its coal exports and the Company’s corporate headquarters in St. Louis, Missouri.
|
|
|
|
|
|
|
|
|
| Peabody Energy Corporation |
2023 Form 10-K |
2 |
U.S. Locations
|
|
|
|
|
|
|
|
|
| Peabody Energy Corporation |
2023 Form 10-K |
3 |
Australian Locations
|
|
|
|
|
|
|
|
|
| Peabody Energy Corporation |
2023 Form 10-K |
4 |
The table below summarizes information regarding the operating characteristics of each of the Company’s mines in the U.S. and Australia. The mines are listed within their respective reporting segment in descending order, as determined by tons produced in 2023.
|
|
|
|
|
|
|
|
|
|
|
|
|
|
|
|
|
|
|
|
|
|
|
|
|
|
|
|
|
|
|
|
|
|
|
|
|
|
|
|
|
|
|
|
|
|
|
|
|
|
|
|
|
|
|
|
|
|
|
|
|
|
|
|
|
|
|
|
|
|
|
Production |
| Segment/Mining Complex |
|
Location |
|
Mine Type |
|
Mining Method |
|
Coal Type |
|
Primary Transport Method |
|
Processing
Plants |
|
Year Ended December 31, |
|
|
|
|
|
|
|
2023 |
|
2022 |
|
2021 |
| Seaborne Thermal |
|
|
|
|
|
|
|
|
|
|
|
(Tons in millions) |
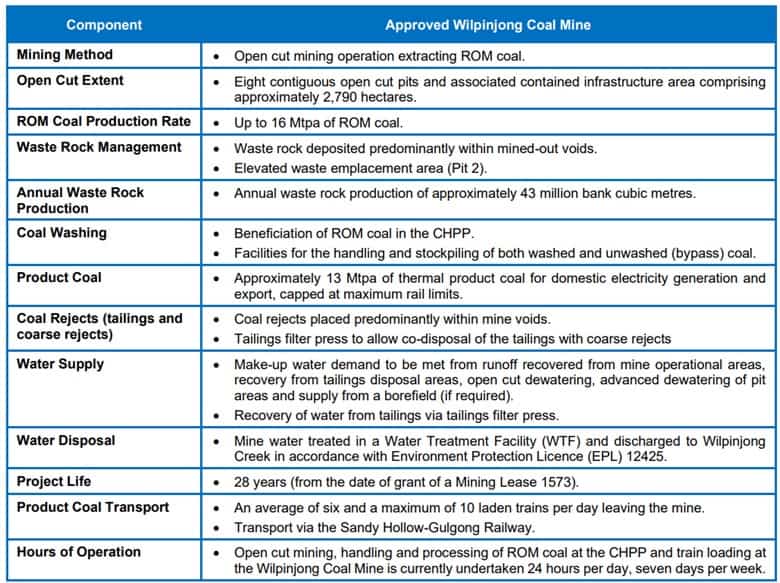
| Wilpinjong |
|
New South Wales |
|
S |
|
D, T/S |
|
T |
|
R, EV |
|
Yes |
|
12.0 |
|
|
12.1 |
|
|
13.2 |
|
Wambo Open-Cut (1) |
|
New South Wales |
|
S |
|
T/S |
|
T, C |
|
R, EV |
|
Yes |
|
2.6 |
|
|
2.0 |
|
|
2.4 |
|
Wambo Underground (2) |
|
New South Wales |
|
U |
|
LW |
|
T, C |
|
R, EV |
|
Yes |
|
1.2 |
|
|
1.1 |
|
|
1.4 |
|
| Seaborne Metallurgical |
|
|
|
|
|
|
|
|
|
|
|
|
|
|
|
|
Metropolitan (3) |
|
New South Wales |
|
U |
|
LW |
|
C, P, T |
|
R, EV |
|
Yes |
|
2.2 |
|
|
1.8 |
|
|
1.0 |
|
Coppabella (4) |
|
Queensland |
|
S |
|
DL, D, T/S |
|
P |
|
R, EV |
|
Yes |
|
2.2 |
|
|
2.4 |
|
|
2.1 |
|
Moorvale (4) |
|
Queensland |
|
S |
|
D, T/S |
|
C, P, T |
|
R, EV |
|
Yes |
|
2.2 |
|
|
1.5 |
|
|
1.3 |
|
Shoal Creek (5) |
|
Alabama |
|
U |
|
LW |
|
C |
|
B, EV |
|
Yes |
|
0.6 |
|
|
0.8 |
|
|
0.1 |
|
|
|
|
|
|
|
|
|
|
|
|
|
|
|
|
|
|
|
|
Middlemount (6) |
|
Queensland |
|
S |
|
D, T/S |
|
C, P |
|
R, EV |
|
Yes |
|
— |
|
|
— |
|
|
— |
|
| Powder River Basin |
|
|
|
|
|
|
|
|
|
|
|
|
|
|
|
|
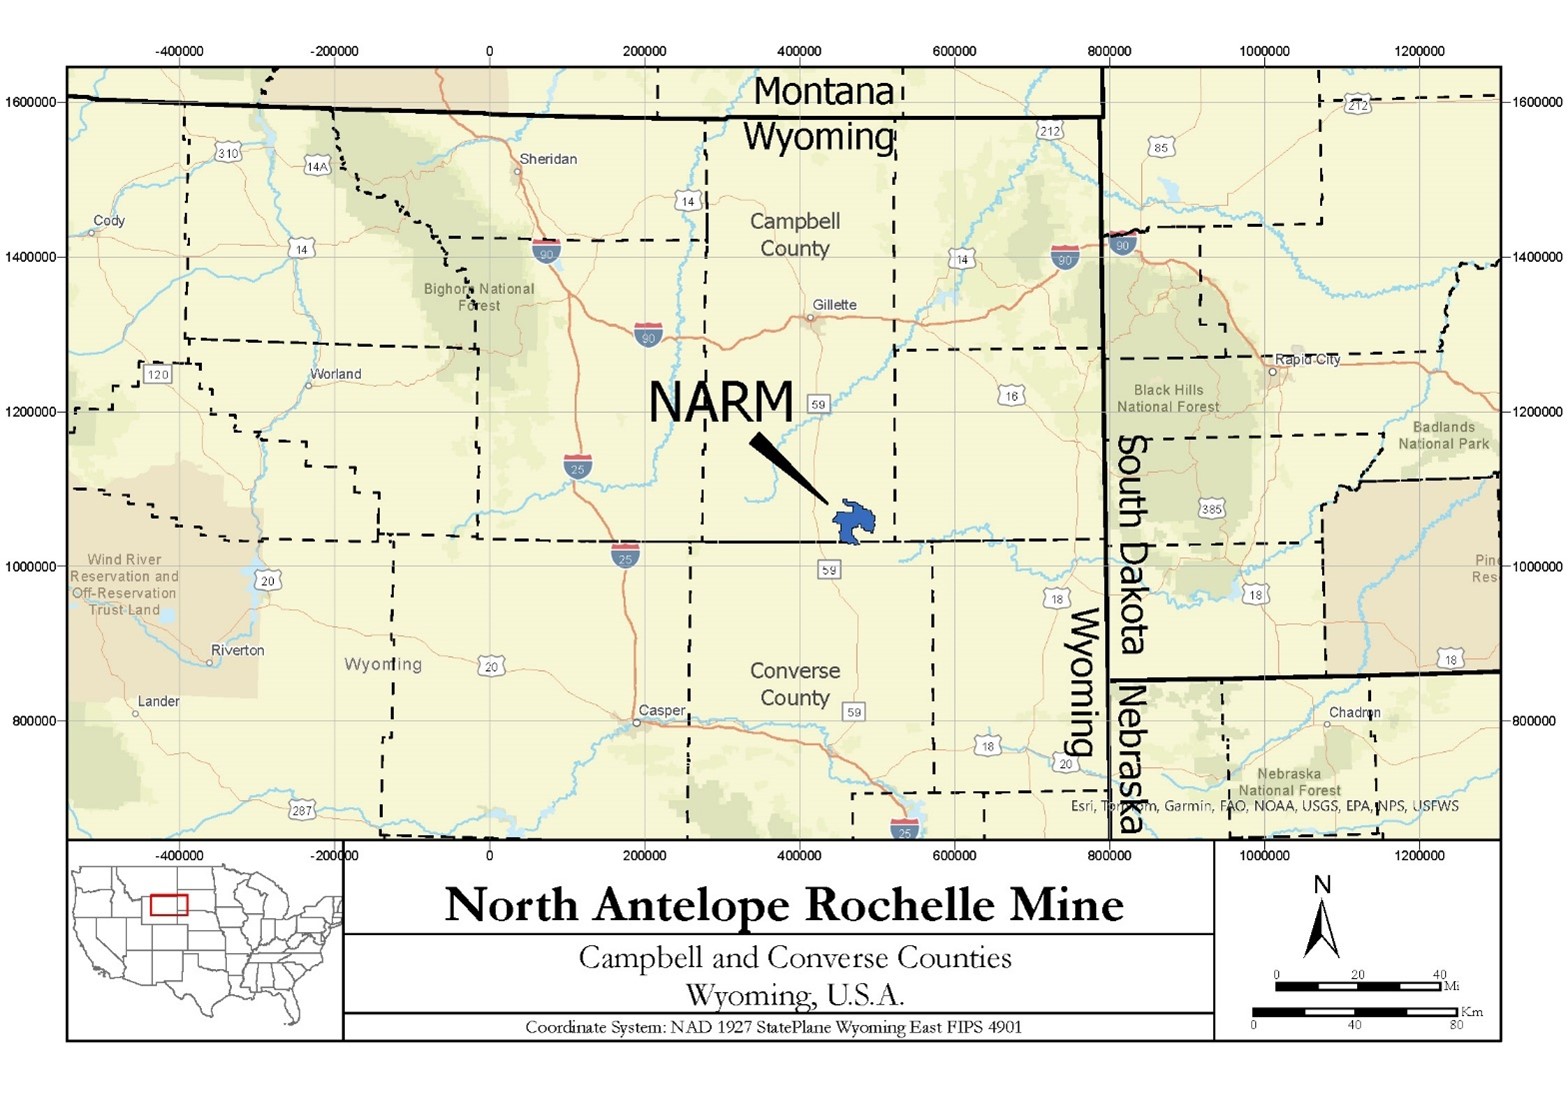
| North Antelope Rochelle |
|
Wyoming |
|
S |
|
DL, D, T/S |
|
T |
|
R |
|
No |
|
62.0 |
|
|
60.4 |
|
|
62.8 |
|
| Caballo |
|
Wyoming |
|
S |
|
D, T/S |
|
T |
|
R |
|
No |
|
15.3 |
|
|
12.1 |
|
|
13.9 |
|
| Rawhide |
|
Wyoming |
|
S |
|
D, T/S |
|
T |
|
R |
|
No |
|
9.8 |
|
|
10.3 |
|
|
11.6 |
|
| Other U.S. Thermal |
|
|
|
|
|
|
|
|
|
|
|
|
|
|
|
|
| Bear Run |
|
Indiana |
|
S |
|
DL, D, T/S |
|
T |
|
Tr, R, EV |
|
Yes |
|
5.5 |
|
|
6.7 |
|
|
6.0 |
|
| El Segundo/Lee Ranch |
|
New Mexico |
|
S |
|
DL, D, T/S |
|
T |
|
R |
|
No |
|
3.4 |
|
|
3.7 |
|
|
3.7 |
|
| Gateway North |
|
Illinois |
|
U |
|
CM |
|
T |
|
Tr, R, R/B, T/B, EV |
|
Yes |
|
2.5 |
|
|
2.4 |
|
|
1.8 |
|
| Francisco Underground |
|
Indiana |
|
U |
|
CM |
|
T |
|
R |
|
Yes |
|
2.0 |
|
|
1.8 |
|
|
1.5 |
|
| Wild Boar |
|
Indiana |
|
S |
|
HW, DL, D, T/S |
|
T |
|
Tr, R, R/B, T/B |
|
Yes |
|
1.9 |
|
|
2.3 |
|
|
2.4 |
|
| Twentymile |
|
Colorado |
|
U |
|
LW |
|
T |
|
R, Tr, EV |
|
Yes |
|
1.3 |
|
|
1.5 |
|
|
1.7 |
|
|
|
|
|
|
|
|
|
|
|
|
|
|
|
|
|
|
|
|
|
|
|
|
|
|
|
|
|
|
|
|
|
|
|
|
|
|
|
|
|
|
|
|
|
|
|
|
|
|
|
|
|
|
|
|
|
|
|
|
|
|
|
|
|
|
|
|
|
|
|
|
|
|
|
|
|
|
|
|
|
|
|
|
|
|
|
|
|
|
|
|
| Legend: |
|
|
|
| S |
Surface Mine |
|
B |
Barge |
| U |
Underground Mine |
|
Tr |
Truck |
| HW |
Highwall Miner |
|
R/B |
Rail to Barge |
| DL |
Dragline |
|
T/B |
Truck to Barge |
| D |
Dozer/Casting |
|
T/R |
Truck to Rail |
| T/S |
Truck and Shovel |
|
EV |
Export Vessel |
| LW |
Longwall |
|
T |
Thermal/Steam |
| CM |
Continuous Miner |
|
C |
Coking |
| R |
Rail |
|
P |
Pulverized Coal Injection |
(1)Peabody owns a 50% undivided interest in an unincorporated joint venture that owns the Wambo Open-Cut Mine. The tons shown reflect its share. The Company’s 50% joint venture interest is subject to an outside non-controlling ownership interest.
(2)Majority-owned mine in which there is an outside non-controlling ownership interest.
(3)The mine restarted production in the second quarter of 2021 after being idled in the fourth quarter of 2020.
(4)Peabody owns a 73.3% undivided interest in an unincorporated joint venture that owns the Coppabella and Moorvale mines. The tons shown reflect its share.
(5)The mine experienced a fire in March 2023 and restarted production in June 2023. In November 2021 the mine restarted production after being idled in the fourth quarter of 2020.
(6)Peabody owns a 50% equity interest in Middlemount, which owns the Middlemount Mine. Because Middlemount is accounted for as an unconsolidated equity affiliate, the table above excludes tons produced from that mine, which totaled 1.2 million, 1.4 million and 2.0 million tons, respectively (on a 50% basis).
Refer to the Reserves and Resources tables within Item 2. “Properties,” which is incorporated by reference herein, for additional information regarding coal reserves and resources, and product characteristics associated with each mine.
|
|
|
|
|
|
|
|
|
| Peabody Energy Corporation |
2023 Form 10-K |
5 |
Coal Supply Agreements
Customers. Peabody’s coal supply agreements are primarily with electricity generators, industrial facilities and steel manufacturers. Most of the Company’s sales from its mining operations are made under long-term coal supply agreements (those with initial terms of one year or longer and which often include price reopener and/or extension provisions). A smaller portion of the Company’s sales from its mining operations are made under contracts with terms of less than one year, including sales made on a spot basis. Sales under long-term coal supply agreements comprised approximately 92%, 85% and 84% of the Company’s worldwide sales from its mining operations (by volume) for the years ended December 31, 2023, 2022 and 2021, respectively.
For the year ended December 31, 2023, Peabody derived 25% of its revenue from coal supply agreements from its five largest customers. Those five customers were supplied primarily from 13 coal supply agreements (excluding trading and brokerage transactions) expiring at various times from 2024 to 2025. Peabody’s largest customer in 2023 contributed revenue of approximately $341 million, or approximately 7% of Peabody’s total revenue from coal supply agreements, and has contracts expiring in 2024.
Backlog. Peabody’s sales backlog, which includes coal supply agreements subject to price reopener and/or extension provisions, was approximately 221 million and 314 million tons of coal as of January 1, 2024 and 2023, respectively. Contracts in backlog have remaining terms ranging from one to eight years and represent approximately two years of production based on the Company’s 2023 production volume of 126.7 million tons. Approximately 51% of its backlog is expected to be filled beyond 2024.
Seaborne Operations. Revenue from Peabody’s Seaborne Thermal and Seaborne Metallurgical segments represented approximately 56%, 59% and 50% of the Company’s total revenue from coal supply agreements for the years ended December 31, 2023, 2022 and 2021, respectively, during which all three periods the coal mining activities of those segments contributed approximately 18% of the Company’s sales volumes from mining operations. Production from these segments is primarily sold into the seaborne thermal and metallurgical markets, with a majority of those sales executed through annual and multi-year international coal supply agreements that contain provisions requiring both parties to renegotiate pricing periodically, with spot, index and quarterly sales arrangements also utilized. Industry commercial practice, and Peabody’s typical practice, is to negotiate pricing for seaborne thermal coal contracts on an annual, spot or index basis and seaborne metallurgical coal contracts on a quarterly, spot or index basis. For its seaborne operations, the portion of sales volume under contracts with a duration of less than one year represented 30% in 2023.
U.S. Thermal Operations. Revenue from Peabody’s Powder River Basin and Other U.S. Thermal segments, in aggregate, represented approximately 44%, 41% and 50% of the Company’s revenue from coal supply agreements for the years ended December 31, 2023, 2022 and 2021, respectively, during which all three periods the coal mining activities of those segments contributed approximately 82% of the Company’s sales volumes from mining operations. The Company expects to continue selling a significant portion of coal production from its U.S. thermal operating segments under existing long-term supply agreements. Certain customers utilize long-term sales agreements in recognition of the importance of reliability, service and predictable coal prices to their operations. The terms of coal supply agreements result from competitive bidding and extensive negotiations with customers. Consequently, the terms of those agreements may vary significantly in many respects, including price adjustment features, price reopener terms, coal quality requirements, quantity parameters, permitted sources of supply, treatment of environmental constraints, extension options, force majeure and termination and assignment provisions. Peabody’s approach is to selectively renew, or enter into new, long-term supply agreements when it can do so at prices and terms and conditions it believes are favorable. Over the last few years, Peabody’s customers have shifted to long-term supply agreements with shorter durations, driven by the reduced utilization of plants and plant retirements, fluidity of natural gas pricing and the increased use of renewable energy sources.
Transportation
Methods of Distribution. Coal consumed in the U.S. is usually sold at the mine with transportation costs borne by the purchaser. Peabody’s U.S. mine sites are typically adjacent to a rail loop; however, in limited circumstances coal may be trucked to a barge site or directly to customers. Title predominately passes to the purchaser at the rail or barge, as applicable. Peabody’s U.S. and Australian export coal is usually sold at the loading port, with purchasers paying ocean freight. In each case, the Company usually pays transportation costs from the mine to the port, including any demurrage costs (fees paid to third-party shipping companies for loading time that exceeded the stipulated time).
|
|
|
|
|
|
|
|
|
| Peabody Energy Corporation |
2023 Form 10-K |
6 |
The Company believes it has good relationships with U.S. and Australian rail carriers and port and barge companies due, in part, to its modern coal-loading facilities and the experience of its transportation coordinators. Beginning in 2022, rail service constraints due, in part, to labor shortages and weather conditions experienced by Peabody’s rail service providers, negatively impacted U.S. thermal shipment volumes. The constraints began to lessen in 2023, resulting in improved rail performance compared to the prior year. Refer to the table in the foregoing “Mining Locations” section for a summary of transportation methods by mine.
Export Facilities. Peabody has generally secured its ability to transport coal in Australia through rail and port contracts and access to five east coast coal export terminals that are primarily funded through take-or-pay arrangements (refer to the “Liquidity and Capital Resources” section in Part II, Item 7. “Management’s Discussion and Analysis of Financial Condition and Results of Operations” for additional information on its take-or-pay obligations). In Queensland, seaborne thermal and metallurgical coal from the Company’s mines is exported through the Dalrymple Bay Coal Terminal, in addition to the Abbot Point Coal Terminal used by its joint venture Middlemount Mine. In New South Wales, the Company’s primary ports for exporting thermal and metallurgical coal are at Port Kembla and Newcastle, which includes both the Port Waratah Coal Services terminal and the terminal operated by Newcastle Coal Infrastructure Group. Peabody has secured its ability to transport coal from its Shoal Creek Mine under barge and port contracts; the primary port is the McDuffie Terminal in Mobile, Alabama, which the Company utilizes without a take-or-pay arrangement.
Peabody’s U.S. thermal operations exported less than 1% of their annual tons sold during the years ended December 31, 2022 and 2021. No tons were exported during the year ended December 31, 2023. The primary port used for U.S. thermal exports is the Kinder Morgan Terminal near Houston, Texas.
Suppliers
Mining Supplies and Equipment. The principal goods Peabody purchases in support of its mining activities are mining equipment and replacement parts, diesel fuel, ammonium-nitrate and emulsion-based explosives, off-the-road tires, steel-related products (including roof control materials), lubricants and electricity. Peabody has many well-established, strategic relationships with its key suppliers of goods and does not believe that it is overly dependent on any of its individual suppliers.
In situations where Peabody has elected to concentrate a large portion of its purchases with one supplier, it has been to take advantage of cost savings from larger volumes of purchases, benefit from long-term pricing for parts and ensure security of supply. Supplier concentration related to the Company’s mining equipment also allows it to benefit from fleet standardization, which in turn improves asset utilization by facilitating the development of common maintenance practices across its global platform, enhancing its flexibility to move equipment between mines and reduce working capital through inventory optimization.
Surface and underground mining equipment demand and lead times for parts and components stabilized throughout 2023. Peabody consistently uses its global leverage with major suppliers and comprehensive planning processes to ensure security of supply to meet the requirements of its active mines.
Services. Peabody also purchases services at its mine sites, including services related to maintenance for mining equipment, construction, temporary labor, use of explosives and various other requirements. Peabody does not believe that it has undue operational or financial risk associated with its dependence on any individual service providers.
Throughout 2022 and 2023, inflationary pressures and supply chain constraints contributed to rising costs for mining equipment, supplies and services. While supply chain constraints eased and inflation somewhat moderated in 2023, future periods could continue to be impacted.
Competition
Demand for coal and the prices that the Company will be able to obtain for its coal are highly competitive and influenced by factors beyond the Company’s control, including but not limited to global economic conditions; the demand for electricity and steel; the cost of alternative sources; the impact of weather on heating and cooling demand; the capacity and cost of transportation; geopolitical risks; and taxes and environmental regulations imposed by the U.S. and foreign governments.
|
|
|
|
|
|
|
|
|
| Peabody Energy Corporation |
2023 Form 10-K |
7 |
Thermal Coal. Demand for Peabody’s thermal coal products is impacted by economic conditions; demand for electricity, which is impacted by energy efficient products; and the cost of electricity generation from coal and alternative forms of generation. Regulatory policies and environmental, social and governance considerations can also have an impact on generation choices and coal consumption. The Company’s products compete with producers of other forms of electricity generation, including natural gas, oil, nuclear, hydro, wind, solar and biomass, that provide an alternative to coal use. The use and price of thermal coal is heavily influenced by the availability and relative cost of alternative fuel sources and the generation of electricity utilizing alternative fuels, with customers focused on securing the lowest cost fuel supply in order to coordinate the most efficient utilization of generating resources in the economic dispatch of the power grid at the most competitive price.
In the U.S., natural gas is highly competitive (along with other alternative fuel sources) with thermal coal for electricity generation. The competitiveness of natural gas has been strengthened by continued growth in domestic natural gas production and new natural gas combined cycle generation capacity. The Henry Hub Natural Gas Prompt Price averaged $2.66 per mmBtu in 2023, versus $6.54 and $3.72 per mmBtu in 2022 and 2021, respectively. In addition, the competitiveness of other alternative fuel sources for electricity generation has been strengthened by the growth of renewable energy generation. These pressures, coupled with increasing regulatory burdens, have contributed to a significant number of coal plant retirements. During 2023, approximately 14 gigawatts of U.S. coal power capacity was retired, and since 2010, U.S. coal power capacity has fallen by approximately forty-one percent.
Internationally, thermal coal also competes with alternative forms of electricity generation. The competitiveness and availability of natural gas, liquefied natural gas, oil, nuclear, hydro, wind, solar and biomass varies by country and region. Seaborne thermal coal consumption is also impacted by the competitiveness of delivered seaborne thermal coal supply from key exporting countries such as Indonesia, Australia, Colombia, the U.S., Russia and South Africa, among others. In addition, seaborne thermal coal import demand can be significantly impacted by the availability of domestic coal production, particularly in the two leading coal import countries, China and India, among others. China’s unofficial ban on Australian coal concluded in January 2023, enabling the reestablishment of some traditional trade flows. Global thermal coal markets were turbulent during 2022 and 2023, due in part to the Russian-Ukrainian conflict and the subsequent ban of Russian coal by European countries.
In addition to its alternative fuel source competitors, Peabody’s principal U.S. direct coal supply competitors (listed alphabetically) are other large coal producers, including Alliance Resource Partners; American Consolidated Natural Resources, Inc.; Arch Resources, Inc.; CONSOL Energy; Eagle Specialty Materials LLC; Foresight Energy; Hallador Energy; Kiewit; and Navajo Transitional Energy Company LLC, among others. Major international direct coal supply competitors (listed alphabetically) include Adaro Energy; BHP; Bumi Resources; China Shenhua Energy; Coal India Limited; Drummond Company; Glencore; SUEK; Whitehaven Coal Limited; and Yancoal Australia Ltd, among others.
Metallurgical Coal. Demand for Peabody’s metallurgical coal products is impacted by economic conditions; government policies; demand for steel; and competing technologies used to make steel, some of which do not use coal as a manufacturing input, such as electric arc furnaces. The Company competes on the basis of coal quality and characteristics, delivered energy cost (including transportation costs), customer service and support and reliability of supply.
Seaborne metallurgical coal import demand can be significantly impacted by the availability of domestic coal production, particularly in leading metallurgical coal import countries such as China, among others, and the competitiveness of seaborne metallurgical coal supply from leading metallurgical coal exporting countries of Australia, the U.S., Russia, Canada, Mongolia and Mozambique, among others. Trade flow disruptions occurred during 2022 and 2023 related to China’s unofficial ban on Australian coal and sanctions imposed on Russian coal imports.
Major international direct competitors (listed alphabetically) include Anglo American; Arch Resources, Inc.; BHP; Foxleigh; Glencore; Jellinbah; KRU; Stanmore; Teck Resources; Warrior Met Coal; Whitehaven Coal Limited; and Yancoal Australia Ltd, among others.
Human Capital
Peabody had approximately 5,400 employees as of December 31, 2023, including approximately 4,200 hourly employees. Additional information on its employees and related labor relations matters is contained in Note 19. “Management — Labor Relations” to the accompanying consolidated financial statements, which information is incorporated herein by reference. Peabody endeavors to engage with its organized workforce and foster strong relationships with those organizations built on trust and communication.
As of December 31, 2023, approximately 3,500 of Peabody’s employees are located in the U.S., with the remainder primarily located in Australia. About 94% of its team members work for mine operations in the U.S. and Australia, while the remaining are based out of its global headquarters in St. Louis or its business offices in Brisbane and Beijing.
|
|
|
|
|
|
|
|
|
| Peabody Energy Corporation |
2023 Form 10-K |
8 |
Peabody strives to create a strong, united workforce with a commitment to safety as a way of life. In 2023, the Company achieved a global safety incidence rate of 1.18 incidents per 200,000 hours worked, which was 57% better than the 2023 U.S. industry average incidence rate of 2.72 incidents per 200,000 hours worked per the Mine Safety and Health Administration (MSHA).
Peabody strives to offer an inclusive work environment and engages, recognizes and develops employees. Peabody seeks a workforce that is comprised of diverse backgrounds, thoughts and experiences as a means to drive innovation and excellence within its business, and has formalized inclusion programs and training in policy and practice. Such diversity may also serve to mitigate risks to the business in the current tight labor market. The Company strives to attract and retain the best people, develop their potential and align their skills to important initiatives and activities. Peabody believes in fostering an inclusive work environment built on mutual trust, respect and engagement. Peabody invests in its employees through health and wellness programs, competitive total rewards and development opportunities. Peabody actively seeks employees' feedback, including through surveys and focus groups on its employee value proposition.
The typical Peabody employee has approximately seven years of experience with the company, and approximately 47% of all Peabody employees remain employed with the company for more than five years. The Company offers a variety of learning events, including mentoring and development programs to aid its employees in their career growth. During the past five years, approximately 25% of open positions and 60% of director and above positions have been filled by internal candidates through promotions or lateral career development opportunities.
Information About Our Executive Officers
Set forth below are the names, ages and positions of Peabody’s executive officers. Executive officers are appointed by, and hold office at the discretion of, Peabody’s Board of Directors (the Board), subject to the terms of any employment agreements.
|
|
|
|
|
|
|
|
|
|
|
|
|
|
|
| Name |
|
Age (1) |
|
Position (1) |
| James C. Grech |
|
62 |
|
President and Chief Executive Officer |
| Mark A. Spurbeck |
|
50 |
|
Executive Vice President and Chief Financial Officer |
| Darren R. Yeates |
|
63 |
|
Executive Vice President and Chief Operating Officer |
| Scott T. Jarboe |
|
50 |
|
Chief Administrative Officer and Corporate Secretary |
| Marc E. Hathhorn |
|
53 |
|
President - U.S. Operations |
| Jamie Frankcombe |
|
63 |
|
President - Australian Operations |
| Patrick J. Forkin III |
|
65 |
|
Chief Development Officer |
| Malcolm Roberts |
|
50 |
|
Chief Marketing Officer |
(1) As of February 16, 2024.
James C. Grech was named Peabody’s President and Chief Executive Officer in June 2021. He has over 30 years of experience in the natural resources industry. Mr. Grech served as Chief Executive Officer and a member of the Board of Directors of Wolverine Fuels, LLC, a thermal coal producer and marketer based in Sandy, Utah, from July 2018 until May 2021. Prior to joining Wolverine Fuels, LLC, Mr. Grech served as President of Nexus Gas Transmission from October 2016 to July 2018, and previously held the position of Chief Commercial Officer and Executive Vice President of Consol Energy. Mr. Grech brings a strong operational, commercial and financial background in both mining and other energy business operations and has extensive utilities and capital markets experience. He serves as a director of Blue Danube. Mr. Grech holds a Bachelor of Science in Electrical Engineering from Lawrence Technological University and an MBA from the University of Michigan.
Mark A. Spurbeck was named Peabody’s Executive Vice President and Chief Financial Officer in June 2020, after serving in an interim capacity from January 2020 through June 2020. He oversees finance, treasury, tax, internal audit, financial reporting, financial planning, risk and mine finance, corporate accounting functions, investor relations and corporate communications, information technology and shared services. Mr. Spurbeck has more than 25 years of accounting and financial experience, most recently serving as the Company’s Senior Vice President and Chief Accounting Officer from early 2018 to January 2020. Prior to joining Peabody, Mr. Spurbeck served as Vice President of Finance and Chief Accounting Officer at Coeur Mining, Inc., a diversified precious metals producer, from March 2013 to January 2018. He also previously held multiple financial positions at Newmont Mining Corporation, a leading gold and copper producer, First Data Corporation, a financial services company, and Deloitte LLP, an international accounting, tax and advisory firm. Mr. Spurbeck is a Certified Public Accountant (inactive) and holds a Bachelor’s Degree in Accounting from Hillsdale College.
|
|
|
|
|
|
|
|
|
| Peabody Energy Corporation |
2023 Form 10-K |
9 |
Darren R. Yeates was named Peabody’s Executive Vice President and Chief Operating Officer in October 2020. He has executive responsibility for global operations including health, safety and environment, mine operations, technical, procurement, and sales and marketing. Mr. Yeates has over 40 years of mining industry experience. From May 2018 to December 2019, Mr. Yeates served as Chief Operating Officer of MACH Energy Australia, a developer and supplier of thermal coal to both the Australian domestic and Asian export markets. From January 2014 until June 2016, Mr. Yeates served as the Chief Executive Officer of GVK Hancock Coal, a joint venture developing the vast potential of the Galilee Basin in Central Queensland. Prior to that, he spent over 22 years with Rio Tinto, a global mining group, including as Acting Managing Director and Chief Operating Officer for Coal Australia, General Manager Ports and Infrastructure for Pilbara Iron and General Manager Tarong Coal. Prior to joining Rio Tinto, Mr. Yeates worked for six years for BHP, a mining, metals and petroleum company, in coal operations and metalliferous exploration. Mr. Yeates holds a Bachelor of Engineering (Mining) from the University of Queensland, a Graduate Diploma in Management from the University of Central Queensland and a Graduate Diploma of Applied Finance and Investment from the Securities Institute of Australia. He holds an Executive MBA from the Monash Mt Eliza Business School and is a Fellow of the Australian Institute of Company Directors.
Scott T. Jarboe was named Peabody’s Chief Administrative Officer and Corporate Secretary in November 2021 after serving as Chief Legal Officer and Corporate Secretary since March 2020. He leads the Company’s global human resources, legal, government affairs, and ethics and compliance functions. Mr. Jarboe joined Peabody in 2010 and has served in a variety of legal roles. Previously, Mr. Jarboe practiced law with Husch Blackwell LLP and Bryan Cave LLP. Mr. Jarboe holds a Bachelor of Arts Degree from the University of Kansas, a Master’s Degree from the University of Missouri – Kansas City and a Juris Doctor degree from Washington University School of Law.
Marc E. Hathhorn was named Peabody’s President - U.S. Operations in November 2021. He has executive responsibility for the Company’s U.S. operating platform, which includes leadership of health, safety and environment, people, operational performance and product delivery. Mr. Hathhorn has more than 30 years of experience in mining engineering and operations in North and South America and in Australia. Mr. Hathhorn joined Peabody in 2011 as Senior Vice President - Midwest Operations, and subsequently served as Group Executive - Americas Operations Support from 2013 to 2016, Group Executive - Americas Operations from 2016 to 2019 and President - Australian Operations until assuming his current role. Previously, Mr. Hathhorn held various leadership positions with Drummond LTD in South America, including Mine Operations Superintendent, Port Manager, and Vice President - Mining Operations. Prior to joining Drummond LTD, Mr. Hathhorn held various engineering and supervisory positions with Newmont Mining Corporation. Mr. Hathhorn holds a Bachelor of Science Degree in Mining Engineering from the University of Idaho, College of Mines.
Jamie Frankcombe was named Peabody’s President - Australian Operations in November 2021. He has executive responsibility for the Company’s Australian operating platform, which includes leadership of health, safety and environment, people, operational performance and product delivery. He is a senior mining executive with 30 years of experience in developing and managing large-scale open cut and underground coal, iron ore, copper and gold mines in Australia, Indonesia, Asia and the Americas. Prior to joining Peabody, Mr. Frankcombe served as Deputy Managing Director for Phu Bia Mining in Laos managing the Phu Kham (copper & gold) and Ban Houayxai (gold & silver) operating assets from June 2021 to November 2021. Prior to that, Mr. Frankcombe served as Integration Team Lead with Aurelia Metals Ltd from November 2020 to April 2021 with the responsibility of integrating the Dargues Gold Mine project and operations into the Aurelia Metals Ltd portfolio. Prior to that, he spent seven years as Chief Operating Officer for Whitehaven Coal Mining Ltd., overseeing operational and safety leadership of four open cut coal mines and one underground mine. In addition, he served as a director of Coal Services Pty Ltd. from September 2017 to July 2021. Mr. Frankcombe holds a Bachelor of Engineering (Mining) from University of Wollongong and a Master of Business Administration (Technology) from Deakin University.
Patrick J. Forkin III was named Chief Development Officer in July 2022 after serving as Senior Vice President - Corporate Development and Strategy since November 2017. He leads global strategy, mergers and acquisitions, portfolio management and renewable energy development. Mr. Forkin joined Peabody in 2010 and has served in a variety of roles. He has an extensive background in corporate finance, the energy industry, mergers and acquisitions and equity market research. Prior to joining Peabody, Mr. Forkin was in senior leadership roles at a U.S. solar development company and investment banking firms specializing in renewable and conventional energy. He spent the first nine years of his career at Deloitte LLP. Mr. Forkin holds a Bachelor of Science degree in Accountancy from the University of Illinois at Urbana-Champaign and is a Certified Public Accountant (inactive).
|
|
|
|
|
|
|
|
|
| Peabody Energy Corporation |
2023 Form 10-K |
10 |
Malcolm Roberts was named Chief Marketing Officer in May 2023. He has responsibility for all Peabody sales, marketing and logistics. Mr. Roberts joined Peabody in 2021 as Executive General Manager - Sales & Marketing. He has more than 25 years of experience in the resources and commodities industry, focused on the energy and steel sector, with roles encompassing key aspects of the value chain including finance, commercial, trading and sales and marketing. During the period of October 2018 to June 2020, Mr. Roberts was a senior trading lead within the trading division of Heidelberg Cement, a company with global operations in the cement and concrete industry. His responsibilities included leading a team of traders focused on the trading of solid fuel and other cementitious products. Prior to that, Mr. Roberts spent thirteen years in sales and marketing roles with Rio Tinto primarily within their Energy Product Group, including eleven years in leadership roles covering Rio Tinto’s global coal sales, marketing, trading, logistics and analytics functions, encompassing both metallurgical and thermal coal. Prior to this, Mr. Roberts worked within sales and marketing and finance roles in both mining and manufacturing industries. Mr. Roberts holds an undergraduate degree in Commerce and Management from Lincoln University in New Zealand and is a CA member of Chartered Accountants Australia and New Zealand.
Regulatory Matters — U.S.
Federal, state and local authorities regulate the U.S. coal mining industry with respect to matters such as employee health and safety, permitting and licensing requirements, air quality standards, water pollution, plant and wildlife protection, the reclamation and restoration of mining properties after mining has been completed, the discharge of materials into the environment, surface subsidence from underground mining and the effects of mining on groundwater quality and availability. In addition, the industry is affected by significant requirements mandating certain benefits for current and retired coal miners. Numerous federal, state and local governmental permits and approvals are required for mining operations. Peabody believes that it has obtained all permits currently required to conduct its present mining operations.
The Company endeavors to conduct its mining operations in compliance with all applicable federal, state and local laws and regulations. However, because of extensive and comprehensive regulatory requirements, violations during mining operations occur from time to time in the industry.
Mine Safety and Health
Peabody is subject to health and safety standards both at the federal and state level. The regulations are comprehensive and affect numerous aspects of mining operations, including training of mine personnel, mining procedures, blasting, the equipment used in mining operations and other matters.
MSHA is the entity responsible for monitoring compliance with the federal mine health and safety standards. MSHA employs various enforcement measures for noncompliance, including the issuance of monetary penalties and orders of withdrawal from a mine or part of a mine.
In Part I, Item 4. “Mine Safety Disclosures” and in Exhibit 95 to this Annual Report on Form 10-K, the Company provides additional details on MSHA compliance.
Black Lung (Coal Workers’ Pneumoconiosis)
Black Lung Benefits. Under the U.S. Black Lung Benefits Revenue Act of 1977 and the Black Lung Benefits Reform Act of 1977, as amended in 1981, each U.S. coal mine operator who was the last to employ a claimant for a cumulative year of employment, with the last day worked for the operator after July 1, 1973, must pay federal black lung benefits and medical expenses to claimants whose claims for benefits are allowed. Coal mine operators must also make payments to a trust fund for the payment of benefits and medical expenses to claimants who last worked in the coal industry prior to July 1, 1973. The federal black lung program also includes automatic survivor benefits paid upon the death of a miner with an awarded black lung claim and a rebuttable presumption with regard to pneumoconiosis among miners with 15 or more years of coal mine employment that are totally disabled by a respiratory condition.
The trust fund has been funded by an excise tax on U.S. production. As a result of legislation enacted in December 2020, the excise tax rates were set at 4.4% of the gross sales price not to exceed $1.10 per ton of underground coal and $0.55 per ton of surface coal for the year ending December 31, 2021. This enacted legislation expired on December 31, 2021 and the excise tax rates reverted back to 2% of the gross sales price not to exceed $0.50 per ton of underground coal and $0.25 per ton of surface coal. Effective October 1, 2022, the excise tax rates reverted back to 4.4% of the gross sales price not to exceed $1.10 per ton of underground coal and $0.55 per ton of surface coal due to the enactment of the Inflation Reduction Act of 2022.
Peabody recognized expense related to the tax of $57.4 million, $32.4 million and $51.5 million for the years ended December 31, 2023, 2022 and 2021, respectively.
|
|
|
|
|
|
|
|
|
| Peabody Energy Corporation |
2023 Form 10-K |
11 |
Black Lung Benefits Act Self-Insurance Requirements. The Black Lung Benefits Act requires each coal mine operator to secure the payment of its potential benefits liability by either qualifying as a self-insurer or by purchasing and maintaining a commercial insurance contract. The Department of Labor’s (DOL) Office of Workers’ Compensation Programs (OWCP) is responsible for authorizing coal mine operators to self-insure and for setting the security amounts. As part of its ongoing efforts to reform the self-insurance program to ensure that operators are adequately securing their liabilities, the OWCP proposed a rule in January 2023 to update its regulations for authorizing operators to self-insure and for determining appropriate security amounts. The public comment period for the proposed rule ended April 19, 2023.
A change in requirements for security posted to self-insure black lung liabilities could result in the Company being required to post additional security for its obligations.
Environmental Laws and Regulations
Peabody is subject to various federal, state, local and tribal environmental laws and regulations. These laws and regulations place substantial requirements on its coal mining operations, and require regular inspection and monitoring of its mines and other facilities to ensure compliance. The Company is also affected by various other federal, state, local and tribal environmental laws and regulations that impact its customers.
Surface Mining Control and Reclamation Act. In the U.S., the Surface Mining Control and Reclamation Act of 1977 (SMCRA), which is administered by the Office of Surface Mining Reclamation and Enforcement (OSMRE), established mining, environmental protection and reclamation standards for surface mining and underground mining. Mine operators must obtain SMCRA permits and permit renewals for mining operations from OSMRE or from the respective state regulatory authority. Where state regulatory agencies have adopted federal mining programs under SMCRA, the state becomes the primary regulatory authority, with oversight from OSMRE. States in which Peabody has active mining operations have achieved primacy control of enforcement through federal authorization. In Arizona, where Peabody performs reclamation work on tribal lands, the Company is regulated by OSMRE because the tribes do not have SMCRA authorization.
SMCRA provides for three categories of bonds: surety bonds, collateral bonds and self-bonds. A surety bond is an indemnity agreement in a sum certain payable to the regulatory authority, executed by the permittee as principal and which is supported by the performance guarantee of a surety corporation. A collateral bond can take several forms, including cash, letters of credit, first lien security interest in property or other qualifying investment securities. A self-bond is an indemnity agreement in a sum certain executed by the permittee or by the permittee and any corporate guarantor made payable to the regulatory authority.
The Company’s total reclamation bonding requirements in the U.S. were $965.9 million as of December 31, 2023. The bond requirements for a mine represent the calculated cost to reclaim the current operations of a mine if it ceased to operate in the current period. The cost calculation for each bond must be completed according to the regulatory authority of each state or OSMRE. The Company’s asset retirement obligations calculated in accordance with generally accepted accounting principles for its active and inactive U.S. operations were $483.8 million as of December 31, 2023. The bond requirement amount for the Company’s U.S. operations significantly exceeds the financial liability for final mine reclamation because the asset retirement obligation liability is discounted from the end of the mine’s economic life to the balance sheet date in recognition that the final reclamation cash outlay is projected to be a number of years away. The bond amount, in contrast with the asset retirement obligation, presumes reclamation begins immediately, as well as different assumptions related to the cost of equipment and services utilized in the reclamation process.
After a permit application is prepared and submitted to the regulatory agency, it goes through a completeness and technical review. Public notice of the proposed permit is given for a comment period before a permit can be issued. Regulatory authorities have considerable discretion in the timing of the permit issuance and the public has the right to comment on and otherwise engage in the permitting process, including public hearings and through intervention in the courts. Before a SMCRA permit is issued, a mine operator must submit a bond or other form of financial security to guarantee the performance of reclamation bonding requirements.
In situations where the Company’s coal resources are federally owned, the U.S. Bureau of Land Management oversees a substantive exploration and leasing process. If surface land is managed by the U.S. Forest Service, that agency serves as the cooperating agency during the federal coal leasing process. Federal coal leases also require an approved federal mining permit under the signature of the Assistant Secretary of the Department of the Interior.
|
|
|
|
|
|
|
|
|
| Peabody Energy Corporation |
2023 Form 10-K |
12 |
The SMCRA Abandoned Mine Land Fund requires a fee on all coal produced in the U.S. The proceeds are used to rehabilitate lands mined and left unreclaimed prior to August 3, 1977 and to pay health care benefit costs of orphan beneficiaries of the Combined Fund created by the Coal Industry Retiree Health Benefit Act of 1992. The fee amount can change periodically based on changes in federal legislation. Pursuant to the Tax Relief and Health Care Act of 2006, from October 1, 2012 through September 30, 2021, the fee was $0.28 and $0.12 per ton of surface-mined and underground-mined coal, respectively. As a result of the Abandoned Mine Land Reclamation Amendments of 2021, which Congress enacted on November 15, 2021 as part of the Infrastructure Investment and Jobs Act, from October 1, 2021 through September 30, 2034, the fee is $0.224 and $0.096 per ton of surface-mined and underground-mine coal, respectively. The Company recognized expense related to the fees of $22.2 million, $21.7 million and $27.0 million for the years ended December 31, 2023, 2022 and 2021, respectively.
Clean Air Act (CAA). The CAA, enacted in 1970, and comparable state and tribal laws that regulate air emissions affect the Company’s U.S. coal mining operations both directly and indirectly.
National Ambient Air Quality Standards (NAAQS). The CAA requires the United States Environmental Protection Agency (EPA) to review national ambient air quality standards every five years to determine whether revision to current standards are appropriate. On January 6, 2023, the EPA proposed to lower the level of the primary standard for particulate matter (PM). If enacted as proposed, this rule could require fossil fuel electric generating units (EGUs) and non-EGUs to install additional emission control technologies, thereby increasing the cost of utilizing fossil fuels for electric generation and industrial uses.
The EPA is also in the process of reviewing the current ozone NAAQS. The level of the ozone NAAQS can affect requirements to install new or improved emission control technologies at fossil fuel-fired EGUs and non-EGU industrial sources.
Final New Source Performance Standards (NSPS) for Fossil Fuel-Fired EGUs. The EPA promulgated a final rule to limit carbon dioxide (CO2) from new, modified and reconstructed fossil fuel-fired EGUs under Section 111(b) of the CAA on August 3, 2015, and published it in the Federal Register on October 23, 2015.
The rule requires that newly-constructed fossil fuel-fired steam generating units achieve an emission standard for CO2 (known as the Best System of Emission Reduction (BSER)) which is based on the performance of a supercritical pulverized coal boiler implementing partial carbon capture, utilization and storage (CCUS). Modified and reconstructed fossil fuel-fired steam generating units must implement the most efficient generation achievable through a combination of best operating practices and equipment upgrades, to meet an emission standard consistent with best historical performance. Reconstructed EGUs must implement the most efficient generating technology based on the size of the unit.
Numerous legal challenges to the final rule were filed in the United States Court of Appeals for the D.C. Circuit (D.C. Circuit). Sixteen separate petitions for review were filed, and the challengers include 25 states, utilities, mining companies (including Peabody), labor unions, trade organizations and other groups. The cases were consolidated under the case filed by North Dakota (D.C. Cir. No. 15-1381). Four additional cases were filed seeking review of the EPA’s denial of reconsideration petitions in a final action published in the May 6, 2016 Federal Register entitled “Reconsideration of Standards of Performance for Greenhouse Gas Emissions From New, Modified, and Reconstructed Stationary Sources: Electric Generating Units; Notice of final action denying petitions for reconsideration.” Pursuant to an order of the court, these cases remain in abeyance, subject to requirements for the EPA to file 90-day status reports.
On December 20, 2018, the EPA proposed to revise the 2015 NSPS to modify the minimum requirements for newly constructed coal-fired units from partial CCUS to efficiency-based standards. (83 Fed. Reg. 65,424 (Dec. 20, 2018)). In contrast to the 2015 rule, the proposed rule defined BSER as the most efficient demonstrated steam cycle in combination with the best operating practices. The EPA indicated that the primary reason for revising BSER was the high cost and limited geographic availability of CCUS technology. Status reports filed with the D.C. Circuit in North Dakota v. EPA indicate that litigation on the 2015 rule should remain in abeyance pending the EPA’s action on the 2018 proposed rule.
EPA Regulation of Greenhouse Gas Emissions from New and Existing Fossil Fuel-Fired EGUs. On May 23, 2023, the EPA proposed a rule that includes five separate actions regarding the control of greenhouse gas (GHG) emissions from fossil fuel-fired power plants. The EPA proposed to revise NSPS to address CO2 emissions from both new fossil fuel-fired steam generating units and new fossil fuel-fired stationary combustion turbines. The EPA also proposed emission guidelines for existing coal- and oil/gas-fired steam generating units and for existing stationary combustion turbines. Finally, in the same proposed rule, the EPA proposed to repeal the Affordable Clean Energy Rule, promulgated by the EPA in 2019 and vacated by the D.C. Circuit in 2021.
|
|
|
|
|
|
|
|
|
| Peabody Energy Corporation |
2023 Form 10-K |
13 |
If finalized in the form proposed, the regulations would require existing fossil fuel-fired steam generating units (primarily coal units) to use CCUS with 90% capture of CO2 if they plan to operate after December 31, 2039. These units, however, may also pursue a different compliance pathway that is based on making a commitment to cease operations. The proposed rule also would require existing stationary combustion turbines over 300 megawatts with a capacity factor greater than 50% (primarily units using natural gas) to either utilize CCUS by 2035 or pursue a pathway that would require co-firing with 30% low-GHG hydrogen by 2032, followed by co-firing with 96% low-GHG hydrogen by 2038. The EPA is also taking comments with regard to imposing standards for stationary combustion turbines under 300 megawatts.
All requirements related to existing affected units – whether fired by coal, oil or natural gas – will be imposed through state plans that can additionally take into account the remaining useful life of a generating unit when determining appropriate controls. The EPA, however, proposes that such plans generally be no less stringent than the emission reductions that would be obtained under the EPA’s guidelines. Under the proposed rule, existing steam generating units would need to comply with the standards by January 1, 2030 and existing stationary combustion turbines would be required to comply by either January 1, 2032 or January 1, 2035, depending on what option for compliance is chosen.
Finally, as part of the proposed rule, any newly constructed steam electric generating unit or newly constructed stationary combustion turbine would be subject to GHG standards as of May 23, 2023, the date of the proposed rule. In addition, as proposed, any new fossil-fuel steam generating unit will need to comply with partial CCUS upon startup as well as a requirement for 90% CO2 reduction through CCUS by 2040. Any new or reconstructed stationary combustion turbine will be subject to different standards based on whether it is considered low load, intermediate load or a base load unit.
If finalized as proposed, the GHG NSPS could have substantial impacts on the use of coal, oil and natural gas for the generation of electricity.
EPA’s Permitting Regulations for Major Emission Sources. Coal-fired and other fossil-fuel fired power plants (as well as industrial facilities) may also be subject to emission limits contained in required CAA permits. These limits may be imposed through the Prevention of Significant Deterioration (PSD) program for newly constructed facilities that are considered to be major sources, as well as for existing facilities that undergo major modifications. The CAA also requires such facilities to obtain a title V operating permit. In general, most permits are issued by state environmental agencies that either implement EPA permitting programs or have an EPA-approved state program.
Cross State Air Pollution Rule (CSAPR) and CSAPR Update Rule. The CSAPR and related updates require numerous U.S. states and the District of Columbia to reduce power plant emissions that cross state lines and significantly contribute to ozone and/or fine PM pollution in other states.
On March 15, 2023, the EPA issued a final rule to address regional ozone transport by imposing new federal ozone season emission budgets for nitrogen oxide (NOx) in 23 states, including California, Nevada, Oklahoma and Texas, as well as some Indian reservations. The rule includes state emission budgets for NOx affecting fossil fuel-fired power plants and a “backstop daily emissions rate” for large coal-fired power plants if they exceed specified limits. The rule also sets first-time limits on certain industrial sources that will apply starting with the 2026 ozone season in 20 states. The EPA estimates that annual compliance costs (for 2023 through 2042) will be $770 million to $910 million. These emission limitations would apply in addition to requirements contained in state implementation plans to control ozone precursors in affected states, although states have the option to replace these limits with equally strict or more stringent limitations. When implemented, this rule could influence the closure of some coal generating units that have not installed selective catalytic reduction technologies. The rule has been challenged in several U.S. Courts of Appeal, including the D.C. Circuit. On December 20, 2023, the U.S. Supreme Court issued an order for oral argument regarding applications for a stay of the rule.
Mercury and Air Toxic Standards (MATS). In 2012, the EPA published the final MATS rule, which revised the NSPS for NOx, sulfur dioxide and PM for new and modified coal-fueled electricity generating plants, and imposed maximum achievable control technology (MACT) emission limits on hazardous air pollutants (HAPs) from new and existing coal-fueled and oil-fueled electric generating plants. MACT standards limit emissions of mercury, acid gas HAPs, non-mercury HAP metals and organic HAPs.
On March 6, 2023, the EPA issued a final rule which reaffirmed its determination to regulate coal- and oil-fired EGUs under CAA section 112, including the regulation of HAPs from EGUs after considering cost. On April 24, 2023, the EPA proposed to amend the 2012 MATS rule and require an additional two-thirds reduction in the filterable PM emission of non-mercury HAP metals from existing coal-fired power plants and to reduce the mercury standard for lignite plants by 70%. The EPA is also proposing to require the use of continuous emissions monitoring systems, and to revise other requirements such as those applicable to the startup of generating units. Under the proposed rule, the EPA estimated that approximately 500 megawatts of coal-fired capacity would retire by 2028. The public comment period on the proposals ended on June 23, 2023.
|
|
|
|
|
|
|
|
|
| Peabody Energy Corporation |
2023 Form 10-K |
14 |
Regional Haze. The CAA contains a national visibility goal for the “prevention of any future, and the remedying of any existing, impairment of visibility in Class I areas which impairment results from manmade air pollution.” The EPA promulgated comprehensive regulations in 1999 requiring all states to submit plans to address regional haze that could affect 156 national parks and wilderness areas, including requirements for certain sources to install the best available retrofit technology and for states to demonstrate “reasonable progress” towards meeting the national visibility goal. States are required to revise plans every 10 years.
New Source Review (NSR). The CAA imposes permitting requirements when a new source undergoes construction or when an existing source is reconstructed or undergoes a major modification. These requirements are contained in the CAA’s PSD and Nonattainment New Source Review programs, generally referred to as NSR.
The EPA has taken action on a number of different rules and guidance affecting the interpretation and application of NSR. These rules and guidance may affect the construction, reconstruction and modification of sources and the level of pollution control requirements that will be necessary on a case-by-case basis.
Federal Coal Leasing Moratorium. The Executive Order on Promoting Energy Independence and Economic Growth (EI Order), signed on March 28, 2017, lifted the Department of Interior’s federal coal leasing moratorium and rescinded guidance on the inclusion of social cost of carbon in federal rulemaking. Following the EI Order, the Interior Secretary issued Order 3349 ending the federal coal leasing moratorium. Environmental groups took the issue to court (District of Montana) and in April 2019, the court held the lifting of the moratorium triggered National Environmental Policy Act (NEPA) review. On May 22, 2020, the court held that the Department of the Interior’s issuance of an Environmental Assessment and Finding of No Significant Impact (FONSI) remedied the prior NEPA violations. Thereafter, environmental groups amended their complaint to challenge the Environmental Assessment and FONSI. On August 12, 2022, the court invalidated the Environmental Assessment and FONSI and reinstated the moratorium until completion of a sufficient NEPA analysis. The August 2022 decision is currently on appeal to the U.S. Court of Appeals for the Ninth Circuit.
Clean Water Act (CWA). The CWA of 1972 directly impacts U.S. coal mining operations by requiring effluent limitations and treatment standards for wastewater discharge from mines through the National Pollutant Discharge Elimination System (NPDES). Regular monitoring, reporting and performance standards are requirements of NPDES permits that govern the discharge of water from mine-related point sources into jurisdictional waters. The U.S. Army Corps of Engineers (Corps) regulates certain activities affecting navigable waters and waters of the U.S., including wetlands. Section 404 of the CWA requires mining companies to obtain permits from the Corps to place dredged or fill material in or mine through jurisdictional waters of the U.S.
States are empowered to develop and apply water quality standards. These standards are subject to change and must be approved by the EPA. Discharges must either meet state water quality standards or be authorized through available regulatory processes such as alternate standards or variances. Standards vary from state to state. Additionally, through the CWA Section 401 certification program, state and tribal regulators have approval authority over federal permits or licenses that might result in a discharge to their waters. State and tribal regulators consider whether the activity will comply with their water quality standards and other applicable requirements in deciding whether or not to certify the activity.
CWA Definition of “Waters of the United States”. On January 18, 2023, the EPA and the Corps finalized a revised definition of “Waters of the United States” to clarify the scope of federal regulatory authority under the CWA. Several courts preliminarily enjoined that rule in 27 states. In addition, on May 25, 2023, the U.S. Supreme Court issued its decision in Sackett v. EPA, No. 21-454, which significantly narrowed the scope of federal regulatory authority over wetlands and non-navigable waters. The agencies finalized a rule on September 8, 2023, to conform key aspects of the regulatory definition to the Sackett decision. Pending litigation over the January 2023 definition has resumed, as the September 2023 final rule did not address many of the claims at issue in those cases.
CWA Water Quality Certification Rule. The EPA issued a final rule in 2020 that would have limited state and tribal regulators’ certification authority under CWA Section 401 by allowing the EPA to certify projects over state or tribal regulator objections in some circumstances. On September 27, 2023, the EPA finalized a superseding rule that would expand state and tribal regulators’ authority to review activities that require federal permits or licenses and to impose conditions they believe are necessary to ensure compliance with water quality requirements. That rule took effect on November 27, 2023.
|
|
|
|
|
|
|
|
|
| Peabody Energy Corporation |
2023 Form 10-K |
15 |
Effluent Limitations Guidelines for the Steam Electric Power Generating Industry. In 2015, the EPA published a final rule setting requirements for wastewater discharge from EGUs. On March 29, 2023, the EPA proposed a rule that would establish more stringent standards for flue gas desulfurization wastewater, bottom ash transport water and combustion residual leachate. If the proposed rule, expected in April 2024, is finalized in substantially the same form, the revised effluent limitations guidelines would significantly increase costs for many coal-fueled steam electric power plants. Concurrently, the EPA issued a direct final rule which extended the deadline through June 2023 for steam electric power plants to commit to the permanent cessation of coal combustion by December 31, 2028 in exchange for less stringent wastewater discharge requirements during the interim. The direct final rule could influence fuel switching or additional coal generating unit retirements by the end of 2028.
National Environmental Policy Act. NEPA, signed into law in 1970, requires federal agencies to review the environmental impacts of their decisions and issue either an environmental assessment or an environmental impact statement. Peabody must provide information to agencies when it proposes actions that will be under the authority of the federal government. The NEPA process involves public participation and can involve lengthy timeframes. The White House Council on Environmental Quality (CEQ) issued a final rule comprehensively updating and modernizing its longstanding NEPA regulations on July 16, 2020. That final rule sought to reduce unnecessary paperwork, burdens and delays, promote better coordination among agency decision makers, and clarify scope of NEPA reviews, among other things. States and environmental groups have filed several lawsuits challenging the final rule. On April 20, 2022, however, the CEQ published the final Phase 1 rule that partially amended the 2020 rule by restoring key provisions of the pre-2020 NEPA regulations. The CEQ proposed a Phase 2 rule on July 31, 2023 that makes broader changes to the 2020 rule, and it expects to finalize those changes in April 2024. Separately, the CEQ published NEPA Guidance on Consideration of Greenhouse Gas Emissions and Climate Change on January 9, 2023. The interim guidance was effective immediately, though the agency accepted comments on the guidance and expects to issue final guidance in April 2024.
Resource Conservation and Recovery Act (RCRA). RCRA, which was enacted in 1976, affects U.S. coal mining operations by establishing “cradle to grave” requirements for the treatment, storage and disposal of hazardous wastes. Typically, the only hazardous wastes generated at a mine site are those from products used in vehicles and for machinery maintenance. Coal mine wastes, such as overburden and coal cleaning wastes, are not considered hazardous wastes under RCRA. While coal combustion residuals (CCR or coal ash) are exempted from regulation as hazardous waste, there are various EPA-imposed requirements regarding CCR management.
Proposed Rule for Disposal of CCR from Electric Utilities; Federal CCR Permit Program and Revisions to Closure Requirements. On February 20, 2020, as required by the Water Infrastructure Improvements for the Nation Act, the EPA proposed a federal permitting program for the disposal of CCR in surface impoundments and landfills. Under the proposal, the EPA would directly implement the permit program in Indian Country, and at CCR units located in states that have not submitted their own CCR permit program for approval. The proposal includes requirements for federal CCR permit applications, content and modification, as well as procedural requirements. The comment period for the EPA’s proposal ended on April 20, 2020. Although the EPA had planned to finalize this rule in 2021, the EPA now expects to issue a final rule around March 2026. Separately, on August 28, 2020 and November 12, 2020, the EPA finalized two sets of amendments to its 2015 CCR rule to partially address the D.C. Circuit’s 2018 decision holding that certain provisions of that rule were not sufficiently protective. The EPA is still deciding how to further revise the 2015 rule to address the remainder of the court decision. The EPA expects to issue two final rules addressing the remainder of that decision in April and October 2024.
Comprehensive Environmental Response, Compensation and Liability Act (CERCLA). Although generally not a prominent environmental law in the coal mining sector, CERCLA, which was enacted in 1980, nonetheless may affect U.S. coal mining operations by creating liability for investigation and remediation in response to releases of hazardous substances into the environment and for damages to natural resources. Under CERCLA, joint and several liabilities may be imposed on waste generators, site owners or operators and others, regardless of fault.
Endangered Species Act (ESA). The ESA of 1973 and counterpart state legislation is intended to protect species whose populations allow for categorization as either endangered or threatened. Changes in listings or requirements under these regulations could have a material adverse effect on Peabody’s costs or its ability to mine some of its properties in accordance with its current mining plans. During the Trump Administration, the Departments of the Interior and Commerce finalized five rules aiming to streamline and update the ESA. But in June 2021, agencies announced their plan to revise, rescind, or reinstate the rules that were finalized (or withdrawn) during the Trump Administration that conflict with the Biden Administration’s objectives. The agencies issued proposed rules on June 22, 2023, and they expect to finalize revised rules in April 2024.
|
|
|
|
|
|
|
|
|
| Peabody Energy Corporation |
2023 Form 10-K |
16 |
Use of Explosives. Peabody’s surface mining operations are subject to numerous regulations relating to blasting activities. Pursuant to these regulations, it incurs costs to design and implement blast schedules and to conduct pre-blast surveys and blast monitoring. The storage of explosives is subject to strict federal regulatory requirements. The U.S. Bureau of Alcohol, Tobacco and Firearms (ATF) regulates the use of explosive blasting materials. In addition to ATF regulation, the Department of Homeland Security is expected to finalize an ammonium nitrate security program rule.
Federal Report on Climate Change. On November 29, 2023, the U.S. Global Change Research Program, a working group comprised of thirteen U.S. governmental departments and agencies, issued parts of the Fifth National Climate Assessment. The report addresses “projected vulnerabilities, risks and impacts associated with climate change across the United States and provides examples of response actions in many communities.” While there are no explicit regulatory actions that flow from the issuance of the report, both the legislative and executive branches of government may rely on its conclusions to shape and justify policies and actions going forward.
SEC Climate-Related Disclosures. On March 21, 2022, the SEC proposed rules that would require public companies to disclose extensive climate-related information in certain SEC filings. Specifically, the proposed rules would add new Subpart 1500 to Regulation S-K and new Article 14 to Regulation S-X to require disclosure of climate-related risks that are reasonably likely to have a material impact on a public company’s business, results of operations or financial condition; GHG emissions associated with a public company that includes, in many cases, an attestation report by a GHG emissions attestation provider; and climate-related financial metrics to be included in a company’s audited financial statements. The Company is currently assessing the potential impact of the proposed rules. The public comment period on the proposed rules has concluded and final rules are expected in April 2024.
Inflation Reduction Act of 2022. The Inflation Reduction Act of 2022 was signed into law on August 16, 2022. Among its many provisions are programs that provide grants and other forms of direct and indirect financial assistance for the deployment of zero emission technologies as well as other actions that could affect energy markets and the future use of coal.
Regulatory Matters — Australia
The Australian mining industry is regulated by Australian federal, state and local governments with respect to environmental issues such as land reclamation, water quality, air quality, dust control, noise, planning issues (such as approvals to expand existing mines or to develop new mines) and health and safety issues. The Australian federal government retains control over the level of foreign investment and export approvals. Industrial relations are regulated under both federal and state laws. Australian state governments also require coal companies to post deposits or give other security against land which is being used for mining, with those deposits being returned or security released after satisfactory reclamation is completed.
New South Wales Coal Directions. The State of New South Wales (NSW) enacted the Energy and Utilities Administration Amendment Act 2022 granting the State Premier and Minister for Energy the ability to issue directions in the event of a coal market price emergency (among other powers). On December 22, 2022, the State Premier declared such an emergency, intended to control coal and electricity pricing. Subsequently, directions were issued to Peabody Energy Australia Pty Ltd and other coal producers with operations in NSW, which have been amended at various dates. The most recent directions require Peabody Energy Australia Pty Ltd to reserve a portion of coal produced by Wambo Coal Pty Ltd and Wilpinjong Coal Pty Ltd for sale to NSW power generators at a capped price until June 30, 2024 and impose additional reporting obligations to demonstrate compliance. While these directions are currently not anticipated to significantly impact the Wambo Mines or the Wilpinjong Mine, the nature and extent of those obligations and associated reporting requirements may continue to evolve if further directions are issued.
Metropolitan Mine Stormwater Discharge. Over the past few years, there has been significantly high rainfall in New South Wales, including unprecedented rain totals at the Metropolitan Mine site. While stormwater collected at the mine site is managed through two sedimentation dams, at times the heavy rainfall presented challenges with managing the significant volumes of stormwater, as the surface water management infrastructure has not had sufficient capacity. As a result, on multiple occasions throughout 2021 and 2022 stormwater was discharged from the mine site. Metropolitan Collieries Pty Ltd (MCPL), a wholly-owned subsidiary of PEC, removed accumulated material from the sedimentation dams to restore full site stormwater capacity by December 31, 2022 and identified and is implementing additional controls for the management of sediment moving forward. Despite the measures undertaken by MCPL to manage and improve the situation, the Environment Protection Authority commenced a prosecution for five breaches of the Protection of the Environment Operations Act 1997 on September 6, 2023.
|
|
|
|
|
|
|
|
|
| Peabody Energy Corporation |
2023 Form 10-K |
17 |
Mining Tenements and Environmental. In Queensland and New South Wales, the development of a mine requires both the grant of a right to extract the resource and an approval which authorizes the environmental impact. These approvals are obtained under separate legislation from separate government authorities. However, the application processes run concurrently and are also concurrent with any native title or cultural heritage process that is required. The environmental impacts of mining projects are regulated by state and federal governments. Federal regulation will only apply if the particular project will significantly impact a matter of national environmental significance (for example, a water resource, an endangered species or particular protected places). Environmental approvals processes involve complex issues that, on occasion, require lengthy studies and documentation.
In February 2019, the New South Wales Land and Environment Court (LEC) upheld the government’s denial of a planning approval for a non-Peabody coal mining project (Gloucester Resources Limited v. Minister for Planning). Although the approval was refused for other reasons, the judge in that case discussed ‘Scope 3’ GHG emissions resulting from the consumption of coal to be mined under the proposed project. Such emissions are often raised as a ground of objection to Australian mining projects, including Peabody’s mining projects. For example, in a subsequent LEC decision (Australian Coal Alliance Incorporated v. Wyong Coal Pty Ltd), the approval of a coal mining project was confirmed after such emissions had been considered by the relevant authority. In August 2019, Peabody and Glencore received approval from the NSW Independent Planning Commission (IPC) for the United Wambo project, subject to conditions (Export Conditions) requiring the joint venture to prepare an Export Management Plan setting out protocols for using all reasonable and feasible measures to ensure that any coal extracted from the mine that is to be exported from Australia is only exported to countries that are parties to the Paris Agreement (as defined below) or countries that the NSW Planning Secretary considers to have similar policies for reducing GHG emissions. The IPC subsequently approved another non-Peabody coal mining project (Rix’s Creek) without any Export Conditions. In October 2019, the NSW government introduced into Parliament proposed amendments to legislation and policy that would, if passed, have the effect of invalidating Export Conditions imposed on future NSW planning approvals, as well as no longer requiring consent authorities to consider ‘downstream emissions’ when assessing developments for the purposes of mining, petroleum production or extractive industry. The NSW government has announced changes to the IPC and planning system process which aim to improve timeframes and efficiencies for project approvals and provide more clarity on the IPC’s role in determining applications including seeking guidance on government policy. In June 2020, the NSW Government released its Strategic Statement on Coal Exploration and Mining in NSW which provides a high level framework for the government's policy approach to the future of the coal sector, as well as details of a streamlined strategic release process. The strategy identifies some potential areas for possible new coal exploration, areas that are ruled out for coal mining and areas where new coal exploration can only occur adjacent to an existing coal title via the Operational Allocation process. In December 2020, the NSW Government finalized and published the Guideline for the Competitive Allocation of Coal, which details the process for considering areas for coal exploration and allocating them by public tender.
In Queensland, laws and regulations related to mining include, but are not limited to, the Mineral Resources Act 1989, Environmental Protection Act 1994 (EP Act), Environmental Protection Regulation 2008, Planning Act 2016, Coal Mining Safety and Health Act 1999, Minerals and Energy Resources (Common Provisions) Act 2014, Explosives Act 1999, Aboriginal Cultural Heritage Act 2003, Water Act 2000, State Development and Public Works Organisation Act 1971, Queensland Heritage Act 1992, Transport Infrastructure Act 1994, Nature Conservation Act 1992, Vegetation Management Act 1999, Biosecurity Act 2014, Land Act 1994, Regional Planning Interests Act 2014, Fisheries Act 1994 and Forestry Act 1959. Under the EP Act, policies have been developed to achieve the objectives of the law and provide guidance on specific areas of the environment, including air, noise, water and waste management. State planning policies address matters of Queensland state interest, and must be adhered to during mining project approvals. The Mineral Resources Act 1989 was amended effective September 27, 2016 to include significant changes to the management of overlapping coal and coal seam gas tenements, and the coordination of activities and access to private and public land. In November 2016, amendments to the EP Act and the Water Act 2000 became effective that facilitate regulatory scrutiny of the environmental impacts of underground water extraction during the operational phase of resource projects for all tenements yet to commence mineral extraction. The ‘chain of responsibility’ provisions of the EP Act, which became effective in April 2016, allow the regulator to issue an environmental protection order (EPO) to a related person of a company in two circumstances: (a) if an EPO has been issued to the company, an EPO can also be issued to a related person of the company (at the same time or later); or (b) if the company is a high risk company (as defined in the EP Act), an EPO can be issued to a related person of the company (whether or not an EPO has also been issued to the company). A guideline has been issued that provides more certainty to the industry on the circumstances in which an EPO may be issued.
|
|
|
|
|
|
|
|
|
| Peabody Energy Corporation |
2023 Form 10-K |
18 |
In New South Wales, laws and regulations related to mining include, but are not limited to, the Mining Act 1992, Work Health and Safety (Mines) Act 2013, Coal Mine Subsidence Compensation Act 2017, Environmental Planning and Assessment Act 1979 (EPA Act), Environmental Planning and Assessment Regulations 2000, Protection of the Environment Operations Act 1997, Contaminated Land Management Act 1997, Explosives Act 2003, Water Management Act 2000, Water Act 1912, Radiation Control Act 1990, Biodiversity Conservation Act 2016 (BC Act), Heritage Act 1977, Aboriginal Land Rights Act 1983, Crown Land Management Act 2016, Dangerous Goods (Road and Rail Transport) Act 2008, Fisheries Management Act 1994, Forestry Act 2012, Native Title (New South Wales) Act 1994, Biosecurity Act 2015, Roads Act 1993 and National Parks & Wildlife Act 1974.
Under the EPA Act, environmental planning instruments must be considered when approving a mining project development application. Decision makers review the significance of a resource and the state and regional economic benefits of a proposed coal mine when considering a development application on the basis that it is an element of the “public interest” consideration contained in the relevant legislation. Effective from March 1, 2018, the EPA Act was amended to introduce a number of changes to planning laws in New South Wales. The EPA Act was further amended in June 2018 to revoke a process for modifying development approvals under the former Section 75W of the EPA Act. As a result, new development approvals will need to be obtained unless the proposed project will be substantially the same development as it was when the development approval was last modified under Section 75W, in which case the existing development approval can be modified. If a new development approval is required then this could take additional time to achieve.
On August 25, 2017, the BC Act commenced in New South Wales and imposes a revised framework for the assessment of potential impacts on biodiversity that may be caused by a development, such as a proposed mining project. The BC Act requires these potential impacts on biodiversity to be offset in perpetuity, by one or more of the following means: securing land based offsets and retiring biodiversity credits, making a payment into a biodiversity conservation fund or in some cases through mine site ecological rehabilitation. The data collected from the biodiversity impact assessment process is inputted into a new offsets payment calculator in order to determine the amount payable by the proponent to offset the impacts. The proposed development can only proceed once the biodiversity offset obligations have been satisfied.
Sharma v Minister for the Environment. On March 15, 2022, the Full Court of the Federal Court of Australia overturned the decision in Sharma v Minister for the Environment [2021] FCA 560 (Sharma), a case which found in 2021 that the Federal Minister for the Environment had a duty to avoid causing personal injury or death to children in Australia as a result of carbon emissions when deciding an application to approve a coal mine expansion. In light of this decision, the Minister for the Environment no longer must consider the effects of carbon emissions when assessing referrals under the Environment Protection and Biodiversity Conservation Act 1999. Sharma did not lodge an application for special leave to the High Court of Australia to appeal this decision and is now out of time to do so.
Mining Rehabilitation (Reclamation). Mine reclamation is regulated by state-specific legislation. As a condition of approval for mining operations, companies are required to progressively reclaim mined land and provide appropriate bonding, or, in certain circumstances (see below in relation to the Mineral and Energy Resources (Financial Provisioning) Act 2018), make alternative financial contributions to the relevant state government as a safeguard to cover the costs of reclamation in circumstances where mine operators are unable to do so. Self-bonding is not permitted. Peabody’s mines provide financial assurance to the relevant authorities which is calculated in accordance with current regulatory requirements. This financial assurance is in the form of cash, surety bonds or bank guarantees which are supported by a combination of cash collateral, deeds of indemnity and guarantee and letters of credit issued under the Company’s collateralized letter of credit program and accounts receivable securitization program. The Company operates in both the Queensland and New South Wales state jurisdictions.
Peabody’s reclamation bonding requirements in Australia were $332.8 million as of December 31, 2023. The bond requirements represent the states’ calculated cost to reclaim the current operations of a mine if it ceases to operate in the current period less any discounts agreed with the state. The cost calculation for each bond must be completed according to the regulatory authority of each state. The Company’s asset retirement obligations calculated in accordance with U.S. generally accepted accounting principles for its active and inactive Australian operations were $219.0 million as of December 31, 2023. The total bonding requirements for the Company’s Australian operations differ from the calculated costs associated with the asset retirement obligations because the costs associated with asset retirement obligations are discounted from the end of the mine’s economic life to the balance sheet date in recognition of the economic reality that reclamation is conducted progressively and final reclamation is projected to be a number of years away, whereas the bonding amount represents the states’ calculated cost of reclamation if a mine ceases to operate immediately as well as different costs assumptions.
New South Wales Reclamation. The Mining Act 1992 (Mining Act) is administered by the Department of Planning and Environment and the New South Wales Resources Regulator and authorizes the holder of a mining tenement to extract a mineral subject to obtaining consent under the EPA Act and other auxiliary approvals and licenses.
|
|
|
|
|
|
|
|
|
| Peabody Energy Corporation |
2023 Form 10-K |
19 |
Through the Mining Act, environmental protection and reclamation are regulated by conditions in all mining leases including requirements for the submission of a mining operations plan (MOP) prior to the commencement of operations. All mining operations must be carried out in accordance with the MOP which describes site activities and the progress toward environmental and reclamation outcomes and are updated on a regular basis or if mine plans change. The mines publicly report their reclamation performance on an annual basis.
In support of the MOP process, a reclamation cost estimate is calculated periodically to determine the amount of bond support required to cover the cost of reclamation based on the extent of disturbance during the MOP period.
Queensland Reclamation. The EP Act is administered by the Department of Environment and Science, which authorizes environmentally relevant activities such as mining activities relating to a mining lease through an Environmental Authority (EA). Environmental protection and reclamation activities are regulated by conditions in the EA. All mining operations must be carried out in a manner so as to ensure compliance with the conditions in the EA. The mines submit an annual return reporting on their EA compliance.
In November 2018, the Queensland government passed the Mineral and Energy Resources (Financial Provisioning) Act 2018 which provided for a new financial assurance (FA) framework and new progressive rehabilitation requirements. The new FA framework created a pooled fund covering most mines and most of the total industry liability, plus other options for providing FA if not part of the pooled fund (for example, allowing insurance bonds or cash). The percentage rate of the total rehabilitation cost payable into the pooled fund takes into account the financial strength of the holder of the EA for the mine and the project strength of the mine. The total rehabilitation cost is determined using an updated rehabilitation cost calculator, which does not provide for discounting.
The new progressive rehabilitation requirements, which commenced on November 1, 2019, require each mine to establish a schedule of rehabilitation milestones covering the life of the mine, and any significant changes to the timing of rehabilitation require regulatory approval. If there is to remain an area within the mine that does not have a post-mining land use (referred to as a non-use management area or NUMA) then each such NUMA will need to pass a public interest evaluation test as part of the approval process. An example of a NUMA is the void that remains after open-cut mining activities have been completed. Under the legislation, an existing mine was exempt from the requirement to justify its NUMAs to the extent that its existing approvals provided for such areas.
Residual Risks. On August 20, 2020, the Environmental Protection and Other Legislation Amendment Act (Queensland) 2020 (EPOLA Act) became law, amending the residual risk framework that aims to ensure that any remaining risks on former resource sites are appropriately identified, costed and managed. On completion of all mining activities, the holder of the EA for the mine can apply to surrender the EA once all conditions, requirements and rehabilitation obligations have been met. When approving the surrender, the government can request a residual risk payment from the holder of the EA for the mine to cover potential rehabilitation or maintenance costs incurred after the surrender has been accepted. It contemplates two approaches for determining residual risk payments. Depending on the level of risk of a particular site, a cost calculator tool might be used or a panel of appropriately qualified experts might undertake a qualitative and quantitative risk assessment.
Native Title and Cultural Heritage. Since 1992, the Australian courts have recognized that native title to lands and water, as recognized under the laws and customs of the Aboriginal inhabitants of Australia, may have survived the process of European settlement. These developments are supported by the federal Native Title Act which recognizes and protects native title, and under which a national register of native title claims has been established. Native title rights do not extend to minerals; however, native title rights can be affected by mining activities unless those rights have previously been extinguished, thereby requiring negotiation with the traditional owners (and potentially the payment of compensation) prior to the grant of certain mining tenements. There is also federal and state legislation to prevent damage to Aboriginal cultural heritage and archaeological sites.
|
|
|
|
|
|
|
|
|
| Peabody Energy Corporation |
2023 Form 10-K |
20 |
Following the May 2020 destruction of caves at the Juukan Gorge in the Pilbara region of Western Australia by an iron ore mining operation, the federal government established a Senate Inquiry. The Senate Inquiry’s terms of reference included reviewing the effectiveness and adequacy of state and federal laws in relation to Aboriginal and Torres Strait Islander cultural heritage in each of the Australian jurisdictions; and how these cultural heritage laws might be improved to guarantee the protection of culturally and historically significant sites. Following an interim report released on December 9, 2020, the Joint Standing Committee on Northern Australia released its final report on October 18, 2021. The final report sets out three key findings and eight recommendations, including that a new framework for cultural heritage protection be implemented at a national level by way of new legislated national minimum standards for State and Territory laws. The recommendations also include that a review of the Native Title Act 1993 (Cth) be undertaken to address inequalities in the negotiating position of Aboriginal and Torres Strait Islander peoples in the future act regime, including the ‘right to negotiate’ process which is associated with the grant of certain mining tenements. On November 24, 2022, the Environment Minister announced the Australian government’s support for all but one of the recommendations from the Senate Inquiry (whether final responsibility for heritage protection should sit with the Indigenous Affairs Minister or the Environment Minister is still being assessed) and indicated laws to protect Aboriginal cultural heritage would be strengthened following a further review of mining standards. Any legislation passed as a result of the recommendations in the final report could potentially impact the Company’s current and future mining tenements and operations.
Occupational Health and Safety. State legislation requires Peabody to provide and maintain a safe workplace by providing safe systems of work, safety equipment and appropriate information, instruction, training and supervision. In recognition of the specialized nature of mining and mining activities, specific occupational health and safety obligations have been mandated under state legislation specific to the coal mining industry. There are some differences in the application and detail of the laws, and mining operators, directors, officers and certain other employees are all subject to the obligations under this legislation.
In September 2020, Safe Work Australia (SWA) recommended new national Workplace Exposure Standards (WES) of 1.5 milligrams per cubic meter (mg/m3) for coal dust and 0.05 mg/m3 for silica. In Queensland, workplace exposure standards for respirable crystalline silica require workplaces to observe an eight hour, time-weighted average airborne concentration of 0.05mg/m3. In New South Wales, a respirable crystalline silica workplace exposure standard of 0.05 mg/m3 applies; a respirable coal dust workplace exposure standard of 1.5 mg/m3 applies and mines must report exceedances of these standards to the NSW Resources Regulator. Additionally, the NSW government requires an exposure standard for diesel particulate matter of 0.1 mg/m3.
In addition, as part of a broader review of workplace exposure standards, SWA is currently considering a proposal to reduce the time weighted average (TWA) WES for CO2 in Australian coal mines from 12,500 ppm to 5,000 ppm. Currently there is a separate TWA for CO2 in coal mines, however SWA proposes to remove this to align with a general industry standard. If implemented, the change has the potential to affect underground mines operating in CO2 rich coal seams, including the primary coal seam of the Company’s Metropolitan Mine. Importantly, a minimum three-year transition period applies for any change to standards.
On July 1, 2020, the Resources Safety and Health Queensland Act 2020 became effective. It establishes Resources Safety and Health Queensland (RSHQ) as a statutory body designed to ensure independence of the mining safety and health regulator. RSHQ includes inspectorates for coal mines, mineral mines and quarries, explosives and petroleum and gas. The new law seeks to enhance the role of advisory committees to identify, quantify and prioritize safety and health issues in the mining and quarrying industries. It also provides for an independent Work Health and Safety Prosecutor to prosecute serious offenses under resources safety legislation.
On May 20, 2020, the Queensland Parliament passed a bill into law that introduces the criminal offense of ‘industrial manslaughter’ for executive officers, individuals who are “senior officers” and companies in the mining industry. Individuals now face a maximum prison sentence of 20 years and companies could be fined up to approximately $13 million Australian dollars. This new law became effective July 1, 2020. The bill also introduced the requirement for statutory role holders to be employees of the coal mine operator entity with an 18-month transition period which ended November 25, 2022.
Industrial Relations. A national industrial relations system, the Fair Work Act and National Employment Standards, administered by the federal government applies to all employers and employees. The matters regulated under the national system include general employment conditions, unfair dismissal, enterprise bargaining, bullying claims, industrial action and resolution of workplace disputes. Most of the hourly workers employed in the Company’s mines are also covered by the Black Coal Mining Industry Award and company specific enterprise agreements approved under the national system.
|
|
|
|
|
|
|
|
|
| Peabody Energy Corporation |
2023 Form 10-K |
21 |
In December 2022, the federal government passed The Fair Work Legislation Amendment (Secure Jobs, Better Pay) Act 2022, which amends the Fair Work Act. The legislation introduced several changes to workplace laws in Australia including changes to enterprise agreement making and termination; when industrial action can be taken; and access to multi-employer bargaining. In addition, employers will no longer be able to employ individuals on a fixed-term contract for more than two years and access to flexible working arrangements for employees has been expanded. A number of measures aimed at addressing the gender pay gap have also been introduced. .
Following this amendment, the Wambo Underground Mine and four other mines in New South Wales were served with an application for a single interest employer authorization by a union representing certain categories of employees. If the authorization is granted by the Fair Work Commission, this will initiate the bargaining process for a single enterprise agreement covering all five employers for those specified employee categories. Peabody is still assessing the potential impacts associated with the application.
In early September 2023, the Fair Work Legislation Amendment (Closing Loopholes) Bill 2023 was presented to the Australian Federal Parliament. The bill proposed amendments to the Fair Work Act 2009 to allow unions and employees to make application to the Fair Work Commission for a ‘regulated labour hire arrangement order’ that, if successful, would require employers to provide similar wages and conditions to regulated workers as those provided to permanent employees, unless the Fair Work Commission is satisfied that it is not fair and reasonable to do so. The bill passed the Australian Federal Parliament on December 7, 2023 and applications for regulated labor hire arrangements can be made beginning in November 2024. The reforms have the potential to increase labor and compliance costs for coal producers, and Peabody is currently considering mitigation strategies.
National Greenhouse and Energy Reporting Act 2007 (NGER Act). The NGER Act imposes requirements for corporations meeting a certain threshold to register and report greenhouse gas emissions and abatement actions, as well as energy production and consumption as part of a single, national reporting system. The Clean Energy Regulator administers the NGER Act. The federal Department of Environment and Energy is responsible for NGER Act-related policy developments and review.
On July 1, 2016, amendments to the NGER Act implemented the Emissions Reduction Fund Safeguard Mechanism. From that date, large designated facilities such as coal mines were issued with a baseline for their covered emissions and must take steps to keep their emissions at or below the baseline or face penalties.
The National Greenhouse and Energy Reporting (Safeguard Mechanism) Rule 2015 outlines key elements of a responsible emitter’s duty to avoid an excess emissions situation and provides detail on how it can meet that requirement. The rule was amended between 2019 and 2021 to transition responsible emitters to new baseline setting arrangements. From the start of the 2020-21 compliance year, baselines must use prescribed production variables (an example being run of mine coal) and default emissions intensity values (being values set by the government to represent the industry average emissions intensity of production over five years) unless specific exemptions apply (such as a facility having site-specific values set).
In May 2023, the Australian Parliament passed reforms to the National Greenhouse and Energy Reporting (Safeguard Mechanism) Rule 2015. The reforms commenced on July 1, 2023 and introduced site specific baseline emissions for heavy emitting facilities as benchmarks for year-on-year improvement (proposed to be 4.9% each year to 2030) before transitioning to industry average emissions benchmarks by 2030. Proponents will earn tradeable credits (Safeguard Mechanism Credits) when emissions are below their baselines or can purchase credits to offset emissions. Access to existing Australian Carbon Credit Units will continue unchanged albeit with a price ceiling of $75 Australian dollars per tonne of CO2 in 2023-24, increasing with the Consumer Price Index plus 2% each year.
On March 27, 2023, the Australian federal government announced several additional emission reduction measures in the Safeguard Mechanism (Crediting) Amendments Bill 2023 which was introduced and passed both Houses of Parliament on March 30, 2023. The legislation introduced a cap on overall net emissions from facilities covered by the scheme through 2030. The legislation also set a cap of net zero tonnes carbon dioxide equivalent for any financial year beginning after June 30, 2049. In addition, if the Minister for Environment and Water grants an approval under the Environment Protection and Biodiversity Conservation Act 1999 (Cth) (EPBC Act) to a new or expanded facility covered by the scheme, the Minister will be required to give an estimate of the facility's Scope 1 emissions to the Minister for Climate Change, the Climate Change Secretary and the Climate Change Authority for assessment against scheme targets. The legislation went into effect on July 1, 2023. The potential impact of these reforms to Peabody’s Australian operations is under review.
|
|
|
|
|
|
|
|
|
| Peabody Energy Corporation |
2023 Form 10-K |
22 |
Queensland Royalty. As part of the Queensland government’s 2019-20 budget, the government committed to freeze royalty rates on coal and minerals for three years, provided companies voluntarily contributed to a Resource Community Infrastructure Fund (the Fund) over this three-year period. The government contributed $30 million Australian dollars towards the Fund, with companies voluntarily contributing $70 million Australian dollars. Peabody’s contribution to the Fund was approximately $1.7 million Australian dollars over the three-year period of 2019-2022.
On and from July 1, 2022, the Queensland government introduced three new royalty tiers for coal produced and sold from the state. The new tier rates are 20% for the portion of prices above $175 Australian dollars per tonne; 30% for the portion of prices above $225 Australian dollars per tonne; and a 40% tier for the portion of prices above $300 Australian dollars per tonne. Previously, the maximum royalty rate was 15% of the value of the coal sold above $150 Australian dollars per tonne. The change follows a three-year freeze on royalty rates for coal in the state. The increased rate structure may impact the Company’s future decisions about its Queensland operations.
New South Wales Royalty. In New South Wales, the royalty applicable to coal is charged as a percentage of the value of production (total revenue less allowable deductions). This is equal to 6.2% for deep underground mines (coal extracted at depths greater than 400 meters below ground surface), 7.2% for underground mines and 8.2% for open-cut mines. As part of its 2023-24 state budget the newly elected New South Wales government announced that from July 1, 2024 it would be increasing each of these rates by 2.6% to 8.8% for deep underground mines, 9.8% for underground mines and 10.8% for open-cut mines. The future impacts of this royalty rate rise on Peabody’s NSW mining operations is being assessed.
Sydney Water Catchment Areas. In November 2017, the New South Wales government established an independent expert panel (Panel) to advise the Department of Planning and Environment (DPE) on the impact of underground mining activities in Sydney’s water catchment areas, including at the Company’s Metropolitan Mine. The Panel issued its final report in October 2019, which made findings and recommendations concerning mining activities and effects across the catchment as a whole.
In response to the Panel’s recommendations, in 2020 the DPE established an interagency taskforce to implement a detailed action plan which includes: ensuring there is a net gain for the metropolitan water supply by requiring more offsetting from mining companies; establishing a new independent expert panel (Independent Advisory Panel) to advise on future mining applications in the catchment; strengthening surface and groundwater monitoring; improving access to and transparency of environmental data; adopting a more stringent approach to the assessment and conditioning of future mining proposals to minimize subsidence impacts; reviewing and updating current and potential future water losses from mining in line with the best available science; introducing a licensing regime to properly account for any water losses; and undertaking further research into mine closure planning to reduce potential long-term impacts.
When requested by the DPE, the Independent Advisory Panel is available to provide informed technical advice to the DPE or the Independent Planning Commission in relation to development applications and post-approval matters relating to the assessment and management of subsidence impacts associated with underground mining across NSW, with a particular focus on risks to the quantity of water in the catchment. The Independent Advisory Panel is comprised of an independent chair and experts in the fields of mining engineering and subsidence, surface water, groundwater and swamp hydrology and ecology. Advice that may be provided by the Independent Advisory Panel may include, but is not confined to, risks to the total water quantity and holding capacity of surface and groundwater systems, including swamps and reservoirs, and the types and reliability of methodologies used to predict, monitor, assess and report on mining effects, impacts and consequences.
Risks Related to Global Climate Change
Peabody recognizes that climate change is occurring and that human activity, including the use of fossil fuels, contributes to GHG emissions. The Company’s largest contribution to GHG emissions occurs indirectly, through the coal used by its customers in the generation of electricity and the production of steel (Scope 3). To a lesser extent, the Company directly and indirectly contributes to GHG emissions from various aspects of its mining operations, including from the use of electrical power and combustible fuels, as well as from the fugitive methane emissions associated with coal mines and stockpiles (Scopes 1 and 2).
Peabody’s Board of Directors and management believe that coal is essential to affordable, reliable energy and will continue to play a significant role in the global energy mix for the foreseeable future. Peabody views technology as vital to advancing global climate change solutions, and the Company supports advanced coal technologies to drive continuous improvement toward the ultimate goal of net-zero emissions from coal.
|
|
|
|
|
|
|
|
|
| Peabody Energy Corporation |
2023 Form 10-K |
23 |
The Board has ultimate oversight for climate-related risk and opportunity assessments, and has delegated certain aspects of these assessments to subject matter committees of the Board. In addition, the Board and its committees are provided regular updates on major risks and changes, including climate-related matters. The senior management team champions the strategic objectives set forth by the Board of Directors and Peabody’s global workforce turns those objectives into meaningful actions.
Management believes that the Company’s external communications, including environmental regulatory filings and public notices, SEC filings, its annual Environmental, Social and Governance (ESG) Report, its website and various other stakeholder-focused publications provide a comprehensive picture of the Company’s material risks and progress. All such communications are subject to oversight and review protocols established by Peabody’s Board and executive leadership team.
The Company faces risks from both the global transition to a net-zero emissions economy and the potential physical impacts of climate change. Such risks may involve financial, policy, legal, technological, reputational and other impacts as the Company meets various mitigation and adaptation requirements.
The transition to a net-zero emissions economy is driven by many factors, including, but not limited to, legislative and regulatory rulemaking processes, campaigns undertaken by non-governmental organizations to minimize or eliminate the use of coal as a source of electricity generation, and the ESG-related policies of financial institutions and other private companies. The Company has experienced, or may in the future experience, negative effects on its results of operations due to the following specific risks as a result of such factors:
•Reduced utilization or closure of existing coal-fired electricity generating plants;
•Electricity generators switching from coal to alternative fuels, when feasible;
•Increased costs associated with regulatory compliance;
•Unfavorable impact of regulatory compliance on supply and demand fundamentals, such as limitations on financing or construction of new coal-fueled power stations;
•Uncertainty and inconsistency in rulemaking processes related to periodic governmental administrative and policy changes;
•Unfavorable costs of capital and access to financial markets and products due to the policies of financial institutions;
•Disruption to operations or markets due to anti-coal activism and litigation; and
•Reputational damage associated with involvement in GHG emissions.
With respect to the potential or actual physical impacts of climate change, the Company has identified the following specific risks:
•Disruption to water supplies vital to mining operations;
•Disruption to transportation and other supply chain activities;
•Damage to the Company’s, customers’ or suppliers’ plant and equipment, or third-party infrastructure, resulting from weather events or changes in environmental trends and conditions; and
•Electrical grid failures and power outages.
While the Company faces numerous risks associated with the transition to a net-zero emissions economy and the physical impacts of climate change, certain opportunities may also emerge, such as:
•Heightened emphasis among multiple stakeholders to develop high-efficiency, low-emissions (HELE) technologies and CCUS technologies;
•Increased steel demand related to construction and other infrastructure projects related to climate change concerns; and
•The relative expense and reliability of renewable energy sources compared to coal may encourage support for balanced-source energy policies and regulations.
Global climate issues continue to attract public and scientific attention. Numerous reports, such as the Fourth and the Fifth Assessment Report of the Intergovernmental Panel on Climate Change, have also engendered concern about the impacts of human activity, especially fossil fuel combustion, on global climate issues. In turn, increasing government attention is being paid to global climate issues and to GHG emissions, including emissions of carbon dioxide from coal combustion by power plants. There have been significant developments in federal and state legislation and regulation and international accords regarding climate change. Such developments are described below in the section “Regulations Related to Global Climate Change” within this Item 1.
|
|
|
|
|
|
|
|
|
| Peabody Energy Corporation |
2023 Form 10-K |
24 |
The enactment of future laws or the passage of regulations regarding emissions from the use of coal by the U.S., some of its states or other countries, or other actions to limit such emissions, could result in electricity generators switching from coal to other fuel sources. Further, policies limiting available financing for the development of new coal-fueled power stations could adversely impact the global demand for coal in the future. The potential financial impact on Peabody of such future laws, regulations or other policies will depend upon the degree to which any such laws or regulations force electricity generators to diminish their reliance on coal as a fuel source. That, in turn, will depend on a number of factors, including the specific requirements imposed by any such laws, regulations or other policies, the time periods over which those laws, regulations or other policies would be phased in, the state of development and deployment of CCUS technologies as well as acceptance of CCUS technologies to meet regulations and the alternative uses for coal. Higher-efficiency coal-fired power plants may also be an option for meeting laws or regulations related to emissions from coal use. Several countries, including major coal users such as China, India and Japan, included using higher-efficiency coal-fueled power plants in their plans under the Paris Agreement. The Company believes HELE and CCUS technologies should be part of the solution to achieve substantial reductions in GHG emissions and should be broadly supported and encouraged, including through eligibility for public funding from national and international sources. In addition, CCUS merits targeted deployment incentives, like those provided to other low-emission sources of energy.
From time to time, the Company’s Board of Directors and management attempt to analyze the potential impact on the Company of as-yet-unadopted, potential laws, regulations and policies. Such analyses require significant assumptions as to the specific provisions of such potential laws, regulations and policies which sometimes show that if implemented in the manner assumed by the analyses, the potential laws, regulations and policies could result in material adverse impacts on the Company’s operations, financial condition or cash flows. Such analyses cannot be relied upon to reasonably predict the quantitative impact that future laws, regulations or other policies may have on the Company’s results of operations, financial condition or cash flows.
Regulations Related to Global Climate Change
In the U.S., Congress has considered legislation addressing global climate issues and GHG emissions, but to date, no new comprehensive, regulatory legislation has been signed into law. The U.S. Congress, however, has approved legislation, the Inflation Reduction Act of 2022, that will provide substantial tax incentives, grants and loan guarantees for energy infrastructure, solar panels, wind turbines, nuclear and geothermal energy, hydrogen projects and carbon capture and storage. While it is possible that the U.S. will adopt additional climate legislation in the future, the timing and specific requirements of any such legislation are uncertain.
The EPA has also undertaken several steps to regulate GHG emissions under existing law, primarily the CAA. In response to the 2007 U.S. Supreme Court ruling in Massachusetts v. EPA, the EPA commenced several rulemaking projects as described under “Regulatory Matters - U.S.” The EPA has indicated that it will continue these efforts and proceed with new regulations affecting GHG emissions from fossil fuel-fired electric generation, methane emissions from oil and gas production and carbon emissions from light and heavy-duty vehicles.
At the same time, a number of states in the U.S. have adopted programs to regulate GHG emissions. For example, 10 northeastern states (Connecticut, Delaware, Maine, Maryland, Massachusetts, New Hampshire, New Jersey, New York, Rhode Island and Vermont) entered into the Regional Greenhouse Gas Initiative (RGGI) in 2005, and Pennsylvania joined in 2022. RGGI is a mandatory cap-and-trade program to cap regional carbon dioxide emissions from power plants. California and the Canadian province of Quebec have adopted greenhouse gas cap-and-trade regulations to date and both programs have begun operating.
Several other U.S. states have enacted legislation establishing GHG emissions reduction goals or requirements. In addition, several states have enacted legislation or have in effect regulations requiring electricity suppliers to use renewable energy sources to generate a certain percentage of power or that provide financial incentives to electricity suppliers for using renewable energy sources. Some states have initiated public utility proceedings that may establish values for carbon emissions.
Increasingly, both foreign and domestic banks, insurance companies and large investors are curtailing or ending their financial relationships with fossil fuel-related companies. This has had adverse impacts on the liquidity and operations of coal producers.
Peabody participated in the Department of Energy’s Voluntary Reporting of Greenhouse Gases Program until its suspension in May 2011, and the Company regularly discloses information regarding its production-related emissions in its annual ESG Report. The vast majority of the Company’s emissions are generated by the operation of heavy machinery to extract and transport material at its mines and fugitive emissions from the extraction of coal.
|
|
|
|
|
|
|
|
|
| Peabody Energy Corporation |
2023 Form 10-K |
25 |
The Kyoto Protocol, adopted in December 1997 by the signatories to the 1992 United Nations Framework Convention on Climate Change (UNFCCC), established a binding set of GHG emission targets for developed nations. The U.S. signed the Kyoto Protocol but it has never been ratified by the U.S. Senate. Australia ratified the Kyoto Protocol in December 2007 and became a full member in March 2008. There were discussions to develop a treaty to replace the Kyoto Protocol after the expiration of its commitment period in 2012, including at the UNFCCC conferences in Cancun (2010), Durban (2011), Doha (2012) and Paris (2015). At the Durban conference, an ad hoc working group was established to develop a protocol, another legal instrument or an agreed outcome with legal force under the UNFCCC, applicable to all parties. At the Doha meeting, an amendment to the Kyoto Protocol was adopted, which included new commitments for certain parties in a second commitment period, from 2013 to 2020. In December 2012, Australia signed on to the second commitment period. During the UNFCCC conference in Paris, France in late 2015, an agreement was adopted calling for voluntary emissions reduction contributions after the second commitment period ends in 2020 (the Paris Agreement). The agreement was entered into force on November 4, 2016 after ratification and execution by more than 55 countries, including Australia, that account for at least 55% of global GHG emissions. On January 20, 2021, the U.S. reentered the Paris Agreement by accepting the agreement and all of its articles and clauses, after having announced its withdrawal from the agreement in November 2019.
In June 2022, the new Australian federal government announced plans to legislate for a 43% reduction in Australia’s GHG emissions by 2030 and to introduce changes by mid-2023 that will require heavy emitting companies producing more than 100,000 tonnes of carbon emissions annually to accelerate their emissions reduction activities. On September 13, 2022, the Australian government passed the Climate Change Act 2022 to set the GHG emissions reduction targets into law.
In May 2023, the Australian Parliament passed reforms to the National Greenhouse and Energy Reporting (Safeguard Mechanism) Rule 2015 (legislated through the National Greenhouse and Energy Reporting Act 2007 (Cth)). Refer to the section “Regulatory Matters — Australia” within this Item 1 for discussion of the reforms.
Available Information
Peabody files or furnishes annual, quarterly and current reports (including any exhibits or amendments to those reports), proxy statements and other information with the SEC. These materials are available free of charge through the Company’s website (www.peabodyenergy.com) as soon as reasonably practicable after such material is electronically filed with, or furnished to, the SEC. Information included on the Company’s website does not constitute part of this document. These materials may also be accessed through the SEC’s website (www.sec.gov).
In addition, copies of the Company’s filings will be made available, free of charge, upon request by telephone at (314) 342-7900 or by mail at: Peabody Energy Corporation, Peabody Plaza, 701 Market Street, St. Louis, Missouri 63101-1826, attention: Investor Relations.
Item 1A. Risk Factors.
The Company operates in a rapidly changing environment that involves a number of risks. The following discussion highlights some of these risks and others are discussed elsewhere in this report. These and other risks could materially and adversely affect the Company’s business, financial condition, prospects, operating results or cash flows. The following risk factors are not an exhaustive list of the risks associated with the Company’s business. New factors may emerge or changes to these risks could occur that could materially affect its business.
Risks Associated with Peabody’s Operations
The Company’s profitability depends upon the prices it receives for its coal.
The Company operates in a competitive and highly regulated industry that has at times experienced strong headwinds. Current pricing levels of both seaborne and domestic coal products may not be sustainable in the future. Declines in coal prices could materially and adversely affect the Company’s operating results and profitability and the value of its coal reserves and resources.
|
|
|
|
|
|
|
|
|
| Peabody Energy Corporation |
2023 Form 10-K |
26 |
Coal prices are dependent upon factors beyond the Company’s control, including:
•the demand for electricity and capacity utilization of electricity generating units (whether coal or non-coal);
•changes in the fuel consumption and dispatch patterns of electric power generators, whether based on economic or non-economic factors;
•the proximity, capacity and cost of transportation and terminal facilities;
•competition with and the availability, quality and price of coal and alternative fuels, including natural gas, fuel oil, nuclear, hydroelectric, wind, biomass and solar power;
•governmental regulations and taxes, including tariffs or other trade restrictions as well as those establishing air emission standards for coal-fueled power plants or mandating or subsidizing increased use of electricity from renewable energy sources;
•the strength of the global economy;
•the global supply and production costs of thermal and metallurgical coal;
•the demand for steel, which may lead to price fluctuations in the monthly and quarterly repricing of the Company’s metallurgical coal contracts;
•weather patterns, severe weather and natural disasters;
•regulatory, administrative and judicial decisions, including those affecting future mining permits and leases;
•competing technologies used to make steel, some of which do not use coal as a manufacturing input, such as electric arc furnaces; and
•technological developments, including those related to alternative energy sources, those intended to convert coal-to-liquids or gas and those aimed at capturing, using and storing carbon dioxide.
Thermal coal accounted for the majority of the Company’s coal sales by volume during 2023 and 2022, with the vast majority of these sales to electric power generators. The demand for coal consumed for electric power generation is affected by many of the factors described above, but primarily by (i) the overall demand for electricity; (ii) the availability, quality and price of competing fuels, such as natural gas, nuclear, fuel oil and alternative energy sources; (iii) utilization of all electricity generating units (whether using coal or not), including the relative cost of producing electricity from multiple fuels, including coal; (iv) stringent environmental and other governmental regulations; (v) other sociopolitical views on coal; and (vi) the coal inventories of utilities. Gas-fueled generation has displaced and could continue to displace coal-fueled generation (particularly from older, less efficient coal-fueled generation units) as current and potentially increasing regulatory costs and other factors impact the operating decisions of electric power generators. In addition, some electric power generators have made decisions to close coal-fueled generation units given ongoing pressure to shift away from coal generation. Many of the new power plants in the U.S. may be fueled by natural gas because gas-fired plants have been less expensive to construct, permits to construct these plants are easier to obtain based on emissions profiles and electric power generators may face public and governmental pressure to generate a larger portion of their electricity from natural gas-fueled units and alternative energy sources. Increasingly stringent regulations along with stagnant electricity demand in recent years have also reduced the number of new power plants being built. In recent years, these trends have reduced demand for the Company’s coal and the related prices. Lower demand for coal consumed by electric power generators could reduce the volume of thermal coal that the Company sells and the prices that it receives for the thermal coal, thereby reducing its revenue and adversely impacting its earnings and the value of its coal reserves and resources.
The Company produces metallurgical coal that is used in the global steel industry. Metallurgical coal accounted for approximately 26% and 32% of its revenue in 2023 and 2022, respectively. Changes in governmental policies and regulations and changes in the steel industry, including the demand for steel, could reduce the demand for the Company’s metallurgical coal. Lower demand for metallurgical coal in international markets could reduce the amount of metallurgical coal that the Company sells and the prices that it receives for the metallurgical coal, thereby reducing its revenue and adversely impacting its earnings and the value of its coal reserves and resources.
The balance between coal demand and supply, factoring in demand and supply of closely related and competing fuel sources, both domestically and internationally, could materially reduce coal prices and therefore materially reduce the Company’s revenue and profitability. The Company competes with other fuel sources used for electricity generation, such as natural gas, nuclear and renewables. The Company’s seaborne products compete with other producers as well as other fuel sources. Declines in the price of natural gas could cause demand for coal to decrease and adversely affect the price of coal. Sustained periods of low natural gas prices or low prices for other fuels may also cause utilities to phase out or close existing coal-fueled power plants or reduce construction of new coal-fueled power plants. In the U.S., no new coal-fueled power plants are being constructed or reopened after closure. These closures could have a material adverse effect on demand and prices for the Company’s coal, thereby reducing its revenue and materially and adversely affecting its business and results of operations.
|
|
|
|
|
|
|
|
|
| Peabody Energy Corporation |
2023 Form 10-K |
27 |
If a substantial number of the Company’s long-term coal supply agreements, including those with its largest customers, terminate, or if the pricing, volumes or other elements of those agreements materially adjust, its revenue and operating profits could suffer if the Company is unable to find alternate buyers willing to purchase its coal on comparable terms to those in its contracts.
Most of the Company’s sales are made under coal supply agreements, which are important to the stability and profitability of its operations. The execution of a satisfactory coal supply agreement is frequently the basis on which the Company undertakes the development of coal reserves and resources required to be supplied under the contract, particularly in the U.S. For the year ended December 31, 2023, the Company derived 25% of its revenue from coal supply agreements from its five largest customers. Those five customers were supplied primarily from 13 coal supply agreements (excluding trading and brokerage transactions) expiring at various times from 2024 to 2025.
Many of the Company’s coal supply agreements contain provisions that permit the parties to adjust the contract price upward or downward at specified times. The Company may adjust these contract prices based on inflation or deflation, price indices and/or changes in the factors affecting the cost of producing coal, such as taxes, fees, royalties and changes in the laws regulating the mining, production, sale or use of coal. In a limited number of contracts, failure of the parties to agree on a price under those provisions may allow either party to terminate the contract. The Company may experience reductions in coal prices in new long-term coal supply agreements replacing some of its expiring contracts. Coal supply agreements also typically contain force majeure provisions allowing temporary suspension of performance by the Company or the customer during the duration of specified events beyond the control of the affected party. Some coal supply agreements allow customers to vary the volumes of coal that they are required to purchase during a particular period, and where coal supply agreements do not explicitly allow such variation, customers sometimes request that the Company amend the agreements to allow for such variation. Most of its coal supply agreements contain provisions requiring the Company to deliver coal meeting quality thresholds for certain characteristics such as Btu, sulfur content, ash content, volatile matter, coking properties, grindability and ash fusion temperature. Failure to meet these specifications could result in economic penalties, including price adjustments, the rejection of deliveries or termination of the contracts. Moreover, some of these agreements allow the Company’s customers to terminate their contracts in the event of changes in regulations affecting the coal industry that restrict the use or type of coal permissible at the customer’s plant or increase the price of coal beyond specified limits.
On an ongoing basis, the Company discusses the extension of existing agreements or entering into new long-term agreements with various customers, but these negotiations may not be successful and these customers may not continue to purchase coal from the Company under long-term supply agreements.
The operating profits the Company realizes from coal sold under supply agreements depend on a variety of factors. In addition, price adjustment and other contract provisions may increase its exposure to short-term coal price volatility. If a substantial portion of the Company’s coal supply agreements were modified or terminated, it could be materially adversely affected to the extent that it is unable to find alternate buyers for its coal at the same level of profitability. Prices for coal vary by mining region and country. As a result, the Company cannot predict the future strength of the coal industry overall or by mining region and cannot provide assurance that it will be able to replace existing long-term coal supply agreements at the same prices or with similar profit margins when they expire. In addition, the Company’s revenue could be adversely affected by a decline in customer purchases (including contractually obligated purchases) due to lack of demand and oversupply, cost of competing fuels and environmental and other governmental regulations.
|
|
|
|
|
|
|
|
|
| Peabody Energy Corporation |
2023 Form 10-K |
28 |
Risks inherent to mining could increase the cost of operating the Company’s business, and events and conditions that could occur during the course of its mining operations could have a material adverse impact on the Company.
The Company’s mining operations are subject to conditions that can impact the safety of its workforce, delay coal deliveries or increase the cost of mining at particular mines for varying lengths of time. These conditions include:
•elevated gas levels;
•fires and explosions, including from methane gas or coal dust;
•accidental mine water discharges;
•weather, flooding and natural disasters;
•hazardous events such as roof falls and high wall or tailings dam failures;
•seismic activities, ground failures, rock bursts or structural cave-ins or slides;
•key equipment failures;
•supply chain constraints or unavailability of equipment or parts;
•variations in coal seam thickness, coal quality, the amount of rock and soil overlying coal deposits and geologic conditions impacting mine sequencing;
•delays in moving its longwall equipment;
•unexpected maintenance problems; and
•unforeseen delays in implementation of mining technologies that are new to its operations.
The Company maintains insurance policies that provide limited coverage for some of the risks referenced above, which may lessen the impact associated with these risks. However, there can be no assurance as to the amount or timing of recovery under its insurance policies in connection with losses associated with these risks.
The Company’s take-or-pay arrangements could unfavorably affect its profitability.
The Company has substantial take-or-pay arrangements with its port access and rail transportation providers, predominately in Australia, totaling $1.2 billion, with terms ranging up to 20 years, that commit the Company to pay a minimum amount for the delivery of coal even if those commitments go unused. The take-or-pay provisions in these contracts sometimes allow the Company to apply amounts paid for subsequent deliveries, but these provisions have limitations and the Company may not be able to apply all such amounts so paid in all cases. Also, the Company may not be able to utilize the amount of capacity for which it has previously paid. Additionally, the Company may continue to deliver coal during times when it might otherwise be optimal to suspend operations because these take-or-pay provisions effectively convert a variable cost of selling coal to a fixed operating cost.
The Company may not recover its investments in its mining, exploration and other assets, which may require the Company to recognize impairment charges related to those assets.
The value of the Company’s assets have from time to time been adversely affected by numerous uncertain factors, some of which are beyond its control, including unfavorable changes in the economic environments in which it operates; declining coal-fired electricity generation; lower-than-expected coal pricing; technical and geological operating difficulties; an inability to economically extract its coal reserves and resources; and unanticipated increases in operating costs. These factors may trigger the recognition of additional impairment charges in the future, which could have a substantial impact on the Company’s results of operations.
Because of the volatile and cyclical nature of coal markets, it is reasonably possible that the Company’s current estimates of projected future cash flows from its mining assets may change in the near term, which may result in the need for adjustments to the carrying value of its assets.
The Company’s ability to operate effectively could be impaired if it loses key personnel or fails to attract qualified personnel.
Peabody manages its business with a number of key personnel, the loss of whom could have a material adverse effect on the Company, absent the completion of an orderly transition. In addition, the Company believes that its future success will depend greatly on its continued ability to attract and retain highly skilled and qualified personnel in tight labor markets, particularly personnel with mining experience. Peabody cannot provide assurance that key personnel will continue to be employed by the Company or that it will be able to attract and retain qualified personnel in the future. Failure to retain or attract key personnel could have a material adverse effect on the Company.
|
|
|
|
|
|
|
|
|
| Peabody Energy Corporation |
2023 Form 10-K |
29 |
The Company could be negatively affected if it fails to maintain satisfactory labor relations.
As of December 31, 2023, the Company had approximately 5,400 employees (excluding employees that were employed at operations classified as discontinued), which included approximately 4,200 hourly employees. The Company is party to labor agreements with various labor unions that represent certain of its employees. Such labor agreements are negotiated periodically, and, therefore, the Company is subject to the risk that these agreements may not be able to be renewed on reasonably satisfactory terms. Approximately 38% of its hourly employees were represented by organized labor unions and generated approximately 18% of its coal production for the year ended December 31, 2023. Relations with its employees and, where applicable, organized labor are important to the Company’s success. If some or all of its current non-union operations were to become unionized, the Company could incur an increased risk of work stoppages, reduced productivity and higher labor costs. Also, if the Company fails to maintain good relations or successfully negotiate contracts with its employees who are represented by unions, the Company could potentially experience labor disputes, strikes, work stoppages, slowdowns or other disruptions in production that could negatively impact its profitability.
The Company could be adversely affected if it fails to appropriately provide financial assurances for its obligations.
U.S. federal and state laws and Australian laws require the Company to provide financial assurances related to requirements to reclaim lands used for mining; to pay federal and state workers’ compensation, such as black lung liabilities; to provide financial assurances for coal lease obligations; and to satisfy other miscellaneous obligations. Historically, the primary methods the Company has used to meet those obligations are to provide a third-party surety bond or a letter of credit. In recent years, the Company has also utilized deposits with regulatory authorities or cash backed bank guarantees. As of December 31, 2023, the Company had $1,139.9 million of outstanding surety bonds; $276.7 million of deposits with regulatory authorities; $275.1 million of letters of credit with third parties; and $64.9 million of cash backed bank guarantees in order to provide required financial assurances for post-mining reclamation, workers’ compensation and other insurance obligations, coal lease-related and other obligations and performance guarantees, in addition to collateral for sureties. Under the Company’s agreement with the providers of its surety portfolio, the Company has $444.0 million in cash held in trust accounts for the benefit of certain surety providers as of December 31, 2023.
The Company’s financial assurance obligations may increase or become more costly due to a number of factors, and surety bonds and letters of credit may not be available to the Company, particularly in light of some banks and insurance companies’ announced unwillingness to support thermal coal producers and other fossil fuel companies. Alternative forms of financial assurance such as self-bonding have been severely restricted or terminated in most of the regions where its mines reside. The Company’s failure to retain, or inability to obtain, surety bonds, bank guarantees or letters of credit, or to provide a suitable alternative, could have a material adverse effect on it. That failure could result from a variety of factors including:
•lack of availability, higher expense or unfavorable market terms of new surety bonds, bank guarantees or letters of credit;
•inability to provide or fund collateral for current and future third-party issuers of surety bonds, bank guarantees or letters of credit; and
•lack of available fronting banks in certain countries where the Company must provide financial assurances but its primary surety providers are not licensed or admitted.
As further described in “Liquidity and Capital Resources” of Part II, Item 7. “Management’s Discussion and Analysis of Financial Condition and Results of Operations,” the Company has a surety transaction support agreement with the providers of its surety bond portfolio. The Company’s failure to provide adequate collateral, or abide by other terms in the agreement, could invalidate the agreement and materially and adversely affect its business and results of operations.
The Company’s failure to maintain adequate bonding would invalidate its mining permits and prevent mining operations from continuing, which could result in its inability to continue as a going concern.
|
|
|
|
|
|
|
|
|
| Peabody Energy Corporation |
2023 Form 10-K |
30 |
If the assumptions underlying the Company’s asset retirement obligations for reclamation and mine closures are materially inaccurate, its costs could be significantly greater than anticipated.
The Company’s asset retirement obligations primarily consist of spending estimates for surface land reclamation and support facilities at both surface and underground mines in accordance with federal and state reclamation laws in the U.S. and Australia as defined by each mining permit. These obligations are determined for each mine using various estimates and assumptions including, among other items, estimates of disturbed acreage as determined from engineering data, estimates of future costs to reclaim the disturbed acreage and the timing of these cash flows, which is driven by the estimated economic life of the mine and the applicable reclamation laws. These cash flows are discounted using a credit-adjusted, risk-free rate. The Company’s management and engineers periodically review these estimates. If its assumptions do not materialize as expected, actual cash expenditures and costs that the Company incurs could be materially different than currently estimated. Moreover, regulatory changes could increase the Company’s obligation to perform reclamation, mine closing and post-closure activities. The resulting estimated asset retirement obligation could change significantly if actual amounts change significantly from its assumptions, which could have a material adverse effect on its results of operations and financial condition.
The Company’s mining operations are extensively regulated, which imposes significant costs on it, and future regulations and developments could increase those costs or limit its ability to produce coal.
The coal mining industry is subject to regulation by federal, state and local authorities with respect to matters such as:
•workplace health and safety;
•limitations on land use;
•mine permitting and licensing requirements;
•reclamation and restoration of mining properties after mining is completed;
•the storage, treatment and disposal of wastes;
•remediation of contaminated soil, sediment and groundwater;
•air quality standards;
•water pollution;
•protection of human health, plant-life and wildlife, including endangered or threatened species and habitats;
•protection of wetlands;
•the discharge of materials into the environment; and
•the effects of mining on surface water and groundwater quality and availability.
Regulatory agencies have the authority under certain circumstances following significant health and safety incidents to order a mine to be temporarily or permanently closed. In the event that such agencies ordered the closing of one of the Company’s mines, its production and sale of coal would be disrupted and it may be required to incur cash outlays to re-open the mine. Any of these actions could have a material adverse effect on the Company’s financial condition, results of operations and cash flows.
New legislation, regulations or orders related to the environment or employee health and safety may be adopted and may materially adversely affect the Company’s mining operations, its cost structure or its customers’ ability to use coal. New legislation or administrative regulations (or new interpretations by the relevant government of existing laws, regulations and approvals), including proposals related to the protection of the environment or the reduction of GHG emissions that would further regulate and tax the coal industry, may also require the Company or its customers to change operations significantly or incur increased costs. Some of the Company’s coal supply agreements contain provisions that allow a purchaser to terminate its contract if legislation is passed that either restricts the use or type of coal permissible at the purchaser’s plant or results in specified increases in the cost of coal or its use. These factors and legislation, if enacted, could have a material adverse effect on the Company’s financial condition and results of operations.
For additional information about the various regulations affecting the Company, see the sections entitled “Regulatory Matters —U.S.” and “Regulatory Matters — Australia.”
|
|
|
|
|
|
|
|
|
| Peabody Energy Corporation |
2023 Form 10-K |
31 |
The Company’s operations may impact the environment or cause exposure to hazardous substances, and its properties may have environmental contamination, which could result in material liabilities to the Company.
The Company’s operations currently use hazardous materials and generate limited quantities of hazardous wastes from time to time. A number of laws, including CERCLA and RCRA in the U.S. and similar laws in other countries where the Company operates, impose liability relating to contamination by hazardous substances. Such liability may involve the costs of investigating or remediating contamination and damages to natural resources, as well as claims seeking to recover for property damage or personal injury caused by hazardous substances. Such liability may arise from conditions at formerly, as well as currently, owned or operated properties, and at properties to which hazardous substances have been sent for treatment, disposal or other handling. Liability under RCRA, CERCLA and similar state statutes is without regard to fault, and typically is joint and several, meaning that a person may be held responsible for more than its share, or even all, of the liability involved.
The Company may be unable to obtain, renew or maintain permits necessary for its operations, or the Company may be unable to obtain, renew or maintain such permits without conditions on the manner in which it runs its operations, which would reduce its production, cash flows and profitability.
Numerous governmental permits and approvals are required for mining operations. The permitting rules, and the interpretations of these rules, are complex, change frequently and are often subject to discretionary interpretations by regulators, all of which may make compliance more difficult or impractical. As part of this permitting process, when the Company applies for permits and approvals, it is required to prepare and present to governmental authorities data pertaining to the potential impact or effect that any proposed exploration for or production of coal may have upon the environment. The public, including non-governmental organizations, opposition groups and individuals, have statutory rights to comment upon and submit objections to requested permits and approvals (including modifications and renewals of certain permits and approvals) and otherwise engage in the permitting process, including bringing citizens’ lawsuits to challenge the issuance of permits, the validity of environmental impact statements or the performance of mining activities. In recent years, the permitting required for coal mining has been the subject of increasingly stringent regulatory and administrative requirements and extensive litigation by environmental groups.
Additionally, the Company’s operations may be affected by sites within or near mining areas that have cultural heritage significance to indigenous peoples, and its mining permits may be rescinded or modified, or its mining plans may be voluntarily adjusted, to mitigate against adverse impacts to such sites.
The costs, liabilities and requirements associated with these permitting requirements and any related opposition may be extensive and time-consuming and may delay commencement or continuation of exploration or production which would adversely affect the Company’s coal production, cash flows and profitability. Further, required permits may not be issued or renewed in a timely fashion or at all, or permits issued or renewed may be conditioned in a manner that may restrict the Company’s ability to efficiently and economically conduct its mining activities, any of which would materially reduce its production, cash flows and profitability.
Concerns about the impacts of coal combustion on global climate are increasingly leading to conditions that have affected and could continue to affect demand for the Company’s products or its securities and its ability to produce, including increased governmental regulation of coal combustion and unfavorable investment decisions by electricity generators.
Global climate issues continue to attract public and scientific attention. Numerous reports, including the Fourth and the Fifth Assessment Report of the Intergovernmental Panel on Climate Change, have also engendered concern about the impacts of human activity, especially fossil fuel combustion, on global climate issues. In turn, increasing government attention is being paid to global climate issues and to emissions of GHGs, including emissions of CO2 from coal combustion by power plants.
The enactment of future laws or the passage of regulations regarding emissions from the use of coal by the U.S., some of its states or other countries, or other actions to limit such emissions, could result in electricity generators switching from coal to other fuel sources. Further, policies limiting available financing for the development of new coal-fueled power stations could adversely impact the global demand for coal in the future. The potential financial impact on Peabody of such future laws, regulations or other policies will depend upon the degree to which any such laws or regulations force electricity generators to diminish their reliance on coal as a fuel source. That, in turn, will depend on a number of factors, including the specific requirements imposed by any such laws, regulations or other policies, the time periods over which those laws, regulations or other policies would be phased in, the state of development and deployment of CCUS technologies as well as acceptance of CCUS technologies to meet regulations and the alternative uses for coal. Higher-efficiency coal-fired power plants may also be an option for meeting laws or regulations related to emissions from coal use. Several countries, including major coal users such as China, India and Japan, included using higher-efficiency coal-fueled power plants in their plans under the Paris Agreement.
|
|
|
|
|
|
|
|
|
| Peabody Energy Corporation |
2023 Form 10-K |
32 |
From time to time, the Company’s Board of Directors and management attempt to analyze the potential impact on the Company of as-yet-unadopted, potential laws, regulations and policies. Such analyses require significant assumptions as to the specific provisions of such potential laws, regulations and policies which sometimes show that if implemented in the manner assumed by the analyses, the potential laws, regulations and policies could result in material adverse impacts on the Company’s operations, financial condition or cash flows. Such analyses cannot be relied upon to reasonably predict the quantitative impact that future laws, regulations or other policies may have on the Company’s results of operations, financial condition or cash flows.
Numerous activist groups are devoting substantial resources to anti-coal activities to minimize or eliminate the use of coal as a source of electricity generation, domestically and internationally, thereby further reducing the demand and pricing for coal, and potentially materially and adversely impacting the Company’s future financial results, liquidity and growth prospects.
Several non-governmental organizations have undertaken campaigns to minimize or eliminate the use of coal as a source of electricity generation in the U.S. and across the globe. In an effort to stop or delay coal mining activities, activist groups have brought lawsuits challenging the issuance of individual coal leases and challenging the federal coal leasing program more broadly. Other lawsuits challenge historical and pending regulatory approvals, permits and processes that are necessary to conduct coal mining operations or to operate coal-fueled power plants, including so-called “sue and settle” lawsuits where regulatory authorities in the past have reached private agreements with environmental activists that often involve additional regulatory restrictions or processes being implemented without formal rulemaking.
The effect of these and other similar developments has made it more costly and difficult to maintain the Company’s business. These cost increases and/or substantial or extended declines in the prices the Company receives for its coal due to these or other factors could reduce its revenue and profitability, cash flows, liquidity, and value of its coal reserves and resources, and could result in material losses.
The Company’s trading and hedging activities do not cover certain risks and may expose it to earnings volatility and other risks.
The Company is subject to coal price volatility, price volatility on diesel fuel utilized in its mining operations and foreign currency exchange rate risk associated with the Australian dollar. The Company hedges certain of these risks through hedging arrangements and may continue in the future to enter into hedging arrangements, including economic hedging arrangements, to manage these risks or other exposures. Since the Company’s existing hedging arrangements do not receive cash flow hedge accounting treatment, all changes in fair value are reflected in current earnings.
Some of these hedging arrangements may require the Company to post margin based on the value of the related instruments and other credit factors. If the fair value of its hedge portfolio moves significantly, or if laws, regulations or exchange rules are passed requiring all hedge arrangements to be exchange-traded or exchange-cleared, the Company could be required to post additional margin, which could negatively impact its liquidity.
The Company’s future success depends upon its ability to continue acquiring and developing coal reserves and resources that are economically recoverable.
The Company’s recoverable reserves and resources decline as it produces coal. The Company has not yet applied for the permits required or developed the mines necessary to use all of its reserves and resources. Moreover, the amount of coal reserves and resources described in Part I, Item 2. “Properties” involves the use of certain estimates and those estimates could be inaccurate. Actual production, revenue and expenditures with respect to its coal reserves and resources may vary materially from estimates.
The Company’s future success depends upon it conducting successful exploration and development activities or acquiring properties containing economically recoverable reserves and resources. The Company’s current strategy includes increasing its coal reserves and resources through acquisitions of government and other leases and producing properties and continuing to use its existing properties and infrastructure. In certain locations, leases for oil, natural gas and coalbed methane reserves are located on, or adjacent to, some of the Company’s coal reserves and resources, potentially creating conflicting interests between it and lessees of those interests. Other lessees’ rights relating to these mineral interests could prevent, delay or increase the cost of developing the Company’s coal reserves and resources. These lessees may also seek damages from the Company based on claims that its coal mining operations impair their interests. Additionally, the U.S. federal government limits the amount of federal land that may be leased by any company to 75,000 acres in any one state and 150,000 acres nationwide. As of December 31, 2023, the Company leased a total of 44,287 acres from the federal government subject to those limitations.
|
|
|
|
|
|
|
|
|
| Peabody Energy Corporation |
2023 Form 10-K |
33 |
The Company’s planned mine development projects and acquisition activities may not result in significant additional reserves and resources, and it may not have success developing additional mines. Most of its mining operations are conducted on properties owned or leased by the Company. Its right to mine some of its coal reserves and resources may be materially adversely affected if defects in title or boundaries exist. In order to conduct its mining operations on properties where these defects exist, the Company may incur unanticipated costs. In addition, in order to develop its reserves and resources, the Company must also own the rights to the related surface property and receive various governmental permits. The Company cannot predict whether it will continue to receive the permits or appropriate land access necessary for it to operate profitably in the future. The Company may not be able to negotiate or secure new leases from the government or from private parties, obtain mining contracts for properties containing additional coal reserves and resources or maintain its leasehold interest in properties on which mining operations have not commenced or have not met minimum quantity or product royalty requirements. From time to time, the Company has experienced litigation with lessors of its coal properties and with royalty holders. In addition, from time to time, its permit applications and federal and state coal leases have been challenged, causing production delays.
To the extent that the Company’s existing sources of liquidity are not sufficient to fund its planned mine development projects or coal reserve and resource acquisition activities, it may require access to capital markets, which may not be available to it or, if available, may not be available on satisfactory terms. If the Company is unable to fund these activities, it may not be able to maintain or increase its existing production rates and could be forced to change its business strategy, which could have a material adverse effect on its financial condition, results of operations and cash flows.
The Company faces numerous uncertainties in estimating its coal reserves and resources and inaccuracies in its estimates could result in lower than expected revenue, higher than expected costs and decreased profitability.
Coal is economically recoverable when the price at which the Company’s coal can be sold exceeds the costs and expenses of mining and selling the coal. The costs and expenses of mining and selling the coal are determined on a mine-by-mine basis, and as a result, the price at which its coal is economically recoverable varies based on the mine. Forecasts of the Company’s future performance are based on, among other things, estimates of its recoverable coal reserves and resources. The Company bases its reserve and resource information on engineering, economic and geological data assembled and analyzed by its staff and third parties, which includes various engineers and geologists. The Company's estimates are also subject to SEC regulations regarding classification of reserves and resources, including subpart 1300 of Regulation S-K. The reserve and resource estimates as to both quantity and quality are updated from time to time to reflect production of coal from the reserves and resources and new drilling or other data received. There are numerous uncertainties inherent in estimating quantities and qualities of coal and costs to mine recoverable reserves and resources, including many factors beyond the Company’s control.
Estimates of economically recoverable coal reserves and resources necessarily depend upon a number of variable factors and assumptions, any one of which may, if incorrect, result in an estimate that varies considerably from actual results. These factors and assumptions include:
•geologic and mining conditions, which may not be fully identified by available exploration data and may differ from the Company’s experience in areas it currently mines;
•demand for coal;
•current and future market prices for coal, contractual arrangements, operating costs and capital expenditures;
•severance and excise taxes, royalties and development and reclamation costs;
•future mining technology improvements;
•the effects of regulation by governmental agencies;
•the ability to obtain, maintain and renew all required permits;
•employee health and safety; and
•historical production from the area compared with production from other producing areas.
The conversion of reported mineral resources to mineral reserves should not be assumed, and the reclassification of reported mineral resources from lower to higher levels of geological confidence should not be assumed. As such, actual coal tonnage recovered from identified reserve and resource areas or properties and revenue and expenditures with respect to the Company’s coal reserves and resources may vary materially from estimates. Thus, these estimates may not accurately reflect its actual reserves and resources. Any material inaccuracy in the Company’s estimates related to its coal reserves and resources could result in lower than expected revenue, higher than expected costs or decreased profitability which could materially and adversely affect its business, results of operations, financial position and cash flows.
|
|
|
|
|
|
|
|
|
| Peabody Energy Corporation |
2023 Form 10-K |
34 |
Joint ventures, partnerships or non-managed operations may not be successful and may not comply with the Company’s operating standards.
The Company participates in several joint venture and partnership arrangements and may enter into others, all of which necessarily involve risk. Whether or not the Company holds majority interests or maintains operational control in its joint ventures, its partners may, among other things, (1) have economic or business interests or goals that are inconsistent with, or opposed to, the Company’s; (2) seek to block actions that the Company believes are in its or the joint venture’s best interests; or (3) be unable or unwilling to fulfill their obligations under the joint venture or other agreements, such as contributing capital, each of which may adversely impact the Company’s results of operations and its liquidity or impair its ability to recover its investments.
Where the Company’s joint ventures are jointly controlled or not managed by it, the Company may provide expertise and advice but have limited control over compliance with its operational standards. The Company also utilizes contractors across its mining platform, and may be similarly limited in its ability to control their operational practices. Failure by non-controlled joint venture partners or contractors to adhere to operational standards that are equivalent to the Company’s could unfavorably affect safety results, operating costs and productivity and adversely impact its results of operations and reputation.
The Company’s expenditures for postretirement benefit obligations could be materially higher than it has predicted if its underlying assumptions prove to be incorrect.
The Company pays postretirement health and life insurance benefits to eligible retirees. Its total accumulated postretirement benefit obligation related to such benefits was a liability of $163.7 million as of December 31, 2023, of which $15.3 million was classified as a current liability.
These liabilities are actuarially determined. The Company uses various actuarial assumptions, including the discount rate, future cost trends, mortality tables, demographic assumptions and expected rates of return on plan assets to estimate the costs and obligations for these items. Its discount rate is determined by utilizing a hypothetical bond portfolio model which approximates the future cash flows necessary to service its liabilities. A decrease in the discount rate used to determine its postretirement benefit obligations could result in an increase in the valuation of these obligations, thereby increasing the cost in subsequent fiscal years. The Company has made assumptions related to future trends for medical care costs in the estimates of retiree health care obligations. Its medical trend assumption is developed by annually examining the historical trend of its cost per claim data. If the Company’s assumptions do not materialize as expected, actual cash expenditures and costs that it incurs could differ materially from its current estimates. Moreover, regulatory changes or changes in healthcare benefits provided by the government could increase its obligation to satisfy these or additional obligations. The Company develops its actuarial determinations of liabilities using actuarial mortality tables it believes best fit its population’s actual results. In deciding which mortality tables to use, the Company periodically reviews its population’s actual mortality experience and evaluates results against its current assumptions as well as consider recent mortality tables published by the Society of Actuaries Retirement Plans Experience Committee in order to select mortality tables for use in its year end valuations. If the Company’s mortality tables do not anticipate its population’s mortality experience as accurately as expected, actual cash expenditures and costs that the Company incurs could differ materially from its current estimates.
High inflation could continue to result in higher costs and decreased profitability.
In recent years the Company has been adversely impacted by inflation, which has increased the cost of materials, labor, equipment, freight, fuel and other cost categories. The Company’s efforts to recover inflation-based cost increases from its customers may be hampered as a result of the structure of its contracts and the contract bidding process as well as the competitive industries, economic conditions and countries in which the Company operates. Accordingly, substantial inflation may result in a material adverse impact on the Company’s costs, profitability and financial results.
The Company’s business, results of operations, financial condition and prospects could be materially and adversely affected by pandemic or other widespread illnesses and the related effects on public health.
The Company’s operations are susceptible to widespread outbreaks of illness or other public health issues. Pandemic illnesses could have a material adverse effect on the Company’s business, results of operations, financial condition and prospects, including its ability to comply with restrictions and covenants under its debt and surety bonding obligations.
|
|
|
|
|
|
|
|
|
| Peabody Energy Corporation |
2023 Form 10-K |
35 |
Pandemic or other widespread illnesses could result in governmental mandates requiring shutdowns of facilities for indefinite periods; serious health issues and absenteeism within the workforce; and disruptions to supply chain and distribution channels impacting both vendors and customers. As a result, the Company could face increased costs or decreased sales. Adverse changes in the general domestic and global economic conditions and disrupted domestic and international credit markets, could negatively affect its customers’ ability to pay the Company as well as its ability to access capital that could negatively affect its liquidity. Despite its efforts to manage these potential impacts, their ultimate impact would also depend on factors beyond the Company’s knowledge or control, including the duration and severity of the pandemic as well as third-party actions taken to contain its spread and mitigate its public health effects. These factors could have a material adverse effect on its business, financial condition, results of operations and prospects.
Peabody is exposed to risks associated with political or international conflicts.
Political or international conflicts can result in worldwide geopolitical and macroeconomic uncertainty, as has been the case with the ongoing conflict between Russia and Ukraine, the Israel-Hamas conflict and escalating tensions in the Middle East. The Company is unable to predict the ultimate impacts related to such conflicts. If a conflict continues for a significant time or expands to other countries, it could have adverse effects on macroeconomic conditions, including but not limited to, turbulent coal pricing and trade flow disruptions resulting from sanctions imposed on coal imports; supply chain disruptions; increased costs; and decreased business spending. Furthermore, political or international conflicts could give rise to disruptions to Peabody or its business partners’ global technology infrastructure, including through cybersecurity attack or cyber intrusion; adverse changes in international trade policies and relations; regulatory enforcement; Peabody’s ability to implement and execute its business strategy; terrorist activities; Peabody’s exposure to foreign currency fluctuations; and constraints, volatility, or disruption in the capital markets, any of which could have a material adverse effect on the Company’s business, results of operations, cash flows and financial condition.
Peabody could be exposed to significant liability, reputational harm, loss of revenue, increased costs or other risks if it sustains cybersecurity attacks or other security breaches that disrupt its operations or result in the dissemination of proprietary or confidential information about the Company, its customers or other third-parties.
Peabody has implemented security protocols and systems with the intent of maintaining the physical security of its operations and protecting the Company’s and its counterparties’ confidential information and information related to identifiable individuals against unauthorized access. Despite such efforts, the Company may be subject to security breaches which could result in unauthorized access to its facilities or the information it is trying to protect. Unauthorized physical access to one of the Company’s facilities or electronic access to its information systems could result in, among other things, unfavorable publicity, litigation by affected parties, damage to sources of competitive advantage, disruptions to its operations, loss of customers, financial obligations for damages related to the theft or misuse of such information and costs to remediate such security vulnerabilities, any of which could have a substantial impact on the Company’s results of operations, financial condition or cash flows.
The Company is subject to various general operating risks which may be fully or partially outside of its control.
The Company’s results of operations, financial position or cash flows could be adversely impacted by various general operating risks which may be fully or partially outside of its control. Such risks stem from internal and external sources and include:
•global economic recessions and/or credit market disruptions;
•deterioration of the creditworthiness of its customers or counterparties to financial instruments, and their ability to perform under contracts;
•inability of suppliers and other counterparties, including those related to transportation, contract mining, service provision, and coal trading and brokerage, to fulfil the terms of their contracts with the Company;
•decreases in the availability or increases in costs of key supplies, capital equipment or commodities such as diesel fuel, steel, explosives and tires;
•disruption to, or increased costs within, the transportation chain for coal, including rail, barge, trucking, overland conveyor, ports and ocean-going vessels;
•new or increased forms of taxation imposed by federal, state, provincial or local governmental authorities, including production taxes, sales-related taxes, royalties, environmental taxes, mining profits taxes and income taxes; and
•uncertainties associated with the Company’s global operating platform, including country and political risks, international regulatory requirements, and foreign currency rates.
|
|
|
|
|
|
|
|
|
| Peabody Energy Corporation |
2023 Form 10-K |
36 |
Risks Related to Peabody’s Capital Structure
The Company may be able to incur more debt, including secured debt, which could increase the risks associated with its indebtedness.
As of December 31, 2023, the Company had approximately $320.0 million of unsecured indebtedness outstanding, excluding finance leases and debt issuance costs. As further discussed in “Liquidity and Capital Resources” of Part II, Item 7. “Management’s Discussion and Analysis of Financial Condition and Results of Operations,” as of January 2024 the Company has an additional $320.0 million in revolving commitments.
The Company may be able to incur additional indebtedness in the future, including secured debt. Although covenants under agreements governing the Company’s other indebtedness, including its revolving credit facility and finance leases, limit the Company’s ability to incur additional indebtedness, these restrictions are subject to a number of qualifications and exceptions. In addition, the agreements governing the Company’s other indebtedness do not limit the Company from incurring obligations that do not constitute indebtedness as defined therein.
The degree to which the Company is leveraged could have important consequences, including, but not limited to:
•making it more difficult for the Company to pay interest and satisfy its debt obligations;
•increasing the cost of borrowing;
•increasing the Company’s vulnerability to general adverse economic and industry or regulatory conditions;
•requiring the dedication of a substantial portion of the Company’s cash flow from operations to the payment of principal and interest on the Company’s indebtedness, thereby reducing the availability of cash flow to fund working capital, capital expenditures, business development or other general corporate requirements;
•limiting the Company’s ability to obtain additional financing to fund future working capital, capital expenditures, business development or other general corporate requirements;
•making it more difficult to obtain surety bonds, letters of credit, bank guarantees or other financing, particularly during periods in which credit markets are weak;
•limiting the Company’s flexibility in planning for, or reacting to, changes in its business and in the coal industry;
•causing a decline in the Company’s credit ratings; and
•placing the Company at a competitive disadvantage compared to less leveraged competitors.
The terms of the agreements and instruments governing the Company’s debt and surety bonding obligations impose restrictions that may limit its operating and financial flexibility.
The agreements governing the Company’s unsecured debt, revolving credit facility and surety bonding obligations contain certain restrictions and covenants, which are described below and which could adversely affect the Company’s ability to operate its business, as well as significantly affect its liquidity, and therefore could adversely affect its business, financial condition and results of operations.
These restrictions and covenants may limit, among other things, the Company’s ability to:
•incur additional indebtedness;
•pay dividends on or make distributions in respect of stock or make certain other restricted payments, such as share repurchases;
•make capital or other investments;
•enter into agreements that restrict distributions from certain subsidiaries;
•sell or otherwise dispose of assets;
•use for general purposes the cash received from certain allowable asset sales or disposals;
•enter into transactions with affiliates;
•create or incur liens;
•merge, consolidate or sell all or substantially all of its assets; and
•receive dividends or other payments from subsidiaries in certain cases.
|
|
|
|
|
|
|
|
|
| Peabody Energy Corporation |
2023 Form 10-K |
37 |
The Company’s ability to comply with these restrictions or covenants may be affected by events beyond its control. A breach of any of these restrictions or covenants together with the expiration of any cure period, if applicable, could result in a default. If any such default occurs, subject to applicable grace periods, the holders of the Company’s indebtedness may elect to declare such indebtedness, together with accrued interest and other amounts payable thereunder, to be immediately due and payable. In addition, the lenders under the Company’s revolving credit facility could elect to require the cash collateralization of any outstanding letters of credit. If the Company’s indebtedness is accelerated, the Company may not have sufficient cash flows and capital resources to repay such indebtedness or be able to restructure or refinance such indebtedness. Even if the Company were able to restructure its indebtedness or obtain additional capital or new or replacement financing, it may not be on commercially reasonable terms or on terms that are acceptable to the Company.
In this regard, if the Company experiences a default under the terms of its unsecured debt, revolving credit facility or surety bonding obligations for any reason, its business, financial condition and results of operations could be materially and adversely affected. In addition, complying with such terms may make it more difficult for the Company to successfully execute its business strategy, including by making it more difficult to compete against competitors who are not subject to such financial restrictions.
The number and quantity of viable financing and insurance alternatives available to the Company may be significantly impacted by unfavorable lending and investment policies by financial institutions and insurance companies associated with concerns about environmental impacts of coal combustion, and negative views around its efforts with respect to environmental and social matters and related governance considerations could harm the perception of the Company by a significant number of investors or result in the exclusion of its securities from consideration by those investors.
Certain banks, other financing sources and insurance companies have taken actions to limit available financing and insurance coverage for the development of new coal-fueled power plants and coal producers and utilities that derive a majority of their revenue from coal, and particularly from thermal coal. This may adversely impact the future global demand for coal. Increasingly, the actions of such financial institutions and insurance companies are informed by non-standardized “sustainability” scores, ratings and benchmarking studies provided by various organizations that assess environmental, social and governance matters. Further, there have been efforts in recent years by members of the general financial and investment communities, including investment advisors, sovereign wealth funds, public pension funds, universities and other institutional investors, to divest themselves and to promote the divestment of securities issued by companies involved in the fossil fuel extraction market, or that have low ratings or scores in studies and assessments of the type noted above, including coal producers. These entities also have been pressuring lenders to limit financing available to such companies.
These efforts may have adverse consequences, including, but not limited to:
•restricting the Company’s ability to access capital and financial markets in the future;
•reducing the demand and price for its equity securities;
•increasing the cost of borrowing;
•causing a decline in the Company’s credit ratings;
•reducing the availability, and/or increasing the cost of, third-party insurance;
•increasing the Company’s retention of risk through self-insurance;
•making it more difficult to obtain surety bonds, letters of credit, bank guarantees or other financing; and
•limiting the Company’s flexibility in business development activities such as mergers, acquisitions and divestitures.
|
|
|
|
|
|
|
|
|
| Peabody Energy Corporation |
2023 Form 10-K |
38 |
Risks Related to Ownership of Peabody’s Securities
The price of Peabody’s securities may be volatile.
The price of Peabody’s common stock (Common Stock) may fluctuate due to a variety of market and industry factors that may materially reduce the market price of its Common Stock regardless of its operating performance, including, among others:
•general economic conditions within the U.S. and internationally, including inflationary pressures and changes in interest rates;
•general market conditions;
•actual or anticipated fluctuations in Peabody’s quarterly and annual results and those of other public companies in its industry;
•industry cycles and trends;
•mergers and strategic alliances in the coal industry;
•changes in government regulation;
•potential or actual military conflicts or acts of terrorism;
•the failure of securities analysts to publish research about Peabody or to accurately predict the results it actually achieves;
•changes in accounting principles;
•announcements concerning Peabody or its competitors;
•the purchase and sale of shares of its Common Stock by significant shareholders;
•lack of or excess of trading liquidity;
•operational incidents; and
•investor sentiment with respect to our policies or efforts on environmental, social or governance matters.
As a result of all of these factors, investors in Peabody’s Common Stock may not be able to resell their stock at or above the price they paid or at all. Further, Peabody could be the subject of securities class action litigation due to any such stock price volatility, which could divert management’s attention and have a material adverse effect on its results of operation.
Peabody’s Common Stock is subject to dilution and may be subject to further dilution in the future.
Peabody’s Common Stock is subject to dilution from its convertible senior debt and its long-term incentive plan. In addition, Peabody may continue issuing equity securities in connection with future investments, acquisitions or capital raising transactions. Such issuances or grants could constitute a significant portion of the then-outstanding Common Stock, which may result in significant dilution in ownership of Common Stock.
There may be circumstances in which the interests of a significant stockholder could be in conflict with other stakeholders’ interests.
Circumstances may arise in which the interests of a significant stockholder may be in conflict with the interests of the Company’s other stakeholders. A significant stockholder may exert substantial influence over the Company to cause the Company to take action that aligns with their interests, for example, to pursue or prevent acquisitions, divestitures or other transactions, including the issuance or repurchase of additional shares or debt, that, in its judgment, could enhance its investment in Peabody or another company in which it invests. Such transactions may advance the interests of the significant stockholder and not necessarily those of other stakeholders, which might adversely affect Peabody or other holders of its Common Stock or debt instruments.
|
|
|
|
|
|
|
|
|
| Peabody Energy Corporation |
2023 Form 10-K |
39 |
The future payment of dividends on Peabody’s stock or future repurchases of its stock is dependent on a number of factors and cannot be assured.
On April 17, 2023, the Company announced that its Board of Directors approved a shareholder return framework which includes share repurchases and cash dividends. The Board also approved a share repurchase program authorizing repurchases of up to $1.0 billion of the Company’s common stock. Under the share repurchase program authorized by the Board, the Company may purchase shares of common stock from time to time at the discretion of management through open market purchases, privately negotiated transactions, block trades, accelerated or other structured share repurchase programs, or other means. The amount of any share repurchase transactions is subject to the Company’s annual Available Free Cash Flow (as defined in Part II, Item 7. “Management’s Discussion and Analysis of Financial Condition and Results of Operations”). The manner, timing and pricing of any share repurchase transactions will be based on a variety of factors, including market conditions, applicable legal requirements and alternative opportunities that the Company may have for the use or investment of capital. The payment of future cash dividends and future repurchases will depend upon Peabody’s earnings, economic conditions, liquidity and capital requirements, and other factors, including its leverage and other financial ratios. Accordingly, the Company cannot make any assurance that future dividends will be paid or future repurchases will be made.
General Risk Factors
The Company may not be able to fully utilize its deferred tax assets.
The Company is subject to income and other taxes in the U.S. and numerous foreign jurisdictions, most significantly Australia. As of December 31, 2023, the Company had gross deferred income tax assets, including net operating loss (NOL) carryforwards, and liabilities of $1,556.1 million and $111.2 million, respectively, as described further in Note 8. “Income Taxes” to the accompanying consolidated financial statements. At that date, the Company also had recorded a valuation allowance of $1,473.5 million.
The Company’s ability to use its U.S. NOL carryforwards may be limited if it experiences an “ownership change” as defined in Section 382 of the Internal Revenue Code of 1986, as amended. An ownership change generally occurs if certain stockholders increase their aggregate percentage ownership of a corporation’s stock by more than 50 percentage points over their lowest percentage ownership at any time during the testing period, which is generally the three-year period preceding any potential ownership change.
Although the Company may be able to utilize some or all of those deferred tax assets in the future if it has income of the appropriate character in those jurisdictions (subject to loss carryforward and tax credit expiry, in certain cases), there is no assurance that it will be able to do so. Further, the Company is presently unable to record tax benefits on future losses in the U.S. until such time as sufficient income is generated by its operations in those jurisdictions to support the realization of the related net deferred tax asset positions. The Company’s results of operations, financial condition and cash flows may adversely be affected in future periods by these limitations.
Acquisitions and divestitures are a potentially important part of the Company’s long-term strategy, subject to its investment criteria, and involve a number of risks, any of which could cause the Company not to realize the anticipated benefits.
The Company has engaged in, and may continue to engage in acquisition or divestiture activity, such as its recent conditional acquisition of the southern part of Stanmore’s Ward Wells Tenements in Queensland’s Bowen Basin, based on its set of investment criteria to produce outcomes that increase shareholder value or provide potential strategic benefits. If the Company fails to accurately estimate the future results and value of these assets or any other acquired or divested business or assets and the related risk associated with such a transaction, or are unable to successfully integrate the businesses or assets it acquires, its business, financial condition or results of operations could be negatively affected. Moreover, any transactions the Company pursues could materially impact its liquidity and an acquisition could increase capital resource needs and may require it to incur indebtedness, seek equity capital or both. The Company may not be able to satisfy these liquidity and capital resource needs on acceptable terms or at all. In addition, future acquisitions could result in its assuming significant long-term liabilities, including potentially unknown liabilities, relative to the value of the acquisitions.
Peabody’s certificate of incorporation and by-laws include provisions that may discourage a takeover attempt.
Provisions contained in Peabody’s certificate of incorporation and by-laws and Delaware law could make it more difficult for a third-party to acquire it, even if doing so might be beneficial to its stockholders. Provisions of Peabody’s by-laws and certificate of incorporation impose various procedural and other requirements that could make it more difficult for stockholders to effect certain corporate actions. These provisions could limit the price that certain investors might be willing to pay in the future for shares of its Common Stock and may have the effect of delaying or preventing a change in control.
|
|
|
|
|
|
|
|
|
| Peabody Energy Corporation |
2023 Form 10-K |
40 |
Diversity in interpretation and application of accounting literature in the mining industry may impact the Company’s reported financial results.
The mining industry has limited industry-specific accounting literature and, as a result, the Company understands diversity in practice exists in the interpretation and application of accounting literature to mining-specific issues. As diversity in mining industry accounting is addressed, the Company may need to restate its reported results if the resulting interpretations differ from its current accounting practices. Refer to Note 1. “Summary of Significant Accounting Policies” to the accompanying consolidated financial statements for a summary of the Company’s significant accounting policies.
Item 1B. Unresolved Staff Comments.
None.
Item 1C. Cybersecurity.
Risk Management and Strategy
Peabody uses digital technology to conduct its business operations and engage with its customers, vendors and partners. As the Company invests in technologies such as cloud, analytics, automation and artificial intelligence, it strives to provide the necessary controls to protect these digital assets from continuously evolving cybersecurity risks.
Peabody’s cybersecurity strategy emphasizes reduction of cybersecurity risk exposure and continuous improvement of its controls and policies based on industry recognized best practices for cybersecurity and information technology, including the National Institute of Standards and Technology (NIST) Cybersecurity Framework (CSF). This strategy includes: (i) proactive management of cybersecurity risk to ensure compliance with contractual, legal and regulatory requirements; (ii) performing due diligence on third parties to ensure they have sound cybersecurity practices in place; (iii) ensuring essential business services remain available during a business disruption; (iv) annual cybersecurity assessments to include NIST CSF maturity assessments, penetration testing and red team assessments, as well as table top exercises with subsequent remediation of key findings; (v) participation in Information Sharing and Collaboration industry groups; (vi) maintaining an updated cybersecurity policy and incident response plan; (vii) exercising cyber incident response plans and risk mitigation strategies to address potential incidents should they occur; and (viii) annual cybersecurity awareness training for all employees and directors, including formal training and simulated phishing events.
Third-party experts are engaged to conduct NIST CSF maturity assessments, penetration testing assessments, periodic red team assessments and table top exercises. At a minimum, at least one of these assessments is conducted annually by a third-party expert. Peabody also engages a third-party expert to assess the risk of its business and operational vendors.
Peabody’s enterprise risk management (ERM) framework considers cybersecurity risk alongside other company risks as part of the Company’s overall risk assessment process. The ERM team collaborates with the Chief Information Security Officer (CISO), to gather insights for assessing, identifying and managing cybersecurity threat risks, their severity, and potential mitigations.
Governance
Peabody’s Board of Directors maintains direct oversight over cybersecurity risks and oversees an enterprise-wide approach to risk management, designed to support the achievement of organizational objectives to enhance long-term performance and stockholder value. The Board, as a whole, and through its committees, is responsible for the oversight of risk management and Peabody’s management is responsible for the day-to-day management of the risks the Company faces. Senior leadership, including Peabody’s CISO, regularly briefs the Board on cybersecurity matters and the Board is informed of cybersecurity incidents deemed to have a moderate or higher business impact, even if such incidents are determined to be immaterial, on an ongoing basis.
Peabody’s global cybersecurity department is responsible for overall cybersecurity strategy, policy, operations and cybersecurity incident response. Team members who support the Company’s cybersecurity program invest in ongoing skills development including maintaining industry recognized certifications such as the ISC2 CISSP, GIAC GCIH, Comp TIA Security+, as well as platform specific certifications focused on Peabody’s current cybersecurity infrastructure.
Impact of cybersecurity risks on business strategy, results of operations or financial condition
While Peabody has experienced cybersecurity incidents in the past, to date none have materially affected the Company’s business strategy, results of operations or financial condition. Peabody continues to invest in the cybersecurity and resiliency of its networks and to enhance its internal controls and processes, which are designed to help protect its systems and infrastructure, and the information they contain.
|
|
|
|
|
|
|
|
|
| Peabody Energy Corporation |
2023 Form 10-K |
41 |
For more information regarding the risks the Company faces from cybersecurity threats, refer to Item 1A. “Risk Factors.”
Item 2. Properties.
Coal Reserves and Resources
Information concerning the Company’s mining properties in this Annual Report on Form 10-K has been prepared in accordance with the requirements of subpart 1300 of Regulation S-K. Subpart 1300 of Regulation S-K requires disclosure of mineral resources, in addition to mineral reserves, both in the aggregate and for each of the Company’s individually material mining properties. The Company’s coal reserves and resources are estimated by individuals deemed Qualified Persons (QP) according to the standards set forth in subpart 1300 of Regulation S-K.
Mineral resources and reserves are defined in subpart 1300 of Regulation S-K as follows:
•Mineral resource. A concentration or occurrence of material of economic interest in or on the earth's crust in such form, grade or quality, and quantity that there are reasonable prospects for economic extraction. A mineral resource is a reasonable estimate of mineralization, taking into account relevant factors such as cut-off grade, likely mining dimensions, location or continuity, that, with the assumed and justifiable technical and economic conditions, is likely to, in whole or in part, become economically extractable. It is not merely an inventory of all mineralization drilled or sampled.
•Mineral reserve. An estimate of tonnage and grade or quality of indicated and measured mineral resources that, in the opinion of a QP, can be the basis of an economically viable project. More specifically, it is the economically mineable part of a measured or indicated mineral resource, which includes diluting materials and allowances for losses that may occur when the material is mined or extracted.
Under subpart 1300 of Regulation S-K, mineral resources may not be classified as mineral reserves unless the determination has been made by a QP that such mineral resources can be the basis of an economically viable project. The conversion of reported mineral resources to mineral reserves should not be assumed.
Coal resources are estimated from geological models constructed from an extensive historical database of drill holes and the Company’s ongoing drilling program. Data from individual drill holes is compiled in a computerized drill-hole database, including the depth, thickness and, where core drilling is used, the quality of the coal observed. For coal deposits, the density of a drill pattern is one of the important factors which determine whether the related coal will be classified as measured, indicated, or inferred.
Mineral resource classifications are differentiated under subpart 1300 of Regulation S-K, in part, as follows:
•Measured resource. That part of a mineral resource with the highest level of geological confidence; quantity and grade or quality are estimated on the basis of conclusive geological evidence and sampling. The level of geological certainty associated with a measured mineral resource is sufficient to allow a qualified person to apply modifying factors in sufficient detail to support detailed mine planning and final evaluation of the economic viability of the deposit.
•Indicated resource. That part of a mineral resource with a level of geological confidence between that of measured and inferred resources; quantity and grade or quality are estimated on the basis of adequate geological evidence and sampling. The level of geological certainty associated with an indicated mineral resource is sufficient to allow a qualified person to apply modifying factors in sufficient detail to support mine planning and evaluation of the economic viability of the deposit.
•Inferred resource. That part of a mineral resource with the lowest level of geological confidence; quantity and grade or quality are estimated on the basis of limited geological evidence and sampling. The level of geological uncertainty associated with an inferred mineral resource is too high to apply relevant technical and economic factors likely to influence the prospects of economic extraction in a manner useful for evaluation of economic viability.
|
|
|
|
|
|
|
|
|
| Peabody Energy Corporation |
2023 Form 10-K |
42 |
The geological confidence surrounding resource classification is first determined by a drill hole spacing analysis performed by a QP using geostatistical techniques. A QP may also use qualitative analysis to determine the geologic confidence based on historical experience with a specific coal deposit. Resources are further evaluated using a set of structure and quality parameters to determine the reasonable prospects for economic extraction. The structure parameters include coal thickness, depth, dipping angle, and strip ratio, among others. The quality parameters include ash and sulfur content, yield, and heat value, among others. Each coal deposit is different with respect to geology, potential mining methods, logistics, and markets. The cut-off criteria of those structure and quality parameters are different for each deposit, and a QP generally forms those criteria based upon experience with the Company’s existing mining operations or adjacent operations with similar geological conditions. Other factors, such as coal control, or surface and underground obstacles are also considered in connection with resource estimates. The reclassification of reported mineral resources from lower to higher levels of geological confidence should not be assumed.
The economically mineable part of a measured coal resource is considered a proven coal reserve and has the highest degree of assurance of economic viability. The economically mineable part of indicated, and sometimes measured, coal resources are considered probable coal reserves and have a moderate degree of assurance of economic viability.
For each mine or future mine, the Company develops Life-of-Mine (LOM) plans which employ a market-driven, risk-adjusted capital allocation process to guide long-term mine planning of active operations and development projects. QPs rely on LOM planning as an integral process for coal reserve and resource estimates. The LOM plans consider dilution and losses during mining and processing as recoverability factors to estimate saleable coal. The LOM plans are developed in consideration of market demands and operational constraints. The LOM plans project, among other things, annual quantities and qualities for each coal product. The saleable product mix for a mine may include multiple thermal and metallurgical products with different targeted qualities and sales prices. The expected volumes for each mine and product, as well as annual pricing forecasts for each product, developed as described below, and related cost forecasts, developed as described below, are then evaluated to determine the economically viable coal in the LOM plans. Other factors impacting the assessment include geological conditions, production expectations for certain areas, the effects of regulation and taxes by governmental agencies, future price and operating cost assumptions and adverse changes in market conditions and mine closure activities.
The Company periodically reviews and updates coal reserve and resource estimates to reflect the production of coal, new drill hole data, the effects of mining activities, analysis of new engineering and geological data, changes in property control, modification of mining methods and other factors.
Mineral Rights
The Company controls coal rights through direct ownership and numerous lease agreements with government or private parties. The majority of the Company’s coal reserves and resources are controlled through lease agreements with the U.S. and Australian governments. In addition, surface rights are required to conduct certain mining-related activities. The Company holds the majority of the required surface rights to meet mid- to long-term production requirements. The additional surface rights to meet long-term production requirements are expected to be acquired as needed.
The Company is party to numerous U.S. federal coal leases that are administered by the U.S. Department of the Interior under the Federal Coal Leasing Amendments Act of 1976. These leases cover Peabody’s principal reserves in the Powder River Basin and other reserves and resources in Alabama, Colorado and New Mexico. Each of these leases continues indefinitely, provided there is diligent development of the property and continued operation of the related mine or mines. The U.S. Bureau of Land Management (BLM) has asserted the right to adjust the terms and conditions of these leases, including rent and royalties, after the first 20 years of their term and at 10-year intervals thereafter. Annual rents on surface land under federal coal leases are now set at $3.00 per acre. Production royalties on federal leases are set by statute at 12.5% of the gross proceeds of coal mined and sold for surface-mined coal and 8% for underground-mined coal. The U.S. federal government limits by statute the amount of federal land that may be leased by any company and its affiliates at any time to 75,000 acres in any one state and 150,000 acres nationwide. As of December 31, 2023, the Company leased 1,610 acres of federal land in Alabama, 3,480 acres in Colorado, 282 acres in New Mexico and 38,915 acres in Wyoming, for a total of 44,287 acres nationwide subject to those limitations. The Company also leases coal-mining properties from various state governments in the U.S.
Private U.S. coal leases normally have terms of between 10 and 20 years and usually give the Company the right to renew the lease for a stated period or to maintain the lease in force until the exhaustion of mineable and merchantable coal contained on the relevant site. These private U.S. leases provide for royalties to be paid to the lessor either as a fixed amount per ton or as a percentage of the sales price. Many private U.S. leases also require payment of a lease bonus or minimum royalty, payable either at the time of execution of the lease or in periodic installments. The terms of private U.S. leases are normally extended by active production at or near the end of the lease term. Private U.S. leases containing undeveloped coal properties may expire or these leases may be renewed periodically.
|
|
|
|
|
|
|
|
|
| Peabody Energy Corporation |
2023 Form 10-K |
43 |
Mining and exploration in Australia are generally carried out under leases or licenses granted by state governments. Mining leases are typically for an initial term of up to 21 years (but which may be renewed) and contain conditions relating to such matters as minimum annual expenditures, restoration and rehabilitation. Royalties are paid to the state government as a percentage of the sales price. Generally, landowners do not own the mineral rights or have the ability to grant rights to mine those minerals. These rights are retained by state governments. Compensation is payable to landowners for loss of access to the land, and the amount of compensation can be determined by agreement or court process. Surface rights are typically acquired directly from landowners through agreement or court determination, subject to some exceptions.
Pricing
The pricing information used in support of the Company’s coal reserve and resource estimates include internal, proprietary price forecasts and existing contract economics, in each case on a mine-by-mine and product-by-product basis. In general, price forecasts are based on a thorough analytical process utilizing detailed supply and demand models, global economic indicators, projected foreign exchange rates, analyses of price relationships among various commodities, competing fuels analyses, projected supply and demand fundamentals for steel production and electricity generation, analyses of supplier costs and other variables. Price forecasts, supply and demand models and other key assumptions and analyses are stress-tested against independent third-party research (not commissioned by the Company) to confirm the conclusions reached through analytical processes, and that price forecasts fall within the ranges of the projections included in this third-party research. The development of the analyses, price forecasts, supply and demand models and related assumptions are subject to multiple levels of management review.
Below is a description of some of the specific factors that the Company evaluates in developing price forecasts for thermal and metallurgical coal products on a mine-by-mine and product-by-product basis. Differences between the assumptions and analyses included in the price forecasts and realized factors could cause actual pricing to differ from the forecasts.
Thermal. Several factors can influence thermal coal supply and demand and pricing. Demand is sensitive to total electric power generation volumes, which are determined in part by the impact of weather on heating and cooling demand and economic activity, inter-fuel competition in the electric power generation mix (such as from natural gas and renewable sources), changes in capacity (additions and retirements), competition from other producers, coal stockpiles and policy and regulations. Supply considerations impacting pricing include coal reserve and resource positions, mining methods, strip ratios, production costs and capacity and the cost of new supply (greenfield developments or extensions at existing mines).
In the United States, natural gas is the most significant substitute for thermal coal for electricity generation and can be one of the largest drivers of shifts in supply and demand and pricing. The competitiveness of natural gas as a generation fuel source has been strengthened by accelerated growth in domestic natural gas production, new natural gas combined cycle generation capacity and comparatively low natural gas prices versus historic levels. The build out of renewable generation and subsidized power can also be a key driver of power market pricing and hence coal prices.
Internationally, thermal coal-fueled generation also competes with alternative forms of electricity generation. The competitiveness and availability of generation fueled by natural gas, oil, nuclear, hydro, wind, solar and biomass vary by country and region and can have a meaningful impact on coal pricing. Policy and regulations, which vary from country to country, can also influence prices. In addition, seaborne thermal coal import demand can be significantly impacted by the availability of domestic coal production, particularly in the two leading coal import countries, China and India, and the competitiveness of seaborne supply from leading thermal coal exporting countries, including Indonesia, Australia, Russia, Colombia, the U.S. and South Africa, among others.
Metallurgical. Several factors can influence metallurgical coal supply and demand and pricing. Demand is impacted by economic conditions, government policies and demand for steel, and is also impacted by competing technologies used to make steel, some of which do not use coal as a manufacturing input. Competition from other types of coal is also a key price consideration and can be impacted by the coal quality and characteristics, delivered energy cost (including transportation costs), customer service and support, and reliability of supply.
Seaborne metallurgical coal import demand can be significantly impacted by the availability of domestic coal production, particularly in leading metallurgical coal import countries such as China, among others, as well as country-specific policies restricting or promoting domestic supply. The competitiveness of seaborne metallurgical coal supply from leading metallurgical coal exporting countries of Australia, the U.S., Russia, Canada, Mongolia and Mozambique, among others, is also an important price consideration.
|
|
|
|
|
|
|
|
|
| Peabody Energy Corporation |
2023 Form 10-K |
44 |
In addition to the factors noted above, the prices which may be obtained at each mine or future mine can be impacted by factors such as (i) the mine’s location, which impacts the total delivered energy costs to its customers, (ii) quality characteristics, particularly if they are unique relative to competing mines, (iii) assumed transportation costs and (iv) other mine costs that are contractually passed on to customers in certain commercial relationships.
Costs
The cost estimates used to establish LOM plans are generally made according to internal processes that project future costs based on historical costs and expected trends. The estimated costs normally include mining, processing, transportation, royalty, add-on tax and other mining-related costs. Estimated mining and processing costs reflect projected changes in prices of consumable commodities (mainly diesel fuel, explosives and steel), labor costs, geological and mining conditions, targeted product qualities and other mining-related costs. Estimates for other sales-related costs (mainly transportation, royalty and add-on tax) are based on contractual prices or fixed rates. Specific factors that may impact the Company’s operating costs include:
•Geological settings. The geological characteristics of each mine are among the most important factors that determine the mining cost. Company geologists conduct the exploration program and provide geological models for the LOM process. Coal seam depth, thickness, dipping angle, partings and quality constrain the available mining methods and size of operations. Shallow coal is typically mined by surface mining methods by which the primary cost is overburden removal. Deep coal is typically mined by underground mining methods where the primary costs include coal extraction, conveyance and roof control.
•Scale of operations and the equipment sizes. For surface mines, dragline systems generally have a lower unit cost than truck-and-shovel systems for overburden removal. Longwall operations are generally more cost-effective than room-and-pillar operations for underground mines.
•Commodity prices. For surface mines, the costs of diesel fuel and explosives are major components of the total mining cost. For underground mines, the steel used for roof control represents a significant cost. Forecasted commodity prices are used to project those costs in the financial models used to establish reserve and resource estimates.
•Target product quality. By targeting a premium quality product, mining and processing processes may experience more coal losses. By lowering product quality the coal losses can be minimized and therefore a lower cost per ton can be achieved. In the Company’s LOM plans, product qualities are estimated to correspond to existing contracts and forecasted market demands.
•Transportation costs. Transportation costs vary by region. Most of the Company’s U.S. thermal operations sell coal at mine loadouts. Therefore, no transportation expenses are included in U.S. thermal cost estimates. The Company’s seaborne operations typically sell coal at designated ports. The estimated costs for seaborne operations include rail and barge transportation and related fees at ports.
•Royalty costs. Royalty costs are based upon contractual agreements for the coal leased from governments or private owners. The royalty rates for coal leased from governments differ by country and, in some cases, by mining method. Estimated add-on taxes and other sales-related costs are determined according to government regulations or historical costs.
•Exchange rates. Costs related to the Company’s Australian production are predominantly denominated in Australian dollars, while the Australian coal exported is sold in U.S. dollars. As a result, Australian/U.S. dollar exchange rates impact the U.S. dollar cost of Australian production.
Summary of Coal Reserves and Resources
Peabody controlled an estimated 2.1 billion tons of coal reserves and 2.7 billion tons of coal resources as of December 31, 2023. Approximately 97% of the Company’s coal reserves and 94% of the Company’s coal resources are held under lease, and the remainder is held through fee ownership.
The following tables summarize the Company’s estimated coal reserves and resources as of December 31, 2023. The quantity of the coal resources is estimated on an in situ basis as attributable to Peabody. Coal resources are reported exclusive of coal reserves. The quantity of the coal reserves is estimated on a saleable product basis as attributable to Peabody. The coal reserves and resources are reported on selected key quality parameters and on different moisture bases generally referenced by sales contracts for each mining property.
|
|
|
|
|
|
|
|
|
| Peabody Energy Corporation |
2023 Form 10-K |
45 |
|
|
|
|
|
|
|
|
|
|
|
|
|
|
|
|
|
|
|
|
|
|
|
|
|
|
|
|
|
|
|
|
|
|
|
|
|
|
|
|
|
|
|
|
|
|
|
|
|
|
|
|
|
|
|
|
|
|
|
|
|
|
|
|
|
|
|
|
|
|
|
|
|
|
|
|
|
|
|
|
|
|
|
|
|
|
|
|
|
|
|
|
|
|
|
|
|
|
|
|
|
|
|
|
|
|
|
|
|
|
|
SUMMARY COAL RESERVES AT END OF THE FISCAL YEAR ENDED DECEMBER 31, 2023 (1) |
| (Tons in millions) |
|
|
|
|
|
|
|
|
|
|
|
|
|
|
|
|
|
|
|
|
|
|
|
|
|
|
|
|
|
|
|
|
|
|
|
|
Peabody |
|
|
|
|
|
|
|
|
Mining |
|
Coal |
|
Proven Coal Reserves |
Probable Coal Reserves |
Total Coal Reserves |
Interest |
| Segment / Mining Complex |
|
Country |
|
State |
|
Stage |
|
Method |
|
Type |
|
Amount |
|
Quality |
|
Amount |
|
Quality |
|
Amount |
|
Quality |
|
(10) |
|
|
|
|
|
|
|
|
|
|
|
|
|
|
|
|
|
|
|
|
|
|
|
|
|
|
|
|
|
|
|
|
|
|
|
|
|
Seaborne Thermal:(2)(4) |
|
|
|
|
|
|
|
|
|
Tons |
|
%Ash |
|
%Sulfur |
|
Kcal/kg(6) |
|
Tons |
|
%Ash |
|
%Sulfur |
|
Kcal/kg(6) |
|
Tons |
|
%Ash |
|
%Sulfur |
|
Kcal/kg(6) |
|
|
| Wilpinjong |
|
AUS |
|
NSW |
|
P |
|
S |
|
T |
|
54 |
|
|
24.2 |
|
|
0.5 |
|
|
5,953 |
|
|
3 |
|
|
30.3 |
|
|
0.4 |
|
|
5,431 |
|
|
57 |
|
|
24.5 |
|
|
0.5 |
|
|
5,925 |
|
|
100 |
% |
Wambo Opencut (9) |
|
AUS |
|
NSW |
|
P |
|
S |
|
T/C |
|
24 |
|
|
11.2 |
|
|
0.3 |
|
|
6,425 |
|
|
1 |
|
|
11.3 |
|
|
0.3 |
|
|
6,418 |
|
|
25 |
|
|
11.2 |
|
|
0.3 |
|
|
6,425 |
|
|
50 |
% |
| Wambo Underground |
|
AUS |
|
NSW |
|
P |
|
U |
|
T/C |
|
1 |
|
|
12.8 |
|
|
0.4 |
|
|
6,473 |
|
|
3 |
|
|
12.3 |
|
|
0.4 |
|
|
6,588 |
|
|
4 |
|
|
12.4 |
|
|
0.4 |
|
|
6,559 |
|
|
100 |
% |
| South Wambo |
|
AUS |
|
NSW |
|
E |
|
U |
|
T/C |
|
— |
|
|
— |
|
|
— |
|
|
— |
|
|
74 |
|
|
9.8 |
|
|
0.3 |
|
|
7,034 |
|
|
74 |
|
|
9.8 |
|
|
0.3 |
|
|
7,034 |
|
|
100 |
% |
| Total |
|
|
|
|
|
|
|
|
|
|
|
79 |
|
|
|
|
|
|
|
|
81 |
|
|
|
|
|
|
|
|
160 |
|
|
|
|
|
|
|
|
|
|
|
|
|
|
|
|
|
|
|
|
|
|
|
|
|
|
|
|
|
|
|
|
|
|
|
|
|
|
|
|
|
|
|
|
|
|
Seaborne Metallurgical:(3)(4) |
|
|
|
|
|
|
|
|
|
Tons |
|
%Ash |
|
%Sulfur |
|
VM%(7) |
|
Tons |
|
%Ash |
|
%Sulfur |
|
VM%(7) |
|
Tons |
|
%Ash |
|
%Sulfur |
|
VM%(7) |
|
|
| Shoal Creek |
|
USA |
|
AL |
|
P |
|
U |
|
C |
|
15 |
|
|
9.6 |
|
|
0.7 |
|
|
30.4 |
|
|
2 |
|
|
9.7 |
|
|
0.7 |
|
|
30.2 |
|
|
17 |
|
|
9.6 |
|
|
0.7 |
|
|
30.3 |
|
|
100 |
% |
| Coppabella |
|
AUS |
|
QLD |
|
P |
|
S |
|
P |
|
7 |
|
|
9.3 |
|
|
0.2 |
|
|
10.2 |
|
|
15 |
|
|
9.5 |
|
|
0.2 |
|
|
10.0 |
|
|
22 |
|
|
9.4 |
|
|
0.2 |
|
|
10.1 |
|
|
73.3 |
% |
| Moorvale |
|
AUS |
|
QLD |
|
P |
|
S |
|
C/P/T |
|
4 |
|
|
11.4 |
|
|
0.3 |
|
|
16.5 |
|
|
— |
|
|
— |
|
|
— |
|
|
— |
|
|
4 |
|
|
11.4 |
|
|
0.3 |
|
|
16.5 |
|
|
73.3 |
% |
| Metropolitan |
|
AUS |
|
NSW |
|
P |
|
U |
|
C/P/T |
|
1 |
|
|
11.7 |
|
|
0.4 |
|
|
18.6 |
|
|
9 |
|
|
11.7 |
|
|
0.4 |
|
|
18.4 |
|
|
10 |
|
|
11.7 |
|
|
0.4 |
|
|
18.4 |
|
|
100 |
% |
| Centurion |
|
AUS |
|
QLD |
|
D |
|
U |
|
C |
|
46 |
|
|
7.4 |
|
|
0.5 |
|
|
20.9 |
|
|
23 |
|
|
7.5 |
|
|
0.5 |
|
|
21.1 |
|
|
69 |
|
|
7.4 |
|
|
0.5 |
|
|
21.0 |
|
|
100 |
% |
| Moorvale South |
|
AUS |
|
QLD |
|
P |
|
S |
|
C/P/T |
|
3 |
|
|
11.1 |
|
|
0.4 |
|
|
18.5 |
|
|
2 |
|
|
9.8 |
|
|
0.4 |
|
|
17.5 |
|
|
5 |
|
|
10.6 |
|
|
0.4 |
|
|
18.1 |
|
|
73.3 |
% |
Middlemount (9) |
|
AUS |
|
QLD |
|
P |
|
S |
|
C/P |
|
26 |
|
|
10.3 |
|
|
0.4 |
|
|
18.0 |
|
|
10 |
|
|
10.3 |
|
|
0.4 |
|
|
18.0 |
|
|
36 |
|
|
10.3 |
|
|
0.4 |
|
|
18.0 |
|
|
50.0 |
% |
| Total |
|
|
|
|
|
|
|
|
|
|
|
102 |
|
|
|
|
|
|
|
|
61 |
|
|
|
|
|
|
|
|
163 |
|
|
|
|
|
|
|
|
|
|
|
|
|
|
|
|
|
|
|
|
|
|
|
|
|
|
|
|
|
|
|
|
|
|
|
|
|
|
|
|
|
|
|
|
|
|
Powder River Basin:(5) |
|
|
|
|
|
|
|
|
|
Tons |
|
%Ash |
|
%Sulfur |
|
Btu(8) |
|
Tons |
|
%Ash |
|
%Sulfur |
|
Btu(8) |
|
Tons |
|
%Ash |
|
%Sulfur |
|
Btu(8) |
|
|
| North Antelope Rochelle |
USA |
|
WY |
|
P |
|
S |
|
T |
|
1,261 |
|
|
4.6 |
|
|
0.2 |
|
|
8,880 |
|
|
103 |
|
|
4.7 |
|
|
0.2 |
|
|
8,885 |
|
|
1,364 |
|
|
4.6 |
|
|
0.2 |
|
|
8,880 |
|
|
100 |
% |
| Caballo |
|
USA |
|
WY |
|
P |
|
S |
|
T |
|
160 |
|
5.2 |
|
|
0.3 |
|
|
8,495 |
|
|
20 |
|
5.5 |
|
|
0.4 |
|
|
8,325 |
|
|
180 |
|
5.2 |
|
|
0.3 |
|
|
8,475 |
|
|
100 |
% |
| Rawhide |
|
USA |
|
WY |
|
P |
|
S |
|
T |
|
87 |
|
5.5 |
|
|
0.4 |
|
|
8,300 |
|
|
3 |
|
5.7 |
|
|
0.3 |
|
|
8,310 |
|
|
90 |
|
5.5 |
|
|
0.3 |
|
|
8,300 |
|
|
100 |
% |
| Total |
|
|
|
|
|
|
|
|
|
|
|
1,508 |
|
|
|
|
|
|
|
|
126 |
|
|
|
|
|
|
|
|
1,634 |
|
|
|
|
|
|
|
|
|
|
|
|
|
|
|
|
|
|
|
|
|
|
|
|
|
|
|
|
|
|
|
|
|
|
|
|
|
|
|
|
|
|
|
|
|
|
Other U.S. Thermal:(5) |
|
|
|
|
|
|
|
|
|
Tons |
|
%Ash |
|
%Sulfur |
|
Btu(8) |
|
Tons |
|
%Ash |
|
%Sulfur |
|
Btu(8) |
|
Tons |
|
%Ash |
|
%Sulfur |
|
Btu(8) |
|
|
| Bear Run |
|
USA |
|
IN |
|
P |
|
S |
|
T |
|
48 |
|
|
10.3 |
|
|
3.1 |
|
|
11,120 |
|
|
24 |
|
|
10.0 |
|
|
2.5 |
|
|
11,100 |
|
|
72 |
|
|
10.2 |
|
|
2.9 |
|
|
11,115 |
|
|
100 |
% |
| El Segundo/Lee Ranch |
|
USA |
|
NM |
|
P |
|
S |
|
T |
|
10 |
|
|
16.0 |
|
|
0.9 |
|
|
9,260 |
|
|
1 |
|
|
12.3 |
|
|
0.7 |
|
|
9,526 |
|
|
11 |
|
|
15.7 |
|
|
0.8 |
|
|
9,280 |
|
|
100 |
% |
| Gateway North |
|
USA |
|
IL |
|
P |
|
U |
|
T |
|
23 |
|
|
8.8 |
|
|
2.9 |
|
|
10,919 |
|
|
3 |
|
|
8.8 |
|
|
2.9 |
|
|
10,944 |
|
|
26 |
|
|
8.8 |
|
|
2.9 |
|
|
10,922 |
|
|
100 |
% |
| Twentymile |
|
USA |
|
CO |
|
P |
|
U |
|
T |
|
8 |
|
|
10.7 |
|
|
0.4 |
|
|
11,277 |
|
|
1 |
|
|
10.6 |
|
|
0.4 |
|
|
11,263 |
|
|
9 |
|
|
10.7 |
|
|
0.5 |
|
|
11,275 |
|
|
100 |
% |
| Wild Boar |
|
USA |
|
IN |
|
P |
|
S |
|
T |
|
7 |
|
|
8.4 |
|
|
2.4 |
|
|
10,985 |
|
|
6 |
|
|
8.1 |
|
|
2.8 |
|
|
11,235 |
|
|
13 |
|
|
8.2 |
|
|
2.6 |
|
|
11,110 |
|
|
100 |
% |
| Francisco Underground |
|
USA |
|
IN |
|
P |
|
U |
|
T |
|
3 |
|
|
8.8 |
|
|
3.0 |
|
|
11,495 |
|
|
2 |
|
|
8.9 |
|
|
3.2 |
|
|
11,490 |
|
|
5 |
|
|
8.8 |
|
|
3.1 |
|
|
11,493 |
|
|
100 |
% |
| Total |
|
|
|
|
|
|
|
|
|
|
|
99 |
|
|
|
|
|
|
|
|
37 |
|
|
|
|
|
|
|
|
136 |
|
|
|
|
|
|
|
|
|
|
|
|
|
|
|
|
|
|
|
|
|
|
|
|
|
|
|
|
|
|
|
|
|
|
|
|
|
|
|
|
|
|
|
|
|
|
| Grand total |
|
|
|
|
|
|
|
|
|
|
|
1,788 |
|
|
|
|
|
|
|
|
305 |
|
|
|
|
|
|
|
|
2,093 |
|
|
|
|
|
|
|
|
|
|
|
|
|
|
|
|
|
|
|
|
|
|
|
|
|
|
|
|
|
|
|
|
|
|
|
|
|
|
|
|
|
|
|
|
|
|
| Stage |
|
|
|
|
|
|
|
Mining Method |
|
|
|
|
|
|
|
|
|
Coal Type |
|
|
|
|
|
|
|
|
|
|
|
|
| P Producing |
|
|
|
|
|
|
|
S |
|
Surface Mine |
|
|
|
|
|
|
|
T |
|
Thermal |
|
|
|
|
|
|
|
|
| I Idle |
|
|
|
|
|
|
|
U |
|
Underground Mine |
|
|
|
|
|
|
|
C |
|
Coking |
|
|
|
|
|
|
|
|
| D Development |
|
|
|
|
|
|
|
|
|
|
|
|
|
|
|
|
|
|
|
|
|
P |
|
Pulverized Coal Injection |
|
|
|
|
|
|
|
|
| E Exploration |
|
|
|
|
|
|
|
|
|
|
|
|
|
|
|
|
|
|
|
|
|
|
|
|
|
|
|
|
|
|
|
|
|
|
|
|
|
|
|
|
|
|
|
|
|
| Peabody Energy Corporation |
2023 Form 10-K |
46 |
|
|
|
|
|
|
|
|
|
|
|
|
|
|
|
|
|
|
|
|
|
|
|
|
|
|
|
|
|
|
|
|
|
|
|
|
|
|
|
|
|
|
|
|
|
|
|
|
|
|
|
|
|
|
|
|
|
|
|
|
|
|
|
|
|
|
|
|
|
|
|
|
|
|
|
|
|
|
|
|
|
|
|
|
|
|
|
|
|
|
|
|
|
|
|
|
|
|
|
|
|
|
|
|
|
|
|
|
|
|
|
|
|
|
|
|
|
|
|
|
|
|
|
|
|
|
|
|
|
|
|
|
|
|
|
SUMMARY COAL RESOURCES AT END OF THE FISCAL YEAR ENDED DECEMBER 31, 2023 (1) |
| (Tons in millions) |
|
|
|
|
|
|
|
|
|
|
|
|
|
|
|
|
|
|
|
|
|
|
|
|
|
|
|
|
|
|
|
|
|
|
|
|
|
|
|
|
|
|
|
|
|
|
|
|
|
|
|
|
|
|
|
|
|
|
|
|
|
|
|
|
|
|
|
|
|
|
|
|
|
Measured and Indicated |
|
|
|
|
|
|
|
|
|
Peabody |
|
|
|
|
|
|
|
|
Mining |
|
Coal |
|
Measured Coal Resources |
Indicated Coal Resources |
Coal Resources |
|
Inferred Coal Resources |
Interest |
| Deposit |
|
Country |
|
State |
|
Stage |
|
Method |
|
Type |
Amount |
Quality |
Amount |
Quality |
Amount |
Quality |
Amount |
Quality |
|
(10) |
|
|
|
|
|
|
|
|
|
|
|
|
|
|
|
|
|
|
|
|
|
|
|
|
|
|
|
|
|
|
|
|
|
|
|
|
|
|
|
|
|
|
|
|
|
Seaborne Thermal:(2)(4) |
|
|
|
|
|
|
|
Tons |
|
%Ash |
%Sulfur |
Kcal/kg(6) |
Tons |
|
%Ash |
%Sulfur |
Kcal/kg(6) |
|
Tons |
|
%Ash |
%Sulfur |
Kcal/kg(6) |
|
Tons |
|
%Ash |
%Sulfur |
Kcal/kg(6) |
|
|
| Wilpinjong |
AUS |
|
NSW |
|
P |
|
S |
|
T |
|
103 |
|
|
23.0 |
|
|
0.5 |
|
|
6,058 |
|
|
25 |
|
|
25.4 |
|
|
0.5 |
|
|
5,861 |
|
|
128 |
|
|
23.5 |
|
|
0.5 |
|
|
6,020 |
|
|
6 |
|
|
27.3 |
|
|
0.5 |
|
|
5,698 |
|
|
100 |
% |
Wambo Opencut (9) |
AUS |
|
NSW |
|
P |
|
S |
|
T/C |
|
217 |
|
|
21.2 |
|
|
0.4 |
|
|
5,757 |
|
|
154 |
|
|
21.5 |
|
|
0.4 |
|
|
5,764 |
|
|
371 |
|
|
21.3 |
|
|
0.4 |
|
|
5,760 |
|
|
265 |
|
|
22.0 |
|
|
0.4 |
|
|
5,437 |
|
|
50 |
% |
| South Wambo |
AUS |
|
NSW |
|
E |
|
U |
|
T/C |
|
219 |
|
|
21.5 |
|
|
0.3 |
|
|
6,068 |
|
|
83 |
|
|
27.2 |
|
|
0.3 |
|
|
5,571 |
|
|
302 |
|
|
23.1 |
|
|
0.3 |
|
|
5,931 |
|
|
47 |
|
|
36.3 |
|
|
0.3 |
|
|
4,745 |
|
|
100 |
% |
| Total |
|
|
|
|
|
|
|
|
|
|
|
539 |
|
|
|
|
|
|
|
|
262 |
|
|
|
|
|
|
|
|
801 |
|
|
|
|
|
|
|
|
318 |
|
|
|
|
|
|
|
|
|
|
|
|
|
|
|
|
|
|
|
|
|
|
|
|
|
|
|
|
|
|
|
|
|
|
|
|
|
|
|
|
|
|
|
|
|
|
|
|
|
|
|
|
|
|
Seaborne Metallurgical:(3)(4) |
|
|
|
|
|
Tons |
|
%Ash |
%Sulfur |
VM%(7) |
Tons |
|
%Ash |
%Sulfur |
VM%(7) |
Tons |
|
%Ash |
%Sulfur |
VM%(7) |
Tons |
|
%Ash |
%Sulfur |
VM%(7) |
|
| Shoal Creek |
USA |
|
AL |
|
P |
|
U |
|
C |
|
37 |
|
|
9.6 |
|
|
0.7 |
|
|
25.1 |
|
|
34 |
|
|
9.9 |
|
|
0.7 |
|
|
24.1 |
|
|
71 |
|
|
9.8 |
|
|
0.7 |
|
|
24.6 |
|
|
7 |
|
|
10.3 |
|
|
0.7 |
|
|
24.0 |
|
|
100 |
% |
| Metropolitan |
AUS |
|
NSW |
|
P |
|
U |
|
C/P/T |
|
7 |
|
|
15.4 |
|
|
0.4 |
|
|
18.6 |
|
|
8 |
|
|
15.3 |
|
|
0.3 |
|
|
18.7 |
|
|
15 |
|
|
15.3 |
|
|
0.4 |
|
|
18.6 |
|
|
2 |
|
|
16.0 |
|
|
0.3 |
|
|
19.0 |
|
|
100 |
% |
| Coppabella |
AUS |
|
QLD |
|
P |
|
S |
|
P |
|
13 |
|
|
15.8 |
|
|
0.3 |
|
|
13.0 |
|
|
46 |
|
|
14.6 |
|
|
0.3 |
|
|
12.8 |
|
|
59 |
|
|
14.9 |
|
|
0.3 |
|
|
12.8 |
|
|
60 |
|
|
15.7 |
|
|
0.3 |
|
|
12.4 |
|
|
73.3 |
% |
| Moorvale |
AUS |
|
QLD |
|
P |
|
S |
|
C/P/T |
|
14 |
|
|
18.5 |
|
|
0.3 |
|
|
16.7 |
|
|
14 |
|
|
17.2 |
|
|
0.3 |
|
|
16.6 |
|
|
28 |
|
|
17.9 |
|
|
0.3 |
|
|
16.7 |
|
|
5 |
|
|
15.9 |
|
|
0.3 |
|
|
16.7 |
|
|
73.3 |
% |
| Moorvale South |
AUS |
|
QLD |
|
P |
|
S |
|
C/P/T |
|
3 |
|
|
18.3 |
|
|
0.4 |
|
|
18.4 |
|
|
7 |
|
|
18.2 |
|
|
0.4 |
|
|
18.3 |
|
|
10 |
|
|
18.2 |
|
|
0.4 |
|
|
18.3 |
|
|
6 |
|
|
16.8 |
|
|
0.4 |
|
|
17.7 |
|
|
73.3 |
% |
| Centurion (GLB2) |
AUS |
|
QLD |
|
E |
|
U |
|
C |
|
— |
|
|
— |
|
|
— |
|
|
— |
|
|
2 |
|
|
14.8 |
|
|
0.5 |
|
|
20.7 |
|
|
2 |
|
|
14.8 |
|
|
0.5 |
|
|
20.7 |
|
|
8 |
|
|
13.6 |
|
|
0.5 |
|
|
20.7 |
|
|
100 |
% |
| Coppabella North |
AUS |
|
QLD |
|
E |
|
U |
|
P |
|
255 |
|
|
15.8 |
|
|
0.3 |
|
|
14.6 |
|
|
102 |
|
|
16.8 |
|
|
0.3 |
|
|
14.6 |
|
|
357 |
|
|
16.1 |
|
|
0.3 |
|
|
14.6 |
|
|
12 |
|
|
16.5 |
|
|
0.3 |
|
|
14.3 |
|
|
75.5 |
% |
| Yeerun |
AUS |
|
QLD |
|
E |
|
S |
|
P |
|
16 |
|
|
16.0 |
|
|
0.4 |
|
|
14.3 |
|
|
57 |
|
|
16.2 |
|
|
0.5 |
|
|
15.0 |
|
|
73 |
|
|
16.2 |
|
|
0.4 |
|
|
14.8 |
|
|
46 |
|
|
17.8 |
|
|
0.5 |
|
|
14.7 |
|
|
83.0 |
% |
| Moorvale North |
AUS |
|
QLD |
|
E |
|
U |
|
P |
|
21 |
|
|
26.0 |
|
|
0.4 |
|
|
12.9 |
|
|
25 |
|
|
24.5 |
|
|
0.5 |
|
|
13.2 |
|
|
46 |
|
|
25.2 |
|
|
0.4 |
|
|
13.1 |
|
|
25 |
|
|
23.2 |
|
|
0.5 |
|
|
13.4 |
|
|
73.3 |
% |
| Gundyer |
AUS |
|
QLD |
|
E |
|
U |
|
P |
|
— |
|
|
— |
|
|
— |
|
|
— |
|
|
54 |
|
|
16.4 |
|
|
0.2 |
|
|
19.7 |
|
|
54 |
|
|
16.4 |
|
|
0.2 |
|
|
19.7 |
|
|
70 |
|
|
18.3 |
|
|
0.2 |
|
|
18.3 |
|
|
90.0 |
% |
| Total |
|
|
|
|
|
|
|
|
|
|
|
366 |
|
|
|
|
|
|
|
|
349 |
|
|
|
|
|
|
|
|
715 |
|
|
|
|
|
|
|
|
241 |
|
|
|
|
|
|
|
|
|
|
|
|
|
|
|
|
|
|
|
|
|
|
|
|
|
|
|
|
|
|
|
|
|
|
|
|
|
|
|
|
|
|
|
|
|
|
|
|
|
|
|
|
|
|
Powder River Basin:(5) |
|
|
|
|
|
|
|
Tons |
|
%Ash |
%Sulfur |
Btu(8) |
Tons |
|
%Ash |
%Sulfur |
Btu(8) |
Tons |
|
%Ash |
%Sulfur |
Btu(8) |
Tons |
|
%Ash |
%Sulfur |
Btu(8) |
|
| Caballo |
|
USA |
|
WY |
|
P |
|
S |
|
T |
|
120 |
|
|
4.9 |
|
|
0.3 |
|
|
8,500 |
|
|
123 |
|
|
5.0 |
|
|
0.4 |
|
|
8,240 |
|
|
243 |
|
|
5.0 |
|
|
0.4 |
|
8,440 |
|
|
2 |
|
|
5.5 |
|
|
0.4 |
|
8,255 |
|
|
100 |
% |
| Rawhide |
|
USA |
|
WY |
|
P |
|
S |
|
T |
|
21 |
|
|
5.5 |
|
|
0.4 |
|
|
8,150 |
|
|
90 |
|
|
5.2 |
|
|
0.3 |
|
|
8,360 |
|
|
111 |
|
|
5.3 |
|
|
0.4 |
|
|
8,320 |
|
|
7 |
|
|
5.8 |
|
|
0.4 |
|
|
8,250 |
|
|
100 |
% |
| Total |
|
|
|
|
|
|
|
|
|
|
|
141 |
|
|
|
|
|
|
|
|
213 |
|
|
|
|
|
|
|
|
354 |
|
|
|
|
|
|
|
|
9 |
|
|
|
|
|
|
|
|
|
|
|
|
|
|
|
|
|
|
|
|
|
|
|
|
|
|
|
|
|
|
|
|
|
|
|
|
|
|
|
|
|
|
|
|
|
|
|
|
|
|
|
|
|
|
Other U.S. Thermal:(5) |
|
|
|
|
|
|
|
Tons |
|
%Ash |
%Sulfur |
Btu(8) |
Tons |
|
%Ash |
%Sulfur |
Btu(8) |
Tons |
|
%Ash |
%Sulfur |
Btu(8) |
Tons |
|
%Ash |
%Sulfur |
Btu(8) |
|
| Bear Run |
USA |
|
IN |
|
P |
|
S |
|
T |
|
73 |
|
|
14.7 |
|
|
3.9 |
|
|
10,800 |
|
|
89 |
|
|
16.6 |
|
|
3.7 |
|
|
10,490 |
|
|
162 |
|
|
15.8 |
|
|
3.8 |
|
|
10,630 |
|
|
29 |
|
|
15.9 |
|
|
3.5 |
|
|
10,600 |
|
|
100 |
% |
| Francisco Underground |
USA |
|
IN |
|
P |
|
U |
|
T |
|
2 |
|
|
13.8 |
|
|
4.7 |
|
|
11,325 |
|
|
5 |
|
|
12.5 |
|
|
4.7 |
|
|
11,540 |
|
|
7 |
|
|
13.1 |
|
|
4.7 |
|
|
11,440 |
|
|
— |
|
|
— |
|
|
— |
|
|
— |
|
|
100 |
% |
| Gateway North |
USA |
|
IL |
|
P |
|
U |
|
T |
|
25 |
|
|
13.1 |
|
|
3.9 |
|
|
10,583 |
|
|
17 |
|
|
13.1 |
|
|
3.9 |
|
|
10,583 |
|
|
42 |
|
|
13.1 |
|
|
3.9 |
|
|
10,583 |
|
|
— |
|
|
— |
|
|
— |
|
|
— |
|
|
100 |
% |
| El Segundo/Lee Ranch |
|
USA |
|
NM |
|
P |
|
S |
|
T |
|
1 |
|
|
13.5 |
|
|
1.0 |
|
|
9,932 |
|
|
5 |
|
|
12.1 |
|
|
0.9 |
|
|
10,036 |
|
|
6 |
|
|
12.4 |
|
|
1.0 |
|
|
10,014 |
|
|
2 |
|
|
14.3 |
|
|
1.2 |
|
|
9,655 |
|
|
100 |
% |
| Wild Boar |
USA |
|
IN |
|
P |
|
S |
|
T |
|
— |
|
|
— |
|
|
— |
|
|
— |
|
|
3 |
|
|
11.7 |
|
|
5.5 |
|
|
11,390 |
|
|
3 |
|
|
11.7 |
|
|
5.5 |
|
|
11,390 |
|
|
1 |
|
|
12.0 |
|
|
5.5 |
|
|
11,290 |
|
|
100 |
% |
| Total |
|
|
|
|
|
|
|
|
|
|
101 |
|
|
|
|
|
|
|
|
119 |
|
|
|
|
|
|
|
|
220 |
|
|
|
|
|
|
|
|
32 |
|
|
|
|
|
|
|
|
|
| Grand total |
|
|
|
|
|
|
|
|
|
1,147 |
|
|
|
|
|
|
|
|
943 |
|
|
|
|
|
|
|
|
2,090 |
|
|
|
|
|
|
|
|
600 |
|
|
|
|
|
|
|
|
|
|
|
|
|
|
|
|
|
|
| Peabody Energy Corporation |
2023 Form 10-K |
47 |
|
|
|
|
|
|
(1) |
The sales price assumptions supporting economic recoverability vary depending upon factors such as coal quality and existing customer volume commitments. For the five-year period 2024 through 2028, the estimated sales prices for seaborne metallurgical mines are based upon estimated premium hard coking coal benchmark prices ranging from $180 to $239 per tonne. The estimated sales prices for seaborne thermal mines are based upon estimated Newcastle benchmark prices ranging from $92 to $128 per tonne for the same period. For U.S. domestic thermal mines, the estimated sales prices for the same period range from approximately $10.44 to $70.52 per ton. Subsequent to 2028, for all mines, sales price escalation is assumed at 2.0% to 3.0% per annum through the end of each LOM plan. |
(2) |
The moisture condition for Seaborne Thermal segment coal quality is on an air-dry basis, except for the Wambo Opencut Mine, which is estimated on an as-shipped basis for coal reserves and an in situ moisture basis for coal resources. |
(3) |
The moisture condition for the Seaborne Metallurgical segment coal quality is on an air-dry basis, except for the Shoal Creek Mine, which is on a dry basis. |
(4) |
The quantities for Australian coal reserves are estimated on an as-shipped moisture basis; quantities for Australian coal resources are estimated on an in situ moisture basis. |
(5) |
The quality and quantity estimates for U.S. thermal coal reserves are calculated on as-shipped moisture basis; the quality and quantity estimates for U.S. thermal coal resources are calculated on an in situ moisture basis. |
(6) |
Kcal/kg (kilocalories per kilogram) is the net calorific value (net heating value) of coal, except for the Wambo Opencut Mine which is estimated as gross calorific value. |
(7) |
VM (volatile matter) represents the proportion of certain organic and mineral components in coal, for example, water, carbon dioxide or sulfur dioxide. Volatile matter is inversely related to coal rank. |
(8) |
Btu (British thermal unit) is the gross heating value of coal per pound, which includes the weight of moisture in coal on an as-sold basis. The range of variability of the moisture content in coal may affect the actual shipped Btu content. |
(9) |
Reserve and resource data is maintained and provided by joint venture managing partners utilizing the Australasian Code for Reporting of Exploration Results, Mineral Resources and Ore Reserves. |
(10) |
The quantities of coal reserves and resources are disclosed at Peabody’s proportional ownership share. |
Individual Property Disclosure
To determine the Company’s individually material mining operations in accordance with subpart 1300 of Regulation S-K, management considered both quantitative and qualitative factors, assessed in the context of the Company’s overall business and financial condition. Such assessment included the Company’s aggregate mining operations on all of its mining properties, regardless of the stage of production or the type of coal produced. Quantitative factors included, among others, mining operations’ relative contributions to the Company’s aggregate historical and estimated revenue, cash flows, and Adjusted EBITDA (as defined in Part II, Item 7. “Management’s Discussion and Analysis of Financial Condition and Results of Operations.”) Qualitative factors may include, as applicable, strategic priorities, the regulatory environment, capital expansion plans, and the long-term pricing outlook. The Company concluded that as of December 31, 2023, its individually material mines are North Antelope Rochelle Mine (NARM), Wilpinjong Mine and Centurion Mine. The Company will update its assessment of individually material mines on an annual basis.
The information that follows relating to such individually material mines is derived, for the most part, from, and in some instances is an extract from, the technical report summaries (TRSs) relating to such properties prepared in compliance with the Item 601(b)(96) and subpart 1300 of Regulation S-K. Portions of the following information are based on assumptions, qualifications and procedures that are not fully described herein.
The changes for NARM from the previous years are not material and no updates for the TRS are included in this filing. Reference should be made to the full text of the TRS, incorporated herein by reference, made a part of Peabody’s Annual Report on Form 10-K for the year ended December 31, 2021, which was filed with the SEC on February 18, 2022.
Reference should be made to the full text of the TRSs for Wilpinjong and Centurion Mines, incorporated herein by reference and made a part of this Annual Report on Form 10-K. The relevant TRSs for Wilpinjong and Centurion Mines are included as Exhibits 96.2 and 96.3, respectively, to this Annual Report on Form 10-K, and specific sections of such TRSs are referenced below using the corresponding exhibit number.
|
|
|
|
|
|
|
|
|
| Peabody Energy Corporation |
2023 Form 10-K |
48 |
North Antelope Rochelle Mine
The North Antelope Rochelle Mine (NARM) is a production-stage surface coal mine located sixty-five miles south of Gillette, Wyoming, USA. NARM is situated in the Gillette Coal Field on the east flank of the Powder River Basin. NARM began operations in 1999 after Peabody combined its interests in the formerly separate North Antelope Mine and Rochelle Mine.
NARM extracts coal from the Wyodak-Anderson coal seam, which ranges from 60- to 80-feet thick and lies from 100 to 400 feet below the surface in the mining area. The Company has secured mineral rights through Federal and State lease agreements which cover 30,159 acres. The typical royalty rate for Federal and State coal leases is 12.5% of realized revenue. Generally, the leases continue indefinitely with periodic renewal, provided there is diligent coal production or other development within the lease area. As of December 31, 2023, all required licenses and permits were in place for the operations of NARM.
The mining operation consists of multiple open pits in four main mining areas, which allows for quality blending and other optimization strategies. Overburden is removed by dragline, truck and shovel, dozer and cast blasting methods. Coal is hauled by truck to one of five dump locations, where it is then crushed and conveyed to silos adjacent to rail load-outs for customer delivery. Coals of varying characteristics may be blended at a central blending facility along the loadout rail loop. Coal is sold unwashed, as a run-of-mine (ROM) product. NARM coal is well recognized for domestic thermal power generation.
The key supporting infrastructure for NARM includes rail services provided by the BNSF Railway Company and Union Pacific Corporation, road access via interstate and state highways and roads, electrical power from a dedicated substation with 230kV and 69kV transmission lines, and water supply from a mine dewatering system and deep wells. The mining industry in the Powder River Basin anchors numerous communities from which the mine attracts qualified personnel.
The property, plant, equipment and mine development assets of NARM had a net book value of approximately $375 million at December 31, 2023. The mine’s operating equipment and facilities meet contemporary mining standards and are adequately maintained to execute the LOM plan. Routine maintenance, overhauls, and necessary capital replacements are generally included in the LOM plan to support future production.
|
|
|
|
|
|
|
|
|
| Peabody Energy Corporation |
2023 Form 10-K |
49 |
The table below presents NARM coal reserve estimates at December 31, 2023, along with comparative quantities at December 31, 2022. NARM did not hold any coal resources as of December 31, 2023. These coal reserve estimates were supported by the analyses of 4,869 total drill holes within the coal lease area. The quantity of the coal reserves is estimated on a saleable product basis and deemed 100% attributable to Peabody. In addition to quantity, the table presents selected key quality parameters on an as-shipped basis.
|
|
|
|
|
|
|
|
|
|
|
|
|
|
|
|
|
|
|
|
|
|
|
|
|
|
|
|
|
|
|
|
|
|
|
|
|
|
|
NARM - SUMMARY OF COAL RESERVES (1) |
| (Tons in millions) |
|
|
|
|
|
|
|
|
|
|
|
|
|
|
|
December 31, 2023 |
|
December 31, 2022 |
Coal Reserves (2)(3)(4) |
|
Tons |
|
%Ash |
|
%Sulfur |
|
Btu |
|
% Mine Yield(5) |
|
Tons |
| Proven |
|
1,261 |
|
|
4.6 |
|
|
0.2 |
|
|
8,880 |
|
|
100 |
% |
|
1,316 |
|
| Probable |
|
103 |
|
|
4.7 |
|
|
0.2 |
|
|
8,885 |
|
|
100 |
% |
|
107 |
|
| Total |
|
1,364 |
|
|
|
|
|
|
|
|
|
|
1,423 |
|
|
|
|
|
|
|
|
|
|
|
|
|
|
| Year-over-year decrease |
|
(4) |
% |
|
|
|
|
|
|
|
|
|
|
The year-over-year decrease in the quantity of coal reserves was driven by production depletion.
|
|
|
|
|
|
(1) |
Economic recoverability is based upon an estimated average sales price per ton of $15.00 for the five-year period ending December 31, 2028 and assumed escalation of 2.0% per annum during the subsequent period through the end of the LOM plan. |
(2) |
The cut-off grade and metallurgical recovery are not limiting factors for coal reserve estimates due to consistent coal thickness and established trends of coal quality in the leased area. The strip ratio increases gradually, but the existing pit length allows an average mineable strip ratio. Besides the results of drill hole analyses, the main limiting factors include surface infrastructure and lease boundaries. |
(3) |
The quality of coal reserves is estimated on an as-shipped basis. |
(4) |
The quantity of coal reserves is estimated on a saleable product basis, which takes into consideration 92% mining recovery. The results of the LOM planning process demonstrate the economic recoverability of the coal reserve estimates. |
(5) |
Mine yield is the ratio of estimated saleable product coal over ROM coal tons, with processing loss considered. |
|
|
|
|
|
|
|
|
|
| Peabody Energy Corporation |
2023 Form 10-K |
50 |
Wilpinjong Mine
The Wilpinjong Mine is a production-stage surface thermal coal mine situated approximately 25 miles northeast of Mudgee in New South Wales, Australia. Peabody acquired the mine as part of its acquisition of Excel Coal Pty Ltd (Excel) in 2006. Excel began the development of Wilpinjong Mine in 2006 and it commenced production under Peabody ownership in 2007. A third-party contractor managed mining operations until 2013, when the Company converted the mine to owner-operated.
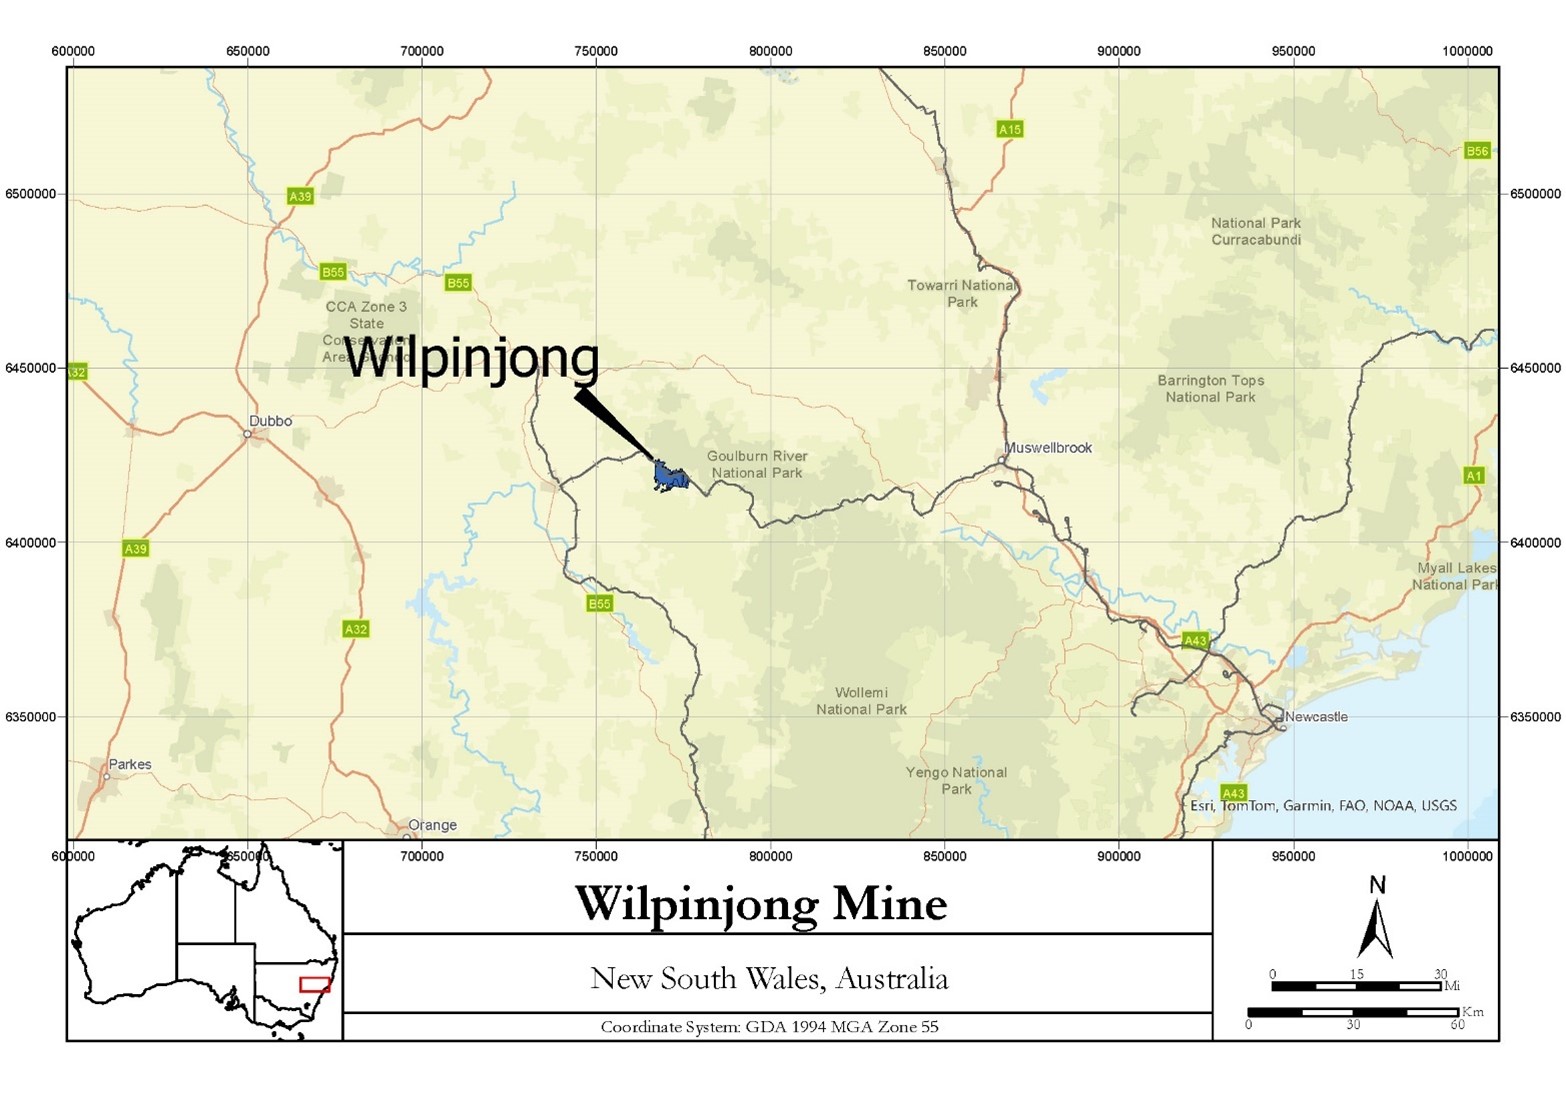
The Wilpinjong Mine extracts coal from the Moolarben and Ulan coal seams which have a combined thickness from 6 to 10 meters and a typical depth less than 60 meters in the Illawarra Coal Measures on the northwest margin of the Sydney Basin. The Company has secured three exploration licenses of 2,958 hectares and four mining leases of 3,790 hectares through the New South Wales Minister of Planning. The typical royalty rate is 8.2% currently, increasing to 10.8% in July of 2024, of the value of coal recovered. The mining leases require renewal upon expiration in 2027 for 2,863 hectares and in 2039-2044 for 927 hectares. Renewal applications for two exploration licenses were approved in 2023, with the terms extended to December 2027 and March 2028, and the third was granted in May 2022 for an initial term of 6 years. As of December 31, 2023, all required licenses and permits were in place for the operations of Wilpinjong.
Conventional open cut mining methods are used at the Wilpinjong Coal Mine, with multiple pits at a low strip ratio allowing for relatively rapid pit advance. Overburden is removed by a combination of cast blasting, dozer, and truck and excavator methods. Haul trucks transport coal to various hoppers and pads for blending and temporary storage, as necessary, and then to a coal handling and processing plant to be crushed and washed. Coal is conveyed to a rail loadout and transported by train to either domestic customers or to the Port of Newcastle and seaborne customers for thermal power generation.
The key supporting infrastructure for Wilpinjong Mine includes road access via public roads, port service at two terminals at the Port of Newcastle, above and below rail services, electrical power from a 66kV transmission line, and water supply from captured surface runoff and deep wells. The mine’s proximity to other large coal producers in the region provides access to a significant pool of experienced mining personnel.
|
|
|
|
|
|
|
|
|
| Peabody Energy Corporation |
2023 Form 10-K |
51 |
The property, plant, equipment and mine development assets of Wilpinjong Mine had a net book value of approximately $307 million at December 31, 2023. The mine’s operating equipment meets contemporary mining standards and is adequately maintained to execute the LOM plan. Routine maintenance, overhauls and necessary capital replacements are generally included in the LOM plan to support future production.
The tables below present Wilpinjong Mine’s estimated coal reserves and resources at December 31, 2023, along with comparative quantities at December 31, 2022. These coal reserve and resource estimates were supported by the analyses of 1,271 total drill holes within the coal lease area. The quantity of the coal resources is estimated on an in situ basis as 100% attributable to Peabody. Coal resources are reported exclusive of coal reserves. The quantity of the coal reserves is estimated on a saleable product basis as 100% attributable to Peabody. Coal reserves and resources are reported on selected key quality parameters on an air-dried basis.
|
|
|
|
|
|
|
|
|
|
|
|
|
|
|
|
|
|
|
|
|
|
|
|
|
|
|
|
|
|
|
|
|
|
|
|
|
|
|
WILPINJONG MINE - SUMMARY OF COAL RESERVES AND RESOURCES (1) |
| (Tons in millions) |
|
|
|
|
|
|
|
|
|
|
|
|
|
|
|
December 31, 2023 |
|
December 31, 2022 |
Coal Reserves (5)(6) |
|
Tons |
|
%Ash |
|
%Sulfur |
|
Kcal/kg |
|
% Mine Yield(7) |
|
Tons |
| Proven |
|
54 |
|
|
24.2 |
|
|
0.5 |
|
|
5,953 |
|
|
82 |
% |
|
63 |
|
| Probable |
|
3 |
|
|
30.3 |
|
|
0.4 |
|
|
5,431 |
|
|
82 |
% |
|
4 |
|
| Total |
|
57 |
|
|
|
|
|
|
|
|
|
|
67 |
|
|
|
|
|
|
|
|
|
|
|
|
|
|
| Year-over-year decrease |
|
(15) |
% |
|
|
|
|
|
|
|
|
|
|
|
|
|
|
|
|
|
|
|
|
|
|
|
|
|
December 31, 2023 |
|
|
|
December 31, 2022 |
Coal Resources (2)(3)(4) |
|
Tons |
|
%Ash |
|
%Sulfur |
|
Kcal/kg |
|
|
|
Tons |
| Measured |
|
103 |
|
|
23.0 |
|
|
0.5 |
|
|
6,058 |
|
|
|
|
103 |
|
| Indicated |
|
25 |
|
|
25.4 |
|
|
0.5 |
|
|
5,861 |
|
|
|
|
25 |
|
| Measured and indicated |
|
128 |
|
|
23.5 |
|
|
0.5 |
|
|
6,020 |
|
|
|
|
128 |
|
| Inferred |
|
6 |
|
|
27.3 |
|
|
0.5 |
|
|
5,698 |
|
|
|
|
6 |
|
| Total |
|
134 |
|
|
|
|
|
|
|
|
|
|
134 |
|
|
|
|
|
|
|
|
|
|
|
|
|
|
|
|
|
|
|
|
|
|
|
|
|
|
|
|
|
|
|
|
|
|
|
|
|
|
|
|
The year-over-year decrease in the quantity of coal reserves was driven by production depletion.
|
|
|
|
|
|
(1) |
Economic recoverability is based upon product-specific estimated average sales prices per tonne of $51.65 for the five-year period ending December 31, 2028 and assumed escalation of 2.0% to 3.0% per annum during the subsequent period through the end of the LOM plan. |
(2) |
The quality of coal resources is on an in situ, air-dry basis. |
(3) |
The quantity of coal resource estimates is on an in situ basis, which does not take into consideration coal loss during mining and processing. |
(4) |
Besides the results from drill hole analyses, the raw ash is a key quality parameter that is relevant to both the cut-off grade and metallurgical recovery. The resource is limited by a maximum of 50% raw ash (air-dry basis). Due to the relatively consistent coal thickness and shallow depth, no other geological limiting factors are applied except for known geological anomalies such as paleochannels and igneous intrusion. |
(5) |
The quality of coal reserves is based on an air-dry basis. It is the laboratory results from the core samples with adjustments that reflect the reconciliation results from actual production. |
(6) |
The quantity of coal reserves is estimated on a saleable product basis, which takes into consideration of mining and processing loss. The economic results from the LOM planning process demonstrate the economic viability of the coal reserve estimate. |
(7) |
Mine yield is the ratio of estimated saleable product coal over ROM coal tons with mainly processing loss considered. |
|
|
|
|
|
|
|
|
|
| Peabody Energy Corporation |
2023 Form 10-K |
52 |
Centurion Mine
The Centurion Mine, which is currently undergoing redevelopment, is an underground longwall metallurgical coal mine located 160 kilometers WSW of Mackay, Queensland, Australia. The Centurion Mine lies on the Collinsville Shelf on the western margin of the Bowen Basin in Central Queensland. White Mining Ltd developed the operation (then known as the North Goonyella Mine), including a rail loop, coal handling preparation plant (CHPP) and nearby accommodation village, following the grant of ML6949 in 1991. Peabody then acquired North Goonyella as part of an acquisition of RAG’s coal assets in April of 2004 and operated it until September of 2018, when a fire in the mine halted operations. The mine has been idled since that time while plans to re-initiate production with regulatory approval were developed.
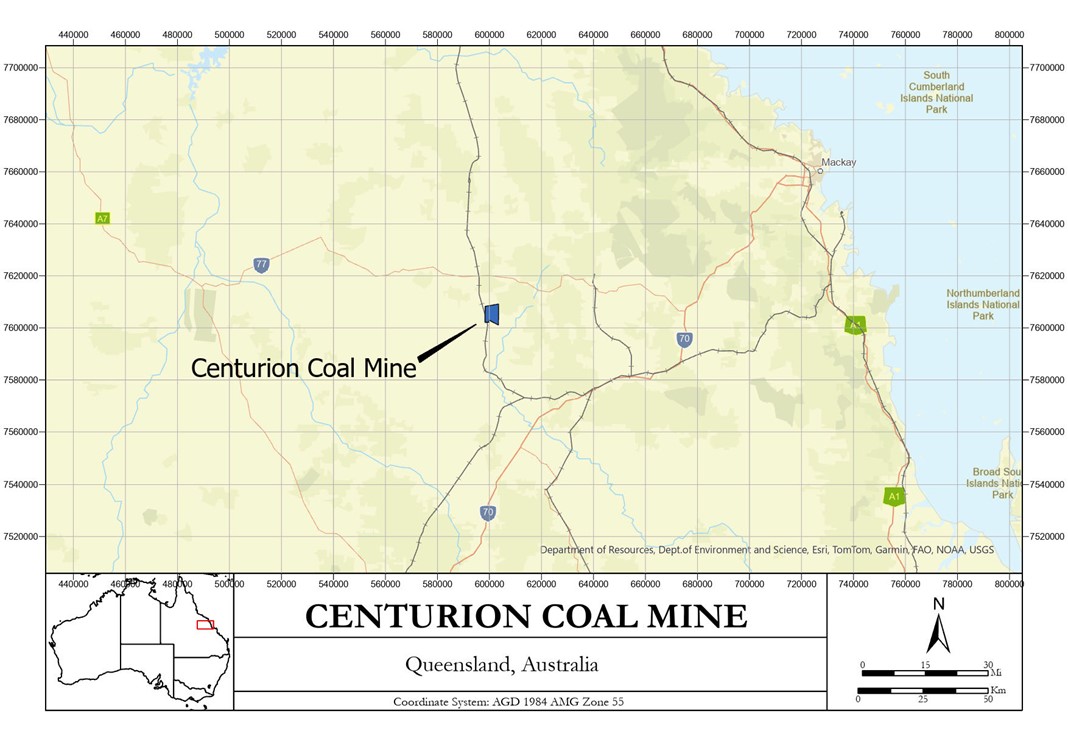
Centurion Mine will extract coal from the Goonyella Middle seam with future plans to extend into the Goonyella Lower B2 (GLB2) seam with mining depths ranging from 210 meters to 540 meters. The Company has secured mineral rights through state mineral leases and has an approved production rate for the operation of 10.2 Mtpa ROM coal that after processing, equates to approximately 7.6 Mtpa product coal. The Centurion Mine operates on a Mining Lease issued by the State Government of Queensland. Tenement holders are bound by the Mineral Resources Act 1989 and the Mineral Resources Regulation 2013 which define the laws pertaining to coal exploration and mining in Queensland. Under the system administered by the Department of Natural Resources, Mines and Energy (DNRME), tenements are held as either EPC (Exploration Permit Coal), MDL (Mineral Development Licence) or ML (Mining Lease).
Production from the Centurion Coal Mine will be subject to the Queensland Government Royalty charged on total revenue. In addition to this standard Government royalty, there is also a special private Royalty agreement established in relation to the sale of the property by a prior owner.
The Centurion Mining Lease, ML6949, encompasses a total of 3,293 hectares. The ML allows mining and sale of coal by both underground and open cut methods. Overlapping this Mining Lease, Centurion also holds a Petroleum Lease, PL504, which enables the company to commercialize any coal seam gas (methane) that may be extracted within the lease area.
|
|
|
|
|
|
|
|
|
| Peabody Energy Corporation |
2023 Form 10-K |
53 |
Coal will be produced primarily using longwall systems. The mine will also use continuous miner units for longwall development and limited production. Mined coal will be processed through the on-site wash plant and conveyed to rail loadout facilities. Product coal will be loaded to train via an existing 1,000t Train Loadout Bin. The loaded trains will then travel some 217km to the Port of Hay Point where it will be bottom dumped to conveyor and onto stockpiles at Dalrymple Bay Coal Terminal (DBCT). Shipping of coal to customers will take place on an ocean-going vessel, often shared with other coal suppliers. Centurion Coking coal is a premium Hard Coking Coal (PHCC) with a mature brand name in the seaborne metallurgical marketplace and is well known in both the Atlantic and Pacific seaborne markets.
The key supporting infrastructure for Centurion Mine includes road access via highways and roads, access to both the Goonyella and Newland Rail Systems, coal export terminals at the Port of Hay Point and the Port of Abbot Point, connection to a High Voltage electricity grid that provides electricity to the existing facilities, and water supplied from the 15GL capacity Burton Gorge Dam. Centurion also has a nearby accommodation village with housing and service amenities for more than 400 workers located 19km east of the mine. The mine’s workforce is drawn primarily from the townships of Moranbah, Nebo and Mackay.
The property, plant, equipment and mine development assets of Centurion Mine had a net book value of approximately $393 million at December 31, 2023. The mine’s operating equipment and facilities meet contemporary mining standards and are adequately maintained to execute the LOM plan. Routine maintenance, overhauls and necessary capital replacements are generally included in the LOM plan to support future production. While the mine was idled since 2018, the Company upgraded the mine’s coal transfer and handling facilities, purchased new mining equipment and made other capital investments to improve its prospective cost structure.
|
|
|
|
|
|
|
|
|
| Peabody Energy Corporation |
2023 Form 10-K |
54 |
The tables below present Centurion Mine’s estimated coal reserves and resources at December 31, 2023, along with comparative quantities at December 31, 2022. These coal reserve and resource estimates were supported by the analyses of 1,776 total drill holes within the coal lease area. The quantity of the coal resources is estimated on an in situ basis as 100% attributable to Peabody. Coal resources are reported exclusive of coal reserves. The quantity of the coal reserves are estimated on a saleable product basis as 100% attributable to Peabody. Coal reserves and resources are reported on selected key quality parameters on an air-dry basis.
|
|
|
|
|
|
|
|
|
|
|
|
|
|
|
|
|
|
|
|
|
|
|
|
|
|
|
|
|
|
|
|
|
|
|
|
|
|
|
CENTURION MINE - SUMMARY OF COAL RESERVES AND RESOURCES (1) |
| (Tons in millions) |
|
|
|
|
|
|
|
|
|
|
|
|
|
|
|
December 31, 2023 |
|
December 31, 2022 |
Coal Reserves (2)(5)(6) |
|
Tons |
|
%Ash |
|
%Sulfur |
|
%VM |
|
% Mine Yield(7) |
|
Tons |
| Proven |
|
46 |
|
|
7.4 |
|
|
0.5 |
|
|
20.9 |
|
|
82 |
% |
|
46 |
|
| Probable |
|
23 |
|
|
7.5 |
|
|
0.5 |
|
|
21.1 |
|
|
82 |
% |
|
24 |
|
| Total |
|
69 |
|
|
|
|
|
|
|
|
|
|
70 |
|
|
|
|
|
|
|
|
|
|
|
|
|
|
| Year-over-year decrease |
|
(1) |
% |
|
|
|
|
|
|
|
|
|
|
|
|
|
|
|
|
|
|
|
|
|
|
|
|
|
December 31, 2023 |
|
|
|
December 31, 2022 |
Coal Resources (2)(3)(4)(5) |
|
Tons |
|
%Ash |
|
%Sulfur |
|
VM% |
|
|
|
Tons |
| Measured |
|
— |
|
|
— |
|
|
— |
|
|
— |
|
|
|
|
— |
|
| Indicated |
|
2 |
|
|
14.8 |
|
|
0.5 |
|
|
20.7 |
|
|
|
|
1 |
|
| Measured and indicated |
|
2 |
|
|
14.8 |
|
|
0.5 |
|
|
20.7 |
|
|
|
|
1 |
|
| Inferred |
|
8 |
|
|
13.6 |
|
|
0.5 |
|
|
20.7 |
|
|
|
|
8 |
|
| Total |
|
10 |
|
|
|
|
|
|
|
|
|
|
9 |
|
|
|
|
|
|
|
|
|
|
|
|
|
|
|
|
|
|
|
|
(1) |
Economic recoverability is based upon an estimated average sales price per tonne of $180 for most of the LOM plan. |
(2) |
The quality of coal reserves and resources are estimated on an air-dry basis. |
(3) |
The quantity of coal resource estimates are on an in situ basis, which doesn’t take into consideration coal loss during mining and processing. |
(4) |
The coal resource boundary is established by considering various factors, including results from drill hole analyses, mining lease, coal control, geological features, faults and other surface features. |
(5) |
The cut-off grade and metallurgical recovery are not limiting factors for the coal reserve and resource estimates due to relatively consistent coal quality and float recovery from the lab results within the assessed area. The Lease boundary, surface infrastructures, and the base of weathering are the main limiting factors. |
(6) |
The quantity of coal reserves is estimated on a saleable product basis, which takes into consideration of unmined coal (pillars, etc.), coal loss during mining and processing, and additional washing recovery. The results from the LOM planning process demonstrate the economic recoverability of the coal reserve estimate. |
(7) |
Mine yield is the ratio of estimated saleable product coal over ROM coal tons with mainly processing loss considered. |
Internal Controls
The preparation of coal reserve and resource estimates is completed in accordance with the Company’s prescribed internal control procedures, which are designed specifically to ensure the reliability of such estimates presented herein. Annually, QPs and other employees review the estimates of mineral reserves and mineral resources, the supporting documentation, and compliance with applicable internal controls. Such controls employ management systems, standardized procedures, workflow processes, multi-functional supervision and management approval, internal and external reviews, reconciliations, and data security covering record keeping, chain of custody and data storage.
The internal controls for coal reserve and resource estimates also cover exploration activities, sample preparation and analysis, data verification, processing, metallurgical testing, recovery estimation, mine design and sequencing, and coal reserve and resource evaluations, with environmental, social and regulatory considerations. The quality assurance and control protocols over the assaying of drill hole samples are performed by reputable commercial laboratories following certification and accreditation programs established by the American Society for Testing and Materials (ASTM) or Australian National Association of Testing Authorities (NATA).
|
|
|
|
|
|
|
|
|
| Peabody Energy Corporation |
2023 Form 10-K |
55 |
The coal reserve and resource estimates have inherent risks due to data accuracy, uncertainty from geological interpretation, mine plan assumptions, uncontrolled rights for mineral and surface properties, environmental challenges, uncertainty for future market supply and demand, and changes in laws and regulations. Management and QPs are aware of those risks that might directly impact the assessment of coal reserves and resources. The current coal reserves and resources are estimated based on the best information available and are subject to re-assessment when conditions change. Refer to Item 1A. “Risk Factors” for discussion of risks associated with the estimates of the Company’s coal reserves and resources.
Item 3. Legal Proceedings.
See Note 21. “Commitments and Contingencies” to the accompanying consolidated financial statements for a description of Peabody’s pending legal proceedings, which information is incorporated herein by reference.
Item 4. Mine Safety Disclosures.
Peabody’s “Safety and Sustainability Management System” has been designed to set clear and consistent expectations for safety, health and environmental stewardship across the Company’s business. It aligns to the National Mining Association’s CORESafety® framework and encompasses three fundamental areas: leadership and organization, risk management and assurance. Peabody also partners with other companies and certain governmental agencies to pursue new technologies that have the potential to improve its safety performance and provide better safety protection for employees.
Peabody continually monitors its safety performance and regulatory compliance. The information concerning mine safety violations or other regulatory matters required by SEC regulations is included in Exhibit 95 to this Annual Report on Form 10-K.
PART II
Item 5. Market for Registrant’s Common Equity, Related Stockholder Matters and Issuer Purchases of Equity Securities.
Peabody’s Common Stock is listed on the New York Stock Exchange, under the symbol “BTU.” As of February 16, 2024 there were 176 holders of the Company’s Common Stock, as determined by counting its record holders and the number of participants reflected in a security position listing provided to the Company by the Depository Trust Company (DTC). Because such DTC participants are brokers and other institutions holding shares of Peabody’s Common Stock on behalf of their customers, the Company does not know the actual number of unique shareholders represented by these record holders.
Share Repurchase Program
On April 14, 2023, the Company amended its existing transaction support agreement with the providers of its surety bond portfolio, dated November 6, 2020, to remove the restrictions on shareholder returns, subject to a minimum liquidity threshold, and terminated the then-existing credit facility.
On April 17, 2023, the Company announced that its Board of Directors authorized a new share repurchase program (2023 Repurchase Program) authorizing repurchases of up to $1.0 billion of its common stock. The 2023 Repurchase Program superseded and replaced the previous repurchase program that had been announced in 2017.
Under the 2023 Repurchase Program, the Company may purchase shares of common stock from time to time at the discretion of management through open market purchases, privately negotiated transactions, block trades, accelerated or other structured share repurchase programs, or other means. The amount of any share repurchase transactions is subject to the Company’s annual Available Free Cash Flow (as defined in Part II, Item 7. “Management’s Discussion and Analysis of Financial Condition and Results of Operations.”) The manner, timing and pricing of any share repurchase transactions will be based on a variety of factors, including market conditions, applicable legal requirements and alternative opportunities that the Company may have for the use or investment of capital. Through December 31, 2023, the Company had repurchased 16.1 million shares of its common stock under the 2023 Repurchase Program for $350.3 million, which included $2.6 million of unsettled share repurchases and commissions paid of $0.3 million, leaving $650.0 million available for share repurchase.
|
|
|
|
|
|
|
|
|
| Peabody Energy Corporation |
2023 Form 10-K |
56 |
Dividends
During the year ended December 31, 2023, the Company declared dividends per share of $0.225. On February 8, 2024, the Company declared an additional dividend per share of $0.075 to be paid on March 13, 2024 to shareholders of record as of February 22, 2024. The declaration and payment of dividends and the amount of dividends will depend on the Company’s annual Available Free Cash Flow (as defined in Part II, Item 7. “Management’s Discussion and Analysis of Financial Condition and Results of Operations.”)
Share Relinquishments
The Company routinely allows employees to relinquish Common Stock to pay estimated taxes upon the vesting of restricted stock units and the payout of performance units that are settled in Common Stock under its equity incentive plans. The value of Common Stock tendered by employees is determined based on the closing price of the Company’s Common Stock on the dates of the respective relinquishments.
Issuances of Equity Securities
In June 2021, the Company announced an at-the-market equity offering program pursuant to which the Company could offer and sell up to 12.5 million shares of its Common Stock. The at-the-market equity offering program was further expanded to 32.5 million shares during 2021. The shares are offered and sold pursuant to the Company’s Registration Statement on Form S-3, which was declared effective by the Securities and Exchange Commission on April 23, 2021, as supplemented by prospectus supplements dated June 4, 2021, September 17, 2021, and December 17, 2021 relating to the offer and sale of the shares. During the year ended December 31, 2021, the Company sold approximately 24.8 million shares for net cash proceeds of $269.8 million. No sales were made under this at-the-market equity offering program during the years ended December 31, 2022 or 2023, leaving approximately 7.7 million shares available for sale.
On March 7, 2022, the Company entered into an at-the-market equity offering program pursuant to which the Company could offer and sell shares of its common stock having an aggregate gross sales price of up of $225 million. The shares are offered and sold pursuant to the Company’s Registration Statement on Form S-3, which was declared effective by the Securities and Exchange Commission on April 23, 2021, as supplemented by a prospectus supplement dated March 7, 2022 relating to the offer and sale of the shares. During the year ended December 31, 2022, the Company sold approximately 10.1 million shares for net proceeds of $222.0 million, thereby concluding this at-the-market equity offering program.
Also during the year ended December 31, 2021, the Company completed multiple bilateral transactions with holders of the 2022 Notes, the 2025 Notes and the 2024 Peabody Notes in which the Company issued an aggregate 10.0 million shares of its Common Stock in exchange for $37.3 million aggregate principal amount of the 2022 Notes, $47.2 million aggregate principal amount of the 2025 Notes and $21.6 million aggregate principal amount of the 2024 Peabody Notes. No such bilateral transactions were completed during the year ended December 31, 2022. The issuance of shares of common stock in exchange for the 2022 Notes, the 2025 Notes and the 2024 Peabody Notes was made in reliance on the exemption from registration provided in Section 3(a)(9) under the Securities Act of 1933, based in part on representations of holders of the 2022 Notes, the 2025 Notes and the 2024 Peabody Notes, and on the basis that the exchange was completed with existing holders of the Company's securities and no commission or other remuneration was paid or given for soliciting the exchange.
Purchases of Equity Securities
The following table summarizes all share purchases for the three months ended December 31, 2023:
|
|
|
|
|
|
|
|
|
|
|
|
|
|
|
|
|
|
|
|
|
|
|
|
|
|
|
| Period |
|
Total Number of Shares
Purchased (1)
|
|
Average Price Paid per Share |
|
Total Number of Shares Purchased as Part of Publicly Announced Program |
|
Maximum Dollar Value of Shares that May Yet Be Used to Repurchase Shares Under the Publicly Announced Program (In millions) |
October 1 through October 31, 2023 |
|
1,206,643 |
|
|
$ |
24.95 |
|
|
1,206,515 |
|
|
$ |
703.5 |
|
November 1 through November 30, 2023 |
|
1,174,073 |
|
|
23.35 |
|
|
1,174,073 |
|
|
676.1 |
|
December 1 through December 31, 2023 |
|
1,085,760 |
|
|
24.06 |
|
|
1,085,760 |
|
|
650.0 |
|
Total |
|
3,466,476 |
|
|
24.13 |
|
|
3,466,348 |
|
|
|
(1) Includes shares withheld to cover the withholding taxes upon the vesting of equity awards, which are not a part of the Repurchase Program Repurchase Program.
|
|
|
|
|
|
|
|
|
| Peabody Energy Corporation |
2023 Form 10-K |
57 |
Stock Performance Graph
The following performance graph compares the cumulative total return on Peabody’s common stock with the cumulative total return of the following indices: (i) the S&P MidCap 400 Stock Index; (ii) a historical peer group comprised of Arch Resources, Inc., Hallador Energy Co., and Warrior Met Coal, Inc. (Custom Composite Index); and (iii) the S&P Metals Mining Select Industry Index, which replaces the Custom Composite Index. As certain competitors within the Custom Composite Index have diversified from coal production, Peabody elected to use a published industry index.
The graph assumes that the value of the investment in BTU and each index was $100 at December 31, 2018. The graph also assumes that all dividends were reinvested and that the investments were held through December 31, 2023. These indices are included for comparative purposes only and do not necessarily reflect management's opinion that such indices are an appropriate measure of the relative performance of the stock involved and are not intended to forecast or be indicative of possible future performance of the common stock.
Item 6. Reserved.
Not applicable.
Item 7. Management’s Discussion and Analysis of Financial Condition and Results of Operations.
The Company’s discussion and analysis of the year ended December 31, 2023 compared to the year ended December 31, 2022 is included herein. For discussion and analysis of the year ended December 31, 2022 compared to the year ended December 31, 2021, please refer to Item 7 of Part II, “Management’s Discussion and Analysis of Financial Condition and Results of Operations” in Peabody’s Annual Report on Form 10-K for the year ended December 31, 2022, which was filed with the SEC on February 24, 2023 and is incorporated by reference herein.
|
|
|
|
|
|
|
|
|
| Peabody Energy Corporation |
2023 Form 10-K |
58 |
Non-GAAP Financial Measures
The following discussion of Peabody’s results of operations includes references to and analysis of Adjusted EBITDA and Total Reporting Segment Costs, which are financial measures not recognized in accordance with U.S. generally accepted accounting principles (U.S. GAAP). Adjusted EBITDA is used by management as the primary metric to measure each of its segments’ operating performance and allocate resources. Total Reporting Segment Costs is also used by management as a component of a metric to measure each of its segments’ operating performance.
Also included in the following discussion of Peabody’s results of operations are references to Revenue per Ton, Costs per Ton and Adjusted EBITDA Margin per Ton for each reporting segment. These metrics are used by management to measure each of its reporting segments’ operating performance. Management believes Costs per Ton and Adjusted EBITDA Margin per Ton best reflect controllable costs and operating results at the reporting segment level. The Company considers all measures reported on a per ton basis to be operating/statistical measures; however, the Company includes reconciliations of the related non-GAAP financial measures (Adjusted EBITDA and Total Reporting Segment Costs) in the “Reconciliation of Non-GAAP Financial Measures” section contained within this Item 7.
In its discussion of liquidity and capital resources, the Company includes references to Available Free Cash Flow (AFCF) which is also a non-GAAP financial measure. AFCF is used by management as a measure of its ability to generate excess cash flow from its business operations.
Peabody believes non-GAAP performance measures are used by investors to measure its operating performance. These measures are not intended to serve as alternatives to U.S. GAAP measures of performance and may not be comparable to similarly-titled measures presented by other companies. Refer to the “Reconciliation of Non-GAAP Financial Measures” section contained within this Item 7 for definitions and reconciliations to the most comparable measures under U.S. GAAP.
Overview
In 2023, Peabody produced and sold 126.7 million and 126.2 million tons of coal, respectively, from continuing operations.
As of December 31, 2023, the Company reports its results of operations primarily through the following reportable segments: Seaborne Thermal, Seaborne Metallurgical, Powder River Basin, Other U.S. Thermal and Corporate and Other.
The business of the Company’s seaborne operating platform is primarily export focused with customers spread across several countries, with a portion of its thermal and metallurgical coal sold within Australia. Generally, revenue from individual countries vary year by year based on electricity and steel demand, the strength of the global economy, governmental policies and several other factors, including those specific to each country. The Company classifies its seaborne mines within the Seaborne Thermal or Seaborne Metallurgical segments based on the primary customer base and coal reserve type of each mining operation. A small portion of the coal mined by the Seaborne Thermal segment is of a metallurgical grade. Similarly, a small portion of the coal mined by the Seaborne Metallurgical segment is of a thermal grade. Additionally, the Company may market some of its metallurgical coal products as a thermal coal product from time to time depending on market conditions.
The Company’s Seaborne Thermal operations consist of mines in New South Wales, Australia. The mines in that segment utilize both surface and underground extraction processes to mine low-sulfur, high Btu thermal coal.
The Company’s Seaborne Metallurgical operations consist of mines in Queensland, Australia, one in New South Wales, Australia and one in Alabama, USA. The mines in that segment utilize both surface and underground extraction processes to mine various qualities of metallurgical coal. The metallurgical coal qualities include hard coking coal, semi-hard coking coal, semi-soft coking coal and pulverized coal injection coal.
The principal business of the Company’s thermal operating segments in the U.S. is the mining, preparation and sale of thermal coal, sold primarily to electric utilities in the U.S. under long-term contracts, with a relatively small portion sold as international exports as conditions warrant. The Company’s Powder River Basin operations consist of its mines in Wyoming. The mines in that segment are characterized by surface mining extraction processes, coal with a lower sulfur content and Btu and higher customer transportation costs (due to longer shipping distances). The Company’s Other U.S. Thermal operations reflect the aggregation of its Illinois, Indiana, New Mexico and Colorado mining operations. The mines in that segment are characterized by a mix of surface and underground mining extraction processes, coal with a higher sulfur content and Btu and lower customer transportation costs (due to shorter shipping distances). Geologically, the Company’s Powder River Basin operations mine sub-bituminous coal deposits and its Other U.S. Thermal operations mine both bituminous and sub-bituminous coal deposits.
|
|
|
|
|
|
|
|
|
| Peabody Energy Corporation |
2023 Form 10-K |
59 |
The Company’s Corporate and Other segment includes selling and administrative expenses, results from equity affiliates, corporate hedging activities, trading and brokerage activities, minimum charges on certain transportation-related contracts, the closure of inactive mining sites and certain commercial matters.
Resource Management. As of December 31, 2023, Peabody controlled approximately 2.1 billion tons of proven and probable coal reserves, 2.7 billion tons of coal resources and approximately 350,000 acres of surface property through ownership and lease agreements. The Company has an ongoing asset optimization program whereby its property management group regularly reviews these coal reserves, coal resources and surface properties for opportunities to generate earnings and cash flow through the sale or exchange of non-strategic coal reserves, coal resources and surface lands. These surface lands include acres where Peabody has completed post-mining reclamation. In addition, the Company generates revenue through royalties from coal reserves and oil and gas rights leased to third parties, farm income from surface lands under third-party contracts and lease income from surface lands under contracts with renewable energy ventures.
Middlemount Mine. Peabody owns a 50% equity interest in Middlemount, which owns the Middlemount Mine in Queensland, Australia. The mine predominantly produces semi-hard coking coal and low-volatile pulverized coal injection (LV PCI) coal for sale into seaborne coal markets through Abbot Point Coal Terminal, with some capacity also secured at Dalrymple Bay Coal Terminal. Mining operations first commenced at the Middlemount Mine in late 2011. During the years ended December 31, 2023 and 2022, the mine sold 1.2 million and 1.6 million tons of coal, respectively (on a 50% basis).
Summary
Spot pricing for premium low-vol hard coking coal (Premium HCC), premium low-vol pulverized coal injection (Premium PCI) coal, Newcastle index thermal coal and API 5 index thermal coal, and prompt month pricing for PRB 8,880 Btu/Lb coal and Illinois Basin 11,500 Btu/Lb coal during the year ended December 31, 2023 is set forth in the table below.
The seaborne pricing included in the table below is not necessarily indicative of the pricing the Company realized during the year ended December 31, 2023 due to quality differentials and a portion of its seaborne sales being executed through annual and multi-year international coal supply agreements that contain provisions requiring both parties to renegotiate pricing periodically, with spot, index and quarterly sales arrangements also utilized. The Company’s typical practice is to negotiate pricing for seaborne metallurgical coal contracts on a quarterly, spot or index basis and seaborne thermal coal contracts on an annual, spot or index basis.
In the U.S., the pricing included in the table below is also not necessarily indicative of the pricing the Company realized during the year ended December 31, 2023 since the Company generally sells coal under long-term contracts where pricing is determined based on various factors. Such long-term contracts in the U.S. may vary significantly in many respects, including price adjustment features, price reopener terms, coal quality requirements, quantity parameters, permitted sources of supply, treatment of environmental constraints, extension options, force majeure and termination and assignment provisions. Competition from alternative fuels such as natural gas and other fuel sources may also impact the Company’s realized pricing.
|
|
|
|
|
|
|
|
|
|
|
|
|
|
|
|
|
|
|
|
|
|
|
|
|
|
|
|
|
|
|
|
|
|
|
High |
|
Low |
|
Average |
|
December 31, 2023 |
|
February 16, 2024 |
Premium HCC (1) |
|
$ |
390.00 |
|
|
$ |
221.50 |
|
|
$ |
296.30 |
|
|
$ |
323.75 |
|
|
$ |
315.00 |
|
Premium PCI coal (1) |
|
$ |
344.00 |
|
|
$ |
154.50 |
|
|
$ |
218.82 |
|
|
$ |
176.00 |
|
|
$ |
166.00 |
|
Newcastle index thermal coal (1) |
|
$ |
397.30 |
|
|
$ |
120.23 |
|
|
$ |
171.28 |
|
|
$ |
148.96 |
|
|
$ |
120.94 |
|
API 5 index thermal coal (1) |
|
$ |
135.29 |
|
|
$ |
84.17 |
|
|
$ |
102.98 |
|
|
$ |
93.26 |
|
|
$ |
94.58 |
|
PRB 8,800 Btu/Lb coal (2) |
|
$ |
15.50 |
|
|
$ |
13.75 |
|
|
$ |
14.36 |
|
|
$ |
13.85 |
|
|
$ |
13.50 |
|
Illinois Basin 11,500 Btu/Lb coal (2) |
|
$ |
133.00 |
|
|
$ |
43.50 |
|
|
$ |
61.15 |
|
|
$ |
43.50 |
|
|
$ |
41.50 |
|
(1) Prices expressed per metric tonne.
(2) Prices expressed per short ton.
Within the global coal industry, supply and demand for its products and the supplies used for mining have been impacted by the ongoing geopolitical events, including the Russian-Ukrainian conflict. Furthermore, inflationary pressures and supply chain constraints contributed to rising costs during the twelve months ended December 31, 2023. While supply chain constraints eased and inflation somewhat moderated in 2023, future periods could continue to be impacted. As future developments related to geopolitical conflict, supply chain disruptions and rising inflation are unknown, the global coal industry data for the twelve months ended December 31, 2023 presented herein may not be indicative of their ultimate impacts.
|
|
|
|
|
|
|
|
|
| Peabody Energy Corporation |
2023 Form 10-K |
60 |
Within the seaborne metallurgical coal market, the volatility which characterized the first nine months of 2023 continued during the balance of the year. Excluding China, the steel sector showed positive growth in crude steel output during the three months ended December 31, 2023, led mainly by India and its ongoing strong economic expansion. Total crude steel output during the period, however, contracted because of a sharp decline in Chinese production where steel producers reported thin margins and slower domestic demand. Metallurgical coal prices contracted over the three months ended December 31, 2023, however supply constraints for premium material, especially in Australia due to weather disruptions, did provide support to the price of premium hard coking coals that are usually core to steel maker’s metallurgical coal requirements. In comparison, non-premium coals such as pulverized coal injection coal and semi soft coking coals observed more substantial price decreases. The seaborne metallurgical coal market is expected to remain volatile in the near term, influenced by both the availability of premium quality export coals and the economic performance of China, India and elsewhere.
Within the seaborne thermal coal market, seasonal demand trends and increased rates of Australian exports contributed to global thermal coal prices becoming rangebound during the three months ended December 31, 2023. In China, despite domestic coal production and renewable generation being strong through the twelve months ended December 31, 2023, a record quantity of imports were observed during the same period lending support to seaborne thermal market growth and price stability year-over-year. Overall, global thermal coal markets remain turbulent amid ample supply and seasonal demand requirements, as well as volatile global markets for oil and natural gas.
In the United States, overall electricity demand decreased approximately 1% year-over-year, negatively impacted by weather. During the year ended December 31, 2023, electricity generation from thermal coal has declined year-over-year due to low natural gas prices and stronger renewable generation despite lower overall electricity demand. Coal’s share of electricity generation has declined to approximately 16% for the year ended December 31, 2023, while wind and solar’s combined generation share has increased to 16% and the share of natural gas generation has increased to 42%. While coal inventories slightly recovered over the summer, this trend reversed and stock levels ended the year approximately 45% higher than the levels at the end of 2022. During the year ended December 31, 2023, utility consumption of PRB coal declined approximately 18% compared to the prior year period.
Department of Labor Settlement
On August 8, 2023, the Company entered into a settlement agreement with the U.S. Department of Labor to resolve a liability dispute regarding the federal black lung claims of the Company’s previously divested legacy operations of Patriot Coal Corporation and certain of its wholly-owned subsidiaries (Patriot). In accordance with the settlement agreement, the Company paid $72.0 million to settle the Patriot federal black lung claims, with the exception of approximately $4.2 million of certain claims for attorney’s fees and additional compensation due to claimants not paid during appeal. As a result of the settlement, the Company recognized a $3.9 million gain within “(Loss) income from discontinued operations, net of income taxes” during the year ended December 31, 2023.
Surety Agreement Amendment and Shareholder Return Program
On April 14, 2023, the Company amended its existing agreement with the providers of its surety bond portfolio, dated November 6, 2020. Under the agreement, the Company was required to post collateral on a periodic basis. Pursuant to the amendment, the Company and its surety bond providers agreed to (i) establish a combined maximum collateral cap, (ii) remove the restrictions on shareholder returns contained in the original agreement, subject to a minimum liquidity threshold, and (iii) extend the expiration date of the existing agreement from December 31, 2025 to December 31, 2026. Peabody also terminated the then-existing letter of credit facility which was previously used primarily for surety collateral, further reducing interest costs and increasing financial flexibility.
On April 17, 2023, the Company announced that its Board approved a new shareholder return framework which includes a share repurchase plan, a fixed quarterly cash dividend and a variable quarterly cash dividend component. The Board also approved a new share repurchase program authorizing repurchases up to $1.0 billion of the Company’s common stock.
Refer to the “Liquidity and Capital Resources” section contained within this Item 7 for a further discussion of the surety agreement amendment.
Other
On March 29, 2023, the Company’s Shoal Creek Mine experienced a fire involving void fill material utilized to stabilize the roof structure of the mine. On June 20, 2023, the Company announced that the Shoal Creek Mine, in coordination with the Mine Safety and Health Administration, had safely completed localized sealing of the affected area of the mine. In November 2023, longwall coal production commenced in a new area of the mine.
|
|
|
|
|
|
|
|
|
| Peabody Energy Corporation |
2023 Form 10-K |
61 |
During the year ended December 31, 2023, the Company recorded a provision for loss of $28.7 million related to the fire. The provision includes $17.8 million related to longwall development and other costs and $10.9 million for equipment deemed inoperable within the affected area of the mine. In October 2023, the Company filed an insurance claim against applicable insurance policies with combined business interruption and property loss limits of $125 million above a $50 million deductible.
On June 23, 2023, the Company’s North Antelope Rochelle Mine sustained damage from a tornado which led to a temporary suspension of operations. The mine resumed operations on June 25, 2023. During the year ended December 31, 2023, the Company recorded a provision for loss of $12.2 million related to the tornado damage. The combined provision includes $4.0 million for materials and supplies inventories, $1.0 million for buildings and equipment and $7.2 million for incremental repair costs. The Company anticipates that incremental repair costs will continue to be recorded in early 2024.
The Company entered into a definitive agreement dated October 26, 2023, with Stanmore SMC Pty Ltd (Stanmore) to acquire the southern part of Stanmore’s Wards Well tenements (Wards Well area) which are adjacent to the Company’s Centurion Mine in Queensland, Australia. The acquisition terms include cash consideration of $136 million and a contingent royalty of up to $200 million. The royalty will only be payable once the Company has recovered its investment and development costs of the Wards Well area and if the average sales price achieved exceeds certain thresholds. No royalty is payable if the Company does not commence mining in the Wards Well area. Completion of the transaction is subject to the satisfaction of certain conditions, including regulatory approvals.
Results of Operations
Year Ended December 31, 2023 Compared to Year Ended December 31, 2022
The decrease in income from continuing operations, net of income taxes for the year ended December 31, 2023 compared to the prior year ($501.4 million) was primarily driven by a higher income tax provision ($347.6 million); decreased results from equity affiliates ($124.3 million); higher operating costs and expenses ($94.3 million), which reflect increased sales price sensitive costs and inflationary pressures for commodities, materials, services, repairs and labor; and a provision of $40.9 million related to the losses at NARM and Shoal Creek. These unfavorable variances were partially offset by lower net interest expense ($188.0 million).
Revenue for the year ended December 31, 2023 was comparatively flat compared to the prior year. Lower revenue from the operating segments ($262.3 million) driven by decreases in seaborne coal pricing, were offset by net unrealized mark-to-market gains on derivative contracts related to forecasted coal sales ($194.8 million) and revenue related to the Company’s assignment of rights to its excess port and rail capacity ($25.9 million).
Adjusted EBITDA for the year ended December 31, 2023 reflected a year-over-year decrease of $480.8 million.
Tons Sold
The following table presents tons sold by operating segment:
|
|
|
|
|
|
|
|
|
|
|
|
|
|
|
|
|
|
|
|
|
|
|
|
|
|
|
(Decrease) Increase |
| |
Year Ended December 31, |
|
to Volumes |
| |
2023 |
|
2022 |
|
Tons |
|
% |
| |
(Tons in millions) |
|
|
| Seaborne Thermal |
15.5 |
|
|
15.6 |
|
|
(0.1) |
|
|
(0.6) |
% |
| Seaborne Metallurgical |
6.9 |
|
|
6.6 |
|
|
0.3 |
|
|
4.5 |
% |
| Powder River Basin |
87.2 |
|
|
82.6 |
|
|
4.6 |
|
|
5.6 |
% |
| Other U.S. Thermal |
16.2 |
|
|
18.4 |
|
|
(2.2) |
|
|
(12.0) |
% |
| Total tons sold from operating segments |
125.8 |
|
|
123.2 |
|
|
2.6 |
|
|
2.1 |
% |
| Corporate and Other |
0.4 |
|
|
0.5 |
|
|
(0.1) |
|
|
(20.0) |
% |
| Total tons sold |
126.2 |
|
|
123.7 |
|
|
2.5 |
|
|
2.0 |
% |
|
|
|
|
|
|
|
|
|
| Peabody Energy Corporation |
2023 Form 10-K |
62 |
Supplemental Financial Data
The following table presents supplemental financial data by operating segment:
|
|
|
|
|
|
|
|
|
|
|
|
|
|
|
|
|
|
|
|
|
|
|
|
|
Year Ended December 31, |
|
(Decrease) Increase |
| |
2023 |
|
2022 |
|
$ |
|
% |
| |
|
|
|
|
|
|
|
Revenue per Ton - Mining Operations (1) |
|
|
|
|
|
|
|
| Seaborne Thermal |
$ |
85.94 |
|
|
$ |
86.07 |
|
|
$ |
(0.13) |
|
|
(0.2) |
% |
| Seaborne Metallurgical |
188.66 |
|
|
243.78 |
|
|
(55.12) |
|
|
(22.6) |
% |
| Powder River Basin |
13.74 |
|
|
12.89 |
|
|
0.85 |
|
|
6.6 |
% |
| Other U.S. Thermal |
54.77 |
|
|
51.82 |
|
|
2.95 |
|
|
5.7 |
% |
Costs per Ton - Mining Operations (1) (2) |
|
|
|
|
|
|
|
| Seaborne Thermal |
$ |
48.66 |
|
|
$ |
44.65 |
|
|
$ |
4.01 |
|
|
9.0 |
% |
| Seaborne Metallurgical |
125.18 |
|
|
125.92 |
|
|
(0.74) |
|
|
(0.6) |
% |
| Powder River Basin |
11.98 |
|
|
12.06 |
|
|
(0.08) |
|
|
(0.7) |
% |
| Other U.S. Thermal |
41.98 |
|
|
38.63 |
|
|
3.35 |
|
|
8.7 |
% |
Adjusted EBITDA Margin per Ton - Mining Operations (1) (2) |
|
|
|
|
|
|
|
| Seaborne Thermal |
$ |
37.28 |
|
|
$ |
41.42 |
|
|
$ |
(4.14) |
|
|
(10.0) |
% |
| Seaborne Metallurgical |
63.48 |
|
|
117.86 |
|
|
(54.38) |
|
|
(46.1) |
% |
| Powder River Basin |
1.76 |
|
|
0.83 |
|
|
0.93 |
|
|
112.0 |
% |
| Other U.S. Thermal |
12.79 |
|
|
13.19 |
|
|
(0.40) |
|
|
(3.0) |
% |
(1)This is an operating/statistical measure not recognized in accordance with U.S. GAAP. Refer to the “Reconciliation of Non-GAAP Financial Measures” section below for definitions and reconciliations to the most comparable measures under U.S. GAAP.
(2)Includes revenue-based production taxes and royalties; excludes depreciation, depletion and amortization; asset retirement obligation expenses; selling and administrative expenses; restructuring charges; asset impairment; amortization of take-or-pay contract-based intangibles; and certain other costs related to post-mining activities.
Revenue
The following table presents revenue by reporting segment:
|
|
|
|
|
|
|
|
|
|
|
|
|
|
|
|
|
|
|
|
|
|
|
|
|
|
|
(Decrease) Increase |
|
Year Ended December 31, |
|
to Revenue |
| |
2023 |
|
2022 |
|
$ |
|
% |
| |
(Dollars in millions) |
|
|
| Seaborne Thermal |
$ |
1,329.7 |
|
|
$ |
1,345.6 |
|
|
$ |
(15.9) |
|
|
(1.2) |
% |
| Seaborne Metallurgical |
1,301.9 |
|
|
1,616.9 |
|
|
(315.0) |
|
|
(19.5) |
% |
| Powder River Basin |
1,198.1 |
|
|
1,065.5 |
|
|
132.6 |
|
|
12.4 |
% |
| Other U.S. Thermal |
888.2 |
|
|
952.2 |
|
|
(64.0) |
|
|
(6.7) |
% |
| Corporate and Other |
228.8 |
|
|
1.7 |
|
|
227.1 |
|
|
13,358.8 |
% |
| Revenue |
$ |
4,946.7 |
|
|
$ |
4,981.9 |
|
|
$ |
(35.2) |
|
|
(0.7) |
% |
Seaborne Thermal. The decrease in segment revenue during the year ended December 31, 2023 compared to the prior year was due to unfavorable realized prices ($273.2 million) driven by an approximately 20% decrease in export pricing, offset by favorable export volumes ($257.3 million).
Seaborne Metallurgical. Segment revenue decreased during the year ended December 31, 2023 compared to the prior year due to unfavorable realized prices ($324.8 million) and unfavorable volumes from the Shoal Creek Mine resulting from the fire in the first quarter of 2023 ($122.9 million), partially offset by favorable volumes from the Australian operations ($132.7 million).
Powder River Basin. Segment revenue increased during the year ended December 31, 2023 compared to the prior year due to favorable realized prices ($74.1 million) and favorable volumes ($58.5 million) resulting from improved rail performance.
|
|
|
|
|
|
|
|
|
| Peabody Energy Corporation |
2023 Form 10-K |
63 |
Other U.S. Thermal. The decrease in segment revenue during the year ended December 31, 2023 compared to the prior year was due to unfavorable volumes ($107.2 million) resulting from decreased demand, offset by favorable realized prices ($43.2 million).
Corporate and Other. Segment revenue increased during the year ended December 31, 2023 compared to the prior year due to net unrealized mark-to-market gains on derivative contracts related to forecasted coal sales in the current year compared to net unrealized mark-to-market losses in the prior year ($194.8 million) and revenue related to the Company’s assignment of rights to its excess port and rail capacity ($25.9 million).
Adjusted EBITDA
The following table presents Adjusted EBITDA for each of the Company’s reporting segments:
|
|
|
|
|
|
|
|
|
|
|
|
|
|
|
|
|
|
|
|
|
|
|
|
|
|
|
(Decrease) Increase to |
| |
Year Ended December 31, |
|
Adjusted EBITDA |
| |
2023 |
|
2022 |
|
$ |
|
% |
| |
(Dollars in millions) |
|
|
| Seaborne Thermal |
$ |
576.8 |
|
|
$ |
647.6 |
|
|
$ |
(70.8) |
|
|
(10.9) |
% |
| Seaborne Metallurgical |
438.1 |
|
|
781.7 |
|
|
(343.6) |
|
|
(44.0) |
% |
| Powder River Basin |
153.7 |
|
|
68.2 |
|
|
85.5 |
|
|
125.4 |
% |
| Other U.S. Thermal |
207.5 |
|
|
242.4 |
|
|
(34.9) |
|
|
(14.4) |
% |
| Corporate and Other |
(12.2) |
|
|
104.8 |
|
|
(117.0) |
|
|
(111.6) |
% |
Adjusted EBITDA (1) |
$ |
1,363.9 |
|
|
$ |
1,844.7 |
|
|
$ |
(480.8) |
|
|
(26.1) |
% |
(1)This is a financial measure not recognized in accordance with U.S. GAAP. Refer to the “Reconciliation of Non-GAAP Financial Measures” section below for definitions and reconciliations to the most comparable measures under U.S. GAAP.
Seaborne Thermal. Segment Adjusted EBITDA decreased during the year ended December 31, 2023 compared to the same period in the prior year as a result of lower realized prices net of sales sensitive costs ($248.7 million) and unfavorable operational costs ($55.7 million) resulting from higher costs for repairs, maintenance and labor. The decreases were offset by favorable export volumes ($228.1 million).
Seaborne Metallurgical. Segment Adjusted EBITDA decreased during the year ended December 31, 2023 compared to the same period in the prior year due to lower realized prices net of sales sensitive costs ($285.4 million) and unfavorable operational costs ($54.0 million) resulting from higher costs for repairs, maintenance and labor at the Australian operations.
Powder River Basin. Segment Adjusted EBITDA increased during the year ended December 31, 2023 compared to the same period in the prior year as a result of favorable commodity pricing and usage ($33.4 million); favorable volumes ($24.7 million); higher realized prices net of sales sensitive costs ($19.1 million); and decreased overburden removal costs ($14.5 million). The increases were partially offset by higher costs for materials, services, repairs and labor ($9.4 million) due in part to timing, increased repairs for an aging equipment fleet and inflationary pressures on materials and services.
Other U.S. Thermal. Segment Adjusted EBITDA decreased during the year ended December 31, 2023 compared to the same period in the prior year due to unfavorable volumes ($76.8 million) and higher costs for labor ($14.2 million) due in part to increased headcounts. These decreases were offset by higher realized prices net of sales sensitive costs ($32.3 million) and favorable commodity pricing ($19.4 million).
|
|
|
|
|
|
|
|
|
| Peabody Energy Corporation |
2023 Form 10-K |
64 |
Corporate and Other Adjusted EBITDA. The following table presents a summary of the components of Corporate and Other Adjusted EBITDA:
|
|
|
|
|
|
|
|
|
|
|
|
|
|
|
|
|
|
|
|
|
|
|
|
|
|
|
(Decrease) Increase |
|
Year Ended December 31, |
|
to Income |
| |
2023 |
|
2022 |
|
$ |
|
% |
| |
(Dollars in millions) |
|
|
Middlemount (1) |
$ |
13.2 |
|
|
$ |
132.8 |
|
|
$ |
(119.6) |
|
|
(90.1) |
% |
Resource management activities (2) |
21.0 |
|
|
29.3 |
|
|
(8.3) |
|
|
(28.3) |
% |
Selling and administrative expenses |
(90.7) |
|
|
(88.8) |
|
|
(1.9) |
|
|
(2.1) |
% |
Other items, net (3) |
44.3 |
|
|
31.5 |
|
|
12.8 |
|
|
40.6 |
% |
| Corporate and Other Adjusted EBITDA |
$ |
(12.2) |
|
|
$ |
104.8 |
|
|
$ |
(117.0) |
|
|
(111.6) |
% |
(1)Middlemount’s results are before the impact of related changes in amortization of basis difference.
(2)Includes gains (losses) on certain surplus coal reserve, coal resource and surface land sales and property management costs and revenue.
(3)Includes trading and brokerage activities, costs associated with post-mining activities, gains (losses) on certain asset disposals, minimum charges on certain transportation-related contracts, costs associated with suspended operations including the Centurion Mine and expenses related to the Company’s other commercial activities.
Corporate and Other Adjusted EBITDA decreased during the year ended December 31, 2023 compared to the same period in the prior year due to unfavorable variances in Middlemount’s results driven by a 30% decrease in sales pricing and lower sales volumes, offset by revenue related to the Company’s assignment of rights to its excess port and rail capacity ($25.9 million).
Income From Continuing Operations, Net of Income Taxes
The following table presents income from continuing operations, net of income taxes:
|
|
|
|
|
|
|
|
|
|
|
|
|
|
|
|
|
|
|
|
|
|
|
|
| |
|
|
(Decrease) Increase to Income |
| |
Year Ended December 31, |
|
| |
2023 |
|
2022 |
|
$ |
|
% |
| |
(Dollars in millions) |
|
|
Adjusted EBITDA (1) |
$ |
1,363.9 |
|
|
$ |
1,844.7 |
|
|
$ |
(480.8) |
|
|
(26.1) |
% |
Depreciation, depletion and amortization |
(321.4) |
|
|
(317.6) |
|
|
(3.8) |
|
|
(1.2) |
% |
| Asset retirement obligation expenses |
(50.5) |
|
|
(49.4) |
|
|
(1.1) |
|
|
(2.2) |
% |
| Restructuring charges |
(3.3) |
|
|
(2.9) |
|
|
(0.4) |
|
|
(13.8) |
% |
|
|
|
|
|
|
|
|
| Asset impairment |
(2.0) |
|
|
(11.2) |
|
|
9.2 |
|
|
82.1 |
% |
| Provision for NARM and Shoal Creek losses |
(40.9) |
|
|
— |
|
|
(40.9) |
|
|
n.m. |
|
|
|
|
|
|
|
|
| Changes in amortization of basis difference related to equity affiliates |
1.6 |
|
|
2.3 |
|
|
(0.7) |
|
|
(30.4) |
% |
| Interest expense |
(59.8) |
|
|
(140.3) |
|
|
80.5 |
|
|
57.4 |
% |
| Net loss on early debt extinguishment |
(8.8) |
|
|
(57.9) |
|
|
49.1 |
|
|
84.8 |
% |
| Interest income |
76.8 |
|
|
18.4 |
|
|
58.4 |
|
|
317.4 |
% |
Net mark-to-market adjustment on actuarially determined liabilities |
0.3 |
|
|
27.8 |
|
|
(27.5) |
|
|
(98.9) |
% |
|
|
|
|
|
|
|
|
| Unrealized gains (losses) on derivative contracts related to forecasted sales |
159.0 |
|
|
(35.8) |
|
|
194.8 |
|
|
544.1 |
% |
| Unrealized gains (losses) on foreign currency option contracts |
7.4 |
|
|
(2.3) |
|
|
9.7 |
|
|
421.7 |
% |
| Take-or-pay contract-based intangible recognition |
2.5 |
|
|
2.8 |
|
|
(0.3) |
|
|
(10.7) |
% |
| Income tax (provision) benefit |
(308.8) |
|
|
38.8 |
|
|
(347.6) |
|
|
(895.9) |
% |
| Income from continuing operations, net of income taxes |
$ |
816.0 |
|
|
$ |
1,317.4 |
|
|
$ |
(501.4) |
|
|
(38.1) |
% |
(1)This is a financial measure not recognized in accordance with U.S. GAAP. Refer to the “Reconciliation of Non-GAAP Financial Measures” section below for definitions and reconciliations to the most comparable measures under U.S. GAAP.
|
|
|
|
|
|
|
|
|
| Peabody Energy Corporation |
2023 Form 10-K |
65 |
Depreciation, Depletion and Amortization. The following table presents a summary of depreciation, depletion and amortization expense by reporting segment:
|
|
|
|
|
|
|
|
|
|
|
|
|
|
|
|
|
|
|
|
|
|
|
|
|
|
|
Increase (Decrease) |
|
Year Ended December 31, |
|
to Income |
| |
2023 |
|
2022 |
$ |
|
% |
| |
(Dollars in millions) |
|
|
| Seaborne Thermal |
$ |
(103.7) |
|
|
$ |
(114.4) |
|
|
$ |
10.7 |
|
|
9.4 |
% |
| Seaborne Metallurgical |
(91.5) |
|
|
(88.8) |
|
|
(2.7) |
|
|
(3.0) |
% |
| Powder River Basin |
(48.8) |
|
|
(42.5) |
|
|
(6.3) |
|
|
(14.8) |
% |
| Other U.S. Thermal |
(69.0) |
|
|
(62.2) |
|
|
(6.8) |
|
|
(10.9) |
% |
Corporate and Other |
(8.4) |
|
|
(9.7) |
|
|
1.3 |
|
|
13.4 |
% |
| Total |
$ |
(321.4) |
|
|
$ |
(317.6) |
|
|
$ |
(3.8) |
|
|
(1.2) |
% |
Additionally, the following table presents a summary of the Company’s weighted-average depletion rate per ton for active mines in each of its operating segments:
|
|
|
|
|
|
|
|
|
|
|
|
|
Year Ended December 31, |
|
2023 |
|
2022 |
| Seaborne Thermal |
$ |
2.13 |
|
|
$ |
2.61 |
|
| Seaborne Metallurgical |
2.16 |
|
|
2.55 |
|
| Powder River Basin |
0.31 |
|
|
0.32 |
|
| Other U.S. Thermal |
1.23 |
|
|
1.23 |
|
The decreases in the weighted-average depletion rate per ton for both the Seaborne Thermal and the Seaborne Metallurgical segments during the year ended December 31, 2023 compared to the same period in the prior year reflects the impact of volume and mix variances across the segment.
Asset Impairment. The Company recognized $2.0 million in aggregate asset impairment charges during the year ended December 31, 2023 related to an investment in equity securities. Aggregate asset impairment charges of $11.2 million recognized during the prior year were related to the sale of certain land interests and an investment in equity securities. Refer to Note 3. “Asset Impairment” to the accompanying consolidated financial statements for further information regarding the nature and composition of those charges, which information is incorporated herein by reference.
Provision for NARM and Shoal Creek Losses. A provision of $40.9 million was recorded during the year ended December 31, 2023 for losses and ongoing incremental repair costs related to the events at NARM and the Shoal Creek Mine, as discussed in Note 17. “Other Events” to the accompanying consolidated financial statements.
Interest Expense. The decrease in interest expense during the year ended December 31, 2023 compared to the prior year primarily reflects debt retirements completed by the Company during 2022 as further described in Note 10. “Long-term Debt” to the accompanying consolidated financial statements.
Net Loss on Early Debt Extinguishment. The net loss on early debt extinguishment recognized during the year ended December 31, 2023 was primarily related to the Company’s terminated letter of credit facility, as further discussed in Note 20. “Financial Instruments, Guarantees With Off-Balance-Sheet Risk and Other Guarantees” to the accompanying consolidated financial statements. The net loss on early debt extinguishment recognized during the prior year was primarily related to the redemption of existing notes, as further discussed in Note 10. “Long-term Debt” to the accompanying consolidated financial statements.
Interest Income. The increase in interest income during the year ended December 31, 2023 compared to the prior year was primarily due to higher cash balances, including restricted cash balances on which the Company earns interest, and higher interest rates in the current year.
Net Mark-to-Market Adjustment on Actuarially Determined Liabilities. The gain recorded during the year ended December 31, 2023 was driven by the favorable impacts of changes for the postretirement benefit plans related to updated claims experience ($5.4 million) and mark-to-market gains on pension and postretirement benefit plan assets ($3.9 million). These increases were offset by decreases to the discount rates for all actuarially determined liabilities ($6.4 million) and a negative adjustment related to Peabody’s black lung liabilities ($2.6 million).
|
|
|
|
|
|
|
|
|
| Peabody Energy Corporation |
2023 Form 10-K |
66 |
The gain recorded during the year ended December 31, 2022 was driven by increases to the discount rates for actuarially determined liabilities ($190.1 million) and the favorable impacts of changes for the postretirement benefit plans related to updated claims experience ($28.6 million). These increases were offset by mark-to-market losses on pension and postretirement benefit plan assets ($162.1 million); the unfavorable impact of the premium paid for the purchase of a buy-in group annuity contract for a qualified pension plan ($17.6 million) and the unfavorable impacts of medical trend updates for the postretirement benefit plans ($15.7 million).
Unrealized Gains (Losses) on Derivative Contracts Related to Forecasted Sales. Unrealized gains (losses) primarily relate to mark-to-market activity on derivative contracts related to forecasted coal sales. For additional information, refer to Note 6. “Derivatives and Fair Value Measurements” to the accompanying consolidated financial statements.
Unrealized Gains (Losses) on Foreign Currency Option Contracts. Unrealized gains (losses) primarily relate to mark-to-market activity on foreign currency option contracts. For additional information, refer to Note 6. “Derivatives and Fair Value Measurements” to the accompanying consolidated financial statements.
Income Tax (Provision) Benefit. The income tax provision recorded during the year ended December 31, 2023 was primarily due to no valuation allowance offsetting earnings in Australia in the current year, whereas the prior year income tax benefit was driven by the release of the valuation allowance related to Australian NOLs. Refer to Note 8. “Income Taxes” to the accompanying consolidated financial statements for additional information.
Net Income Attributable to Common Stockholders
The following table presents net income attributable to common stockholders:
|
|
|
|
|
|
|
|
|
|
|
|
|
|
|
|
|
|
|
|
|
|
|
|
|
|
|
(Decrease) Increase |
|
Year Ended December 31, |
|
to Income |
|
2023 |
|
2022 |
|
$ |
|
% |
| |
(Dollars in millions) |
|
|
| Income from continuing operations, net of income taxes |
$ |
816.0 |
|
|
$ |
1,317.4 |
|
|
$ |
(501.4) |
|
|
(38.1) |
% |
| (Loss) income from discontinued operations, net of income taxes |
(0.4) |
|
|
1.7 |
|
|
(2.1) |
|
|
(123.5) |
% |
| Net income |
815.6 |
|
|
1,319.1 |
|
|
(503.5) |
|
|
(38.2) |
% |
|
|
|
|
|
|
|
|
| Less: Net income attributable to noncontrolling interests |
56.0 |
|
|
22.0 |
|
|
34.0 |
|
|
154.5 |
% |
| Net income attributable to common stockholders |
$ |
759.6 |
|
|
$ |
1,297.1 |
|
|
$ |
(537.5) |
|
|
(41.4) |
% |
Net Income Attributable to Noncontrolling Interests. The increase in net income attributable to noncontrolling interests during the year ended December 31, 2023 compared to the prior year period was primarily due to stronger financial results of Peabody’s majority-owned Wambo operations in which there is an outside non-controlling interest.
Diluted EPS
The following table presents diluted EPS:
|
|
|
|
|
|
|
|
|
|
|
|
|
|
|
|
|
|
|
|
|
|
|
|
|
|
|
Decrease to |
|
Year Ended December 31, |
|
EPS |
| |
2023 |
|
2022 |
|
$ |
|
% |
Diluted EPS attributable to common stockholders: |
|
|
|
|
|
|
|
| Income from continuing operations |
$ |
5.00 |
|
|
$ |
8.29 |
|
|
$ |
(3.29) |
|
|
(39.7) |
% |
| Income from discontinued operations |
— |
|
|
0.02 |
|
|
(0.02) |
|
|
(100.0) |
% |
| Net income attributable to common stockholders |
$ |
5.00 |
|
|
$ |
8.31 |
|
|
$ |
(3.31) |
|
|
(39.8) |
% |
Diluted EPS is commensurate with the changes in results from continuing operations and discontinued operations during that period. Diluted EPS reflects weighted average diluted common shares outstanding of 154.3 million and 157.2 million for the years ended December 31, 2023 and 2022, respectively.
|
|
|
|
|
|
|
|
|
| Peabody Energy Corporation |
2023 Form 10-K |
67 |
Reconciliation of Non-GAAP Financial Measures
Adjusted EBITDA is defined as income from continuing operations before deducting net interest expense, income taxes, asset retirement obligation expenses and depreciation, depletion and amortization. Adjusted EBITDA is also adjusted for the discrete items that management excluded in analyzing each of its segment’s operating performance, as displayed in the reconciliations below.
|
|
|
|
|
|
|
|
|
|
|
|
|
|
| |
Year Ended December 31, |
| |
2023 |
|
2022 |
|
|
| |
(Dollars in millions) |
| Income from continuing operations, net of income taxes |
$ |
816.0 |
|
|
$ |
1,317.4 |
|
|
|
Depreciation, depletion and amortization |
321.4 |
|
|
317.6 |
|
|
|
| Asset retirement obligation expenses |
50.5 |
|
|
49.4 |
|
|
|
| Restructuring charges |
3.3 |
|
|
2.9 |
|
|
|
|
|
|
|
|
|
|
|
|
|
|
|
| Asset impairment |
2.0 |
|
|
11.2 |
|
|
|
| Provision for NARM and Shoal Creek losses |
40.9 |
|
|
— |
|
|
|
|
|
|
|
|
|
| Changes in amortization of basis difference related to equity affiliates |
(1.6) |
|
|
(2.3) |
|
|
|
| Interest expense |
59.8 |
|
|
140.3 |
|
|
|
| Net loss on early debt extinguishment |
8.8 |
|
|
57.9 |
|
|
|
| Interest income |
(76.8) |
|
|
(18.4) |
|
|
|
Net mark-to-market adjustment on actuarially determined liabilities |
(0.3) |
|
|
(27.8) |
|
|
|
|
|
|
|
|
|
| Unrealized (gains) losses on derivative contracts related to forecasted sales |
(159.0) |
|
|
35.8 |
|
|
|
| Unrealized (gains) losses on foreign currency option contracts |
(7.4) |
|
|
2.3 |
|
|
|
| Take-or-pay contract-based intangible recognition |
(2.5) |
|
|
(2.8) |
|
|
|
| Income tax provision (benefit) |
308.8 |
|
|
(38.8) |
|
|
|
| Total Adjusted EBITDA |
$ |
1,363.9 |
|
|
$ |
1,844.7 |
|
|
|
Total Reporting Segment Costs is defined as operating costs and expenses adjusted for the discrete items that management excluded in analyzing each of its segments’ operating performance, as displayed in the reconciliations below:
|
|
|
|
|
|
|
|
|
|
|
|
|
|
|
|
| |
Year Ended December 31, |
|
|
|
2023 |
|
2022 |
|
|
|
| |
(Dollars in millions) |
| Operating costs and expenses |
$ |
3,385.1 |
|
|
$ |
3,290.8 |
|
|
|
|
|
| Unrealized gains (losses) on foreign currency option contracts |
7.4 |
|
|
(2.3) |
|
|
|
|
|
| Take-or-pay contract-based intangible recognition |
2.5 |
|
|
2.8 |
|
|
|
|
|
|
|
|
|
|
|
|
|
| Net periodic benefit credit, excluding service cost |
(41.6) |
|
|
(49.0) |
|
|
|
|
|
| Total Reporting Segment Costs |
$ |
3,353.4 |
|
|
$ |
3,242.3 |
|
|
|
|
|
The following table presents Total Reporting Segment Costs by reporting segment:
|
|
|
|
|
|
|
|
|
|
|
|
|
|
|
Year Ended December 31, |
|
2023 |
|
2022 |
|
|
| |
(Dollars in millions) |
| Seaborne Thermal |
$ |
752.9 |
|
|
$ |
698.0 |
|
|
|
| Seaborne Metallurgical |
863.8 |
|
|
835.2 |
|
|
|
| Powder River Basin |
1,044.4 |
|
|
997.3 |
|
|
|
| Other U.S. Thermal |
680.7 |
|
|
709.8 |
|
|
|
| Corporate and Other |
11.6 |
|
|
2.0 |
|
|
|
| Total Reporting Segment Costs |
$ |
3,353.4 |
|
|
$ |
3,242.3 |
|
|
|
Revenue per Ton and Adjusted EBITDA Margin per Ton are equal to revenue by segment and Adjusted EBITDA by segment, respectively, divided by segment tons sold. Costs per Ton is equal to Revenue per Ton less Adjusted EBITDA Margin per Ton.
|
|
|
|
|
|
|
|
|
| Peabody Energy Corporation |
2023 Form 10-K |
68 |
The following tables present tons sold, revenue, Total Reporting Segment Costs and Adjusted EBITDA by operating segment:
|
|
|
|
|
|
|
|
|
|
|
|
|
|
|
|
|
|
|
|
|
|
|
|
|
Year Ended December 31, 2023 |
|
Seaborne Thermal |
|
Seaborne Metallurgical |
|
Powder River Basin |
|
Other U.S. Thermal |
| |
(Amounts in millions, except per ton data) |
| Tons sold |
15.5 |
|
|
6.9 |
|
|
87.2 |
|
|
16.2 |
|
|
|
|
|
|
|
|
|
| Revenue |
$ |
1,329.7 |
|
|
$ |
1,301.9 |
|
|
$ |
1,198.1 |
|
|
$ |
888.2 |
|
| Total Reporting Segment Costs |
752.9 |
|
|
863.8 |
|
|
1,044.4 |
|
|
680.7 |
|
Adjusted EBITDA |
$ |
576.8 |
|
|
$ |
438.1 |
|
|
$ |
153.7 |
|
|
$ |
207.5 |
|
|
|
|
|
|
|
|
|
| Revenue per Ton |
$ |
85.94 |
|
|
$ |
188.66 |
|
|
$ |
13.74 |
|
|
$ |
54.77 |
|
Costs per Ton |
48.66 |
|
|
125.18 |
|
|
11.98 |
|
|
41.98 |
|
Adjusted EBITDA Margin per Ton |
$ |
37.28 |
|
|
$ |
63.48 |
|
|
$ |
1.76 |
|
|
$ |
12.79 |
|
|
|
|
|
|
|
|
|
|
|
|
|
|
|
|
|
|
|
|
|
|
|
|
|
|
Year Ended December 31, 2022 |
|
Seaborne Thermal |
|
Seaborne Metallurgical |
|
Powder River Basin |
|
Other U.S. Thermal |
| |
(Amounts in millions, except per ton data) |
| Tons sold |
15.6 |
|
|
6.6 |
|
|
82.6 |
|
|
18.4 |
|
|
|
|
|
|
|
|
|
| Revenue |
$ |
1,345.6 |
|
|
$ |
1,616.9 |
|
|
$ |
1,065.5 |
|
|
$ |
952.2 |
|
| Total Reporting Segment Costs |
698.0 |
|
|
835.2 |
|
|
997.3 |
|
|
709.8 |
|
Adjusted EBITDA |
$ |
647.6 |
|
|
$ |
781.7 |
|
|
$ |
68.2 |
|
|
$ |
242.4 |
|
|
|
|
|
|
|
|
|
| Revenue per Ton |
$ |
86.07 |
|
|
$ |
243.78 |
|
|
$ |
12.89 |
|
|
$ |
51.82 |
|
Costs per Ton |
44.65 |
|
|
125.92 |
|
|
12.06 |
|
|
38.63 |
|
Adjusted EBITDA Margin per Ton |
$ |
41.42 |
|
|
$ |
117.86 |
|
|
$ |
0.83 |
|
|
$ |
13.19 |
|
Available Free Cash Flow is defined as operating cash flow minus investing cash flow and distributions to noncontrolling interests; plus/minus changes to restricted cash and collateral (excluding one-time effects of the recent surety agreement amendment) and other anticipated expenditures. See the table below for a reconciliation of Available Free Cash Flow to its most comparable measure under U.S. GAAP.
|
|
|
|
|
|
|
|
|
|
| |
Year Ended December 31, 2023 |
|
|
|
|
|
|
|
|
(Dollars in millions) |
| Net cash provided by operating activities |
$ |
1,035.5 |
|
|
|
|
|
| - Net cash used in investing activities |
(342.6) |
|
|
|
|
|
| - Distributions to noncontrolling interests |
(59.0) |
|
|
|
|
|
| +/- Changes to restricted cash and collateral |
90.2 |
|
|
|
|
|
| - Anticipated expenditures or other requirements |
— |
|
|
|
|
|
| Available Free Cash Flow |
$ |
724.1 |
|
|
|
|
|
Liquidity and Capital Resources
Overview
The Company’s primary source of cash is proceeds from the sale of its coal production to customers. The Company has also generated cash from the sale of non-strategic assets, including coal reserves, coal resources and surface lands, and, from time to time, borrowings under its credit facilities and the issuance of securities. The Company’s primary uses of cash include the cash costs of coal production, capital expenditures, coal reserve lease and royalty payments, debt service costs, finance and operating lease payments, postretirement plans, take-or-pay obligations, post-mining reclamation obligations, collateral and margining requirements, dividends, share repurchases and selling and administrative expenses. The Company has also used cash for early debt retirements.
|
|
|
|
|
|
|
|
|
| Peabody Energy Corporation |
2023 Form 10-K |
69 |
Any future determinations to return capital to stockholders, such as dividends or share repurchases will depend on a variety of factors, including the Company’s net income or other sources of cash, liquidity position and potential alternative uses of cash, such as internal development projects or acquisitions, as well as economic conditions and expected future financial results. The Company’s ability to early retire debt, declare dividends or repurchase shares in the future will depend on its future financial performance, which in turn depends on the successful implementation of its strategy and on financial, competitive, regulatory, technical and other factors, general economic conditions, demand for and selling prices of coal and other factors specific to its industry, many of which are beyond the Company’s control.
Liquidity
As of December 31, 2023, the Company’s cash and cash equivalents balances totaled $969.3 million, including approximately $553 million held by Australian subsidiaries, approximately $400 million held by U.S. subsidiaries and the remainder held by other foreign subsidiaries in accounts predominantly domiciled in the U.S. A significant majority of the cash held by the Company’s foreign subsidiaries is denominated in U.S. dollars. This cash is generally used to support non-U.S. liquidity needs, including capital and operating expenditures in Australia. From time to time, the Company may repatriate excess cash from its foreign subsidiaries to the U.S. During the year ended December 31, 2023, the Company repatriated approximately $250 million through intercompany dividends. If additional foreign-held cash is repatriated in the future, the Company does not expect restrictions or potential taxes will have a material effect to its near-term liquidity.
The Company’s available liquidity decreased from $1,317.8 million as of December 31, 2022 to $1,059.7 million as of December 31, 2023. Available liquidity was comprised of the following:
|
|
|
|
|
|
|
|
|
|
|
|
|
|
|
|
|
December 31, |
|
|
|
2023 |
|
2022 |
|
|
|
(Dollars in millions) |
| Cash and cash equivalents |
|
|
$ |
969.3 |
|
|
$ |
1,307.3 |
|
| Credit facility availability |
|
|
— |
|
|
3.5 |
|
| Accounts receivable securitization program availability |
|
|
90.4 |
|
|
7.0 |
|
| Total liquidity |
|
|
$ |
1,059.7 |
|
|
$ |
1,317.8 |
|
Capital Returns to Shareholders
The Company repurchased approximately 16.1 million shares of its common stock for $350.3 million and paid dividends of $30.6 million during the year ended December 31, 2023.
Surety Agreement Amendment and Collateral Requirements
In April 2023, the Company amended its existing agreement with the providers of its surety bond portfolio, dated November 6, 2020. Under the agreement, the Company was required to post collateral on a periodic basis through December 31, 2025. Prior to the April 2023 amendment, the Company had posted cumulative collateral of $557.8 million, primarily in the form of letters of credit.
Under the April 2023 amendment, the Company and its surety providers agreed to a maximum aggregate collateral amount of $721.8 million based upon bonding levels at the effective date of the amendment. This maximum collateral amount represented a negotiated increase from the uncapped cumulative collateral amount prior to the amendment and will vary prospectively as bonding levels increase or decrease. The amendment also removed restrictions on the payment of dividends and share repurchases, and extended the agreement through December 31, 2026. In order to maintain the new maximum collateral standstill, the Company must remain compliant with a minimum liquidity test and a maximum net leverage ratio, as measured each quarter. The minimum liquidity test requires the Company to maintain liquidity at the greater of $400 million or the difference between the penal sum of all surety bonds and the amount of collateral posted in favor of surety providers, which was $555.2 million at December 31, 2023. The Company must also maintain a maximum net leverage ratio of 1.5 to 1.0, where the numerator consists of its funded debt, net of cash, and the denominator consists of its Adjusted EBITDA for the trailing twelve months. For purposes of calculating the ratio, only 50% of the outstanding principal amount of the Company’s 3.250% Convertible Senior Notes due March 2028 (the 2028 Convertible Notes) is deemed to be funded debt. The Company’s ability to pay dividends and make share repurchases is also subject to the quarterly minimum liquidity test. The Company is in compliance with such requirements, which commenced for the second quarter of 2023. The Company granted second liens on $200.0 million of mining equipment under the original agreement, which remain in force under the April 2023 amendment.
|
|
|
|
|
|
|
|
|
| Peabody Energy Corporation |
2023 Form 10-K |
70 |
To fund the maximum collateral amount, the Company deposited $566.3 million into trust accounts for the benefit of certain surety providers on March 31, 2023. The remainder was comprised of $140.5 million of existing cash-collateralized letters of credit and $15.0 million already held on behalf of a surety provider. The amendment became effective on April 14, 2023, when the Company terminated a then-existing credit agreement which, as amended, provided for $237.2 million of capacity for irrevocable standby letters of credit (LC Facility). The $223.8 million of letters of credit that were outstanding under the LC Facility at March 31, 2023 were cancelled upon its termination and, in certain cases, replaced by cash-collateralized letters of credit or letters of credit issued under the Company’s accounts receivable securitization program.
At December 31, 2023 the Company had restricted cash and collateral of $957.6 million.
Collateralized Letter of Credit Agreement
In February 2022, the Company entered into an agreement, which provides up to $250.0 million of capacity for irrevocable standby letters of credit, primarily to support reclamation bonding requirements. The agreement requires the Company to provide cash collateral at a level of 103% of the aggregate amount of letters of credit outstanding under the arrangement (limited to $5.0 million total excess collateralization.) Outstanding letters of credit bear a fixed fee in the amount of 0.75% per annum. The Company receives a variable deposit rate on the amount of cash collateral posted in support of letters of credit. The agreement has an initial expiration date of December 31, 2025. At December 31, 2023, letters of credit of $167.0 million were outstanding under the agreement, which were collateralized by cash of $172.0 million.
Margin Requirements
From time to time, the Company enters into hedging arrangements, including economic hedging arrangements, to manage various risks, including coal price volatility. Most hedging arrangements require the Company to post margin with its clearing broker based on the value of the related instruments and other credit factors. If the fair value of its exchange-cleared hedge portfolio moves significantly, the Company could be required to post additional margin, which could negatively impact its liquidity.
During the year ended December 31, 2023, the Company’s coal derivative contracts with margin requirements were settled and margin postings declined from $255.5 million at December 31, 2022 to zero at December 31, 2023.
Revolving Credit Facility
On January 18, 2024, the Company established a new revolving credit facility with a maximum aggregate principal amount of $320.0 million in revolving commitments by entering into a credit agreement, dated as of January 18, 2024 (the 2024 Credit Agreement), by and among the Company, as borrower, certain subsidiaries of the Company party thereto, PNC Bank, National Association, as administrative agent, and the lenders party thereto.
The revolving commitments and any related loans, if applicable (any such loans, the Revolving Loans), established by the 2024 Credit Agreement terminate or mature, as applicable, on January 18, 2028, subject to certain conditions relating to the Company’s outstanding 2028 Convertible Notes. The Revolving Loans bear interest at a secured overnight financing rate (SOFR) plus an applicable margin ranging from 3.50% to 4.25%, depending on the Company’s total net leverage ratio (as defined under the 2024 Credit Agreement) or a base rate plus an applicable margin ranging from 2.50% to 3.25%, at the Company’s option.
The 2024 Credit Agreement contains customary covenants that, among other things and subject to certain exceptions (including compliance with financial ratios), may limit the Company and its subsidiaries’ ability to incur additional indebtedness, make certain restricted payments or investments, sell or otherwise dispose of assets, enter into transactions with affiliates, create or incur liens, and merge, consolidate or sell all or substantially all of their assets. The 2024 Credit Agreement is secured by substantially all assets of the Company and its U.S. subsidiaries, as well as a pledge of two Australian subsidiaries.
|
|
|
|
|
|
|
|
|
| Peabody Energy Corporation |
2023 Form 10-K |
71 |
Indebtedness
The Company’s total indebtedness as of December 31, 2023 and 2022 is presented in the table below.
|
|
|
|
|
|
|
|
|
|
|
|
|
December 31, |
| Debt Instrument (defined below, as applicable) |
2023 |
|
2022 |
|
(Dollars in millions) |
|
|
|
|
|
|
|
|
|
|
|
|
|
|
|
|
|
|
|
|
|
|
|
|
| 3.250% Convertible Senior Notes due March 2028 (2028 Convertible Notes) |
$ |
320.0 |
|
|
$ |
320.0 |
|
|
|
|
|
| Finance lease obligations |
22.3 |
|
|
23.6 |
|
| Less: Debt issuance costs |
(8.1) |
|
|
(9.8) |
|
|
334.2 |
|
|
333.8 |
|
| Less: Current portion of long-term debt |
13.5 |
|
|
13.2 |
|
| Long-term debt |
$ |
320.7 |
|
|
$ |
320.6 |
|
During 2022, the Company utilized various methods allowable or required under its then-existing debt agreements to retire all of its senior secured long-term debt, leaving only its 2028 Convertible Notes, which are further described below, and various finance lease obligations outstanding at December 31, 2022.
The Company’s remaining indebtedness requires estimated contractual principal and interest payments, assuming interest rates in effect at December 31, 2023, of approximately $25 million in 2024, $16 million in 2025, $13 million in 2026, $12 million in 2027 and $325 million in 2028.
Cash interest payments amounted to $61.9 million, $118.5 million and $174.9 million during the years ended December 31, 2023, 2022, and 2021, respectively.
3.250% Convertible Senior Notes due 2028
On March 1, 2022, through a private offering, the Company issued the 2028 Convertible Notes in the aggregate principal amount of $320.0 million. The 2028 Convertible Notes are senior unsecured obligations of the Company and are governed under an indenture.
The Company used the proceeds of the offering of the 2028 Convertible Notes and available cash to redeem $62.6 million of senior secured notes maturing in 2024 and $257.4 million of senior secured notes maturing in 2025, and to pay related premiums, fees and expenses relating to the offering and redemptions.
The 2028 Convertible Notes will mature on March 1, 2028, unless earlier converted, redeemed or repurchased in accordance with their terms. The 2028 Convertible Notes bear interest at a rate of 3.250% per year payable semi-annually in arrears on March 1 and September 1 of each year.
During the fourth quarter of 2022, the Company’s reported common stock prices prompted the conversion feature of the 2028 Convertible Notes. As a result, the 2028 Convertible Notes were convertible at the option of the holders during the first quarter of 2023. However, the Company did not receive any conversion requests.
During the year ended December 31, 2023, the Company’s reported common stock prices did not prompt the conversion feature of the 2028 Convertible Notes. As a result, the 2028 Convertible Notes were not convertible at the option of the holders during the remainder of 2023, and will not be similarly convertible during the first quarter of 2024.
LC Facility
The now-terminated LC Facility had an original capacity of $324.0 million and was subsequently amended at various dates to reduce its capacity and effect certain other changes, including in February 2023 to reduce capacity by $65.0 million, accelerate the expiration date to December 31, 2023 from December 31, 2024, and eliminate the prepayment premium due upon any reduction of commitments thereunder prior to July 29, 2023.
Covenant Compliance
The Company was compliant with all relevant covenants under its debt and other finance agreements at December 31, 2023. The April 2023 termination of the Company’s then-existing credit agreement and related letter of credit facility, as described in Note 20. “Financial Instruments, Guarantees With Off-Balance-Sheet Risk and Other Guarantees” of the accompanying consolidated financial statements, eliminated the related compliance requirements as of March 31, 2023 and prospectively.
|
|
|
|
|
|
|
|
|
| Peabody Energy Corporation |
2023 Form 10-K |
72 |
Accounts Receivable Securitization Program
As described in Note 20. “Financial Instruments, Guarantees With Off-Balance-Sheet Risk and Other Guarantees” of the accompanying consolidated financial statements, the Company entered into an accounts receivable securitization program during 2017. The securitization program was amended in February 2023 to increase the available funding capacity from $175.0 million to $225.0 million and adjust the relevant interest rate for borrowings to a SOFR. Funding capacity is limited to the availability of eligible receivables and is accounted for as a secured borrowing. Funding capacity under the program may also be utilized for letters of credit in support of other obligations, which has been the Company’s primary utilization. At December 31, 2023, the Company had no outstanding borrowings and $108.1 million of letters of credit outstanding under the program, which were primarily in support of portions of the Company’s reclamation obligations. The Company was not required to post cash collateral under the securitization program at December 31, 2023.
Capital Expenditures
For 2024, the Company is targeting total capital expenditures of approximately $375 million. Approximately $235 million of such amount is appropriated to major projects and growth capital expenditures, including approximately $150 million for the redevelopment of the Company’s Centurion Mine.
Wards Well Acquisition
The Company anticipates closing the previously announced acquisition of the Wards Well area for approximately $136 million of cash consideration in 2024.
Other Requirements
The Company will incur significant future cash outflows for certain liabilities related to its prior mining activities and former employees. Such cash flows pertain to postretirement benefit plans, work-related injuries and illnesses, defined benefit pension plans, mine reclamation and end-of-mine closure costs and exploration obligations and are estimated to amount to approximately $105 million in 2024, $80 million in 2025, $90 million in 2026, $85 million in 2027, $100 million in 2028 and $1,275 million thereafter.
The Company has various short- and long-term take-or-pay arrangements in Australia and the U.S. associated with rail and port commitments for the delivery of coal, including amounts relating to export facilities. The estimated future cash flows associated with such arrangements are approximately $103 million in 2024, $100 million in 2025, $100 million in 2026, $100 million in 2027, $100 million in 2028 and $685 million thereafter.
The Company’s operating lease commitments, excluding potential contingent rental amounts, will require cash payments of approximately $19 million in 2024, $15 million in 2025, $15 million in 2026, $13 million in 2027, $8 million in 2028 and $4 million thereafter.
Cash Flows
The following table summarizes the Company’s cash flows for the years ended December 31, 2023 and 2022, as reported in the accompanying consolidated financial statements. Available Free Cash Flow is a financial measure not recognized in accordance with U.S. GAAP. Refer to the “Reconciliation of Non-GAAP Financial Measures” section above for definitions and reconciliations to the most comparable measures under U.S. GAAP.
|
|
|
|
|
|
|
|
|
|
|
|
|
|
|
Year Ended December 31, |
|
|
| |
2023 |
|
2022 |
|
|
| |
(Dollars in millions) |
| Net cash provided by operating activities |
$ |
1,035.5 |
|
|
$ |
1,173.6 |
|
|
|
| Net cash used in investing activities |
(342.6) |
|
|
(28.7) |
|
|
|
| Net cash used in financing activities |
(460.3) |
|
|
(681.6) |
|
|
|
| Net change in cash, cash equivalents and restricted cash |
232.6 |
|
|
463.3 |
|
|
|
| Cash, cash equivalents and restricted cash at beginning of period |
1,417.6 |
|
|
954.3 |
|
|
|
| Cash, cash equivalents and restricted cash at end of period |
$ |
1,650.2 |
|
|
$ |
1,417.6 |
|
|
|
|
|
|
|
|
|
|
|
|
|
|
|
|
|
|
|
|
|
|
|
|
|
|
|
| Available Free Cash Flow |
$ |
724.1 |
|
|
|
|
|
|
|
|
|
|
|
|
|
|
| Peabody Energy Corporation |
2023 Form 10-K |
73 |
Operating Activities. The decrease in net cash provided by operating activities for the year ended December 31, 2023 compared to the prior year was driven by lower cash generated from mining operations, an increase in cash used for collateral requirements ($146.3 million) and cash used to settle disputed black lung claims ($72.0 million), offset by the receipt of cash in the current year and posting of cash in the prior year related to variation margin requirements associated with derivative financial instruments ($304.2 million) and the year-over-year increase in operating cash flow from working capital ($295.5 million).
Investing Activities. The increase in net cash used in investing activities for the year ended December 31, 2023 compared to the prior year was driven by lower cash receipts from Middlemount and other related parties ($169.2 million), higher capital expenditures and payments of capital accruals ($121.2 million) and lower cash receipts from the disposal of assets ($17.8 million).
Financing Activities. The decrease in net cash used in financing activities for the year ended December 31, 2023 compared to the prior year was driven by lower repayments of long-term-debt ($1,398.4 million) in the current year, offset by cash proceeds from common stock and debt issuances in the prior year ($222.0 million and $545.0 million, respectively) and common stock repurchases and dividends paid in the current year ($347.7 million and $30.6 million, respectively).
Off-Balance-Sheet Arrangements
In the normal course of business, the Company is a party to various guarantees and financial instruments that carry off-balance-sheet risk and are not reflected in the accompanying consolidated balance sheets. Such financial instruments provide support for the Company’s reclamation bonding requirements, lease obligations, insurance policies and various other performance guarantees. The Company periodically evaluates the instruments for on-balance-sheet treatment based on the amount of exposure under the instrument and the likelihood of required performance. The Company does not expect any material losses to result from these guarantees or off-balance-sheet instruments in excess of liabilities provided for in the accompanying consolidated balance sheets.
As of December 31, 2023, the Company was party to financial instruments with off-balance sheet risk in support of the following obligations:
|
|
|
|
|
|
|
|
|
|
|
|
|
|
|
|
|
|
|
|
|
|
|
|
|
December 31, 2023 |
|
|
|
Reclamation Support |
|
Other Support (1) |
|
Total |
|
|
|
|
|
|
|
(Dollars in millions) |
| Surety bonds |
$ |
1,022.6 |
|
|
$ |
117.3 |
|
|
$ |
1,139.9 |
|
|
|
|
|
|
|
Letters of credit (2) |
6.0 |
|
|
102.1 |
|
|
108.1 |
|
|
|
|
|
|
|
|
1,028.6 |
|
|
219.4 |
|
|
1,248.0 |
|
|
|
|
|
|
|
Less: Letters of credit in support of surety bonds (3) |
(6.0) |
|
|
(12.2) |
|
|
(18.2) |
|
|
|
|
|
|
|
| Obligations supported, net |
$ |
1,022.6 |
|
|
$ |
207.2 |
|
|
$ |
1,229.8 |
|
|
|
|
|
|
|
(1) Instruments support obligations related to pension and health care plans, workers’ compensation, property and casualty insurance, customer and vendor contracts and certain restoration ancillary to prior mining activities.
(2) Amounts do not include cash collateralized letters of credit.
(3) Certain letters of credit serve as collateral for surety bonds at the request of surety bond providers.
Not presented in the above table is $957.6 million of restricted cash and other balances serving as collateral which are included in the accompanying consolidated balance sheets at December 31, 2023, as described in Note 20. “Financial Instruments, Guarantees With Off-Balance-Sheet Risk and Other Guarantees” of the accompanying consolidated financial statements. Such collateral is primarily in support of the financial instruments noted above, including in relation to the Company’s surety bond portfolio, its collateralized letter of credit agreement, mandatory repurchases of credit facility capacity and amounts held directly with beneficiaries which are not supported by surety bonds.
At December 31, 2023, the Company had total asset retirement obligations of $702.8 million. Bonding requirement amounts may differ significantly from the related asset retirement obligation because such requirements are calculated under the assumption that reclamation begins currently, whereas the Company’s accounting liabilities are discounted from the end of a mine’s economic life (when final reclamation work would begin) to the balance sheet date. At December 31, 2023, the reclamation bonding requirements were supported by approximately $825 million of restricted cash and other balances serving as collateral, which exceeds the financial liability for final mine reclamation as calculated in accordance with U.S. GAAP.
|
|
|
|
|
|
|
|
|
| Peabody Energy Corporation |
2023 Form 10-K |
74 |
Guarantees and Other Financial Instruments with Off-Balance Sheet Risk. See Note 20. “Financial Instruments, Guarantees With Off-Balance-Sheet Risk and Other Guarantees” to the accompanying consolidated financial statements for a discussion of the Company’s accounts receivable securitization program and guarantees and other financial instruments with off-balance sheet risk.
Critical Accounting Policies and Estimates
The Company’s discussion and analysis of its financial condition, results of operations, liquidity and capital resources is based upon its consolidated financial statements, which have been prepared in accordance with U.S. GAAP. The Company is also required under U.S. GAAP to make estimates and judgments that affect the reported amounts of assets, liabilities, revenue and expenses, and related disclosure of contingent assets and liabilities. On an ongoing basis, the Company evaluates its estimates. The Company bases its estimates on historical experience and on various other assumptions that it believes are reasonable under the circumstances, the results of which form the basis for making judgments about the carrying values of assets and liabilities that are not readily apparent from other sources. Actual results may differ from these estimates.
Asset Retirement Obligations. The Company’s asset retirement obligations primarily consist of spending estimates for surface land reclamation and support facilities at both surface and underground mines in accordance with applicable reclamation laws and regulations in the U.S. and Australia as defined by each mining permit. Asset retirement obligations are determined for each mine using various estimates and assumptions including, among other items, estimates of disturbed acreage as determined from engineering data, estimates of future costs to reclaim the disturbed acreage and the timing of these cash flows, escalated for inflation and then discounted using a credit-adjusted, risk-free rate. As changes in estimates occur (such as mine plan revisions, changes in estimated costs or changes in timing of the performance of reclamation activities), the revisions to the obligation and asset are recognized at the appropriate credit-adjusted, risk-free rate. If the Company’s assumptions do not materialize as expected, actual cash expenditures and costs that it incurs could be materially different than currently estimated. Moreover, regulatory changes could increase its obligation to perform reclamation and mine closing activities. Amortization associated with the Company’s asset retirement obligation assets of $33.4 million for the year ended December 31, 2023 was included in “Depreciation, depletion and amortization” in the Company’s consolidated statements of operations. Asset retirement obligation expense, consisting of both accretion expense and changes in estimates for the Company’s inactive locations, for the year ended December 31, 2023 was $50.5 million and payments totaled $60.4 million. See Note 12. “Asset Retirement Obligations” to the accompanying consolidated financial statements for additional information regarding the Company’s asset retirement obligations.
Impairment of Long-Lived Assets. The Company evaluates its long-lived assets held and used in operations for impairment as events and changes in circumstances indicate that the carrying amount of such assets might not be recoverable. Factors that would indicate potential impairment to be present include, but are not limited to, a sustained history of operating or cash flow losses, an unfavorable change in earnings and cash flow outlook, prolonged adverse industry or economic trends and a significant adverse change in the extent or manner in which a long-lived asset is being used or in its physical condition. The Company generally does not view short-term declines in thermal and metallurgical coal prices as a triggering event for conducting impairment tests because of historic price volatility. However, the Company generally views a sustained trend of depressed coal pricing (for example, over periods exceeding one year) as an indicator of potential impairment. Because of the volatile and cyclical nature of coal prices and demand, it is reasonably possible that coal prices may decrease and/or fail to improve in the near term, which, absent sufficient mitigation such as an offsetting reduction in the Company’s operating costs, may result in the need for future adjustments to the carrying value of its long-lived mining assets and mining-related investments.
Assets are grouped at the lowest level for which there are identifiable cash flows that are largely independent of the cash flows of other groups of assets. For its active mining operations, the Company generally groups such assets at the mine level, or the mining complex level for mines that share infrastructure, with the exception of impairment evaluations triggered by mine closures. In those cases involving mine closures, the related assets are evaluated at the individual asset level for remaining economic life based on transferability to ongoing operating sites or for expected salvage. For its development and exploration properties and portfolio of surface land and coal reserve and resource holdings, the Company considers several factors to determine whether to evaluate those assets individually or on a grouped basis for purposes of impairment testing. Such factors include geographic proximity to one another, the expectation of shared infrastructure upon development based on future mining plans and whether it would be most advantageous to bundle such assets in the event of a sale to a third party.
|
|
|
|
|
|
|
|
|
| Peabody Energy Corporation |
2023 Form 10-K |
75 |
When indicators of impairment are present, the Company evaluates its long-lived assets for recoverability by comparing the estimated undiscounted cash flows in the LOM plan expected to be generated by those assets under various assumptions to their carrying amounts. If such undiscounted cash flows indicate that the carrying value of the asset group is not recoverable, impairment losses are measured by comparing the estimated fair value of the asset group to its carrying amount. As quoted market prices are unavailable for the Company’s individual mining operations, fair value is determined through the use of an expected present value technique based on the income approach, except for non-strategic coal reserves and resources, surface lands and undeveloped coal properties excluded from its long-range mine planning. In those cases, a market approach is utilized based on the most comparable market multiples available. The estimated future cash flows and underlying assumptions used to assess recoverability and, if necessary, measure the fair value of the Company’s long-lived mining assets are derived from those developed in connection with its planning and budgeting process. The Company believes its assumptions to be consistent with those a market participant would use for valuation purposes. The most critical assumptions underlying its projections and fair value estimates include those surrounding future tons sold, coal prices for unpriced coal, production costs (including costs for labor, commodity supplies and contractors), transportation costs, foreign currency exchange rates and a risk-adjusted, cost of capital (all of which generally constitute unobservable Level 3 inputs under the fair value hierarchy), in addition to market multiples for non-strategic coal reserves and resources, surface lands and undeveloped coal properties excluded from the Company’s long-range mine planning (which generally constitute Level 2 inputs under the fair value hierarchy).
No impairment charges related to long-lived assets of were recorded for the year ended December 31, 2023. When necessary, the assumptions used are based on the Company’s best knowledge at the time it prepares its analysis but can vary significantly due to the volatile and cyclical nature of coal prices and demand, regulatory issues, unforeseen mining conditions, commodity prices and cost of labor. These factors may cause the Company to be unable to recover all or a portion of the carrying value of its long-lived assets.
The Company identified certain assets with an aggregate carrying value of approximately $224 million at December 31, 2023 in its Other U.S. Thermal segment whose recoverability is most sensitive to customer concentration risk.
See Note 3. “Asset Impairment” to the accompanying consolidated financial statements for additional information regarding impairment charges.
Income Taxes. Peabody accounts for income taxes in accordance with accounting guidance which requires deferred tax assets and liabilities to be recognized using enacted tax rates for the effect of temporary differences between the book and tax bases of recorded assets and liabilities. The guidance also requires that deferred tax assets be reduced by a valuation allowance if it is “more likely than not” that some portion or all of the deferred tax asset will not be realized. In its evaluation of the need for a valuation allowance, Peabody takes into account various factors, including taxable income in carryback years, reversals of existing taxable temporary differences, available tax planning strategies and the expected level of future taxable income. At December 31, 2023, the Company maintained valuation allowances for income taxes totaling $1,473.5 million. If actual results differ from the assumptions made in the annual evaluation of its valuation allowance, Peabody may record a change in valuation allowance through income tax expense in the period such determination is made.
Peabody’s liability for unrecognized tax benefits contains uncertainties because management is required to make assumptions and to apply judgment to estimate the exposures associated with its various filing positions. Peabody recognizes the tax benefit from an uncertain tax position only if it is “more likely than not” that the tax position will be sustained on examination by the taxing authorities, based on the technical merits of the position. The tax benefits recognized in the financial statements from such a position must be measured based on the largest benefit that has a greater than 50% likelihood of being realized upon ultimate settlement. At December 31, 2023, the Company had net unrecognized tax benefits of $8.7 million included in recorded liabilities in the consolidated balance sheet. Peabody believes that its judgments and estimates are reasonable; however, to the extent it prevails in matters for which liabilities have been established, or are required to pay amounts in excess of its recorded liabilities, the Company’s effective tax rate in a given period could be materially affected.
See Note 8. “Income Taxes” to the accompanying consolidated financial statements for additional information regarding valuation allowances and unrecognized tax benefits.
Contingent liabilities. From time to time, Peabody is subject to legal and environmental matters related to its continuing and discontinued operations and certain historical, non-coal producing operations. In connection with such matters, the Company is required to assess the likelihood of any adverse judgments or outcomes, as well as potential ranges of probable losses.
|
|
|
|
|
|
|
|
|
| Peabody Energy Corporation |
2023 Form 10-K |
76 |
A determination of the amount of reserves required for these matters is made after considerable analysis of each individual issue. Peabody accrues for legal and environmental matters within “Operating costs and expenses” when it is probable that a liability has been incurred and the amount of the loss can be reasonably estimated. If a range of possible loss exists and no anticipated loss within the range is more likely than any other anticipated loss, the Company records the accrual at the low end of the range, in accordance with Accounting Standards Codification 450, “Contingencies.”
Peabody provides disclosure surrounding loss contingencies when it believes that it is at least reasonably possible that a material loss may be incurred or an exposure to loss in excess of amounts already accrued may exist. Adjustments to contingent liabilities are made when additional information becomes available that affects the amount of estimated loss, which information may include changes in facts and circumstances, changes in interpretations of law in the relevant courts, the results of new or updated environmental remediation cost studies and the ongoing consideration of trends in environmental remediation costs.
Accrued contingent liabilities exclude claims against third parties and are not discounted. The current portion of these accruals is included in “Accounts payables and accrued expenses” and the long-term portion is included in “Other noncurrent liabilities” in the Company’s consolidated balance sheets. In general, legal fees related to environmental remediation and litigation are charged to expense as incurred. The Company includes the interest component of any litigation-related penalties within “Interest expense” in its consolidated statements of operations. See Note 21. “Commitments and Contingencies” to the accompanying consolidated financial statements for further discussion of the Company’s contingent liabilities.
Newly Adopted Accounting Standards and Accounting Standards Not Yet Implemented
See Note 1. “Summary of Significant Accounting Policies” to the accompanying consolidated financial statements for a discussion of newly adopted accounting standards and accounting standards not yet implemented.
Item 7A. Quantitative and Qualitative Disclosures About Market Risk.
The potential for changes in the market value of the Company’s coal and freight-related trading, crude oil, diesel fuel and foreign currency contract portfolios, as applicable, and exposure to interest rate changes is referred to as “market risk.” The Company attempts to manage market price risks through diversification, controlling position sizes and executing hedging strategies. Due to a lack of quoted market prices and the long-term, illiquid nature of the positions, the Company has not quantified market price risk related to its non-trading, long-term coal supply agreement portfolio.
Coal Trading Activities and Related Commodity Price Risk
Peabody engages in direct and brokered trading of physical coal and freight-related commodities in over-the-counter markets. These activities give rise to commodity price risk, which represents the potential loss that can be caused by an adverse change in the market value of a particular commitment. Peabody actively measures, monitors, manages and hedges market price risk due to current and anticipated trading activities to remain within risk limits prescribed by management. Peabody also uses its coal trading and brokerage platform to support various coal production-related activities. These transactions may involve coal to be produced from its mines, coal sourcing arrangements with third-party mining companies, joint venture positions with producers or offtake agreements with producers. While the support activities (such as the forward sale of coal to be produced and/or purchased) may ultimately involve instruments sensitive to market price risk, the sourcing of coal in these arrangements does not involve market risk sensitive instruments.
Peabody also monitors other types of risk associated with its coal trading activities, including credit, market liquidity and counterparty nonperformance.
|
|
|
|
|
|
|
|
|
| Peabody Energy Corporation |
2023 Form 10-K |
77 |
Credit and Nonperformance Risk
The fair values of Peabody’s derivative instruments utilized for corporate hedging and coal trading activities reflect adjustments for credit risk, as necessary. The Company’s exposure is substantially with electric utilities, energy marketers, steel producers and nonfinancial trading houses. Its policy is to independently evaluate each counterparty’s creditworthiness prior to entering into transactions and to regularly monitor exposures. Peabody manages its counterparty risk from its hedging activities related to foreign currency and fuel exposures, as applicable, through established credit standards, diversification of counterparties, utilization of investment grade commercial banks, adherence to established tenor limits based on counterparty creditworthiness and continual monitoring of that creditworthiness. If the Company engages in a transaction with a counterparty that does not meet its credit standards, the Company seeks to protect its position by requiring the counterparty to provide an appropriate credit enhancement. Also, when appropriate (as determined by its credit management function), Peabody has taken steps to reduce its exposure to customers or counterparties whose credit has deteriorated and who may pose a higher risk of failure to perform under their contractual obligations. These steps include obtaining letters of credit or cash collateral (margin), requiring prepayments for shipments or the creation of customer trust accounts held for Peabody’s benefit to serve as collateral in the event of a failure to pay or perform. To reduce its credit exposure related to trading and brokerage activities, Peabody seeks to enter into netting agreements with counterparties that permit it to offset asset and liability positions with such counterparties and, to the extent required, Peabody will post or receive margin amounts associated with exchange-cleared and certain OTC positions. Peabody also continually monitors counterparty and contract nonperformance risk, if present, on a case-by-case basis.
Foreign Currency Risk
The Company has historically utilized currency forwards and options to hedge currency risk associated with anticipated Australian dollar operating expenditures. The accounting for these derivatives is discussed in Note 6. “Derivatives and Fair Value Measurements” to the accompanying consolidated financial statements. As of December 31, 2023, the Company held average rate options with an aggregate notional amount of $456.0 million Australian dollars to hedge currency risk associated with anticipated Australian dollar operating expenditures over the six-month period ending June 30, 2024. As of December 31, 2023, the Company also held purchased collars with an aggregate notional amount of $483.0 million Australian dollars related to anticipated Australian dollar operating expenditures during the nine-month period ending September 30, 2024. Assuming the Company had no foreign currency hedging instruments in place, its exposure in operating costs and expenses due to a $0.10 change in the Australian dollar/U.S. dollar exchange rate is approximately $185 to $195 million for the next twelve months. Based upon the Australian dollar/U.S. dollar exchange rate at December 31, 2023, the currency option contracts outstanding at that date would limit the Company’s exposure to approximately $116 million with respect to a $0.10 increase in the exchange rate, while the Company would benefit by approximately $179 million with respect to a $0.10 decrease in the exchange rate for the next twelve months.
Although Peabody believes its Australian dollar monetary asset position acts as a hedge to lessen the impact on its results from operations, the Company may continue to use options and collars to hedge its cash flow exposure to currency risk associated with anticipated Australian dollar operating expenditures.
Coal Price Risk
The Company predominantly manages its commodity price risk for its non-trading, long-term coal contract portfolio through the use of long-term coal supply agreements (those with terms longer than one year) to the extent possible, rather than through the use of derivative instruments. Sales under such agreements comprised approximately 92%, 85% and 84% of its worldwide sales from its mining operations (by volume) for the years ended December 31, 2023, 2022 and 2021, respectively. As of December 31, 2023, the Company had approximately 100 million tons of U.S. thermal coal priced and committed for 2024. This includes approximately 85 million tons of PRB coal and 15 million tons of other U.S. thermal coal. The Company has the flexibility to increase volumes should demand warrant. Peabody is estimating 2024 thermal coal sales volumes from its Seaborne Thermal segment of 15 million to 16 million tons comprised of thermal export volume of 9 million to 11 million tons and domestic volume of 5.8 million tons. Peabody is estimating full year 2024 metallurgical coal sales from its Seaborne Metallurgical segment of 7.5 million to 8.5 million tons. Sales commitments in the metallurgical coal market are typically not long-term in nature, and the Company is therefore subject to fluctuations in market pricing. The Company’s sensitivity to market pricing in thermal coal markets is dependent on the duration of contracts.
As of December 31, 2023, the Company had no coal derivative contracts related to its forecasted sales. Historically, such financial contracts have included futures, forwards and options.
|
|
|
|
|
|
|
|
|
| Peabody Energy Corporation |
2023 Form 10-K |
78 |
Diesel Fuel Price Risk
The Company expects to consume 90 to 100 million gallons of diesel fuel during the next twelve months. A $10 per barrel change in the price of crude oil (the primary component of a refined diesel fuel product) would increase or decrease its annual diesel fuel costs by approximately $22 million based on its expected usage.
As of December 31, 2023, the Company did not have any diesel fuel derivative instruments in place. The Company partially manages the price risk of diesel fuel through the use of cost pass-through contracts with certain customers.
Interest Rate Risk
Peabody’s objectives in managing exposure to interest rate changes are to limit the impact of interest rate changes on earnings and cash flows and to lower overall borrowing costs. Peabody is primarily exposed to interest rate risk as a result of its interest-earning cash balances and its long-term debt.
Peabody’s interest-earning cash and restricted cash balances are primarily held in deposit accounts and investments with maturities of three months or less. Therefore, these balances are subject to interest rate fluctuations and could produce less income if interest rates fall. Based upon its interest-earning cash and restricted cash balances at December 31, 2023, a one percentage point decrease in interest rates would result in a decrease of approximately $16 million to interest income.
As of December 31, 2023, Peabody had approximately $320 million of fixed-rate borrowings, no variable-rate borrowings outstanding and no interest rate swaps in place. A one percentage point increase in interest rates would result in a decrease of approximately $52 million in the estimated fair value of these borrowings.
Item 8. Financial Statements and Supplementary Data.
See Part IV, Item 15. “Exhibits and Financial Statement Schedules” of this report for the information required by this Item 8, which information is incorporated by reference herein.
Item 9. Changes in and Disagreements with Accountants on Accounting and Financial Disclosure.
None.
Item 9A. Controls and Procedures.
Evaluation of Disclosure Controls and Procedures
Peabody’s disclosure controls and procedures are designed to, among other things, provide reasonable assurance that material information, both financial and non-financial, and other information required under the securities laws to be disclosed is accumulated and communicated to senior management, including the principal executive officer and principal accounting officer, on a timely basis. As of December 31, 2023, the end of the period covered by this Annual Report on Form 10-K, the Company carried out an evaluation of the effectiveness of the design and operation of its disclosure controls and procedures. Based upon that evaluation, Peabody’s Chief Executive Officer and Chief Financial Officer have concluded that such disclosure controls and procedures, as defined in Rules 13a-15(e) and 15d-15(e) under the Exchange Act as of December 31, 2023 were effective to provide reasonable assurance that the desired control objectives were achieved.
Changes in Internal Control Over Financial Reporting
Peabody periodically reviews its internal control over financial reporting as part of its efforts to ensure compliance with the requirements of Section 404 of the Sarbanes-Oxley Act of 2002. In addition, Peabody routinely reviews its system of internal control over financial reporting to identify potential changes to its processes and systems that may improve controls and increase efficiency, while ensuring that the Company maintains an effective internal control environment. Changes may include such activities as implementing new systems; consolidating the activities of acquired business units; migrating certain processes to its shared services organizations and/or managed third parties; formalizing and refining policies, procedures and control documentation requirements; improving segregation of duties and adding monitoring controls. In addition, when Peabody acquires new businesses, it incorporate its controls and procedures into the acquired business as part of its integration activities.
There have been no changes in Peabody’s internal control over financial reporting that occurred during the three months ended December 31, 2023 that have materially affected, or are reasonably likely to materially affect, its internal control over financial reporting.
|
|
|
|
|
|
|
|
|
| Peabody Energy Corporation |
2023 Form 10-K |
79 |
Management’s Report on Internal Control Over Financial Reporting
Management is responsible for establishing and maintaining adequate internal control over financial reporting. An evaluation of the effectiveness of the design and operation of the Company’s internal control over financial reporting, as defined in Rules 13a-15(f) and 15d-15(f) under the Exchange Act, as of the end of the period covered by this report was performed under the supervision and with the participation of management, including its Chief Executive Officer and Chief Financial Officer. This evaluation is performed to determine if the Company’s internal controls over financial reporting provide reasonable assurance regarding the reliability of financial reporting and the preparation of financial statements for external purposes in accordance with generally accepted accounting principles.
Because of inherent limitations, any system of internal control over financial reporting may not prevent or detect misstatements. Also, projections of any evaluation of effectiveness to future periods are subject to the risk that controls may become inadequate because of changes in conditions, or that the degree of compliance with the policies or procedures may deteriorate.
Management conducted an assessment of the effectiveness of the Company’s internal control over financial reporting using the criteria set by the Committee of Sponsoring Organizations of the Treadway Commission (COSO) in Internal Control - Integrated Framework (2013). Based on this assessment, management concluded that the Company’s internal control over financial reporting was effective to provide reasonable assurance that the desired control objectives were achieved as of December 31, 2023.
Peabody’s independent registered public accounting firm, Ernst & Young LLP, has audited the consolidated financial statements included in this annual report and issued an attestation report on Peabody’s internal control over financial reporting, as included herein.
|
|
|
|
|
|
|
|
|
|
|
|
| /s/ James C. Grech |
|
/s/ Mark A. Spurbeck |
|
James C. Grech
President and Chief Executive Officer
|
|
Mark A. Spurbeck
Executive Vice President and Chief Financial Officer
|
February 23, 2024
|
|
|
|
|
|
|
|
|
| Peabody Energy Corporation |
2023 Form 10-K |
80 |
Report of Independent Registered Public Accounting Firm
To the Shareholders and the Board of Directors of Peabody Energy Corporation
Opinion on Internal Control Over Financial Reporting
We have audited Peabody Energy Corporation’s internal control over financial reporting as of December 31, 2023, based on criteria established in Internal Control—Integrated Framework issued by the Committee of Sponsoring Organizations of the Treadway Commission (2013 framework) (the COSO criteria). In our opinion, Peabody Energy Corporation (the Company) maintained, in all material respects, effective internal control over financial reporting as of December 31, 2023, based on the COSO criteria.
We also have audited, in accordance with the standards of the Public Company Accounting Oversight Board (United States) (PCAOB), the consolidated balance sheets of the Company as of December 31, 2023 and 2022, the related consolidated statements of operations, comprehensive income, changes in stockholders’ equity and cash flows for each of the three years in the period ended December 31, 2023, and the related notes and financial statement schedule listed in the Index at Item 15(a) (collectively referred to as the “consolidated financial statements”) and our report dated February 23, 2024 expressed an unqualified opinion thereon.
Basis for Opinion
The Company’s management is responsible for maintaining effective internal control over financial reporting and for its assessment of the effectiveness of internal control over financial reporting included in the accompanying Management’s Report on Internal Control Over Financial Reporting. Our responsibility is to express an opinion on the Company’s internal control over financial reporting based on our audit. We are a public accounting firm registered with the PCAOB and are required to be independent with respect to the Company in accordance with the U.S. federal securities laws and the applicable rules and regulations of the Securities and Exchange Commission and the PCAOB.
We conducted our audit in accordance with the standards of the PCAOB. Those standards require that we plan and perform the audit to obtain reasonable assurance about whether effective internal control over financial reporting was maintained in all material respects.
Our audit included obtaining an understanding of internal control over financial reporting, assessing the risk that a material weakness exists, testing and evaluating the design and operating effectiveness of internal control based on the assessed risk, and performing such other procedures as we considered necessary in the circumstances. We believe that our audit provides a reasonable basis for our opinion.
Definition and Limitations of Internal Control Over Financial Reporting
A company’s internal control over financial reporting is a process designed to provide reasonable assurance regarding the reliability of financial reporting and the preparation of financial statements for external purposes in accordance with generally accepted accounting principles. A company’s internal control over financial reporting includes those policies and procedures that (1) pertain to the maintenance of records that, in reasonable detail, accurately and fairly reflect the transactions and dispositions of the assets of the company; (2) provide reasonable assurance that transactions are recorded as necessary to permit preparation of financial statements in accordance with generally accepted accounting principles, and that receipts and expenditures of the company are being made only in accordance with authorizations of management and directors of the company; and (3) provide reasonable assurance regarding prevention or timely detection of unauthorized acquisition, use, or disposition of the company’s assets that could have a material effect on the financial statements.
Because of its inherent limitations, internal control over financial reporting may not prevent or detect misstatements. Also, projections of any evaluation of effectiveness to future periods are subject to the risk that controls may become inadequate because of changes in conditions, or that the degree of compliance with the policies or procedures may deteriorate.
/s/ Ernst & Young, LLP
St. Louis, Missouri
February 23, 2024
|
|
|
|
|
|
|
|
|
| Peabody Energy Corporation |
2023 Form 10-K |
81 |
Item 9B. Other Information.
Securities Trading Plans of Directors and Executive Officers
During the three months ended December 31, 2023, none of Peabody’s directors or officers adopted or terminated a “Rule 10b5-1 trading arrangement” or “non-Rule 10b5-1 trading arrangement,” as those terms are defined in Item 408 of Regulation S-K.
Item 9C. Disclosure Regarding Foreign Jurisdictions that Prevent Inspections.
Not applicable.
PART III
Item 10.Directors, Executive Officers and Corporate Governance.
The information required by Item 401 of Regulation S-K is included under the caption Proposal 1 - “Election of Directors” in Peabody’s 2024 Proxy Statement and in Part I, Item 1. “Business” of this report under the caption “Information About Our Executive Officers.” The information required by Items 405, 406 and 407(c)(3), (d)(4) and (d)(5) of Regulation S-K is included under the captions “Stock Ownership,” “Additional Information Concerning the Board of Directors - Corporate Governance - Code of Business Conduct and Ethics” and “Additional Information Concerning the Board of Directors - Committee Overview - Audit Committee” in Peabody’s 2024 Proxy Statement. Such information is incorporated herein by reference.
Item 11.Executive Compensation.
The information required by Items 402 and 407(e)(4) and (e)(5) of Regulation S-K is included under the captions “Additional Information Concerning the Board of Directors - Director Compensation,” “Compensation Discussion and Analysis,” “Compensation Committee Interlocks and Insider Participation,” “Compensation Committee Report,” “Risk Assessment in Compensation Programs,” “Executive Compensation Tables,” “Pay Ratio Disclosure” and “Pay Versus Performance Disclosure” in Peabody’s 2024 Proxy Statement and is incorporated herein by reference.
Item 12.Security Ownership of Certain Beneficial Owners and Management and Related Stockholder Matters.
The information required by Item 403 of Regulation S-K is included under the caption “Stock Ownership - Security Ownership of Directors and Management and Certain Beneficial Owners” in Peabody’s 2024 Proxy Statement and is incorporated herein by reference.
|
|
|
|
|
|
|
|
|
| Peabody Energy Corporation |
2023 Form 10-K |
82 |
Equity Compensation Plan Information
As required by Item 201(d) of Regulation S-K, the following table provides information regarding Peabody’s equity compensation plans as of December 31, 2023:
|
|
|
|
|
|
|
|
|
|
|
|
|
|
|
|
|
|
|
|
|
|
|
(a)
Number of Securities
to be Issued
upon Exercise of
Outstanding Options,
Warrants and Rights |
|
Weighted-Average
Exercise Price of
Outstanding Options,
Warrants and Rights |
|
Number of Securities
Remaining Available
for Future Issuance
Under Equity
Compensation Plans
(Excluding
Securities
Reflected in Column
(a)) |
| Plan Category |
|
|
|
Equity compensation plans approved by security holders |
|
113,040 |
|
(1) |
$ |
— |
|
(2) |
6,486,481 |
|
Equity compensation plans not approved by security holders |
|
— |
|
|
— |
|
|
— |
|
| Total |
|
113,040 |
|
|
$ |
— |
|
|
6,486,481 |
|
(1)Shares issuable pursuant to outstanding performance units and vested but not issued deferred stock units. Performance units are shown at target and could change based on actual metrics achieved.
(2)The weighted-average exercise price shown in the table does not take into account outstanding deferred stock units or performance awards.
Refer to Note 16. “Share-Based Compensation” to the accompanying consolidated financial statements for additional information regarding the material features of Peabody’s current equity compensation plans.
Item 13.Certain Relationships and Related Transactions, and Director Independence.
The information required by Items 404 and 407(a) of Regulation S-K is included under the captions “Review of Related Person Transactions” and “Additional Information Concerning the Board of Directors - Board Independence” in Peabody’s 2024 Proxy Statement and is incorporated herein by reference.
Item 14.Principal Accountant Fees and Services.
The information required by Item 9(e) of Schedule 14A is included under the caption “Audit Fees” in Peabody’s 2024 Proxy Statement and is incorporated herein by reference.
PART IV
Item 15.Exhibits and Financial Statement Schedules.
(a) Documents Filed as Part of the Report
(1) Financial Statements.
The following consolidated financial statements of Peabody Energy Corporation and the report thereon of the independent registered public accounting firm are included herein on the pages indicated:
|
|
|
|
|
|
|
|
|
| Peabody Energy Corporation |
2023 Form 10-K |
83 |
(2) Financial Statement Schedules.
The following financial statement schedule of Peabody Energy Corporation is at the page indicated:
All other schedules for which provision is made in the applicable accounting regulation of the Securities and Exchange Commission are not required under the related instructions or are not applicable and, therefore, have been omitted.
(3) Exhibits.
The exhibits below are numbered in accordance with the Exhibit Table of Item 601 of Regulation S-K.
|
|
|
|
|
|
|
|
|
|
|
|
| Exhibit No. |
|
Description of Exhibit |
|
| 2.1 |
|
|
|
| 2.2 |
|
|
|
| 3.1 |
|
|
|
| 3.2 |
|
|
|
| 4.1 |
|
|
|
| 4.2 |
|
|
|
| 4.3 |
|
|
|
| 4.4 |
|
|
|
| 4.5 |
|
|
|
| 4.6 |
|
|
|
| 4.7† |
|
|
|
| 4.8 |
|
|
|
| 4.9 |
|
|
|
| 4.10 |
|
|
|
| 4.11 |
|
|
|
|
|
|
|
|
|
|
|
|
| Peabody Energy Corporation |
2023 Form 10-K |
84 |
|
|
|
|
|
|
|
|
|
|
|
|
| 4.12 |
|
|
|
| 4.13 |
|
|
|
| 4.14 |
|
|
|
| 10.1 |
|
Federal Coal Lease WYW0321779: North Antelope/Rochelle Mine (Incorporated by reference to Exhibit 10.3 of the Registrant’s Form S-4 Registration Statement No. 333-59073, filed July 14, 1998). |
|
| 10.2 |
|
Federal Coal Lease WYW119554: North Antelope/Rochelle Mine (Incorporated by reference to Exhibit 10.4 of the Registrant’s Form S-4 Registration Statement No. 333-59073, filed July 14, 1998). |
|
| 10.3 |
|
Federal Coal Lease WYW5036: Rawhide Mine (Incorporated by reference to Exhibit 10.5 of the Registrant’s Form S-4 Registration Statement No. 333-59073, filed July 14, 1998). |
|
| 10.4 |
|
Federal Coal Lease WYW3397: Caballo Mine (Incorporated by reference to Exhibit 10.6 of the Registrant’s Form S-4 Registration Statement No. 333-59073, filed July 14, 1998). |
|
| 10.5 |
|
Federal Coal Lease WYW83394: Caballo Mine (Incorporated by reference to Exhibit 10.7 of the Registrant’s Form S-4 Registration Statement No. 333-59073, filed July 14, 1998). |
|
| 10.6 |
|
Federal Coal Lease WYW136142 (Incorporated by reference to Exhibit 10.8 of Amendment No. 1 to the Registrant’s Form S-4 Registration Statement No. 333-59073, filed September 8, 1998). |
|
| 10.7 |
|
Royalty Prepayment Agreement by and among Peabody Natural Resources Company, Gallo Finance Company and Chaco Energy Company, dated September 30, 1998 (incorporated by reference to Exhibit 10.9 of the Registrant’s Quarterly Report on Form 10-Q for the quarter ended September 30, 1998). |
|
| 10.8 |
|
|
|
| 10.9 |
|
|
|
| 10.10 |
|
|
|
| 10.11 |
|
|
|
| 10.12 |
|
|
|
| 10.13 |
|
|
|
| 10.14 |
|
|
|
| 10.15 |
|
|
|
| 10.16 |
|
|
|
| 10.17 |
|
|
|
| 10.18 |
|
|
|
| 10.19 |
|
|
|
| 10.20 |
|
|
|
|
|
|
|
|
|
|
|
|
| Peabody Energy Corporation |
2023 Form 10-K |
85 |
|
|
|
|
|
|
|
|
|
|
|
|
| 10.21 |
|
|
|
| 10.22 |
|
|
|
| 10.23* |
|
|
|
| 10.24* |
|
|
|
| 10.25* |
|
|
|
| 10.26 |
|
|
|
| 10.27 |
|
Fifth Amended and Restated Receivables Purchase Agreement, dated as of March 25, 2016, by and among P&L Receivables Company, LLC, Peabody Energy Corporation, the various Sub-Servicers listed on the signature pages thereto, all Conduit Purchasers listed on the signature pages thereto, all Committed Purchasers listed on the signature pages thereto, all Purchaser Agents listed on the signature pages thereto, all LC Participants listed on the signature pages thereto, and PNC Bank, National Association, as Administrator and as LC Bank (Incorporated by reference to Exhibit 10.1 of the Registrant’s Current Report on Form 8-K filed March 31, 2016). |
|
| 10.28 |
|
First Amendment to the Fifth Amended and Restated Receivables Purchase Agreement, dated as of April 12, 2016, by and among P&L Receivables Company, LLC, Peabody Energy Corporation, the various Sub-Servicers listed on the signature pages thereto, and PNC Bank, National Association, as Administrator and as the Sole Purchaser, Committed Purchaser, LC Bank and LC Participant (Incorporated by reference to Exhibit 10.1 of the Registrant’s Current Report on Form 8-K, filed April 13, 2016). |
|
| 10.29 |
|
Second Amendment to the Fifth Amended and Restated Receivables Purchase Agreement, dated as of April 18, 2016, by and among Peabody Energy Corporation, P&L Receivables Company, LLC, the various Sub-Servicers listed on the signature pages thereto, and PNC Bank, National Association, as Administrator and as the Sole Purchaser, Committed Purchaser, LC Bank and LC Participant (Incorporated by reference to Exhibit 10.1 of the Registrant’s Current Report on Form 8-K, filed April 22, 2016). |
|
| 10.30 |
|
Sixth Amendment to the Sixth Amended and Restated Receivables Purchase Agreement, dated as of June 30, 2020, by and among P&L Receivables Company, LLC, Peabody Energy Corporation, all Committed Purchasers listed on the signature pages thereto, all Purchaser Agents listed on the signature pages thereto, all LC Participants listed on the signature pages thereto, and PNC Bank, National Association, as Administrator and as LC Bank (Incorporated by reference to Exhibit 10.2 of the Registrant’s Quarterly Report on Form 10-Q for the quarter ended June 30, 2020). |
|
| 10.31 |
|
|
|
| 10.32 |
|
|
|
| 10.33 |
|
|
|
| 10.34 |
|
Sixth Amended and Restated Receivables Purchase Agreement, dated as of April 3, 2017, by and among P&L Receivables Company, LLC, Peabody Energy Corporation, the various Sub-Servicers listed on the signature pages thereto, all Conduit Purchasers listed on the signature pages thereto, all Committed Purchasers listed on the signature pages thereto, all Purchaser Agents listed on the signature pages thereto, all LC Participants listed on the signature pages thereto, and PNC Bank, National Association, as Administrator and as LC Bank (Incorporated by reference to Exhibit 10.4 of the Registrant’s Current Report on Form 8-K filed April 3, 2017). |
|
| 10.35 |
|
First Amendment to the Sixth Amended and Restated Receivables Purchase Agreement, dated as of June 30, 2017, by and among P&L Receivables Company, LLC, Peabody Energy Corporation, the various parties identified on the signature pages thereto as Sub-Servicers, Metropolitan Collieries Pty Ltd, and PNC Bank, National Association, as Administrator and as the sole Purchaser Agent, Committed Purchaser, LC Bank and LC Participant on the date thereof (Incorporated by reference to Exhibit 10.9 of the Registrant’s Quarterly Report on Form 10-Q, filed August 14, 2017). |
|
|
|
|
|
|
|
|
|
|
| Peabody Energy Corporation |
2023 Form 10-K |
86 |
|
|
|
|
|
|
|
|
|
|
|
|
| 10.36 |
|
Second Amendment to the Sixth Amended and Restated Receivables Purchase Agreement, dated as of December 13, 2017, by and among P&L Receivables Company, LLC, Peabody Energy Corporation, Regions Bank, and PNC Bank, National Association, as Administrator and as the sole Purchaser Agent, Committed Purchaser, LC Bank and LC Participant on the date thereof (Incorporated by reference to Exhibit 10.57 of the Registrant’s Annual Report on Form 10-K for the year ended December 31, 2017). |
|
| 10.37 |
|
Fifth Amendment to the Sixth Amended and Restated Receivables Purchase Agreement, dated as of April 3, 2019, by and among P&L Receivables Company, LLC, Peabody Energy Corporation, all Committed Purchasers listed on the signature pages thereto, all Purchaser Agents listed on the signature pages thereto, all LC Participants listed on the signature pages thereto, and PNC Bank, National Association, as Administrator and as LC Bank (Incorporated by reference to Exhibit 10.1 of the Registrant’s Current Report on Form 8-K, filed April 4, 2019). |
|
| 10.38 |
|
|
|
| 10.39 |
|
|
|
| 10.40 |
|
|
|
| 10.41 |
|
|
|
| 10.42 |
|
|
|
| 10.43 |
|
|
|
| 10.44 |
|
Amendment No. 6 to Credit Agreement, by and among Peabody Energy Corporation, the subsidiaries of Peabody Energy Corporation party thereto as reaffirming parties, the incremental revolving lenders party thereto, Goldman Sachs Bank USA, as existing administrative agent, and JPMorgan Chase Bank, N.A., as successor administrative agent, dated as of September 17, 2019 (Incorporated by reference to Exhibit 10.1 of the Registrant’s Quarterly Report on Form 10-Q for the quarter ended September 30, 2019). |
|
| 10.45 |
|
|
|
| 10.46 |
|
|
|
| 10.47 |
|
Credit Agreement, dated as of January 29, 2021, among the Co-Issuers, as borrowers, Peabody Energy Corporation, as parent, JPMorgan Chase Bank, N.A., as administrative agent, and the lenders party thereto (Incorporated by reference to Exhibit 10.1 of the Registrant’s Current Report on Form 8-K/A filed on February 1, 2021). |
|
| 10.48* |
|
|
|
| 10.49 |
|
|
|
| 10.50 |
|
|
|
| 10.51* |
|
|
|
|
|
|
|
|
|
|
|
|
| Peabody Energy Corporation |
2023 Form 10-K |
87 |
|
|
|
|
|
|
|
|
|
|
|
|
| 10.52* |
|
|
|
| 10.53* |
|
|
|
| 10.54* |
|
|
|
| 10.55 |
|
|
|
| 10.56* |
|
|
|
| 10.57* |
|
|
|
| 10.58* |
|
|
|
| 10.59* |
|
|
|
| 10.60* |
|
|
|
| 10.61* |
|
|
|
| 10.62* |
|
|
|
| 10.63* |
|
|
|
| 10.64* |
|
|
|
| 10.65* |
|
|
|
| 10.66* |
|
|
|
| 10.67* |
|
|
|
| 10.68* |
|
|
|
| 10.69* |
|
|
|
| 10.70* |
|
|
|
| 10.71* |
|
|
|
|
|
|
|
|
|
|
|
|
| Peabody Energy Corporation |
2023 Form 10-K |
88 |
|
|
|
|
|
|
|
|
|
|
|
|
| 10.72* † |
|
|
|
| 10.73* † |
|
|
|
| 10.74* † |
|
|
|
| 10.75 |
|
|
|
| 10.76 |
|
|
|
| 10.77 |
|
|
|
| 10.78 |
|
|
|
| 10.79 |
|
|
|
| 10.80 |
|
|
|
| 10.81 |
|
|
|
| 10.82 |
|
|
|
| 10.83 |
|
Eighth Amendment to the Sixth Amended and Restated Receivables Purchase Agreement, dated as of January 28, 2022, by and among P&L Receivables Company, LLC, Peabody Energy Corporation, all Committed Purchasers listed on the signature pages thereto, all Purchaser Agents listed on the signature pages thereto, all LC Participants listed on the signature pages thereto, PNC Bank, National Association, as Administrator and as LC Bank and PNC Capital Markets LLC, as Structuring Agent (Incorporated by reference to Exhibit 10.1 to the Registrant’s Current Report on Form 8-K filed on January 31, 2022). |
|
| 10.84 |
|
|
|
| 10.85 |
|
|
|
| 10.86 |
|
Amendment No. 1 to Credit Agreement, dated as of March 7, 2022, among Peabody Energy Corporation, certain subsidiaries of Peabody Energy Corporation party thereto, JPMorgan Chase Bank, N.A., as administrative agent, and the lenders party thereto (Incorporated by reference to Exhibit 10.85 of the Registrant’s Annual Report on Form 10-K, filed February 24, 2023). |
|
| 10.87 |
|
Amendment No. 2 to Credit Agreement, dated as of April 29, 2022, among Peabody Energy Corporation, certain subsidiaries of Peabody Energy Corporation party thereto, JPMorgan Chase Bank, N.A., as administrative agent, and the lenders party thereto (Incorporated by reference to Exhibit 10.86 of the Registrant’s Annual Report on Form 10-K, filed February 24, 2023). |
|
| 10.88 |
|
|
|
| 10.89 |
|
Ninth Amendment to the Sixth Amended and Restated Receivables Purchase Agreement, dated as of February 13, 2023, by and among P&L Receivables Company, LLC, Peabody Energy Corporation, all Committed Purchasers listed on the signature pages thereto, all Purchaser Agents listed on the signature pages thereto, all LC Participants listed on the signature pages thereto, PNC Bank, National Association, as Administrator and as LC Bank and PNC Capital Markets LLC, as Structuring Agent (Incorporated by reference to Exhibit 10.1 of the Registrant’s Current Report on Form 8-K, filed February 14, 2023).
|
|
|
|
|
|
|
|
|
|
|
| Peabody Energy Corporation |
2023 Form 10-K |
89 |
|
|
|
|
|
|
|
|
|
|
|
|
| 10.90 |
|
|
|
| 10.91* |
|
|
|
| 10.92 |
|
|
|
| 21† |
|
|
|
| 23.1† |
|
|
|
| 23.2† |
|
|
|
| 23.3† |
|
|
|
| 23.4† |
|
|
|
| 31.1† |
|
|
|
| 31.2† |
|
|
|
| 32.1† |
|
|
|
| 32.2† |
|
|
|
| 95† |
|
|
|
| 96.1 |
|
|
|
| 96.2† |
|
|
|
| 96.3† |
|
|
|
| 97† |
|
|
|
| 101.INS |
|
Inline XBRL Instance Document - the instance document does not appear in the interactive data file because XBRL tags are embedded within the Inline XBRL document |
|
| 101.SCH |
|
Inline XBRL Taxonomy Extension Schema Document |
|
| 101.CAL |
|
Inline XBRL Taxonomy Extension Calculation Linkbase Document |
|
| 101.DEF |
|
Inline XBRL Taxonomy Extension Definition Linkbase Document |
|
| 101.LAB |
|
Inline XBRL Taxonomy Extension Label Linkbase Document |
|
| 101.PRE |
|
Inline XBRL Taxonomy Extension Presentation Linkbase Document |
|
| 104 |
|
Cover Page Interactive Data File (embedded within the Inline XBRL document). |
|
|
|
|
|
| * |
These exhibits constitute all management contracts, compensatory plans and arrangements required to be filed as an exhibit to this form pursuant to Item 15(a)(3) and 15(b) of this report. |
|
|
|
|
|
| † |
Filed herewith. |
|
Pursuant to the Instructions to Exhibits, certain instruments defining the rights of holders of long-term debt securities of the Company and its consolidated subsidiaries are not filed because the total amount of securities authorized under any such instrument does not exceed 10% of the total assets of the Company and its subsidiaries on a consolidated basis. A copy of such instrument will be furnished to the Securities and Exchange Commission upon request.
Item 16.Form 10-K Summary.
None.
|
|
|
|
|
|
|
|
|
| Peabody Energy Corporation |
2023 Form 10-K |
90 |
SIGNATURES
Pursuant to the requirements of Section 13 or 15(d) of the Securities Exchange Act of 1934, the registrant has duly caused this report to be signed on its behalf by the undersigned, thereunto duly authorized.
|
|
|
|
|
|
|
PEABODY ENERGY CORPORATION |
|
|
|
/s/ JAMES C. GRECH |
|
James C. Grech
President and Chief Executive Officer
|
Date: February 23, 2024
Pursuant to the requirements of the Securities Exchange Act of 1934, this report has been signed below by the following persons, on behalf of the registrant and in the capacities and on the dates indicated.
|
|
|
|
|
|
|
|
|
|
|
|
|
|
|
|
|
|
|
|
|
| Signature |
|
Title |
|
Date |
| |
|
|
|
|
| /s/ JAMES C. GRECH |
|
President and Chief Executive Officer,
Director (principal executive officer) |
|
February 23, 2024 |
| James C. Grech |
|
|
|
|
|
|
|
|
| /s/ MARK A. SPURBECK |
|
Executive Vice President and Chief Financial Officer (principal financial and accounting officer) |
|
February 23, 2024 |
| Mark A. Spurbeck |
|
|
|
|
|
|
|
|
| /s/ SAMANTHA ALGAZE |
|
Director |
|
February 23, 2024 |
| Samantha Algaze |
|
|
|
|
|
|
|
|
| /s/ M. KATHERINE BANKS |
|
Director |
|
February 23, 2024 |
| M. Katherine Banks |
|
|
|
|
|
|
|
|
|
|
|
| /s/ ANDREA BERTONE |
|
Director |
|
February 23, 2024 |
| Andrea Bertone |
|
|
|
|
|
|
|
|
| /s/ BILL CHAMPION |
|
Director |
|
February 23, 2024 |
| Bill Champion |
|
|
|
|
|
|
|
|
|
|
| /s/ NICHOLAS CHIREKOS |
|
Director |
|
February 23, 2024 |
| Nicholas Chirekos |
|
|
|
|
|
|
|
|
| /s/ STEPHEN GORMAN |
|
Director |
|
February 23, 2024 |
| Stephen Gorman |
|
|
|
|
|
|
|
|
| /s/ JOE LAYMON |
|
Director |
|
February 23, 2024 |
| Joe Laymon |
|
|
|
|
|
|
|
|
| /s/ ROBERT MALONE |
|
Chairman |
|
February 23, 2024 |
| Robert Malone |
|
|
|
|
|
|
|
|
| /s/ DAVID MILLER |
|
Director |
|
February 23, 2024 |
| David Miller |
|
|
|
|
|
|
|
|
|
|
|
|
|
|
|
|
|
| Peabody Energy Corporation |
2023 Form 10-K |
91 |
Report of Independent Registered Public Accounting Firm
To the Shareholders and the Board of Directors of Peabody Energy Corporation
Opinion on the Financial Statements
We have audited the accompanying consolidated balance sheets of Peabody Energy Corporation (the Company) as of December 31, 2023 and 2022, the related consolidated statements of operations, comprehensive income, changes in stockholders' equity and cash flows for each of the three years in the period ended December 31, 2023, and the related notes and financial statement schedule listed in the Index at Item 15(a) (collectively referred to as the “consolidated financial statements”). In our opinion, the consolidated financial statements present fairly, in all material respects, the financial position of the Company at December 31, 2023 and 2022, and the results of its operations and its cash flows for each of the three years in the period ended December 31, 2023, in conformity with U.S. generally accepted accounting principles.
We also have audited, in accordance with the standards of the Public Company Accounting Oversight Board (United States) (PCAOB), the Company's internal control over financial reporting as of December 31, 2023, based on criteria established in Internal Control-Integrated Framework issued by the Committee of Sponsoring Organizations of the Treadway Commission (2013 framework) and our report dated February 23, 2024 expressed an unqualified opinion thereon.
Basis for Opinion
These financial statements are the responsibility of the Company's management. Our responsibility is to express an opinion on the Company’s financial statements based on our audits. We are a public accounting firm registered with the PCAOB and are required to be independent with respect to the Company in accordance with the U.S. federal securities laws and the applicable rules and regulations of the Securities and Exchange Commission and the PCAOB.
We conducted our audits in accordance with the standards of the PCAOB. Those standards require that we plan and perform the audit to obtain reasonable assurance about whether the financial statements are free of material misstatement, whether due to error or fraud. Our audits included performing procedures to assess the risks of material misstatement of the financial statements, whether due to error or fraud, and performing procedures that respond to those risks. Such procedures included examining, on a test basis, evidence regarding the amounts and disclosures in the financial statements. Our audits also included evaluating the accounting principles used and significant estimates made by management, as well as evaluating the overall presentation of the financial statements. We believe that our audits provide a reasonable basis for our opinion.
Critical Audit Matter
The critical audit matter communicated below is a matter arising from the current period audit of the financial statements that was communicated or required to be communicated to the audit committee and that: (1) relates to accounts or disclosures that are material to the financial statements and (2) involved our especially challenging, subjective or complex judgments. The communication of the critical audit matter does not alter in any way our opinion on the consolidated financial statements, taken as a whole, and we are not, by communicating the critical audit matter below, providing a separate opinion on the critical audit matter or on the accounts or disclosures to which it relates.
|
|
|
|
|
|
|
|
|
| Peabody Energy Corporation |
2023 Form 10-K |
F-1 |
|
|
|
|
|
|
|
Asset Retirement Obligation Liability |
Description
of the
Matter |
At December 31, 2023, the Company’s asset retirement obligation (ARO) liabilities totaled $702.8 million. As discussed in Note 1 and Note 12 of the consolidated financial statements, the Company estimates its ARO liabilities in the U.S. and Australia for final reclamation and mine closure based upon detailed engineering calculations of the amount and timing of the future cash spending for a third party to perform the required work. The Company records an ARO asset associated with the discounted liability for final reclamation and mine closure. The obligation and corresponding asset are recognized in the period in which the liability is incurred. As changes in estimates occur, the revisions to the obligation and asset are recognized at the appropriate credit-adjusted, risk-free rate.
Auditing the Company’s ARO liabilities was complex because the calculation involves subjective assumptions related to estimates of disturbed acreage as determined from engineering data, estimates of future costs to reclaim the disturbed acreage and the timing of these cash flows. |
|
|
How We
Addressed
the Matter
in Our Audit |
We obtained an understanding, evaluated the design, and tested the operating effectiveness of the controls over the Company’s accounting for ARO liabilities, including controls over management’s review of the ARO calculation and the significant assumptions and data inputs described above.
Our audit procedures included, among others, evaluating the methodology used, and testing the significant assumptions discussed above and the underlying data used by the Company in its estimate of ARO liabilities. To assess the estimates of disturbed acreage, estimates of future costs to reclaim the disturbed acreage, and the timing of these cash flows, we evaluated significant changes from the prior estimate, evaluated consistency between timing of reclamation activities and projected mine life, evaluated the estimated costs based on mine type, compared anticipated costs to recent operating or third-party data, and recalculated management's estimate. Additionally, we involved our specialists to assist in our assessment of the Company’s ARO liability. As part of this effort, our specialists interviewed members of the Company’s engineering staff, assessed the completeness of the mine reclamation estimate with respect to meeting mine closure and post closure plan regulatory requirements, and tested the accuracy and completeness of the underlying data used in the engineering estimates and assessed the significant assumptions discussed above.
|
/s/ Ernst & Young, LLP
We have served as the Company’s auditor since 1991.
St. Louis, Missouri
February 23, 2024
|
|
|
|
|
|
|
|
|
| Peabody Energy Corporation |
2023 Form 10-K |
F-2 |
PEABODY ENERGY CORPORATION
CONSOLIDATED STATEMENTS OF OPERATIONS
|
|
|
|
|
|
|
|
|
|
|
|
|
|
|
|
|
|
|
Year Ended December 31, |
|
2023 |
|
2022 |
|
2021 |
| |
(Dollars in millions, except per share data) |
| Revenue |
$ |
4,946.7 |
|
|
$ |
4,981.9 |
|
|
$ |
3,318.3 |
|
| Costs and expenses |
|
|
|
|
|
Operating costs and expenses (exclusive of items shown separately below) |
3,385.1 |
|
|
3,290.8 |
|
|
2,553.1 |
|
| Depreciation, depletion and amortization |
321.4 |
|
|
317.6 |
|
|
308.7 |
|
| Asset retirement obligation expenses |
50.5 |
|
|
49.4 |
|
|
44.7 |
|
| Selling and administrative expenses |
90.7 |
|
|
88.8 |
|
|
84.9 |
|
| Restructuring charges |
3.3 |
|
|
2.9 |
|
|
8.3 |
|
|
|
|
|
|
|
| Other operating (income) loss: |
|
|
|
|
|
| Net gain on disposals |
(15.0) |
|
|
(29.2) |
|
|
(31.5) |
|
|
|
|
|
|
|
| Asset impairment |
2.0 |
|
|
11.2 |
|
|
— |
|
| Provision for NARM and Shoal Creek losses |
40.9 |
|
|
— |
|
|
— |
|
|
|
|
|
|
|
| Income from equity affiliates |
(6.9) |
|
|
(131.2) |
|
|
(82.1) |
|
| Operating profit |
1,074.7 |
|
|
1,381.6 |
|
|
432.2 |
|
| Interest expense |
59.8 |
|
|
140.3 |
|
|
183.4 |
|
| Net loss (gain) on early debt extinguishment |
8.8 |
|
|
57.9 |
|
|
(33.2) |
|
| Interest income |
(76.8) |
|
|
(18.4) |
|
|
(6.5) |
|
| Net periodic benefit credit, excluding service cost |
(41.6) |
|
|
(49.0) |
|
|
(38.3) |
|
Net mark-to-market adjustment on actuarially determined liabilities |
(0.3) |
|
|
(27.8) |
|
|
(43.4) |
|
|
|
|
|
|
|
| Income from continuing operations before income taxes |
1,124.8 |
|
|
1,278.6 |
|
|
370.2 |
|
| Income tax provision (benefit) |
308.8 |
|
|
(38.8) |
|
|
22.8 |
|
| Income from continuing operations, net of income taxes |
816.0 |
|
|
1,317.4 |
|
|
347.4 |
|
| (Loss) income from discontinued operations, net of income taxes |
(0.4) |
|
|
1.7 |
|
|
24.0 |
|
| Net income |
815.6 |
|
|
1,319.1 |
|
|
371.4 |
|
|
|
|
|
|
|
| Less: Net income attributable to noncontrolling interests |
56.0 |
|
|
22.0 |
|
|
11.3 |
|
| Net income attributable to common stockholders |
$ |
759.6 |
|
|
$ |
1,297.1 |
|
|
$ |
360.1 |
|
|
|
|
|
|
|
| Income from continuing operations: |
|
|
|
|
|
| Basic income per share |
$ |
5.52 |
|
|
$ |
9.12 |
|
|
$ |
3.03 |
|
| Diluted income per share |
$ |
5.00 |
|
|
$ |
8.29 |
|
|
$ |
3.00 |
|
| Net income attributable to common stockholders: |
|
|
|
|
|
| Basic income per share |
$ |
5.52 |
|
|
$ |
9.13 |
|
|
$ |
3.24 |
|
| Diluted income per share |
$ |
5.00 |
|
|
$ |
8.31 |
|
|
$ |
3.22 |
|
See accompanying notes to consolidated financial statements
|
|
|
|
|
|
|
|
|
| Peabody Energy Corporation |
2023 Form 10-K |
F-3 |
PEABODY ENERGY CORPORATION
CONSOLIDATED STATEMENTS OF COMPREHENSIVE INCOME
|
|
|
|
|
|
|
|
|
|
|
|
|
|
|
|
|
|
|
Year Ended December 31, |
|
2023 |
|
2022 |
|
2021 |
|
(Dollars in millions) |
| Net income |
$ |
815.6 |
|
|
$ |
1,319.1 |
|
|
$ |
371.4 |
|
Postretirement plans (net of $0.0 tax provisions in each period) |
(53.8) |
|
|
(53.8) |
|
|
93.1 |
|
|
|
|
|
|
|
|
|
|
|
|
|
|
|
|
|
|
|
|
|
|
|
|
|
| Foreign currency translation adjustment |
0.9 |
|
|
(1.6) |
|
|
(1.0) |
|
| Other comprehensive (loss) income, net of income taxes |
(52.9) |
|
|
(55.4) |
|
|
92.1 |
|
| Comprehensive income |
762.7 |
|
|
1,263.7 |
|
|
463.5 |
|
|
|
|
|
|
|
| Less: Net income attributable to noncontrolling interests |
56.0 |
|
|
22.0 |
|
|
11.3 |
|
| Comprehensive income attributable to common stockholders |
$ |
706.7 |
|
|
$ |
1,241.7 |
|
|
$ |
452.2 |
|
See accompanying notes to consolidated financial statements
|
|
|
|
|
|
|
|
|
| Peabody Energy Corporation |
2023 Form 10-K |
F-4 |
PEABODY ENERGY CORPORATION
CONSOLIDATED BALANCE SHEETS
|
|
|
|
|
|
|
|
|
|
|
|
| |
December 31, |
| |
2023 |
|
2022 |
|
(Amounts in millions, except per share data) |
| ASSETS |
|
|
|
| Current assets |
|
|
|
| Cash and cash equivalents |
$ |
969.3 |
|
|
$ |
1,307.3 |
|
|
|
|
|
Accounts receivable, net of allowance for credit losses of $0.0 at December 31, 2023 and 2022 |
389.7 |
|
|
465.5 |
|
| Inventories, net |
351.8 |
|
|
296.1 |
|
| Other current assets |
308.9 |
|
|
303.6 |
|
| Total current assets |
2,019.7 |
|
|
2,372.5 |
|
| Property, plant, equipment and mine development, net |
2,844.1 |
|
|
2,865.0 |
|
| Operating lease right-of-use assets |
61.9 |
|
|
26.9 |
|
| Restricted cash and collateral |
957.6 |
|
|
187.4 |
|
| Investments and other assets |
78.8 |
|
|
84.3 |
|
| Deferred income taxes |
— |
|
|
74.7 |
|
| Total assets |
$ |
5,962.1 |
|
|
$ |
5,610.8 |
|
| LIABILITIES AND STOCKHOLDERS’ EQUITY |
|
|
|
| Current liabilities |
|
|
|
| Current portion of long-term debt |
$ |
13.5 |
|
|
$ |
13.2 |
|
|
|
|
|
| Accounts payable and accrued expenses |
965.5 |
|
|
905.5 |
|
| Total current liabilities |
979.0 |
|
|
918.7 |
|
| Long-term debt, less current portion |
320.7 |
|
|
320.6 |
|
| Deferred income taxes |
28.6 |
|
|
20.4 |
|
| Asset retirement obligations, less current portion |
648.6 |
|
|
665.8 |
|
| Accrued postretirement benefit costs |
148.4 |
|
|
156.5 |
|
| Operating lease liabilities, less current portion |
47.7 |
|
|
11.0 |
|
| Other noncurrent liabilities |
181.6 |
|
|
223.0 |
|
| Total liabilities |
2,354.6 |
|
|
2,316.0 |
|
| Stockholders’ equity |
|
|
|
Preferred Stock — $0.01 per share par value; 100.0 shares authorized, no shares issued or outstanding as of December 31, 2023 or 2022 |
— |
|
|
— |
|
Series Common Stock — $0.01 per share par value; 50.0 shares authorized, no shares issued or outstanding as of December 31, 2023 or 2022 |
— |
|
|
— |
|
Common Stock — $0.01 per share par value; 450.0 shares authorized, 188.6 shares issued and 128.7 shares outstanding as of December 31, 2023 and 187.1 shares issued and 143.9 shares outstanding as of December 31, 2022 |
1.9 |
|
|
1.9 |
|
| Additional paid-in capital |
3,983.0 |
|
|
3,975.9 |
|
Treasury stock, at cost — 59.9 and 43.2 common shares as of December 31, 2023 and 2022 |
(1,740.2) |
|
|
(1,372.9) |
|
| Retained earnings |
1,112.7 |
|
|
383.9 |
|
| Accumulated other comprehensive income |
189.6 |
|
|
242.5 |
|
| Peabody Energy Corporation stockholders’ equity |
3,547.0 |
|
|
3,231.3 |
|
| Noncontrolling interests |
60.5 |
|
|
63.5 |
|
| Total stockholders’ equity |
3,607.5 |
|
|
3,294.8 |
|
| Total liabilities and stockholders’ equity |
$ |
5,962.1 |
|
|
$ |
5,610.8 |
|
See accompanying notes to consolidated financial statements
|
|
|
|
|
|
|
|
|
| Peabody Energy Corporation |
2023 Form 10-K |
F-5 |
PEABODY ENERGY CORPORATION
CONSOLIDATED STATEMENTS OF CASH FLOWS
|
|
|
|
|
|
|
|
|
|
|
|
|
|
|
|
|
|
|
Year Ended December 31, |
| |
2023 |
|
2022 |
|
2021 |
| |
(Dollars in millions) |
| Cash Flows From Operating Activities |
|
|
|
|
|
| Net income |
$ |
815.6 |
|
|
$ |
1,319.1 |
|
|
$ |
371.4 |
|
| Loss (income) from discontinued operations, net of income taxes |
0.4 |
|
|
(1.7) |
|
|
(24.0) |
|
| Income from continuing operations, net of income taxes |
816.0 |
|
|
1,317.4 |
|
|
347.4 |
|
| Adjustments to reconcile income from continuing operations, net of income taxes to net cash provided by operating activities: |
|
|
|
|
|
| Depreciation, depletion and amortization |
321.4 |
|
|
317.6 |
|
|
308.7 |
|
| Noncash interest expense, net |
4.6 |
|
|
17.7 |
|
|
21.3 |
|
|
|
|
|
|
|
| Deferred income taxes |
82.9 |
|
|
(81.6) |
|
|
(7.5) |
|
| Noncash share-based compensation |
6.9 |
|
|
8.4 |
|
|
10.0 |
|
| Asset impairment |
2.0 |
|
|
11.2 |
|
|
— |
|
| Noncash provision for NARM and Shoal Creek losses |
33.7 |
|
|
— |
|
|
— |
|
| Net gain on disposals |
(15.0) |
|
|
(29.2) |
|
|
(31.5) |
|
| Noncash income from port and rail capacity assignment |
(9.6) |
|
|
— |
|
|
— |
|
| Net loss (gain) on early debt extinguishment |
8.8 |
|
|
57.9 |
|
|
(33.2) |
|
| Income from equity affiliates |
(6.9) |
|
|
(131.2) |
|
|
(82.1) |
|
|
|
|
|
|
|
|
|
|
|
|
|
| Foreign currency option contracts |
(7.4) |
|
|
2.3 |
|
|
5.8 |
|
|
|
|
|
|
|
|
|
|
|
|
|
|
|
|
|
|
|
| Changes in current assets and liabilities: |
|
|
|
|
|
| Accounts receivable |
88.4 |
|
|
(115.0) |
|
|
(105.6) |
|
|
|
|
|
|
|
| Inventories |
(59.7) |
|
|
(69.4) |
|
|
35.0 |
|
| Other current assets |
0.9 |
|
|
(29.3) |
|
|
(57.6) |
|
| Accounts payable and accrued expenses |
120.2 |
|
|
68.0 |
|
|
128.1 |
|
| Collateral arrangements |
(199.6) |
|
|
(53.3) |
|
|
(6.3) |
|
| Asset retirement obligations |
(10.3) |
|
|
(22.3) |
|
|
6.8 |
|
| Workers’ compensation obligations |
1.2 |
|
|
(0.9) |
|
|
(2.0) |
|
| Postretirement benefit obligations |
(61.9) |
|
|
(109.3) |
|
|
(108.2) |
|
| Pension obligations |
(1.3) |
|
|
18.6 |
|
|
11.6 |
|
|
|
|
|
|
|
| Other, net |
1.0 |
|
|
2.7 |
|
|
— |
|
| Net cash provided by continuing operations |
1,116.3 |
|
|
1,180.3 |
|
|
440.7 |
|
| Net cash used in discontinued operations |
(80.8) |
|
|
(6.7) |
|
|
(20.7) |
|
| Net cash provided by operating activities |
1,035.5 |
|
|
1,173.6 |
|
|
420.0 |
|
See accompanying notes to consolidated financial statements
|
|
|
|
|
|
|
|
|
| Peabody Energy Corporation |
2023 Form 10-K |
F-6 |
PEABODY ENERGY CORPORATION
CONSOLIDATED STATEMENTS OF CASH FLOWS - (Continued)
|
|
|
|
|
|
|
|
|
|
|
|
|
|
|
|
|
|
|
Year Ended December 31, |
|
2023 |
|
2022 |
|
2021 |
|
(Dollars in millions) |
| Cash Flows From Investing Activities |
|
|
|
|
|
| Additions to property, plant, equipment and mine development |
(348.3) |
|
|
(221.5) |
|
|
(183.1) |
|
| Changes in accrued expenses related to capital expenditures |
2.9 |
|
|
(2.7) |
|
|
7.4 |
|
|
|
|
|
|
|
|
|
|
|
|
|
| Proceeds from disposal of assets, net of receivables |
22.8 |
|
|
40.6 |
|
|
17.8 |
|
|
|
|
|
|
|
| Contributions to joint ventures |
(741.6) |
|
|
(645.9) |
|
|
(485.6) |
|
| Distributions from joint ventures |
721.7 |
|
|
631.6 |
|
|
470.8 |
|
| Advances to related parties |
(0.5) |
|
|
(1.5) |
|
|
(0.5) |
|
| Cash receipts from Middlemount Coal Pty Ltd and other related parties |
2.6 |
|
|
171.8 |
|
|
44.7 |
|
|
|
|
|
|
|
| Other, net |
(2.2) |
|
|
(1.1) |
|
|
(3.0) |
|
| Net cash used in investing activities |
(342.6) |
|
|
(28.7) |
|
|
(131.5) |
|
| Cash Flows From Financing Activities |
|
|
|
|
|
| Proceeds from long-term debt |
— |
|
|
545.0 |
|
|
— |
|
| Repayments of long-term debt |
(9.0) |
|
|
(1,407.4) |
|
|
(285.3) |
|
| Payment of debt issuance and other deferred financing costs |
(0.3) |
|
|
(21.1) |
|
|
(22.5) |
|
| Proceeds from common stock issuances, net of costs |
— |
|
|
222.0 |
|
|
269.8 |
|
| Common stock repurchases |
(347.7) |
|
|
— |
|
|
— |
|
Repurchase of employee common stock relinquished for tax withholding |
(13.7) |
|
|
(2.6) |
|
|
(1.4) |
|
| Dividends paid |
(30.6) |
|
|
— |
|
|
— |
|
| Distributions to noncontrolling interests |
(59.0) |
|
|
(17.5) |
|
|
(4.0) |
|
|
|
|
|
|
|
| Net cash used in financing activities |
(460.3) |
|
|
(681.6) |
|
|
(43.4) |
|
| Net change in cash, cash equivalents and restricted cash |
232.6 |
|
|
463.3 |
|
|
245.1 |
|
Cash, cash equivalents and restricted cash at beginning of period (1) |
1,417.6 |
|
|
954.3 |
|
|
709.2 |
|
Cash, cash equivalents and restricted cash at end of period (2) |
$ |
1,650.2 |
|
|
$ |
1,417.6 |
|
|
$ |
954.3 |
|
|
|
|
|
|
|
|
|
|
|
|
|
|
|
|
|
|
|
|
|
|
|
|
|
|
|
|
|
|
|
|
|
|
|
|
|
|
|
|
|
|
|
|
(1) The following table provides a reconciliation of “Cash, cash equivalents and restricted cash at beginning of period”: |
| Cash and cash equivalents |
$ |
1,307.3 |
|
|
|
|
|
| Restricted cash included in “Restricted cash and collateral” |
110.3 |
|
|
|
|
|
| Cash, cash equivalents and restricted cash at beginning of period |
$ |
1,417.6 |
|
|
|
|
|
|
|
|
|
|
|
(2) The following table provides a reconciliation of “Cash, cash equivalents and restricted cash at end of period”: |
| Cash and cash equivalents |
$ |
969.3 |
|
|
|
|
|
| Restricted cash included in “Restricted cash and collateral” |
680.9 |
|
|
|
|
|
| Cash, cash equivalents and restricted cash at end of period |
$ |
1,650.2 |
|
|
|
|
|
See accompanying notes to consolidated financial statements
|
|
|
|
|
|
|
|
|
| Peabody Energy Corporation |
2023 Form 10-K |
F-7 |
PEABODY ENERGY CORPORATION
CONSOLIDATED STATEMENTS OF CHANGES IN STOCKHOLDERS’ EQUITY
|
|
|
|
|
|
|
|
|
|
|
|
|
|
|
|
|
|
|
|
|
|
|
|
|
|
|
|
|
|
|
|
|
|
|
|
|
|
|
|
|
|
|
|
| |
|
|
Peabody Energy Corporation Stockholders’ Equity |
|
|
|
|
|
|
|
Common
Stock |
|
Additional
Paid-in
Capital |
|
Treasury
Stock |
|
Retained
Earnings
(Accumulated Deficit) |
|
Accumulated
Other
Comprehensive Income |
|
Noncontrolling
Interests |
|
Total
Stockholders’
Equity |
| |
|
|
(Dollars in millions, except per share data) |
| December 31, 2020 |
|
|
$ |
1.4 |
|
|
$ |
3,364.6 |
|
|
$ |
(1,368.9) |
|
|
$ |
(1,273.3) |
|
|
$ |
205.8 |
|
|
$ |
51.7 |
|
|
$ |
981.3 |
|
|
|
|
|
|
|
|
|
|
|
|
|
|
|
|
|
| Net income |
|
|
— |
|
|
— |
|
|
— |
|
|
360.1 |
|
|
— |
|
|
11.3 |
|
|
371.4 |
|
|
|
|
|
|
|
|
|
|
|
|
|
|
|
|
|
|
|
|
|
|
|
|
|
|
|
|
|
|
|
|
|
|
|
|
|
|
|
|
|
|
|
|
|
|
|
|
|
Postretirement plans (net of $0.0 tax provision) |
|
|
— |
|
|
— |
|
|
— |
|
|
— |
|
|
93.1 |
|
|
— |
|
|
93.1 |
|
| Foreign currency translation adjustment |
|
|
— |
|
|
— |
|
|
— |
|
|
— |
|
|
(1.0) |
|
|
— |
|
|
(1.0) |
|
|
|
|
|
|
|
|
|
|
|
|
|
|
|
|
|
|
|
|
|
|
|
|
|
|
|
|
|
|
|
|
|
|
|
|
|
|
|
|
|
|
|
|
|
|
|
|
|
| Share-based compensation for equity-classified awards |
|
|
— |
|
|
10.0 |
|
|
— |
|
|
— |
|
|
— |
|
|
— |
|
|
10.0 |
|
|
|
|
|
|
|
|
|
|
|
|
|
|
|
|
|
|
|
|
|
|
|
|
|
|
|
|
|
|
|
|
|
|
|
|
|
|
|
|
|
|
|
|
|
|
|
|
|
| Common stock issued in exchange for debt retirement |
|
|
0.1 |
|
|
101.8 |
|
|
— |
|
|
— |
|
|
— |
|
|
— |
|
|
101.9 |
|
| Common stock issuances, net of costs |
|
|
0.3 |
|
|
269.2 |
|
|
— |
|
|
— |
|
|
— |
|
|
— |
|
|
269.5 |
|
|
|
|
|
|
|
|
|
|
|
|
|
|
|
|
|
|
|
|
|
|
|
|
|
|
|
|
|
|
|
|
|
| Repurchase of employee common stock relinquished for tax withholding |
|
|
— |
|
|
— |
|
|
(1.4) |
|
|
— |
|
|
— |
|
|
— |
|
|
(1.4) |
|
| Distributions to noncontrolling interests |
|
|
— |
|
|
— |
|
|
— |
|
|
— |
|
|
— |
|
|
(4.0) |
|
|
(4.0) |
|
| December 31, 2021 |
|
|
$ |
1.8 |
|
|
$ |
3,745.6 |
|
|
$ |
(1,370.3) |
|
|
$ |
(913.2) |
|
|
$ |
297.9 |
|
|
$ |
59.0 |
|
|
$ |
1,820.8 |
|
|
|
|
|
|
|
|
|
|
|
|
|
|
|
|
|
| Net income |
|
|
— |
|
|
— |
|
|
— |
|
|
1,297.1 |
|
|
— |
|
|
22.0 |
|
|
1,319.1 |
|
|
|
|
|
|
|
|
|
|
|
|
|
|
|
|
|
|
|
|
|
|
|
|
|
|
|
|
|
|
|
|
|
|
|
|
|
|
|
|
|
|
|
|
|
|
|
|
|
Postretirement plans (net of $0.0 tax provision) |
|
|
— |
|
|
— |
|
|
— |
|
|
— |
|
|
(53.8) |
|
|
— |
|
|
(53.8) |
|
| Foreign currency translation adjustment |
|
|
— |
|
|
— |
|
|
— |
|
|
— |
|
|
(1.6) |
|
|
— |
|
|
(1.6) |
|
|
|
|
|
|
|
|
|
|
|
|
|
|
|
|
|
|
|
|
|
|
|
|
|
|
|
|
|
|
|
|
|
|
|
|
|
|
|
|
|
|
|
|
|
|
|
|
|
|
|
|
|
|
|
|
|
|
|
|
|
|
|
|
|
| Share-based compensation for equity-classified awards |
|
|
— |
|
|
8.4 |
|
|
— |
|
|
— |
|
|
— |
|
|
— |
|
|
8.4 |
|
|
|
|
|
|
|
|
|
|
|
|
|
|
|
|
|
|
|
|
|
|
|
|
|
|
|
|
|
|
|
|
|
|
|
|
|
|
|
|
|
|
|
|
|
|
|
|
|
|
|
|
|
|
|
|
|
|
|
|
|
|
|
|
|
|
|
|
|
|
|
|
|
|
|
|
|
|
|
|
|
| Common stock issuances, net of costs |
|
|
0.1 |
|
|
221.9 |
|
|
— |
|
|
— |
|
|
— |
|
|
— |
|
|
222.0 |
|
| Repurchase of employee common stock relinquished for tax withholding |
|
|
— |
|
|
— |
|
|
(2.6) |
|
|
— |
|
|
— |
|
|
— |
|
|
(2.6) |
|
|
|
|
|
|
|
|
|
|
|
|
|
|
|
|
|
|
|
|
|
|
|
|
|
|
|
|
|
|
|
|
|
|
|
|
|
|
|
|
|
|
|
|
|
|
|
|
|
| Distributions to noncontrolling interests |
|
|
— |
|
|
— |
|
|
— |
|
|
— |
|
|
— |
|
|
(17.5) |
|
|
(17.5) |
|
| December 31, 2022 |
|
|
$ |
1.9 |
|
|
$ |
3,975.9 |
|
|
$ |
(1,372.9) |
|
|
$ |
383.9 |
|
|
$ |
242.5 |
|
|
$ |
63.5 |
|
|
$ |
3,294.8 |
|
| Net income |
|
|
— |
|
|
— |
|
|
— |
|
|
759.6 |
|
|
— |
|
|
56.0 |
|
|
815.6 |
|
Dividends declared ($0.225 per share) |
|
|
— |
|
|
0.2 |
|
|
— |
|
|
(30.8) |
|
|
— |
|
|
— |
|
|
(30.6) |
|
Postretirement plans (net of $0.0 tax provision) |
|
|
— |
|
|
— |
|
|
— |
|
|
— |
|
|
(53.8) |
|
|
— |
|
|
(53.8) |
|
| Foreign currency translation adjustment |
|
|
— |
|
|
— |
|
|
— |
|
|
— |
|
|
0.9 |
|
|
— |
|
|
0.9 |
|
|
|
|
|
|
|
|
|
|
|
|
|
|
|
|
|
|
|
|
|
|
|
|
|
|
|
|
|
|
|
|
|
| Share-based compensation for equity-classified awards |
|
|
— |
|
|
6.9 |
|
|
— |
|
|
— |
|
|
— |
|
|
— |
|
|
6.9 |
|
|
|
|
|
|
|
|
|
|
|
|
|
|
|
|
|
|
|
|
|
|
|
|
|
|
|
|
|
|
|
|
|
|
|
|
|
|
|
|
|
|
|
|
|
|
|
|
|
| Common stock repurchases |
|
|
— |
|
|
— |
|
|
(347.7) |
|
|
— |
|
|
— |
|
|
— |
|
|
(347.7) |
|
| Net change in unsettled common stock repurchases |
|
|
— |
|
|
— |
|
|
(2.6) |
|
|
— |
|
|
— |
|
|
— |
|
|
(2.6) |
|
| Excise tax accrued on common stock repurchases |
|
|
— |
|
|
— |
|
|
(3.3) |
|
|
— |
|
|
— |
|
|
— |
|
|
(3.3) |
|
| Repurchase of employee common stock relinquished for tax withholding |
|
|
— |
|
|
— |
|
|
(13.7) |
|
|
— |
|
|
— |
|
|
— |
|
|
(13.7) |
|
|
|
|
|
|
|
|
|
|
|
|
|
|
|
|
|
|
|
|
|
|
|
|
|
|
|
|
|
|
|
|
|
|
|
|
|
|
|
|
|
|
|
|
|
|
|
|
|
| Distributions to noncontrolling interests |
|
|
— |
|
|
— |
|
|
— |
|
|
— |
|
|
— |
|
|
(59.0) |
|
|
(59.0) |
|
| December 31, 2023 |
|
|
$ |
1.9 |
|
|
$ |
3,983.0 |
|
|
$ |
(1,740.2) |
|
|
$ |
1,112.7 |
|
|
$ |
189.6 |
|
|
$ |
60.5 |
|
|
$ |
3,607.5 |
|
See accompanying notes to consolidated financial statements
|
|
|
|
|
|
|
|
|
| Peabody Energy Corporation |
2023 Form 10-K |
F-8 |
PEABODY ENERGY CORPORATION
NOTES TO CONSOLIDATED FINANCIAL STATEMENTS
(1) Summary of Significant Accounting Policies
Basis of Presentation
The consolidated financial statements include the accounts of Peabody Energy Corporation (PEC) and its affiliates. The Company, or Peabody, are used interchangeably to refer to Peabody Energy Corporation, to Peabody Energy Corporation and its subsidiaries, or to such subsidiaries, as appropriate to the context. Interests in subsidiaries controlled by the Company are consolidated with any outside stockholder interests reflected as noncontrolling interests, except when the Company has an undivided interest in an unincorporated joint venture. In those cases, the Company includes its proportionate share in the assets, liabilities, revenue and expenses of the jointly controlled entities within each applicable line item of the consolidated financial statements. All intercompany transactions, profits and balances have been eliminated in consolidation.
Description of Business
The Company is engaged in the mining of thermal coal for sale primarily to electric utilities and metallurgical coal for sale to industrial customers. The Company’s mining operations are located in the United States (U.S.) and Australia, including an equity-affiliate mining operation in Australia. The Company also markets and brokers coal from other coal producers and trades coal and freight-related contracts. The Company’s other commercial activities include managing its coal reserves and resources and real estate holdings and supporting the development of clean coal technologies. Since 2022, the Company has partnered in a joint venture with the intent of developing various sites, including certain reclaimed mining land held by the Company in the U.S., for utility-scale photovoltaic solar generation and battery storage.
Newly Adopted Accounting Standards
The Company did not adopt any new accounting standards that had a material impact on its consolidated financial statements or disclosures.
Accounting Standards Not Yet Implemented
Joint Ventures. In August 2023, Accounting Standards Update (ASU) 2023-05 was issued, which requires joint ventures to recognize and measure the initial contributions of monetary and nonmonetary assets and its net assets at fair value. The Company is required to apply the amendments for joint ventures with a formation date on or after January 1, 2025. A joint venture that was formed before January 1, 2025 may apply the amendments retrospectively. The Company will apply the guidance to any newly formed joint ventures.
Segments. In November 2023, ASU 2023-07 was issued, which requires public entities to provide in interim periods all disclosures about a reportable segment’s profit or loss that are currently required annually; disclose significant expense categories and amounts that are easily computable from the management reports that are regularly provided to the chief operating decision maker (CODM); disclose how the CODM uses each reported measure to allocate resources; and disclose the name and title of the position of the individual identified as the CODM. The Company is required to adopt the amendments for fiscal years beginning after December 15, 2023 and interim periods within fiscal years beginning after December 15, 2024. Early adoption is permitted. The Company expects this ASU to only impact its disclosures with no impacts to its results of operations, cash flows and financial condition.
Income Taxes. In December 2023, ASU 2023-09 was issued, which requires public entities to disclose more information primarily related to the income tax rate reconciliation and income taxes paid. The guidance also eliminates certain existing disclosure requirements related to uncertain tax positions and unrecognized deferred tax liabilities. The Company is required to adopt the amendments for fiscal years beginning after December 15, 2024. The amendments should be applied prospectively, with a retrospective option. Early adoption is permitted. The Company expects this ASU to only impact its disclosures with no impacts to its results of operations, cash flows and financial condition.
|
|
|
|
|
|
|
|
|
| Peabody Energy Corporation |
2023 Form 10-K |
F-9 |
PEABODY ENERGY CORPORATION
NOTES TO CONSOLIDATED FINANCIAL STATEMENTS — (Continued)
Revenue
The majority of the Company’s revenue is derived from the sale of coal under long-term coal supply agreements (those with initial terms of one year or longer and which often include price reopener and/or extension provisions) and contracts with terms of less than one year, including sales made on a spot basis. The Company’s revenue from coal sales is realized and earned when control passes to the customer. Under the typical terms of the Company’s coal supply agreements, title and risk of loss transfer to the customer at the mine or port, where coal is loaded to the transportation sources that serve the Company’s mines. The Company incurs certain “add-on” taxes and fees on coal sales. Reported coal sales include taxes and fees charged by various federal and state governmental bodies and the freight charged on destination customer contracts.
The Company’s seaborne operating platform is primarily export focused with customers spread across several countries, with a portion of the thermal and metallurgical coal sold within Australia. Generally, revenue from individual countries vary year by year based on electricity and steel demand, the strength of the global economy, governmental policies and several other factors, including those specific to each country. A majority of these sales are executed through annual and multi-year international coal supply agreements that contain provisions requiring both parties to renegotiate pricing periodically. Industry commercial practice, and the Company’s typical practice, is to negotiate pricing for seaborne thermal coal contracts on an annual, spot or index basis and seaborne metallurgical coal contracts on a quarterly, spot or index basis. In the case of periodically negotiated pricing, the Company may deliver coal under provisional pricing until a final agreed-upon price is determined. Variable consideration resulting from provisional pricing arrangements is recognized based on the Company’s best estimate of the amount expected to be received at the time control is transferred to the customer that is not expected to result in a material reversal of revenue.
The Company’s U.S. thermal operating platform primarily sells thermal coal to electric utilities in the U.S. under long-term contracts, with a portion sold into the seaborne markets as conditions warrant. A significant portion of the coal production from the U.S. thermal operating segments is sold under existing long-term supply agreements. Certain customers of those segments utilize long-term sales agreements in recognition of the importance of reliability, service and predictable coal prices to their operations. The terms of coal supply agreements result from competitive bidding and extensive negotiations with customers. Consequently, the terms of those agreements may vary in many respects, including price adjustment features, price reopener terms, coal quality requirements, quantity parameters, permitted sources of supply, treatment of environmental constraints, extension options, force majeure and termination and assignment provisions.
Contract pricing is set forth on a per ton basis, and revenue is generally recorded as the product of price and volume delivered. Many of the Company’s coal supply agreements contain provisions that permit the parties to adjust the contract price upward or downward at specified times. These contract prices may be adjusted based on inflation or deflation and/or changes in the factors affecting the cost of producing coal, such as taxes, fees, royalties and changes in the laws regulating the mining, production, sale or use of coal. In a limited number of contracts, failure of the parties to agree on a price under those provisions may allow either party to terminate the contract. The Company sometimes experiences a reduction in coal prices in new long-term coal supply agreements replacing some of its expiring contracts. Coal supply agreements also typically contain force majeure provisions allowing temporary suspension of performance by the Company or the customer during the duration of specified events beyond the control of the affected party. Most of the coal supply agreements contain provisions requiring the Company to deliver coal meeting quality thresholds for certain characteristics such as Btu, sulfur content, ash content, grindability and ash fusion temperature. Failure to meet these specifications could result in economic penalties, including price adjustments, the rejection of deliveries or termination of the contracts. Moreover, some of these agreements allow the Company’s customers to terminate their contracts in the event of changes in regulations affecting the industry that restrict the use or type of coal permissible at the customer’s plant or increase the price of coal beyond specified limits.
Additional revenue may include gains and losses related to mark-to-market adjustments from economic hedge activities intended to hedge future coal sales, revenue from customer contract-related payments and other insignificant items including royalties related to coal lease agreements, sales agency commissions, farm income and property and facility rentals. Royalty income generally results from the lease or sublease of mineral rights to third parties, with payments based upon a percentage of the selling price or an amount per ton of coal produced.
Discontinued Operations
The Company classifies items within discontinued operations in the consolidated financial statements when the operations and cash flows of a particular component of the Company have been (or will be) eliminated from the ongoing operations of the Company as a result of a disposal (by sale or otherwise) and represents a strategic shift that has (or will have) a major effect on the entity’s operations and financial results.
|
|
|
|
|
|
|
|
|
| Peabody Energy Corporation |
2023 Form 10-K |
F-10 |
PEABODY ENERGY CORPORATION
NOTES TO CONSOLIDATED FINANCIAL STATEMENTS — (Continued)
Discontinued operations include certain former Seaborne Thermal and Other U.S. Thermal segment assets that have ceased production and other previously divested legacy operations, including Patriot Coal Corporation and certain of its wholly-owned subsidiaries (Patriot).
Assets and Liabilities Held for Sale
The Company classifies assets and liabilities (disposal groups) to be sold as held for sale in the period in which all of the following criteria are met: management, having the authority to approve the action, commits to a plan to sell the disposal group; the disposal group is available for immediate sale in its present condition subject only to terms that are usual and customary for sales of such disposal groups; an active program to locate a buyer and other actions required to complete the plan to sell the disposal group have been initiated; the sale of the disposal group is probable, and transfer of the disposal group is expected to qualify for recognition as a completed sale within one year, except if events or circumstances beyond the Company's control extend the period of time required to sell the disposal group beyond one year; the disposal group is being actively marketed for sale at a price that is reasonable in relation to its current fair value; and actions required to complete the plan indicate that it is unlikely that significant changes to the plan will be made or that the plan will be withdrawn.
The Company initially measures a disposal group that is classified as held for sale at the lower of its carrying value or fair value less any costs to sell. Any loss resulting from this measurement is recognized in the period in which the held for sale criteria are met. Conversely, gains are not recognized on the sale of a disposal group until the date of sale. The Company assesses the fair value of a disposal group, less any costs to sell, each reporting period it remains classified as held for sale and reports any subsequent changes as an adjustment to the carrying value of the disposal group, as long as the new carrying value does not exceed the carrying value of the disposal group at the time it was initially classified as held for sale.
Upon determining that a disposal group meets the criteria to be classified as held for sale, the Company reports the assets and liabilities of the disposal group, if material, in the line items assets held for sale and liabilities held for sale in the consolidated balance sheets.
Cash and Cash Equivalents
Cash and cash equivalents are stated at cost, which approximates fair value. Cash equivalents consist of highly liquid investments with original maturities of three months or less.
Accounts Receivable
The timing of revenue recognition, billings and cash collections results in accounts receivable from customers. Customers are invoiced as coal is shipped or at periodic intervals in accordance with contractual terms. Invoices typically include customary adjustments for the resolution of price variability related to prior shipments, such as coal quality thresholds. Payments are generally received within thirty days of invoicing.
Inventories
Coal is reported as inventory at the point in time the coal is extracted from the mine. Raw coal represents coal stockpiles that may be sold in current condition or may be further processed prior to shipment to a customer. Saleable coal represents coal stockpiles which require no further processing prior to shipment to a customer.
Coal inventory is valued at the lower of average cost or net realizable value. Coal inventory costs include labor, supplies, equipment (including depreciation thereto) and operating overhead and other related costs incurred at or on behalf of the mining location. Net realizable value considers the projected future sales price of the particular coal product, less applicable selling costs and, in the case of raw coal, estimated remaining processing costs. The valuation of coal inventory is subject to several additional estimates, including those related to ground and aerial surveys used to measure quantities and processing recovery rates.
Materials and supplies inventory is valued at the lower of average cost or net realizable value, less a reserve for obsolete or surplus items. This reserve incorporates several factors, such as anticipated usage, inventory turnover and inventory levels.
|
|
|
|
|
|
|
|
|
| Peabody Energy Corporation |
2023 Form 10-K |
F-11 |
PEABODY ENERGY CORPORATION
NOTES TO CONSOLIDATED FINANCIAL STATEMENTS — (Continued)
Property, Plant, Equipment and Mine Development
Property, plant, equipment and mine development are recorded at cost. Interest costs applicable to major asset additions are capitalized during the construction period. There was no capitalized interest in any of the periods presented. Expenditures which extend the useful lives of existing plant and equipment assets are capitalized. Maintenance and repairs are charged to operating costs as incurred. Costs incurred to develop coal mines or to expand the capacity of operating mines are capitalized. Maintenance and repair costs incurred to maintain current production capacity at a mine are charged to operating costs as incurred. Costs to acquire computer hardware and the development and/or purchase of software for internal use are capitalized and depreciated over the estimated useful lives.
Coal reserves and resources are recorded at cost, or at fair value in the case of nonmonetary exchanges of coal reserves and resources or business acquisitions.
Depletion of coal reserves and resources and amortization of advance royalties are computed using the units-of-production method utilizing expected recoverable tons (as adjusted for recoverability factors) in the depletion base. Mine development costs are principally amortized over the estimated lives of the mine using the straight-line method. Depreciation of plant and equipment is computed using the straight-line method over the shorter of the asset’s estimated useful life or the life of the mine. At December 31, 2023, the maximum estimated remaining life for any of the Company’s mines was 30 years. As such, the estimated useful lives of the building and improvements and machinery and equipment asset categories range from 1 to 30 years. The estimated life of leasehold improvements is the shorter of useful life or remaining life of the lease.
The Company leases coal reserves under agreements that require royalties to be paid as the coal is sold. Certain agreements also require minimum annual royalties to be paid regardless of the amount of coal mined during the year. Total royalty expense was $448.3 million, $450.0 million and $263.0 million for the years ended December 31, 2023, 2022 and 2021, respectively.
A substantial amount of the coal mined by the Company is produced from mineral reserves leased from the owner. One of the major lessors is the U.S. government, from which the Company leases substantially all of the coal it mines in Wyoming under terms set by Congress and administered by the U.S. Bureau of Land Management. These leases are generally for an initial term of ten years but may be extended by diligent development and mining of the reserves until all economically recoverable reserves are depleted. The Company has met the diligent development requirements for substantially all of these federal leases either directly through production, by including the lease as a part of a logical mining unit with other leases upon which development has occurred or by paying an advance royalty in lieu of continued operations. Annual production on these federal leases must total at least 1.0% of the leased reserve or the original amount of coal in the entire logical mining unit in which the leased reserve resides. In addition, royalties are payable monthly at a rate of 12.5% of the gross realization from the sale of the coal mined using surface mining methods and at a rate of 8.0% of the gross realization for coal produced using underground mining methods.
The remainder of the leased coal is generally leased from state governments, land holding companies and various individuals. The duration of these leases varies greatly. Typically, the lease terms are automatically extended as long as active mining continues. Royalty payments are generally based upon a specified rate per ton or a percentage of the gross realization from the sale of the coal.
Mining and exploration in Australia is generally conducted under leases, licenses or permits granted by the relevant state government. Mining and exploration licenses and their associated environmental protection approvals (granted by the state government, and in some cases also the federal government) contain conditions relating to such matters as minimum annual expenditures, environmental compliance, protection of flora and fauna, restoration and rehabilitation. Royalties are paid to the state government as a percentage of the sales price (less certain allowable deductions in some cases). Generally, landowners do not own the mineral rights or have the ability to grant rights to mine those minerals. These rights are retained by the state government. Compensation is often payable to landowners, occupiers and Aboriginal traditional owners with residual native title rights and interests for the loss of access to the land from the proposed mining activities. The amount and type of compensation and the ability to proceed to grant of a mining tenement may be determined by agreement or court determination, as provided by law.
|
|
|
|
|
|
|
|
|
| Peabody Energy Corporation |
2023 Form 10-K |
F-12 |
PEABODY ENERGY CORPORATION
NOTES TO CONSOLIDATED FINANCIAL STATEMENTS — (Continued)
Leases
The Company determines if an arrangement is a lease at inception. Right-of-use (ROU) assets represent the Company's right to use an underlying asset for the lease term and lease liabilities represent its obligation to make lease payments arising from the lease. Operating lease ROU assets and liabilities are recognized at the lease commencement date based on the present value of lease payments over the lease term. For the purpose of calculating such present values, lease payments include components that vary based upon an index or rate, using the prevailing index or rate at the commencement date, and exclude components that vary based upon other factors. As most of its leases do not contain a readily determinable implicit rate, the Company uses its incremental borrowing rate at commencement to determine the present value of lease payments. The Company does not separate lease components (i.e., fixed payments including rent, real estate taxes and insurance costs) from non-lease components (i.e., common-area maintenance) and recognizes them as a single lease component for the majority of asset classes. Variable lease payments not included within lease contracts are expensed as incurred. The Company's leases may include options to extend or terminate the lease, and such options are reflected in the term when their exercise is reasonably certain. Lease expense is recognized on a straight-line basis over the lease term.
Equity Investments
The Company applies the equity method to investments in joint ventures when it has the ability to exercise significant influence over the operating and financial policies of the joint venture. Investments accounted for under the equity method are initially recorded at cost and any difference between the cost of the Company’s investment and the underlying equity in the net assets of the joint venture at the investment date is amortized over the lives of the related assets that gave rise to the difference. The Company’s pro-rata share of the operating results of joint ventures and basis difference amortization is reported in the consolidated statements of operations in “Income from equity affiliates.” Similarly, the Company’s pro-rata share of the cumulative foreign currency translation adjustment of its equity method investments whose functional currency is not the U.S. dollar is reported in the consolidated balance sheets as a component of “Accumulated other comprehensive income,” with periodic changes thereto reflected in the consolidated statements of comprehensive income. With respect to cash flows attributable to its equity investments, the Company applies the cumulative earnings approach, in which distributions received are considered returns on investment and are classified as cash inflows from operating activities unless the Company’s cumulative distributions received less distributions received in prior periods that were determined to be returns of investment exceed the cumulative equity in earnings recognized by the Company (as adjusted for amortization of basis differences). When such an excess occurs, current-period distributions up to this excess are considered returns of investment and are classified as cash inflows from investing activities.
The Company monitors its equity method investments for indicators that a decrease in investment value has occurred that is other than temporary. Examples of such indicators include a sustained history of operating losses and adverse changes in earnings and cash flow outlook. In the absence of quoted market prices for an investment, discounted cash flow projections are used to assess fair value, the underlying assumptions to which are generally considered unobservable Level 3 inputs under the fair value hierarchy. If the fair value of an investment is determined to be below its carrying value and that loss in fair value is deemed other than temporary, an impairment loss is recognized. No such impairment losses were recorded in any period presented.
Asset Retirement Obligations
The Company’s asset retirement obligation (ARO) liabilities primarily consist of spending estimates for surface land reclamation and support facilities at both surface and underground mines in accordance with applicable reclamation laws and regulations in the U.S. and Australia as defined by each mining permit. Asset retirement obligations are determined for each mine using various estimates and assumptions including, among other items, estimates of disturbed acreage as determined from engineering data and estimates of future costs to reclaim the disturbed acreage.
The Company estimates its ARO liabilities for final reclamation and mine closure based upon detailed engineering calculations of the amount and timing of the future cash spending for a third party to perform the required work. Spending estimates are escalated for inflation and then discounted at the credit-adjusted, risk-free rate. The Company records an ARO asset associated with the discounted liability for final reclamation and mine closure. The obligation and corresponding asset are recognized in the period in which the liability is incurred. The ARO asset is amortized on the units-of-production method over its expected life and the ARO liability is accreted to the projected spending date. As changes in estimates occur (such as mine plan revisions, changes in estimated costs or changes in timing of the performance of reclamation activities), the revisions to the obligation and asset are recognized at the appropriate credit-adjusted, risk-free rate.
|
|
|
|
|
|
|
|
|
| Peabody Energy Corporation |
2023 Form 10-K |
F-13 |
PEABODY ENERGY CORPORATION
NOTES TO CONSOLIDATED FINANCIAL STATEMENTS — (Continued)
Contingent Liabilities
From time to time, the Company is subject to legal and environmental matters related to its continuing and discontinued operations and certain historical, non-coal producing operations. In connection with such matters, the Company is required to assess the likelihood of any adverse judgments or outcomes, as well as potential ranges of probable losses.
A determination of the amount of reserves required for these matters is made after considerable analysis of each individual issue. The Company accrues for legal and environmental matters within “Operating costs and expenses” when it is probable that a liability has been incurred and the amount of the loss can be reasonably estimated. If a range of possible loss exists and no anticipated loss within the range is more likely than any other anticipated loss, the Company records the accrual at the low end of the range, in accordance with Accounting Standards Codification 450, “Contingencies.” The Company provides disclosure surrounding loss contingencies when it believes that it is at least reasonably possible that a material loss may be incurred or an exposure to loss in excess of amounts already accrued may exist. Adjustments to contingent liabilities are made when additional information becomes available that affects the amount of estimated loss, which information may include changes in facts and circumstances, changes in interpretations of law in the relevant courts, the results of new or updated environmental remediation cost studies and the ongoing consideration of trends in environmental remediation costs.
Accrued contingent liabilities exclude claims against third parties and are not discounted. The current portion of these accruals is included in “Accounts payable and accrued expenses” and the long-term portion is included in “Other noncurrent liabilities” in the consolidated balance sheets. In general, legal fees related to environmental remediation and litigation are charged to expense. The Company includes the interest component of any litigation-related penalties within “Interest expense” in the consolidated statements of operations.
Income Taxes
Income taxes are accounted for using a balance sheet approach. The Company accounts for deferred income taxes by applying statutory tax rates in effect at the reporting date of the balance sheet to differences between the book and tax basis of assets and liabilities. A valuation allowance is established if it is “more likely than not” that the related tax benefits will not be realized. Significant weight is given to evidence that can be objectively verified including history of tax attribute expiration and cumulative income or loss. In determining the appropriate valuation allowance, the Company considers the projected realization of tax benefits based on expected levels of future taxable income, available tax planning strategies, reversals of existing taxable temporary differences and taxable income in carryback years.
The Company recognizes the tax benefit from uncertain tax positions only if it is “more likely than not” the tax position will be sustained on examination by the taxing authorities based on the technical merits of the position. The tax benefits recognized from such a position are measured based on the largest benefit that has a greater than fifty percent likelihood of being realized upon ultimate settlement. To the extent the Company’s assessment of such tax positions changes, the change in estimate will be recorded in the period in which the determination is made. Tax-related interest and penalties are classified as a component of income tax expense.
Postretirement Health Care and Life Insurance Benefits
The Company accounts for postretirement benefits other than pensions by accruing the costs of benefits to be provided over the employees’ period of active service. These costs are determined on an actuarial basis. The Company’s consolidated balance sheets reflect the accumulated postretirement benefit obligations of its postretirement benefit plans. The Company accounts for changes in its postretirement benefit obligations as a settlement when an irrevocable action has been effected that relieves the Company of its actuarially-determined liability to individual plan participants and removes substantial risk surrounding the nature, amount and timing of the obligation’s funding and the assets used to effect the settlement. The Company records amounts attributable to actuarial valuation changes currently in earnings rather than recording such amounts within accumulated other comprehensive income and amortizing to expense over applicable time periods. See Note 13. “Postretirement Health Care and Life Insurance Benefits” for information related to postretirement benefits.
|
|
|
|
|
|
|
|
|
| Peabody Energy Corporation |
2023 Form 10-K |
F-14 |
PEABODY ENERGY CORPORATION
NOTES TO CONSOLIDATED FINANCIAL STATEMENTS — (Continued)
Pension Plans
The Company sponsors non-contributory defined benefit pension plans accounted for by accruing the cost to provide the benefits over the employees’ period of active service. These costs are determined on an actuarial basis. The Company’s consolidated balance sheets reflect the funded status of the defined benefit pension plans. The Company records amounts attributable to actuarial valuation changes currently in earnings rather than recording such amounts within accumulated other comprehensive income and amortizing to expense over applicable time periods. See Note 14. “Pension and Savings Plans” for information related to pension plans.
Restructuring Activities
From time to time, the Company initiates restructuring activities in connection with its repositioning efforts to appropriately align its cost structure or optimize its coal production relative to prevailing market conditions. Costs associated with restructuring actions can include the impact of early mine closures, voluntary and involuntary workforce reductions, office closures and other related activities. Costs associated with restructuring activities are recognized in the period incurred.
Included as a component of “Restructuring charges” in the Company’s consolidated statements of operations for the years ended December 31, 2023, 2022 and 2021 were aggregate restructuring charges of $3.3 million, $2.9 million and $8.3 million, respectively, primarily associated with voluntary and involuntary workforce reductions. As of December 31, 2023, a $0.2 million accrual for restructuring charges remained in “Accounts payable and accrued expenses,” which is expected to be paid in the first quarter of 2024.
Derivatives
The Company recognizes at fair value all contracts meeting the definition of a derivative as assets or liabilities in the consolidated balance sheets, with the exception of certain sales contracts for which the Company has elected to apply a normal purchases and normal sales exception.
With respect to derivatives used in hedging activities, the Company assesses at hedge inception whether such derivatives are highly effective at offsetting the changes in the anticipated exposure of the hedged item. The change in the fair value of derivatives designated as a cash flow hedge is recorded in “Accumulated other comprehensive income” in the consolidated balance sheets until the hedged transaction impacts reported earnings, at which time any gain or loss is reclassified to earnings. If the hedge ceases to qualify for hedge accounting, the Company prospectively recognizes changes in the fair value of the instrument in earnings in the period of the change. Gains or losses from derivative financial instruments designated as fair value hedges are recognized immediately in earnings, along with the offsetting gain or loss related to the underlying hedged item.
The Company’s asset and liability derivative positions are offset on a counterparty-by-counterparty basis if the contractual agreement provides for the net settlement of contracts with the counterparty in the event of default or termination of any one contract.
Non-derivative contracts and derivative contracts for which the Company has elected to apply the normal purchases and normal sales exception are accounted for on an accrual basis.
Business Combinations
The Company accounts for business combinations using the purchase method of accounting. The purchase method requires the Company to determine the fair value of all acquired assets, including identifiable intangible assets and all assumed liabilities. The total cost of acquisitions is allocated to the underlying identifiable net assets, based on their respective estimated fair values. Determining the fair value of assets acquired and liabilities assumed requires management’s judgment and the utilization of independent valuation experts, and often involves the use of significant estimates and assumptions, including assumptions with respect to future cash inflows and outflows, discount rates and asset lives, among other items.
|
|
|
|
|
|
|
|
|
| Peabody Energy Corporation |
2023 Form 10-K |
F-15 |
PEABODY ENERGY CORPORATION
NOTES TO CONSOLIDATED FINANCIAL STATEMENTS — (Continued)
Impairment of Long-Lived Assets
The Company evaluates its long-lived assets held and used in operations for impairment as events and changes in circumstances indicate that the carrying amount of such assets might not be recoverable. Factors that would indicate potential impairment to be present include, but are not limited to, a sustained history of operating or cash flow losses, an unfavorable change in earnings and cash flow outlook, prolonged adverse industry or economic trends and a significant adverse change in the extent or manner in which a long-lived asset is being used or in its physical condition. The Company generally does not view short-term declines in thermal and metallurgical coal prices as a triggering event for conducting impairment tests because of historic price volatility. However, the Company generally does view a sustained trend of depressed coal pricing (for example, over periods exceeding one year) as an indicator of potential impairment. Because of the volatile and cyclical nature of coal prices and demand, it is reasonably possible that coal prices may decrease and/or fail to improve in the near term, which, absent sufficient mitigation such as an offsetting reduction in the Company’s operating costs, may result in the need for future adjustments to the carrying value of the Company’s long-lived mining assets and mining-related investments.
Assets are grouped at the lowest level for which there are identifiable cash flows that are largely independent of the cash flows of other groups of assets. For its active mining operations, the Company generally groups such assets at the mine level, or the mining complex level for mines that share infrastructure, with the exception of impairment evaluations triggered by mine closures. In those cases involving mine closures, the related assets are evaluated at the individual asset level for remaining economic life based on transferability to ongoing operating sites or for expected salvage. For its development and exploration properties and portfolio of surface land and coal reserve and resource holdings, the Company considers several factors to determine whether to evaluate those assets individually or on a grouped basis for purposes of impairment testing. Such factors include geographic proximity to one another, the expectation of shared infrastructure upon development based on future mining plans and whether it would be most advantageous to bundle such assets in the event of sale to a third party.
When indicators of impairment are present, the Company evaluates its long-lived assets for recoverability by comparing the estimated undiscounted cash flows expected to be generated by those assets under various assumptions to their carrying amounts. If such undiscounted cash flows indicate that the carrying value of the asset group is not recoverable, impairment losses are measured by comparing the estimated fair value of the asset group to its carrying amount. As quoted market prices are unavailable for the Company’s individual mining operations, fair value is determined through the use of an expected present value technique based on the income approach, except for non-strategic coal reserves, coal resources, surface lands and undeveloped coal properties excluded from the Company’s long-range mine planning. In those cases, a market approach is utilized based on the most comparable market multiples available. The estimated future cash flows and underlying assumptions used to assess recoverability and, if necessary, measure the fair value of the Company’s long-lived mining assets are derived from those developed in connection with the Company’s planning and budgeting process. The Company believes its assumptions to be consistent with those a market participant would use for valuation purposes. The most critical assumptions underlying the Company’s projections and fair value estimates include those surrounding future tons sold, coal prices for unpriced coal, production costs (including costs for labor, commodity supplies and contractors), transportation costs, foreign currency exchange rates and a risk-adjusted, cost of capital (all of which generally constitute unobservable Level 3 inputs under the fair value hierarchy), in addition to market multiples for non-strategic coal reserves, coal resources, surface lands and undeveloped coal properties excluded from the Company’s long-range mine planning (which generally constitute Level 2 inputs under the fair value hierarchy).
Refer to Note 3. “Asset Impairment” for details regarding impairment charges related to long-lived assets of $9.5 million recognized during the year ended December 31, 2022. There were no impairment charges related to long-lived assets during the years ended December 31, 2023 or 2021.
Fair Value
For assets and liabilities that are recognized or disclosed at fair value in the consolidated financial statements, the Company defines fair value as the price that would be received to sell an asset or paid to transfer a liability in an orderly transaction between market participants at the measurement date.
|
|
|
|
|
|
|
|
|
| Peabody Energy Corporation |
2023 Form 10-K |
F-16 |
PEABODY ENERGY CORPORATION
NOTES TO CONSOLIDATED FINANCIAL STATEMENTS — (Continued)
Foreign Currency
Functional currency is determined by the primary economic environment in which an entity operates, which for the Company’s foreign operations is generally the U.S. dollar because sales prices in international coal markets and the Company’s sources of financing for those operations are denominated in that currency. Accordingly, substantially all of the Company’s consolidated foreign subsidiaries utilize the U.S. dollar as their functional currency. Monetary assets and liabilities are remeasured at year-end exchange rates while non-monetary items are remeasured at historical rates. Income and expense accounts are remeasured at the average rates in effect during the year, except for those expenses related to balance sheet amounts that are remeasured at historical exchange rates. Gains and losses from foreign currency remeasurement related to tax balances are included as a component of “Income tax provision (benefit),” while all other remeasurement gains and losses are included in “Operating costs and expenses” in the consolidated statements of operations. The total impact of foreign currency remeasurement on the consolidated statements of operations was a net gain of $5.3 million, $2.7 million, and $3.1 million for the years ended December 31, 2023, 2022 and 2021, respectively.
The Company owns a 50% equity interest in Middlemount Coal Pty Ltd. (Middlemount), which owns the Middlemount Mine in Queensland, Australia. Middlemount utilizes the Australian dollar as its functional currency. Accordingly, the assets and liabilities of that equity investee are translated to U.S. dollars at the year-end exchange rate and income and expense accounts are translated at the average rate in effect during the year. The Company’s pro-rata share of the translation gains and losses of the equity investee are recorded as a component of “Accumulated other comprehensive income” in the consolidated balance sheets. Australian dollar denominated stockholder loans to the Middlemount Mine, which are long term in nature, are considered part of the Company’s net investment in that operation. Accordingly, foreign currency gains or losses on those loans are recorded as a component of foreign currency translation adjustment. The Company recorded a net gain from foreign currency translation of $0.9 million for the year ended December 31, 2023 and net losses of $1.6 million and $1.0 million for the years ended December 31, 2022 and 2021, respectively.
Share-Based Compensation
The Company accounts for share-based compensation at the grant date fair value of awards and recognizes the related expense over the service period of the awards. See Note 16. “Share-Based Compensation” for information related to share-based compensation.
Exploration and Drilling Costs
Exploration expenditures are charged to operating costs as incurred, including costs related to drilling and study costs incurred to convert or upgrade mineral resources to reserves.
Advance Stripping Costs
Pre-production. At existing surface operations, additional pits may be added to increase production capacity in order to meet customer requirements. These expansions may require significant capital to purchase additional equipment, expand the workforce, build or improve existing haul roads and create the initial pre-production box cut to remove overburden (that is, advance stripping costs) for new pits at existing operations. If these pits operate in a separate and distinct area of the mine, the costs associated with initially uncovering coal (that is, advance stripping costs incurred for the initial box cuts) for production are capitalized and amortized over the life of the developed pit consistent with coal industry practices.
Post-production. Advance stripping costs related to post-production are expensed as incurred. Where new pits are routinely developed as part of a contiguous mining sequence, the Company expenses such costs as incurred. The development of a contiguous pit typically reflects the planned progression of an existing pit, thus maintaining production levels from the same mining area utilizing the same employee group and equipment.
|
|
|
|
|
|
|
|
|
| Peabody Energy Corporation |
2023 Form 10-K |
F-17 |
PEABODY ENERGY CORPORATION
NOTES TO CONSOLIDATED FINANCIAL STATEMENTS — (Continued)
Use of Estimates in the Preparation of the Consolidated Financial Statements
These consolidated financial statements have been prepared in conformity with accounting principles generally accepted in the United States (U.S. GAAP). In doing so, estimates and assumptions are made that affect the amounts reported in the consolidated financial statements and accompanying notes. These estimates are based on historical experience and on various other assumptions deemed reasonable under the circumstances, the results of which form the basis for making judgments about the carrying amounts of assets and liabilities that are not readily apparent from other sources. The Company’s actual results may differ materially from these estimates. Significant estimates inherent in the preparation of these consolidated financial statements include, but are not limited to, accounting for sales and cost recognition, postretirement benefit plans, environmental receivables and liabilities, asset retirement obligations, evaluation of long-lived assets for impairment, income taxes including deferred tax assets, fair value measurements and contingencies.
(2) Revenue Recognition
Disaggregation of Revenue
Revenue by product type and market is set forth in the following tables. With respect to its seaborne reporting segments, the Company classifies as “Export” certain revenue from domestically-delivered coal under contracts in which the price is derived on a basis similar to export contracts.
|
|
|
|
|
|
|
|
|
|
|
|
|
|
|
|
|
|
|
|
|
|
|
|
|
|
|
|
|
|
|
|
|
|
|
|
|
Year Ended December 31, 2023 |
|
Seaborne Thermal |
|
Seaborne Metallurgical |
|
Powder River Basin |
|
Other U.S. Thermal |
|
Corporate and Other (1) |
|
Consolidated |
|
(Dollars in millions) |
| Thermal coal |
|
|
|
|
|
|
|
|
|
|
|
| Domestic |
$ |
136.4 |
|
|
$ |
— |
|
|
$ |
1,193.9 |
|
|
$ |
867.7 |
|
|
$ |
— |
|
|
$ |
2,198.0 |
|
| Export |
1,192.5 |
|
|
— |
|
|
— |
|
|
— |
|
|
— |
|
|
1,192.5 |
|
| Total thermal |
1,328.9 |
|
|
— |
|
|
1,193.9 |
|
|
867.7 |
|
|
— |
|
|
3,390.5 |
|
| Metallurgical coal |
|
|
|
|
|
|
|
|
|
|
|
|
|
|
|
|
|
|
|
|
|
|
|
| Export |
— |
|
|
1,299.6 |
|
|
— |
|
|
— |
|
|
— |
|
|
1,299.6 |
|
| Total metallurgical |
— |
|
|
1,299.6 |
|
|
— |
|
|
— |
|
|
— |
|
|
1,299.6 |
|
Other (2) |
0.8 |
|
|
2.3 |
|
|
4.2 |
|
|
20.5 |
|
|
228.8 |
|
|
256.6 |
|
| Revenue |
$ |
1,329.7 |
|
|
$ |
1,301.9 |
|
|
$ |
1,198.1 |
|
|
$ |
888.2 |
|
|
$ |
228.8 |
|
|
$ |
4,946.7 |
|
|
|
|
|
|
|
|
|
|
|
|
|
|
|
|
|
|
|
|
|
|
|
|
|
|
|
|
|
|
|
|
|
|
|
|
|
|
Year Ended December 31, 2022 |
|
Seaborne Thermal |
|
Seaborne Metallurgical |
|
Powder River Basin |
|
Other U.S. Thermal |
|
Corporate and Other (1) |
|
Consolidated |
| |
(Dollars in millions) |
| Thermal coal |
|
|
|
|
|
|
|
|
|
|
|
| Domestic |
$ |
167.6 |
|
|
$ |
— |
|
|
$ |
1,066.0 |
|
|
$ |
943.9 |
|
|
$ |
— |
|
|
$ |
2,177.5 |
|
| Export |
1,177.3 |
|
|
— |
|
|
— |
|
|
3.5 |
|
|
— |
|
|
1,180.8 |
|
| Total thermal |
1,344.9 |
|
|
— |
|
|
1,066.0 |
|
|
947.4 |
|
|
— |
|
|
3,358.3 |
|
| Metallurgical coal |
|
|
|
|
|
|
|
|
|
|
|
|
|
|
|
|
|
|
|
|
|
|
|
| Export |
— |
|
|
1,610.8 |
|
|
— |
|
|
— |
|
|
— |
|
|
1,610.8 |
|
| Total metallurgical |
— |
|
|
1,610.8 |
|
|
— |
|
|
— |
|
|
— |
|
|
1,610.8 |
|
Other (2) |
0.7 |
|
|
6.1 |
|
|
(0.5) |
|
|
4.8 |
|
|
1.7 |
|
|
12.8 |
|
| Revenue |
$ |
1,345.6 |
|
|
$ |
1,616.9 |
|
|
$ |
1,065.5 |
|
|
$ |
952.2 |
|
|
$ |
1.7 |
|
|
$ |
4,981.9 |
|
|
|
|
|
|
|
|
|
|
| Peabody Energy Corporation |
2023 Form 10-K |
F-18 |
PEABODY ENERGY CORPORATION
NOTES TO CONSOLIDATED FINANCIAL STATEMENTS — (Continued)
|
|
|
|
|
|
|
|
|
|
|
|
|
|
|
|
|
|
|
|
|
|
|
|
|
|
|
|
|
|
|
|
|
|
|
|
|
Year Ended December 31, 2021 |
|
Seaborne Thermal |
|
Seaborne Metallurgical |
|
Powder River Basin |
|
Other U.S. Thermal |
|
Corporate and Other (1) |
|
Consolidated |
| |
(Dollars in millions) |
| Thermal coal |
|
|
|
|
|
|
|
|
|
|
|
| Domestic |
$ |
173.5 |
|
|
$ |
— |
|
|
$ |
970.7 |
|
|
$ |
669.9 |
|
|
$ |
— |
|
|
$ |
1,814.1 |
|
| Export |
759.0 |
|
|
— |
|
|
— |
|
|
10.0 |
|
|
— |
|
|
769.0 |
|
| Total thermal |
932.5 |
|
|
— |
|
|
970.7 |
|
|
679.9 |
|
|
— |
|
|
2,583.1 |
|
| Metallurgical coal |
|
|
|
|
|
|
|
|
|
|
|
|
|
|
|
|
|
|
|
|
|
|
|
| Export |
— |
|
|
719.8 |
|
|
— |
|
|
— |
|
|
— |
|
|
719.8 |
|
| Total metallurgical |
— |
|
|
719.8 |
|
|
— |
|
|
— |
|
|
— |
|
|
719.8 |
|
Other (2) |
1.5 |
|
|
7.9 |
|
|
0.5 |
|
|
9.2 |
|
|
(3.7) |
|
|
15.4 |
|
| Revenue |
$ |
934.0 |
|
|
$ |
727.7 |
|
|
$ |
971.2 |
|
|
$ |
689.1 |
|
|
$ |
(3.7) |
|
|
$ |
3,318.3 |
|
(1) Corporate and Other includes the following:
|
|
|
|
|
|
|
|
|
|
|
|
|
|
|
|
|
|
|
Year Ended December 31, |
|
2023 |
|
2022 |
|
2021 |
|
(Dollars in millions) |
| Unrealized gains (losses) on derivative contracts related to forecasted sales |
$ |
159.0 |
|
|
$ |
(35.8) |
|
|
$ |
(115.1) |
|
| Realized losses on derivative contracts related to forecasted sales |
(80.9) |
|
|
(455.1) |
|
|
(45.6) |
|
Revenue from physical sale of coal (3) |
109.4 |
|
|
470.7 |
|
|
140.3 |
|
| Trading revenue |
— |
|
|
10.7 |
|
|
6.1 |
|
Other (2) |
41.3 |
|
|
11.2 |
|
|
10.6 |
|
| Total Corporate and Other |
$ |
228.8 |
|
|
$ |
1.7 |
|
|
$ |
(3.7) |
|
(2) Includes revenue from arrangements such as customer contract-related payments associated with volume shortfalls; royalties related to coal lease agreements; sales agency commissions; farm income; property and facility rentals; and revenue related to the Company’s assignment of rights to its excess port and rail capacity.
(3) Includes revenue recognized upon the physical sale of coal purchased from the Company’s operating segments and sold to customers through the Company’s coal trading business as part of settling certain derivative contracts. Primarily represents the difference between the price contracted with the customer and the price allocated to the operating segment.
Committed Revenue from Contracts with Customers
The Company expects to recognize revenue subsequent to December 31, 2023 of approximately $5.0 billion related to contracts with customers in which volumes and prices per ton were fixed or reasonably estimable at December 31, 2023. Approximately 43% of such amount is expected to be recognized over the next twelve months and the remainder thereafter. Actual revenue related to such contracts may differ materially for various reasons, including price adjustment features for coal quality and cost escalations, volume optionality provisions and potential force majeure events. This estimate of future revenue does not include any revenue related to contracts with variable prices per ton that cannot be reasonably estimated, such as the majority of seaborne metallurgical and seaborne thermal coal contracts where pricing is negotiated or settled quarterly or annually.
Accounts Receivable
“Accounts receivable, net” at December 31, 2023 and 2022 consisted of the following:
|
|
|
|
|
|
|
|
|
|
|
|
|
December 31, |
|
2023 |
|
2022 |
| |
(Dollars in millions) |
| Trade receivables, net |
$ |
322.3 |
|
|
$ |
416.3 |
|
| Miscellaneous receivables, net |
67.4 |
|
|
49.2 |
|
| Accounts receivable, net |
$ |
389.7 |
|
|
$ |
465.5 |
|
None of the above receivables included allowances for credit losses at December 31, 2023 or 2022. No charges for credit losses were recognized during the years ended December 31, 2023, 2022 or 2021.
|
|
|
|
|
|
|
|
|
| Peabody Energy Corporation |
2023 Form 10-K |
F-19 |
PEABODY ENERGY CORPORATION
NOTES TO CONSOLIDATED FINANCIAL STATEMENTS — (Continued)
(3) Asset Impairment
During the year end December 31, 2023, the Company recognized impairment charges of $2.0 million related to the fair value of an investment in equity securities. During the year ended December 31, 2022, the Company recognized impairment charges of $9.5 million related to the sale of certain land interests in Australia and $1.7 million related to the fair value of an investment in equity securities. No asset impairment charges were recognized during the year ended December 31, 2021.
The Company identified certain assets with an aggregate carrying value of approximately $224 million at December 31, 2023 in its Other U.S. Thermal segment whose recoverability is most sensitive to customer concentration risk.
(4) Inventories
“Inventories, net” as of December 31, 2023 and 2022 consisted of the following:
|
|
|
|
|
|
|
|
|
|
|
|
|
December 31, |
| |
2023 |
|
2022 |
| |
(Dollars in millions) |
| Materials and supplies, net |
$ |
153.0 |
|
|
$ |
130.8 |
|
| Raw coal |
105.6 |
|
|
98.3 |
|
| Saleable coal |
93.2 |
|
|
67.0 |
|
| Inventories, net |
$ |
351.8 |
|
|
$ |
296.1 |
|
Materials and supplies inventories, net presented above have been shown net of reserves of $7.2 million and $9.5 million as of December 31, 2023 and 2022, respectively.
(5) Equity Method Investments
The Company’s equity method investments include its joint venture interest in Middlemount, R3 Renewables LLC (R3) and certain other equity method investments.
The table below summarizes the book value of those investments, which are reported in “Investments and other assets” in the consolidated balance sheets, and the related “Income from equity affiliates”:
|
|
|
|
|
|
|
|
|
|
|
|
|
|
|
|
|
|
|
|
|
|
|
|
|
|
|
|
|
|
|
Book Value at |
|
(Income) Loss from Equity Affiliates |
|
December 31, |
|
Year Ended December 31, |
| |
2023 |
|
2022 |
|
2023 |
|
2022 |
|
2021 |
| |
(Dollars in millions) |
| Equity method investment related to Middlemount |
$ |
42.5 |
|
|
$ |
27.1 |
|
|
$ |
(14.8) |
|
|
$ |
(135.1) |
|
|
$ |
(82.1) |
|
| Equity method investment related to R3 |
7.1 |
|
|
7.0 |
|
|
7.9 |
|
|
3.9 |
|
|
— |
|
| Total equity method investments |
$ |
49.6 |
|
|
$ |
34.1 |
|
|
$ |
(6.9) |
|
|
$ |
(131.2) |
|
|
$ |
(82.1) |
|
Middlemount
The Company received no cash payments from Middlemount during the year ended December 31, 2023. The Company received cash payments from Middlemount of $168.4 million and $43.5 million during the years ended December 31, 2022 and 2021, respectively.
Historically, one of the Company’s Australian subsidiaries was party to an agreement to provide a revolving loan to Middlemount. The Company’s participation in the revolving loan did not, at any time, exceed its 50% equity interest of the revolving loan limit. The revolving loan, which bore interest at 10% per annum and expired on December 31, 2023, has not been extended. There was no outstanding revolving loan at December 31, 2023 or 2022.
During the year ended December 31, 2021, the Company determined that a previously established valuation allowance on Middlemount’s net deferred tax position was no longer necessary based on cumulative earnings and expectation of future earnings. The determination resulted in approximately $33 million of income related to the release of the valuation allowance.
|
|
|
|
|
|
|
|
|
| Peabody Energy Corporation |
2023 Form 10-K |
F-20 |
PEABODY ENERGY CORPORATION
NOTES TO CONSOLIDATED FINANCIAL STATEMENTS — (Continued)
During the year ended December 31, 2021, Middlemount entered into an insurance claim settlement agreement attributable to a business interruption and property damage claim from 2019, which resulted in $12.5 million of income for the Company (on a 50% basis).
During the years ended December 31, 2023, 2022 and 2021, respectively, Middlemount generated revenue of approximately $219 million, $441 million and $265 million (on a 50% basis).
Middlemount had current assets, noncurrent assets, current liabilities and noncurrent liabilities of $48.2 million, $199.5 million, $76.6 million and $58.2 million, respectively, as of December 31, 2023 and $75.2 million, $256.3 million, $135.7 million and $97.7 million, respectively, as of December 31, 2022 (on a 50% basis).
R3
In March 2022, the Company entered into a joint venture with unrelated partners to form R3. R3 was formed with the intent of developing various sites, including certain reclaimed mining land held by the Company in the U.S., for utility-scale photovoltaic solar generation and battery storage. The Company contributed $8.0 million and $10.9 million to R3 during the years ended December 31, 2023 and 2022, respectively.
(6) Derivatives and Fair Value Measurements
Derivatives
From time to time, the Company may utilize various types of derivative instruments to manage its exposure to risks in the normal course of business, including (1) foreign currency exchange rate risk and the variability of cash flows associated with forecasted Australian dollar expenditures made in its Australian mining platform, (2) price risk of fluctuating coal prices related to forecasted sales or purchases of coal, or changes in the fair value of a fixed price physical sales contract, (3) price risk and the variability of cash flows related to forecasted diesel fuel purchased for use in its operations and (4) interest rate risk on long-term debt. These risk management activities are actively monitored for compliance with the Company’s risk management policies.
On a limited basis, the Company engages in the direct and brokered trading of coal and freight-related contracts. Except those contracts for which the Company has elected to apply a normal purchases and normal sales exception, all derivative coal trading contracts are accounted for at fair value. The Company had no diesel fuel or interest rate derivatives in place as of December 31, 2023.
Foreign Currency Option Contracts
The Company has historically utilized currency forwards and options to hedge currency risk associated with anticipated Australian dollar operating expenditures. As of December 31, 2023, the Company held average rate options with an aggregate notional amount of $456.0 million Australian dollars to hedge currency risk associated with anticipated Australian dollar operating expenditures over the six-month period ending June 30, 2024. The instruments entitle the Company to receive payment on the notional amount should the quarterly average Australian dollar-to-U.S. dollar exchange rate exceed amounts ranging from $0.69 to $0.72 over the six-month period ending June 30, 2024. As of December 31, 2023, the Company also held purchased collars with an aggregate notional amount of $483.0 million Australian dollars related to anticipated Australian dollar operating expenditures during the nine-month period ending September 30, 2024.The purchased collars have a floor and ceiling of approximately $0.59 and $0.72, respectively, whereby the Company will incur a loss on the instruments for rates below the floor and a gain for rates above the ceiling.
Derivative Contracts Related to Forecasted Sales
As of December 31, 2023, the Company had no coal derivative contracts related to its forecasted sales. Historically, such financial contracts have included futures, forwards and options.
During the year ended December 31, 2023, the Company recorded a net unrealized mark-to-market gain of $159.0 million on financial coal derivative contracts and no unrealized mark-to-market gains or losses on physical forward sales contracts. During the year ended December 31, 2022, the Company recorded a net unrealized mark-to-market loss of $35.8 million on coal derivative contracts, which included approximately $65 million of unrealized mark-to-market losses on financial coal derivative contracts and approximately $29 million of unrealized mark-to-market gains on physical forward sales contracts. During the year ended December 31, 2021, the Company recorded a net unrealized mark-to-market loss of $115.1 million on coal derivative contracts, which included approximately $86 million of unrealized mark-to-market losses on financial coal derivative contracts and approximately $29 million of unrealized mark-to-market losses on physical forward sales contracts.
|
|
|
|
|
|
|
|
|
| Peabody Energy Corporation |
2023 Form 10-K |
F-21 |
PEABODY ENERGY CORPORATION
NOTES TO CONSOLIDATED FINANCIAL STATEMENTS — (Continued)
Financial Trading Contracts
On a limited basis, the Company may enter coal or freight derivative contracts for trading purposes. Such financial contracts may include futures, forwards and options. The Company held nominal financial trading contracts as of December 31, 2023.
Tabular Derivatives Disclosures
The Company has master netting agreements with certain of its counterparties which allow for the settlement of contracts in an asset position with contracts in a liability position in the event of default or termination. Such netting arrangements reduce the Company’s credit exposure related to these counterparties. For classification purposes, the Company records the net fair value of all the positions with a given counterparty as a net asset or liability in the consolidated balance sheets. The fair value of derivatives reflected in the accompanying consolidated balance sheets are set forth in the table below.
|
|
|
|
|
|
|
|
|
|
|
|
|
|
|
|
|
|
|
|
|
|
|
|
| |
December 31, 2023 |
|
December 31, 2022 |
| |
Asset Derivative |
|
Liability Derivative |
|
Asset Derivative |
|
Liability Derivative |
| |
(Dollars in millions) |
| Foreign currency option contracts |
$ |
6.2 |
|
|
$ |
— |
|
|
$ |
3.0 |
|
|
$ |
— |
|
| Derivative contracts related to forecasted sales |
— |
|
|
— |
|
|
100.6 |
|
|
(310.3) |
|
| Financial trading contracts |
— |
|
|
— |
|
|
11.7 |
|
|
— |
|
| Total derivatives |
6.2 |
|
|
— |
|
|
115.3 |
|
|
(310.3) |
|
| Effect of counterparty netting |
— |
|
|
— |
|
|
(100.6) |
|
|
100.6 |
|
| Variation margin (received) posted |
— |
|
|
— |
|
|
(11.7) |
|
|
209.7 |
|
| Net derivatives and variation margin as classified in the balance sheets |
$ |
6.2 |
|
|
$ |
— |
|
|
$ |
3.0 |
|
|
$ |
— |
|
The Company generally posts or receives variation margin cash with its clearing broker on the majority of its financial derivatives as market values of the financial derivatives fluctuate. As of December 31, 2023, the Company had no margin cash posted. As of December 31, 2022, the Company had posted $255.5 million aggregate margin cash, consisting of $198.0 million variation margin cash and $57.5 million initial margin.
The net amount of asset derivatives, net of variation margin, is included in “Other current assets” and the net amount of liability derivatives, net of variation margin, is included in “Accounts payable and accrued expenses” in the accompanying consolidated balance sheets.
|
|
|
|
|
|
|
|
|
| Peabody Energy Corporation |
2023 Form 10-K |
F-22 |
PEABODY ENERGY CORPORATION
NOTES TO CONSOLIDATED FINANCIAL STATEMENTS — (Continued)
Currently, the Company does not seek cash flow hedge accounting treatment for its derivative financial instruments and thus changes in fair value are reflected in current earnings. The tables below show the amounts of pretax gains and losses related to the Company’s derivatives and their classification within the accompanying consolidated statements of operations.
|
|
|
|
|
|
|
|
|
|
|
|
|
|
|
|
|
|
|
|
|
|
|
| |
|
Year Ended December 31, 2023 |
|
|
Total (loss) gain recognized in income |
|
|
|
(Loss) gain realized in income on derivatives |
|
Unrealized gain (loss) recognized in income on derivatives |
| Derivative Instrument |
Classification |
|
|
|
| |
|
(Dollars in millions) |
Foreign currency option contracts |
Operating costs and expenses |
$ |
(1.9) |
|
|
|
|
$ |
(9.3) |
|
|
$ |
7.4 |
|
| Derivative contracts related to forecasted sales |
Revenue |
78.1 |
|
|
|
|
(80.9) |
|
|
159.0 |
|
| Financial trading contracts |
Revenue |
— |
|
|
|
|
11.5 |
|
|
(11.5) |
|
| Total |
|
$ |
76.2 |
|
|
|
|
$ |
(78.7) |
|
|
$ |
154.9 |
|
|
|
|
|
|
|
|
|
|
|
|
|
|
|
|
|
|
|
|
|
|
|
|
| |
|
Year Ended December 31, 2022 |
|
|
Total (loss) gain recognized in income |
|
|
|
(Loss) gain realized in income on derivatives |
|
Unrealized (loss) gain recognized in income on derivatives |
| Derivative Instrument |
Classification |
|
|
|
| |
|
(Dollars in millions) |
Foreign currency option contracts |
Operating costs and expenses |
$ |
(8.4) |
|
|
|
|
$ |
(6.1) |
|
|
$ |
(2.3) |
|
| Derivative contracts related to forecasted sales |
Revenue |
(490.9) |
|
|
|
|
(455.1) |
|
|
(35.8) |
|
| Financial trading contracts |
Revenue |
10.7 |
|
|
|
|
1.1 |
|
|
9.6 |
|
| Total |
|
$ |
(488.6) |
|
|
|
|
$ |
(460.1) |
|
|
$ |
(28.5) |
|
|
|
|
|
|
|
|
|
|
|
|
|
|
|
|
|
|
|
|
|
|
|
|
| |
|
Year Ended December 31, 2021 |
|
|
Total (loss) gain recognized in income |
|
|
|
Gain (loss) realized in income on derivatives |
|
Unrealized (loss) gain recognized in income on derivatives |
| Derivative Instrument |
Classification |
|
|
|
| |
|
(Dollars in millions) |
Foreign currency option contracts |
Operating costs and expenses |
$ |
(5.7) |
|
|
|
|
$ |
1.8 |
|
|
$ |
(7.5) |
|
| Derivative contracts related to forecasted sales |
Revenue |
(160.7) |
|
|
|
|
(45.6) |
|
|
(115.1) |
|
| Financial trading contracts |
Revenue |
6.1 |
|
|
|
|
4.6 |
|
|
1.5 |
|
| Total |
|
$ |
(160.3) |
|
|
|
|
$ |
(39.2) |
|
|
$ |
(121.1) |
|
The Company classifies the cash effects of its derivatives within the “Cash Flows From Operating Activities” section of the consolidated statements of cash flows.
Fair Value Measurements
The Company uses a three-level fair value hierarchy that categorizes assets and liabilities measured at fair value based on the observability of the inputs utilized in the valuation. These levels include: Level 1 - inputs are quoted prices in active markets for the identical assets or liabilities; Level 2 - inputs are other than quoted prices included in Level 1 that are directly or indirectly observable through market-corroborated inputs; and Level 3 - inputs are unobservable, or observable but cannot be market-corroborated, requiring the Company to make assumptions about pricing by market participants.
|
|
|
|
|
|
|
|
|
| Peabody Energy Corporation |
2023 Form 10-K |
F-23 |
PEABODY ENERGY CORPORATION
NOTES TO CONSOLIDATED FINANCIAL STATEMENTS — (Continued)
The following tables set forth the hierarchy of the Company’s net asset (liability) positions for which fair value is measured on a recurring basis. Variation margin cash associated with the derivative balances is excluded from this table.
|
|
|
|
|
|
|
|
|
|
|
|
|
|
|
|
|
|
|
|
|
|
|
|
| |
December 31, 2023 |
| |
Level 1 |
|
Level 2 |
|
Level 3 |
|
Total |
| |
(Dollars in millions) |
| Foreign currency option contracts |
$ |
— |
|
|
$ |
6.2 |
|
|
$ |
— |
|
|
$ |
6.2 |
|
| Derivative contracts related to forecasted sales |
— |
|
|
— |
|
|
— |
|
|
— |
|
| Financial trading contracts |
— |
|
|
— |
|
|
— |
|
|
— |
|
| Equity securities |
0.4 |
|
|
— |
|
|
— |
|
|
0.4 |
|
| Total net assets |
$ |
0.4 |
|
|
$ |
6.2 |
|
|
$ |
— |
|
|
$ |
6.6 |
|
|
|
|
|
|
|
|
|
| |
December 31, 2022 |
| |
Level 1 |
|
Level 2 |
|
Level 3 |
|
Total |
| |
(Dollars in millions) |
| Foreign currency option contracts |
$ |
— |
|
|
$ |
3.0 |
|
|
$ |
— |
|
|
$ |
3.0 |
|
| Derivative contracts related to forecasted sales |
— |
|
|
(209.7) |
|
|
— |
|
|
(209.7) |
|
| Financial trading contracts |
— |
|
|
11.7 |
|
|
— |
|
|
11.7 |
|
| Equity securities |
— |
|
|
— |
|
|
2.5 |
|
|
2.5 |
|
| Total net (liabilities) assets |
$ |
— |
|
|
$ |
(195.0) |
|
|
$ |
2.5 |
|
|
$ |
(192.5) |
|
For Level 1 and 2 financial assets and liabilities, the Company utilizes both direct and indirect observable price quotes, including interest rate yield curves, exchange indices, broker/dealer quotes, published indices, issuer spreads, benchmark securities and other market quotes. In the case of certain debt securities, fair value is provided by a third-party pricing service. Below is a summary of the Company’s valuation techniques for Level 1 and 2 financial assets and liabilities:
•Foreign currency option contracts are valued utilizing inputs obtained in quoted public markets (Level 2) except when credit and non-performance risk is considered to be a significant input, then the Company classifies such contracts as Level 3.
•Derivative contracts related to forecasted sales and financial trading contracts are generally valued based on unadjusted quoted prices in active markets (Level 1) or a valuation that is corroborated by the use of market-based pricing (Level 2) except when credit and non-performance risk is considered to be a significant input (greater than 10% of fair value), then the Company classifies as Level 3.
•Investments in equity securities are currently based on unadjusted quoted prices in active markets (Level 1).
Other Financial Instruments. The following methods and assumptions were used by the Company in estimating fair values for other financial instruments as of December 31, 2023 and 2022:
•Cash and cash equivalents, restricted cash, accounts receivable, including those within the Company’s accounts receivable securitization program, margining cash, notes receivable and accounts payable have carrying values which approximate fair value due to the short maturity or the liquid nature of these instruments.
•Long-term debt fair value estimates are based on observed prices for securities when available (Level 2), and otherwise on estimated borrowing rates to discount the cash flows to their present value (Level 3).
|
|
|
|
|
|
|
|
|
| Peabody Energy Corporation |
2023 Form 10-K |
F-24 |
PEABODY ENERGY CORPORATION
NOTES TO CONSOLIDATED FINANCIAL STATEMENTS — (Continued)
Market risk associated with the Company’s fixed- and variable-rate long-term debt relates to the potential reduction in the fair value and negative impact to future earnings, respectively, from an increase in interest rates. The fair value of debt, shown below, is principally based on reported market values and estimates based on interest rates, maturities, credit risk, underlying collateral and completed market transactions.
|
|
|
|
|
|
|
|
|
|
|
|
| |
December 31, |
|
2023 |
|
2022 |
| |
(Dollars in millions) |
| Total debt at par value |
$ |
342.3 |
|
|
$ |
343.6 |
|
| Less: Unamortized debt issuance costs |
(8.1) |
|
|
(9.8) |
|
| Net carrying amount |
$ |
334.2 |
|
|
$ |
333.8 |
|
|
|
|
|
| Estimated fair value |
$ |
483.9 |
|
|
$ |
560.0 |
|
The Company’s risk management function, which is independent of the Company’s coal trading function, is responsible for valuation policies and procedures, with oversight from executive management. The fair value of the Company’s coal derivative assets and liabilities reflects adjustments for credit risk. The Company’s exposure to credit risk is substantially with electric utilities, energy marketers, steel producers and nonfinancial trading houses.
Significant increases or decreases in the inputs in isolation could result in a significantly higher or lower fair value measurement. The unobservable inputs do not have a direct interrelationship; therefore, a change in one unobservable input would not necessarily correspond with a change in another unobservable input.
The following table summarizes the changes in the Company’s recurring Level 3 net financial assets:
|
|
|
|
|
|
|
|
|
|
|
|
|
|
|
|
|
|
|
|
|
|
|
Year Ended December 31, |
| |
|
2023 |
|
2022 |
|
2021 |
| |
|
(Dollars in millions) |
| Beginning of period |
|
$ |
2.5 |
|
|
$ |
4.0 |
|
|
$ |
4.0 |
|
|
|
|
|
|
|
|
|
|
|
|
|
|
|
|
|
|
|
|
|
|
| Impairment loss included in earnings |
|
(2.0) |
|
|
(1.7) |
|
|
— |
|
|
|
|
|
|
|
|
| Purchases |
|
— |
|
|
0.2 |
|
|
— |
|
|
|
|
|
|
|
|
| Exchange |
|
(0.5) |
|
|
— |
|
|
— |
|
| End of period |
|
$ |
— |
|
|
$ |
2.5 |
|
|
$ |
4.0 |
|
The Company had no transfers between Levels 1, 2 and 3 during any of the periods presented in the table above. The Company’s policy is to value all transfers between levels using the beginning of period valuation.
(7) Property, Plant, Equipment and Mine Development
Property, plant, equipment and mine development, net, as of December 31, 2023 and 2022 consisted of the following:
|
|
|
|
|
|
|
|
|
|
|
|
|
December 31, |
|
2023 |
|
2022 |
|
(Dollars in millions) |
| Land and coal interests |
$ |
2,475.2 |
|
|
$ |
2,514.7 |
|
| Buildings and improvements |
647.6 |
|
|
594.2 |
|
| Machinery and equipment |
1,787.6 |
|
|
1,543.1 |
|
| Less: Accumulated depreciation, depletion and amortization |
(2,066.3) |
|
|
(1,787.0) |
|
| Property, plant, equipment and mine development, net |
$ |
2,844.1 |
|
|
$ |
2,865.0 |
|
Land and coal interests included coal reserves and resources with a net book value of $1.2 billion and $1.3 billion as of December 31, 2023 and 2022, respectively. Such coal reserves and resources were comprised of mineral rights for leased coal interests and advance royalties that had a net book value of $0.7 billion as of both December 31, 2023 and 2022, and coal reserves and resources held by fee ownership of $0.5 billion and $0.6 billion as of December 31, 2023 and 2022, respectively. The amount of coal reserves and resources unassigned to active mining operations, and thus not subject to current depletion, including certain exploratory properties, was $0.1 billion as of both December 31, 2023 and 2022.
|
|
|
|
|
|
|
|
|
| Peabody Energy Corporation |
2023 Form 10-K |
F-25 |
PEABODY ENERGY CORPORATION
NOTES TO CONSOLIDATED FINANCIAL STATEMENTS — (Continued)
(8) Income Taxes
Income from continuing operations before income taxes for the periods presented below consisted of the following:
|
|
|
|
|
|
|
|
|
|
|
|
|
|
|
|
|
|
| |
Year Ended December 31, |
| |
2023 |
|
2022 |
|
2021 |
| |
(Dollars in millions) |
| U.S. |
$ |
77.8 |
|
|
$ |
59.7 |
|
|
$ |
(55.0) |
|
| Non-U.S. |
1,047.0 |
|
|
1,218.9 |
|
|
425.2 |
|
| Total |
$ |
1,124.8 |
|
|
$ |
1,278.6 |
|
|
$ |
370.2 |
|
Total income tax provision (benefit) for the periods presented below consisted of the following:
|
|
|
|
|
|
|
|
|
|
|
|
|
|
|
|
|
|
| |
Year Ended December 31, |
| |
2023 |
|
2022 |
|
2021 |
| |
(Dollars in millions) |
| Current: |
|
|
|
|
|
| U.S. federal |
$ |
(0.1) |
|
|
$ |
(0.2) |
|
|
$ |
(0.5) |
|
| Non-U.S. |
225.9 |
|
|
42.9 |
|
|
30.8 |
|
| State |
0.1 |
|
|
0.1 |
|
|
— |
|
| Total current |
225.9 |
|
|
42.8 |
|
|
30.3 |
|
| Deferred: |
|
|
|
|
|
|
|
|
|
|
|
| Non-U.S. |
82.9 |
|
|
(81.6) |
|
|
(7.5) |
|
|
|
|
|
|
|
| Total deferred |
82.9 |
|
|
(81.6) |
|
|
(7.5) |
|
| Total income tax provision (benefit) |
$ |
308.8 |
|
|
$ |
(38.8) |
|
|
$ |
22.8 |
|
The following is a reconciliation of the expected statutory federal income tax expense to the Company’s income tax provision (benefit) for the periods presented below:
|
|
|
|
|
|
|
|
|
|
|
|
|
|
|
|
|
|
| |
Year Ended December 31, |
| |
2023 |
|
2022 |
|
2021 |
| |
(Dollars in millions) |
| Expected income tax expense at U.S. federal statutory rate |
$ |
236.2 |
|
|
$ |
268.5 |
|
|
$ |
77.7 |
|
| Changes in valuation allowance, income tax |
(11.1) |
|
|
(595.6) |
|
|
(101.3) |
|
|
|
|
|
|
|
|
|
|
|
|
|
| Changes in tax reserves |
(0.8) |
|
|
(1.5) |
|
|
1.9 |
|
| Excess depletion |
(15.0) |
|
|
(17.2) |
|
|
(13.7) |
|
| Foreign earnings repatriation |
— |
|
|
42.3 |
|
|
— |
|
| Foreign earnings provision differential |
91.6 |
|
|
80.7 |
|
|
17.3 |
|
| Global intangible low-taxed income |
— |
|
|
197.2 |
|
|
67.0 |
|
| Tax credits |
— |
|
|
— |
|
|
(26.5) |
|
| Remeasurement of foreign income tax accounts |
(0.9) |
|
|
(2.6) |
|
|
(1.8) |
|
| State income taxes, net of federal tax benefit |
6.3 |
|
|
1.1 |
|
|
(1.1) |
|
| Other, net |
2.5 |
|
|
(11.7) |
|
|
3.3 |
|
| Total income tax provision (benefit) |
$ |
308.8 |
|
|
$ |
(38.8) |
|
|
$ |
22.8 |
|
Certain reconciliation items included in the above table exclude the remeasurement of foreign income tax accounts as these foreign currency effects are separately presented. The Company recognizes the tax on global intangible low-taxed income (GILTI) as a period expense. The Company recorded provisions of $197.2 million and $67.0 million for the years ended December 31, 2022 and 2021, respectively, which was fully offset by the release of valuation allowance associated with the net operating losses (NOLs) that absorbed the GILTI inclusion. No provision for GILTI was recorded for the year ended December 31, 2023.
|
|
|
|
|
|
|
|
|
| Peabody Energy Corporation |
2023 Form 10-K |
F-26 |
PEABODY ENERGY CORPORATION
NOTES TO CONSOLIDATED FINANCIAL STATEMENTS — (Continued)
On August 16, 2022, the Inflation Reduction Act of 2022 was signed into law and contained numerous tax provisions including a 15% minimum tax on book income of certain large corporations. This act did not have a material impact on the Company’s tax provision.
The tax effects of temporary differences that gave rise to significant portions of the deferred tax assets and liabilities as of December 31, 2023 and 2022 consisted of the following:
|
|
|
|
|
|
|
|
|
|
|
|
|
December 31, |
| |
2023 |
|
2022 |
| |
(Dollars in millions) |
| Deferred tax assets: |
|
|
|
| Tax loss carryforwards and credits |
$ |
745.6 |
|
|
$ |
740.1 |
|
Property, plant, equipment and mine development, principally due to differences in depreciation, depletion and asset impairments |
550.1 |
|
|
550.8 |
|
| Accrued postretirement benefit obligations |
38.6 |
|
|
41.4 |
|
| Asset retirement obligations |
99.1 |
|
|
95.1 |
|
|
|
|
|
| Employee benefits |
20.1 |
|
|
22.1 |
|
| Take-or-pay obligations |
6.7 |
|
|
8.2 |
|
| Hedge activities |
— |
|
|
49.1 |
|
|
|
|
|
| Investments and other assets |
40.8 |
|
|
37.0 |
|
| Workers’ compensation obligations |
7.3 |
|
|
7.1 |
|
| Operating lease liabilities |
17.2 |
|
|
7.8 |
|
| Other |
30.6 |
|
|
28.3 |
|
| Total gross deferred tax assets |
1,556.1 |
|
|
1,587.0 |
|
| Valuation allowance, income tax |
(1,473.5) |
|
|
(1,451.0) |
|
| Total deferred tax assets |
82.6 |
|
|
136.0 |
|
| Deferred tax liabilities: |
|
|
|
Property, plant, equipment and mine development, principally due to differences in depreciation, depletion and asset impairments |
84.9 |
|
|
67.5 |
|
| Operating lease right-of-use assets |
16.3 |
|
|
7.6 |
|
|
|
|
|
| Investments and other assets |
10.0 |
|
|
6.6 |
|
| Total deferred tax liabilities |
111.2 |
|
|
81.7 |
|
| Net deferred tax (liability) asset |
$ |
(28.6) |
|
|
$ |
54.3 |
|
| Deferred taxes are classified as follows: |
|
|
|
|
|
|
|
| Noncurrent deferred income tax asset |
$ |
— |
|
|
$ |
74.7 |
|
| Noncurrent deferred income tax liability |
(28.6) |
|
|
(20.4) |
|
| Net deferred tax (liability) asset |
$ |
(28.6) |
|
|
$ |
54.3 |
|
As of December 31, 2023, the Company had gross U.S. federal NOLs of $1.7 billion. The Company’s tax loss carryforwards and credits of $745.6 million as of December 31, 2023 were comprised primarily of net federal NOLs of $366.8 million, tax general business credits (GBCs) of $139.1 million, net Australia NOLs and capital tax loss carryforwards of $138.7 million, state NOLs of $80.3 million and other foreign NOLs of $19.1 million. The foreign tax loss carryforwards have no expiration date. The federal NOLs begin to expire in 2037, the state NOLs begin to expire in 2024 and the GBCs begin to expire in 2027.
|
|
|
|
|
|
|
|
|
| Peabody Energy Corporation |
2023 Form 10-K |
F-27 |
PEABODY ENERGY CORPORATION
NOTES TO CONSOLIDATED FINANCIAL STATEMENTS — (Continued)
In assessing the near-term use of NOLs and tax credits and corresponding valuation allowance adjustments, the Company evaluated the expected level of future taxable income, available tax planning strategies, reversals of existing taxable temporary differences and taxable income in carryback years. The Company maintained valuation allowances of $1.5 billion against the U.S net deferred tax asset position of $1.0 billion and against certain foreign deferred tax assets, primarily in Australia, of $469.1 million. Recognition of the U.S. valuation allowances was driven by recent cumulative book losses, as determined by considering all sources of available income (including items classified as discontinued operations or recorded directly to “Accumulated other comprehensive income”) and availability of future taxable income in assessing the realizability of the related assets. The valuation allowance against certain foreign deferred tax assets continues to be recorded due to unlikely realization.
Unrecognized Tax Benefits
Net unrecognized tax benefits (excluding interest and penalties) were recorded as follows in the consolidated balance sheets as of December 31, 2023 and 2022:
|
|
|
|
|
|
|
|
|
|
|
|
|
December 31, |
| |
2023 |
|
2022 |
|
(Dollars in millions) |
| Deferred income taxes |
$ |
7.4 |
|
|
$ |
8.2 |
|
| Other noncurrent liabilities |
1.3 |
|
|
1.3 |
|
| Net unrecognized tax benefits |
$ |
8.7 |
|
|
$ |
9.5 |
|
| Gross unrecognized tax benefits |
$ |
8.7 |
|
|
$ |
9.5 |
|
The amount of the Company’s gross unrecognized tax benefits decreased by $0.8 million since December 31, 2022 due primarily to adjustments for prior year positions partially offset by additions for current positions. The amount of the net unrecognized tax benefits that, if recognized, would directly affect the effective tax rate was $8.7 million and $9.5 million at December 31, 2023 and 2022, respectively. A reconciliation of the beginning and ending amount of gross unrecognized tax benefits for the periods presented below is as follows:
|
|
|
|
|
|
|
|
|
|
|
|
|
|
|
|
|
|
| |
Year Ended December 31, |
| |
2023 |
|
2022 |
|
2021 |
|
(Dollars in millions) |
| Balance at beginning of period |
$ |
9.5 |
|
|
$ |
11.0 |
|
|
$ |
9.1 |
|
| Additions for current year tax positions |
0.9 |
|
|
0.8 |
|
|
3.0 |
|
| Reductions for prior year tax positions |
(1.7) |
|
|
(2.3) |
|
|
(1.1) |
|
|
|
|
|
|
|
| Balance at end of period |
$ |
8.7 |
|
|
$ |
9.5 |
|
|
$ |
11.0 |
|
The Company recognizes interest and penalties related to unrecognized tax benefits in its income tax provision. The Company recorded $0.2 million of gross interest and penalties in each of the years ended December 31, 2023, 2022, and 2021. The Company had $6.1 million, $5.9 million and $5.7 million of accrued gross interest and penalties related to unrecognized tax benefits at December 31, 2023, 2022 and 2021, respectively.
The Company expects a decrease in its net unrecognized tax benefits of $1.3 million during the next twelve months due to expiration of statutes.
Tax Returns Subject to Examination
The Company’s federal income tax returns for the 2020, 2021 and 2022 tax years are subject to potential examinations by the Internal Revenue Service. The Company’s state income tax returns for the tax years 2016 and thereafter remain potentially subject to examination by various state taxing authorities due to NOL carryforwards. Australian income tax returns for tax years 2019 through 2022 continue to be subject to potential examinations by the Australian Taxation Office.
|
|
|
|
|
|
|
|
|
| Peabody Energy Corporation |
2023 Form 10-K |
F-28 |
PEABODY ENERGY CORPORATION
NOTES TO CONSOLIDATED FINANCIAL STATEMENTS — (Continued)
Foreign Earnings
As of December 31, 2023, the Company has unremitted earnings relating to certain wholly owned subsidiaries that are not permanently reinvested, but there are no residual cash taxes on the unremitted earnings. The Company has an earnings deficit for remaining investments outside the U.S. and continues to be permanently reinvested with respect to its historical earnings. However, when appropriate, the Company has the ability to access foreign cash without incurring residual cash taxes due to the existence of NOLs.
Tax Payments and Refunds
The following table summarizes the Company’s income tax payments, net for the periods presented below:
|
|
|
|
|
|
|
|
|
|
|
|
|
|
|
|
|
|
| |
Year Ended December 31, |
| |
2023 |
|
2022 |
|
2021 |
| |
(Dollars in millions) |
| U.S. — federal |
$ |
(0.2) |
|
|
$ |
(0.3) |
|
|
$ |
(1.3) |
|
| U.S. — state and local |
0.1 |
|
|
— |
|
|
— |
|
| Non-U.S. |
130.7 |
|
|
36.9 |
|
|
12.9 |
|
| Total income tax payments, net |
$ |
130.6 |
|
|
$ |
36.6 |
|
|
$ |
11.6 |
|
The Organisation for Economic Co-operation and Development (OECD)/G20 Inclusive Framework on Base Erosion and Profit Shifting published the Pillar Two model rules designed to address the tax challenges arising from the digitalization of the global economy. Pillar Two legislation has been enacted or substantially enacted in certain jurisdictions in which the Company operates, effective for the financial year beginning January 1, 2024. Based on an assessment performed, the Pillar Two effective tax rates in all jurisdictions in which the Company operates are above 15% and the Company is not currently aware of any circumstances under which this might change. Therefore, the Company does not expect a potential exposure to Pillar Two top-up taxes.
(9) Accounts Payable and Accrued Expenses
Accounts payable and accrued expenses consisted of the following:
|
|
|
|
|
|
|
|
|
|
|
|
|
December 31, |
| |
2023 |
|
2022 |
| |
(Dollars in millions) |
| Trade accounts payable |
$ |
275.8 |
|
|
$ |
240.7 |
|
| Accrued payroll and related benefits |
174.3 |
|
|
199.4 |
|
| Other accrued expenses |
142.4 |
|
|
148.0 |
|
| Income taxes payable |
120.8 |
|
|
25.9 |
|
| Accrued royalties |
71.2 |
|
|
88.4 |
|
| Accrued taxes other than income |
59.3 |
|
|
20.0 |
|
| Asset retirement obligations |
54.2 |
|
|
84.2 |
|
| Accrued insurance |
32.7 |
|
|
22.7 |
|
| Operating lease liabilities |
17.3 |
|
|
16.8 |
|
| Workers’ compensation obligations |
8.7 |
|
|
9.3 |
|
| Liabilities associated with discontinued operations |
5.2 |
|
|
41.9 |
|
| Accrued interest |
3.6 |
|
|
8.2 |
|
|
|
|
|
|
|
|
|
|
|
|
|
|
|
|
|
|
|
|
|
|
|
|
|
| Accounts payable and accrued expenses |
$ |
965.5 |
|
|
$ |
905.5 |
|
|
|
|
|
|
|
|
|
|
| Peabody Energy Corporation |
2023 Form 10-K |
F-29 |
PEABODY ENERGY CORPORATION
NOTES TO CONSOLIDATED FINANCIAL STATEMENTS — (Continued)
(10) Long-term Debt
The Company’s total indebtedness as of December 31, 2023 and 2022 consisted of the following:
|
|
|
|
|
|
|
|
|
|
|
|
|
December 31, |
| Debt Instrument (defined below, as applicable) |
2023 |
|
2022 |
|
(Dollars in millions) |
|
|
|
|
|
|
|
|
|
|
|
|
|
|
|
|
|
|
|
|
|
|
|
|
3.250% Convertible Senior Notes due March 2028 (2028 Convertible Notes) |
$ |
320.0 |
|
|
$ |
320.0 |
|
|
|
|
|
| Finance lease obligations |
22.3 |
|
|
23.6 |
|
| Less: Debt issuance costs |
(8.1) |
|
|
(9.8) |
|
|
334.2 |
|
|
333.8 |
|
| Less: Current portion of long-term debt |
13.5 |
|
|
13.2 |
|
| Long-term debt |
$ |
320.7 |
|
|
$ |
320.6 |
|
As further described below, during 2022, the Company utilized various methods allowable or required under its then-existing debt agreements to retire all of its senior secured long-term debt, leaving only its 2028 Convertible Notes, which are further described below, and various finance lease obligations outstanding at December 31, 2022.
2022 Debt Retirements
Upon maturity on March 31, 2022, the Company retired the remaining principal balance of senior secured notes for $23.1 million.
During the year ended December 31, 2022, $62.5 million principal amount of the Company’s senior secured notes maturing in 2024 was retired using proceeds from the offering of 2028 Convertible Notes, as further described below, and the remaining $0.1 million principal amount was retired through a mandatory repurchase offer required under the terms of the notes’ indenture and the Company’s then-existing letter of credit facility. In addition to the $0.1 million principal amount of senior secured notes maturing in 2024 repurchased through such offers, the Company repurchased $42.2 million of aggregate priority lien obligations under the then-existing letter of credit facility during 2022 at approximately 95%. The repurchases of commitments under the then-existing letter of credit facility were effected by the posting of $40.1 million of collateral with the administrative agent and did not reduce the availability under the facility.
During the year ended December 31, 2022, $257.4 million principal amount of the Company’s senior secured notes maturing in 2025 was retired using proceeds from the offering of 2028 Convertible Notes, as further described below. The remaining senior secured notes maturing in 2025 were retired through an open market repurchase of $11.4 million principal amount at 98.00% and, in accordance with the notes’ indenture, a voluntary prepayment of $66.1 million principal amount at 101.59%.
The Company’s senior secured term loan maturing in 2025 was retired through various open market purchases of $44.1 million principal amount throughout 2022 at an aggregate cost of $42.1 million, scheduled quarterly principal amortization payments of $3.0 million, and, in accordance with the terms of the then-existing credit agreement, a voluntary prepayment of $276.2 million principal amount at par.
The senior secured notes and senior secured term loans maturing in 2024 held by certain wholly-owned subsidiaries of the Company (Co-Issuers) were subject to mandatory prepayment offers. During the year ended December 31, 2022, the Company prepaid $18.5 million principal amount of the Co-Issuer senior secured notes maturing in 2024 at an aggregate cost of $19.2 million and $17.2 million principal amount of the Co-Issuer senior secured term loans maturing in 2024 at par.
Voluntary repurchases of Co-Issuer senior secured term loans maturing in 2024 were permissible through various methods, including a modified Dutch auction process in which the Company could solicit acceptable prices from holders. During the year ended December 31, 2022, the Company solicited bids from all holders of Co-Issuer senior secured term loans for the repurchase of the remaining outstanding principal amount, resulting in the valid tender and purchase of $185.9 million principal amount at an aggregate cost of $195.8 million.
|
|
|
|
|
|
|
|
|
| Peabody Energy Corporation |
2023 Form 10-K |
F-30 |
PEABODY ENERGY CORPORATION
NOTES TO CONSOLIDATED FINANCIAL STATEMENTS — (Continued)
The underlying terms of the Co-Issuer senior secured notes and senior secured term loans maturing in 2024 required parity between holders of Co-Issuer senior secured term loans and holders of Co-Issuer senior secured notes with respect to repurchase offers such as those undertaken through the auction processes described above. As such, the Company solicited commensurate bids from all holders of Co-Issuer senior secured notes at various dates during the year ended December 31, 2022 for the repurchase of the remaining outstanding principal amount, resulting in the valid tender and purchase of $147.3 million principal amount at an aggregate cost of $154.1 million.
Subsequent to the modified Dutch auction processes and related transactions, the Company voluntarily prepaid the remaining $28.1 million principal amount of the Co-Issuer senior secured notes maturing in 2024 and $2.9 million principal amount of Co-Issuer senior secured term loans maturing in 2024 at an aggregate cost of $32.8 million, including certain make whole premium amounts.
The Company’s various debt retirements during 2022 resulted in the realization of net losses from early debt extinguishment of $34.9 million, excluding the loss recorded in connection with the issuance of 2028 Convertible Notes described below.
3.250% Convertible Senior Notes due 2028
On March 1, 2022, the Company issued $320.0 million in aggregate principal amount of 3.250% Convertible Senior Notes due 2028 (the 2028 Convertible Notes) through a private offering. The 2028 Convertible Notes are senior unsecured obligations of the Company and are governed under an indenture.
The Company used the proceeds of the offering of the 2028 Convertible Notes and available cash to redeem $62.6 million of senior secured notes maturing in 2024 and $257.4 million of senior secured notes maturing in 2025, and to pay related premiums, fees and expenses relating to the offering and redemptions. The Company capitalized $11.2 million of debt issuance costs related to the offering and recognized a loss on early debt extinguishment of $23.0 million during the three months ended March 31, 2022.
The 2028 Convertible Notes will mature on March 1, 2028, unless earlier converted, redeemed or repurchased in accordance with their terms. The 2028 Convertible Notes bear interest at a rate of 3.250% per year, payable semi-annually in arrears on March 1 and September 1 of each year.
The 2028 Convertible Notes are convertible at the option of the holders only in the following circumstances: (1) during any calendar quarter commencing after the calendar quarter ended June 30, 2022, if the last reported sale price per share of the Company’s common stock exceeds 130% of the conversion price for each of at least 20 trading days during the 30 consecutive trading days ending on, and including, the last trading day of the immediately preceding calendar quarter; (2) during the five consecutive business days immediately after any five consecutive trading day period (such five consecutive trading day period, the Measurement Period) in which the trading price per $1,000 principal amount of 2028 Convertible Notes for each trading day of the Measurement Period was less than 98% of the product of the last reported sale price per share of the Company’s common stock on such trading day and the conversion rate on such trading day; (3) upon the occurrence of certain corporate events or distributions on the Company’s common stock; (4) if the Company calls any 2028 Convertible Notes for redemption; and (5) at any time from, and including, September 1, 2027 until the close of business on the second scheduled trading day immediately before the maturity date.
Upon conversion, the Company may satisfy its conversion obligation by paying or delivering, as applicable, cash, shares of the Company’s common stock or a combination of cash and shares of the Company’s common stock, at the Company’s election, in the manner and subject to the terms and conditions provided in the indenture. The initial conversion rate for the 2028 Convertible Notes was 50.3816 shares of the Company’s common stock per $1,000 principal amount of 2028 Convertible Notes, which represented an initial conversion price of approximately $19.85 per share of the Company’s common stock. The terms of the indenture require conversion rate adjustments upon the payment of dividends to holders of the Company’s common stock once such cumulative dividends impact the conversion rate by at least 1%. Under the applicable conversion rate formula, the dividends declared and paid during the year ended December 31, 2023 and the dividend declared during the three months ending March 31, 2024, yielded a revised conversion rate which met the 1% threshold to impact the existing conversion rate of 50.3816. As such, effective February 21, 2024, the conversion rate was increased to 51.0440 shares of the Company’s common stock per $1,000 principal amount of 2028 Convertible Notes. The conversion rate is subject to further adjustment under certain circumstances in accordance with the terms of the indenture. If certain corporate events described in the indenture occur prior to the maturity date, or the Company delivers a notice of redemption (as described below), the conversion rate will be increased for a holder who elects to convert its 2028 Convertible Notes in connection with such corporate event or notice of redemption, as the case may be, in certain circumstances.
|
|
|
|
|
|
|
|
|
| Peabody Energy Corporation |
2023 Form 10-K |
F-31 |
PEABODY ENERGY CORPORATION
NOTES TO CONSOLIDATED FINANCIAL STATEMENTS — (Continued)
The Company may not redeem the 2028 Convertible Notes prior to March 1, 2025. The Company may redeem for cash all or any portion of the 2028 Convertible Notes, at its option, on or after March 1, 2025 and on or before the 40th scheduled trading day immediately before the maturity date, at a cash redemption price equal to 100% of the principal amount of the 2028 Convertible Notes to be redeemed, plus accrued and unpaid interest, if any, to, but excluding, the redemption date, but only if the last reported sale price per share of the Company’s common stock exceeds 130% of the conversion price on (1) each of at least 20 trading days, whether or not consecutive, during the 30 consecutive trading days ending on, and including, the trading day immediately before the date the Company sends the related redemption notice; and (2) the trading day immediately before the date the Company sends such notice. However, the Company may not redeem less than all of the outstanding 2028 Convertible Notes unless at least $75 million aggregate principal amount of 2028 Convertible Notes are outstanding and not called for redemption as of the time the Company sends the related redemption notice. No sinking fund is provided for the 2028 Convertible Notes.
If the Company undergoes a fundamental change (as defined in the indenture), noteholders may require the Company to repurchase their 2028 Convertible Notes at a cash repurchase price equal to 100% of the principal amount of the 2028 Convertible Notes to be repurchased, plus accrued and unpaid interest, if any, to, but excluding, the fundamental change repurchase date.
During the fourth quarter of 2022, the Company’s reported common stock prices prompted the conversion feature of the 2028 Convertible Notes. As a result, the 2028 Convertible Notes were convertible at the option of the holders during the first quarter of 2023. However, the Company did not receive any conversion requests.
During the year ended December 31, 2023, the Company’s reported common stock prices did not prompt the conversion feature of the 2028 Convertible Notes. As a result, the 2028 Convertible Notes were not convertible at the option of the holders during 2023, and will not be similarly convertible during the first quarter of 2024.
As of December 31, 2023, the if-converted value of the 2028 Convertible Notes exceeded the principal amount by $74.7 million.
Margin Financing Arrangement
In March 2022, the Company entered into a discrete credit agreement which provided for a $150 million unsecured revolving credit facility. The revolving facility was scheduled to mature in April 2025 and bore interest at a rate of 10.0% per annum on drawn amounts. The revolving facility was intended to support the Company’s near-term liquidity requirements, particularly with respect to the cash margin requirements associated with the coal derivative contracts, which fluctuate depending upon underlying market coal prices. Concurrently with the Company’s then-existing credit agreement, the Company entered into a related agreement for an at-the-market equity offering program for up to $225.0 million of the Company’s common stock.
During the three months ended March 31, 2022, the Company borrowed and repaid $225.0 million under the revolving facility using net proceeds of $222.0 million from at-the-market issuances of 10.1 million shares of common stock and available cash. The Company made no additional borrowings and terminated the facility in August 2022.
Interest Charges
The following table presents the components of the Company’s interest expense related to its indebtedness and financial assurance instruments such as surety bonds and letters of credit. Additionally, the table sets forth the amount of cash paid for interest and the amount of non-cash interest expense primarily related to the amortization of debt issuance costs.
|
|
|
|
|
|
|
|
|
|
|
|
|
|
|
|
|
|
|
Year Ended December 31, |
|
2023 |
|
2022 |
|
2021 |
|
(Dollars in millions) |
| Indebtedness |
$ |
21.6 |
|
|
$ |
87.0 |
|
|
$ |
132.3 |
|
| Financial assurance instruments |
38.2 |
|
|
53.3 |
|
|
51.1 |
|
| Interest expense |
$ |
59.8 |
|
|
$ |
140.3 |
|
|
$ |
183.4 |
|
|
|
|
|
|
|
| Cash paid for interest |
$ |
61.9 |
|
|
$ |
118.5 |
|
|
$ |
174.9 |
|
| Non-cash interest expense |
$ |
4.6 |
|
|
$ |
17.7 |
|
|
$ |
21.3 |
|
|
|
|
|
|
|
|
|
|
| Peabody Energy Corporation |
2023 Form 10-K |
F-32 |
PEABODY ENERGY CORPORATION
NOTES TO CONSOLIDATED FINANCIAL STATEMENTS — (Continued)
Covenant Compliance
The Company was compliant with all relevant covenants under its debt and other finance agreements at December 31, 2023. The April 2023 termination of the Company’s then-existing credit agreement and related letter of credit facility, as described in Note 20. “Financial Instruments, Guarantees With Off-Balance-Sheet Risk and Other Guarantees,” eliminated the related compliance requirements as of March 31, 2023 and prospectively.
Revolving Credit Facility
On January 18, 2024, the Company established a new revolving credit facility with a maximum aggregate principal amount of $320.0 million in revolving commitments by entering into a credit agreement, dated as of January 18, 2024 (the 2024 Credit Agreement), by and among the Company, as borrower, certain subsidiaries of the Company party thereto, PNC Bank, National Association, as administrative agent, and the lenders party thereto.
The revolving commitments and any related loans, if applicable (any such loans, the Revolving Loans), established by the 2024 Credit Agreement terminate or mature, as applicable, on January 18, 2028, subject to certain conditions relating to the Company’s outstanding 2028 Convertible Notes. The Revolving Loans bear interest at a secured overnight financing rate (SOFR) plus an applicable margin ranging from 3.50% to 4.25%, depending on the Company’s total net leverage ratio (as defined under the 2024 Credit Agreement) or a base rate plus an applicable margin ranging from 2.50% to 3.25%, at the Company’s option.
The 2024 Credit Agreement contains customary covenants that, among other things and subject to certain exceptions (including compliance with financial ratios), may limit the Company and its subsidiaries’ ability to incur additional indebtedness, make certain restricted payments or investments, sell or otherwise dispose of assets, enter into transactions with affiliates, create or incur liens, and merge, consolidate or sell all or substantially all of their assets. The 2024 Credit Agreement is secured by substantially all assets of the Company and its U.S. subsidiaries, as well as a pledge of two Australian subsidiaries.
Finance Lease Obligations
Refer to Note 11. “Leases” for additional information associated with the Company’s finance leases, which pertain to the financing of mining equipment used in operations.
(11) Leases
The Company has operating and finance leases for mining and non-mining equipment, office space and certain other facilities under various non-cancellable agreements. Historically, the majority of the Company’s leases have been accounted for as operating leases. Refer to Note 1. “Summary of Significant Accounting Policies” for the Company’s policies regarding “Leases.”
The Company and certain of its subsidiaries have guaranteed other subsidiaries’ performance under various lease obligations. Certain lease agreements are subject to the restrictive covenants of the Company’s credit facilities and include cross-acceleration provisions, under which the lessor could require remedies including, but not limited to, immediate recovery of the present value of any remaining lease payments. The Company typically agrees to indemnify lessors for the value of the property or equipment leased, should the property be damaged or lost during the course of the Company’s operations. The Company expects that losses with respect to leased property, if any, may be covered by insurance (subject to deductibles). Aside from indemnification of the lessor for the value of the property leased, the Company’s maximum potential obligations under its leases are equal to the respective future minimum lease payments, and the Company assumes that no amounts could be recovered from third parties.
|
|
|
|
|
|
|
|
|
| Peabody Energy Corporation |
2023 Form 10-K |
F-33 |
PEABODY ENERGY CORPORATION
NOTES TO CONSOLIDATED FINANCIAL STATEMENTS — (Continued)
The components of lease expense for the periods presented below were as follows:
|
|
|
|
|
|
|
|
|
|
|
|
|
|
|
|
|
|
|
Year Ended December 31, |
|
2023 |
|
2022 |
|
2021 |
|
(Dollars in millions) |
| Operating lease cost: |
|
|
|
|
|
| Operating leases |
$ |
22.1 |
|
|
$ |
18.9 |
|
|
$ |
19.8 |
|
| Short-term leases |
44.3 |
|
|
30.6 |
|
|
15.5 |
|
| Variable leases |
8.7 |
|
|
7.6 |
|
|
2.7 |
|
| Sublease income |
(1.4) |
|
|
(1.3) |
|
|
(1.9) |
|
| Total operating lease cost |
$ |
73.7 |
|
|
$ |
55.8 |
|
|
$ |
36.1 |
|
|
|
|
|
|
|
| Finance lease cost: |
|
|
|
|
|
| Amortization of right-of-use assets |
$ |
7.2 |
|
|
$ |
6.3 |
|
|
$ |
5.9 |
|
| Interest on lease liabilities |
1.7 |
|
|
2.1 |
|
|
2.7 |
|
| Total finance lease cost |
$ |
8.9 |
|
|
$ |
8.4 |
|
|
$ |
8.6 |
|
Supplemental balance sheet information related to leases at December 31, 2023 and 2022 was as follows:
|
|
|
|
|
|
|
|
|
|
|
|
|
December 31, |
|
2023 |
|
2022 |
|
(Dollars in millions) |
| Operating leases: |
|
|
|
| Operating lease right-of-use assets |
$ |
61.9 |
|
|
$ |
26.9 |
|
|
|
|
|
| Accounts payable and accrued expenses |
$ |
17.3 |
|
|
$ |
16.8 |
|
| Operating lease liabilities, less current portion |
47.7 |
|
|
11.0 |
|
| Total operating lease liabilities |
$ |
65.0 |
|
|
$ |
27.8 |
|
|
|
|
|
| Finance leases: |
|
|
|
| Property, plant, equipment and mine development |
$ |
34.3 |
|
|
$ |
36.1 |
|
| Accumulated depreciation |
(15.4) |
|
|
(12.6) |
|
| Property, plant, equipment and mine development, net |
$ |
18.9 |
|
|
$ |
23.5 |
|
|
|
|
|
| Current portion of long-term debt |
$ |
13.5 |
|
|
$ |
13.2 |
|
| Long-term debt, less current portion |
8.8 |
|
|
10.4 |
|
| Total finance lease liabilities |
$ |
22.3 |
|
|
$ |
23.6 |
|
|
|
|
|
| Weighted average remaining lease term (years) |
|
|
|
| Operating leases |
4.6 |
|
|
| Finance leases |
2.3 |
|
|
|
|
|
|
| Weighted average discount rate |
|
|
|
| Operating leases |
6.8 |
% |
|
|
| Finance leases |
6.8 |
% |
|
|
|
|
|
|
|
|
|
|
|
| Peabody Energy Corporation |
2023 Form 10-K |
F-34 |
PEABODY ENERGY CORPORATION
NOTES TO CONSOLIDATED FINANCIAL STATEMENTS — (Continued)
Supplemental cash flow information related to leases for the periods presented below was as follows:
|
|
|
|
|
|
|
|
|
|
|
|
|
|
|
|
|
|
|
Year Ended December 31, |
|
2023 |
|
2022 |
|
2021 |
|
(Dollars in millions) |
| Cash paid for amounts included in the measurement of lease liabilities: |
|
|
|
|
|
| Operating cash flows for operating leases |
$ |
18.8 |
|
|
$ |
20.5 |
|
|
$ |
24.3 |
|
| Operating cash flows for finance leases |
1.7 |
|
|
2.1 |
|
|
3.8 |
|
| Financing cash flows for finance leases |
9.0 |
|
|
9.3 |
|
|
8.2 |
|
|
|
|
|
|
|
| Right-of-use assets obtained in exchange for lease obligations: |
|
|
|
|
|
| Operating leases |
55.6 |
|
|
13.5 |
|
|
7.1 |
|
| Finance leases |
6.7 |
|
|
6.4 |
|
|
24.4 |
|
The Company's leases have remaining lease terms ranging from 1 year to 9 years, and may include options to extend the terms, as applicable. The contractual maturities of lease liabilities were as follows:
|
|
|
|
|
|
|
|
|
|
|
|
|
|
|
| Period Ending December 31, |
|
Operating Leases |
|
Finance Leases |
| |
|
(Dollars in millions) |
| 2024 |
|
$ |
19.0 |
|
|
$ |
14.3 |
|
| 2025 |
|
15.0 |
|
|
5.8 |
|
| 2026 |
|
14.7 |
|
|
3.0 |
|
| 2027 |
|
13.2 |
|
|
1.7 |
|
| 2028 |
|
7.5 |
|
|
0.2 |
|
| 2029 and thereafter |
|
4.2 |
|
|
— |
|
| Total lease payments |
|
73.6 |
|
|
25.0 |
|
| Less imputed interest |
|
(8.6) |
|
|
(2.7) |
|
| Total lease liabilities |
|
$ |
65.0 |
|
|
$ |
22.3 |
|
(12) Asset Retirement Obligations
Reconciliations of the Company’s asset retirement obligations are as follows:
|
|
|
|
|
|
|
|
|
|
|
|
| |
December 31, |
| |
2023 |
|
2022 |
| |
(Dollars in millions) |
| Balance at beginning of period |
$ |
750.0 |
|
|
$ |
719.8 |
|
|
|
|
|
| Liabilities settled |
(60.4) |
|
|
(51.7) |
|
| Accretion expense |
61.3 |
|
|
56.2 |
|
| Revisions to estimates |
(48.1) |
|
|
25.7 |
|
| Balance at end of period |
$ |
702.8 |
|
|
$ |
750.0 |
|
| Less: Current portion (included in “Accounts payable and accrued expenses”) |
54.2 |
|
|
84.2 |
|
| Noncurrent obligation (included in “Asset retirement obligations, less current portion”) |
$ |
648.6 |
|
|
$ |
665.8 |
|
| Balance at end of period — active locations |
$ |
541.3 |
|
|
$ |
557.9 |
|
| Balance at end of period — closed or inactive locations |
$ |
161.5 |
|
|
$ |
192.1 |
|
The Company’s reclamation obligations are secured by surety bonds, which are supported by standby letters of credit and restricted cash, and various other forms of collateral. See Note 20. “Financial Instruments, Guarantees With Off-Balance-Sheet Risk and Other Guarantees” for a discussion of the collateral securing the asset retirement obligations.
|
|
|
|
|
|
|
|
|
| Peabody Energy Corporation |
2023 Form 10-K |
F-35 |
PEABODY ENERGY CORPORATION
NOTES TO CONSOLIDATED FINANCIAL STATEMENTS — (Continued)
(13) Postretirement Health Care and Life Insurance Benefits
The Company currently provides health care and life insurance benefits to qualifying salaried and hourly retirees of its current and certain former subsidiaries and their dependents from benefit plans established by the Company. Plan coverage for health benefits is provided to future hourly and salaried retirees in accordance with the applicable plan document. Life insurance benefits are provided to future represented hourly retirees in accordance with the Company’s benefit plans and any applicable labor agreement.
Net periodic postretirement benefit credit included the following components:
|
|
|
|
|
|
|
|
|
|
|
|
|
|
|
|
|
|
| |
Year Ended December 31, |
| |
2023 |
|
2022 |
|
2021 |
| |
(Dollars in millions) |
| Service cost for benefits earned |
$ |
0.5 |
|
|
$ |
0.8 |
|
|
$ |
1.0 |
|
| Interest cost on accumulated postretirement benefit obligation |
10.2 |
|
|
7.0 |
|
|
10.5 |
|
| Expected return on plan assets |
(0.5) |
|
|
(0.8) |
|
|
(1.0) |
|
| Amortization of prior service credit |
(53.8) |
|
|
(53.8) |
|
|
(46.4) |
|
| Net actuarial gain |
(2.6) |
|
|
(51.2) |
|
|
(54.5) |
|
| Net periodic postretirement benefit credit |
$ |
(46.2) |
|
|
$ |
(98.0) |
|
|
$ |
(90.4) |
|
The actuarial gain for all benefit plans in 2023 was primarily due to favorable impact of claims experience for the year offset by the decrease in the discount rate used to measure the benefit obligation. The actuarial gain for all benefit plans in 2022 was primarily due to the increase in the discount rate used to measure the benefit obligation and favorable impact of claims experience for the year offset by increase in medical trend rate due to inflation as well as the expected impact of the Inflation Reduction Act. The actuarial gain for all benefit plans in 2021 was primarily due to the increase in the discount rate used to measure the benefit obligation, favorable impact of claims experience for the year, and updating the mortality base table and improvement scale to those published by the Society of Actuaries considering the plan’s experience for participants receiving medical benefits under the United Mine Workers of America (UMWA) Coal Act design.
The following includes pretax amounts recorded in “Accumulated other comprehensive income”:
|
|
|
|
|
|
|
|
|
|
|
|
|
|
|
|
|
|
| |
Year Ended December 31, |
| |
2023 |
|
2022 |
|
2021 |
| |
(Dollars in millions) |
| Prior service credit arising during year |
$ |
— |
|
|
$ |
— |
|
|
$ |
(139.5) |
|
| Amortization: |
|
|
|
|
|
| Prior service credit |
53.8 |
|
|
53.8 |
|
|
46.4 |
|
Total recorded in “Accumulated other comprehensive income” |
$ |
53.8 |
|
|
$ |
53.8 |
|
|
$ |
(93.1) |
|
The Company amortizes prior service credit over an amortization period of the average remaining service period to full eligibility for participating employees at the time of the plan change or the expected lifetime of participants in the plan. A prior service credit established during 2021 is described below. The estimated prior service credit that will be amortized from accumulated other comprehensive income into net periodic postretirement benefit cost during the year ending December 31, 2024 is $53.0 million.
|
|
|
|
|
|
|
|
|
| Peabody Energy Corporation |
2023 Form 10-K |
F-36 |
PEABODY ENERGY CORPORATION
NOTES TO CONSOLIDATED FINANCIAL STATEMENTS — (Continued)
The following table sets forth the plans’ funded status reconciled with the amounts shown in the consolidated balance sheets:
|
|
|
|
|
|
|
|
|
|
|
|
| |
December 31, |
| |
2023 |
|
2022 |
| |
(Dollars in millions) |
| Change in benefit obligation: |
|
|
|
| Accumulated postretirement benefit obligation at beginning of period |
$ |
189.9 |
|
|
$ |
258.7 |
|
| Service cost |
0.5 |
|
|
0.8 |
|
| Interest cost |
10.2 |
|
|
7.0 |
|
|
|
|
|
|
|
|
|
| Benefits paid and administrative fees (net of Medicare Part D reimbursements) |
(20.9) |
|
|
(21.2) |
|
| Actuarial gain |
(1.7) |
|
|
(55.4) |
|
| Accumulated postretirement benefit obligation at end of period |
178.0 |
|
|
189.9 |
|
| Change in plan assets: |
|
|
|
| Fair value of plan assets at beginning of period |
17.4 |
|
|
26.1 |
|
| Actual return on plan assets |
1.5 |
|
|
(3.4) |
|
| Employer contributions |
16.3 |
|
|
15.9 |
|
|
|
|
|
| Benefits paid and administrative fees (net of Medicare Part D reimbursements) |
(20.9) |
|
|
(21.2) |
|
| Fair value of plan assets at end of period |
14.3 |
|
|
17.4 |
|
| Funded status at end of period |
(163.7) |
|
|
(172.5) |
|
| Less: Current portion (included in “Accounts payable and accrued expenses”) |
15.3 |
|
|
16.0 |
|
| Noncurrent obligation (included in “Accrued postretirement benefit costs”) |
$ |
(148.4) |
|
|
$ |
(156.5) |
|
In October 2021, the Company announced changes to its postretirement health care benefit plan for certain represented retirees. Effective January 1, 2022, the Company no longer provides medical coverage to certain existing retirees but continues to offer a life insurance benefit to eligible retirees. The impact of the changes on future benefits reduced the Company’s accumulated postretirement benefit obligation by $139.5 million. The reduction was attributable to the elimination of health care benefits for certain represented retirees. The reduction in liability was recorded with an offsetting balance in “Accumulated other comprehensive income” and is being amortized to earnings based upon the estimated remaining life expectancies of certain plan participants (12.0 years and 13.0 years were the remaining amortization periods at December 31, 2023 and 2022, respectively; $117.4 million remaining in “Accumulated other comprehensive income” at December 31, 2023).
A prior service credit established in December 2020 is being amortized to earnings over the average remaining life expectancy of the affected plan (7.5 years and 8.5 years were the remaining amortization periods at December 31, 2023 and 2022, respectively; $7.8 million remaining in “Accumulated other comprehensive income” at December 31, 2023). A prior service credit established in September 2020 is being amortized to earnings over an average remaining service period to full eligibility for participating employees (1.9 years and 2.9 years were the remaining amortization periods at December 31, 2023 and 2022, respectively; $63.5 million remaining in “Accumulated other comprehensive income” at December 31, 2023). A prior service credit established in December 2018 is being amortized to earnings over an average remaining service period to full eligibility for participating employees (0.9 years and 1.9 years were the remaining amortization periods at December 31, 2023 and 2022, respectively; $0.9 million remaining in “Accumulated other comprehensive income” at December 31, 2023).
The weighted-average assumptions used to determine the benefit obligations for the plans as of the end of each year were as follows:
|
|
|
|
|
|
|
|
|
|
|
|
|
December 31, |
| |
2023 |
|
2022 |
| Discount rate |
5.44 |
% |
|
5.70 |
% |
| Measurement date |
December 31, 2023 |
|
December 31, 2022 |
|
|
|
|
|
|
|
|
|
| Peabody Energy Corporation |
2023 Form 10-K |
F-37 |
PEABODY ENERGY CORPORATION
NOTES TO CONSOLIDATED FINANCIAL STATEMENTS — (Continued)
The weighted-average assumptions used to determine net periodic postretirement benefit credit for the plans during each period were as follows:
|
|
|
|
|
|
|
|
|
|
|
|
|
|
|
|
|
|
|
Year Ended December 31, |
| |
2023 |
|
2022 |
|
2021 |
| Discount rate |
5.70 |
% |
|
2.84 |
% |
|
2.55 |
% |
| Expected long-term return on plan assets (pretax) |
5.75 |
% |
|
5.75 |
% |
|
5.75 |
% |
| Measurement date |
December 31, 2022 |
|
December 31, 2021 |
|
December 31, 2020 |
The expected rate of return on plan assets is determined by taking into consideration expected long-term returns associated with each major asset class based on long-term historical ranges, inflation assumptions and the expected net value from active management of the assets based on actual results. The asset allocation of plan assets and long-term capital market expectations remain unchanged from December 31, 2022, therefore the Company’s expected pretax rate of return on plan assets will remain at 5.75% for 2024.
The accumulated postretirement benefit obligation exceeded plan assets for all plans as of December 31, 2023 and 2022. The accumulated postretirement benefit obligation for all plans was $178.0 million and $189.9 million as of December 31, 2023 and 2022, respectively.
The following presents information about the assumed health care cost trend rate:
|
|
|
|
|
|
|
|
|
|
|
|
|
Year Ended December 31, |
| |
2023 |
|
2022 |
| Pre-Medicare: |
|
|
|
| Health care cost trend rate assumed for next year |
6.75 |
% |
|
7.00 |
% |
| Rate to which the cost trend is assumed to decline (the ultimate trend rate) |
4.75 |
% |
|
4.75 |
% |
| Year that the rate reaches the ultimate trend rate |
2032 |
|
2032 |
|
|
|
|
| Post-Medicare: |
|
|
|
Health care cost trend rate assumed for next year (1) |
9.45 |
% |
|
6.75 |
% |
| Rate to which the cost trend is assumed to decline (the ultimate trend rate) |
4.75 |
% |
|
4.75 |
% |
| Year that the rate reaches the ultimate trend rate |
2032 |
|
2032 |
(1) An additional one-time increase of 3% is applied to claims in 2024 to reflect potential reductions in payments from Center for Medicare and Medicaid Services related to the passage of the Inflation Reduction Act in August 2022.
Plan Assets
The Company maintains a Voluntary Employees’ Beneficiary Association (VEBA) trust to pre-fund a portion of benefits for non-represented retirees. Assets of the Peabody Investments Corp. Non-Represented Retiree VEBA Trust (the Non-Represented Trust) are invested in accordance with the investment policy established by the Peabody VEBA Retirement Committee after consultation with outside investment advisors and actuaries. As of December 31, 2023 and 2022, the asset allocation strategy for the Non-Represented Trust is 30% in equity and 70% in fixed income assets. The asset strategy may vary over time based on changes in the status of the Non-Represented Trust, the Company’s risk posture and other factors.
A financial instrument’s level within the valuation hierarchy is based upon the lowest level of input that is significant to the fair value measurement. Following is a description of the valuation techniques and inputs used for investments measured at fair value, including the general classification of such investments pursuant to the valuation hierarchy.
U.S. equity securities. The Non-Represented Trust invests in U.S. equity securities for growth and diversification. Investment vehicles include various domestic large-cap publicly traded common stocks. All common stocks are traded on a national securities exchange and are valued at quoted market prices in active markets and accordingly classified within Level 1 of the valuation hierarchy.
|
|
|
|
|
|
|
|
|
| Peabody Energy Corporation |
2023 Form 10-K |
F-38 |
PEABODY ENERGY CORPORATION
NOTES TO CONSOLIDATED FINANCIAL STATEMENTS — (Continued)
International equity securities. The Non-Represented Trust invests in international equity securities for growth and diversification. Investment vehicles include mutual funds. The mutual funds are traded on a national securities exchange in an active market, are valued using daily publicly quoted net asset value (NAV) prices and accordingly classified within Level 1 of the valuation hierarchy.
Corporate bonds. The Non-Represented Trust invests in corporate bonds for diversification, volatility reduction of equity securities and to provide a hedge to interest rate movements affecting liabilities. Investment types are predominantly investment-grade corporate bonds. Fair value for these securities is provided by a third-party pricing service that utilizes various inputs such as benchmark yields, reported trades, broker/dealer quotes, issuer spreads and benchmark securities as well as other relevant economic measures. Corporate bonds are classified within the Level 2 valuation hierarchy since fair value inputs are derived prices in active markets and the bonds are not traded on a national securities exchange.
U.S. government securities. The Non-Represented Trust invests in U.S. government securities for diversification, volatility reduction of equity securities and to provide a hedge to interest rate movements affecting liabilities. Investment types are predominantly U.S. government bonds, notes, agency securities and municipal bonds. Fair value for these securities is provided by a third-party pricing service that utilizes various inputs such as benchmark yields, reported trades, broker/dealer quotes, issuer spreads and benchmark securities as well as other relevant economic measures. If fair value is based on quoted prices in active markets and traded on a national securities exchange, U.S. government securities are classified within the Level 1 valuation hierarchy; otherwise, U.S. government securities are classified within the Level 2 valuation hierarchy.
Cash funds. The Non-Represented Trust invests in cash funds to manage liquidity resulting from payment of participant benefits and certain administrative fees. The investment consists of non-interest bearing cash funds and U.S. government money market fund which are classified within the Level 1 valuation hierarchy.
The methods described above may produce a fair value calculation that may not be indicative of net realizable value or reflective of future fair values. Furthermore, while the Company believes its valuation methods are appropriate and consistent with other market participants, the use of different methodologies or assumptions to determine the fair value of certain financial instruments could result in a different fair value measurement at the reporting date. The inputs or methodologies used for valuing investments are not necessarily an indication of the risk associated with investing in those investments.
The following tables present the fair value of assets in the Non-Represented Trust by asset category and by fair value hierarchy:
|
|
|
|
|
|
|
|
|
|
|
|
|
|
|
|
|
|
|
|
|
|
|
|
|
December 31, 2023 |
|
Level 1 |
|
Level 2 |
|
Level 3 |
|
Total |
| |
(Dollars in millions) |
| U.S. equity securities |
$ |
3.0 |
|
|
$ |
— |
|
|
$ |
— |
|
|
$ |
3.0 |
|
| International equity securities |
0.9 |
|
|
— |
|
|
— |
|
|
0.9 |
|
| Corporate bonds |
— |
|
|
5.2 |
|
|
— |
|
|
5.2 |
|
| U.S. government securities |
1.8 |
|
|
2.8 |
|
|
— |
|
|
4.6 |
|
| Cash funds |
0.6 |
|
|
— |
|
|
— |
|
|
0.6 |
|
| Total assets at fair value |
$ |
6.3 |
|
|
$ |
8.0 |
|
|
$ |
— |
|
|
$ |
14.3 |
|
|
|
|
|
|
|
|
|
|
|
|
|
|
|
|
|
|
|
|
|
|
|
|
|
|
December 31, 2022 |
|
Level 1 |
|
Level 2 |
|
Level 3 |
|
Total |
| |
(Dollars in millions) |
| U.S. equity securities |
$ |
3.7 |
|
|
$ |
— |
|
|
$ |
— |
|
|
$ |
3.7 |
|
| International equity securities |
1.1 |
|
|
— |
|
|
— |
|
|
1.1 |
|
| Corporate bonds |
— |
|
|
7.1 |
|
|
— |
|
|
7.1 |
|
| U.S. government securities |
2.0 |
|
|
3.0 |
|
|
— |
|
|
5.0 |
|
| Cash funds |
0.5 |
|
|
— |
|
|
— |
|
|
0.5 |
|
| Total assets at fair value |
$ |
7.3 |
|
|
$ |
10.1 |
|
|
$ |
— |
|
|
$ |
17.4 |
|
|
|
|
|
|
|
|
|
|
| Peabody Energy Corporation |
2023 Form 10-K |
F-39 |
PEABODY ENERGY CORPORATION
NOTES TO CONSOLIDATED FINANCIAL STATEMENTS — (Continued)
Contributions
Annual contributions to the Non-Represented Trust are discretionary. During the year ended December 31, 2023, the Company made no contributions to the trust.
Estimated Future Benefit Payments
The following benefit payments (net of retiree contributions and Medicare Part D reimbursements), which reflect expected future service, as appropriate, are expected to be paid by the Company or satisfied from Non-Represented Trust assets:
|
|
|
|
|
|
| |
Postretirement
Benefits |
| |
(Dollars in millions) |
| 2024 |
$ |
21.3 |
|
| 2025 |
20.6 |
|
| 2026 |
19.5 |
|
| 2027 |
18.4 |
|
| 2028 |
17.4 |
|
| Years 2029-2033 |
69.4 |
|
(14) Pension and Savings Plans
One of the Company’s subsidiaries, Peabody Investments Corp. (PIC), sponsored a defined benefit pension plan covering certain U.S. salaried employees and eligible hourly employees at certain PIC subsidiaries (the Peabody Plan). As discussed further below, the Peabody Plan was terminated in 2022 with assets distributed in 2023. A subsidiary of PIC has a defined benefit pension plan covering eligible employees who are represented by the UMWA under the Kayenta Reclamation Agreement of 2020 (the Western Plan and together with the Peabody Plan, the Pension Plans).
Effective May 31, 2008, the Peabody Plan was frozen in its entirety for both participation and benefit accrual purposes. In March 2022, PIC entered into a commitment agreement relating to the Peabody Plan with The Prudential Insurance Company of America (Prudential) and Fiduciary Counselors Inc., as independent fiduciary to the Peabody Plan. Under the commitment agreement, the Peabody Plan purchased a buy-in group annuity contract (GAC) from Prudential for approximately $500 million, which was funded directly by the Peabody Plan’s assets. The benefit obligation was not transferred to Prudential and the Peabody Plan continued to administer and pay the retirement benefits of Peabody Plan participants, but was reimbursed by Prudential for the payment of all benefits covered by the GAC. There was no impact on the monthly retirement benefits paid to Peabody Plan participants and no material impact on contributions for the Peabody Plan in 2022 or 2023 as a result of this transaction.
In May 2022, the Board of Directors of PIC approved the termination of the Peabody Plan effective July 31, 2022. In June 2022, the Peabody Plan’s participants were notified of the Peabody Plan termination and PIC filed an application with the Internal Revenue Service to request a determination as to the qualified status under §401(a) of the Internal Revenue Code of 1986 with respect to the amendment and termination of the Peabody Plan. In May 2023, PIC received a favorable determination from the Internal Revenue Service as to the Peabody Plan’s qualified status with respect to its plan termination.
In February 2023, as part of the Peabody Plan termination process, PIC announced a program to offer a voluntary lump-sum pension payout to certain active and deferred participants of the Peabody Plan which would fully settle the Peabody Plan’s obligation to them. The program provided participants with a limited-time opportunity to elect to receive a lump-sum settlement of their pension benefit or begin to receive their benefit in the form of a monthly annuity in May 2023.
On July 31, 2023, as part of the completion of the standard Employee Retirement Income Security Act plan termination process for the Peabody Plan, the GAC with Prudential was converted from a buy-in group annuity contract to a buy-out group annuity contract, irrevocably transferring the remaining benefit obligation and administration to Prudential. Peabody no longer administers or pays the retirement benefits of Peabody Plan participants. No cash contributions were required to complete the termination process for the Peabody Plan.
|
|
|
|
|
|
|
|
|
| Peabody Energy Corporation |
2023 Form 10-K |
F-40 |
PEABODY ENERGY CORPORATION
NOTES TO CONSOLIDATED FINANCIAL STATEMENTS — (Continued)
During the year ended December 31, 2023, the Company settled $443.2 million of its pension obligations for active and deferred participants in the Peabody Plan with an equal amount paid from plan assets. As a result of the termination process, the Company recorded a settlement gain of $2.2 million during the year ended December 31, 2023, which was reflected in “Net periodic benefit credit, excluding service cost” on the consolidated statement of operations. As a result of the Peabody Plan’s over-funded status, $11.1 million was transferred to a Company sponsored employee retirement account (the Qualified Replacement Plan) during December 2023 as part of the distribution of the Peabody Plan assets resulting from the Peabody Plan termination. The Company will use the funds in the Qualified Replacement Plan at least ratably over a seven year period.
Net periodic pension cost included the following components:
|
|
|
|
|
|
|
|
|
|
|
|
|
|
|
|
|
|
| |
Year Ended December 31, |
| |
2023 |
|
2022 |
|
2021 |
| |
(Dollars in millions) |
| Service cost for benefits earned |
$ |
0.1 |
|
|
$ |
0.1 |
|
|
$ |
0.2 |
|
| Interest cost on projected benefit obligation |
20.1 |
|
|
21.4 |
|
|
20.4 |
|
| Expected return on plan assets |
(17.6) |
|
|
(23.8) |
|
|
(22.9) |
|
|
|
|
|
|
|
| Settlement |
(2.2) |
|
|
— |
|
|
— |
|
| Net actuarial loss |
— |
|
|
20.6 |
|
|
12.7 |
|
| Net periodic pension cost |
$ |
0.4 |
|
|
$ |
18.3 |
|
|
$ |
10.4 |
|
The actuarial loss for all pension plans in 2022 was primarily due to actual returns on plan assets that were lower than expected returns for the year and the premium paid to Prudential to purchase the GAC, offset by the increase in the discount rate used to measure the benefit obligation. The actuarial loss for all pension plans in 2021 was primarily due to actual returns on plan assets that were lower than expected returns for the year, offset by the increase in the discount rate used to measure the benefit obligation.
The following summarizes the change in benefit obligation, change in plan assets and funded status of the Pension Plans:
|
|
|
|
|
|
|
|
|
|
|
|
| |
December 31, |
| |
2023 |
|
2022 |
| |
(Dollars in millions) |
| Change in benefit obligation: |
|
|
|
| Projected benefit obligation at beginning of period |
$ |
580.9 |
|
|
$ |
751.7 |
|
| Service cost |
0.1 |
|
|
0.1 |
|
| Interest cost |
20.1 |
|
|
21.4 |
|
| Benefits paid |
(36.1) |
|
|
(55.1) |
|
| Actuarial loss (gain) |
3.4 |
|
|
(137.2) |
|
| Settlement |
(443.2) |
|
|
— |
|
| Projected benefit obligation at end of period |
125.2 |
|
|
580.9 |
|
| Change in plan assets: |
|
|
|
| Fair value of plan assets at beginning of period |
583.3 |
|
|
772.4 |
|
| Actual return on plan assets |
23.1 |
|
|
(134.0) |
|
| Employer contributions |
(11.1) |
|
|
— |
|
| Benefits paid |
(36.1) |
|
|
(55.1) |
|
| Settlement |
(443.2) |
|
|
— |
|
| Fair value of plan assets at end of period |
116.0 |
|
|
583.3 |
|
| Funded status at end of period |
$ |
(9.2) |
|
|
$ |
2.4 |
|
| Amounts recognized in the consolidated balance sheets: |
|
|
|
| Noncurrent asset (included in “Investments and other assets”) |
$ |
— |
|
|
$ |
9.9 |
|
| Noncurrent obligation (included in “Other noncurrent liabilities”) |
(9.2) |
|
|
(7.5) |
|
| Net amount recognized |
$ |
(9.2) |
|
|
$ |
2.4 |
|
|
|
|
|
|
|
|
|
|
| Peabody Energy Corporation |
2023 Form 10-K |
F-41 |
PEABODY ENERGY CORPORATION
NOTES TO CONSOLIDATED FINANCIAL STATEMENTS — (Continued)
The weighted-average assumptions used to determine the benefit obligations as of the end of each year were as follows:
|
|
|
|
|
|
|
|
|
|
|
|
|
December 31, |
| |
2023 |
|
2022 |
| Discount rate |
5.40 |
% |
|
5.44 |
% |
| Measurement date |
December 31, 2023 |
|
December 31, 2022 |
The weighted-average assumptions used to determine net periodic pension cost (credit) during each period were as follows:
|
|
|
|
|
|
|
|
|
|
|
|
|
|
|
|
|
|
|
Year Ended December 31, |
|
2023 |
|
2022 |
|
2021 |
| Discount rate |
5.44 |
% |
|
2.95 |
% |
|
2.60 |
% |
| Expected long-term return on plan assets |
4.85 |
% |
|
3.20 |
% |
|
2.80 |
% |
| Measurement date |
December 31, 2022 |
|
December 31, 2021 |
|
December 31, 2020 |
The expected rate of return on plan assets is determined by taking into consideration expected long-term returns associated with each major asset class based on long-term historical ranges, inflation assumptions and the expected net value from active management of the assets based on actual results. Effective January 1, 2024, the Company lowered its expected rate of return on plan assets from 4.65% to 4.40% for the Western Plan, reflecting the impact of its asset allocations and capital market expectations.
As of December 31, 2023 and 2022, the accumulated benefit obligation for all plans was $125.2 million and $580.9 million, respectively, which was equal to the projected benefit obligation for those periods. As of December 31, 2023, there were no plan assets, projected benefit obligation or accumulated benefit obligation for the Peabody Plan. As of December 31, 2022, the plan assets for the Peabody Plan of $464.7 million exceeded the projected benefit obligation and accumulated benefit obligation of $454.8 million. The projected benefit obligation and accumulated benefit obligation for the Western Plan as of December 31, 2023 and 2022, was $125.2 million and $126.1 million, respectively, which exceeded the plan assets of $116.0 million and $118.6 million, respectively, for those periods.
Assets of the Pension Plans
Assets of the PIC Master Trust (the Master Trust) are invested in accordance with investment guidelines established by the Peabody Plan Retirement Committee and the Peabody Western Plan Retirement Committee (collectively, the Retirement Committees) after consultation with outside investment advisors and actuaries.
The asset allocation targets have been set with the expectation that the assets of the Master Trust will be managed with an appropriate level of risk to fund each Pension Plan’s expected liabilities. To determine the appropriate target asset allocations, the Retirement Committees consider the demographics of each Pension Plan’s participants, the funded status of each Pension Plan, the business and financial profile of the Company and other associated risk preferences. These allocation targets are reviewed by the Retirement Committees on a regular basis and revised as necessary. As a result of discretionary contributions made in recent years, the Pension Plans have become nearly fully funded and therefore, as of December 31, 2023 and 2022, the Master Trust investment portfolio reflected the Company’s target asset mix of 100% fixed income investments. Prior to December 31, 2023 the Master Trust assets also included investments in various real estate holdings through limited partnerships. The real estate holdings represented approximately less than 1% of total Master Trust assets as of December 31, 2022. All real estate holdings have been liquidated as of December 31, 2023.
Assets of the Master Trust are under management by third-party investment managers, which are selected and monitored by the Retirement Committees. Specific investment guidelines have been established by the Retirement Committees for each major asset class including performance benchmarks, allowable and prohibited investment types and concentration limits. In general, investment guidelines do not permit leveraging the assets held in the Master Trust. However, investment managers may employ various strategies and derivative instruments in establishing overall portfolio characteristics consistent with the guidelines and investment objectives established by the Retirement Committees for their portfolios. Fixed income investment guidelines only allow for exchange-traded derivatives if the investment manager deems the derivative vehicle to be more attractive than a similar direct investment in an underlying cash market or to manage the duration of the fixed income portfolio.
|
|
|
|
|
|
|
|
|
| Peabody Energy Corporation |
2023 Form 10-K |
F-42 |
PEABODY ENERGY CORPORATION
NOTES TO CONSOLIDATED FINANCIAL STATEMENTS — (Continued)
A financial instrument’s level within the valuation hierarchy is based upon the lowest level of input that is significant to the fair value measurement. Following is a description of the valuation techniques and inputs used for investments measured at fair value, including the general classification of such investments pursuant to the valuation hierarchy.
Corporate bonds. The Master Trust invests in corporate bonds for diversification and to provide a hedge to interest rate movements affecting liabilities. Investment types are predominantly investment-grade corporate bonds. Fair value for these securities is provided by a third-party pricing service that utilizes various inputs such as benchmark yields, reported trades, broker/dealer quotes, issuer spreads and benchmark securities as well as other relevant economic measures. Corporate bonds are classified within the Level 2 valuation hierarchy since fair value inputs are derived prices in active markets and the bonds are not traded on a national securities exchange.
U.S. government securities. The Master Trust invests in U.S. government securities for diversification and to provide a hedge to interest rate movements affecting liabilities. Investment types are predominantly U.S. government bonds, agency securities and municipal bonds. Fair value for these securities is provided by a third-party pricing service that utilizes various inputs such as benchmark yields, reported trades, broker/dealer quotes, issuer spreads and benchmark securities as well as other relevant economic measures. If fair value is based on quoted prices in active markets and traded on a national securities exchange, U.S. government securities are classified within the Level 1 valuation hierarchy; otherwise, U.S. government securities are classified within the Level 2 valuation hierarchy.
International government securities. The Master Trust invests in international government securities for diversification and to provide a hedge to interest rate movements affecting liabilities. Investment types are predominantly non-U.S. government bonds. Fair value for these securities is provided by a third-party pricing service that utilizes various inputs such as benchmark yields, reported trades, broker/dealer quotes, issuer spreads and benchmark securities as well as other relevant economic measures. International government securities are classified within the Level 2 valuation hierarchy since fair value inputs are derived prices in active markets and the bonds are not traded on a national securities exchange.
Asset-backed securities. The Master Trust invests in asset-backed securities for diversification and to provide a hedge to interest rate movements affecting liabilities. Investment types are predominately mortgage-backed securities. Asset-backed securities are classified within the Level 2 valuation hierarchy since fair value inputs are derived prices in active markets and the investments are not traded on a national securities exchange.
Cash funds. The Master Trust invests in cash funds to manage liquidity resulting from payment of participant benefits and certain administrative fees. Investment vehicles primarily include a non-interest bearing cash fund with an earnings credit allowance feature, various exchange-traded derivative instruments consisting of futures and interest rate swap agreements used to manage the duration of certain liability-hedging investments. The non-interest bearing cash fund is classified within the Level 1 valuation hierarchy. Exchange traded derivatives, such as options and futures, for which market quotations are readily available, are valued at the last reported sale price or official closing price on the primary market or exchange on which they are traded and are classified within the Level 1 valuation hierarchy.
Group annuity contract. The Master Trust invested in a buy-in GAC to provide a hedge to interest rate movements affecting liabilities. The GAC consisted of a nonparticipating single premium group annuity contract. The initial value of the GAC was equal to the premium paid to secure the contract and was adjusted each reporting period to reflect the estimated fair value of the premium that would be paid for such a contract at that time. Since there were no observable inputs associated with the valuation, the GAC was classified within the Level 3 valuation hierarchy.
Real estate interests. The Master Trust invested in real estate interests for diversification. Investments in real estate represented interests in several limited partnerships, which invest in various real estate properties. Interests in real estate were valued using various methodologies, including independent third party appraisals; fair value measurements were not developed by the Company. For some investments, little market activity may have existed and determination of fair value was then based on the best information available in the circumstances. This involved a significant degree of judgment by taking into consideration a combination of internal and external factors. Accordingly, interests in real estate were classified within the Level 3 valuation hierarchy.
Private mutual funds. The Master Trust invests in mutual funds for growth and diversification. Investment vehicles include an institutional fund that holds a diversified portfolio of long-duration corporate fixed income investments (Corporate Bond Fund). The Corporate Bond Fund is not traded on a national securities exchange and is valued at NAV, the practical expedient to estimate fair value.
|
|
|
|
|
|
|
|
|
| Peabody Energy Corporation |
2023 Form 10-K |
F-43 |
PEABODY ENERGY CORPORATION
NOTES TO CONSOLIDATED FINANCIAL STATEMENTS — (Continued)
The methods described above may produce a fair value calculation that may not be indicative of net realizable value or reflective of future fair values. Furthermore, while the Company believes its valuation methods are appropriate and consistent with other market participants, the use of different methodologies or assumptions to determine the fair value of certain financial instruments could result in a different fair value measurement at the reporting date. The inputs or methodologies used for valuing investments are not necessarily an indication of the risk associated with investing in those investments.
The following tables present the fair value of assets in the Master Trust by asset category and by fair value hierarchy:
|
|
|
|
|
|
|
|
|
|
|
|
|
|
|
|
|
|
|
|
|
|
|
|
| |
December 31, 2023 |
| |
Level 1 |
|
Level 2 |
|
Level 3 |
|
Total |
| |
(Dollars in millions) |
|
|
|
|
|
|
|
|
| Corporate bonds |
$ |
— |
|
|
$ |
66.7 |
|
|
$ |
— |
|
|
$ |
66.7 |
|
| U.S. government securities |
19.3 |
|
|
4.1 |
|
|
— |
|
|
23.4 |
|
| International government securities |
— |
|
|
1.5 |
|
|
— |
|
|
1.5 |
|
| Asset-backed securities |
— |
|
|
0.5 |
|
|
— |
|
|
0.5 |
|
| Cash funds |
3.8 |
|
|
— |
|
|
— |
|
|
3.8 |
|
|
|
|
|
|
|
|
|
|
|
|
|
|
|
|
|
| Total assets at fair value |
$ |
23.1 |
|
|
$ |
72.8 |
|
|
$ |
— |
|
|
95.9 |
|
|
|
|
|
|
|
|
|
Assets measured at net asset value practical expedient (1) |
|
|
|
|
|
|
|
| Private mutual funds |
|
|
|
|
|
|
20.1 |
|
|
|
|
|
|
|
|
|
| Total plan assets |
|
|
|
|
|
|
$ |
116.0 |
|
|
|
|
|
|
|
|
|
|
|
|
|
|
|
|
|
|
|
|
|
|
|
|
|
| |
December 31, 2022 |
| |
Level 1 |
|
Level 2 |
|
Level 3 |
|
Total |
| |
(Dollars in millions) |
|
|
|
|
|
|
|
|
| Corporate bonds |
$ |
— |
|
|
$ |
67.2 |
|
|
$ |
— |
|
|
$ |
67.2 |
|
| U.S. government securities |
23.3 |
|
|
2.8 |
|
|
— |
|
|
26.1 |
|
| International government securities |
— |
|
|
2.0 |
|
|
— |
|
|
2.0 |
|
| Asset-backed securities |
— |
|
|
0.7 |
|
|
— |
|
|
0.7 |
|
| Cash funds |
9.8 |
|
|
— |
|
|
— |
|
|
9.8 |
|
| Group annuity contract |
— |
|
|
— |
|
|
430.1 |
|
|
430.1 |
|
| Real estate interests |
— |
|
|
— |
|
|
0.3 |
|
|
0.3 |
|
| Total assets at fair value |
$ |
33.1 |
|
|
$ |
72.7 |
|
|
$ |
430.4 |
|
|
536.2 |
|
|
|
|
|
|
|
|
|
Assets measured at net asset value practical expedient (1) |
|
|
|
|
|
|
|
| Private mutual funds |
|
|
|
|
|
|
47.1 |
|
|
|
|
|
|
|
|
|
|
|
|
|
|
|
|
|
| Total plan assets |
|
|
|
|
|
|
$ |
583.3 |
|
(1) In accordance with Accounting Standards Update 2015-07, investments that are measured at fair value using the net asset value per share practical expedient have not been classified in the fair value hierarchy. The fair value amounts presented in the tables are intended to permit reconciliation of the fair value hierarchy to the total value of assets of the plans.
The table below sets forth a summary of changes in the fair value of the Master Trust’s Level 3 investments:
|
|
|
|
|
|
|
|
|
|
|
|
|
|
|
|
|
|
| |
Year Ended December 31, |
|
2023 |
|
2022 |
|
2021 |
| |
(Dollars in millions) |
| Balance, beginning of period |
$ |
430.4 |
|
|
$ |
0.3 |
|
|
$ |
1.2 |
|
| Realized (losses) gains |
(10.4) |
|
|
0.1 |
|
|
0.9 |
|
| Unrealized losses relating to investments still held at the reporting date |
— |
|
|
(68.8) |
|
|
(0.6) |
|
| Purchases, sales and settlements, net |
(420.0) |
|
|
498.8 |
|
|
(1.2) |
|
| Balance, end of period |
$ |
— |
|
|
$ |
430.4 |
|
|
$ |
0.3 |
|
|
|
|
|
|
|
|
|
|
| Peabody Energy Corporation |
2023 Form 10-K |
F-44 |
PEABODY ENERGY CORPORATION
NOTES TO CONSOLIDATED FINANCIAL STATEMENTS — (Continued)
Contributions
Annual contributions to the qualified plans are made in accordance with minimum funding standards and the Company’s agreement with the Pension Benefit Guaranty Corporation. Funding decisions also consider certain funded status thresholds defined by the Pension Protection Act of 2006 (generally 80%). As of December 31, 2023, the Company’s qualified plans are expected to be at or above the Pension Protection Act thresholds. The Company was not required to make any payments to its qualified pension plans in 2023 based on minimum funding requirements and did not make any discretionary contributions in 2023.
Estimated Future Benefit Payments
The following benefit payments, which reflect expected future service, as appropriate, are expected to be paid in connection with the Company’s benefit obligation:
|
|
|
|
|
|
| |
Pension Benefits |
| |
(Dollars in millions) |
2024 |
$ |
11.0 |
|
2025 |
10.9 |
|
2026 |
10.8 |
|
2027 |
10.6 |
|
2028 |
10.5 |
|
Years 2029-2033 |
48.6 |
|
Defined Contribution Plans
The Company sponsors employee retirement accounts under three 401(k) plans for eligible U.S. employees. The Company matches voluntary contributions to each plan up to specified levels. For one plan, the Company has sole discretion in making any matching contributions. The expense for these plans was $21.3 million, $20.1 million and $9.7 million for the years ended December 31, 2023, 2022 and 2021, respectively. Discretionary contribution features in the plans allow for additional contributions from the Company. The Company granted discretionary contributions of $7.3 million and $9.2 million during the years ended December 31, 2023 and 2022, respectively. There were no discretionary contributions granted during the year ended December 31, 2021. Discretionary contributions paid during the years ended December 31, 2023 and 2022 were $4.6 million and $4.0 million, respectively. There were no discretionary contributions paid during the year ended December 31, 2021.
Superannuation
The Company makes superannuation contributions for eligible Australia employees in accordance with the employer contribution rate set by the Government of Australia. The expense related to these contributions was $21.9 million, $18.8 million and $17.4 million for the years ended December 31, 2023, 2022 and 2021, respectively. A performance contribution feature allows for additional discretionary contributions from the Company. The Company granted discretionary performance contributions of $1.6 million during both the years ended December 31, 2023 and 2022. There were no discretionary performance contributions granted for the year ended December 31, 2021. Discretionary contributions paid during the year ended December 31, 2023 were $1.3 million. There were no discretionary performance contributions paid during the years ended December 31, 2022 and 2021.
|
|
|
|
|
|
|
|
|
| Peabody Energy Corporation |
2023 Form 10-K |
F-45 |
PEABODY ENERGY CORPORATION
NOTES TO CONSOLIDATED FINANCIAL STATEMENTS — (Continued)
(15) Stockholders’ Equity
Common Stock
In accordance with the Company’s Fourth Amended and Restated Certificate of Incorporation, the Company has 450.0 million authorized shares of Common Stock, par value $0.01 per share. Holders of Common Stock are entitled to one vote per share on all matters to be voted upon by the stockholders. The holders of Common Stock do not have cumulative voting rights in the election of directors. Holders of Common Stock are entitled to receive ratably dividends if, as and when dividends are declared from time to time by the Board of Directors (the Board) out of funds legally available for that purpose, after payment of dividends required to be paid on any outstanding preferred stock or series common stock. Upon dissolution, liquidation or winding up of the Company, the holders of Common Stock are entitled to receive ratably the assets available for distribution to the stockholders after payment of liabilities and subject to the right of holders of any outstanding preferred stock or series common stock. The Common Stock has no preemptive or conversion rights and is not subject to further calls or assessment by the Company. There are no redemption or sinking fund provisions applicable to the Common Stock.
The following table summarizes Common Stock activity during the periods presented below:
|
|
|
|
|
|
|
|
|
|
|
|
|
|
|
|
|
|
|
Year Ended December 31, |
|
2023 |
|
2022 |
|
2021 |
|
(In millions) |
| Shares outstanding at the beginning of the period |
143.9 |
|
|
133.3 |
|
|
97.8 |
|
|
|
|
|
|
|
| Shares issued for vested restricted stock units |
1.5 |
|
|
0.7 |
|
|
1.0 |
|
| Shares issued in exchange for debt retirement |
— |
|
|
— |
|
|
10.0 |
|
| Shares issued under at-the-market equity offering program |
— |
|
|
10.1 |
|
|
24.8 |
|
| Shares repurchased |
(16.7) |
|
|
(0.2) |
|
|
(0.3) |
|
| Shares outstanding at the end of the period |
128.7 |
|
|
143.9 |
|
|
133.3 |
|
Preferred Stock
The Board is authorized to issue up to 100.0 million shares of preferred stock, par value $0.01 per share. The Board can determine the terms and rights of each series, including whether dividends (if any) will be cumulative or non-cumulative and the dividend rate of the series, redemption or sinking fund provisions, conversion terms, prices and rates and amounts payable on shares of the series in the event of any voluntary or involuntary liquidation, dissolution or winding up of the affairs of the Company and whether the shares of the series will be convertible into shares of any other class or series, or any other security, of the Company or any other corporation. The Board may also determine restrictions on the issuance of shares of the same series or of any other class or series, and the voting rights (if any) of the holders of the series. There were no outstanding shares of preferred stock as of December 31, 2023.
Series Common Stock
The Board is authorized to issue up to 50.0 million shares of series common stock, par value $0.01 per share. The Board can determine the terms and rights of each series, whether dividends (if any) will be cumulative or non-cumulative and the dividend rate of the series, redemption or sinking fund provisions, conversion terms, prices and rates and amounts payable on shares of the series in the event of any voluntary or involuntary liquidation, dissolution or winding up of the affairs of the Company and whether the shares of the series will be convertible into shares of any other class or series, or any other security, of the Company or any other corporation. The Board may also determine restrictions on the issuance of shares of the same series or of any other class or series, and the voting rights (if any) of the holders of the series. There were no outstanding shares of series common stock as of December 31, 2023.
Treasury Stock
Shares repurchases. During the fourth quarter of 2020, the Company entered into a transaction support agreement with its surety bond providers which prohibited share repurchases through the earlier of December 31, 2025, or the maturity of the then-existing credit agreement unless otherwise agreed to by the parties to the agreement. Additionally, restrictive covenants in its then-existing credit facility also limited the Company’s ability to repurchase shares. On April 14, 2023, the Company amended the existing transaction support agreement with the surety bond providers to remove the restrictions on shareholder returns, subject to a minimum liquidity threshold, and terminated the then-existing credit facility, which allows share repurchases.
|
|
|
|
|
|
|
|
|
| Peabody Energy Corporation |
2023 Form 10-K |
F-46 |
PEABODY ENERGY CORPORATION
NOTES TO CONSOLIDATED FINANCIAL STATEMENTS — (Continued)
On August 1, 2017, the Board authorized a $500 million share repurchase program of the outstanding shares of the Company’s common stock and/or preferred stock (2017 Repurchase Program), which was eventually expanded to $1.5 billion during 2018. Prior to the suspension of the 2017 Repurchase Program, as discussed above, the Company repurchased 41.5 million shares of its Common Stock for $1,340.3 million, which included commissions paid of $0.8 million. On April 17, 2023, the Board authorized a new share repurchase program (2023 Repurchase Program) authorizing repurchases of up to $1.0 billion of its Common Stock. The 2017 Repurchase Program was superseded and replaced by the 2023 Repurchase Program.
Through December 31, 2023, the Company repurchased 16.1 million shares of its Common Stock for $350.3 million, which included commission fees of $0.3 million. Of this amount repurchased, $2.6 million related to repurchases which settled subsequent to December 31, 2023. As of December 31, 2023, the Company had accrued excise taxes of $3.3 million related to the repurchases, which were unpaid at December 31, 2023. The Company includes commission fees and excise taxes, as incurred, with the cost of treasury stock. At December 31, 2023, $650.0 million remained available under the 2023 Repurchase Program.
Under the 2023 Repurchase Program, the Company may purchase shares of common stock at its discretion. The manner, timing, pricing and amount of any share repurchase transactions will be based on a variety of factors, including market conditions, applicable legal requirements and alternative opportunities that the Company may have for the use or investment of capital.
Shares relinquished. The Company routinely allows employees to relinquish Common Stock to pay estimated taxes upon the vesting of restricted stock units and the payout of performance units that are settled in Common Stock under its equity incentive plans. The number of shares of Common Stock relinquished was 0.6 million, 0.2 million and 0.3 million for the years ended December 31, 2023, 2022 and 2021, respectively. The value of the Common Stock tendered by employees was based upon the closing price on the dates of the respective transactions.
(16) Share-Based Compensation
The Company has established the Peabody Energy Corporation 2017 Incentive Plan (the 2017 Incentive Plan) for employees, non-employee directors and consultants that allows for the issuance of share-based compensation in various forms including options (including non-qualified stock options and incentive stock options), stock appreciation rights, restricted stock, restricted stock units, deferred stock, performance units, dividend equivalents and cash incentive awards. Under the 2017 Incentive Plan, approximately 14 million shares of the Company’s Common Stock were reserved for issuance. As of December 31, 2023, there are approximately 6.1 million shares of the Company’s Common Stock available for grant.
Share-Based Compensation Expense and Cash Flows
The Company’s share-based compensation expense is recorded in “Operating costs and expenses” and “Selling and administrative expenses” in the consolidated statements of operations. Cash received by the Company upon the exercise of stock options is reflected as a financing activity in the consolidated statements of cash flows. Share-based compensation expense and cash flow amounts were as follows:
|
|
|
|
|
|
|
|
|
|
|
|
|
|
|
|
|
|
| |
Year Ended December 31, |
| |
2023 |
|
2022 |
|
2021 |
| |
(Dollars in millions) |
| Share-based compensation expense |
$ |
6.9 |
|
|
$ |
8.4 |
|
|
$ |
10.0 |
|
|
|
|
|
|
|
|
|
|
|
|
|
| Tax benefit |
— |
|
|
— |
|
|
— |
|
| Share-based compensation expense, net of tax benefit |
$ |
6.9 |
|
|
$ |
8.4 |
|
|
$ |
10.0 |
|
|
|
|
|
|
|
Cash received upon the exercise of stock options |
— |
|
|
— |
|
|
— |
|
| Write-off tax benefits related to share-based compensation |
— |
|
|
— |
|
|
— |
|
As of December 31, 2023, the total unrecognized compensation cost related to nonvested awards was $6.0 million, which is expected to be recognized over 2.3 years with a weighted-average period of 0.9 years.
|
|
|
|
|
|
|
|
|
| Peabody Energy Corporation |
2023 Form 10-K |
F-47 |
PEABODY ENERGY CORPORATION
NOTES TO CONSOLIDATED FINANCIAL STATEMENTS — (Continued)
Deferred Stock Units
During the years ended December 31, 2023, 2022 and 2021, the Company granted deferred stock units to each of the non-employee members of the Board. The fair value of these units is equal to the market price of the Company’s Common Stock at the date of grant. These deferred stock units generally vest on a monthly basis over 12 months and are settled in Common Stock three years after the date of grant.
Restricted Stock Units
The Company grants restricted stock units to certain senior management and non-senior management employees. For units granted to both senior and non-senior management employees containing only service conditions, the fair value of the award is equal to the market price of the Company’s Common Stock at the date of grant. Units granted to senior and non-senior management employees vest at various times (none of which exceed three years) in accordance with the underlying award agreement. Compensation cost for both senior and non-senior management employees is recognized on a straight-line basis over the requisite service period. The payouts for active grants awarded during the years ended December 31, 2023, 2022 and 2021 will be settled in the Company’s Common Stock.
Awards granted to certain senior management employees during the year ended December 31, 2022 contain a performance feature in which the award can be increased by up to 100% based on Adjusted EBITDA results over a two-year period. The incremental shares, which can be increased by up to 234,973 shares as of December 31, 2023 if the performance condition is satisfied, are not included in the table below.
A summary of restricted stock unit activity is as follows:
|
|
|
|
|
|
|
|
|
|
|
|
|
Year Ended December 31, 2023 |
|
Weighted
Average
Grant-Date
Fair Value |
| Nonvested at December 31, 2022 |
778,313 |
|
|
$ |
9.13 |
|
| Granted |
217,406 |
|
|
25.09 |
|
| Vested |
(550,352) |
|
|
8.53 |
|
| Forfeited |
(14,953) |
|
|
17.78 |
|
| Nonvested at December 31, 2023 |
430,414 |
|
|
$ |
17.67 |
|
The total fair value at grant date of restricted stock units granted during the years ended December 31, 2023, 2022 and 2021 was $5.5 million, $3.9 million and $3.1 million, respectively.
The restricted stock units receive dividend equivalent units (DEUs) upon payment of cash dividends to holders of Common Stock. DEUs vest subject to the same vesting requirements as the underlying restricted stock unit award. As of December 31, 2023, there were approximately 7,100 nonvested DEUs. The total fair value of restricted stock units and DEUs vested was $13.8 million, $6.8 million and $3.3 million during the years ended December 31, 2023, 2022 and 2021, respectively.
In March 2021 the Company entered into a transition agreement with its former chief executive officer which resulted in a modification to restricted stock units granted. Under terms of the agreement, any restricted stock units held by the former chief executive officer that would have vested under their original terms during the twelve months following the specified termination vested upon such date. As a result of this modification, the Company avoided additional compensation expense of approximately $1.3 million for the year ended December 31, 2021.
Performance Units
Performance units are typically granted annually in January and vest at the end of a three-year period and are primarily limited to senior management personnel. The performance units are usually subject to the achievement of goals.
The performance units granted during the year ended December 31, 2020 were based on the following conditions: three-year return on invested capital and environmental reclamation (performance condition). In addition, the payout of the performance units can be increased or decreased by up to 25% of the award based on three-year stock price performance compared to a custom peer group (market condition). The performance units can be increased by up to a maximum of 100% of the award granted. There were 384,453 incremental shares granted during the year ended December 31, 2023 as a result the performance condition being satisfied which are included in the table below.
|
|
|
|
|
|
|
|
|
| Peabody Energy Corporation |
2023 Form 10-K |
F-48 |
PEABODY ENERGY CORPORATION
NOTES TO CONSOLIDATED FINANCIAL STATEMENTS — (Continued)
The performance units granted during the year ended December 31, 2023 were based on the following conditions: two-year free cash flow and environmental reclamation (performance condition). In addition, the payout of the performance units can be increased by up to 50% of the award granted. The incremental shares, which can be increased by up to 72,204 shares as of December 31, 2023 if the performance condition is satisfied, are not included in the table below.
Awards granted during the year ended December 31, 2023 will be settled in the Company's Common Stock. There were no performance units granted during the years ended December 31, 2022 or 2021.
A summary of performance unit activity is as follows:
|
|
|
|
|
|
|
|
|
|
|
|
|
Year Ended December 31, 2023 |
|
Weighted
Average
Remaining Contractual Life |
| Nonvested at December 31, 2022 |
450,021 |
|
|
— |
|
| Granted |
531,915 |
|
|
|
| Vested |
(834,474) |
|
|
|
| Forfeited |
(3,054) |
|
|
|
| Nonvested at December 31, 2023 |
144,408 |
|
|
2.0 |
|
As of December 31, 2023, there were 834,474 performance units and DEU’s vested that had an aggregate intrinsic value of $21.9 million and a conversion price per share of $26.19.
The performance units receive DEUs upon payment of cash dividends to holders of Common Stock. DEUs vest subject to the same vesting requirements as the underlying performance unit award. As of December 31, 2023, there were approximately 2,300 nonvested DEUs.
In March 2021 the Company entered into a transition agreement with its former chief executive officer which resulted in a modification to performance units granted. Under terms of the agreement, a portion of the performance units held by the former chief executive officer as of the specified termination date remain eligible to vest based on actual performance through the original performance period. As a result of this modification, the Company avoided additional compensation expense of approximately $2.5 million for the year ended December 31, 2021.
(17) Other Events
Coal Deposit Acquisition
The Company entered into a definitive agreement dated October 26, 2023, with Stanmore SMC Pty Ltd (Stanmore) to acquire the southern part of Stanmore’s Wards Well tenements (Wards Well area) which are adjacent to the Company’s Centurion Mine, previously known as the North Goonyella Mine, in Queensland, Australia. The acquisition terms include cash consideration of $136 million and a contingent royalty of up to $200 million. The royalty will only be payable once the Company has recovered its investment and development costs of the Wards Well area and if the average sales price achieved exceeds certain thresholds. No royalty is payable if the Company does not commence mining in the Wards Well area. Completion of the transaction is subject to the satisfaction of certain conditions, including regulatory approvals.
North Antelope Rochelle Mine Tornado
On June 23, 2023, the Company’s North Antelope Rochelle Mine sustained damage from a tornado which led to a temporary suspension of operations. The mine resumed operations on June 25, 2023. During the year ended December 31, 2023, the Company recorded a provision for loss of $12.2 million related to the tornado damage. The combined provision includes $4.0 million for materials and supplies inventories, $1.0 million for buildings and equipment and $7.2 million for incremental repair costs. The Company anticipates that immaterial incremental repair costs will continue to be recorded in early 2024.
Shoal Creek Incident
On March 29, 2023, the Company’s Shoal Creek Mine experienced a fire involving void fill material utilized to stabilize the roof structure of the mine. On June 20, 2023, the Company announced that the Shoal Creek Mine, in coordination with the Mine Safety and Health Administration, had safely completed localized sealing of the affected area of the mine. In November 2023, longwall coal production commenced in a new area of the mine.
|
|
|
|
|
|
|
|
|
| Peabody Energy Corporation |
2023 Form 10-K |
F-49 |
PEABODY ENERGY CORPORATION
NOTES TO CONSOLIDATED FINANCIAL STATEMENTS — (Continued)
During the year ended December 31, 2023, the Company recorded a provision for loss of $28.7 million related to the fire. The provision includes $17.8 million related to longwall development and other costs and $10.9 million for equipment deemed inoperable within the affected area of the mine. In October 2023, the Company filed an insurance claim against applicable insurance policies with combined business interruption and property loss limits of $125 million above a $50 million deductible.
Port and Rail Capacity Assignment
During the year ended December 31, 2023, the Company entered into two agreements to assign the right to its excess port and rail capacity related to its Centurion Mine to unrelated parties. In the first transaction, the Company assigned its right in exchange for $30.0 million Australian dollars. Half of such amount was received by the Company upon entry into the agreement, and half is payable in June 2024, subject to certain conditions. In connection with the transaction, the Company recorded revenue of $19.2 million during the year ended December 31, 2023 and had a discounted receivable of $9.6 million included in “Accounts receivable, net” as of December 31, 2023.
In the second transaction, the Company assigned its right in exchange for $10.0 million Australian dollars, all of which was received as of December 31, 2023. In connection with the transaction, the Company recorded revenue of $6.7 million during the year ended December 31, 2023.
Divestitures and Other Transactions
During July 2021, the Company executed transactions to sell its closed Millennium and Wilkie Creek Mines, which reduced its closed mine reclamation liabilities and associated costs. The Millennium Mine was sold for minimal cash consideration and the assumption of the majority of the mine’s reclamation liabilities. At December 31, 2023, the Company remains responsible for $4.1 million of reclamation liabilities. The Company recorded a gain of $26.1 million in connection with the sale, which is included within “Net gain on disposals” in the accompanying consolidated statements of operations for the year ended December 31, 2021.
The Wilkie Creek Mine was sold for minimal cash consideration and full assumption of the mine’s reclamation liabilities. The Company recorded a gain of $24.6 million in connection with the sale, which is included within “(Loss) income from discontinued operations, net of income taxes” in the accompanying consolidated statements of operations for the year ended December 31, 2021.
(18) Earnings per Share (EPS)
Basic EPS is computed based on the weighted average number of shares of common stock outstanding during the period. Diluted EPS is computed based on the weighted average number of shares of common stock plus the effect of dilutive potential common shares outstanding. As such, the Company includes the 2028 Convertible Notes and share-based compensation awards in its potentially dilutive securities. Generally, dilutive securities are not included in the computation of loss per share when a company reports a net loss from continuing operations as the impact would be anti-dilutive.
For all but performance units, the potentially dilutive impact of the Company’s share-based compensation awards is determined using the treasury stock method. Under the treasury stock method, awards are treated as if they had been exercised with any proceeds used to repurchase common stock at the average market price during the period. Any incremental difference between the assumed number of shares issued and purchased is included in the diluted share computation. For performance units, their contingent features result in an assessment for any potentially dilutive common stock by using the end of the reporting period as if it were the end of the contingency period for all units granted. For further discussion of the Company’s share-based compensation awards, see Note 16. “Share-Based Compensation.”
A conversion of the 2028 Convertible Notes may result in payment in the Company’s common stock. For diluted EPS purposes, the potentially dilutive common stock is assumed to have been converted at the beginning of the period (or at the time of issuance, if later). In periods where the potentially dilutive common stock is included in the computation of diluted EPS, the numerator will be adjusted to add back tax adjusted interest expense, which includes the amortization of debt issuance costs, related to the convertible debt.
|
|
|
|
|
|
|
|
|
| Peabody Energy Corporation |
2023 Form 10-K |
F-50 |
PEABODY ENERGY CORPORATION
NOTES TO CONSOLIDATED FINANCIAL STATEMENTS — (Continued)
The computation of diluted EPS excluded aggregate share-based compensation awards of less than 0.1 million for all of the years ended December 31, 2023, 2022 and 2021, because to do so would have been anti-dilutive for those periods. Because the potential dilutive impact of such share-based compensation awards is calculated under the treasury stock method, anti-dilution generally occurs when the exercise prices or unrecognized compensation cost per share of such awards are higher than the Company’s average stock price during the applicable period. Anti-dilution also occurs when a company reports a net loss from continuing operations, and the dilutive impact of all share-based compensation awards are excluded accordingly.
The following illustrates the earnings allocation method utilized in the calculation of basic and diluted EPS:
|
|
|
|
|
|
|
|
|
|
|
|
|
|
|
|
|
|
| |
Year Ended December 31, |
| |
2023 |
|
2022 |
|
2021 |
| |
(In millions, except per share data) |
| Basic EPS numerator: |
|
|
|
|
|
| Income from continuing operations, net of income taxes |
$ |
816.0 |
|
|
$ |
1,317.4 |
|
|
$ |
347.4 |
|
|
|
|
|
|
|
| Less: Net income attributable to noncontrolling interests |
56.0 |
|
|
22.0 |
|
|
11.3 |
|
| Income from continuing operations attributable to common stockholders |
760.0 |
|
|
1,295.4 |
|
|
336.1 |
|
|
|
|
|
|
|
|
|
|
|
|
|
| (Loss) income from discontinued operations, net of income taxes |
(0.4) |
|
|
1.7 |
|
|
24.0 |
|
|
|
|
|
|
|
|
|
|
|
|
|
| Net income attributable to common stockholders |
$ |
759.6 |
|
|
$ |
1,297.1 |
|
|
$ |
360.1 |
|
|
|
|
|
|
|
| Diluted EPS numerator: |
|
|
|
|
|
| Income from continuing operations, net of income taxes |
$ |
816.0 |
|
|
$ |
1,317.4 |
|
|
$ |
347.4 |
|
| Add: Tax adjusted interest expense related to 2028 Convertible Notes |
12.2 |
|
|
8.7 |
|
|
— |
|
|
|
|
|
|
|
| Less: Net income attributable to noncontrolling interests |
56.0 |
|
|
22.0 |
|
|
11.3 |
|
| Income from continuing operations attributable to common stockholders |
772.2 |
|
|
1,304.1 |
|
|
336.1 |
|
|
|
|
|
|
|
|
|
|
|
|
|
| (Loss) income from discontinued operations, net of income taxes |
(0.4) |
|
|
1.7 |
|
|
24.0 |
|
|
|
|
|
|
|
|
|
|
|
|
|
| Net income attributable to common stockholders |
$ |
771.8 |
|
|
$ |
1,305.8 |
|
|
$ |
360.1 |
|
|
|
|
|
|
|
| EPS denominator: |
|
|
|
|
|
| Weighted average shares outstanding — basic |
137.6 |
|
|
142.1 |
|
|
111.1 |
|
| Dilutive impact of share-based compensation awards |
0.6 |
|
|
1.6 |
|
|
0.9 |
|
| Dilutive impact of 2028 Convertible Notes |
16.1 |
|
|
13.5 |
|
|
— |
|
| Weighted average shares outstanding — diluted |
154.3 |
|
|
157.2 |
|
|
112.0 |
|
|
|
|
|
|
|
| Basic EPS attributable to common stockholders: |
|
|
|
|
|
| Income from continuing operations |
$ |
5.52 |
|
|
$ |
9.12 |
|
|
$ |
3.03 |
|
| (Loss) income from discontinued operations |
— |
|
|
0.01 |
|
|
0.21 |
|
| Net income attributable to common stockholders |
$ |
5.52 |
|
|
$ |
9.13 |
|
|
$ |
3.24 |
|
|
|
|
|
|
|
| Diluted EPS attributable to common stockholders: |
|
|
|
|
|
| Income from continuing operations |
$ |
5.00 |
|
|
$ |
8.29 |
|
|
$ |
3.00 |
|
| (Loss) income from discontinued operations |
— |
|
|
0.02 |
|
|
0.22 |
|
| Net income attributable to common stockholders |
$ |
5.00 |
|
|
$ |
8.31 |
|
|
$ |
3.22 |
|
|
|
|
|
|
|
|
|
|
| Peabody Energy Corporation |
2023 Form 10-K |
F-51 |
PEABODY ENERGY CORPORATION
NOTES TO CONSOLIDATED FINANCIAL STATEMENTS — (Continued)
(19) Management — Labor Relations
On December 31, 2023, the Company had approximately 5,400 employees worldwide, including approximately 4,200 hourly employees; the employee amounts exclude employees that were employed at operations classified as discontinued operations. Approximately 38% of those hourly employees were represented by organized labor unions and were employed by mines that generated 18% of the Company’s 2023 coal production from continuing operations. In the U.S., the hourly employees of one active mine and one inactive mine are represented by an organized labor union. In Australia, the coal mining industry is unionized and the majority of hourly workers employed at the Company’s Australian mining operations are members of trade unions. The Mining and Energy Union (MEU) generally represents the Company’s Australian subsidiaries’ hourly production and engineering employees, including those employed through contract mining relationships.
The following table presents the Company’s active and inactive mining operations as of December 31, 2023 in which the employees are represented by organized labor unions:
|
|
|
|
|
|
|
|
|
|
|
|
|
|
|
|
|
|
|
|
|
| Mine |
|
Approximate Number of Active Employees Represented |
|
Union |
|
Current Agreement Expiration Date or Date Amendable |
|
|
|
|
|
|
|
| U.S. |
|
|
|
|
|
|
| Kayenta |
|
20 |
|
UMWA |
|
November 2024 |
| Shoal Creek |
|
270 |
|
UMWA |
|
December 2024 |
| Australia |
|
|
|
|
|
|
| Wilpinjong |
|
440 |
|
MEU |
|
June 2024 |
| Coppabella |
|
325 |
|
MEU |
|
February 2026 |
Moorvale (1) |
|
210 |
|
MEU |
|
June 2023 |
Centurion (2) |
|
10 |
|
N/A |
|
2028 |
| Metropolitan |
|
|
|
|
|
|
| Underground employees |
|
165 |
|
MEU |
|
May 2025 |
Handling and preparation plant employees (3) |
|
15 |
|
MEU |
|
2027 |
| Wambo Underground |
|
|
|
|
|
|
| Underground employees |
|
120 |
|
MEU |
|
November 2025 |
| Handling and preparation plant employees |
|
20 |
|
MEU |
|
August 2025 |
(1) Employees of the Moorvale Mine operate on individual contracts under a direct engagement model. Such contracts are modeled after the Company’s former labor agreement with the MEU which ended in 2017. The Company is currently negotiating a new labor agreement with the MEU and employees.
(2) The Company and employees have agreed to a new four-year term labor agreement in December, and it is lodged with the Fair Work Commission for approval.
(3) The Company, employees and the MEU have agreed to a new three-year term labor agreement in December, and it is lodged with the Fair Work Commission for approval.
(20) Financial Instruments, Guarantees With Off-Balance-Sheet Risk and Other Guarantees
In the normal course of business, the Company is a party to various guarantees and financial instruments that carry off-balance-sheet risk and are not reflected in the accompanying consolidated balance sheets. Such financial instruments provide support for the Company’s reclamation bonding requirements, lease obligations, insurance policies and various other performance guarantees. The Company periodically evaluates the instruments for on-balance-sheet treatment based on the amount of exposure under the instrument and the likelihood of required performance. The Company does not expect any material losses to result from these guarantees or off-balance-sheet instruments in excess of liabilities provided for in the accompanying consolidated balance sheets.
|
|
|
|
|
|
|
|
|
| Peabody Energy Corporation |
2023 Form 10-K |
F-52 |
PEABODY ENERGY CORPORATION
NOTES TO CONSOLIDATED FINANCIAL STATEMENTS — (Continued)
The following table summarizes the Company’s financial instruments that carry off-balance-sheet risk.
|
|
|
|
|
|
|
|
|
|
|
|
|
|
|
|
|
|
|
|
|
|
|
|
| |
December 31, 2023 |
|
|
| |
Reclamation Support |
|
Other Support (1) |
|
Total |
|
|
|
|
|
|
| |
(Dollars in millions) |
| Surety bonds |
$ |
1,022.6 |
|
|
$ |
117.3 |
|
|
$ |
1,139.9 |
|
|
|
|
|
|
|
Letters of credit (2) |
6.0 |
|
|
102.1 |
|
|
108.1 |
|
|
|
|
|
|
|
|
1,028.6 |
|
|
219.4 |
|
|
1,248.0 |
|
|
|
|
|
|
|
Less: Letters of credit in support of surety bonds (3) |
(6.0) |
|
|
(12.2) |
|
|
(18.2) |
|
|
|
|
|
|
|
| Obligations supported, net |
$ |
1,022.6 |
|
|
$ |
207.2 |
|
|
$ |
1,229.8 |
|
|
|
|
|
|
|
(1) Instruments support obligations related to pension and health care plans, workers’ compensation, property and casualty insurance, customer and vendor contracts, and certain restoration ancillary to prior mining activities.
(2) Amounts do not include cash collateralized letters of credit.
(3) Certain letters of credit serve as collateral for surety bonds at the request of surety bond providers.
Surety Agreement Amendment and Collateral Requirements
In April 2023, the Company amended its existing agreement with the providers of its surety bond portfolio, dated November 6, 2020. Under the agreement, the Company was required to post collateral on a periodic basis through December 31, 2025. Prior to the April 2023 amendment, the Company had posted cumulative collateral of $557.8 million, primarily in the form of letters of credit.
Under the April 2023 amendment, the Company and its surety providers agreed to a maximum aggregate collateral amount of $721.8 million based upon bonding levels at the effective date of the amendment. This maximum collateral amount represented a negotiated increase from the uncapped cumulative collateral amount prior to the amendment and will vary prospectively as bonding levels increase or decrease. The amendment also removed restrictions on the payment of dividends and share repurchases, and extended the agreement through December 31, 2026. In order to maintain the new maximum collateral standstill, the Company must remain compliant with a minimum liquidity test and a maximum net leverage ratio, as measured each quarter. The minimum liquidity test requires the Company to maintain liquidity at the greater of $400 million or the difference between the penal sum of all surety bonds and the amount of collateral posted in favor of surety providers, which was $555.2 million at December 31, 2023. The Company must also maintain a maximum net leverage ratio of 1.5 to 1.0, where the numerator consists of its funded debt, net of cash, and the denominator consists of its Adjusted EBITDA for the trailing twelve months. For purposes of calculating the ratio, only 50% of the outstanding principal amount of the Company’s 2028 Convertible Notes is deemed to be funded debt. The Company’s ability to pay dividends and make share repurchases is also subject to the quarterly minimum liquidity test. The Company is in compliance with such requirements, which commenced for the second quarter of 2023. The Company granted second liens on $200.0 million of mining equipment under the original agreement, which remain in force under the April 2023 amendment.
To fund the maximum collateral amount, the Company deposited $566.3 million into trust accounts for the benefit of certain surety providers on March 31, 2023. The remainder was comprised of $140.5 million of existing cash-collateralized letters of credit and $15.0 million already held on behalf of a surety provider. The amendment became effective on April 14, 2023, when the Company terminated a then-existing credit agreement which, as amended, provided for $237.2 million of capacity for irrevocable standby letters of credit (LC Facility). All letters of credit that were outstanding under the LC Facility were cancelled upon its termination and, in certain cases, replaced by cash-collateralized letters of credit or letters of credit issued under the Company’s accounts receivable securitization program.
LC Facility
The now-terminated LC Facility had an original capacity of $324.0 million and was subsequently amended at various dates to reduce its capacity and effect certain other changes, including in February 2023 to reduce capacity by $65.0 million, accelerate the expiration date to December 31, 2023 from December 31, 2024, and eliminate the prepayment premium due upon any reduction of commitments thereunder prior to July 29, 2023. The Company recorded early debt extinguishment losses of $8.8 million during the year ended December 31, 2023 as a result of the February 2023 amendment and subsequent termination.
Prior to its termination, undrawn letters of credit under the LC Facility bore interest at 6.00% per annum and unused commitments were subject to a 0.50% per annum commitment fee.
|
|
|
|
|
|
|
|
|
| Peabody Energy Corporation |
2023 Form 10-K |
F-53 |
PEABODY ENERGY CORPORATION
NOTES TO CONSOLIDATED FINANCIAL STATEMENTS — (Continued)
Accounts Receivable Securitization
In 2017, the Company entered into the Sixth Amended and Restated Receivables Purchase Agreement, as amended from time to time (the Receivables Purchase Agreement.) The receivables securitization program authorized under the agreement (Securitization Program) is subject to customary events of default. The Receivables Purchase Agreement was amended in February 2023 to increase the available funding capacity from $175.0 million to $225.0 million and adjust the relevant interest rate for borrowings to a SOFR. Such funding is accounted for as a secured borrowing, limited to the availability of eligible receivables, and may be secured by a combination of collateral and the trade receivables underlying the program. Funding capacity under the Securitization Program may also be utilized for letters of credit in support of other obligations, which has been the Company’s primary utilization.
Borrowings under the Securitization Program bear interest at SOFR plus 2.1% per annum and remain outstanding throughout the term of the agreement, subject to the Company maintaining sufficient eligible receivables.
At December 31, 2023, the Company had no outstanding borrowings and $108.1 million of letters of credit outstanding under the Securitization Program, primarily in support of reclamation obligations. Availability under the Securitization Program, which is adjusted for certain ineligible receivables, was $90.4 million at December 31, 2023. The Company was not required to post cash collateral under the Securitization Program at December 31, 2023.
The Company incurred interest and fees associated with the Securitization Program of $3.6 million, $3.8 million and $2.9 million during the years ended December 31, 2023, 2022 and 2021, respectively, which have been recorded as “Interest expense” in the accompanying statements of operations.
Collateralized Letter of Credit Agreement
In February 2022, the Company entered into an agreement, which provides up to $250.0 million of capacity for irrevocable standby letters of credit, primarily to support reclamation bonding requirements. The agreement requires the Company to provide cash collateral at a level of 103% of the aggregate amount of letters of credit outstanding under the arrangement (limited to $5.0 million total excess collateralization.) Outstanding letters of credit bear a fixed fee in the amount of 0.75% per annum. The Company receives a variable deposit rate on the amount of cash collateral posted in support of letters of credit. The agreement has an initial expiration date of December 31, 2025. At December 31, 2023, letters of credit of $167.0 million were outstanding under the agreement, which were collateralized by cash of $172.0 million.
|
|
|
|
|
|
|
|
|
| Peabody Energy Corporation |
2023 Form 10-K |
F-54 |
PEABODY ENERGY CORPORATION
NOTES TO CONSOLIDATED FINANCIAL STATEMENTS — (Continued)
Restricted Cash and Collateral
The following table summarizes the Company’s “Restricted cash and collateral” in the accompanying consolidated balance sheets. Restricted cash balances are held in controlled accounts with minimum balance requirements; withdrawals are subject to the approval of account beneficiaries, such as the Company’s surety providers, who have perfected security interests in the funds. The Company’s other collateral generally includes deposits held by regulatory authorities or financial institutions over which the Company has no control or ability to access.
|
|
|
|
|
|
|
|
|
|
|
|
|
December 31, 2023 |
|
December 31, 2022 |
| |
(Dollars in millions) |
Restricted cash (1) |
|
|
|
Surety trust accounts (2) |
$ |
444.0 |
|
|
$ |
— |
|
Collateralized letters of credit funding (2) |
172.0 |
|
|
110.3 |
|
Cash backed bank guarantees (2) |
64.9 |
|
|
— |
|
|
680.9 |
|
|
110.3 |
|
Other collateral (1) |
|
|
|
| Deposits with regulatory authorities for reclamation and other obligations |
276.7 |
|
|
33.6 |
|
LC Facility (3) |
— |
|
|
28.5 |
|
| Deposit held on behalf of surety |
— |
|
|
15.0 |
|
|
276.7 |
|
|
77.1 |
|
| Restricted cash and collateral |
$ |
957.6 |
|
|
$ |
187.4 |
|
(1) Restricted cash balances are combined with unrestricted cash and cash equivalents in the accompanying consolidated statements of cash flows; changes in restricted cash balances are thus not reflected in the operating, investing or financing activities therein. Changes in other collateral balances are reflected as operating activities therein.
(2) Surety trust accounts, the funding for collateralized letters of credit and cash supporting the bank guarantees are comprised of highly liquid investments with original maturities of three months or less; interest and other earnings on such funds accrue to the Company.
(3) Balance related to the Company’s mandatory repurchase of $30.0 million priority lien obligations under the LC Facility during 2022 at approximately 95%. The Company received approximately $30.0 million upon termination of the LC Facility on April 14, 2023.
Other
The Company is the lessee under numerous equipment and property leases. It is common in such commercial lease transactions for the Company, as the lessee, to agree to indemnify the lessor for the value of the property or equipment leased, should the property be damaged or lost during the course of the Company’s operations. The Company expects that losses with respect to leased property, if any, may be covered by insurance (subject to deductibles). The Company and certain of its subsidiaries have guaranteed other subsidiaries’ performance under various lease obligations. Aside from indemnification of the lessor for the value of the property leased, the Company’s maximum potential obligations under its leases are equal to the respective future minimum lease payments, and the Company assumes that no amounts could be recovered from third parties.
Substantially all of the Company’s U.S. subsidiaries provide financial guarantees under long-term debt agreements entered into by the Company. The maximum amounts payable under the Company’s debt agreements are equal to the respective principal and interest payments.
(21) Commitments and Contingencies
Commitments
Unconditional Purchase Obligations
As of December 31, 2023, purchase commitments for capital expenditures were $86.1 million, all of which is obligated within the next two years, with $79.3 million obligated within the next 12 months.
|
|
|
|
|
|
|
|
|
| Peabody Energy Corporation |
2023 Form 10-K |
F-55 |
PEABODY ENERGY CORPORATION
NOTES TO CONSOLIDATED FINANCIAL STATEMENTS — (Continued)
In Australia, the Company has generally secured the ability to transport coal through rail contracts and ownership interests in five east coast coal export terminals that are primarily funded through take-or-pay arrangements with terms ranging up to 20 years. In the U.S., the Company has entered into certain long-term coal export terminal agreements to secure export capacity through the Gulf Coast. As of December 31, 2023, these Australian and U.S. commitments under take-or-pay arrangements totaled $1.2 billion, of which approximately $103 million is obligated within the next year.
Contingencies
From time to time, the Company or its subsidiaries are involved in legal proceedings arising in the ordinary course of business or related to indemnities or historical operations. The Company believes it has recorded adequate reserves for these liabilities. The Company discusses its significant legal proceedings below, including ongoing proceedings and those that impacted the Company’s results of operations for the periods presented.
Litigation and Matters Relating to Continuing Operations
Metropolitan Mine Stormwater Discharge. Over the past few years, there has been significantly high rainfall in New South Wales, including unprecedented rain totals at the Metropolitan Mine site. While stormwater collected at the mine site is managed through two sedimentation dams, at times the heavy rainfall presented challenges with managing the significant volumes of stormwater, as the surface water management infrastructure has not had sufficient capacity. As a result, on multiple occasions throughout 2021 and 2022 stormwater was discharged from the mine site. Metropolitan Collieries Pty Ltd (MCPL), a wholly-owned subsidiary of PEC, removed accumulated material from the sedimentation dams to restore full site stormwater capacity by December 31, 2022 and identified and is implementing additional controls for the management of sediment moving forward. Despite the measures undertaken by MCPL to manage and improve the situation, the Environment Protection Authority commenced a prosecution for five breaches of the Protection of the Environment Operations Act 1997 on September 6, 2023.
Oregon Climate Change Lawsuit. On July 20, 2023, Peabody Energy was served with a summons issued on behalf of Multnomah County, Oregon. The complaint seeks damages from the Company and other major energy producers for allegedly causing an “extreme heat event” in Multnomah County in late June and early July 2021. The causes of action, pursuant to Oregon state law, include a failure to warn, false or misleading advertisement and public nuisance. The Company will defend the claim and will continue to assert all applicable defenses available in regards to these claims.
Other
At times, the Company becomes a party to other disputes, including those related to contract miner performance, claims, lawsuits, arbitration proceedings, regulatory investigations and administrative procedures in the ordinary course of business in the U.S., Australia and other countries where the Company does business. Based on current information, the Company believes that such other pending or threatened proceedings are likely to be resolved without a material adverse effect on its consolidated financial condition, results of operations or cash flows. The Company reassesses the probability and estimability of contingent losses as new information becomes available.
Claims, Litigation and Settlements Relating to Indemnities or Historical Operations
Patriot-Related Matters. In 2012, Patriot filed voluntary petitions for relief under Chapter 11 of Title 11 of the U.S. Code (the Bankruptcy Code). In 2013, the Company entered into a definitive settlement agreement (2013 Agreement) with Patriot and the United Mine Workers of America, on behalf of itself, its represented Patriot employees and its represented Patriot retirees, to resolve all then-disputed issues related to Patriot’s bankruptcy. In May 2015, Patriot again filed voluntary petitions for relief under the Bankruptcy Code and subsequently initiated a process to sell substantially all of its assets to qualified bidders. On October 9, 2015, Patriot’s bankruptcy court entered an order confirming Patriot’s plan of reorganization, which provided, among other things, for the sale of substantially all of Patriot’s assets to two different buyers.
Patriot had federal and state black lung occupational disease liabilities related to workers employed in periods prior to Patriot’s spin-off from the Company in 2007. Upon spin-off, Patriot indemnified the Company against any claim relating to these liabilities, which amounted to approximately $150 million at that time. The indemnification included any claim made by the U.S. Department of Labor (DOL) against the Company with respect to these obligations as a potentially liable operator under the Federal Coal Mine Health and Safety Act of 1969. The 2013 Agreement included Patriot’s affirmance of indemnities provided in the spin-off agreements, including the indemnity relating to such black lung liabilities; however, Patriot rejected this indemnity in its May 2015 bankruptcy.
|
|
|
|
|
|
|
|
|
| Peabody Energy Corporation |
2023 Form 10-K |
F-56 |
PEABODY ENERGY CORPORATION
NOTES TO CONSOLIDATED FINANCIAL STATEMENTS — (Continued)
By statute, the Company had secondary liability for the black lung liabilities related to Patriot’s workers employed by former subsidiaries of the Company (the Patriot Federal Black Lung Claims). The Company’s accounting for the black lung liabilities related to Patriot was based on an interpretation of applicable statutes. Management believed that inconsistencies existed among the applicable statutes, regulations promulgated under those statutes and the DOL’s interpretative guidance. The Company sought clarification from the DOL regarding these inconsistencies and challenged the DOL’s position in individual black lung claims. The amount of the liability, which was determined on an actuarial basis based on the best information available to the Company, was $82.3 million at December 31, 2022. The liability, which was classified as discontinued operations, was included in the Company’s consolidated balance sheet within “Accounts payable and accrued expenses” and “Other noncurrent liabilities.”
On August 8, 2023, the Company entered into a settlement agreement to resolve the liability dispute with the DOL. In accordance with the settlement agreement, the Company paid $72.0 million to settle the Patriot Federal Black Lung Claims, with the exception of approximately $4.2 million of certain claims for attorney’s fees and additional compensation due to claimants not paid during appeal. As a result of the settlement, the Company recognized a $3.9 million gain within “(Loss) income from discontinued operations, net of income taxes” during the year ended December 31, 2023.
(22) Segment and Geographic Information
The Company reports its results of operations primarily through the following reportable segments: Seaborne Thermal, Seaborne Metallurgical, Powder River Basin, Other U.S. Thermal and Corporate and Other.
The business of the Company’s seaborne operating platform is primarily export focused with customers spread across several countries, with a portion of its thermal and metallurgical coal sold within Australia. Generally, revenue from individual countries vary year by year based on electricity and steel demand, the strength of the global economy, governmental policies and several other factors, including those specific to each country. The Company classifies its seaborne mines within the Seaborne Thermal or Seaborne Metallurgical segments based on the primary customer base and coal reserve type of each mining operation. A small portion of the coal mined by the Seaborne Thermal segment is of a metallurgical grade. Similarly, a small portion of the coal mined by the Seaborne Metallurgical segment is of a thermal grade. Additionally, the Company may market some of its metallurgical coal products as a thermal coal product from time to time depending on market conditions.
The Company’s Seaborne Thermal operations consist of mines in New South Wales, Australia. The mines in that segment utilize both surface and underground extraction processes to mine low-sulfur, high Btu thermal coal.
The Company’s Seaborne Metallurgical operations consist of mines in Queensland, Australia, one in New South Wales, Australia and one in Alabama, USA. The mines in that segment utilize both surface and underground extraction processes to mine various qualities of metallurgical coal. The metallurgical coal qualities include hard coking coal, semi-hard coking coal, semi-soft coking coal and pulverized coal injection coal.
The principal business of the Company’s thermal operating segments in the U.S. is the mining, preparation and sale of thermal coal, sold primarily to electric utilities in the U.S. under long-term contracts, with a relatively small portion sold as international exports as conditions warrant. The Company’s Powder River Basin operations consist of its mines in Wyoming. The mines in that segment are characterized by surface mining extraction processes, coal with a lower sulfur content and Btu and higher customer transportation costs (due to longer shipping distances). The Company’s Other U.S. Thermal operations reflect the aggregation of its Illinois, Indiana, New Mexico and Colorado mining operations. The mines in that segment are characterized by a mix of surface and underground mining extraction processes, coal with a higher sulfur content and Btu and lower customer transportation costs (due to shorter shipping distances). Geologically, the Company’s Powder River Basin operations mine sub-bituminous coal deposits and its Other U.S. Thermal operations mine both bituminous and sub-bituminous coal deposits.
The Company’s Corporate and Other segment includes selling and administrative expenses, results from equity affiliates, corporate hedging activities, trading and brokerage activities, minimum charges on certain transportation-related contracts, the closure of inactive mining sites and certain commercial matters.
|
|
|
|
|
|
|
|
|
| Peabody Energy Corporation |
2023 Form 10-K |
F-57 |
PEABODY ENERGY CORPORATION
NOTES TO CONSOLIDATED FINANCIAL STATEMENTS — (Continued)
The Company’s CODM, defined as its Chief Executive Officer, uses Adjusted EBITDA as the primary metric to measure the segments’ operating performance and allocate resources. Adjusted EBITDA is a non-GAAP financial measure defined as income from continuing operations before deducting net interest expense, income taxes, asset retirement obligation expenses and depreciation, depletion and amortization. Adjusted EBITDA is also adjusted for the discrete items that management excluded in analyzing the segments’ operating performance, as displayed in the reconciliation below. Management believes non-GAAP performance measures are used by investors to measure the Company’s operating performance. Adjusted EBITDA is not intended to serve as an alternative to U.S. GAAP measures of performance and may not be comparable to similarly-titled measures presented by other companies.
Segment results for the year ended December 31, 2023 were as follows:
|
|
|
|
|
|
|
|
|
|
|
|
|
|
|
|
|
|
|
|
|
|
|
|
|
|
|
|
|
|
|
|
|
|
|
|
|
Seaborne Thermal |
|
Seaborne Metallurgical |
|
Powder River Basin |
|
Other U.S. Thermal |
|
Corporate
and Other |
|
Consolidated |
| |
(Dollars in millions) |
| Revenue |
$ |
1,329.7 |
|
|
$ |
1,301.9 |
|
|
$ |
1,198.1 |
|
|
$ |
888.2 |
|
|
$ |
228.8 |
|
|
$ |
4,946.7 |
|
| Adjusted EBITDA |
576.8 |
|
|
438.1 |
|
|
153.7 |
|
|
207.5 |
|
|
(12.2) |
|
|
1,363.9 |
|
Additions to property, plant, equipment and mine development |
62.0 |
|
|
186.4 |
|
|
40.9 |
|
|
47.6 |
|
|
11.4 |
|
|
348.3 |
|
|
|
|
|
|
|
|
|
|
|
|
|
| Income from equity affiliates |
— |
|
|
— |
|
|
— |
|
|
— |
|
|
(6.9) |
|
|
(6.9) |
|
Segment results for the year ended December 31, 2022 were as follows:
|
|
|
|
|
|
|
|
|
|
|
|
|
|
|
|
|
|
|
|
|
|
|
|
|
|
|
|
|
|
|
|
|
|
|
|
|
Seaborne Thermal |
|
Seaborne Metallurgical |
|
Powder River Basin |
|
Other U.S. Thermal |
|
Corporate
and Other |
|
Consolidated |
| |
(Dollars in millions) |
| Revenue |
$ |
1,345.6 |
|
|
$ |
1,616.9 |
|
|
$ |
1,065.5 |
|
|
$ |
952.2 |
|
|
$ |
1.7 |
|
|
$ |
4,981.9 |
|
| Adjusted EBITDA |
647.6 |
|
|
781.7 |
|
|
68.2 |
|
|
242.4 |
|
|
104.8 |
|
|
1,844.7 |
|
Additions to property, plant, equipment and mine development |
38.8 |
|
|
84.8 |
|
|
59.1 |
|
|
35.3 |
|
|
3.5 |
|
|
221.5 |
|
|
|
|
|
|
|
|
|
|
|
|
|
| Income from equity affiliates |
— |
|
|
— |
|
|
— |
|
|
— |
|
|
(131.2) |
|
|
(131.2) |
|
Segment results for the year ended December 31, 2021 were as follows:
|
|
|
|
|
|
|
|
|
|
|
|
|
|
|
|
|
|
|
|
|
|
|
|
|
|
|
|
|
|
|
|
|
|
|
|
|
Seaborne Thermal |
|
Seaborne Metallurgical |
|
Powder River Basin |
|
Other U.S. Thermal |
|
Corporate
and Other |
|
Consolidated |
| |
(Dollars in millions) |
| Revenue |
$ |
934.0 |
|
|
$ |
727.7 |
|
|
$ |
971.2 |
|
|
$ |
689.1 |
|
|
$ |
(3.7) |
|
|
$ |
3,318.3 |
|
| Adjusted EBITDA |
353.1 |
|
|
178.2 |
|
|
134.9 |
|
|
164.2 |
|
|
86.3 |
|
|
916.7 |
|
Additions to property, plant, equipment and mine development |
88.6 |
|
|
25.1 |
|
|
41.4 |
|
|
24.2 |
|
|
3.8 |
|
|
183.1 |
|
|
|
|
|
|
|
|
|
|
|
|
|
| Income from equity affiliates |
— |
|
|
— |
|
|
— |
|
|
— |
|
|
(82.1) |
|
|
(82.1) |
|
Asset details are reflected at the division level only for the Company’s operating segments and are not allocated between each individual segment as such information is not regularly reviewed by the Company’s CODM. Further, some assets service more than one segment within the division and an allocation of such assets would not be meaningful or representative on a segment by segment basis. Assets related to closed, suspended or otherwise inactive mines are included within the Corporate and Other category. Assets related to the Company’s Centurion Mine, which is in redevelopment and targeted to commence mining of development coal in the second quarter of 2024, are included in the Seaborne division level as of December 31, 2023.
Assets as of December 31, 2023 were as follows:
|
|
|
|
|
|
|
|
|
|
|
|
|
|
|
|
|
|
|
|
|
|
|
|
|
Seaborne |
|
U.S. Thermal |
|
Corporate
and Other |
|
Consolidated |
|
(Dollars in millions) |
| Total assets |
$ |
2,088.2 |
|
|
$ |
1,373.2 |
|
|
$ |
2,500.7 |
|
|
$ |
5,962.1 |
|
Property, plant, equipment and mine development, net |
1,565.1 |
|
|
1,149.2 |
|
|
129.8 |
|
|
2,844.1 |
|
| Operating lease right-of-use assets |
33.1 |
|
|
25.0 |
|
|
3.8 |
|
|
61.9 |
|
|
|
|
|
|
|
|
|
|
| Peabody Energy Corporation |
2023 Form 10-K |
F-58 |
PEABODY ENERGY CORPORATION
NOTES TO CONSOLIDATED FINANCIAL STATEMENTS — (Continued)
Assets as of December 31, 2022 were as follows:
|
|
|
|
|
|
|
|
|
|
|
|
|
|
|
|
|
|
|
|
|
|
|
|
|
Seaborne |
|
U.S. Thermal |
|
Corporate
and Other |
|
Consolidated |
|
(Dollars in millions) |
| Total assets |
$ |
1,632.6 |
|
|
$ |
1,359.4 |
|
|
$ |
2,618.8 |
|
|
$ |
5,610.8 |
|
Property, plant, equipment and mine development, net |
1,220.7 |
|
|
1,217.5 |
|
|
426.8 |
|
|
2,865.0 |
|
| Operating lease right-of-use assets |
20.5 |
|
|
0.5 |
|
|
5.9 |
|
|
26.9 |
|
Assets as of December 31, 2021 were as follows:
|
|
|
|
|
|
|
|
|
|
|
|
|
|
|
|
|
|
|
|
|
|
|
|
|
Seaborne |
|
U.S. Thermal |
|
Corporate
and Other |
|
Consolidated |
|
(Dollars in millions) |
| Total assets |
$ |
1,669.6 |
|
|
$ |
1,318.5 |
|
|
$ |
1,961.7 |
|
|
$ |
4,949.8 |
|
Property, plant, equipment and mine development, net |
1,298.8 |
|
|
1,209.5 |
|
|
442.3 |
|
|
2,950.6 |
|
| Operating lease right-of-use assets |
19.2 |
|
|
3.3 |
|
|
13.0 |
|
|
35.5 |
|
A reconciliation of consolidated income from continuing operations, net of income taxes to Adjusted EBITDA follows:
|
|
|
|
|
|
|
|
|
|
|
|
|
|
|
|
|
|
| |
Year Ended December 31, |
| |
2023 |
|
2022 |
|
2021 |
| |
(Dollars in millions) |
| Income from continuing operations, net of income taxes |
$ |
816.0 |
|
|
$ |
1,317.4 |
|
|
$ |
347.4 |
|
| Depreciation, depletion and amortization |
321.4 |
|
|
317.6 |
|
|
308.7 |
|
| Asset retirement obligation expenses |
50.5 |
|
|
49.4 |
|
|
44.7 |
|
| Restructuring charges |
3.3 |
|
|
2.9 |
|
|
8.3 |
|
|
|
|
|
|
|
|
|
|
|
|
|
| Asset impairment |
2.0 |
|
|
11.2 |
|
|
— |
|
| Provision for NARM and Shoal Creek losses |
40.9 |
|
|
— |
|
|
— |
|
|
|
|
|
|
|
| Changes in deferred tax asset valuation allowance and reserves and amortization of basis difference related to equity affiliates |
(1.6) |
|
|
(2.3) |
|
|
(33.8) |
|
| Interest expense |
59.8 |
|
|
140.3 |
|
|
183.4 |
|
| Net loss (gain) on early debt extinguishment |
8.8 |
|
|
57.9 |
|
|
(33.2) |
|
| Interest income |
(76.8) |
|
|
(18.4) |
|
|
(6.5) |
|
Net mark-to-market adjustment on actuarially determined liabilities |
(0.3) |
|
|
(27.8) |
|
|
(43.4) |
|
|
|
|
|
|
|
|
|
|
|
|
|
|
|
|
|
|
|
|
|
|
|
|
|
| Unrealized (gains) losses on derivative contracts related to forecasted sales |
(159.0) |
|
|
35.8 |
|
|
115.1 |
|
| Unrealized (gains) losses on foreign currency option contracts |
(7.4) |
|
|
2.3 |
|
|
7.5 |
|
|
|
|
|
|
|
| Take-or-pay contract-based intangible recognition |
(2.5) |
|
|
(2.8) |
|
|
(4.3) |
|
| Income tax provision (benefit) |
308.8 |
|
|
(38.8) |
|
|
22.8 |
|
| Total Adjusted EBITDA |
$ |
1,363.9 |
|
|
$ |
1,844.7 |
|
|
$ |
916.7 |
|
|
|
|
|
|
|
|
|
|
| Peabody Energy Corporation |
2023 Form 10-K |
F-59 |
PEABODY ENERGY CORPORATION
NOTES TO CONSOLIDATED FINANCIAL STATEMENTS — (Continued)
The following table presents revenue as a percent of total revenue from external customers by geographic region:
|
|
|
|
|
|
|
|
|
|
|
|
|
|
|
|
|
|
| |
Year Ended December 31, |
| |
2023 |
|
2022 |
|
2021 |
| U.S. |
42.4 |
% |
|
36.6 |
% |
|
45.5 |
% |
| Japan |
14.7 |
% |
|
19.4 |
% |
|
14.2 |
% |
| China |
10.9 |
% |
|
— |
% |
|
— |
% |
| Australia |
8.9 |
% |
|
8.5 |
% |
|
7.7 |
% |
| Taiwan |
6.6 |
% |
|
9.3 |
% |
|
14.4 |
% |
| Brazil |
3.6 |
% |
|
2.8 |
% |
|
0.9 |
% |
| Vietnam |
2.4 |
% |
|
2.8 |
% |
|
2.0 |
% |
| Indonesia |
2.0 |
% |
|
1.5 |
% |
|
3.0 |
% |
| France |
1.6 |
% |
|
1.1 |
% |
|
— |
% |
| India |
1.2 |
% |
|
2.9 |
% |
|
5.4 |
% |
| Germany |
1.0 |
% |
|
0.7 |
% |
|
— |
% |
| Belgium |
0.6 |
% |
|
1.3 |
% |
|
— |
% |
| South Korea |
— |
% |
|
2.1 |
% |
|
1.4 |
% |
| Chile |
— |
% |
|
1.1 |
% |
|
0.3 |
% |
| Other |
4.1 |
% |
|
9.9 |
% |
|
5.2 |
% |
| Total |
100.0 |
% |
|
100.0 |
% |
|
100.0 |
% |
The Company attributes revenue to individual countries based on the location of the physical delivery of the coal.
|
|
|
|
|
|
|
|
|
| Peabody Energy Corporation |
2023 Form 10-K |
F-60 |
PEABODY ENERGY CORPORATION
SCHEDULE II — VALUATION AND QUALIFYING ACCOUNTS
|
|
|
|
|
|
|
|
|
|
|
|
|
|
|
|
|
|
|
|
|
|
|
|
|
|
|
|
|
|
|
|
|
|
|
| Description |
|
Balance at
Beginning of Period |
|
Charged to
Costs and Expenses |
|
|
|
Deductions(1) |
|
Other(2) |
|
Balance
at End of Period |
| |
|
(Dollars in millions) |
| Year Ended December 31, 2023 |
|
|
|
|
|
|
|
|
|
|
|
|
| Reserves deducted from asset accounts: |
|
|
|
|
|
|
|
|
|
|
|
|
|
|
|
|
|
|
|
|
|
|
|
|
|
| Reserve for materials and supplies |
|
$ |
9.5 |
|
|
$ |
2.6 |
|
|
|
|
$ |
(4.9) |
|
|
$ |
— |
|
|
$ |
7.2 |
|
|
|
|
|
|
|
|
|
|
|
|
|
|
| Tax valuation allowances |
|
1,451.0 |
|
|
0.6 |
|
|
|
|
— |
|
|
21.9 |
|
|
1,473.5 |
|
| Year Ended December 31, 2022 |
|
|
|
|
|
|
|
|
|
|
|
|
| Reserves deducted from asset accounts: |
|
|
|
|
|
|
|
|
|
|
|
|
| Advance royalty recoupment reserve |
|
$ |
0.3 |
|
|
$ |
(0.3) |
|
|
|
|
$ |
— |
|
|
$ |
— |
|
|
$ |
— |
|
| Reserve for materials and supplies |
|
9.0 |
|
|
1.4 |
|
|
|
|
(0.9) |
|
|
— |
|
|
9.5 |
|
|
|
|
|
|
|
|
|
|
|
|
|
|
| Tax valuation allowances |
|
2,120.8 |
|
|
(583.8) |
|
|
|
|
— |
|
|
(86.0) |
|
|
1,451.0 |
|
| Year Ended December 31, 2021 |
|
|
|
|
|
|
|
|
|
|
|
|
| Reserves deducted from asset accounts: |
|
|
|
|
|
|
|
|
|
|
|
|
| Advance royalty recoupment reserve |
|
$ |
0.3 |
|
|
$ |
— |
|
|
|
|
$ |
— |
|
|
$ |
— |
|
|
$ |
0.3 |
|
| Reserve for materials and supplies |
|
10.4 |
|
|
0.6 |
|
|
|
|
(2.0) |
|
|
— |
|
|
9.0 |
|
|
|
|
|
|
|
|
|
|
|
|
|
|
| Tax valuation allowances |
|
2,287.3 |
|
|
(121.7) |
|
|
|
|
— |
|
|
(44.8) |
|
|
2,120.8 |
|
(1)Reserves utilized, unless otherwise indicated.
(2)Includes the impact of changes in the Australian dollar exchange rates.
|
|
|
|
|
|
|
|
|
| Peabody Energy Corporation |
2023 Form 10-K |
F-61 |
EX-4.7
2
btu_20231231xex47.htm
EX-4.7
Document
DESCRIPTION OF THE COMPANY’S SECURITIES REGISTERED PURSUANT TO
SECTION 12 OF THE SECURITIES EXCHANGE ACT OF 1934
The following is a brief description of the common stock, par value $0.01 per share (“Common Stock”), of Peabody Energy Corporation (the “Company,” “we,” “us” or “our”), which is the only security of the Company registered pursuant to Section 12 of the Securities Exchange Act of 1934. The following summary is not complete and is qualified in its entirety by reference to the Company’s Fourth Amended and Restated Certificate of Incorporation (the “Charter”), including the Certificate of Designation attached thereto, the Company’s Second Amended and Restated Bylaws (the “Bylaws”) and relevant sections of the Delaware General Corporation Law (the “DGCL”).
General
We have the authority to issue a total of 450,000,000 shares of Common Stock, 100,000,000 shares of preferred stock, par value $0.01 per share (“Preferred Stock”), of which 50,000,000 were designated as Series A Convertible Preferred Stock (“Series A Preferred Stock”), and 50,000,000 shares of series common stock, par value $0.01 per share (“Series Common Stock”).
The Board of Directors of the Company (the “Board”) is granted authority to issue both Preferred Stock and Series Common Stock of one or more series and, in connection with the creation of any such series, to fix by the resolution or resolutions providing for the issue of shares, any designation, voting powers, preferences and relative, participating, optional, or other special rights of such series, and the qualifications, limitations or restrictions attaching thereto.
We may not issue non-voting equity securities; provided, however, that such restriction shall (a) not apply beyond what is required under Section 1123(a)(6) of the Bankruptcy Code, (b) only have such force and effect for so long as Section 1123 of the Bankruptcy Code is in effect and applicable to us, and (c) in all events may be amended or eliminated in accordance with applicable law.
Voting Rights
Subject to the voting rights granted to Preferred Stock or Series Common Stock that may be outstanding from time to time, each share of our Common Stock shall be entitled to one vote per share, in person or by proxy, on all matters submitted to a vote for our stockholders on which the holders of Common Stock are entitled to vote. Except as otherwise required in the Charter, Bylaws or by applicable law, the holders of voting stock shall vote together as one class on all matters submitted to a vote of stockholders generally. The Charter and Bylaws do not provide for cumulative voting in connection with the election of directors. Accordingly, holders of more than 50% of the shares voting will be able to elect all of the directors. However, in a contested election, a plurality of the votes shall be enough to elect a director. The holders of a majority of our voting stock issued and outstanding and entitled to vote at a meeting of stockholders, present in person or represented by proxy, constitute a quorum at any such meeting of stockholders for the transaction of business.
Dividend Rights
Subject to any dividend rights granted to Preferred Stock or Series Common Stock that may be outstanding from time to time, the holders of shares of Common Stock shall be entitled to receive such dividends and other distributions in cash, property or shares of stock as may be declared thereon by the Board from time to time out of the assets or funds legally available.
Before payment of any dividend, there may be set aside out of any funds available for dividends such sum or sums as the directors, in their absolute discretion, think proper as a reserve or reserves to meet contingencies, or for equalizing dividends, or for repairing or maintaining any Company property, or for such other purpose as the directors shall think conducive to the interests of the Company, and the directors may modify or abolish any such reserve in the manner in which it was created.
No Preemptive Rights
No holder of our capital stock has any preemptive right to subscribe for any shares of our capital stock issued in the future.
Liquidation Rights
The holders of Common Stock shall be entitled to share ratably in the net assets remaining after payment pursuant to any liquidation rights granted to Preferred Stock or Series Common Stock that may be outstanding from time to time.
Preferred Stock
Series A Convertible Preferred Stock
In connection with the Company’s emergence from its Chapter 11 cases in April 2017, the Company issued shares of new Series A Preferred Stock in a private placement. Under the terms of the Certificate of Designation relating to the Series A Preferred Stock, all outstanding shares of Series A Preferred Stock were mandatorily converted into shares of Common Stock on January 31, 2018. As of February 22, 2024, there are no shares of Series A Preferred Stock outstanding.
Other Preferred Stock
As of February 22, 2024, there are no shares of any series of Preferred Stock outstanding. The Charter provides that the Board may, by resolution, establish one or more series of Preferred Stock having the number of shares and relative voting rights, designations, dividend rates, liquidation and other rights, preferences and limitations as may be fixed by the Board without further stockholder approval. The holders of our Preferred Stock may be entitled to preferences over common stockholders with respect to dividends, liquidation, dissolution or our winding up in such amounts as are established by the resolutions of the Board approving the issuance of such shares.
The issuance of Preferred Stock may have the effect of delaying, deferring or preventing a change in control without further action by the holders and may adversely affect voting and other rights of holders of our securities. In addition, issuance of Preferred Stock, while providing desirable flexibility in connection with possible acquisitions and other corporate purposes, could make it more difficult for a third party to acquire a majority of the outstanding shares of our voting stock.
Series Common Stock
As of February 22, 2024, there are no shares of Series Common Stock outstanding. The Charter provides that the Board may, by resolution, establish one or more series of Series Common Stock having the number of shares and relative voting rights, designations, dividend rates, liquidation and other rights, preferences and limitations as may be fixed by them without further stockholder approval. The holders of our Series Common Stock may be entitled to preferences over common stockholders and holders of Preferred Stock with respect to dividends, liquidation, dissolution or our winding up in such amounts as are established by the resolutions of our Board approving the issuance of such shares of Series Common Stock.
The issuance of Series Common Stock may have the effect of delaying, deferring or preventing a change in control without further action by the holders and may adversely affect voting and other rights of holders of our securities. In addition, issuance of Series Common Stock, while providing desirable flexibility in connection with possible acquisitions and other corporate purposes, could make it more difficult for a third party to acquire a majority of the outstanding shares of our voting stock.
Provisions of Our Charter, Bylaws and Delaware Law That May Have an Anti-Takeover Effect
Preferred Stock and Series Common Stock
See above under “Preferred Stock” and “Series Common Stock.”
Special Meetings of Stockholders
The Charter and Bylaws provide that special meetings of the stockholders may be called by our Chairman of the Board, Chief Executive Officer, President or the Board. A special meeting of stockholders shall also be called by our secretary upon the written request of stockholders entitled to cast at least 40% of all votes entitled to be cast at the special meeting.
Advance Notice of Stockholder Meetings
Notice of any annual or special meeting of stockholders, stating the place (if any), date and hour of the meeting shall be given to each stockholder entitled to notice of such meeting not less than ten nor more than 60 days before the date of such meeting.
Advance Notice for Nominations or Stockholder Proposals at Meetings
The Bylaws also prescribe the procedure that a stockholder must follow to nominate directors or bring business before stockholder meetings.
Nominations of persons for election to the Board and the proposal of business at stockholder meetings may be made by (1) the Company, (2) the Chairman of the Board or (3) any stockholder entitled to vote and who makes the nomination or proposal pursuant to timely notice in proper written form to our Secretary in compliance with the procedures set forth in the Bylaws. For a stockholder to nominate a candidate for director or to bring other business before a meeting, we must receive notice not less than 90 days nor more than 120 days prior to the first anniversary of the preceding year’s annual meeting; provided, however, that in the event that the date of the annual meeting is advanced by more than 20 days, or delayed by more than 70 days from such anniversary date, notice by the stockholder must be so delivered not earlier than 120 days prior to such annual meeting and not later than the close of business on the later of the 90th day prior to such annual meeting or the 10th day following the day on which public announcement of the date of such meeting is made. Notice of a nomination for director must also include a description of various matters regarding the nominee and the shareholder giving notice and comply with other procedures and requirements as set forth in the Bylaws.
In addition, the Bylaws permit a stockholder, or group of no more than 20 stockholders meeting specified eligibility requirements, to include director nominees in our proxy materials for annual meetings. In order to be eligible, stockholders must have owned 3% or more of the outstanding Common Stock continuously for at least three years. Requests to include stockholder-nominated candidates in our proxy materials must be delivered to us within the time periods applicable to stockholder notices of nominations as described in the preceding paragraph.
The maximum number of stockholder nominated candidates is the greater of two directors or the largest whole number that does not exceed 20% of the number of directors in office as of last day on which a notice under these provisions is delivered. The Bylaws provide a process to determine which candidates under these provisions exceed the maximum permitted number. Each stockholder seeking to include a director nominee in our proxy materials pursuant to these provisions is required to provide certain information, as set forth in the Bylaws. A stockholder nominee must also meet certain eligibility requirements, as set forth in the Bylaws.
At a meeting of stockholders, only such business (other than the nomination of candidates for election as directors in accordance with the Bylaws) will be conducted or considered as is properly brought before the annual meeting or a special meeting as specified in the Bylaws.
Action by Written Consent
The Charter prohibits action by written consent by stockholders.
Directors
The Board shall consist of at least three members and no more than 15, and may be fixed from time to time by a resolution adopted by the Board or by the stockholders. As of February 22, 2024, the Board has 10 members. Directors need not be stockholders but are subject to a Company policy that requires that they hold shares of Common Stock having a value equal to a specified multiple of their annual retainer.
Each director to be elected by stockholders shall be elected by a majority vote of the stockholders, except that if the number of nominees exceeds the number of directors to be elected, the directors shall be elected by a plurality of votes. There is no cumulative voting in the election of directors. Directors may be removed, with or without cause, by a majority vote of our voting stock.
All directors will be in one class and serve for a term ending at the annual meeting following the annual meeting at which the director was elected. Our current class of directors will be subject to reelection at our 2024 annual meeting of stockholders
The Board is authorized to adopt, amend, alter or repeal the Bylaws by the affirmative vote of a majority of the directors present at any regular or special meeting, subject to the power of the voting stock to adopt, amend, alter or repeal the Bylaws made by the Board. Notwithstanding anything in the Charter or Bylaws to the contrary, a vote of holders of 75% or more of our voting stock is required to adopt, amend, alter or repeal any provision inconsistent with the foregoing or the manner in which action may be taken by voting stock.
Delaware Law
The Company is a Delaware corporation subject to Section 203 of the DGCL. Section 203 provides that, subject to certain exceptions specified in the law, a Delaware corporation shall not engage in certain “business combinations” with any “interested stockholder” for a three-year period following the time that the stockholder became an interested stockholder unless:
•prior to such time, the Board approved either the business combination or the transaction that resulted in the stockholder becoming an interested stockholder;
•upon consummation of the transaction that resulted in the stockholder becoming an interested stockholder, the interested stockholder owned at least 85% of our voting stock outstanding at the time the transaction commenced, excluding certain shares; or
•at or subsequent to that time, the business combination is approved by the Board and authorized at an annual or special meeting of stockholders, and not by written consent, by the affirmative vote of at least 66 2/3% of the outstanding voting stock that is not owned by the interested stockholder.
Generally, a “business combination” includes a merger, asset or stock sale or other transaction resulting in a financial benefit to the interested stockholder. Subject to certain exceptions, an “interested stockholder” is a person who, together with that person’s affiliates and associates, owns, or within the previous three years did own, 15% or more of our outstanding voting stock.
Under certain circumstances, Section 203 makes it more difficult for a person who would be an “interested stockholder” to effect various business combinations for a three-year period. The provisions of Section 203 may encourage companies or other persons interested in acquiring us to negotiate in advance with the Board because the stockholder approval requirement would be avoided if the Board approves either the business combination or the transaction that results in the stockholder becoming an interested stockholder. These provisions also may have the effect of preventing changes in the Board and may make it more difficult to accomplish transactions that stockholders may otherwise deem to be in their best interests.
EX-10.72
3
btu_20231231xex1072.htm
EX-10.72
Document
Exhibit 10.72
Form of Performance Unit Agreement (with cash)
ELT Level 2024 Award
PEABODY ENERGY CORPORATION 2017 INCENTIVE PLAN
PERFORMANCE UNIT AGREEMENT
THIS PERFORMANCE UNIT AGREEMENT (the “Agreement”), effective as of January 2, 2024, is made by and between PEABODY ENERGY CORPORATION, a Delaware corporation (the “Company”), and the undersigned employee of the Company or a Subsidiary of the Company (the “Grantee”). The Grant Date for the Performance Units evidenced by this Agreement is January 2, 2024 (the “Grant Date”).
WHEREAS, the Company wishes to carry out the Plan, the terms of which are hereby incorporated by reference and made a part of this Agreement;
WHEREAS, the Company deems it essential to the protection of its confidential information and competitive standing in its market to have its key employees have reasonable restrictive covenants in place;
WHEREAS, the Grantee agrees and acknowledges that the Company has a legitimate interest to protect its confidential information and competitive standing;
WHEREAS, the Company deems it essential to the optimal functioning of its business to have its key employees provide advance notice to the Company of their termination of employment; and
WHEREAS, the Compensation Committee of the Board (the “Committee”) has determined that, subject to the provisions of this Agreement and the Plan, it would be to the advantage and best interest of the Company and its shareholders to grant the opportunity to earn the Performance Units evidenced hereby to the Grantee as an incentive for his or her efforts during his or her term of service with the Company or its Subsidiaries or Affiliates, and has advised the Company thereof and instructed the undersigned officer to enter into this Agreement to evidence such Performance Units.
NOW, THEREFORE, in consideration of the mutual covenants herein contained and other good and valuable consideration, receipt of which is hereby acknowledged, the parties hereby agree as follows:
ARTICLE I DEFINITIONS
Whenever the following terms are used in this Agreement, they shall have the meanings specified below. Capitalized terms not otherwise defined in this Agreement shall have the meanings specified in the Plan.
Section 1.1 - “Affiliate” shall mean any other Person directly or indirectly controlling, controlled by, or under common control with the Company. For the purposes of this definition, the term “control” (including, with correlative meanings, the terms “controlling”, “controlled by”
and “under common control with”), as applied to any Person, means the possession, directly or indirectly, of the power to direct or cause the direction of the management and policies of that Person, whether through the ownership of voting securities, by contract or otherwise.
Section 1.2 - “Award” shall mean the Performance Units evidenced by this Agreement.
Section 1.3 - “Good Reason” shall mean (a) “Good Reason” as defined in the Grantee’s employment agreement with the Company, if any; or (b) if the Grantee does not have an employment agreement with the Company or such agreement does not define Good Reason, then:
(i) a material reduction, other than a reduction that generally affects all similarly-situated executives and does not exceed 10% in one year or 20% in the aggregate over three consecutive years, by the Company in the Grantee’s base salary from that in effect immediately prior to the reduction; (ii) a material reduction, other than a reduction that generally affects all similarly- situated executives, by the Company in the Grantee’s target or maximum annual cash incentive award opportunity or target or maximum annual equity-based compensation award opportunity from those in effect immediately prior to any such reduction; (iii) relocation, other than through mutual agreement in writing between the Company and the Grantee or a secondment or temporary relocation for a reasonably finite period of time, of the Grantee’s primary office by more than 50 miles from the location of the Grantee’s primary office as of the Agreement date; or (iv) any material diminution or material adverse change in the Grantee’s duties or responsibilities as they exist as of the Agreement date (other than any diminution or change during a period of mental or physical incapacity); provided, that (x) if the Grantee terminates the Grantee’s employment for “Good Reason,” the Grantee shall provide written notice to the Company at least 30 days in advance of the date of termination, such notice shall describe the conduct the Grantee believes to constitute “Good Reason” and the Company shall have the opportunity to cure the “Good Reason” within 30 days after receiving such notice, (y) if the Company cures the conduct that is the basis for the potential termination for “Good Reason” within such 30-day period, the Grantee’s notice of termination shall be deemed withdrawn and (z) if the Grantee does not give notice to the Company as described in this Section 1.3 within 90 days after an event giving rise to “Good Reason,” the Grantee’s right to claim “Good Reason” termination on the basis of such event shall be deemed waived.
Section 1.4 - “Performance Period” shall mean January 1, 2024 through December 31,
2025.
Section 1.5 - “Plan” shall mean the Peabody Energy Corporation 2017 Incentive Plan, as
amended or amended and restated from time to time.
Section 1.6 - “Retirement” shall mean, for purposes of this Agreement, a Termination of Service, other than for Cause, death or Disability, on or after reaching age 65 or age 60 with five
(5) years of service with the Company or a Subsidiary.
Section 1.7 - “Section 409A” shall mean Section 409A of the Code and the applicable regulations or other guidance issued thereunder.
Section 1.8 - “Vesting Date” shall mean December 31, 2026.
ARTICLE II
GRANT OF PERFORMANCE UNITS
Section 2.1 - Grant of Performance Units. Pursuant to Section 11 of the Plan, the Company has granted to the Grantee an Award consisting of the target number of Performance Units set forth on the signature page hereof (the “Target Units”) upon the terms and subject to the conditions set forth in this Agreement and the Plan. Subject to the degree of attainment of the Performance Goals established for this Performance Unit Award, as approved by the Committee and thereafter communicated to the Grantee (the “Statement of Performance Goals”), the Grantee may earn from 0% to 200% of the Target Units. The grant of the Performance Units was made in consideration of the services to be rendered by the Grantee to the Company and its Subsidiaries and Affiliates and the Grantee’s obligations under the Restrictive Covenant Agreement (as referenced in Article V).
Section 2.2 - No Obligation of Employment. Nothing in this Agreement or in the Plan shall confer upon the Grantee any right to continue in the employ of the Company or any Subsidiary or Affiliate or interfere with or restrict in any way the rights of the Company and its Subsidiaries or Affiliates, which rights are hereby expressly reserved, to terminate the employment of the Grantee at any time for any reason whatsoever, with or without Cause.
Section 2.3 - Adjustments in Performance Units. In the event of the occurrence of one of the corporate transactions or other events listed in Section 4.2 or 13.2 of the Plan, the Committee shall make such substitution or adjustment as provided in Sections 4.2 or 13.2 of the Plan or otherwise in the terms of the Performance Units in order to equitably reflect such corporate transaction or other event. Any such adjustment made by the Committee shall be final and binding upon the Grantee, the Company and all other interested persons.
Section 2.4 - Change in Control. In the event of a Change in Control, the treatment of the Performance Units evidenced hereby will be determined in accordance with the Plan.
ARTICLE III
VESTING AND FORFEITURE OF PERFORMANCE UNITS
Section 3.1 - Normal Vesting. Unless otherwise provided in this Article III, the Performance Units shall vest on the Vesting Date, with the number of Performance Units earned pursuant to the Award determined as of the Vesting Date to the extent that the Performance Goals described in the Statement of Performance Goals for this Award are certified by the Committee, in its sole discretion, as having been achieved during the Performance Period or as of the Vesting Date, as applicable, provided that the Grantee has remained in continuous service with the Company or a Subsidiary through the Vesting Date.
(a)For purposes of this Agreement, “continuously employed” (or substantially similar terms) means the absence of any interruption or termination of the Grantee’s employment with the Company or a Subsidiary. Continuous employment shall not be considered interrupted or terminated in the case of transfers between locations of the Company and its Subsidiaries.
Section 3.2 - Effect of Certain Events. Notwithstanding the foregoing Section 3.1, prior to the Vesting Date:
(a)in the event of the Grantee’s Termination of Service either (i) within twenty four months following a Change in Control, provided such Termination of Service is by the Company without Cause or by the Grantee for Good Reason; or (ii) on account of the Grantee’s death or Disability, the Performance Units shall become earned and vest on the basis of the relative achievement of the Performance Goals determined in accordance with Section 3.1 as if the Grantee had remained in continuous service with the Company or a Subsidiary through the Vesting Date;
(b)in the event of the earlier of: (i) a Termination of Service on account of Retirement; or (ii) except as provided in Section 3.2(a) above, a Termination of Service by the Company without Cause or by the Grantee for Good Reason, a pro-rata portion of the Performance Units, based on the number of days that the Grantee provided services to the Company or a Subsidiary from the beginning of the Performance Period through the date of Termination of Service compared to the number of days from the beginning of the Performance Period through the Vesting Date, shall become earned and vest on the basis of the relative achievement of the Performance Goals determined in accordance with Section 3.1; and
(c)in the event of the earlier of (i) a Termination of Service by the Company for Cause; and (ii) a Termination of Service by the Grantee without Good Reason, the Performance Units shall terminate and the Grantee shall not be entitled to any payment hereunder.
The portion of the Performance Units that vests and become earned in accordance with this Section 3.2 shall be settled as set forth in Article IV of this Agreement.
ARTICLE IV
SETTLEMENT OF PERFORMANCE UNITS
Section 4.1 - Settlement of Vested Performance Units. Subject to Sections 4.2 and 13.2 of the Plan and the exception set forth in Section 4.2 of this Agreement, as well as to any withholding obligations described in Section 6.3 of this Agreement, the Performance Units that vest and become earned shall be equal to (a) the Target Units multiplied by (b) the percentage of achievement of the Performance Goals described in the Statement of Performance Goals, as certified by the Committee. Such earned and vested Performance Units will be delivered as follows: (x) 50% of such Performance Units shall be delivered and issued in the form of Shares, with each Performance Unit being equal to one Share, and (y) 50% of such Performance Units shall be delivered in cash, with each Performance Unit being equal to the fair market value of one Share as of the date on which the Performance Units vest. Such Shares shall be issued and such amount shall be paid as soon as practicable following the Vesting Date, but in any case within the “short term deferral” period determined under Treasury Regulation Section 1.409A-1(b)(4). For the sake of clarity, the settlement of Shares and payment in cash in respect of nonforfeitable Performance Units is intended to comply with Treasury Regulation Section 1.409A-1(b)(4) and will be construed and administered in such a manner. As a result, the Shares will be issued and the amount will be paid no later than the date that is the 15th day of the third calendar month of the year following the year in which the Shares or cash subject to the Performance Units, as applicable, are no longer subject to a “substantial risk of forfeiture” within the meaning of Treasury Regulation Section 1.409A-1(d).
Section 4.2 - Forfeiture of Unvested Performance Units. To the extent that the Grantee does not vest in all or any portion of the Performance Units subject to the Award, all interest in such unvested Performance Units shall be forfeited upon the Grantee’s Termination of Service. The Grantee has no right or interest in any Performance Unit that is forfeited.
Section 4.3 - Treatment of Fractional Performance Units. Notwithstanding anything in this Agreement to the contrary, in the event that any fractional Performance Unit is produced under the terms of the Plan or this Agreement, immediately prior to payment thereof, such fractional Performance Unit shall be rounded to the nearest whole Performance Unit; as a result, there will be no fractional Performance Units to settle under this Agreement.
ARTICLE V
CONDITION TO GRANT OF AWARD; OTHER PROVISIONS
Section 5.1 - Restrictive Covenant Agreement. The Grantee shall not be entitled to receive the Award unless the Grantee shall have executed and delivered the Restrictive Covenant Agreement, substantially in the form attached hereto as Exhibit A, and such shall be in full force and effect. Nothing in this Agreement or the Restrictive Covenant Agreement prevents the Grantee from providing, without prior notice to the Company, information to governmental authorities regarding possible legal violations or otherwise testifying or participating in any investigation or proceeding by any governmental authorities regarding possible legal violations, and for purpose of clarity the Grantee is not prohibited from providing information voluntarily to the Securities and Exchange Commission pursuant to Section 21F of the Exchange Act.
Section 5.2 - Notice Period. The Grantee may terminate the Grantee’s employment with the Company or a Subsidiary at any time for any reason by delivery of notice to the Company at least ninety (90) days in advance of the date of termination (the “Notice Period”); provided, however, that no communication, statement or announcement shall be considered to constitute such notice of termination of the Grantee’s employment unless it complies with Section 6.4 hereof and specifically recites that it is a notice of termination of employment for purposes of this Agreement; and provided, further, that the Company may waive any or all of the Notice Period, in which case the Grantee’s employment with the Company or a Subsidiary or Affiliate will terminate on the date determined by the Company.
Section 5.3 - Breach of Restrictive Covenant Agreement or Section 5.2. Subject to Section 5.1, if the Grantee materially breaches any provision of the Restrictive Covenant Agreement or Section 5.2 hereof, the Company may, among other available remedies, determine that the Grantee (a) will forfeit any unpaid portion of the Performance Units evidenced by this Agreement and (b) will repay to the Company any portion of the Performance Units evidenced by this Agreement previously paid to the Grantee.
Section 5.4 - Conditions to Issuance of Shares. The Shares deliverable hereunder may be either previously authorized but unissued Shares or issued Shares that have been reacquired by the Company. Such Shares shall be fully paid and nonassessable. The Company shall not be required to issue or deliver any certificate or certificates (or other documentation that indicates ownership) for Shares paid hereunder prior to the fulfillment of both of the following conditions:
(a)The obtaining of approval or other clearance from any state or federal governmental agency that the Committee, in its absolute discretion, determines to be necessary or advisable; and
(b)The lapse of such reasonable period of time following the grant as the Committee may establish from time to time for administrative convenience (subject to, and in compliance with the requirements of Section 409A, including any requirements necessary to comply with Treasury Regulation Section 1.409A-1(b)(4)).
Section 5.5 - Rights as a Shareholder; Dividend Equivalents. The Grantee shall not be, and shall not have any of the rights or privileges of, a shareholder of the Company in respect of any Shares underlying Performance Units evidenced by this Agreement unless and until certificates representing such Shares shall have been issued by the Company to the Grantee or such ownership has otherwise been indicated and documented by the Company. From and after the Grant Date and until the earlier of (a) the time when the Performance Units become nonforfeitable and are paid in accordance with Article IV hereof or (b) the time when the Grantee’s right to receive payment for the Performance Units is forfeited in accordance with the provisions of this Agreement, on the date that the Company pays a cash dividend (if any) to holders of Shares generally, the Grantee shall be credited with a number of additional Performance Units (which need not be a whole number) equal to the quotient of (x) the product of (i) the dividend declared per Share multiplied by (ii) the number of Performance Units that remain subject to this Agreement (including any Performance Units representing previously-credited Dividend Equivalents), divided by (y) the Fair Market Value of a Share on the date such dividend is paid to shareholders. Any amounts credited pursuant to the immediately preceding sentence shall be subject to the same terms and conditions (including vesting, payment and forfeitability) as apply to the Performance Units based on which the Dividend Equivalents were credited, and such additional Performance Units (rounded to the nearest whole Performance Unit) shall be paid in Shares or cash, as applicable, at the same time and to the same extent as the Performance Units to which they relate are paid.
Section 5.6 - Restrictions. Performance Units granted pursuant to this Agreement shall be subject to Section 5.9 of the Plan and all applicable policies and guidelines of the Company that relate to (a) share ownership requirements, or (b) recovery of compensation (i.e., clawbacks).
ARTICLE VI MISCELLANEOUS
Section 6.1 - Administration. The Committee has the power to interpret the terms of the Performance Units, the Plan and this Agreement and to adopt such rules for the administration, interpretation and application of the Plan as are consistent therewith and to interpret or revoke any such rules. All actions taken and all interpretations and determinations made by the Committee shall be final and binding upon the Grantee, the Company and all other interested persons. No member of the Committee shall be personally liable for any action, determination or interpretation made in good faith with respect to the Plan or the Performance Units. In its absolute discretion, the Board may at any time and from time to time exercise any and all rights and duties of the Committee under the Plan and this Agreement.
Section 6.2 - Performance Units Not Transferable. Neither the Performance Units nor any interest or right therein or part thereof shall be liable for the debts, contracts or engagements of the Grantee or his or her successors in interest or shall be subject to disposition by transfer, alienation, anticipation, pledge, encumbrance, assignment or any other means whether such disposition is voluntary or involuntary or by operation of law by judgment, levy, attachment, garnishment or any other legal or equitable proceedings (including bankruptcy), and any attempted disposition thereof shall be null and void and of no effect; provided, however, that this Section 6.2 shall not prevent transfers by will or by the applicable laws of descent and distribution.
Section 6.3 - Withholding. As of the date that all or a portion of the Performance Units become settled pursuant to Section 4.1 hereof, the Company will, on a mandatory basis in accordance with Section 16.1(a) of the Plan, withhold a number of Shares (with respect to the portion of the Performance Units payable in Shares) and a portion of the cash payment (with respect to the portion of the Performance Units payable in cash) underlying the then vested Performance Units with a fair market value equal to the aggregate amount required by law to be withheld by the Company in connection with such vesting for applicable federal, state, local and foreign taxes of any kind. To the extent taxes are to be withheld upon vesting for purposes of federal FICA, FUTA or Medicare taxes, such withholding shall be taken from other income owed by the Company to the Grantee and the Grantee hereby agrees to such withholding. For all purposes, the amount withheld by the Company pursuant to this Section 6.3 shall be deemed to have first been paid to the Grantee.
Section 6.4 - Notices. Any notice to be given under the terms of this Agreement to the Company shall be provided to the Chief Administrative Officer and Corporate Secretary, with a copy to the Grantee’s supervisor, and any notice to be given to the Grantee shall be addressed to him or her at the address set forth in the records of the Company. By a notice given pursuant to this Section 6.4, either party may hereafter designate a different address for notices to be given to him, her or it. Any notice which is required to be given to the Grantee shall, if the Grantee is then deceased, be given to the Grantee’s personal representative if such representative has previously informed the Company of his, her or its status and address by written notice under this Section 6.4. Any notice shall be deemed duly given when enclosed in a properly sealed envelope or wrapper addressed as aforesaid, deposited (with postage prepaid) in a post office or branch post office regularly maintained by the United States Postal Service. Notwithstanding the foregoing, any notice required or permitted hereunder from the Company to the Grantee may be made by electronic means, including by electronic mail to the Company-maintained electronic mailbox of the Grantee, and the Grantee hereby consents to receive such notice by electronic delivery. To the extent permitted in an electronically delivered notice described in the previous sentence, the Grantee shall be permitted to respond to such notice or communication by way of a responsive electronic communication, including by electronic mail.
Section 6.5 - Titles. Titles are provided herein for convenience only and are not to serve as a basis for interpretation or construction of this Agreement.
Section 6.6 - Pronouns. The masculine pronoun shall include the feminine and neuter, and the singular the plural, where the context so indicates.
Section 6.7 - Applicability of Plan. The Performance Units and the Shares issued to the Grantee, if any, shall be subject to all of the terms and provisions of the Plan, to the extent applicable to the Performance Units and such Shares. In the event of any conflict between this Agreement and the Plan, the terms of the Plan shall control.
Section 6.8 - Amendment. The Committee may amend this Agreement at any time, provided that no such amendment shall materially impair the rights of the Grantee unless reflected in a writing executed by the parties hereto that specifically states that it is amending this Agreement.
Section 6.9 - Severability. The invalidity or unenforceability of any provision of the Plan or this Agreement shall not affect the validity or enforceability of any other provision of the Plan or this Agreement, and each provision of the Plan and this Agreement shall be severable and enforceable to the extent permitted by law.
Section 6.10 - Dispute Resolution. Any dispute or controversy arising under or in connection with this Agreement shall be resolved by arbitration in St. Louis, Missouri. Arbitrators shall be selected, and arbitration shall be conducted, in accordance with the rules of the American Arbitration Association. The Company shall pay or reimburse any legal fees in connection with such arbitration in the event that the Grantee prevails on a material element of his or her claim or defense. Payments or reimbursements of legal fees made under this Section 6.10 that are provided during one calendar year shall not affect the amount of such payments or reimbursements provided during a subsequent calendar year, payments or reimbursements under this Section 6.10 may not be exchanged or substituted for another form of compensation to the Grantee, and any such reimbursement or payment will be paid within 60 days after the Grantee prevails, but in no event later than the last day of the Grantee’s taxable year following the taxable year in which he incurred the expense giving rise to such reimbursement or payment. This Section 6.10 shall remain in effect throughout the Grantee’s employment with the Company or any Subsidiary and for a period of five (5) years following the Grantee’s Termination of Service.
Section 6.11 - Section 409A.
(a)The Award is intended to comply with the “short-term deferral” rule set forth in Treasury Regulation Section 1.409A-1(b)(4) and, to the maximum extent permitted, this Agreement shall be construed and administered consistent with such intent. Notwithstanding anything contained herein to the contrary, if the Award fails to satisfy the requirements of the short-term deferral rule and is otherwise not exempt from, and therefore deemed to be deferred compensation subject to, Section 409A, references in this Agreement (including in Section 4.1), to payment or settlement of amounts under this Agreement within the “short-term deferral” period determined under Treasury Regulation Section 1.409A-1(b)(4), shall not apply, and instead payments will be made on the applicable payment date or a later date within the same taxable year of the Grantee, or if such timing is administratively impracticable, by the 15th day of the third calendar month following the date specified herein. For clarity, the Grantee is not permitted to designate the taxable year of payment. Notwithstanding anything contained herein to the contrary, if the Grantee is a “specified employee” (within the meaning set forth Section 409A(a)(2)(B)(i) of the Code) as of the date of the Grantee’s “separation from service” (within the meaning of Treasury Regulation Section 1.409A-1(h)), then the issuance of any Shares or other payment that would otherwise be made on the date of the separation from service or within the first six months thereafter will not be made on the originally scheduled dates and will instead be issued in a lump sum on the date that is six months and one day after the date of the separation from service (or upon death, if earlier), with the balance of the Shares and other payment issued thereafter in accordance with the original vesting and issuance schedule set forth above, but if and only if such delay in the issuance of the Shares or other payment is necessary to avoid the imposition of taxation in respect of the Shares or other payment under Section 409A. A termination of employment or service shall not be deemed to have occurred for purposes of this Agreement providing for the payment of any amounts that are considered deferred compensation under Section 409A upon or following a termination of employment or service, unless such termination is also a “separation from service” (within the meaning of Treasury Regulation Section 1.409A- 1(h)) and the payment thereof prior to a “separation from service” would violate Section 409A. Each installment that becomes payable in respect of vested Performance Units subject to the Award is a “separate payment” for purposes of Treasury Regulation Section 1.409A-2(b)(2). In no event shall the Company be liable for all or any portion of any taxes, penalties, interest or other expenses that may be incurred by the Grantee on account of Section 409A.
(b)In the event that the Company determines that any amounts payable hereunder may be taxable to the Grantee under Section 409A prior to the payment and/or delivery to the Grantee of such amount, the Committee may adopt such amendments to the Agreement, and appropriate policies and procedures, including amendments and policies with retroactive effect, that the Committee determines necessary or appropriate to preserve the intended tax treatment of the benefits provided by the Performance Units and this Agreement.
(c)Notwithstanding any provision of this Agreement to the contrary, in light of the uncertainty with respect to the proper application of Section 409A, the Company reserves the right to make amendments to this Agreement and the terms of the Performance Units as the Company deems necessary or desirable to avoid the imposition of taxes or penalties under Section 409A. In any case, neither the Company nor any of its affiliates will have any obligation to indemnify or otherwise hold the Grantee harmless from any or all of such taxes or penalties.
Section 6.12 - Governing Law. The laws of the State of Delaware shall govern the interpretation, validity and performance of the terms of this Agreement regardless of the law that might be applied under principles of conflicts of laws.
Section 6.13 - Counterparts. This Agreement may be executed in counterparts, each of which shall be deemed an original but all of which together will constitute one and the same instrument. Counterpart signatures to this Agreement transmitted by facsimile, electronic mail, or by any other electronic means intended to preserve the original graphic and pictorial appearance of a document, will have the same effect as physical delivery of the paper document bearing an original signature.
Section 6.14 - Acceptance of the Plan. The Grantee hereby acknowledges receipt of a copy of the Plan and this Agreement. The Grantee has read and understands the terms and provisions thereof, and accepts the Performance Units subject to all the terms and conditions of the Plan and this Agreement.
The Grantee acknowledges that there may be adverse tax consequences upon the vesting or settlement of the Performance Units and that the Grantee has been advised to consult a tax advisor prior to such vesting or settlement.
[SIGNATURE PAGE FOLLOWS]
IN WITNESS WHEREOF, this Agreement has been executed and delivered by the parties hereto.
PEABODY ENERGY CORPORATION

Scott T. Jarboe
Chief Administrative Officer & Corporate Secretary
Note: The Grantee is deemed to have executed this Agreement upon clicking “Accept” in the Plan’s online administration site.
EXHIBIT A
RESTRICTIVE COVENANT AGREEMENT
THIS RESTRICTIVE COVENANT AGREEMENT (the “RCA”) dated January 2, 2024, is by
and between PEABODY ENERGY CORPORATION, a Delaware corporation (the “Company”), and (“Grantee”).
WHEREAS, Grantee is a recipient of a 2024 Performance Unit Grant (the “Award”) under the Company’s Peabody Energy Corporation 2017 Incentive Plan, as amended from time to time (the “Plan”);
WHEREAS, Grantee acknowledges and agrees that he or she has access to and/or knowledge of certain trade secrets and other Confidential Information regarding the Company;
WHEREAS, the Company has spent and will continue to expend substantial amounts of time, money, and effort to develop its Confidential Information and Grantee acknowledges benefitting from these efforts;
WHEREAS, the Company deems it essential to the protection of its Confidential Information and competitive standing in its market to have recipients of Awards subject to reasonable restrictive covenants;
WHEREAS, Grantee agrees and acknowledges that the Company has a legitimate interest to protect its confidential information and competitive standing; and
NOW THEREFORE, in consideration for the provisions stated below, and intending to be legally bonded thereby, the parties agree as follows.
1.Grantee has been informed and is aware that the execution of this RCA is a necessary term and condition of Grantee’s receipt of the Award.
2.The term “Confidential Information” as used in this RCA shall be broadly interpreted to include, without limitation, materials and information (whether in written, electronic or other form and whether or not identified as confidential at the time of disclosure) concerning technical matters, business matters, business plans, operations, opportunities, plans, processes, procedures, standards, strategies, policies, programs, software, schematics, models, systems, results, studies, analyses, compilations, forecasts, data, figures, projections, estimates, components, records, methods, criteria, designs, quality control, research, samples, work-in- progress, prototypes, data, materials, clients and prospective clients, customer lists, contracts, projects, suppliers, referral sources, sales, marketing, bidding, purchasing, personnel, financial condition, assets, inventory, accounts payable, accounts receivable, tax matters, books of account, financing, collections, intellectual property, trade secrets and all other know-how and information of the Company or any subsidiary of the Company which has not been published or disclosed to the general public.
a.While employed by the Company and at all times thereafter, Grantee will keep Confidential Information, including trade secrets, confidential and shall not, directly or indirectly, use for himself or herself or use for, or disclose to, any party other than the Company, or any subsidiary of the Company (other than in the ordinary course of Grantee’s duties for the benefit of the Company or any subsidiary of the Company), any Confidential Information.
b.At the termination of Grantee’s employment or at any other reasonable time the Company or any of its subsidiaries may request, Grantee shall promptly deliver to the Company all memoranda, notes, records, plats, sketches, plans or other documents (including, without limitation, any “soft” copies or computerized or electronic versions thereof) containing Confidential Information, including trade secrets or any other information concerning Company’s business, including all copies, then in Grantee’s possession or under Grantee’s control whether prepared by Grantee or others.
c.Notwithstanding the foregoing paragraphs, Company employees, contractors, and consultants may disclose trade secrets in confidence, either directly or indirectly, to a Federal, State or local government official or to an attorney, solely for the purpose of reporting or investigating a suspected violation of law, or in a complaint or other document filed in a lawsuit or other proceeding if such filing is made under seal. Additionally, Company employees, contractors, and consultants who file retaliation suits for reporting a suspected violation of law may disclose related trade secrets to their attorney and use them in related court proceedings, as long as the individual files documents containing the trade secret under seal and does not otherwise disclose the trade secret except pursuant to Court Order.
3.In consideration of the Company’s obligations under the Performance Unit Agreement (the “Agreement”), Grantee agrees that while employed by the Company and for a period of twelve (12) months thereafter, without the prior written consent of the Board of Directors of the Company (the “Board”), he or she shall not, directly or indirectly, as principal, manager, agent, consultant, officer, director, stockholder, partner, investor, lender or employee or in any other capacity, carry on, be engaged in or have any financial interest in, any entity which is in competition with the business of the Company or its subsidiaries.
4.In consideration of the Company’s obligations under the Agreement, Grantee agrees that while employed by the Company and for a period of twelve (12) months thereafter, without the prior written consent of the Board, he or she shall not, on his or her own behalf or on behalf of any person, firm or company, directly or indirectly, (a) solicit or offer employment to or hire any person who is or has been employed by the Company or its subsidiaries at any time during the twelve (12) months immediately preceding such solicitation or (b) solicit or entice away or in any manner attempt to persuade any client, vendor, partner, customer or prospective customer of the Company to discontinue or diminish his, her or its relationship or prospective relationship with the Company or to otherwise provide his, her or its business to any corporation, partnership or other business entity which engages in any line of business in which the Company is engaged (other than the Company).
5.For purposes of this RCA, an entity shall be deemed to be in competition with the Company if it enters into or engages in any business or activity that substantially and directly competes with the business of the Company. For purposes of this paragraph 5, the business of the Company is defined to be: development of new thermal and metallurgical mines, active metallurgical and thermal coal mining, preparation and sale; the marketing, brokering and trading of metallurgical and thermal coal; and the optimization of our metallurgical and thermal coal reserves; in each case by the Company and its direct and indirect subsidiaries or affiliated or related companies. Notwithstanding this paragraph 5 or paragraph 8, nothing herein shall be construed so as to preclude Grantee from investing in any publicly or privately held company, provided that no such investment in the equity securities of an entity with publicly traded equity securities may exceed one percent (1%) of the equity of such entity, and no such investment in any other entity may exceed five percent (5%) of the equity of such entity, without the prior written approval of the Board.
6.Grantee agrees that he or she will not at any time make, directly or indirectly, any negative, derogatory, disparaging or defamatory comment, whether written, oral or in electronic format, to any reporter, author, producer or similar person or entity or to any general public media in any form (including, without limitation, books, articles or writings of any other kind, as well as film, videotape, audio tape, computer/Internet format or any other medium) that concerns directly or indirectly the Company its business or operations, or any of its current or former agents, employees, officers, directors, customers or clients. Grantee understands that nothing in this section or this RCA limits Grantee’s ability to communicate with any government agencies or otherwise participate or cooperate with an investigation conducted by the Equal Employment Opportunity Commission, the Securities and Exchange Commission, or other similar agency, including providing documents or other information, without notice to the Company.
7.Upon the termination of Grantee’s employment for any reason, Grantee or his or her estate shall surrender to the Company all correspondence, letters, files, contracts, mailing lists, customer lists, advertising materials, ledgers, supplies, equipment, checks, and all other materials and records of any kind that are the property of the Company or any of its subsidiaries or affiliates, that may be in Grantee’s possession or under his control, including, without limitation, any “soft” copies or computerized or electronic versions thereof.
8.Grantee agrees that the covenant not to compete, the covenants not to solicit and the covenant not to make disparaging comments are reasonable under the circumstances and will not interfere with his or her ability to earn a living or otherwise to meet his or her financial obligations. Grantee and the Company agree that if in the opinion of any court of competent jurisdiction such restraint is not reasonable in any respect, such court shall have the right, power and authority to excise or modify such provision or provisions of this covenant which appear unreasonable and to enforce the remainder of the covenant as so amended. Grantee agrees that any breach of the covenants contained in this RCA would irreparably injure the Company. Accordingly, Grantee agrees that, in the event that Grantee violates this RCA, the Company may, in addition to pursuing any other remedies it may have in law or in equity, cease making any payments otherwise required under the agreements evidencing the Award, cancel and recoup any portion of the Award already paid to the extent required by law, regulation or listing requirement, or permitted by any Company policy adopted pursuant thereto. The Company may also seek an injunction against Grantee from any court having jurisdiction over the matter restraining any further violation of this RCA by Grantee.
9.No waiver or modification of all or any part of this RCA will be effective unless set forth in a written document signed by both the Company and Grantee expressly indicating their intention to waive or modify the specified provisions of this RCA. If the Company chooses not to enforce its rights in the event Grantee or any other recipient of an Award breaches some or all of the terms of this RCA, the Company’s rights with respect to any such breach shall not be considered a waiver of a future breach by Grantee of this RCA, regardless of whether the breach is of a similar nature or not.
10.This RCA accurately sets forth and entirely sets forth the understandings reached between Grantee and the Company with respect to the matters treated herein. If there are any prior written or oral understandings or agreements pertaining to the subject matter addressed in this RCA, they are specifically superseded by this RCA and have no effect, except, should Grantee be subject to non-compete and non-solicitation obligations (“Restrictive Covenants”) pursuant to an employment agreement or other agreement between Grantee and Company or one of its subsidiaries or affiliates, Grantee shall continue to be bound by the terms of those Restrictive Covenants and they shall run concurrently with those set forth in this RCA. This RCA is binding on Grantee and the Company, and our respective successors, assigns and representatives.
11.Because of Company’s and Grantee’s substantial contacts with the State of Missouri, the fact that Company’s headquarters is located in Missouri, the parties’ interests in ensuring that disputes regarding the interpretation, validity, and enforceability of this RCA are resolved on a uniform basis, and Company’s making and execution of this Agreement in Missouri, the parties agree that the RCA shall be interpreted and governed by the laws of the State of Missouri, without regard for any conflict of law principles. The parties agree that the exclusive venue and jurisdiction for any litigation concerning or arising out of or based on this RCA shall be the federal and state courts located in Missouri. The parties expressly consent to the personal jurisdiction and venue of said courts. The provisions of this paragraph shall not restrict the ability of Company or Grantee to enforce in any court any judgment obtained in Missouri federal or state court.
[SIGNATURE PAGE FOLLOWS]
IN WITNESS WHEREOF, this RC A has been executed and delivered by the parties hereto.
PEABODY ENERGY CORPORATION
Scott T. Jarboe
Chief Administrative Officer & Corporate Secretary
Note: Grantee is deemed to have executed this Agreement upon clicking “Accept” in the Plan’s online administration site.
Statement of Performance Goals
This Statement of Performance Goals applies to the Performance Units granted to the Grantee on the Grant Date as evidenced by the Performance Unit Agreement between the Company and the Grantee (the “Agreement”). Capitalized terms used in this Statement of Performance Goals that are not specifically defined in this Statement of Performance Goals have the meanings assigned to them in the Agreement or in the Plan, as applicable.
1.Definitions. For purposes hereof, as determined by the Committee:
(a)“Determination Date” shall mean December 31, 2025.
(b)“Environmental Reclamation” shall mean the amount of acres graded compared to the amount of acres disturbed, whereas the term “graded” means returning the land to the final contour grading prior to soil replacement and the term “disturbed” means new acres impacted for mining purposes.
(c)“Free Cash Flow” shall mean the Company’s net cash provided by/used in operating activities less the net cash provided by/used in investing activities (as disclosed in the Company’s public filings with the U.S. Securities and Exchange Commission).
(d)“Peer Group” shall mean the entities set forth on Exhibit A hereto. In terms of mandatory adjustments to the Peer Group during the rTSR Performance Period: (i) if any member of the Peer Group files for bankruptcy and/or liquidation, is operating under bankruptcy protection, or is delisted from its primary stock exchange because it fails to meet the exchange listing requirement, then such entity will remain in the Peer Group, but rTSR for the rTSR Performance Period will be calculated as if such entity achieved Total Shareholder Return placing it at the bottom (chronologically, if more than one such entity) of the Peer Group; (ii) if, by the last day of the rTSR Performance Period, any member of the Peer Group has been acquired and/or is no longer existing as a public company that is traded on its primary stock exchange (other than for the reasons as described in subsection (i) above), then such entity will not remain in the Peer Group and rTSR for the rTSR Performance Period will be calculated as if such entity had never been a member of the Peer Group; and (iii) except as otherwise described in subsection (i) and (ii) above, for purposes of this Statement of Performance Goals, for each of the members of the Peer Group, such entity shall be deemed to include any successor to all or substantially all of the primary business of such entity at end of the rTSR Performance Period.
(e)“Relative Total Shareholder Return” or “rTSR” shall mean shall mean the percentile rank of the Company’s Total Shareholder Return as compared to (but not included in) the Total Shareholder Returns of all members of the Peer Group, ranked in descending order, at the end of the rTSR Performance Period.
(f)“rTSR Performance Period” shall mean the period from January 1, 2024 through December 31, 2026.
(g)“Total Shareholder Return” shall mean, with respect to each of the Common Stock and the common stock of each of the members of the Peer Group, a rate of return reflecting stock price appreciation, plus the reinvestment of dividends in additional shares of stock, from the beginning of the rTSR Performance Period through the end of the rTSR Performance Period. For purposes of calculating Total Shareholder Return for each of the Company and the members of the Peer Group, the beginning stock price will be based on the average of the twenty (20) trading days immediately prior to the first day of the rTSR Performance Period on the principal stock exchange on which the stock then traded and the ending stock price will be based on the average of the last twenty (20) trading days of the rTSR Performance Period (including the last day of such rTSR Performance Period) on the principal stock exchange on which the stock then trades.
(h)“Volume” shall mean sales volume in short tons by segment (as disclosed in the Company’s public filings with the U.S. Securities and Exchange Commission). In the event third party coal is purchased and resold at the mine or segment level, those sales volumes will be excluded from the calculation. For these purposes, "segment” shall be defined consistently as disclosed in the Company’s public filings with the
U.S. Securities and Exchange Commission. The Company reports its results of operations primarily through the following reportable segments: Seaborne Thermal, Seaborne Metallurgical, Powder River Basin, Other U.S. Thermal and Corporate and Other. For purposes of segment reporting in relation to volumes, Corporate and Other will not be included as a reportable segment.
2.Calculation of Performance Units Earned. Forty percent (40%) of the target Performance Units evidenced by this Agreement (the “FCF Award”) shall be earned based on achievement of Free Cash Flow during the Performance Period, forty percent (40%) of the target Performance Units evidenced by this Agreement (the “Volume Award”) shall be earned based on achievement of Volume during the Performance Period, and twenty percent (20%) of the target Performance Units evidenced by this Agreement (the “ENV Award”) shall be earned based on achievement of Environmental Reclamation during the Performance Period. The Performance Units earned pursuant to the FCF Award, the Volume Award, and the ENV Award shall be subject to adjustment pursuant to Section 4 of this Statement of Performance Goals.
3.Determination Date. Following the Determination Date, the Committee shall determine whether and to what extent the Free Cash Flow, Volume, and Environmental Reclamation goals have been satisfied for the Performance Period and shall determine the percentage of target FCF Award, target Volume Award and target ENV Award that shall be eligible to become Vested under the Agreement, subject to adjustment based on rTSR, in accordance with the following FCF Performance Matrix, Volume Performance Matrix, and Environmental Reclamation Performance Matrix:
(a)FCF Performance Matrix. The percentage of target FCF Award eligible to be earned shall be determined based on achievement of FCF during the Performance Period as follows: To the extent the FCF is between the FCF targets listed in the FCF Performance Matrix, then the percentage of the target FCF Award eligible to be earned shall be determined using linear interpolation.
|
|
|
|
|
|
|
|
|
Performance Level |
FCF for Performance Period |
FCF Award Earned |
Below Threshold |
|
0% |
Threshold |
$[ ]M |
50% |
Target |
$[ ]M |
100% |
Maximum |
$[ ]M |
200% |
(b)Volume Performance Matrix. The percentage of target Volume Award eligible to be earned shall be determined based on achievement of Volume during the Performance Period as follows:
|
|
|
|
|
|
|
|
|
Performance Level |
Volume for Performance Period |
Volume Award Earned |
Below Threshold |
|
0% |
Threshold |
$[ ]M |
50% |
Target |
$[ ]M |
100% |
Maximum |
$[ ]M |
200% |
To the extent the Volume is between the Volume targets listed in the Volume Performance Matrix, then the percentage of the target Volume Award eligible to be earned shall be determined using linear interpolation.
(c)Environmental Reclamation Performance Matrix. The percentage of target ENV Award eligible to be earned shall be determined based on achievement of Environmental Reclamation during the Performance Period (i.e., the average of 2024 ratio and 2025 ratio) as follows:
|
|
|
|
|
|
|
|
|
Performance Level |
Environmental Reclamation for Performance Period |
ENV Award Earned |
Below Threshold |
|
0% |
Threshold |
[ ] |
50% |
Target |
[ ] |
100% |
Maximum |
[ ] |
200% |
To the extent the Environmental Reclamation Percentile Ranking is between the listed rankings, then the percentage of target ENV Award eligible to be earned shall be determined using linear interpolation.
4.rTSR Modifier. Notwithstanding anything in this Statement of Performance Goals to the contrary, the total number of Performance Units that become earned pursuant to Section 2 of this Statement of Performance Goals shall be adjusted, either upwards or downwards, in accordance with the table below in the event that the Company’s rTSR Percentile Ranking for the rTSR Performance Period is as follows:
|
|
|
|
|
|
rTSR Percentile Ranking |
Payout Adjustment |
Less than or equal to 25th percentile |
Decrease payout percentage by 25 percentage points |
Between 25th and 75th percentile |
0% |
Greater than or equal to 75th percentile |
Increase payout percentage by 25 percentage points |
provided, however, that in no event shall the Grantee earn more than 200% of the target number of Performance Units evidenced by this Agreement after the rTSR modifier is applied, and further, provided, that in no event shall the rTSR modifier be applied to increase the total number of Performance Units that become earned pursuant to Section 2 of this Statement of Performance Goals if the Company’s Total Shareholder Return for the rTSR Performance Period is negative.
EXHIBIT A
Peer Group Entities
|
|
|
|
|
|
Index / Ticker |
Company |
| ARLP |
Alliance Resource |
| AMR |
Alpha Metallurgical |
| ARCH |
Arch |
| CEIX |
CONSOL Energy |
| CRN |
Coronado Global Resources |
| HNRG |
Hallador Energy |
| NHC |
New Hope Corporation |
| METC |
Ramaco |
| SOUHY |
South32 |
| HCC |
Warrior Met Coal |
| WHITF |
Whitehaven |
EX-10.73
4
btu_20231231xex1073.htm
EX-10.73
Document
Exhibit 10.73
Form of Restricted Stock Unit Agreement
ELT Level 2024 Award
PEABODY ENERGY CORPORATION 2017 INCENTIVE PLAN
RESTRICTED STOCK UNIT AGREEMENT
THIS RESTRICTED STOCK UNIT AGREEMENT (the “Agreement”), effective as of January 2, 2024, is made by and between PEABODY ENERGY CORPORATION, a Delaware corporation (the “Company”), and the undersigned employee of the Company or a Subsidiary of the Company (the “Grantee”). The Grant Date for the Restricted Stock Units evidenced by this Agreement is January 2, 2024 (the “Grant Date”).
WHEREAS, the Company wishes to carry out the Plan, the terms of which are hereby incorporated by reference and made a part of this Agreement;
WHEREAS, the Company deems it essential to the protection of its confidential information and competitive standing in its market to have its key employees have reasonable restrictive covenants in place;
WHEREAS, the Grantee agrees and acknowledges that the Company has a legitimate interest to protect its confidential information and competitive standing;
WHEREAS, the Company deems it essential to the optimal functioning of its business to have its key employees provide advance notice to the Company of their termination of employment; and
WHEREAS, the Compensation Committee of the Board (the “Committee”) has determined that, subject to the provisions of this Agreement and the Plan, it would be to the advantage and best interest of the Company and its shareholders to grant the Restricted Stock Units evidenced hereby to the Grantee as an incentive for his or her efforts during his or her term of service with the Company or its Subsidiaries or Affiliates, and has advised the Company thereof and instructed the undersigned officer to enter into this Agreement to evidence such Restricted Stock Units.
NOW, THEREFORE, in consideration of the mutual covenants herein contained and other good and valuable consideration, receipt of which is hereby acknowledged, the parties hereby agree as follows:
ARTICLE I
DEFINITIONS
Whenever the following terms are used in this Agreement, they shall have the meanings specified below. Capitalized terms not otherwise defined in this Agreement shall have the meanings specified in the Plan.
Section 1.1 - “Affiliate” shall mean any other Person directly or indirectly controlling, controlled by, or under common control with the Company. For the purposes of this definition, the term “control” (including, with correlative meanings, the terms “controlling”, “controlled by”
#231429265_v2NAI-1509760774v5
and “under common control with”), as applied to any Person, means the possession, directly or indirectly, of the power to direct or cause the direction of the management and policies of that Person, whether through the ownership of voting securities, by contract or otherwise.
Section 1.2 - “Award” shall mean the number of Restricted Stock Units evidenced by this Agreement.
Section 1.3 - “Plan” shall mean the Peabody Energy Corporation 2017 Incentive Plan, as amended or amended and restated from time to time.
Section 1.4 - “Retirement” shall mean, for purposes of this Agreement, a Termination of Service, other than for Cause, death or Disability, on or after reaching age 65 or age 60 with five
(5) years of service with the Company or a Subsidiary.
Section 1.5 - “Section 409A” shall mean Section 409A of the Code and the applicable regulations or other guidance issued thereunder.
ARTICLE II
GRANT OF RESTRICTED STOCK UNITS
Section 2.1 - Grant of Restricted Stock Units. Pursuant to Section 9 of the Plan, the Company has granted to the Grantee an Award consisting of the number of Restricted Stock Units set forth on the signature page hereof upon the terms and subject to the conditions set forth in this Agreement and the Plan. The grant of the Restricted Stock Units was made in consideration of the services to be rendered by the Grantee to the Company and its Subsidiaries and Affiliates and the Grantee’s obligations under the Restrictive Covenant Agreement (as referenced in Article V).
Section 2.2 - No Obligation of Employment. Nothing in this Agreement or in the Plan shall confer upon the Grantee any right to continue in the employ of the Company or any Subsidiary or Affiliate or interfere with or restrict in any way the rights of the Company and its Subsidiaries or Affiliates, which rights are hereby expressly reserved, to terminate the employment of the Grantee at any time for any reason whatsoever, with or without Cause.
Section 2.3 - Adjustments in Restricted Stock Units. In the event of the occurrence of one of the corporate transactions or other events listed in Section 4.2 or 13.2 of the Plan, the Committee shall make such substitution or adjustment as provided in Sections 4.2 or 13.2 of the Plan or otherwise in the terms of the Restricted Stock Units in order to equitably reflect such corporate transaction or other event. Any such adjustment made by the Committee shall be final and binding upon the Grantee, the Company and all other interested persons.
Section 2.4 - Change in Control. In the event of a Change in Control, the treatment of the Restricted Stock Units evidenced hereby will be determined in accordance with the Plan.
ARTICLE III
VESTING AND FORFEITURE OF RESTRICTED STOCK UNITS
Section 3.1 - Normal Vesting. Subject to Sections 2.4, 3.2 and 3.3, the Restricted Stock Units evidenced by this Agreement shall become nonforfeitable and payable to the Grantee pursuant to Article IV as follows:
(a)Retirement-Eligible Grantee. If the Grantee is eligible for Retirement as of the Grant Date, the Restricted Stock Units shall vest in substantially equal installments on each of the quarterly anniversaries of the Grant Date during the period beginning on the Grant Date and ending on the third anniversary of the Grant Date, conditioned upon the Grantee’s continuous employment with the Company or a Subsidiary through each such date.
(b)Non-Retirement-Eligible Grantee. If the Grantee is not eligible for Retirement as of the Grant Date, the Restricted Stock Units shall vest in substantially equal installments on each of the first, second, and third anniversaries of the Grant Date, conditioned upon the Grantee’s continuous employment with the Company or a Subsidiary through each such date.
(c)Special Rule. If the Grantee becomes eligible for Retirement after the Grant Date, the provisions of Section 3.1(a) above shall apply on and after the date the Grantee becomes eligible for Retirement. However, on the first quarterly anniversary of the Grant Date following the date on which the Grantee becomes eligible for Retirement, a portion of the Restricted Stock Units shall vest. Such vesting portion shall equal the result of the following formula: X multiplied by (Y/4), where “X” is equal to one-third of the aggregate number of Restricted Stock Units granted under this Agreement, and “Y” is equal to the number of full calendar quarters that have elapsed between the Grant Date (or the most recent annual anniversary of the Grant Date) and the then current quarterly anniversary of the Grant Date.
(d)Example. The following example of the operation of Sections 3.1(b) and
(c) hereof is for illustrative purposes only. A non-Retirement-eligible individual receives 360 Restricted Stock Units on January 2, 2024. On January 2, 2025, 120 of the Restricted Stock Units vest and become nonforfeitable. On July 1, 2025, such individual becomes eligible for Retirement. Vesting of 60 Restricted Stock Units would occur on July 2, 2025. On October 2, 2025 and each quarterly anniversary of the Grant Date thereafter until January 2, 2027, 30 Restricted Stock Units shall become vested (1/12 of the aggregate grant).
(e)For purposes of this Agreement, “continuously employed” (or substantially similar terms) means the absence of any interruption or termination of the Grantee’s employment with the Company or a Subsidiary. Continuous employment shall not be considered interrupted or terminated in the case of transfers between locations of the Company and its Subsidiaries. Each installment of Restricted Stock Units that becomes nonforfeitable and payable hereunder is a “separate payment” for purposes of Section 409A.
Section 3.2 - Accelerated Vesting Events. Notwithstanding Section 3.1, upon the Grantee’s death or Disability, 100% of the unvested Restricted Stock Units evidenced by this Agreement shall, to the extent not already forfeited, become immediately nonforfeitable and shall be settled in accordance with Article IV below.
Section 3.3 - Effect of Certain Terminations of Service. The Grantee will forfeit any and all unvested Restricted Stock Units upon (a) the Grantee’s voluntary Termination of Service, (b) the Grantee’s Termination of Service by the Company or a Subsidiary for Cause, or (c) subject to Section 2.4, the Grantee’s Termination of Service by the Company or a Subsidiary without Cause.
ARTICLE IV
SETTLEMENT OF RESTRICTED STOCK UNITS
Section 4.1 - Settlement of Vested Restricted Stock Units. Subject to Sections 4.2 and
13.2 of the Plan and the exception set forth in Section 4.2 of this Agreement, as well as to any withholding obligations described in Section 6.3 of this Agreement, one Share will be issued or delivered for each nonforfeitable Restricted Stock Unit evidenced by this Agreement as soon as practicable following the date on which the Restricted Stock Unit becomes nonforfeitable as set forth in Section 3.1 or Section 3.2, as applicable, but in all cases within the “short term deferral” period determined under Treasury Regulation Section 1.409A-1(b)(4). For the sake of clarity, the settlement of Shares in respect of nonforfeitable Restricted Stock Units is intended to comply with Treasury Regulation Section 1.409A-1(b)(4) and will be construed and administered in such a manner. As a result, the Shares will be issued no later than the date that is the 15th day of the third calendar month of the applicable year following the year in which the Shares subject to the Restricted Stock Units are no longer subject to a “substantial risk of forfeiture” within the meaning of Treasury Regulation Section 1.409A-1(d).
Section 4.2 - Settlement of Restricted Stock Units Vested in Accordance with Section 3.1(a). Notwithstanding Section 4.1 of this Agreement, if the Grantee is eligible for Retirement as of the Grant Date or becomes eligible pursuant to Section 3.1(c) and the Restricted Stock Units vest in substantially equal installments on each of the quarterly anniversaries of the Grant Date pursuant to Section 3.1(a) or 3.1(c), the Shares underlying the vested Restricted Stock Units shall be issued or delivered upon the earlier of (a) each of the first, second, and third year anniversaries of the Grant Date on or immediately following the quarterly vesting dates and (b) as soon as practicable following Retirement, but in all cases within the “short term deferral” period determined under U.S. Treasury Regulation Section 1.409A-1(b)(4) as described in Section 4.1 of this Agreement.
Section 4.3 - Forfeiture of Unvested Restricted Stock Units. To the extent that the Grantee does not vest in all or any portion of the Restricted Stock Units subject to the Award, all interest in such unvested Restricted Stock Units shall be forfeited upon the Grantee’s Termination of Service. The Grantee has no right or interest in any Restricted Stock Unit that is forfeited.
Section 4.4 - Treatment of Fractional Restricted Stock Units. Notwithstanding anything in this Agreement to the contrary, in the event that any fractional Restricted Stock Unit is produced under the terms of the Plan or this Agreement, immediately prior to payment thereof, such fractional Restricted Stock Unit shall be rounded to the nearest whole Restricted Stock Unit; as a result, there will be no fractional Restricted Stock Units to settle under this Agreement.
ARTICLE V
CONDITION TO GRANT OF AWARD; OTHER PROVISIONS
Section 5.1 - Restrictive Covenant Agreement. The Grantee shall not be entitled to receive the Award unless the Grantee shall have executed and delivered the Restrictive Covenant Agreement, substantially in the form attached hereto as Exhibit A, and such shall be in full force and effect. Nothing in this Agreement or the Restrictive Covenant Agreement prevents the Grantee from providing, without prior notice to the Company, information to governmental authorities regarding possible legal violations or otherwise testifying or participating in any investigation or proceeding by any governmental authorities regarding possible legal violations, and for purpose of clarity the Grantee is not prohibited from providing information voluntarily to the Securities and Exchange Commission pursuant to Section 21F of the Exchange Act.
Section 5.2 - Notice Period. The Grantee may terminate the Grantee’s employment with the Company or a Subsidiary at any time for any reason by delivery of notice to the Company at least ninety (90) days in advance of the date of termination (the “Notice Period”); provided, however, that no communication, statement or announcement shall be considered to constitute such notice of termination of the Grantee’s employment unless it complies with Section 6.4 hereof and specifically recites that it is a notice of termination of employment for purposes of this Agreement; and provided, further, that the Company may waive any or all of the Notice Period, in which case the Grantee’s employment with the Company or a Subsidiary or Affiliate will terminate on the date determined by the Company.
Section 5.3 - Breach of Restrictive Covenant Agreement or Section 5.2. Subject to Section 5.1, if the Grantee materially breaches any provision of the Restrictive Covenant Agreement or Section 5.2 hereof, the Company may, among other available remedies, determine that the Grantee (a) will forfeit any unpaid portion of the Restricted Stock Units evidenced by this Agreement and (b) will repay to the Company any portion of the Restricted Stock Units evidenced by this Agreement previously paid to the Grantee.
Section 5.4 - Conditions to Issuance of Shares. The Shares deliverable hereunder may be either previously authorized but unissued Shares or issued Shares that have been reacquired by the Company. Such Shares shall be fully paid and nonassessable. The Company shall not be required to issue or deliver any certificate or certificates (or other documentation that indicates ownership) for Shares paid hereunder prior to the fulfillment of both of the following conditions:
(a)The obtaining of approval or other clearance from any state or federal governmental agency that the Committee, in its absolute discretion, determines to be necessary or advisable; and
(b)The lapse of such reasonable period of time following the grant as the Committee may establish from time to time for administrative convenience (subject to, and in compliance with the requirements of Section 409A, including any requirements necessary to comply with Treasury Regulation Section 1.409A-1(b)(4)).
Section 5.5 - Rights as a Shareholder; Dividend Equivalents. The Grantee shall not be, and shall not have any of the rights or privileges of, a shareholder of the Company in respect of any Shares underlying Restricted Stock Units evidenced by this Agreement unless and until certificates representing such Shares shall have been issued by the Company to the Grantee or such ownership has otherwise been indicated and documented by the Company.
From and after the Grant Date and until the earlier of (a) the time when the Restricted Stock Units become nonforfeitable and are paid in accordance with Article IV hereof or (b) the time when the Grantee’s right to receive payment for the Restricted Stock Units is forfeited in accordance with the provisions of this Agreement, on the date that the Company pays a cash dividend (if any) to holders of Shares generally, the Grantee shall be credited with a number of additional Restricted Stock Units (which need not be a whole number) equal to the quotient of (x) the product of (i) the dividend declared per Share multiplied by (ii) the applicable number of Restricted Stock Units that remain subject to this Agreement (including any Restricted Stock Units representing previously- credited Dividend Equivalents), divided by (y) the Fair Market Value of a Share on the date such dividend is paid to shareholders. Any amounts credited pursuant to the immediately preceding sentence shall be subject to the same applicable terms and conditions (including vesting, payment and forfeitability) as apply to the Restricted Stock Units based on which the Dividend Equivalents were credited, and such additional Restricted Stock Units (rounded to the nearest whole Restricted Stock Unit) shall be paid in Shares at the same time as the Restricted Stock Units to which they relate are paid.
Section 5.6 - Restrictions. Restricted Stock Units granted pursuant to this Agreement shall be subject to Section 5.9 of the Plan and all applicable policies and guidelines of the Company that relate to (a) share ownership requirements, or (b) recovery of compensation (i.e., clawbacks).
ARTICLE VI
MISCELLANEOUS
Section 6.1 - Administration. The Committee has the power to interpret the terms of the Restricted Stock Units, the Plan and this Agreement and to adopt such rules for the administration, interpretation and application of the Plan as are consistent therewith and to interpret or revoke any such rules. All actions taken and all interpretations and determinations made by the Committee shall be final and binding upon the Grantee, the Company and all other interested persons. No member of the Committee shall be personally liable for any action, determination or interpretation made in good faith with respect to the Plan or the Restricted Stock Units. In its absolute discretion, the Board may at any time and from time to time exercise any and all rights and duties of the Committee under the Plan and this Agreement.
Section 6.2 - Restricted Stock Units Not Transferable. Neither the Restricted Stock Units nor any interest or right therein or part thereof shall be liable for the debts, contracts or engagements of the Grantee or his or her successors in interest or shall be subject to disposition by transfer, alienation, anticipation, pledge, encumbrance, assignment or any other means whether such disposition is voluntary or involuntary or by operation of law by judgment, levy, attachment, garnishment or any other legal or equitable proceedings (including bankruptcy), and any attempted disposition thereof shall be null and void and of no effect; provided, however, that this Section 6.2 shall not prevent transfers by will or by the applicable laws of descent and distribution.
Section 6.3 - Withholding. As of the date that all or a portion of the Restricted Stock Units become settled pursuant to Section 4.1 or 4.2 hereof, the Company will, on a mandatory basis in accordance with Section 16.1(a) of the Plan, withhold a number of Shares underlying the then vested Restricted Stock Units with a fair market value equal to the aggregate amount required by law to be withheld by the Company in connection with such vesting for applicable federal, state, local and foreign taxes of any kind.
To the extent taxes are to be withheld upon vesting for purposes of federal FICA, FUTA or Medicare taxes, such withholding shall be taken from other income owed by the Company to the Grantee and the Grantee hereby agrees to such withholding. For all purposes, the amount withheld by the Company pursuant to this Section 6.3 shall be deemed to have first been paid to the Grantee.
Section 6.4 - Notices. Any notice to be given under the terms of this Agreement to the Company shall be provided to the Chief Administrative Officer and Corporate Secretary, with a copy to the Grantee’s supervisor, and any notice to be given to the Grantee shall be addressed to him or her at the address set forth in the records of the Company. By a notice given pursuant to this Section 6.4, either party may hereafter designate a different address for notices to be given to him, her or it. Any notice which is required to be given to the Grantee shall, if the Grantee is then deceased, be given to the Grantee’s personal representative if such representative has previously informed the Company of his, her or its status and address by written notice under this Section 6.4. Any notice shall be deemed duly given when enclosed in a properly sealed envelope or wrapper addressed as aforesaid, deposited (with postage prepaid) in a post office or branch post office regularly maintained by the United States Postal Service. Notwithstanding the foregoing, any notice required or permitted hereunder from the Company to the Grantee may be made by electronic means, including by electronic mail to the Company-maintained electronic mailbox of the Grantee, and the Grantee hereby consents to receive such notice by electronic delivery. To the extent permitted in an electronically delivered notice described in the previous sentence, the Grantee shall be permitted to respond to such notice or communication by way of a responsive electronic communication, including by electronic mail.
Section 6.5 - Titles. Titles are provided herein for convenience only and are not to serve as a basis for interpretation or construction of this Agreement.
Section 6.6 - Pronouns. The masculine pronoun shall include the feminine and neuter, and the singular the plural, where the context so indicates.
Section 6.7 - Applicability of Plan. The Restricted Stock Units and the Shares issued to the Grantee, if any, shall be subject to all of the terms and provisions of the Plan, to the extent applicable to the Restricted Stock Units and such Shares. In the event of any conflict between this Agreement and the Plan, the terms of the Plan shall control.
Section 6.8 - Amendment. The Committee may amend this Agreement at any time, provided that no such amendment shall materially impair the rights of the Grantee unless reflected in a writing executed by the parties hereto that specifically states that it is amending this Agreement.
Section 6.9 - Severability. The invalidity or unenforceability of any provision of the Plan or this Agreement shall not affect the validity or enforceability of any other provision of the Plan or this Agreement, and each provision of the Plan and this Agreement shall be severable and enforceable to the extent permitted by law.
Section 6.10 - Dispute Resolution. Any dispute or controversy arising under or in connection with this Agreement shall be resolved by arbitration in St. Louis, Missouri. Arbitrators shall be selected, and arbitration shall be conducted, in accordance with the rules of the American Arbitration Association.
The Company shall pay or reimburse any legal fees in connection with such arbitration in the event that the Grantee prevails on a material element of his or her claim or defense. Payments or reimbursements of legal fees made under this Section 6.10 that are provided during one calendar year shall not affect the amount of such payments or reimbursements provided during a subsequent calendar year, payments or reimbursements under this Section 6.10 may not be exchanged or substituted for another form of compensation to the Grantee, and any such reimbursement or payment will be paid within 60 days after the Grantee prevails, but in no event later than the last day of the Grantee’s taxable year following the taxable year in which he incurred the expense giving rise to such reimbursement or payment. This Section 6.10 shall remain in effect throughout the Grantee’s employment with the Company or any Subsidiary and for a period of five (5) years following the Grantee’s Termination of Service.
Section 6.11 - Section 409A.
(a)The Award is intended to comply with the “short-term deferral” rule set forth in Treasury Regulation Section 1.409A-1(b)(4) and, to the maximum extent permitted, this Agreement shall be construed and administered consistent with such intent. Notwithstanding anything contained herein to the contrary, if the Award fails to satisfy the requirements of the short-term deferral rule and is otherwise not exempt from, and therefore deemed to be deferred compensation subject to, Section 409A, references in this Agreement (including in Section 4.1), to payment or settlement of amounts under this Agreement within the “short-term deferral” period determined under Treasury Regulation Section 1.409A-1(b)(4), shall not apply, and instead payments will be made on the applicable payment date or a later date within the same taxable year of the Grantee, or if such timing is administratively impracticable, by the 15th day of the third calendar month following the date specified herein. For clarity, the Grantee is not permitted to designate the taxable year of payment. Notwithstanding anything contained herein to the contrary, if the Grantee is a “specified employee” (within the meaning set forth Section 409A(a)(2)(B)(i) of the Code) as of the date of the Grantee’s “separation from service” (within the meaning of Treasury Regulation Section 1.409A-1(h)), then the issuance of any Shares that would otherwise be made on the date of the separation from service or within the first six months thereafter will not be made on the originally scheduled dates and will instead be issued in a lump sum on the date that is six months and one day after the date of the separation from service (or upon death, if earlier), with the balance of the Shares issued thereafter in accordance with the original vesting and issuance schedule set forth above, but if and only if such delay in the issuance of the Shares is necessary to avoid the imposition of taxation in respect of the Shares under Section 409A. A termination of employment or service shall not be deemed to have occurred for purposes of this Agreement providing for the payment of any amounts that are considered deferred compensation under Section 409A upon or following a termination of employment or service, unless such termination is also a “separation from service” (within the meaning of Treasury Regulation Section 1.409A-1(h)) and the payment thereof prior to a “separation from service” would violate Section 409A. Each installment of Shares that becomes payable in respect of vested Restricted Stock Units subject to the Award is a “separate payment” for purposes of Treasury Regulation Section 1.409A-2(b)(2). In no event shall the Company be liable for all or any portion of any taxes, penalties, interest or other expenses that may be incurred by the Grantee on account of Section 409A.
(b)In the event that the Company determines that any amounts payable hereunder may be taxable to the Grantee under Section 409A prior to the payment and/or delivery to the Grantee of such amount, the Committee may adopt such amendments to the Agreement, and appropriate policies and procedures, including amendments and policies with retroactive effect, that the Committee determines necessary or appropriate to preserve the intended tax treatment of the benefits provided by the Restricted Stock Units and this Agreement.
(c)Notwithstanding any provision of this Agreement to the contrary, in light of the uncertainty with respect to the proper application of Section 409A, the Company reserves the right to make amendments to this Agreement and the terms of the Restricted Stock Units as the Company deems necessary or desirable to avoid the imposition of taxes or penalties under Section 409A. In any case, neither the Company nor any of its affiliates will have any obligation to indemnify or otherwise hold the Grantee harmless from any or all of such taxes or penalties.
Section 6.12 - Governing Law. The laws of the State of Delaware shall govern the interpretation, validity and performance of the terms of this Agreement regardless of the law that might be applied under principles of conflicts of laws.
Section 6.13 - Counterparts. This Agreement may be executed in counterparts, each of which shall be deemed an original but all of which together will constitute one and the same instrument. Counterpart signatures to this Agreement transmitted by facsimile, electronic mail, or by any other electronic means intended to preserve the original graphic and pictorial appearance of a document, will have the same effect as physical delivery of the paper document bearing an original signature.
Section 6.14 - Acceptance of the Plan. The Grantee hereby acknowledges receipt of a copy of the Plan and this Agreement. The Grantee has read and understands the terms and provisions thereof, and accepts the Restricted Stock Units subject to all the terms and conditions of the Plan and this Agreement. The Grantee acknowledges that there may be adverse tax consequences upon the vesting or settlement of the Restricted Stock Units and that the Grantee has been advised to consult a tax advisor prior to such vesting or settlement.
[SIGNATURE PAGE FOLLOWS]
IN WITNESS WHEREOF, this Agreement has been executed and delivered by the parties hereto.
PEABODY ENERGY CORPORATION

Scott T. Jarboe
Chief Administrative Officer & Corporate Secretary
Note: The Grantee is deemed to have executed this Agreement upon clicking “Accept” in the Plan’s online administration site.
EXHIBIT A
RESTRICTIVE COVENANT AGREEMENT
THIS RESTRICTIVE COVENANT AGREEMENT (the “RCA”) dated January 2, 2024, is by
and between PEABODY ENERGY CORPORATION, a Delaware corporation (the “Company”), and (“Grantee”).
WHEREAS, Grantee is a recipient of a 2024 Restricted Stock Unit Grant (the “Award”) under the Company’s Peabody Energy Corporation 2017 Incentive Plan, as amended from time to time (the “Plan”);
WHEREAS, Grantee acknowledges and agrees that he or she has access to and/or knowledge of certain trade secrets and other Confidential Information regarding the Company;
WHEREAS, the Company has spent and will continue to expend substantial amounts of time, money, and effort to develop its Confidential Information and Grantee acknowledges benefitting from these efforts;
WHEREAS, the Company deems it essential to the protection of its Confidential Information and competitive standing in its market to have recipients of Awards subject to reasonable restrictive covenants;
WHEREAS, Grantee agrees and acknowledges that the Company has a legitimate interest to protect its confidential information and competitive standing; and
NOW THEREFORE, in consideration for the provisions stated below, and intending to be legally bonded thereby, the parties agree as follows.
1.Grantee has been informed and is aware that the execution of this RCA is a necessary term and condition of Grantee’s receipt of the Award.
2.The term “Confidential Information” as used in this RCA shall be broadly interpreted to include, without limitation, materials and information (whether in written, electronic or other form and whether or not identified as confidential at the time of disclosure) concerning technical matters, business matters, business plans, operations, opportunities, plans, processes, procedures, standards, strategies, policies, programs, software, schematics, models, systems, results, studies, analyses, compilations, forecasts, data, figures, projections, estimates, components, records, methods, criteria, designs, quality control, research, samples, work-in- progress, prototypes, data, materials, clients and prospective clients, customer lists, contracts, projects, suppliers, referral sources, sales, marketing, bidding, purchasing, personnel, financial condition, assets, inventory, accounts payable, accounts receivable, tax matters, books of account, financing, collections, intellectual property, trade secrets and all other know-how and information of the Company or any subsidiary of the Company which has not been published or disclosed to the general public.
a.While employed by the Company and at all times thereafter, Grantee will keep Confidential Information, including trade secrets, confidential and shall not, directly or indirectly, use for himself or herself or use for, or disclose to, any party other than the Company, or any subsidiary of the Company (other than in the ordinary course of Grantee’s duties for the benefit of the Company or any subsidiary of the Company), any Confidential Information.
b.At the termination of Grantee’s employment or at any other reasonable time the Company or any of its subsidiaries may request, Grantee shall promptly deliver to the Company all memoranda, notes, records, plats, sketches, plans or other documents (including, without limitation, any “soft” copies or computerized or electronic versions thereof) containing Confidential Information, including trade secrets or any other information concerning Company’s business, including all copies, then in Grantee’s possession or under Grantee’s control whether prepared by Grantee or others.
c.Notwithstanding the foregoing paragraphs, Company employees, contractors, and consultants may disclose trade secrets in confidence, either directly or indirectly, to a Federal, State or local government official or to an attorney, solely for the purpose of reporting or investigating a suspected violation of law, or in a complaint or other document filed in a lawsuit or other proceeding if such filing is made under seal. Additionally, Company employees, contractors, and consultants who file retaliation suits for reporting a suspected violation of law may disclose related trade secrets to their attorney and use them in related court proceedings, as long as the individual files documents containing the trade secret under seal and does not otherwise disclose the trade secret except pursuant to Court Order.
3.In consideration of the Company’s obligations under the Restricted Stock Unit Agreement (the “Agreement”), Grantee agrees that while employed by the Company and for a period of twelve (12) months thereafter, without the prior written consent of the Board of Directors of the Company (the “Board”), he or she shall not, directly or indirectly, as principal, manager, agent, consultant, officer, director, stockholder, partner, investor, lender or employee or in any other capacity, carry on, be engaged in or have any financial interest in, any entity which is in competition with the business of the Company or its subsidiaries.
4.In consideration of the Company’s obligations under the Agreement, Grantee agrees that while employed by the Company and for a period of twelve (12) months thereafter, without the prior written consent of the Board, he or she shall not, on his or her own behalf or on behalf of any person, firm or company, directly or indirectly, (a) solicit or offer employment to or hire any person who is or has been employed by the Company or its subsidiaries at any time during the twelve (12) months immediately preceding such solicitation or (b) solicit or entice away or in any manner attempt to persuade any client, vendor, partner, customer or prospective customer of the Company to discontinue or diminish his, her or its relationship or prospective relationship with the Company or to otherwise provide his, her or its business to any corporation, partnership or other business entity which engages in any line of business in which the Company is engaged (other than the Company).
5.For purposes of this RCA, an entity shall be deemed to be in competition with the Company if it enters into or engages in any business or activity that substantially and directly competes with the business of the Company. For purposes of this paragraph 5, the business of the Company is defined to be: development of new thermal and metallurgical mines, active metallurgical and thermal coal mining, preparation and sale; the marketing, brokering and trading of metallurgical and thermal coal; and the optimization of our metallurgical and thermal coal reserves; in each case by the Company and its direct and indirect subsidiaries or affiliated or related companies. Notwithstanding this paragraph 5 or paragraph 8, nothing herein shall be construed so as to preclude Grantee from investing in any publicly or privately held company, provided that no such investment in the equity securities of an entity with publicly traded equity securities may exceed one percent (1%) of the equity of such entity, and no such investment in any other entity may exceed five percent (5%) of the equity of such entity, without the prior written approval of the Board.
6.Grantee agrees that he or she will not at any time make, directly or indirectly, any negative, derogatory, disparaging or defamatory comment, whether written, oral or in electronic format, to any reporter, author, producer or similar person or entity or to any general public media in any form (including, without limitation, books, articles or writings of any other kind, as well as film, videotape, audio tape, computer/Internet format or any other medium) that concerns directly or indirectly the Company its business or operations, or any of its current or former agents, employees, officers, directors, customers or clients. Grantee understands that nothing in this section or this RCA limits Grantee’s ability to communicate with any government agencies or otherwise participate or cooperate with an investigation conducted by the Equal Employment Opportunity Commission, the Securities and Exchange Commission, or other similar agency, including providing documents or other information, without notice to the Company.
7.Upon the termination of Grantee’s employment for any reason, Grantee or his or her estate shall surrender to the Company all correspondence, letters, files, contracts, mailing lists, customer lists, advertising materials, ledgers, supplies, equipment, checks, and all other materials and records of any kind that are the property of the Company or any of its subsidiaries or affiliates, that may be in Grantee’s possession or under his control, including, without limitation, any “soft” copies or computerized or electronic versions thereof.
8.Grantee agrees that the covenant not to compete, the covenants not to solicit and the covenant not to make disparaging comments are reasonable under the circumstances and will not interfere with his or her ability to earn a living or otherwise to meet his or her financial obligations. Grantee and the Company agree that if in the opinion of any court of competent jurisdiction such restraint is not reasonable in any respect, such court shall have the right, power and authority to excise or modify such provision or provisions of this covenant which appear unreasonable and to enforce the remainder of the covenant as so amended. Grantee agrees that any breach of the covenants contained in this RCA would irreparably injure the Company. Accordingly, Grantee agrees that, in the event that Grantee violates this RCA, the Company may, in addition to pursuing any other remedies it may have in law or in equity, cease making any payments otherwise required under the agreements evidencing the Award, cancel and recoup any portion of the Award already paid to the extent required by law, regulation or listing requirement, or permitted by any Company policy adopted pursuant thereto. The Company may also seek an injunction against Grantee from any court having jurisdiction over the matter restraining any further violation of this RCA by Grantee.
9.No waiver or modification of all or any part of this RCA will be effective unless set forth in a written document signed by both the Company and Grantee expressly indicating their intention to waive or modify the specified provisions of this RCA. If the Company chooses not to enforce its rights in the event Grantee or any other recipient of an Award breaches some or all of the terms of this RCA, the Company’s rights with respect to any such breach shall not be considered a waiver of a future breach by Grantee of this RCA, regardless of whether the breach is of a similar nature or not.
10.This RCA accurately sets forth and entirely sets forth the understandings reached between Grantee and the Company with respect to the matters treated herein. If there are any prior written or oral understandings or agreements pertaining to the subject matter addressed in this RCA, they are specifically superseded by this RCA and have no effect, except, should Grantee be subject to non-compete and non-solicitation obligations (“Restrictive Covenants”) pursuant to an employment agreement or other agreement between Grantee and Company or one of its subsidiaries or affiliates, Grantee shall continue to be bound by the terms of those Restrictive Covenants and they shall run concurrently with those set forth in this RCA. This RCA is binding on Grantee and the Company, and our respective successors, assigns and representatives.
11.Because of Company’s and Grantee’s substantial contacts with the State of Missouri, the fact that Company’s headquarters is located in Missouri, the parties’ interests in ensuring that disputes regarding the interpretation, validity, and enforceability of this RCA are resolved on a uniform basis, and Company’s making and execution of this Agreement in Missouri, the parties agree that the RCA shall be interpreted and governed by the laws of the State of Missouri, without regard for any conflict of law principles. The parties agree that the exclusive venue and jurisdiction for any litigation concerning or arising out of or based on this RCA shall be the federal and state courts located in Missouri. The parties expressly consent to the personal jurisdiction and venue of said courts. The provisions of this paragraph shall not restrict the ability of Company or Grantee to enforce in any court any judgment obtained in Missouri federal or state court.
[SIGNATURE PAGE FOLLOWS]
IN WITNESS WHEREOF, this RC A has been executed and delivered by the parties hereto.
PEABODY ENERGY CORPORATION
Scott T. Jarboe
Chief Administrative Officer & Corporate Secretary
Note: Grantee is deemed to have executed this Agreement upon clicking “Accept” in the Plan’s online administration site.
EX-10.74
5
btu_20231231xex1074.htm
EX-10.74
Document
Exhibit 10.74
Service-Based Cash Award Agreement (US Employees)
2024 Grant - ELT
SERVICE-BASED CASH AWARD AGREEMENT
THIS SERVICE-BASED CASH AWARD AGREEMENT (the “Agreement”),
effective January 2, 2024 (the “Agreement Date”), is made by and between PEABODY ENERGY CORPORATION, a Delaware corporation (the “Company”), and the undersigned employee of the Company or a Subsidiary who accepts this Agreement in the Plan’s online administration site using the Company’s online acceptance procedures (the “Grantee”). The grant date for this Cash Award is January 2, 2024 (the “Grant Date”).
WHEREAS, the Committee has determined that, subject to the provisions of this Agreement, it would be to the advantage and best interest of the Company and its stockholders to grant the opportunity to earn the service-based cash award provided for herein to the Grantee as an incentive for his or her efforts during his or her service with the Company or its Subsidiaries, and has advised the Company thereof and instructed the undersigned officer to enter into this Agreement to evidence this Cash Award opportunity;
WHEREAS, the Company deems it essential to the protection of its confidential information and competitive standing in its market to have its officers and executives have reasonable restrictive covenants in place;
WHEREAS, Grantee agrees and acknowledges that the Company has a legitimate interest to protect its confidential information and competitive standing; and
WHEREAS, the Company deems it essential to the optimal functioning of its business to have its officers and executives provide advance notice to the Company of their termination of employment.
NOW, THEREFORE, in consideration of the mutual covenants herein contained and other good and valuable consideration, receipt of which is hereby acknowledged, the parties hereby agree as follows:
ARTICLE I.
DEFINITIONS
Whenever the following terms are used in this Agreement, they shall have the meanings specified below. Capitalized terms not otherwise defined in this Agreement shall have the meanings specified in the Plan.
Section 1.1- “Board” means the Board of Directors of the Company.
Section 1.2- “Cash Award” shall mean the service-based cash award opportunity provided by the Company to the Grantee as evidenced by this Agreement.
Section 1.3- “Cause” shall mean (a) “Cause” as defined in the Grantee’s employment agreement with the Company, if any; or (b) if the Grantee does not have an employment agreement with the Company or such agreement does not define “Cause,” then: (i) any willful fraud, dishonesty or misconduct of the Grantee that can reasonably be expected to have a detrimental effect on (A) the reputation or business of the Company or any of its subsidiaries or affiliates or (B) the Grantee’s reputation or performance of his or her duties to the Company or any of its subsidiaries or affiliates; (ii) willful refusal or failure of the Grantee to comply with the Company’s Code of Business Conduct and Ethics, the Company’s Anti-Corruption and Bribery policy or any other material corporate policy of the Company; (iii) the Grantee’s willful or repeated failure to meet documented performance objectives or to perform his or her duties or to follow reasonable and lawful directives of his or her manager (other than due to death or Disability); (iv) the Grantee’s conviction of, or plea of nolo contendere to (A) any felony, or (B) any other criminal charge that may reasonably be expected to have a material detrimental effect on the reputation or business of the Company or any of its subsidiaries or affiliates; or (v) the Grantee’s willful failure to cooperate with a bona fide internal investigation or an investigation by regulatory or law enforcement authorities, whether or not related to the Grantee’s employment with the Company, after being instructed to cooperate by the Chairman of the Board and/or Company’s Chief Executive Officer or by the Board, or the willful destruction of or willful failure to preserve documents or other material known to be relevant to any such investigation; provided, that with respect to clause (ii) or (iii) above, the Grantee shall have 15 business days following written notice of the conduct which is the basis for the potential termination for “Cause” within which to cure such conduct, to the extent it can be cured, to prevent termination for “Cause” by the Company, and if the Grantee cures the conduct that is the basis for the potential termination for “Cause” within such period, the Company’s notice of termination shall be deemed withdrawn.
Section 1.4- “Change in Control” shall mean the occurrence of any one or more of the following: (a) any corporation, person or other entity (other than the Company, a majority-owned subsidiary of the Company or any of its Subsidiaries, or an employee benefit plan (or related trust) sponsored or maintained by the Company or any of its Subsidiaries), including a “group” as defined in Section 13(d)(3) of the Securities Exchange Act of 1934, as amended, becomes the beneficial owner of stock representing more than fifty percent (50%) of the combined voting power of the Company’s then outstanding securities; (b) there is consummated (i) a merger, consolidation, plan of arrangement, reorganization or similar transaction or series of transactions in which the Company is involved, other than such a transaction or series of transactions which would result in the shareholders of the Company immediately prior thereto continuing to own (either by remaining outstanding or by being converted into voting securities of the surviving entity) more than fifty percent (50%) of the combined voting power of the securities of the Company or such surviving entity (or the parent, if any) outstanding immediately after such transaction(s) in substantially the same proportions as their ownership immediately prior to such transaction(s); (ii) a sale or other disposition of all or substantially all of the Company’s assets; or
(iii) approval by the Company’s shareholders of a plan of liquidation of the Company; or (c) within any period of 24 consecutive months, persons who were members of the Board immediately prior to such 24-month period, together with persons who were first elected as directors (other than as a result of any settlement of a proxy or consent solicitation contest or any action taken to avoid such a contest) during such 24-month period by or upon the recommendation of persons who were members of the Board immediately prior to such 24-month period and who constituted a majority of the Board at the time of such election, cease to constitute a majority of the Board; provided, however, that to the extent this Cash Award is subject to liability under Code Section 409A and does not qualify for an exemption from Code Section 409A coverage, a Change in Control shall include any event or series of events described in the foregoing provisions of this Section 1.4, but only to the extent such event or series of events also constitutes a “change of control event” (as described in Treasury Regulation Section 1.409A-3(i)(5)(i)) with respect to the Company.
Section 1.5- “Code” shall mean the Internal Revenue Code of 1986 (and any successor thereto), as amended from time to time. References to a particular section of the Code include references to regulations and rulings thereunder and to successor provisions.
Section 1.6- “Committee” shall mean the Compensation Committee of the Board.
Section 1.7- “Disability” shall mean a mental or physical illness that entitles the Grantee to receive benefits under the long-term disability plan of the Company or any Subsidiary, or if the Grantee is not covered by such a plan or the Grantee is not an employee of the Company or any Subsidiary, a mental or physical illness that renders a Grantee totally and permanently incapable of performing the Grantee’s duties for the Company or a Subsidiary. Notwithstanding the foregoing: (a) a Disability shall not qualify if it is the result of (i) a willfully self-inflicted injury or willfully self-induced sickness; or (ii) an injury or disease contracted, suffered, or incurred while participating in a felony criminal offense; and (b) with respect to this Cash Award if it is subject to liability under Code Section 409A and does not qualify for an exemption from Code Section 409A coverage, Disability shall mean a Grantee’s inability to engage in any substantial gainful activity by reason of any medically determinable physical or mental impairment that can be expected to result in death or can be expected to last for a continuous period of not less than 12 months.
Section 1.8- “Good Reason” shall mean (a) “Good Reason” as defined in the Grantee’s employment agreement with the Company, if any; or (b) if the Grantee does not have an employment agreement with the Company or such agreement does not define Good Reason, then:
(i) a reduction, other than a reduction that generally affects all similarly-situated executives and does not exceed 10% in one year or 20% in the aggregate over three consecutive years, by the Company in the Grantee’s base salary from that in effect immediately prior to the reduction; (ii) a material reduction, other than a reduction that generally affects all similarly-situated executives, by the Company in the Grantee’s target or maximum annual cash incentive award opportunity or target or maximum annual equity-based compensation award opportunity from those in effect immediately prior to any such reduction; (iii) relocation, other than through mutual agreement in writing between the Company and the Grantee or a secondment or temporary relocation for a reasonably finite period of time, of the Grantee’s primary office by more than 50 miles from the location of the Grantee’s primary office as of the Agreement Date; or (iv) any material diminution or material adverse change in the Grantee’s duties or responsibilities as they exist as of the Agreement Date (other than any diminution or change during a period of mental or physical incapacity); provided, that (x) if the Grantee terminates Grantee’s employment for “Good Reason,” the Grantee shall provide written notice to the Company at least 30 days in advance of the date of termination, such notice shall describe the conduct the Grantee believes to constitute “Good Reason” and the Company shall have the opportunity to cure the “Good Reason” within 30 days after receiving such notice, (y) if the Company cures the conduct that is the basis for the potential termination for “Good Reason” within such 30-day period, the Grantee’s notice of termination shall be deemed withdrawn and (z) if the Grantee does not give notice to the Company as described in this Section 1.8 within 90 days after an event giving rise to “Good Reason,” the Grantee’s right to claim “Good Reason” termination on the basis of such event shall be deemed waived.
Section 1.9- “Person” shall mean any individual, sole proprietorship, corporation, partnership, joint venture, limited liability company, association, joint-stock company, trust, unincorporated organization, institution, public benefit corporation, entity or government instrumentality, division, agency, body or department.
Section 1.10- “Plan” shall mean the Peabody Energy Corporation 2017 Incentive Plan, as in effect on the Agreement Date.
Section 1.11- “Retirement” shall mean a Termination of Service on or after age sixty-five
(65) or age sixty (60) with at least five (5) years of service with the Company.
Section 1.12- “Section 409A” shall mean Section 409A of the Code and the applicable regulations or other guidance issued thereunder.
Section 1.13- “Subsidiary” shall mean any Person that directly, or through one (1) or more intermediaries, is controlled by the Company and that would be treated as a single employer with the Company under Sections 414(b) and 414(c) of the Code if the language “at least 50 percent” is used instead of “at least 80 percent” each place it appears in Code Sections 1563(a)(1), (2) and
(3) and Treasury Regulation Section 1.414(c)-2.
Section 1.14- “Termination of Service” occurs (a) on the first day on which an individual is for any reason no longer providing services to the Company or a Subsidiary in the capacity of an employee, director or consultant or (b) with respect to an individual who is an employee or consultant to a Subsidiary, the first day on which such entity ceases to be a Subsidiary of the Company and such individual is no longer providing services to the Company or another Subsidiary; provided, that the Committee shall have the discretion to determine when a Grantee, who terminates services as an employee, but continues to provide services in the capacity of a consultant immediately following such termination, has incurred a Termination of Service. Notwithstanding the foregoing, in the case of this Cash Award if it is subject to liability under Code Section 409A and does not qualify for an exemption from Code Section 409A coverage, a Termination of Service shall only occur at the time of the Grantee’s “separation from service” with the Company within the meaning of Code Section 409A or as otherwise set forth in this Agreement or a deferral election form.
ARTICLE II. GRANT OF CASH AWARD
Section 2.1- Grant of Cash Award. The Company has granted to the Grantee on the Grant Date this Cash Award with respect to the cash amount set forth on the signature page hereto. The grant of the Cash Award has been made in consideration of the services to be rendered by the Grantee to the Company and its Subsidiaries or affiliates and the Grantee’s obligations under the Restrictive Covenant Agreement (as referenced in Article V).
Section 2.2- No Obligation of Employment. Nothing in this Agreement shall confer upon the Grantee any right to continue in the employ of the Company, or any Subsidiary or affiliate, or interfere with or restrict in any way the rights of the Company and its Subsidiaries or affiliates, which are hereby expressly reserved, to terminate the employment of the Grantee at any time for any reason whatsoever, with or without Cause.
Section 2.3- Change in Control. In order to maintain Grantee’s rights with respect to the Cash Award evidenced hereby, upon the occurrence of a Change in Control, the Committee may take any actions with respect to the Cash Award or make any modifications to the Cash Award as it deems appropriate to reflect such Change in Control; provided that no such action or modification results in a violation of Section 409A.
ARTICLE III. VESTING OF CASH AWARD
Section 3.1- Vesting.
(a)Retirement-Eligible Grantee. If the Grantee is eligible for Retirement as of the Grant Date, the Cash Award shall vest in substantially equal installments on each of the quarterly anniversaries of the Grant Date during the period beginning on the Grant Date and ending on the third anniversary of the Grant Date.
(b)Non-Retirement-Eligible Grantee. If the Grantee is not eligible for Retirement as of the Grant Date, then, except as provided in Section 3.1(c) hereof, the Cash Award shall vest in three substantially equal installments on the first three annual anniversaries of the Grant Date during the period beginning on the Grant Date and ending on the third anniversary of the Grant Date.
(c)Special Rule. In the event the Grantee becomes eligible for Retirement after the Grant Date, the provisions of Section 3.1(a) above shall apply on and after the date the Grantee becomes eligible for Retirement. However, on the first quarterly anniversary of the Grant Date following the date on which the Grantee becomes eligible for Retirement, a portion of the Cash Award shall immediately vest. Such vesting portion shall equal the result of the following formula: X multiplied by (Y/4), where “X” is equal to one-third of the aggregate value of the Cash Award (as set forth on the signature page hereto), and “Y” is equal to the number of full calendar quarters that have elapsed between the most recent annual anniversary of the Grant Date and the then current quarterly anniversary of the Grant Date.
Section 3.2- Acceleration Events. Notwithstanding Section 3.1 hereof, the Cash Award shall become fully vested and non-forfeitable upon (a) a Termination of Service within two years following a Change in Control, provided such Termination of Employment is by the Company without Cause or by the Grantee for Good Reason; or (b) the Grantee’s death or Disability (each, an “Acceleration Event”) (provided, that no payment of the Cash Award shall be accelerated to the extent such payment would cause the Cash Award to be subject to the adverse consequences described in Code Section 409A).
Section 3.3- Effect of Termination of Service. Except as provided in Section 3.2, no portion of the Cash Award shall become vested and non-forfeitable following Termination of Service, and any such non-vested and forfeitable portion of the Cash Award shall be immediately and automatically forfeited upon Termination of Service.
ARTICLE IV. SETTLEMENT OF CASH AWARD
Section 4.1- Calculation of Settlement Amount. Subject to any withholding obligations described in Section 6.3, as soon as administratively feasible following the first to occur of (a) each of the first three anniversaries of the Grant Date or (b) the date an Acceleration Event occurs (each such date, a “Computation Date”), and in no event later than 60 days following the applicable Computation Date, the Company shall, subject to Article V, pay to the Grantee the amount of cash equal to such vested portion of the Cash Award to the extent it has not yet been paid. Notwithstanding the foregoing or anything else in this Agreement to the contrary, if any payment hereunder is triggered by a Termination of Service of the Grantee (other than due to the Grantee’s death) and the Grantee is a “specified employee” (as such term is defined in Section 409A and using the identification methodology selected by the Company from time to time), the applicable portion of the Cash Award shall, subject to Article V and any withholding obligations described in Section 6.3, be paid to the Grantee, without interest, on the first day of the seventh month after such Termination of Service.
Section 4.2- Forfeiture of Unvested Portion of Cash Award. To the extent that the Grantee does not vest in a portion of the Cash Award, all interest in such portion of the Cash Award shall be forfeited upon the Grantee’s Termination of Service. The Grantee has no right or interest in any portion of the Cash Award that is forfeited.
ARTICLE V.
CONDITION TO GRANT OF CASH AWARD; OTHER PROVISIONS
Section 5.1- Restrictive Covenant Agreement. The Grantee shall not be entitled to receive the Cash Award unless the Grantee shall have executed and delivered the Restrictive Covenant Agreement, substantially in the form attached hereto as Exhibit A, and such shall be in full force and effect. Nothing in this Agreement or Restrictive Covenant Agreement prevents the Grantee from providing, without prior notice to the Company, information to governmental authorities regarding possible legal violations or otherwise testifying or participating in any investigation or proceeding by any governmental authorities regarding possible legal violations, and for purpose of clarity the Grantee is not prohibited from providing information voluntarily to the Securities and Exchange Commission pursuant to Section 21F of the Exchange Act.
Section 5.2- Notice Period. The Grantee may terminate the Grantee’s employment with the Company or a Subsidiary at any time for any reason by delivery of notice to the Company at least 90 days in advance of the date of termination (the “Notice Period”); provided, however, that no communication, statement or announcement shall be considered to constitute such notice of termination of Grantee’s employment unless it complies with Section 6.5 hereof and specifically recites that it is a notice of termination of employment for purposes of this Agreement; and provided, further, that the Company may waive any or all of the Notice Period, in which case Grantee’s employment with the Company will terminate on the date determined by the Company.
Section 5.3- Breach of Restrictive Covenant Agreement or Section 5.2. If Grantee materially breaches any provision of the Restrictive Covenant Agreement or Section 5.2 hereof, the Company may, among other available remedies, determine that Grantee (a) will forfeit any unpaid portion of the Cash Award and (b) will repay to the Company any portion of the Cash Award previously paid to Grantee.
ARTICLE VI
MISCELLANEOUS
Section 6.1- Administration. The Committee has the power to interpret the Cash Award and this Agreement. All actions taken and all interpretations and determinations made by the Committee shall be final and binding upon the Grantee, the Company and all other interested persons. No member of the Committee shall be personally liable for any action, determination or interpretation made in good faith with respect to the Cash Award. In its absolute discretion, the Board may at any time and from time to time exercise any and all rights and duties of the Committee under this Agreement.
Section 6.2- Cash Award Not Transferable. Neither the Cash Award nor any interest or right therein or part thereof shall be liable for the debts, contracts or engagements of the Grantee or his or her successors in interest or shall be subject to disposition by transfer, alienation, anticipation, pledge, encumbrance, assignment or any other means whether such disposition is voluntary or involuntary or by operation of law by judgment, levy, attachment, garnishment or any other legal or equitable proceedings (including bankruptcy), and any attempted disposition thereof shall be null and void and of no effect; provided, however, that this Section 6.2 shall not prevent transfers by will or by the applicable laws of descent and distribution.
Section 6.3- Withholding. Unless the Grantee makes alternative arrangements satisfactory to the Company to personally remit required withholding amounts, then, as of the date that all or a portion of the Cash Award becomes paid pursuant to Section 4.1 hereof, the Company shall withhold a portion of the Cash Award so paid as required by law to be withheld by the Company in connection with such payment for applicable federal, state, local and foreign taxes of any kind. To the extent taxes are to be withheld upon vesting for purposes of federal FICA, FUTA or Medicare taxes, such withholding shall be taken from other income owed by the Company to the Grantee and the Grantee hereby agrees to such withholding. For all purposes, the amount withheld by the Company pursuant to this Section 6.3 shall be deemed to have first been paid to the Grantee.
Section 6.4- Section 409A.
(a)To the extent applicable, this Agreement is intended to comply with Section 409A so that the income inclusion provisions of Section 409A(a)(1) of the Code do not apply to Grantee, and this Agreement shall be construed, interpreted and administered in a manner that is consistent with this intent and the requirements for avoiding additional taxes or penalties under Section 409A. Notwithstanding the foregoing, in no event shall the Company be liable for all or any portion of any taxes, penalties, interest or other expenses that may be incurred by the Grantee on account of Section 409A.
(b)Except as permitted under Section 409A, any deferred compensation (within the meaning of Section 409A) payable to a Grantee or for the Grantee’s benefit under this Agreement and grants hereunder may not be reduced by, or offset against, any amount owing by the Grantee to the Company or any of its Subsidiaries. Each installment of the Cash Award that becomes payable hereunder is a “separate payment” for purposes of Section 409A.
(c)In the event that the Company determines that any amounts payable hereunder may be taxable to the Grantee under Section 409A prior to the payment and/or delivery to the Grantee of such amount, the Committee may adopt such amendments to the Agreement, and appropriate policies and procedures, including amendments and policies with retroactive effect, that the Committee determines necessary or appropriate to preserve the intended tax treatment of the benefits provided by the Cash Award and this Agreement.
(d)Notwithstanding any provision of this Agreement to the contrary, in light of the uncertainty with respect to the proper application of Section 409A, the Company reserves the right to make amendments to this Agreement and the terms of the Cash Award as the Company deems necessary or desirable to avoid the imposition of taxes or penalties under Section 409A. In any case, neither the Company nor any of its affiliates will have any obligation to indemnify or otherwise hold the Grantee harmless from any or all of such taxes or penalties.
Section 6.5- Notices. Any notice to be given under the terms of this Agreement to the Company shall be provided to the Chief Administrative Officer and Corporate Secretary, with a copy to the Grantee’s supervisor, and any notice to be given to the Grantee shall be addressed to him or her at the address set forth in the records of the Company. By a notice given pursuant to this Section 6.5, either party may hereafter designate a different address for notices to be given to him, her or it. Any notice which is required to be given to the Grantee shall, if the Grantee is then deceased, be given to the Grantee’s personal representative if such representative has previously informed the Company of his, her or its status and address by written notice under this Section 6.5. Any notice shall be deemed duly given when enclosed in a properly sealed envelope or wrapper addressed as aforesaid, deposited (with postage prepaid) in a post office or branch post office regularly maintained by the United States Postal Service. Notwithstanding the foregoing, any notice required or permitted hereunder from the Company to the Grantee may be made by electronic means, including by electronic mail to the Company-maintained electronic mailbox of the Grantee, and the Grantee hereby consents to receive such notice by electronic delivery. To the extent permitted in an electronically delivered notice described in the previous sentence, the Grantee shall be permitted to respond to such notice or communication by way of a responsive electronic communication, including by electronic mail.
Section 6.6- Titles. Titles are provided herein for convenience only and are not to serve as a basis for interpretation or construction of this Agreement.
Section 6.7- Non-Applicability of the Plan. The Cash Award is not granted pursuant to the Plan.
Section 6.8- Pronouns. The masculine pronoun shall include the feminine and neuter, and the singular the plural, where the context so indicates.
Section 6.9- Amendment. The Committee may amend this Agreement at any time, provided that no such amendment shall materially impair the rights of the Grantee unless reflected in a writing executed by the parties hereto that specifically states that it is amending this Agreement.
Section 6.10- Severability. The invalidity or unenforceability of any provision of this Agreement shall not affect the validity or enforceability of any other provision of this Agreement, and each provision of this Agreement shall be severable and enforceable to the extent permitted by law.
Section 6.11- Dispute Resolution. Any dispute or controversy arising under or in connection with this Agreement shall be resolved by arbitration in St. Louis, Missouri. Arbitrators shall be selected, and arbitration shall be conducted, in accordance with the rules of the American Arbitration Association. The Company shall pay or reimburse any legal fees in connection with such arbitration in the event that the Grantee prevails on a material element of his or her claim or defense. Legal fees eligible for reimbursement in one year under this Section 6.11 shall not affect the legal fees eligible for reimbursements during a subsequent calendar year, payments or reimbursements under this Section 6.11 may not be exchanged or substituted for another form of compensation to the Grantee, and any such reimbursement or payment will be paid within 60 days after the Grantee prevails, but in no event later than the last day of the Grantee’s taxable year following the taxable year in which he incurred the expense giving rise to such reimbursement or payment. This Section 6.11 shall remain in effect throughout the Grantee’s employment with the Company and for a period of five years following the Grantee’s Termination of Service.
Section 6.12- Governing Law. The laws of the State of Delaware shall govern the interpretation, validity and performance of this Agreement regardless of the law that might be applied under principles of conflicts of laws.
Section 6.13- Successors. All obligations of the Company under this Agreement with respect to the Cash Award shall be binding on any successor to the Company, whether the existence of such successor is the result of a direct or indirect purchase, merger, consolidation, or otherwise, of all or substantially all of the business and/or assets of the Company.
Section 6.14- Cash Award Not Taken Into Account for Other Benefits. The Cash Award shall be a special incentive payment to the Grantee and shall not be taken into account in computing the amount of salary or compensation of the Grantee for purposes of determining any pension, retirement, death or other benefit under (a) any pension, retirement, profit-sharing, bonus, insurance or other employee benefit plan of the Company or its Subsidiaries, except as such plan shall otherwise expressly provide, or (b) any agreement between the Company or its Subsidiaries and the Grantee, except as such agreement shall otherwise expressly provide.
Section 6.15- Counterparts. This Agreement may be executed in counterparts, each of which shall be deemed an original but all of which together will constitute one and the same instrument. Counterpart signatures to this Agreement transmitted by facsimile, electronic mail, or by any other electronic means intended to preserve the original graphic and pictorial appearance of a document, will have the same effect as physical delivery of the paper document bearing an original signature.
[SIGNATURE PAGE FOLLOWS]
IN WITNESS WHEREOF, this Agreement has been executed and delivered by the parties hereto.
PEABODY ENERGY CORPORATION

Scott T. Jarboe
Chief Administrative Officer & Corporate Secretary
Note: Grantee is deemed to have executed this Agreement upon clicking “Accept” in the Plan’s online administration site.
EXHIBIT A
RESTRICTIVE COVENANT AGREEMENT
THIS RESTRICTIVE COVENANT AGREEMENT (the “RCA”) dated January 2, 2024, is by
and between PEABODY ENERGY CORPORATION, a Delaware corporation (the “Company”), and (“Grantee”).
WHEREAS, Grantee is a recipient of a 2024 incentive award under the Company’s Peabody Energy Corporation 2017 Incentive Plan, as amended from time to time (the “Plan,” and such award, the “Incentive Award”) and/or a 2024 service-based cash award opportunity from the Company (the “Cash Award”) (the Incentive Award and/or Cash Award referred to herein as the “Award”);
WHEREAS, Grantee acknowledges and agrees that he or she has access to and/or knowledge of certain trade secrets and other Confidential Information regarding the Company;
WHEREAS, the Company has spent and will continue to expend substantial amounts of time, money, and effort to develop its Confidential Information and Grantee acknowledges benefitting from these efforts;
WHEREAS, the Company deems it essential to the protection of its Confidential Information and competitive standing in its market to have recipients of Awards subject to reasonable restrictive covenants;
WHEREAS, Grantee agrees and acknowledges that the Company has a legitimate interest to protect its confidential information and competitive standing; and
NOW THEREFORE, in consideration for the provisions stated below, and intending to be legally bonded thereby, the parties agree as follows.
1.Grantee has been informed and is aware that the execution of this RCA is a necessary term and condition of Grantee’s receipt of the Award.
2.The term “Confidential Information” as used in this RCA shall be broadly interpreted to include, without limitation, materials and information (whether in written, electronic or other form and whether or not identified as confidential at the time of disclosure) concerning technical matters, business matters, business plans, operations, opportunities, plans, processes, procedures, standards, strategies, policies, programs, software, schematics, models, systems, results, studies, analyses, compilations, forecasts, data, figures, projections, estimates, components, records, methods, criteria, designs, quality control, research, samples, work-in- progress, prototypes, data, materials, clients and prospective clients, customer lists, contracts, projects, suppliers, referral sources, sales, marketing, bidding, purchasing, personnel, financial condition, assets, inventory, accounts payable, accounts receivable, tax matters, books of account, financing, collections, intellectual property, trade secrets and all other know-how and information of the Company or any subsidiary of the Company which has not been published or disclosed to the general public.
a.While employed by the Company and at all times thereafter, Grantee will keep Confidential Information, including trade secrets, confidential and shall not, directly or indirectly, use for himself or herself or use for, or disclose to, any party other than the Company, or any subsidiary of the Company (other than in the ordinary course of Grantee’s duties for the benefit of the Company or any subsidiary of the Company), any Confidential Information.
b.At the termination of Grantee’s employment or at any other reasonable time the Company or any of its subsidiaries may request, Grantee shall promptly deliver to the Company all memoranda, notes, records, plats, sketches, plans or other documents (including, without limitation, any “soft” copies or computerized or electronic versions thereof) containing Confidential Information, including trade secrets or any other information concerning Company’s business, including all copies, then in Grantee’s possession or under Grantee’s control whether prepared by Grantee or others.
c.Notwithstanding the foregoing paragraphs, Company employees, contractors, and consultants may disclose trade secrets in confidence, either directly or indirectly, to a Federal, State or local government official or to an attorney, solely for the purpose of reporting or investigating a suspected violation of law, or in a complaint or other document filed in a lawsuit or other proceeding if such filing is made under seal. Additionally, Company employees, contractors, and consultants who file retaliation suits for reporting a suspected violation of law may disclose related trade secrets to their attorney and use them in related court proceedings, as long as the individual files documents containing the trade secret under seal and does not otherwise disclose the trade secret except pursuant to Court Order.
3.In consideration of the Company’s obligations under the Restricted Stock Unit Agreement and/or the Service-Based Cash Award Agreement (the “Agreement”), Grantee agrees that while employed by the Company and for a period of twelve (12) months thereafter, without the prior written consent of the Board of Directors of the Company (the “Board”), he or she shall not, directly or indirectly, as principal, manager, agent, consultant, officer, director, stockholder, partner, investor, lender or employee or in any other capacity, carry on, be engaged in or have any financial interest in, any entity which is in competition with the business of the Company or its subsidiaries.
4.In consideration of the Company’s obligations under the Agreement, Grantee agrees that while employed by the Company and for a period of twelve (12) months thereafter, without the prior written consent of the Board, he or she shall not, on his or her own behalf or on behalf of any person, firm or company, directly or indirectly, (a) solicit or offer employment to or hire any person who is or has been employed by the Company or its subsidiaries at any time during the twelve (12) months immediately preceding such solicitation or (b) solicit or entice away or in any manner attempt to persuade any client, vendor, partner, customer or prospective customer of the Company to discontinue or diminish his, her or its relationship or prospective relationship with the Company or to otherwise provide his, her or its business to any corporation, partnership or other business entity which engages in any line of business in which the Company is engaged (other than the Company).
5.For purposes of this RCA, an entity shall be deemed to be in competition with the Company if it enters into or engages in any business or activity that substantially and directly competes with the business of the Company. For purposes of this paragraph 5, the business of the Company is defined to be: development of new thermal and metallurgical mines, active metallurgical and thermal coal mining, preparation and sale; the marketing, brokering and trading of metallurgical and thermal coal; and the optimization of our metallurgical and thermal coal reserves; in each case by the Company and its direct and indirect subsidiaries or affiliated or related companies. Notwithstanding this paragraph 5 or paragraph 8, nothing herein shall be construed so as to preclude Grantee from investing in any publicly or privately held company, provided that no such investment in the equity securities of an entity with publicly traded equity securities may exceed one percent (1%) of the equity of such entity, and no such investment in any other entity may exceed five percent (5%) of the equity of such entity, without the prior written approval of the Board.
6.Grantee agrees that he or she will not at any time make, directly or indirectly, any negative, derogatory, disparaging or defamatory comment, whether written, oral or in electronic format, to any reporter, author, producer or similar person or entity or to any general public media in any form (including, without limitation, books, articles or writings of any other kind, as well as film, videotape, audio tape, computer/Internet format or any other medium) that concerns directly or indirectly the Company its business or operations, or any of its current or former agents, employees, officers, directors, customers or clients. Grantee understands that nothing in this section or this RCA limits Grantee’s ability to communicate with any government agencies or otherwise participate or cooperate with an investigation conducted by the Equal Employment Opportunity Commission, the Securities and Exchange Commission, or other similar agency, including providing documents or other information, without notice to the Company.
7.Upon the termination of Grantee’s employment for any reason, Grantee or his or her estate shall surrender to the Company all correspondence, letters, files, contracts, mailing lists, customer lists, advertising materials, ledgers, supplies, equipment, checks, and all other materials and records of any kind that are the property of the Company or any of its subsidiaries or affiliates, that may be in Grantee’s possession or under his control, including, without limitation, any “soft” copies or computerized or electronic versions thereof.
8.Grantee agrees that the covenant not to compete, the covenants not to solicit and the covenant not to make disparaging comments are reasonable under the circumstances and will not interfere with his or her ability to earn a living or otherwise to meet his or her financial obligations. Grantee and the Company agree that if in the opinion of any court of competent jurisdiction such restraint is not reasonable in any respect, such court shall have the right, power and authority to excise or modify such provision or provisions of this covenant which appear unreasonable and to enforce the remainder of the covenant as so amended. Grantee agrees that any breach of the covenants contained in this RCA would irreparably injure the Company. Accordingly, Grantee agrees that, in the event that Grantee violates this RCA, the Company may, in addition to pursuing any other remedies it may have in law or in equity, cease making any payments otherwise required under the agreements evidencing the Award, cancel and recoup any portion of the Award already paid to the extent required by law, regulation or listing requirement, or permitted by any Company policy adopted pursuant thereto. The Company may also seek an injunction against Grantee from any court having jurisdiction over the matter restraining any further violation of this RCA by Grantee.
9.No waiver or modification of all or any part of this RCA will be effective unless set forth in a written document signed by both the Company and Grantee expressly indicating their intention to waive or modify the specified provisions of this RCA. If the Company chooses not to enforce its rights in the event Grantee or any other recipient of an Award breaches some or all of the terms of this RCA, the Company’s rights with respect to any such breach shall not be considered a waiver of a future breach by Grantee of this RCA, regardless of whether the breach is of a similar nature or not.
10.This RCA accurately sets forth and entirely sets forth the understandings reached between Grantee and the Company with respect to the matters treated herein. If there are any prior written or oral understandings or agreements pertaining to the subject matter addressed in this RCA, they are specifically superseded by this RCA and have no effect, except, should Grantee be subject to non-compete and non-solicitation obligations (“Restrictive Covenants”) pursuant to an employment agreement or other agreement between Grantee and Company or one of its subsidiaries or affiliates, Grantee shall continue to be bound by the terms of those Restrictive Covenants and they shall run concurrently with those set forth in this RCA. This RCA is binding on Grantee and the Company, and our respective successors, assigns and representatives.
11.Because of Company’s and Grantee’s substantial contacts with the State of Missouri, the fact that Company’s headquarters is located in Missouri, the parties’ interests in ensuring that disputes regarding the interpretation, validity, and enforceability of this RCA are resolved on a uniform basis, and Company’s making and execution of this Agreement in Missouri, the parties agree that the RCA shall be interpreted and governed by the laws of the State of Missouri, without regard for any conflict of law principles. The parties agree that the exclusive venue and jurisdiction for any litigation concerning or arising out of or based on this RCA shall be the federal and state courts located in Missouri. The parties expressly consent to the personal jurisdiction and venue of said courts. The provisions of this paragraph shall not restrict the ability of Company or Grantee to enforce in any court any judgment obtained in Missouri federal or state court.
[SIGNATURE PAGE FOLLOWS]
IN WITNESS WHEREOF, this RC A has been executed and delivered by the parties hereto.
PEABODY ENERGY CORPORATION
Scott T. Jarboe
Chief Administrative Officer & Corporate Secretary
Note: Grantee is deemed to have executed this Agreement upon clicking “Accept” in the Plan’s online administration site.
EX-21
6
btu_20231231xex21.htm
EX-21
Document
Exhibit 21
PEABODY ENERGY CORPORATION
LIST OF SUBSIDIARIES
|
|
|
|
|
|
| Name of Subsidiary |
Jurisdiction of Formation |
|
|
| 9 East Shipping Australia Pty Ltd |
Australia |
| 9 East Shipping Limited |
United Kingdom |
| 9 East Shipping US, LLC |
Delaware |
| American Land Development, LLC |
Delaware |
| American Land Holdings of Colorado, LLC |
Delaware |
| American Land Holdings of Illinois, LLC |
Delaware |
| American Land Holdings of Indiana, LLC |
Delaware |
| American Land Holdings of Kentucky, LLC |
Delaware |
| Big Ridge, Inc. |
Illinois |
| Big Sky Coal Company |
Delaware |
| Bowen Basic Coal Joint Venture * |
Australia |
| BTU International B.V. |
Netherlands |
| BTU Western Resources, Inc. |
Delaware |
| Burton Coal Pty Ltd |
Australia |
| Carbones Peabody de Venezuela, S.A. |
Venezuela |
| Cardinal Gasification Center, LLC |
Illinois |
| Complejo Siderurgico Del Lago, C.A. |
Venezuela |
| Conservancy Resources, LLC |
Delaware |
| Coppabella and Moorvale Joint Venture * |
Australia |
| Desarrollos Venshelf IV, CA |
Venezuela |
| El Segundo Coal Company, LLC |
Delaware |
| Excel Equities International Pty Ltd |
Australia |
| Excelven Pty Ltd |
British Virgin Islands |
| Hayden Gulch Terminal, LLC |
Delaware |
| Helensburgh Coal Pty Ltd |
Australia |
| Hillside Recreational Lands, LLC |
Delaware |
| Kayenta Mobile Home Park, Inc. |
Delaware |
| Kentucky United Coal, LLC |
Indiana |
| Metropolitan Collieries Pty Ltd |
Australia |
| Middlemount Coal Pty Ltd |
Australia |
| Middlemount Mine Management Pty Ltd |
Australia |
| Millennium Coal Pty Ltd |
Australia |
| Moffat County Mining, LLC |
Delaware |
| Moorvale West Joint Venture * |
Australia |
| New Mexico Coal Resources, LLC |
Delaware |
| NGS Acquisition Corp., LLC |
Delaware |
| North Goonyella Coal Mines Pty Ltd |
Australia |
| North Wambo Pty Ltd |
Australia |
| P&L Receivables Company, LLC |
Delaware |
| Centurion Coal Mining Pty Ltd |
Australia |
| Peabody (Burton Coal) Pty Ltd |
Australia |
|
|
|
|
|
|
| Peabody (Kogan Creek) Pty Ltd |
Australia |
| Peabody America, LLC |
Delaware |
| Peabody Arclar Mining, LLC |
Indiana |
| Peabody Asset Holdings, LLC |
Delaware |
| Peabody Australia Holdco Pty Ltd |
Australia |
| Peabody Australia Mining Pty Ltd |
Australia |
| Peabody BB Interests Pty Ltd |
Australia |
| Peabody Bear Run Mining, LLC |
Delaware |
| Peabody Bear Run Services, LLC |
Delaware |
| Peabody Bistrotel Pty Ltd |
Australia |
| Peabody Caballo Mining, LLC |
Delaware |
| Peabody Cardinal Gasification, LLC |
Delaware |
| Peabody China, LLC |
Delaware |
| Peabody CHPP Pty Ltd |
Australia |
| Peabody Coal Venezuela Limited |
Bermuda |
| Peabody Coalsales Pacific Pty Ltd |
Australia |
| Peabody COALSALES, LLC |
Delaware |
| Peabody COALTRADE Asia Private Ltd. |
Singapore |
| Peabody Coaltrade India Private Limited |
India |
| Peabody COALTRADE International Limited |
United Kingdom |
| Peabody COALTRADE, LLC |
Delaware |
| Peabody Colorado Operations, LLC |
Delaware |
| Peabody Colorado Services, LLC |
Delaware |
| Peabody Coppabella Pty Ltd |
Australia |
| Peabody Coulterville Mining, LLC |
Delaware |
| Peabody Custom Mining Pty Ltd |
Australia |
| Peabody Development Company, LLC |
Delaware |
| Peabody Electricity, LLC |
Delaware |
| Peabody Employment Services, LLC |
Delaware |
| Peabody Energy Australia Coal Pty Limited |
Australia |
| Peabody Energy Australia PCI (C&M Equipment) Pty Ltd |
Australia |
| Peabody Energy Australia PCI (C&M Management) Pty Ltd |
Australia |
| Peabody Energy Australia PCI Equipment Pty Ltd |
Australia |
| Peabody Energy Australia PCI Financing Pty Ltd |
Australia |
| Peabody Energy Australia PCI Mine Management Pty Ltd |
Australia |
| Peabody Energy Australia PCI Pty Ltd |
Australia |
| Peabody Energy Australia PCI Rush Pty Ltd |
Australia |
| Peabody Energy Australia Pty Ltd |
Australia |
| Peabody Energy Finance Pty Ltd |
Australia |
| Peabody Gateway North Mining, LLC |
Delaware |
| Peabody Gateway Services, LLC |
Delaware |
| Peabody Global Funding, LLC |
Delaware |
| Peabody Global Investments, LLC |
Delaware |
| Peabody Holding Company, LLC |
Delaware |
| Peabody IC Funding Corp. |
Delaware |
| Peabody Illinois Services, LLC |
Delaware |
| Peabody Indiana Services, LLC |
Delaware |
|
|
|
|
|
|
| Peabody International (Gibraltar) Limited |
Gibraltar |
| Peabody International Investments, Inc. |
Delaware |
| Peabody International Services, Inc. |
Delaware |
| Peabody Investment & Development Business Services Beijing Co. Ltd |
China |
| Peabody Investments Corp. |
Delaware |
| Peabody Midwest Management Services, LLC |
Delaware |
| Peabody Midwest Mining, LLC |
Indiana |
| Peabody Midwest Operations, LLC |
Delaware |
| Peabody Midwest Services, LLC |
Delaware |
| Peabody Mongolia, LLC |
Delaware |
| Peabody Monto Coal Pty Ltd |
Australia |
| Peabody Moorvale Pty Ltd |
Australia |
| Peabody Moorvale West Pty Ltd |
Australia |
| Peabody Natural Gas, LLC |
Delaware |
| Peabody Natural Resources Company |
Delaware |
| Peabody New Mexico Services, LLC |
Delaware |
| Peabody Olive Downs Pty Ltd |
Australia |
| Peabody Operations Holding, LLC |
Delaware |
| Peabody Pastoral Holdings Pty Ltd |
Australia |
| Peabody Powder River Mining, LLC |
Delaware |
| Peabody Powder River Operations, LLC |
Delaware |
| Peabody Powder River Services, LLC |
Delaware |
| Peabody Rocky Mountain Management Services, LLC |
Delaware |
| Peabody Rocky Mountain Services, LLC |
Delaware |
| Peabody Sage Creek Mining, LLC |
Delaware |
| Peabody School Creek Mining, LLC |
Delaware |
| Peabody Services Holdings, LLC |
Delaware |
| Peabody Southeast Mining, LLC |
Delaware |
| Peabody Twentymile Mining, LLC |
Delaware |
| Peabody Venezuela Coal Corp. |
Delaware |
| Peabody Venture Fund, LLC |
Delaware |
| Peabody West Burton Pty Ltd |
Australia |
| Peabody West Rolleston Pty Ltd |
Australia |
| Peabody West Walker Pty Ltd |
Australia |
| Peabody Western Coal Company |
Delaware |
| Peabody Wild Boar Mining, LLC |
Delaware |
| Peabody Wild Boar Services, LLC |
Delaware |
| Peabody Williams Fork Mining, LLC |
Delaware |
| Peabody Wyoming Services, LLC |
Delaware |
| Peabody-Waterside Development, L.L.C. |
Delaware |
| PEC Equipment Company, LLC |
Delaware |
| PIC Acquisition Corp. |
Delaware |
| PIC AU Holdings Corporation |
Delaware |
| PIC AU Holdings LLC |
Delaware |
| PT Peabody Mining Services |
Indonesia |
| R3 Renewables Holding, LLC |
Delaware |
| R3 Renewables LLC – Joint Venture * |
Delaware |
|
|
|
|
|
|
| R3R Employer Holdings LLC |
Delaware |
| R3R Employer LLC – Joint Venture * |
Delaware |
| R3 Renewables Development Holdings LLC – Joint Venture * |
Delaware |
| R3 Renewables Land Holdings LLC – Joint Venture * |
Delaware |
| R3 Bear Run LLC – Joint Venture * |
Delaware |
| R3 Friendsville LLC – Joint Venture * |
Delaware |
| R3 Gateway LLC – Joint Venture * |
Delaware |
| R3 Wild Boar LLC – Joint Venture * |
Delaware |
| Ribfield Pty Ltd |
Australia |
| Sage Creek Holdings, LLC |
Delaware |
| Sage Creek Land & Reserves, LLC |
Delaware |
| Seneca Coal Company, LLC |
Delaware |
| Seneca Property, LLC |
Delaware |
| Shoshone Coal Corporation |
Delaware |
| Sterling Centennial Missouri Insurance Corporation |
Missouri |
| Transportes Coal Sea de Venezuela, CA |
Venezuela |
| Twentymile Coal, LLC |
Delaware |
| Twentymile Development, LLC |
Delaware |
| United Minerals Company, LLC |
Indiana |
| Wambo Coal Pty Ltd |
Australia |
| Wambo Coal Terminal Pty Ltd |
Australia |
| West Rolleston Joint Venture * |
Australia |
| West Walker Joint Venture * |
Australia |
| West/North Burton Joint Venture * |
Australia |
| Wilpinjong Coal Pty Ltd |
Australia |
*Unincorporated joint venture.
EX-23.1
7
btu_20231231xex231.htm
EX-23.1
Document
Exhibit 23.1
Consent of Independent Registered Public Accounting Firm
We consent to the incorporation by reference in the following Registration Statements:
(1)Registration Statement (Form S-8 No. 333-217107) pertaining to the Peabody Energy Corporation 2017 Incentive Plan, and
(2)Registration Statement (Form S-3 No. 333-254765) of Peabody Energy Corporation;
of our reports dated February 23, 2024, with respect to the consolidated financial statements of Peabody Energy Corporation and the effectiveness of internal control over financial reporting of Peabody Energy Corporation, included in this Annual Report (Form 10-K) of Peabody Energy Corporation for the year ended December 31, 2023.
/s/ Ernst & Young, LLP
St. Louis, Missouri
February 23, 2024
EX-23.2
8
btu_20231231xex232.htm
EX-23.2
Document
CONSENT of QUALIFIED PERSON
Re: Annual Report on Form 10-K of Peabody Energy Corporation (the “Company”)
I, Karen Lohkamp, Senior Geologist of Peabody Energy Corporation, in connection with the Company’s Annual Report on Form 10-K for the year ended December 31, 2023 (together with any amendment or supplement thereto, the “Form 10-K”), consent to:
•the public filing by the Company and use of the Technical Report Summary titled, “TECHNICAL REPORT SUMMARY NORTH ANTELOPE ROCHELLE MINE”, with an effective date of “December 31, 2021”, and that was prepared in accordance with Subpart 1300 of Regulation S-K promulgated by the U.S. Securities and Exchange Commission, as an exhibit (including by incorporation by reference) to and referenced in the Form 10-K;
•the use of and references to my name, including my status as an expert or “qualified person” (as defined in Subpart 1300 of Regulation S-K promulgated by the U.S. Securities and Exchange Commission), in connection with the Form 10-K and any such Technical Report Summary; and
•any extracts from or a summary of the Technical Report Summary in the Form 10-K and the use of any information derived, summarized, quoted or referenced from the Technical Report Summary, or portions thereof, that was prepared by me, that I supervised the preparation of, and/or that was reviewed and approved by me, that is included or incorporated by reference in the Form 10-K.
I am an employee of the Company and a co-author of the Technical Report Summary to be filed (including by incorporation by reference) as an exhibit to the Form 10-K. This consent pertains to the following Sections of the Technical Report Summary. I certify that I have read the Technical Report Summary to be filed (including by incorporation by reference) as an exhibit to as well as the references to the Technical Report Summary within the Form 10-K and that it fairly and accurately represents the information in the Technical Report Summary sections for which I am responsible.
•Section 2 Introduction
•Section 3 Property Description
•Section 4 Accessibility, Climate, Local Resources
•Section 5 History
•Section 6 Geological and Hydrological Setting, Mineralization, and Deposit
•Section 7 Exploration
•Section 8 Sample Preparation, Analyses, and Security
•Section 9 Data Verification
•Section 10 Mineral Processing and Metallurgical Testing
•Section 11 Mineral Resource Estimates
•Section 21 Other Relevant Data and Information
•Section 24 References
•Section 25 Reliance on Information Provided by the Registrant
•Corresponding Subsections of Section 1: Executive Summary
•Corresponding Subsections of Section 22: Interpretation and Conclusions
•Corresponding Subsections of Section 23: Recommendations I, Clayton Kyle, Sr. Manager Production of Peabody Energy Corporation, in connection with the Company’s Annual Report on Form 10-K for the year ended December 31, 2023 (together with any amendment or supplement thereto, the “Form 10-K”), consent to:
Signature: ____/s/ Karen Lohkamp________
Date: February 23, 2024
Karen Lohkamp
Sr. Geologist
CONSENT of QUALIFIED PERSON
Re: Annual Report on Form 10-K of Peabody Energy Corporation (the “Company”)
•the public filing by the Company and use of the Technical Report Summary titled, “TECHNICAL REPORT SUMMARY NORTH ANTELOPE ROCHELLE MINE” with an effective date of “December 31, 2021”, and that was prepared in accordance with Subpart 1300 of Regulation S-K promulgated by the U.S. Securities and Exchange Commission, as an exhibit (including by incorporation by reference) to and referenced in the Form 10-K;
•the use of and references to my name, including my status as an expert or “qualified person” (as defined in Subpart 1300 of Regulation S-K promulgated by the U.S. Securities and Exchange Commission), in connection with the Form 10-K and any such Technical Report Summary; and
•any extracts from or a summary of the Technical Report Summary in the Form 10-K and the use of any information derived, summarized, quoted or referenced from the Technical Report Summary, or portions thereof, that was prepared by me, that I supervised the preparation of, and/or that was reviewed and approved by me, that is included or incorporated by reference in the Form 10-K.
I am an employee of the Company and a co-author of the Technical Report Summary to be filed (including by incorporation by reference) as an exhibit to the Form 10-K. This consent pertains to the following Sections of the Technical Report Summary. I certify that I have read the Technical Report Summary to be filed (including by incorporation by reference) as an exhibit to as well as the references to the Technical Report Summary within the Form 10-K and that it fairly and accurately represents the information in the Technical Report Summary sections for which I am responsible.
•Section 2 Introduction
•Section 3 Property Description
•Section 4 Accessibility, Climate, Local Resources
•Section 5 History
•Section 12 Mineral Reserve Estimates
•Section 13 Mining Methods
•Section 14 Processing and Recovery Methods
•Section 15 Infrastructure
•Section 16 Market Studies and Material Contracts
•Section 17 Environmental Studies, Permitting, and Plans, Negotiations, or Agreements with
Local Individuals or Groups
•Section 18 Capital and Operating Costs
•Section 19 Economic Analysis
•Section 20 Adjacent Properties
•Section 21 Other Relevant Data and Information
•Section 24 References
•Section 25 Reliance on Information Provided by the Registrant
•Corresponding Subsections of Section 1: Executive Summary
•Corresponding Subsections of Section 22: Interpretation and Conclusions
•Corresponding Subsections of Section 23: Recommendations
Signature: ____/s/ Clayton Kyle___________
Date: February 23, 2024
Clayton Kyle
Sr. Manager Production
EX-23.3
9
btu_20231231xex233.htm
EX-23.3
Document
CONSENT of QUALIFIED PERSON
Re: Annual Report on Form 10-K of Peabody Energy Corporation (the “Company”)
I, Emma Ewart, Senior Geologist of Peabody Energy Corporation, in connection with the Company’s Annual Report on Form 10-K for the year ended December 31, 2023 (together with any amendment or supplement thereto, the “Form 10-K”), consent to:
•the public filing by the Company and use of the Technical Report Summary titled, “TECHNICAL REPORT SUMMARY WILPINJONG MINE”, with an effective date of “December 31, 2023”, and that was prepared in accordance with Subpart 1300 of Regulation S-K promulgated by the U.S. Securities and Exchange Commission, as an exhibit (including by incorporation by reference) to and referenced in the Form 10-K;
•the use of and references to my name, including my status as an expert or “qualified person” (as defined in Subpart 1300 of Regulation S-K promulgated by the U.S. Securities and Exchange Commission), in connection with the Form 10-K and any such Technical Report Summary; and
•any extracts from or a summary of the Technical Report Summary in the Form 10-K and the use of any information derived, summarized, quoted or referenced from the Technical Report Summary, or portions thereof, that was prepared by me, that I supervised the preparation of, and/or that was reviewed and approved by me, that is included or incorporated by reference in the Form 10-K.
I am an employee of the Company and a co-author of the Technical Report Summary to be filed (including by incorporation by reference) as an exhibit to the Form 10-K. This consent pertains to the following Sections of the Technical Report Summary. I certify that I have read the Technical Report Summary to be filed (including by incorporation by reference) as an exhibit to as well as the references to the Technical Report Summary within the Form 10-K and that it fairly and accurately represents the information in the Technical Report Summary sections for which I am responsible.
•Section 2 Introduction
•Section 3 Property Description
•Section 4 Accessibility, Climate, Local Resources
•Section 5 History
•Section 6 Geological Setting, Mineralization, and Deposit
•Section 7 Exploration
•Section 8 Sample Preparation, Analyses, and Security
•Section 9 Data Verification
•Section 10 Mineral Processing and Metallurgical Testing
•Section 11 Mineral Resource Estimates
•Section 21 Other Relevant Data and Information
•Corresponding Subsections of Section 1: Executive Summary
•Corresponding Subsections of Section 22: Interpretation and Conclusions
•Corresponding Subsections of Section 23: Recommendations
•Corresponding Subsections of Section 24: References
•Corresponding Subsections of Section 25: Reliance on Information Provided by Registrants I, Brian Neilsen, Director Engineering of Peabody Energy Corporation, in connection with the Company’s Annual Report on Form 10-K for the year ended December 31, 2023 (together with any amendment or supplement thereto, the “Form 10-K”), consent to:
Signature: ___/s/ Emma Ewart__________
Date: February 23, 2024
Emma Ewart
Sr. Geologist
CONSENT of QUALIFIED PERSON
Re: Annual Report on Form 10-K of Peabody Energy Corporation (the “Company”)
•the public filing by the Company and use of the Technical Report Summary titled, “TECHNICAL REPORT SUMMARY WILPINJONG MINE” with an effective date of “December 31, 2023”, and that was prepared in accordance with Subpart 1300 of Regulation S-K promulgated by the U.S. Securities and Exchange Commission, as an exhibit (including by incorporation by reference) to and referenced in the Form 10-K;
•the use of and references to my name, including my status as an expert or “qualified person” (as defined in Subpart 1300 of Regulation S-K promulgated by the U.S. Securities and Exchange Commission), in connection with the Form 10-K and any such Technical Report Summary; and
•any extracts from or a summary of the Technical Report Summary in the Form 10-K and the use of any information derived, summarized, quoted or referenced from the Technical Report Summary, or portions thereof, that was prepared by me, that I supervised the preparation of, and/or that was reviewed and approved by me, that is included or incorporated by reference in the Form 10-K.
I am an employee of the Company and a co-author of the Technical Report Summary to be filed (including by incorporation by reference) as an exhibit to the Form 10-K. This consent pertains to the following Sections of the Technical Report Summary. I certify that I have read the Technical Report Summary to be filed (including by incorporation by reference) as an exhibit to as well as the references to the Technical Report Summary within the Form 10-K and that it fairly and accurately represents the information in the Technical Report Summary sections for which I am responsible.
•Section 2 Introduction
•Section 3 Property Description
•Section 4 Accessibility, Climate, Local Resources
•Section 5 History
•Section 12 Mineral Reserve Estimates
•Section 13 Mining Methods
•Section 14 Processing and Recovery Methods
•Section 15 Infrastructure
•Section 16 Market Studies and Material Contracts
•Section 17 Environmental Studies, Permitting, and Plans, Negotiations, or Agreements with
Local Individuals or Groups
•Section 18 Capital and Operating Costs
•Section 19 Economic Analysis
•Section 20 Adjacent Properties
•Section 21 Other Relevant Data and Information
•Corresponding Subsections of Section 1: Executive Summary
•Corresponding Subsections of Section 22: Interpretation and Conclusions
•Corresponding Subsections of Section 23: Recommendations
•Corresponding Subsections of Section 24: References
•Corresponding Subsections of Section 25: Reliance on Information Provided by the Registrant
Signature: ___/s/ Brian Neilsen_________
Date: February 23, 2024
Brian Neilsen
Director Engineering
EX-23.4
10
btu_20231231xex234.htm
EX-23.4
Document
CONSENT of QUALIFIED PERSON
Re: Annual Report on Form 10-K of Peabody Energy Corporation (the “Company”)
I, Hui Hu, Dir Geology & Engineering Support of Peabody Energy Corporation, in connection with the Company’s Annual Report on Form 10-K for the year ended December 31, 2023 (together with any amendment or supplement thereto, the “Form 10-K”), consent to:
•the public filing by the Company and use of the Technical Report Summary titled, “TECHNICAL REPORT SUMMARY CENTURION MINE”, with an effective date of “December 31, 2023”, and that was prepared in accordance with Subpart 1300 of Regulation S-K promulgated by the U.S. Securities and Exchange Commission, as an exhibit (including by incorporation by reference) to and referenced in the Form 10-K;
•the use of and references to my name, including my status as an expert or “qualified person” (as defined in Subpart 1300 of Regulation S-K promulgated by the U.S. Securities and Exchange Commission), in connection with the Form 10-K and any such Technical Report Summary; and
•any extracts from or a summary of the Technical Report Summary in the Form 10-K and the use of any information derived, summarized, quoted or referenced from the Technical Report Summary, or portions thereof, that was prepared by me, that I supervised the preparation of, and/or that was reviewed and approved by me, that is included or incorporated by reference in the Form 10-K.
I am an employee of the Company and a co-author of the Technical Report Summary to be filed (including by incorporation by reference) as an exhibit to the Form 10-K. This consent pertains to the following Sections of the Technical Report Summary. I certify that I have read the Technical Report Summary to be filed (including by incorporation by reference) as an exhibit to as well as the references to the Technical Report Summary within the Form 10-K and that it fairly and accurately represents the information in the Technical Report Summary sections for which I am responsible.
•Section 2 Introduction
•Section 3 Property Description
•Section 4 Accessibility, Climate, Local Resources
•Section 5 History
•Section 6 Geological Setting, Mineralization, and Deposit
•Section 7 Exploration
•Section 8 Sample Preparation, Analyses, and Security
•Section 9 Data Verification
•Section 10 Mineral Processing and Metallurgical Testing
•Section 11 Mineral Resource Estimates
•Section 21 Other Relevant Data and Information
•Corresponding Subsections of Section 1: Executive Summary
•Corresponding Subsections of Section 22: Interpretation and Conclusions
•Corresponding Subsections of Section 23: Recommendations
•Corresponding Subsections of Section 24: References
•Corresponding Subsections of Section 25: Reliance on Information Provided by Registrant
Signature: ___/s/ Hui Hu__________
Date: February 23, 2024
Hui Hu
Dir Geology & Engineering Support I, Damien Wichlacz, Sr.
CONSENT of QUALIFIED PERSON
Re: Annual Report on Form 10-K of Peabody Energy Corporation (the “Company”)
Manager Mining Engineering of Peabody Energy Corporation, in connection with the Company’s Annual Report on Form 10-K for the year ended December 31, 2023 (together with any amendment or supplement thereto, the “Form 10-K”), consent to:
•the public filing by the Company and use of the Technical Report Summary titled, “TECHNICAL REPORT SUMMARY CENTURION MINE” with an effective date of “December 31, 2023”, and that was prepared in accordance with Subpart 1300 of Regulation S-K promulgated by the U.S. Securities and Exchange Commission, as an exhibit (including by incorporation by reference) to and referenced in the Form 10-K;
•the use of and references to my name, including my status as an expert or “qualified person” (as defined in Subpart 1300 of Regulation S-K promulgated by the U.S. Securities and Exchange Commission), in connection with the Form 10-K and any such Technical Report Summary; and
•any extracts from or a summary of the Technical Report Summary in the Form 10-K and the use of any information derived, summarized, quoted or referenced from the Technical Report Summary, or portions thereof, that was prepared by me, that I supervised the preparation of, and/or that was reviewed and approved by me, that is included or incorporated by reference in the Form 10-K.
I am an employee of the Company and a co-author of the Technical Report Summary to be filed (including by incorporation by reference) as an exhibit to the Form 10-K. This consent pertains to the following Sections of the Technical Report Summary. I certify that I have read the Technical Report Summary to be filed (including by incorporation by reference) as an exhibit to as well as the references to the Technical Report Summary within the Form 10-K and that it fairly and accurately represents the information in the Technical Report Summary sections for which I am responsible.
•Section 2 Introduction
•Section 3 Property Description
•Section 4 Accessibility, Climate, Local Resources
•Section 5 History
•Section 12 Mineral Reserve Estimates
•Section 13 Mining Methods
•Section 14 Processing and Recovery Methods
•Section 15 Infrastructure
•Section 16 Market Studies and Material Contracts
•Section 17 Environmental Studies, Permitting, and Plans, Negotiations, or Agreements with
Local Individuals or Groups
•Section 18 Capital and Operating Costs
•Section 19 Economic Analysis
•Section 20 Adjacent Properties
•Section 21 Other Relevant Data and Information
•Corresponding Subsections of Section 1: Executive Summary
•Corresponding Subsections of Section 22: Interpretation and Conclusions
•Corresponding Subsections of Section 23: Recommendations
•Corresponding Subsections of Section 24: References
•Corresponding Subsections of Section 25: Reliance on Information Provided by Registrant
Signature: ___/s/ Damien Wichlacz ______
Date: February 23, 2024
Damien Wichlacz
Sr. Manager Mining Engineering
EX-31.1
11
btu_20231231xex311.htm
EX-31.1
Document
Exhibit 31.1
CERTIFICATION
I, James C. Grech, certify that:
1.I have reviewed this Annual Report on Form 10-K of Peabody Energy Corporation (“the registrant”);
2.Based on my knowledge, this report does not contain any untrue statement of a material fact or omit to state a material fact necessary to make the statements made, in light of the circumstances under which such statements were made, not misleading with respect to the period covered by this report;
3.Based on my knowledge, the financial statements, and other financial information included in this report, fairly present in all material respects the financial condition, results of operations and cash flows of the registrant as of, and for, the periods presented in this report;
4.The registrant's other certifying officer and I are responsible for establishing and maintaining disclosure controls and procedures (as defined in Exchange Act Rules 13a-15(e) and 15d-15(e)) and internal control over financial reporting (as defined in Exchange Act Rules 13a-15(f) and 15d-15(f)) for the registrant and have:
(a)designed such disclosure controls and procedures, or caused such disclosure controls and procedures to be designed under our supervision, to ensure that material information relating to the registrant, including its consolidated subsidiaries, is made known to us by others within those entities, particularly during the period in which this report is being prepared;
(b)designed such internal control over financial reporting, or caused such internal control over financial reporting to be designed under our supervision, to provide reasonable assurance regarding the reliability of financial reporting and the preparation of financial statements for external purposes in accordance with generally accepted accounting principles;
(c)evaluated the effectiveness of the registrant's disclosure controls and procedures and presented in this report our conclusions about the effectiveness of the disclosure controls and procedures, as of the end of the period covered by this report based on such evaluation; and
(d)disclosed in this report any change in the registrant's internal control over financial reporting that occurred during the registrant's most recent fiscal quarter (the registrant's fourth fiscal quarter in the case of an Annual Report) that has materially affected, or is reasonably likely to materially affect, the registrant's internal control over financial reporting; and
5.The registrant's other certifying officer and I have disclosed, based on our most recent evaluation of internal control over financial reporting, to the registrant's auditors and the audit committee of the registrant's board of directors (or persons performing the equivalent functions):
(a)all significant deficiencies and material weaknesses in the design or operation of internal control over financial reporting which are reasonably likely to adversely affect the registrant's ability to record, process, summarize and report financial information; and
(b)any fraud, whether or not material, that involves management or other employees who have a significant role in the registrant's internal control over financial reporting.
Date: February 23, 2024
|
|
|
|
|
|
| /s/ James C. Grech |
|
| James C. Grech |
|
| President and Chief Executive Officer |
|
EX-31.2
12
btu_20231231xex312.htm
EX-31.2
Document
Exhibit 31.2
CERTIFICATION
I, Mark A. Spurbeck, certify that:
1.I have reviewed this Annual Report on Form 10-K of Peabody Energy Corporation (“the registrant”);
2.Based on my knowledge, this report does not contain any untrue statement of a material fact or omit to state a material fact necessary to make the statements made, in light of the circumstances under which such statements were made, not misleading with respect to the period covered by this report;
3.Based on my knowledge, the financial statements, and other financial information included in this report, fairly present in all material respects the financial condition, results of operations and cash flows of the registrant as of, and for, the periods presented in this report;
4.The registrant's other certifying officer and I are responsible for establishing and maintaining disclosure controls and procedures (as defined in Exchange Act Rules 13a-15(e) and 15d-15(e)) and internal control over financial reporting (as defined in Exchange Act Rules 13a-15(f) and 15d-15(f)) for the registrant and have:
(a)designed such disclosure controls and procedures, or caused such disclosure controls and procedures to be designed under our supervision, to ensure that material information relating to the registrant, including its consolidated subsidiaries, is made known to us by others within those entities, particularly during the period in which this report is being prepared;
(b)designed such internal control over financial reporting, or caused such internal control over financial reporting to be designed under our supervision, to provide reasonable assurance regarding the reliability of financial reporting and the preparation of financial statements for external purposes in accordance with generally accepted accounting principles;
(c)evaluated the effectiveness of the registrant's disclosure controls and procedures and presented in this report our conclusions about the effectiveness of the disclosure controls and procedures, as of the end of the period covered by this report based on such evaluation; and
(d)disclosed in this report any change in the registrant's internal control over financial reporting that occurred during the registrant's most recent fiscal quarter (the registrant's fourth fiscal quarter in the case of an Annual Report) that has materially affected, or is reasonably likely to materially affect, the registrant's internal control over financial reporting; and
5.The registrant's other certifying officer and I have disclosed, based on our most recent evaluation of internal control over financial reporting, to the registrant's auditors and the audit committee of the registrant's board of directors (or persons performing the equivalent functions):
(a)all significant deficiencies and material weaknesses in the design or operation of internal control over financial reporting which are reasonably likely to adversely affect the registrant's ability to record, process, summarize and report financial information; and
(b)any fraud, whether or not material, that involves management or other employees who have a significant role in the registrant's internal control over financial reporting.
Date: February 23, 2024
|
|
|
|
|
|
| /s/ Mark A. Spurbeck |
|
| Mark A. Spurbeck |
|
| Executive Vice President and Chief Financial Officer |
|
EX-32.1
13
btu_20231231xex321.htm
EX-32.1
Document
Exhibit 32.1
CERTIFICATION PURSUANT TO
SECTION 906 OF THE SARBANES-OXLEY ACT OF 2002
(18 U.S.C. SECTION 1350)
I, James C. Grech, President and Chief Executive Officer of Peabody Energy Corporation, certify, pursuant to 18 U.S.C. Section 1350, as adopted pursuant to Section 906 of the Sarbanes-Oxley Act of 2002, that:
(1)the Annual Report on Form 10-K for the annual period ended December 31, 2023 (the “Annual Report”) which this statement accompanies fully complies with the requirements of Section 13(a) or 15(d) of the Securities Exchange Act of 1934, as amended; and
(2)information contained in the Annual Report fairly presents, in all material respects, the financial condition and results of operations of Peabody Energy Corporation.
Dated: February 23, 2024
|
|
|
|
|
|
| /s/ James C. Grech |
|
James C. Grech |
|
| President and Chief Executive Officer |
|
EX-32.2
14
btu_20231231xex322.htm
EX-32.2
Document
Exhibit 32.2
CERTIFICATION PURSUANT TO
SECTION 906 OF THE SARBANES-OXLEY ACT OF 2002
(18 U.S.C. SECTION 1350)
I, Mark A. Spurbeck, Executive Vice President and Chief Financial Officer of Peabody Energy Corporation, certify, pursuant to 18 U.S.C. Section 1350, as adopted pursuant to Section 906 of the Sarbanes-Oxley Act of 2002, that:
(1)the Annual Report on Form 10-K for the annual period ended December 31, 2023 (the “Annual Report”) which this statement accompanies fully complies with the requirements of Section 13(a) or 15(d) of the Securities Exchange Act of 1934, as amended; and
(2)information contained in the Annual Report fairly presents, in all material respects, the financial condition and results of operations of Peabody Energy Corporation.
Dated: February 23, 2024
|
|
|
|
|
|
| /s/ Mark A. Spurbeck |
|
| Mark A. Spurbeck |
|
| Executive Vice President and Chief Financial Officer |
|
EX-95
15
btu_20231231xex95.htm
EX-95
Document
Exhibit 95
Mine Safety Disclosures
The following disclosures are provided pursuant to Securities and Exchange Commission (SEC) regulations, which require certain disclosures by companies required to file periodic reports under the Securities Exchange Act of 1934, as amended, that operate coal mines regulated under the Federal Mine Safety and Health Act of 1977 (the Mine Act). The disclosures reflect United States (U.S.) mining operations only, as these requirements do not apply to our mines operated outside the U.S.
Mine Safety Information. Whenever the Mine Safety and Health Administration (MSHA) believes that a violation of the Mine Act, any health or safety standard, or any regulation has occurred, it may issue a violation which describes the associated condition or practice and designates a timeframe within which the operator must abate the violation. In some situations, such as when MSHA believes that conditions pose a hazard to miners, MSHA may issue an order removing miners from the area of the mine affected by the condition until hazards are corrected. Whenever MSHA issues a citation or order, it generally proposes a civil penalty, or fine, as a result of the violation that the operator is ordered to pay. Citations and orders can be contested and appealed and, as part of that process, are often reduced in severity and amount, and are sometimes vacated. The number of citations, orders and proposed assessments vary depending on the size and type (underground or surface) of the company and mine. Since MSHA is a branch of the U.S. Department of Labor, its jurisdiction applies only to our U.S. mines. As such, the mine safety disclosures that follow contain no information for our Australian mines.
The table that follows reflects citations and orders issued to us by MSHA during the year ended December 31, 2023, as reflected in our systems. The table includes only those mines that were issued orders or citations during the period presented and, commensurate with SEC regulations, does not reflect orders or citations issued to independent contractors working at our mines. Due to timing and other factors, our data may not agree with the mine data retrieval system maintained by MSHA. The proposed assessments for the year ended December 31, 2023 were taken from the MSHA system as of February 16, 2024.
Additional information about MSHA references used in the table is as follows:
•Section 104 S&S Violations: The total number of violations received from MSHA under section 104(a) of the Mine Act that could significantly and substantially contribute to a serious injury if left unabated.
•Section 104(b)Orders: The total number of orders issued by MSHA under section 104(b) of the Mine Act, which represents a failure to abate a citation under section 104(a) within the period of time prescribed by MSHA. This results in an order of immediate withdrawal from the area of the mine affected by the condition until MSHA determines that the violation has been abated.
•Section 104(d) Citations and Orders: The total number of citations and orders issued by MSHA under section 104(d) of the Mine Act for unwarrantable failure to comply with mandatory health or safety standards.
•Section 104(e) Notices: The total number of notices issued by MSHA under section 104(e) of the Mine Act for a pattern of violations that could contribute to mine health or safety hazards.
•Section 110(b)(2)Violations: The total number of flagrant violations issued by MSHA under section 110(b)(2) of the Mine Act.
•Section 107(a) Orders: The total number of orders issued by MSHA under section 107(a) of the Mine Act for situations in which MSHA determined an imminent danger existed.
•Proposed MSHA Assessments: The total dollar value of proposed assessments from MSHA.
•Fatalities: The total number of mining-related fatalities.
Year Ended December 31, 2023
|
|
|
|
|
|
|
|
|
|
|
|
|
|
|
|
|
|
|
|
|
|
|
|
|
|
|
|
|
|
|
|
|
|
|
|
|
|
|
|
|
|
|
|
|
|
|
|
|
|
|
|
|
Section
104 S&S
Violations |
|
Section
104(b)
Orders |
|
Section
104(d)
Citations and
Orders |
|
Section
104(e) Pattern
of Violations |
|
Section
110(b)(2)
Violations |
|
Section
107(a)
Orders |
|
($)
Proposed
MSHA
Assessments |
|
Fatalities |
Mine (1) |
|
|
|
|
|
|
|
|
| |
|
|
|
|
|
|
|
|
|
|
|
|
|
(In thousands) |
|
|
| Seaborne Metallurgical |
|
|
|
|
|
|
|
|
|
|
|
|
|
|
|
|
| Shoal Creek Mine |
|
155 |
|
|
— |
|
|
5 |
|
|
— |
|
|
— |
|
|
— |
|
|
653.7 |
|
|
— |
|
| Powder River Basin |
|
|
|
|
|
|
|
|
|
|
|
|
|
|
|
|
| Caballo |
|
1 |
|
|
— |
|
|
— |
|
|
— |
|
|
— |
|
|
— |
|
|
7.9 |
|
|
— |
|
| North Antelope Rochelle |
|
26 |
|
|
— |
|
|
2 |
|
|
— |
|
|
— |
|
|
— |
|
|
170.6 |
|
|
— |
|
| Rawhide |
|
3 |
|
|
— |
|
|
— |
|
|
— |
|
|
— |
|
|
— |
|
|
34.0 |
|
|
— |
|
| Other U.S. Thermal |
|
|
|
|
|
|
|
|
|
|
|
|
|
|
|
|
|
|
|
|
|
|
|
|
|
|
|
|
|
|
|
|
|
|
|
|
|
|
|
|
|
|
|
|
|
|
|
|
|
|
| Bear Run |
|
2 |
|
|
— |
|
|
— |
|
|
— |
|
|
— |
|
|
— |
|
|
7.7 |
|
|
1 (2) |
|
|
|
|
|
|
|
|
|
|
|
|
|
|
|
|
|
| El Segundo |
|
5 |
|
|
— |
|
|
— |
|
|
— |
|
|
— |
|
|
— |
|
|
47.7 |
|
|
— |
|
|
|
|
|
|
|
|
|
|
|
|
|
|
|
|
|
|
Francisco Preparation Plant (Francisco Mine) |
|
1 |
|
|
— |
|
|
— |
|
|
— |
|
|
— |
|
|
— |
|
|
0.8 |
|
|
— |
|
| Francisco Underground |
|
67 |
|
|
— |
|
|
3 |
|
|
— |
|
|
— |
|
|
— |
|
|
161.6 |
|
|
— |
|
|
|
|
|
|
|
|
|
|
|
|
|
|
|
|
|
|
| Gateway North |
|
83 |
|
|
2 |
|
|
2 |
|
|
— |
|
|
— |
|
|
— |
|
|
588.7 |
|
|
— |
|
| Gateway Preparation Plant |
|
— |
|
|
— |
|
|
— |
|
|
— |
|
|
— |
|
|
— |
|
|
0.3 |
|
|
— |
|
| Kayenta |
|
— |
|
|
— |
|
|
— |
|
|
— |
|
|
— |
|
|
— |
|
|
0.5 |
|
|
— |
|
| Lee Ranch |
|
— |
|
|
— |
|
|
— |
|
|
— |
|
|
— |
|
|
— |
|
|
1.1 |
|
|
— |
|
| Somerville Central |
|
— |
|
|
— |
|
|
— |
|
|
— |
|
|
— |
|
|
— |
|
|
0.1 |
|
|
— |
|
| Twentymile (Foidel Creek Mine) |
|
49 |
|
|
— |
|
|
2 |
|
|
— |
|
|
— |
|
|
— |
|
|
284.8 |
|
|
— |
|
| Wild Boar |
|
2 |
|
|
— |
|
|
— |
|
|
— |
|
|
— |
|
|
— |
|
|
1.2 |
|
|
— |
|
| Willow Lake Preparation Plant |
|
1 |
|
|
— |
|
|
— |
|
|
— |
|
|
— |
|
|
— |
|
|
1.2 |
|
|
— |
|
|
|
|
|
|
|
|
|
|
|
|
|
|
|
|
|
|
(1)The definition of "mine" under section 3 of the Mine Act includes the mine, as well as other items used in, or to be used in, or resulting from, the work of extracting coal, such as land, structures, facilities, equipment, machines, tools and coal preparation facilities. Also, there are instances where the mine name per the MSHA system differs from the mine name utilized by us. Where applicable, we have parenthetically listed the name of the mine per the MSHA system. Also, all U.S. mines are listed alphabetically within each of our mining segments.
(2)On April 20, 2023, a contractor was fatally injured at the Bear Run Mine.
Pending Legal Actions. The Federal Mine Safety and Health Review Commission (the Commission) is an independent adjudicative agency that provides administrative trial and appellate review of legal disputes arising under the Mine Act. These cases may involve, among other questions, challenges by operators to citations, orders and penalties they have received from MSHA, or complaints of discrimination by miners under section 105 of the Mine Act. The following is a brief description of the types of legal actions that may be brought before the Commission.
•Contests of Citations and Orders: A contest proceeding may be filed with the Commission by operators, miners or miners’ representatives to challenge the issuance of a citation or order issued by MSHA, including citations related to disputed provisions of operators' emergency response plans.
•Contests of Proposed Penalties (Petitions for Assessment of Penalties): A contest of a proposed penalty is an administrative proceeding before the Commission challenging a civil penalty that MSHA has proposed for the violation. Such proceedings may also involve appeals of judges' decisions or orders to the Commission on proposed penalties, including petitions for discretionary review and review by the Commission on its own motion.
•Complaints for Compensation: A complaint for compensation may be filed with the Commission by miners entitled to compensation when a mine is closed by certain withdrawal orders issued by MSHA. The purpose of the proceeding is to determine the amount of compensation, if any, due miners idled by the orders.
•Complaints of Discharge, Discrimination or Interference: A discrimination proceeding is a case that involves a miner’s allegation that he or she has suffered a wrong by the operator because he or she engaged in some type of activity protected under the Mine Act, such as making a safety complaint. This category includes temporary reinstatement proceedings, which involve cases in which a miner has filed a complaint with MSHA stating he or she has suffered discrimination and the miner has lost his or her position.
•Applications for Temporary Relief: An application for temporary relief from any modification or termination of any order or from any order issued under certain subparts of section 104 of the Mine Act may be filed with the Commission at any time before such order becomes final.
The table that follows presents information by mine regarding pending legal actions before the Commission at December 31, 2023. Each legal action is assigned a docket number by the Commission and may have as its subject matter one or more citations, orders, penalties or complaints.
|
|
|
|
|
|
|
|
|
|
|
|
|
|
|
|
|
|
|
|
|
|
|
|
|
|
|
|
|
|
|
|
|
|
|
|
|
|
|
|
|
|
|
|
|
|
|
|
|
|
|
|
|
Pending Legal Actions |
|
Legal Actions Initiated During the Year Ended December 31, 2023 |
|
Legal Actions Resolved During the Year Ended
December 31, 2023 |
| |
|
Number of Pending Legal Actions as of December 31, 2023 |
|
Pre-Penalty Contests of Citations/Orders |
|
Contests of Penalty Assessment (2) |
|
Complaints for Compensation |
|
Complaints of Discharge, Discrimination or Interference |
|
Applications for Temporary Relief |
|
|
Mine (1) |
|
|
|
|
|
|
|
|
|
|
|
|
|
|
|
|
|
|
|
|
|
|
|
|
|
| Seaborne Metallurgical |
|
|
|
|
|
|
|
|
|
|
|
|
|
|
|
| Shoal Creek Mine |
|
10 |
|
— |
|
9 |
|
— |
|
1 |
|
— |
|
18 |
|
17 |
| Powder River Basin |
|
|
|
|
|
|
|
|
|
|
|
|
|
|
|
|
| North Antelope Rochelle |
|
1 |
|
— |
|
1 |
|
— |
|
— |
|
— |
|
2 |
|
3 |
| Other U.S. Thermal |
|
|
|
|
|
|
|
|
|
|
|
|
|
|
|
| Bear Run |
|
— |
|
— |
|
— |
|
— |
|
— |
|
— |
|
— |
|
1 |
| El Segundo |
|
2 |
|
— |
|
2 |
|
— |
|
— |
|
— |
|
2 |
|
1 |
| Francisco Underground |
|
1 |
|
— |
|
1 |
|
— |
|
— |
|
— |
|
1 |
|
2 |
Gateway North |
|
7 |
|
1 |
|
6 |
|
— |
|
— |
|
— |
|
15 |
|
10 |
|
|
|
|
|
|
|
|
|
|
|
|
|
|
|
|
|
|
|
|
|
|
|
|
|
|
|
|
|
|
|
|
|
|
| Twentymile (Foidel Creek) |
|
3 |
|
— |
|
3 |
|
— |
|
— |
|
— |
|
3 |
|
— |
|
|
|
|
|
|
|
|
|
|
|
|
|
|
|
|
|
|
|
|
|
|
|
|
|
|
|
|
|
|
|
|
|
|
|
|
|
|
|
|
|
|
|
|
|
|
|
|
|
|
|
(1)The definition of "mine" under section 3 of the Mine Act includes the mine, as well as other items used in, or to be used in, or resulting from, the work of extracting coal, such as land, structures, facilities, equipment, machines, tools and coal preparation facilities. Also, there are instances where the mine name per the MSHA system differs from the mine name utilized by us. Where applicable, we have parenthetically listed the name of the mine per the MSHA system. Also, all U.S. mines are listed alphabetically within each of our mining segments.
(2)There were no appeals of judge's decisions or orders to the Commission as of December 31, 2023.
EX-96.2
16
btu_20231231xex962.htm
EX-96.2
Document
|
|
|
| TECHNICAL REPORT SUMMARY WILPINJONG MINE |
In accordance with the requirements of SEC Regulation S-K (subpart 1300)
BLANK PAGE
TECHNICAL REPORT SUMMARY WILPINJONG MINE
SIGNATURE PAGE
Title:
Technical Report Summary - Wilpinjong Mine, S-K1300
Peabody Energy Corporation (BTU)
Effective Date of Report:
December 31, 2023
Project Location:
The Wilpinjong Mine (WPJ) is a surface coal mine located approximately 40 kilometres (25 miles) north-east of Mudgee in the State of New South Wales, AUSTRALIA near the village of Wollar. Wilpinjong Coal Pty Ltd, a subsidiary of Peabody Energy Corporation, is the operator for the Wilpinjong Mine. WPJ is situated in the Western Coal Field on the north-west margin of the Sydney Basin.
Qualified Person(s) Preparers:
(With responsible report sections listed.)
Peabody Energy Corporation
/s/ Emma Ewart
Geology
Sections:1,2,3,4,5,6,7,8,9,10,11,21,22,23,24,25
/s/ Brian Neilsen
Mining Engineering
Sections: 1,2,3,4,5,12,13,14,15,16,17,18,19,20,21,22,23,24,25
Signature Date:
BLANK PAGE
TECHNICAL REPORT SUMMARY WILPINJONG MINE
Table of Contents
TECHNICAL REPORT SUMMARY WILPINJONG MINE
TECHNICAL REPORT SUMMARY WILPINJONG MINE
TECHNICAL REPORT SUMMARY WILPINJONG MINE
TECHNICAL REPORT SUMMARY WILPINJONG MINE
Tables
TECHNICAL REPORT SUMMARY WILPINJONG MINE
Figures
TECHNICAL REPORT SUMMARY WILPINJONG MINE
1. EXECUTIVE SUMMARY
1.1. Disclaimer
This Technical Report Summary for the Wilpinjong Mine (WPJ) has been prepared by a team of qualified persons (QP) on staff at Peabody Energy. The purpose of this statement is to provide a report of the Coal Resources and Reserves in accordance with SK-1300. All information within this report has been prepared based on present knowledge and assumptions.
1.2. Property Description
The Wilpinjong Coal mine is an existing open-cut coal mining operation situated approximately 40 kilometres (25 miles) north-east of Mudgee in the State of New South Wales (AUSTRALIA) near the village of Wollar. The general location of WPJ is shown in Figure 1. The coal control is comprised of Mining Leases granted by the state of NSW.
Figure 1. General Location Map
The mine extracts the Moolarben and Ulan seams with a combined thickness from 6 to 10 metres and a typical depth less than 60 metres in the Permian Illawarra Coal Measures on the northwest margin of the Sydney Basin. The mining tenements consist of three exploration licenses of 2958 hectares and four mining leases of 3790 hectares. The mining leases require renewal upon expiration in 2027 for 2863 hectares and in 2039-2044 for 927 acres. Renewal applications for two exploration licenses were approved in 2023, with the terms extended to Dec 2027 and March 2028, and the third was granted in May 2022 for an initial term of 6 years. As of December 31, 2023, all required licenses and permits were in place for the operations of Wilpinjong.
TECHNICAL REPORT SUMMARY WILPINJONG MINE
1.3. Geology and Mineralization
The Wilpinjong Mine is located in the Permian Illawarra Coal Measures on the northwest margin of the Sydney Basin. This coal measure is around 115m thick in the area, where the dominant lithologies are mudstone, siltstone, sandstone, coal, carbonaceous mudstone and tuffaceous claystone. The coal seams of interest at Wilpinjong include the Moolarben seam and the Ulan seam.
The surface geology of the Wilpinjong Mine is dominated by subcrops of the Illawarra Coal Measures. This unit overlies the Shoalhaven Group, which crop out immediately south of Wilpinjong. The coal measures are overlain by the Narrabeen Group, which forms the cliff-lines and plateaus to the north and south, the ridges that protrude out from these plateaus and outliers such as those adjacent to the Slate Gully area. In places, the Illawarra Coal Measures are concealed beneath younger alluvial deposits, particularly those that occupy abandoned channel-fill, referred to on site, as “palaeo-channels”. Quaternary alluvial deposits also flank Wilpinjong and Cumbo Creeks.
The Moolarben seam consists of three plies, of which the lower half of the basal ~0.50m thick ply (M4) is currently being mined. The other plies – M1, M2 and M3 all exceed 40% in ash and have yields of less than 50% and are not considered mining targets. The Moolarben seam has not been mined in the local area in the past.
The Ulan seam ranges between 11 and 22.5 m in total thickness, however the mineable coal plies have a combined thickness of 5.7 to 9.0 m. The seam consists of a number of coal and stone plies that are correlated across the Wilpinjong resource area and into adjacent mines and projects. From these plies, Wilpinjong Coal Mine is currently using selective mining and washing, with some bypass to produce both domestic and export thermal coal products.
The surrounding ridges of resistant Triassic strata have combined with the thick seam and shallow dips resulting in an extensive area of shallow coal that is amenable to open cut mining. These ridges are generally within the National Park and are excluded from mining.
1.4. Exploration
Exploration at Wilpinjong has occurred since the early 1950s when the Joint Coal Board first developed cored boreholes in the area. Since acquiring the Wilpinjong Coal Mine in 2006, Peabody Energy has completed over a large number of boreholes, including holes cored for coal quality analysis.
Geological exploration activities continue to be undertaken to provide input to detailed mine planning and engineering studies to refine the understanding of geological structures and coal quality.
TECHNICAL REPORT SUMMARY WILPINJONG MINE
1.5. Development and Operations
WPJ currently has eight active open cut pit areas, necessary for quality blending, and efficient coal production. Overburden is removed by a combination of cast, doze, and truck/excavator methods.
Figure 2. WPJ Mine Map
1.6. Coal Resource and Reserve Estimates
The Coal Reserve estimate prepared by Peabody is based on a Life of Mine (LOM) Plan and associated financial model. This mine plan excludes any coal quantities considered as Inferred Resources. As reported Coal Resources are exclusive of Reserves, some of the Resources consist of coal volumes that fall within the planned LOM pit shells but are Inferred. Other reported Resources are in areas adjacent to the planned LOM pit shell, but have reasonable prospects for eventual economic extraction subject to conditions (e.g. boundary coal requiring an agreement with a neighboring coal company). Summaries of Coal Resources and Reserves are shown in the following tables.
TECHNICAL REPORT SUMMARY WILPINJONG MINE
|
|
|
|
|
|
|
|
|
|
|
|
|
|
|
| Tenement |
Measured |
Indicated |
Inferred |
Total |
| EL6919 |
38.4 |
8.6 |
1.0 |
48.0 |
| EL7091 |
3.8 |
6.2 |
2.4 |
12.4 |
| ML1573 |
20.2 |
4.0 |
0.8 |
26.2 |
| ML1779 |
14.0 |
1.3 |
0.3 |
15.6 |
| ML1795 |
14.2 |
2.4 |
0.9 |
17.5 |
| ML1846 |
2.6 |
0.1 |
|
2.7 |
| TOTAL |
93.3 |
22.6 |
5.4 |
121.2 |
Table 1. Coal Resources by Tenement (Mt)
|
|
|
|
|
|
|
|
|
|
|
|
|
|
|
|
|
|
|
|
|
|
|
|
|
|
|
|
|
|
|
|
|
|
|
|
|
|
|
|
Run of Mine (ROM) |
Marketable Product |
| Area |
Proven
@MROM
(Mt)
|
Probable @MROM
(Mt)
|
Total
@MROM
(Mt)
|
MROM (%) |
ROM Ash
(% - arb)
|
Strip Ratio
(bcm/t)
|
Proven
@MPROD
(Mt)
|
Probable @MPROD
(Mt)
|
Total
@MPROD
(Mt)
|
Prod Ash
(% - adb)
|
MPROD (%) |
| ML1573 |
21.9 |
0.9 |
22.8 |
8.7 |
30.3 |
3.0 |
18.0 |
0.8 |
18.8 |
25.0 |
9.5 |
| ML1795 |
0.0 |
0.0 |
- |
- |
- |
- |
0.0 |
0.0 |
- |
- |
- |
| ML1779 |
29.9 |
1.9 |
31.8 |
8.8 |
29.6 |
4.0 |
24.0 |
1.9 |
25.9 |
24.0 |
9.6 |
| ML1846 |
8.3 |
0.2 |
8.5 |
9.0 |
31.4 |
4.9 |
6.7 |
0.2 |
6.8 |
25.0 |
9.8 |
| TOTAL |
60.2 |
2.9 |
63.1 |
8.8 |
30.1 |
3.7 |
48.7 |
2.8 |
51.5 |
24.5 |
9.6 |
Table 2. Coal Reserves by Tenement
1.7. Economic Analysis
The coal reserve estimates are supported by the site’s Life of Mine (LOM) plan which is compliant with the requirements of Regulation S-K 1300.
The LOM plan mines the defined Reserves within a 9 year period, during which time the mine is projected to produce 51.5 million tonnes of product with a total cost of $3,544 million and a capital expenditure of $93 million. The LOM plan will produce $271 million in positive total cash flow and ~$285 million Net Present Value (NPV10).
1.8. Conclusion
WPJ has a long operating history and a significant amount of historic exploration, in-mine thickness and elevation measurements, and in-mine channel samples in order to determine Coal Reserve estimates and projected economic viability. The data has been determined by the Qualified Persons to be adequate in quantity and reliability to support the Coal Resource and Reserve estimates in this Technical Report Summary.
The Coal Reserve estimates and supporting Life of Mine (LOM) plan conclude that there are 51.5 million clean recoverable tonnes of surface mineable Reserves at WPJ. The Reserves are economically mineable based on the historical mining performance, mine projections, historical and projected coal sales prices, historical and projected operating costs, and capital expenditure projections for the LOM Plan.
The ability of Peabody, or any coal company, to achieve production and financial projections is dependent on numerous factors. These factors primarily include site-specific geological conditions, the capabilities of management and mine personnel, level of success in acquiring Reserves and surface properties, coal sales prices and market conditions, environmental issues, securing approvals and bonds, and developing and operating mines in a safe and efficient manner. Unforeseen changes in legislation and new industry developments could substantially alter the performance of any mining company.
Coal mining is carried out in an environment where not all events are predictable. While an effective management team can identify known risks and take measures to manage and/or mitigate these risks, there is still the possibility of unexpected and unpredictable events occurring. It is not possible therefore to totally remove all risks or state with certainty that an event that may have a material impact on the operation of a coal mine will not occur.
TECHNICAL REPORT SUMMARY WILPINJONG MINE
1.9. Recommendations
1.9.1. Geology and Resources
Although most of the Wilpinjong deposit is classified as Measured Resources, it is recommended that annual drilling programs are continued to assist with detailed mine planning and marketing strategies.
1.9.2. Mining Processing and Reserves
The Reserves at Wilpinjong aren’t materially sensitive to Coal Prices, with low mining costs providing significant head-room against projected pricing. The mine is a medium to high ash producer (14-30% typically). If the market changes to favour low-ash (i.e. steepening of the price/ash curve) there are some washing strategies that may enable the mine to improve it’s value, but this will have a negative impact on the Marketable (and potentially some of the ROM) Reserves. Conversely, if the price/ash curve flattens out, there are bypass strategies, and additional high-ash coal strata that may be mined. Continued monitoring of the price/ash curve and appropriate adjustment of the washing/bypass strategy to maximise value is recommended.
1.9.3. Environmental, Permitting and Social Considerations
The mine has approvals and permits necessary to deliver the Reserves as described.
1.9.4. Economic Analysis
The ability of Peabody, or any coal company, to achieve production and financial projections is dependent on numerous factors. These factors primarily include site-specific geological conditions, increasing strip ratio, the capabilities of management and mine personnel, level of success in acquiring reserves and surface properties, coal sales prices and market conditions, environmental issues, securing permit renewals and bonds, and developing and operating mines in a safe and efficient manner. Unforeseen changes in legislation and new industry developments could substantially alter the performance of any mining company. It is recommended that those factors should be assessed regularly according to the Company’s internal control and material changes are to be reflected in the future reserve estimates.
TECHNICAL REPORT SUMMARY WILPINJONG MINE
2. INTRODUCTION
2.1. Introduction
This Technical Report Summary was prepared for the Wilpinjong Mine (WPJ), which is operated by Peabody Australia Pty Ltd’s wholly owned subsidiary, Wilpinjong Coal Pty Limited (WCPL).
This Technical Report Summary (TRS) for the Wilpinjong Mine (WPJ) is in accordance with the United States’ Securities and Exchange Commission (SEC) S-K 1300. The S-K 1300 sets the standards for the reporting of scientific and technical information on mineral projects and specifies that the TRS must be prepared by, or under the supervision of, a Qualified Person(s).
This report is the second time filing a TRS in accordance with S-K 1300 for the registrant, with the first report submitted as an appendix to the 2021 10-K provided to the SEC in February of 2022. The report summarizes information on the operation and Coal Reserve estimates. The information will be used to support disclosures in Peabody’s annual SEC filings.
The Qualified Persons identified technical risks related to the reporting and development of these Coal Resources and Reserves. This report is not intended to be a detailed marketing, and/or mining feasibility study and is for advisory purposes only.
2.2. Terms of Reference
Coal Resource and Reserve estimates are reported according to the definitions of S-K 1300 on a 100% controlled basis. The point of reference for Coal Resource estimates is thermal coal as in-situ tonnages. The point of reference for Coal Reserves estimates is thermal coal as the saleable product for an ongoing mining operation. Reserve Estimates are also provided on a Run of Mine (ROM) basis, prior to processing operations taking place.
Coal Resource estimates, exclusive of Coal Reserves, are also provided in this report.
Units used in this report are expressed in the Metric system, unless otherwise noted. Currencies are expressed in year-end 2023 AUD dollars. (These units differ to those summarized in the Annual 10-K filing, which are Imperial Units and year-end 2023 USD.)
Reserve and Resource estimates developed for this report are provided as updates to estimates previously reported in Peabody’s prior annual 10-K submissions.
2.3. Sources of Information and References
The sources of information used in this Technical Report Summary include several systems developed by Peabody that are integrated into a process for estimating and reporting Coal Reserves.
GeoCore - Geologic database of drill hole and coal quality information.
Task Manager – A user interface application for entering, validating and exporting the relevant GeoCore project database;
LOM - Life of Mine Planning includes mine layout, scheduling and economic evaluation in a standardized process used across Peabody’s operations.
LMS – Land Management System which include all property and lease information.
Geology and mining software – Specifically, the Geographical Information System programs Mapinfo and ArcMap for mapping of cadastral, structure, coal quality and geological data and Maptek Vulcan for creating the 3D geological models and mine plans and SPRY for mine scheduling;
WCPL’s publicly available Approvals database, including the project’s Development Consent granted by the relevant government authority and various Management Plans
In-house marketing and supply studies from the Global Analytics Group
2.4. Involvement of Qualified Persons
The following Peabody employees serve as Qualified Persons (QPs) for this report as defined in S-K 1300.
Mining Engineering: Brian Neilsen (BEng(Hons), MAusIMM(CP), RPEQ)
Geology: Emma Ewart (BSc(Hons), MAusIMM)
TECHNICAL REPORT SUMMARY WILPINJONG MINE
Mr. Neilsen is employed as Director of Engineering – Opencut Mining at Peabody’s Corporate Office in Brisbane, Australia. He has responsibilities for supporting mine planning and design at Peabody’s operational open cut mines, particularly regarding the Australian assets. He has over 25 years of coal industry experience in opencut coal mines in the US and Australia. He has regularly travelled to each of the company’s Australian Opencut mines. His latest visit to Wilpinjong was in December of 2023, when he took part in a tour of the entire operation.
Mrs. Ewart is employed as a Sr. Resource Geologist. She is located at Peabody’s Corporate Office in Brisbane, Australia with responsibilities for geological modelling of Peabody’s Australian deposits across multiple coal basins. As part of her role, she often travels to Peabody’s active coal mines and projects. Her last visit to Wilpinjong was in August 2023, where she took part in a tour of the entire operation and the exploration drilling that was being conducted at the time.
TECHNICAL REPORT SUMMARY WILPINJONG MINE
3. PROPERTY DESCRIPTION
3.1. Location
The Wilpinjong Coal Mine is located approximately 40 kilometres north-east of Mudgee, near the Village of Wollar, within the Mid-Western Regional Local Government Area, in central New South Wales (NSW), Australia. The Wilpinjong Coal Mine is owned and operated by Wilpinjong Coal Pty Ltd (WCPL), a wholly owned subsidiary of Peabody Energy Australia Pty Limited (Peabody Energy). The general location of the Mine is shown on Figure 1.
The mine produces thermal coal products which are transported by rail to domestic customers for use in electricity generation and to ports for export. Open cut mining operations and associated mobile equipment movements are undertaken 24 hours per day, seven days per week.
3.2. Property Rights
WCPL and Peabody Pastoral Holdings Pty Ltd are a major landholder owning adjacent rural properties and land to the east and south-east of the mine. Land to the west of the mine are owned by adjacent mining companies, whilst the National Parks and Wildlife Service estate own significant land to the north and south-west of the Mine. Private properties are located predominantly in and around the Wollar Village approximately 1.5 km to the east of the Mine and along Mogo Road to the north of the Mine.
The Mine originally operated under Project Approval (PA 05-0021) that was granted by the Minister for Planning under Part 3A of the NSW Environmental Planning and Assessment Act 1979 (EP&A Act) on 1 February 2006. On 24 April 2017, WCPL was granted Development Consent (SSD-6764) for the Wilpinjong Extension Project (WEP) that provides for the continued operation of the Mine at rates of up to 16 million tonnes per annum (Mtpa) of run-of-mine (ROM) out to 2033, and access to approximately 800 hectares (ha) of open cut extensions. Development Consent (SSD-6764) has superseded the original Project Approval (Project Approval 05-0021). A summary of the conditions of this Approval is shown in the table below:
Table 3. Summary of Mining Approval Conditions
TECHNICAL REPORT SUMMARY WILPINJONG MINE
Land use in the vicinity of the Mine is a combination of coal mining operations, conservation areas, stock grazing and rural residential development.
WPJ approved mining activities occur within ML1573, ML1779, ML1795 and ML1846. ML1573 was granted under the Mining Act 1992, on 08 February 2006. ML1779 was granted under the Mining Act 1992, on 20 December 2018. ML1795 was granted under the Mining Act 1992, on 27 September 2019. ML1846 was granted under the Mining Act 1992, on 28 February 2023.
WCPL’s exploration activities will continue to occur within adjacent exploration licences (EL) EL6169, EL7091 and EL9399 and within ML1573, ML1779, ML1795 and ML1846. The date of grant and duration of mining and explorations licenses relevant to WCPL are provided in Table 4.
TECHNICAL REPORT SUMMARY WILPINJONG MINE
|
|
|
|
|
|
|
|
|
|
|
|
|
|
|
|
|
|
|
|
|
|
|
|
|
|
|
| Tenement |
Tenement Name |
Holder |
Term Years |
Grant Date |
Commencement Date |
Expiry Date |
Status |
Hectares |
| EL6169 |
Wilpinjong Coal Tender Area |
WILPINJONG COAL PTY LTD |
24 |
22/12/2003 |
22/12/2003 |
22/12/2027 |
Current |
1160 |
| EL7091 |
Wilpinjong |
WILPINJONG COAL PTY LTD |
20 |
3/03/2008 |
3/03/2008 |
3/03/2028 |
Current |
130 |
| EL9399 |
|
WILPINJONG COAL PTY LTD |
6 |
3/05/2022 |
3/05/2022 |
3/05/2028 |
Current |
1668 |
| ML1573 |
Wilpinjong |
WILPINJONG COAL PTY LTD |
21 |
8/02/2006 |
8/02/2006 |
7/02/2027 |
Current |
2863 |
| ML1779 |
Wilpinjong Ext No 2 |
WILPINJONG COAL PTY LTD |
21 |
20/12/2018 |
20/12/2018 |
20/12/2039 |
Current |
704 |
| ML1795 |
Wilpinjong Ext No 2 |
WILPINJONG COAL PTY LTD |
21 |
27/09/2019 |
27/09/2019 |
27/09/2040 |
Current |
156.4 |
| ML1846 |
|
WILPINJONG COAL PTY LTD |
21 |
28/02/2023 |
28/02/2023 |
28/02/2044 |
Current |
66.5 |
Table 4. Leases
Figure 3. Coal Control Property Map
In order to maintain Mining Leases and Exploration Licenses, the company is required to pay annual statutory fees (including rental) and levies. All coal mined is also subject to the standard NSW Coal Royalty, which is currently 8.2% of Revenue less certain deductions (note: this royalty is set to increase to 10.8% in July, 2024).
The following tables provide the summary of the other approvals, leases and licences that the Mine operates under.
TECHNICAL REPORT SUMMARY WILPINJONG MINE
|
|
|
|
|
|
|
|
|
|
|
|
Relevant Authority |
Instrument
|
Approval/Licence No.
|
Expiry Date
|
| DPIE |
Development Consent |
SSD-6764 |
28 years from commencement of Project Approval (i.e. 2033) |
|
DRG
|
Mining Lease |
ML1573 |
7 February 2027 |
| Mining Lease |
ML1779 |
20 December 2039 |
| Mining Lease |
ML1795 |
27 September 2040 |
| Mining Lease |
ML1846 |
28 February 2044 |
|
Exploration Licence
|
EL 6169 |
22/12/2027 |
| EL 7091 |
03/03/2028 |
| EL 9399 |
03/05/2028 |
Mine within Wilpinjong B Notification Area |
ML 1573
|
Endorsed DSC 19 February 2013
Approved 24 January 2014
|
Rehabilitation Management Plan |
RMP Dec 2022 |
- |
|
EPA
|
Environment Protection Licence (EPL) |
EPL 12425
|
Until the licence is surrendered, suspended or revoked. The licence is subject to review every 3 years |
NSW Radiation Control Act 1990 Registration |
Licence Number 5061384 |
02 January 2025
|
Work Cover NSW |
Explosives Licence
|
NSW Explosives Act 2003 Part 3 Licence (Licence Number XSTR200024) |
24 March 2023
|
|
DPI-Water
|
Water Licences
|
Refer to *Note: Water entitlement held under NSW Water Management Act, 2000 is granted in perpetuity. One unit is currently equivalent to 1.0 ML as per the Available Water Determination Order for Various NSW Unregulated and Alluvial Water Sources (No. 1) 2013
Table 6
|
Refer to *Note: Water entitlement held under NSW Water Management Act, 2000 is granted in perpetuity. One unit is currently equivalent to 1.0 ML as per the Available Water Determination Order for Various NSW Unregulated and Alluvial Water Sources (No. 1) 2013
Table 6
|
| DCCEEW |
EPBC Approval |
EPBC 2015/7431 |
31 Dec 2033 |
Note: Copies of the Development Consent (SSD-6764), EPL 12425, ML 1573, ML1779, ML1795 and ML1846 are available on the Peabody
Energy website (http://www.peabodyenergy.com)
Table 5. Summary of Approvals
TECHNICAL REPORT SUMMARY WILPINJONG MINE
|
|
|
|
|
|
|
|
|
|
|
|
|
|
|
|
|
|
|
|
|
WAL |
AL # |
Water Source |
Category |
Entitlement* |
Holder |
Work Approval |
|
21499
|
20AL211215
|
Wollar Creek |
Aquifer
|
474 Unit shares |
Peabody Pastoral Holdings Pty Ltd / Wilpinjong Coal Pty Limited as 100/374 share |
20CA211216
|
19045 |
20AL209956 |
Upper Goulburn |
Unregulated |
183 Unit shares |
Peabody Pastoral Holdings Pty Ltd |
20CA209957 |
19055 |
20AL209954 |
Upper Goulburn |
Unregulated |
50 Unit shares |
Peabody Pastoral Holdings Pty Ltd |
20CA209955 |
19057 |
20AL209966 |
Upper Goulburn |
Unregulated |
110 Unit shares |
Peabody Pastoral Holdings Pty Ltd |
20CA209967 |
19058 |
20AL209974 |
Upper Goulburn |
Unregulated |
168 Unit shares |
Peabody Pastoral Holdings Pty Ltd |
20CA209975 |
19426 |
20AL210793 |
Wollar Creek |
Unregulated |
40 Unit shares |
Peabody Pastoral Holdings Pty Ltd |
20CA210794 |
19423 |
20AL210790 |
Wollar Creek |
Domestic & stock |
2 ML |
Peabody Pastoral Holdings Pty Ltd |
20WA210792 |
19425 |
20AL210795 |
Wollar Creek |
Domestic & stock |
1 ML |
Peabody Pastoral Holdings Pty Ltd |
20WA210796 |
19430 |
20AL210798 |
Wollar Creek |
Domestic & stock |
5 ML |
Peabody Pastoral Holdings Pty Ltd |
20WA210799 |
36398 |
20AL212799 |
Wollar Creek |
Domestic & stock |
1 ML |
Peabody Pastoral Holdings Pty Ltd |
20WA212768 |
|
9476
|
N/A
|
Macquarie/ Cudgegong |
Regulated (General
Security)
|
790 Unit shares |
Wilpinjong Coal Pty Limited
|
No nominated work |
|
41862
|
N/A
|
Sydney Basin
- North Coast
Groundwater
|
Aquifer
|
3121 Unit shares
|
Wilpinjong Coal Pty Limited
|
20MW065002
|
*Note: Water entitlement held under NSW Water Management Act, 2000 is granted in perpetuity. One unit is currently equivalent to 1.0 ML as per the Available Water Determination Order for Various NSW Unregulated and Alluvial Water Sources (No. 1) 2013 To the extent known to the QP, there are no other significant factors and risks that may affect access, title of the right or ability to perform work on the property.
Table 6. Water Licences
TECHNICAL REPORT SUMMARY WILPINJONG MINE
3.3. Comments from Qualified Person(s)
TECHNICAL REPORT SUMMARY WILPINJONG MINE
4. ACCESSIBILITY, CLIMATE, LOCAL RESOURCES
4.1. Physiography
WPJ is surrounded by the narrow flood plains associated with the upper reaches and tributaries of the Wollar Creek catchment (which in turn drains to the Goulburn River), the undulating foothills, ridges and escarpments of the Great Dividing Range and the dissected landforms of the Goulburn River National Park.
Local elevations range from approximately 350m (1150ft) AHD (Australian Height Datum) on Wilpinjong Creek just to the east of the confluence with Cumbo Creek, to approximately 745m (2440ft) AHD at a series of peaks to the south of the Project along the Great Dividing Range. Elevations in the Goulburn River National Park to the north of the Project are generally less than 600m (1970ft) AHD. Within the Mining Lease Area, elevations generally range from approximately 350 to 440m (1150 to 1440ft) AHD, while escarpment areas and narrow ridges adjoining the Munghorn Gap Nature Reserve rise to above 510m (1670ft) AHD in places.
The condition of native vegetation in the mine area and surrounds varies, with the most disturbed areas generally occurring along watercourses and on flat and undulating areas which have been cleared for agriculture. Most natural vegetation is restricted to the steep hills and slopes outside of mining disturbance areas. There are some small uncleared areas of remnant vegetation scattered throughout the mining area and surrounds and these are mainly associated with stony outcrops.
The area supports a diversity of flora species and communities. Remnant vegetation is dominated by eucalypt woodland and forests. A number of tree species including Narrowleaved Ironbark (Eucalyptus crebra), Coast Grey Box (E. moluccana), Black Cypress Pine (Callitris endlicheri), and Rough-barked Apple (Angophora floribunda) are widespread and common and associate with many other species. Other dominant tree species include Yellow Box (E. melliodora), Blakely’s Red Gum (E. blakelyi), White Box (E. albens) and Grey Gum (E. punctata).
4.2. Access
WPJ is located approximately 58 kilometres (36 miles) by sealed road to the north-east of Mudgee, NSW.
From Mudgee, take Ulan Road for approximately 45 kilometres (28 miles) before turning right onto the Ulan-Wollar Road. The mine entrance is located on the right hand (south) side of this road approximately 10.6km (6.6miles) from the turn. Mudgee also contains the nearest commercial airport to WPJ, with regular flights to/from Sydney.
TECHNICAL REPORT SUMMARY WILPINJONG MINE
Figure 4. Access Map - from Mudgee
If approaching from the East, from Newcastle, follow the A15 / M15 (Hunter Valley Exp[ressway) for approximately 65km (40miles) before turning on to the Golden Highway (B84). Follow the Golden Highway for 82km (51 miles) to Sandy Hollow before turning onto the Bylong Valley Way and following that road for 85km (53miles) to Wollar. Then follow the Ulan Wollar Road for 11km (7miles) to the Mine Entrance. Newcastle also has a large airport facility, with frequent and regular flights to a number of Australian cities.
Figure 5. Access Map – from Newcastle
All product coal is loaded via the site’s train loading facility, which includes a rail spur and loop. Coal is transported by rail to either
the Antiene-Newdell Coal Unloaders (located between Singleton and Muswellbrook), where coal is offloaded for use as domestic fuel for the Liddell and Bayswater Power Station or
to the Port of Newcastle, where the coal is offloaded for export The rail distances to Antiene and Newcastle are 155km (96miles) and 260km (162miles) respectively.
TECHNICAL REPORT SUMMARY WILPINJONG MINE
Rail Transport corridors are displayed in Figure 6.
Figure 6. NSW Rail Transportation
TECHNICAL REPORT SUMMARY WILPINJONG MINE
4.3. Climate
The area experiences a humid sub-tropical climate, with semi-arid characteristics, allowing for mine operations year-round. Temperatures vary from -8 degrees Celsius (18 oF) in Winter to 44 degrees Celsius (111 oF) in Summer. Yearly average temperature is ~16 degrees Celsius (61 oF). Average rainfall is around 650mm (25.6 inches) per year.
4.4. Available Infrastructure
The mine employs over 500 people directly, most of whom live in the local area. The mine’s proximity to other large coal mining projects provides access to a significant pool of experienced miners, well-equipped support vendors and suppliers.
Electrical power is supplied to the site via a 66kV powerline.
The mine maintains a comprehensive water management system, utilizing a series of on-site water storages to use a combination of captured surface runoff and recycled water to meet requirements for coal processing and dust suppression activities. The mine is permitted to collect make-up water from Water Supply bores on-site if required.
Figure 7. Mine Water Management Schematic
4.5. Comments from Qualified Person(s)
It is the QP’s opinion that the local resources and infrastructure are well developed through historic coal mining developments in the region. It is sufficient to support the declaration of Coal Resources, Reserves and the mine plan.
TECHNICAL REPORT SUMMARY WILPINJONG MINE
5. HISTORY
5.1. Prior Ownership
The Wilpinjong Mine began after Wilpinjong Coal Pty Ltd (WCPL – then a subsidiary of Excel Coal Ltd) successfully tendered in 2003 for a coal supply agreement for Macquarie Generation (then a NSW Government owned company) to supply coal to the nearby Bayswater and Liddell Generating Stations. In December of 2003, Exploration Licence (EL) 6169 was granted to WCPL by the NSW government.
Development of the mine by WCPL began in February 2006, with construction/mining contractor Thiess awarded a contract to build and operate the mine. First coal was railed from the mine in October, 2006. Excel Coal Pty Ltd was purchased by Peabody Energy during 2006, and the mine continued to be operated by Thiess for several years, until Peabody made the decision to convert the mine to Owner-Operate in 2013.
5.2. Exploration, Development, and Production History
The exploration programs leading to the development of the resource knowledge of the Wilpinjong deposit included drilling by:
Joint Coal Board
Joint Development Program
Energy Recycling Corporation Pty Ltd
Electricity Commission of NSW
NSW Department of Mineral Resources
Excel Coal
Wilpinjong Coal Pty Ltd
Joint Coal Board
In the early 1950’s, the Joint Coal Board (JCB) conducted an exploration program in the area to support the development of the Ulan Power Station. In the Wilpinjong area, the JCB drilled the Ulan-Wilpinjong and Ulan-Cumbo series of holes. These holes were NX-size (54.7mm diameter) cored holes, and 12 of these holes were located near Wilpinjong.
Detailed ply sampling and analysis (down to 1” sample size) was undertaken on bore cores. Coal samples were subjected to proximate analysis, sulphur analysis, British Swelling Number and calorific value. Stone samples were only tested for ash content, and no density tests were undertaken. Coal quality data from this drilling has limited value for resource definition, as sampled coal recovery was poor. The boreholes did, however, indicate the continuity of coal in the area.
Joint Development Program
In 1977, under a joint arrangement between the Commonwealth Government, the Joint Coal Board and NSW Department of Mines, 21 scout boreholes were drilled in a program to define Coal Resources in the greater Ulan area. This program provided better core recoveries than the previous JCB drilling and analysis of samples included ply by ply, analysed clean and washed coal composite analysis, and petrography. The size of the core is not specified on the logs from this drilling; however geophysical logs record a nominal hole size of 3 1/8” (79.4mm). Four of these holes occur in the immediate Wilpinjong area and are located outside of the current Wilpinjong coal tenements.
These holes were geophysically logged using self-potential, resistivity, natural gamma, density, neutron, temperature, and caliper tools. Analog outputs from these logs are typical of the vintage of this drilling.
Energy Recycling Corporation Pty Ltd
Energy Recycling Corporation Pty Ltd (ERC) held title to Authorisation No. 167, which covered a large portion of the current Wilpinjong mine area. This company drilled 77 boreholes, which were partly cored and geophysically logged (with the exception of the first four holes). Forty holes were drilled in the immediate Wilpinjong area, including two holes located in Goulburn River National Park to the north. Hole-size is not recorded on the English logs of these holes, but is around 3” (75mm) according to caliper logs.
TECHNICAL REPORT SUMMARY WILPINJONG MINE
The main target of interest to ERC was the Ulan seam, which was sampled in detail. Individual plies were tested for moisture, ash and RD, and combinations of plies (excluding those with ash contents >40%) were analysed for proximate analysis, CSN, specific energy, total sulphur, chlorine and HGI.
Certain boreholes deemed to be located in “potential open cut areas” were subjected to additional tests including ash composition and fusibility, ultimate analysis, forms of sulphur and petrographic analysis.
No washability tests were carried out on the cores, as part of the focus of the program was processing of raw coal in a novel coal beneficiation technique owned by ERC.
Electricity Commission of NSW
The Electricity Commission of NSW held title to Authorisation No. 322. Twenty four holes were drilled as part of this program. Six holes lie due east of Wilpinjong, and were HQ-size cored holes. Ply sampling and analysis from these holes is comprehensive with detailed ply sampling and analysis, raw and washed coal composites, and fairly detailed characterisation tests on thermal and coking coal composites.
Holes were geophysically logged using BPB instruments, and these included gamma, neutron, density, caliper, resistance and sonic logs.
Department of Mineral Resources Drilling
The DMR drilled numerous holes in the region in several programs to define Coal Resources. These programs included the various stages of the Wilpinjong-Moolarben and Cumbo-Wilpinjong Programs.
The first phase of drilling, undertaken in 1992, included the drilling of three partly cored holes, designed to provide an indication of the washability characteristics of the Ulan seam.
The second phase of drilling was completed in 1998 and included the drilling of 13 partly cored boreholes, and 14 rotary holes in the Moolarben area. As with Stage 1, the second stage of drilling targeted resource definition and washability testing of the Ulan seam.
Stage 3 drilling involved the drilling of seven cored holes and four rotary holes. The drilling at this time was focused on open cut and underground resource identification in several prospective areas, including the “Wilpinjong Open Cut” area.
Eighty one of the ‘DM’ holes have been drilled at Wilpinjong and formed the basis for a competitive tender package released in 2002. The drilling was largely HQ-size core.
Documentation of the complete set of drill holes undertaken in the Moolarben and Wilpinjong area by the DMR is poor. Stage 4 and 5 drilling was also undertaken for the project, as evidenced in borehole header data supplied by the DMR. These stages included the drilling of six large diameter holes (146mm or 5¾” core) for detailed sizing and washability analysis. It is unclear from available documentation, what order the holes were drilled in and the exploration rationale for the program. Analysis of the large diameter core samples was reported in 2003.
During these drilling campaigns, the DMR adopted the subdivision of the Ulan seam as used at Ulan Mine. Sampling of the coal seams was largely done on this basis, aided by the recognition of tuffaceous marker bands within the seam. Coal ply samples from the DMR drilling were analysed for RD, proximate analysis, CSN and total sulphur, whereas stone samples were tested for moisture, ash and density. The plies were composited into working sections that matched the seam nomenclature used at Ulan, and subjected to float-sink tests at densities from 1.3 to 2.0 in 0.1 increments. A particular focus of the drilling appeared to be proving up the “DWS” or D working section, which is mined underground at Ulan.
Excel & Peabody Wilpinjong (WCPL)
Following competitive tender, Excel Coal Ltd was granted Exploration Licence (EL) 6169 in December, 2003. In 2004 and 2005, Excel drilled 29 cored holes and 152 open holes. All of these holes were geophysically logged and samples taken from cored holes were subjected to analysis.
In February, 2006, Excel was granted Mining Lease (ML) 1573. During the same year, Peabody Energy acquired Excel and ownership of Wilpinjong Mine. By that stage, Excel had completed around 45 cored holes, and two “gas” holes, and 169 open holes, mostly limit of oxidation drilling. The core drilling was all HQ-size drilling.
TECHNICAL REPORT SUMMARY WILPINJONG MINE
Most of the holes drilled by Excel were geophysically logged. Sampling of the Ulan seam by Excel followed a similar subdivision of the Ulan seam, as adopted by the DMR, but with some refinement to account for local conditions.
Raw coal samples were analysed for proximate analysis, RD, total sulphur and calorific value, whereas stone samples were analysed for moisture, ash, RD and total sulphur. Selected float-sink intervals, largely based on the recognised seam subdivisions, were sized at -11.2m to +0.125mm and float-sink tests undertaken at densities of 1.40 to 1.80 in 0.1 density increments. Ash analysis, ash fusion temperature (red.), chlorine, fluorine and nitrogen were determined on nominated clean coal composites, usually the CF1.60 composite.
The Mine originally operated under Project Approval (PA 05-0021) that was granted by the Minister for Planning under Part 3A of the NSW Environmental Planning and Assessment Act 1979 (EP&A Act) on 1 February 2006. On 24 April 2017, WCPL was granted Development Consent (SSD-6764) for the Wilpinjong Extension Project (WEP) that provides for the continued operation of the Mine at rates of up to 16 million tonnes per annum (Mtpa) of run-of-mine (ROM) out to 2033, and access to approximately 800 hectares (ha) of open cut extensions. Development Consent (SSD-6764) superseded the Project Approval (Project Approval 05-0021).
WCPL continues to conduct ‘in-fill’ exploration drilling in active mining areas as required to improve the confidence levels of the resource within the 5 year mine plan horizon. In recent years, a focus of this drilling has been to delineate coal ‘washout’ features (known as ‘paleo-channels’, in addition to refining structure and coal quality at a finer scale.
In May 2022, WCPL was granted EL9399, covering an area of 1668 hectares adjoining the eastern side of the mine. WCPL is currently undertaking a work program on EL9399 as per a condition of the licence approval.
TECHNICAL REPORT SUMMARY WILPINJONG MINE
6. GEOLOGICAL SETTING, MINERALIZATION, AND DEPOSIT
6.1. Geological Setting
6.1.1. Regional Geology
The Sydney Basin is a large sediment basin located on the east coast of Australia and is part of the larger contiguous Sydney-Gunnedah-Bowen Basin that extents from coastal southern NSW to central Queensland. Sediments in the Sydney Basin date from the Early Permian to Triassic with Quaternary alluvium overlaying the earlier units in erosional valleys and along coastal plains. Two periods of coal deposition occurred during the Permian with the Late Permian where the more widespread coal measures were developed including the Illawarra Coal Measures deposited in the south and west (Hutton, 2009). Generally, the Sydney basin has only been mildly deformed with some faulting cutting the coal measure sequences. Seam dips are mostly sub horizonal with up to 5 to 10o due to local structures.
The Western Coalfield lies along the northwestern margin of the Sydney Basin (Yoo, 2001). The coal bearing sequences in the Western Coalfield is the Permian Illawarra Coal Measures. The coal measures overlay the marine-influenced Shoalhaven Group. A quarto-lithic fluvial sequence of the Narrabeen group then overlay the coal measures. Seams general dip 1 or 2o in an easterly direction except along the margin of the coalfield where dips can reach 10o. Dominate structures are regional scale meridional monoclines with sub parallel large faults with localized small-scale faults of >5m (16ft) throw treading in north-south direction. Jurassic to mid Tertiary Igneous intrusion are present in the centre and north east of the coalfield. Six coal seams are recognized in the Illawarra Coal measures including Katoomba Seam, Middle River Seam, Moolarben Seam, Ulan Seam, Lidsdale Seam and Lithgow Seam. A regional geologic stratigraphic column and geologic map are shown in Figure 8 and Figure 9 respectively.
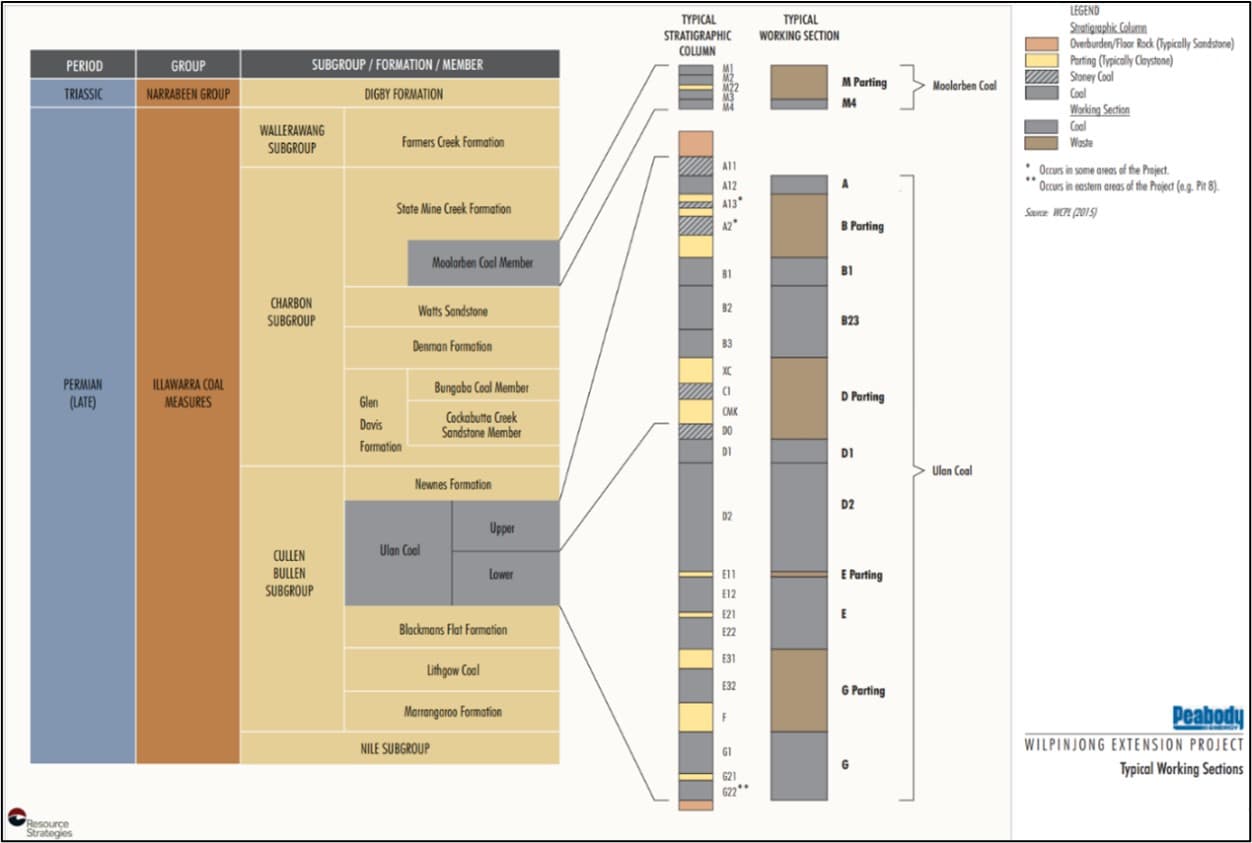
Figure 8. Geologic Stratigraphic Column
TECHNICAL REPORT SUMMARY WILPINJONG MINE
Figure 9. Regional Geology Map
6.1.2. Local Geology
The surface geology of the Wilpinjong Mine is dominated by subcrops of the Illawarra Coal Measures. This unit overlies the Shoalhaven Group, which crop out immediately south of Wilpinjong. The coal measures are overlain by the Narrabeen Group, which forms the cliff-lines and plateaus to the north and south, the ridges that protrude out from these plateaus and outliers such as those adjacent to the Slate Gully area. In places, the Illawarra Coal Measures are concealed beneath younger alluvial deposits, particularly those that occupy abandoned channel-fill, referred to on site, as “palaeo-channels”. Quaternary alluvial deposits also flank Wilpinjong and Cumbo Creeks.
In the Wilpinjong Coal Mine area, the shallow nature of the coal seam, combined with flat topography has resulted in extensive interaction between the base of weathering and the coal seam, to the extent that in some areas the seam has been completely oxidised. In addition, several extensive paleochannels have been identified adjacent to ridgelines that have deeply incised the coal seam. Locally, dips are relatively flat (1 to 3 degrees), with strata dipping to the north-northeast.
The Moolarben seam consists of three plies, of which the lower half of the basal ~0.50m (1.6ft) thick ply (M4) is currently being mined. The other plies – M1, M2 and M3 all generally exceed 40% in ash and have yields of less than 50% and are generally not considered mining targets. The Moolarben seam has not been mined in the local area in the past.
The Ulan seam ranges between 11 and 22.5m (36 to 74ft) in total thickness, however the mineable coal plies have a combined thickness of 5.7 to 9.0m (18.7 to 30.5ft). The seam consists of a number of coal and stone plies that are correlated across the Wilpinjong resource area and into adjacent mines and projects (Figure 43). The Ulan seam has minimal stone partings in the north west of the project with midburden partings opening up to the east.
The Ulan Seam is broken up into the A, B, C, D, E, F and G plies. These sections are selectively mined (Figure 10) and campaign washed or bypassed at the CHPP to produce product coal at a specific ash point for both domestic and export thermal coal products. Some coal plies are mined across the whole site including A12, B1, B23, D1, D2, E1 and G. Other coal plies are mined only in certain pits (eg. C1 and D0 taken in Pit 6). The plies of the D seam (D0, D1, D2, DD2) are mined selectively or combined depending on the coal quality of the mining block. Several smaller splits occur either approximately on an north-south orientation (such as the G floor coal ply) or an east-west trend (such as B1 splitting away from B23). Generalised coal quality trends area also present across Wilpinjong for different coal plies in similar north-south and east-west orientations that the structure of the seams follow.
TECHNICAL REPORT SUMMARY WILPINJONG MINE
Three representative geologic cross section derived from drill hole information and model orientated through the remaining WPJ coal deposit are shown in Figure 11. The exact locations of these cross sections are shown on the Regional Geology Map (Figure 9).
The rank of the coal seams is high volatile bituminous (ASTM D388 ‘Standard classification of Coal by Rank’), based on the volatile matter (daf) content of the coal plies, which is generally in the range 35 to 44%.
The average volatile matter content of the Ulan seam plies ranges from 11 to 35%. For the plies that are less than 40% ash ad, the volatile matter content is between 20 and 35%. The low volatile matter content of parts of the Ulan seam is largely a function of the high inertinite content of the dull coal plies. The basal ply of the Moolarben seam is 32% ad.
The air-dried moisture content of the Ulan seam averages 2.9% ad and is around 2% for high ash plies, and ranges from 2.5 to 3.5% ad for the coal sections. The basal section of the Moolarben seam has an average air-dried moisture content of 3.8% ad.
The total sulphur content of the majority of coal plies is <0.5% ad. Certain plies are known to be locally higher in sulphur content (e.g., E and G plies) with values generally in the range 0.5 to 1.2% ad; and isolated analyses over 2.0%.
The calorific value of the raw coal closely follows that of the ash content. On an air-dried basis, coal that is less than 28% (ad) ash yields greater than 24 MJ/kg (ad) (5730 kcal/kg).
The surrounding ridges of resistant Triassic strata have combined with the thick seam and shallow dips resulting in an extensive area of shallow coal that is amenable to open cut mining. These ridges are generally within National Park and are excluded from mining.
No major faults have been identified within the Wilpinjong Coal Mine area, however, some minor faulting (<5m vertical throw) produces normal faults with a few meters throw or small thrust faults producing localised seam rolls that have limited impact on the current mine’s coal recovery.
Identified igneous activity in the area (Figure 12. Undifferentiated Intrusives) has resulted in one north-south trending dyke in the east of the mining lease, and several smaller localised dykes in the middle of the tenement. There have also been two igneous diatreme features identified whilst mining, and two tertiary basalt plugs in the far east of the tenement which has been confirmed by exploration drilling. The coal tonnes over these have all been excluded from the Resource estimate. There is no heat affected coal zone so an additional exclusion boundary has not been applied.
TECHNICAL REPORT SUMMARY WILPINJONG MINE
Figure 10. Sub plies of the Ulan Seam
TECHNICAL REPORT SUMMARY WILPINJONG MINE
Figure 11. Geological Cross Section
TECHNICAL REPORT SUMMARY WILPINJONG MINE
Figure 12. Undifferentiated Intrusives
6.2. Hydrology Setting
6.2.1. Regional Hydrology
The Project is located at the headwaters of the Goulburn River catchment which is a major tributary of the Hunter River. The Hunter River catchment drains some 22,000 km2 of central-eastern NSW to the Pacific Ocean at Newcastle (Peabody Energy EIS, 2016).
The Hunter River is one of six river basins that have been regulated by the NSW Government however the Goulburn River and other major tributaries of the Hunter River remain unregulated. There are no public water supply dams in the Project area or on the Goulburn River.
The Project area is located in the greater Wollar Creek catchment which drains to the Goulburn River approximately 12 km to the north-east of the Project area. The greater Wollar Creek catchment consists of several tributaries including Wilpinjong Creek, Spring Flat Creek and Barigan Creek.
Baseline surface water quality monitoring has been undertaken for the Wilpinjong project since June 2004 (generally, on a monthly basis and following rainfall events, where possible). Baseline groundwater data has also been reviewied and compiled from a number of sources including mapping data, government department information, Wilpinjong Coal Mine data, assessments and investigations.
A Groundwater Impact Assessment for the Wilpinjong project was conducted by Australasian Groundwater and Environmental Consultants (AGE) in 2005. The assessment included a review of field hydrogeological investigations conducted in 2003 and 2004, as well as the results of groundwater level and groundwater quality monitoring during a bore census in February 2005.
The existing baseline groundwater data was augmented with the results of a Project groundwater investigation programme undertaken by Groundwater Exploration Services in 2014 and 2015.
The main aquifers in the project area are the Ulan seam and the underlying Marrangaroo Formation (sandstone). Additional aquifers are developed in surface alluvial and colluvial deposits as well as in the sandstones and siltstones of the Narrabeen Group and the upper part of the Illawarra Coal Measures (above the Ulan seam).
TECHNICAL REPORT SUMMARY WILPINJONG MINE
6.2.2. Local Hydrology
Records of groundwater levels in the vicinity of the Wilpinjong Coal Mine are available from as early as 2004 (WEP Feasibility Report, 2018). A monitoring network at the Wilpinjong Coal Mine has been progressively expanded over time to include the WCPL exploration tenements, and on Peabody Energy-owned land in and to the south of the Village of Wollar.
An analysis of the available time related data (including hydrographic plots) to illustrate cause and-effect relationships with rainfall, mining and groundwater levels at the Wilpinjong Coal Mine and surrounds was conducted by HydroSimulations in 2015 as part of the Environmental Impact Statement for the Wilpinjong Extension Project (Peabody Energy EIS, 2016).
This analysis indicates a general trend for mining-related drawdown to be apparent in monitoring bores targeting the coal seams, typically within a few hundred metres of active mine areas, but drawdown is much less apparent, if apparent at all, in bores placed in the surface alluvium.
HydroSimulations conclude this is due to the following properties and processes:
alluvial bodies are not directly connected to or intersected by the footprint of the open cut pits;
rock strata between the coal seams and the alluvium mitigate the drawdown response because of low vertical hydraulic conductivity; and
the unconfined conditions and greater aquifer storage of the alluvium compared to the confined coal seams result in a much lower head variation (drawdown) in the alluvium.
No mining effects have been observed in any hard rock or alluvial monitoring bores in the Village of Wollar.
Groundwater in the alluvium has a higher average salinity than the underlying coal measures. Groundwater is monitored via a network of bores, which are monitored and sampled in accordance with the site’s Groundwater Monitoring Program.
Five aquifer systems have been recognised in the Project area including:
alluvial and colluvial deposits;
sandstones and siltstones of the Narrabeen Group
Illawarra Coal Measures overlying the Ulan Seam; The Wilpinjong mine accesses the Ulan Seam, a 15m-thick seam that is hosted at the base of the late Permian aged Illawarra coal measures.
Ulan Seam; and
Marrangaroo Sandstone
TECHNICAL REPORT SUMMARY WILPINJONG MINE
6.3. Mineralization and Deposit Type
The paleoenvironment is a protected swamp environment on the stable Carboniferous granite basement. The Ulan seam consists of ten plies, including plies of good quality coal, high ash coal, stony coal and partings of claystone, carbonaceous claystone, tuffs and other non-coal lithologies. The working plies at the Ulan seam are inter-bedded with clay stone and siltstone horizons. The seam is shallow and sub crops in the deposit area.
The Coal Reserves reported are high volatile bituminous in rank. The various coal products making it marketable for thermal use in domestic electricity generation and export.
Peabody classifies the Wilpinjong property as a coal deposit with low geological complexity based on the following factors:
The Ulan seam is laterally continuous and can be correlated using geophysical logs across large distances with high confidence.
The seam is relatively flat lying (1 to 3 degrees), gently dipping towards the north-northeast
There are no major faults in the area.
The Ulan seam is currently mined across the area at two other mining operations.
The overall confidence in the geological interpretation of the deposit is high. This is due to low variability (both structural and coal quality) as evidenced by the laterally consistent seam dip, lack of structure and relatively homogeneous coal quality (ply by ply basis).
Two areas of relatively high variability are around intrusions (dykes, sills and plugs) and palaeochannels (adjacent to Triassic age ridges and hilltops). In these areas a multi-faceted exploration approach has been utilized to increase confidence in the geological interpretation; including ground mapping, geophysical surveys and associated validation drilling.
6.4. Comments from Qualified Person(s)
In the opinion of the QP, for both regional and local geology, the structural controls on mineralization are well studied and understood from decades of exploration and mining activities over the area. It is sufficient to support the estimation of Coal Resources and Reserves.
TECHNICAL REPORT SUMMARY WILPINJONG MINE
7. EXPLORATION
7.1. Coordinate System
All survey for Wilpinjong is captured in Geocentric Datum of Australia (GDA 94). The standard map projection associated with GDA94 is the Map Grid of Australia 1994 which is a transverse Mercator projection. Older boreholes may have been captured in different coordinate systems however have since been transformed to GDA94.
Height data is captured as Australian Height Datum (AHD) which is tied to mean sea level.
All survey associated with drill collars, geophysical surveys and mine workings conducted using mine site RTK high precision equipment, with an accuracy of <50mm.
7.2. Geological Structure Mapping and Quality Sampling
The geological understanding of the Wilpinjong deposit has been built on successive exploration drilling work in addition to geophysical surveys and pit mapping. This includes a plethora of in-mine seam thickness and structural measurements along with the further described geophysical surveys that have provided targets for drilling. Currently there is no in-pit strip sampling for coal quality. Coal quality samples have been acquired from exploration borecore as described in section 8.1.1
Pit survey data
Pit survey data includes coal roof and floor pickup, base of alluvial channels, fault mapping and intrusion mapping. The mine surveys the coal seam elevation periodically during coal mining process. The surveyed floor elevation of the coal seams has been used as additional structural control in the geological model. The top elevation of coal seams is surveyed as well, but the surveyed results are used for validation purposes. Point cloud data of pit walls is also collected to measure thickness of units (including alluvial channels) and fault traces to validate the model.
In-pit geophysical logging of selected blast holes
The geophysical logging results, mainly density and gamma logs, are interpreted and added to the drilling database for structure delineation only. Blast hole logging is rarely used at Wilpinjong but is helpful for structural control in an area where the seam may show a variation to the geological model.
Local ground magnetic and radiometric geophysical survey (2005, 2014)
Magnetics is an effective tool for locating geological structure (faults, dykes) rapidly and accurately from the surface. Radiometric survey is useful for identify non-magnetic sills. The survey at Wilpinjong was conducted over Pit 8 to identify anomalies that may be a hazard to mining such as faults, dykes and sills. The anomalies were followed up with a drilling program to either discount or confirm them.
Local Thiel Surface Impedance geophysical survey (2014)
The TSIM (Thiel Surface Impedance Method) technique is a geophysical method used to map faults, intrusions, structure, dykes, LOX lines, mineral deposits and coal seam sub crops, with a potential for hydrogeological applications. It is a shallow surveying technique, typically measuring to a depth of around 50 m. TSIM is an electromagnetic surveying technique which receives and records information from single-frequency VLF (very low frequency – typically around 15 to 30 kHz) electromagnetic waves transmitted by a distant source.
The survey at Wilpinjong was acquired in Pit 3 to define an intrusion and Pit 5 to paleochannels.
The area covered in Pit 5 covered an area equivalent to 3 years scheduled production and did help define the paleochannel extent which was followed up with an extensive drilling campaign to confirm the available coal. Further geophysical surface surveys were not conducted to cover the entire potential paleochannel area as pit mapping and drilling provided adequate coverage.
Aerial Survey
Aerial topographic surveys, including Lidar mapping and Orthoimagery, are conducted every month. The survey covers all currently active mining areas. A larger extent Lidar survey was conducted in 2015 and the result is used for the topography model. Topographic control captured using Lidar aerial survey, with an accuracy of +/- 50mm (2 inches).
Geotechnical Data
TECHNICAL REPORT SUMMARY WILPINJONG MINE
Highwall mapping of defects has been done periodically over the last 2 years. This has built up a database of defects to conduct kinematic analysis.
Drilling
Exploration of the property began in the early 1950’s and has been undertaken over the years by both government and private parties. An expansive exploration database has been developed since that time which includes 1271 total holes (Table 7) of which 1142 holes are within the WPJ leased area (Figure 13).
|
|
|
|
|
|
| Hole Type |
Wilpinjong |
| Chip holes |
967 |
| Core holes |
260 |
| Geotechnical holes |
30 |
| Gas Holes |
14 |
Table 7. Drilling Statistics
Figure 13. Exploration Drill Hole (within lease) Location Map
On lease exploration programs are drilled most years. The number of holes drilled for each drilling campaign varies depending on mine plan changes. Significant drilling programs have been conducted since 2010 to better define coal quality and structure. A feature of the coal quality program was to subsample all available coal and rock to refine loss and dilution coal quality parameters applied in the mining model. A feature of the structure drilling program was better definition of the paleochannel interactions with the coal across the south of the mine. The drill holes are geophysically logged for caliper, density, gamma and other parameters as required.
The types of exploration drill holes include:
Chip or rotary holes are drilled with air or water using a blade or PCD (polycrystalline diamond) bit with the chips laid out in 1 m piles on the drill pad. Holes are lined to the base of weathering with PVC or steel casing to ensure that Tertiary sands and gravels and weathered Permian material are isolated from the drilling process. The drill cuttings are geologically logged at 1 m intervals and a suite of downhole geophysical logs are run. The drillers and geologists’ logs are reconciled against the downhole geophysics to establish the exact depth of the seams. These are used to define the structure, such as seam splits, faulting, oxidation lines, paleochannels etc. Cuttings may be collected for overburden suitability analysis or coal oxidation determination. There are currently 967 chip drillhole locations.
TECHNICAL REPORT SUMMARY WILPINJONG MINE
Partially cored holes are generally completed to recover the coal seam for coal quality testing and roof and floor material for dilution and geotechnical testing. Core diameter is typically HQ (61 mm) but other diameter holes may also be collected. Downhole geophysical logs are run and used to define structure while samples of whole core are submitted for coal quality analysis. Samples of the stone roof and floor of each seam are routinely analyzed for mining dilution studies. There are currently 260 core drillholes locations.
Geotechnical core holes are generally fully cored from surface to 6 m below the floor of the target coal seam. Rock samples are often taken from partially cored holes within 6m above a seam and 6m below the basal target seam. Rock samples are generally collected on one-meter intervals and tested to gain a spread of data for different lithology types. The strength testing helps in the highwall height and design. Currently 30 drillhole locations.
Gas holes. These have drilled to determine gas content for fugitive emissions calculations. Often basic coal quality is done on the coal once the gas results are obtained. There are currently 14 locations within the leased area.
Open hole rotary air drilling was completed to below the base of weathering and casing inserted for hole stability.
Diamond drilling (triple tube HQ core) and conventional core (200mm diameter) was completed on the remaining overburden, coal and associated stone partings.
For all chip sections of the holes, samples were obtained on 1m increments and visually assessed by the field geologist.
For all core sections of the holes, samples were visually assessed on a centimeter by centimeter scale by the field geologist and placed in core boxes until down-hole geophysics were run on the completed hole. Once the geophysical logs were received, sampling of the core was undertaken to ensure correct sample intervals, recovery and representivity.
All chip and core samples are visually assessed by the rig geologist in a qualitative manner. Assessment undertaken using industry standard logging format and codes, with sufficient detail to support a Coal Resource estimate.
All drill core was photographed for later reference if required.
Sampling of the core undertaken utilizing down-hole geophysics to ensure correct sample intervals.
The entire hole is logged and recorded, with the detailed logging of core generally accounting for between 50-70% of the hole.
Sampling for analysis only undertaken on drill core.
For coal quality analysis, core is sampled in its entirety, placed into sealed plastic bags and then 200L drums for transport to the laboratory.
For geotechnical analysis, potential samples are chosen on the field table, wrapped tightly in plastic and sealed to prevent moisture loss. Following geophysical review, the relevant samples are dispatched to the laboratory.
Coal analysis types require different amounts of sample mass to ensure validity. The hole diameters mentioned previously are utilized to ensure sufficient sample mass is recovered.
TECHNICAL REPORT SUMMARY WILPINJONG MINE
Data collected includes:
Geologist’s log
Driller run sheet
Geophysical log (Gamma-Density log) with LAS file
Core photos for all cores
Rock samples
Lab instructions (quality, overburden, and/or rock mechanics)
Quality lab certificates (quality and/or rock mechanics)
Final surveyed coordinates in MGA94
Borehole sealing (if applicable)
Borehole rehabilitation (if applicable)
Peabody has maintained records for all survey, geophysical logs and LAS files, geologist logs, quality sampling numbers and lab reports, and core photos. These documents have been scanned and linked to the drill hole within the GeoCORE SQL database.
7.2.1. Recovery
The bore core is logged for lithology type, structure, coal brightness and rock strength factors by geologists experienced in coal geology. Core recovery is compared to the drillers log and verified against geophysical logs. Any discrepancies documented. If less than 90% of the target coal seam is recovered, the hole is generally re-drilled unless the core loss is due to faulting and it is unlikely that a re-drill will improve the recovery.
HQ diameter diamond drilling produced satisfactory results in terms of sample recovery. The large diameter (200mm) drilling was used for specific holes that required greater sample mass for analysis.
Due to the relatively homogeneous nature of the coal seams, minimum sample recovery cut-off was set at 90% of the mining ply.
7.2.2. Drill Hole Surveys
The drill hole elevations are surveyed using GPS equipment and coordinate system as described in 7.1.
All drillhole collars have been compared to the topographic surface model which is based on 1m LIDAR contour data and are within an acceptable range for the purposes of developing a structure model (+/- 2m).
Drill depths are validated by the supervising geologist and are compared to the downhole geophysical logs for exact depth determination. The geophysical contractors which undertake the down hole geophysical logging comply with industry standard calibration techniques (tools are run in a calibration hole where log responses are known, any deviance is resolved prior to dispatching the tool for use on site). In some cases, coal seam intervals with less than 90% linear recovery have been used in the resource estimation have been used due to the consistency of the coal quality.
7.3. Geotechnical Data
Geotechnical testing of exploration bore cores collected from site has identified no weak zones or areas of concern (Peabody Energy WEP Feasibility Report, 2018). The performance of pit wall batter angles is supported through nearly 10 years of historical performance. Palaeochannels consisting of alluvial material are free dug, and walls are laid back at low repose angles in this material to improve stability.
The geological conditions for mining at Wilpinjong mine are relatively benign. Structural disturbances, such as faults and dykes, are present at the mine, however the strata above the mined coal seams is strong. Geotechnical sampling and analysis has not been a significant focus of previous exploration and only a small amount of strength testing has been carried out on historical core samples.
TECHNICAL REPORT SUMMARY WILPINJONG MINE
A geotechnical sampling procedure is now in place with two geotechnical holes were drilled in 2014, PW1138 in Pit 6 and PW1159 in Pit 8 which form the basis for the current area’s generic rockmass properties shown in Table 8. A number of drillholes in Pit 6 and Pit 8 have had acoustic/optical teleview run to scan and a geotechnical report prepared.
Table 8. Wilpinjong Rock Mass Properties
7.4. Hydrogeology
During exploration drilling ground water levels are routinely collected from drillers observations and geophysical logging tools. This is gathered by using an electronic dipmeter tool, or in the case of the geophysical logging is captured by the logging operator by analyzing the density and gamma tools. Water amounts are measured by drillers performing a v-notch test in the water bearing zone. This data is stored with the drilling logs and stored within the geological database.
The Complex has implemented and maintained an extensive groundwater monitoring network within and around the permit area. The network consists of monitor wells, piezometers, creeks, and government registered bores and wells.
7.5. Coal Seam Gas Testing
Gas contents are estimated by containing the coal core sample within a canister immediately after retrieval from the core barrel. Gas is released from the coal as soon as the core is drilled and some gas will therefore be ‘lost’ during core retrieval before containment in the canister. An estimate of the ‘lost’ gas can be determined through measurement of the time since coring and the amount of gas released within the first few minutes after containment (Q1). The canister containing the core is then submitted to a laboratory to measure the amount of gas released after the measurement of Q1 (Q2). Sub-samples are then taken and crushed to measure the amount of gas retained in the coal after measurement of Q1 and Q2 (Q3). The sum of Q1, Q2 and Q3 provides an estimate of the amount of gas contained within the in-situ coal.
In some instances, the bore core is split after Q2 gas desorption testing has been completed and the bore core split submitted for coal quality testing to maximise data return from the same drill hole.
The majority of gas content testing has been conducted on the main Ulan Seam with some samples also representing the upper coal packages and carbonaceous material.
7.6. Comments from Qualified Person(s)
It is the opinion of the qualified person that there is adequate exploration undertaken to provide data for the support mineral resources and reserves.
TECHNICAL REPORT SUMMARY WILPINJONG MINE
8. SAMPLE PREPARATION, ANALYSES AND SECURITY
8.1. Sampling Method
8.1.1. Sampling for Coal Quality
The sampling for coal quality analysis at Wilpinjong follows an established internal site guideline to allow for consistency of sample technique and sample intervals (Figure 14). Historical sampling has often been undertaken on a somewhat different guideline that may not align with the current guideline. Coal quality sampling of the dilution and coal material considers the different plies that develop across the pit though the entire stratigraphy sequence, not just the Ulan seam.
Figure 14. Ulan Seam Sampling Guide
Coal sample sections begin and end at defined geological boundaries. In the field they are identified and designated before sampling begins. Stone bands may be sampled as part of a seam if less than 5cm. Stone bands greater than this are sampled separately from coal. Core loss must not be included in a sample. Where core loss exists, it will be the boundary separating two different samples.
TECHNICAL REPORT SUMMARY WILPINJONG MINE
All borecores are sampled by brightness profile, efforts are made to not sample across the ply boundaries. Normally no roof interburden of floor material is included with the coal sample and is sampled separately.
If the core thickness measurements are not as expected or there is uncertainty as to what to include in a sample then subsampling at a smaller interval will be undertaken,
Samples are named in accordance with the sampling tickets provided for the project. These are usually a digit unique value and are used to identify samples in the lithology log as well as on the sample sheet.
After coal sample sections have been identified marked and photographed, each sample is double bagged in a plastic bag. Double bagging means collecting sample in one bag and then placing this bag into the second bag. The second bag is labelled with all relevant details including project, borehole ID, sample number and sampled depths. A sample ticket with relevant information is placed inside each bag before sealing the bag with zip tie.
Field sampling is supervised by the site geologist who ensures samples are appropriately labeled, bagged and packed ready for dispatched as soon as practical. Samples are transported using the established trucking companies and records of sample receival and delivery are kept. The project geologist issues instructions to the laboratory on a borecore procedure for every sample and whether to combine any subsamples at any of the stages of analysis.
Laboratory results are compared to the field logging and downhole geophysics and any irregularities resolved before final validation and upload to the database.
8.1.2. Sampling from Production
Wilpinjong collects samples from multiple points around the CHPP conveyance system on a regular basis as per internal standard that are laboratory analysed to support processing, blending and shipment decisions.
Samples are collected by means of a Cross-Belt Samplers on conveyors.
Sampling for Bypass and Wash Products to the CHPP’s are collected every 4hrs or when the feed type changes. A composite incorporating each of the 4 hourly samples is analysed every 12 hours to align with completion of sampled shift end (day/night)
CHPP product testing includes:
Weight
Ash
Total Moisture
Total Sulphur
CHPP internal stream sampling occurs on a 12hourly basis and includes:
Plant feed sample analysed for standard ash and total moisture
Plant reject analysed for standard ash and total moisture
Reject thickener underflow standard ash and % solids
Spirals product and reject analysed for standard ash and total moisture (or % solids)
DMC product and reject analysed for standard ash and total moisture
Samples are collected from the Cross-Belt Sampling on the completion of the loading of every train and are analysed for:
Weight
Ash
Total Moisture
Total Sulphur
TECHNICAL REPORT SUMMARY WILPINJONG MINE
8.1.3. Sampling for Rock Mechanics
The sampling for geotechnical analysis at Wilpinjong follows an established internal site guideline to allow for consistency of sample technique and sample intervals.
Field sampling is supervised by the site geologist who ensures samples are appropriately labeled, bagged and packed ready for dispatch. Samples are transported using the established trucking companies and records of sample receival and delivery are kept.
The geotechnical engineer provides the advice on the geotechnical analysis for the samples obtained. Boreholes were logged in agreement with Australian Standard 1726-2017. Rock samples were selected and wrapped in cling wrap and aluminium foil for transport to the NATA registered laboratory, TriLab Pty Ltd in Brisbane.
8.1.4. Sampling for Overburden
Sampling is conducted on an as required basis on the overburden for geochemical assessment. The testing program includes pH and electrical conductivity determination, acid base analysis and net acid generation testing. Sampling advice is provided by site environmental department or by consultants.
8.1.5. Sampling for Gas
The sampling for gas analysis at Wilpinjong has been conducted for a description of the gas reservoir and the implications for Fugitive Emissions Reporting to satisfy NGER guidelines.
The work was conducted consistent with industry standards (in particular, gas content and gas composition sampling was undertaken according to Australian Standard 3980/1999 and International Standards ASTM D1945-03/ISO6976-1995 respectively).
The selection of sites for the test was driven by the desire to sample evenly throughout the lease (spatial and representatively).
Drillholes are fully cored with sampling is done on all coals and all carbonaceous material (density greater than 1.95g/cm and greater than 0.5m) within the borehole. Time has been minimized between cutting of the core and the sample sealed in the cylinder. Canisters are sealed immediately after the removal from the drilling splits. Care is taken to separate main lithological types where reasonable. Canisters are purged with helium in the field and kept at a constant temperature with readings.
Field sampling is supervised by the site geologist who ensures samples are appropriately labeled, bagged and packed ready for dispatch. A gas technician is also used to conduct the initial onsite gas tests. Samples are transported using the established trucking companies and records of sample receival and delivery are kept.
Lithology logging and and photography occur at a later stage in the offline process.
8.2. Laboratory Analyses
8.2.1. Coal Quality Analysis
Core samples for coal quality are crushed at the laboratory to pass 11.2 mm and split into 2 fractions; one quarter for proximate analysis, three quarters used for washability and clean coal composite testing. Pulps are retained and stored at the laboratory for additional assays and repeat testing where required. Splitting of the sample is done using riffle splitters under industry standards.
Core samples acquired by Peabody were submitted to NATA accredited independent laboratories; namely ALS Richlands (formerly ACIRL), Bureau Veritas Australia and SGS Australia.
Coal quality analysis and testing is generally carried out in three stages:
Stage 1: Raw Coal Analysis
Individual coal samples or plies
• Proximate Analysis, Total Sulphur, Specific Energy;
• Apparent Relative Density (ARD) and/or Relative Density (RD).
Stage 1 results were reported on an air dried basis (ad).
TECHNICAL REPORT SUMMARY WILPINJONG MINE
Stage 2: Float/Sink Analysis
Individual coal plies or working section composites (combinations of coal plies where applicable) were subjected to float/sink or washability analyses using the following density fractions including 1.30, 1.35, 1.40, 1.45, 1.50, 1.55, 1.60, 1.70, 1.80, 1.90, 2.0 and 2.2 (density solutions were prepared from an organic medium). All fractions were analysed for:
• Yield; and
• Ash
Stage 2 results were reported on an air dried basis (ad).
Stage 3: Extended Analysis – Metallurgical and Marketing Analyses
Additional analyses for metallurgical and marketing purposes have been conducted on selected boreholes and have included:
• Ultimate analysis, forms of sulphur, chlorine and phosphorous;
• ash analysis and ash fusion;
• Hardgrove Grindability Index and Abrasion Index;
• Trace Element analysis; and
• CSN, Gieseler Plastometer testing and Petrographic analysis.
Stage 3 results were reported on an air dried basis (ad), dry (d) and dry ash free (daf) as required or appropriate.
A recent testing procedure for Wilpinjong is illustrated in Figure below:
Figure 15 Wilpinjong HQ Borecore Procedure 20191210
All coal cores have been analysed by National Association of Testing Authorities (NATA), Australia accredited laboratories.
TECHNICAL REPORT SUMMARY WILPINJONG MINE
8.2.2. Rock Mechanics Test
Geotechnical Boreholes PW1138 and PW1159 form the basis for the strength inputs in the Wilpinjong Mine Rockmass Properties table (Table 8).
Tests were performed at TriLabs Brisbane laboratory to appropriate Standards and included: UCS Tests, Multi-Stage Triaxial Strength Tests (at 100, 200, 300 & 500kPa confining pressures), Direct Shear Tests, and Brazilian Tensile Tests.
8.2.3. Overburden Material Test
Sampling is conducted on an as required basis on the overburden for geochemical assessment. Sampling advice is provided by site environmental department or by consultants. The laboratory program for the assessment included the following tests and
procedures:
• pH and EC determination;
• total sulfur (S) assay;
• maximum potential acidity (MPA) calculation;
• ANC determination;
• net acid producing potential (NAPP) calculation;
• exchangeable cation analysis;
• chromium reducible sulfur (CRS) analysis;
• single addition NAG test;
• acid buffering characteristic curve (ABCC) determination;
• kinetic NAG test; and
• multi-element scans on solids and water extracts.
The sample preparation, exchangeable cation analysis, acid-base analysis (total S assays and ANC determinations), NAG testing and ABCC determinations were performed by Australian Laboratory Services Pty Ltd (ALS) in Brisbane. The pH and EC determinations, and water extract preparation were conducted by GEM, and the multi-element scans were performed by Genalysis Laboratories in Perth.
8.2.4. Gas Material Test
Gas tests are undertaken in the field and at the Laboratory with results reported and QA/QC undertaken. Gas tests include:
• Gas volume measurements;
• Lost Gas (Q1);
• Desorbable Gas (Q2);
• Remaining Gas (Q3);
• Coal Analysis
• Total Gas Content (Qm)
• Gas Composition
Sample preparation and gas tests were undertaken at Australian Laboratory Serves Pty Ltd (ALS) in Richlands Brisbane. Core logging and photography were also done on the samples when offline at the Laboratory.
8.2.5. Density Determination
Laboratory densities are determined as per the relevant Australian Standard listed in Table 9.
8.2.6. Analytical Laboratories
All coal quality and geotechnical analysis techniques are per Australian Standards and completed at NATA accredited independent laboratories. Lab standards follow ASTM DM2013-D2013M for preparing samples.
The National Association of Testing Authorities, Australia (NATA) is Australia’s national accreditation body for the accreditation of laboratories, inspection bodies, calibration services, producers of certified reference materials and proficiency testing scheme providers throughout Australia.
TECHNICAL REPORT SUMMARY WILPINJONG MINE
It is also Australia’s compliance monitoring authority for the OECD Principles of GLP.
Coal quality is expressed in SI units following Australian Standards.
These include AS1038.16 for acceptance and reporting of results, AS 4264.1 for sampling procedures, AS4264.4 for determination of precision and bias and the following standards for specific coal quality testing (Table 9).
|
|
|
|
|
|
|
|
|
| NATA Accredited Tests |
| Hard Coal Test |
Abbreviation |
Standard/Reference |
| Abrasion Index |
AI |
AS1038.19 |
| Adiabatic Self Heating |
|
AL035 (In-House) |
| Ash |
A |
AS1038.3 |
| Ash Fusibility |
|
AS1038.15 |
| Carbon |
|
AS1038.6.4 |
| Carbonate Carbon |
Cm |
AS1038.23 |
| Chlorine |
C1 |
AS1038.8 |
| Crucible Swelling Number |
CSN |
AS1038.12.1 |
| Dilatometer |
|
AS1038.12.3 |
| Fixed Carbon |
FC |
AS1038.3 |
| Float/Sink Analysis |
F/S |
AS4156.1 |
| Forms of Sulfur |
FOS [So, Sp, Ss] |
AS1038.11 |
| Gieseler |
|
AS1038.12.4.1 |
| Gray King Coke Type |
GKCT |
AS1038.12.2 |
| Hardgrove Grindability Index |
HGI |
AS1038.20 |
| Hydrogen |
H |
AS1038.6.4 |
| Moisture (residual) |
Mr |
AS1038.3 |
| Moisture Holding Capacity |
MHC |
AS1038.17 |
| Nitrogen |
N |
AS1038.6.4 |
| Oxygen |
O |
AS1038.16 |
| Phosphorus |
P |
AS1038.14.3* |
| Relative Density |
RD |
AS1038.21.1.1 |
| Relative Ignition Temperature |
RIT |
AL030 (In-House) |
| Size Analysis |
|
AS3881 |
| Gross Calorific Value |
q |
AS1038.5 |
| Total Moisture |
M |
AS1038.1 |
| Total Sulfur |
S |
AS1038.6.3.3 |
| Volatile Matter |
VM |
AS1038.3 |
| Ash Analysis |
|
AS1038.14.3 * |
| Roga Index |
|
ISO335 |
| Caking Index |
|
ISO15585 |
| |
|
|
| Hard Coal Test |
Abbreviation |
Standard/Reference |
| Proximate Analysis |
|
AS1038.4 |
| Note(s): |
| 1. Acceptance and reporting of results is in accordance with AS1038.16 |
| 2. Sampling by ACIRL is in accordance with the following, AS4264.1 Sampling Procedures; AS4264.4 Determination of Precision and Bias |
TECHNICAL REPORT SUMMARY WILPINJONG MINE
|
|
|
|
|
|
|
|
|
| 3. All analyses reported to Air-Dried Basis unless otherwise indicated. |
| *4. Ash Analysis performed at ACTest Newcastle laboratory (accreditation 15784/1422). |
| Non Accredited Tests |
| Test |
|
Standard/Reference |
| Drop Shatter |
|
AS2519 |
| Durham Cone |
|
AS1038.25 |
| Froth Flotation |
|
AS4156.2 and Client Specific Procedures |
| Mineral Matter |
|
AS1038.22 |
| Pre- Treatment |
|
AS2519 |
| Roadway Dusts |
|
QLD Department of Mines and Energy – Quality of incompatible dust, sampling and analysis of roadway dust in underground coal mine – Coal Mining Safety Act 1999 Recognised Standard – No. 05, July 2003 |
| Sapozhnikov |
|
Journal of Mine Metals and Fuels India Oct 1978; GB/T 479-2000 Determination of plastometric indices of bituminous coal |
| Size Adjustment |
|
AS2519 |
Table 9. Relevant Laboratory Standards
8.3. Sample Security
Field sampling is supervised by the site geologist who ensures samples are appropriately labeled, bagged and packed ready for dispatch. Samples are transported using the established courier companies and records of sample receival and delivery are kept.
Samples a subject to a chain of custody arrangement to ensure security. Sample pulps are normally kept at the labs for one year so retesting can occur if required.
8.4. Comments from Qualified Person(s)
It is the opinion of the qualified person(s) responsible for this section that there are standards and procedures in place that are adequate for sample preparation, security and analytical testing.
TECHNICAL REPORT SUMMARY WILPINJONG MINE
9. DATA VERIFICATION
9.1. Data Verification Procedures
Verification of data gathered in the field takes place in several ways:
Drill collar locations are recorded using a GPS at the time of drilling and verified against the planned coordinates. The locations surveyed by a licensed surveyor on a regular basis during the drill programs. Comparison between these 2 datasets allows a measure of location accuracy. Older data is checked by comparing collar elevation to the modelled topography grid created from LIDAR contour data which has a nominal vertical accuracy of 0.2 m in cleared areas.
Geologist logs are reconciled to geophysical logs which have a higher depth precision than normal chip sample and core depths. General practice is to adjust seam depths and sample boundaries using the downhole density log to adjust depths. Generally geophysical tools used can include verticality, gamma, density, resistivity, temperature, sonic, magnetics and acoustic and optical scanners.
Coal assay results from the NATA registered laboratory are compared with coal lithological logs and the downhole geophysical logs and any discrepancies investigated. Additional checks on assay results include reviewing the relationship between related parameters, such as raw ash and density and raw ash and specific energy. Sample results that do not match the predicted trends are investigated and re-assayed from a stored sample if necessary.
The validation process prior to geological modeling and resource generation involves the following steps:
Mine site geologist validates all drill hole data following data acquisition and entry by the rig geologist,
Coal technologist validates coal quality results,
Project geologist validates all primary data (drill holes, geophysical surveys, ground mapping), coal quality results and external data
Resource geologist validates all primary and coal quality data, mine operations data and any external data
Validation routines include, but are not limited to:
Comparison of geology and geophysics in drill holes
Cross sections of model vs drill holes and geophysical surveys
Contours of seam thickness, midburden, roof and floor levels to identify anomalies
Coal quality is compared to a synthetic quality report ran from the quality model, which uses surrounding data to interpolate the estimated quality at the drilled point.
Surveyed locations are taken for every drilled location. Older data is checked by comparing collar elevation to the modelled topography grid and cross checked with legal description.
Photographs of chip and core samples are reviewed when validating data.
Reconciliation of geological model and boreholes against mined out areas
Statistical review of geological and geotechnical data sets to highlight anomalies and outliers
Reconciliation of modelled grids against data points using calculated relationships (ie Ash/Relative Density/Yield)
Peabody’s GeoCore database has built in functions (through an interface application Task Manager) to allow the user to check drill hole location and elevation; geophysical interpretations; stratigraphic correlations and sample depth/thickness match to laboratory analysis. These data validation tools provide for a robust process to verify historical and newly acquired data in both a systematic and efficient manner. This application has additional security measures to limit data entry errors and enforce coding and data formatting requirements.
Data verification is also undertaken in other software such as statistical reviews undertaken in ArcMap Geostatiscs modules and seam contouring comparisons against in pit data undertaken in Maptek Vulcan.
Mine site visits are conducted by the Qualified Person(s) on a regular interval to validate the geological aspects of the exploration activities and active mining operations.
9.2. Limitations
No limitations to note.
TECHNICAL REPORT SUMMARY WILPINJONG MINE
9.3. Comments from Competent Person(s)
It is the opinion of the Qualified Person(s) responsible for this section that there are procedures and tools in place for adequate data verification.
TECHNICAL REPORT SUMMARY WILPINJONG MINE
10. COAL PROCESSING AND QUALITY TESTING
Coal quality trends within the Wilpinjong Mine have been modeled from an extensive database of exploration drill hole cores and in-mine samples covering coal, dilution and overburden material. Previous testing has been described in Section 8.2.1. The coal processing with an established plant is described in Section 14.
10.1. Coal Processing and Analytical Procedures
Coal quality estimates are only representations of the true quality parameters and although they can be considered accurate, they are not always precise. Coal quality models are estimates and may deviate from true values due to uncertainty in the estimation process. Variation from the true quality properties can be introduced through;
Incomplete sampling – although intercepts with less than 90% recovery are excluded from the models in most cases, intervals with up to 10% missing core can be included and this introduces some error.
Incomplete assay – variation in coal analysis procedures over many years of exploration has resulted in some parameters not determined in every sample. An example is where intra-seam stone bands were only assayed for ash and moisture values in some samples; density and volatile matter has been estimated for these samples to complete the full seam section used for compositing.
Although rare, the sub-sampling and separation by density in washability analysis can result in insufficient material for detailed coal quality analysis in some fractions. Estimates are inserted to complete the washability tables in some cases.
Deposit specific relationships between coal quality parameters can be determined by constructing a line of best fit or regression equation. The more ash and stony bands in a coal seam, the less carbon, energy and volatile matter. Conversely, the purer the coal, the lower the density and ash constituents.
The interpolation algorithms used by the modelling software are by definition estimates. These may not account for local variation in properties between drillholes. The geostatistical analysis conducted during resource estimation provides a measure of this variability and determines the categorization of resources into Measured, Indicated and Inferred based on the distance between samples and the variation between seam parameters in these samples
Reported coal quality is for the full seam/ply which may include non-coal intervals up to 0.30m in thickness, but makes no allowance for dilution or loss during mining process
Estimates of clean coal product quality are based on laboratory separations that will not always be exactly reflected in the products of coal processing plants on-site. An example is the measurement of coking and caking parameters which deteriorate with oxidation and are generally underestimated in the exploration samples due to the time delay and sample oxidation between drilling and analysis.
Raw coal quality was composited and validated prior to import into modelling package. The data was then modelled on an air dried basis and included ash, relative density, volatile matter, fixed carbon, total sulphur, specific energy and moisture. Not all samples were analysed for specific energy; due to this a relationship between Ash (ad) and specific energy (Mg/kg) (ad) was developed and additional specific energy values were imputed.
To determine product coal quality, the composited raw database was used to apply variant analysis, data unification and CHPP simulation based on method as described in O’Brien, Meyers and Cameron, (2010) The results were imported into the modelling packing. Product coal qualities of ash, yield, sulphur and rom yield for the working sections were subsequently modelled on an air dried basis at fixed densities of 1.40, 1.45, 1.50, 1.55, 1.60, 1.65, 1.70, 1.75 and 1.80. Nominal working sections are used to reflect expected products.
Coal Quality Report
The following report (Table 10) show the average raw seam/ply qualities reported on an air dried basis of the Wilpinjong deposit.
TECHNICAL REPORT SUMMARY WILPINJONG MINE
|
|
|
|
|
|
|
|
|
|
|
|
|
|
|
|
|
|
|
|
|
|
|
|
| Seam/Working Section |
Thickness (m) |
Raw Ash % (a.d.) |
Relative Density (a.d) |
Inherent Moisture % (a.d.) |
Volatile Matter % (a.d) |
Total Sulphur % (a.d.) |
Specific Energy kcal/Kg (a.d.) |
| M4 |
0.47 |
30.6 |
1.56 |
3.6 |
27.2 |
0.49 |
5158 |
| A12 |
0.50 |
17.4 |
1.41 |
2.8 |
35.3 |
0.66 |
6639 |
| B1 |
0.66 |
27.8 |
1.53 |
3.1 |
26.3 |
0.44 |
5636 |
| B23 |
1.68 |
18.3 |
1.42 |
3.4 |
30.1 |
0.47 |
6376 |
| C1 |
0.60 |
44.8 |
1.71 |
2.3 |
19.5 |
0.30 |
4251 |
| D0 |
0.44 |
47.9 |
1.76 |
2.1 |
17.5 |
0.31 |
3940 |
| D1 |
0.38 |
29.0 |
1.56 |
2.8 |
21.3 |
0.38 |
5564 |
| D2 |
1.97 |
20.0 |
1.46 |
3.0 |
26.3 |
0.46 |
6304 |
| DD2 |
0.20 |
29.9 |
1.54 |
2.5 |
27.3 |
0.45 |
5564 |
| E1 |
1.71 |
29.2 |
1.55 |
2.5 |
26.8 |
0.54 |
5540 |
| G |
0.94 |
32.3 |
1.58 |
2.5 |
23.2 |
0.55 |
5277 |
Table 10. Coal Quality Parameter Statistics
TECHNICAL REPORT SUMMARY WILPINJONG MINE
Whole of site data has been used to establish the float 1.70 rd averages on an air dried basis that is displayed in Table 11. Wilpinjong Simulated Ash and Yield at Cumulative Float 1.70 rd.
|
|
|
|
|
|
|
|
|
| Seam/Ply |
Cumulative Float 1.70 rd Qualities |
| % Ash (a.d.) |
Yield % (a.d.) |
| M4 |
18.8 |
73.1 |
| A12 |
14.7 |
87.8 |
| B1 |
23.5 |
81.1 |
| B23 |
15.7 |
88.2 |
| C1 |
38.2 |
58.0 |
| D0 |
37.1 |
52.5 |
| D1 |
27.0 |
86.1 |
| D2 |
18.9 |
91.2 |
| DD2 |
24.1 |
81.6 |
| E1 |
25.5 |
83.9 |
| G |
26.6 |
78.2 |
Table 11. Wilpinjong Simulated Ash and Yield at Cumulative Float 1.70 rd
10.2. Analytical Laboratories
Laboratories are the same as the ones described in section 8.2.6.
10.3. Recovery Estimates
Generally, yields are determined from the testing of crushed coal to one size at various densities in a testing process known as float/sink analysis. Results are combined to represent cumulate float ash and yields through increasing densities at various cumulative fixed densities. This theoretical number may differ to actual yields that are the result of a variety of sized fractions and densities processed.
Simulated product yield modelling has been undertaken at Wilpinjong to assist with determining a better accuracy for the recovery of coal by standardizing washability, applying liberation and CHPP circuit segregation models and reconciling against CHPP actuals.
10.4. Comments from Qualified Person(s)
It is the opinion of the qualified person(s) responsible for this section that there are significant amounts of data and processes in place to adequately predict coal tonnage and coal quality estimates for Wilpinjong production.
TECHNICAL REPORT SUMMARY WILPINJONG MINE
11. COAL RESOURCE ESTIMATES
11.1. Introduction
A Coal Resource is an occurrence of material of economic interest in the Earth’s crust in such form, quality, and quantity that there are reasonable prospects for economic extraction. A Coal Resource is a reasonable estimate of tonnage, considering relevant factors such as quality, likely mining dimensions, location or continuity, that, with the assumed and justifiable technical and economic conditions, is likely to, in whole or in part, become economically extractable. It is not merely an inventory of all coal tonnage drilled or sampled.
Coal Resources are sub-divided, in order of increasing geological confidence, into Inferred, Indicated and Measured classifications.
11.2. Geologic Model and Interpretation
The Wilpinjong geological model consists of both a stratigraphic and coal quality model based on verified drillhole data from Peabody’s GeoCore database. The model is updated approximately every 1 to 2 years depending on the acquisition of new data from both drilling programs and in pit survey data.
The models are created using the GDCALC module in Vulcan by using the Integrated Stratigraphic Modelling menu, an audit trail is created within the specification files used in grid generation. The modelling method is based on a stacking method that utlises a reference horizon and includes design data from other sources to interpolate the seam structure.
For the structural model, the most lowermost seam was chosen as a reference surface (G1) and the other seams ‘stacked’ above and below using the drillhole intercept data and in pit survey data. Interpolation of the grids is based on a triangulation method, with seam/interburden thickness stacked using inverse distance squared algorithm. A base of weathering model was developed from the drillhole intersections and survey data with all final structure grids used to calculate coal tonnes clipped to this base of weathering surface to ensure oxidised coal was excluded from the Coal Resource calculations. The structural grids in the Wilpinjong model represent the structure of seam roof and floor, coal seam thickness and depth to the roof of the seam.
Coal quality parameters were modelled in house by the coal quality specialist using third party specialist plant simulation software. Composites of borehole sample results where individual samples are combined to represent the ply or working section intersection. The initial coal quality sample list was then flagged where samples thickness didn’t match sample depth. Samples were also flagged where either excessive recovery or loss of samples occurred (<90% or >110%). These flagged samples were set for exclusion.
Coal quality grids were developed in Maptek Vulcan based on inverse distance squared for the mining working sections from the provided coal quality points. Parameters for both raw and simulated product coal quality is modelled at Wilpinjong on an air-dried basis and simulated product coal quality was modelled at a selection of fixed densities.
Local seams modelled are detailed below in Table 12.
TECHNICAL REPORT SUMMARY WILPINJONG MINE
|
|
|
|
|
|
|
|
|
|
|
|
| Seam Name |
Ply |
Parent Seams |
Coal Quality |
| Goulburn |
GLB1 |
-> GLB1_2 -> GLB |
|
| Goulburn |
GLB12 |
-> GLB1_2 -> GLB |
|
| Goulburn |
GLB2 |
-> GLB1_2 -> GLB |
|
| Goulburn |
GLB22 |
-> GLB |
|
| Goulburn |
GLB3 |
-> GLB3_4 -> GLB |
|
| Goulburn |
GLB4 |
-> GLB3_4 -> GLB |
|
| Turill |
TUR1 |
|
|
| Turill |
TUR12 |
|
|
| Turill |
TUR2 |
|
|
| Moolarben |
M1 |
|
|
| Moolarben |
M2 |
|
|
| Moolarben |
M22 |
|
|
| Moolarben |
M3 |
|
|
| Moolarben |
M4 |
|
M4 |
| MLC |
MLC |
|
|
| Ulan |
A11 |
|
|
| Ulan |
A12 |
|
A12 |
| Ulan |
A13 |
|
|
| Ulan |
A2 |
|
|
| Ulan |
B1 |
|
B1 |
| Ulan |
B2 |
-> B23 |
B23 |
| Ulan |
B3 |
-> B23 |
B23 |
| Ulan |
XC |
|
XC |
| Ulan |
C11 |
-> C1 |
C1 |
| Ulan |
C12 |
-> C1 |
C1 |
| Ulan |
CMK |
|
|
| Ulan |
D0 |
|
D0 |
| Ulan |
D1 |
|
D1 |
| Ulan |
D2 |
|
D2/DD2 |
| Ulan |
E11 |
|
|
| Ulan |
E12 |
-> E1 |
E1 |
| Ulan |
E21 |
-> E1 |
E1 |
| Ulan |
E22 |
-> E1 |
E1 |
| Ulan |
E31 |
|
|
| Ulan |
E32 |
|
|
| Ulan |
F |
|
|
| Ulan |
G1 |
-> G |
G |
| Ulan |
G21 |
-> G |
G |
| Ulan |
G22 |
-> G |
G |
Table 12. Seams Modelled
TECHNICAL REPORT SUMMARY WILPINJONG MINE
Coal Quality Parameters modelled are detailed below in Table 13.
|
|
|
|
|
|
| Raw Coal Quality |
Product Coal Quality |
| Moisture % (ad) |
Ash % at Float 1.40, 1.45, 1.50, 1.55, 1.60, 1.65, 1.70, 1.75, 1.80 |
| Ash % (ad) |
Yield % at Float 1.40, 1.45, 1.50, 1.55, 1.60, 1.65, 1.70, 1.75, 1.80 |
| Volatile Matter % (ad) |
Sulphur % at Float 1.40, 1.45, 1.50, 1.55, 1.60, 1.65, 1.70, 1.75, 1.80 |
| Fixed Carbon % (ad) |
|
| Relative Density g/cc (ad) |
|
| Total Sulphur % (ad) |
|
| Specific Energy mj/Kg (ad) |
|
Table 13. Coal Quality Parameters Modelled
11.3. Resource Classification
The resource classification used for Wilpinjong encompasses the qualified person’s confidence on the deposit. There were multiple factors used for the final analysis, including data quality, historic local and regional observations, operational history, as well as quantitative analysis.
Measured resource has the highest level of confidence for the estimated quantity and quality based on the geological evidence and sampling. A set of criteria (Table 15) on the degree of uncertainty is assessed and the low degree of uncertainty normally corresponds to the category of Measured resource.
Indicated resource has a lower level of confidence than the Measured resource, but a higher level of confidence than the Inferred resource. A set of criteria (Table 15) on the degree of uncertainty is assessed and the medium degree of uncertainty normally corresponds to the category of Indicated resource.
Inferred resource has the lowest level of confidence. A set of criteria (Table 15) on the degree of uncertainty is assessed and the high degree of uncertainty normally corresponds to the category of Inferred resource.
Estimation of Coal Resources is based on drill hole intercepts that the QP determines meet the requirements of a Point of Observation (POB). For structural and coal quality POB’s, the hole location must be accurately surveyed and geologically logged and typically would have downhole geophysical logs (gamma and density as minimum). A coal quality POB must also have coal quality analyses of at least 90% of the interval (ash and density as a minimum). Intervals with less than 90% core recovery do not qualify as quality POBs unless otherwise determined by the CP.
The definition of a sample point as a POB provides reasonable confidence that the parameters represented by that sample are valid; accurately located, appropriate lithology and downhole geophysics collected, adequately sampled and assayed by a registered laboratory. The POB then becomes the basis for estimating the properties of the surrounding coal. Analysis of the variability between neighbouring POB’s provides a measure of the distance that coal seam parameters can be extrapolated from a valid POB. This is done through geostatistical analysis based on precision tolerances from global estimation variance; also known as Drill Hole Spacing Analysis (DHSA). The DHSA method of resource classification is both valid and practical for coal deposits as compared to the more complex conditional simulation analysis.
To complete this study, the ArcMap 10.6 geostatistical extension was used to validate and view the normalcy of the input data and construct semi variograms. Once the semi variogram was plotted, the spherical model was fitted to the data using a calculated nugget, range and sill from the optimum model fit. This provides a mathematical function to explain the relationship between real-world values and distances between points. Then, the estimation variance was calculated for a range of test block sizes at varying sizes which in turn was converted to relative error at a 95% confidence. Lastly, the Resource classifications were defined based on relative error precision tolerances of 10%, 20%, 50% for Measured, Indicated and Inferred respectively.
TECHNICAL REPORT SUMMARY WILPINJONG MINE
These precision tolerances were developed by Bertoli et al (2013) regarding the area of a five-year period. From this study the classification radii, based on the distance of the error tolerance, were used to create Resource classification polygons with individual modifications from supporting data as the QP determines.
The geostatistical analysis was conducted on the raw ash and the thickness variables taken from the points of observation. The most variable result (that results in a smaller spacing) of either the raw ash or thickness is used as a base to classify the resources before any individual modifications are made. DHSA classifications at Wilpinjong were undomained for analysis and carried out by working sections.
The Resource and Reserve estimates as of December 31, 2023 were calculated using the classification polygons from the 2021 geostatistical study with the drillhole spacing radii highlighted in bold text in Table 14.
|
|
|
|
|
|
|
|
|
|
|
|
|
|
|
| Seam |
Parameter |
Measured |
Indicated |
Inferred |
| M4 |
Coal Thickness |
555 |
890 |
1935 |
| Raw Ash |
450 |
720 |
1500 |
| A12 |
Coal Thickness |
415 |
770 |
1625 |
| Raw Ash |
335 |
550 |
1010 |
| B1 |
Coal Thickness |
500 |
850 |
1685 |
| Raw Ash |
405 |
705 |
1385 |
| B23 |
Coal Thickness |
820 |
1405 |
2805 |
| Raw Ash |
505 |
900 |
1830 |
| C1 |
Coal Thickness |
370 |
585 |
1075 |
| Raw Ash |
340 |
620 |
1310 |
| D0 |
Coal Thickness |
295 |
555 |
1200 |
| Raw Ash |
345 |
655 |
1505 |
| D1 |
Coal Thickness |
170 |
330 |
730 |
| Raw Ash |
380 |
680 |
1390 |
| D2/DD2 |
Coal Thickness |
545 |
870 |
1580 |
| Raw Ash |
625 |
1000 |
1820 |
| E1 |
Coal Thickness |
945 |
1700 |
4070 |
| Raw Ash |
495 |
910 |
1905 |
| G |
Coal Thickness |
590 |
975 |
1885 |
| Raw Ash |
390 |
745 |
1665 |
Table 14. Drillhole Spacing Radii (m) from Points of Observation derived from Geostatistics
TECHNICAL REPORT SUMMARY WILPINJONG MINE
|
|
|
|
|
|
|
|
|
|
|
|
| Source |
Degree of Uncertainty |
| Low |
Medium |
High |
| Exploration |
No significant issues. Protocols consistent with industry standards. |
Historical information may not capture the array of information now standard. Used in model where more recent infill drilling validates results. |
|
| Sampling method |
Standard site operating procedures and guidelines. |
Sampling sections of coal have changed over time to now sample in more detail. If recovery <90%, data not used. Quality trends across site is fairly consistent. |
|
| Sample Prep/Analysis |
On site, ASTM accredited and independent contracted lab consistent with industry standards. |
Increased uncertainty for older cores where sample preparation and testing procedure may not be recorded. Infilled with newer core holes for comparison. |
|
| Quality Assurance/Quality Control |
Sample prep and analysis procedures follow ASTM and meet current industry standards. Laboratory is NATA certified. Quality is retested to confirm anything that looks abnormal. |
|
|
| Data Verification |
Collar and survey are checked and corrected for minor inconsistencies. Holes with unresolved inconsistencies removed. Surveyed top of coal points are used to confirm drillhole structure and further define currently mined areas with minor structural variations. |
|
|
| Database |
Location, geological and analytical data in the database verified to the QP's satisfaction. Unverified or questionable data inactivated and not used. |
|
|
| Geologic Modeling |
Model is reconciled to production for quantity and quality on an annual basis. |
|
|
| Density |
Borecore sample density and inherent moisture tested extensively across sites. |
|
|
Quantitative analysis
(Drillhole Spacing Analysis ) |
Wilpinjong Mine data was run undomained. Ash is the main constraint from the Drillhole Spacing Analysis. Measured drillhole radii for each deposit highlighted within Table 14 |
Other quality may have higher variability. They are managed through blending. They are not limiting factors for the resources. Indicated drillhole radii for each deposit highlighted withinTable 14. |
Inferred drillhole radii for each deposit highlighted Table 14 |
| Other Classification Criteria |
Classification of high ash C1 and D0 plies is only applied in the west within the Pit 6 mine plan where a combination of lower ash, low/no incremental strip ratio and processing trials have found these plies economic. |
Exposed open cut faces assist in assessing any small gaps within its vicinity in the classification polygons. This can positively affect (full standard coal face) or negatively affect (paleochannel) classification. |
|
| Cut Off Criteria (Cut-off grade and metallurgic recovery) |
The cutoff grade of coal less than 50% ash (ad) is practical for this deposit. Quality is managed through blending. Strip ratio increases gradually, but the existing pit lengths allows average mineable strip ratio. |
|
|
| Mining Methods |
Mature mining technology at existing operation. |
Highwall mining or augering potential options within 500m of existing high walls. |
|
| Environmental and Social Considerations |
Comprehensively mapped and identified features.
Management plans in place.
|
Environmental or Cultural Heritage areas may have an increased uncertainty of eventual economic extraction due to social considerations, |
|
TECHNICAL REPORT SUMMARY WILPINJONG MINE
|
|
|
|
|
|
|
|
|
|
|
|
| Costs |
Long operating history with low cost variation |
|
|
| Prices |
Well established domestic and export market with a number of longtime customers. |
|
|
Table 15: Degree of Uncertainty
The following figures (Figure 16 to Figure 23) have the resource classification and points of observation plotted with the Resource Category component identified the resources that are being declared exclusive of the reserve.
Figure 16. Wilpinjong Mine Resource Classifications - M4 Seam
TECHNICAL REPORT SUMMARY WILPINJONG MINE
Figure 17. Wilpinjong Mine Resource Classifications - A12 Seam
Figure 18. Wilpinjong Mine Resource Classifications - B1 Seam
TECHNICAL REPORT SUMMARY WILPINJONG MINE
Figure 19. Wilpinjong Mine Resource Classifications - B23 Seam
Figure 20. Wilpinjong Mine Resource Classifications - D1 Seam
TECHNICAL REPORT SUMMARY WILPINJONG MINE
Figure 21. Wilpinjong Mine Resource Classifications - D2/DD2 Seam
Figure 22. Wilpinjong Mine Resource Classifications - E1 Seam
TECHNICAL REPORT SUMMARY WILPINJONG MINE
Figure 23. Wilpinjong Mine Resource Classifications - G Seam
11.4. Coal Resource Estimates
Resources have been classified (Table 16 and Table 17) and reported in accordance with the Regulation S-K (Subpart 1300). Resources are classified into “Measured”, “Indicated” and “Inferred” categories based on the distribution of borehole intersections and coal quality data.
Estimation of the Coal Resources are mainly determined by geological criteria and property control boundaries along with the potential of current or future economic viability utilising available mining technologies. The criteria used to modify these Coal Resources to determine Coal Reserves are provided in Chapter 12. The Coal Resource estimates for Wilpinjong provided are on an insitu basis exclusive of these Coal Reserve estimates.
Modifying Factors for the generation of the Coal Resources includes:
• The exclusion of the mined out Resource tonnes up to End of Month December 2023;
• The known igneous intrusion zones have been excluded from the available Resource estimation areas;
• The generation of Coal Resources have been limited to areas within lease boundaries;
• The generation of Coal Resources have been limited to the base of weathering (including paleochannels);
• The generation of Coal Resources is on an insitu basis
• No minimum seam thickness is applied to the seams;
• No loss or dilution assumptions have been applied;
• Working section composites with Ash % (ad) >50% excluded from Resource
• No strip ratio or depth cutoff applied
• No recovery or yield cutoff applied
• Northern boundary of resource limited to within 500m of current high wall extraction
TECHNICAL REPORT SUMMARY WILPINJONG MINE
The in-situ density grid utilized to generate resource estimates was calculated from the relative density grids and inherent moisture grids using the Preston and Sanders formula (Equation 1) assuming an in-situ moisture of 6% for Wilpinjong deposits.
Equation 1. Preston and Sanders Formula
TECHNICAL REPORT SUMMARY WILPINJONG MINE
11.5. Coal Resource Statement
|
|
|
|
|
|
|
|
|
|
|
|
|
|
|
| Tenement |
Measured |
Indicated |
Inferred |
Total |
| EL6919 |
38.4 |
8.6 |
1.0 |
48.0 |
| EL7091 |
3.8 |
6.2 |
2.4 |
12.4 |
| ML1573 |
20.2 |
4.0 |
0.8 |
25.0 |
| ML1779 |
14 |
1.3 |
0.3 |
15.6 |
| ML1795 |
14.2 |
2.4 |
0.9 |
17.5 |
| ML1846 |
2.6 |
0.1 |
|
2.7 |
| TOTAL |
93.3 |
22.6 |
5.4 |
121.2 |
Table 16. Coal Resources by Tenement (Mt)
|
|
|
|
|
|
|
|
|
|
|
|
|
|
|
|
|
|
|
|
|
|
|
|
|
|
|
|
|
|
|
|
|
|
|
|
|
|
|
|
|
|
|
|
|
|
|
|
|
|
|
| |
Measured |
Indicated |
Inferred |
Total |
| Seam |
Insitu Tonnes (millions) |
%Ash (a.d) |
%T.S. (a.d.) |
Energy kcal/kg (a.d.) |
Insitu Tonnes (millions) |
%Ash (a.d.) |
%T.S. (a.d.) |
Energy kcal/kg (a.d.) |
Insitu Tonnes (millions) |
%Ash (a.d.) |
%T.S. (a.d.) |
Energy kcal/kg (a.d.) |
Insitu Tonnes (millions) |
%Ash (a.d.) |
%T.S. (a.d.) |
Energy kcal/kg (a.d.) |
| M4 |
4.0 |
30.3 |
0.50 |
5,188 |
1.6 |
30.7 |
0.49 |
5,143 |
0.4 |
30.1 |
0.50 |
5,181 |
6.0 |
30.4 |
0.50 |
5,176 |
| A12 |
3.9 |
14.3 |
0.67 |
6,905 |
2.4 |
13.4 |
0.68 |
6,984 |
0.7 |
11.1 |
0.68 |
7,161 |
7.0 |
13.8 |
0.67 |
6,958 |
| B1 |
7.7 |
29.7 |
0.43 |
5,513 |
2.4 |
29.5 |
0.44 |
5,541 |
0.2 |
27.2 |
0.53 |
5,720 |
10.4 |
29.7 |
0.44 |
5,524 |
| B23 |
21.0 |
18.2 |
0.48 |
6,407 |
3.1 |
16.9 |
0.49 |
6,513 |
0.1 |
13.5 |
0.54 |
6,785 |
24.1 |
18.0 |
0.48 |
6,422 |
| D1 |
|
|
|
- |
3.2 |
27.9 |
0.43 |
5,645 |
3.0 |
31.0 |
0.40 |
5,399 |
6.2 |
29.4 |
0.42 |
5,526 |
| D2/DD2 |
24.0 |
18.8 |
0.49 |
6,424 |
1.8 |
21.2 |
0.45 |
6,243 |
0.2 |
26.6 |
0.44 |
5,823 |
26.1 |
19.0 |
0.49 |
6,407 |
| E1 |
22.6 |
26.0 |
0.57 |
5,853 |
3.0 |
24.2 |
0.58 |
5,994 |
0.2 |
25.7 |
0.57 |
5,863 |
25.7 |
25.8 |
0.57 |
5,870 |
| G |
10.1 |
31.6 |
0.54 |
5,351 |
5.1 |
32.8 |
0.52 |
5,242 |
0.5 |
30.6 |
0.53 |
5,437 |
15.7 |
32.0 |
0.53 |
5,318 |
| Total |
93.3 |
23.0 |
0.52 |
6,058 |
22.6 |
25.3 |
0.51 |
5,861 |
5.4 |
27.3 |
0.47 |
5,698 |
121.2 |
23.6 |
0.51 |
6,005 |
Table 17. Coal Resources by Seam (Mt)
TECHNICAL REPORT SUMMARY WILPINJONG MINE
11.6. Comments from Qualified Person(s)
Although most of the Wilpinjong deposit is classified as Measured Resources, it is recommended that annual drilling programs are continued to assist with detailed mine planning options (open cut/ high wall mining / augering) and marketing strategies.
A portion of the declared resources sit within exploration leases where there remains a requirement to apply for, and be granted, a mining lease and associated permits to progress any extraction of these resources.
TECHNICAL REPORT SUMMARY WILPINJONG MINE
12. COAL RESERVE ESTIMATES
12.1. Introduction
A Coal Reserve is the economically mineable part of a Measured and/or Indicated Coal Resource. It includes diluting materials and allowances for losses, which may occur when the material is mined or extracted and is defined by studies as appropriate that include application of Modifying Factors. Modifying Factors include, but are not restricted to, mining, processing, metallurgical, infrastructure, economic, marketing, legal, environmental, social, and governmental factors. Such studies demonstrate that, at the time of reporting, extraction could reasonable be justified. Coal Reserves are sub-divided, in order of decreasing geological confidence, into Proven and Probable classifications.
Proven Coal Reserves - Reserves for which (a) quantity is computed from dimensions revealed in outcrops, trenches, workings or drill holes; grade and/or quality are computed from the results of detailed sampling and (b) the sites for inspection, sampling and measurement are spaced so closely and the geologic character is so well defined that size, shape, depth and mineral content of Reserves are well-established. A Proven Coal Reserve can only result from a Measured Coal Resource.
Probable Coal Reserves - Reserves for which quantity and grade and/or quality are computed from information like that used for Proven Reserves, but the sites for inspection, sampling and measurement are farther apart or are otherwise less adequately spaced. The degree of assurance, although lower than that for Proven Reserves, is high enough to assume continuity between points of observation. Although a Probable Coal Reserve is typically associated with Indicated Coal Resources, it can also result from a Measured Coal Resource when the application of modifying factors present a higher risk to conversion of that Resource to a Reserve.
12.2. Coal Reserve Estimates
12.2.1. Reserve Classification
The following criteria were used to limit the Reserves estimate for the WPJ property
Cutoff Grade – no specific cutoff grade has been applied, although most of the modelled coal in the WPJ project has an Ash Content of less than 50% (adb)
Depth Cutoff – no specific depth cut-off, although all of the Resources modelled at Wilpinjong are less than 100m deep.
Strip Ratio Cutoff – while no specific strip ratio cutoff has been applied, an assessment of scheduled strips has been completed and the ratios in the approved mining areas are lower than 8:1 BCM/ROMt
Economic Cutoff – prior economic assessment (in 2021) using an anticipated long term price of $70USD(real)/tonne (NEWC Benchmark Thermal), and historic Activity Based Costs, had been undertaken on all scheduled mining blocks. Using those assumptions, all blocks scheduled in the LOM plan were considered to be economic. This assessment hasn’t been replicated in 2023, however the 2023 LOM financial model shows positive cashflows throughout.
Reserves were estimated as of December 31, 2023
The LOM Plan projections and timing were developed by Peabody based on the pit layouts to maximize economic coal recovery recognizing seam thicknesses, strip ratio, property geometry, mining conditions and coal quality.
TECHNICAL REPORT SUMMARY WILPINJONG MINE
Pit Design Specifications recommended based on Geotechnical considerations are detailed below:
|
|
|
|
|
|
|
|
|
|
|
|
|
|
|
| Pit Wall |
Batter Angle (°) |
Batter
Height (m)
|
Overall Slope
Angle (°)
|
| Weathered/ Paleo |
Fresh |
| Pit 1 |
45 |
70 |
Up to 60* |
70 |
| Pit 2 |
45 |
70 |
Up to 60* |
70 |
| Pit 3 |
45 |
70 |
Up to 60* |
70 |
| Pit 4 |
45 |
70 |
Up to 60* |
70 |
| Pit 5 |
45 |
70 |
Up to 60* |
70 |
| Pit 6 |
45 |
70 |
Up to 60* |
70 |
| Pit 7 |
45 |
70 |
Up to 60* |
70 |
| Pit 8 |
45 |
70 |
Up to 60* |
70 |
| Low wall cuts |
N/A |
45 |
Up to 40 |
45 |
| Dumps |
37 |
37 |
Up to 40 |
37 |
| * Where pit depth is greater than 60 metres, additional controls are evaluated and implemented into the highwall design. |
Table 18. Pit Design Specifications
A mining model was developed in SPRY software to apply modifying factors and develop schedules, utilizing design block volumes and quality information from geologic model grids developed in Vulcan software. The output schedule of coal production from this process was used in the economic cash flow analysis.
TECHNICAL REPORT SUMMARY WILPINJONG MINE
Key assumptions used within the mining model are:
Estimated Moisture Contents
o Insitu – 6%
o Run-of-Mine (ROM) and Product by Seam
|
|
|
|
|
|
|
|
|
| Seam |
ROM (and Bypass Product) Moisture (%) |
Washed Product Moisture (%) |
| M4 |
9.7 |
11.2 |
| A12 |
8.2 |
9.7 |
| B1 |
10.4 |
10.5 |
| B23 |
10.4 |
10.5 |
| C1 |
9.0 |
10.0 |
| D0 |
9.0 |
10.0 |
| D1 |
7.9 |
9.5 |
| D2 |
9.2 |
10.7 |
| DD2 |
9.2 |
10.7 |
| E1 |
7.3 |
9.3 |
| G |
7.8 |
10.6 |
Table 19. ROM and Washed Product Moisture Content by Seam
Minimum Separable Parting – 0.2m
Minimum Mineable Thickness – 0.2m
12.2.2. Mining Loss and Dilution
Loss and Dilution assumptions are based on quantity and quality reconciliations performed in previous years and are summarized below. As per the following Table, each of the separable Ulan seam plies has different Loss and Dilution assumptions applied. These assumptions have been adjusted in recent years, based on the results of reconciliation against actual performance.
TECHNICAL REPORT SUMMARY WILPINJONG MINE
|
|
|
|
|
|
|
|
|
|
|
|
|
|
|
| Seam / Ply |
Top Seam Loss (m) |
Bottom Seam Loss (m) |
Top Seam Dilution (m) |
Bottom Seam Dilution (m) |
| M4 |
0.05 |
0.02 |
0.05 |
0.05 |
| A12 |
0.05 |
0.05 |
0.15 |
0.07 |
| B1 |
0.05 |
0.05 |
0.05 |
0.05 |
| B23 |
0.06 |
0.06 |
0.05 |
0.05 |
| D1 |
0.05 |
- |
0.05 |
- |
| D2 |
- |
0.06 |
0.04 |
0.09 |
| E1 |
0.07 |
0.05 |
0.05 |
0.09 |
| G |
0.13 |
0.13 |
0.06 |
0.02 |
Table 20. Typical Loss and Dilution Assumptions
12.2.3. Coal Product Quality
Coal Qualities are reported in the following tables reporting Coal Reserves by Seam, Pit and Tenement.
12.2.4. Reporting
Reserves are calculated utilizing the Mining Model developed in SPRY with previously described assumptions. Classification of Reserves is based on Resource classifications, converting Measured and Indicated Resources within the mine plan to Proven and Probable Reserves.
Following a review of Modifying Factors, a small area of Measured Resources within the Pit 8 mining area has been removed from the mine plan. This has been done due to community concerns associated with mining through identified sites of high cultural significance in that area. Although approval had previously been granted to mine through this area, the company has resolved to preserve the sites. This area has been removed from the estimation of Reserves.
Likewise, the mine’s approvals allow mining through the Cumbo Creek area, subject to the successful completion of a permanent stream diversion which is capable of sustaining sub-alluvial flows. Due to the high cost of establishment of this diversion, and the risk that it’s performance cannot be satisfactorily demonstrated, it is currently considered that the Cumbo Creek area is unlikely to ever be mined so this area has been left out the mine’s Life of Mine Plan, and the calculated Reserve for Wilpinjong.
Other than as described above, the level of geological certainty reflected in the classification of Measured and Indicated Resources is considered appropriate to convert these Resources planned to be mined in the LOM plan to Proven and Probable Reserves respectively.
12.3. Coal Reserves Statement
Peabody estimates a total of 63.1Mt of ROM Reserves for the Wilpinjong opencut mine. Of the total ROM Reserve, 60.2Mt was assigned to the Proven category directly from the Measured Resource portion of the Moolarben and Ulan seams. The remaining 2.9Mt of ROM Reserve was assigned to the Probable category. Table 21 and Table 22 summarise the ROM Reserves, strip ratio and moisture content of the ROM Reserves.
TECHNICAL REPORT SUMMARY WILPINJONG MINE
|
|
|
|
|
|
|
|
|
|
|
|
|
|
|
|
|
|
|
|
|
|
|
|
|
Run of Mine (ROM) |
| Area |
Proven
@MROM
(Mt)
|
Probable @MROM
(Mt)
|
Total
@MROM
(Mt)
|
MROM (%) |
ROM Ash
(% - arb)
|
Strip Ratio
(bcm/t)
|
|
| ML1573 |
21.9 |
0.9 |
22.8 |
8.7 |
30.3 |
3.0 |
|
| ML1795 |
- |
- |
- |
- |
- |
- |
|
| ML1779 |
29.9 |
1.9 |
31.8 |
8.8 |
29.6 |
4.0 |
|
| ML1846 |
8.3 |
0.2 |
8.5 |
9.0 |
31.4 |
4.9 |
|
| TOTAL |
60.2 |
2.9 |
63.1 |
8.8 |
30.1 |
3.7 |
|
Table 21. Open Cut Coal ROM Reserve by Tenement
|
|
|
|
|
|
|
|
|
|
|
|
|
|
|
|
|
|
|
Run of Mine (ROM) |
| Seam |
Proven
@MROM
(Mt)
|
Probable @MROM
(Mt)
|
Total
@MROM
(Mt)
|
MROM (%) |
ROM Ash
(% - arb)
|
| M4 |
3.2 |
0.01 |
3.2 |
7.9 |
42.7 |
| A12 |
4.5 |
0.02 |
4.6 |
8.2 |
35.8 |
| B1 |
4.7 |
0.12 |
4.8 |
10.4 |
30.6 |
| B23 |
11.4 |
0.06 |
11.5 |
10.4 |
21.1 |
| C1 |
3.0 |
0.04 |
3.1 |
9.0 |
43.3 |
| D0 |
2.6 |
0.05 |
2.6 |
9.0 |
45.6 |
| D1 |
- |
2.58 |
2.6 |
7.9 |
28.6 |
| D2 |
10.4 |
0.04 |
10.4 |
9.2 |
18.3 |
| DD2 |
1.2 |
- |
1.2 |
9.2 |
53.1 |
| E1 |
13.1 |
- |
13.1 |
7.3 |
31.6 |
| G |
6.1 |
- |
6.1 |
7.8 |
35.4 |
| TOTAL |
60.2 |
2.9 |
63.1 |
8.8 |
30.1 |
Table 22. Open Cut Coal ROM Reserves by Seam
TECHNICAL REPORT SUMMARY WILPINJONG MINE
Table 23 summarizes the ROM Reserves on a Pit basis.
|
|
|
|
|
|
|
|
|
|
|
|
|
|
|
|
|
|
| Area |
Run of Mine Reserves |
Quantity (Mtonnes)
@100%
|
ROM Ash
(% arb)
|
As - Recieved Moisture
(%)
|
Inherent Moisture (%) |
| Pit 1 |
Proven Coal Reserves |
1.7 |
30.4 |
8.4 |
2.7 |
| Probable Coal Reserves |
0.2 |
29.5 |
9.4 |
3.3 |
| Pit Sub-Total |
1.9 |
30.3 |
8.5 |
2.8 |
| Pit 2 |
Proven Coal Reserves |
- |
- |
- |
- |
| Probable Coal Reserves |
- |
- |
- |
- |
| Pit Sub-Total |
- |
- |
- |
- |
| Pit 3 |
Proven Coal Reserves |
7.7 |
27.1 |
8.3 |
2.9 |
| Probable Coal Reserves |
0.3 |
30.4 |
7.9 |
2.9 |
| Pit Sub-Total |
8.0 |
27.2 |
8.2 |
2.9 |
| Pit 4 |
Proven Coal Reserves |
- |
- |
- |
- |
| Probable Coal Reserves |
- |
- |
- |
- |
| Pit Sub-Total |
- |
- |
- |
- |
| Pit 5 |
Proven Coal Reserves |
2.5 |
35.0 |
8.2 |
2.6 |
| Probable Coal Reserves |
0.3 |
39.8 |
8.5 |
3.0 |
| Pit Sub-Total |
2.8 |
35.4 |
8.2 |
2.6 |
| Pit 6 |
Proven Coal Reserves |
23.9 |
31.7 |
9.0 |
2.9 |
| Probable Coal Reserves |
0.5 |
23.5 |
8.0 |
3.4 |
| Pit Sub-Total |
24.4 |
31.5 |
9.0 |
3.0 |
| Pit 7 |
Proven Coal Reserves |
- |
- |
- |
- |
| Probable Coal Reserves |
- |
- |
- |
- |
| Pit Sub-Total |
- |
- |
- |
- |
| Pit 8 |
Proven Coal Reserves |
24.4 |
29.1 |
8.9 |
3.0 |
| Probable Coal Reserves |
1.5 |
29.9 |
8.0 |
2.8 |
| Pit Sub-Total |
25.9 |
29.1 |
8.8 |
3.0 |
| WILPINJONG TOTAL |
Proven Coal Reserves |
60.2 |
30.2 |
8.8 |
3.0 |
| Probable Coal Reserves |
2.9 |
29.6 |
8.1 |
2.8 |
| TOTAL |
63.1 |
30.2 |
8.8 |
3.0 |
Table 23. Open Cut Coal ROM Reserves by Pit
Open Cut Marketable Reserves
Marketable Product tonnages have been estimated by converting ROM tonnages using a practical yield based on a maximum density washing plan (F1.70) and historic bypass percentages by seam. Peabody estimate a Marketable Open Cut Reserve of 51.5 Mt within the Wilpinjong Open Cut. A summary of the Marketable Reserve is shown in the following Tables.
TECHNICAL REPORT SUMMARY WILPINJONG MINE
|
|
|
|
|
|
|
|
|
|
|
|
|
|
|
|
|
|
|
|
|
|
|
|
|
Marketable Product |
| Seam |
Proven
@MPROD
(Mt)
|
Probable @MPROD
(Mt)
|
Total
@MPROD
(Mt)
|
Prod Ash
(% - adb)
|
Prod Sulphur
(% - adb)
|
Prod CV
kcal/kg
(adb)
|
MPROD (%) |
| M4 |
1.8 |
0.01 |
1.8 |
21.8 |
0.45 |
6152 |
9.0 |
| A12 |
2.8 |
0.01 |
2.8 |
19.7 |
0.67 |
6326 |
9.7 |
| B1 |
4.5 |
0.12 |
4.6 |
32.1 |
0.42 |
5273 |
10.4 |
| B23 |
9.5 |
0.05 |
9.6 |
16.2 |
0.48 |
6623 |
10.5 |
| C1 |
1.9 |
0.02 |
1.9 |
32.2 |
0.34 |
5268 |
10.0 |
| D0 |
1.4 |
0.02 |
1.4 |
34.1 |
0.49 |
5109 |
10.0 |
| D1 |
- |
2.58 |
2.6 |
30.1 |
0.41 |
5445 |
7.9 |
| D2 |
10.1 |
0.04 |
10.2 |
19.2 |
0.54 |
6372 |
9.6 |
| DD2 |
0.7 |
- |
0.7 |
38.3 |
0.30 |
4751 |
10.5 |
| E1 |
10.8 |
- |
10.8 |
27.0 |
0.52 |
5712 |
8.8 |
| G |
5.0 |
- |
5.0 |
31.6 |
0.50 |
5317 |
9.2 |
| TOTAL |
48.7 |
2.8 |
51.5 |
24.5 |
0.49 |
5922 |
9.6 |
Table 24. Open Cut Marketable Reserves by Seam
TECHNICAL REPORT SUMMARY WILPINJONG MINE
|
|
|
|
|
|
|
|
|
|
|
|
|
|
|
|
|
|
|
|
|
|
|
|
|
Marketable Product |
| Area |
Proven
@MPROD
(Mt)
|
Probable @MPROD
(Mt)
|
Total
@MPROD
(Mt)
|
Prod Ash
(% - adb)
|
Prod Sulphur
(% - adb)
|
Prod CV
kcal/kg
(adb)
|
MPROD (%) |
| ML1573 |
18.0 |
0.8 |
18.8 |
25.0 |
0.50 |
5879 |
9.5 |
| ML1795 |
- |
- |
- |
- |
- |
- |
- |
| ML1779 |
24.0 |
1.8 |
25.9 |
24.0 |
0.49 |
5965 |
9.6 |
| ML1846 |
6.6 |
0.2 |
6.8 |
25.0 |
0.50 |
5875 |
9.8 |
| TOTAL |
48.7 |
2.8 |
51.5 |
24.5 |
0.49 |
5922 |
9.6 |
Table 25. Open Cut Marketable Reserves by Tenement
TECHNICAL REPORT SUMMARY WILPINJONG MINE
|
|
|
|
|
|
|
|
|
|
|
|
|
|
|
|
|
|
|
|
|
| Area |
Marketable Reserves |
Quantity (Mtonnes)
@100%
|
Prod Ash
(% - adb)
|
Prod Sulphur
(% - adb)
|
Prod CV
kcal/kg
(adb)
|
MPROD (%) |
| Pit 1 |
Proven Coal Reserves |
1.4 |
26.8 |
0.57 |
5724 |
9.4 |
| Probable Coal Reserves |
0.18 |
29.2 |
0.50 |
5520 |
9.3 |
| Pit Sub-Total |
1.6 |
27.1 |
0.56 |
5701 |
9.4 |
| Pit 2 |
Proven Coal Reserves |
- |
- |
- |
- |
- |
| Probable Coal Reserves |
- |
- |
- |
- |
- |
| Pit Sub-Total |
- |
- |
- |
- |
- |
| Pit 3 |
Proven Coal Reserves |
6.5 |
21.7 |
0.50 |
6160 |
9.2 |
| Probable Coal Reserves |
0.3 |
31.5 |
0.38 |
5328 |
8.0 |
| Pit Sub-Total |
6.8 |
22.1 |
0.49 |
6120 |
9.1 |
| Pit 4 |
Proven Coal Reserves |
- |
- |
- |
- |
- |
| Probable Coal Reserves |
- |
- |
- |
- |
- |
| Pit Sub-Total |
- |
- |
- |
- |
- |
| Pit 5 |
Proven Coal Reserves |
2.1 |
31.1 |
0.55 |
5363 |
9.3 |
| Probable Coal Reserves |
0.3 |
41.9 |
0.33 |
4445 |
8.5 |
| Pit Sub-Total |
2.4 |
32.3 |
0.52 |
5258 |
9.2 |
| Pit 6 |
Proven Coal Reserves |
19.2 |
25.5 |
0.51 |
5838 |
9.8 |
| Probable Coal Reserves |
0.6 |
23.5 |
0.55 |
6006 |
8.0 |
| Pit Sub-Total |
19.8 |
25.4 |
0.51 |
5843 |
9.8 |
| Pit 7 |
Proven Coal Reserves |
- |
- |
- |
- |
- |
| Probable Coal Reserves |
- |
- |
- |
- |
- |
| Pit Sub-Total |
- |
- |
- |
- |
- |
| Pit 8 |
Proven Coal Reserves |
19.5 |
22.8 |
0.48 |
6065 |
9.8 |
| Probable Coal Reserves |
1.5 |
30.6 |
0.36 |
5406 |
8.0 |
| Pit Sub-Total |
21.0 |
23.4 |
0.47 |
6018 |
9.6 |
| WILPINJONG TOTAL |
Proven Coal Reserves |
48.7 |
24.2 |
0.50 |
5948 |
9.7 |
| Probable Coal Reserves |
2.8 |
30.3 |
0.41 |
5427 |
8.1 |
| TOTAL |
51.5 |
24.5 |
0.49 |
5922 |
9.6 |
Table 26. Open Cut Marketable Reserves by Pit
TECHNICAL REPORT SUMMARY WILPINJONG MINE
Maps
Maps of the Reserve areas by seam ply are displayed below.
Figure 24. Reserve Plan M4 Seam
Figure 25. Reserve Plan A12 Seam
TECHNICAL REPORT SUMMARY WILPINJONG MINE
Figure 26. Reserve Plan B1 Seam
Figure 27. Reserve Plan B23 Seam
TECHNICAL REPORT SUMMARY WILPINJONG MINE
Figure 28. Reserve Plan C1 Seam
Figure 29. Reserve Plan D0 Seam
TECHNICAL REPORT SUMMARY WILPINJONG MINE
Figure 30. Reserve Plan D1 Seam
Figure 31. Reserve Plan D2 Seam
TECHNICAL REPORT SUMMARY WILPINJONG MINE
Figure 32. Reserve Plan DD2 Seam
Figure 33. Reserve Plan E1 Seam
TECHNICAL REPORT SUMMARY WILPINJONG MINE
Figure 34. Reserve Plan G Seam
12.4. Comments from Qualified Person(s)
The Reserves at Wilpinjong aren’t materially sensitive to Coal Prices, with low mining costs providing significant head-room against projected pricing. The mine is a medium to high ash producer (14-30% typically). If the market changes to favour low-ash (i.e. steepening of the price/ash curve) there are some washing strategies that may enable the mine to improve it’s value, but this will have a negative impact on the Marketable (and potentially some of the ROM) Reserves.
TECHNICAL REPORT SUMMARY WILPINJONG MINE
13. MINING METHODS
13.1. Introduction
Conventional open cut mining methods are used at the Wilpinjong Coal Mine, with a low strip ratio allowing for relatively rapid pit advance.
13.2. Mine Design
13.2.1. Geotechnical Considerations
All Peabody Energy open-cut operations are required to have a geotechnical management system that provides a framework to assist relevant mining personnel (including contactors and consultants) relating to the application of sound ground control practices at their respective operations. A Geotechnical Hazard Management Plan (GHMP) is developed to ensure that Principal Hazards associated with geotechnical features of the mine environment are effectively managed.
Typical slope design parameters for excavations and dumps for Wilpinjong Mine are shown in the following sections. Local conditions may require variance to these parameters.
Excavated slopes at Wilpinjong are designed to the specifications detailed in Table 27.
|
|
|
|
|
|
|
|
|
|
|
|
|
|
|
| Pit Wall |
Batter Angle (°) |
Batter
Height (m)
|
|
| Weathered/ Palaeo |
Fresh |
|
| Pit 1 |
45 |
70 |
Up to 60* |
|
| Pit 2 |
45 |
70 |
Up to 60* |
|
| Pit 3 |
45 |
70 |
Up to 60* |
|
| Pit 4 |
45 |
70 |
Up to 60* |
|
| Pit 5 |
45 |
70 |
Up to 60* |
|
| Pit 6 |
45 |
70 |
Up to 60* |
|
| Pit 7 |
45 |
70 |
Up to 60* |
|
| Pit 8 |
45 |
70 |
Up to 60* |
|
| Low wall cuts |
N/A |
45 |
Up to 40 |
|
| Dumps |
37 |
37 |
Up to 40 |
|
* Where pit depth is greater than 60 metres, additional controls must be evaluated and implemented into the highwall design. For example, catch benches, change to slope angle, increase to standoff distance and implementation of berms. |
Table 27. Slope Design specifications for highwalls at Wilpinjong Coal Mine.
TECHNICAL REPORT SUMMARY WILPINJONG MINE
Dump design Parameters are as follows:
In-pit Dump
Dumping of all material is done in line with the Wilpinjong Dumping Guidelines and the site Load, Haul and Dump Procedure. The design of spoil/truck dumps takes into consideration the following parameters, shown in Figure 35.
Overall Slope Angle should not exceed 37° (crest to toe angle).
Lift heights should be 20 m and 40 m dump lifts with standoff distances of 10 m and 20 m for successive lifts.
Dump height should be consistent with the natural stability of the material being dumped. In general, the higher the dump face, the greater the risk the dump face has of collapsing under the influence of the vehicle tipping.
The surface of the dump shall be free draining and comply with dumping procedures.
Seepage from the dump and natural groundwater inflow should be drained to sumps, and ponding at the toe of or within the in-pit dump should be kept to a minimum.
The dump designs and slopes are such that the run of water reports to the site sedimentation dams.
Reduced bench heights minimising the potential dump instability especially in weak material dumping spots.
Maintain a minimum berm, safety windrow or stop log at the tip face of ½ wheel height of the largest vehicle using the dump thereby increasing the Factor of Safety (FoS).
Where the base of the dump is subject to the influence of water or mud, recognise the requirement to dump short of the tip face;
Where cracks appear tip short and seek supervisory and geotechnical advice, especially where cracking may be more severe than minor tension cracks due to dump settlement.
Figure 35. Waste spoil dump/truck dump design.
TECHNICAL REPORT SUMMARY WILPINJONG MINE
Out-of-Pit Waste Dumps
Out-of-pit waste dumps are comprised of either:
20 m lifts with ~35-37o batter angles and a 10 m standoff between the crest and toe of successive lifts, or
40 m lifts with ~35-37o batter angles and a 20 m standoff between the crest and toe of successive lifts.
13.2.2. Hydrological Considerations
As part of the mine approvals process, detailed modelling of both surface and sub-surface hydrology has been undertaken. Monitoring programs for both surface and ground water are continued to enable regular updating and tuning of these models.
Water management activities are undertaken in accordance with the Mine’s water management system. In summary, water management for the Mine is based on the containment and re-use of mine water as well as the control of sediment laden water that may be potentially carried with runoff from disturbed areas. The key components of the Mine’s water management system include:
Collection and re-use of surface runoff from disturbed areas;
Capture and on-site containment of mine water, comprising groundwater inflows and incident rainfall-runoff to operational areas;
Re-use of contained mine water for dust suppression over active surfaces (e.g. haul roads).
Recycling of mine water associated with the CHPP and tailings disposal areas;
Consumption of contained waters in the Mine water supply system;
Management of treated sewage effluent in accordance with the OEH’s Environmental Guidelines for the Utilisation of Treated Effluent;
Discharge of treated water via a water treatment facility to Wilpinjong Creek in accordance with EPL 12425
13.3. Mine Plan
13.3.1. Mining Process
The general sequence of open cut mining is as follows:
1. Vegetation clearance and removal (including mulching).
2. Topsoil/subsoil stripping by scrapers and/or dozers. Stripped topsoil is used directly in progressive rehabilitation or is placed in stockpiles for later re-use.
3. Drilling and blasting of overburden, with some waste rock ‘cast blast’ into the adjacent mined-out strip.
4. Dozer pushing of blasted overburden into the adjacent mined-out strip to expose the target seam, or removal with excavator and haul truck.
5. Drilling and blasting plus ripping of coal/parting material.
6. Mining of exposed coal seams by excavator and loading into haul trucks for transport directly to the ROM dump hopper or ROM pads.
7. Interburden/parting material is then drilled and blasted, ripped, pushed or excavated and hauled to expose the underlying working coal sections.
8. Coarse rejects and tailings from the CHPP are selectively placed within mine voids, waste rock emplacements and approved tailing storage facilities.
9. Hauled overburden/interburden/parting material is strategically placed within mine voids and associated waste rock emplacements to develop the final landform.
TECHNICAL REPORT SUMMARY WILPINJONG MINE
10. Progressive landform profiling and rehabilitation of mine voids and waste rock emplacements. In some areas, temporary rehabilitation is undertaken to stabilise landforms until further mining operations are carried out in the future.
ROM coal is either hauled directly to a ROM dump hopper and conveyed to the CHPP for processing, or delivered to ROM pads and later rehandled to the ROM dump hopper using a front end loader and trucks.
The existing capacity of the ROM pads is over 2.5 million tonnes (Mt). Due to previous spontaneous combustion events on ROM pads that contained coal held on-site for an extended period, WCPL has put in place a risk identification system, whereby coal stockpiles that have a higher propensity to spontaneously combust are closely monitored (including physical inspections at daily intervals and/or use of thermal probes to identify areas of heating). In addition, after select ROM coal types have been stockpiled on-site for a designated period, they are prioritised for washing in the CHPP.
Coal removal is performed 12 hours/shift, 2 shifts/day, 7 days/week.
13.3.2. Production Schedule
The current LOM plan mining sequence map is shown in Figure 36.
Figure 36. Mining Sequence Plan
The latest LOM projected the last year of production from WPJ is 2032. The detailed annual production statistics are projected in Table 28.
It should be noted that the plans developed for modelling the economics to support the estimates of Reserves were based on the Life of Mine Plans developed for Wilpinjong in mid-2023, using projected year-end face positions from a plan starting mid-May 2023. The Reserve estimates stated in this report are based on actual face positions at the end of December, 2023.
TECHNICAL REPORT SUMMARY WILPINJONG MINE
The difference between the projected and actual remaining Product Tonnes is not considered to be material to the economic modelling supporting the estimate of Reserves for Wilpinjong.
Table 28. LOM Production Schedule
13.4. Mining Equipment and Personnel
Peabody is utilizing the following mining equipment at WPJ (Table 29).
Basic Mining Equipment (as of December 2023):
|
|
|
|
|
|
|
|
|
|
Mining Equipment Description
|
Make and Model
|
Number of Fleet
|
|
Excavator (overburden/coal)
|
R9350 |
4 |
R9400 |
1 |
Hitachi 5500 |
1 |
CAT 6060 |
1 |
R9250 |
1 |
EX1200 |
1 |
|
Haul Trucks (overburden/coal)
|
CAT 789 |
20 |
CAT 793 |
8 |
MT4400 |
8 |
|
Dozers (open cut pit/product stockpile)
|
CAT D9 |
3 |
CAT D10 |
7 |
CAT D11 |
15 |
CAT 854 G Wheel |
1 |
Front End Loader |
CAT 994K |
2 |
|
Grader
|
CAT 14M |
1 |
CAT 16M |
3 |
CAT 24M |
1 |
|
Water Trucks
|
Haulmax 3900 |
1 |
20,000 Ltr Water Cart |
3 |
|
Drill Rig
|
ROCD65 |
2 |
PitViper235 |
2 |
ReedrillSKS75 |
1 |
| Scraper |
CAT 637 |
1 |
Table 29. Current Mining Equipment
The type of mining equipment utilized by Peabody is suitable for the mining conditions experienced and expected at WPJ, with a long history of successful operation. Planned requirements for major earthmoving equipment throughout the LOM is as follows.
TECHNICAL REPORT SUMMARY WILPINJONG MINE
Table 30. Projected Mining Equipment Annual Hours
The current workforce is mostly sourced from the immediate surrounding area, with most people living within Mudgee. The current maximum workforce is ~720, with total required numbers fluctuating depending on equipment manning and maintenance requirements as the mine progresses.
14. PROCESSING AND RECOVERY METHODS
14.1. Introduction
ROM coal from the open cut pits at the Wilpinjong Coal Mine is transported via internal haul roads for direct dumping to the ROM hopper, or rehandled from a main or satellite ROM pad to the dump hopper.
14.2. Coal Handling and Processing Plant
ROM coal is reclaimed at a rate of up to 1,600 tph from ROM Dump Hopper 1 and up to 1,400 tph from ROM Dump Hopper 2 to Sizing Station 1 and 2 respectively, via a feeder breaker. The broken coal is then screened, and if oversized, further crushed in separate sizers. Sized coal less than 50 millimetres (mm) is transferred to either a raw coal stockpile or a product coal stockpile (bypass coal). Raw coal is reclaimed from the raw coal stockpiles and is fed to the coal preparation plant at up to 1,400 tph.
Figure 37. Coal Handling and Loading Facilities Map.
TECHNICAL REPORT SUMMARY WILPINJONG MINE
Sized coal is washed in the raw coal and desliming screens, with fine coal/slimes (less than 0.7 mm) fed to the fine coal circuit, washed medium coal (greater than 0.7 mm and less than 2 mm) fed to the medium coal washing circuit and washed coal (greater than 2 mm) fed to the coarse coal circuit.
The fine coal circuit separates coal fines from slimes and comprises cyclones, spirals, centrifuges, a screen and a tailings thickener.
Tailings are pumped from the tailings thickener to the tailings filter press, which then dewaters the material to allow it to be conveyed to the reject bin.
The medium coal and coarse coal circuits comprise dense medium cyclones to separate the coarse rejects from the washed coal.
The fine and coarse rejects from the CHPP are then combined for co-disposal as a component of general ROM waste emplacement operations. Coal products from the CHPP are conveyed to the domestic and export product stockpiles for subsequent reclaim and loading to trains.
Figure 38. Coal Preparation Circuit Flowsheet
14.3. Plant Yield
The various plies mined at Wilpinjong exhibit different washing characteristics. These characteristics are all modelled and wash/bypass decisions are based on this modelling, as well as the specific market requirements at the time.
The efficiency of the plant is monitored to ensure high levels of carbon recovery. The facilities allow the mine to make processing decisions that optimize the value of the coal depending on the current market conditions.
14.4. Energy, Water, Process Material, Personnel Requirements
The coal handling facilities at Wilpinjong have been operational since 2006 with upgrades made several years ago to allow for current production levels, which are not planned to be exceeded in the future. The facilities are powered by existing power infrastructure, and water consumption is monitored and planned as part of the site Water Management strategy.
TECHNICAL REPORT SUMMARY WILPINJONG MINE
15. INFRASTRUCTURE
Most of the on-site infrastructure is centralized near the rail load-out loop. A notated aerial photo of the central infrastructure is shown in Figure 39.
Figure 39. Central Infrastructure Aerial View
The mine also maintains a series of haul roads, light vehicle access roads, communications towers and equipment, remote ‘ready-lines’ for mobile equipment (including mobile crib huts and light maintenance facilities) as well as water management infrastructure. Explosive storage facilities are also maintained away from the central infrastructure area.
To deliver the current LOM, some minor infrastructure (roads, small powerlines and a remote ‘ready-line’) will need to be re-located.
All off-site infrastructure required for the mine is already in place (power, rail, access roads, etc..) and no further changes are required to deliver the LOM plan.
Administration and Ancillary Buildings
As shown above, Wilpinjong has numerous administration buildings, workshops and warehouses located at the site. Additional temporary ‘remote ready-line’ and crib (lunchroom) facilities are also utilized across the sites. These facilities are adequate to support expected production.
TECHNICAL REPORT SUMMARY WILPINJONG MINE
Fuel Storage
Hydrocarbons used on-site include fuels (i.e. diesel and petrol), oils, greases, degreaser and kerosene. Several diesel storage tanks are located on-site of up to 110,000 L capacity. Oil is stored in self-bunded double-skinned oil storage tanks, and a self-bunded multiple compartment hydrocarbon storage tank is also maintained for storage of coolant and oil. Shipping containers are used for the storage of oil and grease pods.
Hydrocarbon storage facilities are constructed and operated in accordance with Australian Standard (AS) 1940:2004 The Storage and Handling of Flammable and Combustible Liquids and the NSW Work Health and Safety Regulation, 2011.
Explosive Storage
Explosives required for the Mine include initiating products and detonators, ammonium nitrate fuel oil and emulsion explosives. The explosives storage and blast reload facilities are currently located in Pit 1, however explosives storages would be periodically relocated as mining progresses. Explosives on-site are stored and used in accordance with AS 2187.2:2006 Explosives – Storage, Transport and Use – Use of Explosives. AS 2187.2:2006 details the requirements for the safe storage, handling and land transport of explosives, safe storage distances from other activities and bunding requirements
Roads
Wilpinjong has established all required roads for off-highway trucks and light vehicles to support daily operations. There is sufficient equipment, such as dozers, grader, water trucks, to continue to maintain and relocate those roads as needed for the current mine plan.
Rail and Train Loadout
A train loading facility capable of loading coal at a rate of approximately 4,500 tonnes per hour is located at the head of the rail loop within the mine infrastructure area. Coal is reclaimed from load out conveyors that run the length of the product coal stockpiles. Product coal is loaded onto trains 24 hours per day, seven days per week.
Coal is railed east to domestic power generation customers or to the Port of Newcastle for export. No coal is railed west of the Mine.
Coal Storages
In order to ensure product coal specifications are met, and to reduce mining related delays in pit operations, Wilpinjong maintains multiple ROM and Product stockpiles according to quality. Although efforts are made to reduce coal rehandle where possible, when required to be stored ROM coal is kept in open stockpiles in near proximity to the two ROM feeder bins to be processed as needed. A recent image depicting the current configuration of ROM stockpiles is shown below.
TECHNICAL REPORT SUMMARY WILPINJONG MINE
Figure 40. ROM Coal Stockpiles
Product Stockpiles are created from raw crushed coal, or from coal washed in the on-site washplant. Multiple piles are created according to ash/energy content, and then blended from these piles into the train loadout. A schematic of the Product Piles is shown below:
Figure 41. Product Coal Stockpile Schematic
Product Stockpile coal is placed by overhead conveyor structures, and withdrawn through recovery valves to be conveyed to the train loadout. Stockpile dozers are used to push coal to and from the valves when required in order to create additional stockpile capacity, or to maintain high recovery rates when loading trains.
TECHNICAL REPORT SUMMARY WILPINJONG MINE
Spoil Piles
Mined waste rock (including overburden and interburden) is progressively placed in mine voids behind the advancing open cut operations, once the coal has been removed. A combination of temporary and permanent out-of-pit waste rock emplacements are located adjacent to the open cut mining operations. Mine waste rock emplacements behind the advancing open cut are constructed to approximate the pre-mining topography. The waste rock emplacements are progressively shaped (as soon as reasonably practicable following disturbance) by dozers for rehabilitation activities (i.e. re-contouring, topsoiling and revegetation).
Some of the overburden is also utilised to construct internal walls for the tailings emplacements and visual bunds along select pit boundaries. Final landform levels and topography of the backfilled mine landforms generally approximate the pre mining topography, with some variations.
Water Supply and Management
See Section 13.2.2
Power Supply
The Wilpinjong Coal Mine receives electricity from a 66 kV supply system owned and operated by Essential Energy. Power is distributed by overhead cable or underground cable where necessary.
Power for remote ready-lines are typically provided by small on-site diesel generators where required.
Camp and Accommodation
There is no current on-site accommodation or camp. All personnel are from nearby towns and they drive in or out to the operations.
TECHNICAL REPORT SUMMARY WILPINJONG MINE
16. MARKET STUDIES AND MATERIAL CONTRACTS
16.1. Introduction
The pricing information used to establish Coal Reserves includes internal, proprietary price forecasts and existing contract economics, in each case on a mine-by-mine and product-by-product basis. In general, price forecasts are based on a thorough analytical process utilizing detailed supply and demand models, global economic indicators, projected foreign exchange rates, analyses of price relationships among various commodities, competing fuels analyses, projected steel demand, analyses of supplier costs and other variables. Price forecasts, supply and demand models and other key assumptions and analyses are stress tested against independent third-party research (not commissioned by Peabody) to confirm the conclusions reached through our analytical processes, and our price forecasts fall within the ranges of the projections included in this third-party research. The development of the analyses, price forecasts, supply and demand models and related assumptions are subject to multiple levels of management review.
16.2. Product and Market
Wilpinjong has a long-term Coal Supply Agreement with AGL to supply power plants located in the Hunter Valley. The contract allows for flexible quantity nominations.
The remaining production is sold on the Seaborne Thermal market (exported to other countries) into a large variety of customers predominately in Asia.
The ash of these products typically ranges from ~15% (6260kcal/kg GAR) to ~33% (5000kcal/kg GAR).
16.3. Market Outlook
Several factors can influence thermal coal supply and demand and pricing. Demand is sensitive to total electric power generation volumes, which are determined in part by the impact of weather on heating and cooling demand, inter-fuel competition in the electric power generation mix (such as from natural gas and renewable sources), changes in capacity (additions and retirements), competition from other producers, coal stockpiles and policy and regulations. Supply considerations impacting pricing include Reserve positions, mining methods, strip ratios, production costs and capacity and the cost of new supply (greenfield developments or extensions at existing mines).
Internationally, thermal coal competes with alternative forms of electricity generation. The competitiveness and availability of natural gas, oil, nuclear, hydro, wind, solar and biomass varies by country and region. Seaborne thermal coal consumption is also impacted by the competitiveness of delivered seaborne thermal coal supply from key exporting countries such as Indonesia, Russia, Colombia, the U.S. and South Africa, among others. In addition, seaborne thermal coal import demand can be significantly impacted by the availability of domestic coal production, particularly in the two leading coal import countries, China and India, among others.
16.4. Material Contracts
Consistent with general coal mining industry in Australia, Peabody maintains a number of supply agreements for various required elements of their operations, including for fuel, electricity, tyres and equipment supply and maintenance. It also has commitments with Port and Rail service and infrastructure providers to enable its products to be brought to market.
In terms of sales, Wilpinjong has a long-term ‘open-book’ Coal Supply Agreement with AGL, a domestic electricity generator. This supply agreement provides for a total amount of energy to be sold to AGL over a multi-year term. Traditionally this has amounted to ~7Mtpa of product coal, but with the retirement of the Liddell power station in early 2023, it has been modelled to reduce in line with customer requirements, and within flexible quantity nominations allowed in the contract.
TECHNICAL REPORT SUMMARY WILPINJONG MINE
17. ENVIRONMENTAL STUDIES, PERMITTING AND SOCIAL OR COMMUNITY IMPACT
17.1. Environment Studies
Prior to the granting of Approvals for mining operations at Wilpinjong in 2006, an Environmental Impact Study (EIS) was completed to satisfy the Terms of Reference provided by the Director General of the Department of Infrastructure, Planning and Natural Resources (DIPNR), now known as the Department of Planning, Industry and Environment (DPIE). A summary of these requirements is listed below:
TECHNICAL REPORT SUMMARY WILPINJONG MINE
Table 31. EIS Terms of Reference
Subsequent to this original EIS, as part of the Wilpinjong Extension Project, another EIS was prepared to address impacts generated by that project. Details of these studies are publicly available at https://www.peabodyenergy.com/Operations/Australia-Mining/New-South-Wales-Mining/Wilpinjong-Mine/Approvals,-Plans-Reports
Wilpinjong Coal Mine has an Environmental Management Strategy in place that has been developed to minimise environmental impacts and provides the strategic context for environmental management of the site. Existing management plans, monitoring programmes and control strategies include:
a Noise Management Plan;
a Blast Management Plan (including a Blast Fume Management Strategy);
an Air Quality Management Plan;
a Water Management Plan (including a Site Water Balance, an Erosion and Sediment Control Plan, a Surface Water Management and Monitoring Plan, a Groundwater Monitoring Program and a Surface and Groundwater Response Plan);
a Biodiversity Management Plan;
an Aboriginal Cultural Heritage Management Plan;
a Waste Management Plan (including a Life of Mine Tailings Strategy);
a Mining Operations Plan (incorporating a Rehabilitation Management Plan);
a Spontaneous Combustion Management Plan;
a Pollution Incident Response Management Plan;
a Bushfire Management Plan; and As of December 31, 2023, all required licenses and permits are in place for all current activities at operation of WPJ. These have been previously summarized in Table 5.
an Environmental Monitoring Program.
TECHNICAL REPORT SUMMARY WILPINJONG MINE
17.2. Permitting
17.3. Social and Community Impact
WCPL is an active contributor to the local community, making regular donations to local charities and events.
WCPL has a range of communication methods in place which enables it to share information with the local community. These methods include:
Community Consultative Committee (CCC);
Aboriginal Heritage Meetings;
The Peabody Energy website - https://www.peabodyenergy.com/Operations/AustraliaMining/New-South-Wales-Mining/Wilpinjong-Mine
Community Newsletters; and
Regular ‘Have a Chat’ meetings which allows for ad hoc meetings with members of the community. The dates of the ‘Have a Chat’ meetings are posted on the Peabody Energy website for WCPL.
The WCPL CCC is run in accordance with NSW Planning and Infrastructure Guidelines for Establishing and Operating Community Consultative Committees for Mining Projects. CCC meetings allow WCPL to provide to the community a report on the progress of the mine as well as environmental performance. CCC meetings are held quarterly and include the following:
An independent chairperson approved by the DPE;
Council (MWRC) and National Parks and Wildlife Services (NPWS) representation;
WCPL representation; and,
Community representation.
WCPL has established a Complaint Response Protocol to respond to all community concerns. This Protocol involves operation of a community information and complaints hotline (Complaints line: 1300 606 625) which receives complaints from members of the public. WCPL also maintains a separate blasting hotline for blasting information (Blast hotline: 1800 649 783).
Complaints received from the community are logged in WCPL’s complaints management system, Consultation Manager.
TECHNICAL REPORT SUMMARY WILPINJONG MINE
17.4. Mine Reclamation and Closure
As part of WCPLs annual financial reporting obligations, a review of Asset Retirement Obligations (ARO) is required to be undertaken. This review estimates the cost of reclaiming the active parts of the mine, including works to remove mine infrastructure and otherwise meet the relinquishment requirements of the mine’s permit (Development Consent). The estimate also includes allowances for ‘post-closure’ costs such as required monitoring, completion surveys, project management etc…
The year end 2023 estimate for Asset Retirement Obligation at Wilpinjong is summarized below (in AUD):
|
|
|
|
|
|
| Support Areas |
$30.4m |
| Closure Costs |
$40.0m |
| Ongoing Areas |
$5.9m |
| TOTAL COSTS |
$76.3m |
Table 32. Asset Retirement Obligation Cost Summary
This estimate is captured in the mine’s LOM Financial Model.
17.5. Comments from Qualified Person(s)
In the opinion of the Qualified Person, the current approach to matters of environmental compliance, permitting and community impacts generally is sound, and doesn’t present any current concerns with respect to the reporting of Resources or Reserves.
TECHNICAL REPORT SUMMARY WILPINJONG MINE
18. CAPITAL AND OPERATING COSTS
18.1. Introduction
WPJ is an active operation with a long operating history. The LOM plans and financial models have been developed and updated on a regular basis. The coal and waste volumes, and product quality are developed from the detailed mine plan. The manpower requirements, operating costs and capital are estimated from the historic data and future mine plan requirements on regular basis.
18.2. Operating Costs
The cost estimates used to establish Coal Reserves are generally estimated according to internal processes that project future costs based on historical costs and expected future trends. The estimated costs normally include mining, processing, transportation, royalty, add-on tax and other mining-related costs. Peabody’s estimated mining costs reflect projected changes in prices of consumable commodities (mainly diesel fuel, and explosives), labor costs, geological and mining conditions, targeted product qualities and other mining-related costs. Estimates for other sales-related costs (mainly transportation, royalty and add-on tax) are based on contractual prices or fixed rates.
Operating costs are projected based on historical operating costs and adjusted based on projected changes in staffing, hours worked, production, and productivity for mining areas in the LOM Plan. The LOM Plan operating cost projections are shown in detail in the following chart:
Table 33. LOM Operating Cost Schedule
These operating cost estimates are based on a substantial operating history, contain no contigency and are in the accuracy range of + - 15%.
18.3. Capital Expenditures
WPJ will require capital expenditures each year for infrastructure additions/extensions, as well as for mining equipment rebuilds/replacements to continue producing coal. The capital expenditures are categorized according to Development and Facilities, Equipment and Land and Reserves. The capital expenditures in escalated AUD are shown in following chart. The capital expenditures have been projected based on mining equipment and infrastructure requirements, with pricing based on current costs.
TECHNICAL REPORT SUMMARY WILPINJONG MINE
Table 34. LOM Capital Cost Schedule
These capital cost estimates are based on a substantial operating history, contain no contingency and are in the accuracy range of + - 15%.
TECHNICAL REPORT SUMMARY WILPINJONG MINE
19. ECONOMIC ANALYSIS
19.1. Macro Economic Assumptions
As part of the Life of Mine Financial Modelling process, several economic assumptions are determined internally within Peabody’s Corporate group. Key assumptions used for the current modelling are:
General Inflation: 2024 4.5%
Beyond 2024 2.0 %
(Note: multiple inflation rates are developed for different cost inputs – the values presented above represent the modelled general inflation index)
Royalties/Levys: NSW Royalty on Opencut Coal – 8.2% of Revenue (less deductions), increasing to 10.8% in July 2024)
Other standard government levies (including Research Levy) are included.
Tax: Australian Corporate Tax of 30%
Discount Rate: 10%
AUD:USD FX Rate: 2024 0.70
2025 and beyond 0.72
Coal Prices:
Table 35. Projected Export Coal Prices (escalated - FOB Newcastle)
Coal sold domestically is priced according to the open-book principles of the Long Term Supply Agreement with AGL.
The average modelled sales price for Wilpinjong is compared to the broker consensus price for the Thermal benchmark coal (NEWC index) in the following chart (Note: the KPMG data is escalated beyond 2028 at 2.0% per annum). The Wilpinjong price shown is the average of all coal sold, so is expected to be lower than the NEWC benchmark in line with the average quality sold.
TECHNICAL REPORT SUMMARY WILPINJONG MINE
Figure 42. Projected average price compared to Broker Consensus of benchmark Thermal coal
19.2. Cash Flow Model
The key results of the Financial Modelling are displayed below, with a summary of annual (undiscounted) cash flows, along with the economic viability metric of NPV at different discount factors. Other economic measures such as IRR and Payback Period are of limited informative value due to the low capital required in an operating mine with strong cashflows.
Table 36. LOM Projected Cashflows
Table 37. Financial Modelling KPIs
These results show that Wilpinjong exhibits strong projected cashflows throughout its planned life, which contribute to a high NPV10. Estimated high operational costs associated with longer waste haulage towards the end of the expected mine life are required as part of the mine’s closure obligations.
19.3. Sensitivity Analysis
A high-level sensitivity analysis of the impact of changes in Sales Price, Cost, Productivity and Capital has been completed in the Financial Model. Sensitiviity to product grade has not been completed, but as a thermal coal product, changes to ash / energy content would have a direct effect on price. The results of this analysis are shown below. This analysis demonstrates the project value to be relatively robust, with positive NPVs reported across the range of values assessed.
TECHNICAL REPORT SUMMARY WILPINJONG MINE
Table 38. Financial Model Sensitivity
TECHNICAL REPORT SUMMARY WILPINJONG MINE
20. ADJACENT PROPERTIES
The Western Coalfield has a number of coal mining operations, of which the nearest are shown in Figure 43. Of importance to the operation at Wilpinjong, are the nearest mines (operator in brackets):
Moolarben Coal Complex (Yancoal Australia Ltd).
o This mine is located to the west of WPJ and extracts from the Ulan Coal Seam using both open cut and underground (longwall) methods. This mine has been operational since 2010, and occupies the area between 0 and 8 km west of Wilpinjong Pit 6, i.e. the approved Moolarben Open Cut 4, once active, will be excavated in an area immediately west of Pit 6.
Ulan Mine Complex (Glencore).
o This mine is located 11 km to the northwest of WPJ on the other side of the Goulburn River, although the bulk of the underground mine is located 12-14 km away. Ulan Mine Complex extracts from the Ulan Coal Seam using both open cut and underground (longwall) methods. Coal mining has occurred at Ulan since the 1920s, however the current open cut and underground operations commenced in the 1980s (Mackie, 2011).
Bylong Coal Project (Kepco Bylong Australia)
o located approximately 15 km to the south-east of WPJ, was a proposed project. In 2019, the Independent Planning Commission (IPC) found that the negative impacts of the project outweighed the mine’s benefits. Following a lengthy appeals process, in February of 2022 the High Court declined the proponents appeal and the project has subsequently been cancelled.
Additionally, Bowden’s Silver Project is a proposed silver mine near Lue. This is more than 25 km south of Wilpinjong. It received IPC project approval in April, 2023.
No information from adjacent properties has been used in the preparation of this Resource and Reserve estimate.
TECHNICAL REPORT SUMMARY WILPINJONG MINE
Figure 43. Adjacent Mining Projects
TECHNICAL REPORT SUMMARY WILPINJONG MINE
21. OTHER RELEVANT DATA AND INFORMATION
Peabody reports greenhouse gas emissions from the Wilpinjong mine according to the requirements of the National Greenhouse and Energy Reporting Act 2007. Fugitive gas emissions released from the mining of coal are reported based on a model developed in accordance with the Method 2 guidelines developed under ACARP project C20005. The mine has established baseline emissions under the safeguard mechanism, and is not anticipating any additional costs associated with exceedance of emissions targets with its current plans.
There is no additional relevant information or data to be discussed.
TECHNICAL REPORT SUMMARY WILPINJONG MINE
22. INTERPRETATION AND CONCLUSIONS
The ability of Peabody, or any coal company, to achieve production and financial projections is dependent on numerous factors. These factors primarily include site-specific geological conditions, the capabilities of management and mine personnel, level of success in acquiring Reserves and surface properties, coal sales prices and market conditions, environmental issues, securing permits and bonds, and developing and operating mines in a safe and efficient manner. Unforeseen changes in legislation and new industry developments could substantially alter the performance of any mining company.
Coal mining is carried out in an environment where not all events are predictable. While an effective management team can identify known risks and take measures to manage and/or mitigate these risks, there is still the possibility of unexpected and unpredictable events occurring. It is not possible therefore to totally remove all risks or state with certainty that an event that may have a material impact on the operation of a coal mine will not occur.
22.1. Geology and Resources
It is the opinion of the Qualified Person that the exploration data reviewed for the WPJ area is sufficient to reasonably interpret the geology of the area and to construct geological and coal quality models. WPJ has been conducting exploration and in-fill drilling programs on the property for many years.
The Qualified Person has reviewed the available studies and geological data on file for WPJ, and has the opinion that the exploration and geological work is thorough and conforms to reasonable standards. The results of the exploration and its interpretation have been consistent over time, lending confidence to the conclusions that have been reached. These include the following bulleted items.
The WPJ geological model for the mining areas reasonably represent the drill hole and other data provided and are a reasonable interpretation of that data. The models are sufficient for use as the basis of Resource and Reserve estimates.
Based on a review of historic performance and the forward projections the projected coal preparation plant yields are reasonable.
Coal sampling procedures, sample preparation; sample analysis and sample security procedures are adequate, within industry standards and sufficient to ensure representative sampling results
22.2. Mining and Reserves
The Wilpinjong Mine has a solid operating history and has a significant number of drill holes, in order to determine Coal Resource and Reserve estimates and projected economic viability. The data has been determined by the Qualified Persons to be adequate in quantity and reliability to support the Coal Resource and Reserve estimates in this Technical Report Summary.
The Coal Reserve estimates are 51.5 million marketable (product) tonnes of surface mineable Reserves, at WPJ. These Reserves are economically mineable based on the historical mining, mine projections, historical and projected thermal coal sales prices, historical and projected operating costs, and capital expenditure projections for the LOM Plan.
22.3. Environmental, Permitting and Social Considerations
As of December 31, 2023, all required licenses and permits are in place for all activities at the operation of WPJ. There remains a requirement to apply for, and be granted, a small Mining Lease in the north-west part of the mine, but there are no foreseen impediments to this process.
Many of these permits require regular monitoring, reporting, and renewals – these activities are a normal undertaking in the business of mining within NSW, AUSTRALIA.
Land reclamation is a vital part of the mining life cycle that is integrated with the mining process. WPJ is committed to being compliant with the Company’s Environmental policy and take responsibility for the environment, benefit our communities and restore the land for generations that follow. The historic performance on the reclamation activities and the projected future reclamation costs are supportive of the Reserve estimates at WPJ.
22.4. Economic Analysis
Based on the results of the LOM Plan, the qualified persons of this report conclude that WPJ is economic, and pre-tax cash flows for proposed operations should generate a positive NPV, based on the saleable coal price levels and exchange rates forecast by Peabody.
TECHNICAL REPORT SUMMARY WILPINJONG MINE
23. RECOMMENDATIONS
23.1. Geology and Resources
WPJ generally has sufficient exploration data to determine mineral Reserves, and most of the Resources within the Mine Plan footprint are considered to be at a Measured status. Future exploration work will be undertaken to provide geologic data primarily to improve the quality of the model to enable better planning of short term operations. This ‘in-fill’ drilling program is budgeted within the LOM financial model, and should be continued according to Peabody’s exploration drilling standards.
23.2. Mining and Reserves
The Reserves at Wilpinjong aren’t materially sensitive to Coal Prices, with low mining costs providing significant head-room against projected pricing. The mine is a medium to high ash producer (14-30% typically). If the market changes to favour low-ash (i.e. steepening of the price/ash curve) there are some washing strategies that may enable the mine to improve it’s value, but this will have a negative impact on the Marketable (and potentially some of the ROM) Reserves. Continued monitoring of the price/ash curve and appropriate adjustment of the washing strategy to maximise value is recommended.
There are some plies within the mining footprint that have not been included in the LOM plan as they are inherently high in ash. When the premium paid for low-ash coal is low, there is a possibility that mining and processing these additional plies becomes an attractive option, as the incremental cost of production is quite low, and the lower ash coal can be blended to create a saleable product that offers more value than would otherwise be assumed. Currently, the amount of data collected for these plies is limited, and they are not used in any way to support the calculation of the Reserves in this report. Although considered unlikely, if in the future the long term view on low-ash price premiums is lowered, additional quality data on these plies may help to increase the Reserves which may be reported at this mine, and extend the expected Mine Life.
23.3. Environmental, Permitting and Social Considerations
The mine requires the granting of a small mining lease in the north-west part of the mine to deliver all of the Reserves in this Technical Report Summary. Although there are no perceived obstacles to the successful granting of this lease area it is recommended that appropriate applications are submitted as required.
23.4. Economic Analysis
The ability of Peabody, or any coal company, to achieve production and financial projections is dependent on numerous factors. These factors primarily include site-specific geological conditions, increasing strip ratio, the capabilities of management and mine personnel, level of success in acquiring reserves and surface properties, coal sales prices and market conditions, environmental issues, securing permit renewals and bonds, and developing and operating mines in a safe and efficient manner. Unforeseen changes in legislation and new industry developments could substantially alter the performance of any mining company. It is recommended that those factors should be assessed regularly according to the Company’s internal control and material changes are to be reflected in the future reserve estimates.
TECHNICAL REPORT SUMMARY WILPINJONG MINE
24. REFERENCES
Bertoli, O., Paul, A., Casley, Z. and Dunn, D., 2013. Geostatistical drillhole spacing analysis for Coal Resource classification in the Bowen Basin, Queensland. International Journal of Coal Geology, 112, pp.107-113.
Resource Strategies, Wilpinjong Coal Project Environmental Impact Study, May 2005
Peabody Energy, Wilpinjong Extension Project Environmental Impact Study, 2016.
Peabody Energy, Wilpinjong Extension Project Feasibility Report, 2018.
Neilsen, B., Peabody Australia Wilpinjong Reserves Statement, Feb 2018.
Ewart, E., Peabody Australia Wilpinjong Resources Statement, Sep 2017.
Neilsen, B. & Ewart, E., Peabody Australia, Wilpinjong Technical Report Summary (as at Dec 2021), Feb 2022.
SEC, Modernization of Property Disclosures for Mining Registrants, Oct 2018
McCullough Robertson, Deed of Amendment and Restatement – Coal Supply Contract for Wilpinjong Coal Mine (between WCPL and AGL), Jan 2012.
WCPL, Wilpinjong Life of Mine Review, 2021
WCPL, Wilpinjong LOM Plan Financial Model, 2021
WCPL, Wilpinjong Life of Mine Review, 2023
WCPL, Wilpinjong LOM Plan Financial Model, 2023
Hutton A. 2009. Geological Setting of Deposits. pp. 40-84 In Kininmonth R.J. & Baafi E.Y. ed.Australasian Coal Mining Practice. Australasian Institute of Mining and Metallurgy, Monograph 12.
O’Brien, Meyers & Cameron, Standardised washability through advances in borecore data unification, Bowen Basin Symposium 2010.
KPMG, Coal Price and FX Market Forecasts December 2023/January 2024
Yoo E.K, Tadros N.K. and Bayly K.W. 2001, A compilation of the geology of the Western Coalfield: notes to accompany the 1:100 000 Western Coalfield geological maps (southern and northern parts), Geological Survey of New South Wales, Report GS2001/204
Websites:
Wilpinjong Public Plans and Reports, https://www.peabodyenergy.com/Operations/Australia-Mining/New-South-Wales-Mining/Wilpinjong-Mine/Approvals,-Plans-Reports
AGL Macquarie Presentation, 27 May 2015, https://www.agl.com.au/~/media/agl/about%20agl/documents/media%20center/asx%20and%20media%20releases/2015/1439987.pdf This technical report summary has been prepared by Qualified Persons who are employees of the registrant.
TECHNICAL REPORT SUMMARY WILPINJONG MINE
Google Maps
Minview (NSW Government)
TECHNICAL REPORT SUMMARY WILPINJONG MINE
25. RELIANCE ON INFORMATION PROVIDED BY THE REGISTRANT
In their specific areas of expertise, these Qualified persons have contributed to the appropriate sections of this report. These Qualified Persons have also relied on the information provided by the Company for property control, marketing, material contracts, environmental studies, permitting and macro-economic assumptions as stated in Section 3.2, Section 16, Section 17, and Section 19. As the mine has been in operation for many years, the Company has considerable experience in those areas. The Qualified Persons have taken all appropriate steps, in their professional opinion, to ensure that the above information from the Company is sound.
EX-96.3
17
btu_20231231xex963.htm
EX-96.3
Document
|
|
|
| TECHNICAL REPORT SUMMARY CENTURION MINE |
In accordance with the requirements of SEC Regulation S-K (subpart 1300)
BLANK PAGE
TECHNICAL REPORT SUMMARY CENTURION MINE
SIGNATURE PAGE
Title: Technical Report Summary - Centurion Mine, SK-1300
Peabody Energy Corporation (BTU)
Effective Date of Report:
December 31, 2023
Project Location:
The Centurion Mine (previously known as the North Goonyella Mine) is an underground coal mine located on the western flank of the Bowen Basin, a major coal producing region in Australia.
Centurion is located approximately 180km west southwest of Mackay, in the Isaac Regional Council local government area. Access to the area is via the sealed section of the Suttor Development road from Lake Elphinstone then along a sealed private road to the mine. Alternative access is via unsealed roads from Moranbah to the south and Charters Towers via Mt Coolon to the west.
Centurion Coal Mining Pty Ltd, (ACN 010 879 526) is the owner of the Centurion Mine and is the holder of Mining Lease 6949 (the Holder). The Holder is a wholly owned subsidiary of Peabody Energy Australia Pty Ltd (ACN 096 909 410) with the overall parent company being Peabody Energy Corporation, a New York Stock Exchange listed entity.
Qualified Person(s):
(With responsible report sections listed.)
Peabody Energy Corporation
/s/ Hui Hu
Geology (Sections:1,2,3,4,5,6,7,8,9,10,11,21,22,23,24,25)
/s/ Damien Wichlacz
Mining Engineering (Sections: 1,2,3,4,5,12,13,14,15,16,17,18,19,20,21,22,23,24,25)
Signature Date:
BLANK PAGE
TECHNICAL REPORT SUMMARY CENTURION MINE
TABLE OF CONTENTS
TECHNICAL REPORT SUMMARY CENTURION MINE
TECHNICAL REPORT SUMMARY CENTURION MINE
TECHNICAL REPORT SUMMARY CENTURION MINE
TECHNICAL REPORT SUMMARY CENTURION MINE
TABLES
Table 16-1. Centurion Coking Coal – Typical Specification (2023) 107
TECHNICAL REPORT SUMMARY CENTURION MINE
TECHNICAL REPORT SUMMARY CENTURION MINE
FIGURES
Figure 8-3. Geotech Sample Packaging 56
TECHNICAL REPORT SUMMARY CENTURION MINE
TECHNICAL REPORT SUMMARY CENTURION MINE
BLANK PAGE
TECHNICAL REPORT SUMMARY CENTURION MINE
1. EXECUTIVE SUMMARY
1.1. Disclaimer
This Technical Report Summary for the Centurion Mine has been prepared by a team of qualified persons (QP) on staff at Peabody Energy. The purpose of this statement is to provide a summary of technical studies which support the coal resources and reserves in accordance with the United States Securities and Exchange Commission’s (SEC) mining rules under the SK-1300 regulation. All information within this report has been prepared based on present knowledge and assumptions.
1.2. Property Description
The Centurion Mine is an existing underground coal mine owned by Centurion Coal Mining Pty Ltd, (ACN 010 879 526) and operated under Environmental Authority (EA) EPML00815613.
Centurion Coal Mining Pty Ltd (Centurion) is a wholly owned subsidiary of Peabody Energy Australia Pty Ltd (ACN 096 909 410) with the overall parent company being Peabody Energy Corporation (Peabody), a New York Stock Exchange listed entity.
The current approved production rate for the operation is 10.2 Mtpa ROM coal that after processing, equates to approximately 7.6 Mtpa product coal. The mine is located on the western flank of the Bowen Basin, approximately 160km WSW of Mackay in Queensland, Australia. (see Figure 1-1)
Figure 1-1. General Location Map
TECHNICAL REPORT SUMMARY CENTURION MINE
1.3. Geology and Mineralization
The Centurion Mine lies on the Collinsville Shelf on the western margin of the Bowen Basin in Central Queensland. The regional stratigraphy of the area comprises the Permian Blackwater Group which comprises three coal bearing sequences, the Moranbah Coal Measures (MCM), the Fort Cooper Coal Measures (FCCM), and the Rangal Coal Measures (RCM, it also contains the Triassic Group sediments (Rewan and Clematis) and Tertiary sequences. The Centurion Mine lease covers the subcrops of the Moranbah and Fort Cooper Coal Measure sequences. The Permian strata were overlain by Triassic Rewan Group and Clematis Group sediments, however in the Centurion area the Triassic sediments have all been removed and a large unconformity exists between the Permian and Tertiary sediments. The main seams of economic interest are the Goonyella Middle and Goonyella Lower B2.
1.4. Exploration
Early exploration in the area was carried out by the former Mines Department, and by the Utah Development Company as part of its regional exploration of the Bowen Basin in the early to mid-1960s. With only the MCM present, early exploration was focused on proving large open cut resources. As most of the Centurion resources were considered underground mineable, the area was relinquished by Utah at the time it applied for ML 1763, Goonyella Mine. Authority to Prospect (ATP) 453C was granted to North Goonyella Coal Properties Pty Ltd (NGCP), which was owned by White Mining Ltd (51%) and a subsidiary of Sumitomo Pty Ltd (49%), in May 1989. After an extensive exploration program, an application for a mining lease was made, leading to the grant of ML 6949 in October 1991 for a period of 35 years.
The lease has continued to be explored using cored and non-cored boreholes, together with the use of geophysics to help determine both the location of resources and reserves, and also to define the structural geology of the area.
1.5. Development and Operations
The Centurion Mine is an underground operation that has extracted several plies of the Goonyella Middle (GM) Seam utilizing continuous miners to develop longwall panels, which are then mined using a longwall system. The mined seams are subsequently washed at the onsite preparation plant before shipping.
White Mining Ltd developed the operation (then known as the North Goonyella Mine), including a rail loop, coal handling preparation plant (CHPP) and nearby accommodation village, following the grant of ML6949 in 1991. The mine commenced longwall production in early 1994. Sumitomo acquired White Mining’s share of NGCP, taking 100% ownership in the mine before selling to a consortium of RAG and Thiess in November 2000. Thiess sold its stake in the mine to RAG in January of 2003. Peabody then acquired North Goonyella as part of an acquisition of RAG’s coal assets in April of 2004 and operated it until September of 2018, when a fire in the mine halted operations. The mine has been idled since that time while plans to re-initiate production with regulatory approval were developed.
During the third quarter of 2022, Peabody initiated the redevelopment of the mine. The project will utilize substantial existing infrastructure and equipment at the mine, including a new 300-metre longwall system, a coal handling preparation plant, a dedicated rail loop for transport to the Dalrymple Bay Coal Terminal, and an accommodation village with housing and service amenities for more than 400 workers. Redevelopment activities which include ventilation, equipment, conveyance and infrastructure updates are underway in anticipation of reaching development coal, subject to regulatory approvals, in the first quarter of 2024.
TECHNICAL REPORT SUMMARY CENTURION MINE
Longwall operations are expected to commence in 2026. In December of 2023, the mine was renamed the Centurion Mine.
1.6. Coal Resource and Reserve Estimates
Coal resource and reserve estimates are summarized in Table 1-1. The total resources for Centurion Mine are estimated at 9.2 million tonnes exclusive of reserves, this includes 1.9 million tonnes classified as measured or indicated, and 7.3 million tonnes as inferred. The total reserves are estimated to be 62.7 million tonnes, with 41.9 million tonnes of proven reserves, and 20.8 million tonnes of probable reserves.
Table 1-1. Coal Resources and Reserves
|
|
|
|
|
|
|
|
|
|
|
|
|
|
|
|
|
|
|
|
|
Resources (in million tonnes) |
Reserves (in million tonnes) |
Measured |
Indicated |
Inferred |
Total |
Proven |
Probable |
Total |
0.1 |
1.8 |
7.3 |
9.2 |
41.9 |
20.8 |
62.7 |
1.7. Economic Analysis
The coal resource as stated in this report is in the same coal field as the areas that have been mined out by the previous North Goonyella mine. The geological features and coal qualities appear to be consistent. To convert those resources to reserves, it will require additional exploration, changes of operating environment, mine design planning, and financial analysis.
The 62.7 million tonnes of coal reserves are supported by the Life of Mine (LOM) plan. The Centurion GM Seam operation is projected to produce 3.5 million tonnes of product annually following commencement of longwall operations, with an average annual total cost of $246.5 million and a capital expenditure of $98 million. The GM Seam LOM plan will produce $53 million in annual cash flow and $155 million Net Present Value (NPV).
Once longwall operations commence within the GLB2 Seam, the operation is projected to produce 3.4 million tonnes of product annually, with an average annual total cost of $298.7 million and a capital expenditure of $27.1 million. The GLB2 Seam LOM plan will produce $115 million in annual cash flow and $278 million Net Present Value (NPV).
1.8. Conclusion
The Centurion Mine has a long operating history with all required permits to mine within the defined tenement (Mining Lease 6949). A fire event in 2018 has delayed operations and damaged some of the underground infrastructure and equipment, however these are currently being replaced or refurbished, to bring the mine back into production.
All required property control, including coal and surface, for the reserve area has been obtained to support the operation. All coal within the resource areas is under control by leases. There is a significant amount of historic exploration and survey data for coal reserve estimates.
TECHNICAL REPORT SUMMARY CENTURION MINE
The data has been determined by the Qualified Persons to be adequate in quantity and reliability to support the coal resource and reserve estimates in this Technical Report Summary. The resources are estimated to be 9.2 million tonnes. The coal reserve estimates and supporting Life of Mine (LOM) plan conclude that there are 62.7 million tonnes of reserves at Centurion Mine. The reserves are economically mineable based on the historical mining, production projections, historical and projected coal sales prices, historical and projected operating costs and capital expenditure projections for the LOM Plan.
1.9. Recommendations
1.9.1. Geology and Resources
Further exploration work should be evaluated to provide additional geological confidence in smaller scale structures not imaged by seismic. This, along with the existing mine geological mapping and surface to inseam drilling, will provide adequate support to the operation for short-term and mid-term planning for production purposes.
It is recommended to further define and ground truth the faults near the most southernly area of the current LOM identified by seismic data. Horizontal drilling should be evaluated from nearby gate roads once they are developed. If this is not possible, then surface exploration drilling, accompanied by borehole acoustic and televiewer logging, should be conducted in a timely manner before development to support fault interpretations.
It is recommended to collate all sample data into Peabody’s GeoCore database. Currently various forms of sample data (coal quality, gas, and geotechnical) are still collated within spreadsheets. Whilst this is still acceptable, collating data into a database will improve the ease and certainty of data validation in the future.
1.9.2. Mining, Processing and Reserves
It is recommended to conduct a reconciliation to further validate the assumptions for loss and dilution during mining and processing. Strip sampling from underground roadways should be used to update coal quality information within the geological model once development operations have commenced. Opportunities to maximize longwall panels should be explored once the extent of faults impacting the mine plan have been further understood from development mining.
The operation should continue to follow the approved roof control and ventilation plan. Any material changes on the plans or from the plans should be assessed, and any related impacts on resource and/or reserve estimates should be incorporated in any future updates.
1.9.3. Environmental, Permitting and Social Considerations
With recent legislative changes in Queensland, all mine sites are required to submit a Progressive Rehabilitation and Closure Plan (PRCP). The Centurion PRCP is due for submission on 29 March 2024, it is recommended that the potential impact on current and future Reserve estimates is assessed against the commitments required by this document.
TECHNICAL REPORT SUMMARY CENTURION MINE
1.9.4. Economic Analysis
The ability of Peabody, or any coal company, to achieve production and financial projections is dependent on numerous factors. These factors primarily include site-specific geological conditions, the capabilities of management and mine personnel, level of success in acquiring coal leases and surface properties, coal sales prices and market conditions, environmental issues, securing permit renewals and bonds, and developing and operating mines in a safe and efficient manner. Unforeseen changes in legislation and new industry developments could substantially alter the performance of any mining company. It is recommended that those factors should be assessed regularly according to the Company’s internal control. Material changes are to be reflected in the future resource and/or reserve estimates.
TECHNICAL REPORT SUMMARY CENTURION MINE
2. INTRODUCTION
2.1. Introduction
This Technical Report Summary was prepared for the Centurion Mine, which is operated by Peabody Energy Corporation’s wholly owned subsidiary, Centurion Coal Mining Pty Ltd.
This Technical Report Summary for the Centurion Mine is prepared in accordance with the United States’ Securities and Exchange Commission (SEC) S-K 1300. The S-K 1300 sets the standards for the reporting of scientific and technical information on mineral projects and specifies that the Technical Report Summary must be prepared by or under the supervision of a Qualified Person(s).
This report is the first time filing for the registrant. The report summarizes information to support the resource and reserve results.
2.2. Terms of Reference
Coal resource and coal reserve estimates are reported according to the definition of S-K 1300 on a 100% controlled basis. The point of reference for coal resources and coal reserves estimates are in situ and saleable product respectively. Coal resource estimates, exclusive of coal reserves, are provided in this report as part of the technical evaluation process.
2.2.1. Units and Abbreviations
Unless otherwise stated, units used in this report are expressed in the Metric system. Currencies are expressed in US dollars (USD) unless otherwise noted. A list of abbreviations used in this report is shown below in Table 2-1.
2.3. Sources of Information and References
The information and references listed here and in Section 23 and Section 24 of this report were used to support its preparation.
GeoCore: Company’s internal geological database of drill hole and coal quality information.
LMS: Company’s internal Land Management System which includes all mineral and land contracts.
Peabody Map View: Company’s internal Geographical Information System (GIS) for mapping.
Life of Mine (LOM): Company’s internal process for mine planning and economic analysis.
IP system: Company’s internal Integrated Planning (IP) system for LOM financial model.
All government permits and approval documents.
TECHNICAL REPORT SUMMARY CENTURION MINE
Table 2-1. List of Units and Abbreviations
|
|
|
|
|
|
|
|
|
|
|
|
|
|
|
AD |
Air Dried |
|
LOM |
Life of Mine |
AHD |
Australian Height Datum |
|
LTCC |
Longwall Top Coal Caving |
ALS |
Australian Laboratory Services |
|
ML |
Mining Lease |
ARO |
Asset Retirement Obligation |
|
MR Act |
Mineral Resources Act 1989 |
ASTM |
American Society of the International Association for Testing and Materials |
|
NPV |
Net Present Value |
AUD |
Australian Dollar |
|
NUMA |
Non Use Management Area |
C |
Degree Celsius |
|
PL |
Petroleum Lease |
CAPEX |
Capital Expenditure |
|
PMLU |
Post Mining Land Use |
CBM |
Coal Bed Methane |
|
POB |
Point of Observation (Resources) |
CDA |
Co-disposal area |
|
PRCP |
Progressive Rehabilitation Closure Plan |
CHPP |
Coal Handling Process Plant |
|
QP |
Qualified Person |
CSR |
Coke Strength after Reaction |
|
ROM |
Run of Mine |
DHSA |
Drill Hole Spacing Analysis |
|
SAI |
Sampling Associates International |
EIS |
Environmental Impact Statement |
|
SEC |
Securities and Exchange Commission |
GM |
Goonyella Mine Seam |
|
TPH |
Tonnes Per Hour |
GLB2 |
Goonyella Lower B2 Seam |
|
UCS |
Uniaxial Compressive Strength |
GPa |
Gigapascals |
|
USD |
United States Dollar |
HV |
High Volatile |
|
VM |
Volatile Matter |
IRR |
Internal Rate of Return |
|
|
|
kWh |
Kilowatt Hour |
|
|
|
LLC |
Limited Liability Company |
|
|
|
LMS |
Land Management System |
|
|
|
TECHNICAL REPORT SUMMARY CENTURION MINE
2.4. Involvement of Qualified Persons
The following Peabody employees serve as Qualified Persons (QPs) for this report as defined in S-K 1300.
Mining Engineering: Damien Wichlacz (Qualified Mining Engineer, AusIMM Member)
Geology: Hui Hu (Professional Engineer, Missouri)
Mr. Wichlacz is employed as Senior Manager Mining Engineering Underground at Peabody’s Corporate Office in Brisbane, Queensland, Australia. He has responsibilities for managing underground engineering and technical services for underground operations and projects within Australia. He has over 15 years of coal industry experience in underground and open cut coal mines in Australia. He regularly travels to Centurion for engineering support. He provided engineering support for Life of Mine Planning and budget mine planning at Centurion.
Mr. Hu is employed as Director of Geology and Engineering Support at Peabody’s Corporate Office in St. Louis, Missouri, USA. He has responsibilities for managing global geological services and supporting engineering activities. He has over 18 years of coal industry experience in underground and open cut coal mines in the US and Australia. He managed and supervised the geologists who support the Centurion mine.
TECHNICAL REPORT SUMMARY CENTURION MINE
3. PROPERTY DESCRIPTION
3.1. Location
The Centurion Mine is an existing underground coal mine owned by Centurion Coal Mining Pty Ltd, (ACN 010 879 526) and operated under Environmental Authority (EA) EPML00815613.
Centurion Coal Mining Pty Ltd (Centurion) is a wholly owned subsidiary of Peabody Energy Australia Pty Ltd (ACN 096 909 410) with the overall parent company being Peabody Energy Corporation (Peabody), a New York Stock Exchange listed entity.
The mine is located on the western flank of the Bowen Basin, approximately 160km WSW of the town of Mackay in Queensland, Australia.
The location of the Centurion Mine within Australia is shown in Figure 1-1, and its position relative to the eastern coast of Australia is shown below in Figure 3-1.
TECHNICAL REPORT SUMMARY CENTURION MINE
Figure 3-1. Regional Location Map
Centurion’s current surface facilities consist of a Drift Entry and Bathhouse, Coal Handling Preparation Plant (CHPP), coal stockpiles, refuse co-disposal facilities, and Rail Loop and Loadout, all of which are located on the Mining Lease (ML) 6949. Centurion also has a nearby Accommodation Village, and the Burton Gorge Dam enables a reliable supply of water to the site. The location of the Drift Entry, CHPP, Train Loadout, Accommodation Village and the Burton Gorge Dam are shown as follows in Table 3-1. All key infrastructure items described are located within the Isaac Regional Council Local Government Area (LGA).
Table 3-1. Mine Facility Coordinates (GDA94 / MGA Zone 55)
|
|
|
|
|
|
|
|
|
Facility |
Easting |
Northing |
Drift Entry |
599,100 |
7,604,270 |
CHPP |
599,520 |
7,603,450 |
Train Loadout |
598,840 |
7,603,450 |
Accommodation Village |
616,765 |
7,608,865 |
Burton Gorge Dam |
616,890 |
7,608,670 |
3.2. Property Rights
The Centurion Mine operates under tenure issued by the State Government of Queensland. Tenement holders are bound by the Mineral Resources Act 1989 and the Mineral Resources Regulation 2013 which define the laws pertaining to coal exploration and mining in Queensland. Under the system administered by the Department of Natural Resources, Mines and Energy (DNRME), tenements are held as either EPC (Exploration Permit Coal), MDL (Mineral Development License) or ML (Mining Lease).
The Centurion Mining Lease, ML6949, encompasses a total of 3,293 hectares. The ML allows for mining and the sale of coal by both underground and open cut methods. Overlapping this Mining Lease, Centurion also holds a Petroleum Lease, PL504, which enables the company to commercialize any coal seam gas (methane) that may be extracted within the lease area.
Table 3-2. Surface and Coal Control
|
|
|
|
|
|
|
|
|
|
|
|
|
|
|
|
|
|
|
|
|
| Title |
Name |
Type |
Purpose |
Area (ha) |
Grant |
Expiry |
| ML 6949 |
North Goonyella |
Mining Lease |
Coal Mining |
3293 |
25/09/1991 |
30/9/2026 |
| PL 504 |
Petroleum Lease |
Coal Seam Gas |
03/12/2015 |
02/12/2041 |
Figure 3-2 shows the Centurion ML and PL areas. The forward plans for Centurion Mine include renewal of these leases as required.
TECHNICAL REPORT SUMMARY CENTURION MINE
Figure 3-2. Mineral Property Map
TECHNICAL REPORT SUMMARY CENTURION MINE
Peabody owns the freehold land which holds North Goonyella and the access road, which goes all the way to the accommodation village and up to the Suttor Development Road (yellow land parcels). Most of the surrounding land is freehold, except for Lot2SP214117, owned by BMC, which is leasehold and underlies the Dabin project.
Figure 3-3 shows the land ownership around the Centurion Mine, overlain with the ML6949/PL504 boundary.
TECHNICAL REPORT SUMMARY CENTURION MINE
Figure 3-3. Surface Property Map
TECHNICAL REPORT SUMMARY CENTURION MINE
Production from the Centurion Coal Mine is subject to the Queensland Government Royalty charged on total revenue. Queensland Government royalties are based on the price paid (in $A) with the rate using the parameters as defined in Queensland Public Ruling MRA001.3. summarized below.
Figure 3-4. Queensland Government Coal Royalty Rates
In addition to this standard government royalty, there is also a special private royalty agreement established in relation to the sale of the property by a prior owner. This special royalty is limited to production from the Goonyella Middle Seam (GMS) within a defined area. The royalty, paid annually, amounts to 20% of the nominal before-tax cashflow attributable to sales from the defined area less capex, and any accumulated losses (since the original sale process was completed in CY2000). The impact of these royalties has been included in the financial modelling for this property.
3.3. Comments from Qualified Person(s)
To the extent known to the QP, there are no other significant factors and risks that may affect access, the title of the right, or ability to perform work on the property.
TECHNICAL REPORT SUMMARY CENTURION MINE
4. ACCESSIBILITY, CLIMATE, LOCAL RESOURCES
4.1. Physiography
The Centurion Mine lies in the Fitzroy River Basin within the Nogoa / Mackenzie System which is bounded by the Denham and Broadsound Ranges to the west and east. The Nogoa / Mackenzie Rivers are the major rivers in the Fitzroy River Basin. The major tributaries of the Mackenzie River are the Isaac, Connors and Comet Rivers.
The Centurion Mine is located within the upper reaches of the Goonyella Creek catchment, which flows into the Isaac River approximately 9 km downstream of the mine. The relative location is shown in Figure 4-1.
Figure 4-1. Regional River Catchments
TECHNICAL REPORT SUMMARY CENTURION MINE
The natural topography of the eastern and northern sections of the Centurion Mine comprises predominantly flat slopes, to undulating low hilly lands, primarily based on alluvial plains overlying Permian sedimentary rocks. In general, the terrain units (topography and geology) across the ML are consistent and typical for the region.
Surface elevations over the lease area range from approximately 280m AHD in the southeastern portion of the lease, to approximately 335m AHD at the peak of Red Hill Bluff to the north.
The primary natural feature in the broader landscape is the Burton Range, which extends in a north to south direction approximately 10km to the east of the site. The topography slopes from the Burton Range in the east down towards the Centurion Mine lease. The Burton Range is approximately 200 – 300m higher than the surface at the Centurion Mine. To the south, the open pits of the Goonyella Riverside Mine extend for approximately 20km in a southerly direction. The waste dumps associated with the Goonyella Riverside Mine are also a significant topographical feature of the area.
Land within the Centurion Mine lease area has historically been used for beef cattle grazing, although the last 30 years have also seen significant coal mining and exploration work undertaken in the surrounding region. The majority of the lease has been cleared for improved pasture, with Buffel Grass well established in most soil units.
4.2. Access
The Centurion Mine, located wholly within Mining Lease (ML) 6949, is located within the Isaac Regional Council area (former Belyando Shire) and is located adjacent to the Goonyella Riverside Coal Mine which is owned and operated by the BHP Mitsubishi Alliance (BMA).
The site is accessed from Mackay on the Peak Downs Highway then via the Suttor Developmental Road, turning off just west of the Isaac River and following the mine access road past the Burton Gorge Dam for a further 17km until the administration area of the Mine is reached. The site is also accessible via Red Hill Road and Goonyella Road to the south, which is the most direct route to the township of Moranbah.
There are two commercial airports in the vicinity of the Centurion mine. Both the Mackay and Moranbah airports provide regular flight services to the state capital of Brisbane as well as other cities on the east coast of Australia. The Mackay airport is the larger airport, with regular jet services supporting a range of industries including tourism, agriculture, and mining.
Figures 4-2 and 4-3 show the access roads from Mackay and Moranbah airports to the Centurion mine.
TECHNICAL REPORT SUMMARY CENTURION MINE
Figure 4-2. Access Map from Mackay Airport
Figure 4-3. Access Map from Moranbah Airport
TECHNICAL REPORT SUMMARY CENTURION MINE
4.3. Climate
According to the Australian Bureau of Meteorology (BOM), the Centurion Mine area is classified as ‘Subtropical’ based on the Koppen classification system. This generally refers to areas that have humid, wet summers and cool, dry winters.
The BOM has a weather station located at the Moranbah Water Treatment Plant, (Station #034038), which has collected climatic records since 1972 through April 2012. This is the closest long-term weather station, located 37km south-west of Centurion Mine. The average monthly climate data recorded at this location is presented in Table 4-1 and provides indicative long-term climate and weather data for the Centurion area.
Moranbah has a warm climate with mean maximum temperatures ranging from 23.7 °C in July to 34.1 °C in December. Mean minimum temperatures range from 9.8 °C in July to 21.9 °C in January. Heat wave conditions can occasionally be expected between October and March and frosts between May and August.
Table 4-1. Moranbah Water Treatment Plant Monthly Temperature (Source: www.bom.gov.au)
|
|
|
|
|
|
|
|
|
|
|
|
|
|
|
|
|
|
|
|
|
|
|
|
|
|
|
|
|
|
|
|
|
|
|
|
|
|
|
|
|
|
Temperature |
Jan |
Feb |
Mar |
Apr |
May |
Jun |
Jul |
Aug |
Sep |
Oct |
Nov |
Dec |
Annual |
Average High (deg C) |
33.9 |
33.1 |
32.2 |
29.6 |
26.5 |
23.7 |
23.6 |
25.5 |
29.3 |
32.3 |
33.1 |
33.9 |
29.7 |
Average Low (deg C) |
21.9 |
21.8 |
20.2 |
17.6 |
14.2 |
11.1 |
9.8 |
11.1 |
14.1 |
17.6 |
19.4 |
21.1 |
16.7 |
Table 4-2. Moranbah Water Treatment Plant Monthly Precipitation (Source: www.bom.gov.au)
|
|
|
|
|
|
|
|
|
|
|
|
|
|
|
|
|
|
|
|
|
|
|
|
|
|
|
|
|
|
|
|
|
|
|
|
|
|
|
|
|
|
Precipitation |
Jan |
Feb |
Mar |
Apr |
May |
Jun |
Jul |
Aug |
Sep |
Oct |
Nov |
Dec |
Annual |
Rainfall (mm) |
103.8 |
100.7 |
55.4 |
36.4 |
34.5 |
22.1 |
18.0 |
25.0 |
9.1 |
35.7 |
69.3 |
103.9 |
613.0 |
The BOM Queensland Flood Summaries indicate that there have been relatively few cyclones in the past 120 years in the Centurion Mining area. The most intense cyclone, a Category 3 event, occurred in March 2010 in Airlie Beach and caused significant wind damage in coastal regions. High floods associated with low pressure systems from active or decaying Tropical Cyclones have also been experienced in all tributaries of the Fitzroy and Burdekin Rivers, especially the Dawson, Mackenzie, Comet and Nogoa Rivers.
Several Category 1 and 2 cyclones have been reported in the Mackay region over the last 120 years, however these cyclones have tended to be weak in intensity and have caused limited damage.
Meteorological monitoring commenced at the Moranbah Water Treatment Plant in 1972. Since 1972, the highest daily rainfall recorded at the Moranbah BOM station was 164.8 mm. Table 4-2 shows the monthly precipitation in the area. There is a risk of regional flooding and impact from cyclonic winds on the Centurion Mine and surrounding infrastructure. This may occasionally, although infrequently, necessitate halting of mining activities.
TECHNICAL REPORT SUMMARY CENTURION MINE
4.4. Available Infrastructure, Water, Electricity, and Personnel
Coal mining operations have been established in this area for many decades and the infrastructure including roads, railroads, powerlines, and waterways is well developed. The warehouse and maintenance facilities from major equipment and material suppliers are accessible for the mining operations in the region.
Local infrastructure in the district includes:
The Peak Downs Highway (State Route 70) from Mackay, approximately 100km to the East via the Suttor Development Road (State Route 11). Access to the east coast network is paved minimum two-lane road;
Access to both the Goonyella and Newland Rail Systems provides access to the coal export terminals at the Port of Hay Point, and the Port of Abbot Point.
Existing Mine Infrastructure Area, Coal Processing and Rail Load Out facilities.
The 15GL capacity Burton Gorge Dam – Centurion holds a license to take 1.7GL/a from this facility to top-up water harvested from on-site catchments.
Connection to a High Voltage electricity grid that provides electricity to the existing facilities.
Townships for supply of labour and materials include:
Moranbah, approximately 60km to the south.
Nebo, approximately 110km to the east; and
Mackay, approximately 190km to the northeast.
Accommodation villages in the area which support the workforce include:
The Centurion Accommodation Village located 19km east of the Centurion Mine; and
Other camps established in or near the Glenden, Nebo and Moranbah townships that support other mining ventures in the area.
4.5. Comments from Qualified Person(s)
The local resources and infrastructure are well developed due to the long history of coal mining activities in the region. It is the QP’s opinion that there are no deficiencies in local infrastructure or resources to support the reserves and resources.
TECHNICAL REPORT SUMMARY CENTURION MINE
5. HISTORY
5.1. Prior Ownership
The Queensland Government granted EPCs in the area to Utah Development company in 1964. The area was relinquished in 1969 when Utah applied for a Mining Lease to commence the Goonyella Mine (ML 1763).
North Goonyella Coal Properties Pty Ltd (NGCP) applied for and was granted EPC 453C covering the Centurion Mine area in 1989. NGCP was owned by White Mining Ltd (51%) and a subsidiary of Sumitomo Pty Ltd (49%).
Following the grant of ML 6949 in 1991, the mine was developed with longwall production coming in early 1994.
Sumitomo acquired White Mining’s share of NGCP, taking 100% ownership in the mine before selling to a consortium of RAG Australia Coal Pty Ltd (RAG) (60%) and Thiess NG Pty Ltd (Thiess) (40%) in November 2000. Thiess sold its stake in the mine to RAG in January of 2003.
Peabody acquired North Goonyella as part of an acquisition of RAG’s coal assets in April of 2004 and operated it until September of 2018, when a fire in the mine halted operations.
Following the announcement that the mine would commence the work necessary to install a new longwall system, Peabody changed the name of North Goonyella to Centurion Mine in December 2023.
5.2. Exploration, Development, and Production History
Early exploration in the area was carried out by the former Mines Department and by Utah Development Company as part of its regional exploration of the Bowen Basin in the early to mid-1960s. With only the Moranbah Coal Measures present, early exploration was focused on proving large open cut resources. As the bulk of the Centurion resources were considered to be underground mineable, the area was relinquished by Utah at the time it applied for ML 1763, Goonyella Mine. Authority to Prospect (ATP) 453C was granted to North Goonyella Coal Properties Pty Ltd (NGCP), owned by White Mining Ltd (51%) and a subsidiary of Sumitomo Pty Ltd (49%), in May 1989. After an extensive exploration program, an application for a mining lease was made, leading to the grant of ML 6949 in October 1991 for a period of 35 years.
White Mining Ltd developed the operation (then known as the North Goonyella Mine), including a rail loop, coal handling preparation plant (CHPP) and nearby accommodation village, following the grant of ML 6949 in 1991. The mine commenced longwall production in early 1994. Peabody acquired the mine in 2004 and operated the mine until a fire halted operations in September 2018. The mine has been idled since that time while plans to re-initiate production with regulatory approval were developed.
During the third quarter of 2022, Peabody initiated the redevelopment of the mine. The project will utilize substantial existing infrastructure and equipment at the mine, including a new 300-metre longwall system, a coal handling preparation plant, a dedicated rail loop for transport to the Dalrymple Bay Coal Terminal, and an accommodation village with housing and service amenities for more than 400 workers. Redevelopment activities which include ventilation, equipment, conveyance, and infrastructure updates, are underway in anticipation of reaching development coal, subject to regulatory approvals, in the first quarter of 2024.
TECHNICAL REPORT SUMMARY CENTURION MINE
Longwall operations are expected to re-commence in 2026.
Historical Annual Coal production from the Centurion Mine is shown in Figure 5-1 and Figure 5-2. (Sources: Woodmac and Peabody)
Figure 5-1. Historical Annual Run of Mine Production
TECHNICAL REPORT SUMMARY CENTURION MINE
Figure 5-2. Historical Annual Marketable Production
6. GEOLOGICAL AND HYDROLOGICAL SETTING, MINERALIZATION, AND DEPOSIT
6.1. Geological Setting
6.1.1. Regional Geology
The Centurion Mine lies on the Collinsville Shelf on the western margin of the Bowen Basin in Central Queensland. The regional stratigraphy of the area comprises the Permian Blackwater Group which comprises three coal bearing sequences, the Moranbah Coal Measures, the Fort Cooper Coal Measures, and the Rangal Coal Measures, it also contains the Triassic Group sediments (Rewan and Clematis) and Tertiary sequences. The Centurion Mine lease covers the subcrops of the Moranbah and Fort Cooper Coal Measure sequences. The Permian strata were overlain by Triassic Rewan Group and Clematis Group sediments, however in the Centurion area the Triassic sediments have all been removed and a large unconformity exists between the Permian and Tertiary sediments. A schematic geological cross-section (Figure 6-1 and Figure 6-2) illustrates the relationship of the major stratigraphic units.
TECHNICAL REPORT SUMMARY CENTURION MINE
Figure 6-1. Centurion Coal Mine schematic regional geological cross section
The Bowen Basin is divided into broad morphotectonic zones which represent areas of maximum sediment accumulation and adjacent shelf areas. Subdivision of these areas is broadly north-northwest to south-southeast in the northern part of the basin often bounded by major faults (Figure 6-3). In the northern part of the Bowen Basin the significant elements are the Collinsville shelf in the west and the Nebo synclinorium to the east. Both formed in extensional grabens in the early Permian period. Post depositional structuring of the Bowen Basin sequence is dominated by compressional tectonics with the major direction of tectonic transport to the west and southwest in the north of the basin. This compressional tectonic phase has formed large meridional regional scale north-northwest trending easterly dipping thrust faults.
TECHNICAL REPORT SUMMARY CENTURION MINE
Figure 6-2. Stratigraphic Section
TECHNICAL REPORT SUMMARY CENTURION MINE
Figure 6-3. North Goonyella Region Geology Map
TECHNICAL REPORT SUMMARY CENTURION MINE
6.1.2. Local Geology
The Centurion Mine occurs within a structurally complex zone on the Collinsville shelf in the north Bowen Basin. The deposit is located near the western edge of the Blackwater Group. Only the Moranbah and Fort Cooper Coal Measure sequences subcrop within the mining lease area. A major unconformity between the Permian and Tertiary sequences accounts for the absence of Triassic sequences in the mine area. A later phase of extension during the Cretaceous period tilted the strata slightly (3° to 5°) to the east. The Tertiary sequence comprises several basalt flows with intervening laterites, sands, clays, and silts infilling the old Permian palaeosurface. A laterite composed of iron pisolites is present as a resistant capping on the remnant hills in the north of the mine area.
Within the Centurion mine lease area there are numerous coal seams within the Moranbah coal measures. There are 16 correlatable seams in total, of which the GM and GLB2 seams are potential underground resources. See Figure 6-4 below for coal seam stratigraphy. The GM and GLB2 seam are highlighted blue and green respectively in geological cross sections in Figure 6-5 and Figure 6-6.
TECHNICAL REPORT SUMMARY CENTURION MINE
Figure 6-4. Coal Seam Stratigraphy
TECHNICAL REPORT SUMMARY CENTURION MINE
The GM seam is of primary interest at Centurion mine and has been mined previously in the area. It consists of 7 plies (6 coal plies GM6, GM5, GM4, GM3, GM2 and GM1 and 1 stone ply GM1a), with the lower plies showing lower ash, with a relative increase in ash towards the upper section of the seam.
The GM plies of GM1, GM1A, and GM2 are based on lithological sections, whilst the GM3 – GM6 are based on calculations for longwall mining sections. The following process helps to identify and calculate the plies of the GM seam:
- GM1. This is the smaller band of coal at the base of the GM. It runs from the base of the GM1A to the base of the GM seam.
- GM1A Identify and note whether it is more or less than 0.2m. It should be a stony band before the base of the GM seam.
- Marker Tuff band (MT) – when tracing the response from the top down, this will be the first major marker/stony band in the GM. It is approximately 4 m from the roof of the GM
- GM2 runs from the top of GM1a to the top of the marker tuff band and includes the couple of stony bands between GM1A and the MT
- Identify the top of GM3 by measuring 4m from…
o The BASE of the GM1, IF THE GM1A IS LESS THAN 0.2m
o The TOP of the GM1a, If GM1a IS MORE THAN 0.2m
- GM3 runs from the top of the marker bed to the measured 4m mark.
- GM4 is 0.25m of coal above the top of GM4.
- GM5 is 0.25m of coal above the top of GM5.
- GM6 is the remainder of the coal from the top of GM5 to the top of the seam.
- The Top Coal Horizon marker (TCH) is the base of a higher ash section of the top of the GM seam (Approximately 0.5 – 1.0m from the top of the seam)
- The Roof Band Horizon marker (RBH) is a small stone band found 1.5 to 2.0m above the Marker Tuff (MT). This is often referred to as the penny band on the mine site. (N.B. the gamma and density response may not be that obvious. If unsure, leave this unpicked)
The GLB2 seam is of consistent thickness of a relatively bright coal of low ash, with few parting bands. The GLB2 seam typically ranges from 2.0 to 3.1m thickness.
TECHNICAL REPORT SUMMARY CENTURION MINE
Figure 6-5. Northwest – Southeast Geologic Section
Figure 6-6. West - East Geologic Section
There are numerous normal and reverse faults within the Centurion mine lease. Many of these have been intersected by workings and mapped underground.
Sliwa (2014) in a study of the structural geology of the area noted the following “thrust faults occur in NS to NE trending zones that extend for several kilometers. Underground mapping shows how the main thrust fault splits into numerous en-echelon segments with 1 to 6m throws that dip on average 30˚ to the east. The larger thrust faults are surrounded by a 1km wide fracture zone of smaller fractures.
Normal faults, shears and joints are the most common type of structure, forming a pervasive fracture pattern that trends ESE to SE. Larger normal faults with >1m throw are typically 50 to 200m long with dips averaging 60° towards the NE or SW. Dip directions are evenly distributed, so that there is little net throw across the mine.
TECHNICAL REPORT SUMMARY CENTURION MINE
Fault throws range from 0.1 to 9m with the vast majority <3m. No structural domains were identified, and the pattern of normal faults mapped in the mine is expected to continue into the down-dip panels.
The relationship between the normal and thrust faults is not a simple overprint. Strain along the thrust faults is partitioned across some of the normal faults and shears, suggesting they initiated as transfers during the compression. However, the continuity of normal faults with relatively small throws suggests that the transfers were reactivated during a later deformation.
A relatively larger fault structure referred to as the “Denham fault zone” has been identified within the southern area of the mining lease. “This fault consists of two NS trending shallow dipping normal faults, that are connected by thrust fault segments that trend NE across the planned southern longwall panels. The Denham fault zone is significantly different to the other fault systems, as it shows both normal and thrust fault characteristics, and has larger throws than any mined faults along with anomalous orientations. The fault is interpreted to have been initiated as a thrust fault that was later reactivated with normal or oblique-slip movements. The reactivation is expected to be associated with a higher degree of rock fracturing than the other faults.” (Sliwa, 2014, p.5).
6.2. Hydrology Setting
6.2.1. Regional Hydrology
The Centurion mines lie within the catchment area of the Isaac River. The area is surrounded by several natural landform features, including the Denham, Peak, Broadsound and Connors Ranges, with the topography of the catchment ranging from approximately 250m AHD elevation along the Isaac River to approximately 325m AHD elevation along sections of the Denham Range that define the western boundary of the valley (Golder, 2018).
The Isaac River is a major tributary of the Mackenzie River in the Fitzroy Basin. Ultimately, the Mackenzie River joins the Fitzroy River, which flows initially north and then southeast towards the east coast of Queensland and discharges into the Coral Sea southeast of Rockhampton, near Port Alma.
Regarding regional hydrogeology, the Isaac River alluvial aquifer is considered the main aquifer in the region of the Northern Bowen Basin. The aquifer is considered of low to moderate productivity with most bore yields of 0.5 to 5 litres per second (Golder, 2018). Isaac river alluvials do not occur within the Centurion mine lease area, with the nearest occurrence approximately 5km south-east and is mostly confined to the current streams and past paleochannels.
In some areas the Isaac River alluvial aquifer sits atop clay of the Suttor Formation which can be up to 10m thick. It is suggested that the potential for connectivity between groundwater in the alluvial deposits along the Isaac River, and the underlying coal seam aquifers is highly unlikely due to the geological and hydraulic properties of the strata (Cenozoic clay, silt, mudstone, and siltstone of the seam overburden) developed in the base of the Quaternary aquifer. Potential pathways between the seam aquifers and the Isaac River alluvial aquifer may only exist where the alluvial aquifer is in direct contact with large scale thrust faults (Golder, 2018).
TECHNICAL REPORT SUMMARY CENTURION MINE
The Isaac River alluvial aquifer is mainly unconfined and recharged by seasonal surface waters along ephemeral rivers, during flooding in the adjoining flood plains, and surface infiltration of rainfall and overland flows into exposed sand and gravel layers where not overlaid by thick clays.
6.2.2. Local Hydrology
The Centurion coal mine is located within the Isaac River catchment that covers approximately 22,410 km2 (Department of Environment and Resource Management, 2011). The mine lease is in the upper reaches of Goonyella Creek. The Isaac River and its tributaries (including Goonyella Creek) experience variable flows, with peak flows expected from December to March. The upper reaches of Goonyella Creek are considered ephemeral. Ephemeral waterways commonly exhibit the following features: elevated turbidity and substantial sediment loads. Significant flow events typically transport a considerable sediment load, an occurrence often heightened by an extended preceding dry period. (Department of Environment and Resource Management, 2011)
Water quality variations in the upper reaches of Goonyella Creek may occur over small spatial areas due to different land management practices and industrial discharges.
The main source of ground water within the Centurion area is within the basalt layers that occupy the tertiary incised valleys of the Permian strata. The basalt is often vesicular and sometimes underlain by tertiary sand lenses. Where the sand layer and basalts are in direct contact, they are hydrologically connected, and considered as part of the one aquifer. These basalt layers are not considered extensive across the Centurion lease area and are mainly present towards the northwestern area.
The basalt aquifer has typical bore yields between 1 and 5 L/s and water quality is considered suitable for livestock. The basalt is not considered a major aquifer in the region due to its variable thickness and heterogeneity (Golder, 2018)
6.3. Mineralization and Deposit Type
The coal seams of interest (GM and GLB2 seams) occur within the Permian Moranbah Coal Measures in a structurally complex zone on the Collinsville Shelf in the northern Bowen Basin in central Queensland, Australia. The stratigraphy gently dips between 4 and 5 degrees towards the northeast and the GM seam averages 6.1m thick. The GM and GLB2 seams are considered medium volatile bituminous by the ASTM Classification of Coal
The Moranbah coal measures occur within a cyclic fluviatile clastic depositional system, that consists of regular fining up sequences of lithic sandstones, siltstones, and mudstones to coal, then coarsening up sequences in the opposite manner.
The coal deposit type of the Centurion mine is considered to have a moderate geologic complexity based on the following factors:
• The Goonyella Middle and Goonyella Lower B2 seams are laterally continuous and can be correlated across the property with the use of geophysical logs, interburden thicknesses, and seam thicknesses.
• The seams are gently dipping with some seam splitting experienced within the Goonyella Lower seams.
TECHNICAL REPORT SUMMARY CENTURION MINE
• There is moderate seam faulting experienced within Goonyella Middle seam that is well mapped and understood from previous mine workings, and various exploration seismic and drilling. However, the transference of this to the Goonyella Lower B2 seam is not as well established, as seismic quality is reduced in areas of increased tertiary cover and increased depth of cover.
• The Goonyella Middle seam has previously been mined throughout the property and in neighboring properties. The Goonyella Lower B2 seam was mined via open cut methods in adjacent properties, but not yet via underground methods.
6.4. Comments from Qualified Person(s)
In the opinion of the QP, for both regional and local geology, the structural controls on mineralization are well studied and understood through decades of exploration and mining activities in the area. This is considered sufficient to support the estimation of coal resources and reserves.
7. EXPLORATION
7.1. Coordinate System
Exploration Survey data for Centurion is based on Australian Geodetic Datum 1984 (AGD84) projected in Australian Map Grid (MGA) zone 55.
Height data is captured as Australian Height Datum (AHD) which is tied to mean sea level.
In most cases surveys associated with drill collars, geophysical surveys, and mine workings were conducted using mine site RTK high precision equipment and by a professional surveyor. In cases where the survey details cannot be found, the exploration point is cross-checked against digital terrain models or other known surveyed borehole points to determine its accuracy before use in a geological model.
7.2. Geological Structure Mapping and Quality Sampling
The northern Bowen Basin is a major coal mining province. It has been drilled extensively. Geological data from mining operations have been collated and interpreted in various studies. The regional geological settings of the region are well understood.
Geological structure mapping was done at Centurion mine through direct and indirect methods. Direct geological mapping has been undertaken by underground geologists within the mine workings since the first longwall was developed. Geological underground mapping is done weekly in development headings and the longwall face. Features mapped include geological structures (faults, folds, joints, and seam rolls), coal cleat directions, roof and floor conditions, rib conditions, and other geological features (dykes, bedding planes, shear zones, ripples etc.). Mapping is undertaken with a tape measure and approved underground compass. Underground mapping locations are estimated to be accurate to within 1m. Mapping data is recorded on hard copy forms and collated in digital format in AutoCAD drawings for reference against underground workings.
Underground quality channel samples have been taken sporadically from development headings in the GM seam. These were taken before the commencement of longwall extraction to provide more understanding of local coal quality of the upcoming longwall panel. These samples have not been used in the resource model as their sampling method was considered biased and incorrect, as ashes were generally higher than nearby bore/core samples.
TECHNICAL REPORT SUMMARY CENTURION MINE
It was interpreted that either too much floor sampling occurred as trenches were cut into the floor of the workings, or too much roof coring was included in the sample composites at the time. Future channel sampling will need to consider carefully how to gain mass representative samples from a development heading.
Various indirect structural mapping has been undertaken at Centurion mine. These include 2D and 3D seismic, as well as airborne geophysical surveys.
The 2D seismic surveys were conducted by seismic company Velseis in 2011, 2013, 2014, and 2018. The 2011 survey included 12 lines in the southern area of the Centurion lease. The 2013 and 2014 surveys included 6 lines in the northern side of the lease. Detailed interpretations of the geological structure from these lines were conducted by Velseis, however structures were not correlated between lines. The 2018 survey included 6 lines (12.16km in total) conducted to the west of the previous seismic surveys, with the aim of imaging the GLB2 seam and GM seam. The survey was met with limited success, due to poor data quality thought to be derived from challenging near surface geological conditions. This is interpreted to be locally thicker tertiary cover causing signal attenuation.
3D seismic surveys were acquired in 2003 and 2018. These 3D seismic surveys were conducted by company Velseis. The 2003 seismic survey was conducted in the central western area of the Centurion lease. In total, approximately 6.9km area of seismic was imaged and interpreted for the GUA, GM, and GLA horizons and faults. Faulting was also separately interpreted by Binzhong Zhou of CSIRO Exploration and Mining (Commonwealth Scientific and Industrial Research Organization). Data quality at the time was largely considered good, with minor areas of increased tertiary cover causing poorer data that did not significantly impact the interpretations at the time. In 2013 the previous 2003 seismic data was reprocessed using updated algorithms and workflows with the reducing noise at the GM seam level. This was successful and contributed to an improved continuity and clarity of the GM structure.
The 2018 3D seismic survey covers an area of approximately 4.3km² and is in the southern area of the Centurion mine lease. The aim of the survey was to provide structure for the GUA, GM, and GLB2 and locate faults and other geological structures to assist in mine planning. Data quality for the shallower GUA seam is considered good, however the deeper target seams data quality, particularly the GLB2 seam, is considered poor at depth due to the coverage of multiple coal seams and seam splitting at depth.
Airborne magnetic and radiometric surveys were conducted in 1998 and 2018. Both were acquired by helicopter. The 1998 survey was conducted by Geo Instruments Pty Ltd with line spacings of 50m from a height of 50m. The 2018 survey was conducted by GPX Surveys Pty Ltd with line spacings of 40m from a height of 40m. The 2018 survey resulted in higher resolution images. Both surveys performed well in delineating of tertiary basalt flows. Sliwa in 2014 noted that when faults from mine mappings and seismic are overlaid with the total magnetic intensity imagery, some relationships can be seen between the persistent faults and distribution of tertiary basalts. Some normal faults and north-south trend thrust faults are located on the edge of basalt flow layers.
TECHNICAL REPORT SUMMARY CENTURION MINE
In considering the construction of the geological model for Centurion mine, faulting data types are ranked in priority of highest to lowest as follows; Underground mine mapping, 3D seismic survey, 2D seismic survey, boreholes, and magnetic/radiometric surveys.
7.3. Drilling
A total of 2,805 borehole holes exists in and around the Centurion tenement. Details of hole type are presented in Table 7-1. with hole locations illustrated in Figure 7-1. Table 7-1 drilling statistics also includes mine service holes such as goaf drainage, ballast drop, and gas risers. Whilst mine service holes are not drilled for the purposes of exploration; they can sometimes provide geological information in the form of chip samples and geophysical logs to assist with coal seam identification.
Table 7-1. Drilling Statistics
|
|
|
|
|
|
Hole Type |
Total |
Fully Cored |
46 |
Partial Cored |
763 |
Rotary (Chip) |
676 |
Unknown |
1320 |
Total |
2805 |
Drilling followed industry standard practices where vertical holes are drilled, using top-drive and table drive, truck mounted exploration drill rigs. The types of exploration drill holes include:
Rotary (Chip) are drilled with air or water using a blade or PCD (polycrystalline diamond) bit with the chips laid out in 1m piles on the drill pad. Holes are mostly lined to the base of the Tertiary and Fairhills formation with a combination of PVC and steel casing to ensure unconsolidated overburden or swelling clays material are isolated from the drilling, as this can produce delays and contamination of drill cuttings. The drill cuttings are geologically logged at 1m intervals by the geologist, and often photographed. A suite of downhole geophysical logs is run, typically including gamma and density measurements. The drillers and geologists’ logs are reconciled against the downhole geophysics to establish the depth of the seams. Chip or rotary holes allow for the establishment of seam continuity and thickness.
Partially cored holes are generally completed for the following purposes: to recover coal seams for coal quality testing, rock samples for geotechnical testing, and samples of coal and carbonaceous material for gas desorption testing. Core diameter is typically HQ (61 mm), other diameter holes such as PQ (93 mm) and 4C (100 mm) were also collected. The drillers and geologist’s logs are reconciled against the downhole geophysics to establish the depth and thickness of the seams and sample locations. Core orientations are not recorded.
TECHNICAL REPORT SUMMARY CENTURION MINE
Fully cored holes are generally completed for the following purposes: to collect rock samples for geotechnical testing, and samples of coal and carbonaceous material for gas desorption testing. Core diameter is typically HQ (61 mm), other diameter holes such as PQ (93 mm) were also collected. The drillers and geologist’s logs are reconciled against the downhole geophysics to establish the depth and thickness of the seams and sample locations. Core orientations are not recorded.
Downhole geophysical logs are run in boreholes, where conditions allow. A majority of the Centurion boreholes are geophysical logged with a minimum gamma, density, and verticality. Wherever it is not possible to geophysical log the borehole it is excluded from the geological model, unless deemed valid by the resource modeler.
Other tools that are run include, but are not limited to; verticality, resistivity, sonic, acoustic scanner, optical televiewer, temperature and dipmeter. These contribute towards further understanding of the structural geology and geotechnical properties of the Centurion area.
From historic drilling at the Centurion area, Peabody was able to obtain the records of paper logs for all the drillers and geologist’s logs, the geophysical logs, and testing certificates in various formats. There are also some electronic drill logs and core photographs obtained from the historical drilling.
For each Peabody drilling program, a set of data is normally collected and stored as the final records in the database. This data includes a geologist’s log, driller’s log, geophysical log, core photos, lab instructions (quality, overburden, and/or rock mechanics), lab certificates, and final surveyed coordinates.
7.3.1. Recovery
The bore core is logged for lithology type, structure, coal brightness and rock strength factors by geologist’s experienced in coal geology. Core recovery is compared to the drillers and geologist’s logs, and then verified against geophysical logs. Any discrepancies are documented. If less than 90% of the target coal seam is recovered, the hole is re-drilled unless the core loss is due to faulting or poor ground conditions, and it is unlikely that a re-drill will improve the recovery.
7.3.2. Drill Hole Surveys
The drill hole collars are surveyed by a competent surveyor using the coordinate system as described in Section 7.1. Down hole surveys have historically been conducted by a geophysical logging contractor. The geophysical contractors which undertake the down hole geophysical logging follow industry standard calibration techniques (tools are run in a calibration hole where log responses are known, any deviance is resolved prior to dispatching the tool for use on site).
TECHNICAL REPORT SUMMARY CENTURION MINE
Figure 7-1. Exploration Activity Map
TECHNICAL REPORT SUMMARY CENTURION MINE
7.4. Geotechnical Data
Geotechnical samples of roof and floor rocks have been acquired from core in 143 holes.
Floor samples were tested for UCS, moisture, density and slake durability and roof samples were tested for Young's Modulus and Poisson's Ratio / 2 x Sonic Velocity, Hoek 3 Stage Tri-Axial. The resulting samples are stored in GeoCore with the results of samples from historical holes stored within the Peabody shared drive.
Selected cored sections of HQ holes were logged with Acoustic Scanner for later geotechnical interpretation. These have been analyzed to determine orientation of maximum and minimum stress directions for consideration in underground mining.
Sonic velocity logs have been acquired from many holes and these can be used to estimate rock strength using a correlation between laboratory derived UCS and the sonic logs.
A summary of rock mass properties of UCS and Young’s Modulus (E) are presented in table 7-2 below.
Table 7-2. Summary of UCS and Young’s Modulus
|
|
|
|
|
|
|
|
|
|
|
|
|
|
|
|
|
|
|
|
|
|
|
|
|
|
|
Lithology |
Min of UCS (Mpa) |
Max of UCS (Mpa) |
Average of UCS (Mpa) |
Min of E (Gpa) |
Max of E (Gpa) |
Average of E (Gpa) |
Number of UCS Results |
Number of Young’s Modulus Results |
Carb. Claystone |
16.5 |
16.5 |
16.5 |
6.3 |
6.3 |
6.3 |
1 |
1 |
Carb. Siltstone |
6.2 |
29.9 |
16.1 |
2.2 |
23.0 |
10.9 |
4 |
4 |
Claystone |
14.5 |
14.5 |
14.5 |
4.2 |
4.2 |
4.2 |
1 |
1 |
Coal |
1.4 |
5.4 |
3.6 |
0.6 |
4.8 |
1.9 |
5 |
5 |
Interbedded Claystone/Siltstone |
25.4 |
25.4 |
25.4 |
7.7 |
7.7 |
7.7 |
1 |
1 |
Interbedded Mudstone/Siltstone |
18.8 |
28.3 |
25.0 |
7.2 |
7.9 |
7.5 |
4 |
4 |
Interbedded Sandstone/Siltstone |
6.0 |
79.5 |
26.7 |
1.3 |
80.5 |
14.1 |
273 |
271 |
Sandstone |
5.5 |
95.1 |
27.3 |
0.2 |
50.9 |
12.2 |
113 |
109 |
Siltstone |
0.5 |
57.2 |
23.2 |
0.2 |
36.2 |
10.2 |
301 |
294 |
Unknown |
31.6 |
54.0 |
41.9 |
5.1 |
16.4 |
10.6 |
4 |
4 |
Total |
|
|
|
|
|
|
707 |
694 |
In recent scientific studies, it is shown that rock strength has a good correlation with the sonic characteristic of rock. Hence sonic geophysical logging is done on selected exploration holes at certain intervals to cover the mining area which can provide a reasonable idea about the rock strength and its characteristics. The location of these Sonic logs is shown in Figure 7-2.
TECHNICAL REPORT SUMMARY CENTURION MINE
Figure 7-2. Sonic Hole Locations
TECHNICAL REPORT SUMMARY CENTURION MINE
7.5. Gas Data
Sampling of gas content has been conducted on 581 surface boreholes within the Centurion deposit. Gas sampling is also conducted on underground in-seam drillholes within the Goonyella Middle seam. In total there are 748 samples from underground in-seam drillholes. Gas sampling locations from surface exploration holes are show in Figure 7-3. Bore/Core gas sample locations.
Gas samples are taken for both estimating seam virgin gas contents (before drainage) and gas conformance contents (post drainage).
The majority of gas content testing has been conducted on the Goonyella Middle Seam as this is often assessed for gas conformance before mining progression. Other seams within surrounding overburden and under burden are tested for gas content also, as these contribute in various amounts to the goaf gas emissions.
Isotherm testing has been carried out on a few Peabody holes. The testing is aimed at defining methane adsorption isotherm parameters to help form a gas in place model.
Other data on gas content and behavior in the deposit is available through data sharing arrangements with coal seam gas explorers in the area.
Gas data is also captured through previous mining operations at Centurion via the mine ventilation monitoring system, goaf stack flares, and tube buddle system.
TECHNICAL REPORT SUMMARY CENTURION MINE
Figure 7-3. Bore/Core Gas Sample Locations
TECHNICAL REPORT SUMMARY CENTURION MINE
7.6. Hydrogeology
During exploration drilling ground water levels are routinely collected from drillers observations and geophysical logging tools. This is gathered by using an electronic dipmeter tool, or in the case of the geophysical logging is captured by the logging operator by analysing the density and gamma tools.
This data is stored with the drilling logs and stored within the geological database.
Various groundwater monitoring bores have been drilled across the Centurion deposit, designed to intersect mainly the Quaternary, Tertiary, and Permian formations. Vibrating wireline piezometers (VPWs) are installed at set horizons designated by a hydrologist or environmental consultant within the boreholes, and data is collected via an electronic data logger at the borehole.
Permeability testing and analysis was conducted within 4 boreholes targeting the GM and GLA1 seam in 2003 and reported by D.A.Casey and Associates at the time. Results reported ranged from 2.27mD to 32.4mD, with a mean of 10.43mD (mD = millidarcy).
7.7. Comments from Qualified Person(s)
The existing exploration program has been validated through historic production. It is the opinion of the Qualified Person that the existing exploration program is adequate to support future operations and the estimates of coal resources and reserves.
TECHNICAL REPORT SUMMARY CENTURION MINE
8. SAMPLE PREPARATION, ANALYSIS, AND SECURITY
Historical drilling that was conducted before Peabody acquired the operations followed acceptable preparation, quality analysis, and security procedures.
The early coal quality drilling programs under White Mining ownership, from 1989-2000, which includes holes GN001C to GN764CR2, did not include raw coal analysis as part of the treatment procedure. These holes were crushed to -12.7mm with washability analysis on 6 density fractions. The washability analysis undertaken fitted into two variants in Table 8-1. below.
Table 8-1. Quality Analysis Under White Ownership
Clean coal composites were typically as follows:
· CF1.45 clean coal composite analysis for the GM Seam.
· CF1.60 clean coal composite analysis for the GLB2 Seam.
The coal quality drilling programs under RAG ownership, from 2001-2004, which includes holes GN823LD to GN1178R, now included raw coal analysis. These holes were now pretreated with detailed washability by size. The washability analysis undertaken fitted into two variants in Table 8-2. below.
TECHNICAL REPORT SUMMARY CENTURION MINE
Table 8-2. Quality Analysis Under RAG Ownership
Clean coal composites were typically as follows:
· CF1.45 clean coal composite analysis for the GM Seam.
· CF1.60 clean coal composite analysis for the GLB2 Seam.
The coal quality drilling programs under Peabody ownership, from 2005-Present, which includes holes GN1179C to GN2025C, followed a similar treatment procedure to the RAG programs. These holes were pretreated with detailed washability by size. The pretreated washability analysis undertaken fitted into two variants in Table 8-3. below.
TECHNICAL REPORT SUMMARY CENTURION MINE
Table 8-3. Quality Analysis Under Peabody Ownership
Clean coal composites were typically as follows:
· CF1.45 clean coal composite analysis for the GM Seam.
· CF1.60 clean coal composite analysis for the GLB2 Seam.
Five holes with GLB2 seam intercepts were crushed rather than pretreated, with detailed washability undertaken on the 12.7 x 0mm material.
8.1. Sampling Method
8.1.1. Sampling for Coal Quality
Sampling for coal quality is mainly conducted via exploration Bore/Core sampling of target coal seams.
Bore/Core is carefully measured, depth marked, and logged by a geologist at the drill site capturing the thickness and brightness profile of the coal seams and lithology units, being careful to note any instances of suspected core losses. Core is then placed in core trays and packaged to minimize breakages and placed in core sheds or cool rooms onsite.
TECHNICAL REPORT SUMMARY CENTURION MINE
On completion of the borehole and once geophysical logs have been completed and the borehole depth corrected, the sample depths and locations are defined by a geologist. A sampling advice sheet is issued, and core is sampled from the stored core trays onsite.
Samples are named in accordance with the sampling tickets provided for the project. These are usually a digit unique value and are used to identify samples in the lithology log as well as on the sample sheet.
After coal sample sections have been identified, marked, and photographed, each sample is double bagged in a plastic bag (Figure 8-1.). Double bagging means collecting sample in one bag and then placing this bag into the second bag. The second bag is labelled with all relevant details including project, borehole ID, sample number and sampled depths. A sample ticket with relevant information is placed inside each bag before sealing the bag with a zip tie.
All samples collected are stored in shade while on site and moved to cool storage area at the end of every shift for storage pending dispatch.
Dispatch of samples occurs as soon as practicable (usually within 7 days) to the laboratory nominated. Laboratory address details and sample information is clearly marked such that the courier company can clearly recognize the details. Samples are prepared for dispatch so that they remain in suitable condition upon arrival at the laboratory.
A sample advice spreadsheet is generated for each hole prior to dispatch of any samples to the preferred laboratory (Figure 8-2.)
Figure 8-1. Example of Sample Ticket and Bag Information
TECHNICAL REPORT SUMMARY CENTURION MINE
Figure 8-2. Example of Sample Advice Sheet
The separate sample bags are then placed in a larger bag or drum with an accompanying sample dispatched sheet. The sample dispatch sheet records the name of the sample, depths, borehole identification, along with the total number of samples. Samples are transported by couriered to a designated coal laboratory and upon receiving samples the laboratory checks and confirms the samples received against the details recorded on the sample dispatch sheet. A sample dispatch and advice sheet may also be sent electronically to the laboratory on dispatch of samples. This ensures all samples are tracked and received by the laboratory.
8.1.2. Sampling for Rock Mechanics
Sampling for rock mechanics is conducted via exploration Bore/Core sampling of overburden, under burden, and coal seams.
Sample lengths are generally 20 – 40cm in length of intact core. Where required for direct shear testing a sample maybe be taken over an identified natural defect (e.g., fault, joint, or shear zone).
The core is logged by a geologist and appropriate sample intervals are selected. Sampled are recorded as separate lithological units to allow for correction of depth later via geophysical reconciliation. Details of the borehole id, sample number, depths, and orientation are written directly on the core sample with either permanent marker or chinagraph pencil. The sample is then photographed before firstly wrapping in cling wrap (plastic wrap), aluminum foil, and finally packing tape. Details of the sample mentioned above are then also written on the exterior of the packaging tape, see image below (figure xxx).
TECHNICAL REPORT SUMMARY CENTURION MINE
Samples are secured in core trays in readiness for transport to the laboratory for testing with accompanying sample dispatch details and testing instructions. Packaging the core in this manner is to minimize moisture loss and breakages in transit to the laboratory. Shown in Figure 8-3.
All samples collected are stored in shade while on site and moved to a cool storage area at the end of every shift for storage pending dispatch.
Dispatch of samples occurs as soon as practicable (usually within 7 days) to the laboratory nominated.
Figure 8-3. Geotech Sample Packaging
Floor samples of the target coal seams were tested for UCS, moisture, density and slake durability and roof of the target coal seams samples were tested for Young's Modulus and Poisson's Ratio / 2 x Sonic Velocity, Hoek 3 Stage Tri-Axial. The results samples are stored in GeoCore with the results of samples from historical holes stored within the Peabody shared drive.
Selected cored sections of HQ holes were logged with Acoustic Scanner for later geotechnical interpretation.
Sonic velocity logs have been acquired from many holes and these can be used to estimate rock strength using a correlation between laboratory derived UCS and the sonic logs.
8.1.3. Sampling for Gas Testing
Gas samples are taken from HQ core in selected boreholes. Care is taken to selected intact coal where possible.
For the purposes of the seam gas conformance three samples are taken from the GM seam and one from the GL1A, if within close proximity (<6m) to the GM floor. The first GM sample is taken from within 1m of the roof of the seam, the second directly above the marker tuff, and the third below the market tuff.
Gas contents are estimated by sealing the coal core sample within a gas canister immediately after retrieval from the core barrel. Gas is released from the coal as soon as the core is drilled, and some gas will therefore be ‘lost’ during core retrieval before containment in the canister. An estimate of the ‘lost’ gas can be determined through measurement of the time since coring and the amount of gas released within the first few minutes after containment (Q1). Q1 gas is measured at the drill site by means of the canister containing the core which is then submitted to a laboratory to measure the amount of gas released after the measurement of Q1 (Q2). Sub-samples are then taken and crushed to measure the amount of gas retained in the coal after measurement of Q1 and Q2 (Q3). The sum of the determination of Q1 (lost gas), Q2 (desorbed gas) and Q3 (residual gas, i.e. gas released on crushing) is the “Measured Gas Content,” also known as “Qm” as defined in AS (Australian Standard) 3980-1999. Gas samples are also tested for gas composition.
TECHNICAL REPORT SUMMARY CENTURION MINE
In some instances, the Bore/Core is split after Q2 gas desorption testing has been completed and the Bore/Core split submitted for coal quality testing to maximize data return from the same drill hole.
Gas canisters and equipment are routinely checked to ensure there are no leaks and they are fit for purpose before use in testing.
8.2. Laboratory Analysis
8.2.1. Coal Quality Analysis
All samples are prepared according to Australian standards AS4156 regarding sample pre-treatment, size analysis, float & sink testing & froth flotation analysis. Historically all coal testing since Peabody took ownership of the Centurion mine was conducted at ALS (formerly ACIRL), Bureau Veritas Australia and SGS Australia coal laboratories. These laboratories are NATA accredited and equipped to conduct all the coal testing according to the ISO and Australian standards.
Raw coal analysis was conducted on holes drilled after 2001. For the holes drilled before 2001, the cumulative ash from the washability testing was used to represent the raw coal ash. Raw coal relative density for the pre 2001 holes was predicted based on the linear relationship between ash and density using the post 2001 raw database. Raw coal calorific value for the pre 2001 holes was predicted based on the linear relationship between ash and CV using the post 2001 raw database.
Raw coal testing results are presented in Table 8-4. below.
Table 8-4. Raw Coal Testing Results
TECHNICAL REPORT SUMMARY CENTURION MINE
Washability testing was conducted on either crushed or pretreated samples at multiple specific gravities ranging from 1.30 to 2.20 as detailed in Section 8.0. This data is difficult to summarize in a table and is best presented as CHPP simulated product ash v yield curves, which will be covered in section 10. The clean coal composite laboratory yields, and product qualities are shown in Table 8-5. below.
Table 8-5. Clean Coal Composite Laboratory Yields
8.2.2. Rock Mechanics Test
A geotechnical engineer provides the advice on the geotechnical analysis for each of the samples obtained via Bore/Core.
Geotechnical testing has been performed at Cardno Ullman and Nolan Geotechnic Pty Ltd laboratory in Mackay to appropriate Standards.
A summary of testing and rock mass properties is presented in Section 7.4.
TECHNICAL REPORT SUMMARY CENTURION MINE
8.2.3. Gas Test
Gas content testing has been routinely conducted at Centurion mine, and extensively within the Moranbah coal measures of the local area.
Gas content testing by GeoGAS Mackay is conducted utilizing the fast desorption method which is widely used within the Australian coal industry in mine exploration. Gas chromatography is carried out on gas samples of the Q2 and Q3 components.
8.2.4. Density Determination
The in-situ density of coal at Centurion has been determined by applying the ACARP equation below (ACARP project No. C10042) to the GM LW cut and GLB2 Bore/Core data points.
Once this equation is applied to predict the in-situ density, the Preston Sanders equation is used to calculate the in-situ moisture. The in-situ density grids generated are then used when compiling both resource and reserve tonnages for reporting purposes.
8.2.5. Analytical Laboratories
Core coal quality samples acquired by Peabody were submitted to NATA accredited independent laboratories; namely ALS Richlands (formerly ACIRL), Bureau Veritas Australia and SGS Australia.
Geotechnical samples acquired by Peabody were submitted to Cardno Ullman and Nolan Geotechnics Pty Ltd.
Gas samples acquired by Peabody were submitted to GeoGAS Mackay. GeoGAS Mackay is NATA accredited in gas content testing (Q1 by Calculation, Q2 and Q3), apparent relative density testing, gas chromatography testing of carbon dioxide, methane, nitrogen and oxygen.
8.3. Sample Security
Field sampling is supervised by the site geologist who ensures samples are appropriately labelled, bagged, and packed ready for dispatch. Samples are transported using the established courier companies and records of sample receival and delivery are kept.
Laboratory results are compared to the field logging and downhole geophysics and any irregularities resolved before final validation and upload to the database.
Sample pulps are normally kept at the labs for one year so retesting can occur if needed.
TECHNICAL REPORT SUMMARY CENTURION MINE
Coal is a relatively low-value commodity and there is no need for special security procedures for the shipping, handling, and storage of coal samples.
8.4. Comments from Qualified Person(s)
It is the opinion of the qualified person(s) responsible for this section that there are sound standards and procedures in place that are adequate for sample preparation, security and analytical testing.
TECHNICAL REPORT SUMMARY CENTURION MINE
9. DATA VERIFICATION
9.1. Data Verification Procedures
Verification of data gathered in the field takes place in several ways:
· Drill collar locations are recorded using a GPS at the time of drilling and verified against the planned coordinates. The borehole’s location is surveyed by a surveyor during or after the completion of the borehole. Comparison between these 2 datasets allows a measure of location accuracy. Older data is checked by comparing collar elevation to the modelled topography grid created from LIDAR contour data which has a nominal vertical accuracy of 0.2 m in cleared areas.
· Geologist logs are reconciled to geophysical logs which have a higher depth precision than normal chip sample and core depths. General practice is to adjust seam depths and sample boundaries using the downhole density log to adjust depths. Generally geophysical tools used can include verticality, gamma, density, resistivity, temperature, sonic, magnetics and acoustic and optical scanners.
· Coal assay results from the NATA registered laboratory are compared with coal lithological logs and the downhole geophysical logs and any discrepancies investigated. Additional checks on assay results include reviewing the relationship between related parameters, such as raw ash and density and raw ash and specific energy. Sample results that do not match the predicted trends are investigated and re-assayed from a stored sample if necessary.
The validation process prior to geological modelling and resource generation involves the following steps:
· Exploration geologists validate all drill hole data following data acquisition and entry by the rig geologist.
· Coal technologist/specialist validates coal quality results.
· Project geologist validates all primary data (drill holes, geophysical surveys, ground mapping), coal quality results and external data.
· Resource geologist validates all primary and coal quality data, mine operations data and any external data.
Validation routines include, but are not limited to:
· Comparison of geology and geophysics in drill holes.
· Cross sections of model vs drill holes and geophysical surveys.
· Contours of seam thickness, midburden, roof and floor levels to identify anomalies.
· Coal quality is compared to a synthetic quality report ran from the quality model, which uses surrounding data to interpolate the estimated quality at the drilled point.
· Surveyed locations are taken for every drilled location. Older data is checked by comparing collar elevation to the modelled topography grid.
· Photographs of chip and core samples are reviewed when validating data.
· Reconciliation of geological model and boreholes against mined out areas.
· Statistical review of geological data sets to highlight anomalies and outliers.
TECHNICAL REPORT SUMMARY CENTURION MINE
Peabody’s GeoCore database has built in functionality to allow the user to check drill hole location and elevation; geophysical interpretations; stratigraphic correlations, and a sample depth/thickness match to laboratory analysis. These data validation tools provide a process to verify historical and newly acquired data in both a systematic and efficient manner. Peabody Australia uses an interface application called Task Manager which is used for data entry, data validation and report generation. This application has additional security measures to limit data entry errors and enforce coding and data formatting requirements.
9.2. Limitations
It should be noted that only holes which had a geophysical log and coal quality sampling, with a seam sample recovery equal to or greater than 90%, were used in the drill hole spacing analysis. This methodology used 95 holes for GM seam and 78 holes for the GLB2 seam of the 1,729 total holes used in the geologic model. This equates to approximately 5% and 4% respectively of the total drillholes used in the geological model for structural modelling (1,729 holes). In terms of the coal quality modelling this equates to approximately 55% (95 of 174 holes) used for GM the seam, and 85% (78 of 92 holes) used for the GLB2 seam. Some older coal quality boreholes from pre 2001 lacked geophysical logs that included gamma and density, with only sonic data available. These holes were excluded from the drillhole spacing analysis.
9.3. Comments from Qualified Person(s)
It is the opinion of the Qualified Person that the data represented in this report is sufficient and in good standing. Data validation techniques are well documented at the mine and within the GeoCore database. Data entry validation is also well controlled through 3rd party software (Task Manager) that limit errors with data coding and formatting. However, it is recommended to incorporate all current and future coal quality sample data into a central database to allow for a more robust validation of data to restrict data entry and formatting errors that may occur with storage within spreadsheets.
TECHNICAL REPORT SUMMARY CENTURION MINE
10. COAL PROCESSING AND METALLURGICAL TESTING
The washability database for Centurion contained a mixture of pre-treated and crushed samples as detailed in section 8.0. The post 2001 Bore/Cores were subjected to drop shatter and wet pre-treatment in the laboratory to simulate the natural breakage that occurs during mining and CHPP processing, with washability by size undertaken to reflect the Centurion CPP circuits in Table 10-1. below.
Table 10-1. Washability by Size
The pre 2001 Bore/Cores had been crushed to -12.7mm, with Float / Sink analysis on the -12.7x0mm material. Crushing generates an unnatural liberation state, whereby coal particles of varying size and density are forced into size fractions where they would not normally exist in a ROM state. Using crushed data for CHPP simulations can result in significant yield and ash errors as the relative proportions assigned to circuit loadings and product streams are incorrect. The washability analysis of a crushed core can be transformed, through a series of unification models, into a washability state that aligns with correctly pre-treated data. These models are built around the predictable relationship between ash and density using the Centurion post 2001 adjusted pre-treated Bore/Cores.
Application of the washability unification models can have significant implications for resource evaluations. Crushed data previously considered unsuitable for CPP simulation may be transformed to provide reliable yield and product ash predictions. This increases data density, providing a more reliable assessment of product yield and quality, and an improved indication of inherent variability throughout a resource. This is a cost effective and technically robust alternative to re-drilling and analyzing new Bore/Cores for Centurion, where crushed data and suitable reference pre-treated data is currently available. Table 10-2. below summarizes the number of crushed and pretreated holes for the GM cut and GLB2 seams.
Table 10-2. Number of Crushed and Pretreated Holes
Washability data unification involved the following processes.
· Float / Sink Unification
The first step in the data unification process is the standardization of float sink density fractions for both the crushed and pre-treated datasets. This involved interpolation and extrapolation of the historic washability data, to deliver a unified series of washability densities as follows in Table 10-3.
TECHNICAL REPORT SUMMARY CENTURION MINE
This process relied upon the strong relationship between density and ash.
Table 10-3. Float / Sink Densities
Circuit Segregation Modelling
Modelling the relationship between washability variability by size. These models are used to split crushed washability data into the three Centurion CPP circuits.
Calculation of the size distribution to apply after Circuit Segregation Modelling
Calculating the size distribution for the crushed data variants, utilizing the head ashes generated for each size fraction following the application of the circuit segregation models above.
10.1. Coal Processing and Analytical Procedures
10.1.1. Washability
The unified washability database was used for CPP simulation to predict the performance of the DMC, Spirals and Flotation circuits in the plant. The simulation targets were as follows:
GM Cut was a fixed ash simulation targeting a coking coal product with a 9.5% ash.
GLB2 was a fixed density simulation targeting a maximum DMC cut-point of 1.55SG.
Product from the Centurion mine was sold as benchmark premium mid-volatile HCC coking coal into the seaborne market. The relevant coking properties were assessed for all shipments to ensure the coking coal specifications were maintained. Periodically pilot-scale coke oven tests were also undertaken on shipments to assess coke quality.
The coal recovery is based on the CPP simulations using the unified Bore/Core database. The clean coal composite data from the Bore/Core is adjusted to align with the simulated product ash.
TECHNICAL REPORT SUMMARY CENTURION MINE
The Table 10-4. below shows the simulation quality results for each seam using the entire Centurion washability database. Included is the washability head ash, DMC cut-point for the GM seam, and adjusted clean coal composite data to fit the simulated product ash. The simulated yields are dilution free and at feed moisture. Adjustments to factor in dilution (reduction in yield) and product moisture (increase in yield) are incorporated in the mine planning software (XPAC)
Table 10-4. Simulation Quality Results
Figure10-1. below shows the average product ash v yield curves. These curves are based on an arithmetic average of fixed DMC cut-point simulations for the GM LW cut and GLB2 seam. From these cures the target ash of 9.5% was determined for the GM LW cut, and maximum density washing of 1.55SG for the GLB2 seam. The tables below summaries these fixed density simulations.
TECHNICAL REPORT SUMMARY CENTURION MINE
Figure 10-1. Average Product vs. Ash Yield Curve
Table 10-5. Fixed Density Simulations
10.1.2. Coking Coal Properties
A coking coal product must be able to pass through a plastic phase upon heating, resulting in a carbon residue as the coke product for steel making. The plastic phase is measured by fluidity and other coking coal properties. The coke producers typically make a product by blending multiple coals with different coking properties. The key properties for coking coal include ash, sulfur, phosphorus, volatile matter, coke strength, reflectance, fluidity, etc. The Centurion operation routinely tested those parameters from different samples. The parameters of ash, sulfur, VM, and fluidity are tested more often using exploration samples, channel samples, and production and shipment samples.
TECHNICAL REPORT SUMMARY CENTURION MINE
Trace elements, such as phosphorus, and petrographic analysis, including reflectance, are tested less frequently since they have less variability and are not always requested by customers. Certain coke strength tests, including Coke Strength after Reaction (CSR), require 450 kilograms of sampled coal for the pilot-scale coking-making process. Due to the requirement for a large sample size, this test is normally done on selected samples from either production or shipment on an as-needed basis.
Coking coal rank is measured by vitrinite reflectance, and the typical range is from 0.65% to 1.65%. Coal rank is the main driver for determining coke strength. The volatile matter in coal is inversely correlated to the coal rank. The higher the volatile matter and lower the rank, the coke yield becomes lower as well. When the coal is too high in rank, it might create high pressure and damage coke oven walls during the coke making process. The volatile matter is preferred to be between 18% to 35%. The ash is merely waste material for coke, and the lower the ash content the better the product. The content of sulfur and phosphorus in coal has deleterious effects on steel quality. The coke strength is measured by various tumbler tests to indicate how resistant coke will be to breakage and abrasion within the blast furnace. The hot coke strength test, (CSR) simulates the blast furnace temperature and gas composition to determine how reactive the coke is to carbon dissolution, and how well coke strength is maintained following a reaction.
Table 10-6. Typical Coal Quality
10.2. Analytical Laboratories
Centurion uses Australian Laboratory Service (ALS) for Bore/Core analysis, production, superintending, small scale, and pilot-scale carbonization testing. ALS is a leading testing, inspection, certification, and verification company headquartered in Brisbane, Australia. ALS are independent commercial entities that have no affiliates to either the Centurion operation or Peabody, other than providing professional test services.
10.3. Recovery Estimates
The ROM coal is fed to the washing plant, which utilizes heavy medium in the DMC circuit, centrifugal forces in the Spirals circuit and surface properties in the Flotation circuit to classify or separate coal from waste. The size and density of the feed material are the main factors determining the recovery. Due to the physical limitation of the different circuits, some coal is lost into the refuse and some refuse material is misplaced in the coal product.
TECHNICAL REPORT SUMMARY CENTURION MINE
Heavy medium circuits are generally more efficient compared to other equipment using water as a medium such as a Baum jig, spiral, etc.
The longwall at Centurion can cut 4.3m of coal from the GM seam. The GM seam is approximately 6.0 to 8.5m thick, so not all the seam is recovered during longwall mining. The bottom of the seam has better coking coal properties, is lower in raw ash and generates a higher yielding lower ash product than the top of the seam. The longwall mining horizon therefore targets the bottom 4.3m of the GM seam.
The GLB2 seam is thinner and will require a different longwall for extraction. The GLB2 seam ranges in thickness from 2.1 to 3.5m. The longwall will extract the full GLB2 seam, adjusting the cut height based on the seam thickness in the geological model.
Coal loss, roof and floor mining assumptions, and moisture adjustments are applied to the simulated yields to predict recovery as described in sections 12.2.2 and 12.2.3.
10.4. Comments from Qualified Person(s)
It is the opinion of the Qualified Person that the data represented in this report is sufficient and accurate. The use of the data for the estimates of coal recovery is the general practice within the coal industry.
TECHNICAL REPORT SUMMARY CENTURION MINE
11. COAL RESOURCE ESTIMATES
11.1. Introduction
A coal resource is an occurrence of material of economic interest in the Earth’s crust in such form, quality, and quantity that there are reasonable prospects for economic extraction. A coal resource is a reasonable estimate of tonnage, considering relevant factors such as quality, likely mining dimensions, location, or continuity, that with the assumed and justifiable technical and economic conditions, is likely to, in whole or in part, become economically extractable. It is not merely an inventory of all coal tonnage drilled or sampled.
Coal resources are sub-divided, in order of increasing geological confidence, into inferred, indicated, and measured classifications.
11.2. Geologic Model and Interpretation
The Centurion geologic model consists of both a stratigraphic and coal quality model based on data from the geological database and coal quality datasheets. The mineable coal seam structural model was derived from both drill hole and seismic data. The geologic model includes bore holes without corresponding geophysical logs that have reasonable thickness from core measurements and coal depth values, where cross checked against nearby drillholes, and or seismic data. In instances where no core measurements, and or geophysical data is missing, the borehole is excluded from the model. 1,979 boreholes were selected for import to the modelling package software, of which 188 were excluded by the modeler from the final model due to validation issues.
The stratigraphic model was developed using Maptek Vulcan software. This is a widely used software package in the coal industry in the Bowen Basin.
The models are created using the GDCALC module in Vulcan by using the Integrated Stratigraphic Modelling menu, an audit trail is created within the specification files used in grid generation. The modelling method is based on a stacking method. The stacking method creates all horizon structure surfaces based upon one selected structural surface. The selected surface becomes a reference for creating the rest of the grids in the model. The remaining surfaces are created by adding and subtracting thicknesses and mid-burdens from the reference surface. The reference surface chosen was the Goonyella Middle roof.
Interpolation of the seam structure grids is based on a triangulation, with seam thickness interpolated using inverse distance squared. A base of weathering model was developed from the drillhole intersections and all final structure grids used to calculate coal tonnes are clipped to this base of weathering surface to ensure oxidized coal was excluded from the coal resource calculations. The structural grid outputs from the models include the structure of seam roof and floor, and seam thickness.
The interpreted fault locations and displacements are incorporated in the seam structure model. The topography grid was generated from triangulated aerial LiDAR survey data. The modeling methods used for Centurion are summarized in Table 11-1.
Geological models are reviewed internally within Peabody and are compared and reconciled to previous models of the area to assess differences.
TECHNICAL REPORT SUMMARY CENTURION MINE
Table 11-1. Interpretation Method
|
|
|
|
|
|
Model Parameter |
Interpretation method |
Seam Structure |
Triangulation |
Structure Thickness |
Inverse Distance (Power 2) |
Coal Quality |
Inverse Distance (Power 2) |
Fault Displacement |
Vertical Displacement |
11.3. Resource Classification
Estimation of coal resources is based on drill hole intercepts that the QP determines meet the requirements of a Point of Observation (POB). For structural and coal quality POB’s, the hole location must be surveyed, geologically logged, and typically would have downhole geophysical logs (gamma and density as minimum). A coal quality POB must also have coal quality analyses of at least 90% of the interval (ash and density as a minimum). Intervals with less than 90% core recovery do not qualify as quality POBs unless otherwise deemed appropriate to be included by the QP.
The definition of a sample point as a POB provides reasonable confidence that the parameters represented by that sample are valid, accurately located, have appropriate lithology and downhole geophysics collected, and are adequately sampled and assayed by a laboratory. The POB then becomes the basis for estimating the properties of the surrounding coal.
Analysis of the variability between neighboring POB’s provides a measure of the distance that coal seam parameters can be extrapolated from a valid POB. This is done through geostatistical analysis based on precision tolerances from global estimation variance; also known as Drill Hole Spacing Analysis (DHSA). The DHSA method of resource classification is both valid and practical for coal deposits as compared to the more complex conditional simulation analysis.
To complete this study, the ArcMap 10.6 geostatistical extension was used to validate and view the normalcy of the input data and construct semi variograms. Once the semi variogram was plotted, the spherical model was fitted to the data using a calculated nugget, range, and sill from the optimum model fit. This provides a mathematical function to explain the relationship between real-world values and distances between points. Then the estimation variance was calculated for a range of test blocks at varying sizes, which in turn was converted to a relative error at a 95% confidence. Lastly, the Resource classifications were defined based on relative error precision tolerances of 10%, 20%, 50% for Measured, Indicated, and Inferred respectively. These precision tolerances were developed by Bertoli et al (2013) regarding the area of a five-year period. From this study the classification radii, based on the distance of the error tolerance, were used to create Resource classification polygons with individual modifications from supporting data as the QP determines.
The geostatistical analysis was conducted on the raw ash and the thickness variables taken from the points of observation utilized in the construction of the geological model. The study area utilized was based on an approximate 5yr production area for both the GM and GLB2 seams. The most variable result (that results in a smaller spacing) of either the raw ash or thickness is used as a base to classify the resources before any individual modifications are made.
TECHNICAL REPORT SUMMARY CENTURION MINE
In a majority of the analysis, the raw ash was the most variable of parameters.
Due to the relative uniformity of the GM seam thickness (5.0 to 7.5m thick) and the consideration of potential for underground mining method (conventional longwall), DHSA was not performed on the seam thickness for the GM seam. DHSA analysis from the GM seam for raw ash was conducted on the working section height of approximately 4.25 to 4.5 metres. It is the QP’s experience that drillhole classification radii from raw ash analysis, is often smaller than radii from seam thickness for this deposit type. Therefore, raw ash spacings are considered more conservative, and were utilized as the basis for the classification of resources. The results are shown in Table 11-2, Figures 11-1 and 11-2.
Table 11-2. Resource Classification Radii in metres
|
|
|
|
|
|
|
|
|
|
|
|
|
|
|
Seam |
Parameter |
Measured |
Indicated |
Inferred |
Goonyella Middle |
Coal Thickness |
n/a |
n/a |
n/a |
Raw Ash |
425 |
775 |
1710 |
Goonyella Lower B2 |
Coal Thickness |
640 |
1090 |
2120 |
Raw Ash |
350 |
650 |
1570 |
The resource classification used for Centurion mine encompasses the qualified person’s confidence in the deposit. There were multiple factors used for the final analysis. This includes data quality, operational history, the QP’s experience, as well as quantitative analysis.
Measured resource has the highest level of confidence for the estimated quantity and quality based on the geological evidence and sampling. A set of criteria (Table 11-3.) on the degree of uncertainty is assessed and the low degree of uncertainty normally corresponds to the category of Measured resource.
Indicated resource has a lower level of confidence than the Measured resource, but a higher level of confidence than the Inferred resource. A set of criteria (Table 11-3.) on the degree of uncertainty is assessed and the medium degree of uncertainty normally corresponds to the category of Indicated resource.
Inferred resource has the lowest level of confidence. A set of criteria (Table 11-3.) on the degree of uncertainty is assessed and the high degree of uncertainty normally corresponds to the category of Inferred resource.
TECHNICAL REPORT SUMMARY CENTURION MINE
Table 11-3. Degree of Uncertainty
|
|
|
|
|
|
|
|
|
|
|
|
Source |
Degree of Uncertainty |
Low |
Medium |
High |
Exploration |
No significant issues. Protocols consistent with industry and Peabody standards. |
Historical boreholes without geophysical logs rely to a certain degree on the drillers accuracy of identifying coal thicknesses. These holes are excluded from the classifications. |
|
Sampling method |
Standard site operating procedure and guidelines |
Sampling sections of coal have changed over time. If <90% represent interval of interest, then data not used. |
|
Sample Prep/Analysis |
On site, ASTM accredited and independent contracted lab - consistent with industry standards. |
Increased uncertainty for older cores where sample preparation and testing procedures are not recorded. |
|
Quality Assurance/Quality Control |
Sample prep and analysis procedures follow ASTM and meet current industry standards. Laboratory is NATA certified. Quality is retested to confirm anything that looks abnormal. |
|
|
Data Verification |
Thickness and depths within Drillers logs have been checked and corrected against Geophysical logs (where available) for accuracy. Quality results have been reviewed, and sample photos reviewed where available |
Some missing analysis reports for historical data that are captured in spreadsheets, however mostly in previously mined out areas |
|
Database |
Geological, analytical, and location data in the model verified to the QP's satisfaction. Unverified or questionable data inactivated and not used. |
Some sample duplication identified in database. Samples reviewed before inclusion to model |
|
Geologic Modeling |
Model is reconciled to previous model upon updates (usually annually) |
Some boreholes verticality survey not included. This can have cause inaccuracies in seam structure RL as depth of cover increases |
|
Density |
Bore/Core sample density and inherent moisture tested extensively across sites. |
|
|
Quantitative analysis (Drill hole Spacing Analysis) |
Single domain analyzed. Only core holes with Geophysical logs included in DHSA. Drill hole radii: GM seam <425M & GLB2 seam <350m |
Historic bore holes without geophysical logs were excluded from Drill hole spacing analysis. Drill hole radii: GM seam 425-775m & GLB2 seam 350-650m |
Drill hole radii: GM seam: 775-1710m & GLB2 seam: 650-1570m |
Cut Off Criteria (Cut-off grade and metallurgic recovery) |
The cutoff grade is not relevant for this deposit. |
|
|
Mining Methods |
Mature longwall mining technology used at operation historically |
|
|
Costs |
Long operating history with documented costs |
|
|
Prices |
Well established market and demand for high grade metallurgical product |
|
|
TECHNICAL REPORT SUMMARY CENTURION MINE
Figure 11-1. Resource Classification - GM
TECHNICAL REPORT SUMMARY CENTURION MINE
Figure 11-2. Resource Classification – GLB2
TECHNICAL REPORT SUMMARY CENTURION MINE
11.4. Coal Resource Estimates
Resources have been classified (Table 11-4) and reported in accordance with the Regulation S-K (Subpart 1300). Resources are classified into “Measured”, “Indicated” and “Inferred” categories based on the distribution of borehole intersections and coal quality data.
Estimation of the Coal Resources are mainly determined by geological criteria and property control boundaries along with the potential of current or future economic viability utilizing available mining technologies. The Coal Resource estimates for Centurion provided are on an insitu basis exclusive of the Coal Reserve estimates.
Centurion reports zero coal resources exclusive of the coal reserves for the Goonyella Middle seam. Available measured and indicated coal resources for the GM seam have been converted to reserves and are discussed in section 12.
Only coal resource estimates exclusive of reserves are reported for the Goonyella Lower B2 seam.
Coal resource estimates for the Goonyella Lower B2 seam are based on the following:
Constrained to lease boundaries.
No minimum mining thickness applied.
No fault losses or exclusions.
A seam quality cut-off greater than 50% raw ash (air-dried moisture basis) is excluded from resources.
There are no yield cut-offs applied.
No weathered coal included.
The in-situ density grid utilized to generate resource estimates was calculation based on the ACARP equation (ACARP project No. C10042) discussed in section 8.2.4 Density Determination.
The long-term coal price projection discussed in Section 19.1 has been considered in the support of the prospects of economic extraction for the coal resources in the future. Along with consideration of the previous historic operations of Centurion mine in the past.
The information of the coal resources and all supporting documents are stored and kept as a record internally. The processes are followed each year to review, update, validate and document the resource estimates.
Centurion lease contains a total resource estimate of 9.2 million tonnes, exclusive of reserves (Table 11-4).
TECHNICAL REPORT SUMMARY CENTURION MINE
11.5. Coal Resource Statement
Coal resources in Table 11-4. are exclusive of reserves and calculated on an in-situ basis for the Goonyella Lower B2 seam.
Table 11-4. Coal Resources
|
|
|
|
|
|
|
|
|
|
|
|
|
|
|
|
|
|
|
|
|
|
|
|
|
|
|
|
|
|
|
|
|
|
|
|
| SEAM |
Resource Classification |
Million Tonnes (metric) |
% Raw Ash (a.d.) |
% Vols (a.d.) |
%
TS (a.d.)
|
% Phos (a.d.) |
%
IM (a.d.)
|
CSN |
%
FC (a.d.)
|
Insitu RD |
RD (a.d.) |
| GLB2 |
Measured |
0.1 |
15.8 |
20.3 |
0.48 |
0.008 |
1.41 |
7 |
62.5 |
1.38 |
1.41 |
| Indicated |
1.8 |
14.8 |
20.6 |
0.51 |
0.009 |
1.37 |
8 |
63.3 |
1.37 |
1.40 |
| Inferred |
7.3 |
13.6 |
20.7 |
0.54 |
0.011 |
1.18 |
7 |
64.6 |
1.34 |
1.37 |
| Grand Total |
9.2 |
13.9 |
20.6 |
0.53 |
0.011 |
1.22 |
7 |
64.3 |
1.35 |
1.38 |
| Sub Total Measured & Indicated |
1.9 |
14.8 |
20.5 |
0.51 |
0.009 |
1.38 |
8 |
63.3 |
1.37 |
1.40 |
11.6. Comments from Qualified Person(s)
Centurion has adequate exploration data to determine coal resources. Future routine exploration and resource estimation work will be undertaken to continue supporting the current operation and any future development. This will include drilling for structure, coal thickness, and quality information, along with fault line delineation. DHSA should be routinely reviewed on the addition of more exploration data, or changes to mining methods. Therefore, it is the opinion of the QP that there are no current geologic or technical factors that are likely to influence the prospect of economic extraction.
TECHNICAL REPORT SUMMARY CENTURION MINE
12. COAL RESERVE ESTIMATES
12.1. Introduction
The Life of Mine (LOM) Plan is the key process to support reserve reporting. The mine plan uses the longwall mining method with projected layouts for longwall panels and development for mains and gate roads. The mining methods historically adopted by Centurion, and the projected economic results demonstrated that the coal in the mine plan is economically mineable based on current market assumptions. The details regarding the marketing and pricing assumptions are included in sections 16 and 19. The mine plan, which supports the coal reserves, is inside of the boundary where Peabody has control of the coal leases. The Centurion mine is an existing operation with all required permits, approvals, and infrastructure to carry out ongoing production. The key assumptions in the mine plan and economic analysis are supported by the past performance. Unless specified otherwise, the quantity for coal reserves is reported as the saleable product, and the coal qualities are on a dry basis.
12.2. Coal Reserve Estimates
12.2.1. Reserve Classification
The geologic model described in section 11.2 is used for the LOM plan. All coal within the LOM plan area is considered either Measured or Indicated resources as discussed in Section 11. The Measured resources are reported as the Proven reserves and the Indicated resources as Probable reserves. There are no other modifying factors that are significant enough to prompt excluding reserve tonnage from the LOM plan or downgrade the reserve classification from proven to probable classification.
12.2.2. Mining Loss and Dilution
The LOM area is laid out with detailed pillar design and barriers between the longwall recovery and mains. The coal pillars and barriers are excluded from reserves. The longwall equipment for the GM Seam is limited to cut the coal seam between 3.2m to 4.5m thick, however the desired cut height has assumed to be 4.3m to ensure face stability and safety of the operators. The longwall equipment will not be able to cut the full seam height as the GM Seam typically ranges between 6.5m to 8.0m in thickness. Shown in Figure 12-1. below. Even though some of the top coal will fall into the face conveyor, the assumption is that the portion of the seam exceeding 4.3m thick will be lost during the mining process. The mining height of 3.6m is assumed for the development unit, which is designed to maintain a certain geometry for ventilation control and accessibility of longwall equipment. The mine plan also assumes that 0.5m of coal is left in the floor for development to ensure favorable floor conditions as a claystone material is located below the GM Seam. Therefore, no out of seam dilution has been included as Run-of-Mine (ROM) coal for development. The Longwall will cut to the floor of the GM Seam and ramp up into the development roadways. Based on this, 0.05m of floor dilution and 0.05m of coal loss has been assumed for the Longwall to account for cutting to the floor and ramping up into the gate roads.
TECHNICAL REPORT SUMMARY CENTURION MINE
Figure 12-1. Insitu Seam Thickness (m) - GM Seam
The GLB2 Seam ranges between 2.1m to 3.5m in thickness displayed in Figure 12-2. with the Longwall being designed to operate within this range. Development roadways have been designed to have a cut height of 3.4m for ventilation purposes. Where the seam is less than 3.4m, roof material will need to be cut to meet the height requirements. Similar to the GM Seam, the mine plan also assumes that 0.3m of coal is left in the floor for development to ensure favorable floor conditions.
TECHNICAL REPORT SUMMARY CENTURION MINE
Figure 12-2. Insitu Seam Thickness (m) - GLB2 Seam
The coal density for the GM seam is modeled from the lab test as discussed in Section 8.2.4 which results in a combined average density of 1.37 tonnes per cubic metre. The mine plan assumes 2.33t/m3 and 2.35t/m3 respectively for roof and floor rock density. The GLB2 seam results in a combined average density of 1.36 tonnes per cubic metre for insitu coal, and the mine plan assumes 2.45t/m3 and 2.49t/m3 respectively for roof and floor rock density.
12.2.3. Coal Product Quality
Once the coal is fed to the CHPP, the different circuits in the plant separate the product coal from high ash reject material. The wash head ash from the Bore/Core data (without dilution) is very low, which will deliver very high yields. When washed through the CHPP the product ash for both the GM cut and GLB2 seams is also very low. This facilitates maximum density washing (1.55SG) through the DMC circuit. Table 12-1. below summarizes the dilution free head ash and the simulated yield and product ash when operating the DMC circuit at maximum density.
TECHNICAL REPORT SUMMARY CENTURION MINE
Table 12-1. Simulated Yield and Product Ash
These results are based on the unified Bore/Core database on an in-situ coal basis only. All out of seam dilution is assumed to be disposed as reject during the washing processes. The assumed maximum density for the DMC circuit should be challenged when operational. There is potential to operate at higher DMC cut-points, which may increase the yields with a minor increase in product ash.
Table 12-2. below summarizes the impact of coal loss, dilution and product moisture assumptions, which are applied in the mine plan.
Table 12-2. Mine Plan Assumptions
|
|
|
|
|
|
|
|
|
Seam |
GM Cut |
GLB2 |
ROM Ash % ad |
14.8% |
13.3% |
Wet Yield % |
83.9% |
80.1% |
12.2.4. Reporting
The assumptions for reserve estimates are verified periodically against actual production. Underground ROM production is measured by the belt scale installed on the drift belt. The clean coal product tonnes and plant yield are monitored and measured by the belt scales at the CHPP. The product coal quality is sample tested using external lab consultants. Additional reconciliation processes include underground channel sampling, coal section surveys, and stockpile surveys.
The information of the coal reserves and all supporting documents are stored and kept as a record internally. The processes are followed every year to review, update, validate and document the reserve estimates.
12.3. Coal Reserves Statement
The LOM plan in section 13.3 is scheduled to resume mining in the first half of 2024. Coal reserves will not be extracted at Centurion until this point in time. Table 12-3. includes coal reserve estimates and key coal quality parameters with an effective date of December 31, 2023.
The total ROM coal quantity and plant yield for the GM Seam are 21.8 million tonnes and 83.9% respectively, which result in 18.3 million tonnes of coal product including 18.2 million tonnes of proven reserves and 0.1 million tonnes of probable reserves.
TECHNICAL REPORT SUMMARY CENTURION MINE
Table 12-3. GM Seam Coal Reserves Statement
|
|
|
|
|
|
|
|
|
|
|
|
|
|
|
|
|
|
|
|
|
Reserve |
Quantity ROM
(tonnes in millions)
|
Quantity Product
(tonnes in millions)
|
Insitu Density
(tonnes per cubic metre)
|
Saleable Product on Dry Basis |
|
Ash
(%)
|
Sulfur
(%)
|
Volatile Matter (%) |
Proven Reserve |
21.7 |
18.2 |
1.37 |
7.3 |
0.48 |
21.8 |
Probable Reserve |
0.1 |
0.1 |
1.37 |
7.2 |
0.48 |
21.6 |
|
|
|
|
|
|
|
Reserve |
Quantity ROM
(tonnes in millions)
|
Quantity Product
(tonnes in millions)
|
Insitu Density
(tonnes per cubic metre)
|
Saleable Product on Dry Basis |
|
Ash
(%)
|
Sulfur
(%)
|
Volatile Matter (%) |
Total |
21.8 |
18.3 |
1.37 |
7.3 |
0.48 |
21.8 |
Figure 12-3. Reserve Classification – GM Seam
TECHNICAL REPORT SUMMARY CENTURION MINE
The total ROM coal quantity and plant yield for the GLB2 Seam shown in Table 12-4. are 54.8 million tonnes and 81.0% respectively, which result in 44.4 million tonnes of coal product including 23.7 million tonnes of proven reserves and 20.7 million tonnes of probable reserves.
Table 12-4. GLB2 Seam Coal Reserves Statement
|
|
|
|
|
|
|
|
|
|
|
|
|
|
|
|
|
|
|
|
|
| Reserve |
Quantity
(tonnes in millions)
|
Quantity Product
(tonnes in millions)
|
Insitu Density
(tonnes per cubic metre)
|
Saleable Product on Dry Basis |
|
Ash
(%)
|
Sulfur
(%)
|
Volatile Matter (%) |
| Proven Reserve |
29.4 |
23.7 |
1.36 |
7.5 |
0.52 |
20.2 |
| Probable Reserve |
25.4 |
20.7 |
1.36 |
7.5 |
0.51 |
21.1 |
|
|
|
|
|
|
|
| Reserve |
Quantity
(tonnes in millions)
|
Quantity Product
(tonnes in millions)
|
Insitu Density
(tonnes per cubic metre)
|
Saleable Product on Dry Basis |
|
Ash
(%)
|
Sulfur
(%)
|
Volatile Matter (%) |
| Total |
54.8 |
44.4 |
1.36 |
7.5 |
0.52 |
20.6 |
|
|
|
|
|
|
|
TECHNICAL REPORT SUMMARY CENTURION MINE
Figure 12-4. Reserve Classification – GLB2 Seam
12.4. Comments from Qualified Person(s)
The geological features around the reserve area are adequately defined, and other factors which could materially affect the reserve have all been addressed. The recent operational history in the nearby panels further demonstrates that the reserve is economically mineable. The coal reserve estimate could be affected by the data accuracy, uncertainty from geological interpretation and mine planning assumptions. Those factors normally don’t pose material risks for the overall reserve estimates. However, other external risks, including unexpected geologic hazards, infrastructure or facility failures caused by natural disasters, changes in laws and regulations, and seaborne coal demand and supply, are not controllable by the company and could severely affect the mine-ability of the reserve.
TECHNICAL REPORT SUMMARY CENTURION MINE
13. MINING METHODS
13.1. Introduction
The mining method best suited for this underground mine is the longwall mining method which has a relatively high recovery rate. The mains and gate roads are required to be developed with the continuous miner prior to the longwall mining. Since the beginning of production at Centurion, this method appears to be relatively safer and more efficient compared to other available methods. Both the GM and GLB2 seams are economic when extracted. For this underground operation, the key consideration includes roof control, subsidence, ventilation, dewatering, mine planning and production schedules, etc.
13.2. Mine Design
13.2.1. Geotechnical Considerations
A design and sign off process by competent geotechnical engineers and the statutory Mining Engineering Manager for the strata control plan is in place at Centurion. These plans are designed to address potential geotechnical issues encountered under current geological and mining conditions, such as mining depth, mining height, and entry widths, etc. The depth in the LOM plan area shown in Figure 13-1. for the GM Seam ranges from 210 to 360m and 160 to 540m for the GLB2 Seam. The typical roof controls are mainly described here for the development section (i.e., mains and gate roads) and the longwall mining system.
Figure 13-1. Depth of Cover – GM Seam
TECHNICAL REPORT SUMMARY CENTURION MINE
For mains development with a five to seven entry system, the typical pillar sizes are 80 metres by 42 metres (center-to-center). The typical entry and crosscut width are 5.4 metres.
The typical longwall gate roads developed by the continuous miner sections consist of two entries with widths typically 40 to 52 metres (center-to-center) for the GM Seam and 32 to 66 metres for the GLB2 Seam. Crosscut centers are typically 133 metres. The typical entries and crosscuts are 5.4 metres wide. The entries may be mined up to 8.5 metres wide with the installation of additional permanent supports. Figures 13-2. and 13-3. illustrate the dimensions for a typical gate road and mains development.
Figure 13-2. Typical Gate Road Development
TECHNICAL REPORT SUMMARY CENTURION MINE
Figure 13-3. Typical Mains Development
The roof control plan approved by competent geotechnical engineers and the statutory Mining Engineering Manager includes the use of primary supports during mains and gate road development, as well as secondary supports at the longwall tailgate. The operation typically uses 6 x 2.1m full resin-grouted bolts per metre advance with roof mesh for the primary roof support. The minimum rib support requirements for development are:
Less than ~300m DOC – 2 x 1.2m rib bolts/1.0m/side, plus rib mesh modules
~300-400m DOC - 3 x 1.2m rib bolts/1.0m/side, plus rib mesh modules
Development intersections are supported using roof bolts with 2 x additional long tendons every 2 metres. Other supplemental roof support materials are used as needed, such as timers, pumpable cribs, prop-setter, etc.
Longwall panels are typically 305 metres wide and of various lengths based on panel geometries constrained by faults or coal thickness. Secondary roof support will be required ahead of longwall retreat. Typical Maingate Belt and Travel Roads will require 8m long, pre-tensioned and post grouted tendons at a density of two tendons every two metres. Belt Road intersections require tendons installed at a density of three tendons every 2m. This support is dependent on longwall retreat and horizontal stress direction and may need to be increased in some instances.
TECHNICAL REPORT SUMMARY CENTURION MINE
Belt Road intersections will also require the installation of five sets of standing support across the entrance to cut-throughs. Additional rib support will also be required ahead of longwall retreat. The Longwall Tailgate will require standing support installed at 4-5m intervals. The relevant roof control plan provides measures for normal mining encountered in the longwall area.
The other specific roof controls are considered for start-up entries, face recovery, shield recovery, bleeder support, etc. As mining depths increase down-dip then support requirements may change accordingly. This should form part of ongoing mine support review and design. Structured areas should be individually assessed and will likely require potentially elevated levels of secondary support and strata pre-consolidation.
13.2.2. Subsidence Considerations
Centurion Mine has conducted numerous and extensive subsidence surveys over many of the longwall panels. Historic studies provide detailed information and data collected from surface subsidence surveys conducted at the mine. Major subsidence characteristics, including the maximum surface subsidence factor and angle of draw of subsidence, have been discussed based on analysis of measured surface subsidence data. As summarized below, several major subsidence features at Centurion Mine have been characterized, and they are consistent with this specific geological and mining condition.
The maximum surface subsidence occurs in the area near the middle of each longwall panel. Maximum subsidence for the GM Seam is predicted to be consistent at 3.2 metres based on a constant mining height and the width of the longwall panel. The subsidence contours for the GM Seam are presented in Figure 13-4.
TECHNICAL REPORT SUMMARY CENTURION MINE
Figure 13-4. GM Seam Subsidence Prediction Contours
The angle of draw associated with subsidence is defined as the angle formed between the vertical projection of a line at the panel edge, and a second line that connects from the panel edge to the point of the last measurable surface deformation. The angle of draw from both the surveyed subsidence data and the modelled data is presented in Figure 13-5. A conservative upper bound of 28 degrees was used for the angle of draw. This is a slight increase on the theoretical 26.5 degrees of half depth.
TECHNICAL REPORT SUMMARY CENTURION MINE
Figure 13-5. Angle of Draw Data
Since subsidence will occur in the areas that will not impact structures, environmental features, or culturally significant sites. The environmental approval with a Subsidence Management Strategy, including the planned subsidence and preventive measures, has been granted for the Centurion mine.
Maintenance requirements are determined through two primary methods:
• Subsidence monitoring; and
• Field surveying.
Field surveying consists of opportunistic observation and systematic surveying. Opportunistic observation occurs through communication with personnel working around the subsidence panels, such as exploration crews, drilling contractors and surveying personnel. Surface cracking through subsidence is noted and communicated to the Environmental Officer. Surface cracking noted through ongoing works are remediated by ripping the affected area on an ‘as required’ basis. The GM Seam subsidence predictions superimposed onto the topography are presented in Figure 13-6.
TECHNICAL REPORT SUMMARY CENTURION MINE
Figure 13-6. GM Seam Subsidence on Topographic Surface
The maximum incremental subsidence for the GLB2 Seam generally ranges from 1.7m to 3.3m depending on single or multi-seam extraction, seam thickness and overburden depth. The incremental subsidence predictions for the GLB2 seam are displayed in Figure 13-7.
TECHNICAL REPORT SUMMARY CENTURION MINE
Figure 13-7. GLB2 Seam Subsidence Prediction Contours
The cumulative subsidence in the areas of multi-seam extraction has maximum subsidence generally ranging from 4m to 8m, where the greatest has LTCC that previously took place in the GM Seam and increased seam thickness in the GLB2. The Cumulative subsidence predictions for both seams are displayed in Figure 13-8.
TECHNICAL REPORT SUMMARY CENTURION MINE
Figure 13-8. GM and GLB2 Seam Cumulative Subsidence Prediction Contours
13.2.3. Ventilation Considerations
Methane is the main hazardous gas released during the mining process. The mine ventilates the underground mine works by utilizing fans installed on the surface in an exhaust system. The main ventilation facilities are listed in Table 13-1. Other underground ventilation controls used include stoppings, seals, tubes, curtains, regulators, auxiliary fans, etc. The operation follows the approved ventilation plan by the statutory Ventilation Officer and Mine Manager to control hazardous gas and dust according to Queensland Coal Mining Regulations. The approved plan defines the minimum required air quantity for different mining sections and processes, minimum air velocities on the longwall face, location, and frequency of methane tests, etc. The monitoring and tracking system, air courses and escape ways are updated routinely on the mine map. The air survey and ventilation model are used to assess any ventilation and mine plan changes.
TECHNICAL REPORT SUMMARY CENTURION MINE
The current ventilation infrastructure in place to support the mining of the GM seam is outlined in Table 13-1. below. In addition to this, small diameter back return shafts and fans will be required in the perimeter roadway of the longwall panes to assist with the management of methane gas and the goaf fringe.
Table 13-1. Ventilation Facilities
|
|
|
|
|
|
|
|
|
|
|
|
|
|
|
| Ventilation Facilities |
Cross Sectional Area |
Elevation (meters) |
Depth |
| (m2) |
Surface |
Bottom |
(meters) |
| Centurion Portal 1:7 Men & Materials Drift |
23.0 |
286 |
182 |
104 |
| Centurion Portal 1:4 Conveyor Drift |
23.0 |
284 |
183 |
101 |
| H9 Shaft (6.0m Diameter) |
28.3 |
301 |
161 |
140 |
| H40 Shaft (5.3m Diameter) |
22.1 |
292 |
42 |
250 |
The GLB2 Seam will be ventilated via inter-seam drifts and staple shafts connecting the GLB2 seam workings to the existing GM Seam workings and ventilation infrastructure. Similar to the GM seam, small diameter back return shafts will be required in the perimeter roadway of the longwall panes in the GLB2 Seam, connecting the workings to surface fans.
13.2.4. Hydrological Considerations
The underground mine water is staged through a series of electric and air pumps to a pit bottom location where 2x100L/sec Truflo Pumps deliver to surface. There are 2 surface water storage dams in series to allow for desilting. Water is reused from these dams in the CHPP.
As mining operations progress down dip, water behind seals is designed to be released through water traps so there is no accumulation of water in sealed areas of the mine up dip from operations. The Southern longwall panels are at a higher elevation than the Northern longwall panels that have been exhausted, hence there is no risk on inundation from goaf water storage. Water levels at the bottom of the Northern longwall panels is regularly monitored and acts as a reserve storage area. Boreholes are in place to allow for pumping as required from electric pumps based on the surface.
13.3. Mine Plan
Centurion Mine uses the underground longwall mining method which requires certain geometry and size for economic extraction. The LOM plan for the GM Seam is limited by existing workings to the North and West and lease boundary to the South and East. The GM Seam mine plan has a mine life of seven years (i.e., 2024 to 2030) with a projection of 22 million tonnes of ROM production and 18 million tonnes of saleable product. The first two years of production are solely development and hence have a lower production output. The average annual production once the longwall has commenced operation is 4.2 million tonnes of ROM coal, and 3.5 million tonnes of saleable product with an average yield of 83%.
TECHNICAL REPORT SUMMARY CENTURION MINE
The interburden between the GM and GLB2 seam is approximately 60m thick. The GLB2 Seam mine plan mirrors the GM mine layout however is slightly offset for geotechnical purposes. The GLB2 Seam mine plan has a mine life of eighteen years (i.e., 2026 to 2043) with a projection of 55 million tonnes of ROM production and 45 million tonnes of saleable product. Prior to the commencement of production, two interseam drifts will be constructed from the GM seam to the GLB2 seam using roadheaders and will take approximately one year to complete. The average annual production once the longwall has commenced operation is 4.1 million tonnes of ROM coal, and 3.4 million tonnes of saleable product with an average yield of 81%.
13.3.1. Mining Process
The typical longwall panel is 300m wide equipped with a shearer, hydraulic shields, armored face conveyor, stage loader, crusher, etc. The shearer cuts a 0.9m thick web along the 300m longwall face for every pass it makes. The cutting height is constrained by equipment size and ranges from 3.2m - 4.5m. The mining process generates some dilution from cutting of the floor rock. The ROM coal, including coal and dilution, is crushed, and conveyed to the washing plant for processing. Most of the dilution is separated in the washing plant from coal and then disposed of as refuse. More discussions for the dilution and recovery are included in sections 12.2.2. and 12.2.3.
Continuous miners are used to cut the entries for mains and gate roads. The coal is transported by shuttle cars to the feeder breaker which reduces mined coal to a consistent, easily handled size for conveyance. The Continuous miner cuts and bolts simultaneously with the newly exposed roof being supported according to the approved roof control plan. The Centurion mine is scheduled to employ three continuous miner systems for the current LOM plan.
13.3.2. Production Schedule
Centurion Mine has two designated districts, the Northern Panels, and the Southern Panels. In the GM Seam the Northern panels (LW01N - LW09N) have been extracted along with five panels to the south (LW01S – LW05S). Five longwall panels to the south (LW06S - LW10S) remain to be extracted with panels with lengths ranging from 2,910 metres to 1,100 metres. The GLB2 Seam includes eleven longwall panels to the North and five longwalls to the South with lengths ranging from 3,610 metres to 720 metres.
Centurion has one set of Caterpillar longwall mining equipment which is currently being stored on the surface at the mine site. Following the development of LW06S in the GM Seam, the longwall will be transported underground via the men & materials drift and installed to commence production. Longwall production is scheduled to commence in 2026. The first longwall consists of two parts with a step-around due to a geological fault. At this point in time, it has been assumed that that longwall will not be able to mine through the fault and therefore a longwall relocation will need to occur around the fault. The detailed mining sequence is illustrated in Figure 13-9.
Centurion will operate seven days per week excluding certain holidays. Each operating day is scheduled with two shifts that are twelve hours per shift. Two shifts per week will be utilized for maintenance and setup. The total retreat rate from the GM Seam and GLB2 Seam longwalls is assumed to be an average of 9 metres per day and 11 metres per day respectively. The difference in daily longwall retreat rates is based on the varying cut heights of the two seams.
TECHNICAL REPORT SUMMARY CENTURION MINE
Longwall moves between panels is schedule to take 52 days for the GM Seam and 36 days for the GLB2 Seam.
Continuous miners will typically operate two, twelve-hour production shifts per day, with maintenance occurring on two shifts per week. The continuous miners are assumed to advance 19 metres per day in gate road development and 13 metres per day in mains development. Each continuous miner unit is projected to be idled for 7 calendar days to relocate to a new section. The current LOM plan for the GM Seam assumes three continuous miner units to develop gate roads and mains from 2024 to 2026. After 2026, two development units are scheduled up until 2028 where only one development unit is required for the remaining LOM plan.
The production projection from 2024 to 2030 in this LOM plan is included in Table 13-2. The supporting annual progress stage plan is also shown in Figure 13-9. below.
Table 13-2. GM Seam LOM Plan Production Schedule
|
|
|
|
|
|
|
|
|
|
|
|
|
|
|
|
|
|
|
|
|
|
|
|
|
|
|
|
|
|
Production in thousands |
2024 |
2025 |
2026 |
2027 |
2028 |
2029 |
2030 |
Total |
ROM Tonnes |
|
212 |
469 |
4,001 |
3,791 |
4,821 |
4,793 |
3,732 |
21,820 |
Yield |
|
84% |
84% |
85% |
84% |
84% |
84% |
83% |
84% |
Product Tonnes |
|
178 |
396 |
3,394 |
3,189 |
4,037 |
4,008 |
3,096 |
18,299 |
TECHNICAL REPORT SUMMARY CENTURION MINE
Figure 13-9. GM Seam LOM Mining Sequence
The current LOM plan for the GLB2 Seam assumes that the two inter-seam drifts from the GM Seam down to the GLB2 Seam commences in 2026 and takes approximately one year to complete. Two continuous miner units then commence development of the main headings in 2027. A third continuous miner joins the fleet to develop gate roads and mains from 2028 to 2029. After 2029, two development units are scheduled up until 2033 where the third continuous miner comes back online to assist with developing the southern panels. Two to three continuous miners are required for the remaining LOM plan based on development intensity.
The production projection from 2026 to 2043 in this LOM plan is included in Table 13-3. The supporting annual progress stage plan is also shown in Figure 13-10. below.
TECHNICAL REPORT SUMMARY CENTURION MINE
Table 13-3. GLB2 Seam LOM Plan Production Schedule
|
|
|
|
|
|
|
|
|
|
|
|
|
|
|
|
|
|
|
|
|
|
|
|
|
|
|
|
|
|
|
|
|
|
|
|
| Production in thousands |
2026 |
2027 |
2028 |
2029 |
2030 |
2031 |
2032 |
2033 |
2034 |
2035 |
| ROM Tonnes |
|
4 |
232 |
395 |
232 |
420 |
3,981 |
4,573 |
4,463 |
3,644 |
3,916 |
| Yield |
|
40% |
39% |
52% |
59% |
75% |
81% |
82% |
82% |
81% |
82% |
| Product Tonnes |
|
2 |
91 |
206 |
137 |
313 |
3,212 |
3,745 |
3,640 |
2,951 |
3,209 |
|
|
|
|
|
|
|
|
|
|
|
|
|
|
|
|
|
|
|
|
|
|
|
|
|
|
|
|
|
|
|
|
|
| Production in thousands |
2036 |
2037 |
2038 |
2039 |
2040 |
2041 |
2042 |
2043 |
Total |
| ROM Tonnes |
|
4,403 |
4,256 |
4,727 |
3,905 |
4,509 |
4,198 |
3,471 |
3,437 |
54,766 |
| Yield |
|
82% |
82% |
79% |
81% |
81% |
83% |
84% |
84% |
81% |
| Product Tonnes |
|
3,606 |
3,474 |
3,752 |
3,177 |
3,655 |
3,478 |
2,899 |
2,872 |
44,420 |
TECHNICAL REPORT SUMMARY CENTURION MINE
Figure 13-10. GLB2 Seam LOM Mining Sequence
13.4. Mining Equipment and Personnel
The Centurion South mine plan estimates 117 hourly and 69 salaried personnel for 2024. Total LOM plan staffing is projected to average 166 hourly and 105 salaried personnel from 2026 to 2030. For GLB2 the mine plan estimates 132 hourly and 66 salaried personnel initially for 2026. Total LOM plan staffing is projected to average 194 hourly and 126 salaried personnel from 2030 to 2043.
The type of mining equipment utilized is suitable for the geologic and mining conditions experienced and expected at Centurion, based on a long history of successful operation. The major mining equipment required for this mine plan is listed in Table 13-4. The listed equipment along with other supporting equipment is all currently at the mine.
TECHNICAL REPORT SUMMARY CENTURION MINE
The equipment is required to be routinely maintained, overhauled, or replaced based on the operating conditions.
Table 13-4. Major Mining Equipment
|
|
|
|
|
|
|
|
|
|
|
|
| Type |
Manufacturer/Model |
Equipment Description |
# of Units |
| Development |
Komatsu 12CM30 |
Continuous Miner |
3 |
| Komatsu BF-14 |
Feeder Breaker |
2 |
| Komatsu 10SC32 |
Shuttle Car |
4 |
| Sandvik LS190 |
Loader |
5 |
| Torque Titan |
Loader |
5 |
| AME Mine Cruisers MK8 |
Personnel Transporter |
10 |
| AMP Control |
Power Center |
2 |
| Howdens 24m3 |
Ancillary Fan |
4 |
| Longwall |
CAT EL3000 |
Shearer |
1 |
| CAT 2m 1501t |
Shields |
153 |
| Cat PF6 1242mm |
AFC |
1 |
| Cat BSL |
Stageloader & Crusher |
1 |
| Kamat |
Hydraulic System |
1 |
| AMP Control |
Power Center |
1 |
TECHNICAL REPORT SUMMARY CENTURION MINE
14. PROCESSING AND RECOVERY METHODS
14.1. Introduction
The ROM coal at Centurion needs to be washed prior to shipping to customers to reduce the ash and enhance the coking coal properties. The coal handling and processing plant at Centurion was constructed in 1994 and has been used to process the ROM coal to meet customers' quality requirements.
14.2. Process Selection and Design
The Centurion Coal Handling and Preparation Plant CHPP was commissioned in June 1993 to produce coking coal from the Goonyella Middle Seam for export. The original plant design throughput was 560tph and following the introduction of open cut mining of 2003, plant modifications were made to improve plant throughput, reliability, efficiency, and product quality control. These modifications improved throughput tonnage to a nominal 700tph.
14.3. Coal Handling and Processing Plant
ROM coal is conveyed via the Drift conveyor onto the Raw Coal Stacking conveyor (skyline conveyor) The material is conveyed via the skyline conveyor onto the raw coal stockpile. A magnet is positioned at the head end of the Drift conveyor to remove tramp scrap steel material such as miner picks and roof bolts, and prevents it being discharged onto the Raw Coal Stockpile which has a capacity of 350,000t.
ROM coal is reclaimed by self-feeding during times of high stockpile height and with bulldozer assistance as the stockpile height decreases. The amount of material reclaimed from the stockpile is controlled to enable the continuous operation of the CHPP. All material transported on the Raw Coal Reclaim conveyor passes over a weightometer.
The material reclaimed from the ROM passes over the raw coal scalping screen to remove any -50mm material from entering the rotary breaker. The -50mm material is conveyed to the CHPP feed surge bin. By scalping the feed before the rotary breaker less fine coal is generated. The +50mm material is discharged from the raw coal scalping screen and enters the rotary breaker.
The rotary breaker crushes the +50mm material by lifting it and dropping it onto breaker plates. Material smashed to less than 50mm falls through holes contained in the breaker barrel and discharges to the breaker product conveyor with the -50mm material from the raw coal scalping screens. Material greater than 50 mm repeats the same procedure several times. Any material that has not broken into minus 50 mm material after 6 rotations is discharged from the breaker onto the breaker reject stockpile for removal by front end loader. The rotary breaker relies on the fact that coal is more brittle and breaks easier than rock, thus rejecting some of the rock in the ROM material.
The CHPP consists of two identical modules fed from a common feed conveyor with a total ROM capacity of 700tph. The following description outlines a single module. The deslime screens are used to separate the CHPP feed into two size fractions. The coarse material (plus 1.0wwmm) which is fed to the DMC. The fine material (minus 1.0wwmm) is fed to the deslime cyclones which separate the fines into two fractions. The midsize material (minus 1.0wwmm plus 0.125mm) is fed to spiral circuits and the undersize material (minus 0.125mm) is fed to the flotation circuit.
TECHNICAL REPORT SUMMARY CENTURION MINE
Product material is collected on the product conveyor and transported to the top of the product stacking conveyor transfer tower. The product conveyor discharge chute is fitted with a sampling device to obtain samples of plant product for monitoring product quality. The material is then conveyed to the tripper where it is divided into two streams by the tripper head chute and falls onto the product coal stockpile which has a capacity of 400,000t.
Product coal is reclaimed by self-feeding during times of high stockpile height and with bulldozers as the stockpile height decreases. Product reclaim recovery is achieved by means of six stockpile activators and coal valves. The coal valves open to allow a free flow of material at the nominated feed rate (max 4500tph) onto the product coal reclaim conveyor. All material transported on the product coal reclaim conveyor passes over a weightometer.
Product coal reclaimed from the product stockpile is conveyed to the 1,000 tonne train loadout bin.
The rejects from all process circuits are collected and pumped to a rejects disposal area where the water is allowed to drain and return to the plant for reuse. When quality allows, spiral rejects can report to product via bypasses in the plant process. The detailed flow sheet, including equipment characteristics and specifications, for the coal processing plant, is shown in Figure 14-1. The general layout of the coal handling and processing plant and related infrastructures are shown in Figure 14-2.
TECHNICAL REPORT SUMMARY CENTURION MINE
Figure 14-1. Plant Flow Sheet
TECHNICAL REPORT SUMMARY CENTURION MINE
Figure 14-2. Preparation Plan
14.4. Plant Yield
The plant yield at Centurion is highly correlated to ROM ash. The DMC circuit is normally configured to separate coal from refuse at a maximum cut-point of 1.55SG. The plant yield for the GM cut and GLB2 seams is consistently high, benefiting from maximum density washing. The undiluted yields ranged from 82% to 87% for the GM cut and 76% to 91% for the GLB2 seam. The projected ROM yield is shown in section 13.3.2. More detailed discussions are included in sections 10.3, 12.2.2, and 12.2.3.
14.5. Energy, Water, Process Material, Personnel Requirements
The main consumables for the coal processing at Centurion are electricity for crushing, conveyance, coal processing, magnetite for heavy media circuits, and water for coal processing. The typical consumptions are 2800 tonnes of magnetite per year, and 262 megaliters of water per year based on historic records.
The coal handling and processing plant has been in care and maintenance since the underground fire event in 2018. The Centurion CHPP will process development coal on an as required basis until longwall production commences in 2026. The CHPP will then operate 12 hours per day, seven days per week. Required maintenance will be scheduled for one 12 hour shift every three weeks. A total of 26 persons consisting of staff and operators are needed to operate and maintain the processing plant at Centurion.
TECHNICAL REPORT SUMMARY CENTURION MINE
15. INFRASTRUCTURE
Centurion has extensive surface infrastructure to support the operation and no additional new infrastructure is required for commencement of production. All infrastructure will require routine maintenance and overhauls to ensure availability.
The main infrastructure was built in 1993 and encompassed the coal handling and processing plant, drift access and conveyor haulage, ventilation shafts, coal refuse disposal areas, rail loadout, stockpiles, administration, carpark, bathhouses, workshop, warehouse, and other supporting facilities. A plan showing the layout of surface infrastructure at Centurion is displayed in Figure 15-1.
Figure 15-1. Site Infrastructure Layout
All personnel are either from nearby towns, and they drive in or out to the operations or FIFO from Brisbane, Queensland. Most of the employees reside at the Centurion Accommodation Village which is located 19km east of the Centurion Mine and has a capacity of 440 workers. Shown in Figure 15-2.
TECHNICAL REPORT SUMMARY CENTURION MINE
Figure 15-2. Centurion Accommodation Village
Centurion has established all required roads for off-highway trucks and light vehicles to support daily operations. The Centurion surface facilities are all accessible by paved and/or improved gravel roads. These are capable of being traversed by personnel vehicles and trucks. The North Goonyella Mine Access Road provides access to the Centurion offices and surface infrastructure. Shown in Figure 15-3.
Figure 15-3. Centurion Surface Infrastructure
TECHNICAL REPORT SUMMARY CENTURION MINE
Product coal is loaded to train via a 1,000t Train Loadout Bin where it loads a train in about three hours and 20 minutes (Figures 15-4 and 15-5). Each train consists of some 120 wagons carrying approx. 10,000mt of coal. The loaded train then travels some 217km to the port of Hay Point where it is bottom dumped to conveyor and onto stockpile at Dalrymple Bay Coal Terminal (DBCT). DBCT is owned by a private company which operates a process of cargo assembly where coal is stockpiled for a named vessel a few days prior to loading. Therefore, Peabody has no dedicated stockpile capacity at the port.
Figure 15-4. Product Stockpile and Loadout Facilities
Figure 15-5. Rail Loop
Shipping of coal to customers usually takes place on an ocean-going vessel shared with other coal suppliers called co-shippers. Typically, Centurion Coking Coal shipment parcels can vary in tonnage from a parcel of two vessel holds (30,000mt to 40,000mt) up to a part capesize vessel (plus 75,000mt )
TECHNICAL REPORT SUMMARY CENTURION MINE
Rail and port contract arrangements for movement of coal from Centurion Coking Coal to the customer’s ship are managed by Peabody Energy Australia for the Goonyella rail and port system and covered under Peabody’s current long-term contracts.
The Centurion Plant will process ROM coal to produce a saleable product. Historically, two waste byproducts result from this processing, coarse refuse, and fine refuse (slurry). The rejects to tailings ratio is approximately 2:1.
The combined rejects are currently pumped into a co-disposal area (CDA) in the current operations area and consists of a series of cells as displayed in Figure 15-6.
Figure 15-6. Centurion CDA Locations
The current CDA areas have a life of three years from the commencement of longwall production which will allow the disposal of combined rejects until 2029. Studies and engineering designs have been completed to raise and expand the current CDA to the East as shown in Figure 15-7. Raising the existing footprint of the current CDA alone will extend the life by 16 years to 2045 and will have sufficient capacity for rejects disposal for the LOM plan.
TECHNICAL REPORT SUMMARY CENTURION MINE
Figure 15-7. Centurion CDA Expansion Design
All refuse storages are monitored, inspected, and certified according to safety and environmental regulations for structures on a mine site. The expansion beyond the active storages for the coarse and slurry refuse storage has been planned and scheduled to meet future production. They will be permitted and constructed through phases in time.
The main water supply for the mine and processing plant is from the mine dewatering system and the Burton Gorge Dam.
Power is supplied by Powerlink infrastructure with CS Energy acting as the service provider. The external 132KV feed is to 2 x 20MVA site transformers which feeds surface infrastructure including the CHPP, surface conveyors and main fans. Power is fed underground via 11KV feeds for redistribution to development operations, panel conveyors, pumping and future longwall. In addition, the main trunk conveyors underground have a 6.6KV direct feed from surface. Full operations at Centurion Mine will have a power demand of 15MWh, this demand means there is redundancy with the 2 x 20MVA site transformers. Peabody is exploring options to internally power the mining operations from coal seam gas to reduce external power demand.
TECHNICAL REPORT SUMMARY CENTURION MINE
16. MARKET STUDIES AND MATERIAL CONTRACTS
16.1. Introduction
The pricing information used to establish coal reserves has been derived from 3rd party index price forecasts combined with historic and existing sales information, to determine appropriate forward pricing on a mine-by-mine and product-by-product basis. In general, these price forecasts are based on a thorough analytical process utilizing detailed supply and demand models, global economic indicators, projected foreign exchange rates, analyses of price relationships among various commodities, competing fuels analyses, projected steel demand, analyses of supplier costs and other variables.
16.2. Product and Market
Centurion Coking coal is a premium Hard Coking Coal (PHCC) with a mature brand name in the seaborne metallurgical marketplace and is well known in both the Atlantic and Pacific seaborne markets. This coal attracts a premium price based on its excellent coking properties (see typical specifications table below). In fact, customers will use this coal’s price as a guide with which to measure other coking coal pricing relativity at time of price settlement. Therefore, we can refer to this coal as a coking coal that can set the Platts Index level for the PLVHCC FOB Australia (PLVHA00) Index and trade on the globalCOAL platform for PHCC’s. This gives the owner of the brand a significant marketing benefit in the marketplace. It also means that in selling this coal brand to a particular customer they are more willing to build a purchased portfolio of other Peabody metallurgical coals that might otherwise be more difficult to achieve in the market.
Centurion Coking Coal is mined from the Goonyella Middle Seam of the Moranbah Coal measure of the Bowen Basin coalfield in Queensland and as such results in a coal with high levels of vitrinite content along with high fluidity that makes for very attractive coal plastic properties and low mineral contaminants. These properties are highly valued by the Coke Oven manager and well respected by the Blast Furnace manager for producing a strong coke with high Coke Strength after reaction that performs to high standards. Centurion Coking Coal in particular, allows the coke maker to blend lower quality, cheaper coals in higher proportions in his coke making blend because the coal is seen as an excellent carrying coal thus adding value and making this coking coal a more valuable component of his blend.
Development coal volumes will be used to re-instate Centurion Coking Coal in its prior markets in Asia and Europe over 2024 and 2025 before longwall production in 2026 will enable it to reset its market network amongst its prior established global customer base and attract new customers who value it as a prominent and globally recognized PHCC.
Current Centurion reserves point to a marketable quality for Centurion Coking displayed in Table 16-1. below.
TECHNICAL REPORT SUMMARY CENTURION MINE
Table 16-1. Centurion Coking Coal – Typical Specification (2023)
TECHNICAL REPORT SUMMARY CENTURION MINE
16.3. Market Outlook
Peabody’s approximately 10 Mtpa of metallurgical production is almost all exported into the seaborne market. Demand for seaborne metallurgical coal is shown in Table 16-2. below and is projected to be ~ 323Mtpa in 2025, growing at ~2.5% CAGR from 2022.
Table 16-2. World Metallurgical Coal Market
Market demand is growing strongly in India and South-East Asia including Indonesia in line with their high rates of macro-economic expansion. In comparison the more mature markets for seaborne metallurgical coal such as Japan and Europe show a declining growth.
Australia is the main supplier of seaborne metallurgical to the world and the market offer covers all quality types from premium Hard (PHCC), Semi-Hard (SHCC), Semi Soft Coking Coals (SSCC) and Pulverized Coal Injection (PCI) coal.
While Australia supplies just over half of the seaborne metallurgical coal demand, it supplies over 2/3 of the premium Hard Coking Coals to the seaborne market.
Mongolian and Russian metallurgical coal is being aggressively promoted to compete in the Chinese and seaborne markets but most of these new supplies will be SSCC or SHCC and so unable to compete with Australian PHCC’s such as Centurion Coking Coal. Mongolian coal is currently restricted in access to seaborne export ports and therefore is targeted on the China market.
TECHNICAL REPORT SUMMARY CENTURION MINE
Metallurgical coals from both these regions have different properties to tried and tested Australian coals.
It is clear the supplies for PHCC will struggle to keep up with demand and will retain and likely increase their premium as compared to the SHCC and especially the SSCC coals. Indian demand is focused heavily on the PHCC quality typified by Centurion Coking Coal.
16.4. Material Contracts
Consistent with general coal mining industry in Australia, Peabody maintains a number of supply agreements for various required elements of their operations, including for fuel, electricity, tires and equipment supply and maintenance. It also has commitments with Port and Rail service and infrastructure providers to enable its products to be brought to market.
In terms of sales, the Centurion Mine has no long-term Coal Supply Agreements but have previously been a consistent supplier to several key customers over many years. As a benchmark product, this coal is expected to enter the market without issue.
Centurion has all supply and service contracts in place to provide necessary materials and services for the current and future operation. Due to the price fluctuation recently, some materials are purchased on a non-contract basis. Table 16-3. includes the key purchase arrangements for the operation.
Table 16-3. Materials and Service Contracts
|
|
|
|
|
|
|
|
|
| Material Type |
Supplier |
Comments |
| Shearer and Longwall Equipment |
Hasting Deering |
Shearer rebuilds including parts required for longwall |
| Continuous Miner |
Komatsu |
Contracts in place to purchase three continuous miners |
| Electric Power |
CS Energy |
Contracted supply of retail electricity |
| Bulk Diesel |
Viva Energy Australia |
Contracted supply if bulk diesel |
| Magnetite |
Kara Magnetite |
Contracted supply of magnetite |
| Greases and Lubes |
Castrol |
Contracted supply bulk and packaged products |
| Roof Bolt |
DSI Underground |
PO Terms and Conditions, agreed pricing adjustments |
TECHNICAL REPORT SUMMARY CENTURION MINE
17. ENVIRONMENTAL STUDIES, PERMITTING AND SOCIAL OR COMMUNITY IMPACT
17.1. Environment Studies
There have been many environmental studies conducted for the Centurion Mine in order to gain approval.
Centurion is located in the Bowen Basin some 38 km to the north of Moranbah in Central Queensland on Mining Lease (ML) 6949. The ML was granted on 10 October 1991 under the Mineral Resources Act 1989 (MR Act) which authorizes mining. An Environmental Impact Statement (EIS) was prepared and submitted as part of the environmental approvals process in 1992 Mining commenced at Centurion in 1994 and Peabody Energy Australia (PEA) acquired the operation in April 2004. Petroleum License (PL) 504 was granted on 3rd December 2015 and includes the area of ML 6949.
The underground operations are covered by EA EPML00815613 that covers all activities within ML 6949 and PL 504. The holder of the EA EPML00815613 is Peabody (Bowen) Pty Ltd.
The Centurion Mine Progressive Rehabilitation and Closure Plan (PRCP) is currently under development and due for submittal on 29 March 2024.
The region is in a sub-tropical climatic zone, which is characterized by high summer temperatures, warm dry winters and a distinct wet and dry season.
Centurion has environmental management strategies in place to minimize environmental impacts and provide the strategic context for environmental management for each environmental value. Requirements and plans for waste and tailings disposal, site monitoring, water management during operations and after mine closure and mine closure include:
• Waste Management Plan (including Coal Waste Disposal).
• Water Management Plan (including a Site Water Balance).
• Erosion and Sediment Control Plan.
• Rehabilitation Management Plan.
• Mine Closure Plan (PRCP currently under development); and
• Environmental Monitoring Program (including Surface Water and Groundwater monitoring).
17.2. Permitting
As of December 31, 2023, all required licenses and permits are in place for all activities for the operation of Centurion.
17.3. Social and Community Impact
Centurion has a Cultural Heritage Management Plan and other agreements in place with the Traditional Owners of the land. Centurion is an active contributor to the local community, making donations to local events and wherever possible procuring locally.
TECHNICAL REPORT SUMMARY CENTURION MINE
Centurion has a range of communication methods in place which enables it to share information with the local community. These methods include:
• Site open days.
• Phone calls and meetings with landholders.
• Meetings with the Traditional Owners.
• Meetings with the Isaac Regional Council.
• The Peabody Energy website - https://www.peabodyenergy.com; and
• Ad hoc Community Newsletters.
Centurion has a Complaint Response Protocol to respond to all community concerns. Complaints and meetings with stakeholder are logged in the consultation management system, Consultation Manager.
17.4. Mine Reclamation and Closure
Mine reclamation is a vital part of the mining life cycle that is integrated with the mining process. Reclamation occurs on an ongoing contemporary basis as soon as land becomes available to create a safe, stable and sustainable landform that benefits generations to follow. Reclamation is undertaken on a progressive basis with consultation between the environmental, technical services and production teams. In any given year, land reclamation activities can vary due to production needs, mine development, weather conditions, or other unforeseen factors.
As part of Centurion’s annual financial reporting obligations, a review of the Asset Retirement Obligations (ARO) is required to be undertaken. The review estimates the cost of reclaiming the active parts of the mine, including works to remove mine infrastructure and otherwise meet the statutory relinquishment requirements for the mine. The estimate also includes allowances for “post-closure) costs such as required monitoring, completion surveys, project management, etc.
The current estimate for the ARO at Centurion is summarized in Table 17-1. (shown in AUD):
Table 17-1. Current ARO Estimate
|
|
|
|
|
|
|
Centurion |
| Support Areas |
$37m |
| Closure Costs |
$34m |
| Ongoing Areas |
$0.3m |
| Total Costs |
$72m |
These estimates are captured in the Financial Models supporting the Reserve estimates.
In November 2018, the Queensland Parliament passed into law the Mineral and Energy Resources (Financial Provisioning) Act (also known as MERFP). As a result of this Law, all active mine sites are required to develop and submit for approval a Progressive Rehabilitation and Closure Plan (PRCP).
TECHNICAL REPORT SUMMARY CENTURION MINE
Peabody has agreed to deliver the PRCP for Centurion in the First Quarter of 2024.
The main purposes of the PRC Plan are to:
Require the holder of the EA to plan for how and where activities will be carried out on land in a way that maximizes the progressive rehabilitation of the land to a stable condition.
Provide for the condition to which the holder must rehabilitate the land before the EA may be surrendered.
The EP Act requires that all areas disturbed within the relevant mining tenure must be rehabilitated to a Post-Mining Land Use (PMLU) or managed as a Non-Use Management Area (NUMA). Any undisturbed land within the relevant mining tenure must also be identified as a PMLU. NUMAs will only be considered appropriate where justified.
A PRC plan will consist of two parts:
1. Rehabilitation Planning part.
2. PRCP schedule.
The Rehabilitation Planning part of the PRC plan must include the information as described below. The purpose of this section is to provide evidence and justification to support the development of the proposed PRCP schedule.
The content requirements for the Rehabilitation Planning part include, but are not limited to:
• general information about the site and operation
• information about community consultation
• analysis and justification of PMLUs and NUMAs
• justification of timeframes for land being available for rehabilitation and available for improvement
• details of the rehabilitation methodologies and techniques that will be used to develop rehabilitation milestones and management milestones and supporting documentation.
The PRCP schedule is approved by the administering authority and will include maps of final rehabilitation and closure outcomes for the site and tables of time-based milestones for achieving each PMLU and/or NUMA. The PRCP schedule consists of the following:
• rehabilitation and management milestones
• milestone criteria
• identification of PMLUs or NUMAs • when land becomes available for rehabilitation and available for improvement • rehabilitation areas and improvement areas
TECHNICAL REPORT SUMMARY CENTURION MINE
• milestone completion dates.
The administering authority may impose conditions on the approval that it considers necessary or desirable. The PRCP schedule operates separately from the EA. The EA authorizes the carrying out of an environmentally relevant activity (ERA) and includes conditions to avoid, mitigate, or manage environmental harm that could occur during an activity. The PRCP schedule contains milestones and conditions that relate to the completion of progressive rehabilitation and mine closure. Both the EA and the PRCP schedule apply to the entire life of the mining activities, irrespective of when the underlying tenure expires.
17.5. Comments from Qualified Person(s)
In the opinion of the Qualified Person, the current approach to matters of environmental compliance, permitting and community impacts generally is sound and doesn’t present any current concerns with respect to the reporting of Resources or Reserves.
TECHNICAL REPORT SUMMARY CENTURION MINE
18. CAPITAL AND OPERATING COSTS
18.1. Introduction
Centurion Mine is an active operation with a long operating history. The LOM plan and financial model have been developed periodically. The coal volumes and product quality are developed from the detailed mine plan with production reflecting historic performance. The manpower requirement, operating cost, and capital are estimated from the historic data and future mine plan requirements on an annual basis.
18.2. Operating Costs
GM Seam
The cost estimates used to establish coal reserves are generally estimated according to internal processes that project future costs based on historical costs and expected future trends. The estimated costs include mining, processing, transportation, royalty, add-on tax, and other mining-related costs. Peabody’s estimated mining costs reflect projected changes in prices of consumable commodities (such as steel), labor costs, geological and mining conditions, targeted product qualities, and other mining-related costs. Estimates for other sales-related costs (mainly transportation, royalty, and add-on tax) are based on contractual prices or fixed rates. All reserves in the LOM plan are leased from private parties or the federal government. The royalty expenses are included in the category of Sales Related Costs computed from the projected revenue and contractual rates. Other sales-related costs include barge transport and port handling. An allowance for Safeguard has been included.
Operating costs are projected based on historical operating costs and adjusted based on projected changes in staffing, hours worked, production, and productivity for mining areas in the LOM plan. These operating cost estimates shown in Table 18-1. are based on a substantial operating history and are in the accuracy range of +/ - 15%. No contingency is included.
Table 18-1. LOM Operating FOR & FOB Cost Projection GM Seam (in millions of US$ as real value)
|
|
|
|
|
|
|
|
|
|
|
|
|
|
|
|
|
|
|
|
|
|
|
|
|
|
|
| US$M |
2023 |
2024 |
2025 |
2026 |
2027 |
2028 |
2029 |
2030 |
| FOR Costs |
26.3 |
34.7 |
50.3 |
164.3 |
198.9 |
218.7 |
211.5 |
152.0 |
| FOB Costs |
0.4 |
7.7 |
16.8 |
145.5 |
138.6 |
183.3 |
241.5 |
181.5 |
| Total Costs |
26.6 |
42.4 |
67.1 |
309.7 |
337.6 |
402.1 |
453.0 |
333.5 |
TECHNICAL REPORT SUMMARY CENTURION MINE
GLB2 Seam
The cost estimates used to establish coal reserves are generally estimated according to internal processes that project future costs based on historical costs and expected future trends. The estimated costs include mining, processing, transportation, royalty, add-on tax, and other mining-related costs. Peabody’s estimated mining costs reflect projected changes in prices of consumable commodities (such as steel), labor costs, geological and mining conditions, targeted product qualities, and other mining-related costs. Estimates for other sales-related costs (mainly transportation, royalty, and add-on tax) are based on contractual prices or fixed rates. All reserves in the LOM plan are leased from private parties or the federal government. The royalty expenses are included in the category of Sales Related Costs computed from the projected revenue and contractual rates. Other sales-related costs include barge transport and port handling. An allowance for Safeguard has been included.
Operating costs are projected based on historical operating costs and adjusted based on projected changes in staffing, hours worked, production, and productivity for mining areas in the LOM plan. These operating cost estimates shown in Table 18-2. are based on a substantial operating history and are in the accuracy range of +/ - 15%. No contingency is included.
Table 18-2. LOM Operating FOR & FOB Cost Projection GLB2 Seam (in millions of US$ as real value)
|
|
|
|
|
|
|
|
|
|
|
|
|
|
|
|
|
|
|
|
|
|
|
|
|
|
|
|
|
|
| US$M |
2026 |
2027 |
2028 |
2029 |
2030 |
2031 |
2032 |
2033 to LOM |
Total |
| FOR Costs |
16 |
59 |
69 |
61 |
83 |
202 |
234 |
2,240 |
2,963 |
| FOB Costs |
6 |
22 |
28 |
27 |
25 |
143 |
165 |
1,698 |
2,115 |
| Total Costs |
22 |
81 |
97 |
88 |
108 |
345 |
400 |
3,937 |
5,078 |
18.3. Capital Expenditures
GM Seam
Centurion GM Seam will require capital expenditures each year for infrastructure additions/extensions, as well as for mining equipment rebuilds/replacements to continue producing coal. The capital expenditures have been projected based on mining equipment and infrastructure requirements as scheduled in the LOM. The capital expenditures are estimated to cover safety, equipment major rebuilds and replacement, conveyance system, infrastructure, etc. The capital expenditures, from 2023 through 2027. are shown in Table 18-3.
The total estimated capital expenditure is $489M from 2023 to 2027 with an annual average of $98M. All capital expenditure is considered as needed to maintain current operations. There is no expansion capital required for the current LOM plan.
TECHNICAL REPORT SUMMARY CENTURION MINE
These capital cost estimates are based on a substantial operating history and are in the accuracy range of +/ - 15%. No contingency is included.
Table 18-3. Capital Expenditure Projection GM Seam (in millions of US$ as real value)
|
|
|
|
|
|
|
|
|
|
|
|
|
|
|
|
|
|
| US$M |
2023 |
2024 |
2025 |
2026 |
2027 |
| Capitalised Operating Costs |
53 |
120 |
121 |
3 |
- |
| Direct Capital Spend |
74 |
31 |
35 |
29 |
23 |
| Total |
127 |
151 |
156 |
32 |
23 |
GLB2 Seam
Centurion GLB2 Seam will require capital expenditures each year for infrastructure additions/extensions, as well as for mining equipment rebuilds/replacements to continue producing coal. The capital expenditures have been projected based on mining equipment including a new fit for purpose longwall, and infrastructure requirements as scheduled in the LOM. The capital expenditures are estimated to cover safety, equipment major rebuilds and replacement, conveyance system, infrastructure, capitalized development etc. The capital expenditures, from 2026 through to LOM are shown in Table 18-4.
The total estimated capital expenditure is $574M from 2026 to 2042 with an annual average of $27.1M. All capital expenditure is considered as needed to maintain current operations. There is no expansion capital required for the current LOM plan. These capital cost estimates are based on a substantial operating history and are in the accuracy range of +/ - 15%. No contingency is included.
Table 18-4. Capital Expenditure Projection GLB2 Seam (in millions of US$ as real value)
|
|
|
|
|
|
|
|
|
|
|
|
|
|
|
|
|
|
|
|
|
|
|
|
|
|
|
|
|
|
| US$M |
2026 |
2027 |
2028 |
2029 |
2030 |
2031 |
2032 |
2033 to LOM |
Total |
| Capitalised Operating Costs |
47 |
20 |
32 |
145 |
- |
- |
- |
- |
243 |
| Direct Capital Spend |
75 |
27 |
43 |
59 |
36 |
11 |
12 |
67 |
331 |
| Total |
122 |
47 |
75 |
204 |
36 |
11 |
12 |
67 |
574 |
TECHNICAL REPORT SUMMARY CENTURION MINE
19. ECONOMIC ANALYSIS
19.1. Macro-Economic Assumptions
The Peabody Markets & Pricing Committee is responsible to provide the macro-economic assumptions according to internal processes which rely on internal proprietary forecasts, existing contract economics and other third-party research. The sales price for Centurion coal is benchmarked as Low-Volatile Premium Hard Coking Coal (LV PHCC) on the seaborne market. The details for the pricing assumption are shown in Table 19-1. The cost and capital in the economic analysis are on a real basis (no inflation assumptions). The tax rate and discount rate used for the cash flow analysis are assumed to be 29% and 11% respectively.
Table 19-1. Sales Price Assumption
|
|
|
|
|
|
|
|
|
|
|
|
|
|
|
|
|
|
|
|
|
| Sales Price |
2026 |
2027 |
2028 |
2029 |
2030 |
2030 Thru LOM |
| LV PHCC (US$/Metric Tonne) |
186.00 |
180.00 |
180.00 |
180.00 |
180.00 |
180.00 |
19.2. Cash Flow Model
GM Seam
The cash flow is calculated in detail as shown in Table 19-2. The annual cash flow averages ~$53 million from the years 2023 to 2032. The coal reserves are projected to be mined out in 2030 with cash flow after 2030 being ARO. The NPV at a 11% annual discount rate is computed as $155 million. The positive NPV demonstrate the positive economic value for reserves in the LOM plan.
Table 19-2. Cash Flow Analysis GM Seam (in millions of US$ in real value)
|
|
|
|
|
|
|
|
|
|
|
|
|
|
|
|
|
|
|
|
|
|
|
|
|
|
|
|
|
|
|
|
|
| US$M Cashflow |
2023 |
2024 |
2025 |
2026 |
2027 |
2028 |
2029 |
2030 |
2031 |
2032 |
| Revenue |
- |
33 |
56 |
624 |
582 |
724 |
722 |
545 |
- |
- |
| Total Costs |
(27) |
(42) |
(67) |
(310) |
(338) |
(402) |
(453) |
(334) |
- |
- |
| DD&A |
- |
(32) |
(52) |
(58) |
(54) |
(47) |
(39) |
(206) |
- |
- |
| Tax |
- |
- |
- |
(37) |
(57) |
(83) |
(69) |
(1) |
- |
- |
| PAT |
(27) |
(42) |
(63) |
218 |
133 |
193 |
161 |
3 |
- |
- |
| DD&A |
- |
32 |
52 |
58 |
54 |
47 |
39 |
206 |
- |
- |
| Changes in Working Capital |
- |
(0) |
(13) |
(18) |
(22) |
17 |
13 |
20 |
- |
- |
| ARO |
- |
- |
- |
- |
- |
- |
- |
- |
(31) |
(17) |
| Capex |
(127) |
(151) |
(156) |
(32) |
(23) |
- |
- |
- |
- |
- |
| Cash Flow |
(153) |
(161) |
(180) |
227 |
141 |
256 |
213 |
230 |
(31) |
(17) |
| Cash Flow Cumulative |
(153) |
(314) |
(494) |
(267) |
(125) |
131 |
344 |
574 |
543 |
526 |
GLB2 Seam
The cash flow is calculated in detail as shown in Table 19-3. The annual cash flow averages ~$115 million thru LOM. The coal reserves are projected to be mined out in 2043 with cash flow after 2043 being ARO. The NPV at a 11% annual discount rate is computed as $278 million.
TECHNICAL REPORT SUMMARY CENTURION MINE
The positive NPV demonstrate the positive economic value for reserves in the LOM plan.
Table 19-3. Cash Flow Analysis GLB2 Seam (in millions of US$ in real value)
|
|
|
|
|
|
|
|
|
|
|
|
|
|
|
|
|
|
|
|
|
|
|
|
|
|
|
|
|
|
| US$M |
2026 |
2027 |
2028 |
2029 |
2030 |
2031 |
2032 |
2033 to LOM |
Total |
| EBITDA (US$) |
(22) |
(65) |
(59) |
(64) |
(51) |
233 |
274 |
2,434 |
2,680 |
| Working Capital |
- |
(21) |
(16) |
91 |
(68) |
4 |
13 |
(4) |
(0) |
| Operating Cashflow |
(22) |
(86) |
(75) |
27 |
(119) |
237 |
288 |
2,430 |
2,680 |
| Capex (US$) |
122 |
47 |
75 |
204 |
36 |
11 |
12 |
67 |
574 |
| Net Cashflow |
(144) |
(132) |
(150) |
(177) |
(155) |
226 |
275 |
2,363 |
2,106 |
19.3. Sensitivity Analysis
GM Seam
The sensitivity analysis is conducted on sales price, FOR cost and capital with the detailed results in Table 19-4. The quality and yield for in situ coal are fairly consistent, and the grade is not included in the sensitivity study. The NPV is calculated using a +/- 15% variance on the variables. The minimum NPV is $40 million at a 15% reduction in sales price with all other variables being constant.
Table 19-4. Sensitivity Analysis GM Seam (in millions of US$ as nominal value)
|
|
|
|
|
|
|
|
|
|
|
|
|
|
|
|
|
|
|
|
|
|
|
|
| NPV Sensitivities |
-15% |
-10% |
-5% |
Base |
5% |
10% |
15% |
| Revenue |
40 |
79 |
117 |
155 |
190 |
221 |
253 |
| FOR Costs |
207 |
190 |
172 |
137 |
119 |
101 |
| Capex |
195 |
182 |
168 |
141 |
126 |
111 |
GLB2
The sensitivity analysis is conducted on sales price, FOR cost and capital with the detailed results in Table 19-5. The quality and yield for in situ coal are fairly consistent, and the grade is not included in the sensitivity study. The NPV is calculated using a +/- 15% variance on the variables. The minimum NPV is $93 million at a 15% reduction in sales price with all other variables being constant.
TECHNICAL REPORT SUMMARY CENTURION MINE
Table 19-5. Sensitivity Analysis GLB2 Seam (in millions of US$ as nominal value)
|
|
|
|
|
|
|
|
|
|
|
|
|
|
|
|
|
|
|
|
|
|
|
|
| NPV Sensitivities |
-15% |
-10% |
-5% |
Base |
5% |
10% |
15% |
| Revenue |
93 |
161 |
219 |
278 |
334 |
392 |
449 |
| FOR Costs |
410 |
365 |
321 |
232 |
188 |
143 |
| Capex |
325 |
309 |
292 |
260 |
245 |
229 |
TECHNICAL REPORT SUMMARY CENTURION MINE
20. ADJACENT PROPERTIES
Of the mining tenures adjacent to Centurion Mine, the only operating coal mine is the BHP Mitsubishi Alliance (BMA) Goonyella Riverside opencut mine to the south, consisting of multiple Mining Leases. To the east of Centurion, BMA hold ML 70241 (“Red Hill”) which also lies to the east of the Goonyella Riverside Mine, and north of a BMA owned and operated underground mine, the Broadmeadow mine.
To the north of the Centurion Mine lie the undeveloped Wards Well and Lancewood MLs owned by Stanmore SMC Pty Ltd (Stanmore). Peabody has recently entered into a definitive sale and purchase agreement with Stanmore to purchase the southern part of the Wards Well lease (ML 1790) as well as ML 70495 and part of ML 70433. The transaction is conditional on the satisfaction of certain limited conditions precedent, including but not limited to – Foreign Investment Review Board (FIRB) approval, execution of a royalty deed and associated royalty security, ministerial approval from QLD Department of Natural Resources and Mines for the sale and boundary realignment and certain other regulatory approvals and agreements in relation to infrastructure sharing arrangements between Peabody and Stanmore. The transaction is expected to close in the first half of 2024. When complete, this purchase will connect Centurion Mine to another Peabody held tenement, Mineral Development License (MDL) 3010 which lies to the east of the Wards Well leases.
In addition to the coal mining tenure, the Centurion Mine also adjoins Potential Commercial Area (PCA) 258, a form of Petroleum tenure which is held by Arrow Energy. Shown in Figure 20-1. Below.
TECHNICAL REPORT SUMMARY CENTURION MINE
Figure 20-1. Mineral Property Map
TECHNICAL REPORT SUMMARY CENTURION MINE
21. OTHER RELEVANT DATA AND INFORMATION
21.1. Gas Emissions Management
Underground development and longwall operations depend heavily on effective gas drainage of the seam(s) which have the potential to be a source of gas emission. Prior to initial mining, some drilling activity will take place from the surface to assist with the pre-drainage of the seam in the form of SIS (Surface to in-seam shown in Figure 21-1) wells. All other drilling and draining activities will take place at in-seam level and will commence once access to the area is established and progressively as the mine develops and extracts the GM and GLB2 seams.
Gas drilling and drainage will utilise various methodologies dependent on gas content and coal seam permeability. Primarily, in-seam drilling provides an effective drainage method as it provides targeted drainage with variable drill hole spacing to accommodate local gas variations and structural influence. Typical UIS (Underground in-seam shown in Figure 21-2) drilling and drainage pattern includes lateral drilling in a fan pattern. The borehole spacing is dependent on the level of drainage required, i.e. high gas, short timeframe means a closer spaced/higher cost drilling density.
Each borehole is isolated from its adjacent hole using standpipes and control valves. Pressure and flow monitoring is provided on each borehole to monitor borehole performance. Gas gathering occurs at the confluence of the fan pattern whereby it then enters an underground to surface gas riser borehole.
Figure 21-1. Typical SIS Drilling Pattern in Advance of Coal Development
Figure 21-2. Typical UIS Fan Pattern in Advance of Coal Development
TECHNICAL REPORT SUMMARY CENTURION MINE
Vertical goaf wells will be required post Longwall mining that will extend in the range of ~+200m depth, designed to be consumable, decommissioned and abandoned in coordination with the rate of mining.
21.2. Other Relevant Data
All other data relevant to the associated mineral reserves and mineral resources have been included in the sections of this Technical Report Summary.
TECHNICAL REPORT SUMMARY CENTURION MINE
22. INTERPRETATION AND CONCLUSIONS
22.1. Geology and Resources
The regional and local geology at Centurion is understood well by the Qualified Person through working experience and historic mining in the area. The exploration data at Centurion has been collected to standards and the geological models have been further enhanced by incorporating underground geological mapping and various seismic programs. The points of observation, including the structure and coal quality, are sufficient for the determination of resource classification criteria, which is developed from the DHSA method, and is widely adopted in the coal mining industry. The coal resources at Centurion are estimated to be 9.2 million tonnes which have the potential to be converted to reserves with additional exploration and studies in the future.
22.2. Mining and Reserves
The Centurion Mine has a long operating history with all required infrastructure to support future production. All required property control, including coal and surface for the reserve area, has been obtained to support the operation. Centurion is an underground mine using a longwall mining method to extract coal, which is processed by the preparation plant on the surface. The mining and processing methods have been adapted and practiced at Centurion and the related mining industry for many decades. All major equipment is either located at the operation or in the process of being supplied to the operation and it will be adequate to support future production. The LOM plan shows the projected economic viability for the estimated reserves of 62.7 million tonnes.
22.3. Environmental, Permitting and Social Considerations
As of December 31, 2023, all required licenses and permits are in place for all activities needed for the operation of Centurion. Many of these permits require regular monitoring, reporting, and renewals – these activities are a normal undertaking in the business of mining within Queensland, Australia.
Land reclamation is a vital part of the mining life cycle integrated with the mining process. The Centurion management is committed to being compliant with the Company’s Environmental Policy and taking responsibility for the environment, benefiting our communities, and restoring the land for generations that follow.
22.4. Economic Analysis
The LOM plan and financial model have been developed periodically. The coal volumes and product quality are developed from the detailed mine plan with production reflecting historic performance. The manpower requirement, operating cost, and capital are estimated from the historic data and future mine plan requirements on an annual basis, and they are considered accurate to support the reserve estimates.
TECHNICAL REPORT SUMMARY CENTURION MINE
23. RECOMMENDATIONS
23.1. Geology and Resources
Further exploration work should be evaluated to provide additional geological confidence in smaller scale structures not imaged by seismic. This, along with the existing mine geological mapping and surface to inseam drilling, will provide adequate support to the operation for short-term and mid-term planning production purposes.
It is recommended to further define and ground truth the faults, near the most southernly area of the current Life of Mine identified by seismic data. Horizontal drilling should be evaluated from nearby gate roads once they are developed. If this is not possible, then surface exploration drilling accompanied by borehole acoustic and televiewer logging should be conducted in a timely manner before development to support faulting interpretations.
It is recommended to collate all sample data into Peabody’s GeoCore database. Currently various forms of sample data (coal quality, gas, and geotechnical) are still collated within spreadsheets. Whilst this is a commonly used method, collating data into a database will improve the ease and certainty of data collation and validation in the future.
23.2. Mining, Processing and Reserves
It is recommended to conduct a reconciliation to further validate the assumptions for loss and dilution during mining and processing. Strip sampling from underground roadways should be used to update coal quality information within the geological model once development operations have commenced. Opportunities to maximize longwall panels should be explored once the extent of faults impacting the mine plan have been further understood from development mining.
The operation should continue to follow the approved roof control and ventilation plan. Any material changes on the plans or from the plans should be assessed, and any related impacts on resource and/or reserve estimates should be incorporated in any future updates.
23.3. Environmental, Permitting and Social Considerations
As of December 31, 2023, all required licenses and permits are in place for all activities at the operation of Centurion. Many of these permits require regular monitoring, reporting, and renewals – these activities are a normal undertaking in the business of mining within Queensland, Australia.
Land reclamation is a vital part of the mining life cycle integrated with the mining process. The Centurion management is committed to being compliant with the Company’s Environmental Policy and taking responsibility for the environment, benefiting our communities, and restoring the land for generations that follow.
23.4. Economic Analysis
The ability of Peabody, or any coal company, to achieve production and financial projections is dependent on numerous factors. These factors primarily include site-specific geological conditions, the capabilities of management and mine personnel, the level of success in acquiring coal leases and surface properties, coal sales prices and market conditions, environmental issues, securing permit renewals and bonds, and developing and operating mines in a safe and efficient manner.
TECHNICAL REPORT SUMMARY CENTURION MINE
Unforeseen changes in legislation and new industry developments could substantially alter the performance of any mining company. It is recommended that those factors should be assessed regularly according to the Company’s internal control, and material changes are to be reflected in the future resource and/or reserve estimates.
TECHNICAL REPORT SUMMARY CENTURION MINE
24. REFERENCES
Bertoli, O., Paul, A., Casley, Z. and Dunn, D., (2013). Geostatistical drill hole spacing analysis for coal resource classification in the Bowen Basin, Queensland. International Journal of Coal Geology, 112, pp.107-113.
Cartwright, P., (2014). Chain Pillar Assessment for GM South and Potential Impacts on Underlying GLB2 Layout
Cartwright, P., (2018). Geotechnical Review of the GM South Area
D.A.Casey & Associates Pty Limited. (2003), Permeability report North Goonyella Coal Properties, Boreholes GN1138C, GN1150C, GN1172C & GN1174C
Department of Environment and Resource Management. (2011). Eaglefield EIS 2011, https://www.qld.gov.au/__data/assets/pdf_file/0023/108347/eaglefield-eis-assessment-report-signed.pdf
Golder. (2018). North Goonyella Coal GLB2 Life Extension Project, Conceptual Hydrogeological Model.
Heritage, Y., (2018). GMS Subsidence Predictions for Revised Mine Plan: North Goonyella Mine
Heritage, Y. Gale, W., (2014). Subsidence Predictions Revised GMS and GLB2 Mine Plans, North Goonyella Coal Mine
Johnson, R. Report No. 204/2/1 February (2003), North Goonyella Coal Project, Eaglefield Opencut Geological Information Package
Johnson, R. Report no. 204/1/13 Febuary (2004). North Goonyella Coal Mine Bowen Basin Central Queensland Southern and Northern Panels 2002/2003 Exploration Report
Sliwa. (2014). Structural synthesis for North Goonyella
TECHNICAL REPORT SUMMARY CENTURION MINE
25. RELIANCE ON INFORMATION PROVIDED BY THE REGISTRANT
This technical report summary has been prepared by Qualified Persons who are employees of the registrant. In their specific areas of expertise, these Qualified persons have contributed to the appropriate sections of this report. These Qualified Persons have also relied on the information provided by the Company for property control, marketing, material contracts, environmental studies, permitting and macro-economic assumptions as stated in Section 3.2, Section 16, Section 17, and Section 19. As the operation has been in production for many years, the Company has considerable experience in those areas. The Qualified Persons have taken all appropriate steps, in their professional opinion, to ensure that the above information from the Company is sound.
EX-97
18
btu_20231231xex97.htm
EX-97
Document
|
|
|
|
|
|
|
PEABODY POLICY
Clawback
August 2023
|
|
| Executive Owner: Chief Administrative Officer & Corporate Secretary |
This Clawback Policy (this “Policy”) has been adopted by the Board of Directors (the “Board”) of Peabody Energy Corporation, a Delaware corporation (the “Company”), effective as of August 3, 2023 (the “Effective Date”) in order to help ensure that incentive compensation is paid or awarded based on accurate financial results. This Policy is intended to comply with and be interpreted in accordance with the requirements of Section 303A.14 (“Section 303A.14”) of the New York Stock Exchange (“NYSE”) Listed Company Manual. The provisions of Section 303A.14 shall prevail in the event of any conflict between the text of this Policy and such section.
In the event of a restatement of the financial results of the Company due to material non-compliance with any financial reporting requirements, as described below, the Company shall seek recovery of incentive compensation that would not otherwise have been paid or awarded to certain executives if the correct financial results had been used to determine the amount payable.
1.Recovery of Excessive Incentive-Based Compensation. If the Company is required to prepare an accounting restatement due to the Company’s material noncompliance with any financial reporting requirement, including any required accounting restatement to correct an error in previously issued financial statements that (a) is material to the previously issued financial statements, or (b) is not material to previously issued financial statements, but would result in a material misstatement if the error were left uncorrected in the current period or the error correction were recognized in the current period, the Compensation Committee of the Board (or any successor thereto, the “Committee”) will review the Incentive-Based Compensation received by the Covered Employees during the Look-Back Period (as defined below).
Except as set forth in paragraph 2 below, the Committee shall seek to recover or cancel the amount of Excessive Incentive-Based Compensation received by a Covered Employee during the Look-Back Period. Any Excessive Incentive-Based Compensation must be collected from any Covered Employee on a pre-tax basis.
2.Exceptions to Applicability. The Committee shall seek to recover the Excessive Incentive-Based Compensation unless the Committee makes a determination that recovery would be impracticable, and at least one of the following applies: (a) the direct expense paid to a third party to assist in enforcing recovery would exceed the Excessive Incentive-Based Compensation, and a reasonable attempt to recover the Excessive Incentive-Based Compensation has already been made and documented, (b) recovery of the Excessive Incentive-Based Compensation would violate home country law (provided such law was adopted prior to November 28, 2022 and that an opinion of counsel in such country is obtained stating that recoupment would result in such violation), or (c) recovery would likely cause an otherwise tax-qualified retirement plan, under which benefits are broadly available to employees of the Company and its subsidiaries, to fail to meet the requirements of 26 U.S.C. 401(a)(13) or 26 U.S.C. 411(a) and regulations thereunder. Notwithstanding the foregoing, the Committee must make a reasonable attempt to recover the Excessive Incentive-Based Compensation and provide proof of such before concluding impracticability.
3.Definitions. For purposes of this Policy, the following terms have the meanings indicated, in addition to the other terms defined herein:
a)“Covered Employee” means an “officer” as defined in Rule 16a-1(f) under the Exchange Act, and any person who met such criteria who may be a former officer but served during the applicable performance period with respect to Incentive-Based Compensation subject to recovery.
For the sake of clarity, “Covered Employee” includes at a minimum executive officers identified by the Board pursuant to 17 CFR 229.401(b).
b)“Excessive Incentive-Based Compensation” means the amount of Incentive-Based Compensation Received by a Covered Employee during the Look-Back Period in excess of the amount of Incentive-Based Compensation that otherwise would have been Received by the Covered Employee had such Incentive-Based Compensation been determined based on the restated amounts in the accounting restatement. For any Incentive-Based Compensation based on a measurement that is not subject to mathematical recalculation (including stock price or total shareholder return), the Excessive Incentive-Based Compensation will be based on the Board’s reasonable estimate (considering any recommendation of the Committee which shall be set forth in writing) of the effect of the accounting restatement on the metric upon which the Incentive-Based Compensation was earned.
c)“Financial Performance Measure” means any reporting measure that is determined and presented in accordance with the accounting principles used in preparing the Company’s financial statements, and any measures that are derived wholly or in part from such measures. Stock price and total shareholder return are also considered to be Financial Performance Measures for purposes of this Policy. A Financial Performance Measure need not be presented within the financial statements or included in a filing with the Commission.
d)“Incentive-Based Compensation” means any compensation that is paid, granted, earned, or vested based wholly or in part on a Financial Performance Measure, where the award or size of the award was contingent on the attainment of such Financial Performance Measure, but does not include compensation that is earned or vested based solely on the continued provision of services for a period of time.
e)“Look-Back Period” means the three completed fiscal years immediately preceding the date of the accounting restatement and any transition period as set forth in Section 303A.14. For purposes of this Policy, the date of an accounting restatement will be deemed to be the earlier of (i) the date the Board, a committee of the Board, or officers authorized to take such action if Board action is not required, concludes, or reasonably should have concluded, that the Company is required to prepare an accounting restatement, and (ii) the date a court, regulator, or other legally authorized body directs the Company to prepare an accounting restatement.
f)“Received” means, with respect to any Incentive-Based Compensation, the fiscal period that the Financial Performance Measure specified in the applicable Incentive-Based Compensation award is attained, even if the payment or grant of the Incentive-Based Compensation occurs after the end of that period.
1.General Process. In the event the Committee determines that there is Excessive Incentive-Based Compensation and except as set forth in paragraph 2 above, the Committee will direct the Company to take prompt and reasonable action in accordance with this Policy to seek recovery of all Excessive Incentive-Based Compensation. Without limiting the foregoing, to the extent permitted by applicable law, any clawback under this Policy may be effectuated through the reduction, forfeiture or cancellation of awards, the return of paid cash or vested or released shares, or the proceeds from the sale of such vested or released shares, adjustments to future incentive compensation opportunities, or in such other manner as the Board in its discretion should determine to be appropriate.
The Company shall not indemnify any Covered Employee or other individual against the loss of any incorrectly awarded or otherwise recouped Excessive Incentive-Based Compensation.
The Committee shall not forgo, settle or release amounts subject to recovery and shall not indemnify or insure Covered Employees against the loss of Excessive Incentive-Based Compensation.
2.Disclosure Required. The Company shall comply with applicable compensation recovery policy disclosure rules of the Securities and Exchange Commission.
3.Interpretation of this Policy; Determinations by the Board. The Board may at any time in its sole discretion supplement or amend any provision of this Policy in any respect, or adopt a new policy relating to recovery of Incentive-Based Compensation with such terms as the Board determines in its sole discretion to be appropriate. The Board has the exclusive power and authority to administer this Policy, including, without limitation, the right and power to interpret the provisions of this Policy and to make all determinations deemed necessary or advisable for the administration of this Policy. All such reasonable actions, interpretations and determinations taken or made by the Board will be final, conclusive and binding.