UNITED STATES
SECURITIES AND EXCHANGE COMMISSION
Washington, D.C. 20549
FORM 40-F
[Check one]
| ☐ | REGISTRATION STATEMENT PURSUANT TO SECTION 12 OF THE SECURITIES EXCHANGE ACT OF 1934 |
OR
| ☒ | ANNUAL REPORT PURSUANT TO SECTION 13(a) OR 15(d) OF THE SECURITIES EXCHANGE ACT OF 1934 |
| For the fiscal year ended December 31, 2025 | Commission File Number 001-34244 |
HUDBAY MINERALS INC.
(Exact name of Registrant as specified in its charter)
N/A
(Translation of Registrant's name into English (if applicable))
Canada
(Province or other jurisdiction of incorporation or organization)
1000
(Primary Standard Industrial Classification Code Number (if applicable))
98-0485558
(I.R.S. Employer Identification Number (if applicable))
25 York Street
Suite 800
Toronto, Ontario
M5J 2V5, Canada
416 362-8181
(Address and telephone number of Registrant's principal executive offices)
Corporation Service Company
2711 Centerville Road, Suite 400
Wilmington, DE 19808
302 636-5401
(Name, address (including zip code) and telephone number (including area code) of agent for service in the United States)
Securities registered or to be registered pursuant to Section 12(b) of the Securities Exchange Act of 1934 (the "Exchange Act").
|
Title of each class |
Trading Symbol(s) |
Name of each exchange on which registered |
|
Common Shares, no par value |
HBM |
The New York Stock Exchange |
Securities registered or to be registered pursuant to Section 12(g) of the Exchange Act.
N/A
(Title of Class)
Securities for which there is a reporting obligation pursuant to Section 15(d) of the ExchangeAct.
N/A
(Title of Class)
For annual reports, indicate by check mark the information filed with this form:
| ☒ Annual Information Form | ☒ Audited Annual Financial Statements |
Indicate the number of outstanding shares of each of the issuer's classes of capital or common stock as of the close of the period covered by the annual report: As at December 31, 2025, 395,521,903 common shares were outstanding.
Indicate by check mark whether the registrant: (1) has filed all reports required to be filed by Section 13 or 15(d) of the Exchange Act during the preceding 12 months (or for such shorter period that the registrant was required to file such reports); and (2) has been subject to such filing requirements in the past 90 days.
| Yes ☒ | No ☐ |
Indicate by check mark whether the registrant has submitted electronically every Interactive Data File required to be submitted pursuant to Rule 405 of Regulation S-T (§232.405 of this chapter) during the preceding 12 months (or for such shorter period that the Registrant was required to submit such files).
| Yes ☒ | No ☐ |
Indicate by check mark whether the registrant is an emerging growth company as defined in Rule 12b-2 of
the Exchange Act.
Emerging growth company ☐
If an emerging growth company that prepares its financial statements in accordance with U.S. GAAP, indicate by check mark if the registrant has elected not to use the extended transition period for complying with any new or revised financial accounting standards† provided pursuant to Section 13(a) of the Exchange Act. ☐
Indicate by check mark whether the registrant has filed a report on and attestation to its management's assessment of the effectiveness of its internal control over financial reporting under Section 404(b) of the Sarbanes-Oxley Act (15 U.S.C. 7262(b)) by the registered public accounting firm that prepared or issued its audit report. ☒
If securities are registered pursuant to Section 12(b) of the Exchange Act, indicate by check mark whether the financial statements of the registrant included in the filing reflect the correction of an error to previously issued financial statements. ☐
Indicate by check mark whether any of those error corrections are restatements that required a recovery analysis of incentive-based compensation received by any of the registrant's executive officers during the relevant recovery period pursuant to §240.10D-1(b). ☐
† The term "new or revised financial accounting standard" refers to any update issued by the Financial Accounting Standards Board to its Accounting Standards Codification after April 5, 2012.
EXPLANATORY NOTE
Hudbay Minerals Inc. (the "Registrant") is a Canadian issuer eligible to file its annual report ("Annual Report") pursuant to Section 13(a) of the Securities Exchange Act of 1934, as amended (the "Exchange Act"), on Form 40-F pursuant to the multi-jurisdictional disclosure system under the Exchange Act. The Registrant is a "foreign private issuer" as defined in Rule 405 under the Securities Act of 1933, as amended (the "Securities Act"), and Rule 3b-4 under the Exchange Act. The equity securities of the Registrant are accordingly exempt from Sections 14(a), 14(b), 14(c), 14(f) and 16 of the Exchange Act pursuant to Rule 3a12-3 under the Exchange Act.
The Registrant is permitted, under the multi-jurisdictional disclosure system adopted by the United States and Canada, to prepare this Annual Report on Form 40-F in accordance with Canadian disclosure requirements, which are different from those of the United States.
This Annual Report contains references to both United States dollars and Canadian dollars. All dollar amounts referenced, unless otherwise indicated, are expressed in United States dollars, and Canadian dollars are referred to as "Canadian dollars" or "C$".
DOCUMENTS INCORPORATED BY REFERENCE
The Registrant's Annual Information Form ("AIF") for the fiscal year ended December 31, 2025 is incorporated herein by reference as Exhibit 99.1.
The audited consolidated financial statements (the "Audited Annual Financial Statements") of the Registrant for the years ended December 31, 2025 and 2024, including the reports of the Independent Registered Public Accounting Firm with respect thereto, are incorporated herein by reference as Exhibit 99.2. The Audited Annual Financial Statements have been prepared in accordance with IFRS® Accounting Standards as issued by the International Accounting Standards Board.
The Registrant's Management's Discussion & Analysis for the year ended December 31, 2025 is incorporated herein by reference as Exhibit 99.3.
The Registrant's Disclosure Pursuant to Section 1503(a) of the Dodd-Frank Wall Street Reform and Consumer Protection Act is incorporated herein by reference as Exhibit 99.4.
DISCLOSURE CONTROLS AND PROCEDURES
As of the end of the period covered by this Annual Report for the Registrant's fiscal year ended December 31, 2025, an evaluation of the effectiveness of the Registrant's "disclosure controls and procedures" (as such term is defined in Rules 13a-15(e) and 15d-15(e) of the Exchange Act) was carried out by the Registrant's management with the participation and supervision of the principal executive officer and principal financial officer. Based upon that evaluation, the Registrant's principal executive officer and principal financial officer have concluded that as of December 31, 2025, the Registrant's disclosure controls and procedures are effective to ensure that information required to be disclosed by the Registrant in reports that it files or submits under the Exchange Act is (i) recorded, processed, summarized and reported within the time periods specified in Commission rules and forms and (ii) accumulated and communicated to the Registrant's management, including its principal executive officer and principal financial officer, to allow timely decisions regarding required disclosure.
INTERNAL CONTROL OVER FINANCIAL REPORTING
The disclosure provided under the heading "Disclosure Controls and Procedures and Internal Control Over Financial Reporting" on page 82 of Exhibit 99.3, Management's Discussion & Analysis for the Year Ended December 31, 2025, is incorporated by reference herein. The Registrant did not make any changes to its "internal control over financial reporting" (as such term is defined in Rules 13a-15(f) and 15d-15(f) of the Exchange Act) during the year ended December 31, 2025 that materially affected, or are reasonably likely to materially affect, its internal control over financial reporting.
Management's report dated February 19, 2026 on the Registrant's internal control over financial reporting contained in Exhibit 99.2, Audited Annual Financial Statements, is incorporated by reference herein.
The Registrant's internal control over financial reporting as of December 31, 2025 has been audited by Deloitte LLP, Independent Registered Public Accounting Firm, who also audited the Audited Annual Financial Statements. Deloitte LLP expressed an unqualified opinion on the effectiveness of the Registrant's internal control over financial reporting.
All internal control systems, no matter how well designed, have inherent limitations. As a result, even systems determined to be effective may not prevent or detect misstatements on a timely basis, as systems can provide only reasonable assurance that the objectives of the control system are met. In addition, projections of any evaluation of the effectiveness of internal control over financial reporting to future periods are subject to the risk that controls may become inadequate because of changes in conditions, or that the degree of compliance with the policies or procedures may change.
ATTESTATION REPORT OF THE REGISTERED PUBLIC ACCOUNTING FIRM
The disclosure provided in the two reports of Deloitte LLP titled "Report of Independent Registered Public Accounting Firm" contained in Exhibit 99.2, Audited Annual Financial Statements for the years ended December 31, 2025 and 2024, are incorporated herein by reference.
BLACKOUT PERIODS
There were no "blackout periods", as defined under Rule 100(b) of Regulation BTR, requiring notice pursuant to Rule 104 of Regulation BTR during the fiscal year ended December 31, 2025.
AUDIT COMMITTEE IDENTIFICATION AND FINANCIAL EXPERT
As at December 31, 2025, the Registrant’s audit committee consisted of Paula C. Rogers (Chair), John E.F. Armstrong, George E. Lafond and Stephen A. Lang . The Registrant’s board of directors has determined that each of Ms. Rogers, Mr. Armstrong, Mr. Lafond and Mr. Lang is an “audit committee financial expert” within the meaning of the Commission’s rules. Each of Ms. Rogers, Mr. Armstrong, Mr. Lafond and Mr. Lang is also “independent” under the criteria of Rule 10A-3 of the Exchange Act as required by the New York Stock Exchange (the “NYSE”). The Commission has indicated that the designation of Ms. Rogers, Mr. Armstrong, Mr. Lafond and Mr. Lang as audit committee financial experts does not make any of them an “expert” for any purpose or impose any duties, obligations or liability on any of them that are greater than those imposed on members of the audit committee and board of directors who do not carry this designation. The audit committee’s charter sets out its responsibilities and duties, qualifications for membership, procedures for committee appointment and reporting to the Registrant’s board of directors. A copy of the current charter is attached to the AIF as Schedule C thereto and is available on the Registrant’s website at www.hudbayminerals.com/about-us/governance/default.aspx.
CODE OF ETHICS
The Registrant has adopted a Code of Business Conduct and Ethics (the "Code of Ethics") that applies to its principal executive officer, principal financial officer, principal accounting officer or controller and persons performing similar functions. A copy of the Code of Ethics is available on the Registrant's website at www.hudbayminerals.com/about-us/governance/default.aspx. The Registrant undertakes to provide to any person, without charge, upon request, a copy of the Code of Ethics. Requests for copies of the Code of Ethics should be made by contacting the Registrant's Senior Vice President, Legal and Organizational Effectiveness at 416-362-8181. No waivers of the Registrant's Code of Ethics were granted to any principal officer of the Registrant or any person performing similar functions during the fiscal year ended December 31, 2025.
During the fiscal year ended December 31, 2025 the Registrant did not make any amendments to its Code of Ethics. All amendments to the Code of Ethics, and all waivers of the Code of Ethics with respect to any of the officers covered by it, will be posted on the Registrant's website at www.hudbayminerals.com/about-us/governance/default.aspx.
PRINCIPAL ACCOUNTANT FEES AND SERVICES
The information about aggregate fees billed to us by our principal accountant, Deloitte LLP (PCAOB ID No. 1208) provided under the heading "Audit Committee Disclosure - Remuneration of Auditor" on page 67 of the AIF is incorporated by reference herein. All audit services, audit-related services, tax services, and other services provided for the fiscal year ended December 31, 2025 were pre-approved by the audit committee in accordance with the Registrant's pre-approval policy as described under the heading "Audit Committee Disclosure - Policy Regarding Non-Audit Services Rendered by Auditors" on page 67 of the AIF.
OFF-BALANCE SHEET ARRANGEMENTS
The Registrant has no off-balance sheet arrangements that have or are reasonably likely to have a current or future effect on the Registrant's financial condition, changes in financial condition, revenues or expenses, results of operation, liquidity, capital expenditures or capital resources that is material to investors.
TABULAR DISCLOSURE OF CONTRACTUAL OBLIGATIONS
The disclosure provided under the heading "Contractual Obligations" on page 53 of Exhibit 99.3, Management's Discussion & Analysis for the Year Ended December 31, 2025, is incorporated by reference herein.
COMPARISON WITH NEW YORK STOCK EXCHANGE GOVERNANCE RULES
The NYSE requires that each listed company meet certain corporate governance standards. These standards supplement the corporate governance reforms adopted by the United States Securities and Exchange Commission pursuant to the Sarbanes-Oxley Act of 2002.
Under the NYSE's Listed Company Manual, a "foreign private issuer", such as the Registrant, is not required to comply with most of the NYSE corporate governance standards. However, foreign private issuers are required to disclose any significant ways in which their corporate governance practices differ from those followed by U.S. companies under the NYSE corporate governance standards.
The Registrant is subject to the listing standards of the Toronto Stock Exchange (the "TSX") and the corporate governance rules of Canadian Securities Administrators. These listing standards and corporate governance rules are substantially similar to the NYSE listing standards. The Registrant complies with these TSX listing standards and Canadian corporate governance rules.
The following are the significant ways in which the Registrant's governance practices differ from those followed by domestic companies under the NYSE corporate governance standards:
Director Independence
The Registrant determines independence of its directors under the policies of the Canadian Securities Administrators. For a director to be considered independent under the policies of the Canadian Securities Administrators, he or she must have no direct or indirect material relationship with us, being a relationship that could, in the view of the board of directors, reasonably be expected to interfere with the exercise of his or her independent judgment, and must not be in any relationship deemed to be not independent pursuant to such policies. To assist in determining the independence of directors for purposes that include compliance with applicable legal and regulatory requirements and policies, the board of directors has adopted certain categorical standards, which are part of our Corporate Governance Guidelines. The Registrant's board of directors also determines whether each member of the Registrant's audit committee is independent pursuant to National Instrument 52-110 Audit Committees and Rule 10A-3 of the Exchange Act. The Registrant's board of directors has not adopted the director independence standards contained in Section 303A.02 of the NYSE's Listed Company Manual.
Approval of Equity Compensation Plans
Section 303A.08 of the NYSE's Listed Company Manual requires shareholder approval of all equity compensation plans and material revisions to such plans. The definition of "equity compensation plans" covers plans that provide for the delivery of both newly issued and treasury securities, as well as plans that rely on securities re-acquired in the open market by the issuing company for the purpose of redistribution to employers and directors. The TSX rules only require that shareholders approve the adoption of equity compensation plans that provide for new issuances of securities. Any amendments to such plans are subject to shareholder approval unless the specific equity compensation plan contains detailed provisions, approved by the shareholders, which specify those amendments requiring shareholder approval and those amendments which can be made without shareholder approval. The Registrant follows the TSX rules with respect to the requirements for shareholder approval of equity compensation plans and revisions to such plans.
Shareholder Approval Requirement
In lieu of Section 312 of the NYSE's Listed Company Manual, the Registrant will follow the TSX rules for shareholder approval of new issuances of its common shares. Following the TSX rules, shareholder approval is required for certain issuances of shares that (i) materially affect control of the Registrant or (ii) provide consideration to insiders in aggregate of 10% or greater of the market capitalization of the listed issuer and have not been negotiated at arm's length. Shareholder approval is also required, pursuant to the TSX rules, in the case of private placements (x) for an aggregate number of listed securities issuable greater than 25% of the number of securities of the listed issuer which are outstanding, on a non-diluted basis, prior to the date of closing of the transaction if the price per security is less than the market price or (y) that during any six month period are to insiders for listed securities or options, rights or other entitlements to listed securities greater than 10% of the number of securities of the listed issuer which are outstanding, on a non-diluted basis, prior to the date of the closing of the first private placement to an insider during the six month period.
INTERACTIVE DATA FILE
The required disclosure for the fiscal year ended December 31, 2025 is filed as Exhibit 101 to this Annual Report on Form 40-F.
MINE SAFETY DISCLOSURE
Pursuant to Section 1503(a) of the Dodd-Frank Wall Street Reform and Consumer Protection Act, issuers that are operators, or that have a subsidiary that is an operator, of a coal or other mine are required to disclose in their periodic reports filed with the Commission information regarding specified health and safety violations, orders and citations, related assessments and legal actions, and mining-related fatalities. For information regarding the Registrant's mine safety disclosures, see "Disclosure Pursuant to Section 1503(a) of the Dodd-Frank Wall Street Reform and Consumer Protection Act" filed as Exhibit 99.4 to this Annual Report on Form 40-F.
FORWARD-LOOKING STATEMENTS
Certain statements in this Annual Report on Form 40-F are forward-looking statements within the meaning of Section 21E of the Exchange Act and Section 27A of the Securities Act. Please see "Forward Looking Information" in the AIF for a discussion of risks, uncertainties, and assumptions that could cause actual results to vary from those forward-looking statements.
UNDERTAKING
The Registrant undertakes to make available, in person or by telephone, representatives to respond to inquiries made by the Commission staff, and to furnish promptly, when requested to do so by the Commission staff, information relating to: the securities registered pursuant to Form 40-F; the securities in relation to which the obligation to file an annual report on Form 40-F arises; or transactions in said securities.
CONSENT TO SERVICE OF PROCESS
The Registrant has previously filed with the Commission a written consent to service of process and power of attorney on Form F-X. Any change to the name or address of the Registrant's agent for service shall be communicated promptly to the Commission by amendment to the Form F-X referencing the file number of the Registrant.
* * *
SIGNATURES
Pursuant to the requirements of the Exchange Act, the Registrant certifies that it meets all of the requirements for filing on Form 40-F and has duly caused this Annual Report to be signed on its behalf by the undersigned, thereto duly authorized.
| HUDBAY MINERALS INC. | ||
| By: | /s/ Patrick Donnelly | |
| Name: | Patrick Donnelly | |
| Title: | Senior Vice President, Legal and Organizational Effectiveness |
|
| Date: | March 26, 2026 | |
EXHIBIT INDEX
Exhibit 97.1
HUDBAY MINERALS INC.
INCENTIVE-BASED COMPENSATION CLAWBACK POLICY
1. Purpose
This incentive-based compensation clawback policy (the "Policy") has been adopted by the Board of Directors (the "Board") of Hudbay Minerals Inc. (the "Company") in order to allow the Board to require, in specific situations, the reimbursement of short-term or long-term incentive compensation received by an Executive Officer (as defined below). The Board believes that it is in the best interests of the Company and its shareholders to create and maintain a culture that emphasizes integrity and accountability and that reinforces the Company's pay-for-performance compensation philosophy.
2. Definitions
For purposes of this Policy, the following terms shall have the meanings set forth below:
"Excess Incentive-Based Compensation" means (i) the amount by which any Incentive-Based Compensation that is approved, granted, awarded or paid to an Executive Officer based on erroneous or inaccurate data contained in Materially Non-Compliant Financial Statements as originally publicly filed exceeds the amount of any Incentive-Based Compensation that otherwise would have been approved, granted, awarded or paid to such Executive Officer based on the correct data contained (or to be provided in) in any subsequent restatement or other correction of such Materially Non-Compliant Financial Statements or (ii) the amount by which any Incentive-Based Compensation that is approved, granted, awarded or paid to an Executive Officer following a Wrongful Act of an Executive Officer of which the Board was not aware exceeds the amount of any Incentive-Based Compensation that otherwise would have been approved, granted, awarded or paid to such Executive Officer had the Board been aware of the Executive Officer's involvement in a Wrongful Act. The amount of Excess Incentive-Based Compensation shall be determined on a gross basis without any regard to any tax payment obligations of an Executive Officer with respect to the Incentive Compensation in question.
"Executive Officers" means Company's president, principal financial officer, principal accounting officer (or if there is no such accounting officer, the controller), any vice-president of the Company in charge of a principal business unit, division, or function (such as sales, administration, or finance), any other officer who performs a policy-making function, any other person who performs similar policy-making functions for the Company or any other officer of the Company who reports directly to the Chief Executive Officer. Executive officers of the Company's subsidiaries are deemed executive officers of the Company if they perform such policy making functions for the Company. Both current and former executive officers as defined above are included as "Executive Officers" for purposes of this Policy.
"HR Committee" means the Compensation and Human Resources Committee of the Board or such other committee as the Board may, from time to time, appoint to oversee the application of this Company's executive compensation policies.
2
"Incentive-Based Compensation" means any variable compensation (for greater certainty, not including base salary), including cash bonuses, stock options, share units and other incentive compensation (cash or equity-based, whether vested or unvested) awarded as compensation, the amount or payment of which is based in whole or in part on a measure or measures (whether quantitative or qualitative) that are intended to serve as an incentive for performance, notwithstanding whether such compensation is determined in whole or in part on an objective, subjective or discretionary basis by the person(s), Board or committee of the Board setting the amount or determining payment of such compensation, which is approved, granted, awarded or paid to an Executive Officer by the Company on or after the Effective Date.
"Lookback Period" means the three-year period preceding the date on which the Company (a)
reasonably determines (or should have determined) that it is required to prepare an accounting restatement to correct the Materially Non-Compliant Financial Statements or (b) discovers the Wrongful Act.
"Materially Non-Compliant Financial Statements" means any financial statements of the Company where (a) a restatement of the financial statements (a "Restatement") is required due to (i) material non-compliance with any financial reporting requirement under applicable securities laws, other than the retrospective application of a change or amendment in accounting principles, or (ii) any materially inaccurate misstatement of the Company's earnings, revenues, gains or other similar criteria; or (b) the Company's financial results are found to be inaccurate in a manner that materially affects the calculation of compensation for Executive Officers but does not give rise to a restatement.
"Wrongful Act" means any material breach of the Company's Code of Conduct, as amended from time to time, that results in the termination of the Executive Officer's employment.
3. Recoupment of Excess Incentive-Based Compensation
In the event of Materially Non-Compliant Financial Statements or if the Board determines in its sole discretion that the Executive Officer has been involved in any Wrongful Act on or following the Effective Date, the Board will review all Incentive-Based Compensation paid, granted or awarded to, or received or earned by, or vested in favour of, Executive Officers on the basis of having attained any financial reporting measure during the current period and the Lookback Period.
In the event that the Board determines that a Restatement is required the Board shall recoup any Excess Incentive-Based Compensation paid, granted or awarded to, or received or earned by, or vested in favour of, any current or former Executive Officer during the current period and the Lookback Period.
If (i) the Materially Non-Compliant Financial Statements do not require a Restatement or (ii) the Board determines in its sole discretion that an Executive Officer has been involved in any Wrongful Act on or following the Effective Date, the Board may determine the amount of any Excess Incentive-Based Compensation and seek to recoup such Excess Incentive-Based Compensation paid, granted or awarded to, or received or earned by, or vested in favour of, any current or former Executive Officer during the current period and the Lookback Period.
3
4. Limitation on Recoupment Period
Any recoupment under Section 3 of this Policy shall be in respect of Incentive-Based Compensation paid, granted or awarded to, or received or earned by, or vested in favour of, any current or former Executive Officer in the current period and the Lookback Period.
5. Means of Recoupment
The Board shall have the sole discretion and authority to determine the means by which any reimbursement required by this Policy shall occur. Reimbursement may, without limitation, (a) require the Executive Officer to repay all or a portion of any cash bonus (including any performance bonus) or other Incentive-Based Compensation granted, awarded or paid to the Executive Officer; (b) cancel all or a portion of any unvested or vested Incentive-Based Compensation granted, awarded or paid to the Executive Officer; (c) require the Executive Officer to repay all or a portion of any gains realized by the Executive Officer on the exercise of stock options or other equity-based compensation; (d) offset the recoupment/clawback amount against any current or future Incentive-Based Compensation; or (e) combine any of items (a) to (d) above.
If the Board cannot determine the amount of Excess Incentive-Based Compensation received by the Executive Officer directly from the information in a Restatement, then it will make its determination based on a reasonable estimate of the effect of such Restatement.
6. Effective Date
This Policy shall be effective as of March 29, 2023 (the "Effective Date") and shall apply to all individuals who are or become Executive Officers on or after the Effective Date in respect of all Incentive-Based Compensation paid, granted, awarded, received, earned or vested in respect of the financial year ending December 31, 2022 and all subsequent periods, whether before or after they became Executive Officers.
7. Board Authority
All determinations, decisions and interpretations to be made under this Policy shall be made by the Board, on the recommendation of the HR Committee. Any determination, decision or interpretation made by the Board under this Policy shall be final, binding and conclusive on all parties. This Policy may be amended or terminated at any time by the Board.
8. Administration of the Policy
Any applicable award agreement, form or other document setting forth the terms and conditions of any Incentive-Based Compensation covered by the Policy which is approved, granted, awarded or paid on or after the Effective Date shall be deemed to include the restrictions imposed herein and incorporate the Policy by reference and, in the event of any inconsistency, the terms of the Policy will govern.
Any determinations of the Board under this Policy shall be binding on the applicable Executive Officer.
4
To the extent necessary and where permitted by law, this Policy shall constitute an agreement to extend and to exclude the applicability of any statute of limitations (including, without limitation, the Limitations Act, 2002 (Ontario)) for recoupment by the Company of any Excess Incentive-Based Compensation or Incentive-Based Compensation.
Executive Officers shall not be entitled to any indemnification by or from the Company with respect to any amounts they are required to repay or forfeit pursuant to this Policy. Further, the Company shall not pay or reimburse any Executive Officers for any insurance policy entered into by an Executive Officer that provides for full or partial coverage of any recoupment obligation under this Policy.
9. No Impairment of Other Remedies
Any recoupment under this Policy is in addition to, and not in lieu of, any other remedies or rights of recoupment that may be available to the Company under applicable law, including, without limitation, (a) dismissing the Executive Officer, (b) adjusting the future compensation of the Executive Officer or (c) authorizing legal action or taking such other action to enforce the Executive Officer's obligations to the Company as it may deem appropriate in view of all of the facts and circumstances surrounding the particular case.
10. Impracticability
The Board shall recover any Excess Incentive-Based Compensation in accordance with this Policy unless such recovery would be impracticable, as determined by the Board in accordance with Rule 10D-1 of the Securities Exchange Act of 1934, as amended, and the New York Stock Exchange's listing standards or the listing standards of any other national securities exchange on which the Company's securities may be listed.
TABLE OF CONTENTS
CAUTION REGARDING FORWARD-LOOKING INFORMATION
This annual information form ("AIF") contains forward-looking information within the meaning of applicable Canadian securities laws and "forward-looking statements" within the meaning of the "safe harbor" provisions of the U.S. Private Securities Litigation Reform Act of 1995. We refer to such forward-looking statements and forward-looking information together in this AIF as forward-looking information. All information contained in this AIF, other than statements of current and historical fact, is forward-looking information. Often, but not always, forward-looking information can be identified by the use of words such as "plans", "expects", "budget", "guidance", "scheduled", "estimates", "forecasts", "strategy", "target", "intends", "objective", "goal", "understands", "anticipates" and "believes" (and variations of these or similar words) and statements that certain actions, events or results "may", "could", "would", "should", "might", "occur", "be achieved" or "will be taken" (and variations of these or similar expressions). All of the forward-looking information in this AIF is qualified by this cautionary note.
Forward-looking information includes, but is not limited to, statements with respect to our production, cost and capital and exploration expenditure guidance, expectations regarding reductions in discretionary spending and capital expenditures, Hudbay's ability to advance and complete the multi-year optimization of the Copper Mountain mine in British Columbia, including with respect to the primary SAG mill repairs and related ramp-up plans, the implementation of stripping strategies and the expected benefits therefrom, the expected timing and benefits of British Columbia growth initiatives, including with respect to the development timelines associated with New Ingerbelle and any challenges to the New Ingerbelle permits (including the LSIB's recent application for judicial review), the estimated timelines and pre-requisites for sanctioning the Copper World project, including the completion and anticipated results of the definitive feasibility study and the potential timing of a project sanctioning decision, the expected benefits of the sanctioning of the Copper World project, the ability for Hudbay to complete mill throughput enhancements at its operating business units in Peru, British Columbia and Manitoba, the expected benefits of Manitoba growth initiatives, including the use of the exploration drift at the 1901 deposit, the potential utilization of excess capacity at the Stall mill, and the advancement of our exploration partnerships with Marubeni Corporation ("Marubeni") and Japan Organization for Metals and Energy Security ("JOGMEC"), the anticipated use of proceeds from financing transactions, our deleveraging strategies and our ability to repay debt as needed including but not limited to with respect to the upcoming maturity of the 2026 Notes, expectations with respect to the timing and the ability to satisfy the conditions required to close the ASCU Transaction and the expected benefits therefrom, expectations regarding our cash balance and liquidity and related cash management strategies, expectations regarding Hudbay's capital planning strategies, including but not limited to Hudbay's enhanced Capital Allocation Framework, expectations regarding the ability to conduct exploration work and execute on exploration programs on our properties and to advance related drill plans, including the advancement of the exploration program at Maria Reyna and Caballito and the status of the related drill permit application process, expectations regarding our ability to further reduce greenhouse gas emissions, our evaluation and assessment of opportunities to reprocess tailings using various metallurgical technologies, expectations regarding the prospective nature of the Maria Reyna and Caballito properties, the anticipated impact of brownfield and greenfield growth projects on our performance, anticipated expansion opportunities and extension of mine life in Snow Lake and our ability to find a new anchor deposit near our Snow Lake operations, anticipated future drill programs and exploration activities and any results expected therefrom, the enhancement of stakeholder engagement and advancement of a pre-feasibility study and related test work at the Mason copper project in Nevada, anticipated mine plans, anticipated metals prices and the anticipated sensitivity of our financial performance to metals prices, events that may affect our operations and development projects, anticipated cash flows from operations and related liquidity requirements, the anticipated effect of external factors on revenue, such as commodity prices, estimation of mineral reserves and resources, mine life projections, reclamation costs, economic outlook, government regulation of mining operations, and business and acquisition strategies. Forward-looking information is not, and cannot be, a guarantee of future results or events. Forward-looking information is based on, among other things, opinions, assumptions, estimates and analyses that, while considered reasonable by us at the date the forward-looking information is provided, inherently are subject to significant risks, uncertainties, contingencies and other factors that may cause actual results and events to be materially different from those expressed or implied by the forward-looking information.
The material factors or assumptions that we identified and were applied by us in drawing conclusions or making forecasts or projections set out in the forward-looking information include, but are not limited to:
- the ability to achieve production, cost and capital and exploration expenditure guidance;
- no significant interruptions to our operations due to social or political unrest in the regions we operate, including the navigation of the complex political and social environment in Peru;
- no interruptions to our plans for advancing the Copper World project, including with respect to any challenges to the Copper World permits;
- no interruptions to our plans for advancing New Ingerbelle, including with respect to any challenges to the New Ingerbelle permits;
- our ability to successfully complete the stabilization and optimization of the Copper Mountain operations and develop and maintain good relations with key stakeholders;
- the ability to satisfy the conditions required to close the ASCU Transaction;
- the ability to execute on our exploration plans and to advance related drill plans;
- the ability to advance the exploration program at the Maria Reyna and Caballito properties;
- the success of mining, processing, exploration and development activities;
- the scheduled maintenance and availability of our processing facilities;
- the accuracy of geological, mining and metallurgical estimates;
- anticipated metals prices and the costs of production;
- the supply and demand for metals we produce;
- the supply and availability of all forms of energy and fuels at reasonable prices;
- no significant unanticipated operational or technical difficulties;
- the execution of our business and growth strategies, including the success of our strategic investments and initiatives;
- the availability of additional financing, if needed;
- the ability to deleverage and repay debt, as needed including but not limited to with respect to the upcoming maturity of the 2026 Notes;
- the ability to complete project targets on time and on budget and other events that may affect our ability to develop our projects;
- the timing and receipt of various regulatory and governmental approvals;
- the availability of personnel for our exploration, development and operational projects and ongoing employee relations;
- maintaining good relations with the employees at our operations;
- maintaining good relations with the labour unions that represent certain of our employees in Manitoba and Peru;
- maintaining good relations with the communities in which we operate, including the neighbouring Indigenous communities and local governments;
- no significant unanticipated challenges with stakeholders at our various projects;
- no significant unanticipated events or changes relating to regulatory, environmental, health and safety matters;
- the timing and possible outcome of pending litigation and no significant unanticipated litigation;
- certain tax matters, including, but not limited to current tax laws and regulations, changes in taxation policies and the refund of certain value added taxes from the Canadian and Peruvian governments; and
- no significant and continuing adverse changes in general economic conditions or conditions in the financial markets (including commodity prices and foreign exchange rates).
- no contests over title to our properties, including as a result of rights or claimed rights of Indigenous peoples or challenges to the validity of our unpatented mining claims; The risks, uncertainties, contingencies and other factors that may cause actual results to differ materially from those expressed or implied by the forward-looking information may include, but are not limited to, risks related to failure to effectively advance and complete the optimization of the Copper Mountain mine operations including with respect to the primary SAG mill repairs and related ramp-up plans, political and social risks in the regions we operate, including the navigation of the complex political and social environment in Peru, risks generally associated with the mining industry and the current geopolitical environment, including fluctuations in commodity prices, the potential implementation or expansion of tariffs, currency and interest rate fluctuations, energy and consumable prices, supply chain constraints and general cost escalation in the current inflationary environment, uncertainties related to the development and operation of our projects, the risk of an indicator of impairment or impairment reversal relating to a material mineral property, risks associated with the development of new projects, risks associated with acquisitions, investments and other strategic transactions including but not limited to the ASCU Transaction, risks related to the Copper World project, including the risk of capital cost escalation, permitting challenges, project delivery risks, and financing risks, risks related to the Lalor mine plan, including the ability to convert inferred mineral resource estimates to higher confidence categories, dependence on key personnel and employee and union relations, risks related to political or social instability, unrest or change, risks in respect of Indigenous and community relations, rights and title claims, operational risks and hazards, including the cost of maintaining and upgrading our tailings management facilities and any unanticipated environmental, industrial and geological events and developments and the inability to insure against all risks, failure of plant, equipment, processes, transportation and other infrastructure to operate as anticipated, compliance with government and environmental regulations, including permitting requirements and anti-bribery legislation, depletion of our reserves, volatile financial markets and interest rates that may affect our ability to obtain additional financing on acceptable terms, the failure to obtain or maintain required permits or approvals from government authorities on a timely basis, uncertainties related to the geology, continuity, grade and estimates of mineral reserves and resources and the potential for variations in grade and recovery rates, uncertain costs of reclamation activities, our ability to comply with our pension and other post-retirement obligations, our ability to abide by the covenants in our debt instruments and other material contracts, liquidity risks and our ability to access capital on acceptable terms, tax refunds, hedging transactions, cybersecurity risks and risks related to the reliability and security of our information technology and operational technology systems, including risks arising from cyber attacks, ransomware, phishing and other malware, risks associated with the use of artificial intelligence technologies, operational disruptions arising from environmental events such as wildfires or other forms of extreme weather, as well as the risks discussed under the heading "Risk Factors" in this AIF.
Should one or more risk, uncertainty, contingency or other factor materialize or should any factor or assumption prove incorrect, actual results could vary materially from those expressed or implied in the forward-looking information. Accordingly, you should not place undue reliance on forward-looking information. We do not assume any obligation to update or revise any forward-looking information after the date of this AIF or to explain any material difference between subsequent actual events and any forward-looking information, except as required by applicable law.
NOTE TO UNITED STATES INVESTORS
This AIF has been prepared in accordance with the requirements of the securities laws in effect in Canada, which differ from the requirements of the United States Securities and Exchange Commission (the "SEC") and reserve and resource information included herein may not be comparable to similar information disclosed by U.S. companies.
Canadian reporting requirements for disclosure of mineral properties are governed by the Canadian Securities Administrators' National Instrument 43-101 Standards of Disclosure for Mineral Projects ("NI 43-101") and the Canadian Institute of Mining, Metallurgy and Petroleum ("CIM") CIM Definition Standards on Mineral Resources and Mineral Reserves, adopted by CIM Council on May 10, 2014, as amended (the "CIM Standards"). Further to recent amendments, mineral property disclosure requirements in the United States are governed by subpart 1300 of Regulation S-K of the Securities Act of 1933, as amended (the "U.S. Rules") which differ from the CIM Standards. The definitions used in NI 43-101 are incorporated by reference from the CIM Standards.
As a foreign private issuer that is eligible to file reports with the SEC pursuant to the multi-jurisdictional disclosure system (the "MJDS"), the Company is not required to provide disclosure on its mineral properties under the U.S. Rules and will continue to provide disclosure under NI 43-101 and the CIM Standards. If the Company ceases to be a foreign private issuer or loses its eligibility to file its annual report on Form 40-F pursuant to the MJDS, then the Company will be subject to the U.S. Rules, which differ from the requirements of NI 43-101 and the CIM Standards.
Pursuant to the U.S. Rules, the SEC recognizes estimates of "measured mineral resources", "indicated mineral resources" and "inferred mineral resources". In addition, the definitions of "proven mineral reserves" and "probable mineral reserves" under the U.S. Rules are "substantially similar" to the corresponding CIM Standards, incorporated by reference in NI 43-101.
United States investors are cautioned that while the above terms are "substantially similar" under NI 43-101 and the CIM Standards, there are differences in the definitions under the U.S. Rules and the CIM Standards. Accordingly, there is no assurance any mineral reserves or mineral resources that the Company may report as "proven mineral reserves", "probable mineral reserves", "measured mineral resources", "indicated mineral resources" and "inferred mineral resources" under NI 43-101 would be the same had the Company prepared the reserve or resource estimates under the standards adopted under the U.S. Rules.
Mineralization described using these terms has a greater amount of uncertainty as to their existence and feasibility than mineralization that has been characterized as reserves. Accordingly, investors are cautioned not to assume that any "measured mineral resources", "indicated mineral resources", or "inferred mineral resources" that the Company reports are or will be economically or legally mineable.
Further, "inferred mineral resources" have a greater amount of uncertainty as to their existence and as to whether they can be mined legally or economically. In accordance with Canadian rules, estimates of "inferred mineral resources" cannot form the basis of feasibility or other economic studies, except in limited circumstances where permitted under NI 43-101.
OTHER IMPORTANT INFORMATION
Certain scientific and technical terms and abbreviations used in this AIF are defined in the "Glossary of Mining Terms" attached as Schedule A.
Unless the context suggests otherwise, references to "we", "us", "our" and similar terms, as well as references to "Hudbay" and the "Company", refer to Hudbay Minerals Inc. and its direct and indirect subsidiaries.
CURRENCY AND EXCHANGE RATES
This AIF contains references to both United States dollars and Canadian dollars. All references to "dollars" or "$", unless otherwise indicated, are expressed in United States dollars, and Canadian dollars are referred to as "Canadian dollars" or "C$". The average exchange rate for 2025 and the closing exchange rate as at December 31, 2025 (being the final trading day of 2025) as reported by the Bank of Canada, were one United States dollar per $1.3978 Canadian dollars and $1.3706 Canadian dollars, respectively.
On March 25, 2026 (being the final trading day prior to the date of this AIF), the Bank of Canada daily exchange rate was one United States dollar per $1.3801 Canadian dollars.
NON-GAAP FINANCIAL PERFORMANCE MEASURES
Hudbay uses certain non-GAAP financial performance measures in this AIF and certain of its other public disclosure documents, including adjusted net earnings (loss) attributable to owners, adjusted net earnings (loss) per share attributable to owners, adjusted EBITDA, realized prices, net debt, net debt to adjusted EBITDA, free cash flow, cash cost, sustaining and all-in sustaining cash cost per pound of copper produced, cash cost and sustaining cash cost per ounce of gold produced, combined unit cost and ratios based on these measures are non-GAAP performance measures. These measures do not have a meaning prescribed by IFRS® Accounting Standards ("IFRS" or "GAAP") as issued by the International Accounting Standards Board and are therefore unlikely to be comparable to similar measures presented by other issuers. These measures should not be considered in isolation or as a substitute for measures prepared in accordance with IFRS and are not necessarily indicative of operating profit or cash flow from operations as determined under IFRS. Other companies may calculate these measures differently.
Management believes adjusted net earnings (loss) attributable to owners and adjusted net earnings (loss) per share attributable to owners provides an alternate measure of the Company's performance for the current period and gives insight into its expected performance in future periods. These measures are used internally by the Company to evaluate the performance of its underlying operations and to assist with its planning and forecasting of future operating results. As such, the Company believes these measures are useful to investors in assessing the Company's underlying performance. We provide adjusted EBITDA to help users analyze our results and to provide additional information about our ongoing cash generating potential in order to assess our capacity to service and repay debt, carry out investments and cover working capital needs. Net debt is shown because it is a performance measure used by the Company to assess our financial position. Net debt to adjusted EBITDA is shown because it is a performance measure used by the Company to assess our financial leverage and debt capacity. Realized price is shown to understand the average realized price of metals sold to third parties in each reporting period. Free cash flow is shown as it provides investors and management additional information in assessing the Company's ability to generate cash flow from current operations after investing in capital to sustain the operations. Cash cost, sustaining and all-in sustaining cash cost per pound of copper produced are shown because we believe they help investors and management assess the performance of our operations, including the margin generated by the operations and the Company. Cash cost and sustaining cash cost per ounce of gold produced are shown because we believe they help investors and management assess the performance of our Manitoba operations. Combined unit cost is shown because we believe it helps investors and management assess our cost structure and margins that are not impacted by variability in by-product commodity prices.
For a description and reconciliation of each of these measures, please see the Non-GAAP Financial Performance Measures section on pages 59 through 80 of Hudbay's management's discussion and analysis for the year ended December 31, 2025, a copy of which has been filed under our profile on SEDAR+ at www.sedarplus.ca and EDGAR at www.sec.gov.
CORPORATE STRUCTURE
INCORPORATION AND REGISTERED OFFICE
We were formed by the amalgamation of Pan American Resources Inc. and Marvas Developments Ltd. on January 16, 1996, pursuant to the Business Corporations Act (Ontario) and changed our name to Pan American Resources Inc. On March 12, 2002, we acquired ONTZINC Corporation, a private Ontario corporation, through a reverse takeover and changed our name to ONTZINC Corporation. On December 21, 2004, we acquired Hudson Bay Mining and Smelting Co., Limited ("HBMS") and changed our name to HudBay Minerals Inc. In connection with the acquisition of HBMS, on December 21, 2004, we amended our articles to consolidate our common shares on a 30 to 1 basis. On October 25, 2005, we were continued under the Canada Business Corporations Act ("CBCA").
On August 15, 2011, we completed a vertical short-form amalgamation under the CBCA with our subsidiary (HMI Nickel Inc.). On January 1, 2017, we completed a vertical short-form amalgamation under the CBCA with two of our subsidiaries (HBMS and Hudson Bay Exploration and Development Company Limited) and changed our name from HudBay Minerals Inc. to Hudbay Minerals Inc. On January 1, 2024, we completed a vertical short-form amalgamation under the CBCA with three of our subsidiaries (Copper Mountain Mining Inc., Hudbay British Columbia Inc. and Rockcliff Metals Corporation) and continued carrying on business as Hudbay Minerals Inc. On January 1, 2025, we completed a vertical short-form amalgamation under the CBCA with two of our wholly-owned subsidiaries (Hudbay Metal Marketing Inc. and Hudbay Marketing & Sales Inc.), and continued carrying on business as Hudbay Minerals Inc., which is the current and existing successor amalgamated entity.
Our registered office is located at 333 Bay Street, Suite 3400, Bay Adelaide Centre, Toronto, Ontario M5H 2S7 and our principal executive office is located at 25 York Street, Suite 800, Toronto, Ontario M5J 2V5.
Our common shares are listed on the Toronto Stock Exchange ("TSX"), New York Stock Exchange ("NYSE") and Bolsa de Valores de Lima under the symbol "HBM".
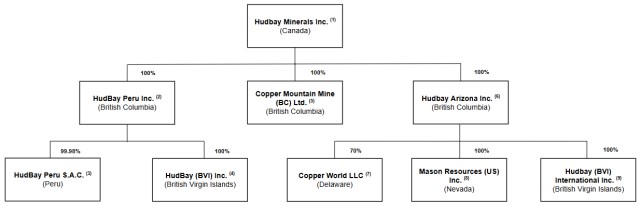
INTERCORPORATE RELATIONSHIPS
The following chart shows our principal subsidiaries as of the date of this AIF, their jurisdiction of incorporation and the percentage of voting securities we beneficially own or over which we have control or direction.
Notes:
1. Hudbay directly owns our mining operations in Manitoba, is the borrower under our Canadian revolving credit facility, the issuer of our Senior Unsecured Notes and a guarantor of our Peruvian revolving credit facility.
2. HudBay Peru Inc. owns 99.98% of HudBay Peru S.A.C. ("Hudbay Peru"). The remaining 0.02% is owned by 6502873 Canada Inc., our wholly-owned subsidiary. HudBay Peru Inc. is a guarantor of our Credit Facilities and our Senior Unsecured Notes.
3. Hudbay Peru owns the Constancia mine and certain exploration properties in Peru, is the borrower under our Peruvian revolving credit facility and is a guarantor of our Canadian revolving credit facility and our Senior Unsecured Notes.
4. HudBay (BVI) Inc. is the party to the precious metals stream agreement in respect of the Constancia mine in Peru and its sole purpose is to fulfill its obligations thereunder.
5. Copper Mountain Mine (BC) Ltd. owns the Copper Mountain mine in British Columbia.
6. Hudbay Arizona Inc., through its subsidiaries, indirectly owns 70% of Copper World LLC and 100% of Mason Resources (US) Inc. ("Mason US").
7. Copper World LLC, a Delaware entity, (formerly known as Copper World, Inc., an Arizona entity) owns the Copper World project in Arizona. MC Americas Resources, a wholly owned subsidiary of Mitsubishi Corporation, acquired a 30% minority interest in Copper World LLC pursuant to the CW JV Transaction.
8. Mason US owns the Mason project in Nevada as well as certain exploration properties in the surrounding area.
9. Hudbay (BVI) International Inc. (formerly known as HudBay Arizona (Barbados) SRL) is the party to the precious metals stream agreement in respect of the Copper World project and its sole purpose is to fulfill its obligations thereunder. HudBay Arizona (Barbados) SRL was discontinued under the laws of Barbados and continued under the laws of the British Virgin Islands as Hudbay (BVI) International Inc., effective December 31, 2025.
DEVELOPMENT OF OUR BUSINESS
BUSINESS, PURPOSE & STRATEGY
Our Business
We are a copper-focused critical minerals company with three long-life operations and a world-class pipeline of copper growth projects in the tier-one mining jurisdictions of Canada, Peru and the United States. Our operating portfolio includes the Constancia mine in Cusco (Peru), the Snow Lake operations in Manitoba (Canada) and the Copper Mountain mine in British Columbia (Canada). Copper is the primary metal we produce, which is complemented by meaningful gold production and by-product zinc, silver and molybdenum. Our growth pipeline includes the Copper World project in Arizona (United States), the Mason project in Nevada (United States), the Llaguen project in La Libertad (Peru) and several expansion and exploration opportunities near our existing operations.
Our Purpose
The value we create and the impact we have is embodied in our purpose statement:
"We care about our people, our communities and our planet. Hudbay provides the metals the world
needs. We work sustainably, transform lives and create better futures for communities."
We transform lives: We invest in our employees, their families and local communities through long-term employment, local procurement and economic development to improve their quality of life and ensure the communities benefit from our presence.
We operate responsibly: From exploration to closure, we operate safely and responsibly, we welcome innovation and strive to minimize our environmental footprint while following leading operating practices in all facets of mining.
We provide critical metals: We produce copper and other metals needed for everyday products and essential for applications to support the energy transition toward a more sustainable future.
Our Strategy
Our mission is to create sustainable value and strong returns by leveraging our core strengths in community relations, focused exploration, mine development and efficient operations.
We believe that copper is the commodity with the best long-term supply/demand fundamentals and offers shareholders the greatest opportunity for sustained risk-adjusted returns. Copper is essential for achieving energy transition and AI technology needs - it is one of the most heavily utilized metals in renewable energy systems and is a key component for power networks, circuit boards and cooling systems in data processing centres. Through the discovery and successful development of economic mineral deposits, and through highly efficient low-cost operations to extract the metals, we believe sustainable value will be created for all stakeholders.
Our successful development, ramp-up and operation of the Constancia open-pit mine in Peru, our long history of underground mining and full life-cycle experience in northern Manitoba, our track record of reserve expansion through effective exploration, and our organic pipeline of copper development projects including Copper World and Mason provide us with a competitive advantage to deliver sustainable value relative to other mining companies of similar scale.
Over the past decade, we have built a world-class asset portfolio by executing a consistent long-term growth strategy focused on copper. We continuously work to generate strong free cash flow and optimize the value of our producing assets through exploration, brownfield expansion projects and efficient and safe operations. Furthermore, we intend to sustainably grow Hudbay through the exploration and development of our robust project pipeline, as well as through the acquisition of other properties that fit our stringent strategic criteria.
To ensure that any investment in our existing assets or acquisition of other mineral assets is consistent with our purpose and mission, we have established a number of criteria for evaluating these opportunities. The criteria include the following:
- Sustainability: We are focused on jurisdictions that support responsible mining activity. Our current geographic focus is on select investment grade countries in the Americas, with strong rule of law and respect for human rights consistent with our long-standing focus on environmental, social and governance ("ESG") principles;
- Copper Focus: We believe copper is the commodity with the best long-term supply/demand fundamentals. Global copper mine supply is challenged due to declining industry grades, major disruptions at large mines, limited exploration success and an insufficient pipeline of development-ready projects, while demand is expected to continue to increase through global decarbonization initiatives and the rapid growth in AI data processing centres. We believe this long-term supply/demand gap will create opportunities for increased risk-adjusted returns. While our primary focus is on copper, we recognize and value the polymetallic nature of copper deposits and, in particular, the complementary benefits of gold in our portfolio;
- Quality: We are focused on investing in long-life, low-cost, expandable, high-quality assets that can capture peak pricing of multiple commodity price cycles and can generate free cash flow through the troughs of price cycles;
- Potential: We consider the full spectrum of acquisition and investment opportunities, from early-stage exploration to producing assets, that offer significant incremental potential for exploration, development, expansion and optimization beyond the stated resources and mine plan;
- Process: We develop a clear understanding of how an investment or acquisition can create value through our robust due diligence and capital allocation process that applies our technical, social, operational and project execution expertise;
- Operatorship: We believe value is created through leveraging our competitive advantages in safe and efficient operations, effective exploration, proven project development and strong community relations. While operatorship is a key criterion, we are open to joint ventures and partnerships that de-risk our portfolio and increase risk-adjusted returns; and
- Capital Allocation: We pursue investments and acquisitions that are accretive to Hudbay on a per share basis. Given that our strategic focus includes allocating capital to assets at various stages of development, when evaluating accretion, we will consider measures such as internal rate of return, return on invested capital, net asset value per share and the contained value of reserves and resources per share.
Our key objectives for 2026 are focused on continued operational excellence, advancement of organic growth opportunities and prudent capital allocation to deliver attractive high-return growth:
1. Demonstrate continued operational excellence to generate substantial free cash flow through consistent copper and gold production, industry-leading cost performance and high-return brownfield reinvestment opportunities.
o Increase mill throughput at Constancia to more than 90,000 tonnes per day in the second half of 2026 through the installation of two pebble crushers.
o Continue mill throughput improvements at New Britannia and recovery enhancements at the Stall mill.
o Advance the 1901 deposit towards full production by the end of 2027.
o Ramp up mill throughput at Copper Mountain to its permitted capacity of 50,000 tonnes per day in the second half of 2026.
2. Advance attractive organic growth opportunities to deliver significant increase in long-term production.
o Complete the definitive feasibility study at Copper World in mid-2026 with final sanctioning decision expected in 2026.
o Following receipt of the New Ingerbelle expansion permits in February 2026, progress New Ingerbelle development activities to add production and mine life extension at Copper Mountain.
o Advance exploration programs and economic evaluations of regional satellite properties in Snow Lake, including the Talbot copper-gold-zinc deposit, the Rail copper-gold deposit and the historical New Britanna gold mine, to further optimize the mine plan and extend mine life.
o Execute extensive exploration program to look for new anchor deposits to meaningfully extend mine life in the Snow Lake area as well as in the Flin Flon area in partnership with Marubeni and JOGMEC.
o Initiate pre-feasibility study activities at Mason to de-risk project development.
o Advance Flin Flon tailings reprocessing opportunities through pre-feasibility analysis.
o Prepare for exploration activities at Maria Reyna and Caballito to identify high-grade satellite deposits within trucking distance of Constancia's milling infrastructure and provide significant long-term upside potential in Peru.
3. Implement the Capital Allocation Framework to maintain strong financial discipline and maximize returns.
o Continue to reduce total debt outstanding and maintain significant financial flexibility throughout Copper World project build.
o Source the most efficient project level financing for Copper World as part of our prudent financial plan for developing the project.
o Evaluate all types of capital redeployment opportunities, including reinvestments and shareholder returns to generate the highest risk-adjusted returns.
THREE YEAR HISTORY
Peru Operations
Mining activities at the Pampacancha satellite deposit were completed in the fourth quarter of 2025, after having achieved commercial production in April 2021. The remaining stockpiled Pampacancha ore was fully processed in January 2026 and the Company is now exclusively mining and processing ore from the Constancia deposit.
Hudbay controls a large, contiguous block of mineral rights with the potential to host mineral deposits in close proximity to the Constancia processing facility, including the past producing Caballito property and the highly prospective Maria Reyna property. The Company commenced early exploration activities at Maria Reyna and Caballito after completing a surface rights exploration agreement with the community of Uchucarcco in August 2022. As part of the drill permitting process, environmental impact assessment applications (each, an "EIA") were submitted for the Maria Reyna property in November 2023 and for the Caballito property in April 2024. The EIA for Maria Reyna was approved by the government in June 2024 and the Caballito EIA was approved by the government in September 2024. The remaining steps in the drill permitting process include the completion by the Peruvian government of the Consulta Previa consultation process with the local community. Surface mapping and geochemical sampling confirm that both Caballito and Maria Reyna host sulfide and oxide rich copper mineralization in skarns, hydrothermal breccias and large porphyry intrusive bodies.
In March 2024, the Company increased mineral reserve estimates at Constancia to include the addition of a tenth mining phase in the Constancia pit after conducting positive geotechnical drilling and studies in 2023. The current expected mine life at Constancia is 2040, reflecting higher mill throughput rates following the Peruvian Ministry of Energy and Mines' decision to approve a regulatory change in June 2024 to allow mining companies in Peru to increase throughput by up to 10% above permitted levels. The Company plans to install two pebble crushers at Constancia in 2026, which is expected to increase mill throughput beginning in the second half of 2026.
Manitoba Operations
On September 14, 2023, Hudbay successfully completed its acquisition of Rockcliff Metals Corp. ("Rockcliff"). Rockcliff was one of the largest landholders in the Snow Lake area, with approximately 1,800 square kilometres across all its properties. Through the Rockcliff acquisition, Hudbay consolidated its ownership interest in the Talbot deposit and acquired the Rail deposit. The Talbot and Rail deposits and additional Rockcliff exploration properties provide further optionality and potential future feed sources for the Stall and New Britannia mills. In 2023, Hudbay also completed the acquisition of mineral claims in the Cook Lake area, which is also located within trucking distance of the existing Snow Lake processing infrastructure and which forms part of Hudbay's current exploration strategy in Manitoba.
Since placing the Flin Flon concentrator and tailings facilities on care and maintenance in 2022, following the closure of the 777 mine, we have continued to evaluate the economic feasibility of reprocessing the tailings in the Flin Flon tailings impoundment area ("FFTIA"). The FFTIA holds more than 100 million tonnes of tailings that have been deposited over approximately 90 years, including tailings generated from the former hydrometallurgical zinc facility, which is currently a focus of the Company's reprocessing evaluation. Hudbay operated a hydrometallurgical zinc facility where high grade critical minerals and precious metals were deposited for more than 25 years. Metallurgical test work continued in 2025 following positive results from the initial confirmatory drill program completed in 2024. An early economic study to evaluate the opportunity to reprocess the zinc plant tailings has confirmed the potential for a technically viable reprocessing alternative, and further engineering work is in progress.
Included in our evaluation of moving forward with the tailings reprocessing opportunity is the potential to more efficiently manage the environmental impacts associated with the existing tailings in the FFTIA and simplify the long-term reclamation process. The studies are specifically evaluating the potential to use the existing Flin Flon concentrator with flow sheet modifications to reprocess tailings to recover critical minerals and precious metals while creating environmental and social benefits for the region.
In 2025, Hudbay continued to execute the largest exploration program in Snow Lake in the Company's history through extensive geophysical surveying and multi-phased drilling campaigns as the Company advanced its search to find a new anchor deposit in Manitoba. Hudbay commenced an extensive summer drill program at the Talbot copper-zinc-gold deposit in July 2025 focused on expanding the known mineralization and testing geophysical targets. Initial drilling results confirmed the continuity of mineralization at depth and supported the potential for resource expansion, with additional drilling ongoing. In 2025, near-mine exploration at the Lalor mine was conducted and is expected to continue into 2026, with the objective of increasing mineral reserves and resources and supporting future production. At the 1901 deposit, Hudbay completed development of the initial exploration drift and commenced delivery of zinc-rich development ore for processing at Stall. Activities over the next two years at 1901 are expected to focus on continued exploration, definition drilling, orebody access and infrastructure to support full production targeted for late 2027.
In 2025, Hudbay continued to prioritize strong relationships with our Indigenous communities of interest in Manitoba. Several meetings with Indigenous communities were held to discuss future exploration and geophysical programs within their traditional territories. In February 2025, Hudbay signed its first-ever exploration agreement with the Kiciwapa Cree Nation, while in April 2025, Hudbay signed its first-ever exploration agreement with the Mosakahiken Cree Nation.
In 2025, Hudbay's Snow Lake operations were temporarily impacted by wildfires and mandatory evacuations in northern Manitoba. Mandatory evacuation orders beginning in late May 2025 resulted in a temporary suspension of operations and production deferrals of over two months, followed by a staged restart. Operations ramped up through the end of August and September of 2025 and normalized in the fourth quarter of 2025 following the lifting of evacuation orders.
British Columbia Operations
On June 20, 2023, Hudbay completed the acquisition of all of the issued and outstanding common shares of Copper Mountain Mining Corp. ("Copper Mountain") (including all CMMC CHESS Depositary Interests ("CMMC CDIs")) (collectively, the "CMMC Shares") pursuant to a court-approved plan of arrangement under the Business Corporations Act (British Columbia) (collectively, the "CMMC Transaction") and, in consideration therefor, former holders of CMMC Shares ("CMMC Shareholders") received 0.381 of a Hudbay share for each CMMC Share held immediately prior to the effective time of the CMMC Transaction.
As a result of the completion of the CMMC Transaction, Copper Mountain became a wholly-owned subsidiary of Hudbay and Hudbay became the indirect owner of 75% of the Copper Mountain mine, with Mitsubishi Materials Corporation ("MMC") holding the remaining interest. On March 26, 2025, Hudbay entered into an agreement with MMC to acquire MMC's 25% minority interest in Copper Mountain Mine (BC) Ltd. for an upfront cash payment of $4.5 million and up to $39.75 million in deferred and contingent cash payments (the "MMC Transaction"). The MMC Transaction closed on April 30, 2025 and Hudbay now holds a 100% indirect interest in the Copper Mountain mine.
Since completing the CMMC Transaction in June 2023, Hudbay has been focused on advancing operational stabilization and optimization plans, including opening up the mine by re-activating the full mining fleet, adding additional haul trucks, adding additional mining faces, optimizing the ore feed to the plant and implementing plant improvement initiatives that mirror Hudbay's successful processes at Constancia. A key pillar of the ramp-up was the successful onboarding of over 240 new employees, significantly expanding the Company's in-house team of skilled equipment operators in British Columbia.
On December 5, 2023, Hudbay released its first NI 43-101 technical report in respect of the Copper Mountain mine. In January 2025, we completed feasibility engineering on a capital project to debottleneck and increase the nominal plant capacity to its permitted capacity of 50,000 tonnes per day earlier than contemplated in the technical report. Mining rates continued to increase through 2025 as part of the Company's optimization plan, with targeted mining rates achieved late in the year. Additionally, conversion of the third ball mill to a second SAG mill was substantially completed in 2025, and the permanent feeder configuration was commissioned in December 2025. Mill throughput is expected to ramp up toward the permitted capacity of 50,000 tonnes per day in the second half of 2026, and a feed-end head replacement for the primary SAG mill is planned for mid-2026.
In February 2026, Hudbay received amended permits for the New Ingerbelle expansion project at the Copper Mountain mine. The permit amendments support an extended mine life and continued production from the New Ingerbelle pit. In parallel with the permitting process, Hudbay also finalized updated participation agreements with the Upper Similkameen Indian Band (the "USIB") and the Lower Similkameen Indian Band (the "LSIB"). On March 23, 2026, the LSIB submitted an application for judicial review of the regulatory decision to grant the Mines Act M-29 permit amendment. Hudbay remains confident in the integrity and robustness of the regulatory process that led to the issuance of the permit amendment and Hudbay believes the court will uphold that process. At the same time, Hudbay remains committed to working with the LSIB in a respectful and constructive manner to try to resolve the LSIB's concerns through the mechanisms that were agreed to by the parties in the participation agreement.
Copper World Project
In September 2023, Hudbay released its de-risked and enhanced pre-feasibility study for Phase I of the Copper World project (the "Copper World PFS"). Phase I is a standalone operation requiring state and local permits only. Phase I has a mine life of 20 years, which is four years longer than the Phase I mine life that was presented in the preliminary economic assessment of the Copper World project in July 2022 (the "Copper World PEA"), largely due to an increase in the capacity for tailings and waste deposition as a result of optimizing the site layout. Phase II is expected to involve an expansion onto federal lands with an extended mine life and enhanced project economics. Phase II would be subject to the federal permitting process and was not included in the PFS results. See "Material Mineral Projects - Copper World" for further information regarding the Copper World PFS findings.
Hudbay has received the three key state permits required for Phase I of the Copper World project. The first key state permit required for Copper World, the Mined Land Reclamation Plan, was initially approved by the Arizona State Mine Inspector in October 2021 and was subsequently amended to reflect a larger private land project footprint. This approval was challenged in state court, but the challenge was dismissed in May 2023. The Aquifer Protection Permit was received on August 29, 2024 from the Arizona Department of Environmental Quality ("ADEQ") following a robust process that included detailed analysis by the ADEQ and Hudbay, along with a public comment period that was completed in the second quarter of 2024. The Aquifer Protection Permit remains unchallenged. The Air Quality Permit was received on January 2, 2025 from the ADEQ following a similarly robust process, including a public comment period that concluded in the third quarter of 2024. Subsequently, the Arizona Office of Administrative Hearings upheld the Air Quality Permit following an appeal. Hudbay remains confident that the Air Quality Permit, and the other permits received for the Copper World project, will continue to be upheld, notwithstanding further ongoing appeal processes.
In August 2025, Hudbay entered into a definitive agreement with Mitsubishi Corporation ("Mitsubishi") pursuant to which Mitsubishi agreed to acquire a 30% minority interest in the Copper World project for aggregate consideration of $600 million (the "CW JV Transaction"). In January 2026, Hudbay announced the closing of the CW JV Transaction, pursuant to which MC Americas Resources, a wholly-owned U.S. subsidiary of Mitsubishi, acquired a 30% minority joint venture interest in Copper World LLC, which owns the Copper World project. On closing, Mitsubishi contributed approximately $420 million of cash to Copper World LLC and is required to contribute the remaining balance of its initial investment in the amount of $180 million within 18 months of closing. Mitsubishi will also fund its pro rata 30% share of future equity capital contributions required to construct the Copper World project. The proceeds from the CW JV Transaction are expected to be used to fund remaining definitive feasibility study and pre-sanction costs and initial development expenditures for Copper World.
As part of our disciplined approach to developing Copper World, in November 2022, Hudbay introduced a three prerequisites plan, including specific leverage targets that it would need to achieve prior to making an investment decision in the project:
1. Permits - receipt of all state level permits required for Phase I
2. Plan - completion of a definitive feasibility study with an internal rate of return of greater than 15%
3. Prudent Financing Strategy - multi-faceted financing strategy including a committed minority joint venture partner, a renegotiated precious metals stream agreement optimized for the current project, and achievement of certain designated financial metrics.
Hudbay has achieved the final key financial elements of its three prerequisites plan for the development of the Copper World project with the closing of the CW JV Transaction and the achievement of stated deleveraged balance sheet targets.
A definitive feasibility study for Copper World is well advanced and is expected to be completed in mid-2026. Hudbay is also advancing detailed engineering, certain long-lead items and other de-risking activities in advance of a potential project sanctioning decision later in the year.
Recent Developments
On March 1, 2026, Hudbay entered into an arrangement agreement (the "Arrangement Agreement") with Arizona Sonoran Copper Company Inc. ("ASCU") pursuant to which Hudbay agreed to acquire all of the issued and outstanding common shares of ASCU (the "ASCU Shares") that it does not already own pursuant to a plan of arrangement under the Business Corporations Act (British Columbia), subject to the satisfaction of the conditions contained in the Arrangement Agreement (the "ASCU Transaction").
Under the terms of the ASCU Transaction, holders of ASCU Shares will receive 0.242 of a Hudbay common share for each ASCU Share. Outstanding equity incentive awards of ASCU will be settled in accordance with the terms of the ASCU Transaction. Following completion of the ASCU Transaction, Hudbay will beneficially own 100% of the issued and outstanding ASCU Shares.
The ASCU Transaction is subject to ASCU shareholder approval and customary regulatory approvals and is expected to close in the second quarter of 2026. If the ASCU Transaction is completed as expected, Hudbay will add the Cactus project, a copper development project in Pinal County, Arizona, to its growth pipeline of copper assets.
Financing Activities and Deleveraging Efforts
On April 9, 2021, Copper Mountain completed an offering of $250 million of secured bonds (the "Copper Mountain Bonds"). The Copper Mountain Bonds provided the bondholders with the right to put all or part of the principal amount of the outstanding Copper Mountain Bonds at a price of 101%, plus accrued interest, following a change of control event. As of the completion of the CMMC Transaction on June 20, 2023, approximately $143 million of Copper Mountain Bonds remained outstanding and, after giving effect to the completion of the CMMC Transaction, the change of control event was triggered and $83.3 million of the Copper Mountain Bonds were put to Copper Mountain on July 17, 2023. The Company utilized its Credit Facilities to finance the redemption of the Copper Mountain Bonds that were put to Copper Mountain. In the fourth quarter of 2023, Hudbay continued its deleveraging efforts by redeeming, in full, the remaining $59.7 million principal amount of outstanding Copper Mountain Bonds. The Copper Mountain Bonds were previously scheduled to mature on April 9, 2026.
On May 24, 2024, we completed a bought deal common share equity offering, pursuant to which a syndicate of underwriters purchased from treasury a total of 42,366,000 of Hudbay common shares at a price of $9.50 per common share for aggregate gross proceeds of $402,477,000. The net proceeds of the offering were intended to be used to fund near-term growth initiatives, including acceleration of mine pre-stripping activities and mill optimization initiatives at Copper Mountain, to enhance balance sheet flexibility through debt repayments as part of our "3P" plan for a sanctioning decision on Copper World, to evaluate mill throughput enhancement opportunities at Constancia and New Britannia, and for general corporate purposes.
After repaying $100 million in prior drawdowns earlier in the year, on November 13, 2024, we completed an amendment of our senior secured revolving credit facilities (the "Credit Facilities"), which (a) extended the maturity date by three years from October 2025 to November 2028, (b) allowed flexibility to leave our 2026 Notes outstanding to maturity, (c) created an improved pricing grid to reflect Hudbay's enhanced financial position and (d) provided an opportunity to increase the Credit Facilities by an additional $150 million (from $450 million to $600 million) at our discretion during the four-year tenor.
In addition, as part of our deleveraging efforts, in 2025 we repurchased and retired a total of $102.5 million of our 4.50% senior unsecured notes due April 2026 (the "2026 Notes"), in aggregate, and, as at December 31, 2025, $542.4 million of our 6.125% senior unsecured notes due April 2029 (the "2029 Notes") and $472.5 million of our 2026 Notes remained outstanding. The Company currently anticipates that it will redeem all of the outstanding 2026 Notes at maturity on April 1, 2026 using the Company's available liquidity. See "Description of Capital Structure - Senior Unsecured Notes" for more information.
As a result of the continued cash flow generation and our deleveraging efforts, we have substantially reduced our net debt to $439.7 million as of December 31, 2025, as compared to $525.7 million at the end of 2024. The net debt reduction, together with higher levels of adjusted EBITDA over the last twelve months, has significantly improved our net debt to adjusted EBITDA ratio to 0.4x compared to 0.6x at the end of 2024. For more information regarding these metrics, please see "Non-GAAP Financial Performance Measures".
Executive Leadership, Board of Directors and Chair Transition
On January 1, 2025, David S. Smith was appointed as the Chair of the Board of Directors, replacing Stephen A. Lang due to health reasons. Mr. Lang, who was appointed as the Chair of the Board of Directors in October 2019, remained on the Board of Directors as an independent director. Prior to being appointed as Chair, Mr. Smith had served as an independent director on the Board of Directors since May 2019.
In recent years, Hudbay has refreshed the constitution of its Board of Directors. Since the beginning of 2022, five new directors have joined Hudbay's Board of Directors, including, most recently, John E. F. Armstrong in May 2025 and Laura Tyler in September 2025. These appointments reflect Hudbay's ongoing commitment to maintaining a Board of Directors with a broad range of skills, experience and perspectives relevant to the Company's strategy and operations.
At the executive leadership level, Hudbay made several promotions in 2025. In May 2025, Robert Carter was promoted to Senior Vice President, Canada, having previously served as Vice President, Manitoba Business Unit since April 2022 and, prior to that, as General Manager of Hudbay's Manitoba mines since 2018. In September 2025, Candace Brûlé was promoted to Senior Vice President, Capital Markets and Corporate Affairs, and Mark Gupta was promoted to Senior Vice President, Corporate Development and Strategy. Ms. Brûlé continues to oversee investor relations, financial planning and analysis, external communications and sustainability reporting, and leads Hudbay's Canadian government engagement efforts, while Mr. Gupta continues to be responsible for corporate strategy and optimizing Hudbay's portfolio through acquisitions, divestitures, investments and partnerships.
DESCRIPTION OF OUR BUSINESS
GENERAL
We have four material mineral projects:
1. our 100% owned Constancia mine, an open pit copper mine in Peru, which achieved commercial production in the second quarter of 2015;
2. our 100% owned Snow Lake operations, including the Lalor mine, an underground gold, zinc and copper mine near Snow Lake, Manitoba, which achieved commercial production in the third quarter of 2014;
3. our 100% owned Copper Mountain mine, an open pit copper mine in southern British Columbia, which also produces gold and silver as by-product metals; and
4. our 70% owned Copper World project, a copper development project in Pima County, Arizona.
In addition to mining properties in northern Manitoba and the Copper Mountain mine in southern British Columbia, Hudbay owns and operates a portfolio of processing facilities in Canada. This includes (i) the Stall concentrator in Snow Lake, Manitoba, which produces zinc and copper concentrates, (ii) the New Britannia mill in Snow Lake, Manitoba, which produces gold/silver doré and copper concentrate, and (iii) the processing facility at the Copper Mountain mine in Princeton, British Columbia, which produces copper concentrate. Hudbay also owns a number of other properties in the Snow Lake, Manitoba region within trucking distance of the Stall and New Britannia mills that have the potential to provide additional feed for our Snow Lake operations.
In Peru, Hudbay owns and operates a processing facility at Constancia, which produces copper and molybdenum concentrates from the Constancia deposit and, prior to its recent depletion, also processed ore from the Pampacancha satellite deposit. Hudbay also owns a large, contiguous block of mineral rights within trucking distance of the Constancia processing facility, including the past producing Caballito property and the highly prospective Maria Reyna property. In addition, Hudbay owns a 100% interest in the Llaguen project in La Libertad, Peru, a greenfield project located close to existing infrastructure.
In Nevada, we own a 100% interest in the Mason project, an early-stage copper project with a substantial mineral resource and a robust PEA. We are currently advancing plans to initiate a pre-feasibility study for the Mason project.
The following map shows where our primary assets and certain exploration properties are located:
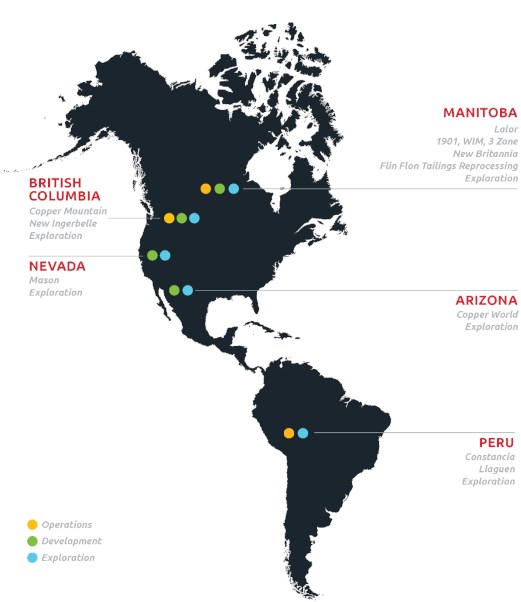
MATERIAL MINERAL PROJECTS
Constancia
Constancia is our 100% owned copper mine in Peru. It is located in the Province of Chumbivilcas in southern Peru. Constancia is a large-scale open pit operation supported by significant processing infrastructure, and Hudbay continues to pursue brownfield optimization opportunities to enhance operating performance and mill throughput. Pampacancha, a high-grade satellite deposit located near the Constancia mine, provided a significant source of higher-grade mill feed in recent years. Mining activities in the Pampacancha pit were completed in the fourth quarter of 2025 following the accelerated depletion of the deposit, and remaining stockpiled Pampacancha ore was processed in early 2026.
Hudbay is currently advancing mill throughput enhancement initiatives at Constancia, including the installation of two pebble crushers and related permitting amendments, which are expected to increase mill throughput to more than 90,000 tonnes per day in the second half of 2026. These initiatives are intended to optimize the utilization of existing infrastructure and support improved long-term operating performance. The expected mine life at Constancia is now until 2040, giving effect to the increased throughput rates.
In 2025, the operations in Peru delivered 85,155 tonnes of copper at a cash cost of $1.08 per pound of copper net of by-products, despite temporary operational interruptions and changes to the mine plan due to social unrest. Full year production of gold, silver and molybdenum in 2025 was 74,480 ounces, 2,415,134 ounces and 1,282 tonnes, respectively. Copper, gold, silver and molybdenum production declined compared to 2024 production levels primarily due to fewer tonnes of ore milled due to the aforementioned temporary operational interruptions in the third quarter of 2025 and lower grades from higher amounts of ore processed from stockpiles. Despite the impact from the temporary operational interruption due to social unrest, Hudbay achieved its 2025 production guidance for copper and gold in Peru, with gold production exceeding the top end of the 2025 guidance range.
Hudbay controls a large, contiguous block of mineral rights with the potential to host mineral deposits in close proximity to the Constancia processing facility, including the past producing Caballito property and the highly prospective Maria Reyna property. These regional targets are being evaluated as potential satellite deposits that could provide additional mill feed to the Constancia processing infrastructure over the longer term. The Company commenced early exploration activities at Maria Reyna and Caballito after completing a surface rights exploration agreement with the community of Uchucarcco in August 2022. As part of the drill permitting process, an EIA was submitted for the Maria Reyna property in November 2023 and for the Caballito property in April 2024. The EIA for Maria Reyna was approved by the government in June 2024 and the Caballito EIA was approved by the government in September 2024. The remaining steps in the drill permitting process include completion of the Consulta Previa consultation process with the local community.
100% of the payable silver and 50% of the payable gold at Constancia is subject to a precious metals stream agreement with Wheaton Precious Metals ("Wheaton"). We receive cash payments equal to the lesser of (i) the market price and (ii) $400 per ounce (for gold) and $5.90 per ounce (for silver), subject to one percent annual escalation, which started in 2019. Gold recovery for purposes of calculating payable gold was originally fixed at 55% for gold mined from Constancia and 70% for gold mined from Pampacancha. On May 10, 2021, an amendment to the Constancia streaming agreement was signed with Wheaton. As part of this amendment, Hudbay agreed to increase the fixed gold recoveries that apply to Constancia ore production from 55% to 70% during the reserve life of Pampacancha, which matches the fixed rate of recovery that applies to Pampacancha production.
On March 29, 2021, we filed a technical report titled "NI 43-101 Technical Report, Constancia Mine, Cuzco, Peru", effective as of January 1, 2021, prepared by Olivier Tavchandjian (our Senior Vice President, Exploration and Technical Services) (the "Constancia Technical Report"), a copy of which is available under our profile on SEDAR+ at www.sedarplus.ca and on EDGAR at www.sec.gov. For additional details on our Constancia mine, refer to Schedule B of this AIF.
Mineral Reserves and Resources
The following table sets forth our estimates of the mineral reserves at the Constancia and Pampacancha mines.
| Constancia and Pampacancha Mineral Reserve Estimates - January 1, 2026(1)(2)(3) | |||||||||||||||
| Tonnes | Cu (%) | Mo (g/t) | Au (g/t) | Ag (g/t) | |||||||||||
| Constancia | |||||||||||||||
| Proven | 458,800,000 | 0.243 | 75 | 0.036 | 2.39 | ||||||||||
| Probable | 28,300,000 | 0.193 | 68 | 0.034 | 1.98 | ||||||||||
| Total Proven and Probable | 487,100,000 | 0.240 | 74 | 0.036 | 2.37 | ||||||||||
| Pampacancha | |||||||||||||||
| Proven | 900,000 | 0.216 | 128 | 0.307 | 3.57 | ||||||||||
| Probable | 0 | 0.000 | 0 | 0.000 | 0.00 | ||||||||||
| Total Proven and Probable | 900,000 | 0.216 | 128 | 0.307 | 3.57 | ||||||||||
| Total Mineral Reserve | 488,000,000 | 0.240 | 74 | 0.036 | 2.37 | ||||||||||
Notes:
1. Totals may not add up correctly due to rounding.
2. Long term metal prices of $4.40 per pound copper, $17.00 per pound molybdenum, $2,800 per ounce gold, and $32.00 per ounce silver were used to confirm the economic viability of the mineral reserve estimates.
3. Mineral reserves are estimated using a minimum NSR cut-off of $7.30 per tonne at Pampacancha, $7.30 per tonne at Constancia and assuming metallurgical recoveries (applied by ore type) of 86% for copper on average for the life of mine.
The following table sets forth our estimates of the mineral resources (exclusive of mineral reserves) at the Constancia and Pampacancha mines.
| Constancia and Pampacancha Mineral Resource Estimates - January 1, 2026(1)(2)(3)(4)(5) | |||||||||||||||
| Tonnes | Cu (%) | Mo (g/t) | Au (g/t) | Ag (g/t) | |||||||||||
| Constancia | |||||||||||||||
| Measured | 106,300,000 | 0.232 | 74 | 0.036 | 2.36 | ||||||||||
| Indicated | 70,400,000 | 0.222 | 87 | 0.032 | 2.00 | ||||||||||
| Inferred - open pit | 27,700,000 | 0.271 | 71 | 0.049 | 2.54 | ||||||||||
| Inferred - underground | 6,500,000 | 1.200 | 69 | 0.140 | 8.62 | ||||||||||
| Pampacancha | |||||||||||||||
| Inferred | 0 | 0.000 | 0 | 0.00 | 0.0 | ||||||||||
| Total Measured + Indicated | 176,700,000 | 0.228 | 79 | 0.034 | 2.22 | ||||||||||
| Total Inferred | 34,200,000 | 0.447 | 71 | 0.067 | 3.70 | ||||||||||
Notes:
1. Totals may not add up correctly due to rounding.
2. Mineral resources are exclusive of mineral reserves and do not have demonstrated economic viability.
3. Mineral resource estimates are based on resource pit design and do not include factors for mining recovery or dilution.
4. The open pit mineral resources are estimated using a minimum NSR cut-off of $7.30 per tonne and assuming metallurgical recoveries (applied by ore type) of 84.6% for copper on average for the life of mine, while the underground inferred resources at Constancia Norte are based on a 0.65% copper cut-off grade
5. Long term metal prices of $4.40 per pound copper, $17.00 per pound molybdenum, $2,800 per ounce gold, and $32.00 per ounce silver were used to estimate mineral resources.
Lalor and 1901
Our 100% owned Snow Lake operations and assets near the town of Snow Lake, Manitoba consist of the Lalor gold-copper- zinc mine, the 1901 zinc-gold deposit and several satellite deposits (which are described further below). The Lalor mine achieved commercial production in 2014 and reached a significant milestone in December 2024 with the recovery of one million ounces of gold from the mine, in aggregate. The 1901 deposit was discovered in 2019, and in 2020 and 2021 Hudbay conducted infill drilling, metallurgical testing and a pre-feasibility study.
Mineral reserve estimates as at January 1, 2026 have extended the expected mine life of our Snow Lake operations by four years to 2041. The life-of-mine production schedule has been optimized for higher mill throughput rates at New Britannia, supporting strong gold production and cash flows.
On March 29, 2021, we released an updated mine plan for Snow Lake. The enhanced mine plan incorporated the results from several optimization initiatives, including: increasing the production rate at Lalor, increasing the throughput rate at the Stall mill; incorporating mineral reserves from the 1901 deposit into the mine plan, and implementing a recovery improvement project at the Stall mill to increase copper and precious metal recoveries.
Refurbishment and commissioning activities at the New Britannia gold mill were completed in July 2021 and the construction of the new copper flotation facility at New Britannia was completed in October 2021, ahead of the original schedule. The copper facility consists of an innovative and first-of-its-kind flotation circuit based entirely on Jameson cells, a modern pneumatic flotation design that offers a compact layout, low-cost process and flexible flowsheet. Following a brief commissioning period, the New Britannia mill achieved commercial production on November 30, 2021.
The commissioning of the Stall mill recovery improvement project was completed in the second quarter of 2023, and subsequent optimization activities proved highly effective, resulting in notably higher recoveries for copper.
During the 2025 calendar year, from a production standpoint, the Snow Lake operations continued to deliver meaningful gold production despite challenging operational disruptions from two months of mandatory wildfire evacuations and a one-week power outage caused by a winter storm. In 2025, the Snow Lake operations produced 173,453 ounces of gold, 9,249 tonnes of copper, 17,646 tonnes of zinc and 800,198 ounces of silver. The production levels were all lower than 2024 on an annual basis, primarily due to the operational disruptions described above. The New Britannia mill continued to perform strongly in 2025, achieving a new monthly throughput record of approximately 2,300 tonnes per day in December of 2025. The performance of the New Britannia mill has supported continued gold production and cash flow generation in Manitoba.
There are several opportunities to enhance the Snow Lake operations through exploration upside and mill processing projects. Progress on the 1901 deposit continued during 2025. Hudbay completed development of the initial exploration drift and commenced delivery of zinc-rich development ore for processing at the Stall mill during the year. Activities over the next two years are expected to focus on continued exploration, definition drilling, orebody access and infrastructure development to support full production targeted for late 2027. Near-mine exploration drilling at Lalor continued during 2025 and is expected to continue into 2026, with the objective of increasing mineral reserves and resources and supporting future production.
Hudbay continued to execute extensive regional exploration programs in the Snow Lake region during 2025 aimed at extending known mineralization at satellite deposits and identifying additional deposits within trucking distance of existing processing infrastructure, in addition to exploring for a potential new anchor deposit.
On March 29, 2021, we filed an updated NI 43-101 technical report titled "NI 43-101 Technical Report, Lalor and Snow Lake Operations, Manitoba, Canada", effective as of January 1, 2021, prepared by Olivier Tavchandjian (our Senior Vice President, Exploration and Technical Services), a copy of which is available under our profile on SEDAR+ at www.sedarplus.ca and on EDGAR at www.sec.gov. For additional details on our Lalor mine, refer to Schedule B of this AIF.
Mineral Reserves and Resources
The following table sets forth our estimates of the mineral reserves at the Lalor mine and 1901 deposit.
| Lalor and 1901 Mineral Reserve Estimates - January 1, 2026 (1)(2)(3)(4)(5) | |||||||||||||||||||||
| Tonnes | Au (g/t) | Zn (%) | Cu (%) | Ag (g/t) | |||||||||||||||||
| Gold | Proven | Lalor | 4,800,000 | 4.28 | 0.70 | 0.51 | 27.0 | ||||||||||||||
| 1901 | - | - | - | - | - | ||||||||||||||||
| Subtotal | 4,800,000 | 4.28 | 0.70 | 0.51 | 27.0 | ||||||||||||||||
| Probable | Lalor | 4,900,000 | 3.41 | 0.27 | 0.87 | 16.8 | |||||||||||||||
| 1901 | - | - | - | - | - | ||||||||||||||||
| Subtotal | 4,900,000 | 3.41 | 0.27 | 0.87 | 16.8 | ||||||||||||||||
| Proven and Probable | Lalor | 9,800,000 | 3.84 | 0.48 | 0.69 | 21.8 | |||||||||||||||
| 1901 | - | - | - | - | - | ||||||||||||||||
| Subtotal | 9,800,000 | 3.84 | 0.48 | 0.69 | 21.8 | ||||||||||||||||
| Base Metal | Proven | Lalor | 4,400,000 | 2.42 | 4.36 | 0.36 | 27.7 | ||||||||||||||
| 1901 | 900,000 | 2.25 | 7.60 | 0.27 | 24.0 | ||||||||||||||||
| Subtotal | 5,300,000 | 2.39 | 4.91 | 0.34 | 27.0 | ||||||||||||||||
| Probable | Lalor | 600,000 | 1.50 | 4.11 | 0.34 | 25.1 | |||||||||||||||
| 1901 | 700,000 | 1.67 | 8.23 | 0.22 | 28.5 | ||||||||||||||||
| Subtotal | 1,400,000 | 1.59 | 6.31 | 0.27 | 26.9 | ||||||||||||||||
| Proven and Probable | Lalor | 5,100,000 | 2.30 | 4.33 | 0.36 | 27.3 | |||||||||||||||
| 1901 | 1,600,000 | 1.99 | 7.89 | 0.24 | 26.0 | ||||||||||||||||
| Subtotal | 6,700,000 | 2.22 | 5.20 | 0.33 | 27.0 | ||||||||||||||||
| Gold and Base Metal | Proven and Probable | Lalor | 14,800,000 | 3.31 | 1.80 | 0.58 | 23.7 | ||||||||||||||
| 1901 | 1,600,000 | 1.99 | 7.89 | 0.24 | 26.0 | ||||||||||||||||
| Total | 16,500,000 | 3.18 | 2.40 | 0.54 | 23.9 | ||||||||||||||||
Notes:
1. Totals may not add up correctly due to rounding.
2. Long-term metal prices of $2,800 per ounce gold, $1.25 per pound zinc, $4.40 per pound copper and $32.00 per ounce silver with an exchange rate of 1.33 C$/US$ were used to confirm the economic viability of the mineral reserve estimates.
3. Lalor mineral reserves are estimated using a NSR cut-off ranging from C$161 to C$185 per tonne, assuming a long hole mining method and depending on the mill destination.
4. Individual stope gold grades at Lalor & 1901 were capped at 10 grams per tonne.
5. 1901 mineral reserves are estimated using a minimum NSR cut-off of C$199 per tonne.
The following table sets forth our estimates of the mineral resources (exclusive of mineral reserves) at the Lalor mine and 1901 deposit.
| Lalor and 1901 Mineral Resource Estimates (Exclusive of Mineral Reserves) - January 1, 2026(1)(2)(3)(4)(5)(6)(7) | |||||||||||||||||||||
| Tonnes | Au (g/t) | Zn (%) | Cu (%) | Ag (g/t) | |||||||||||||||||
| Gold | Inferred | Lalor | 1,400,000 | 4.64 | 0.21 | 2.48 | 15.4 | ||||||||||||||
| 1901 | 2,700,000 | 4.20 | 0.65 | 0.58 | 16.3 | ||||||||||||||||
| Subtotal | 4,100,000 | 4.35 | 0.50 | 1.24 | 16.0 | ||||||||||||||||
| Base Metal | Inferred | Lalor | 400,000 | 1.42 | 1.74 | 1.28 | 18.3 | ||||||||||||||
| 1901 | 100,000 | 1.23 | 8.12 | 0.13 | 38.1 | ||||||||||||||||
| Subtotal | 500,000 | 1.37 | 3.39 | 0.98 | 23.4 | ||||||||||||||||
| Gold and Base Metal | Inferred | Lalor | 1,800,000 | 3.95 | 0.53 | 2.22 | 16.0 | ||||||||||||||
| 1901 | 2,800,000 | 4.06 | 1.01 | 0.56 | 17.3 | ||||||||||||||||
| Total | 4,600,000 | 4.02 | 0.82 | 1.21 | 16.8 | ||||||||||||||||
Notes:
1. Totals may not add up correctly due to rounding.
2. Mineral resources are exclusive of mineral reserves and do not have demonstrated economic viability.
3. Mineral resources do not include factors for mining recovery or dilution.
4. Base metal mineral resources are estimated based on the assumption that they would be processed at the Stall concentrator while gold mineral resources are estimated based on the assumption that they would be processed at the New Britannia concentrator.
5. Long-term metal prices of $2,800 per ounce gold, $1.25 per pound zinc, $4.40 per pound copper and $32.00 per ounce silver with an exchange rate of 1.33 C$/US$ were used to estimate mineral resources.
6. Lalor mineral resources are estimated using a NSR cut-off ranging from C$161 to C$185 per tonne, assuming a long hole mining method and depending on mill destination.
7. 1901 mineral resources are estimated using a minimum NSR cut-off of C$199 per tonne.
Copper Mountain Mine
Our 100% owned Copper Mountain mine is an open pit copper mine in southern British Columbia that also produces gold and silver as by-product metals. Hudbay acquired Copper Mountain as part of the CMMC Transaction in June 2023 and, following the closing of the MMC Transaction on April 30, 2025, now holds a 100% interest in Copper Mountain Mine (BC) Ltd., which owns the Copper Mountain mine.
Hudbay's operations at the Copper Mountain mine include a series of open pits, an ore processing plant, waste rock facilities, a tailings management facility, and other ancillary facilities that support the operations. Since acquiring Copper Mountain in June 2023, Hudbay has been focused on advancing operational optimization and stabilization plans, including opening up the mine by re-activating the full mining fleet, adding additional haul trucks, adding additional mining faces, optimizing the ore feed to the plant and implementing plant improvement initiatives that mirror Hudbay's successful processes at Constancia. Conversion of the third ball mill to a second SAG mill was substantially completed in 2025, and the permanent feeder configuration was commissioned in December 2025. Mill throughput is expected to ramp toward its permitted capacity of 50,000 tonnes per day in the second half of 2026. A feed-end head replacement for the primary SAG mill is planned for mid-2026. Mineral reserve estimates as at January 1, 2026 have extended Copper Mountain's expected mine life by two years until 2045.
In February 2026, amended permits were received for the New Ingerbelle expansion project, supporting an extended mine life and continued production from the New Ingerbelle pit. The New Ingerbelle expansion is a transformative development for Copper Mountain, strategically designed to unlock access to higher-grade gold mineralization while significantly improving operational efficiency with a stripping ratio approximately three times lower than current mining areas. On March 23, 2026, the LSIB submitted an application for judicial review of the regulatory decision to grant the Mines Act M-29 permit amendment for New Ingerbelle. Hudbay remains confident in the integrity and robustness of the regulatory process that led to the issuance of the permit amendment and Hudbay believes the court will uphold that process.
Hudbay has participation agreements in place with each of the USIB and LSIB in respect of the Copper Mountain mine. Hudbay is committed to working collaboratively with the USIB and LSIB to continue to advance responsible mining practices and environmental stewardship, and has communicated its willingness to work with the LSIB in a respectful and constructive manner to try to resolve the LSIB's concerns regarding the Mines Act M-29 permit amendment for New Ingerbelle through the mechanisms that were agreed to by the parties in the participation agreement.
On December 5, 2023, we filed a NI 43-101 technical report titled "NI 43-101 Technical Report, Updated Mineral Resources and Mineral Reserves Estimate, Copper Mountain Mine", effective as of December 1, 2023, prepared by Olivier Tavchandjian (our Senior Vice President, Exploration and Technical Services), a copy of which is available under our profile on SEDAR+ at www.sedarplus.ca and on EDGAR at www.sec.gov. For additional details on the Copper Mountain mine, refer to Schedule B of this AIF.
Mineral Reserves and Resources
The following table sets forth our estimates of the mineral reserves at the Copper Mountain mine (including the New Ingerbelle pit).
| Copper Mountain (including New Ingerbelle) Mineral Reserve Estimates - January 1, 2026(1)(2)(3) | ||||||||||||
| Tonnes | Cu (%) | Au (g/t) | Ag (g/t) | |||||||||
| Proven | 159,000,000 | 0.251 | 0.11 | 0.71 | ||||||||
| Probable | 186,000,000 | 0.260 | 0.13 | 0.60 | ||||||||
| Total Proven + Probable | 345,000,000 | 0.256 | 0.12 | 0.65 | ||||||||
Notes:
1. Totals may not add up correctly due to rounding.
2. Long term metal prices of $4.40 per pound copper, $2,800 per ounce gold, and $32.00 per ounce silver were used to confirm the economic viability of the mineral reserve estimates.
3. Mineral reserves are estimated using a 0.1% copper cut-off grade and assuming metallurgical recoveries (applied by ore type) of 87% for copper for New Ingerbelle, 85% for copper for Copper Mountain, 70% for gold for New Ingerbelle, 65% for gold for Copper Mountain and 70% for silver for both deposits throughout the life of mine.
The following table sets forth our estimates of the mineral resources (exclusive of mineral reserves) at the Copper Mountain mine (including the New Ingerbelle pit).
| Copper Mountain (including New Ingerbelle) Mineral Resource Estimates (Exclusive Of Mineral Reserves) - January 1, 2026(1)(2)(3)(4)(5) |
||||||||||||
| Tonnes | Cu (%) | Au (g/t) | Ag (g/t) | |||||||||
| Measured | 35,000,000 | 0.226 | 0.09 | 0.83 | ||||||||
| Indicated | 87,000,000 | 0.203 | 0.10 | 0.72 | ||||||||
| Inferred | 347,000,000 | 0.235 | 0.12 | 0.57 | ||||||||
| Total Measured + Indicated | 122,000,000 | 0.210 | 0.10 | 0.75 | ||||||||
| Total Inferred | 347,000,000 | 0.235 | 0.12 | 0.57 | ||||||||
Notes:
1. Totals may not add up correctly due to rounding.
2. Mineral resource estimate tonnes and grades are constrained to a Lerch Grossman revenue factor 1 pit shell, post-reserves depletion.
3. Mineral resource estimates are exclusive of mineral reserves. Mineral resources are not mineral reserves as they do not have demonstrated economic viability.
4. Mineral resources are estimated using 0.1% copper cut-off grade.
5. Long term metal prices of $4.40 per pound copper, $2,800 per ounce gold, and $32 per ounce silver were used to estimate mineral resources.
Copper World
Copper World is a copper development project located in Pima County, Arizona, approximately 50 kilometres southeast of Tucson. Following completion of the CW JV Transaction in January 2026, Hudbay holds a 70% interest in Copper World LLC, which owns the Copper World project, with Mitsubishi holding the remaining 30% interest.
In September 2023, Hudbay released the Copper World PFS. The Copper World PFS reflects the results of Hudbay's further technical work on Phase I of the Copper World project. Phase I is a standalone operation requiring state and local permits only. Phase I has a mine life of 20 years, which is four years longer than the Phase I mine life that was presented in the Copper World PEA, largely due to an increase in the capacity for tailings and waste deposition as a result of optimizing the site layout. Phase II is expected to involve an expansion onto federal lands with an extended mine life and enhanced project economics. Phase II would be subject to the federal permitting process and was not included in the PFS results. Phase I contemplates average annual copper production of 85,000 tonnes over a 20-year mine life. A variable cut-off grade strategy allows for higher mill head grades in the first ten years, which increases annual production to approximately 92,000 tonnes of copper.
Hudbay has received the three key state permits required for Phase I of the Copper World project. The first key state permit required for Copper World, the Mined Land Reclamation Plan, was initially approved by the Arizona State Mine Inspector in October 2021 and was subsequently amended to reflect a larger private land project footprint. This approval was challenged in state court, but the challenge was dismissed in May 2023. The Aquifer Protection Permit was received on August 29, 2024 from the ADEQ following a robust process that included detailed analysis by the ADEQ and Hudbay, along with a public comment period that was completed in the second quarter of 2024. The Aquifer Protection Permit remains unchallenged. The Air Quality Permit was received on January 2, 2025 from the ADEQ following a similarly robust process, including a public comment period that concluded in the third quarter of 2024. Subsequently, the Arizona Office of Administrative Hearings upheld the Air Quality Permit following an appeal. Hudbay remains confident that the Air Quality Permit, and the other permits received for the Copper World project, will continue to be upheld, notwithstanding further ongoing appeal processes.
A definitive feasibility study for Copper World is well advanced and is expected to be completed in mid-2026. Hudbay is also advancing detailed engineering, certain long-lead items and other de-risking activities in advance of a potential sanction decision later in 2026.
Hudbay's interest in the Copper World project is subject to a precious metals stream agreement with Wheaton Precious Metals. Under such agreement, Hudbay is entitled to receive a deposit payment of $230 million in exchange for delivering 100% of the payable gold and silver produced from the Copper World project (at a fixed payable rate of 92.5%) to Wheaton. In connection with the updated development plan for the Copper World project and the CW JV Transaction, Hudbay and Wheaton have agreed in principle to amend the existing precious metals stream agreement to, among other things, provide for an additional contingent payment of up to $70 million in connection with a future mill expansion and to modify ongoing payments for gold and silver from fixed pricing to a percentage of spot prices.
On September 8, 2023, we filed a technical report for the Copper World project (the Copper World PFS) titled "Phase I Pre-Feasibility Study and Updated Mineral Resources, Copper World Project, Pima County, Arizona, USA", dated effective as of July 1, 2023, prepared by Olivier Tavchandjian (our Senior Vice President, Exploration and Technical Services), a copy of which is available under our profile on SEDAR+ at www.sedarplus.ca and on EDGAR at www.sec.gov. For additional details on our Copper World project, refer to Schedule B of this AIF. The Copper World PFS supersedes the Copper World PEA in its entirety.
Mineral Reserves and Resources
The following table sets forth our estimates of the mineral reserves for the Copper World project.
| Copper World Mineral Reserve Estimates - January 1, 2026(1)(2)(3)(4)(5) | ||||||||||||||||
| Tonnes | Cu (%) |
CuSS (%) | Mo (g/t) | Au (g/t) | Ag (g/t) | |||||||||||
| Copper World | ||||||||||||||||
| Proven | 319,000,000 | 0.540 | 0.110 | 110 | 0.030 | 5.68 | ||||||||||
| Probable | 66,000,000 | 0.520 | 0.140 | 96 | 0.020 | 4.31 | ||||||||||
| Total Proven and Probable | 385,000,000 | 0.537 | 0.115 | 108 | 0.020 | 5.44 | ||||||||||
Notes:
1. Totals may not add up correctly due to rounding.
2. Long term metal prices of $4.00 per pound copper, $12.00 per pound molybdenum, $1,700 per ounce gold and $23.00 per ounce silver were used to confirm the economic viability of the mineral reserve estimates.
3. Mineral reserve estimates are limited to the portion of the measured and indicated resource estimates scheduled for milling and included in the financial model of the Copper World PFS.
4. Estimate of the mineral reserve does not account for marginal amounts of historical small-scale operations in the area that occurred between 1870 and 1970 and is estimated to have extracted approximately 200,000 tonnes, which is within rounding approximations of the current reserve estimates.
5. Mineral reserve estimates presented on a 100% basis. Hudbay holds a 70% interest in the Copper World project.
| Copper World Mineral Resource Estimates (Exclusive of Mineral Reserves) - January 1, 2026(1)(2)(3)(4)(5)(6) | ||||||||||||||||
| Tonnes | Cu (%) | CuSS (%) | Mo (g/t) | Au (g/t) | Ag (g/t) | |||||||||||
| Copper World - Flotation | ||||||||||||||||
| Measured | 424,000,000 | 0.390 | 0.040 | 150 | 0.022 | 4.10 | ||||||||||
| Indicated | 191,000,000 | 0.360 | 0.060 | 125 | 0.016 | 3.50 | ||||||||||
| Inferred | 192,000,000 | 0.350 | 0.070 | 117 | 0.013 | 3.10 | ||||||||||
| Copper World - Leach | ||||||||||||||||
| Measured | 159,000,000 | 0.280 | 0.200 | n/a | n/a | n/a | ||||||||||
| Indicated | 70,000,000 | 0.260 | 0.200 | n/a | n/a | n/a | ||||||||||
| Inferred | 83,000,000 | 0.260 | 0.190 | n/a | n/a | n/a | ||||||||||
| Total Measured + Indicated | 844,000,000 | 0.352 | 0.088 | 104 | 0.015 | 2.85 | ||||||||||
| Total Inferred | 275,000,000 | 0.323 | 0.106 | 82 | 0.009 | 2.16 | ||||||||||
Notes:
1. Totals may not add up correctly due to rounding.
2. Mineral resource estimates are exclusive of mineral reserves. CIM definitions were followed for the estimation of mineral resources. Mineral resources that are not mineral reserves do not have demonstrated economic viability.
3. Mineral resources are constrained within a computer-generated pit using the Lerchs-Grossman algorithm.
4. Long-term metals prices of $3.75 per pound copper, $12.00 per pound molybdenum, $1,650 per ounce gold and $22.00 per ounce silver were used to estimate mineral resources.
5. Mineral resource estimates were reported using a 0.1% copper cut-off grade and an oxidation ratio lower than 50% for flotation material and a 0.1% soluble copper cut-off grade and an oxidation ratio higher than 50% for leach material.
6. Mineral resource estimates presented on a 100% basis. Hudbay holds a 70% interest in the Copper World project.
OTHER ASSETS
Mason Project
The Mason project is a large greenfield copper deposit located in the historic Yerington District of Nevada and is one of the largest undeveloped copper porphyry deposits in North America. The Mason project's measured and indicated mineral resources are comparable in size to Constancia. We view the Mason project as a long-term future development asset as part of our pipeline of high-quality copper growth opportunities in the United States.
Since acquiring Mason, Hudbay has consolidated a prospective package of patented and unpatented mining claims contiguous to the Mason project and has advanced a number of technical studies, including a revised resource model and the completion of a preliminary economic assessment (the "Mason PEA").
The Mason PEA was completed in April 2021 and contemplates a 27-year mine life with average annual copper production of approximately 140,000 tonnes over the first ten years of full production. At a copper price of $4.00 per pound and based on the cost assumptions in the Mason PEA, the after-tax net present value using a 10% discount rate is $2.0 billion and the internal rate of return is approximately 23%. The Mason PEA is preliminary in nature, includes inferred resources that are considered too speculative to have the economic considerations applied to them that would enable them to be categorized as mineral reserves and there is no certainty the preliminary economic assessment will be realized. We plan to initiate a pre-feasibility study for the Mason project in 2026.
The following table sets forth the estimates of the mineral resources at the Mason project.
| Mason Project Resource Estimates - January 1, 2026(1)(2)(3)(4)(5)(6) | |||||||||||||||
| Tonnes | Cu (%) | Mo (g/t) | Au (g/t) | Ag (g/t) | |||||||||||
| Measured | 1,417,000,000 | 0.29 | 59 | 0.031 | 0.66 | ||||||||||
| Indicated | 801,000,000 | 0.30 | 80 | 0.025 | 0.57 | ||||||||||
| Inferred | 237,000,000 | 0.24 | 78 | 0.033 | 0.73 | ||||||||||
| Total Measured & Indicated | 2,219,000,000 | 0.29 | 67 | 0.029 | 0.63 | ||||||||||
| Total Inferred | 237,000,000 | 0.24 | 78 | 0.033 | 0.73 | ||||||||||
Notes:
1. Totals may not add up correctly due to rounding.
2. Mineral resource estimates that are not mineral reserves do not have demonstrated economic viability.
3. Mineral resource estimates do not include factors for mining recovery or dilution.
4. Metal prices of $3.10 per pound copper, $11.00 per pound molybdenum, $1,500 per ounce gold, and $18.00 per ounce silver were used to estimate mineral resources.
5. Mineral resources are estimated using a minimum NSR cut-off of $6.25 per tonne.
6. Mineral resources are based on resource pit designs containing measured, indicated, and inferred mineral resources.
Llaguen Project
The Llaguen project is 100% owned by Hudbay and is located near the city of Trujillo, the third largest city in Peru. The Llaguen property is at moderate altitude and in close proximity to existing infrastructure, water and power supply, including the port of Salaverry located 62 kilometres away and the Power Subestación Trujillo Nueva (Laredo) electric substation located 40 kilometres away.
The Llaguen copper-molybdenum porphyry deposit is located on the western margin of the Miocene epithermal-porphyry copper-gold belt of northern Peru. Hudbay optioned the Llaguen property from a Vale subsidiary in 2017 and has since completed an exploration agreement with the local community, conducted additional geological mapping and geochemical sampling, and completed a 28-hole confirmatory drill program during 2021 and 2022, which confirmed and extended the footprint of the known mineralization and highlighted the existence of a high-grade zone in the center of the deposit.
Hudbay's tenement comprises 12 mining concessions totaling 8,900 hectares and the mineralization is fully contained within these 100%-controlled tenements. There are no Indigenous communities in the area, and therefore, community agreements are not subject to Peru's Consulta Previa (prior consultation) process.
After completing an initial mineral resource estimate in November 2022, Hudbay initiated preliminary technical studies at Llaguen, including metallurgical test work as well as geotechnical and hydrogeological studies. Additional exploration drilling is warranted on the Llaguen property to test the areas of the deposit that remain open and the several untested geophysical targets in the area to fully define the regional extent of the mineralization. The current mineral resource estimate is also surrounded by a large halo of low grade hypogene copper mineralization, not currently included in the mineral resource estimate, but for which metallurgical test work could assess the potential for sulfide heap leaching via commercially available technologies.
The following table sets forth the estimates of the mineral resources at the Llaguen project.
| Llaguen Mineral Resource Estimates - January 1, 2026(1)(2)(3)(4)(5)(6)(7) | ||||||||||||||||||
| Tonnes | Cu (%) |
Mo (g/t) | Au (g/t) | Ag (g/t) | CuEq (%) | |||||||||||||
| Indicated Global (>= 0.14% Cu) | 271,000,000 | 0.33 | 218 | 0.033 | 2.04 | 0.42 | ||||||||||||
| Including Indicated High-grade (>= 0.30% Cu) | 113,000,000 | 0.49 | 261 | 0.046 | 2.73 | 0.60 | ||||||||||||
| Inferred Global (>= 0.14% Cu) | 83,000,000 | 0.24 | 127 | 0.024 | 1.47 | 0.30 | ||||||||||||
| Including Inferred High-grade (>= 0.30% Cu) | 16,000,000 | 0.45 | 141 | 0.038 | 2.60 | 0.52 | ||||||||||||
Notes:
1. Totals may not add up correctly due to rounding.
2. CIM definitions were followed for the estimation of mineral resources. Mineral resources that are not mineral reserves do not have demonstrated economic viability.
3. Mineral resources are reported within an economic envelope defined by a pit shell optimization algorithm. This pit shell is defined by a revenue factor of 0.33 assuming operating costs adjusted from Hudbay's Constancia open pit operation.
4. Long-term metal prices of $3.60 per pound copper, $11.00 per pound molybdenum, $1,650 per ounce gold and $22.00 per ounce silver were used for the estimation of mineral resources.
5. Metal recovery estimates assume that this mineralization would be processed at a combination of facilities, including copper and molybdenum flotation.
6. Copper-equivalent ("CuEq") grade is calculated assuming 85% copper recovery, 80% molybdenum recovery, 60% gold recovery and 60% silver recovery.
7. Specific gravity measurements were estimated by industry standard laboratory measurements.
Snow Lake Regional Deposits
The mineral reserve and mineral resource estimates at Hudbay's satellite deposits in the Snow Lake region, including the copper-gold WIM, the gold-rich 3 Zone and the zinc-rich Watts, Pen II and Talbot deposits, have the potential to provide future feed for the Stall and New Britannia processing facilities and further extend the life of the Snow Lake operations. Hudbay has also been advancing exploration activities on the newly acquired land in Snow Lake, which is expected to include geophysical and drilling programs on the former Rockcliff claims located within trucking distance of the existing Snow Lake processing infrastructure. Hudbay continued to advance exploration activities across its Snow Lake land package during 2025, including geophysical surveys and multi-phased drilling programs focused on near-mine and regional targets.
Talbot is a copper-zinc-gold rich VMS deposit located within trucking distance to existing processing infrastructure in Snow Lake. Successful drilling campaigns could expand the resource base and support a pre-feasibility study to upgrade the mineral resources to reserves, extending the overall mine life of the Snow Lake operations. In April 2025, Hudbay announced the signing of the exploration agreement with the Mosakahiken Cree Nation on exploration activities in their traditional and ancestral territory, including at Talbot. In July 2025, Hudbay commenced an extensive summer drill program at Talbot focused on expanding the known mineralization at depth, testing geophysical targets as well as conducting an infill drill program in the upper part of the ore body to support a pre-feasibility study. A 2026 drilling program is underway for further exploration work at Talbot. In 2026, the Company plans on progressing a pre-feasibility study and preparing an updated mineral resource estimate for Talbot using Hudbay standard methods that have demonstrated high reserve conversion rates.
At the regional Rail property, which was acquired through the Rockcliff acquisition in 2023, the 2024 exploration program yielded new intersections of high-grade copper-gold mineralization. These results will be combined with historical drilling results on the property to update the geological model and assess its economic potential. Exploration work at Rail continued in 2025, with ongoing evaluation of drilling results and geological modelling to assess the potential for future development.
The following table sets forth our estimates of the mineral reserves and resources at the Snow Lake regional deposits (excluding Lalor and 1901).
| Snow Lake Regional Gold Deposits Mineral Reserve Estimates - January 1, 2026(1)(2)(3)(4) | |||||||||||||||||||||
| Tonnes | Au (g/t) | Zn (%) | Cu (%) | Ag (g/t) | |||||||||||||||||
| Gold | Probable | WIM | 2,450,000 | 1.6 | 0.25 | 1.63 | 6.3 | ||||||||||||||
| 3 Zone | 660,000 | 4.2 | - | - | - | ||||||||||||||||
| Subtotal | 3,110,000 | 2.2 | 0.20 | 1.28 | 5.0 | ||||||||||||||||
Notes:
1. Totals may not add up correctly due to rounding.
2. Long-term metal prices of $1,700 per ounce gold, $1.25 per pound zinc, $4.00 per pound copper and $23.00 per ounce silver with an exchange rate of 1.33 C$/US$ were used to confirm the economic viability of the mineral reserve estimates
3. WIM mineral reserves assume processing recoveries of 98% for copper, 88% for gold, and 70% for silver based on processing through New Britannia's flotation and tails leach circuits.
4. 3 Zone mineral reserves assume processing recoveries of 85% for gold based on processing through New Britannia's leach circuit.
| Snow Lake Mineral Resource Estimates (Exclusive of Mineral Reserves) - January 1, 2026(1)(2)(3)(4)(5) |
|||||||||||||||||||||
| Tonnes | Au (g/t) | Zn (%) | Cu (%) | Ag (g/t) | |||||||||||||||||
| Gold | Inferred | New Britannia | 2,750,000 | 4.5 | - | - | - | ||||||||||||||
| Birch | 570,000 | 4.4 | - | - | - | ||||||||||||||||
| Subtotal | 3,320,000 | 4.5 | - | - | - | ||||||||||||||||
Notes:
1. Totals may not add up correctly due to rounding.
2. Mineral resources that are not mineral reserves do not have demonstrated economic viability.
3. Mineral resources do not include factors for mining recovery or dilution.
4. Gold mineral resources are estimated based on the assumption that they would be processed at the New Britannia concentrator.
5. New Britannia mineral resource estimates have been reported at a minimum true width of 1.5 metres and with a cut-off grade varying from 2 grams per tonne (at the lower part of New Britannia) to 3.5 grams per tonne (at the upper part of New Britannia).
| Snow Lake Mineral Resource Estimates (Exclusive of Mineral Reserves) - January 1, 2026 (1)(2)(3)(4)(5)(6)(7)(8) |
|||||||||||||||||||||
| Tonnes | Au (g/t) | Zn (%) | Cu (%) | Ag (g/t) | |||||||||||||||||
| Base Metal |
Indicated | PEN II | 470,000 | 0.3 | 8.89 | 0.49 | 6.8 | ||||||||||||||
| Talbot | 2,190,000 | 2.1 | 1.79 | 2.33 | 36.0 | ||||||||||||||||
| Subtotal | 2,660,000 | 1.8 | 3.04 | 2.01 | 30.9 | ||||||||||||||||
| Inferred | Watts | 3,150,000 | 1.0 | 2.58 | 2.34 | 31.0 | |||||||||||||||
| PEN II | 130,000 | 0.3 | 9.81 | 0.37 | 6.8 | ||||||||||||||||
| Talbot | 2,450,000 | 1.9 | 1.74 | 1.13 | 25.8 | ||||||||||||||||
| Subtotal | 5,730,000 | 1.3 | 2.39 | 1.78 | 28.3 | ||||||||||||||||
Notes:
1. Totals may not add up correctly due to rounding.
2. Mineral resources that are not mineral reserves do not have demonstrated economic viability.
3. Mineral resources do not include factors for mining recovery or dilution.
4. Base metal mineral resources are estimated based on the assumption that they would be processed at the Stall concentrator.
5. Watts and Pen II mineral resources were initially estimated using metal price assumptions that vary marginally over the assumptions used to estimate mineral resources at Lalor. In the Qualified Person's opinion, the combined impact of these small variations does not have any impact on the mineral resource estimates.
6. Watts mineral resources are estimated using a minimum NSR cut-off of C$150 per tonne, assuming processing recoveries of 90% for copper, 80% for zinc, 70% for gold and 70% for silver.
7. Pen II mineral resources are estimated using a minimum NSR cut-off of C$75 per tonne.
8. The above resource estimates table includes 100% of the Talbot mineral resources reported by Rockcliff Metals Corp. in its 2020 NI 43-101 technical report published under Rockcliff's profile on SEDAR+.
Processing Facilities
Peru
Our processing plant at Constancia has a nominal throughput capacity of 90,000 dry metric tonnes per day. We have improved the performance of the plant over time through technology and process improvements and plan to continue to implement such initiatives, including through the planned installation of two pebble crushers in 2026, which are expected to help increase throughput to more than 90,000 tonnes per day in the second half of 2026 and allow Constancia to deliver steady annual copper production despite lower grades from the depletion of Pampacancha. Hudbay's efforts to increase mill throughput align with the Peru Ministry of Energy and Mines regulatory change to allow mining companies to operate up to 10% above permitted levels. The principal product of the concentrator is copper concentrate, although it also produces molybdenum concentrate. The primary crusher, belt conveyors, thickeners, tanks, flotation cells, mills and various other types of equipment are designed and constructed to be open to the environment. The concentrate filtration and storage building is enclosed. The tailings are pumped to the tailings management facility for storage and water is returned via parallel piping to the process plant for reuse.
The Constancia processing plant achieved copper recoveries of 84.3% in 2025, slightly lower than the 2024 copper recoveries of 85.0% due to the varying ore types being processed but in line with metallurgical models.
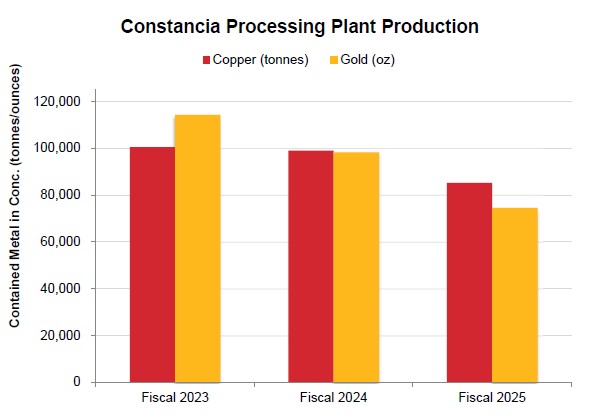
Manitoba
The refurbishment of the New Britannia mill, including the addition of a new copper flotation circuit, was completed in October 2021. The New Britannia mill produces gold/silver doré and copper concentrates and achieved commercial production on November 30, 2021, after reaching the required recoveries and production output in the copper and gold circuits. The final tailings from the New Britannia mill are pumped to the Stall mill via a 6.8 kilometre pipeline and are then either pumped to the Lalor paste plant or diverted to the Anderson tailings impoundment area. The New Britannia mill consistently achieved its nameplate capacity of 1,500 tonnes per day throughout 2022 and achieved record throughput levels averaging 1,650 and over 2,000 tonnes per day in 2023 and 2024, respectively. In the first quarter of 2024, Hudbay received a permit approval to increase the production rate at New Britannia to 2,500 tonnes per day, which provided the opportunity to process more Lalor ore at the New Britannia mill and create additional processing capacity for potential new regional discoveries in Snow Lake. The New Britannia mill processed approximately 2,300 tonnes per day in December 2025, achieving a new monthly throughput record of 71,504 tonnes. This achievement is aligned with the strategy to prioritize gold ore production and resulted from continuous improvement efforts focused on unlocking capacity at designed or improved recovery rates. Despite the wildfire challenges in 2025, New Britannia achieved its second highest annual throughput of 624,631 tonnes as Lalor delivered production from the gold zones, ensuring a consistent feed to the mill. New Britannia's gold recovery in the quarter was 89%, reflecting a slight decrease compared to the third quarter of 2025 due to ore blend resulting in slightly lower gold grades processed at the mill.
Our Stall concentrator in Snow Lake was re-started in 2009 and a new copper recovery circuit was installed in the third quarter of 2012 to facilitate processing of Lalor ore. In 2014, we refurbished equipment and facilities at the Stall concentrator. The Stall mill has a throughput capacity of approximately 3,800 tonnes per day. Since the Flin Flon zinc plant closed in mid-2022, the zinc concentrate production from the Stall mill has been sold to third party customers. The majority of the tailings produced from the Stall mill are pumped to the Lalor paste plant, where it is dewatered, mixed with cement and sent underground as pastefill. If pastefill is not required, the tailings are diverted to the Anderson tailings impoundment area. In 2020, Hudbay completed a feasibility study and a test program exploring various technological upgrades to the flowsheet at the Stall mill to improve recoveries. After the commissioning of these upgrades in the second quarter of 2023, subsequent optimization activities proved highly effective, resulting in notably higher recoveries for copper and gold. The Stall mill continues to focus on process optimization and enhanced gold recovery initiatives targeting over 70% gold recovery from the base metal ore stream. The Stall mill processed significantly less ore in 2025 compared to 2024, which is aligned with the Company's strategy of allocating more Lalor ore feed to New Britannia as noted above.
In 2025, the New Britannia mill and Stall mill collectively processed 1,197,335 tonnes of ore (down from 1,608,708 tonnes in 2024) primarily due to the impact of temporary operational shutdowns due to mandatory wildfire evacuations in 2025.
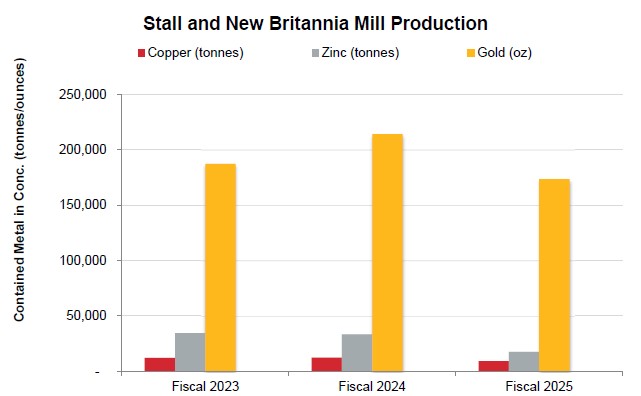
Note:
1. The gold ounces displayed in the table above include production of gold doré. In Fiscal 2023, we produced 40,239 oz of gold doré. In Fiscal 2024, we produced 56,853 oz of gold doré. In Fiscal 2025, we produced 51,428 oz of gold doré.
British Columbia
The processing facility at the Copper Mountain mine includes the primary crusher and conveyor system as well as a semi-autogenous mill. Several mill improvement initiatives were implemented in 2024 and 2025, including, recovery improvements, reprogramming the mill expert system, installation of advanced semi-autogenous grinding control instrumentation, redesigned SAG liner package and updated operational procedures intended to remove magnetite from the pebble stream.
In January 2025, we completed feasibility engineering to debottleneck the mill through a conversion of the third ball mill to a second SAG mill. The SAG mill conversion project was substantially completed during 2025 and is expected to support increased throughput as the operation ramps toward its permitted capacity of 50,000 tonnes per day, which is currently expected in the second half of 2026. Maintenance practices to improve mill availability continue to be a key pillar of Hudbay's stabilization and optimization initiatives post-acquisition.
In 2025, the mill at the Copper Mountain mine processed approximately 11,016,842 tonnes of ore (down from 12,656,679 tonnes in 2024).
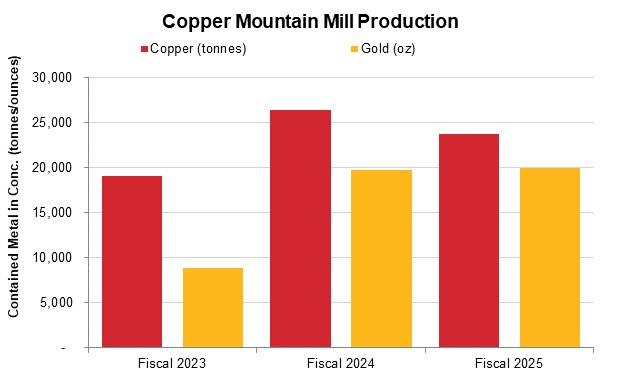
Tailings Management Facilities
We have five tailings structures and facilities, three (including two inactive) in Manitoba, one at the Copper Mountain mine in British Columbia and one at the Constancia mine in Peru. The FFTIA is the only one with partial construction using the upstream construction design method. More recent dam expansions at the FFTIA have been constructed using the downstream method. Our Anderson tailings management facility in Snow Lake uses subaqueous deposition of tailings, and we have received permit approval to transition to subaerial deposition to improve operating efficiency. Subaerial deposition trials continued during 2025 to assess the merits of the proposed transition. In order to accommodate ongoing production from our Lalor mine, in 2022, we raised the dam around Anderson using the downstream method. Our Constancia tailings facility was constructed utilizing a downstream method which created a solid rockfill platform foundation. This foundation supports ongoing centerline construction which will continue until the end of the operating life of the structure.
We established an Independent Technical Review Board ("ITRB") for our Constancia tailings facility in 2012 and extended this to our Manitoba Business Unit's facilities in 2017 and our British Columbia Business Unit in 2023. In 2018, we developed a Tailings Governance Charter to further strengthen our internal governance processes related to tailings management. The charter details existing controls, including a Tailings Management System at the site or business unit that supports day-to-day activities such as planning, monitoring, risk identification and reporting. We conduct independent external reviews, which may include Engineer of Record inspections, ITRB reports and compliance audits.
We require our business units to maintain a level A or higher rating for the tailings protocol in the Mining Association of Canada's Towards Sustainable Mining ("TSM") program. In the latest TSM program, our Manitoba Business Unit received level "A" ratings across all five indicators, our British Columbia Business Unit received level "AA" ratings for four of the five indicators and a level "AAA" for one of the five indicators, and our South America Business Unit received level "AA" ratings across all five indicators. In addition to maintaining a minimum of an "A" rating on all five TSM tailings indicators, we also ensure tailings facilities are constructed following the Canadian Dam Safety Guidelines. We believe following these well-established standards provides effective equivalence to the recently introduced Global Industry Standard on Tailings Management.
At our Manitoba Business Unit, where some of our tailings storage facilities were built 80 years ago, we have worked with our engineer of record, with input from our ITRB, to identify opportunities to proactively upgrade facilities to increase the factor of safety of the structures, particularly in areas previously constructed using the upstream method.
Tailings Reprocessing
During 2025, we continued to evaluate the economic feasibility of reprocessing the tailings in the FFTIA, which holds more than 100 million tonnes of tailings that have been deposited over approximately 90 years. Recent drilling programs indicate high zinc, copper, and silver grades.
We have also advanced metallurgical test work and evaluated metallurgical technologies. In 2025, such metallurgical test work continued following positive results from the initial confirmatory drill program in the section of the tailings facility that was utilized by the zinc plant for 25 years. The results confirmed the grades of precious metals and critical minerals previously estimated from historical zinc plant records. An early economic study to evaluate the opportunity to reprocess the zinc plant tailings has confirmed the potential for a technically viable reprocessing alternative and we plan to carry out pre-feasibility analysis in 2026.
Additionally, the Anderson tailings impoundment area at our Snow Lake operation also contains significant amounts of gold deposited over many years and we may evaluate the potential for reprocessing the tailings in the future.
Exploration
As of the date of this AIF, Hudbay has an exploration portfolio of owned or optioned mineral properties which consists of approximately 557,450 hectares across Canada, Peru and the United States. In 2026, exploration expenditures are expected to total $60 million. The exploration program will be partially funded by the proceeds from the Flow-Through Offerings (as defined below) and the three-party option agreement with Marubeni and JOGMEC, pursuant to which Hudbay has granted Marubeni's wholly-owned Canadian subsidiary and JOGMEC an option to acquire a 20% interest and a 10% interest, respectively, in three projects located within trucking distance of Hudbay's processing facilities in the Flin Flon area by funding exploration expenditures of at least C$12 million over a period of approximately 5 years (in the case of Marubeni) and at least C$6 million over a period of approximately 3 years (in the case of JOGMEC).
In Manitoba, 2026 exploration activities will focus on completing the largest geophysics program in the Company's history, including 800 kilometres of ground electromagnetic surveys and an extensive airborne geophysics survey. The Company plans to complete underground and surface drilling at Lalor to continue expanding its mineral resource and reserve estimates and underground drilling at 1901 from the new exploration drift. In addition, Hudbay plans to continue drilling activities at several regional targets in 2026, including the Talbot deposit and at other regional prospective areas, following up on encouraging results in 2025.
In British Columbia, 2026 exploration activities will focus on the conversion of high value inferred resources at New Ingerbelle to potentially extend mine life at Copper Mountain.
In Peru, 2026 exploration activities will continue to focus on final permitting and drill preparation for the Maria Reyna and Caballito properties near Constancia.
In 2025, Hudbay successfully completed two critical minerals premium flow-through private placement financing transactions for aggregate gross proceeds of approximately C$32.6 million (collectively, the "Flow-Through Offerings"). On September 29, 2025, Hudbay issued 302,000 exploration flow-through common shares ("CEE Shares") at a subscription price of C$33.12 per CEE Share in Manitoba. On December 10, 2025, Hudbay issued 585,000 additional CEE Shares at a subscription price of C$39.33 per CEE Share in Manitoba and C$33.43 per CEE Share in Saskatchewan, respectively. Hudbay expects to use the proceeds from the issuance of the CEE Shares to fund eligible exploration expenditures on certain of the Company's properties in Manitoba and Saskatchewan.
Strategic Investments
As at December 31, 2025, we held minority equity positions in ten mining companies (nine as at December 31, 2024), representing investments with a fair market value of approximately C$180.3 million (approximately C$17.4 million as at December 31, 2024), as part of our strategy to populate a pipeline of projects with the potential for exploration and development. Our early-stage opportunity pipeline consists of minority interests in junior mining companies with projects in the Americas and Europe, and includes our 9.99% toehold position in ASCU, which we acquired in January 2025. We are continuing to evaluate new projects and potential investments to add to our portfolio and will seek to dispose of investments when the underlying projects are no longer consistent with our strategy.
On March 1, 2026, Hudbay entered into the Arrangement Agreement pursuant to which Hudbay agreed to acquire all of the ASCU Shares that it does not already own pursuant to a plan of arrangement under the Business Corporations Act (British Columbia). The ASCU Transaction is subject to ASCU shareholder approval and customary regulatory approvals and is expected to close in the second quarter of 2026. See "Development of Our Business - Three Year History - Recent Developments" for additional information regarding the ASCU Transaction.
Cash and Cash Equivalents
Our cash and cash equivalents (including short-term investments), as of December 31, 2025 were approximately $568.9 million ($541.8 million as of December 31, 2024), and are held in low risk liquid investments and deposit accounts pursuant to our investment policy. After giving effect to the closing of the CW JV Transaction in January 2026, post-closing adjusted cash and cash equivalents as of December 31, 2025 would have been approximately $992 million. The post-closing adjusted year-end cash and cash equivalents of $992 million includes approximately $420 million of cash at the Copper World LLC level received as part of the CW JV Transaction and such cash is designated for exclusive use by the Copper World joint venture.
OTHER INFORMATION
Products and Marketing
Our principal products are copper concentrate, which contains payable copper, gold and silver, zinc concentrate, gold and silver doré and molybdenum concentrate.
In 2025, we produced:
In 2025, copper sales represented approximately 55% (approximately 57% in 2024), gold sales represented approximately 38% (approximately 33% in 2024), and other metal sales, including zinc, silver and molybdenum, collectively represented approximately 7% (approximately 10% in 2024) of our total gross consolidated revenue (which excludes non-cash streaming arrangement items, mark-to-market adjustments on provisionally priced sales, realized and unrealized changes to fair value for non-hedge derivative contracts and adjustments to originally invoiced weights and assays).
Our 2025 revenue breakdown by commodity type is illustrated in the chart below:
| 2025 REVENUE BREAKDOWN |
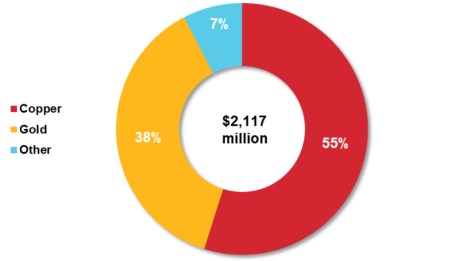 |
| 1. Revenue for the full year ended December 31, 2025. Gold and silver revenues include cash payments applicable to precious metals stream sales. |
| 2. This number excludes treatment and refining charges. |
In 2025, our copper concentrate production was sold through a mix of benchmark related sales, and spot sales. Manitoba copper concentrate production was sold for delivery to a smelter in Canada, Peru copper concentrate production was primarily sold for delivery to smelters in Asia, and British Columbia copper concentrate production was sold to Japan.
Molybdenum concentrate production in 2025 was sold to customers in Asia and North America.
Zinc concentrate production in 2025 was sold mainly to smelters in Europe.
Gold/silver doré production from the New Britannia mill was sent to a refinery in Canada and the outturned precious metals were sold to Canadian financial institutions. In addition, we sold gold and silver equal to the deliverable portion of payable gold and silver produced from our Constancia mine to Wheaton Precious Metals pursuant to the terms of the precious metals stream agreement in respect of our Constancia mine.
Commodity Markets
In addition to our production volumes, our financial performance is directly affected by a number of factors, including metals prices, foreign exchange rates, and input costs, including energy prices. 2026 is expected to be an uncertain year for the copper price due to significant volatility on both supply and demand sides of the market as well as economic uncertainty related to the timing of interest rate reductions and geopolitical turmoil. For more information, please refer to our market analysis of copper, zinc and gold prices on pages 37 and 38 of our management's discussion and analysis for the year ended December 31, 2025, a copy of which has been filed under our profile on SEDAR+ at www.sedarplus.ca and on EDGAR at www.sec.gov.
Specialized Skill and Knowledge
The success of our operations depends in part on our ability to attract and retain geologists, engineers, metallurgists and other personnel with specialized skill and knowledge about the mining and mineral processing industries in the geographic areas in which we operate. For additional information, see "Risk Factors - Recruitment, Retention and Labour Relations".
Competitive Conditions
The mining industry is intensely competitive and we compete with many companies in the search for and acquisition of attractive mineral properties. In addition, we also compete for the technical expertise to find, develop, and operate such properties, the labour to operate the properties, and the capital for the purpose of funding such properties.
Economic Dependence
We do not have any contracts upon which our business is substantially dependent, as our principal products, copper concentrate, zinc concentrate and gold/silver doré are widely traded commodities and we may enter into contracts for the sale of such products with a variety of potential purchasers.
Environmental Protection
Our activities are subject to environmental laws and regulations, and our own internal environmental objectives. We manage our conformance through ISO-certified management systems in place at our producing operations in Manitoba and Peru. At our operations in British Columbia, the assessment of the existing management system remains in progress, following which we expect the management system to become certified. Environmental laws and regulations are evolving in a manner that will require stricter standards and enforcement, increased fines and penalties for non-compliance, more stringent environmental assessments of proposed projects and a heightened degree of responsibility for companies and their officers, directors and employees. For additional information, see "Risk Factors - Governmental and Environmental Regulation". For additional information, see "Tailings Management Facilities" above and "Sustainability" and, in particular, our commitment to follow the TSM program of the Mining Association of Canada at all of our operating locations.
The Company is required to provide financial assurance in connection with its reclamation and closure obligations in the jurisdictions in which it operates. Such financial assurance is typically provided in the form of surety bonds, letters of credit or other acceptable instruments. Please refer to the notes to our financial statements for more information regarding such arrangements and obligations.
Employees
As at December 31, 2025, we had 90 employees at our Toronto-based corporate head office, 988 employees in Manitoba, 810 employees in British Columbia, 1,097 employees in Peru and 87 employees in the United States. As at December 31, 2025, unionized workers represented approximately 69% of our employees in Manitoba and approximately 46% of our employees in Peru.
In July 2024, we entered into a collective bargaining agreement with the union at our Peru operations, which expires in the fourth quarter of 2026. In June 2024, new three-and-a-half year collective bargaining agreements were entered into with the unions at Hudbay's Manitoba operations, effective July 1, 2024.
Hudbay maintains a profit-sharing plan pursuant to which a portion of the after-tax profit of the Manitoba Business Unit (excluding provisions or recoveries for deferred income and mining tax) for any given year is distributed among eligible employees in Hudbay's Manitoba operations, with the exception of executive officers and key management personnel.
In accordance with Peruvian law, Hudbay distributes a portion of the after-tax profit of the Peru Business Unit amongst all employees in Peru, including executive officers and key management personnel.
SUSTAINABILITY
At Hudbay, we view responsible corporate behaviour as integral to the successful execution of our business strategy. In particular, we pride ourselves on maintaining a good relationship with our regulators, communities and other stakeholders and being able to bring that good reputation to new communities and jurisdictions when we embark on new projects. Our mission includes that the regions and communities in which we operate benefit from our presence, meaning that we create benefits and opportunities that contribute to their economic and social wellbeing, and that we protect our natural environment. We also commit to maintaining a safe and healthy work environment for our employees.
As described below, we have adopted a number of voluntary codes and other external instruments that we consider particularly relevant to our business, including Environmental Management System Standard ISO 14001, Occupational Health and Safety Management System Standard ISO 45001, the Voluntary Principles on Security and Human Rights and our commitment to follow the TSM program of the Mining Association of Canada at all of our operating locations.
HEALTH, SAFETY AND ENVIRONMENTAL POLICIES
Among Hudbay's core values are protecting the health and welfare of our employees and contractors and reducing the impact of our operations on the environment. Our producing operations in Manitoba and Peru currently have management systems certified to Safety and Environmental Management System Standards ISO 45001 and ISO 14001. In British Columbia, we are in the process of conducting an internal assessment of the management system and currently expect it to become certified to the appropriate Safety and Environmental Management System Standards in the near future.
We believe that ongoing improvement in the safety of our workplace assists in maintaining healthy labour relations and that our ability to minimize recordable injuries (Medical Aid, Restricted Work and Lost Time injuries) and comply with environmental requirements are significant factors in maintaining social license to operate and realizing opportunities to improve overall operational efficiency. Our safety management systems also focus on identifying and mitigating fatal risks, including implementing critical controls addressing fatal risks and also on thoroughly investigating any incidents that represent a potential fatality regardless of the actual outcome of the incident. We classify injuries across our company using the International Council on Mining and Metals ("ICMM") criteria. Based on the ICMM criteria, in 2025, our recordable injury frequency per 200,000 hours worked was 1.1, which was in line with the results from 2024.
Our environmental management program consists of a corporate environmental policy, and at each site, comprehensive environmental management plans and procedures that are integrated with operating procedures, employee training, regular internal and external audits, and emergency response systems. Appropriate water stewardship plays an important role in the development and operation of our projects, particularly the Copper World project.
We maintain a company wide information system for recording, managing and tracking environmental, health, safety and community incidents. We did not have any material environmental non-compliances in 2025.
In addition, the Board's EHSS Committee provides oversight of our climate-related risks and opportunities, and regularly receives reports from management on our progress against our strategic plans. While our operations are well-positioned in the lower half of the global GHG emissions curve for copper operations, we recognize our role in mitigating climate change and that copper and the metals Hudbay produces play an important role in the world's transition to a greener future.
HUMAN RIGHTS POLICY
Our Human Rights Policy articulates our commitments to human rights and addresses topics such as business and labour practices (including our commitment to prevent forced, compulsory and child labour in our sphere of influence), community participation and security measures. Our Corporate Standards for Supplier Due Diligence, Stakeholder Engagement, Community Giving and Investment, Local Procurement and Employment and Security Management provide our business units with additional corporate direction on minimum standards with respect to meeting the commitments we set out in our Human Rights Policy.
The Voluntary Principles on Security and Human Rights provide important guidance for our security and community relations practices in locations with higher potential for social conflict and, in Peru, we regularly audit security policies and practices and conduct gap analyses against the Voluntary Principles.
SUSTAINABILITY REPORTING
Each year we publish an Annual Report that presents and discusses, among other things, our environmental, social, health and safety performance in the context of our overall business performance. In prior years, Hudbay prepared its Annual Report pursuant to the Global Reporting Initiative (GRI) guidelines and the Sustainability Accounting Standards Board (SASB) Metals and Mining Standard, and also mapped its climate-related disclosures against the recommendations of the Task Force on Climate-related Financial Disclosures from 2021 to 2024. Our 2025 Annual Report, which is expected to be released in the second quarter of 2026, is expected to include enhanced climate disclosures through alignment with the Canadian Sustainability Disclosure Standard 2 (CSDS 2). Additionally, we expect to introduce a supplemental climate disclosure document beginning this year.
RISK FACTORS
An investment in our securities is speculative and involves significant risks that should be carefully considered by investors and prospective investors. In addition to the risk factors described elsewhere in this AIF, the risk factors that impact us and our business include, but are not limited to, those set out below. The risks and uncertainties described below are not the only risks and uncertainties that we face. Additional risks and uncertainties not presently known to us or that we currently deem less material may also impair our business. Any one or more of these risks could have a material adverse effect on our business, results of operations, financial condition and the value of our securities.
METALS PRICES AND FOREIGN EXCHANGE
Commodity prices are a key driver of our financial and operational results. As a result, our profit or loss and financial condition depend upon the market prices of the metals we produce, which are cyclical and which can fluctuate widely with demand. The profitability of our current operations is directly related and sensitive to changes in the market price of copper and gold and, to a lesser extent, that of zinc, silver and molybdenum (see "Sensitivity Analysis" on page 38 of our management's discussion and analysis for the year ended December 31, 2025 (the "2025 MD&A")). Market prices of metals can be affected by numerous factors beyond our control, including the overall state of the economy and expectations for economic growth, geopolitical events, general levels of supply and demand for a broad range of industrial products, the substitution of new or different products in critical applications for existing products, the level of industrial production, expectations with respect to the rate of inflation, foreign exchange rates and the investment demand for commodities, tariffs or expectations with respect to tariffs on commodities, interest rates and speculative activities. Such external economic factors are, in turn, influenced by changes in macroeconomic trends, international investment patterns, monetary systems and political developments.
Recent strength in copper and gold prices may not be sustained, and significant price volatility or a decline from current levels could adversely affect our cash flows, project economics and investment decisions.
The Chinese market is a significant source of global demand for commodities, including copper and zinc. Chinese demand has been a major driver in global commodities markets for many years. A slowing in China's economic growth could result in lower prices and demand for our products, higher treatment and refining charges and negatively impact our results. We could also experience these adverse effects if demand in China slowed for other reasons, such as trade disputes, increased self-sufficiency, tariffs or expectations with respect to tariffs on commodities, increased reliance on other suppliers to meet demand or a prolonged market disruption event, including as a result of geopolitical events and/or global conflicts.
Prices are also affected by the overall supply of the metals we produce, which can be affected by the start-up of major new mines, production disruptions and closures of existing mines. Depending on hedging practices, future metal price declines could cause us to reduce output at our operations (including, possibly, closing one or more of our mines or plants). If such price declines were significant, there could be a material and adverse effect on our cash flow from operations and our ability to finance our projects and satisfy our debt service obligations (see "Liquidity, Access to Capital and Indebtedness" below). In addition to adversely affecting our mineral reserve estimates and the Company's financial condition, declining metals prices can impact operations by requiring an assessment or reassessment of the feasibility of a particular project. We may also curtail or suspend some or all of our exploration and development activities, with the result that our depleted reserves may not be replaced.
In addition, since our core operating assets are located in Canada and Peru, many of our costs are incurred in Canadian dollars and Peruvian soles. However, our revenue is tied to market prices for copper, gold, zinc and other metals we produce, which are typically denominated in United States dollars. If the Canadian dollar or Peruvian sol were to appreciate in value against the United States dollar, our results of operations and financial condition could be materially adversely affected. Although we may use hedging strategies to limit exposure to currency fluctuations, there can be no assurance that such hedging strategies will be successful or that they will mitigate the risk of such fluctuations. In addition, commodity hedging strategies may cap our revenues from selling certain metal products if there are significant price increases. For more information, see "Financial Risk Management - Metals Price Strategic Risk Management" and "Financial Risk Management - Interest Rate and Foreign Exchange Risk Management" on page 55 of our 2025 MD&A.
POLITICAL AND SOCIAL RISKS
In any jurisdiction in which we operate, a change in government, government policy, the declaration of a state of emergency or the implementation of new or the modification of existing laws and regulations affecting our operations and other mineral properties could have a material adverse impact on us and our projects. Such laws or events could involve restrictions on businesses, the expropriation of property, implementation of exchange controls and price controls, increases in production royalties and income and mining taxes, the implementation (or expansion) of cross-border tariffs, restrictions on foreign investment, demands for mitigation or national security agreements, the refusal to grant or renew required permits, licenses, leases or other approvals or requiring unfavourable amendments to or revoking current permits and licenses, and enacting environmental or other laws that would make contemplated operations uneconomic or impractical. New or proposed local laws, ordinances, land use restrictions, transportation restrictions or other municipal or county-level measures could also adversely affect existing operations, development projects, access routes, construction activities or future expansion plans. In addition, policy changes that alter laws regulating the mining industry could have a material adverse effect on us. We are at a heightened risk of having this occur whenever there is a change in government in the countries or regions in which we operate or there is a period of increased national protectionism or geopolitical instability. Any prolonged disruption to our mining and mineral processing infrastructure that may result from such changes in policy could cause us to temporarily shut down our operations, which could have an adverse effect on our financial results and cash flows.
We operate in multiple jurisdictions and rely on the ability to move cash between subsidiaries and repatriate funds for debt service, capital allocation and potential returns to shareholders. Changes in foreign exchange regimes, capital controls, withholding taxes or restrictions on the repatriation of earnings could limit our ability to access or transfer cash on a timely basis and may adversely affect our liquidity, financing flexibility and financial condition.
Since Hudbay operates across several jurisdictions, certain political and regulatory changes in Canada, the United States, Peru, and other countries could negatively impact our operations and financial results. Recent and upcoming national elections, including those in the United States, Peru and Canada, have brought, or may bring, new political leadership with substantially different political, social, and economic policy priorities on both domestic and foreign policy matters, including with respect to critical minerals, trade and tariffs. Political and regulatory risks such as these could have an impact on our operations and financial results. Although we do not currently sell any concentrate or precious metal doré into the United States from Canada, the implementation or expansion of tariffs on exported and/or imported products could negatively affect supply chains, the price of consumables and the cost of mine development and construction.
Global trade policies continue to evolve and may include the introduction or expansion of tariffs, export controls, local content requirements or other trade measures affecting copper and other critical minerals. While we do not currently sell significant volumes of production directly into the United States, such measures could affect global copper markets, smelter demand, treatment and refining charges, supply chains, capital costs and the availability or cost of equipment and consumables. Any such developments could adversely affect our operations, financial condition and results of operations. Government policies relating to critical minerals and domestic supply chains may evolve and could affect permitting, trade measures and market dynamics.
Political or social unrest and instability in Peru, in particular, could adversely affect our ability to operate the Constancia mine and conduct our planned exploration activities at Maria Reyna and Caballito. Such adverse effects could result in positions or actions that may be taken by the national government or at the regional, community or local levels by government or non-governmental actors, including demanding payments, encroaching on our land, challenging the boundaries of such land or our rights to possess and operate on such land, protesting against our operations, impeding project activities through blockades, roadblocks or other public manifestations and attacking project assets or personnel. In recent years, certain mining projects in Peru have continued to be the target of political and community protests. While the Constancia mine has been affected by such activities as recently as 2025, including attempts to restrict access, illegal blockades and trespassing by members of the surrounding communities, these events have been limited in duration and scope.
There is the risk that similar events could recur in the future and could adversely affect production, shipments, costs and cash flows. In addition, it is possible that more significant opposition may be mounted that may affect our ability to operate or to carry out exploration activities. The risk of disruptions from such opposition tends to increase with national, regional and local elections in Peru and changes to the general political and social climate in the area where we operate. We continue to seek to constructively engage with all our stakeholders in the Constancia region, and we continue to actively monitor Peru's social risks and political landscape.
In addition, while we carry out due diligence on our customers, the majority of our copper concentrate production from Constancia is delivered to smelters in China, and there is a risk that geopolitical events could lead to market disruptions, trade disputes or government restrictions that could adversely affect our ability to sell our metal production.
DEVELOPMENT OF NEW PROJECTS
Our ability to successfully develop future growth projects is subject to many risks and uncertainties, including the ability to generate sufficient free cash flows and secure adequate financing to fund the projects; obtaining and maintaining essential permits and approvals from governmental authorities; successful resolution of administrative and legal challenges against permits and other rights that have been issued or granted to us and those permits that may be issued in the future; reaching agreements with potentially affected Indigenous peoples and other community stakeholders; obtaining mineral and surface rights agreements and rights of way, if needed; construction, commissioning and ramp-up risks; scheduling and cost-overrun risks; developing and maintaining good relationships with neighbouring communities, local governments and other stakeholders; and other political and social risks. In the case of the Copper World project, the final investment decision to proceed with project construction is also subject to the approval of our joint venture partner, Mitsubishi Corporation ("Mitsubishi"). Although we believe Mitsubishi will be supportive of the final investment decision and contribute its pro rata share of funding for project construction in line with the project schedule, there can be no assurance that the anticipated benefits of the joint venture arrangement will be realized or that the final investment decision will not be delayed.
In addition, although we have received all the major permits required for the development and operation of the Copper World project, the Air Quality permit is currently the subject of a legal appeal and there is a risk the permit could be overturned, which could adversely affect our development timeline for the project. Also, a right of way that has been granted in respect of the Copper World project is under legal challenge and there is a risk that other authorizations related to federal or state lands that we have obtained, or may require in the future, could be subject to similar challenges or appeals and could impact our mine plan and development timelines.
Significant amounts of capital are required to construct and operate a new mine, such as the Copper World project in Arizona. Our current capital, operating cost and commodity price assumptions for Copper World are based on a 2023 pre-feasibility study, and actual costs and commodity prices are expected to be higher following the completion of a definitive feasibility study. Capital costs may increase due to a variety of factors, including feasibility study engineering, inflationary pressures, project scope changes, supply chain constraints, cross-border tariffs on construction materials and consumables and general cost escalation common to mining projects globally. Factors such as changes to technical specifications, failure to enter into agreements with contractors or suppliers in a timely manner, including contracts in respect of project infrastructure, and shortages of capital, may also delay or prevent the completion of construction or commencement of production or require the expenditure of additional funds. In addition, we have determined that a historical offtake agreement that was entered into by Augusta Resource Corp. in respect of a portion of the copper concentrate production that was anticipated from the former Rosemont project does not apply to the Copper World project. If this historical agreement was to apply, it could negatively impact the terms on which we sell minerals produced at the Copper World project.
In addition, once a construction decision is made for a major capital project, construction costs and timelines can be impacted by various factors, many of which are beyond our control. These include, but are not limited to, weather conditions, ground conditions, performance of the mining fleet and availability of appropriate materials required for construction, availability and performance of contractors and suppliers, cross-border tariffs, delivery and installation of equipment, design changes, accuracy of estimates, global capital cost inflation, local in-country inflation and availability of accommodations for the workforce. Global supply chain disruptions, geopolitical tensions and evolving trade relationships could also continue to affect the availability, cost and timing of equipment, materials and services.
Many major mining projects constructed in recent years have experienced cost overruns that substantially exceeded the capital cost estimated during the basic engineering phase of those projects, sometimes by as much as 50% or more. Should Copper World be brought into construction, any cost overruns and any related delays could have a significant detrimental impact on the near-term cash flows we realize from the project and the economic assumptions that supported our decision to commence construction.
COMMUNITY RELATIONS AND INDIGENOUS RIGHTS
Our relationships and reputation, particularly with the communities in which we operate in Manitoba, British Columbia, Chumbivilcas (Peru), Arizona and Nevada are critical to the success of our existing operations and the construction and development of future projects. There is an increasing level of public attention and advocacy relating to the real and perceived effect of mining activities on the environment and communities impacted by those activities. Publicity adverse to us, our operations, or extractive industries generally, including as a result of anti-mining protests or publications, could have an adverse effect on us and may impact our reputation and relationship with the communities in which we operate, including the communities surrounding our key projects and other stakeholders.
In Peru, although we have entered into life of mine agreements with the two local communities directly affected by the Constancia mine and the one local community directly affected by the development of the Pampacancha deposit, and have a number of agreements in place with other local communities and governments in the area, there can be no assurance that disputes will not arise with these local communities or governments or that other communities or governments in the region with whom we do not have an agreement in place will demand an impact benefit, community investment agreement or will otherwise assert their rights in some form. Furthermore, the terms of the life of mine agreements with the communities of Uchucarcco and Chilloroya are subject to renegotiation from time to time in respect of certain contractual matters, including, among other things, the required social investments to be made thereunder. There can be no assurance that such renegotiated terms will be reached at all or in a timely manner and any failure to do so could cause strain on our relationships with such communities that could negatively impact our ability to operate.
In addition, in situations where we have acquired mineral rights, we may be unable to secure the required surface rights. Any inability to secure the required surface rights or take possession of areas for which we hold surface rights could render us unable to carry out planned exploration, development and mining activities. Relations with local communities may be strained by real or perceived detrimental effects of our activities or those of other mining companies. Those strains may have a negative impact on our ability to enforce our existing community agreements or obtain necessary permits and approvals to operate the Constancia mine. Further, communities and other groups in Peru and elsewhere that self-identify as Indigenous people may assert rights to be consulted and a right to free, prior and informed consent over project decisions. In Peru, this requires compliance with the Consulta Previa law, which may continue to delay the timeline for obtaining any drill permits for Maria Reyna and Caballito. In addition, our existing surface rights agreement with the community for exploration at Maria Reyna and Caballito is for a limited term only and may expire before we complete any exploration activities. Also, we will need to negotiate an exploitation agreement with the community and other stakeholders in the future to commence construction and operations if desirable to do so. There can be no assurance that an extension to the exploration agreement or an exploitation agreement will be reached at all or in a timely manner and it may be an expensive negotiation process.
In British Columbia, the Company acknowledges that its British Columbia operations may affect the communities of the USIB, the LSIB and other potential stakeholders. Hudbay has recently entered into refreshed participation agreements with each of the USIB and LSIB in respect of the Copper Mountain mine and is committed to working collaboratively with the USIB and LSIB to implement the economic and social benefits contemplated by the agreements and to continue to advance responsible mining practices and environmental stewardship. However, there can be no assurance that the USIB and LSIB will support the Province of British Columbia's recent decision to issue the New Ingerbelle expansion permits (as demonstrated by the recent submission by the LSIB of an application for the judicial review), that future disputes will not arise between Hudbay and the USIB and/or the LSIB, as applicable, or that such issues will not adversely affect our development plans or schedule for New Ingerbelle (including as it relates to the outcome of the ongoing judicial review).
In Manitoba, the Company similarly acknowledges that certain of its exploration plans may affect certain local communities. While the Company has proactively sought out meaningful engagement and exploration agreements with such communities, including as evidenced by the recent exploration agreements signed with the Mosakahiken Cree Nation and Kiciwapa Cree Nation, there can be no assurance that we will be able to reach or maintain agreements with all local communities in the future, which may have a negative impact on our exploration strategies and development plans in Manitoba.
Additionally, the reconciliation process with Indigenous peoples in Canada, including the Government of Canada's intention to implement the United Nations Declaration on the Rights of Indigenous Peoples ("UNDRIP"), may result in new such regulations being introduced in Canada. Although we work to engage with and provide opportunities to Indigenous communities near our operations in Manitoba and British Columbia, the asserted rights of Indigenous peoples may adversely affect our ability to operate. In addition, the Government of British Columbia has adopted the Declaration on the Rights of Indigenous Peoples Act (2019) to implement UNDRIP in British Columbia. The legislation commits to a systematic review of British Columbia provincial laws for alignment with UNDRIP principles, while also encouraging new agreements with Indigenous groups that are intended to address outstanding governance questions around the nature of Indigenous rights and title interests in British Columbia.
In addition, from time to time, our operations may be adversely affected by protests and social activism broadly related to Indigenous rights and the reconciliation process in Canada.
While we are committed to operating in accordance with applicable laws and in a socially responsible manner, there can be no assurance that our efforts in this respect will fully mitigate this potential risk.
CHALLENGES TO MINERAL RIGHTS OR TITLE TO PROPERTIES
Although we believe we have taken reasonable measures to ensure valid title to our properties, there can be no assurance that title to any of our properties will not be challenged or impaired or that any minor title defects will be rectified. Third parties may have valid claims underlying portions of our interests, including prior unregistered liens, agreements, transfers or claims, and aboriginal land claims, and title may be affected by, among other things, undetected defects or unforeseen changes to the boundaries of our properties by governmental authorities.
In addition, certain of our properties have a long history and may have historical agreements in place that have somewhat ambiguous terms that could give rise to future disputes. A claim by a third-party that is asserting mineral rights, royalty rights, offtake rights, reconveyance rights or other similar rights with respect to one or more of our properties or projects could result in the Company incurring high costs of defending (or potentially settling) any such claim. If any such claim was successful, it could negatively impact the financial condition of one of our projects or our business generally.
In addition, a portion of the Copper World project and certain other of our mining properties in the United States are located on unpatented mine and millsite claims located on U.S. federal public lands. The right to use such claims is granted under the United States General Mining Law of 1872. Unpatented mining claims are unique property interests in the United States, and are generally considered to be subject to greater title risk than other real property interests because the validity of unpatented mining claims is often uncertain. While we believe there are no material defects in title over the Copper World project lands, there can be no assurance that approvals to resolve minor defects in title or overlapping claim boundary limits will be received or that all of our unpatented mine and millsite claims (including those forming part of the Copper World project) will remain valid and available for development. Any issues with title or mineral rights, even if minor, could require changes to our mine plans that could have a negative impact on the economics of the Copper World project.
JOINT VENTURE RISKS
We may conduct certain of our operations through joint ventures from time to time, including but not limited to our Copper World joint venture with Mitsubishi. We may enter into additional joint ventures in the future. Any current or future joint venture partners may have interests that are different from Hudbay's interests and which may result in conflicting views as to the conduct of the business of the joint venture, including, in the case of Copper World, the final investment decision for project construction. In the event that we have a disagreement with a joint venture partner as to the resolution of a particular issue to come before the joint venture, or as to the management or conduct of the business of the joint venture in general, we may not be able to resolve such disagreement in our favour and such disagreement could have a material adverse effect on our interest in the joint venture or the business of the joint venture in general.
RECRUITMENT, RETENTION AND LABOUR RELATIONS
The success of our operations and development projects depends in part on our ability to attract and retain geologists, engineers, metallurgists, tradespersons, and other required operating personnel in the geographic areas in which we operate. In particular, the success of our existing mining operations in Snow Lake, Manitoba, Princeton, British Columbia and southern Peru (and our planned mining operations at the Copper World project in Pima County, Arizona) depends in part on our ability to attract and train new personnel (including local community members) and retain existing personnel in these geographic areas.
We also depend on a number of key management personnel, and our success will largely depend on the efforts of these individuals and our ability to retain them or recruit qualified successors. The execution of our strategy and development plans depends on the abilities, experience and efforts of our management team and effectiveness of our succession plans. In addition, we also compete with other companies for the technical expertise and required labour to find, develop, and operate our properties. The loss of services from key employees or members of management could adversely impact our prospects and financial condition.
There can be no assurance that our business will not suffer from a work stoppage at any location where we operate. In Peru and Manitoba, approximately 46% and 69%, respectively, of our workforce is unionized as of December 31, 2025, and while we do not currently believe there is a risk of a prolonged work stoppage, there can be no assurance that such events will not occur in the near term or from time to time. If a strike or work stoppage occurred in Peru or Manitoba, while we believe we could continue operating, we would have a reduced workforce, and it may adversely affect our production efficiency in Peru and Manitoba. Additionally, there can be no assurance that unionization efforts will not take place with respect to our British Columbia operations in the future. If such unionization efforts were to take place, there can be no assurance of the terms of any related collective bargaining agreements, and a strike or work stoppage could potentially occur.
In addition, from time to time, we may temporarily suspend or close certain of our operations, and we may incur significant labour and severance costs due to a suspension or closure. Further, temporary suspensions and closures may adversely affect our future access to skilled labour, as laid-off employees may seek employment elsewhere.
LIQUIDITY, ACCESS TO CAPITAL AND INDEBTEDNESS
As at December 31, 2025, we had cash and cash equivalents of approximately $568.9 million (compared to $541.8 million as at December 31, 2024) and our Credit Facilities remained undrawn. While we expect that our current liquidity and future cashflows will be sufficient to meet our obligations in the coming year, there can be no assurances that this will be the case in future years given our exposure to a potential deterioration in metals prices and other similar risks discussed in this AIF.
To fund growth, secure our future reclamation obligations, and in difficult economic times, to ensure continued operations, we may need to secure necessary capital through equity, loans or other forms of permanent capital. The availability of this capital is subject to general economic conditions and lender and investor interest in the Company and our projects and, in the case of the Credit Facilities, the financial maintenance covenants contained therein. Financing may not be available when needed or, if available, may not be available on terms acceptable to us. Failure to obtain or maintain any financing necessary for our capital expenditure plans may result in a delay or indefinite postponement of exploration, development or production on any or all of our properties, including our potential plans to develop future growth projects. With respect to our current development strategies, although we have substantially de-risked Copper World with Mitsubishi's investment and strategic partnership, there can be no certainty that there will be sufficient financing (including from Mitsubishi) to adequately fund the construction of Copper World. See "Development of New Projects" above.
If we cannot make scheduled payments on our debt, or if we breach any of the covenants under our Credit Facilities, the indentures governing the Senior Unsecured Notes or our other debt instruments, we will be in default and holders of our debt could declare all outstanding principal and interest to be due and payable, causing a potential cross-acceleration or cross-default under certain of our other debt agreements and our other creditors could foreclose against the collateral securing our obligations and we could be forced into bankruptcy or liquidation. Additionally, if we were to breach any of the covenants under our Credit Facilities, we may be subject to an accelerated maturity date, based on the terms and conditions of Credit Facilities.
Additionally, to the extent that we incur indebtedness at variable interest rates to fund our growth objectives, we may enter into interest rate hedging arrangements to manage our exposure to short-term interest rates. To the extent that we commit to capital expenditures denominated in foreign currencies, we may enter into foreign exchange forwards or acquire foreign currency outright, which may result in foreign exchange gains or losses in our consolidated income statements. At December 31, 2025, approximately $526.4 million of our cash was held in US dollars, approximately $31.8 million of our cash was held in Canadian dollars, and approximately $10.7 million of our cash was held in Peruvian soles.
We have taken steps to substantially deleverage in advance of making a final investment decision in respect of Copper World, however, we continue to have a significant amount of indebtedness and our indebtedness may increase in connection with Copper World's construction. As of December 31, 2025, we have a total long-term debt of approximately $1,008.6 million. As a result, we have a substantial annual interest expense on long-term debt, amounting to approximately $60.7 million in 2025.
Specifically, our substantial level of indebtedness could have significant consequences, including:
• limiting our ability to access capital to fund future working capital, capital expenditures, acquisitions or other general corporate requirements;
• requiring a substantial portion of our cash flows to be dedicated to debt service payments instead of other purposes, thereby reducing the amount of cash flows available for working capital, capital expenditures, acquisitions and other general corporate purposes;
• increasing our vulnerability to general adverse economic and industry conditions;
• exposing the Company to the risk of increased interest rates for those borrowings that are at variable rates of interest;
• limiting our flexibility in planning for and reacting to changes in the industry in which we compete;
• placing the Company at a disadvantage compared to other less leveraged competitors; and/or
• increasing our cost of additional borrowings.
Subject to the limits contained in the indentures governing the Senior Unsecured Notes and any limits under our other debt instruments existing from time to time, we may incur additional debt (including under our Credit Facilities) to finance working capital, capital expenditures, investments or acquisitions or for other purposes. If we do so, the risks related to our level of indebtedness could intensify and there can be no assurance that the interest rate on any future debt will be as favourable as the Senior Unsecured Notes or any of our other existing debt.
Our ability to make scheduled payments on, repay in full or refinance our debt obligations, including the Senior Unsecured Notes, depends on our financial condition, operating performance and access to equity or debt markets if and as applicable, which in each case are subject to prevailing economic, market and competitive conditions and to certain financial, business, legislative, regulatory and other factors beyond our control, most importantly, metals prices. We may be unable to maintain a level of cash flows from operating activities sufficient to permit us to pay the principal, premium if any, and interest on our indebtedness, including the Senior Unsecured Notes.
If our cash flows and capital resources are insufficient to fund our debt service obligations, we could face substantial liquidity problems and could be forced to reduce or delay investments and capital expenditures or to dispose of material assets or operations, seek additional debt or equity capital or restructure or refinance our indebtedness, including the Senior Unsecured Notes. We may not be able to effect any such alternative measures on commercially reasonable terms or at all and, even if successful, those alternatives may not allow us to meet our scheduled debt service obligations. The indentures governing the Senior Unsecured Notes restrict our ability to dispose of assets and use the proceeds from those dispositions. They may also limit our ability to raise debt or equity capital to be used to repay other indebtedness when it becomes due. We may not be able to consummate those dispositions or to obtain proceeds in an amount sufficient to meet any debt service obligations then due.
In addition, the indentures governing the Senior Unsecured Notes contain a number of restrictive non-financial covenants that impose significant operating and financial restrictions on us and may limit our ability to engage in acts that may be in our long-term best interest, including limitations on our ability to:
• incur additional indebtedness;
• pay dividends or make other distributions or repurchase or redeem capital stock;
• prepay, redeem or repurchase certain debt;
• make loans and investments;
• sell assets;
• incur liens;
• enter into transactions with affiliates;
• alter the businesses we conduct;
• enter into agreements restricting our subsidiaries' ability to pay dividends; and
• consolidate, amalgamate, merge or sell all or substantially all of our assets.
INFORMATION TECHNOLOGY AND OPERATIONS TECHNOLOGY SYSTEMS
Our operations depend, in part, on information technology ("IT") and operations technology ("OT") systems. While we regularly monitor the security of our IT and OT systems, they remain vulnerable to disruption, damage or failure from a variety of sources, including but not limited to errors by employees or contractors, computer viruses, cable cuts, natural disasters, terrorism, power loss, vandalism, cyber-attacks including phishing, ransomware and similar malware, misappropriation of data by outside parties, negative consequences resulting from the use of artificial intelligence applications, and various other threats. While, to date, Hudbay has not experienced any material losses relating to IT or OT system disruptions, failure or damage, cyber-attacks or other information security breaches (including with respect to the use of artificial intelligence applications), there can be no assurance that we will not incur such losses or experience similar events in the future.
Any of these and other events could result in IT system or OT system failures, operational delays, production downtimes, security breaches, destruction or corruption of data, and equipment failure that could cause other risks to be realized, such as but not limited to, inaccurate recordkeeping, disclosure of confidential information, or other improper use of our IT and OT systems and networks. Any of these events could have an adverse effect on our reputation, results of operations, financial reporting and financial condition.
While we employ IT and OT governance practices over our information, data and networks, including implementing systems to monitor and detect threats, information security training for employees with access to sensitive information and data, the use of multi-factor encryption on all personal devices, the use of artificial intelligence applications, the implementation of a formal cyber security awareness, training and testing online platform, the implementation of a layered approach to protect our industrial control systems and the performance of periodic audits and penetration testing, we cannot be certain that it will be successful in securing our information and data from cyber-attacks, phishing attacks or other similar events. There may be instances where we are exposed to malware, cyber-attacks or other unauthorized access or use of our information and data. Our exposure to this risk cannot be fully mitigated because of, among other things, the evolving nature and frequency of these threats, the proliferation of the use of artificial intelligence applications, and the effects and consequences of vulnerable third parties. The techniques used to obtain unauthorized access to or sabotage our systems are under continuous and rapid evolution, and as a result, we may be unable to detect efforts to disrupt our data and systems in advance. As such threats continue to evolve and occur more frequently, we may be required to expend additional resources to continue to change or improve protective measures and to investigate and remediate any security vulnerabilities.
DEPLETION OF RESERVES AND VIABILITY OF OPERATIONS
Subject to any future expansion or other development, production from existing operations at our mines will typically decline over the life of the mine and the risk of the extraction of mineral reserves becoming uneconomic increases. As a result, our ability to maintain our current production or increase our annual production of base and precious metals and generate revenues therefrom will depend significantly upon our ability to discover or acquire new deposits, bring new mines into production successfully and to expand mineral reserves and production at existing mines. While exploration and development of mineral properties involves significant financial risk, the success of our exploration and development plans is crucial to our future operations.
Very few properties that are explored are later developed into operating mines. Whether a mineral deposit will be commercially viable depends on a number of factors, including the particular attributes of the deposit, such as size, grade and proximity to infrastructure; current and future expectations for metal prices; political and social stability; the cost of any required surface rights, particularly in the regions where we operate in Peru; obtaining and maintaining a social license to operate; and government regulation, including regulations relating to prices, taxes, royalties, land tenure, land use, importing and exporting of minerals and environmental protection, and the cost of any legal or administrative challenges related thereto. Even if we identify and acquire what we believe to be an economically viable ore body, several years may elapse until first production.
During this time, we may incur significant expenses to locate and establish mineral reserves, to develop metallurgical processes and to construct mining and processing facilities. We cannot provide assurance that our exploration or development efforts, including those at our Copper World project, at New Ingerbelle, at our mineral properties in Flin Flon and Snow Lake, Manitoba, the Mason project in Nevada, and Maria Reyna and Caballito in Peru, will result in any new commercial mining operations or yield new mineral reserves to replace or expand current mineral reserves.
MINING, PROCESSING, TAILINGS AND INSURANCE
Mining operations, including exploration, development and production of mineral deposits and tailings disposal, generally involve a high degree of risk and are subject to conditions and events beyond our control. Our operations are subject to all of the hazards and risks normally encountered in the mining industry, including the safety and health of personnel involved with the performance of mining or mining-related activities, adverse environmental conditions; industrial and environmental accidents; metallurgical and other processing problems; unusual or unexpected rock formations; ground or slope failures; structural cave-ins or slides; flooding or fires; seismic activity; rock bursts; equipment failures; and periodic interruptions due to weather conditions, as well as intentional acts by individuals or groups who intend to harm or disrupt our operations. These risks could result in the destruction of mines or processing facilities, the failure of tailings management facilities and damage to infrastructure, causing partial or complete shutdowns, personal injury or death, environmental or other damage to our properties or the properties of others, monetary losses and potential legal liability. Although we conduct extensive maintenance and monitoring and incur significant costs to maintain our mines, equipment and infrastructure, including our tailings management facilities, unanticipated failures or damage may occur that cause injuries, production loss or environmental pollution and resulting legal and economic liability, which may be significant. We may be at a heightened risk of such anticipated failures or damage in Manitoba, where some of our mines, equipment and infrastructure, including our tailings management facilities, were built over 80 years ago and, in the case of FFTIA, were based on the upstream construction design method.
As part of our risk management process for tailings, Hudbay has established an Independent Technical Review Board and developed a Tailings Governance Charter to oversee the governance and management of our tailings facilities (see the "Tailings Management Facilities" section in this AIF). Despite the implementation of governance, monitoring and engineering controls, failures of tailings storage facilities or other major infrastructure could occur, and such failures, while considered low probability, could result in significant environmental harm, loss of life, regulatory intervention, substantial remediation obligations, prolonged operational disruptions and material adverse impacts on our financial condition and reputation.
Likewise, as processing facilities go through a stabilization and optimization phase, such as our Copper Mountain mill, the risk of unexpected shutdowns and reduced availability increases. Any inability to provide adequate feed to our processing facilities or maintain the availability of our processing facilities could adversely impact our profitability and impair the viability of our operations.
Our insurance will not cover all the potential risks associated with our operations. In addition, although certain risks are insurable to an extent, no assurance can be given that such insurance will continue to be available or that we will be able to maintain insurance to cover these risks at economically feasible premiums. Insurance against risks such as non-sudden or non-accidental emissions pollution due to exploration and production is not generally available to us on acceptable terms. Business interruption due to pandemics, strikes, riots or other similar disruptive events is generally not covered by business interruption insurance. Losses from uninsured events may cause us to incur significant costs. In addition, insurance coverage may be subject to exclusions, deductibles and limits, and may not cover all losses, including certain environmental, catastrophic or business interruption losses, and insurance premiums and coverage terms may change over time, which could increase costs or leave us exposed to uninsured risks.
RECLAMATION AND MINE CLOSURE COSTS
The ultimate timing and costs for future removal and site restoration could differ from current estimates. Our estimates for this future liability are subject to change based on updated closure plans, amendments to applicable laws and legislation, the nature of ongoing operations and technological innovations. In addition, regulatory authorities in various jurisdictions require us to post financial assurances to secure, in whole or in part, future reclamation and restoration obligations in such jurisdictions based on the approved closure plans. Changes to the amounts required, as well as the nature of the collateral to be provided, including as a result of updated closure plans or changes in government policy, could significantly increase our costs, making the maintenance and development of existing and new mines less economically feasible. Any capital resources we utilize for this purpose will reduce the resources available for our other operations and commitments. Although we accrue for future closure costs based on current disturbance, we do not necessarily reserve cash for these obligations or otherwise fund these obligations in advance or immediately upon the commencement of closure. By way of example, to preserve flexibility for potential future operations, our closure plans for Flin Flon involved putting certain assets on care and maintenance for a period of time, thereby deferring certain closure costs. As a result, we will have significant cash expenditures when we close and restore our metallurgical complex in Flin Flon completely, although this may be reduced if we are able to successfully design and implement a tailings reprocessing operation.
GOVERNMENTAL APPROVALS, PERMITTING AND ENVIRONMENTAL REGULATION
Government approvals and permits are currently required in connection with all of our operations, and further approvals and permits will be required in the future. Certain permits and approvals relating to our existing operations are subject to periodic renewal, amendment, review or replacement, and there can be no assurance that any such renewals, amendments, reviews or replacements will be obtained on a timely basis or on acceptable terms. The success of our efforts to obtain and maintain permits is contingent upon many variables outside of our control, including the public consultation process undertaken by regulatory agencies and the adequacy of government consultation with Indigenous peoples. Obtaining and complying with governmental permits and our obligations under our participation and social investment agreements with local and Indigenous communities may increase costs and cause delays. There can be no assurance that all necessary permits will be obtained and, if obtained, that the time and costs involved will not exceed our estimates or that we will be able to maintain such permits or obtain any required renewals, amendments, reviews or replacements thereof as a result of, among other things, conditions imposed or legal challenges. To the extent such approvals are required and not obtained or maintained, our operations may be curtailed, or we may be prohibited from proceeding with planned exploration, development, or operation of mineral properties.
Environmental regulation continues to evolve, requiring stricter standards and enforcement, increased fines and penalties for non-compliance, and more stringent environmental assessments of proposed projects. There can be no assurance that existing or future environmental regulation will not materially adversely affect our business, financial condition and results of operations. There is contamination on properties that we own or owned or for which we have or have had care, management or control and, in some cases, on neighbouring properties, that may result in remediation requirements, fines and personal injury or natural resource damage claims, which could result in material costs. We could be held responsible for investigative-cleanup costs relating to presently unknown contamination on our properties. We may also acquire properties with environmental risks. Any investigative and remediation costs for known or unknown contamination or future releases of hazardous or toxic substances at our properties or related to our activities could be material.
Although we believe that our operations are currently carried out in material compliance with applicable laws and regulations, no assurance can be given that new laws and regulations will not be enacted or that existing laws and regulations will not be amended or applied in a manner that could have a material adverse effect on our business, financial condition and results of operations, including laws governing our tailings storage facilities. Any failure to comply with such laws and regulations may result in enforcement actions, including orders issued by regulatory or judicial authorities causing operations to cease or be curtailed, and may include corrective measures requiring capital expenditures, installation of additional equipment, or remedial actions. We may be required to compensate those suffering loss or damage relating to mining activities, and we may have civil or criminal fines or penalties imposed for violations of applicable laws or regulations, which costs could be material.
From time to time, we may also be subject to regulatory investigations, administrative proceedings or litigation arising from our operations, incidents or compliance obligations, and such matters may result in delays, increased costs, fines or penalties, even where they are ultimately resolved in our favour.
ENERGY AND OTHER CONSUMABLE PRICES AND AVAILABILITY
Our mining operations and facilities are intensive users of electrical energy, diesel fuel and other consumables (such as steel and metallurgical reagents) that are essential to our business. The prices and availability of energy and other consumables can be affected by numerous factors beyond our control, including general cost inflation, global and regional supply and demand, political, social and economic conditions, supply chain constraints (including as a result of geopolitical events and/or global conflicts) and applicable regulatory regimes. In addition, the implementation or expansion of tariffs on exported and/or imported products could negatively affect supply chains, the price of consumables and the ensuing cost of mine development and construction.
The prices of various sources of energy we rely on may increase significantly from current levels due to the current geopolitical environment, and any carbon-based energy we use may become subject to new or increased carbon taxes; any such significant increase or punitive tax could have an adverse effect on our profitability. As a result of these cost pressures, particularly the current inflationary environment, the operating and capital cost assumptions in our previously published NI 43-101 technical reports may no longer be accurate, which could have an adverse effect on the projected economics of our operations. Our operations also depend on the reliable supply of electricity and interruptions, curtailments or failures of supply or related infrastructure could disrupt operations, increase costs or adversely affect production.
TRANSPORTATION AND INFRASTRUCTURE
At our mines in northern Manitoba and Saskatchewan, we are dependent upon a single railway and certain short-line rail networks to transport products from the Flin Flon metallurgical complex for further processing or to our customers. In Peru, concentrate production from the Constancia mine must travel approximately 450 kilometres by road to the Port of Matarani and in British Columbia concentrate production must travel approximately 300 kilometres by road to the Port in Vancouver. The method and route of ore and concentrate transportation to our processing facilities and for sale give rise to a number of risks.
Transportation routes in Peru, Canada and the United States may be affected by community protests, blockades, labour actions, extreme weather events or other social or environmental disruptions and, from time to time, such disruptions have affected access to sites and shipments of concentrate, which could adversely affect our operations, sales and cash flows. In Peru, we have experienced periodic disruptions affecting concentrate transportation routes and site access, and similar disruptions could recur. In addition, our ability to ship concentrate may be affected by port availability and weather conditions, and port disruptions (including due to severe ocean conditions or any potential disruptions caused directly or indirectly by geopolitical events) could delay shipments, affect sales timing and adversely affect cash flows.
We may have similar dependencies at future mining and processing operations. Inability to secure reliable and cost-effective transportation and other infrastructure, or disruption of these services due to community or political protests, weather-related problems, strikes, lock-outs or other events could have a material adverse effect on our operations. If transportation for our products is or becomes unavailable, our ability to market our products could suffer. In addition, increases in our transportation costs, relative to our competitors, could make our operations less competitive and could adversely affect our profitability.
ENVIRONMENT
Governments and regulatory bodies at the international, national, regional and local levels have introduced or may introduce legislative changes to respond to the potential impacts of climate change. Additional government actions in different jurisdictions to regulate (and price) climate change related measures could increase the direct and indirect costs of our operations and may have a material adverse effect on our business.
In addition, there is increased investor attention on climate change, sustainability and ESG issues more generally. Notwithstanding our commitment to conducting our business in an environmentally and socially responsible manner and to pursue our greenhouse gas reduction goals at each of our operations, to the extent mining companies fall out of favour with some investors due to the industry's real or perceived impacts on climate change, this could negatively affect our shareholder base and access to capital. There has also been increased regulatory attention on such ESG issues, which has resulted in new, pending and proposed anti-greenwashing disclosure rules. While Hudbay has been actively monitoring the impact of such anti-greenwashing disclosure rules and seeks to mitigate any related risks, there can be no assurance that challenges regarding our disclosure will not take place in the future.
Our operations are also subject to the physical risks of climate change, which may include, among other factors:
● Increased extreme weather events: Our current operations are located in geographical areas where typical weather can be hazardous. The Constancia mine is situated in an area susceptible to seismic activity and El Niño and La Niña weather systems and the Copper World project is vulnerable to extreme dry heat. Our Manitoba and British Columbia operations are both situated in regions where potential wildfires may take place in the spring and summer months and are predisposed to cold temperatures, heavy snowfall and the inherent risks associated with sudden and drastic changes in temperature. An increase in extreme weather events at our operations, including increased frequency and severity of storms, winds and changes in precipitation and temperatures, could result in unanticipated challenges and may adversely affect our operations.
● Rising sea levels: A change in sea level can disrupt supply shipping channels, impacting both the transportation of equipment and resources to our operations and the delivery of our products to smelters and other purchasers.
● Water availability: Climate change may adversely affect water availability in arid locations, including the Southwestern United States (where our Copper World and Mason projects are located). Water scarcity and shortage can lead to pressure and government action to reduce industrial water consumption, which may restrict the use of existing water rights. In addition to climate-related physical impacts, our operations require access to sufficient quantities of water of appropriate quality for processing and other activities. Water availability, particularly at our operations in Arizona and Nevada, may be affected by seasonal variability, competing users, regulatory restrictions, permitting conditions or infrastructure limitations. Challenges in sourcing, managing, treating or discharging water, or changes in applicable water regulations, could adversely affect production, costs or the timing and feasibility of development projects.
Despite efforts to anticipate and mitigate the hazards and risks of climate change, the above risks and other factors may impact production forecasts, results of operations, financial condition, corporate strategy and share price, as well as our ability to bring our development projects into operation.
MINERAL RESOURCE AND RESERVE ESTIMATES
There are numerous uncertainties inherent in estimating mineral reserves and mineral resources and the future cash flows that might be derived from their production. Estimates of mineral reserves and mineral resources, and future cash flows necessarily depend upon a number of variable factors and assumptions, including, among other things, ability to achieve anticipated tonnages and grade, geological and mining conditions that may not be fully identified by available exploration data or that may differ from experience in current operations, historical production from the area compared with production from other producing areas, the assumed effects of regulation by governmental agencies and assumptions concerning metals prices, exchange rates, interest rates, inflation, operating costs, development and maintenance costs, reclamation costs, and the availability and cost of labour, equipment, raw materials and other services required to mine and refine the ore. In addition, there can be no assurance that mineral resources will be converted into mineral reserves and that mineral recoveries in small scale laboratory tests will be duplicated in larger scale tests under on-site conditions or during production. For these reasons, estimates of our mineral reserves and mineral resources in our public disclosure, and any estimates of future cash flows may vary substantially from our actual results.
Failure to achieve production, cost or life-of-mine estimates could have an adverse impact on our future cash flows, profitability, results of operations and financial condition. Likewise, the failure to produce marketable mineral concentrates from our operations, or the presence of deleterious elements in our mineral concentrate products, may adversely impact our ability to generate revenues from our production. We are at an increased risk of this at our Constancia operations, where the presence of lead and zinc in certain parts of the ore body requires us to blend production in order to sell marketable copper concentrate. Our actual production, costs and the productive life of a mine may vary from estimates for a variety of reasons, including actual ore mined varying from estimates of grade, tonnage, dilution and metallurgical and other characteristics, short-term operating factors relating to the mineral reserves, such as the need for sequential development of ore bodies and the processing of new or different ore grades, revisions to mine plans, risks and hazards relating to mining and availability of and cost of labour and materials. As a mine matures, the risks that may cause actual production to vary from previous estimates increases and the extraction of mineral reserves may become uneconomic.
There are a number of potential indicators that could trigger non-financial asset impairment or reversal of impairment in the future. One such potential indicator is a change to the life of mine ("LOM") plan for an asset. LOM plans incorporate management's best estimates of key assumptions which include future commodity prices, the value of mineral resources not included in the LOM plan, production based on current estimates of recoverable reserves, discount rates, future operating and capital costs and future foreign exchange rates.
REPUTATIONAL RISK
As a result of the increased usage and reach of social media, artificial intelligence and other technology applications or platforms used to create and publish user-generated content, companies today are at much greater risk of losing control over how they are perceived in the marketplace. Publicity adverse to us, including as a result of such user-generated content, could result from the actual or perceived occurrence of any number of events (for example, with respect to the handling of environmental matters, community relations or litigation), whether true or not. Although Hudbay seeks to mitigate this risk through a number of measures, there can be no assurance that the Company's reputation will not be harmed. Reputation loss may lead to increased challenges in developing and maintaining community relations and decreased investor confidence and could ultimately have a material adverse impact on Hudbay.
ANTI-BRIBERY LEGISLATION
We are subject to the U.S. Foreign Corrupt Practices Act ("FCPA"), which prohibits corporations and individuals from paying, offering to pay, or authorizing the payment of anything of value to any foreign government official, government staff member, political party, or political candidate in an attempt to obtain or retain business or to otherwise influence a person working in an official capacity. The FCPA also requires public companies to make and keep books and records that accurately and fairly reflect their transactions and to devise and maintain an adequate system of internal accounting controls. We are also subject to Canada's Corruption of Foreign Public Officials Act ("CFPOA"), which prohibits corporations and individuals from giving or offering to give a benefit of any kind to a foreign public official, or any other person for the benefit of the foreign public official, where the ultimate purpose is to obtain or retain a business advantage. Our Peru-based operations are also subject to local anti-bribery and anti-corruption laws including without limitation Law No. 30424, which imposes criminal liability for local and foreign bribery, money laundering, terrorism financing and related crimes, and Legislative Decree No. 1385 which sanctions private corruption.
Our international activities, including our Constancia mine and exploration activities elsewhere in South America, create the risk of unauthorized payments or offers of payments by our employees, consultants or agents to foreign persons. While we have implemented safeguards that are intended to prevent these practices, our existing safeguards and any future improvements to such safeguards may not be completely effective, and our employees, consultants or agents may engage in conduct for which we might be held responsible. Any failure to comply with the FCPA, the CFPOA and applicable laws and regulations in Peru and other foreign jurisdictions could result in substantial penalties or restrictions on our ability to conduct business in certain foreign jurisdictions, impair our access to capital and give rise to potential breaches of contracts and covenants, which may have a material adverse impact on us and our share price.
POST-RETIREMENT OBLIGATIONS
We have assets in defined benefit pension plans which accumulate through employer contributions and returns on investments made by the plans. The returns on investments are subject to fluctuations depending upon market conditions and we are responsible for funding any shortfall of pension assets compared to our pension obligations under these plans. Our liabilities under defined benefit pension plans are estimated based on actuarial and other assumptions. These assumptions may prove to be incorrect and may change over time and the effect of these changes can be material. We also have substantial commitments for post-retirement health and other benefits for which no specific funding arrangements are in place.
CREDIT RISK
We mitigate credit risk relating to customers of our copper, zinc and precious metals by carrying out credit evaluations on our customers and making a significant portion of sales on the basis of financial letters of credit. If customers default on the credit extended to them our liquidity and cash flows could be materially adversely affected. Further, we may enter into offsetting derivative contracts for which we do not obtain collateral or other security. In the event of non-performance by counterparties in connection with such derivative contracts, we are further exposed to credit risk.
CREDIT RATINGS
The credit rating agencies which rate Hudbay could re-evaluate their current credit ratings or outlooks at any time. There can be no assurance that the credit ratings assigned to Hudbay will be affirmed or remain in effect for any given period of time and ratings may be upgraded, downgraded, or placed under review by an applicable credit ratings agency at any time. Negative changes in our credit ratings or outlooks may increase the cost of borrowing for us. In addition to higher interest rates, rating downgrades could also potentially adversely impact our access to capital, cost of capital and financial flexibility, as well as the value of our securities. See "Credit Ratings" in this AIF for additional information regarding our current credit ratings and outlooks.
DIVIDEND PAYMENTS
The Senior Unsecured Notes and our Credit Facilities impose certain restrictions on our ability to make restricted payments, including common dividends. Our ability to make future dividend payments will be subject to compliance with the covenants contained in our debt agreements along with other liquidity considerations. At all times, the declaration of dividends is subject to the discretion of our Board of Directors and our Board of Directors may determine to cease our past practice of making dividend payments at any time.
MARKET PRICE OF COMMON SHARES & DILUTION
Our share price may be significantly affected by changes in commodity prices or in our financial condition or results of operations. Other factors unrelated to our performance that may have an effect on the price of our common shares include a lessening in trading volume, shareholder activism and general market interest in our securities and the size of our public float. As a result of any of these factors, the market price of our common shares may fall and otherwise may not accurately reflect our long-term value. Securities class action litigation has been brought against companies following periods of volatility in the market price of their securities (including in the context of shareholder activism campaigns) and issuers listed on U.S. stock exchanges (as we are), in particular, have been subject to increasing shareholder litigation. We may in the future be the target of similar litigation.
The Company cannot predict the size or nature of potential future sales or issuances of securities or the effect, if any, that such future sales and issuances will have on the market price of our common shares. Sales or issuances of substantial numbers of common shares or other securities that are convertible or exchangeable into common shares, or the perception that such sales or issuances could occur, may adversely affect prevailing market prices of our common shares. With any additional sale or issuance of common shares or other securities that are convertible or exchangeable into our common shares, investors will suffer dilution to their voting power and economic interest in the Company. Furthermore, to the extent holders of the Company's stock options or other convertible securities convert or exercise their securities and sell the common shares they receive, the trading price of our common shares may decrease due to the additional amount of common shares available in the market.
GROWTH STRATEGY AND ACQUISITION INTEGRATION
We evaluate growth opportunities and continue to consider potential acquisitions and dispositions of exploration, development and operating properties and other mineral assets to achieve our strategy, as demonstrated by the recent ASCU Transaction, which was announced on March 2, 2026. We, from time to time, engage in discussions in respect of both acquisitions and dispositions, and other business opportunities, but there can be no assurance that any such discussions will result in a successfully completed transaction. In addition, in the event of any such acquisition, including but not limited to the ASCU Transaction (if completed), there can be no assurance that the acquired business will be successfully integrated into our current operations. We also face competition from other companies for the acquisition of mineral properties, development projects and strategic partnerships, which may limit available opportunities, increase acquisition costs or result in the failure to complete transactions on acceptable terms.
PUBLIC HEALTH THREATS
An outbreak of infectious disease, a pandemic or a similar public health threat, or a fear of any of the foregoing, could cause operating, supply chain and project development stoppages and delays and disruptions, labour shortages, reduced product demand, travel and shipping disruption and shutdowns (including as a result of government regulation and prevention measures). The possibility of a global recession arising from an infectious disease, a pandemic or a similar public health threat and attempts to control it may impact metals demand and prices and could reduce available liquidity options. As a result, we may experience production below estimated levels, increased costs or significantly reduced revenue. This can lead to a material adverse effect on the financial performance, liquidity and results of operations.
"PASSIVE FOREIGN INVESTMENT COMPANY" UNDER THE U.S. INTERNAL REVENUE CODE
We do not believe we are a "passive foreign investment company" under Section 1297(a) of the U.S. Internal Revenue Code ("PFIC") for the current taxable year. If we derive 75% or more of our gross income from certain types of ''passive'' income (such as rents, royalties, interest, dividends, and other similar types of income), or if the quarterly average value during a taxable year of our ''passive assets'' (generally, assets that generate passive income) is 50% or more of the average value of all assets held by us, then the PFIC rules may apply to U.S. taxpayers that hold our common shares (regardless of the extent of their ownership interest in us). Several ''look-through'' rules apply in determining PFIC status, including that a 25% or more owned subsidiary corporation's income and assets will be deemed those of its parent for purposes of the PFIC rules. Thus, a sufficiently active subsidiary may allow a parent corporation to avoid PFIC status, depending on the circumstances. Whether we are considered a PFIC for a specific taxable year is a factual determination that must be made annually at the end of that taxable year. As a result, our status in the current and future years will depend on the composition our gross income, our assets and activities in those years and our market capitalization as determined on the end of each calendar quarter, and there can be no assurance that we will or will not be considered a PFIC for any taxable year.
If we are classified as a PFIC during any portion of a U.S. taxpayer's holding period for our common shares, as determined for U.S. federal income tax purposes, such taxpayer would be subject to adverse U.S. federal income tax consequences under the PFIC rules. In such case (except as discussed below), any excess distribution (generally a distribution in excess of 125% of the average distribution over a three- year period or shorter holding period for our common shares) and realized gain on the sale, exchange or other disposition of our common shares will be treated as ordinary income and generally will be subject to tax as if (a) the excess distribution or gain had been realized rateably over the U.S. taxpayer's holding period, (b) the amount deemed realized in each year had been subject to tax in each such year at the highest marginal rate for such year (other than income allocated to the current period or any taxable period before we became a PFIC, which would generally be subject to tax at the U.S. taxpayer's regular ordinary income rate for the current year and would not be subject to the interest charge discussed in (c) below), and (c) the interest charge generally applicable to underpayments of tax had been imposed on the taxes deemed to have been payable in those years. Where a company that is a PFIC meets certain reporting requirements, a U.S. taxpayer may be able to mitigate certain adverse PFIC consequences described above by making a "qualified electing fund" ("QEF") election to be taxed currently on its proportionate share of the PFIC's ordinary income and net capital gains. If we determine that we are a PFIC for any taxable year, we will determine at that time whether we will comply with the necessary accounting and record keeping requirements that would allow a U.S. taxpayer to make a QEF election with respect to us. We have no obligation to determine whether we are a PFIC and may not make any such determination.
DESCRIPTION OF CAPITAL STRUCTURE
COMMON SHARES
We are authorized to issue an unlimited number of common shares, of which there were 397,193,268 common shares issued and outstanding as of March 25, 2026 (being the final trading day prior to the date of this AIF).
Holders of common shares are entitled to receive notice of any meetings of our shareholders, to attend and to cast one vote per common share at all such meetings. Holders of common shares do not have cumulative voting rights with respect to the election of directors and, accordingly, holders of a majority of the common shares entitled to vote in any election of directors may elect all directors standing for election. Holders of common shares are entitled to receive, on a pro-rata basis, such dividends, if any, as and when declared by our board of directors at its discretion from funds legally available therefor. Upon our liquidation, dissolution or winding up, holders of common shares are entitled to receive, on a pro-rata basis, our net assets after payment of debts and other liabilities, in each case, subject to the rights, privileges, restrictions and conditions attaching to any other series or class of shares ranking senior in priority to or on a pro-rata basis with the holders of common shares with respect to dividends or liquidation. The common shares do not carry any pre-emptive, subscription, redemption or conversion rights, nor do they contain any sinking or purchase fund provisions.
PREFERENCE SHARES
We are authorized to issue an unlimited number of preference shares, none of which were issued and outstanding as of March 25, 2026 (being the final trading day prior to the date of this AIF).
Preference shares may from time to time be issued and the Board of Directors may fix the designation, rights, privileges, restrictions and conditions attaching to any series of preference shares. Preference shares shall be entitled to preference over the common shares and over any other of our shares ranking junior to the preference shares with respect to the payment of dividends and the distribution of assets or return of capital in the event of our liquidation, dissolution or winding up or any other return of capital or distribution of our assets among our shareholders for the purpose of winding up our affairs. Preference shares may be convertible into common shares at such rate and upon such basis as the Board of Directors in their discretion may determine. No holder of preference shares will be entitled to receive notice of, attend, be represented at or vote at any annual or special meeting, unless the meeting is convened to consider our winding up, amalgamation or the sale of all or substantially all of our assets, in which case each holder of preference shares will be entitled to one vote in respect of each preference share held. Holders of preference shares will not be entitled to vote or have rights of dissent in respect of any resolution to, among other things, amend our articles to increase or decrease the maximum number of authorized preference shares, increase or decrease the maximum number of any class of shares having rights or privileges equal or superior to the preference shares, exchange, reclassify or cancel preference shares, or create a new class of shares equal to or superior to the preference shares.
SENIOR UNSECURED NOTES
On September 23, 2020, we issued the 2029 Notes. The proceeds of this offering were used to redeem $400 million of our outstanding 7.250% senior unsecured due 2023 and to pay any related premium, costs, and expenses for general corporate purposes.
On March 8, 2021 we issued the 2026 Notes. The proceeds of this offering were used to redeem $600 million of our outstanding 7.625% senior unsecured due 2025.
The 2026 Notes and the 2029 Notes (together, the "Senior Unsecured Notes") are fully and unconditionally guaranteed, jointly and severally, on a senior unsecured basis, by substantially all of our existing and future subsidiaries, other than our subsidiaries associated with our development projects in the United States and certain newly formed or acquired subsidiaries that primarily hold or may develop non-producing mineral assets that are in the pre-construction phase of development. The Senior Unsecured Notes contain certain customary covenants and restrictions for a financing instrument of this type. Although there are no maintenance covenants with respect to our financial performance, there are transaction-based restrictive covenants that limit our ability to incur additional indebtedness and make restricted payments in certain circumstances.
At any time, we may redeem the Senior Unsecured Notes, at our option in whole or in part, at the redemption prices (expressed as percentages of the principal amount of such series of the Senior Unsecured Notes to be redeemed) set forth below, plus accrued and unpaid interest to the applicable date of redemption, if redeemed during the twelve-month period beginning on April 1 of each of the years indicated below. The Company currently anticipates that it will redeem all of the outstanding 2026 Notes at maturity on April 1, 2026 using the Company's available liquidity.
| 2026 Notes Percentage |
2029 Notes | ||
| Year | Percentage | Year | Percentage |
| 2026 and thereafter | 100.000% | 2026 | 101.021% |
| 2027 and thereafter | 100.000% | ||
CREDIT RATINGS
The following table sets out the latest credit ratings received from Standard and Poor's Ratings Services ("S&P"), Moody's Investors Services ("Moody's"), from Fitch Ratings ("Fitch"), and Morningstar DBRS ("DBRS").
| Credit Rating Organization | ||||
| S&P | Moody's | Fitch | DBRS | |
| Corporate Credit Rating | BB- | Ba3 | BB- | BBB (low) |
| Senior Unsecured Notes | BB- | B1 | BB- | BBB (low) |
S&P
In February 2026, S&P raised its issuer credit and issue-level ratings from 'B+' to 'BB-' for Hudbay, following improved cash flow generation, lower leverage and stronger credit measures in 2025. With the expectation that the company will sustain these improved credit measures and maintain robust liquidity over the next couple of years as it advances the Copper World project, the senior unsecured notes recovery rating remains unchanged at '3' and the outlook looks stable.
S&P's corporate credit rating (or issuer rating) is a forward-looking opinion about an obligor's overall creditworthiness in order to pay its financial obligations. This opinion focuses on the obligor's capacity and willingness to meet its financial commitments as they come due. It does not apply to any specific financial obligation.
S&P's corporate credit ratings are on a rating scale that ranges from AAA (highest quality) to D (lowest quality). The ratings from 'AA' to 'CCC' may be modified by the addition of a plus (+) or minus (-) sign to show relative standing within the major rating categories. According to S&P's rating system, an issuer rated 'BB' is less vulnerable in the near term than lower-rated obligors but faces ongoing uncertainties and exposure to adverse business, financial, or economic conditions that could lead to inadequate capacity to meet its financial commitments. A 'BB' rating is the fifth highest of ten categories in S&P's rating system.
Regarding the issue-level rating, according to S&P's rating system, S&P's issue credit ratings are based, in varying degrees, on its analysis of the following considerations: (i) likelihood of payment; (ii) nature of and provisions of the financial obligation; and (iii) protection afforded by, and relative position of, the obligation in the event of bankruptcy or reorganization. S&P's issue-level ratings are similarly on a rating scale that ranges from AAA (highest quality) to D (lowest quality), with the ratings from 'AA' to 'CCC' having plus (+) or minus (-) modifiers. According to S&P's rating system, an issue 'BB' indicates that the obligation is less vulnerable to nonpayment in the near term than lower-rated obligations but faces ongoing uncertainties and exposure to adverse business, financial, or economic conditions that could lead to inadequate capacity to meet its financial commitments. A 'BB' rating is the fifth highest of ten categories in S&P's rating system.
S&P's recovery ratings focus solely on expected recovery in the event of a payment default of a specific issue, and utilize a numerical scale that runs from 1+ to 6. The recovery rating is not linked to, or limited by, the corporate credit rating or any other rating, and provides a specific opinion about the expected recovery. A '3' recovery rating indicates S&P's expectations of meaningful (50%-70%) recovery in the event of default.
Moody's
In February 2026, Moody's upgraded our corporate family rating from 'B1' to 'Ba3', upgraded our probability of default rating from 'B1-PD' to 'Ba3-PD', and upgraded our senior unsecured notes rating from 'B2' to 'B1', reflecting materially reduced debt, improved operating performance and stronger credit metrics. Moody's also upgraded our speculative grade liquidity rating from 'SGL-2' to 'SGL-1' and changed the outlook to stable from positive.
Moody's issuer and issue-level credit ratings are on a rating scale that ranges from Aaa (highest quality) to C (lowest quality). Moody's appends numerical modifiers 1, 2, and 3 to each generic rating classification from Aa through Caa. The modifier 1 indicates that the obligation ranks on the higher end of its generic rating category; the modifier 2 indicates a mid-range ranking; and the modifier 3 indicates a ranking in the lower end of that generic rating category. According to Moody's credit rating system, obligations rated 'Ba' are considered to have speculative elements and are subject to substantial credit risk. A 'Ba' rating is the fifth highest of nine categories in Moody's rating system.
Moody's speculative grade liquidity ratings are on a rating scale that ranges from SGL-1 (best liquidity) to SGL-4 (weakest liquidity). According to Moody's speculative grade liquidity rating system, an issuer with an SGL-1 rating possesses very good liquidity and is expected to have the capacity to meet its obligations over the coming 12 months through internal sources without relying on external sources of committed financing.
Moody's corporate family ratings are long-term ratings that reflect the likelihood of a default on a corporate family's contractually promised payments and the expected financial loss suffered in the event of default. A corporate family rating is assigned to a corporate family as if it had a single class of debt and a single consolidated legal entity structure.
A probability of default rating is a corporate family-level opinion of the relative likelihood that any entity within a corporate family will default on one or more of its long-term debt obligations.
Moody's long-term ratings are assigned to issuers or obligations with an original maturity of one year or more and reflect both on the likelihood of a default on contractually promised payments and the expected financial loss suffered in the event of default.
Moody's speculative grade liquidity ratings are opinions of an issuer's relative ability to generate cash from internal resources and the availability of external sources of committed financing, in relation to its cash obligations over the coming 12 months.
Fitch
In January 2026, Fitch Ratings affirmed Hudbay's Long-Term Issuer Default Rating of 'BB-' and affirmed our Rating Outlook as Stable. Fitch also affirmed our rating of 'BB-'/'RR4' for our Senior Unsecured Notes.
Fitch's credit ratings relating to issuers are an opinion on the relative ability of an entity to meet financial commitments, such as interest, preferred dividends, repayment of principal, insurance claims or counterparty obligations. Credit ratings relating to securities and obligations of an issuer can include a recovery expectation. Credit ratings are used by investors as indications of the likelihood of receiving the money owed to them in accordance with the terms on which they invested.
Fitch defines "investment grade" and "speculative grade" as shorthand to describe the categories 'AAA' to 'BBB' (investment grade) and 'BB' to 'D' (speculative grade), respectively, in-line with general industry practice. Investment grade categories indicate relatively low to moderate credit risk, while ratings in the speculative categories either signal a higher level of credit risk or that a default has already occurred. Credit ratings express risk in relative rank order, which is to say they are ordinal measures of credit risk and are not predictive of a specific frequency of default or loss.
Fitch's credit ratings do not directly address any risk other than credit risk. In particular, ratings do not deal with the risk of a market value loss on a rated security due to changes in interest rates, liquidity and other market considerations. However, in terms of payment obligation on the rated liability, market risk may be considered to the extent that it influences the ability of an issuer to pay upon a commitment. Ratings nonetheless do not reflect market risk to the extent that they influence the size or other conditionality of the obligation to pay upon a commitment (for example, in the case of index-linked bonds).
Fitch Long-Term issuer default ratings, as well as issue-level ratings, are on a rating scale that ranges from AAA (highest quality) to C (lowest quality). Within rating categories, Fitch may use modifiers. The modifiers "+" or "-" may be appended to a rating to denote relative status within major rating categories. Such suffixes are not added to 'AAA' ratings and ratings below the 'CCC' category.
The instrument rating for an issuer's debt (whether secured, senior unsecured, or subordinated) is notched from the issuer's or guarantor's IDR. Rated entities with IDRs of 'BB-' and above usually have senior unsecured instrument ratings at the same level as the IDR, reflecting average (around 40%) rates of recovery across all sectors. For entities rated 'B+' and below, Fitch undertakes a 'bespoke' analysis of recovery upon default for each instrument. The resulting instrument rating reflects the Recovery Rating ("RR") (graded from 'RR1' to 'RR6'), and is notched from the IDR accordingly. Fitch divides the spectrum of recovery percentages from 0% to 100% within the six categories of RRs.
DBRS
In February 2026, DBRS initiated coverage of Hudbay and assigned an Issuer Rating of BBB (low) and a rating of BBB (low) to the Company's Senior Unsecured Notes. The trends on all ratings are Stable.
DBRS issuer ratings provide an opinion on the creditworthiness of an obligor and its capacity to meet its financial obligations in accordance with the terms under which they were issued. Such ratings are forward-looking opinions regarding the risk that an issuer will fail to meet its financial obligations as they come due.
DBRS credit ratings are on a long-term rating scale that ranges from AAA (highest credit quality) to D (lowest credit quality). The ratings from AA to CCC may be modified by the addition of the designations "high" or "low" to show relative standing within the major rating categories. According to DBRS's rating system, obligations rated in the BBB category are considered to have adequate credit quality, with the capacity for the payment of financial obligations considered acceptable; however, the entity may be vulnerable to future events. A rating of BBB (low) represents the lowest rating within the BBB category in DBRS's long-term rating scale. Ratings in the BBB category and above are generally considered to be investment grade, while ratings below BBB are generally considered to be speculative grade. An investment grade credit rating signifies that a bond or issuer has a relatively low risk of default, indicating a strong capacity to meet financial commitments.
DBRS trends provide guidance in respect of the future direction of ratings and are classified as Positive, Stable or Negative. A Stable trend indicates that DBRS does not expect the rating to change in the near term, generally over a period of approximately 12 months.
DBRS issue-level ratings for debt obligations consider, among other things, the likelihood of payment of principal and interest in accordance with the terms of the obligation and the expected recovery in the event of default. Issue-level ratings are generally aligned with the issuer rating for senior unsecured obligations, subject to recovery considerations and structural subordination.
Credit ratings assigned by DBRS address credit risk only. They do not address other risks, including liquidity risk, market value risk or price volatility, and are not statements of fact but rather opinions as to creditworthiness. Ratings may be revised, suspended or withdrawn at any time by DBRS.
The credit ratings and stability ratings we received from S&P, Moody's, Fitch and DBRS are not a recommendation to buy, sell or hold our securities and may be subject to revision or withdrawal at any time by any such credit rating organization. S&P, Moody's, Fitch and DBRS each charged us a fee in respect of the credit ratings service they provided.
WKSI ELIGIBILITY
The securities regulatory authorities in each of the provinces and territories of Canada have published amendments to National Instrument 44-102 - Shelf Distributions ("NI 44-102") and certain related securities law instruments implementing a permanent expedited shelf prospectus regime for well-known seasoned issuers (the "WKSI Rules"), which came into force on November 28, 2025.
As at December 31, 2025 and as at the date of this AIF, Hudbay qualifies as a "well-known seasoned issuer" ("WKSI") by virtue of its "qualifying public equity" (as defined in NI 44-102) and is eligible to rely on the WKSI Rules.
For more information on our financing activities, please refer to pages 49 to 53 of our management's discussion and analysis for the year ended December 31, 2025, a copy of which has been filed under our profile on SEDAR+ at www.sedarplus.ca and on EDGAR at www.sec.gov.
DIVIDENDS
We have historically paid a semi-annual dividend of C$0.01 per share in March and September of each calendar year. However, following Hudbay's recent financial transformation and consistent with its capital allocation framework, in February 2026 the Company's Board of Directors approved the introduction of a new quarterly dividend of C$0.01 per share as the Company has achieved certain financial milestones ahead of schedule and has significantly improved its financial position. This represents the first dividend increase in the Company's history. At all times, the declaration of dividends is subject to the discretion of our Board of Directors.
MARKET FOR SECURITIES
PRICE RANGE AND TRADING VOLUME
Our common shares are listed on the TSX and the NYSE under the symbol "HBM". The volume of trading and the high and low trading price of our common shares on the TSX and NYSE during the periods indicated are set forth in the following table.
| Trading of Common Shares on TSX | Trading of Common Shares on NYSE | |||||
| Period (2025) |
High (C$) |
Low (C$) |
Volume (common shares) |
High ($) |
Low ($) |
Volume (common shares) |
| January | 13.10 | 11.40 | 26,762,841 | 9.11 | 7.92 | 111,285,569 |
| February | 13.94 | 9.90 | 43,664,157 | 9.73 | 6.86 | 149,732,959 |
| March | 12.27 | 9.27 | 43,763,622 | 8.58 | 6.42 | 154,234,058 |
| April | 11.12 | 8.49 | 40,660,802 | 7.78 | 5.95 | 165,246,792 |
| May | 12.85 | 9.97 | 30,066,344 | 9.31 | 7.21 | 144,596,257 |
| June | 14.59 | 12.37 | 26,089,937 | 10.70 | 9.01 | 177,250,612 |
| July | 15.19 | 12.35 | 41,627,274 | 11.13 | 8.93 | 166,150,686 |
| August | 16.69 | 12.44 | 35,894,544 | 12.10 | 9.02 | 142,575,889 |
| September | 21.54 | 16.06 | 43,677,493 | 15.48 | 11.62 | 158,058,217 |
| October | 24.75 | 20.72 | 48,342,621 | 17.73 | 14.81 | 174,391,478 |
| November | 24.22 | 20.26 | 27,032,768 | 17.31 | 14.34 | 103,500,570 |
| December | 27.65 | 22.58 | 29,339,777 | 20.32 | 16.13 | 98,716,645 |
On March 25, 2026 (being the final trading day prior to the date of this AIF), the closing prices of our common shares on the TSX and NYSE were C$27.67 and $20.02 per common share, respectively.
PRIOR SALES
The following table summarizes the issuance of unlisted securities by Hudbay in the most recently completed financial year.
| Date Issued | Type of Security | Amount Issued(1) | Exercise Price |
| January 15, 2025 | Hudbay DSUs(2) | 20,601 | N/A |
| February 21, 2025 | Hudbay PSUs(3) | 397,787 | N/A |
| February 21, 2025 | Hudbay Options(5) | 739,841 | C$10.78 |
| February 21, 2025 | Hudbay RSUs(4) | 592,706 | N/A |
| March 19, 2025 | Hudbay Options(5) | 7,123 | C$13.50 |
| March 19, 2025 | Hudbay RSUs(4) | 11,880 | N/A |
| March 20, 2025 | Hudbay Options(5) | 864 | C$11.95 |
| March 20, 2025 | Hudbay RSUs(4) | 1,159 | N/A |
| March 21, 2025 | Hudbay DSUs(2) | 1,327 | N/A |
| March 21, 2025 | Hudbay RSUs(4) | 1,704 | N/A |
| March 21, 2025 | Hudbay PSUs(3) | 1,345 | N/A |
| March 31, 2025 | Hudbay Options(5) | 13,619 | C$10.99 |
| March 31, 2025 | Hudbay RSUs(4) | 19,576 | N/A |
| April 15, 2025 | Hudbay DSUs(2) | 27,924 | N/A |
| June 25, 2025 | Hudbay RSUs(4) | 7,705 | N/A |
| July 15, 2025 | Hudbay DSUs(2) | 17,843 | N/A |
| September 19, 2025 | Hudbay DSUs(2) | 569 | N/A |
| September 19, 2025 | Hudbay RSUs(4) | 1,010 | N/A |
| September 19, 2025 | Hudbay PSUs(3) | 797 | N/A |
| October 15, 2025 | Hudbay DSUs(2) | 12,268 | N/A |
Notes:
(1) Where partial Hudbay DSUs, Hudbay RSUs or Hudbay PSUs have been issued on the dates listed in the table above, the "Amount Issued" for each such partial issuance of units has been rounded to the nearest whole number.
(2) Hudbay DSUs are issued to members of the Hudbay board of directors from time to time as equity-based compensation. Hudbay DSUs are vested at the time of the applicable grant, but they are not paid out until after a director departs the Hudbay board of directors, at which time they are paid out in cash equal to the number of Hudbay DSUs held multiplied by the price of the Hudbay common shares ("Hudbay Shares") at the time the Hudbay DSUs are paid. When dividends are paid on Hudbay Shares, holders of Hudbay DSUs receive dividend equivalents, which entitle the holder to the number of additional Hudbay DSUs equal to the number of Hudbay DSUs held multiplied by the per share amount of the dividend, divided by the price of Hudbay Shares at the time the dividend is paid.
(3) All Hudbay PSUs are notional units that are each redeemable for a Hudbay Share or a cash amount equal to the value of a Hudbay Share at the vesting date. Hudbay PSUs vest after three years and have performance-based conditions based on a mix of relative total shareholder return, as to 75% of the applicable grant, and return on invested capital, as to 25% of the applicable grant.
(4) All Hudbay RSUs are notional units that are each redeemable for a Hudbay Share or a cash amount equal to the value of a Hudbay Share at the vesting date. All Hudbay RSUs listed in the chart above vest rateably over three years (one third each year).
(5) All Hudbay Options vest in equal installments over three years and remain exercisable for seven years.
DIRECTORS AND OFFICERS
BOARD OF DIRECTORS
|
John E. F. Armstrong Delta, British Columbia, Canada |
Director since: May 20, 2025 Committee memberships: • Compensation and Human Resources ("CHR") Committee • Audit Committee |
Mr. Armstrong had a long career as a strategic advisor and subsequently held the position of CEO of Versamet Royalties, a metals royalty and streaming company. Prior to his time at Versamet, Mr. Armstrong spent many years with BMO Financial Group. Most recently, he held the position of Deputy Head of Investment Banking, BMO Capital Markets where he was responsible for shaping and executing the firm's investment banking strategy across its various industry verticals, and delivering corporate finance and advisory solutions to clients. |
|
Jeane L. Hull Scottsdale, Arizona, United States |
Director since: June 20, 2023 Committee memberships: • CHR Committee • Technical Committee (Chair) |
Ms. Hull has more than 35 years of mining operational leadership and engineering experience, most notably holding the positions of Chief Operating Officer for Rio Tinto plc at the Kennecott Utah Copper Mine and Executive Vice President and Chief Technical Officer of Peabody Energy Corporation. She also held numerous management, engineering and operations positions with Rio Tinto affiliates. Prior to joining Rio Tinto, she held positions with Mobil Mining and Minerals and has additional environmental engineering and regulatory affairs experience in the public and private sectors. She is currently a corporate director and was previously on the board of directors of Copper Mountain prior to the CMMC Transaction in June 2023. |
|
Carin S. Knickel Golden, Colorado, United States |
Director since: May 22, 2015 Committee memberships: • Corporate Governance and Nominating Committee ("CGN Committee") (Chair) • Environmental, Health, Safety and Sustainability ("EHSS") Committee |
Ms. Knickel served as Corporate Vice President, Global Human Resources of ConocoPhillips from 2003 until her retirement in May 2012. She joined ConocoPhillips in 1979 and held various senior operating positions in wholesale marketing, refining, transportation and commercial trading as well as leadership roles in planning and business development throughout her career in the U.S. and Europe. She is currently a corporate director. |
|
Peter Kukielski Toronto, Ontario, Canada |
Director since: May 7, 2019 Committee memberships: • None |
Mr. Kukielski was appointed President and Chief Executive Officer in January 2020 after serving as Interim Chief Executive Officer since July 2019. Mr. Kukielski was President and Chief Executive Officer of Nevsun Resources Ltd. from May 2017 until its acquisition in December 2018. From 2013 to 2017, Mr. Kukielski was Chief Executive Officer of Anemka Resources and from 2008 to 2013, he was the Chief Executive, Mining for ArcelorMittal. From 2006 to 2008, Mr. Kukielski was the Chief Operating Officer of Teck Resources. From 2001 to 2006, he was with Falconbridge (originally Noranda) in senior roles, including Chief Operating Officer. |
|
George E. Lafond Victoria, British Columbia, Canada |
Director since: May 10, 2022 Committee memberships: • Audit Committee • EHSS Committee
|
Mr. Lafond was appointed to Hudbay's Board of Directors in May 2022 and is currently an independent strategic advisor. He is a citizen of the Saskatchewan Muskeg Lake Cree Nation in Treaty Six Territory and was appointed by the Government of Canada as the Treaty Commissioner of Saskatchewan. Mr. Lafond currently advises the Saskatchewan Indian Institute of Technology. In 2016, he received the Saskatchewan Order of Merit and in 2022, he received Queen Elizabeth II's Platinum Jubilee Medal. |
|
Stephen A. Lang Columbia, Missouri, United States |
Director since: October 3, 2019 Committee memberships: • Audit Committee • Technical Committee |
Mr. Lang was the Chair of Hudbay's Board of Directors until January 2025. He was Chief Executive Officer of Centerra Gold Inc. from 2008 to 2012 and served as Centerra's Board Chair from 2012 to 2019. Mr. Lang has also held positions at Stillwater Mining Company, Barrick Gold Corporation, Rio Algom Limited and Kinross Mining Corporation. He is currently a corporate director. |
|
Colin Osborne Burlington, Ontario, Canada |
Director since: May 2018 Committee memberships: • CHR Committee (Chair) • CGN Committee |
Mr. Osborne is President and Chief Executive Officer of Samuel Son & Co. Limited, a $5 billion company focused on providing metal solutions to a variety of end markets. He joined Samuel Son & Co. in August 2015 and was recently elected to its board of directors. From October 2007 through June 2015, Mr. Osborne was Chief Executive Officer and President of Vicwest Inc., and prior to that he was Chief Operating Officer at Stelco Inc. where his duties included overseeing mining operations. |
|
Paula C. Rogers North Vancouver, British Columbia, Canada |
Director since: June 20, 2023 Committee memberships: • Audit Committee (Chair) • CGN Committee
|
Ms. Rogers has more than 30 years of experience working with Canadian-based international public companies in the areas of corporate governance, treasury, mergers and acquisitions, financial reporting and tax strategy. Ms. Rogers has served as an officer of several public companies including Vice-President, Treasurer of Goldcorp Inc. and Treasurer of Wheaton River Minerals Ltd. Previous to those roles, she held various senior finance positions in corporate reporting, tax and treasury at Finning International Inc. over a period of nine years. Ms. Rogers is currently a corporate director and was previously on the board of directors of Copper Mountain prior to the CMMC Transaction in June 2023. |
|
David S. Smith North Vancouver, British Columbia, Canada |
Director since: May 7, 2019 Committee memberships: • None
|
Mr. Smith was appointed Chair of Hudbay's Board of Directors in January 2025. Mr. Smith served as the Chief Financial Officer and Executive Vice President of Finning International Inc. from 2009 to 2014. Prior to joining Finning, Mr. Smith served as Chief Financial Officer and Vice President of Ballard Power Systems, Inc. from 2002 to 2009. Previously, he spent 16 years with Placer Dome Inc. (now Barrick) in various senior positions and 4 years with PriceWaterhouseCoopers. He is currently a corporate director. |
|
Laura Tyler Adelaide, South Australia, Australia |
Director since: September 3, 2025 Committee memberships: • EHSS Committee • Technical Committee |
Ms. Tyler has over 30 years of extensive experience with world-class global mining companies, including a 20-year career at BHP in progressively more senior leadership roles and ultimately serving as Chief Technical Officer where she oversaw the integration of the technology function with exploration, innovation, value engineering and BHP's Centres of Excellence. She recently served as the interim Chief Executive Officer and Managing Director of Adriatic Metals PLC before assuming the full time Chief Executive Officer role prior to the company's sale to Dundee Precious Metals Inc. Her prior experience included various technical and operational roles at Newcrest Mining, Western Mining Corporation and Mount Isa Mines. |
The term of office for each director of the Company will expire upon the completion of the next annual meeting of shareholders of the Company.
Our executive officers as at the date of this AIF are listed below:
EXECUTIVE OFFICERS
|
Peter Kukielski Toronto, Ontario, Canada President and Chief Executive Officer |
For biographical information for Mr. Kukielski, refer above to the heading "Board of Directors". |
|
Eugene Lei Toronto, Ontario, Canada Chief Financial Officer |
Mr. Lei was appointed Chief Financial Officer in October 2022 and is responsible for providing strategic financial and capital markets leadership to the Company. Since joining Hudbay in 2012, Mr. Lei has progressed through several senior management roles and executive responsibilities, most recently serving as Senior Vice President, Corporate Development and Strategy. Prior to joining Hudbay, Mr. Lei was Managing Director, Mining at Macquarie Capital Markets Canada, working as an advisor on global and domestic mergers and acquisitions and equity capital markets offerings. |
|
Andre Lauzon Toronto, Ontario, Canada Chief Operating Officer |
Mr. Lauzon was appointed Chief Operating Officer on January 4, 2022. Mr. Lauzon was previously Vice President, Arizona Business Unit from 2018 to 2021, following almost two years in the role of Vice President, Manitoba Business Unit. Mr. Lauzon has experience with both open pit and underground mines. He has worked in and supported projects and mines in a wide range of challenging locations and conditions, including Voisey's Bay in Newfoundland, Turkey, Alaska, Australia, Indonesia, Brazil, northern Ontario and the United States. |
|
Candace Brûlé Pickering, Ontario, Canada Senior Vice President, Capital Markets and Corporate Affairs |
Ms. Brûlé was promoted to Senior Vice President, Capital Markets & Corporate Affairs in October 2025 and she is responsible for leading Hudbay's investor and external communication activities, financial planning and analysis, Canadian government relations and corporate sustainability reporting. Ms. Brûlé has nearly 20 years of experience in investor relations, corporate development and financial communications in the mining sector, including progressively senior roles at Hudbay. She started her career in global mining investment banking at Macquarie Capital Markets before joining Hudbay in 2010. |
|
Robert Carter Burlington, Ontario, Canada Senior Vice President, Canada |
Mr. Carter currently serves as Senior Vice President, Canada. He was appointed Vice President, Manitoba Business Unit in April 2022 after serving as General Manager of Hudbay's Manitoba mines since 2018. Mr. Carter has held a number of senior operational and technical roles with Hudbay, including Manager of the Lalor mine and Director of Business Development and Technical Services. He has nearly 30 years of mining industry experience across technical, operational and leadership positions. |
|
Patrick Donnelly Oakville, Ontario, Canada Senior Vice President, Legal and Organizational Effectiveness |
Prior to being appointed to his current role as Senior Vice President, Legal and Organizational Effectiveness effective May 30, 2022, Mr. Donnelly served as Vice President, General Counsel for eight years. Prior to joining Hudbay in 2008, Mr. Donnelly practiced corporate and securities law at Osler, Hoskin & Harcourt LLP. |
|
Javier Del Rio Tucson, Arizona, United States Senior Vice President, US Business Unit |
Mr. Del Rio was appointed Senior Vice President, South America and USA in March 2023. Mr. Del Rio previously served as Vice President, South America and USA, following over five years as Vice President, South America Business Unit from 2017 to 2022. Mr. Del Rio also previously served as Executive Director, Business Development - South America from 2010 to 2017. Mr. Del Rio has over 30 years of mining experience and has held management positions in business planning, optimization process, and business analysis with Newmont Mining Corporation in the United States and Peru. |
|
Mark Gupta Toronto, Ontario, Canada Senior Vice President, Corporate Development and Strategy |
Mr. Gupta joined Hudbay in 2014 and currently serves as Senior Vice President, Corporate Development and Strategy. Since first joining Hudbay, Mr. Gupta has held various corporate development roles focused on mergers and acquisitions, capital allocation and strategic planning. He was appointed Vice President, Corporate Development in 2022 and also held the role of Executive Director, Capital Planning and Operations Strategy after returning to Hudbay from BHP, where he served as Lead Principal, Business Development. Before joining Hudbay in 2014, he worked in global mining investment banking roles. |
|
Olivier Tavchandjian Canmore, Alberta, Canada Senior Vice President, Exploration and Technical Services |
Mr. Tavchandjian was appointed Senior Vice President, Exploration and Technical Services in March 2023. Mr. Tavchandjian joined Hudbay in September 2017 and prior to his current role, served as Hudbay's Vice President, Exploration and Technical Services. Mr. Tavchandjian brings 30 years of experience in mineral resource and mineral reserve estimation and reporting, exploration, strategic and life of mine planning, technical support to operations and corporate development. Prior to joining Hudbay, Mr. Tavchandjian was VP, Resource Evaluation for Anemka Resources, the mining portfolio company of a large private investment firm. |
|
Audra Walsh Lima, Peru Vice President, South America Business Unit |
Ms. Walsh was appointed Vice President, South America Business Unit in January 2026. As a leader of the South America Business Unit, Ms. Walsh is responsible for the strategic and operational performance of Hudbay's operational and exploration activities in Peru and exploration activities in Chile. Ms. Walsh brings more than 30 years of international mining experience across both precious and base metals. Previously, she was Chief Executive Officer of Minas de Aguas Teñidas S.A.U., a joint venture between Mubadala and Trafigura, until its sale in 2022. Ms. Walsh has held various CEO roles with private and public companies, as well as senior management and technical roles at Barrick and Newmont. |
As of March 25, 2026 (the final trading day prior to the date of this AIF), our directors and executive officers, as a group, beneficially owned, directly or indirectly, or exercised control or direction over, approximately 760,049 common shares, representing approximately 0.19% of the total number of issued and outstanding common shares.
CORPORATE CEASE TRADE ORDERS, BANKRUPTCIES, PENALTIES AND SANCTIONS
Stephen A. Lang was a director of Hycroft Mining Corporation ("Hycroft"), (formerly Allied Nevada Gold Corp.) which, on March 10, 2015, together with certain of its direct and indirect subsidiaries, filed voluntary petitions of relief under Chapter 11 of the U.S. Bankruptcy Code in the United States Bankruptcy Court for the District of Delaware (the "Delaware Bankruptcy Court"). On October 8, 2015, Hycroft's Plan of Reorganization was approved by the Delaware Bankruptcy Court, and effective October 22, 2015, Hycroft completed its financial restructuring process and emerged from Chapter 11 bankruptcy.
Jeane Hull was the Executive Vice President and Chief Technical Officer of Peabody Energy Corporation ("Peabody") from April 2011 until her retirement on July 31, 2015. Peabody filed for Chapter 11 bankruptcy protection on April 13, 2016 and emerged from Chapter 11 protection on April 2, 2017.
Ms. Hull was also a director of Cloud Peak Energy Inc. ("Cloud Peak") from July 6, 2016 to October 24, 2019. Cloud Peak filed for Chapter 11 bankruptcy protection on May 10, 2019, received court approval for its plan to exit bankruptcy on December 5, 2019 and emerged from bankruptcy on December 17, 2019.
Ms. Hull was also a director of Trevali Mining Corporation ("Trevali") from January 2021 to September 2022. Trevali obtained an initial order from the Supreme Court of British Columbia under the Companies' Creditors' Arrangement Act (Canada) in August 2022. Trevali indicated that its financial position deteriorated significantly in 2022 due to a number of events and challenges which impacted operations and production. On September 6, 2022, Trevali's shares were delisted from the Toronto Stock Exchange. On June 28, 2023, a court-appointed monitor was granted enhanced powers in the proceedings with respect to Trevali's business and affairs.
Carin S. Knickel was a director of Whiting Petroleum Corp. ("Whiting") which, on March 31, 2020, together with certain of its subsidiaries, commenced voluntary Chapter 11 cases under the United States Bankruptcy Code in the U.S. Bankruptcy Court for the Southern District of Texas. On September 1, 2020, Whiting announced that it has successfully completed its financial restructuring and emerged from Chapter 11 protection. Whiting officially concluded its reorganization after completing all required actions and satisfying the remaining conditions to its Plan of Reorganization.
CONFLICTS OF INTEREST
To the best of our knowledge, there are no known existing or potential conflicts of interest among or between us, our subsidiaries, our directors, officers or other members of management, as a result of their outside business interests, except that certain of our directors, officers, and other members of management serve as directors, officers, promoters and members of management of other entities and it is possible that a conflict may arise between their duties as a director, officer or member of management of Hudbay and their duties as a director, officer, promoter or member of management of such other entities.
Our directors and officers are aware of the existence of laws governing accountability of directors and officers for corporate opportunity and requiring disclosures by directors of conflicts of interest and we will rely upon such laws in respect of any directors' and officers' conflicts of interest or in respect of any breaches of duty by any of our directors or officers. All such conflicts are required to be disclosed by such directors or officers in accordance with the CBCA, and such individuals are expected to govern themselves in respect thereof to the best of their ability in accordance with the obligations imposed upon them by law. In addition, our Code of Business Conduct and Ethics requires our directors and officers to act with honesty and integrity and to avoid any relationship or activity that might create, or appear to create, a conflict between their personal interests and our interests.
AUDIT COMMITTEE DISCLOSURE
The Audit Committee is responsible for monitoring our systems and procedures for financial reporting and internal control, reviewing certain public disclosure documents, monitoring the performance and independence of our external auditors, monitoring the performance of our internal audit function and the design and ongoing review of our risk management system. The Audit Committee is also responsible for reviewing our annual audited consolidated financial statements, unaudited consolidated quarterly financial statements and management's discussion and analysis of results of operations and financial condition for annual and interim periods prior to their approval by the full board of directors. There was no instance in the year ended December 31, 2025 where our board of directors declined to adopt a recommendation of the Audit Committee.
The Audit Committee's charter sets out its responsibilities and duties, qualifications for membership, procedures for committee appointment and reporting to our board of directors. A copy of the current Audit Committee charter is attached hereto as Schedule C.
COMPOSITION
As at December 31, 2025, the Audit Committee consisted of Paula C. Rogers (Chair), John E. F. Armstrong, George Lafond, and Stephen A. Lang.
Relevant Education and Experience
Each member of the Audit Committee is independent and financially literate within the meaning of NI 52-110 and has experience as a Chief Financial Officer or Treasurer of a publicly traded company. Set out below is a description of the education and experience of each Audit Committee member that is relevant to the performance of his or her responsibilities as an Audit Committee member.
Ms. Rogers has more than 30 years of experience working with Canadian-based international public companies in the areas of corporate governance, treasury, mergers and acquisitions, financial reporting and tax strategy. Ms. Rogers has served as an officer of several public companies including Vice-President, Treasurer of Goldcorp Inc. and Treasurer of Wheaton River Minerals Ltd. Previous to those roles, she held various senior finance positions in corporate reporting, tax and treasury at Finning International Inc. over a period of nine years. Ms. Rogers holds a Bachelor of Commerce degree from the University of British Columbia and holds a Chartered Professional Accountant, Chartered Accountant designation.
Mr. Armstrong had a long career as a strategic advisor and subsequently held the position of CEO of Versamet Royalties, a metals royalty and streaming company. Prior to his time at Versamet, Mr. Armstrong spent many years with BMO Financial Group. Most recently, he held the position of Deputy Head of Investment Banking, BMO Capital Markets where he was responsible for shaping and executing the firm's investment banking strategy across its various industry verticals, and delivering corporate finance and advisory solutions to clients
Mr. Lafond is a citizen of the Saskatchewan Muskeg Lake Cree Nation in Treaty Six Territory and was appointed by the Government of Canada as the Treaty Commissioner of Saskatchewan. Mr. Lafond currently advises the Saskatchewan Indian Institute of Technology. In 2016, he received the Saskatchewan Order of Merit and in 2022, he received Queen Elizabeth II's Platinum Jubilee Medal.
Mr. Lang was the Chair of Hudbay's Board of Directors until January 2025. He was Chief Executive Officer of Centerra Gold Inc. from 2008 to 2012 and served as Centerra's Board Chair from 2012 to 2019. Mr. Lang has also held positions at Stillwater Mining Company, Barrick Gold Corporation, Rio Algom Limited and Kinross Mining Corporation. He is currently a corporate director.
POLICY REGARDING NON-AUDIT SERVICES RENDERED BY AUDITORS
We have adopted a policy requiring Audit Committee pre-approval of non-audit services. Specifically, the policy requires that proposals seeking approval by the Audit Committee for routine and recurring non-audit services describe the terms and conditions and fees for the services and include a statement by the independent auditor and Chief Financial Officer that the provision of those services could not be reasonably expected to compromise or impair the auditor's independence. The Audit Committee may pre-approve non-audit services without the requirement to submit a specific proposal, provided that any such pre-approval on a general basis shall be applicable for twelve months. The Chair of the Audit Committee has been delegated authority to pre-approve, on behalf of the Audit Committee, the provision of specific non-audit services by the independent auditor where (a) it would be impractical for the services to be provided by another firm; or (b) the estimated fees associated with such services are not expected to exceed C$50,000. Any approvals granted under this delegated authority are to be presented to the Audit Committee at its next scheduled meeting.
REMUNERATION OF AUDITOR
The following table presents, by category, the fees billed by Deloitte LLP as external auditor of, and for other services provided to, the Company for the fiscal years ended December 31, 2025 and 2024, respectively.
|
Category of Fees |
Fiscal 2025 |
Fiscal 2024 |
|
Audit fees |
C$3,334,419 |
C$3,020,615 |
|
Audit-related fees |
C$202,298 |
C$218,284 |
|
Tax fees |
- |
- |
|
All other fees |
C$140,000 |
C$129,638 |
|
Total |
C$3,676,717 |
C$3,368,537 |
"Audit fees" include fees for auditing annual financial statements and reviewing the interim financial statements, as well as services normally provided by the auditor in connection with our statutory and regulatory filings.
"Audit-related fees" are fees for assurance and related services that are reasonably related to the performance of the audit or review of our financial statements and are not reported under "Audit fees", including audit work related to our pension, benefit and profit-sharing plans.
"All other fees" are fees for services other than those described in the foregoing categories.
Management presents regular updates to the Audit Committee of the services rendered by the auditors as part of the Audit Committee's oversight regarding external auditor independence and pre-approved service authorizations.
LEGAL PROCEEDINGS AND REGULATORY ACTIONS
LEGAL PROCEEDINGS
We are not aware of any litigation outstanding, threatened or pending against us as of the date hereof that would reasonably be expected to be material to our financial condition or results of operations.
REGULATORY ACTIONS
We have not: (a) received any penalties or sanctions imposed against us by a court relating to securities legislation or by a securities regulatory authority during the financial year; (b) received any other penalties or sanctions imposed by a court or regulatory body that would likely be considered important to a reasonable investor in making an investment decision; and (c) entered any settlement agreements with a court relating to securities legislation or with a securities regulatory authority during the financial year.
INTEREST OF MANAGEMENT AND OTHERS IN MATERIAL TRANSACTIONS
Except as may be otherwise disclosed in this AIF, since January 1, 2023, none of our directors, executive officers or any shareholders who beneficially own, or control or direct, directly or indirectly, more than 10 percent of our shares and no associate or affiliate of the foregoing persons has or has had any material interest, direct or indirect, in any transaction that has materially affected or is reasonably expected to materially affect us.
TRANSFER AGENT AND REGISTRAR
The transfer agent and registrar for our common shares is TSX Trust Company at its principal office in Toronto, Ontario.
MATERIAL CONTRACTS
Except for those contracts entered into in the ordinary course of our business, the following are the material contracts we entered into (i) within the last financial year or (ii) between January 1, 2002 and the beginning of the last financial year, which are still in effect:
1. the Precious Metals Purchase Agreement dated August 8, 2012, as amended, with Wheaton Precious Metals (previously Silver Wheaton), whereby we agreed to sell a portion of the precious metals production from our 777 mine to Wheaton Precious Metals; 2. the Amended and Restated Precious Metals Purchase Agreement dated November 4, 2013, as amended, with Wheaton Precious Metals (International) Ltd. ("Wheaton International", previously Silver Wheaton (Caymans) Ltd.), whereby we agreed to sell 100% of the silver production and 50% of the gold production from our Constancia mine to Wheaton International;
3. the Amended and Restated Precious Metals Purchase Agreement, dated as of February 8, 2019 between Hudbay (BVI) International Inc. (formerly known as HudBay Arizona (Barbados) SRL), Hudbay, Wheaton International and Wheaton Precious Metals;
4. the Indenture dated as of September 23, 2020 with U.S. Bank National Association, as trustee, governing the Senior Unsecured Notes expiring in 2029;
5. the Indenture dated as of March 8, 2021 with U.S. Bank National Association, as trustee, governing the Senior Unsecured Notes expiring in 2026;
6. the Fifth Amended and Restated Credit Facility with the lenders party thereto from time to time and the Canadian Imperial Bank of Commerce, as administrative agent, dated as of October 26, 2021, as amended, providing for a four-year $300 million revolving credit facility;
7. the Third Amended and Restated Credit Facility with the lenders party thereto from time to time and the Canadian Imperial Bank of Commerce, as administrative agent, dated as of October 26, 2021, as amended, providing for a four-year $150 million revolving credit facility;
8. the Amended and Restated Limited Liability Company Agreement of Copper World LLC dated January 9, 2026 by and among Copper World LLC, Hudbay Arizona (US) Holding Corporation and MC Americas Resources Inc.; and
9. the Arrangement Agreement dated March 1, 2026 by and among Hudbay and Arizona Sonoran Copper Company Inc. in connection with the ASCU Transaction.
QUALIFIED PERSONS
The scientific and technical information contained in this AIF related to all material mineral properties other than the Copper Mountain Mine has been approved by Olivier Tavchandjian, P.Geo., our Senior Vice President, Exploration and Technical Services. Mr. Tavchandjian is a qualified person pursuant to NI 43-101.
The scientific and technical information contained in this AIF related to the Copper Mountain Mine has been approved by Marc-Andre Brulotte, P.Geo., Executive Director, Global Mineral Resource Evaluation. Mr. Brulotte is a qualified person pursuant to NI 43-101.
For a description of the key assumptions, parameters and methods used to estimate mineral reserves and resources, as well as data verification procedures and a general discussion of the extent to which the estimates may be affected by any known environmental, permitting, legal title, taxation, sociopolitical, marketing or other relevant factors, please see the technical reports for our material properties as filed by us on SEDAR+ at www.sedarplus.ca and EDGAR at www.sec.gov.
INTERESTS OF EXPERTS
Each of Olivier Tavchandjian, P.Geo., our Senior Vice President, Exploration and Technical Services, and Marc-Andre Brulotte, our Executive Director, Global Mineral Resource Evaluation, is an expert who has prepared certain technical and scientific reports or statements for Hudbay. As at March 25, 2025 (being the final trading day prior to the date of this AIF), to our knowledge, Mr. Tavchandjian and Mr. Brulotte each beneficially own, directly or indirectly, less than 1% of our outstanding securities and have no other direct or indirect interest in our Company or any of its associates or affiliates.
The auditor of the Company is Deloitte LLP. Deloitte LLP is independent with respect to the Company within the meaning of the rules of professional conduct of the Chartered Professional Accountants of Ontario and within the meaning of the Securities Act of 1933, as amended and the applicable rules and regulations thereunder adopted by the SEC and the Public Company Accounting Oversight Board (United States).
ADDITIONAL INFORMATION
Additional information, including directors' and officers' remuneration and indebtedness, principal holders of our securities and securities authorized for issuance under equity compensation plans, as applicable, is contained in our management information circular dated April 7, 2025. Additional financial information is provided in our financial statements and management's discussion and analysis for the fiscal year ended December 31, 2025.
Additional information relating to the Company may be found under our profile on SEDAR+ at www.sedarplus.ca and EDGAR at www.sec.gov.
SCHEDULE A: GLOSSARY OF MINING TERMS
The following is a glossary of certain mining terms used in this annual information form.
| "mineral reserves" | That part of a measured or indicated mineral resource which could be economically mined, demonstrated by at least a preliminary feasibility study that includes adequate information on mining, processing, metallurgical, economic and other relevant factors that demonstrate, at the time of reporting, that economic extraction can be justified. A mineral reserve includes diluting materials and allowances for losses that may occur when the material is mined. Mineral reserves are those parts of mineral resources which, after the application of all mining factors, result in an estimated tonnage and grade which, in the opinion of the qualified person(s) making the estimates, is the basis of an economically viable project after taking account of all relevant processing, metallurgical, economic, marketing, legal, environment, socio-economic and government factors. Mineral reserves are inclusive of diluting material that will be mined in conjunction with the mineral reserves and delivered to the treatment plant or equivalent facility. The term "mineral reserve" need not necessarily signify that extraction facilities are in place or operative or that all governmental approvals have been received. It does signify that there are reasonable expectations of such approvals. Mineral reserves are subdivided into proven mineral reserves and probable mineral reserves. Mineral reserves fall under the categories of proven mineral reserves and probable mineral reserves. |
| "preliminary economic assessment" | Means a study, other than a pre-feasibility or feasibility study, that includes an economic analysis of the potential viability of mineral resources; |
| "proven mineral reserves" | That part of a measured mineral resource that is the economically mineable part of a measured mineral resource, demonstrated by at least a preliminary feasibility study that includes adequate information on mining, processing, metallurgical, economic, and other relevant factors that demonstrate, at the time of reporting, that economic extraction is justified. |
| "probable mineral reserves" | That part of an indicated and in some circumstances a measured mineral resource that is economically mineable demonstrated by at least a preliminary feasibility study that includes adequate information on mining, processing, metallurgical, economic, and other relevant factors that demonstrate, at the time of reporting, that economic extraction can be justified. |
| "mineral resources" | A concentration or occurrence of natural, solid, inorganic or fossilized organic material in or on the Earth's crust in such form and quantity and of such a grade or quality that it has reasonable prospects for economic extraction. The location, quantity, grade, geological characteristics and continuity of a mineral resource are known, estimated or interpreted from specific geological evidence and knowledge. Mineral resources fall under the categories of measured mineral resource, indicated mineral resource and inferred mineral resource. |
| "measured mineral resource" | That part of a mineral resource for which quantity, grade or quality, densities, shape and physical characteristics are so well established that they can be estimated with confidence sufficient to allow the appropriate application of technical and economic parameters to support production planning and evaluation of the economic viability of the deposit. The estimate is based on detailed and reliable exploration, sampling and testing information gathered through appropriate techniques from locations such as outcrops, trenches, pits, workings and drill holes that are spaced closely enough to confirm both geological and grade continuity. |
| "indicated mineral resource" | That part of a mineral resource for which quantity, densities, shape and physical characteristics can be estimated with a level of confidence sufficient to allow the appropriate application of technical and economic parameters and to support mine planning and evaluation of the economic viability of the deposit. The estimate is based on detailed and reliable exploration and testing information gathered through appropriate techniques from locations such as outcrops, trenches, pits, workings and drill holes that are spaced closely enough for geological and grade continuity to be reasonably assumed. |
| "inferred mineral resource" | That part of a mineral resource for which quantity and grade or quality can be estimated on the basis of geological evidence and limited sampling and reasonably assumed, but not verified, geological and grade continuity. The estimate is based on limited information and sampling gathered through appropriate techniques from locations such as outcrops, trenches, pits, workings and drill holes. |
SCHEDULE B: MATERIAL MINERAL PROJECTS
CONSTANCIA MINE
Project Description, Location and Access
We own a 100% interest in the Constancia mine in southern Peru. Constancia is located approximately 600 kilometres southeast of Lima. Geographic coordinates at the centre of the property are longitude 71° 47' west and latitude 14° 27' south.
We acquired Constancia in March 2011 through our acquisition of all of the outstanding shares of Norsemont Mining Inc. ("Norsemont"). We own a 100% interest in the 66 mining concessions (covering an area of 43,536 hectares) that comprise Constancia, all of which are duly registered in the name of our wholly-owned subsidiary, HudBay Peru S.A.C. Most of the known mineralization is located in the claims Katanga J, Katanga O, Katanga K, and Peta 7, though small mineralized outcrops are common throughout the area. All the mining concessions are currently in good standing. The annual concession fee payments of $3.00 per hectare are due on June 30 each year.
The Pampacancha high-grade satellite open pit mine was operated between 2021 and 2025 and has now been entirely depleted. Closure activities at Pampacancha as defined in regulatory approvals will be initiated in 2026 prior to the property being returned to the community of Chilloroya.
We have entered into life-of-mine agreements with the neighboring communities of Chilloroya and Uchucarcco. These agreements provide us with the surface rights required for operations at both the Constancia and Pampacancha mine sites and specify our commitments to these local communities over the course of the mine life. In particular, the community agreements contemplated cash payments for the land access rights, as well as funds for facilitation of development projects and investment for local enterprises. The agreements also outline ongoing annual investments in community development including medical, educational and agricultural services and contemplate a bi-annual review of certain of the social development terms. The terms of these agreements may need to be renegotiated from time to time in respect of annual rents and social investments to be made thereunder. There can be no assurance that such renegotiated terms will be reached at all or in a timely manner.
Constancia is subject to the following tax regime and agreement concerning mineral production:
1. Peruvian Tax Regime
Constancia is subject to the Peruvian tax regime, which includes the mining tax, mining royalty, 8% labour participation, corporate tax and IGV/VAT. The Special Mining Tax ("SMT") and the Mining Royalty ("MR") were introduced in late-2011 for companies in the mineral extractive industries. Both the SMT and the MR are applicable to mining operating income based on a sliding scale with progressive marginal rates. The effective tax rate is calculated according to the operating profit margin of the Company. Based on Constancia's expected life-of-mine operating profit margin, the effective SMT and MR tax rates are projected to be 2.90% and 2.90% of operating income over the life of the mine. The MR is subject to a minimum of 1% of sales during a given month.
2. Precious Metals Stream Agreement
100% of the silver production and 50% of the gold production from Constancia is subject to our stream agreement with Wheaton Precious Metals, as described in this AIF.
Accessibility, Climate, Local Resources, Infrastructure and Physiography
The Constancia mine and mill operation is accessible from Lima by flying to either Arequipa or Cusco and then proceeding by paved and gravel highway to the mine site, which in each case takes approximately seven hours. The closest town is Yauri (population 23,000), which is approximately 80 kilometres by road from the mine site. Copper concentrate is transported via Yauri to the Matarani port, which is approximately 460 kilometres by road from the mine site.
The climate of the region is typical of the Peruvian altiplano in which the seasons are divided into the wet season between October and March with slightly higher temperatures and a dry season during April to September with colder temperatures. Temperatures can dip below -10° Celsius and rise to 20° Celsius. The sun can be very strong with high ultraviolet readings being common during the mid-day period. There is a climate monitoring station installed at the mine site.
Elevations on the property range from 4,000 to 4,500 metres above sea level with moderate relief and grass-covered altiplano terrain. Slopes are typically covered with grasses at lower elevations. At higher elevations, talus cover is common with very little vegetation. The grasslands are used as pasture for animals and at lower elevations for some limited subsistence agriculture. Water resources are readily available from a number of year-round streams near the mine site.
The infrastructure includes the waste rock facility, tailings management facility, water management system, electrical power supply and transmission and improvements to the roads and port. The primary road to the site consists of a 70 kilometre sealed road (National Route PE-3SG) from Yauri to the Livitaca turn-off and approximately 10 kilometres of unsealed road (CU-764) from the Livitaca turn-off to site. These roads (and bridges) have been upgraded, as necessary, to meet the needs for construction and life of mine use.
The combined maximum demand for electricity from the operation is estimated to be 96 MW with an average load of 85 to 90 MW in the next 5 years. Electricity is supplied via the 220 kV Tintaya substation located about 70 kilometres from the mine site and a dedicated transmission line from this substation to Constancia.
Copper concentrate is shipped from the Constancia site via road (~490 kilometers) and arrives at the Matarani port in trucks. These trucks are equipped with a hydraulically operated covered-box hinged at the rear, the front of which can be lifted to allow the concentrate to be deposited in the concentrate shed assigned to Hudbay by TISUR, the port operator. These trucks can load up to 37 tonnes of Cu Concentrate. All concentrates are dumped into an enclosed receiving system specially designed for Hudbay. This receiving system includes sampling platforms, dump and screening hoppers, dust scrubbers, car wash system and a conveyor underground system that leads into an existing stacking system. Pier C has been assigned to Hudbay and has a 75 thousand tonne capacity, with a minimum of 30kt guaranteed. A chute from the shed will feed a conveyor system in a tunnel below. This feeds a tubular conveyor with a capacity of 1200 metric tonnes per hour capacity. The same conveyor and ship loading equipment is shared with other copper concentrate exporters.
History
The original Constancia property, consisting of 13 concessions, was obtained by Norsemont pursuant to an option agreement with Rio Tinto Mining and Exploration Ltd. ("Rio Tinto"). Norsemont acquired an initial 51% interest in the property from Rio Tinto in November 2007 and in March, 2008, Norsemont acquired the remaining 19% interest held by Rio Tinto. Norsemont acquired the 30% interest in the project from Mitsui Mining and Smelting Company Limited Sucursal Del Peru ("Mitsui") and 23 additional concessions were obtained by Norsemont in 2007 and 2008.
The San Jose prospect (which forms part of the Constancia deposit) was explored by Mitsui during the 1980s. Exploration consisted of detailed mapping, soil sampling, rock chip sampling, and ground magnetic and induced polarization surveys with several drill campaigns. Drilling was mainly focused on the western and southern sides of the prospect. Mitsui completed 24 drill holes (4,200 metres) and Minera Katanga completed 24 shallow close-spaced drill holes at San Jose (1,200 metres).
In 1995, reconnaissance prospecting by Rio Tinto identified evidence for porphyry style mineralization exposed over an area 1.4 x 0.7 kilometres, open in several directions, with some copper enrichment below a widespread leach cap developed in both porphyry and skarn.
In May 2003, Rio Tinto revisited the area and the presence of a leached cap and the potential for a significant copper porphyry deposit were confirmed.
The Rio Tinto exploration activities consisted of geological mapping, soil, and rock chip sampling, and surface geophysics (magnetics and induced polarization). Rio Tinto completed 24 diamond drill holes for a total of 7,500 metres.
Geological Setting, Mineralization, and Deposit Types
The Constancia deposit is a porphyry copper-molybdenum system which includes copper-bearing skarn mineralization. This type of mineralization is common in the Yauri-Andahuaylas metallogenic belt where several porphyry Cu-Mo-Au prospects have been described but not exploited. Multiple phases of monzonite and monzonite porphyry have intruded a sequence of sandstones, mudstones and micritic limestone of Cretaceous age. Structural deformation has played a significant role in preparing and localising the hydrothermal alteration and copper-molybdenum-silver-gold mineralization, including skarn formation. The skarn component of the mineralization is more prevalent along the Yanak fault on the western margin of the Constancia deposit. Recent drilling conducted in 2019-2020 has confirmed a 300m extension of both high grade skarn and shallow porphyry mineralization to the north of deposit into the Constancia North area. In 2021, Hudbay completed an internal positive scoping study which resulted in an inferred mineral resource estimate of 6.5 million tonnes at 1.2% copper in two high grade skarn lenses located below the open pit in the Constancia Norte area. The study concluded these two lenses have the potential to be mined by underground methods once the open pit has reached its final configuration in this area.
The Constancia porphyry copper-molybdenum system, including skarn, exhibits five distinct deposit types of mineralization:
1. Hypogene fracture-controlled and disseminated chalcopyrite mineralization in the monzonite (volumetrically small);
2. Hypogene chalcopyrite (rare bornite) mineralization in the skarns (significant);
3. Supergene digenite-covellite-chalcocite (rare native copper) in the monzonite (significant);
4. Mixed secondary sulphides/chalcopyrite in the monzonite (significant); and
5. Oxide copper mineralization (volumetrically small).
Molybdenite, gold and silver occur within all these mineralization types.
Two areas of porphyry-style mineralization are known within the project area, Constancia and San José. At Constancia, mineralization is deeper than that observed at San José which occurs at surface. The mineralized zone extends about 1,200 metres in the north-south direction and 800 metres in the east- west direction.
Epithermal mineralization of the low sulphidation quartz-sulphides Au + Cu style, accounts for common supergene enriched Au anomalies, and along with other features such as hydrothermal alteration and veins typical of near porphyry settings.
Exploration
A geophysical Titan-24 survey was completed in July 2011 to the south of the Constancia deposit. In late 2013, an aeromagnetic and radiometric helicopter geophysical survey was carried out over an area of 80 square kilometers near Constancia.
A mapping and geochemical sampling program was completed between 2007 to 2014, where 20,789 hectares were mapped. Of the 20,789 hectares, 8,905 were mapped on Hudbay mining concessions, which represent 80% of the mining rights in the area.
Future exploration efforts are anticipated to focus on the Maria Reyna, Caballito and Kusiorco prospective satellite properties located within trucking distance of the Constancia mill. In August 2022, Hudbay executed an exploration agreement with the community of Uchucarco which allowed the company to start preliminary exploration activities over the Caballito property and a large portion of the Maria Reyna and Kusiorco properties.
Drilling
Extensive drilling has been conducted at the Constancia and Pampacancha deposits since the early 2000s. The most recent drilling programs were completed by Hudbay, with prior drilling programs conducted by Rio Tinto and Norsemont Mining. The various drilling campaigns conducted at Constancia and Pampacancha totaled approximately 238,000 meters of drilling with 95% of the drilling being conducted by diamond drilling (coring) methods and only 5% done by reverse circulation (RC).
Sampling and Analysis and Security of Samples
The sample preparation, analysis, security procedures and data verification processes used in the exploration campaigns on the Constancia mine prior to our acquisition were reviewed through the documentation available in previously filed technical reports and we have determined that the sampling methodology, analyses, security measures and data verification processes were adequate for the compilation of data at Constancia and such processes continue to be used by us.
1,555 bulk density measurements were used for the resource block model of Constancia. These measurements were conducted at ALS Chemex, Certimin and Bureau Veritas laboratories using the paraffin wax coat method. These measurements are representative of the different rock and mineralization domains recognized to date.
During the Hudbay drilling campaigns conducted since 2011, samples have been either prepared at site or sent to commercial laboratories. Blanks were inserted into the sample stream as per geologist instruction. Standard references were prepared with material obtained from the Constanciadeposit by Hudbay and were analyzed and certified by Acme labs. Duplicates were obtained by splitting half core samples, obtaining two quarter core sub-samples, one quarter representing the original sample and the other quarter representing the duplicate sample. In addition, external checks have been conducted at independent external commercial laboratories on a regular basis.
Assay data was delivered in digital form by the laboratories. Checks for inconsistent values were made by the senior geologist before data was uploaded.
All lithological, alteration, geotechnical and mineralization data was logged on paper logs that were later entered in spreadsheets from where they were imported into the database. The data entry spreadsheets have a number of built-in logical checks to improve the validity of the database. We checked collar positions visually on plans and down-hole surveys were validated by examining significant deviations.
Mineral Processing and Metallurgical Testing
The metallurgical responses of Constancia ore (ex: Hypogene, Supergene, Skarn, Mixed and High Zinc) is typical of other Andean porphyry deposits in terms of treatment rate, recovery and molybdenum and copper concentrate grades. For example, the copper grade in the final concentrate is higher than 26%, with acceptable levels of zinc, lead, iron, etc. The molybdenum concentrate produced is over 47% molybdenum with low contents of copper, lead, iron, etc. Metallurgical test work performed at laboratory and plant levels with Hypogene, Skarn, Supergene, High Zinc and Mixed ore from different polygons have enabled the operator to identify different reagents which show better performance according to each type of ore treated. Engineering studies continue to evaluate the addition of Pebble Crushers to the comminution circuit to address the expected increase in ore hardness of the hypogene ore.
For the 2025 production year, the Constancia plant achieved an average copper recovery of 84.3%. Despite the projected decline in ore grades over the remaining Life of Mine (LOM), copper recoveries are expected to average around 85%. This sustained performance is driven by the implementation of the Pebble Crushers, the 3rd Flotation Line, and the 6th Tailings Pump projects, along with increased process water flow and the plant flow sheet improvements successfully implemented in 2024.
Hudbay achieved a key regulatory milestone in early 2026 with the approval of an updated Operational Permit (ITM), increasing authorized mill throughput from 81,900 to 85,000 tpd. This shift from 29.9 Mtpa to 31.0 Mtpa serves as the foundation for the company's 34 Mtpa target, which incorporates a 10% capacity allowance. To formalize this growth, Hudbay has concurrently applied for an environmental certification for 34 Mtpa + 10%. Upon approval, the company will seek a subsequent ITM update to establish this new production ceiling, backed by a strategic capital investment plan designed to maximize asset value.
Mineral Resource and Mineral Reserve Estimates
The mineral resource and mineral reserve estimates for the Constancia property is effective January 1, 2026. Other than as disclosed in this AIF, there are no known metallurgical, environmental, permitting, legal, taxation, socio-economic, marketing or political issues that could reasonably be expected to materially impact the mineral resource and mineral reserve estimates.
Resource estimation for the Constancia deposit is based on the most up to date geological interpretations and geochemical results from the drilling data currently available. Multi pass ordinary kriging interpolation setup was used to interpolate the grades in the block model while honoring the geology. The resource models are also regularly monitored for any material discrepancy with mill credit and for local inconsistencies between predicted grade by the model and mine production sampling and adjusted as needed.
The component of the mineralization within the block model that meets the requirements for reasonable prospects of economic extraction was based on the application of a Lerchs-Grossman algorithm.
The updated mine production plan at Constancia contains 604.4 million tonnes of waste, 496.4 million tonnes of ore as well as 13.6 million tonnes of measured mineral resources not converted to mineral reserves as there is no room left in the tailings storage facility to continue to operate the mill using current design, yielding an overall stripping ratio of approximately 1.2 to 1.0. The mineral resource estimates included in the reserves pit design but not reported as mineral reserve estimates due to insufficient engineering work to confirm enough tailings disposal capacity constitute an opportunity to further extend mine life. The production schedule for the life of mine shows an average mining rate of 73 million tonnes of material movement and with a maximum of 87 million tonnes per annum will be required to provide the targeted process feed rate of 34 million tonnes per annum starting in 2027 at average grades of 0.24% Cu, 74 g/t Mo, 0.036 g/t Au and 2.37 g/t Ag.
Reconciliation of Reserves and Resources
Reconciliation results between the January 1, 2025 mineral reserve estimates and mill credited production provided good results at Constancia. The reserve model at Constancia was adjusted to reflect knowledge obtained from mapping in the pit on the geometry of barren dykes that crosscut the mineralization while also incorporating some minor mine design changes. A year-over-year reconciliation of the estimated mineral reserves and resources at Constancia is presented in the tables below.
The mineral reserve estimates remained overall well in line year on year after deducting the 2025 mining depletion. There are no material year-on-year changes to the mineral resource estimates.
| Constancia - January 1, 2026(1)(2)(3)(4)(5)(6)(7)(8) | ||||||
| Mineral Reserve Reconciliation | Tonnes | Cu (%) | Mo (g/t) |
Ag (g/t) |
Au (g/t) |
Cu (t) |
| (Proven & Probable) | ||||||
| A 2025 Mineral Reserve | 517,000,000 | 0.249 | 79 | 2.54 | 0.041 | 1,289,000 |
| B 2025 Production / Depletion (from Reserve) | (28,200,000) | 0.337 | 121 | 3.85 | 0.097 | (95,000) |
| C (A+B) = Depleted Reserve | 488,800,000 | 0.244 | 77 | 2.46 | 0.038 | 1,194,000 |
| D Adjustment to Mine planning factors (recovery/dilution) | 487,900,000 | 0.240 | 74 | 2.37 | 0.036 | 1,170,000 |
| E Adjustment due to new geological model Gain/(Loss) | 100,000 | 0.240 | 74 | 2.37 | 0.036 | 300 |
| F 2026 Mineral Reserve (D+E) including stocks | 488,000,000 | 0.240 | 74 | 2.37 | 0.036 | 1,170,000 |
| Mineral Resource Reconciliation (Exclusive of Mineral Reserves) |
Tonnes | Cu (%) | Mo (g/t) |
Ag (g/t) |
Au (g/t) |
Cu (t) |
| Measured & Indicated | ||||||
| G 2025 Mineral Resource | 179,700,000 | 0.216 | 69 | 2.24 | 0.039 | 388,000 |
| H Adjustment due to new geological model Gain/(Loss) | (9,000,000) | 0.204 | 38 | 3.83 | 0.099 | (18,000) |
| I Economic re-evaluation Gain/(Loss) | 5,900,000 | 32,000 | ||||
| J 2026 Mineral Resource (G+H+I) | 176,700,000 | 0.228 | 79 | 2.22 | 0.034 | 402,000 |
| Mineral Resource Reconciliation (OP Exclusive of Mineral Reserves) |
Tonnes | Cu (%) | Mo (g/t) |
Ag (g/t) |
Au (g/t) |
Cu (t) |
| Inferred | ||||||
| K 2025 Mineral Resource | 34,400,000 | 0.245 | 69 | 2.74 | 0.057 | 84,000 |
| L 2025 Mineral Resource (Depletion) | (700,000) | 0.144 | 54 | 2.46 | 0.083 | (1,000) |
| M (K+L) = Depleted Resource | 33,700,000 | 0.247 | 69 | 2.75 | 0.056 | 83,000 |
| N Adjustment due to new geological model Gain/(Loss) | (9,300,000) | 0.183 | 57 | 2.91 | 0.073 | (17,000) |
| O Economic re-evaluation Gain/(Loss) | 3,300,000 | 0.267 | 51 | 1.49 | 0.047 | 9,000 |
| P 2026 Mineral Resource (M+N+O) | 27,700,000 | 0.271 | 71 | 2.54 | 0.049 | 75,000 |
| Mineral Resource Reconciliation (Underground) |
Tonnes | Cu (%) | Mo (g/t) |
Ag (g/t) |
Au (g/t) |
Cu (t) |
| Inferred | ||||||
| Q 2025 Mineral Resource | 6,500,000 | 1.200 | 69 | 8.62 | 0.140 | 78,000 |
| R 2026 Mineral Resource | 6,500,000 | 1.200 | 69 | 8.62 | 0.140 | 78,000 |
Notes:
1. Totals may not add up correctly due to rounding.
2. Mineral resources are exclusive of mineral reserves and do not have demonstrated economic viability.
3. Mineral resource estimates are based on resource pit design and do not include factors for mining recovery or dilution.
4. The open pit mineral resources are estimated using a minimum NSR cut-off of $6.40 per tonne and assuming metallurgical recoveries of 84.6% for copper on average for the life of mine, while the underground inferred resources at Constancia Norte are based on a 0.65% copper cut-off grade.
5. Mineral reserves are estimated using a minimum NSR cut-off of $7.30 per tonne at Pampacancha, $7.30 per tonne at Constancia and assuming metallurgical recoveries of 84.6% for copper on average for the life of mine.
6. Long term metal prices of $4.40 per pound copper, $17.00 per pound molybdenum, $2,800 per ounce gold, and $32.00 per ounce silver were used to confirm the economic viability of the mineral reserve estimates and to estimate mineral resources.
7. Grades cannot be fully reconciled due to reverse and overlapping changes related to resource models, technical and economic parameters.
8. Mining activities at Pampacancha were completed in the fourth quarter of 2025 following the accelerated depletion of the deposit, and remaining stockpiled Pampacancha ore was processed in early 2026. Total Reserves includes 900,000 tonnes of stockpiled material from Pampacancha that had not yet been processed as of January 1, 2026.
Mining Operations
The Constancia mine is a traditional open pit shovel/truck operation. The operation consists of open pit mining and flotation of sulphide minerals to produce commercial grade concentrates of copper and molybdenum. Silver and a small quantity of payable gold reports to the copper concentrate.
To match the production requirements, operations are conducted from 15 metre high benches using large-scale mine equipment, including: 10-5/8-inch-diameter rotary blast hole drills, 27 cubic metre class hydraulic shovels, 19 cubic metre front-end loaders, and 240 ton off-highway haul trucks.
Constancia's current life of mine is expected to extend until 2040.
Annual production forecasts were initially set out in the Constancia Technical Report. However, changes to the mine plan and other factors cause production forecasts to fluctuate over the life of mine and, as such, Hudbay provides three year production guidance each year based on current assumptions. Please refer to the most recent three year production guidance for the latest annual production forecast.
The information presented in this section is forward looking information. See "Cautionary Statement on Forward-Looking Information" and "Risks and Uncertainties" in this AIF.
Processing and Recovery Operations
In 2025, the processing plant achieved a throughput of 30.3 million tonnes. Mill availability was 95.03% with an average throughput of 91,378 tpd, despite temporary production interruptions due to external social issues that prevented the operation from reaching its full nominal potential.
The primary crusher, belt conveyors, thickeners, tanks, flotation cells, mills and various other types of equipment are located outdoors and are not protected by buildings or enclosures. To facilitate the appropriate level of operation and maintenance, the molybdenum concentrate bagging plant, copper concentrate filters and concentrate storage are housed in clad structural steel buildings.
The processing plant has been laid out in accordance with established good engineering practice for traditional grinding and flotation plants. The major objective is to make the best possible use of the natural ground contours by using gravity flows to minimize pumping requirements and to reduce the height of steel structures.
An instrumentation plan has enhanced the processing plant's performance with various initiatives implemented at different sub-process levels. These initiatives include video cameras at the apron feeder and belts, froth cameras at the flotation cells and a particle-size analyzer, all of which have been installed and commissioned. These initiatives were part of an overall automation plan integrated into the processing plant system.
Capital and Operating Costs
Growth capital expenditures include several projects at the mine and process plant while sustaining capital expenditures include capital required for major mining equipment acquisition, rebuilds, and major repair. The cost also includes site infrastructure expansion (Tailings Management Facility, Waste Rock Facility, etc.) and process plant infrastructure.
Subject to obtaining the required regulatory approvals, the new operating capacity will be fully available starting in 2027 Q1, aligned with the completion of two major projects designed to offset the estimated increase in ore hardness:
1. Pebble Crushers Installation (Investment: US$32.5M / Commissioning: August 2026): This project is critical to mitigate rising SGI levels, ensuring the 34 Mtpa throughput target is maintained by optimizing the efficiency of the SAG milling circuit despite increased rock competency.
2. 3rd Flotation Line (Investment: US$16.3M / Commissioning: December 2026): This expansion provides the necessary residence time to handle the increased ore flow, directly supporting our 85% LOM recovery assumption by ensuring metallurgical efficiency remains stable even at higher throughput rates.
The forecasted life of mine capital and operating costs are set out in the Constancia Technical Report. Cost inflation, changes to the mine plan and commodity price assumptions and other factors may cause these costs to fluctuate over the life of mine and, as such, Hudbay provides a guidance range for capital and operating costs on an annual basis and the 2026 cost guidance was set out in Hudbay's news release dated February 20, 2026.
The information presented in this section is forward looking information. See "Cautionary Statement on Forward-Looking Information" and "Risks and Uncertainties" in this AIF.
Exploration, Development and Production
The Constancia mine commenced initial production in the fourth quarter of 2014 and achieved commercial production in the second quarter of 2015 while the Pampacancha mine achieved commercial production in the third quarter of 2021 and successfully achieved its life of mine plan in December 2025.
In addition, as described in the AIF, we acquired a large, contiguous block of mineral rights to explore for mineable deposits within trucking distance of the Constancia processing facility in 2018. Community agreements have been concluded with the community of Uchucarco in 2022 and with the community of Quehuincha in 2018 allowing Hudbay to start exploration activities on significant portions of the highly prospective Caballito, Maria Reyna and Kusiorco properties. The activities included necessary archeological, environmental and geological base line studies to support the drill permit application submitted for the Maria Reyna and Caballito property in 2024. The EIA for Maria Reyna was approved by the government in June 2024 and the Caballito EIA was approved by the government in September 2024. Surface mapping and geochemical sampling confirm that both Caballito and Maria Reyna host sulfide and oxide rich copper mineralization in skarns, hydrothermal breccias and large porphyry intrusive bodies.
LALOR AND OTHER SNOW LAKE ASSETS
Project Description and Location
Lalor is a gold, zinc and copper mine near the town of Snow Lake in the province of Manitoba. Lalor is located approximately 200 kilometres mostly by paved highway east of Flin Flon, Manitoba. Lalor commenced initial ore production from the ventilation shaft in August 2012 and commenced commercial production from the main shaft in the second half of 2014. The town of Snow Lake is a full-service community with available housing, hospital, police, fire department, potable water system, restaurants and stores. To house non-local employees during their work rotations, the Company provides a camp located in town which services Hudbay employees and contractors for the mine and mill operations. Other infrastructure in the area includes provincial roads, a 115 kV Manitoba Hydro power grid within four kilometres of Lalor and Manitoba Telecom land line and cellular phone service.
As described in this AIF, Hudbay operates two processing facilities in the Snow Lake area that process ore production from the Lalor mine. The Stall concentrator produces zinc and copper concentrates and our recently refurbished New Britannia mill produces copper concentrate and gold/silver doré.
Following the closure of the Flin Flon zinc plant in mid-2022, the zinc concentrates produced from the Stall mill are sold to market.
In February 2019, Hudbay announced the discovery of the 1901 deposit located less than 1,000 metres from the existing ramp between the former Chisel North mine and Lalor and benefiting from the proximity of existing infrastructure. In 2020 and 2021, Hudbay conducted infill drilling, metallurgical testing and a pre-feasibility study to establish the technical and economic viability of the indicated and measured portion of the mineral resource estimates at 1901 and highlighted the exploration potential to increase both the mineral resource and mineral reserve estimates through the discovery of a copper-gold rich feeder lens. In 2025, an exploration drift was successfully completed to reach the 1901 mineralized zone in order to conduct infill drilling and to confirm the most appropriate mining method for both its base metal and gold lenses.
The WIM deposit was acquired by Hudbay in 2018 for approximately C$0.5 million. WIM is a copper-gold deposit that starts from surface and is located approximately 15 kilometres by road north of the New Britannia mill. Access is currently via a winter road, and so a year-round gravel road is required for accessing WIM from New Britannia. Powerlines along the access road will also be required to feed the underground electrical distribution system.
The New Britannia mine is a former producing gold mine that produced approximately 600,000 ounces between 1949 and 1958 and an additional 800,000 ounces between 1995 and 2005. Significant mineral resources remain accessible at New Britannia as well as in the nearby Birch and 3 Zone with some investment in the existing mining infrastructure, such as rehabilitating the existing portal and ramp development at 3 Zone.
3 Zone is currently accessible via road and located approximately 3 kilometres (by road) northwest of New Britannia mill. Like WIM, 3 Zone requires powerlines along the access road, and year-round maintenance to the access road to site. Other surface infrastructure needed to support mining activities at WIM and 3 Zone include maintenance and warehouse facilities, fuel farms and storage tanks, and a mine safety and crew lineup space and changehouse. It is envisaged that the main administration offices will be centralized at either the New Britannia mill or Lalor mine site.
Pen II is a low tonnage and high-grade zinc deposit that starts from surface and is located approximately 6 kilometres by road from the Lalor mine. Access is currently via winter road, with potential for an all-weather road to be established north of Lalor mine.
The Watts deposit is located approximately 100 kilometres by road from the Stall mill and is near existing Manitoba Hydro powerlines. It is between 50 and 900 metres below surface, and in 2019 Hudbay conducted a limited drill program which successfully extended the known high grade copper mineralization along the strike of the ore body.
For all the properties mentioned above, Hudbay owns a 100% interest. Aside from a 1.5% royalty on 3 Zone, there are no other royalties payable other than those potentially payable to the province. Surface rights are held under general permits and are sufficient for purposes of our development plans.
On September 14, 2023, Hudbay successfully completed its acquisition of Rockcliff Metals Corp. ("Rockcliff"). Rockcliff was one of the largest landholders in the Snow Lake area, with approximately 1,800 square kilometres across all its properties. Prior to the transaction, Rockcliff was Hudbay's 49% joint venture partner of the Talbot deposit. The Talbot deposit and the additional Rockcliff exploration properties provide further optionality and potential future feed sources for the Stall and New Britannia mills. The mineral resource estimates reported in this AIF are based on prior estimates reported by Rockcliff. In 2023, Hudbay also completed the acquisition of mineral claims in the Cook Lake area, which is also located within trucking distance of the existing Snow Lake processing infrastructure and which forms part of Hudbay's regional exploration strategy. In 2025, Hudbay initiated an exploration program at Talbot comprised of two phases. The first phase successfully tested and confirmed the extension of the known mineralization at depth while the second phase to be completed by mid-2026 is intended to support a pre-feasibility Study and the reporting of Hudbay's own mineral resource and mineral reserve estimates by the end of 2026.
Accessibility, Climate, Local Resources, Infrastructure and Physiography
At Lalor, the current project infrastructure includes a 3.5 kilometre main access road that was constructed in 2010 from provincial road 395 and provides access from the Chisel North mine site to the Lalor site. This access road includes a corridor with freshwater/discharge pipelines, tailings/discharge pipelines for the Paste Plant and a main hydro line. Access to the site is off paved provincial highway 392, which joins the town of Snow Lake and provincial highway 39 and provides access to Flin Flon.
The Snow Lake area has a typical mid-continental climate, with short summers and long, cold winters. Climate generally has only a minor effect on local exploration and mining activities. The project area is approximately 300 metres above sea level, consisting of ridged to hummocky sloping rocks with depressional lowlands, and has gentle relief that rarely exceeds 10 metres. The area of Lalor and surrounding water bodies (Snow, File, Woosey, Anderson and Wekusko lakes) are located in the Churchill River Upland Ecoregion in the Wekusko Ecodistrict.
We commissioned a 2,000 US gallon per minute water treatment plant in 2008 at Chisel Lake, approximately eight kilometres from Lalor, where water from the Lalor mine is treated in the Water Treatment Plant along with water from the previously operated Chisel Open Pit.
Tailings production associated with the Lalor mine is impounded in the Anderson Tailings Impoundment Area ("TIA") and a capacity expansion has been approved to accommodate our planned future operations.
Power for the site is being transmitted at 25 kV from the Lalor substation located at the Chisel North minesite via a 3.5 kilometre transmission line.
History
The Snow Lake area has a long exploration and mining history. Exploration in the Lalor-Chisel area has been occurring since the 1950s and the Chisel Basin area has hosted four past producing mines. This basin is also the host of the Lalor deposit. Lalor commenced initial ore production from the ventilation shaft in August 2012, only five years after its initial discovery hole and achieved commercial production from the main shaft in the third quarter of 2014.
Gold was first discovered in 1914 approximately 20 kilometres to the southeast of Snow Lake and in 1917, the Moose Horn-Ballast claims produced the first gold in Manitoba. First mine construction at the New Britannia site started in 1945 and in March 1949, the mine was opened as the Nor-Acme mine. Production continued until 1958. 4.9 million tonnes were mined at an average grade of 4.4 g/t and Nor-Acme mill recovered approximately 610,000 ounces of gold during this production period. TVX and High River formed a joint venture to reopen the mine and TVX became the operator. Full production from the main shaft was achieved in August 1996. Through various transactions, Kinross became the operator of the New Britannia mine-mill complex and retains a 60% back-in right to the associated mining properties if a future feasibility study identifies a deposit with at least 3 million ounces of gold resources in the measured and indicated categories. Production ceased at the end of September 2004 and the mill was put on care and maintenance in 2005 due to a low gold price environment after producing 1.6 million ounces of gold.
Geological Setting
The Snow Lake deposits including Lalor are all located within the Trans-Hudson Orogen of the Flin Flon Greenstone Belt. The volcanic assemblages consist of mafic to felsic volcanic rocks with intercalated volcanogenic sedimentary rocks.
The volcanogenic massive sulphide ("VMS") deposits located near the town of Snow Lake have been subdivided into two different groups: Cu-Zn-rich (Cu-Zn, Cu-Zn-Au) and Zn-Cu-rich (Zn-Pb-Cu-Ag) types. The Cu-Zn-rich deposits mainly occur in the Anderson sequence and the Zn-Cu-rich deposits occur in the Chisel sequence. The Watts and Talbot deposits, located east-southeast of the town of Snow Lake lies in the eastern portion of the Flin Flon-Snow Lake Greenstone belt and is a stratabound accumulation of sulphides that precipitated in a depositional environment similar to the base metal deposits of the Snow Lake mining camp.
Mineralization of the lode-gold vein-type deposits are hosted in the Amisk group mafic and felsics volcanic rocks which are structurally controlled and associated with shear zones, faults, fold hinges and axial planes that host simple to complex vein systems. The mineralization is associated with lithological contacts of contrasting properties in the sequence of interlayered volcanic and volcaniclastic rocks.
Drilling
At Lalor, over 6,411 drill holes totaling more than 908,910 metres have been included in the Lalor database to support the 2025 mineral resource and mineral reserve estimates.
Drilling supporting the 1901, Watts, Pen II and Wim mineral resource and mineral reserve estimates totals 85,448 metres, 25,000 metres, 2,000 metres and 43,000 metres, respectively.
For the New Britannia resource estimates including the 3 Zone and Birch zones, over 730,000 metres of drilling completed after 1995 was used. Drilling at all properties is a combination of NQ and BQ diamond drill holes, surveyed with either Reflex downhole tools or Gyro for deeper/longer holes.
Mineralization
The Lalor deposit and its associated 1901 satellite zone are interpreted as a gold enriched VMS deposit that precipitated at or near the seafloor in association with contemporaneous volcanism, forming a stratabound accumulation of sulphide minerals. The depositional environment for the mineralization is similar to that of present and past producing base metal deposits in felsic to mafic volcanic and volcaniclastic rocks in the Snow Lake mining camp. The deposit appears to have an extensive associated hydrothermal alteration pipe.
The Lalor VMS deposit is flat lying, with zinc mineralization beginning at approximately 600 metres from surface and extending to a depth of approximately 1,400 metres. The mineralization trends about 320° to 340° azimuth and dips between 30° and 45° to the northeast. It has a lateral extent of about 1,400 metres in the north-south direction and 780 metres in the east-west direction. Sulphide mineralization is pyrite, sphalerite and chalcopyrite. The current interpretation suggests the deeper copper-gold lens tends to have a much more linear trend to the north than the rest of the zones. Gold and silver enriched zones occur near the margins of the sulphide lenses and in local silicified footwall alterations. These silicified areas often correlate with disseminated stringer chalcopyrite, pyrrhotite and pyrite, whether together or independent of each other. This footwall gold mineralization is typical of VMS footwall feeder zones with copper-rich disseminated and vein style mineralization overlain by massive zinc-rich zones. The gold bearing lithologies remain open down plunge to the north and northeast.
The WIM deposit comprises a stratabound, semi-massive to massive sulphide lens with an adjacent stringer/disseminated sulphide zone. Mineralization is characterized by disseminated to massive, recrystallized and medium to coarse grained pyrite, pyrrhotite, chalcopyrite and minor sphalerite. The VMS mineralization extends from surface to 720 m below surface with a strike length of 725 m with an average thickness of 10 m. The WIM deposit is conformable to stratigraphy, trends to the northwest at a N310º azimuth, a 40-45º dip towards the northeast and a plunge of 40º to the north.
The Snow Lake gold properties including No. 3 and Birch zones belong to the quartz-carbonate vein gold subtype of orogenic lode gold deposits. This subtype of gold deposits consists of simple to complex quartz carbonate vein systems associated with brittle-ductile rock behaviour, corresponding to intermediate depths within the crust, and compressive tectonic settings.
At Watts, sulphide intersections can be up to 23m in core length, with a lateral extent of approximately 1,200m. Diamond drilling has intersected mineralization at depths of 850m below surface. Mineralization was intersected and interpreted as three lenses; Main Lens, Main Footwall Lens, and East Lens comprised of coarse-grained pyrite, pyrrhotite, chalcopyrite, sphalerite, and minor galena. The sulphides have generally been recrystallized to a coarse grain size, but sections of finer grained sulphides do occur.
The Pen II deposit comprises a stratabound, semi-massive to massive sulphide lens with an adjacent stringer/disseminated sulphide zone. Mineralization is characterized by disseminated to massive, recrystallized and medium to coarse-grained sphalerite, pyrite, pyrrhotite and minor chalcopyrite. The mineralization extends from surface to 500 m below surface. The current strike length of the deposit is 400 m with an average thickness of 4 m. The deposit is conformable to stratigraphy, trends to the northeast at a N40º azimuth, a 45-65º dip towards the northwest.
Sampling Methods
As per Hudbay's standard procedures in Snow Lake, drill core is logged, sample intervals selected and marked clearly on the core. The majority of exploration core is cut in half with a diamond saw and a representative portion of the hole is kept. Definition and delineation core is whole core sampled. All samples are placed in a plastic bag with its unique sample identification tag. The average length for the sample intervals is 0.9 metres. The core was photographed before samples were split and bagged for shipment before dispatch to the laboratories.
Sampling and Analysis
Sample preparation has been conducted at three different laboratories over time. Prior to 2016, a total of 160,804 drill core samples were analyzed at the Hudbay laboratory in Flin Flon. Copper, zinc, and silver were digested in aqua regia and analyzed by ICP-OES. Gold was determined by lead-collection fire assay fusion, for total sample decomposition, followed by atomic absorption spectroscopy (AAS) analysis. Fire assays were performed on 15 to 30g subsample pulps to avoid problems due to potential nuggetty gold. All samples with gold values (AAS) > 10 g/t were re-assayed using a gravimetric finish.
Since September 2016, nearly all samples are prepared and assayed at Bureau Veritas in Vancouver. All drill core samples have been sent for analysis at Bureau Veritas while the SGS laboratory in Vancouver was used as the umpire laboratory for quality control purposes. Copper, zinc and silver were digested in aqua regia and analyzed by inductively coupled plasma optical emission spectrometry (ICP-OES) and more recently in 2016 by inductively coupled plasma mass spectrometry (ICP-MS). Samples with copper and zinc over the upper limit of detection (ULD) were analyzed by titration, whereas those samples with silver values over the ULD were analyzed by fire assay and gravimetric finish. Gold was determined by fire assay followed by atomic absorption spectroscopy (AAS).
The sampling methodology, analyses and security measures used by the previous owners at New Britannia have been documented in the Technical Report produced by Genivar for Alexis Resources in 2011 and available on SEDAR. Most of the drill cores and chips assays from 1995 to 2003 from the New Britannia mine were completed at the on-site mill laboratory using a fire assay/atomic absorption finish (FA/AA) method. Standard, blank and duplicate assay samples were added to each batch of 21 samples for drill core and to each batch of 24 samples for chip samples. The sampling and analytical procedures conformed to the industry standards at the time, and these were adequate to ensure a representative determination for the type of gold mineralization identified on the property. In 2019, 6 holes drilled by Hudbay at 3 Zone confirmed previous drilling results.
As of January 1, 2026, a total of 125,781 density measurements were collected by Hudbay. These measurements were performed at the Flin Flon laboratory, Bureau Veritas laboratory or at Hudbay logging facility, using a non-wax-sealed immersion technique to measure the weight of each sample in air and in water and pycnometry methods.
Quality Assurance and Quality Control
Quality Assurance and Quality Control samples were inserted into the sample stream. Hudbay's practice in Lalor involves insertion of the following every 100 samples; 2 blanks, 5 duplicates, 5 standards. The exploration team in 1901 inserts 5 blanks, 5 duplicates and 5 standards per 100 samples.
Results from the QA/QC program for standards, blanks, duplicates and external checks show that the program has been working effectively for the Lalor, 1901, Watts, Pen II and Wim properties, meeting industry standards and the data used provides a representative and unbiased basis for resource modeling purposes.
Security of Samples
Security measures taken to ensure the validity and integrity of the samples collected consist of a chain of custody of drill core from the drill site to the core logging area. All facilities used for core logging and sampling are located on the mine site and all sample splitting and shipping activities are conducted by technicians under the supervision of Hudbay geologists. The sample results are stored on a secure mainframe based Laboratory Information Management System (LIMS). The diamond drill hole database is stored on the secure Hudbay network, using the acQuire database management system with strict access rights.
Mineral Processing and Metallurgical Testing
The Snow Lake processing strategy is based on ore type - base metal ore (zinc-rich/copper-gold) is processed through Stall mill to produce separate copper and zinc concentrates with high grade gold-copper ore processed through New Britannia mill to produce a copper concentrate and gold-silve dore. Stall mill produces an 18% copper concentrate with gold and silver as coproducts, achieving an 86% copper recovery and 68% gold recovery. Zinc concentrate is produced at a 51% zinc grade at an 83 to 85% recovery and contains 3-4% of the gold in the mill feed. New Britannia produces a 15% copper concentrate with gold and silver as coproducts, achieving a 90% copper recovery and 58% gold recovery. The treatment of copper flotation tailings through the subsequent leach circuit produces gold-silver dore, resulting in a global gold recovery of 90%.
Lalor Mine continues to provide a majority of the metal feed, with Copper, Silver and Gold driving revenue production at the mine into future years. As annual production tonnage from the primary Lalor deposits reduces, new base metal feed from the 1901 deposit will offset reduced total volume from the Lalor Mine. This trend will partially be offset in 2027, when the 1901 deposit is expected to enter production in a meaningful proportion to feed Stall with zinc rich mineralization.
Mineral Resource Estimates
The mineral resource and mineral reserve estimates for the Lalor mine and all the other Snow Lake deposits are effective January 1, 2026. Other than as disclosed in this AIF, there are no known metallurgical, environmental, permitting, legal, taxation, socio-economic, marketing or political issues that could reasonably be expected to materially impact the mineral resource and mineral reserve estimates.
The mineral resources for Lalor, 1901, Watts, WIM, 3 Zone, New Britannia, Birch and Pen II are estimated either as base metal lenses or gold zones and classified as Measured, Indicated or Inferred resources, as described in the most recent technical report.
The construction of the mineralized envelopes was based on the type of mineralization intersected.
The resource is based on integrated geological and assay interpretation of information recorded from diamond drill core logging and assaying and underground mapping and is comprised of the following steps: exploratory data analysis, high-grade capping (when required), and estimation and interpolation parameters consistent with industry standards.
The block models were updated using both infill and exploration drilling conducted up until August 31st, 2025 using the methodology documented in the March 2021 Lalor and Snow Lake Operations Technical Report and validated to ensure appropriate honoring of the input data by the following methods:
● Visual inspection of the ordinary kriging ("OK") block model grades in plan and section views in comparison to composites grade;
● Comparison between the nearest neighbour and the OK methods to confirm the absence of global bias in the model; and
● Smoothing correction to remove the smoothing effect of the grade interpolation where necessary.
Hudbay uses a stringent approach to establish the potential for economic extraction of its resource reporting for underground deposits. With this approach, the potential for economic extraction of the mineral resource estimates are reported within the constraint of a 'stope optimization envelope'. This excludes small isolated individual blocks above the economic cut-off criteria from the resource estimate and includes some 'geological dilution' that would need to be included in the economic envelope to maintain minimum spatial continuity requirements to define mineable shapes.
The parameters used as input to define the stope optimization envelope cover all the relevant technical and economic constraints including minimum stope and waste pillar dimensions and a NSR value calculation for each block based on anticipated metal recoveries, long-term metal price forecast and operating and capital costs based on the 2025 Lalor mine and Stall and New Britannia concentrator budgets. Two NSR values are calculated for each block to assess and compare the value of the blocks going to the Stall mill (no material difference between the two) or going to the new Britannia mill. The mineral resource estimates are reported to ensure that each potential stope would cover all its associated operating mining and milling costs.
For the former New Britannia, mine and its satellite gold deposits, the historical resource estimates performed by Kinross and by Alexis Minerals followed a conventional and industry standard approach and have been independently validated in 2018 by WSP Engineering ("WSP"). The cut-off grades for the resource have been estimated over a 6-ft. minimum true width with a variable cut-off by zone. The variation in the cut-off grade is related to new mining versus remnant mining. Given that WSP had to rely on historical documentation for some of the technical information supporting the estimation of the mineral resource estimates, the tonnes and grades previously estimated by Kinross and Alexis Minerals as measured and indicated resources were downgraded to an inferred category. Mineral resources that are not mineral reserves do not have demonstrated economic viability.
Mineral Reserve Estimates
The current mineral reserves were estimated based on a life of mine ("LOM") plan prepared using Deswik mine design software that generated mining inventory based on stope geometry parameters and mine development sequences. Appropriate dilution and recovery factors were applied based on cut and fill and longhole open stoping mining methods with a combination of paste and unconsolidated waste backfill material.
The following steps were followed in developing the reserve estimates at Lalor, 1901, WIM and 3 Zone:
● Calculate two payable (NSR) values for each individual block in the resource model depending on whether processing would occur at the Stall concentrator or at the New Britannia concentrator, using long-term metal prices, concentrator recoveries, metal payability and downstream smelter treatment and refining costs assumptions.
● Design stopes in the Deswik Stope Optimizer, considering depleted mineral resources, existing workings, resource categories and mine and mill operations costs. Dilution and recovery are estimated and applied at this step. Stopes are designed for both the Stall concentrator option and the New Britannia concentrator option.
● Considering grades, value and location in the mine, assign stopes to either Stall or New Britannia concentrator.
● Establish stope economics using a secondary NSR calculation where, along with mine and mill operations costs, mine capital, waste development and offsite administration costs are applied to each stope.
● Assign whether stopes can be upgraded to mineral reserves based on resource classification.
● Design ore development required for mining the reserves. Deplete development from the stopes. Interrogate grades of designed development for inclusion in mineral reserves. Sequence and schedule development and stope production for input to a financial Life of Mine (LOM) study to support mineral reserve economics.
The above methodology takes into consideration the different ore types and the milling options for the mine's future production and considers the various ore types found at these deposits.
The mineral reserve estimates exclude the mined out mineral resources, non-recoverable pillars (rib, post and sill) within mined out areas, mineral resources that are sterilized or not recoverable due to previous mining and stopes based on inferred mineral resource estimates.
Reconciliation of Reserves and Resources
Other than as disclosed in this AIF, there are no known metallurgical, environmental, permitting, legal, taxation, socio-economic, marketing or political issues that could reasonably be expected to materially impact the mineral resource and mineral reserve estimates.
The 2026 reserve estimates of 16.5 million tonnes substantially increased from 2025 after accounting for mining depletion of mineralization mined in 2025 grading above average reserve grade. High grade resource to reserve conversions and re-evaluation gains have offset reductions related to the optimization of the mine plan through removal of lower grade dilution and low value reserves requiring significant development. The 2026 inferred mineral resource estimates reflect a reduction of approximately 1.0 million tonnes essentially due to resource to reserve conversion more than offsetting exploration and re-evaluation gains.
| Lalor Mine and 1901 - January 1, 2026 (1)(2)(3)(4)(5)(6)(7)(8)(9))(10) | |||||||
| Mineral Reserve Reconciliation | Tonnes | Au (g/t) |
Zn (%) | Cu (%) | Ag (g/t) |
Au (oz) | Ag (oz) |
| (Proven & Probable) | |||||||
| A 2025 Mineral Reserve | 12,700,000 | 3.70 | 2.99 | 0.62 | 28.8 | 1,517,000 | 11,807,000 |
| B 2025 Production (from Reserve) | (1,000,000) | 5.16 | 2.45 | 0.77 | 31.3 | (164,000) | (992,000) |
| C (A+B) = Depleted Reserve | 11,800,000 | 3.58 | 3.03 | 0.61 | 28.6 | 1,354,000 | 10,814,000 |
| D Resource to Reserve upgrade | 1,000,000 | 2.90 | 1.43 | 0.66 | 18.4 | 96,000 | 610,000 |
| E Technical re-evaluation Gain/(Loss) | (590,000) | 2.39 | 2.63 | 0.89 | 22.1 | (45,000) | (419,000) |
| F Economic re-evaluation Gain/(Loss) | 4,300,000 | 2.03 | 0.93 | 0.38 | 12.1 | 279,000 | 1,664,000 |
| G 2026 Reserve update (C+D+E+F) | 16,500,000 | 3.18 | 2.40 | 0.54 | 23.9 | 1,683,000 | 12,667,000 |
| Mineral Resource Reconciliation | Tonnes | Au (g/t) |
Zn (%) | Cu (%) | Ag (g/t) |
Au (oz) | Ag (oz) |
| Base Metal & Gold (Inferred) | |||||||
| H 2025 Mineral Resource | 4,400,000 | 4.19 | 1.33 | 1.41 | 18.8 | 594,000 | 2,670,000 |
| I Resource converted to Reserves | (1,000,000) | 2.90 | 1.43 | 0.66 | 18.4 | (96,000) | (610,000) |
| J (H+I) = Depleted Resource | 3,400,000 | 4.58 | 1.30 | 1.64 | 18.9 | 498,000 | 2,060,000 |
| K Technical re-evaluation Gain/(Loss) & Exploration Gains | 1,200,000 | 95,000 | 422,000 | ||||
| L 2026 Resources update (J+K) | 4,600,000 | 4.02 | 0.82 | 1.21 | 16.8 | 594,000 | 2,482,000 |
Notes:
1. Totals may not add up correctly due to rounding.
2. Mineral resources are exclusive of mineral reserves and do not have demonstrated economic viability.
3. Mineral resources do not include factors for mining recovery or dilution.
4. Base metal mineral resources are estimated based on the assumption that they would be processed at the Stall concentrator while gold mineral resources are estimated based on the assumption that they would be processed at the New Britannia concentrator.
5. Long-term metal prices of $2,800 per ounce gold, $1.25 per pound zinc, $4.40 per pound copper and $32.00 per ounce silver with an exchange rate of 1.33 C$/US$ were used to confirm the economic viability of the mineral reserve estimates.
6. Long-term metal prices of $2,800 per ounce gold, $1.25 per pound zinc, $4.40 per pound copper and $32.00 per ounce silver with an exchange rate of 1.33 C$/US$ were used to estimate mineral resources.
7. Lalor mineral reserves and resources are estimated using a NSR cut-off ranging from C$161 to C$185 per tonne assuming a long hole mining method and depending on mill destination.
8. Individual stope gold grades at Lalor & 1901 were capped at 10 grams per tonne.
9. 1901 mineral reserves and resources are estimated using a minimum NSR cut-off of C$199 per tonne.
10. Grades cannot be fully reconciled due to reverse and overlapping changes related to resource models, technical and economic parameters.
The mineral reserve and resource estimates presented in this AIF for WIM, 3 Zone, Pen II, Watts, New Britannia Mine and Talbot remain unchanged from the prior year and are effective January 1, 2026. As a result, a detailed reconciliation has been omitted.
Mining Operations: Mine Planning
Lalor mine is a multi-lens, flat lying orebody with ramp access from surface and shaft access to the 955 metre level. Internal ramps located in the footwall of the orebody provide access between mining levels, with the mine currently developed to the 1,330 meters level in the Copper Gold lens 27. Stopes are accessed by cross-cuts from the major mining levels.
Power is provided to the mine via power cables located in the production shaft. The Chisel North mine ventilation system in sequence with the Lalor mine Downcast Raise, the Access Ramp and the Lalor mine Production Shaft provide a total of 955,000 cfm for ventilation purposes. Mine ventilation air is heated by direct fired propane heaters located at each of the intakes. Lalor mine's fresh water source is Chisel Lake. Mine water reports to the water treatment plant at Chisel Lake where it is treated and released. All water within the mine is collected in intermediary collection sumps and proceeds to the main collection areas via drain lines, drain holes or drainage ditches.
In 2025, Lalor achieved a total of approximately 1.18 million tonnes of production. The life of mine plan is based on a gradual ramp-up in mine production from 4,500 to 5,000 tpd with the additional production from the 1901 deposit subsequently gradually reducing as both the Lalor and 1901 mineral reserve estimates are being depleted.
Mining is done using mobile rubber tired diesel equipment. Load haul dump ("LHD") units vary from 8 to 10 cubic yards. Trucks are currently 42 to 65 tonne units that haul both ore and waste. Autonomous operation of a LHD loader underground is also completed from surface by tele-remote monitoring. Ore is directed to rock breakers located near the production shaft at the 910 metre level, where it is sized to 0.55 metre and conveyed to the shaft for hoisting to surface by two 16 tonne capacity bottom dump skips in balance.
Lateral advance is made in 4 m long segments (rounds), with typical dimensions of 5 metre wide by 5 metre high. Lateral drilling is completed with two boom electric hydraulic jumbo drills, each round requires approximately 80 holes. Following mucking, standard ground support is installed. Mine services, including compressed air, process water and discharge water pipes, paste backfill pipeline, power cables, leaky feeder communications antenna and ventilation duct are installed in main levels and stope entrances.
Two main mining methods are used at Lalor mine, cut and fill and longhole open stoping. Cut and fill methods include: mechanized cut and fill, post pillar cut and fill and drift and fill. Longhole open stoping methods include: transverse, longitudinal retreat and uppers retreat. Each mining area is evaluated to determine the most economic stoping method. In general where the dip exceeds 35° and the orebody is of sufficient thickness, longhole open stoping is used and lateral cut and fill mining methods are used in flatter areas. Approximately 80% of the mineral reserves are to be mined using the longhole open stoping methods, 15% through the cut and fill methods and 5% via development in ore. All stope mining is done using emulsion explosives.
The production is supported by a hoisting plant capable of 6,000 tonnes per operating day, transitioning to more bulk mining methods with additional mining fronts and implementing technology and automation processes to improve mining efficiencies, developing ore passes and transfer raises to reduce truck haulage cycle times from the upper portions of the mine. In addition, a paste backfill plant was commissioned in 2018.
Ore is received at the Stall concentrator, approximately 16 kilometres east of Lalor mine, and offloaded onto a dedicated stockpile at the mill depending on ore type. Ore is crushed in campaigns through a two-stage external crushing plan where the final product size is less than 19 millimeters. Ore crushed for processing through the Stall concentrator is directly conveyed to the fine ore bins or stockpiled. Ore crushed for processing through New Britannia is stockpiled ahead of haulage to the New Britannia concentrator.
Crushed ore is conveyed to Stall's two sequential rod and ball mill combinations operating parallel with each other. The mills feed a sequential flotation process where a bulk rougher copper concentrate is floated first. The copper rougher concentrate is reground, followed by three stages of cleaning producing a concentrate grading approximately 21% copper. The copper concentrate is either thickened and filtered to remove water, and is conveyed to concentrate storage onsite, or is pumped to the New Britannia filtration circuit. The stored copper concentrate is then loaded on to semi-tractor trailer trucks for transport to Flin Flon for transport by rail to third party smelters.
The tails from the copper circuit feed the zinc flotation circuit which produces a zinc rougher concentrate. This is followed by three stages of zinc cleaning which produces a concentrate grading approximately 51% zinc. Zinc concentrate is thickened and filtered and is conveyed to concentrate storage. Like the copper concentrate, the zinc concentrate is loaded on to semi-tractor trailer trucks for transport to Flin Flon for transport by rail to customers. Final tails from the Stall concentrator are currently pumped to the Anderson Tailings Impoundment Area ("TIA") for permanent disposal.
Crushed ore that is hauled to the New Britannia concentrator is side dumped into a loading pocket and conveyed to the fine ore bin. No stockpiling capacity is present at the New Britannia site. The crushed ore is conveyed to the single rod and ball mill line. The mill feeds a single flotation circuit where a copper concentrate is produced. The copper concentrate is thickened and filtered to remove water and is dropped into the concentrate storage on site. The tails from the flotation circuit feeds the tails leach circuit which produces a gold silver doré. The tails leach circuit utilizes a carbon-in-pulp flowsheet from which the tailings are treated to remove residual cyanide before pumping to the Anderson TIA for permanent disposal.
The paste plant is located northeast of the existing headframe complex at the Lalor mine and delivery capacity of the paste can achieve 165 tonnes per hour solids (tails) or 93 cubic metres per hour paste. The paste plant is designed to fill voids left by mining of approximately 4,500 tonnes per day. Taking into account waste generated from development in the LOM and the plan not to hoist waste from underground the combined paste/waste backfilling capacity is approximately 6,000 tonnes per day. The paste plant is capable of varying the binder content in the paste to provide flexibility in the strength gain of the paste where higher and early strength may be required depending on mining method.
Tails required for paste are diverted to the Anderson booster pump station. Capacity of the pumping station range from 110 to 130 tonnes per hour to allow for some variation in the output of tailings from the concentrator. The tailings are directed into the Anderson TIA when not required for the paste plant.
Two pipelines are installed between the Anderson booster pump station and the paste plant located at Lalor mine site, approximately a 13 kilometre distance. Paste is delivered underground via one of two - nominal 8 inch diameter, cased boreholes from surface to the 780 metre level the mine. Only one borehole is required during normal operation, with the second borehole available as a spare in the event of a plug or excessive wear on the primary hole.
A network of underground lateral piping and level to level boreholes transfer the paste from the base of the discharge hopper to the required underground locations.
Permitting and Environmental
The permits required for the current Lalor operation, including the Lalor mine, Stall concentrator, New Britannia concentrator and Anderson tailings facility have all been issued and remain valid.
At this time, there are no known environmental concerns which could adversely affect Hudbay's ability to operate the Lalor mine. Since the mine site is nearby existing facilities in the Snow Lake area, the Lalor mine was able to utilize infrastructure, services, and previously disturbed land associated with permitted, pre-existing and current mining operations in the Snow Lake area. The Lalor mine and associated projects are designed to minimize the potential impact on the surrounding environment by keeping the footprint of the operations as small as possible and by using existing licensed facilities for the withdrawal of water and disposal of wastes.
Initial proposals for baseline work at WIM have been prepared by AECOM. Once complete, these environmental studies will form the basis of the required approvals needed to advance this project should it be deemed viable.
3 Zone is part of the New Britannia site. Significant environmental studies of the area are available, and additional environmental assessments would be utilized to augment our understanding of the property and any potential offsite impacts. Approvals to advance this project would be through Provincial regulators as part of an alteration of the existing Environment Act Licence for the property.
The 1901 deposit will leverage all existing surface and underground development near Lalor operations and is not currently expected to require an amendment to the Environmental Act License for Lalor.
Post closure, all water quality and earthen structures will be monitored and inspected in order to ensure the sites' conditions meet the applicable regulatory requirements.
Capital and Operating Costs
The capital expenditures required to execute the LOM plan at Lalor and 1901 includes pre-production mine development for 1901, and the sustaining capital required to continue capitalized mine development activity and to replace/acquire mining equipment. The 1901 development plan started as planned in 2024 with an exploration drift to access early ore and conduct infill drilling to convert the high grade gold inferred resources to reserves. It is also envisaged that additional synergies with Lalor will exist and so reductions in mine equipment costs and personnel requirements are factored into the cost profile.
Other remaining capitalized expenditures included in the LOM plan relate to milling and environmental activities and growth projects such as the Stall mill recovery improvement program (discussed under "Mineral Processing and Metallurgy" above).
The forecasted life of mine capital and operating costs are set out in the Snow Lake Technical Report. Cost inflation, changes to the mine plan and commodity price assumptions and other factors may cause these costs to fluctuate over the life of mine and, as such, Hudbay provides an annual guidance range each year based on current assumptions. The 2026 cost guidance is set out in Hudbay's news release dated February 20, 2026.
The information presented in this section is forward looking information. See "Cautionary Statement on Forward-Looking Information" and "Risks and Uncertainties" in this AIF.
Exploration, Development and Production
Exploration drilling at Lalor has focused on both adding and converting inferred mineral resource estimates with a strong emphasis on confirming the continuity of the gold rich mineralization.
Hudbay completed a surface drill program in January 2026 in the Snow Lake region testing the down-dip extensions of the Lalor deposit and also testing a number of regional targets identified from previous geophysical surveys. Hudbay is currently completing its largest geophysical campaign in history in Manitoba consisting of both ground and airborne aeromagnetic surveys. This program continued from a focus on converting inferred resources to indicated and confirming the extension of the Talbot deposit at depth.
With the inclusion of the New Britannia mill, net revenue at Lalor has shifted from primarily zinc to primarily gold, positioning Lalor as a primary gold mine with significant zinc, copper and silver by-products. Revenue from precious metals through the remaining life-of-mine is expected to be approximately 73% of total revenue. Significant zinc and copper revenue provides diversified commodity exposure.
With the increase to mineral reserves, the life of mine for the Snow Lake operations has extended by four years until 2041.
Annual production forecasts were initially set out in the Snow Lake Technical Report. However, changes to the mine plan and other factors cause production forecasts to fluctuate over the life of mine and, as such, Hudbay provides three year production guidance each year based on current assumptions. Please refer to the most recent three year production guidance for the latest annual production forecast.
The information presented in this section is forward looking information. See "Cautionary Statement on Forward-Looking Information" and "Risks and Uncertainties" in this AIF.
WIM and 3 Zone Capital and Operating Cost Profiles
The WIM mine development plan contemplates construction activities occurring in 2033, followed by commissioning in 2035 and ramp-up to the maximum production rate by end of 2039. The capital expenditures required for refurbishing the existing mining infrastructures at 3 Zone have been grouped with the WIM capital expenditure and are estimated to be C$172 million, in aggregate from 2032 to 2039.
WIM and 3 Zone will be traditional long hole underground mining operation with waste backfill and ramp access. Ore from both deposits will be trucked using the same haul road to the New Britannia mill which is located 15 kilometres from WIM and 3 kilometres from 3 Zone. It is envisaged to use some of the spare equipment from Lalor as well as an already existing workforce. Given the short distance to the town of Snow Lake, there will be no need for an additional camp.
The information presented in this section is forward looking information. See "Cautionary Statement on Forward-Looking Information" and "Risks and Uncertainties" in this AIF.
COPPER MOUNTAIN MINE
Project Description, Location and Access
After 15 years of care and maintenance, the Copper Mountain Mine (CMM) restarted operations at the CMM in mid-2011. Operations have continued since 2011 without major interruptions.
Hudbay's operations at the CMM include a series of open pits, an ore processing plant, waste rock facilities (WRF), a tailings management facility (TMF), and other ancillary facilities that support the operations.
The CMM is located 21 km from the town of Princeton and 180 km east of Vancouver, British Columbia (B.C.). The CMM property consists of 135 Crown-granted mineral claims, 145 located mineral claims, 14 mining leases, 12 fee simple properties, and 7 cell claims, which together cover 6,354 ha (63.5 km2). All claims are controlled by Copper Mountain Mine (BC) Ltd. (CMBC), Hudbay's wholly-owned subsidiary. The claims straddle the Similkameen River, with New Ingerbelle on the river's west side and the Copper Mountain Main (CM Main) and Copper Mountain North (CM North) Pits on the east. The Hope-Princeton Highway (Highway 3) passes immediately west of the property.
The CMM is within the Traditional Territory of the Smilq'mixw People as represented by the Upper Similkameen Indian Band (USIB), in Hedley, and the Lower Similkameen Indian Band (LSIB). Hudbay respects USIB and LSIB's commitment to the principles of economic sustainability, environmental stewardship, and self-determination regarding Smilq'mixw Territory. Hudbay maintains a cooperative and respectful relationship with USIB and LSIB that is in keeping with these principles and finalized refreshed participation agreements with each Band in February 2026. Hudbay is committed to working with the USIB and LSIB to continue to advance responsible mining practices and environmental stewardship.
Accessibility, Climate, Local Resources, Infrastructure and Physiography
Almost all the CMM property area is accessible by highway, with the site served by a paved access road, local gravel roads, and those used for current mining. Electrical power from the provincial grid is connected to the property. Supplemental water for operations, in addition to water recycled from the TMF, is pumped from the Similkameen River. Property elevations range from approximately 770 m above sea level (masl) to 1,300 masl. The CMM area has a relatively dry climate, typical of B.C.'s southern interior. Summers are warm and dry, and winters are cool, with minor precipitation.
The Town of Princeton connects to the mine by way of an 18.4 km-long paved road, and a gravel road approximately 2.6 km long. The town has a population of approximately 3,000 and a diversified economy driven by mining, ranching, forestry, and tourism. The CMM operation is the predominant employer in the area. Princeton has services typical of its size; however, the mine's proximity to Vancouver, Kamloops, and other larger centres ensures that almost all the services required by mine operations are easily obtainable.
History
Initial exploration in the Copper Mountain area dates to around 1884. Underground mining began in 1923, when Granby Consolidated Mining, Smelting and Power Company (Granby) acquired the property and built a milling facility in Allenby (adjacent to Princeton). Between 1927 and 1957, Granby extracted around 31.5 Mt of economic mineralization with an estimated head grade of 1.08% Cu, as well as significant amounts of gold and silver, mostly from its underground operations. In 1972, Newmont began open pit mining operations at the Ingerbelle Pit. In 1988, Newmont sold the entire property to Cassiar Mining Corporation, which later became Princeton Mining Corporation. Mining operations ceased in 1996.
In 2006 Copper Mountain Mining Corp. (CMMC) acquired an option on the CMM property from Compliance Energy. Following large exploration and drilling programs in 2007 (138 diamond drill holes) and 2008 (275 diamond drill holes), CMMC exercised the option, and decided to work towards putting the property back into production.
In 2009, MMC and CMMC entered into a joint venture agreement in respect of CMM, pursuant to which MMC acquired a 25% interest in CMBC and the Copper Mountain Mine. In connection therewith, CMBC entered into an offtake agreement with MMC, pursuant to which CMBC agreed to sell 100% of the concentrate production from CMM to MMC.
Following extensive exploration and engineering studies, construction was initiated in early 2010, and the current phase of open pit mining began in 2011.
In June 2023, Hudbay acquired CMMC and became the 75% owner of CMBC and the Copper Mountain Mine and, in April 2025, Hudbay acquired MMC's 25% minority interest in CMBC. and became the 100% owner of the Copper Mountain mine.
Geological Setting, Mineralization, and Deposit Types
The CMM porphyry copper deposit lies near the southern end of the Quesnel Terrane, consisting of volcanic, sedimentary, and plutonic rocks. At CMM, the Nicola Group is cut by a suite of intrusive rocks including the composite Copper Mountain Stock (CMS), the Voigt Stock, and the slightly younger, polyphase, Lost Horse Intrusive Complex (LHIC).
The bulk of the known copper-gold mineralization at CMM occurs in a northwesterly trending belt of approximately 5 km long and 2 km wide. Copper-gold mineralization postdates the CMS and is temporally and spatially associated with the LHIC. Host rocks and mineralization in the mine area are cut by numerous late, north-south-trending felsite dykes. Sedimentary and volcanic rocks of the Eocene Princeton Group have been unconformably deposited on Nicola Group rocks and LHIC along the northern margin of the CMM and dip at about 30° to the north.
Alteration types in the CMM deposit are typical of porphyry copper deposits: potassic, sodic, and propylitic. Mineralization had been subdivided into four types, as follows:
● Disseminated and stockwork chalcopyrite, bornite, chalcocite, and pyrite in altered Nicola Group volcanic rocks and LHIC rocks
● Bornite-chalcopyrite associated with pegmatite-like veins (coarse masses of orthoclase, calcite, and biotite)
● Magnetite-(±hematite)-chalcopyrite replacements and/or veins
● Chalcopyrite-bearing magnetite breccias.
Due to Pleistocene glacial erosion most of the CMM deposits are characterized by a relatively fresh erosion surface, with limited surficial oxidation and no significant secondary enrichment of copper.
Copper Mountain is an alkalic porphyry copper-gold deposit, spatially and genetically associated with multiple pulses of volumetrically restricted, and compositionally varied, alkaline porphyry intrusions. Well known examples of alkalic porphyry deposits in B.C. include Copper Mountain, Afton/Ajax, Mt. Milligan, Mount Polley, Lorraine, Red Chris, and Galore Creek.
Exploration
The CMM has a long history of exploration and mining. Historical soil sampling and rock chip sampling were carried out, but there is limited information available on these historical geochemical surveys, and the surficial data are not relevant to the current Mineral Resource estimate.
Airborne geophysical surveys were flown within the CMM area in 1993 and 2014 while ground geophysical surveys were carried out 2007 and 2017. Data from these geophysical surveys have been used to support geological mapping, exploration, and interpretation of the CMM deposits.
The CMM deposits remain open at depth with also a number of undrilled exploration targets generated using a combination of geophysical, geochemical, and structural geology data.
In 2025, Hudbay initiated an infill drilling program over the Pit 2 area to convert a portion of the high grade inferred mineral resource estimates to the indicated category amenable to mineral reserve estimates conversion. This program was successful and led to a significant improvement in the average grade of the mineral reserve estimates reported previously for this zone from approximately 25 million tonnes at 0.219% Cu and 0.106 g/t Au to a similar tonnage but at an average grade of 0.382 % Cu and 0.138 g/t Au.
Drilling
The majority of the Copper Mountain area historical drilling (1912-2007) was diamond drilling, with some percussion holes drilled in the 1950s and reverse-circulation (RC) holes drilled in 1994. Since 2007, the majority of the drilling has been diamond drilling, with some RC drilling carried out in 2021-2022. Drilling on the CMM completed to December 22nd, 2025, includes 4,787 core drill holes (607,896m),1,403 percussion drill holes (85,724 m) and 303 RC drill holes (49,940 m), for a total of 6,493 drill holes (740,560 m).
A number of different drill-core diameters have been employed over the history of the CMM, including BX (36.6 mm core diameter for historical underground), NQ (47.6 mm core diameter), and HQ (63.5 mm core diameter). From 2007 onwards, the standard method of drilling was to start all holes with HQ core, then reduce to NQ core at depth. Core recoveries are typically between 90% and 100%, with local zones of lower recovery associated with fault zones.
Historical collar surveys used industry-standard theodolite instrumentation to establish local grid control. From 2007, drill-hole collars were surveyed using either a total station instrument or differential Global Positioning System.
Downhole survey data were absent in pre-1960 drill holes. Downhole dip data, presumably by acid tests, were included in drill data from 1960 to 1987. From 1988 to 1998, downhole surveys were obtained using a Pajari instrument, which provided both azimuth and dip data. From 2007, downhole surveys were obtained using digital REFLEX instruments (or similar systems) which were compass based. Since Hudbay purchase the property, downhole surveys have been recorded via gyroscopes.
Sample Preparation, Analyses, and Security
Hudbay has no information on quality assurance and quality control (QA/QC) procedures for historical (pre-2007) drill-hole data. However, since 2007 large drilling programs that included QA/QC measures have globally validated the historical data. Historical drill-hole data are also supported by more than 12 years of reconciled copper production and operational data.
From 2012 to 2022, sample preparation and primary analysis for copper and silver was carried out at the CMM laboratory. During this time, pulps from samples that returned >0.1% Cu in the CMM laboratory were routinely sent to a number of different independent laboratories for gold analysis, and on average 10% of these sample pulps were also analyzed for copper and silver. These check-assay results indicate that analytical data from the CCM laboratory are acceptable.
In all, 8,562 specific gravity measurements have been made on drill core and pulp samples, representing a range of lithology, alteration, and mineralization types, using the weigh-in-air/weigh-in-water technique (5,816 measurements) and the pycnometer method (2,749 measurements).
Hudbay has no information on sample security measures prior to 2007. From 2007, samples have been stored in secure areas at the mine site. No significant security issues have been identified. CMM exploration staff continually verified data starting with the drilling programs in 2007-2008, which supported the mine restart in 2011, and continuing through the most recent 2025 drill program.
In 2024, Hudbay conducted a systematic drilling campaign of the low-grade stockpile to confirm the volume, grade and density of this material. The drilling was conducted on an approximate 50m x 50m grid using a sonic drill. Standard QA/QC protocols were applied with blanks, certified reference material and duplicates and assaying was conducted at a commercial laboratory. In 2025, Hudbay conducted 8,697 m of diamond drilling to convert Inferred material resources to the Indicated category and test the continuity of copper mineralization along the planned location of the East haul road that will be used to haul the mine production from the New Ingerbelle area.
Data Validation
There is no direct method for verifying historical (pre-2007) drill data. Although some drill cores remain on site, their condition does not allow for any systematic resampling or reanalysis. However, these historical data were obtained and compiled by major producing mining companies for mine design and production, and it is assumed that the data were acquired in the industry standard manner for their time. Despite this, Hudbay conducted global comparisons of assay results obtained from RC drilling and closely located diamond drilling in order to confirm the absence of sampling biases between the two drilling techniques.
In 2023, a major database migration to move all exploration project data into a cloud-based Seequent MX Deposit Database Management System has been completed. The 2023 project database has been extensively independently validated by Hudbay staff; the process included manual checks for transcription errors, data gaps, hole collar and assay interval locations, and downhole survey measurements.
From 2007 to 2022, QA/QC data were collected and regularly monitored, and do not indicate any problems with the analytical programs. However, QA/QC submission rates varied throughout this time, and from 2021 to early 2022 QA/QC insertion rates dropped below industry-accepted standards. To address this shortcoming, a half-core re-assay program was carried out by CMMC, representing a 5% check of primary analyses of >0.1% Cu from the 2021-2022 drilling program; the results of this re-assay program showed that the original assay results are acceptable. From March 2022, QA/QC insertion rates have met industry-accepted standards.
Hudbay personnel working under the supervision of the Qualified Person have visited the CMM area to conduct site inspections to become familiar with conditions on the property, observe the geology and mineralization, perform core review, and verify the work completed on the property as part of the Mineral Resource estimation and technical report process.
Mineral Processing and Metallurgical Testing
The metallurgical characteristics of the CMM deposits have been developed through extensive mill experience and ongoing on-site and off-site-based testing over the past decade which include comminution, flotation and concentrate characterization.
Feed sourced is competent and hard. To predict processing throughput, a conservative set of hardness values has been used based on recent plant performance from these active mining areas.
The copper-cleaner recovery has been consistent since the beginning of operations (2012) and is expected to remain within the 96% to 98% operating range, for a total copper recovery of 79% to 83%. Gold and silver are recovered as by-products by means of flotation. Historical production data from production records indicates that both gold and silver are correlated with overall copper recovery. There are currently no penalties associated with concentrates produced by the CMM concentrator. Moreover, there is no indication of any potential future concerns.
Mineral Resource and Mineral Reserve Estimates
A total of 734,560 m representing 6,053 holes has been used to construct the resource model for the CMM deposits. When gold and silver grade were not measured, they were calculated from the copper grade using robust regression formulae, by geological domain.
In 2025, the resource model supporting the mineral reserve estimates was adjusted locally to account for limited new drilling, revised volume of backfill and topography based on a more recent survey as well as a new model for the low-grade stockpile based on a systematic drilling campaign conducted in 2024 which yielded average grade estimates very close to the estimates based on production records used for the January 1, 2025 estimates.
The mineral resource and mineral reserve estimates for Copper Mountain are effective January 1, 2026. Other than as disclosed in this AIF, there are no known metallurgical, environmental, permitting, legal, taxation, socio-economic, marketing or political issues that could reasonably be expected to materially impact the mineral resource and mineral reserve estimates.
The Proven and Probable Mineral Reserve estimates at the CMM total 345 Mt at a copper grade of 0.256% Cu that supports a 20-year mine life. The mine plan is based on the capacity of the process plant, which in turn relies on the grinding circuit throughput. The plant is permitted to process 50 kt/d.
Post 2025 mining depletion, the mineral reserve estimates have slightly improved in both tonnes and grade due to the addition of approximately 15 million tonnes at New Ingerbelle through re-evaluation of the optimum reserve pit design and due to the replacement of low-grade mineralization in pit 2 by a new pit design mining a similar tonnage but at much higher grade following a successful infill drilling campaign conducted in 2025.
| Copper Mountain - January 1, 2026(1)(2)(3)(4)(5)(6)(7) | |||||
| Mineral Reserve Reconciliation | Tonnes | Cu (%) | Au (g/t) | Ag (g/t) | Cu (t) |
| (Proven & Probable) | |||||
| A 2025 Mineral Reserve | 346,000,000 | 0.245 | 0.12 | 0.67 | 849,000 |
| B 2025 Production / Depletion (from Reserve) | (8,000,000) | 0.267 | 0.07 | 0.88 | (22,000) |
| C (A+B) = Depleted Reserve | 338,000,000 | 0.245 | 0.12 | 0.66 | 827,000 |
| D New Model Adjustment | (4,000,000) | ||||
| E Pit re-design and price change | 12,000,000 | ||||
| F 2026 Mineral Reserve (C+D+E) including stocks | 345,000,000 | 0.256 | 0.12 | 0.65 | 883,000 |
| Mineral Resource Reconciliation (Exclusive of Mineral Reserves) | Tonnes | Cu (%) | Au (g/t) | Ag (g/t) | Cu (t) |
| Measured & Indicated | |||||
| G 2025 Mineral Resource | 125,000,000 | 0.210 | 0.11 | 0.68 | 262,000 |
| H Reserves Pit re-design and price change | (3,000,000) | 0.200 | (6,000) | ||
| I 2026 Mineral Resource (G+H) | 122,000,000 | 0.210 | 0.10 | 0.75 | 255,000 |
| Mineral Resource Reconciliation (Exclusive of Mineral Reserves) Inferred |
Tonnes | Cu (%) | Au (g/t) | Ag (g/t) | Cu (t) |
| J 2025 Mineral Resource | 372,000,000 | 0.250 | 0.13 | 0.61 | 929,000 |
| K Resources conversion | (25,000,000) | 0.447 | 0.17 | 1.11 | (114,000) |
| L 2026 Mineral Resource (J+K) | 347,000,000 | 0.235 | 0.12 | 0.57 | 815,000 |
Notes:
1. Totals may not add up correctly due to rounding.
2. Mineral resources are exclusive of mineral reserves and do not have demonstrated economic viability.
3. Mineral resource estimates are based on resource pit shell and do not include factors for mining recovery or dilution.
4. Mineral resources are estimated using a 0.1% copper cut-off grade.
5. Mineral reserves are estimated using a 0.1% copper cut-off grade and assuming metallurgical recoveries (applied by ore type) of 87% for copper for New Ingerbell, 85% for copper for Copper Mountain, 70% for gold for New Ingerbell, 65% for gold for Copper Mountain and 70% for silver for both deposits throughout the life of mine.
6. Long term metal prices of $4.40 per pound copper, $2,800 per ounce gold, and $32 per ounce silver were used to confirm the economic viability of the mineral reserve estimates and to estimate mineral resources.
7. Grades can not be fully reconciled due to reverse and overlapping changes related to resource models, technical and economic parameters.
Reconciliation of Reserves and Resources
Hudbay conducted a reconciliation for 2025, which highlighted an underestimation of 13% in tonnes and 7% in copper grade by the long-term model compared to the plant production. Part of the tonnage underestimation is due to the recovery of material blasted over the pit edge in the previous years.
Mining Operations
CMM employs conventional open pit mining methods composed of blasthole drilling, blasting, shovel loading, and rigid-frame rear-dump-truck haulage.
Production schedules are based on achieving a tonnage of mill feed, which is constrained by the specified mining fleet, mineralization and waste-haul profiles, and calculated productivities.
The mine uses a cut-off value of 0.10% Cu. Material above the cut-off can be sent directly to the crusher or to a temporary high-grade stockpile, or alternatively to a low-grade stockpile when the copper grade is between 0.10% and 0.13% Cu, depending upon production rates of the various materials over a given time.
The projected mining fleet owned by Hudbay is ramping up to move approximately 100 Mt/a ex-pit in 2026. Following 2027, the material movement rate will decrease over time as waste stripping demands decrease. The estimated fleet will sustain the projected mill ramp-up production to 50 kt/d by the second half of 2026.
Processing and Recovery Operations
The process plant consists of a crush-grind-flotation circuit, with the crushing circuit (comprising a primary and secondary crusher) feeding two SAG mills. Two ball mills, a pebble crusher, and a regrind mill complete the comminution circuit. The plant operates two shifts 12 h/d, 365 d/a, with targeted plant availability of 92%. The processing plant flowsheet was modified in 2025 with the conversion of one of the three originally installed ball mills to a SAG mill. This upgraded the installed capacity from 45kt/d to 50 kt/d.
The comminution circuit is followed by a sulphide flotation circuit that produces a copper-silver-gold concentrate. The flotation tailings are transported to the TMF unthickened via a gravity pipeline, with the sands and slime separation occurring on the TMF's dam walls via mobile cyclone units. The concentrate is dewatered via two pressure filters and stored on site before transport via truck to the Port of Vancouver for shipment to the final customers.
The process plant throughput is planned to be stabilized at 45 kt/d in the first half of 2026, followed by an expansion to 50 kt/d in the second half of the year via removing process bottlenecks in the primary and secondary crushing circuits, and by fully commissioning the newly-modified second SAG mill.
Permitting and Environmental
The current B.C. Mines Act M-29 permit, issued and enforced by the B.C. Ministry of Energy, Mines, and Low Carbon Innovation (EMLI) authorizes the mine and reclamation plans, tailings, and WRFs, site roads, and water management. It also contains requirements for reclamation liabilities, closure-cost estimates, and associated reclamation bonding.
In February 2026, amendments to the Mines Act M-29 and Environmental Management Act permits were approved through the coordinated authorizations process managed by the British Columbia Major Mines Office ("MMO"). These permit amendments allow Hudbay to pursue its plan to expand the mine through the development of the New Ingerbelle satellite pit. On March 23, 2026, the LSIB submitted an application for judicial review of the regulatory decision to grant the Mines Act M-29 permit amendment. Hudbay remains confident in the integrity and robustness of the regulatory process that led to the issuance of the permit amendment and believes it will be upheld by the court. At the same time, Hudbay remains committed to working with the LSIB in a respectful and constructive manner to try to resolve the LSIB's concerns through the mechanisms that were agreed to by the parties in the participation agreement.
Capital and Operating Costs
Growth capital expenditures include several projects at the mine and process plant while sustaining capital expenditures include capital required for major mining equipment acquisition, rebuilds, and major repair. The cost also includes site infrastructure expansion (Tailings Management Facility, Waste Rock Facility, etc.) and process plant infrastructure.
The forecasted life of mine capital and operating costs are set out in the Copper Mountain Technical Report. Cost inflation, changes to the mine plan and commodity price assumptions and other factors may cause these costs to fluctuate over the life of mine and, as such, Hudbay provides a guidance range for capital and operating costs on an annual basis and the 2026 cost guidance was set out in Hudbay's news release dated February 20, 2026.
The information presented in this section is forward-looking information. See "Cautionary Statement on Forward-Looking Information" and "Risks and Uncertainties" in this AIF.
Exploration, Development and Production
Since completing the acquisition of Copper Mountain in June 2023, Hudbay has been focused on advancing its plans to stabilize the Copper Mountain mine to improve reliability and drive sustainable long-term value.
The planned New Ingerbelle development involves renewing mining activities in the historical Ingerbelle open pit on the west side of the Similkameen River. The reserves from New Ingerbelle will be processed in the existing milling facility at Copper Mountain and the tailings generated from processing will also be stored at the existing TMF on the Copper Mountain side of the Similkameen River. Growth capital expenditures for the New Ingerbelle project are estimated to be approximately C$100 million in 2026.
In 2026, Hudbay has initiated a comprehensive infill drilling program over the New Ingerbelle deposit with the objective to convert a significant portion of inferred mineral resource estimates to the indicated category hence amenable to mineral reserve estimates with the adequate demonstration of technical feasibility and economic viability.
With the annual update to mineral reserves and resources, Copper Mountain's expected mine life has been extended by two years until 2045.
Annual production forecasts were initially set out in the Copper Mountain Technical Report. However, changes to the mine plan and other factors cause these production forecasts to fluctuate over the life of mine and, as such, Hudbay provides three year production guidance each year based on current assumptions. Please refer to the most recent three year production guidance for the latest annual production forecast.
The information presented in this section is forward looking information. See "Cautionary Statement on Forward-Looking Information" and "Risks and Uncertainties" in this AIF.
COPPER WORLD
Project Description, Location and Access
The Project is located within the historical Helvetia-Rosemont Mining District that dates to the 1800's. The deposits lie on the northern end and western foothills of the Santa Rita Mountain range approximately 28 miles (45 km) southeast of Tucson, in Pima County, Arizona, USA. The land is located within Townships 17, 18 and 19 South, Ranges 15 and 16 East, Gila & Salt River Meridian, Pima County, Arizona. The Project geographical coordinates are approximately 31º 86'N and 110º 77'W. Access to the Project is from Santa Rita and Helvetia Roads from the west and Highway 83, over and across Forest Service roads from the east.
The core of the Project Mineral resource is contained within the 132 patented mining claims and mill sites that in total encompass an area of 2,004 acres (811 hectares) (the "Patented Claims"). Surrounding the Patented Claims is a contiguous package of 1,866 unpatented mining claims and mill sites with an aggregate area of more than 22,416 acres (9,072 hectares) (the "Unpatented Claims"). Associated with the Patented Claims and Unpatented Claims are 81 parcels of fee (private) land consisting of approximately 3,461 acres (1,401 hectares) (the "Associated Fee Lands"). The area covered by the Patented Claims, Unpatented Claims and Associated Fee Lands totals approximately 27,721 acres (11,218 hectares).
The patented mining claims are considered to be private lands that provide the owner with both surface and mineral rights. The patented mining claim block, including the core of the mineral resource, is monumented in the field by surveyed brass caps on short pipes cemented into the ground. The fee lands are located by legal description recorded at the Pima County Recorder's Office.
Mineral Rights on US Forest Service and Bureau of Land Management ("BLM") lands have been reserved to Copper World LLC, via the unpatented claims that surround the patented claims. Wooden posts and stone cairns mark the unpatented claim corners, end lines and discovery monuments, all of which have been surveyed. The unpatented claims are maintained through the payment of annual maintenance fees of $200.00 per claim, for a total of approximately $373,200 per year, payable to the BLM.
There is a 3% NSR royalty on all 132 patented claims, 603 of the unpatented claims, and one parcel of the Associated Fee Lands with an area of approximately 180 acres.
In addition, the Project is subject to a precious metals stream agreement with Wheaton Precious Metals, as described in this AIF.
History
The first recorded mining activity in the Helvetia-Rosemont mining district occurred in 1875. The Helvetia-Rosemont mining district was officially established in 1878. Production from mines on both sides of the Santa Rita ridgeline supported the construction and operation of the Columbia Smelter in Helvetia and the Rosemont Smelter in Old Rosemont. Copper production from the district ceased in 1961 after production of about 438,000 tons of ore containing 36,766,000 pounds of copper, 1,130,000 pounds of zinc and 361,600 ounces of silver.
By the late 1950s, the Banner Mining Company (Banner) had acquired most of the claims in the area and had drilled the discovery hole into the East deposit. In 1963, the Anaconda Mining Co. acquired options to lease the Banner holdings. Their exploration program demonstrated that a large-scale porphyry/skarn existed at the East deposit. Regional exploration also identifies targets at the Broadtop Butte and Peach-Elgin prospects.
In 1973, Anaconda Mining Co. and Amax Inc. formed a 50/50 partnership to form the Anamax Mining Co. In 1977, following years of drilling and evaluation, the Anamax joint venture generated a resource estimate of about 445 million tons of sulfide mineralization averaged 0.54% copper using a cut-off grade of 0.20% copper. In addition to the sulfide material, 69 million tons of oxide mineralization averaging 0.45% copper was estimated.
In 1979, Anamax carried out a resource estimate for the Broadtop Butte deposit located about a mile north of the East deposit. Their mineral estimate identified 9 million tons averaging 0.77% copper and 0.037% molybdenum. In 1985, Anamax ceased operations and liquidated their assets.
Asarco purchased the patented and unpatented mining claims in the Helvetia-Rosemont mining district from real estate interests in August 1988 and renewed exploration of the Peach-Elgin and initiated engineering studies on the East deposit. In 1999, Grupo Mexico acquired the Helvetia-Rosemont property through a merger with Asarco. 2004, Grupo Mexico sold the property to a Tucson developer.
In April 2005, Augusta purchased the property from Triangle Ventures LLC. Over the next several years, Augusta continued to evaluate the mineral potential and refine the economics of developing this resource.
Following the acquisition of the Project, Hudbay conducted infill drilling campaign between September 2014 and November 2015 in further efforts to gain a better understanding of the geological setting and mineralization of the East deposit and to collect additional metallurgical and geotechnical information. Drilling conducted by Hudbay was used in combination with previous drilling campaigns to build resource models that supported a Feasibility Study completed and documented in the 2017 Technical Report. The 2017 Technical Report included an estimate of the mineral reserves and mineral resources at the East deposit that is now considered to be a historical estimate.
After significant exploration success on its patented mining claims in 2020 and ongoing litigation uncertainty regarding the project design set forth in the 2017 Feasibility Study, Hudbay began to evaluate alternative design options to unlock value within this prospective district. This included remodeling the 2017 mineral resources, incorporating the new mineral resources from successful exploration results and completing new metallurgical testing work, which led to a comprehensive review of the mine plan, process plant design, tailings deposition strategies and permitting requirements for the new project.
In September 2023, Hudbay released a pre-feasibility study for Phase I of the Copper World project (the "Copper World PFS"). Phase I is a standalone operation requiring state and local permits only. Phase I has a mine life of 20 years, which is four years longer than the Phase I mine life that was presented in the previously published Copper World 2022 PEA, largely due to an increase in the capacity for tailings and waste deposition as a result of optimizing the site layout. A second phase, described in the 2022 PEA is expected to involve an expansion onto federal lands with an extended mine life and enhanced project economics. Phase II would be subject to the federal permitting process and was not included in the PFS results. See "Material Mineral Projects - Copper World" for further information regarding the PFS findings. The Copper World PFS also included an update of the mineral resource estimates exclusive of the mineral reserve estimates.
In January 2026, Hudbay announced the closing of a joint venture agreement with Mitsubishi Corporation ("Mitsubishi"), pursuant to which Mitsubishi acquired a 30% minority interest in the Copper World project for aggregate consideration of $600 million (the "CW JV Transaction"). On closing, Mitsubishi contributed approximately $420 million of cash to Copper World LLC and is required to contribute the remaining balance of its initial investment in the amount of $180 million within 18 months of closing. Mitsubishi will also fund its pro rata 30% share of future equity capital contributions required to construct the Copper World project. The proceeds from the CW JV Transaction are expected to be used to fund remaining definitive feasibility study and pre-sanction costs and initial development expenditures for Copper World.
Geological Setting, Mineralization, and Deposit Types
The deposits are located in the Laramide belt, a major porphyry province that includes a number of other world class deposits. The deposits are located in the northern block of the Santa Rita Mountains dominated by Precambrian granite with slices of Paleozoic and Mesozoic sediments and small stocks and dikes of quartz monzonite or quartz latite porphyry that are related to porphyry copper and skarn mineralization. Tertiary faulting has significantly segmented the original stratigraphy juxtaposing mineralized and unmineralized rocks. Mineralization occurs as both copper oxides and sulfides in skarns and in the intrusive porphyry.
Genetically, skarns form part of the suite of deposit styles associated with porphyry copper centers. The skarns were formed as the result of thermal and metasomatic alteration of Paleozoic carbonate and to a lesser extent Mesozoic clastic rocks. Near surface weathering has resulted in the oxidation of the sulfides in the overlying Mesozoic units at the East deposit and near surface Paleozoic units at Copper World.
Mineralization is mostly in the form of primary (hypogene) copper, molybdenum and silver bearing sulfides, found in stockwork veinlets, and disseminated in the altered host rock at depth. Near surface, along structural zones, and in quartzite units oxidized copper mineralization is present. The oxidized mineralization occurs as mixed copper oxide and copper carbonate minerals. Locally, enrichment of supergene chalcocite and associated secondary mineralization are found in and beneath the oxidized mineralization.
Exploration
In October 2020, Hudbay resumed exploration drilling on targets at its Copper World private land claims located north and west of the East deposit. The drill program included drilling of targets proximal to the historic mines in the Broadtop Butte and Peach areas as well as greenfield drilling over the Elgin, Copper World (now referred to as the "West" deposit) and Bolsa areas.
In 2021, Hudbay expanded its exploration drilling efforts on its private land claims located northwest of the East deposit, now defined as the Copper World areas where small scale copper mining had been conducted between the late 19th century until the 1960's. Drilling confirmed the occurrence of both oxide and sulfide copper mineralization over 7 deposits including: Bolsa, Broad Top Butte, Copper World, Peach South Limb, North Limb, and Elgin deposits. The copper mineralization starts in most cases near surface and contains higher grades at shallower depth than at the East deposit. Hudbay continued to drill in 2022 with a focus on infill drilling to support the future conversion of mineral resource to mineral reserve estimates.
Drilling
Extensive drilling has been conducted at the Copper World deposits by several successive property owners. The most recent drilling was by Hudbay, with prior drilling campaigns completed by Banner Mining Company, Anaconda Mining Co., Anamax, ASARCO and Augusta. In total, 244,260 metres of drilling have been completed on the property. These drill holes were drilled using a combination of churn, percussion, reverse circulation and diamond drilling (coring) methods.
In all of the Hudbay's drilling campaigns, efforts were consistently made to obtain representative samples by drilling either H-size (2.5 inch or 63.5 mm diameter) or N-size (1.9 inch or 47.6 mm diameter) core. Reverse circulation drilling performed under Hudbay's ownership were excluded from mineral resource estimates in skarn mineralization due to a sampling representativity issue. Some limited reverse circulation drilling conducted in the porphyry mineralization was retained as valid and used for resource modeling purposes..
Sampling, Analysis, and Data Verification
The Sampling, Analysis and Data Verification results has been discussed in length in the last technical report published on SEDAR in 2023, therefore, only a high-level description will be presented here.
Sample preparation, security, and analytical procedures used by Augusta and Hudbay since 2005 meet current industry accepted standards. QA/QC procedures including the use of certified reference material, blanks and interlaboratory checks on pulp duplicates have resulted in acceptable precision, accuracy, and contamination level. Statistical comparisons and database entry checks of older historical drilling data did not identify any significant biases or database quality issues. Specific gravity was measured in laboratories using water displacement on core and validated with box weight measurements to derive in-situ density estimates for each mineralization domain.
Mineral Processing and Metallurgical Testing
Numerous metallurgical tests were performed, notably confirmation: testing of the tests conducted by Augusta, comminution, JK drop-weight, SAG Power Index and Bond ball mill work index tests to assess the hardness of the material, mineralogical and metallurgical testing of the oxide material on the Peach, Elgin and Broadtop Butte deposits and also on the East deposit transitional zone mineralization where copper occurs as secondary copper sulfides and copper oxides.
The test work demonstrated that copper-molybdenum separation was achievable but due to the limited amount of test work done to date, Molybdenum recovery estimates are based on industry benchmarking and assume 50% recovery to a 50% molybdenum concentrate.
Through the course of all the mineral processing and metallurgical testing, no deleterious elements were found to have a negative impact on plant performance or on the marketable value of the copper and molybdenum concentrates to be produced at the Project.
On the basis of the body of testwork that exists, including both the historical testwork, and the testing programs completed by Hudbay since the acquisition of the property, forecasts of recovery, concentrate grade and quality, as well as characteristics of the resultant tailing product have been developed. Metal recovery regressions were established for each deposit as a function of the ratio between copper in oxides and total copper.
Mineral Resources Estimate
Hudbay used three-dimensional models of lithological units and mineralization envelopes constructed in Leapfrog Geo™ software using an 'implicit modeling' approach. A wireframe model of the 0.10% Cu grade shell was also constructed in Leapfrog Geo™. The selection of this copper grade thresholds for modelling was based on visual inspection of the spatial and statistical grade distribution. The grade shell includes mineralization grading less than 0.10% Cu where it was deemed necessary in order to maintain a smooth and continuous three-dimensional envelope. The different lithological units were grouped into four structural domains which were further divided into mineralized envelopes based on the dominance of oxide or sulfide copper mineralization within the 0.10% Cu grade shell.
Drill core assay intervals for copper (Cu), soluble copper (CuSS), molybdenum (Mo), and silver (Ag) were composited down hole into a fixed length of 25ft. The composite intervals were back-tagged with a copper grade-shell code based on the wireframe models to be used during grade estimation. Visual checks were conducted to ensure back-tagging worked as expected.
The block model consists of non-rotated regular blocks of 50ftx50ftx50ft as a reasonable proxy for the anticipated Selective Mining Unit (SMU) during open pit mining. All the individual blocks in the model were assigned a mineralized envelope code using the wireframes prepared in Leapfrog™. Within each mineralized envelope, blocks were assigned a dry bulk density based on the mean value of in-situ density measured from core box weights and validated with laboratory measurements.
The Cu, CuSS, Mo and Ag block grade values were interpolated using an Ordinary Kriging (OK) estimator with a three-pass estimation approach with each successive pass having greater search distances and less restrictive sample selection requirements. A firm boundary approach within each mineralized envelope was employed for all metals.
The block model grade estimates were validated by Hudbay through visual inspection comparing composite grades to block grades, statistical checks, and selectivity checks. During its review, Hudbay identified an opportunity to reduce the inherent smoothing of the kriged model. This correction was implemented separately by mineralized envelope based on grade distribution and also by areas with consistent drilling density.
A Lerchs Grossman analysis was performed using the block models constructed by Hudbay. Several economic analyses were developed for nested pit shells. The purpose of this assessment was to evaluate free discounted cash flow, revenue, stripping ratio, development, sustaining capital, and as guidance for internal phases, recoveries by processing route and by deposit. The base-case pit shell retained for resource reporting corresponds to a revenue factor of 1.0 with an assumed copper price of $3.45/lb to ensure potential for economic extraction of the mineral resource estimates.
Mining Operations
The PFS is based on a traditional open pit shovel and truck operation with bench heights of 50 and 100 feet, and 255- ton capacity haul trucks for material and waste movement.
The mining sequence considers the exploitation of the pits and their associated infrastructure over a footprint requiring only state and local permits for 19 years (plus one year of pre-stripping and one year of rehandling stockpiled ore to the process plant). During this period, all waste, tailings, and leach pads are disposed within the limits of Hudbay's private land properties. Through the life of mine of the 2023 PFS, 385 million tonnes of mineral reserves will be mined and milled while approximately 817 million tonnes of waste will be extracted, yielding a life of mine stripping ratio of 2.1:1.0 (including pre-stripping material). The tonnage of waste includes approximately 40 million tonnes of mineral resources that cannot be processed at the end of the mine life due to a lack of tailings disposal capacity. This material represents an opportunity to expand the mine life of Phase I and to reduce the strip ratio to 1.8:1.0.
Pit design and production were conducted using a NSR optimization model in order to select the optimum processing method that maximizes NPV for each mining block extracted from the open pits taking into consideration land restriction both for mining and for the connected actions of waste, leach pads and tailings depositions as well as the maximum capacity of the various components of the processing facilities.
An important constraint on the mine production schedule is the limited space for disposing of waste rock, tailings, and economic material on leach pads. In addition, some of the waste rock can only be disposed of after mining has been completed at the Peach-Elgin, West, and Broadtop Butte pits. These important constraints result in a sub-optimum mining sequence from a strict economic standpoint but allow the mine to operate in a sustainable manner for 20 years until federal permits are in place. Securing these permits earlier would unlock significant benefits to the Project by removing these important constraints on the mining schedule allowing more tons and/or better grade to enter the mine plan earlier than currently planned.
Processing and Recovery Operations
The processing plant will consist of a sulfide concentrator and a concentrate leach facility. The sulfide concentrator will have an installed capacity of 60,000 tons per day process via a primary crushing circuit, and a grinding circuit configured in semi-autogenous mill and ball mill (SAB) configuration. This is followed by a bulk flotation of a copper and molybdenum concentrate, and the subsequent separation of the copper and molybdenum concentrate via a reverse flotation stage. Bulk flotation tailings are thickened before sands/slime separation and discharged to the tailing's storage facility.
The concentrate leach facility will be built in stages from year four of operations. The initial installed capacity will be 800 tons per day of concentrate via an ultrafine grinding circuit and atmospheric oxidative leach circuit with 48hrs residence time. Copper Cathode will be produced via a standard solvent extraction and electrowinning circuit (SXEW) on the pregnant leach solutions, with the leach residue being processed to recover valuable secondary products including Au, Ag and sulfur. Sulfuric acid will be produced onsite from the recovered sulfur and provide process utilities (steam, sulfur dioxide and electrical power) to the processing operations.
Permitting and Environmental
Hudbay has received all three key state permits for the development and operation of the Copper World project, being the Mined Land Reclamation Plan, Aquifer Protection Permit and Air Quality Permit. The Air Quality Permit is currently being appealed by project opponents, as described in this AIF.
Capital and Operating Costs
The total life of mine capital costs of $2,594M estimated in the 2023 PFS consist of $1,690M growth, $542M sustaining, and $362M deferred stripping costs. Growth capital includes two stages of construction; the first stage is the mine, Concentrator Process Plant and related infrastructure totaling $1,323M to be incurred during the 10 quarters prior to commercial production. The second stage is the expanded industrial complex, comprising the Concentrate Leach facility and acid plant facilities totaling $367M that will be incurred during the fourth year of production. Sustaining capital of $542M is primarily mining related costs of the waste rock facility, tailings facility, major repairs and overhauls, and haul roads, as well as plant and general administrative facilities sustaining costs. Deferred stripping of $362M is composed of capitalized mine operating costs for stripping applicable to the portion of the annual strip ratio in excess of the life of mine strip ratio. The cost estimates in the 2023 PFS were based on assumptions at the time of the study and are subject to the risk of cost escalation, as described in this AIF.
Exploration, Development and Production
Hudbay is currently in the process of completing a definitive feasibility study for the Copper World project, which is expected to be completed in mid-2026.
SCHEDULE C: AUDIT COMMITTEE CHARTER
HUDBAY MINERALS INC.
(THE "COMPANY")
AUDIT COMMITTEE CHARTER
| PURPOSE |
The Audit Committee is appointed by the Board of Directors to assist the Board of Directors in its oversight and evaluation of:
• the quality and integrity of the financial statements of the Company,
• the compliance by the Company with legal and regulatory requirements in respect of financial disclosure,
• the qualification, independence and performance of the Company's independent auditor,
• the appointment, independence and performance of the Company's head of the internal audit function,
• the design and ongoing review of the Company's risk management system, and
• the performance of the Company's Chief Financial Officer.
In addition, the Audit Committee provides an avenue for communication among the independent auditor, the internal audit function, the Company's Chief Financial Officer and other financial senior management, other employees and the Board of Directors concerning accounting, auditing and risk management matters.
The Audit Committee is directly responsible for the recommendation of the appointment and retention (and termination) and for the compensation and the oversight of the work of the independent auditor (including oversight of the resolution of any disagreements between senior management and the independent auditor or the internal audit function regarding financial reporting) for the purpose of preparing audit reports or performing other audit, review or attest services for the Company. Also, the Audit Committee is directly responsible for the approval of the appointment and retention (and termination) and the oversight of the work of the internal audit function.
The Audit Committee is not responsible for:
• planning or conducting audits,
• certifying or determining the completeness or accuracy of the Company's financial statements or that those financial statements are in accordance with generally accepted accounting principles.
Each member of the Audit Committee shall be entitled to rely in good faith upon:
• financial statements of the Company represented to him or her by senior management of the Company or in a written report of the independent auditor to present fairly the financial position of the Company in accordance with generally accepted accounting principles; and
• any report of a lawyer, accountant, engineer, appraiser or other person whose profession lends credibility to a statement made by any such person.
The fundamental responsibility for the Company's financial statements and disclosure rests with senior management.
| REPORTS |
The Audit Committee shall report to the Board of Directors on a regular basis and, in any event, before the public disclosure by the Company of its quarterly and annual financial results. The reports of the Audit Committee shall include any issues of which the Audit Committee is aware with respect to the quality or integrity of the Company's financial statements, its compliance with legal or regulatory requirements, the performance and independence of the Company's independent auditor, the performance and independence of the Company's internal audit function and changes in risks over which the Audit Committee has oversight.
The Audit Committee also shall prepare, as required by applicable law, any audit committee report required for inclusion in the Company's publicly filed documents.
| COMPOSITION |
The members of the Audit Committee shall be three or more individuals who are appointed (and may be replaced) by the Board of Directors on the recommendation of the Company's Corporate Governance and Nominating Committee. The appointment of members of the Audit Committee shall take place annually at the first meeting of the Board of Directors after a meeting of shareholders at which directors are elected, provided that if the appointment of members of the Audit Committee is not so made, the directors who are then serving as members of the Audit Committee shall continue as members of the Audit Committee until their successors are appointed. The Board of Directors may appoint a member to fill a vacancy that occurs in the Audit Committee between annual elections of directors. Any member of the Audit Committee may be removed from the Audit Committee by a resolution of the Board of Directors. Unless the Chair is elected by the Board of Directors, the members of the Audit Committee may designate a Chair by majority vote of the members of the Audit Committee.
Each of the members of the Audit Committee shall meet the Company's Categorical Standards for Determining Independence of Directors and shall be financially literate (or acquire that familiarity within a reasonable period after appointment) in accordance with applicable legislation and stock exchange requirements. No member of the Audit Committee shall:
• accept (directly or indirectly) any consulting, advisory or other compensatory fee from the Company or any of its subsidiaries1 (other than remuneration for acting in his or her capacity as a director or committee member) or be an "affiliated person"2 of the Company or any of its subsidiaries, or
• concurrently serve on the audit committee of more than three other public companies without the prior approval of the Audit Committee, the Corporate Governance and Nominating Committee and the Board of Directors and their determination that such simultaneous service would not impair the ability of the member to effectively serve on the Audit Committee (which determination shall be disclosed in the Company's annual management information circular).
Notes:
1 A company is a subsidiary of another company if it is controlled, directly or indirectly, by that other company (through one or more intermediaries or otherwise).
2 An "affiliate" of a person is a person that, directly or indirectly, through one or more intermediaries, controls, or is controlled by, or is under common control with the first person.
| RESPONSIBILITIES |
Independent Auditor
The Audit Committee shall:
• Recommend the appointment and the compensation of, and, if appropriate, the termination of the independent auditor, subject to such Board of Directors and shareholder approval as is required under applicable legislation and stock exchange requirements.
• Obtain confirmation from the independent auditor that it ultimately is accountable, and will report directly, to the Audit Committee and the Board of Directors.
• Oversee the work of the independent auditor, including the resolution of any disagreements between senior management and the independent auditor regarding financial reporting.
• Pre-approve all audit and non-audit services (including any internal control-related services) provided by the independent auditor (subject to any restrictions on such non-audit services imposed by applicable legislation, regulatory requirements and policies of the Canadian Securities Administrators).
• Adopt such policies and procedures as it determines appropriate for the pre-approval of the retention of the independent auditor by the Company and any of its subsidiaries for any audit or non-audit services, including procedures for the delegation of authority to provide such approval to one or more members of the Audit Committee.
• Provide notice to the independent auditor of every meeting of the Audit Committee.
• Approve all engagements for accounting advice prepared to be provided by an accounting firm other than independent auditor.
• Review quarterly reports from senior management on tax advisory services provided by accounting firms other than the independent auditor.
• Review expense reports of the Chairman and the Chief Executive Officer.
Internal Audit Function
The Audit Committee shall:
• Approve the appointment and, if appropriate, the termination of the head of the internal audit function.
• Obtain confirmation from the head of the internal audit function that he or she is ultimately accountable, and will report directly, to the Audit Committee.
• Oversee the work of the internal audit function, including the resolution of any disagreements between senior management and the internal audit function.
• Approve the internal audit function annual plan.
• Review quarterly reports from the head of the internal audit function.
The Audit Process, Financial Statements and Related Disclosure
The Audit Committee shall:
• Meet with senior management and/or the independent auditor to review and discuss,
• the planning and staffing of the audit by the independent auditor,
• before public disclosure, the Company's annual audited financial statements and quarterly financial statements, the Company's accompanying disclosure of Management's Discussion and Analysis and earnings press releases and make recommendations to the Board of Directors as to their approval and dissemination of those statements and disclosure,
• financial information and earnings guidance provided to analysts and rating agencies: this review need not be done on a case by case basis but may be done generally (consisting of a discussion of the types of information disclosed and the types of presentations made) and need not take place in advance of the disclosure,
• any significant financial reporting issues and judgments made in connection with the preparation of the Company's financial statements, including any significant changes in the selection or application of accounting principles, any major issues regarding auditing principles and practices, and the adequacy of internal controls that could significantly affect the Company's financial statements,
• all critical accounting policies and practices used,
• all alternative treatments of financial information within IFRS that have been discussed with senior management, ramifications of the use of such alternative disclosures and treatments, and the treatment preferred by the independent auditor,
• the use of "pro forma" or "adjusted" non-IFRS information,
• the effect of new regulatory and accounting pronouncements,
• the effect of any material off-balance sheet structures, transactions, arrangements and obligations (contingent or otherwise) on the Company's financial statements,
• any disclosures concerning any weaknesses or any deficiencies in the design or operation of internal controls or disclosure controls made to the Audit Committee in connection with certification of forms by the Chief Executive Officer and/or the Chief Financial Officer for filing with applicable securities regulators, and
• the adequacy of the Company's internal accounting controls and management information systems and its financial, auditing and accounting organizations and personnel (including any fraud involving an individual with a significant role in internal controls or management information systems) and any special steps adopted in light of any material control deficiencies.
• Review disclosure of financial information extracted or derived from the Company's financial statements.
• Review with the independent auditor,
• the quality, as well as the acceptability of the accounting principles that have been applied,
• any problems or difficulties the independent auditor may have encountered during the provision of its audit services, including any restrictions on the scope of activities or access to requested information and any significant disagreements with senior management, any management letter provided by the independent auditor or other material communication (including any schedules of unadjusted differences) to senior management and the Company's response to that letter or communication, and
• any changes to the Company's significant auditing and accounting principles and practices suggested by the independent auditor or other members of senior management.
Risks
The Audit Committee shall:
• Recommend to the Board of Directors for approval a policy (the "ERM Policy") that sets out the risk management philosophy of the Company and the expectations and accountabilities for identifying, assessing, monitoring and managing the most significant risks facing the Company (the "Principal Risks") that is developed and is to be implemented by senior management.
• Meet with senior management to review and discuss the Principal Risks that have been assigned to the Audit Committee for monitoring, including business, financial and information technology risks of the Company, including potential emerging risks, and the actions taken by the Company to mitigate those risks.
• Approve a formalized, disciplined and integrated enterprise risk management process (the "ERM Process") that is developed by senior management and, as appropriate, the Board and its Committees, to monitor, manage and report Principal Risks.
• Recommend to the Board of Directors for approval policies (and changes thereto) setting out the framework within which each identified Principal Risks of the Company shall be managed.
• At least semi-annually, obtain from senior management and, as appropriate, with the input of one or more of the Board's Committees, a report specifying the management of the Principal Risks of the Company including compliance with the ERM Policy and other policies of the Company for the management of Principal Risks.
• Review with senior management the Company's tolerance for financial risk and senior management's assessment of the significant financial risks facing the Company.
• Discuss with senior management, at least annually, the guidelines and policies utilized by senior management with respect to financial risk assessment and management, and the major financial risk exposures and the procedures to monitor and control such exposures in order to assist the Audit Committee to assess the completeness, adequacy and appropriateness of financial risk disclosure in Management's Discussion and Analysis and in the financial statements.
• Review policies and compliance therewith that require significant actual or potential liabilities, contingent or otherwise, to be reported to the Board of Directors in a timely fashion.
• Review the adequacy of insurance coverages maintained by the Company.
• At least semi-annually, obtain from senior management a report on information technology matters, including any significant developments related to the Company's information security policies and practices and information technology infrastructure, and the management of related risks.
• Discharge the Board's oversight function in respect of the administration of the pension and other retirement plans of the Company and its affiliates.
Compliance
The Audit Committee shall:
• Obtain reports from senior management that the Company's subsidiary/foreign affiliated entities are in conformity with applicable legal requirements and the Company's Code of Business Conduct and Ethics including disclosures of insider and affiliated party transactions and environmental protection laws and regulations.
• Review with senior management and the independent auditor any correspondence with regulators or governmental agencies and any employee complaints or published reports, which raise material issues regarding the Company's financial statements or accounting policies.
• Review senior management's written representations to the independent auditor.
• Advise the Board of Directors with respect to the Company's policies and procedures regarding compliance with applicable laws and regulations and with the Company's Code of Business Conduct and Ethics.
• Review with the Company's General Counsel legal matters that may have a material impact on the financial statements, the Company's compliance policies and any material reports or inquiries received from regulators or governmental agencies.
• Establish procedures for,
• the receipt, retention and treatment of complaints regarding accounting, internal accounting controls or auditing matters, and
• the confidential, anonymous submission by employees of the Company with concerns regarding any accounting or auditing matters.
Delegation
To avoid any confusion, the Audit Committee responsibilities identified above are the sole responsibility of the Audit Committee, unless otherwise directed by the Board of Directors.
| INDEPENDENT ADVICE |
In discharging its mandate, the Audit Committee shall have the authority to retain (and authorize the payment by the Company of) and receive advice from special legal, accounting or other advisors as the Audit Committee determines to be necessary to permit it to carry out its duties.
Consolidated Financial Statements
(In US dollars)
HUDBAY MINERALS INC.
For the years ended December 31, 2025 and 2024
MANAGEMENT'S REPORT ON INTERNAL CONTROL OVER FINANCIAL REPORTING
Management of Hudbay Minerals Inc. ("Hudbay" or the "Company") is responsible for establishing and maintaining internal control over financial reporting ("ICFR").
Under the supervision of and with the participation of the Chief Executive Officer and the Chief Financial Officer, Hudbay's management assessed the effectiveness of the Company's ICFR as of December 31, 2025 based upon the Internal Control - Integrated Framework (2013) issued by the Committee of Sponsoring Organizations of the Treadway Commission. Based on this evaluation, management concluded that Hudbay's ICFR was effective as of December 31, 2025.
The effectiveness of the Company's ICFR as of December 31, 2025 has been audited by Deloitte LLP, Independent Registered Public Accounting Firm, as stated in their report immediately preceding the Company's audited consolidated financial statements for the year ended December 31, 2025.
| Peter Kukielski | Eugene Lei |
| President and Chief Executive Officer | Chief Financial Officer |
Toronto, Canada
February 19, 2026
Report of Independent Registered Public Accounting Firm
To the shareholders and the Board of Directors of Hudbay Minerals Inc.
Opinion on the Financial Statements
We have audited the accompanying consolidated balance sheets of Hudbay Minerals Inc. and subsidiaries (the "Company") as at December 31, 2025 and 2024, the related consolidated statements of income, comprehensive income, changes in equity, and cash flows, for each of the two years in the period ended December 31, 2025, and the related notes (collectively referred to as the "financial statements"). In our opinion, the financial statements present fairly, in all material respects, the financial position of the Company as at December 31, 2025 and 2024, and its financial performance and its cash flows for each of the two years in the period ended December 31, 2025, in accordance with IFRS Accounting Standards as issued by the International Accounting Standards Board.
We have also audited, in accordance with the standards of the Public Company Accounting Oversight Board (United States) (PCAOB), the Company's internal control over financial reporting as of December 31, 2025, based on criteria established in Internal Control - Integrated Framework (2013) issued by the Committee of Sponsoring Organizations of the Treadway Commission and our report dated February 19, 2026, expressed an unqualified opinion on the Company's internal control over financial reporting.
Basis for Opinion
These financial statements are the responsibility of the Company's management. Our responsibility is to express an opinion on the Company's financial statements based on our audits. We are a public accounting firm registered with the PCAOB and are required to be independent with respect to the Company in accordance with the U.S. federal securities laws and the applicable rules and regulations of the Securities and Exchange Commission and the PCAOB.
We conducted our audits in accordance with the standards of the PCAOB. Those standards require that we plan and perform the audit to obtain reasonable assurance about whether the financial statements are free of material misstatement, whether due to error or fraud. Our audits included performing procedures to assess the risks of material misstatement of the financial statements, whether due to error or fraud, and performing procedures that respond to those risks. Such procedures included examining, on a test basis, evidence regarding the amounts and disclosures in the financial statements. Our audits also included evaluating the accounting principles used and significant estimates made by management, as well as evaluating the overall presentation of the financial statements. We believe that our audits provide a reasonable basis for our opinion.
Critical Audit Matters
The critical audit matters communicated below are matters arising from the current-period audit of the financial statements that were communicated or required to be communicated to the audit committee and that (1) relate to accounts or disclosures that are material to the financial statements and (2) involved our especially challenging, subjective, or complex judgments. The communication of critical audit matters does not alter in any way our opinion on the financial statements, taken as a whole, and we are not, by communicating the critical audit matters below, providing separate opinions on the critical audit matters or on the accounts or disclosures to which they relate.
Impairment - Assessment of Whether Indicators of Impairment or Impairment Reversal Exist in Non- financial Assets - Refer to Notes 2(d) and 3(i) to the financial statements
Critical Audit Matter Description
The Company's determination of whether an indicator of impairment or impairment reversal exists in non-financial assets at the cash generating unit ("CGU") level requires significant management judgment.
While there are several inputs that are required to determine whether or not an indicator of impairment or impairment reversal exists, the judgments with the highest degree of subjectivity are the future long- term copper price and the discount rates. Auditing these estimates and inputs required a high degree of subjectivity in applying audit procedures and in evaluating the results of those procedures. This resulted in an increased extent of audit effort, including the involvement of fair value specialists.
How the Critical Audit Matter Was Addressed in the Audit
Our audit procedures related to the future long-term copper price, and the discount rates in the assessment of indicators of impairment or impairment reversal included the following, among others:
• Evaluated the effectiveness of controls over management's assessment of the indicators of impairment or impairment reversal.
• With the assistance of fair value specialists:
- Evaluated the future long-term copper price by comparing management's forecasts to third party forecasts, and
- Evaluated the reasonableness of the discount rates by comparing the key inputs to independent market data.
British Columbia CGU Annual Goodwill Impairment Test - Refer to Notes 2(d), 3(i) and 13 of the financial statements
Critical Audit Matter Description
On June 20, 2023, the Company acquired 100% of the issued and outstanding shares of Copper Mountain Mining Corporation. Goodwill resulted from the purchase price allocation associated with the Copper Mountain acquisition, which was allocated to the British Columbia CGU. The Company tested the goodwill of the British Columbia CGU as at July 1, 2025 for impairment by determining the recoverable amount using a discounted cash flow model. The discounted cash flow model required management to make significant estimates and assumptions related to future short-term and long-term copper price, production based on current estimates of recoverable resources, value beyond proven and probable ("VBPP"), discount rate, future foreign exchange rates, and future operating and capital costs. The Company determined that there was no impairment of the British Columbia CGU's goodwill based on its annual goodwill impairment test.
While there are several estimates and assumptions that are required to determine the recoverable amount of the British Columbia CGU as at July 1, 2025, the estimates and assumptions with the highest degree of subjectivity are future short-term and long-term copper price, VBPP, discount rate, and future foreign exchange rates. Auditing these estimates and assumptions required a high degree of auditor judgment in applying audit procedures and in evaluating the results of those procedures. This resulted in an increased extent of audit effort, including the involvement of fair value specialists.
How the Critical Audit Matter Was Addressed in the Audit
Our audit procedures related to the future short-term and long-term copper price, VBPP, discount rate, and future foreign exchange rates used to determine the recoverable amount of the British Columbia CGU included the following, among others:
• Evaluated the effectiveness of relevant controls over management's determination of the future short-term and long-term copper price, VBPP, discount rate and future foreign exchange rates.
• With the assistance of fair value specialists:
- Evaluated the future short-term and long-term copper price by comparing management's forecasts to third party forecasts,
- Evaluated the reasonableness of the VBPP by developing a range of independent VBPP valuation estimates from market transactions and comparing to the VBPP valuation selected by management,
- Evaluated the reasonableness of the discount rate by testing the source information underlying the determination of the discount rate and developed a range of independent estimates for the discount rate and compared to the discount rate selected by management, and
- Evaluated the reasonableness of the future foreign exchange rates by comparing our independent research of the forecasted rate to management's assumed rates.
/s/ Deloitte LLP
Chartered Professional Accountants
Licensed Public Accountants
Toronto, Canada
February 19, 2026
We have served as the Company's auditor since 2005.
Report of Independent Registered Public Accounting Firm
To the shareholders and the Board of Directors of Hudbay Minerals Inc.
Opinion on Internal Control over Financial Reporting
We have audited the internal control over financial reporting of Hudbay Minerals Inc. and subsidiaries (the "Company") as of December 31, 2025, based on criteria established in Internal Control - Integrated Framework (2013) issued by the Committee of Sponsoring Organizations of the Treadway Commission (COSO). In our opinion, the Company maintained, in all material respects, effective internal control over financial reporting as of December 31, 2025, based on criteria established in Internal Control - Integrated Framework (2013) issued by COSO.
We have also audited, in accordance with the standards of the Public Company Accounting Oversight Board (United States) (PCAOB), the consolidated financial statements as at and for the year ended December 31, 2025, of the Company and our report dated February 19, 2026, expressed an unqualified opinion on those financial statements.
Basis for Opinion
The Company's management is responsible for maintaining effective internal control over financial reporting and for its assessment of the effectiveness of internal control over financial reporting, included in the accompanying Management's Report on Internal Control over Financial Reporting. Our responsibility is to express an opinion on the Company's internal control over financial reporting based on our audit. We are a public accounting firm registered with the PCAOB and are required to be independent with respect to the Company in accordance with the U.S. federal securities laws and the applicable rules and regulations of the Securities and Exchange Commission and the PCAOB.
We conducted our audit in accordance with the standards of the PCAOB. Those standards require that we plan and perform the audit to obtain reasonable assurance about whether effective internal control over financial reporting was maintained in all material respects. Our audit included obtaining an understanding of internal control over financial reporting, assessing the risk that a material weakness exists, testing and evaluating the design and operating effectiveness of internal control based on the assessed risk, and performing such other procedures as we considered necessary in the circumstances. We believe that our audit provides a reasonable basis for our opinion.
Definition and Limitations of Internal Control over Financial Reporting
A company's internal control over financial reporting is a process designed to provide reasonable assurance regarding the reliability of financial reporting and the preparation of financial statements for external purposes in accordance with generally accepted accounting principles. A company's internal control over financial reporting includes those policies and procedures that (1) pertain to the maintenance of records that, in reasonable detail, accurately and fairly reflect the transactions and dispositions of the assets of the company; (2) provide reasonable assurance that transactions are recorded as necessary to permit preparation of financial statements in accordance with generally accepted accounting principles, and that receipts and expenditures of the company are being made only in accordance with authorizations of management and directors of the company; and (3) provide reasonable assurance regarding prevention or timely detection of unauthorized acquisition, use, or disposition of the company's assets that could have a material effect on the financial statements.
Because of its inherent limitations, internal control over financial reporting may not prevent or detect misstatements. Also, projections of any evaluation of effectiveness to future periods are subject to the risk that controls may become inadequate because of changes in conditions, or that the degree of compliance with the policies or procedures may deteriorate.
/s/ Deloitte LLP
Chartered Professional Accountants
Licensed Public Accountants
Toronto, Canada
February 19, 2026
| HUDBAY MINERALS INC. Consolidated Balance Sheets (In millions of US dollars) |
| Dec. 31, | Dec. 31, | ||||||
| Note | 2025 | 2024 | |||||
| Assets | |||||||
| Current assets | |||||||
| Cash and cash equivalents | 7 | $ | 568.9 | $ | 541.8 | ||
| Short-term investments | 8 | - | 40.0 | ||||
| Trade and other receivables | 9 | 377.8 | 235.5 | ||||
| Inventories | 10 | 199.2 | 197.4 | ||||
| Prepaid expenses and other current assets | 15.2 | 17.4 | |||||
| Other financial assets | 11 | 0.8 | 15.3 | ||||
| Taxes receivable | 1.2 | 1.1 | |||||
| 1,163.1 | 1,048.5 | ||||||
| Taxes receivable | 16.1 | 12.9 | |||||
| Inventories | 10 | 21.6 | 16.6 | ||||
| Other financial assets | 11 | 130.9 | 12.1 | ||||
| Intangibles and other assets | 12 | 58.6 | 44.3 | ||||
| Property, plant and equipment | 14 | 4,693.9 | 4,181.4 | ||||
| Deferred tax assets | 24b | 66.5 | 102.6 | ||||
| Goodwill | 13 | 72.6 | 69.2 | ||||
| $ | 6,223.3 | $ | 5,487.6 | ||||
| Liabilities | |||||||
| Current liabilities | |||||||
| Trade and other payables | 15 | $ | 342.8 | $ | 270.2 | ||
| Taxes payable | 117.4 | 100.7 | |||||
| Other liabilities | 16 | 94.7 | 34.4 | ||||
| Other financial liabilities | 17 | 122.9 | 38.3 | ||||
| Lease liabilities | 18 | 26.7 | 30.5 | ||||
| Current portion of long-term debt | 19 | 472.1 | - | ||||
| Deferred revenue | 20 | 52.1 | 63.1 | ||||
| 1,228.7 | 537.2 | ||||||
| Other financial liabilities | 17 | 155.0 | 114.4 | ||||
| Lease liabilities | 18 | 29.3 | 44.3 | ||||
| Long-term debt | 19 | 536.5 | 1,107.5 | ||||
| Deferred revenue | 20 | 265.0 | 309.1 | ||||
| Pension obligations | 22 | 7.5 | 6.2 | ||||
| Other employee benefits | 23 | 82.4 | 80.3 | ||||
| Environmental and other provisions | 21 | 312.6 | 300.8 | ||||
| Deferred tax liabilities | 24b | 375.3 | 340.4 | ||||
| 2,992.3 | 2,840.2 | ||||||
| Equity | |||||||
| Share capital | 25b | 2,668.2 | 2,641.3 | ||||
| Reserves | 102.3 | 14.3 | |||||
| Retained earnings | 460.5 | (102.4 | ) | ||||
| Equity attributable to owners of the Company | 3,231.0 | 2,553.2 | |||||
| Non-controlling interest | 5 | - | 94.2 | ||||
| $ | 6,223.3 | $ | 5,487.6 | ||||
| Commitments (note 30) |
|
1 |
| HUDBAY MINERALS INC. Consolidated Statements of Income (In millions of US dollars, except per share amounts) |
| Year ended December 31, | |||||||
| Note | 2025 | 2024 | |||||
| Revenue | 6a | $ | 2,211.0 | $ | 2,021.2 | ||
| Cost of sales | |||||||
| Mine operating costs | 1,028.1 | 1,040.8 | |||||
| Depreciation and amortization | 6b | 439.7 | 426.6 | ||||
| 1,467.8 | 1,467.4 | ||||||
| Gross profit | 743.2 | 553.8 | |||||
| Selling and administrative expenses | 94.7 | 57.0 | |||||
| Exploration expenses | 46.3 | 42.6 | |||||
| Other operating expenses | 6e | 7.8 | 57.4 | ||||
| Re-evaluation adjustment - environmental provision | 21 | 0.2 | (3.5 | ) | |||
| Impairment reversal | 6f | (322.3 | ) | - | |||
| Results from operating activities | 916.5 | 400.3 | |||||
| Consideration received from sale of non-core project | 6g | (14.9 | ) | - | |||
| Net interest expense on long term debt | 6h | 60.7 | 69.8 | ||||
| Accretion on streaming arrangements | 6h | 19.9 | 24.2 | ||||
| Change in fair value of financial instruments | 6h | (52.9 | ) | 16.6 | |||
| Other net finance (income) expenses | 6h | (8.3 | ) | 38.1 | |||
| Other expenses | 4.5 | 148.7 | |||||
| Income before tax | 912.0 | 251.6 | |||||
| Tax expense | 24 | 347.7 | 183.8 | ||||
| Net income for the year | $ | 564.3 | $ | 67.8 | |||
| Attributable to: | |||||||
| Owners of the Company | $ | 568.5 | $ | 76.7 | |||
| Non-controlling interest | (4.2 | ) | (8.9 | ) | |||
| Net income for the year | $ | 564.3 | $ | 67.8 | |||
| Earnings per share attributable to owners | |||||||
| Basic and diluted | $ | 1.44 | $ | 0.20 | |||
| Weighted average number of common shares outstanding: | |||||||
| Basic | 27 | 395,521,903 | 376,785,518 | ||||
| Diluted | 27 | 396,648,796 | 377,291,211 | ||||
|
2 |
| HUDBAY MINERALS INC. Consolidated Statements of Comprehensive Income (In millions of US dollars) |
| Year ended December 31, | ||||||
| 2025 | 2024 | |||||
| Net income for the year | $ | 564.3 | $ | 67.8 | ||
| Other comprehensive income: | ||||||
| Item that will be reclassified subsequently to profit or loss: | ||||||
| Recognized directly in equity: | ||||||
| Net gain (loss) on translation of foreign currency balances | 25.7 | (49.9 | ) | |||
| Items that will not be reclassified subsequently to profit or loss: | ||||||
| Recognized directly in equity: | ||||||
| Gold prepayment revaluation | - | 4.3 | ||||
| Tax effect | - | (1.1 | ) | |||
| Remeasurement - actuarial gain | 7.9 | 25.7 | ||||
| Tax effect | (0.7 | ) | (2.0 | ) | ||
| 7.2 | 26.9 | |||||
| Other comprehensive income (loss) net of tax, for the year | 32.9 | (23.0 | ) | |||
| Total comprehensive income for the year | $ | 597.2 | $ | 44.8 | ||
| Attributable to: | ||||||
| Owners of the Company | 598.2 | 60.6 | ||||
| Non-controlling interest | (1.0 | ) | (15.8 | ) | ||
| Total comprehensive income for the year | $ | 597.2 | $ | 44.8 | ||
|
3 |
| HUDBAY MINERALS INC. Consolidated Statements of Cash Flows (In millions of US dollars) |
| Year ended December 31, |
|||||||
| Note | 2025 | 2024 | |||||
| Cash generated from operating activities: | |||||||
| Net income for the year | $ | 564.3 | $ | 67.8 | |||
| Items not affecting cash: | |||||||
| Tax expense | 24 | 347.7 | 183.8 | ||||
| Depreciation and amortization | 6b | 441.2 | 428.0 | ||||
| Share-based compensation | 6c | 61.3 | 19.3 | ||||
| Net finance expenses | 6h | 19.4 | 148.7 | ||||
| Inventory adjustments | 10 | 4.1 | 2.9 | ||||
| Amortization of deferred revenue and variable consideration | 6a | (75.0 | ) | (70.5 | ) | ||
| Pension and other employee benefit payments, net of accruals | 5.3 | 11.9 | |||||
| Amortization of community agreements | 12.4 | 13.7 | |||||
| Re-evaluation adjustment - environmental obligation | 21 | 0.2 | (3.5 | ) | |||
| Write-down/loss on disposal of PP&E | 6e | 3.5 | 27.4 | ||||
| Impairment reversal | 6f | (322.3 | ) | - | |||
| Decommissioning and restoration payments | 21 | (1.7 | ) | (2.1 | ) | ||
| Other | 32a | (27.7 | ) | (3.8 | ) | ||
| Taxes paid | (268.4 | ) | (132.5 | ) | |||
| Operating cash flow before change in non-cash working capital | 764.3 | 691.1 | |||||
| Change in non-cash working capital | 32b | (57.0 | ) | (24.9 | ) | ||
| 707.3 | 666.2 | ||||||
| Cash used in investing activities: | |||||||
| Acquisition of property, plant and equipment | (466.7 | ) | (347.1 | ) | |||
| Acquisition of intangibles | (2.8 | ) | (1.8 | ) | |||
| Community agreements | (17.5 | ) | (9.1 | ) | |||
| Grants received | 0.7 | 3.1 | |||||
| Net purchase of investments | 11 | (61.8 | ) | (3.2 | ) | ||
| Change in restricted cash | 0.8 | 0.8 | |||||
| Maturity of (investment in) short-term investments | 8 | 40.0 | (40.0 | ) | |||
| Consideration received from sale of non-core project | 6g | 14.9 | - | ||||
| Investment income received | 24.0 | 14.4 | |||||
| (468.4 | ) | (382.9 | ) | ||||
| Cash (used in) generated from financing activities: | |||||||
| Repayment of revolving credit facility | 19b | - | (100.0 | ) | |||
| Repurchase of senior unsecured notes, net of discount | (102.1 | ) | (81.9 | ) | |||
| Copper Mountain non-controlling interest - acquisition payment | 5 | (6.0 | ) | - | |||
| Equity and flow-through share issuance, net of issuance costs | 25b | 26.8 | 398.0 | ||||
| Interest paid on long-term debt | (58.4 | ) | (67.9 | ) | |||
| Financing costs | (11.7 | ) | (15.1 | ) | |||
| Lease payments | 18 | (36.9 | ) | (31.4 | ) | ||
| Equipment financing payments | (20.2 | ) | (10.2 | ) | |||
| Gold prepayment repayments | - | (62.3 | ) | ||||
| Deferred Rosemont acquisition payment | - | (10.0 | ) | ||||
| Net payments on settlement of non-QP hedges | (3.4 | ) | (7.9 | ) | |||
| Net proceeds from exercise of stock options and warrants | 3.1 | 4.4 | |||||
| Dividends paid | 25b | (5.6 | ) | (5.5 | ) | ||
| (214.4 | ) | 10.2 | |||||
| Effect of movement in exchange rates on cash | 2.6 | (1.5 | ) | ||||
| Net increase in cash and cash equivalents | 27.1 | 292.0 | |||||
| Cash and cash equivalents, beginning of the year | 541.8 | 249.8 | |||||
| Cash and cash equivalents, end of the year | $ | 568.9 | $ | 541.8 | |||
|
4 |
| HUDBAY MINERALS INC. Consolidated Statements of Changes in Equity (In millions of US dollars) |
| Share capital (note 25) |
Other capital reserves |
Foreign currency translation reserve |
Remeasurement reserve |
Retained earnings |
Total | Non- controlling interest |
Total equity | |||||||||||||||||
| Balance, January 1, 2024 | $ | 2,240.2 | $ | 61.3 | $ | (5.4 | ) | $ | (25.7 | ) | $ | (173.6 | ) | $ | 2,096.8 | $ | 110.0 | $ | 2,206.8 | |||||
| Net income (loss) | - | - | - | 76.7 | 76.7 | (8.9 | ) | 67.8 | ||||||||||||||||
| Other comprehensive (loss) income | - | - | (43.0 | ) | 26.9 | - | (16.1 | ) | (6.9 | ) | (23.0 | ) | ||||||||||||
| Total comprehensive (loss) income | - | - | (43.0 | ) | 26.9 | 76.7 | 60.6 | (15.8 | ) | 44.8 | ||||||||||||||
| Contributions by and distributions to owners: | ||||||||||||||||||||||||
| Dividends (note 25b) | - | - | - | (5.5 | ) | (5.5 | ) | - | (5.5 | ) | ||||||||||||||
| Flow-through shares issued, net of share issuance costs (note 25b) | 8.6 | - | - | - | 8.6 | - | 8.6 | |||||||||||||||||
| Shares issued on equity raise, net of share issuance costs | 386.2 | - | - | - | 386.2 | - | 386.2 | |||||||||||||||||
| Stock options | - | 2.1 | - | - | 2.1 | - | 2.1 | |||||||||||||||||
| Issuance of shares related to stock options and warrants exercised | 6.3 | (1.9 | ) | - | - | 4.4 | - | 4.4 | ||||||||||||||||
| Total contributions by and distributions to owners | 401.1 | 0.2 | - | - | (5.5 | ) | 395.8 | - | 395.8 | |||||||||||||||
| Balance, December 31, 2024 | $ | 2,641.3 | $ | 61.5 | $ | (48.4 | ) | $ | 1.2 | $ | (102.4 | ) | $ | 2,553.2 | $ | 94.2 | $ | 2,647.4 |
|
5 |
| HUDBAY MINERALS INC. Consolidated Statements of Changes in Equity (In millions of US dollars) |
| Share capital (note 25) |
Other capital reserves |
Foreign currency translation reserve |
Remeasurement reserve |
Retained earnings |
Total | Non- controlling interest |
Total equity | |||||||||||||||||
| Balance, January 1, 2025 | $ | 2,641.3 | $ | 61.5 | $ | (48.4 | ) | $ | 1.2 | $ | (102.4 | ) | $ | 2,553.2 | $ | 94.2 | $ | 2,647.4 | ||||||
| Net income (loss) | - | - | - | - | 568.5 | 568.5 | (4.2 | ) | 564.3 | |||||||||||||||
| Other comprehensive income | - | - | 22.5 | 7.2 | - | 29.7 | 3.2 | 32.9 | ||||||||||||||||
| Total comprehensive income (loss) | - | - | 22.5 | 7.2 | 568.5 | 598.2 | (1.0 | ) | 597.2 | |||||||||||||||
| Contributions by and distributions to owners: | ||||||||||||||||||||||||
| Dividends (note 25b) | - | - | - | - | (5.6 | ) | (5.6 | ) | - | (5.6 | ) | |||||||||||||
| Flow-through shares issued, net of share issuance costs (note 25b) | 13.7 | - | - | - | - | 13.7 | - | 13.7 | ||||||||||||||||
| Shares issued on equity raise, net of share issuance costs | 4.2 | - | - | - | - | 4.2 | - | 4.2 | ||||||||||||||||
| Copper Mountain non-controlling interest acquisition (note 5) | 61.3 | (4.0 | ) | - | - | 57.3 | (93.2 | ) | (35.9 | ) | ||||||||||||||
| Stock options | - | 2.5 | - | - | - | 2.5 | - | 2.5 | ||||||||||||||||
| Issuance of shares related to stock options and warrants exercised | 4.6 | (1.5 | ) | - | - | - | 3.1 | - | 3.1 | |||||||||||||||
| Tax adjustments in respect of prior years | 4.4 | - | - | - | - | 4.4 | - | 4.4 | ||||||||||||||||
| Total contributions by and distributions to owners | 26.9 | 62.3 | (4.0 | ) | - | (5.6 | ) | 79.6 | (93.2 | ) | (13.6 | ) | ||||||||||||
| Balance, December 31, 2025 | $ | 2,668.2 | $ | 123.8 | $ | (29.9 | ) | $ | 8.4 | $ | 460.5 | $ | 3,231.0 | $ | - | $ | 3,231.0 |
|
6 |
|
HUDBAY MINERALS INC. Notes to Audited Consolidated Financial Statements (in millions of US dollars, except where otherwise noted) Years ended December 31, 2025 and 2024
|
1. Reporting entity
Hudbay Minerals Inc. ("HMI" or the "Company") is a company existing under the Canada Business Corporations Act. The address of the Company's principal executive office is 25 York Street, Suite 800, Toronto, Ontario. The consolidated financial statements ("financial statements") of the Company for the year ended December 31, 2025 and 2024 represent the financial position and the financial performance of the Company and its subsidiaries (together referred to as "Hudbay").
Wholly owned subsidiaries as at December 31, 2025 included Copper Mountain Mine (BC) Ltd. ("CMBC"), HudBay Peru Inc., HudBay Peru S.A.C. ("Hudbay Peru"), HudBay (BVI) Inc., Hudbay Arizona Inc., Copper World LLC, ("Copper World") and Mason Resources (US) Inc. ("Mason").
Hudbay is a diversified mining company with long-life assets in North and South America. Hudbay's operations in Cusco (Peru) produce copper with gold, silver and molybdenum by-products. Hudbay's operations in Manitoba (Canada) produce gold with copper, zinc and silver by-products. Hudbay's operations in British Columbia (Canada) produce copper with gold and silver by-products. Hudbay has a development pipeline that includes copper development projects in Arizona and Nevada (United States), and a focused growth strategy on exploration, development, operation, and optimization of properties that Hudbay already controls, as well as other mineral assets that Hudbay may acquire that fit the Company's strategic criteria. The Company is governed by the Canada Business Corporations Act and its shares are listed under the symbol "HBM" on the Toronto Stock Exchange, New York Stock Exchange and Bolsa de Valores de Lima.
2. Basis of preparation
(a) Statement of compliance:
These consolidated financial statements have been prepared in accordance with IFRS® Accounting Standards as issued by the International Accounting Standards Board ("IASB") effective for the year ended December 31, 2025.
The Board of Directors approved these consolidated financial statements on February 19, 2026.
(b) Functional and presentation currency:
Hudbay's consolidated financial statements are presented in US dollars, which is the Company's and all material subsidiaries' functional currency, except the Company's Manitoba and British Columbia business units, which have a functional currency of Canadian dollars. All values are expressed in millions except where otherwise indicated.
(c) Basis of measurement:
The consolidated financial statements have been prepared on the historical cost basis except for the following items in the consolidated balance sheets:
- Derivatives, embedded derivatives, other financial instruments, and financial assets measured at fair value through profit or loss ("FVTPL");
- Contingent and deferred consideration arising from the purchase of non-controlling interest are recognized as financial liability at fair value on the date the obligation arises;
- Liabilities for cash-settled share-based compensation arrangements are measured at fair value; and,
- A defined benefit liability is recognized as the net total of the plan assets, unrecognized past service costs and unrecognized actuarial losses, less unrecognized actuarial gains and the present value of the defined benefit obligation.
7 |
|
HUDBAY MINERALS INC. Notes to Audited Consolidated Financial Statements (in millions of US dollars, except where otherwise noted) Years ended December 31, 2025 and 2024
|
(d) Use of judgements and estimates:
The preparation of the consolidated financial statements requires Hudbay to make judgements, estimates and assumptions that affect the application of accounting policies, reported amounts of assets and liabilities and disclosure of contingent assets and liabilities at the date of the consolidated financial statements, and reported amounts of revenue and expenses during the reporting period. Actual results may differ from these estimates.
Hudbay reviews these estimates and underlying assumptions on an ongoing basis, based on experience and other factors, including expectations of future events that the Company believes to be reasonable under the circumstances. Revisions to accounting estimates are recognized prospectively in the period in which the estimates are revised and in any future periods affected.
The following are critical and significant judgements and estimates impacting the consolidated financial statements:
- Indicators and testing of impairment (reversal of impairment) of non-financial assets (notes 3h, 3i, 13 and 14) - There are a number of potential indicators that could trigger non-financial asset impairment or reversal of impairment. These indicators may require critical judgements to determine the extent that external and/or internal environmental business changes may impact Hudbay's overall assessment of the recoverability of non-financial assets. Such business changes include changes to the life of mine ("LOM") plan, changes to budget, changes to closure plans, changes to discount rates, changes to long-term commodity prices and changes that relate to purchase offers resulting in a third party valuation of the CGU. If an impairment or impairment reversal indicator is identified then there are also critical estimates involved in the determination of the recoverable amount of cash generating units ("CGU"). A CGU to which goodwill has been allocated is tested for impairment at least annually or when events or circumstances indicate that an assessment for impairment is required. Recoverable amounts are calculated using discounted after-tax cash flows based on cash flow projections and assumptions in Hudbay's most recent LOM plans. LOM plans are based on optimized mine and processing plans and the assessment of capital expenditure requirements of a mine site. LOM plans incorporate management's best estimates of key assumptions which include future commodity prices, the value of mineral resources not included in the applicable LOM plans, production based on current estimates of recoverable reserves, discount rates, future operating and capital costs and future foreign exchange rates. Most critical to the value of the recoverable amount are the assumptions of future commodity prices and the value of mineral resources not included in the applicable LOM plans. Expected future cash flows used to determine the recoverable amount during impairment testing are inherently uncertain and could materially change over time. Should management's estimate of the future not reflect actual events, impairments may be identified, which could have a material effect on the financial statements. Although it is reasonably possible for a change in key assumptions to occur, the possible effects of a change in any single assumption may not fairly reflect the impact of CGU's fair value as the assumptions are inextricably linked.
- Mineral reserves and resources (notes 3g, 3k and 3i) - Hudbay estimates mineral reserves and resources to determine future recoverable mine production based on assessment of geological, engineering and metallurgical analyses, estimates of future production costs, capital costs and reclamation costs, as well as long term commodity prices and foreign exchange rates. There are numerous uncertainties inherent in estimating mineral reserves and resources, including many factors beyond Hudbay's control. The estimates are based on information compiled by appropriately qualified persons relating to the geological data on the size, depth and shape of the ore body and interpreting this data requires complex geological judgements. Changes in assumptions, including economic assumptions such as metals prices and market conditions, could have a material effect on the financial position and results of operations.
Changes in the mineral reserve or resource estimates may affect:
- the carrying value of exploration and evaluation assets, capital works in progress, mining properties and plant and equipment, goodwill;
- depreciation expense for assets depreciated either on a unit-of-production basis or on a straight line basis where useful lives are restricted by the life of the related mine plan;
- the provision for decommissioning, restoration and similar liabilities;
- the carrying value of deferred tax assets, and
- amortization of deferred revenue.
8 |
|
HUDBAY MINERALS INC. Notes to Audited Consolidated Financial Statements (in millions of US dollars, except where otherwise noted) Years ended December 31, 2025 and 2024
|
- Property plant and equipment (notes 3h and 14) - The carrying amounts of property, plant and equipment and exploration and evaluation assets on Hudbay's consolidated balance sheets are significant and reflect multiple estimates and applications of judgement. Management exercises judgement in determining whether the costs related to exploration and evaluation are eligible for capitalization and whether they are likely to be recoverable by future exploration, which may be based on assumptions about future events and circumstances. Judgement and estimates are used when determining whether exploration and evaluation assets should be transferred to capital works in progress within property, plant and equipment. For mines in the production stage, management applies judgement to determine development costs to be capitalized based on the extent they are incurred in order to access reserves mineable over more than one year. For depreciable property, plant and equipment assets, management makes estimates to determine depreciation. For assets depreciated using the straight line method, residual value and useful lives of the assets or components are estimated. A significant estimate is required to determine the total production basis for units-of-production depreciation. The most currently available reserve and resource report is utilized in determining the basis which has material impacts on the amount of depreciation recorded through inventories and the consolidated statements of income. There are numerous uncertainties inherent in estimating mineral reserves, and assumptions that were valid at the reporting date may change when new information becomes available. The actual volume of ore extracted and any changes in these assumptions could affect prospective depreciation rates and carrying values. In determining whether stripping costs incurred during the production phase of a mining property relate to mineral reserves and mineral resources that will be mined in a future period and therefore should be capitalized, Hudbay makes estimates of the proportion of stripping activity which relates to extracting current ore and the proportion which relates to obtaining access to ore reserves which will be mined in the future.
- Tax provisions (notes 3m and 24) - Management makes estimates in determining the measurement and recognition of deferred tax assets and liabilities recorded on the consolidated balance sheets. The measurement of deferred tax assets and deferred tax liabilities is based on tax rates that are expected to apply in the period that the asset is realized or liability is settled based on tax rates that have been enacted or substantively enacted by the end of the reporting period. Deferred tax assets, including those arising from unutilized tax losses, require management to assess the likelihood of taxable income in the future periods in order to utilize recognized deferred tax assets. Estimates of future taxable income are based on forecasted cash flows from operations and the application of existing tax laws in each jurisdiction. To the extent that future cash flows and taxable income differ significantly from estimates, the ability to realize the net deferred tax assets recorded at the balance sheet date could be affected. At the end of each reporting period, management reassesses the period that the assets are expected to be realized or liabilities are settled and the likelihood of taxable income in future periods in order to support and adjust the deferred tax assets and deferred tax liabilities recognized on the consolidated balance sheets.
- Assaying utilized to determine revenue and recoverability of inventories (notes 3c and 3f) - Assaying of contained metal is a key estimate in determining the amount of revenues recorded in the consolidated statements of income. The estimate is finalized after final surveying is completed, which may extend to six months in certain transactions. Since assays are utilized to determine the value of recorded revenues, significant differences in given assays may result in a material misstatement of revenues on the consolidated statements of income. Assay survey results are also a factor utilized to determine if inventories on hand have a net realizable value that exceeds cost. Material differences in assay results may lead to misstatements of inventory balances in the consolidated balance sheets.
- Decommissioning and restoration obligations (notes 3k and 21) - Significant judgement and estimates are utilized in the determination of the decommissioning and restoration provisions in the consolidated balance sheets. Judgement is involved in determining the timing and extent of cash outflows required to satisfy constructive obligations based on the timing of site closures in the LOM plans, expected unit costs to determine cash obligations to remediate disturbances and regulatory and constructive requirements, as well as technological changes to determine the extent and timing of the remediation required. The timing of cash outflows and discount rates associated with discounting the provision are also key estimates. Changes in these estimates may result in a change in classification of the provision between non-current and current as well as material differences in the total provision recorded in the consolidated balance sheets.
9 |
|
HUDBAY MINERALS INC. Notes to Audited Consolidated Financial Statements (in millions of US dollars, except where otherwise noted) Years ended December 31, 2025 and 2024
|
- Pension and other employee benefit (notes 3j, 22 and 23) - Hudbay's post retirement obligations relate mainly to ongoing health care benefits plans. Hudbay estimates obligations related to the pension and other employee benefits plans using actuarial determinations that incorporate assumptions using management's best estimates of factors including plan performance, salary escalation, retirement dates of employees and drug cost escalation rates. Due to the complexity of the valuation, the underlying assumptions and its long term nature, the defined benefit obligation is highly sensitive to changes in these assumptions. Management reviews all assumptions at each reporting date. In determining the appropriate discount rate, Hudbay considers the interest rates on corporate bonds in the respective currency with at least an AA rating, with extrapolated maturities corresponding to the expected duration of the defined benefit obligation. The mortality rate is based on publicly available mortality tables for the specific country, and Hudbay bases future salary increases and pension increases on expected future inflation rates for the respective country.
3. Material accounting policies
The accounting policies set out below have been applied consistently to all periods presented in these consolidated financial statements and by all Hudbay's entities.
(a) Basis of consolidation:
Intercompany balances and transactions are eliminated upon consolidation. When a Hudbay entity transacts with an associate or jointly controlled entity of the Company, unrealized profits and losses are eliminated to the extent of Hudbay's interest in the relevant associate or joint venture. The accounting policies of Hudbay's entities are changed when necessary to align them with the policies adopted by the Company.
Subsidiaries
A subsidiary is an entity controlled by Hudbay. The financial statements of subsidiaries are included in the consolidated financial statements from the date that control commences until the date that control ceases.
Non-controlling interest
Non-controlling interest in subsidiaries are identified separately from the Company's equity in the subsidiaries. The interest of non-controlling shareholders may be initially measured either at fair value or at the non-controlling interest proportionate share of the fair value of the acquiree's identifiable net assets. The choice of measurement basis is made on an acquisition-by-acquisition basis. Subsequent to acquisition, the carrying amount of non-controlling interest is the amount of that interest at initial recognition plus the non-controlling interest share of subsequent changes in equity. Total comprehensive income is attributed to non-controlling interest even if this results in the non-controlling interest having a deficit balance.
Business combinations and goodwill
Should Hudbay make an acquisition, it first determines whether the assets acquired and liabilities assumed constitute a business, in which case the acquisition requires accounting as a business combination. Management applies judgement in determining whether the acquiree is capable of being conducted and managed for the purpose of providing a return, considering the inputs of the acquiree and processes applied to those inputs that have the ability to create outputs.
Hudbay applies the acquisition method of accounting to business combinations, whereby the goodwill is measured at the acquisition date as the fair value of the consideration transferred including the recognized amount of any non-controlling interest in the acquiree. When the excess is negative, a bargain purchase gain is recognized immediately in the consolidated statements of income. The assessment of fair values on acquisition includes those mineral reserves and resources that are able to be reliably measured. In determining these fair values, management must also apply judgement in areas including future cash flows, metal prices, exchange rates and appropriate discount rates. Changes in such estimates and assumptions could result in significant differences in the amount of goodwill recognized.
The consideration transferred is the aggregate of the fair values, at the date of the acquisition, of the sum of the assets transferred, the liabilities incurred or assumed, and the equity instruments issued by the acquirer in exchange for control of the acquiree. Acquisition-related costs are recognized in the consolidated statements of income as incurred, unless they relate to issuance of debt or equity securities.
10 |
|
HUDBAY MINERALS INC. Notes to Audited Consolidated Financial Statements (in millions of US dollars, except where otherwise noted) Years ended December 31, 2025 and 2024
|
Where applicable, the consideration transferred includes any asset or liability resulting from a contingent consideration arrangement and measured at its acquisition date fair value. Subsequent changes in such fair values are adjusted against the cost of acquisition where they qualify as measurement period adjustments. All other subsequent changes in the fair value of contingent consideration classified as an asset or liability are accounted for in accordance with relevant IFRS Accounting Standards. Changes in the fair value of contingent consideration classified as equity are not recognized.
Where a business combination is achieved in stages, the Company's previously held interest in the acquired entity are remeasured to fair value at the acquisition date, which is the date Hudbay attains control, and any resulting gain or loss is recognized in the consolidated statements of income. Amounts previously recognized in other comprehensive income ("OCI") related to interest in the acquiree prior to the acquisition date are reclassified to the consolidated statements of income, where such treatment would be appropriate if that interest were disposed of.
After initial recognition, goodwill is measured at cost less any accumulated impairment losses. For the purpose of impairment testing, goodwill acquired in a business combination is, from the acquisition date, allocated to each of Hudbay's CGUs that are expected to benefit from the synergies of the combination, irrespective of whether other assets or liabilities of the acquiree are assigned to those units. Goodwill is allocated to the lowest level at which it is monitored for internal management purposes and is not larger than an operating segment before aggregation. Where goodwill forms part of a CGU and part of the operation within that unit is disposed of, the goodwill associated with the disposed operation is included in the determination of any gain or loss on disposal.
Goodwill is not amortized and is tested for impairment annually and whenever there is an indication of impairment. If any such indication exists, the recoverable amount of the CGU is estimated in order to determine the extent of the impairment, if any. The recoverable amount is determined as the higher of fair value less direct costs to sell and the CGU's value in use. When the recoverable amount of the CGU is less than the carrying amount of that CGU, the impairment loss is allocated to reduce the carrying amount of any goodwill allocated to that CGU first, and then to the other assets of that CGU on a pro-rata basis of the carrying amount of each asset in the CGU. An impairment loss in respect of goodwill is not reversed.
Fair value for mineral interest and related goodwill is generally determined as the present value of the estimated future cash flows expected to arise from the continued use of the asset, including any expansion prospects, and its eventual disposal, using assumptions that an independent market participant may take into account.
Value in use is determined as the present value of the estimated future cash flows expected to arise from the continued use of the asset in its present form and its eventual disposal. Value in use is determined by applying assumptions specific to Hudbay's continued use and cannot take into account future development.
The weighted average cost of capital of Hudbay or comparable market participants is used as a starting point for determining the discount rates, with appropriate adjustments for the risk profile of the countries in which the individual CGUs operate and the specific risks related to the development of the project.
Where the asset does not generate cash flows that are independent of other assets, Hudbay estimates the recoverable amount of the CGU to which the asset belongs. If the carrying amount of an asset or CGU exceeds its recoverable amount, the carrying amount of the asset or CGU is reduced to its recoverable amount. An impairment loss is recognized as an expense in the consolidated statements of income.
(b) Translation of foreign currencies:
Management determines the functional currency of each Hudbay entity as the currency of the primary economic environment in which the entity operates.
Foreign currency transactions
Transactions in foreign currencies are translated to the respective functional currencies of Hudbay's entities at exchange rates in effect at the transaction dates.
At the end of each reporting period, monetary assets and liabilities denominated in foreign currencies are translated to the functional currency using the closing exchange rate. Non-monetary assets and liabilities measured at fair value are translated using the exchange rates at the date when fair value was determined. Non-monetary assets and liabilities measured at historical cost in a foreign currency are translated using exchange rates that were in effect at the transaction dates. The same translations are applied when an entity prepares its financial statements from books and records maintained in a currency other than its functional currency, except revenue and expenses may be translated at monthly average exchange rates that approximate those in effect at the transaction dates.
11 |
|
HUDBAY MINERALS INC. Notes to Audited Consolidated Financial Statements (in millions of US dollars, except where otherwise noted) Years ended December 31, 2025 and 2024
|
Foreign currency gains and losses arising on period-end revaluations are recognized in the consolidated statements of income, except for a financial liability designated as a hedge of a net investment in a foreign operation, or qualifying cash flow hedges, which are recognized in OCI.
Foreign operations
For the purpose of the consolidated financial statements, assets and liabilities of Hudbay's entities that have functional currencies other than the US dollar are translated to US dollars at the reporting date using the closing exchange rate. Revenue and expenses are translated at monthly average exchange rates that approximate those in effect at the transaction dates. Differences arising from these foreign currency translations are recognized in OCI and presented within equity in the foreign currency translation reserve. When a foreign operation is disposed, the relevant exchange differences accumulated in the foreign currency translation reserve are transferred to the consolidated statements of income as part of the profit or loss on disposal. On the partial disposal of a subsidiary that includes a foreign operation, the relevant proportion of such amount is reattributed to non-controlling interest. On disposal of a partial investment in an associate or joint venture that includes a foreign operation while retaining significant influence or joint control, the relevant proportion is reclassified to profit or loss.
Net investment in a foreign operation
Foreign currency gains and losses arising on translation of a monetary item receivable from or payable to a foreign operation for which settlement is neither planned nor likely to occur in the foreseeable future are considered to form part of a net investment in the foreign operation. Such gains and losses are recognized in OCI and presented within equity in the foreign currency translation reserve.
(c) Revenue recognition:
Revenue from the sale of goods is measured at the fair value of the consideration received or receivable, net of treatment and refining charges. Revenue from the sale of by-products is included within revenue.
Revenue is recognized when control of the goods sold has been transferred to the customer. Control is deemed to have passed to the customer when significant risk and reward of the product has passed to the customer, Hudbay has a present right to payment, and physical possession of the product has been transferred to the customer. Sales of doré are recorded when a trade confirmation is duly signed and executed between Hudbay and the end purchaser. Sale of concentrate and finished zinc frequently occur under the following terms, and management has assessed these terms in order to determine timing of transfer of control and revenue recognition as generally outlined in the following table.
|
Incoterms used by Hudbay |
Revenue recognized when goods: |
|
Cost, Insurance and Freight (CIF) |
Are loaded on board the vessel |
|
Free on Board (FOB) |
Are loaded on board the vessel |
|
Delivered at place (DAP) |
Arrive at the named place of destination |
|
Delivered at terminal (DAT) |
Arrive at the named place of destination |
|
Free Carrier (FCA) |
Arrive at the named place of delivery |
|
Carriage and Insurance Paid (CIP) |
Arrive at the named place, upon delivery of the goods by the first carrier |
Sales of copper and zinc concentrate and certain other products are provisionally priced. For these contracts, sales prices are subject to final adjustment at the end of a future period after shipment, based on quoted market prices during the quotational period specified in the contract. Revenue is recognized when the above criteria are achieved, using weight and assay results and forward market prices to estimate the fair value of the total consideration receivable. Therefore, revenue is initially recorded based on an initial provisional invoice. Subsequently, at each reporting date, until the provisionally priced sale is finalized, sales receivables are marked to market, with adjustments (both gains and losses) recorded within revenue separately as "Pricing and volume adjustments" in the notes to the consolidated financial statements and in trade and other receivables on the consolidated balance sheets. As per IFRS 15 Revenue from contracts with customers, variability in price is deemed to be fair value movements on provisionally priced receivables under the scope of IFRS 9 Financial Instruments; variability in quantities is deemed to be variable consideration. The variable consideration from weights and assay changes to quantities has been assessed to be insignificant to warrant precluding revenue being recorded as a result of possible future sales reversals. An annual analysis of the accuracy of our weights and assays is completed, and if the accuracy rate falls below a certain threshold, management then evaluates whether revenue from future sales should be constrained as a result of it being highly probable that there would be a significant revenue reversal in the future.
12 |
|
HUDBAY MINERALS INC. Notes to Audited Consolidated Financial Statements (in millions of US dollars, except where otherwise noted) Years ended December 31, 2025 and 2024
|
Hudbay only includes in the transaction price an amount which is not highly likely to be subject to significant subsequent revenue reversal. Within sales contracts with customers, separate performance obligations may arise pertaining to the shipping of goods sold. If applicable, costs and the transaction price are allocated on a relative standalone selling basis to any separate performance obligations and are recognized over the period of time the goods sold are shipped, on a gross basis.
Hudbay recognizes deferred revenue in the event it receives payments from customers before a sale meets criteria for revenue recognition.
Precious metals stream contracts, which at inception of the contract are determined that they can be satisfied through the delivery of Hudbay's own production of non-financial items (i.e. gold and silver credits) rather than cash or other financial assets, are accounted for as deferred revenue. If settlement with Hudbay's own production of gold and silver is not possible, the stream transaction is recognized as a financial liability since settlement may require a cash payment. This would cause a change to the accounting treatment, resulting in the revaluation of the agreement to the fair value through the consolidated statements of income on a recurring basis.
Deferred revenue associated with precious metals stream contracts are subject to variable consideration and contain a significant financing component since funds were received in advance of the delivery of concentrate. When a significant financing component is recognized, finance expense will be higher and revenues will be higher as the larger deferred revenue balance is amortized to revenues. A market-based discount rate is utilized at the inception of each of the respective stream agreements to determine a discount rate for computing the interest charges for the significant financing component of the deferred revenue balance. As product is delivered, the deferred revenue amount including accreted interest will be drawn down. The draw down rate requires the use of proven and probable reserves and certain resources in the calculation that are beyond proven and probable reserves which management is reasonably confident will be transferable to reserves. Key estimates used in determining the significant financing component include the discount rate and the reserve and resources assumed for conversion.
(d) Cost of sales:
Cost of sales consists of those costs previously included in the measurement of inventory sold during the period, as well as certain costs not included in the measurement of inventory, such as the cost of warehousing and distribution to customers, provisional pricing adjustments related to purchased concentrates, profit sharing, royalty payments, share-based compensation expense and other indirect expenses related to producing operations.
Cost of sales also include non-cash net realizable value adjustments to inventory, one-time adjustments related to overheads incurred when not operating at normal capacity and one-time labour charges related to facilitating the production of inventories for past service pension costs, curtailment gains and severance.
(e) Cash and cash equivalents:
Cash and cash equivalents include cash, demand deposits and short-term, highly liquid investments that are readily convertible to known amounts of cash and are subject to an insignificant risk of changes in value. Cash equivalents have maturities of three months or less at the date of acquisition. Interest earned is included in finance income on the consolidated statements of income and in investing activities on the consolidated statements of cash flows.
Amounts that are restricted from being used for at least twelve months after the reporting date or are not available for general disbursement, like a debt service account are classified as non-current assets and presented in other financial assets on the consolidated balance sheets. Changes in restricted cash balances are classified as investing or financing activities on the consolidated statements of cash flows.
(f) Inventories:
Inventories consist of stockpiles, finished goods inventory (concentrates and metals), and materials and supplies. Concentrates, doré, metals and all other saleable products are valued at the lower of cost and estimated net realizable value. Net realizable value represents the estimated selling price for inventories less all estimated direct and indirect costs of completion and costs necessary to make the sale. Where the net realizable value is less than cost, the difference is charged to the consolidated statements of income as an impairment charge in cost of sales. Costs associated with stripping activities in an open pit mine are capitalized to inventory and recorded through cost of sales unless the stripping activity can be shown to improve access to further quantities of ore that will be mined in future periods, in which case, the stripping costs are capitalized to property, plant and equipment.
Cost of production of concentrate inventory is determined on a weighted average cost basis and the cost of production of finished metal inventory is determined using the first in first out basis. The cost of production includes direct costs associated with conversion of production inventory based on normal production capacity: material, labour, contractor expenses, purchased concentrates, and an attributable portion of production overheads and depreciation of all property, plant and equipment involved with the mining and production process. Hudbay measures in-process inventories based on assays of material received at metallurgical plants and estimates of recoveries in the production processes. Due to significant uncertainty associated with volume and metal content, immaterial costs are not allocated to routine operating levels of stockpiled ore. Estimates and judgements are required to assess the nature of any significant changes to levels of ore stockpiles and determining whether allocation of costs is required.
13 |
|
HUDBAY MINERALS INC. Notes to Audited Consolidated Financial Statements (in millions of US dollars, except where otherwise noted) Years ended December 31, 2025 and 2024
|
Supplies are valued at the lower of average cost and net realizable value.
(g) Exploration and evaluation expenditures:
Exploration and evaluation activity begins when Hudbay obtains legal rights to explore a specific area and involves the search for mineral reserves, the determination of technical feasibility, and the assessment of commercial viability of an identified resource. Expenditures incurred in the exploration and evaluation phase include the cost of acquiring interest in mineral rights, licenses and properties and the costs of Hudbay's exploration activities, such as researching and analyzing existing exploration data, gathering data through geological studies, exploratory drilling, trenching, sampling, and certain feasibility studies.
Hudbay expenses the cost of its exploration and evaluation activities and capitalizes the cost of acquiring interest in mineral rights, licenses and properties in business combinations, asset acquisitions or option agreements. Amounts capitalized are recognized as exploration and evaluation assets and presented in property, plant and equipment. Exploration and evaluation assets acquired as a result of an asset acquisition or option agreement are initially recognized at cost, and those acquired in a business combination are recognized at fair value on the acquisition date. They are subsequently carried at cost less accumulated impairment. No depreciation is charged during the exploration and evaluation phase. Hudbay expenses the cost of subsequent exploration and evaluation activity related to acquired exploration and evaluation assets. Cash flows associated with acquiring exploration and evaluation assets are classified as investing activities in the consolidated statements of cash flows; those associated with exploration and evaluation expenses are classified as operating activities.
Judgement is required in determining whether the respective costs are eligible for capitalization where applicable, and whether they are likely to be recoverable, which may be based on assumptions about future events and circumstances. Estimates and assumptions made may change if new information becomes available.
Hudbay monitors exploration and evaluation assets for factors that may indicate their carrying amounts are not recoverable. If such indicators are identified, the Company tests the exploration and evaluation assets or their CGUs, as applicable, for impairment. Hudbay also tests for impairment when assets reach the end of the exploration and evaluation phase.
Exploration and evaluation assets are transferred to capital works in progress within property, plant and equipment once the Company determines that probable future economic benefits will be generated as a result of the expenditures. Hudbay's determination of probable future economic benefit is based on management's evaluation of the technical feasibility and commercial viability of the geological properties of a given ore body based on information obtained through evaluation activities, including metallurgical testing, resource and reserve estimates and the economic assessment of whether the ore body can be mined economically. Tools that may be used to determine this include a preliminary feasibility study, confidence in converting resources into reserves and the probability that the property could be developed into a mine site. At that time, the property is considered to enter the development phase, and subsequent evaluation costs are capitalized.
(h) Property, plant and equipment:
Hudbay measures items of property, plant and equipment at cost less accumulated depreciation and any accumulated impairment losses.
The initial cost of an item of property, plant and equipment includes its purchase price or construction costs, including import duties and non-refundable purchase taxes, any costs directly attributable to bringing the asset into operation, and for qualifying assets, borrowing costs. The initial cost of property, plant and equipment also includes the initial estimate of the cost of dismantling and removing the item and restoring the site on which it is located, the obligation which Hudbay incurs either when the item is acquired or as a consequence of having used the item during a particular period for purposes other than to produce inventories during that period.
Capitalization of costs ceases once an asset is in the location and condition necessary for it to be capable of operating in the manner intended by management. At this time, depreciation commences. For a new mine, this occurs upon commencement of commercial production. Any revenues less cost to produce, earned prior to commencement of commercial production, are included in the consolidated statements of income.
14 |
|
HUDBAY MINERALS INC. Notes to Audited Consolidated Financial Statements (in millions of US dollars, except where otherwise noted) Years ended December 31, 2025 and 2024
|
Carrying amounts of property, plant and equipment, including right-of-use ("ROU") assets, are depreciated to their estimated residual value over the estimated useful lives of the assets or the estimated life of the related mine or plant, if shorter. Where components of an asset have different useful lives, depreciation is calculated on each separate component. Components may be physical or non-physical, including the cost of regular major inspections and overhauls required in order to continue operating an item of property, plant and equipment.
Certain items of property, plant and equipment are depreciated on a unit-of-production basis. The unit-of-production method is based on proven and probable tonnes of ore reserves. There are numerous uncertainties inherent in estimating ore reserves, and assumptions that were valid at the reporting date may change when new information becomes available. The actual volume of ore extracted and any changes in these assumptions could affect prospective depreciation rates and carrying values.
The carrying amount of an item of property, plant and equipment is derecognized on disposal or when no future economic benefits are expected from its use or disposal. Upon derecognition of an item of property, plant and equipment, the difference between its carrying value and net sales proceeds, if any, is presented as a gain or loss in other operating income or expense in the consolidated statements of income.
i. Capital works in progress:
Capital works in progress consist of items of property, plant and equipment in the course of construction or mineral properties in the course of development, including those transferred upon completion of the exploration and evaluation phase. On completion of construction or development, costs are transferred to plant and equipment and/or mining properties as appropriate. Capital works in progress are not depreciated.
ii. Mining properties:
Mining properties consist of costs transferred from capital works in progress when a mining property reaches commercial production, costs of subsequent mine and exploration development, and acquired mining properties in the production stage.
Mining properties include costs directly attributable to bringing a mineral asset into the state where it is capable of operating in the manner intended by management and includes such costs as the cost of shafts, ramps, track haulage drifts, ancillary drifts, pumps, electrical substations, refuge stations, ventilation raises, permanent manways, and ore and waste pass raises. The determination of development costs to be capitalized during the production stage of a mine operation requires the use of judgements and estimates such as estimates of tonnes of waste to be removed over the life of the mining area and economically recoverable reserves extracted as a result.
A mining property is considered to be capable of operating in a manner intended by management when it commences commercial production based on pre-established criteria. Upon commencement of commercial production, a mining property is depreciated on a unit-of-production method. Unit-of-production depreciation rates are determined based on the related proven and probable mineral reserves and associated future development costs.
Subsequent mine development costs are capitalized to the extent they are incurred in order to access reserves mineable over more than one year. Ongoing maintenance and development expenditures are expensed as incurred and included in cost of sales in profit or loss. These include ore stope access drifts, footwall and hangingwall drifts in stopes, drawpoints, drill drifts, sublevels, slots, drill raises, stope manway access raises and definition diamond drilling.
iii. Plant and equipment:
Plant and equipment consists of buildings and fixtures, surface and underground fixed and mobile equipment and assets under lease.
Plant and equipment are depreciated on either unit-of-production or straight-line basis based on factors including the production life of assets and mineable reserves. In general, mining assets are depreciated using a unit-of-production method; equipment is depreciated using the straight-line method, based on the shorter of its useful life and that of the related mine or facility; and plants are depreciated using the straight-line method, with useful lives limited by those of related mining assets.
15 |
|
HUDBAY MINERALS INC. Notes to Audited Consolidated Financial Statements (in millions of US dollars, except where otherwise noted) Years ended December 31, 2025 and 2024
|
iv. Right-of-use lease assets:
At inception of a contract, Hudbay assesses whether a contract is, or contains, a lease. A contract is, or contains, a lease if the contract conveys the right to control the use of an identified asset for a period of time in exchange for consideration. The Company assesses the following criteria in the determination of whether a contract conveys the right to control the use of an identified asset:
• The contract involves the use of an identified asset - this may be specified explicitly or implicitly, and should be physically distinct or represent substantially all of the capacity of a physically distinct asset. If the supplier has substantive substitution rights, then the asset is not identified;
• Hudbay has the right to obtain substantially all of the economic benefits from use of the asset throughout the period of use; and
• Hudbay has the right to direct the use of the asset by means of decision making rights that are most relevant to changing how and for what purpose the asset is used. In the case where decisions about the asset's purpose is predetermined, Hudbay is deemed to have the right to direct the use of the asset if either:
▪ Hudbay has the right to operate the asset; or,
▪ Hudbay designed the asset in a way that predetermines how and for what purpose it will be used.
The Company recognizes a ROU asset and lease liability at the lease commencement date. The initial measurement of the ROU asset is on a present value basis. This is based on the calculated lease liability plus any initial direct costs incurred, an estimate of removal or restoration costs, and any payments made prior to commencement of the lease less any lease incentives received.
The right of use asset is subsequently depreciated using the straight-line method from the commencement date to the earlier of the end of the useful life of the right-of-use asset or the end of the lease term. The estimated useful lives of the right-of-use assets are determined on the same basis as those of property and equipment. In addition, the right-of-use asset is periodically reduced by impairment losses, if any, and adjusted for certain remeasurements of the lease liability.
The lease liability is measured at the present value of the lease payments that are yet to be paid at the commencement date, discounted using the interest rate implicit in the lease or, if that rate cannot be easily determined, Hudbay's incremental borrowing rate. Generally, the Company uses its incremental borrowing rate as the discount rate for applicable leases.
Lease payments included in the measurement of the lease liability comprise fixed payments including in substance fixed payments and variable payments that depend on an index or rate, amounts expected to be payable under a residual value guarantee and the additional costs Hudbay reasonably expects to incur due to purchase options, extension options and termination options reasonably expected to be exercised.
The lease liability is measured at amortized cost using the effective interest method. It is remeasured when there is a change in the expected future cash flows of a leasing contract either due to a change in index or rate, or due to a change in terms of the contract. When the lease liability is remeasured in this way, a corresponding adjustment is made to the carrying amount of the right-of-use asset, or is recorded in profit or loss if the carrying amount of the right-of-use asset is zero.
Hudbay has elected not to separate non-lease components and account for the lease and non-lease components as a single lease component for lease contracts of all asset classes.
The Company has elected not to recognize ROU assets and lease liabilities for short-term leases of machinery that have a lease term of 12 months or less and leases of low-value assets. Hudbay recognizes the lease payments associated with these leases as an expense on a straight-line basis over the lease term.
Hudbay does not enter into transactions where the Company acts as a lessor.
The incremental borrowing rate used to discount leases and to compute interest for new ROU leases is considered a key management judgement.
16 |
|
HUDBAY MINERALS INC. Notes to Audited Consolidated Financial Statements (in millions of US dollars, except where otherwise noted) Years ended December 31, 2025 and 2024
|
v. Depreciation rates of major categories of assets:
| • Capital works in progress | - not depreciated |
| • Mining properties | - unit-of-production |
| • Mining asset | - unit-of-production |
| • Plant and Equipment | |
| ◦ Equipment | - straight-line over 1 to 20 years |
| ◦ Other plant assets | - straight-line over 1 to 20 years/unit-of-production |
| • ROU Assets | - straight-line over 1 to 20 years |
Hudbay reviews its depreciation methods, remaining useful lives and residual values at least annually and accounts for changes in estimates prospectively.
vi. Commercial production:
Commercial production is the level of activities intended by management for a mine, or a mine and mill complex, to be capable of operating in the manner intended by management. Hudbay considers a range of factors when determining the level of activity that represents commercial production for a particular project, including a predetermined percentage of design capacity for the mine and mill; achievement of continuous production, ramp-ups, or other output; or specific factors such as recoveries, grades, or inventory build-ups. In a phased mining approach, management may consider achievement of specific milestones at each phase of completion. In a non-phased mining approach, management considers average actual metrics that are at least 60% of average design capacity or plan over a continuous period. Management assesses the operation's ability to sustain production over a period of approximately one to three months, depending on the complexity related to the stability of continuous operation. Commercial production is considered to have commenced, and depreciation expense is recognized, at the beginning of the month after criteria have been met.
vii. Capitalized borrowing costs:
The Company capitalizes borrowing costs that are directly attributable to the acquisition, construction or production of qualifying assets, which are assets that necessarily take a substantial period of time, generally one year or more, to get ready for their intended use or sale. Capitalization of borrowing costs ceases once the qualifying assets commence commercial production or are otherwise ready for their intended use or sale.
Where funds are borrowed specifically to finance a project, the amount capitalized represents the actual borrowing costs incurred. Where the funds used to finance a project form part of general borrowings, the amount capitalized is calculated using a weighted average of interest rates applicable to relevant general borrowings of Hudbay during the period, to a maximum of actual borrowing costs incurred. Investment income earned by temporarily investing specific borrowings pending their expenditure on qualifying assets is deducted from the borrowing costs eligible for capitalization. Capitalization of interest is suspended during extended periods in which active development is interrupted.
All other borrowing costs are recognized in the consolidated statements of income in the period in which they are incurred.
viii. Capitalized stripping costs:
Costs associated with stripping activities in an open pit mine are capitalized to inventory and recorded through cost of sales unless the stripping activity can be shown to improve access to further quantities of ore that will be mined in future periods, in which case, the stripping costs are capitalized to property, plant and equipment. Capitalized stripping costs are included in "mining properties" within property, plant and equipment.
Capitalized stripping costs are depreciated using a units-of-production method over the expected reserves within a given phase of mine development.
17 |
|
HUDBAY MINERALS INC. Notes to Audited Consolidated Financial Statements (in millions of US dollars, except where otherwise noted) Years ended December 31, 2025 and 2024
|
(i) Impairment of non-financial assets:
At the end of each reporting period, Hudbay reviews the carrying amounts of property, plant and equipment, exploration and evaluation assets and intangible assets - computer software to determine whether there is any indication of impairment. If any such indication exists, the Company estimates the recoverable amount of the asset in order to determine the extent of the impairment loss, if any. Hudbay generally assesses impairment at the level of CGUs, which are the smallest identifiable groups of assets that generate cash inflows that are largely independent of cash inflows from other assets.
Hudbay's CGUs consist of Manitoba, British Columbia, Peru, Arizona and greenfield exploration assets.
The Company allocates near mine exploration and evaluation assets to CGUs based on their operating segment, geographic location and management's intended use for the property. Near mine exploration and evaluation assets are allocated to CGUs separate from those containing producing or development-phase assets, except where such exploration and evaluation assets have the potential to significantly affect the future production of producing or development-phase assets.
Goodwill is tested for impairment annually and whenever there is an indication that the asset may be impaired. The Company performs goodwill impairment tests on an annual basis as at July 1 each year. This represents a change in accounting policy regarding the timing of the annual goodwill impairment test which was previously performed as at December 31. If the carrying value of the CGU or group of CGUs to which goodwill is assigned exceeds its recoverable amount, an impairment loss is recognized. Goodwill impairment losses are recorded in the consolidated statements of income and they are not subsequently reversed.
Where an indicator of impairment exists, a formal estimate of the recoverable amount of the asset or CGU is made. The recoverable amount is the higher of the fair value less costs of disposal and value in use:
- Fair value less costs of disposal is the amount obtainable from the sale of the asset or CGU in an arm's length transaction between knowledgeable, willing parties, less costs of disposal. Fair value for mineral assets is often determined as the present value of the estimated future cash flows expected to arise from the continued use of the asset, including any expansion prospects, and its eventual disposal, using assumptions that an independent market participant may take into account. These cash flows are discounted by an appropriate discount rate that reflects current market assessments of the time value of money and the risks specific to the asset to arrive at a net present value of the asset.
- Value in use is determined as the present value of the estimated future cash flows expected to arise from the continued use of the asset or CGU in its present form and its eventual disposal, discounted using a pre-tax rate that reflects current market assessments of the time value of money and risks specific to the asset for which estimates of future cash flows have not been adjusted. Value in use calculations apply assumptions specific to the Company's continued use and cannot take into account future development. These assumptions are different to those used in calculating fair value, and consequently the value in use calculation is likely to give a different result to a fair value calculation.
Hudbay estimates future cash flows based on estimated future recoverable mine production, expected sales prices (considering current and historical commodity prices, price trends and related factors), production levels and cash costs of production, all based on detailed engineering LOM plans. Future recoverable mine production is determined from reserves and resources after taking into account estimated dilution and recoveries during mining, and estimated losses during ore processing and treatment. Estimates of recoverable production from measured, indicated and inferred mineral resources not included in the LOM plan are assessed for economic recoverability and may also be included in the valuation of fair value less costs of disposal. Gains from the expected disposal of assets are not included in estimated future cash flows. Assumptions underlying future cash flow estimates are subject to risks and uncertainties. Changes in estimates may affect the expected recoverability of the Company's investments in mining properties.
If the carrying amount of an asset or CGU exceeds its recoverable amount, the carrying amount is reduced to the recoverable amount, and an impairment loss is recognized in the consolidated statements of income in the expense category consistent with the function of the impaired asset or CGU. Hudbay presents impairment losses on the consolidated statements of income as part of results from operating activities. Impairment losses recognized in respect of a CGU are allocated first to reduce the carrying amount of any goodwill allocated to the CGU and then to reduce the carrying amounts of other assets in the CGU on a pro-rata basis for depreciable assets.
18 |
|
HUDBAY MINERALS INC. Notes to Audited Consolidated Financial Statements (in millions of US dollars, except where otherwise noted) Years ended December 31, 2025 and 2024
|
The Company assesses previously recognized impairment losses each reporting date for any indications that the losses have decreased or no longer exist. Such an impairment loss is reversed, in full or in part, if there have been significant changes with a positive effect on the estimates used to determine the recoverable amount. An impairment loss is reversed only to the extent that the asset's carrying amount does not exceed the carrying amount that would have been determined, net of depreciation or amortization, if no impairment loss had been recognized for the asset in prior years. Such reversals of impairment losses are recognized in the consolidated statements of income. An impairment loss recognized in relation to goodwill is not reversed for subsequent increases in the recoverable amount.
(j) Pension and other employee benefits:
Hudbay has non-contributory and contributory defined benefit programs for certain of its Canadian employees. The defined benefit pension benefits are based on years of service and final average salary for the salaried plans and are based on a flat dollar amount combined with years of service for the hourly plans. The Company provides non pension health and other post-employment benefits to certain active employees and pensioners (post-employment benefits) and also provides disability income, health benefits and other post-employment benefits to hourly and salaried disabled employees (other long-term employee benefits).
Hudbay accrues its obligations under the defined benefit plans as the employees render the services necessary to earn the pension and post-employment benefits. The actuarial determination of the accrued benefit obligations for pensions and post-employment benefits uses the projected benefit method pro-rated on service (which incorporates management's best estimate of future salary levels, other cost escalation, retirement ages of employees and other actuarial factors). For other long-term employee benefits, the Company recognizes the full cost of the benefit obligation at the time the employee becomes disabled. Actuarial advice is provided by external consultants.
For the funded defined benefit plans, Hudbay recognizes the deficit or excess of the fair value of plan assets over the present value of the defined benefit obligation as a liability or an asset in the consolidated balance sheets. However, the Company recognizes an excess of assets only to the extent that it represents a future economic benefit which is available in the form of refunds from the plan or reductions in future contributions to the plan. When these criteria are not met, it is not recognized but is disclosed in the notes to the consolidated financial statements. Impacts of minimum funding requirements in relation to past service are considered when determining the balance sheet position.
Defined benefit costs are categorized as follows:
- Service costs (including current service cost, past service cost, as well as gains and losses on curtailments and settlements and administration costs);
- Net interest expense or income; and,
- Remeasurement.
The first two components of defined benefit costs shown above are recognized in the consolidated statements of income. Past service cost as well as curtailment gains are recognized in the consolidated statements of income in the period of a plan amendment. Net interest is calculated by applying the discount rate at the beginning of the period to the net defined benefit liability or asset.
Purchases and sales of plan assets are recorded on settlement date.
Remeasurement, comprising actuarial gains and losses, the effect of changes to the asset ceiling (if applicable) and the return on plan assets (excluding interest), is reflected immediately in the consolidated balance sheets with a gain or loss recognized in OCI in the period in which they occur. Remeasurement recognized in OCI is reflected in the remeasurement reserve and will not be reclassified to the consolidated statements of income. For the other long-term employee benefits plan, remeasurements are recognized immediately in the consolidated statements of income.
Actuarial determinations used in estimating obligations relating to these plans incorporate assumptions using management's best estimates of factors including plan performance, salary escalation, retirement dates of employees and healthcare cost escalation rates. Due to the complexity of the valuation, the underlying assumptions and its long-term nature, a defined benefit obligation is highly sensitive to changes in these assumptions. All assumptions are reviewed at each reporting date. In determining the appropriate discount rate, management considers the interest rates on corporate bonds in the respective currency with at least an AA rating, with extrapolated maturities corresponding to the expected duration of the defined benefit obligation. The mortality rate is based on publicly available mortality tables for the specific country. Future salary increases and pension increases are based on expected future inflation rates for the respective country.
Hudbay also has defined contribution plans providing pension benefits for certain of its salaried employees and certain of its US employees utilizing 401K plans. The Company recognizes the cost of the defined contribution plans based on the contributions required to be made during each period.
19 |
|
HUDBAY MINERALS INC. Notes to Audited Consolidated Financial Statements (in millions of US dollars, except where otherwise noted) Years ended December 31, 2025 and 2024
|
Termination benefits are recognized as an expense when Hudbay is committed demonstrably, without realistic possibility of withdrawal, to a formal detailed plan to either terminate employment before the normal retirement date, or to provide termination benefits as a result of an offer made to encourage voluntary redundancy. Termination benefits for voluntary redundancies are recognized as an expense if the Company has made an offer of voluntary redundancy, it is probable that the offer will be accepted, and the number of acceptances can be estimated reliably. Benefits that are payable more than one year after the reporting period are discounted to their present value.
(k) Environmental and other provisions:
Provisions are recognized when Hudbay has a present obligation (legal or constructive) as a result of a past event, it is probable that an outflow of resources will be required to settle the obligation, and a reliable estimate can be made. The provisions are recorded as management's best estimate of the amount required to settle an obligation.
Provisions are stated at their present value, which is determined by discounting the expected future cash flows at a pre-tax rate that reflects current market assessments of the time value of money and the risks specific to the liability.
Decommissioning, restoration and similar liabilities
Provisions are recorded for legal and constructive obligations associated with the future costs of rehabilitating the Company's current and previous operating and development sites. Such costs are associated with decommissioning and restoration activities such as dismantling and removing structures, rehabilitating mines and tailings, and reclamation and re-vegetation of affected areas.
The present value of estimated costs is recorded in the period in which the asset is installed or the environment is disturbed and a reasonable estimate of future costs and discount rates can be made. The provision is discounted using a risk-free rate, and estimates of future cash flows are adjusted to reflect risk.
Subsequent to the initial measurement, the obligation is adjusted to reflect the passage of time and changes in the estimated future cash flows underlying the obligation. The increase in the provision due to the passage of time is recognized as finance expense, whereas increases and decreases due to changes in the estimated future cash flows, which are not the result of current inventory production, are capitalized and depreciated over the life of the related operating asset. Actual costs incurred upon settlement of the site restoration obligation are charged against the provision to the extent the provision was established for those costs. Upon settlement of the liability, a gain or loss may be recorded. For closed sites, changes to estimated costs are recognized immediately in the consolidated statements of income within other expenses.
Hudbay assesses the reasonableness of its estimates and assumptions each year and when conditions change, the estimates are revised accordingly. Judgement is required to determine the scope and timing of future decommissioning and restoration activities, as well as best available estimates and assumptions including discount rates, expected timing of decommissioning and restoration costs, inflationary factors and market risks. Changes in cost estimates, which may arise from changes in technology and pricing of the individual components of the cost may result in offsetting changes to the asset and liability and corresponding changes to the associated depreciation and finance costs. In view of the uncertainties concerning these future obligations, the ultimate timing and cost of reclamation and mine closure may differ materially from these estimates.
If the change in estimate results in a significant increase in the decommissioning liability and therefore an addition to the carrying value of the asset, the Company considers whether this is an indication of impairment of the asset as a whole and, if so, tests for impairment in accordance with IAS 36, Impairment of non-financial assets. If, for mature mines, the revised mine assets net of decommissioning and restoration liabilities exceeds the recoverable value, that portion of the increase is charged directly to expense as an impairment loss, within the gross profit / (loss) line.
In view of the uncertainties concerning environmental remediation, the ultimate cost of decommissioning and restoration liabilities could differ materially from the estimated amounts provided. The estimate of the total liability is subject to change based on amendments to laws and regulations and as new information concerning Hudbay's operations becomes available. Future changes, if any, to the estimated total liability as a result of amended requirements, laws, regulations and operating assumptions, as well as discount rates, may be significant and would be recognized prospectively as a change in accounting estimate, when applicable. Environmental laws, regulations and technology are continually evolving in all regions in which the Company operates. Hudbay is not able to determine the impact, if any, of environmental laws, regulations and technology that may be enacted in the future on its results of operations or financial position due to the uncertainty surrounding the ultimate form that such future laws and regulations may take.
20 |
|
HUDBAY MINERALS INC. Notes to Audited Consolidated Financial Statements (in millions of US dollars, except where otherwise noted) Years ended December 31, 2025 and 2024
|
Onerous contracts
A contract is considered to be onerous when the unavoidable costs of meeting obligations under the contract exceed the economic benefits expected to be received under it. Hudbay records a provision for any onerous contracts at the lesser of costs to comply with a contract and costs to terminate it.
Restructuring provisions
A provision for restructuring is recognized when management, with appropriate authority within Hudbay, has approved a detailed and formal restructuring plan, and the restructuring has either commenced or has been announced publicly. Future operating costs are not provided for.
(l) Financial instruments:
Non-derivative financial instruments are initially recognized at fair value plus, in the case of a financial asset or financial liability not measured at fair value through profit or loss, directly attributable transaction costs. Measurement in subsequent periods depends on the financial instrument's classification. Hudbay uses trade date accounting for regular way purchases or sales of financial assets. The Company determines the classification of its financial instruments and non-financial derivatives at initial recognition.
Financial assets and liabilities are offset and the net amount presented in the consolidated balance sheets when, and only when, Hudbay has a legal right to offset the amounts and intends either to settle on a net basis or to realize the asset and settle the liability simultaneously.
The classification of financial assets is based on the results of the contractual characteristics test and the business model assessment which will result in the financial asset being classified as either: amortized cost, fair value through profit or loss ("FVTPL") or fair value through other comprehensive income ("FVTOCI").
i. Non-derivative financial instruments - classification:
Financial assets at fair value through profit or loss
Provisionally priced copper and zinc concentrate sales receivables, warrants and investments in securities of junior mining companies are classified as financial assets at fair value through profit or loss and are measured at fair value. The gains or losses related to changes in fair value are reported in the consolidated statements of income.
Amortized cost
Cash, certain receivables, other assets related to agreements with communities near the Peru operations, trade and other payables, long-term debt, deferred consideration, contingent consideration and restricted cash are classified as and measured at amortized cost and are carried at amortized cost using the effective interest rate method, less impairment losses, if any.
Non-derivative financial liabilities
Accounts payable and senior unsecured notes are initially recognized at fair value and subsequently accounted for at amortized cost, using the effective interest method. The amortization of senior unsecured notes issue costs is calculated using the effective interest rate method.
ii. Derivatives:
Derivatives are initially recognized at fair value when Hudbay becomes a party to the derivative contract and are subsequently re-measured to fair value at the end of each reporting period. The resulting gain or loss is recognized in the consolidated statements of income immediately unless the derivative is designated and effective as a hedging instrument. Derivatives with positive fair value are recognized as assets; derivatives with negative fair value are recognized as liabilities.
Derivatives contracts that are entered to economically hedge a risk exposure but are not designated as a hedging instrument for hedge accounting purposes, and are physically settled, are initially and subsequently measured at fair value. Subsequent movements in fair value are recognized within the revenue line item in the consolidated statements of income.
21 |
|
HUDBAY MINERALS INC. Notes to Audited Consolidated Financial Statements (in millions of US dollars, except where otherwise noted) Years ended December 31, 2025 and 2024
|
Hudbay enters into derivatives contracts to hedge commodity price risk exposure associated with quotational pricing terms in our sales contract as well as for non-quotational pricing ("non-QP"), which are not designated as hedging instrument for hedge accounting purposes. These non-quotational pricing derivative contracts are not physically settled and are referred to as non-QP hedges. These are initially and subsequently measured at fair value. Subsequent movements in fair value of these non-QP hedges are recognized in change in fair value of financial instruments on the consolidated statement of income.
iii. Embedded derivatives:
Hudbay considers whether a contract contains an embedded derivative when it becomes a party to the contract. Derivatives embedded in other financial liabilities or other non-financial host contracts are treated as separate derivatives when their risks and characteristics are not closely related to those of the host contracts and the host contracts are not measured at FVTPL.
iv. Fair value of financial instruments:
The fair value of a financial instrument is the amount for which an asset could be exchanged, or a liability settled, between knowledgeable, willing parties in an arm's length transaction.
Fair values of financial instruments traded in active markets are determined based on quoted market prices, where available. Bid prices are generally used for assets held or liabilities to be issued; asking prices are generally used for assets to be acquired or liabilities held.
For financial instruments not traded in an active market, fair values are determined based on appropriate valuation techniques. Such techniques may include discounted cash flow analysis, using recent arm's length market transactions, reference to the current fair value of another instrument that is substantially the same, and other valuation models.
The Company applies a hierarchy to classify valuation methods used to measure financial instruments carried at fair value. Levels 1 to 3 are defined based on the degree to which fair value inputs are observable and have a significant effect on the recorded fair value, as follows:
- Level 1: Quoted prices (unadjusted) in active markets for identical assets or liabilities;
- Level 2: Valuation techniques use significant observable inputs, either directly (i.e. as prices) or indirectly (i.e. derived from prices), or valuations are based on quoted prices for similar instruments; and,
- Level 3: Valuation techniques use significant inputs that are not based on observable market data (unobservable inputs).
An analysis of fair values of financial instruments is provided in note 29.
v. Impairment of financial instruments:
Hudbay recognizes loss allowances for Expected Credit Losses ("ECL") for trade receivables not measured at FVTPL.
Loss allowances for trade receivables are measured at an amount equal to lifetime ECL. ECL is a probability-weighted estimate measured at the present value of all cash shortfalls including the impact of forward-looking information.
Hudbay has established a provision based on the Company's historical credit loss experience, adjusted for forward-looking factors specific to the debtors and the economic environment.
vi. Derecognition of financial instruments:
Hudbay derecognizes financial assets when the contractual rights to the cash flows from the assets expire, or when the Company transfers the rights to receive the contractual cash flows on the financial assets in a transaction in which substantially all the risks and rewards of ownership of the financial asset are transferred. Any interest in the transferred financial assets that is created or retained by Hudbay is recognized as a separate asset or liability.
Hudbay derecognizes financial liabilities when its contractual obligations are discharged, cancelled or expire or when its terms are modified and the cash flows of the modified liability are substantially different.
22 |
|
HUDBAY MINERALS INC. Notes to Audited Consolidated Financial Statements (in millions of US dollars, except where otherwise noted) Years ended December 31, 2025 and 2024
|
(m) Taxation:
Current Tax
Current income tax assets and liabilities for the current and prior periods are measured at the amount expected to be recovered from or paid to the taxation authorities. The tax rates and tax laws used to compute the amount are those that are enacted or substantively enacted by the balance sheet date.
Hudbay is subject to income taxes in numerous jurisdictions. Significant judgement is required in determining the worldwide provision for income taxes due to the complexity of legislation. There are many transactions and calculations for which the ultimate tax determination is uncertain during the ordinary course of business. The Company recognizes liabilities for anticipated tax issues based on estimates of whether additional taxes will be due. Where the final tax outcome of these matters is different from the amounts that were initially recorded, such differences will affect the income tax and deferred tax provisions in the period in which such determination is made.
Additionally, future changes in tax laws in the jurisdictions in which Hudbay operates could limit the ability of the Company to obtain tax deductions in future periods.
Deferred Tax
Deferred tax is recognized using the balance sheet method in respect of temporary differences at the balance sheet date between the tax basis of assets and liabilities, and their carrying amounts for financial reporting purposes.
Deferred income tax liabilities are recognized for all taxable temporary differences, except:
- where the deferred income tax liability arises from the initial recognition of goodwill, or the initial recognition of an asset or liability in a transaction that is not a business combination and, at the time of the transaction, affects neither the accounting profit nor taxable profit or loss; and
- in respect of taxable temporary differences associated with investments in subsidiaries, associates and interest in joint ventures, where the timing of the reversal of the temporary differences can be controlled and it is probable that the temporary differences will not reverse in the foreseeable future.
Deferred income tax assets are recognized for all deductible temporary differences, carry-forward of unused tax assets and unused tax losses, to the extent that it is probable that taxable profit will be available against which the deductible temporary differences, and the carry-forward of unused tax assets and unused tax losses can be utilized, except:
- where the deferred income tax asset relating to the deductible temporary difference arises from the initial recognition of an asset or liability in a transaction that is not a business combination and, at the time of the transaction, affects neither the accounting profit nor taxable profit or loss; and
- in respect of deductible temporary differences associated with investments in subsidiaries, associates and interest in joint ventures, deferred tax assets are recognized only to the extent that it is probable that the temporary differences will reverse in the foreseeable future and taxable profit will be available against which the temporary differences can be utilized.
To the extent that it is probable that taxable profit will be available to offset the deductible temporary differences, Hudbay recognizes the deferred tax asset regarding the temporary difference on decommissioning, restoration and similar liabilities and recognizes the corresponding deferred tax liability regarding the temporary difference on the related assets.
The carrying amount of deferred income tax assets is reviewed at each balance sheet date and reduced to the extent that it is no longer probable that sufficient taxable profit will be available to allow all or part of the deferred income tax asset to be utilized. Unrecognized deferred income tax assets are reassessed at each balance sheet date and are recognized to the extent that it has become probable that future taxable profit will be available to allow the deferred tax asset to be recovered.
Judgement is required in determining whether deferred tax assets are recognized on the consolidated balance sheets. Deferred tax assets, including those arising from unutilized tax losses, require management to assess the likelihood of taxable profit in future periods in order to utilize recognized deferred tax assets. Estimates of future taxable income are based on forecast cash flows from operations and the application of existing tax laws in each jurisdiction. To the extent that future cash flows and taxable income differ significantly from estimates, the ability to realize the net deferred tax assets recorded at the balance sheet date could be affected.
23 |
|
HUDBAY MINERALS INC. Notes to Audited Consolidated Financial Statements (in millions of US dollars, except where otherwise noted) Years ended December 31, 2025 and 2024
|
Deferred tax is measured on an undiscounted basis at the tax rates that are expected to apply in the periods in which the asset is realized or the liability is settled, based on tax rates and tax laws enacted or substantively enacted at the balance sheet date.
Deferred income tax assets and deferred income tax liabilities are offset if a legally enforceable right exists to offset current tax assets against current tax liabilities and the deferred income taxes relate to the same taxable entity and the same taxation authority.
Current and deferred taxes relating to items recognized outside profit or loss (whether in other comprehensive income or directly in equity) are recognized outside profit or loss and not in the consolidated statements of income. Mining taxes and royalties are treated and disclosed as current and deferred taxes if they have the characteristics of an income tax.
(n) Share capital and reserves:
Transaction costs
Transaction costs directly attributable to equity transactions are recognized as a deduction from equity.
Other capital reserve
The other capital reserve is used for equity-settled share-based compensation and includes amounts for stocks options granted and not exercised.
Foreign currency translation reserve
The foreign currency translation reserve is used to record exchange differences arising from the translation of the financial statements of foreign operations. Exchange differences arising from the translation of the financial statements of foreign operations form part of the net investment in the foreign operation. Translation gains and losses remain in the reserve until disposal of all or a portion of the foreign operation.
(o) Flow-through shares
Resource expenditure deductions for income tax purposes related to exploration activities funded by flow-through share arrangements are renounced to investors under Canadian income tax legislation. On issuance, the Corporation separates the flow-through share into i) a flow-through share premium, equal to the difference between the current market price of the Corporation's common shares and the issue price of the flow-through share and ii) share capital. Upon qualifying exploration and/or development expenditures being incurred, the sale of tax deductions is recognized as other income in the statement of income and the related liability is reduced. The Company may also be subject to a Part XII.6 tax on flow-through proceeds renounced, in accordance with the Canadian Income Tax Act flow-through regulations. When applicable, the estimated tax payable is accrued until paid.
(p) Share-based compensation:
Hudbay compensates its employees in part through the use of a Deferred Share Unit ("DSU") plan for non-employee members of the Board of Directors, a Restricted Share Unit ("RSU") plan for employees, a Performance Share Unit ("PSU") plan for employees and a stock option plan for employees. These plans are included in provisions on the consolidated balance sheets and further described in note 26. Changes in the fair value of the liabilities are recorded in the consolidated statements of income.
Cash-settled transactions, consisting of DSUs, RSUs and PSUs, are initially measured at fair value and recognized as an obligation at the grant date. The liabilities are remeasured to fair value at each reporting date up to and including the settlement date, with changes in fair value recognized in the consolidated statements of income. Hudbay values the liabilities based on the change in the Company's share price. Additional DSUs, RSUs and PSUs are credited to reflect dividends paid on Hudbay common shares over the vesting period. The current portion of the liability reflects those grants that have vested or that are expected to vest within twelve months.
DSUs vest on the grant date and are redeemable when a participant is no longer a member of the Board of Directors. Issue and redemption prices of DSUs are based on the average closing price of the Company's common shares for the five trading days prior to issuance or redemption.
24 |
|
HUDBAY MINERALS INC. Notes to Audited Consolidated Financial Statements (in millions of US dollars, except where otherwise noted) Years ended December 31, 2025 and 2024
|
RSUs and PSUs are issued under Hudbay's Long Term Equity Plan ("LTEP Plan") and vest on or before the third anniversary of the grant. RSUs and PSUs granted under the LTEP Plan may be settled in the form of the Company's common shares or, at the option of Hudbay, the cash equivalent based on the market price of the common shares as of the vesting date. Hudbay has historically settled RSUs in cash. Except in specified circumstances, RSUs and PSUs terminate when an employee ceases to be employed by the Company. Valuations of RSUs and PSUs reflect estimated forfeitures.
Equity-settled transactions with employees relate to stock options and are measured by reference to the fair value at the earlier of the grant date and the date that the employee unconditionally became entitled to the award. Fair value is determined using a Black-Scholes option pricing model, which relies on estimates of the future risk-free interest rate, future dividend payments, future share price volatility and the expected average life of the options. Hudbay believes this model adequately captures the substantive features of the option awards and is appropriate to calculate their fair values. The fair value determined at the grant date is recognized over the vesting period in accordance with vesting terms and conditions, with a corresponding increase to other capital reserves. The amount recognized as an expense is adjusted to reflect the number of awards for which the related service and non-market vesting conditions are expected to be met.
(q) Earnings per share:
The Company presents basic and diluted earnings (loss) per share ("EPS") data for its common shares. Basic EPS is calculated by dividing the profit or loss attributable to common shareholders of the Company by the weighted average number of common shares outstanding during the period. Diluted EPS is determined by adjusting the profit or loss attributable to common shareholders and the weighted average number of common shares outstanding for the effects of all dilutive potential common shares, which previously consisted of stock options granted to employees and warrants.
When calculating earnings per share for periods where the Company has a loss, Hudbay's calculation of diluted earnings per share excludes any incremental shares from the assumed conversion of stock options as they would be anti-dilutive.
(r) Leases:
Leases, under which substantially all the risks and rewards incidental to ownership of the leased item are transferred to Hudbay, are capitalized as assets at the inception of the lease at the lower of fair value or the present value of the minimum lease payments. Lease payments are apportioned between finance charges and the reduction of the liability so as to achieve a constant periodic rate of interest on the remaining balance of the liability. Finance charges are reflected in the consolidated statements of income as finance costs.
Non-ROU lease payments are recognized as an expense in the consolidated statements of income on a straight-line basis over the lease term.
(s) Segment reporting:
An operating segment is a component of the Company that engages in business activities from which it may earn revenue and incur expenses and for which discrete financial information is available. Hudbay's chief executive officer regularly reviews the operating results of each operating segment to make decisions about resources to be allocated to the segment and assess its performance. In determining operating segments, Hudbay considers location and decision-making authorities. Refer to note 34.
4. New standards
New standards issued but not yet effective
(a) IFRS 18 - Presentation and Disclosure in Financial Statements
In April 2024, the IASB released IFRS 18 Presentation and Disclosure in Financial Statements. IFRS 18 will replace IAS 1 Presentation of Financial Statements. The standard amends the presentation of the statement of income by introducing a newly defined 'operating profit' subtotal and a requirement for income and expenses to be allocated between three new distinct categories based on a company's main business activities, which are Operating, Financing and Investing. In addition, organizations will need to disclose certain 'non-GAAP' measures known as management-defined performance measures. The standard will be effective from January 1, 2027 with early adoption permitted and requires retrospective application. The Company is assessing the impact of adoption of this amendment on its consolidated financial statements.
25 |
|
HUDBAY MINERALS INC. Notes to Audited Consolidated Financial Statements (in millions of US dollars, except where otherwise noted) Years ended December 31, 2025 and 2024
|
(b) Amendments to IFRS 9 - Financial Instruments and IFRS 7 - Financial Instruments: Disclosures
In May 2024, the IASB issued amendments to IFRS 9 and 7 to clarify the recognition or derecognition of a financial asset or liability, with a new exception for some financial liabilities settled through an electronic cash transfer system. The amendments also add guidance for assessing whether a financial asset meets the solely payments of principal and interest (SPPI) criterion, by introducing an additional SPPI test for financial assets with contingent features that are not related directly to a change in basic lending risks or costs. In addition, the amendments will add new disclosures for certain instruments with contractual terms that can change cash flows. Lastly, the amendments will require additional disclosures for equity instruments designated at fair value through other comprehensive income. The amendments will apply for reporting periods beginning on or after January 1, 2026, with early application permitted. The Company has assessed the impact of these amendments to be immaterial to the consolidated financial statements.
In December 2024, the IASB issued amendments to IFRS 9 and 7 to clarify the application of the 'own-use' exemption and provide guidance on hedge accounting for companies that hedge their purchase or sales of electricity using renewable power purchase agreements. The amendments also introduce new disclosure requirements. The amendments will apply for reporting periods beginning on or after January 1, 2026, with early application permitted. Hudbay has concluded that the impact of these amendments will not result in material changes to the consolidated financial statements.
5. Copper Mountain non-controlling interest acquisition
On April 30, 2025, Hudbay completed the acquisition of Mitsubishi Materials Corporation's ("MMC") 25% interest in CMBC (the "Transaction"). The cash consideration of the Transaction consisted of:
• $4.5 million on closing date of the Transaction,
• $21.0 million in seven annual deferred payments of $3.0 million each, commencing on the 12-month anniversary of the closing date of the Transaction, and
• up to $18.75 million in five additional contingent payments of $3.75 million each, payable in the years following New Ingerbelle achieving certain minimum annual operating thresholds. MMC's right to the contingent payments concludes on the 15-year anniversary of the closing date of the Transaction.
As a result of the Transaction, Hudbay increased its ownership of the Copper Mountain mine from 75% to 100%.
The company recorded $35.9 million of total consideration for the Transaction which included the cash payment of $4.5 million on the closing date, $16.6 million of deferred payments and $13.3 million of contingent consideration recorded as financial liability at amortized cost (note 17) and $1.5 million of transaction costs recorded within equity.
As a result of the Transaction, the Company recorded an increase to equity as follows:
| Carrying value of non-controlling interest as at April 30, 2025 | $ | 93.2 | |
| Transfer of net gain on translation of foreign currency balances | 4.0 | ||
| Less: total consideration | (35.9 | ) | |
| Surplus - recorded in equity | 61.3 |
There were no substantive changes to the Company's ownership in CMBC during the year ended December 31, 2024.
26 |
|
HUDBAY MINERALS INC. Notes to Audited Consolidated Financial Statements (in millions of US dollars, except where otherwise noted) Years ended December 31, 2025 and 2024
|
6. Revenue and expenses
(a) Revenue
Hudbay's revenue by significant product types:
| Year ended December 31, |
||||||
| 2025 | 2024 | |||||
| Copper | $ | 1,161.5 | $ | 1,154.8 | ||
| Gold | 794.4 | 673.6 | ||||
| Zinc | 43.5 | 71.1 | ||||
| Silver | 53.6 | 51.5 | ||||
| Molybdenum | 63.9 | 60.1 | ||||
| Other | - | 1.7 | ||||
| Revenue from contracts | 2,116.9 | 2,012.8 | ||||
| Non-cash streaming arrangement items: 1 | ||||||
| Amortization of deferred revenue - gold | 31.3 | 40.7 | ||||
| Amortization of deferred revenue - silver | 33.8 | 33.6 | ||||
| Amortization of deferred revenue - variable consideration adjustments - prior periods | 9.9 | (3.8 | ) | |||
| 75.0 | 70.5 | |||||
| Pricing and volume adjustments 2 | 47.5 | 35.2 | ||||
| 2,239.4 | 2,118.5 | |||||
| Treatment and refining charges | (28.4 | ) | (97.3 | ) | ||
| $ | 2,211.0 | $ | 2,021.2 | |||
| 1 See note 20. | ||||||
| 2 Pricing and volume adjustments represent mark-to-market adjustments on initial estimate of provisionally priced sales, realized and unrealized changes to fair value of quotational pricing hedge derivative contracts and adjustments to originally invoiced weights and assays. |
Consideration from the Company's stream agreements is considered variable (note 20). Gold and silver stream revenue can be subject to cumulative adjustments when the amount of precious metals to be delivered under the contract changes. As a result of changes in the Company's mineral reserve and resource estimate in the first quarter of 2025, the amortization rate by which deferred revenue is drawn down into income was adjusted and, as required, a variable consideration adjustment was made for all prior year stream revenues since the stream agreement inception date. This variable consideration adjustment for the year ended December 31, 2025 resulted in an increase in revenue of $9.9 million (year ended December 31, 2024 - decrease in revenue of $3.8 million).
(b) Depreciation and amortization
Depreciation of property, plant and equipment and amortization of intangible assets are reflected in the consolidated statements of income as follows:
| Year ended December 31, |
||||||
| 2025 | 2024 | |||||
| Cost of sales | $ | 439.7 | $ | 426.6 | ||
| Selling and administrative expenses | 1.5 | 1.4 | ||||
| $ | 441.2 | $ | 428.0 | |||
27 |
|
HUDBAY MINERALS INC. Notes to Audited Consolidated Financial Statements (in millions of US dollars, except where otherwise noted) Years ended December 31, 2025 and 2024
|
(c) Share-based compensation expense
Share-based compensation expenses are reflected in the consolidated statements of income as follows:
| Cash-settled |
Total share- based compensation expense |
||||||||||||||
| RSUs | DSUs | PSUs | Stock options | ||||||||||||
| Year ended December 31, 2025 | |||||||||||||||
| Cost of sales | $ | 5.9 | $ | - | $ | - | $ | - | $ | 5.9 | |||||
| Selling and administrative | 12.9 | 13.9 | 24.6 | 2.5 | 53.9 | ||||||||||
| Other expenses | 1.5 | - | - | - | 1.5 | ||||||||||
| $ | 20.3 | $ | 13.9 | $ | 24.6 | $ | 2.5 | $ | 61.3 | ||||||
| Year ended December 31, 2024 | |||||||||||||||
| Cost of sales | $ | 2.0 | $ | - | $ | - | $ | - | $ | 2.0 | |||||
| Selling and administrative | 4.0 | 6.3 | 4.2 | $ | 2.1 | 16.6 | |||||||||
| Other expenses | 0.7 | - | - | - | 0.7 | ||||||||||
| $ | 6.7 | $ | 6.3 | $ | 4.2 | $ | 2.1 | $ | 19.3 | ||||||
During the year ended December 31, 2025, the Company granted 828,720 stock options (year ended December 31, 2024 - 902,874). For further details on stock options, see note 26b.
The increase in share-based compensation expense during the year ended December 31, 2025 compared with the same periods last year primarily relates to the change in the Company's share price, in addition to anticipated adjustments to the performance based multiplier on performance share units.
28 |
|
HUDBAY MINERALS INC. Notes to Audited Consolidated Financial Statements (in millions of US dollars, except where otherwise noted) Years ended December 31, 2025 and 2024
|
(d) Employee benefits expense
This table presents employee benefit expense recognized in the consolidated statements of income, including amounts transferred from inventory upon sale of goods:
| Year ended December 31, | ||||||
| 2025 | 2024 | |||||
| Current employee benefits | $ | 239.4 | $ | 239.2 | ||
| Profit-sharing plan expense | 82.1 | 51.1 | ||||
| Share-based compensation (notes 6c, 22, 26) | ||||||
| Equity settled stock options | 2.5 | 2.1 | ||||
| Cash-settled restricted share units | 20.3 | 6.7 | ||||
| Cash-settled deferred share units | 13.9 | 6.3 | ||||
| Cash-settled performance share units | 24.6 | 4.2 | ||||
| Employee share purchase plan | 2.1 | 1.8 | ||||
| Post-employee pension benefits | ||||||
| Defined benefit plans | 4.7 | 4.4 | ||||
| Defined contribution plans | 2.5 | 2.1 | ||||
| Past service cost (note 22, 23) | - | 4.3 | ||||
| Other post-retirement employee benefits | 6.0 | 7.5 | ||||
| Termination benefits | 0.7 | 1.7 | ||||
| $ | 398.8 | $ | 331.4 | |||
Manitoba has a profit sharing plan required by the collective bargaining agreement whereby 10% of Manitoba's after tax profit (excluding provisions or recoveries for deferred income tax and deferred mining tax) for any given fiscal year will be distributed to all eligible employees in the Flin Flon/Snow Lake operations, with the exception of executive officers and key management personnel.
Peru has a profit sharing plan required by Peruvian law whereby 8% of Peru's taxable income will be distributed to all employees within Peru's operations.
The Company has an employee share purchase plan for executives and other eligible employees where participants may contribute between 1% and 10% of their pre-tax base salary to acquire Hudbay shares. The Company makes a matching contribution of 75% of the participant's contribution.
In addition, the Company recognized a past service cost provision adjustment related to pensions and post-employment plans for certain Manitoba employees of $nil during the year ended December 31, 2025 (year ended December 31, 2024 - $4.3 million).
See note 22 for a description of Hudbay's pension plans and note 23 for Hudbay's other employee benefit plans.
29 |
|
HUDBAY MINERALS INC. Notes to Audited Consolidated Financial Statements (in millions of US dollars, except where otherwise noted) Years ended December 31, 2025 and 2024
|
(e) Other operating expenses
|
Year ended December 31, |
||||||
| 2025 | 2024 | |||||
| Regional costs | $ | 7.7 | $ | 5.4 | ||
| Write-down/loss on disposal of PP&E | 3.5 | 27.4 | ||||
| Amortization of community costs (other assets) | 7.1 | 8.5 | ||||
| Restructuring | 0.1 | 1.2 | ||||
| Wildfire evacuation costs | 4.4 | - | ||||
| Care & maintenance - Manitoba | 13.2 | 14.6 | ||||
| Evaluation costs | 3.5 | 1.2 | ||||
| Insurance recovery | (25.0 | ) | - | |||
| Reduction of obligation to renounce flow-through share expenditures, net of provisions | (5.5 | ) | (2.0 | ) | ||
| Option agreement proceeds (Marubeni) | (4.5 | ) | (0.4 | ) | ||
| Other | 3.3 | 1.5 | ||||
| $ | 7.8 | $ | 57.4 | |||
During the year ended December 31, 2025, the Manitoba business unit incurred costs related to emergency and evacuation activities of $4.4 million as a result of regional wildfires in Snow Lake, Flin Flon and surrounding areas.
During the year ended December 31, 2025, a recovery of $25.0 million was recorded to reflect the business interruption insurance proceeds related to the wildfire evacuation and temporary suspension of operations at Manitoba. As of December 31, 2025, all of the proceeds related to this gain have been received.
The Flin Flon concentrator and tailings impoundment is on care and maintenance to provide optionality should another mineral discovery occur in the Flin Flon area. During the year ended December 31, 2025, care & maintenance costs were $13.2 million (year ended December 31, 2024 - $14.6 million).
The Arizona business unit held an option to acquire water rights and land, which expired during the first quarter of 2024 without being extended or exercised. The previously capitalized cost to maintain the option, net of accrued interest, of $8.1 million is presented as part of write-down of PP&E in 2024.
During the year ended December 31, 2024, the British Columbia business unit has recognized an impairment loss on a ball mill that is no longer being used in its operation. As a result, the carrying value of the asset has been written down to its recoverable amount, and $7.2 million is presented as part of write-down of PP&E. Furthermore, the British Columbia business unit recognized a loss of $7.8 million resulting from the replacement of components of mobile equipment and disposal of other mill equipment during the year ended December 31, 2024.
30 |
|
HUDBAY MINERALS INC. Notes to Audited Consolidated Financial Statements (in millions of US dollars, except where otherwise noted) Years ended December 31, 2025 and 2024
|
(f) Impairment reversal
| As at December 31, 2025 |
|||
| Pre-tax impairment reversal to: | |||
| Property, plant & equipment (note 14) | $ | (322.3 | ) |
| Tax impact | 79.6 | ||
| After-tax impairment reversal | $ | (242.7 | ) |
On August 12, 2025, the Company entered into an agreement with Mitsubishi Corporation ("Mitsubishi"), pursuant to which Mitsubishi agreed to acquire a 30% interest in Copper World, a wholly-owned subsidiary of Hudbay which owns the fully-permitted Copper World Project in Arizona. Mitsubishi will contribute $420 million of proceeds on closing as well as an additional $180 million within 18 months of closing to complete its 30% minority investment (the "Copper World Transaction") and will also fund its pro-rata 30% share of future equity capital contributions. The Copper World Transaction closed in January 2026 (note 35). Based on the Copper World Transaction, a market participant would value the Arizona CGU at $2,000.0 million.
The Copper World Transaction has been determined to be an indicator of impairment reversal for the Arizona cash generating unit ("CGU"). As a result, an assessment of the recoverable amount of the Arizona CGU was performed. The recoverable amount of the Arizona CGU exceeded the carrying amount of $784.4 million.
Based on this market evidence and updated assumptions, the Company recognized a $322.3 million pre-tax impairment reversal in the consolidated statements of income during the year ended December 31, 2025. The reversal is limited to the amount of the previous impairment and does not increase the carrying amount above the level that would have been determined had no impairment been recognized previously.
(g) Consideration received from sale of non-core project
As part of a contingent consideration deed dated December 12, 2022, Harmony Gold (Australia) PTY Limited agreed to pay the Company a contingent amount upon the discovery of a new resource beyond certain parameters at the Eva project, which was previously sold by Copper Mountain prior to Hudbay's acquisition of Copper Mountain in June 2023. During the year ended 2025, a new discovery was made at the Eva project. As a result, the Company recognized the contingent payment received of $14.9 million as other income on the consolidated statements of income.
31 |
|
HUDBAY MINERALS INC. Notes to Audited Consolidated Financial Statements (in millions of US dollars, except where otherwise noted) Years ended December 31, 2025 and 2024
|
(h) Net finance expense
| Year ended December 31, |
||||||
| 2025 | 2024 | |||||
| Net interest expense on long-term debt | ||||||
| Net interest expense on long-term debt | $ | 60.7 | $ | 69.8 | ||
| Accretion on streaming arrangements (note 20) | ||||||
| Additions | 20.5 | 24.0 | ||||
| Variable consideration adjustments - prior periods | (0.6 | ) | 0.2 | |||
| 19.9 | 24.2 | |||||
| Change in fair value of financial instruments | ||||||
| Gold prepayment liability | - | 10.7 | ||||
| Unrealized loss on non-quotational pricing hedges | - | 0.2 | ||||
| Realized loss on non-quotational pricing hedges | 2.3 | 8.9 | ||||
| Investments at fair value through profit or loss (note 11) | (55.2 | ) | (3.2 | ) | ||
| (52.9 | ) | 16.6 | ||||
| Other net finance (income) expense | ||||||
| Net foreign exchange (gain) loss | (18.6 | ) | 21.0 | |||
| Accretion on community agreements measured at amortized cost | 6.4 | 4.7 | ||||
| Accretion on environmental provisions | 11.1 | 10.5 | ||||
| Accretion on Wheaton refund liability | 0.6 | 0.6 | ||||
| Accretion on deferred and contingent liability (note 17) | 1.4 | - | ||||
| Withholding taxes | - | 2.2 | ||||
| Loss on disposal of investments | - | 0.1 | ||||
| Interest on equipment financing and leases | 9.0 | 6.7 | ||||
| Interest income | (22.3 | ) | (15.7 | ) | ||
| Other finance expense | 4.1 | 8.0 | ||||
| (8.3 | ) | 38.1 | ||||
| Net finance expense | $ | 19.4 | $ | 148.7 | ||
Other finance expense relates primarily to standby fees on Hudbay's revolving credit facilities.
Commencing in the first quarter of 2024, Hudbay has entered into copper forward sales, copper costless collars and gold costless collars which are non-quotational pricing ("non-QP") contracts (note 29b). Subsequent movements in the fair value of non-QP contracts are recognized in change in fair value of financial instruments in the consolidated statements of income. As of December 31, 2025, there are no non-QP hedges outstanding.
During the third quarter of 2024, the Company completed the final delivery and settled the obligation for the gold prepayment liability.
7. Cash and cash equivalents
Cash and cash equivalents balances represent demand deposits and deposits with an original maturity date of less than three months.
32 |
|
HUDBAY MINERALS INC. Notes to Audited Consolidated Financial Statements (in millions of US dollars, except where otherwise noted) Years ended December 31, 2025 and 2024
|
8. Short-term investments
Short-term investments include guaranteed investment certificates held with Canadian financial institutions. The Company currently holds nil guaranteed investment certificates. As at December 31, 2024, the Company held two $20.0 million guaranteed investment certificates that matured in March 2025 and June 2025, respectively.
9. Trade and other receivables
| Dec. 31, 2025 | Dec. 31, 2024 | |||||
| Trade receivables | $ | 343.8 | $ | 179.1 | ||
| Statutory receivables | 30.2 | 50.0 | ||||
| Other receivables | 3.8 | 6.4 | ||||
| $ | 377.8 | $ | 235.5 |
The increase in trade receivables during the year ended December 31, 2025 primarily relates to one shipment, representing approximately 40,000 tonnes of copper, which occurred late in the fiscal year and received revenue recognition but for which timing of cash receipts occur in 2026, along with additional revenue as a result of higher metal prices.
10. Inventories
| Dec. 31, 2025 | Dec. 31, 2024 | |||||
| Current | ||||||
| Stockpile | $ | 17.9 | $ | 26.9 | ||
| Finished goods | 76.0 | 81.6 | ||||
| Materials and supplies | 105.3 | 88.9 | ||||
| 199.2 | 197.4 | |||||
| Non-current | ||||||
| Stockpile | 5.3 | 2.2 | ||||
| Low grade stockpile1 | 5.7 | 5.5 | ||||
| Materials and supplies | 10.6 | 8.9 | ||||
| 21.6 | 16.6 | |||||
| $ | 220.8 | $ | 214.0 |
| 1Primarily all of the low grade stockpile inventory is expected to be processed at the end of the Copper Mountain mine life. |
The cost of inventories recognized as an expense, including depreciation and included in cost of sales, amounted to $1,243.4 million for the year ended December 31, 2025 (year ended December 31, 2024 - $1,288.4 million, respectively).
As a result of the Manitoba wildfires and the social unrest in Peru, both the Manitoba and Peru operations underwent a temporary suspension of operations. Fixed overhead costs of $25.6 million were incurred at Manitoba for the year ended December 31, 2025, which were recognized directly to cost of sales. Additionally, Peru incurred $13.0 million in fixed overhead costs for the year ended December 31, 2025, which were recognized directly to cost of sales.
During the year ended December 31, 2025, Hudbay recognized an expense of nil in cost of sales primarily related to adjustments of the carrying value of copper concentrate and stockpile inventory to net realizable value (year ended December 31, 2024 - $0.2 million).
During the year ended December 31, 2025, Hudbay recognized an expense of $4.1 million in cost of sales related to the writedown of certain non-current inventory supplies (year ended December 31, 2024 - $2.7 million).
33 |
|
HUDBAY MINERALS INC. Notes to Audited Consolidated Financial Statements (in millions of US dollars, except where otherwise noted) Years ended December 31, 2025 and 2024
|
11. Other financial assets
| Dec. 31, 2025 | Dec. 31, 2024 | |||||
| Current | ||||||
| Derivative assets | $ | 0.6 | $ | 14.3 | ||
| Collateral deposit (note 19) | - | 0.6 | ||||
| Restricted cash | 0.2 | 0.4 | ||||
| 0.8 | 15.3 | |||||
| Non-current | ||||||
| Investments at fair value through profit or loss | 130.9 | 12.1 | ||||
| 130.9 | 12.1 | |||||
| $ | 131.7 | $ | 27.4 |
Investments at fair value through profit or loss primarily relate to common shares held in various mining companies. For the year ended December 31, 2025, the Company recorded additions of $62.1 million, unrealized mark-to-market gains of $55.2 million (note 6h), disposals of $0.3 million and unrealized foreign exchange gains of $1.8 million.
12. Intangibles and other assets
Intangibles and other assets of $58.6 million (December 31, 2024 - $44.3 million) includes $51.5 million of other assets (December 31, 2024 - $38.8 million) and $7.1 million of intangibles (December 31, 2024 - $5.5 million).
Other assets include $42.8 million of the carrying value of certain future community costs that relate to agreements with communities near the Peru operations which allow Hudbay to extract or explore minerals over the useful life of Peru operations. The liability remaining for these costs is recorded in agreements with communities recorded at amortized cost (note 17). Amortization of the carrying amount is recorded in the consolidated statements of income within other expenses (note 6e) or exploration expenses, depending on the nature of the agreement.
Other assets also include $8.7 million related to cash advances and equipment financing advances made on long lead equipment (December 31, 2024 - nil).
34 |
|
HUDBAY MINERALS INC. Notes to Audited Consolidated Financial Statements (in millions of US dollars, except where otherwise noted) Years ended December 31, 2025 and 2024
|
Intangibles mainly represent computer software costs. The following table summarizes changes in intangibles:
| Dec. 31, 2025 | Dec. 31, 2024 | |||||
| Cost | ||||||
| Balance, beginning of year | $ | 22.5 | $ | 21.2 | ||
| Additions | 2.1 | 2.5 | ||||
| Effects of movement in exchange rates | 0.7 | (1.2 | ) | |||
| Balance, end of year | 25.3 | 22.5 | ||||
| Accumulated amortization | ||||||
| Balance, beginning of year | 17.0 | 17.2 | ||||
| Depreciation for the year | 0.7 | 0.8 | ||||
| Effects of movement in exchange rates | 0.5 | (1.0 | ) | |||
| Balance, end of year | 18.2 | 17.0 | ||||
| Intangibles, net book value | $ | 7.1 | $ | 5.5 |
35 |
|
HUDBAY MINERALS INC. Notes to Audited Consolidated Financial Statements (in millions of US dollars, except where otherwise noted) Years ended December 31, 2025 and 2024
|
13. Goodwill
The following table summarizes changes in goodwill:
| Balance, January 1, 2024 | $ | 75.3 | |
| Effects of changes in foreign exchange | (6.1 | ) | |
| Balance, January 1, 2025 | $ | 69.2 | |
| Effects of changes in foreign exchange | 3.4 | ||
| Balance, December 31, 2025 | $ | 72.6 |
Goodwill resulted from the purchase price allocation associated with the Copper Mountain acquisition.
As of December 31, 2025, all of the Company's goodwill relates to the British Columbia CGU. Goodwill is tested for impairment annually on July 1 or when circumstances indicate that the carrying value may not be recoverable. Goodwill impairment is determined by assessing the recoverable amount of the CGU.
For the annual impairment test completed at July 1, 2025, FVLCD was used to determine the recoverable amount since it is higher than value in use. FVLCD was calculated using discounted after-tax cash flows based on cash flow projections and assumptions in Hudbay's most current LOM. The fair value measurement in its entirety is categorized as Level 3 based on the degree to which fair value inputs are observable and have a significant effect on the recorded fair value. LOM plans are based on optimized mine and processing plans and the assessment of capital expenditure requirements of a mine site for the CGU.
Management used judgement in determining estimates and assumptions with respect to discount rates, future production levels including amounts of recoverable reserves, resources and exploration potential, operating and capital costs, long-term metal prices, value of mineral resources not included in the LOM plan and future foreign exchange rates. Metal pricing assumptions were based on consensus forecast pricing, and the discount rates were based on a weighted average cost of capital, adjusted for country risk and other risks specific to the CGU. Cash flows were projected through to 2043. Changes in any of the assumptions or estimates used in determining the fair values could impact the impairment analysis.
The discount rate was based on the CGU's weighted average cost of capital, of which the two main components are the cost of equity and the after-tax cost of debt. Cost of equity was calculated based on the capital asset pricing model, incorporating the risk-free rate of return based on the Canadian Government's marketable bond yields as at the valuation date, the Company's beta coefficient adjustment to the market equity risk premium based on the volatility of the Company's return in relation to that of a comparable market portfolio, plus a country risk premium, size premium and company-specific risk factor. Cost of debt was determined by applying an appropriate market indication of the Company's borrowing capabilities and the corporate income tax rate applicable to the segment's jurisdiction. A real discount rate of 7.00% (December 31, 2024 - 7.25%) for the British Columbia CGU was used to calculate the estimated after- tax discounted future net cash flows, commensurate with its individual estimated level of risk.
Commodity prices used in the impairment assessment were determined by reference to external market participant sources. The key commodity price for this assessment is the price of copper. The cash flow calculations were based on estimates of future production levels applying forecasts for metal prices, which utilized a long-term copper price of $4.25/lb (December 31, 2024 - $4.15/lb), and capital, operating and reclamation costs based on the most current LOM plans. A value of $366.5 million was utilized to estimate the value of mineral resources not included in the LOM plan.
Expected future cash flows used to determine the FVLCD in the impairment test are inherently uncertain and could materially change over time. The Company has conducted an analysis of the sensitivity of the impairment test to changes in the key assumptions used to determine the recoverable amount for the CGUs to which goodwill is allocated. Management believes that any reasonably possible change in the key assumptions on which the recoverable amount is based would not cause the aggregate carrying amount to exceed the aggregate recoverable amount of the related CGU.
The estimated recoverable amount of the British Columbia CGU including goodwill exceeded its carrying amount as at July 1, 2025, accordingly no impairment was recorded.
36 |
|
HUDBAY MINERALS INC. Notes to Audited Consolidated Financial Statements (in millions of US dollars, except where otherwise noted) Years ended December 31, 2025 and 2024
|
14. Property, plant and equipment
| Dec. 31, 2025 |
Exploration and evaluation assets |
Capital works in progress |
Mining properties |
Plant and equipment |
Plant and equipment - ROU assets1 |
Total | ||||||||||||
| Balance, Jan. 1, 2025 | $ | 103.4 | $ | 863.9 | $ | 2,578.3 | $ | 3,345.3 | $ | 255.1 | $ | 7,146.0 | ||||||
| Additions | 5.2 | 285.6 | 23.4 | 68.4 | 17.7 | 400.3 | ||||||||||||
| Capitalized stripping and development | - | - | 182.2 | - | - | 182.2 | ||||||||||||
| Decommissioning and restoration | - | 0.3 | (0.9 | ) | 0.4 | - | (0.2 | ) | ||||||||||
| Capitalized accretion and depreciation | - | 2.0 | - | - | (2.0 | ) | - | |||||||||||
| Transfers and other movements | - | (117.5 | ) | 3.7 | 108.2 | 5.6 | - | |||||||||||
| Disposals | (1.1 | ) | (0.6 | ) | - | (13.4 | ) | (5.0 | ) | (20.1 | ) | |||||||
| Impairment reversal (note 6f) | - | 322.3 | - | - | - | 322.3 | ||||||||||||
| Effects of movements in exchange rates | 1.4 | 3.8 | 55.9 | 58.3 | 2.1 | 121.5 | ||||||||||||
| Balance, Dec. 31, 2025 | 108.9 | 1,359.8 | 2,842.6 | 3,567.2 | 273.5 | 8,152.0 | ||||||||||||
| Accumulated depreciation | ||||||||||||||||||
| Balance, Jan. 1, 2025 | - | - | 1,274.4 | 1,524.6 | 165.6 | 2,964.6 | ||||||||||||
| Depreciation for the year | - | - | 225.2 | 208.0 | 28.9 | 462.1 | ||||||||||||
| Disposals | - | - | - | (10.0 | ) | (4.0 | ) | (14.0 | ) | |||||||||
| Effects of movement in exchange rates | - | - | 23.4 | 21.1 | 0.9 | 45.4 | ||||||||||||
| Balance, Dec. 31, 2025 | - | - | 1,523.0 | 1,743.7 | 191.4 | 3,458.1 | ||||||||||||
| Net book value | $ | 108.9 | $ | 1,359.8 | $ | 1,319.6 | $ | 1,823.5 | $ | 82.1 | $ | 4,693.9 |
| 1 Includes $5.3 million of capital works in progress - ROU assets (costs) that relate to the Arizona business unit |
37 |
|
HUDBAY MINERALS INC. Notes to Audited Consolidated Financial Statements (in millions of US dollars, except where otherwise noted) Years ended December 31, 2025 and 2024
|
| Dec. 31, 2024 |
Exploration and evaluation assets |
Capital works in progress |
Mining properties |
Plant and equipment |
Plant and equipment- ROU assets1 |
Total | ||||||||||||
| Balance, Jan. 1, 2024 | $ | 96.9 | $ | 804.6 | $ | 2,482.7 | $ | 3,274.2 | $ | 243.5 | $ | 6,901.9 | ||||||
| Additions | 8.6 | 239.4 | 14.5 | 37.7 | 25.5 | 325.7 | ||||||||||||
| Capitalized stripping and development | - | - | 160.5 | - | - | 160.5 | ||||||||||||
| Decommissioning and restoration | - | - | 13.5 | (18.2 | ) | - | (4.7 | ) | ||||||||||
| Capitalized accretion and depreciation | - | 2.2 | - | - | (1.6 | ) | 0.6 | |||||||||||
| Transfers and other movements | - | (168.4 | ) | (3.7 | ) | 174.6 | (2.5 | ) | - | |||||||||
| Disposals | - | (11.9 | ) | - | (23.7 | ) | (6.4 | ) | (42.0 | ) | ||||||||
| Effects of movements in exchange rates | (2.1 | ) | (2.0 | ) | (89.2 | ) | (99.3 | ) | (3.4 | ) | (196.0 | ) | ||||||
| Balance, Dec. 31, 2024 | 103.4 | 863.9 | 2,578.3 | 3,345.3 | 255.1 | 7,146.0 | ||||||||||||
| Accumulated depreciation | ||||||||||||||||||
| Balance, Jan. 1, 2024 | - | - | 1,093.9 | 1,348.9 | 143.1 | 2,585.9 | ||||||||||||
| Depreciation for the year | - | - | 216.0 | 216.8 | 24.0 | 456.8 | ||||||||||||
| Disposals | - | - | - | (9.4 | ) | (1.0 | ) | (10.4 | ) | |||||||||
| Effects of movement in exchange rates | - | - | (35.5 | ) | (31.7 | ) | (0.5 | ) | (67.7 | ) | ||||||||
| Balance, Dec. 31, 2024 | - | - | 1,274.4 | 1,524.6 | 165.6 | 2,964.6 | ||||||||||||
| Net book value | $ | 103.4 | $ | 863.9 | $ | 1,303.9 | $ | 1,820.7 | $ | 89.5 | $ | 4,181.4 |
1 Includes $3.8 million of capital works in progress - ROU assets (costs) that relate to the Arizona business unit.
On a quarterly basis, management assesses for internal and external indicators of impairment and impairment reversal. During the third quarter of 2025, management identified Mitsubishi's agreement to acquire a 30% interest of Copper World to be an indicator of impairment reversal for Arizona CGU.
As a result, a $322.3 million full reversal of the previously recorded impairment was recorded, as the recoverable amount of the Arizona CGU exceeded the current carrying value (note 6f).
38 |
|
HUDBAY MINERALS INC. Notes to Audited Consolidated Financial Statements (in millions of US dollars, except where otherwise noted) Years ended December 31, 2025 and 2024
|
15. Trade and other payables
| Dec. 31, 2025 | Dec. 31, 2024 | |||||
| Trade payables | $ | 84.8 | $ | 66.7 | ||
| Accruals and payables | 231.9 | 173.4 | ||||
| Accrued interest | 13.8 | 15.1 | ||||
| Statutory payables | 12.3 | 15.0 | ||||
| $ | 342.8 | $ | 270.2 |
Accruals and payables include operational and capital costs and employee benefit amounts owing.
16. Other liabilities
| Dec. 31, 2025 | Dec. 31, 2024 | |||||
| Environmental and other provisions (note 21) | $ | 90.2 | $ | 29.9 | ||
| Pension obligations | 0.9 | 1.0 | ||||
| Other employee benefits | 3.6 | 3.5 | ||||
| $ | 94.7 | $ | 34.4 |
39 |
|
HUDBAY MINERALS INC. Notes to Audited Consolidated Financial Statements (in millions of US dollars, except where otherwise noted) Years ended December 31, 2025 and 2024
|
17. Other financial liabilities
| Dec. 31, 2025 | Dec. 31, 2024 | |||||
| Current | ||||||
| Derivative liabilities | $ | 31.9 | $ | 0.3 | ||
| Equipment financing | 26.2 | 16.3 | ||||
| Deferred Copper Mountain acquisition consideration | 3.0 | - | ||||
| Agreements with communities recorded at amortized cost | 61.8 | 21.7 | ||||
| 122.9 | 38.3 | |||||
| Non-current | ||||||
| Equipment financing | 66.0 | 60.4 | ||||
| Agreements with communities recorded at amortized cost | 44.1 | 46.7 | ||||
| Deferred Copper Mountain acquisition consideration | 14.4 | - | ||||
| Contingent Copper Mountain acquisition consideration | 13.9 | - | ||||
| Wheaton refund liability | 7.9 | 7.3 | ||||
| Other financial liability | 8.7 | - | ||||
| 155.0 | 114.4 | |||||
| $ | 277.9 | $ | 152.7 |
Equipment financing represents agreements that Hudbay has entered into to purchase mining equipment. Hudbay owns the assets and finances the payment of these assets over the specified term. These agreements expire between 2026 and 2032 with interest rates between 2.25% and 7.55% per annum. During the year ended December 31, 2025, $33.1 million (December 31, 2024 - $71.0 million) of capital additions related to the recognition of property, plant and equipment that has been financed (note 32).
Agreements with communities recorded at amortized cost relate to agreements with communities near the Constancia operation which allow Hudbay to extract minerals over the useful life of the Constancia operation, carry out exploration and evaluation activities in the area and provide Hudbay with community support to operate in the region. During the year ended December 31, 2025, there was a change in estimate related to amendments of life of mine agreements with respect to Pampacancha and Constancia, and Hudbay entered into three additional two-year agreements, resulting in net additions of $39.5 million.
As part of the acquisition of the remaining 25% interest in CMBC (note 5), the Company recorded $16.6 million of deferred payment consideration and $13.3 million of contingent consideration as a financial liability at amortized cost on the closing of the transaction. During the year ended December 31, 2025, accretion related to these liabilities was $1.4 million (note 6h).
As part of the streaming agreement for the 777 mine, Hudbay must repay, with precious metals credits, the stream deposit by August 1, 2052, the expiry date of the agreement. If the stream deposit is not fully repaid with precious metals credits from 777 production by the expiry date, a payment for the remaining amount will be due at the expiry date of the agreement. As the 777 mine has concluded all mining activities following the depletion of reserves and finalized the sales of produced concentrate, Hudbay concluded that the remaining stream deposit will not be repaid by means of precious metals credits from 777 production. The repayment amount is recorded as a Wheaton refund liability, which is and will be discounted at the 9.0% rate inherent in the original 777 stream agreement and accreted over the remaining term of the agreement.
40 |
|
HUDBAY MINERALS INC. Notes to Audited Consolidated Financial Statements (in millions of US dollars, except where otherwise noted) Years ended December 31, 2025 and 2024
|
The following table summarizes changes in agreements with communities recorded at amortized cost:
| Balance, January 1, 2024 | $ | 54.9 | |
| Net additions | 18.6 | ||
| Disbursements | (9.1 | ) | |
| Accretion (note 6h) | 4.7 | ||
| Effects of changes in foreign exchange | (0.7 | ) | |
| Balance, December 31, 2024 | $ | 68.4 | |
| Net additions | 39.5 | ||
| Disbursements | (17.5 | ) | |
| Accretion (note 6h) | 6.4 | ||
| Effects of changes in foreign exchange | 9.1 | ||
| Balance, December 31, 2025 | $ | 105.9 |
41 |
|
HUDBAY MINERALS INC. Notes to Audited Consolidated Financial Statements (in millions of US dollars, except where otherwise noted) Years ended December 31, 2025 and 2024
|
18. Lease liabilities
| Balance, January 1, 2024 | $ | 90.3 | |
| Additional capitalized leases | 25.5 | ||
| Lease payments | (31.4 | ) | |
| Derecognized leases | (11.5 | ) | |
| Accretion and other movements | 1.9 | ||
| Balance, December 31, 2024 | $ | 74.8 | |
| Additional capitalized leases | 17.7 | ||
| Lease payments | (36.9 | ) | |
| Derecognized leases | (0.9 | ) | |
| Accretion and other movements | 1.3 | ||
| Balance, December 31, 2025 | $ | 56.0 |
Lease liabilities are reflected in the consolidated balance sheets as follows:
| Dec. 31, 2025 | Dec. 31, 2024 | |||||
| Current | $ | 26.7 | $ | 30.5 | ||
| Non-current | 29.3 | 44.3 | ||||
| $ | 56.0 | $ | 74.8 |
Hudbay has entered into leases which expire between 2026 and 2037. The interest rates on leases which were capitalized have interest rates between 2.50% and 8.49%, per annum. The range of interest rates utilized for discounting the lease depends mostly on Hudbay acting as a lessee and duration of the lease. For certain leases, Hudbay has the option to purchase the equipment and vehicles leased at the end of the terms of the leases. Hudbay's obligations under these leases are secured by the lessor's title to the leased assets. The present value of applicable lease payments has been recognized as an ROU asset, which was included as a non-cash addition to property, plant and equipment, and a corresponding amount as a lease liability.
There are no restrictions placed on Hudbay by entering into these leases.
The following outlines expenses recognized within the Company's consolidated statements of income, relating to leases for which a recognition exemption was applied.
| Year ended December 31, | ||||||
| 2025 | 2024 | |||||
| Short-term leases | $ | 19.6 | $ | 9.7 | ||
| Low value leases | 0.4 | 0.4 | ||||
| Variable leases | 18.6 | 23.0 | ||||
| Total | $ | 38.6 | $ | 33.1 | ||
Payments made for short-term, low value and variable leases would mostly be captured as expenses in the consolidated statements of income, however, certain amounts may be capitalized to PP&E for the Arizona segment during its development phase and certain amounts may be reported in inventories given the timing of sales. Variable payment leases include equipment used for heavy civil works at Constancia.
42 |
|
HUDBAY MINERALS INC. Notes to Audited Consolidated Financial Statements (in millions of US dollars, except where otherwise noted) Years ended December 31, 2025 and 2024
|
19. Long-term debt
| Dec. 31, 2025 | Dec. 31, 2024 | |||||
| Current: | ||||||
| Senior unsecured notes (a) | $ | 472.1 | $ | - | ||
| Non-current: | ||||||
| Senior unsecured notes (a) | 538.8 | 1,111.1 | ||||
| Senior secured revolving credit facilities (b) | (2.3 | ) | (3.6 | ) | ||
| 536.5 | 1,107.5 | |||||
| Total Long-term debt | $ | 1,008.6 | $ | 1,107.5 |
(a) Senior unsecured notes
| Balance, January 1, 2024 | $ | 1,190.6 | |
| Repurchases | (82.6 | ) | |
| Write-down of unamortized transaction costs | 0.6 | ||
| Accretion of transaction costs and premiums | 2.5 | ||
| Balance, December 31, 2024 | $ | 1,111.1 | |
| Repurchases | (102.5 | ) | |
| Write-down of unamortized transaction costs | 0.2 | ||
| Accretion of transaction costs and premiums | 2.1 | ||
| Balance, December 31, 2025 | $ | 1,010.9 |
As at December 31, 2025, $1,014.9 million aggregate principal amount of senior notes were outstanding in two series: (i) a series of 4.50% senior notes due April 2026 ("2026 notes") in an aggregate principal amount of $472.5 million and (ii) a series of 6.125% senior notes due April 2029 ("2029 notes") in an aggregate principal amount of $542.4 million. To date, the Company repurchased and retired a total of $127.5 million of the 2026 notes and $57.6 million of the 2029 notes at a discount.
During the year ended December 31, 2025, the Company repurchased and retired a total of $102.5 million of the 2026 notes at a discount. For the year ended December 31, 2025, the discount of $0.4 million (year ended December 31, 2024 - $0.7 million) was recorded as Other expenses in the consolidated statements of income. Upon the repurchase and retirement of $102.5 million of senior unsecured notes, the unamortized transaction costs related to this principal amount for the year ended December 31, 2025 of $0.1 million (year ended December 31, 2024 - $0.6 million) were recorded as a finance expense in the consolidated statements of income.
The senior notes are guaranteed on a senior unsecured basis by substantially all of the Company's subsidiaries, other than HudBay (BVI) Inc. and certain excluded or unrestricted subsidiaries, and subsidiaries that hold the Copper World and Mason projects as well as any newly formed or acquired subsidiaries that primarily hold or may develop non-producing mineral assets that are in the pre-construction phase of development.
43 |
|
HUDBAY MINERALS INC. Notes to Audited Consolidated Financial Statements (in millions of US dollars, except where otherwise noted) Years ended December 31, 2025 and 2024
|
(b) Senior secured revolving credit facilities
| Balance, January 1, 20241 | $ | 96.9 | |
| Repayments | (100.0 | ) | |
| Accretion of transaction costs | 2.0 | ||
| Transaction costs | (2.5 | ) | |
| Balance, December 31, 20241 | $ | (3.6 | ) |
| Accretion of transaction costs | 1.3 | ||
| Balance, December 31, 20251 | $ | (2.3 | ) |
| 1 Balance, representing deferred transaction costs, is in an asset position. |
Hudbay has two senior secured revolving credit facilities with total commitments of $450.0 million and substantially similar terms and conditions for its Canadian and Peruvian businesses. Hudbay's revolving credit facilities are secured against substantially all of the Company's assets, other than those associated with Copper World and Mason projects. During 2024, Hudbay repaid $10.0 million under its Canadian revolving credit facility and $90.0 million under the Peruvian revolving credit facility. During the fourth quarter of 2024, the two senior secured revolving credit facilities were extended by three years from October 2025 to November 2028. The newly extended $450.0 million revolving credit facility includes an accordion feature to increase the facility by an additional $150 million at Hudbay's discretion during the four-year tenor. Hudbay incurred $2.5 million of transactions costs associated with the extension which were deferred and amortized over the new term of the credit facilities.
As at December 31, 2025, there were nil draws under the Canadian and Peruvian revolving credit facilities, other than letters of credit to support reclamation and pension obligations as described below.
As at December 31, 2025, the Peru segment had nil in letters of credit issued under the Peru revolving credit facility to support its reclamation obligations and the Manitoba segment had $25.2 million in letters of credit issued under the Canadian revolving credit facility to support its reclamation and pension obligations. As at December 31, 2025, we were in compliance with our covenants under the revolving credit facilities.
Surety bonds
The Arizona segment had $18.4 million in surety bonds issued to support future reclamation and closure obligations. No cash collateral is required to be posted under these surety bonds.
The British Columbia segment had $47.9 million in surety bonds issued to support future reclamation and closure obligations. The British Columbia segment had $1.0 million in surety bonds issued to BC Hydro in relation to the BC Hydro transmission system at the Copper Mountain Mine, and to Fisheries and Oceans Canada for fish monitoring. No cash collateral is required to be posted under these surety bonds.
The Peru segment had $23.3 million in surety bonds issued to support future reclamation and closure obligations. No cash collateral is required to be posted under these surety bonds.
Other letters of credit
The Peru segment had $111.7 million in letters of credit issued with various Peruvian financial institutions to support future reclamation and other operating matters. No cash collateral is required to be posted under these letters of credit.
The British Columbia segment had $0.3 million in letters of credit issued to the Ministry of Finance and Ministry of Transport and Transit related to other operating matters. No cash collateral is required to be posted under these letters of credit.
Hudbay has a C$130.0 million bilateral letter of credit facility ("LC Facility") with a major Canadian financial institution. As at December 31, 2025, the Manitoba segment had $56.4 million in letters of credit issued under the LC Facility to support its reclamation and pension obligations.
44 |
|
HUDBAY MINERALS INC. Notes to Audited Consolidated Financial Statements (in millions of US dollars, except where otherwise noted) Years ended December 31, 2025 and 2024
|
20. Deferred revenue
Peru Stream Agreement
For the year ended December 31, 2025, the drawdown rates for the Peru stream agreement for gold and silver were $860 and $15.06 per ounce, respectively (year ended December 31, 2024 - $817 and $14.56 per ounce, respectively).
The following table summarizes changes in deferred revenue:
| Balance, January 1, 2024 | $ | 418.5 | |
| Amortization of deferred revenue | |||
| Liability drawdown | (74.3 | ) | |
| Variable consideration adjustments - prior periods | 3.8 | ||
| Accretion on streaming arrangements | |||
| Current year additions | 24.0 | ||
| Variable consideration adjustments - prior periods | 0.2 | ||
| Balance, December 31, 2024 | $ | 372.2 | |
| Amortization of deferred revenue (note 6a) | |||
| Liability drawdown | (65.1 | ) | |
| Variable consideration adjustments - prior periods | (9.9 | ) | |
| Accretion on streaming arrangements (note 6h) | |||
| Current year-to-date additions | 20.5 | ||
| Variable consideration adjustments - prior periods | (0.6 | ) | |
| Balance, December 31, 2025 | $ | 317.1 |
Consideration from the Company's stream agreement is considered variable. Gold and silver stream revenue can be subject to cumulative adjustments when the number of ounces to be delivered under the contract changes. As a result of changes in the Company's mineral reserve and resource estimate in the first quarter of 2025, the amortization rate by which deferred revenue is drawn down into income was adjusted and, as required, a current period variable adjustment was made for all prior period stream revenues since the stream agreement inception date. This variable consideration adjustment resulted in an increase in revenue of $9.9 million and a decrease of finance expense of $0.6 million for the year ended December 31, 2025 (year ended December 31, 2024 - decrease in revenue of $3.8 million and an increase of finance expense of $0.2 million).
Deferred revenue is reflected in the consolidated balance sheets as follows:
| Dec. 31, 2025 | Dec. 31, 2024 | |||||
| Current | $ | 52.1 | $ | 63.1 | ||
| Non-current | 265.0 | 309.1 | ||||
| $ | 317.1 | $ | 372.2 |
45 |
|
HUDBAY MINERALS INC. Notes to Audited Consolidated Financial Statements (in millions of US dollars, except where otherwise noted) Years ended December 31, 2025 and 2024
|
21. Environmental and other provisions
|
Decommis- sioning, restoration and similar liabilities |
Deferred share units3 |
Restricted share units1, 3 |
Performance share units3 |
Other2 | Total | |||||||||||||
| Balance, January 1, 2025 | $ | 296.9 | $ | 12.3 | $ | 9.6 | $ | 5.5 | $ | 6.4 | $ | 330.7 | ||||||
| Net change in provision | 26.2 | 0.9 | 11.5 | 16.0 | 9.5 | 64.1 | ||||||||||||
| Disbursements | (1.7 | ) | (5.4 | ) | (6.3 | ) | (3.5 | ) | (0.9 | ) | (17.8 | ) | ||||||
| Reduction of obligation to renounce flow-through share expenditures, net of provisions | - | - | - | - | (5.5 | ) | (5.5 | ) | ||||||||||
| Unwinding of discount (note 6h) | 11.1 | - | - | - | - | 11.1 | ||||||||||||
| Effect of change in discount rate | (25.9 | ) | - | - | - | - | (25.9 | ) | ||||||||||
| Effect of foreign exchange | 11.8 | 0.7 | 0.3 | 0.3 | 0.4 | 13.5 | ||||||||||||
| Effect of change in share price | - | 13.0 | 11.0 | 8.6 | - | 32.6 | ||||||||||||
| Balance, December 31, 2025 | $ | 318.4 | $ | 21.5 | $ | 26.1 | $ | 26.9 | $ | 9.9 | $ | 402.8 |
1 Certain amounts relating to the Arizona segment are capitalized.
2 Relates primarily to flow-through share premiums, restructuring costs and other non-capital provisions.
3 Please refer to note 26a for further information.
Provisions are reflected in the consolidated balance sheets as follows:
| December 31, 2025 |
Decommis- sioning, restoration and similar liabilities |
Deferred share units |
Restricted share units |
Performance share units |
Other | Total | ||||||||||||
| Current (note 16) | $ | 20.6 | $ | 21.5 | $ | 20.5 | $ | 19.0 | $ | 8.6 | $ | 90.2 | ||||||
| Non-current | 297.8 | - | 5.6 | 7.9 | 1.3 | 312.6 | ||||||||||||
| $ | 318.4 | $ | 21.5 | $ | 26.1 | $ | 26.9 | $ | 9.9 | $ | 402.8 |
|
Decommis- sioning, restoration and similar liabilities |
Deferred share units3 |
Restricted share units1,3 |
Performan- ce share units3 |
Other2 | Total | |||||||||||||
| Balance, January 1, 2024 | $ | 315.4 | $ | 8.7 | $ | 5.0 | $ | 2.6 | $ | 12.5 | $ | 344.2 | ||||||
| Net additional provisions made | 14.5 | 1.1 | 5.6 | 3.1 | 0.8 | 25.1 | ||||||||||||
| Disbursements | (2.1 | ) | (1.6 | ) | (2.2 | ) | (0.9 | ) | (4.8 | ) | (11.6 | ) | ||||||
| Reduction of obligation to renounce flow-through share-expenditures, net of provisions | - | - | - | - | (2.0 | ) | (2.0 | ) | ||||||||||
| Unwinding of discount (note 6h) | 10.5 | - | - | - | - | 10.5 | ||||||||||||
| Effect of change in discount rate | (22.7 | ) | - | - | - | - | (22.7 | ) | ||||||||||
| Effect of foreign exchange | (18.7 | ) | (1.1 | ) | (0.5 | ) | (0.4 | ) | (0.1 | ) | (20.8 | ) | ||||||
| Effect of change in share price | - | 5.2 | 1.7 | 1.1 | - | 8.0 | ||||||||||||
| Balance, December 31, 2024 | $ | 296.9 | $ | 12.3 | $ | 9.6 | $ | 5.5 | $ | 6.4 | $ | 330.7 |
1 Certain amounts relating to the Arizona segment are capitalized.
2 Relates primarily to restructuring costs and other non-capital provisions.
3 Please refer to note 26a for further information.
46 |
|
HUDBAY MINERALS INC. Notes to Audited Consolidated Financial Statements (in millions of US dollars, except where otherwise noted) Years ended December 31, 2025 and 2024
|
| December 31, 2024 |
Decommis- sioning, restoration and similar liabilities |
Deferred share units |
Restricted share units |
Performance share units |
Other | Total | ||||||||||||
| Current (note 16) | $ | 4.0 | $ | 12.3 | $ | 6.4 | $ | 1.9 | $ | 5.3 | $ | 29.9 | ||||||
| Non-current | 292.9 | - | 3.2 | 3.6 | 1.1 | 300.8 | ||||||||||||
| $ | 296.9 | $ | 12.3 | $ | 9.6 | $ | 5.5 | $ | 6.4 | $ | 330.7 |
Decommissioning, restoration and similar liabilities are remeasured at each reporting date to reflect changes in discount rates, which can significantly affect the liabilities.
Decommissioning, restoration and similar liabilities ("DRO")
Hudbay's decommissioning, restoration and similar liabilities relate to the rehabilitation and closure of currently operating mines and metallurgical plants, development-phase properties and closed properties. The amount of the provision has been recorded based on estimates and assumptions that management believes are reasonable; however, actual decommissioning and restoration costs may differ from expectations.
DRO are remeasured at each reporting date to reflect changes in discount rates, inflation, exchange rates, and timing and extent of cash outflows which can significantly affect the liabilities. The amount of this provision has been recorded based on estimates and assumptions that management believes are reasonable; however, actual decommissioning and restoration costs may differ from expectations.
During the year ended December 31, 2025, the Company recorded a non-cash loss of $0.2 million in the consolidated statements of income mainly related to a revaluation adjustment of Flin Flon's environmental reclamation provision (December 31, 2024 - gain of $3.5 million). The re-evaluation adjustment was impacted by the timing and extent of cash flows for Flin Flon's closed sites. The adjustment also reflects net changes in long term, risk-free real discount rates based on changes in Canadian bond yields as well as increases in inflation rates. Typically, an operating site will reflect any revaluation adjustments of its environmental reclamation provision against its reclamation assets. However, since the Flin Flon operations closed in June 2022, the corresponding Flin Flon assets have been fully depreciated and cannot be reduced below their residual value, resulting in the remaining impact being recorded as a non-cash gain in re-evaluation adjustment - environmental provision in the consolidated statements of income.
Hudbay's decommissioning and restoration liabilities relate mainly to its Manitoba, Peru and British Columbia operations. Management has placed the remaining Flin Flon assets on care and maintenance. The majority of closure activities will occur once all mining activities in Manitoba are completed. These provisions also reflect estimated post-closure cash flows that extend to the year 2124 for ongoing monitoring and water treatment requirements. Management anticipates most decommissioning and restoration activities for the Peru operation will occur from 2039 to 2103, which include ongoing monitoring and water treatment requirements. Management anticipates most decommissioning and restoration activities for the British Columbia operation will occur from 2041 to 2142, which include ongoing monitoring and water treatment requirements.
As at December 31, 2025, decommissioning, restoration and similar liabilities have been discounted to their present value at rates ranging from 2.41% to 4.95% per annum (December 31, 2024 - 2.87% to 4.88%), using pre-tax, risk-free interest rates that reflect the estimated maturity of each specific liability.
47 |
|
HUDBAY MINERALS INC. Notes to Audited Consolidated Financial Statements (in millions of US dollars, except where otherwise noted) Years ended December 31, 2025 and 2024
|
22. Pension obligations
Hudbay maintains non-contributory and contributory defined benefit pension plans for certain of its employees.
The Company uses a December 31 measurement date for all of its plans. For Hudbay's significant plans, the most recent actuarial valuations filed for funding purposes were performed during 2025 using the latest data available as at December 31, 2024. For these plans, the next actuarial valuation required for funding purposes will be performed during 2026 using the data as of December 31, 2025.
Movements in the present value of the defined benefit obligation in the current and previous years were as follows:
| Year ended | ||||||
| Dec. 31, 2025 | Dec. 31, 2024 | |||||
| Opening defined benefit obligation: | $ | 101.4 | $ | 115.3 | ||
| Current service costs | 4.7 | 4.7 | ||||
| Past service cost (note 6d) | - | 2.7 | ||||
| Interest cost | 4.7 | 4.8 | ||||
| Benefits paid from plan | (7.4 | ) | (10.1 | ) | ||
| Benefits paid from employer | (0.7 | ) | (1.3 | ) | ||
| Remeasurement actuarial losses/(gains): | ||||||
| Arising from changes in demographic assumptions | - | (6.2 | ) | |||
| Arising from changes in financial assumptions | (4.3 | ) | 1.3 | |||
| Arising from experience adjustments | (0.8 | ) | (0.5 | ) | ||
| Effects of movements in exchange rates | 5.3 | (9.3 | ) | |||
| Closing defined benefit obligation | $ | 102.9 | $ | 101.4 | ||
The defined benefit obligation closing balance, by member group, is as follows:
| Dec. 31, 2025 | Dec. 31, 2024 | |||||
| Active members | $ | 84.8 | $ | 88.4 | ||
| Deferred members | 4.0 | 2.8 | ||||
| Retired members | 14.1 | 10.2 | ||||
| Closing defined benefit obligation | $ | 102.9 | $ | 101.4 |
48 |
|
HUDBAY MINERALS INC. Notes to Audited Consolidated Financial Statements (in millions of US dollars, except where otherwise noted) Years ended December 31, 2025 and 2024
|
Movements in the fair value of the pension plan assets in the current and previous years were as follows:
| Year ended | ||||||
| Dec. 31, 2025 | Dec. 31, 2024 | |||||
| Opening fair value of plan assets: | $ | 94.2 | $ | 106.0 | ||
| Interest income | 4.3 | 4.6 | ||||
| Contributions from the employer | 0.8 | 1.1 | ||||
| Employer direct benefit payments | 0.7 | 1.3 | ||||
| Contributions from plan participants | - | 0.1 | ||||
| Benefit payment from employer | (0.7 | ) | (1.3 | ) | ||
| Administrative expenses paid from plan assets | - | (0.1 | ) | |||
| Benefits paid | (7.4 | ) | (10.1 | ) | ||
| Settlement payments from plan assets | - | - | ||||
| Remeasurement adjustment: | ||||||
| Return on plan assets (excluding amounts included in net interest expense) | (2.0 | ) | 1.0 | |||
| Effects of changes in foreign exchange rates | 4.6 | (8.4 | ) | |||
| Closing fair value of plan assets | $ | 94.5 | $ | 94.2 | ||
The amount included in the consolidated balance sheets arising from the entity's obligation in respect of its defined benefit plans is as follows:
| Dec. 31, 2025 | Dec. 31, 2024 | |||||
| Present value of funded defined benefit obligation | $ | 87.7 | $ | 87.1 | ||
| Fair value of plan assets | (94.5 | ) | (94.2 | ) | ||
| Present value of unfunded defined benefit obligation | 15.2 | 14.3 | ||||
| Net liability arising from defined benefit obligation | $ | 8.4 | $ | 7.2 |
Reflected in the consolidated balance sheets as follows:
| Dec. 31, 2025 | Dec. 31, 2024 | |||||
| Pension obligation - current (note 16) | $ | 0.9 | $ | 1.0 | ||
| Pension obligation - non-current | 7.5 | 6.2 | ||||
| Total pension obligations | $ | 8.4 | $ | 7.2 |
49 |
|
HUDBAY MINERALS INC. Notes to Audited Consolidated Financial Statements (in millions of US dollars, except where otherwise noted) Years ended December 31, 2025 and 2024
|
Pension expense is as follows:
| Dec. 31, 2025 | Dec. 31, 2024 | |||||
| Service costs: | ||||||
| Current service cost | $ | 4.7 | $ | 4.7 | ||
| Past service cost | - | 2.7 | ||||
| Total service cost | 4.7 | 7.5 | ||||
| Net interest expense | 0.4 | 0.2 | ||||
| Administration cost | - | 0.1 | ||||
| Defined benefit pension expense | $ | 5.1 | $ | 7.8 | ||
| Defined contribution pension expense (note 6d) | $ | 2.5 | $ | 2.1 |
Remeasurement on the net defined benefit liability:
| Dec. 31, 2025 | Dec. 31, 2024 | |||||
| Return on plan assets (excluding amounts included in net interest expense) | $ | 2.0 | $ | (1.0 | ) | |
| Actuarial gain arising from changes in demographic assumptions | - | (6.2 | ) | |||
| Actuarial (gain) loss arising from changes in financial assumptions | (4.3 | ) | 1.3 | |||
| Actuarial gain arising from experience adjustments | (0.8 | ) | (0.5 | ) | ||
| Defined benefit gain related to remeasurement | $ | (3.1 | ) | $ | (6.4 | ) |
| Total pension cost | $ | 4.5 | $ | 3.5 |
Pension amounts recognized include those directly related to production of inventory; such amounts are recognized initially as costs of inventory and are expensed in the consolidated statements of income within cost of sales upon sale of the inventory.
The current service cost, the interest cost and administration cost for the year are included in the employee benefits expense. The remeasurement of the net defined benefit liability is included in OCI.
50 |
|
HUDBAY MINERALS INC. Notes to Audited Consolidated Financial Statements (in millions of US dollars, except where otherwise noted) Years ended December 31, 2025 and 2024
|
The defined benefit pension plans typically expose Hudbay to actuarial risks such as: investment risk, interest rate risk, longevity risk and salary risk.
| Investment risk | The present value of the liabilities for the defined benefit plans is calculated using a discount rate determined by reference to high quality corporate bond yields; if the return on plan assets is below this rate, it will create a plan deficit. Hudbay's primary quantitative investment objectives are maximization of the long term real rate of return, subject to an acceptable degree of investment risk and preservation of principal. Risk tolerance is established through consideration of several factors including past performance, current market condition and the funded status of the plan. |
| Interest risk | A decrease in the bond interest rate will increase the pension plan liabilities; however, this will be partially offset by an increase in the return on the plan's debt investments. |
| Longevity risk | The present value of the defined benefit plans liabilities is calculated by reference to the best estimate of the mortality of plan participants both during and after their employment. An increase in the life expectancy of the plan participants will increase the pension plans liabilities. |
| Salary risk | The present value of the defined benefit plans liabilities for some of the pension plans is calculated by reference to the future salaries of plan participants. As such, an increase in the salary of the plan participants will increase the plans' liabilities. |
The principal assumptions used for the purposes of the actuarial valuations were as follows:
| 2025 | 2024 | |
| Defined benefit cost: | ||
| Discount rate - benefit obligations | 4.66% | 4.64% |
| Discount rate - service cost | 4.73% | 4.64% |
| Expected rate of salary increase1 | 2.75% | 2.75% |
| Average longevity at retirement age for current pensioners (years)2 : | ||
| Males | 20.6 | 20.5 |
| Females | 24.0 | 23.9 |
| Defined benefit obligation: | ||
| Discount rate | 4.92% | 4.66% |
| Expected rate of salary increase1,3 | 2.75% | 2.75% |
| Average longevity at retirement age for current pensioners (years)2 : | ||
| Males | 20.7 | 20.6 |
| Females | 24.0 | 24.0 |
| Average longevity at retirement age for current employees (future pensioners) (years)2 : | ||
| Males | 22.5 | 22.5 |
| Females | 25.7 | 25.6 |
| 1 Plus merit and promotional scale based on member's age | ||
| 2 Revised retirement pension plan only - CPM2014 Priv with MI-2017 projection scale with loading of 1.25 and 1.15 for males and females | ||
| 3The 2024 defined benefit obligation rate of salary increase is 3.0% for 2024 and 2.75% thereafter. |
Hudbay reviews the assumptions used to measure pension costs (including the discount rate) on an annual basis. Economic and market conditions at the measurement date affect these assumptions from year to year. In determining the discount rate, Hudbay uses the cash flow approach.
51 |
|
HUDBAY MINERALS INC. Notes to Audited Consolidated Financial Statements (in millions of US dollars, except where otherwise noted) Years ended December 31, 2025 and 2024
|
Significant actuarial assumptions for the determination of the defined benefit obligation are discount rate, expected salary increase and mortality. The sensitivity analysis below has been determined based on reasonably possible changes of the respective assumptions occurring at the end of the reporting periods, while holding other assumptions constant:
- If the discount rate is 50 basis points higher (lower), the defined benefit obligation would decrease by $8.1 million (increase by $9.2 million).
- If the expected salary growth increases (decreases) by 1%, the defined benefit obligation would increase by $1.1 million (decrease by $1.0 million).
- If the life expectancy increases (decreases) by one year for both men and women, the defined benefit obligation would increase by $0.8 million (decrease by $0.8 million).
The sensitivity analysis presented above may not be representative of the actual change in the defined benefit obligation as it is unlikely that the change in assumptions would occur in isolation of one another as some of the assumptions may be correlated.
Furthermore, in presenting the above sensitivity analysis, the present value of the defined benefit obligation has been calculated using the projected unit credit method at the end of the reporting period, which is the same as that applied in calculating the defined benefit obligation liability recognized in the consolidated balance sheets.
The Company's main pension plans are registered federally with the Office of the Superintendent of Financial Institution and with the Canada Revenue Agency. The registered pension plans are governed in accordance with the Pension Benefits Standards Act and the Income Tax Act. The sponsor contributes the amount needed to maintain adequate funding as dictated by the prevailing regulations.
Expected employer contribution to the pension plans for the fiscal year ending December 31, 2025 is $1.6 million.
The average duration of the pension obligation at December 31, 2025 is 17.6 years (2024 - 18.7 years). This number can be broken down as follows:
- Active members: 19.0 years (2024: 19.8 years)
- Deferred members: 19.0 years (2024: 17.8 years)
- Retired members: 8.4 years (2024: 9.4 years)
Asset-Liability-Matching studies are performed periodically to analyze the investment policies in terms of risk and-return profiles.
The pension plans do not invest directly in either securities or property/real estate of the Company.
With the exception of fixed income investments and certain equity instruments, the plan assets are actively managed by investment managers, with the goal of attaining returns that potentially outperform passively managed investments. Within appropriate limits, the actual composition of the invested funds may vary from the prescribed investment mix.
52 |
|
HUDBAY MINERALS INC. Notes to Audited Consolidated Financial Statements (in millions of US dollars, except where otherwise noted) Years ended December 31, 2025 and 2024
|
The following is a summary of the fair value classification levels for investment:
| December 31, 2025 | Level 1 | Level 2 | Level 3 | Total | ||||||||
| Investments: | ||||||||||||
| Money market instruments | $ | 1.0 | $ | - | $ | - | $ | 1.0 | ||||
| Pooled equity funds | 34.6 | - | - | 34.6 | ||||||||
| Pooled fixed income funds | - | 58.5 | - | 58.5 | ||||||||
| Balanced funds | - | 0.4 | - | 0.4 | ||||||||
| $ | 35.6 | $ | 58.9 | $ | - | $ | 94.5 |
| December 31, 2024 | Level 1 | Level 2 | Level 3 | Total | ||||||||
| Investments: | ||||||||||||
| Money market instruments | $ | 1.1 | $ | - | $ | - | $ | 1.1 | ||||
| Pooled equity funds | 33.0 | - | - | 33.0 | ||||||||
| Pooled fixed income funds | - | 59.6 | - | 59.6 | ||||||||
| Balanced funds | - | 0.5 | - | 0.5 | ||||||||
| $ | 34.1 | $ | 60.1 | $ | - | $ | 94.2 |
53 |
|
HUDBAY MINERALS INC. Notes to Audited Consolidated Financial Statements (in millions of US dollars, except where otherwise noted) Years ended December 31, 2025 and 2024
|
23. Other employee benefits
Hudbay sponsors both other long-term employee benefit plans and non-pension post-employment benefits plans and uses a December 31 measurement date. These obligations relate mainly to commitments for post-retirement health benefits. Information about Hudbay's post-employment and other long-term employee benefits is as follows:
Movements in the present value of the defined benefit obligation in the current and previous years were:
| Year ended | ||||||
| Dec. 31, 2025 | Dec. 31, 2024 | |||||
| Opening defined benefit obligation | $ | 81.5 | $ | 103.2 | ||
| Current service cost1 | 1.8 | 2.8 | ||||
| Past service cost | - | 1.6 | ||||
| Interest cost | 3.8 | 4.5 | ||||
| Benefits paid | (2.8 | ) | (2.9 | ) | ||
| Remeasurement actuarial (gain)/loss: | ||||||
| Arising from changes in demographic assumptions | - | (12.8 | ) | |||
| Arising from changes in financial assumptions | (4.4 | ) | (1.2 | ) | ||
| Arising from experience adjustments | (0.4 | ) | (5.3 | ) | ||
| Effects of movements in exchange rates | 4.1 | (8.4 | ) | |||
| Closing defined benefit obligation | $ | 83.6 | $ | 81.5 | ||
1 Includes remeasurement of other long term employee benefits
The defined benefit obligation closing balance, by group member, is as follows:
| Dec. 31, 2025 | Dec. 31, 2024 | |||||
| Active members | $ | 26.6 | $ | 26.7 | ||
| Inactive members | 57.0 | 54.8 | ||||
| Closing defined benefit obligation | $ | 83.6 | $ | 81.5 |
Movements in the fair value of defined benefit amounts in the current and previous years were as follows:
| Dec. 31, 2025 | Dec. 31, 2024 | |||||
| Employer contributions | $ | 2.8 | $ | 2.9 | ||
| Benefits paid | (2.8 | ) | (2.9 | ) | ||
| Closing fair value of assets | $ | - | $ | - |
The non-pension employee benefit plan obligations are unfunded.
54 |
|
HUDBAY MINERALS INC. Notes to Audited Consolidated Financial Statements (in millions of US dollars, except where otherwise noted) Years ended December 31, 2025 and 2024
|
Reconciliation of assets and liabilities recognized in the consolidated balance sheets:
| Dec. 31, 2025 | Dec. 31, 2024 | |||||
| Unfunded benefit obligation | $ | 83.6 | $ | 81.5 | ||
| Vacation accrual and other - non-current | 2.4 | 2.3 | ||||
| Net liability | $ | 86.0 | $ | 83.8 |
Reflected in the consolidated balance sheets as follows:
| Dec. 31, 2025 | Dec. 31, 2024 | |||||
| Other employee benefits liability - current (note 16) | $ | 3.6 | $ | 3.5 | ||
| Other employee benefits liability - non-current | 82.4 | 80.3 | ||||
| Net liability | $ | 86.0 | $ | 83.8 |
Other employee future benefit expense includes the following:
| Dec. 31, 2025 | Dec. 31, 2024 | |||||
| Current service cost 1 | $ | 1.8 | $ | 2.8 | ||
| Past service cost | - | 1.6 | ||||
| Net interest cost | 3.8 | 4.5 | ||||
| Components recognized in consolidated statements of income | $ | 5.6 | $ | 8.9 |
| 1 Includes remeasurement of other long term employee benefit and curtailment |
| Dec. 31, 2025 | Dec. 31, 2024 | |||||
| Remeasurement on the net defined benefit liability: | ||||||
| Actuarial gain arising from changes in demographic assumptions | $ | - | $ | (12.8 | ) | |
| Actuarial gain arising from changes in financial assumptions | (4.4 | ) | (1.2 | ) | ||
| Actuarial gain arising from changes experience adjustments | (0.4 | ) | (5.3 | ) | ||
| Components recognized in statements of comprehensive income | $ | (4.8 | ) | $ | (19.3 | ) |
| Total other employee future benefit expense / (income) | $ | 0.8 | $ | (10.4 | ) |
Other employee benefit amounts recognized include those directly related to production of inventory; such amounts are recognized initially as costs of inventory and are expensed in the consolidated statements of income within cost of sales upon sale of the inventory.
55 |
|
HUDBAY MINERALS INC. Notes to Audited Consolidated Financial Statements (in millions of US dollars, except where otherwise noted) Years ended December 31, 2025 and 2024
|
| Dec. 31, 2025 | Dec. 31, 2024 | |
| Defined benefit cost: | ||
| Discount rate | 4.74% | 4.64% |
| Initial weighted average health care trend rate | 5.67% | 5.82% |
| Ultimate weighted average health care trend rate | 4.00% | 4.00% |
| Average longevity at retirement age for current pensioners (years)1 : | ||
| Males | 20.6 | 20.5 |
| Females | 24.0 | 23.9 |
| Dec. 31, 2025 | Dec. 31, 2024 | |
| Defined benefit obligation: | ||
| Discount rate | 5.05% | 4.74% |
| Initial weighted average health care trend rate | 5.59% | 5.67% |
| Ultimate weighted average health care trend rate | 4.00% | 4.00% |
| Average longevity at retirement age for current pensioners (years)1 : | ||
| Males | 20.7 | 20.6 |
| Females | 24.0 | 24.0 |
| Average longevity at retirement age for current employees (future pensioners) (years)1 : | ||
| Males | 22.5 | 22.5 |
| Females | 25.7 | 25.6 |
1 CPM2014 Priv with MI-2017 projection scale with loading of 1.25 and 1.15 for males and females.
Hudbay reviews the assumptions used to measure other employee benefit costs (including the discount rate) on an annual basis.
The other employee benefit costs typically expose Hudbay to actuarial risks such as: interest rate risk, health care cost inflation risk and longevity risk.
| Interest risk | A decrease in the bond interest rate will increase the plan liabilities. |
|
Health care cost inflation risk |
The majority of the plan's benefit obligations are linked to health care cost inflation and higher inflation will lead to higher liabilities. |
| Longevity risk |
The majority of the plans' benefit liability is calculated by reference to the best estimate of the mortality of plan participants both during and after their employment. An increase in the life expectancy of the plan participants will increase the plans' liabilities. This is particularly significant for benefits subject to health care cost inflation where increases in inflation result in higher sensitivity to changes in life expectancy. |
56 |
|
HUDBAY MINERALS INC. Notes to Audited Consolidated Financial Statements (in millions of US dollars, except where otherwise noted) Years ended December 31, 2025 and 2024
|
The sensitivity analyses below have been determined based on reasonably possible changes of the respective assumptions occurring at the end of the reporting period, while holding other assumptions constant:
- If the discount rate is 50 basis points higher (lower), the defined benefit obligation would decrease by $5.7 million (increase by $6.4 million).
- If the health care cost assumption increases (decreases) by 1%, the defined benefit obligation would increase by $12.9 million (decrease by $10.4 million).
- If the life expectancy increases (decreases) by one year for both men and women, the defined benefit obligations would increase by $3.2 million (decrease by $3.2 million).
The average duration of the non-pension post-employment obligation at December 31, 2025 is 14.4 years (2024: 15.0 years).
This number can be broken down as follows:
- Active members: 22.3 years (2024: 23.0 years)
- Inactive members: 10.9 years (2024: 11.3 years)
24. Income and mining taxes
(a) Tax expense:
The tax expense is applicable as follows:
| Year ended December 31, | ||||||
| 2025 | 2024 | |||||
| Current: | ||||||
| Income taxes | $ | 209.1 | $ | 119.7 | ||
| Mining taxes | 83.4 | 57.0 | ||||
| Adjustments in respect of prior years | (1.2 | ) | 0.2 | |||
| 291.3 | 176.9 | |||||
| Deferred: | ||||||
| Income tax expense (recovery) - origination, revaluation and/or reversal of temporary differences | 61.3 | 15.3 | ||||
| Mining tax recovery - origination, revaluation and/or reversal of temporary difference | (3.8 | ) | (5.6 | ) | ||
| Adjustments in respect of prior years | (1.1 | ) | (2.8 | ) | ||
| 56.4 | 6.9 | |||||
| $ | 347.7 | $ | 183.8 | |||
Adjustments in respect of prior years refers to amounts changing due to the filing of tax returns and assessments from government authorities as well as any change identified that would result in a difference to our current or deferred tax balances as reported in the prior fiscal year end.
57 |
|
HUDBAY MINERALS INC. Notes to Audited Consolidated Financial Statements (in millions of US dollars, except where otherwise noted) Years ended December 31, 2025 and 2024
|
(b) Deferred tax assets and liabilities as represented on the consolidated balance sheets:
| Dec. 31, 2025 | Dec. 31, 2024 | |||||
| Deferred income tax asset | $ | 66.5 | $ | 102.6 | ||
| Deferred income tax liability | (343.1 | ) | (305.5 | ) | ||
| Deferred mining tax liability | (32.2 | ) | (34.9 | ) | ||
| (375.3 | ) | (340.4 | ) | |||
| Net deferred tax liability balance, end of year | $ | (308.8 | ) | $ | (237.8 | ) |
(c) Changes in deferred tax assets and liabilities:
| Year ended December 31, | ||||||
| 2025 | 2024 | |||||
| Net deferred tax liability balance, beginning of year | $ | (237.8 | ) | $ | (255.3 | ) |
| Deferred tax expense (note 24a) | (56.4 | ) | (6.9 | ) | ||
| OCI transactions | (0.7 | ) | (3.2 | ) | ||
| Foreign currency translation on the deferred tax liability | (13.9 | ) | 27.6 | |||
| Net deferred tax liability balance, end of year | $ | (308.8 | ) | $ | (237.8 | ) |
58 |
|
HUDBAY MINERALS INC. Notes to Audited Consolidated Financial Statements (in millions of US dollars, except where otherwise noted) Years ended December 31, 2025 and 2024
|
(d) Reconciliation to statutory tax rate:
As a result of its mining operations, the Company is subject to both income and mining taxes. Generally, most expenditures incurred are deductible in computing income tax, whereas mining tax legislation, although based on a measure of profitability from carrying on mining operations, is more restrictive in respect of the deductions permitted in computing income subject to mining tax. These restrictions include costs unrelated to mining operations as well as deductions for financing expenses, such as interest and royalties. In addition, income unrelated to carrying on mining operations is not subject to mining tax.
A reconciliation between tax expense and the product of accounting profit multiplied by the Company's statutory income tax rate for the years ended December 31, 2025 and 2024 is as follows:
| Year ended December 31, | ||||||
| 2025 | 2024 | |||||
| Income before tax | $ | 912.0 | $ | 251.6 | ||
| Statutory tax rate | 26.7% | 26.7% | ||||
| Tax expense at statutory rate | 243.5 | 67.2 | ||||
| Effect of: | ||||||
| Deductions related to mining taxes | (24.2 | ) | (16.3 | ) | ||
| Adjusted income taxes | 219.3 | 50.9 | ||||
| Mining tax expense | 76.9 | 50.0 | ||||
| 296.2 | 100.9 | |||||
| Permanent differences related to: | ||||||
| Capital items | (7.4 | ) | 0.5 | |||
| Other income tax permanent differences | (0.8 | ) | 4.1 | |||
| Withholding tax on dividends | 9.0 | 1.8 | ||||
| Impact of remeasurement on decommissioning liability | (1.7 | ) | 6.5 | |||
| Temporary income tax differences (recognized)/not recognized | (5.4 | ) | 8.3 | |||
| Recognition of previously unrecognized deferred tax assets | (2.4 | ) | - | |||
| Impact related to differences in tax rates in foreign operations | 71.6 | 36.7 | ||||
| Impact of changes to statutory tax rates | - | (4.4 | ) | |||
| Effect of flow through shares | 4.3 | 3.9 | ||||
| Foreign exchange on non-monetary items | (15.4 | ) | 26.2 | |||
| Impact related to tax assessments and tax return amendments | 0.4 | (1.2 | ) | |||
| Other | (0.7 | ) | 0.5 | |||
| Tax expense | $ | 347.7 | $ | 183.8 | ||
59 |
|
HUDBAY MINERALS INC. Notes to Audited Consolidated Financial Statements (in millions of US dollars, except where otherwise noted) Years ended December 31, 2025 and 2024
|
(e) Income tax effect of temporary differences - recognized:
The tax effects of temporary differences that give rise to significant portions of the deferred tax assets and deferred tax liabilities at December 31, 2025 and 2024 are as follows:
| Balance sheet | ||||||
| Dec. 31, 2025 | Dec. 31, 2024 | |||||
| Deferred income tax (liability) asset | ||||||
| Property, plant and equipment | $ | (65.5 | ) | $ | (54.5 | ) |
| Pension obligation | 2.3 | 2.0 | ||||
| Other employee benefits | 35.8 | 25.1 | ||||
| Decommissioning and restoration provision | 24.4 | 19.3 | ||||
| Non-capital losses | 53.7 | 107.3 | ||||
| Share issuance and debt cost | 2.9 | 3.8 | ||||
| Deferred revenue | 1.8 | 1.7 | ||||
| Other | 11.1 | (2.1 | ) | |||
| Deferred income tax asset | 66.5 | 102.6 | ||||
| Deferred income tax liability (asset) | ||||||
| Property, plant and equipment | 526.9 | 451.6 | ||||
| Other employee benefits | (1.7 | ) | (1.2 | ) | ||
| Decommissioning and restoration provision | (12.8 | ) | (11.8 | ) | ||
| Non-capital losses | (158.7 | ) | (116.7 | ) | ||
| Other | (10.6 | ) | (16.4 | ) | ||
| Deferred income tax liability | 343.1 | 305.5 | ||||
| Net deferred income tax liability | $ | (276.6 | ) | $ | (202.9 | ) |
The above reconciling items are disclosed at the tax rates that apply in the jurisdiction where they have arisen.
(f) Income tax temporary differences - not recognized:
The Company has not recognized a deferred tax asset on $30.0 million of non-capital losses (December 31, 2024 - $57.2 million), $130.2 million of capital losses (December 31, 2024 - $158.7 million) and $561.6 million (December 31, 2024 - $651.3 million) of other deductible temporary differences since the realization of any related tax benefit through future taxable profits is not probable. The capital losses have no expiry dates and the other deductible temporary differences do not expire under current tax legislation.
The Canadian non-capital losses were incurred between 2013 and 2025 and have a twenty-year carry forward period. The United States net operating losses incurred between 2004 and 2017 have a twenty-year carry forward period. United States net operating losses incurred between 2018 and 2025 may be carried forward indefinitely but are restricted to being applied against a maximum of 80% of taxable income.
60 |
|
HUDBAY MINERALS INC. Notes to Audited Consolidated Financial Statements (in millions of US dollars, except where otherwise noted) Years ended December 31, 2025 and 2024
|
(g) Mining tax effect of temporary differences:
The tax effects of temporary differences that give rise to significant portions of the deferred mining tax assets and liabilities at December 31, 2025 and 2024 are as follows:
| Canada | Dec. 31, 2025 | Dec. 31, 2024 | ||||
| Property, plant and equipment | $ | (40.5 | ) | $ | (40.2 | ) |
| Other | 13.9 | 12.8 | ||||
| $ | (26.6 | ) | $ | (27.4 | ) | |
| Peru | Dec. 31, 2025 | Dec. 31, 2024 | ||||
| Property, plant and equipment | $ | (5.6 | ) | $ | (7.5 | ) |
For the year ended December 31, 2025, Hudbay had unrecognized deferred mining tax assets of approximately $8.8 million (December 31, 2024 - $9.1 million).
(h) Unrecognized taxable temporary differences associated with investments:
There are no taxable temporary differences associated with investments in subsidiaries, associates and joint ventures, for which a deferred tax liability has not been recognized.
(i) Taxes receivable/payable:
The timing of payments results in significant variances in period-to-period comparisons of the tax receivable and tax payable balances.
(j) Other disclosure:
The tax rules and regulations applicable to mining companies are highly complex and subject to interpretation. The Company may be subject in the future to a review of its historic income and other tax filings and, in connection with such reviews, disputes can arise with tax authorities over the interpretation or application of certain tax rules and regulations in respect of the Company's business. These reviews may alter the timing or amount of taxable income or deductions. The amount ultimately reassessed upon resolution of issues raised may differ from the amount accrued.
61 |
|
HUDBAY MINERALS INC. Notes to Audited Consolidated Financial Statements (in millions of US dollars, except where otherwise noted) Years ended December 31, 2025 and 2024
|
25. Share capital
(a) Preference shares:
Authorized: Unlimited preference shares without par value.
Issued and fully paid: Nil.
(b) Common shares:
Authorized: Unlimited common shares without par value.
Issued and fully paid:
| Year ended Dec. 31, 2025 |
Year ended Dec. 31, 2024 |
|||||||||||
|
Common shares |
Amount |
Common shares |
Amount | |||||||||
| Balance, beginning of year | 394,932,374 | $ | 2,641.3 | 350,728,536 | $ | 2,240.2 | ||||||
| Equity issuance, net of issuance costs | 465,394 | 4.2 | 42,366,000 | 386.2 | ||||||||
| Flow through shares, net of share issuance costs and implied premium | 887,000 | 13.7 | 968,900 | 8.6 | ||||||||
| Exercise of options | 478,755 | 4.1 | 482,029 | 3.6 | ||||||||
| Exercise of warrants | 70,708 | 0.5 | 386,909 | 2.7 | ||||||||
| Tax adjustments in respect of prior years | - | 4.4 | - | - | ||||||||
| Balance, end of the year | 396,834,231 | $ | 2,668.2 | 394,932,374 | $ | 2,641.3 | ||||||
Equity issuance
On June 24, 2025, the Company closed a private placement deal to issue 465,394 common shares at a price of C$13.30 per Common Share for aggregate gross proceeds of $4.5 million. Associated with the private placement were $0.3 million of share issuance costs resulting in net equity raised of $4.2 million. The net proceeds of this private placement were used to fund the $4.5 million cash consideration on closing of the acquisition of MMC's 25% interest in CMBC (note 5).
On May 24, 2024, the Company closed an equity financing with a syndicate of underwriters ("the Offering"). Pursuant to the Offering, the Underwriters purchased on a bought deal basis from the Company a total of 42,366,000 common shares at a price of $9.50 per Common Share for aggregate gross proceeds of $402.5 million. Transaction costs related to the Offering were $16.1 million resulting in net proceeds to the Company of $386.4 million. Associated with the Offering were $0.2 million of share issuance costs resulting in net equity raised of $386.2 million.
Flow-through share financing
During the year ended December 31, 2025, the Company completed a Canadian Exploration Expense ("CEE") flow-through financing. The Company issued 887,000 common shares for proceeds, net of transaction costs, of $22.6 million. The implied premium on the flow-through shares of $8.9 million was recorded as a flow-through share liability. The flow-through share liability will be recognized in earnings as eligible expenditures are made. As at December 31, 2025, $1.3 million of flow-through share liability was renounced and recognized in other expenses (note 6e) on the consolidated statements of income.
During the year ended December 31, 2024, the Company completed a Canadian Development Expense ("CDE") and CEE flow-through financing. The Company issued 968,900 common shares for proceeds, net of transaction costs, of $11.8 million. The implied premium on the flow-through shares of $3.2 million was recorded as a flow-through share liability. During the year December 31, 2025, the Company renounced the flow-through share liability recognized in 2024 pursuant to incurring qualified expenditures.
62 |
|
HUDBAY MINERALS INC. Notes to Audited Consolidated Financial Statements (in millions of US dollars, except where otherwise noted) Years ended December 31, 2025 and 2024
|
Dividends
During the year ended December 31, 2025, the Company declared two semi-annual dividends of C$0.01 per share. The Company paid $2.8 million and $2.8 million in dividends on March 21, 2025 and September 19, 2025 to shareholders of record as of March 4, 2025 and September 2, 2025.
During the year ended December 31, 2024, the Company declared two semi-annual dividends of C$0.01 per share. The Company paid $2.6 million and $2.9 million in dividends on March 22, 2024 and September 20, 2024 to shareholders of record as of March 5, 2024 and September 3, 2024.
26. Share-based compensation
(a) Cash-settled share-based compensation:
Hudbay has three cash-settled share-based compensation plans, as described below.
Deferred Share Units (DSU)
At December 31, 2025, the carrying amount and the intrinsic value of the outstanding liability related to the DSU plan was $21.5 million (December 31, 2024 - $12.3 million) (note 21). The following table outlines information related to DSUs granted, expenses recognized and payments made during the year.
| Year ended | ||||||
| Dec. 31, 2025 | Dec. 31, 2024 | |||||
| Number of units, beginning of year | 1,519,500 | 1,571,160 | ||||
| Number of units granted during the year | 91,613 | 143,527 | ||||
| Credits for dividends | 1,896 | - | ||||
| Number of units released/paid | (534,133 | ) | (195,187 | ) | ||
| Number of units, end of year | 1,078,876 | 1,519,500 | ||||
| Weighted average price (C$/unit) | $ | 13.28 | $ | 10.05 | ||
| Expenses recognized during the year1 (notes 6c, 6d) | $ | 13.9 | $ | 6.3 | ||
| Payments made during the year (note 21) | $ | 5.4 | $ | 1.6 | ||
1 This expense relates to the grant of DSUs, as well as mark-to-market adjustments, and is presented within selling and administrative expenses on the consolidated statements of income.
Restricted Share Units (RSU)
RSUs granted under the LTEP Plan may be settled in the form of Hudbay common shares or, at the option of the Company, the cash equivalent based on the market price of the common shares as of the vesting date. RSUs may also be granted under Hudbay's Share Unit Plan; however, the RSUs granted under the Share Unit Plan may only be settled in cash. Hudbay has historically settled all RSUs in cash. The Company has determined that the appropriate accounting treatment is to classify the RSUs as cash settled transactions.
At December 31, 2025, the carrying amount of the outstanding liability related to the RSU plan was $26.1 million (December 31, 2024 - $9.6 million) (note 21). The following table outlines information related to RSUs granted, expenses recognized and payments made in the year.
63 |
|
HUDBAY MINERALS INC. Notes to Audited Consolidated Financial Statements (in millions of US dollars, except where otherwise noted) Years ended December 31, 2025 and 2024
|
| Year ended | ||||||
| Dec. 31, 2025 | Dec. 31, 2024 | |||||
| Number of units, beginning of year | 2,223,237 | 1,787,728 | ||||
| Number of units granted during the year | 691,843 | 984,758 | ||||
| Credits for dividends | 2,714 | 4,618 | ||||
| Number of units forfeited during the year | (155,864 | ) | (158,125 | ) | ||
| Number of units released/paid | (889,851 | ) | (395,742 | ) | ||
| Number of units, end of year | 1,872,079 | 2,223,237 | ||||
| Weighted average price - granted (C$/unit) | $ | 12.03 | $ | 7.56 | ||
| Expenses recognized during the year1 (note 6c, 6d) | $ | 20.3 | $ | 6.7 | ||
| Payments made during the year (note 21) | $ | 6.3 | $ | 2.2 | ||
1 This net expense reflects recognition of RSU expense over the service period, as well as mark-to-market adjustments, and is presented mainly within cost of sales and selling and administrative expenses. Certain amounts related to the Arizona segment are capitalized.
Performance Share Units (PSU)
PSUs granted under the LTEP Plan may be settled in the form of Hudbay common shares or, at the option of the Company, the cash equivalent based on the market price of the common shares as of the vesting date. Hudbay has historically settled similar share-based compensation units in cash. The Company has determined that the appropriate accounting treatment is to classify the PSUs as cash settled transactions. The PSUs contain a performance based multiplier element which will be computed upon vesting.
At December 31, 2025, the carrying amount of the outstanding liability related to PSU plan was $26.9 million (December 31, 2024 - $5.5 million) (note 21). The following table outlines information related to PSUs granted, expenses recognized and payments made in the year.
| Year ended | ||||||
| Dec. 31, 2025 | Dec. 31, 2024 | |||||
| Number of units, beginning of year | 1,446,197 | 1,172,803 | ||||
| Number of units granted during the year | 426,775 | 600,572 | ||||
| Number of units added by performance factor | 183,152 | - | ||||
| Credits for dividends | 2,142 | 2,997 | ||||
| Number of units forfeited during the year | (72,299 | ) | (169,436 | ) | ||
| Number of units released/paid | (490,455 | ) | (160,739 | ) | ||
| Number of units, end of year | 1,495,512 | 1,446,197 | ||||
| Weighted average price - granted (C$/unit) | $ | 12.05 | $ | 7.35 | ||
| Expense recognized during the year (note 6c) | $ | 24.6 | $ | 4.2 | ||
| Payments made during the year (note 21) | $ | 3.5 | $ | 0.9 | ||
64 |
|
HUDBAY MINERALS INC. Notes to Audited Consolidated Financial Statements (in millions of US dollars, except where otherwise noted) Years ended December 31, 2025 and 2024
|
(b) Equity-settled share-based compensation
Stock Options
The Company's stock option plan was approved in June 2005 and amended in May 2008 (the "Plan"). Under the amended Plan, the Company may grant to employees, officers, directors or consultants of the Company or its affiliates options to purchase up to a maximum of 13 million common shares of Hudbay. The Company has determined that the appropriate accounting treatment is to classify the stock options as equity settled transactions.
During the year ended December 31, 2025, the Company granted 828,720 stock options (year ended December 31, 2024 - 902,874).
The following table outlines the changes in the number of stock options outstanding:
| Year ended | Year ended | |||||||||||
| Dec. 31, 2025 | Dec. 31, 2024 | |||||||||||
|
Number of shares subject to option |
Weighted- average exercise price C$ |
Number of shares subject to option |
Weighted average exercise price C$ |
|||||||||
| Balance, beginning of year | 2,484,107 | $ | 7.42 | 2,182,970 | $ | 7.23 | ||||||
| Number of units granted during the year | 828,720 | $ | 10.81 | 902,874 | $ | 7.50 | ||||||
| Exercised | (478,755 | ) | $ | 7.69 | (482,029 | ) | $ | 6.56 | ||||
| Forfeited | (114,892 | ) | $ | 9.01 | (106,850 | ) | $ | 7.62 | ||||
| Expired | (8,766 | ) | $ | 8.31 | (12,858 | ) | $ | 10.03 | ||||
| Balance, end of year | 2,710,414 | $ | 8.34 | 2,484,107 | $ | 7.42 | ||||||
The following table presents the weighted average fair value assumptions used in the Black-Scholes valuation of these options:
| For options granted during the year ended | Dec. 31, 2025 | Dec. 31, 2024 | ||||
| Weighted average share price at grant date (CAD) | $ | 10.81 | $ | 7.50 | ||
| Risk-free rate | 3.07% | 3.49% | ||||
| Expected dividend yield | 0.2% | 0.3% | ||||
| Expected stock price volatility (based on historical volatility) | 45.3% | 51.4% | ||||
| Expected life of option (months) | 84 | 84 | ||||
| Weighted average per share fair value of stock options granted (CAD) | $ | 5.39 | $ | 4.11 |
65 |
|
HUDBAY MINERALS INC. Notes to Audited Consolidated Financial Statements (in millions of US dollars, except where otherwise noted) Years ended December 31, 2025 and 2024
|
The following table outlines stock options outstanding and exercisable:
| Dec. 31, 2025 | |||||||||||||||
|
Range of exercise prices C$ |
Number of options outstanding |
Weighted average remaining contractual life (years) |
Weighted average exercise price C$ |
Number of options exercisable |
Weighted average share price at exercise date C$ |
||||||||||
| $3.76 - $5.26 | 292,198 | 1.15 | $ | 3.76 | 290,732 | $ | 3.76 | ||||||||
| $5.27 - $7.13 | 503,099 | 4.16 | $ | 6.75 | 273,014 | $ | 6.75 | ||||||||
| $7.14 - $8.71 | 687,508 | 5.15 | $ | 7.50 | 164,283 | $ | 7.50 | ||||||||
| $8.72 - $10.60 | 459,772 | 2.73 | $ | 10.13 | 458,500 | $ | 10.13 | ||||||||
| $10.61 - $13.50 | 767,837 | 6.12 | $ | 10.81 | - | $ | - | ||||||||
| Dec. 31, 2024 | |||||||||||||||
|
Range of exercise prices C$ |
Number of options outstanding |
Weighted average remaining contractual life (years) |
Weighted average exercise price C$ |
Number of options exercisable |
Weighted average share price at exercise date C$ |
||||||||||
| $3.76 - $5.26 | 361,658 | 2.15 | $ | 3.76 | 361,658 | $ | 3.76 | ||||||||
| $5.27 - $6.90 | 631,984 | 5.16 | $ | 6.75 | 152,408 | $ | 6.75 | ||||||||
| $6.91 - $8.71 | 866,543 | 6.15 | $ | 7.50 | - | $ | - | ||||||||
| $8.72 - $10.17 | 365,988 | 4.16 | $ | 9.92 | 223,287 | $ | 9.92 | ||||||||
| $10.18 - $10.42 | 257,934 | 3.15 | $ | 10.42 | 257,934 | $ | 10.42 | ||||||||
Hudbay estimates expected life of options and expected volatility based on historical data, which may differ from actual outcomes.
Warrants
The following table outlines the changes in the number of Hudbay warrants outstanding:
| Year ended | Year ended | |||||||||||
| Dec. 31, 2025 | Dec. 31, 2024 | |||||||||||
|
Number of shares subject to warrants |
Weighted- average exercise price C$ |
Number of shares subject to warrants |
Weighted average exercise price C$ |
|||||||||
| Balance, beginning of year | 70,708 | $ | 7.38 | 457,617 | $ | 7.38 | ||||||
| Warrants granted | - | $ | - | - | $ | - | ||||||
| Exercised | (70,708 | ) | $ | 7.38 | (386,909 | ) | $ | 7.38 | ||||
| Expired | - | $ | - | - | $ | - | ||||||
| Balance, end of year | - | $ | - | 70,708 | $ | 7.38 | ||||||
66 |
|
HUDBAY MINERALS INC. Notes to Audited Consolidated Financial Statements (in millions of US dollars, except where otherwise noted) Years ended December 31, 2025 and 2024
|
27. Earnings per share
| Year ended December 31, |
||||||
| 2025 | 2024 | |||||
| Weighted average common shares outstanding | ||||||
| Basic | 395,521,903 | 376,785,518 | ||||
| Plus net incremental shares from: | ||||||
| Assumed conversion: stock options | 1,126,893 | 483,149 | ||||
| Assumed conversion: warrants | - | 22,544 | ||||
| Diluted weighted average common shares outstanding | 396,648,796 | 377,291,211 | ||||
The calculation of dilutive weighted-average number of common shares excludes the impact of 2,474 shares for the year ended December 31, 2025 (year ended December 31, 2024 - 4,127). The shares related to stock options and warrants were excluded as the exercise price related to the particular security exceeded the average market price of the Company's common shares for the period, or the inclusion of the share units had an anti-dilutive effect on net income.
28. Capital management
The Company's definition of capital includes total equity and long-term debt. Hudbay's long-term debt balance as at December 31, 2025 was $1,008.6 million (December 31, 2024 - $1,107.5 million).
The Company's objectives when managing capital are to maintain a strong capital base in order to:
- Advance Hudbay's corporate strategies to create long-term value for its stakeholders; and,
- Sustain Hudbay's operations and growth throughout metals and materials cycles.
Hudbay monitors its capital and capital structure on an ongoing basis to ensure they are sufficient to achieve the Company's short-term and long-term strategic objectives in a capital intensive industry. Hudbay faces several risks, including volatile metals prices, inflationary pressures on costs, access to capital, and risk of delays and cost escalation associated with major capital projects. The Company continually assesses the adequacy of its capital structure to ensure its objectives are met. Hudbay monitors its cash, which was $568.9 million as at December 31, 2025 (2024 - $541.8 million), together with availability under its committed credit facilities. Hudbay invests its cash primarily in Canadian bankers' acceptances, deposits at major Canadian and Peruvian banks, or treasury bills issued by the federal or provincial governments. In addition to the requirement to maintain sufficient cash balances to fund continuing operations, Hudbay must maintain sufficient cash to fund the interest expense on the long-term debt outstanding (note 19). As part of the Company's capital management activities, Hudbay monitors interest coverage ratios and leverage ratios.
67 |
|
HUDBAY MINERALS INC. Notes to Audited Consolidated Financial Statements (in millions of US dollars, except where otherwise noted) Years ended December 31, 2025 and 2024
|
29. Financial instruments
(a) Fair value and carrying value of financial instruments:
The following presents the fair value ("FV") and carrying value ("CV") of Hudbay's financial instruments and non-financial derivatives:
| Dec. 31, 2025 | Dec. 31, 2024 | |||||||||||
| FV | CV | FV | CV | |||||||||
| Financial assets at amortized cost | ||||||||||||
| Cash and cash equivalents1 | $ | 568.9 | $ | 568.9 | $ | 541.8 | $ | 541.8 | ||||
| Short-term investments1 | - | - | 40.0 | 40.0 | ||||||||
| Collateral deposits1 | - | - | 0.6 | 0.6 | ||||||||
| Restricted cash1 | 0.2 | 0.2 | 0.4 | 0.4 | ||||||||
| Fair value through profit or loss | ||||||||||||
| Trade and other receivables2,3 | 347.6 | 347.6 | 185.5 | 185.5 | ||||||||
| Non-hedge derivative assets 4 | 0.6 | 0.6 | 14.3 | 14.3 | ||||||||
| Investments at fair value through profit or loss 5 | 130.9 | 130.9 | 12.1 | 12.1 | ||||||||
| Total financial assets | $ | 1,048.2 | $ | 1,048.2 | $ | 794.7 | $ | 794.7 | ||||
| Financial liabilities at amortized cost | ||||||||||||
| Trade and other payables1, 2 | $ | 330.5 | $ | 330.5 | $ | 255.2 | $ | 255.2 | ||||
| Deferred Copper Mountain acquisition consideration6 | 17.5 | 17.4 | - | - | ||||||||
| Contingent Copper Mountain acquisition consideration6 | 14.1 | 13.9 | - | - | ||||||||
| Agreements with communities 7 | 107.2 | 105.9 | 70.4 | 68.4 | ||||||||
| Wheaton refund liability8 | 13.9 | 7.9 | 9.9 | 7.3 | ||||||||
| Senior unsecured notes 9 | 1,022.7 | 1,010.9 | 1,111.6 | 1,111.1 | ||||||||
| Senior secured revolving credit facilities10 | (2.3 | ) | (2.3 | ) | (3.6 | ) | (3.6 | ) | ||||
| Fair value through profit or loss | ||||||||||||
| Non-hedge derivative liabilities 4 | 31.9 | 31.9 | 0.3 | 0.3 | ||||||||
| Total financial liabilities | $ | 1,535.5 | $ | 1,516.1 | $ | 1,443.8 | $ | 1,438.7 | ||||
| 1 Cash and cash equivalents, short-term investments, collateral deposits, restricted cash, trade and other payables are recorded at carrying value, which approximates fair value due to their short-term nature and generally negligible credit losses. | ||||||||||||
| 2 Excludes tax and other statutory amounts. | ||||||||||||
| 3 Trade and other receivables contain receivables including provisionally priced receivables classified as FVTPL and various other items at amortized cost. The fair value of provisionally priced receivables is determined using forward metals prices (level 2). | ||||||||||||
| 4 Derivatives are carried at their fair value, which is determined based on observable forward market commodity prices corresponding to the maturity of the contract (level 2), | ||||||||||||
| 5 All investments are carried at their fair value, which is determined using quoted market bid prices in active markets for listed shares. | ||||||||||||
| 6 Fair value of the deferred and contingent Copper Mountain acquisition consideration has been determined using an applicable credit-risk adjusted discount rate (level 3). | ||||||||||||
| 7 These financial liabilities relate to agreements with communities near the Constancia mine in Peru (note 17). Fair values have been determined using an applicable credit-risk adjusted discounted rate and foreign exchange rates (level 3). | ||||||||||||
| 8 Discounted value based on a market rate at inception of the applicable Wheaton contract for carrying value (note 17) and fair value using an applicable credit-risk adjusted discount rate (level 3). | ||||||||||||
| 9 Fair value of the senior unsecured notes (note 19a) has been determined using an applicable credit-risk adjusted discount rate (level 3). | ||||||||||||
| 10 Fair value of the senior secured revolving credit facility, when drawn, is valued using an applicable credit adjusted discount rate (level 3). |
68 |
|
HUDBAY MINERALS INC. Notes to Audited Consolidated Financial Statements (in millions of US dollars, except where otherwise noted) Years ended December 31, 2025 and 2024
|
Fair value hierarchy
The table below provides an analysis by valuation method of financial instruments that are measured at fair value subsequent to recognition as well as financial instruments not measured at fair value but for which a fair value is disclosed. Levels 1 to 3 are defined based on the degree to which fair value inputs are observable and have a significant effect on the recorded fair value, as follows:
- Level 1: Quoted prices in active markets for identical assets or liabilities;
- Level 2: Valuation techniques use significant observable inputs, either directly or indirectly, or valuations are based on quoted prices for similar instruments; and,
- Level 3: Valuation techniques use significant inputs that are not based on observable market data.
| December 31, 2025 | Level 1 | Level 2 | Level 3 | Total | ||||||||
| Financial assets at FVTPL: | ||||||||||||
| Provisionally priced receivables | $ | - | $ | 302.2 | $ | - | $ | 302.2 | ||||
| Non-hedge derivatives | - | 0.6 | - | 0.6 | ||||||||
| Investments | 127.9 | - | 3.0 | 130.9 | ||||||||
| $ | 127.9 | $ | 302.8 | $ | 3.0 | $ | 433.7 | |||||
| Financial liabilities at FVTPL: | ||||||||||||
| Non-hedge derivatives | $ | - | $ | 31.9 | $ | - | $ | 31.9 | ||||
| Financial liabilities at amortized cost: | ||||||||||||
| Deferred Copper Mountain acquisition consideration | - | - | 17.5 | 17.5 | ||||||||
| Contingent Copper Mountain acquisition consideration | - | - | 14.1 | 14.1 | ||||||||
| Agreements with communities | - | - | 107.2 | 107.2 | ||||||||
| Wheaton refund liability | - | - | 13.9 | 13.9 | ||||||||
| Senior unsecured notes | 1,022.7 | - | - | 1,022.7 | ||||||||
| $ | 1,022.7 | $ | 31.9 | $ | 152.7 | $ | 1,207.3 |
| December 31, 2024 | Level 1 | Level 2 | Level 3 | Total | ||||||||
| Financial assets at FVTPL: | ||||||||||||
| Provisionally priced receivables | $ | - | $ | 171.3 | $ | - | $ | 171.3 | ||||
| Non-hedge derivatives | - | 14.3 | - | 14.3 | ||||||||
| Investments | 10.6 | - | 1.5 | 12.1 | ||||||||
| $ | 10.6 | $ | 185.6 | $ | 1.5 | $ | 197.7 | |||||
| Financial liabilities at FVTPL: | ||||||||||||
| Non-hedge derivatives | $ | - | $ | 0.3 | $ | - | $ | 0.3 | ||||
| Financial liabilities at amortized cost: | ||||||||||||
| Agreements with communities | - | - | 70.4 | 70.4 | ||||||||
| Wheaton refund liability | - | - | 9.9 | 9.9 | ||||||||
| Senior unsecured notes | 1,111.6 | - | - | 1,111.6 | ||||||||
| $ | 1,111.6 | $ | 0.3 | $ | 80.3 | $ | 1,192.2 |
The Company's policy is to recognize transfers into and transfers out of fair value hierarchy levels as of the date of the event or change in circumstances that caused the transfer. During the year ended December 31, 2025 and year ended December 31, 2024, Hudbay did not make any such transfers.
Valuation techniques used for instruments categorized in Levels 2 and 3 are consistent with the year ended December 31, 2024.
69 |
|
HUDBAY MINERALS INC. Notes to Audited Consolidated Financial Statements (in millions of US dollars, except where otherwise noted) Years ended December 31, 2025 and 2024
|
(b) Derivatives and hedging:
Copper fixed for floating swaps
Hudbay enters into copper fixed for floating swaps in order to manage the risk associated with provisional pricing terms in copper concentrate sales agreements. As at December 31, 2025, Hudbay had 57.9 million pounds of net copper swaps outstanding at an effective average price of $5.18/lb and settling from January to May 2026. As at December 31, 2024, Hudbay had 61.7 million pounds of net copper swaps outstanding at an effective average price of $4.19/lb and settling from January to May 2025. The aggregate fair value of the transactions at December 31, 2025 was a net liability of $26.4 million (December 31, 2024 - an asset position of $13.7 million).
Gold fixed for floating swaps
During the year ended December 31, 2025, Hudbay entered into gold fixed for floating swaps to manage the risk associated with provisional pricing terms on concentrate shipments. As at December 31, 2025, Hudbay had 23,180 ounces of net gold swaps outstanding at an effective average price of $4,333/ounce and settling from January to February 2026. The aggregate fair value of the position at December 31, 2025 was a net liability of $4.9 million.
Zinc fixed for floating swaps
Hudbay enters into zinc fixed for floating swaps in order to manage the risk associated with provisional pricing terms in zinc concentrate sales agreements. As at December 31, 2025, Hudbay had 7.3 million pounds of net zinc swaps outstanding at an effective average price of $1.40/lb and settling in January 2026. As at December 31, 2024, Hudbay had 9.7 million pounds of net zinc swaps outstanding at an effective average price of $1.38/lb and settling from January to April 2025. The aggregate fair value of the transactions at December 31, 2025 was nil (December 31, 2024 - an asset position of $0.3 million).
Copper forward sales
As at December 31, 2025, Hudbay had nil pounds of copper forwards outstanding. As at December 31, 2024, Hudbay had 5.3 million pounds of copper forwards outstanding at an effective average price of $3.95/lb and settling from January to April 2025. The aggregate fair value of the transactions at December 31, 2025 was nil (December 31, 2024 - a liability position of $0.1 million).
Copper costless collars
As at December 31, 2025, Hudbay had nil pounds of copper collars outstanding. As at December 31, 2024, Hudbay had 6.6 million pounds of copper collars outstanding settling from January to April 2025 at an average floor price of $3.88/lb and an average cap price of $4.14/lb. The aggregate fair value of the position at December 31, 2025 was nil (December 31, 2024 - an asset position of $0.1 million).
(c) Provisionally priced receivables
Changes in fair value of provisionally priced receivables
Hudbay records changes in fair value of provisionally priced receivables related to provisional pricing in concentrate purchase, concentrate sale and certain other sale contracts. Under the terms of these contracts, prices are subject to final adjustment at the end of a future period after title transfers based on quoted market prices during the quotation period specified in the contract. The period between provisional pricing and final pricing is typically up to three months.
Changes in fair value of provisionally priced receivables are presented in trade and other receivables when they relate to sales contracts and in trade and other payables when they relate to purchase contracts. At each reporting date, provisionally priced metals are marked-to-market based on the forward market price for the quotation period stipulated in the contract, with changes in fair value recognized in revenue for sales contracts and in inventory or cost of sales for purchase concentrate contracts. Cash flows related to changes in fair value of provisionally priced receivables are classified in operating activities.
70 |
|
HUDBAY MINERALS INC. Notes to Audited Consolidated Financial Statements (in millions of US dollars, except where otherwise noted) Years ended December 31, 2025 and 2024
|
As at December 31, 2025 and December 31, 2024, Hudbay's net position consisted of contracts awaiting final pricing are as indicated below:
| Metal in concentrate |
Sales awaiting final pricing | Average YTD price ($/unit) | |||||||||||
| Unit | Dec. 31, 2025 | Dec. 31, 2024 | Dec. 31, 2025 | Dec. 31, 2024 | |||||||||
| Copper | pounds (in 000s) | 65,791 | 85,731 | 5.64 | 3.96 | ||||||||
| Gold | troy ounces | 33,222 | 47,075 | 4,340 | 2,638 | ||||||||
| Silver | troy ounces | 85,337 | 238,149 | 70.22 | 29.02 | ||||||||
| Zinc | pounds (in 000s) | 8,365 | 12,102 | 1.40 | 1.34 | ||||||||
The aggregate fair value of provisionally priced receivables within the copper and zinc concentrate at December 31, 2025 was an asset position of $40.9 million (December 31, 2024 - a liability position of $13.9 million).
(d) Financial risk management
Hudbay's financial risk management activities are governed by Board-approved policies addressing risk identification, hedging authorization procedures and limits and reporting. The Company's policy objective, when hedging activities are undertaken, is to reduce the volatility of future profit and cash flow within the strategic and economic goals of Hudbay. From time to time, the Company employs derivative financial instruments, including forward and option contracts, to manage risk originating from exposures to commodity price risk, foreign exchange risk and interest rate risk. Significant derivative transactions are approved by the Board of Directors, and hedge accounting is applied when certain criteria have been met. Hudbay does not use derivative financial instruments for trading or speculation purposes. The following is a discussion of the Company's risk exposures.
(i) Market risk
Market risk is the risk that changes in market prices, including foreign exchange rates, commodity prices, share prices, and interest rates will cause fluctuations in the fair value or future cash flows of a financial instrument.
Foreign currency risk
Hudbay's primary exposure to foreign currency risk arises from:
- Translation of Canadian dollar denominated costs and, to a lesser extent, Peruvian soles cost into US dollars. Substantially all of the Company's revenue are denominated in US dollars, while the majority of its operating costs are denominated in either the Canadian dollar or Peruvian sol. Generally, with gross profit, appreciation of the US dollar relative to the Canadian dollar will increase Hudbay's profit.
- Translation of foreign currency denominated cash, trade and other receivables, trade and other payables, as well as other financial liabilities. Appreciation of the US dollar relative to a foreign currency will decrease the net asset value of these balances once they have been translated to US dollars, resulting in foreign currency translation losses on foreign currency denominated assets and gains on foreign currency denominated liabilities.
The Manitoba and British Columbia segment's primary financial instrument foreign currency exposure is on US denominated cash, trade and other receivables and other financial liabilities. The Peru segment's primary financial instrument foreign currency exposure is on Peruvian soles cash, trade and other payables and other financial liabilities.
The Company's economic exposure to foreign currency risk was as follows based on notional financial instrument amounts stated in US equivalent dollars:
71 |
|
HUDBAY MINERALS INC. Notes to Audited Consolidated Financial Statements (in millions of US dollars, except where otherwise noted) Years ended December 31, 2025 and 2024
|
| Dec. 31, 2025 | Dec. 31, 2024 | |||||||||||||||||
| CAD1 | USD2 | PEN3 | CAD1 | USD2 | PEN3 | |||||||||||||
| Cash | $ | 8.8 | $ | 36.6 | $ | 10.7 | $ | 6.4 | $ | 13.9 | $ | 3.8 | ||||||
| Trade and other receivables | 0.1 | 145.7 | 1.0 | 0.1 | 116.4 | 0.4 | ||||||||||||
| Restricted cash | - | - | - | 0.2 | - | - | ||||||||||||
| Other financial assets | 98.7 | - | - | 12.1 | - | - | ||||||||||||
| Trade and other payables | (8.6 | ) | (2.2 | ) | (25.0 | ) | (5.7 | ) | (1.9 | ) | (15.9 | ) | ||||||
| Other financial liabilities | - | (7.9 | ) | (105.9 | ) | - | (7.3 | ) | (68.4 | ) | ||||||||
| $ | 99.0 | $ | 172.2 | $ | (119.2 | ) | $ | 13.1 | $ | 121.1 | $ | (80.1 | ) | |||||
| 1 HMI is exposed to foreign currency risk on CAD. | ||||||||||||||||||
| 2 The Manitoba and British Columbia segments are exposed to foreign currency risk on USD. | ||||||||||||||||||
| 3 The Peru segment is exposed to foreign currency risk on PEN. |
The following sensitivity analysis for foreign currency risk relates solely to financial instruments and non-financial derivatives that were outstanding as at the year-end date; each sensitivity calculation assumes all other variables are held constant. This analysis is based on values as at December 31, 2025 and does not reflect the overall effect that changes in market variables would have on the Company's operating results.
| December 31, 2025 | Change of: |
Would have changed 2025 after-tax earnings by: |
||
| USD/CAD exchange rate1 | + 10% | $ | 1.2 | |
| USD/CAD exchange rate1 | -10% | (1.4 | ) | |
| USD/PEN exchange rate2 | + 10% | 7.0 | ||
| USD/PEN exchange rate2 | -10% | (8.6 | ) | |
| December 31, 2024 | Change of: |
Would have changed 2024 after-tax earnings by: |
||
| USD/CAD exchange rate1 | + 10% | $ | 6.0 | |
| USD/CAD exchange rate1 | -10% | (7.4 | ) | |
| USD/PEN exchange rate2 | + 10% | 4.4 | ||
| USD/PEN exchange rate2 | -10% | (6.2 | ) |
| 1 Effect on profit due to foreign currency remeasurements of balances denominated in a currency different from a Hudbay subsidiary's functional currency. | ||||
| 2 Effect on profit due to foreign currency remeasurement of balances denominated in Peruvian Sol. |
Commodity price risk
Hudbay is exposed to market risk from prices for the commodities the Company produces and sells, such as copper, zinc, gold and silver. From time to time, Hudbay maintains price protection programs and conducts commodity price risk management through the use of derivative contracts. The following sensitivity analysis for commodity price risk relates solely to financial instruments and non-financial derivatives that were outstanding as at the year-end date; each sensitivity calculation assumes all other variables are held constant. This analysis is based on values as at December 31, 2025 and does not reflect the overall effect that changes in market variables would have on the Company's operating results.
72 |
|
HUDBAY MINERALS INC. Notes to Audited Consolidated Financial Statements (in millions of US dollars, except where otherwise noted) Years ended December 31, 2025 and 2024
|
| December 31, 2025 | Change of: | Would have changed 2025 after-tax earnings by: | ||||
| Copper prices ($/lb)1 | + | $0.30 | $ | 1.4 | ||
| Copper prices ($/lb)1 | - | $0.30 | (1.4 | ) | ||
| Gold prices ($/oz)1 | + | $300 | 1.8 | |||
| Gold prices ($/oz)1 | - | $300 | (1.8 | ) | ||
| Zinc prices ($/lb)1 | + | $0.10 | 0.5 | |||
| Zinc prices ($/lb)1 | - | $0.10 | (0.5 | ) | ||
| December 31, 2024 | Change of: |
Would have changed 2024 after-tax earnings by: |
||||
| Copper prices ($/lb)1 | + | $0.30 | $ | 3.4 | ||
| Copper prices ($/lb)1 | - | $0.30 | (3.5 | ) | ||
| Gold prices ($/oz)1 | + | $300 | - | |||
| Gold prices ($/oz)1 | - | $300 | - | |||
| Zinc prices ($/lb)1 | + | $0.10 | 0.1 | |||
| Zinc prices ($/lb)1 | - | $0.10 | (0.1 | ) |
| 1 Effect on profit due to provisional pricing derivatives (note 29c) and derivative contracts (note 29b). |
Share price risk
Hudbay is exposed to market risk from share prices of the Company's investments in publicly listed metals and mining entities. These investments are made to foster strategic relationships, in connection with joint venture agreements and for investment purposes. Management monitors the value of these investments for the purposes of determining whether to add or reduce Hudbay's positions. The following sensitivity analysis of share price risk relates solely to financial instruments that were outstanding as at the year-end date. This analysis is based on values as at December 31, 2025 and does not reflect the overall effect that changes in market variables would have on the Company's finance expenses.
| December 31, 2025 | Change of: |
Would have changed 2025 after- tax earnings by: |
||||
| Share prices | + | 25% | $ | 32.0 | ||
| Share prices | - | 25% | (32.0 | ) | ||
| December 31, 2024 | Change of: | Would have changed 2024 after-tax earnings by: | ||||
| Share prices | + | 25% | $ | 3.0 | ||
| Share prices | - | 25% | (3.0 | ) |
Interest rate risk
Hudbay is exposed to the following interest rate risks:
- cash flow interest rate risk on its cash and cash equivalents; and,
- interest rate risk on its senior secured revolving credit facilities.
The only relevant risks at December 31, 2025 is interest rate risk on cash and short-term investments. The revolving credit facilities remain undrawn as at December 31, 2025. Neither the 2026 Notes nor the 2029 Notes contain embedded derivatives that require bifurcation from the host contract.
As at December 31, 2025 and 2024, the interest rate risk relates to cash on hand and short-term investments.
73 |
|
HUDBAY MINERALS INC. Notes to Audited Consolidated Financial Statements (in millions of US dollars, except where otherwise noted) Years ended December 31, 2025 and 2024
|
This analysis only quantifies the impact of the interest rate risk on cash and short-term investments based on balances held as at December 31, 2025 and 2024 and does not reflect the overall effect that changes in market variables would have on the Company's finance expenses.
| December 31, 2025 | Change of: | Would have changed 2025 after-tax earnings by: | ||||
| Interest rates | + | 2.00% | $ | 8.3 | ||
| Interest rates | - | 2.00% | (8.3 | ) | ||
| December 31, 2024 | Change of: | Would have changed 2024 after-tax earnings by: | ||||
| Interest rates | + | 2.00% | $ | 8.5 | ||
| Interest rates | - | 2.00% | (8.5 | ) |
(ii) Credit risk
Credit risk is the risk of financial loss to Hudbay if a customer or counterparty to a financial instrument fails to meet its obligations. The Company's maximum exposure to credit risk at the reporting date is represented by the carrying amount, net of any impairment losses recognized, of financial assets and non-financial derivative assets recorded on the consolidated balance sheets.
A large portion of Hudbay's cash are on deposit with major Schedule 1 Canadian banks. Deposits with Schedule 1 Canadian banks represented 92% of total cash as at December 31, 2025 (2024 - 87%). Hudbay's investment policy requires it to comply with a list of approved investments, concentration and maturity limits, as well as credit quality. Credit concentrations in the Company's short-term investments are monitored on an ongoing basis.
Transactions involving derivatives are with counterparties Hudbay believes to be creditworthy.
At December 31, 2025, 43% of Hudbay's trade receivables were secured by letters of credit (2024 - 36% were insured or payable by letters of credit). Any additional exposure to credit risk is monitored and approved on an ongoing basis. Expected credit losses on trade and other receivables at December 31, 2025 and December 31, 2024, are insignificant.
Two customers accounted for approximately 23% and 21% of total trade receivables as at December 31, 2025 (2024 - two customers accounted for approximately 39% and 28% of total trade receivables). Credit risk for these customers is assessed as low. As at December 31, 2025, none of the Company's trade receivables were aged more than 30 days past the due date (2024 - nil).
(iii) Liquidity risk
Liquidity risk is the risk that the Company will not be able to meet its obligations associated with financial liabilities. Hudbay's objective is to maintain sufficient liquid resources to meet operational and investing requirements.
The following summarizes the contractual undiscounted cash flows of the Company's non-derivative and derivative financial liabilities, including any interest payments, by remaining contractual maturity and financial assets used to manage liquidity risk. The table includes all instruments held at the reporting date for which payments had been contractually agreed at the reporting date. The undiscounted amounts shown are gross amounts, unless the liabilities will be settled net. Amounts in foreign currency are translated at the closing rate at the reporting date. When a counterparty has a choice of when an amount is paid, the liability is allocated to the earliest possible time period.
74 |
|
HUDBAY MINERALS INC. Notes to Audited Consolidated Financial Statements (in millions of US dollars, except where otherwise noted) Years ended December 31, 2025 and 2024
|
| Dec. 31, 2025 |
Carrying amount |
Contractual cash flows |
Less than 1 Year |
1 - 3 Years | 3 -5 Years |
More than 5 Years |
||||||||||||
| Assets used to manage liquidity risk | ||||||||||||||||||
| Cash | $ | 568.9 | $ | 568.9 | $ | 568.9 | $ | - | $ | - | $ | - | ||||||
| Restricted cash | 0.2 | 0.2 | 0.2 | - | - | - | ||||||||||||
| Trade and other receivables | 347.6 | 347.6 | 347.6 | - | - | - | ||||||||||||
| Non-hedge derivative assets | 0.6 | 0.6 | 0.6 | - | - | - | ||||||||||||
| $ | 917.3 | $ | 917.3 | $ | 917.3 | $ | - | $ | - | $ | - | |||||||
| Non-derivative financial liabilities | ||||||||||||||||||
| Trade and other payables | $ | (330.5 | ) | $ | (330.5 | ) | $ | (330.5 | ) | $ | - | $ | - | $ | - | |||
| Deferred Copper Mountain acquisition consideration | (17.4 | ) | $ | (21.0 | ) | (3.0 | ) | (6.0 | ) | (6.0 | ) | (6.0 | ) | |||||
| Contingent Copper Mountain acquisition consideration | (13.9 | ) | $ | (18.8 | ) | - | - | (7.5 | ) | (11.3 | ) | |||||||
| Agreements with communities 1 | (105.9 | ) | (136.7 | ) | (67.0 | ) | (12.3 | ) | (9.2 | ) | (48.2 | ) | ||||||
| Senior unsecured notes | (1,010.9 | ) | (1,141.8 | ) | (516.4 | ) | (66.4 | ) | (559.0 | ) | - | |||||||
| Wheaton refund liability | (7.9 | ) | (79.2 | ) | - | - | - | (79.2 | ) | |||||||||
| $ | (1,486.5 | ) | $ | (1,728.0 | ) | $ | (916.9 | ) | $ | (84.7 | ) | $ | (581.7 | ) | $ | (144.7 | ) | |
| Derivative financial liabilities | ||||||||||||||||||
| Non hedge derivative contracts | $ | (31.9 | ) | $ | (31.9 | ) | $ | (31.9 | ) | $ | - | $ | - | $ | - | |||
| $ | (31.9 | ) | $ | (31.9 | ) | $ | (31.9 | ) | $ | - | $ | - | $ | - | ||||
| 1 Represents the Peru community agreement obligation, excluding interest. |
| Dec. 31, 2024 |
Carrying amount |
Contractual cash flows |
Less than 1 Year |
1 - 3 Years | 3 -5 Years |
More than 5 Years |
||||||||||||
| Assets used to manage liquidity risk | ||||||||||||||||||
| Cash | $ | 541.8 | $ | 541.8 | $ | 541.8 | $ | - | $ | - | $ | - | ||||||
| Short-term investments | 40.0 | 40.0 | 40.0 | |||||||||||||||
| Collateral deposits | 0.6 | 0.6 | 0.6 | |||||||||||||||
| Restricted cash | 0.4 | 0.4 | 0.4 | - | - | - | ||||||||||||
| Trade and other receivables | 185.5 | 185.5 | 185.5 | - | - | - | ||||||||||||
| Non-hedge derivative assets | 14.3 | 14.3 | 14.3 | - | - | - | ||||||||||||
| $ | 782.6 | $ | 782.6 | $ | 782.6 | $ | - | $ | - | $ | - | |||||||
| Non-derivative financial liabilities | ||||||||||||||||||
| Trade and other payables | $ | (255.2 | ) | $ | (255.2 | ) | $ | (255.2 | ) | $ | - | $ | - | $ | - | |||
| Agreements with communities 1 | (68.4 | ) | (99.0 | ) | (26.1 | ) | (17.0 | ) | (8.3 | ) | (47.6 | ) | ||||||
| Senior unsecured notes | (1,111.1 | ) | (1,305.7 | ) | (59.1 | ) | (654.4 | ) | (592.2 | ) | - | |||||||
| Wheaton refund liability | (7.3 | ) | (79.2 | ) | - | - | - | (79.2 | ) | |||||||||
| $ | (1,442.0 | ) | $ | (1,739.1 | ) | $ | (340.4 | ) | $ | (671.4 | ) | $ | (600.5 | ) | $ | (126.8 | ) | |
| Derivative financial liabilities | ||||||||||||||||||
| Non hedge derivative contracts | $ | (0.3 | ) | $ | (0.3 | ) | $ | (0.3 | ) | $ | - | $ | - | $ | - | |||
| $ | (0.3 | ) | $ | (0.3 | ) | $ | (0.3 | ) | $ | - | $ | - | $ | - | ||||
| 1 Represents the Peru community agreement obligation, excluding interest. |
75 |
|
HUDBAY MINERALS INC. Notes to Audited Consolidated Financial Statements (in millions of US dollars, except where otherwise noted) Years ended December 31, 2025 and 2024
|
30. Commitments
(a) Capital commitments
As at December 31, 2025, Hudbay had outstanding capital commitments in Manitoba of approximately $18.6 million of which $18.4 million can be terminated, approximately $10.5 million in British Columbia of which $nil can be terminated, approximately $25.7 million in Peru all of which can be terminated, and approximately $123.4 million in Arizona, primarily related to the Copper World Complex, of which $121.2 million can be terminated.
(b) Non-capitalized lease commitments
Hudbay has entered into various non-capitalized lease commitments for facilities and equipment. The leases expire in periods ranging from one to two years. There are no restrictions placed on the Company by entering into these leases. Future minimum lease payments under such cancellable leases recognized within results from operating activities at December 31 are:
| 2025 | 2024 | |||||
| Within one year | $ | 24.5 | $ | 16.7 | ||
| After one year but not more than five years | 52.3 | 7.7 | ||||
| More than five years | 2.1 | 2.9 | ||||
| $ | 78.9 | $ | 27.3 |
(c) Contingent liabilities
Hudbay is involved in various claims, litigation and other matters arising in the ordinary course and conduct of business. While it is not possible to determine the ultimate outcome of such actions at this time, and inherent uncertainties exist in predicting such outcomes, it is Hudbay's belief that the ultimate resolution of such actions is not reasonably likely to have a material adverse effect on its consolidated financial position or results of operations. The assessment of contingencies inherently involves the exercise of significant judgement and estimates of the outcome of future events. As a result of the assessment, management believes that no significant contingent liabilities exist.
76 |
|
HUDBAY MINERALS INC. Notes to Audited Consolidated Financial Statements (in millions of US dollars, except where otherwise noted) Years ended December 31, 2025 and 2024
|
31. Related parties
(a) Group companies
The financial statements include the financial statements of the Company and the following significant subsidiaries:
|
Beneficial ownership of ultimate controlling party (Hudbay Minerals Inc.) |
|||||
| Name | Jurisdiction | Business | Entity's Parent | 2025 | 2024 |
| HudBay Peru Inc. |
British Columbia |
Holding company |
HMI | 100% | 100% |
| HudBay Peru S.A.C. | Peru |
Exploration/ development |
HudBay Peru Inc. | 100% | 100% |
| HudBay (BVI) Inc. | British Virgin Islands |
Precious metals sales |
HudBay Peru Inc. | 100% | 100% |
| Hudbay Arizona Inc. | British Columbia |
Holding company |
HMI | 100% | 100% |
| Copper World LLC. | Arizona |
Exploration/ development |
HudBay Arizona (US) Holding Corporation |
100% | 100% |
| Mason Resources (US) Inc. | Nevada |
Exploration/ development |
Hudbay Arizona (US) | 100% | 100% |
| HudBay Arizona (Barbados) SRL | Barbados |
Precious metals sales |
Hudbay Arizona Inc. | 100% | 100% |
| Copper Mountain Mine (BC) Ltd. |
British Columbia |
Exploration/ development |
HMI | 100% | 75% |
Transactions between the Company and its subsidiaries, which are related parties of the Company, have been eliminated on consolidation and are not disclosed in this note.
(b) Compensation of key management personnel
The Company's key management includes members of the Board of Directors, Hudbay's Chief Executive Officer, Chief Financial Officer, Chief Operating Officer, Senior Vice Presidents and Vice Presidents. Total compensation to key management personnel was as follows:
| Year ended December 31, | ||||||
| 2025 | 2024 | |||||
| Short-term employee benefits1 | $ | 11.1 | $ | 11.1 | ||
| Post-employment benefits | 1.0 | 0.9 | ||||
| Termination benefits | - | 0.7 | ||||
| Long-term share-based awards2 | 9.0 | 3.6 | ||||
| $ | 21.1 | $ | 16.3 | |||
77 |
|
HUDBAY MINERALS INC. Notes to Audited Consolidated Financial Statements (in millions of US dollars, except where otherwise noted) Years ended December 31, 2025 and 2024
|
1 Such as salaries and social security contributions, paid annual leave and paid sick leave, profit-sharing, termination benefits, bonuses and non-monetary benefits (such as medical care, housing, cars and free or subsidized goods or services) for current employees.
2 Long-term share-based awards are based on disbursements made during the year.
(c) Transaction with related parties
All transactions with related parties have occurred in the normal course of the Company's operations. MMC was a related party until April 30, 2025, the date Hudbay completed the acquisition of MMC's 25% interest in CMBC. Accordingly, the MMC related party transactions disclosed below for the year ended December 31, 2025, reflect activity from January 1, 2025 to April 30, 2025.
i. During the year ended December 31, 2025, the Company sold copper concentrate under the provision of a long-term contract with MMC for revenues totaling $78.0 million (December 31, 2024 - $274.1 million) including pricing adjustments. As at December 31, 2025, the Company had nil of trade receivables related to these sales outstanding (December 31, 2024 - $45.3 million).
ii. During the year ended December 31, 2024, the Company obtained cash advances on certain concentrate shipments from MMC. For the year ended December 31, 2024, interest expense on these advances amounted to $0.9 million. For the year ended December 31, 2025 no cash advances were received.
iii. During the year ended December 31, 2025, the Company recorded unrealized foreign exchange and foreign currency translation gains on intra-group loan balances totaling $21.6 million (December 31, 2024 - loss of $24.5 million).
32. Supplementary cash flow information
(a) Other operating activities:
| Year ended December 31, | ||||||
| 2025 | 2024 | |||||
| Share-based compensation paid | $ | (14.2 | ) | $ | (4.5 | ) |
| Consideration received from sale of non-core project | (14.9 | ) | - | |||
| Other | 1.4 | 0.7 | ||||
| $ | (27.7 | ) | $ | (3.8 | ) | |
(b) Change in non-cash working capital:
| Year ended December 31, | ||||||
| 2025 | 2024 | |||||
| Change in: | ||||||
| Trade and other receivables | $ | (141.3 | ) | $ | (36.5 | ) |
| Other financial assets/liabilities | 46.3 | (29.4 | ) | |||
| Inventories | (13.6 | ) | 10.0 | |||
| Prepaid expenses | 3.5 | (11.8 | ) | |||
| Trade and other payables | 52.3 | 43.2 | ||||
| Provisions and other liabilities | (4.2 | ) | (0.4 | ) | ||
| $ | (57.0 | ) | $ | (24.9 | ) | |
78 |
|
HUDBAY MINERALS INC. Notes to Audited Consolidated Financial Statements (in millions of US dollars, except where otherwise noted) Years ended December 31, 2025 and 2024
|
(c) Non-cash transactions:
During the year ended December 31, 2025 and 2024, Hudbay entered into the following non-cash investing and financing activities which are not reflected in the consolidated statements of income:
- Remeasurement of Hudbay's decommissioning and restoration liabilities led to a net decrease in related property, plant and equipment assets of $0.2 million (December 31, 2024 - a net decrease of $4.7 million), mainly related to changes to real discount rates associated with remeasurement of the liabilities.
- Property, plant and equipment included $17.7 million (December 31, 2024 - $25.5 million) of capital additions related to the recognition of ROU assets and $33.1 million (December 31, 2024 - $71.0 million) of capital additions related to the recognition of property, plant and equipment that has been financed. Property, plant and equipment and other assets include $39.5 million in net capital additions related to agreements with communities (December 31, 2024 - $18.6 million). Property, plant and equipment includes $2.8 million of deduction for accrued grants related to equipment eligible for credits (December 31, 2024 - nil).
79 |
|
HUDBAY MINERALS INC. Notes to Audited Consolidated Financial Statements (in millions of US dollars, except where otherwise noted) Years ended December 31, 2025 and 2024
|
33. Non-Controlling Interest
On April 30, 2025, Hudbay completed the acquisition on MMC's 25% interest in CMBC. As a result of the Transaction, Hudbay increased its ownership of the Copper Mountain mine from 75% to 100% (note 5). Prior to this, as part of the British Columbia operating segment, the Company owned 75% of CMBC. The remaining 25% ownership stake was held by MMC. The continuity of non-controlling interest balance is disclosed in the consolidated statements of changes in equity.
Summarized financial information for the Copper Mountain mine on an 100% basis is as follows:
Summarized Balance Sheets
|
December 31, 2024 |
|||
| Assets | |||
| Cash and cash equivalents | $ | 12.9 | |
| Trade and other receivables | 44.1 | ||
| Inventories - current | 37.5 | ||
| Property, plant and equipment | 902.9 | ||
| Other assets | 11.1 | ||
| 1,008.5 | |||
| Liabilities | |||
| Trade and other payables | 37.5 | ||
| Amounts due to related parties | 422.6 | ||
| Environmental and other provisions | 35.5 | ||
| Lease liabilities | 20.1 | ||
| Deferred tax liabilities | 119.9 | ||
| Other liabilities | 68.9 | ||
| 704.5 |
80 |
|
HUDBAY MINERALS INC. Notes to Audited Consolidated Financial Statements (in millions of US dollars, except where otherwise noted) Years ended December 31, 2025 and 2024
|
Summarized Statement of Income and Comprehensive (Loss)/Income
|
Year ended December 31, 20251 |
Year ended December 31, 2024 |
|||||
| Total revenue | $ | 76.5 | $ | 274.1 | ||
| Mine operating costs | 56.5 | 210.8 | ||||
| Depreciation and amortization | 16.5 | 50.1 | ||||
| Gross profit | 3.5 | 13.2 | ||||
| Other expenses | 2.6 | 20.2 | ||||
| Finance expense - related parties | 14.4 | 31.3 | ||||
| Other net finance costs | 5.3 | 16.6 | ||||
| Tax recovery | (2.0 | ) | (19.4 | ) | ||
| Net loss for the year | $ | (16.8 | ) | $ | (35.5 | ) |
| Total comprehensive loss | $ | (4.0 | ) | $ | (63.1 | ) |
| 1 The results presented above reflect the transactions for the period January 1, 2025 to April 30, 2025, up to the date on which Hudbay completed the acquisition of MMC's 25% interest in CMBC. |
The above information is presented before inter-company eliminations.
81 |
|
HUDBAY MINERALS INC. Notes to Audited Consolidated Financial Statements (in millions of US dollars, except where otherwise noted) Years ended December 31, 2025 and 2024
|
34. Segmented information
Hudbay is an integrated metals producer. When making decisions on expansions, opening or closing mines, as well as day to day operations, management evaluates the results from operating activities of the Company. Hudbay has the following reportable segments identified by the individual mining operations of Manitoba, British Columbia, Peru, as well as Arizona which holds our Copper World project. The Manitoba, British Columbia and Peru segments generate Hudbay's revenue. The Manitoba segment sells copper concentrate (containing copper, gold and silver), silver/gold doré, zinc concentrate (containing zinc and gold) and other products. The Peru segment consists of Hudbay's Constancia operation and sells copper concentrate and molybdenum concentrate. The British Columbia segment consists of the Copper Mountain operation and sells copper concentrate. Hudbay's Arizona segment consists of the Copper World project located in Arizona. Corporate and other activities include the Company's exploration activities in Chile, Canada and the State of Nevada. The exploration entities are not individually significant, as they do not meet the minimum quantitative thresholds. Corporate activities are not considered a segment and are included as a reconciliation to total consolidated results. Accounting policies for each reported segment are the same as those of the Company. Results from operating activities represents the profit earned by each segment without allocation of corporate costs. This is the measure reported to the chief operating decision-maker, Hudbay's President and Chief Executive Officer, for the purposes of resource allocation and the assessment of segment performance. Total assets and liabilities do not reflect intercompany balances, which have been eliminated on consolidation.
| Year ended December 31, 2025 | ||||||||||||||||||
| Peru | Manitoba |
British Columbia |
Arizona |
Corporate and other activities |
Total | |||||||||||||
| Revenue | $ | 1,161.2 | $ | 748.7 | $ | 301.1 | $ | - | $ | - | $ | 2,211.0 | ||||||
| Cost of sales | ||||||||||||||||||
| Mine operating costs | 516.2 | 273.2 | 238.7 | - | - | 1,028.1 | ||||||||||||
| Depreciation and amortization | 290.0 | 86.4 | 63.3 | - | - | 439.7 | ||||||||||||
| Gross profit (loss) | 355.0 | 389.1 | (0.9 | ) | - | - | 743.2 | |||||||||||
| Selling and administrative expenses | - | - | - | - | 94.7 | 94.7 | ||||||||||||
| Exploration expenses | 15.9 | 30.4 | - | - | - | 46.3 | ||||||||||||
| Other operating expenses (income) | 16.2 | (8.8 | ) | 3.9 | 0.9 | (4.4 | ) | 7.8 | ||||||||||
| Re-evaluation adjustment - environmental provision | - | 0.2 | - | - | - | 0.2 | ||||||||||||
| Impairment - reversal | - | (322.3 | ) | - | (322.3 | ) | ||||||||||||
| Results from operating activities | $ | 322.9 | $ | 367.3 | $ | (4.8 | ) | $ | 321.4 | $ | (90.3 | ) | $ | 916.5 | ||||
| Consideration received from sale of non-core project | (14.9 | ) | ||||||||||||||||
| Net interest expense on long term debt | 60.7 | |||||||||||||||||
| Accretion on streaming arrangements | 19.9 | |||||||||||||||||
| Change in fair value of financial instruments | (52.9 | ) | ||||||||||||||||
| Other net finance income | (8.3 | ) | ||||||||||||||||
| Income before tax | 912.0 | |||||||||||||||||
| Tax expense | 347.7 | |||||||||||||||||
| Net income for the year | $ | 564.3 | ||||||||||||||||
82 |
|
HUDBAY MINERALS INC. Notes to Audited Consolidated Financial Statements (in millions of US dollars, except where otherwise noted) Years ended December 31, 2025 and 2024
|
| Year ended December 31, 2024 | ||||||||||||||||||
| Peru | Manitoba |
British Columbia |
Arizona |
Corporate and other activities |
Total | |||||||||||||
| Revenue | $ | 1,049.7 | $ | 697.4 | $ | 274.1 | $ | - | $ | - | $ | 2,021.2 | ||||||
| Cost of sales | ||||||||||||||||||
| Mine operating costs | 517.4 | 312.6 | 210.8 | - | - | 1,040.8 | ||||||||||||
| Depreciation and amortization | 270.3 | 106.2 | 50.1 | - | - | 426.6 | ||||||||||||
| Gross profit | 262.0 | 278.6 | 13.2 | - | - | 553.8 | ||||||||||||
| Selling and administrative expenses | - | - | - | - | 57.0 | 57.0 | ||||||||||||
| Exploration expenses | 16.5 | 24.4 | - | - | 1.7 | 42.6 | ||||||||||||
| Other operating expenses | 15.7 | 15.8 | 17.1 | 8.3 | 0.5 | 57.4 | ||||||||||||
| Re-evaluation adjustment - environmental provision | - | (3.5 | ) | - | - | - | (3.5 | ) | ||||||||||
| Results from operating activities | $ | 229.8 | $ | 241.9 | $ | (3.9 | ) | $ | (8.3 | ) | $ | (59.2 | ) | $ | 400.3 | |||
| Net interest expense on long term debt | 69.8 | |||||||||||||||||
| Accretion on streaming arrangements | 24.2 | |||||||||||||||||
| Change in fair value of financial instruments | 16.6 | |||||||||||||||||
| Other net finance expense | 38.1 | |||||||||||||||||
| Income before tax | 251.6 | |||||||||||||||||
| Tax expense | 183.8 | |||||||||||||||||
| Net income for the year | $ | 67.8 | ||||||||||||||||
| December 31, 2025 | ||||||||||||||||||
| Peru | Manitoba |
British Columbia |
Arizona |
Corporate and other activities |
Total | |||||||||||||
| Total assets | $ | 2,492.0 | $ | 471.5 | $ | 1,320.2 | $ | 1,147.5 | $ | 792.1 | $ | 6,223.3 | ||||||
| Total liabilities | 1,031.3 | 424.3 | 269.2 | 103.6 | 1,163.9 | 2,992.3 | ||||||||||||
| Property, plant and equipment1 | 1,815.7 | 604.3 | 1,082.6 | 1,144.9 | 46.4 | 4,693.9 | ||||||||||||
| Other Non-Current Assets2 | 64.3 | 21.4 | 9.9 | 0.2 | 0.5 | 96.3 | ||||||||||||
| 1Included in Corporate and Other activities is $33.9 million of property, plant and equipment that is located in Nevada. | ||||||||||||||||||
| 2Other non-current assets includes receivables, inventory, intangibles and other assets. |
| December 31, 2025 | ||||||||||||||||||
| Peru | Manitoba |
British Columbia |
Arizona |
Corporate and other activities |
Total | |||||||||||||
| Additions to property, plant and equipment | $ | 207.0 | $ | 64.9 | $ | 228.1 | $ | 82.2 | $ | 0.3 | $ | 582.5 | ||||||
83 |
|
HUDBAY MINERALS INC. Notes to Audited Consolidated Financial Statements (in millions of US dollars, except where otherwise noted) Years ended December 31, 2025 and 2024
|
| December 31, 2024 | ||||||||||||||||||
| Peru | Manitoba |
British Columbia |
Arizona |
Corporate and other activities |
Total | |||||||||||||
| Total assets | $ | 2,410.0 | $ | 547.4 | $ | 1,076.0 | $ | 757.3 | $ | 696.9 | $ | 5,487.6 | ||||||
| Total liabilities | 960.0 | 421.3 | 281.9 | 14.7 | 1,162.3 | 2,840.2 | ||||||||||||
| Property, plant and equipment1 | 1,897.1 | 595.1 | 900.7 | 747.1 | 41.4 | 4,181.4 | ||||||||||||
| Other Non-Current Assets2 | 47.8 | 17.2 | 8.0 | 0.2 | 0.6 | 73.8 | ||||||||||||
1Included in Corporate and Other activities is $27.7 million of property, plant and equipment that is located in Nevada.
2Other non-current assets includes receivables, inventory, intangibles and other assets.
| December 31, 2024 | ||||||||||||||||||
| Peru | Manitoba |
British Columbia |
Arizona |
Corporate and other activities |
Total | |||||||||||||
| Additions to property, plant and equipment | $ | 177.8 | $ | 63.3 | $ | 214.9 | $ | 30.2 | $ | - | $ | 486.2 | ||||||
84 |
|
HUDBAY MINERALS INC. Notes to Audited Consolidated Financial Statements (in millions of US dollars, except where otherwise noted) Years ended December 31, 2025 and 2024
|
Geographical Segments
The following tables represent revenue information regarding Hudbay's geographical segments for the years ended December 31, 2025 and 2024:
| 2025 | 2024 | |||||
| Revenue by customer location 1 | ||||||
| China | $ | 923.4 | $ | 755.0 | ||
| Canada | 702.0 | 741.1 | ||||
| Japan | 320.2 | 274.1 | ||||
| India | 148.0 | 82.0 | ||||
| Germany | 44.5 | - | ||||
| Peru | 22.2 | - | ||||
| South Korea | 19.5 | 23.0 | ||||
| United States | 14.5 | 67.4 | ||||
| Chile | 11.1 | - | ||||
| Philippines | 4.2 | 63.9 | ||||
| Netherlands | 1.4 | - | ||||
| Switzerland | - | 13.6 | ||||
| Belgium | - | 1.1 | ||||
| $ | 2,211.0 | $ | 2,021.2 |
1 Presented based on the ultimate destination of the product if known. If the eventual destination of the product sold through traders is not known then revenue is allocated to the location of the customer's business office and not the ultimate destination of the product.
During the year ended December 31, 2025, six customers accounted for approximately 22%, 14%, 11%, 7%, 6% and 6%, respectively, of total revenue during the year. Revenue from these customers has been presented in the Manitoba, British Columbia and Peru operating segments.
During the year ended December 31, 2024, six customers accounted for approximately 24%, 14%, 9%, 7%, and 6%, respectively, of total revenue during the year. Revenue from these customers has been presented in the Manitoba, British Columbia and Peru operating segments.
35. Events after reporting period
On January 9, 2026, Hudbay closed the previously announced strategic investment from Mitsubishi for a 30% minority interest in Copper World, which owns the fully-permitted Copper World project in Arizona. On closing, Mitsubishi contributed approximately $420 million of cash to Copper World, and it will contribute an additional $180 million in cash within 18 months in accordance with the terms of the definitive subscription agreement. As a result of the strategic investment, Hudbay continues to control Copper World and the Copper World Transaction will be accounted for as an equity transaction resulting in the recognition of non-controlling interest.
85

Management's Discussion and Analysis of
Results of Operations and Financial Condition
For the year ended
December 31, 2025
February 19, 2026
INTRODUCTION
This Management's Discussion and Analysis ("MD&A") dated February 19, 2026 is intended to supplement Hudbay Minerals Inc.'s consolidated financial statements and related notes for the year ended December 31, 2025 and 2024 (the "consolidated financial statements"). The consolidated financial statements have been prepared in accordance with IFRS® Accounting Standards ("IFRS" or "GAAP") as issued by the International Accounting Standards Board ("IASB").
References to "Hudbay" or the "Company" refer to Hudbay Minerals Inc. and its direct and indirect subsidiaries as at December 31, 2025.
Readers should be aware that:
- This MD&A contains certain "forward-looking statements" and "forward-looking information" (collectively, "forward-looking information") that are subject to risk factors set out in a cautionary note contained in Hudbay's MD&A.
- This MD&A has been prepared in accordance with the requirements of the securities laws in effect in Canada, which may differ materially from the requirements of United States securities laws applicable to US issuers.
- Hudbay uses a number of non-GAAP financial performance measures in Hudbay's MD&A, which do not have standardized meaning under IFRS. For further information and detailed reconciliations of such measures, please see the discussion under the "Non-GAAP Financial Performance Measures" section herein.
- The technical and scientific information in this MD&A has been approved by qualified persons based on a variety of assumptions and estimates. Please see the discussion under the "Qualified Persons and NI 43-101" section herein.
Readers are also urged to review the "Notes to Reader" section beginning on page 83 of this MD&A.
Additional information regarding Hudbay, including the risks related to its business and those that are reasonably likely to affect its consolidated financial statements in the future, is contained in Hudbay's continuous disclosure materials, including its most recent Annual Information Form, consolidated financial statements and Management Information Circular available on SEDAR+ at www.sedarplus.ca and on EDGAR at www.sec.gov.
All amounts are in US dollars unless otherwise noted.
HUDBAY'S BUSINESS
Hudbay is a copper-focused critical minerals company with three long-life operations and a world-class pipeline of copper growth projects in tier-one mining jurisdictions of Canada, Peru and the United States. Hudbay's operating portfolio includes the Constancia mine in Cusco (Peru), the Snow Lake operations in Manitoba (Canada) and the Copper Mountain mine in British Columbia (Canada). Copper is the primary metal produced by the Company, which is complemented by meaningful gold production and by-product zinc, silver and molybdenum. The Company's growth pipeline includes the Copper World project in Arizona (United States), the Mason project in Nevada (United States), the Llaguen project in La Libertad (Peru) and several expansion and exploration opportunities near its existing operations. Hudbay is governed by the Canada Business Corporations Act and its shares are listed under the symbol "HBM" on the Toronto Stock Exchange, New York Stock Exchange and Bolsa de Valores de Lima.
HUDBAY'S PURPOSE
The value Hudbay creates and the impact it has is embodied in its purpose statement: "We care about our people, our communities and our planet. Hudbay provides the metals the world needs. We work sustainably, transform lives and create better futures for communities."
Hudbay transforms lives: Hudbay invests in its employees, their families and local communities through long-term employment, local procurement and economic development to improve their quality of life and ensure the communities benefit from the Company's presence.
Hudbay operates responsibly: From exploration to closure, Hudbay operates safely and responsibly, welcomes innovation and strives to minimize its environmental footprint while following leading operating practices in all facets of mining.
Hudbay provides critical metals: Hudbay produces copper and other metals needed for everyday products and essential for applications to support the energy transition toward a more sustainable future.
HUDBAY'S STRATEGY
Hudbay's mission is to create sustainable value and strong returns by leveraging its core strengths in community relations, focused exploration, mine development and efficient operations.
The Company believes that copper is the commodity with the best long-term supply/demand fundamentals and offers shareholders the greatest opportunity for sustained risk-adjusted returns. Copper is essential for achieving energy transition and AI technology needs - it is one of the most heavily utilized metals in renewable energy systems and is a key component for power networks, circuit boards and cooling systems in data processing centres. Through the discovery and successful development of economic mineral deposits, and through highly efficient low-cost operations to extract the metals, Hudbay believes sustainable value will be created for all stakeholders.
Hudbay's successful development, ramp-up and operation of the Constancia open-pit mine in Peru, the Company's long history of underground mining and full life-cycle experience in northern Manitoba, its track record of reserve expansion through effective exploration, and its organic pipeline of copper development projects including Copper World and Mason provide the Company with a competitive advantage to deliver sustainable value relative to other mining companies of similar scale.
Over the past decade, Hudbay has built a world-class asset portfolio by executing a consistent long-term growth strategy focused on copper. The Company continuously works to generate strong free cash flow and optimize the value of its producing assets through exploration, brownfield expansion projects and efficient and safe operations. Furthermore, Hudbay intends to sustainably grow through the exploration and development of its robust project pipeline, as well as through the acquisition of other properties that fit the Company's stringent strategic criteria.
To ensure that any investment in existing assets or acquisition of other mineral assets is consistent with the Company's purpose and mission, Hudbay has established a number of criteria for evaluating these opportunities. The criteria include the following:
- Sustainability: Hudbay is focused on jurisdictions that support responsible mining activity. The current geographic focus is on select investment grade countries in the Americas, with strong rule of law and respect for human rights consistent with the Company's long-standing focus on environmental, social and governance ("ESG") principles;
- Copper Focus: Hudbay believes copper is the commodity with the best long-term supply/demand fundamentals. Global copper mine supply is challenged due to declining industry grades, major disruptions at large mines, limited exploration success and an insufficient pipeline of development-ready projects, while demand is expected to continue to increase through global decarbonization initiatives and the rapid growth in AI data processing centres. Hudbay believes this long-term supply/demand gap will create opportunities for increased risk-adjusted returns. While the Company's primary focus is on copper, it recognizes and values the polymetallic nature of copper deposits and, in particular, the complementary benefits of gold in the Company's portfolio;
- Quality: Hudbay is focused on investing in long-life, low-cost, expandable, high-quality assets that can capture peak pricing of multiple commodity price cycles and can generate free cash flow through the troughs of price cycles;
- Potential: Hudbay considers the full spectrum of acquisition and investment opportunities, from early-stage exploration to producing assets, that offer significant incremental potential for exploration, development, expansion and optimization beyond the stated resources and mine plan;
- Process: Hudbay develops a clear understanding of how an investment or acquisition can create value through its robust due diligence and capital allocation process that applies the Company's technical, social, operational and project execution expertise;
- Operatorship: Hudbay believes value is created through leveraging its competitive advantages in safe and efficient operations, effective exploration, proven project development and strong community relations. While operatorship is a key criterion, Hudbay is open to joint ventures and partnerships that de-risk its portfolio and increase risk-adjusted returns; and - Capital Allocation: Hudbay pursues investments and acquisitions that are accretive on a per share basis.
Given that the Company's strategic focus includes allocating capital to assets at various stages of development, when evaluating accretion, it will consider measures such as internal rate of return ("IRR"), return on invested capital ("ROIC"), net asset value per share and the contained value of reserves and resources per share.
Hudbay's key objectives for 2026 are focused on continued operational excellence, advancement of organic growth opportunities and prudent capital allocation to deliver attractive high-return growth:
1. Demonstrate continued operational excellence to generate substantial free cash flow through consistent copper and gold production, industry-leading cost performance and high-return brownfield reinvestment opportunities.
◦ Increase mill throughput at Constancia to approximately 90,000 tonnes per day in the second half of 2026 through the installation of two pebble crushers.
◦ Continue mill throughput improvements at New Britannia and recovery enhancements at the Stall mill.
◦ Advance the 1901 deposit towards full production by the end of 2027.
◦ Ramp up mill throughput at Copper Mountain to its permitted capacity of 50,000 tonnes per day in the second half of 2026.
2. Advance attractive organic growth opportunities to deliver significant increase in long-term production.
◦ Complete the definitive feasibility study at Copper World in mid-2026 with final sanctioning decision expected in 2026.
◦ Progress New Ingerbelle permitting and development activities to add production and mine life extension at Copper Mountain.
◦ Advance economic evaluations of regional satellite properties in Snow Lake, including the Talbot copper-gold-zinc deposit and the New Britanna gold deposit, to further optimize the mine plan and extend mine life.
◦ Execute extensive Snow Lake exploration program to look for new anchor deposits to meaningfully extend mine life.
◦ Initiate pre-feasibility study activities at Mason to de-risk project development.
◦ Advance Flin Flon tailings reprocessing opportunities through pre-feasibility analysis.
◦ Prepare for exploration activities at Maria Reyna and Caballito to identify high-grade satellite deposits within trucking distance of Constancia's milling infrastructure and provide significant long-term upside potential in Peru.
3. Implement the Capital Allocation Framework to maintain strong financial discipline and maximize returns.
◦ Continue to reduce total debt outstanding and maintain significant financial flexibility throughout Copper World project build.
◦ Source the most efficient project level financing for Copper World as part of the Company's prudent financial plan for developing the project.
◦ Evaluate all types of capital redeployment opportunities, including reinvestments and shareholder returns to generate the highest risk-adjusted returns.
SUMMARY
Delivered Record Annual Revenue and Adjusted EBITDA; Achieved 2025 Consolidated Copper and Gold Production and Cost Guidance
• Achieved record annual revenue of $2,211.0 million and record annual adjusted EBITDA1 of $1,060.9 million in 2025, demonstrating the resilience and strength of Hudbay's diversified operating platform.
• Achieved full year consolidated copper and gold production guidance, with 118,188 tonnes of copper and 267,934 ounces of gold, despite mandatory wildfire evacuations in Manitoba and temporary operational interruptions in Peru resulting in production deferrals during the year.
• 2025 represents the 11th consecutive year in which Hudbay achieved its annual consolidated copper production guidance, since Constancia declared commercial production, and the 5th consecutive year achieving its annual consolidated gold production guidance, since establishing standalone gold production guidance4.
• Significantly outperformed the twice-improved 2025 consolidated cash cost guidance driven by strong cost control, higher metal prices and meaningful exposure to gold by-product credits resulting in consolidated cash cost1 and sustaining cash cost1, net of by-product credits, of $(0.22) and $1.30 per pound of copper, respectively, in 2025, an improvement of 148% and 20%, respectively, compared to 2024.
• Peru operations produced 85,155 tonnes of copper and 74,480 ounces of gold in 2025 with full year copper production within the 2025 guidance range while gold production far exceeded the top end of the annual guidance range. This production output was attributable to the optimization of the mine plan in 2025 by prioritizing Pampacancha mining activities and fully depleting the high-grade satellite deposit in December. Peru also leveraged the use of stockpiled ore during the third quarter of 2025 as the Company adapted its mine plan due to the social unrest experienced in the region. Peru full year cash cost1 of $1.08 per pound of copper outperformed the low end of the 2025 annual guidance range of $1.35 to $1.65 per pound as a result of stable operating cost performance and higher by-product credits.
• Manitoba operations produced 173,453 ounces of gold, 9,249 tonnes of copper, 17,646 tonnes of zinc and 800,198 ounces of silver in 2025. Production was below the low end of the guidance range for gold and zinc, while copper and silver production was within the guidance range in 2025. These production levels were achieved despite the impacts of over two months of production deferrals due to wildfire evacuations, ramp-up activities throughout the summer and unexpected downtime from an eight day weather-related power outage in October. In addition, zinc production was lower than the guidance range as gold production was prioritized in Manitoba. Manitoba full year cash cost1 of $549 per ounce of gold outperformed the low end of the 2025 annual guidance range of $650 to $850 per ounce as a result of productivity gains and lower treatment and refining charges.
• British Columbia operations produced 23,784 tonnes of copper, 20,001 ounces of gold and 252,811 ounces of silver in 2025. Copper production was below the low end of the production guidance range, while the operations achieved full year 2025 production guidance for gold and silver. Copper production in 2025 was impacted by reduced throughput at the primary semi-autogenous grinding ("SAG") mill in the fourth quarter of 2025 and a higher portion of low-grade stockpiles utilized as ore feed in 2025. British Columbia full year cash cost1 of $3.06 per pound of copper achieved the 2025 annual cost guidance range of $2.45 to $3.45 per pound.
Delivered Strong Fourth Quarter Financial Results Driven by Resilient Operating Performance
• Achieved record quarterly revenue of $732.9 million and record quarterly adjusted EBITDA1 of $385.9 million in the fourth quarter of 2025.
• Demonstrated strong operational performance in the fourth quarter of 2025 as operations normalized after temporary production interruptions in the third quarter with consolidated copper production of 33,069 tonnes and consolidated gold production of 84,298 ounces.
• Maintained industry-leading cost performance in the fourth quarter with consolidated cash cost1 and sustaining cash cost1 per pound of copper produced, net of by-product credits, of $(0.63) and $0.94, respectively.
• Peru operations had the strongest quarter of the year in the fourth quarter with production of 25,038 tonnes of copper, 32,865 ounces of gold and 731,017 ounces of silver as strong copper and gold grades were mined from Pampacancha and less ore was processed from low-grade stockpiles. Hudbay continued to optimize the mine plan during the quarter with more ore mined from Pampacancha than previously expected, resulting in the accelerated depletion of Pampacancha, in late December compared to early 2026. Peru cash cost1, net of by-product credits, was $0.57 per pound of copper in the fourth quarter, outperforming the low end of the annual cost guidance range.
• Manitoba operations produced 47,423 ounces of gold in the fourth quarter, slightly lower than quarterly cadence expectations due to unplanned down time in October from an eight-day weather-related power outage, offset by record monthly throughput at the New Britannia mill in December. Manitoba operations also produced 3,326 tonnes of copper, 5,703 tonnes of zinc and 214,493 ounces of silver in the fourth quarter. Manitoba cash cost1, net of by-product credits, was $705 per ounce of gold in the fourth quarter, well within the annual cost guidance range.
• British Columbia operations produced 4,705 tonnes of copper, 4,010 ounces of gold and 57,475 ounces of silver in the fourth quarter. While the operations completed construction of the permanent feed system for the new second SAG mill in December, total throughput in the fourth quarter was constrained by the primary SAG mill requiring unplanned maintenance early in the fourth quarter of 2025. British Columbia cash cost1, net of by-product credits, was $4.82 per pound of copper in the fourth quarter, reflecting the production impacts from the primary SAG mill maintenance.
• Fourth quarter net earnings attributable to owners and earnings per share attributable to owners were $128.0 million and $0.32, respectively, reflecting the strong gross margins as a result of higher metal prices and a $25.0 million business interruption insurance recovery related to the mandatory wildfire evacuations in Manitoba during the year. After adjusting for the insurance recovery and other non-cash items, fourth quarter adjusted earnings1 per share attributable to owners was $0.22.
• The strong gross margins achieved in the fourth quarter of 2025 resulted in higher employee profit sharing expenses of $36.1 million recorded within cost of sales.
Achieved Deleveraging Targets Ahead of Schedule
• Hudbay's unique copper and gold diversification across its operations provides exposure to higher copper and gold prices, which together with a focus on cost control across the business, continues to expand margins and generate attractive free cash flow.
• While the majority of Hudbay's revenue continues to be derived from copper production, revenue from gold production continues to represent a growing portion of total revenues at 38% of total revenue in 2025, including 41% of revenue in the fourth quarter, compared to 35% in 2024.
• Delivered another quarter of record free cash flow1 generation with $228.2 million achieved during the fourth quarter of 2025, resulting in $387.9 million in free cash flow in 2025.
• Achieved adjusted EBITDA1 of $385.9 million in the fourth quarter of 2025, resulting in record annual adjusted EBITDA1 of $1,060.9 million.
• Repurchased and retired an additional $39.3 million of senior unsecured notes through open market purchases at a discount to par during the fourth quarter of 2025 reducing total debt to $1.0 billion as of December 31, 2025. Since the end of 2024, Hudbay has reduced its long-term debt by $185.1 million.
• Net debt1 decreased by $86.0 million to $439.7 million as at December 31, 2025 compared to $525.7 million at December 31, 2024.
• Net debt to adjusted EBITDA ratio1 was 0.4x at the end of the fourth quarter of 2025, a further improvement from 0.6x at the end of the fourth quarter of 2024.
• After giving effect to the recent closing of the Copper World joint venture transaction, which occurred in January 2026, Hudbay's post-closing adjusted cash and cash equivalents as at December 31, 2025 were approximately $992 million3. In addition, Hudbay had undrawn availability of $424.8 million under its revolving credit facilities as of December 31, 2025, increasing its total post-closing adjusted liquidity to over $1.4 billion3.
Implementing Holistic Capital Allocation Framework to Maintain Strong Financial Discipline, Deliver Growth Initiatives and Maximize Long-term Risk-adjusted Returns
• Enhanced Capital Allocation Framework embedded into Hudbay's annual financial planning cycle to provide a holistic approach to capital allocation decisions, including capital deployment into brownfield projects, greenfield projects and strategic investments, while considering debt repurchases, share buybacks and dividends.
• Hudbay's recent financial transformation has positioned the Company to introduce a new quarterly dividend of C$0.01 per share, an annual increase of 100% compared to its former semi-annual C$0.01 per share dividend, representing the Company's first dividend increase in its history.
• Closed the accretive $600 million joint venture transaction with Mitsubishi Corporation ("Mitsubishi") in January 2026, securing a premier, long-term 30% strategic partner for the development of Copper World. Definitive feasibility study on track for completion in mid-2026 with a sanctioning decision expected in 2026.
• Ongoing optimization efforts at Copper Mountain include executing an accelerated stripping campaign to deliver higher grades starting in 2027 and mill improvement initiatives to achieve the permitted mill throughput capacity of 50,000 tonnes per day in the second half of 2026.
• Expected to deliver higher mill throughput rates at Constancia in the second half of 2026 with the installation of pebble crushers.
• Continued large Snow Lake exploration program to further increase near-term production and mineral reserves, test regional satellite deposits for additional mill feed to utilize available capacity at Stall and explore the large land package for a new anchor deposit to meaningfully extend mine life.
• Underground infrastructure established at the 1901 deposit to enable exploration drilling throughout 2026 and prepare for full production by the end of 2027.
• Drilling activities have increased at the copper-gold-zinc Talbot deposit near Snow Lake with six drill rigs deployed and several step-out drill holes indicating resource expansion potential.
• Engineering work advances on the Flin Flon tailings reprocessing opportunity to assess the economic viability of producing critical minerals and precious metals and the potential to reduce the overall environmental footprint.
• Advancing plans to initiate a pre-feasibility study for the Mason copper project in Nevada.
2026 Guidance Reflects Stable Copper and Gold Production at Industry-leading Margins
• Consolidated copper production of 124,000 tonnes, based on the midpoint of the 2026 guidance range, is expected to increase by 5% compared to 2025 levels, reflecting higher expected production in British Columbia with the anticipated mill throughput ramp-up to the targeted 50,000 tonnes per day in the second half of 2026, partially offset by lower grades in Peru with the depletion of Pampacancha in 2025.
• Consolidated gold production of 244,500 ounces, based on the midpoint of the 2026 guidance range, is expected to be lower than 2025 production, reflecting the depletion of Pampacancha in 2025, but higher in unstreamed gold ounces with higher gold production in Manitoba from mill throughput at New Britannia continuing to exceed expectations.
• Consolidated cash cost1, net of by-product credits, in 2026 is expected to be within ($0.30) to ($0.10) per pound of copper, benefiting from higher gold production and a continued focus on maintaining stable operating costs across the business, driving industry-leading margins.
• Total sustaining capital expenditures are expected to be $435 million in 2026, reflecting approximately $38 million in deferrals from 2025 and $44 million in one-time sustaining capital projects at the operations.
• As the Company embarks on generational reinvestments, total growth capital expenditures at the operations are expected to be $140 million in 2026, including approximately $23 million in deferrals from 2025, to advance several high-return growth projects in 2026 to deliver increased copper exposure, including Peru mill throughput enhancement projects, early works at the New Ingerbelle expansion project in British Columbia, and excludes growth capital related to the Copper World joint venture.
• Growth capital expenditures at Copper World are expected to be $135 million in 2026 for project feasibility, de-risking and pre-sanctioning costs, which have been fully funded by the proceeds received from Mitsubishi as part of the closing of the Copper World joint venture transaction in January 2026, and include approximately $60 million for accelerated long lead items and de-risking activities and $35 million of capital deferrals from 2025.
Summary of Fourth Quarter Results
Hudbay's diversified asset portfolio delivered consolidated copper production of 33,069 tonnes and consolidated gold production of 84,298 ounces in the fourth quarter of 2025. Consolidated copper and gold production was higher than the third quarter of 2025 due to strong copper and gold grades from Pampacancha and less ore processed from low-grade stockpiles compared to the third quarter. Consolidated gold production also benefitted from the ramp-up to full operations in Snow Lake after the mandatory wildfire evacuations were lifted in the third quarter of 2025 and record monthly throughput at the New Britannia mill in December. Consolidated silver production of 1,002,985 ounces and zinc production of 5,703 tonnes in the fourth quarter of 2025 were also higher than the third quarter of 2025 for the aforementioned reasons.
Cash generated from operating activities of $209.4 million decreased compared to the same period in 2024 as the strong gross margins during the quarter was offset by the impacts of changes in non-cash working capital from a higher receivable balance as a result of the timing of sales as well as higher cash taxes paid compared to the same period in 2024. Cash generated from operating activities increased compared to the third quarter of 2025 as a result of higher gross margins driven by strong metal prices and higher sales volumes compared to the third quarter which was impacted by mandatory wildfire evacuations in Manitoba and a temporary operational interruption in Peru. Operating cash flow before change in non-cash working capital was $336.9 million during the fourth quarter of 2025, reflecting an increase of $266.6 million from the third quarter of 2025. This significant increase reflects higher copper and gold sales volumes from normalized operations after temporary interruptions and higher metal prices.
Adjusted EBITDA1 was $385.9 million in the fourth quarter of 2025, an increase compared to $142.6 million in the third quarter of 2025 as higher realized metal prices and higher copper and gold sales volume resulted in strong gross margins during the quarter.
Net earnings attributable to owners was $128.0 million, or $0.32 per share, in the fourth quarter of 2025 compared to $222.4 million, or $0.56 per share, in the third quarter of 2025 and $21.2 million, or $0.05 per share, in the fourth quarter of 2024. The decrease in earnings compared to the third quarter of 2025 is a result of a non-cash after-tax gain of $242.7 million from a full impairment reversal relating to Hudbay's Copper World project that occurred in the third quarter. The increase in earnings compared to the fourth quarter of 2024 is driven by higher realized metal prices resulting in strong gross margin as well as a $25.0 million business interruption insurance recovery related to the Manitoba mandatory wildfire evacuation shutdowns.
Adjusted net earnings attributable to owners1 and adjusted net earnings per share attributable to owners1 in the fourth quarter of 2025 were $86.0 million and $0.22 per share, respectively, after adjusting for various non-cash items on a pre-tax basis including a $25.0 million business interruption insurance recovery related to the Manitoba mandatory wildfire evacuations during the year, a $5.7 million mark-to-market revaluation gain on various instruments such as investments and share-based compensation, and a non-cash $5.4 million foreign exchange gain, among other items. This compares to adjusted net earnings attributable to owners1 and net earnings per share attributable to owners1 of $70.3 million and $0.18 per share in the fourth quarter of 2024 and $10.1 million and $0.03 per share in the third quarter of 2025. The increase compared to the fourth quarter of 2024 is for the same reasons discussed above for net earnings. The increase compared to the third quarter of 2025 is a result of higher realized metal prices and higher sales volumes.
Consolidated cash cost1, net of by-product credits, in the fourth quarter of 2025 was $(0.63) per pound of copper, compared to $0.42 per pound in the third quarter of 2025 and $0.45 in the fourth quarter of 2024, as Hudbay continued to demonstrate strong cost control across its operations. The decrease in cash cost from the comparative periods was a result of higher by-product credits reflecting the benefits of Hudbay's diversified asset portfolio with higher realized prices across all metals.
Consolidated sustaining cash cost1, net of by-product credits, in the fourth quarter of 2025 was $0.94 per pound of copper, compared to $2.09 per pound in the third quarter of 2025 and $1.37 per pound in the fourth quarter of 2024. The decrease was primarily due to the same factors impacting consolidated cash cost noted above, partially offset by planned higher cash sustaining capital expenditures.
Consolidated all-in sustaining cash cost1, net of by-product credits, in the fourth quarter of 2025 was $1.43 per pound of copper, lower than the third quarter of 2025 and the fourth quarter of 2024 mainly due to the same reasons noted above, partially offset by higher corporate general and administrative ("G&A") costs from the revaluation of Hudbay's stock-based compensation due to a higher share price.
As at December 31, 2025, total liquidity was $993.7 million, including $568.9 million in cash and cash equivalents, and undrawn availability of $424.8 million under Hudbay's revolving credit facilities. Net debt1 at the end of the fourth quarter was $439.7 million, marking an $86.0 million improvement from fourth quarter of 2024 as a result of deleveraging activities which included the repurchase and retirement of senior unsecured notes. After giving effect to the closing of the Copper World joint venture transaction, post-closing adjusted cash and cash equivalents as of December 31, 2025 are approximately $992 million3, total post-closing adjusted liquidity increases to over $1.4 billion3 and post-closing net debt1 is approximately zero. Hudbay expects that the current liquidity, together with cash flows from operations, will be sufficient to meet the Company's liquidity needs for the year.
Summary of Full Year Results
Hudbay achieved 2025 consolidated production guidance for copper and gold, with full year production of 118,188 tonnes of copper and 267,934 ounces of gold. In 2025, the operations also produced 17,646 tonnes of zinc, 3,468,143 ounces of silver and 1,282 tonnes of molybdenum. 2025 represents the 11th consecutive year in which Hudbay achieved its annual consolidated copper production guidance, since Constancia declared commercial production, and 5th consecutive year achieving its annual consolidated gold production guidance, since establishing standalone gold production guidance.
With respect to Hudbay's operating business units, Peru exceeded the top end of the gold production guidance and achieved the guidance ranges for copper despite the impact from the temporary operational interruption due to social unrest. While Hudbay was previously tracking within the guidance ranges in Manitoba despite the wildfires, gold and zinc production fell below the low end of the respective ranges as a result of an eight-day weather-related power outage in October. Manitoba achieved guidance for copper and silver production despite these interruptions. British Columbia achieved guidance for gold and silver production, while copper production fell below the low end of the guidance range, primarily due to unplanned maintenance at the primary SAG mill in the fourth quarter and a higher portion of low-grade stockpiles utilized as ore feed in 2025.
Cash generated from operating activities increased to $707.3 million in 2025 from $666.2 million in 2024. Operating cash flow before change in non-cash working capital increased to a record $764.3 million in 2025 from $691.1 million in 2024. The increase in operating cash flow before changes in working capital was primarily the result of higher gross margins driven by higher metal prices and stable cost performance despite temporary operational interruptions during the year. This was partially offset by a significant increase in cash taxes paid of $268.4 million, compared to $132.5 million in 2024 reflecting earlier periods of high taxable income mainly at the Peru and Manitoba operations.
Net earnings attributable to owners were $568.5 million, or $1.44 per share, in 2025, compared to $76.7 million, or $0.20 per share, in 2024. Net earnings were positively impacted by higher realized prices for all metals and a non-cash charge of $242.7 million relating to an impairment reversal with respect to the Copper World project in 2025, partially offset by higher mining and income tax expenses.
Adjusted net earnings attributable to owners1 and adjusted net earnings per share attributable to owners1 in 2025 were $265.5 million and $0.67 per share, respectively, after adjusting for items on a pre-tax basis such as a $322.3 million impairment reversal with respect to the Copper World project, $25.0 million in business interruption insurance recovery related to the Manitoba wildfires, $18.6 million in foreign exchange gains, and $14.9 million in consideration received from sale of a non-core project, among other items. This compares to adjusted net earnings attributable to owners1 and net earnings per share attributable to owners1 of $181.4 million and $0.48 per share in 2024.
Adjusted EBITDA1 was $1,060.9 million in 2025, a 29% increase compared to $822.5 million in 2024, achieving a new annual record. The increase was the result of higher realized metal prices and stable operating performance, driving strong cost control across the business.
Consolidated cash cost1, net of by-product credits, in the fourth quarter of 2025 was $(0.22) per pound of copper, compared to $0.46 per pound of copper in 2024. Hudbay significantly outperformed its twice-improved 2025 consolidated cash cost guidance as a result of higher metal prices with a significant increase in gold by-product credits, partially offset by higher G&A due to higher employee profit sharing in Peru and Manitoba.
Consolidated sustaining cash cost1, net of by-product credits1, in the fourth quarter of 2025 was $1.30 per pound of copper in 2025 decreased from $1.62 per pound of copper in 2024 due to the same reasons affecting cash cost, partially offset by higher cash sustaining capital expenditures. Hudbay outperformed the improved 2025 consolidated sustaining cash cost guidance as a result of the same reasons driving the outperformance on cash cost guidance.
Consolidated all-in sustaining cash cost1, net of by-product credits, in the fourth quarter of 2025 was $1.74 per pound of copper in 2025, lower than $1.88 per pound of copper in 2024 as a result of the same reasons outlined above, partially offset by higher corporate selling and administrative costs primarily due to a revaluation of share-based compensation associated with a higher share price.
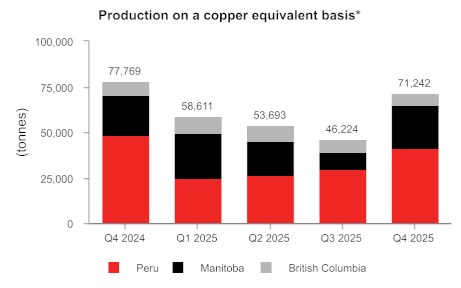
*Copper equivalent production is calculated using the quarter average LME prices for each metal.
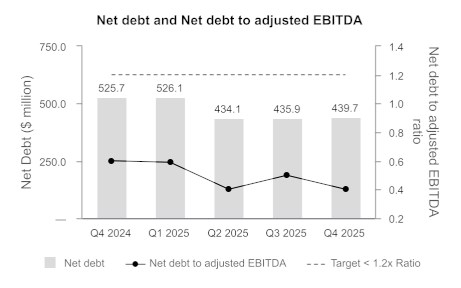
1 Adjusted net earnings - attributable to owners and adjusted net earnings per share - attributable to owners, adjusted EBITDA, cash cost, sustaining cash cost, all-in sustaining cash cost per pound of copper produced, net of by-product credits, cash cost, sustaining cash cost per ounce of gold produced, net of by-product credits, combined unit cost, net debt, net debt to adjusted EBITDA ratio and free cash flow are non-GAAP financial performance measures with no standardized definition under IFRS. For further information and a detailed reconciliation, please see the discussion under the "Non-GAAP Financial Performance Measures" section of this MD&A.
2 Liquidity includes $568.9 million in cash and cash equivalents as well as undrawn total availability of $424.8 million under Hudbay's revolving credit facilities.
3 The post-closing adjusted year-end cash and cash equivalents of $992 million includes December 31, 2025 cash and cash equivalents balance of $568.9 million and approximately $420 million of cash at the Copper World LLC level, which is designated for exclusive use by the Copper World joint venture. Post-closing adjusted liquidity includes the pro-forma cash and cash equivalent plus the undrawn availability of $424.8 million under Hudbay's revolving credit facilities.
4 In 2020, Hudbay's consolidated copper production guidance range was revised during the year due to the impact of COVID-19 at the operations. Hudbay's copper production was within the revised guidance ranges. Prior to 2021, Hudbay provided guidance on a precious metal equivalent instead of gold as a standalone metal.
KEY FINANCIAL RESULTS
| Financial Condition | ||||||
| (in $ millions, except net debt to adjusted EBITDA ratio) | Dec. 31, 2025 | Dec. 31, 2024 | ||||
| Cash and cash equivalents and short-term investments | $ | 568.9 | $ | 581.8 | ||
| Total long-term debt | 1,008.6 | 1,107.5 | ||||
| Net debt1 | 439.7 | 525.7 | ||||
| Working capital2 | (65.6 | ) | 511.3 | |||
| Total assets | 6,223.3 | 5,487.6 | ||||
| Equity attributable to owners of the Company | 3,231.0 | 2,553.2 | ||||
| Net debt to adjusted EBITDA 1 | 0.4 | 0.6 |
1 Net debt and net debt to adjusted EBITDA are non-GAAP financial performance measures with no standardized definition under IFRS. For further information and a detailed reconciliation, please see discussion under the "Non-GAAP Financial Performance Measures" section of this MD&A.
2 Working capital is determined as total current assets less total current liabilities as defined under IFRS and disclosed on the consolidated financial statements. Working capital as of December 31, 2025 was impacted by an increase in the current portion of long-term debt of $472.1 million as the 2026 Notes are now maturing within one year.
| Financial Performance | Three months ended | Year ended | |||||||||||||
| (in $ millions, except per share amounts or as noted below) | Dec. 31, 2025 |
Sep. 30, 2025 |
Dec. 31, 2024 |
Dec. 31, 2025 |
Dec. 31, 2024 |
||||||||||
| Revenue | $ | 732.9 | $ | 346.8 | $ | 584.9 | $ | 2,211.0 | $ | 2,021.2 | |||||
| Cost of sales | 462.8 | 281.5 | 400.5 | 1,467.8 | 1,467.4 | ||||||||||
| Earnings before tax | 257.1 | 330.5 | 103.7 | 912.0 | 251.6 | ||||||||||
| Net earnings | 128.0 | 222.4 | 19.3 | 564.3 | 67.8 | ||||||||||
| Net earnings attributable to owners | 128.0 | 222.4 | 21.2 | 568.5 | 76.7 | ||||||||||
| Basic and diluted earnings per share - attributable | 0.32 | 0.56 | 0.05 | 1.44 | 0.20 | ||||||||||
| Adjusted earnings per share - attributable1 | 0.22 | 0.03 | 0.18 | 0.67 | 0.48 | ||||||||||
| Operating cash flow before change in non-cash working capital | 336.9 | 70.3 | 231.5 | 764.3 | 691.1 | ||||||||||
| Adjusted EBITDA1 | 385.9 | 142.6 | 257.3 | 1,060.9 | 822.5 | ||||||||||
| Free cash flow1 | 228.2 | (15.2 | ) | 149.0 | 387.9 | 368.0 | |||||||||
1 Adjusted earnings per share - attributable to owners, adjusted EBITDA and free cash flow are non-GAAP financial performance measures with no standardized definition under IFRS. For further information and a detailed reconciliation, please see discussion under the "Non-GAAP Financial Performance Measures" section of this MD&A.
KEY PRODUCTION RESULTS
| Three months ended | Year ended | Guidance | |||||
| Dec. 31, 2025 |
Sep. 30, 2025 |
Dec. 31, 2024 |
Dec. 31, 2025 |
Dec. 31, 2024 |
Annual 2025 | ||
| Contained metal in concentrate and doré produced1 | |||||||
| Copper | tonnes | 33,069 | 24,205 | 43,262 | 118,188 | 137,943 | 117,000 - 149,000 |
| Gold | oz | 84,298 | 53,581 | 94,161 | 267,934 | 332,240 | 247,500 - 308,000 |
| Silver | oz | 1,002,985 | 730,394 | 1,311,658 | 3,468,143 | 3,983,851 | 3,520,000 - 4,390,000 |
| Zinc | tonnes | 5,703 | 548 | 8,385 | 17,646 | 33,339 | 21,000 - 27,000 |
| Molybdenum | tonnes | 325 | 185 | 195 | 1,282 | 1,323 | 1,300 - 1,500 |
| Payable metal sold | |||||||
| Copper | tonnes | 34,132 | 18,280 | 37,927 | 114,534 | 125,094 | |
| Gold2 | oz | 84,424 | 38,279 | 92,734 | 260,261 | 335,342 | |
| Silver2 | oz | 871,006 | 418,418 | 1,150,518 | 3,190,552 | 3,549,816 | |
| Zinc | tonnes | 3,972 | 3,452 | 5,261 | 15,152 | 25,120 | |
| Molybdenum | tonnes | 190 | 269 | 182 | 1,334 | 1,287 | |
1 Metal reported in concentrate is prior to deductions associated with smelter contract terms and includes other secondary products.
2 Includes total payable gold and silver in concentrate and in doré sold and other secondary products.
KEY COST RESULTS
| Three months ended | Year ended | Guidance | |||||
| Dec. 31, 2025 |
Sep. 30, 2025 |
Dec. 31, 2024 |
Dec. 31, 2025 |
Dec. 31, 2024 |
Annual 20252 |
||
| Peru cash cost per pound of copper produced | |||||||
| Cash cost1 | $/lb | 0.57 | 1.30 | 1.00 | 1.08 | 1.18 | 1.35 - 1.65 |
| Sustaining cash cost1 | $/lb | 1.53 | 2.11 | 1.48 | 2.02 | 1.86 | |
| Manitoba cash cost per ounce of gold produced | |||||||
| Cash cost1 | $/oz | 705 | 379 | 607 | 549 | 606 | 650 - 850 |
| Sustaining cash cost1 | $/oz | 1,110 | 762 | 908 | 875 | 868 | |
| British Columbia cash cost per pound of copper produced | |||||||
| Cash cost1 | $/lb | 4.82 | 3.21 | 3.00 | 3.06 | 2.74 | 2.45 - 3.45 |
| Sustaining cash cost1 | $/lb | 8.87 | 7.43 | 5.76 | 6.12 | 5.29 | |
| Consolidated cash cost per pound of copper produced | |||||||
| Cash cost1 | $/lb | (0.63) | 0.42 | 0.45 | (0.22) | 0.46 | 0.15 - 0.35 |
| Sustaining cash cost1 | $/lb | 0.94 | 2.09 | 1.37 | 1.30 | 1.62 | 1.85 - 2.25 |
| All-in sustaining cash cost1 | $/lb | 1.43 | 2.78 | 1.53 | 1.74 | 1.88 | |
1 Cash cost, sustaining cash cost, all-in sustaining cash cost per pound of copper produced, net of by-product credits, gold cash cost, sustaining cash cost per ounce of gold produced, and net of by-product credits are non-GAAP financial performance measures with no standardized definition under IFRS. For further information and a detailed reconciliation, please see the discussion under the "Non-GAAP Financial Performance Measures" section of this MD&A.
2 Improved full year 2025 consolidated copper cash cost guidance range to $0.15 to $0.35 per pound from prior guidance of $0.65 to $0.85 per pound and the original guidance range of $0.80 to $1.00 per pound. Improved full year 2025 consolidated sustaining copper cash cost guidance range to $1.85 to $2.25 per pound from the original guidance range of $2.25 to $2.65 per pound.
RECENT DEVELOPMENTS
Continued Free Cash Flow Generation Driving Further Debt Reduction and Significant Financial Flexibility
Hudbay has delivered several quarters of meaningful free cash flow generation as a result of steady operating performance, expanding margins from strong copper and gold exposure and a focus on cost control across the business. This has resulted in Hudbay achieving record annual adjusted EBITDA of $1,060.9 million and record annual free cash flow of $387.9 million in 2025.
As a result of the strong operating and financial performance, Hudbay continued its prudent balance sheet management and further reduced overall debt levels in the fourth quarter of 2025, resulting in a total of $102.5 million in debt repayments during the full year 2025. These deleveraging efforts have reduced total principal debt to $1,008.6 million as of December 31, 2025.
As of December 31, 2025, Hudbay had approximately $569 million in cash and cash equivalents, resulting in a reduction in net debt to $439.7 million compared to $525.7 million at December 31, 2024. Similarly, Hudbay reduced its net debt to adjusted EBITDA ratio to 0.4x at the end of the fourth quarter of 2025, a further improvement from 0.6x at the end of fourth quarter of 2024.
After giving effect to the closing of the Copper World joint venture transaction, as described below, Hudbay's post-closing adjusted cash and cash equivalents as at December 31, 2025 was approximately $992 million3. In addition, Hudbay had undrawn availability of $425 million under Hudbay's revolving credit facilities as of December 31, 2025, increasing total post-closing adjusted liquidity to over $1.4 billion3. Hudbay is well-positioned to advance Copper World and fund its several other high-return growth opportunities across the business.
Prudently Advancing Copper World Towards a Sanction Decision in 2026
In January 2026, Hudbay announced the closing of the joint venture transaction ("JV Transaction") with Mitsubishi, securing a premier, long-term strategic partner for the development of Copper World. The Company continues to progress the detailed engineering work to de-risk Copper World ahead of a sanction decision later this year.
• Realized Accretive JV Transaction - On January 12, 2026, Hudbay announced the closing of the highly accretive $600 million JV Transaction, which represents a significant de-risking milestone in advancing Copper World and further validates the premium long-term value of this world-class asset. The $420 million of proceeds received at closing from Mitsubishi will be used to directly fund the remaining definitive feasibility study ("DFS") costs and pre-sanctioning costs in addition to the initial project development costs for Copper World. Mitsubishi will contribute an additional $180 million within 18 months of closing to complete its 30% minority investment and will also fund its pro-rata 30% share of future equity capital contributions. The JV Transaction increases the project IRR to Hudbay to approximately 90% based on pre-feasibility study ("PFS") estimates2.
• Secured Premier Strategic Joint Venture Partner - Mitsubishi is one of the largest Japanese trading houses with a global mining presence and a significant U.S.-based business. Mitsubishi is the partner of choice with investments in a world-class portfolio of large and high-quality copper assets, including five of the top twenty copper mines globally by 2024 production. This partnership validates the attractive long-term value of Copper World as a world-class copper asset and endorses the strong technical capabilities of Hudbay. It also represents the beginning of a long-term strategic partnership, and the parties are identifying other opportunities for collaboration to advance their respective copper growth strategies.
• Achieved Key Elements of Hudbay's Three Prerequisites (3-P) Plan - Hudbay has achieved the final key elements of its prudent 3-P financial strategy for the development of Copper World with the closing of the JV Transaction and the achievement of stated balance sheet targets. After accounting for proceeds from the JV Transaction, Hudbay has post-closing adjusted cash and cash equivalents of $992 million3 and reduced its post-closing net debt to adjusted EBITDA ratio to 0.0x, far exceeding the stated balance sheet targets. The Mitsubishi initial investment and its future pro-rata equity capital contributions, together with the Wheaton Precious Metals Corp. stream, provide significant financial flexibility by reducing Hudbay's estimated share of the remaining capital contributions to approximately $200 million based on PFS estimates and deferring Hudbay's first capital contribution to 2028 at the earliest.
• Feasibility Study and Detailed Engineering Underway - Feasibility activities for Copper World are well underway with expected completion of the DFS in mid-2026. Hudbay has continued to execute detailed engineering work and other de-risking activities, in preparation for a Copper World sanctioning decision expected in 2026.
Manitoba Exploration Update
Large Exploration Drill Program Continues in Snow Lake
Hudbay continues to execute the largest exploration program in Snow Lake in the Company's history through extensive geophysical surveying and multi-phased drilling campaigns as part of Hudbay's threefold exploration strategy:
• Near-mine Exploration at Lalor and 1901 to Further Increase Near-term Production and Extend Mine Life - Hudbay completed the development of the initial exploration drift at the 1901 deposit in 2025 and the development of the haulage drift is underway. Hudbay received positive initial step-out drilling results from the exploration drift, and during the second half of 2025, some zinc development ore was delivered for processing at Stall. Activities at 1901 over the next two years will focus on exploration, definition drilling, orebody access, and establishing critical infrastructure for full production in late 2027. Exploration activities at 1901 will target additional step-out drilling to potentially extend the orebody and infill drilling to convert inferred mineral resources in the gold lenses to mineral reserves.
• Testing Regional Satellite Deposits to Utilize Available Processing Capacity and Increase Production - Hudbay increased its regional land package by more than 250% in 2023 through the acquisition of Rockcliff Metals Corp. ("Rockcliff"), which included the addition of several known deposits located within trucking distance of the Snow Lake processing infrastructure. The deposits acquired as part of the Rockcliff acquisition, together with several deposits already owned by Hudbay in Snow Lake, have created an attractive portfolio of regional deposits in Snow Lake, including the Talbot, New Britannia, Rail, Pen II, Watts, 3 Zone and WIM deposits. The continued strong performance from the New Britannia mill has freed up processing capacity at the Stall mill, where there is approximately 1,500 tonnes per day of available capacity which could be utilized by the regional satellite deposits to increase production and extend the life of the Snow Lake operations beyond 2037.
• Exploring Large Land Package for a New Anchor Deposit to Significantly Extend Mine Life - A majority of the land claims acquired as part of the Rockcliff acquisition have been untested by modern deep geophysics, which was the discovery method for the Lalor deposit. A large geophysics program is currently underway consisting of surface electromagnetic surveys using cutting edge techniques that enable the team to detect targets at depths of almost 1,000 metres below surface. The planned geophysics program is the largest geophysics program in Hudbay's history and includes 800 kilometres of ground electromagnetic surveys and an extensive airborne geophysics survey.
Talbot Initial Drilling Results Confirm Resource Expansion Potential
Talbot is a copper-zinc-gold rich VMS deposit located within trucking distance to existing processing infrastructure in Snow Lake. Successful drilling campaigns could expand the resource base and support a PFS to upgrade the mineral resources to reserves, extending the overall mine life of the Snow Lake operations. In April 2025, Hudbay announced the signing of the exploration agreement with the Mosakahiken Cree Nation on exploration activities in their traditional and ancestral territory, including at Talbot.
In July 2025, Hudbay commenced an extensive summer drill program at Talbot focused on expanding the known mineralization at depth, testing geophysical targets as well as conducting an infill drill program in the upper part of the ore body to support a PFS. As part of the initial drilling program in 2025, Hudbay drilled six holes to test the continuity of the Talbot deposit at depth, with all the holes yielding positive results and four of them returning mineralized intercepts with economic potential (see table of intercepts below). The 2026 drilling program has now commenced with six drill rigs deployed, including one drill rig focused on continuing to expand the footprint of the deposit at depth. In addition to the intercepts below, another hole provided a significant intercept of copper mineralization over an estimated length of 19.7 metres from core logging and for which assay results are pending.
| Hole ID | From (m) | To (m) | Intercept (m) |
Estimated true width (m)1 |
Cu (%)2 | Au (g/t)2 | Ag (g/t)2 | Zn (%)2 | CuEq. (%)3,4 |
| TLS024 | 1556.0 | 1567.5 | 11.5 | 10.4 | 2.4 | 1.8 | 55.1 | 0.8 | 4.2 |
| TLS025 top | 1435.3 | 1449.5 | 14.2 | 13.2 | 1.2 | 0.8 | 17.8 | 0.5 | 2.0 |
| TLS025 bottom | 1459.0 | 1465.0 | 6.0 | 5.6 | 2.0 | 0.7 | 16.9 | 0.5 | 2.6 |
| TLS026 | 1265.5 | 1273.4 | 7.8 | 7.1 | 1.4 | 0.9 | 18.4 | 0.3 | 2.2 |
| TLS027W02 | 1252.8 | 1271.5 | 18.8 | 16.3 | 1.4 | 0.8 | 18.9 | 1.3 | 2.4 |
1.True widths are estimated based on drill angle and intercept geometry of mineralization.
2 All copper, gold, silver and zinc values are uncut.
3 Copper-equivalent ("CuEq") grade calculated using the following long-term commodity price assumptions: $4.40 per pound copper, $2,800 per ounce gold, $32.00 per ounce silver and $1.25 per pound zinc.
4 Using the combined recoveries of New Britannia and Stall mills of 89% copper, 89% gold, 81% silver and 84% zinc.
In 2026, the Company plans on progressing a PFS and preparing an updated mineral resource estimate for Talbot using Hudbay standard methods that have demonstrated high reserve conversion rates.
Expanded Flin Flon Exploration Partnership with Marubeni and JOGMEC
On January 22, 2026, the Company announced the signing of an amended and restated option agreement with Japan Organization for Metals and Energy Security ("JOGMEC") and Marubeni Corporation ("Marubeni"), where Hudbay granted JOGMEC an option to acquire a 10% interest in three projects located within trucking distance of Hudbay's processing facilities in Flin Flon, Manitoba. In order to exercise its option, JOGMEC is required to fund at least C$6 million in exploration expenditures over a period of approximately three years, with Hudbay acting as the operator carrying out the exploration activities. The agreement is an amendment and restatement of the option agreement with Marubeni from March 2024, pursuant to which Marubeni's wholly-owned Canadian subsidiary was granted an option to acquire a 20% interest in the three projects, provided it, funds at least C$12 million in exploration expenditures over the designated earn-in period, which is inclusive of past contributions made by Marubeni since March 2024.
The option agreement focuses on three projects in the Flin Flon region, namely Cuprus-White Lake, Westarm and North Star, which were selected by Marubeni prior to the original March 2024 agreement and following a period of detailed due diligence. All three properties hold past producing mines that generated meaningful production with attractive grades of both base metals and precious metals. The properties remain highly prospective with potential for further discovery based on the attractive geological setting, limited historical deep drilling and promising geochemical and geophysical targets. Cuprus-White Lake, Westarm and North Star are all within 20 kilometres of Hudbay's Flin Flon milling complex.
Senior Management Team Appointments
In January 2026, Hudbay appointed Audra Walsh to the role of Vice President, South America Business Unit. Ms.Walsh joined Hudbay as acting Vice President in Peru in August 2025 and has transitioned to the permanent role as a testament to her exceptional talent as a professional engineer with over 30 years of technical, operating, management, executive and board experience in the mining industry. As leader of the South America Business Unit, Ms. Walsh is responsible for the strategic performance of Hudbay's operational and exploration activities in Peru and exploration activities in Chile.
Ms. Walsh's leadership experience and deep expertise will be instrumental in helping Hudbay achieve regional milestones and drive growth in Peru with the long-life operations at Constancia, the future development of Caballito and Maria Reyna and further regional exploration.
Holistic Capital Allocation Framework to Deliver Growth and Maximize Long-Term Risk-Adjusted Returns
Hudbay has a proven track record of prudently allocating capital to high-return brownfield investments, such as the New Britannia gold mill refurbishment project and the development of the high-grade Pampacancha satellite deposit, which have delivered significant free cash flows and contributed to Company's deleveraging efforts.
Hudbay has completed a financial transformation over the past three years. The Company has moved from being overleveraged and capital constrained to a preferred position where it can strategically allocate capital across the portfolio to maximize value and generate the highest risk-adjusted returns, creating long-term sustainable value for stakeholders.
Prudent strategic financial planning and execution of the Company's 3-P plan has achieved the Company's balance sheet deleveraging goals and has lowered its cost of capital. With its strongest balance sheet in more than a decade and peer-leading credit metrics, together with the strategic investment by Mitsubishi, Hudbay is very well positioned to sanction the Copper World project and embark on generational investments in the Company's operating portfolio in 2026. These generational investments include allocating capital to high-return brownfield projects at the Company's three operating mines and advance its world-class development and exploration pipeline.
To provide transparency and continued financial discipline, Hudbay has implemented an enhanced Capital Allocation Framework to provide a holistic approach around capital allocation decisions, including with respect to the deployment of capital into the business through near-term brownfield projects, longer-term greenfield projects, strategic investments and exploration, while considering debt repurchases, share buybacks and dividends.
Hudbay's holistic Capital Allocation Framework is embedded into the Company's annual financial planning cycle and includes the following key elements:
• Preserving Balance Sheet Strength - Aligning with successful deleveraging efforts to maintaining net debt to adjusted EBITDA ratios of less than 1.0x throughout the investment and development cycle, continuing to lower the Company's cost of capital and considering unique (non-dilutive) sources of project funding available.
• Strategic Fit for Growth and Diversification - Expanding and optimizing production and mine life from the existing asset base, enhancing Hudbay's strategic commodity exposure to copper and complementary gold, targeting 400,000 tonnes of annual copper-equivalent production, increasing long-term portfolio diversification across tier-1 jurisdictions and aligning with the Company's sustainability goals.
• Accretive Across Key Financial Metrics - Pursuing investment opportunities that are accretive to a mix of key financial performance metrics - Hudbay's net present value per share, copper-equivalent mineral resources per share, return on invested capital and cash flow yields, as well as demonstrating robust internal rate of returns and project paybacks to maximize value and long-term sustainable returns for all stakeholders.
• Rigorous Risk Assessment - Considering risk-adjusted returns based on project-specific characteristics, applying varying discount rates, commodity price scenarios and sensitivity analysis, as well as key qualitative risk considerations.
• Accountable Investment Governance - Integrating detailed project reviews as part of the annual budgeting process and executing investment decisions subject to a formal internal tollgate process, requiring Executive Committee and Board approval, followed by comprehensive post-project reviews to drive continuous improvement.
Increased Annual Dividend
Following Hudbay's recent financial transformation and consistent with its Capital Allocation Framework, the Company has commenced an increase in shareholder returns in the form of a quarterly dividend. Hudbay's Board of Directors approved the introduction of a new quarterly dividend of C$0.01 per share as the Company has achieved certain financial milestones ahead of schedule and has significantly improved its financial position. The new total annual dividend amount of C$0.04 per share represents an increase of 100% or C$0.02 per share over the previous annual dividend, which was paid semi-annually, representing the first dividend increase in the Company's history.
A quarterly dividend of C$0.01 per share was declared on February 19, 2026. The dividend will be paid out on March 27, 2026 to shareholders of record as of close of business on March 10, 2026.
1 Adjusted EBITDA, net debt, net debt to adjusted EBITDA ratio and free cash flow are non-GAAP financial performance measures with no standardized definition under IFRS. For further information and a detailed reconciliation, please see the discussion under the "Non-GAAP Financial Performance Measures" section of this MD&A.
2 Based on the initial capital investment and the $3.75 per pound copper price used in the PFS published on September 8, 2023 with assumptions of approximately $145 million for pre-sanctioning costs, $230 million from the precious metals stream, $350 million from project-level financing and approximately $700 million from Mitsubishi's $420 million initial investment, $180 million investment within 18 months and its pro-rata 30% share of future equity capital contributions.
3 The post-closing adjusted year-end cash and cash equivalents includes approximately $420 million of cash at the Copper World LLC level, including close adjustments received as part of the recent closing of the Copper World joint venture transaction, which is designated for exclusive use by the Copper World joint venture.
CLIMATE CHANGE INITIATIVES
Since inception of Hudbay's climate change strategy in 2022, the Company continues to implement initiatives to reduce its greenhouse gas ("GHG") footprint. The Company strives to measure efficiency against key process drivers, while recognizing the unique characteristics of each business unit, such as fluctuating strip ratios in open pit mines and changing development profiles at underground mines. In 2025, Hudbay updated its climate change targets with new 2030 GHG emissions reduction targets specific to each business unit and focused on areas where the Company believes it can achieve the biggest impact.
The Company has made significant progress towards achieving its climate change goals, including:
• Peru - Hudbay's new 10-year power purchase agreement with ENGIE Energía Perú for access to a 100% renewable energy supply to Constancia came into effect in January 2026. This is expected to be a key contributing factor towards the Peru operations reaching its 2030 target of a 99% reduction in Scope 2 GHG emissions intensity (tonnes of Scope 2 emissions per kilotonne of ore processed) compared to a 2022 baseline.
• Manitoba - Hudbay continues to expand its fleet of electric equipment for use at its underground operations. Following the successful initial trial of an electric Epiroc scooptram ST14 SG at the Lalor mine in 2023, the Company has seen reduced carbon intensity and improved ventilation due to temperature reductions in the deeper areas of the mine. Today, Hudbay has expanded the fleet of battery electric vehicles at Lalor to 10 with two more being added in 2026. Continuing to expand the electric equipment fleet and other operational efficiency initiatives will progress the Snow Lake operations towards its 2030 target of a 25% reduction in Scope 1 GHG emissions intensity (tonnes of Scope 1 emissions per kilometre) compared to a 2022 baseline.
• British Columbia - At the Copper Mountain mine, efforts to drive operational efficiency continue to be a core focus and will enable the B.C. operations to progress towards its 2030 target of 5% reduction in Scope 1 GHG emissions intensity (tonnes of Scope 1 emissions per kilometre) compared to a 2024 baseline. Hudbay utilizes several pieces of electric equipment at Copper Mountain, including, three electric shovels and three electric rotary blasthole drills, which reduces carbon intensity by displacing existing diesel equipment. Additionally, the Company took steps to implement renewable diesel, also known as hydrotreated vegetable oil (HVO) fuel, to power more than 50% of the haul truck fleet in 2025.
• Corporate - Hudbay integrated Scope 1 and Scope 2 GHG emissions into its long-range financial plans to support GHG reduction decision making and alignment with the Company's 2030 goals. The Company also implemented sustainability reporting software to standardize the sustainability data collection process. In January 2025, the Company established an ESG Steering Committee consisting of the COO, CFO and three SVPs to provide enhanced oversight of the Company's sustainability initiatives, procedures and disclosures.Hudbay plans to advance its Scope 3 data collection process in 2026 through supplier and customer engagement to drive transparency and influence positive GHG behaviours throughout the value chain.
PERU OPERATIONS REVIEW
| Three months ended | Year ended | |||||
| Dec. 31, 2025 | Sep. 30, 2025 | Dec. 31, 2024 | Dec. 31, 2025 | Dec. 31, 2024 | ||
| Constancia ore mined1 | tonnes | 5,610,915 | 564,579 | 4,186,058 | 21,539,089 | 15,046,190 |
| Copper | % | 0.31 | 0.25 | 0.40 | 0.31 | 0.34 |
| Gold | g/tonne | 0.03 | 0.02 | 0.04 | 0.03 | 0.04 |
| Silver | g/tonne | 3.27 | 1.92 | 3.88 | 3.18 | 3.08 |
| Molybdenum | % | 0.01 | 0.01 | 0.02 | 0.02 | 0.01 |
| Pampacancha ore mined1 | tonnes | 4,152,000 | 4,260,081 | 4,037,264 | 9,563,442 | 9,317,499 |
| Copper | % | 0.43 | 0.38 | 0.63 | 0.40 | 0.55 |
| Gold | g/tonne | 0.27 | 0.31 | 0.38 | 0.29 | 0.32 |
| Silver | g/tonne | 4.84 | 4.87 | 6.43 | 4.78 | 5.61 |
| Molybdenum | % | 0.01 | 0.01 | 0.00 | 0.01 | 0.01 |
| Total ore mined | tonnes | 9,762,915 | 4,824,660 | 8,223,322 | 31,102,531 | 24,363,689 |
| Strip ratio2 | 0.57 | 1.38 | 1.22 | 1.04 | 1.78 | |
| Ore milled | tonnes | 7,627,853 | 6,991,744 | 7,999,453 | 30,292,668 | 31,933,624 |
| Copper | % | 0.39 | 0.31 | 0.48 | 0.33 | 0.36 |
| Gold | g/tonne | 0.18 | 0.16 | 0.20 | 0.11 | 0.14 |
| Silver | g/tonne | 4.19 | 3.94 | 5.28 | 3.72 | 3.84 |
| Molybdenum | % | 0.01 | 0.01 | 0.01 | 0.01 | 0.01 |
| Copper concentrate | tonnes | 110,431 | 82,796 | 148,283 | 380,211 | 452,473 |
| Concentrate grade | % Cu | 22.67 | 21.88 | 22.92 | 22.40 | 21.88 |
| Copper recovery | % | 84.5 | 83.2 | 87.8 | 84.3 | 85.0 |
| Gold recovery | % | 74.7 | 72.1 | 73.3 | 69.2 | 70.7 |
| Silver recovery | % | 71.1 | 65.2 | 71.4 | 66.7 | 68.8 |
| Molybdenum recovery | % | 38.8 | 33.9 | 37.1 | 37.4 | 41.7 |
| Combined unit operating costs3,4,5 | $/tonne | 14.51 | 13.03 | 15.25 | 13.02 | 12.91 |
1 Reported tonnes and grade for ore mined are estimates based on mine plan assumptions and may not reconcile fully to ore milled.
2 Strip ratio is calculated as waste mined divided by ore mined.
3 Reflects combined mine, mill and general and administrative ("G&A") costs per tonne of ore milled. Reflects the deduction of expected capitalized stripping costs.
4 Combined unit costs is a non-GAAP financial performance measure with no standardized definition under IFRS. For further information and a detailed reconciliation, please see the discussion under the "Non-GAAP Financial Performance Measures" section of this MD&A.
5 Excludes approximately $1.3 million or $0.17 per tonne of overhead costs incurred during temporary suspension during the three months ended December 31, 2025, $7.3 million or $1.04 per tonne for the three months ended September 30, 2025 and $8.6 million or $0.28 per tonne during year ended December 31, 2025.
| Three months ended | Year ended | |||||
| Dec. 31, 2025 | Sep. 30, 2025 | Dec. 31, 2024 | Dec. 31, 2025 | Dec. 31, 2024 | ||
| Contained metal in concentrate produced | ||||||
| Copper | tonnes | 25,038 | 18,114 | 33,988 | 85,155 | 99,001 |
| Gold | oz | 32,865 | 26,380 | 38,079 | 74,480 | 98,226 |
| Silver | oz | 731,017 | 577,446 | 969,502 | 2,415,134 | 2,708,262 |
| Molybdenum | tonnes | 325 | 185 | 195 | 1,282 | 1,323 |
| Payable metal sold | ||||||
| Copper | tonnes | 28,361 | 11,769 | 28,775 | 84,438 | 88,138 |
| Gold | oz | 37,874 | 9,798 | 37,459 | 71,755 | 103,364 |
| Silver | oz | 650,384 | 258,215 | 824,613 | 2,239,832 | 2,343,820 |
| Molybdenum | tonnes | 190 | 269 | 182 | 1,334 | 1,287 |
| Cost per pound of copper produced | ||||||
| Cash cost1,2 | $/lb | 0.57 | 1.30 | 1.00 | 1.08 | 1.18 |
| Sustaining cash cost1 | $/lb | 1.53 | 2.11 | 1.48 | 2.02 | 1.86 |
1 Cash cost and sustaining cash costs, net of by-product credits, per pound of copper produced are not recognized under IFRS. For more detail on these non-GAAP financial performance measures, please see the discussion under the "Non-GAAP Financial Performance Measures" section of this MD&A.
2 Excludes approximately $1.3 million or $0.02 per pound of overhead costs incurred during temporary suspension during the three months ended December 31, 2025, $7.3 million or $0.19 per pound during the three months ended September 30, 2025 and $8.6 million or $0.05 per pound during the year ended December 31, 2025.
Overview
Peru operations had its strongest quarter of the year in the fourth quarter, with continued strong copper and gold grades from Pampacancha and less ore processed from low-grade stockpiles compared to the third quarter of 2025. The Company continued to optimize the mine plan in the fourth quarter with more ore mined from Pampacancha than previously expected, resulting in the accelerated depletion of Pampacancha in late December as opposed to early 2026 and enabling Hudbay to exceed the top end of the 2025 Peru gold guidance range.
Despite the impacts from social unrest in the third quarter, Hudbay achieved its 2025 production guidance for copper and gold in Peru, with gold production exceeding the top end of the 2025 guidance range by 24%. Production of silver and molybdenum fell slightly short of the lower end of guidance.
As mentioned above, mining activities in the Pampacancha pit were completed during the fourth quarter and remaining stockpiled Pampacancha ore has been fully processed during January 2026.
The Company continues to advance the installation of pebble crushers in Peru to increase mill throughput rates starting in the second half of 2026, which will allow Constancia to deliver steady annual copper production despite lower grades from the depletion of Pampacancha. Hudbay's efforts to increase mill throughput align with the Peru Ministry of Energy and Mines regulatory change to allow mining companies to operate up to 10% above permitted levels.
Mining Activities
Total ore mined in the fourth quarter was 102% higher than the third quarter of 2025, a sizable increase due to the impacts from social unrest during the third quarter. Mining activities in the Pampacancha pit were completed during the fourth quarter and the remaining stockpiled Pampacancha ore was fully processed during January 2026. Total ore mined in Peru in the fourth quarter of 2025 was 19% higher than the same period in 2024, despite the ramp up required in October following the temporary operational interruption due to social unrest.
Total ore mined in Peru for the full year of 2025 was 28% higher than the same period in 2024 due to elevated waste stripping in 2024, which was partially offset by the impacts of the temporary interruption of certain mining activities during the third quarter of 2025.
Milling Activities
Total mill throughput increased to 7.6 million tonnes during the fourth quarter of 2025, higher than the third quarter of 2025 due to higher mechanical availability as the prior quarter was impacted by the temporary operational interruption due to social unrest, partially offset by a scheduled semi-annual mill maintenance shutdown in the fourth quarter of 2025. Milled copper grades increased by 26% compared to the third quarter 2025, primarily due to higher grades from Pampacancha and less ore processed from stockpiles. Milled gold grades increased compared to the third quarter of 2025 due to a higher portion of ore feed from Pampacancha where the gold grades are meaningfully higher than at Constancia. Milled gold grades decreased compared to the same period in 2024 since additional gold benches were mined as planned during the comparable quarter last year. Copper recoveries of 85% in the fourth quarter of 2025 were higher compared to the third quarter of 2025 but lower compared to the same period in 2024 due to the different proportions of ore feed from stockpiles and pits. Recoveries of gold and silver during the fourth quarter of 2025 were in line with Hudbay's metallurgical models for the ore that was being processed.
Full year ore milled was 5% lower compared to the same period in 2024 mainly due to the aforementioned social issues in the third quarter of 2025. Full year milled copper grades were 8% lower than the same period in 2024 and milled gold grades decreased by 21% due to lower grades in ore feed from the Constancia pit and lower grades in ore feed from stockpiles, both of which made up a higher proportion of ore feed. Recoveries of copper during the year were 84%, representing a decrease of 1% compared to the 2024 period due to lower head grades primarily from stockpiles. Gold and silver recoveries during the year were 69% and 67%, respectively, representing a decrease of 2% and 3%, respectively, due to ore feed from stockpiles.
Production and Sales Performance
The Peru operations produced 25,038 tonnes of copper, 32,865 ounces of gold, 731,017 ounces of silver and 325 tonnes of molybdenum during the fourth quarter of 2025. Production of copper was higher in the fourth quarter of 2025 compared to the third quarter of 2025 and lower compared to the same period in 2024. The increase in copper production compared to the third quarter of 2025 is primarily due to higher ore milled as the third quarter was impacted by a temporary operational interruption due to social unrest. The decrease in copper production compared to the same quarter last year is mainly the result of higher grades from Pampacancha in the prior year. Production of gold and silver was higher than the third quarter of 2025 but lower than the same period in 2024 for the same reasons as the variance in copper production. Production of molybdenum was higher in the fourth quarter of 2025 compared with both comparable periods due to higher recoveries and additional tonnes of ore milled in the molybdenum plant.
Full year production of copper, gold, silver and molybdenum in 2025 was 85,155 tonnes, 74,480 ounces, 2,415,134 ounces, and 1,282 tonnes, respectively, representing a decrease of 14%, 24%, 11% and 3%, respectively, from the comparative 2024 period primarily due to fewer tonnes of ore milled in the current period due to the aforementioned temporary operational interruption in the third quarter of 2025 and lower grades from higher amounts of ore processed from stockpile.
Fourth quarter copper, gold and silver metal sold was higher than the third quarter of 2025 primarily due to the shifting of copper concentrate sales at the end of the third quarter into early in the fourth quarter as a result of ocean swells at the port in late September. While copper concentrate inventory levels normalized at the end of December 2025, the concentrate contained higher levels of precious metals due to a higher portion of Pampacancha production in the second half of the year, resulting in a shift of some precious metals sales from December 2025 to January 2026.
Full year copper metal sold in 2025 was slightly lower than the comparable period but reflected normal levels of unsold copper concentrate inventory at December 31, 2025. Quantities of gold sold during 2025 were lower than 2024 due to lower production levels and the timing of precious metal sales as mentioned above.
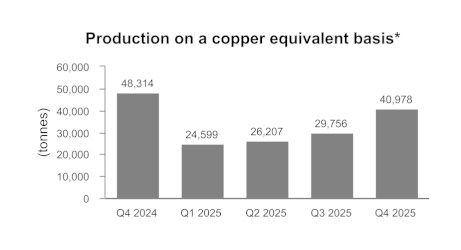
*Copper equivalent production is calculated using the quarter average LME prices for each metal excluding molybdenum.
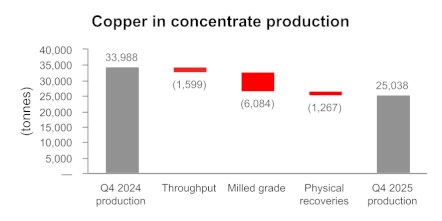
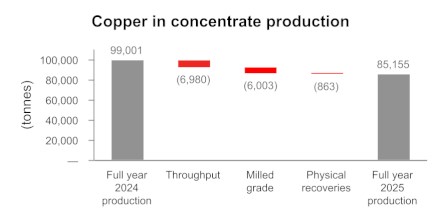
Cost Performance
Combined mine, mill and G&A unit operating cost in the fourth quarter of 2025 was $14.51 per tonne, 5% lower than the same period in 2024 primarily from reduced drilling and blasting together with a lower strip ratio during the current quarter. Combined mine, mill and G&A unit operating cost was 11% higher than the third quarter of 2025 due to higher fuel consumption associated with additional tonnes of material moved, higher water management and dewatering costs, and higher milling costs associated with the scheduled semi-annual mill maintenance program, partially offset by additional tonnes milled.
Combined mine, mill and G&A unit operating cost for the full year 2025 was $13.02 per tonne, which was consistent with 2024.
Cash cost1, net of by-product credits, in the fourth quarter of 2025 was $0.57 per pound of copper, a 43% decrease compared to the same period in 2024 and a 56% decrease compared to the third quarter of 2025. This is a result of higher gold by-product credits, partially offset by higher profit sharing.
Full year 2025 cash cost1, net of by-product credits was $1.08 per pound of copper, a decrease from $1.18 in the same period of 2024 due to lower treatment and refining charges and higher by-product credits from gold, partially offset by higher profit sharing and lower pounds of copper produced due to the impacts from social unrest in the third quarter.
Sustaining cash cost1, net of by-product credits, in the fourth quarter of 2025 was $1.53 per pound of copper, an increase of 3% compared to the same period in 2024 as a result of higher sustaining capitalized expenditures. Sustaining cash cost1, net of by-product credits, per pound of copper decreased by 27% when compared to the third quarter of 2025 due to higher gold by-product credits, partially offset by higher capital spending as a result of timing of sustaining capitalized expenditures, higher community payments and increased lease payments.
On a full year basis, sustaining cash cost1, net of by-products credits, was $2.02 per pound of copper, higher than the $1.86 per pound of copper for the comparable period in 2024 due to lower grade, higher planned mine maintenance, higher lease payments, and higher payments to communities. This was partially offset by lower treatment and refining charges and higher by-product credits from gold.
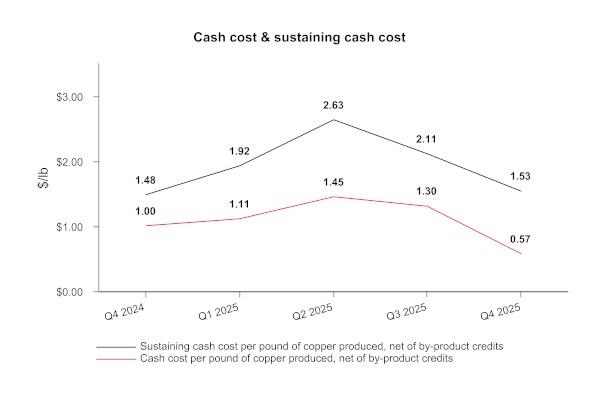
Peru Guidance Outlook
| Three months ended | Year ended | Guidance | |||||
| Dec. 31, 2025 |
Dec. 31, 2024 |
Dec. 31, 2025 |
Dec. 31, 2024 |
Annual 2025 | Annual 20262 | ||
| Contained metal in concentrate produced | |||||||
| Copper | tonnes | 25,038 | 33,988 | 85,155 | 99,001 | 80,000 - 97,000 | 75,000 - 90,000 |
| Gold | oz | 32,865 | 38,079 | 74,480 | 98,226 | 49,000 - 60,000 | 15,000 - 20,000 |
| Silver | oz | 731,017 | 969,502 | 2,415,134 | 2,708,262 | 2,475,000 - 3,025,000 | 1,900,000 - 2,400,000 |
| Molybdenum | tonnes | 325 | 195 | 1,282 | 1,323 | 1,300 - 1,500 | 900 - 1,100 |
| Cost per pound of copper produced | |||||||
| Cash cost1 | $/lb | 0.57 | 1.00 | 1.08 | 1.18 | 1.35 - 1.65 | 1.70 - 2.10 |
1 Cash cost, net of by-product credits, per pound of copper produced,are not recognized under IFRS. For more detail on these non-GAAP financial performance measures, please see the discussion under the "Non-GAAP Financial Performance Measures" section of this MD&A.
2 Refer to the "Outlook" section of this MD&A for more information.
Despite the impact from the temporary operational interruption due to social unrest, Hudbay achieved its 2025 production guidance for copper and gold in Peru, with gold production exceeding the top end of the 2025 guidance range. Production of silver and molybdenum fell slightly short of the lower end of guidance. Additionally, cash costs outperformed the low end of the cash cost guidance range.
MANITOBA OPERATIONS REVIEW
| Three months ended | Year ended | |||||
| Dec. 31, 2025 | Sep. 30, 2025 | Dec. 31, 2024 | Dec. 31, 2025 | Dec. 31, 2024 | ||
| Lalor ore mined | tonnes | 353,819 | 139,006 | 422,454 | 1,180,121 | 1,626,935 |
| Gold | g/tonne | 5.51 | 5.42 | 4.61 | 5.35 | 4.68 |
| Copper | % | 0.82 | 0.67 | 0.95 | 0.79 | 0.85 |
| Zinc | % | 2.55 | 1.93 | 2.95 | 2.41 | 2.84 |
| Silver | g/tonne | 29.52 | 31.57 | 31.91 | 30.43 | 27.14 |
| New Britannia ore milled | tonnes | 179,808 | 92,765 | 185,592 | 624,631 | 715,198 |
| Gold | g/tonne | 6.68 | 6.88 | 5.99 | 6.87 | 6.29 |
| Copper | % | 1.08 | 0.76 | 1.17 | 0.95 | 1.04 |
| Zinc | % | 1.30 | 1.00 | 1.08 | 1.09 | 0.99 |
| Silver | g/tonne | 31.17 | 32.18 | 33.97 | 31.75 | 27.78 |
| Copper concentrate | tonnes | 12,091 | 4,410 | 12,345 | 37,175 | 44,198 |
| Concentrate grade | % Cu | 14.17 | 14.46 | 16.00 | 14.24 | 15.78 |
| Gold recovery1 | % | 88.6 | 91.8 | 90.2 | 89.8 | 89.7 |
| Copper recovery | % | 88.6 | 90.0 | 91.3 | 89.2 | 93.6 |
| Silver recovery1 | % | 77.1 | 78.5 | 79.6 | 79.0 | 80.9 |
| Contained metal in concentrate produced | ||||||
| Gold | oz | 20,846 | 12,330 | 22,011 | 77,463 | 90,011 |
| Copper | tonnes | 1,712 | 637 | 1,975 | 5,294 | 6,976 |
| Silver | oz | 98,205 | 55,012 | 119,201 | 353,970 | 396,333 |
| Metal in doré produced2 | ||||||
| Gold | oz | 14,005 | 6,933 | 12,747 | 51,428 | 56,853 |
| Silver | oz | 40,763 | 25,058 | 46,431 | 157,444 | 165,408 |
| Stall ore milled | tonnes | 169,274 | 43,940 | 222,004 | 572,704 | 893,510 |
| Gold | g/tonne | 3.24 | 3.10 | 3.36 | 3.45 | 3.42 |
| Copper | % | 0.69 | 0.56 | 0.73 | 0.67 | 0.71 |
| Zinc | % | 4.32 | 3.61 | 4.62 | 3.90 | 4.33 |
| Silver | g/tonne | 24.97 | 31.04 | 29.90 | 28.31 | 26.54 |
| Copper concentrate | tonnes | 5,802 | 1,293 | 7,222 | 17,657 | 29,029 |
| Concentrate grade | % Cu | 17.31 | 15.80 | 19.01 | 18.94 | 19.16 |
| Zinc concentrate | tonnes | 10,975 | 1,053 | 16,187 | 34,351 | 64,643 |
| Concentrate grade | % Zn | 51.95 | 52.06 | 51.80 | 51.37 | 51.58 |
| Gold recovery | % | 71.3 | 72.6 | 69.6 | 70.1 | 68.6 |
| Copper recovery | % | 86.5 | 83.4 | 84.4 | 86.7 | 87.4 |
| Zinc recovery | % | 78.0 | 34.6 | 81.7 | 79.0 | 86.2 |
| Silver recovery | % | 55.6 | 50.3 | 55.1 | 55.4 | 56.8 |
| Contained metal in concentrate produced | ||||||
| Gold | oz | 12,572 | 3,178 | 16,680 | 44,562 | 67,361 |
| Copper | tonnes | 1,003 | 205 | 1,372 | 3,344 | 5,560 |
| Zinc | tonnes | 5,703 | 548 | 8,385 | 17,646 | 33,339 |
| Silver | oz | 75,525 | 22,062 | 117,591 | 288,784 | 433,349 |
| 1 Gold and silver recovery includes total recovery from concentrate and doré. | ||||||
| 2 Doré includes sludge, slag and carbon fines. | ||||||
| Three months ended | Year ended | |||||
| Dec. 31, 2025 | Sep. 30, 2025 | Dec. 31, 2024 | Dec. 31, 2025 | Dec. 31, 2024 | ||
| Total contained metal in concentrate and doré produced1 | ||||||
| Gold | oz | 47,423 | 22,441 | 51,438 | 173,453 | 214,225 |
| Copper | tonnes | 3,326 | 842 | 3,347 | 9,249 | 12,536 |
| Zinc | tonnes | 5,703 | 548 | 8,385 | 17,646 | 33,339 |
| Silver | oz | 214,493 | 102,132 | 283,223 | 800,198 | 995,090 |
| Payable metal sold in concentrate and doré2 | ||||||
| Gold | oz | 43,226 | 23,118 | 50,239 | 169,041 | 212,243 |
| Copper | tonnes | 2,024 | 769 | 3,321 | 7,651 | 11,602 |
| Zinc | tonnes | 3,972 | 3,452 | 5,261 | 15,152 | 25,120 |
| Silver | oz | 175,324 | 112,142 | 282,158 | 729,314 | 956,460 |
| Unit Operating Costs3 | ||||||
| Lalor | C$/tonne | 154.73 | 157.38 | 141.13 | 150.86 | 142.59 |
| New Britannia | C$/tonne | 76.85 | 61.54 | 69.09 | 69.62 | 70.99 |
| Stall | C$/tonne | 51.82 | 57.90 | 46.34 | 46.26 | 43.02 |
| Combined unit operating costs4,5,6 | C$/tonne | 248 | 258 | 233 | 236 | 226 |
| Cost per ounce of gold produced | ||||||
| Cash cost6,7 | $/oz | 705 | 379 | 607 | 549 | 606 |
| Sustaining cash cost6 | $/oz | 1,110 | 762 | 908 | 875 | 868 |
1 Total metal reported in concentrate is prior to deductions associated with smelter terms and includes other secondary products.
2 Includes other secondary products.
3 Reflects costs per tonne of ore mined/milled.
4 Reflects combined mine, mill and G&A costs per tonne of milled ore.
5 Excludes overhead costs of $16.0 million or C$163 per tonne during the three months ended September 30, 2025 and $19.2 million or C$22 per tonne during the year ended December 31, 2025.
6 Combined unit costs, cash cost and sustaining cash cost, net of by-product credits, per ounce of gold produced are non-GAAP financial performance measures with no standardized definition under IFRS. For further information and a detailed reconciliation, please see the discussion under the "Non-GAAP Financial Performance Measures" section of this MD&A.
7 Excludes overhead costs of $16.0 million or $713 per ounce of gold produced during the three months ended September 30, 2025 and $19.2 million or $111 per ounce during the year-ended December 31, 2025.
Overview
Manitoba operations normalized in the fourth quarter of 2025 following the significant wildfire disruptions in the second and third quarters of 2025 allowing the Company to achieve quarterly production numbers similar to what were demonstrated earlier in the year. The Manitoba operations produced 47,423 ounces of gold, 3,326 tonnes of copper, 5,703 tonnes of zinc and 214,493 ounces of silver in the fourth quarter of 2025. Production of all metals in the fourth quarter was higher than the third quarter of 2025, which was negatively impacted by mandatory wildfire evacuations.
Achievements in the fourth quarter included improved metal recovery rates, advancements in Hudbay's exploration programs in Flin Flon and Snow Lake, including the prospective copper-gold-zinc Talbot satellite deposit, and the graduation of the second cohort from the mining fundamentals training program focused on providing local and Indigenous communities with valuable mining skills. In 2025, Hudbay signed exploration agreements with the Mosakahiken Cree Nation and the Kiciwapa Cree Nation and achieved record throughput at the New Britannia mill in December. All of this was underpinned by a continued focus on safety with a 15% reduction in total recordable injury frequency achieved in 2025.
The Lalor mine focused on stabilizing production in the fourth quarter after the resumption of operations following the mandatory wildfire evacuations. Lalor averaged over 4,200 tonnes per operating day in the fourth quarter of 2025, strategically prioritizing mining from gold zones to ensure prioritized feed for the New Britannia mill. This was accomplished through a focus on mine planning and the maintenance recovery plan to get Lalor's underground mobile fleet back to pre-wildfire availability numbers.
The 1901 deposit delivered 6,600 tonnes of development ore in 2025 as the project progresses towards full production in 2027. During the year, haulage and exploration drifts were prioritized as infrastructure was being put in place. In 2026, activities at 1901 will prioritize exploration and definition drilling, orebody access, and establishing critical infrastructure ahead of full production in late 2027.
The New Britannia mill processed approximately 2,300 tonnes per day in December, achieving a new monthly throughput record of 71,504 tonnes. This achievement is aligned with the strategy to prioritize gold ore production and resulted from continuous improvement efforts focused on unlocking capacity at designed or improved recovery rates. Despite the wildfire challenges in 2025, New Britannia achieved its second highest annual throughput of 624,631 tonnes as Lalor delivered production from the gold zones, ensuring a consistent feed to the mill. While Lalor and New Britannia focused on gold production, the team at the Stall mill focused on process optimization and enhanced gold recovery initiatives targeting over 70% gold recovery from the base metal ore stream.
Mining Activities
Total ore mined in Manitoba in the fourth quarter of 2025 was impacted by approximately a week long winter storm power outage in October and the subsequent ramp up to normal operations. In the fourth quarter of 2025, gold grades increased by 20% compared to the same period in 2024 and 2% compared to the third quarter of 2025 due to mining techniques resulting in improved ore quality and prioritizing mining gold zones at Lalor.
Total ore mined at Hudbay's Manitoba operations during the year ended December 31, 2025 was 27% lower than the same period in 2024, mainly as a result of the aforementioned mandatory wildfire evacuations and weather-related power outage in 2025. Full year gold and silver grades mined at Lalor were 14% and 12% higher, respectively, compared with the same period in 2024 due to mining sequence and prioritizing mining gold zones in an effort to keep New Britannia fully utilized. Full year copper and zinc grades mined were 7% and 15% lower than the same period in 2024.
Milling Activities
Consistent with Hudbay's strategy of allocating more Lalor ore feed to New Britannia to maximize gold recoveries, adjusting for days interrupted by unplanned down time in October due to a winter storm power outage, New Britannia mill operated for 79.5 days during the quarter at an average throughput of approximately 2,260 tonnes per operating day. Gold recovery in the fourth quarter of 2025 was 89% reflecting a slight decrease compared to the same period in 2024 and the third quarter of 2025 due to ore blend resulting in slightly lower gold grades processed at the mill during the quarter. Full year 2025 total ore milled at New Britannia was 13% lower than 2024, largely driven by the impacts of unexpected downtime from an approximate week long power outage in October and over two months of mandatory wildfire evacuation shutdowns. Full year gold recoveries were consistent with the prior year and milled gold grades were 9% higher compared to 2024.
The Stall mill processed significantly less ore in 2025 compared to the same periods in 2024, which is aligned with the Company's strategy of allocating more Lalor ore feed to New Britannia as noted above. The Stall mill achieved gold recoveries of 71% in the fourth quarter of 2025, reflecting benefits from process optimization and enhanced gold recovery initiatives. Full year gold recovery was 2% higher due to higher gold grades and improvements from the installed gravity concentrator.
Production and Sales Performance
The Manitoba operations produced 47,423 ounces of gold, 3,326 tonnes of copper, 5,703 tonnes of zinc and 214,493 ounces of silver in the fourth quarter of 2025. Production of gold, copper, silver, and zinc decreased by 8%, 1%, 24% and 32%, respectively, compared to the fourth quarter of 2024, due to an eight-day weather-related power outage in October. Production of all metals in the fourth quarter was higher than the third quarter of 2025, which was negatively impacted by mandatory wildfire evacuations.
Full year production of all metals was lower than 2024 as a result of the same factors explained above, including over two months of production deferrals due to mandatory wildfire evacuations and associated ramp-up activities.
Manitoba sales volumes in the fourth quarter of 2025 reflect a rebuild of inventory levels as operations normalized after the wildfires in the second and third quarters of 2025.
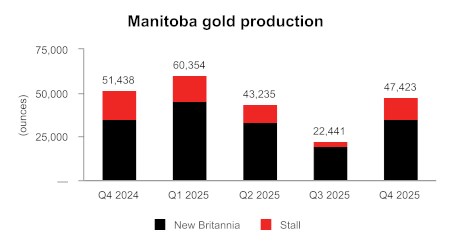
Cost Performance
Combined mine, mill and G&A unit operating costs in the fourth quarter and full year 2025 were C$248 per tonne and C$236 per tonne, respectively, relatively consistent with all comparable periods after adjusting for the allocation of fixed overheads in periods with lower capacity utilization due to the wildfires.
Cash cost4, net of by-product credits, in the fourth quarter of 2025 was $705 per ounce of gold, higher compared to the same period in 2024 primarily as a result of higher G&A costs due to profit sharing and lower gold production in the quarter. Compared to the third quarter of 2025, cash costs increased primarily due to higher overall costs and the impact of the recovery of secondary gold products in the third quarter as a result of mill tank clean-outs, partially offset by higher production.
Sustaining cash cost4, net of by-product credits, in the fourth quarter of 2025 was $1,110 per ounce of gold, higher than the same period in 2024 primarily as a result of lower gold production and higher capital expenditures in the quarter and higher than the third quarter of 2025 primarily due to the same factors affecting cash costs and elevated sustaining capital expenditures.
Cash cost4, net of by-product credits, for the full year 2025 was $549 per ounce of gold, a 9% decrease compared to the same period in 2024 primarily due to lower operating costs partially offset by lower gold production and higher profit sharing. Sustaining cash cost4, net of by-product credits, for the full year 2025 was $875 per ounce of gold, a slight increase from the same period in 2024 primarily due to the same factors affecting cash cost noted above with slightly higher capital expenditures.
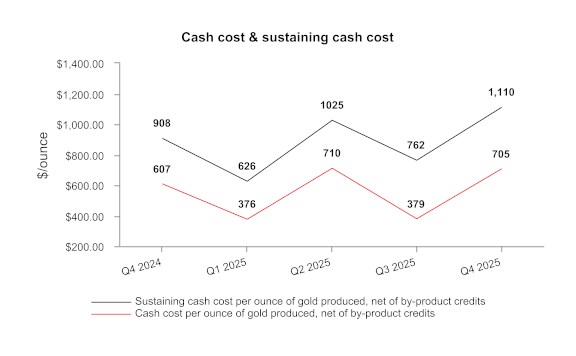
Manitoba Guidance Outlook
| Three months ended | Year ended | Guidance | |||||
| Dec. 31, 2025 |
Dec. 31, 2024 |
Dec. 31, 2025 |
Dec. 31, 2024 |
Annual 2025 | Annual 20266 | ||
| Total contained metal in concentrate and doré produced1 | |||||||
| Gold2 | oz | 47,423 | 51,438 | 173,453 | 214,225 | 180,000 - 220,000 | 180,000 - 220,000 |
| Copper | tonnes | 3,326 | 3,347 | 9,249 | 12,536 | 9,000 - 11,000 | 10,000 - 13,000 |
| Zinc | tonnes | 5,703 | 8,385 | 17,646 | 33,339 | 21,000 - 27,000 | 16,000 - 21,000 |
| Silver3 | oz | 214,493 | 283,223 | 800,198 | 995,090 | 800,000 - 1,000,000 | 800,000 - 1,000,000 |
| Cost per ounce of gold produced | |||||||
| Cash cost4,5 | $/oz | 705 | 607 | 549 | 606 | 650 - 850 | 500 - 800 |
1 Metal reported in concentrate is prior to deductions associated with smelter terms and includes other secondary products.
2 Gold production guidance includes gold contained in concentrate produced and gold in doré and includes other secondary products.
3 Silver production guidance includes silver contained in concentrate produced and silver in doré and includes other secondary products.
4 Combined unit costs, cash cost per ounce of gold produced, net of by-product credits, are non-GAAP financial performance measures with no standardized definition under IFRS. For further information and a detailed reconciliation, please see the discussion under the "Non-GAAP Financial Performance Measures" section of this MD&A.
5 Excludes $19.2 million or $111 per ounce of overhead costs incurred during temporary suspension during the year ended December 31, 2025.
6 Refer to the "Outlook" section of this MD&A for more information.
Full year production in Manitoba in 2025 successfully achieved guidance for copper and silver. While the operations were tracking within all guidance ranges earlier in the year, full year gold and zinc production fell below the low end of the respective ranges. This shortfall was primarily driven by the unprecedented wildfire disruptions, the winter power outage and the subsequent ramp-up period required to restore full operational cadence.
Despite these production headwinds, cash cost for the full year 2025 outperformed the low end of the guidance range. This strong cost performance was supported by the strategic decision to prioritize high-margin gold production over by-product zinc production.
BRITISH COLUMBIA OPERATIONS REVIEW
| Three months ended5 | Year ended5 | |||||
| Dec. 31, 2025 | Sep. 30, 2025 | Dec. 31, 2024 | Dec. 31, 2025 | Dec. 31, 2024 | ||
| Ore mined1 | tonnes | 2,395,166 | 1,815,689 | 2,374,044 | 9,368,918 | 11,360,125 |
| Strip ratio2 | 7.18 | 8.84 | 7.36 | 7.46 | 5.98 | |
| Ore milled | tonnes | 2,268,405 | 3,087,443 | 2,880,927 | 11,016,842 | 12,656,679 |
| Copper | % | 0.26 | 0.22 | 0.26 | 0.27 | 0.25 |
| Gold | g/tonne | 0.09 | 0.08 | 0.09 | 0.09 | 0.08 |
| Silver | g/tonne | 1.10 | 0.78 | 0.92 | 1.02 | 0.96 |
| Copper concentrate | tonnes | 19,966 | 21,560 | 25,554 | 100,958 | 113,528 |
| Concentrate grade | % Cu | 23.6 | 24.4 | 23.2 | 23.6 | 23.3 |
| Copper recovery | % | 78.4 | 76.6 | 79.5 | 78.6 | 82.4 |
| Gold recovery | % | 63.3 | 59.2 | 55.8 | 63.6 | 60.5 |
| Silver recovery | % | 71.4 | 65.5 | 69.0 | 69.7 | 71.8 |
| Combined unit operating costs3,4 | C$/tonne | 39.80 | 25.02 | 23.22 | 28.12 | 20.39 |
1 Reported tonnes and grade for ore mined are estimates based on mine plan assumptions and may not reconcile fully to ore milled.
2 Strip ratio is calculated as waste mined divided by ore mined.
3 Reflects combined mine, mill and general and administrative ("G&A") costs per tonne of ore milled. Reflects the deduction of expected capitalized stripping costs.
4 Combined unit costs is a non-GAAP financial performance measure with no standardized definition under IFRS. For further information and a detailed reconciliation, please see the discussion under the "Non-GAAP Financial Performance Measures" section of this MD&A.
5 Copper Mountain mine results are stated at 100%. On April 30, 2025 Hudbay completed the acquisition of the remaining 25% interest in the Copper Mountain mine and now owns 100%.
| Three months ended2 | Year ended2 | |||||
| Dec. 31, 2025 | Sep. 30, 2025 | Dec. 31, 2024 | Dec. 31, 2025 | Dec. 31, 2024 | ||
| Contained metal in concentrate produced | ||||||
| Copper | tonnes | 4,705 | 5,249 | 5,927 | 23,784 | 26,406 |
| Gold | oz | 4,010 | 4,760 | 4,644 | 20,001 | 19,789 |
| Silver | oz | 57,475 | 50,816 | 58,933 | 252,811 | 280,499 |
| Payable metal sold | ||||||
| Copper | tonnes | 3,747 | 5,742 | 5,831 | 22,445 | 25,354 |
| Gold | oz | 3,324 | 5,363 | 5,036 | 19,465 | 19,735 |
| Silver | oz | 45,298 | 48,061 | 43,747 | 221,406 | 249,536 |
| Cost per pound of copper produced | ||||||
| Cash cost1 | $/lb | 4.82 | 3.21 | 3.00 | 3.06 | 2.74 |
| Sustaining cash cost1 | $/lb | 8.87 | 7.43 | 5.76 | 6.12 | 5.29 |
1 Cash cost and sustaining cash cost, net of by-product credits, per pound of copper produced are non-GAAP financial performance measures with no standardized definition under IFRS. For further information and a detailed reconciliation, please see the discussion under the "Non-GAAP Financial Performance Measures" section of this MD&A.
2 Copper Mountain mine results are stated at 100%. On April 30, 2025 Hudbay completed the acquisition of the remaining 25% interest in the Copper Mountain mine and now owns 100%.
Overview
Throughout 2025, Hudbay focused on advancing its multi-year optimization plan at Copper Mountain, centered on ramping up mining activities and implementing standardized operating practices. A key pillar of this ramp-up was the successful onboarding of over 240 new employees, significantly expanding the Company's in-house team of skilled equipment operators. This strategic investment has led to a meaningful reduction in reliance on temporary contractor labour, ensuring long-term operational stability.
Mining operations have focused on a three-year accelerated stripping program to unlock higher grade ore starting in 2027. In the fourth quarter of 2025, this initiative was bolstered by an optimized mining sequence and enhanced maintenance, driving mining rates to a targeted 300,000 tonnes per day in December. To sustain this momentum, a new production loader was commissioned in January 2026, and a new shovel is currently scheduled for deployment in March 2026.
In the mill, the permanent feeder configuration for the second SAG mill was commissioned late in the fourth quarter, and the temporary conveyor system located on the ore live pile was removed in January 2026. With the completion of the permanent feeder for the second SAG mill project in December, the second SAG mill continued to demonstrate positive contributions to overall throughput in the fourth quarter. While the primary SAG mill continues to operate under a reduced load, it is being rigorously monitored ahead of a feed end head replacement in mid-2026. Total mill throughput is expected to ramp up to 50,000 tonnes per day in the second half of 2026. In the first half of 2026, optimization efforts will focus on automated grinding media loading, installing a mill slicer on the second SAG, implementing advanced process control on grinding and flotation, and a pebble circuit trial to improve overall throughput capacity.
Following the quarter end, the New Ingerbelle project reached a major milestone with the provincial regulators referring the permit application to Statutory Decision Makers on January 16, 2026. New Ingerbelle permits are expected to be received in the first quarter of 2026, and the project is expected to further extend mine life at Copper Mountain. Furthermore, Hudbay finalized refreshed Participation Agreements with the Upper and Lower Similkameen Indian Bands in February 2026, reinforcing the Company's commitment to strong Indigenous partnerships.
Mining Activities
Total ore mined at Copper Mountain in the fourth quarter of 2025 was 2.4 million tonnes, an increase of 1% compared to the fourth quarter of 2024. During this period, the mining team utilized planned ore stockpiles for mill feed and higher grade ore from an advanced phase in the main pit, allowing the operation to prioritize waste stripping activities to expose higher-value mining fronts in the future. On a sequential basis, total ore mined increased by 32% compared to the third quarter of 2025. The significant improvement reflects the optimization of the mining sequence, which improved bench configurations and eliminated phase interference, along with enhanced mobile equipment maintenance protocols leading to more consistent availability.
For the full year 2025, total ore mined was 18% lower than the same period in 2024. This year-over-year decrease was a deliberate operational decision to align mine output with the downstream mill constraints and to prioritize the long-term stripping requirements of the life of mine plan.
Milling Activities
The mill processed 2.3 million tonnes of ore during the fourth quarter of 2025, a decrease of 21% compared to the fourth quarter of 2024 and 27% compared to the third quarter of 2025. Throughput during the period was primarily impacted by unplanned maintenance on the primary SAG mill to address the localized damage to the feed end head. Operations were further constrained by elevated clay content in the ore feed and the planned decrease of the ore feed pile to accommodate the construction and tie-ins for the second SAG expansion project. To mitigate these challenges and build long-term reliability, the team implemented several initiatives in 2025, including crushing circuit chute modifications, the installation of advanced grinding control instrumentation, and a redesigned SAG liner package.
Despite throughput constraints, milled copper grades during the fourth quarter of 2025 were consistent with the prior year and 18% higher than the third quarter of 2025, driven by higher grades in ore mined. Copper recoveries improved to 78% in the fourth quarter of 2025, supported by higher-grade feed and ongoing flotation circuit refinements. Gold recoveries saw a significant 13% increase over the same period in 2024, reaching 63% as a result of general improvements in the flotation system.
Full year 2025 milled copper and gold grades were higher than the same period in 2024 as accelerated stripping efforts successfully enabled a higher-grade mining sequence. While full year copper recoveries of 79% were slightly lower than the previous year due to the characteristics of the ore processed, operational strategy improvements including optimized reagent selection and dosing modifications are currently in progress to stabilize performance.
The mill remains on track to achieve its permitted capacity of 50,000 tonnes per day in the second half of 2026 with the permanent second SAG feeder configuration commissioned in December 2025, the removal of live-pile restrictions in January, the proactive primary SAG feed end head replacement and rollout of automated grinding media loading and advanced process controls.
Production and Sales Performance
During the fourth quarter of 2025, the British Columbia operations produced 4,705 tonnes of copper, 4,010 ounces of gold and 57,475 ounces of silver. Metal production was lower compared to the fourth quarter of 2024 and the third quarter of 2025, primarily reflecting the aforementioned reduced mill throughput caused by the unplanned maintenance on the primary SAG.
For the full year 2025, production of copper, gold and silver was 23,784 tonnes, 20,001 ounces and 252,811 ounces, respectively. Annual copper and silver production were lower year-over-year, reflecting lower mill availability in the fourth quarter of 2025 and the strategic focus on waste stripping during the period. Despite the throughput constraints encountered in the latter half of the year, annual gold production increased by 1% compared to 2024. This growth was driven by higher head grades and improved gold recoveries resulting from the flotation circuit optimizations implemented throughout the year.
Sales volumes for copper, gold, and silver in the fourth quarter of 2025 were lower than the levels seen in both the prior year and the third quarter of 2025. This decrease in quantities sold was directly correlated with the lower production volumes resulting from the reduced throughput in the primary SAG mill and temporary depletion of the crushed ore live pile.
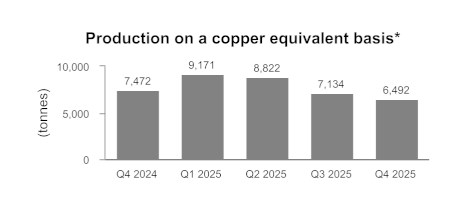
*Copper equivalent production is calculated using the quarter average LME prices for each metal. Copper Mountain mine production is stated at 100%. On April 30, 2025 Hudbay completed the acquisition of the remaining 25% interest in the Copper Mountain mine and now owns 100%.
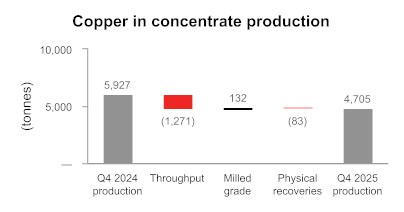
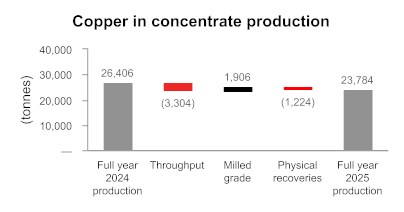
Cost Performance
Combined mine, mill and G&A unit operating costs in the fourth quarter of 2025 were C$39.80 per tonne milled. This increase relative to both the fourth quarter of 2024 and the third quarter of 2025 was primarily due to lower milled throughput and the non-recurring costs associated with the unplanned primary SAG mill maintenance. Additionally, mining and administrative costs were higher as the operations transitioned towards an expanded in-house workforce and continued to advance the accelerated stripping program.
For the full year 2025, unit operating costs were C$28.12 per tonne, compared to C$20.39 per tonne milled in the same period of 2024, reflecting the lower annual throughput and the strategic ramp-up of site-wide optimization initiatives.
Cash cost1 and sustaining cash cost1, net of by-product credits, were $4.82 and $8.87, respectively, per pound of copper, in the fourth quarter of 2025. Cash cost was higher than the fourth quarter of 2024 largely driven by the ramp up of mining activities in fourth quarter of 2025 to advance the accelerated stripping program, partially offset by higher by-product credits due to strong metal prices compared to the same period in 2024. Cash cost was higher than third quarter of 2025, largely due to the same reasons and lower by-product credits as a result of the primary SAG mill maintenance early in the fourth quarter. Sustaining cash costs were higher than the fourth quarter of 2024 mainly as a result of the increases in cash costs. Sustaining cash costs were higher than the third quarter of 2025 due to higher cash costs, offset by lower capitalized stripping costs.
Cash cost1 and sustaining cash cost1, net of by-product credits, were $3.06 and $6.12, respectively, per pound of copper, for the full year 2025 and were higher than the cash cost and sustaining cash cost in 2024 due to higher overall costs, capital and lower production.
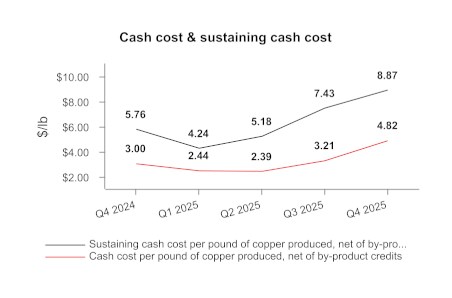
British Columbia Guidance Outlook
| Three months ended2 | Year ended2 | Guidance | |||||
| Dec. 31, 2025 |
Dec. 31, 2024 |
Dec. 31, 2025 |
Dec. 31, 2024 |
Annual 2025 | Annual 20263 | ||
| Contained metal in concentrate produced | |||||||
| Copper | tonnes | 4,705 | 5,927 | 23,784 | 26,406 | 28,000 - 41,000 | 25,000 - 35,000 |
| Gold | oz | 4,010 | 4,644 | 20,001 | 19,789 | 18,500 - 28,000 | 22,000 - 32,000 |
| Silver | oz | 57,475 | 58,933 | 252,811 | 280,499 | 245,000 - 365,000 | 200,000 - 290,000 |
| Cost per pound of copper produced | |||||||
| Cash cost1 | $/lb | 4.82 | 3.00 | 3.06 | 2.74 | 2.45 - 3.45 | 1.50 - 2.50 |
1 Cash cost and sustaining cash cost, net of by-product credits, per pound of copper produced is a non-GAAP financial performance measures with no standardized definition under IFRS. For further information and a detailed reconciliation, please see the discussion under the "Non-GAAP Financial Performance Measures" section of this MD&A.
2 Copper Mountain mine results are stated at 100%. On April 30, 2025 Hudbay completed the acquisition of the remaining 25% interest in the Copper Mountain mine and now owns 100%.
3 Refer to the "Outlook" section of this MD&A for more information.
For the full year 2025, British Columbia operations achieved its production guidance for gold and silver, while copper production fell below the low end of the 2025 guidance range. Copper production was primarily impacted by the unplanned maintenance at the primary SAG mill in the fourth quarter and a higher than anticipated proportion of lower grade stockpile ore processed throughout the year.
Despite the throughput and copper production headwinds, the business unit demonstrated strong cost discipline and full year 2025 cash costs achieved the guidance range.
OUTLOOK
This outlook includes forward-looking information about Hudbay's operations and financial expectations based on its expectations and outlook as of February 19, 2026.
This outlook, including expected results and targets, is subject to various risks, uncertainties and assumptions, which may impact future performance and Hudbay's achievement of the results and targets discussed in this section. For additional information on forward-looking information, refer to the "Forward-Looking Information" section of this MD&A. Hudbay may update its outlook depending on changes in metals prices and other factors, as per its "Commodity Markets" and "Sensitivity Analysis" discussions below. In addition to this section, refer to the "Operations Review", "Financial Review" and "Liquidity and Capital Resources" sections for additional details on Hudbay's outlook for 2026.
Material Assumptions
Hudbay's annual production and operating cost guidance, along with its annual capital and exploration expenditure forecasts are discussed in detail below.
Production Guidance
| Contained Metal in Concentrate and Doré1 | 2026 Guidance | Year ended Dec. 31, 2025 |
2025 Guidance | |
| Peru | ||||
| Copper | tonnes | 75,000 - 90,000 | 85,155 | 80,000 - 97,000 |
| Gold | oz | 15,000 - 20,000 | 74,480 | 49,000 - 60,000 |
| Silver | oz | 1,900,000 - 2,400,000 | 2,415,134 | 2,475,000 - 3,025,000 |
| Molybdenum | tonnes | 900 - 1,100 | 1,282 | 1,300 - 1,500 |
| Manitoba | ||||
| Gold2 | oz | 180,000 - 220,000 | 173,453 | 180,000 - 220,000 |
| Zinc | tonnes | 16,000 - 21,000 | 17,646 | 21,000 - 27,000 |
| Copper | tonnes | 10,000 - 13,000 | 9,249 | 9,000 - 11,000 |
| Silver2 | oz | 800,000 - 1,000,000 | 800,198 | 800,000 - 1,000,000 |
| British Columbia | ||||
| Copper | tonnes | 25,000 - 35,000 | 23,784 | 28,000 - 41,000 |
| Gold | oz | 22,000 - 32,000 | 20,001 | 18,500 - 28,000 |
| Silver | oz | 200,000 - 290,000 | 252,811 | 245,000 - 365,000 |
| Total | ||||
| Copper | tonnes | 110,000 - 138,000 | 118,188 | 117,000 - 149,000 |
| Gold2 | oz | 217,000 - 272,000 | 267,934 | 247,500 - 308,000 |
| Zinc | tonnes | 16,000 - 21,000 | 17,646 | 21,000 - 27,000 |
| Silver2 | oz | 2,900,000 - 3,690,000 | 3,468,143 | 3,520,000 - 4,390,000 |
| Molybdenum | tonnes | 900 - 1,100 | 1,282 | 1,300 - 1,500 |
1 Metal reported in concentrate and doré is prior to refining losses or deductions associated with smelter terms and includes other secondary products.
2 Gold and silver production guidance includes gold and silver contained in concentrate produced and gold and silver in doré, respectively, and includes other secondary products.
On a consolidated basis, Hudbay successfully achieved 2025 production guidance for its primary metals. 2025 represents the 11th consecutive year in which Hudbay achieved its annual consolidated copper production guidance, since Constancia declared commercial production, and the 5th consecutive year achieving its annual consolidated gold production guidance, since establishing standalone gold production guidance2. Peru achieved the guidance range for copper and exceeded the top end of the gold production guidance range despite the impact from the temporary operational interruption due to social unrest. Peru production of silver and molybdenum fell slightly below the low end of guidance. Manitoba was previously tracking within the 2025 guidance ranges despite the wildfire impacts, but as a result of the weather-related power outage in October and the subsequent ramp-up period required to restore full operational cadence, gold and zinc production fell below the low end of their respective ranges. However, Manitoba achieved guidance for copper and silver production despite these interruptions. British Columbia copper production fell below the low end of the guidance range as a result of the unplanned maintenance at the primary SAG mill in the fourth quarter and a higher than anticipated proportion of lower grade stockpile ore processed through the year. However, gold and silver production in British Columbia achieved guidance ranges despite the lower mill availability in the fourth quarter.
In 2026, consolidated copper production is expected to increase by 5% to 124,000 tonnes1. This is driven by higher expected production in British Columbia as a result of mill throughput ramping-up to the targeted 50,000 tonnes per day in the second half of 2026, partially offset by the depletion of the high-grade Pampacancha satellite deposit in December 2025. Consolidated gold production in 2026 is expected to decrease by 9% to 244,500 ounces1 as a result of the depletion of Pampacancha, but unstreamed gold production is expected to increase in 2026 with higher gold production in Manitoba as operations normalize following unprecedented wildfires in 2025 and continue to achieve strong performance from the New Britannia mill.
In Peru, 2026 copper production is expected to be 82,500 tonnes1, a slight decrease of 3% from 2025 due to the depletion of Pampacancha, which has been largely offset by higher mill throughput and operating efficiencies. Peru expects to install two pebble crushers to increase mill throughput in the second half of 2026, in addition to implementing other mill optimization initiatives. Gold production is expected to decline to 17,500 ounces1, lower than 2025 levels as Hudbay optimized the mine plan in 2025 during a period of social unrest by prioritizing Pampacancha mining activities and supplementing mill ore feed from low-grade stockpiles. These short-term mine plan changes resulted in reduced stripping activities in 2025, which is expected to result in some grade re-sequencing in 2026 and higher production in 2027 and 2028. Peru's 2026 production guidance reflects regularly scheduled semi-annual mill maintenance shutdowns at Constancia during the second and fourth quarters of 2026.
In Manitoba, 2026 gold production is expected to be 200,000 ounces¹, an increase of 15% from 2025, reflecting normalized operations after unprecedented wildfires in 2025, continued strong mill throughput at New Britannia and strong gold grades at Lalor. New Britannia mill throughput is expected to continue to exceed expectations and operate above 2,200 tonnes per day in 2026, far exceeding its original design capacity of 1,500 tonnes per day. The production guidance anticipates Lalor operating at approximately 4,500 tonnes per day, supplemented by 35,000 tonnes of ore feed from the 1901 deposit in 2026. Zinc production for 2026 is expected to be 18,500 tonnes¹, representing a 5% increase from 2025, driven by higher production from the 1901 deposit.
In British Columbia, 2026 copper production is expected to be 30,000 tonnes¹, representing a 26% increase from 2025, driven by the completion of the third ball mill to second SAG mill conversion in late 2025. As previously disclosed, Hudbay now expects mill throughput to achieve the targeted 50,000 tonnes per day in the second half of 2026 as opposed to early 2026 due to the impacts of reduced throughput at the primary SAG mill. Installation of the replacement feed end head at the primary SAG mill is scheduled for early in the third quarter of 2026.
Hudbay expects to release an updated three-year production outlook together with its annual mineral reserve and resource update in March 2026.
Cash Cost Guidance
Copper remains the primary revenue contributor on a consolidated basis, and therefore, consolidated cost guidance has been presented as cash cost3 per pound of copper, net of by-product credits. The Company has also provided cash cost guidance for each of Hudbay's operations based on their respective primary metal contributors.
| Cash cost 1 | 2026 Guidance | Year ended Dec. 31, 2025 |
2025 Guidance | |
| Peru cash cost per pound of copper2 | $/lb | 1.70 - 2.10 | 1.08 | 1.35 - 1.65 |
| Manitoba cash cost per ounce of gold3 | $/oz | 500 - 800 | 549 | 650 - 850 |
| British Columbia cash cost per pound of copper4 | $/lb | 1.50 - 2.50 | 3.06 | 2.45 - 3.45 |
| Consolidated cash cost per pound of copper | $/lb | (0.30) - (0.10) | (0.22) | 0.15 - 0.35 (original 0.80 - 1.00)6 |
| Consolidated sustaining cash cost per pound of copper5 | $/lb | 1.70 - 2.10 | 1.30 | 1.85 - 2.25 (original 2.25 - 2.65)6 |
1 Cash cost and sustaining cash cost, net of by-product credits, per pound of copper produced and cash costs, net of by-product credits, per ounce of gold produced are non-GAAP financial performance measure with no standardized definition under IFRS. For further information and a detailed reconciliation, please see the discussion under the "Non-GAAP Financial Performance Measures" section of this MD&A.
2 Peru cash cost, net of by-product credits, per pound of copper produced assumes by-product credits are calculated using the gold and silver deferred revenue drawdown rates for the streamed ounces in Peru in effect on December 31, 2025 and the following commodity prices for unstreamed production in 2026: $3,850 per ounce gold and $20.00 per pound molybdenum.
3 Manitoba cash cost, net of by-product credits, per ounce of gold assumes by-product credits are calculated using the following commodity prices for 2026: $4.75 per pound copper, $42.00 per ounce silver, $1.30 per pound zinc and an exchange rate of 1.37 C$/US$.
4 British Columbia cash cost, net of by-product credits, per pound of copper assumes by-product credits are calculated using the following commodity price assumptions for 2026: $3,850 per ounce gold, $42.00 per ounce silver and an exchange rate of 1.37 C$/US$.
5 Includes cash sustaining capital expenditures, including payments on capitalized leases and equipment financing, payments on certain long-term community agreements, royalties as well as accretion and amortization for expected decommissioning activities for producing assets.
6 Improved full year 2025 consolidated copper cash cost guidance range to $0.15 to $0.35 per pound from prior guidance of $0.65 to $0.85 per pound and the original guidance range of $0.80 to $1.00 per pound. Improved full year 2025 consolidated sustaining copper cash cost guidance range to $1.85 to $2.25 per pound from the original guidance range of $2.25 to $2.65 per pound.
Consolidated cash cost1 in 2026 is expected to remain at historical lows and be within $(0.30) to $(0.10) per pound of copper, net of by-product credits, benefiting from higher gold production and the Company's continued focus on maintaining strong cost control across the business, driving industry-leading margins. Sustaining cash cost1 in 2026 is expected to be within $1.70 to $2.10 per pound of copper, net of by-product credits, benefitting from higher copper production and higher by-product credits, offset by higher sustaining capital expenditures, including substantial capital deferrals from 2025.
Copper cash cost in Peru is expected to be between $1.70 to $2.10 per pound in 2026, reflecting steady unit operating cost performance, offset by lower copper production and by-product credits compared to 2025 from the depletion of Pampacancha. 2026 cash costs are positively affected by lower treatment and refining charges and a new power contract lowering electricity rates.
Gold cash cost in Manitoba is expected to be between $500 and $800 per ounce, an increase compared to 2025, but remaining at industry-low levels driving strong margins compared to current gold prices.
Copper cash cost in British Columbia is expected to be between $1.50 and $2.50 per pound in 2026, a decrease compared to 2025 due to higher copper production, higher by-product credits from higher gold production, and higher capitalized stripping related to continued accelerated stripping activities as part of the three-year stabilization and optimization plan at Copper Mountain.
Capital Expenditure Guidance
| Capital Expenditures1,2 (in $ millions) |
2026 Guidance | Year ended Dec. 31, 2025 |
2025 Guidance |
| Sustaining capital 3 | |||
| Peru4 | 140.0 | 137.0 | 170.0 |
| Manitoba | 105.0 | 45.7 | 60.0 |
| British Columbia - sustaining capital | 60.0 | 33.7 | 50.0 |
| British Columbia - capitalized stripping | 130.0 | 97.7 | 85.0 |
| Total sustaining capital | 435.0 | 314.1 | 365.0 |
| Growth capital | |||
| Peru | 40.0 | 4.7 | 25.0 |
| Manitoba | 15.0 | 7.4 | 15.0 |
| British Columbia | 85.0 | 64.2 | 75.0 |
| Total growth capital - excl. Copper World JV | 140.0 | 76.3 | 115.0 |
| Capitalized exploration | 25.0 | 15.6 | 10.0 |
| Copper World joint venture5 | 135.0 | 71.5 | 110.0 |
1 Excludes capitalized costs not considered to be sustaining or growth capital expenditures.
2 2026 Canadian capital expenditures guidance is converted into U.S. dollars using an exchange rate of 1.37 C$/US$ (2025 - 1.35 C$/US$).
3 Sustaining capital guidance excludes right-of-use lease and equipment financing additions, community agreements and non-cash capitalized stripping.
4 Includes capitalized stripping and development costs.
5 Copper World growth capital shown on a 100% basis. With the announcement of the JV Transaction in August 2025, Hudbay expects to accelerate detailed engineering, long lead items and other de-risking activities by advancing $20 million in growth capital expenditures to 2025 from future years, updating total 2025 Copper World joint venture growth spending guidance to $110 million compared to the original 2025 guidance of $90 million. Approximately $35 million of the 2025 updated growth spending was deferred to 2026.
Total sustaining capital in 2025 was approximately $50 million lower than guidance due to approximately $10 million lower capitalized stripping in Peru from the impact of social unrest, approximately $10 million lower capitalized development at Lalor due to the impact of wildfires, and approximately $38 million in sustaining capital deferrals to 2026, partially offset by $13 million higher capitalized stripping in British Columbia. Excluding Copper World project costs, growth capital in 2025 was approximately $39 million lower than guidance primarily due to timing of expenditure and a majority is expected to be deferred to 2026. Copper World growth spending in 2025 was approximately $39 million lower than guidance due to timing of expenditure, a majority of which will be deferred to 2026.
2026 total capital spending includes approximately $96 million of capital deferrals from 2025, higher growth capital spending as Hudbay reinvests in several high-return growth projects and one-time sustaining capital expenditures at the operations as discussed below.
Peru 2026 sustaining capital expenditures are expected to be maintained at $140 million, which includes $20 million of sustaining capital deferrals to 2026 and $18 million in one-time heavy civil works projects, offset by lower spending on tailings dam raises. Peru 2026 growth capital expenditures of $40 million relate primarily to the installation of two pebble crushers to increase mill throughput starting in the second half of 2026 and includes $13 million in capital deferrals from 2025.
Manitoba 2026 sustaining capital expenditures are expected to temporarily increase to $105 million in 2026 primarily as a result of $20 million in one-time expenditures related to a project at New Britannia to lower nitrogen levels, $12 million for an accelerated one-year construction schedule for a dam raise at the Anderson tailings facility and $5 million in capital deferrals from 2025. Underground capitalized development at Lalor is expected to return to normal levels after reduced levels in 2025 from the wildfires. Manitoba growth capital expenditures are expected to be $15 million in 2026 and relate primarily to the development of exploration platforms and haulage drifts at the 1901 deposit. Manitoba spending guidance excludes approximately $15 million of annual care and maintenance costs related to the Flin Flon facilities in 2026, which are expected to be recorded as other operating expenses.
British Columbia 2026 sustaining capital expenditures are expected to increase to $60 million in 2026 primarily as a result of $5 million in one-time expenditures related to the replacement of the feed end head at the primary SAG and $13 million in capital deferrals from 2025. In addition, Hudbay expects to incur approximately $130 million of capitalized stripping costs in 2026 related to continued accelerated stripping activities as the final year of the three-year stabilization and optimization plan at Copper Mountain. To ensure positive cash flows in British Columbia as the Company executes the last year of accelerated stripping activities, during the first quarter of 2026, the Company entered into copper forward sales contracts at an average price of $6.02 per pound and a zero-cost copper collar program at an average floor price of $5.75 per pound and cap price of $6.34 per pound on approximately 20% of 2026 copper production in British Columbia. British Columbia growth capital expenditures are expected to increase to $85 million in 2026 and includes $10 million in capital deferrals from 2025. Growth capital spending primarily relates to early works and infrastructure development for the New Ingerbelle expansion project.
Copper World joint venture 2026 growth capital guidance of $135 million primarily relates to feasibility study costs and continued de-risking until a Copper World project sanctioning decision, including approximately $60 million for accelerated long lead items and de-risking activities and $35 million of capital deferrals from 2025 and excludes post-project sanction construction costs which will be updated at the time of project sanction.
Exploration Guidance
| Exploration Expenditures (in $ millions) |
Year ended | ||
| 2026 Guidance | Dec. 31, 2025 | 2025 Guidance | |
| Peru1 | 15.0 | 15.9 | 19.0 |
| Manitoba2 | 50.0 | 33.0 | 30.0 |
| British Columbia | 20.0 | 7.7 | 1.0 |
| Total exploration expenditures | 85.0 | 56.6 | 50.0 |
| Capitalized spending | (25.0) | (15.6) | (10.0) |
| Total exploration expense | 60.0 | 41.0 | 40.0 |
1 Peru exploration expenditures exclude approximately $6 million of non-cash amortization of community agreements for exploration properties for 2026 (2025 - $5 million).
2 Manitoba exploration partially funded by approximately $20 million in Canadian Exploration Expense flow-through financing proceeds for 2026 (2025 - $10 million).
Total 2026 exploration expenses are expected to increase to $60 million from $41 million in 2025 as Hudbay continues to execute a multi-year extensive geophysics and drilling program in Snow Lake to extend mine life and explore for new discoveries and focus on the conversion of high value inferred resources at New Ingerbelle, as described below.
In Manitoba, 2026 exploration activities will focus on completing the largest geophysics program in the Company's history, including 800 kilometres of ground electromagnetic surveys and an extensive airborne geophysics survey. The Company plans to complete underground and surface drilling at Lalor to continue expanding its mineral resource and reserve estimates and underground drilling at 1901 from the new exploration drift. In addition, Hudbay plans to continue drilling activities at several regional targets in 2026, including the Talbot deposit and at other regional prospective areas, following up on encouraging results in 2025. A portion of the 2026 Manitoba exploration program will be funded by approximately $20 million in proceeds from a critical minerals premium flow-through financing completed in late 2025.
In British Columbia, 2026 exploration activities will focus on the conversion of high value inferred resources at New Ingerbelle to potentially extend mine life at Copper Mountain.
In Peru, 2026 exploration activities will continue to focus on final permitting and drill preparation for the Maria Reyna and Caballito properties near Constancia.
1 Calculated using the midpoint of the guidance range
2 In 2020, Hudbay's consolidated copper production guidance range was revised during the year due to the impact of COVID-19 at the operations. Hudbay's copper production was within the revised guidance ranges. Prior to 2021, Hudbay provided guidance on a precious metal equivalent instead of gold as a standalone metal.
3 Cash cost and sustaining cash cost, net of by-product credits, per pound of copper produced and cash costs, net of by-product credits, per ounce of gold produced are non-GAAP financial performance measure with no standardized definition under IFRS. For further information and a detailed reconciliation, please see the discussion under the "Non-GAAP Financial Performance Measures" section of this MD&A.
Commodity Markets
Hudbay's 2026 operational and financial performance will be influenced by a variety of factors including production volumes, metal prices and input costs. The general performance of the Chinese, North American and global economies and intervention into markets by world government will influence the demand for copper, zinc and the prices the Company receives. Meanwhile interest rates, inflation, the performance of financial markets, the amount of central bank and investor gold purchases and the level of geopolitical uncertainty will drive the price Hudbay receives for its unstreamed gold and silver.
The realized prices the Company achieves in the commodity markets significantly affect Hudbay's financial performance. The Company's general expectations regarding metals prices and foreign exchange rates are included below and in the "Sensitivity Analysis" section of this MD&A.
Management has developed the following market analysis from various information sources including analyst and industry experts and Hudbay's own market intelligence.
Copper
In 2025, the London Metal Exchange ("LME") Cash copper price began the year at $3.94 per pound and rapidly ran up to $4.53 per pound in late March just before the Trump administration announced "Liberation Day" import tariffs on most nations on April 2, 2025. After a short-lived dip in early April, the price spent the second and third quarters of the year trading between $4.17 and $4.68 per pound before breaking out to the upside in the fourth quarter due to significant supply disruptions at a number of major mines. The LME price closed the year at an annual high of $5.67 per pound and averaged $4.51 per pound for the full year. Concerns that the Section 232 copper review initiated by the US federal government would result in a 50% tariff on USA imports of copper cathode, dominated the market in the first half of 2025. As a result, substantial quantities of copper cathode were imported into the USA and stored in warehouses ahead of the expected mid-year tariff implementation. This artificial demand for copper not only buoyed LME prices and drew down LME stocks but also resulted in a substantial price arbitrage in favour of COMEX over the LME which peaked at a 28% premium in July. Only July 29th, when the USA government announced that there would be no tariffs placed on imports of copper cathode, the arbitrage quickly evaporated.
2026 had already seen the LME cash price breach the $6.00 per pound price for the first time in history, largely on the basis of critical minerals based supply chain concerns in all regions of the world and the announced intention of the USA to begin actively stockpiling copper as part of "Project Vault" and the strong likelihood that China will add to its own strategic copper stockpile. Thus, in spite of underwhelming physical demand for copper in the copper fabricating industry prices are likely to remain strong in 2026.
Growing future demand for copper, driven by green energy transition and AI data centres, will necessitate the development of intrinsically higher capital cost greenfield mines from the world's remaining inventory of lower-grade undeveloped copper deposits, which, in combination with higher operating costs and taxes, is expected to result in strong copper prices in 2027 and beyond.
Zinc
The LME Cash zinc price began the year at approximately $1.30 per pound, dropped significantly to an annual low of $1.14 per pound in mid-April after the Liberation Day tariff announcements and then steadily increased for the rest of the year to end the year at $1.39 per pound. The average price for the year was $1.30 per pound.
So far in 2026 the zinc price has continued its upward trend reaching a high of $1.58 on January 29. The International Lead Zinc Study Group (ILZSG) is projecting a growing surplus for zinc in 2026 with refined production outpacing demand and a variety of new mines coming into production so zinc prices may moderate as the year progresses.
Gold
The physical supply and demand for gold is not an arbitrator of future prices as it is with base metals because most of the gold ever mined is stored in bank vaults. Gold is an investment that has traditionally provided a safe haven for investors during uncertain economic times, as well as a hedge against inflation, future currency devaluation and declining values of other riskier asset classes. After posting a 26% price gain in 2024 and ending the year at $2,609 per ounce, the gold price followed up with an even more impressive price gain of 66% in 2025, closing the year at $4,319 per ounce. Gold strong price performance in 2025 was driven by a combination of factors including strong Central bank purchases out of China and Russia as they move to replace their US dollar reserves with gold, increased geopolitical instability and concerns about the effect of the US government policies on world trade, inflation and the US dollar which have led to the adoption of gold as a significant asset class by an increasing number of investors. In the first month of 2026, the gold price maintained its momentum, hitting an all-time high of $5,417 per ounce (AM fix on the LBMA) on January 28th before retreating very rapidly back below $5,000 per ounce. While the spot gold price is expected to remain volatile during the balance of 2026, the long-term consensus price for gold has escalated significantly over the last two years which should lead to an extended period of strong profitability for gold producers.
Treatment Charges, Refining Charges, and Freight Costs
Hudbay's operating margins are affected by a variety of third-party processing charges and logistics costs that must be incurred to convert Hudbay's concentrates into refined metal. For the copper, zinc and molybdenum concentrates that Hudbay produce, the Company will pay freight costs to deliver these products from its facilities to its customers which include, depending on the destination, various combinations of truck, rail or ocean freight costs along with warehousing and loading fees. The Company also pay treatment and refining charges ("TC/RCs") to its customers who process the Company's copper concentrates. For precious metal doré Hudbay produces, the Company incurs transportation costs to ship to a third-party refinery.
The copper concentrate market remains exceptionally tight, due to a global oversupply of smelting capacity relative to mine production. This fundamental tightness is reflected in both benchmark and spot treatment and refining charges. Chinese smelters have agreed 2026 benchmark TC/RCs at $0/0 cents, down significantly from last year's Chinese benchmark, and representing yet another record low. Spot copper treatment and refining charges are even more extreme, currently trading at negative triple digits for sales from miners to traders. It is unclear when, or how, the copper concentrate market will approach more balanced levels in the short term. Hudbay is also exposed to zinc concentrate treatment charges, as a seller of zinc concentrate. The 2026 zinc concentrate benchmark has not been established yet. While the 2026 benchmark had been expected to increase versus 2025's record low of $80/dmt, the recent tightening in the spot market makes this outcome less certain. Current spot rates, on a delivered China basis, are ~$40/dmt.
Spot bulk ocean freight rates have declined since year end, currently offering attractive spot rates at all of the Company's mines in a historical context. Subdued bunker prices and freight demand uncertainty in part due to geopolitical issues, are expected to constrain spot freight rates for the next several quarters. Consequently, Hudbay will be afforded the opportunity to lock in contracts of affreightment at terms likely attractive relative to 2025.
Sensitivity Analysis
The following table displays the estimated impact of changes in metals prices and foreign exchange rates on The Company's 2026 net profit, earnings per share and operating cash flow, assuming that Hudbay's operational performance is consistent with the mid-point of its guidance for 2026. The effects of a given change in an assumption are calculated in isolation.
| 2026 Base |
Change of +/-10% represented by +/-: |
Impact on Profit +/- |
Impact on EPS +/- 1 |
Impact on Operating CF before changes in NCWC +/- |
|
| Metals Prices | |||||
| Copper price2 | $4.75/lb | $0.48/lb | $82M | $0.21 | $98M |
| Gold price3 | $3,850/oz | $385/oz | $52M | $0.13 | $74M |
| Zinc price | $1.30/lb | $0.13/lb | $3M | $0.01 | $4M |
| Exchange Rates 4 | |||||
| C$/US$ | 1.37 | 0.14 | $77M | $0.19 | $56M |
1 Based on 396.8 million common shares outstanding as at December 31, 2025.
2 Quotational period hedging program neutralizes provisional pricing adjustments.
3 Gold price sensitivity also includes an impact of a +/- 10% change in the silver price (2026 assumption: $42.00/oz of silver).
4 Change in profit from operational performance only, does not include change in profit arising from translation of balance sheet accounts.
FINANCIAL REVIEW
Financial Results
In the fourth quarter of 2025, Hudbay recorded net earnings attributable to owners of $128.0 million compared to the net earnings on the same basis of $21.2 million in the fourth quarter of 2024, representing an increase in net earnings attributable to owners of $106.8 million. For the full year of 2025, Hudbay recorded net earnings attributable to owners of $568.5 million compared to net earnings on the same basis of $76.7 million for the same period in 2024, representing an increase in earnings attributable to owners of $491.8 million.
The following table provides further details on the makeup of this variance:
| (in $ millions) | Three months ended December 31, 2025 |
Year ended December 31, 2025 |
| Increase (decrease) in components of earnings: | ||
| Revenues | 148.0 | 189.8 |
| Cost of sales | ||
| Mine operating costs | (32.0) | 12.7 |
| Depreciation and amortization | (30.3) | (13.1) |
| Selling and administrative expenses | (19.0) | (37.7) |
| Exploration expenses | (0.7) | (3.7) |
| Other operating expenses | 35.7 | 49.6 |
| Re-evaluation adjustment - environmental obligation | 2.7 | (3.7) |
| Impairment reversal | - | 322.3 |
| Consideration received from sale of non-core project | - | 14.9 |
| Net finance expense1 | 49.0 | 129.3 |
| Tax expense | (44.7) | (163.9) |
| Increase in net earnings for the period | 108.7 | 496.5 |
| Change in non-controlling interest | (1.9) | (4.7) |
| Increase in net earnings attributable to owners for the period | 106.8 | 491.8 |
1Net finance expense includes net interest expense on long-term debt, accretion on streaming arrangements, change in fair value of financial instruments and other net finance (income) cost.
Revenue
Revenue for the fourth quarter of 2025 was $732.9 million, $148.0 million higher than the same period in 2024, primarily due to stronger copper and gold realized prices, lower treatment and refining charges, offset by lower sales volume of all metals.
Revenue during the year ended December 31, 2025 was $2,211.0 million, $189.8 million higher than in 2024, primarily as a result of higher metal prices, lower treatment and refining charges, partially offset by lower sales volume of all metals.
While a majority of revenues continue to be from copper, gold represented a significant portion of total revenues at 41% and 38% for the three months and year-ended December 31, 2025, respectively. This is as a result of exposure to higher gold prices.
The following table provides further details on these variances:
| (in $ millions) | Three months ended December 31, 2025 |
Year ended December 31, 2025 2 |
| Metals prices1 | ||
| Higher copper prices | 80.5 | 117.8 |
| Higher gold prices | 105.7 | 275.0 |
| Higher zinc prices | - | 1.0 |
| Higher silver prices | 7.2 | 13.4 |
| Sales volumes | ||
| Lower copper sales volumes | (34.2) | (97.3) |
| Lower gold sales volumes | (19.3) | (168.3) |
| Lower zinc sales volumes | (3.9) | (27.7) |
| Lower silver sales volumes | (6.5) | (8.7) |
| Other | ||
| Molybdenum and other volume and pricing differences | (1.6) | 2.0 |
| Variable consideration adjustments | - | 13.7 |
| Effect of lower treatment and refining charges | 20.1 | 68.9 |
| Increase in revenue in 2025 compared to 2024 | 148.0 | 189.8 |
1 See discussion below for further information regarding metals prices.
2 Copper Mountain mine results are stated at 100%
Hudbay's revenue by significant product type is summarized below:
| Three months ended | Year ended | ||||
| (in $ millions) | Dec. 31, 2025 | Sep. 30, 2025 | Dec. 31, 2024 | Dec. 31, 2025 | Dec. 31, 2024 |
| Copper | 383.3 | 178.8 | 349.0 | 1,161.5 | 1,154.8 |
| Gold | 285.5 | 125.5 | 199.6 | 794.4 | 673.6 |
| Zinc | 12.5 | 9.6 | 16.4 | 43.5 | 71.1 |
| Silver | 16.3 | 9.1 | 15.7 | 53.6 | 51.5 |
| Molybdenum | 9.9 | 14.0 | 9.1 | 63.9 | 60.1 |
| Other metals | 0.2 | - | 1.2 | - | 1.7 |
| Revenue from contracts | 707.7 | 337.0 | 591.0 | 2,116.9 | 2,012.8 |
| Amortization of deferred revenue - gold | 14.7 | 2.3 | 14.6 | 31.3 | 40.7 |
| Amortization of deferred revenue - silver | 9.3 | 4.0 | 11.6 | 33.8 | 33.6 |
| Amortization of deferred revenue - variable consideration adjustments - prior periods | - | - | - | 9.9 | (3.8) |
| Pricing and volume adjustments1 | 7.0 | 8.8 | (6.4) | 47.5 | 35.2 |
| Treatment and refining charges | (5.8) | (5.3) | (25.9) | (28.4) | (97.3) |
| Revenue | 732.9 | 346.8 | 584.9 | 2,211.0 | 2,021.2 |
1 Pricing and volume adjustments represents mark-to-market adjustments on provisionally prices sales, realized and unrealized changes to fair value for non-hedge derivative contracts (QP hedges) and adjustments to originally invoiced weights and assays.
For further detail on variable consideration adjustments, refer to note 20 of Hudbay's consolidated financial statements.
Realized sales prices
This measure is intended to enable management and investors to understand the average realized price of metals sold to third parties in each reporting period. The average realized price per unit sold does not have any standardized meaning prescribed by IFRS, is unlikely to be comparable to similar measures presented by other issuers and should not be considered in isolation or a substitute for measures of performance prepared in accordance with IFRS.
For sales of copper, zinc, gold and silver, Hudbay may enter into non-hedge derivatives ("QP hedges") which are intended to manage the provisional pricing risk arising from quotational period terms in concentrate sales agreements. The gains and losses on QP hedges are included in the calculation of realized prices. Hudbay expects that gains and losses on QP hedges will offset provisional pricing adjustments on concentrate sales contracts.
Hudbay's realized prices for the three months ended December 31, and September 30, 2025 and year ended December 31, 2025 and 2024, respectively, are summarized below:
| Realized prices1 for the | Realized prices1 for the | |||||||
| Three months ended | Year ended | |||||||
| Prices | LME QTD 20252 |
Dec. 31, 2025 |
Sep. 30, 2025 |
Dec. 31, 2024 |
LME YTD 20252 |
Dec. 31, 2025 |
Dec. 31, 2024 |
|
| Copper | $/lb | 5.03 | 5.17 | 4.37 | 4.09 | 4.51 | 4.64 | 4.18 |
| Gold3 | $/oz | 4,152 | 3,580 | 3,522 | 2,327 | 3,440 | 3,297 | 2,241 |
| Zinc | $/lb | 1.39 | 1.30 | 1.39 | 1.29 | 1.26 | ||
| Silver3 | $/oz | 31.34 | 33.22 | 23.12 | 28.43 | 24.23 | ||
1 Realized prices exclude refining and treatment charges and are on the sale of finished metal or metal in concentrate. Realized prices include the effect of provisional pricing adjustments on prior period sales.
2 London Metal Exchange average for Cash copper and zinc prices.
3 Sales of gold and silver from Constancia mine are subject to Hudbay's precious metals stream agreement with Wheaton, pursuant to which Hudbay recognizes deferred revenue for precious metals deliveries and also receive cash payments. Stream sales are included within realized prices and their respective deferred revenue and cash payment rates can be found on page 45 of this MD&A.
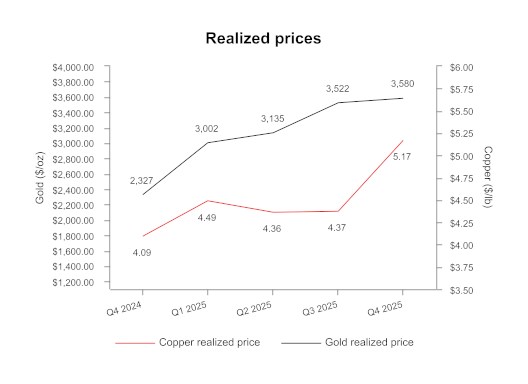
In addition to QP hedges, the Company may periodically undertake metal price hedging in accordance with Board approved policies to achieve strategic objectives, including locking in favourable metal prices to ensure minimum cash flows during or after the construction of a mine or during a period of reduced liquidity due to large capital investments, to manage cash flows at shorter life or higher cost operations or as part of a financing arrangement. The realized prices, denoted in the table above, exclude the impact of derivative mark-to-market gains and losses on these non-QP hedges, which are included in change in fair value of financial instruments in Hudbay's consolidated statements of income.
As of December 31, 2025, Hudbay had no non-QP hedges outstanding.
During the first quarter of 2026, Hudbay entered into the following non-QP hedges:
• Forward sales contracts for a total of 2,200 tonnes of copper production over the period of June 2026 to April 2027 at an average price of $6.02 per pound; and
• Zero-cost collar program for 4,400 tonnes of copper production over the period of June 2026 to April 2027 at an average floor price of $5.75 per pound and an average cap price of $6.34 per pound.
Together, the forward copper sales and zero copper cost collar hedges represent approximately 20% of Copper Mountain's expected 2026 production.
The following tables provide a reconciliation of average realized price per unit sold, by metal, to revenues as shown in the consolidated financial statements.
| Three months ended December 31, 2025 | |||||||
| (in $ millions except for realized price and payable metal sold) 1 | Copper | Gold | Zinc | Silver | Molybdenum | Other | Total |
| Revenue from contracts 2 | 383.3 | 285.5 | 12.5 | 16.3 | 9.9 | 0.2 | 707.7 |
| Amortization of deferred revenue | - | 14.7 | - | 9.3 | - | - | 24.0 |
| Pricing and volume adjustments 3 | 5.4 | 2.0 | (0.3) | 1.7 | (1.8) | - | 7.0 |
| Revenue, including mark-to-market on QP hedges 4 | 388.7 | 302.2 | 12.2 | 27.3 | 8.1 | 0.2 | 738.7 |
| Realized non-QP derivative mark-to-market | - | - | - | - | - | - | - |
| By-product credits 5 | 388.7 | 302.2 | 12.2 | 27.3 | 8.1 | 0.2 | 738.7 |
| Payable metal in concentrate and doré sold 6 | 34,132 | 84,424 | 3,972 | 871,006 | 190 | - | - |
| Realized price 7 | 5.17 | 3,580 | 1.39 | 31.34 | - | - | - |
| Realized price, including realized non-QP derivative 7 | 5.17 | 3,580 | 1.39 | 31.34 | - | - | - |
| Three months ended September 30, 2025 | |||||||
| Revenue from contracts 2 | 178.8 | 125.5 | 9.6 | 9.1 | 14.0 | - | 337.0 |
| Amortization of deferred revenue | - | 2.3 | - | 4.0 | - | - | 6.3 |
| Pricing and volume adjustments 3 | (2.5) | 7.0 | 0.3 | 0.8 | 3.2 | - | 8.8 |
| Revenue, including mark-to-market on QP hedges 4 | 176.3 | 134.8 | 9.9 | 13.9 | 17.2 | - | 352.1 |
| Realized non-QP derivative mark-to-market | - | - | - | - | - | - | - |
| By-product credits 5 | 176.3 | 134.8 | 9.9 | 13.9 | 17.2 | - | 352.1 |
| Payable metal in concentrate and doré sold 6 | 18,280 | 38,279 | 3,452 | 418,418 | 269 | - | - |
| Realized price 7 | 4.37 | 3,522 | 1.30 | 33.22 | - | - | - |
| Realized price, including realized non-QP derivative 7 | 4.37 | 3,522 | 1.30 | 33.22 | |||
| Three months ended December 31, 2024 | |||||||
| Revenue from contracts 2 | 349.0 | 199.6 | 16.4 | 15.7 | 9.1 | 1.2 | 591.0 |
| Amortization of deferred revenue | - | 14.6 | - | 11.6 | - | - | 26.2 |
| Pricing and volume adjustments 3 | (6.6) | 1.6 | (0.3) | (0.7) | (0.4) | - | (6.4) |
| Revenue, including mark-to-market on QP hedges 4 | 342.4 | 215.8 | 16.1 | 26.6 | 8.7 | 1.2 | 610.8 |
| Realized non-QP derivative mark-to-market 5 | (1.3) | (2.9) | - | - | - | - | (4.2) |
| By-product credits 4 | 341.1 | 212.9 | 16.1 | 26.6 | 8.7 | 1.2 | 606.6 |
| Payable metal in concentrate and doré sold 6 | 37,927 | 92,734 | 5,261 | 1,150,518 | 182 | - | - |
| Realized price 7 | 4.09 | 2,327 | 1.39 | 23.12 | - | - | - |
| Realized price, including realized non-QP derivative 7 | 4.08 | 2,296 | 1.39 | 23.12 | |||
1 Average realized price per unit sold may not calculate based on amounts presented in this table due to rounding.
2 As per IFRS Accounting Standards.
3 Pricing and volume adjustments represents mark-to-market adjustments on provisionally priced sales, realized and unrealized changes to fair value for QP hedge derivative contracts and adjustments to originally invoiced weights and assays.
4 Revenue, including mark-to-market on QP hedges is used in the calculation of realized price.
5 By-product credits subtotal is used in the calculated of cash cost per pound of copper and ounce of gold produced, net of by-product credits. Cash cost per pound of copper and per ounce of gold produced, net of by-product credits, are non-GAAP financial performance measures with no standardized definition under IFRS. For further information and a detailed reconciliation, please see the discussion under the "Non-GAAP Financial Performance Measures" section of this MD&A.
6 Copper and zinc shown in metric tonnes and gold and silver shown in ounces.
7 Realized price for copper and zinc in $/lb and realized price for gold and silver in $/oz.
| Year ended December 31, 2025 | |||||||
| (in $ millions except for realized price and payable metal sold) 1 | Copper | Gold | Zinc | Silver | Molybdenum | Other | Total |
| Revenue from contracts 2 | 1,161.5 | 794.4 | 43.5 | 53.6 | 63.9 | - | 2,116.9 |
| Amortization of deferred revenue | - | 31.3 | - | 33.8 | - | - | 65.1 |
| Pricing and volume adjustments 3 | 10.2 | 32.5 | (0.3) | 3.3 | 1.8 | - | 47.5 |
| Revenue, including mark-to-market on QP hedges 4 | 1,171.7 | 858.2 | 43.2 | 90.7 | 65.7 | - | 2,229.5 |
| Realized non-QP derivative mark-to-market | (2.3) | - | - | - | - | - | (2.3) |
| By-product credits 5 | 1,169.4 | 858.2 | 43.2 | 90.7 | 65.7 | - | 2,227.2 |
| Payable metal in concentrate and doré sold 6 | 114,534 | 260,261 | 15,152 | 3,190,552 | 1,334 | - | - |
| Realized price 7 | 4.64 | 3,297 | 1.29 | 28.43 | - | - | - |
| Realized price, including realized non-QP derivative 7 | 4.63 | 3,297 | 1.29 | 28.43 | - | - | - |
| Year ended December 31, 2024 | |||||||
| (in $ millions except for realized price and payable metal sold) 1 | Copper | Gold | Zinc | Silver | Molybdenum | Other | Total |
| Revenue from contracts 2 | 1,154.8 | 673.6 | 71.1 | 51.5 | 60.1 | 1.7 | 2,012.8 |
| Amortization of deferred revenue | - | 40.7 | - | 33.6 | - | - | 74.3 |
| Pricing and volume adjustments 3 | (3.6) | 37.2 | (1.2) | 0.9 | 1.9 | - | 35.2 |
| Revenue, including mark-to-market on QP hedges 4 | 1,151.2 | 751.5 | 69.9 | 86.0 | 62.0 | 1.7 | 2,122.3 |
| Realized non-QP derivative mark-to-market | (5.2) | (3.7) | - | - | - | - | (8.9) |
| By-product credits 5 | 1,146.0 | 747.8 | 69.9 | 86.0 | 62.0 | 1.7 | 2,113.4 |
| Payable metal in concentrate and doré sold 6 | 125,094 | 335,342 | 25,120 | 3,549,816 | 1,287 | - | - |
| Realized price 7 | 4.18 | 2,241 | 1.26 | 24.23 | - | - | - |
| Realized price, including realized non-QP derivative 7 | 4.16 | 2,230 | 1.26 | 24.23 | - | - | - |
1 Average realized price per unit sold may not calculate based on amounts presented in this table due to rounding.
2 As per consolidated financial statements.
3 Pricing and volume adjustments represents mark-to-market adjustments on provisionally priced sales, realized and unrealized changes to fair value for QP hedge derivative contracts and adjustments to originally invoiced weights and assays.
4 Revenue, including mark-to-market on QP hedges is used in the calculation of realized price.
5 By-product credits subtotal is used in the calculated of cash cost per pound of copper and ounce of gold produced, net of by-product credits. Cash cost per pound of copper and per ounce of gold produced, net of by-product credits, are non-GAAP financial performance measures with no standardized definition under IFRS. For further information and a detailed reconciliation, please see the discussion under the "Non-GAAP Financial Performance Measures" section of this MD&A.
6 Copper and zinc shown in metric tonnes and gold and silver shown in ounces.
7 Realized price for copper and zinc in $/lb and realized price for gold and silver in $/oz.
The price, quantity and mix of metals sold affect Hudbay's revenue, operating cash flow and gross profit. Revenue from metals sales can vary from quarter to quarter due to production levels, shipping volumes and transfer of risk and title to customers.
Precious metals - stream sales and realized price breakdown
The following table shows a breakdown of realized prices for precious metals inclusive of stream and offtaker revenue. It further identifies the components of the realized price for stream revenues between the amortized drawdown rate and cash payment rate.
| (in $ millions except for realized price and payable metal sold) | Gold | Silver | |||||||
| Three months ended | Year ended | Three months ended | Year ended | ||||||
| Revenue | Dec. 31, 2025 |
Dec. 31, 2024 |
Dec. 31, 2025 |
Dec. 31, 2024 |
Dec. 31, 2025 |
Dec. 31, 2024 |
Dec. 31, 2025 |
Dec. 31, 2024 |
|
| Stream | 22.0 | 22.2 | 46.8 | 61.8 | 13.2 | 16.6 | 47.9 | 48.0 | |
| Offtaker | 280.2 | 193.6 | 811.4 | 689.7 | 14.1 | 10.0 | 42.8 | 38.0 | |
| Revenue, including mark-to-market on QP hedges 3 | 302.2 | 215.8 | 858.2 | 751.5 | 27.3 | 26.6 | 90.7 | 86.0 | |
| Payable metal sold | |||||||||
| Stream | oz | 17,029 | 17,873 | 36,352 | 49,822 | 612,924 | 796,849 | 2,242,607 | 2,310,394 |
| Offtaker | oz | 67,395 | 74,861 | 223,909 | 285,520 | 258,082 | 353,669 | 947,945 | 1,239,422 |
| Total payable metal sold | oz | 84,424 | 92,734 | 260,261 | 335,342 | 871,006 | 1,150,518 | 3,190,552 | 3,549,816 |
| Deferred revenue drawdown rate1 | $/oz | 860 | 817 | 860 | 817 | 15.06 | 14.56 | 15.06 | 14.56 |
| Cash rate2 | $/oz | 429 | 425 | 427 | 423 | 6.33 | 6.26 | 6.29 | 6.23 |
| Stream realized price | $/oz | 1,289 | 1,242 | 1,287 | 1,240 | 21.39 | 20.82 | 21.35 | 20.79 |
| Offtaker realized price | $/oz | 4,158 | 2,586 | 3,624 | 2,416 | 54.63 | 28.28 | 45.15 | 30.66 |
| Realized price | $/oz | 3,580 | 2,327 | 3,297 | 2,241 | 31.34 | 23.12 | 28.43 | 24.23 |
1 Deferred revenue drawdown rates for gold and silver do not include variable consideration adjustments.
2 The gold and silver cash rate for Peru increased by 1% from $400/oz and $5.90/oz effective August 4, 2019. Subsequently every year, on August 4, the cash rate will increase by 1% compounded.
3 Revenue, including mark-to-market on QP hedges is used in the calculation of realized price.
Subsequent to the variable consideration adjustment recorded on January 1, 2025, the deferred revenue amortization is recorded in Peru at $860 per ounce gold and $15.06 per ounce silver (December 31, 2024 - $817 per ounce gold and $14.56 per ounce silver).
Cost of Sales
Hudbay's detailed cost of sales is summarized as follows:
| (in $ millions) | Three months ended | Year ended | |||
| Dec. 31, 2025 |
Sep. 30, 2025 |
Dec. 31, 2024 |
Dec. 31, 2025 |
Dec. 31, 2024 |
|
| Peru | |||||
| Mining | 37.6 | 34.8 | 47.3 | 131.5 | 145.5 |
| Milling | 52.0 | 40.8 | 53.6 | 195.0 | 197.1 |
| Changes in product inventory | 15.6 | (26.9) | (6.7) | 6.5 | 9.6 |
| Depreciation and amortization | 115.8 | 50.0 | 83.2 | 290.0 | 270.3 |
| G&A | 48.3 | 19.5 | 33.3 | 113.8 | 96.0 |
| Overhead costs incurred during Peru temporary suspension (cash) | 1.3 | 7.3 | - | 8.6 | - |
| Inventory adjustments | (0.2) | (1.3) | (0.2) | - | - |
| Freight, royalties and other charges | 20.2 | 10.9 | 20.7 | 60.8 | 69.2 |
| Total Peru cost of sales | 290.6 | 135.1 | 231.2 | 806.2 | 787.7 |
| Manitoba | |||||
| Mining | 39.3 | 15.8 | 42.6 | 126.9 | 169.4 |
| Milling | 16.2 | 5.9 | 16.6 | 49.9 | 65.2 |
| Changes in product inventory | (2.2) | 3.1 | (0.3) | 3.7 | (2.0) |
| Depreciation and amortization | 22.6 | 16.3 | 27.2 | 86.4 | 106.2 |
| Overhead costs incurred during Manitoba temporary suspension (cash) | - | 16.0 | - | 19.2 | - |
| Inventory adjustments | 0.8 | - | 0.3 | 1.8 | 1.7 |
| G&A | 17.5 | 6.4 | 13.0 | 53.3 | 48.7 |
| Past service costs | - | - | 1.5 | - | 4.3 |
| Freight, royalties and other charges | 5.1 | 2.5 | 7.0 | 18.4 | 25.4 |
| Total Manitoba cost of sales | 99.3 | 66.0 | 107.9 | 359.6 | 418.9 |
| British Columbia1 | |||||
| Mining | 26.3 | 19.6 | 18.2 | 92.0 | 79.1 |
| Milling | 28.3 | 29.1 | 25.2 | 100.6 | 89.8 |
| Changes in product inventory | (9.1) | 4.2 | (3.0) | (2.1) | 3.8 |
| Depreciation and amortization | 14.1 | 16.4 | 11.8 | 63.3 | 50.1 |
| G&A | 10.2 | 7.6 | 5.0 | 30.7 | 20.0 |
| Inventory adjustments | 0.1 | - | 1.2 | 2.3 | 1.2 |
| Freight, royalties and other charges | 3.0 | 3.5 | 3.0 | 15.2 | 16.8 |
| Total British Columbia cost of sales | 72.9 | 80.4 | 61.4 | 302.0 | 260.8 |
| Cost of sales | 462.8 | 281.5 | 400.5 | 1,467.8 | 1,467.4 |
1 Copper Mountain mine results are stated at 100%.
Total cost of sales for the fourth quarter of 2025 was $462.8 million, reflecting an increase of $62.3 million compared to the fourth quarter of 2024.
Peru cost of sales increased by $59.4 million in the fourth quarter of 2025, compared to the same period of 2024 primarily due to higher depreciation primarily as a result of Pampacancha being fully depleted in December 2025 and higher change in product inventory as a result of a 20,000 dry metric tonne copper concentrate shipment from September being deferred to early October 2025, resulting in a larger drawdown of product inventory in the fourth quarter. Manitoba cost of sales decreased by $8.6 million in the fourth quarter of 2025 when compared to the same period of 2024, primarily driven by lower operating activity due to a one-week winter power outage which resulted in lower mining and milling costs as well as lower depreciation. These decreases to Manitoba cost of sales were partially offset by higher profit sharing in the fourth quarter of 2025 compared to the same period in 2024. British Columbia cost of sales increased by $11.5 million primarily driven by higher mining, milling and G&A costs. Mining and G&A costs were higher as the operation transitioned towards an expanded in-house workforce leading to the hiring of 240 new employees as Hudbay continues to ramp-up its optimization plans at Copper Mountain. Milling costs were higher primarily because of lower milled throughput and non-recurring costs associated with the unplanned primary SAG mill maintenance.
Total cost of sales for the year ended December 31, 2025 was $1,467.8 million, remaining relatively consistent with the comparable period, reflecting an increase of $0.4 million.
Peru cost of sales increased by $18.5 million for the year ended December 31, 2025, compared to the same period of 2024 primarily due to the same factors mentioned above, as well as $8.6 million in direct charge to cost of sales as a result of the temporary suspension of operations in the third quarter of 2025. Manitoba cost of sales decreased by $59.3 million primarily due to the Manitoba wildfires leading to lower overall costs in-line with lower production. These decreases have been partially offset by higher overhead costs incurred during the temporary suspension and changes in product inventory. British Columbia cost of sales increased by $41.2 million primarily driven by higher mining, milling, depreciation and G&A, partially offset by lower freight, royalties and other charges and a decrease in changes in product inventory.
For details on unit operating costs, refer to the respective tables in the "Operations Review" section of this MD&A.
For the fourth quarter of 2025, other significant variances in expenses, compared to the same period in 2024, include the following:
- General administration expenses increased by $19.0 million, primarily due to an increase of $22.5 million in share-based compensation mostly from the revaluation of share units to higher stock prices compared to prior period.
- Other operating expenses decreased by $35.7 million, primarily due to a gain of $25.0 million from business interruption insurance proceeds in Manitoba from the temporary suspension of operations related to the wildfire evacuation orders and a decrease of $11.2 million in write-off of previously capitalized PP&E costs.
- Net finance expenses decreased by $49.0 million, primarily due to an increase in mark-to-market gains of $32.5 million from investments, decrease in foreign exchange loss of $22.7 million from the revaluation of foreign currency monetary balances, a decrease of $1.4 million from interest expense on long-term debt benefiting from the retirement of some senior notes, partially offset by an increase in losses of $7.6 million from non-QP hedges.
For the full year of 2025, other significant variances in expenses, compared to the same period in 2024, included the following:
- General administration expenses increased by $37.7 million, primarily due to an increase of $37.3 million in share-based compensation expense mostly from the revaluation of share units due to higher share prices compared to the prior period.
- Exploration expenses increased by $3.7 million, primarily due to Hudbay's planned Snow Lake exploration program consisting of modern geophysical programs and multi-phased drilling campaigns, most of which was funded by flow-through financing.
- Other operating expenses decreased by $49.6 million, primarily due to a gain of $25.0 million from business interruption insurance proceeds in Manitoba as noted above, a decrease of $23.9 million due to a write-off of previously capitalized PP&E costs, an increase of $4.1 million from the Marubeni option agreement as funds are spent on exploration work, higher income of $3.5 million from the amortization of obligations related to the flow through share deferred liability, partially offset by an increase of $4.4 million related to Manitoba wildfire evacuation costs.
- Re-evaluation adjustment - environmental provision gain decreased by $3.7 million due to the relative revaluation of the environmental reclamation provision on Hudbay's Manitoba non-producing sites from changes in long-term risk-free discount and inflation rates. Given the long term nature of the reclamation cash flows, the related environmental reclamation provision is highly sensitive to changes in inflation and long-term-risk free discount rates, and, as such, Hudbay may continue to experience significant quarterly environmental reclamation revaluations.
- Impairment reversal gain reflects a non-cash full impairment reversal of $322.3 million on the carrying value of the Copper World project, following the announcement of the Copper World JV Transaction with Mitsubishi for a 30% minority interest.
- Consideration received from sale of non-core project reflects $14.9 million contingent consideration received from an asset previously sold by Copper Mountain Mining Corporation.
- Net finance expenses decreased by $129.3 million due to an increase in mark-to-market gains of $52.0 million from investments, a $39.6 million decrease in net foreign exchange loss from the revaluation of foreign currency monetary balances, a decrease in the relative revaluation loss of the now retired gold prepayment liability of $10.7 million, a $9.1 million decrease in interest expense on long-term debt, decrease in losses of $6.8 million from non-QP hedges, an increase of $6.6 million in interest income, partially offset by an increase of $2.3 million in interest on equipment financing and leases.
Tax Expense
For the three and twelve months ended December 31, 2025, tax expense increased by $44.7 million and $163.9 million, respectively, compared to the same period in 2024. The following table provides further details:
| (in $ millions) | Three months ended | Year ended | ||
| Dec. 31, 2025 | Dec. 31, 2024 | Dec. 31, 2025 | Dec. 31, 2024 | |
| Current tax expense - income tax | 112.8 | 52.2 | 210.6 | 119.9 |
| Deferred tax expense (recovery) expense - income tax1 | (19.4) | 15.1 | 60.2 | 13.9 |
| Total income tax expense | 93.4 | 67.3 | 270.8 | 133.8 |
| Current tax expense - mining tax | 37.6 | 19.2 | 80.7 | 57.0 |
| Deferred tax recovery - mining tax1 | (1.9) | (2.1) | (3.8) | (7.0) |
| Total mining tax expense | 35.7 | 17.1 | 76.9 | 50.0 |
| Tax expense | 129.1 | 84.4 | 347.7 | 183.8 |
| 1 Deferred tax expense (recovery) represents Hudbay's draw down/increase of non-cash deferred income and mining tax assets/liabilities. | ||||
Income Tax Expense
Applying the estimated Canadian statutory income tax rate of 26.7% to Hudbay's net earnings before taxes of $912.0 million for the full year of 2025 would have resulted in a tax expense of approximately $243.5 million; however, Hudbay recorded an income tax expense of $270.8 million. The primary items causing Hudbay's effective income tax rate to be different than the 26.7% estimated Canadian statutory income tax rate are the following:
- Foreign exchange on the translation of deferred tax balances to group currency, resulting in a deferred tax recovery of $15.4 million.
- The tax expense with respect to Hudbay's foreign operations is recorded using an income tax rate other than the Canadian statutory income tax rate of 26.7%, resulting in a tax expense of $71.6 million.
- Current mining tax deductions resulted in a tax recovery of $24.2 million.
Mining Tax Expense
For the full year of 2025, Hudbay recorded a mining tax expense of $76.9 million. Effective mining tax rates can vary significantly based on the composition of Hudbay's earnings and the expected amount of mining taxable profits. Corporate costs and other costs not related to mining operations are not deductible in computing mining profits. A brief description of how mining taxes are calculated in Hudbay's various business units is discussed below.
Manitoba
The Province of Manitoba imposes mining tax on earnings related to the sale of mineral products mined in the Province of Manitoba (mining taxable profit) at the following rates:
- 10% of total mining taxable earnings if mining profit is C$50 million or less;
- Between mining earnings of C$50 and C$55 million, mining tax is equal to a minimum of C$5 million plus mining earnings less C$50 million multiplied by 65%;
- 15% of total mining taxable earnings if mining profits are between C$55 million and C$100 million;
- Between mining earnings of C$100 million and C$105 million, mining tax is equal to a minimum of C$15 million plus mining earnings less C$100 million multiplied by 57%; and
- 17% of total mining taxable earnings if mining profits exceed C$105 million.
Hudbay estimates that the deferred tax rate that will be applicable when temporary differences reverse will be approximately 10.0%.
Peru
The Peruvian government imposes two parallel mining tax regimes, the Special Mining Tax and the Modified Royalty, on companies' operating mining income on a sliding scale, with progressive rates ranging from 2.0% to 8.4% and 1.0% to 12.0%, respectively. Based on financial forecasts, Hudbay has recorded a deferred tax liability as at December 31, 2025, at the tax rate expected to apply when temporary differences reverse.
British Columbia
The Province of British Columbia imposes a 13% net revenue tax on the sale of mineral products mined in the province of British Columbia after the mine owner has recovered the capital invested in the mine and its "Cumulative Expenditure Account" ("CEA") no longer has a balance. The tax is paid on the profit in excess of the capital that has been invested in the mine. British Columbia mineral tax is deductible for federal and provincial income tax purposes.
While there is a balance in the CEA account, the mine owner must pay a "Net Current Proceeds" ("NCP") tax of 2%. Any amounts paid as NCP can then be claimed in the future against net revenue taxes payable.
Hudbay estimates that the effective tax rate that will be applicable when temporary differences reverse will be approximately 9.49%.
LIQUIDITY AND CAPITAL RESOURCES
As at December 31, 2025, Hudbay's total liquidity of $993.7 million includes $568.9 million in cash as well as undrawn total availability of $424.8 million under Hudbay's revolving credit facilities.
Senior Unsecured Notes
As at December 31, 2025, Hudbay had $472.5. million aggregate principal amount of 2026 Notes and $542.4 million aggregate principal amount of 2029 Notes.
During the full year 2025, Hudbay made open market purchases of $102.5 million of its 4.5% senior notes due April 2026 ("2026 Notes"), at a discount to par. As at December 31, 2025, Hudbay has presented all of the 2026 Notes as a current liability amounting to $472.1 million, which affected working capital in the period.
Senior Secured Revolving Credit Facilities
Hudbay has two senior secured revolving credit facilities with total commitments of $450 million ("the Credit Facilities") for its Canadian and Peruvian businesses on substantially similar terms and conditions. These facilities include an accordion feature that allows Hudbay the option to increase the facility by an additional $150 million at Hudbay's discretion over the four-year term.
As at December 31, 2025, there were no cash drawings under the Revolving Credit Facilities and $25.2 million in letters of credit secured under the Canadian Facility.
As at December 31, 2025, Hudbay was in compliance with its covenants under the Credit Facilities.
Closing of $600 Million Strategic Investment
Subsequent to year-end, Hudbay successfully closed its previously announced strategic partnership with Mitsubishi on January 9, 2026. Under the terms of the agreement, Mitsubishi acquired a 30% interest in the Copper World project for total cash consideration of $600 million. Upon the closing of the partnership, Hudbay received approximately $420 million in cash, which is specifically earmarked to fund the construction and development of Copper World. The remaining $180 million is scheduled to be received within 18 months of closing, in accordance with the terms of the definitive subscription agreement.
C$130 Million Bilateral Letter of Credit Facility
Hudbay has a C$130.0 million bilateral letter of credit facility ("LC Facility") with a major Canadian financial institution. The LC Facility has no financial covenants and enables Hudbay to issue up to C$130.0 million of letters of credit to beneficiaries on an unsecured basis at attractive rates, including C$30.0 million sub-limit for financial letters of credit. As at December 31, 2025, the Manitoba business unit had drawn $56.4 million in letters of credit under the LC Facility.
Surety Bonds and Letters of Credit
As at December 31, 2025, the United States business unit had $18.4 million in surety bonds issued to support future reclamation and closure obligations and the Peru business unit had $135.0 million in letters of credit and surety bonds issued with various Peruvian financial institutions to support future reclamation and other operating matters. In addition, the British Columbia business unit had $47.9 million in surety bonds issued to support future reclamation and $1.3 million in surety bonds and letters of credit to support other operating matters. No cash collateral is required to be posted under these surety bonds.
Working Capital
Working capital decreased by $576.9 million to a negative position of $65.6 million from December 31, 2024 to December 31, 2025, primarily due to reporting a current portion of long-term debt of $472.1 million as the 2026 Notes are now maturing within one year, an increase in other financial liabilities of $84.6 as a result of the revaluation of derivative liabilities and changes to agreements with communities, an increase in trade and other payables of $72.6 million mostly as a result of timing of payables on capital items and employee profit sharing, an increase in other liabilities of $60.3 million primarily related to share based compensation, a decrease in short-term investments of $40.0 million from the release of guaranteed investment certificates, an increase in taxes payable of $16.7 million and a decrease in other financial assets of $14.5 million.
Partially offsetting these items was an increase in trade and other receivables of $142.3 million primarily due to higher metal prices and timing of sales, an increase in cash and cash equivalents of $27.1 million, a decrease in deferred revenue of $11.0 million and a decrease in lease liabilities of $3.8 million.
Cash Flows
The following table summarizes Hudbay's cash flows for the three months ended December 31, 2025, June 30, 2025 and December 31, 2024:
| (in $ millions) | Three months ended | Year ended | |||
| Dec. 31, 2025 |
Sept. 30, 2025 |
Dec. 31, 2024 |
Dec. 31, 2025 |
Dec. 31, 2024 |
|
| Operating cash flow before change in non-cash working capital | 336.9 | 70.3 | 231.5 | 764.3 | 691.1 |
| Change in non-cash working capital | (127.5) | 43.2 | 6.6 | (57.0) | (24.9) |
| Cash generated from operating activities | 209.4 | 113.5 | 238.1 | 707.3 | 666.2 |
| Cash used in investing activities | (183.6) | (99.9) | (99.6) | (468.4) | (382.9) |
| Cash (used in) generated from financing activities | (68.7) | (26.3) | (36.9) | (214.4) | 10.2 |
| Effect of movement in exchange rates on cash | 0.7 | (1.7) | (3.1) | 2.6 | (1.5) |
| Net (decrease) increase in cash | (42.2) | (14.4) | 98.5 | 27.1 | 292.0 |
Cash Flow from Operating Activities
Cash generated from operating activities was $209.4 million during the fourth quarter of 2025, a decrease of $28.7 million compared to the same period in 2024. Operating cash flow before change in non-cash working capital was $336.9 million during the fourth quarter of 2025, reflecting an increase of $105.4 million compared to the fourth quarter of 2024. The increase in operating cash flows before change in working capital compared with the fourth quarter of 2024 was primarily the result of higher metal prices, partially offset by higher cash taxes paid which are a function of higher profits in earlier quarters in Peru and Manitoba that were subsequently payable.
Full year 2025 cash generated from operating activities was $707.3 million in 2025, an increase of $41.1 million compared to the same period in 2024. Operating cash flow before changes in non-cash working capital for the year ended 2025 was $764.3 million, an increase of $73.2 million compared to the same period in 2024. The increase in operating cash flow before changes in working capital was primarily the result of higher metal prices and lower treatment and refining charges, partially offset by the interruptions in Manitoba and Peru impacting full year 2025 sales volumes and a significant increase in cash taxes paid of $135.9 million mainly at Hudbay's Manitoba and Peru operations.
Cash Flow from Investing and Financing Activities
During the fourth quarter of 2025, Hudbay spent $252.3 million in investing and financing activities, primarily driven by $143.2 million in capital expenditures, $42.5 million in purchase of investments, $39.2 million toward the repurchase of senior unsecured notes net of discounts, $15.8 million in capitalized lease and equipment financing payments and $1.8 million in financing costs paid. These cash outflows were offset by cash inflows of $15.7 million proceeds from flow through share financing, net of share issuance costs, $5.4 million of investment income received and $4.5 million from the contingent consideration received on the sale of a non-core project.
Full year 2025, Hudbay spent $682.8 million in investing and financing activities, primarily driven by $466.7 million in capital expenditures, $102.1 million of Hudbay's senior unsecured notes repurchased net of discounts, $61.8 million in net purchases of investments, $58.4 million in interest paid on Hudbay's long-term debt, $57.1 million in capitalized lease and equipment financing payments, $17.5 million in community agreement payments, $11.7 million in financing costs paid, $6.0 million in the Copper Mountain non-controlling interest acquisition payment and related transaction costs, $5.6 million in dividends paid, $3.4 million in payments made on settlement of non-QP hedges and $2.8 million in acquisition of intangible assets.
This was offset by cash inflows of $40.0 million from the release of the guaranteed investment certificates, $26.8 million of proceeds from equity issuance and flow through share financing, net of share issuance costs, $24.0 million of investment income received, $14.9 million from the contingent consideration received on the sale of a non-core project, and $3.1 million from net proceeds from the exercise of stock options and warrants.
Capital Expenditures
The following summarizes accrued and cash additions to capital assets for the periods indicated:
| Three months ended | Year ended | Guidance | ||||
| Dec. 31, 2025 |
Sept. 30, 2025 |
Dec. 31, 2024 |
Dec. 31, 2025 |
Dec. 31, 2024 |
Annual | |
| (in $ millions) | 20252 | |||||
| Peru sustaining capital expenditures1 | 40.5 | 23.6 | 29.9 | 137.0 | 124.4 | 170.0 |
| Manitoba sustaining capital expenditures | 16.4 | 5.5 | 12.5 | 45.7 | 45.6 | 60.0 |
| British Columbia sustaining capital expenditures1,3 | 34.9 | 42.1 | 29.2 | 131.4 | 123.1 | 135.0 |
| Total sustaining capital expenditures | 91.8 | 71.2 | 71.6 | 314.1 | 293.1 | 365.0 |
| Copper World growth capitalized costs4 | 28.0 | 18.4 | 13.4 | 71.5 | 28.9 | 110.0 |
| Peru growth capitalized expenditures | 1.0 | 1.5 | 0.5 | 4.7 | 0.8 | 25.0 |
| Manitoba growth capitalized expenditures | 2.2 | 1.3 | 2.3 | 7.4 | 7.0 | 15.0 |
| British Columbia growth capitalized expenditures | 15.4 | 21.3 | 4.7 | 64.2 | 8.1 | 75.0 |
| Capitalized exploration | 8.3 | 2.8 | 6.7 | 15.6 | 12.2 | 10.0 |
| Right-of-use asset and equipment financing additions | 18.1 | 3.7 | 42.3 | 50.7 | 96.5 | |
| LOM Community agreement additions | 9.2 | 13.6 | 12.7 | 23.4 | 14.5 | |
| Non-cash capitalized stripping | 5.9 | 7.4 | 6.2 | 28.2 | 24.5 | |
| Grants | (1.3) | (0.7) | (0.7) | (3.5) | (3.1) | |
| Other capitalized costs | 6.2 | 0.3 | 3.7 | 6.2 | 3.7 | |
| Total other capitalized expenditures | 93.0 | 69.6 | 91.8 | 268.4 | 193.1 | |
| Total accrued capital additions | 184.8 | 140.8 | 163.4 | 582.5 | 486.2 | |
| Reconciliation to cash capital additions: | ||||||
| Other capitalized costs2 | (33.2) | (24.7) | (61.2) | (102.3) | (135.5) | |
| Change in capital accruals and other | (8.4) | (5.7) | (5.2) | (13.5) | (3.6) | |
| Acquisition of property, plant & equipment - cash | 143.2 | 110.4 | 97.0 | 466.7 | 347.1 | |
1 Peru and British Columbia sustaining capital expenditures include capitalized stripping costs.
2 Other capitalized costs primarily include right-of-use lease and equipment financing additions, which are excluded from guidance in 2025, community agreement additions and non-cash capitalized stripping.
3 Includes 100% of Copper Mountain mine production. On April 30, 2025 Hudbay completed the acquisition of the remaining 25% interest in the Copper Mountain mine and now owns 100%.
4 With the announcement of the JV Transaction Hudbay expects to accelerate detailed engineering, long lead items and other de-risking activities by advancing $20 million in growth capital expenditures to 2025 from future years, updating total 2025 Copper World growth spending guidance to $110 million compared to the original 2025 guidance of $90 million.
For the quarter and year ended December 31, 2025, total capital additions increased by $21.4 million and $96.3 million, respectively, compared to the same period in 2024, primarily due to a planned increase in growth capital in British Columbia and Copper World.
Sustaining capital expenditures in Peru for the quarter and year ended December 31, 2025 were $40.5 million and $137.0 million, respectively, representing an increase of $10.6 million and $12.6 million, respectively, compared to the same periods in 2024 as a result of the timing of various stripping campaigns and civil work projects. Sustaining capital expenditures in Manitoba for the quarter and year ended December 31, 2025 were $16.4 million and $45.7 million, respectively, representing an increase of $3.9 million and $0.1 million, respectively, compared to the same periods in 2024 mostly due to higher capital development at Lalor. Sustaining capital expenditures in British Columbia for the quarter and year ended December 31, 2025 were $34.9 million and $131.4 million, respectively, which included $25.6 million and $97.6 million, respectively, of capitalized stripping related to Hudbay's planned three-year accelerated stripping campaign to access higher grade ore by 2027.
Growth capital expenditures in Peru for the quarter and year ended December 31, 2025 were $1.0 million and $4.7 million, respectively, representing an increase of $0.5 million and $3.9 million, respectively. The increase mainly relates to the implementation of the pebble crusher in Peru. Growth capital spending in Manitoba for the quarter and year ended December 31, 2025 was $2.2 million and $7.4 million, respectively, primarily related to the exploration and haulage drifts towards the 1901 deposit. Growth capital expenditures in British Columbia for the quarter and year ended December 31, 2025 were $15.4 million and $64.2 million, respectively, representing an increase of $10.7 million and $56.1 million, respectively, compared to the same periods in 2024. The increase mainly relates to the Copper Mountain secondary SAG mill optimization project, which is intended to increase nominal capacity at Copper Mountain. Copper World capital expenditures for the quarter and year ended December 31, 2025 were $28.0 million and $71.5 million, respectively, mainly related to feasibility study activities and ongoing carrying costs for Copper World.
Capitalized exploration for the three months and year ended December 31, 2025 was $8.3 million and $15.6 million, respectively.
Total sustaining capital in 2025 was approximately $50 million lower than guidance due to approximately $10 million lower capitalized stripping in Peru from the impact of social unrest, approximately $10 million lower capitalized development at Lalor due to the impact of wildfires, and approximately $38 million in sustaining capital deferrals to 2026, partially offset by $13 million higher capitalized stripping in British Columbia. Excluding Copper World project costs, growth capital in 2025 was approximately $39 million lower than guidance primarily due to timing of expenditure and a majority is expected to be deferred to 2026. Copper World growth spending in 2025 was approximately $39 million lower than guidance due to timing of expenditure, a majority of which will be deferred to 2026.
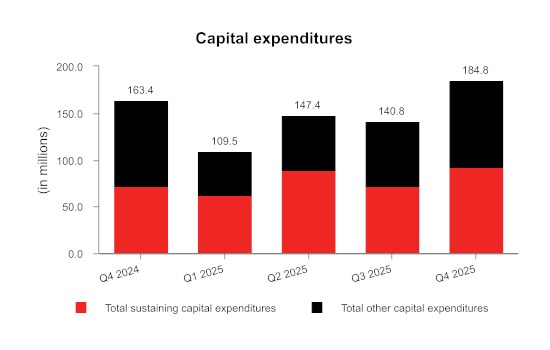
Capital Commitments
As at December 31, 2025, Hudbay had outstanding capital commitments in Canada of approximately $29.1 million, of which $18.4 million can be terminated, approximately $25.7 million in Peru primarily related to sustaining capital commitments and exploration option agreements, all of which can be terminated, and approximately $123.4 million in United States, primarily related to the Copper World project, of which $121.2 million can be terminated.
Contractual Obligations
The following table summarizes Hudbay's significant contractual obligations as at December 31, 2025:
| Total | Less than 12 months |
13 - 36 months |
37 - 60 months |
More than 60 months |
|
| Payment Schedule (in $ millions) | |||||
| Long-term debt obligations1 | 1,148.7 | 518.8 | 70.9 | 559.0 | - |
| Equipment financing and lease obligations | 240.4 | 85.3 | 101.3 | 43.1 | 10.7 |
| Purchase obligation - capital commitments | 178.2 | 128.0 | 38.5 | 1.0 | 10.7 |
| Purchase obligation - other commitments2 | 1,265.7 | 507.9 | 296.5 | 130.1 | 331.2 |
| Deferred payment and contingent obligations | 39.8 | 3.0 | 9.8 | 13.5 | 13.5 |
| Pension and other employee future benefits obligations3 | 93.9 | 6.3 | 12.9 | 8.1 | 66.6 |
| Community agreement obligations4, 5 | 136.7 | 67.0 | 12.3 | 9.2 | 48.2 |
| Decommissioning and restoration obligations5 | 506.5 | 19.6 | 10.4 | 14.9 | 461.6 |
| Total | 3,609.9 | 1,335.9 | 552.6 | 778.9 | 942.5 |
1 Long-term debt obligations include scheduled interest payments, as well as principal repayments
2 Primarily made up of trades payables, accrued liabilities, long-term agreements with operational suppliers, obligations for power purchases, concentrate handling and fleet and port services.
3 Discounted.
4 Represents community agreement obligations and various finalized land user agreements, including Pampacancha.
5 Undiscounted before inflation.
In addition to the contractual obligations included in the above payment schedule, Hudbay also has the following commitments which impact Hudbay's financial position:
- A profit-sharing plan with most Manitoba employees;
- A profit-sharing plan with all Peru employees;
- Share-based compensation;
- Wheaton precious metals stream agreement for the Constancia mine;
- Government royalty payments related to the Constancia mines;
- Participation agreements related to the Copper Mountain mine, and
- Contracts related to future production and sales, such as royalties.
Outstanding Share Data
As of February 18, 2026, the final trading day prior to the date of this MD&A, there were 396,845,111 common shares of Hudbay issued and outstanding. In addition, there were 2,688,437 stock options outstanding.
FINANCIAL RISK MANAGEMENT
The Financial Risk Management risks in this MD&A are not exhaustive. Please also refer to the heading "Risk Factors" in the Company's most recent Annual Information Form for a discussion of the additional risk factors that may affect Hudbay's business, operations and financial condition. In addition to those risks, the Company has identified the following other risks which may affect its consolidated financial statements in the future.
Metals Price Strategic Risk Management
Commodity prices are a key driver of the Company's financial and operational results. Hudbay's strategic objective is to provide its investors with exposure to base metals prices, unless a reason exists to implement a hedging arrangement. From time to time, the Company maintains price protection programs and conducts commodity price risk management in line with Board-approved policies to reduce risk through the use of financial instruments.
In the normal course, the Company typically consider metal price hedging to manage the risk associated with provisional pricing terms in concentrate sales agreements and in connection with stream delivery obligations. The Company may also occasionally consider metal price hedging in accordance with Board approved policies to achieve strategic objectives, including: locking in favourable metal prices to ensure a minimum cash flow during or after the construction of a mine or major capital project during a period of reduced liquidity, to maintain profitable production of shorter life/higher cost operations or as part of a financing arrangement.
During the year, the Company entered into copper, gold and zinc hedging transactions intended to manage the risk associated with provisional pricing terms in concentrate sales agreements.
As at December 31, 2025, Hudbay had 57.9 million pounds of net copper fixed for floating swaps outstanding at an average fixed receivable price of $5.18/lb associated with provisional pricing risk in concentrate sales agreements. These swaps settled beginning in January 2026 and will continue through May 2026.
As at December 31, 2025, Hudbay had 23,180 ounces of net gold fixed for floating swaps outstanding at an average fixed receivable price of $4,333/ounces associated with provisional pricing risk in concentrate sales agreements. These swaps settled beginning in January 2026 and will continue through February 2026.
As at December 31, 2025, Hudbay had 7.3 million pounds of net zinc swaps outstanding at an effective average fixed receivable price of $1.40/lb associated with provisional pricing risk in concentrate sales agreements. These swaps settled in January 2026.
During the first quarter 2026, Hudbay entered into copper forward sales contracts and zero-cost collar hedges to lock in favourable metal prices to ensure minimum cash flows related to large capital investments at Copper Mountain. A total of 2,200 tonnes of copper production over the period of June 2026 to April 2027 at an average price of $6.02 per pound, as well as a zero-cost collar program for 4,400 tonnes of copper production over the period of June 2026 to April 2027 at an average floor price of $5.75 per pound and an average cap price of $6.34 per pound. Together, the forward sales and zero cost collar hedges entered into during the first quarter of 2026 represent approximately 20% of Copper Mountain's 2026 expected production.
From time to time, the Company enters into gold and silver forward sales contracts to hedge the commodity price risk associated with the future settlement of provisionally priced deliveries. The Company is generally obligated to deliver gold and silver to Wheaton Precious Metals Corp. ("Wheaton") prior to the determination of final settlement prices. These forward sales contracts are entered into at the time Hudbay delivers gold and silver to Wheaton, and are intended to mitigate the risk of subsequent adverse gold and silver price changes. Gains and losses resulting from the settlement of these derivatives are recorded directly to revenue, as the forward sales contracts do not achieve hedge accounting, and the associated cash flows are classified in operating activities. The Company's swap agreements are with counterparties it believes to be creditworthy and do not require the Company to provide collateral.
Carrying Values and Mine Plan Updates
At the end of each reporting period, Hudbay reviews its groups of non-financial assets to determine whether there are any indicators of impairment or impairment reversal. If any such indicator exists, the Company estimates the recoverable amount of the non-financial asset group in order to determine the extent of the impairment loss or reversal, if any. In the third quarter of 2025, Hudbay determined there was an indicator of impairment reversal on the carrying value of the Copper World Project following the announcement of the JV Transaction which resulted in the full reversal of the previously recorded impairment charge. At December 31, 2025, the Company assessed whether there were impairment or impairment reversal indicators associated with the general business environment and known changes to business planning and found that there were no impairment or additional impairment reversal indicators.
There are a number of potential indicators that could trigger non-financial asset impairment or reversal of impairment in the future. One such potential indicator is a change to the life of mine ("LOM") plan for an asset, which Hudbay generally publish in the first quarter of every year. LOM plans incorporate management's best estimates of key assumptions which include future commodity prices, the value of mineral resources not included in the LOM plan, production based on current estimates of recoverable reserves, discount rates, future operating and capital costs and future foreign exchange rates.
There is a risk that certain assumptions in the updated LOM plans could give rise to an indicator of impairment or impairment reversal and cause an adjustment to the carrying value of the relevant assets and/or impact Hudbay's financial statements.
Interest Rate and Foreign Exchange Risk Management
To the extent that the Company incurs indebtedness at variable interest rates to fund Hudbay's growth objectives, it may enter into interest rate hedging arrangements to manage the Company's exposure to short-term interest rates. To the extent that the Company makes commitments to capital expenditures denominated in foreign currencies, it may enter into foreign exchange forwards or acquire foreign currency outright, which may result in foreign exchange gains or losses in its consolidated statement of earnings.
At December 31, 2025, approximately $526.4 million of Hudbay's cash was held in US dollars, approximately $31.8 million of its cash was held in Canadian dollars, and approximately $10.7 million of its cash was held in Peruvian soles.
Political and Regulatory Changes - Trade
Since the Company operates across several jurisdictions, certain political and regulatory changes in Canada, the US, Peru, and other countries could negatively impact Hudbay's operations and financial results. National elections, including those in Peru, Canada and the US, have brought, or may bring, new political leadership with substantially different political, social, and economic policy priorities on both domestic and foreign policy matters, including with respect to critical minerals, trade and tariffs. Political and regulatory risks such as these could have an impact on Hudbay's operations and financial results. Although the Company does not currently sell any concentrate or precious metal doré into the United States from Canada, the implementation or expansion of tariffs on exported and/or imported mineral products and other consumables could negatively affect profitability, supply chains and the cost of mine operations, development and construction.
TREND ANALYSIS AND QUARTERLY REVIEW
A detailed quarterly and annual summary of financial and operating performance can be found in the "Summary of Results" section at the end of this MD&A. The following table sets forth selected consolidated financial information for each of Hudbay's eight most recently completed quarters:
| (in $ millions, except per share amounts, production on a copper equivalent basis and average realized copper price) | 2025 | 2024 | ||||||
| Q4 | Q3 | Q2 | Q1 | Q42 | Q3 | Q2 | Q1 | |
| Production on a copper equivalent basis (tonnes) | 71,242 | 46,224 | 53,693 | 58,611 | 77,769 | 60,895 | 47,164 | 62,120 |
| Average realized copper price ($/lb) | 5.17 | 4.37 | 4.36 | 4.49 | 4.09 | 4.24 | 4.56 | 3.91 |
| Average realized gold price ($/oz) | 3,580 | 3,522 | 3,135 | 3,002 | 2,327 | 2,592 | 2,222 | 1,941 |
| Revenue | 732.9 | 346.8 | 536.4 | 594.9 | 584.9 | 485.8 | 425.5 | 525.0 |
| Gross profit | 270.1 | 65.3 | 176.5 | 231.3 | 184.4 | 139.8 | 77.6 | 152.0 |
| Income before tax | 257.1 | 330.5 | 153.1 | 171.3 | 103.7 | 79.7 | 0.4 | 67.8 |
| Net income (loss) | 128.0 | 222.4 | 114.7 | 99.2 | 19.3 | 50.3 | (20.3) | 18.5 |
| Net income (loss) - attributable | 128.0 | 222.4 | 117.7 | 100.4 | 21.2 | 49.7 | (16.5) | 22.4 |
| Adjusted net earnings 1 - attributable | 86.0 | 10.1 | 75.5 | 93.8 | 70.3 | 50.2 | 0.2 | 59.4 |
| Earnings (loss) per share attributable: | ||||||||
| Basic and diluted | 0.32 | 0.56 | 0.30 | 0.25 | 0.05 | 0.13 | (0.04) | 0.06 |
| Adjusted net earnings1 per share - attributable | 0.22 | 0.03 | 0.19 | 0.24 | 0.18 | 0.13 | 0.00 | 0.17 |
| Operating cash flow before change in non-cash working capital | 336.9 | 70.3 | 193.9 | 163.5 | 231.5 | 188.3 | 123.7 | 147.5 |
| Adjusted EBITDA1 | 385.9 | 142.6 | 245.2 | 287.2 | 257.3 | 206.0 | 145.0 | 215.0 |
| Adjusted EBITDA LTM1 | 1,060.9 | 932.3 | 995.9 | 895.7 | 823.3 | 840.4 | 825.1 | 761.3 |
1 Adjusted net earnings (loss) - attributable to owners, adjusted net earnings (loss) per share - attributable to owners, adjusted EBITDA, and adjusted EBITDA last twelve months ("LTM") are non-GAAP financial performance measure with no standardized definition under IFRS. For further information and a detailed reconciliation, please see the discussion under the "Non-GAAP Financial Performance Measures" section of this MD&A.
2 Annual consolidated results may not calculate based on amounts presented in this table due to rounding.
On a quarterly basis, Hudbay's revenue is primarily impacted by metal prices, production mix and sales volumes of the key metals Hudbay produces. In addition to these factors, gross profit, net earnings (loss) attributable, earnings (loss) per share attributable, operating cash flow before change in non-cash working capital and adjusted EBITDA are also impacted by input costs. Net earnings (loss) and earnings (loss) per share are further impacted by net finance expense and re-evaluation adjustments of Hudbay's closed site environmental provision.
During the fourth quarter of 2025, copper equivalent production increased to 71,242 compared to the most recent quarters. This was primarily due to higher realized price across all metals, partially offset by a one-week power outage in Manitoba during the fourth quarter of 2025 due to weather related constraints. Hudbay achieved record quarterly revenue of $732.9 million as a result of high metal prices, despite the one-week operational interruption in Manitoba in October. In addition, along with continued strong cost control and productivity gains coming from previous investments in optimization efforts, Hudbay achieved record high gross profit. The cumulative effect of the high commodity prices, cost control and optimization efforts resulted in Hudbay achieving record adjusted EBITDA over a twelve month period of $1.06 billion.
During the third quarter of 2025, copper equivalent production decreased to 46,224 tonnes because of reduced copper and zinc output. This was primarily due to the temporary suspension of operations in Manitoba in July and August related to the wildfire evacuation order and the Peru temporary suspension for nine days during the third quarter of 2025 caused by social unrest. As a result of the social unrest impacting transportation routes earlier in the quarter and ocean swells impacting port shipments in late September, a 20,000 dry metric tonne copper concentrate shipment valued at $60 million was deferred to early October 2025. The temporary operational suspensions during the quarter increased pressure on gross margins and operating cash flow compared to the earlier quarters. Earnings in the third quarter of 2025 also included an after-tax impairment reversal of $242.7 million, following the announcement of the Copper World JV Transaction with Mitsubishi for a 30% minority interest.
After adjusting for the fixed costs associated with the temporary suspensions in Manitoba and Peru, production costs continue to be well controlled and comparable to prior periods.
During the second quarter of 2025, copper equivalent production decreased to 53,693 tonnes because of reduced copper, gold and silver output. This was primarily due to the temporary suspension of operations in Manitoba in June related to the wildfire evacuation order. This was partially offset by record average gold prices and high copper prices which positively impacted gross profits and contributing to increased net income and higher earnings per share in the second quarter of 2025. While higher profitability led to significant cash taxes paid of $43.9 million, the business's strong operating performance caused the overall impact to operating cash flow before changes in non-cash working capital to remain positive. Higher foreign exchange gains due to the strengthening of the Canadian dollar along with declining net interest cost as a result of Hudbay's deleveraging efforts led to reduced net finance expenses in the second quarter. Adjusted EBITDA over the last twelve months hit a record high of $995.9 million as a result of strong operating performances at the Manitoba and Peru operations resulting in higher sales volumes, benefiting from high copper and gold prices. Net debt to EBITDA is now at its lowest level since the development of the Peru operation more than a decade ago given the business's strong operating performance in conjunction with the same aforementioned deleveraging efforts. The lower net debt and stronger cash position is despite larger reinvestment in the business through growing capital expenditures in recent years.
During the first quarter of 2025, copper equivalent production decreased to 58,611 tonnes as expected, reflecting lower production of copper, gold and silver primarily related to lower planned grades in Peru as the final stripping phase at the Pampacancha deposit was underway. This was partially offset by higher gold production in Manitoba and record average gold prices and high copper prices which positively impacted gross profits.
The Manitoba operations delivered strong quarterly throughput as expected and unlocked better-than-expected grades, resulting in higher production that exceeded Hudbay's quarterly cadence expectations. Strong cost control, a weakening Canadian dollar and meaningful exposure to gold by-product credits resulted in consolidated cash cost1 and sustaining cash cost1 per pound of copper produced, net of by-product credits, in the first quarter of 2025 of $(0.45) and $0.72, respectively, contributing to the increased gross margin and very strong growth in adjusted EBITDA. Higher profits since 2023 in Peru and Canada have resulted in significant cash taxes paid of $117.5 million in the first quarter of 2025, which is reflected in operating cash flow before changes in non-cash working capital. In addition, deleveraging efforts including the repurchases of the Company's senior secured notes over the course of 2024 led to declining net interest cost to service Hudbay's long term debt.
During the fourth quarter of 2024, copper equivalent production increased to 77,769 tonnes. Hudbay's Manitoba and Peru operations delivered strong quarterly production as expected and unlocked higher grade helping the Company exceed 2024 annual gold guidance. Strong cost control and meaningful exposure to gold by-product credits resulted in consolidated cash cost1 and sustaining cash cost1 per pound of copper produced, net of by-product credits1, in the fourth quarter of 2024 of $0.45 and $1.37, respectively, contributing to Hudbay's outperformance of its improved full year 2024 cost guidance. Furthermore, the settlement of the gold prepayment liability in the third quarter of 2024, allowed Hudbay to capitalize on surging gold prices. Since acquiring Copper Mountain in June 2023, Hudbay has moved to optimization efforts which have been focused on ramping up the mining fleet to execute a planned accelerated stripping campaign to gain access to higher grades, as well as plant improvement initiatives to improve mill reliability and recoveries.
During the third quarter of 2024, profitability and cash flows grew compared to the second quarter of 2024. This strength was attributable in part to higher gold, copper and zinc production compared to the second quarter of 2024, along with returning strength in commodity prices including record gold prices. These impacts offset planned lower mined grades observed in Peru in the third quarter of 2024 and the higher cash mining taxes paid in Peru resulting from higher profitability over the past several quarters. Strong operating cost control continued into the third quarter of 2024 resulting from a number of operational initiatives and high levels of mill throughput being experienced throughout the business.
During the second quarter of 2024, realized copper and gold prices continued to climb which overcame the decline in sales volumes of concentrate compared to the first quarter of 2024. Expected lower mined grades observed for the same metals in Peru and Manitoba were the primary factor for the decline in production since the first quarter of the year. Cost control remained favourable as Hudbay continued to track within cost guidance given the expected cadence in the year's production profile. Higher mining taxes continued as Hudbay experienced higher profitability over the past several quarters. Lastly, volatile inter-period copper and gold prices led to relatively high mark-to-market adjustments for Hudbay's strategic non-QP hedging program and high share prices for Hudbay's common shares led to higher share-based compensation expenses. This led to a total of $19.5 million in mark-to-market adjustments to be added back in Hudbay's adjusted net earnings - attributable to owners measure.
The first quarter of 2024 reflected the continuation of strong copper, gold and silver production that commenced in the third quarter of 2023. The increase in copper, gold and silver prices in the first quarter of 2024 also contributed to strong revenue and profitability in the quarter.
The following table sets forth selected consolidated financial information for each of the three most recently completed years:
| (in $ millions, except for earnings (loss) per share, dividends declared per share, production on a copper equivalent basis and average realized copper price) | 2025 | 2024 | 2023 |
| Production on a copper equivalent basis (tonnes) | 229,770 | 247,948 | 225,430 |
| Average realized copper price ($/lb) | 4.64 | 4.18 | 3.84 |
| Average realized gold price ($/oz) | 3,297 | 2,241 | 1,898 |
| Revenue | 2,211.0 | 2,021.2 | 1,690.0 |
| Gross profit | 743.2 | 553.8 | 392.5 |
| Income before tax | 912.0 | 251.6 | 151.8 |
| Net income | 564.3 | 67.8 | 69.5 |
| Net income - attributable | |||
| Adjusted net earnings - attributable 1 | 265.5 | 181.4 | 69.0 |
| Earnings per share attributable: | |||
| Basic and diluted | 1.44 | 0.20 | 0.22 |
| Adjusted net earnings 1 per share - attributable | 0.67 | 0.48 | 0.23 |
| Total assets | 6,223.3 | 5,487.6 | 5,312.6 |
| Working capital | (67.1) | 511.3 | 135.8 |
| Operating cash flow before changes in non-cash working capital | 764.3 | 691.1 | 570.0 |
| Adjusted EBITDA1 | 1,060.9 | 822.5 | 647.8 |
| Dividends declared per share - C$3 | 0.02 | 0.02 | 0.02 |
1 Adjusted net earnings - attributable, adjusted net earnings per share - attributable, and adjusted EBITDA are non-GAAP financial performance measure with no standardized definition under IFRS. For further information and a detailed reconciliation, please see the discussion under the "Non-GAAP Financial Performance Measures" section of this MD&A.
2 Total non-current financial liabilities consists of non-current other financial liabilities, lease liabilities and long-term debt.
3 Dividend paid during March and September of each year.
Hudbay achieved copper equivalent production of 229,770 tonnes overcoming several temporary operational interruptions in 2025 including social unrest in Peru, fire and weather related disruptions in Manitoba and unplanned primary SAG mill downtime in British Columbia. Despite the resulting lower copper equivalent production, strong metal prices resulted in record annual revenue of $2,211.0 million and record annual adjusted EBITDA of $1,060.9 million. The Company's enhanced operating platform delivered a strong consolidated annual performance despite the mandatory wildfire evacuation shutdowns and temporary operational interruptions resulting in production deferrals during the year. Lower production with high metal prices resulted in a record gross margin and Hudbay significantly outperformed its twice-improved 2025 consolidated cash cost guidance. Strong cost control, higher metal prices and meaningful exposure to gold by-product credits resulted in better-than-expected consolidated 2025 cash cost1 and sustaining cash cost1 per pound of copper produced, net of by-product credits, of $(0.22) and $1.30, respectively. Negative working capital of $67.1 million is the result of the reclassification of the 2026 Notes to current liabilities given their imminent maturity. The Company expects to re-establish a more appropriate working capital position in the coming quarters as these notes are refinanced inside of the Company's deleveraging and increasingly favourable liquidity and net debt profile.
Hudbay achieved record production on a copper equivalent basis during 2024 due to additional production from the recently acquired Copper Mountain mine as well a significantly higher copper and gold production from mining the high grade zones of the Pampacancha deposit and higher gold and copper grade zones at Lalor. Operating cash flow before change in non-cash working capital increased by $178.3 million to $570.0 million in 2023 mainly driven by record metal production during the year.
NON-GAAP FINANCIAL PERFORMANCE MEASURES
Adjusted net earnings (loss) attributable to owners, adjusted net earnings (loss) per share attributable to owners, adjusted EBITDA, realized prices, net debt, net debt to adjusted EBITDA, free cash flow, cash cost, sustaining and all-in sustaining cash cost per pound of copper produced, cash cost and sustaining cash cost per ounce of gold produced, combined unit cost and ratios based on these measures are non-GAAP performance measures. These measures do not have a meaning prescribed by IFRS and are therefore unlikely to be comparable to similar measures presented by other issuers. These measures should not be considered in isolation or as a substitute for measures prepared in accordance with IFRS and are not necessarily indicative of gross profit or cash flow from operations as determined under IFRS. Other companies may calculate these measures differently.
Management believes adjusted net earnings (loss) attributable to owners and adjusted net earnings (loss) per share attributable to owners provides an alternate measure of the Company's performance for the current period and gives insight into its expected performance in future periods. These measures are used internally by the Company to evaluate the performance of its underlying operations and to assist with its planning and forecasting of future operating results. As such, the Company believes these measures are useful to investors in assessing the Company's underlying performance. Hudbay provides adjusted EBITDA to help users analyze Hudbay's results and to provide additional information about its ongoing cash generating potential in order to assess its capacity to service and repay debt, carry out investments and cover working capital needs. Net debt is shown because it is a performance measure used by the Company to assess its financial position. Net debt to adjusted EBITDA is shown because it is a performance measure used by the Company to assess its financial leverage and debt capacity. Realized price is shown to understand the average realized price of metals sold to third parties in each reporting period. Free cash flow is shown as it provides investors and management additional information in assessing the Company's ability to generate cash flow from current operations after investing in capital to sustain the operations. Cash cost, sustaining and all-in sustaining cash cost per pound of copper produced are shown because Hudbay believes they help investors and management assess the performance of its operations, including the margin generated by the operations and the Company. Cash cost and sustaining cash cost per ounce of gold produced are shown because Hudbay believes they help investors and management assess the performance of its Manitoba operations. Combined unit cost is shown because Hudbay believes it helps investors and management assess the cost structure and margins that are not impacted by variability in by-product commodity prices.
Adjusted Net Earnings - Attributable to owners
Adjusted net earnings attributable to owners represents net earnings (loss) excluding certain impacts such as mark-to-market adjustments, foreign exchange (gains) loss, revaluation adjustment - environmental provisions for closed sites, variable consideration adjustment related to stream agreements, impairment charges and reversal of impairment charges on assets, (gain) loss on disposal of assets, other items that are not indicative of the underlying operating performance of Hudbay's core business; and tax effect and non-controlling interest of the previously discussed items. These measures are not necessarily indicative of net earnings (loss) as determined under IFRS. The following table provides a reconciliation of net earnings and non-controlling interest per the consolidated statements of income, to adjusted net earnings attributable to owners of the Company for the three months ended December 31 and September 30, 2025 and December 31, 2024 and years ended December 31, 2025 and 2024.
| Three months ended | Year ended | ||||
| (in $ millions) | Dec. 31, 2025 |
Sept. 30, 2025 |
Dec. 31, 2024 |
Dec. 31, 2025 |
Dec. 31, 2024 |
| Earnings for the period | 128.0 | 222.4 | 19.3 | 564.3 | 67.8 |
| Tax expense | 129.1 | 108.1 | 84.4 | 347.7 | 183.8 |
| Earnings before tax | 257.1 | 330.5 | 103.7 | 912.0 | 251.6 |
| Adjusting items: | |||||
| Mark-to-market adjustments1 | (5.7) | 8.7 | (10.3) | 6.2 | 27.1 |
| Foreign exchange (gain) loss | (5.4) | 8.8 | 17.4 | (18.6) | 21.0 |
| Re-evaluation adjustment - environmental provision | (0.2) | 1.4 | 2.5 | 0.2 | (3.5) |
| Manitoba cost of sales and other expense from temporary shutdown | 0.5 | 24.2 | - | 30.0 | - |
| Peru cost of sales from temporary shutdown | 2.1 | 10.9 | - | 13.0 | - |
| Insurance recovery | (25.0) | - | - | (25.0) | - |
| Consideration received from sale of non-core project | - | (14.9) | - | (14.9) | - |
| Copper World impairment reversal | - | (322.3) | - | (322.3) | - |
| Variable consideration adjustment - stream revenue and accretion | - | - | - | (10.5) | 4.0 |
| Inventory adjustments | 0.7 | (1.3) | 1.3 | 4.1 | 2.9 |
| Restructuring charges | - | - | - | 0.1 | 1.2 |
| Reduction of obligation to renounce flow-through share expenditures, net of provisions | (1.6) | (0.8) | 1.0 | (5.5) | (2.0) |
| Loss/write-down (reversal of) on disposal of PP&E | 2.9 | (0.3) | 14.1 | 3.5 | 27.4 |
| Changes in other provisions (non-capital) | - | - | - | 0.7 | - |
| Adjusted earnings before income taxes | 225.4 | 44.9 | 129.7 | 573.0 | 329.7 |
| Tax expense | (129.1) | (108.1) | (84.4) | (347.7) | (183.8) |
| Tax impact of adjusting items | (10.3) | 73.3 | 23.4 | 37.1 | 30.8 |
| Adjusted net earnings | 86.0 | 10.1 | 68.7 | 262.4 | 176.7 |
| Adjusted net earnings attributable to non-controlling interest: | |||||
| Net earnings for the period | - | - | 1.9 | 4.2 | 8.9 |
| Adjusting items, including tax impact | - | - | (0.3) | (1.1) | (4.2) |
| Adjusted net earnings - attributable to owners | 86.0 | 10.1 | 70.3 | 265.5 | 181.4 |
| Adjusted net earnings ($/share) - attributable to owners | 0.22 | 0.03 | 0.18 | 0.67 | 0.48 |
| Basic weighted average number of common shares outstanding (millions) | 396.3 | 395.7 | 394.0 | 395.5 | 376.8 |
1 Includes changes in fair value of the gold prepayment liability, Canadian junior mining investments, other financial assets and liabilities at fair value through net earnings and share-based compensation expenses (recoveries). Also includes gains and losses on disposition of investments.
Adjusted EBITDA
Adjusted EBITDA is net earnings before net finance expense/income, tax expense/recoveries, depreciation and amortization of property, plant and equipment and deferred revenue, as well as certain other adjustments. Hudbay calculates adjusted EBITDA by excluding certain adjustments included within Hudbay's adjusted net earnings attributable measure which reflects the underlying performance of Hudbay's core operating activities. The measure also removes the impact of non-cash items and financing costs that are not associated with measuring the underlying performance of Hudbay's operations. However, Hudbay's adjusted EBITDA is not the measure defined as EBITDA under Hudbay's senior notes or revolving credit facilities and may not be comparable with performance measures with the same name reported by other companies. Adjusted EBITDA should not be considered as a substitute for earnings, which is calculated in accordance with IFRS. Hudbay provides adjusted EBITDA to help users analyze their results and to provide additional information about Hudbay's ongoing cash generating potential in order to assess its capacity to service and repay debt, carry out investments and cover working capital needs.
The following table presents the reconciliation of earnings per the consolidated statements of income, to adjusted EBITDA for the three months ended December 31 and September 30, 2025 and December 31, 2024 and years ended December 31, 2025 and 2024:
| Three months ended | Year ended | ||||
| (in $ millions) | Dec. 31, 2025 |
Sept. 30, 2025 |
Dec. 31, 2024 |
Dec. 31, 2025 |
Dec. 31, 2024 |
| Earnings for the period | 128.0 | 222.4 | 19.3 | 564.3 | 67.8 |
| Add back: | |||||
| Tax expense | 129.1 | 108.1 | 84.4 | 347.7 | 183.8 |
| Net finance expense | (14.6) | 19.6 | 34.4 | 19.4 | 148.7 |
| Other operating expense | (13.6) | 9.1 | 22.1 | 7.8 | 57.4 |
| Depreciation and amortization | 152.5 | 82.7 | 122.2 | 439.7 | 426.6 |
| Amortization of deferred revenue and variable consideration adjustment | (24.0) | (6.3) | (26.2) | (75.0) | (70.5) |
| Adjusting items (pre-tax): | |||||
| Impairment reversal | - | (322.3) | - | (322.3) | - |
| Consideration received from sale of non-core project | - | (14.9) | - | (14.9) | - |
| Re-evaluation adjustment - environmental provision | (0.2) | 1.4 | 2.5 | 0.2 | (3.5) |
| Inventory adjustments | 0.7 | (1.3) | 1.3 | 4.1 | 2.9 |
| Overhead costs incurred during Manitoba temporary suspension (cash) | - | 16.0 | - | 19.2 | - |
| Overhead costs incurred during Peru temporary suspension (cash) | 1.3 | 7.3 | - | 8.6 | - |
| Option agreement proceeds (Marubeni) | 0.9 | 1.1 | - | 4.5 | (0.4) |
| Realized loss on non-QP hedges | - | - | (4.2) | (2.3) | (8.9) |
| Share-based compensation expense 1 | 25.8 | 19.7 | 1.5 | 59.9 | 18.6 |
| Adjusted EBITDA | 385.9 | 142.6 | 257.3 | 1,060.9 | 822.5 |
1 Share-based compensation expense reflected in cost of sales and selling and administrative expenses.
Net Debt
The following table presents Hudbay's calculation of net debt as at December 31, 2025 and December 31, 2024:
| (in $ millions) | Dec. 31, 2025 |
Dec. 31, 2024 |
| Total debt | 1,008.6 | 1,107.5 |
| Cash and cash equivalents | (568.9) | (541.8) |
| Short-term investments | - | (40.0) |
| Net debt | 439.7 | 525.7 |
Net Debt to Adjusted EBITDA Ratio
The following table presents Hudbay's calculation of net debt to adjusted EBITDA, both metrics have been reconciled above to the most comparable IFRS measure, as at December 31, 2025 and December 31, 2024:
| (in $ millions, except net debt to adjusted EBITDA ratio) | Dec. 31, 2025 |
Dec. 31, 2024 |
| Net debt | 439.7 | 525.7 |
| Adjusted EBITDA for the last twelve months | 1,060.9 | 822.5 |
| Net debt to adjusted EBITDA | 0.4 | 0.6 |
Free Cash Flow
Hudbay defines free cash flow as cash generated from operations adjusted for changes in non-cash working capital, sustaining capital expenditures and cash payments from operating sites related to leases, equipment financings and community agreements. Free cash flow is intended to provide additional information only and should not be considered in isolation or as a substitute for measures of performance prepared in accordance with IFRS Accounting Standards. This measure is not necessarily indicative of cash flow from operations as determined under IFRS Accounting Standards. The following table presents Hudbay's calculation of free cash flow and reconciles to the most directly comparable IFRS measure:
| Three months ended | Years ended | |||
| (in $ millions) | Dec. 31, 2025 |
Dec. 31, 2024 |
Dec. 31, 2025 |
Dec. 31, 2024 |
| Cash generated from operations | 209.4 | 238.1 | 707.3 | 666.2 |
| Add back: | ||||
| Change in non-cash working capital | (127.5) | 6.6 | (57.0) | (24.9) |
| Cash sustaining capital expenditures1 | 108.7 | 82.6 | 376.4 | 334.0 |
| Free cash flow | 228.2 | 148.9 | 387.9 | 357.1 |
| Cash sustaining capital expenditures1 | ||||
| Total sustaining capital costs2 | 91.8 | 71.6 | 314.1 | 293.1 |
| Capitalized lease and equipment financing cash payments - operating sites | 12.5 | 10.3 | 53.0 | 38.4 |
| Community agreement cash payments | 4.4 | 0.7 | 9.3 | 2.5 |
| Cash sustaining capital expenditures1 | 108.7 | 82.6 | 376.4 | 334.0 |
1 Excludes amortization of decommissioning and restoration PP&E assets and accretion of decommissioning and restoration liabilities related to producing sites.
2 See reconciliation to property, plant & equipment additions starting on page 72 of this MD&A.
Cash Cost, Sustaining and All-in Sustaining Cash Cost (Copper Basis)
Cash cost per pound of copper produced ("cash cost") is a non-GAAP measure that management uses as a key performance indicator to assess the performance of its operations. Hudbay's calculation designates copper as the primary metal of production as it has been the largest component of revenues. The calculation is presented in four manners:
- Cash cost, before by-product credits - This measure is gross of by-product revenues and is a function of the efforts and costs incurred to mine and process all ore mined. However, the measure divides this aggregate cost over only pounds of copper produced, Hudbay's primary metal of production. This measure is generally less volatile from period to period, as it is not affected by changes in the price received for by-product metals. It is, however, affected by the relative mix of copper concentrate and zinc concentrate production, where an increase in production of zinc concentrate will tend to result in an increase in cash cost under this measure.
- Cash cost, net of by-product credits - In order to calculate the net cost to produce and sell copper, the net of by-product credits measure subtracts the revenues realized from the sale of the metals other than copper. The by-product revenues from zinc, gold, and silver are significant and are integral to the economics of Hudbay's operations. The economics that support Hudbay's decision to produce and sell copper would be different if Hudbay did not receive revenues from the other significant metals being extracted and processed. This measure provides management and investors with an indication of the minimum copper price consistent with positive operating margins, assuming realized by-product metal prices are consistent with those prevailing during the reporting period. It also serves as an important operating statistic that management and investors utilize to measure its operating performance versus that of its competitors. However, it is important to understand that if by-product metal prices decline alongside copper prices, the cash cost net of by-product credits would increase, requiring a higher copper price than that reported to maintain positive cash flows and operating margins.
- Sustaining cash cost, net of by-product credits - This measure is an extension of cash cost that includes cash sustaining capital expenditures, including payments on capitalized leases, payments on equipment financing, capitalized sustaining exploration, net smelter returns royalties, payments on certain long-term community agreements, as well as accretion and amortization for expected decommissioning activities for producing assets. It does not include corporate selling and administrative expenses. It provides a more fulsome measurement of the cost of sustaining production than cash cost, which is focused on operating costs only.
- All-in sustaining cash cost, net of by-product credits - This measure is an extension of sustaining cash cost that includes corporate G&A, regional costs, accretion and amortization for community agreements relating to current operations, and accretion for expected decommissioning activities for non-producing sites. Due to the inclusion of corporate selling and administrative expenses, all-in sustaining cash cost is presented on a consolidated basis only.
The tables below present a detailed build-up of cash cost and sustaining cash cost, net of by-product credits, by business unit in addition to consolidated all-in sustaining cash cost, net of by-product credits, and reconciliations between cash cost, net of by-product credits, to the most comparable IFRS measures of cost of sales for the three months ended December 31, and September 30, 2025 and December 31, 2024 and years ended December 31, 2025 and December 31, 2024. Cash cost, net of by-product credits may not calculate exactly based on amounts presented in the tables below due to rounding.
| Consolidated | Three months ended | Year ended | ||||||||||||
| (in thousands) | Dec. 31, 2025 | Sep. 30, 2025 | Dec. 31, 2024 | Dec. 31, 2025 | Dec. 31, 2024 | |||||||||
| Peru | 55,199 | 39,934 | 74,931 | 187,734 | 218,260 | |||||||||
| Manitoba | 7,333 | 1,856 | 7,379 | 20,391 | 27,637 | |||||||||
| British Columbia | 10,373 | 11,572 | 13,067 | 52,435 | 58,215 | |||||||||
| Net pounds of copper produced1 | 72,905 | 53,362 | 95,377 | 260,560 | 304,112 | |||||||||
1 Contained copper in concentrate.
| Consolidated | Three months ended | |||||
| Dec. 31, 2025 | Sep. 30, 2025 | Dec. 31, 2024 | ||||
| Cash cost per pound of copper produced | $ millions | $/lb | $ millions | $/lb | $ millions | $/lb |
| Cash cost, before by-product credits | 304.0 | 4.17 | 198.0 | 3.71 | 308.6 | 3.23 |
| By-product credits | (350.0) | (4.80) | (175.8) | (3.29) | (265.5) | (2.78) |
| Cash cost, net of by-product credits | (46.0) | (0.63) | 22.2 | 0.42 | 43.1 | 0.45 |
| Consolidated | Year ended | |||
| Dec. 31, 2025 | Dec. 31, 2024 | |||
| Cash cost per pound of copper produced | $ millions | $/lb | $ millions | $/lb |
| Cash cost, before by-product credits | 1,001.3 | 3.84 | 1,107.3 | 3.64 |
| By-product credits | (1,057.8) | (4.06) | (967.4) | (3.18) |
| Cash cost, net of by-product credits | (56.5) | (0.22) | 139.9 | 0.46 |
| Consolidated | Three months ended | |||||
| Dec. 31, 2025 | Sep. 30, 2025 | Dec. 31, 2024 | ||||
| Cash cost per pound of copper produced | $ millions | $/lb | $ millions | $/lb | $ millions | $/lb |
| Mining | 103.2 | 1.42 | 70.2 | 1.32 | 108.1 | 1.13 |
| Milling | 96.5 | 1.32 | 75.8 | 1.42 | 95.4 | 1.00 |
| G&A | 73.4 | 1.01 | 31.8 | 0.59 | 50.6 | 0.53 |
| Onsite costs | 273.1 | 3.75 | 177.8 | 3.33 | 254.1 | 2.66 |
| Treatment & refining | 5.8 | 0.08 | 5.3 | 0.10 | 25.9 | 0.27 |
| Freight & other | 25.1 | 0.34 | 14.9 | 0.28 | 28.6 | 0.30 |
| Cash cost, before by-product credits | 304.0 | 4.17 | 198.0 | 3.71 | 308.6 | 3.23 |
| Consolidated | Year ended | |||
| Dec. 31, 2025 | Dec. 31, 2024 | |||
| Cash cost per pound of copper produced | $ millions | $/lb | $ millions | $/lb |
| Mining | 350.4 | 1.34 | 394.0 | 1.30 |
| Milling | 345.5 | 1.33 | 352.1 | 1.16 |
| G&A | 191.9 | 0.74 | 162.8 | 0.54 |
| Onsite costs | 887.8 | 3.41 | 908.9 | 3.00 |
| Treatment & refining | 28.4 | 0.11 | 97.3 | 0.31 |
| Freight & other | 85.1 | 0.33 | 101.1 | 0.33 |
| Cash cost, before by-product credits | 1,001.3 | 3.84 | 1,107.3 | 3.64 |
| Consolidated | Three months ended | |||||
| Dec. 31, 2025 | Sep. 30, 2025 | Dec. 31, 2024 | ||||
| Supplementary cash cost information | $ millions | $/lb 1 | $ millions | $/lb 1 | $ millions | $/lb 1 |
| By-product credits2: | ||||||
| Zinc | 12.2 | 0.17 | 9.9 | 0.18 | 16.1 | 0.17 |
| Gold3 | 302.2 | 4.15 | 134.8 | 2.53 | 212.9 | 2.23 |
| Silver3 | 27.3 | 0.37 | 13.9 | 0.26 | 26.6 | 0.28 |
| Molybdenum & other | 8.3 | 0.11 | 17.2 | 0.32 | 9.9 | 0.10 |
| Total by-product credits | 350.0 | 4.80 | 175.8 | 3.29 | 265.5 | 2.78 |
| Reconciliation to IFRS: | ||||||
| Cash cost, net of by-product credits | (46.0) | 22.2 | 43.1 | |||
| By-product credits | 350.0 | 175.8 | 265.5 | |||
| Treatment and refining charges | (5.8) | (5.3) | (25.9) | |||
| Inventory adjustments | 0.7 | (1.3) | 1.3 | |||
| Share-based compensation expense | 2.6 | 1.7 | 0.7 | |||
| Past service costs | - | - | 1.5 | |||
| Change in product inventory | 4.3 | (19.6) | (10.0) | |||
| Royalties | 3.2 | 2.0 | 2.1 | |||
| Overhead costs incurred during Manitoba temporary suspension (cash) | - | 16.0 | - | |||
| Overhead costs incurred during Peru temporary suspension (cash) | 1.3 | 7.3 | - | |||
| Depreciation and amortization4 | 152.5 | 82.7 | 122.2 | |||
| Cost of sales5 | 462.8 | 281.5 | 400.5 | |||
1 Per pound of copper produced.
2 By-product credits are computed as revenue per financial statements, including amortization of deferred revenue and pricing and volume adjustments. For more information, please see the realized price reconciliation table on page 43 of this MD&A for these figures.
3 Gold and silver by-product credits do not include variable consideration adjustments with respect to stream arrangements. Variable consideration adjustments are cumulative adjustments to gold and silver stream deferred revenue primarily associated with the net change in mineral reserves and resources or amendments to the mine plan that would change the total expected deliverable ounces under the precious metal streaming arrangement. For the three months ended December 31, 2025 the variable consideration adjustments amounted to $nil (three months ended December 31, 2024 - $nil and September 30, 2025 - $nil).
4 Depreciation is based on concentrate sold.
5 As per consolidated financial statements.
| Consolidated | Year ended | |||
| Dec. 31, 2025 | Dec. 31, 2024 | |||
| Supplementary cash cost information | $ millions | $/lb1 | $ millions | $/lb1 |
| By-product credits2: | ||||
| Zinc | 43.2 | 0.17 | 69.9 | 0.23 |
| Gold3 | 858.2 | 3.29 | 747.8 | 2.46 |
| Silver3 | 90.7 | 0.35 | 86.0 | 0.28 |
| Molybdenum & other | 65.7 | 0.25 | 63.7 | 0.21 |
| Total by-product credits | 1,057.8 | 4.06 | 967.4 | 3.18 |
| Reconciliation to IFRS: | ||||
| Cash cost, net of by-product credits | (56.5) | 139.9 | ||
| By-product credits | 1,057.8 | 967.4 | ||
| Treatment and refining charges | (28.4) | (97.3) | ||
| Inventory adjustments | 4.1 | 2.9 | ||
| Share-based compensation expense | 5.9 | 1.9 | ||
| Past service costs | - | 4.3 | ||
| Change in product inventory | 8.1 | 11.4 | ||
| Royalties | 9.3 | 10.3 | ||
| Overhead costs incurred during Manitoba temporary suspension (cash) | 19.2 | - | ||
| Overhead costs incurred during Peru temporary suspension (cash) | 8.6 | - | ||
| Depreciation and amortization4 | 439.7 | 426.6 | ||
| Cost of sales5 | 1,467.8 | 1,467.4 | ||
1 Per pound of copper produced.
2 By-product credits are computed as revenue per financial statements, including amortization of deferred revenue and pricing and volume adjustments. For more information, please see the realized price reconciliation table on page 44 of this MD&A for these figures.
3 Gold and silver by-product credits do not include variable consideration adjustments with respect to stream arrangements. Variable consideration adjustments are cumulative adjustments to gold and silver stream deferred revenue primarily associated with the net change in mineral reserves and resources or amendments to the mine plan that would change the total expected deliverable ounces under the precious metal streaming arrangement. For the year ended December 31, 2025 the variable consideration adjustments amounted to a gain of $9.9 million (year ended December 31, 2024 - loss of $3.8 million).
4 Depreciation is based on concentrate sold.
5 As per consolidated financial statements.
| Peru | Three months ended | Year ended | |||
| (in thousands) | Dec. 31, 2025 | Sep. 30, 2025 | Dec. 31, 2024 | Dec. 31, 2025 | Dec. 31, 2024 |
| Net pounds of copper produced1 | 55,199 | 39,934 | 74,931 | 187,734 | 218,260 |
| 1 Contained copper in concentrate. | |||||
| Peru | Three months ended | |||||
| Dec. 31, 2025 | Sep. 30, 2025 | Dec. 31, 2024 | ||||
| Cash cost per pound of copper produced | $ millions | $/lb | $ millions | $/lb | $ millions | $/lb |
| Mining | 37.6 | 0.68 | 34.8 | 0.87 | 47.3 | 0.63 |
| Milling | 52.0 | 0.94 | 40.8 | 1.02 | 53.6 | 0.72 |
| G&A | 47.8 | 0.87 | 19.3 | 0.48 | 33.2 | 0.44 |
| Onsite costs | 137.4 | 2.49 | 94.9 | 2.37 | 134.1 | 1.79 |
| Treatment & refining | 2.5 | 0.05 | 3.4 | 0.08 | 16.0 | 0.21 |
| Freight & other | 17.3 | 0.31 | 9.4 | 0.24 | 19.2 | 0.25 |
| Cash cost, before by-product credits | 157.2 | 2.85 | 107.7 | 2.69 | 169.3 | 2.25 |
| By-product credits | (126.0) | (2.28) | (55.5) | (1.39) | (94.0) | (1.25) |
| Cash cost, net of by-product credits | 31.2 | 0.57 | 52.2 | 1.30 | 75.3 | 1.00 |
| Peru | Year ended | |||
| Dec. 31, 2025 | Dec. 31, 2024 | |||
| Cash cost per pound of copper produced | $ millions | $/lb | $ millions | $/lb |
| Mining | 131.5 | 0.70 | 145.5 | 0.67 |
| Milling | 195.0 | 1.04 | 197.1 | 0.90 |
| G&A | 112.8 | 0.60 | 95.5 | 0.44 |
| Onsite costs | 439.3 | 2.34 | 438.1 | 2.01 |
| Treatment & refining | 12.5 | 0.07 | 53.4 | 0.24 |
| Freight & other | 54.3 | 0.29 | 62.5 | 0.29 |
| Cash cost, before by-product credits | 506.1 | 2.70 | 554.0 | 2.54 |
| By-product credits | (303.5) | (1.62) | (295.8) | (1.36) |
| Cash cost, net of by-product credits | 202.6 | 1.08 | 258.2 | 1.18 |
| Peru | Three months ended | |||||
| Dec. 31, 2025 | Sep. 30, 2025 | Dec. 31, 2024 | ||||
| Supplementary cash cost information | $ millions | $/lb 1 | $ millions | $/lb 1 | $ millions | $/lb 1 |
| By-product credits2: | ||||||
| Gold3 | 104.7 | 1.90 | 31.3 | 0.78 | 68.5 | 0.91 |
| Silver3 | 13.2 | 0.24 | 7.0 | 0.18 | 16.8 | 0.22 |
| Molybdenum | 8.1 | 0.14 | 17.2 | 0.43 | 8.7 | 0.12 |
| Total by-product credits | 126.0 | 2.28 | 55.5 | 1.39 | 94.0 | 1.25 |
| Reconciliation to IFRS: | ||||||
| Cash cost, net of by-product credits | 31.2 | 52.2 | 75.3 | |||
| By-product credits | 126.0 | 55.5 | 94.0 | |||
| Treatment and refining charges | (2.5) | (3.4) | (16.0) | |||
| Inventory adjustments | (0.2) | (1.3) | (0.2) | |||
| Share-based compensation expenses | 0.5 | 0.2 | 0.1 | |||
| Change in product inventory | 15.6 | (26.9) | (6.7) | |||
| Royalties | 2.9 | 1.5 | 1.5 | |||
| Overhead costs incurred during Peru temporary suspension (cash) | 1.3 | 7.3 | - | |||
| Depreciation and amortization4 | 115.8 | 50.0 | 83.2 | |||
| Cost of sales5 | 290.6 | 135.1 | 231.2 | |||
1 Per pound of copper produced.
2 By-product credits are computed as revenue per financial statements, including amortization of deferred revenue and pricing and volume adjustments.
3 Gold and silver by-product credits do not include variable consideration adjustments with respect to stream arrangements.
4 Depreciation is based on concentrate sold.
5 As per the consolidated financial statements.
| Peru | Year ended | |||
| Dec. 31, 2025 | Dec. 31, 2024 | |||
| Supplementary cash cost information | $ millions | $/lb 1 | $ millions | $/lb 1 |
| By-product credits2: | ||||
| Gold3 | 188.3 | 1.00 | 182.5 | 0.84 |
| Silver3 | 49.5 | 0.26 | 51.3 | 0.24 |
| Molybdenum | 65.7 | 0.36 | 62.0 | 0.28 |
| Total by-product credits | 303.5 | 1.62 | 295.8 | 1.36 |
| Reconciliation to IFRS: | ||||
| Cash cost, net of by-product credits | 202.6 | 258.2 | ||
| By-product credits | 303.5 | 295.8 | ||
| Treatment and refining charges | (12.5) | (53.4) | ||
| Inventory adjustments | - | - | ||
| Share-based compensation expenses | 1.0 | 0.5 | ||
| Change in product inventory | 6.5 | 9.6 | ||
| Royalties | 6.5 | 6.7 | ||
| Overhead costs incurred during Peru temporary suspension (cash) | 8.6 | - | ||
| Depreciation and amortization4 | 290.0 | 270.3 | ||
| Cost of sales5 | 806.2 | 787.7 | ||
1 Per pound of copper produced.
2 By-product credits are computed as revenue per financial statements, including amortization of deferred revenue and pricing and volume adjustments.
3 Gold and silver by-product credits do not include variable consideration adjustments with respect to stream arrangements.
4 Depreciation is based on concentrate sold.
5 As per the consolidated financial statements.
| British Columbia | Three months ended | Year ended | |||
| (in thousands) | Dec. 31, 2025 | Sep. 30, 2025 | Dec. 31, 2024 | Dec. 31, 2025 | Dec. 31, 2024 |
| Net pounds of copper produced1 | 10,373 | 11,572 | 13,067 | 52,435 | 58,215 |
| 1 Contained copper in concentrate. | |||||
| British Columbia | Three months ended | |||||
| Dec. 31, 2025 | Sep. 30, 2025 | Dec. 31, 2024 | ||||
| Cash cost per pound of copper produced | $ millions | $/lb | $ millions | $/lb | $ millions | $/lb |
| Mining | 26.3 | 2.54 | 19.6 | 1.69 | 18.2 | 1.39 |
| Milling | 28.3 | 2.73 | 29.1 | 2.52 | 25.2 | 1.93 |
| G&A | 9.5 | 0.91 | 7.1 | 0.61 | 4.6 | 0.35 |
| Onsite costs | 64.1 | 6.18 | 55.8 | 4.82 | 48.0 | 3.67 |
| Treatment & refining | 1.3 | 0.12 | 1.0 | 0.09 | 3.4 | 0.26 |
| Freight & other | 2.7 | 0.26 | 3.0 | 0.26 | 2.4 | 0.19 |
| Cash cost, before by-product credits | 68.1 | 6.56 | 59.8 | 5.17 | 53.8 | 4.12 |
| By-product credits | (18.1) | (1.74) | (22.7) | (1.96) | (14.6) | (1.12) |
| Cash cost, net of by-product credits | 50.0 | 4.82 | 37.1 | 3.21 | 39.2 | 3.00 |
| British Columbia | Year ended | |||
| Dec. 31, 2025 | Dec. 31, 2024 | |||
| Cash cost per pound of copper produced | $ millions | $/lb | $ millions | $/lb |
| Mining | 92.0 | 1.76 | 79.1 | 1.36 |
| Milling | 100.6 | 1.92 | 89.8 | 1.54 |
| G&A | 29.0 | 0.55 | 19.6 | 0.34 |
| Onsite costs | 221.6 | 4.23 | 188.5 | 3.24 |
| Treatment & refining | 8.0 | 0.15 | 14.4 | 0.25 |
| Freight & other | 12.4 | 0.23 | 13.2 | 0.22 |
| Cash cost, before by-product credits | 242.0 | 4.61 | 216.1 | 3.71 |
| By-product credits | (81.3) | (1.55) | (56.5) | (0.97) |
| Cash cost, net of by-product credits | 160.7 | 3.06 | 159.6 | 2.74 |
| British Columbia | Three months ended | |||||
| Dec. 31, 2025 | Sep. 30, 2025 | Dec. 31, 2024 | ||||
| Supplementary cash cost information | $ millions | $/lb 1 | $ millions | $/lb 1 | $ millions | $/lb 1 |
| By-product credits2: | ||||||
| Gold | 14.9 | 1.43 | 20.4 | 1.76 | 13.3 | 1.02 |
| Silver | 3.2 | 0.31 | 2.3 | 0.20 | 1.3 | 0.10 |
| Total by-product credits | 18.1 | 1.74 | 22.7 | 1.96 | 14.6 | 1.12 |
| Reconciliation to IFRS: | ||||||
| Cash cost, net of by-product credits | 50.0 | 37.1 | 39.2 | |||
| By-product credits | 18.1 | 22.7 | 14.6 | |||
| Treatment and refining charges | (1.3) | (1.0) | (3.4) | |||
| Inventory adjustments | 0.1 | - | 1.2 | |||
| Change in product inventory | (9.1) | 4.2 | (3.0) | |||
| Share-based compensation expense | 0.7 | 0.5 | 0.4 | |||
| Royalties | 0.3 | 0.5 | 0.6 | |||
| Depreciation and amortization3 | 14.1 | 16.4 | 11.8 | |||
| Cost of sales4 | 72.9 | 80.4 | 61.4 | |||
1 Per pound of copper produced.
2 By-product credits are computed as revenue per financial statements, including amortization of deferred revenue and pricing and volume adjustments.
3 Depreciation is based on concentrate sold.
4 As per consolidated financial statements.
| British Columbia | Year ended | |||
| Dec. 31, 2025 | Dec. 31, 2024 | |||
| Supplementary cash cost information | $ millions | $/lb 1 | $ millions | $/lb 1 |
| By-product credits2: | ||||
| Gold | 71.2 | 1.36 | 49.3 | 0.85 |
| Silver | 10.1 | 0.19 | 7.2 | 0.12 |
| Total by-product credits | 81.3 | 1.55 | 56.5 | 0.97 |
| Reconciliation to IFRS: | ||||
| Cash cost, net of by-product credits | 160.7 | 159.6 | ||
| By-product credits | 81.3 | 56.5 | ||
| Treatment and refining charges | (8.0) | (14.4) | ||
| Inventory adjustments | 2.3 | 1.2 | ||
| Change in product inventory | (2.1) | 3.8 | ||
| Share-based compensation expense | 1.7 | 0.4 | ||
| Royalties | 2.8 | 3.6 | ||
| Depreciation and amortization3 | 63.3 | 50.1 | ||
| Cost of sales4 | 302.0 | 260.8 | ||
1 Per pound of copper produced.
2 By-product credits are computed as revenue per financial statements, including amortization of deferred revenue and pricing and volume adjustments.
3 Depreciation is based on concentrate sold.
4 As per consolidated financial statements.
| Consolidated | Three months ended | |||||
| Dec. 31, 2025 | Sep. 30, 2025 | Dec. 31, 2024 | ||||
| All-in sustaining cash cost per pound of copper produced | $ millions | $/lb | $ millions | $/lb | $ millions | $/lb |
| Cash cost, net of by-product credits | (46.0) | (0.63) | 22.2 | 0.42 | 43.1 | 0.45 |
| Cash sustaining capital expenditures | 111.2 | 1.53 | 87.5 | 1.64 | 85.3 | 0.89 |
| Royalties | 3.2 | 0.04 | 2.0 | 0.03 | 2.1 | 0.03 |
| Sustaining cash cost, net of by-product credits | 68.4 | 0.94 | 111.7 | 2.09 | 130.5 | 1.37 |
| Corporate selling and administrative expenses & regional costs | 32.0 | 0.44 | 33.0 | 0.62 | 11.6 | 0.12 |
| Accretion and amortization of decommissioning and community agreements1 | 4.0 | 0.05 | 3.9 | 0.07 | 3.7 | 0.04 |
| All-in sustaining cash cost, net of by-product credits | 104.4 | 1.43 | 148.6 | 2.78 | 145.8 | 1.53 |
| Reconciliation to property, plant and equipment additions: | ||||||
| Property, plant and equipment additions | 140.9 | 97.6 | 127.6 | |||
| Capitalized stripping net additions | 43.9 | 43.2 | 35.8 | |||
| Total accrued capital additions | 184.8 | 140.8 | 163.4 | |||
| Less other non-sustaining capital costs2 | 93.0 | 69.6 | 91.8 | |||
| Total sustaining capital costs | 91.8 | 71.2 | 71.6 | |||
| Capitalized lease & equipment financing cash payments - operating sites | 12.5 | 14.3 | 10.3 | |||
| LOM Community agreement cash payments | 4.4 | - | 0.7 | |||
| Accretion and amortization of decommissioning and restoration obligations 3 | 2.5 | 2.0 | 2.7 | |||
| Cash sustaining capital expenditures | 111.2 | 87.5 | 85.3 | |||
1 Includes accretion of decommissioning liability relating to non-producing sites, and accretion and amortization of community agreements capitalized to Other assets.
2 Other non-sustaining capital costs include Copper World capitalized costs, capitalized interest, capitalized exploration, right-of-use lease asset additions, equipment financing asset additions, growth capital expenditures and reclassification related to capital spares.
3 Includes amortization of decommissioning and restoration PP&E assets and accretion of decommissioning and restoration liabilities related to producing sites.
| Consolidated | Year ended | |||
| Dec. 31, 2025 | Dec. 31, 2024 | |||
| All-in sustaining cash cost per pound of copper produced | $ millions | $/lb | $ millions | $/lb |
| Cash cost, net of by-product credits | (56.5) | (0.22) | 139.9 | 0.46 |
| Cash sustaining capital expenditures | 385.2 | 1.48 | 342.2 | 1.13 |
| Royalties | 9.3 | 0.04 | 10.3 | 0.03 |
| Sustaining cash cost, net of by-product credits | 338.0 | 1.30 | 492.4 | 1.62 |
| Corporate selling and administrative expenses & regional costs | 102.4 | 0.39 | 62.4 | 0.20 |
| Accretion and amortization of decommissioning and community agreements1 | 13.1 | 0.05 | 17.3 | 0.06 |
| All-in sustaining cash cost, net of by-product credits | 453.5 | 1.74 | 572.1 | 1.88 |
| Reconciliation to property, plant and equipment additions: | ||||
| Property, plant and equipment additions | 400.3 | 325.7 | ||
| Capitalized stripping net additions | 182.2 | 160.5 | ||
| Total accrued capital additions | 582.5 | 486.2 | ||
| Less other non-sustaining capital costs2 | 268.4 | 193.1 | ||
| Total sustaining capital costs | 314.1 | 293.1 | ||
| Capitalized lease & equipment financing cash payments - operating sites | 53.0 | 38.4 | ||
| LOM Community agreement cash payments | 9.3 | 2.5 | ||
| Accretion and amortization of decommissioning and restoration obligations 3 | 8.8 | 8.2 | ||
| Cash sustaining capital expenditures | 385.2 | 342.2 | ||
1 Includes accretion of decommissioning liability relating to non-producing sites, and accretion and amortization of community agreements capitalized to Other assets.
2 Other non-sustaining capital costs include Copper World capitalized costs, capitalized interest, capitalized exploration, right-of-use lease asset additions, equipment financing asset additions, growth capital expenditures and reclassification related to capital spares.
3 Includes amortization of decommissioning and restoration PP&E assets and accretion of decommissioning and restoration liabilities related to producing sites.
| Peru | Three months ended | |||||
| Dec. 31, 2025 | Sep. 30, 2025 | Dec. 31, 2024 | ||||
| Sustaining cash cost per pound of copper produced | $ millions | $/lb | $ millions | $/lb | $ millions | $/lb |
| Cash cost, net of by-product credits | 31.2 | 0.57 | 52.2 | 1.30 | 75.3 | 1.00 |
| Cash sustaining capital expenditures | 50.3 | 0.91 | 30.5 | 0.77 | 34.3 | 0.46 |
| Royalties | 2.9 | 0.05 | 1.5 | 0.04 | 1.5 | 0.02 |
| Sustaining cash cost per pound of copper produced | 84.4 | 1.53 | 84.2 | 2.11 | 111.1 | 1.48 |
| Peru | Year ended | |||
| Dec. 31, 2025 | Dec. 31, 2024 | |||
| Sustaining cash cost per pound of copper produced | $ millions | $/lb | $ millions | $/lb |
| Cash cost, net of by-product credits | 202.6 | 1.08 | 258.2 | 1.18 |
| Cash sustaining capital expenditures | 171.2 | 0.91 | 141.6 | 0.65 |
| Royalties | 6.5 | 0.03 | 6.7 | 0.03 |
| Sustaining cash cost per pound of copper produced | 380.3 | 2.02 | 406.5 | 1.86 |
| British Columbia | Three months ended | |||||
| Dec. 31, 2025 | Sep. 30, 2025 | Dec. 31, 2024 | ||||
| Sustaining cash cost per pound of copper produced | $ millions | $/lb | $ millions | $/lb | $ millions | $/lb |
| Cash cost, net of by-product credits | 50.0 | 4.82 | 37.1 | 3.21 | 39.2 | 3.00 |
| Cash sustaining capital expenditures | 41.7 | 4.02 | 48.4 | 4.18 | 35.4 | 2.71 |
| Royalties | 0.3 | 0.03 | 0.5 | 0.04 | 0.6 | 0.05 |
| Sustaining cash cost per pound of copper produced | 92.0 | 8.87 | 86.0 | 7.43 | 75.2 | 5.76 |
| British Columbia | Year ended | |||
| Dec. 31, 2025 | Dec. 31, 2024 | |||
| Sustaining cash cost per pound of copper produced | $ millions | $/lb | $ millions | $/lb |
| Cash cost, net of by-product credits | 160.7 | 3.06 | 159.6 | 2.74 |
| Cash sustaining capital expenditures | 157.5 | 3.00 | 144.5 | 2.48 |
| Royalties | 2.8 | 0.06 | 3.6 | 0.07 |
| Sustaining cash cost per pound of copper produced | 321.0 | 6.12 | 307.7 | 5.29 |
Gold Cash Cost and Gold Sustaining Cash Cost
Cash cost per ounce of gold produced ("gold cash cost") is a non-GAAP measure that management uses as a key performance indicator to assess the performance of Hudbay's Manitoba operations. This alternative cash cost calculation designates gold as the primary metal of production as it represents a substantial component of revenues for Hudbay's Manitoba business unit and should therefore be less volatile over time than Manitoba cash cost per pound of copper. The calculation is presented in three manners:
- Gold cash cost, before by-product credits - This measure is gross of by-product revenues and is a function of the efforts and costs incurred to mine and process all ore mined. However, the measure divides this aggregate cost over only ounces of gold produced, the assumed primary metal of production. This measure is generally less volatile from period to period, as it is not affected by changes in the price received for by-product metals.
- Gold cash cost, net of by-product credits - In order to calculate the net cost to produce and sell gold, the net of by-product credits measure subtracts the revenues realized from the sale of the metals other than gold. The by-product revenues from copper, zinc, and silver are significant and are integral to the economics of Hudbay's Manitoba operation. The economics that support its decision to produce and sell gold would be different if Hudbay did not receive revenues from the other significant metals being extracted and processed. This measure provides management and investors with an indication of the minimum gold price consistent with positive operating margins, assuming realized by-product metal prices are consistent with those prevailing during the reporting period. It also serves as an important operating statistic that management and investors utilize to measure Hudbay's operating performance at its Manitoba operation versus that of its competitors. However, it is important to understand that if by-product metal prices decline alongside gold prices, the gold cash cost net of by-product credits would increase, requiring a higher gold price than that reported to maintain positive cash flows and operating margins.
- Gold sustaining cash cost, net of by-product credits - This measure is an extension of gold cash cost that includes cash sustaining capital expenditures, capitalized exploration, net smelter returns royalties, as well as accretion and amortization for expected decommissioning activities for producing assets. It does not include corporate selling and administrative expenses. It provides a more fulsome measurement of the cost of sustaining production than gold cash cost, which is focused on operating costs only.
The tables below present a detailed build-up of gold cash cost and gold sustaining cash cost, net of by-product credits, for the Manitoba business unit, and reconciliations between gold cash cost, net of by-product credits, to the most comparable IFRS measures of cost of sales for the three months ended December 31, and September 30, 2025 and December 31, 2024 and year ended December 31, 2025 and 2024. Gold cash cost, net of by-product credits, may not calculate exactly based on amounts presented in the tables below due to rounding.
| Manitoba | Three months ended | Year ended | |||
| (in thousands) | Dec. 31, 2025 | Sep. 30, 2025 | Dec. 31, 2024 | Dec. 31, 2025 | Dec. 31, 2024 |
| Net ounces of gold produced1 | 47,423 | 22,441 | 51,438 | 173,453 | 214,225 |
| 1 Contained gold in concentrate and doré. | |||||
| Manitoba | Three months ended | |||||
| Dec. 31, 2025 | Sep. 30, 2025 | Dec. 31, 2024 | ||||
| Cash cost per ounce of gold produced | $ millions | $/oz1 | $ millions | $/oz1 | $ millions | $/oz1 |
| Mining | 39.3 | 829 | 15.8 | 704 | 42.6 | 828 |
| Milling | 16.2 | 342 | 5.9 | 263 | 16.6 | 323 |
| G&A | 16.1 | 339 | 5.4 | 241 | 12.8 | 249 |
| Onsite costs | 71.6 | 1,510 | 27.1 | 1,208 | 72.0 | 1,400 |
| Treatment & refining | 2.0 | 42 | 0.9 | 40 | 6.5 | 126 |
| Freight & other | 5.1 | 108 | 2.5 | 111 | 7.0 | 136 |
| Cash cost, before by-product credits | 78.7 | 1,660 | 30.5 | 1,359 | 85.5 | 1,662 |
| By-product credits | (45.3) | (955) | (22.0) | (980) | (54.3) | (1,055) |
| Gold cash cost, net of by-product credits | 33.4 | 705 | 8.5 | 379 | 31.2 | 607 |
| Manitoba | Year ended | |||
| Dec. 31, 2025 | Dec. 31, 2024 | |||
| Cash cost per ounce of gold produced | $ millions | $/oz1 | $ millions | $/oz1 |
| Mining | 126.9 | 731 | 169.4 | 791 |
| Milling | 49.9 | 288 | 65.2 | 304 |
| G&A | 50.1 | 289 | 47.7 | 223 |
| Onsite costs | 226.9 | 1,308 | 282.3 | 1,318 |
| Treatment & refining | 7.9 | 45 | 29.5 | 137 |
| Freight & other | 18.4 | 106 | 25.4 | 119 |
| Cash cost, before by-product credits | 253.2 | 1,459 | 337.2 | 1,574 |
| By-product credits | (157.9) | (910) | (207.3) | (968) |
| Gold cash cost, net of by-product credits | 95.3 | 549 | 129.9 | 606 |
| Manitoba | Three months ended | |||||
| Supplementary cash cost information | Dec. 31, 2025 | Sep. 30, 2025 | Dec. 31, 2024 | |||
| $ millions | $/oz 1 | $ millions | $/oz1 | $ millions | $/oz 1 | |
| By-product credits2: | ||||||
| Copper | 22.1 | 466 | 7.4 | 330 | 28.5 | 554 |
| Zinc | 12.2 | 257 | 9.9 | 441 | 16.1 | 313 |
| Silver | 10.8 | 228 | 4.7 | 209 | 8.5 | 165 |
| Other | 0.2 | 4 | - | - | 1.2 | 23 |
| Total by-product credits | 45.3 | 955 | 22.0 | 980 | 54.3 | 1,055 |
| Reconciliation to IFRS: | ||||||
| Cash cost, net of by-product credits | 33.4 | 8.5 | 31.2 | |||
| By-product credits | 45.3 | 22.0 | 54.3 | |||
| Treatment and refining charges | (2.0) | (0.9) | (6.5) | |||
| Past service costs | - | - | 1.5 | |||
| Share-based compensation expenses | 1.4 | 1.0 | 0.2 | |||
| Inventory adjustments | 0.8 | - | 0.3 | |||
| Change in product inventory | (2.2) | 3.1 | (0.3) | |||
| Overhead costs incurred during Manitoba temporary suspension (cash) | - | 16.0 | - | |||
| Depreciation and amortization3 | 22.6 | 16.3 | 27.2 | |||
| Cost of sales4 | 99.3 | 66.0 | 107.9 | |||
| 1 Per ounce of gold produced. | ||||||
| 2 By-product credits are computed as revenue per financial statements, amortization of deferred revenue and pricing and volume adjustments. | ||||||
| 3 Depreciation is based on concentrate sold. | ||||||
| 4 As per consolidated financial statements. | ||||||
| Manitoba | Year ended | |||
| Supplementary cash cost information | Dec. 31, 2025 | Dec. 31, 2024 | ||
| $ millions | $/oz 1 | $ millions | $/oz 1 | |
| By-product credits2: | ||||
| Copper | 83.6 | 482 | 108.2 | 505 |
| Zinc | 43.2 | 249 | 69.9 | 326 |
| Silver | 31.1 | 179 | 27.5 | 128 |
| Other | - | - | 1.7 | 9 |
| Total by-product credits | 157.9 | 910 | 207.3 | 968 |
| Reconciliation to IFRS: | ||||
| Cash cost, net of by-product credits | 95.3 | 129.9 | ||
| By-product credits | 157.9 | 207.3 | ||
| Treatment and refining charges | (7.9) | (29.5) | ||
| Past service costs | - | 4.3 | ||
| Share-based compensation expenses | 3.2 | 1.0 | ||
| Inventory adjustments | 1.8 | 1.7 | ||
| Change in product inventory | 3.7 | (2.0) | ||
| Overhead costs incurred during Manitoba temporary suspension (cash) | 19.2 | - | ||
| Depreciation and amortization3 | 86.4 | 106.2 | ||
| Cost of sales4 | 359.6 | 418.9 | ||
| 1 Per ounce of gold produced. | ||||
| 2 By-product credits are computed as revenue per financial statements, amortization of deferred revenue and pricing and volume adjustments. | ||||
| 3 Depreciation is based on concentrate sold. | ||||
| 4 As per consolidated financial statements. | ||||
| Manitoba | Three months ended | |||||
| Dec. 31, 2025 | Sep. 30, 2025 | Dec. 31, 2024 | ||||
| Sustaining cash cost per ounce of gold produced | $ millions | $/oz | $ millions | $/oz | $ millions | $/oz |
| Gold cash cost, net of by-product credits | 33.4 | 705 | 8.5 | 379 | 31.2 | 607 |
| Cash sustaining capital expenditures | 19.2 | 405 | 8.6 | 383 | 15.5 | 301 |
| Sustaining cash cost per ounce of gold produced | 52.6 | 1,110 | 17.1 | 762 | 46.7 | 908 |
| Manitoba | Year ended | |||
| Dec. 31, 2025 | Dec. 31, 2024 | |||
| Sustaining cash cost per ounce of gold produced | $ millions | $/oz | $ millions | $/oz |
| Gold cash cost, net of by-product credits | 95.3 | 549 | 129.9 | 606 |
| Cash sustaining capital expenditures | 56.5 | 326 | 56.1 | 262 |
| Sustaining cash cost per ounce of gold produced | 151.8 | 875 | 186.0 | 868 |
Combined Unit Cost
Combined unit cost ("unit cost") and zinc plant unit cost is a non-GAAP measure that management uses as a key performance indicator to assess the performance of Hudbay's mining and milling operations. Combined unit cost is calculated by dividing the cost of sales by mill throughput. This measure is utilized by management and investors to assess Hudbay's cost structure and margins and compare it to similar information provided by other companies in the industry. Unlike cash cost, this measure is not impacted by variability in by-product commodity prices since there are no by-product deductions; costs associated with profit-sharing and similar costs are excluded because of their correlation to external metal prices. In addition, the unit costs are reported in the functional currency of the operation which minimizes the impact of foreign currency fluctuations. In all, the unit cost measures provide an alternative perspective on operating cost performance with minimal impact from external market prices.
The tables below present a detailed combined unit cost for the Peru and Manitoba business units, and reconciliations between these measures to the most comparable IFRS measures of cost of sales for the three months ended December 31, 2025 and 2024 and September 30, 2025 and year ended December 31, 2025 and 2024.
| Peru | Three months ended | Year ended | |||
| (in millions except ore tonnes milled and unit cost per tonne) | Dec. 31, 2025 |
Sept. 30, 2025 |
Dec. 31, 2024 |
Dec. 31, 2025 |
Dec. 31, 2024 |
| Combined unit cost per tonne processed | |||||
| Mining | 37.6 | 34.8 | 47.3 | 131.5 | 145.5 |
| Milling | 52.0 | 40.8 | 53.6 | 195.0 | 197.1 |
| G&A1 | 47.8 | 19.3 | 33.2 | 112.8 | 95.5 |
| Less: Other G&A2 | (26.7) | (3.8) | (12.1) | (44.9) | (25.9) |
| Unit cost | 110.7 | 91.1 | 122.0 | 394.4 | 412.2 |
| Tonnes ore milled (in thousands) | 7,628 | 6,992 | 7,999 | 30,293 | 31,934 |
| Combined unit cost per tonne | 14.51 | 13.03 | 15.25 | 13.02 | 12.91 |
| Reconciliation to IFRS: | |||||
| Unit cost | 110.7 | 91.1 | 122.0 | 394.4 | 412.2 |
| Freight & other | 17.3 | 9.4 | 19.2 | 54.3 | 62.5 |
| Other G&A | 26.7 | 3.8 | 12.1 | 44.9 | 25.9 |
| Share-based compensation expenses | 0.5 | 0.2 | 0.1 | 1.0 | 0.5 |
| Inventory adjustments | (0.2) | (1.3) | (0.2) | - | - |
| Change in product inventory | 15.6 | (26.9) | (6.7) | 6.5 | 9.6 |
| Royalties | 2.9 | 1.5 | 1.5 | 6.5 | 6.7 |
| Overhead costs incurred during Peru temporary suspension (cash) | 1.3 | 7.3 | - | 8.6 | - |
| Depreciation and amortization | 115.8 | 50.0 | 83.2 | 290.0 | 270.3 |
| Cost of sales3 | 290.6 | 135.1 | 231.2 | 806.2 | 787.7 |
| 1 G&A as per cash cost reconciliation above. | |||||
| 2 Other G&A primarily includes profit sharing costs. | |||||
| 4 As per consolidated financial statements. | |||||
| Manitoba | Three months ended | Year ended | |||
| (in millions except tonnes ore milled and unit cost per tonne) | Dec. 31, 2025 |
Sept. 30, 2025 |
Dec. 31, 2024 |
Dec. 31, 2025 |
Dec. 31, 2024 |
| Combined unit cost per tonne processed | |||||
| Mining | 39.3 | 15.8 | 42.6 | 126.9 | 169.4 |
| Milling | 16.2 | 5.9 | 16.6 | 49.9 | 65.2 |
| G&A1 | 16.1 | 5.4 | 12.8 | 50.1 | 47.7 |
| Less: Other G&A related to profit sharing costs | (9.4) | (1.8) | (4.0) | (25.6) | (17.0) |
| Unit cost | 62.2 | 25.3 | 68.0 | 201.3 | 265.3 |
| USD/CAD implicit exchange rate | 1.39 | 1.39 | 1.39 | 1.40 | 1.37 |
| Unit cost - C$ | 86.7 | 35.3 | 95.0 | 282.4 | 363.5 |
| Tonnes ore milled | 349,082 | 136,705 | 407,596 | 1,197,335 | 1,608,708 |
| Combined unit cost per tonne - C$ | 248 | 258 | 233 | 236 | 226 |
| Reconciliation to IFRS: | |||||
| Unit cost | 62.2 | 25.3 | 68.0 | 201.3 | 265.3 |
| Freight & other | 5.1 | 2.5 | 7.0 | 18.4 | 25.4 |
| Other G&A related to profit sharing | 9.4 | 1.8 | 4.0 | 25.6 | 17.0 |
| Share-based compensation expenses | 1.4 | 1.0 | 0.2 | 3.2 | 1.0 |
| Inventory adjustments | 0.8 | - | 0.3 | 1.8 | 1.7 |
| Past service costs | - | - | 1.5 | - | 4.3 |
| Change in product inventory | (2.2) | 3.1 | (0.3) | 3.7 | (2.0) |
| Overhead costs incurred during Manitoba temporary suspension (cash) | - | 16.0 | - | 19.2 | - |
| Depreciation and amortization | 22.6 | 16.3 | 27.2 | 86.4 | 106.2 |
| Cost of sales2 | 99.3 | 66.0 | 107.9 | 359.6 | 418.9 |
| 1 G&A as per cash cost reconciliation above. | |||||
| 2 As per consolidated financial statements. | |||||
| British Columbia | Three months ended | Year ended | |||
| (in millions except tonnes ore milled and unit cost per tonne) | Dec. 31, 2025 |
Sept. 30, 2025 |
Dec. 31, 2024 |
Dec. 31, 2025 |
Dec. 31, 2024 |
| Combined unit cost per tonne processed | |||||
| Mining | 26.3 | 19.6 | 18.2 | 92.0 | 79.1 |
| Milling | 28.3 | 29.1 | 25.2 | 100.6 | 89.8 |
| G&A1 | 9.5 | 7.1 | 4.6 | 29.0 | 19.6 |
| Unit cost | 64.1 | 55.8 | 48.0 | 221.6 | 188.5 |
| USD/CAD implicit exchange rate | 1.41 | 1.38 | 1.38 | 1.40 | 1.37 |
| Unit cost - C$ | 90.3 | 77.3 | 66.9 | 309.7 | 258.1 |
| Tonnes ore milled | 2,268 | 3,087 | 2,881 | 11,017 | 12,657 |
| Combined unit cost per tonne - C$ | 39.80 | 25.02 | 23.22 | 28.12 | 20.39 |
| Reconciliation to IFRS: | |||||
| Unit cost | 64.1 | 55.8 | 48.0 | 221.6 | 188.5 |
| Freight & other | 2.7 | 3.0 | 2.4 | 12.4 | 13.2 |
| Change in product inventory | (9.1) | 4.2 | (3.0) | (2.1) | 3.8 |
| Shared based compensation | 0.7 | 0.5 | 0.4 | 1.7 | 0.4 |
| Inventory adjustments | 0.1 | - | 1.2 | 2.3 | 1.2 |
| Royalties | 0.3 | 0.5 | 0.6 | 2.8 | 3.6 |
| Depreciation and amortization | 14.1 | 16.4 | 11.8 | 63.3 | 50.1 |
| Cost of sales2 | 72.9 | 80.4 | 61.4 | 302.0 | 260.8 |
| 1 G&A as per cash cost reconciliation above. | |||||
| 2 As per consolidated financial statements. | |||||
ACCOUNTING CHANGES
New standards and interpretations not yet adopted
For information on new standards and interpretations not yet adopted, refer to note 4 of Hudbay's December 31, 2025 consolidated financial statements.
CRITICAL ACCOUNTING JUDGEMENTS AND ESTIMATES
The preparation of the consolidated financial statements in conformity with IFRS requires us to make judgements, estimates and assumptions that affect the application of accounting policies, reported amounts of assets and liabilities, disclosure of contingent assets and liabilities at the date of the consolidated financial statements, and reported amounts of revenue and expenses during the reporting period. Actual results may differ from these estimates.
The Company review these estimates and underlying assumptions on an ongoing basis based on its experience and other factors, including expectations of future events that Hudbay believe to be reasonable under the circumstances. Revisions to accounting estimates are recognized in the period in which the estimates are revised and in any future periods affected. Certain accounting estimates and judgements have been identified as being "critical" to the presentation of the Company's financial condition and results of operations because they require management to make subjective and/or complex judgements about matters that are inherently uncertain; or there is a reasonable likelihood that materially different amounts could be reported under different conditions or using different assumptions and estimates.
The following are significant judgements and estimates impacting the consolidated financial statements:
- Judgements and estimates that affect multiple areas of the consolidated financial statements:
- Mineral reserves and resources which form the basis of life of mine plans which are utilized in impairment testing, timing of payments related to decommissioning obligations and depreciation of capital assets. The Company estimate its mineral reserves and resources based on information compiled by qualified persons as defined in accordance with NI 43-101;
- Income and mining taxes, including estimates of future taxable profit which impacts the ability to realize deferred tax assets on the Company's balance sheet; and - In respect of the outcome of uncertain future events as it concerns recognizing contingent liabilities.
- Judgements and estimates that relate mainly to assets (these judgements may also affect other areas of the consolidated financial statements):
- Property, plant and equipment:
- Cost allocations for mine development;
- Mining properties expenditures capitalized;
- Classification of supply costs as related to capital development or inventory acquisition;
- Determining when exploration and evaluation assets should be transferred to capital works in progress within property, plant and equipment;
- Determination of when an asset or group of assets is in the condition and location to be ready for use as intended by management for the purposes of commencing depreciation;
- Componentization;
- Assessment of impairment, including determination of cash generating units and assessing for indicators of impairment;
- Recoverability of exploration and evaluation assets, including determination of cash generating units and assessing for indications of impairment;
- Units of production depreciation;
- Plant and equipment estimated useful lives and residual values;
- Capitalized stripping costs; and
- Finite life intangible assets.
- Impairment (and reversal of impairment) of non-financial assets:
- Future production levels and timing;
- Operating and capital costs;
- Future commodity prices;
- Purchase offers;
- Foreign exchange rates; and
- Risk adjusted discount rates.
- In process inventory quantities, inventory cost allocations and inventory valuation.
- Judgements and estimates that relate mainly to liabilities (these judgements may also affect other areas of the consolidated financial statements):
- Determination of deferred revenue per unit related to the precious metals stream transactions and determination of current portion of deferred revenue, which is based on timing of future sales, and adjustments of the expected conversion of resource to reserves;
- Pensions and other employee benefits; and
- Decommissioning, restoration and similar liabilities including estimated future costs and timing of spending.
- Estimates that relate mainly to the consolidated statements of income:
- Assaying used to determine revenues and recoverability of inventories.
For more information on judgements and estimates, refer to note 2 of Hudbay's consolidated financial statements for the year ended December 31, 2025.
DISCLOSURE CONTROLS AND PROCEDURES AND INTERNAL CONTROL OVER FINANCIAL REPORTING
Disclosure controls and procedures ("DC&P")
Management is responsible for establishing and maintaining adequate DC&P. As of December 31, 2025, the Company have evaluated the effectiveness of the design and operation of its DC&P in accordance with requirements of National Instrument 52-109 of the Canadian Securities Commission ("NI 52-109") and the Sarbanes Oxley Act of 2002 (as adopted by the US Securities and Exchange Commission). The Chief Executive Officer ("CEO") and Chief Financial Officer ("CFO") supervised and participated in this evaluation.
As of December 31, 2025, based on management's evaluation, the CEO and CFO concluded that the Company's DC&P were effective to ensure that information required to be disclosed by Hudbay in reports it files or submits is recorded, processed, summarized and reported within the time periods specified in securities legislation and is accumulated and communicated to the Company's management, including the CEO and CFO, to allow timely decisions regarding required disclosure.
Internal control over financial reporting ("ICFR")
Management of Hudbay is responsible for establishing and maintaining adequate ICFR. Under the supervision and with the participation of the Chief Executive Officer and Chief Financial Officer, the Company evaluated the effectiveness of its ICFR as of December 31, 2025 based upon the Internal Control - Integrated Framework (2013) issued by the Committee of Sponsoring Organizations of the Treadway Commission. Based on management's evaluation, the CEO and CFO concluded that its ICFR was effective as of December 31, 2025.
The effectiveness of the Company's ICFR as of December 31, 2025 has been audited by Deloitte LLP, Independent Registered Public Accounting Firm as stated in their report immediately preceding the Company's consolidated financial statements for the year ended December 31, 2025.
Changes in ICFR
Hudbay did not make any changes to ICFR during the year ended December 31, 2025 that materially affected, or are reasonably likely to materially affect, the Company's ICFR.
Inherent limitations of controls and procedures
All internal control systems, no matter how well designed, have inherent limitations. As a result, even systems determined to be effective may not prevent or detect misstatements on a timely basis, as systems can provide only reasonable assurance that the objectives of the control system are met. In addition, projections of any evaluation of the effectiveness of ICFR to future periods are subject to the risk that controls may become inadequate because of changes in conditions, or that the degree of compliance with the policies or procedures may change.
NOTES TO READER
Forward-Looking Information
This MD&A contains forward-looking information within the meaning of applicable Canadian and United States securities legislation. All information contained in this MD&A, other than statements of current and historical fact, is forward-looking information. Often, but not always, forward-looking information can be identified by the use of words such as "plans", "expects", "budget", "guidance", "scheduled", "estimates", "forecasts", "strategy", "target", "intends", "objective", "goal", "understands", "anticipates" and "believes" (and variations of these or similar words) and statements that certain actions, events or results "may", "could", "would", "should", "might" "occur" or "be achieved" or "will be taken" (and variations of these or similar expressions). All of the forward-looking information in this MD&A is qualified by this cautionary note.
Forward-looking information includes, but is not limited to, statements with respect to Hudbay's production, cost and capital and exploration expenditure guidance, Hudbay's ability to advance and complete the multi-year optimization of the Copper Mountain mine in British Columbia, including with respect to the ongoing second SAG mill conversion and configuration project and with respect to the primary SAG mill repairs and related ramp-up plans, the implementation of stripping strategies and the expected benefits therefrom, the expected timing and benefits of British Columbia growth initiatives, including with respect to the permitting and development timelines associated with New Ingerbelle, the estimated timelines and pre-requisites for sanctioning the Copper World project, expectations regarding the anticipated benefits of the JV Transaction and the sanctioning of the Copper World project to Hudbay and the United States, the consummation and timing of the DFS in respect of the Copper World project, expectations regarding the potential impact of recent policy decisions from the United States government, the benefits, timing and consummation of the definitive agreement with Wheaton Precious Metals Corp. ("Wheaton") in respect of the enhanced precious metals stream at Copper World, the expected benefits of Manitoba growth initiatives, including the use of the exploration drift at the 1901 deposit, the ability for Hudbay to complete mill throughput enhancements at its operating business units in Peru, British Columbia and Manitoba, Hudbay's future deleveraging strategies and Hudbay's ability to deleverage and repay debt as needed, expectations regarding Hudbay's cash balance and liquidity and related cash management strategies, expectations regarding Hudbay's capital planning strategies, including but not limited to Hudbay's enhanced Capital Allocation Framework, expectations regarding tax synergies, expectations regarding the ability to conduct exploration work and execute on exploration programs on its properties and to advance related drill plans, including the advancement of the exploration program at Maria Reyna and Caballito and the status and anticipated timing of the related drill permit application process, expectations regarding the prospective nature of the Maria Reyna and Caballito properties, Hudbay's evaluation and assessment of opportunities to reprocess tailings using various metallurgical technologies, the anticipated impact of brownfield and greenfield growth projects on Hudbay's performance, anticipated exploration and expansion opportunities and extension of mine life in Snow Lake and Hudbay's ability to find a new anchor deposit near Hudbay's Snow Lake operations, anticipated future drill programs and exploration activities and any results expected therefrom, the enhancement of stakeholder engagement and advancement of a pre-feasibility study and related test work at the Mason copper project in Nevada, anticipated mine plans, anticipated metals prices and the anticipated sensitivity of Hudbay's financial performance to metals prices, events that may affect Hudbay's operations and development projects, anticipated cash flows from operations and related liquidity requirements, the ability to successfully obtain proceeds from insurance claims, the ability to achieve Hudbay's climate change goals and initiatives, the anticipated effect of external factors on revenue, such as commodity prices, estimation of mineral reserves and resources, mine life projections, reclamation costs, economic outlook, government regulation of mining operations, and business and acquisition strategies. Forward-looking information is not, and cannot be, a guarantee of future results or events. Forward-looking information is based on, among other things, opinions, assumptions, estimates and analyses that, while considered reasonable by Hudbay at the date the forward-looking information is provided, inherently are subject to significant risks, uncertainties, contingencies and other factors that may cause actual results and events to be materially different from those expressed or implied by the forward-looking information.
The material factors or assumptions that Hudbay has identified and were applied in drawing conclusions or making forecasts or projections set out in the forward-looking information include, but are not limited to:
- the ability to achieve production, cost and capital and exploration expenditure guidance;
- no significant interruptions to Hudbay's operations due to social or political unrest in the regions Hudbay operates, including the navigation of the complex political and social environment in Peru and the resolution of grievances raised by local communities and their residents;
- the ability to consummate the definitive agreement with Wheaton in respect of the enhanced precious metals stream at Copper World;
- no interruptions to Hudbay's plans for advancing the Copper World project, including with respect to any successful challenges to the Copper World permits;
- Hudbay's ability to successfully advance and complete the optimization of the Copper Mountain operations, obtain required permits and develop and maintain good relations with key stakeholders;
- the ability to execute on its exploration plans and to advance related drill plans;
- the ability to advance the exploration program at the Maria Reyna and Caballito properties;
- the success of mining, processing, exploration and development activities;
- the scheduled maintenance and availability of Hudbay's processing facilities;
- the accuracy of geological, mining and metallurgical estimates;
- anticipated metals prices and the costs of production;
- the supply and demand for metals Hudbay produces; - no significant interruptions to operations due to adverse effects from extreme weather events, including forest fires that have affected and may continue to affect the regions in which Hudbay operates;
- the supply and availability of all forms of energy and fuels at reasonable prices;
- no significant unanticipated operational or technical difficulties;
- the execution of Hudbay's business and growth strategies, including the success of its strategic investments and initiatives;
- the availability of additional financing, if needed;
- the ability to deleverage and repay debt, as needed;
- the ability to complete project targets on time and on budget and other events that may affect Hudbay's ability to develop Hudbay's projects;
- the timing and receipt of various regulatory and governmental approvals;
- the availability of personnel for Hudbay's exploration, development and operational projects and ongoing employee relations;
- maintaining good relations with the employees at Hudbay's operations;
- maintaining good relations with the labour unions that represent certain of Hudbay employees in Manitoba and Peru;
- maintaining good relations with the communities in which Hudbay operates, including the neighbouring Indigenous communities and local governments;
- no significant unanticipated challenges with stakeholders at Hudbay's various projects;
- no significant unanticipated events or changes relating to regulatory, environmental, health and safety matters;
- no contests over title to Hudbay's properties, including as a result of rights or claimed rights of Indigenous peoples or challenges to the validity of Hudbay's unpatented mining claims;
- the timing and possible outcome of pending litigation and no significant unanticipated litigation;
- certain tax matters, including, but not limited to current tax laws and regulations, changes in taxation policies and the refund of certain value added taxes from the Canadian and Peruvian governments; and
- no significant and continuing adverse changes in general economic conditions or conditions in the financial markets (including commodity prices and foreign exchange rates).
The risks, uncertainties, contingencies and other factors that may cause actual results to differ materially from those expressed or implied by the forward-looking information may include, but are not limited to, risks associated with reaching a definitive agreement with Wheaton in respect of the enhanced precious metals stream, risks related to the failure to effectively advance and complete the optimization of the Copper Mountain mine operations including with respect to the ongoing second SAG mill conversion and configuration project and with respect to the primary SAG mill repairs and related ramp-up plans, political and social risks in the regions Hudbay operates, including the complex political and social environment in Peru and potential disruptions to operations arising from community protests and grievances, risks generally associated with the mining industry and the current geopolitical environment, including future commodity prices, the potential implementation or expansion of tariffs, currency and interest rate fluctuations, energy and consumable prices, supply chain constraints and general cost escalation in the current inflationary environment, uncertainties related to the development and operation of Hudbay's projects, the risk of an indicator of impairment or impairment reversal relating to a material mineral property, risks related to the Copper World project, including in relation to project delivery and financing risks, risks related to the Lalor mine plan, including the ability to convert inferred mineral resource estimates to higher confidence categories, dependence on key personnel and employee and union relations, risks related to political or social instability, unrest or change, risks in respect of Indigenous and community relations, rights and title claims, operational risks and hazards, including the cost of maintaining and upgrading Hudbay's tailings management facilities and any unanticipated environmental, industrial and geological events and developments and the inability to insure against all risks (including any unanticipated significant interruptions to operations due to adverse effects from extreme weather events), failure of plant, equipment, processes, transportation and other infrastructure to operate as anticipated, compliance with government and environmental regulations, including permitting requirements and anti-bribery legislation, depletion of Hudbay's reserves, volatile financial markets and interest rates that may affect Hudbay's ability to obtain additional financing on acceptable terms, the failure to obtain required approvals or clearances from government authorities on a timely basis, uncertainties related to the geology, continuity, grade and estimates of mineral reserves and resources, and the potential for variations in grade and recovery rates, uncertain costs of reclamation activities, Hudbay's ability to comply with Hudbay's pension and other post-retirement obligations, Hudbay's ability to abide by the covenants in Hudbay's debt instruments and other material contracts, tax refunds, hedging transactions, as well as the risks discussed under the heading "Risk Factors" in Hudbay's most recent Annual Information Form which is available on the Company's SEDAR+ profile at www.sedarplus.ca and the Company's EDGAR profile at www.sec.gov.
Should one or more risk, uncertainty, contingency or other factor materialize or should any factor or assumption prove incorrect, actual results could vary materially from those expressed or implied in the forward-looking information. Accordingly, you should not place undue reliance on forward-looking information. Hudbay does not assume any obligation to update or revise any forward-looking information after the date of this MD&A or to explain any material difference between subsequent actual events and any forward-looking information, except as required by applicable law.
Note to United States Investors
This MD&A has been prepared in accordance with the requirements of the securities laws in effect in Canada, which may differ materially from the requirements of United States securities laws applicable to U.S. issuers.
Qualified Persons and NI 43-101
The technical and scientific information in this MD&A related to Hudbay's material mineral projects other than the Copper Mountain mine has been approved by Olivier Tavchandjian, P. Geo, Senior Vice President, Exploration and Technical Services. Mr. Tavchandjian is a qualified person pursuant to National Instrument 43-101 - Standards of Disclosure for Mineral Projects ("NI 43-101").
The technical and scientific information in this MD&A related to the Copper Mountain mine has been approved by Marc-Andre Brulotte, P. Geo, Director, Global Exploration and Resource Evaluation. Mr. Brulotte is a qualified person pursuant to NI 43-101.
For a description of the key assumptions, parameters and methods used to estimate mineral reserves and resources at Hudbay's material mineral properties, as well as data verification procedures and a general discussion of the extent to which the estimates of scientific and technical information may be affected by any known environmental, permitting, legal title, taxation, sociopolitical, marketing or other relevant factors, please see the technical reports for Hudbay's material properties as filed by the Company on SEDAR+ at www.sedarplus.ca and EDGAR at www.sec.gov.
SUMMARY OF HISTORICAL RESULTS
The following unaudited tables set out a summary of quarterly and annual results for the Company.
| 2025 4 | Q4 2025 | Q3 2025 | Q2 2025 | Q1 2025 | 2024 4 | Q4 2024 | Q3 2024 | Q2 2024 | Q1 2024 | 2023 4 | Q4 2023 | ||
| Consolidated Financial Condition ($ millions) | |||||||||||||
| Cash and cash equivalents and short-term investment | $568.9 | $568.9 | $611.1 | $625.5 | $582.6 | $581.8 | $581.8 | $483.3 | $523.8 | $284.4 | $249.8 | $249.8 | |
| Total long-term debt | 1,008.6 | 1,008.6 | 1,047.0 | 1,059.6 | 1,108.7 | 1,107.5 | 1,107.5 | 1,108.9 | 1,155.6 | 1,278.6 | 1,287.5 | 1,287.5 | |
| Net debt1 |
439.7 | 439.7 | 435.9 | 434.1 | 526.1 | 525.7 | 525.7 | 625.6 | 631.8 | 994.2 | 1,037.7 | 1,037.7 | |
| Free cash flow | 387.9 | 228.2 | (15.2) | 87.8 | 87.4 | 357.1 | 148.9 | 88.4 | 32.5 | 87.2 | 320.2 | 160.5 | |
| Consolidated Financial Performance ($ millions except per share amounts) | |||||||||||||
| Revenue | $2,211.0 | $732.9 | $346.8 | $536.4 | $594.9 | $2,021.2 | $584.9 | $485.8 | $425.5 | $525.0 | $1,690.0 | $602.2 | |
| Cost of sales | 1,467.8 | 462.8 | 281.5 | 359.9 | 363.6 | 1,467.4 | 400.5 | 346.0 | 347.9 | 373.0 | 1,297.5 | 405.4 | |
| Earnings (loss) before tax | 912.0 | 257.1 | 330.5 | 153.1 | 171.3 | 251.6 | 103.7 | 79.7 | 0.4 | 67.8 | 151.8 | 81.0 | |
| Net (loss) earnings | 564.3 | 128.0 | 222.4 | 114.7 | 99.2 | 67.8 | 19.3 | 50.3 | (20.3) | 18.5 | 69.5 | 33.5 | |
| Net (loss) earnings attributable to owners1 | 568.5 | 128.0 | 222.4 | 117.7 | 100.4 | 76.7 | 21.2 | 49.7 | (16.5) | 22.3 | 66.4 | 30.7 | |
| Basic and diluted (loss) earnings per share | $1.44 | $0.32 | $0.56 | $0.30 | $0.25 | $0.20 | $0.05 | $0.13 | $(0.04) | $0.06 | $0.22 | $0.09 | |
| Adjusted (loss) earnings per share attributable to owners 1 | $0.67 | $0.22 | $0.03 | $0.19 | $0.24 | $0.48 | $0.18 | $0.13 | $0.00 | $0.17 | $0.23 | $0.20 | |
| Operating cash flow before change in non-cash working capital | 764.3 | 336.9 | 70.3 | 193.9 | 163.5 | 691.1 | 231.5 | 188.3 | 123.7 | 147.5 | 570.0 | 246.5 | |
| Adjusted EBITDA 1 | 1,060.9 | 385.9 | 142.6 | 245.2 | 287.2 | 823.3 | 257.3 | 206.0 | 145.0 | 215.0 | 647.8 | 274.4 | |
| Consolidated Operational Performance | |||||||||||||
| Contained metal in concentrate and doré produced 2 | |||||||||||||
| Copper | tonnes | 118,188 | 33,069 | 24,205 | 29,956 | 30,958 | 137,943 | 43,262 | 31,354 | 28,578 | 34,749 | 131,691 | 45,450 |
| Gold | ounces | 267,934 | 84,298 | 53,581 | 56,271 | 73,784 | 332,240 | 94,161 | 89,073 | 58,614 | 90,392 | 310,429 | 112,776 |
| Silver | ounces | 3,468,143 | 1,002,985 | 730,394 | 814,989 | 919,775 | 3,983,851 | 1,311,658 | 985,569 | 738,707 | 947,917 | 3,575,234 | 1,197,082 |
| Zinc | tonnes | 17,646 | 5,703 | 548 | 5,130 | 6,265 | 33,339 | 8,385 | 8,069 | 8,087 | 8,798 | 34,642 | 5,747 |
| Molybdenum | tonnes | 1,282 | 325 | 185 | 375 | 397 | 1,323 | 195 | 362 | 369 | 397 | 1,566 | 397 |
| Payable metal in concentrate and doré sold | |||||||||||||
| Copper | tonnes | 114,534 | 34,132 | 18,280 | 30,354 | 31,768 | 125,094 | 37,927 | 27,760 | 25,799 | 33,608 | 124,996 | 44,006 |
| Gold | ounces | 260,261 | 84,424 | 38,279 | 62,466 | 75,092 | 335,342 | 92,734 | 73,232 | 61,295 | 108,081 | 276,893 | 104,840 |
| Silver | ounces | 3,190,552 | 871,006 | 418,418 | 894,160 | 1,006,968 | 3,549,816 | 1,150,518 | 663,413 | 667,036 | 1,068,848 | 3,145,166 | 1,048,877 |
| Zinc 3 | tonnes | 15,152 | 3,972 | 3,452 | 2,871 | 4,857 | 25,120 | 5,261 | 8,607 | 5,133 | 6,119 | 28,779 | 7,385 |
| Molybdenum | tonnes | 1,334 | 190 | 269 | 427 | 448 | 1,287 | 182 | 343 | 347 | 415 | 1,462 | 468 |
| Cash cost 1 | $/lb | $(0.22) | $(0.63) | $0.42 | $(0.02) | $(0.45) | $0.46 | $0.45 | $0.18 | $1.14 | $0.16 | $0.80 | $0.16 |
| Sustaining cash cost 1 | $/lb | $1.30 | $0.94 | $2.09 | $1.65 | $0.72 | $1.62 | $1.37 | $1.71 | $2.65 | $1.00 | $1.72 | $1.09 |
| All-in sustaining cash cost 1 | $/lb | $1.74 | $1.43 | $2.78 | $2.03 | $0.97 | $1.88 | $1.53 | $1.95 | $3.07 | $1.29 | $1.92 | $1.31 |
1Net debt, adjusted earnings (loss) per share attributable to owners, adjusted EBITDA, cash cost, sustaining cash cost and all-in sustaining cash cost per pound of copper produced, net of by-product credits, are non-GAAP financial performance measures with no standardized definition under IFRS. For further information and a detailed reconciliation, please see discussion under the "Non-GAAP Financial Performance Measures" section of this MD&A. The above table sets forth selected non-GAAP financial performance measures for each of the Company's nine most recently completed quarters and three most recently completed years; detailed reconciliations for non-comparable prior periods can be found in Hudbay's MD&A for these prior periods in the "Non-GAAP Financial Performance Measures" section of these documents.
2 Metal reported in concentrate is prior to deductions associated with smelter contract terms and includes other secondary products.
3 Includes refined zinc metal sold.
4 Annual consolidated results may not calculate based on amounts presented in this table due to rounding.
| 2025 4 | Q4 2025 | Q3 2025 | Q2 2025 | Q1 2025 | 2024 4 | Q4 2024 | Q3 2024 | Q2 2024 | Q1 2024 | 2023 4 | Q4 2023 | ||
| Peru Operations | |||||||||||||
| Constancia ore mined1 | tonnes | 21,539,089 | 5,610,915 | 564,579 | 6,735,316 | 8,628,279 | 15,046,190 | 4,186,058 | 3,022,931 | 5,277,654 | 2,559,547 | 9,265,954 | 973,176 |
| Copper | % | 0.31 | 0.31 | 0.25 | 0.34 | 0.28 | 0.34 | 0.40 | 0.36 | 0.29 | 0.31 | 0.32 | 0.30 |
| Gold | g/tonne | 0.03 | 0.03 | 0.02 | 0.03 | 0.03 | 0.04 | 0.04 | 0.04 | 0.03 | 0.04 | 0.04 | 0.04 |
| Silver | g/tonne | 3.18 | 3.27 | 1.92 | 3.26 | 3.14 | 3.08 | 3.88 | 3.20 | 2.50 | 2.79 | 2.53 | 2.26 |
| Molybdenum | % | 0.02 | 0.01 | 0.01 | 0.02 | 0.02 | 0.01 | 0.02 | 0.02 | 0.01 | 0.01 | 0.01 | 0.01 |
| Pampacancha ore mined1 | tonnes | 9,563,442 | 4,152,000 | 4,260,081 | 762,172 | 389,189 | 9,317,499 | 4,037,264 | 1,777,092 | 1,288,789 | 2,214,354 | 14,756,416 | 5,556,613 |
| Copper | % | 0.40 | 0.43 | 0.38 | 0.26 | 0.44 | 0.55 | 0.63 | 0.48 | 0.41 | 0.56 | 0.51 | 0.56 |
| Gold | g/tonne | 0.29 | 0.27 | 0.31 | 0.24 | 0.26 | 0.32 | 0.38 | 0.27 | 0.20 | 0.32 | 0.33 | 0.32 |
| Silver | g/tonne | 4.78 | 4.84 | 4.87 | 4.59 | 3.68 | 5.61 | 6.43 | 6.23 | 3.83 | 4.64 | 4.28 | 4.84 |
| Molybdenum | % | 0.01 | 0.01 | 0.01 | 0.01 | 0.01 | 0.01 | 0.00 | 0.01 | 0.02 | 0.02 | 0.01 | 0.01 |
| Strip Ratio | 1.04 | 0.57 | 1.38 | 1.47 | 1.02 | 1.78 | 1.22 | 2.62 | 1.74 | 1.95 | 1.51 | 1.26 | |
| Ore milled | tonnes | 30,292,668 | 7,627,853 | 6,991,744 | 7,559,047 | 8,114,024 | 31,933,624 | 7,999,453 | 8,137,248 | 7,718,962 | 8,077,962 | 30,720,929 | 7,939,044 |
| Copper | % | 0.33 | 0.39 | 0.31 | 0.34 | 0.30 | 0.36 | 0.48 | 0.32 | 0.30 | 0.36 | 0.39 | 0.48 |
| Gold | g/tonne | 0.11 | 0.18 | 0.16 | 0.05 | 0.05 | 0.14 | 0.20 | 0.11 | 0.07 | 0.15 | 0.16 | 0.25 |
| Silver | g/tonne | 3.72 | 4.19 | 3.94 | 3.58 | 3.22 | 3.84 | 5.28 | 3.70 | 2.85 | 3.48 | 3.62 | 4.20 |
| Molybdenum | % | 0.01 | 0.01 | 0.01 | 0.01 | 0.01 | 0.01 | 0.01 | 0.01 | 0.01 | 0.01 | 0.01 | 0.01 |
| Copper recovery | % | 84.3 | 84.5 | 83.2 | 84.5 | 84.6 | 85.0 | 87.8 | 82.6 | 83.1 | 84.9 | 84.2 | 87.4 |
| Gold recovery | % | 69.2 | 74.7 | 72.1 | 56.0 | 56.5 | 70.7 | 73.3 | 68.1 | 61.4 | 73.4 | 71.8 | 77.6 |
| Silver recovery | % | 66.7 | 71.1 | 65.2 | 63.5 | 66.0 | 68.8 | 71.4 | 67.0 | 63.9 | 70.7 | 70.0 | 78.0 |
| Molybdenum | % | 37.4 | 38.8 | 33.9 | 38.7 | 35.7 | 41.7 | 37.1 | 39.0 | 46.3 | 43.2 | 35.8 | 33.6 |
| Contained metal in concentrate | |||||||||||||
| Copper | tonnes | 85,155 | 25,038 | 18,114 | 21,710 | 20,293 | 99,001 | 33,988 | 21,220 | 19,217 | 24,576 | 100,487 | 33,207 |
| Gold | ounces | 74,480 | 32,865 | 26,380 | 7,366 | 7,869 | 98,226 | 38,079 | 20,331 | 10,672 | 29,144 | 114,218 | 49,418 |
| Silver | ounces | 2,415,134 | 731,017 | 577,446 | 551,979 | 554,692 | 2,708,262 | 969,502 | 648,209 | 450,833 | 639,718 | 2,505,229 | 836,208 |
| Molybdenum | tonnes | 1,282 | 325 | 185 | 375 | 397 | 1,323 | 195 | 362 | 369 | 397 | 1,566 | 397 |
| Payable metal sold | |||||||||||||
| Copper | tonnes | 84,438 | 28,361 | 11,769 | 21,418 | 22,890 | 88,138 | 28,775 | 18,803 | 16,806 | 23,754 | 96,213 | 31,200 |
| Gold | ounces | 71,755 | 37,874 | 9,798 | 9,721 | 14,362 | 103,364 | 37,459 | 9,795 | 13,433 | 42,677 | 97,176 | 38,114 |
| Silver | ounces | 2,239,832 | 650,384 | 258,215 | 616,578 | 714,654 | 2,343,820 | 824,613 | 365,198 | 400,302 | 753,707 | 2,227,419 | 703,679 |
| Molybdenum | tonnes | 1,334 | 190 | 269 | 427 | 448 | 1,287 | 182 | 343 | 347 | 415 | 1,462 | 468 |
| Unit cost 2,3 | $/tonne | $13.02 | $14.51 | $13.03 | $13.59 | $11.09 | $12.91 | $15.25 | $12.78 | $12.68 | $10.92 | $12.47 | $12.24 |
| Peru cash cost3 | $/lb | $1.08 | $0.57 | $1.30 | $1.45 | $1.11 | $1.18 | $1.00 | $1.80 | $1.78 | $0.43 | $1.07 | $0.54 |
| Peru sustaining cash cost3 | $/lb | $2.02 | $1.53 | $2.11 | $2.63 | $1.92 | $1.86 | $1.48 | $2.78 | $2.60 | $1.02 | $1.81 | $1.21 |
1 Reported tonnes and grade for ore mined are estimates based on mine plan assumptions and may not fully reconcile to ore milled.
2 Reflects combined mine, mill and G&A costs per tonne of ore milled. Reflects the deduction of expected capitalized stripping costs.
3 Combined unit costs, cash cost, and sustaining cash cost per pound of copper produced, net of by-product credits, are non-GAAP financial performance measures with no standardized definition under IFRS. For further information and a detailed reconciliation, please see the discussion under the "Non-GAAP Financial Performance Measures" section of this MD&A. The above table sets forth selected non-GAAP financial performance measures for each of the Company's nine most recently completed quarters and three most recently completed years; detailed reconciliations for non-comparable prior periods can be found in Hudbay's MD&A for these prior periods in the "Non-GAAP Financial Performance Measures" section of these documents.
4 Annual consolidated results may not calculate based on amounts presented in this table due to rounding.
| 2025 1 | Q4 2025 | Q3 2025 | Q2 2025 | Q1 2025 | 2024 1 | Q4 2024 | Q3 2024 | Q2 2024 | Q1 2024 | 2023 1 | Q4 2023 | ||
| Manitoba Operations | |||||||||||||
| Lalor ore mined | tonnes | 1,180,121 | 353,819 | 139,006 | 303,062 | 384,234 | 1,626,935 | 422,454 | 411,295 | 385,478 | 407,708 | 1,526,729 | 372,384 |
| Gold | g/tonne | 5.35 | 5.51 | 5.42 | 4.97 | 5.46 | 4.68 | 4.61 | 5.45 | 3.75 | 4.84 | 4.74 | 5.92 |
| Copper | % | 0.79 | 0.82 | 0.67 | 0.61 | 0.95 | 0.85 | 0.95 | 0.91 | 0.69 | 0.84 | 0.86 | 1.04 |
| Zinc | % | 2.41 | 2.55 | 1.93 | 2.46 | 2.42 | 2.84 | 2.95 | 2.73 | 2.76 | 2.92 | 3.00 | 2.20 |
| Silver | g/tonne | 30.43 | 29.52 | 31.57 | 29.94 | 31.23 | 27.14 | 31.91 | 30.45 | 22.29 | 23.44 | 24.51 | 28.92 |
| Stall Concentrator: | |||||||||||||
| Ore milled | tonnes | 572,704 | 169,274 | 43,940 | 144,204 | 215,286 | 893,510 | 222,004 | 222,621 | 229,527 | 219,358 | 965,567 | 228,799 |
| Gold | g/tonne | 3.45 | 3.24 | 3.10 | 3.19 | 3.86 | 3.42 | 3.36 | 4.23 | 3.02 | 3.07 | 3.45 | 4.22 |
| Copper | % | 0.67 | 0.69 | 0.56 | 0.56 | 0.76 | 0.71 | 0.73 | 0.89 | 0.59 | 0.64 | 0.74 | 0.73 |
| Zinc | % | 3.90 | 4.32 | 3.61 | 4.20 | 3.44 | 4.33 | 4.62 | 4.12 | 4.05 | 4.54 | 4.36 | 3.20 |
| Silver | g/tonne | 28.31 | 24.97 | 31.04 | 29.55 | 29.53 | 26.54 | 29.90 | 30.20 | 21.74 | 24.46 | 24.19 | 28.63 |
| Gold recovery | % | 70.1 | 71.3 | 72.6 | 67.9 | 70.1 | 68.6 | 69.6 | 70.5 | 65.5 | 68.0 | 64.8 | 67.5 |
| Copper recovery | % | 86.7 | 86.5 | 83.4 | 84.7 | 88.3 | 87.4 | 84.4 | 88.3 | 85.4 | 91.7 | 90.4 | 92.0 |
| Zinc recovery | % | 79.0 | 78.0 | 34.6 | 84.8 | 84.7 | 86.2 | 81.7 | 88.1 | 87.1 | 88.4 | 82.2 | 78.5 |
| Silver recovery | % | 55.4 | 55.6 | 50.3 | 51.9 | 58.7 | 56.8 | 55.1 | 57.8 | 54.2 | 59.8 | 61.4 | 61.8 |
| New Britannia Concentrator: | |||||||||||||
| Ore milled | tonnes | 624,631 | 179,808 | 92,765 | 162,934 | 189,124 | 715,198 | 185,592 | 191,298 | 167,899 | 170,409 | 596,912 | 165,038 |
| Gold | g/tonne | 6.87 | 6.68 | 6.88 | 6.48 | 7.37 | 6.29 | 5.99 | 6.77 | 5.31 | 7.03 | 6.76 | 8.03 |
| Copper | % | 0.95 | 1.08 | 0.76 | 0.65 | 1.18 | 1.04 | 1.17 | 0.93 | 0.94 | 1.13 | 1.03 | 1.46 |
| Zinc | % | 1.09 | 1.30 | 1.00 | 1.01 | 1.00 | 0.99 | 1.08 | 1.12 | 0.92 | 0.82 | 0.84 | 0.85 |
| Silver | g/tonne | 31.75 | 31.17 | 32.18 | 30.29 | 33.35 | 27.78 | 33.97 | 30.24 | 24.42 | 21.60 | 25.11 | 27.97 |
| Gold recovery - concentrate and doré | % | 89.8 | 88.6 | 91.8 | 89.4 | 90.3 | 89.7 | 90.2 | 90.0 | 90.0 | 88.6 | 88.6 | 89.0 |
| Copper recovery | % | 89.2 | 88.6 | 90.0 | 87.4 | 90.3 | 93.6 | 91.3 | 92.8 | 94.4 | 96.2 | 93.3 | 91.6 |
| Silver recovery - concentrate and doré | % | 79.0 | 77.1 | 78.5 | 78.0 | 81.6 | 80.9 | 79.6 | 79.9 | 83.1 | 82.0 | 81.5 | 83.2 |
1 Annual consolidated results may not calculate based on amounts presented in this table due to rounding.
| 2024 4 | Q4 2025 | Q3 2025 | Q2 2025 | Q1 2025 | 2024 4 | Q4 2024 | Q3 2024 | Q2 2024 | Q1 2024 | 2023 4 | Q4 2023 | ||
| Manitoba Operations (continued) | |||||||||||||
| Total Manitoba contained metal in concentrate and doré produced5 | |||||||||||||
| Gold | ounces | 173,453 | 47,423 | 22,441 | 43,235 | 60,354 | 214,225 | 51,438 | 62,468 | 43,488 | 56,831 | 187,363 | 59,863 |
| Copper | tonnes | 9,249 | 3,326 | 842 | 1,612 | 3,469 | 12,536 | 3,347 | 3,398 | 2,642 | 3,149 | 12,154 | 3,735 |
| Zinc | tonnes | 17,646 | 5,703 | 548 | 5,130 | 6,265 | 33,339 | 8,385 | 8,069 | 8,087 | 8,798 | 34,642 | 5,747 |
| Silver | ounces | 800,198 | 214,493 | 102,132 | 197,970 | 285,603 | 995,090 | 283,223 | 281,397 | 210,647 | 219,823 | 851,723 | 255,579 |
| Total Manitoba payable metal sold in concentrate and doré | |||||||||||||
| Gold | ounces | 169,041 | 43,226 | 23,118 | 46,932 | 55,765 | 212,243 | 50,239 | 57,238 | 42,763 | 62,003 | 171,297 | 63,635 |
| Copper | tonnes | 7,651 | 2,024 | 769 | 2,133 | 2,725 | 11,602 | 3,321 | 2,931 | 2,429 | 2,921 | 10,708 | 3,687 |
| Zinc1 | tonnes | 15,152 | 3,972 | 3,452 | 2,871 | 4,857 | 25,120 | 5,261 | 8,607 | 5,133 | 6,119 | 28,779 | 7,385 |
| Silver | ounces | 729,314 | 175,324 | 112,142 | 209,594 | 232,255 | 956,460 | 282,158 | 244,974 | 197,486 | 231,841 | 728,304 | 246,757 |
| Combined unit cost 2,3 | C$/tonne | $236 | $248 | $258 | $241 | $214 | $226 | $233 | $211 | $225 | $235 | $217 | $216 |
| Gold cash cost 3 | $/oz | $549 | $705 | $379 | $710 | $376 | $606 | $607 | $372 | $771 | $736 | $727 | $434 |
| Sustaining gold cash cost 3 | $/oz | $875 | $1,110 | $762 | $1,025 | $626 | $868 | $908 | $553 | $1,163 | $950 | $1,077 | $788 |
1 Includes refined zinc metal sold.
2 Reflects combined mine, mill and G&A costs per tonne of milled ore.
3 Combined unit costs, cash cost, and sustaining cash cost per pound of copper produced, cash cost, and sustaining cash cost per ounce of gold produced, net of by-product credits, are non-GAAP financial performance measures with no standardized definition under IFRS. For further information and a detailed reconciliation, please see the discussion under the "Non-GAAP Financial Performance Measures" section of this MD&A. The above table sets forth selected non-GAAP financial performance measures for each of the Company's nine most recently completed quarters and three most recently completed years; detailed reconciliations for non-comparable prior periods can be found in Hudbay's MD&A for these prior periods in the "Non-GAAP Financial Performance Measures" section of these documents.
4 Annual consolidated results may not calculate based on amounts presented in this table due to rounding.
5 Metal reported in concentrate is prior to deductions associated with smelter terms and includes other secondary products.
| 2025 | Q4 2025 | Q3 2025 | Q2 2025 | Q1 2025 | 2024 5 | Q4 2024 | Q3 2024 | Q2 2024 | Q1 2024 | 2023 5 | Q4 2023 | ||
| British Columbia Operations 4 | |||||||||||||
| Ore mined1 | tonnes | 9,368,918 | 2,395,166 | 1,815,689 | 2,509,969 | 2,648,094 | 11,360,125 | 2,374,044 | 3,098,863 | 2,164,722 | 3,722,496 | 6,975,389 | 2,627,398 |
| Strip Ratio | 7.46 | 7.18 | 8.84 | 7.50 | 6.73 | 5.98 | 7.36 | 6.05 | 7.61 | 4.10 | 3.82 | 5.34 | |
| Ore milled | tonnes | 11,016,842 | 2,268,405 | 3,087,443 | 2,900,008 | 2,760,986 | 12,656,679 | 2,880,927 | 3,363,176 | 3,232,427 | 3,180,149 | 6,862,152 | 3,261,891 |
| Copper | % | 0.27 | 0.26 | 0.22 | 0.28 | 0.33 | 0.25 | 0.26 | 0.24 | 0.25 | 0.27 | 0.35 | 0.33 |
| Gold | g/tonne | 0.09 | 0.09 | 0.08 | 0.09 | 0.10 | 0.08 | 0.09 | 0.09 | 0.07 | 0.07 | 0.07 | 0.06 |
| Silver | g/tonne | 1.02 | 1.10 | 0.78 | 0.97 | 1.28 | 0.96 | 0.92 | 0.73 | 1.01 | 1.19 | 1.36 | 1.36 |
| Copper recovery | % | 78.6 | 78.4 | 76.6 | 81.0 | 78.3 | 82.4 | 79.5 | 84.1 | 82.3 | 83.4 | 79.7 | 78.8 |
| Gold recovery | % | 63.6 | 63.3 | 59.2 | 68.2 | 63.4 | 60.5 | 55.8 | 67.3 | 57.2 | 61.8 | 55.9 | 54.1 |
| Silver recovery | % | 69.7 | 71.4 | 65.5 | 71.8 | 69.8 | 71.8 | 69.0 | 71.2 | 73.9 | 72.4 | 73.0 | 73.8 |
| Contained metal in concentrate produced | |||||||||||||
| Copper | tonnes | 23,784 | 4,705 | 5,249 | 6,634 | 7,196 | 26,406 | 5,927 | 6,736 | 6,719 | 7,024 | 19,050 | 8,508 |
| Gold | ounces | 20,001 | 4,010 | 4,760 | 5,670 | 5,561 | 19,789 | 4,644 | 6,274 | 4,454 | 4,417 | 8,848 | 3,495 |
| Silver | ounces | 252,811 | 57,475 | 50,816 | 65,040 | 79,480 | 280,499 | 58,933 | 55,963 | 77,227 | 88,376 | 218,282 | 105,295 |
| Payable metal | |||||||||||||
| Copper | tonnes | 22,445 | 3,747 | 5,742 | 6,803 | 6,153 | 25,354 | 5,831 | 6,026 | 6,564 | 6,933 | 18,075 | 9,119 |
| Gold | ounces | 19,465 | 3,324 | 5,363 | 5,813 | 4,965 | 19,735 | 5,036 | 6,199 | 5,099 | 3,401 | 8,420 | 3,091 |
| Silver | ounces | 221,406 | 45,298 | 48,061 | 67,988 | 60,059 | 249,536 | 43,747 | 53,241 | 69,248 | 83,300 | 189,443 | 98,441 |
| Combined unit cost 2,3 | C$/tonne | $28.12 | $39.80 | $25.02 | $24.51 | $25.98 | $20.39 | $23.22 | $15.58 | $19.65 | $23.67 | $21.38 | $20.90 |
| Cash cost3 | $/lb | $3.06 | $4.82 | $3.21 | $2.39 | $2.44 | $2.74 | $3.00 | $1.81 | $2.67 | $3.49 | $2.49 | $2.67 |
| Sustaining cash cost 3 | $/lb | $6.12 | $8.87 | $7.43 | $5.18 | $4.24 | $5.29 | $5.76 | $5.06 | $5.56 | $4.85 | $3.41 | $3.93 |
1 Reported tonnes and grade for ore mined are estimates based on mine plan assumptions and may not fully reconcile to ore milled.
2 Reflects combined mine, mill and general and administrative ("G&A") costs per tonne of ore milled. Reflects the deduction of expected capitalized stripping costs.
3 Combined unit costs, cash cost, and sustaining cash cost per pound of copper produced, net of by-product credits, are non-GAAP financial performance measures with no standardized definition under IFRS. For further information and a detailed reconciliation, please see the discussion under the "Non-GAAP Financial Performance Measures" section of this MD&A. The above table sets forth selected non-GAAP financial performance measures for each of the Company's nine most recently completed quarters and three most recently completed years; detailed reconciliations for non-comparable prior periods can be found in Hudbay's MD&A for these prior periods in the "Non-GAAP Financial Performance Measures" section of these documents.
4 Copper Mountain mine results are stated at 100%. On April 30, 2025 Hudbay completed the acquisition of the remaining 25% interest in the Copper Mountain mine and now owns 100%.
5 Annual consolidated results may not calculate based on amounts presented in this table due to rounding.
Exhibit 99.4
Disclosure Pursuant to Section 1503(a) of the Dodd-Frank Wall Street Reform and Consumer
Protection Act
Hudbay Minerals Inc. ("Hudbay") is committed to the health and safety of its employees and to providing an incident free workplace.
Certain of Hudbay's U.S. mining operations are subject to Federal Mine Safety and Health Administration (the "MSHA") regulation under the U.S. Federal Mine Safety and Health Act of 1977 (the "FMSH Act"). MSHA inspects Hudbay's mines on a regular basis and issues citations and orders when it believes a violation has occurred under the FMSH Act. When MSHA issues a citation or order, it also generally proposes a civil penalty, or fine, related to the alleged violation.
Pursuant to Section 1503(a) of the Dodd-Frank Wall Street Reform and Consumer Protection Act (the "Dodd-Frank Act"), issuers that are operators, or that have a subsidiary that is an operator, of a coal or other mine are required to disclose in their periodic reports filed with the Commission information regarding specified health and safety violations, orders and citations, related assessments and legal actions, and mining-related fatalities. The disclosures reflect Hudbay's U.S. mining operations only as the requirements of the Dodd-Frank Act do not apply to Hudbay's mines operated outside the U.S.
During the fiscal year ended December 31, 2025, the Registrant’s Copper World project was issued three Section 104(a) citations by MSHA. These citations were administrative in nature and none of them were classified as significant and substantial. Two of the citations were promptly addressed and closed on the same day they were issued, and one remains under review by MSHA with no penalties assessed to date. No other citations or orders were issued, and no Section 104(e) notices were received, from MSHA in 2025.
There were no mining-related fatalities at either the Registrant’s Copper World project or the Registrant’s Mason project during the fiscal year ended December 31, 2025. No legal actions were pending before the Federal Mine Safety and Health Review Commission as of December 31, 2025 and none were instituted or resolved in 2025. Additionally, the Registrant’s Mason project was not subject to MSHA jurisdiction during the fiscal year ended December 31, 2025.
In addition, as required by the reporting requirements regarding mine safety included in section 1503(a)(2) of the Dodd-Frank Act, for the year ended December 31, 2025, none of the mines operated by Hudbay received written notice from the MSHA of (a) a pattern of violations of mandatory health or safety standards that are of such nature as could have significantly and substantially contributed to the cause and effect of mine health or safety hazards under section 104(e) of the FMSH Act or (b) the potential to have such a pattern.
Exhibit 99.5
Certification by the Chief Executive Officer Pursuant to
Section 302 of the Sarbanes-Oxley Act of 2002
I, Peter Kukielski, certify that:
1) I have reviewed this annual report on Form 40-F of Hudbay Minerals Inc.;
2) Based on my knowledge, this report does not contain any untrue statement of a material fact or omit to state a material fact necessary to make the statements made, in light of the circumstances under which such statements were made, not misleading with respect to the period covered by this report;
3) Based on my knowledge, the financial statements, and other financial information included in this report, fairly present in all material respects the financial condition, results of operations and cash flows of the issuer as of, and for, the periods presented in this report;
4) The issuer's other certifying officer and I are responsible for establishing and maintaining disclosure controls and procedures (as defined in Exchange Act Rules 13a-15(e) and 15d-15(e)) and internal control over financial reporting (as defined in Exchange Act Rules 13a-15(f) and 15d-15(f)) for the issuer and have:
(a) Designed such disclosure controls and procedures, or caused such disclosure controls and procedures to be designed under our supervision, to ensure that material information relating to the issuer, including its consolidated subsidiaries, is made known to us by others within those entities, particularly during the period in which this report is being prepared;
(b) Designed such internal control over financial reporting, or caused such internal control over financial reporting to be designed under our supervision, to provide reasonable assurance regarding the reliability of financial reporting and the preparation of financial statements for external purposes in accordance with generally accepted accounting principles;
(c) Evaluated the effectiveness of the issuer's disclosure controls and procedures and presented in this report our conclusions about the effectiveness of the disclosure controls and procedures, as of the end of the period covered by this report based on such evaluation; and
(d) Disclosed in this report any change in the issuer's internal control over financial reporting that occurred during the period covered by the annual report that has materially affected, or is reasonably likely to materially affect, the issuer's internal control over financial reporting; and
5) The issuer's other certifying officer and I have disclosed, based on our most recent evaluation of internal control over financial reporting, to the issuer's auditors and the audit committee of the issuer's board of directors (or persons performing the equivalent functions):
(a) All significant deficiencies and material weaknesses in the design or operation of internal control over financial reporting which are reasonably likely to adversely affect the issuer's ability to record, process, summarize and report financial information; and
(b) Any fraud, whether or not material, that involves management or other employees who have a significant role in the issuer's internal control over financial reporting.
Date: March 26, 2026
/s/ Peter Kukielski
Peter Kukielski
President and Chief Executive Officer
(Principal Executive Officer)
Exhibit 99.6
Certification by the Chief Financial Officer Pursuant to
Section 302 of the Sarbanes-Oxley Act of 2002
I, Eugene Lei, certify that:
1) I have reviewed this annual report on Form 40-F of Hudbay Minerals Inc.;
2) Based on my knowledge, this report does not contain any untrue statement of a material fact or omit to state a material fact necessary to make the statements made, in light of the circumstances under which such statements were made, not misleading with respect to the period covered by this report;
3) Based on my knowledge, the financial statements, and other financial information included in this report, fairly present in all material respects the financial condition, results of operations and cash flows of the issuer as of, and for, the periods presented in this report;
4) The issuer's other certifying officer and I are responsible for establishing and maintaining disclosure controls and procedures (as defined in Exchange Act Rules 13a-15(e) and 15d-15(e)) and internal control over financial reporting (as defined in Exchange Act Rules 13a-15(f) and 15d-15(f)) for the issuer and have:
(a) Designed such disclosure controls and procedures, or caused such disclosure controls and procedures to be designed under our supervision, to ensure that material information relating to the issuer, including its consolidated subsidiaries, is made known to us by others within those entities, particularly during the period in which this report is being prepared;
(b) Designed such internal control over financial reporting, or caused such internal control over financial reporting to be designed under our supervision, to provide reasonable assurance regarding the reliability of financial reporting and the preparation of financial statements for external purposes in accordance with generally accepted accounting principles;
(c) Evaluated the effectiveness of the issuer's disclosure controls and procedures and presented in this report our conclusions about the effectiveness of the disclosure controls and procedures, as of the end of the period covered by this report based on such evaluation; and
(d) Disclosed in this report any change in the issuer's internal control over financial reporting that occurred during the period covered by the annual report that has materially affected, or is reasonably likely to materially affect, the issuer's internal control over financial reporting; and
5) The issuer's other certifying officer and I have disclosed, based on our most recent evaluation of internal control over financial reporting, to the issuer's auditors and the audit committee of the issuer's board of directors (or persons performing the equivalent functions):
(a) All significant deficiencies and material weaknesses in the design or operation of internal control over financial reporting which are reasonably likely to adversely affect the issuer's ability to record, process, summarize and report financial information; and
(b) Any fraud, whether or not material, that involves management or other employees who have a significant role in the issuer's internal control over financial reporting.
Date: March 26, 2026
/s/ Eugene Lei
Eugene Lei
Chief Financial Officer
(Principal Financial Officer)
Exhibit 99.7
CERTIFICATION PURSUANT TO
18 U.S.C. §1350,
AS ADOPTED PURSUANT TO
SECTION 906 OF THE SARBANES-OXLEY ACT OF 2002
In connection with the Annual Report of Hudbay Minerals Inc. (the "Registrant") on Form 40-F for the period ended December 31, 2025, as filed with the Securities and Exchange Commission on the date hereof (the "Report"), I, Peter Kukielski, President and Chief Executive Officer of the Registrant, hereby certify, pursuant to 18 U.S.C. §1350, as adopted pursuant to Section 906 of the Sarbanes-Oxley Act of 2002, that, to the best of my knowledge:
(1) the Report fully complies with the requirements of Section 13(a) or 15(d) of the Securities Exchange Act of 1934; and
(2) the information contained in this Report fairly presents, in all material respects, the financial condition and results of operations of the Registrant.
March 26, 2026
/s/ Peter Kukielski
Peter Kukielski
President and Chief Executive Officer
(Principal Executive Officer)
Exhibit 99.8
CERTIFICATION PURSUANT TO
18 U.S.C. §1350,
AS ADOPTED PURSUANT TO
SECTION 906 OF THE SARBANES-OXLEY ACT OF 2002
In connection with the Annual Report of Hudbay Minerals Inc. (the "Registrant") on Form 40-F for the period ended December 31, 2025, as filed with the Securities and Exchange Commission on the date hereof (the "Report"), I, Eugene Lei, Chief Financial Officer of the Registrant, hereby certify, pursuant to 18 U.S.C. §1350, as adopted pursuant to Section 906 of the Sarbanes-Oxley Act of 2002, that, to the best of my knowledge:
(1) the Report fully complies with the requirements of Section 13(a) or 15(d) of the Securities Exchange Act of 1934; and
(2) the information contained in this Report fairly presents, in all material respects, the financial condition and results of operations of the Registrant.
March 26, 2026
/s/ Eugene Lei
Eugene Lei
Chief Financial Officer
(Principal Financial Officer)
Exhibit 99.9
CONSENT OF EXPERT
In connection with the Annual Report on Form 40-F of Hudbay Minerals Inc. ("Hudbay") for the year ended December 31, 2025, and any amendments thereto (the "Form 40-F"), I, Olivier Tavchandjian, P.Geo., hereby consent to the use of my name in connection with the references to and summaries of scientific and technical information relating to Hudbay's mineral properties (collectively, the "Incorporated Information") and to the inclusion of the Incorporated Information in the Annual Information Form and Management's Discussion and Analysis of Results of Operations and Financial Condition for the year ended December 31, 2025, each filed as an exhibit to the Form 40-F and incorporated by reference therein.
I do also hereby consent to the use of my name and the incorporation by reference of the Incorporated Information in Registration Statement Nos. 333-170295, 333-197080 and 333-212750 on Form S-8 (including, in each case, any amendments thereto) and Registration Statement No. 333-278311 on F-10 (including any amendments thereto).
Yours very truly,
/s/ Olivier Tavchandjian
Olivier Tavchandjian, P.Geo.
Dated: March 26, 2026
Exhibit 99.10
CONSENT OF EXPERT
In connection with the Annual Report on Form 40-F of Hudbay Minerals Inc. ("Hudbay") for the year ended December 31, 2025, and any amendments thereto (the "Form 40-F"), I, Marc-Andre Brulotte, P.Geo., hereby consent to the use of my name in connection with the references to and summaries of scientific and technical information relating to Hudbay's Copper Mountain mine in Princeton, British Columbia (collectively, the "Incorporated Information") and to the inclusion of the Incorporated Information in the Annual Information Form for the year ended December 31, 2025, which is filed as an exhibit to the Form 40-F and incorporated by reference therein.
I do also hereby consent to the use of my name and the incorporation by reference of the Incorporated Information in Registration Statement Nos. 333-170295, 333-197080 and 333-212750 on Form S-8 (including, in each case, any amendments thereto) and Registration Statement No. 333-278311 on F-10 (including any amendments thereto).
Yours very truly,
/s/ Marc-Andre Brulotte
Marc-Andre Brulotte, P.Geo.
Dated: March 26, 2026
Exhibit 99.11
CONSENT OF INDEPENDENT REGISTERED PUBLIC ACCOUNTING FIRM
We consent to the incorporation by reference in Registration Statement Nos. 333-170295, 333-197080 and 333-212750 on Form S-8 and Registration Statement No. 333-278311 on Form F-10 and to the use of our reports dated February 19, 2026 relating to the financial statements of Hudbay Minerals Inc. (the “Company”) and the effectiveness of the Company’s internal control over financial reporting appearing in this Annual Report on Form 40-F for the year ended December 31, 2025.
/s/ Deloitte LLP
Chartered Professional Accountants
Licensed Public Accountants
Toronto, Canada
March 26, 2026