UNITED STATES
SECURITIES AND EXCHANGE COMMISSION
Washington, D.C. 20549
___________________________
FORM 8-K
CURRENT REPORT
Pursuant to Section 13 or 15(d) of the Securities Exchange Act of 1934
Date of Report (Date of earliest event reported): February 26, 2026
ENERGY FUELS INC.
(Exact name of registrant as specified in its charter)
| Ontario | 001-36204 | 98-1067994 |
| (State or other jurisdiction | (Commission | (IRS Employer |
| of incorporation) | File Number) | Identification No.) |
225 Union Blvd., Suite 600
Lakewood, Colorado, United States
80228
(Address of principal executive offices) (ZIP Code)
Registrant’s telephone number, including area code: (303) 974-2140
Not Applicable
(Former name or former address, if changed since last report)
Check the appropriate box below if the Form 8-K filing is intended to simultaneously satisfy the filing obligation of the registrant under any of the following provisions:
☐ Written communications pursuant to Rule 425 under the Securities Act (17 CFR 230.425)
☐ Soliciting material pursuant to Rule 14a-12 under the Exchange Act (17 CFR 240.14a-12)
☐ Pre-commencement communications pursuant to Rule 14d-2(b) under the Exchange Act (17 CFR 240.14d-2(b))
☐ Pre-commencement communications pursuant to Rule 13e-4(c) under the Exchange Act (17 CFR 240.13e-4(c))
Securities registered pursuant to Section 12(b) of the Act:
| Title of each class | Trading Symbols | Name of each exchange on which registered | ||
| Common shares, no par value | UUUU | NYSE American LLC | ||
| EFR | Toronto Stock Exchange |
Indicate by check mark whether the registrant is an emerging growth company as defined in Rule 405 of the Securities Act of 1933 (§ 230.405 of this chapter) or Rule 12b-2 of the Securities Exchange Act of 1934 (§ 240.12b -2 of this chapter).
Emerging growth company ☐
If an emerging growth company, indicate by check mark if the registrant has elected not to use the extended transition period for complying with any new or revised financial accounting standards provided pursuant to Section 13(a) of the Exchange Act. ☐
Item 7.01 Regulation FD Disclosure
Energy Fuels Inc. is releasing an updated pre-feasibility study entitled "Technical Report on the Updated Pre-Feasibility Study, Pinyon Plain Mine, Coconino County, Arizona, USA," attached hereto as Exhibit 99.1.
Energy Fuels Inc. is also releasing a feasibility study entitled "Technical Report for the Donald Rare Earths and Mineral Sands Project, Victoria, Australia," attached hereto as Exhibit 99.2.
The information furnished pursuant to this Item 7.01, including Exhibits 99.1 and 99.2, shall not be deemed "filed" for purposes of Section 18 of the Securities and Exchange Act of 1934, as amended (the "Exchange Act") or otherwise subject to the liabilities under that Section and shall not be deemed to be incorporated by reference into any filing under the United States Securities Act of 1933, as amended or the Exchange Act, except as expressly set forth by specific reference in such filing.
Item 9.01 Financial Statements and Exhibits.
(d) Exhibits.
| 99.1 | Technical Report on the Updated Pre-Feasibility Study, Pinyon Plain Mine, Coconino County, Arizona, USA |
| 99.2 | Technical Report for the Donald Rare Earths and Mineral Sands Project, Victoria, Australia |
| 104 | Cover Page Interactive Data File (embedded within the Inline XBRL document) |
SIGNATURES
Pursuant to the requirements of the Securities Exchange Act of 1934, the Registrant has duly caused this report to be signed on its behalf by the undersigned hereunto duly authorized.
| ENERGY FUELS INC. | |
| (Registrant) | |
| Dated: February 26, 2026 | By: /s/ David C. Frydenlund David C. Frydenlund Executive Vice President and Chief Legal Officer |

| Energy Fuels Inc. | Pinyon Plain Mine | February 19, 2026 |
| Technical Report on the Updated Pre-Feasibility Study | SLR Project No.: 123.020548.00001 |
Technical Report on the Updated Pre-Feasibility Study, Pinyon Plain Mine,
Coconino County, Arizona, USA
SLR Project No.: 123.020548.00001
Prepared by
SLR International Corporation
1658 Cole Blvd, Suite 100
Lakewood, CO 80401
for
Energy Fuels Inc.
225 Union Blvd, Suite 600
Lakewood, CO 80228
USA
Effective Date - December 31, 2025
Signature Date - February 19, 2026
| Prepared by: Grant Malensek, M.Eng., P.Eng. Mark Mathisen, CPG Yenlai Chee, CPG Murray Dunn, P.Eng. Jeffrey Woods, MMSA (QP) Lee (Pat) Gochnour, MMSA (QP) Peer Reviewed by: Stuart E. Collins, PE. |
Approved by: Project Manager Mark Mathisen, CPG Project Director Grant Malensek, M.Eng., P.Eng. |
| Energy Fuels Inc. | Pinyon Plain Mine | February 19, 2026 |
| Technical Report on the Updated Pre-Feasibility Study | SLR Project No.: 123.020548.00001 |
Table of Contents
| 1.0 Summary | 1-1 |
| 1.1 Executive Summary | 1-1 |
| 1.2 Economic Analysis | 1-6 |
| 1.3 Technical Summary | 1-10 |
| 2.0 Introduction | 2-1 |
| 2.1 Sources of Information | 2-1 |
| 2.2 List of Abbreviations | 2-3 |
| 3.0 Reliance on Other Experts | 3-1 |
| 3.1 Reliance on Information Provided by the Registrant | 3-1 |
| 4.0 Property Description and Location | 4-1 |
| 4.1 Location | 4-1 |
| 4.2 Land Tenure | 4-3 |
| 4.3 Required Permits, Authorizations and Status | 4-5 |
| 4.4 Royalties | 4-5 |
| 4.5 Other Significant Risks | 4-5 |
| 5.0 Accessibility, Climate, Local Resources, Infrastructure and Physiography | 5-1 |
| 5.1 Accessibility | 5-1 |
| 5.2 Vegetation | 5-1 |
| 5.3 Climate | 5-1 |
| 5.4 Local Resources | 5-1 |
| 5.5 Infrastructure | 5-1 |
| 5.6 Physiography | 5-2 |
| 6.0 History | 6-1 |
| 6.1 Prior Ownership | 6-1 |
| 6.2 Exploration and Development History | 6-2 |
| 6.3 Past Production | 6-3 |
| 7.0 Geological Setting and Mineralization | 7-1 |
| 7.1 Regional Geology | 7-1 |
| 7.2 Local Geology | 7-4 |
| 7.3 Mineralization | 7-7 |
| 8.0 Deposit Types | 8-1 |
| 9.0 Exploration | 9-1 |
| 9.1 Geotechnical | 9-1 |
| i |
| Energy Fuels Inc. | Pinyon Plain Mine | February 19, 2026 |
| Technical Report on the Updated Pre-Feasibility Study | SLR Project No.: 123.020548.00001 |
| 9.2 Exploration Potential and Recommended Work Programs | 9-1 |
| 10.0 Drilling | 10-1 |
| 10.1 Copper Mineralization | 10-5 |
| 11.0 Sample Preparation, Analyses, and Security | 11-1 |
| 11.1 Sample Preparation and Analysis | 11-1 |
| 11.2 Sample Security | 11-4 |
| 11.3 Quality Assurance and Quality Control | 11-6 |
| 11.4 Density Analyses | 11-16 |
| 11.5 Conclusions | 11-16 |
| 12.0 Data Verification | 12-1 |
| 12.1 SLR Data Verification - 2021 | 12-1 |
| 12.2 SLR Data Verification - 2025 | 12-1 |
| 12.3 Limitations | 12-1 |
| 13.0 Mineral Processing and Metallurgical Testing | 13-1 |
| 13.1 Metallurgical Testing | 13-1 |
| 13.2 Opinion of Adequacy | 13-3 |
| 14.0 Mineral Resource Estimates | 14-1 |
| 14.1 Summary | 14-1 |
| 14.2 Resource Database | 14-3 |
| 14.3 Geological Interpretation | 14-3 |
| 14.4 Exploratory Data Analysis | 14-6 |
| 14.5 Treatment of High Grade Assays | 14-6 |
| 14.6 Compositing | 14-7 |
| 14.7 Spatial Analysis | 14-9 |
| 14.8 Bulk Density | 14-11 |
| 14.9 Block Models | 14-11 |
| 14.10 Search Strategy and Grade Interpolation Parameters | 14-13 |
| 14.11 Reasonable Prospects for Eventual Economic Extraction for Mineral Resources | 14-14 |
| 14.12 Classification | 14-16 |
| 14.13 Block Model Validation | 14-19 |
| 14.14 Grade Tonnage Sensitivity | 14-25 |
| 15.0 Mineral Reserve Estimates | 15-1 |
| 15.1 Summary | 15-1 |
| 15.2 Comparison to Previous Estimate | 15-2 |
| ii |
| Energy Fuels Inc. | Pinyon Plain Mine | February 19, 2026 |
| Technical Report on the Updated Pre-Feasibility Study | SLR Project No.: 123.020548.00001 |
| 15.3 Conversion to Mineral Reserves | 15-2 |
| 15.4 Dilution | 15-3 |
| 15.5 Extraction | 15-4 |
| 15.6 Cut-off Grade | 15-4 |
| 15.7 Reconciliation | 15-5 |
| 16.0 Mining Methods | 16-1 |
| 16.1 Mine Design | 16-1 |
| 16.2 Mining Method | 16-5 |
| 16.3 Geotechnical | 16-5 |
| 16.4 Hydrogeological | 16-6 |
| 16.5 Life of Mine Plan | 16-7 |
| 16.6 Mine Infrastructure | 16-12 |
| 16.7 Radiation Management | 16-15 |
| 16.8 Mine Equipment | 16-16 |
| 16.9 Personnel Requirements | 16-16 |
| 17.0 Recovery Methods | 17-1 |
| 17.1 Process Description | 17-1 |
| 17.2 Process Design Criteria | 17-2 |
| 18.0 Project Infrastructure | 18-1 |
| 18.1 Power | 18-1 |
| 19.0 Market Studies and Contracts | 19-1 |
| 19.1 Markets | 19-1 |
| 19.2 Contracts | 19-3 |
| 20.0 Environmental Studies, Permitting, and Social or Community Impact | 20-1 |
| 20.1 Environmental Studies | 20-1 |
| 20.2 Permitting | 20-1 |
| 20.3 Social and Community Requirements | 20-3 |
| 20.4 Water Management | 20-4 |
| 20.5 Mineral Examination | 20-6 |
| 20.6 Other Negotiations and Agreements with Local Groups | 20-6 |
| 20.7 Mine Closure Remediation and Reclamation Plans | 20-6 |
| 20.8 Opinion of Adequacy | 20-6 |
| 21.0 Capital and Operating Costs | 21-1 |
| 21.1 Capital Costs | 21-1 |
| iii |
| Energy Fuels Inc. | Pinyon Plain Mine | February 19, 2026 |
| Technical Report on the Updated Pre-Feasibility Study | SLR Project No.: 123.020548.00001 |
| 21.2 Operating Costs | 21-2 |
| 22.0 Economic Analysis | 22-1 |
| 22.1 Economic Criteria | 22-1 |
| 22.2 Cash Flow Analysis | 22-2 |
| 22.3 Sensitivity Analysis | 22-4 |
| 23.0 Adjacent Properties | 23-1 |
| 23.1 Other Breccia Pipes | 23-1 |
| 24.0 Other Relevant Data and Information | 24-1 |
| 25.0 Interpretation and Conclusions | 25-1 |
| 25.1 Geology and Mineral Resources | 25-1 |
| 25.2 Mining and Mineral Reserves | 25-3 |
| 25.3 Mineral Processing | 25-4 |
| 25.4 Infrastructure | 25-4 |
| 25.5 Environment | 25-4 |
| 26.0 Recommendations | 26-1 |
| 26.1 Geology and Mineral Resources | 26-1 |
| 26.2 Mining and Mineral Reserves | 26-1 |
| 26.3 Mineral Processing | 26-2 |
| 26.4 Infrastructure | 26-2 |
| 26.5 Environment | 26-2 |
| 27.0 References | 27-1 |
| 28.0 Date and Signature Date | 28-1 |
| 29.0 Certificate of Qualified Person | 29-1 |
| 29.1 Grant A. Malensek | 29-1 |
| 29.2 Mark B. Mathisen | 29-3 |
| 29.3 Yenlai Chee | 29-4 |
| 29.4 Murray Dunn | 29-5 |
| 29.5 Jeffrey L. Woods | 29-6 |
| 29.6 Lee (Pat) Gochnour | 29-8 |
| 30.0 Appendix 1 - Cash Flow | 30-1 |
Tables
| Table 1-1: 2026 Proposed Underground Delineations Drilling Budget | 1-5 |
| Table 1-2: After-Tax Cash Flow Summary | 1-9 |
| iv |
| Energy Fuels Inc. | Pinyon Plain Mine | February 19, 2026 |
| Technical Report on the Updated Pre-Feasibility Study | SLR Project No.: 123.020548.00001 |
| Table 1-3: Summary of Attributable Uranium Mineral Resources - Effective Date December 31, 2025 | 1-15 |
| Table 1-4: Summary of Estimated Mineral Reserves - December 31, 2025 | 1-16 |
| Table 1-5: Capital Cost Estimate | 1-18 |
| Table 1-6: Operating Cost Summary | 1-18 |
| Table 2-1: Summary of QP Responsibilities | 2-2 |
| Table 4-1: Claims Held by EFR for the Pinyon Plain Mine | 4-3 |
| Table 6-1: Drilling at Pinyon Plain Mine by Previous Operators | 6-2 |
| Table 6-2: Past Production Summary | 6-3 |
| Table 10-1: EFR Drill Hole Database Summary | 10-1 |
| Table 11-1: Summary of QA/QC Submittals | 11-7 |
| Table 11-2: Summary of Copper CRM Performance - 2016/2017 | 11-8 |
| Table 11-3: Summary of Uranium CRM Performance - 2025 | 11-8 |
| Table 11-4: Certified Uranium and Copper Values for OREAS Fine Blank Materials | 11-9 |
| Table 11-5: Basic Comparative Statistics of 2017 Duplicate Assays | 11-11 |
| Table 11-6: Summary of Duplicate Sample Statistics, Hazen Laboratory - 2025 | 11-12 |
| Table 13-1: Conventional Acid Leach Test Results | 13-2 |
| Table 14-1: Summary of Attributable Uranium Mineral Resources - Effective Date December 31, 2025 | 14-2 |
| Table 14-2: Summary of Resource Drill Hole Database | 14-3 |
| Table 14-3: Summary Statistics of Uncapped Radiometric Probe eU3O8 Assays | 14-6 |
| Table 14-4: Summary of Composite Data by Zone | 14-8 |
| Table 14-5: Summary of Block Model Setup | 14-12 |
| Table 14-6: Summary of Block Model Variables | 14-12 |
| Table 14-7: Sample Selection Parameters Employed in the Estimation by Domain | 14-13 |
| Table 14-8: Pinyon Plain Mine Cut-off Grade Calculation for Mineral Resources | 14-15 |
| Table 14-9: Mean Composite Grades Compared to the Mean Block Estimates | 14-19 |
| Table 14-10: Block Model Sensitivity to Cut-off Grade and Uranium Price in the Main-Lower and Juniper Zones (Indicated) | 14-26 |
| Table 14-11: Block Model Sensitivity to Cut-off Grade and Uranium Price in the Main-Lower and Juniper Zones (Inferred) | 14-28 |
| Table 15-1: Summary of Mineral Reserve Estimate - December 31, 2025 | 15-1 |
| Table 15-2: Main Zone Mineral Reserve Comparison to Previous Estimate | 15-2 |
| Table 15-3: Stope Optimizer Parameters | 15-3 |
| Table 15-4: Cut Off Grade Calculation for Mineral Reserves | 15-4 |
| Table 15-5: Reconciliation Data 2024-2025 Production | 15-5 |
| v |
| Energy Fuels Inc. | Pinyon Plain Mine | February 19, 2026 |
| Technical Report on the Updated Pre-Feasibility Study | SLR Project No.: 123.020548.00001 |
| Table 16-1: Life of Mine Production Schedule | 16-11 |
| Table 16-2: Life of Mine Development and Material Movement Schedule | 16-11 |
| Table 16-3: Underground Mining Equipment | 16-16 |
| Table 16-4: Personnel Requirements | 16-17 |
| Table 17-1: Principal Process Operation Criteria | 17-3 |
| Table 20-1: Environmental Permits for Operations | 20-2 |
| Table 21-1: Life of Mine Capital Estimate | 21-1 |
| Table 21-2: Operating Costs Summary | 21-2 |
| Table 22-1: After-Tax Cash Flow Summary | 22-3 |
| Table 22-2: After-tax Sensitivity Analysis | 22-4 |
| Table 26-1: 2026 Proposed Underground Delineations Drilling Budget | 26-1 |
Figures
| Figure 4-1: Location Map | 4-2 |
| Figure 4-2: Land Tenure Map | 4-4 |
| Figure 7-1: Regional Geologic Map | 7-2 |
| Figure 7-2: Regional Stratigraphic Column | 7-3 |
| Figure 7-3: Cross Section of Local Geology | 7-5 |
| Figure 7-4: Pinyon Plain Horizontal Slice Main Zone - Slice 5,200' Level | 7-6 |
| Figure 10-1: Surface Drill Hole Collar Locations | 10-3 |
| Figure 10-2: Cross Section showing All Drill Hole Traces | 10-4 |
| Figure 11-1: Uranium Z-Score for CRMs Analyzed at the Hazen Laboratory- 2025 | 11-9 |
| Figure 11-2: Performance of Coarse Blanks for Uranium at the Hazen Laboratory - 2025 | 11-10 |
| Figure 11-3: Uranium Field Duplicates - HARD and Scatter Plot Comparison (Hazen) | 11-13 |
| Figure 11-4: Uranium Coarse Duplicates - HARD and Scatter Plot Comparison (Hazen) | 11-13 |
| Figure 11-5: Uranium Pulp Duplicates - HARD and Scatter Plot Comparison (Hazen) | 11-14 |
| Figure 11-6: Q-Q Plot and Scatter Plot of U3O8 (wt%) Results for Hazen and White Mesa Mill Check Assays | 11-15 |
| Figure 11-7: Q-Q Plot and Scatter Plot of U3O8 (wt%) Results for Hazen and Pace Check Assays | 11-15 |
| Figure 11-8: Scatter Pot of the Weighted Average of Probe and Assay U3O8 Results Over Drill hole Intercepts within the Main Zone | 11-16 |
| Figure 14-1: Uranium Mineralized Domains | 14-5 |
| Figure 14-2: Histogram of U3O8 Resource Assay in the Main Zone | 14-7 |
| Figure 14-3: Length Histogram | 14-8 |
| vi |
| Energy Fuels Inc. | Pinyon Plain Mine | February 19, 2026 |
| Technical Report on the Updated Pre-Feasibility Study | SLR Project No.: 123.020548.00001 |
| Figure 14-4: U3O8 Variogram for Main Zone | 14-10 |
| Figure 14-5: Block Classification | 14-18 |
| Figure 14-6: Main Zone Swath Plot X (East) Direction | 14-21 |
| Figure 14-7: Main Zone Swath Plot Y (North) Direction | 14-21 |
| Figure 14-8: Main Zone Swath Plot Z (vertical) Direction | 14-22 |
| Figure 14-9: Plan View Comparing Block and Composite U3O8 Grades in the Main Zone (5,180 fasl) | 14-23 |
| Figure 14-10: Plan View Comparing Block and Composite U3O8 Grades in the Juniper Zone (4,890 fasl) | 14-24 |
| Figure 14-11: Indicated Grade Tonnage Curve Main-Lower and Juniper Zones | 14-27 |
| Figure 14-12: Inferred Grade Tonnage Curve Main-Lower and Juniper Zones | 14-29 |
| Figure 16-1: Mine Design Schematic - 3D View | 16-3 |
| Figure 16-2: Mine Design - Section View | 16-4 |
| Figure 16-3: LOM Production Schedule - Tons and Grade | 16-8 |
| Figure 16-4: LOM Production Schedule - U3O8 (lb) and Grade | 16-8 |
| Figure 16-5: LOM Development Schedule | 16-9 |
| Figure 16-6: 3D View Showing LOM Schedule by Quarter | 16-10 |
| Figure 16-7: Pinyon Plan Mine Shaft Plan View | 16-13 |
| Figure 16-8: Schematic of the Ventilation Plan for Main and Juniper Zones | 16-14 |
| Figure 17-1: White Mesa Mill - Location Map | 17-4 |
| Figure 17-2: White Mesa Mill - Site Map | 17-5 |
| Figure 17-3: White Mesa Mill Block Diagram Flow Sheet | 17-6 |
| Figure 18-1: Pinyon Plain Mine Facility Layout | 18-2 |
| Figure 19-1: TradeTech Uranium Market Price Forecast | 19-2 |
| Figure 20-1: Process Flow Diagram for Pinyon Plain Mine | 20-5 |
| Figure 22-1: After-tax NPV 5% Cash flow Sensitivity | 22-5 |
| vii |
| Energy Fuels Inc. | Pinyon Plain Mine | February 19, 2026 |
| Technical Report on the Updated Pre-Feasibility Study | SLR Project No.: 123.020548.00001 |
1.0 Summary
1.1 Executive Summary
SLR International Corporation (SLR) was retained by Energy Fuels Inc. (Energy Fuels), the parent company of Energy Fuels Resources (USA) Inc. (EFR), to prepare a Technical Report on the updated Pre-Feasibility Study (PFS) on the to the Pinyon Plain Mine (Pinyon Plain or the Project), located in Coconino County, Arizona, USA. EFR owns 100% of the Project.
EFR's parent company, Energy Fuels Inc., is incorporated in Ontario, Canada. EFR is a US-based critical materials company focused on developing its uranium/vanadium mines in Colorado, Utah, Arizona, New Mexico, and Wyoming. It also has rare-earth element processing capabilities that complement its uranium processing at its White Mesa Mill in Blanding, Utah, and its rare-earth processing globally. Energy Fuels is listed on the NYSE American Stock Exchange (symbol: UUUU) and the Toronto Stock Exchange (symbol: EFR).
This Technical Report satisfies the requirements of Canadian National Instrument 43-101 Standards of Disclosure for Mineral Projects (NI 43-101) and the United States Securities and Exchange Commission's (SEC) Modernized Property Disclosure Requirements for Mining Registrants as described in Subpart 229.1300 of Regulation S-K, Disclosure by Registrants Engaged in Mining Operations (S-K 1300) and Item 601 (b)(96) Technical Report Summary. The purpose of this Technical Report is to disclose the results of an updated PFS for the Project.
The Pinyon Plain Mine is a uranium and copper breccia pipe deposit in northern Arizona. The mine is permitted and includes a 1,470 ft-deep shaft, headframe, hoist, compressor, and surface facilities, including line power. The mine is currently producing ore from the Main Zone and advancing development toward the Juniper Zone. Environmental compliance activities continue with all infrastructure for mine development in place. The operation is a mechanized underground mining operation in which ore is hoisted to the surface and then trucked to the White Mesa mill for processing under a toll milling agreement.
Energy Fuels operates the mine at a nominal production rate of up to 166 short tons per day (stpd) of ore, and at an average rate of 133 stpd over the life of mine (LOM). The mine life totals 32 months. The life of mine plan includes mining 133,000 tons of ore grading 0.97% U3O8, yielding 2.57 million pounds (Mlb) of U3O8. Process recovery is estimated at 96%, resulting in the production of 2.47 million pounds of U3O8. There are additional Mineral Resources at depth below the Mineral Reserves in the current mine plan.
1.1.1 Conclusions
SLR offers the following interpretations and conclusions on the Project:
1.1.1.1 Geology and Mineral Resources
• The Pinyon Plain Mine hosts a breccia pipe-hosted uranium deposit characterized by a subvertical collapse breccia pipe extending through Paleozoic sedimentary units, with uranium mineralization concentrated in breccia and annular fracture zones, most strongly developed within the lower Hermit and upper Esplanade formations, and occurring as uraninite and pitchblende over a vertical extent of approximately 1,700 ft across multiple stacked mineralized zones.
| 1-1 |
| Energy Fuels Inc. | Pinyon Plain Mine | February 19, 2026 |
| Technical Report on the Updated Pre-Feasibility Study | SLR Project No.: 123.020548.00001 |
• Drilling at the Pinyon Plain Mine, consisting of 206 drill holes (45 surface and 161 underground) totaling approximately 108,862 ft, has adequately defined the geometry, continuity, and vertical extent of breccia pipe-hosted uranium mineralization and provides a sufficient database to support geological interpretation and Mineral Resource estimation.
• In the opinion of the SLR QPs, drilling methods, downhole deviation surveys, radiometric logging, core handling, and geological logging were completed to industry standards, and the resulting drill hole data are of appropriate quality, density, and spatial distribution to support Mineral Resource classification and public disclosure under SEC S-K 1300, NI 43-101, and CIM best practice guidelines.
• Mineral Resources have been classified in accordance with the definitions for Mineral Resources in S-K 1300, which are consistent with Canadian Institute of Mining, Metallurgy and Petroleum (CIM) Definition Standards for Mineral Resources and Mineral Reserves dated May 10, 2014 (CIM, 2014) definitions, which are incorporated by reference in NI 43-101.
• In the SLR QPs' opinion, the assumptions, parameters, and methodology used for the Pinyon Plain Mineral Resource estimate are appropriate for the style of mineralization and mining methods.
• The SLR QPs are of the opinion that the block models are adequate for public disclosure and to support mining activities. The effective date of the Mineral Resource estimate is December 31, 2025.
• Mineral Resources exclude previously reported uranium mineralization within the Cap and Upper zones in accordance with conditions of the Arizona Department of Environmental Quality (ADEQ) Aquifer Protection Permit, which restricts mining between elevations of 5,340 ft and 4,508 ft above sea level.
• Reconciliation to production demonstrates that a domain-specific density (tonnage factor) framework is required to accurately represent in situ mineralization and support compliant Mineral Resource reporting under S-K 1300, NI 43-101, and CIM (2019):
o The previously applied global tonnage factor of 0.082 ton/ft³ materially understates tonnage in high-grade mined areas.
o Production calibration supports a revised tonnage factor of approximately 0.099 st/ft³ for the Main Zone and Juniper Zone.
o The reconciliation variance is interpreted to be primarily density-related, rather than a function of grade estimation bias or geological error.
o Application of the production-derived tonnage factor materially improves reconciliation performance, bringing results within the outer bounds of acceptability under CIM (2019).
o The Cap, Upper, Middle, Lower, and Juniper Lower Zones appropriately retain the core-derived tonnage factor of 0.082 sh. ton/ft³, as these domains lack production calibration and are geologically distinct.
o This dual-density, domain-specific approach is consistent with regulatory requirements that modifying factors be locally representative, data-supported, and transparently disclosed.
| 1-2 |
| Energy Fuels Inc. | Pinyon Plain Mine | February 19, 2026 |
| Technical Report on the Updated Pre-Feasibility Study | SLR Project No.: 123.020548.00001 |
• Mineral Resources for the Pinyon Plain Mine are reported in situ at a long-term uranium price of US$90/lb U₃O₈ using an equivalent uranium cut-off grade of 0.31% eU₃O₈ and an assumed 96% metallurgical recovery. The Mineral Resource estimate is supported by a Reasonable Prospects for Eventual Economic Extraction (RPEEE) assessment incorporating underground stope optimization using Deswik Stope Optimizer and an underground mining scenario consistent with longhole stoping and processing at the White Mesa Mill.
o No minimum mining width was applied in the determination of Mineral Resources. The estimate reflects block model-based grade and tonnage constrained by economic parameters and optimization shapes and does not incorporate detailed mine design criteria such as minimum stope widths, dilution, or mining extraction factors.
o The RPEEE assessment assumes underground mining using longhole stoping, with development rock temporarily stored on surface and subsequently used for backfilling. Ore is transported approximately 320 miles by truck to the White Mesa Mill near Blanding, Utah, for processing.
o The Mineral Resource assumptions differ from those applied to the Mineral Reserve estimate. Mineral Reserves are based on a long-term uranium price of US$80/lb U₃O₈, a breakeven cut-off grade of 0.35% U₃O₈, and detailed mine design parameters including a minimum mining width of 4 ft and 20 ft vertical stope heights, with application of mining dilution and extraction factors.
• At the stated cut-off grade:
o Indicated Mineral Resources total 19,038 short tons (st) grading 0.54% eU₃O₈, containing 205,209 lb U₃O₈.
o Inferred Mineral Resources total 14,917 st grading 0.81% eU₃O₈, containing 241,010 lb U₃O₈.
• Mineral Resources are reported as in situ, are exclusive of Mineral Reserves, and do not have demonstrated economic viability. There is no assurance that Inferred Mineral Resources will be upgraded or that Mineral Resources will be converted to Mineral Reserves.
• Sampling, preparation, analytical, and QA/QC procedures are concluded to have been conducted in accordance with industry-standard practices, and the resulting database is considered adequate to support Mineral Resource estimation and public disclosure under SEC S-K 1300, NI 43-101, and CIM best practice guidelines.
o QA/QC results, including the performance of standards, blanks, duplicates, and check assays, did not identify any systematic bias or material issues that would warrant additional verification work or data remediation.
o Density determinations are considered appropriate for the style of mineralization and have been applied consistently within the Mineral Resource estimation framework
• The SLR QPs consider that the resource cut-off grade and mining shapes used to identify those portions of the Mineral Resource that meet the requirement for the reasonable prospects for economic extraction to be appropriate for this style of uranium deposit and mineralization.
| 1-3 |
| Energy Fuels Inc. | Pinyon Plain Mine | February 19, 2026 |
| Technical Report on the Updated Pre-Feasibility Study | SLR Project No.: 123.020548.00001 |
• The SLR QPs consider the Mineral Resource classification criteria to be reasonable and consistent with geological continuity, data density, and confidence in grade and geometry.
• Based on information available as of the effective date, the SLR QPs are not aware of any geological, environmental, permitting, legal, social, or other factors that would materially affect the reported Mineral Resources, subject to the recommendations outlined elsewhere in this Technical Report.
1.1.1.2 Mining and Mineral Reserves
• Mineral Reserve estimates, as prepared by SLR, have been classified in accordance with the definitions for Mineral Reserves in S-K 1300, which are consistent with CIM (2014) definitions, which are incorporated by reference in NI 43-101.
• The Proven and Probable Mineral Reserve estimate is 133,000 short tons (st) grading 0.97% U3O8 containing 2.571 Mlb of U3O8 and is comprised of 17,500 st grading 1.04% U3O8 of Proven Mineral Reserves containing 0.365 Mlb of U3O8 plus 115,600 tons grading 0.95% U3O8 of Probable Mineral Reserves containing 2.206 Mlb of U3O8
• The Mineral Reserves are based upon a cut-off grade of 0.35% U3O8.
• Measured Mineral Resources were converted to Proven Mineral Reserves, and Indicated Mineral Resources were converted to Probable Mineral Reserves.
• No Inferred Mineral Resources were converted into Mineral Reserves.
• Mineral Reserves are reported in situ, after application of mining dilution and mining extraction, but prior to application of metallurgical recovery. Metallurgical recovery is applied subsequently in the economic analysis to estimate recovered and saleable U₃O₈.
• The existing shaft will be used for the mine access and rock hoisting.
• The ore will be mined using longhole stoping.
• The majority of access and ore development is complete in Main Zone. Development of a decline toward Juniper Zone has commenced.
• Production mining has commenced in Main Zone, and is scheduled to begin in Juniper Zone in early 2027.
• Ore will be mucked and hauled by load-haul-dump (LHD) loaders and haul trucks to a grizzly over the loading pocket feed.
• The SLR QP is not aware of any mining, metallurgical, infrastructure, permitting, or other relevant factors that could materially affect the Mineral Reserve estimate.
1.1.1.3 Mineral Processing
• There is sufficient metallurgical testing to support a uranium process recovery of 96% at the White Mesa Mill.
• The metallurgical test results provided by White Mesa Mill Laboratory personnel indicated that metallurgical recoveries using optimum roasting and leach conditions will be approximately 96% for uranium. The White Mesa Mill has a significant operating history for the uranium solvent extraction (SX) circuit which includes processing of relatively high copper content with no detrimental impact to the uranium recovery or product grade.
| 1-4 |
| Energy Fuels Inc. | Pinyon Plain Mine | February 19, 2026 |
| Technical Report on the Updated Pre-Feasibility Study | SLR Project No.: 123.020548.00001 |
1.1.1.4 Infrastructure
There is suitable existing or planned infrastructure to support the planned operations.
1.1.1.5 Environment
• EFR has secured all the permits required to construct, operate, and close the Pinyon Plain Mine.
o Some permits require regular update/renewal.
o These permits involved significant public participation opportunity.
• Financial assurance is in place to guarantee all reclamation will occur. This amount will continue to be reviewed on a regular basis (at least every five years) to cover any changes at site and/or for any inflationary issue(s).
1.1.2 Recommendations
SLR offers the following recommendations regarding the advancement of the Project.
1.1.2.1 Geology and Mineral Resources
1 Complete the proposed underground delineation drilling program within the Main-Lower and Juniper zones to improve geological continuity and confidence and to support the potential conversion of Inferred Mineral Resources to Indicated Mineral Resources.
2 The recommended program consists of approximately 150 underground drill holes totaling 18,500 ft, as outlined in the Project drilling budget, and should be executed from existing underground development where practicable (Table 1-1).
Table 1-1: 2026 Proposed Underground Delineations Drilling Budget
| Category | Number of Drill Holes/Assay |
Total Feet Drilled |
Unit Cost (US$/ft) |
Budget (US$) |
| Underground Delineation Drilling | 150 | 18,500 | 10.00 | 204,000 |
3 Incorporate results from additional drilling into updated geological interpretations, domain models, and Mineral Resource estimates following industry-standard estimation and validation procedures.
4 Implement and maintain a domain-specific density (tonnage factor) framework calibrated to production to ensure ongoing compliance, reconciliation performance, and reporting reliability:
a) Apply the 0.099 st/ft³ tonnage factor exclusively to the Main and Juniper Zones and retain the 0.082 st/ft³ factor for the Cap, Upper, Middle, Lower, and Juniper Lower Zones unless and until production data support revision.
b) Establish a formal, routine reconciliation program (monthly and annual) integrating production tonnage, moisture, grade, and surveyed mine-out volumes to continuously validate density assumptions.
| 1-5 |
| Energy Fuels Inc. | Pinyon Plain Mine | February 19, 2026 |
| Technical Report on the Updated Pre-Feasibility Study | SLR Project No.: 123.020548.00001 |
c) Expand in situ and bulk density sampling in high-grade domains to further validate and refine production-derived tonnage factors.
d) Periodically review and update geological and grade domains to ensure density models remain spatially and geologically representative.
e) Clearly document all density assumptions, reconciliation procedures, and domain restrictions in future S-K 1300 and NI 43-101 disclosures, including any material limitations or uncertainties.
1.1.2.2 Mining and Mineral Reserves
1 Develop grade control and production reconciliation procedures.
2 Complete a geotechnical study to support mining Juniper Zone below stated Reserves.
3 Develop a program for monitoring the geotechnical conditions in the stopes to provide an early warning of potential ground condition problems or stope wall failures. This is of particularly importance in excavations near to critical infrastructure, namely the RAR from Main Zone to surface. The geotechnical condition of the development headings should be noted and recorded to support any required changes in the ground support regimes.
4 Develop a comprehensive radiation management plan that documents control measures, measurement methods, tracking systems, and thresholds and response plans.
1.1.2.3 Mineral Processing
1 Investigate modifications required to recover copper at White Mesa Mill.
1.1.2.4 Infrastructure
None
1.1.2.5 Environment
1 Consider development of a more formalized environmental management system that lists environmental roles and responsibilities of site personnel, permit conditions, and monitoring requirements for use should someone else unfamiliar with environmental matters have to perform them.
2 Continue to monitor and confirm no changes in permit and projected impact assumptions.
3 Establish a reclamation revegetation test plot program to ensure species selected will work at the site.
1.2 Economic Analysis
An after-tax Cash Flow Projection has been generated from the Life of Mine production schedule and capital and operating cost estimates, as summarized in Table 1-2. A summary of the key criteria is provided below.
| 1-6 |
| Energy Fuels Inc. | Pinyon Plain Mine | February 19, 2026 |
| Technical Report on the Updated Pre-Feasibility Study | SLR Project No.: 123.020548.00001 |
1.2.1 Economic Criteria
1.2.1.1 Revenue
• Total mill feed processed: 133 thousand tons
• Average processing rate: 133 stpd (steady state)
• U3O8 head grade: 0.97%
• Average mill recovery: 96%
• Recovered U3O8: 2.47 Mlb
• Metal price: $80/lb U3O8
• Yellowcake product trucking cost from the toll mill to customer: $0.14/lb U3O8
1.2.1.2 Capital and Operating Costs
• Mine life: 32 months
• LOM capital costs, excluding reclamation, of $9.1 million on Q1 2025 US dollar basis
• LOM operating cost (excluding royalties but including severance taxes) of $73.7 million or $542/ton milled on Q1 2025 US dollar basis
1.2.1.3 Royalties and Severance Taxes
A 3.5% private royalty is payable for the Project based on sliding scale of the value of production expressed in lb/t along with allowances for mining and ore hauling. The royalty payments over the mine life are approximately $1.88/t ore.
Arizona has a severance tax that is 2.5% of the net severance base, which is 50% of the difference between the gross value of production (revenue) and the production costs. Thus, a rate of 1.25% is used to reflect this 50% base reduction. The Arizona severance tax payable to the Project is approximately equivalent to $11.72/t ore during LOM.
1.2.1.4 Income Taxes
EFR states it is not liable for corporate income tax (CIT) expenditures as a corporation, including the period that the Project is expected to operate. In addition, the short mine life of 32 months makes an estimate of income tax payable using a standard tax methodology difficult. Therefore, a proforma CIT estimate was added with the assumption that the Project was a stand-alone entity for tax purposes and does not reflect the company's actual filing position with following assumptions:
• A Federal income tax rate of 10.5% is used in this analysis. This rate takes into account the percentage depletion deduction which allows profitable mining companies to reduce their taxable income by 50% and then the remaining amount is taxed at the current Federal tax rate of 21% so that the net rate is 10.5%.
• The Arizona state income tax rate is 2.5% so the combined Federal and state rate is 13.0%.
• CIT payable for LOM totals $6.0 million.
| 1-7 |
| Energy Fuels Inc. | Pinyon Plain Mine | February 19, 2026 |
| Technical Report on the Updated Pre-Feasibility Study | SLR Project No.: 123.020548.00001 |
1.2.2 Cash Flow Analysis
Table 1-2 presents a summary of the Project economics at an average U3O8 price of $80.00/lb. The full annual cash flow model is presented in Appendix 1.
On a pre-tax basis, the undiscounted cash flow totals $112.6 million over the mine life. The pre-tax Net Present Value (NPV) at a 5% discount rate is $90.1 million. Whereas SLR is of the opinion that an 8% discount rate is standard for most greenfield western U.S. uranium mining projects, the advanced stage of development of the Project with existing shaft and current underground development combined with short mine life of 3 years makes a 5% discount rate acceptable for this stage of the Project.
On an after-tax basis, the undiscounted cash flow totals $97.7 million over the mine life. The after-tax NPV at 5% discount rate is $78.3 million.
LOM Project cost metrics are as follows:
• Cash Operating Costs: $30.08/lb U3O8
• All-in Sustaining Costs: $30.71/lb U3O8
• All-in Costs: $34.39/lb U3O8
| 1-8 |
| Energy Fuels Inc. | Pinyon Plain Mine | February 19, 2026 |
| Technical Report on the Updated Pre-Feasibility Study | SLR Project No.: 123.020548.00001 |
Table 1-2: After-Tax Cash Flow Summary
| Item | Unit | Value |
| U3O8 Price | $/lb | $80.00 |
| U3O8 Sales | klb | 2,468 |
| Total Gross Revenue | US$ 000 | 197,465 |
| Product Transport to Market | US$ 000 | (346) |
| Royalties | US$ 000 | (250) |
| Total Net Revenue | US$ 000 | 196,869 |
| Mining Cost | US$ 000 | (24,477) |
| Ore Trucking Cost | US$ 000 | (12,638) |
| Process Cost | US$ 000 | (34,055) |
| G & A Cost | US$ 000 | (931) |
| Severance Tax | US$ 000 | (1,560) |
| Total Operating Costs | US$ 000 | (73,661) |
| Working Capital | US$ 000 | 0 |
| Operating Cash Flow | US$ 000 | 123,208 |
| Direct Capital | US$ 000 | (7,913) |
| Closure/Reclamation Capital | US$ 000 | (1,540) |
| Contingency | US$ 000 | (1,187) |
| Total Capital | US$ 000 | (10,640) |
| Pre-tax Free Cash Flow | US$ 000 | 112,568 |
| Pre-tax NPV @ 5% | US$ 000 | 90,113 |
| Pre-tax NPV @ 8% | US$ 000 | 79,285 |
| Pre-tax NPV @ 12% | US$ 000 | 67,239 |
| Corporate Income Tax | US$ 000 | (14,834) |
| After-tax Free Cash Flow | US$ 000 | 97,734 |
| After-tax NPV @ 5% | US$ 000 | 78,256 |
| After-tax NPV @ 8% | US$ 000 | 68,861 |
| After-tax NPV @ 12% | US$ 000 | 58,408 |
| Cash Operating Costs | $/lb U3O8 | 30.08 |
| All-in Sustaining Costs | $/lb U3O8 | 30.71 |
| All-in Costs | $/lb U3O8 | 34.39 |
| 1-9 |
| Energy Fuels Inc. | Pinyon Plain Mine | February 19, 2026 |
| Technical Report on the Updated Pre-Feasibility Study | SLR Project No.: 123.020548.00001 |
1.2.3 Sensitivity Analysis
Project risks can be identified in both economic and non-economic terms. Key economic risks were examined by running cash flow sensitivities calculated over a range of variations based on realistic fluctuations within the listed factors:
• U3O8 price: 10% increments between $64/lb and $94/lb
• Head grade: -/+ 20%
• Recovery: -20%/+4% (96% is base case already)
• Operating cost per ton milled: -10% to 25% (AACE Class 3 range)
• Capital cost: -10% to 25% (AACE Class 3 range)
The Project is most sensitive to head grade, uranium price, and recovery, and only slightly less sensitive to operating cost and capital cost at a Class 3 accuracy level. The sensitivities to metallurgical recovery, head grade, and metal price are nearly identical.
1.3 Technical Summary
1.3.1 Property Description and Location
The Pinyon Plain Mine is a fully permitted underground uranium deposit located in northern Arizona, United States. The Project is wholly owned by Energy Fuels Resources (USA) Inc. (EFR) through its subsidiary, EFR Arizona Strip LLC, which holds a 100% interest in the mineral rights. The Project is situated within the Kaibab National Forest in Coconino County, Arizona, on a compact, fully permitted site covering approximately 17 acres.
The Project is located approximately 153 miles north of Phoenix, 86 miles northwest of Flagstaff, 47 miles north of Williams, and approximately seven miles southeast of Tusayan. The approximate center of the Project is defined by Universal Transverse Mercator (UTM) coordinates 401,036.11 mE and 3,971,521.98 mN (Zone 12S), geographic coordinates of 35°52'58.65" N latitude and 112°05'47.05" W longitude, and the State Plane 1983 Arizona Central FIPS 0202 coordinate system. The location is well defined and accessible, and its geographic setting is suitable to support Mineral Resource estimation and underground mine development.
1.3.2 Land Tenure
EFR's property position at the Pinyon Plain Mine consists of nine unpatented lode mining claims (Canyon 64-66, 74-76, and 84-86) covering approximately 186 acres of land administered by the U.S. Forest Service. The claims were originally staked in 1978 and have been continuously maintained since that time. EFR acquired the claims in June 2012 and holds a 100% interest in all claims.
The mining claims are subject to annual federal and county maintenance fees and are renewed each year. All claims are in good standing and are current through the stated renewal period. The Qualified Person is not aware of any title defects, adverse claims, or encumbrances that would materially affect EFR's ownership, access rights, or ability to carry out the proposed work program or support the reporting of Mineral Resources in accordance with S-K 1300, NI 43-101, and CIM 2019 Best Practice Guidelines.
| 1-10 |
| Energy Fuels Inc. | Pinyon Plain Mine | February 19, 2026 |
| Technical Report on the Updated Pre-Feasibility Study | SLR Project No.: 123.020548.00001 |
1.3.3 History
Uranium exploration and mining of breccia pipe deposits in northern Arizona began in 1951 following the discovery of uranium mineralization at the Orphan Mine on the South Rim of the Grand Canyon. This discovery established the economic significance of breccia pipe-hosted uranium mineralization and led to renewed regional exploration during the 1970s, resulting in the identification of multiple high-grade uranium deposits.
The Pinyon Plain Mine is a uranium and copper breccia pipe deposit located in northern Arizona on mining claims originally staked by Gulf Mineral Resources in April 1978. Gulf retained a royalty interest in the property through subsequent changes in ownership. The claims were acquired by Energy Fuels Nuclear Inc. (EFNI) in 1982 and later transferred through ownership by the Concord Group, International Uranium Corporation, and Denison Mines Corporation. In June 2012, Energy Fuels Inc. acquired Denison's U.S. mining assets, and the Project is currently held by Energy Fuels Resources (USA) Inc. (EFR), a wholly owned subsidiary of EFR Arizona Strip LLC.
Exploration and development activities undertaken by previous owners and EFR have included surface and underground drilling, geophysical surveys, the development of a deep-water well, and the construction of underground mine infrastructure. A mine shaft and associated conveyances were developed to a depth of approximately 1,470 feet and remain operational. At the time of EFR's acquisition, the Project was fully permitted and included surface facilities and a shallow shaft, which were refurbished and subsequently extended.
Between 2015 and 2017, EFR completed shaft sinking to its current depth and developed underground levels that have been used as drill stations for resource delineation. The Project was placed on standby in 2013 due to low uranium prices and was subsequently restarted in 2015. The Project was previously known as the Canyon Mine and was renamed to Pinyon Plain in November 2020.
The Project was originally part of the Arizona Strip Uranium Project, which also included the Pinenut and Arizona 1 breccia pipe deposits. The Pinenut Mine was mined out in 2015 and is undergoing reclamation, while the Arizona 1 Mine is on standby. The Pinyon Plain Mine has been considered a standalone asset since 2017.
1.3.4 Geology and Mineralization
The Pinyon Plain Mine is located in northern Arizona, south of the Grand Canyon, within the Kaibab National Forest and the Colorado Plateau physiographic province. The Colorado Plateau is distinct from the Basin and Range Province to the south and is characterized by relatively flat-lying Paleozoic and Mesozoic sedimentary rocks. Regional geologic development has been influenced by north-south-trending fault systems, including the Grand Wash, Hurricane, and Toroweap fault systems, which exhibit east-side upthrow and prominent surface expression. Volcanic activity has occurred regionally since the Pliocene epoch, resulting in lava flows and lava-capped buttes in the surrounding district.
The mineral deposit at the Project is a vertically extensive collapse breccia pipe, one of numerous similar features developed along the margins of the Grand Canyon. The breccia pipe extends from near the surface within the Triassic Moenkopi Formation downward through Paleozoic sedimentary units into the Mississippian Redwall Limestone. At the surface, the pipe is expressed as a broad, shallow depression within the Permian Kaibab Formation. The pipe is subvertical, with an average diameter of less than 200 ft, narrowing to approximately 80 ft through the Coconino and Hermit formations. The pipe extends for at least 2,300 ft vertically from the Toroweap Limestone into the upper Redwall Limestone; the ultimate depth of the structure is unknown.
| 1-11 |
| Energy Fuels Inc. | Pinyon Plain Mine | February 19, 2026 |
| Technical Report on the Updated Pre-Feasibility Study | SLR Project No.: 123.020548.00001 |
Mineralization extends vertically for approximately 1,700 ft both within and adjacent to the breccia pipe. Potentially economic uranium mineralization is concentrated primarily within collapsed portions of the Coconino, Hermit, and Esplanade formations and along annular fracture zones developed at the margins of the breccia pipe. The strongest mineralization occurs within an annular fracture zone developed in the lower Hermit and upper Esplanade horizons. Alteration associated with the breccia pipe includes bleaching of red beds adjacent to the pipe margin. Sulfide mineralization is present throughout the pipe and is locally concentrated in a sulfide-rich cap near the Toroweap-Coconino contact, averaging approximately 20 ft in thickness and consisting primarily of pyrite and bravoite.
Uranium is the primary metal of interest at the Project. Uranium mineralization occurs predominantly as blebs, streaks, small veins, and fine disseminations of uraninite and pitchblende (UO₂), largely within the breccia matrix material, although mineralization locally extends into clasts and larger breccia fragments, particularly were derived from Coconino Sandstone. Uranium mineralization is developed within three principal zones referred to as the Upper/Cap, Main, and Juniper zones, which collectively extend from depths of approximately 650 ft to more than 2,100 ft.
Copper mineralization is also present within the breccia pipe and occurs both with and without associated uranium mineralization. Copper commonly replaces matrix material and occurs primarily as chalcocite, bornite, tennantite, and covellite, with associated silver and trace base metals. Although copper mineralization is locally significant, there is currently no reasonable prospect for economic copper extraction. Accordingly, copper is not included in the Mineral Resource Estimate and is described for completeness only.
1.3.5 Exploration and Development Status
Exploration at the Pinyon Plain Mine has been conducted intermittently since the late 1970s and has focused primarily on drilling of the breccia pipe uranium deposit. Early exploration by Gulf Mineral Resources between 1978 and 1982 included surface rotary drilling that intersected low-grade uranium mineralization. Subsequent drilling by Energy Fuels Nuclear Inc. (EFNI) in 1983 identified economically significant uranium mineralization. From 1983 to 1987, EFNI and its predecessors completed a range of surface geophysical surveys, including controlled-source audio magnetotelluric (CSAMT), ground magnetic, very low frequency (VLF), time-domain electromagnetic (TDEM), surface gravity, and airborne electromagnetic surveys, to support breccia pipe targeting and characterization.
Following discovery, EFNI conducted shallow drilling to locate the center of the collapse feature and guide targeting of the breccia pipe throat, followed by deeper drilling to delineate mineralization. Exploration of breccia pipe deposits in northern Arizona is typically conducted using deep rotary drilling, supplemented by core drilling, to depths of approximately 2,000 ft or greater. Drill holes were surveyed for deviation and logged using downhole gamma logging. In total, EFR and its predecessors have completed 206 drill holes (45 surface and 161 underground), totaling approximately 108,862 ft of drilling between 1978 and 2025.
Energy Fuels Resources (USA) Inc. (EFR) acquired the Project from Denison in 2012. Since that time, EFR has not conducted surface exploration, and exploration work has been limited to underground development and delineation drilling from the production shaft. Between 2016 and 2025, EFR completed 161 underground development drill holes totaling approximately 46,573 ft from six subsurface levels. These data were used to refine the geologic interpretation and update the Mineral Resource estimates. Based on drilling completed to date, uranium mineralization has been interpreted to occur within six vertically stacked mineralized zones, grouped for reporting purposes into the Cap, Upper, Main, Main Lower, Juniper, and Juniper Lower zones.
| 1-12 |
| Energy Fuels Inc. | Pinyon Plain Mine | February 19, 2026 |
| Technical Report on the Updated Pre-Feasibility Study | SLR Project No.: 123.020548.00001 |
At the time of acquisition, the Project was fully permitted and included surface infrastructure and a shaft that had been developed to approximately 50 ft. EFR refurbished the surface facilities and extended the shaft to approximately 278 ft. The Project was placed on standby in late 2013 due to low uranium prices. In October 2015, EFR restarted the Project and completed shaft sinking and underground development. Between October 2015 and March 2017, the shaft was advanced to approximately 1,470 ft, and underground development levels were established at the 1,003 ft, 1,220 ft, and 1,400 ft horizons, which function as drill stations. The Project was formerly known as the Canyon Mine and was renamed to Pinyon Plain in November 2020.
All drill core was handled, logged, and documented in accordance with industry-standard procedures, including core orientation, recovery tracking, radiometric screening, and detailed lithologic and structural logging. All drill holes were logged using radiometric probes to measure natural gamma radiation for indirect estimation of uranium content. In the opinion of the Qualified Person (QP), the drilling, logging, and data quality are adequate to support geologic modeling and Mineral Resource estimation.
Copper mineralization was identified during underground drilling in 2016. Core was screened using handheld X-ray fluorescence (XRF), and selected intervals were submitted for chemical assay. Although copper mineralization is locally significant, EFR considers it uneconomic under current assumptions. Accordingly, copper is not included in the Mineral Resource Estimate and is described for completeness only.
A geotechnical evaluation of mine stability and subsidence potential was completed in 1987 by Dames and Moore, based on data from analogous breccia pipe uranium mines on the Arizona Strip. Numerical modeling evaluated stope stability at depths of approximately 800 ft, 1,200 ft, and 1,600 ft below surface. The study concluded that large stopes could remain stable with appropriate ground support and that long-term subsidence would likely result in minor surface expression. Subsequent to this study, EFR elected to incorporate waste-rock backfilling of stopes, which is expected to further reduce post-mining subsidence.
The SLR QP has not independently verified the 1987 Dames and Moore geotechnical analysis and relies on that report for general context only. The SLR QP notes that the study predates current mining plans, operating practices, and regulatory standards and was based on analog mine data rather than site-specific testing. Accordingly, the historical conclusions should not be relied upon as a substitute for future site-specific geotechnical investigations required to support detailed mine design or Mineral Reserve estimation.
1.3.6 Mineral Resources
This Technical Report presents an updated Mineral Resource Estimate (MRE) for the Pinyon Plain uranium deposit in Coconino County, Arizona, with an effective date of December 31, 2025. Mineral Resources have been classified in accordance with SEC Regulation S-K 1300 (definitions are consistent with CIM (2014), incorporated by reference in NI 43-101). The 2025 MRE supersedes prior public disclosures and reflects updated geological interpretation, revised economic parameters, and application of Reasonable Prospects for Eventual Economic Extraction (RPEEE) informed by underground stope optimization. The estimate was prepared by SLR QPs, who are of the opinion that the methodologies and results are reasonable, robust, and suitable for disclosure.
| 1-13 |
| Energy Fuels Inc. | Pinyon Plain Mine | February 19, 2026 |
| Technical Report on the Updated Pre-Feasibility Study | SLR Project No.: 123.020548.00001 |
The MRE was developed using a conventional block model workflow in Leapfrog Geo/Edge (v2025.2.1), supported by drill logs and downhole radiometric logging. Uranium mineralization was interpreted into six stacked mineralized domains (Cap, Upper, Main, Main Lower, Juniper, and Juniper Lower) using an indicator-based approach and a nominal 0.15% U₃O₈ threshold to define continuity. Due to the pipe geometry and lack of defensible variogram models, uranium grades were estimated using inverse distance squared (ID²) with a variable, geometry-driven search orientation and hard domain boundaries. Model performance was validated using standard industry techniques, including statistical comparisons of composites to block estimates (including parallel ID², OK, and NN checks), swath plots, and visual reviews in plan and section. Assays were composited to 4 ft, no grade capping or high-grade restrictions were applied based on the SLR QP's assessment.
A production-derived in situ tonnage factor of 0.099 short tons per cubic foot (st/ft³) (6.7 ft³/ton or 4.77 t/m³) has been established for high-grade uranium mineralization within the Main and Juniper Zones based on reconciliation of reported production tonnage to surveyed mine-out volumes, reflecting actual mined performance in these domains. This value is materially higher than the previously applied global tonnage factor of 0.082 st/ft³ (12.2 ft³/ton or 2.63 t/m³), which was derived from caliper-based core density measurements and applied uniformly across the deposit; reconciliation demonstrates that the global factor underestimates in situ tonnage within high-grade domains. Accordingly, the Mineral Resource estimate applies a domain-specific density model using 0.099 st/ft³ (4.77 t/m³) for the Main and Juniper Zones and 0.082 st/ft³ (2.63 t/m³) for the Cap, Upper, Middle, Lower, and Juniper Lower Zones.
The updated Mineral Resource estimate reports uranium mineralization only. The previously reported Mineral Resource estimate, with an effective date of December 31, 2022 (SLR 2024), reported uranium and copper Mineral Resources within the Main and Main-Lower zones, and uranium-only Mineral Resources within the Juniper Zone. The updated Mineral Resource estimate reports uranium mineralization only. Copper is not included in the current Mineral Resource estimate, as EFR considers the identified copper mineralization at the Project to be uneconomic under current assumptions.
Mineral Resources also excludes previously reported uranium mineralization within the Cap and Upper zones in accordance with conditions of the Arizona Department of Environmental Quality (ADEQ) Aquifer Protection Permit, which restricts mining between elevations of 5,340 ft and 4,508 ft above sea level.
Mineral Resources are reported as in situ at a US$90/lb U₃O₈ long-term price and an equivalent uranium cut-off grade of 0.31% eU₃O₈, with an assumed 96% metallurgical recovery for uranium. The RPEEE assessment was supported by an underground mining scenario (primarily longhole stoping) and an optimization process using Deswik Stope Optimizer (Deswik.SO), with an assumed acid leach processing scenario consistent with historical feed to the White Mesa Mill.
Table 1-3 summarizes the uranium Mineral Resource reported with an effective date of December 31, 2025. The resources stated in this report supersede any previous Mineral Resources reported for the Project.
| 1-14 |
| Energy Fuels Inc. | Pinyon Plain Mine | February 19, 2026 |
| Technical Report on the Updated Pre-Feasibility Study | SLR Project No.: 123.020548.00001 |
Table 1-3: Summary of Attributable Uranium Mineral Resources - Effective Date December 31, 2025
| Classification | Zone | Cut-Off Grade |
Tonnage Factor |
Tonnage | Grade | Contained Metal |
Metallurgical Recovery U3O8 |
| (% eU3O8) | st/ft3 | (tons) | (% eU3O8) | (lb U3O8) | (%) | ||
| Indicated | Main | 0.31 | 0.099 | 10,454 | 0.604 | 126,197 | 96 |
| Main Lower | 0.082 | 1,385 | 0.407 | 11,281 | |||
| Juniper | 0.099 | 7,198 | 0.471 | 67,731 | |||
| Juniper Lower | 0.082 | 0 | 0.000 | 0 | |||
| Total Indicated | 0.098 | 19,038 | 0.539 | 205,209 | |||
| Inferred | Main | 0.31 | 0.099 | 7,293 | 0.816 | 119,022 | 96 |
| Main Lower | 0.082 | 2,671 | 0.470 | 25,091 | |||
| Juniper | 0.099 | 4,917 | 0.983 | 96,662 | |||
| Juniper Lower | 0.082 | 37 | 0.319 | 235 | |||
| Total Inferred | 0.095 | 14,917 | 0.808 | 241,010 | |||
| Notes: | |||||||
| 1. SEC S-K-1300 definitions were followed for all Mineral Resource categories. These definitions are consistent with CIM (2014) definitions incorporated by reference in NI 43-101. | |||||||
| 2. Mineral Resources are exclusive of Mineral Reserves. | |||||||
| 3. Mineral Resources are estimated at 0.31% U3O8 with estimated recoveries of 96% for uranium. | |||||||
| 4. Mineral Resources are estimated using a long-term uranium price of US$90 per pound. | |||||||
| 5. No minimum mining width was used in determining Mineral Resources. | |||||||
| 6. Mineral Resources were estimated using a domain-specific density model that applies a tonnage factor of 0.099 ton/ft³ (6.7 ft3/ton or 4.77 t/m3) to the high-grade Main and Juniper Zones and a tonnage factor of 0.082 ton/ft³ ft3 (12.2 ft3/ton or 2.63 t/m3).to the Middle, Lower, and Juniper Lower Zones). | |||||||
| 7. Mineral Resources are exclusive of Mineral Reserves and do not have demonstrated economic viability. | |||||||
| 8. Numbers may not add due to rounding. | |||||||
| 9. Mineral Resources are 100% attributable to EFR and are in situ. | |||||||
The SLR QP is of the opinion that, with consideration of the recommendations summarized in Sections 1 and 26, any issues relating to all relevant technical and economic factors likely to influence the prospect of economic extraction can be resolved with further work.
The SLR QP is of the opinion that there are no other known environmental, permitting, legal, social, or other factors that would affect the development of the Mineral Resources.
While the estimate of Mineral Resources is based on the SLR QP's judgment that there are reasonable prospects for economic extraction, no assurance can be given that Mineral Resources will eventually convert to Mineral Reserves.
1.3.7 Mineral Reserves
The Mineral Reserve estimate for Pinyon Plain, summarized in Table 1-4, is based on the Measured and Indicated Mineral Resources as of December 31, 2025, a detailed mine design, and modifying factors such as a feasible mining method, external dilution, and mining extraction factors. No Inferred Mineral Resources were converted to Mineral Reserves. Mineral Reserves are reported in-situ, after application of mining dilution and mining extraction, but prior to application of metallurgical recovery. Metallurgical recovery is applied subsequently in the economic analysis to estimate recovered and saleable U₃O₈.
| 1-15 |
| Energy Fuels Inc. | Pinyon Plain Mine | February 19, 2026 |
| Technical Report on the Updated Pre-Feasibility Study | SLR Project No.: 123.020548.00001 |
The planned mining method at Pinyon Plain is longhole stoping. Development waste rock will be temporarily stored on surface and then used at the end of mining to fill voids created by mining. Metallurgical test results provided by White Mesa Mill laboratory personnel indicated that metallurgical recoveries using optimum roasting and leach conditions will be approximately 96% for uranium.
The underground mine design was based on grade envelopes of assays at a nominal grade of 0.35% U3O8 using underground mining methods and processing via a toll milling agreement.
Current economic conditions, mine design, and cash flow analysis do not account for the processing of copper mineralization, and thus, copper is excluded from the Mineral Reserve estimate.
Table 1-4: Summary of Estimated Mineral Reserves - December 31, 2025
| Classification | Cut-Off Grade (% U3O8 ) |
Tonnage (st) |
Grade (% eU3O8) |
Contained Metal (lb U3O8) |
Metallurgical Recovery U3O8 (%) |
| Main Zone | |||||
| Proven | 0.35% | 17,500 | 1.04% | 365,300 | 96.0 |
| Probable | 0.35% | 79,900 | 1.06% | 1,697,600 | 96.0 |
| Proven | 0.35% | - | - | - | 96.0 |
| Probable | 0.35% | 35,700 | 0.71% | 508,300 | 96.0 |
| Total Proven + Probable | 133,000 | 0.97% | 2,571,200 | 96.0 | |
| Notes: | |||||
|
1. SEC S-K-1300 definitions were followed for all Mineral Reserve categories. These definitions are also consistent with CIM (2014) definitions in NI 43-101. 2. The Mineral Reserve estimate is reported on a 100% ownership basis. 3. Mineral Reserves are reported on an in situ basis after applying dilution and mining extraction. 4. Mineral Reserves are estimated using a long-term uranium price of US$80.00/lb, and a breakeven cut-off grade of 0.35% U3O8. 5. Stope shapes were created using a minimum mining width of 4 ft and 20 ft vertical stope heights. 6. A tonnage factor of 0.099 st/ft3 was used which is derived from operational data. 7. Numbers may not add due to rounding. |
|||||
The SLR QP is not aware of any risk factors associated with, or changes to, any aspects of the modifying factors such as mining, metallurgical, infrastructure, permitting, or other relevant factors that could materially affect the Mineral Reserve estimate.
1.3.8 Mining Method
Pinyon Plain is an underground, shaft-access mine. The primary production method is longhole stoping, using either upholes or downholes drilled from ore sill drives. Development mining uses handheld drills for face advance and ground support installation. Longholes are drilled with buggy drills. Material is hauled using small, mechanized rubber-tired equipment. Ore is hoisted to surface, stored in a surface ore stockpile, and then transported by highway trucks to the White Mesa Mill.
| 1-16 |
| Energy Fuels Inc. | Pinyon Plain Mine | February 19, 2026 |
| Technical Report on the Updated Pre-Feasibility Study | SLR Project No.: 123.020548.00001 |
There are two mining zones at Pinyon Plain. The production shaft is 1,470 ft deep reaching the bottom of the Main Zone. Main Zone production extends over an approximate 200 ft vertical interval from 1,200 ft to 1,400 ft below surface. The Juniper Zone lies beneath the Main Zone, with production extending over an approximate 220 ft vertical interval to a maximum depth of 1,800 ft below surface. The bottom of Juniper Zone is approximately 410 ft below the lowest shaft station.
The Main Zone is roughly cylindrical in shape, with a diameter of up to 200 ft. Production stopes range from 10 ft to up to 40 ft across. Mining levels are spaced at roughly 40 ft vertical intervals. An eight foot diameter return air raise (RAR) is located in the barren centre. A Timberland escape hoist with bullet cage is installed in the raise such that it functions as an emergency escapeway.
The Juniper Zone is also cylindrical in shape, however, less continuous than the Main Zone. Reserves are primarily located on the south and west side of the mineralized cylinder. Mining levels in Juniper Zone are designed at 40 ft vertical spacing. The Juniper Zone mine design includes a switchback decline and eight mining levels.
Due to the circular nature of the breccia pipe, each mining level is developed in a circular fashion, from the mine access drift along the circular ore contacts. Ore drifts are widened to the extent of mineralization by slashing the side walls. Once the ore drive is complete, longhole stoping will typically be initiated on the opposite side of the pipe from the level entrance and retreat back toward the level entrance. An LHD will transport material from the mining face, then load haul trucks at the level entrance. The haul trucks will then move material up the Juniper decline to the shaft loading pocket.
As of January 2025, production in Main Zone is ongoing and expected to be completed in 2028. Decline development is advancing toward the Juniper Zone, with first ore expected in July 2026 when ore development commences on the 4902 level. The production rates are expected to hold steady near 5,000 short tons per month until the end of 2027 when the Juniper Zone nears depletion. The end of the mine production schedule is currently August 2028.
Production is scheduled at up to 5,000 tons per month (166 tpd) when sufficient headings are available. All development headings are scheduled to advance at six feet per day, equal to a standard development round length.
1.3.9 Mineral Processing
Ore will be transported to the White Mesa Mill for processing based on a toll milling agreement. Energy Fuels owns and operates White Mesa Mill, which is located near Blanding, Utah. White Mesa Mill is 270 road miles to 320 road miles from the Pinyon Plain Mine, depending on the route.
The White Mesa Mill currently utilizes agitated hot acid leach and solvent extraction to recover uranium. Historical and metallurgical tests, along with White Mesa Mill production records, confirm this processing method will recover approximately 96% of the contained uranium.
The White Mesa Mill was constructed in 1979 to 1980, and is currently fully operational. All required facility infrastructure items are in place at the White Mesa Mill for processing of Pinyon Plain Mine mineralization.
1.3.10 Project Infrastructure
The Pinyon Plain Mine is a developed site with gravel road access and facilities, including line power. Infrastructure at the Project has been designed to accommodate all mining and transportation requirements. In addition to the mine shaft, existing mine infrastructure includes offices, mine dry, warehousing, development rock storage, standby generators, fuelling station, fresh water well, monitor wells and water tanks, a containment pond, electrical power, rapid response services, explosive magazines, equipment utilities, and a workshop. The haulage distance from the Project to the White Mesa Mill in Blanding, Utah, is 320 miles.
| 1-17 |
| Energy Fuels Inc. | Pinyon Plain Mine | February 19, 2026 |
| Technical Report on the Updated Pre-Feasibility Study | SLR Project No.: 123.020548.00001 |
1.3.11 Market Studies
EFR has signed uranium sales contracts and has term sheets with major nuclear utilities for a portion of the production from the Project. These contracts use both agreed upon base pricing and spot pricing to calculate the actual contract sales price. The average contract and term sheet price over 2026 and 2027 is approximately $82.73/lb based upon the price forecasts from TradeTech. A $5/lb reduction in spot price would result in an average contract and term sheet price of $80.48/lb. Based on the current and forecast spot prices and contracts data, SLR used a constant uranium price of $80/lb for Reserves and in the cash flow analysis.
1.3.12 Environmental, Permitting and Social Considerations
EFR has secured and assesses compliance with all permits necessary to construct, operate, and close the Project. Permitting involved public participation and involvement. EFR maintains regular interactions with the governmental agencies and the public.
1.3.13 Capital and Operating Cost Estimates
The base case capital cost estimate summarized in Table 1-5 covers the three year life of the Project and are based on Q1 2025 US dollars. Based on the American Association of Cost Engineers (AACE) International classifications, Class 3 estimates have an accuracy range between -10% to -20% (low-end) to +10% to +30% (high-end) (AACE International 2012). The base case capital and operating cost estimates are within the Class 3 ranges and would meet the S-K 1300 standard of ± 25% accuracy and ≤15% contingency.
Table 1-5: Capital Cost Estimate
| Description | Total Cost (US$ 000) |
| Mine Development | 7,163 |
| Mining and Infrastructure | 750 |
| Contingency | 1,187 |
| Reclamation | 1,540 |
| Total Capital | 10,640 |
Operating costs are based on EFR's operating experience. Table 1-6 shows the operating costs used in the economic evaluation of the Project in Q1 2025 dollars with no contingency applied.
Table 1-6: Operating Cost Summary
| Area | Cost ($/st ore mined) |
| Mining | $184.00 |
| Haulage | $95.00 |
| 1-18 |
| Energy Fuels Inc. | Pinyon Plain Mine | February 19, 2026 |
| Technical Report on the Updated Pre-Feasibility Study | SLR Project No.: 123.020548.00001 |
| Processing | $256.00 |
| G&A | $7.00 |
| TOTAL Operating Costs | $542.00 |
| Notes: | |
|
1. Mining costs include labor, supplies, equipment operation, and sundries as well as an allowance for ongoing mine development over the life of the Project. 2. Ore haulage covers the cost of trucking ore from the mine to White Mesa mill for toll processing. The contract haulage cost is based on a $0.30/st-mile unit rate and assumes a 5% moisture content of the ore. 3. Processing cost estimate is based on a toll milling arrangement between the Project and the White Mesa Mill. 4. General and Administrative (G&A) costs are based on the assumption that the Project will be supported by existing staff based in EFR's Lakewood, Colorado, office headquarters, with regular site visits as needed during the year. G&A costs, totaling $7.00/st ore, are estimated as 2.5% of direct operating costs. 5. No contingency applied. |
|
| 1-19 |
| Energy Fuels Inc. | Pinyon Plain Mine | February 19, 2026 |
| Technical Report on the Updated Pre-Feasibility Study | SLR Project No.: 123.020548.00001 |
2.0 Introduction
SLR International Corporation (SLR) was retained by Energy Fuels Inc. (Energy Fuels), the parent company of Energy Fuels Resources (USA) Inc. (EFR), to prepare a Technical Report on the updated Pre-Feasibility Study (PFS) on the Pinyon Plain Mine (Pinyon Plain or the Project), located in Coconino County, Arizona, USA. EFR owns 100% of the Project.
EFR's parent company, Energy Fuels Inc., is incorporated in Ontario, Canada. EFR is a US-based critical materials company focused on developing its uranium/vanadium mines in Colorado, Utah, Arizona, New Mexico, and Wyoming. It also has rare-earth element processing capabilities that complement its uranium processing at its White Mesa Mill in Blanding, Utah, and its rare-earth processing globally. Energy Fuels is listed on the NYSE American Stock Exchange (symbol: UUUU) and the Toronto Stock Exchange (symbol: EFR).
This Technical Report satisfies the requirements of Canadian National Instrument 43-101 Standards of Disclosure for Mineral Projects (NI 43-101) and the United States Securities and Exchange Commission's (SEC) Modernized Property Disclosure Requirements for Mining Registrants as described in Subpart 229.1300 of Regulation S-K, Disclosure by Registrants Engaged in Mining Operations (S-K 1300) and Item 601 (b)(96) Technical Report Summary. The purpose of this Technical Report is to disclose the results of an updated PFS for the Project.
The Pinyon Plain Mine is a uranium and copper breccia pipe deposit in northern Arizona. The mine is permitted and includes a 1,470 ft-deep shaft, headframe, hoist, compressor, and surface facilities, including line power. The mine is currently producing ore from the Main Zone and advancing development toward the Juniper Zone. Environmental compliance activities continue with all infrastructure for mine development in place. The operation is a mechanized underground mining operation in which ore is hoisted to the surface and then trucked to the White Mesa mill for processing under a toll milling agreement.
Energy Fuels operates the mine at a nominal production rate of up to 166 short tons per day (stpd) of ore, and at an average rate of 133 stpd over the LOM. The mine life totals 32 months. The life of mine plan includes mining 133,000 tons of ore grading 0.97% U3O8, yielding 2.57 million pounds (Mlb) of U3O8. Process recovery is estimated at 96%, resulting in the production of 2.47 million pounds of U3O8. There are additional Mineral Resources at depth below the Mineral Reserves in the current mine plan.
2.1 Sources of Information
Sources of information and data contained in this Technical Report or used in its preparation are from publicly available sources in addition to private information owned by EFR, including that of past property owners.
This Technical Report was prepared by SLR QPs. Details on the site visits for each of the QPs are listed:
• The independent SLR QP Mathisen visited the Project under care and maintenance on November 16, 2021. Mr. Mathisen toured the operational areas, project offices, and water treatment facility (WTF) and conducted discussions with EFR Project geologists on current and future plans of operations.
• The independent SLR QP Chee has not visited the Project. Ms. Chee considered her discussions with Mr. Mathisen following his site visit with regard to the project geology to be sufficient to conduct the Mineral Resource estimation.
| 2-1 |
| Energy Fuels Inc. | Pinyon Plain Mine | February 19, 2026 |
| Technical Report on the Updated Pre-Feasibility Study | SLR Project No.: 123.020548.00001 |
• The independent SLR QPs, Messrs. Malensek and Gochnour, visited Pinyon Plain on October 27, 2022. Messrs. Malensek and Gochnour toured the surface and underground operational areas, project offices, and WTF, and conducted discussions with EFR site personnel on current and future plans of operations.
• The independent SLR QP Murray Dunn visited the Project on October 6, 2025, visiting underground work areas and surface infrastructure and discussing the current operational status, mining method, and future development plans.
• The independent QP, Jeffrey L. Woods, SLR associate metallurgist, has not visited the Pinyon Plain Mine as all processing will occur at the White Mesa Mill.
Table 2-1 presents a summary of the QP responsibilities for this Technical Report.
Table 2-1: Summary of QP Responsibilities
| Qualified Person | Company | Title/Position | Section |
| Grant A. Malensek, M.Eng., P. Eng. | SLR | Senior Principal Mining Engineer | 1.2, 1.3.11, 1.3.13, 19, 21, 22, 30 |
| Mark B. Mathisen, CPG | SLR | Senior Principal Geologist | 1.1, 1.1.1.1, 1.1.2.1, 1.3.1-1.3.6, 2-12, 14, 23, 24, 25.1, 26.1 |
| Yenlai Chee, CPG | SLR | Senior Resource Geologist | 1.3.6, 14 |
| Murray Dunn, P.Eng. | SLR | Consultant Mining Engineer | 1.1.1.2, 1.1.2.2, 1.3.7, 1.3.8, 15, 16, 25.2, 26.2 |
| Jeffrey L. Woods, MMSA QP | Woods Process Services | Principal Consulting Metallurgist | 1.1.1.3, 1.1.1.4, 1.1.2.3, 1.1.2.4, 1.3.9, 1.3.10, 13, 17, 18, 25.3, 25.4, 26.3, 26.4 |
| Lee (Pat) Gochnour, MMSA (QP) | Gochnour & Associate, Inc. | Associate Principal Environmental Specialist | 1.1.1.5, 1.1.2.5, 1.3.12, 20, 25.5, 26.5 |
| All | - | - | 27 |
During the preparation of this Technical Report, discussions were held with personnel from EFR:
• Dan Kapostasy, P.G., Vice President, Technical Services
• Matthew Germansen, Technical and Environmental Manager
• Jared Tadla, Geologist Technical Lead
• Scott Bakken, P.G., Vice President, Regulatory Affairs
• Nick Martin, Environmental Manager
• Logan Shumway, Vice President, Processing Operations
This Technical Report supersedes the previous Technical Report completed by SLR, dated March 6, 2024.
The documentation reviewed and other sources of information are listed at the end of this Technical Report in Section 27 References.
| 2-2 |
| Energy Fuels Inc. | Pinyon Plain Mine | February 19, 2026 |
| Technical Report on the Updated Pre-Feasibility Study | SLR Project No.: 123.020548.00001 |
2.2 List of Abbreviations
The U.S. System for weights and units has been used throughout this report. Tons are reported in short tons (ton) of 2,000 lb unless otherwise noted. All currency in this Technical Report is US dollars (US$) unless otherwise noted.
Abbreviations and acronyms used in this Technical Report are listed below.
| Unit Abbreviation | Definition | Unit Abbreviation | Definition |
| μ | micron | kWh | kilowatt-hour |
| a | annum | L | liter |
| A | ampere | lb | pound |
| bbl | barrels | m | meter |
| Btu | British thermal units | m3 | meter cubed |
| °C | degree Celsius | M | mega (million); molar |
| cm | centimeter | Ma | one million years |
| cm3 | centimeter cubed | MBtu | thousand British thermal units |
| d | day | MCF | million cubic feet |
| °F | degree Fahrenheit | MCF/h | million cubic feet per hour |
| ft ASL | feet above sea level | mi | mile |
| ft | foot | min | minute |
| ft2 | square foot | Mpa | megapascal |
| ft3 | cubic foot | mph | miles per hour |
| ft/s | foot per second | MVA | megavolt-amperes |
| g | gram | MW | megawatt |
| G | giga (billion) | MWh | megawatt-hour |
| Ga | one billion years | ppb | part per billion |
| gal | gallon | ppm | part per million |
| gal/d | gallon per day | rpm | revolutions per minute |
| g/L | gram per liter | RL | relative elevation |
| g/y | gallon per year | s | second |
| gpm | gallons per minute | ton or st | short ton |
| hp | horsepower | stpa | short ton per year |
| h | hour | stpd | short ton per day |
| Hz | hertz | t | metric tonne |
| in. | inch | US$ | United States dollar |
| in2 | square inch | V | volt |
| J | joule | W | watt |
| k | kilo (thousand) | wt% | weight percent |
| kg/m3 | kilogram per cubic meter | WLT | wet long ton |
| kVA | kilovolt-amperes | y | year |
| kW | kilowatt | yd3 | cubic yard |
| 2-3 |
| Energy Fuels Inc. | Pinyon Plain Mine | February 19, 2026 |
| Technical Report on the Updated Pre-Feasibility Study | SLR Project No.: 123.020548.00001 |
3.0 Reliance on Other Experts
This Technical Report has been prepared by the SLR QP for EFR's parent company, Energy Fuels. The information, conclusions, opinions, and estimates contained herein are based on:
• Information available to the SLR QP at the time of preparation of this Technical Report,
• Assumptions, conditions, and qualifications as set forth in this Technical Report, and
• Data, reports, and other information supplied by Energy Fuels and other third-party sources.
3.1 Reliance on Information Provided by the Registrant
For the purpose of this Technical Report, the SLR QP has relied on information provided by Energy Fuels for the following:
Ownership information for the Project, as described in Section 4 Property Description and Location, and the Summary of this Technical Report, relied upon a legal opinion by Parsons Behle & Latimer dated January 19, 2022, entitled Mining Claim Status Report - Pinyon Mine, Coconino County, Arizona. The SLR QP has not researched property title or mineral rights for the Project, as we consider it reasonable to rely on Energy Fuels' legal counsel, who is responsible for maintaining this information. The SLR QP, in their professional opinion, has taken all appropriate steps to ensure that the above information from Energy Fuels is sound.
Royalties and other encumbrances for the Project, as described in Section 4 Property Description and Location and the relevant sections of the Summary, were confirmed by Matthew Germansen, Technical and Environmental Manager for EFR, in an email dated January 23, 2026.
Environmental and permitting information for the Property, as described in Section 4 Property Description and Location, Section 20 Environmental Studies, Permitting, and Social or Community Impact, and the relevant sections of the Summary, was provided by Scott Bakken, Vice President, Regulatory Affairs for EFR, and Nick Martin, Environmental Manager, and reviewed by the SLR QP. The permit register was also provided by Mr. Martin via email on August 25, 2025. SLR is unaware of any changes in the register since the date of confirmation.
SLR has relied on EFR for guidance on applicable taxes and other government levies or interests, applicable to revenue or income, to evaluate the viability of the Mineral Reserves stated in Section 22 Economic Analysis, and the relevant sections of the Summary of this Technical Report. This information was confirmed by Kara Beck, Tax Manager for EFR, in an email dated February 16, 2026. SLR is unaware of any changes to the US tax code since the date of confirmation.
Except as provided by applicable laws, any use of this Technical Report by any third party is at that party's sole risk.
| 3-1 |
| Energy Fuels Inc. | Pinyon Plain Mine | February 19, 2026 |
| Technical Report on the Updated Pre-Feasibility Study | SLR Project No.: 123.020548.00001 |
4.0 Property Description and Location
The Project is a fully permitted underground uranium and copper deposit in northern Arizona. The mineral rights are held by EFR, a wholly owned subsidiary of EFR Arizona Strip LLC.
4.1 Location
The Project is located in northern Arizona within the Kaibab National Forest, on a fully permitted 17-acre site. It is situated 153 mi north of Phoenix, 86 mi northwest of Flagstaff, 47 mi north of Williams, and seven miles southeast of Tusayan, in Sections 19 and 20, Township 29 North, Range 03 East, Gila and Salt River Meridian (GSRM), Coconino County, Arizona (Figure 4-1).
The approximate center of the Project has the following coordinates:
• Universal Transverse Mercator (UTM): 401036.11 m E, 3971521.98 m N Zone 12S
• Geographic: 35°52'58.65" N latitude and 112°5'47.05" W longitude (degrees, minutes, seconds).
• State Plane 1983 Arizona Central FIPS 0202 (US feet) system.
| 4-1 |
| Energy Fuels Inc. | Pinyon Plain Mine | February 19, 2026 |
| Technical Report on the Updated Pre-Feasibility Study | SLR Project No.: 123.020548.00001 |
Figure 4-1: Location Map

| 4-2 |
| Energy Fuels Inc. | Pinyon Plain Mine | February 19, 2026 |
| Technical Report on the Updated Pre-Feasibility Study | SLR Project No.: 123.020548.00001 |
4.2 Land Tenure
EFR's property position at the Project consists of nine unpatented mining claims (Canyon 64-66, 74-76, and 84-86), located on U.S. Forest Service (USFS) land, encompassing approximately 186 acres (Figure 4-2). Gulf Mineral Resources (Gulf) originally staked the claims in 1978, and various companies have maintained the claims since the original staking. EFR acquired the Project in June 2012 and has a 100% interest in the claims.
All claims, which are renewed annually in September of each year, are in good standing until September 1, 2026 (at which time they will be renewed for the following year as a matter of course). All unpatented mining claims are subject to an annual federal mining claim maintenance fee of $200 per claim plus approximately $10 per claim for county filing fees to the BLM. Table 4-1 lists the mineral claims covering the Project.
Table 4-1: Claims Held by EFR for the Pinyon Plain Mine
| Section | Quadrant | Serial Number | Claim Type | Claim Name | Claimant | Loc. Date | Next Pmt Due Date |
| 19 & 20 | NE(19),NW(20) | AZ101406928 | LODE CLAIM | CANYON #64 | EF ENERGY FUELS | 4/5/1978 | 9/1/2026 |
| 19 & 20 | NE,SE(19),NW,SW(20) | AZ101408027 | LODE CLAIM | CANYON #65 | EF ENERGY FUELS | 4/5/1978 | 9/1/2026 |
| 19 & 20 | SE(19),SW(20) | AZ101422944 | LODE CLAIM | CANYON #66 | EF ENERGY FUELS | 4/5/1978 | 9/1/2026 |
| 20 | NW | AZ101424281 | LODE CLAIM | CANYON #74 | EF ENERGY FUELS | 4/5/1978 | 9/1/2026 |
| 20 | NW,SW | AZ101511848 | LODE CLAIM | CANYON #75 | EF ENERGY FUELS | 4/5/1978 | 9/1/2026 |
| 20 | SW | AZ102522768 | LODE CLAIM | CANYON #76 | EF ENERGY FUELS | 4/5/1978 | 9/1/2026 |
| 20 | NE,NW | AZ101515633 | LODE CLAIM | CANYON #84 | EF ENERGY FUELS | 4/4/1978 | 9/1/2026 |
| 20 | NE,NW,SE,SW | AZ101403513 | LODE CLAIM | CANYON #85 | EF ENERGY FUELS | 4/4/1978 | 9/1/2026 |
| 20 | SE,SW | AZ101408062 | LODE CLAIM | CANYON #86 | EF ENERGY FUELS | 4/4/1978 | 9/1/2026 |
| 4-3 |
| Energy Fuels Inc. | Pinyon Plain Mine | February 19, 2026 |
| Technical Report on the Updated Pre-Feasibility Study | SLR Project No.: 123.020548.00001 |
Figure 4-2: Land Tenure Map

| 4-4 |
| Energy Fuels Inc. | Pinyon Plain Mine | February 19, 2026 |
| Technical Report on the Updated Pre-Feasibility Study | SLR Project No.: 123.020548.00001 |
4.3 Required Permits, Authorizations and Status
The Project is located on public lands managed by the USFS and has an approved Plan of Operations (PoO) with the USFS. The Pinyon Plain Property has also received permit authorizations through the Arizona Department of Environmental Quality (ADEQ), which include an Individual Aquifer Protection Permit (APP) for the Non-Stormwater Impoundment, Intermediate Ore Stockpile and Development Rock Stockpile, an Air Quality Control Permit, and Industrial Stormwater Multi-Sector General Permit (MSGP) coverage. In 2015, the Property also received approval from the US Environmental Protection Agency (EPA) to construct/modify an Underground Uranium Mine pursuant to the National Emissions Standards for Hazardous Air Pollutants (NESHAPs).
The SLR QP is not aware of any factors or risks that may affect access, title, or the right or ability to perform the proposed work program on the Property.
4.4 Royalties
In late 2022, EFR contracted a legal firm, Parsons Behle & Latimer (the Firm), to examine evidence of title and ownership of the existing royalties on the unpatented land claims associated with the Pinyon Plain mine.
The Firm examined records of the Coconino County Recorder related to existing royalties and found a mining deed and lease dated December 1, 1982, between the Gulf Oil Corporation (Gulf) and Energy Fuels Exploration Company (EFEC) reserving a 3.5% royalty based on a sliding pricing guaranteed by the US Government based on ore grade plus allowances for mining and haulage as outlined in the United States Atomic Energy Commission (AEC) Circular 5. Additionally, a 7% net smelter return (NSR) royalty on minerals other than uranium was also agreed upon with Gulf, which is not applicable at this time since uranium is the only metal planned to be milled from the Project as outlined in the economic analysis section (Section 22.0) of this Technical Report.
Based on the AEC guidance, current Pinyon Plain Mineral Reserves, and EFR's uranium contracted price for Pinyon Plain ores, the calculated Pinyon Plain royalty to Gulf is $1.88 per ore ton mined.
4.5 Other Significant Risks
The SLR QP is not aware of any environmental liabilities on the Project. Energy Fuels has all the required permits to conduct the proposed work on the Project. The SLR QP is not aware of any other significant factors and risks that may affect access, title, or the right or ability to perform the proposed work program on the Project.
| 4-5 |
| Energy Fuels Inc. | Pinyon Plain Mine | February 19, 2026 |
| Technical Report on the Updated Pre-Feasibility Study | SLR Project No.: 123.020548.00001 |
5.0 Accessibility, Climate, Local Resources, Infrastructure and Physiography
5.1 Accessibility
Access to the Project site is via State Highway 64 and Federal Highway 180 to within five miles of the mine site, then over unsurfaced public USFS roads (Figure 4-1). The Atchison, Topeka and Santa Fe railway line passes east-west 50 mi south of the site at Williams, and a spur of the railway, which passes 10 mi west of the Project site, services the Grand Canyon National Park. Airports at Flagstaff, Phoenix, and Tusayan provide air access to the area.
Although the Coconino Plateau is sparsely populated, tourist traffic to Grand Canyon National Park results in large numbers of people passing through the region daily.
5.2 Vegetation
Vegetation on the plateaus is primarily ponderosa pine forest with some open pinyon-juniper woodland and shrubs. The local climate allows for a year-round mining operation.
5.3 Climate
The climate in northern Arizona is semi-arid, with cold winters and hot summers. January temperatures range from approximately 7°F to 57°F and July temperatures range from 52°F to 97°F. Annual precipitation, mostly in the form of rain but with some snow, is about 12 in.
5.4 Local Resources
Personnel and supplies for future mining operations are expected to be sourced from the nearby towns of Williams and Flagstaff, Arizona (50 miles and 70 miles, respectively), as well as other underground mining districts in the western United States. Although the Coconino Plateau is sparsely populated, tourist traffic to Grand Canyon National Park results in large numbers of people passing through the region daily.
5.5 Infrastructure
In addition to the mine shaft, existing surface mine infrastructure includes surface maintenance shops, employee offices and change rooms, a water well, an evaporation pond, water treatment plant, explosive magazines, water tanks, fuel tank, and rock stockpile pads (ore and development rock). Electrical power is available through an existing power line that terminates at the site.
In 1982, Energy Fuels Nuclear, Inc. (EFNI), which is not part of Energy Fuels Inc., acquired the Project. From 1982 to 1987, EFNI conducted exploration drilling, permitted the mine, constructed certain surface facilities including a headframe, hoist, and compressor, and sunk the shaft to a depth of 50 ft. From 1987 to 2013, the Project was put on standby due to low uranium prices. In 2012, EFR acquired the Project through its acquisition of Denison Mines Corporation's US assets (Denison). Beginning in 2013, EFR refurbished the surface facilities and extended the shaft an additional 228 ft to a depth of 278 ft. In late 2013, the Project was again placed on standby due to low uranium prices. In October 2015, EFR re-started the Project and committed to completing the shaft and underground delineation drilling program. From October 2015 to March 2018, the shaft was sunk to a final depth of 1,470 ft, and three development levels were started at the 1,000 ft (5,506 ft ASL), 1,220 ft (5,286 ft ASL); and 1,400 ft (5,106 ft ASL) depths, all of which have functioned as drill stations.
| 5-1 |
| Energy Fuels Inc. | Pinyon Plain Mine | February 19, 2026 |
| Technical Report on the Updated Pre-Feasibility Study | SLR Project No.: 123.020548.00001 |
During 2019, a 1,000,000-gallon water tank was installed, in addition to the existing 400,000-gallon tank installed in 2017. These above-ground storage tanks are used for operational flexibility and extra water storage capacity during winter months. Three floating, downcasting, enhanced evaporators were installed in the Non-Stormwater Impoundment to aid in evaporation. The tanks and evaporators are part of Energy Fuels' water balance management practices at the site.
During 2020, a fourth floating, down-casting, enhanced evaporator was installed at the site to increase the operational flexibility of the water balance management practices. Additionally, a water capture and pumping system was installed in the shaft to segregate unimpacted water and store it for beneficial use.
During 2021, a water treatment facility (WTF) was installed to process water for offsite transport. The WTF was commissioned in April 2021. Water use agreements have been entered into with local farmers and ranchers through which they may utilize excess water from the Pinyon Plain Mine for their own beneficial uses within the Coconino Plateau groundwater basin.
In addition to the mine shaft, existing surface mine infrastructure includes surface maintenance shops, employee offices and change rooms, a water well, an evaporation pond, explosive magazines, water tanks, fuel tank, and rock stockpile pads (ore and development rock). Electrical power is available through an existing power line that terminates at the site.
5.6 Physiography
Northern Arizona is part of the Colorado Plateau, a region of the western United States characterized by semi-arid, high-altitude, gently sloping plateaus dissected by steep walled canyons, volcanic mountain peaks, and extensive erosional escarpments. The Project is located on the Coconino Plateau within the Colorado Plateau, at an elevation of approximately 6,500 feet above sea level (ft ASL).
Overall, the land is flat lying across several square miles surrounding the Project. Elevation at the site is 6,500 ft ASL with a southern downward slope averaging 100 ft per mile. Two major regional topographical features include the Red Butte, a lava capped mesa 4.5 mi south at an elevation of 7,234 ft ASL, and the Colorado River, 15 mi to the north at an elevation of 2,500 ft ASL.
Major landforms in the general area of the Project include nearly level drainage bottoms of recent alluvium, gently sloping plateau ridgetops, and moderately sloping canyon sideslopes. Soils have developed from residual or colluvial parent materials, and outcrops of bedrock are typically exposed along shoulder slopes and ridgetops. The Coconino Rim, a north-facing escarpment east and north of the deposit, is the major landform obstructing access between Pinyon Plain and highways to the east.
| 5-2 |
| Energy Fuels Inc. | Pinyon Plain Mine | February 19, 2026 |
| Technical Report on the Updated Pre-Feasibility Study | SLR Project No.: 123.020548.00001 |
6.0 History
Uranium exploration and mining of breccia pipe deposits started in the region in 1951 when a geologist with the U.S. Geological Survey noted uranium ore on the dump of an old copper prospect on the South Rim of the Grand Canyon in Northern Arizona. The prospect was inside Grand Canyon National Park, but on fee land that predated the Park. The Golden Crown Mining Company, which later merged with Western Gold and Uranium Inc., mined a significant high grade uranium deposit, the Orphan Mine, from 1956 to 1969. By the time mining ended, 4.26 million pounds (Mlb) of uranium, along with some minor amounts of copper, vanadium, and silver had been produced (Bennett, n.d.).
After the discovery of this first uranium deposit in the 1950s, an extensive search for other uranium deposits was made by the government and mining industry, but only a few low-grade prospects were found. Exploration started again in the early-1970s.
In the mid-1970s, Western Nuclear leased the Hack Canyon prospect located approximately 25 mi north of the Grand Canyon and found high grade uranium mineralization offsetting an old shallow copper-uranium site. In the next few years, a second deposit was found a mile away along a fault.
In the late-1970s, EFNI formed a uranium exploration venture with several Swiss utilities and acquired significant uranium reserves in southeast Utah. EFNI permitted and built the 2,000 stpd White Mesa Mill near Blanding, Utah, to process Colorado Plateau ore, which was expected to average 0.13% U3O8. When the uranium market fell in 1980, the higher-grade Hack Canyon property was leased by EFNI from Western Nuclear in December 1980 as a likely low-cost source of U3O8 mill feed. Development started promptly, and the Hack Canyon deposits were in production by the end of 1981. They proved to be much better than the initial estimates suggested in terms of both grade and tonnage.
As part of their exploration program, EFNI identified and investigated more than 4,000 circular features, which potentially indicate mineralized breccia pipes, in northern Arizona. Approximately 110 of the most prospective features were further explored by deep drilling, and nearly 50% of those drilled were shown to contain uranium mineralization. Ultimately, nine pipes were developed. Total mine production from the EFNI breccia pipes from 1980 through 1991 was approximately 19.1 Mlb of U3O8 at an average grade of just over 0.60% U3O8.
The Project is a uranium and copper breccia pipe deposit in northern Arizona. The Project was originally included as part of the Arizona Strip Uranium Project. The Arizona Strip Uranium Project was located in the Arizona Strip District, a mining district located in northwestern Arizona, and contained three deposits: the Pinenut Mine, the Arizona 1 Mine, and the Project. The Pinenut and Arizona 1 breccia pipes are located between the town of Fredonia, Arizona, and the Grand Canyon National Park. The Pinenut Mine was mined out in 2015 and is currently being reclaimed. The Arizona 1 Mine is currently on standby. The Project has been considered separate from the Arizona Strip Uranium Project since 2017.
6.1 Prior Ownership
The Project is located on mining claims that EFNI acquired from Gulf in 1982. Gulf originally staked the claims in April 1978. EFNI was acquired by the Concord group in the early-1990s. The Concord group declared bankruptcy in 1995, and most of the EFNI assets, including the Project, were acquired by International Uranium Corporation (IUC) in 1997. IUC merged with Denison Mines Inc. on December 1, 2006, and the new company changed its name to Denison Mines Corporation. In June 2012, Energy Fuels Inc. acquired all of Denison's mining assets and operations in the United States. Currently the Project claims are held by EFR, a wholly-owned subsidiary of EFR Arizona Strip LLC.
| 6-1 |
| Energy Fuels Inc. | Pinyon Plain Mine | February 19, 2026 |
| Technical Report on the Updated Pre-Feasibility Study | SLR Project No.: 123.020548.00001 |
6.2 Exploration and Development History
Since 1994, exploration activities undertaken on the Project have only included drilling. Prior to that, exploration activities carried out by EFR's predecessors from 1983 to 1987 include:
• Ground control source audio magneto tellurium (CSAMT) surveys
• Ground magnetics
• Ground very low frequency (VLF) surveys
• Time domain electro-magnetic surveys (TDEM)
• Surface gravity surveys
• Airborne electromagnetic (EM) surveys.
At the time of the acquisition by EFR, the Project was permitted and contained a headframe, hoist, and compressor, and a shaft to a depth of 50 ft. EFR refurbished the surface facilities and extended the shaft an additional 228 ft to a depth of 278 ft. In late 2013, the Project was placed on standby due to low uranium prices. In October 2015, EFR re-started the Project and committed to completing the shaft and underground delineation drilling program. From October 2015 to March 2017, the shaft was sunk to a depth of 1,470 ft, and three development levels were started at the 1,003 ft, 1,220 ft, and 1,400 ft depths, all of which have functioned as drill stations.
The Project was previously referred to as the Canyon Mine; however, in November 2020, EFR changed the project name to Pinyon Plain.
6.2.1 Drilling
The basic tool for exploring breccia pipes in northern Arizona is deep rotary drilling, supplemented by core drilling, up to a depth of 2,000 ft or more from surface. All drill holes are surveyed for deviation and logged using gamma logging equipment, as described in Section 11.1.1. Previous operators drilled 45 surface holes, including a deep water well, totalling 62,289 ft (Table 6-1). Gulf drilled eight exploration holes at the Project site from 1978 to May 1982 but found only low-grade uranium mineralization. Additional drilling by EFNI in 1983 identified economic uranium mineralization at the Pinyon Plain breccia pipe.
After EFNI identified mineralization, shallow drilling was conducted to locate the center of the collapse feature (holes S01-S13), as a guide to the throat of the underlying breccia pipe. EFNI followed this up with additional deep drilling to better define the mineralization.
Table 6-1: Drilling at Pinyon Plain Mine by Previous Operators
| Year | Company | Location | # Holes | Total Depth (ft) |
Hole ID | Type |
| 1978-1982 | Gulf | Surface | 8 | 13,041 | COG Series | Rotary |
| 1983 | EFNI | Surface | 5 | 10,504 | CYN Series 01-05 | Rotary |
| 1984 | EFNI | Surface | 13 | 1,350 | CYN Series S01-S13 | Rotary |
| 6-2 |
| Energy Fuels Inc. | Pinyon Plain Mine | February 19, 2026 |
| Technical Report on the Updated Pre-Feasibility Study | SLR Project No.: 123.020548.00001 |
| Year | Company | Location | # Holes | Total Depth (ft) |
Hole ID | Type |
| 1984 | EFNI | Surface | 10 | 18,462 | CYN Series 06-14C & 16C | Core/Rotary |
| 1985 | EFNI | Surface | 2 | 3,534 | CYN 15C & CYN 15W1 | Core |
| 1986 | EFNI | Surface | 1 | 3,086 | 55-515772 | Water Well |
| 1994 | EFNI | Surface | 6 | 12,312 | CYN Series 17-22 | Rotary |
| Total | 45 | 62,289 |
6.3 Past Production
A mine shaft and conveyances were developed for underground exploration, as described in Section 5.5. Production at Pinyon Plain commenced in 2024 with ore development in the Main Zone. Longhole stoping activities commenced in late 2025 between the 5170 and 5210 sublevels, and the 5210 and 5250 sublevels. A summary of past production is presented in Table 6-2.
Table 6-2: Past Production Summary
| Year | Tonnage (tons) |
Grade (% U3O8) |
Contained Metal (lb U3O8) |
| 2024 | 6,815 | 1.53 | 207,981 |
| 2025 | 47,194 | 1.62 | 1,533,714 |
| Total | 54,009 | 1.61 | 1,741,695 |
| 6-3 |
| Energy Fuels Inc. | Pinyon Plain Mine | February 19, 2026 |
| Technical Report on the Updated Pre-Feasibility Study | SLR Project No.: 123.020548.00001 |
7.0 Geological Setting and Mineralization
7.1 Regional Geology
The Project is located on the Colorado Plateau, south of the Grand Canyon, within the Kaibab National Forest. The Project's mineralization is controlled by a collapse structure known as a breccia pipe. This breccia pipe is one of thousands of collapse structures found on the north and south rims of the Grand Canyon. The Pinyon Plain pipe extends from the surface (Moenkopi Formation) through various geologic strata into the Redwall Limestone.
Parts of two distant physiographic provinces are found in Arizona: the Basin and Range Province, located in the southern portion of the state, and the Colorado Plateau Province, located across the northern and central portions of the state. Pinyon Plain lies within the Colorado Plateau Province.
Surface exposures near the Project reveal sedimentary and volcanic rocks ranging in age from upper Paleozoic to Quaternary. The area is largely underlain by sedimentary rocks of the Mississippian through Triassic Periods; however, exposed within the Grand Canyon are older rocks reaching Precambrian age.
The region has experienced volcanic activity since the Pliocene epoch. A number of lava-capped buttes rise above the general landscape, and lava flows cover large areas in the southern part of the district. Faulting has exerted significant control on the geologic development and geomorphic history of the region. Major structural features are the Grand Wash, Hurricane, and Toroweap fault systems, all generally trending north-south with an eastern up thrown side. These faults are topographically prominent and show impressive scarps though other less prominent fault systems exist.
The deep incision of the Grand Canyon and associated side canyons, such as Kanab Creek, have dewatered the sedimentary section. Regionally, groundwater is encountered in the Redwall limestone, which coincides with the deeper formations exposed in the Grand Canyon. Perched groundwater, usually in very limited quantities, is often encountered at the base of the Coconino sandstone in contact with the low-permeability Hermit shale sequence. Figure 7-1 is a map showing the regional geology of the Project. Figure 7-2 presents a regional stratigraphic column.
| 7-1 |
| Energy Fuels Inc. | Pinyon Plain Mine | February 19, 2026 |
| Technical Report on the Updated Pre-Feasibility Study | SLR Project No.: 123.020548.00001 |
Figure 7-1: Regional Geologic Map

| 7-2 |
| Energy Fuels Inc. | Pinyon Plain Mine | February 19, 2026 |
| Technical Report on the Updated Pre-Feasibility Study | SLR Project No.: 123.020548.00001 |
Figure 7-2: Regional Stratigraphic Column

| 7-3 |
| Energy Fuels Inc. | Pinyon Plain Mine | February 19, 2026 |
| Technical Report on the Updated Pre-Feasibility Study | SLR Project No.: 123.020548.00001 |
7.2 Local Geology
The Project's surface expression is a broad, shallow depression in the Permian Kaibab Formation. The pipe is essentially vertical with an average diameter of less than 200 ft, but it is considerably narrower through the Coconino and Hermit horizons (80 ft in diameter). The cross-sectional area is approximately 20,000 ft² to 25,000 ft². The pipe extends for at least 2,300 ft vertically from the Toroweap limestone to the upper Redwall horizons (Figure 7-3). The pipe's ultimate depth is unknown. Uranium mineralization is concentrated in an annular ring within the breccia pipe.
7.2.1 Structural Geology
Regional joint systems are rooted below the Redwall trend northwest-southeast and northeast-southwest. The regional joints and fractures cause upward caving of the karstic voids in the Redwall Limestone through the overlying Paleozoic sediments. As surface water and groundwater interact with the pipe, a circular brecciated column forms inside the fracture-controlled boundary.
Fractures related to the pipe can surround the brecciated zone and extend thin "ring fractures" up to 300 ft beyond the breccia pipe. Vertical joints and associated breccia pipes increase permeability and porosity, leading to the mineralization observed in the region. Figure 7-4 presents a horizontal section looking down at the breccia pipe and shows the distribution of mineralization with reference to the pipe structure.
7.2.2 Alteration
The Pinyon Plain breccia pipe is surrounded by bleached zones, particularly notable in the Hermit Formation, where unaltered red sediments contrast sharply with gray-green bleached material. Bleaching is common within 100 ft of the pipe boundary. Sulfide mineralization, commonly in the form of pyrite, is found as streaks or blebs within the bleached zones.
| 7-4 |
| Energy Fuels Inc. | Pinyon Plain Mine | February 19, 2026 |
| Technical Report on the Updated Pre-Feasibility Study | SLR Project No.: 123.020548.00001 |
Figure 7-3: Cross Section of Local Geology
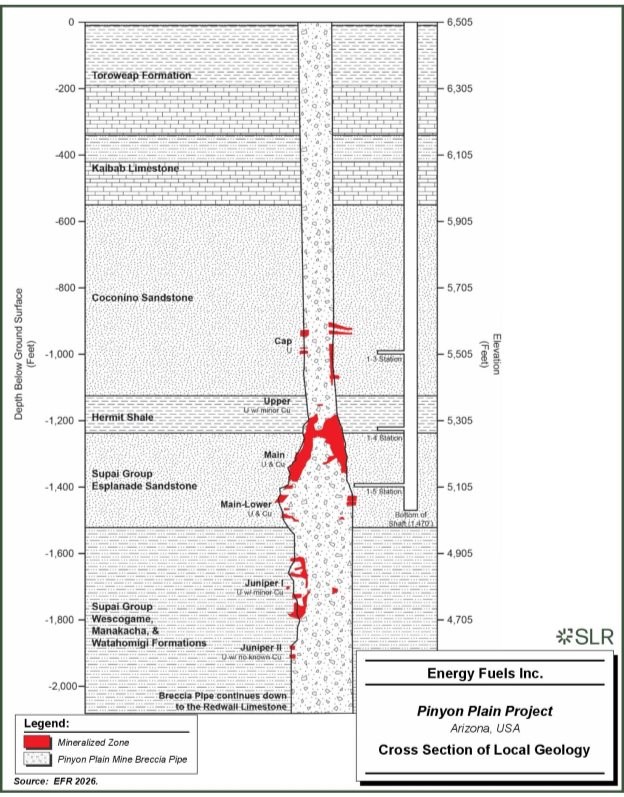
| 7-5 |
| Energy Fuels Inc. | Pinyon Plain Mine | February 19, 2026 |
| Technical Report on the Updated Pre-Feasibility Study | SLR Project No.: 123.020548.00001 |
Figure 7-4: Pinyon Plain Horizontal Slice Main Zone - Slice 5,200' Level

| 7-6 |
| Energy Fuels Inc. | Pinyon Plain Mine | February 19, 2026 |
| Technical Report on the Updated Pre-Feasibility Study | SLR Project No.: 123.020548.00001 |
7.3 Mineralization
Mineralization at the Project extends vertically approximately 1,700 ft, both inside and outside the pipe, but high-grade uranium and copper mineralization is found primarily in the collapsed portions of the Coconino, Hermit, and Esplanade horizons and at the margins of the pipe in fracture zones. Sulfide zones are found scattered throughout the pipe but are especially concentrated (within a sulfide cap) near the Toroweap-Coconino contact, where the cap averages 20 ft thick and consists of pyrite and bravoite, an iron-nickel sulfide. The ore assemblage consists of uranium-pyrite-hematite with massive copper sulfide mineralization common in and near the high-grade zone. The strongest mineralization appears to occur in the lower Hermit-upper Esplanade horizons in an annular fracture zone.
The metal of interest at the Project is uranium, though significant copper mineralization co-exists in the breccia pipe. As the breccia within the pipe consists entirely of sedimentary rocks, mineralization typically occurs in the matrix material (primarily sand) surrounding the larger breccia clasts.
7.3.1 Uranium Mineralization
Uranium mineralization at the Project is concentrated in three stratigraphic levels or zones (Upper/Cap, Main, and Juniper) within a collapse structure ranging from 80 ft to 230 ft wide with a vertical extension from a depth of 650 ft to over 2,100 ft, resulting in approximately 1,450 ft of mineralization. Mineralized intercepts range widely up to several tens of feet with grades in excess of 1.00% U3O8. In previous reports and EFR news releases, the mineralization was subdivided into six distinct zones; those six have been combined into the three listed above for simplicity. The Upper/Cap Zone combines the previously reported Upper and Cap Zones. The Main Zone combines the previously reported Main and Main-Lower zones, and Juniper combines the previously reported Juniper I and Juniper II zones.
Age dating of mineralization (U-Pb) indicates a range of 101-260 million years, suggesting that the earliest uranium mineralization occurred in the Permian Period, before the pipes fully formed in the Triassic Period.
Consistent with other breccia pipe deposits, in the mineralized zone, the uranium mineralization occurs largely as blebs, streaks, small veins, and fine disseminations of uraninite/pitchblende (UO2). Mineralization is mainly confined to matrix material, but may extend into clasts and larger breccia fragments, particularly where these fragments are of Coconino sandstone. Uranium mineralization occurs primarily as uraninite and various uranium-phase minerals (unidentified minerals), with lesser amounts of brannerite and uranospinite.
7.3.2 Copper Mineralization
Currently, there is no reasonable prospect of economic copper extraction at the Project.
Significant copper mineralization occurs at the Project within the Main Zone and, to a lesser extent, in the Main-Lower zone, both with and without uranium mineralization.
Copper mineralization can be disseminated throughout the matrix material (commonly replacing calcite cement) with higher-grade mineralization typically occurring as vug fills, blebs, or streaks within the matrix and sometimes zoning the breccia clasts. The highest-grade copper mineralization completely replaces the matrix cement or replaces the matrix material altogether.
| 7-7 |
| Energy Fuels Inc. | Pinyon Plain Mine | February 19, 2026 |
| Technical Report on the Updated Pre-Feasibility Study | SLR Project No.: 123.020548.00001 |
Copper mineralization occurs primarily as tennantite, chalcocite, and bornite with lesser amounts of covellite. Pyrite and sphalerite are also found throughout the pipe. Silver is commonly associated with the copper mineralization in the Main Zone. Assay values of silver greater than one ounce per short ton are common where copper grades are high. Arsenic is present where tennantite mineralization occurs. Additionally, lower quantities of silver, zinc, lead, molybdenum, copper, nickel, and vanadium are present and scattered throughout the pipe.
| 7-8 |
| Energy Fuels Inc. | Pinyon Plain Mine | February 19, 2026 |
| Technical Report on the Updated Pre-Feasibility Study | SLR Project No.: 123.020548.00001 |
8.0 Deposit Types
Paleozoic Era sedimentary rocks of northern Arizona are host to thousands of breccia pipes. The pipes extend from the Mississippian Redwall Limestone up to the Triassic Chinle Formation, a total of approximately 4,000 ft of section. However, due to erosion and other factors, no single pipe has been observed cutting through the entire section. No pipe occurs above the Chinle Formation or below the Redwall Limestone. Breccia pipes mineralized with uranium are called Solution-Collapse Breccia Pipe Uranium deposits, which are defined as U.S. Geological Survey Model 32e (Finch, 1992).
Breccia pipes within the Arizona Strip District are vertical or near-vertical, circular to elliptical bodies of broken rock composed of slabs, rotated angular blocks, and fragments of surrounding and stratigraphically higher formations. The inclusion of breccia made of stratigraphically higher formations suggests that the pipes formed by solution collapse of underlying calcareous rocks, such as the Redwall Limestone. Surrounding the blocks and slabs making up the breccia is a matrix of fine material comprised of surrounding and overlying rock from various formations. For the most part, the matrix consists of siliceous or calcareous cement.
Breccia pipes are comprised of three interrelated features: a basinal or structurally shallow depression at the surface (designated by some as a collapse cone); a breccia pipe that underlies the structural depression; and annular fracture rings that occur outside but at the margin of the pipes. Annular fracture rings are commonly, but not always, mineralized. The structural depression may range in diameter up to 0.5 miles or more, whereas breccia pipe diameters can range up to approximately 600 ft, but normally range from 200 ft to 300 ft in diameter.
Mineralization in the breccia pipes takes place by water flowing along fractures and through porous materials that provide conduits for fluid flow and typically takes place in stages. Wenrich and Sutphin (1989) identified at least four separate mineralizing events within the Arizona Strip District pipes, with uranium and copper mineralization occurring during the last two.
To date, mineralized breccia pipes appear to occur in clusters or trends. Spacing between pipes ranges from hundreds of feet within a cluster to several miles within a trend. Pipe location may have been controlled by deep-seated faults, but karstification of the Redwall Limestone in the Mississippian and Permian Periods is considered to have initiated formation of the numerous and widespread pipes in the region.
| 8-1 |
| Energy Fuels Inc. | Pinyon Plain Mine | February 19, 2026 |
| Technical Report on the Updated Pre-Feasibility Study | SLR Project No.: 123.020548.00001 |
9.0 Exploration
EFR has completed no exploration work on the Project other than underground development drilling, discussed in Section 10, since acquiring the properties in 2012.
9.1 Geotechnical
In 1987, the geotechnical consulting firm of Dames and Moore (1987) completed an evaluation of mine stability and subsidence potential at the Project.
The scope of work was based on a review of geologic and geotechnical data from similar breccia pipe uranium mines on the Arizona Strip (the Orphan Mine, the Hack 2 Mine, Kanab North, and the Pigeon Mine), including the stability of existing underground stopes.
Numerical modeling of stopes was performed at depths of 800 ft, 1,200 ft, and 1,600 ft below the surface, with a surrounding rock strength of 3,000 psi. Stope dimensions at these mines varied from 60 ft high by 30 ft wide (Orphan Mine) to 350 ft high by 200 ft wide (Hack 2 Mine). Ground support was limited to rock bolts in the stope backs and no backfill.
The report concluded that stopes up to 350 ft high at a depth of 1,200 ft would not develop significant stability problems as long as prudent ground supports were employed, which EFR plans to install during mining. In addition, the report predicted mined out stopes would fill with rubblized rock as a result of subsidence reaching the surface in several hundred years; the surface expression would be less than two feet over a broad area and would be difficult to observe in the field.
Since the geotechnical report was produced, EFR has decided to fill stopes with waste rock generated during orebody access, thereby significantly reducing post-mining surface expression from ground subsidence.
EFR has not conducted any geotechnical work at the Project since its acquisition.
9.2 Exploration Potential and Recommended Work Programs
The Pinyon Plain breccia pipe hosts uranium mineralization over an interpreted vertical extent of approximately 1,700 ft within a collapse structure extending at least 2,300 ft vertically. Six vertically stacked mineralized domains have been interpreted and modeled. Exploration potential is focused on the Main Lower, Juniper, and Juniper Lower zones, which occur beneath, or adjacent to, currently producing Main Zone intervals and remain only partially developed or undeveloped.
9.2.1 Main Lower Zone
The Main Lower Zone underlies the principal Main Zone production interval and contains both Indicated and Inferred Mineral Resources. While production has provided calibration for the Main Zone tonnage factor (0.099 st/ft³), portions of the Main Lower domain retain the core-derived tonnage factor of 0.082 st/ft³ where production calibration is not available.
The zone has not been fully developed or mined and is not included in the current Mineral Reserve estimate. Geological continuity is supported by existing drilling; however, additional underground delineation drilling is required to:
• Improve confidence in grade continuity and domain geometry;
• Refine resource classification;
| 9-1 |
| Energy Fuels Inc. | Pinyon Plain Mine | February 19, 2026 |
| Technical Report on the Updated Pre-Feasibility Study | SLR Project No.: 123.020548.00001 |
• Support potential conversion of Inferred Mineral Resources to Indicated classification; and
• Provide updated inputs for future mine design and potential Reserve consideration.
The Technical Report recommends execution of approximately 150 underground drill holes totaling approximately 18,500 ft from existing underground development where practicable. The Main Lower Zone represents a priority target within this program, as it is accessible from existing Main Zone infrastructure and can be sequenced ahead of deeper Juniper development.
9.2.2 Juniper Zone
The Juniper Zone lies beneath the Main Zone and extends production potential to approximately 1,800 ft below surface. Portions of the Juniper Zone are included in the current Mineral Reserve estimate; however, the zone is described as less continuous than the Main Zone and is only partially developed.
Current mine sequencing includes:
• Ongoing decline development toward the Juniper Zone;
• Planned commencement of production in 2026; and
• Establishment of multiple mining levels at approximately 40 ft vertical spacing.
Additional underground delineation drilling within the Juniper Zone is recommended to:
• Improve geological continuity in areas peripheral to defined Reserve stopes;
• Refine stope geometry and grade envelopes;
• Support potential conversion of Inferred Mineral Resources; and
• Enhance confidence in longer-term mine sequencing below the Main Zone.
Given that underground access is being advanced as part of the current life of mine plan, delineation drilling within the Juniper Zone can be integrated with development sequencing to minimize additional capital requirements.
9.2.3 Juniper Lower Zone
The Juniper Lower Zone represents the deepest currently modeled mineralized domain within the breccia pipe and contains limited Mineral Resources. It is not included in the current Mineral Reserve estimate and remains undeveloped.
Drill density within the Juniper Lower Zone is relatively limited compared to the Main and upper Juniper zones. The domain retains the core-derived tonnage factor of 0.082 st/ft³ due to the absence of production calibration.
Exploration potential in the Juniper Lower Zone is contingent upon:
• Continued decline development and access beyond current Reserve levels;
• Targeted underground delineation drilling from future development horizons; and
• Refinement of domain geometry and grade continuity at depth.
The Juniper Lower Zone represents longer-term vertical exploration potential within the established breccia pipe geometry and may be evaluated following advancement of Juniper Zone development and completion of recommended delineation drilling in higher-priority domains.
| 9-2 |
| Energy Fuels Inc. | Pinyon Plain Mine | February 19, 2026 |
| Technical Report on the Updated Pre-Feasibility Study | SLR Project No.: 123.020548.00001 |
9.2.4 Integrated Development and Budget Linkage
The recommended underground delineation drilling program comprises approximately 150 drill holes totaling 18,500 ft at an estimated budget of approximately US$204,000. This program is designed to:
• Improve geological continuity within the Main Lower and Juniper zones;
• Support potential conversion of Inferred Mineral Resources to Indicated classification;
• Provide updated inputs for mine design refinement; and
• Strengthen density calibration and reconciliation performance where production data become available.
Execution of the recommended drilling from existing underground development is expected to optimize cost efficiency and align exploration activities with planned mine sequencing. Priority should be given to the Main Lower Zone, followed by the Juniper Zone as decline development advances. Evaluation of the Juniper Lower Zone should be staged following completion of higher-priority delineation work and advancement of deeper underground access.
Based on information available as of the effective date, the deeper stacked domains remain open to further delineation within the known breccia pipe structure and represent vertically continuous exploration potential supported by established mineralization in overlying zones
| 9-3 |
| Energy Fuels Inc. | Pinyon Plain Mine | February 19, 2026 |
| Technical Report on the Updated Pre-Feasibility Study | SLR Project No.: 123.020548.00001 |
10.0 Drilling
EFR acquired the Project from Denison in 2012. Since that time, exploration work carried out by EFR at the Project has included the drilling of 161 underground development holes from six subsurface levels accessed from the production shaft to delineate mineralization extents, results of which were used to update the geologic model and Mineral Resource estimates discussed in the following sections of this report.
Based on drilling to date, uranium mineralization has been interpreted as occurring within six vertically stacked zones, from top to bottom: the Cap Zone, Upper Zone, Main Zone, Main Lower Zone, Juniper Zone, and Juniper Lower Zone.
As of the effective date of this report, EFR and its predecessors have completed 206 holes (45 surface and 161 underground development), totalling 108,862 ft, from 1978 to 2025 using core, rotary, and percussion methods. No drilling was conducted on the Project from 1994 to 2016.
Drill hole collar locations are recorded on the original drill logs and radiometric logs created at the time of drilling, including easting and northing coordinates in local grid or modified NAD 1983 Arizona Central FIBPS 0202 (US feet) and elevation of collar in feet above sea level. The timing and methodology of downhole surveying prior to 2024 are uncertain; however, during the most recent drill campaign, drill hole orientations were surveyed on a distance basis (e.g., every 20 ft or 50 ft) using a Reflex EZ Shot or similar deviation tool deployed in the drill string
From 2016 to 2025, EFR completed 161 underground development drill holes, totalling 46,573 ft, from drill stations developed at the Pinyon Plain mineshaft. A summary of drilling completed by EFR is presented in Table 10-1, Figure 10-1 shows the locations of all the surface drill collars from EFR and the previous operators in plan view, and Figure 10-2 illustrates all drill hole traces in section view.
Table 10-1: EFR Drill Hole Database Summary
| Year | Company | Location | # Holes | Total Depth (ft.) | Hole ID | Type |
| 1978-1982 | Gulf | Surface | 8 | 13,041 | COG Series Holes | Rotary |
| 1983 | EFNI | Surface | 5 | 10,504 | CYN Series 01 - 05 | Rotary |
| 1984 | EFNI | Surface | 13 | 1,350 | CYN Series S01 - S13 | Rotary |
| 1984 | EFNI | Surface | 10 | 18,462 | CYN Series 06 - 14-C & 16-C | Core/Rotary |
| 1985 | EFNI | Surface | 2 | 3,534 | CYN-15-C & CYN-15W1 | Core |
| 1986 | EFNI | Surface | 1 | 3,086 | 55-515772 | Water Well |
| 1994 | EFNI | Surface | 6 | 12,312 | CYN Series 17 - 22 | Rotary |
| 2016 | EFR | 1-3 Level | 15 | 12,439 | CMCH Series 001 - 015 | Core |
| 2016 | EFR | 1-4 Level | 25 | 4,171 | CMLH Series 001 - 025 | Percussion |
| 2016-2017 | EFR | 1-4 Level | 42 | 8,421 | CMCH Series 016 - 058 | Core |
| 2017 | EFR | 1-5 Level | 23 | 5,411 | CMCH Series 059 - 081 | Core |
| 2024-2025 | EFR | 1-5 Level | 56 | 16,131 | PPCH and A- D Series | Core |
| Total | 206 | 108,862 |
| 10-1 |
| Energy Fuels Inc. | Pinyon Plain Mine | February 19, 2026 |
| Technical Report on the Updated Pre-Feasibility Study | SLR Project No.: 123.020548.00001 |
All core was removed by the drillers from the wireline core barrel and placed in core boxes, orienting the core to fit together where possible and limiting a core box to a single run. The driller labeled the core box with the drill hole ID, box number, and start/finish depths on both the bottom of the core box and the core box lid. The driller also placed blocks or core markers in the core box to indicate the "from" and "to" depths of the core run as well as the core run number. If core was not recovered during a core run, a wooden block was placed in the core box by the driller with the "from" and "to" depths of no recovery (if known). Core was transported from the drill station by the driller or the geologist to surface for logging.
Upon arrival at the core logging facility on surface, core was photographed and screened radiometrically using a Radiation Solutions RS‐125 Super‐SPEC device and elementally using a handheld x-ray fluorescent (XRF) analyzer. Drill core recovery percentage was noted. The field geologist then logged the core, noting the depth of each stratigraphic unit and providing a description of lithology and structures. Details noted on the lithology log include colour, texture, grain size, cementation, and mineralogy of each lithologically distinct unit, as well as the type of fracture and any voids or vugs.
All drill holes on the Property were logged with a radiometric probe to measure the natural gamma radiation, from which an indirect estimate of uranium content was made and is discussed in Section 11.1.1.
In the opinion of the SLR QP, the drilling, logging, sampling, and conversion and recovery factors at the Project meet or exceed industry standards and are adequate for use in the estimation of Mineral Resources
| 10-2 |
| Energy Fuels Inc. | Pinyon Plain Mine | February 19, 2026 |
| Technical Report on the Updated Pre-Feasibility Study | SLR Project No.: 123.020548.00001 |
Figure 10-1: Surface Drill Hole Collar Locations

| 10-3 |
| Energy Fuels Inc. | Pinyon Plain Mine | February 19, 2026 |
| Technical Report on the Updated Pre-Feasibility Study | SLR Project No.: 123.020548.00001 |
Figure 10-2: Cross Section showing All Drill Hole Traces

| 10-4 |
| Energy Fuels Inc. | Pinyon Plain Mine | February 19, 2026 |
| Technical Report on the Updated Pre-Feasibility Study | SLR Project No.: 123.020548.00001 |
10.1 Copper Mineralization
During exploration drilling completed at the Project in 2016, copper mineralization was identified within the breccia pipe, and underground core was screened for copper using an Olympus Vanta handheld XRF analyzer, with intervals returning approximately 0.5% Cu or higher in the absence of uranium mineralization selected for chemical assay, while intervals containing uranium mineralization as identified by scintillometer were also sampled and submitted for chemical analysis to determine both uranium and copper concentrations; in contrast, during the most recent drill campaign all sampled core was assayed for copper, as well as arsenic and molybdenum for processing information, but no company-level QA/QC program was implemented for those elements, although the analytical laboratory (Hazen) maintained its own internal QA/QV standards.
EFR considers the copper mineralization identified at the Project to be uneconomic under current assumptions, and accordingly, copper has not been included in the Mineral Resource Estimate. The copper mineralization is described here for completeness only.
| 10-5 |
| Energy Fuels Inc. | Pinyon Plain Mine | February 19, 2026 |
| Technical Report on the Updated Pre-Feasibility Study | SLR Project No.: 123.020548.00001 |
11.0 Sample Preparation, Analyses, and Security
11.1 Sample Preparation and Analysis
For drilling campaigns completed in 2016 and 2017, core drilling at the Project, including core handling, sampling, and quality assurance and quality control (QA/QC) procedures, followed the Standard Operating Procedure (SOP) Handbook prepared by EFR in December 2016 (Energy Fuels 2016).
Sample intervals respected geological contacts and ranged from 2 ft to 10 ft, depending on core recovery, the length of the lithological unit, and the presence of mineralization. Most core samples were approximately 4 ft in length, except where intervals were broken along lithological or mineralization contacts. Core located outside the breccia pipe was considered barren and not sampled. Sample intervals and numbers were recorded on the core log, the core sampling log, and the sample bags.
Technicians cut the drill core lengthwise in half using a diamond saw. One-half of the core was returned to the core box, and the remaining half was submitted for sample preparation and analysis. Each sample was identified by a number that referenced the drill hole, depth interval, and sample length. This number was recorded on two aluminum tags. One tag was stapled to the exterior of the sample bag, and the other was placed inside. The exterior tag also included the sampling date and the sampler's initials.
Following sampling, the remaining half-core was returned to the core boxes and archived on-site.
For the 2024 to 2025 Juniper sampling campaign, updated procedures were implemented and documented in the Juniper Zone Core Sampling SOP (Energy Fuels 2025).
Sampling was conducted by trained mine geologists. The core was fully logged before sampling, and all core boxes were re-photographed under controlled lighting conditions to ensure consistent documentation.
Sampling intervals were defined using gamma probe data, core logs, scintillometer readings, and geological interpretation. Samples were nominally 4 ft long. Adjustments between 1 ft and 5 ft were permitted to accommodate core loss, lithological boundaries, or isolated high-grade intervals. Core losses were documented and not sampled.
Core cutting followed bias-reduction practices. The core was longitudinally halved, and, where required, halved again to generate core twin duplicates. Alternating halves were placed in sample bags to reduce geologist bias. The remaining core was archived onsite.
11.1.1 Gamma Logging
All EFR drill holes at the Project were logged using Mount Sopris natural gamma probes, including an HLP probe equipped with a 0.5-inch by 1.5-inch sodium iodide (NaI) crystal and larger 40-LGR and 32-GR models; the HLP probe measured natural gamma radiation over an effective calibrated range from less than 0.1% to approximately 5% U₃O₈ equivalent, while the 32-GR slim probe was utilized in narrower boreholes and provided improved digital count-rate stability, and the larger-diameter 40-LGR probe, incorporating a larger detector volume and additional SP and SPR capabilities, was employed where enhanced count-rate capacity and lithologic/hydrogeologic characterization were required; although these larger probes are not inherently "high-grade" tools, their greater detector volume and electronics can better accommodate elevated count-rate environments relative to smaller-crystal configurations; data were collected at logging speeds of approximately 15-20 ft/min during both downhole and uphole runs, typically in open holes, and in unstable conditions logging was conducted through drill pipe with grade corrections applied to account for pipe material and wall thickness, including appropriate dead-time considerations where applicable.
| 11-1 |
| Energy Fuels Inc. | Pinyon Plain Mine | February 19, 2026 |
| Technical Report on the Updated Pre-Feasibility Study | SLR Project No.: 123.020548.00001 |
The gamma probe measured gamma radiation emitted during the natural radioactive decay of uranium and variations in natural radioactivity related to changes in concentrations of the trace element thorium and the major rock-forming element potassium. Potassium decayed into two stable isotopes, argon and calcium, and emitted gamma rays with energies of approximately 1.46 mega electron-volts (MeV). Uranium and thorium decay through a series of unstable daughter products before ultimately forming stable isotopes of lead. Each decay event in these series was accompanied by emissions of alpha particles, beta particles, or gamma rays, each with characteristic energy levels. The most prominent gamma emission in the uranium decay series originated from the decay of bismuth-214, while the most prominent emission in the thorium series originated from the decay of thallium-208.
Natural gamma measurements were recorded when the detector emitted a pulse of light after being struck by a gamma ray. This light pulse was amplified by a photomultiplier tube, producing an electrical current pulse that was accumulated and reported as counts per second (cps). The gamma probe was lowered to the bottom of each drill hole, and data was recorded during both the downhole and uphole passes. The electrical signal was transmitted to the surface via a conductive cable and processed by the logging system computer, which stored the raw gamma cps data.
Indirect uranium grades, referred to as equivalent U3O8 (eU3O8), were calculated based on the sensitivity of the detector used in the probe. Detector sensitivity was defined as the ratio of cps to a known uranium grade and was established through a calibration factor. Each detector was calibrated at the time of manufacture and was periodically verified throughout its operating life using standard test pits containing known uranium grades or through empirical calibration methods. Application of the calibration factor, together with additional probe correction factors, allowed for immediate field estimation of uranium grades during logging.
Downhole total gamma data were processed using a series of mathematical corrections that accounted for probe-specific parameters, logging speed, borehole diameter, drilling fluids, and the presence or absence of casing. These corrections yielded an indirect measurement of uranium content within the gamma detector's effective radius.
During early exploration drilling, EFR utilized the in-house GAMLOG computer program to convert measured gamma counts per second (cps) into 0.5-ft intervals of equivalent uranium grade (%eU₃O₈), with GAMLOG based on Scott's Algorithm (1962) and employing conversion coefficients derived from calibration at the U.S. Department of Energy Uranium Calibration Pits in Grand Junction, Colorado; in contrast, during the most recent drill campaign, cps data were converted to %U₃O₈ using a Mount Sopris-provided spreadsheet that incorporated probe-specific dead-time corrections and calculated k-factors for cps-to-grade conversion. In drill holes associated with copper mineralization, where EFR personnel observed that the gamma probe underestimated uranium grades above approximately 2% U3O8 due to sodium iodide crystal saturation, chemical assays were used for both uranium and copper. In areas characterized by lower-grade uranium mineralization and low-grade copper mineralization, radiometric data were used in lieu of chemical assay results.
| 11-2 |
| Energy Fuels Inc. | Pinyon Plain Mine | February 19, 2026 |
| Technical Report on the Updated Pre-Feasibility Study | SLR Project No.: 123.020548.00001 |
11.1.1.1 Calibration
For gamma probes to report accurate %eU3O8 values, regular calibration was required. The probes were calibrated by running them through test pits that were historically maintained by the Atomic Energy Commission and subsequently by the United States Department of Energy. These test pits were located in Grand Junction, Colorado; Grants, New Mexico; and Casper, Wyoming. Each test pit contained intervals with known %U3O8 grades, which were measured by the gamma probes during calibration runs.
Dead time (DT) and a K-factor were calculated based on probe responses measured in the calibration pits. These parameters were required to convert raw counts per second (cps) data into equivalent uranium grades expressed as %eU3O8. Dead time accounted for borehole diameter and radioactive decay occurring in the space between the probe and the borehole wall and was expressed in microseconds (µsec). The K-factor was a calibration coefficient used to convert DT-corrected cps values into %eU3O8.
Calibration was typically performed quarterly or semi-annually. More frequent calibration was conducted when data variability was observed or when probes were damaged or suspected of being malfunctioning.
11.1.1.2 Method
Following the completion of a rotary hole, a geophysical logging truck was positioned over the open hole, and a probe was lowered to the hole's total depth. Typically, these probes took multiple readings. In uranium deposits, the holes were usually logged for gamma, resistivity, standard potential, and hole deviation. Only gamma was used in the grade calculation. Once the probe was at the bottom of the hole, it began recording as it was raised. The data quality was affected by the speed at which the probe was removed from the hole. Experience showed that a speed of 20 ft/min was adequate to obtain data for resource modelling. Data were recorded in counts per second (cps), which measured the decay of uranium daughter products, specifically bismuth-214. That data was then processed using calibration factors to calculate an equivalent U3O8 (eU3O8) grade.
Historically, eU3O8 grades were calculated using the Atomic Energy Commission half-amplitude method, which provided a grade over a specific thickness. More recently, eU3O8 grades were calculated on 0.5-ft intervals using software. Depending on the manufacturer of the probe truck and instrumentation, different methods were used to calculate eU3O8 grades; however, all methods, including the Atomic Energy Commission method, were based on the two equations described below.
The first equation converted cps values to cps corrected for dead time (DT), which was determined during calibration.
![]()
The second equation converts the Dead Time Corrected CPS (N) to %eU3O8 utilizing the K-factor (K)
![]()
Depending on the drilling and logging environment, additional multipliers were applied to correct for various environmental factors. These typically included a water factor to account for drill hole mud, a pipe factor when logging was conducted through drill steel, and a disequilibrium factor when the deposit was known to be in radiometric disequilibrium. Tables for water and pipe correction factors were readily available.
| 11-3 |
| Energy Fuels Inc. | Pinyon Plain Mine | February 19, 2026 |
| Technical Report on the Updated Pre-Feasibility Study | SLR Project No.: 123.020548.00001 |
11.1.2 Core Sampling
Until 2021, samples were delivered by EFR personnel to the White Mesa Mill laboratory in Blanding, Utah. The laboratory did not hold formal ISO accreditation. Upon receipt, the samples were weighed, dried for 16 to 24 hours, and then reweighed to determine their moisture content. Samples were crushed using jaw and cone crushers, split using a riffle splitter, and pulverized using a ring and puck mill. Preparation equipment was cleaned between samples using abrasive sand.
A split of the pulverized sample was digested in the laboratory using a combination of nitric, perchloric, and hydrofluoric acids, diluted, and analyzed. Uranium was determined by spectrophotometry using a Thermo Scientific Biomate 3 spectrophotometer. Copper, arsenic, and molybdenum were analyzed using either inductively coupled plasma optical emission spectrometry (ICP-OES) with a PerkinElmer Optima 5300V or inductively coupled plasma mass spectrometry (ICP-MS) with a PerkinElmer ELAN DRC II. Instrument calibration was conducted daily, and approximately four in every 100 analyses were spiked with a standard solution after analysis to monitor analytical consistency. Internal laboratory QA/QC procedures were applied throughout the analytical process.
For the 2024 and 2025 campaign, Hazen Research, Inc. (Hazen) was selected as the primary analytical laboratory. Hazen is an independent laboratory located in Golden, Colorado, USA, operating under a formal quality management system and certified to ISO 9001. Hazen analyzed uranium, copper, arsenic, and molybdenum using ICP-OES following multi-acid digestion. The analytical focus of the 2025 program was uranium. Copper, arsenic, and molybdenum were analyzed for informational purposes only and did not have project-specific QA/QC requirements beyond internal laboratory controls.
Pace Analytical (Pace), formerly known as Inter-Mountain Laboratory (IML), served as an independent third-party umpire laboratory to provide an external check on the primary analytical results. Pace analyzed uranium, copper, arsenic, and molybdenum using ICP-OES following appropriate digestion procedures. The laboratory, which is located in Sheridan, Wyoming, operates under a formal quality management system and is accredited to ISO/IEC 17025 for selected analytical methods.
11.1.3 Radiometric Equilibrium
Disequilibrium in uranium deposits is the difference between equivalent (eU3O8) grades and assayed U3O8 grades. Disequilibrium can be either positive, where the assayed grade is greater than the equivalent grades, or negative, where the assayed grade is less than the equivalent grade. A uranium deposit is in equilibrium when the daughter products of uranium decay accurately represent the uranium present. Equilibrium occurs after the uranium is deposited and has not been added to or removed by fluids after approximately one million years. Disequilibrium is determined during drilling by taking a core sample and measuring it using two methods: a counting method (closed-can) and a chemical assay. If a positive or negative disequilibrium is determined, a disequilibrium factor can be applied to eU3O8 grades to account for this issue.
A comparison of chemical data vs probe data showed that no disequilibrium factor is needed for the Project.
11.2 Sample Security
Up to 2017, bagged samples were placed in barrels, secured in the back of a truck, and transported by EFR personnel to the White Mesa Mill laboratory for analytical testing. White Mesa Mill personnel were responsible for shipping selected check samples to third-party laboratories for analysis. A chain of custody form was maintained throughout sample transport and handling.
| 11-4 |
| Energy Fuels Inc. | Pinyon Plain Mine | February 19, 2026 |
| Technical Report on the Updated Pre-Feasibility Study | SLR Project No.: 123.020548.00001 |
Following analysis, dried and crushed samples were stored in sealed plastic bottles for long-term storage. Pulverized samples were also stored in sealed plastic bottles. All stored samples were kept protected from environmental exposure to preserve sample integrity.
Analytical results were managed using a combination of digital exports from analytical instruments and manual logbook entries, which were compiled into a master spreadsheet. Certificates of analysis were provided to EFR personnel in secured Adobe Acrobat and Microsoft Excel formats.
The SLR QP has reviewed and concurs with EFR's conclusions regarding the sample preparation, security, and analytical procedures applied during the relevant period. In the opinion of the SLR QP, and based on reliance on information and assessments provided by EFR, these procedures were appropriate for the purposes of Mineral Resource estimation and were consistent with generally accepted industry standards and practices in effect at the time the work was performed
Following an internal review of the 2016-2017 drilling campaigns, sample security procedures were significantly improved during the 2024 Juniper sampling campaign through the implementation of formal physical, administrative, and third-party controls designed to strengthen the chain of custody and reduce the risk of sample loss, tampering, or misidentification.
Key improvements included:
• Secured storage: While sampling activities were not underway, all sample storage connex containers were closed and locked, restricting access to authorized personnel only.
• Tamper-resistant transport containers: Prepared samples were loaded into steel 55-gallon drums fitted with locking lids, which were sealed prior to shipment.
• Direct, controlled shipment: Sealed drums were shipped directly to the analytical laboratory by a private shipping company. No other materials were transported with the sample shipments, minimizing the risk of cross-contamination or diversion.
• Formal chain-of-custody: Chain-of-custody documentation was maintained throughout sampling, storage, and transportation. No breaks in custody were permitted.
• Radiation safety oversight: Sample shipment and handling were closely monitored by Radiation Safety Officers representing both Energy Fuels and the analytical laboratory to ensure regulatory compliance for radioactive material transport.
• Independent laboratory segregation: Samples designated for umpire laboratory analysis were physically separated and shipped directly by the primary laboratory to the designated third-party laboratory once sufficient quantities were accumulated, eliminating re-handling by project personnel.
In the opinion of the SLR QP, these procedural controls represent a material improvement over prior practices and bring the sample security program into closer alignment with generally accepted industry standards for Mineral Resource data used in estimation under S-K 1300 and NI 43-101.
| 11-5 |
| Energy Fuels Inc. | Pinyon Plain Mine | February 19, 2026 |
| Technical Report on the Updated Pre-Feasibility Study | SLR Project No.: 123.020548.00001 |
11.3 Quality Assurance and Quality Control
Quality assurance (QA) consists of evidence to demonstrate that the assay data has precision and accuracy within generally accepted limits for the sampling and analytical method(s) used to have confidence in the assay data used in a resource estimate. Quality control (QC) consists of procedures designed to ensure a consistently high level of quality is maintained throughout the process of collecting, preparing, and assaying exploration drilling samples. In general, QA/QC programs are designed to prevent or detect contamination and to enable quantification of analytical performance (assay), precision (repeatability), and accuracy. Additionally, a QA/QC program can reveal the overall variability in sampling and assaying associated with the sampling method itself.
For each batch of 20 routine samples, the required QA/QC sample type and insertion frequency are defined in the batch insertion notes, as outlined in the protocol below:
• Certified Coarse Blank: 1 every 40 samples
• Certified Pulp Blank: 1 every 40 samples
• Coarse Duplicate (CDUP): 1 every 40 samples
• Pulp Duplicate (PDUP): 1 every 40 samples
• Core Twin: 1 every 80 samples
As a control measure, QA/QC insertions need to be reviewed over successive groups of 80 primary samples, excluding QA/QC samples themselves. Each group of 80 routine samples must include four CRMs, two certified coarse blanks, two certified pulp (fine) blanks, two coarse duplicates, two pulp duplicates, and one core twin (field duplicate).
CRMs and fine blanks were shuffled (a random sequence was applied), numbered, and catalogued in the Lakewood, Colorado, office by EFR technical personnel prior to shipment to the laboratory manager. These samples (blind to the laboratory personnel) were inserted into the sample stream at the lab. The coarse blanks were not blind to the laboratory personnel. The results of the QA/QC program were compiled into a series of Microsoft Excel tables and charts on a regular basis as the program progressed and were distributed to project and laboratory personnel. QA/QC trends were discussed as the program progressed, and corrective actions were taken to address identified issues.
QA/QC procedures implemented during the 2025 campaign were designed primarily to monitor uranium assay quality. Control samples were inserted at predefined insertion rates specified in the project QA/QC spreadsheets. QA/QC materials were measured, double-bagged, and prepared in isolated areas at the corporate office prior to shipment directly to the mine. The only exceptions were high-grade CRMs C101A and BL-5, which were shipped directly from the suppliers to the mine and subsequently double-bagged onsite by mine geologists in areas segregated from core handling activities.
Core twins consist of an additional sample collected from the same geological interval. For this Project, core twins were generated by re-splitting previously split drill core. One quarter of the core was submitted as the primary sample, a second quarter as the secondary core twin sample, and the remaining half was retained and archived for reference.
Coarse duplicates consist of additional splits taken from the crushed sample. When a coarse duplicate is required, the laboratory produces four splits: one split is retained as the primary sample, while the remaining three splits are allocated as coarse duplicates for analysis at Hazen, Pace, and White Mesa Mill, respectively. Pulp duplicates follow an equivalent procedure; four splits are produced from the pulverized material, consisting of one primary pulp sample and three pulp duplicates submitted to Hazen, Pace, and White Mesa Mill.
| 11-6 |
| Energy Fuels Inc. | Pinyon Plain Mine | February 19, 2026 |
| Technical Report on the Updated Pre-Feasibility Study | SLR Project No.: 123.020548.00001 |
Table 11-1 outlines the number of submitted QA/QC samples and the portion of the total database they comprise.
Table 11-1: Summary of QA/QC Submittals
| Drilling Campaign (Year) |
Primary Samples |
Coarse Blanks |
Fine Blanks |
CRM | Field Duplicate |
Coarse Duplicate |
Pulp Duplicate |
Check Assay |
Overall Rate |
|||||||
| No. | % | No. | % | No. | % | No. | % | No. | % | No. | % | No. | % | |||
| 2016/2017 | 3,413 | 63 | 2% | 63 | 2% | 125 | 3% | 36 | 1% | 62 | 2% | 69 | 2% | 114 | 3% | 13% |
| 2024/2025 | 594 | 20 | 3% | 19 | 3% | 34 | 5% | 9 | 1% | 17 | 2% | 17 | 2% | 35 | 5% | 20% |
11.3.1 Certified Reference Material
Results of the regular submission of CRMS (standards) are used to identify problems with specific sample batches and biases associated with the primary assay laboratory.
The evaluation criteria for the CRMs were based on the certified expected value (EV) ± 3 standard deviations (SD). Results were classified as failures if an individual result exceeded ±3 SD from the expected value, or if two consecutive results exceeded ±2 SD from the expected value. In addition, bias values of up to ±5% were considered ideal, while those between ±5% and ±10% were acceptable.
SLR Audit (2021)
Three different copper CRMs were submitted into the sample stream at White Mesa Mill, representing low-, medium-, and high-grade copper material. The CRMs were assayed using a four-acid digest or aqua regia technique with inductively coupled plasma (ICP) or atomic absorption (AA) finish.
No U3O8-specific CRMs were sent to White Mesa Mill. As part of the mill's daily protocol for running samples, the equipment was calibrated daily using U3O8 CRM 129-A, sourced from the New Brunswick Laboratory at the U.S. Department of Energy. The SLR QP recommended sourcing three matrix-matched or matrix-similar CRMs for U3O8, representing low-, medium-, and high-grade material at the Project, and incorporating them into the sample stream sent to White Mesa Mill at a rate of one in 25.
The SLR QP calculated failure rates for each copper CRM, prepared contact plots, and examined temporal trends of the CRMs. The results are summarized in Table 11-2. All CRMs assayed at White Mesa Mill displayed a negative bias relative to the expected copper value, as well as a positive temporal trend and a high failure rate. Two of the CRMs, CDN-CM-41 and CDN-ME-1410, were composed of material different from that used at the Project.
The SLR QP recommended that EFR continue to monitor for low-grade bias of copper and slight low-grade bias of U3O8 at the White Mesa Mill laboratory, and continue monitoring temporal trends, defined as changes in the average grade of CRM data over time. The SLR QP also recommended that EFR procure CRMs made from Project resource material (matrix-matched) to obtain an improved understanding of laboratory performance as applied to Project samples; source three matrix-matched or matrix-similar CRMs for U3O8 representing low-, medium-, and high-grade ore at the Project; incorporate these CRMs into the sample stream sent to White Mesa Mill at a rate of one in 25; and ensure that the certified values of these CRMs were blind to the laboratory. In addition, the SLR QP recommended submitting these CRMs to independent laboratories as part of check-assay programs at a rate of 1 in 10 to obtain a meaningful sample size for analysis.
| 11-7 |
| Energy Fuels Inc. | Pinyon Plain Mine | February 19, 2026 |
| Technical Report on the Updated Pre-Feasibility Study | SLR Project No.: 123.020548.00001 |
Table 11-2: Summary of Copper CRM Performance - 2016/2017
| CRM | Expected Value (% Cu) |
Submittals | Failures | Percentage of Failures |
| CDN-CM-41 | 1.71 | 39 | 31 | 79% |
| CDN-ME-1410 | 3.80 | 49 | 25 | 51% |
| OREAS 113 | 13.5 | 37 | 20 | 54% |
| Total | 125 | 76 | 61% |
SLR Audit (2025)
In 2025, a total of 44 CRM samples were inserted into the sample stream, including BL-5 (very high-grade), C101A (high-grade), OREAS 124 (medium-grade), and OREAS 122 (low-grade). Of these, seven were submitted to the Pace laboratory and the White Mesa Mill and were excluded from the statistical evaluation due to insufficient sample counts per CRM type. The remaining 34 CRM samples were analyzed at the Hazen laboratory. Overall, no significant bias or systematic issues were observed.
Two failures were identified for OREAS 124. However, one corresponds to an outlier, as illustrated in Figure 11-1. EFR has attributed this to a sample swap and corrected it in the database.
Table 11-3: Summary of Uranium CRM Performance - 2025
| Laboratory | Element | CRM | Number of Samples |
Mean | Expected Value |
Standard Deviation |
Bias (%) |
Number of Failures |
Failure Rate (%) |
| HAZEN | U (wt%) | BL-5 | 8 | 7.27 | 7.09 | 0.28 | 2.5 | 0 | 0 |
| C101A | 8 | 1.04 | 1.01 | 0.07 | 3.1 | 0 | 0 | ||
| OREAS124 | 9 | 0.17 | 0.18 | 0.01 | -0.14 | 1* | 12.5 | ||
| OREAS122 | 9 | 0.04 | 0.04 | 0 | 5 | 0 | 0 | ||
| *One outlier was excluded from the calculations to avoid distorting the true bias. | |||||||||
| 11-8 |
| Energy Fuels Inc. | Pinyon Plain Mine | February 19, 2026 |
| Technical Report on the Updated Pre-Feasibility Study | SLR Project No.: 123.020548.00001 |
Figure 11-1: Uranium Z-Score for CRMs Analyzed at the Hazen Laboratory- 2025
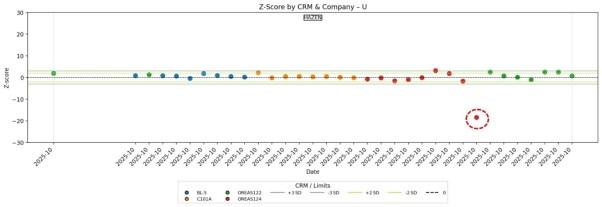
11.3.2 Blanks
The regular submission of blank material was used to assess potential contamination during sample preparation and to identify possible sample numbering errors. The coarse blank sample consisted of a granite matrix sourced from ASL and certified as barren for both copper and uranium. The fine blank material was purchased from Ore Research and Exploration (OREAS), specifically OREAS 24b and OREAS 22i. The certified uranium and copper concentrations for these fine blank materials are summarized in Table 11-4.
Table 11-4: Certified Uranium and Copper Values for OREAS Fine Blank Materials
| CRM | U (ppm) | Cu (ppm) |
| OREAS 24b | 3.06 | 38 |
| OREAS 22i | 0.11 | 7.17 |
SLR Audit (2021)
The SLR QP reviewed the results of the blank samples submitted alongside drill core and tabulated the number of failures for both coarse and fine blanks. A blank sample was considered to have failed if the assay returned a copper or uranium value more than ten times the detection limit for the assay method. No failures were reported for the coarse or fine blank samples.
SLR Audit (2025)
A total of 20 coarse blank samples and 19 fine blank samples were reviewed. One outlier was identified in the coarse blank dataset for uranium, copper, and U3O8, and was interpreted as a likely sample mislabelling, as illustrated in Figure 11-2. This sample was excluded from further consideration. No evidence of uranium contamination was identified in fine blank samples.
| 11-9 |
| Energy Fuels Inc. | Pinyon Plain Mine | February 19, 2026 |
| Technical Report on the Updated Pre-Feasibility Study | SLR Project No.: 123.020548.00001 |
Figure 11-2: Performance of Coarse Blanks for Uranium at the Hazen Laboratory - 2025
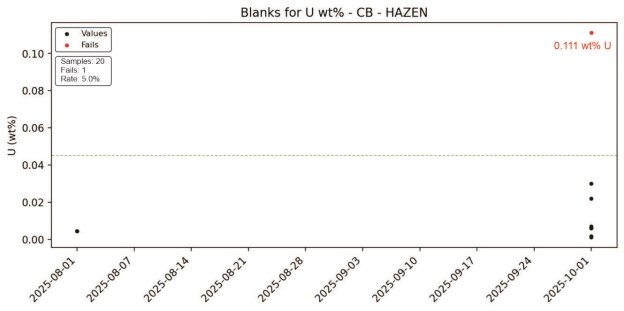
11.3.3 Duplicates
Duplicate samples help to monitor preparation and assay precision and grade variability as a function of sample homogeneity and laboratory error. The field duplicate includes the natural variability of the original core sample, as well as errors at various stages, including core splitting, sample size reduction in the preparatory laboratory, sub-sampling of the pulverized sample, and analytical error. Coarse reject and pulp duplicates provide a measure of the sample homogeneity at different stages of the preparation process (crushing and pulverizing).
Field duplicate samples were collected by the onsite geologist and submitted to the laboratory as separate samples, adjacent in the sample stream, and clearly marked as such. The duplicate protocol and procedure for collecting, submitting, and analyzing coarse and pulp duplicate assays are carried out by the primary laboratory.
SLR Audit (2021)
Results for both coarse and pulp sample pairs showed excellent correlation (Table 11-5), with very good repeatability for both copper and uranium. Of the field, coarse, and pulp duplicate sample sets, less than 20% of each submitted sample type reported grades above the cut-off grade of 0.29% U3O8, and less than 10% were above the expected average grade of 1% U3O8.
Over half of the field duplicates reported U3O8 values with relative differences greater than 20%, which may have been due to uranium occurring as blebs or vug fill. Only one of the four field sample pairs within the grade range of interest, however, had a relative difference greater than 20%. Over half of the field duplicates reported copper values with a relative difference greater than 20%. Only five of the 16 sample pairs with grades higher than 1% Cu, however, had a relative difference greater than 20%.
The SLR QP recommended collecting additional field samples, in the form of half core, within the grade range of interest, to allow more robust conclusions regarding the nature of the material at Pinyon Plain. The SLR QP also recommended implementing a duplicate-assay protocol for field, coarse, and pulp samples that was blinded to the laboratory, with insertion rates of approximately 1 in 50 for field duplicates and 1 in 25 for coarse and pulp duplicates.
| 11-10 |
| Energy Fuels Inc. | Pinyon Plain Mine | February 19, 2026 |
| Technical Report on the Updated Pre-Feasibility Study | SLR Project No.: 123.020548.00001 |
Table 11-5: Basic Comparative Statistics of 2017 Duplicate Assays
| Field | Coarse | Pulp | ||||
| Original | Duplicate | Original | Duplicate | Original | Duplicate | |
| U3O8 | ||||||
| Count | 36 | 36 | 62 | 62 | 69 | 69 |
| Mean (%) | 0.14 | 0.13 | 0.30 | 0.31 | 1.13 | 1.12 |
| Max. Value (%) | 1.45 | 1.00 | 9.71 | 9.80 | 25.90 | 25.36 |
| Min. Value (%) | 0.00 | 0.00 | 0.00 | 0.00 | 0.00 | 0.00 |
| Median (%) | 0.02 | 0.01 | 0.02 | 0.02 | 0.02 | 0.03 |
| Variance | 0.10 | 0.06 | 1.67 | 1.73 | 19.74 | 19.03 |
| Std. Dev. | 0.32 | 0.25 | 1.29 | 1.31 | 4.44 | 4.36 |
| Corr. Coefficient | 0.961 | 1.000 | 1.000 | |||
| % Diff. Btw Means | 8.5 | -2.0 | 1.3 | |||
| Cu | ||||||
| Count | 35 | 35 | 61 | 61 | 69 | 69 |
| Mean (%) | 4.12 | 4.33 | 2.22 | 2.21 | 3.51 | 3.42 |
| Max. Value (%) | 24.22 | 22.60 | 22.38 | 22.84 | 30.50 | 26.14 |
| Min. Value (%) | 0.00 | 0.00 | 0.00 | 0.00 | 0.00 | 0.00 |
| Median (%) | 0.34 | 0.44 | 0.14 | 0.12 | 0.20 | 0.20 |
| Variance | 48.18 | 49.38 | 19.86 | 20.06 | 52.68 | 49.60 |
| Std. Dev. | 6.94 | 7.03 | 4.46 | 4.48 | 7.26 | 7.04 |
| Corr. Coefficient | 0.983 | 0.997 | 0.997 | |||
| % Diff. Btw Means | -5.0 | 0.6 | 2.5 | |||
SLR Audit (2025)
SLR reviewed a total of 43 duplicate samples collected in 2025, comprising nine field duplicates (FD), 17 coarse duplicates (CD), and 17 pulp duplicates (PD). SLR re-evaluated the duplicate results using Half Absolute Relative Difference (HARD) plots, along with scatter plots and basic statistical summaries. Acceptance criteria were defined such that up to 10% of duplicate pairs were permitted to exceed the HARD thresholds of 30% for field duplicates, 20% for coarse duplicates, and 10% for pulp duplicates. The performance of duplicates is summarized in Table 11-6.
Field duplicates for uranium exhibited a high failure rate but a moderate correlation coefficient (R = 0.89), as illustrated in Figure 11-3. Of the four field duplicate samples that failed for uranium, two also failed for additional elements. Following SLR's identification of these failures and recommendations for further review, Energy Fuels requested that the laboratory rerun the affected samples. The second analysis produced results that were more consistent with the duplicate values than with the original primary results. The remaining variability was attributed to strong short-range grade variability within the mineralization.
| 11-11 |
| Energy Fuels Inc. | Pinyon Plain Mine | February 19, 2026 |
| Technical Report on the Updated Pre-Feasibility Study | SLR Project No.: 123.020548.00001 |
In contrast, both coarse and pulp duplicates (Figure 11-4 and Figure 11-5) generally showed strong correlations (R > 0.9), indicating good sample preparation and high analytical precision. Although some failures were observed, samples for which coarse duplicate discrepancies were confirmed through external check assays were reanalyzed and returned more appropriate results. Pulp duplicates showed strong correlation and a tight data distribution on scatter plots, further supporting high analytical precision.
Table 11-6: Summary of Duplicate Sample Statistics, Hazen Laboratory - 2025
| Lab | Duplicate Type |
Element (wt%) |
Pairs | Fails | Fail Rate% | Correlation Coefficient |
| HAZEN | Field | As | 9 | 4 | 44.44 | 0.908 |
| Cu | 3 | 33.33 | 0.977 | |||
| Mo | 2 | 22.22 | 0.984 | |||
| U | 4 | 44.44 | 0.89 | |||
| U3O8 | 4 | 44.44 | 0.89 | |||
| Coarse | As | 17 | 4 | 23.53 | 0.988 | |
| Cu | 5 | 29.41 | 0.98 | |||
| Mo | 7 | 41.18 | 0.631 | |||
| U | 3 | 17.65 | 0.901 | |||
| U3O8 | 4 | 23.53 | 0.899 | |||
| Pulp | As | 17 | 2 | 11.76 | 0.998 | |
| Cu | 2 | 11.76 | 0.996 | |||
| Mo | 4 | 23.53 | 0.996 | |||
| U | 2 | 11.76 | 1 | |||
| U3O8 | 2 | 11.76 | 1 |
| 11-12 |
| Energy Fuels Inc. | Pinyon Plain Mine | February 19, 2026 |
| Technical Report on the Updated Pre-Feasibility Study | SLR Project No.: 123.020548.00001 |
Figure 11-3: Uranium Field Duplicates - HARD and Scatter Plot Comparison (Hazen)

Figure 11-4: Uranium Coarse Duplicates - HARD and Scatter Plot Comparison (Hazen)

| 11-13 |
| Energy Fuels Inc. | Pinyon Plain Mine | February 19, 2026 |
| Technical Report on the Updated Pre-Feasibility Study | SLR Project No.: 123.020548.00001 |
Figure 11-5: Uranium Pulp Duplicates - HARD and Scatter Plot Comparison (Hazen)

11.3.4 Check Assays
SLR Audit (2021)
A total of 114 assays were sent for re-assay at one of three independent laboratories to ascertain if any bias is present within the primary laboratory, the White Mesa Mill laboratory:
• American West Analytical Laboratories, located in Salt Lake City, Utah - Accredited by the National Environmental Laboratory Accreditation Program (NELAP) in Utah and Texas; and state-accredited in Colorado, Idaho, New Mexico, Wyoming, and Missouri. A total of 10 check assay samples were submitted to this laboratory, with no copper CRMs included.
• Energy Laboratories, located in Casper, Wyoming - NELAP accredited Certifications USEPA: WY00002; FL-DOH NELAC: E87641; Oregon: WY200001; Utah: WY00002; Washington: C1012. Five check assay samples were submitted to this laboratory, with no copper CRMs included.
• Inter-Mountain Laboratory (IML, now Pace), located in Sheridan, Wyoming - EPA, DOE, and several other accreditations (http://intermountainlabs.com/certifications.html). A total of 99 check assay samples were submitted to IML, along with 11 copper CRMs.
Because IML is the only laboratory with a significant number of samples and the only laboratory to include CRMs, it was chosen for comparison with the primary laboratory at White Mesa Mill. The results indicate a slight low bias of both copper and U3O8 results at White Mesa Mill. This finding is supported by the low bias observed in the copper CRM results from White Mesa Mill. Copper CRM results from IML are not conclusive due to the small number of submitted samples; however, the CRM results were mostly slightly above the expected value, with no failures.
SLR Audit (2025)
Pulp samples originally analyzed at the Hazen laboratory were submitted for external check assays at White Mesa Mill and Pace. A total of 34 pulp samples were sent to White Mesa Mill, and comparison of the datasets showed a strong correlation (R² = 0.98), indicating excellent analytical agreement with no significant bias observed, as illustrated in Figure 11-6. Additionally, 33 pulp samples were submitted to Pace, and the datasets demonstrated a strong correlation (R² = 0.99) with no significant bias identified. (Figure 11-7).
| 11-14 |
| Energy Fuels Inc. | Pinyon Plain Mine | February 19, 2026 |
| Technical Report on the Updated Pre-Feasibility Study | SLR Project No.: 123.020548.00001 |
Figure 11-6: Q-Q Plot and Scatter Plot of U3O8 (wt%) Results for Hazen and White Mesa Mill Check Assays

Figure 11-7: Q-Q Plot and Scatter Plot of U3O8 (wt%) Results for Hazen and Pace Check Assays

11.3.5 Comparison of Probe vs. Assay Results
A total of 97,944 U₃O₈ 0.5 ft probe samples, for which chemical assay data were unavailable, were included in the 2021 Mineral Resource estimate. To assess for disequilibrium and ensure no bias existed between assay and probe results, EFR assayed several drill holes for which probe data were available. Drill hole intervals in the Main Zone were flagged, and weighted averages were calculated for each method over the interval of interest. These weighted averages were then compared using basic statistics, including scatter and quantile-quantile plots. A total of 14 sample pairs were removed that returned results above 2% U3O8 to account for probe saturation. A scatter plot of the 77 sample pair results is shown in Figure 11-8.
| 11-15 |
| Energy Fuels Inc. | Pinyon Plain Mine | February 19, 2026 |
| Technical Report on the Updated Pre-Feasibility Study | SLR Project No.: 123.020548.00001 |
Figure 11-8: Scatter Pot of the Weighted Average of Probe and Assay U3O8 Results Over Drill hole Intercepts within the Main Zone

The results indicated good correlation between the assay and probe data, with negligible bias.
11.4 Density Analyses
Bulk densities were determined at White Mesa Mill for most of the samples submitted (2,630 of 3,347). A single piece of split core sample, at least four inches in length, was measured in all dimensions using calipers to calculate volume and then weighed dry. Density was calculated using the measured volume and the mass. An additional 37 full-core, six-inch samples were submitted to White Mesa Mill to verify the caliper method. These 37 full core samples were measured with calipers to calculate volume and then weighed dry. Additionally, these samples were immersed in water to determine volume via water displacement. The densities calculated by both methods were compared. The densities calculated by the caliper method were approximately 1% higher than those calculated by water displacement on the same core samples which the SLR QP considers to be immaterial.
11.5 Conclusions
The SLR QP is of the opinion that the sample security, analytical procedures, and QA/QC protocols implemented by Energy Fuels met industry best practices and were adequate to support the Mineral Resource estimate.
Energy Fuels maintained appropriate insertion rates for all control types. Overall, no significant bias or systematic analytical issues were identified. Samples identified as problematic during the QA/QC review were reanalyzed by Energy Fuels, and the reanalysis results showed improved analytical agreement and more consistent results.
| 11-16 |
| Energy Fuels Inc. | Pinyon Plain Mine | February 19, 2026 |
| Technical Report on the Updated Pre-Feasibility Study | SLR Project No.: 123.020548.00001 |
Duplicate sample analysis demonstrated good correlation for field duplicates and strong correlations for coarse and pulp duplicates. External check assay results also showed strong correlation and no significant bias, indicating consistency between the primary and umpire laboratories.
SLR recommends that Energy Fuels continue to monitor and control QA/QC performance in accordance with the existing procedures.
Based on the results of the QA/QC review, the SLR QP concludes that the analytical data are reliable and the QA/QC program was sufficient to support the Mineral Resource estimate.
| 11-17 |
| Energy Fuels Inc. | Pinyon Plain Mine | February 19, 2026 |
| Technical Report on the Updated Pre-Feasibility Study | SLR Project No.: 123.020548.00001 |
12.0 Data Verification
Data verification is the process of confirming that data has been generated with proper procedures, is transcribed accurately from its original source into the project database, and is suitable for use as described in this Technical Report.
As part of the resource estimation procedure, drill data is spot checked by EFR personnel and audited by the SLR QP for completeness and validity.
12.1 SLR Data Verification - 2021
The SLR QP visited the Project on November 16, 2021, and held discussions with the EFR technical team. The team demonstrated a strong understanding of mineralization styles, processing characteristics, and the relationship between analytical results and metallurgical performance. Project data were provided by EFR for independent review in the form of Microsoft Excel spreadsheets and Vulcan digital files, which the SLR QP used to validate Mineral Resource interpolation, tonnage, grade, and classification.
The SLR QP conducted a series of verification tests on the drill hole database, including checks for missing information, verification of unique drill hole collar locations, and identification of overlapping sample or lithology intervals. Empty tables were limited to lithology, alteration, and geotechnical data. No material database issues were identified.
Verification of the assay database included comparing 100% of the copper and uranium assay records against the analytical results provided by White Mesa Mill in Excel format. Several assay values were recorded as 0% Cu or 0% U3O8. Industry practice is to report results below detection limits at half the detection limit; however, this was not considered material to the Mineral Resource estimate. No additional discrepancies were identified.
Based on the work completed, the SLR QP concluded that the database verification procedures applied to the Project were consistent with industry standards and were adequate for the purposes of Mineral Resource estimation.
12.2 SLR Data Verification - 2025
SLR cross-checked the assay database file JUNIPER_ASSAY_RESULTS.csv against analytical certificates provided by the Hazen laboratory. The database comprised 788 samples, and the entire dataset was verified for As, Cu, Mo, U, and U₃O₈, all reported in wt%. A total of 44 chemical certificates, provided in Excel and PDF formats, were reviewed, and no discrepancies were identified. Consistent with observations from the previous audit, the SLR QP maintains the recommendation to report results below the detection limit at half the detection limit, in accordance with industry best practice.
The SLR QP is of the opinion that the assay database is internally consistent and adequate for the purposes of Mineral Resource estimation.
12.3 Limitations
No restrictions or limitations were encountered during the SLR QP's independent verification of the Pinyon Plain drill hole database.
| 12-1 |
| Energy Fuels Inc. | Pinyon Plain Mine | February 19, 2026 |
| Technical Report on the Updated Pre-Feasibility Study | SLR Project No.: 123.020548.00001 |
13.0 Mineral Processing and Metallurgical Testing
13.1 Metallurgical Testing
Preliminary metallurgical bench tests have been completed on samples from the Pinyon Plain Mine to determine both uranium and copper metallurgical performance. Copper mineralization presents a possible upside to the Project but is not considered as part of this PFS.
13.1.1 Preliminary Test Work
Test work was completed at the White Mesa Mill's metallurgical laboratory while confirmatory testing was conducted at the Australian Nuclear Science and Technology Organization (ANSTO), an independent metallurgical laboratory in New South Wales, Australia, that operates a Quality Management System which complies with the requirements ISO 9001:2015 for conduct of strategic and applied nuclear research across three themes, Nuclear Fuel Cycle, Environment, and Human Health Testing included conventional acid leaching, flotation of conventionally leached residue, and roasting pre-treatment followed by conventional acid leaching. The primary goal of the test work was to determine if the existing White Mesa Mill process flow sheet would be suitable for processing the Pinyon Plain Mine's mineralized material types, and if not, what process flow sheet would be appropriate while minimizing capital modifications to the White Mesa Mill circuit.
Two metallurgical composites were used for testing during 2016 and 2017.
The first metallurgical composite was created in October 2016 and was made from 37 core samples. White Mesa Mill laboratory testing showed the average grades for this composite were 0.81% U3O8 and 9.78% Cu. This composite was the most representative of the Main Zone of the deposit from the samples available at the time. Testing was done on this composite from October 2016 to January 2017. The preliminary conventional acid leaching test work was conducted to determine uranium and copper recoveries. Leaching conditions, including temperature, solids density, and free acid and chlorate dosages, were varied between a total of 17 tests.
Uranium recoveries were high for this test series, ranging from 96.3% to 99.8%. Copper recoveries were significantly lower, ranging from 18.7% to 55.5%. Sulfuric acid consumption was higher than normal for ores treated at White Mesa Mill, ranging between 221 pounds per short ton (lb/ton) to 670 lb/ton. Sodium chlorate consumptions were 0 lb/ton to 164 lb/ton of feed, which is significantly higher than the normal ore range of 0 lb/ton to 30 lb/ton.
Owing to the poor copper metallurgical performance during conventional acid leaching, flotation testing of conventional leaching residue was examined. Due to the possibility of uranium deportment to the copper concentrate, it was decided to run flotation concentration tests on leached residue in order to potentially minimize uranium concentrations. Flotation of copper worked very well with rougher copper recovery at 72% with a copper concentrate grade of 33.3%. Unfortunately, uranium deportment to the concentrate exceeded normal treatment charge/refining charge (TC/RC) limits at 0.105% U3O8, making flotation an unlikely processing option.
A second (and larger) composite was made in January 2017 and used for testing thereafter. This composite was the most representative of the Main Zone of the deposit from the samples available at the time. The metallurgical testing composite was generated from 60 core samples representing 240 ft of half drill core (approximately 360 lb) from the Pinyon Plain deposit. A split of this composite was also sent to ANSTO in Australia for independent testing. White Mesa Mill laboratory testing showed the average grades for this composite were 0.76% U3O8 and 9.93% Cu. The primary goal of this program was to determine the metallurgical response using the conventional acid leach process currently in use at White Mesa Mill. Summary results are presented in Table 13-1.
| 13-1 |
| Energy Fuels Inc. | Pinyon Plain Mine | February 19, 2026 |
| Technical Report on the Updated Pre-Feasibility Study | SLR Project No.: 123.020548.00001 |
As expected, uranium recoveries averaged 93.4%, ranging from a low of 68.3% to 99.8%. Copper recoveries were considerably lower, averaging 26.9% and ranging from 4% to 53.7%. Reagent consumptions using the conventional leaching averaged 270.5 lb/ton for sulfuric acid and 56.5 lb/ton for chlorate.
Table 13-1: Conventional Acid Leach Test Results
| Test # | Metallurgical Recovery |
Targets | Actual | Consumption (lb/ton) |
||||||
| U3O8 (%) |
Cu (%) |
Free Acid (g/l) |
Temp (⁰F) |
EMF (mV) |
% Solids | Free Acid (g/l) |
EMF (mV) |
Acid | Chlorate | |
| 1 | 98.2 | 37.6 | 85 | 85 | none | 50 | 80.9 | 385 | 224.0 | 80.0 |
| 2 | 98.0 | 48.6 | 80 | 80 | 500 | 50 | 76.4 | 443 | 434.0 | 128.0 |
| 3 | 96.8 | 50.0 | 50 | 80 | 500 | 50 | 48.5 | 457 | 361.0 | 128.0 |
| 4 | 94.0 | 53.7 | 20 | 80 | 500 | 50 | 18.1 | 439 | 265.0 | 144.0 |
| 5 | 98.0 | 46.9 | 80 | 80 | 450 | 50 | 76.9 | 438 | 420.0 | 120.0 |
| 6 | 99.2 | 53.3 | 80 | 80 | 500 | 33 | 85.3 | 415 | 316.0 | 80.0 |
| 7 | 96.7 | 35.9 | 50 | 50 | 500 | 50 | 39.7 | 658 | 280.0 | 100.0 |
| 8 | 96.6 | 17.0 | 50 | ambient | 500 | 50 | 51.5 | 846 | 258.0 | 80.0 |
| 9 | 97.0 | 33.1 | 50 | 50 | 400 | 50 | 52.4 | 396 | 309.0 | 80.0 |
| 10 | 95.5 | 6.8 | 50 | 50 | none | 50 | 49.5 | 409 | 228.0 | 0.0 |
| 11 | 96.7 | 17.2 | 50 | 50 | none | 50 | 47.0 | 416 | 246.0 | 20.0 |
| 12 | 80.9 | 9.2 | 50 | ambient | none | 50 | 47.5 | 401 | 228.0 | 20.0 |
| 13 | 80.1 | 7.8 | 80 | ambient | none | 50 | 73.0 | 398 | 291.0 | 20.0 |
| 14 | 99.8 | 11.9 | 50 | 60 | none | 50 | 43.1 | 366 | 220.0 | 20.0 |
| 15 | 97.5 | 18.4 | 50 | 60 | none | 33 | 54.9 | 366 | 362.0 | 20.0 |
| 16 | 97.2 | 30.6 | 50 | 60 | none | 50 | 48.5 | 386 | 276.0 | 40.0 |
| 17 | 96.6 | 20.7 | 20 | 50 | none | 50 | 19.1 | 357 | 154.6 | 20.0 |
| 18 | 97.8 | 19.0 | 20 | 80 | none | 50 | 15.2 | 325 | 147.2 | 20.0 |
| 19 | 82.4 | 16.6 | 50 | 60 | none | 50 | 48.0 | 318 | 209.8 | 10.0 |
| 20 | 68.3 | 4.0 | 50 | 60 | none | 50 | 45.6 | 278 | 180.3 | 0.0 |
| Avg. | 93.4 | 26.9 | 270.5 | 56.5 | ||||||
| Max. | 99.8 | 53.7 | 434.0 | 144.0 | ||||||
| Min. | 68.3 | 4.0 | 147.2 | 0.0 | ||||||
| Notes: EMF Electromotive Force |
||||||||||
| 13-2 |
| Energy Fuels Inc. | Pinyon Plain Mine | February 19, 2026 |
| Technical Report on the Updated Pre-Feasibility Study | SLR Project No.: 123.020548.00001 |
13.2 Opinion of Adequacy
Copper test work indicates the best scenario to process the metal is using roasting, followed by acid leach and solvent extraction. Acid leach followed by solvent extraction is the current process used for uranium recovery at the White Mesa Mill. Bench and pilot-scale test work conducted by HAZEN in 2018 indicates that acid leaching after roasting pre-treatment would result in satisfactory copper and uranium recoveries; however, Energy Fuels does not currently plan to recover copper from the Pinyon Plain ore. No copper is included in the economic analysis.
The metallurgical test results provided by the White Mesa Mill, ANSTO, and Hazen indicate that metallurgical uranium recoveries using optimum leach conditions are expected to be approximately 96%.
The metallurgical composites that were used for metallurgical testing are representative of the various types and styles of uranium mineralization for the Main Zone and Juniper Zone. The average U3O8 grades for these two test composites were close to the average grade of the U3O8 presented as a resource in this Technical Report.
There are no known processing factors or deleterious elements that could significantly impact potential economic extraction.
The White Mesa Mill has a significant operating history using the uranium SX circuit, which has included milling relatively high-grade copper ores with no detrimental impact to the uranium recovery or product grade. The SLR QP supports the conclusions of the expected performance of the metallurgical processes based on test work data from the White Mesa Mill, ANSTO, and Hazen, in addition to historical operating data from White Mesa Mill. In the SLR QP's opinion, the metallurgical test work is adequate for the purposes of Mineral Resource estimation.
| 13-3 |
| Energy Fuels Inc. | Pinyon Plain Mine | February 19, 2026 |
| Technical Report on the Updated Pre-Feasibility Study | SLR Project No.: 123.020548.00001 |
14.0 Mineral Resource Estimates
This Technical Report presents an updated Mineral Resource estimate for the Pinyon Plain uranium deposit in Coconino County, Arizona, effective December 31, 2025. Mineral Resources have been classified in accordance with the definitions for Mineral Resources in S-K 1300, which are consistent with the Canadian Institute of Mining, Metallurgy and Petroleum (CIM) Definition Standards for Mineral Resources and Mineral Reserves (CIM (2014) definitions), which are incorporated by reference in NI 43-101.
This Mineral Resource estimate supersedes previous publicly disclosed estimates, reflecting updated geological interpretation, revised economic parameters, and the application of Reasonable Prospects for Eventual Economic Extraction (RPEEE) via underground stope optimization.
The Mineral Resource estimate was prepared by SLR QPs, as defined under S-K 1300 and NI 43-101. The SLR QPs are of the opinion that the Mineral Resource estimate presented herein is robust and reasonable, meets all reporting requirements, and is supported by sound geological, analytical, and geostatistical practices.
14.1 Summary
The Mineral Resource estimate was completed using a conventional block modeling approach. The workflow used by SLR included developing a geological/stratigraphic model of the breccia-pipe host based on drill logs and downhole radiometric logging. Six uranium (U3O8) mineralization domains (wireframes) were interpreted using equivalent uranium grade assays at a nominal cut-off grade of 0.15% U3O8.
Model estimates were validated using standard industry techniques, including statistical comparisons between composite samples and parallel inverse distance squared (ID²), ordinary kriging (OK), and nearest neighbor (NN) estimates; swath plots; and visual reviews in cross-section and plan. Following grade estimation, a visual review comparing block estimates to drill holes was conducted to confirm general lithologic and analytical conformance, and the work was peer-reviewed prior to finalization.
The previously reported Mineral Resource estimate, with an effective date of December 31, 2022 (SLR 2024), reported uranium and copper Mineral Resources within the Main and Main-Lower zones, and uranium-only Mineral Resources within the Juniper Zone. The updated Mineral Resource estimate reports uranium mineralization only. Copper is not included in the current Mineral Resource estimate, as EFR considers the identified copper mineralization at the Project to be uneconomic under current assumptions.
Mineral Resources also excludes previously reported uranium mineralization within the Cap and Upper zones in accordance with conditions of the Arizona Department of Environmental Quality (ADEQ) Aquifer Protection Permit, which restricts mining between elevations of 5,340 ft and 4,508 ft above sea level.
Mineral Resources are reported as in situ at a US$90/lb U₃O₈ long-term price and an equivalent uranium cut-off grade of 0.31% eU₃O₈, with an assumed 96% metallurgical recovery for uranium. The RPEEE assessment was supported by an underground mining scenario (primarily longhole stoping) and an optimization process using Deswik Stope Optimizer (Deswik.SO), with an assumed acid leach processing scenario consistent with historical feed to the White Mesa Mill.
| 14-1 |
| Energy Fuels Inc. | Pinyon Plain Mine | February 19, 2026 |
| Technical Report on the Updated Pre-Feasibility Study | SLR Project No.: 123.020548.00001 |
Table 14-1 summarizes the Mineral Resources reported with an effective date of December 31, 2025.
Table 14-1: Summary of Attributable Uranium Mineral Resources - Effective Date December 31, 2025
| Classification | Zone | Cut-Off Grade |
Tonnage Factor |
Tonnage | Grade | Contained Metal |
Metallurgical Recovery U3O8 |
| (% eU3O8) | st/ft3 | (tons) | (% eU3O8) | (lb U3O8) | (%) | ||
| Indicated | Main | 0.31 | 0.099 | 10,454 | 0.604 | 126,197 | 96 |
| Main Lower | 0.082 | 1,385 | 0.407 | 11,281 | |||
| Juniper | 0.099 | 7,198 | 0.471 | 67,731 | |||
| Juniper Lower | 0.099 | 0 | 0.000 | 0 | |||
| Total Indicated | 0.098 | 19,038 | 0.539 | 205,209 | |||
| Inferred | Main | 0.31 | 0.099 | 7,293 | 0.816 | 119,022 | 96 |
| Main Lower | 0.082 | 2,671 | 0.470 | 25,091 | |||
| Juniper | 0.099 | 4,917 | 0.983 | 96,662 | |||
| Juniper Lower | 0.082 | 37 | 0.319 | 235 | |||
| Total Inferred | 0.095 | 14,917 | 0.808 | 241,010 | |||
| Notes: | |||||||
| 1. SEC S-K-1300 definitions were followed for all Mineral Resource categories. These definitions are consistent with CIM (2014) definitions incorporated by reference in NI 43-101. | |||||||
| 2. Mineral Resources are exclusive of Mineral Reserves. | |||||||
| 3. Mineral Resources are estimated at 0.31% U3O8 with estimated recoveries of 96% for uranium. | |||||||
| 4. Mineral Resources are estimated using a long-term uranium price of US$90 per pound. | |||||||
| 5. No minimum mining width was used in determining Mineral Resources. | |||||||
| 6. Mineral Resources were estimated using a domain-specific density model that applies a tonnage factor of 0.099 ton/ft³ (6.7 ft3/ton or 4.77 t/m3) to the high-grade Main and Juniper Zones and a tonnage factor of 0.082 ton/ft³ ft3 (12.2 ft3/ton or 2.63 t/m3).to the Middle, Lower, and Juniper Lower Zones). | |||||||
| 7. Mineral Resources are exclusive of Mineral Reserves and do not have demonstrated economic viability. | |||||||
| 8. Numbers may not add due to rounding. | |||||||
| 9. Mineral Resources are 100% attributable to EFR and are in situ. | |||||||
The Mineral Resource estimate is supported by a Reasonable Prospects for Eventual Economic Extraction (RPEEE) assessment incorporating underground stope optimization using Deswik Stope Optimizer and an underground mining scenario consistent with longhole stoping and processing at the White Mesa Mill.
No minimum mining width was applied in the determination of Mineral Resources. The estimate reflects block model-based grade and tonnage constrained by economic parameters and optimization shapes and does not incorporate detailed mine design criteria such as minimum stope widths, dilution, or mining extraction factors.
The RPEEE assessment assumes underground mining using longhole stoping, with development rock temporarily stored on the surface and subsequently used for backfilling. Ore is transported approximately 320 miles by truck to the White Mesa Mill near Blanding, Utah, for processing.
The Mineral Resource assumptions differ from those applied to the Mineral Reserve estimate. Mineral Reserves are based on a long-term uranium price of US$80/lb U₃O₈, a breakeven cut-off grade of 0.35% U₃O₈, and detailed mine design parameters including a minimum mining width of 4 ft and 20 ft vertical stope heights, with application of mining dilution and extraction factors.
| 14-2 |
| Energy Fuels Inc. | Pinyon Plain Mine | February 19, 2026 |
| Technical Report on the Updated Pre-Feasibility Study | SLR Project No.: 123.020548.00001 |
The SLR QPs are of the opinion that, with consideration of the recommendations summarized in Sections 1 and 26, any issues relating to all relevant technical and economic factors likely to influence the prospect of economic extraction can be resolved with further work.
The SLR QPs are of the opinion that there are no other known environmental, permitting, legal, social, or other factors that would affect the development of the Mineral Resources.
While the estimate of Mineral Resources is based on the SLR QPs' judgment that there are reasonable prospects for economic extraction, no assurance can be given that Mineral Resources will eventually convert to Mineral Reserves.
14.2 Resource Database
As of the effective date of this report, EFR and its predecessors have completed a total of 206 drill holes (45 surface and 161 underground), totaling 108,862 ft of drilling between 1978 and 2025, of which 186 drill holes (25 surface and 161 underground development) are included in the Mineral Resource database.
Twenty historical drill holes were not included in the database provided by Energy Fuels because the drilling information was incomplete or the holes were located outside the interpreted breccia pipe boundary, and were therefore excluded from the Mineral Resource Estimate.
Of the 186 drill holes contained in the database, four additional surface drill holes were excluded from the Mineral Resource Estimate by SLR because they are located outside the breccia pipe and contain no mineralization.
The Project Mineral Resource database, dated August 22, 2025, includes drilling results from 1978 to 2025, surveyed drill hole collar locations (including dip and azimuth), assay data, radiometric probe data, and lithological logs.
A summary of the Project resource database is presented in Table 14-2.
Table 14-2: Summary of Resource Drill Hole Database
| Area | No. Holes | Total Depth | Average Depth | Number of Records | ||
| (ft) | (ft) | Survey | Lithology | Probe | ||
| Cap | 2 | 3,574 | 1,787 | 67 | - | 89 |
| Upper | 6 | 12,093 | 2,015.5 | 123 | - | 740 |
| Main | 147 | 32,194 | 219 | 982 | 115 | 4,625 |
| Main Lower | 65 | 25,409.8 | 390.92 | 22 | 3 | 834 |
| Juniper | 20 | 7,210 | 360.5 | 480 | 2 | 3,602 |
| Juniper Lower | 3 | 4,793 | 1,597.6 | 199 | - | 361 |
| Total | 243 | 85,273.80 | 6,370.52 | 1,873 | 120 | 10,251 |
14.3 Geological Interpretation
14.3.1 Lithologic Model
The Project is located within the Colorado Plateau Province, where mineralization is hosted in a near-vertical collapse breccia pipe developed within Paleozoic sedimentary strata extending from the Moenkopi Formation at the surface to at least the upper Redwall Limestone. The geological model reflects this vertically extensive, pipe-like geometry and incorporates the established regional stratigraphic framework, including the Kaibab, Toroweap, Coconino, Hermit, Esplanade, and Redwall formations, illustrated in Figure 10-2. Stratigraphic boundaries used in the model are consistent with regional stratigraphic columns and local drill hole observations.
| 14-3 |
| Energy Fuels Inc. | Pinyon Plain Mine | February 19, 2026 |
| Technical Report on the Updated Pre-Feasibility Study | SLR Project No.: 123.020548.00001 |
At the local scale, the geological model defines the breccia pipe as a steeply vertical, cylindrical to slightly irregular body with an average diameter of less than 200 ft, narrowing through the Coconino and Hermit formations to approximately 80 ft, and expanding locally at depth. The modeled pipe extends for at least 2,300 ft vertically, consistent with drilling and underground exposure, and is spatially coincident with a shallow surface depression developed in the Kaibab Formation. The pipe geometry was constrained using drill hole data, underground mapping, and sectional interpretations. The model integrates regional and local geological understanding, structural interpretation, alteration patterns, stratigraphic controls, and the geometry and distribution of uranium mineralization within a solution-collapse breccia pipe setting.
Mineralization domains were defined based on stratigraphic position, structural setting, and continuity of uranium mineralization. Uranium mineralization is modeled as occurring predominantly within annular zones near the margins of the breccia pipe and within collapsed portions of the Coconino, Hermit, and Esplanade horizons.
14.3.2 Mineralization Model
Mineralized wireframes for each breccia pipe zone were interpreted using implicit modeling techniques in Leapfrog Geo. An indicator-interpolation approach with a 0.15% U₃O₈ cutoff grade was used to define mineralization continuity. Indicator interpolants were generated using zone-specific search distances, with a 40 ft search range applied to the Main, Main Lower, and Juniper zones, and a 25 ft search range applied to the Cap, Upper, and Juniper Lower zones, reflecting differences in drill spacing and geological continuity.
The indicator interpolants were constrained by the interpreted breccia pipe boundaries corresponding to each mineralized zone, and a structural trend derived from the breccia pipe geometry was incorporated to guide the orientation and continuity of the mineralized domains. The resulting wireframes are considered reasonable representations of mineralization geometry based on the available drilling data and form the basis of the geological model and Mineral Resource estimates reported herein. The SLR QPs reviewed the uranium mineralization domains and found them to be appropriately extended beyond existing drilling, snapped, and referenced to the principal mineralization controls. The mineralized domains were reviewed and approved by EFR technical personnel.
Uranium mineralization at the Project is concentrated in six stacked vertical zones (Cap, Upper, Main, Main Lower, Juniper, and Juniper Lower) within a collapse structure ranging from 100 ft to 230 ft in plan section, with a vertical extension from a depth of 650 ft to over 2,100 ft below ground surface, resulting in approximately 1,450 ft of mineralization vertically. Intercepts range widely up to several tens of feet, with grades ranging from 0.00% (undetectable or waste) to over 20.00% eU3O8 (high-grade mineralization), as shown in Figure 14-1. The mineralized domains were used to code the drill hole database. This enabled classification of samples into Cap, Upper, Main, Main Lower, Juniper, and Juniper Lower domains. Domain-specific samples were extracted for each area and subjected to statistical analysis. Histograms and probability plots were generated to assess uranium mineralization within each domain.
| 14-4 |
| Energy Fuels Inc. | Pinyon Plain Mine | February 19, 2026 |
| Technical Report on the Updated Pre-Feasibility Study | SLR Project No.: 123.020548.00001 |
Figure 14-1: Uranium Mineralized Domains

| 14-5 |
| Energy Fuels Inc. | Pinyon Plain Mine | February 19, 2026 |
| Technical Report on the Updated Pre-Feasibility Study | SLR Project No.: 123.020548.00001 |
14.4 Exploratory Data Analysis
Grade statistics for all the domains were compiled to assess the presence and continuity of potentially economic mineralization. Only samples located within the defined wireframe models were included in the analysis. Unsampled and barren intervals were assigned a grade of zero to support a conservative estimation. Length-weighted statistics for eU₃O₈ are summarized in Table 14-3.
Table 14-3: Summary Statistics of Uncapped Radiometric Probe eU3O8 Assays
| Estimation Area | Count | Length (ft) |
Assay Statistics in % eU3O8 | |||||
| Mean | SD | CV | Variance | Min | Max | |||
| Cap | 89 | 44.50 | 0.18 | 0.11 | 0.62 | 0.01 | 0.01 | 0.61 |
| Upper | 740 | 370.00 | 0.32 | 0.41 | 1.26 | 0.16 | 0.00 | 4.59 |
| Main | 4,625 | 8,008.48 | 0.93 | 1.81 | 1.95 | 3.29 | 0.00 | 45.12 |
| Main Lower | 834 | 463.44 | 0.17 | 0.30 | 1.71 | 0.09 | 0.00 | 4.09 |
| Juniper | 3,602 | 1,624.45 | 0.70 | 2.27 | 3.25 | 5.15 | 0.00 | 53.82 |
| Juniper Lower | 145 | 72.50 | 0.23 | 0.12 | 0.52 | 0.01 | 0.00 | 0.54 |
14.5 Treatment of High Grade Assays
14.5.1 Capping Levels
When assay distributions are positively skewed or log-normal, high-grade assay values can disproportionately influence mean grade estimates. Grade capping is a commonly applied technique to limit the influence of extreme values by truncating assays above a selected threshold. Selection of capping thresholds relies on professional judgment informed by statistical analysis, particularly when production and reconciliation data are unavailable to provide empirical calibration.
To address these considerations, SLR identified high-grade outliers using frequency histograms, probability plots of % eU3O8, decile analysis, and spatial review of composites. Elevated uranium grades are deposit-wide, but the highest intercepts concentrate in the Main Zone, linked to breccia and structural controls.
Based on this evaluation, grade capping was not applied. Production and reconciliation data indicate that the high-grade values represent geologically legitimate and laterally persistent mineralized zones at the mine scale; accordingly, capping was considered unwarranted for Mineral Resource estimation.
| 14-6 |
| Energy Fuels Inc. | Pinyon Plain Mine | February 19, 2026 |
| Technical Report on the Updated Pre-Feasibility Study | SLR Project No.: 123.020548.00001 |
Figure 14-2: Histogram of U3O8 Resource Assay in the Main Zone

14.5.2 High Grade Restriction
In addition to capping thresholds, a secondary approach to reducing the influence of high-grade composites is to restrict the search ellipse dimension (high yield restriction) during the estimation process. The threshold grade levels, chosen from basic statistics and from visual inspection of the apparent continuity of very high grades within each estimation domain, may indicate the need to further limit their influence by restricting their range, which is generally set to approximately half the distance of the main search.
Upon review of the assays, the SLR QPs determined that no high-grade restrictions are required for a Mineral Resource estimation.
14.6 Compositing
Composites were created from the raw assay values using the downhole compositing function of Seequent's Leapfrog Geo modeling software 2025.2.1. Composite lengths were selected based on the predominant sampling length, the minimum mining width, the style of mineralization, and grade continuity. Assay intervals within the mineralized domains varied in length from 0.5 ft to 10 ft (Figure 14-3), with most intervals approximately 4 feet apart. Drill hole samples were composited into 4-foot sections, starting at the wireframe pierce point for each domain and continuing until the hole exited the domain. A small number of unsampled and missing sample intervals were ignored. Residual composites were retained in the dataset. Composite statistics by zone are summarized in Table 14-4.
| 14-7 |
| Energy Fuels Inc. | Pinyon Plain Mine | February 19, 2026 |
| Technical Report on the Updated Pre-Feasibility Study | SLR Project No.: 123.020548.00001 |
Table 14-4: Summary of Composite Data by Zone
| Area | Count | Length | Assay Statistics in % eU3O8 | |||||
| (ft) | Mean | SD | CV | Variance | Min | Max | ||
| Cap | 12 | 44.50 | 0.18 | 0.09 | 0.48 | 0.01 | 0.08 | 0.38 |
| Upper | 96 | 370.00 | 0.32 | 0.26 | 0.81 | 0.07 | 0.01 | 1.75 |
| Main | 2,067 | 8,008.48 | 0.93 | 1.61 | 1.73 | 2.58 | 0.00 | 26.87 |
| Main Lower | 211 | 464.44 | 0.17 | 0.22 | 1.27 | 0.05 | 0.00 | 1.19 |
| Juniper | 459 | 1,624.45 | 0.70 | 1.70 | 2.43 | 2.88 | 0.00 | 16.35 |
| Juniper Lower | 47 | 180.48 | 0.14 | 0.18 | 1.29 | 0.03 | 0.00 | 1.06 |
Figure 14-3: Length Histogram

| 14-8 |
| Energy Fuels Inc. | Pinyon Plain Mine | February 19, 2026 |
| Technical Report on the Updated Pre-Feasibility Study | SLR Project No.: 123.020548.00001 |
14.7 Spatial Analysis
Spatial continuity was evaluated to assess the suitability of geostatistical interpolation methods and to inform the development of an appropriate grade-estimation approach; however, the available dataset lacked sufficient variability, well-defined spatial structure, or consistent global anisotropy to support the development of reliable experimental or modeled variograms. In addition, the circular geometry of the breccia pipe domains and the resulting curvilinear spatial relationships limited the effectiveness of traditional variography, as results were neither consistently geologically interpretable nor reproducible across mineralized zones. A limited variographic study was also completed on the Main Zone to assess whether ordinary kriging could serve as a comparative estimation technique, and an example variogram is shown in Figure 14-4; however, due to the complex pipe geometry and the absence of defensible variogram models, ID² was selected as the more appropriate methodology.
Given these constraints, grade estimation was carried out using the inverse distance squared (ID²) interpolation method. A variable search orientation was applied to better match breccia pipe geometry. The local orientation of the estimation search ellipsoid was controlled by the interpreted breccia-pipe surfaces for each zone. This allowed the search strategy to follow the circular-to-subvertical morphology and the vertical continuity of mineralization. A dynamically oriented ellipsoid search provided appropriate spatial weighting of samples and helped to reduce potential estimation bias in complex, non-linear domains.
The SLR QPs are of the opinion that the use of ID² with variable orientation guided by the breccia pipe geometry, is appropriate for this style of mineralization. This approach suits the available data and the lack of defensible variogram models
| 14-9 |
| Energy Fuels Inc. | Pinyon Plain Mine | February 19, 2026 |
| Technical Report on the Updated Pre-Feasibility Study | SLR Project No.: 123.020548.00001 |
Figure 14-4: U3O8 Variogram for Main Zone

| 14-10 |
| Energy Fuels Inc. | Pinyon Plain Mine | February 19, 2026 |
| Technical Report on the Updated Pre-Feasibility Study | SLR Project No.: 123.020548.00001 |
14.8 Bulk Density
Bulk density was determined by EFR using specific gravity (SG) measurements on drill core: a minimum 4-inch core sample was measured in all directions with calipers to determine volume. The sample is weighed to obtain its mass, and the density is calculated. This method was used to determine the density of 2,857 samples. The density is modeled using inverse-distance-weighted squared distances, and an average value across the deposit of 0.082 t/ft3 was calculated.
This method of density determination was validated using the water-immersion method according to Archimedes' principle after sealing the core in wax. SG is calculated as weight in air (weight in air - weight in water). Under normal atmospheric conditions, SG (a unitless ratio) is equivalent to density in t/m3. Validation utilized 37 bulk density measurements collected on six-inch drill core samples from the main mineralized zones to represent local major lithologic units, mineralization styles, and alteration types. Samples were collected from the full core retained in the core box prior to splitting. EFR determined that the bulk densities calculated using the caliper method averaged approximately 1% higher than those determined using the water immersion method.
14.8.1 Density and Tonnage Factor Application by Mineralization Domain
Based on reconciliation to actual mine production and comparison of surveyed mine-out volumes to reported tonnage, a production-derived in situ tonnage factor of 0.099 st/ft³ has been determined for the high-grade uranium mineralization in the Main Zone and Juniper Zone. This value is materially higher than the global tonnage factor of 0.082 st/ft³ derived from caliper-based core density measurements and previously applied uniformly across the deposit. Reconciliation demonstrates that the global value is not representative of in situ conditions in high-grade mining domains, where actual production tonnage per unit volume is significantly higher.
In accordance with S-K 1300, NI 43-101, and the CIM (2019) Definition Standards and Best Practice Guidelines, density is treated as a modifying factor that must be locally representative of in situ conditions. Accordingly, the production-derived tonnage factor of 0.099 st/ft³ is applied exclusively to the Main Zone and Juniper Zone, which are characterized by uranium grades exceeding 20% and where reconciliation data directly support the higher density. The lower-grade zones, including the Cap, Upper, Middle, Lower, and Juniper Lower zones, continue to use the core-derived tonnage factor of 0.082 st/ft³, as these domains have not been mined at scale, lack production calibration, and are geologically distinct from the high-grade mineralization.
This dual-density approach reflects a domain-specific tonnage factor model calibrated to operational data when available and preserves the core-based density model when production validation is not yet possible. The methodology improves reconciliation performance, reduces systematic tonnage bias in mined areas, and remains consistent with CIM (2019) guidance, which states that modifying factors should be based on the best available data and restricted to the domains for which they are demonstrably valid.
14.9 Block Models
All modeling work was completed using Seequent's Leapfrog Geo and Leapfrog Edge modeling software (version 2025.2.1). The Pinyon Plain block model is unrotated, with an origin at 646,630 ft East, 1,776,530 ft North, and 4,450 ft elevation, and extends approximately 360 ft east-west, 320 ft north-south, and 1,460 ft vertically. The model consists of whole blocks measuring 4 ft × 4 ft × 4 ft, selected to reflect the interpreted deposit geometry and anticipated selective mining unit dimensions while honoring modeled geological surfaces. Each block was assigned density values and uranium mineralized domain codes based on majority-rule criteria and was classified according to the geological domain containing the block centroid. The model orientation is defined by an azimuth, dip, and plunge of 0.0°, and the selected block size provides appropriate resolution of mineralized zones and supports grade estimation consistent with CIM (2019) Best Practices for Mineral Resource Estimation.
| 14-11 |
| Energy Fuels Inc. | Pinyon Plain Mine | February 19, 2026 |
| Technical Report on the Updated Pre-Feasibility Study | SLR Project No.: 123.020548.00001 |
A summary of the block extents and variables is provided in Table 14-5. A summary of the block model variables used in the block model is provided in Table 14-6.
Table 14-5: Summary of Block Model Setup
| Description | Easting (X) (ft) |
Northing (Y) (ft) |
Elevation (Z) (ft ASL) |
| Block Model Origin (lower left corner) | 646,630 | 1,776,530 | 6,540 |
| Block Dimension (ft) | 4 | 4 | 4 |
| Number of Blocks | 90 | 80 | 600 |
| Rotation | 0 | 0 | 0 |
Table 14-6: Summary of Block Model Variables
| Variable | Type | Default | Description |
| ID_eU3O8_Cap | Numerical | 0 | ID2 estimated U3O8 equivalent grade (%) Cap |
| ID_eU3O8_Upper | Numerical | 0 | ID2 estimated U3O8 equivalent grade (%) Upper |
| ID_eU3O8_Main | Numerical | 0 | ID2 estimated U3O8 equivalent grade (%) Main |
| ID_eU3O8_Main Lower | Numerical | 0 | ID2 estimated U3O8 equivalent grade (%) Main Lower |
| ID_eU3O8_Juniper | Numerical | 0 | ID2 estimated U3O8 equivalent grade (%) Juniper |
| ID_eU3O8_Juniper Lower | Numerical | 0 | ID2 estimated U3O8 equivalent grade (%) Juniper Lower |
| OK_eU3O8_Cap | Numerical | 0 | OK estimated U3O8 equivalent grade (%) Cap |
| OK_eU3O8_Upper | Numerical | 0 | OK estimated U3O8 equivalent grade (%) Upper |
| OK_eU3O8_Main | Numerical | 0 | OK estimated U3O8 equivalent grade (%) Main |
| OK_eU3O8_Main Lower | Numerical | 0 | OK estimated U3O8 equivalent grade (%) Main Lower |
| OK_eU3O8_Juniper | Numerical | 0 | OK estimated U3O8 equivalent grade (%) Juniper |
| OK_eU3O8_Juniper Lower | Numerical | 0 | OK estimated U3O8 equivalent grade (%) Juniper Lower |
| NN_eU3O8_Cap | Numerical | 0 | NN estimated U3O8 equivalent grade (%) Cap |
| NN_eU3O8_Upper | Numerical | 0 | NN estimated U3O8 equivalent grade (%) Upper |
| NN_eU3O8_Main | Numerical | 0 | NN estimated U3O8 equivalent grade (%) Main |
| NN_eU3O8_Main Lower | Numerical | 0 | NN estimated U3O8 equivalent grade (%) Main lower |
| NN_eU3O8_Juniper | Numerical | 0 | NN estimated U3O8 equivalent grade (%) Juniper |
| NN_eU3O8_Juniper Lower | Numerical | 0 | NN estimated U3O8 equivalent grade (%) Juniper Lower |
| depletion: | Text | Unknown | depletion l model evaluation |
| PIPE_ZONES_REV2_DETAILS: | Text | Unknown | Breccia Pipe Zones model evaluation |
| 14-12 |
| Energy Fuels Inc. | Pinyon Plain Mine | February 19, 2026 |
| Technical Report on the Updated Pre-Feasibility Study | SLR Project No.: 123.020548.00001 |
| Variable | Type | Default | Description |
| PP_Classification: | Text | Unknown | Classification model evaluation |
| PP_Final_2025: | Text | Unknown | Mineralization Model |
| STOPES_2023: | Text | Unknown | Stopes 2023 Model |
14.10 Search Strategy and Grade Interpolation Parameters
The key element variable, uranium, was interpolated using the ID2 methodology. Grade estimation was controlled by mineralized geologic zones and target-area boundaries. Hard boundaries were used to limit the use of composites between different mineralization domains.
The selection of the search radii and search ellipsoids was guided by modeled continuity from the variograms of eU3O8In addition, the search radii were established to ensure that all blocks in the estimation domain were estimated.
The block model estimation employed a three-pass search strategy to balance local grade control with full model population while honoring the spatial continuity defined by the variogram models. The first pass used a relatively small search ellipsoid defined at approximately 100% of the modeled variogram continuity ranges (Major = 44 ft, Semi-Major = 64 ft, Minor = 8 ft), oriented to the principal continuity directions (Dip = 0°, Azimuth = 0°, Pitch = 90°), and required a minimum of eight samples with a maximum of 16, with no more than two samples from any single drill hole, providing the highest level of local data support. The second pass was applied to blocks not estimated in the first pass and retained the same search geometry and orientation but reduced the minimum number of samples to four, maintained a maximum of 16, and removed the per-drill-hole restriction, allowing locally constrained blocks to be estimated without increasing the search volume. The third pass expanded the search ellipsoid to approximately 200% of the variogram continuity ranges (Major = 88 ft, Semi-Major = 128 ft, Minor = 32 ft), while maintaining the same orientation, and further relaxed the sample requirements to a minimum of one and a maximum of two samples with no per-hole restriction, ensuring that remaining peripheral or sparsely drilled blocks were populated while still reflecting broader-scale continuity. Search parameters by domain are provided in Table 14-7.
Table 14-7: Sample Selection Parameters Employed in the Estimation by Domain
| Pass | Search Ellipse | Sample Selection | |||||||
| Dip (°) |
Azimuth (°) |
Pitch (°) |
Major (ft) |
Semi-Major (ft) |
Minor (ft) |
Minimum Samples |
Maximum Samples |
Max Samples Per Drill Hole |
|
| Cap | |||||||||
| 1st Pass | 0 | 0 | 90 | 44 | 64 | 8 | 8 | 16 | 2 |
| 2nd Pass | 44 | 64 | 8 | 4 | 16 | 0 | |||
| 3rd Pass | 0 | 0 | 90 | 88 | 128 | 32 | 1 | 2 | 0 |
| Upper | |||||||||
| 1st Pass | 0 | 0 | 90 | 44 | 64 | 8 | 8 | 16 | 2 |
| 2nd Pass | 44 | 64 | 8 | 4 | 16 | 0 | |||
| 3rd Pass | 0 | 0 | 90 | 88 | 128 | 32 | 1 | 2 | 0 |
| 14-13 |
| Energy Fuels Inc. | Pinyon Plain Mine | February 19, 2026 |
| Technical Report on the Updated Pre-Feasibility Study | SLR Project No.: 123.020548.00001 |
| Pass | Search Ellipse | Sample Selection | |||||||
| Dip (°) |
Azimuth (°) |
Pitch (°) |
Major (ft) |
Semi-Major (ft) |
Minor (ft) |
Minimum Samples |
Maximum Samples |
Max Samples Per Drill Hole |
|
| Main | |||||||||
| 1st Pass | 0 | 0 | 90 | 44 | 64 | 8 | 8 | 16 | 2 |
| 2nd Pass | 44 | 64 | 8 | 4 | 16 | 0 | |||
| 3rd Pass | 0 | 0 | 90 | 88 | 128 | 32 | 1 | 2 | 0 |
| Main Lower | |||||||||
| 1st Pass | 0 | 0 | 90 | 44 | 64 | 8 | 8 | 16 | 2 |
| 2nd Pass | 44 | 64 | 8 | 4 | 16 | 0 | |||
| 3rd Pass | 0 | 0 | 90 | 88 | 128 | 32 | 1 | 2 | 0 |
| Juniper | |||||||||
| 1st Pass | 0 | 0 | 90 | 44 | 64 | 8 | 8 | 16 | 2 |
| 2nd Pass | 44 | 64 | 8 | 4 | 16 | 0 | |||
| 3rd Pass | 0 | 0 | 90 | 88 | 128 | 32 | 1 | 2 | 0 |
| Juniper Lower | |||||||||
| 1st Pass | 0 | 0 | 90 | 44 | 64 | 8 | 8 | 16 | 2 |
| 2nd Pass | 44 | 64 | 8 | 4 | 16 | 0 | |||
| 3rd Pass | 0 | 0 | 90 | 88 | 128 | 32 | 1 | 2 | 0 |
14.11 Reasonable Prospects for Eventual Economic Extraction for Mineral Resources
Mineral Resources must demonstrate reasonable prospects for eventual economic extraction (RPEEE), which generally implies that the quantity and grade estimates meet certain economic thresholds and that the Mineral Resources are reported at an appropriate cut-off grade, taking into account extraction scenarios.
Metal prices used to determine Mineral Reserves are based on consensus long-term forecasts from banks, financial institutions, and other sources. For Mineral Resources, metal prices are typically higher than those for Mineral Reserves.
A reporting cut-off grade was established for the Project based on assumed costs for underground mining and commodity prices that provide a reasonable basis for establishing RPEEE for Mineral Resources.
These cost references were modified to align with the Project's assumed production rate. These cost and price assumptions have been used to inform an optimization process using the underground Deswik Stope Optimizer (Deswik.SO) software, which utilizes a Mineable Stope Optimizer (MSO) algorithm. The processing scenario assumption for the Project is an acid leach process, based on historical mine operations feeding the White Mesa Mill in Blanding, Utah
14.11.1 Cut-off Grade
The cut-off grade has been estimated based on an underground mining scenario of primarily longhole stoping. The cut-off was calculated as a breakeven grade at which the revenue from recoverable uranium, after accounting for process recovery and royalties, equals all operating costs required to extract the uranium. Assumptions used in the determination of the Pinyon Plain uranium resource cut-off grade of 0.31% eU3O8 are presented in Table 14-8.
| 14-14 |
| Energy Fuels Inc. | Pinyon Plain Mine | February 19, 2026 |
| Technical Report on the Updated Pre-Feasibility Study | SLR Project No.: 123.020548.00001 |
Table 14-8: Pinyon Plain Mine Cut-off Grade Calculation for Mineral Resources
| Metal Value | Units | Value |
| U3O8 Price | US$/lb | 90.00 |
| Royalties | $/st | $1.88 |
| Process Recovery | % | 96.00% |
| Payable U3O8 | % | 100.00% |
| Net Unit Revenue | US$ / %U3O8 | 1,726 |
| Operating Costs | ||
| Mining - Ore Production | $/st milled | $180.70 |
| Haulage (mine to mill) | $/st milled | $95.00 |
| Processing | $/st milled | $256.00 |
| G&A | $/st milled | $7.00 |
| Total | $/st milled | $538.70 |
| Cut-off Grade (breakeven) | % U3O8 | 0.31% |
No minimum mining width was applied in the determination of Mineral Resources. The estimate reflects block model-based grade and tonnage constrained by economic parameters and optimization shapes and does not incorporate detailed mine design criteria such as minimum stope widths, dilution, or mining extraction factors.
The RPEEE assessment assumes underground mining using longhole stoping, with development rock temporarily stored on the surface and subsequently used for backfilling. Ore is transported approximately 320 miles by truck to the White Mesa Mill near Blanding, Utah, for processing.
The Mineral Resource assumptions differ from those applied to the Mineral Reserve estimate. Mineral Reserves are based on a long-term uranium price of US$80/lb U₃O₈, a breakeven cut-off grade of 0.35% U₃O₈, and detailed mine design parameters including a minimum mining width of 4 ft and 20 ft vertical stope heights, with application of mining dilution and extraction factors.
14.11.2 Factors Affecting the Mineral Resource
The Mineral Resource presented in this Technical Report may be materially impacted by any future changes in the break-even cut-off grade (both up or down), that may result from changes in mining method selection, minimum mining width, mining costs, processing recoveries and costs, metal price fluctuations, or significant changes in geological knowledge.
14.11.3 QP Comments on the Reasonable Prospects of Eventual Economic Extraction
The SLR QPs reviewed the operating costs and cut-off grade reported by EFR and is of the opinion that they are reasonable for the disclosure of Mineral Resources.
| 14-15 |
| Energy Fuels Inc. | Pinyon Plain Mine | February 19, 2026 |
| Technical Report on the Updated Pre-Feasibility Study | SLR Project No.: 123.020548.00001 |
In the SLR QPs' opinion, the U3O8 price assumption used in this Technical Report is consistent with recent trends in the uranium sector and aligns with forecasts from recognized uranium market analysts. The assumptions for mining and processing costs are considered reasonable and are consistent with those applied to similar uranium deposits within the United States, based on current industry benchmarks.
14.12 Classification
Classification of Mineral Resources as defined in S-K 1300 were followed for classification of Mineral Resources. The CIM (2019) definition are consistent with these definitions.
A Mineral Resource is defined as a concentration or occurrence of material of economic interest in or on the Earth's crust in such form, grade or quality, and quantity that there are reasonable prospects for economic extraction. A mineral resource is a reasonable estimate of mineralization, considering relevant factors such as cut-off grade, likely mining dimensions, location, or continuity, that with the assumed and justifiable technical and economic conditions, is likely to, in whole or in part, become economically extractable. It is not merely an inventory of all mineralization drilled or sampled.
Based on this definition of Mineral Resources, the Mineral Resources estimated in this Technical Report have been classified according to the definitions below based on geology, grade continuity, and drill hole spacing.
Measured Mineral Resource is that part of a mineral resource for which quantity and grade or quality are estimated on the basis of conclusive geological evidence and sampling. The level of geological certainty is sufficient for a Qualified Person (QP) to apply modifying factors in enough detail to support detailed mine planning and final evaluation of economic viability. Because it has the highest level of confidence, a Measured Mineral Resource may be converted to a Proven or Probable Mineral Reserve.
Indicated Mineral Resource is that part of a mineral resource for which quantity and grade or quality are estimated on the basis of adequate geological evidence and sampling. Geological confidence is sufficient to allow the application of modifying factors to support mine planning and assessment of economic viability. Due to its lower confidence level compared with Measured Resources, an Indicated Mineral Resource may only be converted to a Probable Mineral Reserve.
Inferred Mineral Resource is that part of a mineral resource for which quantity and grade or quality are estimated based on limited geological evidence and sampling. Geological uncertainty is too high to allow the application of technical and economic factors in a manner useful for evaluating economic viability. Because of its low confidence level, an Inferred Mineral Resource may not be included in economic analyses and cannot be converted to a Mineral Reserve.
The SLR QPs have considered the following factors that can affect the uncertainty associated with each class of Mineral Resources:
• Reliability of sampling data:
• Drilling, sampling, sample preparation, and assay procedures follow industry standards.
• Data verification and validation work confirm drill hole sample databases are reliable.
• No significant biases were observed in the QA/QC analysis results.
Confidence in the interpretation and modeling of geological and estimation domains:
| 14-16 |
| Energy Fuels Inc. | Pinyon Plain Mine | February 19, 2026 |
| Technical Report on the Updated Pre-Feasibility Study | SLR Project No.: 123.020548.00001 |
• Mineralization domains used for classification were interpreted in Leapfrog Geo using implicit modeling and an indicator-interpolation approach constrained by breccia-pipe geometry, ensuring that the modeled wireframes accurately reflected the continuity and orientation of uranium mineralization within each zone. There is good agreement between the drill holes and mineralization wireframe shapes.
• The mineralization wireframe shapes are well defined by sample data in areas classified as Measured and Indicated.
Confidence in block grade estimates:
• Measured and Indicated block grades correlate well with composite data, statistically and spatially, and locally and globally.
Blocks were classified as Indicated or Inferred based on drill hole spacing, confidence in the geological interpretation, and apparent continuity of mineralization.
14.12.1 Measured Mineral Resources
Classification of Measured Resources was limited to blocks contained in the Main Zone, directly adjacent to underground drilling stations, where drill holes were collared in a fan pattern on a general drill hole spacing of 10 ft. All Measured and Indicated Resources in the Main Zone have been converted to Reserves and are excluded from the current Mineral Resource estimate.
14.12.2 Indicated Mineral Resources
The remainder of the blocks within the Main Zone, as well as the blocks in the primary wireframe within Juniper, were assigned a classification of Indicated, in which drill hole pierce point spacing is generally less than 20 ft from underground drilling station 1-4.
14.12.3 Inferred Mineral Resources
All remaining blocks in the model were limited to an Inferred classification.
Figure 14-5 presents the classification of Mineral Resources for all mineralized domains. In the SLR QPs' opinion, the classification of Mineral Resources is reasonable and appropriate for disclosure.
| 14-17 |
| Energy Fuels Inc. | Pinyon Plain Mine | February 19, 2026 |
| Technical Report on the Updated Pre-Feasibility Study | SLR Project No.: 123.020548.00001 |
Figure 14-5: Block Classification

| 14-18 |
| Energy Fuels Inc. | Pinyon Plain Mine | February 19, 2026 |
| Technical Report on the Updated Pre-Feasibility Study | SLR Project No.: 123.020548.00001 |
14.13 Block Model Validation
The Pinyon Plain block model estimates were validated using industry standard techniques including:
• Global validation by comparison of composite statistics versus block estimates (Table 14-)
• Local validation by comparison of average assay grades with average block estimates along different directions (swath plots) (Figure 14-6, Figure 14-7, and Figure 14-8)
• Local validation using visual inspections on plan view, viewing composites versus block estimates (Figure 14-9 and Figure 14-11)
The SLR QPs found grade continuity to be reasonable and confirmed that the block grades were reasonably consistent with local drill hole composite grades.
14.13.1 Global Statistics
Statistical comparisons were conducted between composite grades and estimated block grades to evaluate the consistency of the interpolation. This analysis helps identify potential smoothing or bias and ensures that the block model reasonably reflects the input data as shown in Table 14-9. The SLR QPs reviewed the statistical results and observed that the estimated block grades are consistent with the composite grades, with no material bias or over-smoothing. The SLR QPs consider the statistical comparison results to be reasonable and supportive of the reported Mineral Resource Estimate.
Table 14-9: Mean Composite Grades Compared to the Mean Block Estimates
| Zone | Cap | Upper | Main | |||
| Descriptive Statistic |
4 ft Comp | Block Model | 4 ft Comp | Block Model | 4 ft Comp | Block Model |
| Count | 12 | 385 | 96 | 2,891 | 2067 | 28,338 |
| Mean (%) | 0.18 | 0.19 | 0.32 | 0.31 | 0.93 | 1.10 |
| SD (%) | 0.09 | 0.05 | 0.26 | 0.11 | 1.61 | 1.26 |
| CV | 0.48 | 0.26 | 0.81 | 0.34 | 1.73 | 1.14 |
| Variance (%)2 | 0.01 | 0.00 | 0.07 | 0.01 | 2.58 | 1.58 |
| Min (%) | 0.08 | 0.12 | 0.01 | 0.10 | 0.00 | 0.00 |
| Lower quartile (%) | 0.13 | 0.13 | 0.16 | 0.23 | 0.09 | 0.31 |
| Median (%) | 0.16 | 0.20 | 0.26 | 0.31 | 0.33 | 0.72 |
| Upper quartile (%) | 0.23 | 0.23 | 0.40 | 0.37 | 1.25 | 1.46 |
| Max (%) | 0.38 | 0.37 | 1.75 | 0.87 | 26.87 | 21.54 |
| Notes: SD Standard Deviation CV Coefficient of Variance |
||||||
| 14-19 |
| Energy Fuels Inc. | Pinyon Plain Mine | February 19, 2026 |
| Technical Report on the Updated Pre-Feasibility Study | SLR Project No.: 123.020548.00001 |
| Zone | Main Lower | Juniper | Juniper Lower | |||
| Descriptive Statistic |
4 ft Comp | Block Model | 4 ft Comp | Block Model | 4 ft Comp | Block Model |
| Count | 211 | 5475 | 459 | 11,349 | 47 | 610 |
| Mean (%) | 0.17 | 0.20 | 0.70 | 0.58 | 0.14 | 0.17 |
| SD (%) | 0.22 | 0.13 | 1.70 | 0.84 | 0.18 | 0.09 |
| CV | 1.27 | 0.65 | 2.43 | 1.45 | 1.29 | 0.57 |
| Variance (%)2 | 0.05 | 0.02 | 2.89 | 0.70 | 0.03 | 0.01 |
| Min (%) | 0.00 | 0.01 | 0.00 | 0.01 | 0.00 | 0.01 |
| Lower quartile (%) | 0.06 | 0.11 | 0.13 | 0.20 | 0.04 | 0.05 |
| Median (%) | 0.10 | 0.16 | 0.23 | 0.31 | 0.05 | 0.19 |
| Upper quartile (%) | 0.19 | 0.23 | 0.51 | 0.63 | 0.22 | 0.25 |
| Max (%) | 1.19 | 1.07 | 16.35 | 13.47 | 1.06 | 0.33 |
| Notes: SD Standard Deviation CV Coefficient of Variance |
||||||
14.13.2 Trend Swath Plots
Swath plots were generated for all zones to compare composite and block model grades along the easting (x), northing (y), and elevation (z) directions. For the Main Zone, examples of these swath plots are presented in Figure 14-6, Figure 14-7, and Figure 14-8.
The Main Zone swath plots in the X (east), Y (north), and Z (vertical) directions show strong agreement between composite grades and the block model (OK and NN estimates), indicating that the model reproduces the observed spatial grade trends. In all three directions, the block grades closely track the composite profiles, including the principal grade highs, lows, and inflection points, with only minor localized differences at the margins and no evidence of systematic bias or excessive smoothing. The vertical swath confirms that the model preserves the thickness and vertical continuity of mineralization, while the horizontal swaths demonstrate that lateral grade patterns are well honored. The SLR QPs are of the opinion, the swath plots support the conclusion that the estimation methodology and search strategy adequately reflect the underlying grade distribution in the Main Zone. No significant smoothing or anomalous behavior was identified, and good spatial correlation is observed between the composite grades and the block model grades
| 14-20 |
| Energy Fuels Inc. | Pinyon Plain Mine | February 19, 2026 |
| Technical Report on the Updated Pre-Feasibility Study | SLR Project No.: 123.020548.00001 |
Figure 14-6: Main Zone Swath Plot X (East) Direction
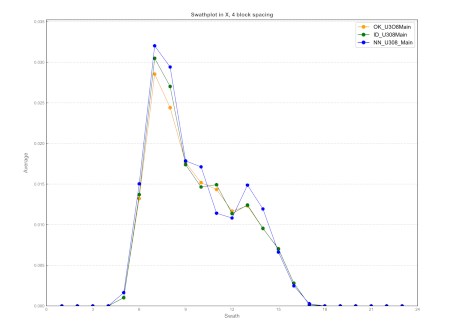
Figure 14-7: Main Zone Swath Plot Y (North) Direction

| 14-21 |
| Energy Fuels Inc. | Pinyon Plain Mine | February 19, 2026 |
| Technical Report on the Updated Pre-Feasibility Study | SLR Project No.: 123.020548.00001 |
Figure 14-8: Main Zone Swath Plot Z (vertical) Direction

14.13.3 Visual Comparison
Block grades were visually compared with drill hole composites on elevation plan views (Figure 14-9 and Figure 14-10). Visual validation comparing assay and composite grades to block grade estimates showed reasonable correlation with no significant overestimation or overextended influence of high grades in all domains.
| 14-22 |
| Energy Fuels Inc. | Pinyon Plain Mine | February 19, 2026 |
| Technical Report on the Updated Pre-Feasibility Study | SLR Project No.: 123.020548.00001 |
Figure 14-9: Plan View Comparing Block and Composite U3O8 Grades in the Main Zone (5,180 fasl)

| 14-23 |
| Energy Fuels Inc. | Pinyon Plain Mine | February 19, 2026 |
| Technical Report on the Updated Pre-Feasibility Study | SLR Project No.: 123.020548.00001 |
Figure 14-10: Plan View Comparing Block and Composite U3O8 Grades in the Juniper Zone (4,890 fasl)

| 14-24 |
| Energy Fuels Inc. | Pinyon Plain Mine | February 19, 2026 |
| Technical Report on the Updated Pre-Feasibility Study | SLR Project No.: 123.020548.00001 |
14.14 Grade Tonnage Sensitivity
The Mineral Resource estimates for the Project are sensitive to the selected cut-off grade. To demonstrate this sensitivity, tonnage and grade estimates derived from the block model are presented for the Main Mineral Resource
Table 14-10 shows the Indicated block model sensitivity to cut-off grade and uranium prices as represented in the grade tonnage curve shown in Figure 14-11.
Table 14-11 shows the Inferred block model sensitivity to cut-off grade and uranium prices as represented in the grade tonnage curve shown in Figure 14-12 .
| 14-25 |
| Energy Fuels Inc. | Pinyon Plain Mine | February 19, 2026 |
| Technical Report on the Updated Pre-Feasibility Study | SLR Project No.: 123.020548.00001 |
Table 14-10: Block Model Sensitivity to Cut-off Grade and Uranium Price in the Main-Lower and Juniper Zones (Indicated)
| Price ($/lb U3O8) |
Cut-Off Grade (%U3O8) |
Tonnage (st) |
Grade (%U3O8) |
Contained Metal (thousand lb U3O8) |
| 150 | 0.187 | 35,722 | 0.39 | 281,538 |
| 145 | 0.193 | 34,506 | 0.40 | 276,911 |
| 140 | 0.200 | 33,239 | 0.41 | 271,938 |
| 135 | 0.208 | 31,553 | 0.42 | 265,071 |
| 130 | 0.216 | 30,413 | 0.43 | 260,239 |
| 125 | 0.224 | 29,076 | 0.44 | 254,355 |
| 120 | 0.234 | 27,581 | 0.45 | 247,505 |
| 115 | 0.244 | 26,079 | 0.46 | 240,315 |
| 110 | 0.255 | 24,520 | 0.47 | 232,549 |
| 105 | 0.267 | 22,797 | 0.49 | 223,538 |
| 100 | 0.281 | 20,959 | 0.51 | 213,469 |
| 95 | 0.295 | 19,318 | 0.53 | 204,018 |
| 90 | 0.312 | 17,652 | 0.55 | 193,928 |
| 85 | 0.330 | 15,916 | 0.57 | 182,848 |
| 80 | 0.351 | 14,218 | 0.60 | 171,271 |
| 75 | 0.374 | 12,457 | 0.64 | 158,489 |
| 70 | 0.401 | 10,594 | 0.68 | 144,055 |
| 65 | 0.432 | 8,946 | 0.73 | 130,419 |
| 60 | 0.468 | 7,457 | 0.78 | 117,035 |
| 55 | 0.510 | 5,975 | 0.86 | 102,580 |
| Notes: 1. U3O8 Recovery and operating costs held constant for sensitivity analysis. 2. Base Case Scenario |
||||
| 14-26 |
| Energy Fuels Inc. | Pinyon Plain Mine | February 19, 2026 |
| Technical Report on the Updated Pre-Feasibility Study | SLR Project No.: 123.020548.00001 |
Figure 14-11: Indicated Grade Tonnage Curve Main-Lower and Juniper Zones

| 14-27 |
| Energy Fuels Inc. | Pinyon Plain Mine | February 19, 2026 |
| Technical Report on the Updated Pre-Feasibility Study | SLR Project No.: 123.020548.00001 |
Table 14-11: Block Model Sensitivity to Cut-off Grade and Uranium Price in the Main-Lower and Juniper Zones (Inferred)
| Price ($/lb U3O8) |
Cut-Off Grade (%U3O8) |
Tonnage (st) |
Grade (%U3O8) |
Contained Metal (thousand lb U3O8) |
| 150 | 0.187 | 21,124 | 0.607 | 256,280 |
| 145 | 0.193 | 20,548 | 0.618 | 254,091 |
| 140 | 0.200 | 19,781 | 0.635 | 251,076 |
| 135 | 0.208 | 17,557 | 0.689 | 241,991 |
| 130 | 0.216 | 16,588 | 0.717 | 237,884 |
| 125 | 0.224 | 15,574 | 0.749 | 233,412 |
| 120 | 0.234 | 14,991 | 0.770 | 230,748 |
| 115 | 0.244 | 14,611 | 0.783 | 228,924 |
| 110 | 0.255 | 14,098 | 0.803 | 226,371 |
| 105 | 0.267 | 13,667 | 0.820 | 224,120 |
| 100 | 0.281 | 13,211 | 0.839 | 221,608 |
| 95 | 0.295 | 12,710 | 0.860 | 218,721 |
| 90 | 0.312 | 12,209 | 0.883 | 215,684 |
| 85 | 0.330 | 11,519 | 0.917 | 211,269 |
| 80 | 0.351 | 10,892 | 0.950 | 206,984 |
| 75 | 0.374 | 10,309 | 0.984 | 202,789 |
| 70 | 0.401 | 9,656 | 1.024 | 197,734 |
| 65 | 0.432 | 8,826 | 1.081 | 190,808 |
| 60 | 0.468 | 8,110 | 1.137 | 184,381 |
| 55 | 0.510 | 7,534 | 1.186 | 178,754 |
| Notes: 1. U3O8 Recovery and operating costs held constant for sensitivity analysis. 2. Base Case Scenario |
||||
| 14-28 |
| Energy Fuels Inc. | Pinyon Plain Mine | February 19, 2026 |
| Technical Report on the Updated Pre-Feasibility Study | SLR Project No.: 123.020548.00001 |
Figure 14-12: Inferred Grade Tonnage Curve Main-Lower and Juniper Zones

| 14-29 |
| Energy Fuels Inc. | Pinyon Plain Mine | February 19, 2026 |
| Technical Report on the Updated Pre-Feasibility Study | SLR Project No.: 123.020548.00001 |
15.0 Mineral Reserve Estimates
15.1 Summary
The Mineral Reserve estimate for Pinyon Plain, summarized in Table 15-1, is based on the Measured and Indicated Mineral Resources as of December 31, 2025, a detailed mine design, and modifying factors such as a feasible mining method, external dilution, and mining extraction factors. No Inferred Mineral Resources were converted to Mineral Reserves. Mineral Reserves are reported in situ, after application of mining dilution and mining extraction, but prior to application of metallurgical recovery. Metallurgical recovery is applied subsequently in the economic analysis to estimate recovered and saleable U₃O₈.
The planned mining method at Pinyon Plain is longhole stoping. Development waste rock will be temporarily stored on surface and then used at the end of mining to fill voids created by mining. Metallurgical test results provided by White Mesa Mill laboratory personnel indicated that metallurgical recoveries using optimum roasting and leach conditions will be approximately 96% for uranium.
The underground mine design was based on grade envelopes of assays at a nominal grade of 0.35% U3O8 using underground mining methods and processing via a toll milling agreement.
Current economic conditions, mine design, and cash flow analysis do not account for processing of copper mineralization, and thus, copper is excluded from the Mineral Reserve estimate.
Table 15-1: Summary of Mineral Reserve Estimate - December 31, 2025
| Category | Cut-Off Grade (% U3O8) |
Tonnage (st) |
Grade (% eU3O8) |
Contained Metal (lb U3O8) |
Metallurgical Recovery U3O8 (%) |
| Main Zone | |||||
| Proven | 0.35% | 17,500 | 1.04% | 365,300 | 96.0 |
| Probable | 0.35% | 79,900 | 1.06% | 1,697,600 | 96.0 |
| Juniper Zone | |||||
| Proven | 0.35% | - | - | - | 96.0 |
| Probable | 0.35% | 35,700 | 0.71% | 508,300 | 96.0 |
| Total Proven + Probable | 133,000 | 0.97% | 2,571,200 | 96.0 | |
| Notes: | |||||
|
1. SEC S-K-1300 definitions were followed for all Mineral Reserve categories. These definitions are also consistent with CIM (2014) definitions incorporated by reference in NI 43-101. 2. The Mineral Reserve estimate is reported on a 100% ownership basis. 3. Mineral Reserves are reported on an in situ basis after applying dilution and mining extraction. 4. Mineral Reserves are estimated using a long-term uranium price of US$80.00/lb, and a breakeven cut-off grade of 0.35% U3O8. 5. Stope shapes were created using a minimum mining width of 4 ft and 20 ft vertical stope heights. 6. A tonnage factor of 0.099 st/ft3 was used which is derived from operational data. 7. Numbers may not add due to rounding. |
|||||
| 15-1 |
| Energy Fuels Inc. | Pinyon Plain Mine | February 19, 2026 |
| Technical Report on the Updated Pre-Feasibility Study | SLR Project No.: 123.020548.00001 |
The SLR QP is not aware of any risk factors associated with, or changes to, any aspects of the modifying factors, such as mining, metallurgical, infrastructure, permitting, or other relevant factors, that could materially affect the Mineral Reserve estimate.
15.2 Comparison to Previous Estimate
A comparison between the current and previously reported Mineral Reserves for Main Zone is presented in Table 15-2. In the Main Zone, the amount of estimated contained U3O8 has decreased due to ongoing ore production while ore grades have increased. This report is the initial disclosure for Mineral Reserves in the Juniper Zone, so no comparison can be made.
Table 15-2: Main Zone Mineral Reserve Comparison to Previous Estimate
| Category | Tonnage (st) |
Grade (% U3O8) |
Contained Metal (lb U3O8) |
| December 31, 2025 Proven and Probable Reserves | |||
| Proven | 17,500 | 1.04% | 365,300 |
| Probable | 79,900 | 1.06% | 1,697,600 |
| Total | 97,400 | 1.06% | 2,062,800 |
| December 31, 2022 Proven and Probable Reserves | |||
| Proven | 7,800 | 0.33% | 50,800 |
| Probable | 126,700 | 0.60% | 1,517,000 |
| Total | 134,500 | 0.58% | 1,567,800 |
| Variance % | |||
| Proven | 124% | 216% | 619% |
| Probable | -37% | 77% | 12% |
| Total | -28% | 83% | 32% |
15.3 Conversion to Mineral Reserves
The Mineral Resource block model developed by SLR forms the basis of the Mineral Reserve estimate. Mine designs and Mineral Reserve work were completed by SLR using Deswik software.
Mineral Reserves were estimated for two mining zones that contain Measured and Indicated Mineral Resources: the Main Zone and the Juniper Zone. Nearly all development is complete in the Main Zone, with minor amounts of ore drive development left to complete. The Main Zone mining levels are spaced with a nominal vertical spacing of 40 ft, and this same spacing was used in the Juniper Zone design.
Stope shapes were created using the stope optimizer tool in Deswik. The small-scale mining equipment used at Pinyon Plain allows for highly selective mining. Stopes were designed with 20 ft heights, half the level spacing interval, and five foot stope lengths, representative of a minimum length ore development round. Through post-processing, stopes were smoothed along strike to reduce contact wall offsets and merged along strike up to 15 ft in length to be more representative of a planned mining panel.
| 15-2 |
| Energy Fuels Inc. | Pinyon Plain Mine | February 19, 2026 |
| Technical Report on the Updated Pre-Feasibility Study | SLR Project No.: 123.020548.00001 |
A single break-even cut-off grade of 0.35% U3O8 was used, representative of average operating costs for mining, ore haulage to White Mesa Mill, processing, and site G&A. The minimum width was set to four feet. Two feet of dilution was added to each contact wall, resulting a final minimum stope width of eight feet. In general, the orebody at Pinyon Plain is steeply dipping; however, a minimum stope dip of 60° was used to ensure that all broken material would exceed the angle of repose and prevent the creation of hangups while mucking.
Ore development was designed based upon the stope locations with centrelines aligned to the approximate centers of stope shapes. Ore drives are nominally 10 ft wide, and where stope shapes exceeded approximately 12 ft in width ore slashes were designed such that development was widened nearer to the stope extents. This method was successfully used while developing Main Zone and is planned to be repeated for Juniper Zone.
A summary of the key stope optimizer inputs is presented in Table 15-3.
Table 15-3: Stope Optimizer Parameters
| Parameter | Unit | Value |
| Stope Height | ft | 20 |
| Stope Length | ft | 5 |
| Cut-Off Grade | % U3O8 | 0.35 |
| Minimum Width | ft | 4 |
| Hanging Wall Dilution | ft | 2 |
| Footwall Dilution | ft | 2 |
| Minimum Dip | ° | 60 |
After stope shapes were created and initial ore development designed, stopes were reviewed for mineability and to confirm economics. Must-take stope shapes were designed and incorporated into the Reserve plan where gaps existed between stope optimizer outputs that would prevent broken ore from being mucked or result in small and unstable pillars left between adjacent stopes. The must-take stope shapes typically fall below cut-off grade; however, all are included in the Reserve totals because the material must be mined to facilitate the mining of ore. There is no system in place to identify and separate the low grade must-take material from the broken ore, so all is treated as ore.
Measured Mineral Resources were converted to Proven Mineral Reserves and Indicated Mineral Resources were converted to Probable Mineral Reserves. No Inferred Mineral Resources were converted to Mineral Reserves. Any Inferred or non-classified material captured within the design shapes has zero metal grade and is reported as Probable tons.
15.4 Dilution
Both planned and unplanned dilution was accounted for in the stope optimization process. Planned dilution is comprised of waste blocks within and surrounding the ore blocks that are captured within the optimized stope shape. Unplanned dilution was accounted for by adding two feet to both the hanging wall and footwall sides of the stopes within the stope optimization process. This additional width represents unplanned overbreak.
Must-take stope shapes represent additional dilution to Reserves. A total of 6,600 st of must-take material is included in the Reserve designs, which corresponds to 5% dilution.
| 15-3 |
| Energy Fuels Inc. | Pinyon Plain Mine | February 19, 2026 |
| Technical Report on the Updated Pre-Feasibility Study | SLR Project No.: 123.020548.00001 |
All dilution is within designed stopes shapes and is thus assigned grades from the block model. Total dilution in the Mineral Reserves is 21%.
15.5 Extraction
Longhole stopes will be drilled from stope overcuts or undercuts using downholes or upholes. Longholes are nominally 30 ft long from the back of the stope undercut to sill breakthrough on the level above or below. Extraction of the planned stopes is 95%. Broken ore will drop to the lowest open undercut and be mucked and transported to the orepass or shaft load out at the 1-5 Shaft Station.
15.6 Cut-off Grade
The calculated cut-off grade for Pinyon Plain Mineral Reserves was based on modifying factors including metal prices, metallurgical recoveries, operating costs, royalties, and other operational constraints. Mine operating costs were based on historical operating costs for similar underground operations on the Arizona Strip operated by Energy Fuels and actual development cost data from Pinyon Plain. Process and ore haulage operating costs are based upon recent data from the Pinyon Plain Mine and White Mesa Mill.
A metal price of US$80.00/lb U3O8 was used for Mineral Reserves. This value was derived from metal price forecasts and actual EFR contracts and term sheets. For Mineral Resources, metal prices used are slightly higher than those for Reserves. Metal pricing and the royalty cost are discussed in Sections 19.1 and 4.4 of this report, respectively.
The cut-off was calculated as a breakeven grade where the revenue from recoverable uranium, after accounting for process recovery and royalties, is equal to all operating costs necessary to extract the uranium. This follows the same methodology as the cut-off grade used for Mineral Resource reporting, the only difference being the U3O8 price. The uranium cut-off grade applied to the Mineral Reserves was 0.35% U3O8 for both the Main and Juniper Zones. Table 15-4 lists the assumptions used to determine the uranium cut-off grade.
Table 15-4: Cut Off Grade Calculation for Mineral Reserves
| Item | Unit | Value |
| U3O8 Price | US$/lb U3O8 | $80.00 |
| Royalties | $/st | 1.88 |
| Process Recovery | % | 96.00% |
| Payable U3O8 | % | 100.00% |
| Net Unit Revenue | US$ / %U3O8 | 1,536 |
| Operating Costs | ||
| Mining - Ore Production | $/st milled | $180.70 |
| Haulage (mine to mill) | $/st milled | $95.00 |
| Processing | $/st milled | $256.00 |
| G&A | $/st milled | $7.00 |
| Total | $/st milled | $538.70 |
| Cut-off Grade (breakeven) | % U3O8 | 0.35% |
| 15-4 |
| Energy Fuels Inc. | Pinyon Plain Mine | February 19, 2026 |
| Technical Report on the Updated Pre-Feasibility Study | SLR Project No.: 123.020548.00001 |
15.7 Reconciliation
Pinyon Plain Mine started production in 2024. As of December 31, 2025, approximately 54,009 st and 1.74 Mlb U3O8 have been mined. The actual production data from the mine exceeds the model predictions.
A reconciliation was completed between reported uranium production for the 2024-2025 period and the Mineral Resource Estimate block model for the Pinyon Plain Mine by depleting the model using company-provided mine-out shapes totaling 553,728 ft³ for the Main Zone and comparing the results to the cumulative production of 1,741,695 lbs U3O8 for 2024-2025.
Using the surveyed mine-out volume and reported production tonnage, the implied in situ tonnage factor for the Main Zone is approximately 0.099 st/ft³, which is materially higher than the global density of 0.082 st/ft³ used in previous resource estimates. The global density was derived from extensive caliper-based specific gravity measurements on 2,857 drill core samples, modeled using inverse distance squared interpolation, and validated against wax-sealed water-immersion measurements on 37 full-core samples, which indicated that the caliper method averages approximately 1% higher, a difference previously considered immaterial.
However, reconciliation demonstrates that this global density is not representative of in situ conditions within the high-grade mined domains. Accordingly, a production-derived tonnage factor of 0.099 st/ft³ was applied on a domain-restricted basis to the Main Zone, consistent with CIM (2019) guidance to apply locally calibrated modifying factors, which was justified by operational data. Using this revised density, the depleted Main Zone resource is estimated at 54,819 tons at 1.30% U3O8, for 1,420,030 lbs U3O8. A comparison between the mine reported production values and updated model results using the higher in situ tonnage factor is presented in Table 15-5.
Table 15-5: Reconciliation Data 2024-2025 Production
| Model vs Production | Tonnage | Grade | Contained Metal |
| (st) | (% U3O8) | (lb U3O8) | |
| Model | 54,819 | 1.30 | 1,420,030 |
| Mine | 54,009 | 1.61 | 1,741,695 |
| Mine to Model (% Difference) | -1.5% | 19.7% | 18.5% |
When compared with the cumulative 2024-2025 production of 1,741,695 lb, the block model remains approximately 321,665 lb (19%) below, indicating that reconciliation performance is within the outer bounds of acceptable tolerance under CIM (2019) best practice. In accordance with S-K 1300, NI 43-101, and the CIM (2019) Definition Standards, the reconciliation supports the conclusion that the primary driver of historical discrepancies is density/tonnage factor representativeness in high-grade domains, rather than systematic grade bias, and that density must be treated as a domain-specific modifying input subject to ongoing calibration to production.
15.8.1 QP Conclusions
• The previously applied global density of 0.082 st/ft³ materially understates tonnage in high-grade mined domains.
| 15-5 |
| Energy Fuels Inc. | Pinyon Plain Mine | February 19, 2026 |
| Technical Report on the Updated Pre-Feasibility Study | SLR Project No.: 123.020548.00001 |
• Production-derived data support a domain-specific tonnage factor of approximately 0.099 st/ft³ for the Main Zone. This factor has been applied to the Juniper Zone as it also contains uranium mineralization in excess of 20%.
• Applying the revised density reduces the reconciliation variance to approximately 15%, which is within the CIM (2019) acceptable tolerance.
• Density is the dominant source of reconciliation variance; no material grade bias is indicated.
• Density must be treated as a locally calibrated, domain-dependent modifying factor.
15.8.2 QP Recommendations
• Implement domain-specific density models for all high-grade zones using production-calibrated tonnage factors.
• Perform routine (monthly/annual) reconciliations integrating production, moisture, and surveyed volumes.
• Expand in situ density sampling in high-grade zones to validate production-derived factors.
• Ensure all future S-K 1300 and NI 43-101 disclosures clearly describe density assumptions, reconciliation methodology, and limitations.
| 15-6 |
| Energy Fuels Inc. | Pinyon Plain Mine | February 19, 2026 |
| Technical Report on the Updated Pre-Feasibility Study | SLR Project No.: 123.020548.00001 |
16.0 Mining Methods
Pinyon Plain is an underground, shaft-access mine. The primary production method is longhole stoping, using either upholes drilled from ore undercuts or downholes drilled from ore overcuts. Development mining uses handheld drills for face advance and ground support installation. Longholes are drilled with buggy drills. Material is hauled using small, mechanized rubber-tired equipment. Ore is hoisted to surface, stored in a surface ore stockpile, and then transported by highway trucks to the White Mesa Mill.
There are two mining zones at Pinyon Plain. The production shaft is 1,470 ft deep reaching the bottom of the Main Zone. Main Zone production extends over an approximate 200 ft vertical interval from 1,200 ft to 1,400 ft below surface. The Juniper Zone lies beneath the Main Zone, with production extending over an approximate 220 ft vertical interval to a maximum depth of 1,800 ft below surface. The bottom of Juniper Zone is approximately 410 ft below the lowest shaft station.
16.1 Mine Design
The production shaft has three shaft stations: at the 1-3 level, above the main zone, the 1-4 level near the top of the Main Zone, and the 1-5 level, near the bottom of the Main Zone. The shaft is equipped with a double drum hoist and is used for personnel and materials.
The Main Zone is roughly cylindrical in shape, with a diameter of up to 200 ft. Production stopes range from 10 ft to up to 40 ft across. A barren centre exists within the breccia pipe that is up to 120 ft across. Mining levels are spaced at roughly 40 ft vertical intervals. An eight foot diameter return air raise (RAR) is located in the barren centre. A Timberland escape hoist with bullet cage is installed in the raise such that it functions as an emergency escapeway.
Access to the Main Zone orebody is through a 10 ft high by 10 ft wide spiral ramp that circles the breccia pipe. The ramp connects the shaft stations of the 1-4 and 1-5 levels and is driven at a nominal 15% gradient. Flat cross cuts from the spiral ramp are developed at five mining levels referenced by their sill elevation above sea level: the 5290, 5250, 5210, 5170, and 5130 levels. From these mining levels, a circular drift is developed around the inside perimeter of the breccia pipe.
A ventilation exhaust drift connects each circular ore drift on a level to the RAR. Vent stoppings control the airflow through each level, which can change depending on where active mining is taking place. A muck raise connects the 1-5 Level up to the 5250 level, the highest mucking level in the production plan.
The Juniper Zone is also cylindrical in shape, however, less continuous than the Main Zone. Reserves are primarily located on the south and west side of the mineralized cylinder. Mining levels in Juniper Zone are designed at 40 ft vertical spacing. The Juniper Zone mine design includes a switchback decline and eight mining levels. The top two levels, 4982 and 4942, consist of level accesses that will allow the RAR to be extended from the bottom of Main Zone to the Juniper Zone. RARs between levels will be constructed as drop raises, using drill and blast, and supported with standard ground support. The Juniper Zone ore is accessed from the six lowest levels at 4902 through 4702 elevations.
| 16-1 |
| Energy Fuels Inc. | Pinyon Plain Mine | February 19, 2026 |
| Technical Report on the Updated Pre-Feasibility Study | SLR Project No.: 123.020548.00001 |
The Juniper Zone will be accessed by a 10 ft high by 10 ft wide decline that switchbacks down from the 1-5 Level, the bottom of Main Zone. The decline is currently being driven and, as of December 31, 2025, was at the 4982 level. Every 40 vertical feet, a level will be driven, which will consist of a level access, remuck, sump, and electrical cut-out. The level access will be driven through the mineralized area into the barren centre of the breccia pipe. At this point, a drop raise will be driven to connect to the level above, which will serve as both an exhaust route as well as a secondary egress.
Figure 16-1 presents the current mine as-built and mine design in 3D view, while Figure 16-2 shows the same data in section view.
| 16-2 |
| Energy Fuels Inc. | Pinyon Plain Mine | February 19, 2026 |
| Technical Report on the Updated Pre-Feasibility Study | SLR Project No.: 123.020548.00001 |
Figure 16-1: Mine Design Schematic - 3D View

| 16-3 |
| Energy Fuels Inc. | Pinyon Plain Mine | February 19, 2026 |
| Technical Report on the Updated Pre-Feasibility Study | SLR Project No.: 123.020548.00001 |
Figure 16-2: Mine Design - Section View

| 16-4 |
| Energy Fuels Inc. | Pinyon Plain Mine | February 19, 2026 |
| Technical Report on the Updated Pre-Feasibility Study | SLR Project No.: 123.020548.00001 |
16.2 Mining Method
Energy Fuels and its predecessors have mined numerous uranium bearing breccia pipes by underground methods dating back to the 1980s. Pinyon Plain is mined by longhole stoping This method is an open stoping, high-production, bulk mining method, applicable to large, steeply dipping, regular ore bodies, having competent ore and host rock that requires little or no support. In isolated areas the sill will be blasted and mucked out (termed a "floor pull"). This is typically used where ore extends a short distance below an ore drive but is not extensive enough to warrant the development of a lower level.
Due to the circular nature of the breccia pipe, each mining level is developed in a circular fashion, from the mine access drift along the circular ore contacts. Ore drifts are widened to the extent of mineralization by slashing the side walls. Once the ore drive is complete, longhole stoping will typically be initiated on the opposite side of the pipe from the level entrance and retreat back toward the level entrance. This will be done in two mining fronts if available; one clockwise and one counter-clockwise.
In Main Zone, longhole mining commenced between the 5170 and 5210 levels and the 5210 and 5250 levels. Mining of the Main Zone will progress upward and downward from these horizons as they are mined out. Since the upper mining block is mined bottom-up, the broken material will fall through previously mined open stopes and report to the 5170 and 5130 Levels. From here a load-haul-dump loaders (LHD) will transport material to the muck raise on either level where it will fall down to the 1-5 Level.
The lower Main Zone mining block is being mined top-down. An LHD trams muck from each undercut to the muck raise that is located on each level. Like in the upper mining block, all ore reports to the bottom of the muck raise on the 1-5 Level. An LHD on the 1-5 Level rehandles broken material from the bottom of the muck raise to the production shaft loading station. The LHD dumps into a grizzly located over the loading pocket feed. The ore control system at the mine will ensure ore and waste are not commingled.
Juniper will be mined in a simple top-down manner. Like in the Main Zone, the circular-shaped ore drives will be driven only once the level access, infrastructure, and ventilation raise is in place in the barren centre of the deposit. Once the ore drive is developed to the ore extent and has been appropriately slashed to the mineralized extents, longhole stoping will begin. Longholes will be drilled as uppers and blasted in a retreat sequence from level extent toward the level entrance. An LHD will transport material from the mining face, then load haul trucks at the level entrance. The haul trucks will then move material up the Juniper decline to the loading pocket located at the 1-5 Level.
Once mining is completed, all development rock stored on surface will be placed back underground through the ventilation raise as part of the Project's reclamation plan, as agreed to with State regulators.
16.3 Geotechnical
In 1987, the geotechnical consulting firm of Dames and Moore completed an evaluation of mine stability and subsidence potential at the Project (Dames and Moore 1987).
The scope of work was based on a review of geologic and geotechnical data from similar breccia pipe uranium mines on the Arizona Strip (the Orphan Mine, the Hack 2 Mine, Kanab North, and the Pigeon Mine), including the stability of existing underground stopes.
| 16-5 |
| Energy Fuels Inc. | Pinyon Plain Mine | February 19, 2026 |
| Technical Report on the Updated Pre-Feasibility Study | SLR Project No.: 123.020548.00001 |
Numerical modelling of stopes was analyzed at depths of 800 ft, 1,200 ft, and 1,600 ft below surface with a surrounding rock strength of 3,000 psi. Stope dimensions at these mines varied from 60 ft high by 30 ft wide (Orphan Mine) to 350 ft high by 200 ft wide (Hack 2 Mine). Ground support was limited to rock bolts in the stope backs and no backfill.
The report concluded that stopes up to 350 ft high at a depth of 1,200 ft would not develop significant stability problems as long as prudent ground supports were employed, which EFR plans on installing during mining. In addition, the paper predicted mined out stopes would fill with rubblized rock as a result of subsidence reaching surface in several hundred years; the surface expression would be less than two feet over a broad area and would be difficult to observe in the field. Since the geotechnical report was produced, EFR has decided to fill stopes with waste rock when mining ceases, which will significantly reduce any post-mining surface expression from to-ground subsidence.
The planned mining excavations within Main Zone fall within the envelope studied by Dames and Moore with respect to stope dimensions and depth below surface. The Juniper Zone extends 200 ft deeper than the maximum depth of the study. SLR recommends that EFR complete a geotechnical study to support continued mining in Juniper Zone, particularly if additional mining levels are added below the current bottom of the Reserves, the 4702 Level.
SLR recommends that EFR develop a program for monitoring the geotechnical conditions in the stopes to provide an early warning of potential ground condition problems or stope wall failures. This is of particular importance in excavations near to critical infrastructure, namely the RAR from Main Zone to surface. The geotechnical condition of the development headings should be noted and recorded to support any required changes in the ground support regimes.
16.4 Hydrogeological
Mine workings are within competent bedrock having low to very low permeability. The breccia pipe and bedrock underlying the workings (the Lower Supai) are both considered nearly impermeable.
Despite the low permeability of the Coconino sandstone at the site, workings (including the mine access shaft) that penetrate saturated portions of the Coconino sandstone experience water seepage. This is due to the relatively large, saturated thickness (approximately 200 ft) of the Coconino sandstone.
Even though fully saturated, the Supai Formation has a hydraulic conductivity (and transmissivity) substantially lower than that of the Coconino sandstone. The majority of mine infrastructure and accesses are located within the Supai Formation.
The mine workings act as sinks for any perched groundwater that is encountered; flow is directed from the country rock toward the workings. Furthermore, the long-term impacts of the relatively small volume of workings penetrating a very large volume of low permeability rock will have a negligible impact on the overall average hydraulic properties of the surrounding rock.
16.4.1 Mine Shaft Seepage
The Mine is located within an area of the Coconino Plateau where the Coconino sandstone contains only locally perched groundwater. Inflow from perched groundwater encountered within the Coconino during sinking of the mine shaft has been slightly higher than, but comparable to, the anticipated levels. Perched groundwater is currently seeping into the shaft at a rate of approximately 8 gpm. Natural dewatering of the saturated Coconino sandstone reduced the seepage rate from approximately 20 gpm to its current rate. EFR has installed water rings within the shaft at the base of the Coconino and at the base of the Kaibab to capture and keep this water separate from any other water that may seep into the shaft. The remaining water is collected in a lined sump at the base of the shaft.
| 16-6 |
| Energy Fuels Inc. | Pinyon Plain Mine | February 19, 2026 |
| Technical Report on the Updated Pre-Feasibility Study | SLR Project No.: 123.020548.00001 |
The rate of seepage of water from the Coconino into the shaft is consistent with the low estimated hydraulic conductivity for the Coconino. The rate of seepage of water from the Kaibab into the shaft is minimal (a few gpm), which is consistent with expectations. Any water from the Coconino and Kaibab that overflows or is not otherwise captured by or pumped out of the water rings reports to the sump at the bottom of the mine shaft.
Seepage from the Coconino has created a cone of depression within the perched groundwater that directs flow inward towards the shaft. Effectively, the shaft acts as a well that is continuously overpumped to the extent that a seepage face is created. As long as the shaft is in use and water is being pumped from the lined sump at the bottom of the shaft, groundwater flow will be directed inward from the Coconino into the shaft.
Potential seepage from perched water zones in other formations penetrated by the shaft (such as the Kaibab, Toroweap, and Upper Supai) is relatively small, however, groundwater flow from these formations will also be directed inward toward the shaft.
The RAR is entirely within the breccia pipe which is comprised of a dense, well-cemented, compact and predominantly dry rock matrix. Little seepage is evident from the RAR.
16.4.2 Drifts into Breccia Pipe Orebody
Drifts extending from the shaft into the orebody are generally dry except when isolated saturated materials are encountered. The ore access drives are within either the Hermit Shale or very low permeability Supai Formation materials, while the ore drives are entirely within the breccia pipe. When isolated saturated material is encountered water seeps into the drifts with a rate roughly proportional to the permeability of the saturated materials. Seepage rates generally abate as the saturated pocket is drained through time.
Drifts are designed to drain toward the shaft such that any seepage is directed away from the active headings, toward the ramp, and ultimately to the lined sump at the base of the production shaft.
16.5 Life of Mine Plan
As of January 2026, production in Main Zone is ongoing and expected to be completed in 2028. Decline development is advancing toward the Juniper Zone, with first ore expected in July 2026 when ore development commences on the 4902 level. The production rates are expected to hold steady near 5,000 short tons per month until the end of 2027 when the Juniper Zone nears depletion. In early 2028 only a single production heading may be available in Main Zone due to depletion of other mining levels, which will slow overall production rates. Minor amount of development remain in Main Zone to establish final stope overcuts and undercuts.
Longhole production mining is expected to commence in Juniper Zone in February 2027 when the first stopes are taken on 4902 Level. Production from the zone quickly ramps up to over 3,000 short tons per month while two independent production headings are consistently available. The rate reduces through the end of 2027 as the zone nears depletion. The end of the mine production schedule is currently August 2028.
Production is scheduled at up to 5,000 tons per month (166 tpd) when sufficient headings are available. Individual stopes are scheduled at an overall blended rate of 55 tpd, which accounts for longhole drilling, blasting, and mucking activities. At this rate a typical 30 ft long and 10 ft wide stope takes approximately 24 days to mine. Three stopes must be active to reach the daily production target.
| 16-7 |
| Energy Fuels Inc. | Pinyon Plain Mine | February 19, 2026 |
| Technical Report on the Updated Pre-Feasibility Study | SLR Project No.: 123.020548.00001 |
All development headings are scheduled to advance at six feet per day, equal to a standard development round length.
Charts below present the production plan by month in Figure 16-3 and Figure 16-4, and development plan by month in Figure 16-5. An isometric showing the LOM schedule progression is coloured coded by quarter in Figure 16-6. LOM plan numbers are presented by quarter for production activities in Table 16-1 and development activities in Table 16-2.
Figure 16-3: LOM Production Schedule - Tons and Grade

Figure 16-4: LOM Production Schedule - U3O8 (lb) and Grade

| 16-8 |
| Energy Fuels Inc. | Pinyon Plain Mine | February 19, 2026 |
| Technical Report on the Updated Pre-Feasibility Study | SLR Project No.: 123.020548.00001 |
Figure 16-5: LOM Development Schedule

| 16-9 |
| Energy Fuels Inc. | Pinyon Plain Mine | February 19, 2026 |
| Technical Report on the Updated Pre-Feasibility Study | SLR Project No.: 123.020548.00001 |
Figure 16-6: 3D View Showing LOM Schedule by Quarter

| 16-10 |
| Energy Fuels Inc. | Pinyon Plain Mine | February 19, 2026 |
| Technical Report on the Updated Pre-Feasibility Study | SLR Project No.: 123.020548.00001 |
Table 16-1: Life of Mine Production Schedule
| Year | Quarter | Total Mill Feed Processed (tons) |
Head Grade U3O8 (%) |
Contained U3O8 (lb) |
Avg. Metallurgical Recovery (%) |
Recovered U3O8 (lb) |
| 2026 | Q1 | 14,300 | 1.57% | 449,000 | 96% | 431,000 |
| Q2 | 14,300 | 0.99% | 281,200 | 96% | 270,000 | |
| Q3 | 15,300 | 1.16% | 355,300 | 96% | 341,100 | |
| Q4 | 16,200 | 0.61% | 198,000 | 96% | 190,100 | |
| 2027 | Q1 | 15,100 | 0.72% | 218,200 | 96% | 209,400 |
| Q2 | 15,700 | 0.92% | 289,200 | 96% | 277,600 | |
| Q3 | 14,800 | 0.83% | 245,800 | 96% | 236,000 | |
| Q4 | 13,600 | 0.89% | 240,900 | 96% | 231,200 | |
| 2028 | Q1 | 6,900 | 1.04% | 144,800 | 96% | 139,000 |
| Q2 | 4,800 | 1.20% | 114,100 | 96% | 109,500 | |
| Q3 | 2,100 | 0.82% | 34,800 | 96% | 33,400 | |
| Q4 | - | - | - | 96% | 431,000 | |
| Total | 133,000 | 0.97% | 2,571,200 | 96% | 2,468,300 | |
| Note: Numbers may not add due to rounding. | ||||||
Table 16-2: Life of Mine Development and Material Movement Schedule
| Ore Mined (tons) |
Waste Mined (tons) |
Total Material Mined (tons) |
Lateral Development (ft) |
Vertical Development (ft) |
Total Development (ft) |
||
| 2026 | Q1 | 14,284 | 3,951 | 18,236 | 645 | 39 | 684 |
| Q2 | 14,262 | 5,859 | 20,121 | 757 | 33 | 791 | |
| Q3 | 15,334 | 6,373 | 21,707 | 883 | 40 | 923 | |
| Q4 | 16,229 | 5,021 | 21,250 | 882 | 27 | 909 | |
| 2027 | Q1 | 15,098 | 7,302 | 22,399 | 1,013 | 67 | 1,080 |
| Q2 | 15,678 | 7,038 | 22,716 | 1,025 | 67 | 1,092 | |
| Q3 | 14,775 | 1,204 | 15,980 | 164 | - | 164 | |
| Q4 | 13,554 | - | 13,554 | - | |||
| 2028 | Q1 | 6,937 | - | 6,937 | |||
| Q2 | 4,754 | - | 4,754 | ||||
| Q3 | 2,122 | - | 2,122 | ||||
| Q4 | - | - | - | ||||
| Total | 133,028 | 36,747 | 169,775 | 5,369 | 274 | 5,643 | |
| Note: Numbers may not add due to rounding. | |||||||
| 16-11 |
| Energy Fuels Inc. | Pinyon Plain Mine | February 19, 2026 |
| Technical Report on the Updated Pre-Feasibility Study | SLR Project No.: 123.020548.00001 |
16.6 Mine Infrastructure
The Project has significant existing infrastructure and has been used for the storage of surplus materials and equipment from other similar mining projects. The existing infrastructure at the Project includes:
• 1,470 ft deep, three compartment shaft, measuring 19 ft 6 in by 8 ft 2 in
• Shaft stations at depths of 1,000 ft, 1,230 ft and 1,400 ft below surface
• Unsheeted steel headframe
• Hoistroom and 400 hp double drum hoist with 10 ft diameter drums
• Water tanks
• Water wells
• Fuel tanks
• 455 kVA back up power generators
• Six mile 12 kV power line to the site, 12kV/4160 V/480V transformers on site
• Evaporation pond
• Fenced yard
• Offices
• Maintenance shop
• Air compressors
16.7.1 Mine Shaft and Hoist
The mine shaft is a conventional three compartment shaft; the shaft bottom is at a depth of 1,470 ft. below the collar. Two compartments are for hoisting and the third is for the manway, ventilation duct, and services. A plan view schematic of the shaft is shown in Figure 16-7.
The shaft is equipped with steel sets on 10 ft spacing with wooden guides for conveyances. The shaft collar is at an elevation of 6,506 ft. The 1-3 level is approximately 1,000 ft below the collar, the 1-4 level is approximately 1,230 ft below the collar, and the lowest station is at the 1-5 level, 1,400 ft below the collar.
A loading pocket with vibratory feeders is installed below the 1-5 station level. A decline exists to shaft bottom to permit shaft bottom clean up.
The shaft is serviced by a Nordberg 400 hp double drum hoist with 10 ft diameter drums grooved for 1.5 in wire rope. The hoisting speed is 800 feet per minute (fpm). The skip has a capacity of 60 ft3. The head frame is an unsheeted steel structure.
| 16-12 |
| Energy Fuels Inc. | Pinyon Plain Mine | February 19, 2026 |
| Technical Report on the Updated Pre-Feasibility Study | SLR Project No.: 123.020548.00001 |
Figure 16-7: Pinyon Plan Mine Shaft Plan View

16.7.2 Mine Ventilation
EFR contracted RME Consulting to complete the pre-feasibility level ventilation design for the Main and Juniper Zones of the Pinyon Plain mine (Rawlins 2022). The existing shaft and drift openings and planned future development drifts (10 ft x 10 ft) were utilized in the design.
The ventilation design followed the production schedule and meets all industry and regulatory standards for mining uranium in the US. Capital and operating costs are based on budgetary quotes based on specifications from the ventilation design.
The calculated air quantity was based on three factors, namely:
1 Diesel equipment fleet requirements
2 Radon exposure from exposed mineralization
3 Mine environmental conditions (heat, dust, noise, etc.).
Other aspects for the mine and ventilation design evaluation included determining acceptable and practical air velocities in intake and return airways.
The ventilation circuit at Pinyon Plain is a pull system with fresh air downcast from the Production Shaft and returning through the Ventilation Raise located in the centre of the orebody.
The RAR is eight feet in diameter. The bend in the RAR ducting has a hinged hatch that allows a Timberland hoist to drop an emergency man-cage through the exhaust duct system to the bottom of the ventilation raise. This system functions as the secondary egress allowing workers to be loaded and brought to surface in an emergency.
Two 250 hp fans, installed on the surface of the RAR and running in parallel, drive the primary ventilation system. The fans deliver approximately 90,000 cfm underground. Fresh air is distributed through the active development and production headings with 30 hp auxiliary fans, which can deliver up to 25,000 CFM at 10 inches of WG. Typical ventilation ducts used for auxiliary air distribution are 30 inches in diameter and are either rigid steel or rigid plastic. Regulators are used where to required to manage airflow distribution and direct it to active work areas.
| 16-13 |
| Energy Fuels Inc. | Pinyon Plain Mine | February 19, 2026 |
| Technical Report on the Updated Pre-Feasibility Study | SLR Project No.: 123.020548.00001 |
The mine ventilation system was designed for both winter and summer conditions; during winter periods, where air temperatures fall below 32°F, a four million British Thermal Unit per Hour (BTUH) propane heater system heats the ambient air to 38°F.
Ventilation doors and bulkheads will be erected as areas are mined-out to minimize air losses.
Figure 16-8 illustrates the primary ventilation design and flow path at Pinyon Plain.
Figure 16-8: Schematic of the Ventilation Plan for Main and Juniper Zones

Source: Rawlins 2022
| 16-14 |
| Energy Fuels Inc. | Pinyon Plain Mine | February 19, 2026 |
| Technical Report on the Updated Pre-Feasibility Study | SLR Project No.: 123.020548.00001 |
16.7.3 Water Management
The mine dewatering facilities consist of:
• 3 hp submersible shaft pump to move up to 50 gpm from the shaft bottom to the 1-5 station level
• 10 hp positive displacement pump (30 gpm capacity) with a four inch line from the 1-5 station level to surface
• 10 hp positive displacement pump (30 gpm capacity) with a two inch line from the 1-4 station level to surface
The last pump listed handles the water from the shaft water rings, installed across the Kaibab and Coconino formations. This water is clean, non-contact mine water and is pumped into storage tanks on surface and can be used for dust control and other uses. Inflow into the rest of the mine is collected in underground sumps and, where possible, used in underground drills and other aspects of operational activities. Excess water that is not used for operations reports to the lined sump on 1-5 Level and pumped to the lined surface impoundment. The total mine inflow averages 14 gpm.
There are five floating evaporators in the lined surface impoundment that are capable of dispersing 25 gpm; more than the typical mine inflow rate. Thus, there is not a water surplus and no water must be discharged from the site. Overall site water management is discussed further in section 20.4.
After closure, the site will be monitored for reclamation performance by state and federal agencies until reclamation is deemed complete and the bond(s) are released.
16.7.4 Compressed Air
Compressed air is supplied from surface from one of three units:
• 970 CFM Ingersoll Rand rotary screw compressor (SSR EP 200)
• 1,200 CFM Ingersoll Rand rotary screw compressor (SSR EP 300)
• 1,500 CFM Quincy rotary screw compressor (QS1 1500)
• The 2 Ingersoll Rand compressors are sufficient for all minesite operations, and the 1,500 CFM unit is a spare.
16.7 Radiation Management
Radiation levels are monitored and managed by EFR employees with assistance from third party radiation specialists.
Gamma radiation is measured by optically stimulated luminescence (OSL) dosimeter badges, worn by each worker. Results are processed on a quarterly basis by Landauer, a radiation monitoring services company.
Radon gas levels are measured by EFR staff in active work areas on a weekly basis using a systematic radon sampling program.
Radon progeny levels are monitored in production areas by radiation prisms which give workers a real-time visual indication of radiation levels, and warn of changing conditions. Prisms are supplied by alphaNUCLEAR, a radiation services company.
| 16-15 |
| Energy Fuels Inc. | Pinyon Plain Mine | February 19, 2026 |
| Technical Report on the Updated Pre-Feasibility Study | SLR Project No.: 123.020548.00001 |
All employees complete exposure sheets where time worked by area is recorded. This allows the operation to cross-reference against gathered radiation data and estimate radiation exposure levels for individuals. Site management is notified of results on a weekly basis and adjust work activities and schedules accordingly to ensure that regulatory requirements are met.
The SLR QP recommends that a comprehensive radiation management plan be developed that documents control measures, measurement methods, tracking systems, and thresholds and response plans.
16.8 Mine Equipment
Surface support equipment was purchased or rehabilitated in 2022. Equipment purchased or rehabilitated in 2022 included three Bobcat loaders for underground, a surface front end loader, vans for personnel transportation to site, air compressors, a chippy hoist, a haul truck with blade for snow removal, and water truck. A list of current underground mining equipment is presented in Table 16-3. No additional mobile mining equipment is required to support planned mining activities.
Table 16-3: Underground Mining Equipment
| Equipment | Make | Model | No. Units |
| Longhole Drills | Boart | Stopemate | 2 |
| Boss Buggy | Kawasaki | Mule 4010 | 1 |
| Jackleg Drills (hammers and legs) | Midwestern | S83F w/ Blackjack Legs | 20 |
| LHD | MTI | LT210 | 1 |
| Komatsu | WX-04 | 1 | |
| MTI | LT350 | 3 | |
| Haul Truck | Elmac | 5 & 7 ton | 3 |
| Skidsteer | Bobcat | S510 | 2 |
| Mini Excavator | Cat | 301.7 | 1 |
| Tractor | Kubota | L4240D | 1 |
| New Holland | N843D | 1 | |
| Telehandler | JCB | 520 | 1 |
| Mobile Welder | Miller | 210 | 1 |
16.9 Personnel Requirements
The Pinyon Plain workforce consists of salary and hourly employees. Most hourly employees work on a two-week on, two-week off rotation. Positions and headcount are summarized in Table 16-4. The staffing level is expected to stay relatively static over the LOM. Production will cease after year 2, after which some of the labor listed will assist in mine reclamation activities.
| 16-16 |
| Energy Fuels Inc. | Pinyon Plain Mine | February 19, 2026 |
| Technical Report on the Updated Pre-Feasibility Study | SLR Project No.: 123.020548.00001 |
Table 16-4: Personnel Requirements
| Position | Number of Workers | |
| Salary | Mine Superintendent | 1 |
| Safety Technician | 1 | |
| Technical Services | 1 | |
| Geologist / Ore Control / Surveyor | 2 | |
| Environmental, Health & Safety Technician | 1 | |
| Subtotal | 6 | |
| Hourly | Lead Miner | 2 |
| Miner | 14 | |
| Lead Mechanic | 2 | |
| Mechanic | 4 | |
| Electrician | 1 | |
| Electrician Apprentice | 1 | |
| Toplander | 2 | |
| Hoist Operator | 2 | |
| Subtotal | 27 | |
| Total | 34 |
| 16-17 |
| Energy Fuels Inc. | Pinyon Plain Mine | February 19, 2026 |
| Technical Report on the Updated Pre-Feasibility Study | SLR Project No.: 123.020548.00001 |
17.0 Recovery Methods
Ore mined at the Pinyon Plain Mine (the Project) will be milled at the Energy Fuels' owned White Mesa Mill located near Blanding, Utah, under a toll milling agreement. The White Mesa Mill was originally built in 1980. Since construction, the White Mesa Mill has processed approximately five million tons of uranium and vanadium containing ores from Arizona, Colorado, and Utah. The White Mesa Mill is currently operated on a campaign basis to process uranium ores. It can also process alternate feed materials.
Capable of processing 2,000 short tons per day (stpd), the White Mesa Mill will process ore from the Pinyon Plain Mine Project, mineralized material from other Energy Fuels' uranium mines as well as potential toll milling mineralized material from other producers in the area, and alternate feed material. This report only addresses the costs and revenues of the Pinyon Plain Mine Project, including project-specific costs at the White Mesa Mill. The location of the White Mesa Mill is shown in Figure 17-1. The site features of the White Mesa Mill are shown in Figure 17-2.
17.1 Process Description
The White Mesa Mill process flow sheet is shown in Figure 17-3.
Ore Receiving
Ore will be hauled to the White Mesa Mill in 24-ton highway haul trucks. When trucks arrive at the White Mesa Mill, they will be weighed and probed prior to stockpiling. Samples will be collected to measure the dry weight, and to perform amenability testing for process control. Trucks will be washed in a contained area, and scanned for alpha, beta, and gamma radiation prior to leaving the White Mesa Mill site.
Grinding
A front-end loader will transfer the ore from the stockpiles to the White Mesa Mill through the 20-in. stationary grizzly and into the ore receiving hopper. The ore is then transferred to the 6 ft. by 18 ft. diameter semi-autogenous grinding (SAG) mill via a 54-in. wide conveyor belt. Water is added into the SAG mill where the grinding is accomplished. The SAG mill is operated in closed circuit with vibrating screens. The coarse material, P80 +28 mesh (28 openings per linear inch) is returned to the SAG mill for additional grinding and the P80 -28 mesh portion is pumped to the pulp (wet) storage tanks.
Leaching
From the pulp storage tanks, slurry is metered into the leach tanks at the desired flow rate. The slurried ore from the pulp storage tanks is generally at 50% solids (wt:wt). This slurry is mixed in the leach tanks with sulfuric acid and sodium chlorate. The leach residue slurry is pumped to the CCD circuit for washing and solid-liquid separation.
Counter Current Decantation
The CCD circuit consists of a series of thickeners in which the pulp (underflow) flows in one direction, while the uranium-bearing solution (overflow) flows in a counter-current direction. Flocculant is added to the feed of each thickener, which assists the solids to settle to the bottom of each thickener. As the pulp is pumped from one thickener to the next, it is washed of its uranium content. When the pulp leaves the last thickener, it is essentially barren solids that are disposed of in the tailings storage facility cells. Typically, solution from the tailings cells is used as wash liquid in CCD.
| 17-1 |
| Energy Fuels Inc. | Pinyon Plain Mine | February 19, 2026 |
| Technical Report on the Updated Pre-Feasibility Study | SLR Project No.: 123.020548.00001 |
Tailings Management
Tailings slurry (approximately 50% solids) is pumped to the tailings cells for permanent disposal. The sands are allowed to settle, and the solutions are reclaimed and recycled in the milling process.
Solvent Extraction
The primary purpose of the uranium SX circuit is to separate and concentrate the uranium. First, the uranium is extracted from the aqueous acid solution to an immiscible organic liquid by ion exchange. Alamine 336 is a long-chain tertiary amine that is used to extract the uranium compound into a kerosene organic phase. The extraction process operates in a counter-current with four mixer-settlers in series that mix and then separate the organic and aqueous phases. The loaded organic phase is then transferred to the stripping circuit where a reverse ion exchange process strips the uranium from the organic phase into the aqueous phase, using sodium chloride solution. The stripping circuit also operates in a counter-current scheme, with four mixer-settlers. Additionally, a scrubbing mixer-settler is utilized between the extraction and stripping circuits to remove impurities from the loaded organic before stripping. A regeneration mixer-settler is also used to remove impurities from the barren organic after stripping.
The uranium barren leach solution, called the raffinate, is pumped to the tailings cells.
With respect to impurities removal, the uranium SX circuit of the White Mesa Mill is highly selective to uranium and consistently produces yellowcake in the 98% to 99% purity range. This includes ores that contain vanadium, arsenic, selenium, and copper, which have shown to be problematic with other uranium recovery methods.
The White Mesa Mill has a vanadium recovery circuit, but it is only operated when justified by the vanadium concentration and economic considerations. Processing for vanadium recovery is not anticipated from the Pinyon Plain Mine ore based on the low vanadium content.
Precipitation, Drying, And Packaging
In the precipitation circuit, the dissolved uranium, is precipitated out of the solution by the addition of ammonia. During precipitation, the uranium solution is continuously agitated to keep the solid particles of uranium in suspension. Leaving the precipitation circuit, the uranium, now a solid particle in suspension, is pumped to a two-stage thickener circuit where the solid uranium particles are allowed to settle. From the bottom of the thickener, the precipitated uranium in the form of a slurry at about 50% solids, is pumped to an acid dissolution tank and mixed with wash water. The solution is then precipitated again with ammonia and allowed to settle in the second thickener. The slurry from the second thickener is de-watered in a centrifuge. From this centrifuge, the solid uranium product is transferred to the multiple hearth dryer and dried at approximately 1,400°F. From the dryer, the uranium oxide (U3O8) concentrated to +95%, reports to a storage hopper and is subsequently packaged in 55-gallon drums. These drums are then labeled and readied for shipment.
17.2 Process Design Criteria
The principal design criteria selected are tabulated below in Table 17-1. The process operation parameters will be finalized following additional metallurgical testing of the uranium SX process.
| 17-2 |
| Energy Fuels Inc. | Pinyon Plain Mine | February 19, 2026 |
| Technical Report on the Updated Pre-Feasibility Study | SLR Project No.: 123.020548.00001 |
Table 17-1: Principal Process Operation Criteria
| General | Criteria |
| Processing rate | 125,000 stpa |
| 500 stpd | |
| Feed grade | 0.94 % uranium |
| Uranium circuit | |
| Final grind | 100% passing 28 Mesh |
| Typical sulfuric acid consumption | 350 lb/ton |
| Product assay | 97% U3O8 |
| Recovery to final concentrate | 95% uranium in feed |
| 17-3 |
| Energy Fuels Inc. | Pinyon Plain Mine | February 19, 2026 |
| Technical Report on the Updated Pre-Feasibility Study | SLR Project No.: 123.020548.00001 |
Figure 17-1: White Mesa Mill - Location Map

| 17-4 |
| Energy Fuels Inc. | Pinyon Plain Mine | February 19, 2026 |
| Technical Report on the Updated Pre-Feasibility Study | SLR Project No.: 123.020548.00001 |
Figure 17-2: White Mesa Mill - Site Map

| 17-5 |
| Energy Fuels Inc. | Pinyon Plain Mine | February 19, 2026 |
| Technical Report on the Updated Pre-Feasibility Study | SLR Project No.: 123.020548.00001 |
Figure 17-3: White Mesa Mill Block Diagram Flow Sheet

| 17-6 |
| Energy Fuels Inc. | Pinyon Plain Mine | February 19, 2026 |
| Technical Report on the Updated Pre-Feasibility Study | SLR Project No.: 123.020548.00001 |
18.0 Project Infrastructure
Pinyon Plain is a developed site with gravel road access and facilities, including line power. Infrastructure at the Project has been designed to accommodate all mining and transportation requirements. In addition to the mine shaft and ventilation raise, existing mine infrastructure includes offices, mine dry, warehousing, air compressor, water lines, ore pad, development rock storage, standby generators, fueling station, fresh water well, monitor wells and water tanks, a containment pond, electrical power, rapid response services, explosive magazines, equipment utilities, and a workshop. The Pinyon Plain Mine Project layout is shown in Figure 18-1.
18.1 Power
Electrical power to Pinyon Plain is available through an existing power line located along Arizona State Highway 64 from the Arizona Public Service (APS). An APS substation provides a six-mile powerline (12 kV) to the mine over a route that parallels the mine access road. Onsite, the power is stepped down to 4160 V, 480 V, and other voltages as needed through several transformers to power the hoist motor, pumps, ventilation fans, onsite buildings, and any remaining site power needs.
A 455 kVA diesel generator provides emergency backup power to operate the mine hoist, an air compressor, and the shaft pumps if line power is interrupted.
| 18-1 |
| Energy Fuels Inc. | Pinyon Plain Mine | February 19, 2026 |
| Technical Report on the Updated Pre-Feasibility Study | SLR Project No.: 123.020548.00001 |
Figure 18-1: Pinyon Plain Mine Facility Layout
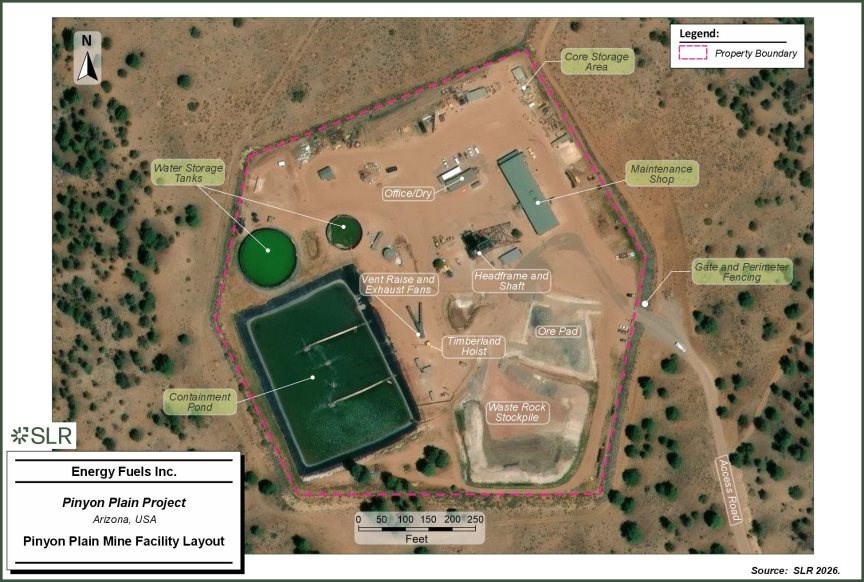
| 18-2 |
| Energy Fuels Inc. | Pinyon Plain Mine | February 19, 2026 |
| Technical Report on the Updated Pre-Feasibility Study | SLR Project No.: 123.020548.00001 |
19.0 Market Studies and Contracts
19.1 Markets
Uranium does not trade on the open market, and many of the private sales contracts are not publicly disclosed since buyers and sellers negotiate contracts privately. Monthly long-term industry average uranium prices based on the month-end prices are published by Ux Consulting, LLC and TradeTech, LLC (TradeTech). EFR primarily utilizes the pricing forecasts from TradeTech, which is considered a leading independent provider of uranium prices and nuclear fuel market information.
19.1.1 Supply
According to the World Nuclear Association (World Nuclear 2025), world uranium requirements totaled more than 60,000 t U in 2024. Production totals increased in 2023 and again in 2024 after a supply trough was experienced following the global pandemic. Production totals are presented below over the last five years:
• 2020 47,731 t U
• 2021 47,805 t U
• 2022 49,614 t U
• 2023 54,433 t U
• 2024 60,213 t U
The top five producing countries (Kazakhstan, Namibia, Australia, Canada, and Uzbekistan) accounted for over 85% of world production in 2024.
The share of uranium produced by in situ recovery (ISR) mining has steadily increased, mainly due to the addition of ISR operations in Kazakhstan, and now accounts for over 50% of production.
Over half of uranium mine production is from state-owned mining companies, some of which prioritise secure supply over market considerations.
19.1.2 Demand
The primary demand for uranium is as a fuel for nuclear power plants. As of 2024, there are approximately 440 reactors in operation worldwide that require approximately 80,000 tonnes of uranium oxide concentrate containing about 67,500 tonnes of uranium (t U) from mines (or the equivalent from stockpiles or secondary sources) each year (World Nuclear 2024). The use of nuclear power generation plants has become increasingly acceptable politically. Both China and India have indicated an intention to increase the percentage of power generated by nuclear plants. The largest increase in demand will come from those two countries.
Demand for uranium fuel is more predictable than for most other mineral commodities, due to the cost structure of nuclear power generation, with high capital and low fuel costs. Once reactors are built, it is very cost-effective to keep them running at high capacity and for utilities to make any adjustments to load trends by cutting back on fossil fuel use. Demand forecasts for uranium thus depend largely on installed and operable capacity, regardless of economic fluctuations.
| 19-1 |
| Energy Fuels Inc. | Pinyon Plain Mine | February 19, 2026 |
| Technical Report on the Updated Pre-Feasibility Study | SLR Project No.: 123.020548.00001 |
The World Nuclear Association website notes that mineral price fluctuations are related to demand and perceptions of scarcity. The price cannot indefinitely stay below the cost of production, nor can it remain at a very high price for longer than it takes for new producers to enter the market and for supply anxiety to subside.
19.1.3 Price
Figure 19-1 shows TradeTech's Q2 2025 uranium price forecast through 2040 (TradeTech, 2025).
Figure 19-1: TradeTech Uranium Market Price Forecast

Source: TradeTech 2025
The production from the Pinyon Plain is near-term, meaning near-term uranium spot prices are meaningful through the LOM.
By their nature, all commodity price assumptions are forward-looking. No forward-looking statement can be guaranteed, and actual future results may vary materially.
| 19-2 |
| Energy Fuels Inc. | Pinyon Plain Mine | February 19, 2026 |
| Technical Report on the Updated Pre-Feasibility Study | SLR Project No.: 123.020548.00001 |
19.2 Contracts
EFR has signed six uranium sales contracts for various terms through 2032 with major nuclear utilities for a portion of the production from the Project. As only a portion of the planned production from Pinyon Plain is required to fulfill contract requirements, EFR will at its discretion sell finished product from Pinyon Plain on the spot market. The contracts use both agreed upon base pricing and spot pricing to calculate the actual contract sales price. The average contract price from 2026 through 2028 is approximately $79.06/lb based upon the price forecasts from TradeTech. A $5/lb reduction in spot price would result in an average contract and term sheet price of $77.30/lb. Based on the current and forecast spot prices and contracts data, SLR used a constant uranium price of $80/lb for Reserves and in the cash flow analysis.
| 19-3 |
| Energy Fuels Inc. | Pinyon Plain Mine | February 19, 2026 |
| Technical Report on the Updated Pre-Feasibility Study | SLR Project No.: 123.020548.00001 |
20.0 Environmental Studies, Permitting, and Social or Community Impact
20.1 Environmental Studies
Environmental studies have been completed for the Pinyon Plain Mine as part of the permitting process through state and federal agencies. These studies include components such as land use, climate, geology and mineralization, seismicity, soils, vegetation, air quality, surface water, ground water, wildlife, radiological, and cultural and archaeological resources. There are no ongoing permit-related environmental studies beyond compliance-based data collection and reporting.
20.2 Permitting
In October 1984, Energy Fuels Nuclear submitted a proposed Plan of Operations (PoO) to mine uranium from the Canyon , approximately 7 miles south of Tusayan, Arizona. The US Forest Service (USFS) completed an Environmental Impact Statement (EIS) to evaluate the Plan, including significant comment and input from federally recognized tribes. The final EIS and Record of Decision (ROD) were issued on September 29, 1986, approving the PoO with modifications. Mine site surface preparation activities began in late 1986. Appeals of this decision were made to the Southwestern Regional Forester, and the Chief of the Forest Service, who both affirmed the Forest Supervisor's decision. The Havasupai Tribe and others then sued over this decision in the U.S. District Court for the District of Arizona. The District Court ruled for the USFS on all counts, and a subsequent appeal was filed with the U.S. Court of Appeals for the Ninth Circuit, which affirmed the District Court on August 16, 1991. In 1992, due to the economic downturn in the price of uranium, the Mine was put into standby status.
On September 13, 2011, Denison Mines informed the Kaibab Forest Supervisor they intended to resume operations at Pinyon Plain Mine under the existing PoO and ROD. On June 25, 2012, the USFS completed a review of the Pinyon Plain Mine PoO and associated approval documentation in anticipation of the resumption of operations. The USFS' review concluded that (a) no modification or amendment to the existing PoO was necessary, (b) no correction, supplementation, or revision to the environmental document was required and (c) that operations at the Pinyon Plain Mine could continue as a result of no further federal authorization being required.
On May 22, 2020, after the matters were briefed, the District Court issued its final order in favor of the Defendants, which the Pinyon Plaintiffs thereafter appealed to the Ninth Circuit. In December 2020, the Pinyon Plaintiffs filed their Appellant's Opening Brief with the Ninth Circuit and, in April 2021, the Defendants filed their respective Answering Briefs. Oral arguments were held remotely on August 30, 2021. On February 22, 2022, the Ninth Circuit filed its Opinion in favor of the USFS and the Company. The Pinyon Plaintiffs did not request a hearing on this matter in front of the U.S. Supreme Court. As such, this matter is now resolved.
In 2020, Energy Fuels submitted a clean closure plan to the USFS to provide a description of how the Company will reclaim the mine to clean closure standards after the cessation of mining operations, as contemplated in the USFS-approved PoO, ROD and modifications to the reclamation plan contained in Appendix B of the EIS. The clean closure plan included an update to the reclamation cost estimate, resulting in an increase in the reclamation bond to its current required amount of $1,407,235.
| 20-1 |
| Energy Fuels Inc. | Pinyon Plain Mine | February 19, 2026 |
| Technical Report on the Updated Pre-Feasibility Study | SLR Project No.: 123.020548.00001 |
In September 2009, the groundwater General Aquifer Protection Permit (APP) was obtained for the water storage pond from the Arizona Department of Environmental Quality (ADEQ). This permit was up for renewal in 2019, and an application for renewal was timely submitted by the Company in 2019. General APPs were also obtained from ADEQ for the development rock stockpile and intermediate ore stockpile in December 2011 and renewed in 2018. At the request of ADEQ, the three General APPs were consolidated into an Individual APP on April 28, 2022, resulting in a supplemental reclamation bond through ADEQ in the amount of $132,581. The Individual APP was amended on October 26, 2022, to establish an alert level (AL) and aquifer quality limit (AQL) for arsenic and an AQL for uranium in a monitoring well completed in the regional Redwall-Muav aquifer. This APP was then issued a Minor Amendment on August 26, 2024, to establish ALs and AQLs in monitoring wells completed in the Coconino aquifer and for the remaining parameters in the Redwall-Muav aquifer well.
An Air Quality Permit was issued by the ADEQ in March 2011, renewed in 2016, amended in 2017, and renewed in 2021. The Company received EPA's approval under the Clean Air Act National Emissions Standard for Hazardous Air Pollutants (NESHAPs) for the Pinyon Plain Project in September of 2015.
The Pinyon Plain Mine has operated a private water system to supply the needs of mine operations during the early stages of development. In December of 2023, Approval of Construction (AOC) was received by ADEQ, and the mine transitioned to a non-transient non-community (NTNC) public water system due to the increase in employees as the mine is brought into production. The water supply well at the Pinyon Plain Mine is completed in the Redwall-Muav aquifer and draws groundwater from this deep regional aquifer, which is encountered at depths of about 2,500 feet below ground surface (bgs) on the Coconino Plateau (McGavock et al. 1986; Bills et al. 2007).
Table 20-1 presents a list of active permits including the approving authority, validity period and expiry dates, status, and indicating if renewal is required or not.
Table 20-1: Environmental Permits for Operations
| Authority | Obligation/License | Date of Issue MM/DD/YY |
Expiration Date MM/DD/YY |
Status |
| ADEQ | Class II Air Quality Permit No. 88788 | 10/20/21 | 10/19/26 | Active |
| ADEQ | Individual APP, Minor Amendment (No. P-100333 LTF ID:103377) (Includes previously approved; Development Rock Stockpile, Intermediate Ore Stockpile and Non-Stormwater Impoundment) | Originally approved 4/28/22 and minor amendment approved on 8/26/24 | N/A | Active |
| ADEQ | AZPDES Stormwater Multi-Sector General Permit - Industrial for Mining (AZMSG2024-002) | 12/26/25 | 1/15/30 | Active |
| ADEQ | Potable Water System ID: AZ0403275 | AOC received 12/26/23 | N/A | Active |
| ADWR | Well Registration Number 55-515772 (Redwall-Muav Water Supply/Monitoring Well) | 10/07/86 | N/A | Active |
| 20-2 |
| Energy Fuels Inc. | Pinyon Plain Mine | February 19, 2026 |
| Technical Report on the Updated Pre-Feasibility Study | SLR Project No.: 123.020548.00001 |
| ADWR | Well Registration Numbers 55-924769 through 55-924771 (Coconino Monitoring Wells) | 08/21/20 | N/A | Active |
| CCDPH | Permit to Construct No. 5918 (Septic System) | 12/17/86 | N/A | Active |
| USEPA | Approval to Construct an Underground Uranium Mine (NESHAPs Subpart B) | 09/21/15 | N/A | Active |
| USFS | Record of Decision | 09/26/86 | N/A | Active |
| USFS | Road Use Permit | 01/20/23 | 10/31/27 | Active |
20.3 Social and Community Requirements
While development and operation of the Mine requires limited surface disturbance (less than 20 acres) and has minimal environmental impact, the Mine has been particularly contentious among local communities due to factors such as (a) its proximity to Grand Canyon National Park (b) claims by the Havasupai Indian Tribe that the Mine site has significant religious value and (c) its location within the US Bureau of Land Management's (BLMs) 2009 mineral withdrawal of approximately one million acres of public lands around Grand Canyon National Park and the August 8, 2023 designation of the Baaj Nwaavjo I'tah Kukveni- Ancestral Footprints of the Grand Canyon National Monument. A discussion of these issues is presented in more detail in Section 20.2 Permitting as it relates to project permitting requirements.
With the start-up of mining and the initiation of transportation of uranium ore from the mine to the mill, some concerns were raised by the Navajo Nation. EFR and the Navajo Nation developed Terms of Agreement that addressed the following:
limiting transportation to specified routes and hours of the day;
not transporting ore on days involving celebrations or public events in respect of the Navajo Nation's culture and traditions;
clearly spelled out emergency response procedures, notice and reporting requirements;
additional insurance requirements;
additional driver qualification and training requirements;
obtaining Navajo Nation transport licenses;
use of state-of-the-art cover systems to prevent fugitive dust from transport trucks;
provisions for escorts and blessings at the discretion of the Nation; and
additional inspection procedures that will enable the Navajo Nation to ensure that all applicable rules and agreements are being satisfied.
As stated in its Environment, Health, Safety and Sustainability Policy, Energy Fuels is committed to the operation of its facilities in a manner that puts the safety of its workers, contractors and community, the protection of the environment, and the principles of sustainable development above all else. Accordingly, Energy Fuels considers environmental and social issues which may impact its stakeholders, including minority groups, local landholders, and the communities in which it operates.
| 20-3 |
| Energy Fuels Inc. | Pinyon Plain Mine | February 19, 2026 |
| Technical Report on the Updated Pre-Feasibility Study | SLR Project No.: 123.020548.00001 |
20.4 Water Management
The Mine has been designed to as a zero discharge facility, to eliminate the possibility of migration of contaminants to groundwater, and to maintain structural integrity during a 500-year, 24-hour stormwater runoff event. All stormwater runoff from surface operations will be contained within the 17-acre mine site. The entire site is surrounded by diversion structures capable of diverting runoff from areas upslope around the perimeter of the facility from a 500-year, 24-hour storm event (ELMA, 1993). All runoff from precipitation that falls within the bermed Mine site drains to the lined Impoundment, as shown in the Site Plan provided in Figure 2. Surface water drainage within the Mine site is diverted away from the Mine access shaft and the ventilation shaft.
Groundwater encountered in the Mine workings below the Coconino Formation is collected in a lined sump at the base of the main shaft and pumped to the surface for on-site use or evaporation in the lined Impoundment and water storage tanks. Two water rings have been installed in the shaft to capture water infiltrating from the Coconino Formation and, to the extent water is available, from the Kaibab Formation. Water collected in the capture rings is pumped to aboveground storage tanks at the site for use as dust control or other beneficial use. Water from the Coconino and Kaibab Formations that is not captured in the water capture rings and pumped to the Impoundment, reports to the Mine shaft sump. Water in the lined Impoundment is used for dust control on the current DRS, and will be used, as needed, for dust control on the future IOS, where drainage and runoff flows are returned to the lined Impoundment. Water in the Impoundment is circulated through a boiler/heat exchanger and APEX 2.0 Wastewater Evaporator ("APEX") units to enhance evaporation. Sump water will also be used in other mining operations when active mining commences. Water management at the site is illustrated in the Process Flow Diagram provided in Figure 20-1.
| 20-4 |
| Energy Fuels Inc. | Pinyon Plain Mine | February 19, 2026 |
| Technical Report on the Updated Pre-Feasibility Study | SLR Project No.: 123.020548.00001 |
Figure 20-1: Process Flow Diagram for Pinyon Plain Mine
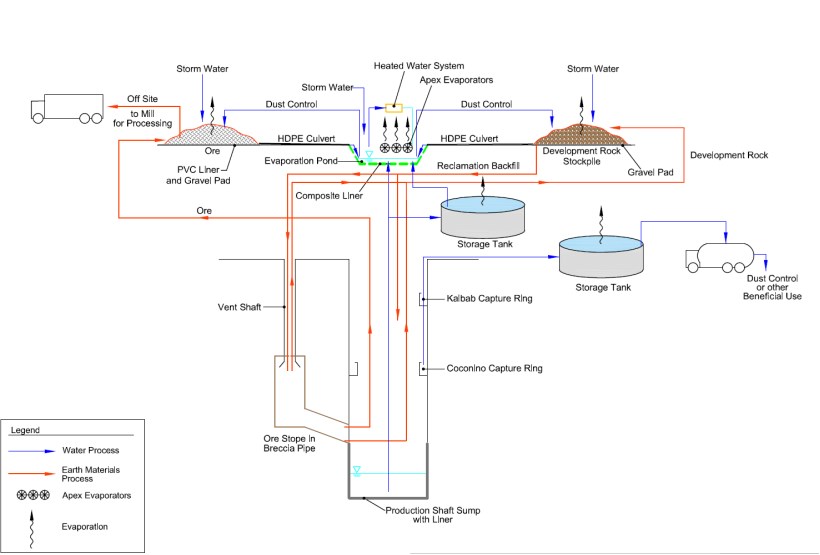
| 20-5 |
| Energy Fuels Inc. | Pinyon Plain Mine | February 19, 2026 |
| Technical Report on the Updated Pre-Feasibility Study | SLR Project No.: 123.020548.00001 |
20.5 Mineral Examination
In July 2009, the BLM issued a Notice of Proposed Withdrawal (the 2009 Notice) under which it proposed that a total of approximately one million acres of public lands around the Grand Canyon National Park be withdrawn from location and entry under the Mining Law of 1872, subject to valid existing rights, for a period of two years. BLM stated that the purpose of the withdrawal, if determined to be appropriate, would be to protect the Grand Canyon watershed from any adverse effect of locatable hardrock mineral exploration and mining. This timeframe was extended an additional six months in July 21, 2011, to complete the EIS studies. In January 2012, the Secretary of the Interior implemented the withdrawal proposed in the 2009 Notice, subject to valid existing rights, for a 20-year period. Whether or not a mining claim is valid must be determined by a Mineral Examination conducted by BLM or the USFS. The Mineral Examination for the Mine deposit was completed by the USFS on April 18, 2012, and determined that the Pinyon Plain Mine has valid existing rights.
20.6 Other Negotiations and Agreements with Local Groups
EFR is committed to supporting local businesses and labor markets in the region of their operations.
20.7 Mine Closure Remediation and Reclamation Plans
The costs to reclaim the project to its pre-mining land use is estimated to be approximately US$1,500,000. Reclamation performance bonds are in place with the USFS in the amount of $1,407,235 and through the state of Arizona in the amount of $132,581. At the conclusion of underground operations, the shafts will be backfilled, mine openings will be plugged and sealed, and most of the buildings and infrastructure will be dismantled and removed. The evaporation pond and other infrastructure such as the office trailer, electrical substation, power line, and perimeter fencing and berms are expected to remain on site for an additional 30 years during long-term monitoring of groundwater. At the end of long-term groundwater monitoring, the remaining infrastructure will be removed, wells will be abandoned, and final reclamation and clean closure activities will be completed. The water supply/monitoring well in the Redwall-Muav aquifer is expected to remain in place as a regional water supply well for livestock grazing or other uses as appropriate.
20.8 Opinion of Adequacy
EFR has all of the permits and authorizations necessary to construct, operate, and close the Project. Financial assurance is in place to guarantee reclamation and closure activities will occur. After closure, the site will be monitored for reclamation performance by state and federal agencies until reclamation is deemed complete and the bond(s) are released.
| 20-6 |
| Energy Fuels Inc. | Pinyon Plain Mine | February 19, 2026 |
| Technical Report on the Updated Pre-Feasibility Study | SLR Project No.: 123.020548.00001 |
21.0 Capital and Operating Costs
EFR has experience in operating several similar underground uranium mines on the Arizona Strip, an area located in northern Arizona, north of the Colorado River to the Colorado border. These past producers include Kanab North, Arizona 1, Pinenut, and EZ1 mines.
Based on the American Association of Cost Engineers (AACE) International classifications, Class 3 estimates have an accuracy range between -10% to -20% (low-end) to +10% to +30% (high-end) (AACE International, 2012). The base case capital and operating cost estimates are within the Class 3 ranges and would meet the S-K 1300 standard of ± 25% accuracy and ≤15% contingency.
21.1 Capital Costs
As the Mine is constructed and in operation, the remaining capital costs for the Mine are estimated to be $10.6 million in Q1 2025 dollars, including $7.1 million in direct capital costs for mine development activities, $0.8 million in general mining and infrastructure, $1.2 million in contingency, and $1.5 million for reclamation. No escalation was included in the project costs.
Table 21-1 shows the life of mine capital estimate.
Table 21-1: Life of Mine Capital Estimate
| Description | Total Cost (US$ 000) |
| Mine Development | 7,163 |
| Mining and Infrastructure | 750 |
| Contingency | 1,187 |
| Reclamation | 1,540 |
| Total Capital | 10,640 |
21.1.1 Development Capital
Mine development capital was based upon the mine design and a development cost of $1,500/ft. Mine development rates are based on recent mine development in Main Zone and EFR experience at similar mine operations.
21.1.2 Contingency
Contingency is an amount added to an estimate to allow for items, conditions, or events which are uncertain and that experience shows will likely result, in aggregate, in additional costs which are expected to be expended.
A contingency of 15% was added to development capital costs based upon the level of detail in the estimate preparation, the operator's experience, the state of the Project, and the SLR QP's experience.
21.1.3 Sustaining Capital
Sustaining capital of $250 thousand per year has been budgeted through the two year mine life to account for minor equipment and replacement and upgrades. Though production ceases midway through 2027 this sustaining capital will be used to transition to reclamation and closure activities.
| 21-1 |
| Energy Fuels Inc. | Pinyon Plain Mine | February 19, 2026 |
| Technical Report on the Updated Pre-Feasibility Study | SLR Project No.: 123.020548.00001 |
21.1.4 Working Capital
Working capital estimates assume 30 days account receivable and account payable terms. The Project has a large supply of consumable inventory at the site as EFR has consolidated material from prior mines and projects in the warehouse. Thus, the inventory working capital adjustment is estimated to be zero over LOM. All working capital will be recaptured at the end of mine life, so the net effect of LOM is zero.
21.1.5 Reclamation
Reclamation costs are based on the clean closure and reclamation cost estimate and surety bond, which EFR has with the USFS as the beneficiary. The reclamation at the Pinyon Plain Mine will start approximately three months before the end of mine life and take 20 months in total to complete.
21.2 Operating Costs
Operating costs are based on EFR's actual costs, forecast to the end of the LOM. Table 21-2 shows the operating costs used in the economic evaluation of the Project.
Table 21-2: Operating Costs Summary
| Area | Cost ($/st ore mined) |
| Mining | $184.00 |
| Haulage | $95.00 |
| Processing | $256.00 |
| G&A | $7.00 |
| TOTAL Operating Costs | $542.00 |
| Notes: | |
|
1. Mining costs include labor, supplies, equipment operation, and sundries as well as an allowance for ongoing mine development over the life of the Project. 2. Ore haulage covers the cost of trucking ore from the mine to White Mesa mill for toll processing. The contract haulage cost is based on a $0.30/st-mile unit rate and assumes a 5% moisture content of the ore. 3. Processing cost estimate is based on a toll milling arrangement between the Project and the White Mesa Mill. 4. General and Administrative (G&A) costs are based on the assumption that the Project will be supported by existing staff based in EFR's Lakewood, Colorado, office headquarters, with regular site visits as needed during the year. G&A costs, totaling $7.00/st ore, are estimated as 2.5% of direct operating costs. 5. No contingency applied. |
|
| 21-2 |
| Energy Fuels Inc. | Pinyon Plain Mine | February 19, 2026 |
| Technical Report on the Updated Pre-Feasibility Study | SLR Project No.: 123.020548.00001 |
22.0 Economic Analysis
An after-tax Cash Flow Projection has been generated from the Life of Mine production schedule and capital and operating cost estimates, as summarized in Table 22-. A summary of the key criteria is provided below.
Copper mineralization is present at the Pinyon Plain deposit; however, it is it not recoverable with the existing processing facility and is thus not included in the economic analysis.
22.1 Economic Criteria
22.1.1 Revenue
• Total mill feed processed: 133 thousand tons
• Average processing rate: 133 stpd (steady state)
• U3O8 head grade: 0.97%
• Average mill recovery: 96%
• Recovered U3O8: 2.47 Mlb
• Metal price: $80/lb U3O8
• Yellowcake product trucking cost from the toll mill to customer: $0.14/lb U3O8
22.1.2 Capital and Operating Costs
• Mine life: 32 months
• LOM capital costs, excluding reclamation, of $9.1 million on Q1 2025 US dollar basis
• LOM operating cost (excluding royalties but including severance taxes) of $73.7 million or $542/st milled on Q1 2025 US dollar basis
22.1.3 Royalties and Severance Taxes
A 3.5% private royalty is payable for the Project based on sliding scale of the value of production expressed in lb/st along with allowances for mining and ore hauling. The royalty payments over the mine life are approximately $1.88/t ore.
Arizona has a severance tax that is 2.5% of the net severance base, which is 50% of the difference between the gross value of production (revenue) and the production costs. Thus, a rate of 1.25% is used to reflect this 50% base reduction. The Arizona severance tax payable to the Project is approximately equivalent to $11.72/st ore during LOM.
22.1.4 Income Taxes
A proforma corporate income tax (CIT) estimate was added with the assumption that the Project was a stand-alone entity for tax purposes with the following assumptions.
• A Federal income tax rate of 10.5% is used in this analysis. This rate takes into account the percentage depletion deduction which allows profitable mining companies to reduce their taxable income by 50% and then the remaining amount is taxed at the current Federal tax rate of 21% so that the net rate is 10.5%.
| 22-1 |
| Energy Fuels Inc. | Pinyon Plain Mine | February 19, 2026 |
| Technical Report on the Updated Pre-Feasibility Study | SLR Project No.: 123.020548.00001 |
• The Arizona state income tax rate is 2.5% so the combined Federal and state rate is 13.0%%
• CIT payable for LOM totals $14.8 million.
22.2 Cash Flow Analysis
On a pre-tax basis, the undiscounted cash flow totals $112.6 million over the mine life. The pre-tax Net Present Value (NPV) at a 5% discount rate is $90.1 million. Whereas SLR is of the opinion that an 8% discount rate is standard for most greenfield western U.S. uranium mining projects, the advanced stage of development of the Project with existing shaft and current underground development combined with short mine life of 3 years makes a 5% discount rate acceptable for this stage of the Project.
On an after-tax basis, the undiscounted cash flow totals $97.7 million over the mine life. The after-tax NPV at 5% discount rate is $78.3 million.
LOM Project cost metrics are as follows:
• Cash Operating Costs: $30.08/lb U3O8
• All-in Sustaining Costs: $30.71/lb U3O8
• All-in Costs: $34.39/lb U3O8
Table 22-1 presents a summary of the Project economics at an average U3O8 price of $80.00/lb. The full annual cash flow model is presented in Appendix 1.
| 22-2 |
| Energy Fuels Inc. | Pinyon Plain Mine | February 19, 2026 |
| Technical Report on the Updated Pre-Feasibility Study | SLR Project No.: 123.020548.00001 |
Table 22-1: After-Tax Cash Flow Summary
| Item | Unit | Value |
| U3O8 Price | $/lb | $80.00 |
| U3O8 Sales | klb | 2,468 |
| Total Gross Revenue | US$ 000 | 197,465 |
| Product Transport to Market | US$ 000 | (346) |
| Royalties | US$ 000 | (250) |
| Total Net Revenue | US$ 000 | 196,869 |
| Mining Cost | US$ 000 | (24,477) |
| Ore Trucking Cost | US$ 000 | (12,638) |
| Process Cost | US$ 000 | (34,055) |
| G & A Cost | US$ 000 | (931) |
| Severance Tax | US$ 000 | (1,560) |
| Total Operating Costs | US$ 000 | (73,661) |
| Working Capital | US$ 000 | 0 |
| Operating Cash Flow | US$ 000 | 123,208 |
| Direct Capital | US$ 000 | (7,913) |
| Closure/Reclamation Capital | US$ 000 | (1,540) |
| Contingency | US$ 000 | (1,187) |
| Total Capital | US$ 000 | (10,640) |
| Pre-tax Free Cash Flow | US$ 000 | 112,568 |
| Pre-tax NPV @ 5% | US$ 000 | 90,113 |
| Pre-tax NPV @ 8% | US$ 000 | 79,285 |
| Pre-tax NPV @ 12% | US$ 000 | 67,239 |
| Corporate Income Tax | US$ 000 | (14,834) |
| After-tax Free Cash Flow | US$ 000 | 97,734 |
| After-tax NPV @ 5% | US$ 000 | 78,256 |
| After-tax NPV @ 8% | US$ 000 | 68,861 |
| After-tax NPV @ 12% | US$ 000 | 58,408 |
| Cash Operating Costs | $/lb U3O8 | 30.08 |
| All-in Sustaining Costs | $/lb U3O8 | 30.71 |
| All-in Costs | $/lb U3O8 | 34.39 |
| 22-3 |
| Energy Fuels Inc. | Pinyon Plain Mine | February 19, 2026 |
| Technical Report on the Updated Pre-Feasibility Study | SLR Project No.: 123.020548.00001 |
22.3 Sensitivity Analysis
Project risks can be identified in both economic and non-economic terms. Key economic risks were examined by running cash flow sensitivities calculated over a range of variations based on realistic fluctuations within the listed factors:
• U3O8 price: 20% increments between $64/lb and $96/lb
• Head grade: -/+ 20%
• Recovery: -20%/+4% (96% is base case already)
• Operating cost per ton milled: -10% to 25% (AACE Class 3 range)
• Capital cost: -10% to 25% (AACE Class 3 range)
The after-tax cash flow sensitivities are shown in Table 22-2 and Figure 22-1. The Project is most sensitive to head grade, uranium price, and recovery, and only less sensitive to operating cost and capital cost at a Class 3 accuracy level. The sensitivities to metallurgical recovery, head grade, and metal price are nearly identical.
Table 22-2: After-tax Sensitivity Analysis
| Factor Change | U3O8 Price (US$/lb) |
NPV at 5% (US$ 000) |
| 0.80 | $64 | $51,152 |
| 0.90 | $72 | $64,704 |
| 1.00 | $80 | $78,256 |
| 1.10 | $88 | $91,808 |
| 1.20 | $96 | 105,359 |
| Factor Change | Head Grade (% U3O8) |
NPV at 5% (US$ 000) |
| 0.80 | 0.77% | $51,200 |
| 0.90 | 0.87% | $64,728 |
| 1.00 | 0.97% | $78,256 |
| 1.10 | 1.06% | $91,784 |
| 1.20 | 1.16% | $105,312 |
| Factor Change | Metallurgical Recovery (%) |
NPV at 5% (US$ 000) |
| 0.80 | 77% | $51,200 |
| 0.90 | 86% | $64,728 |
| 1.00 | 96% | $78,256 |
| 1.02 | 98% | $80,961 |
| 1.04 | 100% | $83,667 |
| 22-4 |
| Energy Fuels Inc. | Pinyon Plain Mine | February 19, 2026 |
| Technical Report on the Updated Pre-Feasibility Study | SLR Project No.: 123.020548.00001 |
| Factor Change | Operating Costs (US$/ton milled) |
NPV at 5% (US$ 000) |
| 0.90 | $488 | $83,195 |
| 0.95 | $515 | $80,725 |
| 1.00 | $542 | $78,256 |
| 1.13 | $612 | $71,835 |
| 1.25 | $678 | $65,908 |
| Factor Change | Capital Costs (US$ million) |
NPV at 5% (US$ 000) |
| 0.90 | $9,576 | $79,002 |
| 0.95 | $10,108 | $78,629 |
| 1.00 | $10,640 | $78,256 |
| 1.13 | $12,023 | $77,286 |
| 1.25 | $13,300 | $76,390 |
Figure 22-1: After-tax NPV 5% Cash flow Sensitivity

| 22-5 |
| Energy Fuels Inc. | Pinyon Plain Mine | February 19, 2026 |
| Technical Report on the Updated Pre-Feasibility Study | SLR Project No.: 123.020548.00001 |
23.0 Adjacent Properties
23.1 Other Breccia Pipes
There are two mineralized breccia pipes near the Pinyon Plain Mine. The Black Box and the New Years pipes are exploration properties located within two miles of Pinyon Plain. Drilling on both these pipes in the 1980s indicates the presence of uranium and some copper mineralization, but it was determined that neither had economic quantities of either mineral. The Orphan Mine located approximately 13 miles north-northwest of Pinyon Plain produced both copper and uranium during its production run between 1956 and 1969. EFR has successfully mined and reclaimed the Pinenut and Arizona 1 breccia pipes, both of which are located on the north rim of the Grand Canyon.
The SLR QP has not independently verified this information, and this information is not necessarily indicative of the mineralization at the Pinyon Plain Mine.
| 23-1 |
| Energy Fuels Inc. | Pinyon Plain Mine | February 19, 2026 |
| Technical Report on the Updated Pre-Feasibility Study | SLR Project No.: 123.020548.00001 |
24.0 Other Relevant Data and Information
EFR knows of no other relevant data related to the Pinyon Plain Mine.
| 24-1 |
| Energy Fuels Inc. | Pinyon Plain Mine | February 19, 2026 |
| Technical Report on the Updated Pre-Feasibility Study | SLR Project No.: 123.020548.00001 |
25.0 Interpretation and Conclusions
SLR offers the following interpretations and conclusions on the Project:
25.1 Geology and Mineral Resources
• The Pinyon Plain Mine hosts a breccia pipe-hosted uranium deposit characterized by a subvertical collapse breccia pipe extending through Paleozoic sedimentary units, with uranium mineralization concentrated in breccia and annular fracture zones, most strongly developed within the lower Hermit and upper Esplanade formations, and occurring as uraninite and pitchblende over a vertical extent of approximately 1,700 ft across multiple stacked mineralized zones.
• Drilling at the Pinyon Plain Mine, consisting of 206 drill holes (45 surface and 161 underground) totaling approximately 108,862 ft, has adequately defined the geometry, continuity, and vertical extent of breccia pipe-hosted uranium mineralization and provides a sufficient database to support geological interpretation and Mineral Resource estimation.
• In the opinion of the SLR QPs, drilling methods, downhole deviation surveys, radiometric logging, core handling, and geological logging were completed to industry standards, and the resulting drill hole data are of appropriate quality, density, and spatial distribution to support Mineral Resource classification and public disclosure under SEC S-K 1300, NI 43-101, and CIM best practice guidelines.
• Mineral Resources have been classified in accordance with the definitions for Mineral Resources in S-K 1300, which are consistent with Canadian Institute of Mining, Metallurgy and Petroleum (CIM) Definition Standards for Mineral Resources and Mineral Reserves dated May 10, 2014 (CIM, 2014) definitions, which are incorporated by reference in NI 43-101.
• In the SLR QPs' opinion, the assumptions, parameters, and methodology used for the Pinyon Plain Mineral Resource estimate are appropriate for the style of mineralization and mining methods.
• The SLR QPs are of the opinion that the block models are adequate for public disclosure and to support mining activities. The effective date of the Mineral Resource estimate is December 31, 2025.
• Mineral Resources exclude previously reported uranium mineralization within the Cap and Upper zones in accordance with conditions of the Arizona Department of Environmental Quality (ADEQ) Aquifer Protection Permit, which restricts mining between elevations of 5,340 ft and 4,508 ft above sea level.
• Reconciliation to production demonstrates that a domain-specific density (tonnage factor) framework is required to accurately represent in situ mineralization and support compliant Mineral Resource reporting under S-K 1300, NI 43-101, and CIM (2019):
o The previously applied global tonnage factor of 0.082 ton/ft³ materially understates tonnage in high-grade mined areas.
o Production calibration supports a revised tonnage factor of approximately 0.099 st/ft³ for the Main Zone and Juniper Zone.
| 25-1 |
| Energy Fuels Inc. | Pinyon Plain Mine | February 19, 2026 |
| Technical Report on the Updated Pre-Feasibility Study | SLR Project No.: 123.020548.00001 |
o The reconciliation variance is interpreted to be primarily density-related, rather than a function of grade estimation bias or geological error.
o Application of the production-derived tonnage factor materially improves reconciliation performance, bringing results within the outer bounds of acceptability under CIM (2019).
o The Cap, Upper, Middle, Lower, and Juniper Lower Zones appropriately retain the core-derived tonnage factor of 0.082 sh. ton/ft³, as these domains lack production calibration and are geologically distinct.
o This dual-density, domain-specific approach is consistent with regulatory requirements that modifying factors be locally representative, data-supported, and transparently disclosed.
• Mineral Resources for the Pinyon Plain Mine are reported in situ at a long-term uranium price of US$90/lb U₃O₈ using an equivalent uranium cut-off grade of 0.31% eU₃O₈ and an assumed 96% metallurgical recovery. The Mineral Resource estimate is supported by a Reasonable Prospects for Eventual Economic Extraction (RPEEE) assessment incorporating underground stope optimization using Deswik Stope Optimizer and an underground mining scenario consistent with longhole stoping and processing at the White Mesa Mill.
o No minimum mining width was applied in the determination of Mineral Resources. The estimate reflects block model-based grade and tonnage constrained by economic parameters and optimization shapes and does not incorporate detailed mine design criteria such as minimum stope widths, dilution, or mining extraction factors.
o The RPEEE assessment assumes underground mining using longhole stoping, with development rock temporarily stored on surface and subsequently used for backfilling. Ore is transported approximately 320 miles by truck to the White Mesa Mill near Blanding, Utah, for processing.
o The Mineral Resource assumptions differ from those applied to the Mineral Reserve estimate. Mineral Reserves are based on a long-term uranium price of US$80/lb U₃O₈, a breakeven cut-off grade of 0.35% U₃O₈, and detailed mine design parameters including a minimum mining width of 4 ft and 20 ft vertical stope heights, with application of mining dilution and extraction factors.
• At the stated cut-off grade:
o Indicated Mineral Resources total 19,038 short tons (st) grading 0.54% eU₃O₈, containing 205,209 lb U₃O₈.
o Inferred Mineral Resources total 14,917 st grading 0.81% eU₃O₈, containing 241,010 lb U₃O₈.
• Mineral Resources are reported as in situ, are exclusive of Mineral Reserves, and do not have demonstrated economic viability. There is no assurance that Inferred Mineral Resources will be upgraded or that Mineral Resources will be converted to Mineral Reserves.
• Sampling, preparation, analytical, and QA/QC procedures are concluded to have been conducted in accordance with industry-standard practices, and the resulting database is considered adequate to support Mineral Resource estimation and public disclosure under SEC S-K 1300, NI 43-101, and CIM best practice guidelines.
| 25-2 |
| Energy Fuels Inc. | Pinyon Plain Mine | February 19, 2026 |
| Technical Report on the Updated Pre-Feasibility Study | SLR Project No.: 123.020548.00001 |
o QA/QC results, including the performance of standards, blanks, duplicates, and check assays, did not identify any systematic bias or material issues that would warrant additional verification work or data remediation.
o Density determinations are considered appropriate for the style of mineralization and have been applied consistently within the Mineral Resource estimation framework
• The SLR QPs consider that the resource cut-off grade and mining shapes used to identify those portions of the Mineral Resource that meet the requirement for the reasonable prospects for economic extraction to be appropriate for this style of uranium deposit and mineralization.
• The SLR QPs consider the Mineral Resource classification criteria to be reasonable and consistent with geological continuity, data density, and confidence in grade and geometry.
• Based on information available as of the effective date, the SLR QPs are not aware of any geological, environmental, permitting, legal, social, or other factors that would materially affect the reported Mineral Resources, subject to the recommendations outlined elsewhere in this Technical Report.
25.2 Mining and Mineral Reserves
• Mineral Reserve estimates, as prepared by SLR, have been classified in accordance with the definitions for Mineral Reserves in S-K 1300, which are consistent with CIM (2014) definitions, which are incorporated by reference in NI 43-101.
• The Proven and Probable Mineral Reserve estimate is 133,000 short tons (st) grading 0.97% U3O8 containing 2.571 Mlb of U3O8 and is comprised of 17,500 st grading 1.04% U3O8 of Proven Mineral Reserves containing 0.365 Mlb of U3O8 plus 115,600 tons grading 0.95% U3O8 of Probable Mineral Reserves containing 2.206 Mlb of U3O8
• The Mineral Reserves are based upon a cut-off grade of 0.35% U3O8.
• Measured Mineral Resources were converted to Proven Mineral Reserves, and Indicated Mineral Resources were converted to Probable Mineral Reserves.
• No Inferred Mineral Resources were converted into Mineral Reserves.
• Mineral Reserves are reported in situ, after application of mining dilution and mining extraction, but prior to application of metallurgical recovery. Metallurgical recovery is applied subsequently in the economic analysis to estimate recovered and saleable U₃O₈.
• The existing shaft will be used for the mine access and rock hoisting.
• The ore will be mined using longhole stoping.
• The majority of access and ore development is complete in Main Zone. Development of a decline toward Juniper Zone has commenced.
• Production mining has commenced in Main Zone, and is scheduled to begin in Juniper Zone in early 2027.
| 25-3 |
| Energy Fuels Inc. | Pinyon Plain Mine | February 19, 2026 |
| Technical Report on the Updated Pre-Feasibility Study | SLR Project No.: 123.020548.00001 |
• Ore will be mucked and hauled by load-haul-dump (LHD) loaders and haul trucks to a grizzly over the loading pocket feed.
• The SLR QP is not aware of any mining, metallurgical, infrastructure, permitting, or other relevant factors that could materially affect the Mineral Reserve estimate.
25.3 Mineral Processing
• There is sufficient metallurgical testing to support a uranium process recovery of 96% at the White Mesa Mill.
• The metallurgical test results provided by White Mesa Mill Laboratory personnel indicated that metallurgical recoveries using optimum roasting and leach conditions will be approximately 96% for uranium. The White Mesa Mill has a significant operating history for the uranium solvent extraction (SX) circuit which includes processing of relatively high copper content with no detrimental impact to the uranium recovery or product grade.
25.4 Infrastructure
There is suitable existing or planned infrastructure to support the planned operations.
25.5 Environment
• EFR has secured all the permits required to construct, operate, and close the Pinyon Plain Mine.
o Some permits require regular update/renewal.
o These permits involved significant public participation opportunity.
• Financial assurance is in place to guarantee all reclamation will occur. This amount will continue to be reviewed on a regular basis (at least every five years) to cover any changes at site and/or for any inflationary issue(s).
| 25-4 |
| Energy Fuels Inc. | Pinyon Plain Mine | February 19, 2026 |
| Technical Report on the Updated Pre-Feasibility Study | SLR Project No.: 123.020548.00001 |
26.0 Recommendations
TSLR offers the following recommendations regarding the advancement of the Project.
26.1 Geology and Mineral Resources
1 Complete the proposed underground delineation drilling program within the Main-Lower and Juniper zones to improve geological continuity and confidence and to support the potential conversion of Inferred Mineral Resources to Indicated Mineral Resources.
2 The recommended program consists of approximately 150 underground drill holes totaling 18,500 ft, as outlined in the Project drilling budget, and should be executed from existing underground development where practicable (Table 26-1).
Table 26-1: 2026 Proposed Underground Delineations Drilling Budget
| Category | Number of Drill Holes/Assay |
Total Feet Drilled |
Unit Cost (US$/ft) |
Budget (US$) |
| Underground Delineation Drilling | 150 | 18,500 | 10.00 | 204,000 |
3 Incorporate results from additional drilling into updated geological interpretations, domain models, and Mineral Resource estimates following industry-standard estimation and validation procedures.
4 Implement and maintain a domain-specific density (tonnage factor) framework calibrated to production to ensure ongoing compliance, reconciliation performance, and reporting reliability:
a) Apply the 0.099 st/ft³ tonnage factor exclusively to the Main and Juniper Zones and retain the 0.082 st/ft³ factor for the Cap, Upper, Middle, Lower, and Juniper Lower Zones unless and until production data support revision.
b) Establish a formal, routine reconciliation program (monthly and annual) integrating production tonnage, moisture, grade, and surveyed mine-out volumes to continuously validate density assumptions.
c) Expand in situ and bulk density sampling in high-grade domains to further validate and refine production-derived tonnage factors.
d) Periodically review and update geological and grade domains to ensure density models remain spatially and geologically representative.
e) Clearly document all density assumptions, reconciliation procedures, and domain restrictions in future S-K 1300 and NI 43-101 disclosures, including any material limitations or uncertainties.
26.2 Mining and Mineral Reserves
1 Develop grade control and production reconciliation procedures.
2 Complete a geotechnical study to support mining Juniper Zone below stated Reserves.
3 Develop a program for monitoring the geotechnical conditions in the stopes to provide an early warning of potential ground condition problems or stope wall failures. This is of particularly importance in excavations near to critical infrastructure, namely the RAR from Main Zone to surface. The geotechnical condition of the development headings should be noted and recorded to support any required changes in the ground support regimes.
| 26-1 |
| Energy Fuels Inc. | Pinyon Plain Mine | February 19, 2026 |
| Technical Report on the Updated Pre-Feasibility Study | SLR Project No.: 123.020548.00001 |
4 Develop a comprehensive radiation management plan that documents control measures, measurement methods, tracking systems, and thresholds and response plans.
26.3 Mineral Processing
1 Investigate modifications required to recover copper at White Mesa Mill.
26.4 Infrastructure
None
26.5 Environment
1 Consider development of a more formalized environmental management system that lists environmental roles and responsibilities of site personnel, permit conditions, and monitoring requirements for use should someone else unfamiliar with environmental matters have to perform them.
2 Continue to monitor and confirm no changes in permit and projected impact assumptions.
3 Establish a reclamation revegetation test plot program to ensure species selected will work at the site.
| 26-2 |
| Energy Fuels Inc. | Pinyon Plain Mine | February 19, 2026 |
| Technical Report on the Updated Pre-Feasibility Study | SLR Project No.: 123.020548.00001 |
27.0 References
AACE International. 2012. Cost Estimate Classification System - As Applied in the Mining and Mineral Processing Industries, AACE International Recommended Practice No. 47R-11, 17 p.
ANSTO Minerals. 2017. Progress Note 1, Processing of Pinyon Plain Mine Ore, Dated May 16, 2017, ANSTO Minerals, 2017 Progress Note 2-Update on Batch Tests; Processing of Pinyon Plain Mine Ore, Dated June 14, 2017
Bennett, D. (n.d.). Orphan Mine. Retrieved November 2021, from Nature, Culture and History at the Grand Canyon: https://grcahistory.org/history/logging-mining-and-ranching/mining/orphan-mine/
Canadian Institute of Mining, Metallurgy and Petroleum (CIM). 2014. CIM Definition Standards for Mineral Resources and Mineral Reserves, adopted by CIM Council on May 10, 2014.
Cottrell, J.T. 1994. Internal Memorandum to I.W. Mathisen on Canyon Resource - 1994 Changes; written for Energy Fuels Nuclear, Inc., unpublished, June 27, 1994.
Dames and Moore. 1987: Evaluation of Underground Mine Stability and Subsidence Potential, Proposed Pinyon Plain Mine, Arizona.
Electronic Code of Federal Regulations, Title 17: Commodity and Securities Exchanges, Chapter II, Part 229 Standard Instructions for Filing Forms Under Securities Act of 1933, Securities Exchange Act of 1934 and Energy Policy and Conservation Act of 1975- Regulation S-K. (https://www.ecfr.gov/cgi-bin/text-idx?amp;node=17:3.0.1.1.11&rgn=div5#se17.3.229_11303)
Energy Fuels. 2016. Standard Operating Procedure: Core Handling, Sampling and QA/QC Protocols for Core Drilling at the Pinyon Plain Mine, internal report.
Energy Fuels. 2020. Application to Consolidate Existing Environmental Protections in an Individual Aquifer Protection Permit for the Pinyon Plain Mine, submitted to Arizona Department of Environmental Quality, November 11, 2020, Section 1.4.7, page 23.
Energy Fuels. 2025. Standard Operating Procedure: Juniper Zone Core Sampling, internal report.
Finch, W.I. 1992. Descriptive Model of Solution-Collapse Breccia Pipe Uranium Deposits, in, Bliss, J.D., ed., Developments in Mineral Deposit Modeling, U.S. Geological Survey Bulletin 2004, p. 33-35.
RME Consulting. 2022. Pinyon Plain & Juniper Underground Mine Ventilation Design, (August 2022).
RPA. 2017. Technical Report on the Canyon Mine, Coconino County, Arizona, USA, RPA NI 43-101 report prepared for Energy Fuels Inc. Available at www.sedar.com
Mathisen, I.W., Jr. 1985. Internal Memorandum, written for Energy Fuels Nuclear, Inc., unpublished, January 15, 1985.
Mining Cost Service, 2021, Transportation, InfoMine USA, Inc. Section TR, Appendix A, p. TR A5.
Montgomery, E.L. et al. 1985. Appendix F -Groundwater Conditions Canyon Mine Region, Coconino County, Arizona, Draft Environmental Impact Statement Canyon Uranium Mine, p. 206
| 27-1 |
| Energy Fuels Inc. | Pinyon Plain Mine | February 19, 2026 |
| Technical Report on the Updated Pre-Feasibility Study | SLR Project No.: 123.020548.00001 |
Parsons Behle & Latimer. 2022. Mining Claim Status Report - Pinyon Plain Mine, Coconino County, Arizona, letter report to Energy Fuels Resources (USA) Inc., January 19, 2022, 8 pp.
Pool, T.C. and Ross, D.A. 2012. Technical Report on the Arizona Strip Uranium Projects, Arizona, USA, RPA NI 43-101 Report prepared for Energy Fuels Inc. June 27, 2012. Available at www.sedar.com
Price, J.W. and Schwartz, R.L. 2018. Hazen Research Project 12493 Demonstration of Copper Extraction from Canyon Mine Uranium-Copper Ore, Revision 1, prepared for Energy Fuels Resources, Inc., December 11, 2018, p. 313.
Rawlins, C.A. 2022. Pinyon Plain and Juniper Underground Mine Ventilation Design, August 2022.
Scott, J.H. 1962. GAMLOG A Computer Program for Interpreting Gamma-Ray Logs; United States Atomic Energy Commission, Grand Junction Office, Production Evaluation Division, Ore Reserves Branch, TM-179, September 1962.
Shumway, L. 2017. Energy Fuels Nuclear, Inc. Internal Memorandum dated June 9, 2017
SLR. 2024. Technical Report on the Pinyon Plain Project, Coconino County, Arizona, USA, SLR NI 43-101 / S-K 1300 report prepared for Energy Fuels Inc., Amended March 6, 2024, p. 181, Available at www.sedar.com
TradeTech, LLC. 2022. Uranium Market Study, 2022: Issue 4.
US Department of Agriculture, Forest Service, Southwestern Region, Kaibab National Forest. 1985. Draft Environmental Impact Statement, Pinyon Plain Uranium Mine, Appendix F 4Groundwater Conditions.
US Securities and Exchange Commission. 2018. Regulation S-K, Subpart 229.1300, Item 1300 of Regulation S-K, Disclosure by Registrants Engaged in Mining Operations and Item 601 (b)(96) of Regulation S-K, Technical Report Summary.
Wenrich, K.J. and Sutphin, H.B. 1989. Lithotectonic setting necessary for formation of a uranium rich, solution collapse breccia pipe province, Grand Canyon Region, Arizona, in Metallogenesis of uranium deposits; Technical committee meeting on metallogenesis of uranium deposits, organized by the International Atomic Energy Agency, Vienna, 9-12 March 1987, p. 307-344
Wenrich, K.J. 1992. Breccia Pipes in the Red Butte Area of the Kaibab National Forest, Arizona, U.S. Geological Survey, Open File Report 92-219, p. 14
World Nuclear. 2024. Uranium Markets. Updated August 2024. Retrieved January 2026 from World Nuclear Association: https://world-nuclear.org/information-library/nuclear-fuel-cycle/uranium-resources/uranium-markets
World Nuclear. 2025. World Uranium Mining Production. Updated September 2025. Retrieved January 2026 from World Nuclear Association: https://world-nuclear.org/information-library/nuclear-fuel-cycle/mining-of-uranium/world-uranium-mining-production
| 27-2 |
| Energy Fuels Inc. | Pinyon Plain Mine | February 19, 2026 |
| Technical Report on the Updated Pre-Feasibility Study | SLR Project No.: 123.020548.00001 |
28.0 Date and Signature Date
This report titled "Technical Report on the Updated Pre-Feasibility Study, Pinyon Plain Mine, Coconino County, Arizona, USA" with an effective date of December 31, 2025 was prepared and signed by the following authors:
| (Signed & Sealed) Grant A. Malensek | |
| Dated at Lakewood, CO | Grant A. Malensek, M.Eng., P.Eng. |
| February 19, 2026 | |
| (Signed & Sealed) Mark B. Mathisen | |
| Dated at Lakewood, CO | Mark B. Mathisen, CPG |
| February 19, 2026 | |
| (Signed & Sealed) Murray Dunn | |
| Dated at Vancouver, BC | Murray Dunn, M.Eng., P.Eng. |
| February 19, 2026 | |
| (Signed & Sealed) Jeffrey Woods | |
| Dated at Sparks, NV | Jeffrey Woods, MMSA QP. |
| February 19, 2026 | |
| (Signed & Sealed) Lee (Pat) Gochnour | |
| Dated at Aberdeen, WA | Lee (Pat) Gochnour, MMSA QP |
| February 19, 2026 |
| 28-1 |
| Energy Fuels Inc. | Pinyon Plain Mine | February 19, 2026 |
| Technical Report on the Updated Pre-Feasibility Study | SLR Project No.: 123.020548.00001 |
29.0 Certificate of Qualified Person
29.1 Grant A. Malensek
I, Grant A. Malensek, M.Eng., P.Eng., as an author of this report entitled "Technical Report on the Updated Pre-Feasibility Study, Pinyon Plain Mine, Coconino County, Arizona, USA" with an effective date of December 31, 2025 prepared for Energy Fuels Inc., do hereby certify that:
1. I am Technical Director - US Mining Advisory, and Senior Principal Mining Engineer with SLR International Corporation, of Suite 100, 1658 Cole Boulevard, Lakewood, CO, USA 80401.
2. I am a graduate of the University of British Columbia, Canada, in 1987 with a Bachelor of Science degree in Geological Sciences and Colorado School of Mines, USA in 1997 with a Master of Engineering degree in Geological Engineering.
3. I am registered as a Professional Engineer/Geoscientist in the Province of British Columbia (Reg.# 23905). I have worked as a mining engineer/geologist for a total of 27 years since my graduation. My relevant experience for the purpose of the Technical Report is:
• Feasibility, prefeasibility, and scoping studies
• Fatal flaw, due diligence, and Independent Engineer reviews for equity and project financings.
• Financial and technical-economic modelling, analysis, budgeting, and forecasting.
• Property and project valuations.
• Capital cost estimates and reviews.
• Mine strategy reviews.
• Options analysis and project evaluations in connection with mergers and acquisitions.
4. I have read the definition of "qualified person" set out in National Instrument 43-101 (NI 43-101) and certify that by reason of my education, affiliation with a professional association (as defined in NI 43-101) and past relevant work experience, I fulfill the requirements to be a "qualified person" for the purposes of NI 43-101.
5. I visited the Pinyon Plain Mine on October 27, 2022.
6. I am responsible for Sections 1.2, 1.3.11, 1.3.13, 19, 21, 22, and 30, and related disclosure in Section 27, of the Technical Report.
7. I am independent of the Issuer applying the test set out in Section 1.5 of NI 43-101.
8. I was the Project Manager for the report entitled "Technical Report on the Pinyon Plain Project, Coconino County, Arizona, USA" with an effective date of December 31, 2021, and I was the Project Manager and a Qualified Person for the report entitled, "Technical Report on the Pre-Feasibility Study on the Pinyon Plain Project, Coconino County, Arizona, USA" with an effective date of December 31, 2022.
9. I have read NI 43-101, and the Technical Report has been prepared in compliance with NI 43-101 and Form 43-101F1.
| 29-1 |
| Energy Fuels Inc. | Pinyon Plain Mine | February 19, 2026 |
| Technical Report on the Updated Pre-Feasibility Study | SLR Project No.: 123.020548.00001 |
10. At the effective date of the Technical Report, to the best of my knowledge, information, and belief, the sections in the Technical Report for which I am responsible contain all scientific and technical information that is required to be disclosed to make the Technical Report not misleading.
Dated this 19th day of February, 2026
(Signed) Grant A. Malensek
Grant A. Malensek, M.Eng., P.Eng.
| 29-2 |
| Energy Fuels Inc. | Pinyon Plain Mine | February 19, 2026 |
| Technical Report on the Updated Pre-Feasibility Study | SLR Project No.: 123.020548.00001 |
29.2 Mark B. Mathisen
I, Mark B. Mathisen, C.P.G., as an author of this report entitled "Technical Report on the Updated Pre-Feasibility Study, Pinyon Plain Mine, Coconino County, Arizona, USA" with an effective date of December 31, 2025 prepared for Energy Fuels Inc., do hereby certify that:
1. I am Senior Principal Geologist with SLR International Corporation, of Suite 100, 1658 Cole Boulevard, Lakewood, CO, USA 80401.
2. I am a graduate of Colorado School of Mines, Golden, CO, USA in 1984 with a Bachelor of Science degree in Geophysical Engineering.
3. I am a Registered Professional Geologist in the State of Wyoming (Reg.# PG-2821), a Certified Professional Geologist with the American Institute of Professional Geologists (Reg.# CPG-11648), and a Registered Member of SME (Reg.# 04156896). I have worked as a geologist for a total of 28 years since my graduation. My relevant experience for the purpose of the Technical Report is:
• Mineral Resource estimation and preparation of NI 43-101 Technical Reports.
• Director, Project Resources, with Denison Mines Corp., responsible for resource evaluation and reporting for uranium projects in the USA, Canada, Africa, and Mongolia.
• Project Geologist with Energy Fuels Nuclear, Inc., responsible for planning and direction of field activities and project development for an in situ leach uranium project in the USA. Cost analysis software development.
• Design and direction of geophysical programs for US and international base metal and gold exploration joint venture programs.
4. I have read the definition of "qualified person" set out in National Instrument 43-101 (NI 43-101) and certify that by reason of my education, affiliation with a professional association (as defined in NI 43-101) and past relevant work experience, I fulfill the requirements to be a "qualified person" for the purposes of NI 43-101.
5. I visited the Pinyon Plain Mine on November 16, 2021.
6. I am responsible for sections 1.1, 1.1.1.1, 1.1.2.1, 1.3.1 to 1.3.6, 2 to 12, 14, 23, 24, 25.1, 26.1, and related disclosure in Section 27 of the Technical Report.
7. I am independent of the Issuer applying the test set out in Section 1.5 of NI 43-101.
8. I was involved previously with the Project from 2006 to 2012 when serving as Director of Project Resources with Denison Mines. Since the Project was acquired by Energy Fuels Resources (USA) in 2012, I have authored technical reports on the Project that were issued in 2022 and 2024.
9. I have read NI 43-101, and the Technical Report has been prepared in compliance with NI 43-101 and Form 43-101F1.
10. At the effective date of the Technical Report, to the best of my knowledge, information, and belief, the sections in the Technical Report for which I am responsible contain all scientific and technical information that is required to be disclosed to make the Technical Report not misleading.
Dated this 19th day of February, 2026
(Signed) Mark B. Mathisen
Mark B. Mathisen, CPG
| 29-3 |
| Energy Fuels Inc. | Pinyon Plain Mine | February 19, 2026 |
| Technical Report on the Updated Pre-Feasibility Study | SLR Project No.: 123.020548.00001 |
29.3 Yenlai Chee
I, Yenlai Chee, C.P.G., as an author of this report entitled "Technical Report on the Updated Pre-Feasibility Study, Pinyon Plain Mine, Coconino County, Arizona, USA" with an effective date of December 31, 2025 prepared for Energy Fuels Inc., do hereby certify that:
1 I am Senior Resource Geologist with SLR International Corporation, of Suite 100, 1658 Cole Boulevard, Lakewood, CO, USA 80401.
2 I am a graduate of the University of Texas in El Paso with a B.Sc. Biology (major) and Geology (minor) (2004), B.Sc. Environmental Science (2005), and M.Sc. Geology (2007).
3 I am registered as a Certified Professional Geologist with the American Institute of Professional Geologists (Reg.# CPG-12268). I have worked as a geologist for a total of 18 years since my graduation. My relevant experience for the purpose of the Technical Report is:
o Mineral Resource estimation and preparation of NI 43-101 Technical Reports.
o Senior Project Geologist with Leapfrog software provider Seequent
o Resource Geologist for Condor Gold PLC in Nicaragua
o Project Geologist for Premium Exploration Inc. in Idaho, USA
4 I have read the definition of "qualified person" set out in National Instrument 43-101 (NI 43-101) and certify that by reason of my education, affiliation with a professional association (as defined in NI 43-101) and past relevant work experience, I fulfill the requirements to be a "qualified person" for the purposes of NI 43-101.
5 I have not visited the Pinyon Plain Project
6 I am responsible for Sections 1.3.6 and 14 of the Technical Report.
7 I am independent of the Issuer applying the test set out in Section 1.5 of NI 43-101.
8 I have had no prior involvement with the property that is the subject of the Technical Report.
9 I have read NI 43-101, and the Technical Report has been prepared in compliance with NI 43-101 and Form 43-101F1.
10 At the effective date of the Technical Report, to the best of my knowledge, information, and belief, the sections in the Technical Report for which I am responsible contain all scientific and technical information that is required to be disclosed to make the Technical Report not misleading.
Dated this 19th day of February, 2026
(Signed) Yenlai Chee
Yenlai Chee, C.P.G
| 29-4 |
| Energy Fuels Inc. | Pinyon Plain Mine | February 19, 2026 |
| Technical Report on the Updated Pre-Feasibility Study | SLR Project No.: 123.020548.00001 |
29.4 Murray Dunn
I, Murray Dunn, M.Eng., P.Eng., as an author of this report entitled "Technical Report on the Updated Pre-Feasibility Study, Pinyon Plain Mine, Coconino County, Arizona, USA" with an effective date of December 31, 2025 prepared for Energy Fuels Inc., do hereby certify that:
1. I am Consultant Mining Engineer with SLR Consulting (Canada) Ltd, of Suite 107, 1726 Dolphin Ave, Kelowna, BC V1Y 9R9.
2. I am a graduate of University of British Columbia, Vancouver BC, in 2010, with a Bachelor of Applied Science degree in Mining Engineering and a graduate of Graz University of Technology/Montanuniversität, Austria in 2019 with Master of Engineering degree in Tunnel Engineering.
3. I am registered as a Professional Mining Engineer in the Province of British Columbia (Reg.# 225970). I have worked as a mining engineer for a total of 15 years since my graduation. My relevant experience for the purpose of the Technical Report is:
• Technical and supervisory roles at mines under construction, and during commissioning and operation.
• Mine design and scheduling in multiple commodities using bulk and selective underground methods.
• Mineral Reserve evaluations, geotechnical design, and cost estimation.
• Experienced user of mine design and scheduling software.
4. I have read the definition of "qualified person" set out in National Instrument 43-101 (NI 43-101) and certify that by reason of my education, affiliation with a professional association (as defined in NI 43-101) and past relevant work experience, I fulfill the requirements to be a "qualified person" for the purposes of NI 43-101.
5. I visited the Pinyon Plain Mine on October 6, 2025.
6. I am responsible for 1.1.1.2, 1.1.2.2, 1.3.7, 1.3.8, 15, 16, 25.2, 26.2, and related disclosure in Section 27 of the Technical Report.
7. I am independent of the Issuer applying the test set out in Section 1.5 of NI 43-101.
8. I have had no prior involvement with the property that is the subject of the Technical Report.
9. I have read NI 43-101, and the Technical Report has been prepared in compliance with NI 43-101 and Form 43-101F1.
10. At the effective date of the Technical Report, to the best of my knowledge, information, and belief, the sections in the Technical Report for which I am responsible contain all scientific and technical information that is required to be disclosed to make the Technical Report not misleading.
Dated this 18th day of February, 2026
(Signed) Murray Dunn
Murray Dunn, P.Eng.
| 29-5 |
| Energy Fuels Inc. | Pinyon Plain Mine | February 19, 2026 |
| Technical Report on the Updated Pre-Feasibility Study | SLR Project No.: 123.020548.00001 |
29.5 Jeffrey L. Woods
I, Jeffrey L. Woods, MMSA QP, as an author of this report entitled "Technical Report on the Updated Pre-Feasibility Study, Pinyon Plain Mine, Coconino County, Arizona, USA" with an effective date of December 31, 2025 prepared for Energy Fuels Inc., do hereby certify that:
1. I am Principal Consulting Metallurgist with Woods Process Services, of 1112 Fuggles Drive, Sparks, Nevada 89441.
2. I am a graduate of Mackay School of Mines, University of Nevada, Reno, Nevada, U.S.A., in 1988 with a B.S. degree in Metallurgical Engineering.
3. I am a member in good standing of Society for Mining, Metallurgy and Exploration, membership #4018591 and a member of the Mining and Metallurgical Society of America (MMSA #01368QP). I have practiced my profession continuously for 35 years since graduation. My relevant experience for the purpose of the Technical Report is:
• Review and report as a consultant on numerous exploration, development, and production mining projects around the world for due diligence and regulatory requirements
• Metallurgical engineering, test work review and development, process operations and metallurgical process analyses, involving copper, gold, silver, nickel, cobalt, uranium, and base metals located in the United States, Canada, Mexico, Honduras, Nicaragua, Chile, Turkey, Cameroon, Peru, Argentina, and Colombia
• Senior Process Engineer for a number of mining-related companies
• Manager and Business Development for a small, privately owned metallurgical testing laboratory in Plano, Texas, USA
• Vice President Process Engineering for at a large copper mining company in Sonora, Mexico
• Global Director Metallurgy and Processing Engineering for a mid-tier international mining company
4. I have read the definition of "qualified person" set out in National Instrument 43-101 (NI 43-101) and certify that by reason of my education, affiliation with a professional association (as defined in NI 43-101) and past relevant work experience, I fulfill the requirements to be a "qualified person" for the purposes of NI 43-101.
5. I have not visited the Pinyon Plain Mine
6. I am responsible for Section 1.1.1.3, 1.1.1.4, 1.1.2.3, 1.1.2.4, 1.3.9, 1.3.10, 13, 17, 18, 25.3, 25.4, 26.3, 26.4, and contributions to Section 27 of the Technical Report.
7. I am independent of the Issuer applying the test set out in Section 1.5 of NI 43-101.
8. I was a Qualified Person for the report entitled, "Technical Report on the Pre-Feasibility Study on the Pinyon Plain Project, Coconino County, Arizona, USA" with an effective date of December 31, 2022.
9. I have read NI 43-101, and the Technical Report has been prepared in compliance with NI 43-101 and Form 43-101F1.
| 29-6 |
| Energy Fuels Inc. | Pinyon Plain Mine | February 19, 2026 |
| Technical Report on the Updated Pre-Feasibility Study | SLR Project No.: 123.020548.00001 |
10. At the effective date of the Technical Report, to the best of my knowledge, information, and belief, the sections in the Technical Report for which I am responsible contain all scientific and technical information that is required to be disclosed to make the Technical Report not misleading.
Dated this 19th day of February, 2026
(Signed) Jeffrey L. Woods
Jeffrey L. Woods, MMSA QP
| 29-7 |
| Energy Fuels Inc. | Pinyon Plain Mine | February 19, 2026 |
| Technical Report on the Updated Pre-Feasibility Study | SLR Project No.: 123.020548.00001 |
29.6 Lee (Pat) Gochnour
I, Lee (Pat) Gochnour, MMSA QP (#01160), as an author of this report entitled "Technical Report on the Updated Pre-Feasibility Study, Pinyon Plain Mine, Coconino County, Arizona, USA" with an effective date of December 31, 2025, (the Technical Report), prepared for Energy Fuels Inc. (the Issuer), do hereby certify that:
1. I am Associate Principal Environmental Specialist, and Principal of Gochnour & Associates, Inc. of 915 Fairway Lane, Aberdeen, Washington, 98520.
2. I am a graduate of Eastern Washington University in 1981 with a B.A. in Park Administration and Land Use Planning.
3. I am a member in good standing of Mining and Metallurgical Society of America (#01160). I have practiced my profession continuously for 43 years since graduation. My relevant experience for the purpose of the Technical Report is:
• Vice President of Environmental Services for Pincock, Allen & Holt
• Corporate Environmental Manager for St. Joe Minerals, Bond International Gold, LAC Minerals and MinVen Gold Corporation
• Environmental audits, permitting programs, developing Plan of Operations and EA/EIS, alternative siting studies, reclamation planning, environmental contingency planning, remediation and environmental litigation support
• Environmental and permitting feasibility support for project financing for domestic and international projects and clients
4. I have read the definition of "qualified person" set out in National Instrument 43-101 (NI 43-101) and certify that by reason of my education, affiliation with a professional association (as defined in NI 43-101) and past relevant work experience, I fulfill the requirements to be a "qualified person" for the purposes of NI 43-101.
5. I visited the Pinyon Plain Mine on October 27, 2022.
6. I am responsible for Sections 1.1.1.5, 1.1.2.5, 1.3.12, 20.0, 25.5, and 26.5, and contributions to Section 27 of the Technical Report.
7. I am independent of the Issuer applying the test set out in Section 1.5 of NI 43-101.
8. I was a Qualified Person for the report entitled, "Technical Report on the Pre-Feasibility Study on the Pinyon Plain Project, Coconino County, Arizona, USA" with an effective date of December 31, 2022.
9. I have read NI 43-101, and the Technical Report has been prepared in compliance with NI 43-101 and Form 43-101F1.
10. At the effective date of the Technical Report, to the best of my knowledge, information, and belief, the sections in the Technical Report for which I am responsible contain all scientific and technical information that is required to be disclosed to make the Technical Report not misleading.
Dated this 19th day of February, 2026
(Signed) Lee (Pat) Gochnour
Lee (Pat) Gochnour, MMSA QP
| 29-8 |
| Energy Fuels Inc. | Pinyon Plain Mine | February 19, 2026 |
| Technical Report on the Updated Pre-Feasibility Study | SLR Project No.: 123.020548.00001 |
30.0 Appendix 1 - Cash Flow
Table 30-1: Cash Flow
| Units | Total | Year 1 | Year 2 | Year 3 | Year 4 | |
| Mining | ||||||
| Underground | ||||||
| Mine Operating Days | days | 1,004 | 365 | 365 | 274 | 365 |
| Tonnes milled per day | tons / day | 133 | 165 | 162 | 50 | - |
| Tonnes moved per day | tons / day | 169 | 223 | 205 | 50 | - |
| Ore Production | 000 dry tons | 133 | 60 | 59 | 14 | - |
| Ore Grade | % U3O8 | 0.97% | 1.07% | 0.84% | 1.06% | |
| Waste | 000 tons | 37 | 21 | 16 | - | - |
| Total Moved | 000 tons | 170 | 81 | 75 | 14 | - |
| Processing | ||||||
| Ore to Milling and Flotation | 000 dry tons | 133 | 60 | 59 | 14 | - |
| Head Grade U3O8 | % U3O8 | 0.97% | 1.07% | 0.84% | 1.06% | 0.00% |
| Contained U3O8 | tons | 1,286 | 642 | 497 | 147 | - |
| Recovery | % | 96% | 96% | 96% | 96% | 96% |
| Payable U3O8 | lb U3O8 | 2,468,307 | 1,232,230 | 954,219 | 281,858 | - |
| Revenue | ||||||
| Metal Price | US$/lb U3O8 | 80 | 80 | 80 | 80 | 80 |
| Total Gross Revenue | US$ 000 | 197,465 | 98,578 | 76,338 | 22,549 | - |
| Transportation | US$ 000 | 346 | 173 | 134 | 39 | - |
| Royalty | US$ 000 | 250 | 113 | 111 | 26 | - |
| Net Smelter Return | US$ 000 | 196,869 | 98,293 | 76,093 | 22,483 | - |
| Unit NSR | US$/st milled | 1,480 | 1,635 | 1,287 | 1,628 | - |
| Operating Cost | ||||||
| Underground Mining Cost | US$/st milled | 184.00 | 184.00 | 184.00 | 184.00 | 184.00 |
| Haulage Cost | US$/st milled | 95.00 | 95.00 | 95.00 | 95.00 | 95.00 |
| Milling & Processing | US$/st milled | 256.00 | 256.00 | 256.00 | 256.00 | 256.00 |
| G&A | US$/st milled | 7.00 | 7.00 | 7.00 | 7.00 | 7.00 |
| Total Unit Operating Cost | US$/st milled | 542.00 | 542.00 | 542.00 | 542.00 | - |
| Underground Mining Cost | US$ 000 | 24,477 | 11,060 | 10,875 | 2,542 | - |
| Haulage Cost | US$ 000 | 12,638 | 5,710 | 5,615 | 1,312 | - |
| 30-1 |
| Energy Fuels Inc. | Pinyon Plain Mine | February 19, 2026 |
| Technical Report on the Updated Pre-Feasibility Study | SLR Project No.: 123.020548.00001 |
| Units | Total | Year 1 | Year 2 | Year 3 | Year 4 | |
| Milling & Processing | US$ 000 | 34,055 | 15,388 | 15,131 | 3,536 | - |
| G&A | US$ 000 | 931 | 421 | 414 | 97 | - |
| Total Operating Cost | US$ 000 | 72,101 | 32,580 | 32,035 | 7,487 | - |
| AZ Severance Tax | US$ 000 | 1,560 | 821 | 551 | 187 | - |
| Total Operating Cost w/ Severance Tax | US$ 000 | 73,661 | 33,401 | 32,585 | 7,674 | - |
| Unit Operating Cost | US$/st milled | 556.32 | 558.53 | 553.58 | 558.43 | - |
| Operating Cashflow | US$ 000 | 123,208 | 64,892 | 43,508 | 14,809 | - |
| Capital Costs | ||||||
| Direct Cost | ||||||
| Mine Development | US$ 000 | 7,163 | 4,191 | 2,972 | - | - |
| Mining | US$ 000 | 750 | 250 | 250 | 250 | - |
| Processing | US$ 000 | - | - | - | - | - |
| Infrastructure | US$ 000 | - | - | - | - | - |
| Tailings | US$ 000 | - | - | - | - | - |
| Total Direct Cost | US$ 000 | 7,913 | 4,441 | 3,222 | 250 | - |
| Other Costs | ||||||
| EPCM / Owners / Indirect Cost | US$ 000 | - | - | - | - | - |
| Subtotal Costs | US$ 000 | 7,913 | 4,441 | 3,222 | 250 | - |
| Contingency | USS$ 000 | 1,187 | 666 | 483 | 38 | - |
| Total Capital Cost | US$ 000 | 9,100 | 5,108 | 3,705 | 288 | - |
| Sustaining | US$ 000 | - | - | - | - | - |
| Reclamation and closure | US$ 000 | 1,540 | - | - | - | 1,540 |
| Total Capital Cost | US$ 000 | 10,640 | 5,108 | 3,705 | 288 | 1,540 |
| Cash Flow | ||||||
| Net Pre-Tax Cashflow | US$ 000 | 112,568 | 59,784 | 39,803 | 14,522 | (1,540) |
| Cumulative Pre-Tax Cashflow | US$ 000 | 59,784 | 99,587 | 114,108 | 112,568 | |
| Taxes | US$ 000 | 14,834 | 7,772 | 5,174 | 1,888 | - |
| After-Tax Cashflow | US$ 000 | 97,734 | 52,012 | 34,628 | 12,634 | (1,540) |
| Cumulative After-Tax Cashflow | US$ 000 | 52,012 | 86,640 | 99,274 | 97,734 |
| Project Economics | Units | Pre-Tax | After-Tax | ||||
| NPV at 5% discounting | US$ 000 | 90,113 | 78,256 | ||||
| NPV at 8% discounting | US$ 000 | 79,285 | 68,861 | ||||
| NPV at 12% discounting | US$ 000 | 67,239 | 58,408 | ||||
| Note: IRR is not an applicable metric for this stage of the Project | |||||||
| 30-2 |

 |
Energy Fuels Inc. Technical Report – Donald Rare Earths and Mineral Sands Project, Victoria, Australia |
This report was prepared as a National Instrument 43-101 Standards of Disclosure for Mineral Projects (NI 43-101) Technical Report and a Subpart 229.1300 of Regulation S-K Disclosure by Registrants Engaged in Mining Operations (S-K 1300) and Item 601 (b)(96) Technical Report Summary (collectively Technical Report) for Energy Fuels Inc. (Energy Fuels) by Datamine Australia Pty Ltd (Snowden Optiro). The quality of information, conclusions, and estimates contained herein are consistent with the quality of effort involved in Snowden Optiro's services. This Technical Report is intended to satisfy the requirements of a Feasibility Study under both NI 43-101 and S-K 1300. The information, conclusions, and estimates contained herein are based on: i) information available at the time of preparation, ii) data supplied by outside sources, and iii) the assumptions, conditions, and qualifications set forth in this report. The user of this document should ensure that this is the most recent Technical Report for the property as it is not valid if a new Technical Report has been issued.
© 2026
All rights are reserved.
| Issued by: | Perth Office | |
| Doc ref: | Signed_DA213254 Donald Technical Report.docx | |
| Effective date: | 31 December 2025 |

|
Energy Fuels Inc. Technical Report – Donald Rare Earths and Mineral Sands Project, Victoria, Australia |
Table of contents
| 1 Summary | 13 |
| 1.1 Property description, ownership and background | 13 |
| 1.2 Geological setting and mineralization | 14 |
| 1.3 Exploration and drilling | 15 |
| 1.4 Sample preparation, analyses, and data verification | 15 |
| 1.5 Mineral processing and metallurgical testwork | 16 |
| 1.6 Mineral Resource estimate | 18 |
| 1.7 Mining and Mineral Reserve estimates | 20 |
| 1.8 Processing methods and infrastructure | 23 |
| 1.9 Permitting, environmental and social | 24 |
| 1.10 Costs and economic analysis | 24 |
| 1.11 Other relevant data and information | 27 |
| 1.12 Conclusions and recommendations | 28 |
| 2 Introduction | 29 |
| 2.1 Terms of reference | 29 |
| 2.2 Abbreviations and units | 31 |
| 3 Reliance on information provided by the registrant | 37 |
| 4 Property description and location | 38 |
| 4.1 Location and area | 38 |
| 4.2 Type of mineral tenure | 39 |
| 4.2.1 Legal framework | 39 |
| 4.2.2 Property mineral titles | 39 |
| 4.3 Issuer's interest | 40 |
| 4.4 Surface rights | 41 |
| 4.5 Royalties, back-in rights, payments, agreements, encumbrances | 42 |
| 4.6 Environmental liabilities | 43 |
| 4.7 Permits | 43 |
| 4.8 Other significant factors and risks | 44 |
| 5 Accessibility, climate, local resources, infrastructure and physiography | 45 |
| 5.1 Topography, elevation and vegetation | 45 |
| 5.2 Access | 45 |
| 5.3 Proximity to population centre and transport | 45 |
| 5.4 Climate and length of operating season | 45 |
| 5.5 Infrastructure | 45 |
|
Energy Fuels Inc. Technical Report – Donald Rare Earths and Mineral Sands Project, Victoria, Australia |
| 5.6 Workforce | 46 |
| 6 History | 47 |
| 6.1 CRA | 47 |
| 6.2 Zirtanium | 48 |
| 6.3 Astron | 48 |
| 6.4 Historical resource estimates | 48 |
| 6.4.1 CRA | 48 |
| 6.4.2 Zirtanium | 49 |
| 6.4.3 Astron | 49 |
| 7 Geological setting and mineralization | 53 |
| 7.1 Regional geology | 53 |
| 7.2 Local geology and mineralization | 54 |
| 8 Deposit types | 57 |
| 9 Exploration | 59 |
| 9.1 Geotechnical studies | 59 |
| 9.2 Hydrological studies | 60 |
| 10 Drilling | 61 |
| 10.1 Type and extent | 61 |
| 10.1.1 Aircore drilling | 66 |
| 10.1.2 Sonic drilling | 67 |
| 10.1.3 Calweld drilling | 67 |
| 10.2 Procedures | 67 |
| 10.2.1 Surveying | 67 |
| 10.2.2 Sampling and logging | 68 |
| 10.2.3 Data management and security | 69 |
| 11 Sample preparation, analyses, and security | 71 |
| 11.1 Sample preparation and analysis | 71 |
| 11.1.1 CRA | 71 |
| 11.1.2 Zirtanium | 71 |
| 11.1.3 Astron | 72 |
| 11.2 Bulk density | 75 |
| 11.2.1 CRA | 75 |
| 11.2.2 Zirtanium | 76 |
| 11.2.3 Astron | 76 |
| 11.3 Quality control quality assurance procedures | 76 |
| 11.3.1 Pre-2022 analytical data | 76 |
| 11.3.2 2022 analytical data | 77 |
| 11.3.3 2025 analytical data | 78 |
| 11.4 Security | 78 |
|
Energy Fuels Inc. Technical Report – Donald Rare Earths and Mineral Sands Project, Victoria, Australia |
| 11.5 Qualified Person's opinion | 78 |
| 12 Data verification | 80 |
| 12.1 Data management | 80 |
| 12.2 Survey | 80 |
| 12.3 Drilling and sampling | 80 |
| 12.4 Sample analysis | 80 |
| 12.5 Qualified Person's opinion on the adequacy of the data | 81 |
| 13 Mineral processing and metallurgical testing | 82 |
| 13.1 Introduction | 82 |
| 13.2 Historical testwork | 82 |
| 13.3 Recent testwork | 86 |
| 13.3.1 WCP pilot plant | 86 |
| 13.3.2 Confirmatory flowsheet testwork | 88 |
| 13.3.3 Metallurgical summary | 89 |
| 13.4 Sample representativity and metallurgical risks | 90 |
| 13.5 Qualified Person's opinion | 91 |
| 14 Mineral Resource estimates | 92 |
| 14.1 Geological model and mineralization interpretation | 94 |
| 14.2 Data analysis | 95 |
| 14.2.1 Area 1 | 95 |
| 14.2.2 Area 2 | 99 |
| 14.2.3 Mineral assemblage analysis | 99 |
| 14.3 Grade estimation and model validation | 102 |
| 14.3.1 Total HM, slimes and oversize | 102 |
| 14.3.2 Mineral assemblage | 103 |
| 14.3.3 Density | 104 |
| 14.3.4 Model validation | 104 |
| 14.4 Classification | 105 |
| 14.5 Mineral Resource estimate | 106 |
| 14.6 Grade control model | 109 |
| 14.7 Independent reviews | 110 |
| 15 Mineral Reserve estimates | 111 |
| 15.1 Key parameters and assumptions | 111 |
| 15.2 Pit optimization | 112 |
| 15.2.1 Optimization parameters | 112 |
| 15.2.2 Cut-off grade | 113 |
| 15.3 Pit design | 114 |
| 15.4 Mineral Reserve estimate | 116 |
|
Energy Fuels Inc. Technical Report – Donald Rare Earths and Mineral Sands Project, Victoria, Australia |
| 15.5 Risks and opportunities | 118 |
| 15.5.1 Land acquisition | 118 |
| 15.5.2 Other | 118 |
| 15.6 Independent reviews | 119 |
| 16 Mining methods | 120 |
| 16.1 Geotechnical | 120 |
| 16.2 Mining method | 121 |
| 16.2.1 Hydrology and dewatering | 121 |
| 16.2.2 Topsoil and subsoil stripping | 123 |
| 16.2.3 Overburden mining | 124 |
| 16.2.4 Ore mining | 124 |
| 16.2.5 Dividing bund construction and filling | 124 |
| 16.2.6 Exposed mining area | 125 |
| 16.3 Mining and ancillary fleet selection | 125 |
| 16.3.1 Test pit study | 125 |
| 16.3.2 Mining and ancillary fleet selection | 127 |
| 16.3.3 Mining production rates | 127 |
| 16.3.4 Personnel | 128 |
| 16.4 Life of mine production schedule | 128 |
| 17 Recovery methods | 133 |
| 17.1 Mining unit plant | 133 |
| 17.2 ROM screen, hydro-cyclones, thickening plant | 134 |
| 17.3 Wet concentration plant | 135 |
| 17.4 Concentrate upgrade plant | 136 |
| 17.5 Heavy mineral concentrate storage and loading | 137 |
| 17.5.1 Rare earth element concentrate | 137 |
| 17.5.2 Heavy mineral concentrate | 137 |
| 17.6 Ancillary processing facilities | 137 |
| 17.7 Process plant requirements | 137 |
| 18 Project infrastructure | 139 |
| 18.1 Site layout | 139 |
| 18.2 Tailings storage facility | 139 |
| 18.2.1 External TSF design | 139 |
| 18.2.2 In-pit TSF design | 142 |
| 18.3 Power | 143 |
| 18.4 Raw water supply | 143 |
| 18.5 Access and security | 144 |
| 18.6 Ancillary facilities | 144 |
| 18.7 Accommodation | 145 |
|
Energy Fuels Inc. Technical Report – Donald Rare Earths and Mineral Sands Project, Victoria, Australia |
| 18.8 Communications | 145 |
| 18.9 Logistics | 145 |
| 19 Market studies and contracts | 147 |
| 19.1 Market studies | 147 |
| 19.1.1 Mineral sands market | 147 |
| 19.1.2 REE market | 148 |
| 19.2 Contracts | 150 |
| 20 Environmental studies, permitting, and social or community impact | 151 |
| 20.1 Environmental studies | 151 |
| 20.1.1 Flora | 151 |
| 20.1.2 Fauna | 153 |
| 20.1.3 Hydrology and hydrogeology | 153 |
| 20.1.4 Groundwater dependent ecosystems | 154 |
| 20.2 Waste and tailings disposal, REEC management, site monitoring, and water management | 154 |
| 20.2.1 Tailings management | 154 |
| 20.2.2 Radioactive material management | 157 |
| 20.2.3 Hazardous materials storage | 158 |
| 20.2.4 Water management | 158 |
| 20.2.5 Land management | 159 |
| 20.2.6 Sewage treatment and waste disposal | 159 |
| 20.2.7 Noise and air quality | 159 |
| 20.2.8 Carbon emissions | 160 |
| 20.3 Approvals and permitting | 160 |
| 20.3.1 Local | 160 |
| 20.3.2 State | 160 |
| 20.3.3 Federal | 162 |
| 20.3.4 Status of approvals and permitting | 163 |
| 20.4 Social and community related requirements | 163 |
| 20.4.1 Historic heritage | 163 |
| 20.4.2 Cultural heritage | 163 |
| 20.4.3 Community | 164 |
| 20.5 Closure requirements and costs | 166 |
| 20.6 Qualified Person's opinion on the adequacy of current plans | 166 |
| 21 Capital and operating costs | 167 |
| 21.1 Capital costs | 168 |
| 21.1.1 Process and infrastructure | 168 |
| 21.1.2 Process plant | 169 |
| 21.1.3 Quantity development | 170 |
| 21.1.4 Equipment and bulk commodity pricing | 171 |
| 21.1.5 Installation | 171 |
| 21.1.6 Infrastructure capex | 172 |
|
Energy Fuels Inc. Technical Report – Donald Rare Earths and Mineral Sands Project, Victoria, Australia |
| 21.1.7 Mining pre-production costs | 172 |
| 21.2 Sustaining capital costs | 173 |
| 21.3 Operating costs | 174 |
| 21.3.1 Mining | 174 |
| 21.3.2 Processing | 175 |
| 21.3.3 Transport and logistics | 176 |
| 21.3.4 General and administration | 176 |
| 21.4 Closure | 177 |
| 22 Economic analysis | 178 |
| 22.1 Price assumptions | 178 |
| 22.1.1 HMC | 178 |
| 22.1.2 REEC price assumptions | 180 |
| 22.1.3 Other price assumptions | 181 |
| 22.1.4 Economic assumptions | 181 |
| 22.2 Cash flow analysis | 182 |
| 22.3 Sensitivity analysis | 186 |
| 23 Adjacent properties | 187 |
| 23.1 Jackson | 187 |
| 23.2 Watchem | 187 |
| 24 Other relevant data and information | 188 |
| 24.1 Phase 2 | 188 |
| 24.2 Phase 2 historical resource estimate | 189 |
| 24.3 Phase 2 historical reserve estimate | 196 |
| 25 Interpretation and conclusions | 199 |
| 26 Recommendations | 201 |
| 26.1 Mineral Resource estimates | 201 |
| 26.2 Other | 201 |
| 26.2.1 Overburden and tailings handling optimization | 201 |
| 26.2.2 Mine sequence refinement | 201 |
| 26.2.3 Dewatering system optimization | 201 |
| 26.2.4 Technology integration for cost reduction | 201 |
| 26.2.5 Detailed engineering and process optimization | 202 |
| 26.2.6 Environmental, social, and regulatory compliance | 202 |
| 26.2.7 Logistics and infrastructure readiness | 202 |
| 26.2.8 Financing strategy | 202 |
| 27 References | 203 |
| 28 Certificates | 205 |
| Certificate of Qualified Person - Allan Earl | 205 |
|
Energy Fuels Inc. Technical Report – Donald Rare Earths and Mineral Sands Project, Victoria, Australia |
| Certificate of Qualified Person - Pier Federici | 206 |
| Certificate of Qualified Person - Christine Standing | 207 |
| Certificate of Qualified Person - Peter Allen | 208 |
| Certificate of Qualified Person - Peter Theron | 209 |
| Certificate of Qualified Person - Gené Main | 210 |
| 29 Date and signature | 211 |
Figures
| Figure 1.1 Donald Phase 1 LOM cash flow summary (100% equity) | 26 |
| Figure 1.2 LOM pre-tax NPV sensitivity analysis | 27 |
| Figure 4.1 Location of Donald Property | 38 |
| Figure 4.2 Donald JV ownership structure | 40 |
| Figure 4.3 Plan of MIN5532 | 41 |
| Figure 7.1 Regional geological setting | 53 |
| Figure 7.2 Donald Project area generalized stratigraphic column | 55 |
| Figure 7.3 Representative geological cross-section looking north along 5,959,750 mN with drillholes coloured by total HM%* | 56 |
| Figure 8.1 WIM-style HM sand deposit model | 58 |
| Figure 10.1 Drilling in MIN5532 (black outline) coloured by year and used for Mineral Resource estimation | 62 |
| Figure 10.2 Drilling in MIN5532 (purple outline) during 2025 - not used for Mineral Resource estimation | 62 |
| Figure 10.3 Extent of drilling in RL2002 (blue outline) coloured by program | 63 |
| Figure 10.4 Location of RL2002 and mineralized drillhole intersections outside of the MIN5532 and RL2002 resource models | 65 |
| Figure 11.1 2022 analytical testwork flowsheet | 74 |
| Figure 12.1 DMS170 - downhole plots for verification results for total HM (left), slimes (centre) and oversize (right) results | 81 |
| Figure 14.1 Plan of drillholes coloured by drilling program and section line of representative cross-sections included in Figure 7.3 and Figure 14.4 | 93 |
| Figure 14.2 Total HM in Domain 221 - horizontal variogram fan and directional variograms with interpreted models | 97 |
| Figure 14.3 Plan of drillholes with mineral assemblage data used for Area 1 and Area 2 | 100 |
| Figure 14.4 Representative geological cross-section looking north along 5,959,750 mN with drillholes coloured by total HM%* | 104 |
| Figure 14.5 MIN5532 Mineral Resource classification | 106 |
| Figure 14.6 Plan of 2025 Mineral Reserve area and remaining 2025 Mineral Resource within MIN5532 | 107 |
| Figure 15.1 Cut-off grade curve - percent ore and equivalent total HM% | 114 |
| Figure 15.2 Long section through first eight ore blocks (5961700 mN) | 114 |
| Figure 15.3 Plan view showing MIN5532 mining blocks and RF floor | 115 |
| Figure 16.1 Schematic cross-section of mining approach (conceptual) | 121 |
| Figure 16.2 Location of wells for 2024 slug testing | 122 |
| Figure 16.3 Layout of mining/in-pit tailings cell configuration | 125 |
| Figure 16.4 Test pit excavation viewed from northern end | 126 |
| Figure 16.5 Test pit ore excavation trial showing extraction of ore zone | 126 |
| Figure 16.6 LOM schematic showing final mine plan with mining block sequence and the position of fixed infrastructure within MIN5532 and the Work Plan area | 129 |
| Figure 16.7 Annualized MIN5532 mining schedule - ex-pit movement | 130 |
| Figure 16.8 Annualized MIN5532 processing schedule - raw HM | 130 |
| Figure 16.9 Annualized MIN5532 concentrate product schedule | 131 |
| Figure 17.1 MUP flowsheet | 133 |
| Figure 17.2 Process plant layout | 134 |
|
Energy Fuels Inc. Technical Report – Donald Rare Earths and Mineral Sands Project, Victoria, Australia |
| Figure 17.3 WCP feed preparation circuit flowsheet | 134 |
| Figure 17.4 WCP spiral circuit flowsheet | 135 |
| Figure 17.5 CUP circuit flowsheet | 136 |
| Figure 18.1 Site layout in Work Plan area | 140 |
| Figure 18.2 External TSF design | 141 |
| Figure 20.1 Ecological vegetation classes and retained vegetation in the Work Plan area | 152 |
| Figure 20.2 Water management system schematic | 158 |
| Figure 20.3 Historic and cultural heritage sites | 164 |
| Figure 22.1 Donald Phase 1 LOM cash flow summary (100% equity) | 183 |
| Figure 22.2 LOM NPV sensitivity analysis | 186 |
| Figure 24.1 Extent of resource within RL2002 | 189 |
| Figure 24.2 RL2002 - plans of drillholes analyzed for HM and section line of representative cross-section included in Figure 24.3 and Figure 24.4 (left) and mineral assemblage (right) | 190 |
| Figure 24.3 Representative cross-section looking north along 5,954,500 mN with interpreted mineralized horizons and drillholes coloured by total HM%* | 191 |
| Figure 24.4 Representative cross-section looking north along 5,954,500 mN with drillholes with mineral assemblage data and mineral assemblage horizon used to constrain the reported historical resource* | 191 |
| Figure 24.5 RL2002 resource classification | 193 |
| Figure 24.6 Plan of reserve area and remaining historical resource (with mineral assemblage data) within RL2002 | 195 |
Tables
| Table 1.1 Metallurgical performance summary | 17 |
| Table 1.2 Donald Mineral Resource exclusive of Mineral Reserves within MIN5532 as of 31 December 2025 (100% equity) | 20 |
| Table 1.3 Donald Mineral Reserve within MIN5532 as of 31 December 2025 (100% equity) | 22 |
| Table 1.4 Pre-production capital cost estimate | 24 |
| Table 1.5 LOM sustaining capital costs | 25 |
| Table 1.6 LOM operating cost estimate | 25 |
| Table 2.1 Responsibilities of each Qualified Person | 30 |
| Table 2.2 Astron information sources | 30 |
| Table 2.3 Abbreviations and units of measurement | 32 |
| Table 4.1 Donald project mineral titles | 39 |
| Table 6.1 Drilling by mineral title | 47 |
| Table 6.2 Subset of the 2006 resource reported by AMC in EL4433 (which included MIN5532 and extended into RL2002) | 50 |
| Table 6.3 MIN5532 resource (subset with VHM) reported by AMC in 2010 | 50 |
| Table 6.4 MIN5532 resource (subset with VHM) reported by AMC in June 2012 | 51 |
| Table 6.5 MIN5532 resource (subset with VHM) reported by AMC in September 2012 | 51 |
| Table 6.6 MIN5532 resource (subset with VHM) reported by AMC in 2016 | 51 |
| Table 6.7 RL4433 (now RL2002) resource (subset with VHM) reported by AMC in 2012 | 52 |
| Table 6.8 RL4433 (now RL2002) resource (subset with VHM) reported by AMC in 2012 | 52 |
| Table 10.1 Drilling completed on MIN5532 | 61 |
| Table 10.2 Drilling completed on RL2002 (outside of MIN5532) | 61 |
| Table 10.3 Mineralised (>1% total HM) intersections within RL2002 not included in the extent of the resource models | 64 |
| Table 11.1 Troxler nuclear gauge bulk density readings | 76 |
| Table 11.2 Bulk density testwork results | 76 |
| Table 11.3 QAQC results from field duplicate samples | 78 |
| Table 12.1 Summary statistics from verification analysis of hole DMS170 | 80 |
| Table 13.1 2016 mineral classification to chemical component conversion matrix | 85 |
| Table 13.2 Metallurgical performance summary | 90 |
| Table 13.3 Metallurgical sample summary | 91 |
| Table 14.1 Drilling history (AC and one 2000 Calweld drillhole) at the Donald deposit - within resource area and used for 2025 Mineral Resource estimate (which extends into RL2002) | 92 |
|
Energy Fuels Inc. Technical Report – Donald Rare Earths and Mineral Sands Project, Victoria, Australia |
| Table 14.2 Thickness of geological units and mineralized horizon | 94 |
| Table 14.3 Donald deposit resource model domains | 95 |
| Table 14.4 Summary statistics of 2022 HM, slimes and oversize data | 96 |
| Table 14.5 Interpreted variogram parameters for HM | 98 |
| Table 14.6 Correlation coefficients of mineral assemblage data - composite samples | 101 |
| Table 14.7 Factors applied to 2004 zircon and titania mineral assemblage data | 102 |
| Table 14.8 Discount factors applied to LP2 mineral assemblage data | 102 |
| Table 14.9 Donald Mineral Resource exclusive of Mineral Reserves within MIN5532 as of 31 December 2025 (100% equity) | 108 |
| Table 15.1 Processing recovery (%) assumptions used for pit optimization | 113 |
| Table 15.2 Processing recovery (%) assumptions | 113 |
| Table 15.3 Donald Mineral Reserve within MIN5532 as of 31 December 2025 (100% equity) | 117 |
| Table 16.1 Typical mining equipment list | 127 |
| Table 16.2 Operating hours assumptions | 128 |
| Table 16.3 MIN5532 ex-pit mining and minerals sands and concentrate product schedule | 132 |
| Table 17.1 Processing consumables assumptions | 138 |
| Table 20.1 Donald Project approvals and licences obtained | 163 |
| Table 20.2 Donald Project approvals and licences pending | 163 |
| Table 21.1 Pre-production capital cost estimate | 168 |
| Table 21.2 Pre-production project development capital cost estimate | 168 |
| Table 21.3 Pre-production process plant capital cost estimate | 169 |
| Table 21.4 Pre-production on-site infrastructure capital cost estimate | 169 |
| Table 21.5 Pre-production off-site infrastructure capital cost estimate | 169 |
| Table 21.6 Pre-production transport and logistics capital cost estimate | 169 |
| Table 21.7 Pre-production mining capital cost estimate | 173 |
| Table 21.8 LOM sustaining capital costs | 173 |
| Table 21.9 Mining LOM operating cost estimate | 175 |
| Table 21.10 LOM processing operating cost estimate | 175 |
| Table 21.11 Concentrate transport and logistics cost estimate | 176 |
| Table 21.12 Site LOM G&A cost estimate | 177 |
| Table 22.1 Donald six-year concentrate sales forecast | 178 |
| Table 22.2 ZrO2 unit price forecast | 179 |
| Table 22.3 TiO2 unit price forecast | 180 |
| Table 22.4 Forecast REE oxide prices (US$/kg) to 2040 (base case) | 180 |
| Table 22.5 Relative distribution of saleable minerals in REE oxides in REEC | 181 |
| Table 22.6 REEC basket price on blended price forecast (US$/t REEC) | 181 |
| Table 22.7 REEC low and high basket price on blended price forecast (US$/t REEC) used in sensitivity analysis | 181 |
| Table 22.8 Phase 1 key project milestones | 182 |
| Table 22.9 Financial model economic assumptions | 182 |
| Table 22.10 Donald Phase 1 LOM financial model (100% equity) 2026-2035 | 184 |
| Table 22.11 Donald Phase 1 LOM financial model (100% equity) 2036-2045 | 184 |
| Table 22.12 Donald Phase 1 LOM financial model (100% equity) 2046-2055 | 185 |
| Table 22.13 Donald Phase 1 LOM financial model (100% equity) 2056-2065 | 185 |
| Table 22.14 Donald Phase 1 LOM financial model (100% equity) 2066-2067 | 186 |
| Table 23.1 Jackson resource subset reported by AMC in 2016 within RL2003 | 187 |
| Table 24.1 RL2002 - interpreted variogram parameters for HM | 192 |
| Table 24.2 Historical resources exclusive of reserves reported by Snowden Optiro from AMC model within RL2002 and outside of MIN5532 as of March 2016 (100% equity) | 194 |
| Table 24.3 Summary of material assumptions for RL2002 reserve estimate | 197 |
| Table 24.4 Donald reserve within RL2002 and outside of MIN5532 as of May 2023 (100% equity) | 198 |
|
Energy Fuels Inc. Technical Report – Donald Rare Earths and Mineral Sands Project, Victoria, Australia |
Forward-looking information
This Technical Report contains "forward-looking information" and "forward-looking statements" within the meaning of applicable Canadian and United States securities legislation (collectively, "forward-looking information") which involves a number of risks and uncertainties. Forward-looking information includes, but is not limited to: information with respect to strategy, plans, expectations or future financial or operating performance, such as expectations and guidance regarding project development, production outlook, including estimates of production, grades, recoveries and costs; estimates of Mineral Resources and Mineral Reserves; construction plans; mining and recovery methods; mining and mineral processing and rates; tailings disposal design and capacity; mine life; timing and success of exploration programs and project related risks as well as any other information that expresses plans and expectations or estimates of future performance. Often, but not always, forward-looking information can be identified by the use of words such as "plans", "expects", or "does not expect", "is expected", "budget", "scheduled", "estimates", "forecasts", "intends", "anticipates", or "does not anticipate", or "believes", or variations of such words and phrases or state that certain actions, events or results "may", "could", "would", "might" or "will" be taken, occur or be achieved.
Forward-looking information is based on the opinions, estimates and assumptions of contributors to this Technical Report. Certain key assumptions are discussed in more detail. Forward-looking information involves known and unknown risks, uncertainties and other factors which may cause the actual results, performance or achievements to be materially different from any other future results, performance or achievements expressed or implied by the forward-looking information.
Such factors and assumptions underlying the forward-looking information in this Technical Report includes, but are not limited to: risks associated with community relationships; risks related to estimates of production, cash flows and costs; risks inherent to mining operations; shortages of critical supplies; the cost of non-compliance and compliance; volatility in commodity prices; risks related to compliance with environmental laws and liability for environmental contamination; the lack of availability of infrastructure; risks related to the ability to obtain, maintain or renew regulatory approvals, permits and licenses; imprecision of Mineral Reserve and Mineral Resource estimates; deficient or vulnerable title to concessions, easements and surface rights; inherent safety hazards and risk to the health and safety of employees and contractors; risks related to the workforce and its labour relations; key talent recruitment and retention of key personnel; the adequacy of insurance; uncertainty as to reclamation and decommissioning; the uncertainty regarding risks posed by climate change; the potential for litigation; and risks due to conflicts of interest.
There may be other factors than those identified that could cause actual actions, events or results to differ materially from those described in forward-looking information, there may be other factors that cause actions, events or results not to be anticipated, estimated or intended. There can be no assurance that forward-looking information will prove to be accurate, as actual results and future events could differ materially from those anticipated in such information. Accordingly, readers are cautioned not to place undue reliance on forward-looking information. Unless required by Canadian or United States securities legislation, the authors and Snowden Optiro undertake no obligation to update the forward-looking information if circumstances or opinions should change.
|
Energy Fuels Inc. Technical Report – Donald Rare Earths and Mineral Sands Project, Victoria, Australia |
1 Summary
This Technical Report was prepared for Energy Fuels Inc. (Energy Fuels) to support the disclosure of Exploration Results, Mineral Resources and Mineral Reserves for Phase 1 of the Donald Rare Earths and Mineral Sands Project (Donald or the Property), a mineral exploration and development property located in western Victoria, Australia.
This Technical Report satisfies the requirements of Canadian National Instrument 43-101 Standards of Disclosure for Mineral Projects (NI 43-101) and the United States Securities and Exchange Commission's (SEC's) Modernized Property Disclosure Requirements for Mining Registrants as described in Subpart 229.1300 of Regulation S-K Disclosure by Registrants Engaged in Mining Operations (S-K 1300), and Item 601(b)(96) Technical Report Summary.
This Technical Report was authored by the following Qualified Persons (as such term is defined under NI 43-101 and S-K 1300):
• Mr. Allan Earl and Mrs. Christine Standing of Snowden Optiro, a business unit of Datamine Australia Pty Ltd (Snowden Optiro) were responsible for the preparation of this Technical Report, including the review of the geology, Mineral Resource estimates, mine planning, mining capital and operating cost estimates, and the economic analysis.
• Mr. Peter Allen of GR Engineering Services (GRE) was responsible for the review of the metallurgy, processing, infrastructure and processing capital and operating cost estimates.
• Ms. Gené Main and Mr. Peter Theron of Prime Resources (Prime) were responsible for the review of the environmental studies, permitting and social.
• Mr. Pier Federici of AMC Consultants Pty Ltd (AMC) was responsible for the review of the Mineral Reserve estimates.
The effective date of this Technical Report is 31 December 2025.
Unless otherwise specified, all units of currency are in Australian dollars ($) and all measurements are metric.
1.1 Property description, ownership and background
Donald is a planned greenfields mineral sands mine development in the Wimmera region of western Victoria, Australia. The Property comprises two areas, Mining Licence 5532 (MIN5532) and Retention Licence 2002 (RL2002), covering a combined area of 27,155 ha (271.55 km2), held by Astron Limited (formerly Astron Corporation Limited) (collectively Astron) through its subsidiary Donald Project Pty Ltd (DPPL).
Astron completed a "definitive feasibility study" in April 2023 for the Phase 1 operation within MIN5532 and a "pre-feasibility study" in June 2023 for the Phase 2 operation within RL2002, based on a plan to open pit mine the Donald heavy mineral (HM) deposit with on-site processing to produce a HM (zircon and titanium minerals) concentrate (HMC) and rare earth element concentrate (REEC) (Phase 1), and proposed future processing of the HMC into zircon and titania (titanium feedstock) final products (Phase 2).
On 4 June 2024, Energy Fuels entered into a farm-in and joint venture agreement and related ancillary agreements (Agreement) with Astron for a joint venture (JV) to develop the Donald deposit within MIN5532 and RL2002. Energy Fuels will contribute the first $183 million of equity capital to earn a 49% interest in DPPL. As at the effective date of this Technical Report, Energy Fuels held a 9.48% equity interest in DPPL and its remaining earn-in obligation is forecast to be $132 million (after taking into account funds already advanced and approximately $16 million of debt finance provided by EFRD which upon a final investment decision (FID) will be recognised as earn-in funding). Energy Fuels also entered into an offtake agreement for 100% of the Phase 1 and Phase 2 REEC monazite and xenotime production at commercial prices. Under the Agreement, and subject to its terms, Astron and its affiliates have the right to enter into an offtake agreement for 100% of the zircon and titanium HMC for processing at Astron's mineral separation plant in China and at third-party facilities.
|
Energy Fuels Inc. Technical Report – Donald Rare Earths and Mineral Sands Project, Victoria, Australia |
DPPL completed an "Updated Economics Study" on 14 July 2025 to support a FID for the Phase 1 operation following the receipt of major regulatory approvals including the Work Plan covering the initial 19 years of operation (Phase 1A area of 1,143 ha in MIN5532). This study was updated in the "Draft - Donald Project Revised Economics Study Q4 2025" report dated 19 December 2025.
Once commissioned, the combined Phase 1A and 1B operation will mine and process 7.5 million tonnes per annum (Mt/a) of ore and is expected to produce an average of about 192 thousand tonnes per annum (kt/a) of HMC and about 7,100 tonnes per annum (t/a) of REEC for the 40-year project life.
1.2 Geological setting and mineralization
The Murray Basin is a low-lying, saucer-shaped intracratonic depression in southeastern Australia hosting thin, flat-lying Cainozoic sediments overlying deformed early Palaeozoic turbidites, volcanic and volcaniclastic rocks of the Lachlan Fold Belt. A succession of Tertiary freshwater, marine, coastal and continental sediments containing HM were deposited into the basin.
The Late Miocene to Late Pliocene Loxton Sand is the host sequence to all the known HM sand deposits in the Murray Basin. These deposits are of two principal types: the coarser-grained strandline occurrences and the finer-grained "WIM-style" accumulations. The strandline-style deposits occur along the seaward face of ancient shorelines and are the result of concentration and winnowing in a littoral environment. The WIM-style deposits, named after the Wimmera area of the Murray Basin, consist of a solitary or composite broad, lobate sheet-like body of highly sorted HM associated with fine grained, micaceous sand with considerable areal extent. These deposits are thought to represent accumulations formed below the active wave base in a near-shore environment, possibly representing the submarine equivalent of the strandline-style deposits. The WIM-style deposits are typically considerably larger in tonnage and lower in grade than the strandline deposits. The HM sand deposits are typically buried beneath Quaternary and Tertiary aged fluvial sediments.
The WIM-style HM sands in the Property are concentrated mainly within the lower units (LP2 and LP3) of the Loxton Sand, which ranges in thickness from 10 m to 15 m. HM concentrations decrease in grade towards the top of the fine-grained LP2 unit. A medium to coarse-grained sand unit (Loxton Sand LP1) overlies the fine-grained LP2 unit.
North-south trending, discrete higher-grade zones have formed within the greater Donald deposit, presenting a focus for the initial stages of the mining operation. To the west, the mineralization deepens and overburden increases. On the southern margins, the fine-grained, silty HM sand disperses in an east-west direction following silty clay units, which are interpreted as washout zones that tend to contain no HM.
The Loxton Sand is overlain by clays of the Pliocene to Holocene Shepparton Formation, which range in thickness from 5 m to 20 m. "Stringer" sands of the overlying Quaternary Woorinen Formation develop as discontinuous or meandering channels of up to 10 m in thickness within the Shepparton Formation clays. The drillhole geology shows that the top of the Loxton Sand at the Donald deposit is reached at a depth of around 9 m, depending on local topography such as sand dunes.
The HM sand deposit typically comprises the following minerals of economic interest:
• Zircon
• Rutile (and anatase)
• Leucoxene
• Ilmenite
• Monazite
• Xenotime.
|
Energy Fuels Inc. Technical Report – Donald Rare Earths and Mineral Sands Project, Victoria, Australia |
Zircon is rich in the element zirconium. Rutile (and anatase), leucoxene and ilmenite contain titanium. Monazite and xenotime contain rare earth elements (REEs).
1.3 Exploration and drilling
The Property has been subject to several major evaluation campaigns by three companies: Conzinc Rio Tinto Australia (CRA) from 1985 to 1991; Zirtanium Ltd from 2002 to 2004 and Astron from 2010 to 2022 and in 2025. There has been no previous mine production within the Property.
To date, 847 holes for a total of 20,622.9 m have been drilled within MIN5532 and a further 805 holes for a total of 20,944 m within the surrounding RL2002. This includes 133 pre-production, grade control (GC) and 10 sonic holes drilled within MIN5532 during 2025 for a total of 3,637.5 m. All holes were vertical and orientated perpendicular to the sub-horizontal mineralized horizon. Most holes were drilled using reverse circulation aircore (AC) with 82 holes in MIN5532 drilled by the sonic method for verification of the AC drilling, geotechnical and metallurgical testwork. In addition, groundwater monitoring bores were drilled.
Some problems with recovery were experienced in the pre-2004 drilling with refinements subsequently made to the drilling equipment and technique to improve recovery. In the 2002 Zirtanium drilling program, poor HM% correlation with the CRA drilling was reported. These results were disregarded for the Mineral Resource estimate, with the holes used for geological interpretation only.
For the 2004, 2010 and 2015 drilling programs, the entire sample from each 1 m interval was collected at the drill rig with the samples dried before splitting to remove any uncertainty from the splitting of wet samples at the drill rig. In 2022, the 1 m samples were split at the drill rig using a rotary splitter with attention paid to cleaning and minimizing contamination under the supervision of an Astron representative. The sample splits were deemed acceptable and quality control data indicated that the data from the 2022 drill program is of a high quality and suitable for resource estimation. All GC samples collected in 2025 are from the entire 1 m interval and samples were split at the assay laboratory. Recovery factors were not applied to the data.
1.4 Sample preparation, analyses, and data verification
Definition of Area 1 and Area 2 was defined based on the various drilling programs for data analysis and grade estimation for the 2022 and subsequent 2025 Mineral Resource estimate. Only assay data from the 2022 drilling program were used for the MIN5532 (Phase 1) Mineral Resource estimate in Area 1. Assay data from the 2004, 2010 and 2015 drilling programs were used for resource estimation in Area 2. The area covered by the 2022 drilling is coded as Area 1 and encompasses 97% of the total area of MIN5532.
Data from the CRA drillholes were used for geological interpretation only, due to the historical nature of the data and inconsistencies in the size fractions and analytical methodologies with the data obtained in 2022. Analytical laboratories Western GeoLabs in Perth and Titanatek were used by Zirtanium; however, no details are available on their accreditation. The sample preparation and analytical process involved drying, crushing, screening, desliming and centrifugal heavy liquid separation of the +38 μm/-1 mm fraction for HM (%) calculation and mineralogy analysis (+38 µm/-90 µm fraction).
From 2010, Astron adopted similar sample preparation and analytical procedures to those used by Zirtanium at Western GeoLabs. Analytical work for the 2022 drill program was performed by independent laboratory Bureau Veritas at its Adelaide, South Australia facility (ISO/IEC 17025 (2017) accreditation). The sample preparation and analytical process was:
• Oven dry samples
• Break up clays in bag with mallet
• Rotary split 500 g for testwork with an additional 500 g split off every 28th sample for the laboratory duplicate
• Soak overnight in a 1% tetrasodium pyrophosphate (TSPP) solution
|
Energy Fuels Inc. Technical Report – Donald Rare Earths and Mineral Sands Project, Victoria, Australia |
• Wet screen at 20 µm, 250 µm and 1 mm to create an in-size sample of between 20 µm and 250 μm
• Dry and weigh in-size and oversize samples
• Rotary split off approximately 100 g for heavy liquid separation
• Centrifugal and heavy liquid separation using tetrabromoethane (TBE), >2.96 g/cm3 specific gravity (SG)
• Wash, dry and weigh sinks.
Total HM was measured in the +20 μm/-250 μm fraction and reported as a percentage of the whole sample. Mineralogy on 53 composite samples, generated from individual samples of >1% total HM from the 227 holes drilled in 2022 was also performed by Bureau Veritas using x-ray fluorescence spectrometry (XRF), laser ablation inductively coupled plasma mass spectrometry (ICP-MS) and QEMSCAN® analysis.
Quality control data for the 2004 drill program included interlaboratory analysis of duplicate samples. The results were good, with correlation coefficients of over 0.94 for total HM, slimes and oversize. AMC reviewed the quality control data for laboratory repeat analysis of drill samples from the 2010 drilling and field duplicate and laboratory repeat analysis of drill samples from the 2015 drilling. AMC reported that the 2015 field duplicates showed a bias for total HM and oversize. For the MIN5532 (Phase 1) Mineral Resource, this data was used for estimation within Area 2 only.
Quality assurance and quality control (QAQC) procedures for the 2022 drilling program included insertion of standards and field duplicates at the drill site (rate of 1 in 40). Blank samples were not inserted and are generally not used in the mineral sands industry. In addition, duplicate and standard samples were inserted by the laboratory. Performance of the standard samples throughout the program was considered moderately acceptable and no bias was noted for HM, slimes or oversize contents over time. The field duplicate samples showed no overall bias for total HM and a small bias to lower slimes and oversize contents in the duplicate samples. The duplicate analysis indicates good overall precision. The results from internal laboratory standards and duplicates were reviewed by Snowden Optiro and the overall performance of the analyses was deemed acceptable. The Qualified Person concluded that the data from the 2022 drill program is of a high quality and suitable for resource estimation. There is less confidence in the assay data from the 2004, 2010 and 2015 drill programs, which was limited to resource estimation in Area 2.
No issues were noted by the Qualified Person from verification work completed on data management, surveying, sample security and sample analysis. There were no drilling or sampling programs in progress during the time of the Qualified Person's site visit in August 2024.
1.5 Mineral processing and metallurgical testwork
The finer grained (generally <90 μm) WIM-style HM historically were not suited to simple gravity separation and to achieve effective selectivity and recovery, attritioning has been required to remove the iron staining and clay cementation to present clean particle surfaces for a flotation stage.
The development of a new spiral in the late 1990s (the FM1 and subsequently the MG12) was effective in separating HM down to around the 20 μm particle size and pilot plant testwork on a bulk sample from a test pit at the Donald deposit in the mid-2000s was successful in producing a pre-concentrate. From 2010, ongoing testwork developed a gravity spiral and flotation flowsheet to produce an HMC.
To reduce flowsheet risk, a confirmatory testwork program using samples from a sonic drilling program commenced in 2015 for both the gravity circuit to produce HMC and downstream processing to final products. Continued re-assessment of the project from mining operations through the process flowsheet and product transport logistics, identified further opportunities for reducing capital, operating and product handling costs. The 2008 Environment Effects Statement (EES) conditions also prevented a mineral separation plant (MSP) on the project site, requiring the HMC to be transported elsewhere for sale or treatment.
A substantial body of testwork at pilot scale as well as additional testwork confirming the final flowsheet design and the response of ore samples extracted from the first few years of mining has been carried out since 2018. In 2019, a 1,000 metric tonne (t) bulk sample from the re-opened test pit was shipped to the Corridor Sands operation in Queensland where a pilot wet concentration plant (WCP) was constructed. After attritioning, the reprocessed HMC was floated in a continuous pilot flotation facility at an independent laboratory in Western Australia, which produced a quantity of on-spec rare earth concentrate grade at a high recovery. Further bulk samples from a sonic drilling program specifically targeting the first few years of mining were recovered and processed in 2022.
|
Energy Fuels Inc. Technical Report – Donald Rare Earths and Mineral Sands Project, Victoria, Australia |
Characteristics of the HMC produced (which were all in line with previous results) were:
• An average particle size of 50 μm
• 94.3% HM assaying 33.1% TiO2 with 17.9% ZrO2 and 0.87% CeO2
• An estimated radioactivity of 12 becquerels per gram (Bq/g), as expected from the elevated HM grade
• The mass balance produced slightly lower overall recoveries than the continuous and integrated pilot plant as this testwork was carried out without the ability to recycle between stages
• Concentrate upgrade plant (CUP) processing of the raw HMC to separate minerals containing REEs returned results in accordance with previous testwork
• The opportunity to further streamline the CUP flowsheet by eliminating gravity (tabling) upgrading of the rare earth flotation concentrate was identified.
The final flowsheet comprises:
• Scrubbing for disaggregation
• Ex-pit trommel at 10 mm prior to pumping to the WCP
• At the WCP, screen the slurry at 1 mm to reject residual oversize that has not been further deagglomerated in pumping and transport
• Single stage hydro-cyclone desliming to reject -20 μm slimes
• Retention in a Lyons Feed Control Unit (LCFU) surge bin
• Mass flow and density-controlled feed to a rougher, middlings scavenger and cleaner gravity spiral circuit using MG12 spirals
• Interstage fine screening at 250 μm ahead of the final recleaner stage using HG10i spirals to produce a raw HMC
• Selective flotation of the rare earth minerals in the raw HMC into a concentrate with filter cake drummed and containerized for transport
• Filtering, stockpiling and loading of the final high-grade, rare earth free HMC into half-height containers for transport.
Table 1.1 summarizes the metallurgical performance including stagewise recoveries of HM and the valuable components from the in-size HM fraction as well as target HM grades at each process stage and final product grades.
Table 1.1 Metallurgical performance summary
| Stage wise recovery and grade parameters |
MUP recovery |
WCP recovery |
CUP recovery |
CUP recovery |
Overall recovery to HMC |
Product grade |
| From | ROM | WCP feed | Raw HMC | Raw HMC | ROM | HMC |
| To | WCP feed | Raw HMC | HMC | REEC | HMC, REEC | REEC |
| Oversize (+250 µm) | 6.4% | 0.0% | 0.0% | 0.0% | 0.0% | - |
| Slimes (-20 µm) | 17.4% | 0.0% | 0.0% | 0.0% | 0.0% | - |
|
Energy Fuels Inc. Technical Report – Donald Rare Earths and Mineral Sands Project, Victoria, Australia |
| Stage wise recovery and grade parameters |
MUP recovery |
WCP recovery |
CUP recovery |
CUP recovery |
Overall recovery to HMC |
Product grade |
| Sand (+20 µm/-250 µm = in-size) | 78.6% | 5.5% | 95.7% | 3.0% | 4.3% | - |
| Mass yield | 61.6% | 5.2% | 95.7% | 3.0% | 3.2% | - |
| Total HM (+2.85 g/cm3 SG; in-size) | 89.0% | 77.9% | 96.1% | 3.2% | 66.7% | - |
| TiO2 (in total HM; in-size) | 99.4% | 70.7% | 99.2% | 0.6% | 69.7% | 33.5% |
| ZrO2 (in total HM; in-size) | 99.6% | 94.3% | 99.0% | 1.0% | 93.0% | 14.6% |
| CeO2 (in total HM; in-size) | 99.5% | 94.5% | 1.9% | 97.5% | 91.7% | 21.3% |
| Y2O3 (in total HM; in-size) | 99.5% | 94.5% | 2.2% | 97.2% | 91.4% | 11.6% |
| Total HM grade | 6.3% | 94.3% | 94.8% | 99.0% | - | - |
Source: Astron, 2023a
Notes: Assumes no oversize in raw HMC, HMC and REEC. Assumes no slimes in HMC and REEC.
1.6 Mineral Resource estimate
The Mineral Resource estimate, which is within MIN5532 and includes part of RL2002 (to the south of MIN5532), contains data from a total of 844 vertical AC drillholes (for a total of 20,648 m) and one Calweld drillhole (for a total of 19 m) drilled by CRA, Zirtanium and Astron. Assay data from 82 sonic drillholes (for a total of 1,948.9 m), drilled for bulk density, geotechnical and metallurgical testwork and verification of the AC drilling. Data from the pre-production AC GC holes drilled during 2025 were not used for the 2025 Mineral Resource estimate. Density data from sonic holes were used for tonnage estimation.
The Mineral Resource was estimated in 2022, and this model was updated in 2025 to include updated density data and estimates of rare earth oxides (REOs). In addition, the monazite was re-estimated using data from ICP-MS analysis rather than XRF data, as was used for the 2022 Mineral Resource estimate.
Geological information from all historical drilling campaigns was used to inform the geological interpretation for resource modelling. Sample assay data (including mineral assemblage data) derived from the 2022 drilling program were used for grade estimation within Area 1. Assay data from the 2004 drilling program (assayed using the +38 µm/-90 µm fraction) and data from the 2010 and 2015 drilling programs were also used for HM, slimes and oversize estimation in Area 2. Data from the 2004 drilling was also used for estimation of the mineral assemblage components within Area 2.
Four lithological surfaces were interpreted for the resource model (top of Loxton Sand, base of LP1, base of LP2, and base of LP3) using all available geological logging data. Surfaces were interpreted to define the top and base of the mineralization using a nominal 1% total HM cut-off grade from the total HM contained within the +20 μm/-250 μm fraction (following calibration of the data from the -38 μm and the +38 μm/-90 μm fractions to the -20 μm and +20 μm/-250 μm fractions within Area 2).
Data compositing was not required, as all the sample intervals with assay data were 1 m. A hard boundary was used for variography and grade estimation of total HM within the mineralized horizon in LP1, LP2 and LP3. Examination of the slimes and oversize data indicated a gradational boundary from the mineralized domains to the surrounding material within LP1 and LP2 and soft boundary conditions were used for variography and grade estimation of slimes and oversize within these domains.
The distributions of the total HM, slimes and oversize data within each geological unit and within the mineralized horizon are positively skewed; however, the total HM, slimes and oversize all have low coefficients of variation (less than 0.95). High-grade outliers are not present and so top cut grades (cap grades) were not applied.
Variogram analysis was undertaken using a normal scores transformation to determine the total HM, slimes and oversize continuity. Kriging neighbourhood analysis was carried out to optimize the block size, number of samples used for grade estimation, search ellipse dimensions and the block discretization.
|
Energy Fuels Inc. Technical Report – Donald Rare Earths and Mineral Sands Project, Victoria, Australia |
The mineral assemblage data was attributed to each drillhole interval that was incorporated into the composite sample, and the data was coded using the wireframe surfaces for the mineralized horizon and each geological sequence. Along-strike and across-strike variograms were examined for rutile, leucoxene, ilmenite, zircon, monazite and xenotime.
Block grades for total HM were estimated using both ordinary kriging (OK) and inverse distance squared (ID2) techniques, and block grades for slimes and oversize were estimated using OK techniques. The OK HM estimate was used for Mineral Resource reporting and the ID2 estimate was used for validation of the OK estimate. The block model has a parent block size of 100 mE by 200 mN by 1 mRL. The parent blocks were allowed to sub-cell down to 25 mE by 50 mN by 0.25 mRL to more accurately represent the geometry and volumes of the geological units and the mineralization horizon. Grade estimation was into the parent blocks and a three-pass search scheme was used.
Block grades for the mineral assemblage components (all titania mineral subdivisions, zircon, monazite, and xenotime) and TiO2, ZrO2+HfO2 and REOs were estimated using inverse distance cubed (ID3) techniques and grade estimation was into the parent blocks.
The estimated grades in the resource model were validated by:
• Visual comparison of the drillholes and blocks
• Comparing the mean input grades with the estimated block grades
• Examining trend plots of the input data and estimated block grades by easting, northing and elevation slices.
Data from a total of 149 density samples, collected from test pits in 2005 (nuclear density measurements) and 2018 (sand replacement), from nuclear density measurements in 2024, and from sonic drill core samples in 2022, 2024 and 2025 were used to determine average density values for the Shepparton Formation and LP1, LP2 and LP3. These average density values were applied for tonnage estimation of the 2025 Mineral Resource.
The 2025 Mineral Resource estimate was classified into the Measured, Indicated and Inferred categories, taking into account data quality, data density, geological continuity, grade continuity and confidence in the estimation of HM content and mineral assemblage. Measured and Indicated Mineral Resources were defined Area 1 (covered by the 2022 drilling on a nominal spacing of 250 mE by 350 mN) and where the mineral assemblage was determined by QEMSCAN®, XRF and ICP-MS analysis. The eastern area of LP1 (Domain 210 - outside of mineralized horizon) and the LP3 unit within the area of 2022 drilling were classified as Indicated. Domain 210 is thinner in the east and grade estimation was supported by sparser data compared to the western area. Inferred Resources were not defined in the area drilled in 2022. Mineral Resources were classified as Indicated and Inferred in Area 2 (outside of the 2022 drilling) as the historical nature of the data, and changes in the grain size and data calibration reduced confidence in the data used for estimation. The LP2 unit was classified as Indicated where mineral assemblage data was obtained from the 2004 drilling and was classified as Inferred where there was a lack of mineral assemblage data. Mineral Resources within LP1and LP3 were classified as Inferred in Area 2.
The 2025 Mineral Resource for the Donald deposit within MIN5532 exclusive of the Mineral Reserve reported above a cut-off grade of 1.0% total HM is summarized in Table 1.2.
The Donald 2025 Mineral Resources have been classified in accordance with the definitions for Mineral Resources in S-K 1300, which are consistent with the CIM Definition Standards for Mineral Resources & Mineral Reserves (the 2014 CIM Definition Standards) incorporated by reference in NI 43-101.
|
Energy Fuels Inc. Technical Report – Donald Rare Earths and Mineral Sands Project, Victoria, Australia |
Table 1.2 Donald Mineral Resource exclusive of Mineral Reserves within MIN5532 as of 31 December 2025 (100% equity)
| Classification | Tonnes (Mt) |
Density (t/m3) |
Total HM (%) |
Slimes (%) |
Oversize (%) |
% of total HM | |||||
| Zircon | Rutile | Leuco- xene |
Ilmenite | Monazite | Xenotime | ||||||
| Measured | 71 | 1.8 | 4.1 | 14 | 9 | 16 | 7.3 | 24 | 20 | 1.7 | 0.66 |
| Indicated | 26 | 1.7 | 3.2 | 23 | 10 | 16 | 5.8 | 18 | 18 | 1.8 | 0.64 |
| Measured + Indicated | 96 | 1.7 | 3.9 | 17 | 9 | 16 | 7.0 | 23 | 20 | 1.7 | 0.66 |
| Inferred | 21 | 1.7 | 2.3 | 22 | 14 | 13 | 6.9 | 19 | 19 | 1.2 | 0.51 |
| Classification | Tonnes (Mt) |
Total HM (%) |
% of total HM | ||||||||
| ZrO2+ HfO2 |
TiO2 | CeO2 | Y2O3 | Pr6O11 | Nd2O3 | Dy2O3 | Tb4O7 | TREO | |||
| Measured | 71 | 4.1 | 11 | 33 | 0.48 | 0.28 | 0.058 | 0.21 | 0.041 | 0.0065 | 1.46 |
| Indicated | 26 | 3.2 | 10 | 28 | 0.50 | 0.28 | 0.061 | 0.22 | 0.041 | 0.0065 | 1.50 |
| Measured + Indicated | 96 | 3.9 | 11 | 32 | 0.48 | 0.28 | 0.059 | 0.21 | 0.041 | 0.0065 | 1.47 |
| Inferred | 21 | 2.3 | 9 | 30 | 0.34 | 0.23 | 0.041 | 0.15 | 0.032 | 0.0049 | 1.07 |
Notes:
1.7 Mining and Mineral Reserve estimates
MIN5532 will be mined using a conventional strip-mining method, designed as about 500 m wide strips separated by in-situ ore bunds between the strips. Each strip comprises a series of 500 m wide and 250 m long mining blocks separated by bunds constructed from overburden stripped from the active mining area. The mining blocks will be extracted in a progressive sequence within each strip, before shifting to a new strip. Wells will be used to dewater the active mining area and the active tailings cell.
Process tailings will be returned to tailings cells constructed in the void left behind the active mining block. A downstream embankment will be constructed between the active tailings block and active mining block. Waste overburden will be backfilled behind the active tailings cell and above consolidated tailings.
The mining contract will include topsoil and subsoil stripping, overburden stripping, ore mining to an in-pit mine upgrade plant (MUP) using bulldozer push, construction of the tailings cells, overburden backfilling and subsoil and topsoil replacement and contouring. The bulldozer push to a tracked MUP reduces reliance on truck haulage on potentially soft pit floors. Final rehabilitation will be carried out by other specialized contractors.
|
Energy Fuels Inc. Technical Report – Donald Rare Earths and Mineral Sands Project, Victoria, Australia |
The 2025 Mineral Resource block model and 2025 GC model were used to generate the 2025 Mineral Reserve estimate. To accommodate the wall angles in the pit optimization process and to provide better resolution of the mining boundaries, the resource model was re-blocked to 25 mE by 25 mN by 1.0 mRL cell size. A slope angle of 20° and a 6% ore loss to account for in-situ bunds were applied. The mining costs used for the pit optimization were developed from contractor costs, and processing costs from the process design consultant. Processing recoveries were supplied by Metmac Services Pty Ltd. Product prices were supported by market analysis reports.
The pit optimization considered the Measured and Indicated Mineral Resource model blocks only within the MIN5532 boundary, with all Inferred and unclassified blocks treated as waste. The pit optimization generated a series of nested pit shells for a range of revenue factors (RFs) ranging from 10% (RF10) to 110% (RF110) of the base case prices. There was very little change in the optimization results beyond the RF60 pit shell because the economic pit was constrained by the MIN5532 boundary. The RF50 shell, which targets the higher-grade areas within the Work Plan area (Phase 1A), was selected for the initial mining area and the RF70 shell, which covers the entire MIN5532 area, was selected for the remaining MIN5532 mine life.
The cut-off for defining ore, has been increased to improve cash flow. The cut-off within the Work Plan Area was further increased to improve the initial cash flow and reduce payback. This has been achieved by raising the base of the mine and lowering the top of ore surface to exclude lower value material
The excavation was designed to exclude cultural and environmentally significant areas, the external tailings storage facility (TSF), the process plant footprint, roads and other support facilities. An offset of 100 m was used from the MIN5532 boundary to the crest of the closest pit excavation. The floor of the mine design was a surface created from the combined RF50 and RF70 shells.
The Measured Mineral Resource component was classified as a Proven Mineral Reserve and Indicated Mineral Resource was classified as a Probable Mineral Reserve. The Donald Mineral Reserve estimate within MIN5532 reported by AMC as of December 2025 is summarized in Table 1.3.
The information in this Technical Report that relates to the MIN5532 Mineral Reserve estimate is based on information compiled by Mr. Pier Federici and fairly represents this information. Mr. Federici is a Fellow of the Australasian Institute of Mining and Metallurgy and a full-time employee of AMC and is independent of DPPL, Astron and Energy Fuels. Mr. Federici has sufficient experience that is relevant to the style of mineralization and type of deposit under consideration and to the activity being undertaken to qualify as a Qualified Person as defined in NI 43-101 and S-K 1300.
The Mineral Reserve is in a granted Mining Licence in good standing with state and federal environmental approvals and an approved Cultural Heritage Management Plan (CHMP) in place over the Phase 1A Work Plan area within MIN5532. The Work Plan area covers 1,143.4 ha, of which Astron owns freehold titles over an area of 705 ha. The remaining freehold titles are contracted to DPPL with settlement scheduled at FID.
The Phase 1A Work Plan area will support mining for about 19 years. Mining over areas within MIN5532 outside the Work Plan area will require a CHMP and approval of a Work Plan amendment. There is an additional 1,646.6 ha of land within MIN5532 outside of the Work Plan area. DPPL will need to engage with those landowners to ensure appropriate access under MIN5532 is secured.
|
Energy Fuels Inc. Technical Report – Donald Rare Earths and Mineral Sands Project, Victoria, Australia |
Table 1.3 Donald Mineral Reserve within MIN5532 as of 31 December 2025 (100% equity)
| Class. | Tonnes (Mt) |
Total HM (%) |
Slimes (%) |
Over- size (%) |
Zircon (%) |
Mona- zite (%) |
Xeno- time (%) |
TiO2 (%) |
ZrO2+ HfO2 (%) |
Pr6O11 (%) |
Nd2O3 (%) |
Dy2O3 (%) |
Tb4O7 (%) |
TREO (%) |
| Proven | 255 | 4.5 | 15 | 9 | 17 | 1.7 | 0.68 | 34 | 11 | 0.057 | 0.20 | 0.042 | 0.0065 | 1.5 |
| Probable | 39 | 4.3 | 18 | 11 | 16 | 1.6 | 0.64 | 32 | 11 | 0.056 | 0.20 | 0.040 | 0.0062 | 1.4 |
| Total | 293 | 4.5 | 16 | 10 | 17 | 1.7 | 0.67 | 34 | 11 | 0.056 | 0.20 | 0.041 | 0.0064 | 1.4 |
Source: AMC, 2025a
Notes:
|
Energy Fuels Inc. Technical Report – Donald Rare Earths and Mineral Sands Project, Victoria, Australia |
1.8 Processing methods and infrastructure
The Phase 1 process flowsheet includes the following units:
• A tracked MUP located in the pit
• Screens, deslime hydro-cyclones, thickening plant
• A wet concentration plant (WCP)
• A concentrate upgrade plant (CUP), including a REEC packing plant
• A HMC storage and loading plant.
The process plant was designed at a nominal annual plant throughput of 7.5 Mt.
Run-of-mine (ROM) ore extracted from each mining block will be bulldozed and fed to the in-pit MUP situated close to the crest of the active mining face. The MUP has been designed to scrub and screen the ROM ore before pumping to the WCP, which can be relocated as it moves along the active mining strip. The main process plant and ancillary facilities will be situated in the northwestern corner of MIN5532.
ROM screens at the front end of the WCP have been designed to remove coarse (+1 mm) gangue particles from the scrubbed and screened (-10 mm) ROM material pumped from the MUP. Deslime hydro-cyclones will be positioned above the WCP surge bin to remove fine slimes from the ore slurry prior to entering the surge bin and subsequent spiral circuit. The WCP will include a series of spirals to separate the HM from the screened and deslimed ore.
The CUP will separate the minerals containing rare earth elements from the raw HMC produced in the WCP. This will be achieved by attritioning the HMC to ensure that the surfaces of all minerals are sufficiently exposed prior to the flotation circuit used to collect the rare earth minerals into the REEC. The flotation process uses various chemical reagents so the rare earth minerals float to the surface of the cell with the froth, while the remaining HM sink to the bottom of the cell. The CUP building will be sealed to prevent interference from the environment (rain and wind) and to limit personnel access and time spent in proximity of the product which contains radioactive mineral particles.
Dewatered REEC will be loaded directly from the product bin into 2-tonne bulka bags and loaded into half-height lined shipping containers that meet Class 7 radioactive material transport requirements. Containers will be sealed, weighed, labelled, and placarded in accordance with International Atomic Energy Agency (IAEA) regulations for Class 7 transport and all other applicable regulatory requirements. The filled containers will be stored on site until dispatched to Energy Fuels, who will be responsible for final disposal of the container liners.
The HMC storage facility will be in a separate structure where the product will be pumped from the CUP, dried and loaded into custom-built half height shipping containers with a front-end loader.
Ancillary process infrastructure includes a reagents storage and dosing facility and a flocculant storage and preparation plant for the safe delivery, storage and use of reagents.
Other site infrastructure will include an external TSF immediately south of the proposed process plant with 12 months capacity to store tailings until sufficient in-pit void space is available, a power substation and network, raw water supply, water treatment plant and access roads. Other ancillary facilities include administrative buildings, first aid building, ablution blocks, change rooms, crib rooms, laboratory, workshops, storage facilities and loading and delivery bays.
|
Energy Fuels Inc. Technical Report – Donald Rare Earths and Mineral Sands Project, Victoria, Australia |
1.9 Permitting, environmental and social
Following the 2008 EES, approval has been received under the Federal Environment Protection and Biodiversity Conservation Act 1999 (EPBC Act) in 2009 and renewed in 2018. The CHMP was approved for the Work Plan area in 2014 and the radiation licence obtained in 2015 and renewed in 2024. The HMC export license issued in 2016 has expired and a new permit is being sought to export the REEC (a permit is no longer required for the HMC owing to the changed composition).
DPPL's amended Phase 1A Work Plan, incorporating and addressing formal feedback and comments received from Earth Resources Regulator (ERR) Victoria and its referral agencies, was approved in June 2025. Other approvals in progress include infrastructure outside of MIN5532 relating to road upgrades, road decommissioning, and other secondary licences and permits for groundwater extraction and surface water capture. A Rehabilitation Plan was prepared in 2023, and DPPL is in the process of determining the closure cost estimate and required bond. Once determined, this will be submitted for approval with ERR. A Construction Rehabilitation Bond of $27 million has already been approved by the regulator.
The Phase 1 operations within MIN5532 cover arable, mixed-use freehold farming land. The Phase 1A Work Plan area encompasses 1,143.4 ha of land. DPPL currently owns freehold titles for a total of 705 ha within the Work Plan area. The remaining freehold titles are contracted to DPPL with settlement scheduled at FID.
In June 2022, DPPL established the Community Reference Group. Membership comprises 25 representatives of local community, business, agency stakeholders and DPPL. The Community Reference Group aims to facilitate information exchange from DPPL to stakeholders and to provide an avenue for community members to raise project-related issues. The Community Reference Group operates in an advisory capacity and does not hold regulatory authority.
1.10 Costs and economic analysis
The life of mine (LOM) capital cost and operating cost estimates for the 40-year mine life were developed to an AACE Class 2 level of accuracy (typically -15% to +15%) which meets the requirements for a feasibility study. The effective date of capital cost estimate is Q4 2025. The components of the pre-production capital cost estimate are summarized in Table 1.4.
Table 1.4 Pre-production capital cost estimate
| Description | Unit | Cost |
| Project development | $ M | 114.60 |
| Process plant | $ M | 188.44 |
| On-site infrastructure | $ M | 77.41 |
| Off-site infrastructure | $ M | 9.48 |
| Product transport and logistics | $ M | 1.85 |
| Mining | $ M | 48.24 |
| Total | $ M | 440.02 |
Source: DPPL
Sustaining capital costs (Table 1.5) were developed on a bottom-up basis consistent with the defined mining and processing strategy and the level of study supporting the FID. The estimate includes ongoing capital required to sustain operations over the LOM, such as mining equipment replacement and rebuilds, progressive in-pit tailings cell and embankment construction, mobile equipment additions, plant and infrastructure upgrades, and ongoing landform rehabilitation works. Cost allowances were derived from first principles estimates, vendor budget quotations, and benchmarking against comparable mineral sands operations, and were scheduled in the LOM model based on asset lives, production schedules, and maintenance strategies. Sustaining capital excludes initial development and pre-production capital and was prepared in real terms at the FID base date for inclusion in the cash flow model supporting the Mineral Reserve estimate.
|
Energy Fuels Inc. Technical Report – Donald Rare Earths and Mineral Sands Project, Victoria, Australia |
Table 1.5 LOM sustaining capital costs
| Description | Unit | Cost |
| Project development | $ M | 62.79 |
| Process plant | $ M | 36.14 |
| On-site infrastructure | $ M | 21.00 |
| Off-site infrastructure | $ M | 17.36 |
| Product transport and logistics | $ M | 0.18 |
| Mining | $ M | 18.02 |
| Total | $ M | 155.49 |
Source: DPPL
The LOM operating cost estimate summarized in Table 1.6 was developed from a range of quotes and benchmarking performed against other similar projects in Australia.
Table 1.6 LOM operating cost estimate
| Activity | Unit | Cost |
| Mining | $ M | 2,957.54 |
| Processing | $ M | 1,319.98 |
| Transport and logistics | $ M | 958.59 |
| G&A | $ M | 557.16 |
| Total | $ M | 5,793.27 |
Source: DPPL
Mining operating costs were developed by DPPL based on the detailed strip mining method defined for MIN5532 using unit costs provided by potential mining contractors submitted via tender. Costs were derived from first principles using estimated mining activities, including topsoil and subsoil stripping, overburden removal, ore mining and haulage to the process plant, construction of in-pit tailings cells, progressive backfilling, and landform rehabilitation. Unit rates reflect contractor-supplied pricing, equipment productivity assumptions, haulage profiles, material rehandling requirements, and allowances for operational delays.
Processing operating costs were developed by Mineral Technologies, based on the selected flowsheet, design throughput, reagent and consumable requirements, power and water consumption, and staffing levels. Costs were estimated from similar mineral sands operations and vendor quotations and scaled to the project operating parameters.
Tailings and residue management costs are included within the mining and processing cost estimates and reflect the in-pit tailings deposition strategy, embankment construction, dewatering, and progressive backfilling.
General and administrative (G&A) costs were estimated by DPPL and include site administration, technical services, environmental management, safety, and corporate overheads attributable to the operation.
Logistics, marketing and royalty costs were estimated by DPPL and include concentrate handling, transport, port charges, marketing costs, and applicable royalties. These costs were included in the cut-off grade determination and the LOM operating cost model.
All operating costs were prepared in real terms, at the FID base date, and were incorporated into the LOM cash flow model supporting the Mineral Reserve estimate.
There is a 2.75% government royalty and $30 million closure cost for MIN5532.
|
Energy Fuels Inc. Technical Report – Donald Rare Earths and Mineral Sands Project, Victoria, Australia |
The financial model developed for the Phase 1 project summarizes the annualized LOM plan with inputs derived from detailed mine planning, mining and processing schedules, and capital and operating costs. The model aligns to the key inputs as described in this Technical Report that underpin the overall project plan and is based on Proven and Probable Mineral Reserves only.
The LOM plan assumes ore mining at 7.5 Mt/a feeding the MUP. The resultant rougher head feed is processed in the WCP at a rate of about 1,060 t/h at 7,200 h/a, producing an average of approximately 192 kt/a of HMC and 7,100 t/a of REEC over the 40-year project life. HMC and REEC production is higher in the first six years because mining is initially focused within the RF50 shell and approved Work Plan area, which targets higher value mineral assemblages, resulting in a higher recoverable mineral output at a constant plant throughput.
Figure 1.1 presents a summary of annual (calendar year) post-tax cash flows to 2067. Initial capital expenditure commences in 2026. Following the initial investment period, which results in a maximum negative cash flow of about $473 million in mid-2027, payback is achieved in 2034. Over the LOM, the project generates a cumulative post-tax cash flow of about $3,000 million, a pre-tax and post-tax NPV of about $800 million and $496 million respectively, at an 8% discount rate applied to quarterly cash flows, with an IRR of 16%.
Figure 1.1 Donald Phase 1 LOM cash flow summary (100% equity)

Source: Snowden Optiro
A sensitivity analysis of the pre-tax financial model NPV considered a variety of value drivers to arrive at discrete upside and downside value impacts for:
• Pricing for REEC using the high/low prices reported in Item 22.1.2
• Pricing for HMC using the high/low prices reported in Item 22.1.1
• Operating costs (±10%)
• TiO2 recoveries (74.1% / 84.1%)
• ZrO2 recoveries (89.5% / 95.5%)
• US$ exchange rate (0.6/0.7)
• Discount rate (9%/7%)
• Capital costs (±10%).
|
Energy Fuels Inc. Technical Report – Donald Rare Earths and Mineral Sands Project, Victoria, Australia |
The most significant and material driver of project value is concentrate pricing (Figure 1.2).
Figure 1.2 LOM pre-tax NPV sensitivity analysis

Source: DPPL
1.11 Other relevant data and information
The June 2023 "pre-feasibility study" for the proposed Phase 2 development comprised:
• Duplication of the Phase 1 throughput with 7.5 Mt/a ROM material mined and processed within RL2002 to produce HMC and REEC
• Construction of a mineral separation plant (MSP) on MIN5532, sized to process the HMC equivalent of 15 Mt/a mined from both MIN5532 (Phase 1) and RL2002 (Phase 2), to separate the HMC into premium (ceramic) and secondary (chemical) grade zircon and final titania products.
The Phase 2 historical resource estimate for the extensions to the Donald deposit, outside of MIN5532 and contained within RL2002, was reported by AMC in 2016 based on data from 794 AC holes drilled by CRA, Zirtanium and Astron. All holes are vertical and the spacing varies from 125 mE by 450 mN to 500 mE by 500 mN and were analyzed for HM, slimes and oversize contents. Mineral assemblage data were obtained from composite samples from 348 drillholes on a spacing of approximately 200 mE by 450 mN. Adjustments were applied to the mineral assemblage data obtained prior to 2015 for ilmenite and rutile.
The RL2002 historical resource was classified and reported in accordance with the guidelines of the JORC Code (2012). The Qualified Person has not done sufficient work to classify the historical estimate as a current Mineral Resource in accordance with CIM Definition Standards for Mineral Resources & Mineral Reserves or S-K 1300 Definitions.
AMC also prepared the reserve estimate for Phase 2 using the 2016 historical resource estimate and studies completed on RL2002 by Astron, which included cost and price inputs, a strategic mine schedule and recovery rates. AMC updated the inputs and assumptions where appropriate, using external sources such as contractor prices, its in-house proprietary tool to estimate mining and operating costs from first principles, and experience with similar mining projects. The results were also compared with benchmarks. The basis of the 2023 reserve estimate and related assumptions were established to a ±25% level of accuracy. The methodology in determining the reserve estimate was similar to that adopted for the Phase 1 Mineral Reserve estimate.
The RL2002 reserve was initially classified in accordance with the guidelines of the JORC Code (2012). The Qualified Person has not done sufficient work to classify the historical estimate as a current Mineral Reserve and the estimate does not meet CIM Definition Standards for Mineral Resources & Mineral Reserves and S-K 1300 Definitions.
|
Energy Fuels Inc. Technical Report – Donald Rare Earths and Mineral Sands Project, Victoria, Australia |
The following material issues have been identified by the Qualified Person responsible for the review of the reserve estimate regarding modifying factors that may materially affect the progress of Phase 2 and the future conversion of Mineral Resources to Mineral Reserves:
• The reserve is in a Retention Licence without the necessary and state and federal approvals and permits in place for mining, environmental, cultural and social issues.
• DPPL has limited freehold ownership over the surface of RL2002 outside of MIN5532. There is no guarantee that land can be purchased or accessed in a timely manner to allow production to proceed.
• The reserve is based on a study at ±25% accuracy completed in June 2023. The HM and REE concentrate prices, and capex and opex assumptions used in the study are subject to review to reflect current market conditions.
• The financing and timing for the commencement of the Phase 2 operation has yet to be determined.
1.12 Conclusions and recommendations
Key conclusions of this Technical Report include:
• The Phase 1 project (MIN5532) comprises 293 Mt of Proven and Probable Mineral Reserves at 4.5% total HM.
• The 40-year Phase 1 LOM plan involves a 7.5 Mt/a open pit mining operation using conventional strip mining. Ore will be processed through a MUP, WCP and CUP to produce HMC and REEC for sale under offtake agreements with Astron and Energy Fuels respectively.
• The first capital expenditure is in 2026. Following the initial investment period, which results in a maximum negative cash flow of about $473 million in mid-2027, payback is achieved in 2034. Over the LOM, the project generates a cumulative post-tax cash flow of about $3,000 million, a post-tax NPV of about $496 million at an 8% discount rate applied to annual cash flows, with an IRR of 16%. The financial model is highly sensitive to HMC and REEC pricing, making commodity price fluctuations a critical factor. The Phase 1A operation covering the first 19 years of the LOM plan has key approvals in place for the Work Plan area, including federal environmental permits, a CHMP and a radiation licence. Key outstanding critical path items include final land acquisitions and approval of the REEC export licence.
The future development of Phase 2 will be subject to the receipt of additional approvals, securing the required surface rights and completion of a feasibility study.
Key recommendations include:
• Improving Mineral Resource confidence through additional drilling and data calibration
• Optimizing tailings handling and pit sequencing to reduce costs and enhance mine efficiency
• Strengthening financial and cost management with refined estimates, bulk purchasing strategies and lease vs purchase evaluations
• Securing HMC offtake agreements and financing options to mitigate revenue uncertainty and attract investment
• Enhancing stakeholder engagement and permitting efforts for long-term project viability.
|
Energy Fuels Inc. Technical Report – Donald Rare Earths and Mineral Sands Project, Victoria, Australia |
2 Introduction
2.1 Terms of reference
This Technical Report was prepared for Energy Fuels to support the disclosure of Exploration Results, Mineral Resources and Mineral Reserves for Phase 1 of the Donald Rare Earths and Mineral Sands Project, a mineral exploration and development property located in western Victoria, Australia.
This Technical Report satisfies the requirements of Canadian NI 43-101 and the SEC's Modernized Property Disclosure Requirements for Mining Registrants as described in Subpart 229.1300 of Regulation S-K Disclosure by Registrants Engaged in Mining Operations (S-K 1300), and Item 601 (b)(96) Technical Report Summary.
The Technical Report was authored by the following Qualified Persons (as such term is defined under NI 43-101 and S-K 1300):
• Mr. Allan Earl and Mrs. Christine Standing of Snowden Optiro, a business unit of Datamine Australia Pty Ltd (Snowden Optiro) were responsible for the preparation of this Technical Report, including the review of the geology, Mineral Resource estimates, mine planning, mining capital and operating cost estimates and the economic analysis.
• Mr. Peter Allen of GRE and an Associate of Snowden Optiro was responsible for the review of the metallurgy, processing, infrastructure and processing capital and operating cost estimates.
• Ms. Gené Main and Mr. Peter Theron of Prime Resources and Associates of Snowden Optiro were responsible for the review of the tailings dam, environmental studies, permitting and social.
• Mr. Pier Federici of AMC was responsible for the review of the Mineral Reserve estimates.
Mr. Earl completed a two-day site visit to the Property in August 2024. The site visit included an inspection of the proposed mining area, an inspection of the core shed, the collection of samples for check analysis, confirmation of a previous drillhole collar location (DM170) within rehabilitated agricultural land, a visit to nearby towns and an inspection of the likely service areas.
Mr. Pier Federici conducted a site visit to the Property in July 2013. The purpose of the visit was to familiarize himself with the site conditions, including existing mining activities, proposed pit limits, waste dump locations, site drainage and geotechnical considerations, access to the deposit, general landforms, and areas of vegetation proposed to be preserved. During the visit, Mr. Federici also observed sample preparation activities. In Mr. Federici's opinion, no material changes have occurred at the site since the time of the visit that would materially affect the Mineral Reserve estimate.
Site visits were not carried out by the other Qualified Persons, as there was no additional work or development completed at the Property that would contribute materially to the technical information and data provided. Mrs. Standing has previously conducted site visits to the WIM 150 and Avonbank WIM-style deposits in the Murray Basin.
All the Qualified Persons are eligible members in good standing of a recognized professional organization (RPO) within the mining industry and have at least five years of relevant experience in the type of mineralization and type of deposit under consideration and in the specific type of activity that the Qualified Person is undertaking as disclosed in Table 2.1 at the time this Technical Report was prepared.
|
Energy Fuels Inc. Technical Report – Donald Rare Earths and Mineral Sands Project, Victoria, Australia |
Table 2.1 Responsibilities of each Qualified Person
| Qualified Person | Employer | Qualifications and affiliation |
Details of site inspection |
Responsibility |
| Mr. Allan Earl | Snowden Optiro | AWASM, FAusIMM | 27-28 August 2024 | Snowden Optiro's Qualified Person responsible for this report. Review of property description, data verification, mining, mining costs and economic analysis. Items 1-6, 16, 19, 21.1.7, 21.3.1, 21.3.3-21.3.4, 21.4, and 22-29. |
| Mrs. Christine Standing | Snowden Optiro | BSc (Geol), MSc (Min Econs), MAIG | - | Review of history, geology, drilling, sample preparation and analysis, data verification, Mineral Resources. Items 7-12 and 14. |
| Mr. Peter Allen | Snowden Optiro | BE(Metallurgy), MAusIMM (CP) | - | Review of metallurgy, processing, infrastructure, and processing and infrastructure costs. Items 13, 17, 18.1 and 18.3-18.9, 21.1.1 -6, 21.2, 21.3.2 - 21.3.4 |
| Ms. Gené Main | Snowden Optiro | MSc (Botany), Member EAPASA; Pr.Sci.Nat. SACNASP | - | Review of environmental studies, permitting and social. Items 20.1 and 20.3-20.6. |
| Mr. Pier Federici | AMC | FAusIMM (CP Min) | July 2013 | Mineral Reserves. Items 15. |
| Mr. Peter Theron | Snowden Optiro | B Eng (Civil), MSAIMM, Pr Eng ECSA | Items 18.2 and 20.2. |
Unless otherwise stated, the information and data contained in this Technical Report or used in its preparation was provided by the Property owner, Astron Limited (Astron). The Qualified Persons of this Technical Report reviewed information and documents provided by Astron via a virtual data room. The primary information sources were the "Donald Rare Earth & Mineral Sands Project Phase 1 - Definitive Feasibility Study" dated 27 April 2023, the "Donald Rare Earth & Mineral Sands Project Phase 2 - RL2002 Pre-feasibility Study Report" dated 26 June 2023, the "Donald Rare Earths & Mineral Sands Project Updated Economics Study" for Phase 1 dated 14 July 2025 and the "Draft - Donald Project Revised Economics Study Q4 2025" report for Phase 1 dated 19 December 2025. The virtual data room also included internal company technical reports, diagrams and maps, spreadsheets and reports prepared by Astron's external consultants.
Further information was received from the Astron representatives listed in Table 2.2 in response to queries submitted by Snowden Optiro.
Table 2.2 Astron information sources
| Name | Position |
| Mr. Sean Chelius | Donald Project Director |
| Mr. Peter Coppin | Senior Geologist |
| Mr. Greg Bell | Chief Financial Officer |
The Property comprises two areas:
• Mining Licence 5532 (MIN5532) area where the licence holder is entitled to mine the land covered by the licence; explore for minerals and construct mining facilities related to the mining operation
• Retention Licence 2002 (RL2002) where a resource has been identified but the resource is not yet commercially viable to mine or is required to support an existing mining operation in the future.
|
Energy Fuels Inc. Technical Report – Donald Rare Earths and Mineral Sands Project, Victoria, Australia |
The Donald Mineral Resources and Mineral Reserves with MIN5532 were initially classified under the 2012 edition of the Australasian Joint Ore Reserves Committee Code (JORC Code, 2012). The confidence categories assigned under the JORC Code (2012) were reconciled to the confidence categories in the Canadian Institute of Mining, Metallurgy and Petroleum (CIM) Definition Standards for Mineral Resources and Mineral Reserves (2014 CIM Definition Standards) and reported in compliance with NI 43-101 and
S-K 1300. For MIN5532, the confidence category definitions are the same and no modifications to the confidence categories were required. The RL2002 historical resource and reserve estimates disclosed in Item 24 were classified under the JORC Code (2012) and have not been adjusted to conform with NI 43-101 or S-K 1300. Energy Fuels is not treating the historical estimates as a current Mineral Resources or Mineral Reserves and are disclosed for background purposes only and should not be relied upon.
The Qualified Persons listed in Table 2.1 were responsible for this Technical Report and declare that they have taken all reasonable care to ensure that the information contained in this report is, to the best of their knowledge, in accordance with the facts and contains no material omissions.
In preparing this report, the Qualified Persons have extensively utilized information collated by other parties. The Qualified Persons have critically examined this information, made their own enquiries, and applied their general mineral industry competence.
The Qualified Persons believe that their opinions must be considered as a whole, and that selection of portions of the analysis or factors considered by them, without considering all factors and analyses together, could create a misleading view of the process underlying the opinions presented in this Technical Report. The preparation of a Technical Report is a complex process and does not lend itself to partial analysis or summary.
A draft copy of this Technical Report was provided to Astron and Energy Fuels for review on omission and factual accuracy. The Qualified Persons who have authored this Technical Report do not disclaim responsibility for the contents of this report.
The effective date of this Technical Report is 31 December 2025. As at the effective date of this Technical Report, none of the Qualified Persons had an association with Astron or Energy Fuels or their respective employees, or any interest in the securities of Astron or Energy Fuels or any other interests that could reasonably be regarded as capable of affecting their ability to give an independent unbiased opinion in relation to the Property.
This Technical Report constitutes a Feasibility Study for purposes of both NI 43-101 and S-K 1300 with respect to Donald Phase 1 and contains the initial NI 43-101 and S-K 1300 estimates of Mineral Resources and Mineral Reserves. This report does not include any NI 43-101 and S-K 1300 estimates of Mineral Resources or Mineral Reserves relating to Donald Phase 2.
Snowden Optiro, Prime, GRE and AMC will be paid a fee for the preparation by its Qualified Persons of this Technical Report based on a standard schedule of rates for professional services, plus any expenses incurred. This fee is not contingent on the outcome of the Technical Report, and neither Snowden Optiro nor the Qualified Persons will receive any other benefit for the preparation of this report.
2.2 Abbreviations and units
Unless otherwise specified, all units of currency are in Australian dollars ($) and all measurements are metric.
|
Energy Fuels Inc. Technical Report – Donald Rare Earths and Mineral Sands Project, Victoria, Australia |
Table 2.3 Abbreviations and units of measurement
| Abbreviation/Unit | Description |
| $ | Australian dollars |
| ° | degree(s) |
| °C | degree(s) Celsius |
| % | percent |
| μm | micrometre or micron |
| 3D | three-dimensional |
| a | annum |
| AACE | Association for the Advancement of Cost Engineering |
| AC | aircore |
| AER | Australian Energy Regulator |
| AMC | AMC Consultants Pty Ltd |
| ANC | acid neutralizing capacity |
| ANCOLD | Australian National Committee on Large Dams |
| Argus | Argus Media Ltd |
| As | arsenic |
| Astron | Astron Limited (formerly Astron Corporation Limited) |
| ATC Williams | ATC Williams Pty Ltd |
| Au | gold |
| B | boron |
| bcm | bank cubic metre(s) |
| BESS | battery energy storage system |
| BGLC | Barengi Gadjin Land Council |
| Bq, Bq/g | becquerel(s), becquerels per gram |
| CAGR | compound annual growth rate |
| capex | capital expenditure or capital cost |
| CAT | Caterpillar |
| CDM | co-disposal mixture |
| Ce | cerium |
| CeO2 | cerium oxide |
| CEP | Community Engagement Plan |
| cfm | cubic feet per minute |
| CHMP | Cultural Heritage Management Plan |
| CIF | cost, insurance and freight |
| CIM | Canadian Institute of Mining, Metallurgy and Petroleum |
| CNY | Chinese yuan renminbi |
| CRA | Conzinc Rio Tinto Australia |
| CUP | concentrate upgrade plant |
| DEECA | Department of Energy, Environment and Climate Action |
| DPPL | Donald Project Pty Ltd |
| DTP | Department of Transport and Planning |
| DWT | deadweight tonnage |
| Dy | dysprosium |
| Dy2O3 | dysprosium oxide |
| ECI | early contractor involvement |
|
Energy Fuels Inc. Technical Report – Donald Rare Earths and Mineral Sands Project, Victoria, Australia |
| Abbreviation/Unit | Description |
| EE Act | Environmental Effects Act 1978 |
| EES | Environment Effects Statement |
| EHP | Ecology and Heritage Partners Pty Ltd |
| EL | exploration licence |
| Energy Fuels | Energy Fuels Inc. |
| EP Act | Environment Protection Act 2017 |
| EPA | Environment Protection Authority |
| EPBC Act | Environment Protection and Biodiversity Conservation Act 1999 |
| EPC | engineering, procurement and construction |
| Er | erbium |
| ERC | Environmental Review Committee |
| ERR | Earth Resources Regulator |
| ESG | environmental, social and governance |
| Eu | europium |
| EU | European Union |
| FFG Act | Flora and Fauna Guarantee Act 1988 |
| F | fluorine |
| FID | final investment decision |
| FIRB | Foreign Investment Review Board |
| FOB | free on board |
| FX | foreign exchange |
| g | gram |
| g/t | gram(s) per tonne |
| G&A | general and administrative |
| GC | grade control |
| Gd | gadolinium |
| GHG | greenhouse gas |
| GL, GL/a | gigalitre(s), gigalitres per annum |
| GPS | global positioning system |
| GRE | GR Engineering Services |
| GWM | Grampians Wimmera Mallee |
| GWMWater | Grampians Wimmera Mallee Water |
| H2SO4 | sulphuric acid |
| h, h/a | hour(s), hours per annum |
| ha | hectare(s) |
| HARD | half absolute relative difference |
| HfO2 | hafnium dioxide or hafnia |
| HM | heavy mineral(s) |
| HMC | heavy mineral concentrate |
| Ho | holmium |
| HREE | heavy rare earth elements |
| HSE | health, safety and environment |
| IAEA | International Atomic Energy Agency |
| ICP-MS | inductively coupled plasma mass spectrometry |
| ID2 | inverse distance squared |
| ID3 | inverse distance cubed |
|
Energy Fuels Inc. Technical Report – Donald Rare Earths and Mineral Sands Project, Victoria, Australia |
| Abbreviation/Unit | Description |
| IFC | issued for construction |
| IGT | International Groundwater Technologies Ltd |
| Incoterms | international commercial terms |
| IRR | internal rate of return |
| ISO | International Organization for Standardization |
| JORC Code | Australasian Code for Reporting of Exploration Results, Mineral Resources and Ore Reserves (2012 edition) |
| JV | joint venture |
| kg, kg/bcm, kg/t | kilogram(s), kilograms per bank cubic metre, kilograms per tonne |
| km, km2 | kilometres, square kilometres |
| kt, kt/a | thousand tonnes, thousand tonnes per annum |
| kV | kilovolts |
| L, L/s | litre(s), litres per second |
| La | lanthanum |
| LCFU | Lyons Feed Control Unit |
| LIDAR | light detection and ranging |
| LIMS | low intensity magnetic separator |
| LG | Lerch Grossman |
| LOM | life of mine |
| LREE | light rare earth elements |
| Lu | lutetium |
| M | million(s) or mega |
| m, m2, m3 | metre(s), square metres, cubic metres |
| Mbcm | million bank cubic metres |
| mg/L | milligrams per litre |
| MIN | mining licence |
| ML, ML/a | megalitre(s), megalitres per annum |
| mm | millimetre(s) |
| Mm3 | million cubic metres |
| MRSD Act | Mineral Resources (Sustainable Development) Act 1990 |
| MRSD Regulations | Mineral Resources (Sustainable Development) (Mineral Industries) Regulations 2019 |
| MSP | mineral separation plant |
| Mt, Mt/a | million tonnes, million tonnes per annum |
| MTO | material take offs |
| MUP | mining unit plant |
| NAF | non-acid forming |
| Nd | neodymium |
| Nd2O3 | neodymium oxide |
| NEPM | National Environment Protection (Assessment of Site Contamination) Measure 2013 |
| NI 43-101 | (Canadian Securities Administrator's) National Instrument 43-101 Standards of Disclosure for Mineral Projects |
| NPV | net present value |
| OEM | original equipment manufacturer |
| OK | ordinary kriging |
| opex | operating expenditure or operating cost |
| P&ID | piping and instrumentation diagram(s) |
|
Energy Fuels Inc. Technical Report – Donald Rare Earths and Mineral Sands Project, Victoria, Australia |
| Abbreviation/Unit | Description |
| Pa, kPa | pascal, kilopascal |
| PAM | polyacrylamide |
| Pm | promethium |
| PMF | possible maximum flood |
| Pr | praseodymium |
| Pr6O11 | praseodymium oxide |
| Prime | Prime Resources |
| PSD | particle size distribution |
| psi | pounds per square inch |
| PV | photovoltaic |
| QAQC | quality assurance and quality control |
| REE | rare earth element |
| REEC | rare earth element concentrate |
| REO | rare earth oxide |
| RF | revenue factor |
| RL | retention licence |
| ROM | run-of-mine |
| rpm | revolutions per minute |
| s | second(s) |
| SEC | (United States) Securities and Exchange Commission |
| SG | specific gravity |
| S-K 1300 | Subpart 229.1300 of Regulation S-K, Disclosure by Registrants Engaged in Mining Operations |
| Sm | samarium |
| t, t/a, t/h, t/m3 | tonne(s), tonnes per annum, tonnes per hour, tonnes per cubic metre |
| Tb | terbium |
| Tb4O7 | terbium oxide |
| TBE | tetrabromoethane |
| TDS | total dissolved solids |
| Te | tellurium |
| TiO2 | titanium dioxide or titania |
| Tm | thulium |
| TREO | total rare earth element oxide |
| TS | total sulphur |
| TSF | tailings storage facility |
| TSPP | tetrasodium pyrophosphate |
| TZMI | TZ Minerals International Pty Ltd |
| US$ | United States dollar(s) |
| VHM | valuable heavy minerals |
| WCP | wet concentration plant |
| VHM | valuable heavy minerals |
| WHIMS | wet high intensity magnetic separation |
| WIFT | Wimmera Intermodal Freight Terminal |
| WIM | Wimmera area |
| wmt | wet metric tonne |
| wt | wet tonne(s) |
| XRD | x-ray diffraction |
|
Energy Fuels Inc. Technical Report – Donald Rare Earths and Mineral Sands Project, Victoria, Australia |
| Abbreviation/Unit | Description |
| XRF | x-ray fluorescence spectrometry |
| Y | yttrium |
| Y2O3 | yttrium oxide or yttria |
| Zn | zinc |
| ZrO2 | zirconium dioxide or zirconia |
|
Energy Fuels Inc. Technical Report – Donald Rare Earths and Mineral Sands Project, Victoria, Australia |
3 Reliance on information provided by the registrant
The Qualified Persons have relied on Energy Fuels for the legal aspects of land title and mineral tenure information, as summarized in Item 4 of this Technical Report, and the legality of any underlying agreement(s) that may exist concerning the permits or other agreement(s) between third parties, as summarized in Item 4 of this Technical Report. In particular, the Qualified Persons have relied on Energy Fuels' acceptance of information provided by representatives of Astron. The mineral tenure information was also confirmed on the GeoVic website of Resources Victoria1.
The Qualified Persons have relied on Energy Fuels for guidance on applicable political and environmental matters outside the expertise of the Qualified Persons, as summarized in Item 20 of this Technical Report, and tax matters for the proposed Donald mining and processing operation, as summarized in Item 22 of this Technical Report.
Having made enquiries and taken appropriate steps to confirm this information in the public domain, the Qualified Persons consider it reasonable to rely on the information provided by Energy Fuels.
1 https://resources.vic.gov.au/geology-exploration/maps-reports-data/geovic.
|
Energy Fuels Inc. Technical Report – Donald Rare Earths and Mineral Sands Project, Victoria, Australia |
4 Property description and location
4.1 Location and area
Donald is in the Wimmera region of Victoria (latitude 36°29'25" S, longitude 142°46'21" E), approximately 300 km northwest of Victoria's capital city, Melbourne (Figure 4.1). The area of the Property is 271.55 km2.
Figure 4.1 Location of Donald Property

Source: Astron
|
Energy Fuels Inc. Technical Report – Donald Rare Earths and Mineral Sands Project, Victoria, Australia |
4.2 Type of mineral tenure
4.2.1 Legal framework
Resources Victoria sits within the Department of Energy, Environment and Climate Action (DEECA). It includes the Earth Resources Regulator (ERR) and Geological Survey of Victoria and plays a key role in:
• Regulating the resources industry to effectively manage risks to the environment and community
• Managing access to Victoria's resources for current and future use
• Policy development and regulatory reform
• Regulatory approval coordination
• Regional geoscientific investigations and data provision.
The Mineral Resources (Sustainable Development) Act 1990 (MRSD Act) is the legal framework for mining and extractive industries that is compatible with the economic, social and environmental objectives of the State. The Mineral Resources (Sustainable Development) (Mineral Industries) Regulations 2019 (MRSD Regulations) set clear work plan and rehabilitation plan requirements to manage risks associated with mining and mineral exploration.
An Exploration Licence (EL) gives the holder exclusive rights to explore for specific minerals within the specified licence area for five years. No mining activities can be undertaken on an EL. ELs may be renewed once, for up to five years. A second renewal, for up to five years, is only allowed in exceptional circumstances and where it can be demonstrated that there is a likelihood of the licensee identifying minerals during the period of the renewal. No further renewals are permitted.
Minimum expenditure conditions and progressive relinquishments of the licence area from year 2 (leaving 10% of the original licence area at the end of year 10) apply to an EL.
A Retention Licence (RL) is suitable where a resource has been identified but the resource is not yet commercially viable to mine or is required to support an existing mining operation in the future. The maximum term for a RL is 10 years and may be renewed for two additional periods of 10 years. The work required under a RL reflects the work program that was submitted with the licence application.
A Mining Licence (MIN) holder is entitled to mine the land covered by the licence, explore for minerals and construct mining facilities related to a mining operation. Before work can start, the holder needs to have an approved work plan for mining, provide a rehabilitation bond and obtain the necessary consents and permits.
A MIN can be granted for up to 20 years, or longer with the Minister's agreement, and there is no limit to the number of renewals, subject to the holder's record of compliance and various other matters, including whether mining will be feasible in the foreseeable future.
4.2.2 Property mineral titles
Astron's Donald Project comprises three granted mineral tenements and one application (Table 4.1 and Figure 4.1). MIN5532 and RL2002 form part of the Donald JV with Energy Fuels (the Property).
Table 4.1 Donald project mineral titles
| ID | Type | Status | Registered owner |
Area (ha) |
Grant date | Expiry date |
Bond | Comments |
| MIN5532* | Mining licence | Granted | Donald Project Pty Ltd | 2,784 | 20/08/2010 | 19/08/2030 | $10,000 | Primary area of Phase 1 |
| RL2002* | Retention licence | Granted | Donald Project Pty Ltd | 24,371 | 10/10/2019 | 9/10/2029 | $70,000 | Covers future expansions in Phase 2 |
|
Energy Fuels Inc. Technical Report – Donald Rare Earths and Mineral Sands Project, Victoria, Australia |
| ID | Type | Status | Registered owner |
Area (ha) |
Grant date | Expiry date | Bond | Comments |
| RL2003 | Retention licence | Granted | Jackson Mineral Sands Pty Ltd | 15,481 | 10/10/2021 | 9/10/2031 | $10,000 | Covers the Jackson deposit |
| EL8516 | Exploration licence | Application | Jackson Mineral Sands Pty Ltd | 6,653 |
*MIN5532 and RL2002 form part of the joint venture with Energy Fuels. Energy Fuels retains a Right of First Refusal on RL2003, as disclosed in Item 4.5.
Source: Astron
4.3 Issuer's interest
Astron holds its interest in the Donald JV mineral titles (MIN5532 and RL2002) through its subsidiary Donald Project Pty Ltd (DPPL, Figure 4.2).
Figure 4.2 Donald JV ownership structure
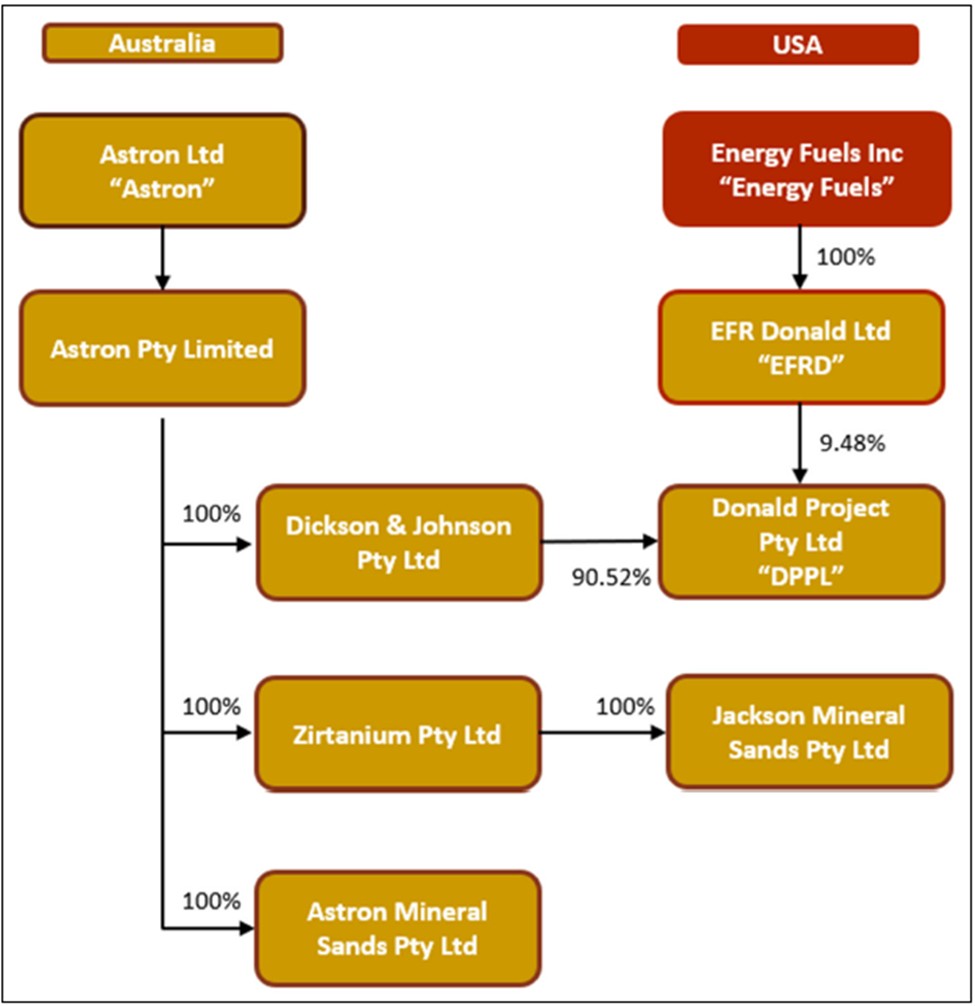
Source: Astron
On 4 June 2024, Energy Fuels entered into a farm-in and joint venture agreement and ancillary agreements (Agreement) with Astron for a JV to develop the Donald deposit within MIN5532 and RL2002. Energy Fuels will contribute the first $183 million of equity capital to earn a 49% interest in DPPL. As at the effective date of this Technical Report, Energy Fuels held a 9.48% equity interest in DPPL through its subsidiary company EFR Donald Ltd (EFRD). EFRD's remaining earn-in obligation is forecast to be $127.3 million (after taking into account funds already advanced and approximately $22.4 million of debt finance provided by EFRD, which upon FID will be recognised as earn-in funding).
|
Energy Fuels Inc. Technical Report – Donald Rare Earths and Mineral Sands Project, Victoria, Australia |
Energy Fuels also entered into an offtake agreement for 100% of the Phase 1 and Phase 2 REEC monazite and xenotime production at commercial prices. Under the Agreement and subject to its terms, Astron and its affiliates retain a right to enter into an offtake agreement for 100% of the zircon and titanium HMC for processing at Astron's mineral separation plant in China and at third-party facilities.
Astron Mineral Sands Pty Ltd is the manager of the JV.
4.4 Surface rights
The Phase 1 operations within MIN5532 cover arable, mixed-use freehold farming land. The Phase 1A Work Plan area encompasses 1,143.4 ha of land (Figure 4.3).
DPPL currently owns freehold titles covering 705 ha within the Work Plan area, which are currently leased to local farmers for agricultural purposes. The remaining freehold titles within the Work Plan area are either held by Astron and leased to DPPL for the term of the Donald project, owned by DPPL, or are the subject of an option in favour of DPPL with settlement scheduled at FID. There is an additional 1,646.6 ha of land within MIN5532 outside of the Work Plan area (Phase 1B).
Figure 4.3 Plan of MIN5532

Source: Astron, 2025
|
Energy Fuels Inc. Technical Report – Donald Rare Earths and Mineral Sands Project, Victoria, Australia |
Astron subsidiary, Jackson Mineral Sands Pty Ltd, owns an additional 1,138 ha of land outside of the Work Plan area, which is also leased out to local farmers providing alternative land for farming whilst the Work Plan area is mined, rehabilitated and returned to active farming.
Two parcels of Crown Land within the Work Plan area form part of the decommissioned open channel Wimmera Mallee Water Supply System and are no longer required for water supply purposes. Local roads within the Work Plan area are managed by Yarriambiack Shire Council and will revert to Crown Land if decommissioned.
A Public Conservation and Resource Zone runs along Dunmunkle Creek (to the west of the Work Plan area) and Richardson River (to the east of the Work Plan area) to protect and conserve the natural environment. Other areas of bushland to the northeast and southwest are conservation reserves designated Crown Land for reserve management.
Once the remaining freehold titles within the Work Plan area are purchased following exercise of the relevant purchase options by DPPL, the surface rights on MIN5532 will be sufficient for the proposed Phase 1A operation including all mining, processing and waste disposal. Overburden and process tailings will be backfilled into the void created by mining. A permanent ex-pit storage facility has been designed for tailings until sufficient mining void becomes available for backfilling.
4.5 Royalties, back-in rights, payments, agreements, encumbrances
The MRSD Act states that the royalty rate is 2.75% of the net market value (or mine gate value), which is the commercial value of the mineral at the time it is first sold, transferred or disposed of less any costs reasonably, necessarily, and directly incurred in connection with the sale, transfer or disposal, including insurance, freight and marketing.
The market value of the mineral means the value of the mineral if it were sold to an unrelated party in an arms-length commercial sale.
The Agreement with Astron provides for Energy Fuels to invest the first $183 million of capital required for the proposed Donald Project development and comprises:
• $1.5 million exclusivity fee, which has already been paid
• Funding for agreed project development activities until FID
• Secured interest free loans of up to $22.4 million for certain land and equipment acquisitions, whereupon following FID the loans will be recognised as earn-in funding and converted to equity in DPPL
• Sole funding of the balance of Donald project development costs up to a total of the earn-in amount of $183 million.
The conditions precedent under the Agreement included the transfer of assets, comprising the Donald deposit tenements (MIN5532 and RL2002) and water rights, to DPPL and Energy Fuels obtaining Foreign Investment Review Board (FIRB) approval from the Australian Government for its investment in Donald. FIRB approval was received on 19 September 2024, and completion of the JV agreement was achieved on 26 September 2024.
In addition, Energy Fuels agreed to issue common stock with a value of US$17.5 million to Astron in two tranches. The first tranche of US$3.5 million was issued upon the satisfaction (or waiver) of conditions precedent to the JV becoming effective. The second tranche of US$14.0 million will be issued upon approval of the FID for Phase 1 of the project.
Astron transferred MIN5532 and RL2002 and the water rights to DPPL during 2024. Land owned by Astron has been leased to the JV for the duration of operations with the JV responsible for all outgoings, rates and taxes. Astron will retain the right to develop the Jackson deposit on RL2003 independently. If the development of RL2003 is planned with a third party, Energy Fuels has a first right of refusal to participate.
|
Energy Fuels Inc. Technical Report – Donald Rare Earths and Mineral Sands Project, Victoria, Australia |
Upon the expenditure of the full earn-in amount, Energy Fuels will have earned a 49% interest in the JV and Astron will retain a 51% interest. Any additional capital contributions will be funded by the parties pro-rata to their respective interests in the JV after taking into account the amount of certain pre-JV expenditure by Astron.
Energy Fuels' REEC offtake agreement will come into effect following the FID on the project. The price of REEC will be based on a formula derived from the market price of the constituent REOs (being neodymium and praseodymium combined, terbium and dysprosium), a payability factor and the actual assemblage of the REEC product (i.e. the percentage of the REOs). The JV will be responsible for organizing transport to Energy Fuels' White Mesa Mill in Utah, and the parties will work collectively in obtaining the necessary export permits.
The REEC offtake agreement will be subject to a floor price whereby, should the unit price of the REEC drop below the floor price, Energy Fuels may elect to suspend the REEC offtake until the realised prices of the downstream rare earth products recover. During this period, the JV may market the REEC product to third parties on the spot market.
Under the Agreement and subject to its terms, Astron and its affiliates have the right to enter into an offtake agreement for 100% of the project's HMC product on arms-length terms based on market pricing of the constituent products for processing at Astron's mineral separation plant (MSP) in Yingkou, China and at third-party facilities.
Astron Mineral Sands Pty Ltd as manager of the JV will charge a management fee of 5% of the allowable project costs pre-FID and 1.25% of allowable project costs post-FID plus reimbursement of all costs directly incurred by the manager in carrying out its duties as manager.
4.6 Environmental liabilities
Environmental bonds currently lodged against the Donald Project tenements are summarized in Table 4.1. A previously excavated test pit on land owned by Astron was fully rehabilitated in 2018. Prior to commencing Phase 1A site works, the bond requirements will be set by the responsible Victorian Government Minister.
A Rehabilitation Plan was prepared in accordance with the MRSD Act and associated MRSD Regulations in 2023 and approved as part of the Work Plan. A rehabilitation bond of $27 million to cover the liability up to process plant commissioning must be in place prior to commencing site works. Discussions with the ERR bonds team are ongoing regarding the bond calculation approach for the subsequent stages.
No other surface disturbances, land compensation, road maintenance or other liabilities or payments are required.
4.7 Permits
Following the 2008 Environment Effects Statement (EES), approval was received under the Federal Environment Protection and Biodiversity Conservation Act 1999 (EPBC Act) in 2009 and varied in 2018. The Cultural Heritage Management Plan (CHMP) was approved for the Work Plan area in 2014, and the radiation licence obtained in 2015 and varied and renewed in 2024. The HMC export licence issued in 2016 has expired and a new export licence is being sought relating to the REEC product.
DPPL's amended Work Plan, incorporating and addressing formal feedback and comments received from ERR and its referral agencies, was approved in June 2025. Other approvals in progress include infrastructure outside of MIN5532 relating to road upgrades, road decommissioning and water pipeline, and other secondary licences and permits for water supply connection, groundwater extraction and surface water capture.
Further details on the status of permitting are provided in Item 20.3.
|
Energy Fuels Inc. Technical Report – Donald Rare Earths and Mineral Sands Project, Victoria, Australia |
4.8 Other significant factors and risks
The Work Plan area covers 1,143.4 ha, of which DPPL either owns or has obtained options to acquire the entirety of the Work Plan land area. There is an additional 1,646.6 ha of land within MIN5532 outside of the Work Plan area, of which 1,138 ha has already been purchased or contracted (Phase 1B).
DPPL will need to engage with the landowners within the Phase 1B area (to the extent they are different from the landowners within the Work Plan area and own land other than already held by DPPL) to ensure that appropriate access to the resource under MIN5532 is secured by the commencement of construction and preliminary mining activities for the Phase 1B operation. The options available to securing land access within the Phase 1B area include:
• Purchasing the freehold title or entering a long-term option to purchase agreement
• Leasing the land
• Entering into a compensation agreement under the MRSD Act
• Obtaining a compensation determination from the Victorian Civil and Administrative Tribunal (VCAT) or Supreme Court of Victoria (i.e. compulsory pathway).
There are Crown Land parcels and historical water channel reserves located both within the Work Plan area and the broader MIN5532. DPPL's understanding is that areas of Crown Land covered by MIN5532 are restricted to roads and de-commissioned water channels. DPPL will need to obtain the consent of the relevant Crown Land minister and other authorities, which cannot be unreasonably withheld, and can be granted subject to conditions including the payment of compensation.
There are nine sensitive receptors within 2 km of the MIN5532 boundary. Dust and noise modelling is currently being undertaken and will inform decision-making with respect to potential mitigation effects for these properties.
|
Energy Fuels Inc. Technical Report – Donald Rare Earths and Mineral Sands Project, Victoria, Australia |
5 Accessibility, climate, local resources, infrastructure and physiography
5.1 Topography, elevation and vegetation
The topography of the Property is flat to gently undulating at an elevation of 126 m to 132 m above sea level. The land is extensively cleared of native vegetation (Eucalyptus and Buloke woodland and grassland) and used for cropping and livestock grazing.
5.2 Access
The Property can be accessed via sealed road from the capital city of Melbourne approximately 300 km to the southeast. Good access through the Property is provided by a network of unsealed roads and tracks servicing the freehold blocks.
5.3 Proximity to population centre and transport
The Work Plan area within the Property is 13.4 km east of the township of Minyip and approximately 65 km northeast of the regional centre of Horsham, in Victoria (Figure 4.1). The population of Minyip is approximately 390 and Horsham is approximately 15,600. There are several other townships in proximity to the Property, the largest of which is Donald with a population of approximately 1,400.
A rail line runs through Minyip. There are several aerodromes servicing nearby towns which are suitable for use by light aircraft.
5.4 Climate and length of operating season
The Property has a semi-arid climate with hot dry summers and cool wet winters, with most of the rain falling in winter and early spring. Mean diurnal temperature range from 4°C to 13°C during the winter months of June to August and from 13°C to 30°C during the summer months of December to February. The average annual rainfall is approximately 400 mm falling on an average of 98 days per annum.
The Phase 1 mine and process plant is scheduled to operate year-round on two 12-hour shifts per day, seven days per week with provision made for shutdowns and weather interruptions.
5.5 Infrastructure
The sufficiency of the surface rights to support the proposed Phase 1A project is discussed in Item 4.4.
Existing infrastructure includes telecommunications cables, low voltage transmission lines and water supply pipelines.
Power for the Phase 1 project will be supplied via an onsite hybrid microgrid using a mixture of solar, battery and diesel power generation.
The project will use a combination of groundwater, surface water and raw water supply for the mining and processing operations. The raw water supply will be drawn from Astron's Grampians Wimmera Mallee Water Headworks water allowance of 6.975 GL/a stored in Taylors Lake, outside of Horsham. An upgrade of the existing water reticulation systems to transmit the water from the Minyip Pumping Station to the mine site has been completed.
Access to the Property via the existing road network will be upgraded in part to meet local Shire and State government requirements.
|
Energy Fuels Inc. Technical Report – Donald Rare Earths and Mineral Sands Project, Victoria, Australia |
5.6 Workforce
The project benefits from its location close to Horsham and Melbourne without the need for a fly-in-fly-out workforce. The preferred option for the Phase 1 operation is for a residential workforce to support the local communities. As such, the project is not planning to build permanent housing stock but rather work with local parties to jointly develop solutions, including utilizing existing housing stock in the area.
The construction workforce is estimated to peak at approximately 120 during an estimated 9-month construction period. During the operations phase, the 100-person residential workforce will work on two rosters:
• 2 weeks on/1 week off for shift roles
• 5 days on/2 days off for non-shift roles.
|
Energy Fuels Inc. Technical Report – Donald Rare Earths and Mineral Sands Project, Victoria, Australia |
6 History
The Property has been subject to several major evaluation campaigns by three companies. The Donald deposit was discovered by CRA Exploration Ltd (CRA) in the early 1980s. Zirtanium Ltd (Zirtanium) acquired the tenements in 2000 and sold them to Astron in 2004. Since then, Astron has invested approximately $100 million in the project's development, including exploration, mining, metallurgical studies, obtaining necessary regulatory approvals and acquiring farmland and water rights. There has been no previous mine production within the Property.
6.1 CRA
During the 1980s, CRA actively explored the Murray Basin for multiple commodities, including brown coal, uranium, gold, diamonds and HM sands.
Anomalous accumulations of fine-grained HM were first identified through downhole geophysical logging (gamma ray spectroscopy). Following the discovery of the WIM 150 HM sands deposit near Horsham, CRA embarked on extensive regional AC drilling programs aimed at identifying similar mineral sands deposits. In 1990, CRA reported the partial delineation of the WIM 50, WIM 100, WIM 200 (current Jackson deposit) and WIM 250 (current Donald deposit within the Property).
From approximately 1982 to 1991, CRA undertook exploration and resource definition drilling over the Jackson and Donald deposits. CRA completed approximately 423 AC drillholes at Donald (within MIN5532 and RL2002) for an estimated total of 11,220 m (Table 6.1).
Table 6.1 Drilling by mineral title
| Company | Year | No. holes | Metres | Type | Comment |
| MIN5532 | |||||
| CRA | 1982-1989 | 91 | 2,250 | AC | 55 holes in MIN5523 used for geological interpretation only. |
| Zirtanium | 2000 | 1 | 19 | Calweld | 940 mm Calweld hole used for bulk sampling. Used for geological interpretation only in MIN5523. |
| 2002 | 14 | 327 | AC | 10 holes in MIN5523 used for geological interpretation only in MIN5523. | |
| 2004 | 225 | 4,967 | AC | 160 holes in MIN5523 used for geological interpretation. Assay and mineral assemblage data used for Area 2 where total HM data is from +38 μm to 90 μm fraction. | |
| Astron | 2010 | 167 | 3,969 | AC | 157 holes in MIN5523 - used for geological interpretation. Assay data (total HM, slimes and oversize) use for grade estimation in Area 2. |
| 2015 | 10 | 256.7 | Sonic | Not used for Mineral Resource estimation. Used for metallurgical testwork. | |
| 2015 | 102 | 2,777 | AC | 10 holes in MIN5523 used for geological interpretation. Assay data (total HM, slimes and oversize) used for grade estimation in Area 2. | |
| 2022 | 245 | 6,355 | AC | All geological, assay and mineral assemblage data used for Mineral Resource in Area 1. | |
| 2022 | 25 | 648.5 | Sonic | Not used for Mineral Resource estimation. Used for bulk density and metallurgical testwork, geotechnical studies and to expand network of groundwater monitoring bores. | |
| 2024 | 37 | 793.2 | Sonic | Not used for Mineral Resource estimation. Used for metallurgical testwork and geotechnical studies. | |
| 2025 | 133 | 3,387 | AC | Not used for Mineral Resource estimation. Used for development of GC model. | |
|
Energy Fuels Inc. Technical Report – Donald Rare Earths and Mineral Sands Project, Victoria, Australia |
| Company | Year | No. holes | Metres | Type | Comment |
| 2025 | 10 | 250.5 | Sonic | Not used for Mineral Resource estimation. Used for bulk density testwork. | |
| Total | 1,060 | 25,999.9 | |||
| RL2002 | All data used for historical resource estimation. | ||||
| CRA | 1982-1989 | 332 | 8,970 | AC | 300 holes with HM assays, 275 with VHM assays. |
| 2002 | 23 | 558 | AC | 23 holes with HM assays, 15 with VHM assays. | |
| Zirtanium | 2004 | 118 | 2,603 | AC | 108 holes with HM assays, 51 with VHM assays. |
| 2010 | 179 | 4,607 | AC | 176 holes with HM assays, 21 with VHM assays. | |
| Astron | 2015 | 153 | 4,206 | AC | 150 holes with HM assays, 21 with VHM assays. |
| Total | 805 | 20,944 | |||
Note: VHM - valuable heavy minerals.
6.2 Zirtanium
Between 2002 and 2004, Zirtanium Ltd completed 397 AC drillholes for a total of 6,097 m over the Donald deposit within MIN5532 and RL2002 (Table 6.1).
6.3 Astron
Astron completed four phases of AC drilling primarily focused on resource delineation between 2010 and 2022 and pre-production GC drilling in 2025 (Table 6.1):
• 2010 within MIN5532 and RL2002
• 2013 within RL2003 (Jackson deposit - not included in this report)
• 2015 within MIN5532, RL2002 and RL2003
• 2022 within MIN5532
• 2025 within MIN5532 (GC drilling for first two years of production).
Sonic drilling programs within MIN5532 were completed in 2015, 2022, 2024 and 2025 for geotechnical, bulk density and metallurgical testwork, to twin existing drillholes and add to the network of groundwater monitoring bores.
Further details of the drilling programs completed within MIN5532 and RL2002 are provided in Item 10.
A test pit was also excavated by Astron in 2005 about 1-2 km from the first mining blocks to a depth of 18 m. The test pit provided bulk samples for metallurgical testwork along with details on soil handling characteristics and observations of the rehabilitation requirements that will be encountered. A second bulk sample was taken, and the test pit was backfilled and rehabilitated during 2018.
6.4 Historical resource estimates
6.4.1 CRA
CRA completed resource modelling of the Donald deposit in 1990 (Smart and Allnut, 1990) and generated kriged block models for tonnage, grade and contained HM tonnes estimates. Separate tonnages for overlying clay and barren sand were also estimated.
The modelling was reportedly completed without a full assay database due to laboratory backlog and included assay results from two analytical methods. The older dataset used a minimum grain size of 38 μm and the newer dataset included grades for a concentrate nominally above 10 μm. Variogram analysis was used to determine grade estimation parameters, and the two datasets were subject to separate variogram analyses.
|
Energy Fuels Inc. Technical Report – Donald Rare Earths and Mineral Sands Project, Victoria, Australia |
Drillholes with no mineralization were allocated mineralization thickness and grade values of zero and drillholes with suspect analytical data and abandoned holes were omitted from the analysis. The statistics indicated reasonable continuity structures for grade and thickness data in the north-south direction. A parent block size of 500 m by 500 m was used, selected from the drillhole spacing, total HM grades were estimated using OK, and a bulk density of 1.65 t/m3 was assigned for tonnage estimation.
The Donald deposit was reported as a north-northeast trending deposit of about 135 km2 in area. The highest but thinnest HM grades were reported in the south. The bulk of the HM was found in the north-central zone. The reported tonnage-grade curve showed a slight inflection at the 3% HM cut-off and the "global resource" was reported as 1,270 Mt at 5.3% HM. This included the north-central zone of the Donald deposit which was reported as containing 520 Mt at 5.4% HM with a combined cut-off criteria of 4 m minimum thickness and 4% HM minimum grade.
CRA reported that the Donald resource estimate was classified as "Indicated" in accordance with the Australian Code for Reporting of Identified Mineral Resources and Ore Reserves (JORC Code,1989 edition). The Qualified Person has not done sufficient work to classify the historical estimate as a current Mineral Resource and the estimate does not meet CIM Definition Standards for Mineral Resources & Mineral Reserves and S-K 1300 Definitions. Energy Fuels is not treating the historical estimate as a current Mineral Resource and is disclosed for background purposes only and should not be relied upon.
CRA undertook further drilling after the resource study was completed in 1990.
6.4.2 Zirtanium
In February 2004, JB Mining remodelled the Donald deposit using all CRA's drilling results and results from Zirtanium's drilling carried out in August 2002 to verify the resource. The resource reported for Donald was 1,392 Mt at 6.4% HM (Thiess, 2004a).
A subset of the Donald deposit was remodelled by JB Mining in September 2004 and reported by Thiess, and mineral assemblage data was included in the resource estimate (Thiess, 2004b). The 2004 resource for the central area of Donald was reported to contain 355 Mt at 6.3% HM, and the HM fraction was reported to include 19% zircon, 20% leucoxene, 8% rutile and 30% ilmenite.
The resource for the Donald deposit was re-estimated in 2005. The mineralized horizon was interpreted using a 1.5% HM cut-off grade and a polygonal method was used for grade and tonnage estimation. Shepherd (2005) reported a resource of 187 Mt at 6.3% HM above a 1.5% HM cut-off and the HM fraction was reported to contain 19% zircon, 8% rutile, 20% leucoxene and 32% ilmenite.
The Qualified Person has not done sufficient work to classify the historical estimates as a current Mineral Resource and the estimates do not meet CIM Definition Standards for Mineral Resources & Mineral Reserves and S-K 1300 Definitions. Energy Fuels is not treating the historical estimates as a current Mineral Resource and are disclosed for background purposes only and should not be relied upon.
6.4.3 Astron
Historical resource estimates for the Donald deposit have previously been reported by AMC in 2006 (EL4433, including current MIN5532), 2010 (proposed MIN5532), 2011 (EL4433 and proposed MIN5532) and 2012 (EL4433 and MIN5532). The Qualified Person has not done sufficient work to classify the historical estimates as current Mineral Resources and the estimates do not meet CIM Definition Standards for Mineral Resources & Mineral Reserves and S-K 1300 Definitions. Energy Fuels is not treating the historical estimates as a current Mineral Resource and are disclosed for background purposes only and should not be relied upon. The most recent Mineral Resource estimate for MIN5532 (Phase 1) was prepared by Snowden Optiro and reported in 2022 and subsequently updated in 2025 to include updated density data and estimates of REOs, as disclosed in Item 14. The most recent Mineral Resource estimate for RL2002 (previously EL4433) was prepared by AMC and reported in 2016, as disclosed in Item 24.2 for Phase 2.
|
Energy Fuels Inc. Technical Report – Donald Rare Earths and Mineral Sands Project, Victoria, Australia |
AMC prepared a resource estimate for EL4433 in 2006 which included the area that was subsequently covered by MIN5532 and extended into the area now covered by RL2002. The resource estimate was classified and reported in accordance with the guidelines of the 2004 edition of the JORC Code. AMC reported a total resource above a 1% HM cut-off grade of 693 Mt with an average grade of 5.1% HM, an average slimes content of 15.3% and an average oversize content of 7.3% (AMC, 2006). Mineral assemblage data was not available for the total resource and AMC reported a subset of the resource, with mineral assemblage data (Table 6.2). The total HM content of the subset resource was not reported, and the valuable heavy minerals (VHM) were reported as a percentage of the total material.
Table 6.2 Subset of the 2006 resource reported by AMC in EL4433 (which included MIN5532 and extended into RL2002)
| Classification | Tonnes (Mt) | Zircon % | Rutile % | Leucoxene % | Ilmenite % |
| Indicated | 368 | 1.1 | 0.3 | 1.2 | 1.8 |
| Inferred | 109 | 1.0 | 0.2 | 0.9 | 1.7 |
Source: AMC, 2006
MIN5532 (Phase 1)
AMC prepared a resource estimate within the area of the proposed MIN5532 in 2010. This resource was classified and reported in accordance with the guidelines of the 2004 edition of the JORC Code. Mineral assemblage data was not available for the total resource and AMC reported a subset of the resource, with mineral assemblage data. The resource estimates for HM and the VHM assemblage, reported above a 1% total HM cut-off grade by AMC in 2010, are summarized in Table 6.3. Slimes and oversize contents were not reported for the subset resource. AMC reported an additional resource, without estimated VHM assemblage data, above a 1% HM cut-off grade of 235 Mt with an average grade of 2.8% HM, an average slimes content of 13.7% and an average oversize content of 14.3% (AMC, 2011).
Table 6.3 MIN5532 resource (subset with VHM) reported by AMC in 2010
| Classification | Tonnes (Mt) |
Total HM (%) |
% of total HM | |||
| Zircon | Rutile | Leucoxene | Ilmenite | |||
| Measured | 192 | 5.09 | 17.32 | 5.62 | 14.77 | 31.74 |
| Indicated | 70 | 5.17 | 18.75 | 5.22 | 10.32 | 31.13 |
| Measured + Indicated | 262 | 5.11 | 17.71 | 5.51 | 13.57 | 13.71 |
| Inferred | 23 | 4.96 | 18.51 | 3.50 | 6.27 | 33.26 |
Source: AMC, 2011
The resource estimate within the area of the proposed MIN5532 was updated by AMC in 2011 and was classified and reported in accordance with the guidelines of the 2004 edition of the JORC Code. Mineral assemblage data was not available for the total resource and AMC reported a subset of the resource, with mineral assemblage data. The resource estimates for HM and the VHM assemblage, reported above a 1% total HM cut-off grade by AMC in 2012, are summarized in Table 6.4. Slimes and oversize contents were not reported for the subset resource. AMC reported an additional resource, without estimated VHM assemblage data, above a 1% HM cut-off grade of 232 Mt with an average grade of 2.4% HM, an average slimes content of 14.0% and an average oversize content of 13.4% (AMC, 2012a).
|
Energy Fuels Inc. Technical Report – Donald Rare Earths and Mineral Sands Project, Victoria, Australia |
Table 6.4 MIN5532 resource (subset with VHM) reported by AMC in June 2012
| Classification | Tonnes (Mt) |
Total HM (%) |
% of total HM | |||
| Zircon | Rutile | Leucoxene | Ilmenite | |||
| Measured | 239 | 5.1 | 19 | 6.8 | 21 | 32 |
| Indicated | 85 | 5.0 | 20 | 6.5 | 22 | 34 |
| Measured + Indicated | 324 | 5.1 | 19 | 6.7 | 21 | 33 |
| Inferred | 10 | 4.7 | 21 | 7.6 | 17 | 35 |
Source: AMC, 2012a
The resource estimate within MIN5532 was updated by AMC in September 2012. This resource was classified and reported in accordance with the guidelines of the current JORC Code (2012). AMC reported the resource above a 2.5% HM cut-off grade and between cut-off grades of 1% and 2.5% HM (AMC, 2012b). The resource estimates for HM and the VHM assemblage, reported above a 1% total HM cut-off grade are summarized in Table 6.5.
Table 6.5 MIN5532 resource (subset with VHM) reported by AMC in September 2012
| Classification | Tonnes (Mt) |
Total HM (%) |
Slimes (%) |
Over- size (%) |
% of total HM | |||
| Zircon | Rutile | Leucoxene | Ilmenite | |||||
| Measured | 319 | 4.6 | 15 | 16.9 | 18.5 | 6.5 | 21.7 | 31.0 |
| Indicated | 116 | 4.3 | 13.9 | 15.8 | 17.7 | 6.8 | 18.0 | 31.9 |
| Measured + Indicated | 435 | 4.5 | 14.7 | 16.6 | 18.3 | 6.6 | 20.8 | 31.2 |
| Inferred | 17 | 3.6 | 14.2 | 14.1 | 17.0 | 5.8 | 13.9 | 30.1 |
Source: AMC, 2012b
AMC prepared a resource estimate within MIN5532 in April 2016. This was classified and reported in accordance with the guidelines of the JORC Code (2012). AMC reported a total resource above a 1% HM cut-off grade of 454 Mt with an average grade of 4.4% HM with an average slimes content of 14.2% and an average oversize content of 12.8% (AMC, 2016a). Mineral assemblage data was not available for the total resource and AMC reported a subset of the resource, with mineral assemblage data. The resource estimates for HM and the VHM assemblage, reported above a 1% total HM cut-off grade by AMC in 2016, are summarized in Table 6.6.
Table 6.6 MIN5532 resource (subset with VHM) reported by AMC in 2016
| Classification | Tonnes (Mt) |
Total HM (%) |
Slimes (%) |
Over- size (%) |
% of total HM | ||||
| Zircon | Rutile + anatase |
Leuco- xene |
Ilmenite | Monazite | |||||
| Measured | 264 | 5.4 | 14.2 | 12.2 | 18.7 | 7.0 | 22.4 | 31.3 | 1.8 |
| Indicated | 49 | 4.9 | 13.6 | 12.1 | 20.3 | 7.0 | 22.0 | 33.3 | 2.0 |
| Measured + Indicated | 313 | 5.3 | 14.1 | 12.2 | 18.9 | 7.0 | 22.3 | 31.6 | 1.8 |
| Inferred | 5 | 4.2 | 13.5 | 10.5 | 22.0 | 7.2 | 19.7 | 35.7 | 2.7 |
Source: AMC, 2016a
RL2002 (Phase 2)
AMC prepared a resource estimate within EL4433 (now RL2002) in 2011. This resource was classified and reported in accordance with the guidelines of the 2004 edition of the JORC Code. Mineral assemblage data was not available for the total resource and AMC reported a subset of the resource, with mineral assemblage data. The resource estimates for HM and the VHM assemblage, reported above a 1% total HM cut-off grade by AMC in 2012, are summarized in Table 6.7. Slimes and oversize contents were not reported for the subset resource. AMC reported an additional resource, without estimated VHM assemblage data, above a 1% HM cut-off grade of 1,521 Mt with an average grade of 3.8% HM, an average slimes content of 14.4% and an average oversize content of 8.2% (AMC, 2012a).
|
Energy Fuels Inc. Technical Report – Donald Rare Earths and Mineral Sands Project, Victoria, Australia |
Table 6.7 RL4433 (now RL2002) resource (subset with VHM) reported by AMC in 2012
| Classification | Tonnes (Mt) |
Total HM (%) |
% of total HM | |||
| Zircon | Rutile | Leucoxene | Ilmenite | |||
| Measured | 7 | 5.4 | 16 | 8.6 | 21 | 33 |
| Indicated | 447 | 4.9 | 18 | 7.0 | 18 | 34 |
| Measured + Indicated | 454 | 4.9 | 18 | 7.0 | 18 | 33 |
| Inferred | 796 | 5.4 | 18 | 9.7 | 16 | 34 |
Source: AMC, 2012a
AMC prepared a resource estimate within EL4433 (now RL2002) which was classified and reported in 2012 in accordance with the guidelines of the JORC Code (2012). Mineral assemblage data was not available for the total resource and AMC reported a subset of the resource, with mineral assemblage data. The resource estimates for HM and the VHM assemblage, reported above a 1% total HM cut-off grade by AMC in 2012, are summarized in Table 6.8. Slimes and oversize contents were not reported for the subset resource. AMC reported an additional resource, without estimated VHM assemblage data, above a 1% HM cut-off grade of 1,203 Mt with an average grade of 4.0% HM, an average slimes content of 14.3% and an average oversize content of 7.0% (AMC, 2012c).
Table 6.8 RL4433 (now RL2002) resource (subset with VHM) reported by AMC in 2012
| Classification | Tonnes (Mt) |
Total HM % |
% of total HM | |||
| Zircon | Rutile | Leucoxene | Ilmenite | |||
| Measured | 8 | 5.3 | 16 | 10 | 21 | 32 |
| Indicated | 566 | 4.6 | 17 | 8 | 15 | 34 |
| Measured + Indicated | 574 | 4.6 | 17 | 8 | 15 | 34 |
| Inferred | 822 | 5.2 | 18 | 7 | 10 | 34 |
Source: AMC, 2012c
|
Energy Fuels Inc. Technical Report – Donald Rare Earths and Mineral Sands Project, Victoria, Australia |
7 Geological setting and mineralization
7.1 Regional geology
The Murray Basin is a low-lying, saucer-shaped intracratonic depression in southeastern Australia hosting thin, flat-lying Cainozoic sediments. The basin overlies deformed early Palaeozoic turbidites, volcanic and volcaniclastic rocks of the Lachlan Fold Belt, is up to 600 m in thickness and extends approximately 850 km from east to west and 750 km from north to south, covering an area of approximately 320,000 km2 over southwestern New South Wales, northwestern Victoria and southeastern South Australia (Figure 7.1).
Figure 7.1 Regional geological setting

Source: Astron
A succession of Tertiary freshwater, marine, coastal and continental sediments deposited HM into the basin. Much of the sedimentary sequence is the result of repeated marine incursions from the southwest, with the latest transgression-regression event resulting in deposition of the Late Miocene to Late Pliocene Loxton Sand (formerly called the Parilla Sand or Loxton-Parilla Sand). The Loxton Sand was deposited in shallow marine, littoral and fluvial conditions and comprises fine to coarse grained, commonly moderately well sorted sand with minor clay, silt, mica and gravel.
The Loxton Sand is the host sequence to all the known HM sand deposits in the Murray Basin. These deposits are of two principal types: the coarser-grained strandline occurrences and the finer-grained "WIM-style" accumulations.
The strandline-style deposits occur along the seaward face of ancient shorelines and are the result of concentration and winnowing in a littoral environment. These deposits are consistent with the present (and ancient) east and southwest Australian coastlines and are characterized by one or more relatively narrow composite lenses generally from 2 m to 12 m in thickness and are frequently persistent along any specific mineralized shoreline. These deposits are generally associated with relatively coarse, clean sand and gravel, consistent with any modern active beach environment.
|
Energy Fuels Inc. Technical Report – Donald Rare Earths and Mineral Sands Project, Victoria, Australia |
The WIM-style deposits, named by CRA, consist of a solitary or composite broad, lobate sheet-like body of highly sorted HM associated with fine grained, micaceous sand with considerable aerial extent. These deposits are thought to represent accumulations formed below the active wave base in a near-shore environment, possibly representing the submarine equivalent of the strandline-style deposits. The WIM-style deposits are typically considerably larger in tonnage and lower in grade than the strandline deposits.
In the late Pliocene or early Pleistocene ages, the Murray Basin was closed by uplift in the southwest. Major lakes formed and deposited a thick sequence of sediments dominated by clay. The onset of arid climate conditions about 500,000 years ago added an extensive system of playa lakes and aeolian sands to the cover sequence of the central and northern Murray Basin. Quaternary to Recent river systems helped create the present-day surface geology and geomorphology. The HM sand deposits are typically buried beneath Quaternary and Tertiary aged fluvial and aeolian sediments.
7.2 Local geology and mineralization
The oldest rocks in the general area of the Property are a series of medium-grade (low to middle greenschist facies) metamorphic sediments of the Ordovician St Arnaud Group. These occur at depths ranging from 40 m to 75 m as determined by a few holes drilled into basement rocks (Figure 7.2).
Unconformably overlying the basement rocks are medium-grained sands (with occasional gravels) of the Eocene Renmark Group. These are essentially clean quartz sands with wood and seed fragments overlain by carbonaceous (occasionally lignitic) clays. The sands often contain crystalline masses or concretions of marcasite and are commonly water saturated. The Late Oligocene to Mid Miocene Geera Clay conformably overlies the Renmark Group as 10 m to 30 m thick sequence of dark green to black marly clay, with shell fragments and rare shark's teeth, and pyrite (which has the potential to form acid sulphate soil).
The HM sands in the Property are concentrated mainly within the lower units (LP2 and LP3) of the unconformably overlying Late Miocene to Late Pliocene Loxton Sand, which ranges in thickness from 10 m to 15 m. HM concentrations occur immediately above the Geera Clay and decrease in grade towards the top of the fine-grained LP2 unit. A medium to coarse-grained sand unit (Loxton Sand LP1) overlies the fine-grained LP2 unit: this unit also contains HM sands.
Minor amounts of iron oxides within the HM concentrations can form iron-cemented or indurated sandstone, developed as sub-horizontal layers within the deposit. The top of the HM deposit is often seen as a similarly developed cemented zone of less than 1 m in thickness. The HM occur as very fine laminae within clayey silt and have been shown to be gently dipping imbricated laminae within sub-horizontal bands of sediment, indicating deposition within an offshore deep-water, ripple bed environment.
North-south trending, discrete higher-grade zones have formed within the greater Donald deposit presenting a focus for the initial stages of the mining operation. To the west, the mineralization deepens and overburden increases. On the southern margins, the fine-grained, silty HM sand disperses in an east-west direction following silty clay units, which are interpreted as washout zones that tend to contain no HM.
The Loxton Sand is overlain by heavy (slaking) clays of the Pliocene to Holocene Shepparton Formation, which ranges in thickness from 5 m to 20 m. These widespread brown clays commonly show mottling due to hydrated iron oxides with local developments of haematitic pisolites or nodules. "Stringer" sands of the overlying Quaternary Woorinen Formation develop as discontinuous or meandering channels of up to 10 m in thickness within the Shepparton Formation clays.
|
Energy Fuels Inc. Technical Report – Donald Rare Earths and Mineral Sands Project, Victoria, Australia |
Figure 7.2 Donald Project area generalized stratigraphic column

Source: Astron, 2023a
Note: Not to scale.
The drillhole geology shows that the top of the Loxton Sand at the Donald deposit is reached at a depth of around 9 m, depending on local topography such as sand dunes. The Loxton Sand is seen as a fine to medium grained sand at the base of the Shepparton Formation clays. A hard or silica cemented horizon (possibly the Karoonda Surface - a weathering profile created by a sea level hiatus) is seen a few metres into this sand, which can indicate the start of the very fine sand to silt zone of the Loxton Sand unit (LP2). The lower portion of the Loxton Sand is often below the water table.
Geological logging has differentiated the following interpreted depositional facies within the Loxton Sand (Figure 7.3). The depositional facies are used to geologically domain the deposit for resource modelling of the Donald deposit within MIN5532 (Phase 1). HM content is generally highest within the LP2 domain.
• LP1 - fine to very coarse friable quartz sands and minor silty, clay and gravel beds representing dunal, foreshore and surf zone sediments.
• LP2 - near-shore, very fine silty micaceous quartz sands, minor clays and gravels, representing sediments deposited below the wave base that show friable laminated and truncated HM mineralized beds. LP2 is the principal fine-grained HM target throughout the Murray Basin and contains most of the mineralization in the Donald deposit.
|
Energy Fuels Inc. Technical Report – Donald Rare Earths and Mineral Sands Project, Victoria, Australia |
• LP3 - deep water sedimentation containing higher silt and clay material than LP2.
The Geera Clay is usually encountered at depths ranging from 18 m to 30 m and, due to its potential to form acid sulphate soil, mining is to be restricted to above this horizon.
Figure 7.3 Representative geological cross-section looking north along 5,959,750 mN with drillholes coloured by total HM%*

*Section location included in Figure 14.1
Note: As discussed in Item 14, for data and block model coding, the geological surfaces took precedence over the mineralization surfaces, with the mineralization constrained to within the Loxton Sand sequence (LP1, LP2 and LP3).
Source: Snowden Optiro
The mineralized horizon, within the Loxton Sand LP1, LP2 and LP3 layers, covers the entire area of MIN5532 (6 km east-west by 6 km north-south) and extends to the north, south, east and west of MIN5532 to within RL2002. Within RL2002 the mineralized horizon extends for 33 km north-south and from 3 km to 8 km east-west. The mineralized horizon ranges from 3 m to 20 m and has an average thickness of 9.8 m within MIN5532.
|
Energy Fuels Inc. Technical Report – Donald Rare Earths and Mineral Sands Project, Victoria, Australia |
8 Deposit types
HM sand deposits contain concentrations of economically important minerals which are heavier than common sand minerals such as quartz. HM sand deposits typically comprise the following minerals of economic interest:
• Zircon
• Rutile (and anatase)
• Leucoxene
• Ilmenite
• Monazite
• Xenotime.
Zircon is rich in the element zirconium. Rutile (and anatase), leucoxene and ilmenite contain titanium. Monazite and xenotime contain REEs. Other minerals such as magnetite and garnet may also be present.
Victoria's HM sand deposits occur a long way from the modern coastline and reflect the presence of former inland seas and associated coastal processes. The two main types of HM sand deposits recognized in the Murray Basin are strandline deposits and Wimmera-style (WIM) deposits.
The strandline-style deposits occur along the seaward face of ancient shorelines and are the result of concentration and winnowing in a littoral environment. These deposits are consistent with the present (and ancient) east and southwest Australian coastlines and are characterized by one or more relatively narrow composite lenses, generally from 2 m to 12 m in thickness, and are frequently persistent along any specific mineralized shoreline for more than 2 km. These deposits typically have a 5-20% HM sand content with coarse-grained (>100 µm) HM assemblages associated with relatively coarse, clean sand and gravel, consistent with any modern active beach environment.
The WIM-style deposits, which are present and substantially pattern-drilled in the Property, are characterized by a sheet-like body of highly sorted HM associated with fine grained sand with considerable aerial extent. The deposits can be up to 25 m thick, 10 km long and 8 km wide and are relatively high tonnage and low grade (2-5% HM sand content) with a fine-grained (<250 µm) HM sand assemblage.
These deposits are thought to represent accumulations formed below the active wave base in a near-shore environment, possibly representing the submarine equivalent of the strandline-style deposits (Figure 8.1). The Donald deposit is geologically domained into LP1 beach facies, LP2 shallow sea and LP3 deeper water facies.
|
Energy Fuels Inc. Technical Report – Donald Rare Earths and Mineral Sands Project, Victoria, Australia |
Figure 8.1 WIM-style HM sand deposit model

Source: Astron, 2023c
|
Energy Fuels Inc. Technical Report – Donald Rare Earths and Mineral Sands Project, Victoria, Australia |
9 Exploration
As disclosed in Item 7, WIM-style HM sand deposits within the Property are typically buried beneath Quaternary and Tertiary aged fluvial and aeolian sediments, so surface exploration techniques such as mapping and geochemistry are not commonly performed or considered effective.
Excluding drilling, there has been no recent exploration conducted by DPPL relevant to the Property.
9.1 Geotechnical studies
ATC Williams Pty Ltd (ATC Williams) was engaged for the initial external tailings cells and subsequent in-pit tailings cell construction and deposition modelling. Numerous site geotechnical investigations have been undertaken since 2015 by Douglas Partners, GHD, and ATC Williams. ATC Williams provided geotechnical slopes of 1:2 (~27°) for in-situ slopes and 1:2.5 (~22°) for constructed slopes.
The most recent open pit geotechnical work completed by ATC Williams in 2022 was to obtain disturbed and undisturbed samples for laboratory testing to identify suitable material parameters for inclusion in the design of the co-disposal tailings facilities. The following testwork was completed by ATC Williams:
• Particle size distribution (PSD) of all material types
• Plasticity of fine-grained material encountered
• Emerson class testing to estimate dispersity of foundation material
• Particle density of the foundation materials
• Bulk density estimates from Lexan tube samples
• Compaction testing of remoulded samples for construction purposes
• Triaxial testing on selected undisturbed samples
• Remoulded permeabilities of foundation material for construction purposes.
Laboratory testing was undertaken to assess material strength of the Shepparton Clays, LP1, LP2 and Geera Clay materials. This work incorporated:
• Three consolidation tests on clay materials (Unit 2/Shepparton Formation, Unit 4/LP3 and Unit 5/Geera Clay) at Melbourne University
• Three triaxial tests.
In 2024 and 2025, ATC Williams completed an expanded program with:
• 17 geotechnical boreholes, 25 test pits, and 11 shallow boreholes in the pit, process plant, and external TSF areas
• 38 Lexan undisturbed samples and extensive in-situ testing (Pocket Penetrometer, Standard Penetration Test)
• Laboratory testing for PSD (sieve/hydrometer), Atterberg limits, SG, compaction, permeability, pinhole dispersion, Emerson, pH, California Bearing Ratio (standard and lime-stabilized), shrink-swell potential, sulphate content, and salinity/chemistry
• Integration of results into final pit slope design, TSF foundation design, and in-pit tailings consolidation modelling.
|
Energy Fuels Inc. Technical Report – Donald Rare Earths and Mineral Sands Project, Victoria, Australia |
9.2 Hydrological studies
CDM Smith undertook a structured program of hydrogeological testwork to characterize surface and groundwater conditions at the Donald (MIN5532) Project. Data were acquired through a combination of drilling, bore construction, aquifer testing, and groundwater sampling using both slug and pump tests. Boreholes were completed to appropriate depths to intercept the key stratigraphic units, and monitoring wells were installed to enable long-term data collection. Groundwater levels were measured using dataloggers and manual dips to establish seasonal and short-term fluctuations. Sampling for water quality was conducted in accordance with industry-standard protocols to minimize contamination, and analyzed for major ions, trace elements, and nutrients at accredited laboratories, ensuring reliable baseline chemistry.
Hydraulic properties were characterized using constant rate aquifer pumping tests, step tests, and slug tests. These methods are widely accepted for determining transmissivity, storativity, and hydraulic conductivity. QAQC procedures included calibration of flow meters and water level loggers, appropriate test durations, and comparison of recovery data. Results demonstrated the presence of permeable zones within unconsolidated alluvial and sandy units, with hydraulic conductivities varying across the deposit. Pumping test responses confirmed aquifer yields sufficient for localized water supply, with storativity values indicative of confined to semi-confined behaviour in deeper units.
The conceptual model incorporates recharge from rainfall infiltration, limited lateral inflows, and discharge to surface features under natural conditions. A numerical groundwater model was developed and calibrated using observed heads, pumping test results, and long-term monitoring data. Material assumptions included homogeneity within mapped hydro-stratigraphic units, anisotropy aligned with depositional geometry, and steady-state recharge estimates derived from regional rainfall infiltration rates. Model outputs provided estimates of flow directions, aquifer connectivity, and sustainable abstraction rates, and were used to establish a water balance and predict potential drawdown impacts.
The Qualified Person concludes that the methods applied were appropriate and industry-standard, the data quality is sufficient for robust interpretation, and the models reliably characterize the aquifer systems underlying the project.
|
Energy Fuels Inc. Technical Report – Donald Rare Earths and Mineral Sands Project, Victoria, Australia |
10 Drilling
10.1 Type and extent
Details of the drilling evaluating the Mineral Resource within MIN5532 are summarized in Table 10.1 and presented in Figure 10.1. Data from sonic holes, drilled for bulk density and geotechnical testwork and to expand network of groundwater monitoring bores, were not used for resource estimation. A representative cross-section is provided in Figure 7.3 with the location of the cross-section shown in Figure 14.1.
In addition, 133 AC holes and 10 sonic holes were drilled within MIN5532 during 2025 (Table 10.1 and Figure 10.2) that were not used for the current Mineral Resource estimate. A pre-production GC model was generated in 2025 using data from these drillholes.
Table 10.1 Drilling completed on MIN5532
| Company | Year | No. of holes | Metres | Type |
| CRA | 1985-1991 | 55 | 1,377 | AC |
| Zirtanium | 2000 | 1 | 19 | Calweld |
| 2002 | 10 | 231 | AC | |
| 2004 | 160 | 3,497 | AC | |
| Astron | 2010 | 157 | 3,708 | AC |
| 2015 | 4 | 100 | AC | |
| 2015* | 10 | 256.7 | Sonic | |
| 2022 | 245 | 6,355 | AC | |
| 2022* | 25 | 648.5 | Sonic | |
| 2024* | 37 | 793.2 | Sonic | |
| 2025* | 133 | 3,387 | AC | |
| 2025* | 10 | 250.5 | Sonic | |
| Total | 1985-2025 | 847 | 20,622.9 |
*Not used for Mineral Resource estimation.
The drillholes completed over RL2002 (outside of MIN5532) are summarized in Table 10.2 with the drillhole collars shown in Figure 10.3.
All holes were vertical and orientated perpendicular to the sub-horizontal mineralized horizon.
Table 10.2 Drilling completed on RL2002 (outside of MIN5532)
| Company | Year | No. of holes | Metres | Type |
| CRA | 1985-1991 | 332 | 8,970 | AC |
| Zirtanium | 2002 | 23 | 558 | AC |
| 2004 | 118 | 2,603 | AC | |
| Astron | 2010 | 179 | 4,607 | AC |
| 2015 | 153 | 4,206 | AC | |
| Total | 1985-2024 | 805 | 20,944 |
|
Energy Fuels Inc. Technical Report – Donald Rare Earths and Mineral Sands Project, Victoria, Australia |
Figure 10.1 Drilling in MIN5532 (black outline) coloured by year and used for Mineral Resource estimation

Source: Snowden Optiro
Figure 10.2 Drilling in MIN5532 (purple outline) during 2025 - not used for Mineral Resource estimation

Source: Astron
|
Energy Fuels Inc. Technical Report – Donald Rare Earths and Mineral Sands Project, Victoria, Australia |
Figure 10.3 Extent of drilling in RL2002 (blue outline) coloured by program

Source: Astron
|
Energy Fuels Inc. Technical Report – Donald Rare Earths and Mineral Sands Project, Victoria, Australia |
There are 19 holes drilled by CRA in the 1980s that intersected mineralization with >1% total HM within RL2002 to the north and outside of the extent of the MIN5532 Mineral Resource model (as discussed in item 14) and the RL2002 historical resource model defined by AMC (as discussed in Item 24.2). These drillhole intersections are listed in Table 10.3 and illustrated in Figure 10.4. All drillholes are vertical.
Table 10.3 Mineralised (>1% total HM) intersections within RL2002 not included in the extent of the resource models
| Drillhole | Easting | Northing | From (m) | To (m) | Length (m) | Total HM% |
| DO051 | 661223 | 5989878 | 25 | 31 | 6 | 5.62 |
| DO058 | 661722 | 5980778 | 20 | 26 | 6 | 6.84 |
| DO059 | 658423 | 5981278 | 23 | 33 | 10 | 2.79 |
| DO101 | 663322 | 5980578 | 20 | 28 | 8 | 3.62 |
| DO102 | 660823 | 5980928 | 20 | 26 | 6 | 4.60 |
| DO103 | 659323 | 5981178 | 21 | 23 | 2 | 4.20 |
| 26 | 29 | 3 | 3.90 | |||
| DO104 | 658072 | 5983228 | 23 | 26 | 3 | 4.57 |
| 36 | 37 | 1 | 1.40 | |||
| DO116 | 659273 | 5989578 | 19 | 20 | 1 | 4.20 |
| 24 | 32 | 8 | 3.58 | |||
| DO117 | 660123 | 5989378 | 23 | 25 | 2 | 3.50 |
| 26 | 34 | 8 | 4.40 | |||
| DO118 | 661072 | 5989028 | 25 | 29 | 4 | 8.15 |
| 30 | 31 | 1 | 3.00 | |||
| DO211 | 663123 | 5978478 | 20 | 23 | 3 | 6.90 |
| DO221 | 660822 | 5986078 | 25 | 27 | 2 | 10.00 |
| DO222 | 658872 | 5986378 | 28 | 29 | 1 | 8.62 |
| DO251 | 661323 | 5982678 | 22 | 26 | 4 | 6.16 |
| 27 | 29 | 2 | 4.58 | |||
| DO252 | 659923 | 5983028 | 26 | 31 | 5 | 4.59 |
| DO253 | 658823 | 5983078 | 21 | 23 | 2 | 4.32 |
| 26 | 30 | 4 | 2.92 | |||
| DO256 | 663523 | 5982378 | 27 | 28 | 1 | 5.63 |
| DO365 | 662622 | 5976378 | 19 | 22 | 3 | 6.81 |
| DO366 | 663023 | 5977278 | 20 | 22 | 2 | 6.25 |
Source: Snowden Optiro
|
Energy Fuels Inc. Technical Report – Donald Rare Earths and Mineral Sands Project, Victoria, Australia |
Figure 10.4 Location of RL2002 and mineralized drillhole intersections outside of the MIN5532 and RL2002 resource models
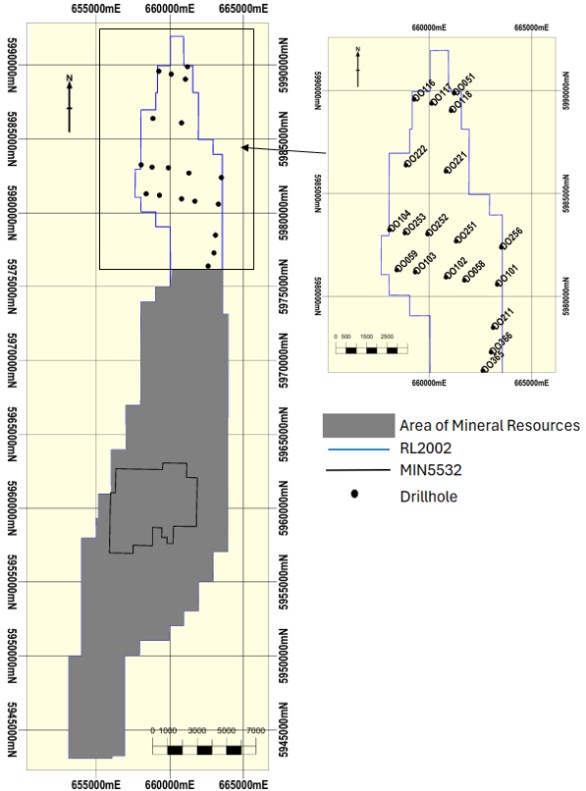
Source: Snowden Optiro
|
Energy Fuels Inc. Technical Report – Donald Rare Earths and Mineral Sands Project, Victoria, Australia |
10.1.1 Aircore drilling
The AC drilling completed by CRA over the Donald deposit was by a Mantis 200 drill rig. The drill spacing was generally at 500-800 m centres, with some closer spaced drilling (100-300 m) in selected areas. The average drillhole depth was 27 m below ground surface.
Zirtanium drilled the Donald deposit during 2002-2004 on a 250 m by 500 m grid pattern using a 10-tonne Mercedes truck-mounted (D28) Mantis 75 AC rig with a 300 cfm/175 psi compressor. NQ drill rods (70 mm diameter) with a three-blade drill bit were used for the 82 mm diameter holes. The holes were drilled to a depth of 24 m or until the Geera Clay was intersected.
The 2010 Astron program comprised infill AC drilling on MIN5532 and the area directly to the north. The purpose of this drilling was to:
• Provide sufficient coverage to enable the resource contained within MIN5532 to be upgraded to the Measured Resource category
• Obtain further information on the VHM composition within the HM resource and to enable the VHM resource to be increased
• Obtain further information on the resource to the immediate north where it appears that the high-grade zircon formation found within the resource area continues.
In 2015, a further AC drilling program was completed covering an area to the south of MIN5532 within RL2002. The program was primarily focused on delineating resources outside of MIN5532; however, a small number of holes provided information relevant to the southern part of MIN5532.
A Mantis 80 Toyota 6WD mounted drill rig with a NQ drill string and tungsten tip bladed NQ (82 mm) core bit was used for both programs.
Astron completed a further 245 vertical infill AC holes across MIN5532 in 2022 to:
• Provide new sample data for HM grade estimation covering the 20-250 μm size fraction to align with expected processing capabilities
• Address the difference in the domain sizes between the previously estimated and reported HM resource and VHM resource
• Sample more extensively above and below the deposit as previously interpreted
• Provide further logging information to enable a more detailed geological, domain-based resource estimation
• Determine rare earth mineral grades.
The drilling was completed on 250 mE by 250 mN and 250 mE by 500 mN patterns with holes spaced between existing drill traverses to improve the overall drillhole spacing. A Mantis AC75 drill rig with a 300 cfm/175 psi compressor and a NQ based drill string with three-blade AC drill bit was used for the program. All holes were drilled vertically, and the average hole depth was 26 m.
Astron undertook GC drilling in early 2025. For the GC program, AC drillholes were spaced on a 100 m by 100 m grid covering the first eight mining blocks, which represents approximately the first two years of mining production. Holes were drilled to intersect the entire Loxton Sand and to extent into the Geera Clay by 1 m. In addition to the regular grid-pattern, other drillholes included were:
• 14 drillholes infilling nearby areas that either were unavailable during the 2022 drilling or may become unavailable after the commencement of earthworks, due to the placement of long-term soil stockpiles or the need to establish drainage infrastructure.
|
Energy Fuels Inc. Technical Report – Donald Rare Earths and Mineral Sands Project, Victoria, Australia |
• 10 drillholes drilled as twins of existing AC holes from the 2025 program with the only difference being that samples were split with a rotary splitter at the drill site. This exercise was undertaken to confirm if samples split at the rig can be considered reliably representative of the overall drill-sample.
• Four extra AC holes drilled north of the grid area following up on a potential high-grade zone seen in logging during the program.
10.1.2 Sonic drilling
In 2015, a 10-hole sonic drilling program was completed in the mining commencement zone of MIN5532. The core was sent to Mineral Technologies for metallurgical and engineering analysis. A selection of samples from were also analyzed by Ultra-Trace Laboratory for TiO2, Fe2O3, Al2O3, ZrO2, HfO2 and loss-on-ignition by XRF analysis. No details are available on the accreditation or certification of Ultra-Trace Laboratory.
A second 25-hole program of sonic drilling was completed within MIN5532 during 2022 with the following objectives:
• To gather geotechnical information about the deposit including geology, material strength, compaction, moisture and bulk density
• To twin existing AC drillholes from the 2022 drilling program
• Collection of a bulk sample for further metallurgical testwork
• To add to the network of groundwater monitoring bores.
A 37-hole program of sonic drilling was completed during 2024, and a 10-hole program was completed in 2025 to collect additional geotechnical, bulk density and bulk samples for mineralogical analysis.
The 2015 and 2022 sonic drilling was carried out using a Boart Longyear LS600 drill rig. Sonic drilling after 2015 has been performed by Star Drilling Pty Ltd either using 6-inch core or 8-inch core. All geotechnical testwork was performed using a 6-inch core, whereas bulk samples were derived using the larger 8-inch core holes. Lexan Liner samples for bulk density analysis were taken from both hole sizes and from a range of locations across MIN5532. Assay data from the sonic holes were not used for Mineral Resource estimation.
10.1.3 Calweld drilling
In 2000, Zirtanium completed one large diameter (940 mm) Calweld drillhole to a total depth of 19 m to obtain a bulk sample.
10.2 Procedures
10.2.1 Surveying
The CRA reports do not include details of the survey methodology used for the holes drilled in the 1990s. As disclosed in Table 14.1, data from the CRA holes was used for geological interpretation only.
All Zirtanium's drillholes were surveyed using a global positioning system (GPS) unit with an accuracy of ±2 m. The drill collar elevation was estimated by GeoReality software using a high-resolution digital elevation model with an accuracy of ±1.2 m. AMC reported that later drillhole collars were surveyed using a differential GPS (AMC, 2016a).
The 2010 Astron holes were surveyed by GPS prior to drilling, and all holes were drilled within 1 m of the surveyed peg. At completion, the hole locations were surveyed by licensed surveyors.
All 2022 drillhole locations were set out using GPS survey equipment with the final hole locations also surveyed by licensed surveyors using a Leica Captivate GS18 unit and CS20 controller.
|
Energy Fuels Inc. Technical Report – Donald Rare Earths and Mineral Sands Project, Victoria, Australia |
The coordinate systems used for all location data prior to 2025 was GDA94/MGA94 Zone 54 and the Australian Height Datum.
All 2025 drillhole locations were set out by licensed surveyors using a Leica Captivate GS18 unit and CS20 controller. Where holes were moved, the final hole locations also surveyed by licensed surveyors. The coordinate systems used for all 2025 location data was GDA2020/MGA2020 Zone 54 and the Australian Height Datum.
10.2.2 Sampling and logging
CRA
CRA's drill samples were collected at 1 m intervals in plastic lined garbage bins. Each drill sample was visually logged for lithology, colour, grainsize, sorting, grain shape, accessory minerals and bottom of the clay horizon. A handheld scintillometer recorded the gamma count of each sample to assess a relative HM grade.
Prior to 1988, drill samples were collected at 1 m intervals, with an equal dry split by weight composited for a 2 m interval and submitted for heavy liquid separation. A composite of the >2.96 g/cm3 SG concentrate for all drill samples from each hole was prepared for mineralogy studies.
The technique was modified in 1988 to reduce time spent on sample preparation. Previously, the work involved a conventional dry riffle splitting technique to generate a 1 kg dry sample representing the composite 1 m intervals in equal proportions by weight for a particular sample interval.
A concrete mixer was subsequently used to prepare a wet sample for a lithologically consistent bulked sample interval. This allowed ferruginous granules/pisolites in the drill samples to remain in suspension. CRA assumed that HM grains less than 100 μm would remain evenly disseminated in suspension. A wet sample was scooped from the mixer and dried to a 1 kg sample for analysis. A close correlation between the new technique and the conventional dry splitting technique was reported for recovered HM concentrates.
To allow for rapid analysis of samples collected during resource infill drilling, CRA used a hand coring technique to collect a sample from selected single metre intervals following compositing. Checks were made against the conventional dry splitting method and good correlations were reported.
On completion of the hole, a downhole natural gamma logging device was used to identify radiometric anomalies (thorium in monazite). Based on the gamma log values, individual samples were composited into larger intervals (usually two or three composites per hole) and sent for preparation and assay. The natural gamma logging results provided the depth to the top and base of mineralization and the interpreted thickness of the HM sand deposit in the drillhole. This information was later correlated with the assayed samples.
Zirtanium
For Zirtanium's drilling program, calico bags were used to collect the samples and water via a cyclone. At the completion of the drilling program, the geologist assessed the drill logs and selected the samples sent for HM analysis.
The drillholes were geologically logged at 1 m intervals recording the lithology, estimated HM, interpreted stratigraphic horizon and presence of indurated material. Samples for HM and size analysis were collected at 1 m intervals from identified mineralized horizon.
Prior to moving to the next location, each hole was plugged; backfilled and the site cleaned. The on-site geologist panned and extracted representative subsamples, and visually logged lithology, colour, estimated HM (%) and estimated HM grain size.
|
Energy Fuels Inc. Technical Report – Donald Rare Earths and Mineral Sands Project, Victoria, Australia |
Astron
Astron's sampling method for the 2010 program replicated the process from Zirtanium's 2004 drilling campaign. Two types of samples were collected from each hole:
• Surface or topsoil sample using a pick and shovel
• HM samples collected at 1 m intervals from the identified mineralized horizon.
The HM samples were collected by cyclone at 1 m intervals. The recovered material was dropped into buckets from the cyclone and visually assessed for overall lithological description. Once potentially relevant HM-bearing sand and silt intervals were reached, a small sample of each interval was panned to determine the HM content, and the sample described in the logs. When the top of the HM-bearing interval was determined, calico sample bags were placed directly under the cyclone and the whole of the recovered material over 1 m was collected. The hole was terminated once the Geera Clay was intersected.
The drillholes were geologically logged at 1 m intervals recording the lithology, colour, mineralization, contamination and any other features.
For the 2022 program, representative samples were collected in calico bags at 1 m intervals using a rig mounted cyclone and rotary sample splitter (25% split). The holes were typically sampled from the top of the Loxton Sand until the intersection of the Geera Clay. The samples were sun dried before dispatch to the assay laboratory. Residue from the sample splitter was collected into larger calico bags for backup testing and recovery calculations. Field duplicate samples over a 1 m interval were also collected from the sample splitter every 40 samples. Standard samples sourced from Placer Consulting Pty Ltd were also inserted every 40 samples.
For the 2025 GC AC program, the entire sample for each 1 m interval was collected for 123 of the 133 holes, and samples were split at the assay laboratory. Ten twin AC holes were drilled, and a 25% split was taken at the drill rig with a rotary splitter. The 2025 sonic holes were sampled on 0.5 m intervals. All 2025 AC holes were sampled from the top of the Loxton Sand until the intersection of the Geera Clay. Geological logging recorded lithology, lithology proportion, grain size, colour, induration (presence and strength), hardness, geological stratigraphical unit and HM type and content estimation, and estimated clay content. The 2025 samples were not used for Mineral Resource estimation but were used to generate a separate GC model for the first two years of mining.
Sample representativity
While the AC drilling technique was extensively used for the evaluation of the Donald deposit, some problems with recovery were experienced in the pre-2004 drilling with refinements subsequently made to the drilling equipment and technique to improve recovery. In the 2002 Zirtanium drilling program, poor HM% correlation with the CRA drilling was reported. These results were not used for the current Mineral Resource estimate (as disclosed in Item 14), with the holes used for geological interpretation only.
For the 2004, 2010 and 2015 drilling programs, the entire sample from each 1 m interval was collected at the drill rig with the samples dried before splitting to remove any uncertainty from the splitting of wet samples at the drill rig. In 2022, the samples were split (25%) at the drill rig using a rotary splitter with attention paid to cleaning and minimizing contamination under the supervision of an Astron representative. The sample splits were deemed acceptable and quality control data (discussed in Item 11.3) indicated that the data from the 2022 drill program is of a high quality and suitable for resource estimation. Recovery factors were not applied to the data. For the 2025 GC AC program, the entire sample for each 1 m interval was collected for 123 of the 133 holes, and samples were split at the assay laboratory.
10.2.3 Data management and security
DPPL's samples are stored in a shed at Minyip.
|
Energy Fuels Inc. Technical Report – Donald Rare Earths and Mineral Sands Project, Victoria, Australia |
Prior to February 2025, the DPPL master database was stored within a Microsoft Access format that contained all historical and recent drilling and assay information. The database was independently reviewed by AMC prior to its last Mineral Resource update in 2016 and by IHC Mining in 2021-2022.
Between 2022 and February 2025 all information added to the database and subsequent validation was the sole responsibility of Astron's senior geologist. Validation work included checking the imported data against the original assay reports. The database and backups were stored on Astron's Microsoft SharePoint document management platform, which has built-in access restrictions.
Since February 2025, DPPL's data has been managed in Quest by third party provider EarthSQL Pty Ltd in a fully relational SQL Server database hosted on Microsoft Azure. All data is gathered from either the field or the laboratory via pre-determined templates and vetted prior to being uploaded.
 |
Energy Fuels Inc. Technical Report – Donald Rare Earths and Mineral Sands Project, Victoria, Australia |
11 Sample preparation, analyses, and security
11.1 Sample preparation and analysis
11.1.1 CRA
CRA's samples were initially analyzed at independent laboratory AMDEL and at CRA's internal Belmont laboratory in Perth, Western Australia. No accreditation or certification details were disclosed for AMDEL or CRA's internal laboratory.
The analytical procedure used up to mid-1989 was heavy liquid and magnetic separation of a sieved fraction (>38 μm and <1 mm) followed by mineralogical detection by a combination of chemical and optical methods. Duplicate samples reportedly showed a good correlation between the two laboratories for total HM.
A new analytical technique was developed in 1989 (the 'WIM Method') to facilitate a more accurate assessment of the titanium mineral suite and to capture the fine material lost when sieving samples at 38 μm. The new procedure allowed better liberation of minerals cemented with clay or goethite, recovered the denser HM such as zircon and monazite in the <38 μm fraction and used chemical analysis rather than optical methods to determine the mineral assemblage of the HM fraction.
As disclosed in Table 14.1, data from the CRA holes were used for geological interpretation only. Assay data for HM, slimes, oversize and mineral assemblage data were not used for the MIN5532 Mineral Resource estimate due to the historical nature of the data and inconsistencies in the size fractions and analytical methodologies with the data obtained by Astron in 2022.
11.1.2 Zirtanium
Due to the large number of drill samples, multiple laboratories under the supervision of consultant's Titanatek were used by Zirtanium.
Titanatek gave each laboratory instructions for the sample preparation developed for WIM-style, fine-grained material. Independent commercial laboratory, Western GeoLabs laboratory in Perth, Western Australia performed the analytical work, using the following sample preparation procedure:
• Kiln dry samples (6-9 kg) at 110°C.
• Weigh samples for recovery estimate.
• Hammer each sample to break up clays.
• Screen sample using a 4 mm oversize screen, remove rocks and crush remainder of +4 mm fraction via a jaw crusher.
• Return crushed sample to 4 mm screen and hand crush +4 mm clays if required.
• Weigh and record all +4 mm product and discard.
• Riffle split all -4 mm material to obtain nominal 130 g subsample.
• Retain residue as reference/audit sample.
• Weigh subsample (25 g) and carry out soak/attrition desliming at 38 μm.
• Wet sieve to deslime and retain +38 μm product in aluminium tray and dry.
• Weigh dry sample and screen at +1 mm and record weight.
• Centrifugal heavy liquid separation of the +38 μm/-1 mm fraction.
• Screen sink material to +38 μm/-90 μm and weigh for in-size HM (%) calculation and mineralogy analysis.
|
Energy Fuels Inc. Technical Report – Donald Rare Earths and Mineral Sands Project, Victoria, Australia |
• Composite mineral samples by weight for mineralogy analysis. Mineralogy testwork results were adjusted for potential use with +38 μm/-1 mm total HM assay data.
Comparative testwork using a centrifuge achieved an increase in the recovery of HM for the fine-grained fraction vs standard heavy liquid separation. Centrifuge was selected as the routine method for HM% determination using the following standardized procedures:
• Prepare a 25 g sample and place in a 110 ml centrifuge tube and add TBE (>2.96 g/cm3 SG) and mix.
• Centrifuge for 5 minutes at 1,500 rpm, re-stir and repeat spin.
• Scoop off floats and wash the sides of the tube with TBE and leave to settle for 5 minutes.
• Gently pour the remainder of the floats off, drain into filter paper and wash with TBE so that all HM are collected on the filter paper.
• Transfer to a wash basin and clean with acetone. Wash into a drying dish and oven dry.
• Weigh the HM content and save in labelled plastic bag.
Further testing by Titanatek confirmed that there was no statistical difference using a 25 g sample instead of the 70 g sample normally used by Titanatek. The smaller size was adopted and Western GeoLabs duplicated 1 in every 10 samples as part of its internal quality control procedure. To identify potential laboratory analytical errors, 1 in 20 samples was sent to external laboratories and results were statistically analyzed for bias, repeatability and reproducibility.
Analysis of the VHM component indicated a size range from 10 µm to 90 µm, the majority of which lies above 38 µm, with an average of approximately 50 µm to 55 µm. Western GeoLabs reported its HM% results as +38 μm/-1 mm, even though the majority of the VHM reported in the 38 μm to 75 μm range.
From 2004, Western GeoLabs reported the HM% results adjusted to a +38 μm/-90 μm HM size range definition for consistency with mineralogy assemblage testwork.
Geochempet Services performed mineralogical analysis on a sample set. To provide maximum control over the mineralogical data for resource estimation, every second hole on every second drill line was selected by Zirtanium for mineralogical analysis (1,000 m by 500 m coverage). The mineralogical analysis included composite samples prepared by Titanatek based on a 1.5% HM cut-off grade using a weighted average of the individual 1 m HM intervals.
No details are available on the accreditation or certification of Western GeoLabs, Geochempet Services or Titanatek.
11.1.3 Astron
From 2010, Astron adopted the same sample preparation and analytical techniques used by Zirtanium at Western GeoLabs. The only exception was the removal of jaw crushing +4 mm oversize material and the splitting of samples down to 250 g, which was outsourced to independent laboratory Gekko Pty Ltd in Victoria (ISO/IEC 17025 (2017) accreditation) to reduce the volume of material shipped to Western GeoLabs in Perth and improve the assay turnaround time.
As the plant process flowsheet did not include a crushing module, it was considered inappropriate to include this in the sample preparation procedure, resulting in a substantial increase in oversize percentage. Further analysis of the oversize by Western GeoLabs verified that most of this material is mineralized clay that has solidified during the sample drying process. Water in the trommel and subsequent processes will break this material down during processing, releasing any contained HM.
Western GeoLabs' laboratory in Perth carried out the heavy media separation by TBE and centrifuge.
|
Energy Fuels Inc. Technical Report – Donald Rare Earths and Mineral Sands Project, Victoria, Australia |
Samples for mineralogy were either composited or selected on a per metre basis. Robbins Metallurgical (who purchased Titanatek and is now part of the Royal IHC group) prepared the samples and Geochempet Services performed the mineralogical studies.
Astron's analytical work during 2022 was performed by independent laboratory Bureau Veritas at its Adelaide, South Australia facility (ISO 9001:2015 accreditation). As disclosed in Item 14, Area 1 and Area 2 were defined, based on the drilling programs, for data analysis and grade estimation for the current Mineral Resource. The area covered by the 2022 drilling is coded as Area 1 and encompasses 97% of the total area of MIN5532.
The sample preparation and analytical process for the 2022 samples was:
• Oven dry samples
• Break up clays in bag with mallet
• Rotary split 500 g for testwork with an additional 500 g split off every 28th sample for the laboratory duplicate
• Soak overnight in a 1% TSPP solution
• Wet screen at 20 µm, 250 µm and 1 mm to create an in-size sample of between 20 µm and 250 μm
• Dry and weigh in-size and oversize samples
• Rotary split off approximately 100 g for heavy liquid separation
• Centrifugal and heavy liquid separation using TBE (>2.96 g/cm3 SG)
• Centrifugal and heavy liquid separation of laboratory duplicate
• Centrifugal and heavy liquid separation of standard (supplied by Bureau Veritas) every 28th primary sample
• Wash, dry and weigh sinks.
Total HM was measured in the +20 μm/-250 μm fraction and reported as a percentage of the whole sample.
The analytical testwork flowsheet is presented in Figure 11.1.
The need for additional breaking up of solidified clays and aggregate particles was monitored throughout the process with the possibility of adding a second pass of wet screening after further mechanical agitation in 1% TSPP solution, but this was deemed unnecessary at the time of the program.
Mineralogy on 53 composite samples, generated from individual samples of >1% total HM from 227 holes drilled in the 2022, was also performed by Bureau Veritas using XRF, laser ablation inductively coupled plasma mass spectrometry (ICP-MS) and QEMSCAN® analysis. Testwork was performed on the in-size (+20 μm/-250 μm fraction) HM sinks composited by representative geological domains (LP1, LP2 and LP3) and geographic domains (from nearby or adjacent holes). This was done primarily to obtain enough sample mass for the QEMSCAN® analysis.
The process for the mineralogy was:
• Compositing - homogenize and subsample as required
• QEMSCAN® analysis
• Pulverise samples for assay
• XRF and ICP-MS
• Quantitative x-ray diffraction (XRD) analysis for validation and comparison with XRF and QEMSCAN®.
|
Energy Fuels Inc. Technical Report – Donald Rare Earths and Mineral Sands Project, Victoria, Australia |
Figure 11.1 2022 analytical testwork flowsheet

Source: Snowden Optiro, 2022
The "particle classification" data from the QEMSCAN® analysis was used to estimate the titania minerals, XRF data was used to estimate the zircon, TiO2% and ZrO2+HfO2%, and the ICP-MS data was used to estimate monazite, xenotime and REOs (including CeO2% and Y2O3%) within the HM fraction.
The breakpoints used for the titania minerals were as follows:
• Rutile (including anatase) (≥95% TiO2)
• Leucoxene (50-95% TiO2)
• Ilmenite (30-50% TiO2).
Zircon and monazite and xenotime were estimated using the follow conversions:
• Zircon = ZrO2+HfO2 / 0.667
• Monazite = CeO2 / 0.28
• Xenotime = Y2O3 / 0.42.
The REEs (in parts per million (ppm)) were converted to REOs in percent using the following conversions, and TREO was calculated as the sum of these REOs:
• CeO2 = Ce x 1.2284/10,000
• Dy2O3 = Dy x 1.1477/10,000
• Er2O3= Er x 1.1435/10,000
• Eu2O3 = Eu x 1.1579/10,000
• Gd2O3 = Gd x 1.1526/10,000
|
Energy Fuels Inc. Technical Report – Donald Rare Earths and Mineral Sands Project, Victoria, Australia |
• Ho2O3 = Ho x 1.1455/10,000
• La2O3 = La x 1.1728/10,000
• Lu2O3 = Lu x 1.1371/10,000
• Nd2O3 = Nd x 1.1664/10,000
• Pr6O11 = Pr x 1.2082/10,000
• Sm2O3 = Sm x 1.1596/10,000
• Tb4O7 = Tb x 1.1762/10,000
• Tm2O3 = Tm x 1.1421/10,000
• Y2O3 = Y x 1.2699/10,000
• Yb2O3 = Yb x 1.1387/10,000.
As discussed in Item 14, this data was used as input to an inverse distance estimate of the mineral assemblage components of the HM fraction.
The 2025 GC samples were analyzed by ALS Global Metallurgy in Perth, Western Australia (ISO 9001 accreditation). The following procedures were used for sample preparation and analysis:
• Clay dispersion in container of 1% TSPP solution - overnight soak time.
• Mild stirring for two minutes to disperse and homogenize.
• Dissociation by bottle-roll (steel).
• Wet screened to 1 mm, 250 µm and 20 µm using stacked screens.
• Sample fractions dried and weighted.
• Riffle split of +20 µm/-250 µm fraction for HM determination. Initially, 100 g was taken for the heavy liquid separation start weight, this was increased to 150 g mid-program to ensure enough sink material was produced for mineralogy work on low grade samples.
• Riffle spit fraction and processed via heavy liquid separation at 2.96 g/cm3 SG using TBE.
• The percentage of total HM calculated for the entire sample.
• Chemical analysis of heavy liquid separation sinks by XRF for mineral sands element suite and by D4ZM lithium metaborate fusion ICP-MS for REEs.
QEMSCAN analysis was not undertaken and so the individual titania minerals (rutile, leucoxene and ilmenite) were not determined. The above conversions for zircon, monazite, xenotime and REEs to REOs were applied.
11.2 Bulk density
11.2.1 CRA
CRA initially assigned bulk density values derived from the nearby WIM 150 deposit for the Donald (WIM 250) resource estimates due to their similarity. Initial determinations by CRA, derived from weighing a known volume of competent drill core, returned an average bulk density of 2.0 t/m3 within a range of 1.8 t/m3 to 2.2 t/m3. CRA used a more conservative bulk density of 1.75 t/m3 for the initial WIM 150 resource estimate.
Trenches excavated for bulk sampling allowed for further bulk density testwork, resulting in an average dry bulk density of 1.65 t/m3.
|
Energy Fuels Inc. Technical Report – Donald Rare Earths and Mineral Sands Project, Victoria, Australia |
11.2.2 Zirtanium
Roadlab Pty Ltd, accredited by the National Association of Testing Authorities (NATA), conducted field density measurements from a test pit excavated during 2005 using a Troxler nuclear gauge. The results are summarized in Table 11.1 and confirmed the samples in Loxton Sand mineralization agreed with the bulk density value of 1.65 t/m3 used by CRA.
Table 11.1 Troxler nuclear gauge bulk density readings
| Formation | Lithology | No. of samples |
Depth (m) |
Moisture (%) |
Wet density (t/m3) |
Dry density (t/m3) |
| Shepparton Formation | Clay | 6 | 2 to 6 | 26.4 | 1.89 | 1.50 |
| Loxton Sand | Fine-grained sand | 3 | 9 to 12 | 17.9 | 1.98 | 1.68 |
Source: Astron, 2023a
11.2.3 Astron
As part of the 2022 sonic drilling program, 15 holes that were drilled primarily for geotechnical testwork were also used to collect samples for bulk density testwork specific to the geological domains (LP1, LP2 and LP3) used for the 2022 Mineral Resource estimate. Samples were analyzed by the ATC Williams Laboratory (ISO 9001 accreditation) using the Australian Standard test for Bulk Density (AS1289.6.4.1).
Further bulk density sampling was conducted as part of the 2024 and 2025 sonic drilling programs. These samples were analyzed using the same technique. Data for bulk density of soil types and the Shepparton Formation clays (0-10 m below surface) were also gathered from surface test pitting work as part of soil profile investigations in 2024.
Data from a total of 149 density samples, collected from test pits in 2005 (nuclear density measurements) and 2018 (sand replacement), from nuclear density measurements in 2024, and from sonic drill core samples in 2022, 2024 and 2025 were used to determine average density values for the Shepparton Formation and LP1, LP2 and LP3 (Table 11.2). These average density values were applied for tonnage estimation (Item 14).
Table 11.2 Bulk density testwork results
| Geological unit | No. of samples | Moisture (%) | Dry density (t/m3) | ||
| Range | Average | Range | Average | ||
| Shepparton Formation | 70 | 17.1-39.9 | 29.5 | 1.10-1.68 | 1.45 |
| Loxton Sand - LP1 | 34 | 5.7-24.0 | 15.2 | 1.58-2.14 | 1.84 |
| Loxton Sand - LP2 | 36 | 16.0-34.2 | 22.4 | 1.47-2.13 | 1.75 |
| Loxton Sand - LP3 | 10 | 23.4-28.2 | 28.2 | 1.52-1.85 | 1.67 |
Source: Snowden Optiro, 2025b
11.3 Quality control quality assurance procedures
11.3.1 Pre-2022 analytical data
The CRA reports do not include details of QAQC data or procedures used for the samples collected in the 1990s. As disclosed in Table 14.1, data from the CRA holes was used for geological interpretation only in the MIN5532 Mineral Resource estimate.
A detailed review of the historical assay data by Astron (which included the collation of assay data from the original laboratory reports) revealed that different size fractions were used for the analysis of the total HM content of the whole sample post breakup and riffle splitting as follows:
• CRA: +38 μm/-1 mm fraction for HM%, mineralogy determined in +38 μm/-90 μm fraction (in-house laboratory) and +38 μm/-75 μm fraction (AMDEL) with all results adjusted to % of whole sample.
|
Energy Fuels Inc. Technical Report – Donald Rare Earths and Mineral Sands Project, Victoria, Australia |
• Zirtanium, 2000 and 2002: +38 μm/-1 mm fraction for HM%, mineralogy determined in +38 μm/-90 μm fraction and adjusted to % of whole sample.
• Zirtanium, 2004: +38 μm/-1 mm fraction for HM%, mineralogy determined in +38 μm/-90 μm fraction and adjusted to % of whole sample.
• Astron, 2010 and 2015: +38 μm/-90 μm fraction.
Only assay data from the 2022 drilling program was used for the MIN5532 Mineral Resource estimate in Area 1. Assay data from the 2004, 2010 and 2015 drilling programs were used for resource estimation in Area 2 (Table 14.1).
Quality control data for the 2004 drilling program included interlaboratory analysis of duplicate samples. Western GeoLabs produced two 1 kg subsamples from 1 in 20 samples for analysis at Dune and Titanatek laboratories. The results were good with correlation coefficients of over 0.94 for total HM, slimes and oversize.
Six sets of twinned holes were drilled during 2004. Zirtanium (2005) reported that the mineralization intercept intervals were comparable, comparisons of the slimes and oversize data were acceptable, and the total HM content varied between the twin holes.
AMC reviewed the quality control data for laboratory repeat analysis of drill samples from the 2010 drilling and field duplicate and laboratory repeat analysis of drill samples from the 2015 drilling (AMC, 2016a). AMC reported that the 2015 field duplicates showed a bias for total HM and oversize. For the MIN5532 Mineral Resource estimate, this data was used for estimation within Area 2 only and was classified as Indicated at best (refer to Item 14.4).
11.3.2 2022 analytical data
QAQC procedures for the 2022 drilling program included insertion of standards and field duplicates at the drill site (rate of 1 in 40). Blank samples were not inserted and are generally not used in the mineral sands industry. In addition, duplicate and standard samples were inserted by the laboratory.
Standards
Prior to drilling, a batch of HM sand standard material was acquired from Placer Consulting Pty Ltd in Western Australia. The standard material was not officially certified. The standard samples used were primarily sourced for HM% content monitoring and the stated expected value for the supplied standard material was 3% HM.
Performance of the standard throughout the program was considered moderately acceptable averaging 2.87% HM over 121 standards assayed. The performance of the slimes content was more inconsistent with the content of the whole batch determined by large-scale mixing of slimes material into the batch. Similarly, the oversize (>1 mm) content was very low and consistent apart from two outlier results.
The standard could only be used to assess bias or drift in the batches of results over time. No bias was noted for HM, slimes or oversize contents over time.
For the 2022 drilling, the rates of insertion of standards are in line with industry standard rates. It is recommended that at least three different standards are included with the samples submitted for analysis.
Field duplicates
Duplicate samples were collected from the cyclone at the drill rig and inserted at a rate of 1 per 40 samples, with the results summarized in Table 11.3.
Assays for the original and repeat field duplicates show a high correlation (0.91 to 0.98). The 90th percentile HARD (half absolute relative difference) values were good for total HM and slimes (17% and 10% respectively) and were acceptable for oversize (33%). The field duplicate samples showed no overall bias for total HM and a small bias (less than 4% relative difference) to lower slimes and oversize contents in the duplicate samples. The duplicate samples performed well and indicate good precision of the total HM, slimes and oversize analysis.
|
Energy Fuels Inc. Technical Report – Donald Rare Earths and Mineral Sands Project, Victoria, Australia |
Table 11.3 QAQC results from field duplicate samples
| Total HM | Slimes | Oversize | |||||||
| Original | Duplicate | % Diff. | Original | Duplicate | % Diff. | Original | Duplicate | % Diff. | |
| Count | 118 | 118 | - | 118 | 118 | - | 118 | 118 | - |
| Minimum | 0.04 | 0.04 | 0.0 | 5.48 | 7.02 | 28.1 | 0.82 | 0.48 | -41.5 |
| Maximum | 10.11 | 9.23 | -8.7 | 66.74 | 53.64 | -19.6 | 54.23 | 50.66 | -6.6 |
| Mean | 2.72 | 2.79 | 2.8 | 21.23 | 20.44 | -3.7 | 12.51 | 12.06 | -3.6 |
| Median | 0.23 | 0.22 | -2.4 | 1.15 | 1.01 | -12.0 | 1.03 | 1.02 | -0.8 |
| Standard deviation | 1.86 | 2.00 | 7.3 | 15.92 | 16.41 | 3.1 | 10.31 | 8.90 | -13.7 |
| Correlation coefficient | 0.9839 | 0.9180 | 0.9142 | ||||||
Source: Snowden Optiro, 2022
Laboratory QAQC
Internal laboratory QAQC practices at Bureau Veritas for the 2022 drillhole samples consisted of standards and duplicates inserted at a rate of 1 in 28 throughout the program. The results of this work were reviewed by the Qualified Person for the Mineral Resource estimate, and the overall performance of the standard and duplicate analyses were deemed acceptable.
The average returned HM% value across 155 laboratory standards was 4.0% HM with an expected value of 4.0% HM. Scatter plots comparing laboratory duplicate results for HM %, slimes % and oversize % to the parent sample assays showed excellent correlation.
11.3.3 2025 analytical data
Field duplicates were not collected for the 2025 GC program, as the entire 1 m sample was submitted to the assay laboratory. Data from the twin-holes was used to assess the quality of the data. Only 17 field standards were submitted as part of the sample stream. The available data from the twin drillholes and standards have not indicated any issues. The 2025 samples were not used for Mineral Resource estimation but were used to generate a separate pre-production GC model for the first two years of mining.
11.4 Security
All samples from 2022 onwards were dispatched from site under the supervision of Astron's senior geologist. The samples were bagged into larger polyweave bags, numbered and zip tied prior to loading into numbered bulka bags on pallets for transport to Bureau Veritas using a commercial freight service.
Previously, assay data from the laboratory was emailed in spreadsheet files by batch number and imported into the Microsoft Access database by Astron's senior geologist. Since February 2025, data from the laboratory is emailed to EarthSQL Pty Ltd where it is vetted prior to being uploaded into the SQL Server database.
11.5 Qualified Person's opinion
Industry standard practice and a reputable laboratory have been used for sample preparation and sample analysis of the samples from the 2022 drilling program. Transfer of the 2022 assay data from the laboratory and inclusion in Astron's database was verified by the Qualified Person for the MIN5532 Mineral Resource estimate (refer to Item 12.4). No issues were noted by the Qualified Person on data management, sample security or sample analysis.
|
Energy Fuels Inc. Technical Report – Donald Rare Earths and Mineral Sands Project, Victoria, Australia |
Following review of the data quality and assay techniques, the Qualified Person concluded that the dataset from the 2022 drill program is of a high quality and suitable for resource estimation and potential Measured classification. Within MIN5532 (Phase 1), only the 2022 assay data were used for estimation of 92% of the Mineral Resources: this includes all of the Measured Resources and 82% of the Indicated Resources in MIN5532 (refer to Item 14.4).
There is less confidence in the assay data from the 2004, 2010 and 2015 drilling programs, which were used for resource estimation in Area 2. Consequently, the Qualified Person assigned a lower classification, and Mineral Resources within Area 2 were classified as Indicated at best (refer to Item 14.4). Analysis of the CRA data and Zirtanium 2000 and 2002 samples used different size fractions, so assay data from these programs were not used for the current Mineral Resource estimate. Data from these drilling programs were only used to guide geological interpretation.
|
Energy Fuels Inc. Technical Report – Donald Rare Earths and Mineral Sands Project, Victoria, Australia |
12 Data verification
12.1 Data management
The Qualified Person for the Mineral Resource estimate compared the assay data sheets for the 2022 drilling program from the laboratory against the assay data files provided by Astron. All the 2022 assay data extracted from the database matched the data in the assay data sheets supplied by Bureau Veritas. Only assay data from the 2022 drilling program were used for resource estimation in Area 1 (refer to Item 14). The area covered by the 2022 drilling is coded as Area 1 and encompasses 97% of the total area of MIN5532.
12.2 Survey
The Qualified Person checked the drillhole collar data for all 2000-2022 drillholes against the topographical surface provided by DPPL. A few minor discrepancies were noted between the topographical surface and the 2022 drillhole collars and, as the 2022 drillhole collars were surveyed by licensed surveyors (refer to Item 10.2.1), the topographical surface was adjusted to align with all 2022 drillhole collars.
During the site visit by the Qualified Person, confirmation of a drillhole collar location within rehabilitated agricultural land was completed.
12.3 Drilling and sampling
There were no drilling or sampling programs in progress during the time of the Qualified Person's site visit in August 2024.
12.4 Sample analysis
During the Qualified Person's site visit in August 2024, 21 samples from AC drillhole DMS170, completed during the 2022 drilling program, were selected and submitted to Bureau Veritas for analysis. The results are summarized as downhole plots of the total HM, slimes and oversize data in Figure 12.1. Correlation coefficients of the datasets are moderately high for total HM (r2 = 0.84) and slimes (r2 = 0.81) and high for oversize (r2 = 0.94). The average total HM, slimes and oversize contents are slightly higher for the original assay data (Table 12.1). In the Qualified Person's opinion, the repeat analysis results indicate acceptable verification of the original 2022 assay data.
Table 12.1 Summary statistics from verification analysis of hole DMS170
| Total HM | Slimes | Oversize | ||||
| Original | Repeat | Original | Repeat | Original | Repeat | |
| Minimum | 0.20 | 0.26 | 15.84 | 15.33 | 0.02 | 0.04 |
| Maximum | 5.82 | 5.39 | 47.50 | 43.31 | 13.58 | 12.77 |
| Mean | 2.17 | 1.97 | 25.27 | 24.37 | 3.28 | 3.04 |
| Correlation coefficient | 0.84 | 0.81 | 0.94 | |||
Source: Snowden Optiro
|
Energy Fuels Inc. Technical Report – Donald Rare Earths and Mineral Sands Project, Victoria, Australia |
Figure 12.1 DMS170 - downhole plots for verification results for total HM (left), slimes (centre) and oversize (right) results

Source: Snowden Optiro
12.5 Qualified Person's opinion on the adequacy of the data
The Qualified Person confirmed that the 2022 assay data supplied by the laboratory matched the database and concluded that the data from Astron's 2022 drill program are suitable for resource estimation and potential Measured classification. Within MIN5532 (Phase 1), only the 2022 assay data were used for estimation of 92% of the Mineral Resources: this includes all the Measured Resources and 82% of the Indicated Resources in MIN5532 (as discussed in Item 14.4).
As discussed in Item 11, there is less confidence in the assay data from the 2004, 2010 and 2015 drilling programs, which were used for resource estimation in Area 2 (8% of the Mineral Resource). Consequently, the Qualified Person assigned a lower classification, and Mineral Resources within Area 2 were classified as Indicated at best (refer to Item 14.4). Analysis of the CRA data and Zirtanium 2000 and 2002 samples used different size fractions, so assay data from these programs were not used for the current Mineral Resource estimate. Data from these drilling programs were only used to guide geological interpretation.
|
Energy Fuels Inc. Technical Report – Donald Rare Earths and Mineral Sands Project, Victoria, Australia |
13 Mineral processing and metallurgical testing
13.1 Introduction
The finer grained (generally <250 μm) WIM-style HM sand deposits are geologically older than the strandline-style deposits and have undergone a number of geological processes which have altered some of the key minerals.
The WIM-style titania-bearing minerals have undergone substantial weathering, which has resulted in variable removal of iron from ilmenite, variable partial oxidation of the residual iron, as well as incorporation of impurity elements including clays and redeposited iron oxides into micro-pores created through those processes. In turn, this has led to a complex and continuous spectrum of titania-bearing particles rather than any specific mineral type. Variable iron content, oxidation and redeposition of elements or compounds makes classification of the titania-bearing particles into traditional mineral nomenclature difficult and potentially misleading.
Some of the zircon has been affected by the presence of radioactive elements (uranium and thorium and radioactive progeny). While these elements are inherent in all zircons, it has potentially been exacerbated by the deposition of radioactive elements onto the surface and within the pores and cracks of zircon grains in cemented clays. The WIM-style zircon has a higher than usual degree of internal micro-cracking (metamict zones) in which impurity elements can reside as well as some significant surface staining and clay (slime) cementation.
In the early 1990s, having identified that the fine-grained minerals were not suited to gravity separation, CRA built and operated a flotation pilot plant for treatment of the WIM150 deposit. The flowsheet was developed by CRA in collaboration with Lakefield Research, Canada. To achieve effective flotation selectivity and recovery, attritioning was required to remove the iron staining and clay cementation to present clean particle surfaces to the flotation stage.
At that time, flotation was inefficient and costly, requiring significant upfront investment. It also required a high usage of power and water as well as a costly range of reagents.
Some ensuing technological developments and external factors resulted in paradigm shifts that generated real opportunities for the processing of the WIM-style deposits:
• In the late 1990s, Mineral Technologies developed a new spiral called the FM1, which was effective for separating HM down to around the 20 μm particle size.
• Global markets for zircon stabilized as more widespread uses for zircon and zirconia emerged. This market preferred fine minerals over coarse mineral particles and offered an advantage for WIM-style zircon.
• The emerging rare earth mineral market offered an additional revenue stream over and above titania and zircon.
13.2 Historical testwork
In 2004, independent mineral processing company Mineral Technologies (ISO 9001 accreditation) was commissioned by Astron to undertake testwork at its facility in Queensland using the FM1 spirals for the concentration of the WIM-style, fine-grained HM. The testwork made use of the mineralization recovered from a test pit excavated at the Donald deposit.
Initial testwork at Mineral Technologies demonstrated that a HMC with grades of up to 90% HM could be produced using a gravity spiral and wet magnetic separation flowsheet.
|
Energy Fuels Inc. Technical Report – Donald Rare Earths and Mineral Sands Project, Victoria, Australia |
In 2005, the successful pre-concentration of 200 tonnes of mineralization from the test pit was undertaken in a pilot plant using gravity concentration. The pilot plant gravity stage produced a pre-concentrate containing 19.9% HM, with an overall HM recovery of 84.8% and a zircon recovery of 91.2%.
The pre-concentrate was processed in a concentrate upgrade circuit, consisting of two stages of wet high intensity magnetic separation (WHIMS) to produce magnetic and non-magnetic concentrates. A five-stage spiral separator/wet shaking table circuit was used to upgrade the non-magnetic concentrate to an HMC containing greater than 90% HM. While the testwork confirmed that fine mineral recoveries at commercial scale could be achieved, there was scope for improvement.
Further laboratory-scale work was undertaken from 2007 to 2010 to simplify the initial flowsheet and reduce the number of spiral stages. In association with Mineral Technologies, Astron continued to work on the means to enhance the recovery of the fine VHM.
It was recognized that with better feed preparation, the intermediary WHIMS circuits could be eliminated allowing a spiral only flowsheet to produce HMC. Laboratory-scale testwork confirmed the production of a 90% HMC grade, containing rare earth, zircon and titanium minerals at recoveries of 92.6%, 94.6% and 60.4% respectively.
Utilizing the experience gained in developing and applying the FM1 spiral to fine-grained minerals, Mineral Technologies subsequently developed the MG12 (medium grade) spiral. The MG12 spiral yielded better results for the Donald fine mineral separation than the FM1. In 2010 to 2012, testwork demonstrated that MG12 spirals could enable a reduction in the number of spiral separation stages from five to four. Together with the smaller footprint of the MG12 spiral compared to the FM1 spiral, the smaller overall plant would give savings in capital expenditure and operational cost.
As a result of this technological development and the testwork results, a simplified, four-stage gravity spiral flowsheet was developed. This flowsheet was able to achieve commercial level HM recoveries comparable to coarse-grained mineral sands operations.
Up to 2010, it was assumed that the HMC could be efficiently separated by flotation as had been achieved in the original CRA work. Mineral Technologies and others had attempted mineral separation using combinations of the traditional unit operations of wet magnetics, wet gravity, dry electrostatics, dry magnetics and screening. However, it was difficult to achieve the combination of high recoveries with acceptable grades and unit throughputs with the primary issues being:
• The fineness of the particles
• The continuous spectrum of titania-bearing particles rather than the discrete minerals of ilmenite and rutile
• The paramagnetism (weak magnetic response) of the rare earths which tended to disperse across all products and recycle streams.
With the assistance of AMML at its independent laboratory in New South Wales, Australia and the development of new, benign reagents compared to the regimes employed in the CRA flowsheet, a metallurgically effective flowsheet was defined and tested. The flowsheet consisted of a series of selective flotation steps, of which rare earth flotation was a previously identified and successful step. The flowsheet steps consisted of:
1) Attrition and desliming of the HMC. This was a much-reduced volume of material to be attritioned compared to the original flotation flowsheet treating the whole of ore.
2) Zircon flotation.
3) Rare earth flotation.
4) Residual quartz and silica flotation from the titania; and optionally
5) Chromite flotation from the titania. This step still required quite aggressive reagents.
|
Energy Fuels Inc. Technical Report – Donald Rare Earths and Mineral Sands Project, Victoria, Australia |
To this point, the WCP testwork had been carried out in discrete laboratory tests, albeit with full-scale spirals, and with material from the original test pit excavation. To reduce flowsheet risk, a confirmatory testwork program commenced in 2015 for both the gravity circuit to HMC flowsheet and downstream processing to final products. Samples for this testwork were provided from a sonic drilling program completed across the Donald deposit (refer to Item 10.1).
Key outcomes of the testwork campaign by Mineral Technologies at its Queensland facility were:
• Minimal loss of recoverable (>20 μm) VHM over the feed preparation unit operations
• Definition of the underlying spiral separation efficiencies for the gravity separation circuit
• Confirmation that significant improvement in rougher spiral performance was achieved by fine screening of the gravity circuit feed at 250 μm
• Processed about 6 tonnes to generate a HMC with around 90% HM at recoveries for ZrO2, CeO2 and TiO2 of 94.6%, 92.6% and 60.4% respectively from the spiral circuit feed.
Key outcomes of the MSP testwork campaign by AMML at its New South Wales facility were:
• After effective attritioning, a zircon concentrate could be floated from the HMC with a single pass recovery of about 83% determined by the zircon reporting to the float tail.
• A zircon product could be produced at about 65.5% ZrO2 (93% recovery) from the flotation concentrate. A primary zircon grade of 66% ZrO2 could be achieved albeit at only 56% recovery from the flotation concentrate. The remainder would be a secondary zircon grade product.
• Very selective flotation of rare earths as indicated by CeO2. The float test was not taken to completion and only 82% CeO2 was recovered to concentrate in a single rougher stage.
• Simple and effective gravity rejection of trash minerals that were co-floated with the rare earths to produce a very high-grade rare earth concentrate at >90% rare earth minerals.
• The rare earth float tails were subsequently fractionated to a range of notional titania products including a rutile, leucoxene, and high and low chrome grades of ilmenite. However, all the titania products had significant quality issues associated either with silica or chromia content and/or were of very low yield from the HMC.
Subsequent testwork was carried out by Mineral Technologies in 2016 using a 3.8-tonne sample collected from six sonic drillholes and the same approach. The WCP testwork:
• Confirmed similar underlying spiral separation efficiencies for the gravity separation circuit to those achieved in 2015
• Processed about 3 tonnes to a HMC with around 82% HM at recoveries for ZrO2, CeO2 and TiO2 of 94.6%, 92.6% and 73.4% respectively from the spiral circuit feed
• Demonstrated the flexibility and robustness of the proposed gravity circuit; however, to a slightly lower HM grade in the HMC.
Both the 2015 and 2016 WCP campaigns:
• Demonstrated minimal loss of recoverable VHM in the feed preparation stages for oversize removal by scrubber, trommel and screen as well as slime (-20 μm) clay removal by single-stage hydro-cyclone
• Confirmed the underlying spiral separation efficiencies for the gravity separation circuit
• Demonstrated full-scale, single-start spiral operation stepwise through the gravity separation flowsheet.
The 2016 MSP testwork was also carried out at the Mineral Technologies facility. Issues with the operation of the large-scale attritioning unit resulted in poor attritioning of the large sample in tests that were intended to be semi-continuous (locked cycle), where recycle streams such as the cleaner tail and scavenger concentrate are recycled to subsequent tests to demonstrate process stability.
|
Energy Fuels Inc. Technical Report – Donald Rare Earths and Mineral Sands Project, Victoria, Australia |
Notwithstanding this, the flowsheet was simulated at small-scale with the following outcomes:
• After effective attritioning, locked cycle tests demonstrated stable zircon flotation with an overall recovery about 80-82% to zircon concentrate. The absence of a quick turnaround analytical unit prevented higher recoveries being achieved, as most rougher-scavenger float cycles were terminated prior to optimum zircon recovery.
• A 65.5% ZrO2 zircon product could be produced at about 93% recovery from the flotation concentrate. This zircon was subsequently upgraded to around 66% ZrO2 by dry magnetic processing.
• Very selective flotation of rare earths as indicated by CeO2.
• Simple and effective gravity rejection of gangue minerals that were entrained with the rare earths produced a very high-grade rare earth concentrate at >90% rare earth minerals.
It was realised early in the development of the metallurgical flowsheets, that tracking mineral classifications was complex, expensive and impractical. The simplest, most cost effective and ultimately the most relevant means of tracking grades and recoveries through metallurgical testwork was by XRF analysis where the components TiO2, ZrO2, CeO2 and Y2O3 were used as trackers of the entire titania-bearing spectrum, zircon, monazite and xenotime.
Up to 2016, correlations were required for converting mineralogical classification of resource data in mine schedules to an estimate of the component compositions from which the testwork derived recoveries and grades (Table 13.1).
Table 13.1 2016 mineral classification to chemical component conversion matrix
| Mineral | ZrO2 | CeO2 | TiO2 | Comment |
| Ilmenite | 0.0% | 0.0% | 55.0% | Notional average TiO2 for "ilmenite" classification |
| Leucoxene | 0.0% | 0.0% | 72.5% | Notional average TiO2 for "leucoxene" classification |
| Rutile | 0.0% | 0.0% | 90.0% | Notional average TiO2 for "rutile" classification |
| Anastase | 0.0% | 0.0% | 90.0% | Notional average TiO2 for "anatase" classification |
| Zircon | 64.0% | 0.0% | 0.0% | ZrO2 assumes dirty zircon as in-situ |
| Monazite | 0.0% | 32.0% | 0.0% | Assumes that "monazite" classification in mine plan refers only to "monazite" and does not include xenotime |
| Other HM | 0.0% | 0.0% | 10.0% | Notional average TiO2 for "Other HM" classification (includes titano-silicates) |
Source: Astron, 2023a
Process performance was therefore assessed in terms of the recovery of TiO2, ZrO2 and CeO2 as components specific to the respective titania, zircon and rare earth concentrates. The whole stream XRF assays and recoveries of these components had to be adjusted to align with the +38 μm/-90 μm data used for resource definition. The drilling campaigns from 2020 onwards have assigned the sizing ranges and incorporated both QEMSCAN® mineralogy and XRF analyses of in-size HM.
Reviews in 2017 identified several risks and potential issues related to the metallurgy of the project:
• An absence of definitive, continuous pilot scale operation of the HMC process from ore to HMC
• Concern regarding the processing of HMC to final products by flotation alone
• High capital and operating costs related to ore processing and HMC beneficiation despite the considerable simplification and streamlining of the flowsheet over the previous decade or more
• Confirmatory testwork on a representative sample from the first three to five years of mining operations.
Continued re-assessment of the project from mining operations through the process flowsheet and product transport logistics, identified some further opportunities for reducing capital, operating and product handling costs. This also included a refocussing on the implications of the flowsheet against the conditions of the established EES. Some significant optimization opportunities arose:
|
Energy Fuels Inc. Technical Report – Donald Rare Earths and Mineral Sands Project, Victoria, Australia |
• The conditions of the 2008 EES would prevent an MSP on the project site and the HMC would have to be shipped either for sale to third parties, toll treated or a dedicated MSP built elsewhere.
• It had been identified that as the HM grade of the HMC increased beyond 85% HM, the rejection of non-HM quartz, silicates and low SG particles resulted in concentration of the radioactivity to the point that the HMC product would exceed 10 Bq/g. While not inherently dangerous, the HMC product would require placarding and require more expensive product handling. It was also understood that at 85% HM, the HM component of the HMC also contained a substantial fraction of highly altered titano-silicates representing an unnecessary transport cost and even additional waste disposal costs.
• As the bulk of the radioactivity was present in the rare earth minerals, investigative testwork at Mineral Technologies demonstrated that the rare earths could be readily floated from the raw HMC at very high grade and recovery using the same reagent scheme that was already proven in the earlier MSP work. This resulted in capturing the bulk of the radioactivity into a much smaller quantity of material which could be more readily transported in a safe manner.
• The WCP could now target a HMC with grades up to 95% HM with conventional wet magnetic, wet gravity and dry electrostatic equipment arranged in a less complex flowsheet without any discernible loss of the VHM components.
13.3 Recent testwork
A substantial body of testwork at pilot scale as well as additional testwork confirming the final flowsheet design and the response of ore samples extracted from the first few years of mining has been carried out since 2018.
In 2019, a 1,000-tonne bulk sample from the re-opened test pit was shipped to the Corridor Sands operation at Woongoolba in Queensland where a pilot WCP was designed and constructed in JV with Mineral Technologies and a third-party western Victoria project developer.
The flowsheet aligned with the design of the 2015-2016 testwork. The HMC produced was subsequently reprocessed over an HG10i spiral at Mineral Technologies facility in Queensland to bring it to the desired 95% HM to provide a design level feed for subsequent processing. After attritioning at Mineral Technologies, the reprocessed HMC was floated in a continuous pilot flotation facility at Nagrom's independent laboratory in Western Australia, which produced a quantity of on-spec rare earth concentrate grade at a high recovery. The flotation tail was repatriated to Mineral Technologies where it was separated using conventional magnetic and electrostatic techniques into several grades of zircon product and a single titania concentrate, which would be readily marketable as a chloride slag feedstock.
A sonic drilling program specifically targeting the first few years of mining was completed in 2022 with approximately 6 tonnes recovered and processed through the Mineral Technologies facility in Queensland to a high-grade HMC. This HMC was floated for rare earths with the float tail separated into the constituent zircon and titania products confirming the response of this sample to the design flowsheet.
In 2024 and 2025, further metallurgical testwork was completed as part of the 2025 Updated Economics Study, including extended pilot plant trials for both the WCP and the rare earth minerals flotation and hydrometallurgical circuits. These programs processed representative bulk samples from multiple mining stages and ore zones to validate and optimise the process flowsheet under continuous operating conditions.
13.3.1 WCP pilot plant
The WCP pilot plant at the Corridor Sands facility consisted of the following equipment:
• A feed bin loaded by front-end loader.
• Conveying to a scrubber trommel screening at 3 mm.
|
Energy Fuels Inc. Technical Report – Donald Rare Earths and Mineral Sands Project, Victoria, Australia |
• Single-stage cyclone desliming of the trommel undersize at a nominal 20 μm.
• Screening of the cyclone underflow on a vibrating screen. The screen was fitted with both 400 μm and 250 μm screen panels to allow spiral performance in response to screen size to be evaluated for optimal design purposes.
• Four-stage gravity spiral separation with MG12 spirals installed for rougher, middlings scavenger and cleaner stages. A HG10i spiral was provided for recleaner duty.
• HMC was discharged to a settler and bulka bag collection. Tails and slimes were discharged to an appropriate location within the Corridor Sands site.
In the absence of XRF analytical capability, metallurgical control was maintained with the use of a gravity table fitted to one of the distributor legs of the recleaner feed. Manual sample points were installed at several locations for regular survey and overall metallurgical accounting.
The bulk sample was characterized as follows:
• Density separation by size fraction indicated the -250 μm/+20 μm size fraction contained 5.1% HM, with 45.3% of the HM having a density greater than 4.05 g/cm3.
• Sizing analysis indicated the average particle size of the sample was 98 μm, with 64.3% by weight reporting to the -250 μm/+20 μm size fraction.
• Almost 20% of the in-size HM had a density less than 4.05 g/cm3. This light HM fraction included trash minerals such as tourmaline, garnet and variously altered ilmenites and titano-silicates. The gravity separation stage and the setting of the final HMC HM target grade control the extent to which this largely non-valuable HM fraction is rejected to tails in the WCP.
• The recoverable total HM content of the sample was back calculated as 3.3% (i.e. ignoring any HM in the oversize and the slimes).
• The recoverable feed assay was calculated as 2.22% TiO2, 0.67% ZrO2 and 0.03% CeO2.
The pilot plant produced the following key results:
• 24 tonnes of HMC at an average HM grade of 90.6%, which was slightly less than the targeted 95% HM.
• Respective recoveries of key components, relative to the in-size fraction of the spiral circuit feed, were:
– Total HM: 82%
– VHM: 93%
– TiO2: 88% and 57% of total TiO2 relative to the sample highlighting the TiO2 fraction in the highly altered trash HM fraction
– ZrO2: 94%
– CeO2: 94%.
The raw pilot plant HMC was subsequently passed through a 250 μm screen at Mineral Technologies facility in Queensland to eliminate residual oversize and 15 tonnes of the screened HMC was re-passed over an HG10i spiral to correct the raw HMC to the target 95% HM. Virtually no VHM was lost in the post-processing steps with rejected material either being +250 μm oversize and light HM trash.
A 12-tonne subsample of the upgraded HMC was attritioned and deslimed at Mineral Technologies before despatch to a pilot plant flotation facility at Nagrom in Western Australia. Approximately 9 tonnes of HMC were processed with the following key results:
• 91% recovery of rare earth minerals to the REEC
• A total rare earth element oxide (TREO) grade of 56%.
|
Energy Fuels Inc. Technical Report – Donald Rare Earths and Mineral Sands Project, Victoria, Australia |
13.3.2 Confirmatory flowsheet testwork
In 2022, 10 sonic drillholes were drilled across the northern and central area of MIN5532 to collect representative samples from the first few years of mining.
Approximately 4 tonnes was recovered from the mineralized sections of the core samples. While subsamples were taken for separate characterization, the samples were consolidated into three composites reflecting years 1, 2 and 3 (and beyond). Characterization was also carried out on subsamples taken from the year 1 composite above and below the water table.
The bulk samples from each year were processed through scrubbing for deagglomeration, screening at 1 mm and desliming at 20 μm. Each of the deslimed bulk samples underwent primary rougher gravity separation. To maintain, overall sample quantity for bulk treatment, each of the rougher concentrates was combined as were each of the rougher middlings. The now single rougher middlings sample was processed to a middlings concentrate and combined with the rougher concentrate as per the flowsheet. A single cleaner feed was then processed through the spiral cleaner stage.
In accordance with the flowsheet, the cleaner spiral concentrate was screened at 250 μm prior to recleaner gravity spiral processing to produce a raw HMC.
The raw HMC was processed through the concentrate upgrade circuit flowsheet consisting of attritioning with removal of generated slimes followed by rougher and scavenger flotation of the rare earth minerals.
The rare earth concentrate was passed over a gravity table for the effective rejection of alumina bearing trash minerals (typically tourmaline and garnet), which had floated with the rare earth minerals.
During this work, it was discovered that preferential flotation of the phosphates in the rougher stage could be enhanced by fine tuning of the reagent additions in attrition and float as well as average retention time. Further testwork on a retained sample of the upgraded pilot plant HMC demonstrated that this differential flotation behaviour between the phosphate and alumina-bearing minerals could be optimized. Concentrates with >60% TREO and at 92-94% total rare earth phosphate were floated. This allowed a further refinement of the concentrate upgrade circuit to eliminate most or all the gravity table circuit by simple diversion of the alumina-rich scavenger concentrate to the head of the circuit as a recycle or if necessary, retreatment by a single gravity table.
Key outcomes from this phase of testwork were:
• The mineralization within the first three to four years of mining is broadly homogenous in character with only minor variations in oversize, slimes and HM grade. This also applied to samples from above or below the water table apart from the iron content as the result of weathering below the water table.
• At a composite scale, the results of the characterization, feed preparation and HM concentration were consistent with the testwork results.
Characteristics of the HMC produced (which were all in line with previous results) were:
• An average particle size of 60 μm
• 94.3% HM assaying 33.1% TiO2 with 17.9% ZrO2 and 0.87% CeO2
• An estimated radioactivity of 12 Bq/g, as expected from the elevated HM grade
• The mass balance produced slightly lower overall recoveries than the continuous and integrated pilot plant as this testwork was carried out without the ability to recycle between stages
• CUP processing of the raw HMC returned results in accordance with previous testwork
• The opportunity to further streamline the CUP flowsheet by eliminating gravity (tabling) upgrading of the rare earth flotation concentrate was identified.
|
Energy Fuels Inc. Technical Report – Donald Rare Earths and Mineral Sands Project, Victoria, Australia |
Pilot-scale testing undertaken in 2024 and 2025 at Mineral Technologies' Carrara facility in Queensland successfully validated the WCP and downstream rare earth minerals flotation circuits proposed for the Donald Project. The pilot program confirmed design throughput and metallurgical performance, achieving or exceeding targeted recoveries for HM and REEC products. Product quality specifications for zircon, ilmenite, rutile and REEC were met, with reduced levels of deleterious minerals compared to earlier campaigns. Minor refinements to equipment sizing, classification stages and flotation reagent regimes resulted in improved concentrate grades, lower reagent consumption and enhanced process stability. Testing of material from multiple ore zones demonstrated consistent metallurgical performance across anticipated feed variability, and operational data from the continuous runs were incorporated into the 2025 Updated Economics Study for final capital and operating cost estimation.
The float tails (together with all other products and unused feed) were returned to Mineral Technologies, where the tails were separated to a primary and secondary zircon product at respective grades of 66.5% and 65.7% ZrO2 with an estimated overall ZrO2 recovery of 85% relative to the HMC assuming stranded stream recycles were closed. A single titania concentrate was also produced at 66% TiO2 at a recovery of TiO2 relative to HMC of 86%.
13.3.3 Metallurgical summary
The Donald mineralization comprises four components:
• HM: defined as the -250 μm/+20 μm portion that will sink in a heavy liquid at a SG of 2.85 g/cm3.
• Sand (quartz): defined as the -250 μm/+20 μm portion that will float in a heavy liquid at a SG of 2.85 g/cm3.
• Clay fines (slimes): defined as the portion that is -20 μm in size.
• Oversize: defined as the portion that is +250 μm in size and consists of coarse quartz, trash minerals and rock.
The final flowsheet comprises:
• Scrubbing for disaggregation.
• Ex-pit trommel at 10 mm prior to pumping to the WCP
• At the WCP, screen the slurry at 1 mm to reject residual oversize that has not been further deagglomerated in pumping and transport
• Single stage hydro-cyclone desliming to reject -20 μm slimes
• Retention in a LCFU surge bin
• Mass flow and density-controlled feed to a rougher, middlings scavenger and cleaner gravity spiral circuit using MG12 spirals
• Interstage fine screening at 250 μm ahead of the final recleaner stage using HG10i spirals to produce a raw HMC
• Selective flotation of the rare earth minerals in the raw HMC into a concentrate with filter cake bagged and containerized for transport
• Filtering, stockpiling and loading of the final high-grade, rare earth free HMC into half-height containers for transport.
Table 13.2 summarizes the metallurgical performance including stagewise recoveries of HM and the valuable components from the in-size HM fraction as well as target HM grades at each process stage and final product grades.
|
Energy Fuels Inc. Technical Report – Donald Rare Earths and Mineral Sands Project, Victoria, Australia |
Table 13.2 Metallurgical performance summary
| Stage wise recovery and grade parameters |
MUP recovery |
WCP recovery |
CUP recovery |
CUP recovery |
Overall recovery to HMC |
Product grade |
| From | ROM | WCP feed | Raw HMC | Raw HMC | ROM | HMC |
| To | WCP feed | Raw HMC | HMC | REEC | HMC, REEC | REEC |
| Oversize (+250 µm) | 6.4% | 0.0% | 0.0% | 0.0% | 0.0% | |
| Slimes (-20 µm) | 17.4% | 0.0% | 0.0% | 0.0% | 0.0% | |
| Sand (+20 µm/-250 µm = in-size) | 78.6% | 5.5% | 95.7% | 3.0% | 4.3% | |
| Mass yield | 61.6% | 5.2% | 95.7% | 3.0% | 3.2% | |
| Total HM (+2.85 g/cm3 SG; in-size) | 89.0% | 77.9% | 96.1% | 3.2% | 66.7% | |
| TiO2 (in total HM; in-size) | 99.4% | 70.7% | 99.2% | 0.6% | 69.7% | 33.5% |
| ZrO2 (in total HM; in-size) | 99.6% | 94.3% | 99.0% | 1.0% | 93.0% | 14.6% |
| CeO2 (in total HM; in-size) | 99.5% | 94.5% | 1.9% | 97.5% | 91.7% | 21.3% |
| Y2O3 (in total HM; in-size) | 99.5% | 94.5% | 2.2% | 97.2% | 91.4% | 11.6% |
| Total HM grade | 6.3% | 94.3% | 94.8% | 99.0% |
Source: Astron, 2023a
Notes: Assumes no oversize in raw HMC, HMC and REEC. Assumes no slimes in HMC and REEC.
Discrepancies in HM% and oversize% as well as mineralogy grades were noted in the recent metallurgical testwork performed on the sonic drilling core samples. Further testwork was performed on samples from the 2022 AC drilling program, which informed the Mineral Resource estimate, to isolate the source of these discrepancies.
It was hypothesized that a difference in the sample preparation technique used for the metallurgical testwork, where additional attritioning was applied to the sample, was responsible for increased liberation of HM minerals from oversize material or sample agglomerates. Results indicated an increase in the in-size material proportion; however, a clear relationship and upgrade in the HM% grade was not apparent. The results were within the accuracy range of the resource model.
In 2024 and 2025, Mineral Technologies' Carrara facility conducted extended pilot runs, processing bulk samples from multiple mining zones. The WCP and rare earth minerals flotation circuits met or exceeded targets for throughput, recovery and product quality. Zircon, ilmenite, rutile and REEC products achieved specification grades with fewer deleterious minerals. Performance was consistent across ore variability, and the resulting operational data were incorporated into the 2025 Updated Economics Study cost models to improve economic confidence.
13.4 Sample representativity and metallurgical risks
The process design and projected metallurgical performance have been based on the results of testwork and large-scale pilot plant testing. Material from the deposit for the metallurgical programs was composited from drill core and included bulk samples over 1,000 tonnes obtained from test pits. Metallurgical characterization and scoping testwork was completed on samples from drill core and trenches within the mine work plan. Two bulk samples have been used.
In 2005, a test pit was mined adjacent to drillhole D04-045 that provided 1,760 tonnes of mineralized material comprising 1,000 tonnes of low-grade HM from 9 m to 12 m depth and 760 tonnes of high-grade HM from 12 m to 18 m depth. A total of 200 tonnes of material was despatched for testwork in Australia with the rest shipped to China by Zirtanium at that time. The test pit was located 7.8 km from the centre of the planned MIN5532 mine plan Work Area. The methodology for selection of the 200-tonne sample out of the total material mined is not known and therefore the representativity of the sample can only be deduced by comparing the assays and performance in testwork with other samples from within the mine plan.
|
Energy Fuels Inc. Technical Report – Donald Rare Earths and Mineral Sands Project, Victoria, Australia |
The second bulk sample came from a 40 m extension of the same test pit to the southeast. This 1,000-tonne sample was mined in 2018 by Astron and treated by Mineral Technologies through the Corridor Sands WCP in Queensland over a continuous two-month period at 10 t/h.
Despite being sourced from outside the MIN5532 Work Plan area, the test pit is in the RL2002 Phase 2 area. The geology of the MIN5532 Work Plan area and the test pit are considered the same as the mineralogy (minerals and extent of alteration), PSD and liberation (zircon and REO) generally consistent across the region.
A summary of samples used for the metallurgical testwork since 2005 is provided in Table 13.3.
Table 13.3 Metallurgical sample summary
| FS | Channel sample |
Drillhole D04-045 |
Bulk test pit sample | Sonic drill core | |||||
| Year | 2023 | 2004? | 2004 | 2005 | 2018 | 2016 | 2022 | 2022 | 2022 |
| Description | 9-17 m | 9-18 m | 200 t | 9-14 m; 1,000 t | 3.8 t | Year 0-1 | Year 1-2 | Years 2+ | |
| HM % | 4.6 | 8.04 | 6.24 | 8.01 | 3.3 | 4.0 | 3.33 | 4.52 | 3.16 |
| Slimes % | 15.4 | 18.4 | 19.28 | 20.74 | 16 | 15.9 | 17.4 | 18.9 | 21.8 |
| Oversize % | 9.8 | 3.75 | 3.87 | 3.38 | 3.23 | 3.0 | 4.03 | 3.3 | 3.75 |
In 2015-2016, a 3.8-tonne sample was composited from six sonic drillholes (300 mm diameter) drilled to 18 m depth within the MIN5532 area representing mining areas in years 1, 3, 4 and 8. Ten sonic drillholes were completed in 2022 to provide 4 tonnes of samples representing the northern and central area of MIN5532 with subsamples representing year 1, year 2 and years 3+ of mining. The later samples were tested to verify the flowsheet performance for the different mining periods and to assess any differences in treating material from above and below the water table.
The data from the 2022 testing indicated the ore was homogeneous with small differences in the PSD of the ROM and relatively consistent chemical composition of in-size sand particles.
Performance of the processing facilities will rely on the feed ore characteristics (clay content, PSD, proportion of weathered titanium minerals) being blended to remain within the ranges of the design envelope and minimizing the inclusion of Geera Clay.
Recycle of dewatering hydro-cyclone overflow within the rare earth flotation circuit may lead to build-up of slimes or colloidal material and residual reagent that can interfere with performance of the flotation stage. The performance of the flotation circuit to remove the minerals associated with radioactivity is important for maintaining low levels in the HMC.
The salt content of the groundwater (17,000 mg/L total dissolved solids (TDS)) may fluctuate and increase over time and require treatment for some sections of the plant.
The 2024 and 2025 pilot plant test results confirmed that metallurgical performance remained consistent across the anticipated range of feed variability, with product quality and recoveries achieving or surpassing the design criteria. In the Qualified Person's opinion, the data is adequate for the purposes used in this Technical Report.
13.5 Qualified Person's opinion
Mr. Peter Allen, MAusIMM (CP), has reviewed and relied upon specialist input provided by Mr. Shier in relation to metallurgical testwork, process design and processing cost estimates. Mr. Shier is an experienced mineral processing specialist but is not a Qualified Person as defined under NI 43-101 and is not designated as a Qualified Person for the purposes of Regulation S-K 1300. Mr. Allen has reviewed the information provided, considers such reliance to be reasonable, and accepts responsibility for the mineral processing information and conclusions presented in this Technical Report.
|
Energy Fuels Inc. Technical Report – Donald Rare Earths and Mineral Sands Project, Victoria, Australia |
14 Mineral Resource estimates
Snowden Optiro was contracted by Astron in 2022 to assist with updating the Donald deposit Mineral Resource estimate within the area of MIN5532 (Snowden Optiro, 2022). A Mineral Resource estimate was prepared in 2022 (Snowden Optiro, 2022) and this was updated in December 2025 to include REO data and updated density data (Snowed Optiro, 2025a). The 2025 Mineral Resource within MIN5532 is referred to as the Phase 1 Mineral Resource. MIN5532 is within the central area of RL2002 (Figure 4.1) and the resource area extends outside of MIN5532 and into the adjacent RL2002. The reported Phase 1 Mineral Resource is screened to within MIN5532. Extensions to the Donald deposit are within RL2002 and Mineral Resources within RL2002 were estimated by AMC in 2016. The additional resource that is within RL2002 and outside of MIN5532 is referred to as the Phase 2 historical resource and is discussed in Item 24.2.
The 2025 Mineral Resource estimate within MIN5532 updates the resource previously reported by AMC in 2016 and incorporates data from an additional 245 AC drillholes (for a total of 6,355 m) completed within MIN5532 during 2022. The Mineral Resource area extends to the south of MIN5532 within RL2002 but does not cover all the resource within RL2002. As discussed in Item 24.2, the 2016 AMC resource model has been retained for the Phase 2 historical resource estimate.
The resource area used for the 2022 and subsequent 2025 models contain data from a total of 844 vertical AC drillholes (for a total of 20,648 m) and one Calweld drillhole (for a total of 19 m) drilled by CRA in the 1990s, Zirtanium from 2000 to 2004 and Astron in 2010, 2015, 2022 and 2025. Assay data was obtained from 7 of the 25 sonic drillholes drilled in 2022. These holes were drilled for verification of the AC drilling, metallurgical testwork, geotechnical studies and to extend the network of groundwater monitoring bores. The assay data from these sonic holes were not used for the Mineral Resource estimate. Data from the pre-production AC GC holes drilled by Astron during 2025 were not used for the 2025 Mineral Resource estimate. Data from these holes were used for the development of a separate GC model. Density data from the sonic drillholes (drilled in 2015, 2022, 2024 and 2025) were used for tonnage estimation. The data used for the Mineral Resource estimate are summarized in Table 14.1 and illustrated in Figure 14.1.
Table 14.1 Drilling history (AC and one 2000 Calweld drillhole) at the Donald deposit - within resource area and used for 2025 Mineral Resource estimate (which extends into RL2002)
| Company | Year | No. of drillholes | Metres drilled | Comment |
| CRA | 1990s | 91 | 2,250 | Used for geological interpretation only. |
| Zirtanium | 2000 | 1 | 19 | Used for geological interpretation only. |
| 2002 | 14 | 327 | ||
| 2004 | 225 | 4,967 | Used for geological interpretation. Assay and mineral assemblage data used for Area 2 where total HM data is from +38 µm/-90 µm fraction. | |
| Astron | 2010 | 167 | 3,969 | Used for geological interpretation. Assay data (total HM, slimes and oversize) used for grade estimation in Area 2. |
| 2015 | 102 | 2,777 | ||
| Astron | 2022 | 245 | 6,358 | All geological, assay and mineral assemblage data used for Area 1. |
| Total | 845 | 20,667 | ||
Geological information from all historical drilling campaigns (pre-2022) was used to inform the geological interpretation for resource modelling in the MIN5532 area. The Mineral Resource estimate was divided into two areas (Area 1 and 2) based on the drillhole coverage. The nominal drill spacing for the 2022 drilling was approximately 250 mE by 350 mN. In general, the historical drillhole spacing ranges from 125 mE by 400 mN to 250 mE by 500 mN. The area covered by the 2022 drilling is coded as Area 1 and encompasses 97% of the total area of MIN5532 (Figure 14.1). The resource model was extended to cover MIN5532 and an area to the south of MIN5532 (to improve analysis of the Area 2 data). The area outside of the 2022 drilling was coded as Area 2.
|
Energy Fuels Inc. Technical Report – Donald Rare Earths and Mineral Sands Project, Victoria, Australia |
Figure 14.1 Plan of drillholes coloured by drilling program and section line of representative cross-sections included in Figure 7.3 and Figure 14.4

Source: Snowden Optiro
Sample assay data (including mineral assemblage data) derived from the 2022 drilling program were primarily used for the Mineral Resource estimate which informed the Phase 1 study. Only the 2022 data were using for grade estimation within Area 1. Assay data from the 2004 drilling program (assayed using the +38 µm/-90 µm fraction) and data from the 2010 and 2015 drilling programs were also used for HM, slimes and oversize estimation in Area 2. Data from the 2004 drilling were also used for estimation of the mineral assemblage components within Area 2. Only data with a complete set of mineral assemblage analysis data were used for mineral assemblage estimation within Area 2. The 2010 and 2015 mineral assemblage data did not include analysis of xenotime.
|
Energy Fuels Inc. Technical Report – Donald Rare Earths and Mineral Sands Project, Victoria, Australia |
14.1 Geological model and mineralization interpretation
Geological logs from the 2022 drilling program identified the Shepparton Formation, the LP1, LP2 and LP3 units of the Loxton Sand sequence and the underlying Geera Clay. The 2022 holes were drilled to intersect the entire Loxton Sand sequence and were terminated in the underlying Geera Clay.
Only limited geological data was available from the CRA drillholes (the majority of which terminated within the Loxton Sand sequence), and so precedence was given to the geological logging data from the later drillholes. The CRA data included the depth to the top and base of the "host horizon" (Loxton Sand sequence); however, these holes did not extend below the Loxton Sand sequence and did not record the depth to the base of the overlying Shepparton Formation or LP1.
Geological logging data, along with assay data for slimes and oversize contents were used to guide the interpretation, with preference given to the 2022 data. Data was examined in long and cross-sections and minor modifications were made to the logged lithologies to generate consistent 3D surfaces of the interpreted lithological horizons. In particular, inconsistencies were noted in the geological logging of the LP3 and Geera Clay units between the 2022 and historical drilling (2004 to 2015). The interpreted base of mineralization surface is irregular, due to the inconsistencies in interpretation of LP3 and samples selected for analysis.
Four lithological surfaces were interpreted for the resource model, using all available geological logging data (including the CRA top and base of host Loxton Sand sequence):
• Base of Shepparton Formation/top of Loxton Sand.
• Base of LP1 - contact was selected where there is a sudden decrease in oversize content or change in logged grain size and where intervals above were generally logged as LP or LP1.
• Base of LP2 - contact was selected where there is marked increase in slimes or where it is logged as clay (but not black clay) or gravel. Material above is generally logged as LP2 and intervals below are generally logged as LP3.
• Base of LP3/top of Geera Clay - contact was selected where Geera Clay was logged in the 2022 drilling data and where the clay is logged as being black or dark brown in the previous drilling programs.
The resource model is screened to above the top of Geera Clay surface and the classified Mineral Resource is screened to within the Loxton Sand.
Examination of the cumulative probability plot of the total HM data (<5%) from the 2022 drilling indicated that there is a grade inflection at around 1% total HM and a nominal grade of 1% total HM was used for definition of the mineralization within the sediments. Surfaces were interpreted to define the top and base of the mineralization using a nominal 1% total HM cut-off grade from the total HM contained within the +20 μm/
-250 μm fraction (following calibration of the +38 μm/-90 μm fraction within Area 2 (as discussed in Item 14.2.2).
A cross-section through the Donald deposit showing the geological and mineralization interpretation is presented in Figure 7.3 with the location of the cross-section shown in Figure 14.1. The minimum, maximum and average thicknesses of the Shepparton Formation, the Loxton Sand and the mineralized horizon as intersected by the drillholes are summarized in Table 14.2.
Table 14.2 Thickness of geological units and mineralized horizon
| Unit | Minimum (m) | Maximum (m) | Average (m) |
| Shepparton Formation | 3 | 15 | 8.7 |
| Loxton Sand - LP1 | 1 | 17 | 3.4 |
| Loxton Sand - LP2 | 4 | 17 | 9.3 |
| Loxton Sand - LP3 | 1 | 12 | 2.5 |
| Mineralized horizon | 3 | 20 | 9.8 |
Source: Snowden Optiro, 2022
|
Energy Fuels Inc. Technical Report – Donald Rare Earths and Mineral Sands Project, Victoria, Australia |
As illustrated in Figure 7.3, the main HM (WIM-style) mineralized horizon is within the LP2 layer. Minor HM mineralization is present within the LP1 horizon within the eastern area of the deposit. This is associated with fine-grained sands and is not the more traditional mineralization associated with strandline mineralization often found in the upper layers of the Loxton Sand. It has been interpreted as an extension to the underlying WIM-style mineralization and is included in the resource model. For data and block model coding, the geological surfaces took precedence over the mineralization surfaces, with the mineralization constrained to within the Loxton Sand sequence.
The 2022 drilling also intersected isolated zones of possible strandline mineralization within LP1 in the western area of the deposit. With the wide spaced drilling, the across-strike extend of the potential strandline mineralization could not be defined and so the potential strandline mineralization was not included in the resource model.
The domains assigned to the geological units in the resource model are summarized in Table 14.3.
Table 14.3 Donald deposit resource model domains
| Description | Outside of mineralized horizon | Within mineralized horizon |
| Shepparton Formation | 100 | - |
| Loxton Sand - LP1 | 210 | - |
| - | 211 | |
| Loxton Sand - LP2 | 220 | - |
| - | 221 | |
| Loxton Sand - LP3 | 230 | - |
| - | 231 | |
| Geera Clay (model screened to exclude this) | 300 | - |
Source: Snowden Optiro, 2022
14.2 Data analysis
14.2.1 Area 1
Grade estimation for Area 1 only used the assay data from the 2022 drilling program. All the sample intervals were 1 m and so data compositing was not required.
Statistical analysis
Summary statistics of the coded 2022 data were generated for total HM, slimes and oversize within each geological unit (LP1, LP2 and LP3) and within the mineralized horizon (Table 14.4). The distributions of the total HM, slimes and oversize data within each geological unit and within the mineralized horizon (Domains 211, 221 and 231) are positively skewed; however, the total HM, slimes and oversize all have low coefficients of variation (less than 0.95). High-grade outliers are not present, so top cut grades (cap grades) were not applied. Top cut grades are generally not applied for resource estimation of HM, slimes or oversize contents in mineral sands deposits.
Within the mineralized domains, the overlying LP1 has a lower total HM (mean of 2.79%) and higher slimes (mean of 19.38%) and oversize (mean of 17.4%) contents compared to LP2 (mean of 4.42% total HM, 15.13% slimes and 9.27% oversize). The slimes content increases in the underlying LP3 (mean of 27.98%), the average total HM grade decreases to 3.31% and the oversize content increases to 10.81%.
|
Energy Fuels Inc. Technical Report – Donald Rare Earths and Mineral Sands Project, Victoria, Australia |
Table 14.4 Summary statistics of 2022 HM, slimes and oversize data
| Geological unit | LP1 | LP2 | LP3 | ||||
| Domain | 210 | 211 | 220 | 221 | 230 | 231 | |
| Number of samples | 748 | 372 | 331 | 1,835 | 3 | 819 | |
| Total HM | Minimum | 0.03 | 0.39 | 0.14 | 0.71 | 0.33 | 0.72 |
| Maximum | 7.27 | 12.98 | 3.79 | 13.58 | 0.99 | 12.31 | |
| Mean | 0.56 | 2.79 | 0.72 | 4.42 | 0.67 | 3.31 | |
| Standard deviation | 0.50 | 1.88 | 0.37 | 2.26 | 0.27 | 1.63 | |
| Coefficient of variation | 0.90 | 0.67 | 0.52 | 0.51 | 0.40 | 0.49 | |
| Slimes | Minimum | 3.33 | 5.92 | 5.76 | 4.73 | 5.79 | 2.12 |
| Maximum | 79.34 | 54.34 | 37.54 | 40.93 | 53.94 | 53.60 | |
| Mean | 19.15 | 19.39 | 13.39 | 15.13 | 32.15 | 27.98 | |
| Standard deviation | 7.61 | 8.46 | 4.29 | 3.99 | 19.92 | 9.90 | |
| Coefficient of variation | 0.40 | 0.44 | 0.32 | 0.26 | 0.62 | 0.35 | |
| Oversize | Minimum | 0.00 | 0.06 | 0.13 | 0.02 | 11.44 | 0.02 |
| Maximum | 59.80 | 60.77 | 54.23 | 58.50 | 26.73 | 71.96 | |
| Mean | 15.02 | 17.40 | 7.61 | 9.27 | 18.76 | 10.81 | |
| Standard deviation | 12.08 | 12.73 | 6.90 | 8.69 | 6.26 | 9.37 | |
| Coefficient of variation | 0.80 | 0.73 | 0.91 | 0.94 | 0.33 | 0.87 | |
Source: Snowden Optiro, 2022
Boundary analysis indicates a sharp change in the total HM grade in LP1 and LP2, within and outside of the mineralized horizon. As there are only three data points within Domain 230, boundary analysis was not possible within LP3. A hard boundary was used for variography and grade estimation of total HM within the mineralized domains. Examination of the slimes and oversize data indicates a gradational boundary from the mineralized domains to the surrounding material within LP1 and LP2 and soft boundary conditions were used for variography and grade estimation of slimes and oversize. Hard boundary conditions were applied between the geological units (LP1, LP2 and LP3) in recognition of the different depositional environments. Hard boundary conditions mean that data analysis and grade estimation use data only from within that domain and soft boundary conditions allow data to be used from adjacent domains for data analysis and grade estimation.
Variography
Variogram analysis was undertaken using a normal scores transformation to determine the total HM, slimes and oversize continuity. Domain 230 was not included for variogram analysis as this domain only had three data points. Total HM continuity was analyzed for each of the geological and mineralization domains and examples are provided for Domain 221 in Figure 14.2. As contact analysis determined that a soft boundary should be applied for slimes within each of the LP units, the data was combined within LP1 (Domains 210 and 211), LP2 (Domains 220 and 221) and LP3 (Domains 230 and 231). Similarly, as contact analysis determined that a soft boundary should be applied for oversize within LP1, the data from Domains 210 and 211 were combined.
|
Energy Fuels Inc. Technical Report – Donald Rare Earths and Mineral Sands Project, Victoria, Australia |
Figure 14.2 Total HM in Domain 221 - horizontal variogram fan and directional variograms with interpreted models


Source: Snowden Optiro
Strike directions were interpreted from horizontal variogram fans and directional variograms were generated for the along strike, across strike and perpendicular orientations and modelled using the spherical scheme. Continuity for total HM, slimes and oversize had a strike orientation of between 005° and 015° within a flat lying plane. The back-transformed variogram parameters used for total HM grade estimation are summarized in Table 14.5.
|
Energy Fuels Inc. Technical Report – Donald Rare Earths and Mineral Sands Project, Victoria, Australia |
Table 14.5 Interpreted variogram parameters for HM
| Domain | Direction (°) |
Nugget variance |
Sill 1 | Range 1 (m) |
Sill 2 | Range 2 (m) |
Sill 3 | Range 3 (m) |
| 210 | 0→005 0→275 -90→360 |
0.262 | 0.526 | 280 340 4 |
0.212 | 1,430 470 5 |
- | - |
| 211 | 0→015 0→285 -90→360 |
0.106 | 0.399 | 560 400 2.5 |
0.163 | 1,170 1,450 3 |
0.332 | 2,335 1,460 3 |
| 220 | 0→015 0→285 -90→360 |
0.297 | 0.261 | 600 420 1.2 |
0.442 | 1,000 860 2.4 |
- | - |
| 221 | 0→010 0→285 -90→360 |
0.063 | 0.168 | 400 140 2.9 |
0.264 | 3,460 310 3 |
0.505 | 3,460 1,800 3 |
| 231 | 0→015 0→285 -90→360 |
0.252 | 0.264 | 390 270 3 |
0.203 | 1,415 300 3 |
0.281 | 1,425 1,130 3 |
Source: Snowden Optiro, 2022
The maximum grade continuity ranges for total HM, slimes and oversize are oriented along 005° to 015°. The total HM data have low and moderate nugget variances (6% to 30%), the slimes data have low nugget variances (9% to 20%), and oversize data have low and moderate nugget variances (14% to 44%). Total HM has a maximum continuity range of 1,000 m to 3,460 m along strike, 470 m to 1,800 m across strike and 2.4 m to 5 m vertically. Maximum continuity ranges interpreted for the slimes are 2,150 m to 3,090 m along strike, 1,135 m to 1,600 m across strike and 3 m to 5 m vertically and for oversize are 1,410 m to 4,400 m along strike, 875 m to 2,270 m across strike and 2.8 m to 7.8 m vertically.
Kriging neighbourhood analysis
Kriging neighbourhood analysis was carried out to optimise the block size, number of samples used for grade estimation, search ellipse dimensions and the block discretization. This analysis used the variogram parameters determined for total HM within Domain 221, which contains most of the mineralization. Block configurations varying between 100 m and 400 m in the easting axis (X) and northing axis (Y) and 1 m and 2 m bench heights were tested. The results indicated that for the blocks tested, the kriging efficiency and regression slope results were not overly sensitive to the block size. A block size of 100 mE by 200 mN by 1 mRL was selected to provide local definition of the grade variability.
The influence of the number of informing samples on the block estimate was tested. For this analysis, the block size was set to 100 mE by 200 mN by 1 mRL, and the sample numbers were varied between two and 40. The minimum and maximum numbers of samples were selected to be eight and 22, respectively, for the first search and second search passes and the minimum number of samples was reduced to six for the third search pass.
The influence of the search ellipse dimensions was investigated. The results indicated that the kriging efficiency and regression slope results decreased with increasing search ellipse dimensions. Given the long variogram ranges, a search ellipse with half the maximum variogram ranges was selected for the first search. The search dimensions were increased to the maximum variogram ranges for the second pass and were increased further to complete the estimate for the third search pass.
The influence of the discretization parameters on the block estimate was also tested. The results indicated that the kriging efficiency and regression slope results were not overly sensitive to the discretization, and this was set to 6 X by 6 Y by 4 Z for grade estimation.
|
Energy Fuels Inc. Technical Report – Donald Rare Earths and Mineral Sands Project, Victoria, Australia |
14.2.2 Area 2
Area 2 encompasses 3% of the total area of MIN5532. As discussed in Item 11.3.1, the CRA data and most of the 2004 Astron data analyzed the +38 µm/-1 mm fraction to determine the total HM content. Data obtained during 2010 and 2015, and some of the 2004 samples, were analyzed using the +38 µm/-90 µm fraction. For all samples, oversize data was the +1 mm fraction and for all data obtained prior to 2022, slimes data was the -38 µm fraction. Only data from samples where total HM was analyzed using the +38 µm/-90 µm fraction were used for data analysis and resource estimation within Area 2. Data compositing was not required as all the sample intervals were 1 m.
The 2022 data used total HM from the +20 µm/-250 µm fraction to align with the expected processing. Calibration equations were developed for total HM and slimes within each of the LP1, LP2 and LP3 units. These were used to estimate the total HM data within the +20 µm/-250 µm fraction from the total HM within the +38 µm/-90 µm fraction, and to estimate the slimes data within the -20 µm fraction from slimes within the -38 µm fraction.
Snowden Optiro used the global distributions of HM and slimes from the two different size fractions within Area 1 to determine equations to calibrate the distribution of total HM from the +38 µm/-90 µm fraction to the distribution of total HM from the +20 µm/-250 µm fraction, and the distribution of slimes from the -38 µm fraction to the distribution of slimes from the -20 µm fraction.
Astron analyzed 30 samples for verification of the calibration equations. Duplicate samples that had been screened at -20 µm were re-screened at -38 µm. Total HM was analyzed within the +38 µm/-250 µm fraction, which was then screened at 90 µm to obtain total HM from the +38 µm/-90 µm and +90 µm/-250 µm fractions. Two slimes data pairs were excluded as the -38 μm slimes was less than the -20 μm slimes and one of the total HM data pairs was excluded as the total HM from the +38 μm/-90 μm was less than from the +20 μm/- 250 μm fractions.
As discussed in Item 14.4, part of LP2 was assigned an Indicated classification and all of LP1 and LP3 within Area 2 were classified as Inferred. There were 22 sets of paired data within LP2, and these provided reasonable confidence in the calibration equations used for LP2 within Area 2. There was insufficient data for verification of the calibration equations within LP1 (two pairs of data) and LP3 (three pairs of data).
The variogram models interpreted from the 2022 total HM, slimes and oversize data were checked against the directional variograms generated using the combined dataset. These confirmed that the variogram parameters used for Area 1 could be used for grade estimation of the calibrated data within Area 2. For grade estimation within Area 2, the calibrated data within Areas 1 and 2 were combined with the 2022 data to prevent boundary effects between Area 1 and Area 2.
14.2.3 Mineral assemblage analysis
Astron selected representative intervals from each of the LP1, LP2 and LP3 units to generate 53 composite samples of HMC. These are from 227 drillholes and include intervals from over a total of 1,611 m (Figure 14.3). Where possible, Astron excluded samples from the top and base of the LP1, LP2 and LP3 units to ensure that the composite samples are representative of each geological unit and only individual samples reporting >1% total HM were used in these composites.
|
Energy Fuels Inc. Technical Report – Donald Rare Earths and Mineral Sands Project, Victoria, Australia |
Figure 14.3 Plan of drillholes with mineral assemblage data used for Area 1 and Area 2

Source: Snowden Optiro
Area 1
As discussed in Item 11 QEMSCAN® analysis was used for determination of the titania minerals, XRF data (ZrO2 and HfO2) were used to determine zircon contents and ICP-MS data (CeO2 and Y2O3) were used to determine monazite and xenotime contents.
Correlation coefficients of the 2022 mineral assemblage data from the Area 1 composite samples (Table 14.6) indicate a strong positive relationship between zircon and monazite, zircon and xenotime, and monazite and xenotime; a moderate positive relationship between rutile and the other mineral assemblage components, and between xenotime and the other mineral assemblage components; and a poor positive correlation between leucoxene and ilmenite, leucoxene and zircon, leucoxene and monazite, and ilmenite and monazite.
|
Energy Fuels Inc. Technical Report – Donald Rare Earths and Mineral Sands Project, Victoria, Australia |
Table 14.6 Correlation coefficients of mineral assemblage data - composite samples
| Rutile | Leucoxene | Ilmenite | Zircon | Monazite | Xenotime | |
| Rutile | 1.00 | 0.75 | 0.76 | 0.78 | 0.63 | 0.78 |
| Leucoxene | 1.00 | 0.38 | 0.51 | 0.50 | 0.61 | |
| Ilmenite | 1.00 | 0.80 | 0.58 | 0.73 | ||
| Zircon | 1.00 | 0.92 | 0.98 | |||
| Monazite | 1.00 | 0.96 | ||||
| Xenotime | 1.00 |
Source: Snowden Optiro, 2022
The mineral assemblage data was attributed to each drillhole interval that was incorporated into the composite sample, and the data was coded using the wireframe surfaces for each geological sequence. Most of the mineral assemblage data is from LP2 (30 composite samples). Within LP1, there are a total of seven composite samples and within LP3 there are 16 composites samples.
LP2 contains the highest ilmenite, zircon, monazite and xenotime concentrations, LP1 contains the lowest ilmenite, zircon, monazite and xenotime concentrations and LP3 contains the lowest leucoxene and rutile concentrations.
Along strike and across strike variograms were examined for rutile, leucoxene, ilmenite, zircon, monazite and xenotime. Along-strike (015°) ranges of 580 m to 1,010 m and across-strike ranges (285°) of 480 m to 900 m were interpreted, with leucoxene having the shorter ranges and monazite having the longest ranges. The zircon variograms were selected as being the most robust and were in line with the ranges determined for ilmenite, rutile and monazite. The zircon ranges of 940 m along strike by 880 m across strike were used for the horizontal search ellipse dimensions and a vertical search of 3.5 m was selected, which is about half the average sampled interval used for the composite samples.
The mineral assemblage components (all titania mineral subdivisions, zircon, monazite and xenotime) and TiO2, ZrO2+HfO2 and REOs were estimated using ID3 estimation within the LP1, LP2 and LP3 sequences. Hard boundary conditions were applied between the geological units.
Area 2
For Area 2, mineral assemblage and XRF data obtained from the 2004 drilling was used for estimation of the titania minerals and zircon. Mineral assemblage data was determined using HM concentrate from within the +38 µm/-90 µm fraction. The 2004 data (following the adjustments discussed below) was combined with the 2022 data for mineral assemblage estimation within Area 2.
The 2022 REE data was used for estimation of the REOs, and monazite and xenotime were estimated from the 2022 cerium and yttrium ICP-MS data.
The particle distribution data from the +20 µm/-250 µm HM concentrate was used to determine the proportion of HM and the proportions of zircon and the titania minerals that were within the -40 µm (considered equivalent to 38 µm for this analysis), the +40 µm/-90 µm and the +90 µm fractions within the LP1, LP2 and LP3 sediments. The proportions of zircon and the titania minerals that were within the combined
-40 µm and +90 µm HMC were less than within the +40 µm/-90 µm HMC and the inclusion of total HM from the +20 µm/-38 µm and +90 µm/-250 µm fractions in the 2022 data will have diluted the mineral assemblage components. The dilution factors determined from this analysis and applied to the 2004 zircon and titania data are summarized in Table 14.7.
|
Energy Fuels Inc. Technical Report – Donald Rare Earths and Mineral Sands Project, Victoria, Australia |
Table 14.7 Factors applied to 2004 zircon and titania mineral assemblage data
| Unit | Mineral | Within +40 µm/-90 µm fraction |
-40 µm and +90 µm fractions |
Dilution factor for additional 40 µm and +90 µm HM |
| LP1 | Total HM | 59.0 | 41.0 | - |
| Titania | 59.9 | 40.1 | 0.86 | |
| Zircon | 74.0 | 26.0 | 0.73 | |
| LP2 | Total HM | 87.0 | 13.0 | - |
| Titania | 67.4 | 32.6 | 0.93 | |
| Zircon | 76.5 | 23.5 | 0.91 | |
| LP3 | Total HM | 57.0 | 43.0 | - |
| Titania | 63.6 | 36.4 | 0.82 | |
| Zircon | 76.0 | 24.0 | 0.71 |
Source: Snowden Optiro, 2022
Within Area 2, mineral assemblage data had only been analyzed within the LP2 sequence. Analysis of the data within Area 1 indicated that the mineral assemblage contents in LP2 were higher than in LP1 and LP3. The mineral assemblage within LP2 was discounted for estimation within the LP1 and LP3 units. The discount factors applied were the average proportion of each of variable within LP1 and within LP3 compared to LP2 (Table 14.8). As discussed in Item 14.4, the LP1 and LP3 units within Area 2 were assigned an Inferred classification to account for the uncertainties in the mineral assemblage estimates.
Table 14.8 Discount factors applied to LP2 mineral assemblage data
| LP1 | LP3 | |
| Rutile | 0.81 | 0.73 |
| Leucoxene | 0.98 | 0.73 |
| Ilmenite | 0.63 | 0.79 |
| Zircon | 0.61 | 0.86 |
Source: Snowden Optiro, 2022
14.3 Grade estimation and model validation
The 2022 and subsequent 2025 block models were constructed using the parameters determined from the kriging neighbourhood analysis and the expected mining methods. The block model had a parent block size of 100 mE by 200 mN by 1 mRL. The parent blocks were allowed to sub-cell down to 25 mE by 50 mN by 0.25 mRL to more accurately represent the geometry and volumes of the geological units and the mineralization horizon. The block model was screened above the interpreted top of Geera Clay surface.
14.3.1 Total HM, slimes and oversize
Block grades for total HM were estimated using both OK and ID2 techniques, and block grades for slimes and oversize were estimated using OK techniques. Grade estimation was into the parent blocks.
Grade estimation for Area 1 only used the 2022 assay data. Grade estimation for Area 2 used the 2022 data, and the data that was analyzed using 38 µm and 90 µm screens (2010, 2015 and some of the 2004 data) and was calibrated with the +20 µm/-250 µm total HM and the -20 µm slimes data (as discussed in Item 14.2.2), Grade estimation of total HM was within the +20 µm/-250 µm fraction, slimes was the -20 µm fraction and oversize was the +1 mm fraction.
The search ellipses were oriented within the plane of the mineralization using Datamine's dynamic anisotropy methodology. Centre-line surfaces were generated through the interpreted mineralized domains, and the local dip and dip orientations of the surface were determined and estimated into the block model for each domain. These dips and dip orientations were used to control the orientation of the search ellipse and variogram model for grade estimation.
|
Energy Fuels Inc. Technical Report – Donald Rare Earths and Mineral Sands Project, Victoria, Australia |
As discussed in Item 14.2, a combination of hard and soft boundary conditions was applied. Hard boundary conditions were applied for Domains 210, 211, 220, 221 and 231 for estimation of total HM so only data from within each domain was used for grade estimation within that domain. For slimes, soft boundary conditions were applied within each of the geological units and hard boundary conditions were applied between the geological units. Data from Domains 210 and 211 were used for slimes estimation within LP1, data from Domains 220 and 221 were used for slimes estimation within LP2 and data from Domains 230 and 231 were used for slimes estimation within LP3. For oversize, hard boundary conditions were applied between the geological units and within LP2. Data from Domains 210 and 211 were used for oversize estimation within LP1, data from Domains 230 and 231 were used for oversize estimation within LP3, data from within Domain 220 were used for oversize estimation within LP2 Domain 220 and data from within Domain 221 were used for oversize estimation within LP2 Domain 221.
A three-pass search scheme was used. As determined from the kriging neighbourhood analysis, the search ellipse dimensions for the first search corresponded to half of the mineralization continuity ranges interpreted from the variogram analysis for total HM, slimes and oversize. For the second search pass, the search ranges were double the initial search ranges (i.e. to the maximum variogram ranges). For the third search pass, the search ranges were increased to complete grade estimation within each of the mineralized domains and the minimum number of samples reduced to six.
Even with the increased third search ranges, not all total HM and oversize block grades were estimated within Domain 220 in Area 1. A total HM grade of 0.74% and an oversize grade of 7.84% were assigned to the remaining blocks. Domain 230 contained only three data points and a total HM grade of 0.76% was assigned to this domain. Soft boundary conditions were used for the estimation of slimes and oversize within the LP3 layer (Domains 230 and 231), so these variables were estimated within Domain 230.
Approximately 71% of the total HM block grades were estimated in the first search pass, 16% within the second search pass and 3% in the third search pass. For the remaining 10% of blocks (which are mainly within Domain 230 which has only three data points), the average total HM grade was assigned to Domain 230 and to 1% of the blocks within Domain 220. For slimes, approximately 96% of the block grades were estimated in the first search pass, 6% within the second search pass and the remaining 0.1% estimated in the third search pass. Approximately 93% of the oversize block grades were estimated in the first search pass, 6% within the second search pass and 0.6% estimated in the third search pass. For the remaining 0.1% of the blocks, the average oversize grade estimated for Domain 220 was assigned to these blocks.
The percentages of parent blocks with total HM, slimes and oversize grades estimated in each search pass and domain for Area 2 were also recorded. Approximately 61% of the total HM block grades were estimated in the first search pass, 26% within the second search pass and 13% in the third search pass. For slimes, approximately 89% of the block grades were estimated in the first search pass, 11% within the second search pass and the remaining 0.4% estimated in the third search pass. Approximately 87% of the oversize block grades were estimated in the first search pass, 11% within the second search pass and 1% in the third search pass.
14.3.2 Mineral assemblage
Block grades for the mineral assemblage components (all titania mineral subdivisions, zircon, monazite, and xenotime) and TiO2, ZrO2+HfO2 and REEs were estimated using ID3 techniques and grade estimation was into the parent blocks.
Estimation for Area 1 only used the 2022 QEMSCAN® mineral assemblage, XRF and ICP-MS data. Grade estimation of zircon and the titania minerals for Area 2 used the 2022 data, and the 2004 data that was analyzed using HMC from the +38 µm/-90 µm fraction. Estimation of the REEs used the 2022 data obtained in Area 1 and this was extrapolated into Area 2. The block estimates of the REEs (ppm) were converted to REOs (%) and the TREO determined using the conversion formulae listed in Item 11.1.3. As for the total HM, the search ellipses were oriented within the plane of the mineralization using Datamine's dynamic anisotropy methodology.
|
Energy Fuels Inc. Technical Report – Donald Rare Earths and Mineral Sands Project, Victoria, Australia |
Within Area 1, 92% of the grades were estimated in the first search pass, 8% within the second search pass and the remaining 0.2% in the third search pass. Within Area 2, 57% of the zircon and titania mineral grades were estimated in the first search pass, 39% within the second search pass and the remaining 4% in the third search pass, and almost 40% of the REE, monazite and xenotime grades were estimated in the first search pass, almost 60% within the second search pass and the remaining 0.5% in the third search pass.
14.3.3 Density
The density values in Table 11.2 were applied to the Shepparton Formation and the LP1, LP2 and LP3 units. The model was screened to above the top of Geera Clay surface.
14.3.4 Model validation
The estimated grades in the resource model were validated by:
• Visual comparison of the drillholes and blocks
• Comparing the mean input grades with the estimated block grades
• Examining trend plots of the input data and estimated block grades by easting, northing and elevation slices.
Visual validation of the block models was carried out by examining cross-section, long section and plan views of the drillhole data and the estimated block grades. These indicated good correlation of the estimated block grades with the input drillhole data. A cross-section through the Donald deposit showing the drillhole HM data and estimated HM block grades is presented in Figure 14.4.
Figure 14.4 Representative geological cross-section looking north along 5,959,750 mN with drillholes coloured by total HM%*

*Section location included in Geological information from all historical drilling campaigns (pre-2022) was used to inform the geological interpretation for resource modelling in the MIN5532 area. The Mineral Resource estimate was divided into two areas (Area 1 and 2) based on the drillhole coverage. The nominal drill spacing for the 2022 drilling was approximately 250 mE by 350 mN. In general, the historical drillhole spacing ranges from 125 mE by 400 mN to 250 mE by 500 mN. The area covered by the 2022 drilling is coded as Area 1 and encompasses 97% of the total area of MIN5532 (Figure 14.1). The resource model was extended to cover MIN5532 and an area to the south of MIN5532 (to improve analysis of the Area 2 data). The area outside of the 2022 drilling was coded as Area 2
Source: Snowden Optiro
The Mineral Resource was reported using the OK estimate for total HM and the ID2 estimate was used as validation of this model. Trend plots were used to compare the total HM OK estimate with the ID2 estimate for total HM in the easting, northing and elevation directions. The average block estimates were similar for each model slice, with minor differences noted in areas of sparse data. The relative percentage difference between the average total HM grades estimated using OK and estimated using ID2 was less than 2%.
|
Energy Fuels Inc. Technical Report – Donald Rare Earths and Mineral Sands Project, Victoria, Australia |
The HM slimes and oversize block estimates were statistically validated against the input data. The mean estimated total HM, slimes and oversize grades were compared to the input and the declustered input data means. Within Area 1, the relative differences between the input data means and the mean estimated grades were all less than 6% and the relative differences between the declustered input data means and the mean estimated grades were all less than 8%. Within Area 2, the relative differences between the input data means and the mean estimated grades were all less than 8% and the relative differences between the declustered input data means and the mean estimated grades were all less than 11%. As discussed in Item 14.4, Mineral Resources within Area 2 were assigned an Indicated or Inferred classification.
The mean estimated mineral assemblage component grades were compared to the input data means. The relative differences are all less than 4% within Area 1. Within Area 2, mineral assemblage data was only available within LP2, and the relative differences were all less than 7%. As discussed in Item 14.2.3, discount factors were applied to the LP2 zircon and titania mineral assemblage components for estimation within LP1 and LP3. The REO, monazite and xenotime grades in Area 2 were extrapolated for the 2022 data. As discussed in Item 14.4, LP2 in Area 2 was classified as Indicated at best and LP1 and LP3 were assigned an Inferred classification within Area 2.
The validation plots indicated a good correlation between the input total HM, oversize and slimes grades and the block grades. The block grades followed the trends present in the input data in the easting, northing and elevation trend plots although, as would be expected, the model grades were slightly smoother than the input data. The validation plots for the mineral assemblage components indicated good correlation between the input data and the block grades for the easting and northing trend plots. Elevation plots were not examined as the mineral assemblage data are from downhole composited samples.
14.4 Classification
The 2025 Mineral Resource estimate was classified into the Measured, Indicated and Inferred categories, taking into account data quality, data density, geological continuity, grade continuity and confidence in the estimation of HM content and mineral assemblage.
Measured and Indicated Mineral Resources were defined within the Area 1, in areas covered by the 2022 drilling (on a nominal spacing of 250 mE by 350 mN) and where the mineral assemblage was determined by QEMSCAN®, XRF and ICP-MS analysis. Measured Mineral Resources were defined within the LP1 (Domains 210 and 211) and LP2 units (Domains 220 and 221). Domain 210 in the east and the LP3 unit (Domains 230 and 231) were classified as Indicated. Domain 210 is thinner in the east and grade estimation was supported by sparser data compared to the western area. Inferred Resources were not defined in Area 1.
Within Area 2, the drilling data used for the Mineral Resource estimate was generally on a spacing of 250 m to 500 m east-west and 250 m to 500 m north-south. The historical nature of the data, and changes in the grain size and data calibration reduced confidence in the data used for estimation. Mineral Resources within Area 2 were classified as Indicated and Inferred. The LP2 unit was classified as Indicated where there is 2004 mineral assemblage data and was classified as Inferred where there was a lack of mineral assemblage data. Mineral Resources within LP1and LP3 were classified as Inferred.
The classifications for the reported 2025 Mineral Resource (>1% total HM) are illustrated in Figure 14.5.
|
Energy Fuels Inc. Technical Report – Donald Rare Earths and Mineral Sands Project, Victoria, Australia |
Figure 14.5 MIN5532 Mineral Resource classification

Source: Snowden Optiro
14.5 Mineral Resource estimate
The 2025 Mineral Resource estimate is reported above a cut-off grade of 1% total HM within a RF100 pit shell identified using the geotechnical parameters, operating costs, metal prices and recoveries disclosed in Item 15.2.1 as determined from the Mineral Reserve study. As disclosed in Item 15, the 2025 Mineral Reserve has been estimated within MIN5532, based on the Mineral Resource within the area outlined in Figure 14.6.
A buffer zone within and around the edges of MIN5523 has been excluded from the 2025 Mineral Reserve estimate and the remaining 2025 Mineral Resource has been reported within this buffer zone. The previously reported reserve within RL2002 (refer to Item 24.3) abuts MIN5523 and, should the project advance to Phase 2, which proposes mining within RL2002, it is expected that the Mineral Resource within the buffer zone has reasonable prospects for economic extraction.
|
Energy Fuels Inc. Technical Report – Donald Rare Earths and Mineral Sands Project, Victoria, Australia |
The 2025 Mineral Resource for the Donald deposit within MIN5532 and outside of the Mineral Reserve area (and areas sterilized by mining) is illustrated in Figure 14.6 and reported in Table 14.9. The reported 2025 Mineral Resource includes Inferred Mineral Resources within the outline of the 2025 Mineral Reserve area. The total HM% is reported as a percentage of the total material. The mineral assemblage components (rutile, leucoxene, ilmenite, zircon, monazite and xenotime) and the oxides are reported as a percentage of the total HM that is within the +20 µm/-250 µm fraction. The oxide components are contained within the minerals and are not in addition to the minerals. The slimes content is the -20 µm fraction and oversize is the +1 mm fraction.
Figure 14.6 Plan of 2025 Mineral Reserve area and remaining 2025 Mineral Resource within MIN5532
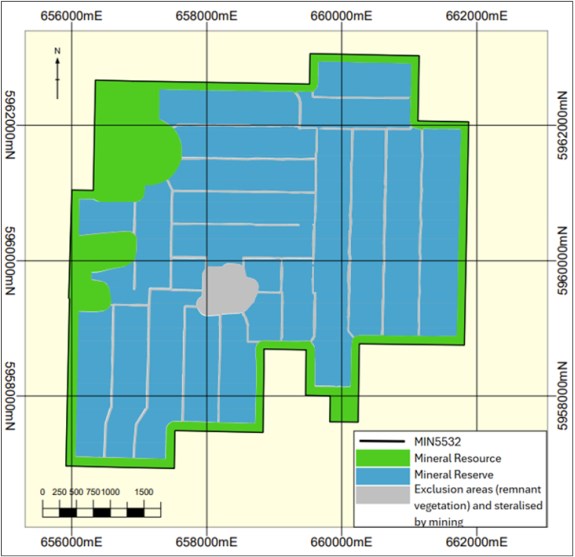
Source: Snowden Optiro
|
Energy Fuels Inc. Technical Report – Donald Rare Earths and Mineral Sands Project, Victoria, Australia |
Table 14.9 Donald Mineral Resource exclusive of Mineral Reserves within MIN5532 as of 31 December 2025 (100% equity)
| Classification | Tonnes (Mt) |
Density (t/m3) |
Total HM (%) |
Slimes (%) |
Over- size (%) |
% of total HM | |||||
| Zircon | Rutile | Leuco- xene |
Ilmenite | Monazite | Xeno- time |
||||||
| Measured | 71 | 1.8 | 4.1 | 14 | 9 | 16 | 7.3 | 24 | 20 | 1.7 | 0.66 |
| Indicated | 26 | 1.7 | 3.2 | 23 | 10 | 16 | 5.8 | 18 | 18 | 1.8 | 0.64 |
| Measured + Indicated | 96 | 1.7 | 3.9 | 17 | 9 | 16 | 7.0 | 23 | 20 | 1.7 | 0.66 |
| Inferred | 21 | 1.7 | 2.3 | 22 | 14 | 13 | 6.9 | 19 | 19 | 1.2 | 0.51 |
| Classification | Tonnes (Mt) |
Total HM (%) |
% of total HM | ||||||||
| ZrO2+ HfO2 |
TiO2 | CeO2 | Y2O3 | Pr6O11 | Nd2O3 | Dy2O3 | Tb4O7 | TREO | |||
| Measured | 71 | 4.1 | 11 | 33 | 0.48 | 0.28 | 0.058 | 0.21 | 0.041 | 0.0065 | 1.46 |
| Indicated | 26 | 3.2 | 10 | 28 | 0.50 | 0.28 | 0.061 | 0.22 | 0.041 | 0.0065 | 1.50 |
| Measured + Indicated | 96 | 3.9 | 11 | 32 | 0.48 | 0.28 | 0.059 | 0.21 | 0.041 | 0.0065 | 1.47 |
| Inferred | 21 | 2.3 | 9 | 30 | 0.34 | 0.23 | 0.041 | 0.15 | 0.032 | 0.0049 | 1.07 |
Notes:
Mineral Resources are reported on a 100% basis. As at the effective date of this Technical Report, Energy Fuels held a 9.48% interest in the Property.
Mineral Resources that are not Mineral Reserves do not have demonstrated economic viability.
Measured and Indicated Mineral Resources that are within the Mineral Reserve outline have been excluded from the reported Mineral Resource. Inferred Mineral Resources within the Mineral Reserve outline are included in the reported remaining Mineral Resource.
The reference point for the Mineral Resources is in-situ without assumed recovery modifying factors.
The MIN5532 Mineral Resource has been classified and reported in accordance with the 2014 CIM Definition Standards incorporated in NI 43-101 and S-K 1300 Definitions.
Total HM is from within the +20 µm to -250 µm size fraction and is reported as a percentage of the total material. Slimes is the
-20 µm fraction and oversize is the +1 mm fraction.
Estimates of the mineral assemblage (zircon, ilmenite, rutile (including anatase), leucoxene, monazite and xenotime) are presented as percentages of the total HM component. Estimates of the oxide components (presented as percentages of the total HM component) are contained within the minerals and are not in addition to the minerals. The REOs (CeO2, Y2O3, Pr6O11, Nd2O3, Dy2O3, Tb4O7) are a subset of the TREO.
The information in this Technical Report that relates to the MIN5532 Mineral Resource estimate is based on, and fairly reflects, information and supporting documentation compiled by Mrs. Christine Standing, who is a Member of the Australian Institute of Geoscientists. Mrs. Standing is an employee of Snowden Optiro and the Qualified Person responsible for Item 14.
Mrs. Standing has sufficient experience that is relevant to the style of mineralization and type of deposit under consideration and to the activity being undertaken to qualify as a Qualified Person as defined in the CIM guidelines and S-K 1300 Definitions. Mrs. Standing consents to the inclusion in the report of the matters based on her information in the form and context in which it appears.
The Donald 2025 Mineral Resources have been classified in accordance with the definitions for Mineral Resources in S-K 1300, which are consistent with CIM Definition Standards for Mineral Resources and Mineral Reserves dated 10 May 2014 (CIM, 2014) incorporated by reference in NI 43-101.
|
Energy Fuels Inc. Technical Report – Donald Rare Earths and Mineral Sands Project, Victoria, Australia |
The Qualified Person is unaware of any issues that materially affects the Mineral Resource in a detrimental sense. These conclusions are based on the following:
• The Mineral Resource is in a granted Mining Licence in good standing with state and federal environmental approvals in place and an approved CHMP
• DPPL currently owns several freehold titles and is in the process of acquiring or negotiating land use terms over the remaining Work Plan area
• Astron has represented that there are no outstanding legal issues, no legal actions or injunctions pending against the Phase 1 project
• There are no material marketing, political, socio-economic or taxation issues
• There are no known infrastructure issues.
14.6 Grade control model
During 2025, Astron undertook a GC drilling program within the area that is expected to be mined during the first two years of production (Ore Blocks 1 to 8). This included 133 AC holes and 10 sonic holes within MIN5532 during 2025 (Table 10.1 and Figure 10.2). Data from these holes were not used for the current Mineral Resource estimate as modifications were made to the sample preparation method used by ALS for the 2025 GC samples.
For the 2022 samples, a traditional sample preparation procedure was used by Bureau Veritas, which included agitation of a soaked sample. Astron noted that processing of the testwork samples (using scrubbing/trommel) reduced the oversize component and increased the HM sinks, and the in-size sand fraction (+20 µm/-250 µm, from which the HM are recovered), with an increase to the in-situ HM grade. The sample preparation method used by ALS included bottle-rolling, to mimic the scrubbing process used for the testwork samples. Additional data is required that covers the full extent of MIN5532, before the impact of the increased in-situ HM can be assessed for the Mineral Resource.
A 2025 GC model was developed within the area of Ore Blocks 1 to 8 for short-term mine planning that used only the 2025 AC data (Snowden Optiro, 2025b). The block model used a parent block size of 50 mE by 50 mN by 1 mRL with sub-celling to 12.5 mE by 12.5 mN by 0.25 mRL to more accurately represent the geometry and volumes of the geological units and the interpreted mineralized zones. Block grades for total HM, slimes and oversize were estimated using OK and grade estimation was into the parent blocks
XRF and ICP-MS of the 1 m samples were used for analysis of the mineral assemblage and oxide contents of the total HM fraction. These were estimated into the parent blocks using OK. QEMSCAN analysis was not undertaken on the GC samples and so the individual titania minerals (rutile, leucoxene and ilmenite) were not estimated: only the total TiO2 is reported. Zircon and monazite and xenotime were estimated using the follow conversions:
• Zircon = ZrO2+HfO2 / 0.667 (from XRF data)
• Monazite = CeO2 / 0.28 (from ICP-MS data)
• Xenotime = Y2O3 / 0.42 (from ICP-MS data).
The 2025 GC model has been assigned a Measured classification, taking into account data quality, data density, geological continuity, grade continuity and confidence in the estimation of HM content and the mineral assemblage and oxides contained in the heavy mineral fraction. The classification of the 2025 GC model is in accordance with the definitions for Mineral Resources in S-K 1300, which are consistent with Canadian Institute of Mining, Metallurgy and Petroleum (CIM) Definition Standards for Mineral Resources and Mineral Reserves dated 10 May 2014 (CIM, 2014) incorporated by reference in NI 43-101. The entire 2025 GC model is contained within the 2025 Mineral Reserves, as discussed in Item 15.
|
Energy Fuels Inc. Technical Report – Donald Rare Earths and Mineral Sands Project, Victoria, Australia |
14.7 Independent reviews
An independent review of the Mineral Resource estimate for MIN5523 and for Ore Block 1 to 8 has not been completed. The Mineral Resource was estimated by the Qualified Person for the Mineral Resource estimate. Internal reviews were completed by Snowden Optiro.
|
Energy Fuels Inc. Technical Report – Donald Rare Earths and Mineral Sands Project, Victoria, Australia |
15 Mineral Reserve estimates
The mine designs and schedules from the 2023 "Mining Feasibility Study" (AMC, 2023a) and "Mining Work Plan" (AMC, 2023b) were based on Lerchs-Grossmann open pit optimizations within MIN5532. The mine schedules and Mineral Reserve were updated by AMC in 2025 (AMC, 2025a) using the 2025 Mineral Resource model and 2025 GC model. Pit optimizations were updated for 2025 costs and metal prices and constrained within the mine crest to avoid protected vegetation, tailings storage, and the wet concentrator footprint. The first two years of production (the first eight mining blocks) is informed by the recently developed 2025 GC model, together with detailed mine planning and scheduling.
Figure 4.3 provides an outline of the Work Plan area and the MIN5532 boundary. The Work Plan area will support operations at the target throughput rate of 7.5 Mt/a for about 19 years. The MIN5532 area will support mining and processing activities for a total of about 40 years (Phase 1).
15.1 Key parameters and assumptions
MIN5532 will be mined using a conventional strip-mining method, designed as 500 m wide strips separated by in-situ ore bunds between the strips. Each strip comprises a series of about 500 m wide and 250 m long mining blocks separated by bunds constructed from overburden stripped from the active mining area. The mining blocks will be extracted in a progressive sequence within each strip, before shifting to a new strip (refer to Item 16.1). Spear point wells will be used to dewater the active mining area and the active tailings cell.
Once the ore is exposed bulldozers will push ore to a track-mounted, self-relocating Mining Unit Plant (MUP), enabling in-pit ore feeding. The ore will be screened and pumped to the process plant. The MUP will be relocated to follow the mining front and minimize bulldozer distances.
Process tailings will be returned to tailings cells constructed in the void left behind the active mining block. A downstream embankment will be constructed between the active tailings block and active mining block. Waste overburden will be backfilled behind the active tailings cell and above consolidated tailings.
Tailings cells are contained within sets of constraining bunds. Two types of bunds will be used:
• In-situ bunds which are left between strips of mining blocks, resulting in ore loss which is accounted for in the 2025 Mineral Reserve estimate
• Constructed in-pit bunds placed between the tailing cells.
ATC Williams was engaged for the initial external tailings cells and subsequent in-pit tailings cell construction and deposition design. Numerous site geotechnical investigations have been undertaken since 2015 by Douglas Partners, GHD and ATC Williams. ATC Williams provided geotechnical slopes of 1:2 (~27°) for in-situ slopes and 1:2.5 (~22°) for constructed slopes. The most recent site open pit geotechnical work was completed by ATC Williams in 2024 and is discussed in Item 16.1.
Based on this work, the design progressed considering a modified co-disposed tailings slurry (mix of sand and slimes) that is initially hydraulically placed within an external TSF until sufficient in-pit void space has been generated through the mining operation to allow tailings to be deposited within in-pit tailings cells (refer to Item 18.2 for further details).
The mine blocks are sized to allow better control over the tailings rate of rise which is linked to the overall settled density of the tailings (i.e. lower rate of rise generally equates to an improved final settled density).
The geological units are relatively fine-grained and clayey and form a low permeability water table aquifer system. Bore yields are less than 0.5 L/s and there are no groundwater extraction bores within 20 km of the site, largely because the typical groundwater salinity is about 17,000 mg/L TDS. The depth to the (saline) water table is about 10-14 m, indicating very low potential for groundwater dependent vegetation.
|
Energy Fuels Inc. Technical Report – Donald Rare Earths and Mineral Sands Project, Victoria, Australia |
15.2 Pit optimization
The 2025 Mineral Resource block model and 2025 GC model were used by AMC to generate the MIN5532 Mineral Reserve estimate.
A pit optimization was completed by AMC in 2025 to confirm the economically mineable portion of the Donald Mineral Resource and to support Mineral Reserve estimation.
The 2025 Mineral Resource block model was re-blocked to a uniform cell size of 25 mE by 25 mN by 1.0 mRL for optimization purposes. This block size was selected to improve resolution of pit boundaries and accurately represent pit wall geometries in the optimization process.
Economic inputs applied in the optimization included mining, processing, and transport and shipping cost assumptions, together with forecast product prices, royalties and recoveries. Block revenues were calculated from HM assemblage grades within the model. Geotechnical constraints were incorporated by applying a nominal overall pit slope angle of 20°, reflecting the shallow nature of the mineralization and the low pit wall heights expected during mining.
A mining loss of 6% was applied during optimization to account for in-situ bunds and practical mining constraints. No additional dilution was applied; any lateral edge dilution is expected to be predominantly mineralized material.
The optimization was carried out using industry-standard pit optimization algorithms to generate a series of nested pit shells. The selected shells formed the basis for detailed pit designs, production scheduling, and Mineral Reserve estimation.
15.2.1 Optimization parameters
The following mining costs used for the pit optimization were developed by AMC and DPPL based on contractor quotations:
• Clearing and rehabilitation cost: $3,300/ha disturbed footprint.
• Topsoil mining and placement cost inclusive of clearing and rehabilitation, rehandle and ancillary costs: $1.66/bcm.
• Subsoil mining and placement cost inclusive of clearing and rehabilitation, rehandle and ancillary costs: $1.66/bcm.
• Overburden mining cost inclusive of 20% rehandle and ancillary costs: $3.16/bcm.
• Ore mining cost inclusive of 6% ore loss, rehandle, ore feed and ancillary costs: $6.25/bcm.
The following processing costs used in the optimization were developed by Mineral Technologies:
• Ore processing cost including reagents, tailings disposal and dewatering: $6.24/t of ore.
• Royalty: 5% of mine gate value (a 2.5% mine gate value is applied in the economic model discussed Item 22 to reflect the state royalty in Victoria).
The oxide prices adopted for the optimization were based on independent market studies as disclosed in Item 19.1 and Item 22.1.
• HMC:
– HM content - 94.1%
– ZrO2 price - US$18.52/% in product
– TiO2 content - US$3.51/% in product
– Transport to port cost - $160.8/wet t
– Shipping cost - US$46/wet t.
|
Energy Fuels Inc. Technical Report – Donald Rare Earths and Mineral Sands Project, Victoria, Australia |
• REEC:
– CeO2 content - 20.3%
– Pr6O11 price -US$2,340/ % in product
– Nd2O3 price - US$8,240/ % in product
– Tb4O7 content - US$3,830/ % in product
– DyO3 content - US$8,100/ % in product
– Transport to port - $104.47 / wet t
– Shipping - US$/957.07/ wet t.
• Concentrate moisture content - 8%.
• Exchange rate – 0.7 US$:A$.
The processing recovery assumptions used in the pit optimization are summarized in Table 15.1 and Table 15.2.
Table 15.1 Processing recovery (%) assumptions used for pit optimization
| Product | HM | Zircon | Rutile | Leucoxene | Ilmenite | Monazite | Xenotime | TiO2 |
| HMC | 51.20 | 92.98 | 54.34 | 54.34 | 54.34 | 2.40 | 2.60 | 54.34 |
| REEC | 2.20 | 0.90 | 0.30 | 0.30 | 0.30 | 92 | 88 | 0.3 |
Source: AMC, 2025a
Table 15.2 Processing recovery (%) assumptions
| Product | ZrO2+HfO2 | CeO2 | Y2O3 | Pr6O11 | Nd2O3 | Dy2O3 | Tb4O7 |
| HMC | 92.98 | ||||||
| REEC | 0.90 | 92 | 88 | 92 | 92 | 88 | 88 |
Source: AMC, 2025a
The pit optimization considered the Measured and Indicated Mineral Resource model blocks only within the MIN5532 boundary; all Inferred and unclassified blocks were treated as waste.
The pit optimization process allowed the generation of a series of nested pit shapes (pit shells) for a range of RFs ranging from 10% (RF10) to 110% (RF110) of the base case prices. At a RF100, the incremental cost = incremental revenue. No pit shells were generated at RFs lower than 34%.
There was very little change in the optimization results beyond the RF60 pit shell because the economic pit was constrained by the MIN5532 boundary. The RF50 shell, which targets the higher-grade areas within the Work Plan area, was selected for the initial mining area and the RF70 shell, which covers the entire MIN5532 area, was selected for the remaining MIN5532 mine life. Based on current HMC and REE pricing (discussed in Item 22), the resulting MIN5532 pit design is consistent with the RF70 shell used by AMC in the 2023 "Mining Feasibility Study".
15.2.2 Cut-off grade
The ore block shapes (defining ore) were delineated using top and bottom of ore surfaces determined in AMC's 2023 study (AMC 2023a). In-situ bunds were removed from the ore block shapes. The Mineral Reserve is contained within these ore blocks. The ore blocks were tested against the 2025 Mineral Resource block model and 2025 GC model and are still appropriate for reporting the 2025 Mineral Reserve.
99.6% of ore within the ore blocks is above a 1.0%. The relationship between economic ore and HM cut-off is shown in Figure 15.1.
|
Energy Fuels Inc. Technical Report – Donald Rare Earths and Mineral Sands Project, Victoria, Australia |
Figure 15.1 Cut-off grade curve - percent ore and equivalent total HM%

Source: AMC
Figure 15.2 is a long section through the 2025 Mineral Resource block model coloured on operating surplus per tonne (value per tonne) showing the first eight blocks to be mined. The ore block top and bottom limits are coloured black. The value per tonne (based on the 2025 parameters reported in Item 15.2.1) is inclusive of revenue less royalties and operating costs for processing, mining, and off-site. The ore blocks are entirely within the positive value sand. To improve project NPV and the payback period, the ore block boundaries were designed to exclude negative and lower value (yet positive value) mineral assemblage. There is potential to further redefine the ore block boundaries to further improve the project financial return.
Figure 15.2 Long section through first eight ore blocks (5961700 mN)
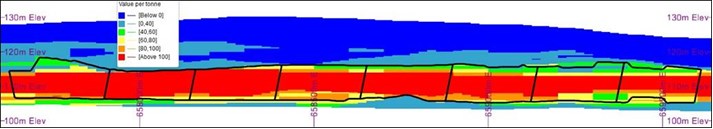
Source: AMC
15.3 Pit design
The RF70 pit shell was chosen for the basis of the MIN5532 mine design (Figure 15.3). The RF surfaces are based on the reduced level of the highest accumulated value from the surface at that RF. Detailed pit designs were prepared for the Work Plan area to inform the mine schedule and the Mineral Reserve estimate.
|
Energy Fuels Inc. Technical Report – Donald Rare Earths and Mineral Sands Project, Victoria, Australia |
Figure 15.3 Plan view showing MIN5532 mining blocks and RF floor

Source: AMC, 2023b
The RF70 shell was modified to exclude cultural and environmentally significant areas, the external TSF, the process plant footprint, roads and other support facilities. An offset of 100 m was used from the MIN5532 boundary to the crest of the closest pit excavation. The floor of the mine was a surface created from the combined RF50 and RF70 shells.
|
Energy Fuels Inc. Technical Report – Donald Rare Earths and Mineral Sands Project, Victoria, Australia |
RF70 (and the lower RF selections used for early mining) are considered conservative because they are materially below the project's base-case economic assumptions and deliberately limit the pit extent to areas that remain robust under downside conditions.
Detailed pit designs were finalized, incorporating bund geometry per ATC Williams' recommendations, refinements to accommodate the final process plant footprint, and optimized haulage and in-pit tailings deposition layouts. These designs were validated against the mine schedule and confirmed the planned production profile and tailings capacity.
15.4 Mineral Reserve estimate
The Donald Mineral Reserve estimate within MIN5532 as of December 2025 is reported in Table 15.3. The Measured Mineral Resource component was classified as a Proven Mineral Reserve and Indicated Mineral Resource was classified as a Probable Mineral Reserve. The Mineral Reserve estimate included appropriate allowances for mining, metallurgical, social, environmental, statutory and revenue aspects.
The physicals generated from the mine schedule provided input into the project cash flow model described in Item 22.2, which demonstrated at the time of reporting that the project was economically viable.
The information in this Technical Report that relates to the MIN5532 Mineral Reserve estimate is based on information compiled by Mr. Pier Federici and fairly represents this information. Mr. Federici is a Fellow of the Australasian Institute of Mining and Metallurgy and a full-time employee of AMC and is independent of DPPL, Astron and Energy Fuels. Mr. Federici has sufficient experience that is relevant to the style of mineralization and type of deposit under consideration and to the activity being undertaken to qualify as a Qualified Person as defined in NI 43-101 and S-K 1300.
|
Energy Fuels Inc. Technical Report – Donald Rare Earths and Mineral Sands Project, Victoria, Australia |
Table 15.3 Donald Mineral Reserve within MIN5532 as of 31 December 2025 (100% equity)
| Class. | Tonnes (Mt) |
Total HM (%) |
Slimes (%) |
Over- size (%) |
Zircon (%) |
Mona- zite (%) |
Xeno- time (%) |
TiO2 (%) |
ZrO2+ HfO2 (%) |
Pr6O11 (%) |
Nd2O3 (%) |
Dy2O3 (%) |
Tb4O7 (%) |
TREO (%) |
| Proven | 255 | 4.5 | 15 | 9 | 17 | 1.7 | 0.68 | 34 | 11 | 0.057 | 0.20 | 0.042 | 0.0065 | 1.5 |
| Probable | 39 | 4.3 | 18 | 11 | 16 | 1.6 | 0.64 | 32 | 11 | 0.056 | 0.20 | 0.040 | 0.0062 | 1.4 |
| Total | 293 | 4.5 | 16 | 10 | 17 | 1.7 | 0.67 | 34 | 11 | 0.056 | 0.20 | 0.041 | 0.0064 | 1.4 |
Source: AMC, 2025a
Notes:
Mineral Reserves are reported on a 100% basis. As at the effective date of this Technical Report, Energy Fuels held a 9.48% interest in the Property.
The Mineral Reserve is based on Measured and Indicated Mineral Resources contained within a practical mine design.
Estimates of the mineral assemblage (zircon, monazite and xenotime) are presented as percentages of the total HM component. Estimates of the oxide components (presented as percentages of the total HM component) are contained within the minerals and are not in addition to the minerals. The REOs (Pr6O11, Nd2O3, Dy2O3, Tb4O7) are a subset of the TREO.
The Mineral Reserve is reported by individual heavy mineral components for transparency of mineralogical composition and processing considerations.
The reference point for the Mineral Reserve is in-situ with allowance for mining recovery.
All tonnages and grades have been rounded to reflect the relative uncertainty of the estimate, thus the sum of columns may not equal.
The nominal cut-off grade is 1.0% HM using the metal price, cost and recovery assumptions for as disclosed in Item 15.2.1.
The MIN5532 Mineral Reserve has been classified and reported in accordance with the 2014 CIM Definition Standards incorporated in NI 43-101 and S-K 1300 Definitions.
|
Energy Fuels Inc. Technical Report – Donald Rare Earths and Mineral Sands Project, Victoria, Australia |
15.5 Risks and opportunities
15.5.1 Land acquisition
The Phase 1A Work Plan area covers 1,143.4 ha of which Astron owns freehold titles encompassing an area of 705 ha, with the remaining freehold titles under contract to be settled upon an FID (refer to Item 4.4).
There is an additional 1,646.6 ha of land within MIN5532 outside of the Work Plan area. DPPL will need to engage with those landowners to ensure appropriate access is secured. These areas will only be mined +19 years from the start of production.
There are Crown Land parcels and historical water channel reserves located both within the Work Plan area and the broader MIN5532. DPPL will need to obtain the consent of the Crown Land minister and other relevant authorities, which cannot be unreasonably withheld.
There are nine residences within 2 km of the MIN5532 boundary. Dust and noise modelling is currently being undertaken and will inform decision-making with respect to potential land purchase of these properties.
The Mining Licence for MIN5532 expires in August 2030. It is reasonable to expect that this licence will be extended subject to DPPL meeting the appropriate conditions and requirements.
The Phase 1A Work Plan area will support mining for about 19 years. Mining outside the Work Plan area, but within MIN5532 (Phase 1B) will continue until about Year 40. Mining over areas outside the Work Plan area will require a CHMP and approval of a Work Plan amendment under current Victorian regulations (refer to Item 20.3).
15.5.2 Other
Other material issues identified by the Qualified Person that could materially impede the progress at Donald or the conversion of Mineral Resources to Mineral Reserves are:
• Equipment productivity risk due to pit moisture affecting trafficability and the ability to meet scheduled production rates
• Geotechnical risk from potential pit floor heave
• Noise impacts on local receptors, with potential constraints on mining rates
• Dust generation impacting local receptors
• In-pit TSF risk related to tailings consolidation time; delayed settlement could defer backfilling and rehabilitation and increase overburden rehandling
• External TSF risk associated with environmental and social approvals and stakeholder impact.
Opportunities identified by the Qualified Person include:
• Placement of overburden adjacent to pit cells to reduce rehandle distances
• Development of a test pit to confirm operational conditions and groundwater behaviour
• Updated noise modelling based on the revised mine plan and equipment selection
• Installation of perimeter bunds around the Work Plan Area to reduce noise impacts on local receptors
• Use of more direct haulage routes during operations to reduce travel time and fleet requirements
• Re-location of overburden stockpiles during operations to reduce haulage distances and associated costs.
|
Energy Fuels Inc. Technical Report – Donald Rare Earths and Mineral Sands Project, Victoria, Australia |
The MIN5532 Mineral Reserve estimate is based on detailed mine planning and scheduling. The level of accuracy is at a feasibility study level.
15.6 Independent reviews
The Mineral Reserve estimate for MIN5532 has been reviewed internally by senior consultants at AMC. No independent reviews have been undertaken.
|
Energy Fuels Inc. Technical Report – Donald Rare Earths and Mineral Sands Project, Victoria, Australia |
16 Mining methods
16.1 Geotechnical
ATC Williams was engaged for the initial external tailings cells and subsequent in-pit tailings cell construction and deposition modelling. Numerous site geotechnical investigations have been undertaken since 2015 by Douglas Partners, GHD and ATC Williams. ATC Williams provided geotechnical slopes of 1:2 (~27°) for in-situ slopes and 1:2.5 (~22°) for constructed slopes.
Geotechnical work completed by ATC Williams in 2022 obtained disturbed and undisturbed samples for laboratory testing to identify suitable material parameters for inclusion in the design of the co-disposal tailings facilities. The following testwork was completed:
• PSD of all material types
• Plasticity of fine-grained material encountered
• Emerson class testing to estimate dispersity of foundation material
• Particle density of the foundation materials
• Bulk density estimates from Lexan tube samples
• Compaction testing of remoulded samples for construction purposes
• Triaxial testing on selected undisturbed samples
• Remoulded permeabilities of foundation material for construction purposes.
Laboratory testing was undertaken to assess material strength of the Shepparton Clays, LP1, LP2 and Geera Clay materials. This work incorporated:
• Three consolidation tests on clay materials (Unit 2/Shepparton Formation, Unit 4/LP3 and Unit 5/Geera Clay) at Melbourne University
• Three triaxial tests.
In 2024 and 2025, ATC Williams completed an expanded program with:
• 17 geotechnical boreholes, 25 test pits, and 11 shallow boreholes in the pit, process plant and external TSF areas.
• 38 Lexan undisturbed samples and extensive in-situ testing (Pocket Penetrometer, Standard Penetration Test)
• Laboratory testing for PSD (sieve/hydrometer), Atterberg limits, SG, compaction, permeability, pinhole dispersion, Emerson, pH, CBR (standard and lime-stabilized), shrink-swell potential, sulphate content and salinity/chemistry
• Integration of results into final pit slope design, TSF foundation design and in-pit tailings consolidation modelling.
Based on geotechnical testwork, the design progressed considering a modified co-disposed tailings slurry (mix of sand and slimes) that is initially hydraulically placed within an external TSF until sufficient in-pit void space has been generated through the mining operation to allow tailings to be deposited within in-pit tailings cells (refer to Item 18.2.2 for further details).
The mine blocks are sized to allow better control over the tailings rate of rise which is linked to the overall settled density of the tailings (i.e. lower rate of rise generally equates to an improved final settled density).
The Loxton Sand geological units are relatively fine-grained and clayey compared to other regions of the Murray Basin and together with the shallow Shepparton Formation form a low permeability water table aquifer system. Bore yields are less than 0.5 L/s and there are no groundwater extraction bores within 20 km of the site, largely because the typical groundwater salinity is about 17,000 mg/L TDS. The depth to the (saline) water table is about 10-14 m, indicating very low potential for groundwater dependent vegetation.
|
Energy Fuels Inc. Technical Report – Donald Rare Earths and Mineral Sands Project, Victoria, Australia |
16.2 Mining method
The proposed mining extraction sequence is shown in the following schematic cross-section (Figure 16.1):
• Perimeter and in-path dewatering bores (spear point wells) will be used to lower the groundwater table.
• Topsoil and subsoil will be removed by scrapers and stockpiled separately adjacent to the mining area.
• The overburden will be mined using excavators and off-highway haul trucks to expose the top of ore contact. Overburden will be initially stockpiled. Once sufficient volume has been mined, overburden will be trucked directly for bund construction and to backfill above filled tailings cells.
• Exposed ore will be pushed by bulldozer to an in-pit tracked, self-relocating MUP, reducing haulage requirements and handling costs.
• Tailings cells will be established behind the active mining face, formed by leaving in-situ bunds along both sides of the mining strip and dividing bunds constructed across the mining void from overburden waste and spaced about 250 m apart.
• The tailings cells will be backfilled with tailings pumped from the processing facility.
• Once the tailings have consolidated (about three months after final placement), overburden will be placed over the tailings followed by the replacement of subsoil and topsoil, after which the final rehabilitation can be completed.
The general mining approach is described in Items 16.2.1 to 16.2.5.
Figure 16.1 Schematic cross-section of mining approach (conceptual)

Source: AMC, 2023b
16.2.1 Hydrology and dewatering
CDM Smith conducted hydraulic testing of the aquifer in and around MIN5532 in the form of slug tests on 15 wells (DMS05 to DMS16, RP319, ZW10 and ZW12 as shown in Figure 16.2) in July 2024. Works were undertaken in accordance with the CDM Smith Slug Test Procedures. The data was analyzed using Aqtesolv Pro 4.0 software to estimate hydraulic conductivity in metres per day (m/day) for the screened aquifer at each bore.
|
Energy Fuels Inc. Technical Report – Donald Rare Earths and Mineral Sands Project, Victoria, Australia |
Figure 16.2 Location of wells for 2024 slug testing
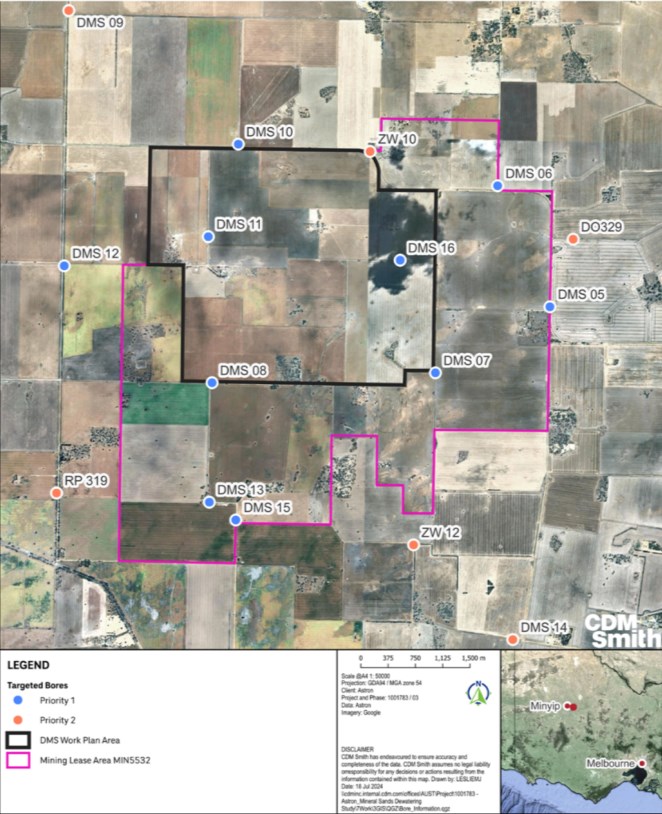
Source: CDM Smith Australia, 2025
|
Energy Fuels Inc. Technical Report – Donald Rare Earths and Mineral Sands Project, Victoria, Australia |
In March 2025, CDM Smith conducted a seven-day aquifer pumping test within mining block 1. The test included the drilling and installation of one pumping and two observation bores to facilitate an aquifer pumping test. During the seven-day pump test from the pumping bore, aquifer testing (slug testing) was conducted on the two observation bores.
A groundwater model was developed to examine the effectiveness of a wellfield dewatering design to dewater the orebody in mine block 1. This work provided an update to previous modelling undertaken in 2007. The model, developed using MODFLOW in FloPy, relies on site-specific hydrogeological data collected by CDM Smith during concurrent field programs, and allows for iterative model runs to optimise mine-scale dewatering design. This includes performing Monte Carlo analyses of parameter combinations, allowing for an understanding of how the uncertainty of hydraulic parameters at the site impacts potential dewatering success.
The final results of the modelling indicated that a wellfield dewatering design within the constraints of modelled variables is not expected to achieve dewatering of block 1 due to the hydraulic constraints of the Loxton Parilla Sand. The depth of dewatering is expected to be variable across the dewatered block, with complete dewatering around each well, and a cone of recovery in an inverted parabolic shape extending between dewatering wells. The Monte Carlo analysis and scenario modelling indicates that the remnant uncertainty in site hydraulic parameters is unlikely to raise the potential of achieving better than 60-70% dewatering of LP2. Hydraulic conditions at block 1 are not thought to be representative of those across the entirety of the project site, particularly in the eastern mining blocks, where aquifer thickness is thought to be greater and the aquifer may be more permeable, therefore there may be a greater potential for LP2 dewatering via wellfield.
The work to date has significantly reduced uncertainty in the dewatering requirements of mining block 1.
Further filed tests will be carried out in mining blocks 2 to 8 (first two years of mining) to confirm the hydraulic conditions (considering the potential permeability increase moving into the eastern blocks) and inform dewatering requirements. Works will include the installation of new test dewatering and observation wells, water level monitoring, permeability (slug) testing and dewatering tests with drainage infrastructure. These tests will be carried out in advance of mining and provide data for ongoing aquifer modelling and final determination of dewatering requirements.
While groundwater conditions will vary across the mine site primarily due to oversize in the orebody, there is no material impact on geotechnical ground bearing capacity for the MUP in-pit operations. As a result, groundwater conditions can be monitored by installing single bores ahead of the mining front to test conditions and allow time for an appropriate response if required.
The deposited tailings will be actively dewatered at the decant area to promote tailings consolidation. The active tailings cell will remain dewatered until the deposited tailings elevation is above the pre-mining groundwater level.
ATC Williams (2024) completed a site wide surface water management study to assess surface water flows across the site and ways to manage stormwater flows, including extreme storm events and impacts on mining operations.
16.2.2 Topsoil and subsoil stripping
Topsoil (about the top 200 mm) and subsoil (about the next 800 mm) will be stripped from the first mining block (block 1) by either tractor-pulled scrapers or scrapers and bulldozers. The topsoil and subsoil will be stockpiled within MIN5532 and to a height of less than 2 m and 5 m, respectively. Topsoil and subsoil will also be removed from under the base of any overburden and ore stockpiles, the external TSF and adjacent roads as part of the initial mining activities.
|
Energy Fuels Inc. Technical Report – Donald Rare Earths and Mineral Sands Project, Victoria, Australia |
16.2.3 Overburden mining
The overburden will be mined from the active mining area with hydraulic excavators and off-highway haul trucks. The overburden ranges in thickness from 8.5 m to 16.6 m and mining will occur on at least two benches simultaneously to optimise the production rate of the mining equipment. Temporary haul ramps will be cut with a bulldozer from the surface roads down to the base of overburden. Ramps are designed at a width of 22 m with a gradient of 10%.
The proposed overburden fleet will consist of two 250-tonne hydraulic excavators matched to 150-tonne capacity off-highway haul trucks. The trucks will haul the overburden to one of three destinations depending on the timing of the mining sequence:
• An overburden stockpile
• An existing mining void for the construction of bunds
• An existing void to cover the consolidated tailings.
The same fleet will be used for the rehandle of overburden from the overburden stockpile to the existing void to cover the tailings. The first overburden mined will be used for the construction of the external TSF, process plant pads, dam walls, roads and noise bunds around the WCP.
16.2.4 Ore mining
The top and bottom ore surfaces within the active mining area will be mined to an economic cut-off value contour.
After the overburden stripping has advanced sufficiently in front of the exposed ore block (a distance of about 250 m), ore will be mined using an in-pit MUP configuration, with ore pushed by tracked bulldozers directly to a track-mounted, self-relocating MUP for in-pit feed. The MUP will be positioned on a prepared working platform constructed from approximately 3 m of compacted overburden material to provide a competent and trafficable operating surface. Mining will be undertaken in sequential pit blocks, with each block divided into two halves to allow preparation of travel paths and operating pads between MUP relocations to minimise relocation time. Upon completion of ore mining within a block, the MUP will be relocated to the adjacent block, allowing backfilling of overburden and progressive rehabilitation to be completed. This ore mining method eliminates ore stockpiling and rehandling and is a proven approach for mineral sands operations.
The bulldozer push to a tracked MUP reduces reliance on truck haulage on potentially soft pit floors. Temporary access ramps will be cut at a gradient of about 10% by bulldozer from the surface down to the base of the ore.
The MUP will slurry the ore and pump it to the WCP for production of the HM and REE concentrates.
16.2.5 Dividing bund construction and filling
When sufficient void space is created, a tailings cell will be constructed by controlled compacted construction techniques using overburden material.
The dividing bund will be used for decant pond infrastructure and to provide protection of downstream mining personnel against the risk of a breach of the active upstream tailings cell.
An external TSF will be used until the first tailings cell is available for filling. When the cell is ready, tailings will be pumped from the WCP. The tailings cell will be filled and the tailings allowed to consolidate. A decant pump and dewatering bores (spear point wells) installed at the crest of the tailings cells will provide tailings dewatering until consolidation occurs.
Overburden will be backfilled above the consolidated tailings. Subsoil and topsoil will be reclaimed from stockpiles and placed over the overburden and contoured to achieve the desired final landform. The tailings cells will be constructed below the natural ground surface and the final tailings elevation will be no higher than 2 m below the final landform design to account for closure requirements.
|
Energy Fuels Inc. Technical Report – Donald Rare Earths and Mineral Sands Project, Victoria, Australia |
Construction of the first tailings cells is shown schematically in Figure 16.3 and will be replicated for all remaining tailings cells. The active tailings cell and the mining front will be separated by an empty tailings cell.
Figure 16.3 Layout of mining/in-pit tailings cell configuration

Source: ATC Williams, 2024
Based on a tailings production rate of approximately 547,500 tonnes per month (365,000 m3 per month) at a deposited dry density of 1.5 t/m3, it will take approximately three to four months to fill each cell with a corresponding rate of rise of approximately 6 m per month. The estimated storage capacity for each cell is approximately 2 Mt or 1.33 Mm3 based on a nominal pit depth of 22 m.
The active tailings cell will require dewatering from the perimeter spear points until the tailings elevation has exceeded the long-term natural groundwater level. The dormant half of the next cell and the active mining area below the water table will also require dewatering.
16.2.6 Exposed mining area
The exposed mining area, covering all mining activities from initial topsoil stripping to final backfilling of the mined void, averages about 80 ha but peaks at about 190 ha during the early years of the mine life.
16.3 Mining and ancillary fleet selection
16.3.1 Test pit study
A shallow pit was excavated at a location 1-2 km from the proposed early mining areas by International Groundwater Technologies Pty Ltd (IGT) in 2005 to test possible mining methods (Figure 16.4). The test pit demonstrated that ground conditions were generally favourable for the proposed mining method at a larger scale. IGT concluded that the soil general properties do not present significant stability issues during excavation. Suitable slope management, excavation and backfilling methods, and groundwater controls should suffice to maintain a safe working environment on a scaled-up version, provided that geological conditions do not change significantly.
Test pit excavations have shown that ore can be mined effectively in the presence of groundwater, with only minor seepage observed and no material handling issues encountered, as indicated in Figure 16.5.
|
Energy Fuels Inc. Technical Report – Donald Rare Earths and Mineral Sands Project, Victoria, Australia |
Figure 16.4 Test pit excavation viewed from northern end

Source: IGT, 2005
Figure 16.5 Test pit ore excavation trial showing extraction of ore zone

Source: IGT, 2005
|
Energy Fuels Inc. Technical Report – Donald Rare Earths and Mineral Sands Project, Victoria, Australia |
16.3.2 Mining and ancillary fleet selection
Mining will be undertaken by an experienced mining contractor and will include topsoil stripping, overburden stripping, ore mining and delivery to the process plant via an in-pit MUP, construction of tailings cells, overburden backfilling and topsoil replacement. Rehabilitation activities will be undertaken by specialist contractors.
A typical mining and ancillary fleet for the Work Plan area was estimated by AMC using the quantities and haulage profiles developed in the mining schedule and advise from experienced mining contractors. The mining equipment list is based on Caterpillar (CAT) equipment as summarized in Table 16.1 and is similar to the equipment numbers proposed by the preferred mining contractors, albeit from a different manufacturer.
Table 16.1 Typical mining equipment list
| Descriptor | Nominal equipment model | Number |
| Overburden mining excavator 250 t | CAT 6020B | 2 |
| Overburden mining haul truck 150 t | CAT 785D | 1 to 4 |
| Bulldozer | CAT D10T | 5 |
| Bulldozer | CAT D9R | 1 |
| Grader | CAT 16M | 1 |
| Support excavator | CAT 345GC (45 t) | 1 |
| Water truck | CAT 777WT | 1 |
| Water truck | CAT 745WT | 1 |
| Support front-end loader | CAT 980M | 1 |
| Service truck | Light highway service truck | 1 |
| Soil compactor | CAT CP76 | 1 |
| Lighting plants | Allight | 6 |
| Scraper | CAT 657G | 1 |
| Bus | Toyota | 1 |
| Grade control drill | FlexiROC D65 | 1 |
| Light vehicles | Toyota 4WD | 11 |
Source: AMC, 2023b
16.3.3 Mining production rates
Loading unit and haul truck operating hours were estimated and compared to the AMC benchmark database. AMC's database has relevant data on the mining fleet availability, utilization and typical operating hours. Bulldozer production rates were provided by experienced mining contractors.
The ore mining production rates were set based on a processing constraint of 7.5 Mt/a. Ore mined will be pushed to the in-pit MUP.
The overburden mining fleet selection for a production rate of 15 Mt/a was developed from first principles by AMC and used an average 3.2 km return haulage of overburden direct to void cell and to stockpile.
The operation is based on two 12-hours shifts, seven days a week. The mine operating hour assumptions are summarized in Table 16.2.
|
Energy Fuels Inc. Technical Report – Donald Rare Earths and Mineral Sands Project, Victoria, Australia |
Table 16.2 Operating hours assumptions
| Descriptor | Value | Descriptor | Value | |
| Loading unit operating hours | Haul truck operating hours | |||
| Availability | 90% | Availability | 90% | |
| Use of availability | 90% | Use of availability | 80% | |
| Operator efficiency | 87% | Operator efficiency | 90% | |
| Operating hours/annum | 6,173 | Operating hours/annum | 5,676 | |
| Effective utilization | 70% | Effective utilization | 65% | |
Source: AMC, 2023b
16.3.4 Personnel
Mining operations will run on two 12-hour shifts, 7 days a week, and will use a contractor to provide the full mining fleet and personnel. The specific mining personnel numbers are based on the contractor's proposed roster to support ore mining, overburden removal, tailings cell construction and rehabilitation works. These headcounts are integrated with support functions such as maintenance, grade control and mine services, and are aligned with the operational assumptions for equipment availability and utilization in Table 16.2.
The owner's mining team is planned to comprise five personnel covering:
• Mine manager (or mining superintendent)
• Mining engineer/planner
• Mine geologist (grade control supervision)
• Mine surveyor
• Health, safety and environment (HSE) advisor (mining focus).
The mining contract workforce will average 96 personnel over the initial five-year term, with a composition of about 5% local hires and the remaining 95% housed in paid accommodation, transitioning to about 90% local hires and 10% in paid accommodation by the end of the term.
16.4 Life of mine production schedule
MIN5532 has been divided into a series of about 500 m wide strips, with each strip subdivided into 7 to 10 mining blocks with dimensions of about 250 m long by 500 m wide as shown in the final mine plan schematic (Figure 16.6). Mining will progress linearly along each strip, commencing in block 1 and then move progressively eastwards to block 8, before returning to block 9 to commence the next strip, and so on.
The LOM sequence for MIN5532 targets the RF50 pit designs for about the first five years and RF70 pit designs for the remainder of the mine life. Focusing early production on the higher value Work Plan area (Figure 16.6) provides the highest project value. By targeting the RF50 shell during the initial years, the mine plan concentrates on higher-grade ore with stronger margins, which improves early cash flow, shortens payback, and reduces exposure to downside price or cost variability during the capital recovery phase. This approach also limits early mining to areas with the highest confidence in grade and continuity within the Work Plan area, reducing technical and execution risk.
|
Energy Fuels Inc. Technical Report – Donald Rare Earths and Mineral Sands Project, Victoria, Australia |
Figure 16.6 LOM schematic showing final mine plan with mining block sequence and the position of fixed infrastructure within MIN5532 and the Work Plan area

Source: DPPL
The schedule was based on the detailed pit design, TSF voids, in-situ and constructed in-pit bunds and stockpiling. Mine scheduling for both the initial Work Plan period and the remaining LOM was prepared using Deswik mining and scheduling software.
Deswik incorporates sequencing of mining blocks and key dependencies linking soil stripping, overburden and ore mining, in-pit bund construction, tailings cell filling, and backfilling of overburden and soil. Stockpiling of soil and overburden with rehandle, loading unit productivities, haulage profiles and associated hours were also modelled.
The sequence of mining follows the mine schedule, which is designed to capture higher value material earlier in the mine life. Each block is mined top-down (topsoil, subsoil, overburden and ore), then following construction of the in-pit bund is filled from the bottom-up (pumped tails, overburden, subsoil, topsoil).
The annual LOM annual ex-pit movements are shown in Figure 16.7 by calendar year. Annual process throughput is shown in Figure 16.8 and annual concentrate production is shown in Figure 16.9. Mining, processing and concentrate production is summarized in Table 16.4, annually from 2028 to 2034, in 10-year increments from 2035 to 2054, and then the remaining LOM to 2069.
The open area being mined and backfilled to achieve these production rates (defined as start of soil stripping to end of tails backfilling) is about 115 ha per annum.
|
Energy Fuels Inc. Technical Report – Donald Rare Earths and Mineral Sands Project, Victoria, Australia |
The start date for the mining schedule is Q1 2028, which assumes site earthworks for plant construction will commence in Q1 2026.
Figure 16.7 Annualized MIN5532 mining schedule - ex-pit movement

Source: DPPL
Figure 16.8 Annualized MIN5532 processing schedule - raw HM

Source: DPPL
|
Energy Fuels Inc. Technical Report – Donald Rare Earths and Mineral Sands Project, Victoria, Australia |
Figure 16.9 Annualized MIN5532 concentrate product schedule

Source: DPPL
|
Energy Fuels Inc. Technical Report – Donald Rare Earths and Mineral Sands Project, Victoria, Australia |
Table 16.3 MIN5532 ex-pit mining and minerals sands and concentrate product schedule
| Material moved | Unit | Total | 2028 | 2029 | 2030 | 2031 | 2032 | 2033 | 2034 | 2035-44 | 2045-54 | 2055-64 | 2065-67 |
| Mined | |||||||||||||
| Topsoil | Mbcm | 5.2 | 0.7 | 0.1 | 0.1 | 0.1 | 0.1 | 0.1 | 0.1 | 1.5 | 1.2 | 1.1 | 0.2 |
| Subsoil | Mbcm | 21.0 | 2.6 | 0.4 | 0.5 | 0.4 | 0.5 | 0.4 | 0.4 | 5.9 | 4.7 | 4.4 | 0.6 |
| Overburden | Mbcm | 294.4 | 11.7 | 7.3 | 6.5 | 7.5 | 7.9 | 7.5 | 5.3 | 88.8 | 62.5 | 72.4 | 17.0 |
| Ore | Mt | 293.3 | 6.8 | 7.5 | 7.5 | 7.5 | 7.5 | 7.5 | 7.5 | 75.1 | 75.0 | 75.1 | 16.3 |
| Processed | |||||||||||||
| Raw HM | kt | 11,691.57 | 259.33 | 380.71 | 341.82 | 313.97 | 326.93 | 313.01 | 310.84 | 2,979.48 | 2,950.83 | 2,878.27 | 636.38 |
| TiO2 | % | 38.1 | 40.6 | 37.2 | 38.1 | 38.1 | 38.4 | 38.1 | 38.4 | 38.9 | 38.4 | 37.1 | 36.5 |
| ZrO2 | % | 18.1 | 19.4 | 18.3 | 19.1 | 18.8 | 19.3 | 18.9 | 19.0 | 18.8 | 17.7 | 17.1 | 18.2 |
| Concentrate produced | |||||||||||||
| HMC | kt | 7,540.0 | 137.2 | 245.5 | 220.4 | 202.5 | 210.8 | 201.9 | 200.5 | 1,921.5 | 1,903.0 | 1,856.2 | 440.4 |
| REEC | kt | 314.6 | 6.2 | 10.5 | 9.2 | 8.0 | 8.7 | 8.2 | 8.0 | 78.1 | 67.1 | 93.4 | 17.2 |
Source: DPPL
|
Energy Fuels Inc. Technical Report – Donald Rare Earths and Mineral Sands Project, Victoria, Australia |
17 Recovery methods
Mineral Technologies completed the process plant design and developed capital and operational cost estimates to inform the Phase 1 study. The flowsheet included the following process units:
• Mining unit plant (MUP)
• ROM screens, deslime hydro-cyclones, thickening plant
• Wet concentrator plant (WCP)
• Concentrate upgrade plant (CUP) including REEC packing plant
• HMC storage and loading plant.
The process plant was designed at a 1,000 t/h solids (dry basis) ROM feed rate with an estimated 7,500 operating hours per annum, equating to a nominal annual plant throughput of 7.5 Mt.
A ROM feed grade of 5.1% HM was used for the design, with an operating range of 4.0% to 6.5% HM. At the minimum feed grade, the feed rate to the plant is maintained at the nominal rate of 1,000 t/h, while at the maximum feed grade, the feed rate will be constrained to approximately 900 t/h due to higher concentrate production rates through the back end of the circuit.
The process plant and ancillary facilities will be situated in the northwestern corner of MIN5532 (Figure 16.6).
17.1 Mining unit plant
The in-pit tracked MUP has been designed to scrub and screen the ROM ore before pumping it to the WCP for further processing, as indicated in Figure 17.1.
Figure 17.1 MUP flowsheet

Source: DPPL
The MUP will be located within the mining cells, away from the process plant and is designed to scrub and screen the ROM ore before pumping to the WCP for further processing. The MUP is designed to be relocatable and moves along the designated mining path. The MUP is expected to be relocated approximately every two weeks. Each move should take around 12 hours from shutdown to restarting ore washing. Longer intervals may be required to extend the installed infrastructure, such as piping and power cables, and be coordinated with planned plant maintenance activities.
|
Energy Fuels Inc. Technical Report – Donald Rare Earths and Mineral Sands Project, Victoria, Australia |
17.2 ROM screen, hydro-cyclones, thickening plant
The ROM screens at the front end of the WCP (Figure 17.2 and Figure 17.3) have been designed to remove coarse (+1 mm) gangue particles from the scrubbed and screened (-10 mm) ROM material pumped from the MUP. This screen provides protection to the WCP by removing coarse (mainly silicate) particles which would otherwise increase wear on spirals and negatively impact on spiral performance.
Figure 17.2 Process plant layout

Source: DPPL, 2025
Figure 17.3 WCP feed preparation circuit flowsheet

Source: Astron, 2023a
|
Energy Fuels Inc. Technical Report – Donald Rare Earths and Mineral Sands Project, Victoria, Australia |
The tails dewatering hydro-cyclones will be utilized to control the density of the tailings being pumped to the mine void and to recover a large proportion of the contained water for reuse in the WCP circuit.
The deslime hydro-cyclones will be positioned above the WCP surge bin (also referred to as the ROM surge bin or LFCU) and will remove fine slimes from the ore slurry prior to entering the surge bin and subsequent spiral circuit. Deslime hydro-cyclone overflow will gravitate to a thickener for removal and dewatering of the slimes and to recover process water.
The WCP surge bin will provide surge capacity at the head of the WCP, enabling up to two hours downtime of the MUP prior to the requirement to shut down the WCP. The design of the surge bin will allow for accurate control of feed rate and slurry density to the WCP rougher spirals.
The LFCU has been designed as a mass flow bin, so discharge of slurry can be readily restarted, even if the bin is full of solids.
The slimes thickener processes overflow from the deslime hydro-cyclones and WCP surge bin, as well as internal dilution water, and has been located adjacent to the settling ponds to reduce pipework and allow for gravity flow from the thickener to the settling pond. The slimes thickener can process 6,000 m3/h of slurry, consisting of deslime hydro-cyclone and WCP surge bin overflow as well as internal dilution water.
17.3 Wet concentration plant
The WCP will include the equipment required to separate the HM from the screened and deslimed ore (Figure 17.4). This equipment will comprise primarily of spiral (gravity separation) technology (MG12 and HG10i spirals).
Figure 17.4 WCP spiral circuit flowsheet

Source: Astron, 2023a
|
Energy Fuels Inc. Technical Report – Donald Rare Earths and Mineral Sands Project, Victoria, Australia |
Based on the extensive testwork and pilot plant testing that has been completed (refer to Item 13), the MG12 has been demonstrated to meet the performance requirements for this plant in the rougher, middlings scavenger and cleaner spiral stages of the WCP. The HG10i spiral has also been tested and is used specifically in the recleaner spiral stage where the feed to the spirals is high-grade material.
The overall WCP structure has been designed with cladding around the spiral level of the building to provide protection from the seasonal high winds that may affect the performance of the spirals.
Pilot-scale testing undertaken in 2024 and 2025 confirmed the WCP flowsheet and spiral configurations. Performance across rougher, middlings scavenger, cleaner and recleaner stages was consistent with, or exceeded, earlier results, with stable operation achieved across the full range of expected feed variability. Minor refinements to equipment sizing and operational settings were incorporated into the final design to improve concentrate grades and reduce operating costs. The WCP layout and process design were integrated with the slimes thickening and tailings water recovery systems to optimise water balance, operational efficiency, and environmental performance.
17.4 Concentrate upgrade plant
The CUP will separate the minerals containing REEs from the nominally 40 t/h (dry solids basis) of raw HMC produced in the WCP. This will be achieved by attritioning the HMC to ensure that the surfaces of all minerals are sufficiently exposed prior to the flotation circuit used to collect the rare earth minerals into the REEC (Figure 17.5).
Figure 17.5 CUP circuit flowsheet
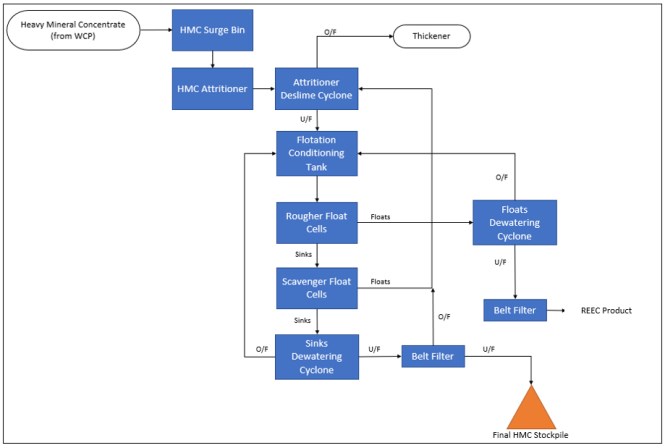
Source: Astron, 2023a
|
Energy Fuels Inc. Technical Report – Donald Rare Earths and Mineral Sands Project, Victoria, Australia |
The flotation process uses various chemical reagents so the rare earth minerals float to the surface of the cell with the froth, while the remaining HM sink to the bottom of the cell.
The CUP building will be sealed to prevent interference from the environment (rain and wind) and to limit personnel access and time spent in proximity of the product which contains radioactive mineral particles.
HMC will be pumped from the WCP to the CUP surge bin, similar in construction to the WCP surge bin (LFCU).
17.5 Heavy mineral concentrate storage and loading
17.5.1 Rare earth element concentrate
The REEC will be dewatered and stored in the REEC product bin, which will provide 30 tonnes of storage capacity. When the product bin is full, feed to the CUP will be stopped until space is made available in the bin. The CUP will have 12 hours of storage capacity in the surge bin before the WCP feed will need to stop.
Dewatered REEC will be loaded directly from the product bin into 2-tonne bulka bags and loaded into half-height lined shipping containers that meet Class 7 radioactive material transport requirements. Containers will be sealed, weighed, labelled, and placarded in accordance with IAEA regulations for Class 7 transport and all other applicable regulatory requirements. The filled containers will be stored on site until dispatched to Energy Fuels, who will be responsible for final disposal of the bulka bags.
The transport and logistics contractor will provide the required forklifts for handling the containers. All other plant and equipment have been included in the process plant capital cost.
17.5.2 Heavy mineral concentrate
The HMC storage facility will be located within a separate structure (Figure 17.2), where the product will be dried and loaded into custom-built half height shipping containers with a front-end loader.
The HMC product will be pumped from the CUP facility to the final HMC belt filter. The washed and dewatered final HMC filter cake will then be deposited onto a reversible discharge conveyor which will discharge into one of two concrete walled bunkers. One bunker will receive product while final HMC is being loaded by a front-end loader into half-height shipping containers. The entire structure is clad to protect the product from wind and rain.
The storage facility will be included in the process plant capital cost. The front-end loader and half-height shipping containers will be provided by the transport and logistics contractor.
17.6 Ancillary processing facilities
The process infrastructure will include a reagents storage and dosing facility and a flocculant storage and preparation plant for the safe delivery, storage and use of reagents.
Two existing independent structures (dimensions of 25 m by 15 m and 30 m by 15 m) located on land owned by DPPL will be removed.
The required water and power infrastructure is discussed in Item 18.
17.7 Process plant requirements
Design work completed in 2025 integrated the process services with site-wide water and power balance models. The process water supply will be maintained via a closed-loop system linking the WCP, CUP and tailings return water, with redundancy built into pumping and pipeline systems to maintain plant uptime. Potable water will be produced on-site using a dedicated treatment plant fed from licensed bore fields. Critical power circuits will be supported by uninterruptible power supply (UPS) systems to protect control and safety equipment. A site-wide fibre-optic communications backbone will support plant control systems, mining operations, and environmental monitoring. All services have been designed with capacity for potential future expansion of the processing facilities.
|
Energy Fuels Inc. Technical Report – Donald Rare Earths and Mineral Sands Project, Victoria, Australia |
The raw water demand is 2,520 ML per year, sourced from the GWM Water Headworks allocation, supplemented by recovered groundwater and decant water. Potable water demand is 13 kL per day with two 50 kL on-site storage tanks, and provision for future treatment if required. Instrument air, firewater and washdown water systems, sewage disposal capacity of 15 kL per day to off-site treatment, and a light vehicle wash bay with oily water separation are included.
The power requirement from the power station for each year of operation has been determined by developing an annual load profile for the site (including planned minor and major shutdowns) based on the calculated maximum demand of each area/plant across the project. Total processing power requirements including the MUP is approximately 4.7 MW. This consists of approximately 1.7 MW for the MUP, 1.6 MW for the WCP, 0.5 MW for the CUP, 0.5 MW for process water and services, and other areas consisting of 0.3 MW.
Site power will be supplied by a modular micro-grid comprising solar PV, battery energy storage system (BESS) and high-efficiency diesel generators as spinning/backup capacity. The system is designed for islanded operation with black-start capability, N-1 redundancy on critical feeders and staged expansion to match throughput increases. The micro-grid integrates with plant control systems for automated load-following, and with the process water/REEC handling schedules to minimize fuel use and emissions. Protection and metering are configured to utility standards, with provision to inter-tie to the 66 kV network in future if required.
Flocculants comprise the largest portion of the processing consumables cost. Dosage rates provided by SciDev based on trial results are summarized in Table 17.1.
Table 17.1 Processing consumables assumptions
| Consumable | Dosage rate |
| Flocculant (Maxifloc 530M) - Thickener Feed | 250 g/t thickener feed |
| Flocculant (Maxifloc 530M) - Tailings Discharge | 185 g/t tailings discharge |
| Sulphuric acid (98% w/w) | 138 g/t flotation feed |
| Quebracho | 45 g/t flotation feed |
| Dextrin | 100 g/t flotation feed |
| Collector (Flotinor 18080) | 475 g/t flotation feed |
| Sodium Silicate | 200 g/t flotation feed |
| Sodium Hydroxide | 180 g/t flotation feed |
| Frother (Flottec F150) | 20 g/t flotation feed |
Source Astron, 2025
The process plant workforce is about 57 personnel. This includes:
• Operations (management, supervision, plant operators, control room, field technicians) - 28
• Maintenance (mechanical, electrical, instrumentation) - 19
• Metallurgist, laboratory and QAQC staff - 10.
These positions are largely rostered across shifts to support 24/7 operation. Contractors are also expected to supplement the workforce during major shutdowns and maintenance campaigns.
 |
Energy Fuels Inc. Technical Report – Donald Rare Earths and Mineral Sands Project, Victoria, Australia |
18 Project infrastructure
18.1 Site layout
A key factor influencing the site layout is the ore zone extending across the entire Work Plan area. To minimize ore sterilization and maximize resource utilization, the pit design and disturbance area was based on the following constraints:
• Avoidance of culturally significant areas.
• Avoidance of environmentally significant areas, including native vegetation to be retained and protected, and vegetation "no-go zones"
• Allowance of a 100 m buffer zone between the pit crest and Work Plan area boundary for haul roads, utility infrastructure and surface water management structures
• Allowance for a geotechnical offset to exclude any potential impacts on public safety, the environment, land, property and infrastructure
• Offset area for the process plant infrastructure and external TSF
• Allowance for geotechnically designed pit slopes
• Allowance for siting the modular microgrid, including solar photovoltaic (PV) arrays, BESS, and diesel backup units.
Figure 18.1 shows the general site layout including process plant area, external TSF, pit crest, haul roads, project infrastructure, buffer zones, Work Plan boundary and vegetation "no-go zones".
18.2 Tailings storage facility
18.2.1 External TSF design
The external TSF site selection process consisted of selecting the lowest value area close to the site infrastructure to reduce pumping/capital costs. As such, the external TSF has been situated immediately south of the proposed process plant within MIN5532 where there is no impact on any ecological or cultural heritage zones (Figure 18.1).
The external TSF (Figure 18.2) was configured by GEOAnalytica as a modified central thickened discharge (CTD) arrangement. CTD-type TSFs are commonly used in the mineral sands industry, including in the Murray Basin at multiple mine sites.
The confining embankments will be constructed to approximately 8.8 m high while the central spine will be constructed to nominally 16.3 m high with the decant pond located in the northwestern corner of the facility. The TSF has been sized to accommodate approximately 12 months of initial tailings storage (nominally 6.4 Mt). The overall dimensions of the external TSF are approximately 1,100 m by 760 m.
The embankments are expected to be constructed using a clay core comprising Unit 2 Shepparton Formation clay with Unit 3a/LP1 material placed over the core. In the area of the decant pond, the clay core will extend to the upstream face of the embankment, and the initial 1.5 m of clay facing will be lime-stabilized (nominally 3%) to reduce dispersivity. Designs indicate that embankment crest widths will be 20 m with upstream and downstream slopes of approximately 2H:1V and 2.5H:1V, respectively. The results of the stability analyses completed (static and post seismic) demonstrate compliance with or exceedance of the minimum required ANCOLD Factor of Safety.
|
Energy Fuels Inc. Technical Report – Donald Rare Earths and Mineral Sands Project, Victoria, Australia |
Figure 18.1 Site layout in Work Plan area

Source: DPPL, 2024
|
Energy Fuels Inc. Technical Report – Donald Rare Earths and Mineral Sands Project, Victoria, Australia |
Figure 18.2 External TSF design


Source: Astron, 2025
The external TSF will be founded on a compacted low permeability liner of Unit 2 Shepparton Formation clay and hence any seepage through the base of the facility will be slow. A seepage collection sump has been included in the design to allow accumulated seepage removal and minimize seepage through the embankment walls. A surface water management system, comprising swale drains located on the northern and western sides and outside the external TSF and two stormwater ponds also located on the northern and western sides outside the facility, to capture and manage locally generated stormwater.
|
Energy Fuels Inc. Technical Report – Donald Rare Earths and Mineral Sands Project, Victoria, Australia |
The water balance results indicate an average operating decant pond of approximately 0.6 m in depth. Water return will be undertaken via a skid mounted pump located on an access ramp in the decant pond area. The water balance model indicates that a 700 m3/h pump is required to maintain decant pond levels, and minor ongoing pumping will be required post-tailings deposition to maintain a low decant pond level. The return water system has been designed for additional capacity at a maximum rate of 1,000 m3/h.
A diversion bund north of the TSF has been incorporated in the design to divert potential dam break flows from the process plant area. The diversion bund is expected to tie-in with the proposed noise bunds around the process plant and extends to the east for approximately 600 m by partially wrapping around the external TSF.
A consequence category assessment was undertaken considering post flood failure conditions to assess the worst-case scenario in terms of ANCOLD standards. While recent dam break modelling suggests a "LOW" consequence rating with an Incremental Potential Loss of Life (PLL) of 0.05 and Population at Risk (PAR) of approximately 2.9, the design of the external TSF has been designed in accordance with a higher consequence category. A spillway has been designed to accommodate the probable maximum flood, ensuring adequate conveyance of peak flows and controlling maximum flood depth. To minimize embankment height, the spillway depth was preliminary set at 0.5 m, resulting in a spillway width of approximately 30 m.
18.2.2 In-pit TSF design
Once sufficient in-pit void space is available, tailings deposition will take place within the pit. The tailings cells will be constructed below the natural ground surface (i.e. final tailings elevation will be no higher than 3.2 m below the natural surface to account for closure requirements). Indicative tailings cells of approximately 250 m by 500 m are planned, with individual cells expected to operate for several months, subject to detailed design and operational requirements. The active in-pit cell and the active mining face will be separated by an empty cell.
The adopted design parameters for the in-pit TSFs (Figure 16.3) are based on the consequence category assessment of "Significant" and ANCOLD design criteria.
Like the external TSF, the cross-pit embankments will be constructed using Unit 3a/LP1 material with about a 1.5 m thick (measured horizontally) low permeability facing in the areas where the normal operating pond will be located. The embankments are expected to be constructed with a 20 m wide final crest with 2.5:1 (H:V) side slopes. The marginally flatter slopes are required due to the increased height of the embankments for the in-pit TSF (in comparison with the external TSF). The remaining confining embankments for each cell will be accounted for by leaving an in-situ embankment (i.e. pit wall).
The design is based on the requirement that the pit will remain dewatered for at least the active tailings cell, dormant/empty cell and active mining front. Once the deposited tailings elevation has increased sufficiently beyond the groundwater elevation, dewatering can cease in the area around the active tailings cell, subject to operational and water management considerations.
The tailings transportation to the in-pit TSFs will be completed by tailings transportation pipeline mains. Return water will be dealt with in the same manner as the external TSF (i.e. access ramp and skid mounted pump). Tailings will typically be deposited from multiple sides of each cell and the decant pond will form on either side of the dividing embankment.
SciDev Ltd undertook testing to assess the sand:slimes mix ratio, define the most appropriate flocculant type and identify the dose rate. A density of 1.5 t/m3 was adopted for the tailings deposition assessment, which equates to approximately 13,333 m3 per day of consumed void space.
In-pit deposition of tailings within the in-pit TSFs will require permission from the EPA to deposit waste to an aquifer (A18 permit). All required regulatory approvals will be obtained prior to the commencement of in-pit tailings deposition.
|
Energy Fuels Inc. Technical Report – Donald Rare Earths and Mineral Sands Project, Victoria, Australia |
18.3 Power
Power for the operation will be supplied by a site-based modular microgrid rather than a direct connection to the Victorian electricity distribution network. The microgrid will comprise a hybrid generation system of PV arrays, BESS, and high-efficiency diesel generators to provide spinning reserve and backup capacity.
The microgrid is designed for fully islanded operation, with redundancy on critical feeders and black-start capability. Generation and storage modules will be staged to align with project ramp-up, with provision for future expansion to support potential throughput increases. Automated load-following control will optimise the use of renewable energy and minimize diesel fuel consumption, integrating closely with plant operating schedules and the water management system.
The microgrid will be located to the southeast of the process plant to optimize electrical distribution efficiency to the WCP, CUP and mining areas, while minimizing interference with mine sequencing. Protection, metering, and operational control systems will be built to utility standards, with the option for future intertie to the 66 kV grid if commercially advantageous.
Two shortlisted tenderers propose alternative hybrid power configurations, providing a range of installed capacities. Diesel generation capacity is in the order of 10-11 MVA, based on alternative modular generator configurations, with solar capacity from 10 MW to 15 MW (peak). Battery energy storage capacity averages approximately 15 MWh, based on alternative system configurations. Both options achieve an estimated renewable energy penetration of 45%.
18.4 Raw water supply
The mining and processing operations will source water from:
• Groundwater recovered from dewatering activities
• Surface water recovered from the tailings decant ponds and rainfall
• A makeup raw water supply of approximately 3 GL/a.
Raw water will be drawn from the Grampians Wimmera Mallee (GWM) Water Headworks water allowance in accordance with a contract executed in 2011. The Headworks Water Allocation is stored in Taylors Lake east of Horsham (Figure 4.1) and the Headworks Water Allowance is 6.975 GL/a. In 2018, a deed of variation was executed that, inter-alia, extended the term from 2018 for 25 years.
In February 2023, W3Plus was engaged to develop a detailed basis of design and a preliminary Design Application. That work was progressed to detailed design in early 2024, and the final design was subsequently approved by Grampians Wimmera Mallee Water (GWMWater).
Work completed during 2024 and 2025 included:
• Gun Club Road pipeline fully installed and commissioned to draw from the Wimmera Mallee Pipeline upstream of Minyip Pumping Station (14 km route)
• Pipeline capacity of 100 L/s, consistent with the project's licensed maximum take
• GWMWater issued final acceptance of the completed pipeline in November 2025.
Raw water storage in the freshwater pond at the mine site (Figure 17.2) will cater for a three-day disruption to the GWM raw water supply.
|
Energy Fuels Inc. Technical Report – Donald Rare Earths and Mineral Sands Project, Victoria, Australia |
18.5 Access and security
The 2008 EES included several conditions issued under the Victorian Environment Effects Act relating to public roads, traffic and transport. To satisfy these requirements and those of the local shire councils, a number of initiatives have been advanced:
• Developing a Transport Management Plan and its revision in November 2024
• Forming a Transport Working Group in 2023 with representatives from Yarriambiack Shire, Buloke Shire, Northern Grampians Shire, Horsham Rural City Council, the Department of Transport and Planning (DTP), and emergency services
• Road condition and traffic investigations to inform detailed design.
The public road upgrade scope includes:
• Upgrade to the Minyip-Rich Avon Road servicing the mine site
• Construction of a Minyip bypass road
• Henty Highway, Horsham-Minyip Road and Donald-Murtoa Road intersection upgrades (Figure 4.1).
Based on earlier utility location surveys, feature surveys, geotechnical results and cadastral surveys completed in 2022-2023, Driscoll Engineering (RMG Driscoll) was engaged in November 2024 to deliver detailed haul route and intersection designs. These are currently under review by Yarriambiack Shire Council (for local roads) and DTP (for state roads). The Minyip bypass alignment has been refined to avoid GWMWater infrastructure, and GWMWater has confirmed the design meets asset protection requirements. The Transport Management Plan revisions also incorporated additional DTP requirements, including widening sections of Horsham-Minyip Road and upgrades to the Donald-Murtoa Road intersection. The road upgrade works will be staged, with Stage 1 included in project capex prior to mining operations, and Stage 2 to be delivered post-commissioning under sustaining capital.
The only rail infrastructure upgrade requirements will be at the rail level crossing in Minyip. Upgrades will include new boom gates, active warning devices, and pavement improvements in accordance with VicTrack and DTP standards.
General vehicle site access, including the transport of mine products and all deliveries, will be via the Minyip-Rich Avon Road which forms the northern border of the site. Access will be controlled entry via dual activation boom gates. The boom gates will be fitted with closed-circuit television (CCTV) systems and lighting to allow for 24 hours of operational activities and to monitor vehicle and people movements.
A car park is provided external to the main security fence and gate with personnel access into the office compound via dedicated turnstiles through the fence line into the main plant area.
The entire process plant perimeter including raw water pond, process water pond and settling ponds will be fenced with a 1.8 m high topped chain wire fence with three strands of barbed wire.
The roads within the process plant area and the structural capping of earthworks will require a certain volume of imported gravel fill. Fill will be sourced locally from operating quarries.
Haul roads will be constructed of materials found within the Work Plan area and the coarse sands extracted during mining.
18.6 Ancillary facilities
Allowance has been made for administrative buildings including a main office building, first aid building, ablution blocks, change rooms, crib rooms and laboratory. Diesel fuel will be stored and contained in self-bunded tanks.
|
Energy Fuels Inc. Technical Report – Donald Rare Earths and Mineral Sands Project, Victoria, Australia |
Offices and associated amenities (ablution blocks, medical facilities and change rooms) are contained within a fenced off area south of the main car park area accessible via a swipe-card activated turnstile.
The process plant will include an ablution block, laboratory and laboratory office. Workshop buildings and storage facilities will include:
• Process plant maintenance workshop and stores
• A transport logistics unloading bay located adjacent to the workshop and stores
• Light vehicle washdown bay with a hydrocarbon/water treatment unit
• Mining maintenance and stores structure/s constructed outside the process plant area and closer to the mining area.
18.7 Accommodation
The mine site is situated within a farming community with the surrounding small towns providing services primarily to agriculture. The preferred option for the Phase 1 operation is for a residential workforce to support the local communities. As such, the project is not planning to build permanent housing stock but rather work with local parties to jointly develop solutions, including utilizing existing housing stock in the area.
The construction workforce is estimated to peak at approximately 120 during an estimated nine-month process plant construction period. A 100-person residential workforce is estimated during the operations phase.
18.8 Communications
The project Wide Area Network (WAN) will be a multi-protocol label switching (MPLS) network which will fully support the minimum technical specifications to provide end-to-end support. A two-way radio communications system will also be installed.
18.9 Logistics
The logistics strategy for the operation has been developed to optimize efficiency, reduce transport risk and align delivery schedules with construction and operational requirements.
Inbound logistics:
• Bulk construction materials (aggregates, cement, structural steel) will be sourced from regional suppliers where feasible, reducing long-haul freight requirements.
• Major process plant components and modular assemblies will be fabricated off-site (including selected international suppliers) and transported via the Port of Adelaide to site by road freight under oversize/over-mass permits.
Outbound logistics:
• HMC will be trucked in containers from site to the Wimmera Intermodal Freight Terminal (WIFT) at Dooen (near Horsham).
• At WIFT, the containers will be loaded onto trains for transport to the Port of Portland, Victoria for export. Empty containers will be loaded onto trucks for return to the mine site.
• REEC will be containerized on site and transported by road and rail via WIFT to the Port of Adelaide, South Australia for export to the Port of Seattle, USA in compliance with Class 7 dangerous goods requirements per IAEA regulations.
|
Energy Fuels Inc. Technical Report – Donald Rare Earths and Mineral Sands Project, Victoria, Australia |
Operational support logistics:
• Local contractors will be engaged for fuel supply, consumables delivery and routine maintenance logistics.
• Deliveries will be staged to match construction sequencing and reduce on-site laydown requirements.
|
Energy Fuels Inc. Technical Report – Donald Rare Earths and Mineral Sands Project, Victoria, Australia |
19 Market studies and contracts
19.1 Market studies
Two products will be produced at the Phase 1 operation:
• A HMC consisting of zircon and titanium feedstock minerals
• A REEC consisting of the REE-bearing minerals monazite and xenotime.
The two products will have distinct markets and revenue streams which are subject to different market forces and cycles. The mineral sands market is more mature and, historically, influenced by urbanization and construction trends. The rare earths market has increased in prominence in recent years and is forecast to grow significantly commensurate with the shift toward decarbonization and increasing adoption of renewable sources of energy.
Independent market studies were commissioned by Astron to support the economic assumptions used in the Donald project evaluation:
• TZ Minerals International Pty Ltd (TZMI, November 2025) provided analysis and long-term forecasts for zircon and titanium feedstocks, including supply-demand fundamentals, market segmentation and inducement pricing assumptions
• Argus Media Ltd (Argus, December 2025) prepared an independent market assessment for the REEC product, incorporating global supply-demand projections, competitive positioning and price outlooks
• Adamas Intelligence contributed confidential supply, demand, and pricing forecasts for REOs.
Together, these studies underpin the revenue forecasts presented in Item 22.
19.1.1 Mineral sands market
Zircon
Zircon is primarily used in ceramics (tiles, sanitaryware, glazes), with additional applications in foundry casting, refractories and specialty chemicals. No direct substitutes exist that match zircon's physical and chemical properties, and zircon cannot be economically recycled.
According to TZMI's market study, current global zircon consumption is approximately 1.14 Mt/a. Global titanium dioxide consumption is estimated at 8.1 Mt/a TiO2 equivalent. Zircon sales are conducted under a combination of term contracts and spot sales, either directly to end users or via intermediate processors. Purchasing decisions are driven by product specifications and customer requirements. There is no formal traded market for mineral sands products, which results in less price transparency compared to widely traded commodities such as base and precious metals.
Global zircon demand is forecast to increase to 1.46 Mt by 2033, representing a compound annual growth rate (CAGR) of 2.8% from 2023. The ceramics segment is expected to remain the largest market share in 2033 at ~47%, followed by foundry and refractory segments, which are forecast to grow at CAGRs of 2.2% and 2.9%, respectively. Growth is partly driven by renewable energy applications such as PV glass and by advanced manufacturing sectors, including electric vehicle production.
China is expected to remain the largest consumer, accounting for ~46% of global demand in 2033. India is forecast to be the fastest-growing major market, with its share rising from 9% in 2023 to ~10% by 2033, reflecting a CAGR of 4.6%.
On the supply side, zircon production is expected to peak in 2026 at ~1.29 Mt/a before gradually declining in the absence of new large-scale developments. TZMI identified a supply decline of nearly 300,000 tonnes by 2033, highlighting the strategic importance of new projects such as Donald.
|
Energy Fuels Inc. Technical Report – Donald Rare Earths and Mineral Sands Project, Victoria, Australia |
Independent whiteness and impurity testing by Chinese end-users confirmed that the Donald zircon qualifies as a "premium" product, with high whiteness (L* value of ~94.8) and very low impurities, meeting strict ceramic industry requirements.
Titanium
Titanium feedstocks are classified by their titanium dioxide (TiO2) content and include, amongst other minerals, rutile, leucoxene and ilmenite. Titanium dioxide feedstocks are used predominantly to produce titanium dioxide pigment, and for the manufacture of paint, plastics and other forms of coating. Other applications include the production of titanium metal sponge for the manufacture of titanium metal.
In 2023, titanium feedstock demand was 8.12 million TiO2 units and forecast by TZMI to grow to 10.7 million TiO2 units by 2033, a CAGR of 2.8%. Macroeconomic factors, such as urbanization and increased expenditure on consumer goods will influence this growth.
Over 2022 and 2023, there was a cumulative market surplus of approximately 422,000 TiO2 units. In 2023, this surplus was concentrated in chloride pigment feedstock, reflecting reduced operating rates among Western chloride pigment producers. Despite the surplus, TZMI projects that underlying demand over the next decade will only be met if all potential new supply sources commence production on schedule. Given the low likelihood of full and timely project delivery, medium-term supply constraints remain a distinct possibility.
Independent smelter studies confirm that Donald ilmenite produces a high-yield, low-impurity slag when blended appropriately, making it a suitable feedstock for chloride pigment plants in both Western markets and China.
19.1.2 REE market
REEs are a set of 17 metallic elements, including 15 lanthanides, scandium and yttrium. REEs exhibit special magnetic and conductive properties and have become necessary components across a wide range of technological applications including consumer products and industrial, medical and defence applications. REEs are also central to a range of clean energy, environmental and alternative fuel source initiatives. Their categorization as "critical minerals" indicates the commercial and strategic importance.
REEs are classified as light rare earth elements (LREEs) or heavy rare earth elements (HREEs) based on the atomic weights. LREE include lanthanum (La), cerium (Ce), praseodymium (Pr), neodymium (Nd), promethium (Pm), samarium (Sm), europium (Eu) and sometimes gadolinium (Gd), while HREEs include terbium (Tb), dysprosium (Dy), erbium (Er), holmium (Ho), lutetium (Lu) and thulium (Tm). LREEs typically comprise over 90% of the TREO content of a rare earth mineral deposit and, as such, represent most of the global TREO production volumes.
Broadly, REE end-uses can be classified into eight categories:
• Battery alloys (La, Ce, Pr, Nd)
• Catalysts (La, Ce)
• Ceramics, pigments and glazes (La, Ce, Pr, Nd, Y)
• Glass polishing powders and additives (Ce, La, Er, Gd, Y)
• Metallurgy and alloys (La, Ce, Ho, Gd, Y)
• Permanent magnets (Nd, Pr, Dy, Tb, Sm)
• Phosphors (Ce, La, Y, Tb, Eu)
• Other (La, Ce, Nd, Dy, Tb, Gd, Lu, Tm).
|
Energy Fuels Inc. Technical Report – Donald Rare Earths and Mineral Sands Project, Victoria, Australia |
The saleable products in Donald REEC are expected to comprise Nd as Nd2O3, Pr as Pr6O11, Dy as Dy2O3 and Tb as Tb4O7, as reported in the 2025 Mineral Reserve estimate.
Argus' market report noted that in 2023 the glass industry accounted for the largest share of REE demand by volume at ~31% but contributed only ~7% of market value. In contrast, permanent magnet applications represented ~25% of demand by volume and ~78% of value. By 2034, Argus projects magnets will account for ~40% of rare earth demand by volume and nearly 90% of value. This reflects the significantly higher value contribution of magnet materials, driven primarily by neodymium and praseodymium and supplemented by critical heavy rare earths such as dysprosium and terbium, both of which are forecast to remain in structural deficit without new supply.
TREO demand increased by 7% in 2022, with a further lift of 6% in 2023. In 2024, the demand was expected to grow 4% to about 210,000 tonnes. This increase in demand has primarily been driven by the permanent magnet sector (Argus Media, 2025). This is largely associated with the increased demand for electric vehicles, wind turbines, automotive electrification, and other permanent magnet applications.
Forecast TREO demand for all sectors is expected to increase by about 3.5% per annum to 2030. Argus then expects demand growth to moderate to 3% per annum to 2035 and further reduce to 2% per annum to 2040. Permanent magnet demand is forecast to grow by 8.5% per annum to 2030, moderating to 3% per annum to 2035 and then reducing to 1.5% per annum to 2040. Electric vehicle traction motors and generators use high-temperature, performance-grade permanent magnets that contain higher volumes of dysprosium and terbium, which are expected to account for more than 50% of total dysprosium and terbium demand. Other automotive applications such as micromotors, sensors and speakers are also forecast to increase, outpacing the underlying vehicle market, as manufacturers deploy TREO in new models to reduce weight, improve fuel efficiency and extend driving range. Demand from wind power generation is also expected to rise, with direct drive and hybrid drive turbines requiring high-performance magnets. New areas of innovation, such as robotics, will also contribute to growing demand.
Direct drive and hybrid drive wind power generation demand for permanent magnets is forecast to increase for both onshore and offshore applications as global energy generation shifts more toward renewable sources. For offshore wind power alone, Argus forecasts rare earth demand in permanent magnets to increase from 3,850 tonnes TREO in 2024 to 10,650 tonnes in 2030, 15,750 tonnes in 2035 and 18,250 tonnes in 2040, representing CAGRs of 18%, 8% and 3% respectively.
China has dominated both mine production of REE and processing of refined products. It also controls the downstream market, including the high-value magnet sector. In 2023, Argus estimated that China accounted for more than 90% of global downstream magnet market value. With rising demand for rare earths, prices have increased significantly over the past decade, incentivizing exploration, evaluation and development of new deposits.
Outside China, governments are actively supporting new production to create additional raw material supply chains and reduce reliance on Chinese output. New global projects could contribute ~25% of supply by 2035. The drive to expand and diversify supply chains and encourage new ex-Chinese downstream capacity is expected to support prices. However, with many projects yet to reach feasibility stage and construction, lead times remaining long, and demand for rare earths, particularly dysprosium and terbium required for permanent magnets, is expected to remain tight through the early 2030s.
Argus notes that forecast increases in supply will struggle to meet the growing demand for magnet materials, particularly neodymium, praseodymium, dysprosium and terbium, by the early 2030s. Demand for these magnet materials has been rising steadily and accounted for ~32% of total rare earth demand in 2024. According to Argus, prices for rare earth magnet materials dipped in 2023 but appeared to have bottomed in 2024. Prices are forecast to rebound strongly in 2025-2026, moving above breakeven levels for Chinese producers, and then grow steadily through the remainder of the decade. Additional upside may be supported by government policy and regulatory settings, particularly in the European Union (EU) and USA, which are aimed at strengthening ex-Chinese supply chains.
|
Energy Fuels Inc. Technical Report – Donald Rare Earths and Mineral Sands Project, Victoria, Australia |
19.2 Contracts
Material contracts required for the Phase 1 development following FID will include mining, construction, rehabilitation, transportation, handling, sales and hedging, and forward sales contracts or offtake arrangements.
DPPL plans to award several large contracts through competitive tendering or justified sole sourcing to minimize risks and optimise management. Key contracts include earthworks, engineering, procurement and construction (EPC), project management, mining, and transport and logistics to cover the full supply chain from mine to port with initial terms of 5-10 years.
Sedgman Pty Ltd has been engaged for early contractor involvement to develop the design and execution strategy for the process plant with a target cost estimate contract. Agilitus has provided project management services including project planning, engineering management, procurement, quality, HSE, construction and commissioning management under a performance-based contract.
Invitations to tender for the sitewide earthworks contracts have been made. The process plant and ancillary facilities, excluding the in-pit MUP, will be delivered under a single EPC contract. The contract for the in-pit MUP will be structured as a design-and-construct delivery model. An independent power provider will be engaged under either a build-own-operate contract or equipment hire and services contract to provide the power station, including generators, solar units and energy storage system. Negotiations are in progress with the bidders for the transport and logistics contract.
The project has a binding offtake agreement with Energy Fuels covering 100% of the REEC production from Phase 1. The agreement uses a formula linked to the market prices of constituent REOs (neodymium, praseodymium, dysprosium, terbium) published by Asian Metal, adjusted for payability factors, product assemblage. There is a REEC floor price mechanism tied to the project EBITDA, allowing Energy Fuels to suspend offtake if prices fall too low; in that case, DPPL may sell into the spot market. In the Qualified Person's opinion, the terms of the offtake agreement are no more favourable to the terms that would be offered to a third party given that revenue is linked to generally accepted market pricing mechanisms.
The contract for the supply and construction of the water supply infrastructure from the GWMWater network was completed in November 2025. A contract for the supply of spirals was executed with Mineral Technologies in September 2025. The process plant earthworks contract was awarded to Unyte Southern Pty Ltd in December 2025.
No other material contracts have been executed at the effective date of this Technical Report.
|
Energy Fuels Inc. Technical Report – Donald Rare Earths and Mineral Sands Project, Victoria, Australia |
20 Environmental studies, permitting, and social or community impact
20.1 Environmental studies
The Property is within the Wimmera Bioregion and would have once been covered in woodlands variously dominated or co-dominated by Yellow Gum, Buloke, Black Box and Grey Box with large areas of native grassland occurring between the woodlands. Most of the Work Plan area now comprises cleared land used for dry land agriculture and livestock which is typical of the Wimmera plains. Native vegetation mapped within the Work Plan area by Ecology and Heritage Partners Pty Ltd (EHP) in 2023 included Ecological Vegetation Classes 803 Plains Woodland and 823 Plains Savannah, both of which have Bioregional Conservation Statuses of "endangered" within the Wimmera Bioregion (DEECA, 2023).
The Work Plan area (black boundary in Figure 4.3) within MIN5532 (green boundary) was selected on the following criteria:
• To minimize impacts on Crown and Shire infrastructure
• To minimize impacts on biodiversity and heritage resources
• To provide higher value ore early in the mine life
• To include sufficient area to support mining for over a decade.
20.1.1 Flora
Native vegetation exists as scattered patches or along roadsides. An assessment by EHP (2023) was undertaken to review and update the previous ecological data that was obtained as part of the 2008 EES to minimize and offset the proposed removal of native vegetation and outline any implications associated with changes in the legislative and policy framework.
As part of the flora and fauna management, vegetation "no-go zones" were derived by identifying tree protection zones and applying a minimum buffer of 10 m around threatened ecological communities. The vegetation "no-go zones" are shown on Figure 20.1.
|
Energy Fuels Inc. Technical Report – Donald Rare Earths and Mineral Sands Project, Victoria, Australia |
Figure 20.1 Ecological vegetation classes and retained vegetation in the Work Plan area

Source: DPPL, 2024
Flora species of State significance were observed during the EHP 2023 site assessment:
• Buloke (Allocasuarina luehmannii) - Endangered, protected under the EPBC Act2
• Buloke Mistletoe (Amyema linophylla subsp. orientale) - Critically Endangered, protected under the FFG Act3
• Golden Wattle (Acacia pycnantha) - Considered "protected flora" under the FFG Act, requiring legal authorization for its removal from public land
• Fuzzy New Holland Daisy (Vittadinia cuneata)4 - Endangered (Victoria), protected under the FFG Regulations (2020)
• Umbrella Wattle (Acacia oswaldii) - Vulnerable (Victoria), protected under the FFG Act.
Prior to native vegetation removal DPPL will, among others, ensure that all required approvals and/or offsets have been secured in accordance with Federal and State legislation.
As part of meeting its conditions in the approval, DPPL identified two suitable offset sites approximately 3 km apart, identified as Habitat Zone 21 (13 ha of Buloke Woodlands at 163 R Funckes Road, Minyip - within the Work Plan area) and Barry's Block (16 ha of Buloke Woodlands at 472 Barru-Lawler Road, Rich Avon West - adjacent to and outside MIN5532). The offset sites, combined with active management were deemed suitable to compensate for the project impacts to Buloke Woodlands. The offsets will be secured via a Section 69 agreement (or similar)5 to protect and improve the extent and quality of native vegetation on the sites. The two offset sites will be managed for the purposes of conservation.
___________________________
2 Environment Protection and Biodiversity Conservation Act, 1999; refer to Item 20.3.3.
3 Flora and Fauna Guarantee Act, 1988; refer to Item 20.3.2.
4 Unconfirmed but presumably including both subspecies morrisii and hirsuta.
5 A Section 69 offset agreement, established under the Conservation, Forests and Lands Act 1987, is a legally binding on-title agreement in Victoria, Australia, between a landowner and the Secretary to the Department of Energy, Environment and Climate Action (DEECA). It secures land for the long-term protection and management of native vegetation, enabling the owner to generate credits that can be sold to third parties to meet native vegetation removal permit requirements.
|
Energy Fuels Inc. Technical Report – Donald Rare Earths and Mineral Sands Project, Victoria, Australia |
20.1.2 Fauna
Ninety-eight fauna species were identified during the 2008 Coffey assessment, including the following protected species:
• Brown Treecreeper (Climacteris picumnus victoriae) - Vulnerable, protected under the EPBC Act
• Bush Stone-curlew (Burhinus grallarius) - Critically Endangered, protected under the FFG Act
• Diamond Firetail (Stagonopleura guttata) - Vulnerable, protected under the EPBC Act
• Eastern Bearded Dragon (Pogona barbata) - Vulnerable (Victoria), protected under the FFG Act
• Fat-tailed Dunnart (Sminthopsis crassicaudata) - Vulnerable, protected under the FFG Act
• Hooded Robin (Melanodryas cucullate) - Vulnerable, protected under the FFG Act
• Southern Whiteface (Aphelocephala leucopsis) - Vulnerable, protected under the EPBC Act.
Three species were identified as state significant fauna occurring within MIN5532:
• Brown Treecreeper (Climacteris picumnus victoriae)
• Bush Stone-curlew (Burhinus grallarius)
• Diamond Firetail (Stagonopleura guttata).
The assessment of the 2008 EES concluded that there were not any significant risks to protected threatened fauna species due to the project. There is no indication as to whether this study will be updated.
20.1.3 Hydrology and hydrogeology
The Work Plan area is split between the Wimmera and the Avon-Richardson catchments and does not contain any defined watercourses or water bodies. There are two redundant and decommissioned domestic and stock supply channels (Taylors Lake Extension Channel and the Laen East Channel). The closest defined waterways are the Richardson River (4 km to the east) and Dunmunkle Creek (2 km to the west). The closest major water body is Lake Buloke (25 km to the northeast). Sheet floodwater flows can occur following major rainfall events.
The regional hydrogeology is generally understood, but on a wider scale only. The main aquifer is the Loxton Sand, an unconfined aquifer with high salinity and low yield that hosts the HM sand deposits. The regional groundwater salinity varies between 14,000 mg/L and 35,000 mg/L TDS and the average local salinity is 16,930 mg/L TDS. In vicinity of the Work Plan area, depth to groundwater ranges from approximately 11 m to 15 m below surface and the regional groundwater flow is northwesterly towards the deeper section of the Murray Basin. Bore yields are less than 0.5 L/s.
The top of ore is approximately 3.0 m above the groundwater level, while the base of ore is about 6.8 m below groundwater levels. This suggests that the ore is partially saturated.
Dewatering of the operating cells will draw down local groundwater levels. Numerical modelling suggests the drawdown may extend 2.5 km from the mine site. The drawdown cone is not expected to impact groundwater users as the closest registered stock or domestic groundwater bores are approximately 20 km from the mine site and will not intersect adjacent water features (i.e. Richardson River and Dunmunkle Creek).
|
Energy Fuels Inc. Technical Report – Donald Rare Earths and Mineral Sands Project, Victoria, Australia |
A Take and Use Licence is required from GWMWater for dewatering groundwater from the Loxton Sand aquifer. In-pit tailings deposition will require a permit from the Environment Protection Authority (EPA) as it is considered discharge of waste to aquifer. It is reasonable to assume that they will be issued prior to requirement.
20.1.4 Groundwater dependent ecosystems
Within 5 km of the Work Plan area, only two temporary wetlands and marsh/meadows were identified related to surface water drainage features and topographic depressions. The site to the southwest is classified as having a low potential for reliance on groundwater; the site to the south is unclassified.
There are several small and isolated potential terrestrial groundwater dependent ecosystems mapped within a 5 km radius of the mine site that were not ground-truthed. There is low potential for groundwater dependent vegetation, based on the saline water table in this area and the depth to the water table of around 10 m.
The closest terrestrial vegetation mapped as high potential groundwater dependent ecosystems included plain woodlands and drainage line woodlands along the Richardson River, approximately 4 km east of the project. In the groundwater impact assessment, CloudGMS (2023) considered that any changes in the water table from the mine operations would not impact on such vegetation.
20.2 Waste and tailings disposal, REEC management, site monitoring, and water management
20.2.1 Tailings management
Processing overview
The non-valuable solids rejected primarily by the WCP must be treated before placement back into the mine pits or initially into the external TSF. The tailings need dewatering to reduce the time needed for rehabilitation of the tailings cells and to maximize water recovery.
The dewatering of the tailings is done over two phases:
• Coarse or sand tails dewatering
• Slimes thickening.
The coarse tails are comprised of the ROM screen oversize and the tailings streams from the rougher and mid scavenger spirals which are directed to and combined in the tailings cyclone feed sump. From there, the tailings are pumped under pressure to the tailings dewatering cyclone cluster to remove most of the water. The dewatering cycloned tails discharge into the tailings sump at about 60% solids.
The desliming cyclone and surge bin overflow streams are combined in a high-rate thickener to separate and recover as much water as possible for reuse in the WCP. Slimes thickening refers to the process in which fine slimes solids are separated in a large tank (+35 m in diameter) from water in a dilute slurry, resulting in a thickened slurry containing a higher percentage of solids. This is done to facilitate recovery of much of the contained water to be reused in the process as possible, reducing overall water consumption, and to provide a cost-effective method to dispose of undesired sands which have no financial value. Flocculant is used in the thickening process to bind the small particles of solids (slimes/clay).
Dewatered coarse sand tailings will be combined with the high-rate thickener underflow and pumped back to the external TSF or when available, the mine pit. A flocculant will be added at the discharge (pipe head) of this tailings line to promote the settling of solids in the tailings cells to speed up rehabilitation of the mine pit as well as increasing water recovery.
|
Energy Fuels Inc. Technical Report – Donald Rare Earths and Mineral Sands Project, Victoria, Australia |
Tailings testing
Laboratory testing was undertaken to identify suitable material parameters for inclusion in the design of the tailings facilities. Representative samples of the tailings were provided to SciDev and ATC Williams in 2022 and 2024 for laboratory testing.
Additional testing was undertaken by RGS who undertook geochemical screening tests of sonic drill core. The sonic drillholes were selected to cover the spatial extent of the mineral strand. The field pH screening tests were performed on every 1 m interval of core for five drillholes (i.e. overburden and ore).
The key outcomes from the testing were:
• Tailings classification - CH
• Initial settled density - 1.28 t/m3
• Bleed rate - 0.82 t/m3 (dry tons of tailings)
• Segregation threshold - 55%
• Shrinkage limit density - 1.51 t/m3
• Adopted final settled density for tailings deposition - 1.4 t/m3 for the external TSF and 1.5 t/m3 for the in-pit TSF.
Key results from the geochemical testwork undertaken to identify potential for acid mine drainage, including soluble metal(loid) and salt release from tailings (sand and slimes) produced from processing of the HM deposit, were:
• The total sulphur (TS) content of the samples ranged from 0.01% TS to 0.06% TS, with a median value of 0.04% TS. Approximately 50% of the TS in the samples is present as sulphide sulphur.
• The acid neutralizing capacity (ANC) values for the samples were considered low with a median of 4.4 kg sulphuric acid (H2SO4) per tonne.
• The tailings processing waste samples had a negligible to low sulphide sulphur content, low ANC and were classified as non-acid forming (NAF) (barren) with low to negligible risk of generating saline drainage.
• There is a low risk of any significant acid generation from these materials.
• The NAF tailings classified by static leach tests were confirmed to be NAF via kinetic leach testing. The amount of potential acidity that could be generated from the samples is expected to be negligible, with all samples having low reactivity.
• The water leach results indicate the risk of generating metalliferous drainage is very low. Concentrations of soluble boron (B) and zinc (Zn) may be occasionally above Aquatic Freshwater Ecosystem guidelines.
• Arsenic (As), gold (Au) and tellurium (Te) that were shown to be enriched in the solid tailings samples, were not readily soluble under the testing conditions.
• Kinetic results from sand and slimes tailings indicate there is a minor risk of generating elevated boron (B) and fluorine (F) concentrations in leachate over time.
• Generally, tailings represented by these samples are likely to generate pH neutral surface runoff and seepage with low/moderate salinity and generally low concentrations of dissolved metals(loids) (excluding those mentioned above).
Deposition management
Tailings deposition will initially occur within the external TSF until sufficient space is available for the establishment of in-pit tailings cells. Tailings will be deposited via a secondary flocculated sand/slimes mix (i.e. Modified Co-Disposed or ModCod tailings). Laboratory testwork (2022-2024) confirmed an optimal sand-to-slimes ratio of 4.4:1, with flocculant type Maxiflox 530 applied at a dose of 185 g/t. The use of flocculant permits the formation of temporary tailings structures that allows water release with relative ease and increases evaporation effects.
|
Energy Fuels Inc. Technical Report – Donald Rare Earths and Mineral Sands Project, Victoria, Australia |
Tailings will be pumped via a pipeline to the discharge location at the TSF. Two spigot manifolds are connected to the tailings pipe. Tailings will be distributed via spigot downpipes spaced approximately 40 m apart. These tailings spigot downpipes are connected to the spigot manifolds with knife gate valves. The spigot downpipes will discharge tailings to perforated PVC sleeve pipes installed on the embankment.
For both the external and in-pit TSFs, water return will be undertaken via a skid mounted pump located on an access ramp in the decant pond area. The pump can then be relocated up the ramp as the tailings and decant pond level increases.
High-level consolidation and evaporative drying modelling work has been undertaken to understand:
• Tailings density increases with time and depth
• Tailings strength gains over time (shear strength estimation)
• Rapid strength gain testing showed undrained shear strengths of 380-610 Pa within 30-60 minutes of deposition.
A model was developed to simulate the likely filling conditions for the in-pit tailings cells which is comparable to the external facility. The input parameters for initial settled density, SG, initial void ratio, material compressibility and permeability were obtained from the tailings testing results, which indicate:
• Approximately 0.36-1.07 m of tailings consolidation is expected under self-weight over a period of approximately two years following the end of deposition.
• After one year of surface drying, subsequent to the cessation of fulltime tailings deposition, results of the evaporative drying modelling indicates that a crust of greater than 25 kPa strength is predicted to develop to a depth of approximately 3.0 m. Following a further two years of evaporative drying, this depth is expected to increase to approximately 7.5 m and is considered sufficient crust development to support direct placement of capping layers.
• Beach slopes are predicted at 2.4-3.7%, with design values of 3.7% (upper beach) and 0.5% (lower beach).
Flocculant
A program of testwork was conducted on samples of thickened slimes and sand tailings by SciDev assessing the flocculant to be used in operations (Maxiflox 530(M) as anionic polyacrylamide (PAM)). The objectives of the work were to assess the rheological and dewatering behaviour of the slimes and a flocculated co-disposal mixture. The work program assessed the viscosity and yield stress behaviour of both the slimes alone and the co-disposal mixture before secondary flocculation, and the water release, yield stress and compression-permeability characteristics of the co-disposal mixture after flocculation.
Based on the test results, a flocculant dosage of 155-185 g/t should be targeted as this will provide good water release, dewatering and consolidation rates at a lower flocculant dosage, whilst avoiding excessively stiff structure development which could adversely impact spreading and storage utilization. Ongoing flocculant assessment and optimization is proposed in the detailed design phase of the project to ensure decant water recovery and flocculant use is optimized.
PAM has limited mobility in the environment and low toxicity; however, PAM may biodegrade to acrylamide and commercial flocculant formulations may also contain trace amounts of this compound, which is mobile in the environment and a known neurotoxin and potential carcinogen. Acrylamide completely degrades to ammonia and acrylic acid within days to months.
|
Energy Fuels Inc. Technical Report – Donald Rare Earths and Mineral Sands Project, Victoria, Australia |
Given its rapid degradation, the very low concentrations in commercial PAM, and the low potential for acrylamide to be formed by PAM degradation, acrylamide was considered unlikely to be detected in groundwater in the vicinity of the TSFs where flocculent is used.
It was concluded that there is potential for PAM based flocculant, including Maxiflox 530(M), to cause impact on the environment. As such, management practices must be established to ensure regulatory compliance and to minimize risk as reasonably practicable.
20.2.2 Radioactive material management
All HM sands deposits contain traces of uranium and thorium, together with their decay products in association with some of the HM. However, the only component of mineral sands that is significantly radioactive is monazite. Monazite will be part of the HM assemblage extracted during the ore treatment process and most of it will leave the site as REEC (195 Bq/g) in containerized bulka bags.
Radiation management plans have been developed and approved for the operational phase and include a Radiation Management Plan, Radiation Transport Management Plan, and Radioactive Waste Management Plan.
Although the REEC product exhibits a relatively low level of radioactivity, an average radiation reading of 195 Bq/g subjects it to both Australian and international regulations. Australia's legislative framework relating to the safe and secure transport of radioactive material is based on international requirements published by the International Atomic Energy Agency (IAEA). The Australian Code for the Safe Transport of Radioactive Material (RPS C-2), published by the Australian Radiation Protection and Nuclear Agency (ARPANSA), adopts the IAEA's Specific Safety Requirements No. SSR-6 Regulations for the Safe Transport of Radioactive Material. The Code establishes requirements for adoption by the Commonwealth, the States and the Territories that will maintain a system for safe transport of radioactive material by road and rail, and by waterways other than those subject to the Navigation Act 2012. The Victorian Radiation Act of 2005 and Radiation Regulations 2007 regulate radioactive material that emits ionizing radiation exceeding a prescribed activity or activity concentration.
Following the classification procedure in IAEA SSR-6, the REEC product will be classified for international transport as UN 2912 - Radioactive Material, Low Specific Activity (LSA-I), non-fissile or fissile-excepted which is assigned to Class 7 (Radioactive Material). As a result, each bulka bag and sealed container will be fully marked, labelled, placarded, and otherwise shipped in accordance with IAEA regulations for Class 7 transport.
The HMC product total activity is approximately 3 Bq/g, which is under the SSR-6 Class 7 Radioactive Material classification of >10 Bq/g.
The risk of radioactive dust inhalation will be minimized by:
• The moving pit concept, which allows mined out cells to be progressively backfilled and re-vegetated minimizing ore and tailings exposure to the environment
• Ore pumped as a wet slurry to the WCP avoiding potential for dust creation
• Tailings pumped as a slurry, minimizing the potential for inhalation of radioactive dust and/or transport of dust into the environment during the disposal of tailings to the external TSF and in-pit mine voids
• The CUP being contained within a completely enclosed shed
• Transport off site in bulka-bags in sealed containers.
Dedicated forwarders, carriers, and agents who are involved in radioactive transportation have the required experience to execute the shipments. In addition, these entities are required to complete specific Class 7 training and maintain emergency response plans. The radiation licence has recently been renewed and is valid until October 2025. Radiation management plans were submitted with the Radiation Management Licence renewal.
|
Energy Fuels Inc. Technical Report – Donald Rare Earths and Mineral Sands Project, Victoria, Australia |
Radioactive waste management
Once operations commence, estimates of waste materials will be confirmed via specific radionuclide and/or chemical analysis to accurately characterize waste streams. Overburden from the mine pit will have only marginally greater uranium-238 and thorium-232 content (0.084 Bq/g) to topsoil from the area.
Oversize mineralized material from the MUP is likely to have low radionuclide concentrations but may have some residual HM content. The exposure risk from this material is negligible.
The fines and slime tailings from the WCP are expected to be very low in HM content, especially monazite. Therefore, the dose rate for both materials is likely to be extremely low.
There is virtually no waste generated from the CUP.
20.2.3 Hazardous materials storage
The project will have a reagent storage and dosing facility and a flocculant storage and preparation plant that allows for the safe delivery, storage and use of the essential reagents. Hazardous reagents will be stored in intermediate bulk containers and on-site storage tanks within a bunded area inside a reagent shed.
20.2.4 Water management
The surface water management system of the project involves several interlinked storages, catchments, the WCP, external TSF, in-pit TSFs and water pumping systems. A schematic of the modelled water management system is presented in Figure 20.2.
Figure 20.2 Water management system schematic

Source: DPPL, 2024
|
Energy Fuels Inc. Technical Report – Donald Rare Earths and Mineral Sands Project, Victoria, Australia |
A global water balance was developed from the flowsheet and by estimating losses to tailings, evaporation and other site usage (for potable water, dust suppression, etc.). Water gain was estimated from average local area rainfall, inherent ROM moisture and water recovered from mine dewatering. Water recovery from tailings will not be available at the beginning of operations, so water storage on-site will need to be at a maximum level prior to starting operations.
The operation has been identified as a no-spill mine and the water balance model has been used to size storages and pumping infrastructure accordingly. A rainfall event design criteria of 1% annual exceedance probability (AEP) has been adopted for the design of bunds used to divert surface water flow away from the active mine cells and to ensure runoff in the mine area is contained during high rainfall events.
The management of water across the site was considered at different stages of the operation. Multiple mine schedule stage plans were proposed at various points in time to ensure the surface water management options accounted for the changes in site conditions.
The separation of the circuits for process water and clean water ensures:
• The diversion of clean surface water away from disturbed areas via diversion channels and bunds.
• The capture of contact water (from disturbed surfaces) into on-site dams to meet the no-spill commitment and use of the contact water as a priority for demands. This water is reticulated through the closed processing water circuit by being constantly recaptured and recycled.
20.2.5 Land management
Prior to mining each land parcel, a preliminary site investigation will be undertaken in accordance with the National Environment Protection (Assessment of Site Contamination) Measure 2013 (NEPM). The investigation will be undertaken at the earliest opportunity once the relevant consent to access land parcels have been granted by the landholder.
Given the current and historical agricultural land use, the probability of contamination is relatively low.
The NEPM outlines a staged approach to the investigation and assessment of existing contamination that proceeds in stages, in proportion to the risks of environmental harm. Further work may be required pending the outcome of the site investigations.
20.2.6 Sewage treatment and waste disposal
Sewage from the process plant and mining contractor facilities is captured via local collection sumps and pumped through a reticulation system to a central 50 kL sewage storage tank and removed every two days by a licensed local waste contractor.
On-site waste disposal will be minimized where practicable, and recyclable material will be separated from landfill waste. Non-hazardous waste generated from mining operations will be stored in dedicated areas, with landfill and recyclable materials sorted and separated in dedicated areas. All waste, including recyclables will be removed by an appropriately licenced waste management contractor for off-site disposal or recycling.
All petrochemical and chemical waste, including from the on-site laboratory and process area, will be stored to the appropriate regulatory requirements and be removed by an appropriately licensed waste management contractor.
20.2.7 Noise and air quality
The mine design incorporates a reduced footprint that increases the buffer distance to receptors, reduced haul distances and truck movements, noise attenuation on equipment, full and partial enclosure of the process plant, slurry, and the active selection of the mobile MUP location to maximize separation from receptors, as well as a progressive rehabilitation strategy.
|
Energy Fuels Inc. Technical Report – Donald Rare Earths and Mineral Sands Project, Victoria, Australia |
Key noise contributions will be from the mobile plant operating within the mine pit. All activities will be managed through noise control measures and the noise management strategy presented in the Noise Management Plan. The plan details receptor management requirements for specified activities during construction, operations and rehabilitation, and the time period (day, evening or night) when certain activities must be restricted to meet noise requirements. The noise management strategy includes building treatments or land acquisition and is subject to agreement with the landholder.
The main sources of emissions will be from earthworks and mining activities. Assuming all mitigation measures proposed in the Air Quality Management Plan are implemented, including reaching an agreement with two sensitive receptors (to not inhabit their properties) prior to the construction of the project, air emissions associated with the project are expected to comply with relevant criteria at all surrounding residences.
20.2.8 Carbon emissions
The Donald project is currently estimated to produce 93,815 t-CO2e6 per annum across Scope 1, 2 and 3 emissions for each year of Phase 1. Significant sources of emissions are expected to be diesel fuel, use of heavy mine machinery and diesel generated electricity use in the mine plant. A greenhouse gas (GHG) Management Plan has been prepared in line with the EPA Guideline for minimizing GHG emissions - 2048 (2022). The Management Plan provides plans and actions to eliminate, minimize or reduce as far as reasonably practicable the emissions of Scope 1, 2 and 3 GHG emissions to the atmosphere.
Emissions will be reduced where practicable by utilizing energy and fuel efficiency measures and through the development of an energy efficiency plan. The plan will identify energy efficiency targets and measures to achieve these targets with consideration to Victoria's Climate Change Framework, which sets out the State's long-term plan to achieve net zero emissions by 2050.
20.3 Approvals and permitting
The following local, state and federal government legislation is applicable to the development of the Phase 1 project within the Work Plan area.
20.3.1 Local
The Work Plan area within MIN5532 occupies land managed by Yarriambiack Shire Council, which is classified as "Farming Zone" under the council's planning scheme. The project is exempt from a planning permit to use or develop land for mining under the local planning scheme on account that an EES and assessment has been prepared.
20.3.2 State
Environmental Effects Act 1978
The Environmental Effects Act 1978 (EE Act) applies to works that the Victorian Minister for Planning determines are capable of having a significant effect on the environment.
In 2005, the project was referred to the Minister for Planning requesting a decision on whether an EES was required. The Minister determined that an EES was required to assess the environmental effects of the project. An EES was prepared and publicly exhibited in January 2008. In November 2008, the Minster responded to the overall recommendation of the inquiry recommending that the project be approved under the relevant legislation, subject to the conditions.
Since the approval of the EES in 2008, there have been amendments to regulations governing mining and environmental protection, and these, in addition to updates to the project design have resulted in certain impact assessments needing to be updated. A new EES was determined to not be required as the changes were not considered significant.
___________________________
6 Tonnes carbon dioxide equivalent.
|
Energy Fuels Inc. Technical Report – Donald Rare Earths and Mineral Sands Project, Victoria, Australia |
Mineral Resources (Sustainable Development) Act 1990
Under the MRSD Act, authorization of mining work is granted by a Work Plan approved by the Head of ERR within DEECA. The Work Plan was submitted to ERR, including a rehabilitation plan, risk management plan and community engagement plan. The updated Work Plan (V3) was submitted to ERR on 18 October 2024 and was approved in June 2025. The following must also be in place prior to commencing on-site plant construction works:
• A rehabilitation bond of $27 million covering site activities up until process plant commissioning
• Public liability insurance (reviewing existing cover; will likely require increased coverage for additional activities in 2025)
• Relevant landholder consent/compensation agreements (obtained for all existing work plans; underway for low impact exploration activities)
• All other necessary consents or approvals under the MRSD Act or any other relevant Act.
The MRSD Act exempts the licensee from obtaining certain other permits (such as planning approvals or mining works within land covered by the mining licence) if an EES for the work has been prepared and assessed in accordance with the EE Act.
Environment Protection Act 2017
The Environment Protection Act 2017 (EP Act) and subsequent amendment in 2018 comprise the principal Victorian statutes dealing with the protection of the environment from pollution and the management of waste and is administered by the EPA Victoria.
The general environmental duty referred to in Section 25 of the EP Act is a continuing duty. It requires that a "person who is engaging in an activity that may give rise to risks of harm to human health or the environment from pollution or waste must minimise those risks, so far as reasonably practicable."
Water Act 1989
The Water Act 1989 defines water entitlements and establishes the mechanisms for managing Victoria's water resources.
All groundwater pumped out of the aquifer (dewatering) will be stored and used on site. A Groundwater Extraction Licence is required to remove this groundwater, which needs to be applied for under Section 51 of the Water Act.
The project also requires a water supply of up to 3 GL/a for processing that will be drawn from the GWMWater Headworks Water allowance of 6.975 GL/a currently stored in Taylors Lake, outside of Horsham.
Flora and Fauna Guarantee Act 1988
The FFG Act is the primary legislation dealing with biodiversity conservation and sustainable use of native flora and fauna in Victoria.
As the project has an assessed EES and approval of the Work Plan in accordance with the MRSD Act, no further permit is required to "take" (kill, injure, disturb or collect) listed and/or protected flora species or listed vegetation communities within the Work Plan area.
|
Energy Fuels Inc. Technical Report – Donald Rare Earths and Mineral Sands Project, Victoria, Australia |
Radiation Act 2005
The principal framework for the regulation of radiation protection of people and the environment is stipulated in the Victorian Radiation Act 2005 and the Radiation Regulations 2017 outline the requirements. The legislation defines the levels of prescribed radioactive substances for their application and contain provisions relating to the limits on occupational and public exposures arising from the mining and processing operations. The Radiation Act is administered by a radiation section within the Department of Health.
Under Regulation 6, the prescribed activity concentration for natural Uranium (U-nat) + natural Thorium (Th-nat) combined, is 1 Bq/g. Based on the estimated activity concentrations, the final products including HMC and REEC, are classified as prescribed radioactive material under Regulation 6, and therefore the Radiation Act is applicable. The project is deemed a radiation practice and has been issued a Radiation Act Management Licence (Licence No. 300066740) to cover the radiation safety related aspects of project operations in accordance with the provisions of the regulations. As is standard, the licence was issued with conditions imposed by the Department of Health.
Aboriginal Heritage Act 2006
The Aboriginal Heritage Act 2006 works primarily to provide for the protection of Aboriginal cultural heritage in Victoria. The Act allows different organizations, groups and bodies to connect and better enforce and preserve policies regarding Aboriginal heritage. Under Section 49 of the Act, an Aboriginal CHMP must be prepared for any project for which an EES has been required.
DPPL has established and maintains a good working relationship with the Barengi Gadjin Land Council (BGLC) representing Traditional Owner custodians of the lands encompassing MIN5532. The CHMP for the project, approved in 2014, applies to activities conducted in the Work Plan area and was developed with the involvement of the BGLC. DPPL will seek a further CHMP for the area south of the existing Work Plan area.
Heritage Act 2017
The purpose of the Heritage Act 2017 is to provide for the protection and conservation of the cultural heritage of Victoria. The Act creates a framework to identify the most important non-Aboriginal heritage in Victoria and regulates changes to those places. The Act also creates offences and other enforcement measures to protect and conserve heritage.
20.3.3 Federal
Native Title Act 1993
The Native Title Act 1993 establishes a framework for the protection and recognition of Native Title. The Act gives Indigenous Australians who hold Native Title rights and interests or who have made a Native Title claim the right to be consulted and, in some cases, to participate in decisions about activities proposed to be undertaken on the land.
Based on the 2005 federal consent determination (Federal Court File No. VID6002/1998), there are no Native Title rights or interests overlapping the project area.
Environment Protection and Biodiversity Conservation Act 1999
The EPBC Act provides a legal framework to protect and manage nationally and internationally significant flora, fauna, ecological communities and heritage places defined in the Act (typically referred to as "Matters of National Environmental Significance" or MNES).
Project approval under the EPBC Act was received in 2009 with the period of effect of the approval extended to 2042. A key matter in the approval conditions is the offsets required in relation to the endangered Buloke woodlands that will be impacted by the project (refer to Item 20.1.1). DPPL is working with the Department of Climate Change, Energy, the Environment and Water to address the conditions.
|
Energy Fuels Inc. Technical Report – Donald Rare Earths and Mineral Sands Project, Victoria, Australia |
20.3.4 Status of approvals and permitting
Following the Ministerial assessment of the 2008 EES, the following permits and licences for the project to proceed have been obtained (Table 20.1).
Table 20.1 Donald Project approvals and licences obtained
| Year | Approval/Licence | Expiry |
| 2009 | EPBC Act approval (including variations) | 2042 |
| 2010 | MIN 5532 | 2030 |
| 2011 | Water supply rights (6.975 GL/a bulk water entitlement from GWMWater) with option to extend | 2039 |
| 2014 | CHMP - Management plan No. 11572 approved for Work Plan area | NA |
| 2015 | Radiation license No. 300066740 | 2026 |
| 2016 | HMC export licence - requires renewal | Expired (see Table 20.2) |
| 2024 | De-listing (2) and protection (1) of heritage sites from Heritage Inventory | |
| 2025 | Developer works agreement with GWMWater for water pipeline and supply | NA |
| 2025 | Instrument of authority to possess and sell uranium and thorium | 2030 |
| 2025 | EPA (A18) permit/s to remove, use and return tailings to in-pit tailings storage | 2030 |
| 2025 | Phase 1A Work Plan approval (including variation for onsite power generation) from ERR | 2030 |
Source: DPPL, 2024
Approvals required to be issued prior to the commencement of construction and operations are summarized in Table 20.2.
Table 20.2 Donald Project approvals and licences pending
| Approval/Licence | Status |
| Planning and approvals for off-MIN infrastructure | Vegetation clearing permits and other permits for road discontinuance, and road upgrades from Shire Council. |
| Water licensing | Consent to connect to take water through the GWMWater, groundwater extraction and surface water capture. |
| Approval of Transport Management Plan | Submitted to transport working group and ERR on 18 October 2024; awaiting approval. |
| EPA development licence or permitting for sewage treatment | Wastewater treatment plant has been deferred and is not urgently required. |
| Renewal of export licence | Based on the current understanding of uranium and thorium concentrations in HMC, an export licence is not required. Export licence for REEC is in progress. |
Source: Adapted from Astron, 2025
20.4 Social and community related requirements
20.4.1 Historic heritage
Three non-indigenous historic heritage sites are present in the Work Plan area (Figure 20.3). Two of the sites that will be disturbed by mining activities are of low historical significance and have recently been de-listed. One site present in the Work Plan area is of moderate historical significance and will be preserved by DPPL.
20.4.2 Cultural heritage
The CHMP for the project was developed with the integral involvement of the BGLC. DPPL continues to engage with the BGLC to ensure that cultural heritage is appropriately protected.
|
Energy Fuels Inc. Technical Report – Donald Rare Earths and Mineral Sands Project, Victoria, Australia |
Sixty-six Aboriginal cultural heritage places were recorded in the activity area. DPPL has designed the mine to avoid disturbance to nine sites. Permanent protective fences will be erected around each of these sites prior to the commencement of works to ensure that activities do not inadvertently impinge on them.
Three trees will be recovered and stored prior to the commencement of works. This work will be supervised by a Cultural Heritage Advisor with participation of the BGLC.
Several Aboriginal cultural heritage places, in the form of mainly angular fragments found either solitarily or in scatters, will be supervised by a Cultural Heritage Advisor with participation of the BGLC prior to disturbance to avoid their destruction.
The cultural sensitivity areas in the vicinity of the Work Plan and cultural and heritage sites to be retained and protected within the Work Plan area are shown in Figure 20.3.
Figure 20.3 Historic and cultural heritage sites

Source: DPPL, 2024
20.4.3 Community
The region is a leading agricultural region in Victoria, with a strong rural community identity. Despite experiencing long-term population decline since the 1960s, the last decade has seen modest population growth, years of robust agricultural production, and the emergence of new and diverse sectors in tourism, mining, and renewable energies. At the same time, there are some key barriers to growth, the most prominent of which appears to be the availability of housing in the community. A 2024 regional skills and housing study confirmed that labour attraction will remain constrained without significant new housing stock.
|
Energy Fuels Inc. Technical Report – Donald Rare Earths and Mineral Sands Project, Victoria, Australia |
Within approximately 50 km of the project are the city of Horsham, the towns of St Arnaud, Warracknabeal, Donald, Rupanyup, Murtoa and Minyip, and numerous smaller areas in between. The local government areas within this area are the Northern Grampians, Yarriambiack, and Buloke.
Community engagement for the project commenced in 2005 during the EES process and has continued since that time. During the finalization of the feasibility study (April 2023) and development of the Work Plan, key stakeholder issues raised were related to the housing market, unemployment, rehabilitation and land access. The approved Community Engagement Plan (CEP) covers community engagement matters for all activities under the Work Plan including rehabilitation. A 2017 Memorandum of Understanding (updated in 2022) with the Yarriambiack Shire Council provides for the parties to work collaboratively to maximise economic and social outcomes from the development and operation of the project, and to build relationships to support the project. A shortage of housing stock has been highlighted as a particular challenge, which DPPL has indicated it will support pending more detailed discussions. This includes participation in Yarriambiack Shire's Housing Working Group and assessment of worker accommodation models.
In June 2022, DPPL established the Community Reference Group. Membership comprises 28 representatives of local community, business, agency stakeholders and DPPL. The Community Reference Group aims to facilitate information exchange from DPPL to stakeholders and to provide an avenue for community members to raise project-related issues. The Community Reference Group operates in an advisory capacity and does not hold regulatory authority.
An Environmental Review Committee (ERC) will be established upon Work Plan approval by the ERR and prior to the commencement of construction to review the project's environmental performance. The ERC will meet on a biannual basis to discuss the environmental and social performance of the mine.
The community members primarily affected by noise and air quality emissions are landholders and residents near MIN5532. To maximize the buffer between mining activities and nearby residents, DPPL has gradually increased its landholdings in proximity to and within the Work Plan area. DPPL has engaged with every receptor identified in the Air Quality and Noise and Vibration Management Plans. Agreements have been executed for all except two, which are expected to be finalized prior to construction. The agreements are unique to each receptor.
Engagement with the community indicates that returning land to agricultural uses, with additional native revegetation, is the preferred option at closure. The main concern raised by community members is whether the rehabilitated land would retain its pre-mining productivity, with several farmers indicating that they would be interested in returning to farming on rehabilitated land. DPPL has shared results of rehabilitation of the test pit excavated in 2005 and rehabilitated with crop cover in 2017. A 2022 inspection showed positive results with no significant difference in yield between the rehabilitated pit and the rest of the paddock.
Public meetings in the past (2022) saw community members inquire about the project's water use. Most of the agricultural community had previously struggled through the Millennium Drought (1997-2010) and more recent "flash drought" periods a decade ago. During drier years, the project's water use will likely become a greater concern within the community. DPPL's engagement to date on water use issues has been through the Community Reference Group and directly with individual landowners. These pre-existing relationships will inform ongoing engagement on water use.
Since the EES, a potential impact that has become more prominent is that of competing with existing employers in the job market. DPPL is cognisant of not "poaching" workers from other employers or to be seen as doing so. DPPL is engaging on preferred approaches for recruitment and procurement with local government, recruitment service providers, training providers, employers, statutory authorities and the general community. In January 2024, DPPL commissioned a regional workforce skills study to assess labour availability by job type, skill level and location. The company is also participating in multilateral forums with Regional Development Victoria and Wimmera Southern Mallee Development to coordinate projected workforce demand across industries. Partnerships with local training providers have been expanded to support skill development pathways, including initiatives under the Memorandum of Understanding with Yarriambiack Shire Council. Community forums and contractor portals are being used to provide transparent access to employment and procurement opportunities.
|
Energy Fuels Inc. Technical Report – Donald Rare Earths and Mineral Sands Project, Victoria, Australia |
While no formal agreements are in place for local procurement or hiring, DPPL will engage with local businesses where practicable. Recent examples include the appointment of Unyte Southern Pty Ltd for the process plant earthworks.
20.5 Closure requirements and costs
The 2024 Rehabilitation Plan was prepared in accordance with the MRSD Act and associated MRSD Regulations. The overall mine rehabilitation concept is, as far as reasonably practicable, to restore the land disturbed by mining and mineral processing to an achievable and sustainable land use capability, suitable for both agricultural land and native vegetation. DPPL has commenced an ongoing program of soil sampling to understand the physical and chemical properties of the soil on the mine site and baseline topography to achieve the required results in returning the land to productive agriculture.
Rehabilitation of the operations will be undertaken progressively through the LOM, with the external TSF and most of the in-pit TSF cells being rehabilitated during operations. At closure, the mine site including the process plant and supporting infrastructure will be decommissioned except for the raw water pipeline and raw water storage dam, which will be retained. Site entry access points will also remain.
Rehabilitation of the mine will be subject to ongoing monitoring until the following objectives are achieved:
• Landforms that are safe to people and animals
• Landforms that are structurally, geotechnically and hydro-geologically stable
• Landforms and an environment that are non-polluting to air, land, water and biological receptors
• Alignment with the principles of sustainable development.
The Rehabilitation Plan will be updated within two years of project commissioning based on the rehabilitation milestones and will be reviewed annually thereafter during operations. The rehabilitation bond calculation will be reviewed and updated at appropriate stages of the project. Internal reviews of the Rehabilitation Plan will be supported by a review of estimated closure and rehabilitation costs.
A rehabilitation bond of $27 million to cover the liability up to process plant commissioning must be in place prior to commencing site works. Discussions with the ERR bonds team are ongoing regarding the bond calculation approach for the subsequent stages.
DPPL is in the process of determining the closure cost estimate and required bond. Once determined, this will be submitted for approval with ERR. The financial model includes a closure cost of $30 million.
20.6 Qualified Person's opinion on the adequacy of current plans
The Qualified Person is of the opinion that the current plans for environmental compliance, permitting, and community engagement are adequate to address identified issues, with strategies in place to meet regulatory requirements and respond to the concerns of local individuals and groups.
|
Energy Fuels Inc. Technical Report – Donald Rare Earths and Mineral Sands Project, Victoria, Australia |
21 Capital and operating costs
The LOM capital cost (capex) and operating cost (opex) estimates were developed to an AACE Class 2 level of accuracy (typically -15% to +15%). This level is consistent with a feasibility study level cost estimate. The capital cost estimate has been developed on a real Q4-2025 basis with no forward escalation included and is supported by a high level of engineering definition and tendered pricing.
The estimate has been built-up from the following engineered, designed and tendered inputs:
• Process plant - Sedgman Total Cost Estimate developed through Early Contractor Involvement (ECI), incorporating detailed engineering, vendor quotations and market pricing.
• External TSF - competitively tendered as part of the site-wide earthworks package based on detailed design developed by ATC Williams and GEOAnalytica.
• Mining - mobilization and site establishment costs based on competitively tendered pricing; ongoing mining operations are treated as operating costs.
• Earthworks - engineered and detail designed by Agilitus to IFC level and competitively tendered for both process plant area and site-wide bulk earthworks.
• Road upgrades for transport and logistics route - based on functional and detailed designs for road and intersection upgrades priced by regional contractors.
• Dewatering, tailings deposition and decant return systems - based on detailed engineering and vendor pricing, with operating labour costs included in operating costs.
• Ultra-high frequency (UHF) radio communications design and system by Agilitus.
• Telecommunications and IT infrastructure design by Agilitus.
• Owner's costs - including project management, engineering, approvals, environmental, health and safety, environmental, social and governance (ESG), operations readiness and commissioning support developed by the Donald Operations Readiness team based on typical labour rates.
• Land acquisitions based on agreed contract values and current market prices.
Exclusion from the capital cost estimate include:
• Goods and services tax (GST)
• Import duties
• Forex risk contingency
• Escalation beyond the estimate base date
• Contingency in excess of the P50 contingency
• Residual value of temporary equipment and facilities
• Cost of pre-FID study, engineering, legal, land purchases, preproduction drilling/assaying and approvals, including any further environmental studies and any other costs incurred prior to a positive FID
• JV company overheads
• Any cost associated with transportation and logistics
• Operating costs beyond the start of ore commissioning
• Work Plan approval costs for the area within MIN5532 but outside the Work Plan area
• Pre-FID committed funds for enabling works such as the water supply infrastructure installation completed December 2025
|
Energy Fuels Inc. Technical Report – Donald Rare Earths and Mineral Sands Project, Victoria, Australia |
• Procurement of Mineral Technologies equipment paid as part of pre-FID costs (i.e. part payment for MG12 Spirals).
21.1 Capital costs
Pre-production capital costs (2026 to 2028) are itemized in Table 21.1 and summarized by activity in Table 21.2 to Table 21.7.
Sustaining capital costs are listed in Table 21.8.
The estimate is in Australian dollars, with the following foreign exchange rates applied where applicable:
• Euro: $1.77
• South African Rand (ZAR): $0.90
• US$: $1.54
• China CNY: $0.21.
The estimate is predominantly based on preliminary design or higher levels of definition, with IFC and detailed design applied to major infrastructure and process plant scopes. Most costs are supported by market or tendered pricing, consistent with an AACE Class 2 estimate. The total preproduction capital cost is $440.02 million, inclusive of a contingency allowance of $33.86 million.
Table 21.1 Pre-production capital cost estimate
| Description | Unit | Cost |
| Project development | $ M | 114.60 |
| Process plant | $ M | 188.44 |
| On-site infrastructure | $ M | 77.41 |
| Off-site infrastructure | $ M | 9.48 |
| Product transport and logistics | $ M | 1.85 |
| Mining | $ M | 48.24 |
| Total | $ M | 440.02 |
Source: DPPL
21.1.1 Process and infrastructure
Pre-production capital costs are listed in Table 21.2 to Table 21.6.
Table 21.2 Pre-production project development capital cost estimate
| Description | Unit | Cost |
| On-mine permits and approvals | $ M | 14.16 |
| Off-mine permits and approvals | $ M | 0.05 |
| Financing | $ M | 0.74 |
| Overheads | $ M | 17.37 |
| Project execution | $ M | 28.06 |
| Operational readiness | $ M | 20.36 |
| Contingency | $ M | 33.86 |
| Total | $ M | 114.60 |
Source: DPPL
|
Energy Fuels Inc. Technical Report – Donald Rare Earths and Mineral Sands Project, Victoria, Australia |
Table 21.3 Pre-production process plant capital cost estimate
| Description | Unit | Cost |
| Wet concentration | $ M | 55.43 |
| CUP | $ M | 18.32 |
| Product handling, storage | $ M | 17.15 |
| Processing services, utilities and infrastructure | $ M | 10.76 |
| Reagents building and infrastructure | $ M | 6.66 |
| Non-process infrastructure | $ M | 0.32 |
| Process plant contractors indirects | $ M | 44.45 |
| Allowances and fees | $ M | 21.08 |
| Free issue equipment | $ M | 14.27 |
| Total | $ M | 188.44 |
Source: DPPL
Table 21.4 Pre-production on-site infrastructure capital cost estimate
| Description | Unit | Cost |
| Process plant earthworks | $ M | 12.65 |
| Site-wide earthworks | $ M | 29.34 |
| External TSF | $ M | 5.89 |
| Power distribution | $ M | 8.23 |
| Communications | $ M | 2.96 |
| Non-process infrastructure | $ M | 9.14 |
| Buildings | $ M | 7.32 |
| Off-site facility design | $ M | 1.86 |
| Total | $ M | 77.41 |
Source: DPPL
Table 21.5 Pre-production off-site infrastructure capital cost estimate
| Description | Unit | Cost |
| Access road upgrade | $ M | 8.81 |
| Water supply infrastructure | $ M | 0.27 |
| Mobile services upgrade | $ M | 0.40 |
| Total | $ M | 9.48 |
Source: DPPL
Table 21.6 Pre-production transport and logistics capital cost estimate
| Description | Unit | Cost |
| Product transport and logistics | $ M | 1.85 |
| Total | $ M | 1.85 |
Source: DPPL
21.1.2 Process plant
The process plant capital cost estimate has been developed by Sedgman to an AACE Class 2 level of accuracy, with an expected accuracy range of -15% to +15%. The estimate is presented in Australian dollars on a real cost basis with a base date of 28 November 2025 and is not adjusted for escalation beyond the base date. Contingency has been applied on a line-by-line basis to reflect residual technical and execution risk and does not include delay-related escalation.
|
Energy Fuels Inc. Technical Report – Donald Rare Earths and Mineral Sands Project, Victoria, Australia |
The process plant will be delivered under an Engineer, Procure and Construct (EPC) target cost estimate contracting model following an ECI phase. The target cost estimate structure is an incentivized, reimbursable actual-cost arrangement with contractor overheads and margin established as a defined fee and incorporating pain/gain share mechanisms and performance guarantees.
The capital estimate has been developed using a high level of engineering definition. More than 98% of the process plant scope is at preliminary design stage or higher, supported by detailed material take-offs, vendor quotations and market pricing. Process plant earthworks have been developed to Issued-for-Construction (IFC) level and contract executed for the construction of the earthworks, while site-wide bulk earthworks have been tendered separately.
Process scope refinements incorporated into the estimate include upgrades to the concentrate handling and screening configuration and the inclusion of a wet concentrator plant fire deluge system identified through the hazard and value optimization process.
21.1.3 Quantity development
Mechanical equipment quantities were developed from project-specific process flow diagrams (PFDs), piping and instrumentation diagrams (P&IDs), design criteria and the consolidated equipment list prepared for the project. Quantities for minor equipment items were derived from Sedgman project-specific estimating data and validated against similar facilities.
Quantities and cost estimates were developed using the EPC contractor's deterministic estimating system (ESy) and compiled against the project work breakdown structure at Levels 2 to 4, consistent with AACE Class 2 estimating practices.
Concrete quantities were derived from material take-offs based on project-specific general arrangement drawings, equipment foundation plans and the 3D plant model. These quantities were supported by detailed layouts for major foundations, including thickeners and large process equipment.
Structural steel quantities were developed from the project 3D model and detailed layouts progressed through value optimization. For the WCP and tailings thickener structures, material take-offs were supported by vendor-supplied information. Structural steel quantities for the CUP, HMC, reagent handling and REEC facilities were developed from the project 3D model and detailed engineering layouts categorized by material type (including primary steel, secondary steel, grating and handrails).
Mechanical bulk materials, including platework and conveyor transfer chutes, were quantified using project-specific general arrangement drawings, detailed layouts and the 3D model.
Piping quantities were developed from project-specific P&IDs and the 3D model for major process and service piping systems.
Electrical and instrumentation quantities were developed using detailed equipment lists, P&IDs, single-line diagrams, cable schedules, general arrangement drawings and the 3D model, reflecting a preliminary to detailed level of design maturity appropriate for a Class 2 estimate.
Earthworks quantities for the process plant area were developed from detailed digital terrain models and survey data and progressed to IFC level. Site-wide bulk earthworks quantities were estimated separately and tendered outside the EPC process plant scope.
Estimated quantities across all disciplines were subject to benchmarking against comparable projects and Sedgman reference data. A discipline-based quantity growth allowance was applied in accordance with the EPC contractor's estimating methodology and the level of engineering definition, consistent with the AACE Class 2 estimate classification.
|
Energy Fuels Inc. Technical Report – Donald Rare Earths and Mineral Sands Project, Victoria, Australia |
21.1.4 Equipment and bulk commodity pricing
Pricing for major equipment items was developed using vendor quotations obtained through the ECI process and supported by market pricing where firm quotations were not available. Competitive vendor pricing was obtained where practicable, with specialized or proprietary equipment priced on a sole-source basis where required by the process design.
Pricing for minor equipment items and bulk commodities was derived from Sedgman's project-specific estimating databases and validated against current market rates and recent comparable projects.
Request for quotation (RFQ) packages were issued to equipment suppliers and vendors and included datasheets, scopes of work, specifications and commercial terms. Quotations were subject to technical and commercial evaluation prior to incorporation into the capital estimate. Sole-specified mineral separation equipment, including spirals, launders, distributors and gravity separation equipment, was priced in collaboration with Mineral Technologies based on vendor budget pricing and prior supply history.
Bulk material pricing for structural steel, platework, piping and associated fabrication was based on vendor quotations, subcontractor pricing and market rates appropriate to the assumed fabrication locations and execution strategy. Structural steel pricing includes supply, fabrication, surface treatment and associated ancillary items such as packers, shims, splice plates and fasteners.
Electrical equipment pricing, including switch rooms and switchboards, was based on packaged supply from reputable vendors using budget quotations or market pricing consistent with the level of design maturity.
Where vendor quotations included delivery to site, the quoted logistics costs were included directly in the capital estimate. Where delivery was excluded, freight and logistics costs were estimated separately based on the applicable Incoterms, equipment dimensions and weights, transport mode and haul distances, using market-based logistics pricing.
The capital estimate includes allowances for vendor commissioning support through wet and sequence testing (C4), vendor attendance during commissioning and initial consumables and first fills (including oils and lubricants), consistent with the EPC scope definition.
21.1.5 Installation
Installation costs and construction man-hours were developed using a first principles estimating approach consistent with the EPC contractor's deterministic estimating methodology and AACE Class 2 requirements. Direct installation man-hours were derived using Sedgman project-specific installation norms applied to the quantities developed for each discipline and equipment type.
Site labour productivity factors were applied based on Sedgman historical performance data from comparable projects and adjusted to reflect the anticipated site conditions, execution strategy and construction schedule for the project.
Electrical and instrumentation installation man-hours were estimated using material take-offs derived from equipment lists, cable schedules, instrument lists, single-line diagrams and the 3D model, consistent with the level of engineering definition.
Structural steel and platework installation costs were developed from first principles based on material take-off quantities and standard installation rates, considering the installation sequence and access constraints identified in the construction methodology.
Construction plant, equipment and temporary facilities including cranes, vehicles, tools and elevated work platforms were included within indirect construction costs in accordance with the EPC contractor's estimating structure.
|
Energy Fuels Inc. Technical Report – Donald Rare Earths and Mineral Sands Project, Victoria, Australia |
Indirect costs were estimated based on the services, consumables, temporary facilities and site support infrastructure required to execute the works within the planned construction schedule.
Supervision requirements were estimated using standard supervision-to-labour ratios appropriate to the scope and schedule, while project management costs were developed on a level-of-effort basis aligned with the project execution plan and construction duration, covering both site-based and off-site roles.
21.1.6 Infrastructure capex
Infrastructure capex has been estimated based on engineered scope definitions, completed enabling works, competitively tendered pricing and market-based estimates.
Capital costs for off-site infrastructure, including public road upgrades, access road works and intersection upgrades along the transport and logistics route, were developed from functional and detailed design scopes and priced using market-based estimates and regional contractor pricing.
Mine dewatering system capital costs were developed from detailed engineering scope and vendor pricing for bore field development, pumping infrastructure and associated controls, with operating labour and power costs treated as operating expenditure.
Site infrastructure capital costs include non-process buildings and facilities such as offices, workshops, warehouses, laboratories, site utilities, communications and power distribution infrastructure, developed from detailed layouts and market pricing consistent with the level of engineering definition.
Indirect capital costs include owner's costs and allowances necessary to deliver the project and bring the facilities to an operational state, including:
• Owner's project management team and external project management support
• Engineering, permitting and approvals
• Operational readiness, start-up and commissioning support
• Land acquisition costs based on executed contracts and market values
• Landowner compensation associated with infrastructure corridors
• Project insurance during construction
• Temporary construction facilities and services
• Freight associated with equipment supply where not included in vendor pricing
• Spare parts and commissioning spares
• Initial consumables, first fills, oils and lubricants.
Uncertainty associated with infrastructure scope and execution risk is addressed through line-by-line contingency applied in accordance with AACE Class 2 estimating practices.
21.1.7 Mining pre-production costs
Mining pre-production capital costs include contractor mobilization, site establishment and demobilization, together with capital costs associated with the MUP. These costs are capitalized in accordance with the mining execution strategy adopted for the project, with all ongoing mining and ore extraction activities treated as operating expenditure. Mining and MUP capital costs are based on competitively tendered pricing and vendor quotations, supported by schedules and quantities developed for the initial operating period within the approved Work Plan area. Earthworks associated with permanent infrastructure, including the process plant, TSFs and site-wide bulk earthworks, are included within infrastructure capital costs rather than mining pre-production costs.
Mining pre-production costs are listed in Table 21.7.
|
Energy Fuels Inc. Technical Report – Donald Rare Earths and Mineral Sands Project, Victoria, Australia |
Table 21.7 Pre-production mining capital cost estimate
| Description | Unit | Cost |
| Mining | $ M | 2.05 |
| MUP | $ M | 44.73 |
| Dewatering system | $ M | 1.26 |
| Test pits | $ M | 0.20 |
| Total | $ M | 48.24 |
Source: DPPL
21.2 Sustaining capital costs
Sustaining capital costs (Table 21.8) have been estimated based on equipment life expectancies defined by original equipment manufacturers and design engineers and are applied at scheduled replacement or refurbishment intervals over the LOM. Sustaining capital costs are additional to routine maintenance costs included in operating expenditure.
Table 21.8 LOM sustaining capital costs
| Description | Unit | Cost |
| Project development | $M | 62.79 |
| Process plant | $M | 36.14 |
| On-site infrastructure | $M | 21.00 |
| Off-site infrastructure | $M | 17.36 |
| Product transport and logistics | $M | 0.18 |
| Mining | $M | 18.02 |
| Total | $M | 155.49 |
Source: DPPL
Sustaining capital includes allowances averaging about $5.0 million per annum ($0.68/ore t) comprising:
• MUP:
– Relocation and re-establishment associated with pit progression
– Replacement or refurbishment of MUP equipment based on service life.
• Process plant sustaining capital:
– Scheduled replacement or refurbishment of major mechanical equipment
– Electrical and instrumentation renewals at end-of-life
– Structural, piping and ancillary equipment refurbishment where required.
• Tailings and water management infrastructure:
– Sustaining works to maintain tailings deposition and water return systems
– Routine tailings bund construction is treated as an operating cost.
• Mobile and site infrastructure:
– Replacement of mobile equipment and site infrastructure not covered by routine maintenance
– Refurbishment of non-process infrastructure required to support ongoing operations.
• Land access and property:
– Future land acquisitions required to support LOM mining progression.
• Other LOM sustaining allowances:
– Capitalized replacements driven by asset life rather than annual maintenance
|
Energy Fuels Inc. Technical Report – Donald Rare Earths and Mineral Sands Project, Victoria, Australia |
– Sustaining works required to maintain operability, safety and regulatory compliance.
21.3 Operating costs
The operating cost estimate has been developed using a first principles cost build-up in Australian dollars and is supported by tendered pricing, vendor quotations and market-based rates. Key inputs to the estimate include outsourced mining operations based on a competitive mining contractor tender, processing plant operating and maintenance requirements developed by the Donald Project team for the MUP, WCP and CUP, and competitively tendered transport and logistics contracts for product haulage, port handling and shipping.
Operating cost assumptions are supported by consumption rates, unit costs and labour rates, with benchmarking undertaken against comparable Australian mineral sands operations where appropriate. The operating cost estimate is presented in real Q4 2025 terms and excludes contingency. The diesel fuel pricing used is $1.08/L.
The base case for power provision has been estimated using a Power Purchase Agreement (PPA) with an independent power provider (IPP) for a Microgrid Hybrid Power Station. The Microgrid Power Station contains both solar and BESS facilities, which supplements diesel power generation with renewable power generation. The annual electricity demand for the project has been determined by developing a site-wide load profile, including planned minor and major shutdowns, based on the calculated maximum demand of each plant and operating area across the project. The average annual power operating cost for the process plant is about $8.9 million with a unit processing power cost of about $1.19/t ore processed. The sitewide cost of power is $15.6 million or $2.09/t ore processed.
21.3.1 Mining
Mining operations will be undertaken under an outsourced mining contract, with an initial contract term of five years. The mining operating cost estimate is based on a competitive tender process undertaken to obtain binding offers for the initial five-year mining period.
Mining costs are derived from the preferred contractor's tendered schedule of fixed and variable rates applied to the LOM material movement schedule. Fixed rates cover contractor management, site establishment, mobilization and supporting infrastructure, while variable rates apply to surface mining activities including topsoil and overburden removal, ore mining and haulage, ore blending and loading to the MUP, oversize management, in-pit tailings wall construction, rehabilitation and associated support activities.
Allowances for dayworks and ripping have been included based on the tendered rates and quantities assessed during post-tender review.
LOM mining costs have been developed using tendered rates for the initial five-year contract period, with average rates applied beyond the initial term. Contractor mobilization, demobilization and site establishment costs are capitalized and incurred at the commencement and completion of mining operations, with all other mining costs treated as operating expenditure.
Mining operating costs are in real terms and are calculated on a $/t basis consistent with the production schedule.
Mining costs incurred outside the contractor relate to a range of activities required to support the ongoing operation of the mine, including specialist consulting services for mine planning, Mineral Resource and Mineral Reserve updates, groundwater modelling and geotechnical support, together with mining-related software licensing. The costs also include pre-mine bore field dewatering and mine water management activities, technical services functions such as grade control, survey and specialist engineering support, and the progressive repositioning and extension of the tailings discharge and decant water return systems in line with the mining sequence, and MUP relocations.
|
Energy Fuels Inc. Technical Report – Donald Rare Earths and Mineral Sands Project, Victoria, Australia |
The LOM mining operating cost estimate is summarized in Table 21.9.
Table 21.9 Mining LOM operating cost estimate
| Activity | Unit | Cost |
| Site preparation | $ M | 8.80 |
| Mining - overburden | $ M | 1,023.82 |
| Mining - ore | $ M | 498.39 |
| Dayworks | $ M | 128.02 |
| Water | $ M | 30.93 |
| Diesel | $ M | 125.96 |
| Management | $M | 556.86 |
| Oversize | $ M | 32.98 |
| Site labour | $ M | 105.79 |
| Electricity | $ M | 248.42 |
| Maintenance | $ M | 48.82 |
| Services | $ M | 148.76 |
| Total | $ M | 2,957.54 |
Source: DPPL
21.3.2 Processing
Direct processing operating costs have been estimated using a first principles cost build-up based on the proposed processing facilities and operating strategy. Processing labour requirements were developed from the approved operations organization structure and regional labour rates, including statutory on-costs, and reflect the staffing required to operate the MUP, WCP and CUP on a continuous operating basis.
Maintenance costs were developed from equipment lists and maintenance task schedules and include routine and shutdown maintenance labour, materials and contractor support. Processing operating costs also include site health and safety, ESG functions, and G&A costs necessary to sustain ongoing operations.
Processing consumables were estimated using design consumption rates and budget pricing for reagents, flocculants, utilities and raw water supply. Mobile equipment operating costs were estimated based on anticipated utilization, with lease, maintenance and fuel costs derived from vendor information and OEM data where applicable.
LOM processing operating cost estimate is summarized in Table 21.10.
Table 21.10 LOM processing operating cost estimate
| Activity | Unit | Cost |
| Site labour | $ M | 222.39 |
| Electricity | $ M | 351.76 |
| Maintenance | $ M | 210.34 |
| Consumables | $ M | 488.23 |
| Mobile equipment | $ M | 47.26 |
| Total | $ M | 1,319.98 |
Source: DPPL
|
Energy Fuels Inc. Technical Report – Donald Rare Earths and Mineral Sands Project, Victoria, Australia |
21.3.3 Transport and logistics
HMC transport and logistics cost include:
• Half-height containers
• Operations at the mine
• Road transport of full and empty containers to and from the WIFT at Dooen
• Operations at the WIFT
• Rail haulage to the Port of Portland
• Operations at the Port of Portland
• Off-shore port charges
• Vessel chartering and shipping charges to Zhanjiang, China by 38,000 DWT bulk vessel
• Marine insurance
• HMC transport costs on an FOB China basis
• Consignment documentation.
REEC transport and logistics costs include:
• Operations at the mine
• Road transport of containers to WIFT at Dooen for intermodal transfer
• Operations at the Port of Adelaide
• Off-shore port charges
• Container booking shipping charges to the Port of Seattle, USA by container vessel
• Marine insurance
• Import inspections, customs and clearance duties at USA
• Consignment documentation.
The LOM transport and logistics operating cost estimate is summarized in Table 21.11.
Table 21.11 Concentrate transport and logistics cost estimate
| Activity | Unit | Cost |
| Road transport | $ M | 456.73 |
| REEC freight | $ M | 501.87 |
| Total | $ M | 958.59 |
Source: DPPL
21.3.4 General and administration
Site LOM G&A costs are summarized in Table 21.12.
|
Energy Fuels Inc. Technical Report – Donald Rare Earths and Mineral Sands Project, Victoria, Australia |
Table 21.12 Site LOM G&A cost estimate
| Activity | Unit | Cost |
| Management fee | $ M | 42.08 |
| Site labour | $ M | 191.66 |
| Electricity | $ M | 17.82 |
| Maintenance | $ M | 25.39 |
| HSE | $ M | 20.76 |
| ESG | $ M | 48.90 |
| Other G&A | $ M | 209.02 |
| Post-load commissioning support | $ M | 1.51 |
| Total | $ M | 557.16 |
Source: DPPL
21.4 Closure
The LOM cash flow model includes allowance for a closure cost of $30 million at the end of mining in MIN5532.
|
Energy Fuels Inc. Technical Report – Donald Rare Earths and Mineral Sands Project, Victoria, Australia |
22 Economic analysis
The financial model developed for Phase 1 of the project summarizes the annualized LOM plan with inputs derived from detailed mine planning, mining and processing schedules, and capital and operating costs. The model aligns to the key inputs as described in this Technical Report that underpin the overall project plan and is based on Proven and Probable Mineral Reserves only.
The LOM plan assumes ore mining at 7.5 Mt/a feeding the MUP. The resultant rougher head feed is processed in the WCP at a rate of about 1,060 t/h at 7,200 h/a producing an average of approximately 192 kt/a of HMC and 7,100 t/a of REEC over the 40-year project life. HMC and REEC production is higher in the first six years because mining is initially focused within the RF50 shell and approved Work Plan area, which targets higher-grade Proven Mineral Reserve and more favourable mineral assemblages, resulting in higher recoverable mineral output at a constant plant throughput. Concentrate production for the first six years is summarized in Table 22.1.
Table 22.1 Donald six-year concentrate sales forecast
| Unit | 2028 | 2029 | 2030 | 2031 | 2032 | 2033 | |
| HMC | Kt | 137.2 | 245.5 | 220.4 | 202.5 | 210.8 | 201.9 |
| REEC | kt | 6.2 | 10.5 | 9.2 | 8.0 | 8.7 | 8.2 |
Source: DPPL
Market and price forecast assumptions for the HMC and REEC products were provided by TZMI and Argus and Adamas Intelligence. The price forecasts as disclosed in Item 22.1 were reviewed by the Qualified Person and are considered reasonable.
DPPL proposes to sell the Phase 1 HMC product to Astron for supply to third party downstream processors in China. Based on the indicative uranium and thorium levels for the HMC product, radioactivity is expected to be below the threshold for international transport under the Class 7 classification.
All REEC product will be sold to Energy Fuels under a binding offtake agreement.
22.1 Price assumptions
The revenue assumptions for the economic analysis are based on titanium minerals (such as ilmenite, leucoxene and rutile) valued on a TiO2 basis, zircon valued on a ZrO2 basis, and rare earth minerals (monazite and xenotime) valued as individual rare earth oxides, which collectively are reported as TREOs.
22.1.1 HMC
HMC pricing is based on free-on-board (FOB) China in real Q4 2025 terms. Base case pricing was provided by TZMI (2025). The following saleable mineral products are recovered from HMC:
• Zircon - reported and sold on a ZrO2 basis
• Titanium minerals, comprising ilmenite, leucoxene and rutile, each reported in the Mineral Reserve as discrete mineral products and sold on a TiO2 basis, with the associated TiO2 content reported separately in the Mineral Reserve.
ZrO2 unit price
Donald deposit zircon contains about 66% ZrO2. For the revenue forecasts in the project financial model, a ZrO2 unit price is derived from TZMI's zircon price forecasts. TZMI's price forecasts are expressed on a real Q4-2025 basis. Base-case, high-case and low-case bulk zircon price scenarios are applied over the period 2028 to 2035 and thereafter, the TZMI long term incentive price for the remainder of the mine life.
|
Energy Fuels Inc. Technical Report – Donald Rare Earths and Mineral Sands Project, Victoria, Australia |
TZMI's zircon and price forecast was converted to a ZrO2 unit price (US$/%.t) and modified for:
• Sea freight cost
• A quality discount of 5% for the targeted product
• Toll processing costs
• Port charges
• A recovery factor
• A processor margin
• A final product quality assumption of 66.0% ZrO2.
Transport, processing and treatment charges applied in the financial model are commercial-in-confidence. These assumptions have been reviewed by the Qualified Person, are considered reasonable for the basis of the economic analysis and have been incorporated into the project financial evaluation.
The assumed ZrO2 unit price base-case, high-case and low-case unit price forecasts are summarized in Table 22.2. Prices are flat from 2035 to the end of mine production.
Table 22.2 ZrO27 unit price forecast
| Case | Unit | 2028 | 2029 | 2030 | 2031 | 2032 | 2033 | 2034 | 2035+ |
| Low | US$/%.t | 11.13 | 11.44 | 12.39 | 13.20 | 14.05 | 14.52 | 14.26 | 18.06 |
| Base | US$/%.t | 12.90 | 13.65 | 15.07 | 16.27 | 17.58 | 18.64 | 19.06 | 18.06 |
| High | US$/%.t | 14.92 | 16.38 | 18.32 | 19.97 | 21.98 | 23.28 | 23.85 | 18.06 |
Source: DPPL
TiO2 unit price
The TZMI titanium feedstock price forecasts are applied on a TiO2 unit basis (US$/t TiO2) and adjusted to account for:
• Sea freight costs
• Product quality adjustments relative to benchmark specifications
• Processing and handling costs
• Port charges
• Recovery factors
• A processor or offtake margin
• Final product TiO2 content assumptions consistent with the saleable mineral specifications.
Transport, processing and treatment charges applied are commercial-in-confidence. These assumptions have been reviewed by the Qualified Person, are considered reasonable for the basis of the study, and have been incorporated into the project financial evaluation
Q4 2025 (real) TiO2 unit base-case, high-case and low-case price forecasts used in the financial model are summarized in Table 22.3. Prices are flat from 2035 to the end of mine production.
___________________________
7 The project financial model applies unit prices on a ZrO2 basis. In the LOM schedule, zircon grades for mining Blocks 9 and greater are reported as combined ZrO2 + HfO2, reflecting the natural association of hafnium with zirconium in zircon minerals. Hafnium oxide typically represents approximately 5% of the combined oxide content. As hafnium is not separately priced or credited in the financial model, the inclusion of HfO2 within the reported ZrO2 basis has a negligible impact on the calculated zircon revenue and is not considered material to the project economic outcomes.
|
Energy Fuels Inc. Technical Report – Donald Rare Earths and Mineral Sands Project, Victoria, Australia |
Table 22.3 TiO2 unit price forecast
| Case | Unit | 2028 | 2029 | 2030 | 2031 | 2032 | 2033 | 2034 | 2035+ |
| Low | US$/%.t | 2.26 | 2.42 | 2.63 | 2.84 | 2.97 | 3.03 | 3.02 | 3.57 |
| Base | US$/%.t | 2.68, | 2.97 | 3.38 | 3.70 | 3.81 | 3.92 | 4.01 | 3.57 |
| High | US$/%.t | 3.18 | 3.59 | 4.12 | 4.56 | 4.78 | 4.93 | 5.01 | 3.57 |
Source: DPPL, 2025
HMC revenue calculation
Project revenue has been calculated using the following methodology:
• HMC revenue = HMC (t) * HMC price (US$/t) /US$/A$ exchange rate (US$:A$).
• Where: HMC price = HMC TiO2 grade (%) * TiO2 unit price (US$/% TiO2.t) + HMC ZrO2 grade (%) * ZrO2 unit price (US$/% ZrO2.t).
The TiO2 grade in HMC ranges from 35.2% to 41.4%, averaging about 38.1%; the ZrO2 grade in HMC ranges from 16.1% to 21.4%, averaging about 18.1%.
A US$/A$ exchange rate of 0.66 was used.
22.1.2 REEC price assumptions
Cerium (Ce) and yttrium (Y) are used as tracer elements to estimate the abundance of monazite- and xenotime-hosted rare earths within the ore and resulting REEC product. Metallurgical testwork on the final REEC demonstrates that Ce and Y oxides comprise about 20.3% and 11.9% of the concentrate, respectively, and show very strong correlations between Ce and Nd-Pr (99.96%) and between Y and Dy-Tb (99.7%). On this basis, the recovered Ce and Y oxide contents have been used to back-calculate total REEC production and derive the concentrations of the payable REOs (Nd, Pr, Dy and Tb). These derived proportions are then applied to estimate REEC pricing using the established pricing formula.
The saleable REE oxides in REEC are Nd2O3 and Pr6O11 (being LREEs) and Dy2O3 and Tb4O7 (being HREEs). The REE oxide pricing in the financial model is based on CIF China using an average of the pricing (US$/kg) sourced from Argus for forecasts from Q3 2025 (Table 22.4). The Argus price forecasts are reported on a nominal 2025 basis and are adjusted within the financial model by applying an appropriate conversion factor to establish real 2025 prices consistent with the model's real-term assumptions.
Table 22.4 Forecast REE oxide prices (US$/kg) to 2040 (base case)
| Oxide | 2028 | 2029 | 2030 | 2031 | 2032 | 2033 | 2034 | 2035 | 2036 | 2037 | 2038 | 2039 | 2040+ |
| Nd | 100.48 | 102.25 | 103.05 | 103.85 | 104.67 | 105.49 | 107.35 | 109.24 | 112.23 | 116.40 | 120.73 | 125.22 | 132.32 |
| Pr | 103.49 | 105.32 | 106.14 | 105.93 | 106.76 | 107.60 | 110.57 | 112.51 | 116.72 | 122.22 | 127.97 | 135.24 | 145.56 |
| Dy | 495.43 | 504.15 | 513.03 | 522.07 | 638.54 | 643.54 | 724.13 | 793.57 | 838.61 | 845.17 | 851.79 | 916.80 | 1,032 |
| Tb | 1,694 | 1,708 | 1,721 | 1,701 | 1,714 | 1,761 | 1,775 | 1,823 | 1,873 | 1,925 | 1,977 | 2,032 | 2,187 |
| NdPr | 98.47 | 100.20 | 100.99 | 101.78 | 102.57 | 103.38 | 105.20 | 107.05 | 109.98 | 114.07 | 118.31 | 122.71 | 129.68 |
Source: DPPL
The relative distribution of the saleable oxide minerals in REEC is summarized in Table 22.5.
|
Energy Fuels Inc. Technical Report – Donald Rare Earths and Mineral Sands Project, Victoria, Australia |
Table 22.5 Relative distribution of saleable minerals in REE oxides in REEC
| REE oxide | Relative distribution of TREO minerals in REEC (% TREO) |
| Pr6O11 | 3.85 |
| Nd2O3 | 13.85 |
| Tb4O7 | 0.41 |
| Dy2O3 | 2.67 |
Source: DPPL analysis
The value of the individual Nd, Pr Dy and Tb oxides per tonne of REEC is calculated as the blended price for each saleable mineral * % of mineral in concentrate, adjusted for:
• The % total TREO in concentrate (60.6%)
• The percentage of all payable minerals in concentrate
• The payability of minerals in concentrate.
The individual contributions are summed to derive a REEC basket price (Table 22.6). The 2040 basket price is fixed for the remaining LOM. The REEC transport and treatment charges are commercial-in-confidence. These charges have been reviewed by the Qualified Person, are considered reasonable, and have been allowed for in the financial evaluation.
Table 22.6 REEC basket price on blended price forecast (US$/t REEC)
| 2028 | 2029 | 2030 | 2031 | 2032 | 2033 | 2034 | 2035 | 2036 | 2037 | 2038 | 2039 | 2040+ |
| 10,095 | 10,255 | 10,371 | 10,451 | 11,340 | 11,466 | 12,146 | 12,786 | 13,304 | 13,601 | 13,908 | 14,644 | 15,969 |
Source: DPPL analysis
Table 22.7 lists the low and high REEC basket price used for the sensitivity analysis.
Table 22.7 REEC low and high basket price on blended price forecast (US$/t REEC) used in sensitivity analysis
| Case | 2028 | 2029 | 2030 | 2031 | 2032 | 2033 | 2034 | 2035+ |
| Low | 8,815 | 9,283 | 9,731 | 10,707 | 11,780 | 13,182 | 13,259 | 13,664 |
| High | 11,398 | 11,830 | 12,200 | 12,731 | 13,542 | 14,228 | 14,738 | 15,403 |
Source: DPPL analysis
22.1.3 Other price assumptions
The financial model and Mineral Reserve estimates are based solely on prices for the minerals discussed in Item 22.1.1 and Item 22.1.2. No other minerals or by-products contribute to revenue in the project financial model.
Although CeO2 does not contribute directly to revenue, its recovery is a key indicator of overall rare earth recovery and process performance and has a direct influence on the recovery and cost of payable REOs.
22.1.4 Economic assumptions
The project execution schedule was developed from DPPL's indicative timeframes for the completion of primary approvals and delivery of long-lead time items following discussions with regulators, potential EPC contractors and suppliers of other equipment and infrastructure required for the commencement of mining activities. The key milestones for project execution are outlined in Table 22.8. These milestones are based on early works being carried out from January to March 2026.
|
Energy Fuels Inc. Technical Report – Donald Rare Earths and Mineral Sands Project, Victoria, Australia |
Table 22.8 Phase 1 key project milestones
| Activity | Estimated date |
| Financing and FID | March 2026 |
| Process plant EPC award | March 2026 |
| Earthworks commenced | March 2026 |
| Commissioning and ramp-up completion | Q1 2028 |
| First product shipment | Q1 2028 |
| Full production achieved | Q1 2028 |
| End mining and processing | Q2 2067 |
Source: DPPL
Other key economic assumptions used in the financial model are summarized in Table 22.9. The economic analysis supporting the Mineral Reserve applies a corporate income tax rate of 30%, calculated on taxable income after depreciation. No tax losses, tax credits, incentives, or accelerated depreciation have been assumed.
Table 22.9 Financial model economic assumptions
| Assumption | Value |
| Base date | 31 December 2025 |
| Financial modelling | Real |
| Discount rate | 8% post-tax |
| Forex rate | US$0.66:A$1.00 |
| Corporate tax rate | 30% |
| Debt | Unlevered |
| Point of product sale - HMC | FOB Portland/Geelong |
| Point of product sate - REEC | DAP Seattle |
| Royalty | 2.75% of mine gate value |
| Depreciation rate | Straight line LOM |
| Closure cost | $30 million |
Source: DPPL
22.2 Cash flow analysis
Figure 22.1 and Table 22.10 to Table 22.14 present a summary of annual (calendar year) post-tax cash flows to 2067. Initial capital expenditure commences in 2026. Following the initial investment period, which results in a maximum negative cash flow of about $473 million in mid-2027, payback is achieved in 2034. Over the LOM, the project generates a cumulative post-tax cash flow of about $3,000 million, a pre-tax and post-tax NPV of about $800 million and $496 million respectively, at an 8% discount rate applied to quarterly cash flows, with an IRR of 16%.
|
Energy Fuels Inc. Technical Report – Donald Rare Earths and Mineral Sands Project, Victoria, Australia |
Figure 22.1 Donald Phase 1 LOM cash flow summary (100% equity)

Source: DPPL
|
Energy Fuels Inc. Technical Report – Donald Rare Earths and Mineral Sands Project, Victoria, Australia |
Table 22.10 Donald Phase 1 LOM financial model (100% equity) 2026-2035
| Item | Unit | Total | 2026 | 2027 | 2028 | 2029 | 2030 | 2031 | 2032 | 2033 | 2034 | 2035 |
| Ore processed | Mt | 293.3 | - | - | 6.8 | 7.5 | 7.5 | 7.5 | 7.5 | 7.5 | 7.5 | 7.5 |
| HMC | kt | 7,540.0 | - | - | 137.2 | 245.5 | 220.4 | 202.5 | 210.8 | 201.9 | 200.5 | 196.7 |
| REEC | kt | 279.9 | - | - | 6.2 | 10.5 | 9.2 | 8.0 | 8.7 | 8.2 | 8.0 | 7.7 |
| Revenue | $ M | 10,992 | - | - | 162 | 286 | 270 | 254 | 293 | 285 | 293 | 280 |
| Operating cost | $ M | (5,793) | - | - | (140) | (159) | (155) | (159) | (157) | (153) | (145) | (148) |
| Capital cost | $ M | (596) | (233) | (185) | (33) | (11) | (11) | (4) | (1) | (2) | (14) | (1) |
| Royalty | $ M | (276) | - | - | (4) | (7) | (7) | (6) | (7) | (7) | (7) | (7) |
| Rehabilitation | $ M | (30) | - | - | (1) | (1) | (1) | (1) | (1) | (1) | (1) | (1) |
| Taxation | $ M | (1,293) | - | - | (22) | (25) | (19) | (31) | (29) | (34) | (29) | |
| Cash flow | $ M | 3,005 | (233) | (185) | (16) | 85 | 72 | 66 | 97 | 93 | 92 | 94 |
Source: DPPL (excludes working capital adjustment)
Table 22.11 Donald Phase 1 LOM financial model (100% equity) 2036-2045
| Item | Unit | 2036 | 2037 | 2038 | 2039 | 2040 | 2041 | 2042 | 2043 | 2044 | 2045 |
| Ore processed | Mt | 7.5 | 7.5 | 7.5 | 7.5 | 7.5 | 7.5 | 7.5 | 7.5 | 7.5 | 7.5 |
| HMC | kt | 191.7 | 202.1 | 203.7 | 191.1 | 184.8 | 184.6 | 188.9 | 188.2 | 189.8 | 189.3 |
| REEC | kt | 7.2 | 7.7 | 7.7 | 7.2 | 7.6 | 7.9 | 8.2 | 8.1 | 7.9 | 8.6 |
| Revenue | $ M | 268 | 285 | 290 | 282 | 311 | 320 | 334 | 332 | 323 | 344 |
| Operating cost | $ M | (155) | (148) | (144) | (149) | (157) | (160) | (163) | (154) | (152) | (164) |
| Capital cost | $ M | (3) | (4) | (2) | (6) | (1) | (2) | (7) | (0) | (0) | (3) |
| Royalty | $ M | (7) | (7) | (7) | (7) | (8) | (8) | (8) | (8) | (8) | (9) |
| Rehabilitation | $ M | (1) | (1) | (1) | (1) | (1) | (1) | (1) | (1) | (1) | (1) |
| Taxation | $ M | (23) | (30) | (33) | (29) | (35) | (36) | (39) | (41) | (39) | (41) |
| Cash flow | $ M | 79 | 96 | 103 | 91 | 110 | 113 | 116 | 127 | 123 | 127 |
Source: DPPL (excludes working capital adjustment)
|
Energy Fuels Inc. Technical Report – Donald Rare Earths and Mineral Sands Project, Victoria, Australia |
Table 22.12 Donald Phase 1 LOM financial model (100% equity) 2046-2055
| Item | Unit | 2046 | 2047 | 2048 | 2049 | 2050 | 2051 | 2052 | 2053 | 2054 | 2055 |
| Ore processed | Mt | 7.5 | 7.5 | 7.5 | 7.5 | 7.5 | 7.5 | 7.5 | 7.5 | 7.5 | 7.5 |
| HMC | kt | 194.8 | 203.2 | 198.6 | 188.4 | 182.8 | 187.9 | 190.1 | 185.1 | 182.8 | 181.3 |
| REEC | kt | 8.3 | 6.8 | 6.0 | 5.7 | 5.6 | 5.9 | 6.0 | 5.8 | 5.9 | 5.9 |
| Revenue | $ M | 337 | 293 | 267 | 256 | 248 | 258 | 261 | 256 | 258 | 253 |
| Operating cost | $ M | (163) | (144) | (135) | (134) | (133) | (136) | (136) | (133) | (135) | (136) |
| Capital cost | $ M | (1) | (21) | (3) | (3) | (3) | (3) | (3) | (3) | (3) | (3) |
| Royalty | $ M | (9) | (7) | (7) | (6) | (6) | (6) | (7) | (6) | (6) | (6) |
| Rehabilitation | $ M | (1) | (1) | (1) | (1) | (1) | (1) | (1) | (1) | (1) | (1) |
| Taxation | $ M | (50) | (42) | (37) | (34) | (32) | (34) | (35) | (34) | (34) | (32) |
| Cash flow | $ M | 114 | 77 | 85 | 78 | 73 | 78 | 80 | 79 | 79 | 75 |
Source: DPPL (excludes working capital adjustment)
Table 22.13 Donald Phase 1 LOM financial model (100% equity) 2056-2065
| Item | Unit | 2056 | 2057 | 2058 | 2059 | 2060 | 2061 | 2062 | 2063 | 2064 | 2065 |
| Ore processed | Mt | 7.5 | 7.5 | 7.5 | 7.5 | 7.5 | 7.5 | 7.5 | 7.5 | 7.5 | 7.5 |
| HMC | kt | 192.7 | 187.5 | 175.9 | 180.1 | 192.5 | 195.1 | 191.3 | 182.5 | 177.4 | 177.7 |
| REEC | kt | 6.2 | 6.4 | 6.0 | 5.9 | 6.4 | 6.7 | 6.5 | 6.2 | 6.1 | 6.6 |
| Revenue | $ M | 267 | 273 | 257 | 254 | 276 | 281 | 270 | 258 | 257 | 273 |
| Operating cost | $ M | (139) | (142) | (146) | (148) | (143) | (140) | (139) | (139) | (153) | (156) |
| Capital cost | $ M | (3) | (3) | (3) | (3) | (3) | (3) | (3) | (3) | (3) | (3) |
| Royalty | $ M | (7) | (7) | (6) | (6) | (7) | (7) | (7) | (6) | (6) | (7) |
| Rehabilitation | $ M | (1) | (1) | (1) | (1) | (1) | (1) | (1) | (1) | (1) | (1) |
| Taxation | $ M | (36) | (36) | (30) | (29) | (36) | (39) | (36) | (32) | (27) | (30) |
| Cash flow | $ M | 82 | 85 | 70 | 67 | 86 | 92 | 85 | 77 | 67 | 77 |
Source: DPPL (excludes working capital adjustment)
|
Energy Fuels Inc. Technical Report – Donald Rare Earths and Mineral Sands Project, Victoria, Australia |
Table 22.14 Donald Phase 1 LOM financial model (100% equity) 2066-2067
| Item | Unit | 2066 | 2067 |
| Ore processed | Mt | 7.5 | 1.3 |
| HMC | kt | 187.4 | 75.3 |
| REEC | kt | 7.7 | 2.9 |
| Revenue | $ M | 307 | 119 |
| Operating cost | $ M | (139) | (62) |
| Capital cost | $ M | (3) | (1) |
| Royalty | $ M | (8) | (3) |
| Rehabilitation | $ M | (1) | (0) |
| Taxation | $ M | (48) | (15) |
| Cash flow | $ M | 109 | 37 |
Source: DPPL (excludes working capital adjustment)
22.3 Sensitivity analysis
A sensitivity analysis of the pre-tax financial model NPV considered a variety of value drivers to arrive at discrete upside and downside value impacts for:
• Pricing for REEC using the base and high/low prices reported in Item 22.1.2
• Pricing on HMC using the high/low prices reported in Item 22.1.1
• Operating costs (± 10%)
• TiO2 recoveries (74.1% / 84.1%)
• ZrO2 recoveries (89.5% / 95.5%)
• Exchange rate (0.60 / 0.70)
• Post-tax discount rate range (9% / 7%)
• Capital costs (± 10%).
The sensitivity of project pre-tax NPV (about $800 million) to discrete changes in these key value drivers is presented in Figure 22.2.
Figure 22.2 LOM NPV sensitivity analysis

Source: DPPL
The most significant and material drivers for project value are concentrate pricing (including exchange rate), recovery and operating cost.
|
Energy Fuels Inc. Technical Report – Donald Rare Earths and Mineral Sands Project, Victoria, Australia |
23 Adjacent properties
The general region surrounding the Property is held by a wide range of private and public companies under exploration and retention licences for which limited information is publicly available. Properties known to host HM deposits within 50 km of MIN5532 include Astron's Jackson deposit to the immediate southwest of Donald and Watchem (owned by ACDC Metals Ltd).
23.1 Jackson
Astron's adjoining Jackson deposit is a similar "WIM-style" HM deposit within RL2003 (Figure 4.1).
A resource for Jackson was last estimated by AMC and reported in accordance with the JORC Code (2012) by Astron on 7 April 20168 using the same methodology described for AMC's Donald Mineral Resource estimate within RL2002 (refer to Item 24.2). A subset of the total estimate with mineral assemblage data above a 1% total HM cut-off grade is presented in Table 23.1 for comparative purposes only.
Table 23.1 Jackson resource subset reported by AMC in 2016 within RL2003
| Classification | Tonnes (Mt) |
Total HM (%) |
Slimes (%) |
Oversize (%) |
% of total HM | ||||
| Zircon | Rutile + anatase |
Leuco- xene |
Ilmenite | Monazite | |||||
| Measured | - | - | - | - | - | - | - | - | - |
| Indicated | 670 | 4.9 | 18 | 5.4 | 18 | 9 | 17 | 32 | 2 |
| Measured + Indicated | 670 | 4.9 | 18 | 5.4 | 18 | 9 | 17 | 32 | 2 |
| Inferred | 160 | 4.0 | 15 | 3.1 | 21 | 9 | 15 | 32 | 2 |
Note: Tonnes rounded to the nearest 10 Mt and grades rounded to one or two significant figures by Snowden Optiro.
The Qualified Person has been unable to verify the above information and has not done sufficient work to classify the historical estimate as a current Mineral Resource. The estimate may not meet CIM Definition Standards for Mineral Resources & Mineral Reserves and S-K 1300 Definitions and is disclosed for background purposes only and should not be relied upon.
As disclosed in Item 4.5, Astron retains the right to develop the Jackson deposit on RL2003 independently. If the development of RL2003 is planned with a third party, Energy Fuels has a first right of refusal to participate.
23.2 Watchem
ACDC Metals' Watchem property comprises four exploration licences that immediately adjoin RL2002 to the northwest and continue approximately 100 km to the north of MIN5532. AC drilling completed by ACDC Metals along wide-spaced traverses in 2023 and 2024 confirmed the presence of significant HM mineralization associated with several strandlines that collectively extend to the north of RL2002 over a considerable distance. The exploration work completed to date is an early stage of assessment with the drilling results released to date summarized in ACDC Metals' 2024 Annual Report9. No details have been disclosed on the future exploration plans.
The Qualified Person has been unable to verify the information disclosed by ACDC Metals and cautions that this information is not necessarily indicative of the mineralization on the Property that is the subject of this Technical Report.
___________________________
8 https://stocknessmonster.com/announcements/atr.asx-2A916480/
9 wcsecure.weblink.com.au/pdf/ADC/02857817.pdf
|
Energy Fuels Inc. Technical Report – Donald Rare Earths and Mineral Sands Project, Victoria, Australia |
24 Other relevant data and information
24.1 Phase 2
In June 2023, Astron completed a "pre-feasibility study" for the proposed Phase 2 development of the Donald Project. The accuracy range of the study was at an AACE Class 3 level of accuracy (-20%/+30%). The study did not comply with NI 43-101 or S-K 1300 standards and is being disclosed herein solely for informational purposes and should not be relied upon.
The Phase 2 project comprises:
• Duplication of the Phase 1 throughput with 7.5 Mt/a ROM material mined and processed within RL2002 to produce HMC and REEC.
• Construction of a mineral separation plant (MSP) on MIN5532, sized to process the HMC equivalent of 15 Mt/a mined from both MIN5532 (Phase 1) and RL2002 (Phase 2). When the MSP is commissioned, HMC produced from Phase 1 and Phase 2 will be separated into premium (ceramic) and secondary (chemical) grade zircon and final titania products.
The Phase 2 operations will be carried out on RL2002 to the north and south of MIN5532 and has been separated into two sub-phases:
The Phase 2A operation will be a duplication of the Phase 1 operation and will comprise:
• Conventional truck and shovel open pit mining, by an independent contractor, to produce 7.5 Mt/a of feed to a MUP located adjacent to the pit
• Concentration in a WCP to produce an HMC
• Processing of the HMC through a CUP where the rare earth concentrate will be separated from the titanium and zircon concentrate by flotation to produce REEC and HMC product streams
• REEC product bagged and made ready for sale to offtake partners
• HMC loaded into half-height containers ready for sale to offtake partners or pumped to the MSP for processing to final products (Phase 2b)
• Sand tailings mixed with slimes deposited in an external TSF during startup and commissioning and, subsequently, returned to the mined areas as part of the progressive mine rehabilitation.
The Phase 2B operation will comprise:
• Construction of an MSP on MIN5532 sized to process the HMC equivalent from a 15 Mt/a feed rate
• Pumping HMC from Phase 1 and Phase 2A CUPs to the MSP feed tank on MIN5532
• Processing the HMC feed through a low intensity magnetic separator (LIMS) and two stages of wet high intensity magnetic separators (WHIMS) to produce magnetic and non-magnetic concentrate streams
• Beneficiation of the non-magnetic concentrates using a multistage gravity circuit to produce a zircon concentrate and a non-magnetic titanium mineral concentrate, comprising rutile and leucoxene, and rejecting the low specific gravity titano-silicates
• Processing zircon concentrates (non-magnetics) through a drying circuit using multi-stage electrostatic and magnetic circuits to produce premium grade and secondary (chemical grade) zircon products
• Processing the combined WHIMS magnetic and non-magnetic titania concentrate through a drying circuit using multi-stage electrostatic and magnetic circuits to produce a final titania product
• Transporting the final zircon and titania products by truck to Dooen intermodal rail terminal before railing to a Victorian port for export.
|
Energy Fuels Inc. Technical Report – Donald Rare Earths and Mineral Sands Project, Victoria, Australia |
24.2 Phase 2 historical resource estimate
A historical resource estimate for the extensions to the Donald deposit, outside of MIN5532 and contained within RL2002, was prepared by AMC in 2015 and reported in 2016 (AMC, 2016b). Datamine software was used for geological and domain interpretation, data analysis and grade estimation and the final model (bmfin2015f.dm) was used for definition of reserves (as discussed in Item 24.3). This is referred to as the Phase 2 historical resource estimate, the extent of which is included in Figure 24.1. An independent review of the historical resource estimate for RL2002 has not been completed by the Qualified Person for the Mineral Resource. The following section contains a summary and extracts from AMC's 2016 report (AMC, 2016b).
Figure 24.1 Extent of resource within RL2002

Source: Snowden Optiro
|
Energy Fuels Inc. Technical Report – Donald Rare Earths and Mineral Sands Project, Victoria, Australia |
The Phase 2 historical resource estimate is based on data from 794 AC drillholes that were analyzed for HM, slimes and oversize contents. Data from holes drilled by CRA, Zirtanium and Astron were used for data analysis and resource estimation (Figure 24.2).
Figure 24.2 RL2002 - plans of drillholes analyzed for HM and section line of representative cross-section included in Figure 24.3 and Figure 24.4 (left) and mineral assemblage (right)


Source: Snowden Optiro
AMC reported that Zirtanium reviewed the quality control data in 2005 and noted that internal laboratory checks and inter-laboratory checks (1 in 20 samples) gave acceptable results. Twining of CRA holes by Zirtanium from bulk samples collected using a Caldwell drill rig showed a 35% lower grade. AMC reviewed the quality control data for the field duplicate samples and laboratory repeats for HM, slimes and oversize from the drilling carried out by Astron in 2010 and 2015. Field duplicates were only available for the 2015 drilling. AMC's review of the field duplicates indicated a bias for HM and oversize results.
|
Energy Fuels Inc. Technical Report – Donald Rare Earths and Mineral Sands Project, Victoria, Australia |
All holes are vertical and spacing varies from 125 mE by 450 mN to 500 mE by 500 mN. The resource is constrained to within the interpreted Loxton Sand. AMC interpreted high (>5% HM), medium (3-5% HM) and low (<3%) grade HM horizons (Figure 24.3) and a horizon that included mineral assemblage data (within the horizon with higher total HM contents). Only total HM, slimes and oversize contents were estimated and reported within the material surrounding the mineral assemblage horizon. A top-cut value of 70% was applied to the oversize data.
Figure 24.3 Representative cross-section looking north along 5,954,500 mN with interpreted mineralized horizons and drillholes coloured by total HM%*

*Section location included in Figure 24.2
Source: Snowden Optiro
Mineral assemblage data was obtained from composite samples from 348 drillholes on a spacing of approximately 200 mE by 450 mN. The composite samples were selected from the horizon with higher total HM contents and (as noted above) AMC treated this as a separate horizon and mineral assemblage components were estimated and reported only within this horizon (Figure 24.4). Zircon estimates are from a combination of grain count data and calculation of the zircon from ZrO2 data obtained from XRF analysis.
Figure 24.4 Representative cross-section looking north along 5,954,500 mN with drillholes with mineral assemblage data and mineral assemblage horizon used to constrain the reported historical resource*

*Section location included in Figure 24.2
Source: Snowden Optiro
AMC reported that the following adjustments were applied to the mineral assemblage data obtained prior to the 2015 data:
• Ilmenite analyzed from the Astron composite samples contained magnetite and, based on a comparison with the CRA data, the Astron ilmenite grades were decreased by 1.6% to remove magnetite.
• Of the 719 samples assayed for rutile, 178 were reported as rutile + anatase, 497 samples included data for rutile and anatase (and this data was combined) and for 44 samples, only rutile assays were reported. AMC calculated rutile + anatase for these samples using the following formula:
– Rutile + anatase = 1.015 x rutile + 1.89
|
Energy Fuels Inc. Technical Report – Donald Rare Earths and Mineral Sands Project, Victoria, Australia |
The maximum rutile + anatase assay, following adjustment by AMC was 26.3% and a top-cut value of 15% was applied to the rutile + anatase data.
Variogram analysis was undertaken by AMC to determine the continuity of HM, slimes, oversize and each of the mineral assemblage components. The variogram parameters used for total HM grade estimation are summarized in Table 24.1. The maximum grade continuity ranges for total HM, slimes and oversize were oriented along strike. The total HM data within each of the three HM domains have low nugget variances (11-17%). AMC interpreted maximum continuity range of 625-930 m along strike, 314-588 m across strike and 8-29 m vertically for total HM.
The slimes data have a low nugget variance (5%), and oversize data has a moderate nugget variance (27%). Maximum continuity ranges interpreted by AMC for the slimes are 449 m along strike, 317 m across strike and 22 m vertically and for oversize are 921 m along strike, 703 m across strike and 10 m vertically.
The mineral assemblage components were all interpreted by AMC to have low nugget variances (1-6%). Maximum continuity ranges interpreted are 1,336-4,981 m along strike, 1,030-4,062 m across strike and 19-80 m vertically with ilmenite displaying the shorter maximum continuity ranges and rutile + anatase displaying the longest continuity ranges.
Table 24.1 RL2002 - interpreted variogram parameters for HM
| Variable | Rotation around Z axis |
Nugget variance |
Sill 1 | Range 1 (m) |
Sill 2 | Range 2 (m) |
| HM - high (>5%) horizon |
-45° | 0.14 | 0.54 | 102 102 7.5 |
0.32 | 625 477 8 |
| HM - medium (3-5%) horizon | 0° | 0.17 | 0.45 | 362 115 3 |
0.38 | 930 314 14 |
| HM - low (<3%) horizon |
0° | 0.11 | 0.39 | 112 179 3 |
0.50 | 696 588 29 |
Source: AMC, 2016b
A block model was constructed by AMC using a parent block size of 100 mE by 200 mN by 1 mRL. The parent blocks were allowed to sub-cell down to 20 mE by 40 mN by 0.25 mRL to more accurately represent the geometry and volumes of the geological units and the mineralization horizon. Total HM, slimes, oversize and mineral assemblage grades were estimated using OK and the parameters determined from the variogram analysis. Hard boundaries (where only data from each domain is used for grade estimation) were applied between the three mineralized domains (high, medium and low). Search ellipses were orientated to align with the direction of maximum continuity defined from the variograms and an octant search with a minimum of 3 samples was applied. The search ranges were based on the variogram ranges, but with the smallest range large enough to include samples from the next line of drilling in the estimation. Up to three estimation passes were applied with increasing search ellipse dimensions for each search pass. A minimum of 6 samples and a maximum of 18 samples were applied for search passes one and two and the minimum number of samples was reduced to 3 for the third search pass. A maximum of 2 samples per drillhole was applied.
AMC checked the block model by visually comparing the input data for each of the variables against the block estimates. Trend plots and histograms were also used to compare the input data against the block estimates.
AMC used the following formula for estimation of the bulk density and tonnage:
• Bulk density = 0.01 x total HM% + 1.65
|
Energy Fuels Inc. Technical Report – Donald Rare Earths and Mineral Sands Project, Victoria, Australia |
AMC classified the resource in accordance with the guidelines of the JORC Code (2012 edition) and based on drill spacing and consideration of the geological and HM grade continuity. Measured Resources were defined where drilling is generally on a spacing of 100 mE by 400 mN, Indicated Resources were defined where drilling is wider than the Measured Resource areas and is generally 250 mE by 400 mN. Inferred Resources were defined where the drill spacing is wider than 250 mE by 400 mN. The classification is illustrated in Figure 24.5. Mineral assemblage data was not available for the total resource and AMC reported a subset of the resource with mineral assemblage data.
Figure 24.5 RL2002 resource classification
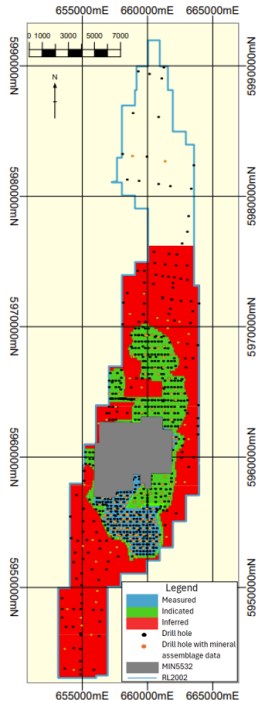
Source: Snowden Optiro
|
Energy Fuels Inc. Technical Report – Donald Rare Earths and Mineral Sands Project, Victoria, Australia |
The Qualified Person's review indicates that there is reasonable confidence in the HM and mineral assemblage grades within the Measured and Indicated Resource areas and the Qualified Person concurs with the classification applied by AMC (in accordance with the guidelines of the JORC Code, 2012) within the horizon with mineral assemblage data and used for estimation of reserves (refer to Item 24.3). AMC also reported additional Measured (158 Mt), Indicated (379 Mt) and Inferred (948 Mt) Resources above and below the horizon with mineral assemblage data. These resources do not have mineral assemblage data. In the Qualified Person's opinion, the resources without mineral assemblage data do not meet the standards for Measured and Indicated Resources and these have been reclassified as Inferred Resources in accordance with the guidelines of the JORC Code.
The RL2002 historical resources have been classified and reported in accordance with the guidelines of the JORC Code (2012) and have not been adjusted to conform with the 2014 CIM Definition Standards or S-K 1300 Definitions.
The AMC block model contains estimates outside of RL2002 and within MIN5532 and also within RL2003 to the south (Jackson deposit). The Qualified Person screened AMC's block model to within RL2002 and outside of MIN5532. There are minor differences between the resource reported by AMC and the resource reported by the Qualified Person, which are not regarded as material.
The historical resource for the Donald deposit within RL2002 exclusive of reserves and outside of MIN5532 above a cut-off grade of 1% total HM is reported in Table 24.2. The reported historical resource exclusive of reserves includes Inferred resources within the outline of the reserve area (Figure 24.6).
Table 24.2 Historical resources exclusive of reserves reported by Snowden Optiro from AMC model within RL2002 and outside of MIN5532 as of March 2016 (100% equity)
| Classification | Tonnes (Mt) |
Total HM % |
Slimes % |
Oversize % |
% of total HM | ||||
| Zircon | Rutile + anatase |
Leuco- xene |
Ilmenite | Monazite | |||||
| Measured | 18 | 4.1 | 21 | 8.7 | 18 | 9.8 | 20 | 30 | 1.6 |
| Indicated | 37 | 4.1 | 18 | 7.9 | 20 | 8.9 | 20 | 32 | 1.9 |
| Measured + Indicated | 55 | 4.1 | 19 | 8.2 | 19 | 9.2 | 20 | 31 | 1.8 |
| Inferred | 650 | 4.9 | 16 | 5.8 | 19 | 8.6 | 17 | 33 | 1.8 |
| 1,490 | 2.3 | 16 | 8.4 | Not available | |||||
| Total Inferred | 2,130 | 3.1 | 16 | 7.6 | - | - | - | - | - |
Notes:
Historical resources are reported on a 100% basis. As at the effective date of this Technical Report, Energy Fuels held a 9.48% interest in the Property.
Resources that are not reserves do not have demonstrated economic viability.
Resources are reported above a cut-off grade of 1.0% total HM within RL2002.
Measured and Indicated Resources that are within the reserve outline have been excluded from the reported historical resource. Inferred Resources within the reserve outline are included in the reported remaining resource. Inferred Resources without mineral assemblage data are in addition to Inferred Resources with mineral assemblage data.
The reference point for the historical resources is in-situ.
The RL2002 historical resources have been classified and reported in accordance with the guidelines of the JORC Code (2012) and have not been adjusted to conform with the 2014 CIM Definition Standards or S-K 1300 Definitions.
Total HM is reported as a percentage of the total material. Estimates of the mineral assemblage (zircon, ilmenite, rutile, leucoxene and monazite) are presented as percentages of the total HM component.
All tonnages and grades have been rounded to reflect the relative uncertainty of the estimate, thus the sum of columns may not equal.
|
Energy Fuels Inc. Technical Report – Donald Rare Earths and Mineral Sands Project, Victoria, Australia |
Figure 24.6 Plan of reserve area and remaining historical resource (with mineral assemblage data) within RL2002

Source: Snowden Optiro
|
Energy Fuels Inc. Technical Report – Donald Rare Earths and Mineral Sands Project, Victoria, Australia |
The information in this Technical Report that relates to the RL2002 historical resource estimate is based on information compiled by Mr. Rod Webster. Mr. Webster is a Member of the Australasian Institute of Mining and Metallurgy and Australian Institute of Geoscientists. Mr. Webster is independent of DPPL, Astron and Energy Fuels. Mr. Webster has sufficient experience that is relevant to the style of mineralization and type of deposit under consideration and to the activity being undertaken to qualify as a Competent Person as defined in the JORC Code (2012).
The RL2002 resource was initially classified in accordance with the guidelines of the JORC Code (2012). The Qualified Person has not done sufficient work to classify the historical estimate as a current Mineral Resource and the estimate does not meet CIM Definition Standards for Mineral Resources & Mineral Reserves and S-K 1300 Definitions. Energy Fuels is not treating the historical estimate as a current Mineral Resource and is disclosed for background purposes only and should not be relied upon.
24.3 Phase 2 historical reserve estimate
Astron completed the Phase 2 - RL2002 "pre-feasibility study" for the Donald project in June 2023. AMC prepared the reserve estimate using the historical resource estimate (bmfin2015f.dm) reported by AMC in 2016 (AMC, 2016b) and studies completed on RL2002 by Astron, which included cost and price inputs, a strategic mine schedule and recovery rates. AMC updated the inputs and assumptions where appropriate, using external sources such as contractor prices, its in-house proprietary tool to estimate mining and operating costs from first principles, and experience with similar mining projects. The results were also compared with benchmarks.
The basis of the reserve estimate and related assumptions were established to a ±25% level of accuracy as follows:
• Product pricing assumptions for HM sands products based on consensus real Q1 2023 forecast prices provided by TZMI in a commissioned mineral sands market report and adjusted for the quality characteristics of the Donald products. Downstream processing costs were considered in the pricing assumptions applied to the production of HMC.
• Product pricing assumptions for rare earth products based on real Q1 2023 forecast prices provided by Adamas Intelligence, which considered the costs of processing REEC products into final products.
• Product specifications and recovery assumptions based on metallurgical testwork results derived from the laboratory-scale and pilot-scale testwork involving test pit material and sonic drill bulk samples as disclosed in Item 13.
• The exclusion of xenotime due to the historical samples used in the resource estimate not being analyzed for xenotime. Metallurgical testwork confirmed the REE composition (monazite-to-xenotime ratio) to be relatively consistent across the Donald deposit. As such, the economic model used for the reserve estimate included assumptions used in the MIN5532 Mineral Reserve estimate to account for the xenotime content of REEC.
• Mining cost assumptions developed by AMC including clearing, rehabilitation, and topsoil, subsoil and ore mining costs.
• Vehicle and haulage costs determined from first principles based of the required vehicle fleet, haulage travel times, operating hours and productivities.
• Processing cost assumptions determined from first principles, with estimated operating costs for each stage of processing. Costs relate to ore processing, reagents, concentrate transport and zircon cleaning.
• Transport and logistics costs assumptions based on recent container freight and haulage costs to port and from Australia to international markets.
• Other operating costs such as administration, labour, environmental management and general expenses developed from first principles based on expected organizational structure and manning levels, operating schedules and rostering requirements, materials requirements, other equipment, communications, IT, consultants and recruitment costs.
|
Energy Fuels Inc. Technical Report – Donald Rare Earths and Mineral Sands Project, Victoria, Australia |
The material assumptions used in the reserve estimate are summarized in Table 24.3.
Table 24.3 Summary of material assumptions for RL2002 reserve estimate
| Criteria | Assumption (real 2022 terms) |
| Physical production parameters |
• Average strip ratio - 2.2:1 • Mining equipment - truck and shovel • Ore mining rate - 7.5 Mt/a up to 15 Mt/a |
| Opex | • LOM average costs: – Direct mining - $6.15/bcm of combined ore, overburden and topsoil – Processing - $2.90/t of ore mined – Other operating costs - $3.86/t of ore processed – Rehabilitation costs - $0.07/t of ore mined – Selling costs - $2.26/t of ore mined |
| Escalation | • All modelling has been performed on a real basis based on assumed product pricing and quoted operating costs |
| FX rate | • US$0.70:A$1.00 |
Source: AMC
The methodology in determining the reserve estimate was:
• The deposit was assessed through pit optimization, detailed mine design, mine scheduling and economic modelling.
• Individual discrete mining blocks were digitized around ore and overburden. Pillars of in-situ material were left between adjacent mining strips to prevent tails from entering the working areas. Mining dilution and ore loss were inherent in the process, and no additional dilution or ore loss was applied when converting the resource model for mine planning.
• The extent and depth of the area to be mined was decided by pit optimization using the Lerchs- Grossmann algorithm. Nested pit shells were generated and tested with sensitivities on mining cost, processing cost, metal price and recoveries, and formed the basis of the optimal pit shell to maximize value and achieve operational design requirements.
• The Lerchs-Grossmann pit optimizations assessed Measured and Indicated classified material only. No Inferred material was included in the Lerchs-Grossmann assessment.
• Vertical walls were used for the geotechnical slopes for the purpose of the Lerchs-Grossmann optimization.
• Required capital expenditure mostly related to mining vehicles, with a portion related to infrastructure such as fuel storage and a workshop.
• The pit to be mined in 500 mN by 500 mE wide blocks in a strip sequence. The mining method will be by truck and excavator, similar to the method proposed for MIN5532.
• Ore will be fed into a MUP where it is screened and slurried and pumped to the WCP.
• Sand tails from the WCP will be returned to the mine void and placed in constructed cells to be covered by previously stockpiled overburden prior to rehabilitation.
• Ore was defined as material that meets the mill limited, variable cut-off criteria. This was where the revenue from mining the ore will be greater than costs related to processing, overhead, marketing and royalties. Costs did not include mining or initial capital costs. Revenue was calculated after mining and processing recoveries. Material below the cut-off grade and above the ore was mined as overburden or waste.
|
Energy Fuels Inc. Technical Report – Donald Rare Earths and Mineral Sands Project, Victoria, Australia |
The reserve reported within RL2002 and outside of MIN5532 as of May 2023 in accordance with the guidelines of the JORC Code (2012) is summarized in Table 24.4.
Table 24.4 Donald reserve within RL2002 and outside of MIN5532 as of May 2023 (100% equity)
| Class. | Tonnes (Mt) |
Total HM (%) |
Slimes (%) |
Oversize (%) |
% of total HM | |||||
| Zircon | Rutile | Leucoxene | Ilmenite | Monazite | Xenotime | |||||
| Proved | 152 | 5.6 | 7.1 | 18.8 | 21.1 | 9.4 | 18.2 | 31.3 | 1.8 | - |
| Probable | 364 | 4.1 | 13.7 | 15.7 | 17.1 | 7.5 | 19.3 | 32.8 | 1.6 | - |
| Total | 516 | 4.6 | 11.7 | 16.6 | 18.6 | 8.2 | 18.9 | 32.3 | 1.7 | - |
Source: AMC, 2023a
Notes:
Historical reserves are reported on a 100% basis. As at the effective date of this Technical Report, Energy Fuels held a 9.48% interest in the Property.
The reserve is based on Measured and Indicated Resources contained within a mine design above a variable where the recovered block value > mining + processing cost.
The reference point for the reserve is in-situ with allowance for mining recovery.
All tonnages and grades have been rounded to reflect the relative uncertainty of the estimate, thus the sum of columns may not equal.
The reserve has been classified and reported in accordance with the guidelines of the JORC Code (2012) and has not been adjusted to conform with the 2014 CIM Definition Standards or S-K 1300 Definitions.
The information in this Technical Report that relates to the RL2002 reserve estimate is based on information compiled by Mr. Pier Federici and fairly represents this information. Mr. Federici is a Fellow of the Australasian Institute of Mining and Metallurgy and a full-time employee of AMC and is independent of DPPL, Astron and Energy Fuels. Mr. Federici has sufficient experience that is relevant to the style of mineralization and type of deposit under consideration and to the activity being undertaken to qualify as a Competent Person as defined in the JORC Code (2012).
The RL2002 historical reserve was initially classified in accordance with the guidelines of the JORC Code (2012). The Qualified Person has not done sufficient work to classify the reserve estimate as a current Mineral Reserve and the estimate does not meet CIM Definition Standards for Mineral Resources & Mineral Reserves and S-K 1300 Definitions. Energy Fuels is not treating the historical estimate as a current Mineral Reserve and is disclosed for background purposes only and should not be relied upon.
The following material issues have been identified by the Qualified Person responsible for the review of the Mineral Reserve estimate regarding modifying factors that may materially affect the progress of Phase 2 and the conversion of the RL2002 resources to Mineral Reserves:
• The reserve is in a Retention Licence without the necessary and state and federal approvals and permits in place for mining, environmental, cultural and social issues.
• DPPL has limited freehold ownership over the surface of RL2002 outside of MIN5532. There is no guarantee that land can be purchased or accessed in a timely manner to allow production to proceed.
• The reserve is based on a study at ±25% accuracy completed in June 2023. The HM and REE concentrate prices, and capex and opex assumptions used in the study are subject to review to reflect current market conditions.
• The financing and timing for the commencement of the Phase 2 operation has yet to be determined.
|
Energy Fuels Inc. Technical Report – Donald Rare Earths and Mineral Sands Project, Victoria, Australia |
25 Interpretation and conclusions
The Donald Rare Earths and Mineral Sands Project is a planned greenfield development of the Donald HM sands deposit in the Wimmera region of western Victoria, Australia. The deposit is covered by Mining Licence MIN5532 and Retention Licence RL2002 (the Property) owned by Astron through its subsidiary DPPL. In June 2024, Energy Fuels Inc. entered a JV agreement with Astron, committing the first $183 million in capital investment to earn a 49% interest in the Property. Energy Fuels also secured offtake rights for 100% of the REEC product. As at the effective date of this Technical Report, Energy Fuels held a 9.48% equity interest in DPPL and its remaining earn-in obligation is forecast to be $127.3 million.
The Loxton Sand is the host sequence to the sheet-like HM sand deposit that contains zircon, rutile (and anatase), leucoxene, ilmenite, monazite, and xenotime. Monazite and xenotime contain rare earth elements, including neodymium, praseodymium, dysprosium, and terbium.
The project has undergone multiple drilling programs, and a total of 704 holes (16,985.4 m) have been drilled in MIN5532 and 805 holes (20,944 m) in RL2002.
The Phase 1 development will mine ore at a rate of 7.5 Mt/a and produce an average of approximately 192 kt/a of HMC and 7,100 t/a of REEC over a 40-year project life within MIN5532.
Mining will follow a strip mining method. Process tailings will be returned to tailings cells constructed in the void left behind the active mining block. Waste overburden will be backfilled behind the active tailings cell and above consolidated tailings.
Conventional truck and shovel open pit mining, by an independent contractor will produce 7.5 Mt/a of feed to a relocatable in-pit MUP. The mining contract will include topsoil and subsoil stripping, overburden stripping, ore mining by bulldozer push to the MUP, construction of the tailings cells, overburden backfilling and subsoil and topsoil replacement and contouring. Final site rehabilitation will be carried out by other contractors.
Specialized processing is required due to the fine-grained nature of the deposit. Testwork since 2018 confirmed a gravity and flotation process flowsheet to produce HMC and REEC. The process includes spiral separation, flotation and filtration to achieve high recovery rates. The processing infrastructure includes:
• Screens, deslime hydro-cyclones, thickening plant
• The WCP
• The CUP
• HMC storage and transport facilities.
The Mineral Reserve within MIN5532 (as of 31 December 2025) is Proven: 254 Mt at 4.5% HM and Probable: 40 Mt at 4.2% HM. Environmental approvals were renewed in 2018 for the Work Plan area within ML5532, which will provide the initial 19-year mine life. Approval of the final Phase 1A Work Plan variation is anticipated ahead of the scheduled FID in March 2026.
DPPL currently owns freehold titles covering a total of 705 ha within the Work Plan area. The remaining freehold titles are the subject of an option in favour of DPPL with settlement scheduled at FID.
Initial capital expenditure commences in 2026. Following the initial investment period, which results in a maximum negative cash flow of about $473 million in mid-2027, payback is achieved in 2034. Over the LOM, the project generates a cumulative post-tax cash flow of about $3,000 million, a post-tax NPV of about $470 million at an 8% discount rate applied to annual cash flows, with an IRR of 16%.
The key milestone dates for the Phase 1 project development are:
• Process plant earthworks contract awarded - January 2026
• FID - March 2026
|
Energy Fuels Inc. Technical Report – Donald Rare Earths and Mineral Sands Project, Victoria, Australia |
• Process plant EPC contract award - March 2026
• Earthworks commence - March 2026
• Process plant EPC works commence - September 2026
• Process plant commissioning commences - August 2027
• First products produced - Q1 2028.
Critical path activities required to develop the project include:
• Receipt of outstanding regulatory approvals including secondary permits
• Finalise acquisition of remaining surface rights within the Work Plan area
• Debt funding secured
• TSF development
• Mine development and pre-strip
• Process plant construction.
The identified material project risks for Phase 1 are:
• Commodity pricing - the project is very sensitive to the low side concentrate prices. A sustained low-price environment would materially impact project economics.
• The estimated processing operating cost of approximately $4.46/t is on the low side relative to comparable mineral sands operations. While several cost assumptions appear reasonable, there is potential upside risk, particularly in labour and reagent costs. Labour rates are based on published benchmarks that have shown limited escalation in recent years and may understate current market conditions, and some internal inconsistencies are noted between comparable supervisory roles. Reagent and consumables pricing is lower than recent experience on similar projects, and actual costs may be higher once final supplier quotations are obtained. Power and consumables assumptions, while broadly reasonable, could further contribute to cost variability if offsets are lower than assumed. Product transport costs of approximately $60/t are considered reasonable. Overall, the operating cost estimate is viewed as optimistic but within an acceptable range for the level of study, with identified risks addressed through sensitivity analysis.
• The process plant capital cost estimate is based largely on mid-2024 pricing with limited escalation applied to the December 2025 FID date and given recent industry cost escalation rates and construction labour risks, actual capital costs may be higher and trend toward the upper end of the stated estimate accuracy range.
• Inability to secure timely land access to the remaining portions of MIN5532 not owned by DPPL due to unrealistic land value expectations or landowners unwilling to negotiate. Failure to secure timely access could delay execution.
• Raw water shortages as only 3.1 GL/a can be sourced through the GWMWater network upgrade. This may be insufficient under stress conditions or ramp up.
• Ore loss/dilution during mining process due to misalignment between the Mineral Reserve and actual mining performance. This could negatively affect recoveries and project economics.
• Reduced mining productivity due to insufficient dewatering of the orebody with water remaining in, or re-entering, mining blocks due to incorrect feasibility study dewatering assumptions or dewatering methods. This could materially reduce mining productivity.
|
Energy Fuels Inc. Technical Report – Donald Rare Earths and Mineral Sands Project, Victoria, Australia |
26 Recommendations
The following recommendations are made by the Qualified Persons. The activities are considered part of normal operational and compliance improvements and are not expected to materially affect the economic viability of the project. The costs associated with implementing these recommendations are adequately covered within the proposed capital and operating cost estimates disclosed in Item 21. DPPL currently has no work program or budget in place to undertake these recommendations.
26.1 Mineral Resource estimates
The Qualified Person for the Mineral Resource estimate recommends the following to improve Mineral Resource confidence in MIN5532 (Phase 1):
• Data calibration within Area 2 of the MIN5532 Mineral Resource was used to align the historical data with the 2022 data for preliminary mining studies; however, this has reduced confidence in the Mineral Resource within Area 2 (3% of the total area of MIN5532). Additional data is required within Area 2 to improve Mineral Resource confidence and to obtain a consistent dataset.
• When access is obtained, the 250 mE by 350 mN spaced drilling should be extended to cover all of MIN5532. Data analysis should use the same grain size fractions that were used for the 2022 drilling in Area 1 and mineral assemblage, XRF and laser ablation data should be obtained that is consistent with that obtained during 2022 for Area 1. The Mineral Resource should be updated to incorporate this data.
• Inconsistencies were noted in the geological logging of the LP3 and Geera Clay units between the 2022 and historical drilling (2004-2015). The interpreted base of mineralization surface is irregular, due to the inconsistencies in interpretation of LP3 and samples selected for analysis. DPPL intends to refine the base of ore modelling, following staged grade control drilling of MIN5532 ahead of the mining advance.
26.2 Other
26.2.1 Overburden and tailings handling optimization
Explore accelerated consolidation methods (e.g. polymer additives or mechanical dewatering) to shorten tailings settlement times and reduce rehabilitation expenses.
26.2.2 Mine sequence refinement
Continue to assess early-stage pit designs to maximize high-value material extraction while minimizing initial capital expenditure.
26.2.3 Dewatering system optimization
Assess real-time groundwater monitoring and predictive modelling to improve efficiency and reduce excess pumping costs.
Investigate potential for water recycling from dewatering operations to reduce overall water demand.
26.2.4 Technology integration for cost reduction
Consider the use of high-precision GPS-controlled excavation and haulage systems to improve accuracy and reduce material movement costs.
|
Energy Fuels Inc. Technical Report – Donald Rare Earths and Mineral Sands Project, Victoria, Australia |
26.2.5 Detailed engineering and process optimization
Conduct additional engineering design refinements to further optimize material handling, energy efficiency, and water recycling.
Assess opportunities to further automate key processing steps to reduce operational costs and improve plant reliability.
26.2.6 Environmental, social, and regulatory compliance
Strengthen EES, ensuring full alignment with local and international regulations for mining waste management, water usage, and emissions control.
Expand community and stakeholder engagement efforts, particularly around relocation plans, job creation, and environmental sustainability initiatives.
26.2.7 Logistics and infrastructure readiness
Finalize agreements with transport and logistics contractors for shipping container handling and export procedures.
26.2.8 Financing strategy
Secure final offtake agreements for HMC to provide revenue certainty and attract investors.
Explore opportunities for government incentives, subsidies, or strategic partnerships to enhance project financing.
By implementing these recommendations in the next study stage, the project can significantly improve its investment attractiveness, reduce risks, and secure the necessary funding for full-scale development.
|
Energy Fuels Inc. Technical Report – Donald Rare Earths and Mineral Sands Project, Victoria, Australia |
27 References
| Author | Title |
| Argus Media, 2024 | Donald Rare Earths and Mineral Sands Project Independent Market Expert Report. Unpublished report prepared for Astron Corporation October 2024. |
| Adamas Intelligence, (2025) | Medium and long term price forecasting updates in Q4, 2025. Unpublished report prepared for Astron Corporation Ltd, Q4 2025 |
| Astron Corporation Limited, 2023a | Donald Rare Earth & Mineral Sands Project Phase 1 - Definitive Feasibility Study. Unpublished report prepared for Astron Corporation Ltd, 27 April 2023 |
| Astron Corporation Limited, 2023b | Donald Rare Earth & Mineral Sands Project Phase 2 - RL2002 Pre-feasibility Study Report. Unpublished report prepared for Astron Corporation Ltd, 26 June 2023 |
| Astron Corporation Limited, 2023c | Investor Presentation Donald Project DFS. ASX market announcement 17 May 2023 |
| Astron Corporation Limited, 2025d | Astron.FinModUpdate.011.xls. Excel cashflow model. |
| DMS1-01400-FN-REP-0001 _OPEX Estimate Report - signed | |
| DMS1-01400-FN-REP-0002_0 Capex BOE Report - signed | |
| DMS1-06700-GO-REP-0001_Review of Test Pits Rev01 - signed | |
| Astron Limited, 2025 | Draft - Donald Project Revised Economics Study Q4 2025. Unpublished report prepared for Astron Ltd, 19 December 2025 |
| AMC Consultants Pty Ltd, 2006 | Mineral Resource Estimate Mineral Sand Deposit Donald Project Area, Phase 2. Unpublished report prepared for Astron Limited. AMC Project 105084. |
| AMC Consultants Pty Ltd, 2010 | Update of the Resource Estimate for the Mining Application area of the Donald Deposit, Murray Basin Victoria, to include recent drilling results. Unpublished report prepared for Astron Limited. AMC Project 110097. |
| AMC Consultants Pty Ltd, 2011 | Resource Estimate for Proposed MIN5532 and EL4433 Donald Mineral Sands Deposits. Unpublished report prepared for Astron Limited. AMC Project 110097. |
| AMC Consultants Pty Ltd, 2012a | Donald Feasibility Study & Reserve Estimate. Unpublished letter report prepared for Donald Mineral Sands Pty Ltd. AMC Project 111019. |
| AMC Consultants Pty Ltd, 2012b | Resource Estimates for MIN5532 Donald Mineral Sands Deposits. Unpublished report prepared for Donald Mineral Sands Pty Ltd. AMC Project 111070. |
| AMC Consultants Pty Ltd, 2012c | Resource Estimates for EL4433 Donald Mineral Sands Deposits. Unpublished report prepared for Donald Mineral Sands Pty Ltd. AMC Project 111070. |
| AMC Consultants Pty Ltd, 2016a | Resource Estimate for MIN5532 Donald Mineral Sands Deposits. Unpublished report prepared for Donald Mineral Sands Pty Ltd. AMC Project 115075. |
| AMC Consultants Pty Ltd, 2016b | Resource Estimate for RL2002 Donald Mineral Sands Deposits. Unpublished report prepared for Donald Mineral Sands Pty Ltd. AMC Project 115075. |
| AMC Consultants Pty Ltd, 2023a | Donald Rare Earth and Mineral Sands Project - Mining Feasibility Study. Unpublished report prepared for Donald Mineral Sands Pty Ltd, 31 March 2023. AMC Project 122003 |
| AMC Consultants Pty Ltd, 2023b | Donald Rare Earth and Mineral Sands Project - Mining Work Plan. Unpublished report prepared for Donald Mineral Sands Pty Ltd, 1 August 2023. AMC Project 122003 |
| AMC Consultants Pty Ltd, 2025a | Donald Project Ore Reserve Update. Unpublished report prepared for Donald Mineral Sands Pty Ltd, 10 December 2025. AMC Project 0125226 |
| AMC Consultants Pty Ltd, 2025b | Donald Project Donald Mineral Sands Alternative MUP. Unpublished report prepared for Donald Mineral Sands Pty Ltd, 10 December 2025. AMC Project 0124111 |
| ATC Williams Pty Ltd, 2023 | Donald Rare Earths and Mineral Sands Project, Tailings Storage Facility Definitive Feasibility Design. Unpublished report prepared for Donald Mineral Sands Pty Ltd, April 2023. |
| ATC Williams Pty Ltd, 2024 | Donald Project, External Tailings Storage Facility, Detailed Design. Unpublished report prepared for Astron Limited, November 2024. |
| CDM Smith Australia, 2025 | Groundwater modelling of dewatering optimisation, Unpublished report prepared for Astron Corporation, November 2025. |
|
Energy Fuels Inc. Technical Report – Donald Rare Earths and Mineral Sands Project, Victoria, Australia |
| Author | Title |
| CIM, 2014 | CIM Definition Standards for Mineral Resources & Mineral Reserves. Prepared by the CIM Standing Committee on Reserve Definitions. Adopted by CIM Council on 19 May, 2014 |
| CloudGSM, 2023 | Donald Mineral Sands Groundwater Impact Assessment. Unpublished report prepared for Donald Mineral Sands Pty Ltd, August 2023. Report number DMS1 01100 EN REP 0003 |
| Donald Project Pty Ltd, 2024 | Donald Rare Earth and Mineral Sands Project, Mine Work Plan. Unpublished report prepared for Donald Project Pty Ltd, May 2024 |
| Donald Project Pty Ltd, 2025 | Donald Rare Earth and Mineral Sands Project, Updated Economics Study. Unpublished report prepared for Donald Project Pty Ltd, July 2025 |
| JORC Code, 2012 | The 2012 edition of the Australasian Code for Reporting of Exploration Results, Mineral Resources and Ore Reserves. Prepared by the Joint Ore Reserves Committee of The Australasian Institute of Mining and Metallurgy, Australian Institute of Geoscientists and Minerals Council of Australia (JORC). |
| Rheinberger, G. M., 1990 | EL's 757, 774, 787, 789-791, 793, 798-800, 808, 999, 1255-1258. 1260, 1261, 1264, 1266, 1298, 1315, 1344, 1362, 1364, 1424 & 1917 Combined Horsham and Kerang Blocks, Victoria, Statutory Progress Report for Six Month Period Ending 31st July, 1990. Unpublished report prepared for CRA Exploration Pty Limited. CRAE Report No. 16782. |
| Rheinberger, G. M., 1991 | EL's 757, 774, 787, 789-791, 793, 798-800, 808, 999, 1255-1258. 1260, 1261, 1264, 1266, 1298, 1315, 1344, 1362, 1364, 1424 & 1917 Combined Horsham and Kerang Blocks, Victoria, Statutory Progress Report for Six Month Period Ending 31st January, 1991. Unpublished report prepared for CRA Exploration Pty Limited. CRAE Report No. 17148. |
| Rhein Berger, G. M., 1991 | EL's 757, 774, 787, 789-791, 793, 798-800, 808, 999, 1255-1258. 1260, 1261, 1264, 1266, 1298, 1315, 1344, 1362, 1364, 1424 & 1917 Combined Horsham and Kerang Blocks, Victoria, Statutory Progress Report for Six Month Period Ending 31st July, 1991. Unpublished report prepared for CRA Exploration Pty Limited. CRAE Report No. 17457. |
| Snowden Optiro, 2022 | Donald Deposit - 2022 Mineral Resource Estimate. Unpublished report prepared for Astron Corporation Ltd, November 2022. Snowden Optiro Project Number DA206891 |
| Snowden Optiro, 2025a | Donald Deposit - Updated 2022 Mineral Resource Estimate. Unpublished report prepared for Astron Corporation Ltd, December 2025. Snowden Optiro Project Number DA206891 |
| Snowden Optiro, 2025b | Donald Deposit - 2025 Grade Control Model. Unpublished report prepared for Astron Corporation Ltd, December 2025. Snowden Optiro Project Number DA206891 |
| Sedgman Pty Ltd, 2024a | B078-D02-10011-PA-0002_Donald TCE Basis of Estimate_Sedgman |
| Sedgman Pty Ltd, 2024b | DMS1-01400-FN-REP-0002_0 Capex BOE Report - signed |
| Shepherd, M., 2005 | Donald Mineral Resource Report for Prefeasibility Study. Unpublished report prepared by Michael Sheperd & Associates for Zirtanium Ltd in May 2005. |
| Smart, J. and Allnutt, S. L., 1990 | Preliminary Resource Estimates for the Jackson (WIM 200), Donald (WIM 250) and Balmoral North (WIM 100) Prospects and Revision of WIM 150 and Balmoral. Unpublished report prepared for CRA Exploration Pty Limited. |
| Thiess, 2004a | Conceptual Mine Plan for the Zirtanium Minerals Sands Project, Central Western Victoria. Unpublished report prepared for Zirtanium Ltd in February 2004. |
| Thiess, 2004b | Resource Analysis Zirtanium Minerals Sands Project, Central Western Victoria. Unpublished report prepared for Zirtanium Ltd in September 2004. |
| TZMI, 2025 | HMC and Product Pricing Update. Unpublished report prepared Astron Corporation in November 2025. |
| Waterfield, D. W., 1992 | EL's 757, 774, 787, 789-791, 793, 798-800, 808, 999, 1255-1258. 1260, 1261, 1264, 1266, 1298, 1315, 1344, 1362, 1364, 1424 & 1917 Combined Horsham and Kerang Blocks, Victoria, Annual Report for Period Ending 31st July, 1992. Unpublished report prepared for CRA Exploration Pty Limited. CRAE Report No. 18162. |
| Zirtanium Ltd, 2005 | Prefeasibility Study on the Donald Project Area. Unpublished report. |
|
Energy Fuels Inc. Technical Report – Donald Rare Earths and Mineral Sands Project, Victoria, Australia |
28 Certificates
Certificate of Qualified Person - Allan Earl
I, Allan Earl, Executive Consultant of Snowden Optiro, Level 9/216 St Georges Terrace, Perth Western Australia, do hereby certify that:
a) I am the co-author of the technical report titled Technical Report for the Donald Rare Earths and Mineral Sands Project, Australia and dated effective 31 December 2025 (the 'Technical Report') prepared for Energy Fuels Inc.
b) I graduated with an Associateship in Mining Engineering from the Western Australian School of Mines in 1977.
c) I am a Fellow of the Australasian Institute of Mining and Metallurgy, with membership no. 110247.
d) I have worked as a mining engineer continuously for 45 years since graduation. I have been involved as a mining and resource evaluation consultant for over 30 years, and work has included: scoping studies, prefeasibility studies, feasibility studies, and reserve estimation for open pit and underground mines for at least 5 years of these years.
e) I have read the definition of 'qualified person' set out in National Instrument 43-101 ('the Instrument') and certify that by reason of my education, affiliation with a professional association and past relevant work experience, I fulfil the requirements of a 'qualified person' for the purposes of the Instrument.
f) I made a current visit to the Donald project on 27-28 August 2024.
g) I am responsible for the preparation of Items 1-6, 16, 21.1.7, 21.3.1, 21.3.3-21.3.4 and 22-29 of the Technical Report.
h) I am independent of the issuers as defined in section 1.5 of the Instrument.
i) I have had prior involvement with the property that is the subject of the Technical Report.
j) I have read the Instrument and Form 43-101F1, and the Technical Report has been prepared in compliance with that instrument and form.
k) As of the effective date of this Technical Report, to the best of my knowledge, information and belief, the Technical Report contains all the scientific and technical information that is required to be disclosed to make the Technical Report not misleading.
Dated at Perth WA this 17th February 2026
Allan Earl AWASM, FAusIMM
Executive Consultant
|
Energy Fuels Inc. Technical Report – Donald Rare Earths and Mineral Sands Project, Victoria, Australia |
Certificate of Qualified Person - Pier Federici
I, Pier Federici, Principal Consultant of AMC Consultants, Level 12, 477 Collins Street, Melbourne, Victoria, Australia, do hereby certify that:
a) I am the co-author of the technical report titled Technical Report for the Donald Rare Earths and Mineral Sands Project, Victoria, Australia and dated effective 31 December 2025 (the 'Technical Report') prepared for Energy Fuels Inc.
b) I graduated with a Batchelor of Engineering in Mining Engineering from Curtin University in 1991.
c) I am a Fellow of the AusIMM, and Chartered Professional with membership number 102640.
d) I have worked as a mining engineer continuously for 35 years.
e) I have read the definition of 'qualified person' set out in National Instrument 43-101 ('the Instrument') and certify that by reason of my education, affiliation with a professional association and past relevant work experience, I fulfil the requirements of a 'qualified person' for the purposes of the Instrument.
f) I made a site visit to the Donald Project in July 2013.
g) I am responsible for the preparation of Item 15 of the Technical Report.
h) I am independent of the issuers as defined in section 1.5 of the Instrument.
i) I have had prior involvement with the property that is the subject of the Technical Report.
j) I have read the Instrument and Form 43-101F1, and the Technical Report has been prepared in compliance with that instrument and form.
k) As of the effective date of this Technical Report, to the best of my knowledge, information and belief, the Technical Report contains all the scientific and technical information that is required to be disclosed to make the Technical Report not misleading.
Dated at Melbourne Victoria this 17th February 2026
Pier Federici, Qualifications and other affiliations FAusIMM (CP Mining)
Principal Consultant
|
Energy Fuels Inc. Technical Report – Donald Rare Earths and Mineral Sands Project, Victoria, Australia |
Certificate of Qualified Person - Christine Standing
I, Christine Standing, Executive Consultant of Snowden Optiro, Level 9, 216 St Georges Terrace, Perth, Western Australia, do hereby certify that:
a) I am the co-author of the technical report titled Technical Report for the Donald Rare Earths and Mineral Sands Project, Victoria, Australia and dated effective 31 December 2025 (the 'Technical Report') prepared for Energy Fuels Inc.
b) I graduated with a B.Sc. (Hons) in Geology from the University of Western Australia (Australia) in 1981, and with an M.Sc. in Mineral Economics from Curtin University (Australia) in 2016.
c) I am a Member in good standing of the Australian Institute of Geoscientists - Membership No. 2470.
d) I have worked as a geologist continuously for 44 years since graduation from the University of Western Australia. I have worked as an exploration geologist for 6 years and have worked as a consultant for the past 38 years, working on resource estimation, due diligence studies and reconciliation for a range of commodities, including heavy mineral sands.
e) I have read the definition of 'qualified person' set out in National Instrument 43-101 ('the Instrument') and certify that by reason of my education, affiliation with a professional association and past relevant work experience, I fulfil the requirements of a 'qualified person' for the purposes of the Instrument.
f) I have not made a current visit to the Donald Rare Earths and Minerals Sands Project.
g) I am responsible for the preparation of Items 6, 7, 8, 10, 11, 12, 14 and 24.2 of the Technical Report.
h) I am independent of the issuer as defined in section 1.5 of the Instrument.
i) I have had no prior involvement with the property that is the subject of the Technical Report.
j) I have read the Instrument and Form 43-101F1, and the Technical Report has been prepared in compliance with that instrument and form.
k) As of the effective date of this Technical Report, to the best of my knowledge, information and belief, the Technical Report contains all the scientific and technical information that is required to be disclosed to make the Technical Report not misleading.
Dated at Perth, Western Australia this 17th February 2026
Christine Standing MAIG, BSc (Hons), MSc
Executive Consultant
|
Energy Fuels Inc. Technical Report – Donald Rare Earths and Mineral Sands Project, Victoria, Australia |
Certificate of Qualified Person - Peter Allen
I, Peter Allen, Manager – Technical Services of GR Engineering Services, 71 Daly Street, Ascot, Western Australia, and an Associate of Snowden Optiro do hereby certify that:
a) I am the co-author of the technical report titled Donald Rare Earths and Mineral Sand Project, Victoria, Australia and dated 31 December 2025 (the 'Technical Report') prepared for Anglo American plc.
b) I graduated with a B. Eng. (Metallurgy) from the University of Queensland in 1981.
c) I am a Registered Professional Engineer of Queensland (RPEQ) and a Member and Chartered Professional in good standing of the Australasian Institute of Mining and Metallurgy (MAusIMM) (CP) - membership no. 103637.
d) I have more than 35 years' experience including process design, process equipment selection and evaluation, metallurgical testwork initiation and development, plant commissioning, and ongoing operational support. Throughout this career, I have been responsible for, and provided key technical input into, the process engineering and design of numerous minerals projects in Australia and internationally.
e) I have read the definition of 'qualified person' set out in National Instrument 43-101 ('the Instrument') and certify that by reason of my education, affiliation with a professional association and past relevant work experience, I fulfil the requirements of a 'qualified person' for the purposes of the Instrument.
f) I have not made a current site visit to the Donald Rare Earths and Mineral Sands Project.
g) I am responsible for the preparation of Items 13, 17, 18.1 and 18.3-18.9, 21.1.1-21.1.6, 21.2 and 21.3.2-21.3.4 of the Technical Report.
h) I am independent of the issuer as defined in section 1.5 of the Instrument.
i) I have had no prior involvement with the property.
j) I have read the Instrument and Form 43-101F1, and the Technical Report has been prepared in compliance with that instrument and form.
k) As of the effective date of this Technical Report, to the best of my knowledge, information and belief, the Technical Report contains all the scientific and technical information that is required to be disclosed to make the Technical Report not misleading.
Dated at Ascot, Western Australia this 17th February 2026
Peter Allen B. Eng. (Metallurgy), RPEQ, MAusIMM (CP)
Manager - Technical Services
|
Energy Fuels Inc. Technical Report – Donald Rare Earths and Mineral Sands Project, Victoria, Australia |
Certificate of Qualified Person - Peter Theron
I, Peter Jonathan Theron, Director and Principal Consultant of Prime Resources (Pty) Ltd, The Workshop, 70-7th Avenue, Parktown North, Johannesburg, South Africa, and an Associate of Snowden Optiro do hereby certify that:
a) I am the co-author of the technical report titled Technical Report for the Donald Rare Earths and Mineral Sands Project, Victoria, Australia and dated effective 31 December 2025 (the 'Technical Report') prepared for Energy Fuels Inc.
b) I graduated from the University of Pretoria with a B. Eng. (Civil) in 1985 and from the Witwatersrand University with a Graduate Diploma in Engineering (GDE) in 1995.
c) I am a member in good standing of the Engineering Council of South Africa and am registered as a Professional Engineer - registration no. 950329. I am a Member in good standing of the South African Institute of Mining and Metallurgy (SAIMM) - membership no. 703496.
d) I have worked as a civil and environmental engineer continuously since graduation. I have more than 35 years of consulting experience in the field of tailings design, waste management and environmental studies.
e) I have read the definition of 'qualified person' set out in National Instrument 43-101 ('the Instrument') and certify that by reason of my education, affiliation with a professional association and past relevant work experience, I fulfil the requirements of a 'qualified person' for the purposes of the Instrument.
f) I have not made a current visit to the Donald Rare Earths and Minerals Sands Project.
g) I am responsible for the preparation of Items 18.2 and 20.2 of the Technical Report.
h) I am independent of the issuer as defined in section 1.5 of the Instrument.
i) I have had no prior involvement with the property that is the subject of the Technical Report.
j) I have read the Instrument and Form 43-101F1, and the Technical Report has been prepared in compliance with that instrument and form.
k) As of the effective date of this Technical Report, to the best of my knowledge, information and belief, the Technical Report contains all the scientific and technical information that is required to be disclosed to make the Technical Report not misleading.
Dated at Hermanus, South Africa this 17th February 2026
Peter J Theron B. Eng. (Civil), GDE, Pr. Eng. (ECSA), MSAIMM
Associate Principal Consultant
|
Energy Fuels Inc. Technical Report – Donald Rare Earths and Mineral Sands Project, Victoria, Australia |
Certificate of Qualified Person - Gené Main
I, Gené Main, Principal Environmental Consultant of Prime Resources (Pty) Ltd, The Workshop, 70-7th Avenue, Parktown North, Johannesburg, South Africa, and an Associate of Snowden Optiro do hereby certify that:
a) I am the co-author of the technical report titled Technical Report for the Donald Rare Earths and Minerals Sands Project, Victoria, Australia and dated effective 31 December 2025 (the 'Technical Report') prepared for Energy Fuels Inc.
b) I graduated with a B.Sc. (Hons.) in Environmental Science from Rhodes University (South Africa) in 2003, and with a M.Sc. in Botany from the University of the Western Cape (South Africa) in 2006.
c) I am registered as a Certified Environmental Practitioner (registration no. 2019/1257) with the Environmental Assessment Practitioners Association of South Africa (EAPASA), and as a as a Professional Natural Scientist (Environmental Science) (registration no. 400370/13) with the South African Council for Natural Scientific Professions (SACNASP). I am a member in good standing of the International Association for Impact Assessment South Africa (IAIASA) (membership no. 5932).
d) I have worked as an environmental and social consultant for 18 years since graduation. I have worked as a Principal Environmental Consultant for 10 years, primarily in the mining and waste management sectors.
e) I have read the definition of 'qualified person' set out in National Instrument 43-101 ('the Instrument') and certify that by reason of my education, affiliation with a professional association and past relevant work experience, I fulfil the requirements of a 'qualified person' for the purposes of the Instrument.
f) I have not made a current visit to the Donald Rare Earths and Minerals Sands Project.
g) I am responsible for the preparation of Items 20.1 and 20.3-20.3.6 of the Technical Report.
h) I am independent of the issuer as defined in section 1.5 of the Instrument.
i) I have had no prior involvement with the property that is the subject of the Technical Report.
j) I have read the Instrument and Form 43-101F1, and the Technical Report has been prepared in compliance with that instrument and form.
k) As of the effective date of this Technical Report, to the best of my knowledge, information and belief, the Technical Report contains all the scientific and technical information that is required to be disclosed to make the Technical Report not misleading.
Dated at Rotorua, New Zealand this 17th February 2026
"Signed"
Gené Main, M.Sc. (Botany), Registered EAP (EAPASA), Pr.Sci.Nat. (Environmental Science)
Associate Principal Consultant
|
Energy Fuels Inc. Technical Report – Donald Rare Earths and Mineral Sands Project, Victoria, Australia |
29 Date and signature
This report titled "Technical Report for the Donald Rare Earths and Mineral Sands Project, Victoria, Australia" with an effective date of 31 December 2025 was prepared and signed by the following authors:
| /s/ Allan Earl |
|
| Dated at Perth Australia 17 February 2026 |
Mr. Allan Earl, FAusIMM |
| /s/ Christine Standing |
|
| Dated at Perth Australia 17 February 2026 |
Mrs. Christine Standing, MAIG |
| /s/ Pier Federici |
|
| Dated at Melbourne Australia 17 February 2026 |
Mr. Pier Federici, FAusIMM (CP Min) |
| /s/ Peter Allen |
|
| Dated at Perth Australia 17 February 2026 |
Mr. Peter Allen, MAusIMM (CP) |
|
/s/ Peter Theron |
|
| Dated at Hermanus South Africa 17 February 2026 |
Mr. Peter Theron, MSAIMM, Pr Eng ECSA |
|
/s/ Gené Main |
|
| Dated at Rotorua New Zealand 17 February 2026 |
Ms. Gené Main, Member EAPASA; Pr.Sci.Nat. SACNASP |