UNITED STATES
SECURITIES AND EXCHANGE COMMISSION
Washington, D.C. 20549
Form 6-K
REPORT OF FOREIGN PRIVATE ISSUER PURSUANT TO RULE 13a-16 OR 15d-16 UNDER THE
SECURITIES EXCHANGE ACT OF 1934
For the month of November 2025
Commission File Number: 001-39966
New Found Gold Corp.
(Exact name of registrant as specified in its charter)
1133 Melville Street, Suite 3500,
Vancouver, British Columbia
V6E 4E5 Canada
(Address of principal executive office)
Indicate by check mark whether the registrant files or will file annual reports under cover Form 20-F or 40-F:
Form 20-F ☐ Form 40-F ☒ Pursuant to the requirements of the Securities Exchange Act of 1934, the registrant has duly caused this report to be signed on behalf by the undersigned, thereunto duly authorized.
SUBMITTED HEREWITH
| Exhibit | Description | |
| 99.1 | Feasibility Study Technical Report for the Hammerdown Gold Project in Newfoundland dated October 6, 2022 |
SIGNATURES
| NEW FOUND GOLD CORP. | ||
| (Registrant) | ||
| Date: November 20, 2025 | By: | /s/ Keith Boyle |
| Keith Boyle | ||
| Chief Executive Officer | ||
 |
 |
DATE AND SIGNATURE PAGE
This report entitled NI 43-101 Feasibility Study Technical Report for the Hammerdown Project, effective as of August 15, 2022 was prepared and signed by the following authors:
Original document signed and sealed by:
| Name "Carolyn Anstey-Moore" | October 6, 2022 |
| Carolyn Anstey-Moore, P.Geo. | Date Signed |
| Name "Joannes Arisz" | October 6, 2022 |
| Joannes Arisz, M.Sc.E., P.Eng., FCSCE | Date Signed |
| Name "Robert Bowell" | October 6, 2022 |
| Robert Bowell, CChem, CGeol, FIMMM | Date Signed |
| Name "Carly Church" | October 6, 2022 |
| Carly Church, P. Eng. | Date Signed |
| Name "Gord Doerksen" | October 6, 2022 |
| Gord Doerksen, P. Eng. | Date Signed |
| Name "Dorota El Rassi" | October 6, 2022 |
| Dorota El Rassi, M. Sc., P. Eng. | Date Signed |
| Name "Michael Franceschini" | October 6, 2022 |
| Michael Franceschini, P. Eng. | Date Signed |
| Name "Stacy Freudigmann" | October 6, 2022 |
| Stacy Freudigmann, P.Eng., F.Aus.IMM. | Date Signed |
| Name "Tysen Hantelmann" | October 6, 2022 |
| Tysen Hantelmann, P. Eng. | Date Signed |
| Name "Pierre Landry" | October 6, 2022 |
| Pierre Landry, P. Geo. | Date Signed |
| Name "Mike Levy" | October 6, 2022 |
| Mike Levy, P.Eng. | Date Signed |
|
|
| Name "Shawn Russell" | October 6, 2022 |
| Shawn Russell, P.Eng. | Date Signed |
| Name "Ivana Sabaj Abumohor" | October 6, 2022 |
| Ivana Sabaj Abumohor, P.Eng. | Date Signed |
| Name "Leanne Stein" | October 6, 2022 |
| Leanne Stein, P.Eng. | Date Signed |
|
|
NOTICE
JDS Energy & Mining, Inc. prepared this National Instrument 43-101 Technical Report, in accordance with Form 43-101F1, for Maritime Resources Corp. The quality of information, conclusions and estimates contained herein is based on: (i) information available at the time of preparation; (ii) data supplied by outside sources, and (iii) the assumptions, conditions, and qualifications set forth in this report.
Maritime Resources Corp. filed this Technical Report with the Canadian Securities Regulatory Authorities pursuant to provincial securities legislation. Except for the purposes legislated under provincial securities law, any other use of this report by any third party is at that party's sole risk.
|
|
Table of Contents
| 1 Executive Summary | 1-1 |
| 1.1 Introduction | 1-1 |
| 1.2 Project Description | 1-1 |
| 1.3 Property Description - Location and Access | 1-2 |
| 1.4 Ownership | 1-2 |
| 1.5 History, Exploration and Drilling | 1-3 |
| 1.6 Geology and Mineralization | 1-3 |
| 1.7 Metallurgical Testing and Mineral Processing | 1-4 |
| 1.8 Mineral Resource Estimate | 1-4 |
| 1.9 Mineral Reserve Estimate | 1-5 |
| 1.10 Mining | 1-6 |
| 1.11 Recovery Methods | 1-7 |
| 1.12 Infrastructure and Facilities | 1-8 |
| 1.13 Environmental Studies, Permitting and Social Impacts | 1-9 |
| 1.14 Operating and Capital Cost Estimates | 1-10 |
| 1.15 Economic Analysis | 1-12 |
| 1.15.1 Main Assumptions | 1-12 |
| 1.15.2 Results | 1-14 |
| 1.15.3 Sensitivities | 1-14 |
| 1.16 Conclusions | 1-14 |
| 1.16.1 Geology and Mineral Resources | 1-15 |
| 1.17 Recommendations | 1-15 |
| 2 Introduction | 2-1 |
| 2.1 Qualified Persons (QPs) | 2-1 |
| 2.1.1 Scope of Work of Contributing Companies | 2-1 |
| 2.1.2 Qualifications and Responsibilities | 2-2 |
| 2.2 Terms of Reference | 2-4 |
| 2.3 Sources of Information | 2-4 |
| 2.4 QP Site Visits | 2-5 |
|
|
| 2.5 List Of Previous Relevant Technical Reports | 2-6 |
| 2.6 Units, Currency and Rounding | 2-7 |
| 3 Reliance on Other Experts | 3-1 |
| 4 Property Description and Location | 4-1 |
| 4.1 Location | 4-1 |
| 4.2 Mineral Tenure | 4-4 |
| 4.3 Royalties and Related Rights | 4-7 |
| 4.4 Environmental Liabilities and Considerations | 4-7 |
| 4.5 Permit Requirements | 4-7 |
| 4.6 Other Relevant Factors | 4-7 |
| 5 Accessibility, Climate, Local Resources, Infrastructure and Physiography | 5-1 |
| 5.1 Accessibility | 5-1 |
| 5.2 Local Resources and Infrastructure | 5-2 |
| 5.3 Climate | 5-3 |
| 5.4 Physiography | 5-3 |
| 6 History | 6-1 |
| 6.1 Production History | 6-3 |
| 7 Geological Setting and Mineralization | 7-1 |
| 7.1 Regional Geology | 7-1 |
| 7.2 Property Geology | 7-3 |
| 7.3 Property Mineralization | 7-6 |
| 7.4 Hammerdown-Rumbullion-Muddy Shag Vein System | 7-8 |
| 7.4.1 Hammerdown Gold Veins | 7-9 |
| 7.4.2 Rumbullion Gold Veins | 7-10 |
| 7.4.3 Muddy Shag Gold Veins | 7-10 |
| 7.4.4 Wisteria Gold Zone | 7-11 |
| 7.5 Other Mineralization | 7-13 |
| 7.5.1 Golden Anchor (Zn/Au) - (Peters, 2016), (Maritime, 2019) | 7-14 |
| 7.5.2 Orion Gold Deposit | 7-14 |
| 7.5.3 Lochinvar Deposit (Pb/Zn/Cu/Au/Ag) | 7-19 |
| 7.5.4 Rendell-Jackman Cu/Au Deposit - (Peters, 2016) | 7-21 |
| 7.5.5 Rendell-Jackman Southeast (Au) - (Peters, 2016) | 7-23 |
|
|
| 7.5.6 Whisky Bravo (Cu/Au) - (Mitton, 2005) | 7-23 |
| 7.5.7 Timber Pond VMS (Cu) - (Dyke, B., and Hussey, A.M., 2004) | 7-24 |
| 7.5.8 Timber Pond (Au/Ag) - (Dyke, B., and Hussey, A.M., 2004) | 7-24 |
| 7.5.9 Sprucy Pond Trend (Au) - (Mitton, 2005) | 7-24 |
| 7.5.10 Beetle Pond (Au/Zn) - (Peters, 2016) | 7-25 |
| 7.5.11 Muir Pond (Zn/Pb) - (Moore, P.J., and Mullen, D.V., 2002) | 7-26 |
| 7.5.12 Batters Brook (Zn) - (Moore, P.J. and Mullen, D.V., 2002) | 7-27 |
| 7.5.13 Rigel (Zn) - (Moore, P.J., and Mullen, D.V., 2002) | 7-29 |
| 7.5.14 Ursa Major / Ursa Minor / Southern Cross - (Moore, P.J., and Mullen, D.V. 2002) | 7-29 |
| 7.5.15 Pisces (Zn) - (Peters, 2016) | 7-29 |
| 7.5.16 Goldfish (Zn) - (Peters, 2016) | 7-30 |
| 7.5.17 Indian Brook (Zn) - (Moore, P.J., and Mullen, D.V. 2002) | 7-30 |
| 7.5.18 Catchers Valley (Zn) - (Moore, P.J. and Mullen, D.V., 2002) | 7-30 |
| 7.5.19 Harry's Brook (Cu) - (Peters, 2016) | 7-30 |
| 8 Deposit Types | 8-1 |
| 9 Exploration | 9-1 |
| 9.1 Introduction | 9-1 |
| 9.2 2019 Work Program | 9-3 |
| 9.3 Airborne Magnetic-Radiometric-VLF Survey | 9-3 |
| 9.4 IP Survey | 9-6 |
| 9.5 LiDAR Survey | 9-10 |
| 9.6 Diamond Drilling | 9-11 |
| 9.6.1 Golden Anchor Drilling | 9-12 |
| 9.6.2 Hammerdown East-Rumbullion Drilling | 9-14 |
| 9.7 2020 / 2021 Work Programs | 9-16 |
| 9.8 Airborne Magnetics VTEM, AIIP and ZTEM | 9-16 |
| 9.9 Ground SPEM Geophysical Surveys | 9-21 |
| 9.10 2020 to Present | 9-23 |
| 9.11 Orion North Exploration | 9-24 |
| 9.12 Area 22 Exploration | 9-24 |
| 9.13 Golden Anchor and Lochinvar Exploration | 9-27 |
| 9.13.1 Golden Anchor Gold Target | 9-27 |
|
|
| 9.13.2 Lochinvar VMS Target | 9-27 |
| 9.14 Beetle Pond Exploration | 9-27 |
| 10 Drilling (Hammerdown) | 10-1 |
| 10.1 Introduction | 10-1 |
| 10.2 Maritime Resources 2012-2019 Diamond Drill Program | 10-3 |
| 10.2.1 Maritime Resources 2012 Hammerdown Drill Program | 10-3 |
| 10.2.2 Maritime Resources 2012 Rumbullion Channel Sampling Program | 10-3 |
| 10.2.3 Maritime Resources 2017 Hammerdown Channel Sampling Program | 10-3 |
| 10.2.4 Maritime Resources 2018 Hammerdown Drill Program | 10-3 |
| 10.2.5 Maritime Resources 2019 Hammerdown Drill Program | 10-3 |
| 10.3 Maritime Resources 2020-2022 Channel Sampling and Diamond Drill Program | 10-3 |
| 10.3.1 Maritime Resources 2020 Hammerdown Drill Program | 10-4 |
| 10.3.2 2020-2021 Wisteria Channel Sampling Program | 10-6 |
| 10.3.3 2021-2022 Hammerdown Drill Program | 10-6 |
| 10.4 Diamond Drilling Procedures | 10-8 |
| 10.4.1 Drilling Procedures | 10-8 |
| 10.4.2 Surveying: Collar and Downhole Surveys | 10-8 |
| 10.4.3 Core Delivery | 10-8 |
| 10.4.4 Core Logging and Sampling | 10-8 |
| 10.4.5 Core Photography | 10-9 |
| 10.4.6 Core Cutting | 10-11 |
| 10.4.7 Core Storage | 10-12 |
| 10.5 Channel Sampling Procedures | 10-13 |
| 10.6 Drill Hole and Channel Sample Database | 10-13 |
| 10.7 Hammerdown Deposit Results | 10-13 |
| 10.8 2020 Hammerdown Grade Control Diamond Drill Program | 10-26 |
| 11 Sample Preparation, Analyses and Security | 11-1 |
| 11.1 Introduction | 11-1 |
| 11.2 Samples Preparation | 11-1 |
| 11.2.1 Pre-2012 | 11-1 |
| 11.2.2 Maritime Resources | 11-1 |
| 11.3 Analytical Method | 11-2 |
|
|
| 11.3.1 Pre-2012 | 11-2 |
| 11.3.2 Maritime Resources | 11-2 |
| 11.4 Sample Security | 11-2 |
| 11.5 Quality Control & Quality Assurance | 11-3 |
| 11.5.1 Sample Blanks | 11-3 |
| 11.6 Certified Reference Materials | 11-5 |
| 11.6.1 OREAS 217 | 11-5 |
| 11.6.2 OREAS 218 | 11-7 |
| 11.6.3 OREAS 228 | 11-8 |
| 11.6.4 OREAS 229b | 11-9 |
| 11.6.5 OREAS 231 | 11-10 |
| 11.6.6 OREAS 237 | 11-11 |
| 11.6.7 Coarse Reject Duplicates | 11-12 |
| 11.7 Qualified Person's Opinion | 11-14 |
| 12 Data Verification | 12-1 |
| 12.1 Verifications by the Authors of this Technical Report | 12-1 |
| 13 Mineral Processing and Metallurgical Testing | 13-1 |
| 13.1 Introduction | 13-1 |
| 13.2 Testing & Procedures | 13-1 |
| 13.3 Mineralogical Evaluations | 13-3 |
| 13.3.1 Mineralogy | 13-3 |
| 13.4 Testwork | 13-3 |
| 13.4.1 Historical Metallurgical Testing | 13-3 |
| 13.4.2 Recent Metallurgical Testing (2021-2022) | 13-5 |
| 13.5 Recovery Predictions | 13-15 |
| 14 Mineral Resource Estimate | 14-1 |
| 14.1 Summary | 14-1 |
| 14.2 Comparison to Previous Estimates | 14-2 |
| 14.3 Resource Database | 14-3 |
| 14.4 Reconciliation to Production Data | 14-6 |
| 14.4.1 Historical Stopes and Development | 14-6 |
| 14.4.2 Comparison | 14-6 |
|
|
| 14.5 Geological Interpretation | 14-7 |
| 14.6 Resource Assays | 14-13 |
| 14.7 Treatment of High Grade Assays | 14-14 |
| 14.7.1 Capping | 14-18 |
| 14.7.2 High Grade Restriction | 14-23 |
| 14.8 Compositing | 14-24 |
| 14.9 Trend Analysis | 14-27 |
| 14.9.1 Variography | 14-27 |
| 14.9.2 Grade Contouring | 14-36 |
| 14.10 Search Strategy and Grade Interpolation Parameters | 14-43 |
| 14.11 Bulk Density | 14-49 |
| 14.12 Block Models | 14-49 |
| 14.13 Cut-off Grade and Whittle Parameters | 14-49 |
| 14.13.1 Cut-Off Grade | 14-50 |
| 14.13.2 Pit shell Optimization | 14-50 |
| 14.13.3 Underground Constraining Shapes | 14-51 |
| 14.14 Classification | 14-51 |
| 14.15 Block Model Validation | 14-64 |
| 14.16 Mineral Resource Reporting | 14-76 |
| 14.16.1 Model Regularization Comparison | 14-78 |
| 15 Mineral Reserve Estimate | 15-1 |
| 15.1 Introduction | 15-1 |
| 15.2 Open Pit Optimization | 15-1 |
| 15.2.1 Basis of Estimate | 15-1 |
| 15.2.2 Open Pit Optimization Input Parameters | 15-3 |
| 15.2.3 Open Pit Optimization Results | 15-4 |
| 15.3 Open Pit Design | 15-8 |
| 15.3.1 Geotechnical Pit Slope Recommendations | 15-11 |
| 15.3.2 Road/Ramp Width | 15-11 |
| 15.4 Mineral Reserve Estimate | 15-12 |
| 16 Mining Methods | 16-1 |
| 16.1 Introduction | 16-1 |
|
|
| 16.2 Deposit Characteristics | 16-2 |
| 16.3 Geotechnical Analysis and Recommendations | 16-4 |
| 16.3.1 Geotechnical Characterization | 16-4 |
| 16.3.2 Geotechnical Domains and Rock Mass Properties | 16-6 |
| 16.3.3 Slope Stability Analysis | 16-8 |
| 16.3.4 Pit Slope Design Recommendations | 16-9 |
| 16.3.5 Mining Through Historic Underground Workings | 16-10 |
| 16.4 Hydrogeology | 16-10 |
| 16.5 Mining Methods | 16-11 |
| 16.6 Mine Design | 16-11 |
| 16.6.1 Waste Storage | 16-15 |
| 16.7 Mine Production Schedule | 16-16 |
| 16.8 Mine Operations | 16-22 |
| 16.8.1 Drilling | 16-23 |
| 16.8.2 Blasting | 16-23 |
| 16.8.3 Loading | 16-24 |
| 16.8.4 Hauling | 16-25 |
| 16.8.5 Support | 16-25 |
| 16.8.6 Dilution Management | 16-26 |
| 16.9 Mine Equipment | 16-26 |
| 16.10 Mine Personnel | 16-27 |
| 17 Process Description / Recovery Methods | 17-1 |
| 17.1 Introduction | 17-1 |
| 17.2 Run-of-Mine Pre-Concentration (Crushing and Sorting) | 17-1 |
| 17.2.1 Crushing and Sorting Process Design Criteria | 17-5 |
| 17.2.2 Primary Crushing | 17-6 |
| 17.2.3 Secondary Crushing and Screening | 17-6 |
| 17.2.4 Sorting | 17-6 |
| 17.2.5 Tertiary Crushing and Screening | 17-7 |
| 17.2.6 Crushed Material Stockpiling | 17-7 |
| 17.3 Nugget Pond Mineral Processing | 17-7 |
| 17.3.1 Grinding and CIP Process Design Criteria | 17-12 |
|
|
| 17.3.2 Transportation and Storage | 17-13 |
| 17.3.3 Primary and Secondary Grinding Circuit | 17-15 |
| 17.3.4 Pre-Leach Thickener | 17-17 |
| 17.3.5 Leaching and Carbon-in-Pulp Circuit | 17-17 |
| 17.3.6 Stripping, Refining, and Carbon Regeneration | 17-17 |
| 17.3.7 Tailings and Cyanide Destruction | 17-18 |
| 17.3.8 Process / Reclaim Water | 17-18 |
| 17.3.9 Reagents and Services | 17-18 |
| 18 Project Infrastructure and Services | 18-1 |
| 18.1 Hammerdown Site | 18-1 |
| 18.1.1 Existing Infrastructure | 18-1 |
| 18.1.2 General Site Arrangement | 18-1 |
| 18.1.3 Site Access Road | 18-3 |
| 18.1.4 Site Roads | 18-3 |
| 18.1.5 Buildings and Support Infrastructure | 18-3 |
| 18.1.6 Power | 18-4 |
| 18.1.7 Utilities | 18-5 |
| 18.1.8 Sewage System | 18-5 |
| 18.1.9 Water Management | 18-5 |
| 19 Market Studies and Contracts | 19-1 |
| 19.1 Market Studies | 19-1 |
| 19.2 Royalties | 19-1 |
| 19.3 Metal Prices | 19-1 |
| 19.4 Exchange Rate | 19-2 |
| 19.5 Contracts | 19-3 |
| 20 Environmental Studies, Permitting and Social or Community Impacts | 20-1 |
| 20.1 Baseline and Site Characterization Studies | 20-2 |
| 20.2 Environmental Setting | 20-3 |
| 20.2.1 Terrestrial Environment | 20-3 |
| 20.2.2 Aquatic Environment | 20-6 |
| 20.2.3 Socioeconomic Environment | 20-8 |
| 20.2.4 Hydrology, Surface Water and Sediment Quality Baseline Studies | 20-9 |
| 20.2.5 Hydrogeology Baseline Studies | 20-11 |
|
|
| 20.3 Other Supporting Studies | 20-13 |
| 20.3.1 Site Wide Geotechnical Investigation | 20-13 |
| 20.4 Jurisdiction, Applicable Laws and Regulations | 20-15 |
| 20.4.1 Environmental Assessment Processes | 20-15 |
| 20.4.2 Other Legislation | 20-17 |
| 20.5 Environmental Permitting | 20-19 |
| 20.6 Rehabilitation and Closure Plan | 20-21 |
| 20.6.1 Regulatory Requirements | 20-21 |
| 20.6.2 Objectives and Approach | 20-21 |
| 20.6.3 Progressive Rehabilitation | 20-22 |
| 20.6.4 Closure Rehabilitation | 20-23 |
| 20.6.5 Post-Closure and Long-Term Monitoring | 20-26 |
| 20.6.6 Cost Estimate for Closure | 20-26 |
| 20.6.7 Financial Assurance | 20-27 |
| 20.7 Economic Benefit | 20-27 |
| 20.8 Consultation | 20-27 |
| 20.8.1 Public Consultation | 20-27 |
| 20.8.2 Industry Relations | 20-28 |
| 20.8.3 Regulatory Consultation | 20-28 |
| 20.9 Geochemistry of Mine Waste | 20-29 |
| 20.9.1 Methodology | 20-29 |
| 20.9.2 Results | 20-31 |
| 20.9.3 Metal Leaching Assessment | 20-34 |
| 20.9.4 Predictive Calculations of Future Water Quality | 20-37 |
| 20.9.5 Summary | 20-38 |
| 21 Capital Cost Estimate | 21-1 |
| 21.1 Capital Cost Summary | 21-1 |
| 21.2 Basis of Estimate | 21-2 |
| 21.3 Mine Capital Cost Estimate | 21-2 |
| 21.4 Site Development and On-Site Infrastructure Direct Cost Estimate | 21-3 |
| 21.4.1 Direct Pre-Production Capital | 21-3 |
| 21.5 Processing Cost Estimate | 21-4 |
| 21.5.1 Processing Infrastructure Capital Cost Methodology | 21-4 |
|
|
| 21.6 Infrastructure Cost Estimate | 21-6 |
| 21.7 Indirect Cost Estimate | 21-6 |
| 21.7.1 EPCM Cost Estimate | 21-7 |
| 21.8 Owners Cost Estimate | 21-8 |
| 21.8.1 Pre-Production G&A - Labour | 21-8 |
| 21.8.2 Pre-Production G&A - Expenses and Services | 21-9 |
| 21.9 Contingency | 21-10 |
| 21.10 Closure Cost Estimate | 21-10 |
| 21.11 Capital Estimate Exclusions | 21-10 |
| 22 Operating Cost Estimate | 22-1 |
| 22.1 Operating Cost Summary | 22-1 |
| 22.2 Basis of Estimate | 22-3 |
| 22.3 Mine Operating Cost Estimate | 22-3 |
| 22.4 Processing Operating Cost Estimate | 22-4 |
| 22.4.1 Mineral Processing Operating Cost | 22-4 |
| 22.5 Transportation / Haulage Operating Cost Estimate | 22-8 |
| 22.6 Tailings Operating Cost Estimate | 22-8 |
| 22.7 General and Administration Operating Cost Estimate | 22-9 |
| 23 Economic Analysis | 23-1 |
| 23.1 Summary of Results | 23-1 |
| 23.2 Basis of Analysis | 23-2 |
| 23.3 Assumptions | 23-3 |
| 23.4 Taxes | 23-4 |
| 23.5 Royalties | 23-5 |
| 23.6 Results | 23-5 |
| 23.7 Sensitivities | 23-7 |
| 24 Adjacent Properties | 24-1 |
| 25 Other Relevant Data and Information | 25-1 |
| 26 Interpretations and Conclusions | 26-1 |
| 26.1 Geology and Mineral Resources | 26-1 |
| 26.2 Risks | 26-1 |
|
|
| 26.3 Opportunities | 26-4 |
| 27 Recommendations | 27-1 |
| 27.1 Recommendations | 27-1 |
| 27.1.1 Exploration | 27-1 |
| 27.1.2 QA/QC | 27-1 |
| 27.1.3 Mineral Resources | 27-2 |
| 28 References | 28-1 |
| 29 Units of Measure, Abbreviations and Acronyms | 29-1 |
|
|
List of Figures
| Figure 4-1: Maritime Resources Gold Project Location Map | 4-2 |
| Figure 4-2: Project Location Map Regional Scale | 4-3 |
| Figure 4-3: Hammerdown Project Area Mining Licenses and Mining Leases | 4-5 |
| Figure 5-1: King's Point | 5-1 |
| Figure 5-2 Road Access Map | 5-2 |
| Figure 5-3: Typical Landscape in the Project Area | 5-4 |
| Figure 7-1: Regional Geology Setting | 7-2 |
| Figure 7-2: Property Geology | 7-5 |
| Figure 7-3: Property Mineralization | 7-7 |
| Figure 7-4: Hammerdown-Rumbullion-Muddy Shag Vein System | 7-12 |
| Figure 7-5: Hammerdown Cross-Section 554830 East | 7-13 |
| Figure 7-6: Orion Geology | 7-16 |
| Figure 7-7: Orion Cross-Section | 7-18 |
| Figure 7-8: Lochinvar and Beetle Pond Interpretive Plan Section and Historical Intersections | 7-19 |
| Figure 7-9: Lochinvar Cross-section and Significant Intersections | 7-20 |
| Figure 7-10: Interpretive Plan Map and Significant Intersections on the Rendell-Jackman Deposit | 7-22 |
| Figure 7-11: Cross-Section of the Rendell-Jackman Deposit with Significant Drill Intersections | 7-23 |
| Figure 7-12: Batters Brook Interpretive Plan Section and Historical Intersections | 7-27 |
| Figure 7-13: Batters Brook Cross-section and Significant Intersections | 7-28 |
| Figure 9-1: 1995 Sial CVG Magnetics Map Depicting Drilling, PEA Deposit Whittle Shells and Exploration Highlights, Showings and Trends | 9-2 |
| Figure 9-2: Questor Magnetic Map Products for Green Bay Property | 9-5 |
| Figure 9-3: Hammerdown West IP Grid depicting 2019 Volterra 3D IP Chargeability Voxel Model | 9-7 |
| Figure 9-4: Hammerdown East IP Grid depicting 2019 Volterra 3D IP Chargeability Voxel | 9-9 |
| Figure 9-5: Hammerdown Mine 2019 LiDAR Map | 9-11 |
| Figure 9-6: Plan Map of 2019 Eastern IP Grid Depicting drilling locations | 9-13 |
| Figure 9-7: Plan Map depicting 2016 HLEM Geophysical Anomalies | 9-15 |
| Figure 9-8: Plan Map Depicting 2020 Geotech VTEM dB/dt Z Component Channel 35 | 9-17 |
| Figure 9-9: Project Map Depicting Total Magnetic Intensity (TMI), Mineral Occurrences and VTEM Geophysical Targets (dashed circles indicate target areas) | 9-18 |
| Figure 9-10: Regional Project Map Depicting AIIP Mapping and Interpreted Fault and Areas of Interest | 9-20 |
|
|
| Figure 9-11: Regional Project Map Depicting ZTEM Shallow 30Hz Channel | 9-21 |
| Figure 9-12: Hammerdown SPEM Loop and Grid Configuration Depicting Modelled Conductive Plates | 9-22 |
| Figure 9-13: Orion North SPEM Loop and Grid Configuration depicting modelled Conductive Plates | 9-23 |
| Figure 9-14: Plan Map of Orion-Hammerdown Area Depicting Magnetic and Mineralized Trends | 9-25 |
| Figure 9-15: Cross Section of DC-22-02 Intersection and Hammerdown Wireframes and PEA Pit Shape | 9-26 |
| Figure 10-1: Hammerdown Project Plan Map, Wireframes, and Geology | 10-2 |
| Figure 10-2: Plan Map Depicting 2020 Drilling of Wisteria Zone | 10-5 |
| Figure 10-3: Cross-section Depicting 2020 Drilling of Wisteria Zone | 10-6 |
| Figure 10-4: Core Photography Set-up | 10-10 |
| Figure 10-5: Drill Core Photography Set-Up with Tablet Control | 10-11 |
| Figure 10-6: Maritime Resource Cutting Facility | 10-12 |
| Figure 10-7: Plan View- Hammerdown Wireframes and Drill Hole Locations | 10-14 |
| Figure 10-8: East Orientated Cross-Section Depicting 2022 Hammerdown Wireframes and Drill Hole Locations | 10-15 |
| Figure 10-9: Plan View - Hammerdown Wireframes and Grade Control Drill Hole Locations | 10-27 |
| Figure 10-10: East Facing Cross-Section of Grade Control Diamond Drill Holes with Intercepts Confirming Wireframes | 10-28 |
| Figure 11-1: Hammerdown Blanks Chart | 11-4 |
| Figure 11-2: QC Chart for Standard OREAS 217 (2020-2021) | 11-6 |
| Figure 11-3: QC Chart for Standard OREAS 218 (2020-2021) | 11-7 |
| Figure 11-4: QC Chart for Standard OREAS 228 (2020-2021) | 11-8 |
| Figure 11-5: QC Chart for Standard OREAS 229b (2020-2021) | 11-9 |
| Figure 11-6: QC Chart for Standard OREAS 231 (2020-2021) | 11-10 |
| Figure 11-7: QC Chart for Standard OREAS 237 (2020-2021) | 11-11 |
| Figure 11-8: Hammerdown Reject Duplicates Chart | 11-13 |
| Figure 11-9: Hammerdown Reject Duplicates Chart (Axes capped to 7 g/t Au) | 11-14 |
| Figure 13-1: Leach Recovery vs. Grind Size for the Master Composite | 13-4 |
| Figure 13-2: Leach Recovery vs. Time for the Master Composite Under Varying Conditions | 13-5 |
| Figure 13-3: Overall Sorting Circuit Recovery for Hammerdown and Orion Mineralization | 13-6 |
| Figure 13-4: IsaMill Test Graph | 13-9 |
| Figure 13-5: Overall Average Gold Recovery on Different Mineralization Under Varying Conditions | 13-10 |
| Figure 13-6: Overall Average Gold Recovery on Orion with Carbon-In-Leach | 13-11 |
| Figure 13-7: Effect of Pulp Density on Hammerdown | 13-12 |
|
|
| Figure 13-8: Effect of NaCN Dose on Hammerdown | 13-13 |
| Figure 13-9: Composite Recoveries | 13-15 |
| Figure 13-10: Grade-Recovery | 13-16 |
| Figure 14-1: Hammerdown Excluded Interval (6 m Viewing Corridor) | 14-5 |
| Figure 14-2: Oblique View of the Muddy Shag, Wisteria, Hammerdown, and Rumbullion Zones, Looking Northeast | 14-9 |
| Figure 14-3: Hammerdown, Wisteria, and Rumbullion Zones Mineralization Model Plan View (10 m Viewing Corridor) | 14-11 |
| Figure 14-4: Grouped and Individual Domains Mineralization Model Cross Section (10 m Viewing Corridor) | 14-12 |
| Figure 14-5: Log Probability Plot for Hammerdown Central Domain (Gold) | 14-15 |
| Figure 14-6: Histogram for Hammerdown Central Domain (Gold) | 14-16 |
| Figure 14-7: Log Probability Plot for Rumbullion Central Domain (Gold) | 14-17 |
| Figure 14-8: Histogram for Rumbullion Central Domain (Gold) | 14-18 |
| Figure 14-9: Comparison Between Raw Assay and Composite Lengths Rumbullion Central | 14-26 |
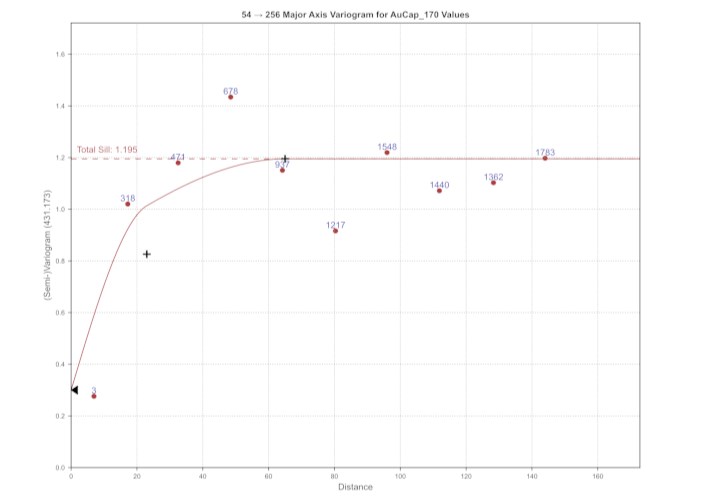
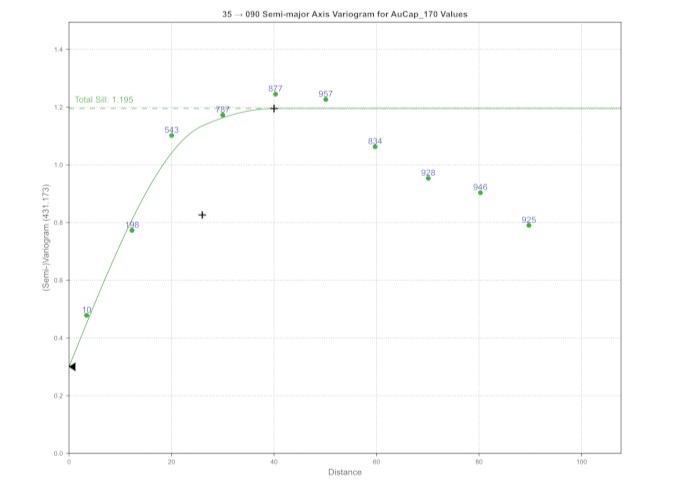
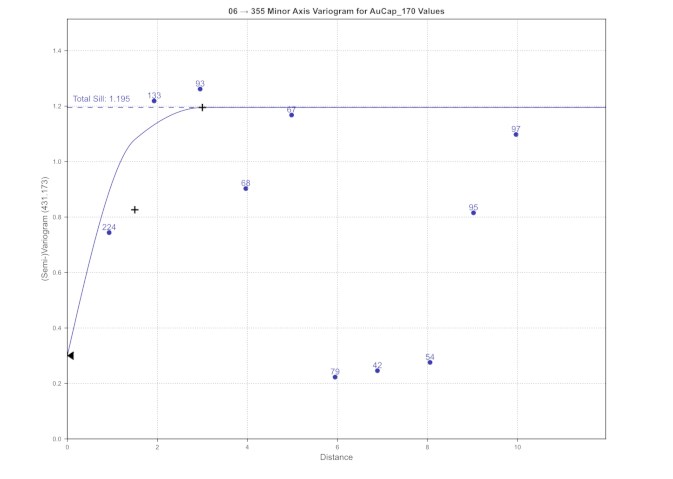
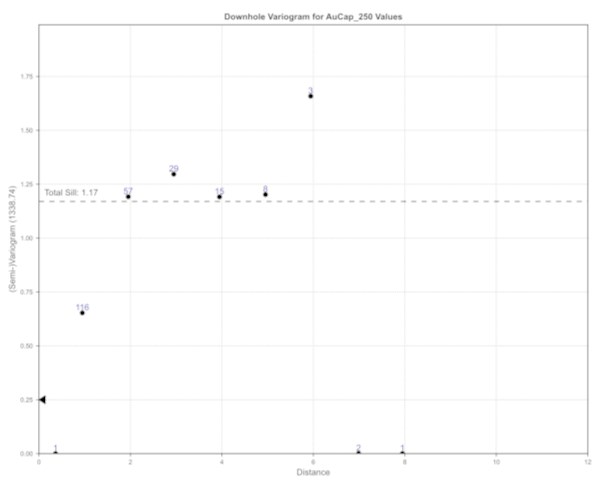
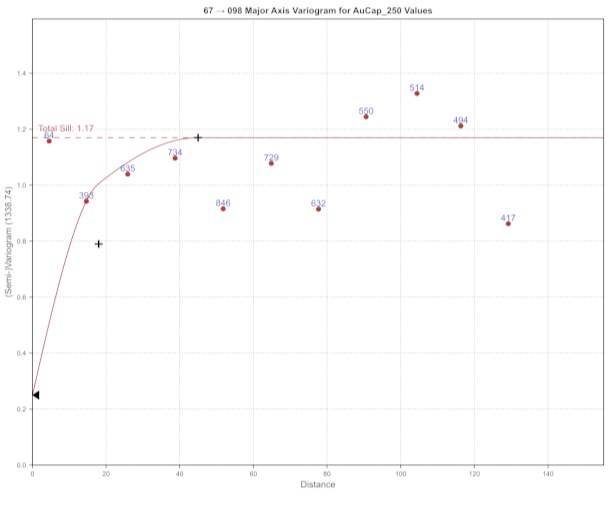
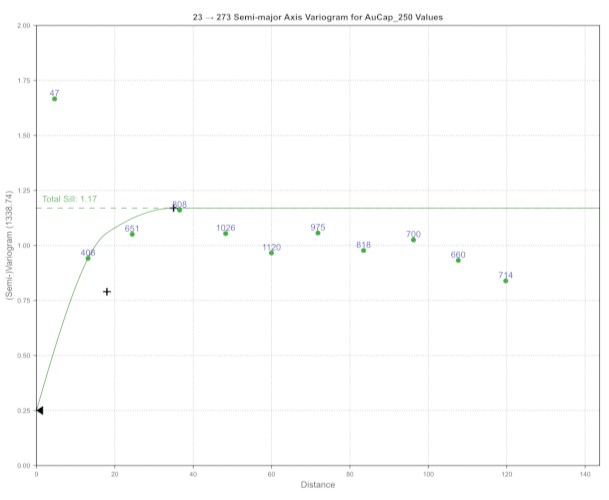
| Figure 14-10: Gold Variogram Models - m08 | 14-28 |
| Figure 14-11: Gold Variogram Models -m06 | 14-32 |
| Figure 14-12: Gold Grade and Thickness Contours - m06 (Grade (g/t Au)) | 14-38 |
| Figure 14-13: Gold Grade and Thickness Contours - m06 (Thickness (m)) | 14-39 |
| Figure 14-14: Gold Grade and Thickness Contours - m06 (Grade x Thickness (g/t-m)) | 14-40 |
| Figure 14-15: Gold Grade and Thickness Contours - m09 (Grade (g/t Au)) | 14-41 |
| Figure 14-16: Gold Grade and Thickness Contours - m09 (Thickness (m)) | 14-42 |
| Figure 14-17: Gold Grade and Thickness Contours - m09 (Grade x Thickness (g/t-m)) | 14-43 |
| Figure 14-18: Plan View Classification of Mineral Resources (2.5 m Corridor) | 14-62 |
| Figure 14-19: Cross section, Looking West, Classification of Mineral Resources (2.50 m Corridor) | 14-63 |
| Figure 14-20: m08 Classification of Mineral Resources - Hammerdown (Longitudinal View) | 14-64 |
| Figure 14-21: Gold Plots - 5 Block Spacing (X) | 14-71 |
| Figure 14-22: Gold Plots - 10 Block Spacing (Y) | 14-72 |
| Figure 14-23: Gold Plots - 5 Block Spacing (Z) | 14-73 |
| Figure 14-24: Hammerdown and Rumbullion Block Model Plan View 150 EL (10 m Viewing Corridor) | 14-74 |
| Figure 14-25: Hammerdown Block Model Cross Section A-B Looking East (10 m Viewing Corridor) | 14-75 |
| Figure 14-26: m08 Vein Longitudinal View | 14-76 |
| Figure 15-1: Overall Pit Shell Results for the Hammerdown Optimization | 15-7 |
| Figure 15-2: Incremental Pit Shell Results for the Hammerdown Optimization | 15-8 |
|
|
| Figure 15-3: Final Open Pit Design | 15-9 |
| Figure 15-4: Measured and Indicated Resources Relative to the Final Pit Design | 15-9 |
| Figure 15-5: Cross Section of Final Pit Showing Measured and Indicated Resources (554,810E looking East) | 15-10 |
| Figure 15-6: Long Section of Final Pit showing Measured and Indicated Resources (5,489,100N looking North) | 15-10 |
| Figure 15-7: Open Pit Slope Design Recommendations | 15-11 |
| Figure 16-1: Overall Mine Layout | 16-1 |
| Figure 16-2: Section View of the Hammerdown Deposit (looking East) | 16-3 |
| Figure 16-3: Location of Drillholes Geotechnically Logged (top) and Televiewed (bottom) | 16-5 |
| Figure 16-4: Distribution of RMR for the Mafic Volcanics and Dykes | 16-7 |
| Figure 16-5: Geotechnical Domains and Respective Discontinuity Sets | 16-8 |
| Figure 16-6: Backbreak Analysis Results for North and East Geotechnical Domains | 16-9 |
| Figure 16-7: Pit Slope Design Recommendations for Hammerdown Final Pit | 16-10 |
| Figure 16-8: Pushback 1 Design | 16-12 |
| Figure 16-9: Pushback 2 Design | 16-13 |
| Figure 16-10: Pushback 3 Design (Ultimate Pit) | 16-14 |
| Figure 16-11: Mining Pushback Summary | 16-15 |
| Figure 16-12: Waste Storage Locations | 16-16 |
| Figure 16-13: Mine Status Map - End of Pre-production | 16-18 |
| Figure 16-14: Mine Status Map - End of Year 1 | 16-19 |
| Figure 16-15: Mine Status Map - End of Year 2 | 16-20 |
| Figure 16-16: Mine Status Map - End of Year 3 | 16-21 |
| Figure 16-17: Mine Status Map - End of Year 4 (Final) | 16-22 |
| Figure 17-1: Hammerdown Crushing and Sorting Summary Flowsheet | 17-3 |
| Figure 17-2: Hammerdown Crushing and Sorting Plant Layout | 17-4 |
| Figure 17-3: Nugget Pond Hydrometallurgical Plant | 17-9 |
| Figure 17-4: Nugget Pond Grinding and Gold Recovery Summary Flowsheet | 17-10 |
| Figure 17-5: Nugget Pond Site Plan with New Unloading, Storage and Grinding Circuit | 17-11 |
| Figure 17-6: Nugget Pond Stockpile Cover and Reclaim Tunnel Section | 17-14 |
| Figure 17-7: Nugget Pond Grinding Circuit Layout and Building Extension | 17-16 |
| Figure 18-1: Hammerdown Overall Site Layout | 18-2 |
| Figure 19-1: Historical Gold Price | 19-2 |
| Figure 19-2: Historical USD:CAD Exchange Rate | 19-3 |
|
|
| Figure 20-1: Project Study Area | 20-1 |
| Figure 20-2: Biology Survey | 20-4 |
| Figure 20-3: Project Watersheds Showing Surface Water and Sediment Sampling Locations | 20-7 |
| Figure 20-4: Groundwater Flow - Geotech Test Locations | 20-10 |
| Figure 20-5: Comparison of Reactivity (paste pH) to Acid Generation Potential (sulfur, wt%) | 20-31 |
| Figure 20-6: NP vs AGP Prediction, Hammerdown Lithologies. Red Boxes Identify Samples for which Kinetic Tests were Performed | 20-32 |
| Figure 20-7: Prediction of Acid Generation from Process Waste, Hammerdown Deposit (Neutralization Potential vs Acid Generation Potential in eq. kg CaCO3/t) | 20-33 |
| Figure 20-8: Ficklin Plots, Hammerdown Project Waste Rock and LGO | 20-34 |
| Figure 20-9: pH Release from HCT's Hammerdown Waste Rock | 20-35 |
| Figure 20-10: Consumption of Neutralization Potential from HCT's Hammerdown Waste Rock | 20-36 |
| Figure 22-1: Breakdown of Estimated Operating Costs | 22-2 |
| Figure 23-1: LOM Payable Gold | 23-4 |
| Figure 23-2: Annual After-Tax Cash Flow | 23-6 |
| Figure 23-3: Post-Tax NPV5% Sensitivity | 23-8 |
| Figure 24-1: Property Location Map and Adjacent Areas | 24-2 |
List of Tables
| Table 1-1: Summary of Hammerdown Mineral Resources as of June 30, 2022 | 1-5 |
| Table 1-2: Hammerdown Mineral Reserve Estimate | 1-6 |
| Table 1-3: Open Pit Optimization Parameters | 1-7 |
| Table 1-4: Summary of Capital Cost Estimate ($C) | 1-10 |
| Table 1-5: Summary of Operating Cost Estimate ($C) | 1-11 |
| Table 1-6: Main OPEX Component Assumptions | 1-11 |
| Table 1-7: LOM Summary | 1-12 |
| Table 1-8: Economic Assumptions | 1-13 |
| Table 1-9: Off-site Gold Costs and Payable Assumptions | 1-13 |
| Table 1-10: Gold Value Assumptions | 1-13 |
| Table 1-11: Economic Results | 1-14 |
| Table 1-12: Sensitivity Analysis Results | 1-14 |
| Table 2-1: QP Responsibilities | 2-3 |
|
|
| Table 2-2: QP Site Visits to the Hammerdown Project | 2-5 |
| Table 4-1: Hammerdown Mineral Licenses | 4-6 |
| Table 6-1: Property History Summary | 6-2 |
| Table 6-2: Hammerdown Production Summary | 6-3 |
| Table 9-1: Drillhole Collar Data | 9-12 |
| Table 9-2: 2019 Golden Anchor Drilling Results | 9-14 |
| Table 9-3: 2022 Beetle Pond Drilling Results | 9-28 |
| Table 10-1: Summary of Drilling and Channel Sampling Completed on Hammerdown Property | 10-7 |
| Table 10-2: Key Diamond Drill Hole Parameters Shown in HD Cross-Section | 10-16 |
| Table 10-3: Summary of Hammerdown Cross-Section Diamond Drill Hole Significant Intercepts > 1.0 (g/t) Au | 10-18 |
| Table 10-4: 2021 Wisteria Channel Sample Composite Locations | 10-25 |
| Table 10-5: 2021 Wisteria Channel Sampling Significant Intercepts > 1.0 (g/t) | 10-25 |
| Table 10-6: 2020 Hammerdown Grade Control Diamond Drill Hole Parameters | 10-29 |
| Table 10-7: Summary of 2020 Grade Control Diamond Drill Hole Significant Intercepts > 1.0 (g/t) Au | 10-29 |
| Table 11-1: Example of Hammerdown Blank Failures and Remedial Actions | 11-5 |
| Table 13-1: Summary of Test Work Completed | 13-2 |
| Table 13-2: Bond Ball Mill Work Index Results | 13-8 |
| Table 13-3: Detoxification Result Summary | 13-14 |
| Table 14-1: Summary of Mineral Resources as of June 30, 2022 | 14-1 |
| Table 14-2: Summary of Mineral Resources as of February 29, 2020 | 14-2 |
| Table 14-3: Hammerdown Database | 14-4 |
| Table 14-4: Summary of Historical Production (2001 to 2004) | 14-7 |
| Table 14-5: Summary of Tonnes and Grade from Resource Model for Mined Out Shapes (2001 to 2004) | 14-7 |
| Table 14-6: Mineralization Domains | 14-10 |
| Table 14-7: Raw Assays Au (g/t) | 14-13 |
| Table 14-8: Assay Capping Levels | 14-19 |
| Table 14-9: Raw and Capped Assays Au (g/t) | 14-20 |
| Table 14-10: Search Restriction Thresholds | 14-23 |
| Table 14-11: Composite Statistics (g/t Au) | 14-25 |
| Table 14-12: Selected Hammerdown Gold Variograms | 14-36 |
| Table 14-13: Interpolation and Search Ellipse Parameters | 14-45 |
| Table 14-14: Block Model Definition | 14-49 |
|
|
| Table 14-15: Cut-Off Grade Parameters | 14-50 |
| Table 14-16: Open Pit Optimization Inputs | 14-51 |
| Table 14-17: Classification Volume Weighted Statistics | 14-53 |
| Table 14-18: Gold Assays, Composites, and Blocks Comparison | 14-66 |
| Table 14-19: Mineral Resource Estimate as of June 30, 2022 | 14-77 |
| Table 14-20: Model Comparison: Parent Blocks and Sub-Blocks | 14-80 |
| Table 15-1: Open Pit Optimization Input Parameters | 15-3 |
| Table 15-2: Overall Results of the Hammerdown Deposit Open Pit Optimization | 15-5 |
| Table 15-3: In-Pit Haulage Road Design Parameters | 15-12 |
| Table 15-4: Proven and Probable Mineral Reserve Estimate | 15-13 |
| Table 16-1: Summary of Rock Mass Characteristics by Lithology | 16-6 |
| Table 16-2: Summary of the Mine Material Movement and Mill Schedule | 16-17 |
| Table 16-3: Drilling Productivity | 16-23 |
| Table 16-4: Blasting Patterns and Powder Factors | 16-24 |
| Table 16-5: Loading Parameters | 16-24 |
| Table 16-6: Haulage Cycle Parameters | 16-25 |
| Table 16-7: Equipment Utilization Assumptions | 16-27 |
| Table 16-8: Main Mining Equipment Fleet (average number of units) | 16-27 |
| Table 16-9: Mining Personnel Requirements | 16-28 |
| Table 17-1: Hammerdown Crushing Plant Process Design Criteria | 17-5 |
| Table 17-2: Nugget Pond Grinding, Leach/ CIP Process Design Criteria | 17-12 |
| Table 18-1: Project Power Requirements | 18-5 |
| Table 19-1: Net Smelter Return Assumptions | 19-1 |
| Table 20-1: Environmental Approvals, Authorizations, and Permits Currently in Place | 20-19 |
| Table 20-2: Environmental Approvals, Authorizations, and Permits that may be Required | 20-19 |
| Table 20-3: Lithology and Alteration Sample Selection Matrix (Hammerdown) | 20-30 |
| Table 21-1: Capital Cost Summary | 21-1 |
| Table 21-2: Mining Capital Cost Estimate | 21-2 |
| Table 21-3: Surface Construction Estimate Basis | 21-3 |
| Table 21-4: Process Plant CAPEX | 21-5 |
| Table 21-5: Infrastructure CAPEX | 21-6 |
| Table 21-6: Indirect Cost Basis of Estimate | 21-7 |
| Table 21-7: Project Indirects CAPEX | 21-8 |
| Table 21-8: Owner's Costs CAPEX | 21-8 |
|
|
| Table 22-1: Breakdown of Estimated Operating Costs | 22-1 |
| Table 22-2: Summary of Personnel | 22-2 |
| Table 22-3: Mine Operating Cost Estimate | 22-3 |
| Table 22-4: Mine Personnel Requirement | 22-4 |
| Table 22-5: Mineral Processing Operating Cost | 22-5 |
| Table 22-6: Mineral Processing Electrical Consumption and Cost | 22-6 |
| Table 22-7: Mineral Processing Reagents Consumption and Cost | 22-7 |
| Table 22-8: Mineral Processing Consumable and Major Equipment Wear Components | 22-7 |
| Table 22-9: G&A Costs | 22-9 |
| Table 23-1: Life of Mine (LOM) Summary | 23-2 |
| Table 23-2: Metal Prices and Exchange Rates | 23-3 |
| Table 23-3: NSR Parameters | 23-3 |
| Table 23-4: Summary of Results | 23-6 |
| Table 23-5: Pre-Tax and After-Tax Sensitivity Results on NPV at 5% | 23-7 |
| Table 23-6: Project NPV at Various Discount Rates | 23-8 |
| Table 23-7: Economic Cash Flow Model | 23-9 |
| Table 26-1: Main Controllable Project Risks | 26-2 |
| Table 26-2: Identified Project Opportunities | 26-5 |
|
|
1 EXECUTIVE SUMMARY
1.1 Introduction
JDS Energy & Mining Inc. (JDS) was commissioned by Maritime Resources Corp. (Maritime) to carry out a Feasibility Study (FS) of the Hammerdown Gold Project (Hammerdown or the Project), a gold resource development project 100% owned by Maritime located within Maritime's 391 km2 land package in the Baie Verte mining district in north-central Newfoundland and Labrador. The Project is located about 5 km southwest of the Town of King's Point and 13 km by road due west of the Town of Springdale.
JDS teamed with Halyard Inc. (Halyard), a Toronto-based multidisciplinary engineering company, that provided mineral processing, mineral handling and Nugget Pond infrastructure details for the project. Canenco Consulting Corp. (Canenco) provided metallurgical expertise for sampling, testing, analysis and recommendations for the mineral processing design and recoveries. SRK Consulting (UK) Ltd. was responsible for geochemistry, waste management and mine closure guidance. GEMTEC was responsible for environmental management and water planning while SLR produced the mineral resource estimate and block model that is the basis for the mine plan and mineral reserve estimate.
1.2 Project Description
The project envisions open pit mining of the Hammerdown deposit, which is made up of a system of narrow, near-vertically dipping veins, and the wider, more continuous, lower-grade Wisteria Zone.
The FS envisions open pit mining of the Hammerdown deposit, which is made up of a system of narrow, near-vertically dipping veins, and the wider, more continuous, lower-grade Wisteria Zone. Unlike the 2020 PEA Technical Report, the FS did not consider any contribution from the Orion deposit as the Orion project is at the exploration stage and requires additional exploration, technical and environmental studies before a feasibility level assessment supporting a stand-alone project can be prepared. In contrast, the Hammerdown project is at an advanced stage of development with feasibility level detail and a release from Environment Assessment by the province of Newfoundland and Labrador in 2021. As well, the Orion project shares no common infrastructure with the Hammerdown project and would require its own dedicated infrastructure for any future development. The infrastructure needed on the Orion project would be vastly different from that of the Hammerdown project given the different project mining concepts applicable to each project - that being an open pit concept for the Hammerdown project, versus a likely underground concept for the Orion project. As such, Maritime is treating the Hammerdown and Orion projects as two separate projects. Open pit mining is planned to produce 1,200 tonnes per day (t/d) of run-of-mine (ROM) ore using conventional equipment of two sizes for ore and waste. The overall strip ratio for the planned open pit is approximately 20:1 but is 16:1 and 12:1 in years -1 and 1 respectively. Narrow vein zones are projected to be mined under geology control using tightly-spaced definition drilling and geologist oversight during loading operations. A stockpile of lower-grade material is planned to be maintained through mine life and processed at the end. ROM ore tonnes and grades are estimated to be approximately 1.9 Mt at a head grade of 4.46 g/t Au over the five-year mine life.
|
|
ROM ore is planned to be crushed and fed to two ore sorters that will pull an estimated 40% of the total feed out as low-grade waste. The upgraded 700 t/d of ore is planned to be trucked 140 km to the Nugget Pond mill mainly on public highways where it is planned to be fed through a new grinding circuit to a CIL gold leach circuit attached to Rambler's Nugget Pond Mill but owned by Maritime. Gold doré will be produced at Nugget Pond and the Hammerdown tailings co-mingled with Rambler's tailings in Rambler's existing, permitted tailings facility.
Payable gold production is planned to be 247,000 oz in total and 50,000 oz annually.
The Hammerdown property is a brownfield site that was previously mined in the 2000s by Richmont Mines using underground methods. The site has had a full geochemical investigation conducted and is not expected to have acid rock drainage or metal leaching (ARD/ML) issues.
1.3 Property Description - Location and Access
The Hammerdown deposit occurs within Hammerdown property located approximately 5 km southwest of King's Point and 10 km west of Springdale, NL. The Hammerdown deposit is centered at approximately:
• 49°33'10" N latitude and 56°14'25" W longitude; or
• 554,900 mE and 5,489,200 mN (NAD 83, Zone 21U).
The Hammerdown deposit is located within Maritime's 390 km2 land package.
The property is comprised of moderate topography at an elevation of about 200 metres above sea level (masl). The Hammerdown deposit, planned sorting plant and infrastructure are located on a broad ridge that splits two drainages, The north side of the ridge drops off to into a NE-SW trending valley while the south side of the ridge is relatively flat.
Birch, black spruce and fir dominate the property flora, although most of the planned site has been logged. Peat bogs occur on the western side of the Hammerdown site.
1.4 Ownership
Maritime Resources Green Bay property encompasses 98 square kilometers (22,216 acres) held under 34 individual mineral licenses. The project area is bounded to the west by Maritime licenses and all of the Hammerdown Project mineral licenses are owned 100% by Maritime either by direct map staking or earned through option agreements.
|
|
1.5 History, Exploration and Drilling
A total of 808 diamond drillholes totaling approximately 85,000 m have been completed on the Project. Most of the drilling was completed by Richmont Mines Inc. (Richmont) while the Hammerdown deposit was in operation.
The Hammerdown deposit was mined by Richmont using underground and open pit methods from 2001 to 2004. Approximately 290,000 t of ore were mined at a grade of 15.74 g/t Au. Richmont utilized the Nugget Pond mill to treat the ore, achieving an average of 97% gold recovery over the mine life. Lack of exploration success at the time lead to the mine shutting down. Gold prices averaged about US$350 /oz from 2002-2004.
1.6 Geology and Mineralization
The Project is located in the northeastern extremity of the Appalachian Orogen of eastern North America, where it is predominantly underlain by Paleozoic volcanic rocks of the Newfoundland Appalachians within the Notre Dame Subzone (Williams et al., 1988) of the Dunnage tectono- stratigraphic sub-division (Williams, 1979).
The rocks underlying the area are represented by volcano-sedimentary assemblages of oceanic supra- subduction zone (ophiolitic) and mature-arc derivations (Szybinski and Jenner, 1989; Swinden, 1991; Kean et al., 1995) accreted to the ancient North American (Laurentian) continental margin during the Taconian Orogeny (Ordovician to Silurian) and further deformed during the Silurian-Devonian, post accretion, Acadian Orogeny (Swinden, 1991).
Other geological elements cover portions of the property including Silurian sub-aerial to fluviatile sediments (conglomerates) of the Springdale Group to the southeast (Kean, 1980; Coyle and Strong, 1987; Kean et al., 1995), Devonian intrusive rocks of the King's Point Complex, Siluro-Devonian intrusive rocks of Burlington Granodiorite to the northwest (Hibbard, 1983), and Devonian granitic intrusive rocks of the Topsails Granite to the southwest (Kean, 1980). A suite of mafic volcanics (informally referred to as the Hammerdown Basalt) in the northeastern part of the area were removed from the Lushs Bight Group and reassigned to the Catchers Pond Group and the Lushs Bight Group (Kean, 1984; Jenner and Szybinski, 1987, O'Brien and Dunning, 2014).
The Property is host to numerous underexplored gold prospects and showings along with VMS style base metal mineralization. The Property is also host to four gold deposits two of which, the Hammerdown and Rumbullion have seen historical mining development.
The most important and well-defined gold deposits include the Hammerdown, Rumbullion, Muddy Shag and Orion deposits, which all occur within the Hammerdown Deformation Zone (HDZ). The HDZ is described has a 100-250 wide structural corridor of strong ductile to brittle shearing hosted in the uppermost units of the Catchers Pond Group. The historic Lochinvar VMS base metal deposit also occurs in the HDZ along with the Golden Anchor gold veins and Beetle Pond VMS alteration zone.
|
|
1.7 Metallurgical Testing and Mineral Processing
A number of test work programs have been undertaken on the Hammerdown project prior to the FS as summarized in the previous reports. The most recent metallurgical test program described in Section 13, is the basis for the process selected for the Hammerdown mineralization. The program included comminution, sorting, gravity separation, flotation, cyanidation, detoxification, and solid/liquid separation studies. Historical and FS test work results indicate that the mineralization responded well to leaching for precious metal extraction.
Grindability test work on the Hammerdown samples indicated that the hardest 75th Percentile Bond Work Index (BWi) of the sorted plant feed was 16.9 kWh/t and the SAG Mill Comminution test (SMC) A*b was 70.6, which places the mineralization in the medium-hard classification for comminution and it is amenable to SAG milling.
The gold leach extractions achieved to date for the Hammerdown composites using the optimized conditions range from 94.6& to 97.5% and average 96.0%. Assuming solution losses of approximately 0.5% the overall Hammerdown gold recovery is predicted to be in the range of 95.5%.
1.8 Mineral Resource Estimate
Canadian Institute of Mining, Metallurgy and Petroleum (CIM) Definition Standards for Mineral Resources and Mineral Reserves (CIM (2014) definitions) were used for Mineral Resource classification. See Table 1-1 for the Mineral Resource Estimate.
|
|
Table 1-1: Summary of Hammerdown Mineral Resources as of June 30, 2022
| Category | Tonnes (kt) |
Grade (g/t Au) |
Contained Metal (000 oz Au) |
| Open Pit Resources | |||
| Measured | 698 | 5.47 | 123 |
| Indicated | 2,146 | 3.00 | 207 |
| Measured + Indicated | 2,845 | 3.61 | 330 |
| Inferred | 302 | 1.31 | 13 |
| Underground Resources | |||
| Measured | 1 | 7.05 | - |
| Indicated | 54 | 5.10 | 9 |
| Measured + Indicated | 55 | 5.10 | 9 |
| Inferred | 66 | 4.00 | 9 |
Notes:
1. Mineral Resource Estimate completed by Pierre Landry, P.Geo., of SLR Consulting (Canada) Ltd. (SLR), an independent qualified person (QP), as defined by NI 43-101.
2. Effective date: June 30, 2022. All Mineral Resources have been estimated in accordance with Canadian Institute of Mining and Metallurgy and Petroleum (CIM) definitions, as required under NI 43-101.
3. Open Pit Mineral Resources are inclusive of Mineral Reserves
4. Open Pit Mineral Resources are estimated at a cut-off grade of 0.50 g/t Au.
5. Open Pit Mineral Resources are reported at a block cut-off from whole blocks measuring 2.5 m x 1.0 m x 2.5 m.
6. Mineral Resources are estimated using a long-term gold price of US$1,800 per ounce, and a US$/C$ exchange rate of 0.75.
7. Bulk density is 2.84 t/m³ for rock and 1.90 t/m³ for mined out areas.
8. Underground Mineral Resources are estimated at a cut-off grade of 2.00 g/t Au.
9. Underground Resources are reported at a block cut-off from whole blocks measuring 2.5 m x 1.0 m x 2.5 m and have been subject to additional reporting shapes to remove isolated blocks.
10. Numbers may not add due to rounding.
11. Mineral Resources reported demonstrate reasonable prospect of eventual economic extraction, as required under NI 43-101.
12. Mineral Resources are not Mineral Reserves and do not have demonstrated economic viability.
13. The Mineral Resources would not be materially affected by environmental, permitting, legal, marketing, and other relevant issues based on information currently available.
Source: SLR (2022)
1.9 Mineral Reserve Estimate
The Mineral Reserve estimation has been constrained to the Hammerdown deposit for this FS. Both Open Pit and Underground mining methods were evaluated but, in the end, the project was designed as an Open Pit only based on the best expected economic outcome. The Mineral Resources were evaluated using open pit optimization software to identify an optimum shell which was then used as a basis for detailed design. The final design along with dilution and mine recovery estimates and a cut-off grade were then used to quantify the final Mineral Reserves.
|
|
The mineral reserves for the Hammerdown deposit are reported below within the final pit design and based on cut-off grades of 0.73 g/t for Vein material and 1.06 g/t for the Wisteria zone. The effective date of the Mineral Reserve stated in this report is August 15, 2022.
The QPs have not identified any known legal, political, environmental, or other risks that would materially affect the potential development of the Mineral Reserves. The mine permitting is well advanced and is not seen as a significant risk.
Table 1-2: Hammerdown Mineral Reserve Estimate
| Zone & Class | Tonnes (kt) |
Diluted Grade (g/t Au) |
Contained Gold (koz) |
| Proven Reserves | |||
| Vein | 556 | 5.94 | 106 |
| Wisteria | 0 | 1.68 | 0 |
| Total Proven | 556 | 5.94 | 106 |
| Probable Reserves | |||
| Vein | 1,134 | 4.19 | 153 |
| Wisteria | 206 | 1.99 | 13 |
| Total Probable | 1,340 | 3.85 | 166 |
| Total Proven and Probable | 1,895 | 4.46 | 272 |
Notes:
1. Mineral Reserve Estimate completed by Tysen Hantelmann, P.Eng. of JDS Energy & Mining Inc. (QP).
2. Mineral Reserves follow CIM definitions and are effective as of August 15, 2022.
3. Mineral Reserves are estimated at a cut-off of 0.73 g/t for Veins and 1.06 g/t for Wisteria Zone based on: Gold price of US$1650/oz; Exchange rate of 0.77 USD:CAD; combined transport, treatment, payables and royalties of US$25/oz; an overall metallurgical recovery (including ore sorting) of 90.25% for Veins and 85.5% for Wisteria; and an overall processing operating cost of C$45/t ore mined for Veins and C$62/t ore mined for Wisteria.
4. The final FS pit design contains an additional 94 kt of Inferred resources above the economic cut-off grade at an average grade of 1.62 g/t. Inferred Mineral Resources are considered too speculative geologically to have economic considerations applied to them that would enable them to be categorized as Mineral Reserves, and there is no certainty that any part of the Inferred Resources could be converted into Mineral Reserves.
5. Tonnages are rounded to the nearest 1,000 t, gold grades are rounded to two decimal places. Tonnage and grade measurements are in metric units; contained gold is reported as thousands of troy ounces.
1.10 Mining
While both open pit and underground mining methods were evaluated, the final design is based on conventional open pit mining (drill, blast, load, and haul) due to its relatively low cost and higher production rates. Ore material will be delivered to a crusher/ore sorter located just South- East of the pit at a nominal rate of 1,200 t/d (426 kt/a) and provide 700 t/d (256 kt/a) to an offsite Mill for final mineral processing. Over the life-of-mine (LOM), the mine will produce 1.9 Mt of ore at an average gold grade of 4.46 g/t. Waste materials (40 Mt) will be contained within a Waste Storage Facility (WSF) located just South of the pit.
|
|
The design parameters used to define the optimum shape and size of the pit are shown in Table 1-3.
Table 1-3: Open Pit Optimization Parameters
| Parameter | Unit | Hammerdown | Wisteria |
| Gold price | US$/oz | 1,650 | 1,650 |
| Payable metal | % | 99.8 | 99.8 |
| TC / RC / Transport | US$/oz | 5.0 | 5.0 |
| Royalty | % | 1 | 1 |
| Gold value per ounce | US$/oz | 1,625 | 1625 |
| Exchange rate | USD:CAD | 0.77 | 0.77 |
| Gold value per gram | C$/g | 67.86 | 67.86 |
| Ore mining cost | C$/t ore mined | 5.00 | 5.00 |
| Waste Mining Cost | $/t waste mined | 4.00 | 4.00 |
| Ore transport | $/t processed | 16.74 | 23.72 |
| Mineral processing | $/t processed | 18.00 | 25.50 |
| G&A | $/t processed | 6.00 | 8.50 |
| Ore sorting mass pull | % | 60 | 85 |
| Ore sorting gold recovery | % | 95 | 95 |
| Milling gold recovery | % | 95 | 90 |
| Overall gold recovery | % | 90.25 | 85.50 |
| External dilution | % | 0 | 0 |
| Mining recovery | % | 100 | 100 |
| In-situ cut-off Au grade | g/t | 0.73 | 1.06 |
Note: No external dilution was validated due to a combination of using an ore sorter as well as the addition of a significant amount of internal dilution within the block model.
1.11 Recovery Methods
The Feasibility Study's approach to mineral processing includes a crushing and ore sorting stage at the Hammerdown mine site to remove dilution and concentrate the ROM ore into a high-grade feed product for the mill. This product will be hauled 140 km to the Nugget Pond mill for final mineral processing including grinding, thickening, carbon in pulp leaching, refining to doré bars and disposal of tailings.
Hammerdown
The processing facilities will be designed to produce a -12 mm minus crushed and sorted product. The crushing and sorting plant will be designed for 1,200 t/d of ROM feed with a maximum capacity of 1,800 t/d.
ROM feed will be subjected to primary and secondary crushing stages to produce a -50 mm sorter feed product. It is estimated that 23% of ROM feed will be rejected as a fine fraction (-12 mm) prior to sorting. The coarse (+25-50 mm) and middling (+12-25 mm) size fractions will be sent to two X-ray transmission (XRT) sorters for concentration.
|
|
The sorting program was completed on several bulk and variability samples and has demonstrated that the crushed mineralization is highly amenable to sorting with an average of 52% of the feed to the sorting circuit being separated as waste material resulting in 40% of the crushing plant feed mass being rejected with approximately 5% gold loss.
Sorted product will be tertiary crushed to -12 mm prior to stockpiling in the storage building and hauled to Nugget Pond. Sorter rejects will be stockpiled and back hauled in mine trucks to the low-grade stockpile.
Nugget Pond Mill
The hydrometallurgical plant was designed and constructed in 1996 and subsequently run by Richmont as a nominal 500 t/d CIP plant at 97% gold recovery. The operational plan for this feasibility study is to process up to 700 t/d at 95.5% gold recovery.
A new truck unloading, storage and reclaim facility will feed a new grinding circuit consisting of ball and vertical grinding mills to achieve a P80 grind size of 50 micron. Post grinding slurry will proceed through the existing leach / carbon in pulp (CIP) circuit to produce gold doré bars. The new circuit will run in parallel with the Rambler copper concentrator.
Residues from the hydrometallurgical plant will be combined with existing flows and stored in the Nugget Pond tailings storage facility.
1.12 Infrastructure and Facilities
At the Hammerdown mine site the main infrastructure will consist of the crushing and ore sorting plant. Other structures have been planned to site operational requirements and will include an administration complex, security gatehouse, explosive storage facility, truck scales, a warehouse, and a mine equipment maintenance shop. Site geotechnical investigations have been performed to support the engineering effort for site infrastructure design. Water from the open pit will be pump and directed to site drainage and pond facilities around the project site. Power will be supplied to the Hammerdown site by a new 570 m long utility line connection to the existing 25 kV grid at Route 391, operated by Newfoundland and Labrador Hydro. The entrance to the Hammerdown site is located a short distance from Route 391 via the Shoal Pond forest access road. A new 2 km bypass road is envisioned to ensure safe passage for the general public, rerouting light vehicle and other traffic away from the Hammerdown mine area.
At the Nugget Pond mill the main facilities will be the material handling system and covered ore stockpile ahead of the grinding and CIP circuits. An existing, operational, and fully permitted tailings storage facility is present and will be operated under a custom processing agreement with Rambler Mining and Metals Canada Limited. Power is supplied by an existing line connection to the provincial power grid. An existing 10 km access road connects Nugget Pond to provincial highway 414. Upgrades to the access road have been incorporated into the Feasibility Study to address widening and culvert replacements in certain areas.
|
|
1.13 Environmental Studies, Permitting and Social Impacts
Maritime has developed a comprehensive environmental baseline that characterizes the existing biophysical environment of the proposed mine development area. A high-level summary of Project environmental baseline conditions is provided in Section 20 of this report and draws on the results of numerous desktop and field studies and assessments undertaken since 2016 including atmospheric, terrestrial, aquatic, hydrological and hydrogeological studies, as well as supporting site-wide geotechnical investigation (for areas outside of the proposed open pit and historical mine workings footprint) and acid rock drainage/metal leaching studies.
In July 2020, the Project was registered as per the requirements of the Newfoundland and Labrador Environmental Assessment Act (Maritime, 2020). Since the proposed mine production capacity is less than the federal Impact Assessment Act trigger of 5,000 t/d, the Project was not required to complete a federal Environmental Assessment (EA) review. Following provincial review of the EA registration document, the Project was subsequently required to prepare an Environmental Preview Report (EPR) (Maritime, 2021a). The EPR was submitted on March 4, 2021, and included additional requested information on the following:
• Water management;
• Greenhouse gas emissions;
• Plans for enhancing positive impacts and mitigating negative impacts of the Project on the health of local residents, visitors, and business owners;
• Further consultation with occupants with nearby properties to address potential land use conflicts;
• Development of a waste management plan;
• Development of a gender equity and diversity plan; and
• Additional information on Project occupations and hiring arrangements.
Following regulatory review of the EPR, the Government of Newfoundland and Labrador approved the Project and issued a release from the EA process in May 2021.
A complete set of provincial and federal approvals, authorizations and permits to approve the construction and operation of the Project have been identified and are in progress. Future permitting in support of the start of construction will focus on the completion and submission of both the Project Development Plan, and the Rehabilitation and Closure Plan (RCP). Provincial regulatory approval of these two plans is required prior to the start of construction.
The RCP will be directly linked to mine development and operation over the life of the mine. Review and revisions of the RCP are needed throughout the development and operational stages of a project, allowing adjustments that reflect the operational and planning changes that can occur. Objectives of rehabilitation and closure will generally be to restore the land to as close to natural conditions as practically possible, minimize any long-term impact of the environment, creation of a landscape which is visually acceptable and compatible with surrounding terrain and land use, mitigation and control to within acceptable levels the potential sources of contamination, pollution, fire risk, and public liability, and provide a safe environment for long term public access. Activities will be undertaken progressively and at end of mine life to meet these objectives. The preliminary cost estimate for closure is estimated to be $3.5 million in 2022 Canadian Funds, excluding Harmonized Sales Tax.
|
|
To date, Maritime has discussed the proposed Project with the towns of King's Point and Springdale as well as a number of provincial and federal government departments and agencies. Maritime will maintain consultation with applicable stakeholders, including government departments throughout the planning, permitting, development, operation, and closure phases of the Project. Carrying out meaningful community consultation is not only important for Maritime to obtain social acceptability but is also necessary to fulfill all the regulatory requirements and expectations under the NL EA process. Maritime carried out its most recent public meeting on November 4, 2020, as per the EPR requirements.
1.14 Operating and Capital Cost Estimates
Capital costs have a basis of estimate at Class 3 (Front End Loading (FEL) 3) with a stated -15% / +30% accuracy (after the Association for the Advancement of Cost Engineering International) and are stated in Q2 2022 Canadian dollars.
Capital cost contingency has been allocated on scopes of work depending on level of completion for each scope. The combined contingency for all scopes of work is equivalent to 9.8% of Direct + Indirect Costs or 20% of direct costs, excluding mining equipment and pre-stripping. More than 82% of equipment costs, bulk materials and labour rates are estimated with budget quotes from vendors. The remaining 18% of costs are estimated from consultant databases on precedent projects, or from factoring such items as freight and construction indirect costs from supply pricing.
Mine equipment is assumed to be acquired through a combination of leasing for most production and support equipment, rentals for pioneering drills, and purchase of some support equipment.
The initial capital cost, including contingency, is estimated at $75.0 million and net LOM sustaining capital cost is estimated at $4.9 million, net of closure costs and salvage values for major equipment, for a total capital cost of $80.0 million. See Table 1-4.
Table 1-4: Summary of Capital Cost Estimate ($C)
| Item | Units | Total |
| Mining | $M | 10.6 |
| Site development | $M | 4.7 |
| Mineral processing | $M | 24.7 |
| Water management | $M | 0.6 |
| On-site infrastructure | $M | 5.9 |
| Project indirect costs | $M | 17.3 |
|
|
| Item | Units | Total |
| Owner's costs | $M | 4.0 |
| Subtotal | $M | 67.9 |
| Contingency | $M | 7.2 |
| Total initial capital | $M | 75.0 |
| Sustaining capital | $M | 11.0 |
| Closure | $M | 3.5 |
| Salvage | $M | 9.6 |
| Total net sustaining capital | $M | 4.9 |
| Total capital | $M | 80.0 |
Mine operating costs, excluding pre-stripping, are estimated at $4.49/t mined with a strip ratio of 20.3 (waste:ore) over the LOM.
Processing and tailings storage related costs are estimated at $48.06/t processed. General and administration costs are estimated at $12.04/t processed. Diesel costs are estimated at $1.53/l and power at $0.085/kWh (net charge for generated power). See Table 1-5 and Table 1-6.
Overall LOM Cash Costs are estimated at US$897 per payable ounce of gold. The LOM All-In Sustaining Costs are estimated at US$912 per payable ounce of gold.
Table 1-5: Summary of Operating Cost Estimate ($C)
| Item | Units | Total |
| Mining costs | $/t mined | 4.49 |
| Trucking | $/t milled | 25.50 |
| Mineral processing | $/t milled | 48.06 |
| G&A | $/t milled | 12.04 |
| Total | $/t milled | 234.45 |
| On-Site OPEX | $M | 278.7 |
Table 1-6: Main OPEX Component Assumptions
| Item | Unit | Value |
| Electrical power cost | $/kWh | 0.085 |
| Average power consumption | MW | 3.39 |
| Overall power consumption (all facilities) | kWh/t processed | 6.26 |
| Diesel cost (delivered) | $/litre | 1.53 |
| LOM average manpower (including contractors, excluding corporate) | employees | 270 |
|
|
1.15 Economic Analysis
An economic model was developed to estimate annual cash flows and sensitivities of the Project. All costs, metal prices, and economic results are reported in Canadian currency ($C) unless stated otherwise.
Pre-tax estimates of Project values were prepared for comparative purposes, while after-tax estimates were developed to approximate the true investment value. It must be noted, however, that tax estimates involve many complex variables that can only be accurately calculated during operations and, as such, the after-tax results are only approximations.
This Technical Report contains forward-looking information regarding projected mine production rates, construction schedules, and forecasts of resulting cash flows as part of this study. The mill head grades are based on sampling that is reasonably expected to be representative of the realized grades from actual mining operations. Factors such as the ability to obtain permits to construct and operate a mine, to obtain major equipment or skilled labour on a timely basis, or to achieve the assumed mine production rates at the assumed grades may cause actual results to differ materially from those presented in this economic analysis.
The reader is cautioned that the gold prices and exchange rates used in this study are only estimates based on recent historical performance and there is absolutely no guarantee that they will be realized if the Project is taken into production. The price of gold is based on many complex factors and there are no reliable methods of predicting the long-term gold price.
At the base case gold price (US$1,750/oz Au and a $0.77 US$/C$ exchange rate), the Project is estimated to generate an after-tax NPV5% of $102.8M and an after-tax IRR of 48.1%. Payback on initial capital is calculated to be 1.7 years.
1.15.1 Main Assumptions
Table 1-7 outlines the LOM summary and the basis for the economic analysis.
Table 1-7: LOM Summary
| Parameter | Unit | Value |
| Ore Mined/Sorted | kt | 1,895 |
| Average Mined Gold Grade | g/t | 4.46 |
| Ore Processed | kt | 1,189 |
| Mill Average Daily Production | t/d | 700 |
| Average Gold Mill Grade | g/t | 6.76 |
| Gold Contained* | koz | 258 |
| Gold Recovered | koz | 247 |
| Gold Recovery | % | 95.7 |
|
|
| Parameter | Unit | Value |
| Average Gold Production | koz/year | 52 |
| Initial Capital Cost | $M | 75.0 |
| Sustaining Capital Cost (net of salvage) | $M | 4.9 |
| Life of Mine Capital | $M | 80.0 |
*Contained in sorted tonnes.
The main assumptions used in the economic analysis of the Project are outlined in Table 1-8 and Table 1-9 below.
Table 1-8: Economic Assumptions
| Item | Unit | Value |
| NPV Discount Rate | % | 5 |
| Federal Income Tax Rate | % | 15 |
| Provincial Income Tax Rate | % | 15 |
| Equity Finance | % | 100 |
| Capital Contingency (Overall) | % | 10.3% |
Table 1-9: Off-site Gold Costs and Payable Assumptions
| Off-site Costs and Payables | Unit | Value |
| Payables for Doré | % | 99.97% |
| Doré Refining/Transport Costs | US$/payable oz | 0.38 |
| Transport Cost | US$/payable oz | 1.35 |
Table 1-10 outlines the metal prices and exchange rates used in the economic analysis.
Table 1-10: Gold Value Assumptions
| Assumptions | Unit | Value |
| Au Price | US$/oz | 1,750 |
| FX Rate | US$:C$ | 0.77 |
|
|
1.15.2 Results
The economic results for the Project, based on the assumptions outlined above are presented in Table 1-11.
Table 1-11: Economic Results
| Parameter | Unit | Pre-Tax Results | After-Tax Results |
| NPV0% | M$ | 194 | 130 |
| NPV5% | M$ | 159 | 103 |
| IRR | % | 67.7 | 48.1 |
| Payback period | Production years | 1.0 | 1.7 |
The break-even gold price for the project after-tax (NPV0%) is US$ 1,115/oz.
1.15.3 Sensitivities
Sensitivity analyses were performed using metal prices, mill head grade, CAPEX, and OPEX as variables. The value of each variable was changed plus and minus 25% independently while all other variables were held constant. The results of the sensitivity analyses are shown in Table 1-12.
Table 1-12: Sensitivity Analysis Results
| Variable | After-Tax NPV5% (M$) | Pre-Tax NPV5% (M$) | ||||
| -25% Variance |
0% Variance |
25% Variance |
-25% Variance |
0% Variance |
25% Variance |
|
| Metal Price or Head Grade | 27 | 103 | 176 | 37 | 159 | 281 |
| OPEX | 141 | 103 | 64 | 220 | 159 | 97 |
| CAPEX | 123 | 103 | 83 | 179 | 159 | 139 |
1.16 Conclusions
It is the conclusion of the QPs that the FS summarized in this technical report contains adequate detail and information to support a FS-level report. Standard industry practices, equipment and design methods were used in the FS.
Based on the assumptions used for this study, the project shows positive economics and should proceed to permit finalization and expansion of resources through additional drilling.
|
|
The most significant potential risks associated with the project are uncontrolled dilution with waste rock and rock from different mineralized zones, operating and capital cost escalation, permitting and environmental compliance, unforeseen schedule delays, changes in regulatory requirements, ability to raise financing, ability to find and retain qualified personnel and gold price. These risks are common to most mining projects, many of which can be mitigated with adequate engineering, planning and pro-active management.
To date, the QPs are not aware of any fatal flaws for the Project.
1.16.1 Geology and Mineral Resources
• The Hammerdown deposit most closely resembles a mesothermal volcanic hosted (greenstone belt) gold deposit.
• The Hammerdown Mineral Resource estimates were prepared in accordance with Canadian Institute of Mining, Metallurgy and Petroleum (CIM) for Mineral Resources and Mineral Reserves dated May 10, 2014 (CIM (2014) definitions).
• The sampling, sample preparation, analyses, security, and data verification meet industry standards and are appropriate for Mineral Resource estimation.
• Open pit Measured and Indicated Mineral Resources total 2,845 thousand tonnes (kt) at an average grade of 3.61 g/t Au, containing 329,900 oz Au, and Inferred Mineral Resources total 302 kt at an average grade of 1.31 g/t Au, containing approximately 12,700 oz Au.
• Underground Measured and Indicated Mineral Resources total 55 kt at an average grade of 5.10 g/t Au, containing 9,000 oz Au, and Inferred Mineral Resources total 66 kt at an average grade of 4.00 g/t Au, containing approximately 9,000 oz Au.
• A cut-off grade of 0.50 g/t Au was used to report open pit Mineral Resources for the Hammerdown deposit, while a cut-off grade of 2.0 g/t Au was used to report underground Mineral Resources.
1.17 Recommendations
It is recommended that the Project continues to advance towards a construction decision and complete final permitting and additional exploration drilling around the Hammerdown deposit to extend the mine life and improve project economics.
• Project Permitting: File Hammerdown closure and development plans for mine construction permit. The estimated cost of permit application completion is $100,000.
• Exploration drilling near Hammerdown: Focus exploration drilling on the Orion - Hammerdown trend where potential exists to draw new mineral resources into the Hammerdown mine plan. The first phase of drilling should include a 5,000 m program. The cost of the drilling program is estimated to be $1.0M based on a $150 /m drilling cost, all-in, and $0.25M for contingency and QA/QC modifications.
|
|
2 INTRODUCTION
The Hammerdown Gold Project is an advanced stage gold project, located in Newfoundland, Canada. It is located approximately 5 km southwest of the town of King's Point and 13 km west of the town of Springdale, Newfoundland and Labrador. Maritime owns 100% of the Hammerdown and Wisteria deposits, the focus of this FS. In 2021, Maritime Resources commissioned JDS Energy & Mining Inc. (JDS) to lead a feasibility study (FS) on the project. Several other engineering and consulting companies contributed to the FS and Technical Report. A list of contributing companies is shown in Section 2.1.1.
2.1 Qualified Persons (QPs)
2.1.1 Scope of Work of Contributing Companies
This technical report summarizes the work of several consultants with the scope of work for each company listed below, which combined, comprises the total Project scope.
JDS Energy & Mining Inc. (JDS):
• Project management and report compilation;
• Economic modeling;
• Open pit geotechnical analysis;
• Open pit mine planning, project production schedule, CAPEX and OPEX;
• Mineral reserve estimate;
• Hammerdown site infrastructure; and
• Infrastructure and Owner's CAPEX and overall CAPEX compilation.
Halyard Engineering (Halyard):
• Process plant design (crushing/sorting plant and gold leach plant);
• Process infrastructure and power distribution design; and
• Processing CAPEX and OPEX estimation.
Canenco Consulting Corp. (Canenco):
• Metallurgical sample selection;
|
|
• Metallurgical test work planning and management;
• Process design criteria input;
• Interpretation of test work results and estimation of recoveries and concentration factors; and
• Estimation of reagent usage.
GEMTEC Consulting Engineers and Scientists Limited (GEMTEC):
• Environmental Studies and Permitting
• Site Wide geotechnical and hydrogeological investigations
• Water management design; and
• Closure cost estimation.
SLR (SLR):
• Geological investigations; and
• Mineral resource estimation.
SRK Consulting (SRK):
• Waste rock geochemical test management and analysis and interpretation of results.
2.1.2 Qualifications and Responsibilities
The results of this FS are not dependent upon any prior agreements concerning the conclusions to be reached, nor are there any undisclosed understandings concerning any future business dealings between Maritime Resources and the QPs. The QPs are being paid a fee for their work in accordance with normal professional consulting practice and are independent of Maritime as per NI 43-101 definition of independence.
The following individuals, by virtue of their education, experience and professional association, are considered QPs as defined in the NI 43-101, and are members in good standing of appropriate professional institutions / associations. The QPs are responsible for the specific report sections as follows:
|
|
Table 2-1: QP Responsibilities
| QP | Company | QP Responsibility / Role | Report Section(s) |
| Carolyn Anstey-Moore, P.Geo. | GEMTEC | Environmental Studies and Permitting | 1.13, 20.1, 20.2, 20.4, 20.5, 20.7, and 20.8 |
| Hans Arisz, M.Sc.E., P.Eng., FCSCE | GEMTEC | Water Management | 18.1.9 |
| Rob Bowell, CChem, CGeol, FIMMM | SRK | Geochemistry | 20.9 |
| Carly Church, P. Eng. | JDS | Hammerdown site infrastructure design, CAPEX and G&A OPEX | 1.12, 1.14, 18 (except 18.1.6 and 18.1.9), 21 (except 21.3 & 21.5), 22 (except 22.3 & 22.4) |
| Gord Doerksen, P. Eng. | JDS | Overall project management, general information sections and project description, economics, marketing and contracts, conclusions and recommendations | 1.1 to 1.5, 1.15 to 1.17 (except 1.16.1), 2 to 6, 19, 23 to 25, 26.2, 26.3, 27 to 29 |
| Dorota El Rassi, M. Sc., P. Eng. | SLR | Geology, Mineralization, QA/QC and Data Validation | 1.6, 7, 8, 9, 11, 12 |
| Michael Franceschini, P. Eng. | Halyard | Hammerdown and Nugget Pond process plant and process infrastructure design and CAPEX | 18.1.6, 21.5 & 22.4 |
| Ivana Sabaj Abumohor, P.Eng | Halyard | Process design, equipment selection and process OPEX. | 1.11, 17 |
| Stacy Freudigmann, P. Eng. | Canenco | Metallurgical testing program management, analyses and interpretation. Processing circuit design criteria and flowsheet development, gold recoveries and reagent use estimates | 1.7, 13 |
| Tysen Hantelmann, P. Eng. | JDS | Mineral Reserves, Mine planning, production schedule and open pit CAPEX and OPEX | 1.9, 1.10, 15,16 (except 16.3), 21.3, 22.3 |
| Pierre Landry, P. Geo. | SLR | Geology, Mineralization, Drilling, QA/QC, Data Validation and Mineral Resource Estimate | 1.6, 1.8, 1.16.1, 7, 8, 9, 10, 11, 12, 14, 26.1 |
| Mike Levy, P.Eng. | JDS | Open pit geotechnical | 16.3 |
| Shawn Russell, P.Eng. | GEMTEC | Site wide geotechnical | 20.3 |
| Leanne Stein, P.Eng. | GEMTEC | Closure cost estimation | 20.6 |
|
|
2.2 Terms of Reference
This Technical Report was prepared for Maritime Resources Corp., a Canadian public company, trading on the TSX Venture Exchange under the symbol TSXV: MAE.V. The purpose of this Technical Report is to:
• Summarize the FS conducted on the Hammerdown / Wisteria deposits only within Maritime's Hammerdown Project. No other deposits were included in the FS;
• Present the updated Mineral Resource Estimates for the Hammerdown and Wisteria deposits;
• Provide updated metallurgical test results;
• Explain updated site information;
• Describe FS-level infrastructure and mineral processing designs;
• Produce a life of mine production schedule and mine designs;
• Provide FS-level operating and capital cost estimations and construction schedule;
• Produce an estimate of the FS-level economics for the open pit mining of the Hammerdown / Wisteria deposits;
• Estimate Mineral Reserves; and
• Provide Maritime with a Technical Report for public disclosure to potentially be used to raise funds for the continued to develop of the Project by conducting exploration work, technical investigations and detailed engineering and construction preparation.
This Technical Report was prepared using guidance from National Instrument 43-101 and Canadian Institute of Mining, Metallurgy and Petroleum (CIM) Standards on Mineral Resources and Reserves: Definitions and Guidelines, May 10, 2014.
2.3 Sources of Information
This report is based on information collected by the QPs during site visits performed as per Table 2-2, on additional information provided by Maritime throughout the course of the FS investigations. Other information was obtained from the public domain, from discussions with regulatory agencies, from vendors and from test laboratories. JDS has no reason to doubt the reliability of the information provided by Maritime or any of the other sources.
The documentation reviewed, and other sources of information, are listed at the end of this Technical Report in Section 28.
|
|
2.4 QP Site Visits
QP site visits were conducted as shown in Table 2-2.
Table 2-2: QP Site Visits to the Hammerdown Project
| Qualified Person | Company | Date | Accompanied by | Description of Inspection |
| Carolyn Anstey-Moore, P.Geo. | GEMTEC | Oct. 14, 2020 | G. Macdonald, P. Goudie, P. Blanchard of Maritime |
Conducted a site walkover of Hammerdown Project. |
| Hans Arisz, P.Eng. | GEMTEC | May 10-11, 2022 | G. Macdonald, P. Goudie, P. Blanchard of Maritime |
Performed full site walkover and reviewed general site topography, existing drainage dynamics, presence of watercourses and wetlands, and proposed locations of mine pit and site infrastructure. |
| Rob Bowell, CChem, CGeol, FIMMM | SRK | Aug. 2019; Sep. 2021; Nov. 2021 | G. Macdonald, P. Blanchard and other various Maritime personnel |
Visit and full inspection of the Hammerdown site. |
| Carly Church, P. Eng. | JDS | May 10-11, 2022 | G. Macdonald, P. Goudie, P. Blanchard of Maritime |
Complete walking site tour of Hammerdown and the Nugget Pond gold circuit. Driving tour of local area and road to Nugget Pond |
| Gord Doerksen, P. Eng. | JDS | May 10-11, 2022 | G. Macdonald, P. Goudie, P. Blanchard of Maritime |
Complete walking site tour of the Hammerdown Project and the Nugget Pond gold circuit. Driving tour of local area and road to Nugget Pond |
| Dorota El Rassi, M. Sc., P. Eng. | SLR | Sep. 7-9, 2020 | J. Niemi, L. Pilgrim J. Flight of Maritime and S Zelligan, Independent Consultant |
Visited the core shack, reviewed the logging environment and procedures for data collection and sampling, inspected core samples and outcrops in the Hammerdown, Orion and Whisky Valley areas, interviewed Maritime personnel, and gathered other information for the completion of this report. Discussions were held during the site visit and virtually afterwards with the following personnel from Maritime Resources and their consultants. |
| Michael Franceschini, P. Eng. | Halyard | May 10-11, 2022 | G. Macdonald, P. Goudie, P. Blanchard of Maritime |
Complete walking site tour of Hammerdown and the Nugget Pond gold circuit. Driving tour of local area and road to Nugget Pond |
| Tysen Hantelmann, P. Eng. | JDS | May 10-11, 2022 | G. Macdonald, P. Goudie, P. Blanchard of Maritime |
Complete walking site tour of Hammerdown and the Nugget Pond gold circuit. Driving tour of local area and road to Nugget Pond |
|
|
| Qualified Person | Company | Date | Accompanied by | Description of Inspection |
| Mike Levy, P.Eng. | JDS | Nov. 9, 2020 | L. Pilgrim, J. Flight of Maritime |
Inspected the Hammerdown site including the historic pit and reviewed core for geotechnical properties. |
| Shawn Russell, P.Eng. | GEMTEC | Oct. 14, 2020 | P. Goudie, P. Blanchard of Maritime |
Reviewed site-wide geotechnical and hydrogeological drillhole locations, geotechnical testing and sampling procedures, and quality assurance/quality control (QA/QC) procedures. In addition, conducted a site walkover to observe any potential areas of slope instability, or localized subsidence, outside of the proposed pit footprint and existing mine workings. |
| Leanne Stein, P.Eng. | GEMTEC | Oct. 26 - Nov. 4, 2020 | P. Goudie, P. Blanchard of Maritime |
While supporting the site-wide geotechnical and hydrogeological field investigation had the opportunity to become familiar with site topography, ground conditions and layout of proposed mine infrastructure. |
Ivana Sabaj Abumohor, P.Eng., did not conduct a site visit but relied upon information gained from Michael Franceschini, P.Eng. of Halyard.
Stacy Freudigmann, P.Eng., F.Aus.IMM., did not conduct a site visit, but as the Metallurgy QP visited laboratories and relied upon process information gained from Michael Franceschini, P.Eng. of Halyard.
Pierre Landry, P.Geo., did not conduct a site visit and relied on the information from Dorota El Rassi's site visit on behalf of SLR.
2.5 List Of Previous Relevant Technical Reports
The previous Technical Report, "Hammerdown Gold Project, Newfoundland and Labrador Preliminary Economic Assessment", April 15, 2020, WSP et. al. (WSP 2020) was the most recent Technical Report.
The WSP (2020) report considered the use of both underground and open pit mining methods at a combined production rate to the ore sorters of 1,400 t/d and then transport of the sorter concentrate to the Nugget Pond mill for gold leaching. The WSP (2020) report included the mining of Hammerdown / Rumbullion and Orion deposits. The WSP (2020) report is no longer valid, however, site descriptions and basic project information were used in this report after verification and/or editing by the FS QPs.
|
|
The FS did not consider any contribution from the Orion deposit as this project is at the exploration stage and requires additional exploration work, technical and environmental studies before a feasibility level assessment supporting a stand-alone project. In contrast the Hammerdown project is at an advanced stage of development with feasibility level detail and a release from Environment Assessment by the province of Newfoundland and Labrador in 2021. As such Maritime is treating Hammerdown and Orion as two separate projects.
2.6 Units, Currency and Rounding
The units of measure used in this report are as per the International System of Units (SI) or "metric" except for Imperial units that are commonly used in industry (e.g., ounces (oz.) for the mass of precious metals).
All dollar figures quoted in this report refer to Canadian dollars (C$ or $) unless otherwise noted.
Frequently used abbreviations and acronyms can be found in Section 29. This report includes technical information that required subsequent calculations to derive subtotals, totals and weighted averages. Such calculations inherently involve a degree of rounding and consequently introduce a margin of error. Where these occur, the QPs do not consider them to be material.
This report may include technical information that requires subsequent calculations to derive sub-totals, totals and weighted averages. Such calculations inherently involve a degree of rounding and consequently introduce a margin of error. Where these occur, JDS does not consider them to be material.
|
|
3 RELIANCE ON OTHER EXPERTS
The QPs opinions contained herein are based on information provided by Maritime and others throughout the course of the study. The information, conclusions, opinions, and estimates contained herein are based on:
• Information available to the QPs at the time of preparation of this Technical Report.
• Assumptions, conditions, and qualifications as set forth in this Technical Report.
• The geotechnical analysis relied upon laboratory test data provided by Queens University and WSP as well as geotechnical core logging data provided by WSP and Maritime.
The QPs have taken reasonable measures to confirm information provided by others and take responsibility for the information.
Non-QP specialists relied upon for specific advice are:
• Gord Doerksen relied upon the work of:
Maritime personnel (Larry Pilgrim and Jeremy Niemi) for input into Section 13 for sample selection, locations and site chain of custody.
The QPs used their experience to determine if the information from previous reports was suitable for inclusion in this technical report and adjusted information that required amending.
|
|
4 PROPERTY DESCRIPTION AND LOCATION
4.1 Location
Maritime holds mineral rights to a large package of map staked mineral licenses located approximately 5 km southwest of the Town of King's Point and approximately 15 km northwest of the Town of Springdale in the province of Newfoundland and Labrador (Figure 4-1). The property is situated on North American Topographic Sheet (NTS) 12H/08 and 09 and is centered on coordinates 554475 East, 5488890 North NAD 83 Zone 21. The total package of contiguous mineral licenses encompasses 391 km2 in 62 mineral licenses containing 1564 claim units. The mineral licenses are referred to under three project areas including the Hammerdown Project (also referred to as the Green Bay Property), Whisker Valley Project and the Gull Ridge Project. Maritime's most advanced gold deposit Hammerdown is located on the Hammerdown Project area (Figure 4-2). The Hammerdown Project area encompasses 98 km2 (24,216 acres) held under 22 individual map staked mineral licenses (9,800 ha).
|
|
Figure 4-1: Maritime Resources Gold Project Location Map
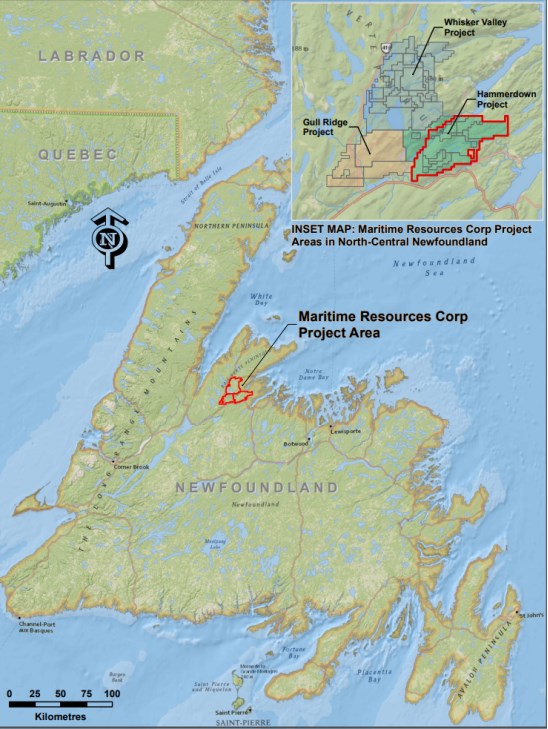
Source: Maritime Resources (2022)
|
|
Figure 4-2: Project Location Map Regional Scale
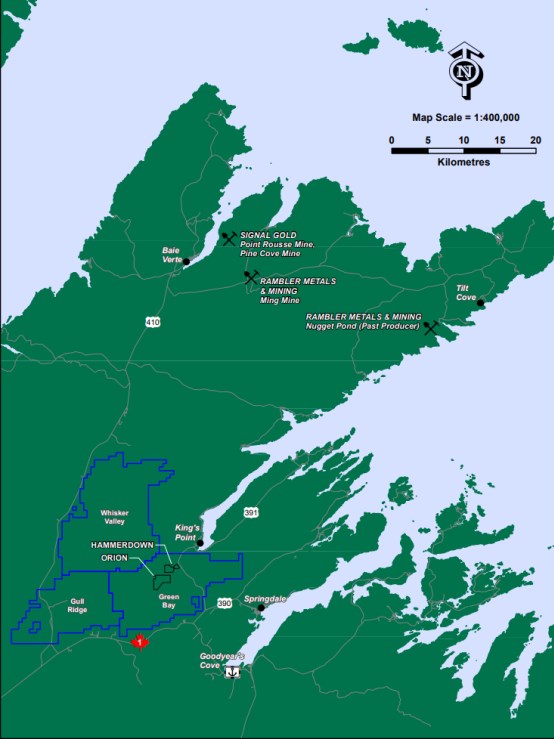
Source: Maritime Resources (2022)
|
|
4.2 Mineral Tenure
The Hammerdown Project area encompasses 98 km2 (24,216 acres) held under 22 individual map staked mineral licenses (9,800 ha) which includes three mining leases (Figure 4-3). The project area is bounded to the west by Maritime licenses and the project is also referred to as the Hammerdown Project. All the Hammerdown Project mineral licenses are owned 100% by Maritime either by direct map staking or earned through option agreements.
All mineral licenses and the mining leases were in good standing as of the issue date of this technical report. Table 4-1 summarizes the mineral license details, along with the Mining Lease details. Figure 4-3 shows the location of the mineral licenses and mining leases on the Hammerdown Project area.
|
|
Figure 4-3: Hammerdown Project Area Mining Licenses and Mining Leases
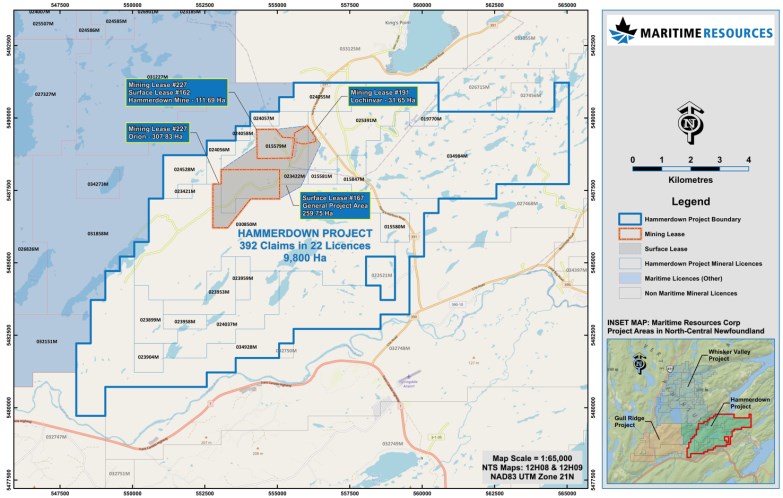
Source: Maritime Resources (2022)
|
|
Table 4-1: Hammerdown Mineral Licenses
| Hammerdown Mineral Licenses | |||||
| Licence Number | Claim Units |
Area (ha) |
Licence Holder | Issue Date | Renewal Date |
| 015579M | 17 | 425 | Maritime Resources Corp. | 2006-11-02 | 2026-11-02 |
| 015580M | 4 | 100 | Maritime Resources Corp. | 2006-11-02 | 2026-11-02 |
| 015581M | 2 | 50 | Maritime Resources Corp. | 2006-11-02 | 2026-11-02 |
| 015847M | 6 | 150 | Maritime Resources Corp. | 2009-02-19 | 2024-02-19 |
| 019770M | 1 | 25 | Maritime Resources Corp. | 2012-01-19 | 2027-01-19 |
| 023421M | 1 | 25 | Maritime Resources Corp. | 2015-10-22 | 2025-10-22 |
| 023422M | 2 | 50 | Maritime Resources Corp. | 2015-10-22 | 2025-10-22 |
| 023899M | 8 | 200 | Maritime Resources Corp. | 2016-05-05 | 2026-05-05 |
| 023904M | 4 | 100 | Maritime Resources Corp. | 2016-05-05 | 2026-05-05 |
| 023953M | 10 | 250 | Maritime Resources Corp. | 2016-05-19 | 2026-05-19 |
| 023958M | 3 | 75 | Maritime Resources Corp. | 2016-05-19 | 2026-05-19 |
| 023959M | 3 | 75 | Maritime Resources Corp. | 2016-05-19 | 2026-05-19 |
| 024037M | 18 | 450 | Maritime Resources Corp. | 2016-07-08 | 2026-07-08 |
| 024055M | 10 | 250 | Maritime Resources Corp. | 2016-08-01 | 2026-08-01 |
| 024056M | 4 | 100 | Maritime Resources Corp. | 2016-08-01 | 2026-08-01 |
| 024057M | 2 | 50 | Maritime Resources Corp. | 2016-08-01 | 2026-08-01 |
| 024058M | 1 | 25 | Maritime Resources Corp. | 2016-08-01 | 2026-08-01 |
| 024528M | 7 | 175 | Maritime Resources Corp. | 2016-12-02 | 2026-12-02 |
| 025391M | 29 | 725 | Maritime Resources Corp. | 2006-11-02 | 2026-11-02 |
| 030850M | 96 | 2400 | Maritime Resources Corp. | 2015-10-22 | 2025-10-22 |
| 034928M | 88 | 2200 | Maritime Resources Corp. | 2013-06-24 | 2023-06-24 |
| 034984M | 76 | 1900 | Maritime Resources Corp. | 2019-11-07 | 2024-11-07 |
| Hammerdown Mining Leases | |||||
| Licence Number | Area (ha) |
Licence Holder | Issue Date | Renewal Date |
|
| #191 - Lochinvar (11294M) | 31.654 | Maritime Resources Corp. | 2021-08-18 | 2028-08-18 | |
| #227 - Orion (9813M) | 307.828 | Maritime Resources Corp. | 2020-04-28 | 2030-04-28 | |
| #237 - Hammerdown (15579M) | 111.694 | Maritime Resources Corp. | 2016-11-01 | 2026-11-01 | |
Source: Maritime Resources (2022)
|
|
4.3 Royalties and Related Rights
Commander Resources Ltd. (Commander) holds a 1% Net Smelter Return (NSR) royalty on the Project, excluding the Orion deposit. Additionally, there is a $3.165 M royalty payment, commencing one year after the onset of commercial production, payable to holders who received royalty units from the Maritime Resources July 2016 financing, and funded solely from 10% of annual net cash flow from the Project, with net cash flow representing net production revenues realized from the Project after deduction of all Project operating and debt servicing costs. At the option of the Company, the royalty payments will be paid either in cash or in gold.
4.4 Environmental Liabilities and Considerations
All discussions related to environmental permits and any liabilities are disclosed in detail in Section 20 of this technical report. The historical Hammerdown mining footprint site has been completely rehabilitated and the closure was accepted by the NL Government, Department of Natural Resources, on January 12, 2005. There are no known environmental impacts affecting Hammerdown at this time.
4.5 Permit Requirements
The surface rights immediately surrounding the property are held by the Crown. The permits required to conduct exploration work on the Project are as follows and are renewed prior to expiry:
• Mineral Exploration Permit Green Bay Property E220214 issued by Department of Natural Resources, Government of Newfoundland, and Labrador, expires June 1, 2023.
• Commercial Wood Cutting Permit Green Bay Property 22-09-01527 issued by Department of Natural Resources, Government of Newfoundland, and Labrador, expires December 3, 2022.
4.6 Other Relevant Factors
There are no other relevant factors that would impact the Project.
|
|
5 ACCESSIBILITY, CLIMATE, LOCAL RESOURCES, INFRASTRUCTURE AND PHYSIOGRAPHY
Figure 5-1: King's Point
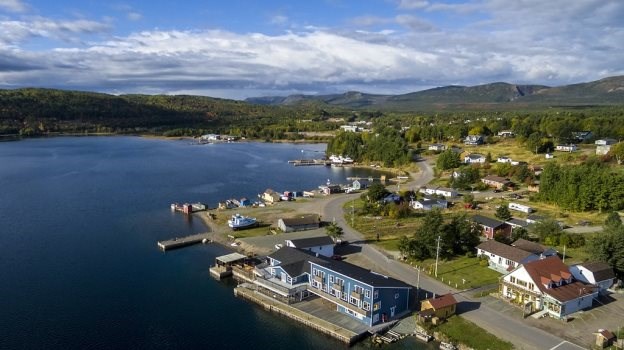
Source: Maritime Resources (2022)
5.1 Accessibility
Access to the Project is via Highways 1, 390 and 391, approximately 120 km from Deer Lake, a town of about 5,000 people and a regional hub. From Highway 391 the project is accessed on a 2 km long all-weather gravel road. The Project is easily accessed all year.
The largest airport close to the project site is at Deer Lake. The Deer Lake Regional Airport (YDF). The airport has several scheduled flights every day to Toronto, Montreal, St. Johns, Halifax and others. The YDF runway is 2,440 m long and 46 m wide.
There are small port facilities at Springdale and South Brook. The nearest industrial port facility is located in Cornerbrook, about 150 km from the Project.
|
|
Figure 5-2 Road Access Map
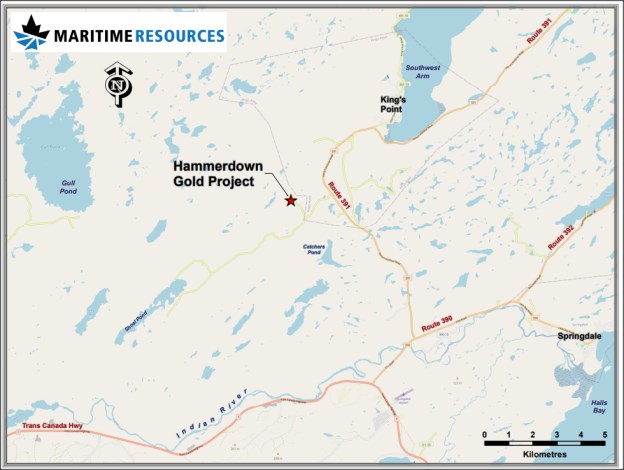
Source: Maritime Resources (2022)
5.2 Local Resources and Infrastructure
The towns closest to the Project are:
• King's Point: Population: 700 people Road distance to Project: 5 km
• Springdale Population: 2,800 people Road distance to Project: 5 km
• Deer Lake Population: 5,000 people Road distance to Project: 120 km
King's Point, Springdale and Deer Lake are modern communities that have an abundance of skilled labour and many service providers for the mining industry including diamond drilling, analytical services, welding, electrical, forestry, mining contractors, trucking contractors and general contractors. The Provincial hydroelectric grid transmission line parallels the highway 2 km east the Project along highway 391
|
|
5.3 Climate
The Project experiences a maritime climate of warm summers and cold winters. Average highs and lows July, the warmest month are 23°C and 16°C respectively. Average highs and lows in February are -3°C and -14°C (Environment Canada).
Annual precipitation is spread relatively evenly throughout the year with slightly more rain in in late summer and the fall.
The Project climate is conducive to year-round operations.
5.4 Physiography
The property is comprised of moderate topography at an elevation of about 200 masl. The Hammerdown deposit, planned sorting plant and infrastructure are located on a broad ridge that splits two drainages, The north side of the ridge drops off to into a NE-SW trending valley while the south side of the ridge is relatively flat (Figure 5-3).
Birch, black spruce and fir dominate the property flora, although most of the planned site has been logged. Peat bogs occur on the western side of the Hammerdown site.
There are sufficient sources of power, water, mining personnel, potential waste disposal areas, ore stockpile areas, and potential ore sorting plant sites. Tailings storage would be conducted at Nugget Pond and there is sufficient capacity for the volume of Hammerdown tailings estimated in this report pending final sign-off from Rambler.
|
|
Figure 5-3: Typical Landscape in the Project Area
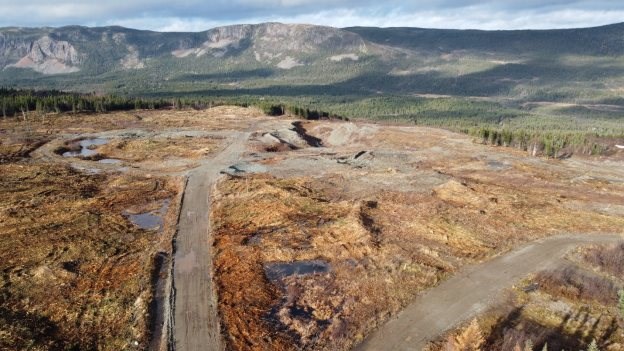
Source: Maritime Resources (2022)
|
|
6 HISTORY
This part of Newfoundland and Labrador has been actively explored for more than a century, however, the area experienced extensive gold exploration activity that only start in the mid-1980s. This work was conducted mainly by Noranda Exploration Company Ltd. (Noranda) in conjunction with other mining companies as joint venture partners. One such partnership with Major General Resources Ltd. (Major General) resulted in the 1988 discovery of two gold deposits, Hammerdown and Rumbullion, and several gold prospects, including Muddy Shag and Wisteria.
Noranda acquired the ground surrounding the Rendell-Jackman property by staking and by an option agreement with Shear Exploration Pty Ltd. in 1986 (Huard, 1987). In joint venture partnerships with White Bay Resources and later Springer Resources, Noranda conducted an extensive program of soil sampling, ground geophysics, trenching, and diamond drilling (Andrews, 1988; Tuach, 1991). This work outlined a cluster of eight gold-in-soil anomalies ranging from 10 ppb to 125 ppb gold over a 200 m distance near what would later become the Hammerdown and Rumbullion areas, collectively referred to as the Hammerdown deposit. More robust anomalies from other areas surveyed were followed up with limited success but no other work was done near the deposit anomaly. In 1991, Hemlo Gold Mines Inc. (Hemlo Gold) acquired Noranda's Newfoundland assets, including the Rendell-Jackman property.
Major General acquired the remaining interest in the Rendell-Jackman property from Hemlo Gold in 1993 and conducted drill programs on several of the existing prospects during 1993 and 1994. Encouraging results prompted Major General to expand their land holdings, mainly to the southwest. Their exploration focus shifted to base metals as significant zinc-rich massive sulphide mineralization was expanded at Lochinvar, though gold exploration still received some attention.
Higher-density check soil sampling conducted in August and September 1995 confirmed and expanded the Noranda gold-in-soil anomaly cluster on the former Shear Option, returning values up to 135 ppb gold. Subsequent diamond drilling of this anomaly in October 1995 (BB-95-06) resulted in the discovery of the central portion of the Orion gold deposit. In November 1995, another cluster of five gold-in-soil anomalies (up to 85 ppb gold) was outlined 250 m along strike to the southwest. This anomaly was drill-tested in February 1996 (BB-96-32), resulting in the discovery of the western segment of the deposit (Orion West).
Since acquiring the Project, Maritime has been conducting systematic exploration to advance the Project, including additional diamond drilling, surface sampling, geophysics, metallurgical testing, and environmental baseline studies.
Table 6-1 summarizes the historical exploration programs completed at the Property.
|
|
Table 6-1: Property History Summary
| Year | Company | Program | Holes Drilled |
Metres Drilled |
Notes |
| 1987 | Noranda | Soil Sampling | - | - | Discovered Muddy Shag Zone |
| 1988 | Noranda | Diamond Drilling | 3 | 369.4 | MS-88-01 TO MS-88-03 on Hammerdown along with concurrent Trenching program |
| 1989 | Noranda | Diamond Drilling | 22 | 4,064.5 | MS-88-04 TO MS-88-25 on Hammerdown along with concurrent Trenching program |
| 1990 | Noranda | Diamond Drilling | 26 | 6,721.5 | MS-90-26 to MS-90-49 on Hammerdown along with trenching lead to discovery of Rumbullion zone |
| 1993 | Major General | Diamond Drilling | 34 | 6,698.3 | MS-93-50 to MS-93-83 on Hammerdown / Rumbullion |
| 1994 | Major General | Diamond Drilling | 10 | 1,550.7 | MS-94-84 to MS-94-93 on Hammerdown / Rumbullion |
| 1995-2002 | Commander Resources (formerly Major General) | Diamond Drilling | 45 | 11,634.9 | Orion Drilling |
| 1998 | Les Mines McWatters Inc | Due Diligence | 5 | 779.5 | MS94-MS98 on Hammerdown / Rumbullion |
| 1999 | Abiting Inc. | Diamond Drilling | 47 | 4,512.7 | MS101-MS147 "Abiting" was a front for Richmont when purchasing the property |
| 1999-2004 | Richmont | Drilling/Mining | 531 | 35,645.5 | Drilling/Mining on Hammerdown / Rumbullion |
| Total | Diamond Drilling | 673 | 59,562.60 | Prior to Maritime Resources |
Source: Maritime Resources (2022)
|
|
6.1 Production History
Richmont developed and operated the Hammerdown deposit from 2000 to 2004 as an open pit and an underground mine. Material from the mine was processed off-site at the Nugget Pond mill located approximately 140 km away. Table 6-2 summarizes the production records at the Hammerdown mine (Tully, 2004).
Table 6-2: Hammerdown Production Summary
| Year | Production Score | Tonnes Milled | Head Grade (g/t) | Total Gold Produced (oz) |
| 2000 | Open Pit | 17,504 | 15.85 | 8,597 |
| 2001 | Underground | 53,818 | 20.72 | 34,209 |
| 2002 | Underground | 93,451 | 16.02 | 47,470 |
| 2003 | Underground | 90,125 | 13.47 | 37,797 |
| 2004 | Underground | 35,282 | 13.52 | 14,922 |
| Total | 290,180 | 15.74 | 142,998 | |
Source: Tully (2004)
 |
 |
7 GEOLOGICAL SETTING AND MINERALIZATION
7.1 Regional Geology
The Project is located in the northeastern extremity of the Appalachian Orogen of eastern North America, where it is predominantly underlain by Paleozoic volcanic rocks of the Newfoundland Appalachians (Figure 7-1) within the Notre Dame Subzone (Williams et al., 1988) of the Dunnage tectono-stratigraphic sub-division (Williams, 1979).
The rocks underlying the area are represented by volcano-sedimentary assemblages of oceanic supra-subduction zone (ophiolitic) and mature-arc derivations (Szybinski and Jenner, 1989; Swinden, 1991; Kean et al., 1995) accreted to the ancient North American (Laurentian) continental margin during the Taconian Orogeny (Ordovician to Silurian) and further deformed during the Silurian-Devonian, post accretion, Acadian Orogeny (Swinden, 1991).
Other geological elements cover portions of the property including Silurian sub-aerial to fluviatile sediments (conglomerates) of the Springdale Group to the southeast (Kean, 1980; Coyle and Strong, 1987; Kean et al., 1995), Devonian intrusive rocks of the King's Point Complex, Siluro-Devonian intrusive rocks of Burlington Granodiorite to the northwest (Hibbard, 1983), and Devonian granitic intrusive rocks of the Topsails Granite to the southwest (Kean, 1980). A suite of mafic volcanics (informally referred to as the Hammerdown Basalt) in the northeastern part of the area were removed from the Lushs Bight Group and reassigned to the Catchers Pond Group and the Lushs Bight Group (Kean, 1984; Jenner and Szybinski, 1987, O'Brien and Dunning, 2014).
|
|
Figure 7-1: Regional Geology Setting
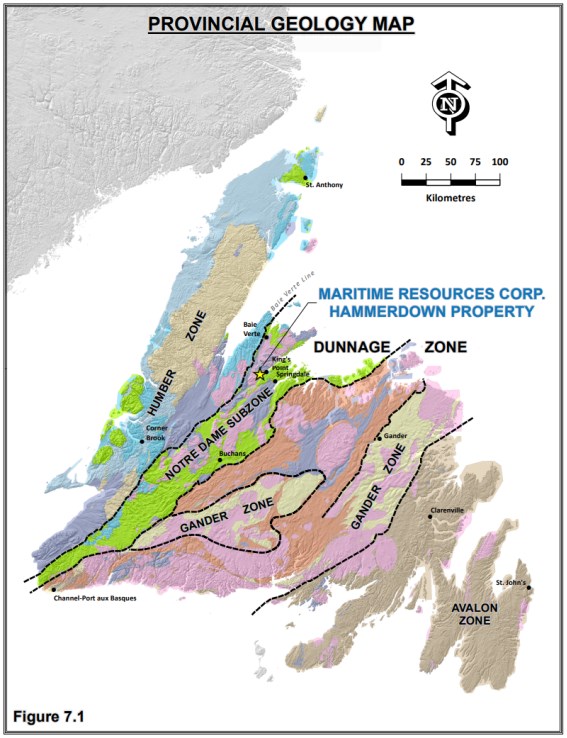
Source: Maritime Resources (2022) Adapted from Geological Survey NL Map 90-01, 20132022
|
|
7.2 Property Geology
The property area is principally underlain by Ordovician volcanic rocks of the Catchers Pond and the Lushs Bight Groups (Figure 7-2), however peripheral segments of the area extend over other geological elements of the region.
The Catchers Pond Greenstone belt consists of a series of lower Ordovician felsic to mafic volcanics interbedded with sequences of fine-grained arenaceous and chemical sediments. The greenstones are related to the Buchan's Greenstones located 75 km to the south, which produced base and precious metals from rich volcanogenic deposits for over 60 years.
The Catchers Pond Group consist of a north facing, conformable sequence of submarine, predominantly felsic volcanic rocks intercalated with several units of submarine mafic flows, tuffs and rare sediments. The rocks are divided into three subgroups in the property area including the basement Indian Brook Formation overlain by the Long Pond Formation overlain by the lowest member of the West Waters Pond Formation.
The Indian Brook Formation consists of mainly pillowed basalts, pillow breccias, interflow cherts and subvolcanic intrusions. Throughout most of the unit dark green, well stratified, medium to fine-grained pillowed basalts occur with massive, medium to coarse-grained flows of plagioclase-porphyritic andesite and abundant gabbroic sills and multiple diabase dykes. The pillow lavas display pipe vesicles, glassy selvages, interstitial grey-green chert, and breccia. Minor pyrite-chalcopyrite mineralization occurs in gossans present along contacts between mafic breccia and massive flows.
The Long Pond Formation consists mainly of mafic extrusive and intermediate pyroclastic strata with thin sulphidic or jasperitized interbeds of dark to light green, fine-grained plagioclase-phyric dacitic crystal tuff and light grey felsic lithic-crystal tuff typified by quartz eyes set in a lapilli-rich matrix at the base. The middle part of the formation consists of a well stratified interval of polylithic tuff having conspicuous fragments of light green dacitic ejecta together with clasts of light pink rhyolitic glass. The upper part of the formation consists of extensively carbonate-altered and highly silicified basalt flows capping glassy intermediate tuff and jasperitized felsic tuff together hosting laterally discontinuous stratabound zones of massive jasper and crosscutting zones of hematite-bearing quartz veinlets.
The lower felsic unit of the West Waters (Silver) Pond Formation, forming the most widespread unit of felsic volcanic rocks in the Catchers Pond Group, consists mainly of fine-grained felsic pyroclastic strata. At the base of the unit, thin, bedded to laminated, very fine-grained, crystal-lithic tuffs are overlain (in places) by finely laminated ash tuff and lapilli tuff intercalated with banded siliceous argillite, overlain by quartz-phyric tuff and quartz-feldspar crystal tuff commonly carbonate altered.
Late Ordovician to early Silurian-aged Harry's Brook Gabbro intrusives of the Rainy Lake Complex occur within the Catchers Pond Group rocks at the northwestern portion of the property. The intrusives occur mainly as folded intrusive sheets of medium grained, equigranular to porphyritic gabbros and diorites.
The Early Ordovician-aged Lushs Bight Group is considered to form the basement in the area and outcrops in the northeastern portions of the property. The group is composed of a sequence of sheeted diabase dykes, pillow basalts, pillow breccias, basaltic tuffs and cherty argillites interpreted to represent the oceanic crust. Generally non-magnetic extrusive rocks host numerous chalcopyrite-rich gossans and alteration zones marked by polymineralic veins. This is the host rock for the historical Rendell-Jackman volcanic massive sulphide (VMS) deposit.
|
|
The Lushs Bight Group of rocks are bounded to the west by younger Cambrian to early Ordovician-aged Western Arm Group of rocks composed of massive flows of generally non-magnetic light grey plagioclase-porphyritic basalt and highly magnetic tholeiitic basalt and tholeiitic gabbro sills (Jenner and Szybinski, 1987). Disseminated epidote alteration is common. Thin horizons of porphyroblastic chalcopyrite occurs in mafic greenschist.
The southwestern portion of the property, located south of Shoal Pond, is underlain by early to late Silurian-aged Topsails Igneous Suite rocks composed mainly of light grey hornblende-bearing microgranites, biotite-bearing granophyres, feldspar and quartz porphyries, granites, while the northwest is bounded by the multi-phased Burlington granodiorite and middle Silurian-aged (and older) King's Point Complex felsic volcanics.
To the southeast and south, the Catchers Pond Group is in contact with the Silurian-aged subaerial rhyolites to terrestrial sediments (conglomerates) of the Springdale Group (Kean, 1980; Kean et al., 1995). Contact relationships between rocks of the Springdale and Catchers Pond Groups on the east-central portion of the area are un-clear and it is speculated that while the contact is fault modified (Lobster Cove Fault), an unconformable contact may exist whereby rocks of the Catchers Pond Group may underlie conglomerates of the Springdale Group.
Contacts between the Ordovician volcanics and the peripheral elements to the north and northwest are typically faulted as defined by the Green Bay Fault running north-easterly through the area. Phases of the Topsails granite are, however, interpreted to intrude volcanic rocks of the Catchers Pond Group on the southwestern portion of the property (Kean, 1980).
The Green Bay Fault, its splays and spatially associated structures are part of a regional system of Appalachian faults which have probably been intermittently active throughout much of the Palaeozoic history of northwestern Newfoundland (O'Brien, 1996). Ductile shear zones and discrete brittle structures displaying variable orientations and senses of movement started forming during the Taconian (early mid Ordovician), Salinic (late Silurian), Acadian (early Devonian), and Variscan (late Carboniferous) Orogenies, finally ceasing during the Alleghanian (Permo-Carboniferous) orogeny.
The volcanic rocks of the Catchers Pond and Lushs Bight Groups are commonly chloritized and epidotized, believed to be related to sea-floor hydrothermal alteration occurring at greenschist facies temperatures whereas the younger Springdale Group rocks are undeformed and lack the greenschist facies metamorphism of the oceanic rocks to the north.
Structural attitudes of various units vary across the property with northeast striking stratigraphy. Rocks of the Catchers Pond Group are interpreted to be folded about a broad open northeast plunging antiformal fold north of Beetle Pond. Stratigraphic units on the western limb of the fold typically dip steeply north, whereas units on the eastern limb typically dip moderately towards the northeast.
At least two generations of faulting are interpreted in the region including early thrusting (e.g. Shoal Pond thrust contact) and later brittle faulting displaying both apparent sinistral and dextral displacement with unknown vertical offset, most prominently displayed by the Catchers Valley and the Captain Nemo Faults.
|
|
Figure 7-2: Property Geology
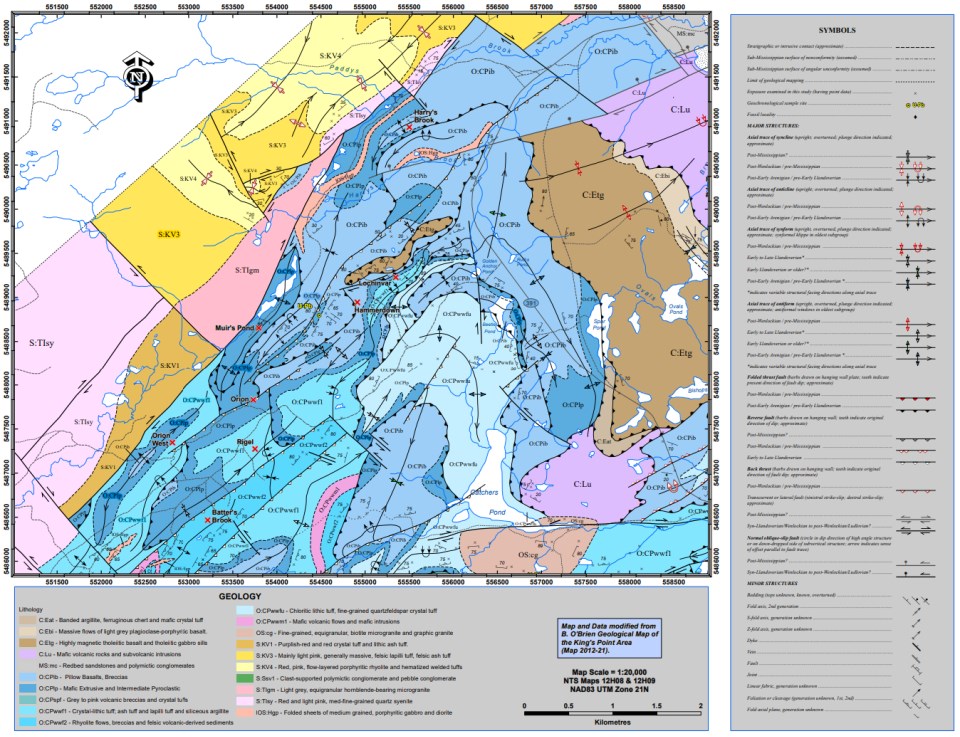
Source: Adapted from Geological survey NL, O'Brien Map 2012-21
|
|
7.3 Property Mineralization
The property is host to numerous underexplored gold prospects and showings along with VMS style base metal mineralization. The property is also host to four gold deposits two of which, the Hammerdown and Rumbullion have seen historical mining development. (Figure 7-3).
The most important and well-defined gold deposits include the Hammerdown, Rumbullion, Muddy Shag and Orion deposits, which all occur within the Hammerdown Deformation Zone (HDZ). The HDZ is described has a 100 m to 250 m wide structural corridor of strong ductile to brittle shearing hosted in the uppermost units of the Catchers Pond Group. The historic Lochinvar VMS base metal deposit also occurs in the HDZ along with the Golden Anchor gold veins and Beetle Pond VMS alteration zone.
|
|
Figure 7-3: Property Mineralization
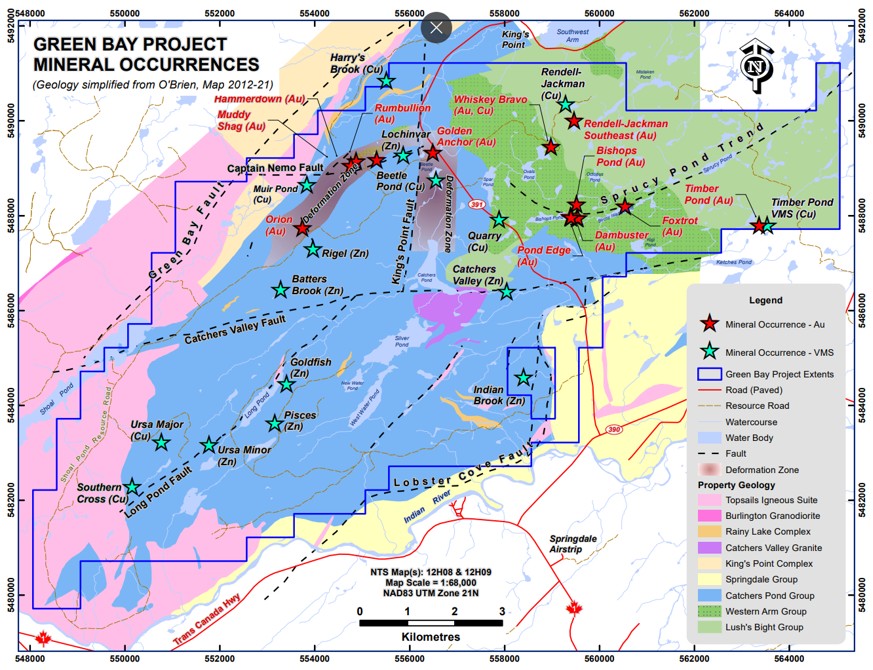
Source: Maritime Resources (2022)
|
|
7.4 Hammerdown-Rumbullion-Muddy Shag Vein System
The Hammerdown-Rumbullion-Muddy Shag-Wisteria gold systems consist of both a series of stacked gold veins as well as a zone of broadly disseminated to veinlet hosted gold and pyrite mineralization. Both styles of mineralization are hosted within an 1,800 m long shear zone informally referred to as the HDZ. A plan map and representative cross-section through the centre of the Hammerdown deposit are shown in Figure 7-4 and Figure 7-5. The vein system is now considered to be a single deposit however, historical definition drilling has identified internal faults that have served to segregate the veins into several mineralized domains.
Geologically, the Hammerdown deposit is situated close to the contact of a Lower Ordovician mafic sequence of ophiolitic origin with an overlying felsic island arc sequence. The contact area was uplifted, folded, and intensely sheared, then intruded by early Silurian quartz feldspar porphyry dykes, which were closely followed by the gold-bearing quartz-sulphide veins.
A structural interpretation by Szybinski (internal unpublished report 2003), defined the deposits as being located within a high-strain shear zone that has experienced a prolonged and intense deformational history. At least four major deformational events were determined that shaped the present geometry of this shear zone. Detailed interpretation of the deposits concluded that the Captain Nemo Fault and the Rumbullion Fault represent only smaller segments of much larger and complex fault system. This fault system is characterized by an intricate pattern of en-echelon faults and shears that step right and are oblique to the general trend of the entire system, producing a number of fault-bounded panels containing different slices of the host stratigraphy.
Szybinski described the complex pattern of faults and veins as similar to the strike-slip duplexes of Woodcock and Fisher (1986), which form in 3-D in releasing and restraining bends along faults. The overall geometry of the fault system is characteristic of a contractional duplex or fan formed in a dextral strike slip.
At depth, the entire shear zone, including most gold zones, are cut off by the extensive Captain Nemo Fault, which is a north dipping, normal fault with some strike slip movement. Geological interpretation indicates down drop of the Hammerdown area to be several hundred metres. As the Captain Nemo Fault cuts through the Hammerdown shear at an oblique angle, veins are cut off at depths varying from 150 m to 250 m. Several of the veins appear to pinch out naturally before reaching the fault. During Richmont mining operation (2000 to 2004) cataclastized mineralized material was partly mined from the fault zone.
The Rumbullion Fault, a north-easterly trending right lateral fault, defines the boundary of the Hammerdown designated veins from the Rumbullion veins to the east. To the west, the Hammerdown vein system pinches out at a strong flexure in the shear zone which rotates the shear from east-west at Hammerdown to the southwest. This southwest trending shear extends for several hundred metres and hosts the Muddy Shag gold zone.
The more robust veins in the Hammerdown zone are closely associated with the most extensive of the late quartz feldspar porphyry (QFP) dykes near the top of the hanging wall overturned mafic sequence. Hanging wall veins are hosted in the mafic rocks, and limited drilling into the footwall has identified mineralization hosted in older footwall felsic units. Younger porphyry dykes are only erratically associated with mineralized veins in both footwall and hanging wall locations.
|
|
In the Rumbullion and Muddy Shag zones veins at this stage appear to be less numerous and narrower, possibly due to the lack of more extensive QFP intrusions.
The gold-bearing veins throughout the mineralized system consist essentially of vein quartz with 5% to 20% pyrite occurring as massive stringers and dense disseminations. Base metal sulphides total about 1%, with zinc content equaling combined copper and lead values. Minor bismuth occurs as native metal as well as the sulphosalt hammarite.
Gold is intimately associated with all sulphide phases, occurring as discrete grains within sulphides, at sulphide grain boundaries and, occasionally in quartz fractures near sulphide grains. There is a direct relationship between sulphide content and gold grade in veins. The gold is always fine grained, with 80% being of grain size less than 20 µm. The largest grain size is slightly over 100 µm along the long axis; relatively little visual gold occurs in the deposit.
In addition to quartz, gangue minerals include chlorite and carbonate (calcite and ankerite) with minor rutile. Hydrothermal alteration of mafic wall rocks consists mainly of muscovite/sericite and calcite, with minor rutile, creating a light bleaching halo usually similar in thickness to the gold-bearing vein.
During the historical exploration and mining phase, at least 19 veins were designated as making up the entire Hammerdown-Rumbullion-Muddy Shag mineralized system. This vein designation was also used in a 2017 Pre-feasibility Study Technical Report on the Green Bay Property (McCracken et al., 2017) which estimated the remaining resources and reserves in the three deposits. In 2018 and 2019, Maritime completed two in-fill drilling campaigns to better define the geometry of the remaining un-mined resource. The new in-fill drilling and re-interpretation of the mineralized intersections generated 62 new wireframes representing the entire vein system. The original 19-vein wireframe geological interpretation used in 2017 resource/reserve calculation had included un-assayed intervals in the drill core which were believed at that time to be mineralized but un-sampled. Removing these interpreted un-sampled intersections expanded the original 19 wireframes into 62 smaller wireframe shapes.
In 2020 and 2021 additional tight spaced definition drilling was completed around the Hammerdown and deposit in anticipation for a 2022 Feasibility Study. With this additional drill resolution and extensive borehole sampling it was possible to generate 100 vein wireframes. The drilling also noted numerous significant gold assay intervals that could not be incorporated with the new wireframes.
7.4.1 Hammerdown Gold Veins
At Hammerdown, the more robust main veins are located along the north and south contacts of a fairly continuous, sill-like felsic porphyry body intruding the sheared mafic volcanic host. The veins dip predominantly to the north although at depth they rotate to a steep southerly dip due to drag folding has they near the Captain Nemo Fault. The veins also appear to plunge to the west but high-grade shoots within the plane of the vein plunge steeply to the east. These larger veins were the target for the 2000 to 2004 cut and fill mining phase by Richmont and have therefore been predominantly mined out, however the updated wireframes in this report have determined that some of the veins remain at the peripheral edges of the historical mining, probably due to the higher cut-off grade used at the time in defining mining blocks.
|
|
The Hammerdown hanging wall veins to the main veins mostly occur in less deformed mafic volcanics with a minor iron formation component and leucoxene bearing mafic dykes. Felsic porphyry sills are present but smaller and do not seem to influence the location of the veins like the larger QFP associated with the larger main veins. The hanging wall veins generally do not have the same depth extension as the larger vein system therefore they do not reach the Captain Nemo Fault. They do exhibit merging and/or bifurcation both along strike and vertically. Dips progressively shallow from south to north but are still quite steep (80°). High-grade shoots within individual veins have steep easterly plunges.
The footwall veins to the main veins are hosted by strongly sheared mafic and felsic volcanics and volcaniclastics intruded by felsic porphyry sills. As with the Main Zone, the porphyries play a significant role in localizing the veining, with the strongest veins occurring along the southern contact of the sills. Dips are near vertical, and all footwall veins are truncated by the Captain Nemo Fault.
7.4.2 Rumbullion Gold Veins
At this stage the veins at Rumbullion are less numerous and are contained in shear zones developed along the limbs of tight, S2 folds in mafic volcanics and leucoxene-bearing mafic dykes. Some veins are preferentially localized along volcanic-dyke contacts. The veins strike east-west in the western portion of the deposit then swing to the northeast in the eastern portion while dips are steep to the north. Although drill spacing is not as tight as at Hammerdown, there appears to be a moderate 45° westward plunge to the high-grade shoots within the western segments of the Rumbullion veins opposite to the plunge exhibited at Hammerdown.
East of the Rumbullion Fault, the Rumbullion vein system continues in an easterly direction for approximately 150 m, where an abrupt flexure rotates the vein system sharply to the northeast. The vein system continues to the northeast for at least 500 m however, the number of lenses seems to reduce in this direction.
Along the north-easterly trend of the Rumbullion zone, the Captain Nemo Fault appears to develop into multiple fault panels which may or not contain QFP dykes and or mineralized veins.
The fault panels and veins diverge to the east and remains open both at depth and along strike. Approximately 500 m along strike to the east, gold intercepts (Golden Anchor Zone) have been encountered in the hanging wall to the zinc-rich Lochinvar VMS deposit.
7.4.3 Muddy Shag Gold Veins
At Muddy Shag, several sub-vertical dipping quartz vein zones with a strike of 050° are hosted within moderately- to strongly-sheared mafic to felsic volcaniclastics and minor black cherty sediments assigned to the Ordovician Lushs Bight Group. All zones are gold-bearing and show significant vertical and lateral geological continuity. The immediate area is intruded by a series of sheeted mafic dykes (often leucoxene bearing) and quartz feldspar porphyry dykes.
One of the stronger veins is intimately associated with a quartz-feldspar porphyry dyke contained within strongly foliated mafic schist. Occurring both within the dyke and along its margins are sulphide-bearing quartz veins which reach up to 5 cm to 10 cm wide and contain up to 40% coarse granular pyrite and lesser sphalerite. Strong pinching and swelling within this vein zone often make it difficult to follow by drilling.
|
|
One of the veins also occurs within strongly foliated pyritic mafic schist and is comprised of numerous quartz-calcite stringers which contain up to 40% to 50% coarse granular pyrite. Albeit individually these stringers may not represent a significant zone, when combined in high densities over 1 m to 3 m, these stringers represent a significant gold zone.
7.4.4 Wisteria Gold Zone
The Wisteria Zone gold mineralization is located in the footwall to the Hammerdown deposit near the intersection of the Captain Nemo Fault and the Rumbullion Fault (Figure 7-4 and Figure 7-5). The mineralization is hosted in an intensely deformed fault bound sliver of felsic volcanics with discontinuous quartz veinlets and widespread sericite and pyrite alteration. Gold grade is within the Wisteria Zone is linked with sulphide and base metal content with the highest grades being associated with accumulations of pyrite, galena, and sphalerite. When compared to the high-grade veins typically seen elsewhere at the Hammerdown deposit the disseminated gold mineralization in Wisteria is typically low to moderate in grade but over much broader widths and occasionally associated with high-grade shoots. The Wisteria style of mineralization is similar in character to the nearby Orion Deposit located 2 km southwest of Hammerdown.
|
|
Figure 7-4: Hammerdown-Rumbullion-Muddy Shag Vein System
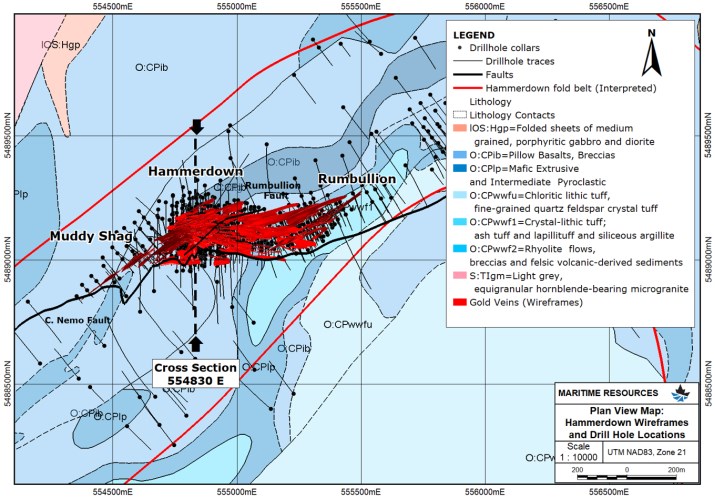
Source: Maritime Resources (2022)
|
|
Figure 7-5: Hammerdown Cross-Section 554830 East
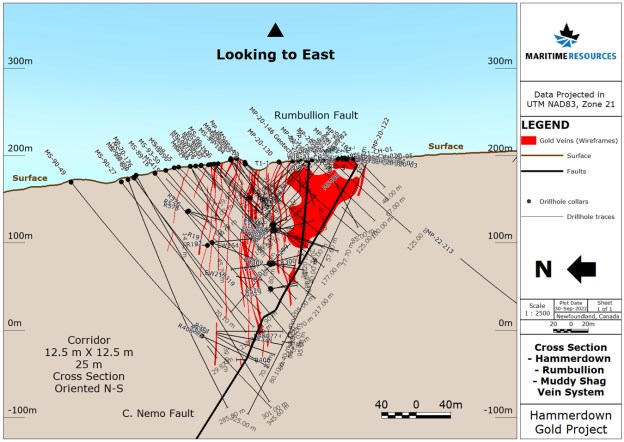
Source: Maritime Resources (2022)
7.5 Other Mineralization
Numerous sporadic exploration campaigns have been completed over the property since the 1950s, with base metals being the focus in the earlier years, and it was not until the 1980s that gold became the exploration target. The Lushs Bight Group which underlies the northeastern portion of the property is well-known for ophiolitic style VMS deposits, however, in more recent years, exploration has identified potential shear hosted mesothermal style gold mineralization.
The Catchers Pond Group which underlies the bulk of the property, is host to VMS style base metal prospects and showings along with accompanying stringer style feeder zones contained within large hydrothermal alterations zones. The project area is predominantly underlain by the Catchers Pond Group. These rocks are considered to be analogous to those hosting the Buchans orebodies. Previous explorers have discovered numerous volcanogenic massive sulphide showings throughout the project with grades and mineralogy similar to the Buchans ores (i.e., combined Zn+Pb grades >20% with Zn:Pb ratios ~2:1).
|
|
The following is a summary of the known mineral projects, prospects and showings that occur across the property. These projects are not included in the FS in any way and are described for information purposes only. Descriptions which have been adapted from various industry and government reports.
7.5.1 Golden Anchor (Zn/Au) - (Peters, 2016), (Maritime, 2019)
The Golden Anchor prospect is located approximately 100 m northeast of the Hammerdown gold deposit and occurs stratigraphically above the zinc rich Lochinvar VMS deposit. In the Golden Anchor area, the geological structures change direction to the south creating a fold nose and the potential for dilational openings to occur creating a similar mineralizing structural environment similar to the Hammerdown and Rumbullion deposits. Previous exploration in the area has highlighted anomalous gold in soil surveys while historical shallow drilling reported multiple intersections of auriferous quartz/sulphide veins both along strike and in the hanging to the Lochinvar base metal deposit.
In 2019, Maritime completed a deep seeking geophysical Volterra IP survey (9 km) over the Golden Anchor area. The survey located a large, untested chargeability anomaly starting at a depth of approximately 200 m below surface. Historically, chargeability responses are associated with sulphides, as at Hammerdown and Orion where gold is associated with pyrite. The 2019 two-hole drill program completed in late November to December 2019 targeted the 350 m long by 150 m wide chargeability IP anomaly. The 2019 drillholes (GA19-23 and GA19-24) were drilled north and south designed to scissor the chargeability anomaly at a target depth below 200 m. The drilling intersected multiple narrow quartz sulphide veins in a hanging wall mafic sequence down to approximately 200 m to an intensely hydrothermally altered and pyritic felsic volcanic sequence believed to be the Lochinvar horizon which hosts the zinc/silver rich Lochinvar VMS historical deposit 600 m to the west. Assaying of the hanging wall quartz sulphide veins reported anomalous to significant gold grades up to 11.7 g/t over 0.3 m with anomalous base metal values geochemically similar to the Hammerdown / Rumbullion veins further west. The highly altered pyritic felsic units returned anomalous gold values with significant silver and associated highly anomalous zinc values. One 0.35 m intersection of semi-massive sulphides in GA19-24 returned an assay of 169 g/t Ag and 12.8% Zn. Both holes intersected intense and chaotic fault zones with classic tectonic breccias reflecting the folded and faulted geological structures in the area.
In 2020 and 2021 an additional 20 drillholes tested the Golden Anchor and Lochinvar trends. Drilling intersected multiple narrow quartz sulphide veins extending the Golden Anchor trend to the east and west. The best result identified in the 2020 program was GA-20-35 which tested the western extension of the Golden Anchor trend towards the Hammerdown deposit. The hole intersected thin veins with a spectacular occurrence of visible gold and returning 10.24 g/t Au and 18 g/t Ag over 4 m. As a result of this additional drilling the gold vein system at Golden Anchor has been remodelled and is presently interpreted as a fan of nine stacked veins. The Golden Anchor veins that have been partially delineated over a strike length of 600 m.
7.5.2 Orion Gold Deposit
The Orion gold deposit is hosted by strongly deformed metavolcanics and metasedimentary units of the Ordovician Catchers Pond Group (Figure 7-6). A major fault zone (Horsehead Fault) has thrust the Catchers Pond Group assemblage over younger, less deformed and possibly sub-aerial volcanics of the Shoal Pond Group (informal name) correlative with the Silurian age Springdale Group (Moore et al., 2002). This northerly striking fault dips 50° to the east and terminates the Orion gold zones to the west. As the fault trends oblique to the N50E strike of the Orion vein system, the base of the gold zones plunges about 40° to the northeast.
|
|
Intruding the stratigraphy are numerous sill-like lenses of quartz-feldspar porphyry up to 6 m thick and a myriad of mafic dykes and sills (often leucoxene-bearing) up to 10 m thick.
The rocks hosting the Orion deposit have undergone a protracted history of complex polyphase deformation, including both folding and ductile to brittle faulting (Dubé et al., 1992). At least three deformational events influenced vein emplacement and overall geometry of the mineralized zones. A Taconian deformation (D1-2) was responsible for the development of the high-strain zone within intensely foliated (S1) and folded (F2) volcanic rocks. The veining is hosted by ductile-brittle D3 high strain zones of Silurian or younger age. Thin section study reveals that quartz-carbonate ±chlorite veins can generally be divided into two populations:
1) an early set which in general does not trend parallel to S2 fabrics; and
2) a late set which trends parallel to sub-parallel to a well-developed planar to wavy S2 foliation/banding (Cunnison, 1996).
The development of the high-strain zones is genetically related to layer anisotropy induced by intrafolial F2 folds and by the presence of felsic porphyry dykes (Gaboury et al., 1996). Post mineralization D4-5 deformation, which included two generations of folds (F4 and F5) and late brittle faulting have also been observed.
Variable degrees of alteration characterize the host lithologies at the Orion gold deposit. The mafic rocks are moderately to strongly chlorite-bearing (with the exception of highly-epidotized samples) and often contain magnetite. The felsic lithologies do not contain magnetite, are strongly sericitic and locally silicified, calcitic, chloritic, and pyritic.
The most highly gold mineralized samples all show increased abundances of sericite, calcite, silica, and pyrite along with higher percentages of late brittle-ductile quartz- carbonate ± chlorite veinlets (Cunnison, 1996). An early pre-kinematic phase of quartz-carbonate veining with recrystallized mineralogy and oriented fabrics definitely pre-dates hydrothermal sericite development (Wells, 1997). Two generations of pyrite are present: an early subhedral to anhedral type occasionally overgrown by magnetite, and a late subhedral to euhedral minimally altered type that appears to have formed during late-stage quartz-carbonate-chlorite alteration (Cunnison, 1996). Gold is usually associated with the late-stage, coarse, crystalline pyrite.
|
|
Figure 7-6: Orion Geology
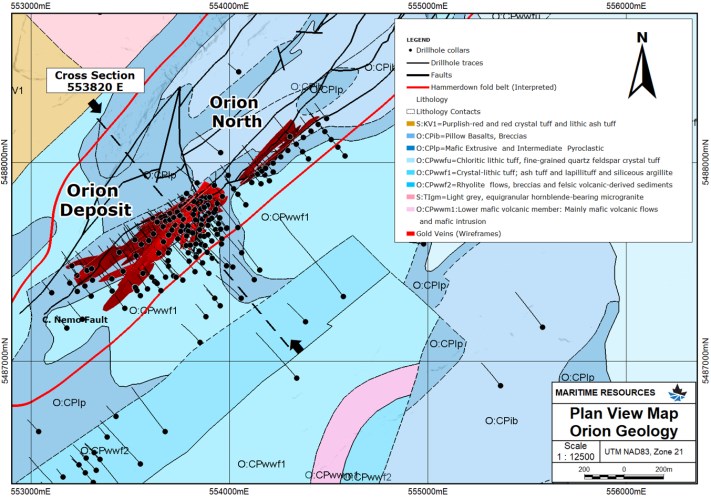
Source: Maritime Resources (2022)
|
|
The Discovery Zone, as the name suggests, was the first to be discovered at the Orion deposit. The zone is situated near the transition from the "mixed" mafic-felsic schist. The Discovery Zone consists of single to multiple 1 cm to 30 cm quartz-calcite veins with 1% to 3% pyrite (locally to 10%) and minor amounts of light-coloured sphalerite and chalcopyrite. One vein contained 50 occurrences of visible gold, but otherwise visible gold is generally rare. The hosting schists often have a distinct yellow ochre sericite developed adjacent to the veining. Silicification is also common.
A second larger zone was discovered at Orion deposit and is now referred to as the Main Zone. The Main Zone is situated within the felsic schist generally 10 m to 30 m northwest of the Discovery Zone. Like the Discovery Zone, it can be traced along strike for 950 m.
The Main Zone consists of multiple 0.5 cm to 15 cm quartz-calcite veins (mainly 1 cm to 3 cm) and strong patchy silicification with 5% to 10% disseminated pyrite (up to 25%) with minor, though locally abundant chalcopyrite, and sphalerite. Visible gold was observed in two drillholes. The host schists are strongly sericitic, silicified, and locally display salmon-coloured bleaching.
The EMS Zone is the smallest of the three significant zones at the Orion deposit. Like the Discovery and Main Zones, it is contained within a distinct stratigraphic interval; in this case the graphitic cherty sediments/volcanic turbidite unit. The zone has a much shorter strike of 350 m while "better grade" mineralization is confined to only about a 50 m strike between 50 m and 100 m below surface. The zone occurs approximately 100 m southeast of the Discovery Zone.
|
|
Figure 7-7: Orion Cross-Section
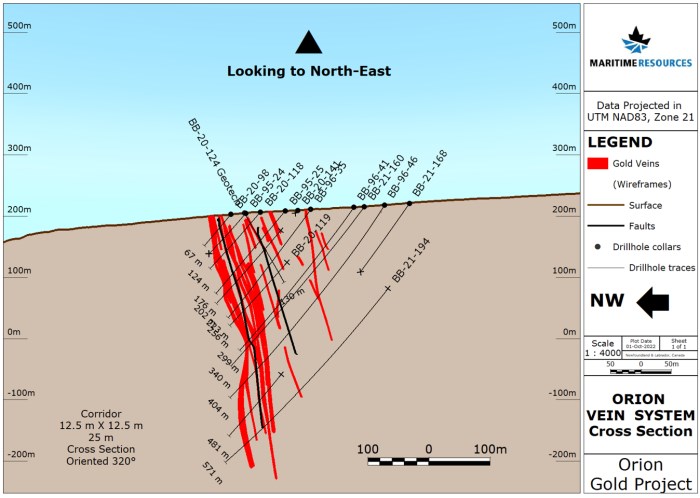
Source: Maritime Resources (2022)
|
|
7.5.3 Lochinvar Deposit (Pb/Zn/Cu/Au/Ag)
Figure 7-8: Lochinvar and Beetle Pond Interpretive Plan Section and Historical Intersections
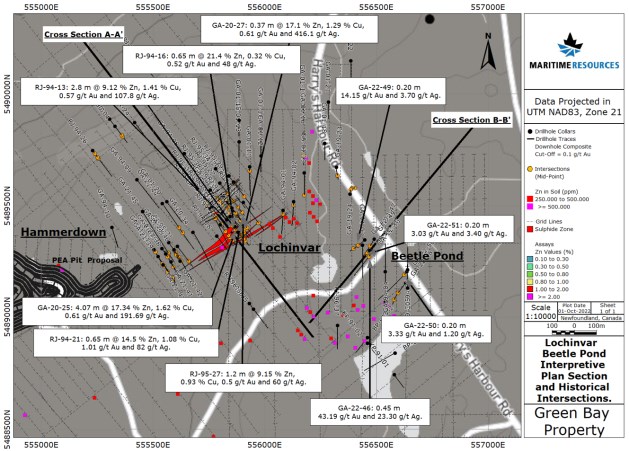
Source: Maritime Resources (2022)
|
|
Figure 7-9: Lochinvar Cross-section and Significant Intersections
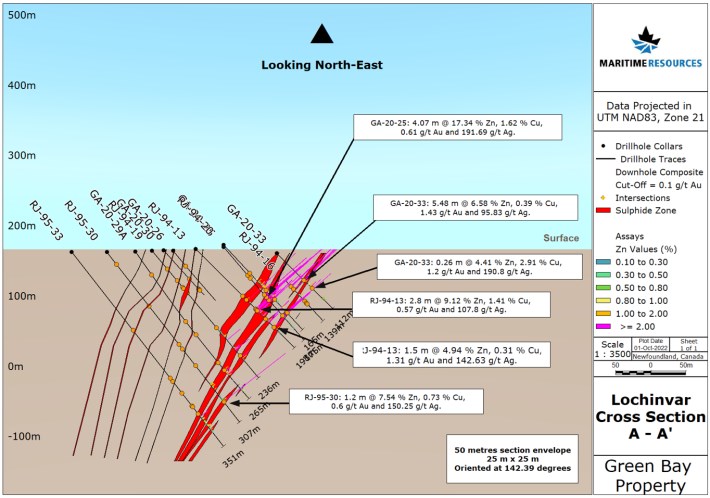
Source: Maritime Resources (2022)
|
|
The historical Lochinvar VMS deposit is located approximately 200 m northeast from the former Hammerdown Gold Mine. Two steeply plunging, massive sulphide lenses have been traced from surface to approximately 200 m depth where they remain open, though there are indications that they will be truncated at depth along the late Captain Nemo Fault. The mineralization is partially delineated over a strike length of 700 m and remains open to the northeast.
The mineralization consists of heavily disseminated to massive sphalerite, galena, chalcopyrite, and pyrite with lesser barite and significant tennantite and electrum. It occurs within a steeply-dipping, strongly sericitized, carbonatized and locally chloritized, soda-depleted (0.2% Na2O), schistose felsic volcanic package up to 75 m thick. The altered felsic package is separated from an underlying undeformed mafic volcaniclastic unit by the "Captain Nemo Fault" and is overlain by a unit of aphyric, green andesite/dacite fragmental rocks.
7.5.4 Rendell-Jackman Cu/Au Deposit - (Peters, 2016)
The Rendell-Jackman is a massive sulphide prospect was discovered in 1909. Initial drilling identified two lenses of massive sulphide and in 1910 a shaft was sunk on the Northern lens to a depth of 46 m. In total an estimated 1600 tonnes of ore were brought to surface before closing in 1912 after the death of the Mine Manager. Subsequent IP surveys identified a chargeability anomaly extending approximately 1,200 m to the northwest and southeast of the workings. All historic drilling tested relatively shallow targets, the deepest drillhole extending to 137 m. In 1990, three drillholes tested reconnaissance targets northwest of the workings with only one drillhole testing the IP chargeability extension (Figure 7-10). Recent selective mineralized rock sampling over the Rendell-Jackman workings graded to a maximum of 9.9% Cu and 12 g/t Au, averaging 2.9% Cu and 3.0 g/t Au. A sample chipped from this outcrop graded 11.2% Cu, 0.195% Zn, and 0.44 g/t Au (Figure 7-11). Recent IP surveys on the Rendell-Jackson clearly defined the subsurface mineralization and indicate a stronger broader response at depth (Fraser, 2015).
|
|
Figure 7-10: Interpretive Plan Map and Significant Intersections on the Rendell-Jackman Deposit
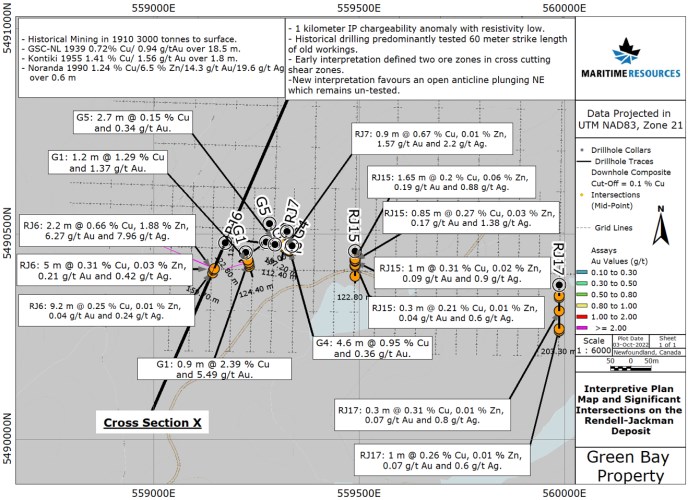
Source: Maritime Resources (2022)
|
|
Figure 7-11: Cross-Section of the Rendell-Jackman Deposit with Significant Drill Intersections
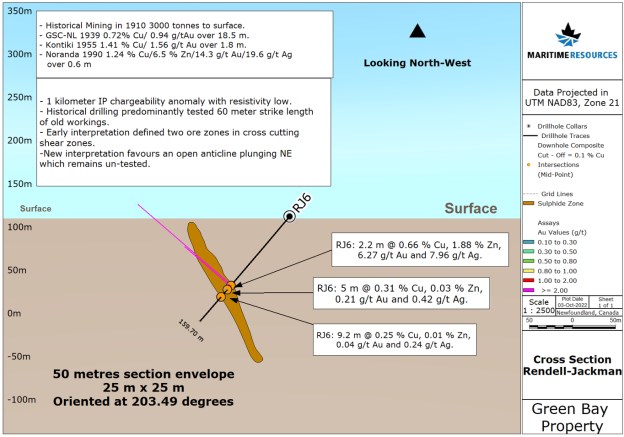
Source: Maritime Resources (2022)
7.5.5 Rendell-Jackman Southeast (Au) - (Peters, 2016)
In 1990, a trench was dug 400 m southeast of the Rendell-Jackman deposit to test a weak gold in till anomaly. It exposed two narrow (<5 cm) discontinuous quartz veins containing 3% to 5% sulphides. Two grab samples returned values of 7.9 g/t Au, 7.2 g/t Ag, 0.04% Cu, 0.36% Pb, 0.32% Zn, and 4.3 g/t Au, 4.1 g/t Ag, 0.15% Cu, 0.30% Pb, 0.07% Zn. The quartz veins could not be traced beyond the trench (Andrews, 1991). Due to the high lead content, the mineralized quartz veins are considered similar to the Hammerdown style mineralization.
7.5.6 Whisky Bravo (Cu/Au) - (Mitton, 2005)
The Whiskey Bravo Showing consists of a massive pyrite horizon hosted in strongly sheared mafic volcanic rock of the Lushs Bight group. Maximum width is 0.6 m; continuous length is 5 m, with a second narrower outcropping located 20 m southeast. It is a distinct sulphide lens, with sharp planar contacts, in strongly sheared mafic volcanic rock. There are also three parallel, 5 cm to 15 cm wide, semi to massive pyrite layers/veins exposed here over a 10 m width. Most of the sheared and un-sheared wall rock is moderately to strongly silicified/sericitized hosting 1% to 5% fine grained disseminated pyrite. Gold values from the 14 grab samples returned from 51 to 616 ppb gold. Base metal values are elevated; up to 1,006 ppm copper.
|
|
7.5.7 Timber Pond VMS (Cu) - (Dyke, B., and Hussey, A.M., 2004)
The Timber Pond Massive Sulphide showing is located 8 km east of Hammerdown and approximately 200 m south of the south end of Timber Pond. The showing is hosted by chloritized, magnetite-rich ophiolitic basalt and is composed of a massive sulphide horizon that is 4 m thick and 8 m long. The massive sulphide contains mostly pyrite and pyrrhotite, with laminae of chalcopyrite and sphalerite. Noranda Exploration Company Ltd. completed a five-hole drill program between 1987 and 1989. The best result obtained from this program were 1.0% Cu, 0.23% Zn, and 2.8 g/t Au over 4.0 m (Jacobs, 1999).
In 2021 Maritime Resources identified a large regional EM anomaly coincident with the Timber Pond VMS Showing. Geophysicists modelled the EM anomaly and successfully generated an EM plate which was subsequently drilled in holes TP-21-01 and TP-21-02 which encountered a pyrrhotite rich massive sulphide lense grading 2.06 m of 0.5% Cu and 3.48 m of 0.77% Cu respectively.
7.5.8 Timber Pond (Au/Ag) - (Dyke, B., and Hussey, A.M., 2004)
The Timber Pond Au-Ag Showing was discovered during an attempt by Noranda Exploration Company Ltd. to source a 6,434 ppb Au stream sediment anomaly. The showing is contained in silicified zones within in a 1.0 m to 2.0 m wide shear zone with up to 15% disseminated pyrite. The shear zone is contained in a brecciated interflow sediment consisting of basaltic ash in a cherty matrix, interbedded with massive and pillowed basaltic flows (Huard, 1987). Channel sampling, by Noranda Exploration Company Ltd. in 1987, returned values up to 5.05 g/t Au, 102.3 g/t Ag, 0.07% Cu, 0.38% Pb, and 0.56% Zn over 1.0 m. Subsequent diamond drilling by Noranda did not intersect the mineralized horizon (Jacobs-NFLD/2655, 1996).
In 2021 Maritime Resources conducted a phase 1 exploratory drilling program consisting of five drill holes totaling 647 m. Drilling tested both the known VMS and gold occurrences. This drilling encountered zones of both massive and disseminated sulphide mineralization as well as a lens of gold mineralization in the hanging wall to the massive sulphides. Two holes encountered significant gold mineralization with hole TP-21-05 encountering 2.33 g/t Au over 4 m, including 6.08 g/t Au over 1.5 m and hole TP-21-03 encountering high grade silver consisting of 0.73 g/t Au and 339.7 g/t Ag over 2.0 m, including 1.12 g/t Au and 659.0 g/t Ag over 1.0 m. These zones are open at depth and along strike.
7.5.9 Sprucy Pond Trend (Au) - (Mitton, 2005)
The Sprucy Pond Trend (SPT) occurs over a strike length of approximately 1,400 m and contains four separate gold showings. This strong northeast striking linear is represented by sheared mafic volcanics hosting gold-bearing quartz-carbonate veins. An almost continuous exposure of bedrock was examined over a 300 m length during a period of low water. The mafic volcanic unit here is strongly sheared, displaying a moderate to steep north-dipping, east-west trending shear foliation. Ubiquitous stockwork style carbonate (calcite +/- ankerite) veinlets are present with local 1% to 2% disseminated pyrite and trace chalcopyrite mineralization. Limonite alteration and mineralization increase towards the Dambusters Showing area and further to the west. Exploration in this area has been limited to general prospecting so it is unsure at this point if the host rock is the Western Arm or Catchers Pond Group.
|
|
Birchy Island Pond Gold Zone: Located 5 km east of Hammerdown, this target is a newly discovered quartz vein system defined on surface by a mineralized boulder train at the intersection of several faults highlighted on surface as a well-defined 4 km long linear structure. Ground based IP surveys have identified several chargeable anomalies suggesting the presence of disseminated sulphide mineralization. Phase 1 exploratory drilling was completed including five drill holes totaling 1,116 m with drill hole BIP-21-03 intersecting 0.90 g/t Au over 3.42 m, including 10.86 g/t Au over 0.20 m.
Foxtrot Showing: 20% disseminated pyrite and 1% galena in quartz vein (1.249 g/t Au). Strong limonite and sericite alteration. Large angular float at edge of Sprucy pond.
Dambusters Showing: Outcrop quartz-carbonate vein, approximately 10 cm wide, strongly sericitic and limonitic; 3% fine-grained disseminated pyrite, <1% galena and trace chalcopyrite (7.72 g/t Au and 1.96 g/t Au).
Pond Edge Showing: In early 2004, prospecting located two new gold occurrences in quartz +/- carbonate veins (322 ppb, 557 ppb, and 567 ppb Au). One occurrence is hosted in a 20 m to 25 m wide zone of very strongly sericitic and limonitic sheared mafic volcanic rock which outcrops on the east side of a pond. Later grab samples taken from this exposure returned 2.278 g/t Au and 1.429 g/t Au. The strike length from the Dambusters Showing to the Pond Edge Showing is ~170 m. The Sprucy Pond Trend is interpreted to continue westward under the pond.
7.5.10 Beetle Pond (Au/Zn) - (Peters, 2016)
The Beetle Pond showing, is located 1 km east of the Hammerdown deposit and is interpreted as being an extension of the Golden Anchor and Lochinvar Prospects that have been offset by folding and faulting. The showing is 500 m East of Golden anchor and is associated with a high-grade gold and base metal in soil trend that extends for over 325 m and is associated with a large coincident magnetic and IP anomaly. Historic drilling in the Beetle Pond area identified local base metal mineralization and extensive hydrothermal alteration. Beetle Pond was drilled as part of the Company's 2022 drilling program with the first hole encountering a quartz/sulphide vein with abundant visible gold (Figure 7-12 and Figure 7-13)). Samples of the mineralized interval were sent for rush analysis at Eastern Analytical and returned grades of 150.37 g/t Au over 0.20 m in drill hole GA-22-46. In the footwall to the mineralized quartz veins a lower sulphide horizon containing local occurrences of base metals was identified and is interpreted to be an extension of the Lochinvar Horizon.
|
|
7.5.11 Muir Pond (Zn/Pb) - (Moore, P.J., and Mullen, D.V., 2002)
Discovered by prospecting in 1911 and drilled by Brinex in the 1960s (Roderick, 1960), this prospect consists of disseminated to massive pyrite-rich sulphides associated with altered felsic volcanics. The best assay returned from this prospect came from a grab sample grading 21.73% Zn, 9.61% Pb (Roderick, 1960), however several subsequent campaigns of drilling failed to return significant results, intersecting only narrow barren semi-massive pyrite over 0.5 m (unpublished Noranda report, 1990).
|
|
7.5.12 Batters Brook (Zn) - (Moore, P.J. and Mullen, D.V., 2002)
Figure 7-12: Batters Brook Interpretive Plan Section and Historical Intersections
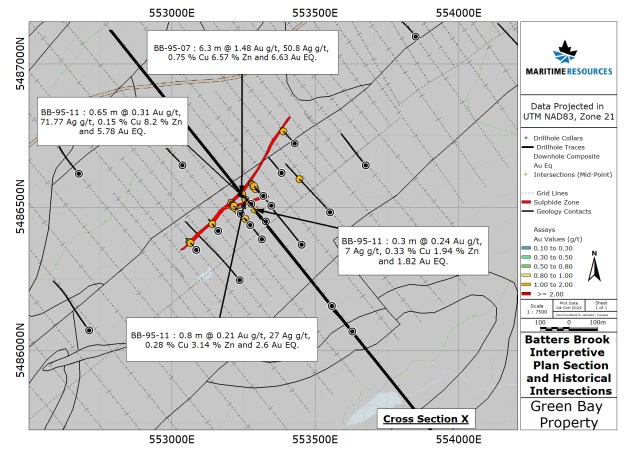
Source: Maritime Resources (2022)
|
|
Figure 7-13: Batters Brook Cross-section and Significant Intersections
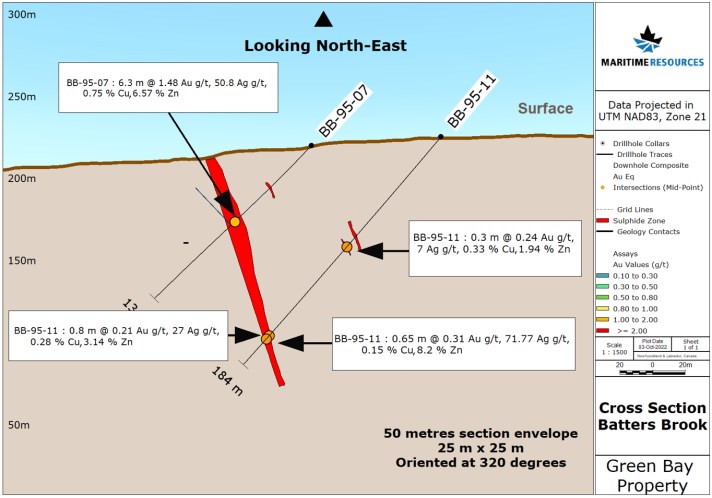
Source: Maritime Resources (2022)
|
|
The zone occurs within a 1.5 km long mineralized felsic volcanic horizon which joins the Rigel massive sulphide prospect along strike to the northeast. The zone remains open at depth and in both strike directions, however, drilling completed by Hudson Bay HBED in 2001 and 2002, has further restrained the potential for possible significant extensions to the mineralization. The discovery hole, BB 7, yielded the best intersection to date cutting 6.3 m averaging 6.57% Zn, 2.7% Pb, 0.75% Cu, 50.8 g/t Ag, and 1.48 g/t Au, including 0.9 m of 23.4% Zn, 12.6% Pb, 2.2% Cu, 147 g/t Ag, and 1.0 g/t Au. Anglo American completed four drillholes to test this zone's potential to extend down plunge towards the northeast and southwest, as well as down dip to 300 m depth. Of these, only one hole, BB-77, intersected massive sulphides comparable to the high-grade shallowly drilled intersections previously obtained by Major General. This hole intersected a 20 cm wide section of zinc-rich massive sulphides approximately 280 m below surface, suggesting the zone may plunge steeply towards the southwest where it remains open below this depth.
7.5.13 Rigel (Zn) - (Moore, P.J., and Mullen, D.V., 2002)
Interpreted to be a continuation of the Batters Brook mineralized horizon, this massive sulphide zone has been intersected by six holes drilled to a maximum depth of 150 m by Major General Resources. Composed of semi-massive to massive sulphides, the best intersection to date includes 1.0 m assaying 11.6% Zn, 1.0% Pb, 4.0 % Cu, 23 g/t Ag, and 0.8 g/t Au. Except for this intersection (hole BB-65), the zone appears to be relatively low grade typically assaying <1% Zn over similar widths.
7.5.14 Ursa Major / Ursa Minor / Southern Cross - (Moore, P.J., and Mullen, D.V. 2002)
These prospects are located approximately 4 km southwest of the Batters Brook massive sulphide prospect. Of these, Ursa Major and Southern Cross, occur within mafic volcanic rocks while the Ursa Minor prospect occurs within felsic volcanics of the Batters Brook package. Host rocks to these prospects are interpreted to lie stratigraphically below the Batters Brook-Rigel horizon. The Ursa Minor zone consists of stringer and semi-massive sulphide mineralization returning low-grade base and precious metal assays over broad widths including 0.23 g/t Au and 25 g/t Ag over 30.8 m as well as 1.1% Zn over 13.5 m. The Ursa Major and Southern Cross prospects have returned sections of disseminated to semi massive sulphides assaying up to 3.7% Cu over 0.2 m.
7.5.15 Pisces (Zn) - (Peters, 2016)
The Pisces Occurrence (Cu, Pb, Zn) was discovered by Phelps Dodge in 1997. This zone is hosted by felsic volcanics of the Indian Brook package and consists of a narrow band of massive sulphides intersected in drilling grading 12.9% Zn, 8.5% Pb, 1.02% Cu, 54 g/t Ag, and 0.11g/t Au over 0.13 m (drillhole GF-3, Thurlow, 1997). Subsequent drilling by Phelps Dodge intersected similar sulphides down dip; however, the zone remains untested along strike and at depth below 100 m (Thurlow, 1998).
|
|
7.5.16 Goldfish (Zn) - (Peters, 2016)
The Goldfish Occurrence (Cu, Pb, Zn) was discovered by Phelps Dodge in 1997, and consists of a 0.65 m wide section of granular, pyritic massive sulphides intersected in drill hole GF-9 grading 1.36% Zn, 0.69% Pb, 0.06% Cu, 164.5 g/t Ag, and 0.95 g/t Au over 0.65 m (Thurlow, 1997). The mineralization is interpreted to occur at a transitional contact between aphyric rhyolite breccias (Indian Brook felsic package) and an overlying sequence of felsic tuffaceous rocks and sediments (Batters Brook felsic volcanic package). Subsequent shallow drilling by Phelps Dodge failed to intersect additional comparable mineralization down dip or along strike; however, drilling of the horizon was hampered by a sequence of mafic dyke/sill units which dilate stratigraphy in the area.
7.5.17 Indian Brook (Zn) - (Moore, P.J., and Mullen, D.V. 2002)
This prospect represents one of the earliest discovered base metal showings within Catchers Pond volcanics. The showing is believed to have been originally found by Falconbridge in 1952 and consists of disseminated to stringer base metal sulphides hosted by felsic volcanics of the Indian Brook package. Grab samples from the original trenches have returned assays in excess of 10% Zn (e.g., Jenner and Szybinski, 1987).
7.5.18 Catchers Valley (Zn) - (Moore, P.J. and Mullen, D.V., 2002)
This prospect is located approximately 600 m east of the southeast end of Catchers Pond. The showing is reported to consist of a broad, 40 m wide, zone of disseminated sulphides with local narrow sections of semi-massive sulphides. The best assay returned from drilling included 2.5% Zn and 0.61% Pb over 0.3 m (drillhole CV-1, Major General, 1996).
7.5.19 Harry's Brook (Cu) - (Peters, 2016)
In 2001, Hudson Bay Exploration drilled two holes in the Harry's Brook area, targeting base metal-in-soil and weak IP chargeability anomalies. Both drillholes intersected minor amounts of disseminated to fracture-controlled sulphides including minor chalcopyrite within Indian Brook Formation mafic volcanics in the vicinity of Silurian-aged Harrys Lake gabbroic intrusives. The anomalies were explained as being caused by the sulphides observed in drilling. The best interval assayed graded 0.24% Cu over 0.3 m.
|
|
8 DEPOSIT TYPES
Gold-bearing quartz veins at the property are hosted by Ordovician metavolcanic and metasedimentary rocks of the Catchers Pond Group. The style of veining, mineralization, alteration, host rock, and tectonism most closely resemble other mesothermal volcanic- hosted (greenstone belt) gold deposits throughout the world. This deposit type is referred to as Type I01 by the British Columbia Ministry of Energy, Mines and Natural Gas Deposit Profiles and as United States Geological Survey (USGS) Model 36a. Examples of this deposit type include many of the gold deposits of the Abitibi Greenstone Belt in Ontario and Québec, and the gold deposits of the Kalgoorlie District of Western Australia.
This deposit type is characterized by the following geologic elements:
• Vein systems occur in the central part of discrete shear zones associated with larger regional shear/fault structures or "breaks", but individual veins may extend into less deformed wallrock;
• Vein systems are tabular, sub-vertical structures, with typical thicknesses measured in metres, and strike and dip dimensions measured in tens to hundreds of metres, though the economically viable part of the system may be considerably smaller;
• Quartz-feldspar porphyry dykes and sills are often spatially associated with the vein systems;
• Individual veins generally consist of "cherty" quartz with lesser amounts of albite, carbonate, sericite, chlorite, and occasionally tourmaline;
• Pyrite is ubiquitous, while accessory sulphide minerals often include chalcopyrite, sphalerite, galena, and trace arsenopyrite;
• Gold is often not visible and is usually intimately associated with pyrite;
• Sericite, quartz, carbonate (calcite and/or ankerite), pyrite, and occasional albite characterize wallrock alteration envelopes; and
• Visible alteration extends tens of metres from the auriferous veins.
|
|
9 EXPLORATION
9.1 Introduction
Since 2012, Maritime Resources Corp. has conducted extensive exploration on the Green Bay Property and focused on identifying and delineating gold resources near the Hammerdown gold deposit.
|
|
Figure 9-1: 1995 Sial CVG Magnetics Map Depicting Drilling, PEA Deposit Whittle Shells and Exploration Highlights, Showings and Trends
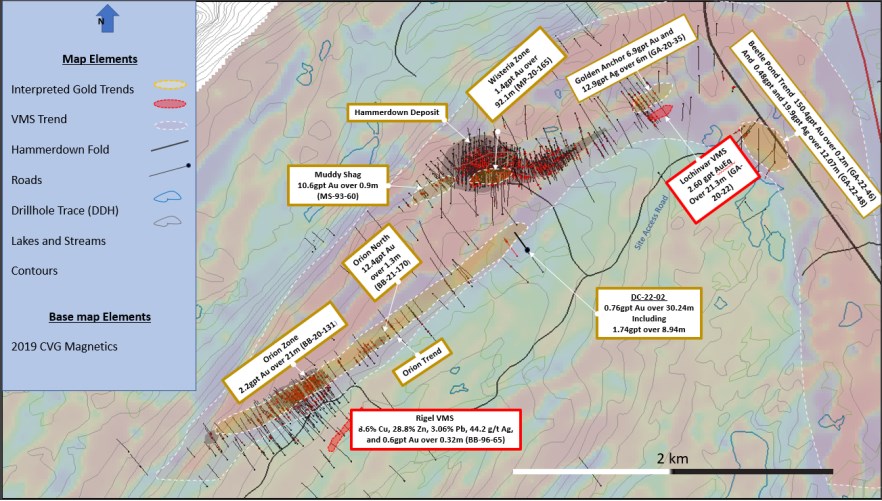
Source: Maritime Resources (2022)
|
|
Two deposits with mineral resources have been delineated at on the Green Bay Property, the Hammerdown and Orion deposits have been the primary focus of exploration efforts since this time.
Exploration work in the immediate periphery of the Hammerdown deposit has focused on expanding the footprint of the deposit by exploring for extensions of the deposit to the west, east and south, and have resulted in the partial delineation of the Muddy Shag, Rumbullion and Wisteria Zones (Figure 9-1). At present mineralization in these areas has only partially been incorporated into the mining plan and for the time being these areas are considered as highly prospective for future resource growth opportunities.
Immediately northeast of the Hammerdown deposit advanced prospects at Golden Anchor and Lochinvar and exploration targets at Beetle Pond and Harrys Brook provide an excellent opportunity for future resource growth.
Exploration work in the immediate periphery of the Orion Deposit has identified a northern extension to the deposit that has been the focus of recent advanced stage exploration. The Orion North Extension has identified limited vein style gold mineralization up to 750 m north of the known Orion deposit with isolated intersections up to 1.4 km away as seen in drillhole DC-22-02. This exploration corridor is considered by workers to be a high priority for future resource growth.
Work from 2012 to 2018 is discussed in detail in the WSP (2020) PEA Report.
9.2 2019 Work Program
In 2019, Maritime Resources Corp. conducted an extensive exploration program over the Hammerdown site and surrounding Green Bay Property consisting of:
• Airborne Magnetic-Radiometric-VLF Survey;
• IP Survey;
• LiDAR Survey; and
• Diamond Drilling.
9.3 Airborne Magnetic-Radiometric-VLF Survey
Questor Services Inc. located in Keene, ON was contracted by Maritime Resources to fly a high resolution airborne-magnetic gradient, gamma-ray spectrometry, and VLF survey over the Green Bay Property, as part of a larger survey covering all of Maritime's Property in the Springdale-Baie Verte area (see Figure 9-2). The survey was flown from July 6, 2019 to August 10, 2019.
The system consisted of a PC-based data acquisition system (XDAS), GPS Novatel Pwrpac 7 navigation, Laser Altimeter, Radar Altimeter, a Radiation Solutions RSX5 multi-channel gamma-ray Spectrometer, Billingsley Fluxgate Magnetometer, three Scintrex CS-3 high-sensitivity Cesium magnetometer mounted at the wingtips and tail, a VLF TOTEM-2A system. A Piper Aztec PA-23-250 was used to fly the survey.
|
|
For the Green Bay Property, 150 m spaced traverse lines with 1,500 m spaced tie lines were flow at 330° azimuth and at a nominal terrane clearance of 50 m.
|
|
Figure 9-2: Questor Magnetic Map Products for Green Bay Property
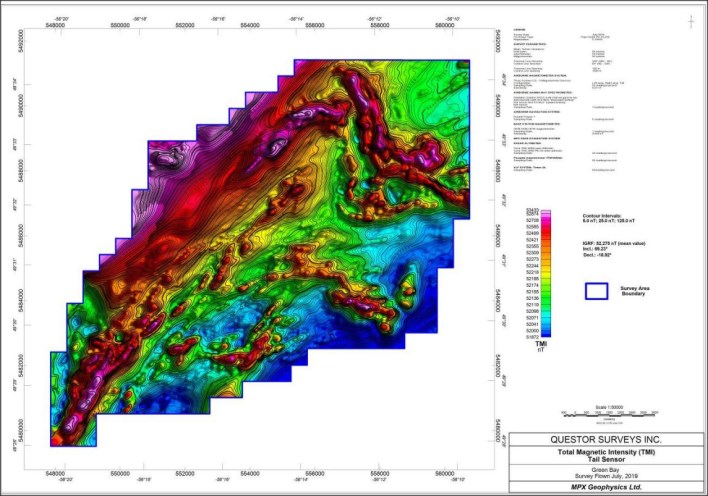
Source: Maritime Resources (2019)
|
|
9.4 IP Survey
In 2019, approximately 15.75-line km of exploration grids were established on both the east and west side of the HDZ.
Western Grid: covered 6.475-linear km and covered the Western side of the Hammerdown deposit including the Muddy Shag extension of the Hammerdown deposit.
|
|
Figure 9-3: Hammerdown West IP Grid depicting 2019 Volterra 3D IP Chargeability Voxel Model
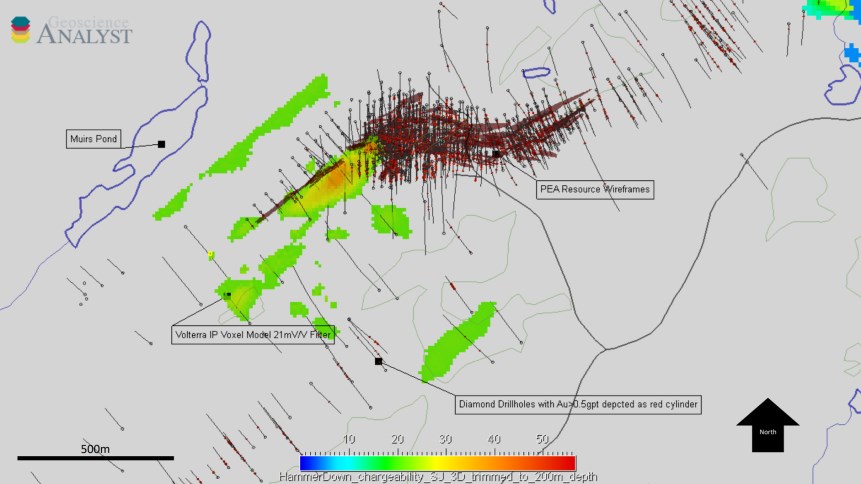
Source: Maritime Resources (2022)
|
|
Figure 9-3 depicts the 2019 Volterra 3D-IP chargeability voxel model at a 21 mV/V filter. The Western Grid survey was successful in defining a number of shallow chargeability anomalies to the west of Hammerdown and delineated a narrow near surface chargeability anomaly that is coincident with the Hammerdown's Muddy Shag extension. The survey also identified several untested chargeability trends that may be related to additional untested mineralized trends.
Figure 9-4 shows the Eastern Grid chargeability voxel model at a 21 mV/V filter. The survey block covered 9.275-linear km and covered the eastern side of the HDZ in the vicinity of the Golden Anchor, Lochinvar, and Beetle Pond Prospects.
|
|
Figure 9-4: Hammerdown East IP Grid depicting 2019 Volterra 3D IP Chargeability Voxel
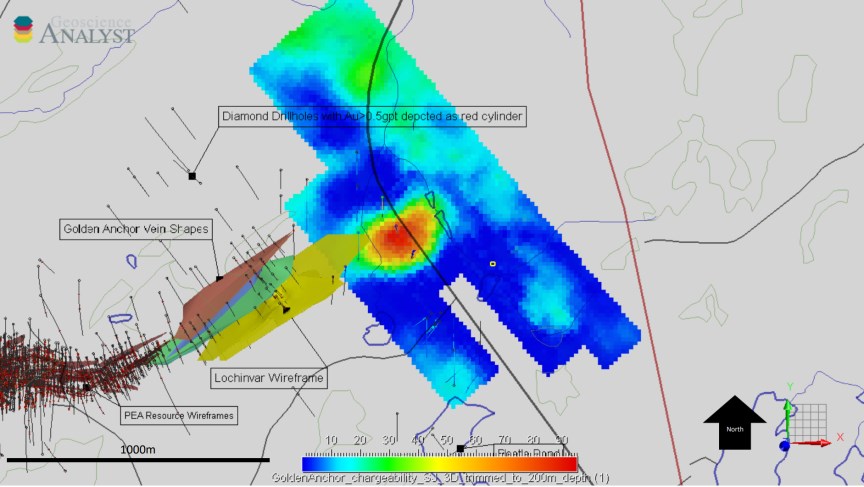
Source: Maritime Resources (2022)
|
|
The Eastern Grid survey was successful in defining a number of shallow chargeability anomalies along the eastern side of the HDZ. The most conspicuous of these anomalies occurs in the centre of the IP grid and appears to line up with the Lochinvar VMS trend. This anomaly is likely indicative of a large halo of disseminated sulphide and chargeable clays associated with the massive sulphide trend and may be suggestive of an easterly extension of the Lochinvar mineralization.
Two additional less obvious chargeability anomalies occur in the Northeast and Southwest extremities of the survey area. Although the intensity of the Northeast and Southwest chargeability anomalies depicted on the survey appear relatively weak; the chargeability is still significant and more in-line with the moderate chargeability anomalies that are associated with the gold mineralization at the Hammerdown deposit.
9.5 LiDAR Survey
A LiDAR survey was completed by RPM Aerial Services, Holyrood, NL between August 16, 2019 and September 13, 2019, over a V-shaped area south of the former Hammerdown mine. The purpose of the survey was to produce a detailed digital terrain model of the proposed future laydown area for the proposed re-start of the Hammerdown mine. The total area cover by the LiDAR survey was approximately 7 km2. Figure 9-5 shows the spatial extents of the 2019 LiDAR survey.
|
|
Figure 9-5: Hammerdown Mine 2019 LiDAR Map
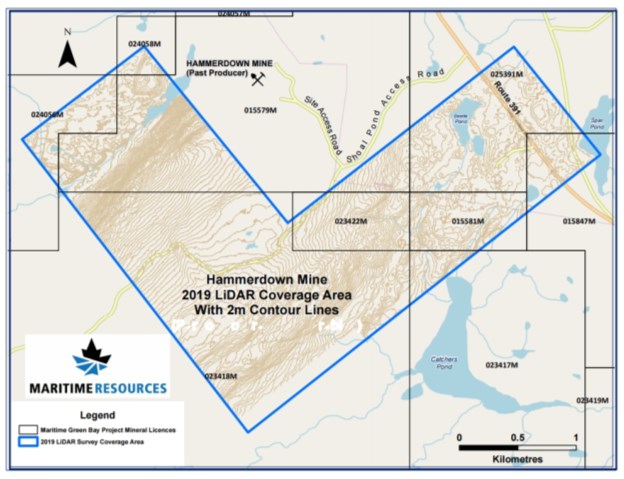
Source: Maritime Resources (2019)
9.6 Diamond Drilling
Three diamond drill holes were completed on license 15579M from June to July 2019 and two holes were completed on license 23591M in November 2019. The three holes on license 15579M were drilled to test conductors defined by a 2016 detailed EM survey in the Hammerdown-East Rumbullion area. The two holes on license 23591M were drilled to test an IP chargeability anomaly in the Golden Anchor area defined by the 2019 IP survey. The five holes totaled 1,441.25 m of NQ drilling and are summarized in Table 9-1.
|
|
Table 9-1: Drillhole Collar Data
| Hole ID | Easting NAD 83 |
Northing NAD 83 |
Elevation (m) |
Azimuth | Dip | Depth (m) |
Start Date | End Date |
| GA19-23 | 556321 | 5489671 | 159 | 180 | -85 | 359.25 | 07-Nov-19 | 14-Nov-19 |
| GA19-24 | 556382 | 5489551 | 156 | 0 | -75 | 341.00 | 16-Nov-19 | 22-Nov-19 |
| HD-19-01 | 555734 | 5489868 | 110 | 149 | -45 | 199.00 | 24-June19 | 26-June19 |
| HD-19-02 | 555713 | 5489897 | 110 | 313 | -45 | 190.00 | 26-Jun-19 | 28-Jun-19 |
| HD-19-03 | 555575 | 5489829 | 110 | 322 | -45 | 352.00 | 29-Jun-19 | 05-Jul-19 |
Source: Maritime Resources (2019)
9.6.1 Golden Anchor Drilling
Two holes were drilled to test a large (350 m by 150 m at approximately 200 m depth) highly chargeable IP anomaly defined by the 2019 IP survey and centred approximately 400 m north of the Golden Anchor Prospect and approximately 600 m northeast of the Lochinvar VMS Prospect. A total of 700.25 m of NQ drilling was completed, as illustrated in Figure 9-6.
|
|
Figure 9-6: Plan Map of 2019 Eastern IP Grid Depicting drilling locations
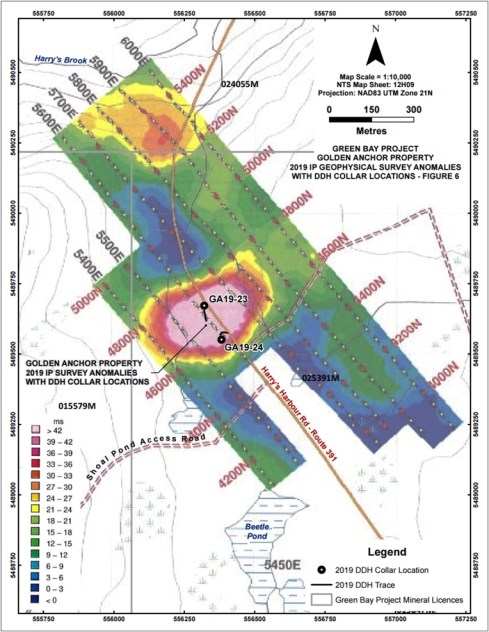
Source: Maritime Resources (2019)
Both holes collared in mafic volcanics and intersected broad zones of hydrothermally altered felsic volcanics and tuffs at depth. A number of minor mineralized quartz veins were intersected. Table 9-2 below provides a table of significant drill results.
|
|
Table 9-2: 2019 Golden Anchor Drilling Results
| Hole ID | From (m) |
To (m) |
Width (m) |
Au (g/t) |
Ag (g/t) |
Comments |
| GA19-23 | 95.24 | 95.49 | 0.25 | 0.46 | - | quartz-pyrite veins |
| GA19-23 | 195.00 | 196.00 | 1.00 | 0.47 | - | quartz-calcite veins with pyritic halos |
| GA19-23 | 267.33 | 267.83 | 0.50 | 0.65 | 6.7 | sericite altered rhyolite |
| GA19-23 | 271.03 | 271.73 | 0.70 | 0.17 | 8.5 | semi-massive pyrite in quartz porphyry |
| GA19-23 | 282.88 | 283.50 | 0.62 | 0.41 | 12.2 | quartz-pyrite-galena vein and lower fault zone |
| including | 282.88 | 283.00 | 0.12 | 1.03 | 45.8 | quartz-pyrite-galena vein |
| GA19-24 | 91.91 | 92.11 | 0.20 | 2.25 | - | quartz-pyrite-galena vein |
| GA19-24 | 108.95 | 109.15 | 0.20 | 1.31 | - | quartz-calcite-pyrite- veins |
| GA19-24 | 157.00 | 157.20 | 0.20 | 3.23 | - | grey quartz-pyrite veins with sericite halos |
| GA19-24 | 165.18 | 165.55 | 0.37 | 1.02 | - | milky quartz veins with sericite halos |
| GA19-24 | 171.10 | 171.93 | 0.83 | 4.98 | - | quartz vein with lower mafic shoulder sample |
| including | 171.10 | 171.43 | 0.33 | 11.70 | - | quartz-pyrite vein |
Source: Maritime Resources (2019)
9.6.2 Hammerdown East-Rumbullion Drilling
The three holes drilled in the East Rumbullion area designed to test conductors defined by a 2016 detailed EM survey. A total of 700.25 m of NQ drilling was completed, as illustrated in Figure 9-7.
|
|
Figure 9-7: Plan Map depicting 2016 HLEM Geophysical Anomalies
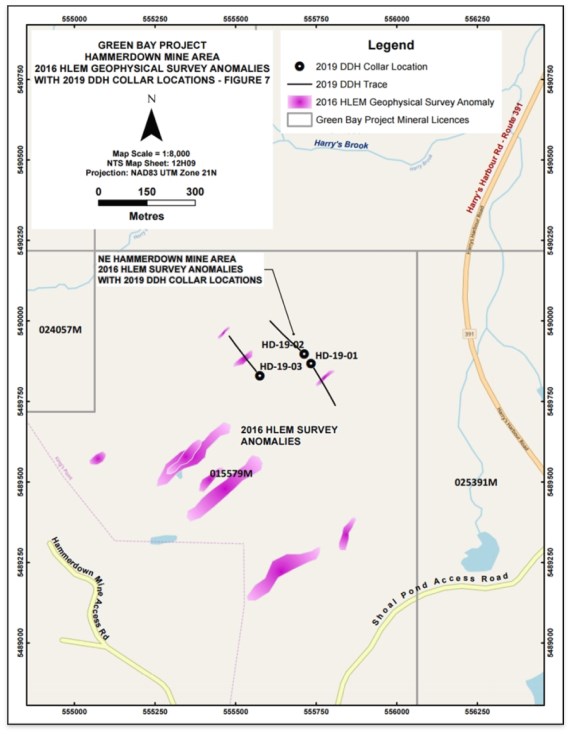
Source: Maritime Resources (2019)
|
|
The three holes HD-19-01 to HD-19-03 failed to intersect appreciable gold grades; however, two of the holes intersected pyrrhotite lenses that are believed to be responsible for the EM anomalies.
9.7 2020 / 2021 Work Programs
Throughout 2020 and 2021, Maritime Resources conducted a wide-ranging exploration program over the Hammerdown site and surrounding Green Bay Property consisting of:
• Airborne Versatile Time Domain Electromagnetic (VTEM), airborne inductively induced polarization (AIIP), and ZTEM surveys; and
• Ground Surface Pulse Electromagnetic (SPEM) Geophysical Surveys
9.8 Airborne Magnetics VTEM, AIIP and ZTEM
In 2020, Maritime engaged Geotech Ltd. to conduct airborne VTEM and ZTEM surveys over the Hammerdown deposit as well as some of Maritime's other mineral projects within the province. Due to variations in the survey parameters of both surveys Geotech completed this program in two phases.
Phase 1 consisted of helicopter borne EM survey using the VTEM) plus system. A total of 2342 linear-km of geophysical data were acquired during the survey covering an area of 423 km2. Over 50 strong conductive anomalies were identified on the land holdings, the best of which were selected for follow-up ground SPEM surveys. Figure 9-8 shows the spatial extents of the 2020 VTEM survey.
|
|
Figure 9-8: Plan Map Depicting 2020 Geotech VTEM dB/dt Z Component Channel 35
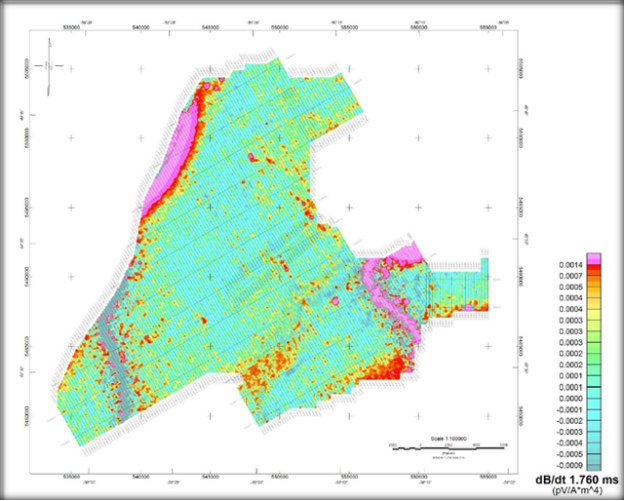
Source: Maritime Resources (2020)
|
|
Figure 9-9: Project Map Depicting Total Magnetic Intensity (TMI), Mineral Occurrences and VTEM Geophysical Targets (dashed circles indicate target areas)
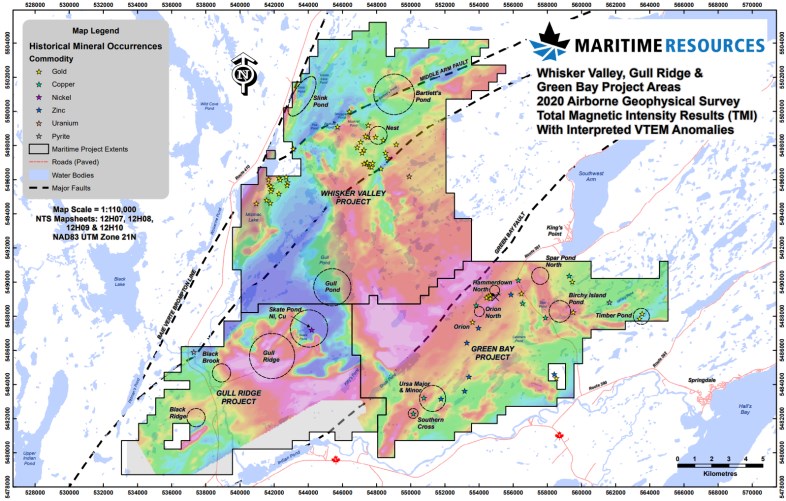
Source: Maritime Resources (2020)
|
|
Figure 9-9 shows the TMI magnetic results of the 2020 airborne along with interpreted VTEM anomalies and significant mineral occurrences. In addition to the numerous conductive anomalies, a series of large-scale conductive lows were also identified. These have been interpreted by geophysicists as potential zones of chargeability which may be the result of widespread disseminated sulphides or conductive clays. Based on the recommendation of Geotech Ltd. the VTEM survey data was re-processed to provide AIIP map products.
The objective of AIIP mapping of the VTEM data is to derive Cole-Cole parameters. Airborne VTEM™ plus data reflect mainly two physical phenomena in the earth:
• Electromagnetic (EM) induction related to sub-surface conductivity and governed by Faraday's Law of induction; and
• Induced polarization (IP) effect, related to the relaxation of polarized charges in the ground (Pelton et al., 1978, Weidelt, 1982, Kratzer and Macnae, 2012 and Kwan et al., 2015a and 2015b).
For mineral exploration, near-surface sources of AIIP chargeability are clays through membrane polarization (electrical energy stored at boundary layer) and most metallic sulphides, some oxides (i.e., magnetite) and graphite through electrode polarization (electrical charges accumulated through electrochemical diffusion at ionic-electronic conduction interfaces).
The resulting AIIP mapping identified numerous chargeability anomalies. Geotech personnel using various geophysical parameters delineated several major structures as well as six areas of interest associated with prominent chargeability anomalies, as presented in Figure 9-10.
|
|
Figure 9-10: Regional Project Map Depicting AIIP Mapping and Interpreted Fault and Areas of Interest
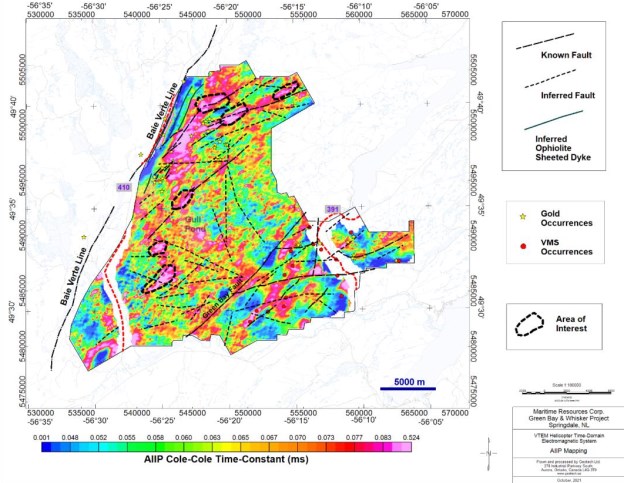
Source: Maritime Resources (2020)
Phase 2 consisted of helicopter borne high-resolution airborne ZTEM. The survey was completed by Geotech Ltd. and covers 484 km2, covering the Green Bay, Whisker Valley, and Gull Ridge Project areas (Figure 9-11).
ZTEM is a type of EM survey to measure variations in the electrical properties of rocks. EM surveys try to identify bodies of rock that conduct electricity well, like massive sulfide bodies of copper or nickel ore, or rocks that resist carrying current more than their surroundings, like the silicic alteration found in the core of porphyry deposits. ZTEM surveys are different to other commercial EM systems because they measure variations in naturally occurring EM fields rather than introducing an EM field into the ground and measuring the responding field, like VTEM. Instead, ZTEM measures variations in the naturally occurring or passive magnetic fields produced by thunderstorms around the world. This magnetic field is planar-constant in all directions, but areas of highly conductive or very resistive rock will cause measurable disruptions. ZTEM surveys are designed to map resistivity contrasts to great depths, exceeding one kilometre to two kilometre, making ZTEM well-suited to finding porphyry-hosted and structurally controlled exploration targets at depth.
|
|
Figure 9-11: Regional Project Map Depicting ZTEM Shallow 30Hz Channel
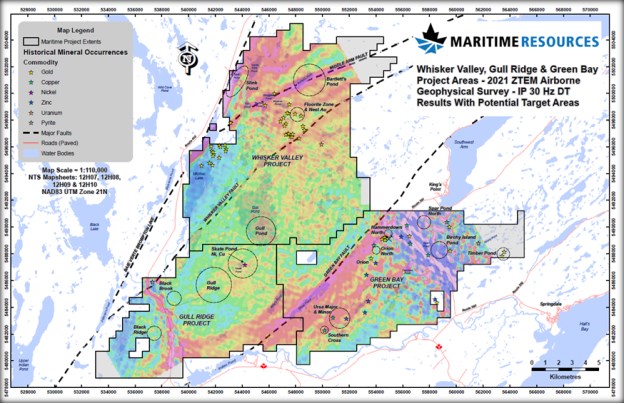
Note: Hot colours indicate conductivity highs.
Source: Maritime Resources (2020)
The ZTEM survey was successful in identifying major structures at depth as well as a series of resistivity anomalies throughout the region that warrant further testing.
9.9 Ground SPEM Geophysical Surveys
As a result of the 2021 Airborne VTEM program, a number of promising EM anomalies were selected by Brian Bengert of Platform Geophysics. Two of the EM anomalies located in the HDZ were referred to as the Orion North EM Target and the Hammerdown North EM Target, and were selected for further exploration via SPEM surveys. The SPEM survey was designed in consultation with Platform Geophysics and Eastern Geophysics, with the latter providing the equipment and operators to execute the survey.
|
|
In the Hammerdown area, the surface loop and lines were configured as depicted in Figure 9-12. The survey resulted in the identification of multiple conductive plate anomalies, the strongest of which are interpreted as belonging to the Hammerdown deposit. A small single line EM plate was identified north of Hammerdown.
This target was subsequently drilled in drill hole MP-21-212, which encountered an iron formation in the hole coincident with the modelled EM plate.
Figure 9-12: Hammerdown SPEM Loop and Grid Configuration Depicting Modelled Conductive Plates
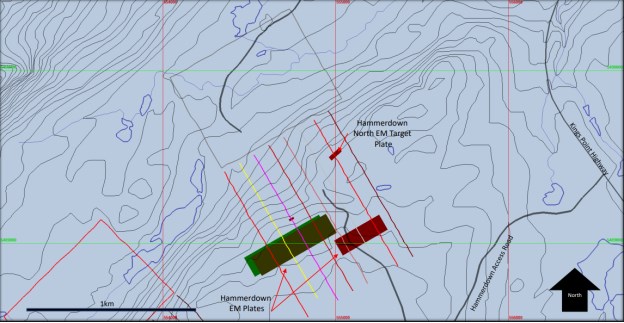
Note: Grid spacing is 1,000 m.
Source: Maritime Resources (2021)
|
|
Figure 9-13: Orion North SPEM Loop and Grid Configuration depicting modelled Conductive Plates
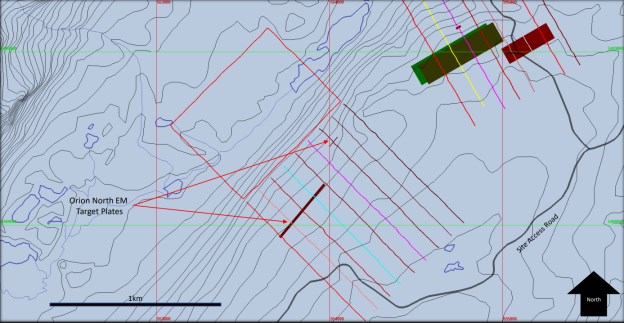
Note: Grid spacing is 1,000 m.
Source: Maritime Resources (2021)
In the Orion North area, the surface loop and lines were configured as depicted in Figure 9-13. The survey resulted in the identification of two conductive anomalies which were subsequently modelled as steeply dipping plates. The larger westernmost plate spanned five lines and was intersected in historic drilling which had identified a thin brecciated horizon of semi-massive pyrrhotite. The smaller northerly anomaly spanned only one line.
These targets were subsequently drill tested with holes BB-21-172 and BB-21-174 testing the larger Plate 1 and BB-21-173 testing the smaller westerly Plate 2. Holes 172 and 173 both intersected pyrrhotite rich massive sulphide lenses with no appreciable metal value while hole BB-21-174 intersected a fault breccia with minor pyrite where the plate should be.
9.10 2020 to Present
Maritime has a number of ongoing exploration programs occurring within the Hammerdown and Orion Mining leases but outside of the current mine plan and represent future resource growth opportunities. These ongoing programs may not be reported in annual assessment reports but are periodically reported in company press releases and are available on: https://maritimeresourcescorp.com/news-releases/. The following sections offer a brief summary of these ongoing programs and is derived from various company press releases.
|
|
9.11 Orion North Exploration
Initial drilling in the Orion North Area was planned in 2020 as part of a condemnation program to outline an area for waste rock storage immediately northeast of the Orion Deposit. This waste rock storage area was planned within the 2 km long gap between the Orion Deposit and the Hammerdown deposit and was intended to provide waste rock storage for both anticipated mine sites. The initial hole BB-20-123 collared 300m northeast of Orion and intersected several zones of gold mineralization, including a narrow quartz/sulphide vein with visible gold. The sampled intersection returned 22.7 g/t Au over 0.44 m at a vertical depth of 50 m. Since this initial hole drilling has traced mineralization in the Orion North Zone for 550 m and remains open to the northeast. Highlights from the Orion North drilling to date include BB-21-147 which yielded 3.3 g/t Au over 6.3 m, including a high-grade sampling grading 90.7 g/t Au over 0.3 m.
9.12 Area 22 Exploration
Initial drilling in the newly discovered Area 22 target was undertaken as part of a 2022 condemnation drilling program to outline an area for waste rock storage immediately south of the Hammerdown deposit. In total, five broadly spaced holes were drilled in this area with the central hole DC-22-02 intersecting a broad interval of gold mineralization grading 0.76 g/t Au over 30.2 m including 8.9 m grading 1.74 g/t Au. This newly discovered zone is located just 300 m south of the Hammerdown PEA pit shell presents a unique growth opportunity on the doorstep of the Hammerdown deposit. The mineralization encountered in DC-22-02 resembles mineralization in the nearby Orion Deposit and Wisteria Zone and it was noted that the mineralization encountered in DC-22-02 occurs along the prominent magnetic lineament that hosts the Orion Deposit and Orion North Trend as outlined in Figure 9-14 and Figure 9-15.
|
|
Figure 9-14: Plan Map of Orion-Hammerdown Area Depicting Magnetic and Mineralized Trends
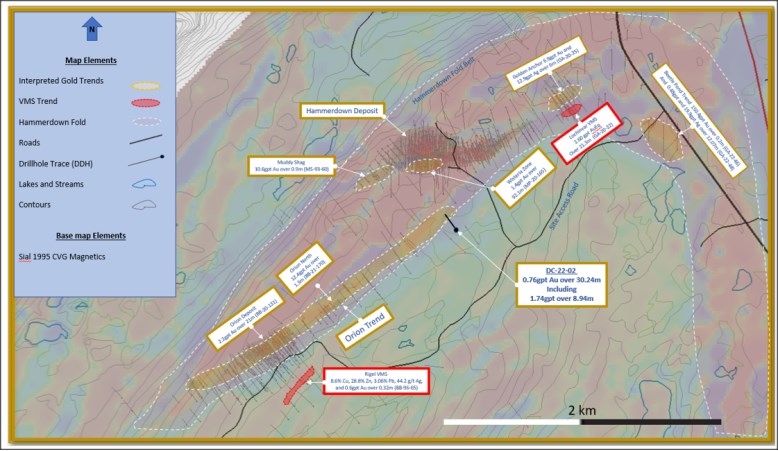
Source: Maritime Resources (2022)
|
|
Figure 9-15: Cross Section of DC-22-02 Intersection and Hammerdown Wireframes and PEA Pit Shape
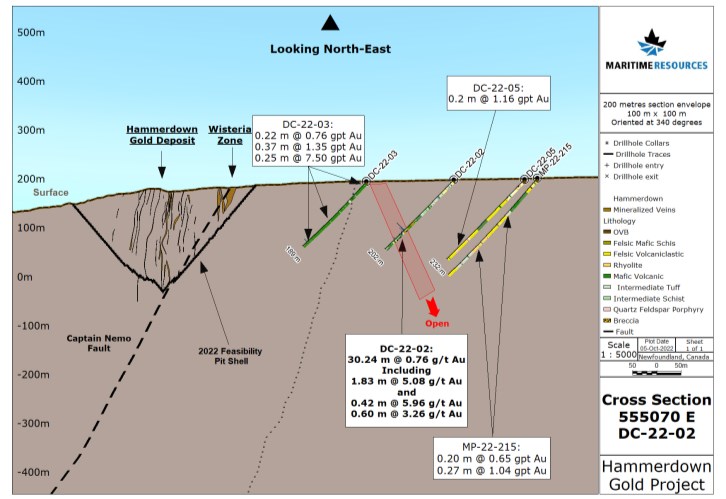
Source: Maritime Resources (2022)
|
|
9.13 Golden Anchor and Lochinvar Exploration
Throughout the 2020 and 2021 field season multiple drill programs have targeted the Golden Anchor and Lochinvar Prospects in order bring these projects to a resource stage. The two exploration targets form sub-parallel trends located Northeast of Hammerdown. Golden Anchor mineralization typically occurs as quartz sulphide veins with high grade gold typically occurring stratigraphically above the Lochinvar VMS trend. Lochinvar is a polymetallic massive sulphide deposit known for high Ag, Zn and Pb tenor hosted in a broad zone of sericite altered felsic volcanics and tuffs.
9.13.1 Golden Anchor Gold Target
2021 drilling at the Golden Anchor zone, intersected 2.94 g/t Au and 30.55 g/t Ag over 2.98 m in GA-21-36. This was a follow-up to a significant intersection in drill hole GA-20-35 containing a quartz/sulphide vein with visible gold grading 6.9 g/t Au over 6.0 m, including 19.9 g/t Au over 2.0 m (see press release dated February 1, 2021). The Golden Anchor zone is located 200 m east of the Hammerdown deposit, is open in all directions and represents a key area for potential resource expansion.
9.13.2 Lochinvar VMS Target
Drilling at the Lochinvar VMS target continues to return broad intervals of gold, silver and base metal mineralization. Recent results include 0.4 g/t Au, 29.7 g/t Ag, 0.2% Cu, 2.0% Zn and 1.0% Pb over 21.3 m, including 2.8 m grading 2.7 g/t Au, 178.3 g/t Ag, 0.7% Cu, 12.7% Zn and 6.8% Pb from drill hole GA-20-33. The Lochinvar VMS target is located approximately 800 m northeast from the Hammerdown gold deposit. Two steeply plunging, massive sulphide lenses have been traced from surface to approximately 200 m below surface where they remain open. The mineralization consists of heavily disseminated to massive sphalerite, galena, chalcopyrite and pyrite with lesser barite and significant tennantite and electrum.
9.14 Beetle Pond Exploration
In 2022, Maritime completed a 6-hole, 1,206-m diamond drilling program in the Beetle Pond area 1 km east of the Hammerdown deposit. The program was designed to test the potential extension of the Golden Anchor gold vein system as well as the Lochinvar VMS system. Historical mapping and magnetics in this region indicated that the Lochinvar and Golden Anchor trends had been displaced due to folding and faulting with these rotated and offset mineralized trends likely now occurring in the Beetle Pond Area to the Southeast. Soil sampling in this area indicated a 300 m long strong coincident gold and base metal anomaly coincident with a prominent magnetic lineament.
The initial drillhole at Beetle Pond GA-22-46 intersected a mineralized quartz veins with visible gold grading 150.3 g/t Au and 81.3 g/t Ag over 0.2 m. The vein style mineralization resembles the Golden Anchor style veins with the deeper portions of the hole intersecting sericite and pyrite altered felsic volcanics and tuffs that are typical to the hydrothermal alteration halo commonly seen around the Lochinvar Massive Sulphide.
|
|
In addition to the intersection in GA-22-46, five of the six holes drilled in the Beetle Pond area intersected mineralized zones with over 1 g/t Au with hole GA-22-48 returning 12.1 m grading 19.9 g/t Ag, 0.48 g/t Au, including 4.1m grading 40.87 g/t Ag and 1.07 g/t Au. A table of significant results is available in Table 9-3.
Table 9-3: 2022 Beetle Pond Drilling Results
| Hole # | From | To | Length | Au (g/t) |
Ag (g/t) |
Cu (%) |
Pb (%) |
Zn (%) |
Comments |
| GA-22-46 | 57.62 | 57.82 | 0.20 | 150.38* | 81.30 | 0.01 | 0.02 | 0.01 | Golden Anchor Type Vein |
| And | 249.85 | 253.31 | 3.46 | 0.28 | 2.25 | 0.03 | 0.01 | 0.08 | Lochinvar VMS Stringer Type |
| GA-22-47 | 71.45 | 71.65 | 0.20 | 0.63 | 0.20 | 0.01 | 0.01 | 0.01 | Golden Anchor Type Vein |
| GA-22-48 | 120.03 | 120.23 | 0.20 | 1.08 | 0.80 | 0.02 | 0.00 | 0.01 | Golden Anchor Type Vein |
| And | 200.90 | 212.97 | 12.07 | 0.48 | 19.90 | 0.03 | 0.12 | 0.25 | Lochinvar VMS Stringer Type |
| Including | 205.96 | 210.04 | 4.08 | 1.07 | 40.87 | 0.04 | 0.12 | 0.28 | |
| And | 222.34 | 223.35 | 1.01 | 0.05 | 4.60 | 0.20 | 0.07 | 3.38 | Lochinvar VMS Stringer Type |
| GA-22-49 | 52.76 | 52.96 | 0.20 | 14.15 | 3.70 | 0.01 | 0.04 | 0.02 | Golden Anchor Type Vein |
| And | 58.30 | 58.50 | 0.20 | 1.49 | 1.90 | 0.03 | 0.40 | 0.02 | Golden Anchor Type Vein |
| And | 91.00 | 92.00 | 1.00 | 1.19 | 0.80 | 0.01 | 0.02 | 0.01 | Golden Anchor Type Vein |
| GA-22-50 | 27.45 | 27.65 | 0.20 | 3.33 | 1.20 | 0.01 | 0.01 | 0.01 | Golden Anchor Type Vein |
| And | 213.74 | 215.30 | 1.56 | 0.06 | 1.94 | 0.04 | 0.01 | 0.55 | Lochinvar VMS Stringer Type |
| GA-22-51 | 31.29 | 31.49 | 0.20 | 1.05 | 0.70 | 0.01 | 0.01 | 0.01 | Golden Anchor Type Vein |
| And | 46.65 | 46.85 | 0.20 | 3.03 | 3.40 | 0.02 | 0.04 | 0.02 | Golden Anchor Type Vein |
| And | 86.29 | 87.59 | 1.30 | 0.05 | 4.84 | 0.09 | 0.04 | 0.18 | Golden Anchor Type Vein |
*Au Previously Reported
Source: Maritime Resources (2022)
 |
 |
10 DRILLING (HAMMERDOWN)
10.1 Introduction
Drilling and channel sampling of the Hammerdown deposit has been completed by multiple operators since the 1980s. The Mineral Resource estimate for the Hammerdown deposit incorporates drilling and channel sampling conducted by the previous owners in addition to the more recent programs completed by Maritime Resources. The Hammerdown project plan map, with wireframes, drill holes, and geology, can be seen in Figure 10-1. Historical diamond drilling data is summarized in Section 6.
|
|
Figure 10-1: Hammerdown Project Plan Map, Wireframes, and Geology
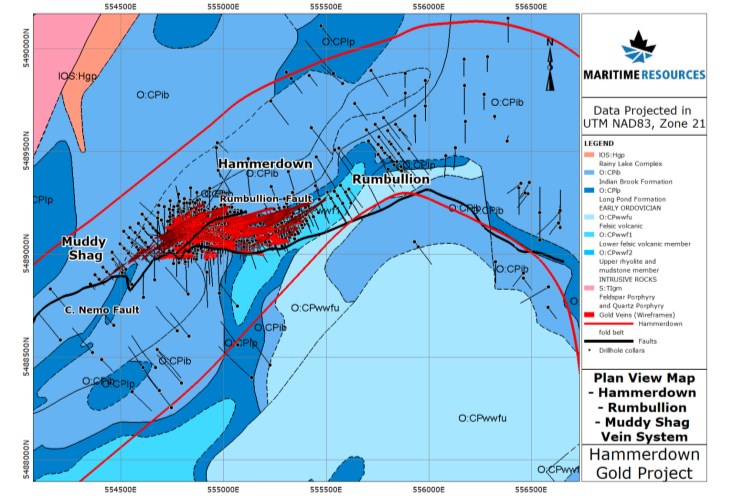
Source: SLR (2022)
|
|
10.2 Maritime Resources 2012-2019 Diamond Drill Program
Since 2012, Maritime Resources has completed several drilling and channel sampling programs. A brief overview of the individual programs is provided below and summarized in Table 10-1.
10.2.1 Maritime Resources 2012 Hammerdown Drill Program
The 2012 Hammerdown / Rumbullion drill program consisted of 16 holes [MP-12-01 to MP-12-16] totalling 2582.8 m of NQ size drill core.
10.2.2 Maritime Resources 2012 Rumbullion Channel Sampling Program
The 2012 Rumbullion trenching program exposed approximately 120 m mineralized veining in the Rumbullion area of the Hammerdown deposit. A total of 44 channels were cut [RCS-12-01 to RCS-13-44]. From the 44 channels, the total combined length of the channel sampling was 151.3 m from which 477 individual samples were collected.
10.2.3 Maritime Resources 2017 Hammerdown Channel Sampling Program
The 2017 trenching program was designed to define the surface expression of specific veins at the Hammerdown deposit. The veins were partially exposed from historic mine operation and only required minor amounts of additional stripping and cleaning. In total fourteen channels totaling 35 m were cut [T1-1 to T3-5] producing 75 samples.
10.2.4 Maritime Resources 2018 Hammerdown Drill Program
The 2018 Hammerdown drill program consisted of 31 drill holes [MP-18-17 to MP-18-47]. A total of 1,729.8 m NQ size drilling was completed. A locally manufactured Duralite 500 coring drill rig was mobilized to the Project from March 28 to May 3, 2018. Core recovery for the drill program exceeded 90%.
10.2.5 Maritime Resources 2019 Hammerdown Drill Program
The 2019 Hammerdown drill program consisted of 27 drill holes [MP-19-48 to MP-19-74]. A total of 4,620 m of NQ drilling was completed. A Duralite 500 coring drill rig was mobilized to the Project from April 26 to August 3, 2019. Core recovery for the drill program exceeded 90%.
10.3 Maritime Resources 2020-2022 Channel Sampling and Diamond Drill Program
Since 2020, 165 drill holes have been completed at the Hammerdown Property totalling 19,872.91 m of new drilling.
|
|
10.3.1 Maritime Resources 2020 Hammerdown Drill Program
During the 2020 drill program at Hammerdown, a total of 128 drill holes were completed totaling 14,654.11 m including:
• 20 drill holes [HD-GC-20-01 to HD-GC-20-20] drilled at 10 m spacing totaling 1,160 m to confirm validity of wireframes and to improve the understanding of grade variability at short ranges.
• 104 drill holes [MP-20-75 to MP-20-178] totaling 11,882.11 m consisting of both in-fill drilling as well as step-out holes.
• Four drill holes [HD-20-01 to HD-20-04] totaling 1,612 m targeting near-pit exploration concepts.
Springdale Forest Resources Inc. (Springdale Forest), of Springdale, Newfoundland and Labrador, was contracted by Maritime Resources to provide drilling services. A Duralite 500 coring drill rig was mobilized to the Project from June 22, 2020 to December 13, 2020. Core recovery for the drill program exceeded 90%.
10.3.1.1 2020 Wisteria Drill Program
The Wisteria zone is a broad mineralized shear zone located near the juncture of the Captain Nemo and the Rumbullion Fault zones and has been refined by recent drilling campaigns at Hammerdown. Mechanical trenching in 2020 by Maritime Resources exposed the Wisteria mineralization, which is typified as strongly sheared and altered felsic/mafic volcanic assemblage, and Hammerdown style quartz/sulphide veins along with broad zones of finely disseminated pyrite and millimetre scale veins which have returned significant gold grades. In 2020, limited drilling was completed over the Wisteria zone, with holes MP-20-164, MP-20-130, MP-20-126 and MP-20-127 returning 92.1 m at 1.4 g/t Au, 31.0 m at 2.90 g/t Au, 25.2 m at 1.62 g/t Au, and 22.0 m at 1.45 g/t Au, respectively. Figure 10-2 shows a plan map of the 2020 Wisteria drilling campaign and Figure 10-3 provides a representative cross-section of the same campaign.
These broad intersections are located on the south side of the 2022 Feasibility Study open pit design where the Captain Nemo and Rumbullion faults converge. Historically, there has been limited sampling in this area of the Project and holes from previous operators were selectively sampled for quartz veins and overlooked the disseminated mineralization style. The recent drill results from Wisteria represent an opportunity for the discovery of additional a bulk tonnage disseminated mineralization on Maritime's mineral licenses.
SLR recommends that future exploration drill holes are fully sampled to avoid missing new styles of mineralization. Larger sample lengths can be used in areas that are believed to be barren and can be re-sampled using ¼ core should the results prove otherwise.
|
|
Figure 10-2: Plan Map Depicting 2020 Drilling of Wisteria Zone
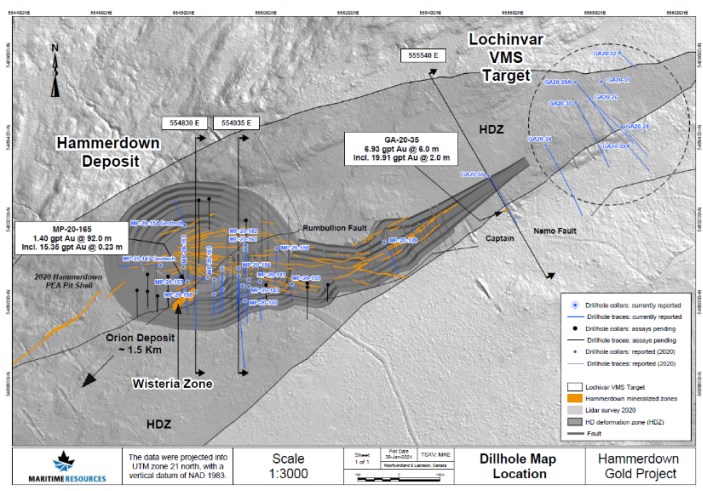
Source: Maritime Resources (2022)
|
|
Figure 10-3: Cross-section Depicting 2020 Drilling of Wisteria Zone
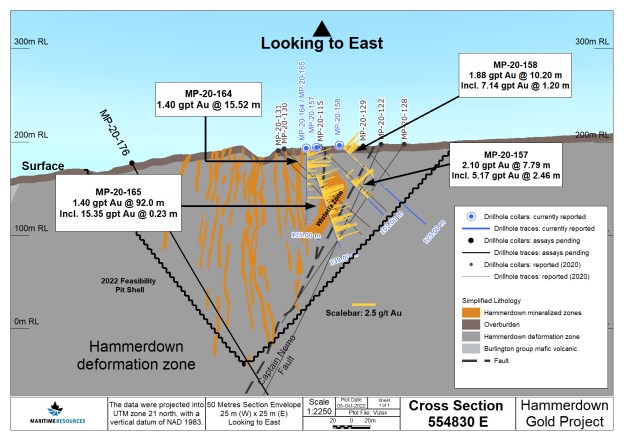
Source: Maritime Resources (2022)
10.3.2 2020-2021 Wisteria Channel Sampling Program
The 2020 Wisteria channel sampling program consisted of 12 channels [WIST-20-Chan-01 to WIST-20-Chan-06 and WIS-21-CH-01 to WIS-21-CH-06]. A total of 78.79 m of sampling was completed.
10.3.3 2021-2022 Hammerdown Drill Program
During the 2021 Hammerdown Drill Program 34 drill holes were completed [MP-21-179 to MP-21-212] totalling 4,432.8m of NQ size drilling. A Duralite 500 coring drill rig was mobilized to the Project from June 2 to July 7, 2021. Core recovery for the drill program exceeded 90%. Maritime Resources 2022 Hammerdown Drill Program
|
|
Most recently, during the 2022 Hammerdown drill program, three drill holes were completed [MP-22-213 to MP-22-215] totalling 786 m of NQ size drilling. A Duralite 500 coring drill rig was mobilized to the Project from March 3 to April 7, 2022. Core recovery for the drill program exceeded 90%. These three holes were not included within the Resource Estimate.
A summary of drilling and channel sampling programs completed at the Hammerdown Project is provided in Table 10-1.
Table 10-1: Summary of Drilling and Channel Sampling Completed on Hammerdown Property
| Year | Company | Program | Number of Holes Drilled |
Metres Drilled / Channeled |
Notes |
| 1988 - 2004 | Various Owners | Diamond Drilling/Mining | 673 | 59,562.60 | Drilling conducted prior to Maritime Resources ownership |
| 2012 | Maritime Resources | Diamond Drilling | 16 | 2,582.80 | MP-01 to MP-16 on Hammerdown and Rumbullion |
| 2012 - 2013 | Maritime Resources | Channel Sampling | 44 | 151.95 | RCS-12-01 to RCS-13-44 targeting Rumbullion East veins. |
| 2017 | Maritime Resources | Channel Sampling | 19 | 34.93 | Channel Sampling of Hammerdown T1-1 to T3.5 |
| 2018 | Maritime Resources | Diamond Drilling | 31 | 1,732.80 | Drilling on Hammerdown |
| 2019 | Maritime Resources | Diamond Drilling | 27 | 4,620.00 | Drilling on Hammerdown and Rumbullion |
| 2020 | Maritime Resources | Diamond Drilling | 128 | 14,654.11 | Drilling on Hammerdown including grade control intervals |
| 2020 - 2021 | Maritime Resources | Channel Sampling | 17 | 78.80 | Channel Sampling of Wisteria Trenching |
| 2021 | Maritime Resources | Diamond Drilling | 34 | 4,432.80 | Drilling on Hammerdown |
| 2022 | Maritime Resources | Diamond Drilling | 3 | 786 | Drilling on Hammerdown |
| Total | Channel Sampling | 80 | 265.02 | ||
| Total | Diamond Drilling | 912 | 88,371.11 | ||
Source: SLR (2022)
|
|
10.4 Diamond Drilling Procedures
10.4.1 Drilling Procedures
Since acquiring the Property in 2012, Springdale Forest have provided diamond drilling service on the Hammerdown Project.
All drill hole collar locations were positioned in the field using either a handheld Garmin GPS or when warranted a high-precision Trimble Differential GPS system. Upon completion of drilling, the final collar location was surveyed using differential GPS. Since acquiring the project, all drilling was planned and surveyed using NAD83 UTM Coordinate system.
All drill holes were numbered in accordance with the historical naming scheme with "MP" (Muir Pond) dash "12" (the year) dash "01" (the next hole number in sequence). The "MP" prefix also allows for a distinction between the holes drilled by Maritime Resources and the "MS" series holes drilled during initial exploration and mining campaigns.
Since 2012, diamond drilling programs have utilized drill pads which were constructed using either a dozer or excavator and were generally eight metres to nine metres in diameter. Fore and back sight pickets (oriented with a Brunton compass) were used to orient the mast of the drill at the desired azimuth upon being established on the pad. The final azimuth would be either confirmed by Maritime personnel in the field or through confirmation of the azimuth from a Reflex Azimuth Point System (APS). The dip was confirmed with the use of a clinometer by placing it on the head of the drill. Upon completion of a drill hole, the casing was left in the ground. A pressure-treated picket was then inserted into the ground to mark the collar location. A metal tag was then engraved using a Dymo gun and attached to the picket which denoted the hole number, location, azimuth, dip, and hole length.
10.4.2 Surveying: Collar and Downhole Surveys
During the drilling process, downhole surveys were taken every 30 m using a Reflex multi-shot survey tool.
10.4.3 Core Delivery
Springdale Forest was contracted by Maritime Resources for the 2012 to 2022 diamond drill programs. At the end of each shift, the drill core was boxed and sealed at the drill site and delivered to the core facility by the drillers. The geologist or geotechnician would meet the drillers at the core shack to receive the core for logging and safe storage.
10.4.4 Core Logging and Sampling
Upon receiving the core, the geologist or geotechnician would lay-out the core on the core benches and orientate the drill core in the box making sure to remove unnecessary gaps and fit core together as best as possible. Once ready, the technician would annotate the core with the downhole meter marks using a white grease pencil. The technician would also mark the core recovery and RQD (Rock Quality Designation) at the end of each three metre run of core. The box depth interval, RQD and Recovery data would then be entered into MX Deposit by the technician. The hole number and depth interval for each core box would be recorded and placed onto a metal core box tag and affixed to the end of each core box.
|
|
Observations made by the core logging geologist are directly recorded into the Mx Deposit database. The selection of sampling intervals are marked by the geologist using a minimum and maximum sample interval of 0.20 m and 1.20 m, respectively. The start of the first sample is marked with "START" and an arrow pointing in the direction of sampling. Each subsequent sample is marked with red arrows and a perpendicular red line denoting the sample breaks. At the end of the last sample, the core is marked with an up-hole pointing arrow and marked "END". A cut line, to be followed during cutting, is then drawn down the highline of the core. The sample intervals are recorded in a sample book and the logging computer. The sample tag is inserted into the box at the start of each sample.
All core boxes were then photographed using a digital camera. Each box containing samples are placed in the core cutting rack. Finally, a geotechnician labels all core boxes with aluminum tags and staples the tags to the core boxes.
10.4.5 Core Photography
Maritime Resources used a Nikon D800E and a Canon Rebel T7 cameras to photograph all drill core after logging and sampling has been completed. The camera is attached to a metal stand which maintains the consistency of core photos and can be found in Figure 10-4 and Figure 10-5, respectively. Maritime Resources requires that the following items must be visible in each drill core photo:
• Hole ID;
• Box numbers;
• Depth intervals;
• Meter blocks;
• Sample tag numbers (if applicable);
• Lithology contacts;
• PXRF sample locations; and
• Magnetic susceptibility locations.
Photographs are completed with both dry and wet core by the logging geologist or geotechnician and are digitally filed for future reference.
|
|
Figure 10-4: Core Photography Set-up
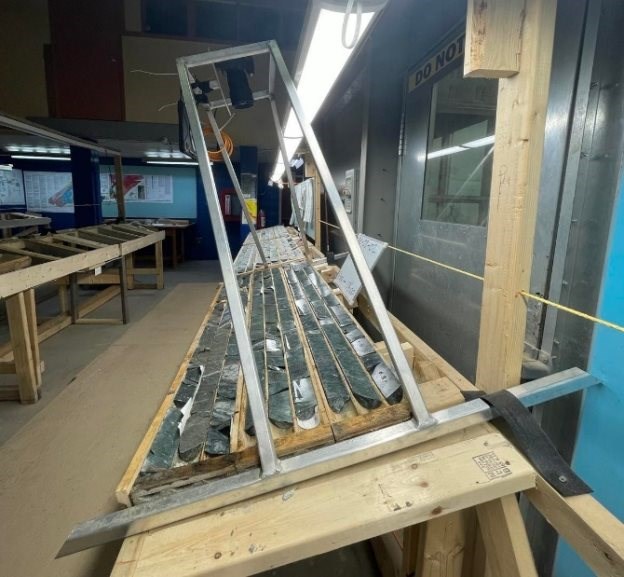
Source: SLR (2022)
|
|
Figure 10-5: Drill Core Photography Set-Up with Tablet Control
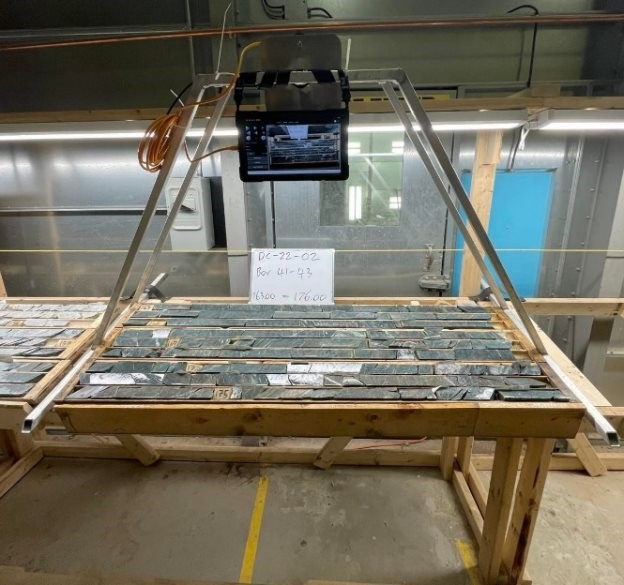
Source: SLR (2022)
10.4.6 Core Cutting
Core cutting is completed as the final step of the drill procedures. The employee designated to cutting core uses a DeWalt masonry saw to cut samples marked by the core logging geologist. Cut intervals and tags are placed in sample bags with a corresponding sample number, recorded and sent to Eastern Analytical for assay. The Maritime Resources core cutting setup is shown in Figure 10-6.
|
|
Figure 10-6: Maritime Resource Cutting Facility
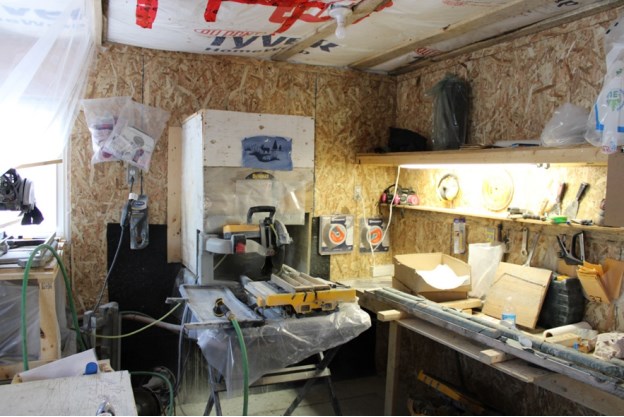
Source: SLR (2022)
10.4.7 Core Storage
Historical drill holes prior to and including 2012 are stored at the Eastern Analytical core facility. The QP has reviewed the condition of the core stored at Eastern Analytical core yard. The core ranges from AX to BQ in size and the run markers within the boxes can be hard to read given the age and previous storage conditions of the boxes.
Following the 2012 diamond drill program, drill core has been stockpiled on site at the core facility.
|
|
10.5 Channel Sampling Procedures
Upon completion of mechanical trenching or grubbing program the bedrock surface would be cleaned. The project geologist would identify the mineralized zones and lay-out channel samples so that channels are cut to intersect perpendicular to the targeted vein at regular intervals along the strike of the exposed veins. The trace and ends of each channel would be marked on the bedrock surface using surveyors spray paint. Once the channel samples are marked on the bedrock surface, notes were recorded for each sample denoting the sample width, location, and any important geological and structural information. Samples were cut using a Stihl TS420 cut-off saw. Once cut, chisels and a hammer were used to liberate the samples from the bedrock. A copy of the associated sample tag would be inserted into the channel.
Once complete sealed sample bags were placed in a rice bag, sealed, and stored at a secure location on site prior to transport to Eastern Analytical for assay.
10.6 Drill Hole and Channel Sample Database
Maritime Resources directly records geological logging and geotechnical measurements of drill core into MX Deposit.
Sampling intervals designated by the core logging geologist and their corresponding assay results from Eastern Analytical are also recorded in MX Deposit.
Historical drill logs and assays that were completed on the Hammerdown Project by previous property owners have also been compiled and loaded into the MX Deposit database.
10.7 Hammerdown Deposit Results
The combined drilling and channel sampling data from Maritime Resources and previous operators has been compiled into the Maritime Resources drill hole database. This database contains data from surface drilling, underground drilling, and channel sampling. Modelling of the drill hole and channel sampling assay data resulted in the construction of 101 mineralization wireframes depicting the multiple veins and disseminated body that make up the Hammerdown deposit. Figure 10-7 and Figure 10-8 below depict a plan map and cross section of the Hammerdown wireframes and Table 10-2 to
Table 10-5 detail significant drill hole and channel sample details and composites related to the cross section.
|
|
Figure 10-7: Plan View- Hammerdown Wireframes and Drill Hole Locations

Source: SLR (2022)
|
|
Figure 10-8: East Orientated Cross-Section Depicting 2022 Hammerdown Wireframes and Drill Hole Locations

Source: SLR (2022)
|
|
Table 10-2: Key Diamond Drill Hole Parameters Shown in HD Cross-Section
| Hole Number | Hole Type | Easting | Northing | Elevation (m) |
Azimuth (◦) |
Dip (◦) |
Depth (m) |
| EW212 | UDDH | 554824.6602 | 5489116.38 | 151.42 | 320 | 5 | 21.3 |
| EW213 | UDDH | 554825.5601 | 5489088.71 | 114.1 | 180 | 14 | 46.6 |
| EW214 | UDDH | 554825.6602 | 5489088.71 | 113.34 | 180 | -18 | 57.6 |
| EW215 | UDDH | 554838.79 | 5489088.98 | 115.68 | 180 | -19 | 77.7 |
| EW216 | UDDH | 554837.9399 | 5489089.39 | 116.5 | 180 | 0 | 22.9 |
| EW233 | UDDH | 554841.6602 | 5489090.7 | 113.6 | 159 | 0 | 45.6 |
| EW264 | UDDH | 554841.5698 | 5489165.06 | 97.17 | 2.09 | 0 | 14.02 |
| R191 | UDDH | 554829.2998 | 5489159.89 | 99.95 | 163.68 | -20 | 60.35 |
| R192 | UDDH | 554829.2798 | 5489159.98 | 100.49 | 177 | 5 | 55.16 |
| R284 | UDDH | 554837.8501 | 5489091.17 | 121.29 | 182.25 | 45 | 46 |
| R285 | UDDH | 554837.8999 | 5489091.08 | 120.35 | 180 | 22 | 18.2 |
| R286 | UDDH | 554826.5898 | 5489089.17 | 120.71 | 184.33 | 30 | 21.3 |
| R297 | UDDH | 554825.2202 | 5489094.48 | 76.86 | 178.88 | 14 | 40.2 |
| R298 | UDDH | 554825.23 | 5489094.57 | 75.88 | 178.5 | -10 | 40 |
| R299 | UDDH | 554838.4702 | 5489092.69 | 75 | 358.88 | -50 | 70.1 |
| R300 | UDDH | 554838.6699 | 5489092.84 | 75.89 | 358.35 | -8 | 45.7 |
| R301 | UDDH | 554838.25 | 5489092.28 | 77.2 | 180 | 45 | 30.4 |
| R302 | UDDH | 554838.1099 | 5489089.78 | 76.01 | 180 | -5 | 25.2 |
| R408 | UDDH | 554841.98 | 5489171.62 | -6.69 | 179.8 | -25 | 70.1 |
| R519 | UDDH | 554833.8398 | 5489092.57 | 46.71 | 179 | 14 | 31.7 |
| R520 | UDDH | 554825.9302 | 5489092.77 | 47.51 | 179.5 | 7 | 30.48 |
| R575 | UDDH | 554831.1299 | 5489188.2 | 136.05 | 202 | -24 | 48.77 |
| R576 | UDDH | 554831.02 | 5489188.08 | 135.67 | 206.25 | -40 | 47.24 |
| R578 | UDDH | 554830.96 | 5489187.01 | 136.33 | 194.44 | -15 | 57.91 |
| MS095 | SDDH | 554830.0498 | 5489164.18 | 189.503 | 184.5 | -43 | 177 |
| MS096 | SDDH | 554833.1201 | 5489203.19 | 185.931 | 179 | -49 | 205 |
| MS157 | SDDH | 554828.8799 | 5489138.85 | 194.66 | 180 | -51 | 57 |
| MS158 | SDDH | 554834.2798 | 5489132.08 | 196.782 | 180 | -46 | 45.1 |
| MS159 | SDDH | 554834.3101 | 5489132.64 | 196.758 | 180 | -59 | 51.8 |
| MS171 | SDDH | 554842.52 | 5489157.55 | 190.366 | 180 | -48 | 85.3 |
| MS257 | SDDH | 554836.7798 | 5489048.8 | 194.937 | 0 | -55 | 81.1 |
| MS258 | SDDH | 554823.4502 | 5489052 | 194.473 | 0 | -54 | 55.2 |
| MS272 | SDDH | 554835.9102 | 5489050.86 | 194.849 | 0 | -45 | 76.2 |
| MS274 | SDDH | 554824.1899 | 5489051.46 | 194.533 | 355 | -44 | 55.4 |
| MS275 | SDDH | 554836.2998 | 5489060.9 | 194.277 | 0 | -45 | 49.7 |
| MS276 | SDDH | 554825.1299 | 5489067.42 | 193.561 | 0 | -45 | 45.7 |
|
|
| Hole Number | Hole Type | Easting | Northing | Elevation (m) |
Azimuth (◦) |
Dip (◦) |
Depth (m) |
| MS399 | SDDH | 554840.6401 | 5489032.71 | 194.321 | 0 | -54 | 75.28 |
| MS417 | SDDH | 554842.4102 | 5489185.1 | 187.544 | 180 | -55 | 53.03 |
| MS422 | SDDH | 554842.3799 | 5489184.54 | 187.573 | 180 | -66 | 69.79 |
| MS566 | SDDH | 554842.9902 | 5489178.69 | 188.068 | 180 | -45 | 39.62 |
| MS-88-05 | SDDH | 554832.5801 | 5489131.71 | 196.608 | 180 | -46 | 172.8 |
| MS-88-07 | SDDH | 554831.5498 | 5489161.45 | 189.652 | 180 | -45 | 150 |
| MS-88-15 | SDDH | 554832.9902 | 5489198.24 | 186.634 | 180 | -50 | 217 |
| MS-89-16 | SDDH | 554837.7402 | 5489225.41 | 179.48 | 180 | -52 | 245.7 |
| MS-90-27 | SDDH | 554839.6699 | 5489264.15 | 169.84 | 180 | -52 | 348.7 |
| MS-90-49 | SDDH | 554841.02 | 5489321.43 | 169.572 | 180 | -52 | 345.6 |
| MS-93-50 | SDDH | 554833.4102 | 5489213.14 | 182.943 | 180 | -50 | 225.7 |
| MS-93-51 | SDDH | 554835.77 | 5489256.14 | 172.25 | 180 | -70 | 285 |
| MS-99-103 | SDDH | 554826.73 | 5489121.7 | 190.331 | 183 | -45 | 29.57 |
| MS-99-104 | SDDH | 554827.4702 | 5489137.93 | 194.791 | 183 | -45 | 55.17 |
| MS-99-105 | SDDH | 554828.9302 | 5489153.04 | 190.416 | 183 | -46 | 69.49 |
| MS-99-106 | SDDH | 554828.8599 | 5489172.25 | 188.736 | 183 | -47 | 94.49 |
| MS-99-107 | SDDH | 554828.8999 | 5489172.73 | 188.638 | 183 | -52 | 105.16 |
| MS-99-120 | SDDH | 554835.46 | 5489249.21 | 174.145 | 183 | -53 | 218.24 |
| MS-99-127 | SDDH | 554840.8198 | 5489157.15 | 190.261 | 183 | -45 | 76.2 |
| MS-99-144 | SDDH | 554840.8901 | 5489157.94 | 190.091 | 183 | -58 | 100.58 |
| MS-99-147 | SDDH | 554840.2402 | 5489122.45 | 192.384 | 183 | -45 | 39.62 |
| MP-18-24 | SDDH | 554831.8398 | 5489058.8 | 194.731 | 357 | -44.2 | 31 |
| MP-18-32 | SDDH | 554845.0601 | 5489038.7 | 194.537 | 2.9 | -44.9 | 43.8 |
| MP-18-46 | SDDH | 554833.2402 | 5489047.84 | 194.864 | 1.2 | -45.1 | 46 |
| MP-19-54 | SDDH | 554822.7178 | 5489250.011 | 174.762 | 180.52 | -53.7 | 220 |
| MP-20-115 | SDDH | 554830.0498 | 5489045.31 | 194.999 | 185.97 | -47.45 | 100 |
| MP-20-122 | SDDH | 554829.7002 | 5488980.12 | 197.337 | 356.94 | -64.65 | 325 |
| MP-20-130 | SDDH | 554830.1001 | 5489083.61 | 192.57 | 176.56 | -48.2 | 125 |
| MP-20-146 Geotech | SDDH | 554844.9199 | 5489060.55 | 193.725 | 178.3 | -47.9 | 152.35 |
| MP-20-158 | SDDH | 554830.0698 | 5489024.79 | 196.152 | 180.5 | -43.5 | 125 |
| MP-20-176 | SDDH | 554837.481 | 5489247.027 | 177.312 | 180 | -62 | 301 |
| MP-21-181 | SDDH | 554827.7192 | 5489006.339 | 195.773 | 179.5 | -44 | 67 |
| MP-21-182 | SDDH | 554845.2979 | 5488993.845 | 196.876 | 196.88 | -46 | 46 |
| MP-21-194 | SDDH | 554830.7959 | 5489138.982 | 194.815 | 178.6 | -64.5 | 31 |
| MP-21-195 | SDDH | 554841.5479 | 5489138.595 | 196.484 | 177.5 | -53.4 | 38.5 |
Source: SLR (2022)
|
|
Table 10-3: Summary of Hammerdown Cross-Section Diamond Drill Hole Significant Intercepts > 1.0 (g/t) Au
| Hole Number | From (m) |
To (m) |
Length (m) |
Au (g/t) |
| EW212 | 0.00 | 1.30 | 1.30 | 5.99 |
| EW212 | 5.80 | 6.20 | 0.40 | 25.25 |
| EW213 | 4.75 | 5.00 | 0.25 | 8.21 |
| EW213 | 10.90 | 11.60 | 0.70 | 43.08 |
| EW214 | 13.10 | 13.70 | 0.60 | 2.18 |
| EW214 | 41.75 | 42.05 | 0.30 | 26.16 |
| EW215 | 1.20 | 1.30 | 0.10 | 4.45 |
| EW215 | 2.00 | 2.30 | 0.30 | 2.05 |
| EW215 | 11.13 | 11.28 | 0.15 | 158.55 |
| EW215 | 29.90 | 30.00 | 0.10 | 4.31 |
| EW215 | 31.10 | 31.50 | 0.40 | 1.45 |
| EW215 | 34.40 | 34.50 | 0.10 | 1.97 |
| EW216 | 0.00 | 1.80 | 1.80 | 4.84 |
| EW233 | 9.50 | 11.00 | 1.50 | 33.71 |
| EW264 | 10.50 | 11.40 | 0.90 | 8.77 |
| R191 | 0.21 | 1.11 | 0.90 | 2.15 |
| R191 | 45.10 | 45.80 | 0.70 | 99.11 |
| R192 | 0.80 | 1.30 | 0.50 | 10.01 |
| R192 | 8.50 | 9.00 | 0.50 | 3.49 |
| R192 | 38.20 | 38.50 | 0.30 | 112.70 |
| R192 | 47.25 | 48.50 | 1.25 | 65.54 |
| R284 | 4.00 | 5.50 | 1.50 | 1.09 |
| R284 | 14.00 | 14.70 | 0.70 | 60.50 |
| R284 | 33.80 | 35.70 | 1.90 | 1.49 |
| R285 | 10.26 | 12.56 | 2.30 | 14.18 |
| R286 | 8.10 | 10.60 | 2.50 | 1.65 |
| R286 | 17.00 | 18.00 | 1.00 | 2.35 |
| R297 | 34.40 | 34.90 | 0.50 | 2.45 |
| R298 | 30.80 | 31.90 | 1.10 | 1.02 |
| R299 | 35.25 | 37.40 | 2.15 | 6.54 |
| R299 | 43.50 | 44.00 | 0.50 | 24.46 |
| R299 | 49.00 | 49.60 | 0.60 | 2.18 |
| R300 | 24.00 | 25.00 | 1.00 | 6.38 |
| R300 | 27.80 | 29.60 | 1.80 | 31.94 |
| R300 | 32.15 | 34.40 | 2.25 | 9.59 |
| R301 | 11.10 | 12.60 | 1.50 | 3.40 |
|
|
| Hole Number | From (m) |
To (m) |
Length (m) |
Au (g/t) |
| R301 | 14.90 | 15.90 | 1.00 | 2.47 |
| R302 | 12.80 | 13.30 | 0.50 | 3.71 |
| R302 | 23.40 | 23.90 | 0.50 | 6.71 |
| R408 | 7.95 | 8.60 | 0.65 | 6.08 |
| R408 | 13.30 | 14.00 | 0.70 | 17.26 |
| R575 | 29.80 | 32.17 | 2.37 | 36.46 |
| R576 | 43.72 | 44.45 | 0.73 | 140.95 |
| R578 | 37.07 | 38.14 | 1.07 | 41.56 |
| MS095 | 10.80 | 13.30 | 2.50 | 35.88 |
| MS095 | 15.30 | 15.72 | 0.42 | 2.63 |
| MS095 | 35.10 | 35.65 | 0.55 | 30.25 |
| MS095 | 44.20 | 45.20 | 1.00 | 5.70 |
| MS095 | 51.70 | 52.50 | 0.80 | 4.17 |
| MS095 | 59.25 | 60.00 | 0.75 | 2.01 |
| MS095 | 64.05 | 68.60 | 4.55 | 23.10 |
| MS095 | 72.35 | 81.20 | 8.85 | 2.32 |
| MS095 | 110.70 | 111.00 | 0.30 | 5.25 |
| MS095 | 119.00 | 120.60 | 1.60 | 1.31 |
| MS095 | 123.40 | 128.30 | 4.90 | 1.09 |
| MS095 | 135.50 | 137.50 | 2.00 | 1.54 |
| MS095 | 142.15 | 143.66 | 1.51 | 2.24 |
| MS096 | 15.60 | 16.40 | 0.80 | 1.21 |
| MS096 | 36.56 | 36.70 | 0.14 | 9.99 |
| MS096 | 56.00 | 57.66 | 1.66 | 24.03 |
| MS096 | 63.97 | 64.17 | 0.20 | 11.36 |
| MS096 | 66.73 | 67.32 | 0.59 | 1.92 |
| MS096 | 69.97 | 71.76 | 1.79 | 29.31 |
| MS096 | 81.35 | 81.52 | 0.17 | 165.70 |
| MS096 | 93.00 | 93.30 | 0.30 | 2.60 |
| MS096 | 113.10 | 113.56 | 0.46 | 134.13 |
| MS096 | 116.10 | 121.65 | 5.55 | 15.42 |
| MS096 | 132.20 | 133.65 | 1.45 | 1.05 |
| MS096 | 193.65 | 196.16 | 2.51 | 66.68 |
| MS157 | 17.70 | 18.40 | 0.70 | 8.16 |
| MS157 | 36.60 | 37.10 | 0.50 | 1.23 |
| MS157 | 37.90 | 38.50 | 0.60 | 15.93 |
| MS157 | 41.10 | 44.69 | 3.59 | 10.82 |
| MS157 | 52.30 | 53.30 | 1.00 | 2.59 |
|
|
| Hole Number | From (m) |
To (m) |
Length (m) |
Au (g/t) |
| MS158 | 5.80 | 6.40 | 0.60 | 59.00 |
| MS158 | 25.80 | 26.80 | 1.00 | 5.89 |
| MS158 | 29.30 | 35.10 | 5.80 | 24.51 |
| MS159 | 8.20 | 9.10 | 0.90 | 2.28 |
| MS159 | 32.80 | 36.20 | 3.40 | 4.93 |
| MS159 | 38.70 | 40.40 | 1.70 | 126.10 |
| MS159 | 50.80 | 51.80 | 1.00 | 1.62 |
| MS171 | 14.50 | 16.00 | 1.50 | 7.35 |
| MS171 | 55.50 | 62.80 | 7.30 | 6.40 |
| MS171 | 68.90 | 70.10 | 1.20 | 88.59 |
| MS171 | 85.10 | 85.30 | 0.20 | 3.65 |
| MS257 | 9.20 | 10.20 | 1.00 | 1.88 |
| MS257 | 27.80 | 28.30 | 0.50 | 2.15 |
| MS257 | 40.90 | 42.75 | 1.85 | 14.58 |
| MS257 | 66.50 | 67.50 | 1.00 | 30.84 |
| MS258 | 49.10 | 53.50 | 4.40 | 6.48 |
| MS272 | 29.00 | 31.80 | 2.80 | 37.66 |
| MS272 | 34.10 | 35.80 | 1.70 | 67.86 |
| MS272 | 38.20 | 39.40 | 1.20 | 1.52 |
| MS272 | 40.60 | 44.70 | 4.10 | 51.09 |
| MS272 | 54.40 | 54.90 | 0.50 | 3.46 |
| MS274 | 11.30 | 11.80 | 0.50 | 3.57 |
| MS274 | 47.00 | 48.70 | 1.70 | 18.81 |
| MS275 | 13.30 | 15.30 | 2.00 | 1.42 |
| MS275 | 19.30 | 22.00 | 2.70 | 3.99 |
| MS276 | 21.00 | 21.50 | 0.50 | 47.71 |
| MS276 | 32.30 | 32.90 | 0.60 | 13.47 |
| MS276 | 39.00 | 39.90 | 0.90 | 11.78 |
| MS399 | 48.20 | 48.60 | 0.40 | 12.14 |
| MS399 | 58.30 | 58.50 | 0.20 | 1.52 |
| MS417 | 30.50 | 31.00 | 0.50 | 69.01 |
| MS417 | 45.20 | 45.70 | 0.50 | 12.90 |
| MS422 | 36.30 | 36.80 | 0.50 | 8.28 |
| MS422 | 52.09 | 52.59 | 0.50 | 2.47 |
| MS422 | 57.91 | 58.36 | 0.45 | 106.60 |
| MS566 | 18.04 | 19.04 | 1.00 | 1.11 |
| MS566 | 23.68 | 25.21 | 1.53 | 14.66 |
| MS566 | 37.66 | 38.22 | 0.56 | 17.25 |
|
|
| Hole Number | From (m) |
To (m) |
Length (m) |
Au (g/t) |
| MS-88-05 | 5.25 | 6.30 | 1.05 | 16.61 |
| MS-88-05 | 21.45 | 21.55 | 0.10 | 1.71 |
| MS-88-05 | 24.40 | 24.90 | 0.50 | 2.99 |
| MS-88-05 | 26.10 | 30.05 | 3.95 | 9.00 |
| MS-88-05 | 31.10 | 31.20 | 0.10 | 2.40 |
| MS-88-05 | 33.30 | 34.60 | 1.30 | 5.22 |
| MS-88-05 | 46.00 | 46.35 | 0.35 | 8.88 |
| MS-88-05 | 53.10 | 53.25 | 0.15 | 11.80 |
| MS-88-05 | 60.60 | 61.10 | 0.50 | 4.56 |
| MS-88-05 | 63.80 | 65.60 | 1.80 | 5.57 |
| MS-88-05 | 68.70 | 71.90 | 3.20 | 20.82 |
| MS-88-05 | 82.20 | 83.80 | 1.60 | 6.62 |
| MS-88-05 | 86.60 | 90.80 | 4.20 | 1.34 |
| MS-88-05 | 91.90 | 92.50 | 0.60 | 1.06 |
| MS-88-05 | 108.70 | 108.80 | 0.10 | 60.11 |
| MS-88-05 | 119.10 | 130.60 | 11.50 | 1.37 |
| MS-88-05 | 132.10 | 139.30 | 7.20 | 1.24 |
| MS-88-05 | 140.30 | 151.70 | 11.40 | 1.18 |
| MS-88-07 | 6.30 | 8.95 | 2.65 | 22.31 |
| MS-88-07 | 30.60 | 32.20 | 1.60 | 17.33 |
| MS-88-07 | 37.40 | 38.10 | 0.70 | 12.93 |
| MS-88-07 | 40.65 | 40.75 | 0.10 | 18.26 |
| MS-88-07 | 46.72 | 47.90 | 1.18 | 3.73 |
| MS-88-07 | 56.00 | 56.75 | 0.75 | 3.72 |
| MS-88-07 | 58.80 | 64.30 | 5.50 | 42.02 |
| MS-88-07 | 68.40 | 71.93 | 3.53 | 2.88 |
| MS-88-07 | 93.25 | 97.60 | 4.35 | 3.56 |
| MS-88-07 | 106.10 | 106.60 | 0.50 | 10.50 |
| MS-88-07 | 118.10 | 118.20 | 0.10 | 8.20 |
| MS-88-07 | 121.20 | 124.70 | 3.50 | 2.66 |
| MS-88-07 | 130.70 | 135.60 | 4.90 | 5.66 |
| MS-88-07 | 136.60 | 142.80 | 6.20 | 2.74 |
| MS-88-15 | 12.60 | 12.80 | 0.20 | 4.01 |
| MS-88-15 | 30.40 | 31.40 | 1.00 | 1.43 |
| MS-88-15 | 46.60 | 46.70 | 0.10 | 3.46 |
| MS-88-15 | 50.90 | 51.20 | 0.30 | 161.00 |
| MS-88-15 | 57.40 | 57.75 | 0.35 | 8.08 |
| MS-88-15 | 75.80 | 76.80 | 1.00 | 178.54 |
|
|
| Hole Number | From (m) |
To (m) |
Length (m) |
Au (g/t) |
| MS-88-15 | 104.80 | 104.90 | 0.10 | 3.50 |
| MS-88-15 | 106.90 | 113.10 | 6.20 | 5.48 |
| MS-88-15 | 114.60 | 118.00 | 3.40 | 8.13 |
| MS-88-15 | 146.00 | 147.20 | 1.20 | 1.92 |
| MS-88-15 | 157.90 | 163.80 | 5.90 | 1.82 |
| MS-88-15 | 166.80 | 169.80 | 3.00 | 1.30 |
| MS-88-15 | 172.60 | 174.20 | 1.60 | 1.43 |
| MS-88-15 | 177.00 | 187.00 | 10.00 | 3.32 |
| MS-89-16 | 36.10 | 36.70 | 0.60 | 2.73 |
| MS-89-16 | 80.70 | 80.90 | 0.20 | 2.29 |
| MS-89-16 | 81.50 | 81.70 | 0.20 | 1.13 |
| MS-89-16 | 84.20 | 84.60 | 0.40 | 26.10 |
| MS-89-16 | 112.60 | 113.20 | 0.60 | 4.38 |
| MS-89-16 | 129.20 | 129.40 | 0.20 | 13.60 |
| MS-89-16 | 152.40 | 154.60 | 2.20 | 6.39 |
| MS-89-16 | 155.50 | 156.70 | 1.20 | 19.47 |
| MS-89-16 | 166.40 | 168.60 | 2.20 | 5.32 |
| MS-90-27 | 80.10 | 80.50 | 0.40 | 18.90 |
| MS-90-27 | 180.20 | 180.70 | 0.50 | 1.97 |
| MS-90-49 | 248.40 | 251.00 | 2.60 | 24.63 |
| MS-93-50 | 88.00 | 88.50 | 0.50 | 2.48 |
| MS-93-50 | 131.20 | 131.70 | 0.50 | 44.28 |
| MS-93-50 | 139.60 | 146.40 | 6.80 | 29.22 |
| MS-93-50 | 147.90 | 150.50 | 2.60 | 34.22 |
| MS-93-50 | 164.20 | 164.70 | 0.50 | 1.05 |
| MS-99-103 | 15.91 | 17.62 | 1.71 | 46.74 |
| MS-99-104 | 14.02 | 14.33 | 0.31 | 6.74 |
| MS-99-104 | 26.03 | 26.64 | 0.61 | 1.85 |
| MS-99-104 | 30.08 | 31.79 | 1.71 | 7.32 |
| MS-99-104 | 35.45 | 38.37 | 2.92 | 19.93 |
| MS-99-105 | 5.46 | 7.92 | 2.46 | 4.58 |
| MS-99-105 | 14.81 | 15.24 | 0.43 | 7.73 |
| MS-99-105 | 16.15 | 16.58 | 0.43 | 14.14 |
| MS-99-105 | 24.60 | 26.82 | 2.22 | 2.83 |
| MS-99-105 | 28.74 | 29.14 | 0.40 | 2.21 |
| MS-99-105 | 39.01 | 39.32 | 0.31 | 2.44 |
| MS-99-105 | 48.65 | 55.47 | 6.82 | 35.56 |
| MS-99-105 | 57.15 | 57.45 | 0.30 | 1.69 |
|
|
| Hole Number | From (m) |
To (m) |
Length (m) |
Au (g/t) |
| MS-99-105 | 63.03 | 63.34 | 0.31 | 1.94 |
| MS-99-106 | 6.98 | 7.28 | 0.30 | 5.55 |
| MS-99-106 | 24.02 | 26.00 | 1.98 | 45.27 |
| MS-99-106 | 54.41 | 56.54 | 2.13 | 3.21 |
| MS-99-106 | 65.23 | 65.90 | 0.67 | 2.47 |
| MS-99-106 | 68.15 | 68.46 | 0.31 | 17.39 |
| MS-99-106 | 72.82 | 73.85 | 1.03 | 4.45 |
| MS-99-106 | 78.97 | 85.95 | 6.98 | 57.58 |
| MS-99-107 | 8.32 | 8.63 | 0.31 | 3.15 |
| MS-99-107 | 26.15 | 27.13 | 0.98 | 59.41 |
| MS-99-107 | 28.04 | 28.35 | 0.31 | 6.27 |
| MS-99-107 | 39.84 | 40.14 | 0.30 | 4.08 |
| MS-99-107 | 50.47 | 50.78 | 0.31 | 23.57 |
| MS-99-107 | 58.09 | 58.40 | 0.31 | 3.84 |
| MS-99-107 | 76.87 | 77.88 | 1.01 | 5.35 |
| MS-99-107 | 83.21 | 91.32 | 8.11 | 30.65 |
| MS-99-107 | 94.27 | 96.56 | 2.29 | 7.37 |
| MS-99-120 | 125.76 | 126.10 | 0.34 | 1.94 |
| MS-99-120 | 179.56 | 179.86 | 0.30 | 52.61 |
| MS-99-127 | 14.87 | 15.18 | 0.31 | 41.22 |
| MS-99-127 | 31.70 | 32.00 | 0.30 | 1.27 |
| MS-99-127 | 51.82 | 54.41 | 2.59 | 7.64 |
| MS-99-127 | 56.02 | 56.33 | 0.31 | 5.04 |
| MS-99-127 | 63.03 | 63.79 | 0.76 | 110.40 |
| MS-99-144 | 17.68 | 18.11 | 0.43 | 80.15 |
| MS-99-144 | 27.55 | 27.86 | 0.31 | 29.83 |
| MS-99-144 | 38.47 | 38.77 | 0.30 | 12.54 |
| MS-99-144 | 41.82 | 44.50 | 2.68 | 1.01 |
| MS-99-144 | 66.84 | 67.57 | 0.73 | 22.52 |
| MS-99-144 | 81.99 | 82.97 | 0.98 | 52.08 |
| MS-99-144 | 84.73 | 85.04 | 0.31 | 9.73 |
| MS-99-147 | 14.48 | 14.78 | 0.30 | 6.19 |
| MS-99-147 | 19.99 | 23.10 | 3.11 | 31.33 |
| MP-18-32 | 28.50 | 30.64 | 2.14 | 5.90 |
| MP-18-32 | 38.43 | 39.23 | 0.80 | 7.79 |
| MP-18-32 | 41.78 | 43.80 | 2.02 | 2.49 |
| MP-18-46 | 7.67 | 8.00 | 0.33 | 2.36 |
| MP-18-46 | 37.67 | 37.98 | 0.31 | 1.64 |
|
|
| Hole Number | From (m) |
To (m) |
Length (m) |
Au (g/t) |
| MP-19-54 | 67.82 | 68.02 | 0.20 | 9.71 |
| MP-19-54 | 82.10 | 82.30 | 0.20 | 1.18 |
| MP-19-54 | 136.12 | 136.32 | 0.20 | 1.32 |
| MP-19-54 | 144.31 | 145.72 | 1.41 | 2.75 |
| MP-19-54 | 172.89 | 173.31 | 0.42 | 10.63 |
| MP-19-54 | 213.58 | 213.88 | 0.30 | 2.47 |
| MP-20-115 | 7.09 | 7.29 | 0.20 | 4.07 |
| MP-20-115 | 19.54 | 22.00 | 2.46 | 1.55 |
| MP-20-115 | 28.28 | 38.00 | 9.72 | 1.30 |
| MP-20-115 | 44.53 | 46.90 | 2.37 | 3.05 |
| MP-20-115 | 55.00 | 60.02 | 5.02 | 1.67 |
| MP-20-122 | 4.70 | 6.37 | 1.67 | 24.86 |
| MP-20-122 | 24.00 | 25.00 | 1.00 | 2.54 |
| MP-20-130 | 25.00 | 42.00 | 17.00 | 2.65 |
| MP-20-130 | 43.00 | 51.00 | 8.00 | 4.83 |
| MP-20-130 | 52.00 | 56.00 | 4.00 | 1.50 |
| MP-20-130 | 75.07 | 75.85 | 0.78 | 1.82 |
| MP-20-158 | 4.80 | 12.70 | 7.90 | 2.08 |
| MP-20-158 | 13.20 | 15.00 | 1.80 | 1.47 |
| MP-21-181 | 8.00 | 14.50 | 6.50 | 1.78 |
| MP-21-181 | 22.65 | 22.85 | 0.20 | 5.01 |
| MP-21-181 | 25.62 | 27.12 | 1.50 | 1.32 |
| MP-21-182 | 1.17 | 1.50 | 0.33 | 1.41 |
| MP-21-182 | 3.78 | 4.00 | 0.22 | 1.00 |
| MP-21-182 | 11.50 | 12.26 | 0.76 | 2.45 |
| MP-21-195 | 6.00 | 6.21 | 0.21 | 10.15 |
| MP-21-195 | 17.90 | 18.10 | 0.20 | 1.87 |
| MP-21-195 | 22.55 | 22.85 | 0.30 | 10.33 |
| MP-21-195 | 37.88 | 38.08 | 0.20 | 4.29 |
Source: SLR (2022)
|
|
Table 10-4: 2021 Wisteria Channel Sample Composite Locations
| Hole Number | Easting | Northing | Elevation (m) | Azimuth (◦) | Dip (◦) |
Depth (m) |
| WIST-CH-20-03 | 554822.5542 | 5488992.328 | 195.404 | 42.83 | 4.77 | 2.44 |
| WIST-CH-20-04 | 554821.3569 | 5488995.834 | 195.576 | 31.08 | 1.63 | 2.282 |
| WIST-CH-20-05 | 554823.355 | 5488997.398 | 195.666 | 46.24 | -2.66 | 1.21 |
| WIST-CH-20-06 | 554828.896 | 5489007.043 | 195.927 | 40.21 | 1.32 | 10.78 |
| WIS-21-CH-01 | 554835.7969 | 5489015.172 | 196.177 | 38.54 | -8.33 | 3.43 |
| WIS-21-CH-02 | 554830.5308 | 5489005.05 | 195.801 | 62.84 | 2.58 | 0.935 |
| WIS-21-CH-02A | 554831.0439 | 5489005.846 | 195.82 | 36.74 | 1.35 | 5.972 |
| WIS-21-CH-02B | 554834.5972 | 5489010.428 | 196.47 | 30.58 | 0.85 | 1.22 |
| WIS-21-CH-02C | 554835.5908 | 5489010.967 | 196.465 | 54.13 | -1.93 | 3.26 |
| WIS-21-CH-03 | 554840.561 | 5489008.497 | 196.787 | 212.7 | 10.02 | 11 |
| WIS-21-CH-04 | 554843.8701 | 5489010.617 | 197.009 | 203.18 | -2.42 | 2.35 |
| T1-1 | 554824.2632 | 5489082.903 | 192.411 | 182.84 | 2.5 | 1.29 |
Source: SLR (2022)
Table 10-5: 2021 Wisteria Channel Sampling Significant Intercepts > 1.0 (g/t)
| Hole Number | From (m) | To (m) | Length (m) | Au (g/T) |
| WIS-21-CH-01 | 0.00 | 0.32 | 0.32 | 1.00 |
| WIS-21-CH-01 | 1.41 | 3.43 | 2.02 | 1.76 |
| WIS-21-CH-02 | 0.00 | 0.94 | 0.94 | 1.09 |
| WIS-21-CH-02A | 0.46 | 1.05 | 0.59 | 1.17 |
| WIS-21-CH-02A | 2.93 | 3.48 | 0.55 | 0.84 |
| WIS-21-CH-02A | 4.49 | 5.51 | 1.02 | 8.63 |
| WIS-21-CH-02B | 0.84 | 1.22 | 0.38 | 1.43 |
| WIS-21-CH-02C | 0.51 | 3.01 | 2.50 | 1.97 |
| WIS-21-CH-03 | 1.48 | 1.97 | 0.49 | 0.59 |
| WIS-21-CH-03 | 6.44 | 11.00 | 4.56 | 1.60 |
| WIS-21-CH-04 | 0.90 | 1.41 | 0.51 | 1.29 |
| WIST-CH-20-04 | 0.00 | 1.60 | 1.60 | 0.86 |
| WIST-CH-20-06 | 2.71 | 10.78 | 8.07 | 3.96 |
| T1-1 | 0.47 | 1.29 | 0.82 | 2.58 |
Source: SLR (2022)
|
|
10.8 2020 Hammerdown Grade Control Diamond Drill Program
The 2020 Hammerdown / Rumbullion Grade Control Drill Program consisted of 20 holes [HD-GC-20-01 to HD-GC-20-20] totaling 1,160 m of NQ size drilling. A Duralite 500 coring drill rig was mobilized to the Project from June 29 to July 13, 2020. The purpose of the 2020 grade control diamond drill program was to confirm the validity of the Hammerdown open pit wireframes and to improve characterization of gold variability in drill core at a short range.
Figure 10-9 provides a plan view of the grade control diamond drill holes. A cross section of the grade control diamond drill holes with gold intercepts confirming validity of wireframes can be seen in Figure 10-10. Diamond drill hole location and survey data pertaining to the grade control holes is summarized in Table 10-6. A summary of significant intercepts from the grade control program is provided in Table 10-7.
|
|
Figure 10-9: Plan View - Hammerdown Wireframes and Grade Control Drill Hole Locations
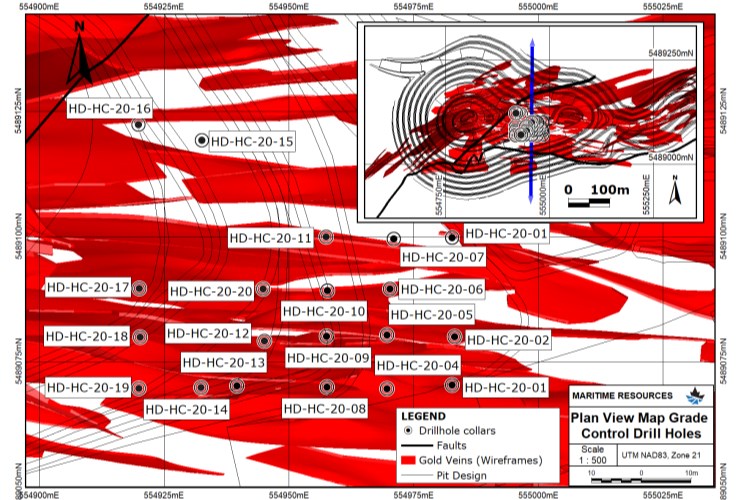
Source: SLR (2022)
|
|
Figure 10-10: East Facing Cross-Section of Grade Control Diamond Drill Holes with Intercepts Confirming Wireframes
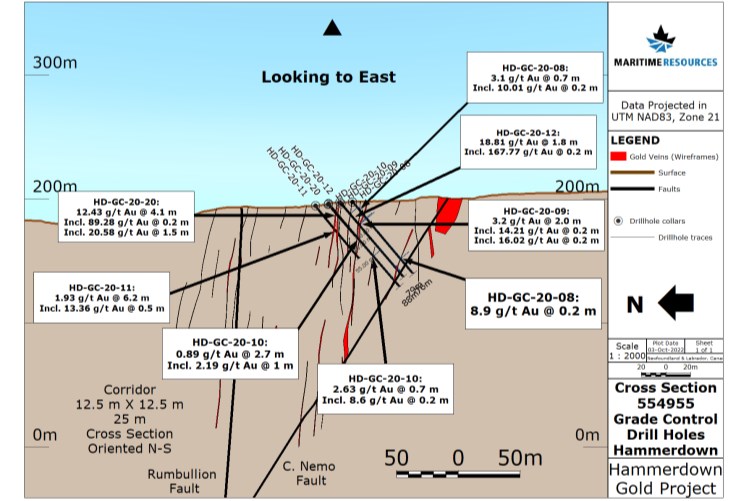
Source: SLR (2022)
|
|
Table 10-6: 2020 Hammerdown Grade Control Diamond Drill Hole Parameters
| Hole Number | Easting | Northing | Elevation (m) |
Azimuth (◦) |
Dip (◦) |
Depth (m) |
| HD-GC-20-01 | 554982.78 | 5489070.26 | 197.74 | -47.1 | 179.13 | 76 |
| HD-GC-20-02 | 554983.26 | 5489079.96 | 197.43 | -48.39 | 183.28 | 76 |
| HD-GC-20-03 | 554982.74 | 5489099.74 | 196.55 | -49.55 | 171.24 | 100 |
| HD-GC-20-04 | 554969.68 | 5489069.48 | 197.58 | -51.98 | 176.03 | 25 |
| HD-GC-20-05 | 554969.68 | 5489080.25 | 197.34 | -55.5 | 174.61 | 37 |
| HD-GC-20-06 | 554970.29 | 5489089.46 | 196.84 | -48.11 | 187.1 | 43 |
| HD-GC-20-07 | 554971.05 | 5489099.48 | 196.36 | -42.97 | 169.67 | 67 |
| HD-GC-20-08 | 554957.64 | 5489069.87 | 197.66 | -49.94 | 185.65 | 76 |
| HD-GC-20-09 | 554957.53 | 5489080.02 | 197.13 | -49.2 | 183.32 | 79 |
| HD-GC-20-10 | 554957.7 | 5489089.18 | 196.14 | -51.3 | 176.68 | 88 |
| HD-GC-20-11 | 554957.51 | 5489099.96 | 194.32 | -51.2 | 178.15 | 55 |
| HD-GC-20-12 | 554945.13 | 5489079.04 | 196.23 | -50.37 | 182.08 | 23 |
| HD-GC-20-13 | 554939.57 | 5489070.1 | 197.12 | -52.08 | 179.41 | 7 |
| HD-GC-20-14 | 554932.38 | 5489069.78 | 196.88 | -49.6 | 187.43 | 7 |
| HD-GC-20-15 | 554932.57 | 5489119.24 | 193.98 | -51.09 | 182.37 | 91 |
| HD-GC-20-16 | 554919.83 | 5489122.39 | 194.07 | -49.88 | 181.27 | 121 |
| HD-GC-20-17 | 554920.03 | 5489089.6 | 193.81 | -48.64 | 177.92 | 26 |
| HD-GC-20-18 | 554920.19 | 5489079.8 | 195.08 | -40.04 | 175.26 | 37 |
| HD-GC-20-19 | 554919.93 | 5489069.57 | 195.93 | -50.8 | 179.54 | 91 |
| HD-GC-20-20 | 554944.89 | 5489089.5 | 195.46 | -49.9 | 179.13 | 35 |
Source: SLR (2022)
Table 10-7: Summary of 2020 Grade Control Diamond Drill Hole Significant Intercepts > 1.0 (g/t) Au
| Hole Number | From (m) |
To (m) |
Length (m) |
Au (g/t) |
| HD-GC-20-01 | 8.27 | 8.5 | 0.23 | 174.49 |
| HD-GC-20-01 | 40.87 | 41.37 | 0.5 | 1.43 |
| HD-GC-20-01 | 42 | 43 | 1 | 1.61 |
| HD-GC-20-01 | 45 | 45.5 | 0.5 | 1.50 |
| HD-GC-20-02 | 2.3 | 2.58 | 0.28 | 12.88 |
| HD-GC-20-02 | 21.35 | 21.76 | 0.41 | 23.72 |
| HD-GC-20-02 | 22.26 | 22.51 | 0.25 | 6.61 |
| HD-GC-20-02 | 74.83 | 75.03 | 0.2 | 9.06 |
| HD-GC-20-03 | 31 | 32 | 1 | 2.89 |
| HD-GC-20-03 | 50.5 | 50.8 | 0.3 | 27.97 |
|
|
| Hole Number | From (m) |
To (m) |
Length (m) |
Au (g/t) |
| HD-GC-20-03 | 62.6 | 63 | 0.4 | 85.29 |
| HD-GC-20-03 | 63 | 63.5 | 0.5 | 30.43 |
| HD-GC-20-03 | 63.5 | 63.76 | 0.26 | 53.36 |
| HD-GC-20-03 | 77 | 78 | 1 | 1.74 |
| HD-GC-20-03 | 78 | 79 | 1 | 2.87 |
| HD-GC-20-04 | 7.5 | 8.5 | 1 | 1.79 |
| HD-GC-20-04 | 15.45 | 15.7 | 0.25 | 19.80 |
| HD-GC-20-05 | 24.69 | 24.89 | 0.2 | 41.61 |
| HD-GC-20-05 | 29.56 | 29.78 | 0.22 | 8.18 |
| HD-GC-20-06 | 12.41 | 12.76 | 0.35 | 11.63 |
| HD-GC-20-06 | 14.64 | 14.84 | 0.2 | 2.95 |
| HD-GC-20-06 | 35.5 | 35.7 | 0.2 | 7.87 |
| HD-GC-20-06 | 36.66 | 36.84 | 0.18 | 87.10 |
| HD-GC-20-06 | 36.84 | 37.34 | 0.5 | 4.24 |
| HD-GC-20-06 | 40.56 | 40.84 | 0.28 | 1.40 |
| HD-GC-20-07 | 27.24 | 27.74 | 0.5 | 9.05 |
| HD-GC-20-07 | 32.65 | 32.85 | 0.2 | 3.19 |
| HD-GC-20-07 | 49.15 | 49.65 | 0.5 | 1.02 |
| HD-GC-20-07 | 50.38 | 50.58 | 0.2 | 32.61 |
| HD-GC-20-08 | 8.88 | 9.08 | 0.2 | 10.01 |
| HD-GC-20-08 | 60.04 | 60.24 | 0.2 | 8.90 |
| HD-GC-20-09 | 12.18 | 12.38 | 0.2 | 8.92 |
| HD-GC-20-09 | 12.38 | 12.61 | 0.23 | 1.33 |
| HD-GC-20-09 | 22.98 | 23.18 | 0.2 | 14.21 |
| HD-GC-20-09 | 23.82 | 24.02 | 0.2 | 16.02 |
| HD-GC-20-09 | 68 | 69 | 1 | 1.53 |
| HD-GC-20-09 | 70 | 71 | 1 | 1.64 |
| HD-GC-20-09 | 72 | 73 | 1 | 1.47 |
| HD-GC-20-10 | 14.45 | 14.65 | 0.2 | 1.11 |
| HD-GC-20-10 | 24 | 25 | 1 | 1.68 |
| HD-GC-20-10 | 36 | 37 | 1 | 2.19 |
| HD-GC-20-10 | 55.58 | 55.78 | 0.2 | 8.60 |
| HD-GC-20-10 | 81 | 82 | 1 | 1.23 |
| HD-GC-20-11 | 23.4 | 23.9 | 0.5 | 1.41 |
| HD-GC-20-11 | 23.9 | 24.33 | 0.43 | 3.05 |
| HD-GC-20-11 | 24.52 | 25.12 | 0.6 | 1.34 |
| HD-GC-20-11 | 27.77 | 28.17 | 0.4 | 1.64 |
| HD-GC-20-11 | 28.17 | 28.65 | 0.48 | 13.36 |
|
|
| Hole Number | From (m) |
To (m) |
Length (m) |
Au (g/t) |
| HD-GC-20-11 | 28.65 | 29.03 | 0.38 | 1.37 |
| HD-GC-20-11 | 29.37 | 29.57 | 0.2 | 1.87 |
| HD-GC-20-11 | 40 | 40.2 | 0.2 | 1.40 |
| HD-GC-20-11 | 45.62 | 45.82 | 0.2 | 5.36 |
| HD-GC-20-11 | 45.82 | 46.2 | 0.38 | 1.21 |
| HD-GC-20-11 | 50.15 | 50.35 | 0.2 | 4.90 |
| HD-GC-20-11 | 51.33 | 51.53 | 0.2 | 1.71 |
| HD-GC-20-12 | 14.19 | 14.39 | 0.2 | 167.77 |
| HD-GC-20-15 | 66.35 | 66.55 | 0.2 | 2.60 |
| HD-GC-20-15 | 71.3 | 71.62 | 0.32 | 1.59 |
| HD-GC-20-15 | 75.11 | 75.31 | 0.2 | 45.98 |
| HD-GC-20-16 | 42.5 | 43 | 0.5 | 1.89 |
| HD-GC-20-16 | 49.5 | 49.77 | 0.27 | 78.01 |
| HD-GC-20-16 | 73.59 | 74.09 | 0.5 | 2.46 |
| HD-GC-20-16 | 74.09 | 74.73 | 0.64 | 29.71 |
| HD-GC-20-17 | 7 | 8 | 1 | 1.36 |
| HD-GC-20-17 | 18.2 | 18.4 | 0.2 | 3.29 |
| HD-GC-20-18 | 6.26 | 6.46 | 0.2 | 3.15 |
| HD-GC-20-18 | 17 | 18 | 1 | 1.90 |
| HD-GC-20-18 | 18 | 19 | 1 | 1.18 |
| HD-GC-20-19 | 5.95 | 6.8 | 0.85 | 1.67 |
| HD-GC-20-19 | 50.4 | 50.6 | 0.2 | 1.11 |
| HD-GC-20-19 | 84.04 | 84.3 | 0.26 | 1.33 |
| HD-GC-20-19 | 84.3 | 84.8 | 0.5 | 5.19 |
| HD-GC-20-19 | 84.8 | 86 | 1.2 | 3.00 |
| HD-GC-20-20 | 9.02 | 9.25 | 0.23 | 89.28 |
| HD-GC-20-20 | 11.25 | 11.45 | 0.2 | 25.15 |
| HD-GC-20-20 | 11.45 | 12 | 0.55 | 1.40 |
| HD-GC-20-20 | 12 | 12.7 | 0.7 | 34.34 |
| HD-GC-20-20 | 24.65 | 24.85 | 0.2 | 9.52 |
Source: SLR (2022)
It is the QP's opinion that the drilling and logging procedures in place at the Hammerdown deposit meet acceptable industry standards and the information is suitable for disclosure in this Technical Report and for use in future Mineral Resource estimates.
|
|
11 SAMPLE PREPARATION, ANALYSES AND SECURITY
11.1 Introduction
All exploration samples submitted for analysis by Maritime Resources and used in the mineral resource estimate database were prepared and analyzed at Eastern Analytical Ltd. (Eastern Analytical) located in Springdale, Newfoundland. Eastern Analytical is a private laboratory that has been in operation since 1987, is an accredited laboratory meeting the requirements of ISO/IEC 17025, and is independent of Maritime Resources Corp. Based on the historic certificates in Maritime Resources' possession, it appears that all previous operators also used Eastern Analytical for the preparation and analysis of their exploration samples.
11.2 Samples Preparation
11.2.1 Pre-2012
Based on the historic certificates in Maritime's possession, it appears that the sample preparation procedures used by previous operators is the same as the same sample preparation procedures currently in use by Maritime Resources. Channel samples and drill core samples were delivered to Eastern Analytical and the following sample preparation steps were taken:
• Crush up to 3 kg to 80% of -10 mesh;
• Split to 250 g; and
• Pulverize up to 95% of 150 mesh.
11.2.2 Maritime Resources
Channel samples and drill core samples were delivered to Eastern Analytical and the following sample preparation steps were taken:
• Crush up to 3 kg to 80% of -10 mesh;
• Split to 250 g; and
• Pulverize up to 95% of 150 mesh
At no time was an employee of Maritime involved in the preparation of the samples.
|
|
11.3 Analytical Method
11.3.1 Pre-2012
Based on the historic certificates in Maritime's possession, it appears that the analytical methods used by previous operators were similar or the same as those currently in use by Maritime Resources. Maritime believes that atomic absorption (AA) methods at Eastern Analytical may have changed over time in keeping with changes in industry standard practices between 1988 and 2012. Maritime believes that Richmont used the following analytical procedure for fire assay with an AA finish at Eastern Analytical.
Eastern Analytical analyzed each sample for gold and silver by fire assay (at no time was an employee of Maritime involved in the analytical process). The following is a brief description of the analytical procedure for fire assay with an Atomic Absorption (AA) method finish at Eastern Analytical.
• A 30 g fire assay is a lead-collection-fusion into a silver doré bead;
• The silver bead is dissolved in an aqua regia digestion and analyzed by AA; and
• A typical reporting range is between 5 ppb to 50,000 ppb.
11.3.2 Maritime Resources
Samples submitted by Maritime Resources to Eastern Analytical analyzed each sample for gold and silver by fire assay (at no time was an employee of Maritime involved in the analytical process). The following is a brief description of the analytical procedure for fire assay with an Atomic Absorption (AA) method finish at Eastern Analytical.
• A 30g fire assay is a lead-collection-fusion into a silver doré bead;
• The silver bead is dissolved in an aqua regia digestion and analyzed by AA;
• A typical reporting range is between 5 pbb to 30,000 ppb:
AA is calibrated to 20,000 ppb; and
If a sample exceeds 20,000 ppb, a dilution is done to bring the solution back within range. Pipettes are checked on a regular basis to ensure they are accurate.
11.4 Sample Security
Samples were transported in batches contained in sealed rice sacks from the Maritime Resources core facility to Eastern Analytical by company vehicle. Upon receipt of samples, laboratory personnel checked the seals on both the rice sacks and individual sample bags to ensure that sample integrity had been maintained during transport.
|
|
Historical drill holes prior to 2012 are stored at the Eastern Analytical Core Facility in Springdale, Newfoundland and Labrador. Drill core from the 2012 to 2022 diamond drill programs completed by Maritime Resources is stockpiled on site at the core facility.
11.5 Quality Control & Quality Assurance
As well as reviewing the results of Eastern Analytical's internal quality control procedures, Maritime Resources conducted their own QA/QC program to monitor the performance of the laboratory. Geologists inserted a repeating sequence of control samples consisting of blanks, certified reference materials (CRM), and duplicate sample tags at the rate of one control sample in every 10 drill-core samples. The resulting insertion rates for blanks, CRMs, and coarse reject duplicates is 1 in 30 samples.
Maritime Resources personnel reviewed the results of the control samples against set control limits. If the assay value was outside of the control limits, the batch was re-assayed as a corrective measure and the results of the initial assays were rejected, assuming the control sample had returned an acceptable value within the control limits. The materials used, protocols, control limits, and results are described below.
SLR recommends that Maritime use the available tools provided by their current database software provider, MX Deposit, to develop more robust QA/QC procedures and improve the timely management of QA/QC failures.
11.5.1 Sample Blanks
Maritime Resources used granite blocks from a local quarry as a source of control blank material that, from many years of analysis, have been proven to assay below 5 ppb gold. The assay was considered a failure if the value was greater than three times the lower detection limit of 5 ppb gold or 15 ppb gold.
11.5.1.1 2012 Blanks
A total of 88 blank samples were submitted during the 2012 Hammerdown drill and channel sampling programs. This represents approximately 0.5% of the 2012 dataset. While it is typical industry practice to have higher rates of blank insertion, the SLR QP notes that a large portion of the dataset is from the Richmont underground drilling campaigns and is no longer of material interest as most of the material has been mined.
There was only one failure indicated during the 2012 drilling program at Hammerdown; the failure has been reviewed by Maritime personnel.
A total of 25 blank samples were submitted during the channel sampling campaign at Rumbullion. The results from this QA/QC program produced a larger proportion of failures. Maritime's investigation of the failures indicated that a different standard material containing trace mineralization was inadvertently used instead of the blocks of local granite.
|
|
11.5.1.2 Post-2012 Blanks
A total of 567 sample blanks were submitted for the post 2012 drilling programs. This represents approximately 3% of the dataset. The chart shows a small number of samples above Maritime Resources' blank failure threshold of 15 ppb, with two values above SLR's blank failure threshold of 50 ppb corresponding to ten times the detection limit (Figure 11-1).
Figure 11-1: Hammerdown Blanks Chart
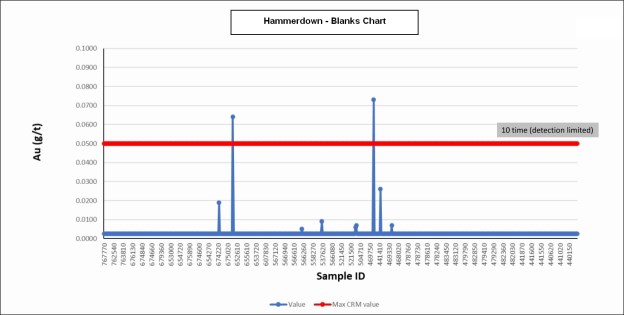
Source: Maritime Resources (2022)
Based on Maritime QA/QC protocols, batches with failed blanks were identified and submitted for re-analysis. An example of the failure investigation process for blanks is provided in Table 11-1.
|
|
Table 11-1: Example of Hammerdown Blank Failures and Remedial Actions
| Blank Failure Investigation | ||||||
| Hole No. | *Au ppb Au-FA certificate |
Sample Number |
Status | *Au ppb Au-FA |
Investigation Findings | Remedial Action Recommended |
| MP-21-197 | 472-2126248 - Au | 674230 | Failed | 19 | No indication of high grade contamination from surrounding samples. Sample above contained 22 ppb Au | Request lab re-analyze batch |
| MP-21-188 | 472-2126178 - Au RUSH | 653960 | Failed | 64 | Sample surrounded by high grade interval and may be reflecting sample contamination | Request lab re-analyze batch |
| MP-20-142 | 472-2023907 - Au | 469670 | Failed | 73 | Above and below have lower grades. No nearby high grades samples to contaminate. This may be a mislabelled duplicate of the sample above which was 58 ppb | No Remedial action recommended. May need to review database to reflect this as a duplicate analysis |
| MP-20-140 | 472-2023889 - Au | 441440 | Failed | 26 | Samples above are below detection limited. No indication of contamination from nearby samples. | Request lab re-analyze batch. |
Source: Maritime Resources (2022)
SLR recommends that Maritime develop a more targeted approach for the insertion of blanks within the sample stream focusing on the insertion of blanks after samples that have been interpreted as high grade or when visible gold is present.
11.6 Certified Reference Materials
Maritime used various CRM control standards sourced from several labs in the drilling programs. These included CDN Research Laboratories in Langley, British Columbia, XRF Scientific Ltd in Perth, Australia (RockLabs brand standards), and OREAS North America Inc in Sudbury, Ontario. Current CRM insertion rates for exploration drilling are one in 30 samples.
A total of 600 standard samples were submitted which represents approximately 3% of the dataset. Figure 11-2 through Figure 11-7 present the results for six of the latest standards used during the 2020 and 2021 drilling programs are shown below.
11.6.1 OREAS 217
A total of five standards of OREAS 217 were submitted. No failures were detected (Figure 11-2).
|
|
Figure 11-2: QC Chart for Standard OREAS 217 (2020-2021)
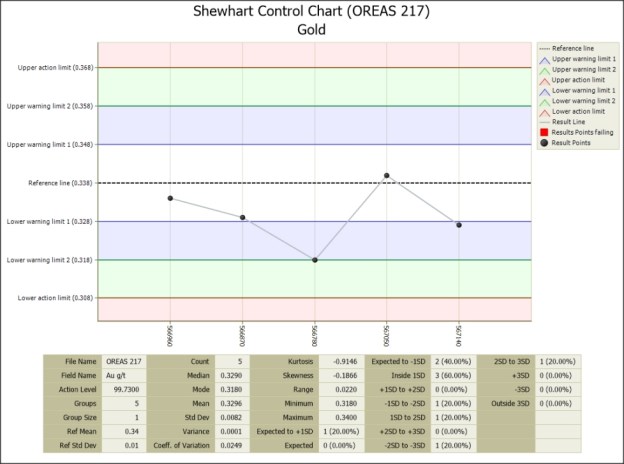
Source: Maritime Resources (2022)
While no failures were detected, SLR notes that there were an insufficient number of standards submitted for OREAS 217 to properly assess its performance within the Maritime Resources QA/QC program.
|
|
11.6.2 OREAS 218
A total of 78 standards of OREAS 218 were submitted. There were 11 warnings detected (Figure 11-3).
Figure 11-3: QC Chart for Standard OREAS 218 (2020-2021)
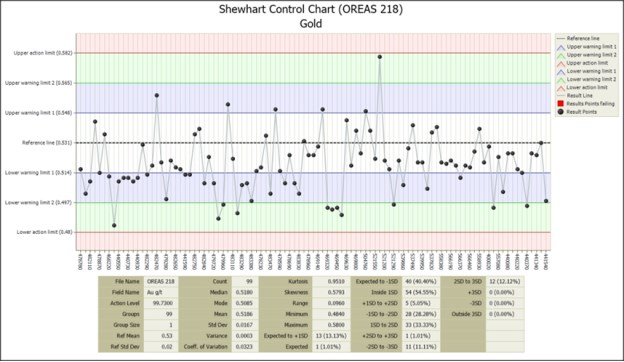
Source: Maritime Resources (2022)
While no failures were detected, SLR notes that the majority of samples fall below the reference line of 0.531 g/t Au. The QC Chart for standard OREAS 218 indicates that there may be an analytical low bias for this standard.
|
|
11.6.3 OREAS 228
A total of 12 standards of OREAS 228 were submitted. No failures were detected (Figure 11-4).
Figure 11-4: QC Chart for Standard OREAS 228 (2020-2021)
Source: Maritime Resources (2022)
While no failures were detected, SLR notes that there were an insufficient number of standards submitted for OREAS 228 to properly assess its performance within the Maritime Resources QA/QC program. While there are not enough samples to properly assess its performance, SLR notes that the majority of samples fall below the reference line of 8.73 g/t Au.
|
|
11.6.4 OREAS 229b
A total of 143 standards of OREAS 229b were submitted. There were 38 warnings and 13 failures detected (Figure 11-5).
Figure 11-5: QC Chart for Standard OREAS 229b (2020-2021)
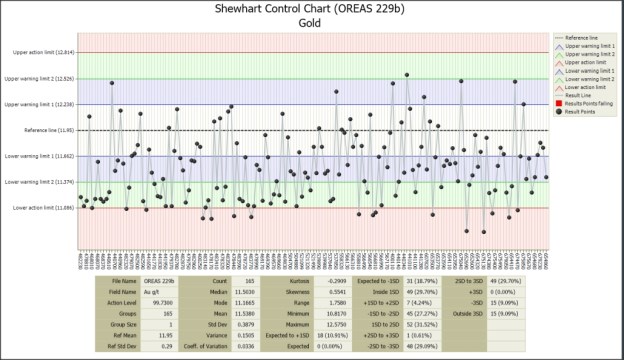
Source: Maritime Resources (2022)
Maritime Resources investigated the 13 failures and identified a potential lower bias on higher grade (>20,000 ppb Au) samples and standards. Maritime Resources is initiating a testing program to determine if using screen metallics analysis or fire assay with a gravimetric finish is required for higher grade samples. SLR supports the development of this testing program and recommends further investigation across all grade ranges.
|
|
11.6.5 OREAS 231
A total of 68 standards of OREAS 231 were submitted. Four warnings were detected (Figure 11-6).
Figure 11-6: QC Chart for Standard OREAS 231 (2020-2021)
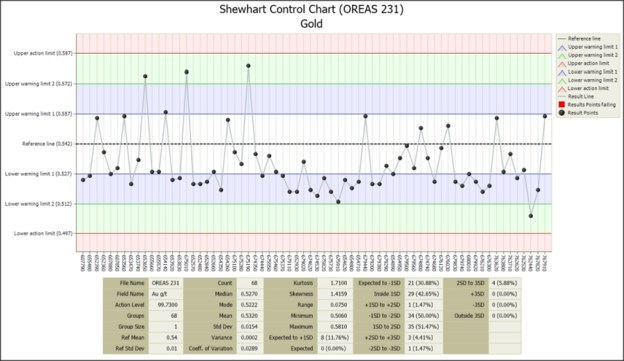
Source: Maritime Resources (2022)
While no failures were detected, SLR notes that the majority of samples fall below the reference line of 0.54 g/t Au. The QC Chart for standard OREAS 231 indicates that there may be an analytical low bias for this standard.
|
|
11.6.6 OREAS 237
A total of 161 standards of OREAS 237 were submitted. One failure and 49 warnings were detected (Figure 11-7). Following Maritime's QA/QC protocols, the single failure of OREAS 237 triggered the investigation process to determine if re-analysis of the batch would be required.
Figure 11-7: QC Chart for Standard OREAS 237 (2020-2021)
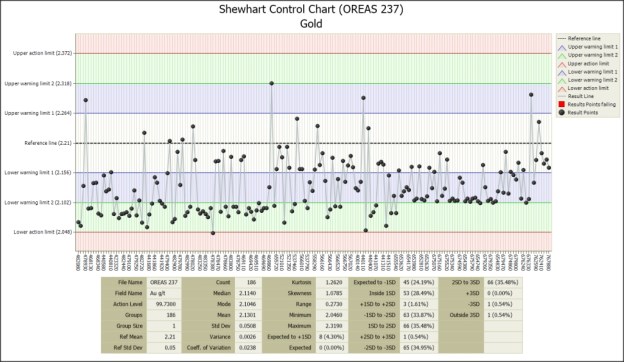
Source: Maritime Resources (2022)
While no failures were detected, SLR notes that the majority of samples fall below the reference line of 2.21 g/t Au. The QC Chart for standard OREAS 237 indicates that there may be an analytical low bias for this standard. The 400,000 and 500,000 series sample numbers show more variability and lower bias than the 600,000 and 700,000 series sample numbers which show less variability but a consistent low bias. These results may reflect an instrumental correction performed at the lab between the two ranges of sample numbers.
Although the CRMs have a passing rate of 98%, SLR observed a general low bias for all standards with a sufficient number of analytical measurements to properly assess their performance within the Maritime Resources QA/QC program. At the present state of investigation, SLR is of the opinion that the general low bias of the CRMs do not adversely affect the overall confidence in the assays. In addition to the testing programs currently underway, SLR recommends Maritime Resources develop an umpire check sample program to help monitor the analytical precision of Eastern Analytical relative to an umpire laboratory that uses the identical assay technique.
|
|
11.6.7 Coarse Reject Duplicates
Maritime did not insert any blind field control duplicates during the 2012 exploration drilling program with all duplicates being based on the Eastern Analytical internal process. Duplicate sample tags for coarse reject duplicates were inserted during core-logging as part of the control procedures for the post-2012 drilling programs. Current coarse reject duplicate insertion rates for exploration drilling are one in 30 samples.
11.6.7.1 2012 Duplicates
A total of 185 coarse reject duplicates were run during the Hammerdown diamond drill and channel sampling campaigns. A total of 36 errors were detected. Two errors occurred above 10 g/t gold that could be ignored as the precision of the AA system above 10 g/t dictates that a gravimetric or metallic screen assay should be used. Twenty errors occurred with samples less than 0.1 g/t and are not of material interest.
11.6.7.2 Post 2012 Duplicates
A total of 574 duplicate samples were run during the post 2012 drilling program. This represents approximately 3% of the dataset. A total of seven outliers were detected, as illustrated in Figure 11-8. Figure 11-9 shows a Duplicates Chart with the upper limits of the x-axis and the y-axis set to 7 g/t Au to better show the duplicate reject samples that occupy lower grade ranges.
In general, SLR finds that the coarse reject duplicates show good reproducibility at grades above 1 g/t Au and only minor scatter above the open pit resource cut-off grade of 0.50 g/t Au.
|
|
Figure 11-8: Hammerdown Reject Duplicates Chart
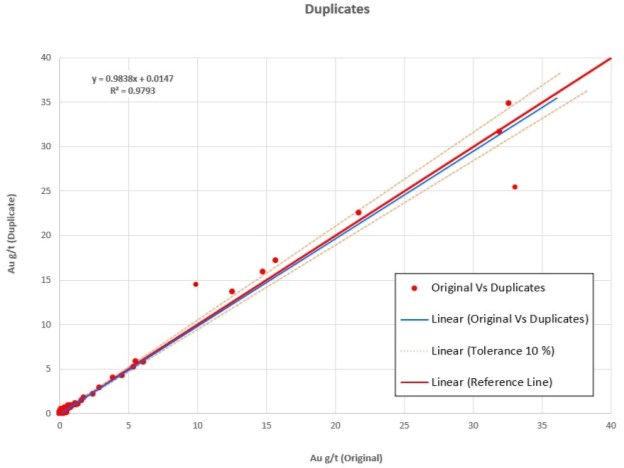
Source: Maritime Resources (2022)
|
|
Figure 11-9: Hammerdown Reject Duplicates Chart (Axes capped to 7 g/t Au)
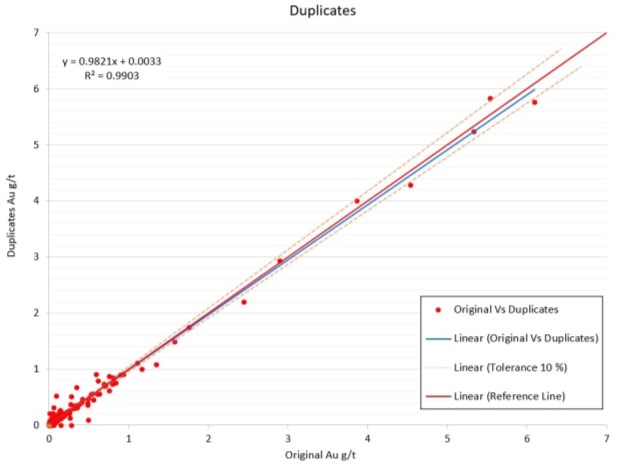
Source: Maritime Resources (2022)
SLR recommends that future duplicate programs for coarse rejects include a higher proportion of samples whose grades are expected to be similar to the estimated average resource grades.
11.7 Qualified Person's Opinion
In the QP's opinion, the sample preparation, analysis, and security procedures at the Hammerdown deposit are adequate for use in the estimation of Mineral Resources.
In the QP's opinion, the QA/QC program as designed and implemented by Maritime Resources is adequate and the assay results within the database are suitable for use in a Mineral Resource estimate.
|
|
12 DATA VERIFICATION
Data verification of the drill hole database included manual verification against original digital sources, a series of digital queries, and a review of Maritimes' QA/QC procedures and results which are described in Section 11, Sample Preparation, Analyses, and Security. SLR is of the opinion that database verification procedures for the Hammerdown property comply with industry standards and are adequate for the purposes of Mineral Resource estimation.
Pursuant to NI 43-101, Ms. Dorota El-Rassi, P.Eng., of SLR completed a site visit to the Hammerdown Project and other related facilities from September 7 to 9, 2020. Ms. El-Rassi visited the core shack, reviewed the logging environment and procedures for data collection and sampling, inspected core samples and outcrops in the Hammerdown, Orion, and Whisky Valley areas, interviewed Maritime personnel, and gathered other information for the completion of this report. Additionally, Ms. El-Rassi examined drill hole core relevant to Mineral Resource estimation, including visually checking stratigraphy against interpreted drilling sections. Maritime provided full access during all parts of the site visits. Ms. El-Rassi was accompanied by Mr. Larry Pilgrim, Project Manager, and Jason Flight, Senior Geologist for Maritimes.
12.1 Verifications by the Authors of this Technical Report
The review of the resource database included the collar, survey, lithology, and assay tables. Database verification was performed using tools provided within Leapfrog Geo Version 2021.1.4 software package (Leapfrog). A visual check on the drill hole Leapfrog collar elevations and drill hole traces was completed. No major discrepancies were identified.
SLR compared assay records for gold in the resource database against a total of 51 digital laboratory analysis certificates, which were sent to the Maritime database manager directly from Eastern Analytical then passed to SLR. In addition, the SLR QP:
• Completed validity checks for out-of-range values, overlapping intervals, and mismatched sample intervals.
• Reviewed the reasonableness of the geological interpretations relative to the nature of the previously defined mineralization and the newly discovered mineralized intervals.
SLR's QP is of the opinion that the drill hole database is reasonable and acceptable to support the current resource estimate.
QP Mike Levy reviewed the geotechnical logging data provided by Maritime and WSP and spot-checked data against respective core photographs to confirm data quality and internal consistency. Photographs of core samples provided by Queens University and WSP taken before and after testing were reviewed to validate the test results to the extent possible. JDS considers the data to be suitable for a feasibility-level of study.
There were no limitations or inability to conduct data verification through the course of doing the FS.
|
|
13 MINERAL PROCESSING AND METALLURGICAL TESTING
13.1 Introduction
The metallurgical test work carried out to support the development of the Hammerdown project and which creates the basis of this section has been summarized, managed and directed by Stacy Freudigmann P.Eng. F.Aus.IMM. of Canenco Consulting Corp.
13.2 Testing & Procedures
A number of test work programs have been undertaken on the project since 1999, as illustrated in Table 13-1.
Test work programs have been completed by independent reputable metallurgical laboratories, using core samples from exploration drilling and bulk samples from core and surface trenching, and have included but are not limited to, characterization and mineralogical studies, comminution studies, gravity concentration tests, flotation and leach tests. Metallurgical and mineralogical factors encountered in the test work have been alleviated by the process flowsheet development test work, to illuminate the best potential for precious metal extraction.
In previous project development phases prior to the latest metallurgical program completed in 2022, testing was undertaken on composites blended from vein material, sampled from drill core representing areas of the deposits on the Hammerdown property. More recent test work, through the 2021-2022 Feasibility Study metallurgical program, was carried out on bulk samples and numerous composites from drill core from the Hammerdown (HAM) and Wisteria (WIS) zones, selected to represent the grade, lithology, and spatial aspects of the resource.
Testing on these composites was designed to understand the downstream metallurgical changes from the introduction of pre-concentration by sorting to the flowsheet. The resulting test work data and more closely defined process variables were then used to further refine the previously determined process flowsheet that produces doré and update the metallurgical performance evaluating the gold recoveries.
Samples from the Orion (ORN) zone were included in the recent metallurgical programs however, the resulting data summarized within is not included in the current feasibility study but will be used in future engineering phases.
|
|
Table 13-1: Summary of Test Work Completed
| Year | Laboratory/ Consultant | Report No. | Mineralogy | Sorting / Gravity |
Comminution | Flotation | Leaching | Dewatering / Detox |
Other |
| 1999 | Lakefield Research Ltd. | - | X | X | X | X | ABA | ||
| 2001-04 | Nugget Pond Plant Operations | - | X | ||||||
| 2019 | Research & Productivity Council. (RPC) | MIS-J10013 | X | X | X | X | |||
| 2019 | Canenco Consulting Corp. | TMPFS001 TMPFS002 |
X | ||||||
| 2020 | Lakefield Research Ltd. | - | X | DMS | |||||
| 2020 | Canenco Consulting Corp. | TMPFS003 TMPFS004 |
X | ||||||
| 2021 | Canenco Consulting Corp. | TMFS001 | X | ||||||
| 2022 | Tomra Sorting Gmbh | O2024-19 | X | ||||||
| 2022 | ALS Metallurgy Kamloops | KM6690 | X | ||||||
| 2022 | Base Metallurgical Laboratories Ltd. | - | X | ||||||
| 2022 | Blue Coast Research Ltd. | PJ5330 | X | X | X | X | X |
Source: Canenco (2022)
|
|
13.3 Mineralogical Evaluations
13.3.1 Mineralogy
For historical mineralogical analyses prior to 2022, please refer to previous technical reports such as the April 15, 2020 NI 43-101 Technical Report "Hammerdown Gold Project, Newfoundland and Labrador, Preliminary Economic Assessment"
13.4 Testwork
13.4.1 Historical Metallurgical Testing
For historical test work summaries from 1999 to 2020, including all the prefeasibility sorting test work undertaken in 2020, please refer to previous technical reports.
The leach parameters that were tested included a primary grind P80 range from approximately 38 µm to 2800 µm, lead nitrate additions, leach residence times of 48 hours, cyanide dosages of 2 g/L with a pH 11 and pulp density at 50%.
As illustrated in Figure 13-1, the test results indicated that there was a relationship between grind and recovery, such that finer grinds increased overall recoveries and leach kinetics.
|
|
Figure 13-1: Leach Recovery vs. Grind Size for the Master Composite
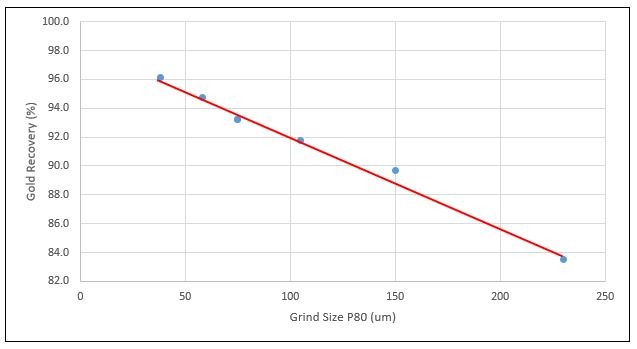
Source: Canenco - RPC Data (2019)
Lead nitrate had limited benefits on the overall recovery and leach kinetics and no further testing was undertaken with this reagent.
|
|
Figure 13-2: Leach Recovery vs. Time for the Master Composite Under Varying Conditions
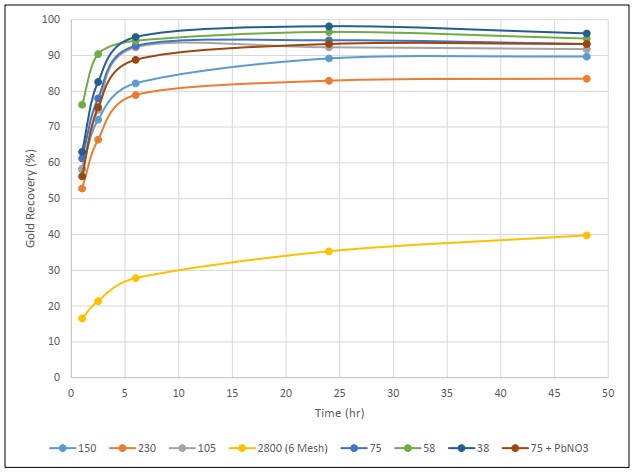
Source: Canenco - RPC Data (2019)
Historical Whole-Ore-Leach (WOL) extraction was predominantly complete in 24 hours or less as illustrated in Figure 13-2. The finer grinds at a P80 of ~38 µm and ~58 µm achieved the highest gold extractions at 24 hours of 98.1% and 96.6% respectively. Any grind finer than 105 µm P80 achieves gold leach recoveries above 90%.
13.4.2 Recent Metallurgical Testing (2021-2022)
13.4.2.1 Samples and Sorting
From 2019 through to 2022, four (4) bulk samples, together representing approximately 5.9 t of material, have been tested for sorting response. During the Feasibility Study program, a 2.6 t bulk sample of Hammerdown mineralization, a 0.9 t bulk sample of Orion mineralization and eleven (11) variability composites (VC) ranging in mass from 54 kgs - 190 kgs for a total mass of 1,267 kgs, were tested for their sorting response. These samples were selected from bulk surface trenching and drill core to spatially represent the deposits and the range of gold grades and lithologies as they were then understood.
|
|
Figure 13-3: Overall Sorting Circuit Recovery for Hammerdown and Orion Mineralization
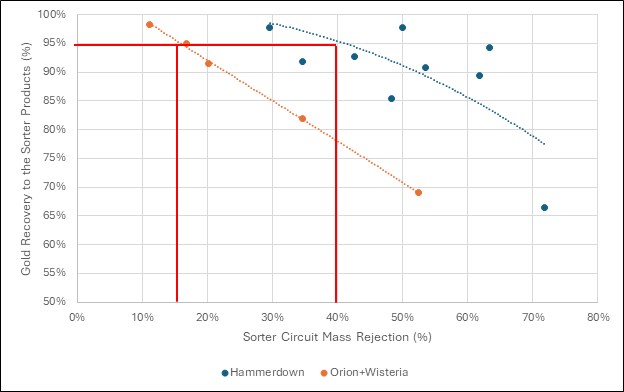
Source: Canenco (2022)
The overall gold recovery results using both the bulk and variability composites sampled to date, provided a design target of ~95% gold recovery to the sorted product while rejecting ~40% of the feed to the sorting circuit from the Hammerdown samples and 15% of the feed to the sorting circuit from the Orion samples. It was observed that the Wisteria and Orion samples had similar sorting responses and that the gold mineralization was more finely disseminated within these zones.
The main results include:
• The FS Bulk sample from Hammerdown grading at approximately 11 g/t Au, achieved screening and sorting gold recovery of 98% to the final product, (i.e., screen undersize (fines) and sorted product combined). There was an approximate gold grade upgrade of 53% to 17.3 g/t Au while 36% of the feed mass was rejected as waste grading 0.76 g/t Au. The screen fines were observed to often have a similar grade to the feed of which they comprised 20% of the mass;
|
|
• The average of the Variability Composites from Hammerdown grading at approximately 3.4 g/t Au, achieved screening and sorting gold recovery of 93% to the final product. There was an approximate gold grade upgrade of 61% to 5.4 g/t Au while 42% of the feed mass was rejected as waste grading 0.56 g/t Au. The screen fines were observed to often have a slightly lower grade to the feed of which they comprised 12% of the mass; and
• The FS Bulk sample from Orion grading at approximately 1.5 g/t Au, achieved screening and sorting gold recovery of 82% to the final product. There was an approximate gold grade upgrade of 25% to 1.9 g/t Au while 35% of the feed mass was rejected as waste grading 0.78 g/t Au. The screen fines were observed to have a similar grade to the feed of which they comprised 18% of the mass.
13.4.2.2 Comminution
The Crushing Work Index for the Hammerdown mineralization was medium-hard at 10.7 kWh/t. The abrasion indices indicated potential for the Hammerdown mineralization to be medium-very abrasive at 0.496 g while the Orion material is considered only slightly abrasive at 0.207 g. The Semi-Autogenous Grinding (SAG) Mill Comminution (SMC) tests returned Axb results of 70.6 and 34.6 for Hammerdown and Orion respectively, indicating that the Hammerdown is very amenable to SAG milling while the Orion material, although would mill, is relatively less amenable.
|
|
Table 13-2: Bond Ball Mill Work Index Results
| Composite | Closing Screen Size (CSS) (micron) |
~P80 Grind Size (micron) |
Bond Wi (kWh/t) |
| MC2 - HAM | 75 | 50 | 16.9 |
| MC2 - HAM | 106 | 75 | 16.9 |
| MC2 - HAM | 150 | 106 | 16.9 |
| VC1 - HAM | 106 | 75 | 16.4 |
| VC2 - HAM | 106 | 75 | 14.5 |
| VC4 - HAM | 106 | 75 | 16.4 |
| VC5 - HAM | 106 | 75 | 15.7 |
| VC6 - HAM | 106 | 75 | 17.7 |
| VC7 - HAM | 106 | 75 | 15.7 |
| VC8 - HAM | 106 | 75 | 16.7 |
| VC9 - ORN | 106 | 75 | 16.0 |
| VC10 - ORN | 75 | 50 | 17.4 |
| VC11 - ORN | 75 | 50 | 15.4 |
| VC12 - ORN | 75 | 50 | 16.3 |
| MC2 - ORN | 75 | 50 | 16.2 |
Source: Canenco (2022)
The Ball Mill Bond Work Index (BWi) 75th percentile for the different zones is 16.9 kWh/t and 16.3 kWh/t for Hammerdown and Orion respectively. These are both considered to be medium-hard mineralization.
The results from the IsaMill fine grinding test undertaken on the Hammerdown master composite at ALS Metallurgy in Kamloops and illustrated in Figure 13-4 following, aligned well with the Bond results, indicating that a primary grind P80 of approximately 50 µm would have a Specific Energy of about 17 kWh/t.
|
|
Figure 13-4: IsaMill Test Graph
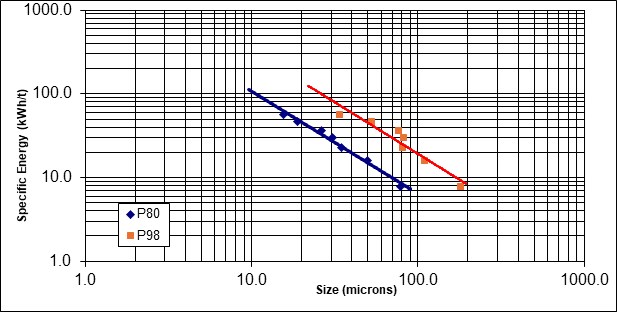
Source: ALS Metallurgy Kamloops (2022)
13.4.2.3 Grinding & Leach Parameters - Test Program PJ5330
Through 2021 and 2022, the feasibility metallurgical program was undertaken at Blue Coast Research Ltd. in Parksville, British Columbia with portions completed at Base Metallurgical Laboratories in Kamloops, British Columbia. A summary of the main results of that test program as they pertain to milling through the Nugget Pond Plant Whole-Ore-Leach (WOL) process flowsheet follows. It was observed during the test program that metallurgically, mineralization from the Wisteria zone responds very similarly to the Orion deposit mineralization, and thus the results are often combined together through the summary.
The grind-leach recovery relationship was repeated, and the feasibility results align well with the historical data.
|
|
Figure 13-5: Overall Average Gold Recovery on Different Mineralization Under Varying Conditions
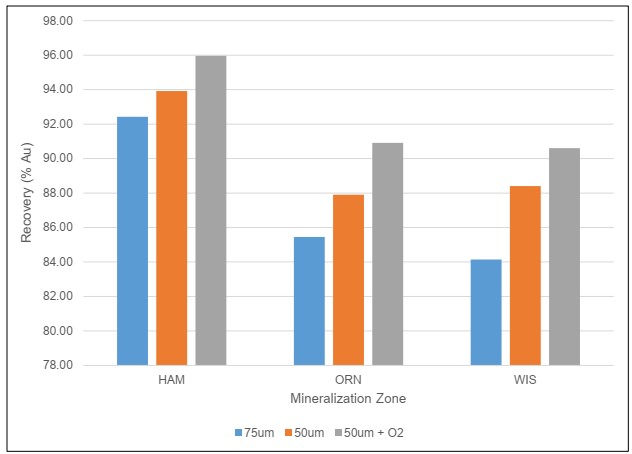
Source: Canenco (2022)
Grinding finer from a P80 of approximately 75 µm to 50 µm, increases overall average gold recovery on Hammerdown, Orion and Wisteria zone mineralization, by approximately 1.5%, 2.5% and 4.3% respectively. At that finer grind and with oxygen in the leach, the average overall gold recovery increases again to 96.0%, 90.9% and 90.6%, while significantly increasing leach kinetics, i.e., leaching was essentially complete in 12 hours or less.
|
|
Figure 13-6: Overall Average Gold Recovery on Orion with Carbon-In-Leach
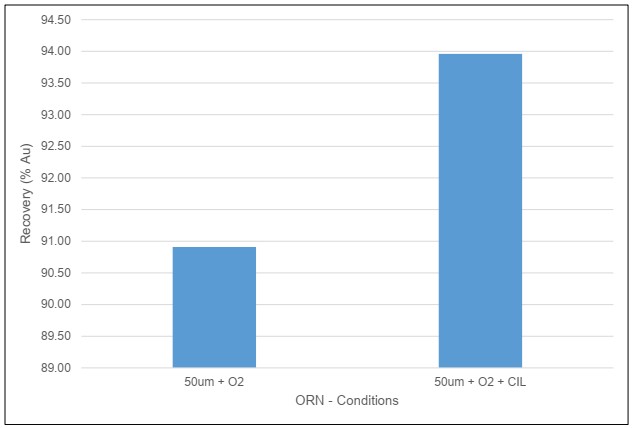
Source: Canenco (2022)
The test results indicated that carbon-in-leach (CIL) had no benefit on the Hammerdown or the Wisteria mineralization, however it increased the overall average recoveries on the Orion deposit material by approximately 3% from 90.9% to just over 93.9%.
|
|
Figure 13-7: Effect of Pulp Density on Hammerdown
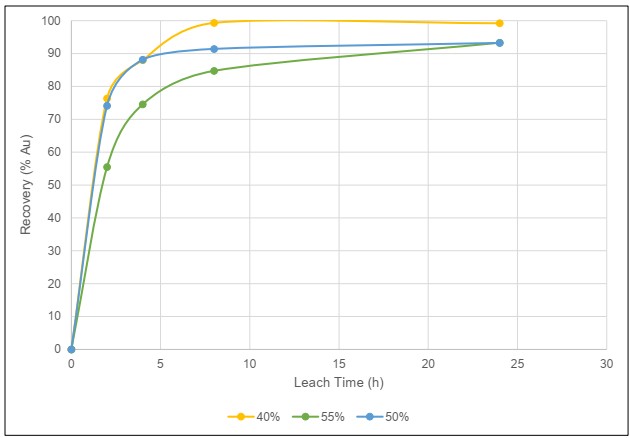
Source: Canenco (2022)
There was a small effect on the Hammerdown kinetics with varying pulp densities when using air in the leach, such that decreasing the pulp density increased the leach kinetics and leach recovery. The remainder of the tests were undertaken at 40% solids, however with the use of oxygen expect there to be marginal difference at this feed grade.
|
|
Figure 13-8: Effect of NaCN Dose on Hammerdown
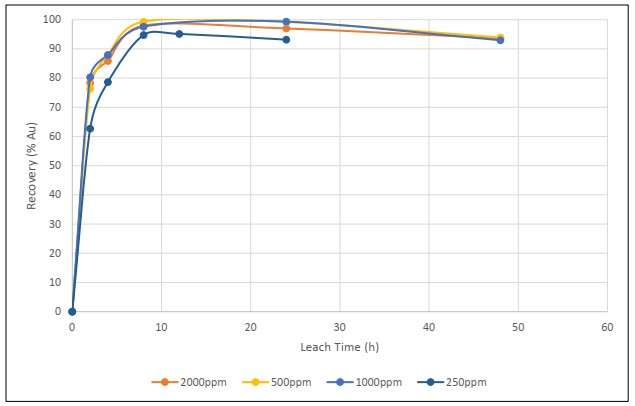
Source: Canenco (2022)
Historically, the test work and operations were run at a NaCN dose of 2000 ppm (2.0 g/l), however, as illustrated in Figure 13-8, this can be decreased to approximately 500 ppm (0.5 g/l) before observing any adverse effects on overall recovery on the Hammerdown mineralization. Further testing on Orion and Wisteria mineralization indicated there may be a small benefit to the overall recovery and leach kinetics if NaCN was increased. Subsequent tests were then undertaken a 1000 ppm NaCN (1.0 g/l).
The following leach parameters have been proposed for the mineralization tested to date:
• Primary grind of ~50 µm P80;
• Leach Time of 15-24 hours;
• NaCN at 1,000 ppm (1 g/L);
• Pulp density at 40%, solids;
• pH 11; and
|
|
• and Dissolved Oxygen (DO) >15 ppm using Oxygen.
13.4.2.4 Dewatering
Flocculant (floc) screening and static and dynamic thickening testwork was undertaken on Hammerdown and Orion pre-leach and detox slurry samples. The tests evaluated four flocculants; Magna Floc 10, 336, 351 and 1011. Magna Floc 10 (MF10) was selected, providing best overflow clarity and fastest free settling rate and it was observed that increasing pH also improved settling characteristics.
For Hammerdown pre-leach thickening, 40 to 60 g/t MF10 at pH 10.0 was suitable for thickening, while on detox tailings, 40 to 60 g/t at natural pH was suitable, both with loading rates ranging from 0.5 to 1.0 t/m2/hr. The same dosages and floc were also tested on the Orion samples with loading rate of 0.7 t/m2/hr. Underflow densities achieved, ranged from 57 to 65.4 percent solids across all the tests.
13.4.2.5 Detoxification
Both the Hammerdown and Orion mineralization is amenable to cyanide detoxification using the SO2:Air process. All the continuous cyanide detoxification tests were successful in decreasing the Cyanide Weak-Acid Dissociable (CNWAD) levels in the slurry below the target of 20 ppm within 60 minutes, at varying leach cyanide dosages and with different sources of oxygen.
Table 13-3: Detoxification Result Summary
| Composite | Leach NaCN (ppm) |
Detox Oxygen Supply |
SMBS:CNWAD Ratio |
CuSO4 Target (ppm) |
CNWAD Target (ppm) |
CNWAD (ppm @ 60 mins) |
| HAM | 500 | OXYGEN | 5.5 | 300 | >20 | 4.1 |
| HAM | 500 | AIR | 6.0 | 300 | >20 | 4.7 |
| HAM | 1000 | AIR | 6.5 | 425 | >20 | 7.6 |
| ORN | 500 | AIR | 6.0 | 300 | >20 | 0.5 |
| ORN | 1000 | AIR | 6.5 | 425 | >20 | 6.3 |
Source: Canenco (2022)
The 60 minutes time frame was the approximate residence time available in the current process plant at the design throughput at the time of testing, so the reagent dosages were adjusted to achieve the desired detoxification levels. These reagents dosages may be able to be decreased with longer residence time. Decreasing the cyanide dose in the leach, not only decreases the leach cyanide consumption, but it also decreases the reagent requirements in the cyanide detoxification, so it is recommended that more cyanide optimization test work is undertaken in the next phase of engineering. Oxygen injection into the detoxification process also decreases its reagent requirements.
The following detoxification parameters have been proposed for the mineralization tested to date:
|
|
• SO2: CNWAD ratio at 5.5:1;
• CuSO4 addition at 0.75 g/l to target 300 ppm;
• Retention Time at 60 mins;
• pH at 9.0;
• Pulp Density at 40%; and
• Target DO of 8-10 ppm using oxygen.
13.5 Recovery Predictions
• The gold recoveries achieved to date for the Hammerdown composites using the optimized conditions range from 94.6 - 97.5% and average 96.0%. Assuming solution losses of approximately 0.5% the overall Hammerdown gold recovery is in the range of 95.5%; and
• The gold recoveries achieved to date for the Orion and Wisteria composites using the optimized conditions range from 87.8 - 93.1% and average 91.0%. Assuming solution losses of approximately 0.5% the overall Orion and Wisteria gold recovery is in the range of 90.5%.
Figure 13-9: Composite Recoveries
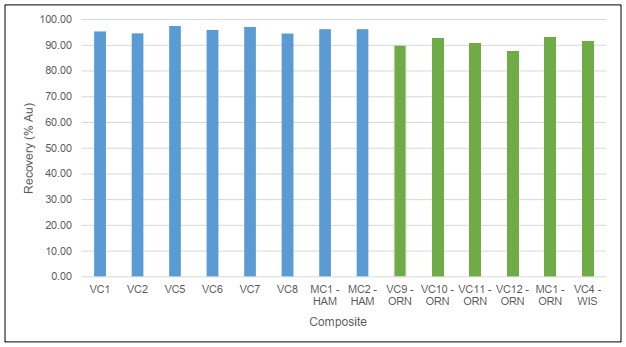
Source: Canenco (2022)
|
|
The test results also indicate that the gold recovery is static for both deposit mineralization's until the mill feed grade drops below 1.5 g/t Au. (Figure 13-10).
Figure 13-10: Grade-Recovery
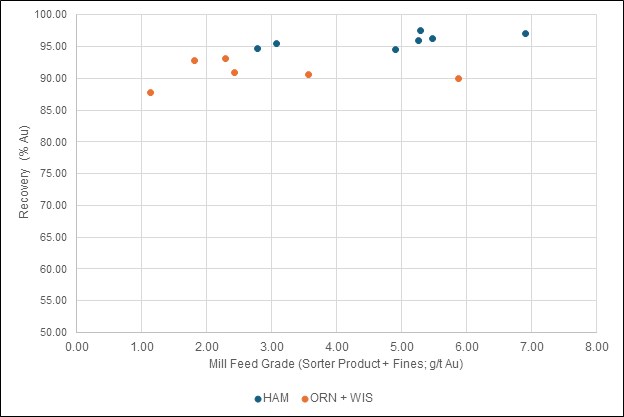
Source: Canenco (2022)
 |
 |
14 MINERAL RESOURCE ESTIMATE
14.1 Summary
Canadian Institute of Mining, Metallurgy and Petroleum (CIM) Definition Standards for Mineral Resources and Mineral Reserves (CIM (2014) definitions) were used for Mineral Resource classification.
Table 14-1: Summary of Mineral Resources as of June 30, 2022
| Category | Tonnes (kt) |
Grade (g/t Au) |
Contained Metal (000 oz Au) |
| Open Pit Resources | |||
| Measured | 698 | 5.47 | 123 |
| Indicated | 2,146 | 3.00 | 207 |
| Measured + Indicated | 2,845 | 3.61 | 330 |
| Inferred | 302 | 1.31 | 13 |
| Underground Resources | |||
| Measured | 1 | 7.05 | - |
| Indicated | 54 | 5.10 | 9 |
| Measured + Indicated | 55 | 5.10 | 9 |
| Inferred | 66 | 4.00 | 9 |
Notes:
1. Mineral Resource Estimate completed by Pierre Landry, P.Geo., of SLR Consulting (Canada) Ltd. (SLR), an independent qualified person (QP), as defined by NI 43-101.
2. Effective date: June 30, 2022. All Mineral Resources have been estimated in accordance with Canadian Institute of Mining and Metallurgy and Petroleum (CIM) definitions, as required under NI 43-101.
3. Open Pit Mineral Resources are inclusive of Mineral Reserves
4. Open Pit Mineral Resources are estimated at a cut-off grade of 0.50 g/t Au.
5. Open Pit Mineral Resources are reported at a block cut-off from whole blocks measuring 2.5 m x 1.0 m x 2.5 m.
6. Mineral Resources are estimated using a long-term gold price of US$1,800 per ounce, and a US$/C$ exchange rate of 0.75.
7. Bulk density is 2.84 t/m³ for rock and 1.90 t/m³ for mined out areas.
8. Underground Mineral Resources are estimated at a cut-off grade of 2.00 g/t Au.
9. Underground Resources are reported at a block cut-off from whole blocks measuring 2.5 m x 1.0 m x 2.5 m and have been subject to additional reporting shapes to remove isolated blocks.
10. Numbers may not add due to rounding.
11. Mineral Resources reported demonstrate reasonable prospect of eventual economic extraction (RPEEE), as required under NI 43-101.
12. Mineral Resources are not Mineral Reserves and do not have demonstrated economic viability.
13. The Mineral Resources would not be materially affected by environmental, permitting, legal, marketing, and other relevant issues based on information currently available.
Source: SLR (2022)
|
|
The QP is not aware of any environmental, permitting, legal, title, taxation, socio-economic, marketing, political, or other relevant factors that could materially affect the Mineral Resource estimate.
14.2 Comparison to Previous Estimates
The previous estimate, with an effective date of February 29, 2020 (WSP, 2020), was reported at an open pit cut-off grade of 1.00 g/t Au and an underground cut-off grade of 2.0 g/t Au (Table 14-2).
Table 14-2: Summary of Mineral Resources as of February 29, 2020
| Category | Tonnes (kt) |
Grade (g/t Au) |
Contained Metal (000 oz Au) |
| Open Pit Resources | |||
| Measured | 285 | 11.75 | 108 |
| Indicated | 739 | 8.17 | 194 |
| Measured + Indicated | 1,024 | 9.16 | 302 |
| Inferred | 860 | 4.62 | 128 |
| Underground Resources | |||
| Measured | 4 | 9.74 | 1 |
| Indicated | 30 | 9.36 | 9 |
| Measured + Indicated | 34 | 9.39 | 10 |
| Inferred | 448 | 4.29 | 62 |
Notes:
1. Mineral resources were prepared in accordance with NI 43-101 and the CIM Definition Standards (2014). Mineral resources that are not mineral reserves do not have demonstrated economic viability.
2. Open pit mineral resources are reported at a cut-off grade of 1.0 g/t gold that is based on a gold price of US$1,500/oz.
3. Underground mineral resources are reported at a cut-off grade of 2.0 g/t gold that is based on a gold price of US$1,500/oz.
4. Appropriate mining costs, processing costs, metal recoveries, and inter -ramp pit slope angles were used to generate the pit shell.
5. Rounding may result in apparent summation differences between tonnes, grade, and contained metal content.
Source: WSP (2020)
Current total open pit Measured and Indicated Mineral Resources are 178% higher in tonnage, 61% lower in grade, and 9% higher in contained metal, compared to the February 2020 estimate. While open pit Inferred Mineral Resources are 65% lower in tonnage, 72% lower in grade, and 90% lower in contained metal, compared to the February 2020 estimate.
The resource pits for both resource estimates are quite similar in terms of size, however, there are a number of changes between the two models. The changes are primarily due to three main factors:
|
|
• Additional in-fill and step-out drilling;
• Updated mineralization interpretation;
• Updated stope and development wireframes; and
• Reduced cut-off grade
Based on Table 10-1, the current database for the Hammerdown deposit includes 162 more holes and 19,087 m (28%) more than the database used by WSP. Many of these holes were drilled within the WSP resource pit shell to assist with the conversion of Inferred Mineral Resources to Indicated or Measured Mineral Resources. The additional drilling allowed isolated high-grade assays within the WSP "inter vein domains" to be incorporated into volumetrically constrained vein mineralization wireframes.
Many of the WSP vein intercepts were updated as a result of the new drilling. In total, the WSP estimate had 56 mineralization wireframes, while the current estimate uses 101 mineralization wireframes within a similar spatial extent.
The wireframes for the stopes and development at Hammerdown have been updated from those available on the effective date of the WSP model. These updates are spatially more extensive than previous versions and are based on sections and plans submitted to the Province of Newfoundland and Labrador. In addition to the digitized stopes and development, additional shapes were created by Maritime personnel to address the misalignment of stopes relative to modelled mineralization caused by the transformation from a local grid to a UTM grid. These updated stopes and additional shapes increase the amount of material that has been depleted from the model, decreasing the overall resource.
When reducing the cut-off grade from the 1.00 g/t Au cut-off grade used in the WSP model to the 0.50 g/t Au cut-off grade in the current model the tonnage of the current model showed greater sensitivity than the ounces. Reducing the cut-off grade from 1.00 g/t Au to 0.50 g/t Au in the current model increases Measured and Indicated tonnes by 49% but only increases Measured and Indicated ounces by 7%. This sensitivity is a by-product of the re-blocking of the sub-blocked model prior to reporting.
For the underground estimate, the model changes are largely driven by the additional in-fill and step-out drilling and its associated updated mineralization interpretation. The increased drilling density reduced extrapolation distances for existing wireframes and allowed isolated high grade assays within the WSP "inter vein domains" to be incorporated into volumetrically constrained vein mineralization wireframes. Another reason for the model changes relates to the interpreted position of the Captain Nemo fault which has been updated with the new drilling. The fault is interpreted as truncating the vein mineralization in the hanging wall, leaving a relatively barren footwall. This has resulted in model "deletions" where the underground Mineral Resources in the WSP model extended into the current footwall.
14.3 Resource Database
The resource database for Hammerdown was provided by Maritime for the purposes of a Mineral Resource estimate. Drilling information and analytical results available as of September 8, 2021, were imported into Leapfrog Geo by Maritime personnel, subsequent information received after this date was excluded from the Mineral Resource estimate. The Maritime database for the Hammerdown deposit comprises 595 surface diamond drill holes and 192 underground diamond drill holes for a total of 72,808 m of drilling and 80 trenches and channels for a total of 266 m of sampling. This database is a reduced subset of the 912 drill holes and 80 channels summarized in Table 10-1. For purposes of estimation, the subset was spatially restricted to include only those holes that are located within 50 m of the mineralization wireframes constructed for the Muddy Shag, Wisteria, Hammerdown, and Rumbullion zones. Table 14-3 summarizes the Hammerdown database subset.
|
|
Table 14-3: Hammerdown Database
| No. of Drill Holes or Channels | Length (m) | |
| Surface Drill Holes | 595 | 61,213 |
| UG Drill Holes | 192 | 11,595 |
| Total Drill Holes | 787 | 72,808 |
| Surface Channels | 80 | 266 |
Source: SLR (2022)
Hammerdown has many instances of underground fan drilling adjacent to mined out stopes where only one or two of the fan holes were assayed within the primary vein (mined out) that was intercepted. The remaining fan holes were assayed selectively when adjacent veins were visually thought to exceed a desired grade tenor.
For the purpose of the Mineral Resource estimate, a total of 86 drill holes were partially or completely excluded from the Hammerdown database. The drill holes or sample intervals excluded were either unsampled or selectively sampled within areas of known mineralization. Four holes that were completely unsampled were excluded. The remaining 82 holes had portions of the holes selectively excluded based on proximity to more recent drilling that was more thoroughly sampled. The proximity of the excluded intervals to newer holes that were more thoroughly sampled is typically 10 m or less. Figure 14-1 shows the specific unsampled excluded intervals relative to the other unsampled intervals which were assigned zeros.
|
|
Figure 14-1: Hammerdown Excluded Interval (6 m Viewing Corridor)
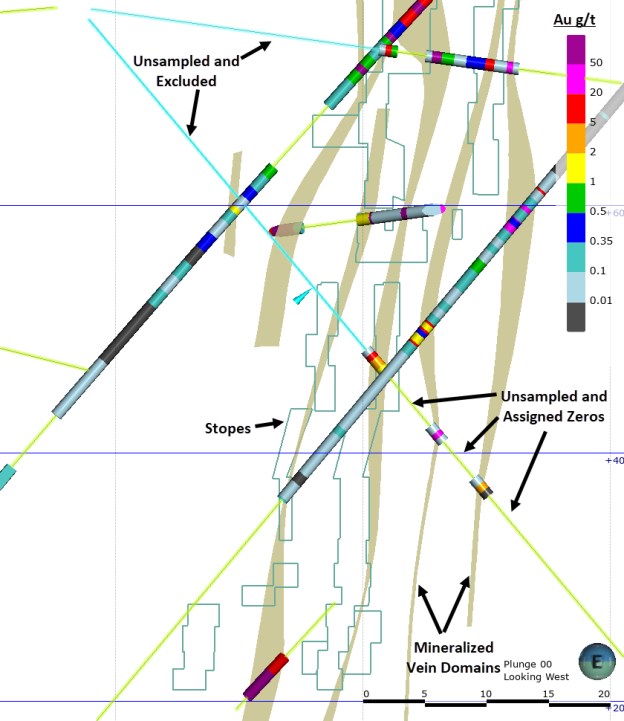
Source: SLR (2022)
|
|
SLR recommends that Maritime continue to drill new holes within 10 m or less of unsampled historic holes that intersect otherwise well-supported vein mineralization to improve local estimates. This drilling should continue to be restricted to unmined areas.
14.4 Reconciliation to Production Data
14.4.1 Historical Stopes and Development
Historic stopes and development at Hammerdown were digitized in a local grid from available sections and plans submitted to the Province of Newfoundland and Labrador. These shapes were transformed from local grid to a UTM grid and visually inspected by SLR for their alignment with the modelled mineralization. SLR identified a number of areas within the model where the transformation appeared to be misaligned. In these areas, additional shapes were created by Maritime personnel to address the areas within the model that were misaligned. Both the digitized stope and development shapes and the additional shapes created to address the misalignment were used to deplete the resource estimate.
14.4.1.1 Local Grid to UTM Grid Transformation
The transformation of digitized wireframes was done using pairs of points: two points in the local coordinate system and two points in the UTM coordinate system. The two points were drill holes MS-88-03 and MS-90-48. The transformation resulted in a rotation of approximately 2.554° and an approximate re-scaling factor of 0.999.
SLR recommends that Maritime Resources review alternative point pairs or transformation methods that may improve the alignment of the transformed historical stopes and development with the modelled mineralization.
14.4.2 Comparison
In SLR's opinion, the most appropriate method to test the accuracy of a resource estimate is to compare the Mineral Resources and Mineral Reserves in a given volume versus the actual production results as determined by the process plant. SLR has compared the historic production to the tonnes and grade from the current resource model reported from within the mined out stopes and development.
A production summary of the historical mining from 2001 to 2004 is provided in Table 14-4.
|
|
Table 14-4: Summary of Historical Production (2001 to 2004)
| Year | Ore Tonnes Mined |
Grade (g/t Au) |
Waste Tonnes Mined |
Total Tonnes Mined |
Total Tonnes Milled |
Milled Grade (g/t Au) |
Recovery (%) |
Produced Metal (oz Au) |
| 2001 | 39,460 | 22.70 | 33,736 | 73,196 | 53,818 | 20.72 | 97.80 | 34,210 |
| 2002 | 93,272 | 15.74 | 76,746 | 170,018 | 93,451 | 16.24 | 96.94 | 47,470 |
| 2003 | 88,486 | 13.35 | 109,254 | 197,740 | 90,125 | 13.47 | 96.86 | 37,798 |
| 2004 | 33,696 | 12.12 | 29,762 | 63,458 | 36,494 | 13.11 | 96.91 | 14,922 |
| Total | 254,914 | 15.51 | 249,498 | 504,412 | 273,888 | 15.79 | 97.08 | 134,400 |
Source: Maritime Resources (2022)
A summary of the tonnes, grade, and contained metal reported from the current resource model for mined out shapes from 2001 to 2004 is provided in Table 14-5.
Table 14-5: Summary of Tonnes and Grade from Resource Model for Mined Out Shapes (2001 to 2004)
| Area | Vein Tonnes Mined |
Vein Grade (g/t Au) |
Vein Metal (oz Au) |
Waste Tonnes Mined |
Waste Grade (g/t Au) |
Metal (oz Au) |
| Development | 19,530 | 9.49 | 5,961 | 301,517 | 0.02 | 239 |
| Stopes | 111,724 | 20.03 | 71,961 | 211,448 | 0.06 | 426 |
| Total | 131,254 | 18.47 | 77,923 | 512,965 | 0.04 | 665 |
Source: SLR (2022)
Reporting the current model from the mined-out shapes accounts for nearly 60% of the reported metal produced between 2001 and 2004. The vein grades reported appear to be reasonable and fall within the range of historical mined grades. While the contained metal reported from the model falls short of the reported historical production, the digitized mined out shapes report more total tonnes mined. The combined ore and waste material (644,219 t) reported from the digitized shapes is markedly different than the historic reported total tonnes mined (504,412 t). Based on the observed reporting discrepancies, SLR recommends that reporting differences between the current model and historical production reports continue to be investigated as the mineralization interpretation changes and new information becomes available.
14.5 Geological Interpretation
Muddy Shag, Wisteria, Hammerdown, and Rumbullion are essentially one mineralized system contained in separate faulted blocks and is collectively referred to as the Hammerdown deposit, while the Orion deposit is located approximately 2 km to the southwest. Only the Hammerdown and Rumbullion have seen historical development and mining.
|
|
All deposits occur in the Hammerdown Deformation Zone (HDZ), which is described as a 100 m to 250 m wide structural corridor of strong ductile to brittle shearing hosted in bi-modal volcanic rocks. The Hammerdown-Rumbullion-Muddy Shag vein system consists of a series of stacked gold veins which were emplaced after the bi-modal volcanics were uplifted, folded, and intensely sheared, then intruded by quartz feldspar porphyry dykes.
The Wisteria mineralization is located at the intersection of the Rumbullion and Captain Nemo faults just south of the Hammerdown vein system where the vein system forms a gentle open fold. Wisteria forms broad mineralized zones consisting of strong quartz-sericite-pyrite alteration with finely disseminated sulphides and millimetre scale quartz veins.
The mineralization wireframes presented in Figure 14-2 were constructed by Maritime Resources and their consultants, including significant contributions by Scott Zelligan, for the Muddy Shag, Wisteria, Hammerdown, and Rumbullion zones:
• Vein Mineralization Wireframes - For the vein hosted mineralization at Muddy Shag, Hammerdown, and Rumbullion, these wireframes are based on a nominal 0.50 g/t Au cut-off grade and were constructed to represent continuous and discrete high grade vein mineralization that lies within a broad deformation corridor of sporadically mineralized waste rock. Both drill holes and channel samples were used to construct the vein mineralization wireframes.
• Disseminated Mineralization Wireframes - For the disseminated mineralization at Wisteria, the wireframes are based on a nominal 0.35 g/t Au cut-off grade and were constructed to represent broad lower grade mineralization that lies within a broad deformation corridor of sporadically mineralized waste rock. Both drill holes and channel samples were used to construct the disseminated mineralization wireframes.
|
|
Figure 14-2: Oblique View of the Muddy Shag, Wisteria, Hammerdown, and Rumbullion Zones, Looking Northeast
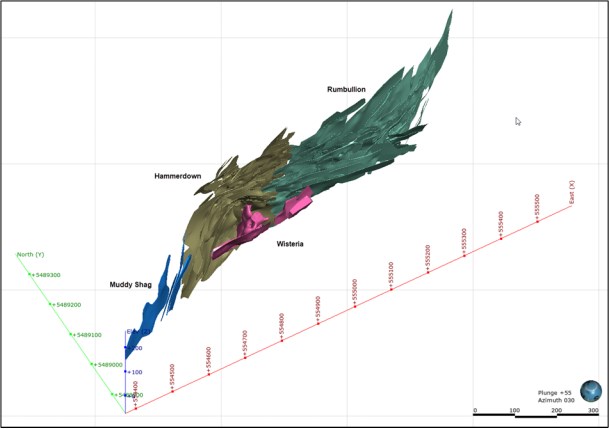
Source: SLR (2022)
The interpretation of the vein and disseminated domain wireframes was guided by previous mineralization interpretations constructed by Maritime personnel. In general, the vein domain wireframe interpretation shows good agreement with historic stopes digitized from engineering drawings submitted to the Province of Newfoundland and Labrador.
Mineralization domains were modelled individually and named according to the nomenclature set out in Table 14-6. Individual veins from each zone were either grouped or left as individual veins based on a variety of factors such as, historical mining, spatial proximity, and grade.
|
|
Table 14-6: Mineralization Domains
| Zone | Group | Domain (Mineralization Type) |
Wireframe Name |
| Wisteria | i01 | Disseminated | i01 |
| VS | Disseminated (Corridors) | i02, i03, i04, i05, i06 | |
| Hammerdown | Central | Vein | m01, m02, m03, m05, m07, m10, m11, m03b, m05a, m05b, m07a, m09a, m10a |
| North | Vein | n01, n02, n03, n04, n03a, o01, o02a, p01, p02, p03, p04, p05, p06, p02a, p03a, p05a, q01, q02 | |
| South | Vein | j01, j01a, k02, k03a, l01, l02 | |
| Individual Veins | Vein | k03, m04, m06, m08, m09, o02 | |
| Rumbullion | Central | Vein | ro01, rp00, rp01a, rq01 |
| East | Vein | rk02, rk03, rk01a, rk02a | |
| North | Vein | ro02, ro01b, rp02, rq02, rq03, rq04, rq05, rq03a, rr02, rr03 | |
| Northeast | Vein | rl04, rl05, rl04a, rm04, rm05, rm06, rm04a, rm05a, rn04, rn05, rn04a, rn05a, rr01 | |
| South | Vein | rk01, rl01, rl01a, rm01, rm02, rm03, rm01a, rm02a, rm02b, rn01, rn02, rn03, rn03a, ro01a | |
| Individual Veins | Vein | rl02, rl03, rp01 | |
| Muddy Shag | Vein | mm01, mm02, mm03, mm04 | |
| Interstitial | Minor Veins and Splays, Veinlets |
Source: SLR (2022)
The mineralized system at Muddy Shag, Hammerdown, and Rumbullion strikes at an approximately 065° azimuth, ranging from 045° to 100° along its 1,250 m strike length. The mineralized system takes on an en-échelon sigmoidal shape in plan view. Extending approximately 250 m below surface, the vein domain wireframes are truncated at depth by the east striking and moderately north dipping Captain Nemo Fault. The vein domains are steeply dipping and anastomosing at times, and range in thickness from 0.1 m to 5.0 m and are generally 0.4 m to 0.8 m thick. The vein domains within a given zone are separated by relatively barren, altered rocks one metre to ten metres thick.
The mineralized system at Wisteria appears to have two groups: a single north-northeast striking disseminated body (i01) that terminates against the southernmost Hammerdown veins and a set of disseminated corridors (VS) that trend parallel to the east striking Captain Nemo fault. The VS group wireframes are also truncated at depth by the Captain Nemo Fault. The i01 group strikes at an approximately 005° azimuth, extending over an 80 m strike length and to a depth of approximately 100 m below surface. The VS group strikes at an approximately 085° azimuth, extending over a 275 m strike length and to a depth of approximately 130 m below surface.
|
|
Figure 14-3 and Figure 14-4 present the Hammerdown, Wisteria, and Rumbullion mineralization model.
Figure 14-3: Hammerdown, Wisteria, and Rumbullion Zones Mineralization Model Plan View (10 m Viewing Corridor)
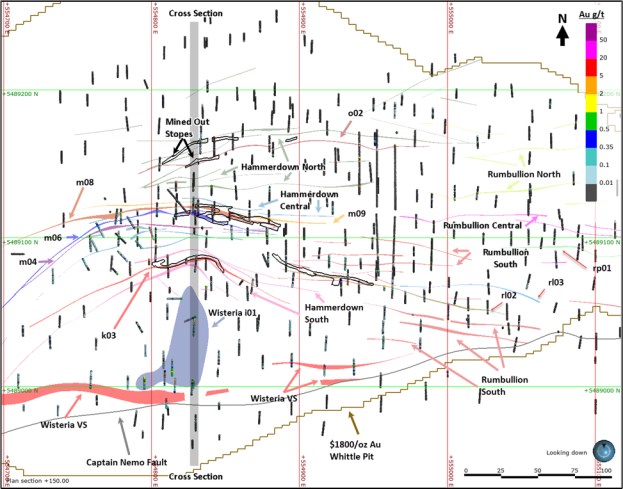
Source: SLR (2022)
|
|
Figure 14-4: Grouped and Individual Domains Mineralization Model Cross Section (10 m Viewing Corridor)
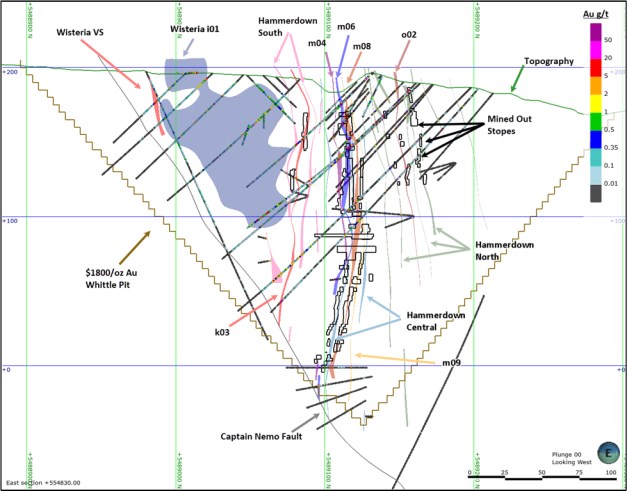
Note: Mineralization was modelled 10 m above surface to capture channel samples during grade estimation. All reported tonnages were depleted above the topography surface.
Source: SLR (2022)
Outside of the grouped domains is the Interstitial area. The Interstitial area is a domain that captures smaller vein structures and splays within the Hammerdown vein system that possess limited continuity that prohibits the incorporation of those samples within discrete wireframes. The construction of a domain to capture the interstitial material between the grouped domains allows for the use of locally accurate dilution grades when regularizing the sub-blocked model to the parent block size.
SLR recommends that Maritime continue to refine the mineralized domains based on the historic stopes and as more information becomes available from surface trenching and drilling.
|
|
14.6 Resource Assays
Assay values located within the Hammerdown mineralized domains were tagged with zone, group and individual vein identifiers and exported for statistical analysis. SLR compiled and reviewed the basic statistics for gold assays, which are summarized in Table 14-7. Gold assays were composited and used for the purposes of Mineral Resource estimation.
Table 14-7: Raw Assays Au (g/t)
| Zone | Groupor Individual Vein |
Count | Length (m) |
Mean (g/t Au) |
Coefficient of Variation (g/t Au) |
Minimum (g/t Au) |
Maximum (g/t Au) |
| Wisteria | i01 | 1,191 | 804.13 | 1.17 | 3.43 | 0.0025 | 149.44 |
| VS | 510 | 349.52 | 1.12 | 5.02 | 0.0025 | 148.26 | |
| Hammerdown | Central | 746 | 359.86 | 13.70 | 2.32 | 0.00 | 303.40 |
| North | 675 | 239.85 | 10.57 | 3.11 | 0.00 | 330.10 | |
| South | 310 | 169.11 | 9.00 | 3.05 | 0.0025 | 260.90 | |
| k03 | 196 | 106.67 | 15.67 | 2.10 | 0.00 | 284.18 | |
| m04 | 235 | 121.34 | 9.74 | 2.97 | 0.00 | 427.65 | |
| m06 | 419 | 192.18 | 25.94 | 1.94 | 0.00 | 530.20 | |
| m08 | 560 | 276.91 | 13.25 | 3.04 | 0.00 | 505.80 | |
| m09 | 165 | 69.04 | 13.97 | 2.16 | 0.00 | 226.00 | |
| o02 | 155 | 61.82 | 17.29 | 1.91 | 0.00 | 265.20 | |
| Rumbullion | Central | 117 | 53.88 | 5.58 | 3.33 | 0.06 | 175.73 |
| East | 104 | 52.20 | 8.16 | 3.61 | 0.0025 | 241.25 | |
| North | 265 | 124.69 | 4.88 | 2.31 | 0.0025 | 98.00 | |
| Northeast | 434 | 191.44 | 9.19 | 1.90 | 0.0025 | 150.00 | |
| South | 414 | 174.81 | 6.33 | 2.48 | 0.008 | 167.77 | |
| rl02 | 188 | 102.76 | 14.69 | 1.73 | 0.00 | 128.05 | |
| rl03 | 132 | 55.51 | 17.87 | 1.78 | 0.018 | 190.15 | |
| rp01 | 107 | 57.53 | 12.12 | 2.59 | 0.05 | 272.15 | |
| Muddy Shag | - | 88 | 37.85 | 2.59 | 1.30 | 0.02 | 17.43 |
| Interstitial | - | 26,798 | 17,777.72 | 0.11 | 21.28 | 0.00 | 354.80 |
Notes:
1. Statistics are length weighted.
Source: SLR (2022)
|
|
14.7 Treatment of High Grade Assays
SLR applied high grade capping to gold assays for Hammerdown in order to limit the influence of a small number of extreme values located in the upper tail of the metal distributions. Log probability plots were inspected for each mineralized domain group or individual vein and a high grade cap was applied where significant inflections or population breaks occurred. Examples of these for Hammerdown Central and Rumbullion Central can be seen in Figure 14-5 to Figure 14-8. Raw assays were capped prior to compositing, and high-grade capping was not required for some domains.
|
|
Figure 14-5: Log Probability Plot for Hammerdown Central Domain (Gold)
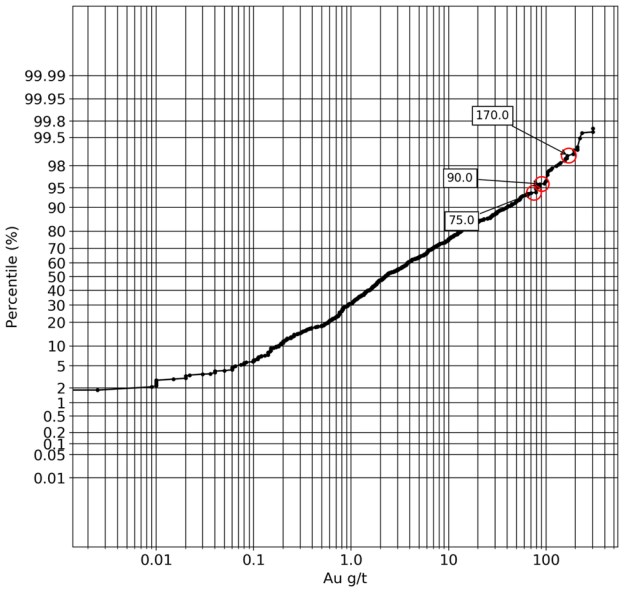
Source: SLR (2022)
|
|
Figure 14-6: Histogram for Hammerdown Central Domain (Gold)
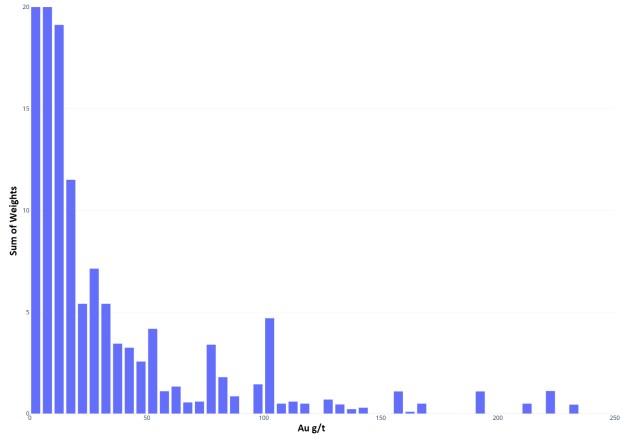
Source: SLR (2022)
|
|
Figure 14-7: Log Probability Plot for Rumbullion Central Domain (Gold)
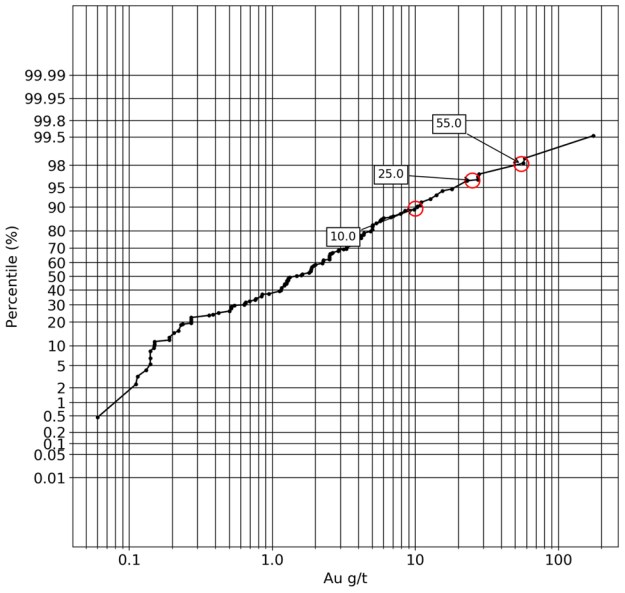
Source: SLR (2022)
|
|
Figure 14-8: Histogram for Rumbullion Central Domain (Gold)
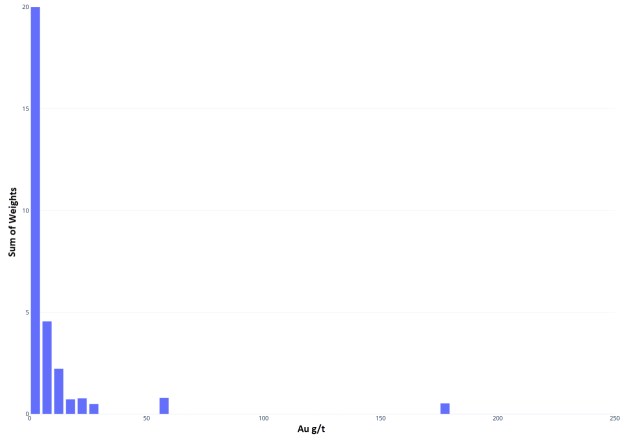
Source: SLR (2022)
14.7.1 Capping
The capping grades applied to each domain are provided in Table 14-8, while the basic statistics of capped and uncapped sample populations is summarized by domain in Table 14-9. SLR has reviewed the capped and uncapped sample distributions for gold within all domains and concludes that the values used are appropriate for the current stage of the Project.
|
|
Table 14-8: Assay Capping Levels
| Zone | Group | Domain (Mineralization Type) |
Capping Value (g/t Au) |
| Wisteria | i01 | Disseminated | 25 |
| VS | Disseminated (Corridors) | 25 | |
| Hammerdown | Central | Vein | 170 |
| North | Vein | 115 | |
| South | Vein | 80 | |
| k03 | Vein | 80 | |
| m04 | Vein | 170 | |
| m06 | Vein | 250 | |
| m08 | Vein | 170 | |
| m09 | Vein | 170 | |
| o02 | Vein | 115 | |
| Rumbullion | Central | Vein | 55 |
| East | Vein | 65 | |
| North | Vein | 30 | |
| Northeast | Vein | 80 | |
| South | Vein | 90 | |
| rl02 | Vein | 90 | |
| rl03 | Vein | 90 | |
| rp01 | Vein | 55 | |
| Muddy Shag | Vein | No Cap | |
| Interstitial | Waste | 20 |
Source: SLR (2022)
|
|
Table 14-9: Raw and Capped Assays Au (g/t)
| Zone | Variable Name |
Group or Individual Vein |
Count | Length (m) |
Mean (g/t Au) |
Coefficient of Variation |
Minimum (g/t Au) |
Maximum (g/t Au) |
No. Capped Assays |
% Metal Loss |
| Wisteria | Au | i01 | 1,191 | 804.13 | 1.17 | 3.43 | 0.0025 | 149.44 | ||
| AuCap_25 | i01 | 1,191 | 804.13 | 1.07 | 1.99 | 0.0025 | 25.00 | 9 | 9 | |
| Au | VS | 510 | 349.52 | 1.12 | 5.02 | 0.0025 | 148.26 | |||
| AuCap_25 | VS | 510 | 349.52 | 0.95 | 2.48 | 0.0025 | 25.00 | 5 | 15 | |
| Hammerdown | Au | Central | 746 | 359.86 | 13.70 | 2.32 | 0.00 | 303.40 | ||
| AuCap_170 | Central | 746 | 359.86 | 13.22 | 2.18 | 0.00 | 170.00 | 9 | 4 | |
| Au | North | 675 | 239.85 | 10.57 | 3.11 | 0.00 | 330.10 | |||
| AuCap_115 | North | 675 | 239.85 | 8.72 | 2.30 | 0.00 | 115.00 | 13 | 18 | |
| Au | South | 310 | 169.11 | 9.00 | 3.05 | 0.0025 | 260.90 | |||
| AuCap_80 | South | 310 | 169.11 | 7.22 | 2.24 | 0.0025 | 80.00 | 7 | 20 | |
| Au | k03 | 196 | 106.67 | 15.67 | 2.10 | 0.00 | 284.18 | |||
| AuCap_80 | k03 | 196 | 106.67 | 13.37 | 1.70 | 0.00 | 80.00 | 7 | 15 | |
| Au | m04 | 235 | 121.34 | 9.74 | 2.97 | 0.00 | 427.65 | |||
| AuCap_170 | m04 | 235 | 121.34 | 9.25 | 2.60 | 0.00 | 170.00 | 2 | 5 | |
| Au | m06 | 419 | 192.18 | 25.94 | 1.94 | 0.00 | 530.20 | |||
| AuCap_250 | m06 | 419 | 192.18 | 24.47 | 1.84 | 0.00 | 250.00 | 3 | 2 |
|
|
| Zone | Variable Name |
Group or Individual Vein |
Count | Length (m) |
Mean (g/t Au) |
Coefficient of Variation |
Minimum (g/t Au) |
Maximum (g/t Au) |
No. Capped Assays |
% Metal Loss |
| Au | m08 | 560 | 276.91 | 13.25 | 3.04 | 0.00 | 505.80 | |||
| AuCap_170 | m08 | 560 | 276.91 | 11.93 | 2.54 | 0.00 | 170.00 | 6 | 10 | |
| Au | m09 | 165 | 69.04 | 13.97 | 2.16 | 0.00 | 226.00 | |||
| AuCap_170 | m09 | 165 | 69.04 | 13.41 | 1.98 | 0.00 | 170.00 | 2 | 4 | |
| Au | o02 | 155 | 61.82 | 17.29 | 1.91 | 0.00 | 265.20 | |||
| AuCap_115 | o02 | 155 | 61.82 | 15.83 | 1.59 | 0.00 | 115 | 3 | 8 | |
| Rumbullion | Au | Central | 117 | 53.88 | 5.58 | 3.33 | 0.06 | 175.73 | ||
| AuCap_55 | Central | 117 | 53.88 | 4.37 | 2.11 | 0.06 | 55 | 3 | 22 | |
| Au | East | 104 | 52.20 | 8.16 | 3.61 | 0.0025 | 241.25 | |||
| AuCap_65 | East | 104 | 52.20 | 6.36 | 2.91 | 0.0025 | 65.00 | 3 | 22 | |
| Au | North | 265 | 124.69 | 4.88 | 2.31 | 0.0025 | 98.00 | |||
| AuCap_30 | North | 265 | 124.69 | 4.03 | 1.69 | 0.0025 | 30.00 | 12 | 17 | |
| Au | Northeast | 434 | 191.44 | 9.19 | 1.90 | 0.0025 | 150.00 | |||
| AuCap_80 | Northeast | 434 | 191.44 | 8.92 | 1.81 | 0.0025 | 80.00 | 7 | 3 | |
| Au | South | 414 | 174.81 | 6.33 | 2.48 | 0.008 | 167.77 | |||
| AuCap_90 | South | 414 | 174.81 | 6.17 | 2.35 | 0.008 | 90.00 | 4 | 2 | |
|
|
| Zone | Variable Name |
Group or Individual Vein |
Count | Length (m) |
Mean (g/t Au) |
Coefficient of Variation |
Minimum (g/t Au) |
Maximum (g/t Au) |
No. Capped Assays |
% Metal Loss |
| Au | rl02 | 188 | 102.76 | 14.69 | 1.73 | 0.00 | 128.05 | |||
| AuCap_90 | rl02 | 188 | 102.76 | 13.87 | 1.60 | 0.00 | 90.00 | 2 | 6 | |
| Au | rl03 | 132 | 55.51 | 17.87 | 1.78 | 0.018 | 190.15 | |||
| AuCap_90 | rl03 | 132 | 55.51 | 15.63 | 1.46 | 0.018 | 90.00 | 4 | 13 | |
| Au | rp01 | 107 | 57.53 | 12.12 | 2.59 | 0.05 | 272.15 | |||
| AuCap_55 | rp01 | 107 | 57.53 | 9.15 | 1.62 | 0.05 | 55 | 7 | 25 | |
| Muddy Shag | Au | - | 88 | 37.85 | 2.59 | 1.30 | 0.02 | 17.43 | ||
| Au | - | 88 | 37.85 | 2.59 | 1.30 | 0.02 | 17.43 | - | - | |
| Interstitial | Au | - | 26,798 | 17,777.72 | 0.11 | 21.28 | 0.00 | 354.80 | ||
| AuCap_20 | - | 26,798 | 17,777.72 | 0.09 | 6.09 | 0.00 | 20.00 | 20 | 18 |
Notes:
1. Statistics are length weighted.
2. % Metal Loss has been rounded to nearest whole number
Source: SLR (2022)
|
|
14.7.2 High Grade Restriction
The presence of isolated high grades within the various mineralized domains at Hammerdown present a risk of over estimation and grade smearing in areas where drill spacing is larger than the average 10 m spacing. These potential risks are only present at the extremities of the wireframes where the extrapolation distances between holes is farther. Accordingly, the search restriction for the mineralized domains was only applied for the third and fourth estimation passes using a restricted search radii of 80 m.
The various restriction thresholds presented in Table 14-10 were based on log probability plots and histograms, and calibrated based on visual review of estimated blocks. Examples of probability plot inflections can be seen at 90.00 g/t Au in Figure 14-5 and 25.00 g/t Au in Figure 14-7.
Table 14-10: Search Restriction Thresholds
| Zone | Group | Capping Value (g/t Au) |
Composite Search Restriction Threshold (g/t Au) |
Restricted Search Ellipse Size (m) |
| Wisteria | i01 | 25 | - | - |
| VS | 25 | 7.50 | 80 | |
| Hammerdown | Central | 170 | 90 | 80 |
| North | 115 | 50 | 80 | |
| South | 80 | 40 | 80 | |
| k03 | 80 | 40 | 80 | |
| m04 | 170 | 90 | 80 | |
| m06 | 250 | 90 | 80 | |
| m08 | 170 | 90 | 80 | |
| m09 | 170 | 90 | 80 | |
| o02 | 115 | 50 | 80 | |
| Rumbullion | Central | 55 | 25 | 80 |
| East | 65 | 10 | 80 | |
| North | 30 | 15 | 80 | |
| Northeast | 80 | 45 | 80 | |
| South | 90 | 50 | 80 | |
| rl02 | 90 | 50 | 80 | |
| rl03 | 90 | 50 | 80 | |
| rp01 | 55 | 25 | 80 | |
|
|
| Zone | Group | Capping Value (g/t Au) |
Composite Search Restriction Threshold (g/t Au) |
Restricted Search Ellipse Size (m) |
| Muddy Shag | - | 6 | 80 | |
| Interstitial | 20 | 10 | 80 |
Source: SLR (2022)
14.8 Compositing
SLR composited the capped assays to one metre, which corresponds to the next to largest sampling length for Hammerdown. Composites were weighted by length and unsampled core intervals were assigned a value of zero.
The full length of each drill hole will seldom be divisible into a whole number of intervals for the specified compositing length. As such residual segments will occur at the end of each drill hole and where there is data missing down the length of the drill hole. For all domains, composites with residual intervals less than 0.25 m were added to the previous interval. Composites with lengths greater than 0.25 m and less than one metre were retained.
Differences between the total assay lengths and the total composited lengths are primarily related to two separate drill hole sampling conditions:
1. Unsampled intervals that do not have down hole intervals entered in the database; and
2. A small number of unsnapped wireframe intercepts that passed through waste that was sampled using a sample interval larger than the one metre composite length.
In the latter condition, the assay length is not counted if the assay interval mid-point does not lie within the wireframe shape. Furthermore, snapping to the wider interval would have added both volume and created additional composite samples.
The basic statistics for the gold composites of each grouped domain are provided in Table 14-11. A comparison between raw assay and composite lengths for Hammerdown Central are shown in Figure 14-9.
|
|
Table 14-11: Composite Statistics (g/t Au)
| Zone | Group or Individual Vein |
Count | Length (m) |
Mean (g/t Au) |
Coefficient of Variation |
Minimum (g/t Au) |
Maximum (g/t Au) |
| Wisteria | i01 | 848 | 833.99 | 1.02 | 1.41 | 0.00 | 10.90 |
| VS | 411 | 395.06 | 0.84 | 2.23 | 0.00 | 25 | |
| Hammerdown | Central | 625 | 453.40 | 10.49 | 2.13 | 0.00 | 170 |
| North | 545 | 324.05 | 6.45 | 2.19 | 0.00 | 115 | |
| South | 283 | 212.06 | 5.74 | 2.28 | 0.00 | 80 | |
| k03 | 176 | 132.50 | 10.77 | 1.72 | 0.00 | 80 | |
| m04 | 182 | 139.95 | 7.80 | 2.36 | 0.00 | 170 | |
| m06 | 254 | 214.02 | 22.87 | 1.65 | 0.00 | 194.35 | |
| m08 | 371 | 314.51 | 10.50 | 2.11 | 0.00 | 170 | |
| m09 | 158 | 99.91 | 9.27 | 2.09 | 0.00 | 170 | |
| o02 | 122 | 71.18 | 13.75 | 1.64 | 0.00 | 115 | |
| Rumbullion | Central | 114 | 62.14 | 3.79 | 2.24 | 0.00 | 55 |
| East | 64 | 52.71 | 5.28 | 1.74 | 0.00 | 65 | |
| North | 303 | 172.28 | 2.92 | 1.94 | 0.00 | 30 | |
| Northeast | 364 | 232.95 | 7.31 | 1.60 | 0.00 | 80 | |
| South | 315 | 204.38 | 5.18 | 2.14 | 0.00 | 90 | |
| rl02 | 174 | 132.23 | 10.78 | 1.73 | 0.00 | 90 | |
| rl03 | 87 | 56.52 | 14.89 | 1.30 | 0.00 | 90 | |
| rp01 | 90 | 65.25 | 8.07 | 1.42 | 0.00 | 55 | |
| Muddy Shag | - | 50 | 38.64 | 2.54 | 0.95 | 0.00 | 12.70 |
| Interstitial | - | 75,473 | 74,430.92 | 0.02 | 9.26 | 0.00 | 17 |
Notes:
1. Statistics are length weighted.
Source: SLR (2022)
|
|
Figure 14-9: Comparison Between Raw Assay and Composite Lengths Rumbullion Central
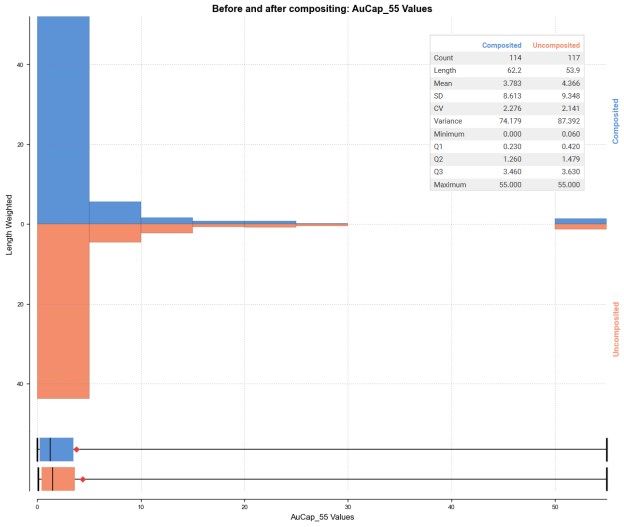
Source: SLR (2022)
As noted above, specific intervals from 82 holes were selectively excluded based on proximity to more recent drilling that was more thoroughly sampled. The proximity of the excluded intervals to newer holes that were more thoroughly sampled is typically 10 m or less.
|
|
14.9 Trend Analysis
14.9.1 Variography
SLR prepared variograms for gold using composites located within the nine largest individual vein domains. These nine domains represent the best supported mineralization based on drill hole spacing and grade continuity both along and across strike. As shown in Figure 14-10 for m08 and Figure 14-11 for m06, the ranges obtained in the major and semi-major orientations show a down plunge directional anisotropy. For individual vein domains within the Hammerdown zone, m08 represents the "higher-end" of observed anisotropy ratios, while m06 represents the "lower-end" of the range of observed anisotropy ratios.
Veins mapped at the Wisteria i01 domain during a 2020 surface mapping campaign show a Northwest-Southeast vein orientation. While grade trends within the Wisteria i01 domain were oriented East-West and steeply plunging to the North, parallel to the Captain Nemo fault. The grade trends within i01 implied anisotropy ratios of 2:1 between the major and semi-major axes and 1:1 between the semi-major and minor axes. The variograms within the Wisteria i01 domain showed relatively short ranges and 1:1 ratio between the major and semi-major axes along with a semi-major axis to minor axis ratio of 2:1. SLR chose to align the search ellipses based on the grade trends during grade estimation. SLR recommends that Maritime re-evaluate the grade trends at Wisteria as more information becomes available from drilling, trenching, and mapping.
Gold grades at Hammerdown were estimated using ID3, as such variogram ranges and anisotropy were not applied during estimation as they would be when using other estimation methods such as ordinary kriging. Variogram ranges were used to provide a guide for search ellipse dimensions and ranges. Variogram ranges were also considered as one of the resource classification criteria. Variogram parameters for m08 and m06 are provided in Table 14-12.
|
|
Figure 14-10: Gold Variogram Models - m08
|
Downhole |
|
|
|
|
|
Major Axis |
|
|
|
Semi-Major Axis |
|
|
|
|
|
Minor Axis |
|
|
|
|
Source: SLR (2022)
|
|
Figure 14-11: Gold Variogram Models -m06
|
Downhole |
|
|
|
|
|
Major Axis |
|
|
|
Semi-Major Axis |
|
|
|
|
|
Minor Axis |
|
|
|
|
Source: SLR (2022)
|
|
Table 14-12: Selected Hammerdown Gold Variograms
| Parameter | Units | m08: Variogram Model | m06: Variogram Model |
| Dip | Degrees (°) | 83.50 | 88.50 |
| Dip Azimuth | Degrees (°) | 175.50 | 184.00 |
| Pitch | Degrees (°) | 125.00 | 66.83 |
| Variance | γ(h) | 431.2 | 1338.74 |
| Nugget | γ(h) | 129.40 | 334.70 |
| Normalised Nugget | γ(h) | 0.30 | 0.25 |
| Structure | Spherical | Spherical | |
| Alpha | Axial Distance (h) | ||
| Major | Axial Distance (h) | 23.00 | 18 |
| Semi-Major | Axial Distance (h) | 26.00 | 18 |
| Minor | C0 | 1.50 | 1.50 |
| Sill | C0 | 226.90 | 722.90 |
| Normalised Sill | 0.53 | 0.54 | |
| Structure | Axial Distance (h) | Spherical | Spherical |
| Alpha | Axial Distance (h) | ||
| Major | Axial Distance (h) | 65.00 | 45.00 |
| Semi-Major | C0 | 40.00 | 35.00 |
| Minor | C0 | 3.00 | 8.00 |
| Sill | 159.00 | 508.70 | |
| Normalized Sill | 0.37 | 0.38 |
Notes:
1. γ(h) is the value of the variogram at distance h, where h is measured in metres.
2. The sill (C0) defines the upper limit of the model, the distance where there ceases to be any correlation between values.
3. The variance is the magnitude of the variance for the data set at the Sill.
4. The normalized sill represents the same information as the sill, but proportionally scaled to a range between 0 and 1, where 1 represents the data variance.
5. The nugget is measured as the value of the variogram at distance 0.
6. The normalized nugget is measured as the value of the variogram at distance 0.
Source: SLR (2022)
14.9.2 Grade Contouring
14.9.2.1 Hammerdown
SLR prepared grade and thickness contours for Hammerdown using composites located within the nine largest individual vein domains. These nine domains represent the best supported mineralization based on drill hole spacing and grade continuity both along and across strike. Grade and thickness contouring of the nine vein domains showed sub vertical high grade shoots within six of the nine domains. The three remaining vein domains showed moderate plunges to the North.
|
|
When compared to the grade contouring, the variography showed mixed results. The longest ranges obtained in the major and semi-major directions varied in orientation between moderately to steeply plunging to the West (m08 and m09) and moderately to steeply plunging to the East (m06 and o02). During estimation dynamic anisotropy used ellipses that were vertically plunging to better align with the trends observed in grade contouring. Historical stopes within the Hammerdown zone show plunges of 70° to the West. SLR is of the opinion that further refinements to the mineralized domains based on the historic stopes may yield more conclusive grade contours that more consistently match the moderate westward plunge of the historic stopes.
As presented in Figure 14-12 to Figure 14-14 for m06 and Figure 14-15 to Figure 14-17 for m09, the grade and thickness ranges in the major and semi-major orientations, obtained for parts of vein domains with grade x thickness contours greater than 5 g/t-m, are 150 m and 75 m, respectively, for m06, and 75 m and 40 m, respectively, for m09.
|
|
Figure 14-12: Gold Grade and Thickness Contours - m06 (Grade (g/t Au))
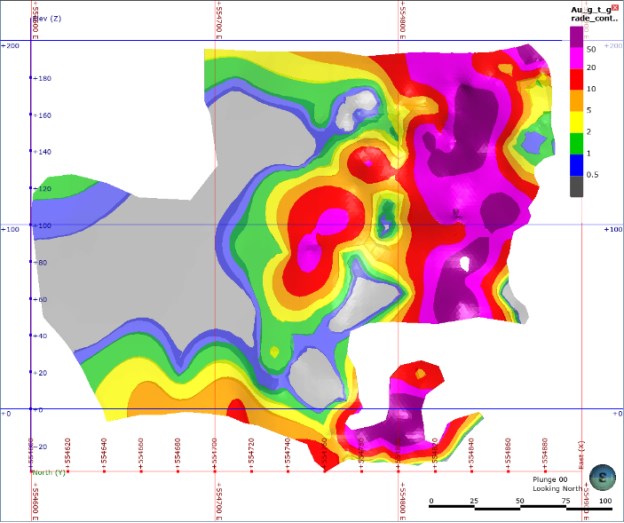
Source: SLR (2022)
|
|
Figure 14-13: Gold Grade and Thickness Contours - m06 (Thickness (m))
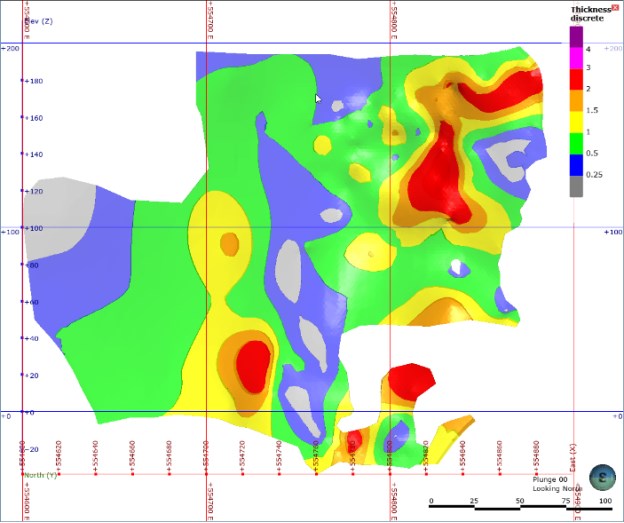
Source: SLR (2022)
|
|
Figure 14-14: Gold Grade and Thickness Contours - m06 (Grade x Thickness (g/t-m))
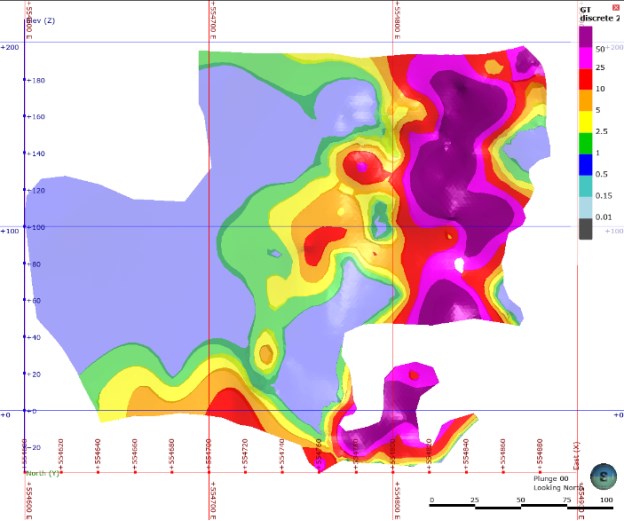
Source: SLR (2022)
|
|
Figure 14-15: Gold Grade and Thickness Contours - m09 (Grade (g/t Au))
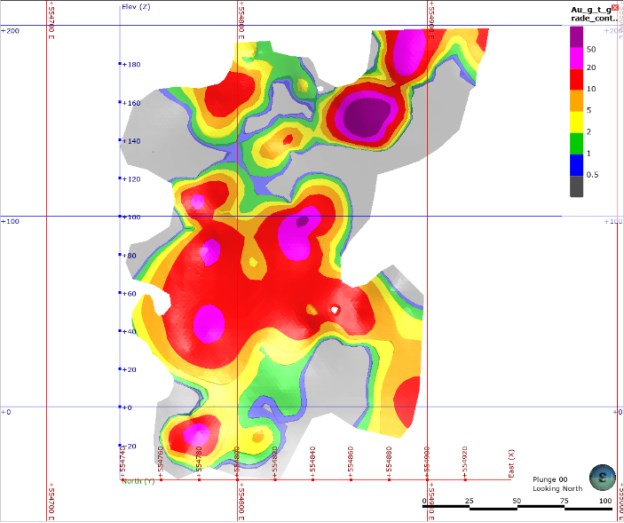
Source: SLR (2022)
|
|
Figure 14-16: Gold Grade and Thickness Contours - m09 (Thickness (m))
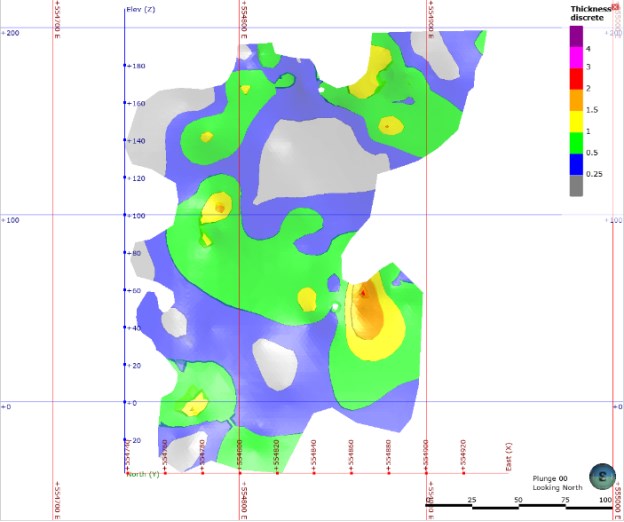
Source: SLR (2022)
|
|
Figure 14-17: Gold Grade and Thickness Contours - m09 (Grade x Thickness (g/t-m))
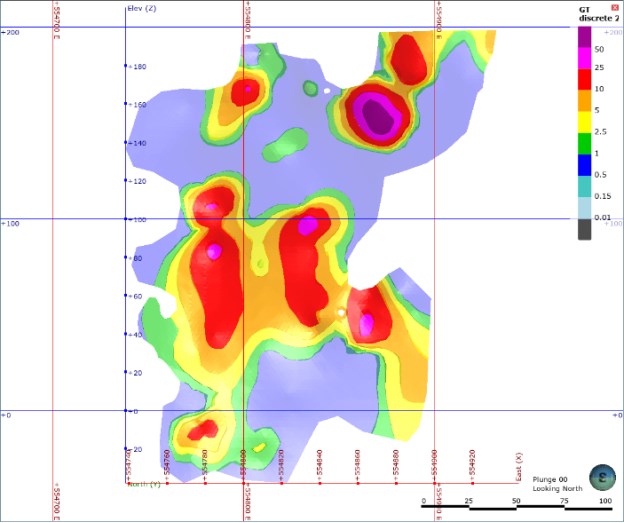
Source: SLR (2022)
14.10 Search Strategy and Grade Interpolation Parameters
Gold grades in the Muddy Shag, Wisteria, Hammerdown, and Rumbullion zones were interpolated using ID3. Variography ranges, grade contouring ranges, and drill hole spacing were used to determine the search ellipsoid orientation and dimensions. Search ellipsoids were oriented using a variable orientation object within Leapfrog EDGE that adjusts the search ellipse orientation based on hanging wall and footwall angles extracted from the mineralization wireframes.
|
|
Following statistical analysis and variography, SLR applied grade search restrictions to constrain high grade values and prevent unwanted smearing and artefacts in the third and/or fourth passes used for block grade interpolation in all grouped and individual Domains. The restriction thresholds varied on a domain by domain basis and were based on probability plots, histograms, and the observed extent of high grade areas that are well supported by drilling. The parameters were iteratively adjusted along with the search restriction threshold grades to achieve the desired continuity.
During estimation selected trend surfaces from the individual vein wireframes are used to guide the search ellipse orientation within the Interstitial area. The estimation of the Interstitial area is done using a hard boundary and grades from the neighboring individual and grouped domains do not influence grades within the Interstitial area. Regions of the Interstitial area where grades show continuity along multiple drill intercepts can be considered drilling targets and are potential candidates for future inclusion within vein wireframes.
Interpolation and search parameters used by SLR are summarized in Table 14-13.
|
|
Table 14-13: Interpolation and Search Ellipse Parameters
| Est | Domain | Pass | Ellipsoid Ranges (m) | Ellipsoid Directions Variable Orientation Domain Hanging Wall and Footwall or Dip / Azimuth / Pitch |
No. of Samples | Outlier Restrictions | Drill Hole Limit Max Samples per Hole |
|||||
| Max | Inter | Min | Min | Max | Method | Distance (m) |
Threshold (g/t Au) |
|||||
| ID3 | m04 | P1 | 30 | 15 | 2.5 | Hammerdown - m04 | 3 | 6 | 2 | |||
| ID3 | m04 | P2 | 60 | 30 | 5 | Hammerdown - m04 | 3 | 6 | 2 | |||
| ID3 | m04 | P3 | 120 | 60 | 10 | Hammerdown - m04 | 2 | 6 | Clamp | 80.00 | 90 | 2 |
| ID3 | m04 | P4 | 240 | 120 | 20 | Hammerdown - m04 | 2 | 6 | Clamp | 80.00 | 90 | 2 |
| ID3 | m06 | P1 | 30 | 15 | 2.5 | Hammerdown - m06 | 3 | 6 | 2 | |||
| ID3 | m06 | P2 | 60 | 30 | 5 | Hammerdown - m06 | 3 | 6 | 2 | |||
| ID3 | m06 | P3 | 120 | 60 | 10 | Hammerdown - m06 | 2 | 6 | Clamp | 80.00 | 90 | 2 |
| ID3 | m06 | P4 | 240 | 120 | 20 | Hammerdown - m06 | 2 | 6 | Clamp | 80.00 | 90 | 2 |
| ID3 | m08 | P1 | 30 | 15 | 2.5 | Hammerdown - m08 | 3 | 6 | 2 | |||
| ID3 | m08 | P2 | 60 | 30 | 5 | Hammerdown - m08 | 3 | 6 | 2 | |||
| ID3 | m08 | P3 | 120 | 60 | 10 | Hammerdown - m08 | 2 | 6 | Clamp | 80.00 | 90 | 2 |
| ID3 | m08 | P4 | 240 | 120 | 20 | Hammerdown - m08 | 2 | 6 | Clamp | 80.00 | 90 | 2 |
| ID3 | m09 | P1 | 30 | 15 | 2.5 | Hammerdown - m09 | 3 | 6 | 2 | |||
| ID3 | m09 | P2 | 60 | 30 | 5 | Hammerdown - m09 | 3 | 6 | 2 | |||
| ID3 | m09 | P3 | 120 | 60 | 10 | Hammerdown - m09 | 2 | 6 | Clamp | 80.00 | 90 | 2 |
| ID3 | m09 | P4 | 240 | 120 | 20 | Hammerdown - m09 | 2 | 6 | Clamp | 80.00 | 90 | 2 |
| ID3 | Hammerdown Central | P1 | 30 | 15 | 2.5 | Hammerdown Central | 3 | 6 | 2 | |||
| ID3 | Hammerdown Central | P2 | 60 | 30 | 5 | Hammerdown Central | 3 | 6 | 2 | |||
| ID3 | Hammerdown Central | P3 | 120 | 60 | 10 | Hammerdown Central | 2 | 6 | Clamp | 80.00 | 90 | 2 |
| ID3 | Hammerdown Central | P4 | 240 | 120 | 20 | Hammerdown Central | 2 | 6 | Clamp | 80.00 | 90 | 2 |
| ID3 | o02 | P1 | 30 | 15 | 2.5 | Hammerdown - o02 | 3 | 6 | 2 | |||
| ID3 | o02 | P2 | 60 | 30 | 5 | Hammerdown - o02 | 3 | 6 | 2 | |||
|
|
| Est | Domain | Pass | Ellipsoid Ranges (m) | Ellipsoid Directions Variable Orientation Domain Hanging Wall and Footwall or Dip / Azimuth / Pitch |
No. of Samples | Outlier Restrictions | Drill Hole Limit Max Samples per Hole |
|||||
| Max | Inter | Min | Min | Max | Method | Distance (m) |
Threshold (g/t Au) |
|||||
| ID3 | o02 | P3 | 120 | 60 | 10 | Hammerdown - o02 | 3 | 6 | Clamp | 80.00 | 50 | 2 |
| ID3 | o02 | P4 | 240 | 120 | 20 | Hammerdown - o02 | 3 | 6 | Clamp | 80.00 | 50 | 2 |
| ID3 | Hammerdown North | P1 | 30 | 15 | 2.5 | Hammerdown North | 3 | 6 | 2 | |||
| ID3 | Hammerdown North | P2 | 60 | 30 | 5 | Hammerdown North | 3 | 6 | 2 | |||
| ID3 | Hammerdown North | P3 | 120 | 60 | 10 | Hammerdown North | 2 | 6 | Clamp | 80.00 | 50 | 2 |
| ID3 | Hammerdown North | P4 | 240 | 120 | 20 | Hammerdown North | 2 | 6 | Clamp | 80.00 | 50 | 2 |
| ID3 | k03 | P1 | 30 | 15 | 2.5 | Hammerdown - k03 | 3 | 6 | 2 | |||
| ID3 | k03 | P2 | 60 | 30 | 5 | Hammerdown - k03 | 3 | 6 | 2 | |||
| ID3 | k03 | P3 | 120 | 60 | 10 | Hammerdown - k03 | 2 | 6 | Clamp | 80.00 | 40 | 2 |
| ID3 | k03 | P4 | 240 | 120 | 20 | Hammerdown - k03 | 2 | 6 | Clamp | 80.00 | 40 | 2 |
| ID3 | Hammerdown South | P1 | 30 | 15 | 2.5 | Hammerdown South | 3 | 6 | 2 | |||
| ID3 | Hammerdown South | P2 | 60 | 30 | 5 | Hammerdown South | 3 | 6 | 2 | |||
| ID3 | Hammerdown South | P3 | 120 | 60 | 10 | Hammerdown South | 2 | 6 | Clamp | 80.00 | 40 | 2 |
| ID3 | Hammerdown South | P4 | 240 | 120 | 20 | Hammerdown South | 2 | 6 | Clamp | 80.00 | 40 | 2 |
| ID3 | Muddy Shag | P1 | 30 | 15 | 2.5 | Muddy Shag | 3 | 6 | 2 | |||
| ID3 | Muddy Shag | P2 | 60 | 30 | 5 | Muddy Shag | 3 | 6 | 2 | |||
| ID3 | Muddy Shag | P3 | 120 | 60 | 10 | Muddy Shag | 2 | 6 | Clamp | 80.00 | 6 | 2 |
| ID3 | Muddy Shag | P4 | 240 | 120 | 20 | Muddy Shag | 2 | 6 | Clamp | 80.00 | 6 | 2 |
| ID3 | rp01 | P1 | 30 | 15 | 2.5 | Rumbullion - rp01 | 3 | 6 | 2 | |||
| ID3 | rp01 | P2 | 60 | 30 | 5 | Rumbullion - rp01 | 3 | 6 | 2 | |||
| ID3 | rp01 | P3 | 120 | 60 | 10 | Rumbullion - rp01 | 2 | 6 | Clamp | 80.00 | 25 | 2 |
| ID3 | rp01 | P4 | 240 | 120 | 20 | Rumbullion - rp01 | 2 | 6 | Clamp | 80.00 | 25 | 2 |
| ID3 | Rumbullion Central | P1 | 30 | 15 | 2.5 | Rumbullion Central | 3 | 6 | 2 | |||
|
|
| Est | Domain | Pass | Ellipsoid Ranges (m) | Ellipsoid Directions Variable Orientation Domain Hanging Wall and Footwall or Dip / Azimuth / Pitch |
No. of Samples | Outlier Restrictions | Drill Hole Limit Max Samples per Hole |
|||||
| Max | Inter | Min | Min | Max | Method | Distance (m) |
Threshold (g/t Au) |
|||||
| ID3 | Rumbullion Central | P2 | 60 | 30 | 5 | Rumbullion Central | 3 | 6 | 2 | |||
| ID3 | Rumbullion Central | P3 | 120 | 60 | 10 | Rumbullion Central | 2 | 6 | Clamp | 80.00 | 25 | 2 |
| ID3 | Rumbullion Central | P4 | 240 | 120 | 20 | Rumbullion Central | 2 | 6 | Clamp | 80.00 | 25 | 2 |
| ID3 | Rumbullion East | P1 | 30 | 15 | 2.5 | Rumbullion East | 3 | 6 | 2 | |||
| ID3 | Rumbullion East | P2 | 60 | 30 | 5 | Rumbullion East | 3 | 6 | 2 | |||
| ID3 | Rumbullion East | P3 | 120 | 60 | 10 | Rumbullion East | 2 | 6 | Clamp | 80.00 | 10 | 2 |
| ID3 | Rumbullion East | P4 | 240 | 120 | 20 | Rumbullion East | 2 | 6 | Clamp | 80.00 | 10 | 2 |
| ID3 | Rumbullion North | P1 | 30 | 15 | 2.5 | Rumbullion North | 3 | 6 | 2 | |||
| ID3 | Rumbullion North | P2 | 60 | 30 | 5 | Rumbullion North | 3 | 6 | 2 | |||
| ID3 | Rumbullion North | P3 | 120 | 60 | 10 | Rumbullion North | 2 | 6 | Clamp | 80.00 | 15 | 2 |
| ID3 | Rumbullion North | P4 | 240 | 120 | 20 | Rumbullion North | 1 | 6 | Clamp | 80.00 | 15 | 2 |
| ID3 | Rumbullion Northeast | P1 | 30 | 15 | 2.5 | Rumbullion Northeast | 3 | 6 | 2 | |||
| ID3 | Rumbullion Northeast | P2 | 60 | 30 | 5 | Rumbullion Northeast | 3 | 6 | 2 | |||
| ID3 | Rumbullion Northeast | P3 | 120 | 60 | 10 | Rumbullion Northeast | 2 | 6 | Clamp | 80.00 | 45 | 2 |
| ID3 | Rumbullion Northeast | P4 | 240 | 120 | 20 | Rumbullion Northeast | 2 | 6 | Clamp | 80.00 | 45 | 2 |
| ID3 | rl02 | P1 | 30 | 15 | 2.5 | Rumbullion - rl02 | 3 | 6 | 2 | |||
| ID3 | rl02 | P2 | 60 | 30 | 5 | Rumbullion - rl02 | 3 | 6 | 2 | |||
| ID3 | rl02 | P3 | 120 | 60 | 10 | Rumbullion - rl02 | 2 | 6 | Clamp | 80.00 | 50 | 2 |
| ID3 | rl02 | P4 | 240 | 120 | 20 | Rumbullion - rl02 | 2 | 6 | Clamp | 80.00 | 50 | 2 |
| ID3 | rl03 | P1 | 30 | 15 | 2.5 | Rumbullion - rl03 | 3 | 6 | 2 | |||
| ID3 | rl03 | P2 | 60 | 30 | 5 | Rumbullion - rl03 | 3 | 6 | 2 | |||
| ID3 | rl03 | P3 | 120 | 60 | 10 | Rumbullion - rl03 | 2 | 6 | Clamp | 80.00 | 50 | 2 |
| ID3 | rl03 | P4 | 240 | 120 | 20 | Rumbullion - rl03 | 2 | 6 | Clamp | 80.00 | 50 | 2 |
|
|
| Est | Domain | Pass | Ellipsoid Ranges (m) | Ellipsoid Directions Variable Orientation Domain Hanging Wall and Footwall or Dip / Azimuth / Pitch |
No. of Samples | Outlier Restrictions | Drill Hole Limit Max Samples per Hole |
|||||
| Max | Inter | Min | Min | Max | Method | Distance (m) |
Threshold (g/t Au) |
|||||
| ID3 | Rumbullion South | P1 | 30 | 15 | 2.5 | Rumbullion South | 3 | 6 | 2 | |||
| ID3 | Rumbullion South | P2 | 60 | 30 | 5 | Rumbullion South | 3 | 6 | 2 | |||
| ID3 | Rumbullion South | P3 | 120 | 60 | 10 | Rumbullion South | 2 | 6 | Clamp | 80.00 | 50 | 2 |
| ID3 | Rumbullion South | P4 | 240 | 120 | 20 | Rumbullion South | 2 | 6 | Clamp | 80.00 | 50 | 2 |
| ID3 | Unknown | P1 | 30 | 15 | 2.5 | Selected Veins | 3 | 6 | 2 | |||
| ID3 | Unknown | P2 | 60 | 30 | 5 | Selected Veins | 3 | 6 | 2 | |||
| ID3 | Unknown | P3 | 120 | 60 | 10 | Selected Veins | 2 | 6 | 2 | |||
| ID3 | Unknown | P4 | 240 | 120 | 20 | Selected Veins | 2 | 6 | Clamp | 80.00 | 10 | 2 |
| ID3 | Wisteria i01 | P1 | 30 | 15 | 15 | 72.50° / 355° / 90° | 4 | 9 | 3 | |||
| ID3 | Wisteria i01 | P2 | 60 | 30 | 30 | 72.50° / 355° / 90° | 4 | 9 | 3 | |||
| ID3 | Wisteria i01 | P3 | 120 | 60 | 60 | 72.50° / 355° / 90° | 3 | 9 | Clamp | 3 | ||
| ID3 | Wisteria i01 | P4 | 240 | 120 | 120 | 72.50° / 355° / 90° | 3 | 9 | Clamp | 3 | ||
| ID3 | Wisteria VS | P1 | 30 | 15 | 2.5 | Wisteria VS | 3 | 6 | 2 | |||
| ID3 | Wisteria VS | P2 | 60 | 30 | 5 | Wisteria VS | 3 | 6 | 2 | |||
| ID3 | Wisteria VS | P3 | 120 | 60 | 10 | Wisteria VS | 2 | 6 | Clamp | 80.00 | 7.5 | 2 |
| ID3 | Wisteria VS | P4 | 240 | 120 | 20 | Wisteria VS | 2 | 6 | Clamp | 80.00 | 7.5 | 2 |
Source: SLR (2022)
|
|
14.11 Bulk Density
A bulk density value of 2.84 t/m3 was used for rock material in the Mineral Resource estimate. The bulk density value is the same as the value used in previous estimates and is based on the results from 20 specific gravity measurements collected by Lakefield Research (Kant et. al., 1994; Jackman and Biggs, 1994).
SLR recommends that Maritime continue to collect specific gravity measurements from the various rock types and grade distributions to ensure that the specific gravity value of 2.84 continues to be representative of all zones and mineralization types.
A bulk density value of 1.90 t/m3 was used for mined out stopes and development in the Mineral Resource estimate for Hammerdown that have been backfilled.
At the Hammerdown site, overburden has been removed in most pit areas based on previous mining and development activities.
14.12 Block Models
The individual wireframes comprising the grouped domains were filled with blocks in Leapfrog EDGE. The block model was sub-celled at wireframe boundaries including topography with parent cells measuring 2.5 m by 1.0 m by 2.5 m and minimum sub-cell sizes of 0.15625 m by 0.0625 m by 1.25 m. The block model setup is given in Table 14-14.
Table 14-14: Block Model Definition
|
Parameter |
X |
Y |
Z |
|
Origin (m) |
554,335.00 |
5,488,800.00 |
230.00 |
|
Parent Block Size (m) |
2.5 |
1 |
2.5 |
|
Size in Blocks |
502 |
570 |
138 |
|
Sub-block Count |
16 |
16 |
2 |
|
Sub-Block Size (m) |
0.15625 |
0.0625 |
1.25 |
14.13 Cut-off Grade and Whittle Parameters
Metal prices used for reserves are based on consensus, long term forecasts from banks, financial institutions, and other sources. For resources, metal prices used are slightly higher than those for reserves.
|
|
14.13.1 Cut-Off Grade
Cut-off grades were calculated for an open pit production scenario. Gold grades were used as the basis for the cut-off grades and pit shell optimizations constraints.
SLR has not reviewed the potential value contribution of silver to the economic value of the Hammerdown deposit. The drill hole dataset for silver is not as comprehensive as the gold dataset and there are several drill holes missing silver assay data. In SLR's opinion, excluding silver in the economic assumptions to calculate the cut-off grade does not materially impact the results of the optimization scenarios.
Metal prices used for Mineral Resources are based on consensus, long term forecasts from banks, financial institutions, and other sources. The operating costs assumptions were sourced from comparable open pit and underground projects in Canada. Cut-off grades of 0.50 g/t Au and 2.00 g/t Au were calculated for the reporting of Mineral Resources for open pit and underground, respectively. A list of key assumptions is presented in Table 14-15.
Table 14-15: Cut-Off Grade Parameters
| Inputs | Units | Open Pit | Underground |
| Au Recovery | % | 97 | 97 |
| Exchange Rate | US$:C$ | 0.75 | 0.75 |
| Au Price | US$/oz | 1,800 | 1,800 |
| Selling Costs | US$/oz | 5.00 | 5.00 |
| Operating Costs | |||
| Mining (Open Pit) | US$/t moved | 3.00 | |
| Mining (Underground) | US$/t milled | 75.00 | |
| Processing | US$/t milled | 22.50 | 22.50 |
| G&A | US$/t milled | 5.63 | 5.63 |
| Cut-Off Grade | g/t Au | 0.50 (Pit Discard) | 2.00 (Break-Even) |
14.13.2 Pit shell Optimization
To fulfill the CIM requirement of "reasonable prospects for eventual economic extraction" (RPEEE) for an open pit mining method, SLR prepared a preliminary open pit shell for the Hammerdown deposit to constrain the block model for Mineral Resource reporting purposes.
SLR generated optimized pit shells using the Lerchs-Grossman optimization method in Whittle as constraints for the preparation of Mineral Resource estimates. The pit shells were run on a regularized model, with blocks measuring 2.5 m by 1.0 m by 2.5 m. The optimization used pit slope angles of 50° in rock. The input parameters are presented in Table 14-16.
|
|
Table 14-16: Open Pit Optimization Inputs
| Inputs | Units | |
| Slope Angles | ° | 50 |
| Process Recovery | % | 97% |
| Mining Costs | $/t moved | 3.00 |
| Processing Cost | $/t milled | 22.50 |
| G&A | $/t milled | 5.63 |
| Au Price | US$/oz | 1,800.00 |
| Exchange Rate | US: CAD$ | 0.75 |
| Selling Cost | $/oz | 5.00 |
| Royalties | % | 1 |
| Royalties | $/oz | 16.50 |
14.13.3 Underground Constraining Shapes
To fulfill the CIM requirement of RPEEE for an underground mining method, SLR considered a minimum horizontal width requirement of 1.0 m. This was achieved by re-blocking the sub-blocked model to the parent block size of 2.5 m x 1.0 m x 2.5 m.
The grade continuity of the mineralization was also considered in fulfilling the CIM requirement of RPEEE. Only those parent sized blocks above the 2.00 g/t Au cut-off grade that exhibited good spatial continuity were selected for reporting. The selection of groups of contiguous blocks above the 2.00 g/t Au cut-off grade was achieved by constructing constraining volumes that prohibit the reporting of isolated blocks with limited spatial continuity.
14.14 Classification
Definitions for Resource categories used in this report are consistent with those defined by CIM (2014) and adopted by NI 43-101. In the CIM classification, a Mineral Resource is defined as "a concentration or occurrence of solid material of economic interest in or on the Earth's crust in such form, grade or quality and quantity that there are reasonable prospects for eventual economic extraction". Mineral Resources are classified into Measured, Indicated, and Inferred categories. A Mineral Reserve is defined as the "economically mineable part of a Measured and/or Indicated Mineral Resource" demonstrated by studies at Pre-Feasibility or Feasibility level, as appropriate. Mineral Reserves are classified into Proven and Probable categories.
A range of criteria were used in determining an appropriate Mineral Resource classification including:
• Drill hole spacing;
|
|
• Geological continuity and reasonableness of the interpreted mineralized model;
• Proximity to historical stopes and development;
• Geostatistical spatial continuity; and
• Grade contour trends.
Table 14-17 provides an overview of the basic statistics for grade, minimum distance of a block to the closest sample, and the average distance of samples to the estimated block for the Hammerdown deposit. Overall, grades are notably higher in the blocks classified as Measured and Indicated. Blocks classified as Measured also show average distances to the informing samples and minimum block distances to the closest sample that are typically half of those observed in the blocks classified as Indicated. Similarly, the blocks classified as Inferred show average distances to the informing samples and minimum block distances to the closest sample that are typically double the distances observed in the blocks classified as Indicated.
|
|
Table 14-17: Classification Volume Weighted Statistics
| Domain | Classification Category |
Attribute | Volume (m3) |
Mean | Minimum | Lower Quartile |
Median | Upper Quartile |
Maximum |
| Hammerdown Central | Measured | MinDist (m) | 17,677 | 4.41 | 0.21 | 2.94 | 4.38 | 5.78 | 26.68 |
| AvgDist (m) | 17,677 | 9.59 | 1.97 | 7.67 | 9.30 | 11.03 | 35.01 | ||
| Au (g/t) | 17,677 | 12.71 | 0.00 | 2.51 | 5.83 | 13.97 | 169.93 | ||
| Indicated | MinDist (m) | 58,999 | 9.90 | 0.21 | 6.25 | 9.22 | 13.03 | 39.93 | |
| AvgDist (m) | 58,999 | 17.82 | 1.82 | 11.94 | 16.10 | 22.02 | 74.47 | ||
| Au (g/t) | 58,999 | 8.30 | 0.00 | 0.76 | 2.90 | 8.36 | 169.93 | ||
| Inferred | MinDist (m) | 12,805 | 22.29 | 0.63 | 17.57 | 22.29 | 26.96 | 44.92 | |
| AvgDist (m) | 12,805 | 36.34 | 13.35 | 28.04 | 34.65 | 43.60 | 77.27 | ||
| Au (g/t) | 12,805 | 1.75 | 0.00 | 0.50 | 0.72 | 1.29 | 30.48 | ||
| Hammerdown North | Measured | MinDist (m) | 8,862 | 4.65 | 0.10 | 3.09 | 4.60 | 6.02 | 14.93 |
| AvgDist (m) | 8,862 | 10.86 | 1.99 | 8.57 | 10.52 | 12.53 | 39.15 | ||
| Au (g/t) | 8,862 | 7.98 | 0.00 | 1.58 | 3.70 | 8.81 | 114.61 | ||
| Indicated | MinDist (m) | 57,703 | 9.50 | 0.10 | 5.96 | 8.92 | 12.40 | 41.85 | |
| AvgDist (m) | 57,703 | 18.01 | 1.46 | 12.53 | 16.87 | 22.70 | 59.39 | ||
| Au (g/t) | 57,703 | 6.21 | 0.00 | 0.96 | 2.79 | 7.04 | 114.92 | ||
| Inferred | MinDist (m) | 8,252 | 20.61 | 0.94 | 14.41 | 19.68 | 25.46 | 64.18 | |
| AvgDist (m) | 8,252 | 39.19 | 8.79 | 26.37 | 39.23 | 50.89 | 84.18 | ||
| Au (g/t) | 8,252 | 4.80 | 0.00 | 1.95 | 3.77 | 8.63 | 20.45 | ||
| Hammerdown South | Measured | MinDist (m) | 7,983 | 4.62 | 0.17 | 3.04 | 4.56 | 6.03 | 16.10 |
| AvgDist (m) | 7,983 | 9.66 | 1.68 | 7.69 | 9.72 | 11.50 | 26.99 | ||
| Au (g/t) | 7,983 | 8.45 | 0.00 | 1.61 | 4.07 | 11.10 | 74.64 | ||
| Indicated | MinDist (m) | 25,227 | 10.15 | 0.15 | 5.98 | 9.04 | 13.27 | 45.06 | |
| AvgDist (m) | 25,227 | 18.10 | 1.68 | 11.25 | 15.29 | 23.23 | 65.45 |
|
|
| Domain | Classification Category |
Attribute | Volume (m3) |
Mean | Minimum | Lower Quartile |
Median | Upper Quartile |
Maximum |
| Au (g/t) | 25,227 | 4.24 | 0.00 | 0.86 | 1.89 | 4.15 | 79.47 | ||
| Inferred | MinDist (m) | 697 | 21.64 | 12.20 | 17.76 | 20.71 | 24.03 | 48.87 | |
| AvgDist (m) | 697 | 39.39 | 20.81 | 33.20 | 41.30 | 44.84 | 58.30 | ||
| Au (g/t) | 697 | 2.90 | 0.28 | 1.10 | 2.24 | 4.50 | 9.33 | ||
| Hammerdown - k03 | Measured | MinDist (m) | 7,117 | 4.46 | 0.33 | 2.94 | 4.39 | 5.85 | 11.76 |
| AvgDist (m) | 7,117 | 9.48 | 2.53 | 7.42 | 9.52 | 11.28 | 30.15 | ||
| Au (g/t) | 7,117 | 15.45 | 0.00 | 3.87 | 9.87 | 22.04 | 79.06 | ||
| Indicated | MinDist (m) | 12,723 | 9.88 | 0.33 | 6.49 | 9.12 | 12.33 | 37.84 | |
| AvgDist (m) | 12,723 | 17.38 | 2.53 | 11.61 | 14.73 | 20.87 | 62.76 | ||
| Au (g/t) | 12,723 | 7.66 | 0.00 | 0.87 | 2.69 | 9.87 | 79.06 | ||
| Inferred | MinDist (m) | 109 | 19.20 | 9.18 | 18.28 | 19.18 | 20.98 | 24.10 | |
| AvgDist (m) | 109 | 32.33 | 15.47 | 26.69 | 34.34 | 36.37 | 58.77 | ||
| Au (g/t) | 109 | 0.79 | 0.00 | 0.31 | 1.02 | 1.21 | 1.25 | ||
| Hammerdown - m04 | Measured | MinDist (m) | 7,400 | 4.49 | 0.14 | 2.96 | 4.44 | 5.96 | 11.88 |
| AvgDist (m) | 7,400 | 9.37 | 1.18 | 7.54 | 9.23 | 11.02 | 26.46 | ||
| Au (g/t) | 7,400 | 9.82 | 0.00 | 1.32 | 2.86 | 8.92 | 144.57 | ||
| Indicated | MinDist (m) | 13,697 | 10.46 | 0.22 | 6.90 | 9.61 | 13.37 | 31.05 | |
| AvgDist (m) | 13,697 | 17.79 | 2.02 | 12.44 | 15.69 | 21.96 | 49.08 | ||
| Au (g/t) | 13,697 | 7.52 | 0.00 | 0.55 | 2.74 | 9.43 | 144.20 | ||
| Inferred | MinDist (m) | 2,674 | 29.25 | 0.46 | 18.45 | 26.54 | 39.42 | 70.67 | |
| AvgDist (m) | 2,674 | 46.30 | 7.87 | 34.65 | 44.56 | 54.78 | 89.99 | ||
| Au (g/t) | 2,674 | 0.56 | 0.00 | 0.32 | 0.49 | 0.86 | 1.04 | ||
| Hammerdown - m06 | Measured | MinDist (m) | 15,743 | 5.51 | 3.00 | 5.00 | 6.00 | 6.00 | 6.00 |
| AvgDist (m) | 15,743 | 5.07 | 0.21 | 3.27 | 4.97 | 6.58 | 15.24 | ||
| Au (g/t) | 15,743 | 10.33 | 1.60 | 8.05 | 9.82 | 11.93 | 35.91 |
|
|
| Domain | Classification Category |
Attribute | Volume (m3) |
Mean | Minimum | Lower Quartile |
Median | Upper Quartile |
Maximum |
| Indicated | MinDist (m) | 15,743 | 29.80 | 0.01 | 4.26 | 18.83 | 46.94 | 190.87 | |
| AvgDist (m) | 19,382 | 11.58 | 0.27 | 7.71 | 10.73 | 14.67 | 34.27 | ||
| Au (g/t) | 19,382 | 19.53 | 2.45 | 13.37 | 18.94 | 24.75 | 49.72 | ||
| Inferred | MinDist (m) | 19,382 | 9.26 | 0.00 | 0.51 | 1.76 | 7.13 | 190.87 | |
| AvgDist (m) | 8,584 | 21.71 | 0.98 | 16.05 | 21.19 | 26.78 | 47.30 | ||
| Au (g/t) | 8,584 | 40.56 | 15.99 | 29.34 | 39.22 | 49.97 | 94.39 | ||
| Hammerdown - m08 | Measured | MinDist (m) | 19,828 | 4.71 | 0.17 | 3.22 | 4.71 | 6.13 | 12.57 |
| AvgDist (m) | 19,828 | 9.65 | 1.27 | 7.93 | 9.29 | 11.05 | 30.16 | ||
| Au (g/t) | 19,828 | 11.26 | 0.00 | 1.86 | 5.04 | 13.25 | 144.48 | ||
| Indicated | MinDist (m) | 36,884 | 10.13 | 0.17 | 6.91 | 9.75 | 13.03 | 32.73 | |
| AvgDist (m) | 36,884 | 16.85 | 1.27 | 12.00 | 15.63 | 20.45 | 64.25 | ||
| Au (g/t) | 36,884 | 10.27 | 0.00 | 1.47 | 5.69 | 13.21 | 123.27 | ||
| Inferred | MinDist (m) | 1,525 | 21.69 | 1.10 | 17.97 | 21.89 | 25.90 | 41.71 | |
| AvgDist (m) | 1,525 | 37.55 | 4.45 | 30.76 | 35.86 | 42.54 | 65.03 | ||
| Au (g/t) | 1,525 | 1.58 | 0.48 | 0.60 | 0.81 | 1.99 | 6.90 | ||
| Hammerdown - m09 | Measured | MinDist (m) | 6,233 | 4.52 | 0.18 | 3.06 | 4.47 | 5.87 | 19.23 |
| AvgDist (m) | 6,233 | 10.47 | 3.91 | 8.46 | 9.91 | 11.54 | 32.02 | ||
| Au (g/t) | 6,233 | 13.16 | 0.01 | 2.18 | 7.99 | 17.12 | 169.30 | ||
| Indicated | MinDist (m) | 9,315 | 10.47 | 0.22 | 6.83 | 9.81 | 13.73 | 25.64 | |
| AvgDist (m) | 9,315 | 18.71 | 3.46 | 12.67 | 17.45 | 24.66 | 49.74 | ||
| Au (g/t) | 9,315 | 7.87 | 0.00 | 1.33 | 4.56 | 11.01 | 169.30 | ||
| Inferred | MinDist (m) | - | - | - | - | - | - | - | |
| AvgDist (m) | - | - | - | - | - | - | - | ||
| Au (g/t) | - | - | - | - | - | - | - | ||
| Hammerdown - o02 | Measured | MinDist (m) | 4,588 | 4.69 | 0.47 | 3.19 | 4.65 | 6.08 | 12.05 |
|
|
| Domain | Classification Category |
Attribute | Volume (m3) |
Mean | Minimum | Lower Quartile |
Median | Upper Quartile |
Maximum |
| AvgDist (m) | 4,588 | 11.22 | 2.64 | 9.25 | 10.86 | 12.72 | 28.93 | ||
| Au (g/t) | 4,588 | 16.58 | 0.02 | 3.26 | 8.43 | 22.24 | 114.63 | ||
| Indicated | MinDist (m) | 9,119 | 9.52 | 0.41 | 6.57 | 8.97 | 11.93 | 29.08 | |
| AvgDist (m) | 9,119 | 19.26 | 2.64 | 12.89 | 16.37 | 23.58 | 65.51 | ||
| Au (g/t) | 9,119 | 13.10 | 0.00 | 3.16 | 7.29 | 16.40 | 114.92 | ||
| Inferred | MinDist (m) | 90 | 23.18 | 13.64 | 18.95 | 22.48 | 27.13 | 37.03 | |
| AvgDist (m) | 90 | 42.00 | 22.90 | 39.71 | 42.99 | 45.96 | 56.16 | ||
| Au (g/t) | 90 | 1.85 | 1.32 | 1.51 | 1.66 | 1.99 | 4.05 | ||
| Rumbullion Central | Measured | MinDist (m) | 967 | 4.43 | 0.39 | 3.13 | 4.47 | 5.80 | 10.42 |
| AvgDist (m) | 967 | 12.01 | 3.47 | 8.75 | 10.25 | 13.99 | 28.70 | ||
| Au (g/t) | 967 | 4.68 | 0.16 | 0.79 | 2.27 | 4.89 | 54.44 | ||
| Indicated | MinDist (m) | 19,588 | 10.67 | 0.21 | 6.57 | 9.89 | 13.65 | 42.67 | |
| AvgDist (m) | 19,588 | 20.88 | 2.99 | 14.00 | 19.08 | 25.36 | 74.37 | ||
| Au (g/t) | 19,588 | 3.93 | 0.00 | 1.06 | 2.23 | 4.60 | 54.66 | ||
| Inferred | MinDist (m) | 2,545 | 30.46 | 0.71 | 19.74 | 29.80 | 39.61 | 76.20 | |
| AvgDist (m) | 2,545 | 51.75 | 18.17 | 39.54 | 52.06 | 62.32 | 90.66 | ||
| Au (g/t) | 2,545 | 3.46 | 0.25 | 1.87 | 3.40 | 4.64 | 10.05 | ||
| Rumbullion East | Measured | MinDist (m) | - | - | - | - | - | - | - |
| AvgDist (m) | - | - | - | - | - | - | - | ||
| Au (g/t) | - | - | - | - | - | - | - | ||
| Indicated | MinDist (m) | 11,046 | 10.45 | 0.31 | 5.71 | 9.02 | 13.07 | 65.79 | |
| AvgDist (m) | 11,046 | 17.67 | 2.81 | 11.30 | 16.10 | 21.74 | 70.72 | ||
| Au (g/t) | 11,046 | 5.03 | 0.00 | 1.54 | 2.67 | 6.80 | 32.20 | ||
| Inferred | MinDist (m) | 1,736 | 22.15 | 12.69 | 17.90 | 20.97 | 24.92 | 61.56 | |
| AvgDist (m) | 1,736 | 29.08 | 14.77 | 22.58 | 27.29 | 34.03 | 68.74 |
|
|
| Domain | Classification Category |
Attribute | Volume (m3) |
Mean | Minimum | Lower Quartile |
Median | Upper Quartile |
Maximum |
| Au (g/t) | 1,736 | 3.54 | 0.36 | 1.88 | 2.20 | 6.04 | 10.73 | ||
| Rumbullion North | Measured | MinDist (m) | 2,374 | 4.52 | 0.31 | 3.05 | 4.50 | 5.90 | 10.94 |
| AvgDist (m) | 2,374 | 11.10 | 1.74 | 8.39 | 10.19 | 13.05 | 29.26 | ||
| Au (g/t) | 2,374 | 2.40 | 0.00 | 0.83 | 1.70 | 2.95 | 18.79 | ||
| Indicated | MinDist (m) | 51,978 | 10.95 | 0.18 | 6.95 | 10.39 | 14.13 | 37.27 | |
| AvgDist (m) | 51,978 | 21.02 | 1.74 | 14.60 | 20.12 | 25.81 | 68.32 | ||
| Au (g/t) | 51,978 | 3.60 | 0.00 | 0.67 | 1.67 | 4.46 | 30.00 | ||
| Inferred | MinDist (m) | 40,569 | 28.33 | 0.49 | 18.69 | 26.10 | 35.69 | 97.02 | |
| AvgDist (m) | 40,569 | 50.60 | 2.77 | 36.07 | 49.57 | 62.36 | 119.45 | ||
| Au (g/t) | 40,569 | 3.14 | 0.00 | 0.74 | 1.38 | 4.07 | 27.17 | ||
| Rumbullion Northeast | Measured | MinDist (m) | 8,018 | 4.88 | 0.09 | 3.28 | 4.79 | 6.37 | 15.50 |
| AvgDist (m) | 8,018 | 10.99 | 2.43 | 8.98 | 10.79 | 12.75 | 40.00 | ||
| Au (g/t) | 8,018 | 11.12 | 0.09 | 3.74 | 7.92 | 16.36 | 71.50 | ||
| Indicated | MinDist (m) | 38,126 | 9.38 | 0.05 | 5.82 | 8.61 | 11.91 | 43.64 | |
| AvgDist (m) | 38,126 | 18.08 | 2.43 | 12.23 | 15.81 | 22.88 | 64.24 | ||
| Au (g/t) | 38,126 | 5.68 | 0.00 | 0.96 | 2.63 | 7.08 | 79.83 | ||
| Inferred | MinDist (m) | 9,201 | 20.18 | 0.30 | 14.79 | 19.80 | 25.47 | 62.22 | |
| AvgDist (m) | 9,201 | 37.39 | 9.92 | 28.88 | 35.70 | 43.13 | 88.46 | ||
| Au (g/t) | 9,201 | 3.90 | 0.01 | 0.94 | 1.94 | 4.41 | 45.33 | ||
| Rumbullion South | Measured | MinDist (m) | 6,783 | 4.36 | 0.27 | 3.01 | 4.35 | 5.67 | 12.43 |
| AvgDist (m) | 6,783 | 10.84 | 3.74 | 8.82 | 10.54 | 12.28 | 30.16 | ||
| Au (g/t) | 6,783 | 6.79 | 0.01 | 1.12 | 2.36 | 6.66 | 89.14 | ||
| Indicated | MinDist (m) | 37,117 | 9.95 | 0.06 | 5.99 | 8.94 | 12.81 | 43.69 | |
| AvgDist (m) | 37,117 | 19.99 | 1.26 | 12.63 | 17.27 | 25.36 | 68.89 | ||
| Au (g/t) | 37,117 | 4.50 | 0.00 | 1.00 | 2.11 | 5.43 | 89.14 |
|
|
| Domain | Classification Category |
Attribute | Volume (m3) |
Mean | Minimum | Lower Quartile |
Median | Upper Quartile |
Maximum |
| Inferred | MinDist (m) | 4,002 | 29.85 | 11.92 | 21.84 | 28.10 | 36.78 | 62.52 | |
| AvgDist (m) | 4,002 | 48.48 | 15.09 | 40.44 | 48.62 | 58.30 | 81.58 | ||
| Au (g/t) | 4,002 | 4.41 | 0.00 | 1.84 | 2.84 | 3.23 | 46.84 | ||
| Rumbullion rl02 | Measured | MinDist (m) | 9,482 | 4.68 | 0.26 | 3.16 | 4.63 | 6.03 | 12.54 |
| AvgDist (m) | 9,482 | 10.03 | 3.92 | 8.26 | 9.94 | 11.62 | 20.98 | ||
| Au (g/t) | 9,482 | 12.96 | 0.01 | 3.09 | 8.17 | 17.64 | 89.25 | ||
| Indicated | MinDist (m) | 12,245 | 10.11 | 0.27 | 6.64 | 9.30 | 12.74 | 37.08 | |
| AvgDist (m) | 12,245 | 16.79 | 4.62 | 12.46 | 14.99 | 19.72 | 48.63 | ||
| Au (g/t) | 12,245 | 8.67 | 0.00 | 1.03 | 3.82 | 13.11 | 88.89 | ||
| Inferred | MinDist (m) | 1,703 | 15.49 | 0.38 | 9.01 | 14.51 | 20.72 | 39.64 | |
| AvgDist (m) | 1,703 | 24.46 | 7.41 | 17.06 | 24.87 | 30.61 | 52.46 | ||
| Au (g/t) | 1,703 | 2.02 | 0.00 | 0.12 | 0.35 | 3.16 | 11.60 | ||
| Rumbullion rl03 | Measured | MinDist (m) | 4,745 | 4.87 | 0.26 | 3.34 | 4.78 | 6.34 | 11.93 |
| AvgDist (m) | 4,745 | 10.68 | 4.15 | 9.19 | 10.46 | 11.96 | 24.01 | ||
| Au (g/t) | 4,745 | 18.05 | 0.01 | 7.81 | 14.70 | 22.33 | 89.24 | ||
| Indicated | MinDist (m) | 4,643 | 10.10 | 0.28 | 7.09 | 9.39 | 12.36 | 34.07 | |
| AvgDist (m) | 4,643 | 16.56 | 4.15 | 12.31 | 15.27 | 19.84 | 45.85 | ||
| Au (g/t) | 4,643 | 13.90 | 0.00 | 4.46 | 9.01 | 18.37 | 77.02 | ||
| Inferred | MinDist (m) | - | - | - | - | - | - | - | |
| AvgDist (m) | - | - | - | - | - | - | - | ||
| Au (g/t) | - | - | - | - | - | - | - | ||
| Rumbullion rp01 | Measured | MinDist (m) | 3,222 | 4.51 | 0.47 | 3.06 | 4.48 | 5.91 | 11.25 |
| AvgDist (m) | 3,222 | 9.99 | 2.97 | 8.03 | 9.89 | 11.45 | 25.86 | ||
| Au (g/t) | 3,222 | 11.50 | 0.20 | 3.77 | 8.91 | 16.43 | 54.95 | ||
| Indicated | MinDist (m) | 14,672 | 10.35 | 0.46 | 6.86 | 10.03 | 13.44 | 31.49 |
|
|
| Domain | Classification Category |
Attribute | Volume (m3) |
Mean | Minimum | Lower Quartile |
Median | Upper Quartile |
Maximum |
| AvgDist (m) | 14,672 | 19.32 | 3.54 | 13.48 | 18.05 | 23.51 | 62.97 | ||
| Au (g/t) | 14,672 | 7.08 | 0.01 | 1.63 | 3.53 | 8.76 | 54.95 | ||
| Inferred | MinDist (m) | 2,468 | 24.51 | 1.16 | 19.72 | 24.54 | 29.42 | 44.59 | |
| AvgDist (m) | 2,468 | 50.72 | 18.43 | 34.72 | 51.62 | 63.48 | 87.84 | ||
| Au (g/t) | 2,468 | 2.90 | 0.79 | 1.33 | 1.95 | 4.32 | 11.38 | ||
| Muddy Shag | Measured | MinDist (m) | - | - | - | - | - | - | - |
| AvgDist (m) | - | - | - | - | - | - | - | ||
| Au (g/t) | - | - | - | - | - | - | - | ||
| Indicated | MinDist (m) | - | - | - | - | - | - | - | |
| AvgDist (m) | - | - | - | - | - | - | - | ||
| Au (g/t) | - | - | - | - | - | - | - | ||
| Inferred | MinDist (m) | 52,076 | 19.34 | 0.46 | 12.69 | 18.93 | 25.09 | 58.09 | |
| AvgDist (m) | 52,076 | 33.14 | 1.60 | 24.45 | 33.33 | 41.40 | 96.47 | ||
| Au (g/t) | 52,076 | 2.17 | 0.12 | 1.22 | 1.74 | 2.51 | 12.70 | ||
| Wisteria - i01 | Measured | MinDist (m) | - | - | - | - | - | - | - |
| AvgDist (m) | - | - | - | - | - | - | - | ||
| Au (g/t) | - | - | - | - | - | - | - | ||
| Indicated | MinDist (m) | 166,540 | 9.15 | 0.12 | 5.11 | 8.03 | 11.87 | 36.84 | |
| AvgDist (m) | 166,540 | 15.13 | 1.45 | 10.17 | 13.22 | 17.55 | 46.02 | ||
| Au (g/t) | 166,540 | 0.95 | 0.00 | 0.42 | 0.76 | 1.23 | 8.04 | ||
| Inferred | MinDist (m) | - | - | - | - | - | - | - | |
| AvgDist (m) | - | - | - | - | - | - | - | ||
| Au (g/t) | - | - | - | - | - | - | - | ||
| Wisteria VS | Measured | MinDist (m) | - | - | - | - | - | - | - |
| AvgDist (m) | - | - | - | - | - | - | - |
|
|
| Domain | Classification Category |
Attribute | Volume (m3) |
Mean | Minimum | Lower Quartile | Median | Upper Quartile | Maximum |
| Au (g/t) | - | - | - | - | - | - | - | ||
| Indicated | MinDist (m) | 108,846 | 10.83 | 0.12 | 6.39 | 9.88 | 14.27 | 48.19 | |
| AvgDist (m) | 108,846 | 17.06 | 2.48 | 11.51 | 15.59 | 21.54 | 52.54 | ||
| Au (g/t) | 108,846 | 0.98 | 0.00 | 0.30 | 0.51 | 1.03 | 24.96 | ||
| Inferred | MinDist (m) | 10,415 | 26.44 | 0.88 | 19.20 | 25.14 | 33.56 | 51.96 | |
| AvgDist (m) | 10,415 | 35.20 | 12.00 | 26.65 | 33.88 | 43.14 | 63.38 | ||
| Au (g/t) | 10,415 | 0.88 | 0.01 | 0.20 | 0.33 | 0.69 | 11.36 | ||
| Interstitial | Measured | MinDist (m) | 1,295 | 4.73 | 0.09 | 3.22 | 4.65 | 6.10 | 23.61 |
| AvgDist (m) | 1,295 | 9.08 | 1.49 | 7.50 | 8.93 | 10.53 | 24.91 | ||
| Au (g/t) | 1,295 | 0.06 | 0.00 | 0.01 | 0.03 | 0.08 | 12.72 | ||
| Indicated | MinDist (m) | 1,819,136 | 8.84 | 0.05 | 5.01 | 7.91 | 11.73 | 49.76 | |
| AvgDist (m) | 1,819,136 | 14.41 | 0.89 | 9.95 | 13.26 | 17.35 | 57.88 | ||
| Au (g/t) | 1,819,136 | 0.04 | 0.00 | 0.00 | 0.01 | 0.04 | 13.85 | ||
| Inferred | MinDist (m) | 28,128,747 | 15.65 | 0.05 | 7.87 | 13.20 | 20.85 | 112.75 | |
| AvgDist (m) | 28,128,747 | 24.28 | 0.70 | 14.09 | 21.26 | 31.25 | 114.05 | ||
| Au (g/t) | 28,128,747 | 0.02 | 0.00 | 0.00 | 0.00 | 0.01 | 16.70 |
Notes:
1. Classification statistics are not constrained by a resource pit shell.
2. Sub-blocks are not uniform in size and are not an accurate proxy for volume.
3. Fractional volumes smaller than 100 m3 were excluded from reporting volume weighted statistics.
4. Numbers may not add due to rounding.
Source: SLR (2022)
|
|
The drill hole spacing varies across the Muddy Shag, Wisteria, Hammerdown, and Rumbullion zones. The higher grade deposits that were previously mined, such as Hammerdown and Rumbullion, have generally seen tighter spaced drilling. Reconciliation between the current resource model and the historical production reports are described above in Section 14.4. Additional efforts have been made to correctly deplete the current model by manually adding additional depletion shapes where the digitized stopes are misaligned with the vein domain models.
Smaller regions within the individual and grouped vein domains that are proximal to areas of historical mining have a spacing of approximately 5 m to 15 m between holes. Outside of these tighter spaced areas, drilling is typically 15 m to 25 along strike and down dip. Spacing typically increases on the extremities of the observed mineralization trends and can be as much as 40 m to 60 along strike and 30 m to 50 m down dip in the Muddy Shag zone.
As shown by the variogram ranges, the ratio between the major and semi-major axes ranges from 1.3 to 2.5 across the various zones of the Hammerdown deposit. These zones are all considered to share the same mineralization style, as discussed in Section 14.5, except for the disseminated domain of the Wisteria zone. The major axis in this context is oriented down plunge while the semi-major axis is oriented along strike.
Initial guidance for drill hole spacing requirements to support Measured classification was derived by examining grade and thickness contouring of the nine largest individual vein domains. The ranges observed from grade contouring correspond to approximately 60% to 75% of the total sill of the variograms for most of the individual vein domains. The major and semi-major ranges for m08 at 65% of the total sill are approximately 15 m and 10 m, respectively. SLR notes that the upper end of this range (15 m) appears to be appropriate for classifying blocks as Measured within individual vein domains that have adequate drill hole spacing and well supported grade and mineralization continuity. Other factors such as, proximity to historical stopes and development, also helped guide the classification process. The Measured classification shapes primarily use a 7.5 m radius from composites within the grouped and individual vein domains on a wireframe-by-wireframe basis to assign blocks with the Measured classification.
Drill hole spacing requirements to support Indicated classification were also derived by examining grade and thickness contouring of the nine largest individual vein domains. The ranges observed from grade contouring correspond to approximately 90% to 100% of the total sill of the variograms for most of the individual vein domains. The major and semi-major ranges for m08 at 90% of the total sill are approximately 30 m and 17.5 m, respectively. SLR notes that the upper end of this range (30 m) appears to be appropriate for classifying blocks as Indicated within nearly all domains in the Hammerdown and Rumbullion zones apart from the extremities where the down dip and along strike extents of the wireframes were extrapolated distances beyond a nominal drill spacing of 30 m. The Indicated classification shapes primarily use a 15 m radius from composites within the grouped and individual vein domains to assign blocks with the Indicated classification.
The major and semi-major variogram ranges for m08 are 65 m and 40 m, respectively. SLR notes that upper end of this range (60 m) appears to be appropriate for classifying blocks as Inferred within all domains. The Inferred classification shapes primarily use a 30 m radius from composites within the grouped domains, individual vein domains, and Interstitial domain to assign blocks with the Inferred classification.
|
|
A typical example of the classification at Hammerdown is provided in Figure 14-18 to Figure 14-20.
Figure 14-18: Plan View Classification of Mineral Resources (2.5 m Corridor)
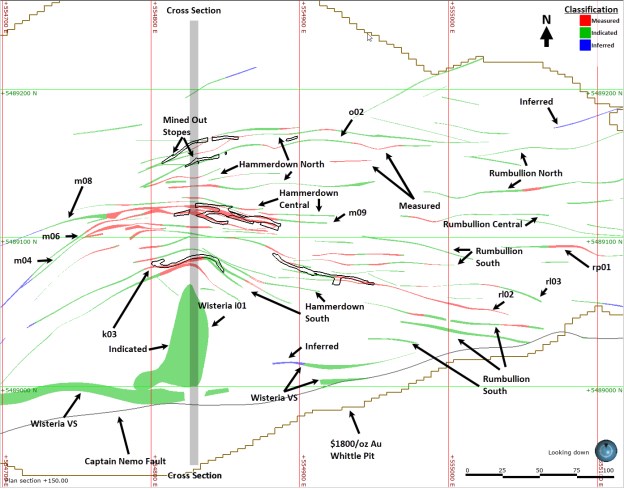
Source: SLR (2022)
|
|
Figure 14-19: Cross section, Looking West, Classification of Mineral Resources (2.50 m Corridor)
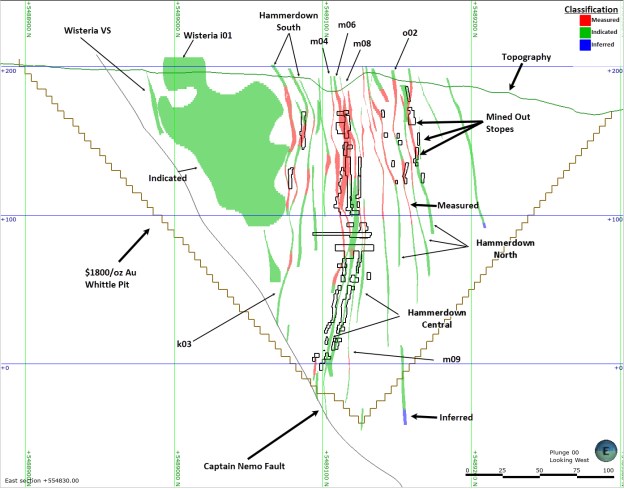
Source: SLR (2022)
|
|
Figure 14-20: m08 Classification of Mineral Resources - Hammerdown (Longitudinal View)
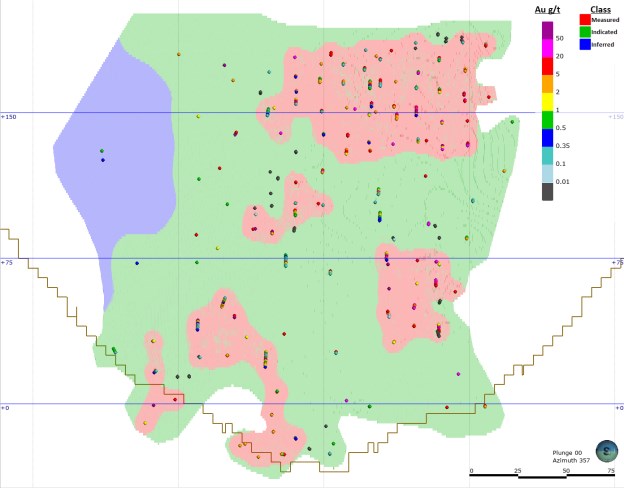
Source: SLR (2022)
14.15 Block Model Validation
A number of validation steps were performed by SLR including:
• Statistical comparison of assay, composite, and block statistics (Table 14-18);
• Swath plots showing inverse distance cubed (ID3) versus nearest neighbour (NN) gold block model for the grouped and individual domains (Figure 14-21 to Figure 14-23); and
• Visual inspection of composites versus block grades (Figure 14-24 to Figure 14-26).
|
|
For many of the variables and mineralization domains, there is good agreement between the assay, composite, and block means. Similar trends are observed on the swath plots.
|
|
Table 14-18: Gold Assays, Composites, and Blocks Comparison
| Zone | Variable Name | Group or Individual Vein | Volume (m3) |
Count (No.) |
Length (m) |
Mean (g/t Au) |
Coefficient of Variation |
Minimum (g/t Au) |
Maximum (g/t Au) |
| Wisteria | Capped Assays | i01 | - | 1,191 | 804.13 | 1.07 | 1.99 | 0.0025 | 25 |
| Composites | i01 | - | 848 | 833.99 | 1.02 | 1.41 | 0 | 10.9 | |
| Blocks - ID3 | i01 | 166,540 | - | - | 0.95 | 0.82 | 0.00 | 8.04 | |
| Blocks - NN | i01 | 166,540 | - | - | 1.02 | 1.43 | 0.00 | 10.90 | |
| Capped Assays | VS | - | 510 | 349.52 | 0.95 | 2.48 | 0.0025 | 25 | |
| Composites | VS | - | 411 | 395.06 | 0.84 | 2.23 | 0.00 | 25 | |
| Blocks - ID3 | VS | 119,261 | - | - | 0.97 | 1.75 | 0.00 | 24.96 | |
| Blocks - NN | VS | 119,261 | - | - | 1.18 | 2.60 | 0.00 | 25.00 | |
| Hammerdown | Capped Assays | Central | 746 | 359.86 | 13.22 | 2.18 | 0 | 170 | |
| Composites | Central | 625 | 453.4 | 10.49 | 2.13 | 0 | 170 | ||
| Blocks - ID3 | Central | 90,437 | - | - | 8.19 | 1.86 | 0.00 | 169.93 | |
| Blocks - NN | Central | 90,437 | - | - | 7.70 | 2.50 | 0.00 | 170.00 | |
| Capped Assays | North | 675 | 239.85 | 8.72 | 2.3 | 0 | 115 | ||
| Composites | North | 545 | 324.05 | 6.45 | 2.19 | 0 | 115 | ||
| Blocks - ID3 | North | 76,415 | - | - | 6.22 | 1.48 | 0.00 | 114.92 | |
| Blocks - NN | North | 76,415 | - | - | 6.07 | 2.05 | 0.00 | 115.00 | |
| Capped Assays | South | - | 310 | 169.11 | 7.22 | 2.24 | 0.0025 | 80 | |
| Composites | South | - | 283 | 212.06 | 5.74 | 2.28 | 0 | 80 | |
| Blocks - ID3 | South | 33,907 | - | - | 5.21 | 1.66 | 0.00 | 79.47 |
|
|
| Zone | Variable Name | Group or Individual Vein | Volume (m3) |
Count (No.) |
Length (m) |
Mean (g/t Au) |
Coefficient of Variation |
Minimum (g/t Au) |
Maximum (g/t Au) |
| Blocks - NN | South | 33,907 | - | - | 4.92 | 2.24 | 0.00 | 80.00 | |
| Capped Assays | k03 | - | 196 | 106.67 | 13.37 | 1.7 | 0 | 80 | |
| Composites | k03 | - | 176 | 132.5 | 10.77 | 1.72 | 0 | 80 | |
| Blocks - ID3 | k03 | 19,949 | - | - | 10.40 | 1.32 | 0.00 | 79.06 | |
| Blocks - NN | k03 | 19,949 | - | - | 9.35 | 1.90 | 0.00 | 80.00 | |
| Capped Assays | m04 | - | 235 | 121.34 | 9.25 | 2.6 | 0 | 170 | |
| Composites | m04 | - | 182 | 139.95 | 7.8 | 2.36 | 0 | 170 | |
| Blocks - ID3 | m04 | 23,770 | - | - | 7.45 | 1.77 | 0.00 | 144.57 | |
| Blocks - NN | m04 | 23,770 | - | - | 7.02 | 2.54 | 0.00 | 170.00 | |
| Capped Assays | m06 | - | 419 | 192.18 | 24.47 | 1.84 | 0 | 250 | |
| Composites | m06 | - | 254 | 214.02 | 22.87 | 1.65 | 0 | 194.35 | |
| Blocks - ID3 | m06 | 43,763 | - | - | 15.05 | 1.70 | 0.00 | 190.87 | |
| Blocks - NN | m06 | 43,763 | - | - | 14.43 | 2.21 | 0.00 | 194.35 | |
| Capped Assays | m08 | - | 560 | 276.91 | 11.93 | 2.54 | 0 | 170 | |
| Composites | m08 | - | 371 | 314.51 | 10.5 | 2.11 | 0 | 170 | |
| Blocks - ID3 | m08 | 58,236 | - | - | 10.38 | 1.34 | 0.00 | 144.48 | |
| Blocks - NN | m08 | 58,236 | - | - | 10.47 | 2.13 | 0.00 | 150.08 | |
| Capped Assays | m09 | - | 165 | 69.04 | 13.41 | 1.98 | 0 | 170 | |
| Composites | m09 | - | 158 | 99.91 | 9.27 | 2.09 | 0 | 170 | |
| Blocks - ID3 | m09 | 15,547 | - | - | 9.99 | 1.34 | 0.00 | 169.30 |
|
|
| Zone | Variable Name | Group or Individual Vein | Volume (m3) |
Count (No.) |
Length (m) |
Mean (g/t Au) |
Coefficient of Variation |
Minimum (g/t Au) |
Maximum (g/t Au) |
| Blocks - NN | m09 | 15,547 | - | - | 9.23 | 2.21 | 0.00 | 170.00 | |
| Capped Assays | o02 | - | 155 | 61.82 | 15.83 | 1.59 | 0 | 115 | |
| Composites | o02 | - | 122 | 71.18 | 13.75 | 1.64 | 0 | 115 | |
| Blocks - ID3 | o02 | 13,798 | - | - | 14.19 | 1.27 | 0.00 | 114.92 | |
| Blocks - NN | o02 | 13,798 | - | - | 14.63 | 1.60 | 0.00 | 115.00 | |
| Rumbullion | Capped Assays | Central | - | 117 | 53.88 | 4.37 | 2.11 | 0.06 | 55 |
| Composites | Central | - | 114 | 62.14 | 3.79 | 2.24 | 0 | 55 | |
| Blocks - ID3 | Central | 23,115 | - | - | 3.91 | 1.43 | 0.00 | 54.66 | |
| Blocks - NN | Central | 23,115 | - | - | 4.13 | 2.11 | 0.00 | 55.00 | |
| Capped Assays | East | - | 104 | 52.2 | 6.36 | 2.91 | 0.0025 | 65 | |
| Composites | East | - | 64 | 52.71 | 5.28 | 1.74 | 0 | 65 | |
| Blocks - ID3 | East | 12,782 | - | - | 4.82 | 1.04 | 0.00 | 32.20 | |
| Blocks - NN | East | 12,782 | - | - | 4.84 | 1.55 | 0.00 | 32.63 | |
| Capped Assays | North | - | 265 | 124.69 | 4.03 | 1.69 | 0.0025 | 30 | |
| Composites | North | - | 303 | 172.28 | 2.92 | 1.94 | 0 | 30 | |
| Blocks - ID3 | North | 123,254 | - | - | 3.40 | 1.24 | 0.00 | 30.00 | |
| Blocks - NN | North | 123,254 | - | - | 3.12 | 1.77 | 0.00 | 30.00 | |
| Capped Assays | Northeast | - | 434 | 191.44 | 8.92 | 1.81 | 0.0025 | 80 | |
| Composites | Northeast | - | 364 | 232.95 | 7.31 | 1.6 | 0 | 80 | |
| Blocks - ID3 | Northeast | 57,432 | - | - | 6.03 | 1.29 | 0.00 | 79.83 |
|
|
| Zone | Variable Name | Group or Individual Vein | Volume (m3) |
Count (No.) |
Length (m) |
Mean (g/t Au) |
Coefficient of Variation |
Minimum (g/t Au) |
Maximum (g/t Au) |
| Blocks - NN | Northeast | 57,432 | - | - | 5.84 | 1.81 | 0.00 | 80.00 | |
| Capped Assays | South | - | 414 | 174.81 | 6.17 | 2.35 | 0.008 | 90 | |
| Composites | South | - | 315 | 204.38 | 5.18 | 2.14 | 0 | 90 | |
| Blocks - ID3 | South | 48,136 | - | - | 4.81 | 1.62 | 0.00 | 89.14 | |
| Blocks - NN | South | 48,136 | - | - | 4.90 | 2.18 | 0.00 | 90.00 | |
| Capped Assays | rl02 | - | 188 | 102.76 | 13.87 | 1.6 | 0 | 90 | |
| Composites | rl02 | - | 174 | 132.23 | 10.78 | 1.73 | 0 | 90 | |
| Blocks - ID3 | rl02 | 23,492 | - | - | 9.90 | 1.25 | 0.00 | 89.25 | |
| Blocks - NN | rl02 | 23,492 | - | - | 10.20 | 1.76 | 0.00 | 90.00 | |
| Capped Assays | rl03 | - | 132 | 55.51 | 15.63 | 1.46 | 0.018 | 90 | |
| Composites | rl03 | - | 87 | 56.52 | 14.89 | 1.3 | 0 | 90 | |
| Blocks - ID3 | rl03 | 9,388 | - | - | 15.99 | 0.89 | 0.00 | 89.24 | |
| Blocks - NN | rl03 | 9,388 | - | - | 11.76 | 1.33 | 0.00 | 90.00 | |
| Capped Assays | rp01 | - | 107 | 57.53 | 9.15 | 1.62 | 0.05 | 55 | |
| Composites | rp01 | - | 90 | 65.25 | 8.07 | 1.42 | 0 | 55 | |
| Blocks - ID3 | rp01 | 21,055 | - | - | 7.11 | 1.16 | 0.01 | 54.95 | |
| Blocks - NN | rp01 | 21,055 | - | - | 7.33 | 1.59 | 0.00 | 55.00 | |
| Muddy Shag | Capped Assays | - | - | 88 | 37.85 | 2.59 | 1.3 | 0.02 | 17.43 |
| Composites | - | - | 50 | 38.64 | 2.54 | 0.95 | 0 | 12.7 | |
| Blocks - ID3 | 52,076 | - | - | 2.17 | 0.74 | 0.12 | 12.70 |
|
|
| Zone | Variable Name | Group or Individual Vein | Volume (m3) |
Count (No.) |
Length (m) |
Mean (g/t Au) |
Coefficient of Variation |
Minimum (g/t Au) |
Maximum (g/t Au) |
| Blocks - NN | 52,076 | - | - | 2.56 | 0.88 | 0.11 | 12.70 | ||
| Interstitial | Capped Assays | - | - | 26,798 | 17,777.72 | 0.09 | 6.09 | 0 | 20 |
| Composites | - | - | 75,473 | 74,430.92 | 0.02 | 9.26 | 0 | 17 | |
| Blocks - ID3 | - | 60,206,218 | - | - | 0.02 | 6.34 | 0.00 | 16.70 |
Notes:
1. Assay and Composite statistics are length weighted.
2. Block statistics are volume weighted.
3. Block volumes are sub-blocks within a wireframe.
Source: SLR (2022)
|
|
Figure 14-21: Gold Plots - 5 Block Spacing (X)
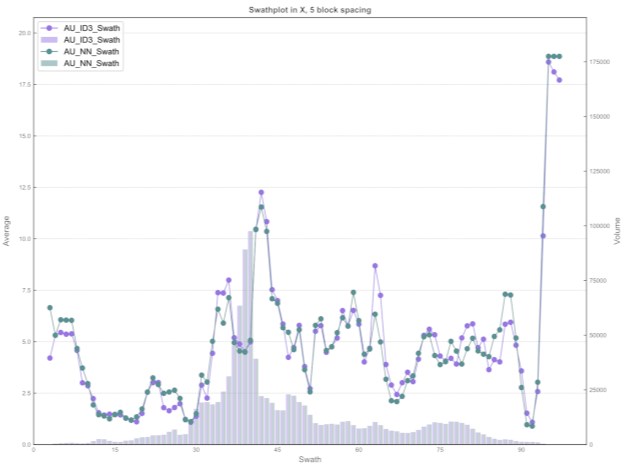
Source: SLR (2022)
|
|
Figure 14-22: Gold Plots - 10 Block Spacing (Y)
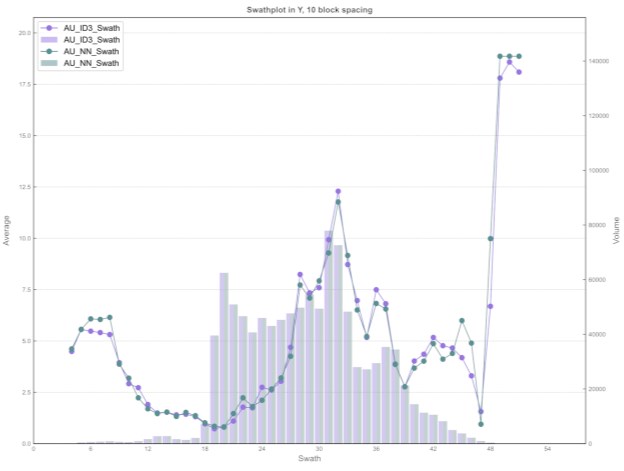
Source: SLR (2022)
|
|
Figure 14-23: Gold Plots - 5 Block Spacing (Z)
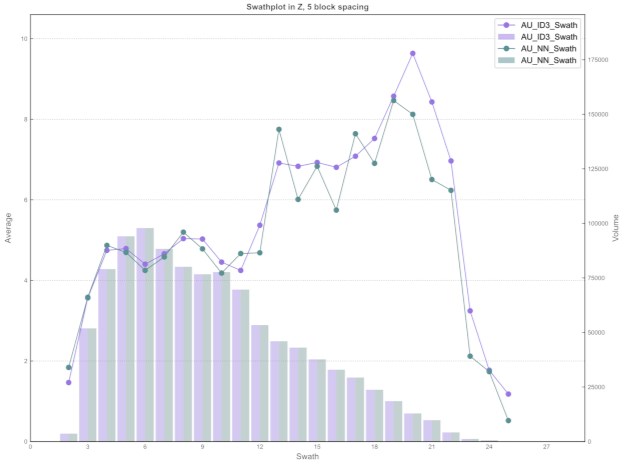
Source: SLR (2022)
14.15.1.1 Visual Comparison
Evaluation of the accuracy of the local estimate was also carried out by visually comparing the composites against the estimated block grades in plan and cross-sectional views. Examples are presented in Figure 14-24 to Figure 14-26. While variances were observed at a local scale, SLR found grade continuity to be reasonable and confirmed that the block grades were reasonably consistent with local drill hole composite grades particularly in the areas of higher sample data density.
|
|
Figure 14-24: Hammerdown and Rumbullion Block Model Plan View 150 EL (10 m Viewing Corridor)
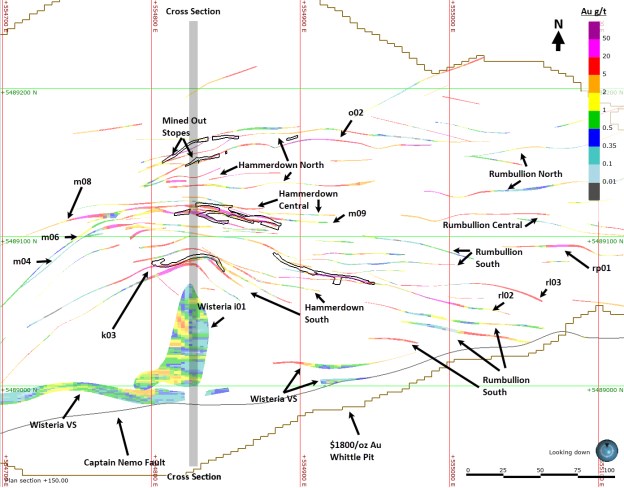
Source: SLR (2022)
|
|
Figure 14-25: Hammerdown Block Model Cross Section A-B Looking East (10 m Viewing Corridor)
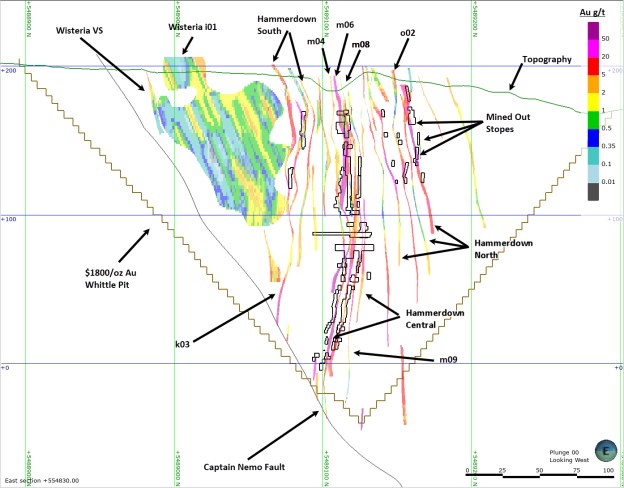
Source: SLR (2022)
|
|
Figure 14-26: m08 Vein Longitudinal View
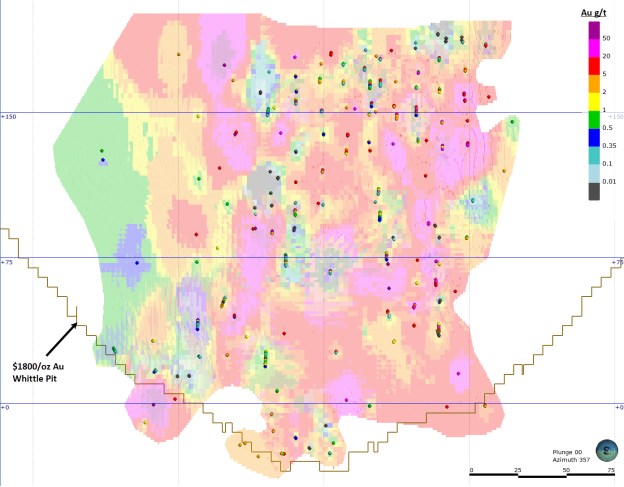
Source: SLR (2022)
14.16 Mineral Resource Reporting
Mineral Resources potentially amenable to open pit mining methods are reported within a preliminary, optimized pit shell at a cut-off grade of 0.50 g/t Au. Resources located outside the pit shell and potentially amenable to underground mining methods are reported at a cut-off grade of 2.00 g/t Au. Cut-off grades are based on a gold price of US$1,800/oz and gold recoveries dependent on the mining method, material type, and/or location.
Table 14-19 provides a detailed resource report by classification, mining method, and zone.
|
|
Table 14-19: Mineral Resource Estimate as of June 30, 2022
| Category | Tonnes (kt) |
Grade (g/t Au) |
Contained Metal (000 oz Au) |
| Open Pit Resources | |||
| Measured | |||
| Hammerdown | 490 | 6.08 | 96 |
| Rumbullion | 209 | 4.05 | 27 |
| Total Open Pit Measured | 699 | 5.47 | 123 |
| Indicated | |||
| Hammerdown | 949 | 4.08 | 125 |
| Rumbullion | 720 | 2.71 | 63 |
| Wisteria | 471 | 1.29 | 19 |
| Interstitial | 6 | 1.05 | - |
| Total Open Pit Indicated | 2,146 | 3.00 | 207 |
| Measured + Indicated | |||
| Hammerdown | 1,439 | 4.76 | 220 |
| Rumbullion | 929 | 3.01 | 90 |
| Wisteria | 471 | 1.29 | 20 |
| Interstitial | 6 | 1.05 | - |
| Total Open Pit M + I | 2,845 | 3.61 | 330 |
| Inferred | |||
| Hammerdown | 30 | 1.58 | 2 |
| Rumbullion | 50 | 1.80 | 3 |
| Wisteria | 9 | 2.00 | 1 |
| Muddy Shag | 65 | 1.22 | 2 |
| Interstitial | 147 | 1.08 | 5 |
| Total Open Pit Inferred | 302 | 1.31 | 13 |
| Underground Resources | |||
| Measured | |||
| Hammerdown | 1 | 7.11 | - |
| Rumbullion | - | 2.37 | - |
| Total Underground Measured | 1 | 7.05 | - |
| Indicated | |||
| Hammerdown | 28 | 5.79 | 5 |
| Rumbullion | 25 | 4.31 | 3 |
| Total Underground Indicated | 54 | 5.10 | 9 |
| Measured + Indicated | |||
| Hammerdown | 30 | 5.85 | 6 |
| Rumbullion | 25 | 4.31 | 3 |
|
|
| Category | Tonnes (kt) |
Grade (g/t Au) |
Contained Metal (000 oz Au) |
| Total Underground M + I | 55 | 5.15 | 9 |
| Inferred | |||
| Hammerdown | 16 | 4.47 | 2 |
| Rumbullion | 39 | 3.92 | 5 |
| Muddy Shag | 11 | 3.61 | 1 |
| Total Underground Inferred | 66 | 4.00 | 9 |
Notes:
1. Mineral Resource Estimate completed by Pierre Landry, P.Geo., of SLR Consulting (Canada) Ltd. (SLR), an independent qualified person (QP), as defined by NI 43-101.
2. Effective date: June 30, 2022. All Mineral Resources have been estimated in accordance with Canadian Institute of Mining and Metallurgy and Petroleum (CIM) definitions, as required under NI 43-101.
3. Open Pit Mineral Resources are inclusive of Mineral Reserves
4. Open Pit Mineral Resources are estimated at a cut-off grade of 0.50 g/t Au.
5. Open Pit Mineral Resources are reported at a block cut-off from whole blocks measuring 2.5 m x 1.0 m x 2.5 m.
6. Mineral Resources are estimated using a long-term gold price of US$1,800 per ounce, and a US$/C$ exchange rate of 0.75.
7. Bulk density is 2.84 t/m3 for rock and 1.90 t/m3 for mined out areas.
8. Underground Mineral Resources are estimated at a cut-off grade of 2.00 g/t Au.
9. Underground Resources are reported at a block cut-off from whole blocks measuring 2.5 m x 1.0 m x 2.5 m and have been subject to additional reporting shapes to remove isolated blocks.
10. Numbers may not add due to rounding.
11. Mineral Resources reported demonstrate reasonable prospect of eventual economic extraction, as required under NI 43-101.
12. Mineral Resources are not Mineral Reserves and do not have demonstrated economic viability.
13. The Mineral Resources would not be materially affected by environmental, permitting, legal, marketing, and other relevant issues based on information currently available..
14.16.1 Model Regularization Comparison
Prior to pit optimization and reporting, the sub-block model was regularized to the parent block dimensions measuring 2.5 m by 1.0 m by 2.5 m. Regularizing the block model takes the volumetric proportion of both vein and interstitial material within a given block and uses those relative proportions and their respective grades to calculate a whole block grade on a fully diluted, 100% basis. Open Pit Mineral Resources have been reported on a fully diluted basis at the parent block size.
The regularization was performed in Datamine after exporting the sub-blocked model from Leapfrog. The block classification was applied to the sub-blocked model and SLR used a binary (0 or 1) indicator approach to avoid the artefacts resulting from averaging of classification or applying "majority-rules" during regularizing. Prior to regularizing, binary fields are created for each classification. During regularization the executed code looks for any value in these indicators greater than 0 and assigns the class to it with Measured as highest priority and unclassified as lowest. Using this method during regularization helps maintain contiguous groups of classified blocks and minimizes creating an irregular, patchwork of isolated blocks.
Table 14-20 summarizes the impact of regularizing the Hammerdown model to the parent block size prior to pit optimization and reporting. To facilitate a comparison to the Resource table (Table 14-19), both the regularized model and sub-block models are reported within a preliminary, optimized pit shell at a cut-off grade of 0.50 g/t Au. The optimized pit shell used for reporting was derived from the regularized model.
|
|
Table 14-20: Model Comparison: Parent Blocks and Sub-Blocks
| Regularized Parent Block | Sub-Blocked | Differences | |||||||
| Category | Tonnes (kt) |
Grade (g/t Au) |
Contained Metal (000 oz Au) |
Tonnes (kt) |
Grade (g/t Au) |
Contained Metal (000 oz Au) |
Tonnes (kt) |
Grade (g/t Au) |
Contained Metal (000 oz Au) |
| Open Pit Resources | |||||||||
| Measured | |||||||||
| Hammerdown | 489.6 | 6.08 | 95.8 | 203.7 | 13.34 | 87.4 | 285.9 | -7.26 | 8.4 |
| Rumbullion | 208.7 | 4.05 | 27.1 | 78.2 | 9.81 | 24.7 | 130.5 | -5.76 | 2.4 |
| Total Open Pit Measured | 698.4 | 5.47 | 122.9 | 282.0 | 12.36 | 112.1 | 416.4 | -6.89 | 10.8 |
| Indicated | |||||||||
| Hammerdown | 949.5 | 4.08 | 124.6 | 479.9 | 8.86 | 136.6 | 469.6 | -4.78 | -12.0 |
| Rumbullion | 720.0 | 2.71 | 62.7 | 349.1 | 6.11 | 68.5 | 370.9 | -3.40 | -5.8 |
| Wisteria | 470.9 | 1.29 | 19.5 | 454.6 | 1.37 | 20.1 | 16.3 | -0.08 | -0.6 |
| Interstitial | 5.7 | 1.05 | 0.2 | 23.6 | 1.00 | 0.8 | -17.9 | 0.05 | -0.6 |
| Total Open Pit Indicated | 2,146.2 | 3.00 | 207.0 | 1,307.2 | 5.38 | 226.0 | 839.0 | -2.38 | -19.0 |
| Measured + Indicated | |||||||||
| Hammerdown | 1,439.1 | 4.76 | 220.4 | 683.7 | 10.19 | 224.0 | 755.4 | -5.43 | -3.6 |
| Rumbullion | 928.7 | 3.01 | 89.8 | 427.4 | 6.78 | 93.2 | 501.3 | -3.77 | -3.4 |
| Wisteria | 471.1 | 1.29 | 19.5 | 454.6 | 1.37 | 20.1 | 16.5 | -0.08 | -0.6 |
| Interstitial | 5.7 | 1.05 | 0.2 | 23.6 | 1.00 | 0.8 | -17.9 | 0.05 | -0.6 |
| Total Open Pit M + I | 2,844.6 | 3.61 | 329.9 | 1,589.2 | 6.62 | 338.0 | 1,255.4 | -3.01 | -8.1 |
| Inferred | |||||||||
| Hammerdown | 30.4 | 1.58 | 1.6 | 36.9 | 2.06 | 2.4 | -6.5 | -0.48 | -0.8 |
| Rumbullion | 50.1 | 1.80 | 2.9 | 17.7 | 5.83 | 3.3 | 32.4 | -4.03 | -0.4 |
| Wisteria | 9.4 | 2.00 | 0.6 | 8.1 | 2.49 | 0.6 | 1.3 | -0.49 | 0.0 |
| Muddy Shag | 64.7 | 1.22 | 2.5 | 32.2 | 2.50 | 2.6 | 32.5 | -1.28 | -0.1 |
| Interstitial | 147.1 | 1.08 | 5.1 | 152.8 | 1.07 | 5.2 | -5.7 | 0.01 | -0.1 |
| Total Open Pit Inferred | 301.7 | 1.31 | 12.7 | 247.7 | 1.79 | 14.2 | 54.0 | -0.48 | -1.5 |
|
|
The sub-blocked Hammerdown block model does not show significant metal loss when the block model is regularized. Regularizing the sub-blocked model to the parent block size yielded a 79% increase in Measured and Indicated tonnes at grades that are 45% lower, resulting in an overall 2% decrease in contained metal. Inferred tonnes increased 22% and Inferred grades decreased 27%, resulting in an overall 11% decrease in metal.
The relationship between the parent block dimensions and the thickness and geometry of individual vein wireframes is the biggest factor in comparing regularized tonnages and grades to those of the sub-blocked model. The main source of dilution at Hammerdown is the Y block dimension of 1 m which is larger in thickness than some of the individual vein wireframes which average between 0.4 m to 0.8 m thick. The regularization methodology used to maintain classification will also result in greater apparent dilution in the Measured blocks, however, this is not so much dilution as it is the reclassification of tonnes between the Measured and Indicated classes during regularization.
The Inferred results are somewhat misleading since the majority of the interstitial blocks that make up approximately 49% of the Inferred tonnes are already parent sized blocks. If the interstitial blocks are removed from the Inferred comparison, regularizing yields a 63% increase in Inferred tonnes at grades that are 48% lower, resulting in an overall 16% decrease in contained metal. Unlike the Measured and Indicated categories where the sub-blocked grades are higher, the relatively low grade of the Inferred blocks prior to regularizing results in more contained metal failing to meet the reporting cut-off grade of 0.50 g/t Au.
It is the opinion of the QP that the mineral resource estimates would not be materially affected by any known environmental, permitting, legal, title, taxation, socio-economic, marketing, political, or other relevant factors.
 |
 |
15 MINERAL RESERVE ESTIMATE
15.1 Introduction
The Hammerdown project includes two deposits (Hammerdown and Orion) which are separated by approximately 1.5 km; however, only the larger Hammerdown deposit was considered for Mineral Reserve estimation. The project was designed as an Open Pit with an ore sorter to be able to process offsite at a rate of 700 t/d. The Mineral Resources were evaluated using open pit optimization software to identify an optimum shell which was then used as a basis for detailed design. The final design along with dilution and mine recovery estimates and a cut-off grade were then used to quantify the final Mineral Reserves. The details of this process are described within this section.
It is the opinion of the QP that the mineral reserve estimates are unlikely to be materially affected by mining, metallurgical, infrastructure, permitting, and other relevant factors as these components are well understood to a FS level.
15.2 Open Pit Optimization
The open pit optimization process generates a series of nested pit shell surfaces for the purpose of approximating potentially mineable resources of a given mineral deposit. The Lerchs-Grossmann algorithm in the NPVS software package was used for the optimization and associated analysis. The resulting nested pit shells were generated by varying the profit by applying a factor to the base case value. One of these shells was then selected to guide detailed design.
15.2.1 Basis of Estimate
15.2.1.1 Resource Model
The mineable resource for the property is based on the mineral resource estimate completed by SLR with an effective date of June 30, 2022. The block model was comprised of blocks sized 2.5 m x 1.0 m x 2.5 m with parameters that describe in-situ density, resource classification, resource domain and gold grade. The resource model was imported by JDS and validated against the mineral resource tables provided by SLR to ensure the block model data was correct.
Mineral resources that were classified as Inferred were excluded in the optimization as obligatory for a PFS level of study.
15.2.1.2 Commodity Pricing
The gold price set at US$1,650/oz which was the approximate 3-year trailing average in Dec 2021. Further details on commodity pricing can be found in Section 19.4.
|
|
15.2.1.3 Royalties and Selling Costs
The resources at the Hammerdown deposit are currently subject to a 1% NSR royalty. Further details can be found in Section 19.3.
15.2.1.4 Mining Method and Operating Costs
A conventional truck/shovel open pit mining method was selected for the project. Mining costs used in the pit optimization were based on first-principles mine cost build-ups using a preliminary production schedule as guidance.
15.2.1.5 Processing and General & Administrative Costs
Processing and General & Administrative (G&A) operating costs were developed for the treatment of mineralized material. The battery limits for the determination of the process operating costs commence from the crushing facilities and include ore sorting, transportation, processing and continue through to the placement of tailings. G&A costs cover the various site services and administration. The operating costs are based on a mill production rate of 700 t/d (256 kt/a).
15.2.1.6 Mining Dilution & Losses
Mining dilution is expected to have a minimal impact for the project due to the use of an ore-sorter which is expected to be able to remove the majority of waste materials sent to the crusher.
The block model was originally created as a percent model (each block quantifies a percent that is considered mineralized) but the final resource model that was provided was developed as whole block model which includes internal dilution. In comparing the percent model to the whole block model, approximately 90% internal dilution has been added to Vein materials which are relatively narrow and 5% to the Wisteria zone which is significantly bulkier in nature. For a 2 m wide vein, this would indicate that approximately 0.9 m of waste was added on both sides of the vein and included as resource. To help reduce dilution in the mine plan, small excavators are planned to be used when mining ore materials. Due to the amount of internal dilution that was added, the expected selectivity of the mining equipment, and having an ore sorter to reject waste material from the ore, no additional external dilution was added.
From a risk perspective, an increase in dilution should not impact the mill head grade but would rather increase the amount of sorter-reject waste which would then require rehandling. Any impacts to the cut-off grade would be minimal.
In comparing the sub-blocked resource block model to the regularized resource block model, approximately 12% of the vein resources were internally diluted to below the cut-off grade even though in actual practice much of this material will very likely be sent to the ore sorter. Given these losses, along with the fact that the ore will be visible in the field and the ability of the ore sorter to separate out waste materials, no additional ore losses were included for reserve calculations.
|
|
15.2.1.7 Mining Recovery
The ore will first go through an ore sorter which has an expected gold recovery of 95%. The sorted ore will then go through the Mill process which has an expected recovery of 95% for Vein materials and 90% for Wisteria material.
15.2.1.8 Overall Pit Slope Angles
Overall pit slope angles for each deposit were estimated by adjusting the recommended Inter-ramp angles to include an allowance for access ramps. To determine the potential location of pit access ramps, a preliminary pit shell was developed followed by locating a potential 10% ramp that would allow access to each bench. The ramp width is expected to be approximately 20 m. The overall slopes were then calculated for various elevation ranges based on the number of times the ramp passes through the final pit walls. The overall slopes are expected to range from 42° to 55°. More details on this can be found in Section 15.3.1.
15.2.2 Open Pit Optimization Input Parameters
A summary of the open pit optimization input parameters is shown in Table 15-1 below. Pit shell generation was not constrained by any existing infrastructure as all of the major infrastructure facilities planned for the project will be external to the ultimate pit designs and their area of influence.
Table 15-1: Open Pit Optimization Input Parameters
| Parameter | Unit | Hammerdown | Wisteria |
| Gold price | US$/oz | 1,650 | 1650 |
| Payable metal | % | 99.8 | 99.8 |
| TC/RC/Transport | US$/oz | 5.0 | 5.0 |
| Royalty | % | 1 | 1 |
| Net Gold value per ounce | US$/oz | 1,625 | 1,625 |
| Exchange Rate | USD:CAD | 0.77 | 0.77 |
| Net Gold value per gram | C$/g | 67.86 | 67.86 |
| Ore Mining Cost | C$/t ore mined | 5.00 | 5.00 |
| Waste Mining Cost | $/t waste mined | 4.00 | 4.00 |
| Ore transport | $/t processed | 16.74 | 23.72 |
| Mineral processing | $/t processed | 18.00 | 25.50 |
| G&A | $/t processed | 6.00 | 8.50 |
| Ore sorting mass pull | % | 60 | 85 |
| Ore sorting gold recovery | % | 95 | 95 |
| Milling gold recovery | % | 95 | 90 |
| Overall gold recovery | % | 90.25 | 85.50 |
|
|
| Parameter | Unit | Hammerdown | Wisteria |
| External dilution* | % | 0 | 0 |
| Mining recovery* | % | 100 | 100 |
| In-situ cut-off Au grade | g/t | 0.73 | 1.06 |
Note: No external dilution was validated due to a combination of using an ore sorter as well as the addition of a significant amount of internal dilution within the block model.
15.2.3 Open Pit Optimization Results
A series of optimized shells were generated for the Hammerdown deposit based on varying revenue factors to produce the series of nested shells and their respective Net Present Value (NPV) results. The results were analyzed with shells chosen as the basis for ultimate limits and phase selection. The optimization software produces both best case and a worst-case scenarios. These two scenarios provide a range of possible outcomes to help guide final pit selection. The best case is typically an optimistic evaluation while the worst case is considered to be conservative.
Initially, underground mining was considered a possibility, so the pit optimizations were run as an open pit / underground cross-over to help identify the optimum transition point between the two mining methods. After further economic evaluations, it was decided to pursue mining the Hammerdown deposit as an Open pit as it captures a larger portion of the resource.
The results of the final pit optimization evaluation are summarized in Table 15-2, Figure 15-1 and Figure 15-2. Note that the NPV in this optimization summary does not take into account capital expenditures and is used only as a guide in shell selection and determination of the mining shapes. The ultimate pit shell was selected not only on the basis of maximizing NPV, but also minimizing the addition of increasingly lower grade and higher strip ratio mineralized material (i.e., higher incremental strip ratios) that generate only a minimal improvement on the overall NPV. Pit Shell #23 (revenue factor of 0.92) was selected for the as a basis for detailed mine design.
|
|
Table 15-2: Overall Results of the Hammerdown Deposit Open Pit Optimization
| LG Shell (#) |
RevFac % |
Ore (Mt) |
Au (g/t) |
Au (koz) |
Waste (Mt) |
SR (w:o) |
Total (Mt) |
TCF (CAD$M) |
NPV Best (CAD$M) |
NPV Worst (CAD$M) |
| Pit 1 | 4 | 0.00 | 22.07 | 3.5 | 0.0 | 1.2 | 0.0 | 6.5 | 6.5 | 6.5 |
| Pit 2 | 8 | 0.02 | 14.64 | 10.9 | 0.0 | 2.1 | 0.1 | 19.5 | 19.5 | 19.5 |
| Pit 3 | 12 | 0.05 | 11.37 | 17.2 | 0.1 | 2.8 | 0.2 | 29.9 | 29.8 | 29.8 |
| Pit 4 | 16 | 0.06 | 10.40 | 20.4 | 0.2 | 3.2 | 0.3 | 35.0 | 34.9 | 34.9 |
| Pit 5 | 20 | 0.10 | 8.41 | 26.8 | 0.4 | 3.8 | 0.5 | 44.6 | 44.4 | 44.3 |
| Pit 6 | 24 | 0.20 | 6.64 | 43.4 | 1.1 | 5.6 | 1.3 | 68.1 | 67.5 | 67.2 |
| Pit 7 | 28 | 0.32 | 6.08 | 63.1 | 2.4 | 7.3 | 2.7 | 94.8 | 93.3 | 92.9 |
| Pit 8 | 32 | 0.53 | 5.60 | 96.1 | 5.1 | 9.5 | 5.6 | 136.4 | 132.6 | 131.7 |
| Pit 9 | 36 | 0.64 | 5.51 | 112.7 | 6.6 | 10.4 | 7.2 | 156.5 | 151.4 | 150.1 |
| Pit 10 | 40 | 0.81 | 5.27 | 136.4 | 8.9 | 11.0 | 9.7 | 183.1 | 175.7 | 173.3 |
| Pit 11 | 44 | 0.89 | 5.18 | 148.2 | 10.3 | 11.6 | 11.2 | 195.6 | 187.0 | 183.9 |
| Pit 12 | 48 | 0.95 | 5.13 | 156.1 | 11.3 | 12.0 | 12.3 | 203.7 | 194.2 | 190.7 |
| Pit 13 | 52 | 0.96 | 5.11 | 157.6 | 11.5 | 12.0 | 12.5 | 205.1 | 195.4 | 191.7 |
| Pit 14 | 56 | 1.07 | 4.98 | 170.7 | 13.6 | 12.8 | 14.7 | 216.1 | 205.2 | 200.6 |
| Pit 15 | 60 | 1.44 | 4.72 | 218.1 | 21.9 | 15.3 | 23.4 | 253.1 | 236.4 | 228.1 |
| Pit 16 | 64 | 1.47 | 4.70 | 222.7 | 22.8 | 15.5 | 24.3 | 256.4 | 239.2 | 230.5 |
| Pit 17 | 68 | 1.60 | 4.69 | 240.8 | 27.0 | 16.9 | 28.6 | 268.0 | 248.7 | 238.5 |
| Pit 18 | 72 | 1.63 | 4.66 | 244.4 | 27.8 | 17.0 | 29.4 | 270.0 | 250.3 | 239.5 |
| Pit 19 | 76 | 1.76 | 4.68 | 264.5 | 33.4 | 19.0 | 35.2 | 279.8 | 258.2 | 245.4 |
| Pit 20 | 80 | 1.78 | 4.68 | 267.1 | 34.1 | 19.2 | 35.9 | 280.9 | 259.1 | 245.9 |
| Pit 21 | 84 | 1.81 | 4.67 | 271.6 | 35.5 | 19.6 | 37.3 | 282.4 | 260.4 | 246.5 |
| Pit 22 | 88 | 1.82 | 4.66 | 272.9 | 35.9 | 19.7 | 37.7 | 282.8 | 260.6 | 246.5 |
| Pit 23 | 92 | 1.96 | 4.55 | 286.6 | 39.9 | 20.4 | 41.9 | 285.8 | 263.0 | 245.8 |
| Pit 24 | 96 | 1.98 | 4.53 | 288.4 | 40.5 | 20.5 | 42.5 | 286.0 | 263.1 | 245.5 |
|
|
| LG Shell (#) |
RevFac % |
Ore (Mt) |
Au (g/t) |
Au (koz) |
Waste (Mt) |
SR (w:o) |
Total (Mt) |
TCF (CAD$M) |
NPV Best (CAD$M) |
NPV Worst (CAD$M) |
| Pit 25 | 100 | 2.00 | 4.52 | 291.2 | 41.6 | 20.8 | 43.6 | 286.0 | 263.2 | 245.1 |
| Pit 26 | 104 | 2.01 | 4.52 | 291.9 | 41.8 | 20.8 | 43.8 | 286.0 | 263.1 | 244.9 |
| Pit 27 | 108 | 2.02 | 4.51 | 292.5 | 42.1 | 20.9 | 44.1 | 285.9 | 263.1 | 244.7 |
| Pit 28 | 112 | 2.03 | 4.50 | 293.5 | 42.5 | 20.9 | 44.5 | 285.7 | 262.9 | 244.2 |
| Pit 29 | 116 | 2.09 | 4.52 | 302.8 | 46.8 | 22.4 | 48.8 | 283.3 | 261.0 | 240.5 |
| Pit 30 | 120 | 2.11 | 4.52 | 306.5 | 48.5 | 23.0 | 50.6 | 282.1 | 260.1 | 238.8 |
|
|
Figure 15-1: Overall Pit Shell Results for the Hammerdown Optimization
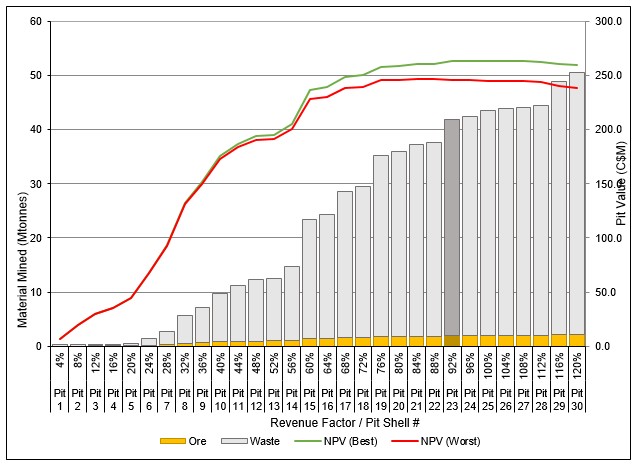
|
|
Figure 15-2: Incremental Pit Shell Results for the Hammerdown Optimization
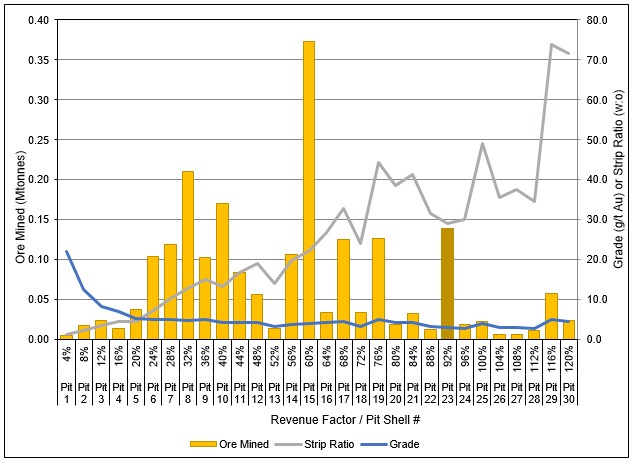
15.3 Open Pit Design
The selected optimized pit shell was converted into a detailed open pit mine design that formed the basis of the Mineral Reserve estimate and production scheduling. The pit wall slope angles, bench heights and access ramp details are discussed in further detail below. The final pit design is approximately 800 m long and has a maximum depth of 215 m. The main pit ramp is planned to exit at an elevation of 150 masl at the North-West corner as this side of the pit is significantly lower and will minimize waste stripping requirements. The final pit design is shown in Figure 15-3. Measured and Indicated resources above the economic cut-off grade (0.73 g/t for Veins and 1.06 g/t for Wisteria) are shown relative to the final pit design in Figure 15-4, Figure 15-5 and Figure 15-6.
|
|
Figure 15-3: Final Open Pit Design
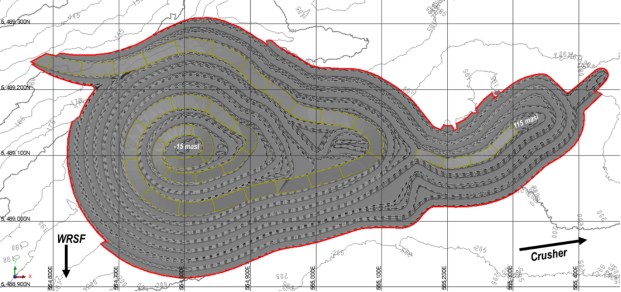
Figure 15-4: Measured and Indicated Resources Relative to the Final Pit Design
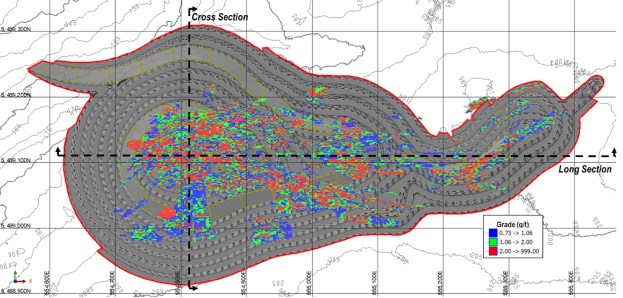
|
|
Figure 15-5: Cross Section of Final Pit Showing Measured and Indicated Resources (554,810E looking East)
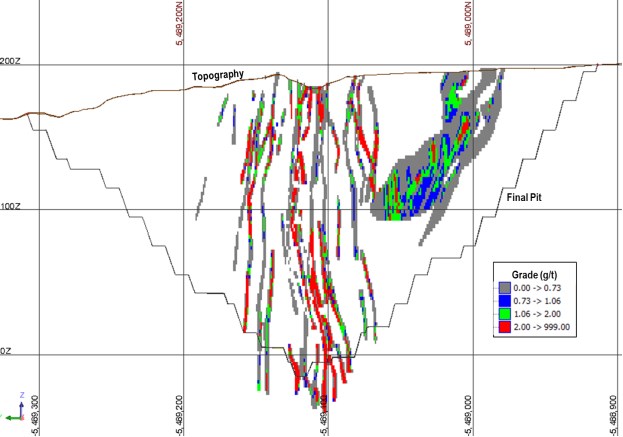
Figure 15-6: Long Section of Final Pit showing Measured and Indicated Resources (5,489,100N looking North)
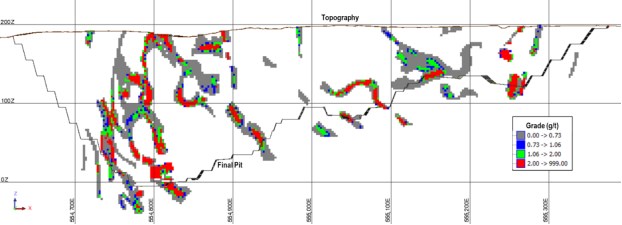
|
|
15.3.1 Geotechnical Pit Slope Recommendations
The slopes of the final pit design were divided into separate design sectors where structural characteristics and pit slope orientations were similar. The recommended pit slope design parameters are shown in Figure 15-7 including bench face angle (BFA) and inter-ramp angle (IRA). For high, continuous inter-ramp slopes that are not broken up by a ramp, a 15 m wide geotechnical berm was incorporated into the design spaced at vertical intervals no greater than 125 m. Further details of the Geotechnical analysis can be found in Section 16.3.
Figure 15-7: Open Pit Slope Design Recommendations
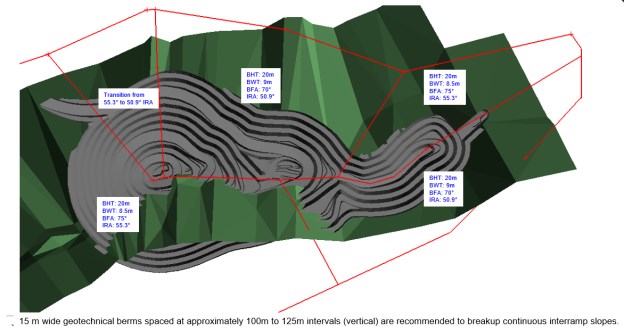
15.3.2 Road/Ramp Width
The main in-pit haul roads and ramps are designed to have an overall road width allowance of 20 m. The selected road allowance is adequate for accommodating three times the width of the largest haul truck (55 t), with additional room for drainage ditches and safety berms as summarized in Table 15-3. The majority of the internal pit ramps are designed with a maximum gradient of 10%; however, they were narrowed to single-lane access and steepened to 12% for the lowest benches of the open pit.
|
|
Table 15-3: In-Pit Haulage Road Design Parameters
| Item | Double-Lane (m) | Single-Lane (m) |
| Truck (55 t) operating width | 4.9 | 4.9 |
| Running surface | 14.7 | 9.8 |
| Berm height (3/4 tire height) | 1.6 | 1.6 |
| Berm width | 3.3 | 3.3 |
| Ditch width | 2.0 | 1.9 |
| Total Road Allowance | 20.0 | 15.0 |
| Maximum Gradient | 10% | 12% |
15.4 Mineral Reserve Estimate
The mineral reserves are reported below within the final pit design and based on cut-off grades of 0.73 g/t for Vein material and 1.06 g/t for the Wisteria zone. The effective date of the Mineral Reserve stated in this report is August 15, 2022.
The QPs have not identified any known legal, political, environmental, or other risks that would materially affect the potential development of the Mineral Reserves. Mine permitting is well advanced and it is anticipated it will be approved.
|
|
Table 15-4: Proven and Probable Mineral Reserve Estimate
| Zone & Class | Tonnes (kt) |
Diluted Grade (g/t Au) |
Contained Gold (koz) |
| Proven Reserves | |||
| Vein | 556 | 5.94 | 106 |
| Wisteria | 0 | 1.68 | 0 |
| Total Proven | 556 | 5.94 | 106 |
| Probable Reserves | |||
| Vein | 1,134 | 4.19 | 153 |
| Wisteria | 206 | 1.99 | 13 |
| Total Probable | 1,340 | 3.85 | 166 |
| Total Proven and Probable | 1,895 | 4.46 | 272 |
Notes:
1. Mineral Reserve Estimate completed by Tysen Hantelmann, P.Eng. of JDS Energy & Mining Inc. (QP).
2. Mineral Reserves follow CIM definitions and are effective as of August 15, 2022.
3. Mineral Reserves are estimated at a cut-off of 0.73 g/t for Veins and 1.06 g/t for Wisteria Zone based on: Gold price of US$1650/oz; Exchange rate of 0.77 USD:CAD; combined transport, treatment, payables and royalties of US$25/oz; an overall metallurgical recovery (including ore sorting) of 90.25% for Veins and 85.5% for Wisteria; and an overall processing operating cost of C$45/t ore mined for Veins and C$62/t ore mined for Wisteria.
4. The final FS pit design contains an additional 94 kt of Inferred resources above the economic cut-off grade at an average grade of 1.62 g/t. Inferred Mineral Resources are considered too speculative geologically to have economic considerations applied to them that would enable them to be categorized as Mineral Reserves, and there is no certainty that any part of the Inferred Resources could be converted into Mineral Reserves.
5. Tonnages are rounded to the nearest 1,000 t, gold grades are rounded to two decimal places. Tonnage and grade measurements are in metric units; contained gold is reported as thousands of troy ounces.
|
|
16 MINING METHODS
16.1 Introduction
Hammerdown deposit has been planned to be developed as an open pit mine. Ore material will be delivered to a crusher/ore sorter located just South-East of the pit at a nominal rate of 1,200 t/d (426 kt/a) and provide 700 t/d (256 kt/a) to an offsite Mill. Over the life-of-mine (LOM), the mine will produce 1.9 Mt of ore at an average gold grade of 4.46 g/t.
Waste materials (40 Mt) will be contained within a Waste Storage Facility (WSF) located just South of the pit. The overall site layout is shown in Figure 16-1.
Figure 16-1: Overall Mine Layout
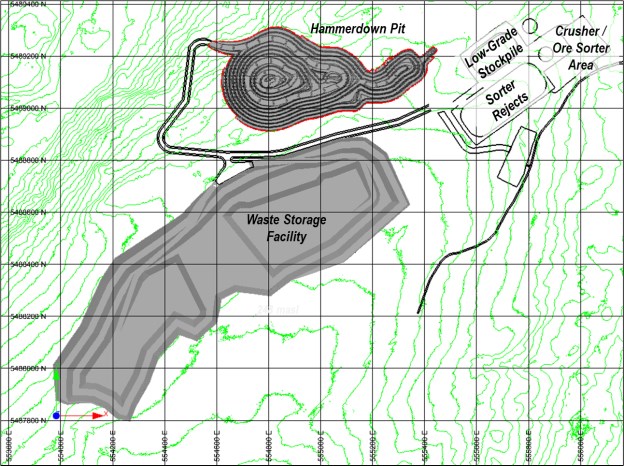
|
|
16.2 Deposit Characteristics
The Hammerdown deposit contains many near vertical narrow high-grade gold veins and single, more bulky, lower-grade zone call Wisteria. The strike length of the deposit is approximately 1.2 km long and extends 280 m deep. The thickness of the modeled veins ranges from less than one metre to several metres thick and outcrop on the existing topography. The deposit is situated on the edge of a ridge which dips down to the North-West.
The resources were initially modelled as a sub-blocked model but the final resource model provided by SLR was a regularized to a block size of 2.5 m x 1 m x 2.5 m and includes a significant amount of internal dilution. A typical cross section of the modelled resources is shown in Figure 16-2.
|
|
Figure 16-2: Section View of the Hammerdown Deposit (looking East)
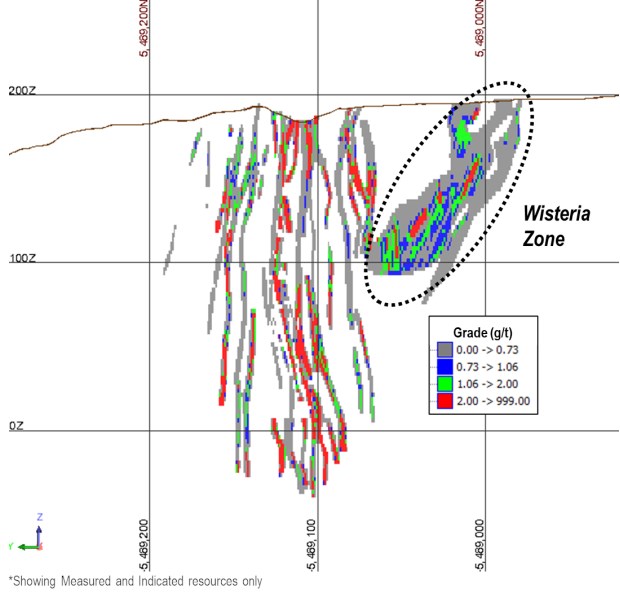
|
|
16.3 Geotechnical Analysis and Recommendations
16.3.1 Geotechnical Characterization
Two geotechnical core logging and downhole televiewer programs have been carried out to characterize rock mass conditions and geological discontinuity orientations for the Hammerdown pit. An initial, Pre-feasibility study geotechnical investigation was carried out in 2019 by WSP (2020a) with a supplemental geotechnical program developed by JDS in 2020 to support a feasibility-level pit slope design. Geotechnical core logging for both programs collected information necessary to classify rock mass quality according to the Bieniawski (1989) rock mass rating (RMR) system. Logging parameters also included the ISRM (1978) intact rock weathering and hardness indices.
Geotechnical logging for the five, 2019 drillholes was completed by WSP while logging of the three, 2020 drillholes was carried out by Maritime geologists under JDS (2020) direction. Televiewer surveys were completed in 2019 and 2020 by DGI Geoscience (DGI) to characterize the variability in orientation of the dominant geologic discontinuity sets. JDS (2021) has reviewed the geotechnical logging and spot-checked data against respective core photographs to confirm data quality and internal consistency. JDS considers the data to be suitable for a feasibility-level of study.
The two programs combined included geotechnical logging of 8 drillholes (1,415 m total length) and downhole televiewing of 10 drillholes (1,516 m total length). The distribution of these drillholes relative to the final Hammerdown FS pit design is shown on Figure 16-3.
|
|
Figure 16-3: Location of Drillholes Geotechnically Logged (top) and Televiewed (bottom)
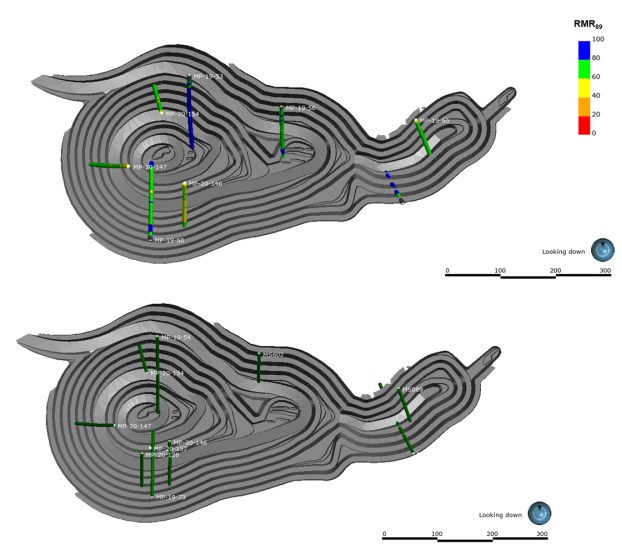
Core samples were selected from both programs for laboratory strength testing including unconfined compressive strength (UCS), Brazilian indirect tensile strength and direct shear strength of discontinuities. Measurement of elastic properties and densities were also made as part of the laboratory programs. Testing was completed by laboratories at WSP and Queen's University.
|
|
16.3.2 Geotechnical Domains and Rock Mass Properties
Data from both geotechnical programs were combined for analysis along with RQD (Deere 1989) and core recovery data acquired by Maritime from numerous resource drillholes. The combined database was then evaluated together with the lithologic and geologic structural models. Table 16-1 contains a summary of the key rock mass properties derived from the geotechnical logging programs.
The Hammerdown pit walls will be comprised primarily of mafic volcanics and dykes with occasional leucoxyene and quartz feldspar porphyry dykes. The volcanics typically have a well-developed, sub-vertical foliation that trends northeast-southwest. Various schist units also exist within the deposit but are located mostly internal to the final pit walls.
The available geotechnical data indicates similar rock mass quality and intact rock strengths between the various lithologies. The rock mass classifies as mostly "Good" geomechanical quality according to the Bieniawski (1989) RMR classification system.
Table 16-1: Summary of Rock Mass Characteristics by Lithology
| Lithology | Avg. UCS* (MPa) |
No. of Core Runs |
Length (m) | RMR89 | |||
| Cumulative | % of Total | 20% | Avg. | 80% | |||
| Mafic Volcanic | 71 (20) | 255 | 1,176 | 85.7 | 60 | 69 | 80 |
| Intermixed Felsic & Mafic Schist | - | 1 | 1.4 | 0.1 | - | 76 | - |
| Mafic Dyke | 73 (6) | 31 | 93.0 | 6.8 | 63 | 65 | 68 |
| Leucoxyene Mafic Dyke | 67 (4) | 19 | 70.2 | 5.1 | 72 | 74 | 86 |
| Quartz Feldspar Porphyry Dyke | 61 (1) | 13 | 31.2 | 2.3 | 61 | 74 | 84 |
Note:
*Number shown in parentheses is the total number of laboratories UCS tests the average is based on.
The site contains a thin covering of overburden soils. The depth of bedrock weathering below ground surface is minimal and no major fault zones were observed in the core. The known major structures such as the Captain Nemo and Rumbullion Faults are typically discrete without extensive hanging wall or footwall damage zones.
The combined distribution of rock mass properties was used as the basis for the feasibility study analyses. Figure 16-4 contains a histogram and cumulative frequency plot of the RMR data for the mafic volcanics and various dykes combined.
Discontinuity orientation data from each of the drillholes was contoured on stereographic pole plots for delineation of the dominant discontinuity sets across the pit. The orientation data was initially analyzed by rock type for each individual drillhole to identify significant variations in set orientations across the different rock types and pit. Considering drillhole directional biases, visual inspection indicates that orientation data can be grouped together for the North, Southwest and East domains as summarized on Figure 16-5.
|
|
The most dominant structural trend for the Hammerdown deposit is the sub-vertical, northeast-southwest trending foliation. Dominant sub-vertical, east-southeast trending discontinuities as well as moderate southwest and northeast dipping sets are also evident within the North and East geotechnical domains as shown on Figure 16-5.
Figure 16-4: Distribution of RMR for the Mafic Volcanics and Dykes
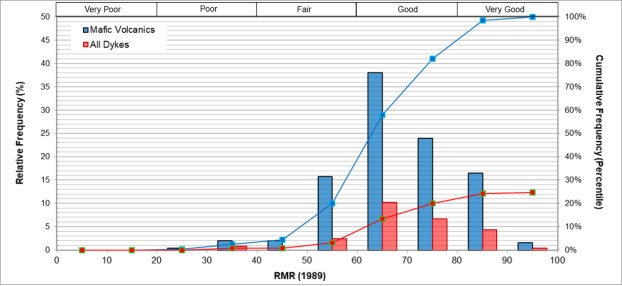
|
|
Figure 16-5: Geotechnical Domains and Respective Discontinuity Sets
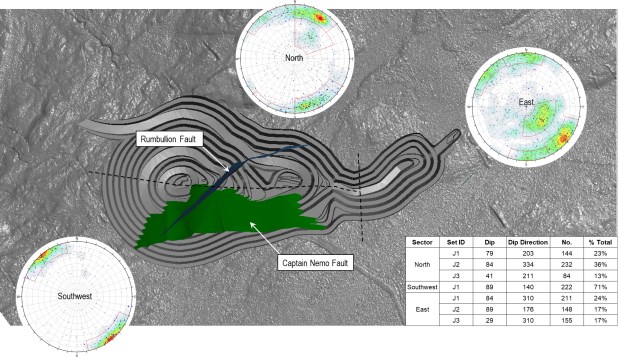
16.3.3 Slope Stability Analysis
Due to the overall "Good" rock mass quality indicated by the geotechnical core logging and televiewing programs and the relatively shallow pit depth, kinematic, or structurally controlled, failures were identified as the dominant factor controlling pit slope stability. The discontinuity sets identified from the televiewer data were assessed individually and combined for potential planar and wedge type failures for each of the three geotechnical domains.
The North and East domains were determined to be subject to planar failures fostered by the moderately, southwest and northwest dipping joint sets, respectively. Stochastic, backbreak analyses were conducted to estimate maximum achievable effective bench face angles for these sectors. The analyses use Monte Carlo simulations to randomly sample statistical distributions developed to represent discontinuity dip, dip direction, length, spacing and shear strength for a given slope orientation. The output from the analysis is a statistical distribution of effective bench face angles for each slope orientation analyzed. Results of the backbreak analysis for the North and East geotechnical domains are shown on Figure 16-6.
|
|
Figure 16-6: Backbreak Analysis Results for North and East Geotechnical Domains
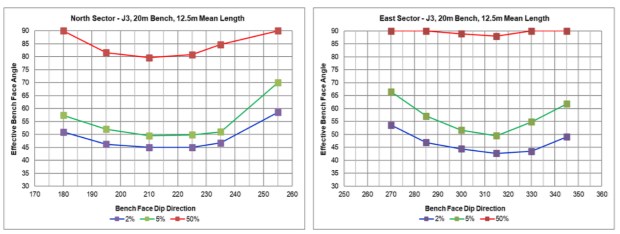
Limit equilibrium modeling of overall slopes was not conducted based on the anticipated high rock mass strength, the relatively shallow pit depth and the mostly favorable orientation of the dominant discontinuity sets.
16.3.4 Pit Slope Design Recommendations
Pit slope design parameters recommended for the final Hammerdown pit by slope design sector are summarized on Figure 16-7. In addition to the recommendations contained in Figure 16-7, 15 m wide geotechnical berms spaced at approximately 100m to 125 m intervals (vertical) are recommended to breakup continuous inter-ramp slopes.
Based on the overall "Good" rock mass quality and the limited joint sets, the maximum achievable inter-ramp slope angle for the Southwest sector is expected to be dependent primarily on the quality of blasting and scaling practices. Review of available geotechnical data and core photographs suggests that the Captain Nemo fault in this area is a discrete structure without significant hanging wall or footwall damage zones.
Careful geological and geotechnical mapping in the south wall will be required during operation to confirm the location, orientation and characteristics of the Captain Nemo fault and to identify any parallel structures that may exist. The existence of parallel structures may present risk of slope instability due to their adverse orientation (i.e., dipping sub-parallel to the wall). Special excavation procedures, mechanical ground support and/or modifications to pit slope geometry may be required in local areas if such structures are identified.
|
|
Figure 16-7: Pit Slope Design Recommendations for Hammerdown Final Pit
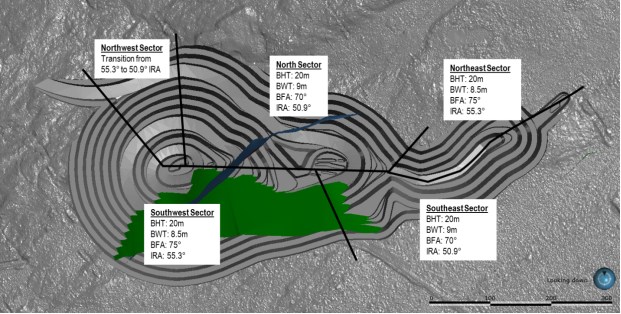
16.3.5 Mining Through Historic Underground Workings
Lower portions of the internal phases and final pit walls will intersect historic underground mine workings. Based on WSP (2020b), the primary mining method employed was mechanized cut and fill with some shrinkage mining done in the eastern portion. Stopes were mostly backfilled with unconsolidated rock fill.
Given that the stopes and development are narrow (spans typically 3 m to 5 m) and mostly backfilled, the existing underground workings are not anticipated to have significant influence on pit wall stability. Voids from historic underground workings could present operational hazards in some cases. Operational plans should include probe drilling to confirm the location and extents of the historic workings. Local modifications to blast designs could be necessary to ensure voids are collapsed when blasting the benches above.
16.4 Hydrogeology
Runoff and flows from areas potentially impacted by mining operations will be collected in contact water ditches. All flows collected in the contact water ditches will be kept separate from non-contact water and will be directed to one of three ponds to settle any suspended solids, strip potential ammonia from blasting residue or receive water quality treatment if needed.
Due to the shallow groundwater table at the site, dewatering will be required for the proposed open pit. Preliminary analysis of anticipated groundwater inflow rates into the open pit is estimated to be 3,426 m3/d at full development and under steady state conditions (GEMTEC, 2022b).
|
|
16.5 Mining Methods
Historically, the Hammerdown deposit has been mined with a small open pit and narrow vein underground mining (shrinkage and cut & fill mining methods). For this Feasibility study, the deposit has been developed purely as an open pit mine due to its relatively low cost and the near-surface nature of the deposit. The possibility of including underground mining was also evaluated but was ultimately excluded based on the overall expected economic outcome.
Ore material will be drilled and blasted on 5 m benches and then excavated using a 2 m3 excavator, and 38 t trucks. Ore will be delivered to a crusher/ore sorter located just South-East of the pit at a nominal rate of 1,200 t/d (426 kt/a) in order to provide 700 t/d (256 kt/a) to an offsite Mill. The average waste rejection rate of the ore sorter is expected to be approximately 40% for Vein material and 15% for the Wisteria zone.
Waste materials will be drill and blasted on either 10m benches when in larger waste zones or on 5 m benches when near ore zones. Waste will be mined using 8 m3 excavators and/or front-end loaders and 55 t trucks. This material will be contained within a Waste Storage Facility (WSF) located just South of the pit.
16.6 Mine Design
Industry-standard methodologies for pit limit analysis, mining sequence, cut-off grade optimization, and detailed design were adopted.
The main steps in the planning process were:
• Assignment of economic criteria to the geological resource model;
• Definition of optimization parameters such as commodity prices, preliminary operating cost estimates, pit wall angles, dilution and metallurgical recovery estimates for each material type;
• Calculation of economic ultimate pit limits for the deposit using open pit optimization software (applies the Lerchs-Grossmann algorithm to define optimal mining shells); and
• Development of detailed ultimate pit designs and mining phases (incorporating pit accesses and appropriate bench heights and pit geometry).
The ultimate pit design was split into three pushbacks to assist in smoothing production rates during operations. The approximate pushback shapes were selected from the generated pit shells as part of the pit optimization process which provide a sequence based on overall value. The access ramps were designed to safely handle 55 t haul trucks and each pushback was designed to have a minimum mining width of 50 m. The details of the open pit optimization used to guide the pit designs is discussed in Section 15.2. Additional details on the inputs used to develop the detailed pit designs are discussed in Section 15.3.
|
|
The initial pit phase is planned in the centre of the main pit as shown in Figure 16-8. Pushback 2 (Figure 16-9) mines the upper portion of the pit to final limits while leaving access into the lower eastern side of the pit. Pushback 3 (Figure 16-10) mines the remainder of the material to the ultimate design.
Figure 16-8: Pushback 1 Design
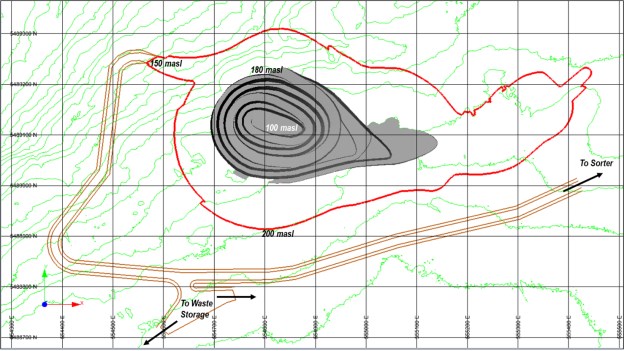
|
|
Figure 16-9: Pushback 2 Design
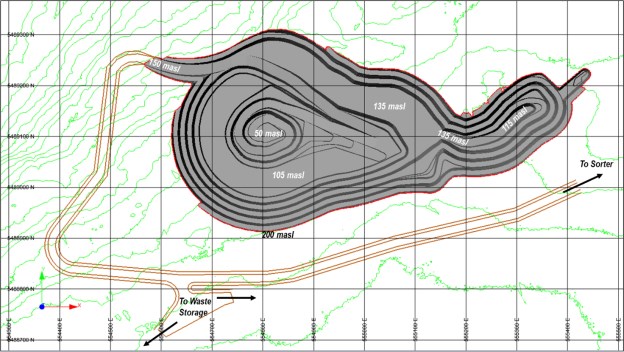
|
|
Figure 16-10: Pushback 3 Design (Ultimate Pit)
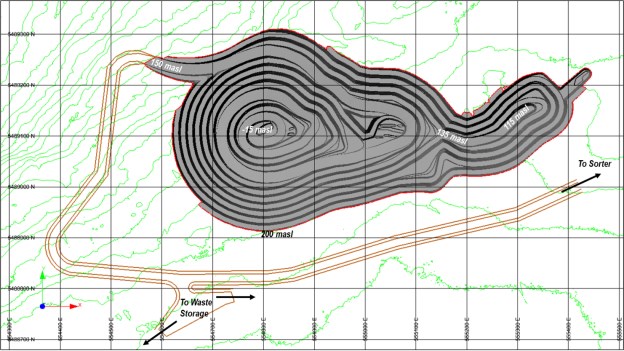
The ultimate pit design contains a total of 1.895 Mt of ore with an average gold grade 4.46 g/t and 40.4 Mt of waste for a strip ratio of 20.3:1 (waste:ore). Figure 16-11 further summarizes the pushback designs, illustrating ore and waste mined tonnages, grade, strip ratio.
|
|
Figure 16-11: Mining Pushback Summary
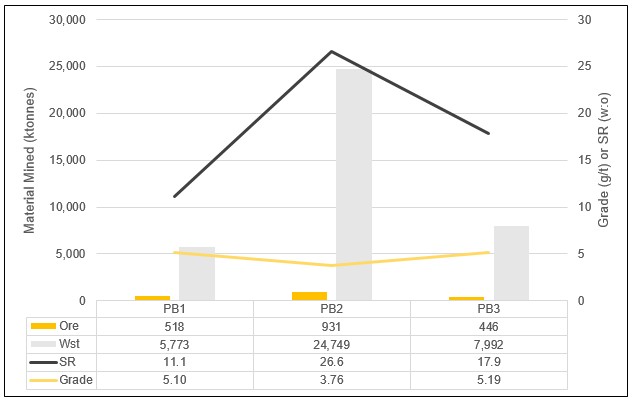
Note:
Ore is defined using a cut-off grade of 0.73 g/t for Veins and 1.06 g/t for the Wisteria zone.
16.6.1 Waste Storage
A total of 40.4 Mt of waste rock material will be mined over the mine life and will be contained within a single storage facility located just South of the pit.
Over the LOM, the ore sorter is expected to reject approximately 37% of the mined ore as waste rejects. Initially, this reject material will be stored in a temporary stockpile close to the ore sorter. As part of the site closure plan, the sorter rejects will ultimately be placed within the mined-out pit and could start as early as the middle of Year 3, once the Eastern lobe of the pit has been completely mined.
Figure 16-12 shows the storage locations for the waste materials.
|
|
Figure 16-12: Waste Storage Locations
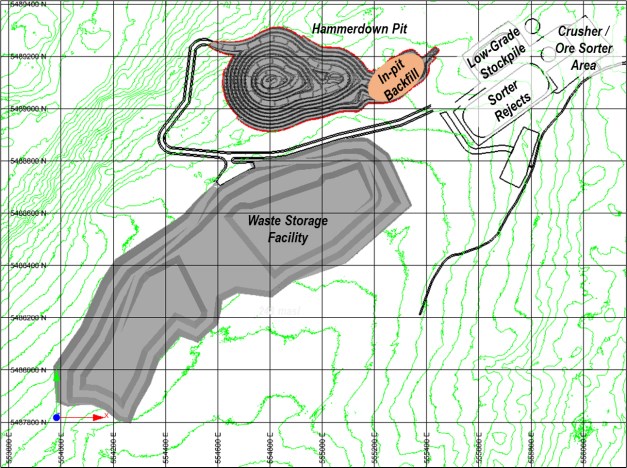
16.7 Mine Production Schedule
The mining sequence focuses on achieving the required mill production (700 t/d), and mines higher value material early in the mine life, while balancing grade and strip ratios. The lower-grade Wisteria zone was stockpiled, and then rehandled at the end of mine life to help generate higher cashflows earlier in the mine life.
The mine will require approximately 3 months of pre-production for waste stripping to expose enough ore to maintain mill targets. Mining rates are expected to start at 15 kt/d and increase to 43 kt/d in Year 2. The current expected mine life is 4 years for mining related activities.
Dilution has been accounted for within the block model through regularizing the blocks of the original sub-blocked resource model. Details on the dilution and mining recovery are discussed in Section 15.2.1.6. Table 16-2 summarizes the mine material movement and mill schedule by year over the LOM.
|
|
Table 16-2: Summary of the Mine Material Movement and Mill Schedule
| Mining Schedule | Unit | Total | Year -1 | Year 1 | Year 2 | Year 3 | Year 4 | Year 5 |
| Description | ||||||||
| Vein Ore | ||||||||
| Tonnes | (kt) | 1,689 | 53 | 373 | 426 | 426 | 412 | 0 |
| Grade | (g/t) | 4.77 | 4.30 | 5.18 | 3.84 | 4.00 | 6.20 | 0.00 |
| Contained Metal | (k Oz) | 259 | 7 | 62 | 53 | 55 | 82 | 0 |
| Wisteria Ore | ||||||||
| Tonnes | (kt) | 206 | 2 | 25 | 95 | 82 | 1 | 0 |
| Grade | (g/t) | 1.99 | 1.83 | 1.81 | 2.17 | 1.83 | 3.11 | 0.00 |
| Contained Metal | (k Oz) | 13 | 0 | 1 | 7 | 5 | 0 | 0 |
| Total Ore Mined | ||||||||
| Tonnes | (kt) | 1,895 | 56 | 397 | 521 | 508 | 413 | 0 |
| Grade | (g/t) | 4.46 | 4.20 | 4.97 | 3.54 | 3.65 | 6.19 | 0.00 |
| Contained Metal | (k Oz) | 272 | 7 | 63 | 59 | 60 | 82 | 0 |
| Waste | (kt) | 38,513 | 913 | 5,129 | 15,059 | 11,787 | 5,625 | 0 |
| Strip | (w:o) | 20.3 | 16.4 | 12.9 | 28.9 | 23.2 | 13.6 | 0.0 |
| Rock | (kt) | 40,408 | 969 | 5,526 | 15,580 | 12,295 | 6,038 | 0 |
| Mining Rate | kt/d | 26 | 11 | 15 | 43 | 34 | 17 | 0 |
| Mill Schedule (After-Sorter) | Year -1 | Year 1 | Year 2 | Year 3 | Year 4 | Year 5 | ||
| Description | Units | Total | ||||||
| Vein | ||||||||
| Tonnes | (kt) | 1,014 | 0 | 256 | 255 | 256 | 247 | 0 |
| Grade | (g/t) | 7.55 | 0.00 | 8.02 | 6.09 | 6.34 | 9.81 | 0.00 |
| Contained Metal | (k Oz) | 246 | 0 | 66 | 50 | 52 | 78 | 0 |
| Wisteria | ||||||||
| Tonnes | (kt) | 175 | 0 | 0 | 0 | 0 | 9 | 167 |
| Grade | (g/t) | 2.23 | 0.00 | 0.00 | 0.00 | 0.00 | 2.23 | 2.23 |
| Contained Metal | (k Oz) | 13 | 0 | 0 | 0 | 0 | 1 | 12 |
| Total Milled | ||||||||
| Tonnes | (kt) | 1,189 | 0 | 256 | 255 | 256 | 256 | 167 |
| Grade | (g/t) | 6.76 | 0.00 | 8.02 | 6.09 | 6.34 | 9.56 | 2.23 |
| Contained Metal | (k Oz) | 258 | 0 | 66 | 50 | 52 | 79 | 12 |
Note:
Ore is defined using a cut-off grade of 0.73 g/t for Veins and 1.06 g/t for the Wisteria zone.
|
|
The mine begins its initial development in the middle of the main pit, exposing enough ore to be able to sustain the planned Mill throughput of 700 t/d. Waste material will be used to build mine roads and pads for the various stockpiles. Any excess waste goes to the Waste Storage Facility. A total of 1 Mt will be mined over a 3-month period. Figure 16-13 shows the status of the mine at the end of the pre-production period.
Figure 16-13: Mine Status Map - End of Pre-production
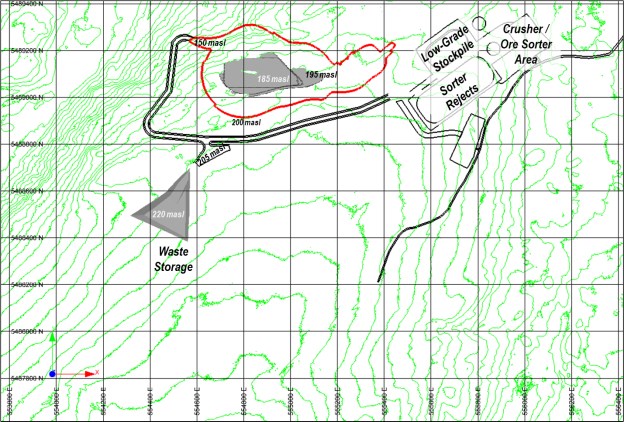
In Year 1, the ore is mainly produced from the higher-grade pushback #1, but pre-stripping of pushback #2 begins. A total of 5.5 Mt of material is mined (15 kt/d). The mine status at the end of Year 1 is shown in Figure 16-14.
|
|
Figure 16-14: Mine Status Map - End of Year 1
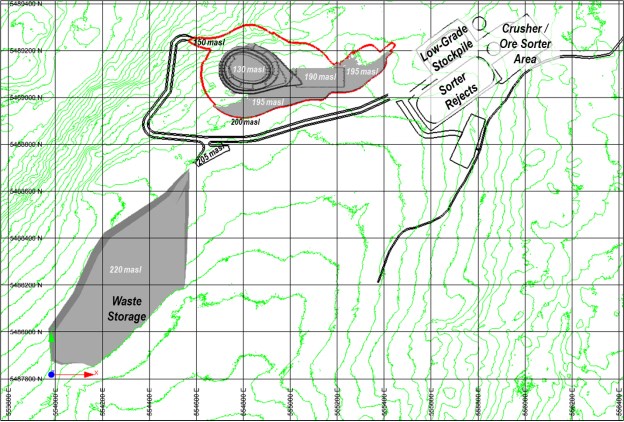
In Year 2, pushback #1 is mined-out and the production rate is increased to 43 kt/d in order to expose a sufficient quantity of ore. This is the peak production year moving a total of 15.6 Mt of material. Figure 16-15 shown the mine status at the end of Year 2.
|
|
Figure 16-15: Mine Status Map - End of Year 2
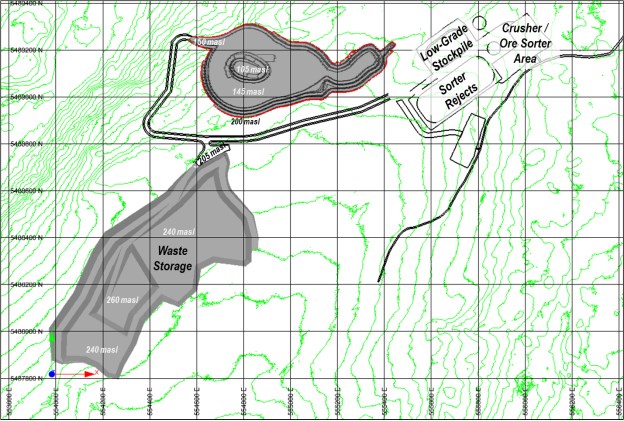
During Year 3, the pushback designs are followed such that the Eastern lobe of the pit can be mined-out without losing access. Once the Eastern lobe has been completely mined, this area is available for in-pit backfill for sorter reject material. The first 6 months of Year 3 are still at peak production rates but start to drop-off as the pit gets deeper. A total of 12.3 Mt is mined in Year 3 and the end of year status is shown in Figure 16-16.
|
|
Figure 16-16: Mine Status Map - End of Year 3
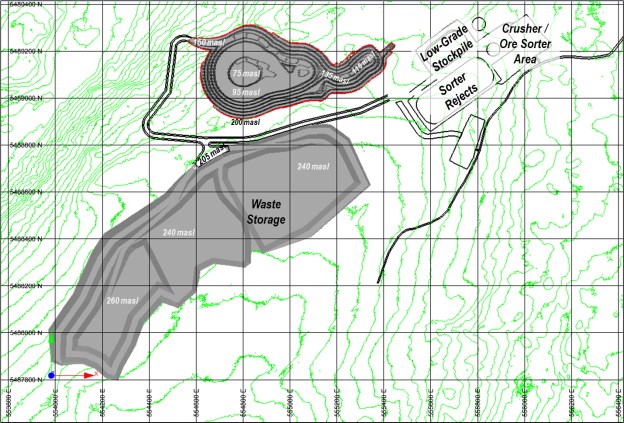
Year 4 completes all mining activities, and the Wisteria stockpile starts to be rehandled to the crusher to maximize Mill feed. The end of mine life status map is shown in Figure 16-17.
|
|
Figure 16-17: Mine Status Map - End of Year 4 (Final)
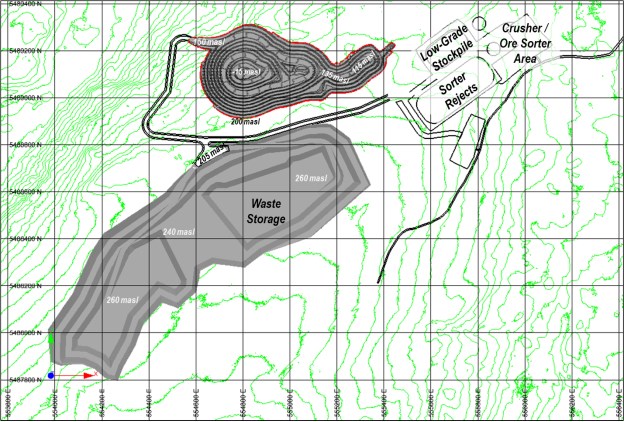
16.8 Mine Operations
The open pit mining activities have been assumed to be undertaken by the owner with conventional drill, blast, load and haul activities. Bulk excavation of material will be primarily undertaken by hydraulic excavators with a front-end loader as back-up. The mining fleet will consist of a 2.0 m3 excavator paired with 38 t haul trucks for ore, and 8 m3 excavators or front-end loader (FEL) paired with 55 t trucks for waste. Drilling will be undertaken with either 89 mm or 152 mm diameter drills. Given the overall scale of operations and equipment requirements, the fleet will be all diesel-powered.
The open pits are designed primarily with 5 m benches to help with ore selectivity and minimizing dilution. Where possible, waste material will be drilled and blasted in 10 m benches to increase productivity. Mining is scheduled to advance sequentially through the pit pushbacks, typically with two mining areas active at any given time. Given the required production rate and pit geometries, vertical advance rates average 12 benches per year. With the selected equipment and mine sequence, a maximum production rate of 15.6 Mt/year (43 kt/d) is achieved.
|
|
Ore material is hauled to the crusher area where it can either feed the crusher directly or be added to one of the ore stockpiles. The high-grade stockpile is planned to be located near the crusher and will be primarily used to help keep the crusher fully occupied by using an FEL to tram material to the crusher as necessary. The low-grade stockpile is designed to be mainly for the Wisteria zone ore which is lower grade and will be processed at the end of mine life.
16.8.1 Drilling
Production drilling will be with an 89 mm diameter drill on 5 m benches or 152 mm drill on 10 m benches. The final pit walls will quadruple-benched to a height of 20 m and will be pre-sheared. Drilling productivity for each material type is shown in Table 16-3 below.
Table 16-3: Drilling Productivity
| Unit | Ore | Wst-5 m | Wst-10 m | Wall Control | |
| Hole Diameter | mm | 89 | 89 | 152 | 89 |
| Material UCS | Mpa | 100.0 | 100.0 | 100.0 | 100.0 |
| Pen. Rate | m / hr | 42.6 | 42.6 | 42.6 | 42.6 |
| Hole Length | m | 5.50 | 5.50 | 11.00 | 20.00 |
| Drilling Time per Hole | min / hl | 7.8 | 7.8 | 15.5 | 28.2 |
| Non-Drilling Time per Hole | min / hl | 4.6 | 4.6 | 4.6 | 9.1 |
| Total Time per Hole | min / hl | 12.4 | 12.4 | 20.1 | 37.3 |
| Drilling Productivity | m / NOH | 26.7 | 26.7 | 32.8 | 32.2 |
16.8.2 Blasting
Blasting will be done primarily using a blend of ANFO and emulsion explosives. Blasting was assumed to be by a contractor, including, production, delivery, hole loading and blast initiation. The blasting patterns and powder factors for each material are shown in Table 16-4 below.
|
|
Table 16-4: Blasting Patterns and Powder Factors
| Unit | Ore | Wst-5 m | Wst-10 m | Wall Control | |
| Bench Height | m | 5.0 | 5.0 | 10.0 | 20.0 |
| Sub Drill | m | 0.5 | 0.5 | 1.0 | 0.0 |
| Hole Length | m | 5.5 | 5.5 | 11.0 | 20.0 |
| Hole Diameter | mm | 89 | 89 | 152 | 89 |
| Burden | m | 2.60 | 2.80 | 5.00 | 1.30 |
| Spacing | m | 3.00 | 3.20 | 5.80 | 1.10 |
| Powder/hole | kg | 27.7 | 27.7 | 174.0 | 20.0 |
| Powder Factor | kg / m3 | 0.71 | 0.62 | 0.60 | 0.70 |
16.8.3 Loading
A 2.0 m3 hydraulic excavator will be the primary ore loading tool. This unit is able to effectively load trucks with payloads of 38 t and allow for selective mining to help manage dilution. Additional time was allocated to the small excavator to account for manual separation along the ore/waste contacts.
Larger 8 m3 excavators with a 7 m3 FEL as back-up will do the majority of the mining in waste to expose the ore. The waste will be loaded into 55 t trucks.
The number of passes and fill factors are summarized in Table 16-5. In addition to the loading time, the loading unit productivities include waiting, maneuver and unproductive time estimates.
Table 16-5: Loading Parameters
| Unit | Excavator (ore) |
Excavator (waste) |
FEL | |
| Dry Density | t/m3 | 2.82 | 2.82 | 2.82 |
| Material Swell Factor | % | 30 | 30 | 30 |
| Production Delays | min/op hr | 20 | 10 | 10 |
| Bucket Size | m3 | 2.0 | 8.1 | 7.0 |
| Bucket Fill Factor | % | 98 | 98 | 95 |
| Truck Payload | t | 38.2 | 55.3 | 55.3 |
| Total Buckets for Load (Average) | # | 4 | 4 | 4 |
| Spot Time | sec | 30 | 30 | 30 |
| Swing Time | sec | 40 | 35 | 60 |
| Total Time to Load | min | 3.17 | 2.25 | 4.50 |
|
|
16.8.4 Hauling
A fleet of 38 t trucks will be required for ore haulage and rehandling of the sorter rejects. Larger 55 t trucks will be used for waste haulage. The combination of these trucks is also ideal to help with the initial construction activities. Haulage profiles were created for several benches of each mining pushback to each potential destination. The haul profiles were run through simulation software to estimate individual cycle times for each bench in each mining pushback. The simulation software adjusts the speed of the truck based on the truck rimpull curve and safe downhill speeds. Manual inputs were made to each haul profile to account for locations where the trucks would slow-down or stop such as switch-backs and intersections. Table 16-6 summarizes the haul cycle parameters used in calculating truck productivities. Truck performance was calculated for every loading unit and period of the mine plan. It reflects travel time and other fixed times of the load / haul / dump cycle.
Table 16-6: Haulage Cycle Parameters
| Parameter | Unit | Value |
| Rated payload | tonnes | 38 / 55 |
| Travel time (loaded/empty) | minutes/load | simulated |
| Maximum Speed | km/h | 50 |
| Dump time at crusher / stockpile | minutes/load | 1.5 |
| Dump time at waste dump | minutes/load | 1 |
| Production inefficiencies (non-hauling) | % of Net operating hour | 10 |
16.8.5 Support
The support and auxiliary equipment selection was made considering the size and type of the primary loading and hauling fleet, the geometries of the various open pits, and the number of roads and waste material destinations that would be in operation at any given time.
The following items were also included in the list of owner's support equipment:
• Track dozers, primarily used for maintenance of waste storage locations, road construction, stockpile maintenance, highwall cleaning and other activities as needed;
• Front-end loader to be used to support pattern cleanup, shovel floor maintenance, stockpile maintenance and rehandling;
• Graders to be used primarily for road maintenance and pit and dump floor maintenance, road construction;
• Fuel trucks for the supply of diesel fuel to all the hydraulic diesel excavators, dozers;
|
|
• Low-boy transporter trailer for transportation of dozers, drills, small backhoe and major equipment components;
• Dewatering pumps and piping;
• Water truck for dust suppression;
• Light vehicles for supervisors/technical personnel; and
• Mobile lights for lighting of pits, waste dumps and construction areas.
16.8.6 Dilution Management
For narrow vein gold deposits, the control of dilution is critical for the operational success. In order to keep dilution to a manageable level, the mine is expected to use the following practices:
• Grade Control Drilling - NQ diamond drill with angle holes spaced 15 m every 10 m vertically to delineate ore veins;
• Smaller drill holes (76 mm) and tighter drill / blast patterns in ore zones (2.6 m x 3.0 m) to control rock breakage. Where appropriate, choke blasting techniques or blasting mats could be used to enhance blasting controls;
• Field ore control with visual inspections/confirmation by Geologists; and
• Use of a small 2 m3 excavator in ore zones to increase selectivity. Equipment will have GPS installed to guide excavation activities.
As a backup, the ore sorter has additional throughput capacity and can handle larger amounts of dilution (up to an additional 200%) without restricting mill production targets. It is expected that the ore sorter will be able to reject any external dilution that is sent to the crusher.
From a risk perspective, an increase in dilution should not impact the mill head grade but would rather increase the amount of sorter-reject waste which would then require rehandling. Any impacts to the cut-off grade would be minimal.
16.9 Mine Equipment
Based on the productivity parameters discussed in Section 16.8, operating hours for the various equipment were estimated accounting for the amount of material that is planned to be moved within a specified period. The fleet size was then calculated using total operating hours for the period and the maximum available operating hours per unit within the period. The assumptions of mechanical availability, and overall utilization of the different equipment types are listed in Table 16-7.
|
|
Table 16-7: Equipment Utilization Assumptions
| Parameter | UNITS | Drills | Shovel / Exc |
FEL | Trucks | Support |
| Non-Operating Days | days / year | 30 | 10 | 10 | 10 | 10 |
| Use of Availability | % | 92 | 97 | 97 | 97 | 97 |
| Availability (Initial) | % | 85 | 90 | 85 | 88 | 75 |
| Availability (Y5-LOM) | % | 75 | 85 | 80 | 82 | 65 |
| Operating Delays per Day | hrs / day | 3.5 | 3.8 | 3.8 | 4.4 | 4.4 |
| Operating Hours per Day | hrs / day | 20.5 | 20.2 | 20.2 | 19.6 | 19.6 |
| Operating Efficiency | % | 85 | 84 | 84 | 82 | 82 |
| Overall Utilization | % | 59 | 70 | 65 | 65 | 52 |
A summary of the main open pit fleet requirements is shown in Table 16-8. The fleet requirement reaches its peak in Year 2. It would be beneficial to rent some equipment instead of purchasing new gear to cover the relatively short peak production period in Year 2 to 3. Given the short mine life, no replacements for any equipment will be necessary.
Table 16-8: Main Mining Equipment Fleet (average number of units)
| # Units Required | Year -1 | Year 1 | Year 2 | Year 3 | Year 4 | Year 5 |
| 152 mm Drill | 0.0 | 0.0 | 1.0 | 1.0 | 0.8 | 0.0 |
| 89 mm Drill | 2.0 | 2.3 | 4.0 | 3.5 | 2.8 | 1.3 |
| 8 m3 Excavator | 1.0 | 1.0 | 2.0 | 2.0 | 1.3 | 0.8 |
| 2 m3 Excavator | 1.0 | 1.0 | 1.0 | 1.0 | 1.0 | 0.8 |
| 7 m3 Front-End Loader | 1.0 | 1.0 | 1.0 | 1.0 | 1.0 | 0.8 |
| 4 m3 Front-End Loader | 0.0 | 1.0 | 1.0 | 1.0 | 1.0 | 1.0 |
| 55 t Truck | 3.0 | 4.5 | 13.3 | 12.8 | 9.0 | 2.8 |
| 38 t Truck | 1.0 | 1.0 | 2.0 | 2.0 | 2.0 | 1.0 |
| 310 hp Track Dozer | 1.0 | 1.0 | 2.0 | 2.0 | 1.5 | 1.0 |
| 4.3 m Grader | 1.0 | 1.0 | 1.0 | 1.0 | 1.0 | 1.0 |
16.10 Mine Personnel
The work schedule assumes a 24-hour/day, 7-days/week and 365-days/year mining operation. Operations and maintenance personnel who support the 24-hour operation will work two 12-hour shifts per day. The roster for this group will rotate with 4 operating shifts. Technical Services and Management will also follow the same shift rotation as the production crews.
|
|
Equipment operator labour requirements are based on the number of equipment units, operating requirements and shift rotations. Maintenance labour requirements are based on the number of equipment units to be maintained, estimates of mechanical availability, and estimates on the ratio of maintenance labour requirements to the number of units for each open pit fleet type.
The mine operations department will be responsible for the mining operation, including drilling, loading, and hauling of ore and waste, waste rock storage facility operations, haul road construction and maintenance, and mine dewatering. Each crew will be led by a mine shift foreman. The delivery and loading of explosives to the blast holes will be done by a contractor.
Annual personnel requirements (all crews) excluding contractors are summarized in Table 16-9. Mining personnel includes mine supervision, mine operations, mine maintenance and technical services. Personnel requirements peak around 208 people during the second year of production.
Table 16-9: Mining Personnel Requirements
| Year -1 | Year 1 | Year 2 | Year 3 | Year 4 | Year 5 | |
| Mine General | 2 | 8 | 7 | 7 | 7 | 6 |
| Mine Operations | 7 | 41 | 98 | 88 | 68 | 32 |
| Mine Maintenance | 9 | 46 | 90 | 82 | 66 | 35 |
| Technical Services | 4 | 13 | 13 | 13 | 13 | 11 |
| Total (all crews) | 22 | 108 | 208 | 190 | 154 | 84 |
|
|
17 PROCESS DESCRIPTION / RECOVERY METHODS
17.1 Introduction
This section describes the parameters used to design a new crushing and sorting facility at Hammerdown and a new grinding circuit and refurbishment of the existing Nugget Pond carbon in pulp (CIP) plant. The Hammerdown crushing and sorting plant is designed for a processing rate of 1,200 t/d (438,000 t/a) producing concentrate for processing at Nugget Pond at a processing rate of 700 t/d (255,500 t/a).
This Feasibility Study considers a two-stage processing approach for the project.
• Run of mine ore will be pre-concentrated at the mine site using crushing and X-ray transmission (XRT) particle sorting equipment to reduce the daily throughput rate from 1,200 t/d to 700 t/d (i.e., the sorting process will reject roughly 40% of the mined mass as a low gold grade, low sulphide waste stream).
• The on-site sorting plant "concentrate" will be transported by road to the Nugget Pond Mill, an existing facility located approximately 140 km away on the Baie Verte Peninsula. The Nugget Pond gold plant utilizes grinding, thickening, carbon in pulp leaching (CIP), and refining to recover the gold into a doré product for sale. CIP residue slurry will be disposed of in the existing tailings pond together with Rambler tailings.
Laboratory scale test work completed by established vendors of the technology has shown that the on-site sorting process is very effective. Site works consisting of primary jaw crushing, secondary and tertiary cone crushing, screening, X-ray transmission (XRT) sorting, and product stockpiling were selected for the study.
The Nugget Pond Mill was selected at the Prefeasibility Study level as the preferred processing facility for this brownfields gold project, as the direct cyanidation of preconcentrated ore provides a low risk, highly efficient processing route. In addition, when Richmont owned and ran the Hammerdown and Nugget Pond operations, this plant was used to process Hammerdown material. Between 2000 and 2004, Richmont processed 240,000 tonnes of ore grading 15.4 g/t Au from Hammerdown at Nugget Pond. Recoveries averaged 96% and a total of 145,000 ounces of gold were produced during this period. New truck unloading, materials handling, ore storage, and grinding facilities will be installed at Nugget Pond and will be utilized in conjunction with the existing leach / CIP circuit and refinery.
The various stages of metallurgical processing are described herein, starting with the pre-concentration process that will be located at the mine site, adjacent to the open pit mine at Hammerdown.
17.2 Run-of-Mine Pre-Concentration (Crushing and Sorting)
At the Hammerdown mine site, the processing facilities will be designed to produce a -12 mm crushed and sorted product that will be loaded out and trucked to feed the off-site process plant. The crushing and sorting plant will be designed for 1,200 t/d of ROM feed with a maximum capacity of 1,800 t/d. ROM feed will be subjected to primary and secondary crushing stages to produce a -50 mm product. It is estimated that 23% of ROM feed will be rejected as a fine fraction (-12 mm) prior to sorting. The coarse and middling size fractions from the secondary triple deck screen will be sent to two ore sorters operating in parallel, one receiving the 12-25 mm size fraction and the second one 25-50 mm size fraction.
|
|
The sorting program completed on several bulk samples has demonstrated that the crushed ore is highly amenable to sorting with an average of 52% of the feed to the sorting circuit being separated as waste material resulting in 40% of the crushing plant feed mass being rejected out of the circuit with only 5% of gold losses.
Sorted product material will be conveyed to a final tertiary crushing stage to reduce the product to -12mm prior to stockpiling in the ore storage building. Sorter reject material will be stockpiled then back hauled in mine trucks to the low-grade stockpile for long term storage.
The crushing and sorting plant will include:
• Primary crushing plant;
• Secondary crusher in closed circuit with a triple deck screen;
• Secondary screen undersize (fines) stockpile;
• Coarse sorting circuit and middlings sorting circuit; and
• Tertiary crusher in closed circuit with a single deck screen.
Due to the varying levels of dilution accompanying the mineralization, the crushing plant will be designed to facilitate a throughput of 1,200 t/d with average life-of-mine (LOM) feed grade of approximately 4.5 g/t Au. Both the crushing and sorting circuits will operate at an availability of 75%, on a 16 hr/d schedule which results in an instantaneous plant throughput of 100 t/h.
A summary of the process flowsheet is presented on Figure 17-1; a general arrangement of the sorting facility is shown on Figure 17-2.
|
|
Figure 17-1: Hammerdown Crushing and Sorting Summary Flowsheet
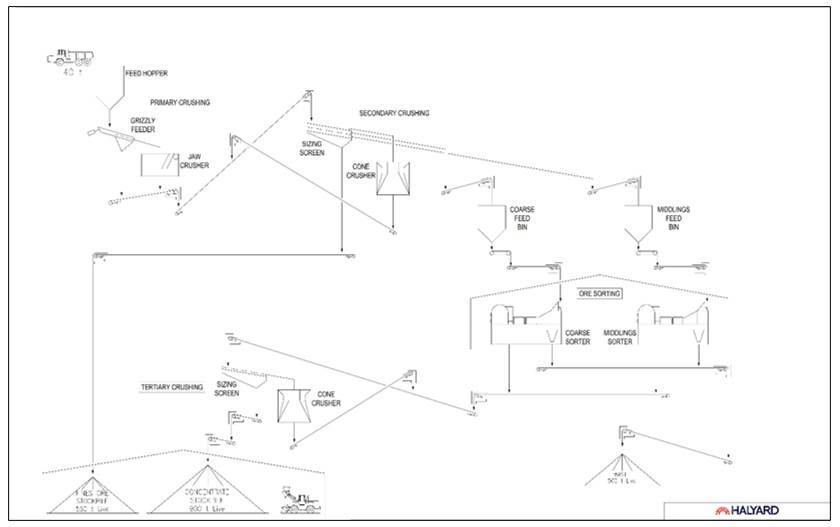
Source: Halyard (2022)
|
|
Figure 17-2: Hammerdown Crushing and Sorting Plant Layout
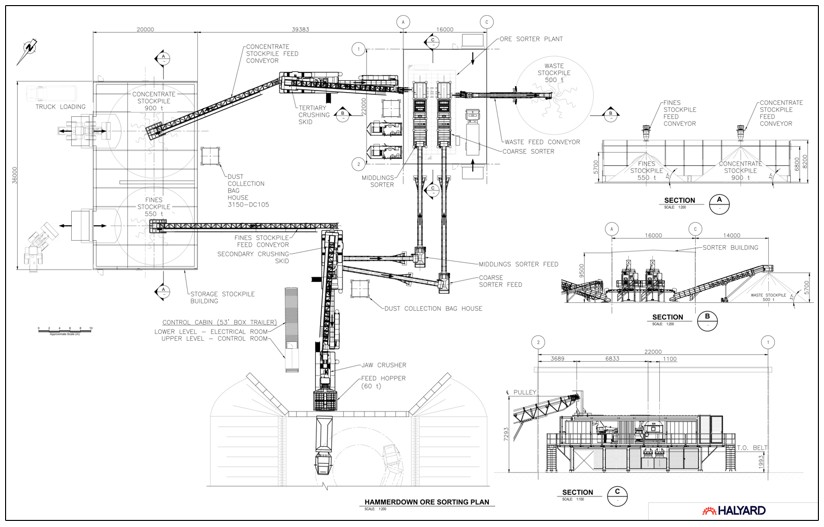
Source: Halyard (2022)
|
|
17.2.1 Crushing and Sorting Process Design Criteria
The process design criteria and mass balance detail the annual production capabilities, major mass flows and capacities, and availability for the sorting plant. Consumption rates for major operating and maintenance consumables can be found in the operating cost estimate described in Section 22. Key process design criteria from Section 13 are summarized in Table 17-1.
Table 17-1: Hammerdown Crushing Plant Process Design Criteria
| Criteria | Unit | Nominal Value |
| Crushing Plant Throughput | t/d | 1,200 |
| Crushing Plant Schedule | h/d | 16 |
| Availability / Utilization | % | 75 |
| LOM Average Au Head Grade | g/t | 4.5 |
| Feed Solids Density | SG | 2.77 |
| Feed Moisture | %w/w | 5.0 |
| Sorting plant Au Recovery | % | 95 |
| Crushing Plant Throughput | t/h | 100 |
| Number of Crushing Stages | - | 3 |
| ROM Top Size | mm | 600 |
| Secondary Screen Coarse Size, P100 | mm | 50.0 |
| Secondary Screen Middlings Size, P100 | mm | 25.0 |
| Secondary Screen Fines Size, P100 | mm | 12.0 |
| Tertiary Screen Undersize, P100 | mm | 12.0 |
| Sorter Type | - | XRT |
| Coarse Sorter - Waste Reject | % | 52.0% |
| Middlings Sorter - Waste Reject | % | 52.0% |
| Total Waste from Crushing Circuit Feed | % | 40.0% |
| Concentrates plus Fines | t/h | 60 |
| Waste Stockpile | t | 500 |
| Concentrate Stockpile | t | 900 |
| Fines Stockpile | t | 550 |
Source: Halyard (2022)
|
|
The recovery method will consist of the following unit operations:
17.2.2 Primary Crushing
The primary crushing circuit will consist of a 60 t ROM feed hopper, a 0.9 m x 4.2 m vibrating grizzly feeder and a 1,060 mm x 700 mm nominal opening 150 hp jaw crusher in open circuit, producing a final product P80 of approximately 80 mm. The plant is designed for a 600 mm top size feed and a rock breaker is allowed to assist with raking rocks into the crusher, reduce oversize, and clearing jams.
Cross belt self-cleaning magnets will be located at the head pulleys of the sacrificial and secondary screen feed conveyors for tramp metal removal.
The primary crushing equipment will be chassis mounted and road portable. The 60 t dump hopper will be self-supporting and skid mounted. Skid / chassis mounted equipment will be founded on a levelled, compacted granular pad. A 7.0 m high wire faced MSE wall will be constructed from crushed mine waste. A truck access ramp graded at 10% incline will provide access to a 24 m x 20 m ROM pad allowing for haul truck direct dump of ROM.
17.2.3 Secondary Crushing and Screening
The secondary crushing circuit will consist of a 125 hp motor single-stage cone crusher in closed circuit with a 1.9 m x 4.9 m triple deck screen. The screen will receive product from the jaw crusher and grizzly feeder. Undersize of the screen with a particle top size of -12 mm will report to the Fines Ore Stockpile and is expected to be approximately 23% of the circuit fresh feed. The 12-25 mm size fraction from the bottom deck screen will report to the Middlings Sorter Feed Bin. The 25-50 mm size fraction from the middle deck will report to the Coarse Sorter Feed Bin. Oversize from the top deck will report to the secondary cone crusher.
Sorter feed bins will provide approximately twenty minutes of retentions time and will be equipped with live bottom belt feeders to provide constant sorter feed rate.
The secondary crushing equipment will be chassis mounted and road portable. A wheel mounted stacker conveyor will transfer primary crushed material between the primary and secondary crushing chassis. Chassis mounted equipment will be founded on a levelled compacted granular pad.
17.2.4 Sorting
X-ray transmission (XRT) sensors combined with compressed air jets will be used to separate the ore containing sulphides from the inert waste rock dilution taken during the mining process. The middlings sorter and the coarse sorter operate in parallel. Both sorters direct concentrates to a common transfer conveyor to feed the tertiary crushing circuit and tails to a common transfer conveyor to feed the waste stockpile.
The sorters will be containerized in modified 40' sea containers and elevated 3.0 m above grade on a steel frame complete with access stairs and elevated platform. The frame will have skids and be founded on a compacted granular pad. The sorter containers will be housed within a 16 mW x 22 mL x 9.5 mH fabric building with overhead door access and space allocated for maintenance. The building will be complete with fire retardant polyethylene fabric cladding over galvanized tubular truss frame, with side openings for feed conveyor discharge. The fabric building will not be heated and will have dust collection and ventilation. Overhead lighting and power distribution for roll-up doors and minor electrical loads will be provided. The building will be founded on a pre-cast concrete block footings.
|
|
Each sorter will have a dedicated containerized compressed air system housed in modified 20' sea containers. Each system will be comprised of a compressor, wet and dry air receivers and drier to deliver instrument quality compressed air. The containers will be positioned adjacent to the sorter building and founded on a level compacted granular pad.
17.2.5 Tertiary Crushing and Screening
The tertiary crushing circuit will consist of a 250 hp motor single-stage cone crusher in closed circuit with a 1.9 m x 4.9 m single deck screen. The screen will receive concentrate from both ore sorters. Undersize of the screen with a top particle size of -12 mm will report to the Concentrate Ore Stockpile and is expected to be 37% of the circuit fresh feed. Oversize will be recycled back to the tertiary cone crusher.
17.2.6 Crushed Material Stockpiling
The fines size fraction produced at the secondary crushing circuit will be stored in a 550 t stockpile. Concentrate produced by the sorters and sized through the tertiary crushing circuit will be stored in a 900 t stockpile. Each stockpile provides approximately 24 hours of retention and will be reclaimed by front end loader. Both products will be housed in a common fabric building, and will be hauled to the Nugget Pond Mill for further processing.
The fabric building will be 20 mW x 36 mL x 6.8 mH and be complete with fire retardant polyethylene fabric cladding over galvanized tubular truss frame, with roof openings for product conveyor discharge. The fabric building is not heated and will have dust collection and ventilation. Overhead lighting and power distribution for roll-up doors and minor electrical loads will be provided. The side wall will be equipped with overhead doors to accommodate mobile equipment. The building will be founded on a pre-cast concrete block footings with a 1.2 m high interior perimeter wall to protect the fabric from rolling ore and material handling equipment.
A 500 t capacity stockpile for the waste produced at the sorting circuit will be located outside and will provide approximately 12 hours of storage. Sorter rejects will be hauled to the low-grade stockpile for long term storage.
17.3 Nugget Pond Mineral Processing
The hydromet plant at Nugget Pond was designed and constructed in 1996 and subsequently run by Richmont as a nominal 500 t/d CIP plant at 97% gold recovery (Figure 17-3). The operational plan for this feasibility study is to process up to 700 t/d at 95.5% gold recovery. This extra capacity will be added as follows:
|
|
• New crushing and grinding facilities will be installed with sufficient power to give P80 50 µm grind at 700 t/d throughput rate.
• Existing leach and detox tanks provide sufficient residence time for complete leaching of the fine grind and tails detoxification.
• A new oxygen plant will be installed for use in lieu of air in the leaching and detox circuits in accordance with the feasibility study testwork program.
• Pumps, carbon circuit and other intermediate equipment will be upgraded where necessary to handle larger flows as part of the plant refurbishment.
• Review of the existing CIP circuit has determined that additional retention time may be required to achieve 99.5% CIP gold recovery (99.5% overall). Additional testwork is recommended to confirm this observation and to determine the extra residence time required. In addition, there are alternate process configurations involving a lower CAPEX that could be installed if necessary, such as utilizing the last leach tank as a CIL (Carbon in Leach) tank. For these reasons, no allowance for additional CIP tanks was included in this feasibility study.
A new front-end ore storage and grinding circuit to the existing hydrometallurgical plant will be installed in such a manner as to allow running in parallel with the Rambler sulphide flotation mill and to tie-in to the existing leach / CIP circuit. In addition to the new front-end, the existing downstream leaching and carbon circuits will be refurbished and / or upgraded as required to achieve the planned throughput rate.
Residues from the hydrometallurgical plant will be combined with existing flows and stored in the Nugget Pond tailings storage facility.
A summary of the process flowsheet is presented in Figure 17-4, the Nugget Pond site plan is shown in Figure 17-5.
|
|
Figure 17-3: Nugget Pond Hydrometallurgical Plant
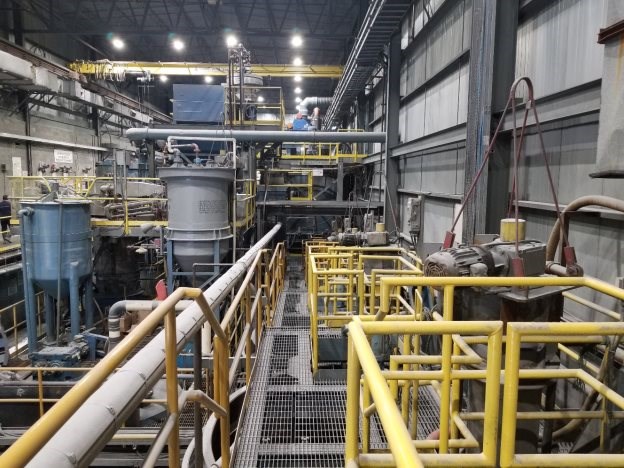
Source: JDS (2022)
|
|
Figure 17-4: Nugget Pond Grinding and Gold Recovery Summary Flowsheet
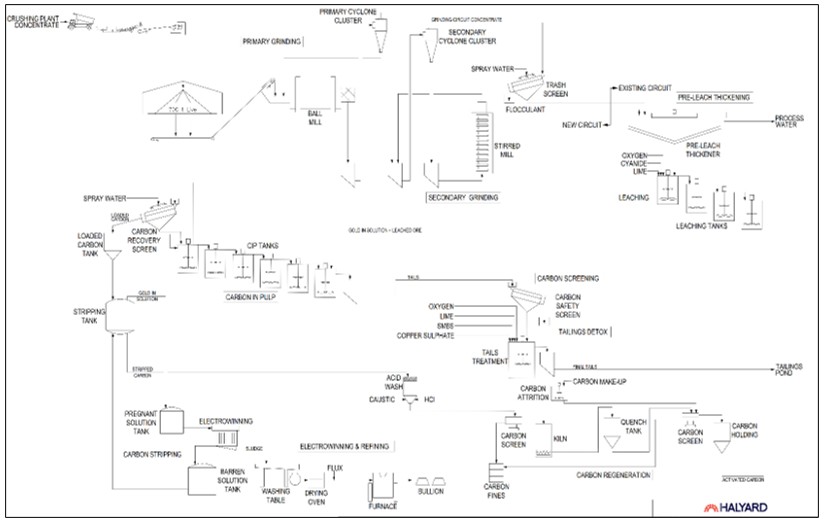
Source: Halyard (2022)
|
|
Figure 17-5: Nugget Pond Site Plan with New Unloading, Storage and Grinding Circuit
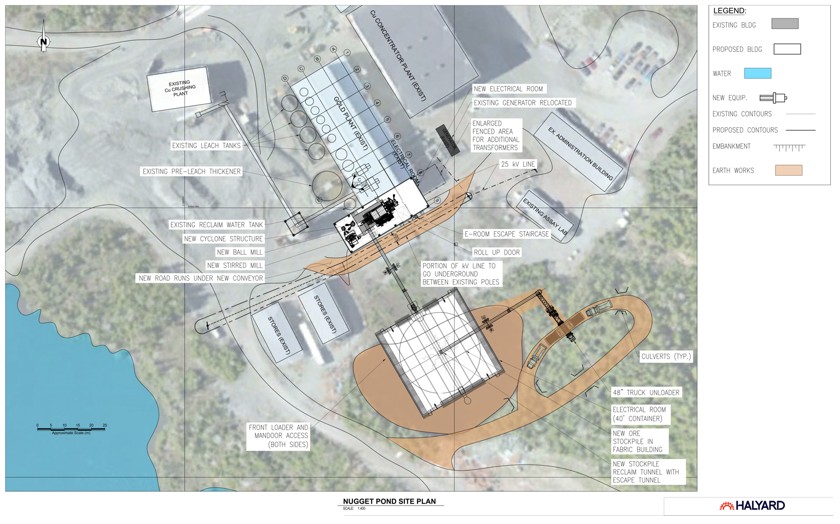
Source: Halyard (2022)
|
|
17.3.1 Grinding and CIP Process Design Criteria
The Process Design Criteria and Mass Balance detail the annual production capabilities, major mass flows and capacities, and availability for the griding circuit and leach / CIP plant. Consumption rates for major operating and maintenance consumables can be found in the operating cost estimate described in Section 22. Key process design criteria from Section 13 are summarized in Table 17-2.
Table 17-2: Nugget Pond Grinding, Leach/ CIP Process Design Criteria
| Criteria | Unit | Nominal Value |
| Grinding Circuit Daily Throughput | t/d | 700 |
| Grinding Circuit Au Head Grade | g/t | 6.97 |
| Feed Solids Density | SG | 2.77 |
| Feed Moisture | %w/w | 5.0 |
| Availability/Utilization | % | 92 |
| Grinding Circuit Hourly Throughput | dmt/h | 31.7 |
| Number of Grinding Stages | - | 2 |
| Grinding Circuit Feed Size, F100 | mm | 12 |
| Grinding Circuit Feed Size, F80 | mm | 9.5 |
| Grinding Circuit Product Size, P80 | µm | 50 |
| Primary Grinding Stage Circuit Type | - | Ball Mill + Hydrocyclones in Closed Circuit |
| Secondary Grinding Stage Circuit Type | - | Stirred Mill + Hydrocyclones in Closed Circuit |
| Leaching Circuit Gold Recovery | % | 96 |
| Leaching Circuit Residence Time | h | 18 |
| CIP Circuit Gold Recovery | % | 99.5 |
| Carbon Concentration in CIP Circuit | g/l | 35 |
| Overall Gold Recovery | % | 95.5 |
| NaCN Destruction Method | Inco SO2/air | |
| WAD CN Final Tails Concentration | mg/l | 20 |
| Detox Residence Time | h | 1 |
Source: Halyard (2022)
The recovery method will consist of the following unit operations.
|
|
17.3.2 Transportation and Storage
Process plant feed crushed to -12 mm (P80 9.5 mm) at Hammerdown mine site will be transported by road to Nugget Pond on 30 t haulage trucks. The trucks will offload via belly dump onto an automated 50 hp truck unloader that will convey the material to a 700 t live (24 hr) covered stockpile. Material will be transferred from the stockpile to a reclaim conveyor by two vibrating pan feeders, working in a duty standby configuration, and then transported to the ball mill by a second conveyor.
The stockpile will be housed in a fabric building 30 m W x 32 mL x 11.3 m H and be complete with fire retardant polyethylene fabric cladding over galvanized tubular truss frame, with roof opening for feed conveyor discharge. The fabric building will not be heated and will be naturally ventilated. Power distribution for roll-up doors and minor electrical loads will be provided. The side wall will be equipped with overhead doors to accommodate mobile equipment for periodic manipulation of dead material. The building will be founded on repurposed sea containers which will form a perimeter wall for protection from rolling ore and material handling equipment. The sea containers will provide cold storage and house electrical distribution equipment for the materials handling circuit.
A modular partially inground reclaim tunnel system will house preinstalled reclaim hoppers, duty-standby vibrating feeders, reclaim conveyor, lighting, and electrical distribution. The conveyor and escape tunnels will be bolted steel plate arches with reinforced structural tubing with a 2.4 m H x 2.4 m W cross-section as shown in Figure 17-6. The conveyor tunnel will be 23 mL, the escape tunnel will be 12.5 mL and sloped to the south following the natural site drainage.
|
|
Figure 17-6: Nugget Pond Stockpile Cover and Reclaim Tunnel Section
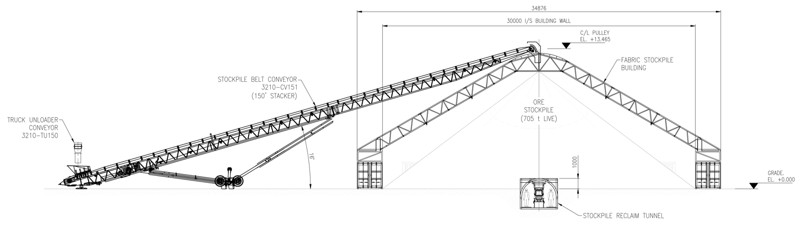
Source: Halyard (2022)
|
|
17.3.3 Primary and Secondary Grinding Circuit
The grinding circuit will be fed at a nominal rate of 31.7 dtph from the covered stockpile. The new grinding circuit will reduce the particle size from P80 9.5 mm to P80 50 µm using two stages in series grinding. The primary stage will consist of a 10.5' D x 21' L 1,000 hp ball mill operating in closed circuit with three 250 mm hydro-cyclones, working in two duty and one standby configuration. The secondary grinding stage will consist of a 450 hp vertical stirred mill operating in closed circuit with three 250 mm hydro-cyclones, two in duty and one standby. Both circuits will have redundancy for the primary and secondary cyclone 40 hp feed pumps and the 10 hp stirred mill feed pump. The secondary cyclone cluster overflow will report to a new trash screen and then to the existing pre-leach thickener for dewatering before entering the leach / CIP circuit.
The new grinding circuit will be housed within a 12.3 mW × 27 mL × 13.1 mH pre‐engineered building. The building roof profile will match the existing mill building and be connected along the south wall. The building will be complete with metal cladding, insulation, HVAC, and snow guards. Overhead doors on the south and west sides will accommodate mobile equipment access to the laydown and secondary grinding areas. The process building will be equipped with a 10 t single girder overhead crane along the span servicing the grinding and laydown areas.
The pre‐engineered building will be installed on a concrete perimeter wall with footings under the pre-engineered columns. The footing will be founded on bedrock, utilizing rock anchors to optimize concrete quantities where required. The foundation will be backfilled and compacted on the interior and exterior of the building. A sloped concrete slab in the process plant will contain and direct spillage toward inground sumps complete with sump pumps.
A 12 mW x 7 mL mezzanine level will house the new electrical room and will mirror the existing electrical room. A double door with monorail will provide lift access to the ground level laydown area. Below the mezzanine will be a 12 mW x 7 mL mechanical room, which will mirror the existing compressor room. The space will house the new skid mounted PSA oxygen plant.
Layout drawing of the process plant building extension is shown in Figure 17-7.
|
|
Figure 17-7: Nugget Pond Grinding Circuit Layout and Building Extension
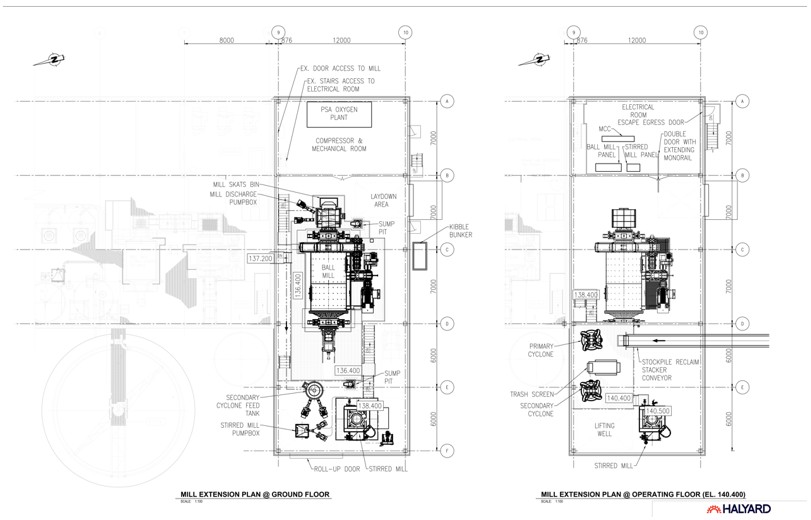
Source: Halyard (2022)
|
|
17.3.4 Pre-Leach Thickener
The new 0.9 m x 2.4 m trash screen underflow slurry will gravitate to the existing 12.2 m diameter pre-leach thickener. The underflow pumps will remove thickened slurry at an average density of approximately 42% solids. The thickener overflow will report to an existing pipeline which gravity flows to the tailings pond.
Settling test work conducted for this feasibility study suggested that the existing thickener will be of sufficient capacity for the 700 t/d processing rate by adding 40 to 60 g/t of flocculant at an average underflow density of 42% solids.
This feasibility study allows for the complete replacement of the pre-leach thickener rake and drive to allow reliable operation.
17.3.5 Leaching and Carbon-in-Pulp Circuit
The existing leaching circuit is composed of four 5.8 m D x 9.8 m H tanks. Refurbishment of the existing tanks, mainly launder and baffles, and new 15 hp twin impellor agitators will be required, which in conjunction with the addition of oxygen and a feed density of 42% solids, would result in an expected gold recovery of 96% at the leaching circuit.
The overflow from the final leach tank gravitates to the head of the existing carbon in-pulp (CIP) circuit, composed of six 3.05 m D x 3.66 m H tanks. Refurbishment of the tanks to replace corroded launders and gate valves will be required. It is estimated that these tanks will provide 5 h of residence time at a feed rate of 700 t/d. Each CIP tank will be equipped with a new 7.5 hp agitator for mass transfer and solids suspension. Slurry will gravitate between tanks towards the tail end, while granular activated carbon (GAC) will be added at the tail end and pumped between tanks counter-current to the slurry. New enlarged 3 hp inter-stage screens and 7.5 hp carbon advance pumps will be used for countercurrent carbon transfer within each tank.
The CIP tanks carbon concentration will be increased from 20 g/L to 35 g/L from the original CIP circuit design to ensure a loaded carbon gold concentration close to 5,000 g/t.
17.3.6 Stripping, Refining, and Carbon Regeneration
Loaded carbon retained on the new 1.2 m W x 2.4 m L carbon recovery screen will be stored and then sent to an existing 1.0 m D x 2.6 m H stripping vessel in 1 t batches, nominally once per day. The stripping solution will be heated to 150 °C using a refurbished 60 kW electric heater to strip the adsorbed gold from carbon back into solution. The pregnant strip solution will be removed from the circuit and stored in the existing 3.0 m D x 3.0 m H pregnant solution tank, then pumped to a new electrowinning cell within the refinery where the gold in solution is electro-deposited on cathodes made of steel wool.
The cathodes and sludge will be washed and oven-dried before being mixed with flux and added to an existing propane fired refining furnace where the gold is smelted, and a clean matte is poured into doré bars.
|
|
The barren strip solution will be returned from the electrowinning circuit to the existing stripping tank to begin the cycle again. Barren carbon from the stripping tank will be washed with acid and rinsed. Once rinsed, the carbon will be regenerated in an electric reactivation kiln, quenched, screened, and stored in a holding tank. From there, carbon will be periodically returned to the last carbon-in-pulp tank. Fresh carbon will be topped up as required from the carbon attrition tank via the second carbon sizing screen.
17.3.7 Tailings and Cyanide Destruction
The slurry exiting from the final CIP tank will pass through a replaced 1.2 m W x 2.4 m L carbon safety screen to collect fine carbon particles that may have passed through the inter-stage screens. The screen underflow will gravitate to the cyanide destruction reactor while the overflow, which contains fine loaded carbon, will be collected in a tote bin.
The existing 3.7 m D x 6.1 m H tailings treatment tank will provide 1 hr retention time at 700 t/d and will be used for the cyanide destruction reaction. Oxygen, copper sulphate, and sodium metabisulphite will be added in the SO2 process to reduce cyanide to suitable levels for discharge (20 mg/L CNWAD). A new 15 hp agitator will be installed to aggressively blend and aerate the slurry and reagents. Detoxified tailings will overflow to the existing tails pump box and will be pumped by new 15 hp tails pumps in duty / standby configuration to the operating tailings storage facility.
Hammerdown's relatively small tailings volume of approximately 0.72 M m3 can be readily stored within the existing and future tailings storage facility at Nugget Pond as per the tentative operating agreement with Rambler.
17.3.8 Process / Reclaim Water
Reclaim water is continuously circulated by existing 60 hp duty / standby pumps to the existing 3.7 m D x 6.1 m H process water tank located adjacent to the process building. Process water for the new grinding circuit will be provided by tie-in with existing reclaim water circuit. A new process water booster pump will provide higher pressure water (20 m3/h) for use at screen sprays. Overflow from the process water tank will gravitate back to the tailings storage facility. Circulation of the reclaim / process water overflow has proven to prevent winter freeze over at the reclaim water pumps.
17.3.9 Reagents and Services
Existing reagent receiving, mixing, storage and dosing facilities are used to ensure that the process is running optimally. Reagents necessary for the CIP Plant operation include:
• Flocculant;
• Sodium cyanide;
• Oxygen;
|
|
• Lime;
• Sodium metabisulphite;
• Copper sulphate;
• Sodium hydroxide; and
• Hydrochloric acid.
 |
 |
18 PROJECT INFRASTRUCTURE AND SERVICES
The project infrastructure is designed to support the operation of the mine at the Hammerdown site and processing plant at the Nugget Pond site. Limited additional infrastructure is needed at Nugget Pond and any requirements were covered in Section 17. The project infrastructure required to support the mine at the Hammerdown site is described below.
18.1 Hammerdown Site
The Hammerdown site is located approximately 5 km from Kings Point, NL and accessible by the existing 500 m of site road off Route 391.
Surface infrastructure will include temporary buildings (office, dry, truck shop warehouse, sorting facility, explosive storage and gate).
Water management infrastructure will include freshwater pumping station, water distribution, dewatering pumps for the mine and settling ponds.
Electrical systems will include powerline from utility company, main substation, electrical distribution, telecommunications, and security systems.
18.1.1 Existing Infrastructure
The only existing surface infrastructure on the Hammerdown site are the roads. All existing roads will require partial clearing, minor granular refilling, culverts addition and/or repair, and will need to be leveled with a grader.
18.1.2 General Site Arrangement
The site layout has been designed to minimize environmental and community impacts, provide security-controlled site access, minimize construction costs and optimize operational efficiency. Primary buildings have been located to allow easy access for construction and utilize existing topography to minimize bulk earthworks volumes.
|
|
Figure 18-1: Hammerdown Overall Site Layout
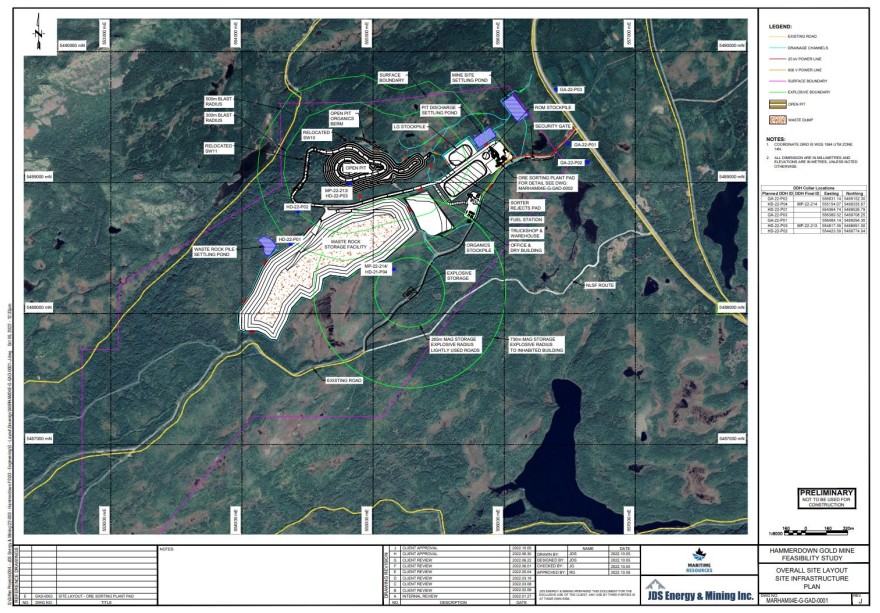
|
|
18.1.3 Site Access Road
The site is accessible from Route 391 via the Shoal Pond Forest Access Road. The site access road will be upgraded and paved, to accommodate regular traffic from the ore haulage trucks. A new 2km bypass road will be constructed to redirect the general public off the existing access road and around the mine area.
18.1.4 Site Roads
Light vehicle access roads and Haul roads will be developed as required to support the site, using and upgrading the existing roads as much as practical. A new haul road from the open pit to the waste storage facility and crushing & sorting pad will be constructed to support the mine fleet.
18.1.5 Buildings and Support Infrastructure
18.1.5.1 Stockpile Pads
Three stockpile pads will be constructed to store Low Grade (LG) Material, Run of Mine (ROM) Material and rejects from the Ore Sorter. The ROM and LG stockpiles will be lined with an HDPE Geomembrane. The rejects stockpile will be cleared and stripped and provide temporary storage for the sorter rejects until they can be backfilled within the Hammerdown pit.
18.1.5.2 Truck Shop and Warehouse
The truck shop will be an 80'x 125' structure, with seacan walls, located to the south of the rejects stockpile and easily accessible from the min site. This garage will contain a minimum amount of equipment to perform basic maintenance works. Additional seacans will be located near the truck shop to provide additional storage for spare parts.
18.1.5.3 Security
There will be a security trailer located along the main access road, controlling access to the site. A weigh scale, to track Ore haulage offsite to the Nugget Pond site, will be located next to the security building.
18.1.5.4 Office and Dry Building
Office facilities and Mine Dry will be located near the truck shop and warehouse. The facilities will be constructed from modular units.
18.1.5.5 Fuel Station
The fuel station in assumed to be included in the fuel supplier package. The electrical power will be brought to this location to provide power for the lighting, control and motorizations of the fuel station
|
|
18.1.5.6 Explosives Storage
The explosives magazine is included in the explosive supplier package. A cleared and leveled area to the south waste rock storage facility will be provided for their use.
18.1.6 Power
The power required for the site will be in the range of 1.3 MW. Power will be provided by Newfoundland and Labrador Hydro (NL Hydro), the local electrical utility.
Generators will be used for pit dewatering, as well as to provide power at the explosives storage area and the security trailer.
18.1.6.1 Hammerdown Power Distribution
The Hammerdown site is serviced by the nearby Newfoundland Labrador Hydro provincial grid via existing 25 kV, 3-phase distribution line running parallel to route 391. As part of the project, a new 570 m pole line extension along the site access road will be constructed. A substation with power metering, disconnect switch, and 2.0 MVA 25 kV-600 V transformer will be installed in proximity to the crushing plant. Site power distribution will be via two containerized e-rooms at the crushing plant and administration complex using buried 600 V feeders.
18.1.6.2 Nugget Pond Power Distribution
The Nugget Pond site is serviced by an existing connection to Newfoundland Labrador Hydro provincial grid. As part of the project, a 110 m portion of the existing pole line will be buried along the mill access road. The existing substation will be expanded to incorporate power metering, disconnect switch, and 2.5 MVA 25 kV-600 V transformer providing power to the new unloading, storge and grinding circuit. Power distribution to new equipment will be via 600 V MCCs installed in a new electrical room within the expanded mill building. No changes to power supply for existing equipment is envisioned.
18.1.6.3 Project Power Demand
Combined connected load and average power demand for both Hammerdown and Nugget Pond sites is shown in Table 18-1 considering demand and utilization factors and estimated system losses.
|
|
Table 18-1: Project Power Requirements
| Hammerdown Site | Connected Load (kW) | Average Load (kW) | Electrical Usage (MWh/Year) |
| Hammerdown | |||
| Process Equipment & buildings | 1,221 | 1,037 | 5,648 |
| Non-process surface infrastructure | 485 | 243 | 2,050 |
| Subtotal - Hammerdown | 1,706 | 1,280 | 7,698 |
| Nugget Pond | |||
| Process Equipment | 2,314 | 2,114 | 13,120 |
| Project Total | 4,020 | 3,394 | 20,818 |
Source: Halyard (2022)
18.1.7 Utilities
18.1.7.1 Water Supply
Water will be supplied via a well installed near the office and mine dry. The water storage tanks will be located close to the offices. From there the water will be distributed to the office and dry, the garage and warehouse.
Bottled water will be supplied to the site by local vendors.
18.1.8 Sewage System
A septic system will service the office and dry trailers.
18.1.9 Water Management
The hydraulic control infrastructure to manage the site water includes three water quality / settling ponds, non-contact water interception ditches and contact water conveyance ditches. Settling ponds were sized to store the runoff volume from a 25-year return period storm event with a 6-hour duration and are anticipated to be able to settle suspected solids down to 10 microns during a 10-year return period, 24-hour storm event. The design criteria for hydraulic conveyance infrastructure (e.g., interception ditches, channels, and spillways) were sized based on a 100-year return period storm event, including the predicted effects of climate change.
A total of three water quality / settling ponds will be constructed on site, one pond each to control the flow from the waste rock stockpile (Pond #1), the dewatering flows from the open pit mine works (Pond #2), and the runoff from the ore stockpile pads, plant site area, and the organics stockpile (Pond #3).
|
|
All three ponds will be designed as wet ponds and include an outlet control structure to attenuate inflow fluctuations, water level control measures to increase retention time and/or stop outflow (if / when desired), an emergency spillway to maintain pond embankment stability during extreme storm events. All ponds will be excavated into the ground / rock to minimize the height of the downstream embankment and maximize pond embankment stability and safety. The ponds will be lined if / as needed to enable proper water containment (excluding waste rock stockpile, as ARDML testing shows waste rock pond water will be inert and will not generate acid).
Outflow from Pond #2 can be routed through Pond #3 if additional water quality treatment is needed or can be discharged directly to the receiving environment if the water quality meets regulatory discharge limits.
Runoff and flows from areas of the Project site not impacted by mining operations will be collected in non-contact ditches and discharged to receiving watercourses.
Runoff and flows from all site areas potentially impacted by mining and ore processing operations (open pit, waste rock stockpile, ore stockpile pads and plant site) will be collected in contact water ditches. All flows collected in the contact water ditches will be kept separate from non-contact water and will be directed to one of three ponds to settle any suspended solids, strip potential ammonia from blasting residue or receive water quality treatment if needed.
|
|
19 MARKET STUDIES AND CONTRACTS
19.1 Market Studies
No market study was completed on the potential sale of doré from the Hammerdown Project. Gold refining terms used in the analysis were based on recent indicative terms from other Canadian projects. The indicative terms were reviewed and found to be reasonable by QP Gordon Doerksen, P.Eng.
Table 19-1 outlines the terms used in the economic analysis and are deemed by the QP to be within industry norms.
Table 19-1: Net Smelter Return Assumptions
| Parameter | Unit | Value |
| Gold (Au) Payable | % | 99.97 |
| Gold (Au) Refining Charge | US$/pay oz | 0.38 |
| Transportation | US$/pay oz | 1.35 |
19.2 Royalties
Commander Resources Ltd. (Commander) holds a 1% Net Smelter Return (NSR) royalty on the Hammerdown Project, excluding the Orion deposit. Additionally, there is a $3.165 M royalty payment due one year after the onset of commercial production payable to holders who received royalty units from the April 2016 financing for Maritime Resources.
19.3 Metal Prices
The precious metal markets are highly liquid and benefit from terminal markets around the world (London, New York, Tokyo, and Hong Kong). Historical gold prices and exchange rates (US$:C$) are shown in Figure 19-1 and Figure 19-2.
Three-year trailing average metal prices were rounded to US$1,750/oz and used in the FS economic model. The spot gold price on the report effective date was US$1,799.
|
|
Figure 19-1: Historical Gold Price
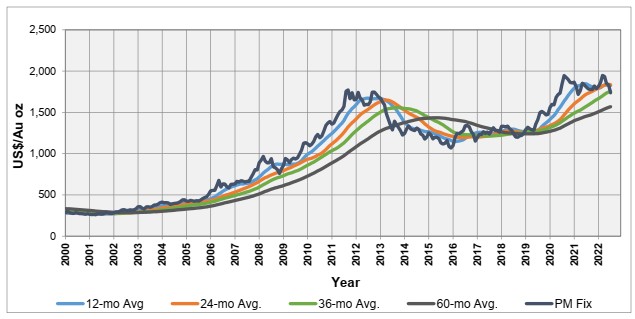
Source: Kitco Data (2022)
19.4 Exchange Rate
The three-year average USD:CAD exchange rate of 0.77 was used in the economic model. The spot exchange rate on August 15, 2022 was also 0.77 USD:CAD.
|
|
Figure 19-2: Historical USD:CAD Exchange Rate
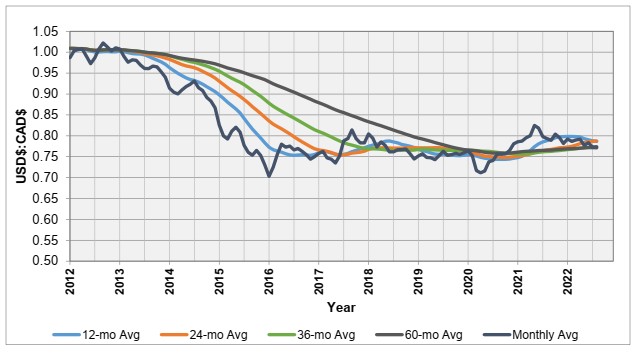
Source: Bank of Canada Data (2022)
19.5 Contracts
At this time, no contractual arrangements for mining, shipping, refining, sales, hedging, forward sales, port usage, or any other material items exist except as noted below.
Processing of sorted feed from the Hammerdown project through the Nugget Pond gold circuity would be conducted through a custom processing and tailings deposition agreement between Maritime and Rambler, an agreement that companies have reached in principle since the gold circuit was acquired by Maritime in April, 2021. Rambler maintains a current mill operating permit with the provincial Department of Natural Resources. Hammerdown's relatively small tailings volume of approximately 0.72 M m3 can be readily stored within the existing and future tailings storage facility at Nugget Pond. Maritime will also be responsible for its share of operating, sustaining capital and closure expenditures at the Nugget Pond site over related the processing of feed from Hammerdown.
|
|
20 ENVIRONMENTAL STUDIES, PERMITTING AND SOCIAL OR COMMUNITY IMPACTS
Information presented in this Chapter is based on publicly available information and supplemented by environmental baseline studies conducted in support of the development of Hammerdown. The study area associated with the Hammerdown deposit is presented on Figure 20-1. All environmental aspects included herein will likely require further review and assessment as the Project proceeds through the remaining planning and engineering stages. As the Project advances, additional studies may be required within the study area.
Figure 20-1: Project Study Area
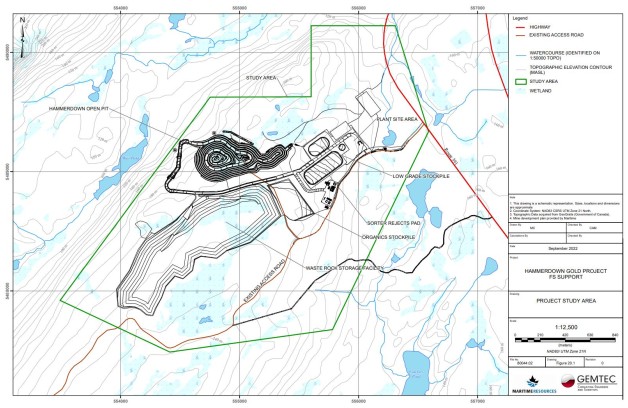
Source: GEMTEC (2022)
|
|
20.1 Baseline and Site Characterization Studies
The following lists the baseline and site characterization studies completed to date in support of Hammerdown. These studies include those completed in 2016 and 2017 associated with previous underground redevelopment plans as well as recent environmental and geotechnical site-wide programs reported in 2020 and 2021.
• Baseline Air Quality Monitoring Report, Hammerdown Underground Gold Mine Re-activation, Final Report (Stantec, 2017a);
• Surface Water and Water Quality Baseline Report, Hammerdown Underground Gold Mine Re-activation, Final Report (Stantec, 2017b);
• Terrestrial and Aquatic Baseline Program, Hammerdown Underground Gold Mine Re-activation, Final Report (Stantec, 2017c);
• Ecological Baseline Report, Hammerdown Gold Mine Development Project, King's Point, NL (GEMTEC, 2019a);
• Fish Habitat Assessment, Maritime Resources Corp.'s Hammerdown Gold Mine Development Project. King's Point, NL (GEMTEC, 2019b);
• Hammerdown Gold Mine Redevelopment Project: Baseline Hydrogeology Scoping Study, King's Point, NL (GEMTEC, 2019c);
• Hydrogeology Baseline Report, Hammerdown Gold Mine Development Project. King's Point, NL (GEMTEC, 2019d);
• Hydrology and Surface Water and Sediment Quality Baseline Report, Hammerdown Gold Mine Development Project, King's Point, NL (GEMTEC, 2019e);
• Limited Scope Test Pit Investigation for the Proposed Waste Rock Dump, Low Grade Ore Stockpile, Crushing Plant and Administration Building Areas, Hammerdown Gold Mine near King's Point, NL (GEMTEC, 2020a);
• A Preliminary Geochemical Characterization on the Hammerdown Gold Project, Newfoundland & Labrador, Canada (SRK, 2019);
• Environmental Assessment Registration, Hammerdown Gold Project. King's Point, NL. Maritime Resources Corporation. 2020;
• Environmental Preview Report (EPR), Hammerdown Gold Project. King's Point, NL. Maritime Resources Corporation. 2021a;
• Hammerdown Gold Project - Abridged Development and Rehabilitation and Closure Plan, Maritime Resources Corporation. 2021b;
• Feasibility Study-Level Site-Wide Geotechnical and Hydrogeological Investigations, Hammerdown Gold Project, Maritime Resources Corp., King's Point, NL (GEMTEC, 2021);
|
|
• EPR Response - Groundwater Monitoring Report, August 2019 to May 2021, Maritime Resources, Hammerdown Gold Project, Kings Point, NL (GEMTEC, 2022b); and
• Initial Results for Groundwater Inflow and Pit Flooding Calculations, Hammerdown Pit and Orion Pit, Hammerdown Gold Project, King's Point, NL. GEMTEC Technical Memo No. 80044.02.12, June 30, 2022 (GEMTEC 2022c).
20.2 Environmental Setting
The Project is located in north-central Newfoundland, approximately 5 km southwest of King's Point and 15 km northwest of Springdale. It lies within the Central Newfoundland Forest Ecoregion, in the Northcentral Subregion. This subregion is characterized by higher summer maximum temperatures, lower rainfall, and higher fire frequency than anywhere else in Newfoundland and extends from Clarenville in the east to Deer Lake in the west. Relatively low moisture, coarse soils and the prevalence of Black Spruce cover vegetation make this subregion particularly susceptible to regeneration failure. Where tree regeneration is lacking, succession to dwarf shrub heath dominated by Sheep Laurel (Kalmia angustifolia) occurs on the nutrient-poor, coarse-textured till that is prevalent throughout much of this area. The rolling to undulating topography, typically below 200 masl, is characterized by shallow till of medium quality for plant growth with a soil texture range from sandy loam to loam (NLDFLR, 2019).
The Project is located primarily on a brownfield site with a history of mining operations. As a result, disturbed areas (representing ~4% of the Project area) are present in and around the Hammerdown deposit area associated with previous mining operations.
A suite of environmental programs have been carried out since 2016 to characterize the existing biophysical environment of the Project, including atmospheric, terrestrial, aquatic, hydrological and hydrogeological studies. The following sections summarize the key baseline observations and findings of these studies.
20.2.1 Terrestrial Environment
In the Northcentral Subregion, the annual precipitation averages approximately 1,000 mm. The average annual temperature is approximately 3.5˚C, ranging from -8.5˚C in January to 16.2˚C in July. Mean annual runoff in the Project area is approximately 700 mm (NLDMAE, 1992).
The preliminary field surveys completed in 2016 to characterize the baseline terrestrial environment conditions for vegetation, wetlands, wildlife, avifauna and short-eared owl were expanded upon in 2019 following similar sampling protocols in order to facilitate comparison and integration of datasets obtained from the studies. Generally, the results from 2016 are comparable to the 2019 programs discussed below (Figure 20-2).
|
|
Figure 20-2: Biology Survey
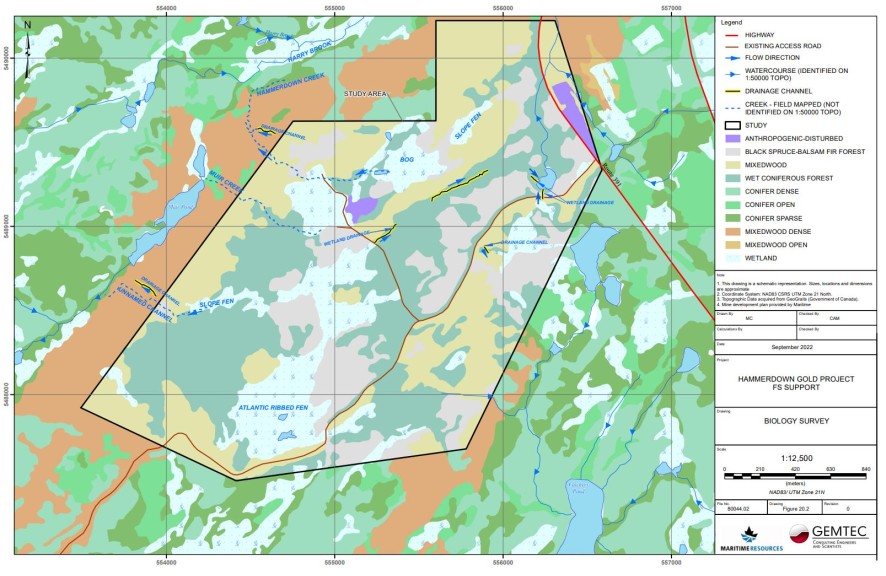
Source: GEMTEC (2022)
|
|
The 2019 baseline programs included two field visits designed to capture different flowering seasons in the Hammerdown deposit area. Results revealed that the majority (82%) of the landscape surveyed is forested habitat of various classes, including Black Spruce/Balsam Fir Forest, Wet Coniferous Forest, and Mixedwood Forest. Non-forested and non-wetland land cover classes are also found in the area and include Wetlands (14%), Open Water Body (0.2%) and Disturbed Area (~4%). The disturbed areas generally represent previous mining operations dating from the early 2000s.
Complete vegetation inventories were completed and although two rare vegetation species (Boreal Felt Lichen and Low Seablite, a maritime plant) have potential to occur in the area (ACCDC 2019), neither was identified during either of the two field visits (GEMTEC, 2019a).
Wetland types identified within the Hammerdown deposit area include bogs and fens, and the 2019 field surveys corroborated existing wetland mapping as recognized by the NL Water Resources Management Division (WRMD).
The region is home to a variety of typical boreal forest wildlife and bird species. Wildlife detected during field surveys include moose (Alces alces), black bear (Ursus americanus), eastern coyote (Canis latrans), snowshoe hare (Lepus americanus), American beaver (Castor canadensis), red squirrel (Tamiasciurus hudsonicus) and bats (Myotis spp.). These species were detected from scat and tracks, except for red squirrel, which was directly observed (GEMTEC, 2019a).
In NL, species at risk (SAR) include species listed as extirpated, endangered, threatened, vulnerable, or of special concern under the NL Endangered Species Act (ESA), the federal Species at Risk Act (SARA), or by the Committee on the Status of Endangered Wildlife in Canada (COSEWIC). No wildlife SAR were detected or identified during either 2016 or 2019 field programs.
Of note, however, both the little brown bat (Myotis lucifugus) and the Northern long-eared bat (Myotis septentrionalis) are SAR protected under SARA, and both are possibly present within the Hammerdown project area. Both species were given an emergency listing of "Endangered" by SARA in 2014 because of rapid population declines in Canada due to a deadly wildlife disease known as White-nose Syndrome (WNS) (ECCC, 2020). An acoustic bat survey was conducted at the Hammerdown deposit area in 2019 and confirmed that, although Myotis spp. are likely using an area in the vicinity of a former underground mine adit for foraging, they are not using this area for roosting or hibernating. No visual identification was made of the Myotis spp. so the presence of one or both species cannot be definitively confirmed (GEMTEC, 2019a).
Other mammals that may be found in the area but were not detected during field surveys, include Newfoundland marten (Martes americana atrata, American mink (Neovison vison), ermine (Mustela erminea), deermouse (Peromyscus maniculatus), masked shrew (Sorex cinereus), and southern red-backed vole (Myodes gapperi).
American toad (Anaxyrus americanus) was the only amphibian species detected during field surveys; however, wood frog (Lithobates sylvaticus), green frog (Lithobates clamitans), and mink frog (Lithobates septentrionalis) are known to occur on the island of NL and may be present within the Hammerdown deposit area.
A total of 37 bird species comprising 106 individual records were documented during the 2019 field surveys. The most numerous species recorded overall include white-throated sparrow (Zonotrichia albicollis), ruby-crowned kinglet (Regulus calendula), American robin (Turdus migratorius), black and white warbler (Mniotilta varia), hermit thrush (Catharus guttatus), and black-throated green warbler (Dendroica virens). The 2016 field program found similar bird species, abundance, and distribution in the forest and wetland habitats in the Hammerdown deposit area (Stantec, 2017c).
|
|
While none were detected during the 2016 or 2019 field programs, five avifauna SAR and species of conservation concern (SOCC) have the potential to occur in the Hammerdown deposit area. These include, gray-cheeked thrush (Catharus minimus), rusty blackbird (Euphagus carolinus), red crossbill (Loxia curvirostra), short-eared owl (Asio flammeus), and olive-sided flycatcher (Contopus cooperi). Critical habitat, as defined by SARA, for these species has not been identified in the Hammerdown deposit area (GEMTEC, 2019a). A short-eared owl survey carried out in 2019 did not detect any individuals (GEMTEC, 2019a).
20.2.2 Aquatic Environment
Field programs were conducted in 2016 and in 2019 to evaluate the aquatic environment in the Hammerdown deposit area (Figure 20-3). For the surface water bodies in the Hammerdown deposit area, the 2016 field program found that Hammerdown Creek originates in a wetland, has intermittent dry sections, and contains complete natural barriers to fish migration that preclude the possibility of fish presence. Brook trout were confirmed to be present in Harry Brook in a section of stream extending from the confluence with Hammerdown Creek to a distance 500 m downstream (Stantec, 2017c). Muir Creek originates in a wetland and receives flow from four historical settling ponds, also has dry sections and drains west into Muir Brook. Muir Creek contains complete barriers to fish migration in the form of steep terrain containing waterfalls and cascades that also preclude the possibility of fish presence. Muir Brook is part of the larger Indian River watershed that is known to contain five fish species, including brook trout and Atlantic salmon.
|
|
Figure 20-3: Project Watersheds Showing Surface Water and Sediment Sampling Locations
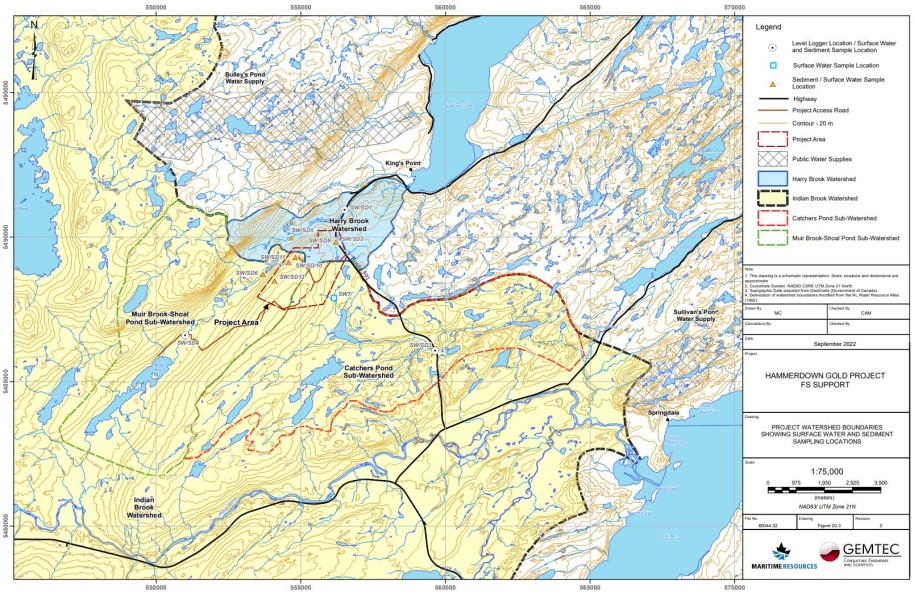
Source: GEMTEC (2022)
|
|
Field surveys completed in 2019 confirmed the 2016 findings, and also evaluated fish habitat and the potential for fish presence in Hammerdown Creek and Muir Creek, as well as two other watercourses flowing through the Hammerdown deposit area that also originate in on-site wetlands. A stream assessment revealed that portions of each watercourse were dry along its length.
An electrofishing program was carried out on the four on-site watercourses but no fish were detected or observed, although some marginal fish habitat was identified. Based on multiple study results, Maritime concludes there are no fish present within the watercourses studied in the Hammerdown deposit area (GEMTEC, 2019b).
20.2.3 Socioeconomic Environment
The proposed Project is located on the Baie Verte Peninsula in rural north-central Newfoundland, approximately 5 km southwest of the nearest community of King's Point. The economy of this region of central Newfoundland has been shaped primarily by natural resource-based industries, including mining, fishing, and forestry.
There are several operating mines on the Baie Verte Peninsula, including the Ming Mine operated by Rambler Metals and Mining (Rambler), and the Point Rousse Project, operated by Signal Gold. In addition, mineral exploration is ongoing in a number of areas in the region and there are other mineral licenses surrounding the Project area. It is Maritime's hope that staged development of the Project into an operational mine will contribute to employment and local procurement opportunities in the region.
Maritime met with the council of the Town of King's Point on June 11, 2019 to present preliminary Project details. The Town raised no concerns and followed up with a letter to Maritime in which they stated their support for the proposed Project and outlined the resources available in the Town that could be of benefit to Maritime during Project construction and operation (Town of King's Point, 2019).
A number of recreational activities are carried out in the area including hunting, trapping, angling, firewood harvesting, and snowmobiling. The NL Snowmobile Federation maintains a snowmobile trail that runs in a generally southwest to northeast direction and crosses property included in the Orion mining lease.
There are various other land use activities occurring in the region. A silvicultural management area is located immediately west of the Project area and the western portion of the property intersects a domestic woodcutting area. There are three quarries located 2-3 km to the southeast of the property along Route 391. There are several remote cottages to the west and northwest of the Project area. A commercial outfitter is located approximately 6 km west of the Project area.
Maritime has and will continue to engage with potentially affected stakeholders at various stages of Project development.
Consultation with the Provincial Archaeology Office (PAO) determined that there is a low potential for archaeological or heritage resources from the pre-contact period relative to the historic Beothuk and Mi'kmaq to be located in the Project area. While no known archaeological sites have been identified within the Project area, Maritime has a standard reporting protocol in place whereby any discoveries will be reported to the PAO.
|
|
20.2.4 Hydrology, Surface Water and Sediment Quality Baseline Studies
Baseline hydrology studies for the Hammerdown deposit area were completed in 2016 and 2019.
In 2016, Stantec installed a flow monitoring station downstream of the proposed site discharge location, Muir Creek, and recorded a flow of 1.12 m3/s. This measurement, coupled with measured water levels, was used to predict flow rates at various times throughout the year. The 2019 baseline program expanded on the earlier work and characterized the existing hydrology, and sediment and surface water quality across the full Hammerdown deposit area and included stream flow analysis and sampling within all three surface water catchment areas bounding the Project, including 1) Harry Brook watershed, 2) Catchers Pond sub-watershed, and 3) Muir Creek-Shoal Pond sub-watershed.
In 2019 stream flow monitoring was carried out at 11 locations within the three watershed areas (Figure 20-3) to estimate run-off originating in the Project area. Using same-day flow data and water level measurements, a rating curve was derived, and water level measurements were converted to flow discharges expressed as a time-series.
|
|
Figure 20-4: Groundwater Flow - Geotech Test Locations
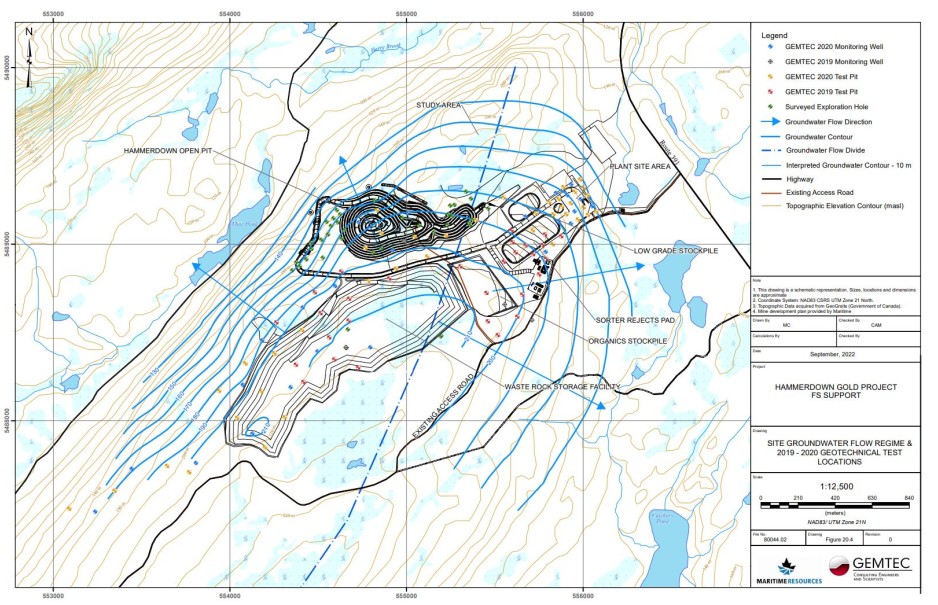
Source: GEMTEC (2022)
|
|
Based on the flow discharge data, monthly run-off depths were determined for Harry Brook, Catcher's Pond and Muir Creek over an extended monitoring period from May to November 2019, with values ranging from 24.61 mm in Muir Brook in August 2019 to 293 mm in Catchers Pond in May 2019. Insufficient temporal data prevented estimation of the annual runoff depth coefficient at the Hammerdown deposit area. However, the annual runoff coefficient was estimated using the average annual run-off estimate from Springdale Hydrometric Station (626.9 mm) and the average annual precipitation estimate from Springdale Climate Station (932.8 mm). Based on topography the majority of streams in the Hammerdown deposit area are expected to drain to Muir Brook with an annual runoff coefficient in the Hammerdown deposit area of approximately 67% (GEMTEC, 2019e).
To characterize surface water quality, three seasonal sampling events were completed at each of the 11 stream flow monitoring stations in 2019. Results indicated that surface waters in the Hammerdown deposit area are fresh, range from slightly acidic to slightly basic, and have healthy concentrations of dissolved oxygen. Analytical laboratory results indicate that aluminum concentrations are elevated in some surface waters and frequently exceed the federal freshwater aquatic life (FAL) guideline. Iron and mercury concentrations also exceeded the FAL guideline values at two locations. The 2016 program was focused on the Muir Creek-Shoal Pond sub-watershed and found water quality to be generally good with exceptions for aluminum and iron (Stantec, 2017b).
Localized concentrations of arsenic, cadmium, and zinc that exceeded federal freshwater sediment quality guidelines were identified at one sample location located down-gradient of the Project in an un-named tributary of Harry Brook. No other sediment exceedances were identified as part of baseline sampling programs at the Project.
20.2.5 Hydrogeology Baseline Studies
A baseline hydrogeology study across the Hammerdown deposit, Plant and Waste Rock Storage Facility areas were completed in 2019 and involved the installation of six monitoring wells, including two paired well systems to evaluate horizontal and vertical hydraulic gradients, in-situ hydraulic conductivity testing (packer testing and slug testing), groundwater level monitoring and groundwater sampling (GEMTEC, 2019d).
Additional baseline hydrogeological characterization data was collected as part of a feasibility-level site-wide geotechnical and hydrogeological program completed in 2020 (GEMTEC, 2021). This program included assessing groundwater conditions to a maximum of 30 m depth through the drilling of 25 boreholes, all of which were completed with screened monitoring well installations. One paired well system was installed to determine vertical hydraulic gradient. Hydraulic conductivity (k) testing was completed in all monitoring wells, including falling and rising head (slug) tests. In-situ packer (Lugeon) and falling head response testing was conducted in bedrock intervals during drilling to evaluate the K of the rock mass. Groundwater sampling was carried out in five monitoring wells as part of this program. Static water level measurements were collected in all monitoring wells and long-term water level data loggers were installed in four of the monitoring wells.
Based on a review of geological maps and borehole drilling in 2019 and 2020, the overburden material in the Hammerdown deposit area consists primarily of till comprising very loose to compact, silty sand with occasional gravel, cobbles, and clay. This till occurs both as thin discontinuous veneer as well as more extensive plain deposits, with average thickness of 2.4 m. Along with glacial units, deposits of poorly-drained organic and peaty soils were commonly encountered in the Project area, overlying either till or bedrock. A substantial area of bog occurs along the ridge in the centre of the site. Local ridges and knobs of exposed bedrock occur within the till and other surficial deposits in the Project area.
|
|
The Project site is underlain by an unconfined aquifer occurring within the saturated overburden and underlying folded and faulted volcanic and volcaniclastic bedrock. Groundwater levels are near ground surface across the site. Groundwater (piezometric) contours derived from site-wide water level surveys of monitoring wells and existing exploration boreholes in 2019 and 2020 (Figure 20-4) indicate that the site is situated along a groundwater divide and an area of groundwater recharge. This area corresponds to the surface water divide between the Catcher's Pond and Muir Brook - Shoal Pond sub-watersheds along the crest of the topographic ridge. The bordering drainage features on the flanks of the ridge are areas of groundwater discharge. Groundwater flow is predominantly directed to the west-northwest in the vicinity of the proposed open pit area, and to the north-northeast where the topographic ridge slopes northward toward Harry Brook (including the Crushing and Sorting Plant area). Adjacent to the Crushing and Sorting Plant (in the vicinity of the low grade and rejects stockpiles), groundwater is inferred to flow south-eastwards towards the Catchers Pond drainage system. Typical inferred horizontal hydraulic gradients are approximately 9% towards the Harry Brook watershed and 6% towards the Catchers Pond sub-watershed. The gradient towards the Muir Brook sub-watershed is estimated to be steeper, with a maximum gradient of approximately 14%. The vertical component of groundwater flow at the site is generally downward, ranging from 1% to 9%.
Groundwater flow through the overburden is controlled by primary porosity, while groundwater flow within the underlying bedrock occurs mainly within secondary porosity (such as fractures, joints and faults). Bedrock groundwater flow varies depending on the frequency and interconnection of these discontinuities. In the proposed pit area, groundwater flow is also expected to be influenced by the historical underground workings. Soil and bedrock (down to approximately 30 m) have moderately low permeabilities at this site. K values for soil (till) ranged from 9.84E-07 m/s to 1.46E-06 m/s, and with a geometric mean of 2.85E-06 m/s. No overall significant trends in bedrock K were identified based on lithology or depth to 30 m, with K values for all rock types ranging from 6.61E-08 m/s to 7.51E-05 m/s, and with a geometric mean of 3.39E-06 m/s. It is noted that the current bedrock K data set for the proposed pit area is limited to several shallow test results down to a depth of 30 m and may not be fully representative of bulk bedrock K values over the full depth of the proposed open pit including influences associated with the historical underground workings.
Seasonal fluctuations in groundwater were tracked in six monitoring wells across the site from August 2019 to January 2021 and are presented in GEMTEC (2021). The 17-month monitoring period captured a full range of seasonal groundwater level fluctuations. For all monitoring wells, groundwater levels were typically lower during the winter months prior to spring freshet and also in the mid- to late summer, corresponding to a period of relatively lower precipitation. The highest groundwater levels were recorded during spring freshet and during the fall rainy period. Seasonal fluctuations in groundwater levels ranged from 0.6 m to 2.37 m. Observed day-to-day variability in groundwater levels and the apparent coincidence of these variations with rainfall events at all six monitoring well locations support the concept that the Project site overburden and shallow bedrock aquifer is an unconfined system.
Baseline groundwater quality sampling was carried out during the 2019 and 2020 programs as well as during two supplemental seasonal sampling events to satisfy environmental permitting requirements and are presented in GEMTEC (2022). Baseline groundwater quality sampling indicate that shallow groundwater at the site is a calcium bicarbonate type and likely of meteoric origin flowing along shallow, short flow paths. This is consistent with the setting of the site on a topographic ridge. Shallow site groundwater is slightly basic to slightly acidic (pH 8.30 to 6.05), ranging from soft to hard (less than 50 mg/L to 219 mg/L), with relatively low total dissolved solids. A number of dissolved metals, including aluminum, arsenic, cadmium, cobalt, copper, iron, lead, manganese, silver, vanadium and zinc, were detected in at least one sample at concentrations exceeding federal environmental groundwater quality and Canadian Drinking Water Quality Guidelines.
|
|
Due to the shallow groundwater table at the site, some dewatering will be required for service trenches, and excavations for site infrastructure, and for the proposed open pit. Preliminary analysis of anticipated groundwater inflow rates into the proposed open pit required for dewatering is estimated to be 3,426 m3/d at full development and under steady state conditions (GEMTEC, 2022b).
20.3 Other Supporting Studies
20.3.1 Site Wide Geotechnical Investigation
A preliminary site wide geotechnical investigation was carried out at the Project area in 2019 by GEMTEC. The investigation consisted of 29 test pits excavated across the proposed development area for the purpose of providing preliminary factual information on the existing subsurface conditions (GEMTEC, 2020a).
GEMTEC also conducted a feasibility study level site geotechnical investigation in 2020 including 36 test pits and 22 boreholes advanced across the proposed development footprint area, to assess overburden soils, bedrock, and groundwater conditions in the upper 30 m of the proposed Project site development area (GEMTEC, 2021). This scope of work included the excavation of test pits, the drilling of geotechnical boreholes, geotechnical logging, soil/rock testing, installation of monitoring wells, in-situ hydraulic conductivity testing of soil and bedrock (packer and slug testing) and groundwater quality sampling. This scope did not include design recommendations for the development of the open pit mine areas and the deeper underground mine workings. The 2019 and 2020 geotechnical investigation test locations are provided on Figure 20-4.
The subsurface conditions observed in the proposed mine development areas (site areas) are summarized as follows:
• Hammerdown Pit and Underground area - up to 0.5 m of organic material (peat and rootmat) overlying up to 4.8 m of loose to dense glacial till (predominantly silty gravelly sand or silty sandy gravel) overlying mafic dyke and mafic volcanic bedrock;
• Haul Road area - 0.2 to 0.4 m of organic material (peat and rootmat) overlying up to 1.8 m of loose to dense glacial till (silty gravelly sand or silty sandy gravel) overlying bedrock;
• Plant Site area - up to 1.22 m of organic material (peat and rootmat) overlying up to 5.79 m of loose to dense glacial till (predominantly silty gravelly sand or silty sandy gravel) overlying bedrock. Bedrock types encountered varied across the area and included mafic volcanics, mafic dyke, felsic schist, sericite schist, quartz eye felsic schist, and feldspar porphyry dyke;
|
|
• Low Grade Ore/Rejects Stockpiles area - up to 0.91 m of organic material (peat and rootmat) overlying up to 7.16 m of loose to dense glacial till (predominantly silty gravelly sand or silty sandy gravel) overlying mafic dyke and mafic volcanic bedrock; and
• Waste Rock Dump area - up to 0.91 m of organic material (peat and rootmat) overlying up to 4.77 m of loose to dense glacial till (predominantly silty gravelly sand or silty sandy gravel) overlying bedrock. Bedrock types encountered varied across the area and included mafic volcanics, mafic dyke, felsic schist, sericite schist, quartz eye felsic schist, feldspar porphyry dyke.
The native glacial till was generally loose becoming dense at depths greater than 2.5 m. Cobbles and boulders were noted within the native till layer.
The following preliminary design recommendations were derived based on preliminary design assumptions made by GEMTEC based on available conceptual site layout information provided by Maritime at the time of this report. It is understood that these preliminary recommendations are provided for site characterization and conceptual design requirements for the purposes of a feasibility study level characterization and must be reviewed and updated accordingly by GEMTEC prior to the onset of detailed design work for site development:
• The glacial till is frost-susceptible. Structures placed within the frost-susceptible zone should consider the requirements for insulation or moving vulnerable structural elements outside of the zone;
• A seismicity site class "C" can be used for the Project. In cases where there will be more than 3 m of overburden soil between the underside of the footings and the bedrock, site class "D" should be used. The potential for soil liquefaction during a significant earthquake is considered to be negligible at this site;
• Organic and loose glacial till soils are not suitable for use as a subgrade, the native glacial till soils will be susceptible to softening in the presence of water and construction activities. To minimize disturbance, equipment travel on the prepared excavation base must be minimized or managed by leaving a sacrificial layer of unsuitable material above final excavation level or by placing an engineered granular working base. Control of surface and groundwater seepage into excavations and impacting existing exposed subgrade materials will be critical for the proposed development;
• The excavations for the proposed structures and services will be carried out mostly through variable thicknesses of native till and bedrock. The sides of the overburden excavations and cut slopes in waste rock materials should be sloped in accordance with the requirements in Regulation 5/12 under the Newfoundland and Labrador Occupational Health and Safety Act. Side slopes of 2H: 1V, or flatter, are recommended for excavation of the soils below the groundwater table. Localized bedrock removal could be carried out using hoe ramming techniques in conjunction with line drilling on close centers. Provided that proper bedrock excavation techniques are used, the bedrock could be excavated using near vertical side walls. Any loose rock should be scaled from the sides of the excavation;
|
|
• Organics and native glacial till soils are not suitable for reuse as engineered structural fill. Blast rock could be used as engineered structural fill so long as it is processed in accordance with the recommendations of this report. Unsuitable material may be used as common fill for landscaping purposes. Subject to evaluation of loading and type of structure by a geotechnical engineer, the undisturbed dense native till will likely be suitable as a founding strata for most structural applications. For heavily loaded structures, the bedrock may be more suitable as a founding bearing strata. Where suitable strata cannot be identified at founding level, engineered structural fill may be suitable depending on foundation loading conditions;
• The concentration of soluble sulphate in the groundwater is low and any concrete in contact with the native soil or groundwater could be batched with General Use (GU) Portland cement. The groundwater in the area of the work can be classified as light to moderately corrosive. The manufacturer of any buried steel elements that will be in contact with the soil or groundwater should be consulted to ensure that the durability of the intended product is appropriate; and
• Preliminary slope stability assessment of the Waste Rock Dump suggest that the valley topographical feature to the west of the waste rock dump, surface gradient underneath the structure, and glacial till thickness, is negatively impacting the factor of safety of the waste rock pile slopes on the west face. Detailed design of the waste rock pile must carefully consider the impact of the topographical features on site and ensure that restrictions on waste rock slope steepness and height are in place to satisfy the waste rock piles life time serviceability.
20.4 Jurisdiction, Applicable Laws and Regulations
The proposed Project components are exclusively located within the province of NL. As such, it is subject to the environmental assessment (EA) provisions of Part X of the NL Environmental Protection Act, (the Act) and the Environmental Assessment Regulations (s.33 (2)).
Maritime consulted with the federal Impact Assessment Agency (IAA) and determined that this proposed Project, as currently understood, should not be subject to a federal EA review. However, a description of both the provincial and federal processes are provided in the section below.
20.4.1 Environmental Assessment Processes
20.4.1.1 Provincial Process
The provincial EA process is a stepped process providing for public review and with defined decision points. Although the process has legislated timelines for the review periods and decision steps, extensions are common. Section 33(2) of the NL EA Regulations states:
An undertaking that will be engaged in the mining, beneficiating and preparing of a mineral as defined in the Mineral Act whether or not these operations are to be performed in conjunction with a mine or at mills that will be operated separately shall be registered.
|
|
The initial step in the NL EA process is to submit a Registration document to the EA Division of the Newfoundland and Labrador Department of Environment and Climate Change (NLDECC) that includes, but is not limited to, a description of the following:
• Surrounding biophysical environment;
• Surrounding land and resource use;
• Potential pollutants and discharges during development, operation, and closure;
• Potential interactions of the proposed development, both positive and negative, with the biophysical and socioeconomic environments;
• Applicable permitting and regulatory requirements; and
• Draft schedule of development.
An EA registration document (Maritime, 2020) pursuant to the Newfoundland and Labrador Environmental Protection Act (Part X) was submitted for this project on July 7, 2020, and describes the development, operation, and reclamation of the Hammerdown project area.
The EA process follows that after a prescribed 45-day period, and based on government agency and public review, the Minister of the NLDECC will issue a decision / recommendation on the proposed development that will be one of the following:
• Release, with or without conditions;
• Further review in the form of an Environmental Preview Report (EPR) or an Environmental Impact Statement (EIS); or
• Rejection of the proposed undertaking via a recommendation to Cabinet.
An EPR or an EIS is typically required if the initial EA review process identifies information gaps such that the Minister is unable to make an informed decision based on the Registration document submitted. Both an EPR and an EIS require the submission of additional information and both will have project specific guidelines issued to them by the provincial EA Division.
The writing of an EPR is guided by Guidelines issued by the EA Division and an EPR typically requires the inclusion of existing information and/or the completion of further studies. There is also a component of proponent-driven public consultation associated with the completion of an EPR. At the completion of the EPR review period, the Minister will issue a decision similar to above whereby the project may be released, with or without conditions, or it may require an EIS.
An EIS is required when there is a potential for significant adverse environmental effects or when there is significant public concern about a proposed project. However, the EPR was sufficient to satisfy the Minister of the NLDECC and an EIS was not required.
As a result of the initial EA review following Registration, the Project was subsequently required to prepare an EPR (Maritime, 2021a). The EPR required additional information on the following:
|
|
• Water management;
• Greenhouse Gas (GHG) emissions;
• Plans for enhancing positive impacts and mitigating negative impacts of the Project on the health of local residents, visitors, and business owners;
• Further consultation with occupants with nearby properties to address potential land use conflicts;
• Development of a waste management plan;
• Development of a gender equity and diversity plan; and
• Additional information on Project occupations and hiring arrangements.
The Hammerdown EPR was submitted on March 4, 2021, and included all additional requested information. Following regulatory review of the EPR, the Project was released from the EA process on May 10, 2021.
The federal EA Process is described below but was not required for this Project.
20.4.1.2 Federal EA Process
The Physical Activities Regulations that support the Impact Assessment Act (IAA), 2019 came into force on August 28, 2019. This regulation establishes clear criteria for when a project may be subject to a federal impact assessment. Section 18(c) of the Regulations states:
The construction, operation, decommissioning and abandonment of a new metal mine, other than a rare earth element mine, placer mine or uranium mine, with an ore production capacity of 5,000 t/day or more.
Maritime is planning a production capacity of less than 700 t/d, well under the IAA trigger of 5,000 t/d. As such, Maritime was not required to complete a federal EA review.
There is currently no formal harmonization agreement between the province and the federal government relative to the coordination of EA reviews. Since the Project has been released from the provincial EA process as of May 10, 2021 and the production capacity does not meet the federal IAA requirements of Section 18(c), we anticipate there are no further EA related approvals required.
20.4.2 Other Legislation
20.4.2.1 NL Management of Greenhouse Gas Act and Carbon Emissions Pricing
Both the federal government, as part of the 2015 Paris Agreement, and the provincial government, as part of The Way Forward on Climate Change (2019), have committed to reducing greenhouse gas (GHG) emissions by 30% below 2005 levels by 2030. Proposed GHG reduction targets are linked to carbon pricing, and the 2016 PanCanadian Framework on Clean Growth and Climate Change included commitments to introduce carbon pricing in all provinces and territories.
|
|
NL's carbon system went into effect on January 1, 2019 and includes performance standards for large industrial facilities measured in terms of GHG emissions per unit of output within a facility boundary, and a carbon tax on fuels combusted outside regulated facilities' boundaries. In addition, certain new industrial facilities are required to use best available control technologies (BACT). The Management of Greenhouse Gas Act (MGGA) and its regulations are the mechanisms to implement performance standards and BACT, and the Revenue Administration Act (RAA) and its regulations are the mechanisms to implement a carbon tax.
If diesel fuel usage reaches 5.5 M l/a, equal to 15 t GHG, then the facility is obligated to report to the Climate Change Branch (CCB) of the NLDECC as per the MGGA. Regulations associated with BACT do not apply to operations emitting under 15 t GHG annually. GHG emissions for activities outside the Project boundary are subject to RAA carbon tax provisions. Maritime does not anticipate reaching 15 t of GHG emissions annually.
A BACT analysis, including an emissions inventory, was completed by GEMTEC as required by the EPR guidelines for the Project that provided an assessment that met the EPR requirements. To complete this work, GEMTEC reviewed the Registration stage comments provided by the Climate Change Branch (CCB), reviewed the EPR guidelines, discussed issues associated with Maritime's Project and consulted with officials of the CCB. The steps in this analysis followed guidance provided by the CCB.
20.4.2.2 The Canada Fisheries Act, 2019
The federal government amended the Fisheries Act in 2019 whereby many of the provisions from the pre-2012 Fisheries Act have been reinstated, reverting in large part to the concept of fish habitat protection, prohibiting harmful alteration and disruption or destruction of fish habitat (HADD). Maritime is not anticipating any requirement for a HADD authorization with respect to development of the Hammerdown deposit area.
20.4.2.3 Metal and Diamond Mining Effluent Regulations
The Metal and Diamond Mining Effluent Regulations (MDMER), formerly the Metal Mining Effluent Regulations, authorize the use of water frequented by fish for mine waste disposal. The MDMER also set out limits for certain deleterious substances and pH, prohibit the discharge of effluent that is acutely lethal to rainbow trout, and specify the requirements for carrying out effluent sampling, reporting, and environmental effects monitoring (EEM). Any release of water from the site will be in compliance with the MDMER guidelines (MDMER, 2002) and will meet the final discharge point (FDP) requirements. Water quality testing at the FDP will be conducted throughout operations and site closure and will continue until the MDMER criteria are met.
The MDMER are regulations made pursuant to the Canada Fisheries Act, and, when verifying compliance with the regulations, enforcement personnel act in accordance with the Compliance and Enforcement Policy for the Habitat Protection and Pollution Prevention Provisions of the Fisheries Act.
|
|
20.5 Environmental Permitting
Following release from the provincial EA process, a number of approvals, authorizations and/or permits are required prior to the start of construction and operations. Table 20-1 provides a list of approvals currently in place by Maritime. Table 20-2 provides a preliminary list of approvals, authorizations and permits that may be required from various municipal, provincial, and federal agencies.
Table 20-1: Environmental Approvals, Authorizations, and Permits Currently in Place
| Environmental Permit, Approval or Authorization Activity |
Issuing / Approval Agency |
| Surface and Mining Lease | Mineral Lands Division - Department of Industry, Energy and Technology (DIET) |
| Mineral Licence | |
| Exploration Permit | |
| Abridged Development and Rehabilitation and Closure Plan | Mineral Development Division - DIET |
| Environmental Protection Plan | Pollution Prevention Division (PPD) and EA Division- DECC |
| Release from EA Process | EA Division & Minister - DECC |
| Waste Management Plan Approval | Water Resources Management Division (WRMD) - DECC |
| Gender Equity and Diversity Plan | Office for Women and Gender Equality |
Source: GEMTEC (2022)
Table 20-2: Environmental Approvals, Authorizations, and Permits that may be Required
| Environmental Permit, Approval or Authorization Activity |
Issuing / Approval Agency |
| Provincial | |
| Approval to use Waste Disposal Site | Central NL Waste Management |
| Certificate of Approval (C of A) for Construction and Operation | Pollution Prevention Division (PPD) - DECC |
| Certificate of Approval for Generators | |
| Approval of Environmental Contingency Plan/Emergency Spill Response | |
| Permit to Construct a Non-Domestic Well | WRMD - DECC |
| Culvert Installation | |
| Water Management Plan | |
| Fording | |
| Pipe Crossing/Water Intake | |
| Real Time Water Quality Monitoring | |
|
|
| Environmental Permit, Approval or Authorization Activity |
Issuing / Approval Agency |
| Stream Modification or Diversion | |
| Other Works Within 15 m of a Body of a Water | |
| Water Use Licence | |
| Permit to Occupy Crown Land | Crown Lands Division - Department of Fisheries, Forestry and Agriculture (DFFA) |
| Highway Access Permit | Department of Transportation and Infrastructure (DTI) |
| Permit to Control Nuisance Animals | Wildlife Division - DFFA |
| Operating Permit to Carry out an Industrial Operation During Forest Fire Season on Crown Land | Forestry and Agrifoods Branch - DFFA |
| Permit to Cut Crown Timber | |
| Permit to Burn | |
| 2nd Early Work Plan | Mineral Development Division - DIET |
| Development Plan | |
| Rehabilitation and Closure Plan | |
| Financial Assurance | |
| Blaster Certification - ensure this is available onsite | Occupational Health and Safety Division - Digital Government and Service NL |
| Explosives Magazine Permit - one permit for each magazine | |
| Miners Medical - ensure a copy is available onsite | |
| Approval for Storage and Handling of Gasoline and Associated Products | Government Service Centre, Digital Government and Service NL |
| Fuel Tank Registration | |
| Temporary Fuel cache | |
| Approval for Used Oil Storage Tank System (Oil/Water Separator) | |
| Fire, Life and Safety Program | |
| Application to Develop Land for Septic | |
| C of A for a Sewage/Septic System | |
| Building Accessibility Registration | |
| Mine Rescue Certification re Mine Rescue Training Standards | Workplace NL |
| Federal | |
| License to Store, Manufacture, or Handle Explosives (Magazine Licence) | Natural Resources Canada |
| Environmental Effects Monitoring (EEM) under MDMER | Environment and Climate Change Canada |
Source: GEMTEC (2022)
|
|
Maritime will comply with all terms and conditions of release, will apply for all required permits and approvals, and will ensure all commitments made during the EA process are addressed throughout the planning, construction, operation, and decommissioning stages.
Maritime intends to process ore from the Project at the existing Nugget Pond Mill, operated by Rambler. Rambler will ensure that all mill permits, and authorizations are updated relevant to processing Hammerdown ore at their facility.
20.6 Rehabilitation and Closure Plan
20.6.1 Regulatory Requirements
A Rehabilitation and Closure Plan (RCP) is a requirement of the Newfoundland and Labrador Mining Act, chapter M-15.1, Sections (8), (9), and (10). Under the Mining Act, the RCP is defined as the plan that describes the process of rehabilitation of a mining project at any stage of the project, up to and including cessation of operations and closure. Rehabilitation has been defined as the measures taken to restore the property as close as reasonably possible to its former use or condition, or to an alternative use or condition that is considered appropriate and acceptable by the Newfoundland and Labrador Department of Industry, Energy and Technology (NLDIET).
An approved RCP is required in order to obtain approval for project development under the NL Environmental Protection Act. The RCP is required to be submitted with or immediately following the submission of the Development Plan and provides the basis for the establishment of the financial assurance for a project. Review of the submitted RCP by NLDIET will only occur after a project has been released from the EA Process. Review and approval of the RCP can take typically between four months to one year.
The RCP is directly linked to mine development and operation over the life of the mine and therefore must be considered a "live" document. Review and revisions of the RCP are needed throughout the development and operational stages of a project, allowing adjustments that reflect the operational and planning changes that can occur. These reviews and revisions typically occur once every five years or with all major project changes.
20.6.2 Objectives and Approach
To date, a complete RCP has not yet been developed. An early works (abridged) plan (Maritime, 2021b) was submitted and approved in September of 2021 for early works activities carried out in October of 2021. The initial early works plan consisted mainly of site clearing and grubbing. A second early work is contemplated for the fourth quarter of 2022, which will include clearing the remainder of the site, road widening and culvert installation. The complete RCP will align with the main objective of mine rehabilitation which is to restore the site to a satisfactory condition by:
• Restoration of the land to as close to natural state as practically possible;
• Minimize any long-term impact on the environment, fauna and flora;
|
|
• Creation of a landscape which is visually acceptable and compatible with surrounding terrain and land use;
• Mitigation and control to within acceptable levels the potential sources of contamination, pollution, fire risk, and public liability; and
• Provide a safe environment for long term public access.
The Project rehabilitation and closure cost estimate is based on previous plans and experience on similar projects and complies with the current guidelines and accepted practices within NL.
For most mines, there are three main stages of rehabilitation that occur over its life:
• Progressive rehabilitation;
• Closure rehabilitation; and
• Post-closure monitoring and treatment.
Progressive rehabilitation involves rehabilitation work that is completed throughout mining operations prior to closure, wherever possible or practicable to do so. Such activities may include the placement of a waste rock berm/barricade and signage around the perimeter of any exhausted open pits. There may also be an opportunity to carry out the demolition and removal of disused infrastructure, as well as the re-vegetation of disturbed areas that are no longer in use and completed areas of the waste rock dump. In addition, there will be an opportunity to back-haul the ore rejects and place them in exhausted open pits and/or underground workings.
Closure rehabilitation involves activities that are completed after mining operations cease, to rehabilitate the site to as close to its pre-mining condition as practicable. Such activities include the complete demolition and removal of site infrastructure, re-vegetation of disturbed areas, removal of contaminated materials if applicable, water management, reshaping of landscape, and other activities to achieve the requirements and goals as detailed in the final RCP.
Once closure and rehabilitation activities have been completed, a period of post-closure monitoring will commence to confirm that rehabilitation activities have been successful. This may include for example the monitoring of slopes for long-term stability, re-vegetation success, environmental monitoring and other monitoring deemed appropriate. Once post-closure monitoring demonstrates that site rehabilitation has been successful, the site can be closed out or released by the province and an application can then be made to relinquish the property back to the Crown.
As planning and development continues, Maritime will consider all options and opportunities for optimal rehabilitation and closure and ensure they are incorporated into the final plan.
20.6.3 Progressive Rehabilitation
As the mine advances through the operations phase, Maritime will, whenever possible, carry out progressive rehabilitation activities such as:
|
|
• Demolition and rehabilitation of all buildings, roads, and laydown areas no longer used/required;
• Erosion stabilization and re-vegetation of waste rock dumps or areas no longer used/required;
• Re shaping of the waste rock pile where and when possible, in order to be compatible with the landscape;
• Completing rehabilitation activities relative to exhausted mining areas (e.g., pit perimeter berms/barricades, signage, sloping of pit sides);
• Allow Pit flooding;
• Placing the ore rejects back into the open pit or making them available for use as in site development throughout operations; and
• Completing re-vegetation studies and trials, if required.
20.6.4 Closure Rehabilitation
Final closure rehabilitation activities will be initiated once it is no longer economical to mine the deposit or when all economic resources have been exhausted from the deposit. The conceptual plan for final rehabilitation and closure has been developed to meet regulatory requirements of the NL Mining Act and is summarized below. For the closure cost estimate, no salvage value from the sales of equipment or machinery was considered, as per NLDIET requirements.
20.6.4.1 Open Pit
The open pit will be designed for closure and will be constructed with appropriate benching with sidewall height for stability. At closure, powerlines and all dewatering infrastructure will be removed, and the open pit will be allowed to naturally infill with surface water runoff, precipitation, and groundwater seepage. Berms/barricades that were not constructed during mine operations will be constructed along the crest of the open pit, as well as across any access roads or ramps, ensuring an adequate level of public safety and restricting access. Where necessary, access ramps will be left in place following closure to allow safe egress for extended or ongoing closure activities. Signage that was not posted during operations will be erected at regular intervals along the berm/barricade notifying the public of the presence of the open pit. While the pit is infilling, monitoring will be considered, for an appropriate amount of time, to ensure stability of the rock mass during re-saturation.
20.6.4.2 Open Holes at Surface
Open holes that remain from exposed underground workings in the pit wall and floor will be filled with waste rock. The need to prevent water from entering into the underground through these openings will be evaluated and mitigated if required.
|
|
20.6.4.3 Surface Rehabilitation
All disturbed surfaces, including roads, stockpile areas (organics stockpile, low-grade stockpile, ROM stockpile), the ore processing area (sorter rejects pad, ore sorting plant pad), the truck shop and warehouse area, the office and dry building area, settling pond footprints, the security area, and the explosives magazine area will be rehabilitated by contouring to create natural drainage patterns and to match the adjacent natural contours, and spreading of organics and seeding/scarifying to encourage revegetation of the surfaces.
A qualified agronomist will be contracted at closure to address the most appropriate use of the organic material and overburden soils stockpiled at site. Revegetation studies will be carried out progressively throughout operations to support this assessment.
20.6.4.4 Ore Storage
There will be no crushed ore remaining on surface at the end of mine life. Areas would be rehabilitated in accordance with surface rehabilitation practices consistent with other areas of site.
20.6.4.5 Ore Rejects
All ore sorter rejects will be placed back in the open pit. Maritime anticipates starting the placement of the ore rejects back in the exhausted pits in approximately year three of the mine plan and continue to the end of mine life. Over the life of mine there will be approximately 740,000 t of ore rejects generated; however, at the end of mine life none will remain on the surface. As per NLDIET requirements, the financial assurance is calculated based on the assumption of the maximum amount of ore on surface at any time throughout the life of mine, to account for a worst-case scenario in the case of an early mine closure. Based on the current design, the maximum amount of ore sorter rejects on the surface would be approximately 388,000 t at the end of Year three.
20.6.4.6 Waste Rock Storage Facility
A waste rock storage facility will be developed throughout the operations. Approximately 38 Mt of waste rock will exist on the surface at the end of mine life. During operations, the dump slopes will be benched and designed/constructed in a manner to ensure that an adequate factor of safety for slope stability is provided during operations and following closure. Where required, the waste rock dump will be re-graded at closure to ensure long-term stability. Organics/overburden will be placed on 100% of the slope/bench area to promote natural re-vegetation. The surface will then be seeded to foster regrowth and mitigate against erosion and sedimentation development. Some of these measures may also be implemented during operations as part of a progressive rehabilitation strategy. Surface water quality monitoring will be carried out as per all regulatory requirements during closure activities. Where deemed necessary, control measures will be implemented to prevent unauthorized access to the waste rock dump during and after closure.
20.6.4.7 Access and Haul Roads
The on-site haul roads and other mine access roads will be contoured and graded to promote natural drainage and to match the adjacent natural contours. Stockpiled organics will be spread, and the area will be scarified and seeded to promote revegetation. All culverts will be removed, and boulders will be placed on both sides of each water crossing. Main access roads will be left in place for post-closure monitoring activities.
|
|
20.6.4.8 Surface Buildings and Infrastructure
All buildings and associated equipment will be dismantled/demolished and removed from the site at the end of mine life:
• All processing equipment associated with the ore sorting plant will be disconnected, drained, cleaned, and where possible, sold or recycled, or otherwise disposed of at an approved off-site facility;
• All hazardous chemicals will be removed and dispose of at an approved off-site facility per applicable regulations;
• All site buildings will be removed from site. Wherever possible, the buildings will be sold. During dismantling/demolition work, recycling of construction material will be maximized. All remaining demolition waste will be disposed of at an approved off-site facility. All concrete bases will be demolished, and the concrete will be crushed and buried onsite;
• All mobile equipment, service trailers and machinery will either be sold or recycled, or otherwise disposed of at an approved off-site facility;
• The explosives magazine and related facilities will be dismantled and removed from site by a contractor;
• The fuel and propane depots will be removed by the fuel supplier;
• Septic system and associated infrastructure will be rehabilitated, including pumping and removal of tanks, draining and removal of pipes, and excavation and backfill of the footprint;
• The electrical substation, electrical distribution system from the main power line to the mine site (transmission wires, transformers and poles) will be dismantled; and
• Any generators will be removed.
The surface buildings and infrastructure sites, including parking lots, will be graded and/or scarified to promote natural re-vegetation. Some areas may require the addition of overburden / organics and be seeded to promote natural re-vegetation.
In addition to site buildings and infrastructure on the Hammerdown property, Maritime will be responsible for closure of the gold circuit located within the Nugget Pond processing facility currently owned and operated by Rambler Metals and Mining Ltd. Closure of this component will include cleaning, draining, dismantling and removal/disposal of all associated equipment and components.
20.6.4.9 Water Management Infrastructure
The pumping and piping distribution networks will be removed, with all sedimentation ponds breached and allowed to drain. The sedimentation ponds will be backfilled and re-vegetated once liners are removed for off-site disposal. No long-term treatment of surface or mine water is anticipated. Any pre-mining drainage patterns that were interrupted will be re-established.
|
|
Any groundwater wells will be decommissioned in accordance with the Water Resources Management Division Guidelines for Sealing Groundwater Wells.
20.6.4.10 Environmental Site Assessment
An environmental site assessment will be carried out by a registered site professional at any fuel storage/dispensing facility locations, explosive storage areas, and at any other areas of concern throughout the site. In the event that contaminated soils are encountered, they will either be handled in-situ or excavated and transported off-site to be disposed of at an approved facility. Areas where soil has to be removed will be backfilled and re-vegetated.
20.6.5 Post-Closure and Long-Term Monitoring
At the cessation of mining operations, Maritime will submit a request to move into the post-closure monitoring phase. Post-closure monitoring will continue after the final closure activities are completed for an estimated duration of five additional years. The duration of post-closure monitoring activities will depend on recommendations and requirements of the regulatory community. When the site is deemed physically and chemically stable, and approved by the appropriate regulators, the site will be relinquished to the Crown.
Maritime will finalize post-closure and long-term monitoring plans, in consultation with the appropriate regulators, once design is complete and operations are underway. Maritime anticipates that closure monitoring plans will be similar to operational monitoring plans in order to provide a continuity of data whereby robust comparisons can be made. Post-closure monitoring will include physical monitoring of vegetation efforts, slope stability, and public safety measures, chemical monitoring of surface water and groundwater, and reporting. At any point during the post-closure monitoring phase, if any of these components requires specific attention (e.g., re-seeding, slope adjustment, or similar), Maritime will act accordingly to ensure that all the necessary measures are implemented to rectify any concern.
Maritime anticipates that post-closure monitoring requirements will decrease over time until they are no longer required.
20.6.6 Cost Estimate for Closure
The estimated cost to complete the closure activities for the Project is based on the current level of detail for the Project and is estimated to be accurate to within + 15%. The preliminary cost estimate for closure is estimated to be $3.5 million in 2022 Canadian Funds, excluding Harmonised Sales Tax. This estimate includes the applicable percentages for project management, engineering, and contingency, as outlined in the Mining Act and is based on currently available Project details.
This cost estimate assumes that final closure and rehabilitation activities will be carried out by a third-party contractor, as required by the Mining Act and associated guidelines. Any associated credit for salvageable materials and equipment is not accounted for in the cost estimate, as outlined in the Mining Act; however, these options will be pursued upon closure.
|
|
20.6.7 Financial Assurance
As defined in Regulation 42/00 of the Mining Act, a financial assurance must be provided as part of an RCP. The financial assurance, excluding salvage value, is based on the cost estimate for closure activities presented in the RCP. The financial assurance shall be provided in a form acceptable to the Minister. The financial assurance for the Project may be proportioned and deferred to later years considering the stages of development and the associated rehabilitation and closure requirements. The proposed financial assurance schedule will be presented in the RCP for approval by NLDIET.
The financial assurance for closure can be recovered by Maritime following the completion of the minimum post-closure monitoring period and once NLDIET has deemed the mine closure to be satisfactory. In addition, financial assurance associated with progressive rehabilitation and closure activities can be recovered progressively as these activities are completed and approved by NLDIET.
20.7 Economic Benefit
Maritime anticipates significant socioeconomic benefits for both the communities within the Project region, and the Province. The Project will contribute over $64.4 million in direct federal and provincial taxation benefits over the LOM with an additional operational expenditure forecasted at over $278.7 million. Approximately 1,000 person years of direct employment will be generated for operations, in addition to local contract opportunities for ore transport and other operational support services. Maritime has previously received provincial government approval for its Employment and Benefits Agreement and its Gender Equity and Diversity Plan for the Project.
20.8 Consultation
20.8.1 Public Consultation
In June 2019 and 2020, Maritime officials met with the Council for the Town of King's Point and the Town of Springdale to present a preliminary description of the Project. Maritime's communications plan ensures that all interested stakeholders are kept informed of the Project details as well as its progress. Maritime has or will present the Project to community stakeholders including, but not limited to, the following:
• Municipal Councils;
• Educational and Training Institutions;
• Economic Development and Industry Groups;
|
|
• Outfitters and Recreational Groups;
• Environmental Groups;
• Cabin Owners;
• Cabin Owners Association;
• NL Snowmobile Association; and
• Local Health and Law Enforcement Authorities.
Carrying out meaningful community consultation is not only important for Maritime to obtain social acceptability but was also necessary to fulfill all the regulatory requirements and expectations under the NL EA process. Maritime carried out a public meeting, November 4, 2020, as per the EPR requirements.
20.8.2 Industry Relations
Maritime has been an active member in the NL mining industry community since 2015. Maritime regularly attends local and provincial industry conferences, including the Mineral Resources Review, held annually in St. John's, NL, and the Baie Verte Mining Conference, held annually in Baie Verte, NL.
20.8.3 Regulatory Consultation
Maritime has been consulting regularly with municipal, provincial and federal government departments to discuss plans and activities since the onset of its exploration activities at the Hammerdown site in 2016. Since 2016, Maritime has consulted, in various ways, with officials from the following municipal, provincial and federal departments and agencies:
• Municipal Governments:
– Town councils of adjacent communities to the Project:
◾ Town of Springdale; and
◾ Town of King's Point.
• Provincial Government:
– Department of Industry, Energy and Technology:
◾ Mines Branch.
– Department of Environment and Climate Change:
◾ Environmental Assessment Division;
◾ Pollution Prevention Division;
◾ Water Resources Management Division; and
|
|
◾ Climate Change Branch.
– Department of Fisheries, Forestry and Agriculture:
◾ Wildlife Division.
– Department of Tourism, Culture, Industry and Innovation:
◾ Provincial Archaeology Office.
– Department of Transportation and Infrastructure.
• Federal Government:
– Fisheries and Oceans Canada; and
– Impact Assessment Agency.
Maritime will maintain consultation with applicable government departments throughout the planning, permitting, development, operation, and closure phases of the Project.
20.9 Geochemistry of Mine Waste
A waste rock geochemical characterization assessment has been completed to evaluate the Acid Rock Drainage and Metal Leaching (ARDML) potential from waste rock associated with the Project.
20.9.1 Methodology
This work has been undertaken at RPC laboratories in Fredericton, New Brunswick. The work in this phase has comprised of static and kinetic testwork on waste rock, low-grade ore, tailings and ore sorter rejects from the Hammerdown deposit (SRK, 2022a). A total of 141 samples were collected, with a matrix of lithologies and alteration provided in Table 20-3.
|
|
Table 20-3: Lithology and Alteration Sample Selection Matrix (Hammerdown)
| Lithology Group |
Alteration | ||||||||||
| Oxide | Potassic | Propylitic | Quartz Vein | Sericite | Silicified | Unaltered | Argillic | Carbonate | Tuff | Phyllic | |
| Fault | 1 | 1 | 2 | 1 | 1 | 1 | 1 | 1 | |||
| Felsic | 1 | 3 | 1 | 2 | 2 | 1 | |||||
| Host | 1 | ||||||||||
| Leucoxene | 1 | 6 | 2 | 2 | |||||||
| Mafic | 3 | 1 | 35 | 11 | 6 | 2 | 4 | 1 | |||
| Overburden | 1 | 3 | |||||||||
| Quartz Vein | 3 | 2 | 7 | 3 | 4 | ||||||
| Sediment | 7 | 2 | 1 | ||||||||
| Tuff | 4 | 1 | 1 | ||||||||
| Vein | 2 | 3 | |||||||||
| Waste | 3 | ||||||||||
| Totals | 8 | 6 | 59 | 1 | 21 | 15 | 20 | 4 | 5 | 1 | 1 |
Note: Where the number of samples were 1, then this was estimate to form <1% of the overall waste rock mass. For some of the smaller volume material types there were limited horizons available to sample.
Source: SRK (2022)
Fourteen samples of tailings and ore sorter reject samples from different process campaigns were also assessed using the same methods.
|
|
20.9.2 Results
20.9.2.1 Assessment of Acid Generation
Overall, the work has shown that most of the waste rock from Hammerdown are NAG. A low proportion of samples are PAG with the remainder classified as having an uncertain acid generating potential.
Paste pH, a measure of reactivity, results ranged between 7.3 and 9.6, with an average of 8.9 across all samples. Low-grade ore samples yielded paste pH values of 6.7 to 8.6, averaging 7.5. The lowest paste pH values are generally associated with the highest total sulfur content, as shown in Figure 20-5. For example, four of the lowest paste pH measurements of between 6.8 and 7.7 corresponded with the four highest total sulfur contents of between 3.6% and 5.7%. All of these are low grade ore samples.
Figure 20-5: Comparison of Reactivity (paste pH) to Acid Generation Potential (sulfur, wt%)
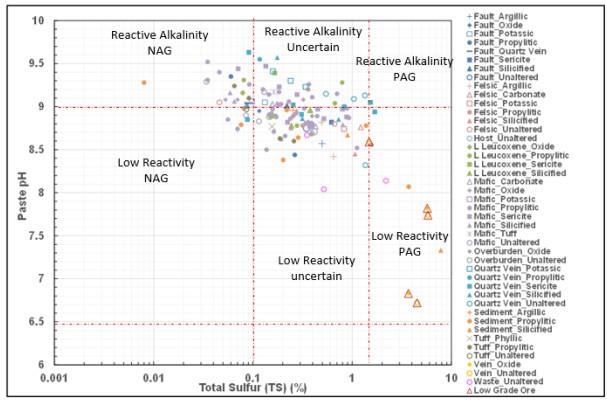
Source: SRK (2022)
|
|
Results for modified Sobek method for Acid Base Accounting.
Figure 20-6: NP vs AGP Prediction, Hammerdown Lithologies. Red Boxes Identify Samples for which Kinetic Tests were Performed
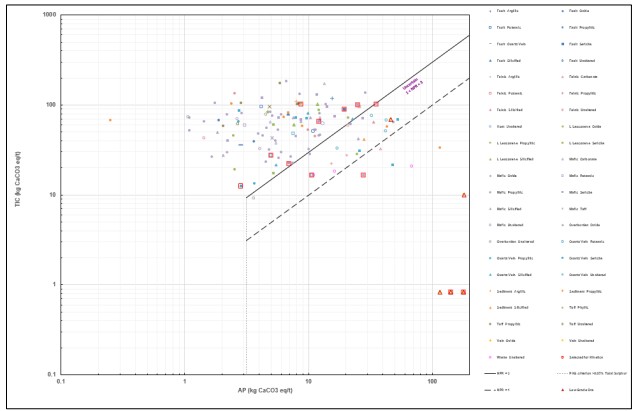
Source: SRK (2022)
The highest total sulfur content across the samples tested were associated with the samples of ore. Total sulfur within the ore samples was between from 0.39% to 5.8% with an average of 2.8%. Total sulfur within the tailings samples was between from 0.08% to 2.8% with an average of 0.76% with the ore sorter rejects recording the lowest total sulfur contents, between 0.1% and 0.49% (average, 0.28%). In general, for the majority of sorter reject samples, sulfur is present as sulfide sulfur (calculated by difference) with low sulfate sulfur measurements (between <0.005% and 0.049%). All samples contained higher titratable neutralization potential (NP), as measured by the laboratory, when compared to carbonate content calculated NP. This reflects the presence of silicate minerals (which are acid buffering) that contribute to the NP measurement but are not as effective in terms of effective neutralization potential when compared to carbonate minerals such as calcite and dolomite.
|
|
The ratio of neutralizing potential to acid generating (NPR) potential provides a measure of the acid rock drainage potential for the ore sorter rejects and tailings are shown in Figure 20-7. Samples are classified as non-potentially acid generating (NAG) when the NPR is greater than 3, as PAG when ratios are less than 1 and are classed as having an uncertain potential for ARD when ratios are between 1 and 3. Thus low-grade ore and two of the leach tailings show potential for acid generation. Leach tails will be placed on containment at Nugget Pond site and the low-grade ore will be processed during mine life so neither are a long-term issue.
Figure 20-7: Prediction of Acid Generation from Process Waste, Hammerdown Deposit (Neutralization Potential vs Acid Generation Potential in eq. kg CaCO3/t)
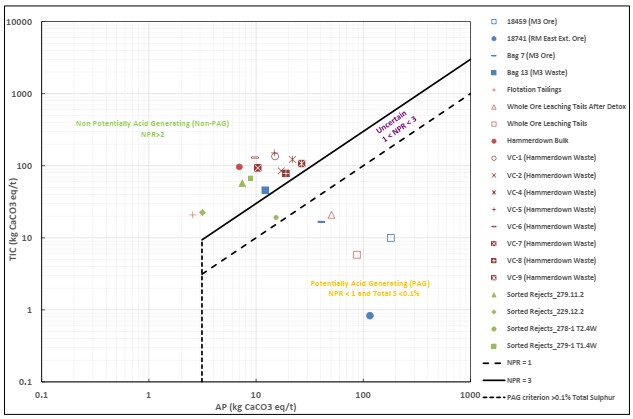
Source: SRK (2022)
Net Acid Generation results confirm the results made using modified Sobek ABA method. Static testwork indicate that the majority of ore sorter reject from Hammerdown and tailings from both deposits are NAG. Kinetic HCT tests on those samples did not shows signs of acid generation.
Overall, the assessment shows that the material is largely unreactive, majority is neutralizing or uncertain potential with a small component of the waste being acid generating. This material that is comes from the wallrock selvage zone to the mineralization and will likely be mined to a great extent with low grade ore and processed that way. The small pockets of sulfide material that will end up in the waste rock facility will not influence the overall prediction.
|
|
20.9.3 Metal Leaching Assessment
The modified 1312 short-term leachate extraction test and ASTM (1344-14D) methods were applied to determine potential for metal leaching. The pH of the leachates generated during the deionized water leach tests were uniformly neutral to moderately alkaline ranging from pH 8.1 to 9.1. Concentrations of sulfate were between 3 mg/L and 195 mg/L with the highest concentrations of 101 mg/L and 195 mg/L associated with samples associated with the "sediment" lithological group.
These samples were responsible for the lowest pH values recorded (8.1-8.2). All other samples recorded concentrations of sulfate that were below 60 mg/L. As shown in Figure 20-8 all of leachates generated during the deionized water leach test can be classed as 'near-neutral, low-metal waters' based on the Ficklin classification scheme (Ficklin et al., 1992); i.e. pH 5.5 or greater and total Ficklin metal (Cu + Cd + Co + Ni + Pb + Zn) concentrations less than 1 mg/L.
Figure 20-8: Ficklin Plots, Hammerdown Project Waste Rock and LGO
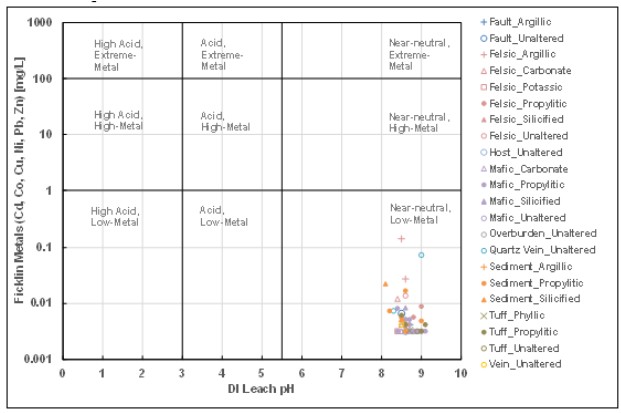
Source: SRK (2022)
|
|
Kinetic HCT tests on Hammerdown waste rock did not shows signs of acid generation and metal release was low. Mineralogical analysis of waste rock confirmed that there is an excess of neutralizing carbonates in comparison to acid generating sulfide.
The range of release pH values is shown in Figure 20-9. As can be observed only the LGO samples (HC1 and HC2) indicate acidic pH development. Consistent with this, neutralization potential was present in all waste rocks (Figure 20-10).
Release rates calculated using the HCT results can be used to evaluate trends of elements to provide a qualitative indication of the leaching potential of these parameters. The release rates can also be used to develop water and load balance input source terms to evaluate if constituent concentrations pose environmental risk when accounted for in the context of the proposed mine waste and water management strategies.
Figure 20-9: pH Release from HCT's Hammerdown Waste Rock
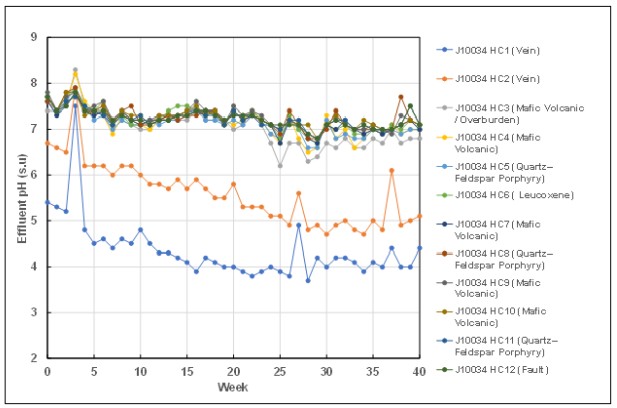
Source: SRK (2022)
|
|
Figure 20-10: Consumption of Neutralization Potential from HCT's Hammerdown Waste Rock
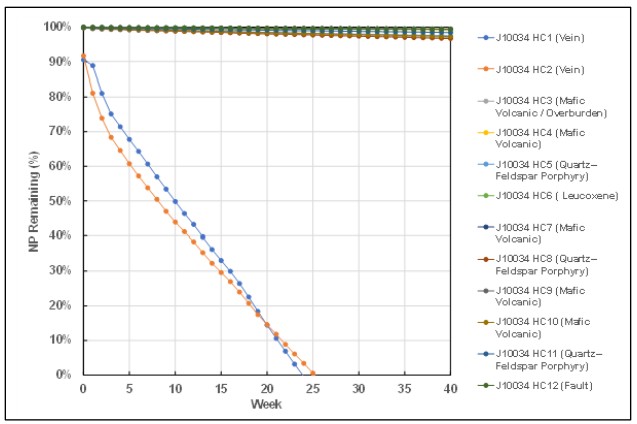
Source: SRK (2022)
The development of the source terms and the water and load balance will be completed as part of the main characterization report, therefore release rates are interpreted here to provide a qualitative interpretation of elemental leaching potential.
Key parameters are defined as:
• Are included in the Metal and Diamond Mining Effluent Regulations (MDMER) Schedule 4 discharge criteria (arsenic, copper, lead, nickel and zinc);
• Those that provide insight to acid generation potential (pH, alkalinity, sulfate, NP remaining and sulfate remaining);
• Elements greater than 12 times the average crustal abundances (arsenic, cadmium, copper, lead, selenium, silver and zinc);
• Increasing concentrations during the testing period (e.g., EC, aluminium, beryllium, cadmium, copper, iron, lead, and zinc); and
|
|
• Other parameters of interest, such as manganese due to its likely association with carbonate minerals and cobalt which it typically presents in mine drainages.
Ore from the testwork indicates a variable potential for acid rock drainage. Kinetic HCT tests on Hammerdown ore samples have generated some potential for acidic leachates although some have not, remaining circum-neutral. Higher metal release rates have been observed from the low-grade ore samples, particularly those that turned acidic. However, ore stockpiles are not anticipated to be stored on site long term. Mineralogical analysis generally indicated that the Hammerdown ore samples had an excess of sulfide minerals in comparison to neutralizing carbonates, but these are crystalline and coarse and so would not be predicted to be particularly reactive. Waste rock from Hammerdown shows no potential for exceedances of MDMER effluent regulations.
In keeping with predictions of acid generation, ore sorter rejects having low sulfide showed no potential for acid generation in kinetic testwork and reported low sulfate and metal releases. Similarly, floatation tailings were also predicted to be NAG with low solute release.
A single sample of supernatant liquid sample, associated with the flotation tailings was analyzed. The pH of the supernatant solution was near-neutral at 7.6. EC was recorded at 155 µS/cm, with sulfate and alkalinity recorded at 24 mg/L and 40 mgCaCO3/L respectively. In terms of solute chemistry, copper, zinc, arsenic, cobalt, chromium, mercury, iron, nickel, selenium, thallium, tin, uranium and vanadium were present close to or below the reported detection limit. With a circum-neutral pH the supernatant water can be classed as 'near-neutral, low-metal waters' based on the Ficklin classification scheme (Ficklin et al., 1992); i.e., pH 5.5 or greater and total Ficklin metal (Cu + Cd + Co + Ni + Pb + Zn) concentrations less than 1 mg/L.
20.9.4 Predictive Calculations of Future Water Quality
Interaction of exposed rock materials with rainfall and other contact waters can release solutes that will determine the contact water chemistry. Release of contact waters into the environment with elevated solute concentrations has the potential to impact on local water quality.
Numerical assessments have been undertaken to evaluate the potential contact water quality to identify where interactions with mine materials may lead to potential risks of deterioration to local water quality and to identify where mitigation measures may be required. These water quality assessments have been undertaken for the following facilities:
• Waste rock dump (WRD);
• Ore Sorter Reject (OSR);
• Low Grade Ore (LGO) - temporary stockpile; and
• Pit lake and in-pit dewatering.
An estimate of contact water quality for the WRD and OSR indicates that it will be circum-neutral with generally low solute content. The estimate indicates no exceedances of the MDMER. However, it is estimated that a number of parameters will be above the Freshwater EQS guideline values in particular for aluminium, copper and lead. These results are broadly consistent with water quality sampling undertaken for mine impacted water from existing workings, which also show no exceedances of MDMER values, but some exceedances of the Freshwater EQS guideline values. Consequently, with a negligible potential no special pad development or liner is required for the waste rock. Management of surface runoff and seepage will be required for sediment control only.
|
|
An estimate of contact water quality for the LGO indicates that it will be acidic with generally high solute contents, a result that is expected for material of this type. The estimate indicates several exceedances of the MDMER guideline values for copper, lead and zinc. As the LGO stockpile will be temporary and the reactivity is predicted to be low, so a liner is not required.
The Hammerdown pit lake is predicted to be circum-neutral with low solute content. All but selenium and mercury are below the CCME guidelines, although this outcome for both parameters is likely an artefact of laboratory detection limits and are not likely to be a real concern.
Sensitivity analysis for all modelled facilities indicate that the outcomes of this assessment are not particularly sensitive to changes in assumptions (such as temperature, reactive masses, or decreased rainfall).
A number of recommendations are made based on the results of the study:
• It is recommended that ongoing monitoring programmes going forward seek lower LoD for these parameters in particular for mercury and selenium to confirm no potential CCME exceedances;
• Exceedances of the MDMER guideline values have been identified for the LGO stockpile. Contact water from this facility will require management in order to prevent impact to the environment. It is understood that the LGO stockpile will be underlain by a compacted ground to prevent ingress of contact water to groundwater during operations, but there will be a requirement to capture toe seepages and to either treat prior to discharge or re-use the water in the process. It is understood that the LGO stockpile will be temporary in nature and will not exist post-closure. If it is present, it will require in perpetuity containment;
• No exceedances of the MDMER guidelines have been identified (with the exception of the LGO); and
• For lead, CCME exceedance in the OSR and WRD this is most likely due to detection limit issues. For aluminium and copper the appropriate closure strategy would be cover the material to restrict infiltration of water. For the OSR, placement of the material in the Hammerdown pit lake would be the most appropriate long term management strategy as that would prevent oxidation of trace sulfides.
20.9.5 Summary
The implications of this study are:
• That waste rock can be largely assumed as NAG and can be considered relatively unreactive. Consequently, drainage quality is not predicted to exceed MDMER effluent guidelines so no special pad development or liner is required for the waste rock. Management of surface runoff and seepage will be required for sediment control only. On closure no special cover is required only for erosion control;
|
|
• The overwhelming amount of non-PAG waste rock mean that the relatively low amounts of PAG waste rock are not likely to be problematic, although localized ARDML but it will mitigated by overwhelming NAG waste;
• Ore material and low grade ore material is predicted to be acid generating but has slow reactivity and a low metal released metal content. However, it will be processed soon after mining and this will mitigate much of the risk. The observed reactivity in static and kinetic tests would indicate the requirement to manage contact water around any ore stockpiles through collection of seepage and runoff for sediment control is required during operations. As the stockpiles will be processed during operations no requirements will be required in closure except clean up of the ground under and around the former stockpiles. This material can be placed on passive containment on the waste rock dumps; and
• Hammerdown pit lake will form but the prediction is for neutral chemistry with low salinity and metal contents with no predicted exceedances to MDMER guidelines. As such the only requirement on closure will be for monitoring.
|
|
21 CAPITAL COST ESTIMATE
21.1 Capital Cost Summary
The capital cost estimate was prepared using first principles, applying project experience and avoiding the use of general industry factors. The estimate is derived from engineers, contractors, and suppliers who have provided similar services to existing operations and have demonstrated success in executing the plans set forth in the study. Given that assumptions have been made due to a lack of available engineering information, the accuracy of the estimate and/or ultimate construction costs arising from the engineering work cannot be guaranteed. The target accuracy of the estimate is -15/+30%.
Costs are expressed in C$ with no escalation unless stated otherwise. Foreign exchange rates of C$$1.30:US$1.00.
The estimate is based on the assumption that contractors would mobilize only once to carry out their work and are not already mobilized on site performing other work.
Total life of mine capital costs are estimated to be $80M. Pre-production capital costs amount to $75M. Capital costs during production years total $4.9M. These costs are summarized in Table 21-1. The capital costs do not include mining fleet as it is accounted for in operating costs through leasing, with the exception of applicable down payments. Contingency for the project totals $7.2M. Individual contingency rates were applied to each of the capital cost categories, with rates ranging from 5-20%. This resulted in a blended contingency rate of 9.8%.
Table 21-1: Capital Cost Summary
| Capital Costs | Pre-Production (M$) |
Sustaining / Closure (M$) |
Total (M$) |
| Mining | 10.6 | 4.8 | 15.5 |
| Site Development | 4.7 | 0.4 | 5.1 |
| Mineral Processing incl Sorting | 24.7 | 5.0 | 29.6 |
| Waste & Water Management | 0.6 | 0.1 | 0.8 |
| On-Site Infrastructure | 5.9 | 0 | 5.9 |
| Project Indirects | 17.3 | 0 | 17.3 |
| Owner's Costs | 4.0 | 0.7 | 4.7 |
| Closure | 0 | 3.5 | 3.5 |
| Contingency | 7.2 | 0 | 7.2 |
| Salvage | 0 | (9.6) | (9.6) |
| Total Capital Costs | 75.0 | 4.9 | 80.0 |
*Numbers may not add due to rounding
|
|
21.2 Basis of Estimate
The Project capital estimates include all costs to develop and sustain the project at a commercially operable status. The capital costs do not include the costs related to operating consumables inventory purchased before commercial production.
The following key parameters apply to the capital estimates:
• Estimate Class: The estimate is a Class 3 Estimate, deemed to have an accuracy of -15% to +30% based on the amount of design, engineering completed, and quotations received;
• Estimate Base Date: The base date of the capital estimate is Q2 2022. No escalation has been applied to the capital estimate for future costs; and
• Currency: All capital costs are expressed in C$.
21.3 Mine Capital Cost Estimate
Mining costs were derived from the JDS mining cost model which used a first principles approach in building up development costs. Pre-stripping costs are the capitalized portion of the operating costs before the production of first gold. The majority of mining equipment fleet has been assumed to be leased (20% down payment with the remainder paid monthly for 48 months with a 5% interest rate). Monthly lease payments are covered under the Mine operating costs. The equipment supply cost and leasing terms were quoted by Vendors. Allowances have been made for freight, spare parts, and assembly for the equipment. Table 21-2 provides a summary of the mining capital costs.
Table 21-2: Mining Capital Cost Estimate
| Processing Plant CAPEX | Pre-Production (M$) |
Sustaining / Closure (M$) |
Total |
| Pre-Stripping | 5.1 | 0.0 | 5.1 |
| Mobile Equipment Down Payments | 3.3 | 2.8 | 6.2 |
| Miscellaneous Equipment / Parts | 2.2 | 2.0 | 4.2 |
| Total | 10.6 | 4.8 | 15.5 |
Note: Numbers may not add due to rounding
|
|
21.4 Site Development and On-Site Infrastructure Direct Cost Estimate
21.4.1 Direct Pre-Production Capital
Site construction costs include site development, sorting and mineral processing plants, and on-site infrastructure. These cost estimates are primarily based on material and equipment costs from material take-offs (MTOs) and detailed mechanical equipment lists (MEL). Pricing for main equipment and bulk materials was primarily determined from quoted sources or database pricing, with some judgment factors applied for minor cost elements.
Table 21-3 presents a summary basis of estimate for the various commodity types within the surface construction estimates. Growth factors were included above neat material take-off quantities for all areas.
Table 21-3: Surface Construction Estimate Basis
| Scope | Quantity Basis | Description |
| Site Preparation and Bulk Earthworks | MTOs | Quantities of Site Prep and Earthworks have been developed from the preliminary 3-D model and sketches. |
| Concrete | MTOs | Quantities of Concrete have been developed from preliminary 2-D drawings. Contractor quoted supply & install unit rates. |
| Ancillary Buildings & Warehouses | MTOs | Quoted costs for the mine dry, administration offices, maintenance and warehouse building, cold storage structure, database costs from recent projects for the mine truck shop. |
| Mechanical Equipment | MEL | New equipment pricing from budget quotation. Refurbished equipment from Vendor quotation or percentage of replacement cost. |
| Mechanical Platework/ Tanks | MTOs | Included in equipment supply cost for crushing plant. Minor platework quantities developed from 2D drawings/ historic database. |
| Process Piping | MTOs / Allowance |
New piping has been developed from MTO's. Allowance made for refurbishment as a percentage of mechanical equipment. |
| Electrical Bulks | MTOs / Allowance | MTOs were developed based on Single Line Diagrams and Site General Arrangement Layouts. |
| Instrumentation | MTOs / Allowance | MTOs were developed for new process areas. Control system updates were costed by legacy supplier. Existing circuit allowances provided as a percentage of mechanical equipment. |
Source: Halyard (2022)
|
|
21.5 Processing Cost Estimate
21.5.1 Processing Infrastructure Capital Cost Methodology
Process infrastructure capital costs represent process equipment, process buildings inclusive of foundations architectural finishes and HVAC, internal structures, ROM pad / retaining wall and ramp, power distribution, pipework, instrumentation, and controls.
The process plant capital cost was estimated using engineering documents developed during the Feasibility Study, mainly:
• Process design basis:
– Process design criteria;
– Mechanical equipment list; and
– Process flow diagrams
• Tender Packages (equipment and contract packages):
– Site conditions;
– Scopes of work; and
– Technical specifications and datasheets.
• Drawings:
– General site layouts;
– Process building general arrangements;
– Mechanical arrangement drawings;
– Conveyor profiles;
– Power distribution general arrangement; and
– Single line diagrams.
• Material Quantities:
– Cut, fill and rock excavation with input from LIDAR survey and geotechnical investigations.
– Steel and concrete takeoff using major equipment and building loads and layout drawings.
– Platework take-off from drawings / representative historic models.
– Major piping take-off from layout drawings.
– Electrical bulks take-off from layout and single line drawings.
– Valve & instrumentation estimate from PFD.
|
|
– Preliminary I/O count for control system.
Capital cost inputs for equipment, bulk materials and labour were derived primary from Vendor budget proposal and to a lesser degree from recent database base pricing or first principles.
• Civil (earthworks) - contractor supply and install unit rates based on project specific material quantities reviewed for technical compliance.
• Concrete & structural steel - contractor supply and install unit rates based on project specific material quantities reviewed for technical compliance.
• Buildings & stockpile covers - Contractor supply and install pricing from multiple Vendor budget quotations reviewed for technical compliance.
• Mechanical equipment - new equipment pricing from multiple Vendor budget quotations reviewed for technical compliance. Refurbished equipment costs from sole source Vendor quotation or estimated as a percentage of replacement cost.
• Platework - materials handling platework included with Vendor budget pricing. Minor platework cost built up from unit rates derived from historical pricing of representative platework.
• Piping, valves & instruments - Database unit rates. Overland HDPE piping quoted for pit dewatering.
• Electrical equipment - new equipment pricing from multiple Vendor budget quotations reviewed for technical compliance.
• Electrical bulks - supply unit rates based on project specific material quantities reviewed for technical compliance.
• Control system and programming - Sole source Vendor pricing from legacy supplier.
Table 21-4: Process Plant CAPEX
| Processing Plant CAPEX | Pre-Production (M$) |
Sustaining / Closure (M$) |
Total |
| Mine Site Crushing & Sorting | 8.3 | 5.0 | 13.3 |
| Process Plant Comminution | 15.9 | 15.9 | |
| Process Utilities | 0.1 | 0.1 | |
| Reagents | 0.4 | 0.4 | |
| Total | 24.7 | 5.0 | 29.6 |
|
|
21.6 Infrastructure Cost Estimate
Surface construction costs include site development, ancillary buildings, utilities, and on-site infrastructure. These cost estimates are primarily based on material and equipment costs from MTO's and detailed equipment lists. Pricing for main equipment and bulk materials was primarily determined from quoted sources, with some factors applied for minor cost elements.
A summary of the surface infrastructure costs is outlined in Table 21-5.
Table 21-5: Infrastructure CAPEX
| Infrastructure CAPEX | Pre-Production (M$) |
Sustaining / Closure (M$) |
Total |
| Onsite Development | |||
| Earthworks | 1.5 | 0 | 1.5 |
| Roads | 0.8 | 0 | 0.8 |
| Surface Water Management | 2.4 | 0.4 | 2.8 |
| Total | 4.7 | 0.4 | 5.1 |
| Waste Management | |||
| Waste Rock Storage Facility | 0.6 | 0.2 | 0.8 |
| Total | 0.6 | 0.2 | 0.8 |
| Infrastructure | |||
| Onsite Electrical Distribution | 3.4 | 3.4 | |
| Water Supply | 0.1 | 0.1 | |
| Waste Management | 0.1 | 0.1 | |
| Ancillary Buildings | 1.7 | 1.7 | |
| Mobile Equipment | 0.6 | 0.6 | |
| IT, Communications & Software | 0.1 | 0.1 | |
| Total | 5.9 | 0 | 5.9 |
21.7 Indirect Cost Estimate
Indirect costs are classified as costs not directly accountable to a specific cost object. Table 21-6 presents the subjects and basis for the indirect costs within the capital estimate.
|
|
Table 21-6: Indirect Cost Basis of Estimate
| Commodity | Basis |
| Contractor Field Indirects (may vary depending on contractor or facility) | Estimated by first principles, and including the following items: |
|
|
|
|
|
|
|
|
|
|
|
|
|
|
|
|
| Indirect Labour (incl survey, site services, QA/QC, security, safety) | Built up based on hours and rotations to complete the work |
| Diesel/Fuel | Built up based on contractor hour and fuel burn rates |
| Travel | Built up based on rotations from the EPCM, G&A and Owners travel schedule |
| Pre-Production Labour | Based on requirements determined by engineering from the operating usages |
| Freight and Logistics | Quoted shipping rates for major equipment and infrastructure or included in the quoted price. Preliminary quotes received for bulk shipping to each mine site |
| Vendor Representatives | Based on % of mechanical equipment for similar locations and applications |
| Capital Spares | Based on % of mechanical equipment for similar locations and applications |
| Start-up and Commissioning | Included under EPCM (personnel), Owner's team costs (material and consumables), and first principles build-up of estimated contractor labour requirements |
| First Fills/Consumables | Based on requirements determined by engineering from the operating usages |
21.7.1 EPCM Cost Estimate
21.7.1.1 Detailed Engineering and Procurement
The estimate was based on deliverables for engineering and drafting, and time based on project management services required to oversee project development. Engineering and procurement services and costs are based on judgment factors derived from previous projects.
|
|
21.7.1.2 Project and Construction Management
The staffing plan was built up against the development schedule for project management, health and safety, construction management, field engineering, project controls, and contract administration. Costs are based on an EPCM execution strategy.
Table 21-7: Project Indirects CAPEX
| Indirect CAPEX | Total ($M) |
| On-site Contract Services | 2.2 |
| Temporary Facilities & Utilities | 0.3 |
| Contractor Indirects | 2.0 |
| Freight | 1.3 |
| Startup & Commissioning | 1.0 |
| Temporary Accommodations | 1.5 |
| EPCM | 9.1 |
| Total | 17.3 |
21.8 Owners Cost Estimate
Owner's costs are classified as the management, oversight and site operation costs to develop the Project. These costs are capitalized during the construction phase. Any owner's costs that continue beyond the project phase are then incorporated into the site G&A operating costs. Salvage costs for the plant equipment are carried under Owner's costs. Table 21-8 presents owner's costs within the capital estimate.
Table 21-8: Owner's Costs CAPEX
| Owner's Cost | Pre-Production (M$) |
Sustaining / Closure (M$) |
Total |
| Owners G&A | 3.3 | (2.2) | 1.1 |
| Owners Project Costs | 0.7 | 0.7 | |
| Total | 4.0 | (2.2) | 1.9 |
21.8.1 Pre-Production G&A - Labour
Costs for general and administrative labour are included for the following sectors:
|
|
• General management;
• Finance and accounting;
• Health and Safety;
• Environmental management;
• Human resources;
• Procurement & logistics;
• Security; and
• Owners Project Team
21.8.2 Pre-Production G&A - Expenses and Services
Costs for general and administrative expenses and fees are included for the following sectors:
• Health, safety and medical supplies;
• New hire orientations;
• Staff safety equipment (surface staff PPE);
• Surface support equipment operation fuel and maintenance;
• Surface facilities electrical power consumption;
• Site facilities maintenance supplies and consumables;
• Environmental services, fees, and outside laboratory costs;
• Construction insurance;
• Legal and regulatory, including property tax;
• External consulting;
• IT and communications;
• Site office costs;
• Office equipment lease and services; and
• Waste disposal.
|
|
21.9 Contingency
Contingency has been applied to the estimate determined by the estimate class of the sub-categories. Where additional contingency was deemed necessary, based on the level of confidence for that sub-category, a growth allowance was added to those specific items. The overall contingency is applied after the growth allowance has been added. Overall contingency has been calculated to be 9.8% of the overall direct / indirect costs and 9.0% of the overall costs.
The CAPEX contingency on the total direct costs, excluding mining, was 20%. Additionally, indirect and owner's costs were 59.3% of the direct costs, excluding mining.
21.10 Closure Cost Estimate
The closure cost estimate of $3.5M was developed based on information and quantities provided by Maritime, and in accordance with provincial government guidelines for rehabilitation and closure planning prepared by the NL Mineral Development Division (MDD) in August of 2020 (the guidelines). Per the guidelines:
• The cost estimate was prepared by a third party (GEMTEC);
• Unit rates, allowances, and lump sums were developed based on third party construction quotes provided by local contractors (not preferred rates) and/or using RS Means Costworks software;
• Costing includes all known aspects of site decommissioning and rehabilitation after closure, based on the current level of design;
• Closure cost includes infrastructure on the Nugget Pond property owned by Maritime;
• Closure cost does not include closure related to the Rambler Tailings Facility;
• Lump sum estimates for Project Management (7%) and Engineering (3%) have been added to the sub-total; and
• Salvage values have been excluded from the closure cost.
21.11 Capital Estimate Exclusions
The following items have been excluded from the capital cost estimate:
• Working capital (which is included in the financial model);
• Currency fluctuations;
• Lost time due to severe weather conditions beyond those expected in the region;
|
|
• Lost time due to force majeure;
• Additional costs for accelerated or decelerated deliveries of equipment, materials or services resultant from a change in Project schedule;
• Warehouse inventories, other than those supplied in initial fills, capital spares, or commissioning spares;
• Any Project sunk costs (studies, exploration programs, etc.); and
• Escalation cost.
 |
 |
22 OPERATING COST ESTIMATE
22.1 Operating Cost Summary
The operating cost estimate was prepared using first principles, applying project experience and avoiding the use of general industry factors. Inputs are derived from engineers, contractors and suppliers who have provided similar services to other projects.
The operating cost estimate is broken into five major sections:
• Mining;
• Processing;
• Tailings;
• Transportation; and
• General & Administrative.
Certain items within the operating costs begin during the construction phase and continue through the life of the mine. Some of the costs incurred during the pre-production period relate to the costs to purchase items such as consumables required for the following year of production. The timing of these costs has been accounted for in the economic analysis and the costs in this section represent the costs incurred during the production period of the project.
Operating costs are presented in 2022 CAD dollars on a calendar year basis. No escalation or inflation is included. Diesel costs are estimated at $1.53/l and power at $0.085/kWh (net charge for generated power).
Total operating costs over the life of mine are $278.7M and are summarized in Table 22-1 and Table 22-2 shows the peak labour build up over the LOM. Figure 22-1 shows the breakdown and distribution of the life of mine operating costs by category.
Table 22-1: Breakdown of Estimated Operating Costs
| Operating Costs | $/t Milled | LOM (M$) |
| Mining | 148.9 | 176.9 |
| Processing | 47.31 | 56.2 |
| Tailings | 0.75 | 0.9 |
| Transportation (Haulage) | 25.5 | 30.3 |
| G&A | 12.04 | 14.3 |
| Total | 234.45 | 278.7 |
|
|
Figure 22-1: Breakdown of Estimated Operating Costs
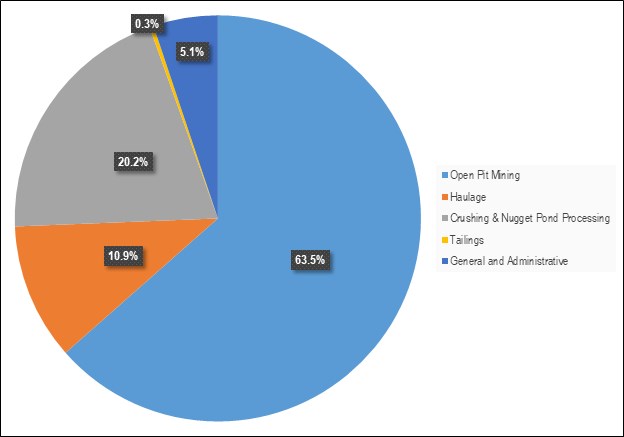
Table 22-2: Summary of Personnel
| Position | Peak Quantity |
| Mining | |
| Mining General | 8 |
| Mine Operations | 98 |
| Mine Maintenance | 90 |
| Technical Services | 13 |
| Total Mining Personnel | 208 |
| Process | |
| Process Operations | 4 HD + 13 NP = 17 |
| Process Maintenance | 5.5 HD + 12 NP = 17.5 |
| Process Technical Services | 1 HD + 8.5 NP = 9.5 |
| Total Process Plant Personnel | 10.5 HD + 33.5 NP = 44 |
|
|
| Position | Peak Quantity |
| G&A | |
| Subtotal - Surface & Infrastructure Maintenance | 2 |
| Subtotal - Procurement & Logistics | 4 |
| Subtotal - Environment | 1 |
| Subtotal - Administration | 4 |
| Subtotal - Health & Safety | 2 |
| Subtotal - Human Resources | 1 |
| Subtotal - Security | 4 |
| Total General & Administration | 18 |
| Total Personnel - All Areas | 270 |
22.2 Basis of Estimate
The operating cost estimate was developed from a number of sources, including quoted costs, benchmarks against similar projects in Canada, and database information as required. Process cost determinations were based on fixed and variable components relating to mill throughput and plant flow sheet. G&A costs were based on a first principles build up from information based on similar projects in Canada.
22.3 Mine Operating Cost Estimate
Mine operating costs were derived from the JDS mining cost model which used a first principles approach in building up equipment hours, parts and consumables and labour requirements. Operating costs exclude pre-stripping costs prior to first gold. The majority of mining equipment fleet has been assumed to be leased (20% down payment with the remainder paid monthly for 48 months with a 5% interest rate). Monthly lease payments are covered under the Mine operating costs. A breakdown of the mining operating cost is shown in Table 22-3 and the annual mine labour requirements is shown in Table 22-4.
Table 22-3: Mine Operating Cost Estimate
| $ / t mined | $ / t milled | % | |
| Labour | 1.62 | 53.8 | 36 |
| Fuel / Lube | 0.99 | 32.9 | 22 |
| Parts & Consumables | 0.35 | 11.8 | 8 |
| Explosives | 0.54 | 17.8 | 12 |
| Services, Rentals & Lease Payments | 0.98 | 32.5 | 22 |
| Total | 4.49 | 148.9 | 100 |
|
|
Table 22-4: Mine Personnel Requirement
| Year -1 | Year 1 | Year 2 | Year 3 | Year 4 | Year 5 | |
| Mine General | 2 | 8 | 7 | 7 | 7 | 6 |
| Mine Operations | 7 | 41 | 98 | 88 | 68 | 32 |
| Mine Maintenance | 9 | 46 | 90 | 82 | 66 | 35 |
| Technical Services | 4 | 13 | 13 | 13 | 13 | 11 |
| Total (all crews) | 22 | 108 | 208 | 190 | 154 | 84 |
22.4 Processing Operating Cost Estimate
22.4.1 Mineral Processing Operating Cost
Mineral processing operating cost are associated with crushing, sorting, ore storage, grinding, leach / CIP, doré refining, reagents and tailings. Operating cost for mining and non-process infrastructure including water management, domestic water and sewage treatment are covered elsewhere in Section 22.
Processing operating costs have been estimated from first principles, using mechanical equipment specifications for estimation of power consumption, metallurgical testwork for reagent and grinding media consumption, and labour schedules and salary build‐ups for process labour. Maintenance costs were estimated as a percentage of mechanical equipment supply cost.
Quotations for consumables such as reagents, lime, and grinding media were obtained from local suppliers inclusive of transportation to the Nugget Pond site. Major consumables for mechanical equipment including crusher liners, sorter spares, ball mill liners and stirred mill disks were sourced from vendor equipment quotations.
Annual operating cost for Hammerdown and Nugget Pond sites are show in Table 22-5. Costs are separated into fixed and variable cost where fixed costs are derived on an annual basis and consist of labour, fuel, maintenance and assaying costs. Variable costs are throughput-based costs inclusive of reagents, power, consumables / wear items for process equipment and tailings disposal. Hammerdown and Nugget Pond per tonne costs are based annual throughputs of 438,000 t/a and 255,500 t/a respectively.
|
|
Table 22-5: Mineral Processing Operating Cost
| Mineral Process Costs | Hammerdown | Nugget Pond | Total | |||
| Annual Cost ($CAD) |
Tonne Crushed ($CAD/t) |
Annual Cost ($CAD) |
Tonne Milled ($CAD/t) |
Annual Cost ($CAD) |
Tonne Milled ($CAD/t) |
|
| Fixed Costs | ||||||
| Labour | 845,000 | 1.93 | 2,888,000 | 11.31 | 3,734,000 | 14.61 |
| Fuel (Diesel) | 93,000 | 0.21 | 107,000 | 0.42 | 200,000 | 0.78 |
| Maintenance | 493,000 | 1.13 | 344,000 | 1.35 | 837,000 | 3.28 |
| Lubrication | 25,000 | 0.06 | 25,000 | 0.10 | 50,000 | 0.20 |
| Safety Equipment | 12,000 | 0.03 | 35,000 | 0.14 | 46,000 | 0.18 |
| Assaying Cost | 150,000 | 0.34 | 152,000 | 0.59 | 302,000 | 1.18 |
| Subtotal | 1,618,000 | 3.69 | 3,551,000 | 13.90 | 5,169,000 | 20.23 |
| Variable Costs | ||||||
| Reagents | - | 0.00 | 3,911,000 | 15.31 | 3,911,000 | 15.31 |
| Electrical Power | 481,000 | 1.10 | 1,118,000 | 4.38 | 1,599,000 | 6.26 |
| Consumables | 297,000 | 0.68 | 1,110,000 | 4.35 | 1,407,000 | 5.51 |
| Tailings2 | - | 0.00 | 192,000 | 0.75 | 192,000 | 0.75 |
| Subtotal (inc. tailings) | 778,000 | 1.78 | 6,331,000 | 24.78 | 7,109,000 | 27.82 |
| Total (inc. tailings) | 2,397,000 | 5.47 | 9,882,000 | 38.68 | 12,278,000 | 48.06 |
Notes:
1. Totals may not sum due to rounding.
2. An estimate operating cost of tailings deposition was calculated based on projected sustaining costs for tailings containment structure expansions and equated to a deposition unit cost anticipated to be finalized with Rambler.
Source: Halyard (2022)
22.4.1.1 Labour
Hammerdown will require a complement of 10.5 full time equivalent positions, including supervision, operations, maintenance and general labour. Additional G&A and mining personnel will be located at this site as detailed elsewhere in Section 22.
Nugget Pond general and administrative positions will be shared with the existing Rambler operation with 3.5 additional full time equivalent positions added. The new facilities and existing gold circuit will require a complement of 30 full time equivalent personnel for supervision, operations, sample preparation and laboratory technicians, maintenance and general labour.
Labour rates and burdens have been aligned with current Rambler operation and benchmarked against comparable operations in Newfoundland.
|
|
22.4.1.2 Power
The total power demand is calculated using connected load and adjusting for utilization (operating hours), demand factor (% of nameplate draw), drive efficiency, and system losses. Power will be supplied from the Newfoundland Labrador provincial grid at $0.085/kWh net charge for generated power. Annual power consumption and cost are estimated in Table 22-6.
Table 22-6: Mineral Processing Electrical Consumption and Cost
| Mineral Processing Electrical Cost | Connected Load (kW) |
Electricity Usage (kWh/ year) |
Electrical Cost ($CAD/ year) |
($CAD/t) 1 |
| Hammerdown | ||||
| Crushing & Sorting Plant | 1,201 | 5,413,000 | 461,000 | 1.05 |
| Fabric Buildings | 20 | 70,000 | 6,000 | 0.01 |
| Power Distribution System Losses | 165,000 | 14,000 | 0.03 | |
| Subtotal | 1,221 | 5,648,000 | 481,000 | 1.10 |
| Nugget Pond | ||||
| Process Plant | 2,221 | 11,977,000 | 1,021,000 | 3.99 |
| Oxygen Plant | 93 | 604,000 | 52,000 | 0.20 |
| Power Distribution System Losses | 539,000 | 46,000 | 0.18 | |
| Subtotal | 2,314 | 13,120,000 | 1,118,000 | 4.38 |
| Total | 3,535 | 18,768,000 | 1,599,000 | 6.26 |
Notes:
1. Hammerdown $/t is based on 438,000 t/a ROM feed to the crushing plant. Nugget Pond and total $/t are based on 255,500 t/a mill feed.
2. Totals may not sum due to rounding.
Source: Halyard (2022)
22.4.1.3 Reagents
Cost of the various reagents added to the process are calculated using average LOM consumption rates derived from metallurgical testwork and unit rate budget quotations from local reagent suppliers, inclusive of transportation to site. Annual reagent consumption and cost are summarized in Table 22-7.
|
|
Table 22-7: Mineral Processing Reagents Consumption and Cost
| Reagent | Reagent Unit Cost ($/kg) |
Consumption Rate (g/t) |
Annual Consumption (t/y) |
Annual Cost 1 ($CAD) |
Tonne Milled ($CAD/t) |
| Hydrated Lime | 0.53 | 2,541 | 649.2 | 398,000 | 1.56 |
| Sodium Cyanide | 3.90 | 850 | 217.2 | 846,000 | 3.31 |
| SMBS | 1.23 | 3,161 | 807.6 | 1,061,000 | 4.15 |
| Copper sulphate | 3.77 | 1,408 | 359.7 | 1,384,000 | 5.42 |
| Activated carbon | 5.97 | 50 | 12.8 | 76,000 | 0.30 |
| Caustic | 1.10 | - | 8.2 | 9,000 | 0.04 |
| Hydrochloric acid | 0.97 | - | 23.5 | 23,000 | 0.09 |
| Antiscalant | 4.81 | - | 3.0 | 14,000 | 0.06 |
| Flocculant - Mag10 | 6.49 | 60 | 15.3 | 100,000 | 0.39 |
| Total | 3,911,000 | 15.31 |
Notes:
1. Annual cost is inclusive of transportation to Nugget Pond site.
2. Totals may not sum due to rounding.
Source: Halyard (2022)
22.4.1.4 Consumables
Cost for steel and ceramic grinding media were obtained from Supplier budget pricing, inclusive of delivery to site. Consumption rates were estimated from Vendor proposals and benchmarked again industry standards. Major equipment consumable cost and estimated replacement intervals for the ore sorters, jaw and cone crusher liners, ball mill liners and stirred mill disks were sourced from equipment Vendor budget quotations. Annual consumption rate and unit cost inclusive of transportation to site are estimated in Table 22-8.
Table 22-8: Mineral Processing Consumable and Major Equipment Wear Components
| Mineral Processing Consumables |
Annual Consumption |
Unit | Unit Cost ($CAD/ unit) |
Annual Cost ($CAD) 1 |
Tonnes Milled ($CAD/t) 2 |
| Grinding Media | |||||
| Ball Mill (forged) | 256 | t | 1,404 | 428,000 | 1.67 |
| Stirred Mill (ceramic) | 22 | t | 22,013 | 478,000 | 1.87 |
| Subtotal | 906,000 | 3.55 | |||
| Equipment Wear Parts | |||||
| Jaw Crusher | 3.0 | set | 23,000 | 70,000 | 0.27 |
| Secondary Crusher | 4.1 | set | 11,000 | 45,000 | 0.17 |
| Tertiary Crusher | 4.1 | set | 13,100 | 53,000 | 0.21 |
|
|
| Mineral Processing Consumables |
Annual Consumption |
Unit | Unit Cost ($CAD/ unit) |
Annual Cost ($CAD) 1 |
Tonnes Milled ($CAD/t) 2 |
| Sorters | 1.5 | set | 88,615 | 129,000 | 0.51 |
| Ball Mill Liner (Rubber) | 0.8 | set | 113,900 | 137,000 | 0.53 |
| Stirred Mill Discs | 30.9 | disc | 2,188 | 68,000 | 0.26 |
| Subtotal | 501,000 | 1.96 | |||
| Total | 1,407,000 | 5.51 |
Notes:
1. Annual cost is inclusive of transportation to Nugget Pond site.
2. $/t is based on 255,500 t/a mill feed.
3. Totals may not sum due to rounding.
Source: Halyard (2022)
22.4.1.5 Maintenance
The estimated cost of spare parts and consumables used for routine process plant maintenance are factored from mechanical equipment supply costs. The factors used for new process areas at Hammerdown and Nugget Pond for mechanical maintenance are 4% plus an additional 1% for electrical and instrumentation. For the existing Nugget Pond leach / CIP circuit, the historical maintenance budget from 2004 was adjusted for inflation. Annual estimated maintenance budgets are $492,976 ($1.13 / t crushed) and $343,960 ($1.35/ t milled) for Hammerdown and Nugget Pond respectively.
22.4.1.6 Assay Lab
The quantity and type of assays is estimated by process area. Assay costs were derived from historic unit pricing. The Nugget Pond site will utilize the existing on-site assay laboratory for sample preparation and testing. Annual allowance is $302,048 approximately split evenly between Hammerdown and Nugget Pond sites.
22.5 Transportation / Haulage Operating Cost Estimate
The transportation cost represents the cost of hauling sorted material from the Hammerdown site to the Nugget Pond site for final processing. Quotes from local contracting companies were received. Total haulage costs over the LOM are $30.3M.
22.6 Tailings Operating Cost Estimate
Operating cost of $0.75/t milled was added to account for additional capacity required in the existing Nugget Pond tailings storage facility to fund Maritime's proportional share of any future expansions. Total tailings costs over the LOM are estimated to be $0.9M.
|
|
22.7 General and Administration Operating Cost Estimate
On-site items as such as, overall management and administration, health and safety, environmental, human resources, insurance, legal, external consulting, IT, communications and office supplies, site service equipment operation and maintenance, and procurement and warehousing are covered under site G&A costs.
General and administrative costs comprise the following categories:
• Labour;
• Expenses;
• Vehicle & Equipment Operations;
• Power; and
• Supplies
Table 22-9 summarizes the annual G&A operating costs.
Table 22-9: G&A Costs
| Operating Costs | Production ($M) |
| Labour | 8.1 |
| Expenses | 3.6 |
| Vehicle Operations | 0.6 |
| Power | 1.2 |
| Supplies | 0.9 |
| Total | 14.5 |
|
|
23 ECONOMIC ANALYSIS
An engineering economic model was developed to estimate annual cash flows and sensitivities of the Project. Pre-tax estimates of Project values were prepared for comparative purposes, while after-tax estimates were developed and are likely to approximate the true investment value. It must be noted, however, that tax estimates involve many complex variables that can only be accurately calculated during operations and, as such, the after-tax results are only approximations.
Only material defined as Mineral Reserves were used for the calculation of project revenues. All other mined material was considered as zero-value waste.
Univariate sensitivity analyses were performed for variations in metal prices, head grades, operating costs, capital costs, and discount rates to determine their relative importance as Project value drivers.
This technical report contains forward-looking information regarding projected mine production rates, construction schedules and forecasts of resulting cash flows as part of this study. The mill head grades are based on sufficient sampling that is reasonably expected to be representative of the realized grades from actual mining operations. Factors such as the ability to obtain permits to construct and operate a mine, or to obtain major equipment or skilled labour on a timely basis, to achieve the assumed mine production rates at the assumed grades, may cause actual results to differ materially from those presented in this economic analysis.
The estimates of capital and operating costs have been developed specifically for this Project and are summarized in Section 21 and Section 22 of this report (presented in 2022 dollars). The economic analysis has been run with no inflation (constant dollar basis).
23.1 Summary of Results
The summary of the mine plan and payable metals produced is outlined in Table 23-1.
|
|
Table 23-1: Life of Mine (LOM) Summary
| Parameter | Unit | Value |
| Mine Life | Years | 4.8 |
| Resource Mined | kt | 1,895 |
| Gold (Au) Grade | g/t | 4.46 |
| Mill Feed (after sorting) | kt | 1,189 |
| Gold (Au) Grade | g/t | 6.76 |
| Processing Rate | t/d | 700 |
| Gold (Au) Payable | koz | 247 |
| koz/a | 52 |
23.2 Basis of Analysis
The economic analysis was based on the following factors:
• Discount rate of 5%;
• Nominal 2022 Canadian dollars;
• Revenues, costs, taxes are calculated for each period in which they occur rather than actual outgoing / incoming payment;
• Working capital calculated as three months of operating costs (mining, hauling, crushing, processing and G&A) split between Year -1 and Year 1;
• Results are based on 100% ownership;
• No management fees or financing costs (equity fund-raising was assumed); and
• The model excludes all pre-development and sunk costs up to the start of detailed engineering (i.e., exploration and resource definition costs, engineering fieldwork and studies costs, environmental baseline studies costs, financing costs, etc.).
Table 23-2 outlines the metal prices and exchange rate assumptions used in the economic analysis. The gold price selected was based on the three-year trailing average as at July 2022 and is in line with recently released comparable Technical Reports.
The reader is cautioned that the metal prices and exchange rates used in this study are only estimates based on recent historical performance and there is absolutely no guarantee that they will be realized if the Project is taken into production. The metal prices are based on many complex factors and there are no reliable long-term predictive tools.
|
|
Table 23-2: Metal Prices and Exchange Rates
| Parameter | Unit | Value |
| Gold (Au) Price | US$/oz | 1,750 |
| FX Rate | C$:US$ | 0.77 |
23.3 Assumptions
Mine revenue is derived from the sale of doré bars into the international marketplace. No contractual arrangements for refining currently exist. Table 23-3 indicates the NSR parameters that were used in the economic analysis.
Table 23-3: NSR Parameters
| Parameter | Unit | Value |
| Gold (Au) Recovery | % | 95.7 |
| Gold (Au) Payable | % | 99.97 |
| Gold (Au) Refining Charge | US$/pay oz | 0.38 |
| Transportation | US$/pay oz | 1.35 |
| Royalties | % | 1.0 |
| Royalty Units (one-time payment) | C$M | 3.2 |
Figure 23-1 shows the value of the payable gold (Au) on an annual basis. A total of 247 koz of gold is projected to be produced over the life of mine.
|
|
Figure 23-1: LOM Payable Gold
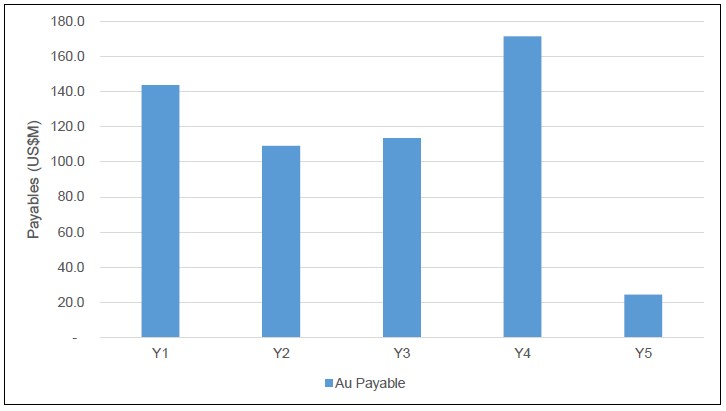
23.4 Taxes
The Project has been evaluated on an after-tax basis to provide a more indicative, but still approximate, value of the potential Project economics. A tax model was prepared by Wentworth Taylor, an independent tax consultant, and reviewed by JDS and Maritime personnel. Current tax pools were used in the analysis. The tax model contains the following assumptions:
• Federal Income Tax: 15%;
• Provincial Income Tax: 15%;
• Newfoundland Mineral Tax: (15-20%); and
• Capital cost allowance applied on units of production basis and at specific rates in the tax act.
Total taxes for the Project amount to $64 M.
|
|
23.5 Royalties
Commander Resources Ltd. (Commander) holds a 1% Net Smelter Return (NSR) royalty on the Project, excluding the Orion deposit. Additionally, there is a $3.165 M royalty payment, commencing one year after the onset of commercial production, payable to holders who received royalty units from the Maritime Resources July 2016 financing, and funded solely from 10% of annual net cash flow from the Project, with net cash flow representing net production revenues realized from the Project after deduction of all Project operating and debt servicing costs. At the option of the Company, the royalty payments will be paid either in cash or in gold.
23.6 Results
The Hammerdown Project is economically viable with a post-tax IRR of 48% and a net present value using a 5% discount rate (NPV5%) of $103 M using the metal prices described in Section 23.2. Figure 23-2 shows the projected cash flows, and Table 23-4 summarizes the economic results of the Project.
The post-tax break-even gold price is approximately US$1,115/oz, based on the LOM plan presented herein. This is the gold price at which the Project NPV at 0% discount rate is zero.
The life of mine all-in sustaining cost (AISC) is US$912/oz. The straight AISC cost is calculated by adding the refining, transport, royalty, operating, and sustaining and closure costs together and dividing by the total payable ounces of gold.
|
|
Figure 23-2: Annual After-Tax Cash Flow
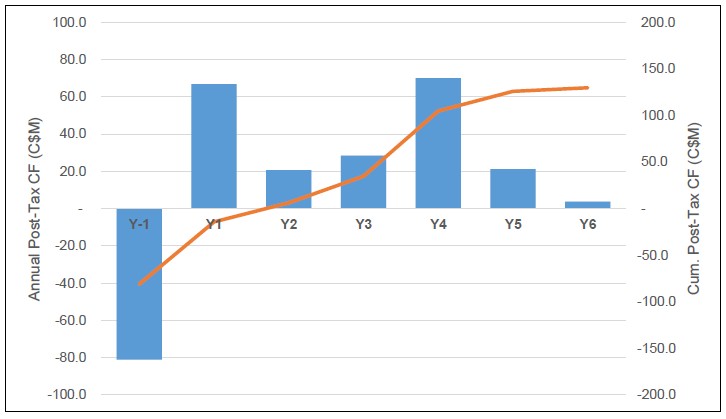
Table 23-4: Summary of Results
| Summary of Results | Unit | Value |
| AISC* | US$/oz | 912 |
| Capital Costs | ||
| Pre-Production Capital | M$ | 67.9 |
| Pre-Production Contingency | M$ | 7.2 |
| Total Pre-Production Capital | M$ | 75.0 |
| Sustaining and Closure Capital (net of salvage) | M$ | 4.9 |
| Sustaining and Closure Contingency | M$ | 0.0 |
| Total Sustaining and Closure Capital | M$ | 4.9 |
| Total Capital Costs Incl. Contingency | M$ | 80.0 |
| Working Capital | M$ | 12.3 |
| Pre-Tax Cash Flow | LOM M$ | 194.2 |
| M$/a | 40.9 | |
| Taxes | LOM M$ | 64.4 |
| After-Tax Cash Flow | LOM M$ | 129.7 |
| M$/a | 27.3 | |
|
|
| Summary of Results | Unit | Value |
| Economic Results | ||
| Pre-Tax NPV5% | M$ | 159 |
| Pre-Tax IRR | % | 68 |
| Pre-Tax Payback | Years | 1.0 |
| After-Tax NPV5% | M$ | 103 |
| After-Tax IRR | % | 48 |
| After-Tax Payback | Years | 1.7 |
Notes:
*All-in Sustaining Cost is calculated as: (Refining & transport costs + royalties+ operating costs + sustaining and closure capital) / payable gold ounces.
23.7 Sensitivities
A univariate sensitivity analysis was performed to examine which factors most affect the Project economics when acting independently of all other cost and revenue factors. Each variable evaluated was tested using the same percentage range of variation, from -25% to +25%, although some variables may actually experience significantly larger or smaller percentage fluctuations over the LOM. For instance, the metal prices were evaluated at a +/- 25% range to the base case, while the capex and all other variables remained constant. This may not be truly representative of market scenarios, as metal prices may not fluctuate in a similar trend. The variables examined in this analysis are those commonly considered in similar studies - their selection for examination does not reflect any particular uncertainty.
Notwithstanding the above noted limitations to the sensitivity analysis, which are common to studies of this sort, the analysis revealed that the Project is most sensitive to metal prices and head grade. The Project showed the least sensitivity to capital costs. Table 23-5 and Figure 23-3 show the results of the sensitivity tests, while Table 23-6 shows the NPV at various discount rates.
Table 23-5: Pre-Tax and After-Tax Sensitivity Results on NPV at 5%
| Variable | After-Tax NPV5% (M$) | Pre-Tax NPV5% (M$) | ||||
| -25% Variance |
0% Variance |
25% Variance |
-25% Variance |
0% Variance |
25% Variance |
|
| Metal Price or Head Grade | 27 | 103 | 176 | 37 | 159 | 281 |
| OPEX | 141 | 103 | 64 | 220 | 159 | 97 |
| CAPEX | 123 | 103 | 83 | 179 | 159 | 139 |
|
|
Figure 23-3: Post-Tax NPV5% Sensitivity
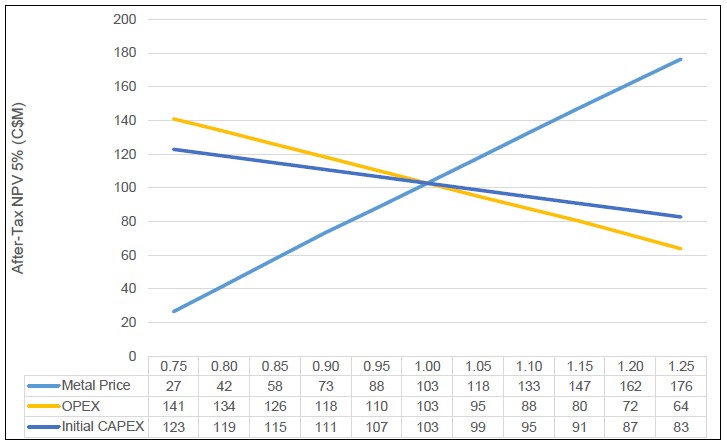
Table 23-6: Project NPV at Various Discount Rates
| Discount Rate (%) | Pre-Tax NPV (M$) | Post-Tax NPV (M$) |
| 0 | 194 | 130 |
| 5 | 159 | 103 |
| 6 | 153 | 98 |
| 7 | 147 | 94 |
| 8 | 141 | 89 |
| 10 | 130 | 81 |
| 12 | 120 | 74 |
The economic cash flow model for the Project is illustrated in Table 23-7.
|
|
Table 23-7: Economic Cash Flow Model
| Parameter | Unit | LOM Total | Y-2 | Y-1 | Y1 | Y2 | Y3 | Y4 | Y5 | Y6 | Y7 | Y8 | Y9 | Y10 |
| METAL PRICES & F/X RATE | ||||||||||||||
| Au | US$/oz | 1,750 | 1,750 | 1,750 | 1,750 | 1,750 | 1,750 | 1,750 | 1,750 | 1,750 | 1,750 | 1,750 | 1,750 | 1,750 |
| USD:CAD | x:x | 0.77 | 0.77 | 0.77 | 0.77 | 0.77 | 0.77 | 0.77 | 0.77 | 0.77 | 0.77 | 0.77 | 0.77 | 0.77 |
| MINE SCHEDULES | ||||||||||||||
| Hammerdown | ||||||||||||||
| Ore Mined | ktonnes | 1,689 | - | 53 | 373 | 426 | 426 | 412 | - | - | - | - | - | - |
| Au Grade | g/t | 4.77 | - | 4.30 | 5.18 | 3.84 | 4.00 | 6.20 | - | - | - | - | - | - |
| Contained Au | koz | 259 | - | 7 | 62 | 53 | 55 | 82 | - | - | - | - | - | - |
| Wisteria | ||||||||||||||
| Ore Mined | ktonnes | 206 | - | 2 | 25 | 95 | 82 | 1 | - | - | - | - | - | - |
| Au Grade | g/t | 1.99 | - | 1.83 | 1.81 | 2.17 | 1.83 | 3.11 | - | - | - | - | - | - |
| Contained Au | koz | 13 | - | 0 | 1 | 7 | 5 | 0 | - | - | - | - | - | - |
| TOTAL MINED | ||||||||||||||
| Ore Mined | ktonnes | 1,895 | - | 56 | 397 | 521 | 508 | 413 | - | - | - | - | - | - |
| Au Grade | g/t | 4.46 | - | 4.20 | 4.97 | 3.54 | 3.65 | 6.19 | - | - | - | - | - | - |
| Waste Mined | ktonnes | 38,513 | - | 913 | 5,129 | 15,059 | 11,787 | 5,625 | - | - | - | - | - | - |
| Total Mined | ktonnes | 40,408 | - | 969 | 5,526 | 15,580 | 12,295 | 6,038 | - | - | - | - | - | - |
| Strip Ratio | w:o | 20.3 | - | 16.4 | 12.9 | 28.9 | 23.2 | 13.6 | - | - | - | - | - | - |
| Operating Days | days | 1,556 | - | 92 | 366 | 366 | 366 | 366 | - | - | - | - | - | - |
| Mining Rate | t/d | 25,969 | - | 10,530 | 15,099 | 42,569 | 33,592 | 16,498 | - | - | - | - | - | - |
| Contained Au | koz | 272 | - | 7 | 63 | 59 | 60 | 82 | - | - | - | - | - | - |
| MILL SCHEDULE & PAYABLE METALS | ||||||||||||||
| Hammerdown | ||||||||||||||
| OP ROM to Sorter | ktonnes | 1,689 | - | - | 426 | 426 | 426 | 412 | - | - | - | - | - | - |
| Grade | g/t | 4.77 | - | - | 5.07 | 3.84 | 4.00 | 6.20 | - | |||||
| Mass Pull | % | 60.0% | 60.0% | 60.0% | 60.0% | 60.0% | 60.0% | 60.0% | 60.0% | 60.0% | 60.0% | 60.0% | 60.0% | 60.0% |
| Sorter Recovery | % | 95.0% | 95.0% | 95.0% | 95.0% | 95.0% | 95.0% | 95.0% | 95.0% | 95.0% | 95.0% | 95.0% | 95.0% | 95.0% |
| Mill Feed | ktonnes | 1,014 | - | - | 256 | 255 | 256 | 247 | - | - | - | - | - | - |
| Grade | g/t | 7.55 | - | - | 8.02 | 6.09 | 6.34 | 9.81 | - | - | - | - | - | - |
| Au | koz | 246 | - | - | 66 | 50 | 52 | 78 | - | - | - | - | - | - |
| Au Recovery | % | 96.0% | 96.0% | 96.0% | 96.0% | 96.0% | 96.0% | 96.0% | 96.0% | 96.0% | 96.0% | 96.0% | 96.0% | 96.0% |
| Au Recovered | koz | 236 | - | - | 63 | 48 | 50 | 75 | - | - | - | - | - | - |
| % Payable | % | 99.97% | 99.97% | 99.97% | 99.97% | 99.97% | 99.97% | 99.97% | 99.97% | 99.97% | 99.97% | 99.97% | 99.97% | 99.97% |
| Payable Au | koz | 236 | - | - | 63 | 48 | 50 | 75 | - | - | - | - | - | - |
|
|
| Parameter | Unit | LOM Total | Y-2 | Y-1 | Y1 | Y2 | Y3 | Y4 | Y5 | Y6 | Y7 | Y8 | Y9 | Y10 |
| Hammerdown Gross Revenues | US$M | 413.1 | - | - | 110.7 | 84.0 | 87.5 | 130.9 | - | - | - | - | - | - |
| C$M | 536.5 | - | - | 143.7 | 109.0 | 113.6 | 170.1 | - | - | - | - | - | - | |
| Au Refining Charge | US$/Au oz | 0.38 | 0.38 | 0.38 | 0.38 | 0.38 | 0.38 | 0.38 | 0.38 | 0.38 | 0.38 | 0.38 | 0.38 | 0.38 |
| US$M | 0.1 | - | - | 0.0 | 0.0 | 0.0 | 0.0 | - | - | - | - | - | - | |
| Au Transportation Cost | US$/Au oz | 1.35 | 1.35 | 1.35 | 1.35 | 1.35 | 1.35 | 1.35 | 1.35 | 1.35 | 1.35 | 1.35 | 1.35 | 1.35 |
| US$M | 0.3 | - | - | 0.1 | 0.1 | 0.1 | 0.1 | - | - | - | - | - | - | |
| Hammerdown Net Revenue | US$M | 412.7 | - | - | 110.6 | 83.9 | 87.4 | 130.8 | - | - | - | - | - | - |
| C$M | 535.9 | - | - | 143.6 | 108.9 | 113.5 | 169.9 | - | - | - | - | - | - | |
| Wisteria | ||||||||||||||
| OP ROM to Sorter | ktonnes | 206 | - | - | - | - | - | 10 | 196 | - | - | - | - | - |
| Grade | g/t | 1.99 | - | - | - | - | - | 1.99 | 1.99 | - | ||||
| Mass Pull | % | 85.0% | 85.0% | 85.0% | 85.0% | 85.0% | 85.0% | 85.0% | 85.0% | 85.0% | 85.0% | 85.0% | 85.0% | 85.0% |
| Sorter Recovery | % | 95.0% | 95.0% | 95.0% | 95.0% | 95.0% | 95.0% | 95.0% | 95.0% | 95.0% | 95.0% | 95.0% | 95.0% | 95.0% |
| Mill Feed | ktonnes | 175 | - | - | - | - | - | 9 | 167 | - | - | - | - | - |
| Grade | g/t | 2.23 | - | - | - | - | - | 2.23 | 2.23 | - | - | - | - | - |
| Au | koz | 13 | - | - | - | - | - | 1 | 12 | - | - | - | - | - |
| Au Recovery | % | 90.3% | 90.3% | 90.3% | 90.3% | 90.3% | 90.3% | 90.3% | 90.3% | 90.3% | 90.3% | 90.3% | 90.3% | 90.3% |
| Au Recovered | koz | 11 | - | - | - | - | - | 1 | 11 | - | - | - | - | - |
| % Payable | % | 99.97% | 99.97% | 99.97% | 99.97% | 99.97% | 99.97% | 99.97% | 99.97% | 99.97% | 99.97% | 99.97% | 99.97% | 99.97% |
| Payable Au | koz | 11 | - | - | - | - | - | 1 | 11 | - | - | - | - | - |
| Wisteria Gross Revenues | US$M | 19.8 | - | - | - | - | - | 1.0 | 18.8 | - | - | - | - | - |
| C$M | 25.7 | - | - | - | - | - | 1.2 | 24.4 | - | - | - | - | - | |
| Au Refining Charge | US$/Au oz | 0.38 | 0.38 | 0.38 | 0.38 | 0.38 | 0.38 | 0.38 | 0.38 | 0.38 | 0.38 | 0.38 | 0.38 | 0.38 |
| US$M | 0.0 | - | - | - | - | - | 0.0 | 0.0 | - | - | - | - | - | |
| Au Transportation Cost | US$/Au oz | 1.35 | 1.35 | 1.35 | 1.35 | 1.35 | 1.35 | 1.35 | 1.35 | 1.35 | 1.35 | 1.35 | 1.35 | 1.35 |
| US$M | 0.0 | - | - | - | - | - | 0.0 | 0.0 | - | - | - | - | - | |
| Wisteria Net Revenue | US$M | 19.8 | - | - | - | - | - | 1.0 | 18.8 | - | - | - | - | - |
| C$M | 25.7 | - | - | - | - | - | 1.2 | 24.4 | - | - | - | - | - | |
| Total | ||||||||||||||
| ROM to Sorter | ktonnes | 1,895 | - | - | 426 | 426 | 426 | 422 | 196 | - | - | - | - | - |
| Grade | g/t | 4.46 | - | - | 5.07 | 3.84 | 4.00 | 6.10 | 1.99 | - | - | - | - | - |
| Mill Feed after Sorting | ktonnes | 1,189 | - | - | 256 | 255 | 256 | 256 | 167 | - | - | - | - | - |
| Grade | g/t | 6.76 | - | - | 8.02 | 6.09 | 6.34 | 9.56 | 2.23 | - | - | - | - | - |
| Operating Days | days | 1,734 | - | - | 365 | 365 | 365 | 365 | 274 | - | - | - | - | - |
| Mill Throughput | t/d | 686 | - | - | 2,800 | 2,800 | 2,800 | 2,802 | 1,825 | - | - | - | - | - |
| Au Contained | koz | 258 | - | - | 66 | 50 | 52 | 79 | 12 | - | - | - | - | - |
| Au Recovered | koz | 247 | - | - | 63 | 48 | 50 | 75 | 11 | - | - | - | - | - |
| Au Payable | koz | 247 | - | - | 63 | 48 | 50 | 75 | 11 | - | - | - | - | - |
|
|
| Parameter | Unit | LOM Total | Y-2 | Y-1 | Y1 | Y2 | Y3 | Y4 | Y5 | Y6 | Y7 | Y8 | Y9 | Y10 |
| Gross Revenues | US$M | 432.9 | - | - | 110.7 | 84.0 | 87.5 | 131.9 | 18.8 | - | - | - | - | - |
| C$M | 562.1 | - | - | 143.7 | 109.0 | 113.6 | 171.3 | 24.4 | - | - | - | - | - | |
| Au Refining Charge | US$M | 0.1 | - | - | 0.0 | 0.0 | 0.0 | 0.0 | 0.0 | - | - | - | - | - |
| Au Transportation Cost | US$M | 0.3 | - | - | 0.1 | 0.1 | 0.1 | 0.1 | 0.0 | - | - | - | - | - |
| Total TC/RC & Transport | US$M | 0.4 | - | - | 0.1 | 0.1 | 0.1 | 0.1 | 0.0 | - | - | - | - | - |
| C$M | 0.6 | - | - | 0.1 | 0.1 | 0.1 | 0.2 | 0.0 | - | - | - | - | - | |
| Royalty Units | C$M | 3.2 | - | - | - | 3.2 | - | - | - | - | - | - | - | - |
| Hammerdown Royalty | % | 1.0% | 0.0% | 0.0% | 1.0% | 1.0% | 1.0% | 1.0% | 0.0% | 0.0% | 0.0% | 0.0% | 0.0% | 0.0% |
| C$M | 5.6 | - | - | 1.4 | 1.1 | 1.1 | 1.7 | 0.2 | - | - | - | - | - | |
| Total Net Revenue | C$M | 552.8 | - | - | 142.2 | 104.7 | 112.4 | 169.4 | 24.2 | - | - | - | - | - |
| C$/t milled | 465.06 | - | - | 556.37 | 409.79 | 439.76 | 662.71 | 145.15 | - | - | - | - | - | |
| OPEX | ||||||||||||||
| Open Pit Mining | C$M | 176.9 | - | - | 27.2 | 55.8 | 50.4 | 35.2 | 8.3 | - | - | - | - | - |
| C$/t mined | 4.49 | - | - | 4.92 | 3.58 | 4.10 | 5.84 | - | - | - | - | - | - | |
| Haulage | C$M | 30.3 | - | - | 6.5 | 6.5 | 6.5 | 6.5 | 4.2 | - | - | - | - | - |
| C$/t ore milled | 25.50 | - | - | 25.50 | 25.50 | 25.50 | 25.50 | 25.50 | - | - | - | - | - | |
| Crushing & Nugget Pond Processing | C$M | 56.2 | - | - | 12.1 | 12.1 | 12.1 | 12.1 | 7.9 | - | - | - | - | - |
| C$/t ore milled | 47.31 | - | - | 47.31 | 47.31 | 47.31 | 47.31 | 47.31 | - | - | - | - | - | |
| Tailings | C$M | 0.9 | - | - | 0.2 | 0.2 | 0.2 | 0.2 | 0.1 | - | - | - | - | - |
| C$/t ore milled | 0.75 | - | - | 0.75 | 0.75 | 0.75 | 0.75 | 0.75 | - | - | - | - | - | |
| General and Administrative | C$M | 14.3 | - | - | 3.0 | 3.1 | 3.0 | 3.0 | 2.2 | - | - | - | - | - |
| C$/t ore milled | 12.04 | - | - | 11.72 | 12.04 | 11.80 | 11.74 | 13.37 | - | - | - | - | - | |
| Total OPEX | C$M | 278.7 | - | - | 49.0 | 77.7 | 72.2 | 57.0 | 22.7 | - | - | - | - | - |
| C$/t ore milled | 234.45 | - | - | 191.78 | 304.14 | 282.57 | 223.11 | 136.57 | - | - | - | - | - | |
| Net Operating Income | C$M | 274.1 | - | - | 93.2 | 27.0 | 40.2 | 112.4 | 1.4 | - | - | - | - | - |
| C$/t milled | 230.61 | - | - | 364.59 | 105.64 | 157.18 | 439.60 | 8.58 | - | - | - | - | - | |
| CAPEX | ||||||||||||||
| Mining (incl. Salvage) | C$M | 8.7 | - | 10.6 | 3.0 | 1.8 | - | - | (4.5) | (2.3) | - | - | - | - |
| Site Development | C$M | 5.1 | - | 4.7 | 0.2 | 0.1 | 0.1 | - | - | - | - | - | - | - |
| Mineral Processing (incl. Sorting Plant) | C$M | 29.6 | - | 24.7 | 1.2 | 1.2 | 1.2 | 1.2 | - | - | - | - | - | - |
| Waste & Water Management | C$M | 0.8 | - | 0.6 | 0.1 | 0.0 | - | - | - | - | - | - | - | - |
| On-Site Infrastructure | C$M | 5.9 | - | 5.9 | - | - | - | - | - | - | - | - | - | - |
| Off-Site Infrastructure | C$M | 0.0 | - | - | - | - | - | - | - | - | - | - | - | - |
| Project Indirects | C$M | 17.3 | - | 17.3 | - | - | - | - | - | - | - | - | - | - |
| Owner Costs | C$M | 1.9 | - | 4.0 | 0.2 | 0.2 | 0.2 | 0.2 | (2.8) | - | - | - | - | - |
| Subtotal Pre-Contingency | C$M | 69.3 | - | 67.9 | 4.8 | 3.4 | 1.5 | 1.4 | - 7.3 | - 2.3 | - | - | - | - |
|
|
| Parameter | Unit | LOM Total | Y-2 | Y-1 | Y1 | Y2 | Y3 | Y4 | Y5 | Y6 | Y7 | Y8 | Y9 | Y10 |
| Contingency | C$M | 7.2 | - | 7.2 | - | - | - | - | - | - | - | - | - | - |
| Total - Initial & Sustaining Capital | C$M | 76.4 | - | 75.0 | 4.8 | 3.4 | 1.5 | 1.4 | - 7.3 | - 2.3 | - | - | - | - |
| Closure | C$M | 3.5 | - | - | - | - | - | - | 0.9 | 2.6 | - | - | - | - |
| Total CAPEX | C$M | 80.0 | - | 75.0 | 4.8 | 3.4 | 1.5 | 1.4 | (6.4) | 0.3 | - | - | - | - |
| Pre-Production | C$M | 75.0 | - | 75.0 | - | - | - | - | - | - | - | - | - | - |
| Sustaining | C$M | 4.9 | - | - | 4.8 | 3.4 | 1.5 | 1.4 | (6.4) | 0.3 | - | - | - | - |
| AISC | US$/oz | 912 | - | - | 674 | 1,371 | 1,154 | 616 | 1,188 | - | - | - | - | - |
| Working Capital | C$M | 0.0 | - | 6.1 | 6.1 | - | - | - | (12.3) | - | - | - | - | - |
| Net Pre-Tax Cash Flow | C$M | 194.2 | - | - 81.2 | 82.3 | 23.6 | 38.7 | 111.0 | 20.1 | - 0.3 | - | - | - | - |
| Cumulative Net Pre-Tax Cash Flow | C$M | 194.2 | - | - 81.2 | 1.1 | 24.7 | 63.4 | 174.4 | 194.5 | 194.2 | 194.2 | 194.2 | 194.2 | 194.2 |
| TAXES | ||||||||||||||
| Income Taxes | C$M | 64.4 | - | - | 15.5 | 3.1 | 10.2 | 41.0 | (1.1) | (4.1) | (0.1) | - | - | - |
| Net Post-Tax Cash Flow | C$M | 129.7 | - | - 81.2 | 66.8 | 20.6 | 28.5 | 70.0 | 21.2 | 3.8 | 0.1 | - | - | - |
| Cumulative Net Post-Tax Cash Flow | C$M | 129.7 | - | - 81.2 | - 14.4 | 6.2 | 34.7 | 104.7 | 125.9 | 129.6 | 129.7 | 129.7 | 129.7 | 129.7 |
| ECONOMIC INDICATORS | ||||||||||||||
| Pre-Tax Results | ||||||||||||||
| NPV @ 0% | C$M | 194.2 | ||||||||||||
| NPV @ 5% | C$M | 158.8 | ||||||||||||
| NPV @ 8% | C$M | 141.0 | ||||||||||||
| NPV @ 10% | C$M | 130.3 | ||||||||||||
| IRR | % | 67.7% | ||||||||||||
| Payback | Years | 1.0 | ||||||||||||
| Post-Tax Results | ||||||||||||||
| NPV @ 0% | C$M | 129.7 | ||||||||||||
| NPV @ 5% | C$M | 102.8 | ||||||||||||
| NPV @ 8% | C$M | 89.2 | ||||||||||||
| NPV @ 10% | C$M | 81.1 | ||||||||||||
| IRR | % | 48.1% | ||||||||||||
| Payback | Years | 1.7 | ||||||||||||
|
|
24 ADJACENT PROPERTIES
There are no adjacent properties to the Hammerdown Project that would impact the conclusions of this report. Maritime's lease area provides a significant buffer zone around the Hammerdown deposit.The Hammerdown Project is located within the larger Green Bay Property and holds contiguous mineral claims to the west and northwest. Maritime's claims to the west and northwest are referred to by the company as the Whisker Valley and Gull Ridge Projects respectively (Figure 24-1). These claims are being actively being explored by Maritime for gold and base metals.
To the north of the Hammerdown Project a large claim block consisting of 253 claims is held by Shoreline Exploration and contains no known mineral resources or reserves.
The series of claims located northeast of Hammerdown Project are held by Vulcan Minerals Inc. Vulcan refers to these claims as the Springdale Copper-Gold Project.
|
|
Figure 24-1: Property Location Map and Adjacent Areas
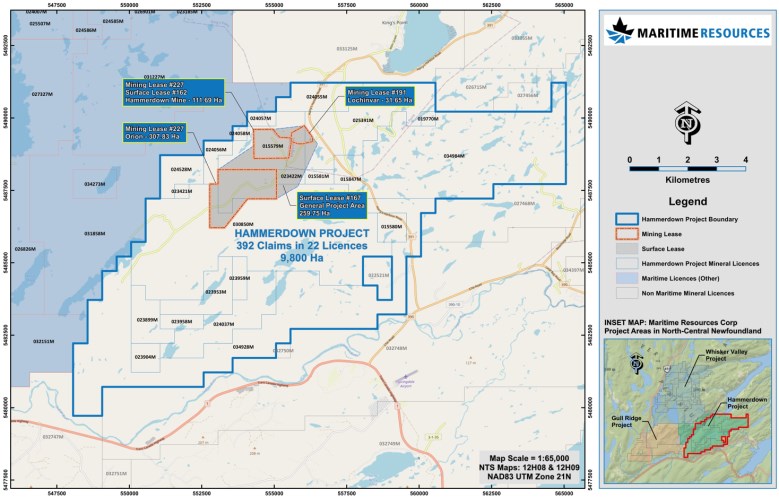
Source: SLR (2022)
|
|
25 OTHER RELEVANT DATA AND INFORMATION
No other relevant data and information.
|
|
26 INTERPRETATIONS AND CONCLUSIONS
The results of this FS show Hammerdown to be a relatively low CAPEX, economically attractive gold project in a province that is supportive of responsible mineral development. While grade control will be a key feature of the open pit mining plan, the rest of the project is quite conventional and the sorting plant followed by leaching is based on extensive laboratory results and realistic interpretation.
Project risks and opportunities are highlighted in the next two sub-sections.
26.1 Geology and Mineral Resources
• The Hammerdown deposit most closely resembles a mesothermal volcanic hosted (greenstone belt) gold deposit.
• The Hammerdown Mineral Resource estimates were prepared in accordance with Canadian Institute of Mining, Metallurgy and Petroleum (CIM) for Mineral Resources and Mineral Reserves dated May 10, 2014 (CIM (2014) definitions).
• The sampling, sample preparation, analyses, security, and data verification meet industry standards and are appropriate for Mineral Resource estimation.
• Open pit Measured and Indicated Mineral Resources total 2,845 kt at an average grade of 3.61 g/t Au, containing 329,900 oz Au, and Inferred Mineral Resources total 302 kt at an average grade of 1.31 g/t Au, containing approximately 12,700 oz Au.
• Underground Measured and Indicated Mineral Resources total 55 kt at an average grade of 5.15 g/t Au, containing 9,000 oz Au, and Inferred Mineral Resources total 66 kt at an average grade of 4.00 g/t Au, containing approximately 9,000 oz Au.
• A cut-off grade of 0.50 g/t Au was used to report open pit Mineral Resources for the Hammerdown deposit, while a cut-off grade of 2.0 g/t Au was used to report underground Mineral Resources.
26.2 Risks
The Hammerdown Project has many risks they are inherent in almost all mining projects and largely uncontrollable by the owner. These risks include such things as fluctuations in gold price, exchanges rates, commodity prices, inflation, cost of capital, capital market conditions, etc. The main risks that are more specific to the Project are summarized in Table 26-1.
|
|
Table 26-1: Main Controllable Project Risks
| Risk | Explanation/Potential Impact | Possible Risk Mitigation |
| Dilution | Higher than expected dilution would have negative impact on project economics. The mine must ensure accurate drilling and blasting practices are maintained to minimize dilution from wall rock backfill and other mineralized zones, minimize secondary breaking and optimize extraction. The ability to segregate higher grade material, early in the mine life, is critical to project economics. | A detailed, well-planned grade control program was developed for the FS that includes extensive grade control drilling and geologist control at ore faces. The ore sorting plant was designed to accommodate significantly more tonnage than planned giving the crusher and sorters additional production capacity should the feed have higher waste levels. |
| Resource Modelling | All mineral resource estimates carry some risk and are one of the most common issues with project success. | Maritime embarked on a very rigid re-estimation of the resource that significantly improved the level of confidence from the historical resource estimate. |
| The Hammerdown mine was previously in production from 2001 to 2004. Upon closure in 2004 limited drawings and files were preserved to inform final extents of mining and development. In SLR's opinion, there is a moderate risk that the volumes used for depletion are understated is some areas. | Remote check surveys of old UG stopes with a cavity monitoring system, if possible. | |
| Agreement with Rambler | The project as defined in this study requires a contractual agreement with Rambler for the operation of Maritime's gold plant and deposition of the Hammerdown tailings on the Rambler Nugget Pond site. Failure to secure a final agreement would mean a change of scope for the project and potential development delays. | Rambler and Maritime are well advanced in their cooperation agreement and most of the main items have been resolved, but not signed off. |
| CAPEX and OPEX | The ability to achieve the estimated CAPEX and OPEX costs are important elements of project success and are greater risks in an inflationary period. If OPEX increases then the cut-off grade would increase and, all else being equal, the size of the mineable resource would reduce yielding fewer mineable tonnes. If the CAPEX increases, the project NPV and IRR will decrease. |
Cost estimates were about 80% based on quotes with the remaining 20% based on recent experience and data base information. Detailed engineering with further define CAPEX and OPEX estimates |
| Permit Acquisition | The ability to secure all of the permits to build and operate the project is of paramount importance. Failure to secure the necessary permits could stop or delay the project. | Maritime's development of close relationships with the local communities and government along with a thorough environmental baseline and planning work give the project a very strong chance of permit acquisition. |
|
|
| Risk | Explanation/Potential Impact | Possible Risk Mitigation |
| Development Schedule | The project development could be delayed for a number of reasons and could impact project economics. A change in schedule would alter the project economics. |
Work with local contractors and equipment suppliers to ensure the project execution plan is properly managed. |
| Ability to Attract Experienced Professionals | The ability to attract and retain competent, experienced professionals is a key success factor for the project. High turnover or the lack of appropriate technical and management staff at the project could result in difficulties meeting project goals. |
The location of the project may promote the return to Newfoundland of many experienced professionals, artisans and operators from other parts of the country. Maritme must have a wage structure competitive with the industry. |
| Gold Recovery | Reduced recoveries reduce project economics. Redesign of the gold recovery process plant may lead to additional capital expenditure. | Conduct geometallurgical studies; create mineralogical block models; additional sampling and metallurgical testwork; further review of testwork done to date. Batching of mineralization from specific deposit areas may alleviate potential issues. |
| Process Optimization | Installed technology of carbon regeneration circuit is not current. CIP circuit capacity is marginal compared to industry standard. |
Intermittent or partial regeneration of carbon. Alternate process strategy such as introduction of carbon into final stage leach tank to improve gold recovery. |
| Mill Throughput | If not achieved will result in a possible reduction in gold recovery. If finer, more power will be required for a lower throughput increasing operating costs. | Ongoing sampling and metallurgical testwork; further review of testwork done to date; ball mill on VSD with additional power optionality. Full comminution circuit modelling to be undertaken in next phase. |
| Gold Grade | Gold is potentially lost to tails. | In next phase, need to have more granularity on grade swings and profiles from the mine to make sure the absorption test work is adequate and consequently the ADR and Refinery are adequately sized. |
| Pit Groundwater Inflow | Pit groundwater inflow amounts being less favourable than that assumed for the FS-level design of the Hammerdown pit | Additional hydrogeological pit study to better characterize the pit hydrogeological conceptual model and verify preliminary groundwater inflow estimates |
| Process Water Management | Reclaim water from combined TMF may contain trace reagents from both CIP and copper flotation circuits. | Water treatment of reclaimed water prior to reuse if required. |
|
|
26.3 Opportunities
Several important opportunities exist for the Project. These are summarized in Table 26-2.
|
|
Table 26-2: Identified Project Opportunities
| Opportunity | Explanation | Potential Benefit |
| Expansion of the Mine | The mineral resource has not been fully delineated and there is an opportunity to expand the mineral resource with more drilling and exploration work. | Increased mine life. A 5,000 m drill program is planned for Fall 2022. |
| Increased Production | Increased production may be possible. A higher extraction and processing scenario was investigated and yielded improved economic, but more work would need to be done to verify this potential. | Reduced unit operating costs, increased early revenue and quicker payback. |
| Source good used or new-used equipment | Search and secure good used equipment for potential CAPEX savings and construction time reduction. | Shorter construction duration, lower CAPEX, higher NPV and quicker payback. |
| Satellite Deposits | Potential additional resources from other deposits and targets. | Additional mill feed (especially at higher grade) could improve the project economics by speeding up project payback and/or extending the mine life |
| Gold Recovery | Increased recoveries improve project economics. | Conduct geometallurgical studies; create mineralogical block models; additional sampling and metallurgical testwork; further review of testwork done to date. Batching of mineralization from specific deposit areas. |
| Process Optimization | Reduced operating costs or increased recoveries improve project economics. Optimize cyanide addition rate during operations. |
Review available technology and applicability to the process and mineralization. Reduced reagent consumption in leach and detox - reduced OPEX. |
| Mill Throughput | If finer will result in a possible increase in gold recovery. If coarser, less power will be required for a higher throughput decreasing operating costs. | Ongoing sampling and metallurgical testwork; further review of testwork done to date; ball mill on VSD with additional power optionality. Full comminution circuit modelling to be undertaken in next phase. |
| Gold Grade | Increased grade results in better project economics. | In next phase, need to have more granularity on grade swings and profiles from the mine to make sure the absorption test work is adequate and consequently the ADR and Refinery are adequately sized. |
|
|
27 RECOMMENDATIONS
27.1 Recommendations
It is recommended that the Project continues to advance towards a construction decision and complete final permitting and additional exploration drilling around the Hammerdown deposit to extend the mine life and improve project economics.
• Project Permitting: File Hammerdown closure and development plans for mine construction permit. The estimated cost of permit application completion is $100,000.
• Exploration drilling near Hammerdown: Focus exploration drilling on the Orion - Hammerdown trend where potential exists to draw new mineral resources into the Hammerdown mine plan. The first phase of drilling should include a 5,000 m program. The cost of the drilling program is estimated to be $1.0M based on a $150 /m drilling cost, all-in, and $0.25M for contingency and QA/QC modifications. Some specific recommendations falling in the exploration program umbrella are as follows. Costs for the items below are included in the $1.0 M drilling program.
27.1.1 Exploration
• Continue planned exploration, targeting both shallow and deep extensions to mineralization along the vein domain trends as well as at Wisteria.
• Proceed with the in-fill diamond drilling campaign planned to upgrade Inferred Resources within vein domains and Wisteria to the Indicated category.
• Continue ongoing exploration work near the resource pit limits of the Hammerdown deposit. Fully sample future exploration drill holes to avoid missing new styles of mineralization.
27.1.2 QA/QC
• Develop improved assay protocols to better account for coarse gold particles.
• Develop a more targeted approach for the insertion of blanks within the sample stream focusing on the insertion of blanks after samples that have been interpreted as high grade or when visible gold is present.
• Consider the use of a high-grade standard (30 g/t Au to 100 g/t Au) within QA/QC program that is paired with the appropriate analytical method.
|
|
• Include a higher proportion of coarse reject duplicate samples whose grades are expected to be similar to the estimated average resource grades.
• Use the available tools provided by MX Deposit, to develop more robust QA/QC procedures and improve the timely management of QA/QC failures.
27.1.3 Mineral Resources
• Review alternative point pairs or transformation methods that may improve the alignment of the transformed historical stopes and development with the modelled mineralization.
• Continue to be investigate reporting differences between the current model and historical production reports as the mineralization interpretation changes and new information becomes available.
• Continue to refine the mineralized domains based on the historic stopes and as more information becomes available from surface trenching and drilling. These types of refinements may yield more conclusive grade contours that more consistently match the moderate westward plunge of the historic stopes.
• Re-evaluate the grade trends at Wisteria as more information becomes available from drilling, trenching, and mapping.
• Re-examine and adjust gold capping values as required based on new drilling information.
• Collect specific gravity measurements from the various rock types and grade distributions to ensure that the specific gravity value of 2.84 continues to be representative of all deposit areas and mineralization types.
• Drill new holes within 10 m or less of unsampled historic holes that intersect otherwise well-supported vein mineralization to improve local estimates. This drilling should continue to be restricted to unmined areas
|
|
28 REFERENCES
ACCDC, 2019. Atlantic Canada Conservation Data Centre. Website: http://accdc.com/
Bieniawski, Z.T. (1989). Engineering Rock Mass Classifications, John Wiley & Sons, New York.
CCME. Canadian Environmental Quality Guidelines. http://ceqg-rcqe.ccme.ca/en/index.html
COSEWIC. Committee on the Status of Endangered Wildlife in Canada. http://cosewic.ca/index.php/en-ca/
Deere, D U (1989). Rock quality designation (RQD) after twenty years. U.S. Army Corps of Engineers Contract Report GL-89-1, U.S. Army Engineer Waterways Waterways Experiment Station, Vicksburg, MS.
Environment and Climate Change Canada. Impact Assessment Act. 2019. Published by the Minister of Justice, http://laws-lois.justice.gc.ca.
Environment and Climate Change Canada. Migratory Birds Convention Act.1994. Published by the Minister of Justice, http://laws-lois.justice.gc.ca.
Environment and Climate Change Canada. Pan-Canadian Framework on Clean Growth and Climate Change: Canada's plan to address climate change and grow the economy. 2016. https://www.canada.ca/en/services/environment/weather/climatechange/pan-canadian-framework/climate-change-plan.html
Environment and Climate Change Canada. Species at Risk Act. 2002. Published by the Minister of Justice, http://laws-lois.justice.gc.ca.
Environment and Climate Change Canada. Accessed March 2020. https://www.canada.ca/en/environment-climate-change/services/species-risk-education-centre/fact-sheets/bats-white-nose-syndrome/emergency-listing-order.html
GEMTEC. 2019a. Ecological Baseline Report. Hammerdown Gold Mine Development Project, King's Point, NL. GEMTEC Report No. 80044.02 R01 to Maritime Resources Corp., December 20, 2019.
GEMTEC, 2019b. Fish Habitat Assessment, Maritime Resources Corp.'s, Hammerdown Gold Mine Development Project, King's Point, NL. GEMTEC Report No. 80044.02 to Maritime Resources Corp., November 12, 2019.
GEMTEC, 2019c. Hammerdown Gold Mine Redevelopment Project: Baseline Hydrogeology Scoping Study, King's Point, NL. GEMTEC Report No. 80044.02 to Maritime Resources Corp., June 26, 2019.
GEMTEC, 2019d. Hydrogeology Baseline Report. Hammerdown Gold Mine Development Project, King's Point, NL. GEMTEC Report No. 80044.02 to Maritime Resources Corp., December 20, 2019.
|
|
GEMTEC, 2019e. Hydrology and Surface Water and Sediment Quality Baseline Report. Hammerdown Gold Mine Development Project, King's Point, NL. GEMTEC Report No. 80044.02 to Maritime Resources Corp., December 20, 2019.
GEMTEC, 2020a. Limited Scope Test Pit Investigation for the Proposed Waste Rock Dump, Low Grade Ore Stockpile, Crushing Plant and Administration Building Areas, Hammerdown Gold Mine near King's Point, NL. GEMTEC Report No. 80044.02 to Maritime Resources Corp., February 19, 2020.
GEMTEC, 2020b, Water Management Plan Background Information Overview, Hammerdown Gold Mine near King's Point, December 23, 2020
GEMTEC, 2021. Feasibility Study-Level Site-Wide Geotechnical and Hydrogeological Investigations, Hammerdown Gold Project, Maritime Resources Corp., King's Point, NL. GEMTEC Report No. 80044.09 to Maritime Resources Corp., December 3, 2021.
GEMTEC, 2022a. EPR Response - Groundwater Monitoring Report, August 2019 to May 2021, Maritime Resources, Hammerdown Gold Project, King's Point, NL. GEMTEC Report No. 80044.12 to Maritime Resources Corp., February 22, 2022.
GEMTEC, 2022b. Initial Results for Groundwater Inflow and Pit Flooding Calculations, Hammerdown Pit and Orion Pit, Hammerdown Gold Project, King's Point, NL. GEMTEC Technical Memo No. 80044.02.12, June 20, 2022.
GEMTEC, 2022c. Water Management Plan, Hammerdown Gold Project, King's Point, NL, September 26, 2022
Government of Newfoundland and Labrador (GNL), Endangered Species Act, 2001 cE-10.1 s1.
Government of Newfoundland and Labrador (GNL), Environmental Protection Act, 2001 cE-10.1 s1.
Government of Newfoundland and Labrador (GNL), Environmental Assessment Regulations
ISRM (1978) International Society for Rock Mechanics Commission on Standardization of Laboratory and Field Tests, Suggested Methods for the Quantitative Descriptions of Discontinuities in Rock Masses. International Journal of Rock Mechanics, Mining Sciences and Geomechanics Abstracts, Vol. 15, 1978. P. 319-368.
JDS Energy & Mining, Inc. (2020). Geotechnical Logging Recommendations, memo dated October 4, 2020.
JDS Energy & Mining, Inc. (2021). Hammerdown Gold Project Geotechnical Assessment, presentation prepared for Maritime Resources Corp., dated May 7, 2021.
King's Point. 2019. Town of King's Point Resource Guide. Letter from Town of King's Point to Maritime Resources Corp., June 12, 2019.
Maritime Resources Corporation. 2020. Environmental Assessment Registration, Hammerdown Gold Project. King's Point, NL, July 7, 2020.
|
|
Maritime Resources Corporation. 2021a. Environmental Preview Report, Hammerdown Gold Project. King's Point, NL., March 4, 2021
Maritime Resources Corporation. 2021b. Hammerdown Gold Project - Abridged Development and Rehabilitation and Closure Plan, September 3,2021.
MDMER, 2002. Metal and Diamond Mining Effluent Regulations, Government of Canada Fisheries Act, SOR/2002-222. Website: https://laws-lois.justice.gc.ca/eng/regulations/sor-2002-222/FullText.html, accessed 15 Sep 2022.
MEND, 2009: Prediction Manual for Drainage Chemistry from Sulphidic Geologic Materials, MEND Report 1.20.1 by William A. Price for MEND Program, Natural Resources Canada, December 2009, 579 p.
NLDFRL, 2019. Newfoundland and Labrador Department of Fisheries and Land Resources. Ecoregions of Newfoundland. Website: https://www.faa.gov.nl.ca/forestry/maps/eco_nf.html, accessed November 2019
NLDFLR, 2020. Baie Verte Newfoundland Moose Management Area 14. Newfoundland and Labrador Department of Fisheries and Land Resources. https://www.flr.gov.nl.ca/wildlife/hunting/pdf/MMA14_y2014m07d28pm_17by22.pdf, Accessed January 2020.
NLDMAE, 1992. Newfoundland and Labrador Department of Municipal Affairs and Environment (at the time of publishing Department of Environment and Lands), Water Resources Atlas of Newfoundland, 1992.
NLDTCII, 2020. Newfoundland and Labrador Department of Tourism, Culture, Industry and Innovation. Provincial Parks. https://www.tcii.gov.nl.ca/parks/maps/parks_reserves_map.pdf, accessed January 2020.
SRK, 2019. A Preliminary Geochemical Characterization on the Hammerdown Gold Project, Newfoundland & Labrador, Canada. Report No. xxxx by SRK Consulting (UK) Limited to Maritime Resources Corp., [date].
Stantec, 2017a. Baseline Air Quality Monitoring Report, Hammerdown Underground Gold Mine Re-activation, Final Report. Report No. 121414271 by Stantec Consulting Ltd. to Maritime Resources Corp., November 29, 2017.
Stantec, 2017b. Surface Water and Water Quality Baseline Report, Hammerdown Underground Gold Mine Re-activation. Report No. 121414271 by Stantec Consulting Ltd. to Maritime Resources Corp., November 29, 2017.
Stantec, 2017c. Terrestrial and Aquatic Baseline Program, Hammerdown Underground Gold Mine Re-activation, Final Report. Report No121414271 by Stantec Consulting Ltd. to Maritime Resources Corp., November 29, 2017.
WSP (2020a), Hammerdown Project Prefeasibility Geotechnical Design Parameters, report prepared for Maritime Resources Corp., dated June 26, 2020.
|
|
WSP (2020b), Hammerdown Gold Project Preliminary Economic Assessment, prepared for Maritime Resources Corp., dated April 15, 2020.
|
|
29 UNITS OF MEASURE, ABBREVIATIONS AND ACRONYMS
| Symbol / Abbreviation | Description |
| ' | minute (plane angle) |
| " | second (plane angle) or inches |
| ° | degree |
| °C | degrees Celsius |
| 3D | three-dimensions |
| A | ampere |
| a | annum (year) |
| ac | acre |
| ALT | active layer thickness |
| amsl | above mean sea level |
| AN | ammonium nitrate |
| ARD | acid rock drainage |
| Au | gold |
| AWR | all-weather road |
| B | billion |
| BD | bulk density |
| Bt | billion tonnes |
| BTU | British thermal unit |
| bya | billion years ago |
| C$ | dollar (Canadian) |
| Ca | calcium |
| cfm | cubic feet per minute |
| CHP | combined heat and power plant |
| CIM | Canadian institute of mining and metallurgy |
| cm | centimetre |
| cm2 | square centimetre |
| cm3 | cubic centimetre |
| cP | centipoise |
| cu | copper |
| d | day |
| d/a | days per year (annum) |
| d/wk | days per week |
| dB | decibel |
| dBa | decibel adjusted |
|
|
| Symbol / Abbreviation | Description |
| DGPS | differential global positioning system |
| DMS | dense media separation |
| dmt | dry metric ton |
| DWT | dead weight tonnes |
| EA | environmental assessment |
| EIS | environmental impact statement |
| ELC | ecological land classification |
| ERD | explosives regulatory division |
| FEL | front-end loader |
| ft | foot |
| ft2 | square foot |
| ft3 | cubic foot |
| ft3/s | cubic feet per second |
| g | gram |
| G&A | general and administrative |
| g/cm3 | grams per cubic metre |
| g/L | grams per litre |
| g/t | grams per tonne |
| Ga | billion years |
| gal | gallon (us) |
| GJ | gigajoule |
| GPa | gigapascal |
| gpm | gallons per minute (us) |
| GSC | geological survey of Canada |
| GW | gigawatt |
| h | hour |
| h/a | hours per year |
| h/d | hours per day |
| h/wk | hours per week |
| ha | hectare (10,000 m2) |
| ha | hectare |
| HDZ | Hammerdown Deformation Zone |
| HG | high grade |
| hp | horsepower |
| HPGR | high-pressure grinding rolls |
| HQ | drill core diameter of 63.5 mm |
| Hz | hertz |
| ICP-MS | inductively coupled plasma mass spectrometry |
|
|
| Symbol / Abbreviation | Description |
| in | inch |
| in2 | square inch |
| in3 | cubic inch |
| IRR | internal rate of return |
| JDS | JDS Energy & Mining Inc. |
| K | hydraulic conductivity |
| k | kilo (thousand) |
| kg | kilogram |
| kg | kilogram |
| kg/h | kilograms per hour |
| kg/m2 | kilograms per square metre |
| kg/m3 | kilograms per cubic metre |
| KIM | kimberlitic indicator mineral |
| km | kilometre |
| km/h | kilometres per hour |
| km2 | square kilometre |
| kPa | kilopascal |
| kt | kilotonne |
| kV | kilovolt |
| kVA | kilovolt-ampere |
| kW | kilowatt |
| kWh | kilowatt hour |
| kWh/a | kilowatt hours per year |
| kWh/t | kilowatt hours per tonne |
| L | litre |
| L/min | litres per minute |
| L/s | litres per second |
| LDD | large-diameter drill |
| LG | low grade |
| LOM | life of mine |
| m | metre |
| M | million |
| m/min | metres per minute |
| m/s | metres per second |
| m2 | square metre |
| m3 | cubic metre |
| m3/h | cubic metres per hour |
| m3/s | cubic metres per second |
|
|
| Symbol / Abbreviation | Description |
| Ma | million years |
| MAAT | mean annual air temperature |
| MAE | mean annual evaporation |
| MAGT | mean annual ground temperature |
| mamsl | metres above mean sea level |
| MAP | mean annual precipitation |
| masl | metres above mean sea level |
| Mb/s | megabytes per second |
| mbgs | metres below ground surface |
| Mbm3 | million bank cubic metres |
| Mbm3/a | million bank cubic metres per annum |
| mbs | metres below surface |
| mbsl | metres below sea level |
| mg | milligram |
| mg/L | milligrams per litre |
| min | minute (time) |
| mL | millilitre |
| mm | millimetre |
| Mm3 | million cubic metres |
| mo | month |
| MPa | megapascal |
| Mt | million metric tonnes |
| MVA | megavolt-ampere |
| MW | megawatt |
| NAD | North American datum |
| NG | normal grade |
| ni | nickel |
| NI 43-101 | national instrument 43-101 |
| NQ | drill core diameter of 47.6 mm |
| NRC | natural resources Canada |
| OP | open pit |
| OSA | overall slope angles |
| oz | troy ounce |
| P.Geo. | professional geoscientist |
| Pa | Pascal |
| PAG | potentially acid generating |
| PEA | preliminary economic assessment |
| PFS | preliminary feasibility study |
|
|
| Symbol / Abbreviation | Description |
| PGE | platinum group elements |
| PMF | probable maximum flood |
| ppb | parts per billion |
| ppm | parts per million |
| psi | pounds per square inch |
| QA/QC | quality assurance/quality control |
| QP | qualified person |
| RC | reverse circulation |
| RMR | rock mass rating |
| ROM | run of mine |
| rpm | revolutions per minute |
| RQD | rock quality designation |
| s | second (time) |
| S.G. | specific gravity |
| Scfm | standard cubic feet per minute |
| SEDEX | sedimentary exhalative |
| SFD | size frequency distribution |
| SG | specific gravity |
| t | tonne (1,000 kg) (metric ton) |
| t | metric tonne |
| t/a | tonnes per year |
| t/d | tonnes per day |
| t/h | tonnes per hour |
| TCR | total core recovery |
| TFFE | target for further exploration |
| TMF | tailings management facility |
| ts/hm3 | tonnes seconds per hour metre cubed |
| US | United States |
| US$ | United States dollar |
| UTM | universal transverse mercator |
| V | volt |
| VEC | valued ecosystem components |
| VMS | volcanic massive sulphide |
| VSEC | valued socio-economic components |
| w/w | weight/weight |
| wk | week |
| wmt | wet metric ton |
| WRSF | waste rock storage facility |
|
|
| Symbol / Abbreviation | Description |
| WRSF | waste rock storage facility |
| μm | microns |
| μm | micrometre |
| Scientific Notation | Number Equivalent |
| 1.0E+00 | 1 |
| 1.0E+01 | 10 |
| 1.0E+02 | 100 |
| 1.0E+03 | 1,000 |
| 1.0E+04 | 10,000 |
| 1.0E+05 | 100,000 |
| 1.0E+06 | 1,000,000 |
| 1.0E+07 | 10,000,000 |
| 1.0E+09 | 1,000,000,000 |
| 1.0E+10 | 10,000,000,000 |