UNITED STATES
SECURITIES AND EXCHANGE COMMISSION
Washington, D.C. 20549
FORM 6-K
REPORT OF FOREIGN PRIVATE ISSUER PURSUANT TO RULE 13a-16 OR 15d-16
UNDER THE SECURITIES EXCHANGE ACT OF 1934
For the month of November 2025
Commission File Number: 001-33153
ENDEAVOUR SILVER CORP.
(Translation of registrant's name into English)
#1130-609 Granville Street
Vancouver, British Columbia, Canada V7Y 1G5
(Address of principal executive offices)
Indicate by check mark whether the registrant files or will file annual reports under cover Form 20-F or Form 40-F.
[ ] Form 20-F [ x ] Form 40-F Exhibits 99.1 and 99.2 to this Form 6-K of Endeavour Silver Corp.
Incorporated by Reference
(the “Company”) are hereby incorporated by reference as exhibits to the Registration Statement on Form F-10 (File No. 333-287602) of the Company, as amended or supplemented.
SUBMITTED HEREWITH
SIGNATURES
Pursuant to the requirements of the Securities Exchange Act of 1934, the registrant has duly caused this report to be signed on its behalf by the undersigned, thereunto duly authorized.
| Endeavour Silver Corp. | ||
| (Registrant) | ||
| Date: November 7, 2025 | By: | /s/ Daniel Dickson |
| Daniel Dickson | ||
| Title: | CEO | |

Endeavour Silver Corp.
Condensed Consolidated Interim Financial Statements
Unaudited
Three and Nine Months Ended September 30, 2025 and 2024
ENDEAVOUR SILVER CORP.
CONDENSED CONSOLIDATED INTERIM STATEMENTS OF FINANCIAL POSITION
(unaudited)
(expressed in thousands of US dollars)
| September 30, 2025 |
December 31, 2024 |
||||||
| Notes | |||||||
| ASSETS | |||||||
| Current assets | |||||||
| Cash and cash equivalents | $ | 57,027 | $ | 106,434 | |||
| Other investments | 1,096 | 1,070 | |||||
| Accounts and other receivables | 5 | 19,925 | 5,166 | ||||
| Inventories | 7 | 58,350 | 36,010 | ||||
| IVA receivables | 6 | 59,043 | 5,119 | ||||
| Derivative assets | 18 | 3,650 | - | ||||
| Prepaids and other current assets | 8,840 | 3,848 | |||||
| Total current assets | 207,931 | 157,647 | |||||
| Non-current income tax receivable | 3,939 | 3,572 | |||||
| Non-current IVA receivable | 6 | 1,761 | 31,301 | ||||
| Non-current derivative assets | 18 | 644 | - | ||||
| Other non-current assets | 8 | 8,677 | 20,524 | ||||
| Mineral properties, plant and equipment | 8 | 794,074 | 506,205 | ||||
| Total assets | $ | 1,017,026 | $ | 719,249 | |||
| LIABILITIES AND SHAREHOLDERS' EQUITY | |||||||
| Current liabilities | |||||||
| Accounts payable, accrued liabilities and other | $ | 109,565 | $ | 53,943 | |||
| Income taxes payable | 25,725 | 9,457 | |||||
| Precious metal prepayments obligation | 9 | 14,630 | - | ||||
| Loans payable | 10 | 44,301 | 5,234 | ||||
| Copper stream liability | 18 | 6,107 | - | ||||
| Derivative liabilities | 18 | 63,661 | 10,232 | ||||
| Total current liabilities | 263,989 | 78,866 | |||||
| Non-current loans payable | 10 | 114,763 | 115,002 | ||||
| Provisions for reclamation and rehabilitation | 23,760 | 11,635 | |||||
| Deferred income tax liability | 21,368 | 10,315 | |||||
| Non-current copper stream liability | 18 | 30,538 | - | ||||
| Non-current derivative liabilities | 18 | 42,317 | 16,627 | ||||
| Contingent payment | 4, 18 | 8,430 | - | ||||
| Other non-current liabilities | 3,057 | 2,367 | |||||
| Total liabilities | 508,222 | 234,812 | |||||
| Shareholders' equity | |||||||
| Common shares | 11 | 971,435 | 850,986 | ||||
| Contributed surplus | 11 | 4,842 | 5,606 | ||||
| Retained deficit | (467,473 | ) | (372,155 | ) | |||
| Total shareholders' equity | 508,804 | 484,437 | |||||
| Total liabilities and shareholders' equity | $ | 1,017,026 | $ | 719,249 |
The accompanying notes are an integral part of these condensed consolidated interim financial statements.
Approved on behalf of the Board:
| /s/ Margaret Beck | /s/ Daniel Dickson |
| Director | Director |
ENDEAVOUR SILVER CORP.
CONDENSED CONSOLIDATED INTERIM STATEMENTS OF COMPREHENSIVE EARNINGS (LOSS)
(unaudited)
(expressed in thousands of US dollars, except for shares and per share amounts)
| Three months ended | Nine months ended | ||||||||||||
| September 30, | September 30, | September 30, | September 30, | ||||||||||
| Notes | 2025 | 2024 | 2025 | 2024 | |||||||||
| Revenue | 12 | $ | 142,831 | $ | 53,443 | $ | 294,926 | $ | 175,428 | ||||
| Cost of sales: | |||||||||||||
| Direct production costs | 93,913 | 28,704 | 188,335 | 99,112 | |||||||||
| Royalties | 9,262 | 5,151 | 21,963 | 17,207 | |||||||||
| Share-based compensation | 11(b)(c) | 132 | 73 | 302 | 226 | ||||||||
| Depreciation | 23,915 | 7,032 | 48,131 | 24,548 | |||||||||
| 127,222 | 40,960 | 258,731 | 141,093 | ||||||||||
| Mine operating earnings | 15,609 | 12,483 | 36,195 | 34,335 | |||||||||
| Expenses: | |||||||||||||
| Exploration, evaluation and development | 13 | 7,258 | 4,707 | 16,718 | 13,267 | ||||||||
| General and administrative | 14 | 6,537 | 3,982 | 18,418 | 12,266 | ||||||||
| 13,795 | 8,689 | 35,136 | 25,533 | ||||||||||
| Operating earnings | 1,814 | 3,794 | 1,059 | 8,802 | |||||||||
| Finance costs | 997 | 509 | 2,550 | 1,100 | |||||||||
| Other income (expense): | |||||||||||||
| Foreign exchange gain (loss) | 602 | (3,070 | ) | 300 | (5,889 | ) | |||||||
| Loss on derivative contracts | 18 | (39,034 | ) | (19,379 | ) | (80,958 | ) | (28,632 | ) | ||||
| Investment and other | 156 | 5,875 | 2,288 | 6,478 | |||||||||
| (38,276 | ) | (16,574 | ) | (78,370 | ) | (28,043 | ) | ||||||
| Loss before income taxes | (37,459 | ) | (13,289 | ) | (79,861 | ) | (20,341 | ) | |||||
| Income tax expense: | |||||||||||||
| Current income tax expense | 10,663 | 4,523 | 25,036 | 13,068 | |||||||||
| Deferred income tax recovery | (6,166 | ) | (512 | ) | (9,579 | ) | (908 | ) | |||||
| 4,497 | 4,011 | 15,457 | 12,160 | ||||||||||
| Net loss | $ | (41,956 | ) | $ | (17,300 | ) | $ | (95,318 | ) | $ | (32,501 | ) | |
| Basic loss per share | $ | (0.14 | ) | $ | (0.07 | ) | $ | (0.34 | ) | $ | (0.14 | ) | |
| Diluted loss per share | $ | (0.14 | ) | $ | (0.07 | ) | $ | (0.34 | ) | $ | (0.14 | ) | |
| Basic and diluted weighted average number of shares outstanding | 11(e) | 291,373,472 | 246,000,878 | 279,183,612 | 238,827,655 | ||||||||
The accompanying notes are an integral part of these condensed consolidated interim financial statements.
ENDEAVOUR SILVER CORP.
CONDENSED CONSOLIDATED INTERIM STATEMENTS OF CHANGES IN SHAREHOLDERS' EQUITY
(unaudited)
(expressed in thousands of US dollars, except for shares and per share amounts)
| Notes | Number of shares |
Share Capital |
Contributed Surplus |
Retained Deficit |
Total Shareholders' Equity |
|||||||||||
| Balance at December 31, 2023 | 217,245,492 | $ | 722,695 | $ | 4,556 | $ | (340,910 | ) | $ | 386,341 | ||||||
| Public equity offerings, net of issuance costs | 27,540,971 | 53,790 | - | - | 53,790 | |||||||||||
| Exercise of options | 11(b) | 1,242,600 | 3,715 | (1,201 | ) | - | 2,514 | |||||||||
| Canceled options | 11(b) | - | - | (231 | ) | 231 | - | |||||||||
| Share-based compensation | 11(b) | - | - | 2,896 | - | 2,896 | ||||||||||
| Loss for the period | - | - | - | (32,501 | ) | (32,501 | ) | |||||||||
| Balance at September 30, 2024 | 246,029,063 | $ | 780,200 | $ | 6,020 | ($373,180 | ) | $ | 413,040 | |||||||
| Public equity offerings, net of issuance costs | 15,825,000 | 68,583 | - | - | 68,583 | |||||||||||
| Exercise of options | 11(b) | 469,800 | 2,203 | (760 | ) | - | 1,443 | |||||||||
| Canceled options and performance share units | 11(b) | - | - | - | - | - | ||||||||||
| Share-based compensation | 11(b) | - | - | 346 | - | 346 | ||||||||||
| Loss for the period | - | - | - | 1,025 | 1,025 | |||||||||||
| Balance at December 31, 2024 | 262,323,863 | $ | 850,986 | $ | 5,606 | $ | (372,155 | ) | $ | 484,437 | ||||||
| Public equity offerings, net of issuance costs | 11(a) | 15,523,915 | 61,339 | - | - | 61,339 | ||||||||||
| Exercise of options | 11(b) | 2,057,355 | 10,437 | (3,603 | ) | - | 6,834 | |||||||||
| Redemption of deferred share units | 11(c) | 103,373 | 300 | (300 | ) | - | - | |||||||||
| Issued as part of business acquisition | 4 | 14,075,357 | 48,373 | - | - | 48,373 | ||||||||||
| Share-based compensation | 11(b) | - | - | 3,139 | - | 3,139 | ||||||||||
| Loss for the period | - | - | - | (95,318 | ) | (95,318 | ) | |||||||||
| Balance at September 30, 2025 | 294,083,863 | $ | 971,435 | $ | 4,842 | $ | (467,473 | ) | $ | 508,804 |
The accompanying notes are an integral part of these condensed consolidated interim financial statements.
ENDEAVOUR SILVER CORP.
CONDENSED CONSOLIDATED INTERIM STATEMENTS OF CASH FLOWS
(unaudited)
(expressed in thousands of US dollars)
| Three months ended | Nine months ended | ||||||||||||
| September 30, | September 30, | September 30, | September 30, | ||||||||||
| Notes | 2025 | 2024 | 2025 | 2024 | |||||||||
| Operating activities | |||||||||||||
| Net loss for the period | $ | (41,956 | ) | $ | (17,300 | ) | $ | (95,318 | ) | $ | (32,501 | ) | |
| Items not affecting cash: | |||||||||||||
| Share-based compensation | 11 (b)(c) | 942 | 564 | 3,139 | 2,896 | ||||||||
| Depreciation | 8 | 24,085 | 7,352 | 48,823 | 25,420 | ||||||||
| Deferred income tax recovery | (6,166 | ) | (664 | ) | (9,579 | ) | (908 | ) | |||||
| Unrealized foreign exchange loss (gain) | (1,325 | ) | 1,445 | (3,852 | ) | 3,777 | |||||||
| Finance costs | 997 | 509 | 2,550 | 1,100 | |||||||||
| Interest income | (273 | ) | (4,413 | ) | (1,838 | ) | (5,685 | ) | |||||
| Accretion of loans receivable | (51 | ) | (72 | ) | (151 | ) | (206 | ) | |||||
| Loss on remeasurement of contingent consideration | 4,18 | 506 | - | 506 | - | ||||||||
| Loss on copper stream revaluation | 2,157 | - | 3,416 | - | |||||||||
| Unrealized (gain) loss on derivatives | 18 | 34,065 | 17,109 | 74,825 | 26,362 | ||||||||
| Unrealized (gain) loss on other investments | (501 | ) | (75 | ) | (822 | ) | 1,228 | ||||||
| Change in precious metal prepayments | 9 | 1,129 | - | 14,630 | - | ||||||||
| Net changes in working capital | 15 | 13,443 | 4,012 | 15,649 | 2,480 | ||||||||
| Cash from operating activities | 27,052 | 8,467 | 51,978 | 23,963 | |||||||||
| Investing activities | |||||||||||||
| Payment for mineral properties, plant and equipment | 8 | (34,649 | ) | (48,796 | ) | (130,384 | ) | (149,494 | ) | ||||
| Net cash paid on business acquisition | 4 | - | - | (72,828 | ) | - | |||||||
| Proceeds from disposal of other investments | - | - | 796 | 3,292 | |||||||||
| Proceeds from loans receivable | - | 200 | 150 | 900 | |||||||||
| Interest received | 273 | 4,413 | 1,838 | 5,685 | |||||||||
| Cash used in investing activities | (34,376 | ) | (44,183 | ) | (200,428 | ) | (139,617 | ) | |||||
| Financing activities | |||||||||||||
| Repayment of loans payable | 10 | (3,418 | ) | (860 | ) | (6,966 | ) | (3,019 | ) | ||||
| Repayment of lease liabilities | (326 | ) | (98 | ) | (747 | ) | (299 | ) | |||||
| Interest paid | 10 | (3,535 | ) | (1,611 | ) | (9,856 | ) | (1,862 | ) | ||||
| Net proceeds from public equity offerings | 11 (a) | 14,777 | - | 61,339 | 53,790 | ||||||||
| Proceeds from exercise of options | 11 (b) | 5,955 | 367 | 6,834 | 2,514 | ||||||||
| Proceeds from loans payable | 10 | - | 25,000 | 15,000 | 85,000 | ||||||||
| Proceeds from copper stream prepayment | 18 | - | - | 35,000 | - | ||||||||
| Repayment of copper stream | 18 | (1,327 | ) | - | (1,771 | ) | - | ||||||
| Payment of deferred financing fees | - | (602 | ) | - | (1,333 | ) | |||||||
| Cash from financing activities | 12,126 | 22,196 | 98,833 | 134,791 | |||||||||
| Effect of exchange rate change on cash and cash equivalents | 25 | 357 | 210 | 511 | |||||||||
| Increase (decrease) in cash and cash equivalents | 4,827 | (13,163 | ) | (49,407 | ) | 19,648 | |||||||
| Cash and cash equivalents, beginning of the period | 52,200 | 68,097 | 106,434 | 35,286 | |||||||||
| Cash and cash equivalents, end of the period | $ | 57,027 | $ | 54,934 | $ | 57,027 | $ | 54,934 | |||||
| Supplemental cash flow information (Note 15) | |||||||||||||
The accompanying notes are an integral part of these condensed consolidated interim financial statements.
| ENDEAVOUR SILVER CORP. NOTES TO THE CONDENSED CONSOLIDATED INTERIM FINANCIAL STATEMENTS Three months and nine months ended September 30, 2025 and 2024 (unaudited) (expressed in thousands of US dollars, unless otherwise stated) |
1. CORPORATE INFORMATION
Endeavour Silver Corp. (the "Company" or "Endeavour Silver") is a corporation governed by the Business Corporations Act (British Columbia). The Company is engaged in silver mining in Mexico and Peru and related activities including acquisition, exploration, development, extraction, processing, refining and reclamation. The Company is also engaged in exploration activities in Chile and United States. On May 1, 2025, the Company completed its acquisition of Compañia Minera Kolpa S.A. ("Minera Kolpa"), which operates the Huachocolpa Uno Mine in Peru (Note 4). The address of the registered office is Suite 3500, 1133 Melville Street Vancouver, BC, Canada V6E 4E5.
2. BASIS OF PRESENTATION
These condensed consolidated interim financial statements have been prepared in accordance with IAS 34 Interim Financial Reporting and do not include all of the information required for full annual financial statements and should be read in conjunction with the Company's annual audited consolidated financial statements as at and for the year ended December 31, 2024.
Certain comparative figures have been reclassified to conform with the current period's presentation (Note 6).
The Board of Directors approved these condensed consolidated interim financial statements for issue on November 6, 2025.
The preparation of consolidated financial statements requires management to make judgments, estimates and assumptions that affect the application of accounting policies and the reported amounts of assets, liabilities, income and expenses. Actual results may differ from these estimates.
These consolidated financial statements are presented in the Company's functional currency of US dollars and include the accounts of the Company and its subsidiaries all of which are wholly owned including Minera Kolpa for the period May 1, 2025, to September 30, 2025, and as of September 30, 2025. The Company determined that the functional currency of Minera Kolpa is also US dollars. All intercompany transactions and balances have been eliminated upon consolidation of these subsidiaries.
3. MATERIAL ACCOUNTING POLICIES
The accounting policies applied in these condensed consolidated interim financial statements are the same as those applied in the Company's annual audited consolidated financial statements as at and for the year ended December 31, 2024, except as described below.
In preparing these condensed consolidated interim financial statements, the significant judgements made by management in applying the Company's accounting policies and the key sources of estimation uncertainty were the same as those that were applied to the annual audited consolidated financial statements for the year ended December 31, 2024, except for:
- Estimates and judgements related to the valuation of assets acquired and liabilities assumed in the acquisition of Minera Kolpa (Note 4), including those related to contingent payment that is part of the consideration (Note 18); and
- Estimates and judgements related to the accounting treatment and valuation of the copper stream liability (Note 18).
The accounting policies below have been applied consistently to all periods presented and by all subsidiaries in the group.
Business acquisitions
During the period, the Company completed the acquisition of Minera Kolpa, which was accounted for as a business combination under IFRS 3 - Business Combinations (Note 4) using the acquisition method. The cost of an acquisition is measured as the aggregate of the fair values, at the date of exchange, of assets transferred, liabilities incurred or assumed, and equity instruments issued by the Company in exchange for control of the acquiree. The contingent consideration is measured at its acquisition-date fair value and included as part of the consideration transferred. The identifiable assets acquired, and liabilities assumed are recognized at their fair values as of the acquisition date. Acquisition-related costs are expensed as incurred.
| ENDEAVOUR SILVER CORP. NOTES TO THE CONDENSED CONSOLIDATED INTERIM FINANCIAL STATEMENTS Three months and nine months ended September 30, 2025 and 2024 (unaudited) (expressed in thousands of US dollars, unless otherwise stated) |
The results of Minera Kolpa have been included in the condensed consolidated interim financial statements from May 1, 2025 (the "Acquisition Date"). The purchase price allocation is preliminary and subject to adjustment as the Company completes its assessment of the fair values of the assets acquired and liabilities assumed.
Copper stream liability
The Company has entered into a copper stream agreement effective April 1, 2025 (Note 18). The agreement is outside of the scope of IFRS 15 Revenue from contracts with customers, and the Company has determined that the copper stream represents a hybrid financial liability with embedded derivatives. The entire hybrid copper stream liability is designated as fair value through profit or loss under the fair value option. Fair value is determined using observable copper forward prices corresponding to the estimated production and delivery of copper ounces along with an estimate of credit-risk for similar instruments (level 3).
Restricted share units ("RSUs")
The Company has a Share Units Plan for employees and directors as part of its long-term incentive compensation. RSUs are granted in accordance with this plan and generally vest over a period of up to three years.
RSUs are measured at fair value on the grant date and recognized as a share-based compensation expense over the vesting period, with a corresponding increase in equity. The fair value of RSUs is determined based on the market price of the Company's common shares on the grant date. The number of RSUs expected to vest is estimated at each reporting date, and any changes in estimates are recognized prospectively.
Precious metal prepayments obligation
Precious metal prepayments obligation represents the Company's obligation to transfer goods or services to a customer for which consideration has been received. Prepayments obligations arise primarily from advance payments received in respect of future deliveries of metals.
Precious metal prepayments obligation is recognized when payment is received by the Company and is subsequently recognized as revenue when the related performance obligations to deliver metal are satisfied. The Company classifies precious metal prepayments obligation as current and does not adjust for the effects of a financing component when the timing of payment and performance is less than one year.
4. ACQUISITION OF MINERA KOLPA
On the Acquisition Date, the Company completed its acquisition of Minera Kolpa pursuant to a share purchase agreement entered into in April 2025 (the "Agreement"). As a result of the acquisition, Minera Kolpa became a wholly-owned subsidiary of the Company.
The total consideration for the acquisition was $134,265. The following table summarizes the consideration paid as part of the purchase price:
| Cash consideration transferred to and on behalf of vendors as per the share purchase agreement | $ | 77,966 | |
| Company's common shares transferred (14,075,357 shares) | 48,373 | ||
| Fair value of the contingent payment payable in cash upon occurrence of certain events | 7,926 | ||
| Total consideration transferred as purchase price | $ | 134,265 |
Contingent payment is payable in cash up to an additional $10,000, in increments of $500 for each 1 million silver ounce equivalent defined above 100 million silver ounce equivalents, across proven, probable, measured, indicated and inferred categories in technical report prepared and filed by the Company with respect to Kolpa within 24 months of closing of the acquisition.
Primary reason for the acquisition of Minera Kolpa was to acquire their primary asset - Huachocolpa Uno Mine and related facilities, located in the districts of Huachocolpa and Santa Ana, approximately 490 kilometers southeast of Lima, Peru. Minera Kolpa has been in operation for 25 years and its assets include Huachocolpa Uno Mine, processing infrastructure, permits, and associated working capital. Management has concluded that Minera Kolpa constitutes a business, and therefore, the acquisition is accounted for in accordance with IFRS 3 - Business Combinations.
The Company has consolidated the operating results, cash flows, and net assets of Minera Kolpa from the Acquisition Date. The determination of the fair value of assets acquired and liabilities assumed is based on a detailed valuation utilizing income, market, and cost approaches, conducted with the assistance of an independent third party. The purchase price is allocated on a preliminary basis until the final valuation report is completed. This is based on management's best estimates at the time these condensed consolidated interim financial statements were prepared, using information available as of the Acquisition Date. Any future changes to the purchase price allocation may result in adjustments to identifiable assets and liabilities.
| ENDEAVOUR SILVER CORP. NOTES TO THE CONDENSED CONSOLIDATED INTERIM FINANCIAL STATEMENTS Three months and nine months ended September 30, 2025 and 2024 (unaudited) (expressed in thousands of US dollars, unless otherwise stated) |
The fair value of assets acquired, and liabilities assumed is subject to change for up to one year from the Acquisition Date. If new information arises that impacts management's assessment of fair value as of the Acquisition Date, any adjustments will be recognized retrospectively, and comparative information will be revised accordingly.
Allocation of Purchase Price
| Cash and cash equivalents | $ | 5,138 | |
| Accounts and other receivables | 8,813 | ||
| Inventories | 7,596 | ||
| Sales tax receivables (IGV) | 95 | ||
| Prepaid expenses and other current assets | 4,755 | ||
| Mineral property, plant and equipment | 189,203 | ||
| Right-of-use assets | 1,537 | ||
| Other non-current assets | 1,654 | ||
| Accounts payable, accrued liabilities and other | (23,328 | ) | |
| Income taxes payable | (3,089 | ) | |
| Loans payable | (25,760 | ) | |
| Lease obligations | (1,930 | ) | |
| Reclamation liabilities | (9,787 | ) | |
| Deferred income tax liabilities | (20,632 | ) | |
| Net assets acquired | $ | 134,265 |
The Company determined the fair value of the mining interest using a discounted cash flow model. This model incorporated estimates of: future silver, lead, zinc, and copper prices; projected ore reserves and mineral resources; and anticipated production costs and capital expenditures, based on the life-of-mine plan as of the Acquisition Date. A discount rate of 15.8% was applied, reflecting the Company's assessment of country risk, project-specific risk, and other relevant factors.
The significant assumptions used in the determination of the fair value of the mining interests were as follows:
| Average long-term prices: | |||
| Silver (USD/oz) | $ | 29.10 | |
| Lead (USD/lb) | $ | 1.18 | |
| Zinc (USD/lb) | $ | 0.91 | |
| Copper (USD/lb) | $ | 4.20 |
| ENDEAVOUR SILVER CORP. NOTES TO THE CONDENSED CONSOLIDATED INTERIM FINANCIAL STATEMENTS Three months and nine months ended September 30, 2025 and 2024 (unaudited) (expressed in thousands of US dollars, unless otherwise stated) |
Pro Forma Financial Information
The following pro-forma financial information presents consolidated results assuming acquisition occurred on January 1, 2025:
| Three months ended | Nine months ended | |||||
| September 30, 2025 |
September 30, 2025 |
|||||
| Revenue | $ | 142,831 | $ | 341,952 | ||
| Net Income (loss) | $ | (41,956 | ) | $ | (95,491 | ) |
These pro forma amounts have been calculated after applying the Company's accounting policies and adjusting the results of Minera Kolpa to reflect the additional depreciation and depletion that would have been recognized assuming the fair value adjustments to property, plant, and equipment, and mining properties had been applied from January 1, 2025.
5. ACCOUNTS AND OTHER RECEIVABLES
| September 30, | December 31, | |||||
| 2025 | 2024 | |||||
| Trade receivables | $ | 14,121 | $ | 3,310 | ||
| Sales tax receivables (GST and IGV) | 483 | 101 | ||||
| Other receivables | 3,071 | 355 | ||||
| Current portion of loan receivable | 2,250 | 1,400 | ||||
| $ | 19,925 | $ | 5,166 |
The trade receivables include receivables from concentrate sales. The fair value of receivables arising from concentrate sales that contain provisional pricing mechanisms is determined by using the appropriate period end closing prices from the exchange that is the principal active market for the particular metal. As such, these receivables, which meet the definition of an embedded derivative, are classified within Level 2 of the fair value hierarchy (Note 18).
6. IVA RECEIVABLES
As at September 30, 2025, total Mexican subsidiaries value added tax, Impuesto al Valor Agregado ("IVA") of $60,804 (December 31, 2024 - $36,420) has been allocated between the current portion of $59,043, and the non-current portion of $1,761 (December 31, 2024 - $5,119 and $31,301, respectively). The non-current portion relates to Pitarrilla's claims which will be eligible for submission upon generation of revenue (December 31, 2024 - $1,948). At December 31, 2024, $29,353 of non-current IVA tax receivables were related to Terronera's claims which have become eligible, have been submitted for reimbursement and have been reclassified to IVA receivables. During the current period, the Company has made a change in presentation within its statement of financial position to separately disclose IVA receivables from other receivables, in order to provide greater clarity and disaggregation of tax-related assets. As a result, the comparative figures for IVA receivables as at December 31, 2024 have been reclassified from other receivables to align with the current period presentation.
| ENDEAVOUR SILVER CORP. NOTES TO THE CONDENSED CONSOLIDATED INTERIM FINANCIAL STATEMENTS Three months and nine months ended September 30, 2025 and 2024 (unaudited) (expressed in thousands of US dollars, unless otherwise stated) |
7. INVENTORIES
| September 30, | December 31, | |||||
| 2025 | 2024 | |||||
| Warehouse inventory | $ | 34,462 | $ | 19,694 | ||
| Stockpile inventory | 13,854 | 7,349 | ||||
| Finished goods inventory | 8,763 | 7,213 | ||||
| Work in process inventory | 1,271 | 1,754 | ||||
| $ | 58,350 | $ | 36,010 |
The finished goods and stockpile inventory balance as of June 30, 2025 included a $1,192 provision in Terronera, for inventory produced at a cost above net realisable value. That inventory has been sold or consumed during the third quarter, and as of September 30, 2025 ending inventory balances are carried at cost as their net realizable value exceeds the carrying value.
| ENDEAVOUR SILVER CORP. NOTES TO THE CONDENSED CONSOLIDATED INTERIM FINANCIAL STATEMENTS Three months and nine months ended September 30, 2025 and 2024 (unaudited) (expressed in thousands of US dollars, unless otherwise stated) |
8. MINERAL PROPERTIES, PLANT AND EQUIPMENT AND OTHER NON-CURRENT ASSETS
| Exploration & evaluation assets |
Mineral properties |
Plant & Buildings |
Machinery & equipment |
Transport & office equipment |
Total | |||||||||||||
| Cost | ||||||||||||||||||
| Balance at December 31, 2023 | $ | 80,231 | $ | 575,916 | $ | 159,164 | $ | 117,977 | $ | 15,036 | $ | 948,324 | ||||||
| Additions | 3,712 | 118,381 | 70,443 | 32,035 | 1,655 | 226,226 | ||||||||||||
| Impairment of exploration properties | (181 | ) | - | - | - | - | (181 | ) | ||||||||||
| Disposals | - | - | (42 | ) | (299 | ) | (129 | ) | (470 | ) | ||||||||
| Balance at December 31, 2024 | $ | 83,762 | $ | 694,297 | $ | 229,565 | $ | 149,713 | $ | 16,562 | $ | 1,173,899 | ||||||
| Additions | 1,701 | 7,171 | 132,514 | 8,437 | 1,248 | 151,071 | ||||||||||||
| Disposals | - | - | - | (2,436 | ) | (137 | ) | (2,573 | ) | |||||||||
| Acquired in business combination | - | 70,564 | 102,814 | 10,349 | 5,476 | 189,203 | ||||||||||||
| Balance at September 30, 2025 | $ | 85,463 | $ | 772,032 | $ | 464,893 | $ | 166,063 | $ | 23,149 | $ | 1,511,600 | ||||||
| Accumulated depreciation | ||||||||||||||||||
| Balance at December 31, 2023 | $ | - | $ | 466,704 | $ | 95,378 | $ | 61,484 | $ | 10,101 | $ | 633,667 | ||||||
| Depreciation | - | 22,582 | $2,225 | 8,137 | 1,461 | 34,405 | ||||||||||||
| Disposals | - | - | ($42) | ) | (295 | ) | (41 | ) | (378 | ) | ||||||||
| Balance at December 31, 2024 | $ | - | $ | 489,286 | $ | 97,561 | $ | 69,326 | $ | 11,521 | $ | 667,694 | ||||||
| Depreciation | $ | - | 28,655 | 11,792 | 10,174 | 1,727 | 52,348 | |||||||||||
| Disposals | - | - | - | (2,436 | ) | (80 | ) | (2,516 | ) | |||||||||
| Balance at September 30, 2025 | $ | - | $ | 517,941 | $ | 109,353 | $ | 77,064 | $ | 13,168 | $ | 717,526 | ||||||
| Net book value | ||||||||||||||||||
| At December 31, 2024 | $ | 83,762 | $ | 205,011 | $ | 132,004 | $ | 80,387 | $ | 5,041 | $ | 506,205 | ||||||
| At September 30, 2025 | $ | 85,463 | $ | 254,091 | $ | 355,540 | $ | 88,999 | $ | 9,981 | $ | 794,074 |
At the end of the third quarter, following the completion of the commissioning phase of the Terronera Project, the Company assessed the grouping of the fully constructed assets and directly attributable development overhead costs.
As a result of this assessment, the Company determined that it was appropriate to group plant and buildings together, as this better reflected the nature of its mine site assets, including those at Terronera. Comparative figures have been re-presented accordingly to align with the revised asset groupings.
Included in mineral properties is $145,927 for acquisition and development costs of development properties (December 31, 2024 - $157,146). During the three and nine months periods ended September 30, 2025, the Company capitalized borrowing costs related to the Terronera Debt Facility in the amounts of $3,591 and $10,167 respectively, using a capitalization rate of 11.1%.
Other non-current assets include $3,647 (December 31, 2024 - $18,299) of deposits related to items of property, plant and equipment at Terronera.
| ENDEAVOUR SILVER CORP. NOTES TO THE CONDENSED CONSOLIDATED INTERIM FINANCIAL STATEMENTS Three months and nine months ended September 30, 2025 and 2024 (unaudited) (expressed in thousands of US dollars, unless otherwise stated) |
9. PRECIOUS METAL PREPAYMENTS OBLIGATION
On June 11, 2025, Refinadora Plata Guanaceví S.A. de C.V. ("Guanaceví"), a subsidiary of the Company entered into a prepayment agreement with Auramet International Inc.("Auramet") for an initial term ending May 31, 2026.
Under the agreement, Auramet advances prepayments of up to $15,000 to the Company in consideration for the future delivery of the Guanaceví's precious metal. The advances are repaid by deliveries adjusted for the interest equivalent to SOFR plus 3.75%. The Company may draw additional amounts under the agreement once prior amounts are settled.
The prepayments amount received is initially recognized as a revenue contract liability and is subsequently being recognized as revenue as control of the metal transfers to Auramet and related shipment's performance obligations have been satisfied.
During the three and nine months ended September 30, 2025 the Company has received $25,006 and $44,463 prepayments respectively under this agreement. Of the prepayments received during the three and nine months ended September 30, 2025, $23,877 and $29,833 respectively were recognized as revenue. The remaining $14,630 is presented as precious metals prepayments obligation in the statement of financial position at September 30, 2025.
| ENDEAVOUR SILVER CORP. NOTES TO THE CONDENSED CONSOLIDATED INTERIM FINANCIAL STATEMENTS Three months and nine months ended September 30, 2025 and 2024 (unaudited) (expressed in thousands of US dollars, unless otherwise stated) |
10. LOANS PAYABLE
| Terronera Debt Facility |
Equipment Financing | Kolpa Loans |
Total | |||||||||
| Loan currency | USD | USD | USD | |||||||||
| Year of maturity | 2031 | 2029 | 2028 | |||||||||
| Balance at December 31, 2023 | $ | - | $ | 8,519 | $ | - | $ | 8,519 | ||||
| Loans drawdowns | 120,000 | 3,470 | - | 123,470 | ||||||||
| Applied deferred financing fees | (8,770 | ) | - | - | (8,770 | ) | ||||||
| Finance cost | 7,200 | 441 | - | 7,641 | ||||||||
| Repayments of principal | - | (4,081 | ) | - | (4,081 | ) | ||||||
| Payments of interest | (3,665 | ) | (438 | ) | - | (4,103 | ) | |||||
| Balance at December 31, 2024 | $ | 114,765 | $ | 7,911 | $ | - | $ | 122,676 | ||||
| Loans drawdowns | 15,000 | 3,452 | - | 18,452 | ||||||||
| Assumed on business acquisition | - | 1,064 | 24,696 | 25,760 | ||||||||
| Finance cost | 10,252 | 552 | 959 | 11,763 | ||||||||
| Repayments of principal | - | (3,851 | ) | (3,115 | ) | (6,966 | ) | |||||
| Payments of interest | (8,115 | ) | (541 | ) | (1,101 | ) | (9,757 | ) | ||||
| Balance at September 30, 2025 | $ | 131,902 | $ | 8,587 | $ | 21,439 | $ | 161,928 | ||||
| Less: Current portion of loans payable | 31,000 | 4,363 | 8,938 | 44,301 | ||||||||
| Less: Accrued interest | 2,864 | - | - | 2,864 | ||||||||
| Balance: Non-current loans payable | $ | 98,038 | $ | 4,224 | $ | 12,501 | $ | 114,763 |
Terronera Debt Facility
The Debt Facility is secured through corporate guarantees from the Company, certain of the Company's subsidiaries and a first ranking security interest over the Terronera project. The Debt Facility is subject to certain customary covenants and, as at September 30, 2025, the Company was in compliance with these covenants. During the second quarter, the Company entered into an amendment of the Debt Facility agreement, increasing the facility for an additional $15 million to a total of $135 million. The additional tranche was drawn on June 23, 2025, and will be repayable over the 12 months following the date of the statement of financial position. The key terms of the original tranches of Debt Facility remain unchanged. Funds are to be used for completion and ramp up of the Terronera project.
Equipment Financing
The equipment financing is secured by the underlying equipment purchased and is subject to various non-financial covenants, and as at September 30, 2025, the Company was in compliance with these covenants. As at September 30, 2025, the net book value of equipment included $19,098 (December 31, 2024 - $15,661) of equipment pledged as security for the equipment financing.
Kolpa Loans
As part of the Kolpa acquisition, on May 1, 2025, the Company assumed two syndicated loans originally entered into by Minera Kolpa with Banco BTG Pactual S.A. - Cayman Branch and Banco Santander Perú S.A. As collateral for these loans, Minera Kolpa entered into trust agreements and issued promissory notes to the lender. Loans are subject to certain financial covenants, which are based on the Minera Kolpa's earnings before interest, taxes, depreciation, and amortization. The loans are structured as follows:
- A loan with original balance of $15 million at a variable interest rate of SOFR plus 5.5% for a period of 4.5 years starting May 5, 2022.
- A loan with original balance of $27 million at a variable interest rate called SOFR plus 5%, for a period of 4 years starting January 9, 2024.
| ENDEAVOUR SILVER CORP. NOTES TO THE CONDENSED CONSOLIDATED INTERIM FINANCIAL STATEMENTS Three months and nine months ended September 30, 2025 and 2024 (unaudited) (expressed in thousands of US dollars, unless otherwise stated) |
11. SHARE CAPITAL
(a) Common Shares
As of September 30, 2025, the Company had 294,083,863 common shares issued, issuable and outstanding, with no par value (December 31, 2024 - 262,323,863). In order to finance a portion of cash consideration paid on the acquisition of Minera Kolpa, the Company completed a $45 million bought equity financing. Financing was completed on April 8, 2025, issuing 11,600,000 common shares at $3.88 per share. On April 16, 2025, underwriters exercised their over-allotment option, issuing an additional 1,285,000 common shares at $3.88 per share. The Company has received gross proceeds of $49,994, less commission of $2,792 and recognized $574 of other transaction costs related to the financing as share issuance costs, which have been presented net within share capital.
On May 27, 2025, the Company filed an updated Base Shelf prospectus, and on July 10, 2025, issued a prospectus supplement for an offering of up to $60,000 of shares through an at-the-market ("ATM") distributions ("ATM Facility"). During the three and nine months period ended September 30, 2025, the Company issued 2,638,915 common shares under the ATM Facility at an average price of $5.81 per share for gross proceeds of $15,333, less commission of $307 and $315 of other transaction costs recognized as share issuance costs, which have been presented net within share capital.
(b) Stock Options
| Expressed in Canadian dollars | Nine months ended | Year ended | ||||||||||
| September 30, 2025 |
December 31, 2024 |
|||||||||||
| Number of options |
Weighted average exercise price |
Number of options |
Weighted average exercise price |
|||||||||
| Outstanding, beginning of period | 3,181,491 | $4.13 | 3,488,291 | $4.24 | ||||||||
| Granted | 763,530 | $5.36 | 1,994,000 | $2.94 | ||||||||
| Exercised | (2,057,355 | ) | $4.57 | (1,712,400 | ) | $3.17 | ||||||
| Expired and forfeited | (89,120 | ) | $4.21 | (588,400 | ) | $3.55 | ||||||
| Outstanding, end of period | 1,798,546 | $4.15 | 3,181,491 | $4.13 | ||||||||
| Options exercisable at the end of the period | 873,442 | $3.84 | 1,896,491 | $4.82 | ||||||||
Subsequent to September 30, 2025, an additional 93,636 common shares were issued on the exercise of 93,636 options, with a weighted average exercise price of CAN$3.71.
| Expressed in Canadian dollars | |||||||||||||||
| Options Outstanding | Options Exercisable | ||||||||||||||
| Number | Weighted Average | Weighted Average | Number Exercisable |
Weighted Average |
|||||||||||
| Exercise | Outstanding | Remaining | |||||||||||||
| Price | as at | Contractual Life | Exercise | as at | Exercise | ||||||||||
| Intervals | September 30, 2025 | (Number of Years) | Price | September 30, 2025 | Price | ||||||||||
| $2.00 - $2.99 | 843,700 | 3.4 | $ | 2.89 | 501,900 | $ | 2.89 | ||||||||
| $4.00 - $4.99 | 204,000 | 2.9 | $ | 4.24 | 170,000 | $ | 4.16 | ||||||||
| $5.00 - $5.99 | 654,652 | 4.5 | $ | 5.39 | 105,348 | $ | 5.40 | ||||||||
| $6.00 - $6.99 | 96,194 | 1.1 | $ | 6.49 | 96,194 | $ | 6.49 | ||||||||
| 1,798,546 | 3.6 | $ | 4.15 | 873,442 | $ | 3.84 | |||||||||
During the three and nine months ended September 30, 2025, the Company recognized share-based compensation expense of $371 and $1,191 respectively (September 30, 2024 - $455 and $1,589 respectively) based on the fair value of the vested portion of options.
| ENDEAVOUR SILVER CORP. NOTES TO THE CONDENSED CONSOLIDATED INTERIM FINANCIAL STATEMENTS Three months and nine months ended September 30, 2025 and 2024 (unaudited) (expressed in thousands of US dollars, unless otherwise stated) |
The weighted-average fair values of stock options granted have been estimated using the Black-Scholes Option Pricing Model with the following assumptions:
| Nine months ended |
||||||
| September 30, 2025 |
September 30, 2024 |
|||||
| Weighted-average fair value of options in CAN$ | $ | 2.53 | $ | 1.40 | ||
| Risk-free interest rate | 2.48% | 3.75% | ||||
| Expected dividend yield | 0% | 0% | ||||
| Expected share price volatility | 63% | 62% | ||||
| Expected options life in years | 3.63 | 3.52 | ||||
(c) Share Units Plan
Performance Share Units (PSUs)
| Nine months ended | Year ended | |||||
| September 30, 2025 |
December 31, 2024 |
|||||
| Number of units | Number of units | |||||
| Outstanding, beginning of period | 1,078,000 | 878,000 | ||||
| Granted | 299,900 | 635,000 | ||||
| Cancelled | (163,000 | ) | (435,000 | ) | ||
| Outstanding, end of period | 1,214,900 | 1,078,000 |
Performance criteria are based on the Company's share price performance relative to a representative group of other mining companies. On March 24, 2025, 163,000 PSUs were cancelled as the performance criteria were not met. Of the outstanding PSUs, 320,000 vest on March 6, 2026, 595,000 vest on March 13, 2027, and 299,900 vest on April 2, 2028 once certain performance criteria are met.
During the three and nine months ended September 30, 2025, the Company recognized share-based compensation expense of $360 and $1,036 respectively related to the PSUs (September 30, 2024 - $91 and $854 respectively).
Deferred share units (DSUs) - Equity Settled
| Nine months ended | Year ended | |||||
| September 30, 2025 |
December 31, 2024 |
|||||
| Number of units | Number of units | |||||
| Outstanding, beginning of period | 564,841 | 330,078 | ||||
| Granted | 134,297 | 234,763 | ||||
| Settled | (103,373 | ) | - | |||
| Outstanding, end of period | 595,765 | 564,841 |
During the nine months ended September 30, 2025, under the Share Units Plan, there were 134,297 DSUs granted (September 30, 2024 - 217,170). During the three and nine months ended September 30, 2025, the Company recognized share-based compensation expense of $26 and $577 respectively related to the DSUs (September 30, 2024 - $18 and $453 respectively).
| ENDEAVOUR SILVER CORP. NOTES TO THE CONDENSED CONSOLIDATED INTERIM FINANCIAL STATEMENTS Three months and nine months ended September 30, 2025 and 2024 (unaudited) (expressed in thousands of US dollars, unless otherwise stated) |
Restricted Share Units (RSUs)
The Company may award to its directors and employees non-transferable RSUs. The awards typically vest over a three-year period and at the election of the Company can be settled in equity upon vesting.
| Expressed in Canadian dollars | Nine months ended | Year ended | ||||
| September 30, 2025 |
December 31, 2024 |
|||||
| Number of Units | Number of Units | |||||
| Outstanding, beginning of period | - | - | ||||
| Granted | 374,310 | - | ||||
| Cancelled | (10,790 | ) | - | |||
| Outstanding, end of period | 363,520 | - |
During the three and nine months ended September 30, 2025, the Company recognized share-based compensation expense of $185 and $335 respectively related to the RSUs (September 30, 2024 - $0).
(d) Historical Cash Settled Deferred Share Units
The Company previously had a deferred share unit plan whereby deferred share units were granted to independent directors of the Company. These cash settled deferred share units vested immediately and are redeemable for cash. They are redeemable based on the market value of the units upon certain circumstances, at the time of a director's retirement. Since the adoption of the share unit plan in March 2021, no new cash settled deferred share units have been granted.
| Expressed in Canadian dollars | Nine months ended | Year ended | ||||||||||
| September 30, 2025 |
December 31, 2024 |
|||||||||||
| Number of Units |
Weighted Average Grant Price |
Number of Units |
Weighted Average Grant Price |
|||||||||
| Outstanding, beginning of period | 1,044,204 | $3.19 | 1,044,204 | $3.19 | ||||||||
| Settled | (101,576 | ) | $2.74 | - | - | |||||||
| Outstanding, end of period | 942,628 | $3.24 | 1,044,204 | $3.19 | ||||||||
| Fair value at period end | 942,628 | $10.90 | 1,044,204 | $5.27 | ||||||||
During the three and nine months ended September 30, 2025, the Company recognized a mark to market expense on cash-settled Deferred Share Units related to director's compensation, which is included in general and administrative employee costs, of $2,742 and $3,962 respectively (September 30, 2024 - a mark to market expense of $454 and $2,078 respectively) based on the change in the fair value of the cash-settled Deferred Share Units granted in prior years. On June 3, 2025, following the retirement of Ricardo Campoy, 101,576 units were settled. As of September 30, 2025, deferred share units outstanding have a fair market liability value of $7,791 (December 31, 2024 - $3,829) recognized in accounts payable, accrued liabilities and other.
| ENDEAVOUR SILVER CORP. NOTES TO THE CONDENSED CONSOLIDATED INTERIM FINANCIAL STATEMENTS Three months and nine months ended September 30, 2025 and 2024 (unaudited) (expressed in thousands of US dollars, unless otherwise stated) |
(e) Diluted loss per Share
| Three months ended | Nine months ended | |||||||||||
| September 30, 2025 |
September 30, 2024 |
September 30, 2025 |
September 30, 2024 |
|||||||||
| Net loss | $ | (41,956 | ) | $ | (17,300 | ) | $ | (95,318 | ) | $ | (32,501 | ) |
| Basic weighted average number of shares outstanding | 291,373,472 | 246,000,878 | 279,183,612 | 238,827,655 | ||||||||
| Effect of potentially dilutive securities: | ||||||||||||
| Stock options | - | - | - | - | ||||||||
| Restricted share units | - | - | - | - | ||||||||
| Equity settled deferred share units | - | - | - | - | ||||||||
| Performance share units | - | - | - | - | ||||||||
| Diluted weighted average number of share outstanding | 291,373,472 | 246,000,878 | 279,183,612 | 238,827,655 | ||||||||
As of September 30, 2025, there are a total of 3,972,731 stock options, equity settled deferred share units, restricted share units and performance share units that were anti-dilutive and excluded from the diluted earnings per share calculation (September 30, 2024 - 3,167,664)
12. REVENUE
| Three months ended | Nine months ended | |||||||||||
| September 30, | September 30, | September 30, | September 30, | |||||||||
| 2025 | 2024 | 2025 | 2024 | |||||||||
| Silver sales | $ | 76,194 | $ | 30,145 | $ | 164,218 | $ | 106,601 | ||||
| Gold sales | 49,158 | 23,794 | 101,930 | 70,264 | ||||||||
| Lead sales | 10,460 | - | 17,195 | - | ||||||||
| Zinc sales | 8,775 | - | 14,397 | - | ||||||||
| Copper sales | 1,151 | - | 1,712 | - | ||||||||
| Other metals sales | 231 | - | 589 | - | ||||||||
| Less: smelting and refining costs | (3,138 | ) | (496 | ) | (5,115 | ) | (1,437 | ) | ||||
| Revenue | $ | 142,831 | $ | 53,443 | $ | 294,926 | $ | 175,428 | ||||
Changes in fair value from provisional pricing are included in silver, gold, lead, zinc and copper sales. Revenue per product type was as follows:
| Three months ended | Nine months ended | |||||||||||
| September 30, | September 30, | September 30, | September 30, | |||||||||
| 2025 | 2024 | 2025 | 2024 | |||||||||
| Concentrate sales | $ | 85,031 | $ | 17,861 | $ | 145,747 | $ | 50,956 | ||||
| Provisional pricing adjustments | 5,551 | 117 | 6,187 | (511 | ) | |||||||
| Total revenue from concentrate sales | 90,582 | 17,978 | 151,934 | 50,445 | ||||||||
| Refined metal sales | 52,249 | 35,465 | 142,992 | 124,983 | ||||||||
| Total revenue | $ | 142,831 | $ | 53,443 | $ | 294,926 | $ | 175,428 | ||||
Provisional pricing adjustments on sales of concentrate are pricing adjustments made upon finalization of the sales contract. The Company's concentrate sales contracts are initially priced with provisional pricing periods lasting typically one to three months, with provisional pricing adjustments recorded to revenue as market prices vary.
| ENDEAVOUR SILVER CORP. NOTES TO THE CONDENSED CONSOLIDATED INTERIM FINANCIAL STATEMENTS Three months and nine months ended September 30, 2025 and 2024 (unaudited) (expressed in thousands of US dollars, unless otherwise stated) |
13. EXPLORATION, EVALUATION AND DEVELOPMENT
| Three months ended | Nine months ended | |||||||||||
| September 30, | September 30, | September 30, | September 30, | |||||||||
| 2025 | 2024 | 2025 | 2024 | |||||||||
| Depreciation | $ | 133 | $ | 221 | $ | 387 | $ | 568 | ||||
| Share-based compensation | 154 | (204 | ) | 416 | 74 | |||||||
| Employee costs | 995 | 657 | 2,659 | 1,954 | ||||||||
| Direct exploration expenditures | 4,881 | 2,363 | 9,878 | 5,821 | ||||||||
| Evaluation and development employee costs | 561 | 1,181 | 1,970 | 2,640 | ||||||||
| Direct evaluation and development expenditures | 534 | 489 | 1,408 | 2,210 | ||||||||
| $ | 7,258 | $ | 4,707 | $ | 16,718 | $ | 13,267 | |||||
14. GENERAL AND ADMINISTRATIVE
| Three months ended | Nine months ended | |||||||||||
| September 30, |
September 30, | September 30, | September 30, | |||||||||
| 2025 | 2024 | 2025 | 2024 | |||||||||
| Depreciation | $ | 98 | $ | 99 | $ | 305 | $ | 304 | ||||
| Share-based compensation | 655 | 695 | 2,421 | 2,596 | ||||||||
| Employee costs | 1,032 | 924 | 3,025 | 3,085 | ||||||||
| Directors' DSU expense | 2,742 | 454 | 3,962 | 2,078 | ||||||||
| Direct general and administrative expenditures | 2,010 | 1,810 | 5,103 | 4,203 | ||||||||
| Business acquisition costs | - | - | 3,602 | - | ||||||||
| $ | 6,537 | $ | 3,982 | $ | 18,418 | $ | 12,266 | |||||
15. SUPPLEMENTAL DISCLOSURE WITH RESPECT TO CASH FLOWS
| Three months ended | Nine months ended | |||||||||||
| September 30, | September 30, | September 30, | September 30, | |||||||||
| 2025 | 2024 | 2025 | 2024 | |||||||||
| Net changes in non-cash working capital: | ||||||||||||
| Accounts and other receivables | $ | (675 | ) | $ | (62 | ) | $ | (5,099 | ) | $ | (5,725 | ) |
| Income tax receivable | (229 | ) | 1,975 | (744 | ) | 3,836 | ||||||
| Inventories | 1,222 | (303 | ) | (12,859 | ) | 2,855 | ||||||
| Prepaids | 854 | 1,347 | 235 | 2,556 | ||||||||
| Accounts payable, accrued liabilities and other | 9,336 | (1,459 | ) | 40,006 | (4,831 | ) | ||||||
| Income taxes payable | 6,683 | 2,514 | 13,179 | 3,789 | ||||||||
| IVA receivable | (3,748 | ) | - | (19,069 | ) | - | ||||||
| $ | 13,443 | $ | 4,012 | $ | 15,649 | $ | 2,480 | |||||
| Non-cash financing and investing activities: | ||||||||||||
| Reclamation included in mineral properties, plant and equipment |
$ | - | $ | (606 | ) | - | $ | (1,156 | ) | |||
| Fair value of exercised options allocated to share capital | $ | (3,176 | ) | $ | (178 | ) | $ | (3,603 | ) | $ | (1,201 | ) |
| Fair value of capital assets acquired under finance leases | $ | 3,452 | - | $ | 3,452 | - | ||||||
| Other cash disbursements: | ||||||||||||
| Income taxes paid | $ | 2,192 | $ | 2,357 | $ | 6,413 | $ | 4,941 | ||||
| Special mining duty paid | $ | - | $ | - | $ | 3,913 | $ | 2,574 | ||||
| ENDEAVOUR SILVER CORP. NOTES TO THE CONDENSED CONSOLIDATED INTERIM FINANCIAL STATEMENTS Three months and nine months ended September 30, 2025 and 2024 (unaudited) (expressed in thousands of US dollars, unless otherwise stated) |
16. SEGMENT DISCLOSURES
The Company's operating segments are based on internal management reports that are reviewed by the Company's executives (the chief operating decision makers) in assessing performance. The Company has three operating mining segments which are located in Mexico (Guanaceví and Bolañitos) and in Peru, (Kolpa) and a development mine segment, Terronera, which reached commercial production in October 2025. The Company has Exploration and Corporate segments. The Exploration segment consists of projects in the exploration and evaluation phases in Mexico, Chile and the USA. Exploration projects that are in the local district surrounding a mine are included in the mine's segments. Revenues, cost of sales, exploration costs and income taxes are attributed to the operation in which they arise. General and administrative costs, foreign exchange gains and losses, and investment and other income are managed centrally and are presented within the Corporate segment. Gains and losses from remeasurement of assets and liabilities measured at fair value are attributed to the segment in which the related asset or liability resides. Segment results are presented net of intersegment transactions where services are performed on behalf of other Group entities. There are no amounts unallocated to reportable segments.
| Three months ended September 30 |
Revenue | Cost of sales - direct |
Cost of sales - depreciation |
Cost of sales - other |
Mine operating earnings |
Net earnings and comprehensive earnings |
|||||||||||||
| Guanaceví | 2025 | $ | 52,249 | $ | 26,250 | $ | 8,264 | $ | 7,610 | $ | 10,125 | $ | 7,843 | ||||||
| 2024 | 35,465 | 18,968 | 4,656 | 5,118 | 6,723 | 3,226 | |||||||||||||
| Bolañitos | 2025 | 20,090 | 11,681 | 2,948 | 247 | 5,214 | 3,607 | ||||||||||||
| 2024 | 17,978 | 9,737 | 2,376 | 105 | 5,760 | 5,246 | |||||||||||||
| Terronera | 2025 | 31,478 | 29,166 | 5,091 | 858 | (3,637 | ) | (42,247 | ) | ||||||||||
| 2024 | - | - | - | - | - | (21,048 | ) | ||||||||||||
| Kolpa | 2025 | 39,014 | 26,816 | 7,612 | 679 | 3,907 | 3,299 | ||||||||||||
| 2024 | - | - | - | - | - | - | |||||||||||||
| Exploration | 2025 | - | - | - | - | - | (6,163 | ) | |||||||||||
| 2024 | - | - | - | - | - | (3,037 | ) | ||||||||||||
| Corporate | 2025 | - | - | - | - | - | (8,295 | ) | |||||||||||
| 2024 | - | - | - | - | - | (1,687 | ) | ||||||||||||
| Consolidated | 2025 | $ | 142,831 | $ | 93,913 | $ | 23,915 | $ | 9,394 | $ | 15,609 | $ | (41,956 | ) | |||||
| 2024 | $ | 53,443 | $ | 28,705 | $ | 7,032 | $ | 5,223 | $ | 12,483 | $ | (17,300 | ) | ||||||
The Exploration segment included $1,094 of costs incurred in Chile for the three months ended September 30, 2025 (September 30, 2024 - $212) and $16 of costs incurred in USA (September 30, 2024 - $9).
| Nine months ended September 30 |
Revenue | Cost of sales - direct |
Cost of sales - depreciation |
Cost of sales - other |
Mine operating earnings |
Net earnings and comprehensive earnings |
|||||||||||||
| Guanaceví | 2025 | $ | 142,993 | $ | 74,752 | $ | 21,148 | $ | 19,959 | $ | 27,134 | $ | 19,217 | ||||||
| 2024 | 124,983 | 68,855 | 16,436 | 17,128 | 22,564 | 11,674 | |||||||||||||
| Bolañitos | 2025 | 54,332 | 33,004 | 8,332 | 648 | 12,348 | 8,641 | ||||||||||||
| 2024 | 50,445 | 30,258 | 8,112 | 304 | 11,771 | 10,501 | |||||||||||||
| Terronera | 2025 | 34,756 | 37,462 | 5,882 | 955 | (9,543 | ) | (92,580 | ) | ||||||||||
| 2024 | - | - | - | - | - | (33,482 | ) | ||||||||||||
| Kolpa | 2025 | 62,845 | 43,117 | 12,769 | 703 | 6,256 | 2,423 | ||||||||||||
| 2024 | - | - | - | - | - | - | |||||||||||||
| Exploration | 2025 | - | - | - | - | - | (13,340 | ) | |||||||||||
| 2024 | - | - | - | - | - | (8,417 | ) | ||||||||||||
| Corporate | 2025 | - | - | - | - | - | (19,679 | ) | |||||||||||
| 2024 | - | - | - | - | - | (12,777 | ) | ||||||||||||
| Consolidated | 2025 | $ | 294,926 | $ | 188,335 | $ | 48,131 | $ | 22,265 | $ | 36,195 | $ | (95,318 | ) | |||||
| 2024 | $ | 175,428 | $ | 99,113 | $ | 24,548 | $ | 17,432 | $ | 34,335 | $ | (32,501 | ) | ||||||
| ENDEAVOUR SILVER CORP. NOTES TO THE CONDENSED CONSOLIDATED INTERIM FINANCIAL STATEMENTS Three months and nine months ended September 30, 2025 and 2024 (unaudited) (expressed in thousands of US dollars, unless otherwise stated) |
The Exploration segment included $1,910 of costs incurred in Chile for the nine months ended September 30, 2025 (September 30, 2024 - $847) and $94 of costs incurred in USA (September 30, 2024 - $32).
| |
Total assets | Total liabilities | Additions to fixed assets |
||||||||
| Guanaceví | September 30, 2025 | 130,430 | 64,050 | 13,216 | |||||||
| December 31, 2024 | 114,745 | 43,896 | 22,876 | ||||||||
| Bolañitos | September 30, 2025 | 42,896 | 17,030 | 7,473 | |||||||
| December 31, 2024 | 53,176 | 7,886 | 7,893 | ||||||||
| Terronera | September 30, 2025 | 514,201 | 280,703 | 114,312 | |||||||
| December 31, 2024 | 373,531 | 173,376 | 189,912 | ||||||||
| Kolpa | September 30, 2025 | 220,470 | 88,046 | 14,610 | |||||||
| December 31, 2024 | - | - | - | ||||||||
| Exploration | September 30, 2025 | 88,229 | 811 | 1,431 | |||||||
| December 31, 2024 | 86,579 | 1,326 | 1,571 | ||||||||
| Corporate | September 30, 2025 | 20,800 | 57,582 | 29 | |||||||
| December 31, 2024 | 91,218 | 8,328 | 3 | ||||||||
| Consolidated | September 30, 2025 | 1,017,026 | 508,222 | 151,071 | |||||||
| December 31, 2024 | $ | 719,249 | $ | 234,812 | $ | 222,255 |
17. COMMITMENTS & CONTINGENCIES
Commitments
As of September 30, 2025, the Company had $4,587 committed for capital equipment purchases.
Contingencies
Due to the nature of the Company's activities, various legal and tax matters are outstanding from time to time. The Company is routinely subject to audit by tax authorities in the countries in which it operates and has received a number of tax assessments in various locations, which are currently at various stages of progress with the relevant authorities. The outcomes of these audits and assessments are uncertain however, the Company is confident of its position on the various matters under review.
18. FINANCIAL INSTRUMENTS AND FAIR VALUE MEASUREMENTS
Copper Stream liability
Concurrently with the acquisition of Minera Kolpa on May 1, 2025, the Company entered into a ten year Copper Stream agreement on copper produced from Kolpa (the "Copper Stream ") with Versamet Royalties Corporation ("Versamet"). Under the Copper Stream agreement, Versamet provided a $35 million prepayment used to finance the cash consideration of Kolpa acquisition on May 1, 2025. In exchange Versamet will receive refined copper LME Warrants or copper credits in the amount greater of: (i) 95.8% of produced copper or (ii) 0.03 pounds of copper per pound of produced lead. After 6,000 tonnes are delivered, Versamet will purchase 71.85% of produced copper, decreasing to 47.9% after 10,500 tonnes until the end of the term of the agreement.
The purchase price is based on the spot price of refined copper. Untill the liability is repaid, Versamet will pay 10% in cash per tonne, with the remaining 90% offset against the prepayment. Once the prepayment is fully applied, Versamet will continue to pay 10% of the spot price. Versamet holds a right of first refusal on future royalties, streams, or similar interests from Kolpa. The agreement is secured by an equity pledge in Kolpa.
The copper stream liability is classified as level 3 in the fair value hierarchy and measured at fair value through profit or loss. The stream is valued using a discounted cash flow model based on current market and operational assumptions. The key unobservable inputs used in the valuation include a discount rate of 8.6%, reflecting credit risk and asset-specific risk, a copper price forecasts, based on observable forward price curves over the expected production term. The valuation involves significant judgment related to the life-of-mine production schedule, including expected output timing and volumes.
| ENDEAVOUR SILVER CORP. NOTES TO THE CONDENSED CONSOLIDATED INTERIM FINANCIAL STATEMENTS Three months and nine months ended September 30, 2025 and 2024 (unaudited) (expressed in thousands of US dollars, unless otherwise stated) |
Contingent payment on business acquisition (Note 4)
The contingent payment is payable in cash within 24 months of closing of the acquisition, and is classified as level 3 in the fair value hierarchy and measured at fair value through profit or loss. Consideration is valued using a discounted cash flow model. The key unobservable inputs used in the valuation include a discount rate of 15.0%, as well as assumptions about future technical report's silver equivalent ounces contained in Kolpas reserves and resources.
Commodity contracts
In connection with the Terronera Debt Facility (Note 10), on March 28, 2024, the Company entered into gold forward swap contracts to hedge against the fluctuation in gold prices. These have been amended to reflect the current gold production profile with settlement of 68,000 oz from August 2025 to June 2027 with a forward price of $2,311 per ounce of gold. During the three months ended September 30, 2025 the Company settled 3,585 gold oz and as of September 30, 2025 had 64,415 gold oz outstanding under gold forward swap contracts.
In June 2025 in relation to the amendment to the Terronera Debt facility, the Company implemented un-margined zero cost collars for 968,000 ounces of silver with a price range of $31 to $42, settling over the period from October 2025 to July 2026.
Foreign exchange contracts
The Company also hedges a portion of the estimated operating expenditures incurred in Mexican Pesos. As of September 30, 2025, the Company had $50,400 Mexican Peso forward contracts with a weighted average settlement exchange rate of 20.28 pesos for US dollar settling between October 2025 and December 2026.
Interest rate contracts
As part of the business acquisition the Company has acquired a fixed for variable interest rate swap in the amount of $8,308, maturing in April 2026 measured at fair value through profit and loss at $26 as of September 30, 2025.
| Gold forward swap |
Silver collars |
Mexican Peso forward |
Copper stream liability |
Total | |||||||||||
| Derivative liability at December 31, 2024 | $ | (24,618 | ) | $ | - | $ | (2,241 | ) | $ | - | $ | (26,859 | ) | ||
| Recognized at copper stream inception | - | - | - | (35,000 | ) | (35,000 | ) | ||||||||
| (Loss) gain on revaluation | (76,867 | ) | (4,493 | ) | 6,535 | (3,416 | ) | (78,241 | ) | ||||||
| Settled copper stream liability | - | - | - | 1,771 | 1,771 | ||||||||||
| Derivative asset (liability) at September 30, 2025 | $ | (101,485 | ) | $ | (4,493 | ) | $ | 4,294 | $ | (36,645 | ) | $ | (138,329 | ) | |
| Presented in the statement of financial position: | |||||||||||||||
| Derivative asset | $ | - | $ | - | $ | 3,650 | $ | - | $ | 3,650 | |||||
| Non-current derivative assets | - | - | 644 | - | 644 | ||||||||||
| Derivative liabilities | (59,168 | ) | (4,493 | ) | - | - | (63,661 | ) | |||||||
| Non-current derivative liabilities | (42,317 | ) | - | - | - | (42,317 | ) | ||||||||
| Current copper stream liability | - | - | - | (6,107 | ) | (6,107 | ) | ||||||||
| Non-current copper stream liability | $ | - | $ | - | $ | - | $ | (30,538 | ) | $ | (30,538 | ) | |||
| Derivative asset (liability) at September 30, 2025 | $ | (101,485 | ) | $ | (4,493 | ) | $ | 4,294 | $ | (36,645 | ) | $ | (138,329 | ) | |
| Gold forward swap | Silver collars |
Mexican Peso forward | Copper stream liability | Total | |||||||||||
| (Loss) gain on revaluation | $ | (76,867 | ) | $ | (4,493 | ) | $ | 6,535 | $ | (3,416 | ) | $ | (78,241 | ) | |
| Realized (loss) gain on derivatives | (3,772 | ) | - | 1,055 | - | (2,717 | ) | ||||||||
| Loss on derivative contracts | $ | (80,639 | ) | $ | (4,493 | ) | $ | 7,590 | $ | (3,416 | ) | $ | (80,958 | ) |
| ENDEAVOUR SILVER CORP. NOTES TO THE CONDENSED CONSOLIDATED INTERIM FINANCIAL STATEMENTS Three months and nine months ended September 30, 2025 and 2024 (unaudited) (expressed in thousands of US dollars, unless otherwise stated) |
(a) Financial assets and liabilities
As at September 30, 2025, the carrying and fair values of the Company's financial instruments by category were as follows:
| Fair value through profit or loss |
Amortized cost | Carrying value | Fair value | |||||||||
| Financial assets: | ||||||||||||
| Cash and cash equivalents | $ | - | $ | 57,027 | $ | 57,027 | $ | 57,027 | ||||
| Other investments | 1,096 | - | 1,096 | 1,096 | ||||||||
| Trade and other receivables | 14,121 | 3,554 | 17,675 | 17,675 | ||||||||
| Derivative assets | 4,294 | - | 4,294 | 4,294 | ||||||||
| Loan receivable | - | 3,006 | 3,006 | 3,006 | ||||||||
| Total financial assets | $ | 19,511 | $ | 63,587 | $ | 83,098 | $ | 83,098 | ||||
| Financial liabilities: | ||||||||||||
| Accounts payable, accrued liabilities and other | $ | 7,791 | $ | 101,774 | $ | 109,565 | $ | 109,565 | ||||
| Derivative liabilities | 105,978 | - | 105,978 | 105,978 | ||||||||
| Copper stream liability | 36,645 | - | 36,645 | 36,645 | ||||||||
| Contingent payment | 8,430 | - | 8,430 | 8,430 | ||||||||
| Loans payable | - | 159,064 | 159,064 | 159,064 | ||||||||
| Total financial liabilities | $ | 158,844 | $ | 260,838 | $ | 419,682 | $ | 419,682 |
As at December 31, 2024, the carrying and fair values of the Company's financial instruments by category were as follows:
| Fair value through profit or loss |
Amortized cost | Carrying value | Fair value | |||||||||
| Financial assets: | ||||||||||||
| Cash and cash equivalents | $ | - | $ | 106,434 | $ | 106,434 | $ | 106,434 | ||||
| Other investments | 1,070 | - | 1,070 | 1,070 | ||||||||
| Trade and other receivables | 3,310 | 355 | 3,665 | 3,665 | ||||||||
| Loan receivable | - | 2,556 | 2,556 | 2,556 | ||||||||
| Total financial assets | $ | 4,380 | $ | 109,345 | $ | 113,725 | $ | 113,725 | ||||
| Financial liabilities: | ||||||||||||
| Accounts payable, accrued liabilities and other | $ | 3,853 | $ | 50,090 | $ | 53,943 | $ | 53,943 | ||||
| Derivative liabilities | 26,859 | - | 26,859 | 26,859 | ||||||||
| Loans payable | - | 120,236 | 120,236 | 120,236 | ||||||||
| Total financial liabilities | $ | 30,712 | $ | 170,326 | $ | 201,038 | $ | 201,038 |
| ENDEAVOUR SILVER CORP. NOTES TO THE CONDENSED CONSOLIDATED INTERIM FINANCIAL STATEMENTS Three months and nine months ended September 30, 2025 and 2024 (unaudited) (expressed in thousands of US dollars, unless otherwise stated) |
(b) Fair value hierarchy
Assets and liabilities as at September 30, 2025 measured at fair value on a recurring basis include:
| Level 1 | Level 2 | Level 3 | Total | |||||||||
| Financial assets: | ||||||||||||
| Other investments | $ | 1,034 | $ | - | $ | 62 | $ | 1,096 | ||||
| Trade receivables | - | 14,121 | - | 14,121 | ||||||||
| Derivative assets | - | 4,294 | - | 4,294 | ||||||||
| Total financial assets | $ | 1,034 | $ | 18,415 | $ | 62 | $ | 19,511 | ||||
| Financial liabilities: | ||||||||||||
| Cash settled deferred share units | $ | 7,791 | $ | - | $ | - | $ | 7,791 | ||||
| Derivative liabilities | - | 105,978 | - | 105,978 | ||||||||
| Copper Stream liability | - | - | 36,645 | 36,645 | ||||||||
| Contingent payment | - | - | 8,430 | 8,430 | ||||||||
| Total financial liabilities | $ | 7,791 | $ | 105,978 | $ | 45,075 | $ | 158,844 |
Assets and liabilities as at December 31, 2024 measured at fair value on a recurring basis include:
| Level 1 | Level 2 | Level 3 | Total | |||||||||
| Financial assets: | ||||||||||||
| Other investments | $ | 1,050 | $ | - | $ | 20 | $ | 1,070 | ||||
| Trade receivables | - | 3,310 | - | 3,310 | ||||||||
| Total financial assets | $ | 1,050 | $ | 3,310 | $ | 20 | $ | 4,380 | ||||
| Financial liabilities: | ||||||||||||
| Cash settled deferred share units | $ | 3,829 | $ | - | $ | - | $ | 3,829 | ||||
| Share appreciation rights | - | 24 | - | 24 | ||||||||
| Derivative liability | - | 26,859 | - | 26,859 | ||||||||
| Total financial liabilities | $ | 3,829 | $ | 26,883 | $ | - | $ | 30,712 |
19. SUBSEQUENT EVENT
On October 1, 2025, the Company determined that commercial production had been achieved at the Terronera mine, as the operation met the defined criteria set forth by management, including sustained throughput level and recovery rates.
| ENDEAVOUR SILVER CORP. NOTES TO THE CONDENSED CONSOLIDATED INTERIM FINANCIAL STATEMENTS Three months and nine months ended September 30, 2025 and 2024 (unaudited) (expressed in thousands of US dollars, unless otherwise stated) |
HEAD OFFICE Suite 1130, 609 Granville Street
Vancouver, BC, Canada V7Y 1G5
Telephone: (604) 685-9775
1-877-685-9775
Website: www.edrsilver.com
DIRECTORS Margaret Beck
Daniel Dickson
Amy Jacobsen
Angela Johnson
Rex McLennan
Kenneth Pickering
Mario Szotlender
OFFICERS Daniel Dickson - Chief Executive Officer
Donald Gray - Chief Operating Officer
Elizabeth Senez - Chief Financial Officer
Greg Baylock - Vice President, Operations
Luis Castro - Senior Vice President, Exploration
Dale Mah - Vice President, Corporate Development
Allison Pettit - Vice President, Investor Relations
Alejandra Hincapie - Corporate Secretary
REGISTRAR AND Computershare Trust Company of Canada
TRANSFER AGENT 3rd Floor - 510 Burrard Street
Vancouver, BC, Canada V6C 3B9
AUDITORS KPMG LLP
777 Dunsmuir Street
Vancouver, BC, Canada V7Y 1K3
SOLICITORS Blake, Cassels & Graydon LLP
Suite 3500, 1133 Melville Street
Vancouver, BC, Canada V6E 4E5
SHARES LISTED Toronto Stock Exchange
Trading Symbol - EDR
New York Stock Exchange
Trading Symbol - EXK

Endeavour Silver Corp.
Management’s Discussion & Analysis
For the Three Months and Nine Months Ended September 30, 2025 and 2024
| MANAGEMENT'S DISCUSSION AND ANALYSIS FOR THE PERIOD ENDED SEPTEMBER 30, 2025 |
This Management Discussion and Analysis ("MD&A") should be read in conjunction with the condensed consolidated interim financial statements of Endeavour Silver Corp. ("Endeavour" or "the Company") for the period ended September 30, 2025 and the related notes contained therein, which were prepared in accordance with IAS 34 - Interim financial reporting of the International Financial Reporting Standards ("IFRS") as issued by the International Accounting Standards Board. The Company uses certain non-IFRS financial measures in this MD&A as described under "Non-IFRS Measures". Additional information relating to the Company, including the most recent Annual Information Form (the "Annual Information Form"), is available on SEDAR+ at www.sedarplus.com, and the Company's most recent annual report on Form 40-F has been filed with the U.S. Securities and Exchange Commission (the "SEC") on EDGAR at www.sec.gov. This MD&A contains "forward-looking statements" that are subject to risk factors set out in a cautionary note contained herein. All dollar ($) amounts are expressed in United States ("$") dollars and tabular amounts are expressed in thousands of U.S. dollars unless Canadian dollars (CAN$) or Mexican pesos (MXN) are otherwise indicated. This MD&A is dated as of November 6, 2025, and all information contained is current as of November 6, 2025, unless otherwise stated.
Cautionary Note to U.S. Investors Regarding Mineral Reserves and Resources
This MD&A has been prepared in accordance with the requirements of Canadian provincial securities laws, which differ from the requirements of U.S. securities laws. As a result, the Company reports the mineral reserves and resources of the projects it has an interest in according to Canadian standards. Canadian reporting requirements for disclosure of mineral properties are governed by National Instrument 43-101 - Standards of Disclosure for Mineral Projects ("NI 43-101"). NI 43-101 is a rule developed by the Canadian Securities Administrators that establishes standards for all public disclosure an issuer makes of scientific and technical information concerning mineral projects. These standards differ from the requirements of the SEC that are applicable to domestic United States reporting companies under subpart 1300 of Regulation S-K ("S-K 1300") under the Exchange Act. As an issuer that prepares and files its reports with the SEC pursuant to the Multijurisdictional Disclosure System, the Company is not subject to the requirements of S-K 1300. Any mineral reserves and mineral resources reported by the Company in accordance with NI 43-101 may not qualify as such under or differ from those prepared in accordance with S-K 1300. Accordingly, information included or incorporated by reference in this MD&A concerning descriptions of mineralization and estimates of mineral reserves and resources under Canadian standards may not be comparable to similar information made public by United States companies subject to the reporting and disclosure requirements of S-K 1300.
Forward-Looking Statements
This MD&A contains "forward-looking statements" within the meaning of the U.S. Securities Litigation Reform Act of 1995, as amended and "forward-looking information" within the meaning of applicable Canadian securities legislation. Such forward-looking statements and information include, but are not limited to, statements regarding the development of the Terronera Project (as defined herein), the Company's areas of focus for the Terronera Project, estimated Terronera Project economics; Terronera Project's forecasted operations, costs and expenditures; the reliability of mineral resource estimates; the continuation of exploration and mining operations; the Company's future production and cost guidance announcements; mineral resource estimations and life of mine plans; planned expansions, exploration and drilling activities, and the Company's areas of focus for each; plans to develop a current mineral resource estimate for Kolpa and related timing; the Company's plans for drilling and technical work; Endeavour's annual outlook including anticipated performance in 2025, including production and cost guidance and financial results, silver and gold grades and recoveries, cash costs per ounce ("oz"), anticipated operating costs, planned capital expenditures and sustaining capital the price of gold and silver; planned capital allocation; working capital; the Company's capital requirements and the adequacy of the operating cash flow and existing working capital to meet capital requirements and the timing and results of various activities. Forward-looking statements are frequently characterized by words such as "plan", "expect", "forecast", "project", "intend", "believe", "anticipate", "outlook" and other similar words, or statements that certain events or conditions "may" or "will" occur. Forward-looking statements are based on the opinions and estimates of management at the dates the statements are made, and are subject to a variety of risks and uncertainties and other factors that could cause actual events or results to differ materially from those projected in the forward-looking statements.
The Company does not intend to, and does not assume any obligation to, update such forward-looking statements or information, other than as required by applicable law. Forward-looking statements or information involve known and unknown risks, uncertainties and other factors and are based on assumptions that may cause the actual results, level of activity, performance or achievements of the Company and its operations and related timeframes to be materially different from those expressed or implied by such statements. Such factors and assumptions include, among others: the ongoing effects of inflation and supply chain issues on project economics; fluctuations in the prices of silver and gold; fluctuations in the currency markets (particularly the Mexican peso, Chilean peso, Canadian dollar, Peruvian sol, and U.S. dollar); fluctuations in interest rates; effects of inflation changes in national and local governments, legislation, taxation, controls, regulations and political or economic developments in Canada, Peru and Mexico; operating or technical difficulties in mineral exploration, development and mining activities; risks and hazards of mineral exploration, development and mining (including, but not limited to environmental hazards, industrial accidents, unusual or unexpected geological conditions, pressures, cave-ins and flooding); inadequate insurance, or inability to obtain insurance; availability of and costs associated with mining inputs and labour; the speculative nature of mineral exploration and development; diminishing quantities or grades of mineral reserves as properties are mined; risks in obtaining necessary licenses and permits; challenges to the Company's title to properties; as well as those factors described under "Risk Factors" in the Company's most recent Annual Information Form and in the Company's prospectus dated July 10, 2025. Although the Company has attempted to identify important factors that could cause actual results to differ materially from those contained in forward-looking statements or information, there may be other factors that cause results to be materially different from those anticipated, described, estimated, assessed or intended. There can be no assurance that any forward-looking statements or information will prove to be accurate as actual results and future events could differ materially from those anticipated in such statements or information. Accordingly, readers should not place undue reliance on forward-looking statements or information.
Certain forward-looking statements and information in this MD&A may be considered "financial outlook" within the meaning of applicable Canadian securities legislation. Financial outlook is presented in this MD&A for the purpose of assisting investors and others in understanding certain key elements of the Company's financial results and business plan, as well as the objectives, strategic priorities and business outlook of the Company, and in obtaining a better understanding of the Company's anticipated operating environment. Readers are cautioned that such financial outlook may not be appropriate for other purposes.
Qualified Person
The scientific and technical information contained in this MD&A relating to the Company's mines and mineral projects has been reviewed and approved by Dale Mah, B.Sc., P.Geo., Vice President Corporate Development of Endeavour, a Qualified Person within the meaning of NI 43-101.
Table of Contents
OVERVIEW OF THE BUSINESS
The Company is engaged in silver mining in Mexico and related activities including property acquisition, exploration, development, mineral extraction, processing, refining and reclamation. The Company is also engaged in exploration activities in Chile and Nevada, USA. The Company's operations are comprised of the Guanaceví and Bolañitos mines located in Durango, Mexico and Guanajuato, Mexico respectively. The Company was developing the Terronera project located in Jalisco State, Mexico (the "Terronera Project") and on October 16, 2025, announced that commercial production had been achieved as at October 1, 2025, as the operation met the defined criteria set forth by management, including sustained throughput level and recovery rates. The Company is advancing several other exploration projects in order to achieve its goal of becoming a premier senior producer in the silver mining sector.
On May 1, 2025, the Company completed the acquisition of all outstanding shares of Compañia Minera Kolpa S.A. ("Minera Kolpa" or "Kolpa"), a privately held silver-focused polymetallic mining company located in Huancavelica, Peru. The total consideration was approximately $134.3 million, comprising $78.0 million in cash, $48.4 million in Endeavour common shares, and up to $10.0 million in contingent payments based on mineral resource expansion targets (the "Transaction"), valued at $7.9 million at the date of the acquisition. As part of the Transaction, Endeavour also assumed $25.8 million in debt.
The Company's common shares are listed on the Toronto Stock Exchange (TSX: EDR) and the New York Stock Exchange (NYSE: EXK).
OPERATING HIGHLIGHTS
|
Three Months Ended September 30 |
|
Q3 2025 Highlights |
Nine months Ended September 30 |
|||||
|
2025 |
2024 |
% Change |
|
2025 |
2024 |
% Change |
||
|
|
|
|
Production |
|
|
|
||
|
1,766,926 |
874,717 |
102% |
Silver ounces produced |
4,456,455 |
3,647,295 |
22% |
||
|
7,285 |
9,290 |
(22%) |
Gold ounces produced |
23,379 |
29,972 |
(22%) |
||
|
5,664 |
- |
- |
Lead tonnes produced |
9,167 |
- |
- |
||
|
3,666 |
- |
- |
Zinc tonnes produced |
5,982 |
- |
- |
||
|
3,037,156 |
1,617,925 |
88% |
Silver equivalent ounces produced(1) |
7,438,645 |
6,045,055 |
23% |
||
|
18.09 |
11.35 |
59% |
Cash costs per silver ounce(2) |
16.58 |
12.83 |
29% |
||
|
28.95 |
18.65 |
55% |
Total production costs per ounce(2) |
26.43 |
19.41 |
36% |
||
|
30.53 |
25.82 |
18% |
All-in sustaining costs per ounce (2) |
27.19 |
23.10 |
18% |
||
|
400,245 |
175,065 |
129% |
Processed tonnes |
913,580 |
615,848 |
48% |
||
|
144.88 |
138.54 |
5% |
Direct operating costs per tonne(2) |
145.91 |
137.90 |
6% |
||
|
192.78 |
189.85 |
2% |
Direct costs per tonne(2) |
198.92 |
187.95 |
6% |
||
|
|
|
|
Financial |
|
|
|
||
|
111.4 |
53.4 |
109% |
Revenue from operations ($ millions) |
260.2 |
175.4 |
48% |
||
|
1,762,484 |
1,017,392 |
73% |
Silver ounces sold |
4,441,848 |
3,991,055 |
11% |
||
|
7,478 |
9,412 |
(21%) |
Gold ounces sold |
23,722 |
30,179 |
(21%) |
||
|
38.58 |
29.63 |
30% |
Realized silver price per ounce |
35.07 |
26.71 |
31% |
||
|
3,550 |
2,528 |
40% |
Realized gold price per ounce |
3,308 |
2,328 |
42% |
||
|
31.5 |
- |
- |
Pre-operating production revenue ($ millions) |
34.8 |
- |
- |
||
|
722,130 |
- |
- |
Pre-operating production silver equivalent ounces sold(1) |
807,841 |
- |
- |
||
|
(42.0) |
(17.3) |
(143%) |
Net earnings (loss) ($ millions) |
(95.3) |
(32.5) |
(193%) |
||
|
(2.1) |
1.6 |
(231%) |
Adjusted net earnings (loss) ($ millions)(2) |
(11.5) |
0.9 |
(1,384%) |
||
|
15.6 |
12.5 |
25% |
Mine operating earnings ($ millions) |
36.2 |
34.3 |
5% |
||
|
39.7 |
19.6 |
102% |
Mine operating cash flow before taxes ($ millions)(2) |
84.6 |
59.1 |
43% |
||
|
13.6 |
4.5 |
205% |
Operating cash flow before working capital changes(2) |
36.3 |
21.5 |
69% |
||
|
(12.6) |
(5.6) |
(126%) |
EBITDA ($ millions)(2) |
(29.3) |
5.7 |
(617%) |
||
|
28.2 |
13.9 |
103% |
Adjusted EBITDA ($ millions)(2) |
54.1 |
42.0 |
29% |
||
|
(56.1) |
29.4 |
(291%) |
Working capital ($ millions) (2) |
(56.1) |
29.4 |
(291%) |
||
|
|
|
|
Shareholders |
|
|
|
||
|
(0.14) |
(0.07) |
(100%) |
Earnings (loss) per share - basic ($) |
(0.34) |
(0.14) |
(143%) |
||
|
(0.01) |
0.01 |
(200%) |
Adjusted earnings (loss) per share - basic ($)(2) |
(0.04) |
0.00 |
(100%) |
||
|
0.05 |
0.02 |
150% |
Operating cash flow before working capital changes per share(2) |
0.13 |
0.09 |
44% |
||
|
291,373,472 |
246,000,878 |
18% |
Weighted average shares outstanding |
279,183,612 |
238,827,655 |
17% |
||
(1) Silver equivalents are calculated using an 80:1 (Ag:Au) ratio, 60:1 (Ag:Pb) ratio, 85:1 (Ag:Zn) ratio and 300:1 (Ag:Cu) ratio.
(2) Non-IFRS measure. For a description of how these measures are calculated and a reconciliation of these measures to the most directly comparable measures specified, defined or determined under IFRS and presented in the Company's financial statements, refer to "Non-IFRS Measures".
The above highlights are key measures used by management, however they should not be the sole measures used in determining the performance of the Company's operations.
REVIEW OF OPERATING RESULTS
Consolidated Production Results from Operations for the Three Months and Nine Months Ended September 30, 2025 and 2024
|
Three Months Ended September 30 |
CONSOLIDATED |
Nine Months Ended September 30 |
||||
|
2025 |
2024 |
% Change |
|
2025 |
2024 |
% Change |
|
400,245 |
175,065 |
129% |
Ore tonnes processed |
913,580 |
615,848 |
48% |
|
1,766,926 |
874,717 |
102% |
Total silver ounces produced |
4,456,455 |
3,647,295 |
22% |
|
7,285 |
9,290 |
(22%) |
Total gold ounces produced |
23,379 |
29,972 |
(22%) |
|
5,664 |
- |
- |
Total lead tonnes produced |
9,167 |
- |
- |
|
3,666 |
- |
- |
Total zinc tonnes produced |
5,982 |
- |
- |
|
120 |
- |
- |
Total copper tonnes produced |
178 |
- |
- |
|
3,037,156 |
1,617,925 |
88% |
Silver equivalent ounces produced(1) |
7,438,645 |
6,045,055 |
23% |
|
18.09 |
11.35 |
59% |
Cash costs per silver ounce(2) |
16.58 |
12.83 |
29% |
|
28.95 |
18.65 |
55% |
Total production costs per ounce(2) |
26.43 |
19.41 |
36% |
|
30.53 |
25.82 |
18% |
All in sustaining costs per ounce (2) |
27.19 |
23.10 |
18% |
|
144.88 |
138.54 |
5% |
Direct operating costs per tonne(2) |
145.91 |
137.90 |
6% |
|
192.78 |
189.85 |
2% |
Direct costs per tonne(2) |
198.92 |
187.95 |
6% |
(1) Silver equivalents are calculated using an 80:1 (Ag:Au) ratio, 60:1 (Ag:Pb) ratio, 85:1 (Ag:Zn) ratio and 300:1 (Ag:Cu) ratio (or $30/oz silver, $2,400/oz gold, $1,800/tonne lead, $2,550/tonne zinc and $9,000/tonne copper)
(2) Non-IFRS measure. For a description of how these measures are calculated and a reconciliation of these measures to the most directly comparable measures specified, defined or determined under IFRS and presented in the Company's financial statements, refer to "Non-IFRS Measures".
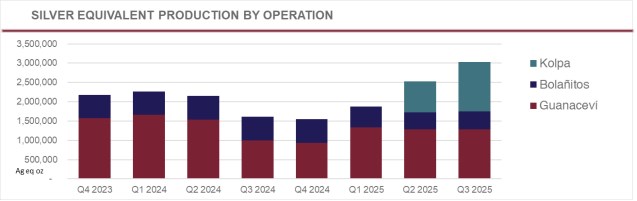
(1) Silver equivalents are calculated using an 80:1 (Ag:Au) ratio, 60:1 (Ag:Pb) ratio, 85:1 (Ag:Zn) ratio and 300:1 (Ag:Cu) ratio
Consolidated Production
Three months ended September 30, 2025 (compared to the three months ended September 30, 2024)
Consolidated plant throughput for the quarter was 400,245 tonnes, 129% higher than 175,065 tonnes in Q3 2024. Plant throughput has primarily increased due to the addition of the Kolpa mine which contributed 195,752 tonnes or 49% of the consolidated throughput as well as due to a 48% increase at Guanaceví which had lower throughput in the comparative period following a trunnion failure in early August 2024. Throughput at Bolañitos of 105,153 tonnes was 3% lower compared to Q3 2024.
Consolidated silver production during Q3 2025 was 1,766,926 oz, 102% higher than 874,717 oz in Q3 2024. The higher silver production was primarily due to the addition of the Kolpa mine, acquired on May 1, 2025, which contributed 598,689 oz of silver during the quarter. In addition Guanaceví had 33% higher silver production than the same period in 2024 due to a trunnion failure. Bolañitos had 36% higher silver production, due to the higher silver grade in the current period.
Kolpa also added new base metal outputs, including 5,664 tonnes of lead, 3,666 tonnes of zinc, and 120 tonnes of copper, none of which were present in the comparative period.
Gold production totaled 7,285 oz, 22% lower than the same period in 2024. This decline was driven by the 37% decrease at Bolañitos as a result of lower gold grades and was partially offset by a 13% increase at Guanaceví due to the higher throughput and offsetting lower grades experienced.
Nine months ended September 30, 2025 (compared to the nine months ended September 30, 2024)
Consolidated silver production for the nine months ended September 30, 2025, was 4,456,455 ounces, 22% higher than 3,647,295 ounces produced in the same period of 2024. Gold production totaled 23,379 ounces, 22% lower than the same period in 2024. Plant throughput reached 913,580 tonnes, a 48% increase over the 615,848 tonnes processed in the first nine months of 2024.
Higher throughput and silver production were primarily due to the addition of the Kolpa mine, acquired on May 1, 2025, which contributed 314,648 tonnes or 34% of consolidated throughput and 979,327 of silver oz. Consolidated gold production was 22% lower primarily due to decline in average gold grades at both Bolañitos and Guanaceví and partially due to the 6% lower throughput at Bolañitos.
Consolidated Operating Costs
Three months ended September 30, 2025 (compared to the three months ended September 30, 2024)
Direct operating costs per tonne in Q3 2025 were $144.88, 5% higher than $138.54 in Q3 2024. This increase was caused by the addition of Kolpa which has higher direct operating cost per tonne, and higher direct operating cost per tonne at Bolañitos and Guanaceví, offset by higher throughput at Guanaceví compared to Q3 2024.
Consolidated cash costs per silver ounce, net of by-product credits, were $18.09 in Q3 2025, a 59% increase compared to $11.35 in Q3 2024. The increase was driven by a shift in the ratio of silver to gold production at Bolañitos and Guanaceví, with lower grades of gold leading to lower by-product credits and higher cash costs net of by-product. Higher consolidated cash costs per silver ounce were further driven by the higher cost of third party purchased material and was partially offset by the addition of Kolpa, which at $16.43 cash cost per ounce had a positive impact on the average cash cost.
All-In Sustaining Costs (AISC) per silver ounce in Q3 2025 were $30.53, 18% higher than $25.82 in Q3 2024. This increase was driven by the higher AISC at Bolañitos caused by higher cash costs net of by-product discussed above as well as due to the higher corporate general and administrative expenses caused by the revaluation of the deferred share unit due to the share price increase.
Nine months ended September 30, 2025 (compared to the nine months ended September 30, 2024)
Consolidated direct operating costs per tonne for the nine months ended September 30, 2025, were $145.91, 6% higher than $137.90 in the same period of 2024. This increase was impacted by higher costs per tonne at Bolañitos, due to the higher direct production costs, lower throughput and lower by-product credits.
Consolidated cash costs per silver ounce, net of by-product credits, were $16.58 for the nine months ended September 30, 2025, 29% higher than $12.83 in the same period of 2024. The increase was driven by increased costs at Guanaceví due to the higher cost of third-party purchases and fewer silver ounces produced, as well as increased costs at Bolañitos, partially offset by the addition of Kolpa, which at $14.64 per ounce helped decrease the consolidated average cash cost.
Consolidated AISC in the first nine months of 2025 was $27.19 per ounce, 18% higher than the first nine months of 2024, driven by increase in cash costs net of by-product and corporate general and administrative expenses as noted above.
GUANACEVÍ OPERATIONS
The Guanaceví operation is currently producing from two underground silver-gold mines along a five kilometre ("km") length of the prolific Santa Cruz vein. Guanaceví provides steady employment to 580 employees and engages over 250 contractors. The Guanaceví Mine purchases mill feed from small scale local miners.
In July 2019, the Company acquired a 10 year right to explore and exploit the El Porvenir and El Curso concessions from Ocampo Mining SA de CV ("Ocampo"), a subsidiary of Grupo Frisco. The Company agreed to meet certain minimum production targets from the properties, subject to various terms and conditions, and pay Ocampo a $12 fixed per tonne production payment plus a floating net smelter return royalty based on the silver spot price. The Company pays a 4% royalty on sales below $15.00 per silver oz, 9% above $15.00 per silver oz, 13% above $20.00 per silver oz, and a maximum of 16% above $25 per silver oz.
Production Results for the Three Months and Nine Months Ended September 30, 2025 and 2024
|
Three Months Ended September 30 |
GUANACEVÍ |
Nine Months Ended September 30 |
||||
|
2025 |
2024 |
% Change |
|
2025 |
2024 |
% Change |
|
99,340 |
67,094 |
48% |
Ore tonnes processed |
298,612 |
294,995 |
1% |
|
340 |
402 |
(15%) |
Average silver grade (g/t) |
350 |
388 |
(10%) |
|
94.3 |
88.7 |
6% |
Silver recovery (%) |
90.4 |
89.7 |
1% |
|
1,024,321 |
768,905 |
33% |
Total silver ounces produced |
3,037,523 |
3,300,400 |
(8%) |
|
1,021,248 |
766,599 |
33% |
Payable silver ounces produced |
3,028,411 |
3,290,499 |
(8%) |
|
1.07 |
1.46 |
(27%) |
Average gold grade (g/t) |
1.22 |
1.32 |
(8%) |
|
93.5 |
89.8 |
4% |
Gold recovery (%) |
91.7 |
89.4 |
3% |
|
3,194 |
2,828 |
13% |
Total gold ounces produced |
10,745 |
11,195 |
(4%) |
|
3,184 |
2,821 |
13% |
Payable gold ounces produced |
10,713 |
11,162 |
(4%) |
|
1,279,860 |
995,146 |
29% |
Silver equivalent ounces produced(1) |
3,897,142 |
4,196,000 |
(7%) |
|
22.98 |
19.59 |
17% |
Cash costs per silver ounce(2) |
20.88 |
17.24 |
21% |
|
30.98 |
24.68 |
26% |
Total production costs per ounce(2) |
28.08 |
22.00 |
28% |
|
31.09 |
30.83 |
1% |
All in sustaining costs per ounce (2) |
28.24 |
24.96 |
13% |
|
186.11 |
206.56 |
(10%) |
Direct operating costs per tonne(2) |
182.56 |
180.38 |
1% |
|
349.83 |
330.55 |
6% |
Direct costs per tonne(2) |
328.42 |
279.68 |
17% |
(1) Silver equivalents are calculated using an 80:1 (Ag:Au) ratio.
(2) Non-IFRS measure. For a description of how these measures are calculated and a reconciliation of these measures to the most directly comparable measures specified, defined or determined under IFRS and presented in the Company's financial statements, refer to "Non-IFRS Measures".
Guanaceví Production Results
Three months ended September 30, 2025 (compared to the three months ended September 30, 2024)
During the three months ended September 30, 2025, the Guanaceví mine processed 99,340 tonnes of ore, 48% higher than 67,094 tonnes in the same period of 2024, due to the trunnion failure in August 2024 that impacted Q3 2024 production. The average silver grade was 340 g/t in Q3 2025, down from 402 g/t in Q3 2024. Silver recovery was 94.3%, up from 88.7% for the same period in the prior year. The higher milled tonnes were partially offset by lower silver grades, resulting in a 33% increase in total silver production to 1,024,321 ounces, compared to 768,905 ounces in Q3 2024.
Gold production totaled 3,194 ounces, 13% higher than 2,828 ounces in Q3 2024. Higher gold production is result of higher throughput and higher recovery rates, partially offset by 27% lower gold grades. Changes in grade and recovery reflect expected variations to differences between planned and actual grades and from accessing different areas in the mine.
Nine months ended September 30, 2025 (compared to the nine months ended September 30, 2024)
During the nine months ended September 30, 2025, the Guanaceví mine processed 298,612 tonnes of ore, 1% higher than 294,995 tonnes processed in the same period of 2024. The average silver grade was 350 g/t in 2025, down from 388 g/t in 2024. Silver recovery was 90.4%, slightly higher than 89.7% in the prior year period. Despite the consistent throughput recoveries the lower grades drove lower total silver production which was 3,037,523 ounces, 8% lower than 3,300,400 ounces in 2024.
Gold production for the nine months ended September 30, 2025, was 10,745 ounces, 4% lower than 11,195 ounces produced in the same period of 2024. The lower silver and gold production was primarily due to lower average grades, partially offset by slightly higher recoveries and stable throughput.
Guanaceví Operating Costs
Three months ended September 30, 2025 (compared to the three months ended September 30, 2024)
Direct operating costs per tonne for the three months ended September 30, 2025, were $186.11, a 10% decrease compared to $206.56 in the same period in 2024, largely driven by the lower throughput in prior period caused by the trunnion failure. Including royalty and special mining duty costs, direct costs per tonne rose by 6% to $349.83 in Q3 2025 compared with $330.55 in Q3 2024. Direct costs per tonne have increased due to 57% higher costs partially offset by 48% higher tonnes. Increase in direct cost was in turn caused by higher third-party material purchases which have become more expensive on a per tonne basis as well as a higher volume purchased than in Q3 2024. The purchase of local purchased material contributed $73.9 per tonne during Q3, 2025 compared to $41.7 per tonne in Q3 2024; the volume of purchased material was higher at 19,146 tonnes compared to 10,216 tonnes in the same period in 2024. Total royalty expense increased from $5.1 million in 2024 to $7.6 million, royalty expense being included in cost per tonne and cost per oz metrics. Royalty expense has increased due to the higher realized silver prices and volume of silver ounces sold in the period.
Cash costs per silver ounce were $22.98 in Q3 2025, 17% higher than $19.59 in Q3 2024. Total production costs per ounce were $30.98, a 26% increase compared to $24.68 in Q3 2024, mostly due to 56% higher cash costs net of by-product credits, partially offset by 33% higher silver production. AISC per ounce also rose by 1% to $31.09 compared to $30.83 in Q3 2024, primarily due to the 34% higher underlying all-in sustaining costs, partially offset by 33% higher silver production.
Nine months ended September 30, 2025 (compared to the nine months ended September 30, 2024)
Direct operating costs per tonne for the nine months ended September 30, 2025, were $182.56, 1% higher than $180.38 in the same period in 2024. Including royalty and special mining duty costs, direct costs per tonne were $328.42, 17% higher than $279.68 in 2024. This increase reflects impact of higher cost of third-party material purchases, royalty costs and special mining duty which have become more expensive per tonne due to higher metal prices and increased income before tax.
Cash costs per silver ounce, net of by-product credits, were $20.88 for the nine months ended September 30, 2025, 21% higher than $17.24 in 2024, driven by higher underlying cash costs net of by-product credits, and lower silver production. AISC per ounce were $28.24, 13% higher than $24.96 in the same period of 2024, due to the same cost drivers.
BOLAÑITOS OPERATIONS
The Bolañitos operation encompasses three underground silver-gold mines and a flotation plant. Bolañitos provides steady employment for 520 employees and engages 230 contractors.
Production Results for the Three Months and Nine Months September 30, 2025 and 2024
|
Three Months Ended September 30 |
BOLAÑITOS |
Nine Months Ended September 30 |
||||||
|
2025 |
2024 |
% Change |
|
2025 |
2024 |
% Change |
||
|
105,153 |
107,971 |
(3%) |
Ore tonnes processed |
300,320 |
320,853 |
(6%) |
||
|
50 |
36 |
39% |
Average silver grade (g/t) |
55 |
40 |
38% |
||
|
85.1 |
84.7 |
1% |
Silver recovery (%) |
82.8 |
84.1 |
(2%) |
||
|
143,916 |
105,812 |
36% |
Total silver ounces produced |
439,605 |
346,895 |
27% |
||
|
137,052 |
100,694 |
36% |
Payable silver ounces produced |
418,312 |
330,563 |
27% |
||
|
1.36 |
2.00 |
(32%) |
Average gold grade (g/t) |
1.48 |
1.99 |
(26%) |
||
|
89.0 |
93.1 |
(4%) |
Gold recovery (%) |
88.4 |
91.5 |
(3%) |
||
|
4,091 |
6,462 |
(37%) |
Total gold ounces produced |
12,634 |
18,777 |
(33%) |
||
|
3,968 |
6,291 |
(37%) |
Payable gold ounces produced |
12,265 |
18,267 |
(33%) |
||
|
471,158 |
622,779 |
(24%) |
Silver equivalent ounces produced(1) |
1,450,287 |
1,849,055 |
(22%) |
||
|
(11.47) |
(51.38) |
78% |
Cash costs per silver ounce(2) |
(10.32) |
(30.97) |
67% |
||
|
9.70 |
(27.25) |
136% |
Total production costs per ounce(2) |
9.93 |
(6.34) |
257% |
||
|
27.22 |
(12.31) |
321% |
All in sustaining costs per ounce (2) |
16.72 |
4.59 |
265% |
||
|
111.44 |
96.27 |
16% |
Direct operating costs per tonne(2) |
114.12 |
98.84 |
15% |
||
|
118.41 |
102.42 |
16% |
Direct costs per tonne(2) |
120.54 |
103.61 |
16% |
||
(1) Silver equivalents are calculated using an 80:1 (Ag:Au) ratio.
(2) Non-IFRS measure. For a description of how these measures are calculated and a reconciliation of these measures to the most directly comparable measures specified, defined or determined under IFRS and presented in the Company's financial statements, refer to "Non-IFRS Measures".
Bolañitos Production Results
Three months ended September 30, 2025 (compared to the three months ended September 30, 2024)
During the three months ended September 30, 2025, the Bolañitos mine processed 105,153 tonnes of ore, 3% lower than 107,971 tonnes in the same period of 2024. The average silver grade was 50 g/t in Q3 2025, higher than 36 g/t in Q3 2024. Silver recovery was steady at 85.1%, slightly higher than 84.7% in the prior year period. The higher silver grade was partially offset by slightly lower throughput, resulting in 36% higher silver production of 143,916 ounces, compared to 105,812 ounces in Q3 2024.
Gold production totaled 4,091 ounces, 37% lower than 6,462 ounces in Q3 2024, reflecting a 32% decrease in average gold grade (1.36 g/t vs. 2.00 g/t), and slightly lower gold recovery and throughput. The fluctuations in silver and gold grades are due to differences between planned and actual grades rom accessing different areas of the mine.
Nine months ended September 30, 2025 (compared to the nine months ended September 30, 2024)
Silver production at the Bolañitos mine was 439,605 oz during the nine months ended September 30, 2025, 27% higher than the same period of 2024. Gold production during the nine months was 33% lower at 12,634 oz compared to the same period in 2024.
Plant throughput for the nine months ended September 30, 2025, was 6% lower at 300,320 tonnes, partially due to the essential maintenance for the repair of the ball mill motor stator and primary crusher replacement in Q2. Average silver grades were 38% higher at 55 gpt silver driving the 27% higher silver production, however average gold grades were 26% lower at 1.48 gpt gold, driving the 33% lower gold production.
Bolañitos Operating Costs
Three months ended September 30, 2025 (compared to the three months ended September 30, 2024)
Cash costs per silver ounce were negative $11.47 in Q3 2025, compared to negative $51.38 in Q3 2024. This change is predominantly due to the 37% lower gold production, which resulted in a lower by-product credit, partially offset by higher silver production. Total production costs per ounce increased to positive $9.70 per oz from negative $27.25 per oz in Q3 2024, reflecting the same cost drivers. As a result of higher cash cost per silver oz, slightly higher sustaining capital expenditures, and higher allocated general and administrative expenses, driven by DSU revaluation AISC has increased from negative $12.31 per oz to positive $27.22 per oz.
Nine months ended September 30, 2025 (compared to the nine months ended September 30, 2024)
Cash costs per silver ounce were negative $10.32 for the nine months ended September 30, 2025, compared to negative $30.97 in the same period of 2024. This change is predominantly due to the 33% lower gold production, which resulted in a lower by-product credit, in addition to slightly higher direct operating costs, and was partially offset by 27% higher silver production. Total production costs per ounce increased to positive $9.93 from negative $6.34 in 2024, reflecting the same cost drivers. AISC per ounce increased to $16.72 compared to $4.59 in the same period of 2024, due to the higher cash costs net of by product, higher sustaining capital expenditures, partially offset by lower loan payments, general and administrative expenses, and mine site exploration costs compared to the same period of 2024.
KOLPA OPERATIONS
Kolpa, was acquired by Endeavour Silver in May 2025 and is located in the Huachocolpa region of Huancavelica, about 490 kilometers southeast of Lima. Peru, a key mining jurisdiction, ranks as the world's third largest silver producer. In 2024, Kolpa processed approximately 685,000 tonnes, yielding 2.0 million ounces of silver, along with 19,820 tonnes lead, 12,554 tonnes zinc and 518 tonnes copper. In silver-equivalent terms, this amounted to a total production of 5.1 million ounces (Moz). The Kolpa mine produces three types of concentrate and receives payment for other contained minerals, including gold and antimony. Kolpa provides steady employment for over 660 employees and engages 1,500 contractors.
The Company has filed a technical report prepared in accordance with NI 43-101 entitled, "Technical Report on the Huachocolpa Uno Mine Property, Huancavelica Province, Peru" (the "Current Technical Report"). The Current Technical Report has an effective date of December 31, 2024, and was prepared by Allan Armitage, Ph. D., P. Geo., Ben Eggers, MAIG, P.Geo., Henri Gouin, P.Eng. each of SGS Geological Services, and by Dale Mah, P.Geo., and Donald Gray, SME-RM of Endeavour.
The Current Technical Report contains a historical mineral resource estimate (the "Historical Estimate"), originally disclosed in a technical report titled "Huachocolpa Uno Preliminary Economic Assessment" dated May 7, 2024. The Historical Estimate is not considered current and is not being relied upon by the Company. A qualified person has not done sufficient work to classify the Historical Estimate as current mineral resources. The Company is not treating the Historical Estimate as current mineral resources, has not verified this information and is not relying on it.
The Company plans to prepare a current mineral resource estimate for Kolpa in 2026. As such, the Company has not provided production guidance for 2025.
Production Results for the Three Months and Nine Months September 30, 2025 and 2024
|
Three Months Ended September 30(3) |
KOLPA |
Nine Months Ended September 30(3) | ||||||
|
2025 |
2024 |
% Change |
|
2025 |
2024 |
% Change |
||
|
195,752 |
- |
- |
Ore tonnes processed |
314,648 |
- |
- |
||
|
104.93 |
- |
- |
Average silver grade (g/t) |
107.37 |
- |
- |
||
|
90.7 |
- |
- |
Silver recovery (%) |
90.2 |
- |
- |
||
|
598,689 |
- |
- |
Total silver ounces produced |
979,327 |
- |
- |
||
|
567,017 |
- |
- |
Payable silver ounces produced |
926,364 |
- |
- |
||
|
3.07 |
- |
- |
Average Pb grade (%) |
3.09 |
- |
- |
||
|
94.2 |
- |
- |
Lead recovery (%) |
94.3 |
- |
- |
||
|
5,664 |
- |
- |
Total lead tonnes produced |
9,167 |
- |
- |
||
|
5,381 |
- |
- |
Payable lead tonnes produced |
8,699 |
- |
- |
||
|
2.20 |
- |
- |
Average Zn grade (%) |
2.22 |
- |
- |
||
|
85.1 |
- |
- |
Zinc recovery (%) |
85.6 |
- |
- |
||
|
3,666 |
- |
- |
Total zinc tonnes produced |
5,982 |
- |
- |
||
|
3,247 |
- |
- |
Payable zinc tonnes produced |
5,204 |
- |
- |
||
|
0.21 |
- |
- |
Average Cu grade (%) |
0.21 |
- |
- |
||
|
29.2 |
- |
- |
Copper recovery (%) |
26.4 |
- |
- |
||
|
120 |
- |
- |
Total copper tonnes produced |
178 |
- |
- |
||
|
115 |
- |
- |
Payable copper tonnes produced |
170 |
- |
- |
||
|
1,286,139 |
- |
- |
Silver equivalent ounces produced(1) |
2,091,217 |
- |
- |
||
|
16.43 |
- |
- |
Cash costs per silver ounce(2) |
14.64 |
- |
- |
||
|
29.95 |
- |
- |
Total production costs per ounce(2) |
28.50 |
- |
- |
||
|
30.31 |
- |
- |
All in sustaining costs per ounce(2) |
28.51 |
- |
- |
||
|
141.92 |
- |
- |
Direct operating costs per tonne(2) |
141.47 |
- |
- |
||
|
153.03 |
- |
- |
Direct costs per tonne(2) |
150.82 |
- |
- |
||
(1) Silver equivalents are calculated using an 60:1 (Ag:Pb) ratio, 85:1 (Ag:Zn) ratio and 300:1 (Ag:Cu) ratio.
(2) Non-IFRS measure. For a description of how these measures are calculated and a reconciliation of these measures to the most directly comparable measures specified, defined or determined under IFRS and presented in the Company's financial statements, refer to "Non-IFRS Measures".
(3) The production results for the nine months ended September 30, 2025, show only five months of operations, following the Kolpa acquisition on May 1, 2025. As the asset was not owned or operated by the Company during the comparative periods in 2024, no corresponding data is presented for those periods. As such, year-over-year comparisons are not applicable and should be interpreted accordingly.
Kolpa Production Results
Three months ended September 30, 2025
During the three months ended September 30, 2025, the Kolpa mine processed 195,752 tonnes of ore. The average silver grade was 104.93 g/t, with a recovery of 90.7%, resulting in silver production of 598,689 ounces. Lead production totaled 5,664 tonnes, based on an average grade of 3.07% and a recovery of 94.2%. Zinc production was 3,666 tonnes, with an average grade of 2.20% and a recovery of 85.1%. Copper production reached 120 tonnes, with an average grade of 0.21% and a recovery of 29.2%. Throughput has been steadily increasing during Q3 but was offset by lower grades. Production was in line with management's expectations and historical performance.
Year to date discussion & analysis: Five months ended September 30, 2025
During the five months ended September 30, 2025, the Kolpa mine processed 314,648 tonnes of ore. The average silver grade was 107.37 g/t, with a recovery of 90.2%, resulting in silver production of 979,327 ounces. Lead production totaled 9,167 tonnes, based on an average grade of 3.09% and a recovery of 94.3%. Zinc production was 5,982 tonnes, with an average grade of 2.22% and a recovery of 85.6%. Copper production reached 178 tonnes, with an average grade of 0.21% and a recovery of 26.4%. Throughput has been steadily increasing during the five month period, but was offset by lower grades. Production was in line with management's expectations and historical performance.
Kolpa Operating Costs
Three months ended September 30, 2025
During the three months ended September 30, 2025, Kolpa's cash costs were $16.43 per silver ounce. Inclusive of depreciation and share-based compensation, total production costs totaled $29.95 per ounce. Compared to Q2 2025 and management expectations production costs have increased - mostly driven by higher metal prices which have negatively impacted the cost of purchased of third-party material, royalties, special mining duty, and employee participation in profits. AISC included additional exploration, general and administrative which were higher compared to Q2 2025 mainly due to the allocation to Kolpa of its share of $2.7 million DSU revaluation caused by share price increase included in corporate general & administrative costs, as well as higher sustaining capital expenditures during the period. AISC totaled $30.31 per ounce, due to the reasons stated above.
Year to date discussion & analysis: Five months ended September 30, 2025
During the five months ended September 30, 2025, Kolpa's cash costs were $14.64 per silver ounce. Inclusive of depreciation and share-based compensation, total production costs totaled $28.50 per ounce. All-in sustaining costs included additional exploration, general and administrative, and sustaining capital expenditures totaling $28.51 per ounce. Costs were higher than Q2 2025 driven by the factors discussed above.
TERRONERA PROJECT
The Terronera Project, located approximately 40 km northeast of Puerto Vallarta in the state of Jalisco, Mexico, hosts a high-grade silver-gold mineral resource along the Terronera vein. During the Q3 period, Terronera processed 145,680 tonnes of material, with average grades of 64 grams per tonne (g/t) silver and 2.08 g/t gold, producing approximately 212,043 ounces of silver and 6,256 ounces of gold. During the quarter, the mill achieved average metal recoveries of 70.7% for silver and 64.2% for gold.
On September 24, operations were temporarily impacted due to a circuit electrical problem in the SAG mill, caused by high humidity and condensation, which damaged the pre-charge resistors. As a result, the plant remained offline for six days while new resistors were fabricated and installed. Operations resumed successfully on September 30. Between September 1 and September 23, Terronera processed a total of 39,190 tonnes of material, reaching a single-day peak of 2,162 tonnes and averaging 1,866 tonnes per day, with average metal recoveries of 82.8% for silver and 72.3% for gold. This included two down days in early September for planned maintenance. Between July 1 and October 15, Terronera recorded 100 days of continuous activity, with only eight days of downtime, and has sustained strong metal recoveries since mid-August, demonstrating stable plant performance and operating reliability.
Given the consistent performance during the period, and notwithstanding the unplanned offline periods for the plant as noted above, the mine and processing plant consistently exceeded 90% of the nameplate capacity (2,000 tpd) while also achieving 90% of projected metallurgical recoveries. Therefore, the Company made a declaration of commercial production effective October 1, 2025.
EXPLORATION AND EVALUATION
At Guanaceví, the Company drilled a total of 4 holes totaling 1,173 meters at a total expense of $0.3 million, focusing on underground diamond drilling in the El Curso mine, specifically targeting the La Cruz area between Milache and El Curso. Geological mapping was carried out across multiple claims, including San Pedro, Mina de Agua, La Arianeña, and Santa Cruz Cuatro. Environmental and reclamation activities, such as tree planting and soil conservation, were also completed during the quarter. This is in addition to 12 holes totaling 2,769 meters drilled at a total expense of $0.6 million in the first half of 2025.
At Bolañitos, the Company drilled 9 holes totaling 1,984 meters during the quarter at a total expense of $0.3 million, primarily focused on surface diamond drilling in the La Luz North area, targeting the La Luz, La Paz, and San Bernabé veins. Geological mapping and topographical surveying were conducted across multiple zones, including La Paz, Lucita, and the road connecting La Luz North to the Bolañitos processing plant. Engagement with local landowners and ongoing maintenance of core storage facilities continued. This is in addition to 23 holes totaling 4,917 meters drilled at a total expense of $0.4 million in the first half of 2025.
At Terronera, the Company drilled 19 holes totaling 2,957 meters during Q3 2025, at the total cost of $0.7 million. Exploration effort was primarily focused on underground diamond drilling in the La Luz vein area. Geological mapping and underground sampling advanced across multiple zones, including Real, La Cadena, and Quiteria. Additional activities included topographical surveying, maintenance of drilling equipment, supporting ongoing exploration and development efforts in Terronera. This is in addition to 10 holes totaling 1,213 meters drilled at a total expense of $0.2 million in the first half of 2025.
At Parral the Veta Colorada Mine, activities focused on monitoring pumps at various levels and maintaining underground infrastructure. Topographical surveying and maintenance work continued, with ongoing support for environmental and reclamation programs in the broader project area, at a total cost of $0.1 million in addition to $0.2 million of costs incurred in the first half of 2025.
At Pitarrilla, the Company did not perform any drilling but has instead focused the exploration efforts on infrastructure and study work at the total expense of $1.4 million. Work performed during the quarter included recovering a collapsed exploration ramp, with progress including the manufacture and installation of steel frames, patching and reinforcement, and injection of approximately 1,400 m³ of expansive resin to fill the cavity. Environmental efforts continued with monthly monitoring of 57 wells and piezometers, regular water table checks, and the rescue and relocation of 701 cacti (totaling 3,603 plants), alongside completion of the first fieldwork campaign for the environmental baseline study. This is in addition to 42 holes totaling 7,333 meters drilled at a total expense of $3.4 million in the first half of 2025.
In Chile the Company drilled 6 holes totaling 1,288 meters at the cost of $0.9 million. Drilling was mainly performed at the Anastasia project, targeting the Jimena and Quillay veins. Exploration also progressed at the Aida, Genesis, and Catalina projects through environmental permitting, geochemical and spectral studies, and community engagement. This is in addition to 4 holes totaling 1,546 meters drilled at a total expense of $0.7 million in the first half of 2025.
At Kolpa, the Company drilled 64 holes totaling 8,950 meters during the quarter at a total cost of $1.5 million, conducting both surface and underground exploration in the Bienaventurada, Caudalosa, and Yamila areas. The program confirmed the mineral potential of both zones and supported continued resource development in the district. This is in addition to 100 holes totaling 5,006 meters drilled at the expense of $1.0 million in the first half of the 2025.
Holding costs were recorded for concessions and properties across the broader exploration portfolio.
CONSOLIDATED FINANCIAL RESULTS
Three months ended September 30, 2025 (compared to the three months ended September 30, 2024)
Revenue of $142.8 million in Q3 2025, net of $3.1 million of smelting and refining costs, has significantly increased compared to $53.4 million, net of $0.5 million of smelting and refining costs, in Q3 2024. Gross sales of $146.0 million in Q3 2025 are 171% higher than gross sales of $53.9 million for the same period in 2024. Revenue have increased predominantly due to the $39.0 million of revenue contribution from Kolpa, and $31.5 million of revenue from Terronera, with the remaining increase caused by a 30% increase in realized price of silver and 40% increase in realized price of gold and partially offset by slightly lower production from Bolañitos and Guanaceví.
During Q3 2025, the Company sold 1,975,175 oz silver and 13,847 oz gold (inclusive of 212,691oz of silver and 6,368 oz of gold from pre-operating production at Terronera ), for realized prices of $38.58 and $3,550 per oz, respectively, compared to sales of 1,017,392 oz silver and 9,412 oz gold, for realized prices of $29.63 and $2,528 per oz, respectively, in the same period of 2024. For the three months ended September 30, 2025, the realized prices of silver were within 2% with the average market prices and gold prices were within 3% of market prices. Silver and gold market prices averaged $39.38 and $3,458 per oz, respectively. Additionally, the company recorded $10.5 million from sales of lead, $8.8 million from sales of zinc, $1.2 million from sales of copper, and $0.2 million from sales of other metals including antimony.
Cost of sales for Q3 2025 was $127.2 million, an increase of 211% over the cost of sales of $41.0 million for Q3 2024. The increase in the cost of sales compared to the prior period was driven by $35.1 million costs at Kolpa and $35.1 million from Terronera. The Company's mine operating earnings were $15.6 million in Q3 2025, 25% higher than the $12.5 million in the comparative period due to the $2.8 million higher operating earnings in Bolañitos and Guanaceví, as well as $3.9 million operating earnings from Kolpa, partially offset by Terronera's mine operating loss of $3.6 million during the commissioning period.
Exploration, evaluation and development expenses were $7.3 million compared to $4.7 million incurred in the same period of 2024, primarily due to the additional exploration expenditures in Q3 2025 on advancing the Pitarrilla Project as well as additional exploration work at Kolpa which has incurred $1.5 million of exploration expenses. General and administrative expenses of $6.5 million in Q3 2025 were higher compared to the $4.0 million incurred for the same period of 2024. Of the $2.5 million of the general and administrative expenses increase, $2.3 million was due to the larger revaluation of the DSU's to their fair market value caused by the increase in the share. As a result, the Company incurred operating earnings of $1.8 million for the quarter (Q3 2024 - earnings of $3.8 million).
The Company incurred a foreign exchange gain of $0.6 million in Q3 2025 compared to a loss of $3.1 million in Q3 2024 due to changes in U.S. dollar value of foreign currency monetary balances at the end of the period, primarily the Mexican peso. For the three months period ended September 30, 2025, due to the revaluation of the Mexican peso forward contracts and gold forward swap contracts, the Company recognized a net loss on derivative contracts of $39.0 million (Q3 2024 - $19.4 million), primarily from the loss on revaluation of the gold forward swap contracts of $34.0 million (Q3 2024 - $17.9 million) and silver collar contract of $4.5 million (Q3 2024 - $ nil), and $2.1 million loss on revaluation of copper stream liability (Q3 2024 - $nil), partially offset by $1.6 million gains on Mexican peso forward contracts (Q3 2024 - loss of $1.5 million).
The Company incurred $1.0 million in finance charges primarily from interest on loans related to mobile equipment and accretion of reclamation and rehabilitation liabilities, compared to $0.5 million in the same period in 2024. Additionally, in Q3 2025 the Company recognized an income of $0.2 million in investment and other income, compared to income of $5.9 million in Q3 2024. The change is predominantly caused by the interest income on previously disputed VAT refund following a court resolution that was received in Q3 2024 as well as the loss on revaluation of the contingent payments recorded in Q3 2025. These losses, partially offset by the foreign exchange gains, contributed to a loss before taxes for Q3 2025 of $37.5 million (Q3 2024 - loss of $13.3 million).
Income tax expense was $4.5 million in Q3 2025 compared to $4.0 million in Q3 2024. The $4.5 million tax expense is comprised of $10.7 million expense in current income tax (Q3 2024 – expense of $4.5 million) and a recovery of $6.2 million in deferred income tax (Q3 2024 – recovery of $0.5 million). The current income tax expense consists of $2.4 million in special mining duty taxes and $8.3 million expense of current income taxes. The deferred income tax recovery of $6.2 million is derived from changes in temporary timing differences between accounting and tax recognition. After these tax charges, the Company realized a net loss for the period of $42.0 million (Q3 2024 – net loss of $17.3 million).
The Company’s adjusted net loss was $2.1 million in Q3 2025, compared to adjusted net earnings of $1.6 million in Q3 2024, largely due to the $5.7 million comparative difference in investment and other category partially offset by the higher mine profitability. Adjusted net earnings (loss) is a Non-IFRS measure. For a description of how these measures are calculated and a reconciliation of these measures to the most directly comparable measures specified, defined or determined under IFRS and presented in the Company’s financial statements, refer to “Non-IFRS Measures”.
As at September 30, 2025, the Company's finished goods inventory included 228,652 oz of silver and 775 oz of gold, compared to 280,265 oz silver and 1,526 oz gold at June 30, 2025. The cost allocated to these finished goods was $8.8 million as at September 30, 2025, compared to $11.5 million at June 30, 2025. As at September 30, 2025, the finished goods inventory fair market value was $13.5 million, compared to $15.1 million at June 30, 2025.
Nine months ended September 30, 2025 (compared to the nine months ended September 30, 2024)
Revenue of $294.9 million, net of $5.1 million of smelting and refining costs, increased by 68% compared to $175.4 million, net of $1.4 million of smelting and refining costs, in 2024. Gross sales of $300.0 million in the period are 70% higher than $176.8 million during the same period in 2024.
The increase in revenue was driven primarily by the addition of $62.8 million from Kolpa and $34.8 million from Terronera as well as a 31% increase in realized silver prices and a 42% increase in realized gold prices. During the period, the Company sold 4,682,170 oz silver and 30,816 oz gold (inclusive of 240,231 oz of silver and 7,094 oz of gold from pre-operating production at Terronera), for realized prices of $35.07 and $3,308 per oz, respectively, compared to sales of 3,991,055 oz silver and 30,179 oz gold, with realized prices of $26.71 and $2,328 per oz, respectively, in the same period of 2024.
Cost of sales for the nine months ended September 30, 2025, totaled $258.7 million, an 83% increase over $141.1 million in the same period in 2024. This increase was primarily driven by $56.6 million in cost of sales in Kolpa, as well as by $44.3 million in Terronera, which resulted in mine operating earnings of $36.2 million (2024 - $34.3 million).
Exploration and evaluation expenses were $16.7 million, compared to $13.3 million incurred in the same period of 2024. General and administrative expenses of $18.4 million for the nine months ended September 30, 2025, were 50% higher compared to the $12.3 million incurred for the same period of 2024, primarily due to the $3.6 million of Kolpa business acquisition costs which are ineligible to be capitalized, and $1.9 million comparatively higher loss on revaluation of directors DSU's carried at fair market value. These changes resulted in operating earnings of $1.1 million (2024 - earnings of $8.8 million).
The Company incurred loss on derivative valuation of $81.0 million (2024 – $28.6 million) mostly driven by $80.7 million loss on a gold forward swap (2024 – 25.1 million), furthered by a $4.5 million loss on silver collars (2024 – $ nil) and $3.4 million copper stream liability revaluation (2024 – $ nil) and partially offset by $7.6 million gain on Mexican Peso forward (2024 – loss of $3.5 million). Due to less volatility in the Mexican Peso, the Company incurred foreign exchange gain of $0.3 million during the nine-months period ended September 30, 2025, compared to a foreign exchange loss of $5.9 million in 2024. The Company incurred $2.6 million in finance charges primarily from interest on loans and partially due to interest on leases, accretion of reclamation and rehabilitation liabilities. These finance charges are in comparison to $1.1 million for the same period in 2024. The Company recognized $2.3 million in investment and other income compared to $6.5 million in investment and other income in 2024, resulting from recognizing $1.8 million in interest income (2024 – $5.7 million), unrealized gain on marketable securities of $0.8 million (2024 – loss of $1.2 million) and $0.2 million of other various gains (2024 – $1.0 million) offset by $0.5 million of loss on revaluation of contingent liabilities. During the nine months ended September 30, 2024 contractual conditions have been met and the Company recognized $1.0 million of previously contingent consideration on the sale of the Cubo mine. As a result, the loss before taxes for the nine-months period ended September 30, 2025 was $79.9 million (2024 – $20.3 million).
Income tax expense was $15.5 million for the nine-months period ended September 30, 2025, compared to $12.2 million for the same period in 2024. The $15.5 million tax expense is comprised of $25.0 million in current income tax expense (2024 – $13.1 million) and a recovery of $9.6 million in deferred income tax (2024 – recovery of $0.9 million). The current income tax expense consists of $5.5 million in special mining duty taxes and $19.5 million of income taxes. The deferred income tax recovery of $9.6 million is derived from changes in temporary differences between the timing of deductions for accounting purposes compared to deductions for tax purposes.
KEY ECONOMIC TRENDS
Precious Metal Price Trends

The prices of silver and gold are a critical factor in determining profitability and cash flow from operations. The financial performance of the Company has been, and is expected to continue to be, closely linked to the prices of silver and gold.
During nine months ended September 30, 2025, the average price of silver was $35.04 per ounce, with silver trading between $29.41 and $46.95 per oz based on the London Fix silver price. This compares to an average of $27.22 per oz for the nine months ended September 30, 2024, with a low of $22.09 and a high of $32.48 per oz. For the nine months ended September 30, 2025, the Company realized an average price of $35.07 per silver oz compared with $26.71 per oz for the nine months ended September 30, 2024.
During nine months ended September 30, 2025, the average price of gold was $3,205 per oz, with gold trading between $2,633 and $3,834 per oz based on the market gold price. This compares to an average of $2,297 per oz for the nine months ended September 30, 2024, with a low of $1,985 and a high of $2,664 per oz. For the nine months ended September 30, 2025, the Company realized an average price of $3,308 per oz compared with $2,328 per oz for the nine months ended September 30, 2024.
Several factors drove the largest annual rise in gold price since 2010. Global tensions, including conflicts in Ukraine and the Middle East, expectation of slower economic growth, concerns over U.S. trade policies, and tariffs pushed investors and central banks toward gold to diversify away from the U.S. dollar and fiat currencies. These dynamics propelled gold to record highs, with prices reaching an all-time peak of $3,834 per ounce in September 2025 and silver following and reaching $46.95 per oz in the same month. Beyond the safe haven characteristic of silver, there has been a growing sense of optimism in the silver market, driven by industrial demand and supply constraints. The global push towards electrification, renewable energy, and electric vehicles (EVs), is expected to increase the demand for silver in industrial applications. Silver plays an indispensable role in solar panels, batteries, and other key technologies, positioning it as a strategic metal in the clean energy transition. Over this same period of industrial demand growth, the silver market has faced supply-demand deficits in recent years, with exploration, new discoveries and new production not keeping pace with mine depreciation. A lack of new major projects coming online, is creating a supply-demand imbalance that has supported the rise of silver price since the beginning of 2023.
Currency Fluctuations
The Company's operations in Q3 2025 were located in Mexico and Peru therefore a significant portion of operating costs and capital expenditures are denominated in Mexican pesos and Peruvian soles. The Company's corporate activities are based in Vancouver, Canada with a portion of these expenditures being denominated in Canadian dollars.
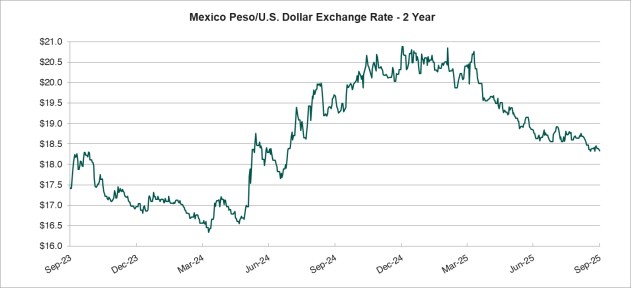
During nine months ended September 30, 2025, the Mexican peso strengthened against the U.S. dollar. The average foreign exchange rate was $19.48 Mexican pesos per U.S. dollar, with the peso trading within a range of $18.32 to $20.88. This compares to the same period in 2024 where the peso traded at an average of $17.66 Mexican pesos per U.S. dollar, and a range of $16.34 to $19.99 Mexican pesos per U.S. dollar.
Cost Trends

The Company's profitability is subject to industry-wide cost pressures on development and operating costs with respect to labour, energy, consumables and capital expenditures. Underground mining is labour intensive and approximately 33% of the Company's production costs are directly tied to labour. To mitigate the impact of higher labour and consumable costs, the Company focuses on continuous improvement by promoting more efficient use of materials and supplies and by pursuing more advantageous pricing while increasing performance and without compromising operational integrity. During the year ended December 31, 2024, costs continued to be impacted by inflationary and industry costs pressures, offset by downward pressure from a weaker Mexican peso. Higher metal prices in Q3 2025 drove a substantially higher cost of purchased third party material, higher royalties and higher special mining duty, which in combination with the strengthening Mexican peso and combined with the decrease in own mined material and lower plant throughput resulted in higher cost per tonne. Additionally, 1% higher special mining duty rate enacted by the Mexico government from January 1, 2025, contributed to higher special mining duty costs in 2025. The increase in cost per tonne was partially offset by incorporating Kolpa operations in period May 1, 2025, to September 30, 2025, as Kolpa has lower cost per tonne in comparison to Guanaceví and Bolañitos.
ANNUAL OUTLOOK
2025 Production and Cost Guidance
As announced at the beginning of 2025, Guanaceví and Bolañitos silver production was expected to range from 4.5 to 5.2 million oz and gold production is expected to be between 30,500 to 34,000 oz, for total silver equivalent production to between 7.0 and 7.9 million oz using an 80:1 silver:gold ratio. In the first nine months of 2025 these operations produced 5.3 million silver equivalent oz, in line with guidance.
As noted previously, the Kolpa mine has not defined a current mineral resource as per national instrument 43-101 and therefore has not provided production guidance for 2025. Throughput during the five months to September 2025 has increased as the plant as initiated its capital expansion plans, and continued throughput at least at this rate is expected to continue into the fourth quarter.
At Terronera, the Company forecasts throughput of approximately 360,000 tonnes over the next six months, with average grades estimated at 122 g/t silver and 2.52 g/t gold. Higher grade zones are scheduled to be accessed by mid-2026, which is expected to further enhance production. Management plans to issue annualized 2026 production and cost guidance for the Terronera mine in January 2026.
Consolidated cash costs and AISC (excluding Terronera and Kolpa) in 2025 were estimated to be $16.00-$17.00 per oz silver and $25.00-26.00 per oz silver, respectively, net of gold by-product credits. Consolidated cash costs (excluding Terronera and Kolpa) on a per ounce basis were expected to be higher in 2025 compared to 2024, primarily due to lower silver production from these mines as they enter their final years of production, and a lower estimated gold price. AISC were expected to be slightly higher in 2025 than realized in 2024 as higher levels of sustaining capital will be required with costs being borne by lower silver production.
| Cash costs, net of by-product credits1 | $/oz | $16.00 - $17.00 |
| AISC, net of by-product credits1 | $/oz | $25.00 - $26.00 |
| Sustaining capital1 budget | $M | $33.6 |
| Exploration & Corporate capital budget | $M | $2.6 |
(1) Non-IFRS measure. For a description of how these measures are calculated and a reconciliation of these measures to the most directly comparable measures specified, defined or determined under IFRS and presented in the Company's financial statements, refer to "Non-IFRS Measures".
Operating mines
At Guanaceví, 2025 plant throughput is estimated to range from 1,000 tonnes per day (tpd) to 1,100 tpd and average 1,060 tpd with material mined mainly from the Porvenir Cuatro extension on the El Curso concessions. The El Curso concessions were leased from a third party with no upfront costs, but with significant royalty payments on production. Mine grades in 2025 were expected to be slightly lower and recoveries are expected to be similar to 2024. Cash costs per ounce, AISC per ounce and direct costs on a per tonne basis were expected to be slightly higher in 2025 compared to 2024 due to the lower metal production and lower gold by-product credits from the lower gold price estimate. For the nine months ended September 30, 2025 Guanaceví plant throughput has averaged 1,094, at the higher end of the 2025 guidance. Due to the variation in grades achieved, silver production was at the lower end and gold production was the higher end of the guided range, with the silver equivalent production of 3.9 million for nine months period, falling in the middle of the guided range.
In 2025, plant throughput at Bolañitos was expected to range from 1,100 tpd to 1,200 tpd and average 1,170 tpd, sourcing material from the Plateros-La Luz, Lucero-Karina and Bolañitos-San Miguel vein systems. Mine grades were expected to be higher for silver and lower for gold and recoveries are expected to be similar to 2024. Cash costs per oz, AISC and direct costs on a per tonne basis are expected to be higher in 2025 compared to 2024. Ounce metrics were expected to be higher due to lower gold by-product credits driven by the lower gold price estimate, and higher costs on a per tonne basis. Direct costs per tonne were expected to be higher due to the lower throughput. For the nine months ended September 30, 2025 plant throughput has averaged 1,100 tpd, in line with the low end of the 2025 guided range. Due to the throughput being at the lower end of the range and grades being lower than expected, gold production of 12,634 oz for the nine months ended below the guided range and silver production landed at the low end of the guided range. Consequently, the silver equivalent production of 1.5 million for nine months period, was below the guided range of 2.2-2.4 million per year.
At Kolpa during the five months ended September 30, 2025, plant throughput was 314,648 tonnes in line with the designated mill capacity is 2,000 tpd. Plans are underway to expand the plant capacity to 2,500 tpd. Throughput and costs during this period were in line with management's expectations.
Consolidated Operating Costs
Direct operating costs per tonne for 2025 were estimated to be $130-$140. Direct costs, which include royalties and special mining duties, and take account of the impact of the higher Mexico mining taxes enacted at the start of 2025, are estimated to be in the range of $175-$185 per tonne.
Management used the following assumptions in calculating its 2025 cost forecasts: $27.50 per oz silver price, $2,200 per oz gold price, 18:1 Mexican peso per US dollar exchange rate, and a 4% Mexican annual inflation rate.
2025 Planned Capital Expenditures
| Sustaining Mine Development |
Sustaining Other Capital |
Total Sustaining Capital |
Growth Capital | Total Capital |
|
| Guanaceví | $12.7 million | $6.6 million | $19.3 million | - | $19.3 million |
| Bolañitos | $9.7 million | $4.6 million | $14.3 million | - | $14.3 million |
| Kolpa | $3.0 million | $15.0 million | $18.0 million | $12.5 million | $30.5 million |
| Pitarrilla | - | - | - | $9.1 million | $9.1 million |
| Exploration | - | - | - | $2.4 million | $2.4 million |
| Corporate | - | - | - | $0.2 million | $0.2 million |
Terronera Capital Expenditures
The Company has announced project completion upon reaching commercial production effective October 1, 2025. The Company has not incurred significant expenditures on the development of Terronera during Q3 2025. The final project cost was $339 million.
Sustaining Capital Investments
In 2025, Endeavour planned to invest $33.6 million in sustaining capital at its two operating mines and an additional $18.0 million at Minera Kolpa, inclusive of amounts already spent in the first half of 2025. At assumed metal prices, the sustaining capital investments are expected to be paid out of operating cash flow. For the first nine months of 2025, sustaining capital totaled $26.5 million.
At Guanaceví, $19.3 million was planned to be invested in capital projects, the largest of which being 5.3 kilometers of mine development at El Curso and Milache for an estimated $12.7 million. An additional $2.8 million was to be invested in mine infrastructure and equipment. A further $1.8 million was to be invested in the plant and tailings storage facility, including further work on the tailing facility expansion. The remaining $2.0 million was to be spent on various surface infrastructure or equipment. For the first nine months of 2025, spending on capital projects totaled $13.2 million.
At Bolañitos, $14.3 million will be invested in capital projects, including $9.7 million for 6.7 kilometers of mine development to access resources in the Plateros-La Luz, Lucero-Karina, and Bolañitos-San Miguel areas. An additional $4.6 million will go to upgrade the mining fleet, plant improvements and to support site infrastructure. For the first nine months of 2025, spending on capital projects totaled $7.5 million.
At Kolpa, for the period May to December 2025, sustaining capital is estimated to be $18.0 million which includes $7.6 million expansion of the tailings dam, $2.7 million allocated for mine infrastructure, $2.0 million for stockpile storage improvements, $1.3 million for ventilation systems and $4.4 million on various projects. For the period May 1, 2025, to September 30, 2025, sustaining capital expenditures at Kolpa totaled $5.9 million.
The Company also planned to spend $2.6 million to maintain exploration concessions, acquire mobile exploration equipment and cover corporate infrastructure. For the period from January 1, 2025, to September 30, 2025, this capital expenditure totaled $1.6 million.
LIQUIDITY AND CAPITAL RESOURCES
The Company has historically funded its acquisition, exploration and development activities through equity financings, debt facilities and convertible debentures. In recent years, the Company has financed most of its acquisition, exploration, development and operating activities from production cash flows, treasury, equity offerings and debt. The Company may choose to undertake equity, debt, convertible debt or other financings, on an as-needed basis, in order to facilitate its growth. On May 27, 2025, the Company filed an updated Base Shelf prospectus, and on July 10, 2025, issued a prospectus supplement for an offering of up to $60 million of shares through an at-the-market ("ATM") distributions ("ATM Facility"). As of September 30, 2025, $44.7 million of the facility remains available.
Management of the Company believes that operating cash flow and existing current assets will be sufficient to cover capital requirements and meet its short-term obligations for at least the next twelve months. The Company continues to assess financing alternatives, including equity or debt or a combination of both, to fund future growth, including the ramp up period at Terronera.
| Expressed in thousands of US dollars | As at September 30, 2025 | As at December 31, 2024 | ||
| Current assets | $207,931 | $157,647 | ||
| Current liabilities | 263,989 | 78,866 | ||
| Working capital surplus (deficit) | ($56,058) | $78,781 | ||
As at September 30, 2025, the Company had a working capital deficit of $56.1 million (December 31, 2024 - working capital surplus $78.8 million). The $134.8 million decrease in working capital was primarily due to the $114.3 million fixed asset additions at Terronera using working capital (both cash and current loans) for the completion of construction, commissioning, and ramp up as well as due to the $81.4 million increase in gold forward swap and silver collars derivative liabilities, due to the increase of the price of metals. The working capital balance was further negatively affected by the reclassification to current derivatives liability being settled during the twelve months after the balance sheet date which was partially offset by the reclassification from previously non-current IVA and additional accumulation of IVA for a total of $53.9 million. Management expects the working capital deficit to improve and become a working capital surplus over the next twelve months, through settlement of the portion of the gold forward swaps and silver collars and due to Terronera becoming a cash generating entity in the upcoming periods.
Three months ended September 30, 2025 (compared to the three months ended September 30, 2024)
Cash flow provided by operating activities
During Q3 2025, operating activities generated cash flow of $27.1 million compared to $8.5 million in Q3 2024. Cash flow provided by operations before working capital changes was $13.6 million in Q3 2025, compared to $4.5 million in Q3 2024. While Q3 2025 operating losses were higher than Q3 2024, operating cash flow before working capital adjustments was better than Q3 2024, mainly due to the higher metal prices driving the stronger cashflow.
Cash flow used by investing activities
During Q3 2025, investing activities used net cash of $34.4 million compared to $44.2 million in Q3 2024. Payments for mineral properties, plant and equipment totaled $34.6 million in Q3 2025 compared to $48.8 million in Q3 2024 due to the substantial development activity at Terronera in Q3 2024, as part of the project construction or subsequent commissioning phase.
Of the $34.6 million invested in mineral properties, plants and equipment during Q3 2025, $21.3 million was at Terronera, primarily on equipment and infrastructure. Additionally, $3.9 million was invested at Kolpa, primarily related to capacity expansion and mine development. At Guanaceví, the Company invested $5.0 million, with $3.6 million spent on mine development. At Bolañitos, $3.9 million was invested, $1.8 million of which was related to mine development. The remaining capital expenditures were related to Pitarrilla, exploration sites, or administrative investments
Cash flow provided by financing activities
Financing activities for the three months period ended September 30, 2025, provided $12.1 million, compared to $22.2 million in the same period of 2024. The largest changes were due to: $20.7 million proceeds received from options and public equity offerings in comparison to Q3 2024 which had no proceeds from offerings but had proceeds $25.0 million from loans payable. Other movements include $3.7 million of loans and lease payments (Q3 2024 - 1.0 million), $3.5 million of interest paid (Q3 2024 -$1.6 million) and $1.3 million repayment of the copper stream (Q3 2024 - $nil). In Q3 2024 the Company also had $0.6 million payment of deferred financing fees.
Nine months ended September 30, 2025 (compared to the nine months ended September 30, 2024)
Cash flow provided by operating activities
During the nine months ended September 30, 2025, operating activities generated cash flow of $52.0 million compared to $24.0 million in the same period of 2024. Cash flow provided by operations before working capital changes was $36.3 million in 2025, compared to $21.5 million in 2024. While 2025 operating losses were higher than 2024, operating cash flow before working capital adjustments was better in 2025 than in 2024, mainly due to a precious metals prepayment of $14.6 million at Guanaceví in 2025, a new prepayment facility set up during the period.
Cash flow used by investing activities
During the nine months ended September 30, 2025, investing activities used net cash of $200.4 million compared to $139.6 million in 2024. Payments for mineral properties, plant and equipment totaled $130.4 million in 2025 compared to $149.5 million in 2024, primarily due to lower spending on Terronera during 2025 compared to 2024 as construction was more intense in the prior year. The first nine months of 2025 included $72.8 million in net cash used for the Kolpa acquisition.
Of the $130.4 million invested in mineral properties, plants and equipment during the nine months ended September 30, 2025, $98.7 million was at Terronera, primarily on equipment and infrastructure. Additionally, $10.4 million was invested at Kolpa, primarily related to capacity expansion and mine development. At Guanaceví, the Company invested $13.2 million, of which $10.3 million was spent on mine development. At Bolañitos, the Company invested $7.5 million, $4.3 million of which was related to mine development. The remaining capital expenditures were related to Pitarrilla, exploration sites, or administrative investments.
Cash flow provided by financing activities
Financing activities for the nine months ended September 30, 2025, provided $98.8 million, compared to $134.8 million in the same period of 2024. The biggest changes include $70 million lower proceeds from loans payable in 2025, offset by $35 million of proceeds from copper stream prepayment received in 2025. $11.9 million higher proceeds from equity and option exercises have been offset by $12.4 million higher payments of loans, leases and interest.
Equity financings
During the three- and nine-months period ended September 30, 2025, the Company issued 2,638,915 common shares under the ATM Facility at an average price of $5.81 per share for gross proceeds of $15.3 million less commission of $0.3 million and $0.3 million of other transaction costs recognized as share issuance costs, which have been presented net within share capital.
On April 8, 2025, the Company completed a bought deal equity offering for the issuance of a total of 11,600,000 common shares at a price of $3.88 per share, which raised net cash proceeds of $45 million. On April 16, 2025 the underwriters exercised their over-allotment option with additional issuance of 1,285,000 common shares at a price of $3.88 per share. The Company has received gross proceeds of $50.0 million, less commission of $2.8 million and recognized $0.6 million of other transaction costs related to the financing as share issuance costs, which have been presented net within share capital. The Company used the net proceeds of the offering to fund the purchase price of Minera Kolpa.
| Use of proceeds (thousands) | |||
| Net proceeds received | $ | 46,562 | |
| Purchase Minera Kolpa | 46,562 | ||
| Allocated to working capital | $ | - |
On November 27, 2024 the Company completed a bought deal equity offering for the issuance of a total of 15,825,000 common shares at a price of $4.60 per share, which raised gross proceeds of $72,795,000 (the "November 2024 Financing").
For the November 2024 Financing, the net proceeds as at September 30, 2025 have been used as follows:
| Use of proceeds (thousands) | |||
| Net proceeds received | $ | 68,582 | |
| Advancing Pitarrilla project | 9,720 | ||
| Allocated to working capital | $ | 58,862 |
Debt financings
On October 6, 2023, the Company, through its wholly-owned subsidiary Terronera Precious Metals, S.A. de C.V. entered into a credit agreement with Société Generale and ING Capital LLC (together with ING Bank N.V.) for a senior secured debt facility for up to $120 million (the "Debt Facility"). On June 23, 2025, the credit agreement was amended and restated to include a third tranche of $15 million bringing the total of the fully drawn debt facility to $135 million. The third tranche is due in repayments over the 12 months following the quarter end.
The Debt Facility includes certain restrictive covenants with respect to the use of the loan proceeds, including restrictions on transferring funds out of the Terronera entity. These restrictions are not expected to have any impact on the Company's ability to meet its obligations.
Contingencies
The Company has a number of disputes with the Mexican tax authorities as disclosed in the MD&A for the year ended December 31, 2024, which are currently being addressed in the Mexican court process, and judgment is employed to assess the likelihood of outcomes in favour of the Company and recognition of any liabilities. The Company is also required to use judgement to determine certain tax treatments in calculating income tax expense and IVA recoverable. A number of these judgements are subject to various uncertainties. From time to time, Mexican authorities may apply, re-interpret legislation or disregard precedents and it is possible that these uncertainties may be resolved unfavorably for the Company.
Capital Requirements
As of September 30, 2025, the Company held $57.0 million in cash and cash equivalents and had a working capital deficit of $56.1 million. The Company may be required to raise additional funds through future debt or equity financings in order to carry out other business plans.
Contractual Obligations
The Company had the following undiscounted contractual obligations at September 30, 2025:
| Payments due by period (in thousands of US dollars) | |||||||||||||||
| Contractual Obligations |
Total | Less than 1 year | 1 - 3 years | 3 - 5 years | More than 5 years |
||||||||||
| Capital asset purchases | $ | 4,587 | $ | 4,587 | $ | - | $ | - | $ | - | |||||
| Accounts payable, accrued liabilities and other | 109,565 | 109,565 | - | - | - | ||||||||||
| Loans payable | 200,090 | 65,802 | 79,494 | 54,794 | - | ||||||||||
| Lease liabilities | 2,436 | 1,471 | 915 | 50 | - | ||||||||||
| Other contracts | 350 | 134 | 216 | - | - | ||||||||||
| Reclamation obligations | 28,090 | - | 3,209 | 9,784 | 15,097 | ||||||||||
| Total | $ | 345,118 | $ | 181,559 | $ | 83,834 | $ | 64,628 | $ | 15,097 | |||||
FINANCIAL INSTRUMENTS AND FAIR VALUE MEASUREMENTS
As at September 30, 2025, the carrying and fair values of the Company's financial instruments by category were as follows:
| As at September 30, 2025 | As at December 31, 2024 | |||||||||||
| Expressed in thousands of US dollars | Carrying value | Estimated Fair value |
Carrying value | Estimated Fair value |
||||||||
| Financial assets: | ||||||||||||
| Cash and cash equivalents | $ | 57,027 | $ | 57,027 | $ | 106,434 | $ | 106,434 | ||||
| Other investments | 1,096 | 1,096 | 1,070 | 1,070 | ||||||||
| Trade and other receivables | 17,675 | 17,675 | 3,665 | 3,665 | ||||||||
| Derivative assets | 4,294 | 4,294 | - | - | ||||||||
| Loan receivable | 3,006 | 3,006 | 2,556 | 2,556 | ||||||||
| Total financial assets | $ | 83,098 | $ | 83,098 | $ | 113,725 | $ | 113,725 | ||||
| Financial liabilities: | ||||||||||||
| Accounts payable, accrued liabilities and other current liabilities | $ | 109,565 | $ | 109,565 | $ | 53,943 | $ | 53,943 | ||||
| Derivative liabilities | 105,978 | 105,978 | 26,859 | 26,859 | ||||||||
| Copper stream liability | 36,645 | 36,645 | - | - | ||||||||
| Contingent payment | 8,430 | 8,430 | - | - | ||||||||
| Loans payable | 159,064 | 159,064 | 120,236 | 120,236 | ||||||||
| Total financial liabilities | $ | 419,682 | $ | 419,682 | $ | 201,038 | $ | 201,038 | ||||
Fair value hierarchy
Fair value is the price that would be received to sell an asset or paid to transfer a liability in an orderly transaction between market participants at the measurement date. The fair value hierarchy establishes three levels to classify the inputs to valuation techniques used to measure fair value. Level 1 inputs are quoted prices (unadjusted) in active markets for identical assets or liabilities. Level 2 inputs are quoted prices in markets that are not active, quoted prices for similar assets or liabilities in active markets, inputs other than quoted prices that are observable for the asset or liability (for example, interest rate and yield curves observable at commonly quoted intervals, forward pricing curves used to value currency and commodity contracts and volatility measurements used to value option contracts), or inputs that are derived principally from or corroborated by observable market data or other means. Level 3 inputs are unobservable (supported by no or little market activity). The fair value hierarchy gives the highest priority to Level 1 inputs and the lowest priority to Level 3 inputs.
Assets and liabilities as at September 30, 2025 that measured at fair value on a recurring basis include:
| As at September 30, 2025 | ||||||||||||
| Expressed in thousands of US dollars | Total | Level 1 | Level 2 | Level 3 | ||||||||
| Financial Assets: | ||||||||||||
| Other investments | $ | 1,096 | $ | 1,034 | - | $ | 62 | |||||
| Trade receivables | $ | 14,121 | - | $ | 14,121 | - | ||||||
| Derivative assets | $ | 4,294 | - | $ | 4,294 | - | ||||||
| Total financial assets | $ | 19,511 | $ | 1,034 | $ | 18,415 | $ | 62 | ||||
| Financial Liabilities: | ||||||||||||
| Cash-settled deferred share units | $ | 7,791 | $ | 7,791 | - | - | ||||||
| Copper stream liability | $ | 36,645 | - | - | $ | 36,645 | ||||||
| Contingent payment | $ | 8,430 | - | - | $ | 8,430 | ||||||
| Derivative liabilities | $ | 105,978 | - | $ | 105,978 | - | ||||||
| Total financial liabilities | $ | 158,844 | $ | 7,791 | $ | 105,978 | $ | 45,075 | ||||
Other investments
The Company holds marketable securities classified as Level 1 and Level 3 in the fair value hierarchy. The fair values of Level 1 investments are determined based on a market approach reflecting the closing price of each particular security at the reporting date. The closing price is a quoted market price obtained from the stock exchange that is the principal active market for the particular security, being the market with the greatest volume and level of activity for the assets. For Level 3 investments, which consist of share purchase warrants where inputs are not observable, they have an estimated value determined by using an option pricing model. Changes in fair value on available for sale marketable securities are recognized in earnings or loss.
Trade receivables
The trade receivables consist of receivables from provisional silver and gold sales from the Bolañitos and Kolpa mines. The fair value of receivables arising from concentrate sales contracts that contain provisional pricing mechanisms is determined using the appropriate quoted closing price on the measurement date from the exchange that is the principal active market for the particular metal. As such, these receivables, which meet the definition of an embedded derivative, are classified within Level 2 of the fair value hierarchy.
Derivative assets
The Company also hedged a portion of the estimated remaining capital and operating expenditures incurred in Mexican Pesos. The fair value of the foreign exchange forward contracts is determined using mark-to-market values provided by counterparties. These valuations are based on observable market inputs, including spot rate, forward foreign exchange rates and interest rate curves. Accordingly, the instruments are classified as Level 2 in the fair value hierarchy.
Deferred share units ("DSUs")
The Company has a cash settled DSU plan whereby DSUs may be granted to independent directors of the Company in lieu of compensation in cash or stock options. The DSUs vest immediately and are redeemable for cash based on the market value of the units at the time of a director's retirement. The DSUs are classified as Level 1 in the fair value hierarchy. The liability is determined based on a market approach reflecting the closing price of the Company's common shares at the reporting date. Changes in fair value are recognized in general and administrative expenses.
Copper stream liability
The Company entered into a copper stream agreement on copper produced by Kolpa. Under the copper stream agreement, Company received a $35 million prepayment used to finance the cash consideration of Kolpa acquisition on May 1, 2025. The copper stream liability is classified as level 3 in the fair value hierarchy and measured at fair value through profit or loss. The stream is valued using a discounted cash flow model based on current market and operational assumptions. The key unobservable inputs used in the valuation include a discount rate of 8.6%, reflecting credit risk and asset-specific risk, a copper price forecasts, based on observable forward price curves over the expected production term. The valuation involves significant management's judgment related to the life-of-mine production schedule, including expected output timing and volumes.
Derivative liabilities
Company holds certain gold forward swap contracts to hedge against the fluctuation in gold prices. The fair value of the gold forward swap contracts is determined using mark-to-market values provided by counterparties. These valuations are based on observable market inputs, including gold spot price, forward price curve and interest rate curves. Accordingly, the instruments are classified as Level 2 in the fair value hierarchy.
Financial Instrument Risk Exposure and Risk Management
The Company is exposed to a variety of financial instrument related risks. The board of directors approves and monitors the risk management process. The types of risk exposure and the way in which such exposure is managed is provided as follows:
Credit Risk
The Company is exposed to credit risk on its bank accounts, accounts receivable and loan receivable. Credit risk exposure on bank accounts is limited through maintaining the Company's balances with high-credit quality financial institutions, maintaining investment policies, assessing institutional exposure and continual discussion with external advisors. Value-added tax receivables are generated on the purchase of supplies and services to produce silver, which are refundable from the Mexican government. Trade receivables are generated on the sale of concentrate inventory to reputable metal traders. The loan receivable is related to the remaining proceeds for the sale of the El Compas mine to Grupo ROSGO. There has been no indication of a change in the creditworthiness of the counterparty to the loan receivable since the initial recognition.
Liquidity Risk
Liquidity risk is the risk that the Company will not be able to meet its financial obligations as they come due. The Company manages its liquidity risk by continually monitoring forecasted and actual cash flows. The Company has in place a planning and budgeting process to help determine the funds required to support its normal operating requirement and development plans. The Company aims to maintain sufficient liquidity to meet its short-term business requirements, taking into account its anticipated cash flows from operations, its holdings of cash and cash equivalents, and its committed and anticipated liabilities.
The Company's Mexican subsidiaries pay IVA on the purchase and sale of goods and services. The net amount paid is recoverable but is subject to review and assessment by the tax authorities. The Company regularly files the required IVA returns and all supporting documentation with the tax authorities, however a smaller portion of IVA refund requests are denied from time to time based on the alleged lack of compliance of certain formal requirements and information returns by the Company's third-party suppliers. The Company takes necessary legal action on the delayed refunds as well as any denied refunds. The Company is in regular contact with the tax authorities in respect of its IVA filings and believes that the full amount of its IVA receivables will ultimately be received; however, the timing of recovery of these amounts and the nature and extent of any adjustments to the Company's IVA receivables remains uncertain.
Market Risk
The significant market risk exposures to which the Company is exposed are foreign currency risk, interest rate risk, and commodity price risk.
Foreign Currency Risk - The Company's operations in Mexico, Peru and Canada make it subject to foreign currency fluctuations. Certain of the Company's operating expenses are incurred in Mexican pesos, Peruvian sol and Canadian dollars; therefore, the fluctuation of the U.S. dollar in relation to these currencies will consequently have an impact upon the profitability of the Company and may also affect the value of the Company's assets and the amount of shareholders' equity. The Company also hedged a portion of the estimated remaining capital and operating expenditures incurred in Mexican Pesos. As of September 30, 2025, the Company had $50.4 million Mexican Peso forward contracts with weighted average rate 20.28 pesos for US dollar settling between October 2025 and December 2026.
Interest Rate Risk - The interest rate risk is the risk that the fair value or the future cash flows of a financial instrument will fluctuate because of changes in market interest rates. The interest rate on the Debt Facility as well as the loans payable held by Kolpa are variable, and based on the exposure as of September 30, 2025, a 1% change in interest rate would result in an increase or decrease of interest costs of $1.6 million per year. The Company holds a fixed for variable interest rate swap in the amount of $8.3 million, maturing in April 2026. As of September 30, 2025, all of the Company's outstanding equipment financing obligations bear interest at fixed rates and are therefore not exposed to changes in future cash flows attributable to changes in market interest rates.
The Company is exposed to interest rate risk on its cash and cash equivalents. The cash and cash equivalent interest earned is based on bank account interest rates which may fluctuate. Based on the exposure as of September 30, 2025, a 1% change in the interest rates would result in an increase or decrease of approximately $0.6 million in interest earned by the Company. The Company has not entered into any derivative contracts to manage the interest rate risk.
Commodity Price Risk - The Company is subject to commodity price risk related to silver, gold, lead, zinc, and copper. Fluctuations in the market prices of these metals can have a direct and immediate impact on the valuation of related financial instruments, non-financial assets, and overall net earnings. Gold and silver prices have historically fluctuated significantly and are affected by numerous factors outside of the Company's control, including, but not limited to, industrial and retail demand, central bank lending, forward sales by producers and speculators, levels of worldwide production, short-term changes in supply and demand because of speculative hedging activities and certain other factors.
At September 30, 2025, there are 106,642 oz of silver and 3,109 oz of gold as well as trivial amounts of base metals, which do not have a final settlement price and the estimated revenues have been recognized at current market prices. As at September 30, 2025, with other variables unchanged, a 10% decrease in the market value of silver and gold would result in a reduction of revenue and the associated receivable of $1.7 million.
On May 1, 2025, concurrently with the acquisition of Minera Kolpa shares, Endeavour entered into a ten year $35 million copper stream agreement with Versamet Royalties Corporation to help fund the cash portion of the Kolpa acquisition. Under the terms of the stream:
This agreement includes security over the acquired entity and provides Versamet the right of first refusal on future streaming arrangements.
In connection with the Debt Facility, on March 28, 2024, the Company entered into gold forward swap contracts for 68,000 oz, a portion of the expected gold sales in the first three years of production, to hedge against the fluctuation in gold prices. The Company amended the forward swap contracts during nine months ended September 30, 2025, which will settle from October 2025 to September 2027 with revised forward price of $2,311 per ounce of gold. As of September 30, 2025 64,415 oz remains outstanding.
In September 2025 in relation to the amendment to the Debt Facility, the Company implemented un-margined zero cost collars for 968,000 ounces of silver with a price range of $31 to $42, settling over the period from October 2025 to October 2026.
OUTSTANDING SHARE DATA
As of November 6, 2025, the Company had the following securities issued, issuable and outstanding:
As at September 30, 2025, the Company's issued share capital was $971 million (December 31, 2024 - $851 million), representing 294,083,863 common shares (December 31, 2024 - 262,323,863), and the Company had options outstanding to purchase 1,798,546 common shares (December 31, 2024 - 3,181,491) with a weighted average exercise price of CAD$4.15 (December 31, 2024 - CAD$4.13).
The Company considers the items included in the consolidated statement of shareholders' equity as capital. The Company's objective when managing capital is to safeguard its ability to continue as a going concern so that it can continue to provide returns for shareholders and benefits for other stakeholders. The Company manages the capital structure and makes adjustments to it in light of changes in economic conditions and the risk characteristics of the underlying assets. In order to maintain or adjust the capital structure, the Company may issue new shares through private placements, prospectus offerings, convertible debentures, asset acquisitions or return capital to shareholders. The Company is not subject to externally imposed capital requirements.
CHANGES IN ACCOUNTING POLICIES AND CRITICAL ACCOUNTING ESTIMATES
Accounting standards adopted during the period:
The material accounting policies applied in the Company's condensed consolidated interim financial statements for the three and nine months ended September 30, 2025 are the same as those applied in the Company's annual audited consolidated financial statements as at and for the year ended December 31, 2024.
Critical Accounting Estimates
The preparation of financial statements requires the Company to make estimates that affect the reported amounts of assets and liabilities and disclosure of contingent assets and liabilities at the date of the financial statements and the reported amounts of revenues and expenses during the reporting period. Significant areas requiring the use of management's judgment relate to the determination of mineralized reserves and resources, plant and equipment lives, estimating the fair values of financial instruments and derivatives, impairment of non-current assets, reclamation and rehabilitation provisions, recognition of deferred tax assets, and assumptions used in determining the fair value of share-based compensation.
CONTROLS AND PROCEDURES
Disclosure Controls and Procedures
The Company's officers and management are responsible for establishing and maintaining disclosure controls and procedures for the Company. Disclosure controls and procedures are designed to provide reasonable assurance that material information required to be disclosed by the Company under securities legislation is recorded, processed, summarized and reported within the applicable time periods and to ensure that required information is gathered and communicated to the Company's management, including the Chief Executive Officer (CEO) and Chief Financial Officer (CFO) as is appropriate to permit timely decisions regarding public disclosure. There are inherent limitations to the effectiveness of any system of disclosure controls and procedures. Accordingly, even effective disclosure controls and procedures can only provide reasonable assurance of achieving their control objectives.
Changes in Internal Control over Financial Reporting
Management, including the CEO and CFO, has evaluated the Company's internal controls over financial reporting to determine whether any changes occurred during the period that have materially affected, or are reasonably likely to materially affect, the Company's internal controls over financial reporting.
During the three and nine months ended September 30, 2025, there have been no significant changes in internal control over financial reporting that have materially affected, or are reasonably likely to materially affect, the Company's internal control over financial reporting.
QUARTERLY RESULTS AND TRENDS
The following table presents selected financial information for each of the most recent eight quarters:
| Table in thousands of U.S. dollars except for share numbers and per share amounts | 2025 | 2024 | 2023 | |||||
| Q3 | Q2 | Q1 | Q4 | Q3 | Q2 | Q1 | Q4 | |
| Gross Sales | $145,969 | $90,138 | $63,934 | $42,746 | $53,939 | $58,708 | $64,218 | $51,005 |
| Smelting and refining costs included in revenue | 3,138 | 1,541 | 436 | 536 | 495 | 448 | 493 | 506 |
| Total Revenue | 142,831 | 88,597 | 63,498 | 42,210 | 53,444 | 58,260 | 63,725 | 50,499 |
| Direct production costs | 93,913 | 59,249 | 35,173 | 25,404 | 28,705 | 33,703 | 36,705 | 32,817 |
| Royalties | 9,262 | 6,458 | 6,243 | 3,661 | 5,151 | 5,648 | 6,408 | 5,105 |
| Mine operating cash flow before taxes | 39,656 | 22,890 | 22,082 | 13,145 | 19,588 | 18,909 | 20,612 | 12,577 |
| Share-based compensation | 132 | 136 | 34 | 55 | 73 | 74 | 79 | 44 |
| Depreciation | 23,915 | 15,010 | 9,206 | 5,346 | 7,032 | 8,639 | 8,877 | 7,181 |
| Mine operating earnings (loss) | $15,609 | $7,744 | $12,842 | $7,744 | $12,483 | $10,196 | $11,656 | $5,352 |
| Basic earnings (loss) per share | ($0.14) | ($0.07) | ($0.13) | $0.00 | ($0.07) | ($0.06) | ($0.01) | $0.01 |
| Diluted earnings (loss) per share | ($0.14) | ($0.07) | ($0.13) | $0.00 | ($0.07) | ($0.06) | ($0.01) | $0.01 |
| Weighted shares outstanding | 291,373,472 | 283,534,276 | 262,323,863 | 252,169,924 | 246,000,878 | 242,899,679 | 227,503,581 | 196,018,623 |
| Net earnings (loss) | ($41,956) | ($20,455) | ($32,907) | $1,025 | ($17,300) | ($14,007) | ($1,194) | $3,049 |
| Depreciation | 24,146 | 15,116 | 9,561 | 5,706 | 7,352 | 8,933 | 9,135 | 7,458 |
| Finance costs | 684 | 846 | 184 | 294 | 357 | 103 | 135 | 164 |
| Current income tax | 10,663 | 9,094 | 5,279 | (162) | 4,523 | 2,878 | 5,667 | 207 |
| Deferred income tax (recovery) | (6,166) | (3,199) | (214) | (2,507) | (512) | (163) | (233) | (2,544) |
| EBITDA | ($12,629) | $1,402 | ($18,097) | $4,356 | ($5,580) | ($2,256) | $13,510 | $8,334 |
The following table presents selected production and costs information for each of the most recent eight quarters:
| 2025 | 2024 | 2023 | ||||||
| Q3 | Q2 | Q1 | Q4 | Q3 | Q2 | Q1 | Q4 | |
| Processed tonnes | 400,245 | 303,828 | 209,507 | 165,591 | 175,065 | 218,989 | 221,794 | 220,464 |
| Guanaceví | 99,340 | 96,834 | 102,438 | 58,798 | 67,094 | 112,897 | 115,004 | 110,781 |
| Bolañitos | 105,153 | 88,098 | 107,069 | 106,793 | 107,971 | 106,092 | 106,790 | 109,683 |
| Kolpa | 195,752 | 118,896 | - | - | - | - | - | - |
| Silver ounces | 1,766,926 | 1,483,736 | 1,205,793 | 824,529 | 874,717 | 1,312,572 | 1,460,006 | 1,406,423 |
| Guanaceví | 1,024,321 | 997,875 | 1,015,327 | 718,797 | 768,905 | 1,195,753 | 1,335,742 | 1,271,679 |
| Bolañitos | 143,916 | 105,223 | 190,466 | 105,732 | 105,812 | 116,819 | 124,263 | 134,744 |
| Kolpa | 598,689 | 380,638 | - | - | - | - | - | - |
| Silver equivalent ounces(1) | 3,037,156 | 2,528,562 | 1,872,833 | 1,550,529 | 1,617,925 | 2,156,453 | 2,270,676 | 2,175,063 |
| Guanaceví | 1,279,860 | 1,282,853 | 1,334,447 | 928,557 | 995,146 | 1,535,161 | 1,665,648 | 1,569,359 |
| Bolañitos | 471,158 | 440,678 | 538,386 | 621,972 | 622,779 | 621,292 | 605,028 | 605,704 |
| Kolpa | 1,286,139 | 805,032 | - | - | - | - | - | - |
| Cash costs per oz (2) | $18.09 | $15.35 | $15.89 | $13.68 | $11.35 | $13.43 | $13.19 | $12.54 |
| Guanaceví | $22.98 | $19.91 | $19.73 | $20.25 | $19.59 | $17.17 | $15.94 | $14.95 |
| Bolañitos | ($11.47) | ($17.26) | ($5.60) | ($33.11) | ($51.38) | ($26.67) | ($17.69) | ($11.23) |
| Kolpa | $16.43 | $11.81 | - | - | - | - | - | - |
| AISC per oz (2) | $30.53 | $25.16 | $24.48 | $27.33 | $25.82 | $23.13 | $21.44 | $21.48 |
| Guanaceví | $31.09 | $26.81 | $26.50 | $32.40 | $30.83 | $24.53 | $21.96 | $21.50 |
| Bolañitos | $27.22 | $7.04 | $13.16 | ($8.78) | ($12.31) | $8.15 | $15.59 | $21.27 |
| Kolpa | $30.31 | $25.66 | - | - | - | - | - | - |
| Direct costs per tonne (2) | $192.78 | $201.24 | $207.27 | $209.49 | $189.85 | $192.68 | $181.77 | $168.71 |
| Guanaceví | $349.83 | $325.40 | $310.52 | $365.23 | $330.55 | $269.36 | $260.13 | $239.76 |
| Bolañitos | $118.41 | $137.72 | $108.49 | $123.73 | $102.42 | $111.07 | $97.39 | $96.94 |
| Kolpa | $153.03 | $147.20 | - | - | - | - | - | - |
(1) Silver equivalent production is calculated using an 80:1 (Ag:Au) ratio, 60:1 (Ag:Pb) ratio, 85:1 (Ag:Zn) ratio, and 300:1 (Ag:Cu) ratio.
(2) Cash cost per oz, AISC per oz and direct costs per tonne are non-IFRS measures.
NON-IFRS MEASURES
Non-IFRS and Other Financial Measures and Ratios
We have included certain non-IFRS financial measures and ratios in this MD&A, as discussed below. We believe that these measures, in addition to conventional measures prepared in accordance with IFRS, provide investors an improved ability to evaluate the underlying performance of the Company. The non-IFRS measures and ratios are intended to provide additional information and should not be considered in isolation or as a substitute for measures of performance prepared in accordance with IFRS. These financial measures and ratios do not have any standardized meaning prescribed under IFRS, and therefore may not be comparable to other issuers.
Non-IFRS financial measures are defined in National Instrument 52-112 - Non-GAAP and Other Financial Measures Disclosure ("NI 52-112") as a financial measure disclosed that (a) depicts the historical or expected future financial performance, financial position or cash flow of an entity, (b) with respect to its composition, excludes an amount that is included in, or includes an amount that is excluded from, the composition of the most directly comparable financial measure disclosed in the primary financial statements of the entity, (c) is not disclosed in the financial statements of the entity, and (d) is not a ratio, fraction, percentage or similar representation.
A non-IFRS ratio is defined by 52-112 as a financial measure disclosed that (a) is in the form of a ratio, fraction, percentage or similar representation, (b) has a non-IFRS financial measure as one or more of its components, and (c) is not disclosed in the financial statements.
Working capital is a non-IFRS measure that is a common measure of liquidity but does not have any standardized meaning. The most directly comparable measure prepared in accordance with IFRS is current assets and current liabilities. Working capital is calculated by deducting current liabilities from current assets. Working capital should not be considered in isolation or as a substitute from measures prepared in accordance with IFRS. The measure is intended to assist readers in evaluating our liquidity.
| Expressed in thousands of US dollars | As at September 30, 2025 | As at December 31, 2024 | ||
| Current assets | $207,931 | $157,647 | ||
| Current liabilities | 263,989 | 78,866 | ||
| Working capital | ($56,058) | $78,781 | ||
Adjusted earnings and adjusted earnings per share are non-IFRS measures that supplement information to the Company's consolidated financial statements. The Company believes that, in addition to the conventional measures prepared in accordance with IFRS, the Company and certain investors and analysts use this information to evaluate the Company's underlying core operating performance. The presentation of adjusted earnings and adjusted earnings per share is not meant to be a substitute for net income and net income per share presented in accordance with IFRS, but rather should be evaluated in conjunction with such IFRS measures.
The Company defines the adjusted earnings as net income adjusted to include certain non-cash and unusual items, and items that in the Company's judgement are subject to volatility as a result of factors which are unrelated to the Company's operation in the period. Certain items that become applicable in a period may be adjusted for, with the Company retroactively presenting comparable periods with an adjustment for such items and, conversely, items no longer applicable may be removed from the calculation. During the current period, the Company has included unrealized foreign exchange (gain) loss, (gain) loss on derivatives, changes in the fair value of its investments in marketable securities and change in fair value of cash settled DSUs and made retroactive adjustments to prior periods for the same.
The following table provides a detailed reconciliation of net income as reported in the Company's financial statement to adjusted earnings and adjusted earnings per share.
| Expressed in thousands US dollars | Three Months Ended September 30 |
Nine Months Ended September 30 |
||||||||||
| 2025 | 2024 | 2025 | 2024 | |||||||||
| Net earnings (loss) for the period per financial statements | ($41,956 | ) | ($17,300 | ) | ($95,318 | ) | ($32,501 | ) | ||||
| Unrealized foreign exchange (Gain) loss | (1,325 | ) | 1,445 | (3,852 | ) | 3,777 | ||||||
| Gain (loss) on derivatives, copper stream and contingent liabilities revaluations | 38,939 | 17,109 | 80,958 | 26,362 | ||||||||
| Acquisition costs | - | - | 3,602 | - | ||||||||
| Change in fair value of investments | (501 | ) | (109 | ) | (822 | ) | 1,177 | |||||
| Change in fair value of cash settled DSUs | 2,742 | 454 | 3,962 | 2,078 | ||||||||
| Adjusted net earnings (loss) | ($2,101 | ) | $ | 1,599 | ($11,470 | ) | $ | 893 | ||||
| Basic weighted average share outstanding | 291,373,472 | 246,000,878 | 279,183,612 | 238,827,655 | ||||||||
| Adjusted net earnings (loss) per share | ($0.01 | ) | $ | 0.01 | ($0.04 | ) | $ | 0.00 | ||||
Mine operating cash flow before taxes is a non-IFRS measure that does not have a standardized meaning prescribed by IFRS and therefore may not be comparable to similar measures presented by other issuers. Mine operating cash flow is calculated as revenue minus direct production costs and royalties. Mine operating cash flow is used by management to assess the performance of the mine operations, excluding corporate and exploration activities, and is provided to investors as a measure of the Company's operating performance.
| Expressed in thousands US dollars | Three Months Ended September 30 |
Nine Months Ended September 30 |
||||||||||
| 2025 | 2024 | 2025 | 2024 | |||||||||
| Mine operating earnings per financial statements | $ | 15,609 | $ | 12,483 | $ | 36,195 | $ | 34,335 | ||||
| Share-based compensation | 132 | 73 | 302 | 226 | ||||||||
| Depreciation | 23,915 | 7,032 | 48,131 | 24,548 | ||||||||
| Mine operating cash flow before taxes | $ | 39,656 | $ | 19,588 | $ | 84,628 | $ | 59,109 | ||||
Operating cash flow before working capital changes per share is a non-IFRS measure that does not have a standardized meaning prescribed by IFRS and therefore may not be comparable to similar measures presented by other issuers. Operating cash flow per share is calculated by dividing cash from operating activities by the weighted average shares outstanding. Operating cash flow per share is used by management to assess operating performance on a per share basis, irrespective of working capital changes and is provided to investors as a measure of the Company's operating performance.
| Expressed in thousands US dollars | Three Months Ended September 30 |
Nine Months Ended September 30 |
||||||||||
| (except for per share amounts) | 2025 | 2024 | 2025 | 2024 | ||||||||
| Cash from (used in) operating activities per financial statements | $ | 27,052 | $ | 8,467 | $ | 51,978 | $ | 23,963 | ||||
| Net changes in non-cash working capital per financial statements | 13,443 | 4,012 | 15,649 | 2,480 | ||||||||
| Operating cash flow before working capital changes | $ | 13,609 | $ | 4,455 | $ | 36,329 | $ | 21,483 | ||||
| Basic weighted average shares outstanding | 291,373,472 | 246,000,878 | 279,183,612 | 238,827,655 | ||||||||
| Operating cash flow before working capital changes per share | $ | 0.05 | $ | 0.02 | $ | 0.13 | $ | 0.09 | ||||
EBITDA is a non-IFRS financial measure, which excludes the following from net earnings:
Adjusted EBITDA excludes the following additional items from EBITDA:
Adjusted EBITDA per share is calculated by dividing Adjusted EBITDA by the basic weighted average number of shares outstanding for the period.
Management believes EBITDA is a valuable indicator of the Company's ability to generate liquidity by producing operating cash flow to fund working capital needs, service debt obligations, and fund capital expenditures.
Management uses EBITDA for this purpose. EBITDA is also frequently used by investors and analysts for valuation purposes whereby EBITDA is multiplied by a factor or "EBITDA multiple" based on an observed or inferred relationship between EBITDA and market values to determine the approximate total enterprise value of a Company.
EBITDA is intended to provide additional information to investors and analysts. It does not have any standardized definition under IFRS and should not be considered in isolation or as a substitute for measures of operating performance prepared in accordance with IFRS. EBITDA excludes the impact of cash costs of financing activities and taxes, and the effects of changes in operating working capital balances, and therefore is not necessarily indicative of operating profit or cash flow from operations as determined by IFRS. Other companies may calculate EBITDA and Adjusted EBITDA differently.
Certain items that become applicable in a period may be adjusted for, with the Company retroactively presenting comparable periods with an adjustment for such items and, conversely, items no longer applicable may be removed from the calculation.
| Expressed in thousands US dollars | Three Months Ended September 30 |
Nine Months Ended September 30 |
||||||||||
| 2025 | 2024 | 2025 | 2024 | |||||||||
| Net earnings (loss) for the period per financial statements | ($41,956 | ) | ($17,300 | ) | ($95,318 | ) | ($32,501 | ) | ||||
| Depreciation - cost of sales | 23,915 | 7,032 | 48,131 | 24,548 | ||||||||
| Depreciation - exploration, evaluation and development | 133 | 221 | 387 | 568 | ||||||||
| Depreciation - general & administration | 98 | 99 | .305 | 304 | ||||||||
| Finance costs | 684 | 357 | 1,714 | 595 | ||||||||
| Current income tax expense | 10,663 | 4,523 | 25,036 | 13,068 | ||||||||
| Deferred income tax expense (recovery) | (6,166 | ) | (512 | ) | (9,579 | ) | (908 | ) | ||||
| EBITDA | ($12,629 | ) | ($5,580 | ) | ($29,324 | ) | $ | 5,674 | ||||
| Share based compensation | 942 | 564 | 3,139 | 2,896 | ||||||||
| Unrealized foreign exchange (gain) loss | (1,325 | ) | 1,445 | (3,852 | ) | 3,777 | ||||||
| Gain (loss) on derivatives, copper stream and contingent liabilities revaluations | 38,939 | 17,109 | 80,958 | 26,362 | ||||||||
| Change in fair value of investments | (501 | ) | (109 | ) | (822 | ) | 1,177 | |||||
| Change in fair value of cash settled DSUs | 2,742 | 454 | 3,962 | 2,078 | ||||||||
| Adjusted EBITDA | $ | 28,168 | $ | 13,883 | $ | 54,061 | $ | 41,964 | ||||
| Basic weighted average shares outstanding | 291,373,472 | 246,000,878 | 279,183,612 | 238,827,655 | ||||||||
| Adjusted EBITDA per share | $ | 0.10 | $ | 0.06 | $ | 0.19 | $ | 0.18 | ||||
Cash costs per silver oz, total production costs per oz, direct operating costs per tonne and direct costs per tonne are measures developed by precious metals companies in an effort to provide a comparable standard; however, there can be no assurance that the Company's reporting of these non-IFRS measures and ratios are similar to those reported by other mining companies. Cash costs per oz, total production costs per oz and direct costs per tonne are measures used by the Company to manage and evaluate operating performance at each of the Company's operating mining units. They are widely reported in the silver mining industry as a benchmark for performance, but do not have a standardized meaning and are disclosed in addition to IFRS measures. Direct operating costs include mining, processing (including smelting, refining, transportation and selling costs) and direct overhead at the operation sites. Direct costs include all direct operating costs plus royalties and special mining duty. Cash costs include all direct costs less by-product gold sales and changes in finished gold inventories.
Total production costs include all cash costs plus depreciation, changes in depreciation in finished goods inventory and site share-based compensation. Cash costs per silver ounce and total production costs per ounce are calculated by dividing cash costs and total production costs by the payable silver ounces produced. Direct operating cost per tonne and direct costs per tonne are calculated by dividing direct operating costs and direct costs by the number of processed tonnes. The following tables provide a detailed reconciliation of these measures to the Company's direct production costs, as reported in its consolidated financial statements.
| Expressed in thousands of US dollars | Three Months Ended September 30, 2025 |
|||||||||||
| Guanaceví | Bolañitos | Kolpa | Total | |||||||||
| Direct production costs per financial statements | $ | 26,250 | $ | 11,681 | $ | 26,816 | $ | 64,747 | ||||
| Purchase of the third-party material | (7,346 | ) | - | (984 | ) | (8,330 | ) | |||||
| Smelting and refining costs included in revenue | - | 431 | 1,924 | 2,355 | ||||||||
| Opening finished goods | (5,939 | ) | (935 | ) | (574 | ) | (7,448 | ) | ||||
| Closing finished goods | 5,523 | 541 | 600 | 6,664 | ||||||||
| Direct operating costs | 18,488 | 11,718 | 27,782 | 57,988 | ||||||||
| Purchase of the third-party material | 7,346 | - | 984 | 8,330 | ||||||||
| Royalties | 7,562 | 212 | 630 | 8,404 | ||||||||
| Special mining duty (1) | 1,356 | 521 | 559 | 2,436 | ||||||||
| Direct costs | 34,752 | 12,451 | 29,955 | 77,158 | ||||||||
| By-products sales | (11,302 | ) | (14,667 | ) | (20,618 | ) | (46,587 | ) | ||||
| Opening by-products inventory fair market value | 2,302 | 1,310 | 526 | 4,138 | ||||||||
| Closing by-products inventory fair market value | (2,288 | ) | (666 | ) | (548 | ) | (3,502 | ) | ||||
| Cash costs net of by-products | 23,464 | (1,572 | ) | 9,315 | 31,207 | |||||||
| Depreciation | 8,264 | 2,948 | 7,612 | 18,824 | ||||||||
| Share-based compensation | 48 | 35 | 49 | 132 | ||||||||
| Opening finished goods depreciation | (1,843 | ) | (214 | ) | (125 | ) | (2,182 | ) | ||||
| Closing finished goods depreciation | 1,707 | 132 | 131 | 1,970 | ||||||||
| Total production costs | $ | 31,640 | $ | 1,329 | $ | 16,982 | $ | 49,951 | ||||
| Expressed in thousands of US dollars | Three Months Ended September 30, 2024 |
|||||||||||
| Guanaceví | Bolañitos | Kolpa | Total | |||||||||
| Direct production costs per financial statements | $ | 18,968 | $ | 9,737 | $ | - | $ | 28,705 | ||||
| Purchase of the third-party material | (2,796 | ) | - | - | (2,796 | ) | ||||||
| Smelting and refining costs included in revenue | - | 496 | - | 496 | ||||||||
| Opening finished goods | (4,038 | ) | (557 | ) | - | (4,595 | ) | |||||
| Closing finished goods | 1,725 | 718 | - | 2,443 | ||||||||
| Direct operating costs | 13,859 | 10,394 | - | 24,253 | ||||||||
| Purchase of the third-party material | 2,796 | - | - | 2,796 | ||||||||
| Royalties | 5,060 | 91 | - | 5,151 | ||||||||
| Special mining duty (1) | 463 | 573 | - | 1,036 | ||||||||
| Direct costs | 22,178 | 11,058 | - | 33,236 | ||||||||
| By-products sales | (8,289 | ) | (15,505 | ) | - | (23,794 | ) | |||||
| Opening by-products inventory fair market value | 2,187 | 751 | - | 2,938 | ||||||||
| Closing by-products inventory fair market value | (1,059 | ) | (1,478 | ) | - | (2,537 | ) | |||||
| Cash costs net of by-products | 15,017 | (5,174 | ) | - | 9,843 | |||||||
| Depreciation | 4,656 | 2,376 | - | 7,032 | ||||||||
| Share-based compensation | 59 | 14 | - | 73 | ||||||||
| Opening finished goods depreciation | (1,326 | ) | (144 | ) | - | (1,470 | ) | |||||
| Closing finished goods depreciation | 515 | 184 | - | 699 | ||||||||
| Total production costs | $ | 18,921 | ($2,744 | ) | $ | - | $ | 16,177 | ||||
| Expressed in thousands of US dollars | Three Months Ended September 30, 2025 |
|||||||||||
| Guanaceví | Bolañitos | Kolpa | Total | |||||||||
| Throughput tonnes | 99,340 | 105,153 | 195,752 | 400,245 | ||||||||
| Payable silver ounces | 1,021,248 | 137,052 | 567,017 | 1,725,317 | ||||||||
| Cash costs per silver ounce | $ | 22.98 | ($11.47 | ) | $ | 16.43 | $ | 18.09 | ||||
| Total production costs per ounce | $ | 30.98 | $ | 9.70 | $ | 29.95 | $ | 28.95 | ||||
| Direct operating costs per tonne | $ | 186.11 | $ | 111.44 | $ | 141.92 | $ | 144.88 | ||||
| Direct costs per tonne | $ | 349.83 | $ | 118.41 | $ | 153.03 | $ | 192.78 | ||||
| Expressed in thousands of US dollars | Three Months Ended September 30, 2024 |
|||||||||||
| Guanaceví | Bolañitos | Kolpa | Total | |||||||||
| Throughput tonnes | 67,094 | 107,971 | - | 175,065 | ||||||||
| Payable silver ounces | 766,599 | 100,694 | - | 867,293 | ||||||||
| Cash costs per silver ounce | $ | 19.59 | ($51.38 | ) | - | $ | 11.35 | |||||
| Total production costs per ounce | $ | 24.68 | ($27.25 | ) | - | $ | 18.65 | |||||
| Direct operating costs per tonne | $ | 206.56 | $ | 96.27 | - | $ | 138.54 | |||||
| Direct costs per tonne | $ | 330.55 | $ | 102.42 | - | $ | 189.85 | |||||
| Expressed in thousands of US dollars | Nine Months Ended September 30, 2025 |
|||||||||||
| Guanaceví | Bolañitos | Kolpa | Total | |||||||||
| Direct production costs per financial statements | $ | 74,752 | $ | 33,004 | $ | 43,117 | $ | 150,873 | ||||
| Purchase of the third-party material | (20,313 | ) | - | (1,606 | ) | (21,919 | ) | |||||
| Smelting and refining costs included in revenue | - | 1,212 | 3,012 | 4,224 | ||||||||
| Opening finished goods | (5,448 | ) | (485 | ) | (610 | ) | (6,543 | ) | ||||
| Closing finished goods | 5,523 | 541 | 600 | 6,664 | ||||||||
| Direct operating costs | 54,514 | 34,272 | 44,513 | 133,299 | ||||||||
| Purchase of the third-party material | 20,313 | - | 1,606 | 21,919 | ||||||||
| Royalties | 19,825 | 553 | 630 | 21,008 | ||||||||
| Special mining duty (1) | 3,419 | 1,375 | 707 | 5,501 | ||||||||
| Direct costs | 98,071 | 36,200 | 47,456 | 181,727 | ||||||||
| By-products sales | (35,728 | ) | (40,621 | ) | (33,893 | ) | (110,242 | ) | ||||
| Opening by-products inventory fair market value | 3,185 | 772 | 544 | 4,501 | ||||||||
| Closing by-products inventory fair market value | (2,288 | ) | (666 | ) | (548 | ) | (3,502 | ) | ||||
| Cash costs net of by-products | 63,240 | (4,315 | ) | 13,559 | 72,484 | |||||||
| Depreciation | 21,148 | 8,332 | 12,769 | 42,249 | ||||||||
| Share-based compensation | 134 | 95 | 73 | 302 | ||||||||
| Opening finished goods depreciation | (1,188 | ) | (92 | ) | (134 | ) | (1,414 | ) | ||||
| Closing finished goods depreciation | 1,707 | 132 | 131 | 1,970 | ||||||||
| Total production costs | $ | 85,041 | $ | 4,152 | $ | 26,398 | $ | 115,591 | ||||
| Expressed in thousands of US dollars | Nine Months Ended September 30, 2024 |
|||||||||||
| Guanaceví | Bolañitos | Kolpa | Total | |||||||||
| Direct production costs per financial statements | $ | 68,855 | $ | 30,258 | $ | - | $ | 99,113 | ||||
| Purchase of the third-party material | (10,231 | ) | - | (10,231 | ) | |||||||
| Smelting and refining costs included in revenue | - | 1,436 | - | 1,436 | ||||||||
| Opening finished goods | (7,137 | ) | (699 | ) | - | (7,836 | ) | |||||
| Closing finished goods | 1,725 | 718 | - | 2,443 | ||||||||
| Direct operating costs | 53,212 | 31,713 | - | 84,925 | ||||||||
| Purchase of the third-party material | 10,231 | - | - | 10,231 | ||||||||
| Royalties | 16,948 | 259 | - | 17,207 | ||||||||
| Special mining duty (1) | 2,113 | 1,270 | - | 3,383 | ||||||||
| Direct costs | 82,504 | 33,242 | - | 115,746 | ||||||||
| By-products sales | (27,642 | ) | (42,622 | ) | - | (70,264 | ) | |||||
| Opening by-products inventory fair market value | 2,909 | 619 | - | 3,528 | ||||||||
| Closing by-products inventory fair market value | (1,059 | ) | (1,478 | ) | - | (2,537 | ) | |||||
| Cash costs net of by-products | 56,712 | (10,239 | ) | - | 46,473 | |||||||
| Depreciation | 16,436 | 8,112 | - | 24,548 | ||||||||
| Share-based compensation | 181 | 45 | - | 226 | ||||||||
| Opening finished goods depreciation | (1,459 | ) | (197 | ) | - | (1,656 | ) | |||||
| Closing finished goods depreciation | 515 | 184 | - | 699 | ||||||||
| Total production costs | $ | 72,385 | ($2,095 | ) | $ | - | $ | 70,290 | ||||
| Expressed in thousands of US dollars | Nine Months Ended September 30, 2025 |
|||||||||||
| Guanaceví | Bolañitos | Kolpa | Total | |||||||||
| Throughput tonnes | 298,612 | 300,320 | 314,648 | 913,580 | ||||||||
| Payable silver ounces | 3,028,411 | 418,312 | 926,364 | 4,373,087 | ||||||||
| Cash costs per silver ounce | $ | 20.88 | ($10.32 | ) | $ | 14.64 | $ | 16.58 | ||||
| Total production costs per ounce | $ | 28.08 | $ | 9.93 | $ | 28.50 | $ | 26.43 | ||||
| Direct operating costs per tonne | $ | 182.56 | $ | 114.12 | $ | 141.47 | $ | 145.91 | ||||
| Direct costs per tonne | $ | 328.42 | $ | 120.54 | $ | 150.82 | $ | 198.92 | ||||
| Expressed in thousands of US dollars | Nine Months Ended September 30, 2024 |
|||||||||||
| Guanaceví | Bolañitos | Kolpa | Total | |||||||||
| Throughput tonnes | 294,995 | 320,853 | - | 615,848 | ||||||||
| Payable silver ounces | 3,290,499 | 330,563 | - | 3,621,062 | ||||||||
| Cash costs per silver ounce | $ | 17.24 | ($30.97 | ) | - | $ | 12.83 | |||||
| Total production costs per ounce | $ | 22.00 | ($6.34 | ) | - | $ | 19.41 | |||||
| Direct operating costs per tonne | $ | 180.38 | $ | 98.84 | - | $ | 137.90 | |||||
| Direct costs per tonne | $ | 279.68 | $ | 103.61 | - | $ | 187.95 | |||||
(1) Special mining duty is an EBITDA royalty tax presented as a current income tax in accordance with IFRS.
| Expressed in thousands of US dollars | September 30, 2025 | |||||||||||
| Guanaceví | Bolañitos | Kolpa | Total | |||||||||
| Closing finished goods | 5,523 | 541 | 600 | 6,664 | ||||||||
| Closing finished goods depreciation | 1,707 | 132 | 131 | 1,970 | ||||||||
| Finished goods inventory | $ | 7,230 | $ | 673 | $ | 731 | $ | 8,634 | ||||
| Expressed in thousands of US dollars | September 30, 2024 | |||||||||||
| Guanaceví | Bolañitos | Kolpa | Total | |||||||||
| Closing finished goods | 1,725 | 718 | - | 2,443 | ||||||||
| Closing finished goods depreciation | 515 | 184 | - | 699 | ||||||||
| Finished goods inventory | $ | 2,240 | $ | 902 | $ | - | $ | 3,142 | ||||
AISC per oz and all-in costs per oz are measures developed by the World Gold Council (and used as a standard of the Silver Institute) in an effort to provide a comparable standard within the precious metal industry; however, there can be no assurance that the Company's reporting of these non-IFRS measures are similar to those reported by other mining companies. These measures are used by the Company to manage and evaluate operating performance at each of the Company's operating mining units and consolidated group, and are widely reported in the silver mining industry as a benchmark for performance, but do not have a standardized meaning and are disclosed in addition to IFRS measures. The following tables provide a detailed reconciliation of these measures to the Company's cost of sales, as reported in the Company's consolidated financial statements.
| Expressed in thousands of US dollars | Three Months Ended September 30, 2025 |
|||||||||||
| Guanaceví | Bolañitos | Kolpa | Total | |||||||||
| Cash costs net of by-products | $ | 23,464 | ($1,572 | ) | $ | 9,315 | $ | 31,207 | ||||
| Operations share-based compensation | 48 | 35 | 49 | 132 | ||||||||
| Corporate general and administrative | 2,584 | 954 | 2,245 | 5,784 | ||||||||
| Acquisition costs | - | - | - | - | ||||||||
| Corporate share-based compensation | 218 | 79 | 358 | 655 | ||||||||
| Reclamation - amortization/accretion | 165 | 93 | 55 | 313 | ||||||||
| Mine site expensed exploration | 286 | 269 | 1,540 | 2,095 | ||||||||
| Equipment loan payments | - | - | 104 | 104 | ||||||||
| Capital expenditures sustaining | 4,989 | 3,873 | 3,521 | 12,383 | ||||||||
| All-In-Sustaining Costs | $ | 31,754 | $ | 3,731 | $ | 17,187 | $ | 52,673 | ||||
| Acquisition costs | - | |||||||||||
| Growth exploration, evaluation and development | 4,876 | |||||||||||
| Growth capital expenditures | 22,266 | |||||||||||
| All-In-Costs | $ | 79,815 | ||||||||||
| Expressed in thousands of US dollars | Three Months Ended September 30, 2024 |
|||||||||||
| Guanaceví | Bolañitos | Kolpa | Total | |||||||||
| Cash costs net of by-products | $ | 15,017 | ($5,174 | ) | $ | - | $ | 9,843 | ||||
| Operations share-based compensation | 59 | 14 | - | 73 | ||||||||
| Corporate general and administrative | 2,034 | 1,154 | - | 3,188 | ||||||||
| Corporate share-based compensation | 428 | 267 | - | 695 | ||||||||
| Reclamation - amortization/accretion | 85 | 68 | - | 153 | ||||||||
| Mine site expensed exploration | 313 | 321 | - | 634 | ||||||||
| Equipment loan payments | - | 19 | - | 19 | ||||||||
| Capital expenditures sustaining | 5,696 | 2,092 | - | 7,788 | ||||||||
| All-In-Sustaining Costs | $ | 23,632 | ($1,239 | ) | $ | - | $ | 22,393 | ||||
| Growth exploration, evaluation and development | 4,056 | |||||||||||
| Growth capital expenditures | 41,008 | |||||||||||
| All-In-Costs | $ | 67,457 | ||||||||||
| Expressed in thousands of US dollars | Three Months Ended September 30, 2025 |
|||||||||||
| Guanaceví | Bolañitos | Kolpa | Total | |||||||||
| Throughput tonnes | 99,340 | 105,153 | 195,752 | 400,245 | ||||||||
| Payable silver ounces | 1,021,248 | 137,052 | 567,017 | 1,725,317 | ||||||||
| Silver equivalent production (ounces) | 1,279,860 | 471,158 | 1,286,139 | 3,037,156 | ||||||||
| All-in-Sustaining cost per ounce | $ | 31.09 | $ | 27.22 | $ | 30.31 | $ | 30.53 | ||||
| Expressed in thousands of US dollars | Three Months Ended September 30, 2024 |
|||||||||||
| Guanaceví | Bolañitos | Kolpa | Total | |||||||||
| Throughput tonnes | 67,094 | 107,971 | - | 175,065 | ||||||||
| Payable silver ounces | 766,599 | 100,694 | - | 867,293 | ||||||||
| Silver equivalent production (ounces) | 995,146 | 622,779 | - | 1,617,925 | ||||||||
| - | ||||||||||||
| All-in-Sustaining cost per ounce | $ | 30.83 | ($12.31 | ) | - | $ | 25.82 | |||||
| Expressed in thousands of US dollars | Nine Months Ended September 30, 2025 |
|||||||||||
| Guanaceví | Bolañitos | Kolpa | Total | |||||||||
| Cash costs net of by-products | $ | 63,240 | ($4,315 | ) | $ | 13,559 | $ | 72,484 | ||||
| Operations share-based compensation | 134 | 95 | 73 | 302 | ||||||||
| Corporate general and administrative | 6,334 | 2,357 | 7,000 | 15,692 | ||||||||
| Acquisition costs | - | - | (3,602 | ) | (3,602 | ) | ||||||
| Corporate share-based compensation | 1,268 | 472 | 681 | 2,421 | ||||||||
| Reclamation - amortization/accretion | 472 | 268 | 96 | 836 | ||||||||
| Mine site expensed exploration | 855 | 645 | 2,576 | 4,076 | ||||||||
| Equipment loan payments | - | - | $ | 170 | 170 | |||||||
| Capital expenditures sustaining | 13,216 | 7,473 | $ | 5,853 | 26,542 | |||||||
| All-In-Sustaining Costs | $ | 85,519 | $ | 6,995 | $ | 26,406 | $ | 118,921 | ||||
| Acquisition costs | 3,602 | |||||||||||
| Growth exploration, evaluation and development | 11,839 | |||||||||||
| Growth capital expenditures | 103,842 | |||||||||||
| All-In-Costs | $ | 238,204 | ||||||||||
| Expressed in thousands of US dollars | Nine Months Ended September 30, 2024 |
|||||||||||
| Guanaceví | Bolañitos | Kolpa | Total | |||||||||
| Cash costs net of by-products | $ | 56,712 | ($10,239 | ) | $ | - | $ | 46,473 | ||||
| Operations share-based compensation | 181 | 45 | - | 226 | ||||||||
| Corporate general and administrative | 6,501 | 2,865 | - | 9,366 | ||||||||
| Corporate share-based compensation | 1,802 | 794 | - | 2,596 | ||||||||
| Reclamation - amortization/accretion | 288 | 218 | - | 506 | ||||||||
| Mine site expensed exploration | 776 | 970 | - | 1,746 | ||||||||
| Equipment loan payments | 206 | 306 | - | 512 | ||||||||
| Capital expenditures sustaining | 15,657 | 6,557 | - | 22,214 | ||||||||
| All-In-Sustaining Costs | $ | 82,123 | $ | 1,516 | $ | - | $ | 83,639 | ||||
| Growth exploration, evaluation and development | 10,879 | |||||||||||
| Growth capital expenditures | 127,280 | |||||||||||
| All-In-Costs | $ | 221,798 | ||||||||||
| Expressed in thousands of US dollars | Nine Months Ended September 30, 2025 |
|||||||||||
| Guanaceví | Bolañitos | Kolpa | Total | |||||||||
| Throughput tonnes | 298,612 | 300,320 | 314,648 | 913,580 | ||||||||
| Payable silver ounces | 3,028,411 | 418,312 | 926,364 | 4,373,087 | ||||||||
| Silver equivalent production (ounces) | 3,897,142 | 1,450,287 | 2,091,217 | 7,438,645 | ||||||||
| All-in-Sustaining cost per ounce | $ | 28.24 | $ | 16.72 | $ | 28.51 | $ | 27.19 | ||||
| Expressed in thousands of US dollars | Nine Months Ended September 30, 2024 |
|||||||||||
| Guanaceví | Bolañitos | Kolpa | Total | |||||||||
| Throughput tonnes | 294,995 | 320,853 | - | 615,848 | ||||||||
| Payable silver ounces | 3,290,499 | 330,563 | - | 3,621,062 | ||||||||
| Silver equivalent production (ounces) | 4,196,000 | 1,849,055 | - | 6,045,055 | ||||||||
| All-in-Sustaining cost per ounce | $ | 24.96 | $ | 4.59 | - | $ | 23.10 | |||||
| Expressed in thousands of US dollars | Three Months Ended September 30 |
Nine Months Ended September 30 |
||||||||||
| 2025 | 2024 | 2025 | 2024 | |||||||||
| Capital expenditures sustaining | $ | 12,383 | $ | 7,788 | $ | 26,542 | $ | 22,214 | ||||
| Growth capital expenditures | 22,266 | 41,008 | 103,842 | 127,280 | ||||||||
| Property, plant and equipment expenditures per Consolidated Statement of Cash Flows | $ | 34,649 | $ | 48,796 | $ | 130,384 | $ | 149,494 | ||||
| Expressed in thousands of US dollars | Three Months Ended September 30 |
Nine Months Ended September 30 |
||||||||||
| 2025 | 2024 | 2025 | 2024 | |||||||||
| Mine site expensed exploration | $ | 2,095 | $ | 634 | $ | 4,076 | $ | 1,746 | ||||
| Growth exploration, evaluation and development | 4,876 | 4,056 | 11,839 | 10,879 | ||||||||
| Total exploration, evaluation and development | 6,971 | 4,690 | 15,915 | 12,625 | ||||||||
| Exploration, evaluation and development depreciation | 133 | 221 | 387 | 568 | ||||||||
| Exploration, evaluation and development share-based compensation | 154 | (204 | ) | 416 | 74 | |||||||
| Exploration, evaluation and development expense | $ | 7,258 | $ | 4,707 | $ | 16,718 | $ | 13,267 | ||||
| Expressed in thousands of US dollars | Three Months Ended September 30 |
Nine Months Ended September 30 |
||||||||||
| 2025 | 2024 | 2025 | 2024 | |||||||||
| Gross silver sales | $ | 76,194 | $ | 30,145 | $ | 164,218 | $ | 106,601 | ||||
| Silver ounces sold | 1,975,175 | 1,017,392 | 4,682,170 | 3,991,055 | ||||||||
| Realized silver price per ounce | $ | 38.58 | $ | 29.63 | $ | 35.07 | $ | 26.71 | ||||
1) inclusive of 212,691 oz of silver from pre-operating production at Terronera during three months and 240,321 oz during the nine months ended September 30, 2025
| Expressed in thousands of US dollars | Three Months Ended September 30 |
Nine Months Ended September 30 |
||||||||||
| 2025 | 2024 | 2025 | 2024 | |||||||||
| Gross gold sales | $ | 49,158 | $ | 23,794 | $ | 101,930 | $ | 70,264 | ||||
| Gold ounces sold | 13,847 | 9,412 | 30,816 | 30,179 | ||||||||
| Realized gold price per ounce | $ | 3,550 | $ | 2,528 | $ | 3,308 | $ | 2,328 | ||||
1) inclusive of 6,368 oz of gold from pre-operating production at Terronera during three months and 7,094 oz during the nine months ended September 30, 2025
| Expressed in thousands of US dollars | Three Months Ended September 30 |
Nine Months Ended September 30 |
||||||||||
| 2025 | 2024 | 2025 | 2024 | |||||||||
| Gross lead sales | $ | 10,460 | - | $ | 17,195 | - | ||||||
| Lead tonnes sold | 5,345 | - | 8,689 | - | ||||||||
| Realized lead price per tonne | $ | 1,957 | - | $ | 1,979 | - | ||||||
| Expressed in thousands of US dollars | Three Months Ended September 30 |
Nine Months Ended September 30 |
||||||||||
| 2025 | 2024 | 2025 | 2024 | |||||||||
| Gross Zinc sales | $ | 8,775 | - | $ | 14,397 | - | ||||||
| Zinc tonnes sold | 3,115 | - | 5,089 | - | ||||||||
| Realized zinc price per tonne | $ | 2,817 | - | $ | 2,829 | - | ||||||
| Expressed in thousands of US dollars | Three Months Ended September 30 |
Nine Months Ended September 30 |
||||||||||
| 2025 | 2024 | 2025 | 2024 | |||||||||
| Gross Copper sales | $ | 1,151 | - | $ | 1,712 | - | ||||||
| Copper tonnes sold | 115 | - | 172 | - | ||||||||
| Realized copper price per tonne | $ | 10,009 | - | $ | 9,953 | - | ||||||
Form 52-109F2
Certification of Interim Filings
Full Certificate
I, Daniel Dickson, Chief Executive Officer of Endeavour Silver Corp., certify the following:
1. Review: I have reviewed the interim financial report and interim MD&A (together, the "interim filings") of Endeavour Silver Corp. (the "issuer") for the interim period ended September 30, 2025.
2. No misrepresentations: Based on my knowledge, having exercised reasonable diligence, the interim filings do not contain any untrue statement of a material fact or omit to state a material fact required to be stated or that is necessary to make a statement not misleading in light of the circumstances under which it was made, with respect to the period covered by the interim filings.
3. Fair presentation: Based on my knowledge, having exercised reasonable diligence, the interim financial report together with the other financial information included in the interim filings fairly present in all material respects the financial condition, financial performance and cash flows of the issuer, as of the date of and for the periods presented in the interim filings.
4. Responsibility: The issuer's other certifying officer(s) and I are responsible for establishing and maintaining disclosure controls and procedures (DC&P) and internal control over financial reporting (ICFR), as those terms are defined in National Instrument 52-109 Certification of Disclosure in Issuers' Annual and Interim Filings, for the issuer.
5. Design: Subject to the limitations, if any, described in paragraphs 5.2 and 5.3, the issuer's other certifying officer(s) and I have, as at the end of the period covered by the interim filings
(a) designed DC&P, or caused it to be designed under our supervision, to provide reasonable assurance that
(i) material information relating to the issuer is made known to us by others, particularly during the period in which the interim filings are being prepared; and
(ii) information required to be disclosed by the issuer in its annual filings, interim filings or other reports filed or submitted by it under securities legislation is recorded, processed, summarized and reported within the time periods specified in securities legislation; and
(b) designed ICFR, or caused it to be designed under our supervision, to provide reasonable assurance regarding the reliability of financial reporting and the preparation of financial statements for external purposes in accordance with the issuer's GAAP.
5.1 Control framework: The control framework the issuer's other certifying officer(s) and I used to design the issuer's ICFR is the Internal Control - Integrated Framework (2013) (COSO Framework) published by The Committee of Sponsoring Organizations of the Treadway Commission (COSO).
5.2 ICFR - material weakness relating to design: N/A
5.3 Limitation on scope of design: N/A
6. Reporting changes in ICFR: The issuer has disclosed in its interim MD&A any change in the issuer's ICFR that occurred during the period beginning on July 1, 2025 and ended on September 30, 2025 that has materially affected, or is reasonably likely to materially affect, the issuer's ICFR.
Date: November 7, 2025
"Daniel Dickson"
_______________________
Daniel Dickson
Chief Executive Officer
Form 52-109F2
Certification of Interim Filings
Full Certificate
I, Elizabeth Senez, Chief Financial Officer of Endeavour Silver Corp., certify the following:
1. Review: I have reviewed the interim financial report and interim MD&A (together, the "interim filings") of Endeavour Silver Corp. (the "issuer") for the interim period ended September 30, 2025.
2. No misrepresentations: Based on my knowledge, having exercised reasonable diligence, the interim filings do not contain any untrue statement of a material fact or omit to state a material fact required to be stated or that is necessary to make a statement not misleading in light of the circumstances under which it was made, with respect to the period covered by the interim filings.
3. Fair presentation: Based on my knowledge, having exercised reasonable diligence, the interim financial report together with the other financial information included in the interim filings fairly present in all material respects the financial condition, financial performance and cash flows of the issuer, as of the date of and for the periods presented in the interim filings.
4. Responsibility: The issuer's other certifying officer(s) and I are responsible for establishing and maintaining disclosure controls and procedures (DC&P) and internal control over financial reporting (ICFR), as those terms are defined in National Instrument 52-109 Certification of Disclosure in Issuers' Annual and Interim Filings, for the issuer.
5. Design: Subject to the limitations, if any, described in paragraphs 5.2 and 5.3, the issuer's other certifying officer(s) and I have, as at the end of the period covered by the interim filings
(a) designed DC&P, or caused it to be designed under our supervision, to provide reasonable assurance that
(i) material information relating to the issuer is made known to us by others, particularly during the period in which the interim filings are being prepared; and
(ii) information required to be disclosed by the issuer in its annual filings, interim filings or other reports filed or submitted by it under securities legislation is recorded, processed, summarized and reported within the time periods specified in securities legislation; and
(b) designed ICFR, or caused it to be designed under our supervision, to provide reasonable assurance regarding the reliability of financial reporting and the preparation of financial statements for external purposes in accordance with the issuer's GAAP.
5.1 Control framework: The control framework the issuer's other certifying officer(s) and I used to design the issuer's ICFR is the Internal Control - Integrated Framework (2013) (COSO Framework) published by The Committee of Sponsoring Organizations of the Treadway Commission (COSO).
5.2 ICFR - material weakness relating to design: N/A
5.3 Limitation on scope of design: N/A
6. Reporting changes in ICFR: The issuer has disclosed in its interim MD&A any change in the issuer's ICFR that occurred during the period beginning on July 1, 2025 and ended on September 30, 2025 that has materially affected, or is reasonably likely to materially affect, the issuer's ICFR.
Date: November 7, 2025
"Elizabeth Senez"
_______________________
Elizabeth Senez
Chief Financial Officer