UNITED STATES
SECURITIES AND EXCHANGE COMMISSION
Washington, D.C. 20549
FORM 6-K
REPORT OF FOREIGN PRIVATE ISSUER PURSUANT TO RULE 13a-16 OR 15d-16
UNDER THE SECURITIES EXCHANGE ACT OF 1934
For the month of October 2025
Commission File No. 001-31965
TASEKO MINES LIMITED
(Translation of registrant's name into English)
12th Floor - 1040 West Georgia Street
Vancouver, British Columbia, V6E 4H1, Canada
(Address of principal executive office)
Indicate by check mark whether the registrant files or will file annual reports under cover of Form 20-F or Form 40-F
Form 20-F [ ] Form 40-F [X]
Indicate by check mark if the registrant is submitting the Form 6-K in paper as permitted by Regulation S-T Rule 101(b)(1) [ ]
Indicate by check mark if the registrant is submitting the Form 6-K in paper as permitted by Regulation S-T Rule 101(b)(7) [ ]
SUBMITTED HEREWITH
| Exhibits | |
| 99.1 | Technical Report Update on the Yellowhead Copper Project, British Columbia Canada dated June 15, 2025 with an effective date of July 10, 2025 |
SIGNATURE
Pursuant to the requirements of the Securities Exchange Act of 1934, the registrant has duly caused this report to be signed on its behalf by the undersigned, thereunto duly authorized.
TASEKO MINES LIMITED
Date: October 15, 2025
/s/ Bryce Hamming
________________________________
Bryce Hamming
Chief Financial Officer
TECHNICAL REPORT UPDATE
ON THE YELLOWHEAD COPPER PROJECT
BRITISH COLUMBIA, CANADA
QUALIFIED PERSONS:
Richard Weymark, P.Eng., MBA
Jeremy Guichon, P.Eng.
Adil Cheema, P.Eng.
Effective date: June 15th, 2025
date: July 10th, 2025
TABLE OF CONTENTS
| Section | |
| Summary | 1 |
| Introduction | 2 |
| Reliance on Other Experts | 3 |
| Property Description and Location | 4 |
| Accessibility, Climate, Local Resources, Infrastructure and Physiography | 5 |
| History | 6 |
| Geological Setting and Mineralization | 7 |
| Deposit Type | 8 |
| Exploration | 9 |
| Drilling | 10 |
| Sample Preparation, Analysis and Security | 11 |
| Data Verification | 12 |
| Mineral Processing and Metallurgical Testing | 13 |
| Mineral Resource Estimate | 14 |
| Mineral Reserve Estimate | 15 |
| Mining Method | 16 |
| Recovery Method | 17 |
| Project Infrastructure | 18 |
| Market Studies and Contracts | 19 |
| Environmental Studies, Permitting and Social or Community Impact | 20 |
| Capital and Operating Costs | 21 |
| Economic Analysis | 22 |
| Adjacent Properties | 23 |
TABLE OF CONTENTS - Cont'd
| Section | |
| Other Relevant Data and Information | 24 |
| Interpretation and Conclusions | 25 |
| Recommendations | 26 |
| References | 27 |
SECTION 1
SUMMARY
SECTION 1: SUMMARY
Table of Contents
| Page | ||
| 1.1 | Introduction | 1 |
| 1.2 | Property Description and Location | 1 |
| 1.3 | Accessibility and Infrastructure | 2 |
| 1.4 | History | 3 |
| 1.5 | Geology and Deposit | 4 |
| 1.6 | Mineral Processing and Metallurgical Testing | 5 |
| 1.7 | Mineral Resource and Reserve Estimate | 6 |
| 1.8 | Mining Method | 9 |
| 1.9 | Recovery Method | 10 |
| 1.10 | Project Infrastructure | 11 |
| 1.11 | Market Studies & Contracts | 12 |
| 1.12 | Environmental, Permitting, Social and Community Impact | 12 |
| 1.13 | Capital and Operating Costs | 13 |
| 1.14 | Economic Analysis | 15 |
| 1.15 | Interpretation and Conclusions | 16 |
| 1.16 | Recommendations | 16 |
| List of Tables | ||
| Table 1-1: Yellowhead Mineral Resource Estimate | 7 | |
| Table 1-2: Yellowhead Mineral Reserve Estimate | 8 | |
| Table 1-3: Mine Production Schedule | 9 | |
| Table 1-4: Initial Capital Costs | 13 | |
| Table 1-5: Sustaining Capital Costs | 14 |
| Table 1-6: Operating Costs Summary | 14 |
| Table 1-7: Onsite Operating Costs Summary | 14 |
| Table 1-8: Long-Term Street Consensus Metal Pricing and Foreign Exchange Rate | 15 |
| Table 1-9: Before-Tax Economic Valuation | 15 |
| Table 1-10: Before-Tax Yellowhead Project Cashflow Summary | 15 |
| Table 1-11: After-Tax Economic Valuation | 16 |
| Section 1 | Summary | Page 1 |
1.1 Introduction
The purpose of this report is to summarize the prefeasibility level engineering and cost estimate that support the updated Yellowhead Copper Project (the "Yellowhead Project" or the "Project") economics which incorporate updated metal prices, foreign exchange rates, capital and operating costs, gold recovery projections and a new transmission line design. The mineral reserve estimate, production schedule and project design remain consistent with the 2020 Technical Report. This report also describes the geotechnical site investigation, metallurgical testing, environmental baseline, permitting and First Nations engagement work completed since then.
The Qualified Persons (QPs) responsible for the content of this report are Richard Weymark, P.Eng., MBA, Jeremy Guichon, P.Eng. and Adil Cheema, P.Eng. Mr. Weymark is employed by the company as Vice President, Engineering, Mr. Guichon as Director, Mine Engineering and Mr. Cheema as Director, Process Engineering.
All measurement units used in this report are metric, and currency is expressed in Canadian dollars unless otherwise stated.
1.2 Property Description and Location
The Yellowhead property is located in the Thompson-Nicola area of BC, approximately 150 km northeast of Kamloops and are centered at latitude 51°30' north and longitude 119°48' west (Figure 4-1) in the Kamloops Mining Division.
The property consists of 1 mining lease and 94 mineral claims covering approximately 42,358 hectares. Taseko, through its wholly owned subsidiary Yellowhead Mining Inc. (YMI) (FMC 285998), is the 100% owner of these mineral tenures which are all in good standing. There are three parcels of fee simple land located 2.5 km west of Vavenby where the rail load-out facility will be located.
Six mineral claims, five of which have been incorporated into the mining lease are subject to a 2.5% NSR royalty to XStrata. Additionally, 31 claims, 27 of which have been incorporated into the mining lease, are subject to a 3% NSR royalty to US Steel Corp., capped at $3.9 million, subject to inflation. The mining lease encompasses the deposit area and plant site footprint.
| Section 1 | Summary | Page 2 |
1.3 Accessibility and Infrastructure
The Yellowhead Project is accessed via the Yellowhead Highway (Highway #5), 150 km by road north of Kamloops, which is serviced with daily flights from Vancouver and Calgary.
The primary access to site from Highway #5 is via the Vavenby Bridge Road through Vavenby and across the North Thompson River to the Birch Island Lost Creek Road (BILCR). From there, access is about 20 km along a network of existing Forest Service Roads (FSRs) that climb up to the Project site.
The Yellowhead Highway, the CN Rail transcontinental main line, and the 138 kV BC Hydro North Thompson transmission line all pass approximately 8 km north of the Project area.
YMI owns a property with an existing rail siding 2.5 km west of Vavenby and approximately 25 km by road from the Project site. This property will be used for the rail load-out facility and central parking and bus staging for transporting site personnel during construction and operations.
| Section 1 | Summary | Page 3 |
1.4 History
Copper mineralization was discovered in the immediate vicinity of the deposit in the mid- 1960s. The initial discovery was followed up by extensive prospecting, line cutting, road building, surface geochemical sampling, geological mapping, geophysics, trenching and diamond drilling programs.
Noranda Exploration Company (Noranda) and Québec Cartier Mining Company (QCM), a 100% wholly owned subsidiary of US Steel, staked claims in the deposit area in 1965 and 1966 respectively. This resulted in the area west of the Harper Creek tributary belonging to Noranda and east of it to QCM. The two companies worked independently on their properties from 1966 until 1970. In late 1970, the companies formed a joint venture, which explored their contiguous properties until 1974.
Further work in the deposit area occurred in 1986 and 1996. This included sampling historical trenches, core resampling and additional drilling.
Historical core drilling took place on the property in 11 different years totalling 30,800 m from 191 holes. Of these holes, 165 are located within what is now known as the Yellowhead Copper Deposit, for a total of 28,200 m or 92% of the overall drilling. No further drilling took place on the deposit area until 2006.
Yellowhead Mining Inc. (YMI) formed as a private British Columbia company in 2005 and obtained control of the Project through staking, purchase and option agreements. Exploration completed between 2005 and 2013 included diamond drilling, historical core relogging, airborne and ground geophysics, soil and rock sampling, geological mapping and other exploration activities.
By the end of 2013 YMI had completed 65,000 m of additional drilling on the property from 217 drillholes. A Feasibility Study was published on July 31, 2014 which proposed an open pit mine with a production capacity of 70,000 tpd and a 28-year operating life.
In 2015, an Environmental Assessment (EA) Application was accepted for review by the BC Environmental Assessment Office (BC EAO) and Canadian Environmental Assessment Agency (CEAA). In mid-2015, the application review was suspended at YMI's request and after an initial three-year extension, the provincial EA process was terminated in July 2018 by the BC EAO due to inactivity on the file.
In February 2019, Taseko acquired a 100% interest in YMI thus acquiring a 100% interest in the Project and withdrew from the federal EA process in May 2019. In 2020, Taseko published a technical report which summarized an updated development plan for the Project based on a mill throughput of 90,000 tonnes per day and a 25-year operating life.
| Section 1 | Summary | Page 4 |
1.5 Geology and Deposit
The Project is located within structurally complex, low-grade metamorphic rocks of the Eagle Bay Assemblage, part of the Kootenay Terrane on the western margin of the Omineca Belt in south-central BC.
The Eagle Bay Assemblage incorporates Lower Cambrian to Mississippian sedimentary and volcanic rocks subject to deformation and metamorphism. The Eagle Bay Assemblage divides into four northeast-dipping thrust sheets that collectively contain a succession of Lower Cambrian rocks overlain by a succession of Devonian-Mississippian rocks. The Lower Cambrian rocks include quartzites, grits and quartz mica schists (units EBH and EBQ), mafic metavolcanic rocks and limestone (unit EBG), and overlying schistose sandstones and grits (unit EBS) with minor calcareous and mafic volcanic units. These older units are overlain by Devonian-Mississippian succession of mafic to intermediate metavolcanic rocks (units EBA and EBF) intercalated with and overlain by dark grey phyllite, sandstone and grit (unit EBP).
Unit EBA of the Devonian-Mississippian succession hosts the deposit.
The deposit type is interpreted as a remobilized polymetallic volcanogenic massive sulphide deposit, comprising lenses of disseminated, fracture-filling and banded iron and copper sulphides with accessory magnetite. Mineralization is generally conformable with the host-rock stratigraphy as is consistent with the volcanogenic model. Observed sulphide lenses measure many tens of metres in thickness with km-scale strike and dip extents.
The northeast trending Harper Creek Fault separates the deposit into a west domain and east domain. In the west domain, chalcopyrite mineralization is primarily in three copper bearing horizons. The upper horizon ranges from 60 m to 170 m in width and is continuous along an east-west strike for some 1,300 m, dipping approximately 30º north. The middle horizon is not as well developed and is often fragmented. It ranges from 30 m to 40 m in width at the western extent, increasing up to 90 m locally eastward, gradually appearing to blend into the upper horizon. The lowest or third horizon has less definition mainly due to a lack of drill intersections. It can range from 30 m to 90 m in width although typical intersections are in the 30 m range. These horizons generally contain foliation-parallel wisps and bands as the dominant style of sulphide mineralization.
In the east domain, mineralization characterized by high angle, discontinuous, tension fractures of pyrrhotite, chalcopyrite ± bornite. Mineralization is not selective to individual units and frequently transgresses lithological contacts throughout the area. At the near surface areas in the south and down-dip to the north, widths of mineralization typically range from 120 m to 160 m. In the central area of the east domain where thrust/reverse fault stacking has been interpreted, mineralization thicknesses typically range from 220 m to 260 m with local intersections of up to 290 m.
| Section 1 | Summary | Page 5 |
1.6 Mineral Processing and Metallurgical Testing
The Yellowhead Project's process flowsheet consists of a conventional SAG and ball milling circuit, followed by rougher flotation, regrinding of rougher concentrate, and a three-stage cleaner flotation circuit. Metallurgical testing from both the historical G&T program and more recent SGS program confirms the suitability of this design for the ore.
Comminution testing demonstrated that the ore is soft to moderately soft, with low abrasivity and no requirement for pebble crushing. Mineralogical characterization confirmed chalcopyrite is the dominant copper bearing mineral across the deposit, comprising more than 98% of the copper species in the majority of the deposit.
Lock cycle tests from both programs consistently produced final copper concentrates grading between approximately 25.5% to 26%, with copper recoveries near 90%. Final concentrates were clean with minor deleterious elements below typical smelter penalty thresholds, and also contained payable gold and silver credits.
The copper and silver recovery models remain consistent with historical models used for the Project and are well supported by the more recent test work completed at SGS. The gold recovery model was refined based on SGS test results and a re-evaluation of historical test data. Together, the validated historical copper and silver models and refined gold model form the basis for the Project's updated metallurgical recovery projections.
Future metallurgical test programs undertaken for the Project should consider evaluating opportunities to improve gold recovery and additional variability testing using the updated flowsheet and reagent scheme.
| Section 1 | Summary | Page 6 |
1.7 Mineral Resource and Reserve Estimate
(a) Resource Estimate
The most recent update to the resource block model was completed in 2014 as documented in the technical report titled "Technical Report & Feasibility Study of the Harper Creek Copper Project", dated July 31, 2014 which has an effective date of July 31, 2014. There have been no additional relevant exploration results within the resource area nor changes to the resource block model since that time.
The sample database for the Project contains results from 353 core holes (90,779 m) drilled between 1967 and the end of 2013.
The mineralized stratigraphy comprises a sequence of phyllites and schists overlying un- mineralized gneiss. Weakly mineralized to barren phyllites overlie the main mineralized horizons. The Harper Creek Fault bisects the deposit in a southwest-northeast direction and dips steeply to the southeast. The three main lithologic domains (gneiss, mineralized meta- sediments and overlying phyllites) were modeled as 3D wireframes. The Harper Creek Fault was modeled as a surface and acts as a hard boundary for both the lithologic and grade models. In order to further constrain the block model grade estimation, gradeshells based on a 700ppm copper cut-off were generated by modeling log transformed data. Separate zones were modeled on either side of the Harper Creek Fault.
Block dimension are 12 m x 12 m x 12 m. Block volumes in in-situ rock domains use a density factor ranging from 2.71 to 2.85 dependant on lithology while density of overburden was assigned a factor of 2.2.
Copper, gold and silver grades within the northwest and southeast zone domains were estimated in three passes using the inverse distance squared weighting method (ID2). The second pass used an octant search in order to differentiate interpolated from extrapolated block grade estimates for classification.
Resource classifications used conform to CIM Definition Standards for Mineral Resources and Mineral Reserves (2014). Blocks were initially classified as measured if they were estimated in the first pass with a minimum of 4 composites from at least 2 drillholes within 82.5 m of the block centroid corresponding to one third of the maximum variogram range. The blocks meeting these criteria were then examined visually and some blocks were downgraded to indicated if they were in areas missing precious metal assays or in isolated clusters.
| Section 1 | Summary | Page 7 |
1.7 Mineral Resource and Reserve Estimate - Cont'd
(a) Resource Estimate - Cont'd
Remaining unclassified blocks were flagged as indicated if they were estimate in the 2nd pass which used an octant search to limit extrapolation. Some extrapolated estimates from the third pass were also classified as indicated if the closest composite was within 125 m of a block centroid corresponding to half the maximum variogram range. A series of blocks estimated in the third pass that were adjacent to the Harper Creek Fault and not estimated in the octant search due to the imposed hard boundary were also classified as indicated.
All other estimated blocks were classified as inferred.
A Lerchs-Grossman pit optimization was generated to constrain the resource within the block model. Metal prices used were US$4.25/lb for copper, US$2,400/oz for gold and US$28.00/oz for silver at a foreign exchange rate of C$1.30 : US$1.00. Average metal recoveries are 89% for copper, 35% for gold and 59% for silver at a 0.15% copper cut-off grade. Combined processing and G&A costs were set at C$7.40/t milled. Pit-rim mining cost for ore and waste were C$2.31/t mined with a bench increment of C$0.035/t mined and pit slopes were set based on wall azimuth.
The mineral resource estimate for the Project is shown in Table 1-1.
Table 1-1: Yellowhead Mineral Resource Estimate
| Yellowhead Project Mineral Resources Effective June 1, 2025 At 0.15% Copper Cut-off |
||||
| Classification | Tonnes (millions) |
Copper Grade (%) |
Gold Grade (gpt) |
Silver Grade (gpt) |
| Measured | 561 | 0.27 | 0.029 | 1.2 |
| Indicated | 735 | 0.24 | 0.027 | 1.2 |
| Measured and Indicated | 1,296 | 0.25 | 0.028 | 1.2 |
| Inferred | 111 | 0.24 | 0.026 | 1.2 |
Notes:
1. Mineral Resources follow CIM Definition Standards for Mineral Resources and Mineral Reserves (2014).
2. Mineral Resources are reported inclusive of Mineral Reserves.
3. Mineral Resources that are not Mineral Reserves do not have demonstrated economic viability.
4. The Mineral Resource has been confined by a Lerchs-Grossman pit optimization to meet "reasonable prospects of eventual economic extraction" using the following assumptions: Metal prices of US$4.25/lb Cu, US$2,400/oz Au and US$28.00/oz Ag; a foreign exchange rate of C$1.30 : US$1.00; average metal recoveries of 89% for copper, 35% for gold and 59% for silver; combined processing and G&A costs of C$7.40/t milled; and pit-rim mining cost of C$2.31/t mined with a bench increment of C$0.035/t mined.
5. Bulk density is estimated by lithology and ranges between 2.71 t/m3 and 2.85 t/m3 in rock and 2.2 t/m3 in overburden.
6. Numbers may not add due to rounding.
| Section 1 | Summary | Page 8 |
1.7 Mineral Resource and Reserve Estimate - Cont'd
(b) Reserve Estimate
The extent of the reserve pit was determined by applying the Lerchs-Grossman pit optimization algorithm to the measured and indicated resources. The resultant reserve basis pit shell was used as a guide to develop the detailed reserve pit design.
The input parameters used to derive the reserve basis pit shell include conservative commodity prices, appropriate metal recoveries and unit costs for mining, processing, water treatment, general and administration (G&A), a sustaining capital allowance, and consultant recommended pit wall slopes.
Reserves are stated at a copper cut-off grade of 0.17% based an evaluation documented in the 2020 Technical Report. A break-even cut-off grade analysis was performed and demonstrated that the copper cut-off grade of 0.17% is conservative.
Proven and probable reserves are derived from measured and indicated resources respectively, that are contained within the reserve pit design and are above the stated copper cut-off grade. Table 1-2 summarizes the proven and probable mineral reserves as of June 1, 2025.
Table 1-2: Yellowhead Mineral Reserve Estimate
| Yellowhead Project Mineral Reserves Effective June 1, 2025 At 0.17% Copper Cut-off |
|||||
| Category | Tonnes (millions) |
Cu (%) |
Au (gpt) | Ag (gpt) | Cu Eq. * (%) |
| Proven | 458 | 0.29 | 0.031 | 1.3 | 0.30 |
| Probable | 359 | 0.26 | 0.028 | 1.2 | 0.28 |
| Total | 817 | 0.28 | 0.030 | 1.3 | 0.29 |
Notes:
1. Mineral Reserves follow CIM Definition Standards for Mineral Resources and Mineral Reserves (2014).
2. Mineral Reserves are contained within Mineral Resources.
3. Mineral Reserves are assumed to be extracted using open pit mining methods and are based on the following assumption: Metal prices of US$2.85/lb Cu, US$1,610/oz Au and US$18.75/oz Ag; a foreign exchange rate of C$1.30 : US$1.00; average metal recoveries of 90% for copper, 36% for gold and 59% for silver; combined processing, G&A and water treatment costs of C$7.40/t milled; pit-rim mining costs of C$2.33/t of overburden, C$2.28/t of non-PAG waste, C$2.79/t of PAG waste and C$2.07/t of ore with a bench increment of C$0.035/t mined per bench and sustaining capital allowance of C$0.20/t mined; average offsite costs of C$0.48/lb of copper; payable metal terms of 96.1% for copper, 90% for gold and 90% for silver; and overall pit slopes of 30 to 40 degrees.
4. Bulk density is estimated by lithology and ranges between 2.71 and 2.85 in rock and 2.2 in overburden.
5. Copper equivalency is based on US$4.25/lb price and 90% metallurgical recovery for copper, US$2,400/oz and 36% metallurgical recovery for gold, and US$28.00/oz and 59% metallurgical recovery for silver. CuEq can be calculated using the formula CuEq% = Cu% + Au(gpt) × 0.3351 + Ag(gpt) × 0.006331.
6. Numbers may not add due to rounding.
| Section 1 | Summary | Page 9 |
1.8 Mining Method
The Yellowhead Project envisions an open pit mine utilizing conventional truck and shovel mining techniques. The equipment utilized will be typical of that found in other modern, large-scale, open pit mines. Open pit operations are planned to supply the concentrator with 90,000 tpd of ore at a cut-off grade of 0.17% copper. Ore will be delivered to a primary crusher located at the southwestern rim of the ultimate pit. An ore stockpile will be built during the first five years of operation to maximize ore grade delivered to the concentrator during that period and mitigate operational disruptions.
Overburden of sufficient quality for use in reclamation will be segregated from non-acid generating (NAG) waste rock and stockpiled in several locations surrounding the pit. Surplus NAG waste rock not designated for TSF embankment construction will be stored in four locations located to the south and southwest of the open pit. Potentially acid generating (PAG) waste rock will be co-disposed within the TSF.
A summary of the production schedule is shown in Table 1-3.
Table 1-3: Mine Production Schedule
| Project Period | Pre- Production Total |
Years 1-5 Total |
Years 6-10 Total |
Years 11- 15 Total |
Years 16- 20 Total |
Years 21- 25 Total |
Grand Total |
|
| Tonnes Mined | (Mt) | 45 | 378 | 425 | 435 | 395 | 246 | 1,923 |
| Mill Feed | (Mt) | -- | 160 | 164 | 164 | 164 | 164 | 817 |
| Copper in Mill Feed | (%) | -- | 0.32 | 0.24 | 0.26 | 0.26 | 0.30 | 0.28 |
| Gold in Mill Feed | (gpt) | -- | 0.039 | 0.025 | 0.028 | 0.027 | 0.029 | 0.030 |
| Silver in Mill Feed | (gpt) | -- | 1.3 | 1.2 | 1.2 | 1.4 | 1.2 | 1.3 |
| Section 1 | Summary | Page 10 |
1.9 Recovery Method
The sulphide concentrator for the Project will include three stages of comminution, followed by three stages of flotation and a final concentrate dewatering stage. Process design and equipment sizing for the concentrator were informed by results from the G&T FS program completed in 2011 to 2012 and the SGS metallurgical test program completed in 2020 to 2021.
The concentrator is designed to process a nominal 90,000 tpd of ore and produce a marketable copper concentrate containing payable amounts of gold and silver. The concentrator will consist of a primary gyratory crusher fed run-of-mine (ROM) ore from the pit transported via haul trucks. The product from the crusher will be transported via overland conveyors to a coarse ore stockpile. Ore from the stockpile will then be reclaimed and fed to two parallel SAG-ball mill circuits which produce feed for a single rougher flotation bank. The rougher flotation concentrate will be reground with two parallel vertical stirred mills prior to being upgraded in a two-stage cleaner flotation circuit which includes both tank and column flotation cells. Flotation reagents added will include dual collectors with mercaptan and thionocarbamate based chemistry, a frother with an alcohol and glycol- ether based chemistry, and lime as pH regulator.
The final concentrate will be dewatered by thickening followed by filtration prior to being conveyed to the final concentrate stockpile. The final concentrate will be trucked off site to a nearby rail load-out facility for subsequent transport to the Port of Vancouver or direct rail to other North American markets.
Both rougher and first cleaner flotation tailings will be transported separately to the tailings storage facility (TSF). Process water from the TSF will be reclaimed and recycled back to the concentrator for reuse.
| Section 1 | Summary | Page 11 |
1.10 Project Infrastructure
During construction, a full-service, self-contained temporary construction camp will be installed on site to accommodate the construction workforce.
During operations, mine support facilities will include a mobile equipment maintenance shop, a welding tent, a bulk explosives facility and storage magazines, fuel stations for mining and ancillary equipment, and designated storage areas for overburden, waste rock and ore.
The concentrator and supporting facilities will include a primary crusher, overland conveyor system, a coarse ore stockpile, and the concentrator buildings housing the grinding, flotation, dewatering, and reagent storage and distribution equipment. Additional support facilities near the concentrator will include a process water pond, assay laboratory, separate concentrator office building, a fixed plant maintenance shop, and a covered concentrate storage and truck loading area.
Tailings and water management infrastructure will include a TSF designed to store tailings from the concentrator and PAG waste rock from the mine, with cyclone sand from NAG tailings used to construct the TSF main embankment. Process water will be reclaimed from a floating barge in the TSF to the process water pond and recirculated to the concentrator for reuse. A water treatment plant will treat excess contact water, and site water management systems will handle pit dewatering and surface runoff.
Additional onsite ancillary infrastructure will include a gatehouse and emergency response building, mine dry, warehouse with additional cold storage area, potable water and sewage treatment systems, and fire protection infrastructure.
Offsite infrastructure will include a new 230 kV transmission line from 100 Mile House which will tie into a new substation located at the plant site and a rail load-out facility located near Vavenby.
| Section 1 | Summary | Page 12 |
1.11 Market Studies & Contracts
The Project's copper concentrate is estimated to have a 25.5% copper grade with payable amounts of gold and silver and no element approaching typical smelter penalty levels. A concentrate marketing study completed in 2025 confirmed the marketability of the anticipated final concentrate quality.
While there are currently no contracts in place for the sale of concentrate, it is expected that the clean nature of the concentrate will make it attractive to a large array of smelters globally. The offsite costs associated with concentrate transport, port storage, stevedoring, shipping, treatment and refining have been incorporated into the Project's economic analysis based on inputs developed from the concentrate marketing study and Taseko's current experience at it's Gibraltar Mine.
For evaluating the Project, Taseko has relied on long-term street consensus metal pricing as of May 2025. Standard procurement contracts will be required for construction, materials delivery and some site services.
1.12 Environmental, Permitting, Social and Community Impact
Environmental baseline studies were performed between 2007 and 2014 with additional studies conducted by Taseko from 2019 to present.
Taseko has engaged with both the BC Environmental Assessment Office (EAO) and the Impact Assessment Agency of Canada (IAAC) regarding submission of an Initial Project Description (IPD) and Engagement Plan (EP) to start the Early Engagement and Planning phases of the provincial and federal assessment processes, respectively.
A comprehensive permitting process will be undertaken following the assessment process for the Project to enable construction, operation, and eventual closure of the Project.
The Project is situated primarily within the territory of the Simpcw First Nation
̓
(Simpcwúlecw). Taseko is focused on working collaboratively with the Simpcw and has agreed to participate in the Simpcw Process, an Indigenous-led assessment process.
In British Columbia, mining companies are required to reclaim mine disturbance when mining is complete in accordance with the Code. Further discussion of post-closure requirements will occur during the Environmental Assessment (EA) and subsequent permitting processes. This period will continue until all conditions of the Code and permits have been fulfilled and Taseko has been released from all regulatory obligations.
Before any work on a site is conducted, the province requires companies to provide security in accordance with the Code. The reclamation security amount will be developed as part of the permitting phase.
| Section 1 | Summary | Page 13 |
1.13 Capital and Operating Costs
Capital costs are based on budgetary quotes for equipment and current pricing for materials, labour and services in the Province of British Columbia. Operating costs are based on a combination of vendor supplied quotes and Taseko's experience operating the Gibraltar Mine.
All costs shown are current as of Q2, 2025 and are stated in Canadian dollars unless otherwise stated.
A summary of the initial capital costs estimated for the Project is provided in Table 1-4.
Table 1-4: Initial Capital Costs
| Area | Total Capital ($ millions) |
| Mine and Support Infrastructure | 295 |
| Concentrator and Support Infrastructure | 623 |
| Tailings and Water Management | |
| Infrastructure | 213 |
| Onsite Ancillary Infrastructure | 143 |
| Offsite Infrastructure | 153 |
| Subtotal Direct Costs | 1,427 |
| Indirect Costs | 207 |
| Owner's Costs | 52 |
| Contingency | 299 |
| Subtotal Indirect Costs | 558 |
| Total Initial Capital | 1,985 |
Note: totals may not add due to rounding
The sustaining capital cost estimate includes a water treatment plant (WTP), staged TSF embankment construction, additional water collection systems, additional mining equipment, primary mining equipment fleet lease payments, and general sustaining capital through the life of the mine. Sustaining capital costs are shown in Table 1-5.
| Section 1 | Summary | Page 14 | ||||
1.13 Capital and Operating Costs - Cont'd
Table 1-5: Sustaining Capital Costs
| Area | Total Capital ($ millions) |
| Water Treatment, TSF Construction & Water Management | 182 |
| Mine Incremental Capital and Equipment Leases | 458 |
| General Sustaining Capital | 323 |
| Total Sustaining Capital | 963 |
Note: totals may not add due to rounding
Operating costs for the Project are summarized in Table 1-6.
Table 1-6: Operating Costs Summary
| Area | Unit Cost (US$/lb) |
| Onsite Costs | 1.76 |
| Offsite Costs | 0.39 |
| Byproduct Credits | (0.25) |
| Total Operating Cost* | 1.90 |
Note: totals may not add due to rounding
* Net of byproduct credits
Onsite operating costs include mining, processing and general and administration costs as summarized in Table 1-7. Offsite costs include copper concentrate transportation costs, smelter fees and deductions, and royalty payments. Byproduct credits are calculated using the metal prices and production rates described in Section 1.14.
Table 1-7: Onsite Operating Costs Summary
| Area | Cost per Tonne Milled ($/t) |
| Mining | 6.06 |
| Processing | 5.75 |
| G&A | 1.07 |
| Total Onsite Cost | 12.89 |
Note: totals may not add due to rounding
| Section 1 | Summary | Page 15 |
1.14 Economic Analysis
Metal prices are based on long-term street consensus metal pricing as of Q2 2025 and long- term foreign exchange rates based on Taseko's expectations informed by historical exchange rates and are shown in Table 1-8. A discounted cashflow model using a discount rate of 8% is used for the valuation basis with an effective date of June 15, 2025. Results of the valuation are presented on a 100% basis and assume no debt financing costs except for mining equipment leases. All values are in Canadian dollars unless otherwise stated.
Table 1-8: Long-Term Street Consensus Metal Pricing and Foreign Exchange Rate
| Long-Term Forecasts | Metal Price |
| Copper Price | US$4.25/lb |
| Gold Price | US$2400/oz |
| Silver Price | US$28.00/oz |
| Foreign Exchange | US$1.00 : C$1.35 |
Before-tax economic indicators for the Project are presented in Table 1-9.
Table 1-9: Before-Tax Economic Valuation
| Economic Indicator | Value |
| Average Annual Before-Tax Cash Flow | $480 million |
| Before-Tax NPV at 8% | $2.8 billion |
| Before-Tax Internal Rate of Return | 22% |
| Before-Tax Payback Period | 3.7 years |
A summary of the before-tax cashflow for the Project is presented in Table 1-10.
Table 1-10: Before-Tax Yellowhead Project Cashflow Summary
| Project Period | Pre- Production Total |
Years 1-5 Total |
Years 6-10 Total |
Years 11-15 Total |
Years 16-20 Total |
Years 21- 25 Total |
Grand Total |
|
| Copper Production | (M lbs) | -- | 1,028 | 760 | 837 | 852 | 965 | 4,441 |
| Gold Production | (000 oz) | -- | 82 | 43 | 52 | 49 | 56 | 282 |
| Silver Production | (000 oz) | -- | 3,762 | 3,547 | 3,846 | 4,605 | 3,642 | 19,402 |
| Operating Profit | (C$ M) | -- | 3,415 | 1,865 | 2,226 | 2,291 | 3,276 | 13,073 |
| Capital Costs | (C$ M) | 1,985 | 576 | 108 | 168 | 93 | 18 | 2,948 |
| Net Cash Flow | (C$ M) | -1,985 | 2,839 | 1,758 | 2,058 | 2,198 | 3,258 | 10,125 |
Note: totals may not add due to rounding
| Section 1 | Summary | Page 16 |
1.14 Economic Analysis - Cont'd
After-tax economic indicators for the Project are presented in Table 1-11. This assessment assumes current federal and provincial tax laws remain in force and that the Project is eligible for the Clean Technology Manufacturing Investment Tax Credit that would result in a tax refund of approximately $540 million in the year following completion of construction.
Table 1-11: After-Tax Economic Valuation
| Economic Indicator | Value |
| After-Tax NPV at 8% | $2.0 billion |
| After-Tax Internal Rate of Return | 21% |
| After-Tax Payback Period | 3.3 years |
1.15 Interpretation and Conclusions
The Yellowhead property contains adequate mineral reserves to develop an open pit mine and supply a process plant with 90,000 tpd of ore for a period of at least 25 years.
The design is to a sufficient level of study to support a mineral reserve statement and there are no known conditions that would preclude the establishment of the infrastructure as designed.
Environmental baseline studies have been advanced by a number of consultant groups to a level commensurate with initiating an environmental assessment.
The estimation of capital and operating costs is based on a sufficient level of study to support a mineral reserve statement and are current as of Q2 2025.
The economics of mining and processing the stated mineral reserves of this project are appropriate and demonstrate that, as of the effective date of this report, extraction can reasonably be justified.
1.16 Recommendations
Additional environmental baseline studies, geotechnical site investigation, modelling and effects assessment work are recommended as inputs to support an environmental assessment.
It is recommended that additional bench-scale metallurgical test work be undertaken consisting of gold recovery testing, additional variability testing and settling and filtration testing.
SECTION 2
INTRODUCTION
SECTION 2: INTRODUCTION
Table of Contents
| Page | ||
| 2.1 | Introduction | 1 |
| Section 2 | Introduction | Page 1 |
2.1 Introduction
This technical report has been prepared by Taseko Mines Limited (Taseko) a company existing under the British Columbia Business Corporations Act and having its head office at 1040 West Georgia Street, Vancouver, British Columbia, Canada.
The purpose of this report is to summarize the prefeasibility level engineering and cost estimate that support the updated Yellowhead Copper Project (the "Yellowhead Project" or the "Project") economics which incorporate updated metal prices, foreign exchange rates, capital and operating costs, gold recovery projections and a new transmission line design. The mineral reserve estimate, production schedule and project design remain consistent with the 2020 Technical Report. This report also describes the geotechnical site investigation, metallurgical testing, environmental baseline, permitting and First Nations engagement work completed since then.
The information, conclusions, opinions, and estimates contained herein are based on:
• Information available to Taseko at the time of preparation of this report;
• Assumptions, conditions and qualifications as set forth in this report;
• Data, reports and opinions supplied by Taseko and other third party sources listed as references.
The Qualified Persons (QPs) responsible for the content of this report are Richard Weymark, P.Eng., MBA, Jeremy Guichon, P.Eng. and Adil Cheema, P.Eng.
Mr. Weymark supervised preparation of Sections 1 through 5, 19, 20 and 23 through 27 and has reviewed the mineral tenure, environmental baseline studies, permitting requirements and long-term commodity price assumptions. Mr. Weymark's current position is Vice President, Engineering and he has been employed by Taseko since July 2018. His most recent personal inspection of the property occurred on October 4th and 5th, 2024.
Mr. Guichon supervised the preparation of Sections 6 through 11, 14 through 16, 21 and 22 of this report and has reviewed the methods used to produce the grade and tonnage estimates in the geological model, the mineral resource estimate, the pit design, the long range mine plan, the capital and operating cost estimates and the economic analysis. In addition, he reviewed the drilling, sampling, QA/QC, sample preparation and analytical methodologies used. Mr. Guichon's current position is Director, Mine Engineering and he has been employed by Taseko since June 2012. His most recent personal inspection of the property occurred on October 3rd to 5th, 2024.
| Section 2 | Introduction | Page 2 |
2.1 Introduction - Cont'd
Mr. Cheema supervised the preparation of Sections 12, 13, 17 and 18 of this report and has reviewed the data verification activities, laboratory analytical methods as well as the test work methodology used to determine the metallurgical recovery projections used in the economic analysis accompanying this report. Mr. Cheema's current position is Director, Process Engineering and he has been employed by Taseko since March of 2019. His most recent personal inspection of the property occurred on October 3rd to 5th, 2024.
All measurement units used in this report are metric, and currency is expressed in Canadian dollars unless otherwise stated.
SECTION 3
RELIANCE ON OTHER EXPERTS
SECTION 3: RELIANCE ON OTHER EXPERTS
Table of Contents
| Page | ||
| 3.1 | Reliance on Other Experts | 1 |
| Section 3 | Reliance on Other Experts | Page 1 |
3.1 Reliance on Other Experts
Standard professional procedures have been followed in the preparation of this technical report. Data used in this report has been verified where possible and the authors have no reason to believe that data was not collected in a professional manner and no information has been withheld that will affect the conclusions of this report.
The information, conclusions, opinions, and estimates contained herein are based on:
• Information available to Taseko as of the effective date of this report; and,
• Assumptions, conditions, and qualifications as stated in this report.
For the purposes of this report, the QPs have relied on title and property ownership obtained from the Mineral Titles Online (MTO) system as of June 15, 2025 to confirm Taseko's internal tenure tracking system. MTO is an internet-based mineral title administration system maintained by the Mineral Titles Branch of the B.C Ministry of Mining and Critical Minerals. This tenure information applies to Section 4.2 of this report.
Standard tax calculations for BC based mining projects were reviewed internally in June 2025 by Taseko's CFO Bryce Hamming CFA, CPA, CA, an accountant with knowledge in Canadian mining taxation, and were incorporated into the cashflow model and tax related information referenced in Section 22.
Except for the purposes legislated under provincial securities laws, any use of this report by any third party is at that party's sole risk.
SECTION 4
PROPERTY DESCRIPTION AND LOCATION
SECTION 4: PROPERTY DESCRIPTION AND LOCATION
| Table of Contents | ||
| Page | ||
| 4.1 | Property Description and Location | 1 |
| 4.2 | Land Tenure | 3 |
| 4.3 | Environmental Liabilities | 8 |
| 4.4 | Permits Obtained and To Be Acquired | 8 |
| List of Tables | ||
| Table 4-1: Mineral Tenures | 3 | |
| Table 4-2: Yellowhead Mineral Tenures | 5 | |
| List of Figures | ||
| Figure 4-1: Project Location | 2 | |
| Figure 4-2: Mineral Tenures | 4 | |
| Section 4 | Property Description and Location | Page 1 |
4.1 Property Description and Location
The Yellowhead property is located in the Thompson-Nicola area of BC, approximately 150 km northeast of Kamloops and is centered at latitude 51°30' north and longitude 119°48' west (Figure 4-1) in the Kamloops Mining Division. Clearwater, the largest community in the project area is 124 km north of Kamloops, along the Yellowhead Highway route (Highway #5). Vavenby, the closest community to the project area, is 27 km east of Clearwater along Highway #5.
| Section 4 | Property Description and Location | Page 2 |
4.1 Property Description and Location - Cont'd

Figure 4-1: Project Location
| Section 4 | Property Description and Location | Page 3 |
4.2 Land Tenure
The property consists of 1 mining lease, which is valid until at least June 2050, and 94 mineral claims. Taseko, through its wholly owned subsidiary Yellowhead Mining Inc. (FMC 285998), is the 100% owner of these mineral tenures which cover a total combined area of approximately 42,358 hectares as summarized in Table 4-1 and shown in Figure 4- 2.
Table 4-1: Mineral Tenures
| Tenure Type | Number | Area (ha) |
| Claims | 94 | 39,552 |
| Leases | 1 | 2,805 |
| Total | 95 | 42,358 |
All mineral tenures are in good standing and details of each are provided in Table 4-2.
There are three parcels of fee simple land located 2.5 km west of Vavenby where the rail load-out facility will be located.
Six mineral claims, five of which have been incorporated into the mining lease are subject to a 2.5% NSR royalty to XStrata. Additionally, 31 claims, 27 of which have been incorporated into the mining lease, are subject to a 3% NSR royalty to US Steel Corp., capped at $3.9 million, subject to inflation. The mining lease encompasses the deposit area and plant site footprint.
| Section 4 | Property Description and Location | Page 4 |
4.2 Land Tenure - Cont'd

Figure 4-2: Mineral Tenures
| Section 4 | Property Description and Location | Page 5 |
4.2 Land Tenure - Cont'd
Table 4-2: Yellowhead Mineral Tenures
| Title Number |
Claim Name | Title Sub Type |
Issue Date | Good To Date |
Area (ha) |
| 1076941 | Lease | 2020/JUN/25 | 2026/JUN/25 | 2805 | |
| 572097 | SANDRA4 | Claim | 2007/DEC/18 | 2026/AUG/01 | 503.4 |
| 572098 | CHELSEA | Claim | 2007/DEC/18 | 2026/AUG/01 | 382.6 |
| 572099 | STEPHANIE | Claim | 2007/DEC/18 | 2026/AUG/01 | 382.6 |
| 572100 | ISABEL | Claim | 2007/DEC/18 | 2026/AUG/01 | 463.2 |
| 582783 | Claim | 2008/APR/25 | 2026/AUG/01 | 201.3 | |
| 592574 | Claim | 2008/OCT/05 | 2026/AUG/01 | 503.1 | |
| 592579 | Claim | 2008/OCT/05 | 2026/AUG/01 | 502.9 | |
| 592580 | Claim | 2008/OCT/05 | 2026/AUG/01 | 462.5 | |
| 592581 | Claim | 2008/OCT/05 | 2026/AUG/01 | 442.7 | |
| 606977 | DUNN | Claim | 2009/JUL/03 | 2026/AUG/01 | 415.4 |
| 627844 | HARP | Claim | 2009/SEP/03 | 2026/AUG/01 | 301.7 |
| 663643 | Claim | 2009/NOV/02 | 2026/AUG/01 | 502.4 | |
| 663658 | Claim | 2009/NOV/02 | 2026/AUG/01 | 402.0 | |
| 1096428 | Claim | 2022/JUN/29 | 2026/AUG/01 | 281.1 | |
| 1096429 | Claim | 2022/JUN/29 | 2026/AUG/01 | 40.2 | |
| 1098385 | Claim | 2022/OCT/20 | 2026/AUG/01 | 120.5 | |
| 220797 | HAIL 102 | Claim | 1966/JUL/22 | 2026/AUG/02 | 25.0 |
| 220798 | HAIL 104 | Claim | 1966/JUL/22 | 2026/AUG/02 | 25.0 |
| 220799 | HAIL 106 | Claim | 1966/JUL/22 | 2026/AUG/02 | 25.0 |
| 220800 | HAIL 108 | Claim | 1966/JUL/22 | 2026/AUG/02 | 25.0 |
| 501608 | HARPER 2 | Claim | 2005/JAN/12 | 2026/AUG/02 | 221.3 |
| 502603 | Claim | 2005/JAN/12 | 2026/AUG/02 | 603.4 | |
| 502606 | Claim | 2005/JAN/12 | 2026/AUG/02 | 502.9 | |
| 506422 | Claim | 2005/FEB/09 | 2026/AUG/02 | 563.0 | |
| 509217 | Claim | 2005/MAR/18 | 2026/AUG/02 | 422.2 | |
| 513235 | Claim | 2005/MAY/24 | 2026/AUG/02 | 321.7 | |
| 519327 | TOM1 | Claim | 2005/AUG/25 | 2026/AUG/02 | 502.4 |
| 519329 | TOM2 | Claim | 2005/AUG/25 | 2026/AUG/02 | 502.4 |
| 519330 | TOM3 | Claim | 2005/AUG/25 | 2026/AUG/02 | 502.4 |
| Section 4 | Property Description and Location | Page 6 |
4.2 Land Tenure - Cont'd
Table 4-2: Yellowhead Mineral Tenures - Cont'd
| Title Number |
Claim Name | Title Sub Type |
Issue Date | Good To Date |
Area (ha) |
| 519331 | TOM4 | Claim | 2005/AUG/25 | 2026/AUG/02 | 502.4 |
| 519332 | TOM5 | Claim | 2005/AUG/25 | 2026/AUG/02 | 502.5 |
| 519333 | TOM6 | Claim | 2005/AUG/25 | 2026/AUG/02 | 502.3 |
| 519334 | TOM7 | Claim | 2005/AUG/25 | 2026/AUG/02 | 462.1 |
| 530337 | SUN 1 | Claim | 2006/MAR/20 | 2026/AUG/02 | 502.3 |
| 530338 | SUN 2 | Claim | 2006/MAR/20 | 2026/AUG/02 | 502.7 |
| 532057 | HAR2 | Claim | 2006/APR/13 | 2026/AUG/02 | 241.5 |
| 538962 | Claim | 2006/AUG/09 | 2026/AUG/02 | 501.8 | |
| 538963 | Claim | 2006/AUG/09 | 2026/AUG/02 | 501.6 | |
| 538966 | Claim | 2006/AUG/09 | 2026/AUG/02 | 501.8 | |
| 538968 | Claim | 2006/AUG/09 | 2026/AUG/02 | 501.9 | |
| 538970 | Claim | 2006/AUG/09 | 2026/AUG/02 | 501.6 | |
| 538971 | Claim | 2006/AUG/09 | 2026/AUG/02 | 421.5 | |
| 538972 | Claim | 2006/AUG/09 | 2026/AUG/02 | 501.6 | |
| 538973 | Claim | 2006/AUG/09 | 2026/AUG/02 | 501.6 | |
| 538974 | Claim | 2006/AUG/09 | 2026/AUG/02 | 200.6 | |
| 538996 | Claim | 2006/AUG/09 | 2026/AUG/02 | 502.0 | |
| 538997 | Claim | 2006/AUG/09 | 2026/AUG/02 | 502.1 | |
| 538999 | Claim | 2006/AUG/09 | 2026/AUG/02 | 421.8 | |
| 539000 | Claim | 2006/AUG/09 | 2026/AUG/02 | 502.1 | |
| 539001 | Claim | 2006/AUG/09 | 2026/AUG/02 | 421.7 | |
| 539002 | Claim | 2006/AUG/09 | 2026/AUG/02 | 421.7 | |
| 539004 | Claim | 2006/AUG/09 | 2026/AUG/02 | 281.1 | |
| 539770 | Claim | 2006/AUG/22 | 2026/AUG/02 | 442.8 | |
| 539771 | Claim | 2006/AUG/22 | 2026/AUG/02 | 322.0 | |
| 564330 | GRAF1 | Claim | 2007/AUG/09 | 2026/AUG/02 | 503.0 |
| 564331 | GRAF2 | Claim | 2007/AUG/09 | 2026/AUG/02 | 503.0 |
| 564333 | DUNN1 | Claim | 2007/AUG/09 | 2026/AUG/02 | 503.2 |
| 564334 | DUNN2 | Claim | 2007/AUG/09 | 2026/AUG/02 | 503.3 |
| 564335 | DUNN3 | Claim | 2007/AUG/09 | 2026/AUG/02 | 463.2 |
| 564337 | DUNN4 | Claim | 2007/AUG/09 | 2026/AUG/02 | 362.6 |
| Section 4 | Property Description and Location | Page 7 |
4.2 Land Tenure - Cont'd
Table 4-2: Yellowhead Mineral Tenures - Cont'd
| Title Number |
Claim Name | Title Sub Type |
Issue Date | Good To Date |
Area (ha) |
| 564338 | GRAF3 | Claim | 2007/AUG/09 | 2026/AUG/02 | 502.8 |
| 564339 | GRAF4 | Claim | 2007/AUG/09 | 2026/AUG/02 | 502.8 |
| 564340 | GRAF5 | Claim | 2007/AUG/09 | 2026/AUG/02 | 503.0 |
| 564341 | GRAF6 | Claim | 2007/AUG/09 | 2026/AUG/02 | 442.8 |
| 564342 | GRAF7 | Claim | 2007/AUG/09 | 2026/AUG/02 | 503.0 |
| 564343 | GRAF8 | Claim | 2007/AUG/09 | 2026/AUG/02 | 502.8 |
| 564344 | GRAF9 | Claim | 2007/AUG/09 | 2026/AUG/02 | 503.1 |
| 564346 | GRAF10 | Claim | 2007/AUG/09 | 2026/AUG/02 | 442.5 |
| 564347 | GRAF11 | Claim | 2007/AUG/09 | 2026/AUG/02 | 462.5 |
| 564348 | GRAF12 | Claim | 2007/AUG/09 | 2026/AUG/02 | 402.0 |
| 564349 | GRAF13 | Claim | 2007/AUG/09 | 2026/AUG/02 | 502.3 |
| 564350 | GRAF14 | Claim | 2007/AUG/09 | 2026/AUG/02 | 502.3 |
| 564351 | GRAF15 | Claim | 2007/AUG/09 | 2026/AUG/02 | 461.9 |
| 564352 | GRAF16 | Claim | 2007/AUG/09 | 2026/AUG/02 | 502.1 |
| 564353 | GRAF17 | Claim | 2007/AUG/09 | 2026/AUG/02 | 401.5 |
| 564354 | GRAF18 | Claim | 2007/AUG/09 | 2026/AUG/02 | 501.7 |
| 564355 | GRAF19 | Claim | 2007/AUG/09 | 2026/AUG/02 | 501.7 |
| 564356 | GRAF20 | Claim | 2007/AUG/09 | 2026/AUG/02 | 461.6 |
| 564357 | DUNN5 | Claim | 2007/AUG/09 | 2026/AUG/02 | 120.7 |
| 564358 | GRAF21 | Claim | 2007/AUG/09 | 2026/AUG/02 | 401.2 |
| 564360 | GRAF22 | Claim | 2007/AUG/09 | 2026/AUG/02 | 200.6 |
| 564361 | GRAF23 | Claim | 2007/AUG/09 | 2026/AUG/02 | 501.6 |
| 564362 | GRAF24 | Claim | 2007/AUG/09 | 2026/AUG/02 | 501.8 |
| 564363 | GRAF25 | Claim | 2007/AUG/09 | 2026/AUG/02 | 502.1 |
| 564364 | GRAF26 | Claim | 2007/AUG/09 | 2026/AUG/02 | 502.3 |
| 564365 | GRAF27 | Claim | 2007/AUG/09 | 2026/AUG/02 | 502.5 |
| 564366 | GRAF28 | Claim | 2007/AUG/09 | 2026/AUG/02 | 502.7 |
| 564367 | GRAF29 | Claim | 2007/AUG/09 | 2026/AUG/02 | 503.0 |
| 564368 | GRAF30 | Claim | 2007/AUG/09 | 2026/AUG/02 | 503.2 |
| 564370 | GRAF31 | Claim | 2007/AUG/09 | 2026/AUG/02 | 322.1 |
| 569337 | Claim | 2007/NOV/04 | 2026/AUG/02 | 261.6 |
| Section 4 | Property Description and Location | Page 8 |
4.2 Land Tenure - Cont'd
Table 4-2: Yellowhead Mineral Tenures - Cont'd
| Title Number |
Claim Name | Title Sub Type |
Issue Date | Good To Date |
Area (ha) |
| 572094 | SANDRA1 | Claim | 2007/DEC/18 | 2026/AUG/02 | 503.4 |
| 572095 | SANDRA2 | Claim | 2007/DEC/18 | 2026/AUG/02 | 483.1 |
| 572096 | SANDRA3 | Claim | 2007/DEC/18 | 2026/AUG/02 | 483.1 |
4.3 Environmental Liabilities
The Yellowhead property is subject to environmental liabilities related to the reclamation of surface disturbance associated with permits received for previous exploration and site investigation programs. Funds to cover the expense of these reclamation activities are held in trust and are fully recoverable once the site has been rehabilitated to the satisfaction of the Inspector of Mines. There are no other environmental liabilities to which the property is subject.
4.4 Permits Obtained and To Be Acquired
Section 20 provides the list of major permits, licenses, approvals, consents and material authorizations required to occupy, use, construct and operate the project.
SECTION 5
ACCESSIBILITY, CLIMATE, LOCAL RESOURCES,
INFRASTRUCTURE AND PHYSIOGRAPHY
SECTION 5: ACCESSIBILITY, CLIMATE, LOCAL RESOURCES,
INFRASTRUCTURE AND PHYSIOGRAPHY
Table of Contents
| Page | ||
| 5.1 | Accessibility | 1 |
| 5.2 | Climate | 3 |
| 5.3 | Physiography | 3 |
| 5.4 | Local Resources | 4 |
| 5.5 | Infrastructure | 4 |
| Table of Figures | ||
| Figure 5-1: Site Access | 2 | |
| Section 5 Accessibility, Climate, Local Resources, Infrastructure and Physiography | Page 1 |
5.1 Accessibility
The Yellowhead Project is accessed via the Yellowhead Highway (Highway #5), 150 km by road north of Kamloops, which is serviced with daily flights from Vancouver and Calgary.
As shown in Figure 5-1, the primary access to site from Highway #5 is via the Vavenby Bridge Road through Vavenby and across the North Thompson River to the Birch Island Lost Creek Road (BILCR). From there, access is about 20 km along a network of existing Forest Service Roads (FSRs) that climb up to the project site. The FSRs will be upgraded where required including a 2.5 km road extension to the project site.
The primary access route will be in frequent use during the operations phase for the transport of concentrate from the mine site to the rail load out facility and transportation of personnel, goods and services.
Oversized and heavy loads will use a secondary access route across the North Thompson River. This route crosses the North Thompson River at the BILCR bridge then follows the previously described access. The secondary route will be in use primarily during construction and as required during operations.
| Section 5 Accessibility, Climate, Local Resources, Infrastructure and Physiography | Page 2 |
5.1 Accessibility - Cont'd

Figure 5-1: Site Access
| Section 5 Accessibility, Climate, Local Resources, Infrastructure and Physiography | Page 3 |
5.2 Climate
The climate is typical of the central interior of BC, with short warm summers and comparatively mild Canadian winters. The winter season runs from late October to late March. There is significant relief on the project site, and site climatic conditions are dependent on location and elevation.
Temperatures on site range from highs of +26°C to lows of -35°C. The mean annual precipitation is 1,259 mm at an elevation of 1,837 masl, with about 40% falling as rain and 60% falling as snow. At the higher site elevations, precipitation falls almost exclusively as snow from November through March, and as rain from June through August. The mean annual wind speed is approximately 1.6 m/s, with the wind predominantly blowing from the east-southeast year-round, although east-northeast winds are common during the summer. The mean annual relative humidity is approximately 75%.
5.3 Physiography
The project area is hosted within the Shuswap Highlands characterized by gently sloping upland ridges and flanked by steepened valley slopes. These valleys include the Harper Creek Valley to the west and the Barrière River to the East, with the moderately sloped Thompson River Valley to the north. The elevations of the area range from approximately 1,100 masl at the floor of the Harper Creek Valley to 1,900 masl at the ridges surrounding the TSF area.
The average elevation of the open pit area and plant site is approximately 1,800 masl. The area has been glaciated and mountain tops are typically rounded. The project site is covered in coniferous forest and has undergone extensive logging.
| Section 5 Accessibility, Climate, Local Resources, Infrastructure and Physiography | Page 4 |
5.4 Local Resources
In 2021, the population of the Thompson-Nicola Regional District numbered 144,000 residents. Kamloops is the largest centre in the area and has a population of 98,000. With several operating mines in the area, Kamloops is a regional mining hub home to many suppliers, consultants, and contractors that service the mining industry.
Accommodation for mine employees is available in the nearby towns of Clearwater, Vavenby, Barrière, and surrounding district which have a combined population of approximately 6,000. With the recent decline in the forestry sector and the closure of several mills in the North Thompson Valley, including the permanent closure of the last operating sawmill in Vavenby in 2019, there is a local workforce with industrial experience in need of economic development.
The Project will give employment preference to people from the North Thompson Valley. Vavenby has served as the local base for the Project's exploration activities but provides limited facilities or services at this time. Industrial activities within the regional area include forestry, CN Rail and Trans Mountain pipeline operations, all of which run through the North Thompson Valley, including Vavenby.
5.5 Infrastructure
The Yellowhead Highway, the CN Rail transcontinental main line, and the 138 kV BC Hydro North Thompson transmission line all pass approximately 8 km north of the project area.
Other than the existing network of FSRs, there are no services or utilities currently routed to the immediate project site.
The area's established infrastructure reduces the extent of offsite infrastructure required for the Project, aside from upgrading and extending the site access road and constructing a new overhead transmission line. Power for the Project will be supplied by a new 230 kV transmission line extending approximately 110 km from the existing BC Hydro substation at 100 Mile House to a new substation at the project site. Routing for the transmission line has been identified and may be refined through the Environmental Assessment process.
YMI holds sufficient mineral tenures to accommodate mining operations, tailings storage areas, waste disposal areas, processing facilities and site infrastructure.
YMI owns a property with an existing rail siding 2.5 km west of Vavenby and approximately 25 km by road from the project site. This property will be used for the rail load-out facility and central parking and bus staging for transporting site personnel during construction and operations.
SECTION 6
HISTORY
SECTION 6: HISTORY
Table of Contents
| Page | ||
| 6.1 | Historical Operators | 1 |
| 6.2 | Yellowhead Mining Inc. | 2 |
| 6.3 | Production from the Project | 2 |
| Section 6 | History | Page 1 |
6.1 Historical Operators
Prospecting and geochemical reconnaissance led to the discovery of copper mineralization in the immediate vicinity of the deposit in 1966. In 1967, the initial discovery was followed up by extensive prospecting, line cutting, road building, surface geochemical sampling, geological mapping, geophysics, trenching and diamond drilling programs.
Noranda Exploration Company (Noranda) and Québec Cartier Mining Company (QCM), a 100% wholly owned subsidiary of US Steel, staked claims in the deposit area in 1965 and 1966 respectively. This resulted in the area west of the Harper Creek tributary belonging to Noranda (Harper Creek claims) and east of it to QCM (Hail claims). The two companies worked independently on their properties from 1966 until 1970. In late 1970, the companies formed a joint venture, which explored their contiguous copper deposits.
Work on the property continued for nine consecutive years and included extensive drilling on the deposit, a number of expanded geophysical and geochemical surveys and some drilling of other targets on the property. By the end of 1974, work was curtailed on the original showing. Sporadic prospecting, geochemical, geophysical and geological work by a number of operators continued in other outlying areas of the current property.
In April 1986, Aurun Mines Ltd. (Aurun) signed an option agreement with QCM to investigate the potential of both small higher-grade and large lower-grade copper deposits and to test for the presence of precious metals in the massive sulphide layers on the QCM claims. Assessments also considered the significance of titanium-bearing minerals and the possibility of leaching low-grade copper mineralization. Work proceeded through sampling of historical trenches and selected historical drill core. Results of gold and silver analysis showed the potential for modest credits to be attributable to these metals.
Aurun also commissioned a pre-feasibility study by Phillips Barratt Kaiser Engineering Ltd. in April 1986 that considered both the eastern QCM and western Noranda deposits. In July, 1991 QCM officially terminated the option agreement with Aurun (insolvent and in receivership as of 2014).
American Comstock Exploration Ltd (American Comstock) purchased the Noranda claims and acquired an option on the QCM claims in 1996 and completed an 8-hole drilling program of that year. Eventually American Comstock dropped the option but maintained ownership of the Noranda group of claims.
| Section 6 | History | Page 2 |
6.1 Historical Operators - Cont'd
Outside of the deposit area, Esso Resources Canada Limited drilled one hole on a geochemical and geological target 3 km northeast of the deposit on the historical Len claims which yielded no results of interest. Then from 1985 to 1987, Nu-Crown Resources Inc (Nu-Crown) conducted drilling on geophysical targets 4 km north of the deposit on the historical Tia claims. This drilling intersected anomalous to low-grade lead, zinc and barium mineralization.
Between 1967 and 1996, drilling took place on the property in 11 different years totalling 30,800 m from 191 holes. Of these holes, 165 are located within what is now known as the Yellowhead Copper Deposit, for a total of 28,200 m or 92% of the overall drilling. No further drilling took place on the deposit area until 2006.
6.2 Yellowhead Mining Inc.
Yellowhead Mining Inc. (YMI) formed as a private British Columbia company in 2005 and obtained control of the Project through staking, purchase and option agreements. Exploration completed between 2005 and 2013 included diamond drilling, historical core relogging, airborne and ground geophysics, soil and rock sampling, geological mapping and other exploration activities.
By the end of 2013 YMI had completed 65,000 m of additional drilling on the property from 217 drillholes. A Feasibility Study was published on July 31, 2014 which proposed an open pit mine with a production capacity of 70,000 tpd and a 28-year operating life.
In 2015, an Environmental Assessment (EA) Application was accepted for review by the BC Environmental Assessment Office (BC EAO) and Canadian Environmental Assessment Agency (CEAA). In mid-2015, the application review was suspended at YMI's request and after an initial three-year extension, the provincial EA process was terminated in July 2018 by the BC EAO due to inactivity on the file.
In February 2019, Taseko acquired a 100% interest in YMI thus acquiring a 100% interest in the Project and withdrew from the federal EA process in May 2019. In 2020, Taseko published a technical report (2020 Technical Report) which summarized an updated development plan for the Project based on a mill throughput of 90,000 tonnes per day and a 25-year operating life.
6.3 Production from the Project
There has been no production from the Project to date.
SECTION 7
GEOLOGICAL SETTING AND MINERALIZATION
SECTION 7: GEOLOGICAL SETTING AND MINERALIZATION
Table of Contents
| Page | ||
| 7.1 | Regional Geology and Mineralization | 1 |
| 7.2 | Property Geology and Mineralization | 5 |
| 7.3 | Deposit Geology and Mineralization | 8 |
| List of Tables | ||
| Table 7-1: Geological Rock Type Code List and Descriptions | 9 | |
| Table 7-2: Geological Package Code List and Descriptions | 10 | |
| Table 7-3: Deposit Sequence of Formation | 25 | |
| List of Figures | ||
| Figure 7-1: Regional Geology and Economic Setting | 3 | |
| Figure 7-2: Geology Map, Yellowhead Copper Property | 6 | |
| Figure 7-3: Geology & Drilling Plan | 11 | |
| Figure 7-4: Geological Cross Section 304060E (West Domain) | 12 | |
| Figure 7-5: Geological Cross Section 305420E (East Domain) | 13 | |
| Section 7 | Geological Setting and Mineralization | Page 1 |
7.1 Regional Geology and Mineralization
(a) Regional Geology
The project is located within structurally complex, low-grade metamorphic rocks of the Eagle Bay Assemblage, part of the Kootenay Terrane on the western margin of the Omineca Belt in south-central BC (Figure 7-1). Flanking these rocks are high-grade Kootenay Terrane metamorphic rocks of the Shuswap Complex immediately to the east and rocks of the Fennell Assemblage immediately to the west. The project lies within the Cretaceous Bayonne plutonic belt represented by two large batholiths, Baldy to the south and Raft to the north.
Regional unit names (typically prefixed EB) and many of the descriptions used in Sections 7.1 through 7.3 are after Schiarizza and Preto (1987) and Naas (2012a, 2012b, 2012c, 2013), except as noted.
Lower Cambrian to Mississippian Eagle Bay Assemblage
The Eagle Bay Assemblage incorporates Lower Cambrian to Mississippian sedimentary and volcanic rocks subject to deformation and metamorphism during a Jurassic-Cretaceous orogeny. The Eagle Bay Assemblage divides into four northeast-dipping thrust sheets that collectively contain a succession of Lower Cambrian rocks overlain by a succession of Devonian-Mississippian rocks. The Lower Cambrian (and possibly Late Proterozoic) rocks include quartzites, grits and quartz mica schists (units EBH and EBQ), mafic metavolcanic rocks and limestone (unit EBG), and overlying schistose sandstones and grits (unit EBS) with minor calcareous and mafic volcanic units. These older units are overlain by Devonian-Mississippian succession of mafic to intermediate metavolcanic rocks (units EBA and EBF) intercalated with and overlain by dark grey phyllite, sandstone and grit (unit EBP).
Unit EBA of the Devonian-Mississippian succession hosts the deposit. To the south, unit EBA is over-thrusted by the Lower Cambrian greenstones, chloritic phyllites, quartzitic units and orthogneiss of unit EBG and to the north by dominantly metasedimentary rocks of unit EBP.
According to Bailey et al (2001), the Devonian volcanic rocks of the Eagle Bay Assemblage (EBA and EBF) belong to bimodal basalt-rhyolite association of alkalic affinity corresponding to a rifted continental marginal setting.
| Section 7 | Geological Setting and Mineralization | Page 2 |
7.1 Regional Geology and Mineralization - Cont'd
(a) Regional Geology - Cont'd
Devonian to Permian Fennell Formation
The Fennell Formation is located northeast of the project and is comprised of Devonian to Permian oceanic rocks of the Slide Mountain Terrane. Tectonic emplacement of these units over the Mississippian rocks of the Eagle Bay Assemblage occurred in the early Mesozoic. The Fennell Formation comprises two major divisions. The lower structural division is a heterogeneous assemblage of bedded chert, gabbro, diabase, pillowed basalt, sandstone, quartz-feldspar-porphyry rhyolite and intraformational conglomerate. The upper division consists almost entirely of pillowed and massive basalt, with minor bedded cherts and gabbros. The Fennell Formation appears to be the deep oceanic basin distal equivalent to the Eagle Bay Assemblage. There are striking similarities found in both formations and a hypothesis is that the sandstone of the Fennell Formation derived from the sandstones of the Eagle Bay Assemblage.
Mid-Cretaceous Bayonne Plutonic Belt
The north-south belt of mid-Cretaceous Bayonne Plutonic rocks consists of mostly peraluminous, subalkalic hornblende-biotite granodiorite and highly fractionated two-mica granites, aplites and pegmatites (Logan, 2002). The Baldy batholith to the south and the Raft batholith to the north are representative of this plutonic suite in the project area.
The west-trending multiphase Baldy batholith pluton covers approximately 650 square kilometres. It intrudes Proterozoic to middle Paleozoic Kootenay Terrane metasedimentary and metavolcanic rocks and postdates most of the penetrative deformation in the area. The pluton incorporates potassium-feldspar megacrystic hornblende-biotite quartz monzonite, biotite monzogranite to granite and biotite-muscovite granite.
The Raft batholith is an elongate granitic pluton that extends for about 70 kilometres in a west-northwest direction, and cuts across the boundaries between the Kootenay, Slide Mountain and Quesnel Terranes (Schiarizza et al, 2002). It is composed mostly of hornblende-biotite granodiorite to monzogranite intruded by dykes of pegmatite, aplite and quartz-feldspar porphyry. The southern Raft batholith margin dips southward in exposures of deeper structural levels (Okulitch, 1979).
| Section 7 | Geological Setting and Mineralization | Page 3 |
7.1 Regional Geology and Mineralization - Cont'd
(a) Regional Geology - Cont'd

Figure 7-1: Regional Geology and Economic Setting
| Section 7 | Geological Setting and Mineralization | Page 4 |
7.1 Regional Geology and Mineralization - Cont'd
(b) Regional Mineralization
The Eagle Bay Assemblage hosts numerous polymetallic massive sulphide deposits, found mainly within Devonian felsic volcanic rocks (Figure 7-1). These deposits formed in a volcanic arc environment in response to eastward subduction of a paleo-Pacific ocean (Höy and Goutier, 1986; Höy, 1999; Bailey et al, 2000). The general characteristics of these massive sulphide deposits allow the more important ones to be grouped into several types, such as silver-lead-zinc stratabound massive sulphides within metasedimentary rocks (units EBG and EBQ), copper-zinc-cobalt volcanogenic massive sulphides (Fennell Formation) and gold-silver-zinc-lead-copper-barite volcanogenic massive sulphides (units EBA and EBF).
The Baldy batholith hosts a variety of mineral occurrences. According to Logan (2000, 2001), copper, copper-molybdenum porphyry and base metal polymetallic vein showings are associated with the hornblende-biotite granite phase of the pluton. Muscovite-biotite granite is associated with pegmatites, aplites and porphyry molybdenum mineralization. Areas encompassing the known intrusive-related deposits extend from the mainly steep- dipping contacts of the Baldy batholith for at least 7.5 km (Logan, 2001).
| Section 7 | Geological Setting and Mineralization | Page 5 |
7.2 Property Geology and Mineralization
(a) Property Geology
Rocks that underlie the property are primarily of the Eagle Bay Assemblage with a lithological succession interpreted as the Dgn, EBQ, EBA, EBF and EBG units of this group. This succession consists of a series of orthogneisses, metasediments, metavolcanics and metavolcanic clastics respectively, structurally overlain by the Tshinakin limestone unit belonging to unit EBG. Regional structure encompasses a complicated sequence of polyphase deformation consisting of sequences of thrust faulting, intrusion‐related folding and faulting, strike‐slip and normal faulting all of which imposed a complex alteration and metamorphic fabric on the rocks.
The mid-Cretaceous Baldy batholith cuts this succession at the southern end of the property and a late epidote alteration event relates to this intrusion. (Armstrong and Hawkins, 2009). Figure 7‐2 is a simplified property-scale geology map modified from Paradis et al (2006).
| Section 7 | Geological Setting and Mineralization | Page 6 |
7.2 Property Geology and Mineralization - Cont'd
(a) Property Geology - Cont'd

Figure 7-2: Geology Map, Yellowhead Copper Property
| Section 7 | Geological Setting and Mineralization | Page 7 |
7.2 Property Geology and Mineralization - Cont'd
(b) Property Mineralization
The principal area of mineralization on the property is the Yellowhead Copper Deposit (the Deposit). The northeast trending Harper Creek Fault separates the deposit into a west domain and an east domain (Figure 7-3). In the west domain, chalcopyrite mineralization is primarily in three copper bearing horizons. The upper horizon ranges from 60 m to 170 m in width and is continuous along an east-west strike for some 1,300 m, dipping approximately 30º north. Mineralization within this horizon occurs within felsic and mafic volcanics and volcaniclastic rock units. The middle horizon is not as well developed and is often fragmented. It primarily exists within a graphitic and variably silicified package of rocks that range from 30 m to 40 m in width at the western extent, increasing up to 90 m locally eastward, gradually appearing to blend into the upper horizon. Of the three horizons, this contains strong to intense silicification and localized tension fractures filled with mineralization. The lowest or third horizon has less definition mainly due to a lack of drill intersections. Commonly hosted within mafic to intermediate volcaniclastics and fragmental rocks, it can range from 30 m to 90 m in width although typical intersections are in the 30 m range. These horizons host within felsic and mafic metavolcanics and metavolcaniclastics and generally contain foliation-parallel wisps and bands as the dominant style of sulphide mineralization.
In the east domain, mineralization characterized by high angle, discontinuous, tension fractures of pyrrhotite, chalcopyrite ± bornite is frequently associated with quartz carbonate gangue. This style is common within, but not limited to, the metasedimentary rocks and areas of increased pervasive silicification. Mineralization is not selective to individual units and frequently transgresses lithological contacts throughout the area. Locating mineralized horizons in this area has proven difficult due to multiple east-west trending and northward dipping interpreted thrust faults (or possible reverse faults). At the near surface areas in the south and down-dip to the north, widths of mineralization typically range from 120 m to 160 m. In the central area of the east domain where thrust/reverse fault stacking has been interpreted, mineralization thicknesses typically range from 220 m to 260 m with local intersections of up to 290 m. Mafic metavolcanics and coarse-grained quartz-rich metasedimentary rocks generally contain higher grade copper mineralization.
The primary focus of exploration by YMI on the property has been on the main deposit area and mineralization outside of there is not well known.
| Section 7 | Geological Setting and Mineralization | Page 8 |
7.3 Deposit Geology and Mineralization
(a) Geological Lithologies
Metamorphic rocks of the Eagle Bay Assemblage host the deposit. Pervasive alteration and structural deformation of these host rocks has made confident identification of their protolith difficult. Four metamorphic rock types: quartz-bearing schists, non-quartz- bearing schists, phyllite, orthogneiss, comprise about 90% of lithologies drilled in the deposit and the quartz/quartz-eye schist unit comprises almost half of them. The four dominant lithologic units are coded in drill core as 7, 8, 9 and 10. Phyllites and schists are subdivided further based on their mineral or textural characteristics. Table 7-1 summarizes the geological rock type groups, subgroups, code lists and descriptions used on the project.
Phyllites of unit 7 have been subdivided into graphite (unit 7a), sericite-chlorite (7b), calcareous chlorite-sericite (unit 7c) and sericite-chlorite-quartz (unit 7d) with unit 7d being the most common phyllite subunit identified through drilling.
Schists of unit 8 have been subdivided into sericite-chlorite (unit 8a), sericite-chlorite- fuchsite (unit 8b) and chlorite sericite fragmental (unit 8c). Of these, unit 8a is the most common subunit encountered in drilling.
Schists of unit 9 have been subdivided into sericite hornblende-quartz-feldspar (unit 9a), sericite-chlorite-quartz (unit 9b), sericite-chlorite-quartz-feldspar (unit 9c), sericite-augen quartz (unit 9d) and siliceous chlorite-sericite quartz (unit 9e). Within unit 9, the sericite- chlorite-quartz schists represent the most significant component, followed by sericite- chlorite-quartz-feldspar type.
Areas where pervasive alteration completely masks the geological textures assign to a unique unit number (unit 11). This unit is subdivided based on alteration product. Currently defined are silica (unit 11a) and chlorite (unit 11b).
Areas of massive sulphides, although not significant volumetrically, are assigned separately (unit 12) due to their mineralogical importance. This unit is subdivided based on the dominant sulphide.
In rare situations where the protolith is identifiable, rocks are classified accordingly as intrusives (unit 3), volcanic flows or intrusions (unit 4), volcaniclastics (unit 5) and sedimentary (unit 6). The area immediately southeast of the deposit has the most notable intersections of argillites and sandstones. Limestones, as identified in several drillholes, tend to be rare and thin. Drill core has intersected a late-stage series of andesitic dykes and sills (unit 4a) in various areas of the deposit. To date, there is only one occurrence of an intrusive (granodiorite, unit 3a) in the drilling.
| Section 7 | Geological Setting and Mineralization | Page 9 |
7.3 Deposit Geology and Mineralization - Cont'd
(a) Geological Lithologies - Cont'd
Table 7-1: Geological Rock Type Code List and Descriptions
| Code | Unit | Sub | Description |
| 0 | Overburden | Unconsolidated overburden | |
| 1 | Faults | Fault zones | |
| Fault gouge, fault breccia & healed, shear zones | |||
| 2 | Veins | Veins | |
| Quartz, carbonate, quartz-carbonate, sulphide veins | |||
| 3 | Intrusives | Intrusive rock protolith | |
| Granodiorite, hornblende-biotite granodiorite, quartz monzonite | |||
| 4 | Volcanic flows or | Volcanic flow or intrusive rock protolith | |
| intrusions | Includes late-stage andesitic dykes & sills, lamprophyre dykes | ||
| 5 | Volcaniclastics | Volcaniclastic rock protolith | |
| 6 | Sedimentary | Sedimentary rock protolith | |
| Sandstone, argillite, limestone | |||
| 7 | Phyllite metamorphic rock | ||
| 7a | Graphite | ||
| 7 | Phyllites | 7b | Sericite-chlorite |
| 7c | Calcareous chlorite-sericite | ||
| 7d | Sericite-chlorite-quartz | ||
| 8 | Schist metamorphic rock with minimal or no quartz content | ||
| 8 | Schists (<quartz) | 8a | Sericite-chlorite |
| 8b | Sericite-chlorite-fuchsite | ||
| 8c | Chlorite-sericite fragmental | ||
| 9 | Schists metamorphic rock with quartz content &/or quartz eyes | ||
| 9a | Sericite hornblende-quartz-feldspar | ||
| 9 | Schists (>quartz) | 9b | Sericite-chlorite-quartz |
| 9c | Sericite-chlorite-quartz-feldspar | ||
| 9d | Sericite-augen quartz | ||
| 9e | Siliceous chlorite-sericite quartz | ||
| 10 | Orthogneiss | 10a | Orthogneiss metamorphic rock |
| 11 | Pervasively altered rock, protolith unknown | ||
| 11 | Pervasively altered | 11a | Silica altered |
| 11b | Chlorite altered | ||
| 12 | Massive sulphides | ||
| 12a | Undivided massive sulphides | ||
| 12 | Massive sulphides | 12b | Magnetite dominant |
| 12c | Pyrrhotite | ||
| 12d | Pyrite | ||
| 12e | Chalcopyrite |
| Section 7 | Geological Setting and Mineralization | Page 10 |
7.3 Deposit Geology and Mineralization - Cont'd
(b) Geological Packages
Due to multiphase deformation and alteration, correlation of lithologies between drillholes is difficult. Creation of a set nine of geological packages with common characteristics and affinities maintained the lithological detail, yet simplified correlation of essentially similar geological units. The packages are coded A, B, C, D, E, Fa, Fb, G and H, where package A represents the lowest stratigraphic unit, moving up-section to package H at the top. Table 7-2 summarizes the geological packages, codes and styles of copper mineralization.
Table 7-2: Geological Package Code List and Descriptions
| Code | Description of Geologic Package Composition | Copper Mineralization |
| H | Mafic polymictic volcaniclastics 8c, 8a, 7c +/-9a hornblende crystals, frequently calcareous & deformed 7d | No |
| G | Graphitic horizon, somewhat calcareous | No |
| Fb | Intermediate to mafic polymictic volcaniclastics 8c, 8a, 7c ± 9a hornblende crystals, somewhat calcareous | Yes |
| Fa | Felsic to intermediate volcaniclastics: 9c, 8c & 8a | Yes |
| E | Graphitic horizon: mixed 11a silicified +7a | Yes |
| D | Intermediate volcaniclastics & Fragmentals, somewhat calcareous: dominated by 8c/7c | Remobilized |
| C | Graphitic horizon | Remobilized |
| B | Sandy sediment dominant: 9b + 8a mafic sediments in the west. 9b graphitic of 9b + 9c felsic sediments ± 8a in the east | Remobilized |
| A | Orthogneiss: 10a and associated border phases 9d and others | Remobilized |
Figure 7-3 is a surface plan map of the deposit area illustrating the geological packages, topographic features, drillhole collar locations and the location of the accompanying cross- sections. Figures 7-4 and 7-5 are vertical, west-looking example cross-sections at 304060E and 305420E respectively. They show geological package stratigraphy and downhole assay grade bars on drill traces and illustrate significant intersections of copper mineralization from the west and east domains of the deposit.
| Section 7 | Geological Setting and Mineralization | Page 11 |
7.3 Deposit Geology and Mineralization - Cont'd
(b) Geological Packages - Cont'd

Figure 7-3: Geology & Drilling Plan
| Section 7 | Geological Setting and Mineralization | Page 12 |
7.3 Deposit Geology and Mineralization - Cont'd
(b) Geological Packages - Cont'd

Figure 7-4: Geological Cross Section 304060E (West Domain)
| Section 7 | Geological Setting and Mineralization | Page 13 |
7.3 Deposit Geology and Mineralization - Cont'd
(b) Geological Packages - Cont'd

Figure 7-5: Geological Cross Section 305420E (East Domain)
| Section 7 | Geological Setting and Mineralization | Page 14 |
7.3 Deposit Geology and Mineralization - Cont'd
(b) Geological Packages - Cont'd
Package A
Package A comprises the Late Devonian orthogneiss (unit 10a) and the strongly to intensely deformed marginal-phase of the orthogneiss intrusion. The latter frequently has texturally destructive deformation that classifies as sericite-chlorite-quartz phyllite (unit 7d). Interpretation is that these are strongly deformed felsic intrusives (sericite-augen quartz schists, unit 9d). This unit often cuts through the upper sections of this package.
Unit 7d occurs in the zone of intense deformation encountered immediately before the orthogneiss downhole. This unit shows possible relict textures of a metasedimentary unit 9b and may in fact be related to an older sequence of metasediments EBQgn (as defined by Schiarizza and Preto, 1987) proximal to the intrusive body. Definition of the rocks proximal to the orthogneiss is difficult due to deformation and strong to intense biotite alteration. The colour of intensely foliated and deformed unit 7d ranges from medium green to dark green to brown, as a function of biotite content. The frequent presence of weak to moderate interstitial calcite along with the textural and compositional change is indicative of the proximity to basement rock.
Unit 7d contains foliation-parallel quartz bands and boudinage that are commonly milky, 1 cm to 15 cm wide, and internally fractured with iron carbonate and occasionally calcium carbonate infill. Cutting throughout units 10a and 7d are felsic dykes of unit 9d. These dykes are beige to pale green and show strong to intense foliation. They contain 15% to 20%, grey to translucent, augen-shaped quartz eyes up to 1 cm in size.
Sulphide mineralization is poor within package A, consisting predominantly of foliation- parallel bands or disseminations of pyrite with lesser amounts of pyrrhotite and localized fine-grained, foliation-parallel disseminations and rare fracture-fill chalcopyrite.
Package A corresponds to the regionally mapped Devonian granitic orthogneiss unit Dgn. This orthogneiss, situated on the northern and southeastern portions of the Baldy batholith, overlies and intrudes metasedimentary units.
| Section 7 | Geological Setting and Mineralization | Page 15 |
7.3 Deposit Geology and Mineralization - Cont'd
(b) Geological Packages - Cont'd
Package B
This package is a heterogeneous group of rocks consisting primarily of very fine- to coarse- grained clastic metasediments, intercalated with felsic to mafic metavolcaniclastics and silt-sized argillaceous horizons.
In both the western and eastern domains, this package is primarily composed of sandy sequences of the sericite-chlorite-quartz schists (unit 9b), consisting mainly of fine to coarse polycrystalline sand intercalated with thin to thick beds of felsic and mafic silts and metavolcaniclastics.
In the western half of the deposit area, this package primarily consists of intercalated sericite-chlorite-quartz schists (unit 9b, 30-50%) and sericite-chlorite schists (unit 8a, 5- 40%). Other intercalated units not present in every succession include, sericite-chlorite- quartz feldspar schists (unit 9c, <1%), graphitic phyllites (unit 7a, approximately 1%), sericite-chlorite-quartz phyllites (unit 7d, approximately 5-30%) and siliceous chlorite- quartz schists (unit 9e, <5%).
To the east, there is a noticeable increase in the abundance of unit 9c within this package, typically 5-10% and as high as 30%. Unit 7d also increases in abundance, ranging from 5- 20%.
Both domains have some intensely silicified intervals of unit 11a, as well as possible pebble conglomerates (unit 9e) which range up to 5%. Unit 8a intercalations consist of a well- foliated matrix with no visible quartz grains. Units of 9b that grade in and out of 8a horizons may indicate a siltstone version of metasediments or mafic metavolcaniclastics.
| Section 7 | Geological Setting and Mineralization | Page 16 |
7.3 Deposit Geology and Mineralization - Cont'd
(b) Geological Packages - Cont'd
Package B - Cont'd
In the easternmost portion of the deposit, metasediments become the dominant lithology. Package B is observed at the top of the stratigraphy with small intervals of Fa, E, or D situated between a second interval of package B at the bottom. In the top interval, there is a graphitic component to the metasediments not seen in the west. This is evident with intercalations and seams of graphite as well as black to smoky grey quartz grains commonly observed in other graphite-influenced sedimentary intervals. A second section of package B separated by pinching out of intervals from packages Fa, E, and/or D is intersected in the bottom half of these easterly drilled holes. This strongly intercalated zone has an increased abundance of unit 9c (up to 50%) while unit 8a decreases and becomes more rare. It is unclear whether the graphitic 9b unit and the zones with unit 9c are different geological packages or are just one large sedimentary interval with interfingering volcanic sequences. Metavolcaniclastic rocks wane to the east and metasediments increase significantly, possibly indicating that this area was previously a sedimentary basin some distance from the volcanic source.
Copper mineralization is generally weak within this package of rocks and only occurs as sporadic intervals containing fracture-fill and very fine-grained chalcopyrite disseminations through most of the deposit, unless inundated with pervasive secondary silicification. In the far eastern part of the deposit, copper mineralization occurs in greater abundance within this package. Following the unmineralized graphitic portion, mineralization is no longer generally selective to packages Fa and D, but instead occurs in large intervals throughout. This may result from increased intervals of unit 9c (which are typically well mineralized) and thus influence mineralization within the surrounding metasediments. Styles of mineralization include very fine-grained disseminations, fracture- fill, and foliation parallel wisps.
| Section 7 | Geological Setting and Mineralization | Page 17 |
7.3 Deposit Geology and Mineralization - Cont'd
(b) Geological Packages - Cont'd
Package C
This package occurs as a graphitic phyllite (unit 7a) horizon ranging from 2 to 25 m in thickness. It is common as an uppermost mudstone horizon at the top of the package B sequence, possibly defining an unconformity. Being less competent in relation to the other lithologies, it is a preferred horizon for thrust faulting. Package C is therefore a marker horizon that separates packages B and D in the west domain.
In the east domain, this package occurs more commonly as intercalations rather than as a distinct horizon. There the package is often absent altogether and package D overlies package B.
Sulphide mineralization within package C is low. Sulphides are mainly present as pyrite, lesser pyrrhotite and locally trace chalcopyrite. Pyrite and pyrrhotite precipitated as porphyroblasts up to 1.5 cm in size and as fine-grained disseminations. Increased copper mineralization occurs in conjunction with high angle tension fractures of quartz, carbonate, and chalcopyrite.
| Section 7 | Geological Setting and Mineralization | Page 18 |
7.3 Deposit Geology and Mineralization - Cont'd
(b) Geological Packages - Cont'd
Package D
This package occurs between two graphitic horizons. It is comprised predominantly of intermediate to mafic metavolcaniclastic tuffs and fragmental volcaniclastics that frequently contain secondary quartz and calcite alteration that occurs interstitially and as foliation-parallel bands. The dominant lithologies consist of sericite-chlorite schists (unit 8a) and chlorite-carbonate phyllites (unit 7c), similar to the rocks observed within the upper Fb package.
In the west domain, package D transitions eastwardly from predominantly mafic metavolcaniclastic tuffs and silts to a package with increased intercalations of quartz-rich metasediments (unit 9b). This is observed in western drillholes whereas, further east the intercalations of metasediments (sericite-chlorite-quartz schists, unit 9b) increase to comprise 20-70% of the package. Sporadic, discontinuous intercalations of sericite- chlorite-quartz-feldspar schists (unit 9c, <1%), sericite-chlorite-quartz phyllites (unit 7d, <5%), siliceous chlorite-sericite-quartz schists (unit 9e, <1%), and pervasive silica alteration (unit 11a, <1%) are also observed within the package and increase towards the east.
In the east domain, package D gradually decreases in thickness and intercalations of more felsic units (units 9b and 9c) increase in abundance where package D is present as a lens. This may indicate a shallower marine environment moving distally away from the source of the mafic volcanic rocks. Unit 8a comprises between 25 to 85% of the rock, averaging approximately 50%, with a noticeable increase (15-30%) in felsic metavolcaniclastics (unit 9c). Locally, this package may also include discontinuous lenses of units 9b (1-45%), 7d (<1-30%) and 9e (<1-5%). Moving further eastwards (east of 305560E) mafic metavolcaniclastics continue to decrease in abundance. Package D does not occur in many of these drillholes and felsic metavolcaniclastics and metasediments are the dominant rock types. In the west domain, unit 8a is generally present with unit 9b in the D and B packages. In the far eastern part of the deposit, package D decreases and it appears that units 9b and 9c have replaced the intervals previously occupied by unit 8a.
Sulphide mineralization within package D is not consistent. There is sporadic emplacement of wide multiple sulphide lenses up to 5 m. Thick lenses more common within package Fa are not present here. Zones of sulphide mineralization are present in units 8a, 7c, and 9b and frequently transgress lithological contacts without preference to lithology. Chalcopyrite mineralization is mainly seen parallel to foliation as wisps and bands with quartz ± calcite and interstitial sulphide disseminations. Locally chalcopyrite is noted as hairline tension fractures bleeding into foliation planes.
| Section 7 | Geological Setting and Mineralization | Page 19 |
7.3 Deposit Geology and Mineralization - Cont'd
(b) Geological Packages - Cont'd
Package E
Package E consists of a pervasive, often texturally destructive silica-altered host (unit 11a) that overlies a graphitic phyllite (unit 7a). The silica altered host portion of the package appears to consist mainly of a succession of intercalated fine to medium grained (<1 mm) sandstones intercalated with siltstone. Preserved within the silica-flooded host, are relict opaline-blue quartz grains, commonly observed within package B (unit 9b). Impermeable mudstone has metamorphosed to graphitic phyllite (unit 7a). However, in many places it also shows strong to intense silicification. This package may occupy a large thrust fault along weak graphitic units where silicification has resulted from increased fluid movement related to the Harper Creek normal fault. Structures including the Harper Creek Fault are abundant in the area. Package E could be related to them.
Package E traces easily from west to east throughout the drillholes in the west domain and ranges from 15 to 91 m in thickness. In the east domain, the trend is discontinuous and not frequently observed. The contact between packages D and Fa does not confine silicified intervals resembling package E, as this alteration occurs randomly throughout the stratigraphy. Unsilicified graphitic intervals are also randomly present in the east domain and may represent mudstone and/or shear planes. Package E intervals in the east domain range in width from 4 to 80 m. Here, silicified and graphitic intervals are generally not associated with one another as they are in the west domain.
Sulphide mineralization within package E is strong and high-grade lenses of copper trace throughout. Chalcopyrite (<1-3%) is mainly noted as fracture-fill in tension fractures at 10° to 30° to core axis. Specularite (and locally molybdenite) are frequently present as is rare bornite. This sulphide assemblage is a useful marker within the silicified section. Interpretation is of an increased temperature gradient moving eastward within the sulphide fluid phase, as specularite appears to decrease while molybdenite and bornite increase.
| Section 7 | Geological Setting and Mineralization | Page 20 |
7.3 Deposit Geology and Mineralization - Cont'd
(b) Geological Packages - Cont'd
Package Fa
Pale to medium brown to medium greenish grey and green sericite-chlorite-quartz-feldspar schists (unit 9c), mainly derived from felsic volcanic and volcaniclastic rocks, dominate this assemblage. Intercalations include green to dark green mafic volcanics, chlorite- sericite schists (unit 8a), sericite-chlorite-quartz phyllites (unit 7d), graphitic phyllites (unit 7a), sericite-chlorite phyllite (unit 7b) and rare sericite-chlorite-quartz schists (unit 9b) with local intense zones of silica-altered host (unit 11a).
In the west domain, unit 9c comprises 30 to 60% of the package while unit 8a comprises 10 to 40%. Large deformation zones (unit 7d) make up 10 to 50% of the package, with the larger zones often overlying the silica-altered zone stratigraphically below. Argillaceous intervals comprising unit 7a and 9b metasediments (without opaline-blue quartz grains) represent less than 5% of the package. Locally pervasive silica altered host intervals (unit 11a) may also be present.
Package Fa is intensely convoluted, indistinct and difficult to trace across drillholes in the east domain, similar to package D. The abundance of unit 9c decreases markedly and its occurrence ranges from 10 to 50%. Zones of texturally destructive deformation increase and unit 7d makes up to 80% of the package locally. These zones may have originally been felsic volcanics or unit 9c. Strongly silicified intervals (unit 11a) persist (up to 30%) while mafic units (8a) are generally inconsistent (but up to 50% locally). Metasediments also exist in the Fa package in the east and are variable in abundance (up to 20%).
Metasediments become the dominant lithology moving eastwards and package Fa appears to decrease in size and abundance as package Fa becomes lensoidal or pinches-out.
This package commonly contains the highest percentage of chalcopyrite mineralization within the deposit. Mineralization is predominantly hosted within the sericite-chlorite- quartz-feldspar schists (unit 9c), that are interpreted to represent a sequence of felsic volcanics and volcaniclastics intervals. Chalcopyrite, ranging from <1 to 3%, commonly occurs as very fine-grained foliation-parallel wisps on rims of pyritic chain-of-grain bands, interstitial disseminations and locally filling tension fractures at 10° to 30° to core axis.
| Section 7 | Geological Setting and Mineralization | Page 21 |
7.3 Deposit Geology and Mineralization - Cont'd
(b) Geological Packages - Cont'd
Package Fb
This package is composed primarily of polymictic fragmental chlorite schists (unit 8c) and chlorite-carbonate phyllites (unit 7c) likely derived from mafic volcanic and volcaniclastic rocks. Similar to package D, these units frequently contain secondary quartz and calcite alteration that occurs interstitially and in foliation parallel bands. Intersections of this package in the southern area of the deposit predominantly contain secondary dolomite rather than calcite within the same textural variety. Although rare, strong to intense biotite alteration occurs within the chlorite-carbonate phyllites. The fragmental variety of the package consists of flattened, foliation-parallel fragments that appear to range in composition from mafic to felsic. Locally fine- to coarse-grained pyroxene and amphibole phenocrysts are preserved. Where textures preserved reasonably well, the unit shows a flow-like texture and appears similar to a welded ignimbrite. A marked increase in titanium and phosphorus, which is consistent throughout the deposit, defines this package geochemically.
This package is most notably present in the west domain and is situated in the northern part of the deposit and the western part of the deposit. Unit 8c represents 40 to 90% of this package, along with unit 8a (20-50%) and unit 7c (up to 60%). Noted locally, are intercalations of unit 9c, (5-40%) and unit 9a (40%). Unit 9a represents a hornblende-quartz phyric tuff, generally only found in the northern part of the west domain of the deposit and is likely part of the EBF unit described by Schiarizza and Preto (1987).
In the east domain, package Fb occurs in two areas, near surface in the south and in the north at depth. Unit 8c comprises 30 to 80% of the package with variable amounts of unit 7c (<60%), unit 8a (10-40%), unit 7d (5-10%) and unit 7a (<5%). These units are not consistently present in all successions. It is possible that these very similar looking rocks belong to two different formations.
Sulphide mineralization in package Fb consists mainly of pyrite as chain-of-grain bands that overprint bands of carbonate. Pyrite occurs as very fine-grained disseminations ranging from less than 1% to 7%. Pyrrhotite is also present, generally appearing as foliation-parallel wisps in concentrations of 1 to 5%. Trace chalcopyrite generally occurs on rims of pyrite in chain-of-grain bands and with pyrrhotite wisps. Sulphides, as bands in fractures, appear to be selective to carbonate.
| Section 7 | Geological Setting and Mineralization | Page 22 |
7.3 Deposit Geology and Mineralization - Cont'd
(b) Geological Packages - Cont'd
Package G
Package G is a graphitic horizon ranging from 6 to 40 m in thickness interpreted to represent a black mudstone with intercalations of possible mafic tuffs, silts and sandstones. Alternatively, the unit may represent a shear zone separating package Fb and package H. The package consists primarily of a calcareous graphitic phyllite (unit 7a). It is marked by pale grey to white, moderate to strongly deformed, discontinuous wispy to lensoidal calcite and quartz veining, ranging from less than 1 mm, to 11 cm in width. It is well foliated and appears locally fragmental in texture with lenticular to banded fragments parallel to foliation (1 mm to 6 cm). Intercalations of medium to dark grey limestone (unit 6f) occur within this package.
In the east domain, the package occurs as sporadic lenses, which do not correlate well across the deposit. It is calcite-dominant in the southwest with intercalated graphitic limestone. Centrally, dolomite is the more prominent carbonate and occurs interstitially and in foliation parallel bands.
Sulphide mineralization in package G is mainly pyrite (up to 3%) and pyrrhotite (up to 1%) as anhedral to euhedral porphyroblasts and foliation-parallel wisps. Trace chalcopyrite occurs locally as fracture-fill or foliation-parallel wisps.
Package H
This is the uppermost package of rocks within the deposit. Its known occurrence thus far is restricted to rocks observed in the far north and west of the deposit. The base of this package appears to have undergone strong to intense deformation as noted by the presence of thick intersections of sericite-chlorite-quartz phyllites (unit 7d) frequently intercalated within a succession that resembles felsic volcanic tuffs similar to those identified within the 9c unit. Local intercalations of hornblende-feldspar-quartz crystal lithic tuffs are likely representative of the regional EBF assemblage.
Mineralization within the package is often weak and dominated by fine to medium-grained pyrite and pyrrhotite, frequently with chlorite, possibly as mafic mineral replacement.
| Section 7 | Geological Setting and Mineralization | Page 23 |
7.3 Deposit Geology and Mineralization - Cont'd
(c) Structure
Harper Creek Fault
The large Harper Creek Fault zone trends northeast and dips 80° to the southeast in the deposit area. This structure follows a northeast trending tributary of Harper Creek and marks the separation of the deposit into the east and west domains (Figure 7-3).
Several wide zones of pale grey to green gougy faults and localized quartz and iron carbonate-healed fault breccias commonly occur within this structure. Fault breccias within these structures include polylithic fragments, often silicified, that commonly have disseminated and fracture-fill mineralization. Quartz-iron carbonate breccias are generally barren, faulted by a later event defined by reactivated gougy sections. Common within the structure is strong to intense deformation, often seen as kink folding, in addition to abundant clay (argillic) alteration. As the structure is composed of several fault zones, thickness varies from hole to hole, however it generally ranges from 25 to 50 m in thickness. Interpretation of structural movement is oblique right lateral offset with some possible rotational movement. Drop down on the south side appears to be in the range of 60 to 100 m.
The structure also contains several mafic to andesitic dykes interpreted as late Tertiary that show no regional deformation. Many dyke intersections are gougy and brecciated, possibly due to later northerly trending faults. Several of these dykes appear to have used the Harper Creek Fault as a structural pathway.
| Section 7 | Geological Setting and Mineralization | Page 24 |
7.3 Deposit Geology and Mineralization - Cont'd
(c) Structure - Cont'd
East Domain Structures
The east domain appears to have separated into several fault slices by a structural event. Fault structures noted throughout the domain likely caused offsets in mineralized zones as well as offsets in packages of rocks that may range from tens to possibly hundreds of metres. The actual degree of mineralized zone offset caused by these structures is unknown. Related to these fault slices is the east-west trending Larry Fault.
The orientation of these structures trends west southwest (~250°) with a northwest dip of 20° to 35°. The style is that of an imbricated thrust fault system with multiple variations in strength and orientation.
Characteristics of these structures vary with the host lithology they pass through. Feldspar- dominated units 9c, 8a, 8c, and 7c exhibit abundant foliation-parallel flaking. This is evident in core that is broken into disc shapes and with multiple foliation-parallel gouge zones where back and forth movement has occurred. More silicified and weakly foliated sericite-chlorite-quartz schist units 9b and 11a occur as broken fragments with abundant hairline fractures of no preferred orientation. Fracture surfaces within silicified areas frequently have clay and gouge. Iron carbonate and silica-healed breccias also occur within gouge zones in several areas.
| Section 7 | Geological Setting and Mineralization | Page 25 |
7.3 Deposit Geology and Mineralization - Cont'd
(d) Geological Interpretation
The proposed sequence of formation for the deposit according to Nass (2012a) is presented in Table 7-3.
Table 7-3: Deposit Sequence of Formation
| 1. Lower Cambrian |
|
• Deposition of the B and C package sediments followed by the deposition of mafic volcaniclastics of the D package. • Concurrent deposition, elsewhere, of packages Fb, G, H and I, calcareous volcaniclastics and sediments including limestones. • Middle Cambrian to Middle Devonian: Depositional hiatus. |
| 2. Late Devonian-Early Mississippian |
|
• Deposition of the Fa felsic volcaniclastics and Fb mafic volcaniclastic packages with syngenetic volcanogenic sulphide mineralization. |
| 3. Late Devonian |
|
• Intrusion of the orthogneiss, unit 10a. • Late Triassic to Early Jurassic: first regional phase of deformation. Not directly observed in the immediate deposit area. |
| 4. Late Jurassic-Early Cretaceous |
|
• Continuous folding accompanied by southwest-directed thrust faulting. • Possible repetition of the stratigraphy by thrusting of B, C, D, Fa and Fb packages on top of itself in places on the property. • Thrusting of the Fb, G, H and I packages on top of the Fa and Fb packages. • Remobilization of the sulphide mineralization along thrust fault planes and foliation. |
| 5. Mid-Cretaceous |
|
• Intrusion of the Baldy batholith to the south. • Accompanied by contact metamorphism, east-west trending folds and kinks and the west-northwest trending system of reverse faulting system, which reconfigured the stratigraphy of the east domain and thickened the mineralized zone by repetition |
| 6. Late Cretaceous: |
| • Southwest-northeast trending Harper Creek Fault separating the west and east structural domains with a strike-slip displacement. |
| 7. Tertiary |
|
• North trending normal faults. This generation of faults occurs in both the west and the east domains; potentially sub-parallel to the orientation of the drill sections. Emplacement not pinpointed with accuracy at this time. Displacement appears to be minimal. • Intrusion of quartz-feldspar porphyry, andesite, and lamprophyre dykes. |
| 8. Erosion to current topography. |
SECTION 8
DEPOSIT TYPE
SECTION 8: DEPOSIT TYPE
Table of Contents
| Page | ||
| 8.1 | Deposit Type | 1 |
| Section 8 | Deposit Type | Page 1 |
8.1 Deposit Type
Interpretation of the deposit type is that of a remobilized polymetallic volcanogenic massive sulphide (VMS) deposit, comprising lenses of disseminated, fracture-filling and banded iron and copper sulphides with accessory magnetite. Mineralization is generally conformable with the host-rock stratigraphy as is consistent with the volcanogenic model. Observed sulphide lenses measure many tens of metres in thickness with kilometer-scale strike and dip extents. In 2009, YMI conducted a program of field mapping, sampling, relogging, petrographic examination of existing thin sections and re-assessment of the total digestion geochemical dataset that confirmed the deposit type hypothesis for the deposit (Armstrong and Hawkins, 2009).
Support for this model is as follows:
• The generally stratabound nature of the highest grades of mineralization, which can be interpreted as deformed massive to semi-massive sulphide lenses;
• An overall metal assemblage consistent with a copper-rich VMS;
• Interpretation of widespread, lower grade mineralization as a deformed feeder or alteration zone originally located below higher-grade massive sulphide horizons; this also accounts for the overall discordance of mineralization to stratigraphy;
• Host rocks are highly altered felsic volcanic rocks within a bimodal volcanic sequence, similar to those that host many major VMS deposits globally;
• The presence in the region of numerous deposits clearly compatible with a VMS genetic model.
SECTION 9
EXPLORATION
SECTION 9: EXPLORATION
Table of Contents
| Page | ||
| 9.1 | Historical Operators | 1 |
| 9.2 | Yellowhead Mining Inc. | 4 |
| 9.3 | Taseko Mines Limited | 9 |
| List of Tables | ||
| Table 9-1: Historical ARIS Reports Filed on the Property | 3 | |
| Table 9-2: Yellowhead Mining Inc. ARIS Reports on the Property | 4 | |
| List of Figures | ||
| Figure 9-1: Soil Sampling Areas | 7 | |
| Section 9 | Exploration | Page 1 |
9.1 Historical Operators
(a) Noranda Exploration Company Ltd.
Noranda discovered copper mineralization at the headwaters of Baker Creek and Jones Creek on the Harper Creek claims in 1966 by prospecting and stream sediment sampling which had indicated higher levels of cadmium, copper, aluminum and iron in the stream sediments. Upon completion of an orientation survey the following year, Noranda surveyed a soil sample grid. Extension of the soil grid to the south and west and cross line infilling took place in 1968 and 1970.
Between 1967 and 1971, Noranda undertook geophysical surveys comprising 11.5 km in 9 lines of magnetometer, 51.5 km in 28 lines of very low frequency - electromagnetic (VLF-EM), and 58 km in 8 lines of induced polarization (IP). The IP survey was conducted as a test survey after drilling in the area had been completed.
(b) Québec Cartier Mining Company
In 1966, QCM discovered copper mineralization at the headwaters of a tributary of Harper Creek on the Hail Claims through a program of prospecting and stream sediment sampling similar to that undertaken by Noranda.
In 1967, QCM established a 13-line grid totaling 129 km in an area broadly defined by the results of the silt-sampling program. Analysis of 2,500 B-horizon soil samples collected on this grid was for copper and zinc. A 5 km extension of a local logging road facilitated creation of seven trenches on the western side of the Hail Claims. Excavation of 1,500 m3 of material and the taking of 31 channel samples along 3 m bedrock lengths resulted. A ground magnetic survey conducted the same year included 9,000 vertical component observations at 15 m intervals over 137 km.
| Section 9 | Exploration | Page 2 |
9.1 Historical Operators - Cont'd
(c) Noranda / Québec Cartier Joint Venture
Noranda and QCM formed a joint venture with Noranda as the project operator in late 1970 for continued exploration on the combined properties.
A soil orientation survey on the QCM grid in fall 1970 warranted a check sampling comparison of the results for the two grid systems. In 1971, Noranda re-sampled a portion of the QCM grid. Copper and zinc analysis of all soil samples and the analysis of two lines for molybdenum took place.
In 1972, exploration expanded out from the main deposit to the southwest, south, and north. Work included detailed stream sediment sampling, reconnaissance geological mapping, soil sampling, and geophysical surveying. Internal preliminary feasibility work conducted that year evaluated open pit designs of the combined Noranda and QCM deposits.
In 1973, groundwork shifted back to the deposit area, as newly constructed logging roads opened up new areas. A total of 22 km of VLF-EM surveying took place on new or re- established grids in that year.
In 1974, geological mapping of newly cut logging roads and relogging of historical drill core was the only work undertaken. Upgrades to the internal prefeasibility studies using revised parameters took place in 1973 and 1974. Results of these studies are unknown.
(d) Aurun Mines Ltd.
In April 1986, Aurun Mines Ltd. (Aurun) signed an option agreement with QCM to investigate the potential of both small higher-grade and large lower-grade copper deposits and to test for the presence of precious metals in the massive sulphide layers on the QCM claims. Assessments also considered the significance of titanium-bearing minerals and the possibility of leaching low-grade copper mineralization. Work proceeded through sampling of historical trenches and selected historical drill core. Results of gold and silver analysis showed the potential for modest credits to be attributable to these metals.
| Section 9 | Exploration | Page 3 |
9.1 Historical Operators - Cont'd
(e) Other Operators
Several other historical operators performed exploration within the current bounds of the property but well outside the deposit area between 1970 and 2005. Table 9-1 lists the technical assessment reports of mineral exploration and development performed by all historical workers on the property as filed in the government of British Columbia Assessment Report Indexing System (ARIS).
Table 9-1: Historical ARIS Reports Filed on the Property
| ARIS | Year | Area/Claim(s) | Operator | Work Program |
| 1035 | 1967 | Hail | Québec Cartier Mining Company | Geochemical & geological |
| 1612 | Hail L, M, N & O | Drilling, geological, geochemical, geophysical | ||
| 2988 | 1970 | VH | Royal Canadian Ventures Ltd. | Geochemical & geophysical |
| 3141 | 1971 | PY | Supertest Investments & Petroleum Ltd. | Line cutting |
| 3151 | 1970 | PY | Geochemical | |
| 3195 | 1971 | VM #2 | Royal Canadian Ventures Ltd. | Geochemical |
| 3430 | Hilltop, Bob, Hissy, Fill | Dynasty Explorations Limited | Geological, geophysical, geochemical | |
| 3525 | VM & VA | Royal Canadian Ventures Ltd. | Geological & geochemical | |
| 3781 | 1972 | PY | Supertest Investments & Petroleum Ltd. | Line cutting |
| 3941 | CAP, PAC | MacDonald, WE | Line cutting | |
| 5502 | 1975 | Bullion & Pat | H Doyle & J Arden | Prospecting |
| 5909 | 1976 | Vav | John H Kruzick | Geological |
| 5929 | Lucky Strike | JA Fennell | Drilling | |
| 6161 | Toreador 1 | Torwest Resources (1962) Ltd (NPL) | Geological & geophysical | |
| 6220 | 1977 | Green | Copper Lake Explorations Ltd NPL | Prospecting |
| 6252 | Lake | Prospecting | ||
| 6317 | Have | Miller, JT | Geological | |
| 6383 | Vav | Greenwood Explorations Limited | Geophysical & prospecting | |
| 6773 | 1978 | Toreador | Highmont Mining Corp | Geological, geochemical, geophysical |
| 6792 | Lucky Strike | JA Fennell | Geological | |
| 6878 | AV 1-2 | Cominco | Geochemical & geological | |
| 7503 | 1979 | Crown | Union Oil Company pf Canada Ltd | Geological, geochemical, geophysical |
| 7647 | Baker Creek Area | Geophysical | ||
| 7990 | 1980 | Foggy 11 | Barrier Reef Resources Ltd | Geological, geochemical, geophysical |
| 10627 | 1982 | Crown Property | Union Oil Company pf Canada Ltd | Geophysical |
| 11462 | 1983 | Crown Property | Geochemical | |
| 11475 | Len | Esso Resources Canada Limited | Drilling | |
| 12092 | 1984 | Carbide Property | Gordon Leask | Geological |
| 12904 | Foggy | Esso Resources Canada Limited | Drilling | |
| 13560 | McCorvie | Newmont Exploration of Canada Ltd | Geological, geophysical, geochemical | |
| 13862 | 1985 | Tia | Nu Crown Resources Inc. | Geochemical & geophysical |
| 14206 | Tia | Drilling | ||
| 14505 | Reg 2 & 3 | Newmont Exploration of Canada Ltd | Geophysical | |
| 15236 | 1986 | Tia 14 | Nu Crown Resources Inc. | Geophysical |
| 15738 | Hail, Harper Creek | Aurun Mines Ltd | Geological & physical | |
| 16226 | 1987 | Hail, Harper Creek | Aurun Mines Ltd | Geochemical |
| 16482 | Tia | Nu Crown Resources Inc. | Geophysical | |
| 17035 | Tia | Drilling | ||
| 17555 | 1988 | Birch Group | Foundation Resources Ltd. | Geological & geochemical |
| 17650 | Hail, Harper Creek | Aurun Mines Ltd | Pre-Feasibility study | |
| 18970 | 1989 | Birch Group | Foundation Resources Ltd. | Geological, geophysical, geochemical |
| 20218 | 1990 | Birch Group | Gemstar Resources Ltd. | Geological & geochemical |
| 24822 | 1996 | Hail, Harper Creek | American Comstock Exploration Ltd | Drilling |
| 25036 | 1997 | Willy 1 & 2 | Edward Hayes | Physical work |
| 26926 | 2002 | Mag | Belik, GD | Mag survey |
| 27611 | 2005 | Avery & Jones | Christopher O Naas | Soil & Rock sampling |
| 28044 | Harper Creek | Soil sampling |
| Section 9 | Exploration | Page 4 |
9.2 Yellowhead Mining Inc.
(a) Introduction
YMI began the company's first phase of field exploration on the project in 2005. Exploration completed between 2005 and 2013 included diamond drilling and relogging historical core (described in Section 11.3(a)), airborne geophysics (magnetic and electromagnetic), ground geophysics (magnetic, electromagnetic and induced polarization), soil sampling, rock sampling, geological mapping and petrographic and whole rock analysis of drill core and surface rock samples. This work largely focussed on the west-central part of the property in the deposit area.
Table 9-2 lists the ARIS assessment reports filed by YMI on the property since 2006, all authored by C.O. Naas, P.Geo.
Table 9-2: Yellowhead Mining Inc. ARIS Reports on the Property
| ARIS Number |
Year | Work Program |
| 28472 | 2006 | Core logging & resampling |
| 28812 | 2007 | Airborne geophysics |
| 29404 | Drilling, geophysics | |
| 29732 | 2008 | Drilling, geophysics, geochemistry |
| 30320 | Drilling | |
| 30566 | 2009 (rev 2009) | Geology, geochemistry, geophysics, road & reclamation |
| 31278 | 2009 (rev 2010) | Geology, geochemistry, reclamation |
| 31986 | 2011 | Resource modelling & estimation |
| 32220 | Drilling, geochemistry | |
| 32723 | 2012 | Drilling, core relogging and geological modelling |
| 34525 | 2014 | Drilling, geology, geochemistry |
| Section 9 | Exploration | Page 5 |
9.2 Yellowhead Mining Inc. - Cont'd
(b) Geophysical Surveys Airborne Geophysics
Aeroquest Limited helicopter-borne magnetic and electromagnetic geophysics surveys conducted in 2006 and re-processed by Insight Geophysics in 2007, included over 1000 line-kilometers at predominantly 100 m line spacing. Follow up of airborne geophysical targets identified was by ground survey.
Ground Geophysics
In 2007 and 2008, ground-based geophysical surveys included horizontal loop electromagnetic (HLEM), magnetics and induced polarization (IP). HLEM and ground magnetic survey coverage included the Harper West, Jones Creek, Northwest, and M Anomaly grids. Ground magnetic and IP survey coverage included the Harper South and southeastern area of the M Anomaly grids respectively.
A 32 line-km IP/Resistivity survey conducted by Insight Geophysics in 2007 tested anomalous targets defined previously by ground geophysics and soil sampling. The survey identified three anomalous areas within the Harper West grid and three conductor axes within the Northwest grid. The surveys also detected conductive areas on the western edge and north-northeast of the Northwest grid. Of note on the Jones Creek grid, were three areas of coincident conductivity and anomalous soils. Results from M Anomaly grid consist of numerous profiles that may indicate the shallow depth extent of vertically trending responses.
The 40 line-km ground magnetometer survey at 25 m intervals conducted by CME Consultants in 2008 on the Harper South grid indicated a prominent boundary between higher magnetic rocks to the north and a moderate magnetic unit to the south. This corresponds with field observations of the contact between Eagle Bay orthogneiss and metavolcanic / metasedimentary units.
| Section 9 | Exploration | Page 6 |
9.2 Yellowhead Mining Inc. - Cont'd
(c) Soil and Rock Sampling Soil Sampling
YMI collected 4,532 soil samples between 2006 and 2008 from eight soil sample grids and one soil line established over high priority targets identified by the airborne geophysics.
Survey grid cross-lines were oriented NNW-SSE, perpendicular to the regional trend, except for the north-south oriented Northwest grid. Cross-line spacing ranged from 100 m for detailed sampling, up to 400 m for reconnaissance-scale sampling, with GPS located sample stations spaced 25 m along lines. A typical sample taken from the B-horizon at 20 cm to 30 cm depth from surface ranged from 200 to 400 g in size. Samples were of the C- horizon in areas of poor soil development. Unsampled areas include those with unsuitable material (i.e. roads, swamp). Sample bags included local grid coordinate labels along with a corresponding bar code. The sampling areas are shown in Figure 9-1.
The Harper South grid immediately adjacent to the open pit is the strongest soil anomaly identified on the property and has a number of highly anomalous copper values over 1,000 ppm. It is 450 m long and 100 to 400 m wide and appears to be representative of the surface expression of the deposit. YMI soil sampling of the M anomaly confirmed and refined the historically identified copper anomalies there. A coincident zinc and copper anomaly and a moderate discontinuous copper anomaly occur on the Northwest grid and there is a persistent copper anomaly across the entire Avery Lake grid. The smaller Vavenby grid has a possible weak copper anomaly and the NZ soil line has two anomalous copper values. The Summit grid is weakly anomalous for copper and the Jones and Farmer grids are not very anomalous.
| Section 9 | Exploration | Page 7 |
9.2 Yellowhead Mining Inc. - Cont'd
(c) Soil and Rock Sampling - Cont'd
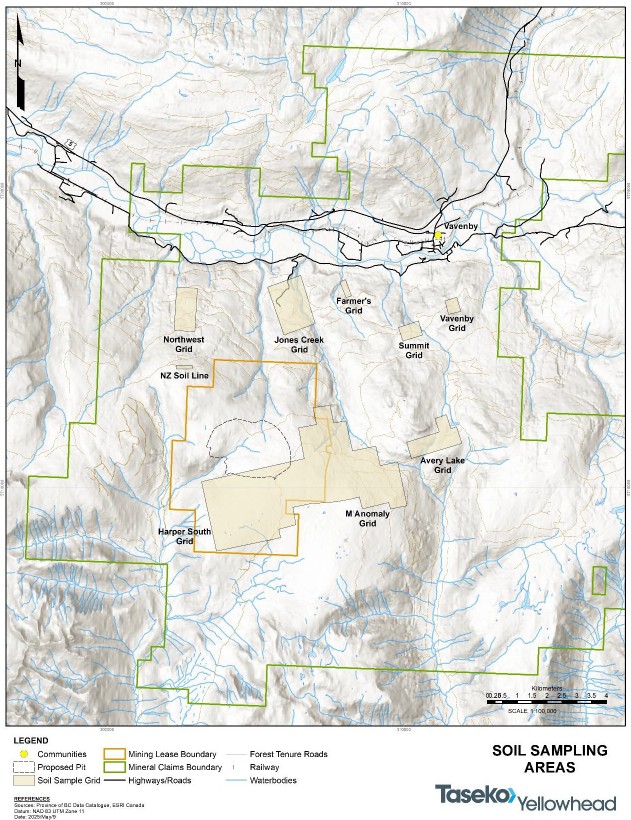
Figure 9-1: Soil Sampling Areas
| Section 9 | Exploration | Page 8 |
9.2 Yellowhead Mining Inc. - Cont'd
(c) Soil and Rock Sampling - Cont'd
Rock Sampling
Between 2004 and 2008, 462 rock samples were collected on the property from historical trenches, sub-crop, out-crop and float. They were taken for geochemical analysis and review of lithology, alteration and mineralization and as part of a wider mapping program outside of the main deposit area. The rock sample database contains 351 samples taken by YMI in 2006 and 2008, along with results from 111 rock samples collected in 2004 and 2005 by a previous operator.
Sample size varied but was typically >100 g, large enough to incorporate a representative sample for assay. GPS located samples were marked in the field using orange or pink flagging with the sample number and described in terms of lithology and alteration with estimated mineral and sulphide abundance. Samples were marked with a sample number and placed in 20 by 30 cm poly sample bags. This program identified numerous significant copper and other base metal occurrences and several significant precious metal occurrences. Twenty percent of the 351 samples collected by YMI were greater than 0.1% Cu and seven greater than 1 % Cu. Two grab samples from outcrop in the M Anomaly grid area returned results greater than 1 gpt gold. Other samples also had appreciable silver, lead and molybdenum.
(d) Additional Studies Petrographic Studies
Petrographic studies completed in 2007 and 2008 included thin and polished section work and whole rock analysis on drill core and rock sample specimens. These studies led to a better understanding of lithology, alteration and mineralization characteristics of the deposit. These studies were undertaken prior to the development of the current geological model and as such, their lithological descriptions may not match the current terminology. In support of geological modeling, additional thin sections were prepared, and petrographic descriptions completed, along with whole rock analysis of these samples in 2009.
Additional Studies
In 2009, a program of field mapping, sampling, relogging, petrographic examination of existing thin sections and re-assessment of the total digestion geochemical dataset was undertaken to confirm the mineralization style of the deposit (Armstrong and Hawkins, 2009). This assessment confirmed the hypothesis that the deposit is a volcanic-hosted massive sulphide (VHMS) deposit. Additional description of the deposit type is provided in Section 8.1.
| Section 9 | Exploration | Page 9 |
9.3 Taseko Mines Limited
No exploration work has been conducted on the property since Taseko acquired the project in 2019, however in 2024, Taseko undertook a site investigation program to characterize the foundation conditions of the main embankment for the tailings storage facility (TSF).
SECTION 10
DRILLING
SECTION 10: DRILLING
| Table of Contents | ||
| Page | ||
| 10.1 | Introduction | 1 |
| 10.2 | Historical Operators | 4 |
| 10.3 | Yellowhead Mining Inc. | 7 |
| 10.4 | Taseko Mines Limited | 11 |
| List of Tables | ||
| Table 10-1: Summary of Drilling on the Property | 2 | |
| List of Figures | ||
| Figure 10-1: Drilling Plan by Operator | 3 | |
| Section 10 | Drilling | Page 1 |
10.1 Introduction
A significant amount of drilling has taken place on the Yellowhead Copper Project in 19 different years between 1967 and 2024 by Taseko and historical operators, totalling over 96,000 m in 415 holes all of which were cored diamond drillholes. Of these holes, 348 are located within what is now known as the Yellowhead Deposit, for a total of 90,400 m or 94% of the overall drilling. Results from these drill programs are the basis for the mineral resource estimate reported in Section 14. There are no drilling, sampling, or recovery factors that could materially impact the accuracy and reliability of the results.
Table 10-1 summarizes the drilling on the project by operator, year and purpose. Drillhole locations are shown in Figure 10-1 and representative cross sections are provided in Section 7.3(b) of this report.
| Section 10 | Drilling | Page 2 |
10.1 Introduction - Cont'd
Table 10-1: Summary of Drilling on the Property
| Operator | Year | Drillhole ID's | No. of Holes |
Core Size | Total (m) |
Avg. Depth (m) |
Purpose |
| Québec Cartier Mining Company |
1967 | 67-H-1 to 6 | 6 | NQ & BQ | 546 | 91 | Exploration |
| 1969 | 69-H-1 to 27 | 27 | BQ | 4,739 | 176 | ||
| Noranda Exploration Co. Ltd. |
1968 | NH-1 to 18 | 17 | 2,106 | 124 | ||
| 1969 | NH-18 to 30 | 13 | 1,734 | 133 | |||
| 1970 | NH-31 to 96 | 57 | 8,316 | 146 | |||
| Noranda / Québec Cartier Joint Venture |
1970 | J-1 to 12 | 12 | 2,329 | 194 | ||
| 1971 | J-13 to 39 | 27 | 5,594 | 207 | |||
| 1972 | J-40 to 43 | 4 | 457 | 114 | |||
| 1973 | J-44 to 48 | 5 | 632 | 126 | |||
| Esso Resources Canada Limited |
1983 | LBC83-1 | 1 | NQ | 84 | 84 | |
| Nu-Crown Resources Inc |
1985 | DDH-01 to 04 | 4 | BQ | 427 | 107 | |
| 1987 | DDH-05 to 14 | 10 | 942 | 94 | |||
| American Comstock Exploration Ltd |
1996 | 96-1 to 8 | 8 | NQ2 | 2,847 | 356 | |
| Yellowhead Mining Inc |
2006 | HC06-01 to 12 | 12 | 4,101 | 342 | Resource | |
| 2007 | HC07-13 to 52 | 40 | 15,880 | 397 | |||
| 2008 | HC08-53 to 75 | 23 | 7,603 | 331 | |||
| 2010 | HC10-76 to 82 | 7 | 3,487 | 498 | |||
| 2011 | HC11-83 to 130 | 48 | 15,571 | 310 | |||
| HC11-C01 to 08 | 8 | 1,791 | 224 | Condemnation | |||
| HC11-GM01 to 07 | 8 | HQ | 2,433 | 304 | Geomechanical | ||
| HC11-GT01 to 24 | 24 | 1,270 | 53 | Geotechnical | |||
| HC11-M01 to 04 | 4 | PQ | 441 | 110 | Metallurgical | ||
| 2012 | HC12-131 to 142 | 12 | NQ2 | 3,803 | 317 | Resource | |
| HC12-GT01 to 08 | 8 | HQ3 | 442 | 55 | Geotechnical | ||
| 2013 | HC13-143 to 165 | 23 | NQ2 | 8,166 | 355 | Resource | |
| Taseko Mines Limited | 2024 | GT24-01 to 07 | 7 | HQ3 | 298 | 43 | Geotechnical |
| Total | 1967 to 2024 | 415 | 96,039 | 231 | |||
| Section 10 | Drilling | Page 3 |
10.1 Introduction - Cont'd

Figure 10-1: Drilling Plan by Operator
| Section 10 | Drilling | Page 4 |
10.2 Historical Operators
(a) Québec Cartier
QCM collared the first diamond drillhole on the property in 1967 to target a geochemical anomaly found by surface sampling in 1966 and encountered copper mineralization over its entire cored length from 3 m to 108 m. QCM went on to complete six diamond drillholes in that year, five of which were NQ (47.6 mm diameter) and one BQ (36.4 mm diameter). The average depth of these holes was 91 m. Of the 546 m of total drilling, 40 m was overburden that was not recovered, logged or assayed. Recovery in the 526 m of cored intervals was 88%.
QCM resumed drilling in 1969 with 27 BQ size drillholes averaging 176 m in length.
Drillhole orientations ranged from −45° to −85° to the south. Of the 4,739 m of total drilling, 158 m was overburden that was not recovered, logged or assayed. Recovery in the 4,581 m of cored intervals was 95%.
Drilling on the QCM claims resumed in late 1970 under the Noranda / QCM joint venture exploration program.
(b) Noranda
In 1968 Noranda completed a 17-hole drill program with holes averaging 124 m in depth. Of the 2,106 m of total drilling, 116 m was overburden that was not recovered, logged or assayed. Recovery of the 1,990 m of cored intervals is unknown. Most drillhole orientations were vertical, with six holes drilled −60° to the south.
In 1969, Noranda drilled 13 holes at orientations of −60° south to an average depth of 133 m. Of the 1,734 m of total drilling, 119 m was overburden that was not recovered, logged or assayed. Recovery of the 1,615 m of cored intervals is unknown.
Noranda resumed drilling in 1970 and completed 57 drillholes averaging 146 m in length. Drillhole orientations from this program were either −60° south or vertical. Of the 8,316 m of total drilling, 432 m was overburden that was not recovered, logged or assayed. Recovery of the 7,883 m of cored intervals is unknown.
All Noranda core was drilled BQ size. Noranda stored boxes containing half split remaining core cross-stacked and in the open at their camp. The core remained there unsecured until moved to a storage facility in Vavenby, BC by YMI in 2008.
Availability of core photographs of historical Noranda core recovered by YMI is good. Resampling of historical half core by YMI after photography consumed the remaining material. Sample assay pulps from the historical core resampling programs are well stored in a secure container at Vavenby, BC.
| Section 10 | Drilling | Page 5 |
10.2 Historical Operators - Cont'd
(c) Noranda / Québec Cartier Joint Venture
The Noranda / QCM joint venture completed a 12-hole drill program in 1970. Holes were drilled to the south at orientations from −45° to vertical and an average depth of 194 m. Of the 2,329 m of total drilling, 125 m was overburden that was not recovered, logged or assayed. Recovery of the 1,987 m of cored intervals is unknown.
The joint venture commenced drilling again in 1971, completing 27 holes. All holes were vertical except three −60° south holes. Of the 5,594 m of total drilling, 342 m was overburden that was not recovered, logged or assayed. Recovery of the 5,468 m of cored intervals is unknown.
In 1972, drilling resumed on a 4-hole program. Holes had southeast to south −60° to −70° orientations. Of the 457 m of total drilling, 12 m was overburden that was not recovered, logged or assayed. Recovery of the 445 m of cored intervals is unknown.
In 1973, the joint venture completed a 5-hole program. The orientation of the holes was −55° south. Of the 632 m of total drilling, 27 m was overburden that was not recovered, logged or assayed. Recovery of the 605 m of cored intervals is unknown.
All Noranda / QCM joint venture core was drilled BQ size. Noranda stored boxes containing half split remaining core cross-stacked and in the open at their camp. The core remained there unsecured until moved to a storage facility in Vavenby, BC by YMI in 2008.
Availability of core photographs of historical joint venture core recovered by YMI is limited. Resampling of historical half core by YMI after photography consumed the remaining material. Sample assay pulps from the historical core resampling programs are stored in a secure container at Vavenby, BC.
(d) American Comstock Exploration Ltd.
American Comstock completed an 8-hole NQ2 (50.6 mm diameter) core drilling program in 1996. The holes averaged 356 m in length and targeted deeper mineralization than previous programs. All were drilled south at −55° except one vertical hole. Of the 2,847 m of total drilling, 47 m was overburden that was not recovered, logged or assayed. Recovery of the 2,800 m of cored intervals is unknown.
| Section 10 | Drilling | Page 6 |
10.2 Historical Operators - Cont'd
(e) Esso Resources Canada Limited
In 1983 Esso Resources Canada Limited drilled one NQ hole to a depth of 84 m on a geochemical and geological target 3 km northeast of the deposit on the historical Len claims that yielded no results of interest. Split drill core was stored at site.
(f) Nu-Crown Resources Inc.
Nu-Crown Resources Inc drilled 14 BQ holes on geophysical targets 4 km north of the deposit on the historical Tia claims. This drilling intersected anomalous to low-grade lead- zinc-barium mineralization. In 1985 they completed 427 m in a 4-hole program and in 1987, 10 holes were completed totaling 942 m. All holes were drilled at −55° to the south.
(g) Historical Surveys
Diamond drillhole collars were located in the field by transit surveys and reported in a company specific local grid. McElhanney of Vancouver, BC surveyed the QCM drillholes in 1969. Noranda contracted McWilliam, Whyte, Goble and Associates of Kamloops to undertake a legal survey of collar locations in 1971. Noranda also converted the QCM grid to the Noranda grid to integrate the geological databases of the two companies in that year. Only dip tests performed on inclined holes exist for the Noranda, QCM and joint venture data. Some inclined holes lack dip surveys and no downhole directional (azimuth) surveys exist for any of these holes. Vertical holes were not downhole surveyed.
| Section 10 | Drilling | Page 7 |
10.3 Yellowhead Mining Inc.
(a) Introduction
From 2006 through 2013 YMI drilled 64,990 m in 217 drillholes representing 68% of the total metres drilled on the property. Yellowhead and consultants geologically and geotechnically logged and photographed all core recovered from their drill programs. Over 90% of this drilling focussed on the confirmation, delineation and definition of copper resources within the main body of mineralization. Geomechanical, condemnation, geotechnical and metallurgical holes comprised the balance of the drilling.
CME Consultants Inc of Richmond, BC (CME) was responsible for management of the resource, condemnation, and metallurgical drill programs. Knight Piésold of Vancouver, BC was responsible for management of the geomechanical and geotechnical drilling. Drill core is stored at a secure facility in Vavenby, BC.
A typical drill run length for the Yellowhead programs was 3 m with an overall average run length of 2.9 m. The average core recovery for the 20,288 drill runs cored and measured in these campaigns in the deposit area is 98% with an average RQD of 40%.
(b) Resource Drilling
Yellowhead completed 58,612 m in 165 holes of confirmation, delineation and infill drilling in support of geological modelling and resource estimation between early 2006 and mid-2013. Sampling and assaying included the entire cored length of all resource drillholes. Section 11.3 describes this in further detail. All holes were drilled NQ2 core size and most were oriented in a southerly direction at inclinations of −50° to −60°. Overall drill spacing in the central part of the deposit is from 50 to 70 m, increasing to over 100 m in the fringes.
In 2006, Yellowhead completed 4,101 m in 12 core holes numbered HC06-1 through HC06-12 for resource confirmation purposes. Nine drillholes targeted the western side of the deposit, while the remaining three drillholes targeted the eastern side. Drilling was oriented to the south at inclinations of −50° to −60°.
In 2007, a program to delineate and infill the northern and southern parts of the resource area included 15,880 m of drilling in 40 core holes numbered HC07-13 through HC07-52. These holes also extended below the intersections of historical holes to test the extent of mineralization at depth. Holes were oriented to the south at inclinations of −55° to −60°. A downhole orientation-marking tool used in holes HC07-39 and HC07-40 enabled orientation measurements to be made of geological features, including cleavages, foliations, veins and structures. The average of 1,933 measurements, 259° azimuth 30° N dip, confirmed the suitability of the preferred drill orientation used by Yellowhead and
| Section 10 | Drilling | Page 8 |
10.3 Yellowhead Mining Inc. - Cont'd
(b) Resource Drilling - Cont'd
historical workers. All casing remained in the ground after drillhole completion for the 2006 and selected 2007 drillholes for possible re-entry purposes.
The 2008 program consisted of 7,603 m in 23 core holes numbered HC08-53 to HC08-75, all oriented to the south at inclination of −60°. These infill and delineation drillholes targeted the east and southeast areas of the deposit.
There was no drilling in 2009.
The seven holes drilled in the 2010 program numbered HC10-76 through HC10-82 average 498 m in length for a total of 3,487 m. The three holes drilled in the west side and four on the east side of the deposit further extended the known depth extent of mineralization. All were oriented to the south at inclination of −60°.
The extensive 2011 delineation and infill drill program totalled 15,571 m in 48 holes. The purpose was to target areas of low drilling density to increase confidence in the resource and assist in the creation of a geological model. Although most holes were drilled south at inclinations of −60°, a number of orientations deviated from this to intersect specific areas of mineralization and structure.
In the 2012 and 2013 programs, the focus on increasing the drill density in the deposit continued with 12 holes totalling 3,803 m and 23 holes totalling 8,166 m completed respectively in those years. All holes were drilled south at inclinations of −60°.
(c) Condemnation Drilling
In 2011, potential mineralization below proposed mine site infrastructure was tested in an eight-hole 1,791 m NQ2 core drilling program. These condemnation holes numbering HC11-C01 through HC11-C08 targeted proposed infrastructure and facilities associated with YMI's project design from the 2014 Feasibility Study. Holes were drilled to depths of 200 m in a southerly direction at −60° except as noted. Drillhole HC11-C06 was the longest at 340 m because of its proximity to mineralization around the deposit which is just 250 m to the east. HC11-C04 was drilled subvertically and hole HC11-C08 was drilled northwest at −47° to a depth of 246 m.
The two holes drilled closest to the deposit, HC11-C06 and HC11-C-08, had intercepts of >0.2% Cu over intervals ≥1 m. The other six holes did not return any significant results for copper.
| Section 10 | Drilling | Page 9 |
10.3 Yellowhead Mining Inc. - Cont'd
(d) Metallurgical Drilling
Yellowhead completed a 4-hole, 441 m PQ core size (83 mm diameter) metallurgical drill program to collect drill core for metallurgical and crushing/grinding test-work in 2011. These drillholes twinned four historical holes NH-27, NH-29, J-4, and 69-H-22. Dawson Metallurgical Laboratories of Midvale, UT, received the crushing/grinding samples for test-work from these holes. G&T Metallurgical Services in Kamloops, BC received the remaining samples. Section 13 includes information on the metallurgical results. Sampling and geochemical analysis of 137 core samples from metallurgical drillhole HC11-M04 took place in addition to sampling in this hole specifically for metallurgical test-work.
(e) Geomechanical and Geotechnical Drilling
Knight Piésold completed a series of geomechanical and geotechnical drillholes as part of their site investigation studies. Geomechanical drilling undertaken in the proposed pit area consisted of eight HQ core size (63.5 mm diameter) drillholes totaling 2,433 m. These holes numbered HC11-GM01, HC11-GM01A, and HC11-GM02 to HC11-GM07, drilled in a variety of orientations to intersect proposed pit walls. In addition to core samples selected by Knight Piésold for the geomechanical studies, were 1,025 samples submitted for geochemical analysis from six of these holes.
Geotechnical drilling undertaken in various areas of proposed mine infrastructure consisted of 24 HQ drillholes totaling 1,270 m in 2011. These 30 to 130 m long holes numbered HC11-GT01 to HC11-GT24 are vertical, except for HC11-GT15, located in the proposed tailings storage facility area which was drilled northwest at −75°. There were 191 core samples collected and submitted for geochemical analysis from 13 of these holes.
Eight additional vertical geotechnical drillholes completed in 2012 total 442 m in length. These holes, numbered HC12-GT01 to HC12-GT08, are HQ3 core size (61.1 mm diameter). No sampling of these holes for geochemical analysis took place.
(f) Surveys
In 2005, Yellowhead converted the Noranda local grid to the NAD83 UTM Zone 11 North coordinate system, the grid currently in use on the property. As a check on the transformation, 20 historical drillholes from the Noranda, QCM, Noranda / QCM joint venture programs and all but two of the Comstock drillholes, were located in the field and resurveyed using a differential GPS with differences being minor.
Yellowhead updated the topographic mapping based on one-metre resolution imagery in 2007. Cohesion Consulting checked the drill collars on cross section views against the 2007 topographic surface in 2019 and found no significant discrepancies.
| Section 10 | Drilling | Page 10 |
10.3 Yellowhead Mining Inc. - Cont'd
(f) Surveys - Cont'd
Yellowhead staff and consultants surveyed all drillhole collar coordinates and elevations using a satellite-based Global Positioning System (GPS). The survey instrument used from 2006 to 2008 was a Trimble GeoExplorer XT Rover. Data from this unit were differentially corrected using information from the Williams Lake public domain GPS base station. Accuracy achieved by this method is sub-metre for easting and northing readings and 3 to 5 m for elevation readings. The use of drillhole collar elevations obtained from drillholes plotted on the 1 m contour interval digital terrain model provided improved accuracy.
Surveying of all drill collars from 2008 to 2013 was by a Trimble GeoExplorer XH Rover instrument utilizing a Tornado antenna. Differential correction of the collected survey points utilized data recorded by a Trimble 5700 base station and Zephyr antenna located at the Yellowhead field camp, 2.5 kilometres up the Jones Creek forest service road. Accuracy by this method is sub-metre for easting, northing and elevation readings relative to the base station. Elevations used for all drillholes during this period utilized GPS readings.
Upon completion of all resource holes, downhole surveying was by a multishot instrument utilizing a magnetic compass and inclinometer, with seven exceptions. The first two 2006 holes were by the acid-etch dip test method. Instrument failure precluded surveying in five pre-2008 holes. A single shot Sperry Sun downhole survey tool used as a backup survey system on a number of drillholes was at approximately 100 m intervals downhole as drilling proceeded.
All the condemnation and metallurgical drillholes were down hole surveyed for both azimuth and dip using digital multi-shot or single-shot instruments. Geotechnical drillholes were not down hole surveyed.
Five geomechanical holes were downhole surveyed. Downhole surveying did not take place on geomechanical holes HC11-GM03, HC11-GM07 and HC11-GM01 (abandoned and re-drilled as HC11-GM01A).
Local concentrations of magnetic minerals, (i.e., magnetite and pyrrhotite), which are known to exist on the property can affect magnetic compass / inclinometer survey tool readings. Yellowhead personnel measured magnetic susceptibility of the core and reviewed downhole survey measurements for orientations that appeared suspect. Some instruments used automatically flagged measurements that appeared radically different from adjacent readings. Removal of all suspect surveys followed these assessments.
| Section 10 | Drilling | Page 11 |
10.4 Taseko Mines Limited
In 2024, Taseko undertook a site investigation to characterize the foundation conditions of the main embankment for the tailings storage facility (TSF). The program was focused on gathering detailed geotechnical and hydrogeological data to support the design and permitting of the TSF.
Knight Piésold was responsible for management of the program and completed 7 hybrid sonic/diamond drillholes totalling 298 m. All holes were drilled vertically and are numbered GT24-01 to GT24-07. Sonic drilling was used in overburden with 6" sized casing and a 4" sized core barrel. Diamond drilling was used in bedrock with an HQ3 sized core barrel.
Detailed geotechnical logging and sampling was performed by Knight Piésold field staff in all drillholes, however no geochemical sampling or analysis was performed. Core recovery for the 217 m of diamond drilling was 97% with an average RQD of 73%. Drillhole coordinates were collected using GAIA phone app (accuracy +/- 5 m) with elevation interpolated from topographic map (1 m LIDAR survey contours). No downhole surveys were conducted. Drill core collected is currently stored at a secure facility in Vavenby, BC.
SECTION 11
SAMPLE PREPARATION, ANALYSIS AND SECURITY
SECTION 11: SAMPLE PREPARATION, ANALYSIS AND SECURITY
Table of Contents
| Page | ||
| 11.1 | Introduction | 1 |
| 11.2 | Historical Operators | 3 |
| 11.3 | Yellowhead Mining Inc. | 5 |
| 11.4 | Conclusion | 18 |
| List of Tables | ||
| Table 11-1: Original Assay Laboratories & Elements Analysed - Drill Core | 1 | |
| Table 11-2: Elements Analysed by Eco-Tech 4-Acid Digestion ICP Method | 8 | |
| Table 11-3: Elements Analysed by Eco-Tech Aqua Regia Digestion ICP Method | 9 | |
| Table 11-4: Details of Elements Reported on ALS Method ME-ICP61 | 12 | |
| Table 11-5: QA/QC Sample Types Used | 14 | |
| Table 11-6: Assay Standards Certified Mean Values | 15 | |
| Table 11-7: Blanks Inserted | 17 | |
| List of Figures | ||
| Figure 11-1: Sampling, Sample Preparation, Security & Analytical Flow Chart (2013) | 7 | |
| Section 11 | Sample Preparation, Analysis and Security | Page 1 |
11.1 Introduction
YMI and previous project operators systematically sampled and analyzed all potentially mineralized sections of drill core on the Yellowhead deposit for copper, the primary element of interest. Early operators in the 1960's and 1970's, typically only analyzed for copper. This expanded to include a handful of other elements in the programs of the 1980's and 1990's. From 2005 onwards, over 30 elements made up the standard assaying protocol for drill core, including historical core that was resampled and reanalysed since then. This resampled historical core was originally from the Noranda, Noranda / QCM Joint Venture and American Comstock drilling. Samples taken for copper assay from all historical and modern drillholes number over 55,000 with an average core length of 1.5 m. Table 11-1 lists the analytical laboratories used and the elements analyzed by the original operators for each drill program.
Table 11-1: Original Assay Laboratories & Elements Analysed - Drill Core
| Years | Operator | Primary Assay Laboratory | Elements Analysed |
| 1967, 1969 | Québec Cartier | Bondar Clegg, N. Vancouver, BC & unknown lab(s) |
Cu only† |
| 1968-1970 | Noranda | Unknown lab(s) | |
| 1970-1973 | Noranda / QCM JV | ||
| 1986 | Aurun‡ | ALS Minerals, N. Vancouver, BC | Ag, Au |
| 1983 | Esso Minerals⸸ | Min-En Laboratories, N. Vancouver, BC | Cu, Ag, Au, Pb, Zn |
| 1985 | Nu-Crown⸸ | Acme Analytical, Vancouver, BC | Cu, Ag, Au, Ba, Pb, Zn |
| 1987 | Eco-Tech, Kamloops, BC | ||
| 1996 | American Comstock |
Acme Analytical, Vancouver, BC | Cu, Ag, Au, Mo, Pb, Zn |
| 2006 | YMI | Eco-Tech, Kamloops, BC | Cu, Ag, Au & 22 Elements |
| 2007, 2008 | Cu, Ag, Au & 27 Elements | ||
| 2010, 2011* | Cu, Ag, Au & 32 Elements | ||
| 2011*, 2012, 2013 | ALS Minerals, N. Vancouver, BC | Cu, Ag, Au & 31 Elements |
† Noranda assayed a small number of selected samples and composites for Au, Ag, Cu, Pb and Zn.
‡ Aurun re-assayed 38 sample intervals from seven Noranda / Québec Cartier Joint Venture drillholes for Au and Ag.
⸸ Esso Minerals and Nu-Crown did not drill any holes in the deposit area.
* 2011 drillholes from HC11-83 to HC11-98 assayed by Eco-Tech. Holes HC11-95, 97, 99 assayed by Eco-Tech & ALS. All other 2011 holes assayed by ALS Minerals.
| Section 11 | Sample Preparation, Analysis and Security | Page 2 |
11.1 Introduction - Cont'd
Resampling and reanalysis of historical core by YMI provided precious metal and multi- element results for 131 pre-2006 holes drilled on the deposit. The creation of two separate assay tables in the drillhole database was necessary as it was not possible to match the resampling intervals with the original assay intervals in many instances. The primary table contains the intervals and results of copper assays only as sampled and assayed by the original workers.
The second assay table includes gold, silver and a number of other elements including those obtained through resampling and analysis of historical core by YMI from 2005 onwards. Sample intervals in the second table differ from the original sampling in the first table for many resampled historical holes, but intervals for modern holes match. Average interval lengths for resampled historical core in the second table tend to be shorter than in the typical 3 m sample intervals of the original Cu-only samples. Just under 55,000 assay intervals are in this table with an average length of 1.4 m.
| Section 11 | Sample Preparation, Analysis and Security | Page 3 |
11.2 Historical Operators
(a) Québec Cartier Mining Company
Due to the extremely foliated nature of the rock, QCM did not split their drill core, but instead took 1,703 whole core samples in 3 m intervals from all core drilled. In 1967, Bagged samples were sent to Bondar Clegg & Company laboratory in North Vancouver, BC and were subject to hot acid extraction and atomic absorption spectroscopy (AAS) finish for copper. Drill core sample preparation methods are unknown and there are no existing analytical certificates. The assay laboratory and methods used on the 1969 drilling are unknown and there is no record of the insertion or analysis of any QA/QC samples for either program.
There are no core photographs and no sample material remaining from any of the QCM core programs.
(b) Noranda and Noranda / Québec Cartier Joint Venture
Noranda and the Noranda / QCM joint venture took 6,194 samples and generally analyzed for copper only. Sampling and assaying typically included all core recovered in the deposit area with a few minor exceptions. Outside of the main area, core sampling and assaying was much less frequent. Additional analysis, for zinc, lead, gold and silver took place on selected samples from the 1970 drilling. Also from the 1970 drilling, analysis for copper, gold and silver also took place on composited intervals from selected drillholes.
No records of the methods of sampling, sample preparation or analysis, laboratories used, or any assay certificates exist for the Noranda and joint venture drill core analytical programs. There is no record of the insertion or analysis of any QA/QC samples.
Noranda stored boxes containing half split remaining core cross-stacked and in the open at their camp. The core remained there unsecured until it was moved to a storage facility in Vavenby, BC by YMI in 2008.
Availability of core photographs of historical core recovered by YMI is good for the NH- series of Noranda holes, however, only limited joint venture (J-series) holes are available.
Resampling of historical half core by YMI after photography consumed the remaining material. Sample assay pulps from the historical core resampling programs are well stored in a secure container at Vavenby, BC.
| Section 11 | Sample Preparation, Analysis and Security | Page 4 |
11.2 Historical Operators - Cont'd
(c) American Comstock Exploration Ltd.
Analysis was conducted on 686 samples collected at 3 m intervals for copper, molybdenum and silver. Gold, lead and zinc assays on composited 15 m intervals from one drillhole were also completed. Sampling and analysis of these holes was only for intervals with visible mineralization. This left 754 m of core unassayed.
Samples were shipped to Acme Analytical Laboratories in Vancouver, BC for sample preparation and analysis for copper, molybdenum and silver by digestion of a 1 g sample in aqua regia and analysis by inductively coupled plasma atomic emission spectroscopy (ICP-AES). Lead and zinc analyses on 15 m composites followed the same sample digestion and analytical methods as the other elements. Gold analysis was by fire assay on one assay ton samples.
(d) Other Operators
Esso Resources Canada Limited collected 11 samples which were analyzed for copper, gold, silver, lead and zinc by Min-En Labs of North Vancouver, BC and yielded no results of interest.
Nu-Crown Resources Inc. collected 188 samples which were analyzed for gold, silver, copper, lead, zinc and barium. Analysis on samples from the 1985 drilling was by Acme laboratories by aqua regia digestion ICP-AES (Belik, 1985) and on 1987 samples was by Eco-Tech of Kamloops, BC. Drillhole collar locations and orientations are in the current project database but analytical results are not.
| Section 11 | Sample Preparation, Analysis and Security | Page 5 |
11.3 Yellowhead Mining Inc.
(a) Resampling of Historical Drill Core
YMI started exploring the Yellowhead Copper Deposit in 2005 by salvaging, re-logging and resampling remaining historical diamond drill core. The objectives of this program were to confirm historically reported copper grades, perform precious metal and multi- element analyses, obtain host rock geological information and gain further understanding on mineralization controls.
Initial sampling of the historical core was conducted in the field at the former Noranda camp. In 2008 salvaged core was moved to CME's core processing facility for later analysis. YMI relogged and resampled historical core for assay between 2005 and 2011 using similar procedures to those described in Sections 11.3(b) and 11.3(c), with important differences as noted in the following paragraph.
Resampling was of the remaining half core in its entirety due to a strong prevalent schistosity in the rock that precluded accurate quarter core sampling. Some historical core boxes were in very poor condition and sections of core were missing. These were marked as not sampled (NS) based on estimated start and endpoints. Resampling took place at nominal 3 m intervals to match the original samples wherever possible. Actual sample length varied considerably due to missing core and geological selection criteria. The average interval length of resampled sections was 2.2 m. Reanalysis of sample pulps from the 1996 American Comstock drill program also took place after retrieval from storage at Acme Laboratories.
Of the 191 drillholes completed prior to YMI's involvement, 131 drillholes were subject to resampling and relogging. The resampled intervals totalled 18,874 m of the 30,745 total metres drilled by the historical operators, or over 66% of the historically cored intervals. A total 9,465 samples from historical core were analysed. Of the 131 reanalysed drillholes, 123 are located within the deposit.
The historical core resampling and reanalysis program was successful in validating the reported historical copper grades and providing a substantial number of additional gold and multi-element analyses.
| Section 11 | Sample Preparation, Analysis and Security | Page 6 |
11.3 Yellowhead Mining Inc. - Cont'd
(b) Core Handling and Field Preparation
YMI maintained full chain of custody control for all analytical samples from the 2006 through 2013 drill campaigns, from collection at the drill rig through to delivery at the analytical laboratory. Drill company employees, YMI employees and company consultants were in charge of the security of all drill core on the property during drilling, logging and sampling procedures. Figure 11-1 is an example flow chart of the sampling, sample preparation, security and analytical procedures for the 2013 drill program.
Sample intervals are nominally 1.0 to 2.0 m in length, with breaks at changes in lithology, alteration, mineralization and core size accounting for most variations from this. Mineralization broadly tends to follow the trend of the stratigraphy and changes in mineralization intensity are often gradual and cannot be easily discriminated by inspection, consequently intervals are typically at even metre or half metre increments. The median sample interval length is 1.2 m.
Core sampling took place based at intervals marked by a geologist upon completion of logging procedures. A company technician used a diamond-bladed rock saw to cut the core in half lengthwise. Half of the core went into the appropriately numbered and tagged sample bag that was sealed and placed in a secure location prior to shipment. The remaining half went back into the core box for long-term storage. Bags containing samples were stored in a locked, secure structure pending packing and transport to the laboratory.
Sorting and scanning of bags containing drill core samples and placement into rice bags took place before transport to analytical laboratories in Kamloops, BC. Prior to 2007, delivery was by commercial courier. After that, laboratory personnel picked up the samples at the Vavenby core logging facility and took responsibility for their transport and delivery.
Eco-Tech Laboratories Ltd. (Eco-Tech) did the sample preparation and analysis for the project from 2005 to 2011 at their laboratory in Kamloops, BC. Stewart Group purchased Eco-Tech in July 2008 and continued operating the Kamloops laboratory under the Eco- Tech name until 2011. In July 2011, ALS Minerals (ALS) purchased Stewart Group and sample preparation work transferred to the ALS laboratory in Kamloops at the end of that year for balance of the program. The ALS laboratory in North Vancouver, BC completed the analytical work for the 2012 and 2013 programs.
| Section 11 | Sample Preparation, Analysis and Security | Page 7 |
11.3 Yellowhead Mining Inc. - Cont'd
(b) Core Handling and Field Preparation - Cont'd
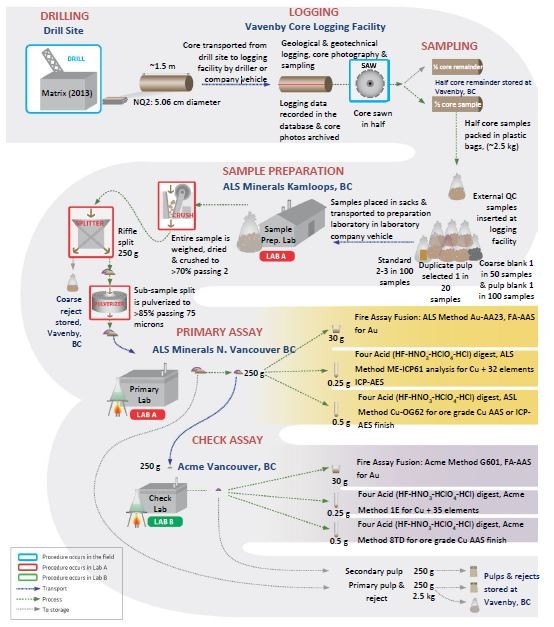
Figure 11-1: Sampling, Sample Preparation, Security & Analytical Flow Chart (2013)
| Section 11 | Sample Preparation, Analysis and Security | Page 8 |
11.3 Yellowhead Mining Inc. - Cont'd
(c) Sample Preparation and Analysis Eco-Tech (2005-2011)
Eco-Tech, a laboratory registered under ISO9001:2008 for the provision of geochemical, assaying and environmental analytical services, performed sample preparation and analysis for the resampling of historical core and the 2006 through 2011 drilling and sampling programs.
Sample Preparation
Dried drill core samples were subject to comminution prior to analysis. The first step was to crush the entire sample using jaw crushers and cone or rolls crushers to achieve a nominal -10 mesh (2 mm) size. Splitting of the crushed product by passing it through a Jones riffle provided a 250 g sub-sample. Preparation of the 250 g pulverized sample (assay pulp) to a >95% passing -140 mesh (0.1 mm) size was by ring and puck pulverizer. Rolling of the pulverized samples after that homogenized them further.
Copper Analysis
Assay-level analysis performed on all samples with elevated concentrations of copper were by aqua regia (HCl-HN03) acid digestion of a 0.5 g aliquot (analytical sub-sample) with AAS finish. Laboratory quality control procedures included repeats every nine samples and the use of certified reference materials for each batch of 35 samples or fewer.
Multi-Element Analysis
Multi-element analysis of all samples was by 4-acid digestion (HF-HClO4-HN03-HCl) with ICP-AES finish. This method provided results for up to 35 elements, including copper and silver. There are over 44,000 results by this method in the drillhole database. Table 11-2 is a list of the elements analyzed by the 4-acid ICP method at Eco-Tech.
Table 11-2: Elements Analysed by Eco-Tech 4-Acid Digestion ICP Method
| Element | Element | Element | Element | Element | Element |
| Ag | Ca | Hg† | Mo | S† | Ti |
| Al | Cd | K | Na | Sb† | U* |
| As* | Co | La* | Ni | Sc† | V |
| Ba | Cr | Li† | P | Se† | W |
| Be† | Cu | Mg | Pb | Sn* | Y |
| Bi | Fe | Mn | Rb‡ | Sr | Zn |
|
* Element not analysed in years 2005 and 2006. † Element not analyzed in years 2005 through 2007. ‡ Only one hole analyzed (HC10-76). |
|||||
| Section 11 | Sample Preparation, Analysis and Security | Page 9 |
11.3 Yellowhead Mining Inc. - Cont'd
(c) Sample Preparation and Analysis Eco-Tech (2005-2011) - Cont'd
Minimum thresholds of copper results from the 4-acid ICP method also determined which samples were re-analysed by single element copper assay. This threshold was 2,900 ppm from 2005 to 2008 and decreased to 2,000 ppm Cu between 2010 and 2011. Single element ICP values greater than the upper detection limit also triggered a small number of single element, aqua regia digestion AAS overlimit assays for silver, lead and zinc using similar methods to the copper assays. The upper limits for these elements by the 4-acid digestion ICP-AES method is 30 ppm for silver and 10,000 ppm for lead and zinc.
A second multi-element ICP-AES method employed on all YMI core, surface rock and soil samples prior to May 31, 2007 was aqua regia digestion of a 0.5 g aliquot for the determination of 29 elements, including copper and silver. There are over 8,800 results on drill core by this method. Table 11-3 lists the elements analyzed by this method by Eco- Tech.
Table 11-3: Elements Analysed by Eco-Tech Aqua Regia Digestion ICP Method
| Element | Element | Element | Element | Element | Element |
| Ag | Ca | Fe | Mo | Sb | V |
| Al | Cd | K* | Na | Sn | W |
| As | Co | La | Ni | Sr | Y |
| Ba | Cr | Mg | P | Ti | Zn |
| Bi | Cu | Mn | Pb | U | |
| * Some samples were not analysed for K. | |||||
Precious Metal Analysis
Gold analysis performed on all core sampled by YMI was by fire assay with an AAS finish. A 30 g aliquot mixed with litharge and appropriate fluxes was subject to fusion and cupellation at high temperatures. Analysis of the resulting doré bead after parting was by AAS with results reported in ppb. The reportable concentration range for this method is 5 to 1,000 ppb. There are almost 55,000 gold assays by this method. Values over 1,000 ppb were re-analysed by the same fire assay method with a gravimetric finish and results reported in gpt (ppm).
Analysis for palladium of historical drill core samples collected in 2005 and one YMI hole in 2008 used this same analytical method, reporting units and range as the gold assays. There are palladium assays for 697 samples from 10 historical holes and 96 samples from drillhole HC08-54.
| Section 11 | Sample Preparation, Analysis and Security | Page 10 |
11.3 Yellowhead Mining Inc. - Cont'd
(c) Sample Preparation and Analysis Eco-Tech (2005-2011) - Cont'd
Whole Rock Analysis
Whole rock analysis completed by Eco-Tech on 57 core and surface rock samples selected in 2009 for petrographic analysis was on a 0.5 g sub-sample fused with lithium metaborate (LiBO2) and finished by ICP-AES.
Surface Samples
Descriptions of the soil and surface rock sampling procedures used by YMI are in Section 9.2(c). Soil samples submitted to Eco-Tech were prepared by sieving at 80-mesh (0.18 mm) to obtain an analytical sub-sample. Samples with insufficient material for analysis at minus 80-mesh were screened at a coarser fraction and flagged accordingly. Surface rock samples were prepared in the same manner as drill core samples. Analysis of soil and rock samples was by the same aqua regia digestion ICP-AES and gold fire assay AAS methods as for drill core, with some rock samples also analysed by 4-acid digestion ICP-AES.
| Section 11 | Sample Preparation, Analysis and Security | Page 11 |
11.3 Yellowhead Mining Inc. - Cont'd
(d) Sample Preparation and Analysis ALS Minerals (2011-2013)
ALS Minerals Kamloops sample preparation facility is ISO 17025:2005 certified and ALS Minerals laboratory in North Vancouver, BC is ISO 9001:2015 registered and ISO/IEC 17025:2017 certified. This accreditation also applies to mineral analysis by ALS methods for the determination of copper, gold and multiple-elements performed on the Yellowhead samples in the 2011 through 2013 drill programs.
Sample Preparation
Specifications of drill core sample preparation at ALS were drying, crushing to >70% passing 10 mesh (2 mm), riffle splitting of a 250 g sub-sample and pulverization of that sub-sample to >85% passing 200 mesh (75 micron).
Copper Analysis
Copper assays completed on all samples analyzed was by ALS laboratory method Cu- OG62, in which 0.5 g aliquots are subject to four acid digestion and analytical finish by either AAS or ICP-AES.
Multi-Element Analysis
Analysis for copper and 32 other elements was by ALS trace level multi-element Method ME-ICP61 in which a 0.25 aliquot is subject to four acid digestion and instrumentation finish by ICP-AES. Table 11-4 lists the elements reported, units and detection limits of this method.
| Section 11 | Sample Preparation, Analysis and Security | Page 12 |
11.3 Yellowhead Mining Inc. - Cont'd
(d) Sample Preparation and Analysis ALS Minerals (2011-2013) - Cont'd
Table 11-4: Details of Elements Reported on ALS Method ME-ICP61
| Element | Symbol | Units | Lower Limit |
Upper Limit |
Element | Symbol | Units | Lower Limit |
Upper Limit |
|
| Silver | Ag | ppm | 0.5 | 100 | Molybdenum | Mo | ppm | 1 | 10000 | |
| Aluminum | Al | % | 0.01 | 50 | Sodium | Na | % | 0.01 | 10 | |
| Arsenic | As | ppm | 5 | 10000 | Nickel | Ni | ppm | 1 | 10000 | |
| Barium | Ba | ppm | 10 | 10000 | Phosphorus | P | ppm | 10 | 10000 | |
| Beryllium | Be | ppm | 0.5 | 1000 | Lead | Pb | ppm | 2 | 10000 | |
| Bismuth | Bi | ppm | 2 | 10000 | Sulphur | S | % | 0.01 | 10 | |
| Calcium | Ca | % | 0.01 | 50 | Antimony | Sb | ppm | 5 | 10000 | |
| Cadmium | Cd | ppm | 0.5 | 500 | Scandium | Sc | ppm | 1 | 10000 | |
| Cobalt | Co | ppm | 1 | 10000 | Strontium | Sr | ppm | 1 | 10000 | |
| Chromium | Cr | ppm | 1 | 10000 | Thorium | Th | ppm | 20 | 10000 | |
| Copper | Cu | ppm | 1 | 10000 | Titanium | Ti | % | 0.01 | 10 | |
| Iron | Fe | % | 0.01 | 50 | Thallium | Tl | ppm | 10 | 10000 | |
| Gallium | Ga | ppm | 10 | 10000 | Uranium | U | ppm | 10 | 10000 | |
| Potassium | K | % | 0.01 | 10 | Vanadium | V | ppm | 1 | 10000 | |
| Lanthanum | La | ppm | 10 | 10000 | Tungsten | W | ppm | 10 | 10000 | |
| Magnesium | Mg | % | 0.01 | 50 | Zinc | Zn | ppm | 2 | 10000 | |
| Manganese | Mn | ppm | 5 | 100000 |
Precious Metal Analysis
Gold assays completed on all samples were by ALS Method Au-AA23 in which a 30 g aliquot mixed with litharge and borax flux was subject to fusion and cupellation at high temperatures. Analysis of the resulting doré bead after parting was by AAS with results reported in ppm to a lower limit of 0.005 and an upper limit of 10 ppm.
| Section 11 | Sample Preparation, Analysis and Security | Page 13 |
11.3 Yellowhead Mining Inc. - Cont'd
(e) Analysis - Other Laboratories Geoscience Laboratories
In 2008, Geoscience Laboratories, formerly Geo Labs of Sudbury, ON, completed whole rock and trace element analyses of 27 core samples from 15 YMI and 6 historical drillholes. Sample preparation was to jaw crush, riffle split and pulverize samples in a planetary ball mill. The whole rock and trace element analytical method was X-ray fluorescence (XRF). Major oxides determined are Al2O3, CaO, Fe2O3, K2O, MgO, MnO, Na2O, P2O5, SiO2 and TiO2. Analysis for selected trace elements included Ba, Co, Cs, Mo, Nb, Sc, Sn, Sr, Rb, Zr and V. Other analyses included total carbon reported as CO2, total sulphur reported as S, ferrous iron reported as FeO, moisture content, rare earth elements, high field strength elements and large-ion lithophile elements.
Check Assay Laboratories
Inter-laboratory check assays for copper done on 5% of the original assay pulps were part of the drill program Quality Assurance / Quality Control (QA/QC) protocol. Check laboratories used similar analytical methods to the primary laboratory.
Acme was the check assay laboratory for the 2006 and 2010 through 2013 drill programs. Acme analysed original assay pulps from the 2006 program for copper by 4-acid digestion of a 0.5 g aliquot with an AAS finish. Two methods were added to the check assay protocol for the 2010 through 2013 programs, 4-acid digestion ICP-AES finish on a 0.25 g aliquot for 36 elements including copper and gold by fire assay fusion of a 30 g sample with an AAS finish.
For the 2007 and 2008 drill programs, the check assay laboratory was Assayers Canada (Assayers) of Vancouver, BC (now SGS). Assayers analysed original assay pulps for copper by nitric, hydrobromic and hydrochloric (HN03, HBr, HCl) acid digestion of a 1 g aliquot with AAS finish.
| Section 11 | Sample Preparation, Analysis and Security | Page 14 |
11.3 Yellowhead Mining Inc. - Cont'd
(f) Quality Assurance and Quality Control
YMI implemented an effective external QA/QC program and applied it to the 2005 through 2013 drilling and sampling programs. Insertion of QA/QC samples was designated by the core-logging geologists at the logging facility within the regular sample stream prior to shipment of samples to the sample preparation and analytical laboratories. These QA/QC procedures were in addition to those used internally by the analytical laboratories. Table 11-5 lists the QA/QC sample types used.
Table 11-5: QA/QC Sample Types Used
| Sample | Description | Percent of |
| Type | Total | |
| Regular | Samples of actual drill core submitted for preparation and analysis at | 90.8% |
| the primary laboratory. | ||
| An additional split taken from the remaining assay pulp after analysis | ||
| Duplicate | and submitted to a check laboratory. Selected over broad grade | 4.6% |
| ranges. | ||
| Control sample with mineralised material in pulverised form with a | ||
| Standard | known concentration and distribution of elements of interest. | 2.3% |
| Randomly inserted. | ||
| Blank | Control sample in coarse or pulverised form with no appreciable | 2.3% |
| grade used to test for contamination. Randomly inserted. |
YMI technical staff and consultants monitored the copper results of control samples, including selected inter-laboratory duplicates, inserted standards and blanks. Failed batches resulting from control samples outside set limits, duplicated sample pairs in disagreement and high blanks were subject to review. If no field logging or coding errors were evident, laboratory reruns of affected analytical batches ensued. QA/QC review also applied the rerun results returned. Results from reruns that passed QA/QC superseded the original data in failed batches.
| Section 11 | Sample Preparation, Analysis and Security | Page 15 |
11.3 Yellowhead Mining Inc. - Cont'd
(f) Quality Assurance and Quality Control - Cont'd
Standards
Certified reference materials are assay standards used for QA/QC monitoring purposes with expected mean values and control limits. YMI inserted standards of prepackaged pulps from CDN Resource Laboratories or Ore Research that were typically 60 to 150 g in size. Table 11-6 lists the 16 different standards used in the YMI sampling programs.
YMI improved their standard insertion protocol as the drill programs progressed. The insertion rate of one standard for every 50 regular samples used from 2006 through 2008 was increased to one in 33 regular samples from 2011 onwards. This gave an effective insertion rate of about one standard for every 40 regular samples overall. Discontinuation of the practice of inserting non-blind standards, in which the analytical laboratory can readily identify the standard, occurred in late 2007. Insertion of blind standards took place from then until 2013.
Standards submitted in soil batches was at a rate of one in 100 samples and typically one per batch for surface rock samples.
Review of copper and gold results of inserted standards reported by Eco-Tech and ALS resulted in analytical reruns of a reasonably small number of batches. Reanalysis of these batches returned acceptable results for the standards and application of these revisions took place accordingly. This protocol provided good confirmation of the veracity of the copper and gold results used in the drillhole database.
Table 11-6: Assay Standards Certified Mean Values
| Standard | Cu (%) | Au (gpt) | Times Used |
Standard | Cu (%) | Au (gpt) | Times Used |
|
| CDN-CGS-6 | 0.318 | 0.26 | 20 | CDN-CGS-27 | 0.379 | 0.432 | 183 | |
| CDN-CGS-8 | 0.105 | 0.08* | 29 | CDN-CGS-29 | 0.585 | 0.228 | 95 | |
| CDN-CGS-9 | 0.473 | 0.34 | 148 | CDN-CM-1 | 0.853 | 1.85 | 105 | |
| CDN-CGS-12 | 0.265 | 0.29 | 77 | CDN-CM-25 | 0.191 | 0.228 | 35 | |
| CDN-CGS-13 | 0.329 | 1.01 | 29 | CDN-CM-27 | 0.592 | 0.636 | 35 | |
| CDN-CGS-15 | 0.451 | 0.57 | 171 | CDN-FCM-1 | 0.94 | 1.71 | 1 | |
| CDN-CGS-22 | 0.725 | 0.64 | 20 | CDN-HLLC | 1.49 | 0.83 | 45 | |
| CDN-CGS-24 | 0.486 | 0.487 | 118 | OREAS 152A | 0.385 | 0.116 | 169 |
* Provisional value only.
| Section 11 | Sample Preparation, Analysis and Security | Page 16 |
11.3 Yellowhead Mining Inc. - Cont'd
(f) Quality Assurance and Quality Control - Cont'd
Duplicates
The protocol for duplicate sample analysis was to submit the original assay pulp to a second laboratory after receipt of assay results from the primary laboratory. Sample selection was not random, but targeted representative copper grade ranges. A standard was included with each batch of duplicate pulps sent to the check laboratory. Drill core samples from the 2006 to 2008 drill programs sent the check assay laboratories numbered about 5% of the total, or one in 20 samples. This ratio decreased to 4%, or one in 25 samples from 2010 onwards for an overall effective rate of about 4.3%.
Eco-Tech and ALS also analysed duplicate splits of assay pulps and coarse rejects and reported them on their analytical certificates.
The results of the inter-laboratory pulp duplicate analysis program on drill core samples substantiate the copper results of the original assay laboratories.
Historical core resampling programs by YMI resulted in over 2,100 half-core duplicate core assay pairs for copper. Assay results from re-assayed historical core correlate well with the historically reported copper grades from similar core sections.
| Section 11 | Sample Preparation, Analysis and Security | Page 17 |
11.3 Yellowhead Mining Inc. - Cont'd
(f) Quality Assurance and Quality Control - Cont'd
Blanks
Blanks are control samples with no appreciable grade used to test for contamination. Coarse blanks inserted for analytical QA/QC purposes consisted of visually barren crushed granite tile and decorative limestone landscape rock prior to 2012. They are not true analytical blanks, as their copper and gold content prior to insertion is unknown.
The premise for using granite tile and limestone blanks was that they contained very low levels of copper and gold. However, a number of results received on these uncertified coarse blanks during the course of the YMI drill campaigns were anomalously high for copper or gold, typically from two to 10 times the anticipated values. Possible reasons for this include mislabelling of blank and regular samples in the field, cross-contamination of samples during sample preparation and challenges of analysing high carbonate samples in a stream of generally low carbonate samples, amongst others. The overall impact of this is reasonably low, as the high blank results are still well below a reasonable threshold of what constitutes mineralized rock. However, use of these blanks for QA/QC monitoring was not ideal.
Two certified blank materials obtained from Analytical Solutions Ltd (ASL) for use in the 2012 and 2013 drill programs are designated as ASL-Blank-125 (100 g pulp blank) and ASL-Blank-10 (500 g coarse blank). Monitoring and control of the certified blanks proceeded in a similar way to the assay standards. These certified blanks provided better quality assurance and quality control. Table 11-7 lists the blanks used and average of the results received for copper and gold.
Table 11-7: Blanks Inserted
| Standard | Average Cu (ppm) |
Average Au (ppb)‡ |
Times Used |
| Crushed Granite Tile | 11† | 4.0 | 26 |
| Limestone Landscape Rock | 10 | 3.1 | 1,117 |
| ASL-Blank-125 (pulp) | 5.2 | 2.5 | 88 |
| ASL-Blank-10 (coarse) | 11 | 2.5 | 10 |
† One outlier of 457 ppm removed.
‡ Calculated based on <5 ppb value set as 2.5 ppb for calculation purposes.
| Section 11 | Sample Preparation, Analysis and Security | Page 18 |
11.3 Yellowhead Mining Inc. - Cont'd
(g) Density Measurements
The overall median bulk density value obtained from 10,739 drill core measurements in the deposit is of 2.78 t/m3 and the average (mean) value is 2.80 t/m3. Measurements taken by Yellowhead using the water immersion method were on dry, uncoated 10 to 12 cm long pieces of whole core. Selection was of two pieces of core from geochemical sample intervals in drillholes HC06-01 to HC07-39 (excluding HC06-08). The average of the two test values provided the density applied to each sample interval. Testing of only one piece of core took place where a lack of sufficient or appropriate sample material existed for a second test.
The Ohaus Scout Pro digital balance used for all weight determinations has 2.0 kg capacity and 0.1 g sensitivity. Calibration of the balance was with a 2 kg standard weight. Recorded measurements included water temperature, core length, dry sample weight in air and weight of the sample submerged in water. Calculation of sample specific gravity (SG) was by:
Specific Gravity = Dry weight in air ÷ (Dry weight in air - Weight in water)
Calculation of density was by the formula:
Density = Specific Gravity × Density of water
Sixty specimens re-analyzed at ALS laboratory in 2012 showed no significant differences to the Yellowhead measurements.
11.4 Conclusion
The QP is of the opinion that the security, sampling, sample preparation and analytical methods used on the historical and modern Yellowhead Copper Project drill core is comparable to industry standard practice in mineral deposits of this type. Furthermore, the QA/QC measures and protocols used lend credence to the veracity of the drillhole database.
SECTION 12
DATA VERIFICATION
SECTION 12: DATA VERIFICATION
Table of Contents
| Page | ||
| 12.1 | Drillhole Database | 1 |
| 12.2 | Metallurgical Recovery Projections | 1 |
| 12.3 | Other Data Verification | 2 |
| 12.4 | Conclusion | 2 |
| Section 12 | Data Verification | Page 1 |
12.1 Drillhole Database
Taseko engaged Cohesion Consulting Group (CCG) in 2019 to complete an audit of the Yellowhead Project drillhole database. CCG reviewed the digital files comprising the drillhole database, assay certificates, geological models and supporting documents used in the mineral resource and mineral reserve estimates. The audit found no errors, omissions, QA/QC failures or differences between this drillhole database and the supporting documents of significance to the resource and reserve estimate. Since that time there has been no additional relevant drilling completed in the deposit area.
Between 2005 and 2011 YMI resampled over 66% of the historical core drilled for assay as discussed in Section 11.3(a). This program was successful in validating the reported historical copper grades. Taseko verified this conclusion by comparing the historical and resampled copper assay results for 13 drillholes within the database.
In July 2020, Taseko completed an inspection of historic drill core and retrieved select intervals to support the SGS metallurgical test program discussed in Section 13.4. The half NQ2-sized core consisted of intervals from 13 drillholes completed during YMI's resource drilling programs between 2006 and 2013 discussed in Section 10.3.
These intervals were shipped to SGS's laboratory in Burnaby and composited into 28 sub- blends categorized by lithology, spatial zone, and copper grade profile. Estimated grades for copper, gold, and silver for each sub-blend were calculated using weighted averages from the drillhole database and compared to actual head assays. The results showed good agreement, with no systematic bias, further supporting the validity and representativeness of the drillhole database.
12.2 Metallurgical Recovery Projections
Taseko undertook additional metallurgical testing in 2020 and 2021 using lower-grade composites with broader spatial representation to better reflect expected life-of-mine feed. The results from this program aligned well with the historical copper and silver metallurgical recovery models, verifying that they provide a well-supported basis for reserve estimation and project economics. The gold recovery model was refined based on the new test results and a re-evaluation of historical test data.
| Section 12 | Data Verification | Page 2 |
12.3 Other Data Verification
Additional data verification conducted by Taseko QPs includes:
• Mineral tenure information was verified using the Mineral Titles Online (MTO) system to confirm Taseko's internal tenure tracking system.
• The security, sampling, sample preparation, analytical methods and QA/QC measures and protocols used on the historical and modern Yellowhead Project drill core were verified and determined to be adequate for the purposes of this technical report.
• The resource block model was reviewed and determined to be adequate to support detailed pit design and production scheduling.
• The site layout and waste and water management strategies were reviewed and verified in the field to be reasonable and adequate for the purposes of this technical report.
• The geotechnical parameters used in the pit design were verified against geotechnical consultant recommendations.
• Mineral Reserves and Mineral Resources estimates were reviewed and confirmed to follow CIM Definition Standards for Mineral Resources and Mineral Reserves (2014).
• The production schedule and economic model calculations were verified and inputs validated against Gibraltar Mine data where appropriate.
• Capital and operating costs were reviewed and verified against vendor quotations, cost estimates and Gibraltar Mine costs where appropriate.
• Commodity pricing and foreign exchange rate assumptions were verified using analyst research reports, peer comparisons and historical data.
• Environmental baseline studies and permitting requirements were reviewed and determined to be adequate for the purposes of this technical report.
12.4 Conclusion
The QP has reviewed the data verification procedures and is of the opinion that the data is adequate to support the geological modelling, resource and reserve estimation and economic analysis summarized in this technical report.
SECTION 13
MINERAL PROCESSING AND METALLURGICAL TESTING
SECTION 13: MINERAL PROCESSING AND METALLURGICAL TESTING
Table of Contents
| 13.1 | Introduction | 1 |
| 13.2 | Historical Metallurgical Testing | 2 |
| 13.3 | G&T FS Metallurgical Test Program (2011/2012) | 3 |
| 13.4 | SGS Metallurgical Test Program (2020/2021) | 14 |
| 13.5 | Concentrate Quality | 21 |
| 13.6 | Recovery Models | 23 |
| 13.7 | Conclusion | 25 |
| List of Tables | ||
| Table 13-1: Composite Samples Head Assay Summary | 4 | |
| Table 13-2: G&T Ore Hardness Testing Summary | 8 | |
| Table 13-3: FLS Comminution Testing Results | 9 | |
| Table 13-4: SGS Program Drill Hole Sample Origin Summary | 15 | |
| Table 13-5: SGS Program Composite Samples Head Assay Summary | 16 | |
| Table 13-6: SGS Lock Cycle Test Results Summary - Average of LCT-2 to LCT-04 | 20 | |
| Table 13-7: Final Concentrate Minor Elemental Composition Summary | 21 | |
| List of Figures | ||
| Figure 13-1: Variability Composites Mineral Speciation | 5 | |
| Figure 13-2: Variability Composites Copper Deportment by Mineral Species | 6 | |
| Figure 13-3: Cu Sulphide Distribution by Class of Variability Composites | 6 | |
| Figure 13-4: Platey Breakage Example on Core Sample B | 10 | |
| Figure 13-5: Master Composites Mineral Speciation | 18 | |
| Figure 13-6: Master Composites Copper Deportment by Mineral Species | 18 | |
| Figure 13-7: Copper Recovery vs. Copper Head Grade | 23 |
| Figure 13-8: Gold Recovery vs. Gold Head Grade | 24 |
| Figure 13-9: Silver Recovery vs. Silver Head Grade | 24 |
| Section 13 | Mineral Processing and Metallurgical Testing | Page 1 |
13.1 Introduction
The most recent update to the metallurgical recovery models was documented in the technical report titled "Technical Report & Feasibility Study of the Harper Creek Copper Project", dated July 31, 2014 which has an effective date of July 31, 2014. The basis for these models was a feasibility (FS) level metallurgical test program completed in 2011 and early 2012 at the G&T Metallurgical Services Ltd. (G&T) laboratory in Kamloops, BC. Taseko undertook additional metallurgical testing in 2020 and 2021 at the SGS Canada Inc. (SGS) metallurgical laboratory in Burnaby, BC.
The G&T program consisted of a suite of open circuit batch flotation testing, lock cycle testing, ore hardness testing, a pilot plant campaign, and mineralogical characterization. Test work was performed on a master composite representing feed from earlier phases of mine development, as well as a series of variability composites representing different lithologies and spatial zones within the planned pit. Additional comminution testing was also completed in 2011 at FLSmidth Laboratories in Pennsylvania to support comminution circuit design and power requirements.
The SGS program focused on validating the historical metallurgical recovery models and investigating flotation optimization opportunities, particularly the use of more selective flotation collectors to reduce lime consumption. This work included batch and lock cycle flotation testing, as well as mineralogical characterization, conducted on five new composites assembled from existing drill core to better represent the life-of-mine feed. The results from this program aligned well with the historical copper and silver recovery models, confirming their continued validity. The gold recovery model was refined based on the new test results and a re-evaluation of historical test data.
The current metallurgical recovery models used for the Project consist of the validated historical copper and silver models and a refined gold model. These models and the results of both programs that support them are summarized in this section.
| Section 13 | Mineral Processing and Metallurgical Testing | Page 2 |
13.2 Historical Metallurgical Testing
Metallurgical testing on the Yellowhead deposit dates back to 1968, with several programs completed leading up to the G&T FS metallurgical test program. These early programs demonstrated that the copper mineralization, primarily chalcopyrite, is amenable to conventional flotation.
Initial work by Lakefield Research (1968) and Noranda (1971) confirmed favorable copper recoveries and concentrate grades using conventional flotation on sulphide composites with a head grade of around 0.42% copper. The ore was found to be relatively soft and easily ground, with a Bond rod mill work indices (RWi) near 10 kWh/t.
Testing conducted between 2005 and 2008 by Process Research Associates (PRA) evaluated flotation performance over a range of grind sizes and reagent schemes. Results showed that copper and silver recovery were relatively insensitive to grind size, while gold recovery and mass pull were more sensitive. Lock cycle tests achieved copper recoveries up to 88% at concentrate grades exceeding 30% copper using a combination of Cytec 3418A, Sodium Isopropyl Xanthate (SIPX), and elevated pH for pyrite suppression.
Further metallurgical test work was initiated in 2010 at G&T to refine the flotation flowsheet. This program evaluated a new master composite and confirmed chalcopyrite as the dominant copper bearing mineral, with minor amounts of bornite, chalcocite, covellite, and tennantite. The ore again was characterized as soft to medium in hardness and amenable to SAG milling. Rougher flotation tests indicated limited sensitivity to primary grind size, and lock cycle tests confirmed favorable copper recoveries and grades using regrinding and lime addition.
These earlier programs confirmed the amenability of Yellowhead's mineralization to conventional flotation and informed the development of the G&T FS metallurgical test program, which is described in Section 13.3.
| Section 13 | Mineral Processing and Metallurgical Testing | Page 3 |
13.3 G&T FS Metallurgical Test Program (2011/2012)
(a) Sample Origin and Composite Blends
In 2011, a drilling program sourced a sample of PQ sized core for the FS metallurgical test program conducted at G&T. Four drillhole (HC11-M01 through HC11-M04) locations were specifically selected with consideration given to obtaining a suite of sample lithologies and grades from spatially unique zones representing ore feed from the earlier pit phases of the mine life. Broadly, samples from holes HC11-M01 and HC-M02 came from the west zone, HC11-M03 from the south zone, and HC11-M04 from the east zone.
Approximately 5 tonnes of whole core was sent to G&T for testing and about 750 kilograms was sent to FLSmidth for comminution testing.
Ten lithology composite samples were assembled from the four drillholes to represent the major lithology and grade profiles of the deposit. These composites were then partially combined in proportion to their relative abundance within the deposit to assemble the master composite sample designated Master Composite 2, which was used as the primary feed for all the upfront flowsheet development test work.
Additionally, six zonal composites representing varying grade profiles from the south, east and west zones of the deposit were also assembled from the lithology composites. All of the lithology composites and zonal composites were carried forward into the flotation variability testing discussed in Section 13.3(g).
| Section 13 | Mineral Processing and Metallurgical Testing | Page 4 |
13.3 G&T FS Metallurgical Test Program (2011/2012) - Cont'd
(b) Composite Head Assays
Standard analytical techniques were used to assay each assembled composite.
Copper, gold, silver and sulphur feed grades across the composites ranged from approximately 0.17% to 0.43% copper, 0.01 to 0.1 gpt gold, 1 to 4 gpt silver, and 0.95 to 3.32% sulphur, respectively, as summarized in Table 13-1.
The Master Composite 2 sample, which was used in majority of the flowsheet development work, contained a feed grade of 0.31% copper, 0.1 gpt gold, 2 gpt silver, and 1.95% sulphur.
Table 13-1: Composite Samples Head Assay Summary
| Sample Name | Element for Assay - % or gpt | ||||
| Cu | Au | Ag | S | Fe | |
| Master Composite 2 | 0.31 | 0.1 | 2 | 1.95 | 3.79 |
| Phyllite | 0.30 | 0.04 | 4 | 1.57 | 5.27 |
| QZ Eye Sch 1 | 0.20 | 0.1 | <2 | 1.22 | 2.67 |
| QZ Eye Sch 2 | 0.20 | 0.03 | <2 | 1.22 | 2.44 |
| QZ Eye Sch 3 | 0.35 | 0.06 | 2 | 2.32 | 3.37 |
| QZ Eye Sch 4 | 0.38 | 0.05 | 2 | 1.37 | 3.4 |
| Schist 1 | 0.33 | 0.04 | 2 | 2.27 | 3.47 |
| Schist 2 | 0.25 | 0.03 | 2 | 0.95 | 3.93 |
| Silica Altered 1 | 0.19 | 0.04 | 2 | 1.57 | 2.62 |
| Silica Altered 2 | 0.23 | 0.07 | <2 | 2.23 | 3.5 |
| Vein 1 | 0.43 | 0.05 | 2 | 3.32 | 3.9 |
| West LG | 0.27 | 0.04 | 2 | 2.04 | 2.88 |
| West NG | 0.31 | 0.03 | 2 | 1.66 | 3.05 |
| East LG | 0.17 | 0.02 | <1 | 1.08 | 2.26 |
| East NG | 0.32 | 0.03 | 1 | 1.75 | 2.6 |
| South LG | 0.26 | 0.01 | 1 | 1.23 | 3.67 |
| South NG | 0.36 | 0.03 | 2 | 1.46 | 3.46 |
| Section 13 | Mineral Processing and Metallurgical Testing | Page 5 |
13.3 G&T FS Metallurgical Test Program (2011/2012) - Cont'd
(c) Mineralogy
Mineralogical analysis was conducted on Master Composite 2 and the ten lithology composites. Consistent with the historical results, 97% of the copper in Master Composite 2 was present as chalcopyrite, with minor amounts of bornite and secondary copper minerals.
Similarly, results from the lithology composites showed that chalcopyrite accounted for over 98% of the copper bearing minerals. The exception was the Silica Altered 1 lithology composite, which contained 94% chalcopyrite with 2% bornite and minor amounts of covellite and chalcocite. The mineralogical composition of each composite is shown in Figures 13-1 to 13-3.

Figure 13-1: Variability Composites Mineral Speciation
| Section 13 | Mineral Processing and Metallurgical Testing | Page 6 |
13.3 G&T FS Metallurgical Test Program (2011/2012) - Cont'd
(c) Mineralogy - Cont'd

Figure 13-2: Variability Composites Copper Deportment by Mineral Species

Figure 13-3: Cu Sulphide Distribution by Class of Variability Composites
| Section 13 | Mineral Processing and Metallurgical Testing | Page 7 |
13.3 G&T FS Metallurgical Test Program (2011/2012) - Cont'd
(c) Mineralogy - Cont'd
Key conclusions drawn from mineralogy results were:
• Sulphide mineral content ranged from about 2% to 5% across the samples;
• Chalcopyrite was the dominant copper bearing sulphide mineral in all samples;
• Quartz and muscovite were the two primary gangue minerals;
• The pyrite to chalcopyrite ratio ranged from 1 : 1 to 3.5 : 1, with 7 out of 10
samples being below 3 : 1 ratio(generally favourable for copper recovery by flotation);
• At a primary grind size of about 80% passing (P80) 180 µm, copper sulphide liberation ranged between 50 to 70% supporting favourable recovery of copper to a rougher concentrate; and
• Most of the unliberated copper sulphide minerals were in binary form with non- sulphide gangue minerals.
| Section 13 | Mineral Processing and Metallurgical Testing | Page 8 |
13.3 G&T FS Metallurgical Test Program (2011/2012) - Cont'd
(d) Ore Hardness and Grindability Testing
As part of the FS metallurgical test program, two independent ore hardness characterization programs were undertaken.
The first program was completed at G&T using four samples (SMC1 to SMC4), each assembled from the four drillholes (HC11-M01 through HC11-M04), representing distinct spatial zones within the deposit. A Bond ball mill work index at a close size setting of 106 µm, Bond abrasion test, and JK SMC tests were conducted on each sample. The test data indicated that the samples ranged from soft to moderately soft in terms of ball mill breakage, with low abrasivity observed across all samples except SMC4. The A*b values from the SMC tests indicated soft to medium ore competency for SAG mill breakage. Results from this work are summarized in Table 13-2.
Table 13-2: G&T Ore Hardness Testing Summary
| Sample Name | Bond Ball Mill Work Index (kWh/t) |
Bond Abrasion Index |
A*b |
| SMC 1 | 12.2 | 0.084 | 60.5 |
| SMC 2 | 12.2 | 0.102 | 42.3 |
| SMC 3 | 9.5 | 0.042 | 48.9 |
| SMC 4 | 10.5 | 0.36 | 51.4 |
The second program was executed by FLSmidth, which tested nine whole core samples with variable lithologies (samples A through I). Crusher work index (CWi), Bond abrasion index (Ai), unconfined compressive strength (UCS), and Bond ball mill work index (BWi) tests were performed at the FLSmidth Bethlehem Catasaqua test facility. Bond rod mill work index (RWi) tests were completed at Phillips Enterprises LLC in Golden, Colorado, using standard procedures at a closing screen of 1180 µm. The BWi tests were conducted at a closing screen of 74 um. Results are summarized in Table 13-3.
| Section 13 | Mineral Processing and Metallurgical Testing | Page 9 |
13.3 G&T FS Metallurgical Test Program (2011/2012) - Cont'd
(d) Ore Hardness and Grindability Testing - Cont'd
Table 13-3: FLS Comminution Testing Results
| Sample ID |
UCS | CWi | Ai | BWi | RWi | Lithology/Hole ID |
| Average | Average | Average | Average | Average | ||
| (PSI) | (kWh/t) | (g) | (kWh/t) | (kWh/t) | ||
| A | 2,414 | 5.68 | 0.33 | 10.79 | 19.10 | Qtz Vein (M11-01) |
| B | NA | 7.06 | 0.17 | 11.09 | 11.70 | Phyllite - Calcareous Chlorite (M11-02) |
| C | 4,867 | 8.76 | 0.06 | 11.56 | 10.50 | Phyllite - Calcareous Chlorite (M11-03) |
| D | 9,755 | 7.45 | 0.09 | 11.97 | 11.70 | Schists (no qtz eyes) (M11-02) |
| E | 6,955 | 8.07 | 0.43 | 10.95 | 14.00 | Silica Alt. Schists (qtz eyes) (M11-02) |
| F | 10,384 | 7.49 | 0.32 | 10.30 | 12.80 | Silica Alt. Schists (qtz eyes) (M11-02) |
| G | 8,699 | 6.88 | 0.08 | 11.54 | 10.70 | Schists (qtz eyes) (M11-01) |
| H | NA | 5.23 | 0.16 | 13.41 | 14.20 | Schists (qtz eyes) (M11-04) |
| I | 4,526 | 2.73 | 0.19 | 14.35 | 14.00 | Schists (qtz eyes) (M11-01) |
| A to I | 6,800 | 6.59 | 0.20 | 11.77 | 13.19 |
The results were generally consistent with historical data, and the work indices showed good agreement across the samples tested. Sample A which was representative of a quartz vein material was the only outlier with a high BWi of 19.1 kWh/t. This ore type comprises less than 0.5% of the resource and will be blended in the mill feed.
Due to the conditions inherent in the core samples, some modifications to the sample preparation were necessary, which introduced some uncertainty into the interpretation of the results. It was elected to have a third party, KWM, review the comminution test work before finalizing any conclusions.
Key observations from this review included:
• The vast majority of the core has a foliation plane perpendicular to the axis of drilling resulting in fracturing of the core while in the core box, creating what was termed as the "poker chip" effect;
• The "poker chip" effect lead to difficulties in preparing samples of an appropriate size for testing. As such, sample preparation procedures for the drop weight test were modified to incorporate sawing because splitting produced samples too small for testing.
| Section 13 | Mineral Processing and Metallurgical Testing | Page 10 |
13.3 G&T FS Metallurgical Test Program (2011/2012) - Cont'd
(d) Ore Hardness and Grindability Testing - Cont'd
In general, the screen analysis used in power equations assumes cubical particles passing through the screen. Because of the poker chip effect exhibited by samples tested, interpretation of the result were biased toward a harder ore than what actually exists.
Following the independent review, it was concluded that the relatively low work index and observed platey breakage supported the use of a conventional SAG/ball mill grinding circuit without the need for pebble crushing.
An example of "poker chip" effect on sample B is shown in Figure 13-4 below.

Figure 13-4 : Platey Breakage Example on Core Sample B
| Section 13 | Mineral Processing and Metallurgical Testing | Page 11 |
13.3 G&T FS Metallurgical Test Program (2011/2012) - Cont'd
(e) Open Circuit Flotation Testing
Both open circuit and lock cycle flotation tests were conducted on the Master Composite 2 and the variability samples. Flowsheet development was based on testing completed using Master Composite 2. The resulting flowsheet and test conditions were then applied to the variability samples to assess metallurgical performance.
Some key features from the flotation testing included:
• Potassium amyl xanthate (PAX) was used as the sulphide mineral collector;
• Methyl isobutyl carbinol (MIBC) was used as the flotation frother;
• Lime was used as a pH regulator.
Initial rougher kinetic testing on Master Composite 2 evaluated performance across primary grind sizes ranging from a P80 of 102 µm to 243 µm and rougher pH values from 8.5 to 11. The results indicated that approximately 95% of the copper in feed could be recovered in 6% of the feed mass at a P80 primary grind size of 189 µm and pH of 11 in the rougher circuit. These conditions were selected as the optimal compromise between copper recovery and mass pull and were carried forward in subsequent test work.
A suite of open circuit batch cleaner tests were then conducted to evaluate variable regrind sizes and rougher/cleaner pH conditions. Regrind sizes between 16 µm to 25 µm were tested. The test work demonstrated that a final copper grade of 26% and a copper recovery of 92% was achievable at a regrind size of 25 µm and a pH of 11 in both the roughers and cleaner circuits. These conditions were used for all subsequent variability and lock cycle tests described in the next sections.
| Section 13 | Mineral Processing and Metallurgical Testing | Page 12 |
13.3 G&T FS Metallurgical Test Program (2011/2012) - Cont'd
(f) Lock Cycle Testing
Lock cycle flotation tests were completed on Master Composite 2, zonal composites, and selected lithology composites. The results of the first lock cycle test carried out on Master Composite 2 achieved a concentrate grade of 26.3% copper, and a recovery of 89.6% copper, 57.9% gold, and 66.8% silver. The test was carried out after a P80 primary grind size of 189 μm, at a pH of 11 and using PAX as the collector. Rougher concentrate was reground to 27 μm and cleaned at a pH of 11 using PAX and MIBC as a frother. No additional depressants were used apart from lime for pH control.
The test was repeated at a slightly finer regrind and gave similar results producing a final copper concentrate grade of 25.6% with a 90.0% copper recovery. Results from these duplicate tests formed the basis for the historical recovery models and process design. These recovery models were subsequently validated by the SGS program discussed in Section 13.4.
(g) Variability Testing
Following the establishment of the flowsheet and reagent scheme, variability flotation testing was completed on the ten lithology composites and the six zonal composites. Results generally conformed to the Master Composite 2, with two exceptions. One sample had a relatively low copper grade near the projects cut off grade, while the other contained a higher proportion of non-chalcopyrite copper minerals, which were more friable, and more susceptible to slimes losses and atypical of the deposit.
As this lithology was included in the Master Composite 2, the discounted recovery was reflected in the master composite test results.
| Section 13 | Mineral Processing and Metallurgical Testing | Page 13 |
13.3 G&T FS Metallurgical Test Program (2011/2012) - Cont'd
(h) Pilot Plant Testing
To generate sufficient concentrate for smelter acceptability tests, a 10-hour pilot plant campaign was completed at G&T using 871 kilograms of Master Composite 2 as feed. A feed rate of between 82 and 106 kilograms per hour was maintained throughout the run. The same flowsheet developed during bench scale testing was applied, including a primary grind of P80 180 μm, rougher flotation, regrind stage, and three stages of dilution cleaning.
The primary grinding was conducted in an open circuit rod mill, operating at 55% solids by weight. Grab samples were used to monitor grind size, and adjustments were made to the mill speed and rod charge to maintain target grind size. Regrinding was completed using a 2 liter stirred mill targeting a P80 of 30 μm. The reagent scheme followed that used in the lock cycle testing, though PAX additions were notably lower in the pilot plant. A pH of 11 was targeted in both the rougher and cleaner circuits, with lime added primarily in the rod mill and regrind mills, and supplemented with unmetered additions in the rougher and first cleaner when required to meet pH targets.
Due to the short campaign duration, circuit stability was not consistently achieved, particularly during start-up and shutdown, resulting in production of lower than targeted final concentrate grades at times. When steady-state conditions were established, concentrate grades and recoveries were similar to lock cycle test results. Additional concentrate was produced during circuit shutdown, which initially had a lower grade but was upgraded through batch rougher kinetic testing to approximately 26% copper. The final output from the pilot campaign was just under 8 kilograms (estimated dry weight) of concentrate grading about 26% copper.
| Section 13 | Mineral Processing and Metallurgical Testing | Page 14 |
13.4 SGS Metallurgical Test Program (2020/2021)
Taseko completed additional metallurgical testing between 2020 and 2021 at SGS's metallurgical laboratory in Burnaby, BC. The objective of the program was to validate the historical recovery model projections and investigate flotation optimization opportunities using more spatially representative feed composites assembled from a broader set of drill core samples.
(a) Sample Origin and Composite Blends
The test program was conducted on five master composites prepared from approximately 500 kilograms of historic NQ2 drill core retrieved from core storage. The core was sourced from 13 drill holes collected between 2006 and 2013 as part of YMI's resource drilling programs, described in Section 10.3 of this report.
Each master composite was assembled using blends of sub-composites categorized by lithology, spatial zone (west, east, or south), and copper grade profile (low, medium, high). In total, 28 sub-blends were created to enable flexibility in blending feed composites for specific test objectives. These included 11 sub-blends from the west zone, nine from the east zone, and eight from the south zone of the deposit.
The drill holes used in the program and their spatial distribution are summarize in Table 13-4.
| Section 13 | Mineral Processing and Metallurgical Testing | Page 15 |
13.4 SGS Metallurgical Test Program (2020/2021) - Cont'd
(a) Sample Origin and Composite Blends - Cont'd
Table 13-4: SGS Program Drill Hole Sample Origin Summary
| Year Drilled | Drill Hole ID | Deposit Area |
| 2006 | HC06-01 | West |
| 2007 | HC07-14 | West |
| 2007 | HC07-30 | South |
| 2008 | HC08-62 | East |
| 2008 | HC08-66 | East |
| 2012 | HC12-131 | West |
| 2012 | HC12-132 | West |
| 2013 | HC13-144 | West |
| 2013 | HC13-150 | South |
| 2013 | HC13-151 | West |
| 2013 | HC13-155 | South |
| 2013 | HC13-158 | East |
| 2013 | HC13-162 | East |
The initial composite (Master Composite 1) was assembled to closely replicate the lithology and grade profile of Master Composite 2 from the G&T FS program. Master Composites 2 through 4 were used to evaluate flotation performance across a broader spatial representation of the deposit, using different reagent schemes and grind sizes. Master Composite 5 incorporated material from all 28 sub-composites and captured the full range of lithologies and zones across the deposit. This composite was used to support lock cycle testing and assess metallurgical performance under blended feed conditions.
| Section 13 | Mineral Processing and Metallurgical Testing | Page 16 |
13.4 SGS Metallurgical Test Program (2020/2021) - Cont'd
(b) Composite Head Assays
Standard analytical techniques were used by SGS to assay the five master composites for total copper, gold, silver, and sulphur. Assay results are summarized in Table 13-5.
Feed grades across the composites ranged from approximately 0.29% to 0.34% copper, 0.03 to 0.07 gpt gold, 1.2 to 1.7 gpt silver, and 1.4% to 1.9% sulphur, aligning well with average feed grade profiles expected based on the life-of-mine plan.
Table 13-5: SGS Program Composite Samples Head Assay Summary
| Composite ID | Cu, % | Au, gpt | Ag, gpt | S, % | Fe, % |
| Master Composite 1 | 0.32 | 0.07 | 1.3 | 1.93 | 3.8 |
| Master Composite 2 | 0.30 | 0.04 | 1.4 | 1.64 | 3.62 |
| Master Composite 3 | 0.29 | 0.03 | 1.2 | 1.4 | 4.33 |
| Master Composite 4 | 0.34 | 0.04 | 1.7 | 1.9 | 5.12 |
| Master Composite 5 | 0.29 | 0.04 | 1.5 | 1.64 | 4.14 |
| Section 13 | Mineral Processing and Metallurgical Testing | Page 17 |
13.4 SGS Metallurgical Test Program (2020/2021) - Cont'd
(c) Mineralogy
Mineralogical analysis was conducted on the five master composites (Master Composite 1 through Master Composite 5) and selected flotation products using QEMSCAN to assess copper, sulphur, and iron deportment, as well as sulphide mineral associations and exposure.
Consistent with the FS program results, chalcopyrite was confirmed as the dominant copper-bearing mineral, accounting for over 98% of the copper in each composite. Minor amounts of bornite were observed, and secondary copper sulphides such as covellite and chalcocite were not significant. The pyrite to chalcopyrite ratio across the master composites ranged from approximately 1.8 to 3.6, in-line with the ratios observed in the FS test program and supporting amenability to conventional flotation.
The composites were primarily composed of quartz (48 to 59%) with varying amounts of muscovite, chlorite, and carbonate minerals. These gangue species were consistent with those identified in the FS program. At a primary grind size of P80 190 µm, chalcopyrite liberation was high, with between 66% and 85% of the mineral classified as liberated, with over 80% of the mineral surface area classified as exposed.
Mineralogical trends across the master composites are summarized in Figure 13-5, which shows mineral speciation, and Figure 13-6, which summarizes copper deportment by mineral species.
Overall, mineralogical results confirmed that the composites were well-liberated and amenable to conventional flotation.
| Section 13 | Mineral Processing and Metallurgical Testing | Page 18 |
13.4 SGS Metallurgical Test Program (2020/2021) - Cont'd
(c) Mineralogy - Cont'd

Figure 13-5: Master Composites Mineral Speciation

Figure 13-6: Master Composites Copper Deportment by Mineral Species
| Section 13 | Mineral Processing and Metallurgical Testing | Page 19 |
13.4 SGS Metallurgical Test Program (2020/2021) - Cont'd
(d) Open Circuit Flotation Testing
Open circuit batch flotation tests were conducted on Master Composites 1 through 5 to evaluate flotation response across a range of reagent schemes, grind sizes, pH conditions, and flotation times. This work aimed to identify a reagent system that could maintain metallurgical performance while reducing lime consumption through improved selectivity.
Rougher flotation tests were performed across a grind size range of P80 130 to 220 µm and pH values from 9.0 to 11.5. A variety of reagent combinations were evaluated, including different types and dosages of xanthate-based collectors, thionocarbamates, and mercaptan-based collectors, as well as pyrite depressants and pH modifiers. Flotation retention time and stage-wise reagent addition strategies were also varied to determine optimal recovery conditions.
Cleaner flotation tests were conducted on selected rougher concentrates to further assess pH sensitivity (evaluated from 10.5 to 11.5), collector and frother dosing strategies, flotation retention times, and the impact of reagent addition staging. Alcohol- and glycol ether-based frothers were tested in combination with the different collector systems.
Testing ultimately identified a flowsheet using a primary grind size of P80 165 µm and regrind size of P80 25 µm, a dual collector system incorporating mercaptan- and thionocarbamate-based chemistry, and a frother blend based on alcohol and glycol-ether chemistry. The optimal flotation pH for the rougher circuit was established at 10, which represented a meaningful reduction in lime addition relative to the FS program. A slightly longer rougher retention time and a three-stage cleaner circuit were also selected as part of the optimized flowsheet. These conditions were carried forward to locked cycle testing.
| Section 13 | Mineral Processing and Metallurgical Testing | Page 20 |
13.4 SGS Metallurgical Test Program (2020/2021) - Cont'd
(e) Lock Cycle Testing
Triplicate locked cycle flotation tests (LCT-02 through LCT-04) were conducted on Master Composite 5 using the optimized flowsheet and reagent scheme established during open circuit testing. Reagents were added in multiple stages in both the rougher and cleaner circuits to manage selectivity and recovery.
The average metallurgical performance across the three tests is summarized in Table 13-6.
Table 13-6: SGS Lock Cycle Test Results Summary - Average of LCT-2 to LCT-04
| Concentrate Grade, %, gpt | Concentrate Recovery, % | |||||||
| Cu, % | Au, gpt | Ag, gpt | S,% | Mass | Cu | Au | Ag | S |
| 25.7 | 1.5 | 94.5 | 34 | 1.0 | 89.7 | 36.8 | 63.3 | 22.3 |
The lock cycle tests achieved a final concentrate grade of 25.7% copper and recoveries of approximately 90% copper, 39% gold, 63% silver, and 22% sulphur. These results are consistent with the FS program for copper and silver, despite being conducted on a more spatially representative and lower grade composite.
The lock cycle tests confirmed that the updated reagent scheme and flotation conditions could maintain metallurgical performance while achieving reductions in lime consumption and overall reagent usage.
| Section 13 | Mineral Processing and Metallurgical Testing | Page 21 |
13.5 Concentrate Quality
Minor element determinations were completed on concentrate samples produced from a lock cycle test (LCT-13) and pilot plant test from the G&T FS program and the triplicate lock cycle tests (LCT-02 to LCT-04) from the SGS program. All samples were analyzed using standard analytical techniques with the results summarized in Table 13-7.
Table 13-7: Final Concentrate Minor Elemental Composition Summary
| Element | Symbol | Units | G&T FS Test Program (2011/2012) |
SGS Test Program (2020/2021) |
|
| Lock Cycle Concentrate (LCT-13) |
Pilot Plant Concentrate (P2 ) |
Lock Cycle Concentrate (LCT-2-4) |
|||
| Copper | Cu | % | 26.3 | 25.5 | 25.4 |
| Gold | Au | g/t | 1.6 | 1.9 | 1.7 |
| Silver | Ag | g/t | 123 | 122 | 104 |
| Aluminum | Al | % | 0.3 | 1.1 | 0.4 |
| Antimony | Sb | g/t | 10 | 20 | 94 |
| Arsenic | As | g/t | 87 | 104 | 154 |
| Bismuth | Bi | g/t | 31 | 13 | 42 |
| Cadmium | Cd | g/t | 32 | 34 | 30 |
| Calcium | Ca | % | 0.4 | 0.7 | 0.5 |
| Carbon | C | % | 0.3 | 0.8 | 0.7 |
| Cobalt | Co | g/t | 0.4 | 110 | 63 |
| Fluorine | F | g/t | 101 | 151 | 70 |
| Iron | Fe | % | 31.6 | 27.3 | 31.1 |
| Lead | Pb | % | 0.2 | 0.2 | 0.1 |
| Magnesium | Mg | % | 0.2 | 0.8 | 0.5 |
| Manganese | Mn | g/t | 100 | 240 | 204 |
| Mercury | Hg | g/t | <1 | <1 | 0.5 |
| Molybdenum | Mo | g/t | 100 | 201 | 1040 |
| Nickel | Ni | g/t | 206 | 350 | 223 |
| Phosphorus | P | g/t | 76 | 418.2 | 120 |
| Selenium | Se | g/t | 127 | 131 | 223 |
| Silicon | Si | % | 1.3 | 3.3 | 1.2 |
| Sulphur | S | % | 33.7 | 30.0 | 35.3 |
| Zinc | Zn | % | 0.5 | 0.4 | 0.7 |
| Section 13 | Mineral Processing and Metallurgical Testing | Page 22 |
13.5 Concentrate Quality - Cont'd
The results show that concentrate quality from both programs was broadly consistent and considered clean, with deleterious elements below typical smelter penalty thresholds. Copper grades ranged from 25.4 to 26.3%, and precious metal contents ranged from 1.5 to 2.0 gpt gold and 104 to 123 gpt silver, supporting favourable payable terms across all samples tested.
A concentrate marketing study completed in 2025, confirmed the marketability of the final product, highlighting its high copper grade and low impurity levels as attractive to a wide range of global smelters.
| Section 13 | Mineral Processing and Metallurgical Testing | Page 23 |
13.6 Recovery Models
The project's recovery models for copper, gold, and silver are defined by equations that relate metallurgical recovery to head grade. These models were initially developed based on test results from the G&T FS program.
The SGS test program was completed in 2020 and 2021 to validate the historical metallurgical recovery models using triplicate lock cycle tests on a more spatially representative, lower-grade composite that better reflected the average expected life-of- mine feed.
Copper and silver recoveries aligned well with the historical recovery models, confirming their continued validity. The gold recovery model was refined based on SGS test results in conjunction with an evaluation of historical test data.
Together, the validated historical copper and silver models and the refined gold model form the updated metallurgical recovery basis for the Project. The recovery models used to estimate copper, gold, and silver recoveries in the reserve are shown in Figures 13-7 to 13- 9.Copper Head Grade (%Cu)

Figure 13-7: Copper Recovery vs. Copper Head Grade
| Section 13 | Mineral Processing and Metallurgical Testing | Page 24 |

Figure 13-8: Gold Recovery vs. Gold Head GradeSilver Head Grade (gpt)

Figure 13-9: Silver Recovery vs. Silver Head Grade
| Section 13 | Mineral Processing and Metallurgical Testing | Page 25 |
13.7 Conclusion
The Yellowhead Project's process flowsheet consists of a conventional SAG and ball milling circuit, followed by rougher flotation, regrinding of rougher concentrate, and a three-stage cleaner flotation circuit. Metallurgical testing from both the G&T FS program and more recent SGS test program confirms the suitability of this design for the ore.
Comminution testing demonstrated that the ore is soft to moderately soft, with low abrasivity and no requirement for pebble crushing. Mineralogical characterization confirmed chalcopyrite is the dominant copper bearing mineral across the deposit, comprising more than 98% of the copper species in the majority of the deposit.
Lock cycle tests from both programs consistently produced final copper concentrates grading between approximately 25.5% to 26%, with copper recoveries near 90%. Final concentrates were clean with minor deleterious elements below typical smelter penalty thresholds, and also contained payable gold and silver credits.
The copper and silver recovery models remain consistent with historical models used for the Project and are well supported by the more recent test work completed at SGS. The gold recovery model was refined based on SGS test results and a re-evaluation of historical test data. Together, the validated historical copper and silver models and refined gold model form the basis for the Project's updated metallurgical recovery projections.
Future metallurgical test programs undertaken for the Project should consider evaluating opportunities to improve gold recovery and additional variability testing using the updated flowsheet and reagent scheme.
SECTION 14
MINERAL RESOURCE ESTIMATE
SECTION 14: MINERAL RESOURCE ESTIMATE
Table of Contents
| Page | ||
| 14.1 | Introduction | 1 |
| 14.2 | Exploratory Data Analysis | 2 |
| 14.3 | Outlier Analysis | 7 |
| 14.4 | Deposit Modeling | 8 |
| 14.5 | Compositing | 10 |
| 14.6 | Density | 10 |
| 14.7 | Variogram Analysis | 11 |
| 14.8 | Block Model and Grade Estimation Procedures | 12 |
| 14.9 | Mineral Resource Classification | 15 |
| 14.10 | Model Validation | 18 |
| 14.11 | Mineral Resource Estimate | 21 |
| 14.12 | Factors Which Could Affect the Mineral Resource Estimate | 26 |
| List of Tables | ||
| Table 14-1: Resource Drillhole Summary (Geosim) | 2 | |
| Table 14-2: Sample Statistics (Geosim) | 3 | |
| Table 14-3: Grade Capping (Geosim) | 7 | |
| Table 14-4: Composite Statistics (Geosim) | 10 | |
| Table 14-5: Bulk Density Statistics for Modeled Lithologies (Geosim) | 10 | |
| Table 14-6: Semi-Variogram Model Parameters (Geosim) | 11 | |
| Table 14-7: Block Model Parameters (Geosim) | 12 | |
| Table 14-8: Grade Model Search Parameters (Geosim) | 12 | |
| Table 14-9: Global Mean Grade Comparison (Geosim) | 18 |
| Table 14-10: Open Pit Slopes by Azimuth | 21 |
| Table 14-11: Mineral Resource Estimate | 24 |
| List of Figures | |
| Figure 14-1: Frequency Distribution of Copper | 4 |
| Figure 14-2: Frequency Distribution of Gold | 4 |
| Figure 14-3: Frequency Distribution of Silver | 5 |
| Figure 14-4: Scatterplot of Copper vs Gold and Silver Sample Data | 5 |
| Figure 14-5: Scatterplot of Gold vs Silver Sample Data | 6 |
| Figure 14-6: Block Model Lithology | 8 |
| Figure 14-7: Gradeshell Constraints | 9 |
| Figure 14-8: Frequency Distribution of Copper Grades in Block Model | 13 |
| Figure 14-9: Frequency Distribution of Gold Grades in Block Model | 13 |
| Figure 14-10: Frequency Distribution of Silver Grades in Block Model | 14 |
| Figure 14-11: Block Classification - Plan View | 17 |
| Figure 14-12: Copper Swath Plot (E-W) at 5711516-5711576 North | 19 |
| Figure 14-13: Gold Swath Plot (E-W) at 5711516-5711576 North | 19 |
| Figure 14-14: Silver Swath Plot (E-W) at 5711516-5711576 North | 20 |
| Figure 14-15: Block Grade Distribution Section 304060E | 21 |
| Figure 14-16: Block Grade Distribution Section 304518E | 22 |
| Figure 14-17: Block Grade Distribution Section 304650E | 22 |
| Figure 14-18 : Block Grade Distribution Section 305418E | 23 |
| Figure 14-19: Block Grade Distribution Section 305538E | 23 |
| Figure 14-20: Block Grade Distribution Section 5711228N | 23 |
| Section 14 | Mineral Resource Estimate | Page 1 |
14.1 Introduction
The most recent update to the resource block model was completed in 2014 as documented in the technical report titled "Technical Report & Feasibility Study of the Harper Creek Copper Project", dated July 31, 2014 which has an effective date of July 31, 2014. There have been no additional relevant exploration results within the deposit area nor changes to the resource block model since that time.
| Section 14 | Mineral Resource Estimate | Page 2 |
14.2 Exploratory Data Analysis
The sample database for the project contains results from 353 core holes (90,779 m) drilled between 1967 and the end of 2013. Of these, 177 were completed since the start of 2006 by YMI and comprise 69% of the total sampled core length. Seven condemnation holes (1,545 m) were also drilled in 2011 but were outside of the resource area. A total of 24 geotechnical holes (1,270 m) were also completed in 2011. The drilling used to develop the resource model is summarized in Table 14-1.
Table 14-1: Resource Drillhole Summary (Geosim)
| Series | Year | Company | Holes Drilled |
Core Diam |
Total Metres |
Intervals Assayed |
Metres Assayed |
| 67-H-1 to 6 | 1967 | Quebec Cartier | 6 | NQ & BQ | 546 | 174 | 526 |
| NH-1 to 17 | 1968 | Noranda | 17 | BQ | 2,106 | 709 | 1,988 |
| 69-H-1 to 27 | 1969 | Quebec Cartier | 27 | BQ | 4,739 | 1,528 | 4,579 |
| NH-18 to 30 | 1969 | Noranda | 13 | BQ | 1,734 | 532 | 1,615 |
| J-1 to 12 | 1970 | Noranda | 12 | BQ | 2,329 | 617 | 1,894 |
| NH-31 to 95 | 1970 | Noranda | 57 | BQ | 8,316 | 2,503 | 7,654 |
| J-13 to 43 | 1971 | Noranda | 27 | BQ | 5,594 | 1,728 | 5,354 |
| J-40 to 42 | 1972 | Noranda | 4 | BQ | 457 | 39 | 118 |
| J-44 to 48 | 1973 | Noranda | 5 | BQ | 625 | 13 | 40 |
| 96-1 to 8 | 1996 | American Comstock | 8 | NQ2 | 2,847 | 686 | 2,046 |
| Subtotal 1967-1996 | 176 | 29,292 | 8,529 | 25,813 | |||
| HC06-01 to 12 | 2006 | YMI | 12 | NQ2 | 4,101 | 2,536 | 4,029 |
| HC07-13 to 52 | 2007 | YMI | 40 | NQ2 | 15,880 | 12,569 | 15,602 |
| HC08-53 to75 | 2008 | YMI | 23 | NQ2 | 7,603 | 6,991 | 7,496 |
| HC10-76 to 82 | 2010 | YMI | 7 | NQ2 | 3,486 | 2,637 | 3,406 |
| HC11-83 to 130 | 2011 | YMI | 48 | NQ2 | 15,571 | 11,865 | 14,930 |
| HC11-GM01 to GM07 | 2011 | YMI | 8 | HQ | 2,433 | 1,025 | 1,291 |
| HC11-M01 to M04 | 2011 | YMI | 4 | PQ | 441 | 137 | 143 |
| Subtotal 2006-2011 | 142 | 49,516 | 37,760 | 46,897 | |||
| HC12-131 to 142 | 2012 | YMI | 12 | NQ2 | 3,803 | 2,547 | 3,466 |
| HC13-143 to 165 | 2013 | YMI | 23 | NQ2 | 8,166 | 5,206 | 7,259 |
| Subtotal 2012-2013 | 35 | 11,969 | 7,753 | 10,726 | |||
| Total | 353 | 90,778 | 54,042 | 83,436 |
| Section 14 | Mineral Resource Estimate | Page 3 |
14.2 Exploratory Data Analysis - Cont'd
Many of the legacy holes, not assayed for precious metals at the time of drilling, were re- assayed by YMI for copper, gold, and silver. Because the original assay intervals were not always maintained, two independent databases were established; one for copper grades and one for precious metal grades.
Legacy holes were sampled on regular 3.05 m (10 ft) lengths corresponding to the length of the core barrel and drill rods. YMI drilling was sampled on nominal 3 m intervals in 2006, 2 m intervals in 2007 and 1 m intervals in 2010-2011. YMI also broke sample intervals at lithologic boundaries.
Cumulative frequency distribution for the copper, gold, and silver samples within resource domains are illustrated in Figure 14-1 to Figure 14-3. The sample population for copper is a highly skewed approaching log normal distribution with no significant bimodality evident. Some bi-modality is suggested in the log cumulative frequency distribution of gold and this is attributed to the more irregular distribution of gold in the deposit.
Copper shows a moderate positive correlation with gold and a weaker positive correlation with silver with correlation coefficients of 0.23 and 0.13 respectively (Figure 14-4).
Gold and silver show a weak positive correlation (correlation coefficient = 0.2) and a linear regression yields a low R2 value of 0.03 (Figure 14-5).
Basic statistics for samples falling within the resource domains are shown in Table 14-2.
Table 14-2: Sample Statistics (Geosim)
| Copper | Gold | Silver | |
| n | 33,452 | 30,539 | 30,477 |
| Min | 0.00 | 0.001 | 0.0 |
| Max | 10.50 | 1.940 | 410.0 |
| Median | 0.16 | 0.013 | 0.8 |
| Mean | 0.24 | 0.027 | 1.3 |
| Wt avg | 0.23 | 0.026 | 1.2 |
| Variance | 0.09 | 0.002 | 17.2 |
| Std dev | 0.31 | 0.044 | 4.1 |
| CV | 1.27 | 1.59 | 3.10 |
| Section 14 | Mineral Resource Estimate | Page 4 |
14.2 Exploratory Data Analysis - Cont'd

Figure 14-1: Frequency Distribution of Copper

Figure 14-2: Frequency Distribution of Gold
| Section 14 | Mineral Resource Estimate | Page 5 |
14.2 Exploratory Data Analysis - Cont'd

Figure 14-3: Frequency Distribution of Silver

Figure 14-4: Scatterplot of Copper vs Gold and Silver Sample Data
| Section 14 | Mineral Resource Estimate | Page 6 |
14.2 Exploratory Data Analysis - Cont'd

Figure 14-5: Scatterplot of Gold vs Silver Sample Data
| Section 14 | Mineral Resource Estimate | Page 7 |
14.3 Outlier Analysis
Before compositing, grade distribution in the raw sample data was examined to determine if grade capping or special treatment of high outliers was warranted. Cumulative log probability plots (CPP) were examined for outlier populations and decile analyses were performed for copper, gold and silver within the resource constraint domains. As a general rule, the cutting of high grades is warranted if:
• the last decile (upper 10% of samples) contains more than 40% of the metal; or
• the last decile contains more than 2.3 times the metal of the previous decile; or
• the last centile (upper 1%) contains more than 10% of the metal; or
• the last centile contains more than 1.75 times the next highest centile.
None of these criteria were met by this sample population suggesting that capping or special treatment of outliers is not warranted. However, examination of CPP plots did reveal a few scattered outliers that could have a local impact on block grades and it was decided to cap grades as shown in Table 14-3.
Table 14-3: Grade Capping (Geosim)
| Item | Cap Level | Unit | Samples Affected |
| Copper | 5 | % | 15 |
| Gold | 1 | gpt | 4 |
| Silver | 30 | gpt | 10 |
| Section 14 | Mineral Resource Estimate | Page 8 |
14.4 Deposit Modeling
The mineralized stratigraphy comprises a sequence of phyllites and schists (units 7-9) overlying un-mineralized gneiss (unit 10). Weakly mineralized to barren phyllites overlie the main mineralized horizons. The Harper Creek Fault bisects the deposit in a southwest- northeast direction and dips steeply to the southeast. The three main lithologic domains (gneiss, mineralized meta-sediments and overlying phyllites) were modeled in Surpac Vision software as 3D wireframes. The Harper Creek Fault was modeled as a surface and acts as a hard boundary for both the lithologic and grade models. The final lithology assigned to the block model is illustrated in Figure 14-6.
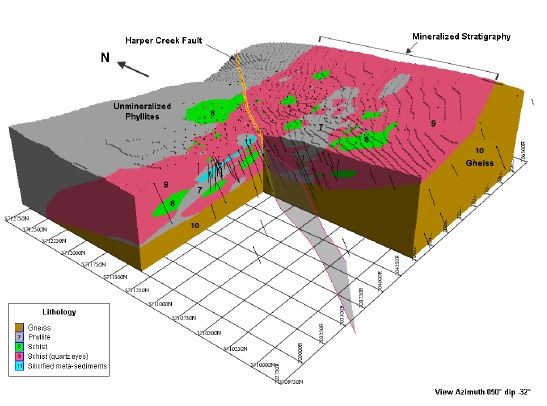
Figure 14-6: Block Model Lithology
| Section 14 | Mineral Resource Estimate | Page 9 |
14.4 Deposit Modeling - Cont'd
In order to further constrain the block model grade estimation, gradeshells based on a 700ppm copper cut-off were generated by modeling log transformed data using Leapfrog3d© software. Separate zones were modeled on either side of the Harper Creek Fault (Figure 14-7) and are referred to as the northwest and southeast zones.
A bedrock surface digital elevation model was constructed in Surpac based on drillhole data and projected to the edges of the resource model.

Figure 14-7: Gradeshell Constraints
| Section 14 | Mineral Resource Estimate | Page 10 |
14.5 Compositing
Best fit downhole composites of copper, gold and silver were generated using 6 m intervals within the zone domains. All samples within the domain constraints were capped prior to compositing at levels of 5% for copper, 1 gpt for gold and 30 gpt for silver. Statistics for composites are summarized Table 14-4. The combination of capping and compositing reduce the coefficient of variation (CV) for copper from 1.27 in the raw sample data to 0.75. The CV for gold was reduced from 1.59 to 1.04 and silver dropped from 3.1 to 0.84.
Table 14-4: Composite Statistics (Geosim)
| Copper in 700ppm Cu grade shells |
Gold in 700ppm Cu grade shells |
Silver in 700ppm Cu grade shells |
|||||||
| NW | SE | COMB | NW | SE | COMB | NW | SE | COMB | |
| n | 2,810 | 5,676 | 8,486 | 2,408 | 4,437 | 6,844 | 2,408 | 4,437 | 6,845 |
| Min | 0.00 | 0.00 | 0.00 | 0.000 | 0.000 | 0.000 | 0.0 | 0.0 | 0.0 |
| Max | 1.62 | 2.38 | 2.38 | 0.541 | 0.453 | 0.541 | 12.6 | 11.4 | 12.0 |
| Median | 0.17 | 0.19 | 0.18 | 0.035 | 0.019 | 0.019 | 1.5 | 1.0 | 0.9 |
| Mean | 0.30 | 0.30 | 0.30 | 0.010 | 0.032 | 0.033 | 0.5 | 1.4 | 1.5 |
| Wt avg | 0.23 | 0.23 | 0.23 | 0.029 | 0.025 | 0.026 | 1.2 | 1.2 | 1.2 |
| Variance | 0.04 | 0.03 | 0.03 | 0.001 | 0.000 | 0.001 | 1.2 | 0.9 | 1.0 |
| Std dev | 0.20 | 0.16 | 0.17 | 0.034 | 0.022 | 0.027 | 1.1 | 0.9 | 1.0 |
| CV | 0.84 | 0.70 | 0.75 | 1.17 | 0.90 | 1.03 | 0.91 | 0.80 | 0.84 |
14.6 Density
A total of 10,739 bulk density measurements were made on core sampled between 2006 and 2007. After removal of outliers, the median bulk density values for each modeled lithology were assigned to the corresponding blocks in the resource model as shown in Table 14-5. Density of overburden was assumed to be 2.2 t/m3.
Table 14-5: Bulk Density Statistics for Modeled Lithologies (Geosim)
| Material | Code | No. of Measurements |
Model Density (t/m3) |
| HC Fault | 1 | 51 | 2.72 |
| Phyllite | 7 | 1,588 | 2.80 |
| Schist | 8 | 1,493 | 2.85 |
| Schist | 9 | 2,742 | 2.76 |
| Gneiss | 10 | 142 | 2.74 |
| Silicified | 11 | 745 | 2.71 |
| Section 14 | Mineral Resource Estimate | Page 11 |
14.7 Variogram Analysis
Directional pairwise relative semi-variograms for copper, gold and silver were modeled using composites falling within the domain constraint in order to determine search parameters and anisotropy. Maximum ranges for copper in both zones were 250 m while gold and silver had modeled ranges of 250 m in the southeast zone and 200 m in the northwest zone. Variogram model parameters for copper, gold and silver are shown in Table 14-6.
Table 14-6: Semi-Variogram Model Parameters (Geosim)
| Item Zone |
Type | Axis | Azim | Dip | co | c1 | a1 | c2 | a2 |
| Copper | Pairwise | major | 0 | -30 | 0.007 | 0.0219 | 80 | 0.0138 | 250 |
| Relative | semi-major | 90 | 0 | 0.007 | 0.0219 | 80 | 0.0138 | 250 | |
| NW | |||||||||
| Spherical | minor | 180 | -60 | 0.007 | 0.0219 | 15.6 | 0.0138 | 49 | |
| Copper | Pairwise | major | 47.1 | -21.4 | 0.007 | 0.0087 | 80 | 0.0087 | 250 |
| Relative | semi-major | 306.6 | -25 | 0.007 | 0.0087 | 80 | 0.0087 | 250 | |
| SE | |||||||||
| Spherical | minor | 352.8 | 56 | 0.007 | 0.0087 | 15.5 | 0.0087 | 48.5 | |
| Gold | Pairwise | major | 0 | -30 | 0.0004 | 0.000 | 75 | 0.000448 | 200 |
| Relative | semi-major | 90 | 0 | 0.0004 | 0.000 | 75 | 0.000448 | 200 | |
| NW | |||||||||
| Spherical | minor | 180 | -60 | 0.0004 | 0.000 | 17.8 | 0.000448 | 40.5 | |
| Gold | Pairwise | major | 47.1 | -21.4 | 0.000156 | 0.000115 | 80 | 0.000155 | 250 |
| Relative | semi-major | 306.6 | -25 | 0.000156 | 0.000115 | 80 | 0.000155 | 250 | |
| SE | |||||||||
| Spherical | minor | 352.8 | 56 | 0.000156 | 0.000115 | 25 | 0.000155 | 70 | |
| Silver | Pairwise | major | 0 | -30 | 0.464 | 0.547 | 75 | 0.203 | 200 |
| Relative | semi-major | 90 | 0 | 0.464 | 0.547 | 75 | 0.203 | 200 | |
| NW | |||||||||
| Spherical | minor | 180 | -60 | 0.464 | 0.547 | 15 | 0.203 | 55 | |
| Silver | Pairwise | major | 47.1 | -21.4 | 0.327 | 0.179 | 80 | 0.1558 | 250 |
| Relative | semi-major | 306.6 | -25 | 0.327 | 0.179 | 80 | 0.1558 | 250 | |
| SE | |||||||||
| Spherical | minor | 352.8 | 56 | 0.327 | 0.179 | 17 | 0.1558 | 80 | |
| Section 14 | Mineral Resource Estimate | Page 12 |
14.8 Block Model and Grade Estimation Procedures
A block model was created in Gemcom-Surpac Vision© software using a block size 12 m x12 m x12 m. Block model extents are summarized in Table 14-7.
Table 14-7: Block Model Parameters (Geosim)
| East | North | Elev | |
| Minimum | 303,000 | 5,709,850 | 1,000 |
| Maximum | 306,000 | 5,712,850 | 1,816 |
| Extent | 3,000 | 3,000 | 816 |
| Block Size (m) | 12 | 12 | 12 |
| No. of Blocks | 250 | 250 | 68 |
The model blocks were first coded by the partial percent within the zone domain and below topography. Lithologic codes and SG values were then assigned as described in Sections 14.4 and 14.6.
Copper, gold and silver grades within the northwest and southeast zone domains were estimated in three passes using the inverse distance squared weighting method (ID2). The second pass used an octant search in order to differentiate interpolated from extrapolated block grade estimates for classification. Search parameters are outlined in Table 14-8. The frequency distributions of block grades are shown in Figures 14-8 to 14-10.
Table 14-8: Grade Model Search Parameters (Geosim)
| Zone | Pass | Search Type |
Max Search Dist (m) |
Min # Composites |
Max # Composites |
Min Octants Required |
Max per Hole |
| NW | 1 | Ellipsoidal | 82.5 | 4 | 24 | 3 | |
| 2 | Octant | 250 | 4 | 24 | 5 | ||
| 3 | Ellipsoidal | 250 | 4 | 24 | 3 | ||
| SE | 1 | Ellipsoidal | 82.5 | 4 | 24 | 3 | |
| 2 | Octant | 250 | 4 | 24 | 5 | ||
| 3 | Ellipsoidal | 250 | 4 | 24 | 3 |
| Section 14 | Mineral Resource Estimate | Page 13 |
14.8 Block Model and Grade Estimation Procedures - Cont'd

Figure 14-8: Frequency Distribution of Copper Grades in Block Model

Figure 14-9: Frequency Distribution of Gold Grades in Block Model
| Section 14 | Mineral Resource Estimate | Page 14 |
14.8 Block Model and Grade Estimation Procedures - Cont'd

Figure 14-10: Frequency Distribution of Silver Grades in Block Model
| Section 14 | Mineral Resource Estimate | Page 15 |
14.9 Mineral Resource Classification
Resource classifications used in this study conform to CIM Definition Standards for Mineral Resources and Mineral Reserves (2014):
Mineral Resource
A Mineral Resource is a concentration or occurrence of solid material of economic interest in or on the Earth's crust in such form, grade or quality and quantity that there are reasonable prospects for eventual economic extraction.
The location, quantity, grade or quality, continuity and other geological characteristics of a Mineral Resource are known, estimated or interpreted from specific geological evidence and knowledge, including sampling.
Measured Mineral Resource
A Measured Mineral Resource is that part of a Mineral Resource for which quantity, grade or quality, densities, shape, and physical characteristics are estimated with confidence sufficient to allow the application of Modifying Factors to support detailed mine planning and final evaluation of the economic viability of the deposit.
Geological evidence is derived from detailed and reliable exploration, sampling and testing and is sufficient to confirm geological and grade or quality continuity between points of observation.
A Measured Mineral Resource has a higher level of confidence than that applying to either an Indicated Mineral Resource or an Inferred Mineral Resource. It may be converted to a Proven Mineral Reserve or to a Probable Mineral Reserve.
Indicated Mineral Resource
An Indicated Mineral Resource is that part of a Mineral Resource for which quantity, grade or quality, densities, shape and physical characteristics are estimated with sufficient confidence to allow the application of Modifying Factors in sufficient detail to support mine planning and evaluation of the economic viability of the deposit.
Geological evidence is derived from adequately detailed and reliable exploration, sampling and testing and is sufficient to assume geological and grade or quality continuity between points of observation.
An Indicated Mineral Resource has a lower level of confidence than that applying to a Measured Mineral Resource and may only be converted to a Probable Mineral Reserve.
| Section 14 | Mineral Resource Estimate | Page 16 |
14.9 Mineral Resource Classification - Cont'd
Inferred Mineral Resource
An Inferred Mineral Resource is that part of a Mineral Resource for which quantity and grade or quality are estimated on the basis of limited geological evidence and sampling. Geological evidence is sufficient to imply but not verify geological and grade or quality continuity.
An Inferred Mineral Resource has a lower level of confidence than that applying to an Indicated Mineral Resource and must not be converted to a Mineral Reserve. It is reasonably expected that the majority of Inferred Mineral Resources could be upgraded to Indicated Mineral Resources with continued exploration.
Resource Classification
Blocks were initially classified as measured if they were estimated in the 1st pass with a minimum of 4 composites from at least 2 drillholes within 82.5 m of the block centroid corresponding to 1/3 of the maximum variogram range. The blocks meeting these criteria were then examined visually and some blocks were downgraded to indicated if they were in areas missing precious metal assays or in isolated clusters.
Remaining unclassified blocks were flagged as indicated if they were estimated in the 2nd pass which used an octant search to limit extrapolation. Some extrapolated estimates from the 3rd pass were also classified as indicated if the closest composite was within 125 m of a block centroid corresponding to half the maximum variogram range. A series of blocks estimated in the 3rd pass that were adjacent to the Harper Creek Fault and not estimated in the octant search due to the imposed hard boundary were also classified as indicated.
All other estimated blocks were classified as inferred. Block classification is illustrated in Figure 14-11.
| Section 14 | Mineral Resource Estimate | Page 17 |
14.9 Mineral Resource Classification - Cont'd

Figure 14-11: Block Classification - Plan View
| Section 14 | Mineral Resource Estimate | Page 18 |
14.10 Model Validation
Model verification was initially carried out by visual comparison of blocks and sample grades in plan and section views. The estimated block grades showed reasonable correlation with adjacent composite grades.
Block grades were also estimated using the nearest neighbour method and separate kriging runs were carried out for copper. A comparison of global mean values within the grade shell domain shows a reasonably close relationship with samples, composites and block model values (Table 14-9).
Table 14-9: Global Mean Grade Comparison (Geosim)
| Copper (%) |
Gold (gpt) |
Silver (gpt) |
|
| Samples (wt avg) | 0.231 | 0.027 | 1.3 |
| Samples capped | 0.230 | 0.027 | 1.3 |
| Composites | 0.229 | 0.026 | 1.2 |
| ID² blocks | 0.215 | 0.025 | 1.2 |
| Nearest neighbour | 0.215 | 0.025 | 1.2 |
| Kriged blocks | 0.210 |
Swath plots were generated to assess the model for global bias by comparing kriged, ID2 and nearest neighbour estimates on panels through the deposit. Results show a reasonable comparison between the methods, particularly in the main portions of the deposit indicated by the bar charts (Figure 14-12 to Figure 14-14).
| Section 14 | Mineral Resource Estimate | Page 19 |
14.10 Model Validation - Cont'd

Figure 14-12: Copper Swath Plot (E-W) at 5711516-5711576 North
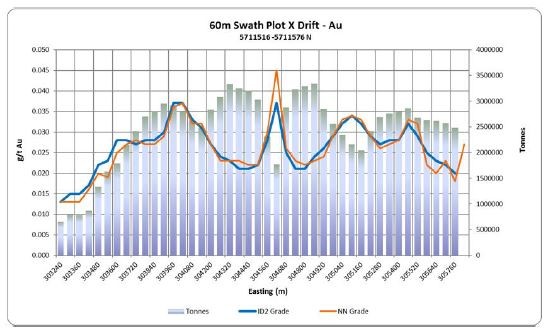
Figure 14-13: Gold Swath Plot (E-W) at 5711516-5711576 North
| Section 14 | Mineral Resource Estimate | Page 20 |
14.10 Model Validation - Cont'd
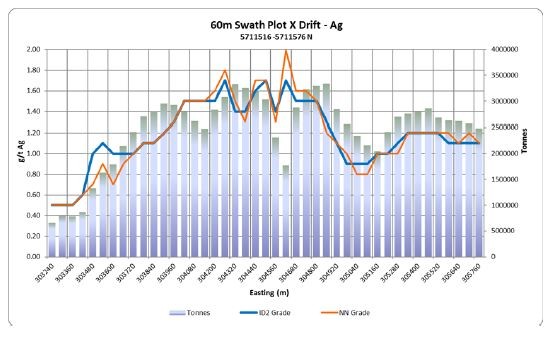
Figure 14-14: Silver Swath Plot (E-W) at 5711516-5711576 North
| Section 14 | Mineral Resource Estimate | Page 21 |
14.11 Mineral Resource Estimate
In order to meet the requirements of CIM Definition Standards for Mineral Resources and Mineral Reserves (2014) that are incorporated by reference into NI 43-101with respect to reasonable prospects of eventual economic extraction by open pit mining methods, a Lerchs-Grossman pit optimization was generated to constrain the resource within the block model. Metal prices used were US$4.25/lb for copper, US$2,400/oz for gold and US$28.00/oz for silver at a foreign exchange rate of C$1.30 : US$1.00. Metal recoveries are based on recovery models discussed in Section 13 of this report applied to block grades with average recoveries of 89% for copper, 35% for gold and 59% for silver at a 0.15% copper cut-off grade. Combined processing and G&A costs were set at C$7.40/t milled. Pit-rim mining cost for ore and waste were C$2.31/t mined with a bench increment of C$0.035/t mined. Pit slopes were set based on wall azimuth as outlined in Table 14-10. No allowances were made for mining losses or dilution.
Table 14-10: Open Pit Slopes by Azimuth
| Wall Azimuth | Pit Sector | Wall Slope |
| 0°-115° | North, West | 40° |
| 115°-230° | Southwest, South | 30° |
| 230°-360° | West, Northwest | 40° |
Profiles of the pit with estimated copper grade distributions are included in Figures 14-15 to 14-20.

Figure 14-15: Block Grade Distribution Section 304060E
| Section 14 | Mineral Resource Estimate | Page 22 |
14.11 Mineral Resource Estimate - Cont'd

Figure 14-16: Block Grade Distribution Section 304518E
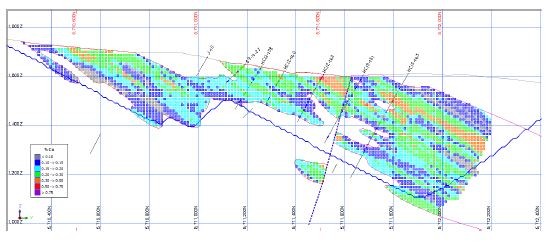
Figure 14-17: Block Grade Distribution Section 304650E
| Section 14 | Mineral Resource Estimate | Page 23 |
14.11 Mineral Resource Estimate - Cont'd

Figure 14-18 : Block Grade Distribution Section 305418E
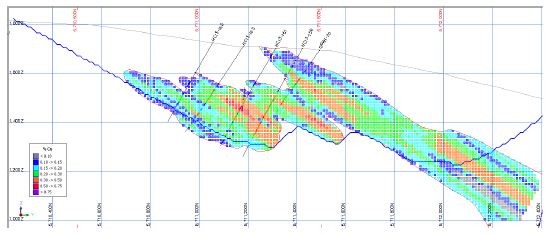
Figure 14-19: Block Grade Distribution Section 305538E

Figure 14-20: Block Grade Distribution Section 5711228N
| Section 14 | Mineral Resource Estimate | Page 24 |
14.11 Mineral Resource Estimate - Cont'd
Table 14-11 presents the mineral resource estimate for the project at a range of cut-off grades with the base case highlighted. The selected base case cut-off grade of 0.15% copper is reasonable compared to other large-scale open pit copper mines in British Columbia.
Table 14-11: Mineral Resource Estimate
| Yellowhead Project Mineral Resources Effective June 1, 2025 | |||||
| Classification | Cut-off Grade (% Cu) |
Tonnes (millions) |
Copper Grade (%) |
Gold Grade (gpt) |
Silver Grade (gpt) |
| Measured | 0.30 | 173 | 0.39 | 0.043 | 1.6 |
| 0.25 | 269 | 0.35 | 0.037 | 1.4 | |
| 0.20 | 403 | 0.31 | 0.033 | 1.3 | |
| 0.15 | 561 | 0.27 | 0.029 | 1.2 | |
| 0.10 | 706 | 0.24 | 0.027 | 1.2 | |
| Indicated | 0.30 | 141 | 0.37 | 0.041 | 1.5 |
| 0.25 | 262 | 0.32 | 0.036 | 1.4 | |
| 0.20 | 447 | 0.28 | 0.031 | 1.3 | |
| 0.15 | 735 | 0.24 | 0.027 | 1.2 | |
| 0.10 | 939 | 0.21 | 0.025 | 1.2 | |
| Measured and Indicated |
0.30 | 314 | 0.38 | 0.042 | 1.5 |
| 0.25 | 531 | 0.34 | 0.037 | 1.4 | |
| 0.20 | 850 | 0.29 | 0.032 | 1.3 | |
| 0.15 | 1,296 | 0.25 | 0.028 | 1.2 | |
| 0.10 | 1,645 | 0.22 | 0.026 | 1.2 | |
| Inferred | 0.30 | 24 | 0.38 | 0.035 | 1.4 |
| 0.25 | 39 | 0.33 | 0.033 | 1.3 | |
| 0.20 | 69 | 0.28 | 0.030 | 1.3 | |
| 0.15 | 111 | 0.24 | 0.026 | 1.2 | |
| 0.10 | 160 | 0.20 | 0.024 | 1.1 | |
Notes:
1. Mineral Resources follow CIM Definition Standards for Mineral Resources and Mineral Reserves (2014).
2. Mineral Resources are reported inclusive of Mineral Reserves.
3. Mineral Resources that are not Mineral Reserves do not have demonstrated economic viability.
4. The Mineral Resource has been confined by a Lerchs-Grossman pit optimization to meet "reasonable prospects of eventual economic extraction" using the following assumptions: Metal prices of US$4.25/lb Cu, US$2,400/oz Au and US$28.00/oz Ag; a foreign exchange rate of C$1.30 : US$1.00; average metal recoveries of 89% for copper, 35% for gold and 59% for silver; combined processing and G&A costs of C$7.40/t milled; and pit-rim mining cost of C$2.31/t mined with a bench increment of C$0.035/t mined.
5. Bulk density is estimated by lithology and ranges between 2.71 t/m3 and 2.85 t/m3 in rock and 2.2 t/m3 in overburden.
6. Numbers may not add due to rounding.
| Section 14 | Mineral Resource Estimate | Page 25 |
14.11 Mineral Resource Estimate - Cont'd
Mineral Resources reported in Table 14-11 are reported inclusive of those Mineral Resources converted to Mineral Reserves. Mineral Resources that are not converted to Mineral Reserves do not have demonstrated economic viability.
It is the opinion of the QP that the classification of Mineral Resources as presented in Table 14-11 meet the definitions of Measured, Indicated and Inferred Mineral Resources as stated by the CIM Definition Standards for Mineral Resources and Mineral Reserves (2014) that are incorporated by reference into NI 43-101.
| Section 14 | Mineral Resource Estimate | Page 26 |
14.12 Factors Which Could Affect the Mineral Resource Estimate
Areas of uncertainty that may materially impact the mineral resource estimate include:
• Commodity price assumptions;
• Foreign exchange assumptions;
• Assumptions that all required permits will be forthcoming;
• Pit slope angles;
• Metal recovery assumptions; and
• Mining and Processing cost assumptions.
There are no other known factors or issues that materially affect the estimate other than normal risks faced by mining projects in the Province of British Columbia with respect to environmental, permitting, taxation, socioeconomic, marketing and political factors. There are no known legal or title issues that would materially affect the mineral resource estimate.
There is a degree of uncertainty in the estimation of mineral reserves and mineral resources and corresponding grades being mined or assigned to future production. The estimation of mineralization is a subjective process and the accuracy of estimates is a function of the accuracy, quantity, and quality of available data, the accuracy of statistical computations, as well as the assumptions used and judgments made in interpreting engineering and geological information. There is significant uncertainty in any mineral resource/mineral reserve estimate, and the actual deposits encountered and the economic viability of mining a deposit may differ significantly from these estimates until mineral reserves or mineral resources are actually mined and processed, the quantity of mineral resources/mineral reserves and their respective grades must be considered as estimates only. In addition, the quantity of mineral reserves and mineral resources may vary depending on, among other things, metal prices.
Any material changes in quantity of mineral reserves, mineral resources, grade, or strip ratio may affect the economic viability of a property. In addition, there can be no assurance that recoveries in small scale laboratory tests will be duplicated in larger scale tests under on site conditions or during production. Fluctuation in metal or commodity prices, results of additional drilling, metallurgical testing, receipt of new information, and production and the evaluation of mine plans subsequent to the date of any estimate may require revision of such mineral resources may be materially affected by mining, infrastructure, or other relevant factors.
SECTION 15
MINERAL RESERVE ESTIMATE
SECTION 15: MINERAL RESERVE ESTIMATE
Table of Contents
| Page | ||
| 15.1 | Assumptions, Parameters and Methods | 1 |
| 15.2 | Mineral Reserves | 5 |
| 15.3 | Mineral Reserve Sensitivity to Mining, Metallurgical, Infrastructure, Permitting, and Other Relevant Factors | 7 |
| List of Tables | ||
| Table 15-1: Lerchs-Grossmann Inputs | 1 | |
| Table 15-2: Overall Pit Slope Design Criteria | 2 | |
| Table 15-3: Yellowhead Mineral Reserve Estimate | 6 | |
| List of Figures | ||
| Figure 15-1: Reserve Pit - Plan View | 2 | |
| Figure 15-2: Reserve Pit - Section 304400E Looking West | 3 | |
| Figure 15-3: Reserve Pit - Section 305225E Looking West | 3 | |
| Section 15 | Mineral Reserve Estimate | Page 1 |
15.1 Assumptions, Parameters and Methods
(a) Pit Size Determination
The extent of the reserve pit was determined by applying the Lerchs-Grossman pit optimization algorithm to the measured and indicated resources described in Section 14 of this report. The resultant reserve basis pit shell was used as a guide to develop the detailed reserve pit design.
The input parameters used to derive the reserve basis pit shell are detailed in Table 15-1. Metal recovery estimates were produced based on grade recovery models developed from the metallurgical testing discussed in Section 13 of this report.
All costs are in Canadian dollars (C$) and units are metric unless stated otherwise.
Table 15-1: Lerchs-Grossmann Inputs
| Model Input | Value |
| Copper Price | US $2.85/lb |
| Gold Price | US $1,610/ oz |
| Silver Price | US $18.75/ oz |
| Exchange Rate | US$1.00 : C$1.30 |
| Pit Rim Mining Cost - Overburden | $2.33/tonne mined |
| Pit Rim Mining Cost - Non-PAG Waste | $2.28/tonne mined |
| Pit Rim Mining Cost - PAG Waste | $2.79/tonne mined |
| Pit Rim Mining Cost - Ore | $2.07/tonne mined |
| Bench Incremental Cost | $0.035/tonne per bench |
| Processing Cost | $6.00/tonne milled |
| Water Treatment Cost | $0.20/tonne milled |
| G&A Cost | $1.20/tonne milled |
| Sustaining Capital | $0.20/tonne mined |
| Copper cut-off grade | 0.17% Cu |
| Average Copper Recovery* | 90% |
| Average Gold Recovery* | 36% |
| Average Silver Recovery* | 59% |
| Off-Property Costs | $0.48/lb Cu |
| Payable Copper in Concentrate | 96.1% |
| Payable Silver in Concentrate | 90% |
| Payable Gold in Concentrate | 90% |
| Overall Slopes | Range from 30 to 40 degrees |
* Average metal recoveries calculated for ore contained within the pit optimization limits
| Section 15 | Mineral Reserve Estimate | Page 2 |
15.1 Assumptions, Parameters and Methods - Cont'd
(b) Pit Design
Access ramps, sector-specific wall angles, practical mining development considerations and scheduling factors were incorporated into the reserve pit design.
The overall pit slope design is based on recommendations made by geotechnical consultants shown in Table 15-2. Other open pit design parameters are discussed further in Section 16.2.
Table 15-2: Overall Pit Slope Design Criteria
| Zone | Azimuth | Maximum Overall Slope |
| North and Northwest Facing Slopes |
120o to 225o | 30° |
| All Other Slopes | 0° to 120° 225o to 360o |
40° |
The reserve pit design is illustrated in Figure 15-1 with selected cross sections shown in Figures 15-2 and 15-3.

Figure 15-1: Reserve Pit - Plan View
| Section 15 | Mineral Reserve Estimate | Page 3 |
15.1 Assumptions, Parameters and Methods - Cont'd
(b) Pit Design - Cont'd

Figure 15-2: Reserve Pit - Section 304400E Looking West
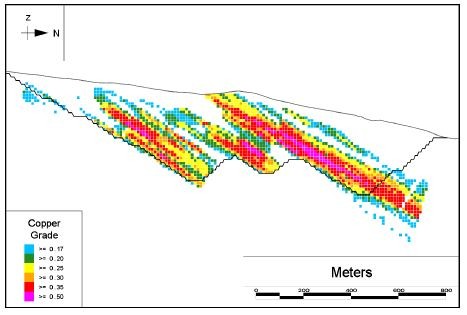
Figure 15-3: Reserve Pit - Section 305225E Looking West
| Section 15 | Mineral Reserve Estimate | Page 4 |
15.1 Assumptions, Parameters and Methods - Cont'd
(c) Cut-Off Grade
Reserves are stated at a copper cut-off grade of 0.17% based an evaluation documented in the 2020 Technical Report.
To validate the copper cut-off grade used, a break-even cut-off grade was calculated using the processing, G&A, water treatment and offsite costs described in Table 15-1. Mining costs of C$2.31 per ton mined were assumed based on average pit-rim mining costs plus allowances for mining at depth, and stockpile rehandle. For a copper price of US$4.25/lb and foreign exchange rate of US$1.00 : C$1.30, the break-even cut-off grade is 0.13% copper, demonstrating that the copper cut-off grade of 0.17% remains elevated and therefore conservative. Revenues from gold and silver were ignored for this analysis.
In the opinion of the QP, the current copper cut-off grade of 0.17% is appropriate based on the grade distribution of the orebody, mill capacity, forecast long range metal prices, capital costs, and operating costs.
| Section 15 | Mineral Reserve Estimate | Page 5 |
15.2 Mineral Reserves
Reserve classifications used in this study confirm to the 2014 CIM Definition Standards:
Modifying Factors are considerations used to convert Mineral Resources to Mineral Reserves. These include, but are not restricted to, mining, processing, metallurgical, infrastructure, economic, marketing, legal, environmental, social and governmental factors.
A Mineral Reserve is the economically mineable part of a Measured and/or Indicated Mineral Resource. It includes diluting materials and allowances for losses, which may occur when the material is mined or extracted and is defined by studies at Pre-Feasibility or Feasibility level as appropriate that include application of Modifying Factors. Such studies demonstrate that, at the time of reporting, extraction could reasonably be justified.
The reference point at which Mineral Reserves are defined, usually the point where the ore is delivered to the processing plant, must be stated. It is important that, in all situations where the reference point is different, such as for a saleable product, a clarifying statement is included to ensure that the reader is fully informed as to what is being reported.
The public disclosure of a Mineral Reserve must be demonstrated by a Pre-Feasibility Study or Feasibility Study.
Mineral Reserves are sub-divided in order of increasing confidence into Probable Mineral Reserves and Proven Mineral Reserves. A Probable Mineral Reserve has a lower level of confidence than a Proven Mineral Reserve.
A Probable Mineral Reserve is the economically mineable part of an Indicated, and in some circumstances, a Measured Mineral Resource. The confidence in the Modifying Factors applying to a Probable Mineral Reserve is lower than that applying to a Proven Mineral Reserve.
A Proven Mineral Reserve is the economically mineable part of a Measured Mineral Resource. A Proven Mineral Reserve implies a high degree of confidence in the Modifying Factors.
In order to meet the requirements of CIM Definition Standards for Mineral Resources and Mineral Reserves (2014) that are incorporated by reference into NI 43-101with respect to determining the economically mineable part of the resource, a reserve basis pit shell was determined through the process discussed in Section 15.1. This pit shell was used as a guide to develop the detailed reserve pit design, production schedule and economic model. This technical report includes adequate information on mining, processing, metallurgical, economic, and other relevant modifying factors that demonstrate, at the time of reporting, that economic extraction is justified.
| Section 15 | Mineral Reserve Estimate | Page 6 |
15.2 Mineral Reserves - Cont'd
Proven and probable reserves are derived from measured and indicated resources respectively, that are contained within the reserve pit design and are above the stated copper cut-off grade. Table 15-3 summarizes the proven and probable mineral reserves as of June 1, 2025.
Table 15-3: Yellowhead Mineral Reserve Estimate
| Yellowhead Project Mineral Reserves Effective June 1, 2025 At 0.17% Copper Cut-off |
|||||
| Category | Tonnes (millions) |
Cu (%) | Au (gpt) | Ag (gpt) | Cu Eq. * (%) |
| Proven | 458 | 0.29 | 0.031 | 1.3 | 0.30 |
| Probable | 359 | 0.26 | 0.028 | 1.2 | 0.28 |
| Total | 817 | 0.28 | 0.030 | 1.3 | 0.29 |
Notes:
1. Mineral Reserves follow CIM Definition Standards for Mineral Resources and Mineral Reserves (2014).
2. Mineral Reserves are contained within Mineral Resources.
3. Mineral Reserves are assumed to be extracted using open pit mining methods and are based on the following assumption: Metal prices of US$2.85/lb Cu, US$1,610/oz Au and US$18.75/oz Ag; a foreign exchange rate of C$1.30 : US$1.00; average metal recoveries of 90% for copper, 36% for gold and 59% for silver; combined processing, G&A and water treatment costs of C$7.40/t milled; pit-rim mining costs of C$2.33/t of overburden, C$2.28/t of non-PAG waste, C$2.79/t of PAG waste and C$2.07/t of ore with a bench increment of C$0.035/t mined per bench and sustaining capital allowance of C$0.20/t mined; average offsite costs of C$0.48/lb of copper; payable metal terms of 96.1% for copper, 90% for gold and 90% for silver; and overall pit slopes of 30 to 40 degrees.
4. Bulk density is estimated by lithology and ranges between 2.71 and 2.85 in rock and 2.2 in overburden.
5. Copper equivalency is based on US$4.25/lb price and 90% metallurgical recovery for copper, US$2,400/oz and 36% metallurgical recovery for gold, and US$28.00/oz and 59% metallurgical recovery for silver. CuEq can be calculated using the formula CuEq% = Cu% + Au(gpt) × 0.3351 + Ag(gpt) × 0.006331.
6. Numbers may not add due to rounding.
The reference point for the reserves is the point where the ore is delivered to the concentrator. The mineral reserves presented in Table 15-3 are contained within the mineral resources stated in Section 14 of this report.
It is the opinion of the QP that the classification of proven and probable mineral reserves as estimated in Table 15-3 meets the definitions of proven and probable mineral reserves as stated by the CIM Definition Standards for Mineral Resources and Mineral Reserves (2014) that are incorporated by reference into NI 43-101.
| Section 15 | Mineral Reserve Estimate | Page 7 |
15.3 Mineral Reserve Sensitivity to Mining, Metallurgical, Infrastructure, Permitting, and Other Relevant Factors
As with any mining operation there are a number of factors that may have a material and adverse impact on the operating performance, operating costs, and revenue estimated as the basis for resources and reserves in this report. The mineral reserve estimate was based upon economic parameters, geotechnical design criteria and metallurgical recovery estimates detailed in this report. Changes in these assumptions may impact the mineral reserve estimate.
Relative to the estimates presented in this report, increases in operating costs and/or reductions in estimated revenue, whether due to metallurgical recovery, commodity prices, or exchange rates, will negatively impact economic valuation of the project. However, the conservative commodity price assumptions relative to consensus pricing used to confine the reserve and the use of an elevated cut-off grade as opposed to a break-even cut-off grade will accommodate some variability in these factors without affecting the reserve estimate.
The project will require licenses and permits from various governmental authorities. There can be no assurances that Taseko will be able to obtain all necessary licenses and permits that may be required to carry out all proposed development and operations.
SECTION 16
MINING METHOD
SECTION 16: MINING METHOD
Table of Contents
| Page | ||
| 16.1 | Introduction. | 1 |
| 16.2 | Pit Design | 1 |
| 16.3 | Mine Dewatering | 2 |
| 16.4 | Waste Rock and Overburden Storage | 2 |
| 16.5 | Ore Storage | 3 |
| 16.6 | Dilution and Ore Loss | 3 |
| 16.7 | Production Schedule | 4 |
| 16.8 | Major Mine Equipment | 9 |
| List of Tables | ||
| Table 16-1 : Pit Slope Design Criteria | 1 | |
| Table 16-2 : Mine Production Schedule | 4 | |
| Table 16-3: Major Mining Equipment | 9 | |
| List of Figures | ||
| Figure 16-1: Mill Feed by Phase | 5 | |
| Figure 16-2: End of Pre-Production | 5 | |
| Figure 16-3: End of Year 5 | 6 | |
| Figure 16-4: End of Year 10 | 6 | |
| Figure 16-5: End of Year 15 | 7 | |
| Figure 16-6: End of Year 20 | 7 | |
| Figure 16-7: End of Operations (Year 25) | 8 | |
| Section 16 | Mining Method | Page 1 |
16.1 Introduction
The Yellowhead Project envisions an open pit mine utilizing conventional truck and shovel mining techniques. The equipment utilized will be typical of that found in other modern, large-scale, open pit mines. Open pit operations are planned to supply the concentrator with 90,000 tpd of ore at a cut-off grade of 0.17% copper. Ore will be delivered to a primary crusher located at the southwestern rim of the ultimate pit. An ore stockpile will be built during the first five years of operation to maximize ore grade delivered to the concentrator during that period and mitigate operational disruptions. Potentially acid generating (PAG) waste rock will be co-disposed within the TSF while overburden and non-acid generating (NAG) waste rock will be stored in designated storage areas surrounding the open pit.
16.2 Pit Design
Access ramps, sector-specific wall angles, practical mining development considerations and scheduling factors were incorporated into the reserve pit design and intermediate phases.
Slope designs for the open pit are based on recommendations made by geotechnical consultants shown in Table 16-1. A single-bench configuration of 15 m high benches is used based on the scale of mining equipment selected. Inter-ramp slopes up to 150 m high are used with enlarged berms or haul roads breaking up larger slopes to honor overall slope requirements.
Table 16-1 : Pit Slope Design Criteria
| Zone | Azimuth | Bench Face Angle |
Inter-Ramp Angle |
Maximum Overall Slope |
| North and Northwest Facing Slopes |
120 to 225o | 60o | 35° | 30° |
| All Other Slopes | 0 to 120° 225 to 360o |
70o | 44° | 40° |
Haul roads are designed 40 m wide to allow for double-lane hauling including allowances for berms and ditches. Single-lane, 27.5 m wide roads are used to maximize ore extraction and mining width at pit bottoms. Road grades are limited to 10% with flat switchbacks.
| Section 16 | Mining Method | Page 2 |
16.3 Mine Dewatering
A dewatering system is designed to remove surface runoff and groundwater inflows from the open pit. The system is designed to initially remove water from the starter pits and will be expanded as the pit depth increases. Water will be pumped to the process water pond at the plant site.
16.4 Waste Rock and Overburden Storage
Total waste material produced from the open pit will be 1.1 billion tonnes. This includes:
• 50 million tonnes of overburden type waste;
• 560 million tonnes of non-acid generating (NAG) waste rock; and
• 500 million tonnes of potentially acid generating (PAG) waste rock.
Overburden waste consists of the unconsolidated materials located above bedrock. Overburden of sufficient quality for use in reclamation will be segregated from NAG waste rock and stored in several locations surrounding the pit.
Surplus NAG waste rock not designated for TSF embankment construction will be stored in four locations located to the south and southwest of the open pit. PAG waste rock will be co-disposed within the TSF so that it is submerged by water or tailings to prevent oxidation.
In-pit storage of waste rock is planned for later in the mine life when final pit walls have been exposed. Both NAG and PAG waste rock will be stored in-pit with PAG placed so that it will be submerged as the pit fills with water in closure.
Waste rock storage areas are designed based on the recommendations of geotechnical consultants. In-pit storage areas and other temporary slopes that will not require re-sloping in closure are designed using slopes of 1.3 : 1.
| Section 16 | Mining Method | Page 3 |
16.5 Ore Storage
Ore is classed into the following three categories: PAG ore, high-grade NAG ore and low- grade NAG ore using a cut-over grade of 0.25% copper.
PAG ore and high-grade NAG ore mined during the pre-production period will be stored within the ultimate pit footprint and processed during the first year of operations. Excess low-grade NAG ore mined will also be stored within the ultimate pit footprint and west of the ultimate pit adjacent to the primary crusher for processing in years 6 through 11.
16.6 Dilution and Ore Loss
For reserve and planning purposes dilution and ore loss are considered to be zero for the following reasons:
• The deposit shows good lateral and vertical continuity at the cut-off grades applied for scheduling;
• There is a broad width to the ore zones on individual benches;
• A detailed grade control program will be implemented; and
• Internal dilution is reflected through sample compositing and interpolation techniques used to generate the resource model.
| Section 16 | Mining Method | Page 4 |
16.7 Production Schedule
To facilitate scheduling, the reserve pit discussed in Section 15 of this report has been divided into five mining phases. The production schedule considers the following objectives to ensure efficient and practical mining operations:
• Target areas of higher copper grade to maximize copper production early in the mine plan;
• Maintain sufficient mining width on each bench for efficient operations in each phase;
• Limit vertical bench mining rate to 6 benches per year;
• Supply enough non-acid generating (NAG) waste rock to meet TSF and other construction requirements; and
• Provide an efficient ramp system that minimizes haul distances to ore and waste destinations.
The production schedule consists of a 2-year pre-production period followed by a 25-year operational period. Pre-production mining focuses on pre-stripping of pit phases 1 and 2; establishment of an ore stockpile to support mill start-up; and supplying NAG waste for construction of haul roads to the various material destinations, construction of the TSF starter embankment and filling out the primary crusher pad.
In the production phase, mining is scheduled to supply ore to the primary crusher at a rate of 90,000 tonnes per day except in year 1 to allow for commissioning and ramp-up of the concentrator. Mining in the first two pit phases continues and then expands to the south, then west, then east in a series of pushbacks.
A summary of the production schedule is shown in Table 16-2 and mill feed by pit phase is shown in Figure 16-1. End of period figures showing end of pre-production and years 5, 10, 15, 20, and 25 are shown in Figures 16-2 through 16-7.
Table 16-2 : Mine Production Schedule
| Project Period | Pre- Production Total |
Years 1-5 Total |
Years 6-10 Total |
Years 11- 15 Total |
Years 16- 20 Total |
Years 21- 25 Total |
Grand Total |
|
| Tonnes Mined | (Mt) | 45 | 378 | 425 | 435 | 395 | 246 | 1,923 |
| Mill Feed | (Mt) | -- | 160 | 164 | 164 | 164 | 164 | 817 |
| Copper in Mill Feed | (%) | -- | 0.32 | 0.24 | 0.26 | 0.26 | 0.30 | 0.28 |
| Gold in Mill Feed | (gpt) | -- | 0.039 | 0.025 | 0.028 | 0.027 | 0.029 | 0.030 |
| Silver in Mill Feed | (gpt) | -- | 1.3 | 1.2 | 1.2 | 1.4 | 1.2 | 1.3 |
| Section 16 | Mining Method | Page 5 |
16.7 Production Schedule - Cont'd
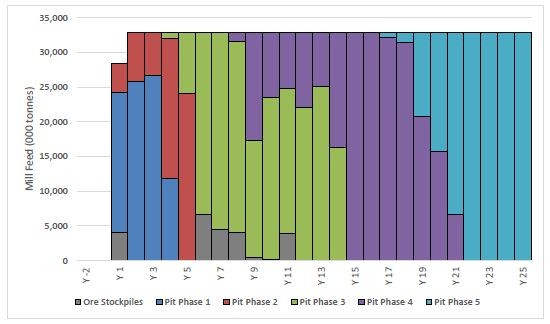
Figure 16-1: Mill Feed by Phase

Figure 16-2: End of Pre-Production
| Section 16 | Mining Method | Page 6 |
16.7 Production Schedule - Cont'd
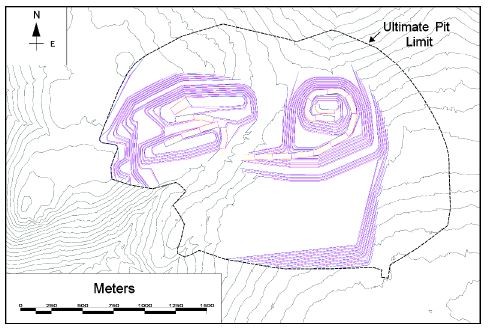
Figure 16-3: End of Year 5

Figure 16-4: End of Year 10
| Section 16 | Mining Method | Page 7 |
16.7 Production Schedule - Cont'd

Figure 16-5: End of Year 15

Figure 16-6: End of Year 20
| Section 16 | Mining Method | Page 8 |
16.7 Production Schedule - Cont'd
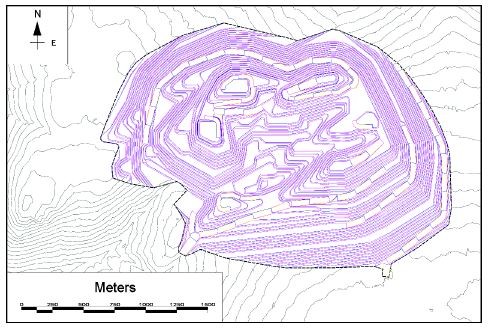
Figure 16-7: End of Operations (Year 25)
| Section 16 | Mining Method | Page 9 |
16.8 Major Mine Equipment
The major mining equipment fleet is listed in Table 16-3.
Table 16-3: Major Mining Equipment
| Unit | Capacity | Maximum Fleet Size |
| Electric Rotary Drill | 311 mm hole size | 5 |
| Electric Rope Shovel | 55 m3 | 3 |
| Diesel Hydraulic Shovel | 36 m3 | 1 |
| Front-End Loader | 30 m3 | 1 |
| Haul Truck | 290 t | 25 |
Production fleet equipment requirements have been determined using industry standard first principle-based calculations for productivities and equipment hours required to meet production requirements. The mine is assumed to operate 24 hours per day, 365 days per year on 12-hour shifts.
The major mining equipment fleet will ramp up during the pre-production period with all major equipment in-service by year 1 of operation except for one drill which will be added in year 4 and five haul trucks which will be added in years 13 through 15.
A fleet of support equipment consisting of track dozers, wheel loaders, motor graders and service vehicles is also included.
SECTION 17
RECOVERY METHOD
SECTION 17: RECOVERY METHOD
Table of Contents
| Page | ||
| 17.1 | Introduction | 1 |
| 17.2 | Plant Design & Equipment | 3 |
| 17.3 | Energy Requirements | 14 |
| 17.4 | Instrumentation & Control System | 14 |
| 17.5 | Staffing Requirements | 14 |
| List of Tables | ||
| Table 17-1: Major Process Design Criteria | 5 | |
| Table 17-2: Energy Requirements by Concentrator Area | 14 | |
| List of Figures | ||
| Figure 17-1: Simplified Process Flowsheet | 2 | |
| Figure 17-2: Concentrator General Arrangement Drawing | 4 | |
| Section 17 | Recovery Method | Page 1 |
17.1 Introduction
The sulphide concentrator for the Yellowhead Project will include three stages of comminution, followed by three stages of flotation and a final concentrate dewatering stage. The concentrator has been designed for simplicity of operations and maintenance and to meet the project's metallurgical targets. Process design and equipment sizing were informed by results from the 2011/2012 G&T and 2020/2021 SGS metallurgical test programs as discussed in Section 13 of this report.
The concentrator is designed to process 90,000 tonnes per day of ore and produce a marketable copper concentrate containing payable amounts of gold and silver. The first stage of comminution will consist of a gyratory crusher fed ROM ore from the open pit. The product from the crusher will be transported via overland conveyors to a coarse ore stockpile. Ore from the stockpile will be reclaimed and fed to two parallel SAG-ball mill circuits which produce feed for a single rougher flotation bank. Sulphide minerals will be recovered using typical flotation reagents such as collectors, a frother, and a pH modifier. The rougher flotation concentrate will be reground in two parallel vertical stirred mills prior to being processed in a two-stage cleaner flotation circuit which will include both tank and column flotation cells.
The final concentrate will be dewatered by thickening followed by filtration to meet transportation moisture requirements prior to being conveyed to the final concentrate stockpile. From there, the final concentrate will be trucked off site to a nearby rail load-out facility for subsequent transport to the Port of Vancouver or direct rail to other North American markets.
Both rougher and first cleaner flotation tailings will be transported separately to the tailings storage facility (TSF). Process water from the TSF will be reclaimed and recycled back to the process water pond for reuse.
A simplified process flowsheet is presented in Figure 17-1.
| Section 17 | Recovery Method | Page 2 |
17.1 Introduction - Cont'd
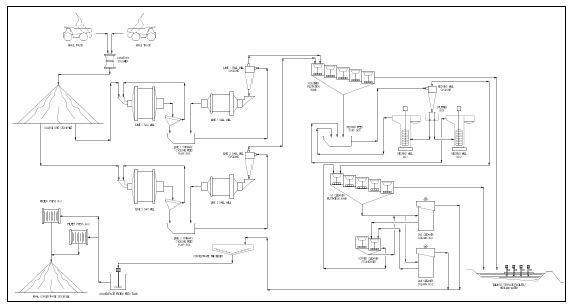
Figure 17-1: Simplified Process Flowsheet
| Section 17 | Recovery Method | Page 3 |
17.2 Plant Design & Equipment
The crusher facility will be located near the ultimate pit rim, with crushed ore being transported via an overland conveyor system to the concentrator, located near the topological high between the pit and TSF areas. The TSF will be located in the valley to the south of the concentrator and tailings will be transported from the concentrator via gravity pipelines.
The concentrator is designed with the following unit operations:
• Crushing and overland conveying;
• Coarse ore stockpile and reclaim;
• Primary grinding;
• Rougher flotation;
• Concentrate regrind;
• Cleaner flotation;
• Concentrate dewatering;
• Concentrate storage and transportation;
• Tailings storage and water reclaim;
• Reagents handling and distribution;
• Assay and metallurgical laboratory;
• Water supply systems.
The following sections provide details on the process design criteria and each of the process unit operations.
An overall general arrangement for the concentrator facility is presented in Figure 17-2.
| Section 17 | Recovery Method | Page 4 |
17.2 Plant Design & Equipment - Cont'd

Figure 17-2: Concentrator General Arrangement Drawing
| Section 17 | Recovery Method | Page 5 |
17.2 Plant Design & Equipment - Cont'd
(a) Major Design Criteria
The process facilities are designed to achieve a nominal throughput rate of 90,000 tpd, or 33 million tonnes per annum. Table 17-1 summarizes the major design criteria used for the facilities.
Table 17-1: Major Process Design Criteria
| Design Criteria | Unit | Value |
| Operating Days | Days | 365 |
| Operating Time | Hours | 24 |
| Daily Throughput | tpd | 90,000 |
| Annual Throughput | tpa | 32,850,000 |
| Design Processing Rate | tph | 4,076 |
| Design Process Plant Copper Recovery | % | 90 |
| Design Final Concentrate Grade | % Cu | 26 |
| Crusher Utilization | % | 60 |
| Grinding and Flotation Availability | % | 92 |
| Ore Specific Gravity | t/m3 | 2.8 |
| Crusher Work Index | kWh/t | 6.6 |
| Bond Rod Mill Work Index | kWh/t | 11.8 |
| Bond Ball Mill Work Index | kWh/t | 13.2 |
| A*b | 50.8 | |
| Primary Crushing Rate, dry | tph | 7,500 |
| Grinding and Flotation Process Rate, dry | tph | 4,076 |
| Ball Mill P80 Product Size | µm | 165 |
| Regrind P80 Product Size | µm | 25 |
The SAG and ball mills were sized based on energy calculations using ore hardness results from SMC grindability and Bond work index testing described in Section 13 of this report. The specific energy requirements for the regrind circuit were benchmarked from a pilot plant campaign conducted on an ore sample of comparable ore hardness with a similar target regrind product size.
The flotation cells were sized based on the estimated slurry flow rates and the flotation retention time requirements informed by the 2020/2021 metallurgical test program described in Section 13. Typical scale‐up factors were applied for sizing flotation cells and a minimum number of cells were applied based on experience to avoid short circuiting.
| Section 17 | Recovery Method | Page 6 |
17.2 Plant Design & Equipment - Cont'd
(b) Crushing
The crusher facility is designed with a single gyratory crusher with a double-sided dump pocket for the mine haulage trucks. The facility will be located on south-west edge of the open pit to minimize ore haulage distances. The crusher will be serviced by a fixed hydraulic crane and a rock breaker. The crusher and conveyor system have been sized to process ROM ore at design rate of 7,500 tonnes per hour (tph), which is an excess capacity of approximately 45 percent more than concentrator throughput. This excess crushing capacity provides operating and maintenance flexibility while minimizing feed disruptions to the concentrator. The P80 product size generated at the discharge of the crusher is expected to range between 160mm to 250mm, depending on the crusher gap setting. The crusher product will discharge into a surge bin sized to hold approximately two truckloads of material. From the surge bin the crushed ore will discharge via an apron feeder which meters the crushed material onto the conveyor system that transports the ore onto the coarse ore stockpile. The crushing facility will also be equipped with a dust suppression/collection system to control any fugitive dust that is generated during crushing, material loading, and related operations.
The major equipment in this area includes:
• One 1,370 kW gyratory crusher, 1,524 mm x 2,794 mm;
• One apron feeder, 2,438 mm wide x 10,100 mm long;
• One hydraulic rock breaker;
• One fixed hydraulic crane;
• One 800 kW sacrificial conveyor, 1,828 mm wide x 360 m long;
• Two 4,500 kW overland belt conveyors, 1,524 mm wide x of 1,700 m (total length);
• One 1,500 kW stacking conveyor, 1,524 mm wide x 380 m long;
• Dust suppression systems.
| Section 17 | Recovery Method | Page 7 |
17.2 Plant Design & Equipment - Cont'd
(c) Stockpile and Reclaim
The coarse ore stockpile is designed with a live storage capacity of 45,000 tonnes. The crushed ore will be reclaimed from the stockpile via two parallel conveying systems with three apron feeders installed on each conveyor line.
The apron feeders for each grinding line have been sized to achieve nominal design throughput rates while operating only two out of the three feeders. The reclaimed ore from the apron feeders will discharge onto a belt conveyor, transporting the crushed ore to the SAG mills.
Each SAG mill feed conveyor has been designed with 30 percent excess capacity compared to nominal plant throughout and will be equipped with a belt scale to measure and control the SAG mill throughput. The reclaim area will be equipped with a dust collection system to control fugitive dust generated during loading and transport of the crushed ore.
The major equipment in this area includes:
• Six 22 kW apron feeders, 1,219 mm wide x 7,000 mm long;
• Two 447 kW conveyor belts, 1,828 mm wide x 243 m long;
• Dust suppression system.
| Section 17 | Recovery Method | Page 8 |
17.2 Plant Design & Equipment - Cont'd
(d) Primary Grinding
Primary grinding consists of two parallel SAG mill and ball mill circuits. Each circuit includes variable speed, dual pinion driven SAG and ball mills powered by low-speed induction motors. All the grinding mills use identical electrical drive systems to standardize equipment and allow for interchangeable parts.
Each grinding line is designed with a SAG mill discharging onto a vibrating double-deck screen equipped with spray bars to wash entrained fines from the screen oversize. The screen oversize is recirculated to the SAG mill feed via a pebble conveying system. Consideration has been made in the design for the installation of a future pebble crusher, if required.
Screen undersize combines with the ball mill discharge in a common primary cyclone feed pump box where it's pumped by a single centrifugal pump to a hydrocylone cluster. Cyclone underflow returns to the ball mill, while cyclone overflow flows by gravity to the rougher flotation circuit. The ball mills have been designed for a circulating load of 350 percent and to produce a P80 product size of 165 μm.
Reject steel from the SAG mills will be recovered via belt magnets installed on the pebble recycle conveying system, while reject steel from the ball mills will be collected via trommel magnets installed on the ball mill discharge. Steel media will be loaded into the mills via skips from steel media storage bins located on the south wall of the grinding circuit.
The major equipment in this area includes:
• Two 17 MW dual pinion SAG mills, 11 m x 7 m driven by variable frequency low speed induction motors;
• Two dual pinion 17 MW ball mills, 7.9 m x 12.1 m driven by variable frequency low speed induction motors;
• Two pebble recycle conveying systems, consisting of three conveyors including a high-angle conveyor;
• Two hydrocyclone clusters, each with fifteen- 700 mm hydrocyclones per cluster;
• Two vibrating double-deck Screens: 3.6 m x 7.3 m with 7.5 o incline;
• Two 2.2 MW Primary Cyclone Feed Pumps.
| Section 17 | Recovery Method | Page 9 |
17.2 Plant Design & Equipment - Cont'd
(e) Flotation and Regrinding Circuits
The ground ore from both grinding lines will be combined and processed in the flotation and regrind circuits to recover the valuable minerals. The recovery process will consist of rougher flotation, concentrate regrind, and two stages of cleaner flotation.
Copper Rougher Flotation Circuit
The rougher flotation circuit is designed with a single bank of forced air flotation tank cells fed with the cyclone overflow product from both primary grinding lines. The rougher flotation circuit will produce a concentrate which will be pumped to the regrind circuit and a tailing stream which will gravity flow to the TSF. Flotation reagents added to the rougher flotation include lime as a pH regulator, a dual collector system based on mercaptan and thionocarbamate chemistry, and a frother based on alcohol and glycol ether chemistry.
The major equipment in this area includes:
• Six 630 m3 rougher flotation tank cells
Regrind Circuit
The regrind circuit is designed with two vertical stirred mills operating in parallel. Rougher concentrate slurry will be pumped from the regrind cyclone feed pump box to a cluster of regrind cyclones. The cyclones will classify the slurry with the underflow being split to feed the vertical stirred mills. The discharge of the vertical mills will be returned to the regrind cyclone feed pumpbox by gravity flow. The regrind cyclone overflow will transport the classified circuit product to the cleaner flotation circuit. The regrind hydrocyclone and pumping system has been designed for a circulating load of 250 percent. Lime will be added to the circuit to maintain slurry pH targets for downstream processing in the cleaner flotation circuit.
The major equipment in this area includes:
• Two 3,355 kW stirred mills;
• One hydrocyclone cluster containing twelve 400 mm hydrocyclones;
• Two 220 kW hydrocyclone feed pumps (one operating and one standby).
| Section 17 | Recovery Method | Page 10 |
17.2 Plant Design & Equipment - Cont'd
(e) Flotation and Regrinding Circuits - Cont'd
Cleaner Flotation Circuit
The cleaner flotation circuit will consist of an open circuit first cleaner flotation stage and a closed circuit second cleaner stage. Reground rougher concentrate will be pumped to the first cleaner stage consisting of a bank of six forced air flotation tank cells. The tailings from the first cleaner cells will flow by gravity to the TSF through a dedicated pipeline.
The concentrate from the first cleaner flotation cells will be pumped to the second cleaner stage consisting of two parallel flotation columns equipped with an external hydrodynamic sparging system to maximize fine particle recovery. The concentrate from both columns will be the final copper concentrate and be pumped to the copper concentrate dewatering circuit.
The tailings from both columns will be pumped to a second cleaner scavenger stage consisting of two forced air tank flotation cells. Concentrate from the scavenger cells will be recycled back to the second cleaner column feed, while the tailings will be returned to the feed of the first cleaners.
The major equipment in this area includes:
• Six 160 m3 first cleaner flotation tank cells;
• Two 5 m x 12 m second cleaner flotation columns operated in parallel;
• Two 50 m3 second cleaner scavenger flotation tank cells.
| Section 17 | Recovery Method | Page 11 |
17.2 Plant Design & Equipment - Cont'd
(f) Concentrate Dewatering
The concentrate dewatering circuit consists of a high rate thickener, pressure filter, and material handling equipment to stockpile concentrate for shipment to the smelters. Final concentrate generated from the flotation columns will be pumped to the concentrate thickener, where flocculent will be added to aid the settling process.
The thickener underflow, estimated at 55 to 65 percent solids density, will be pumped to the concentrate stock tank and then pumped to the pressure filters for further dewatering to approximately 8 percent moisture. Filtered concentrate will be transported by conveyor to a stockpile prior to it being transported by truck to the off‐site concentrate handling facility in Vavenby.
The filtrate generated from the pressure filters will be returned to the concentrate thickener as dilution water. The concentrate thickener overflow will be collected and sent to the TSF and reclaimed back to the process water pond to be reused as process make‐up water.
The major equipment in this area include:
• One 35 m high rate thickener;
• One fully automated flocculant mixing and dosing system;
• Two parallel vertical plate pressure filters;
• Conveying system to concentrate stockpile;
• Slurry pumps, including the high head pumps for the pressure filters.
| Section 17 | Recovery Method | Page 12 |
17.2 Plant Design & Equipment - Cont'd
(g) Tailings Storage and Water Reclaim
The TSF will be located to the south of the concentrator. The rougher and first cleaner flotation tailings from the concentrator will be transported to the TSF separately via gravity. Process water will be reclaimed back from the drained tailings and recycled back to the concentrator for re-use via a pump-back systems and the associated process water pond. Further details on the TSF can be found in Section 18 and further details on the reclaim water system can be found in Section 17.2(j).
(h) Reagent Handling and Distribution
The reagent facility will be located adjacent to the main concentrator and is designed to include systems to mix, store and distribute the various reagents required to support the flotation and concentrate dewatering operations. Reagents will be delivered to site in dry or liquid form and stored in dedicated areas within the facility, which will be equipped with appropriate containment, ventilation, and safety infrastructure that will include:
• Lime silo and slaking system;
• Reagent mixing and storage tanks;
• Automated flocculant mixing and dosing skids;
• Metering pumps and distribution piping;
• Containment systems, ventilation, and standard safety equipment such as eye- wash stations and safety showers.
| Section 17 | Recovery Method | Page 13 |
17.2 Plant Design & Equipment - Cont'd
(i) Assay and Metallurgical Laboratory
The assay and metallurgical laboratory, located south of the concentrator, will be designed and equipped to support the necessary analytical and metallurgical needs for the mine, the concentrator, and the environmental departments. It will provide all routine assay analysis as well as metallurgical test work for plant monitoring and optimization.
The analytical lab will include sample preparation stations and instruments for fire assay, atomic absorption spectroscopy (AAS), and inductively coupled plasma (ICP) analysis. Dedicated wet lab space will also support environmental testing.
The metallurgical laboratory will house bench-scale flotation cells, grinding mills, and other equipment suitable for circuit optimization and troubleshooting
The major equipment in this area includes:
• Sample preparation stations including drying oven, jaw crusher, and pulveriser;
• Fire assay furnace and related equipment;
• AAS and ICP analytical instruments;
• Fume hoods and wet lab equipment for environmental analysis;
• Bench-scale flotation cells, grinding mills and test work apparatus.
(j) Water Supply Systems
All of the process water will be distributed to the plant site from the process water pond. The bulk of the process water will be supplied from water reclaimed from the TSF via a reclaim barge and water pumping system. The reclaim barge consists of six vertical turbine pumps to feed the process water pond. Some supplementary water from pit dewatering and site collection ponds will also be pumped to the process water pond. The pond has been designed to have a storage capacity of 26,000m3, amounting to approximately three hours of storage capacity based on nominal plant water demand. Separate fire water and process water pumping systems have been designed to draw from the pond as required.
Major equipment in this area includes:
• One 14.6 m x 29.2 m x 3.7 m floating barge;
• Six 1,865 kW reclaim water barge pumps;
• Four 745 kW reclaim water booster pumps.
| Section 17 | Recovery Method | Page 14 |
17.3 Energy Requirements
The annual power consumption for the concentrator (MWh per year) is based on the plant operating 24/7 with an availability of 92%. The primary grinding circuit will consume the largest proportion of energy in the concentrator at about 75 percent. The average and total consumed electrical loads in the concentrator are summarized by area in Table 17-2 below.
Table 17-2: Energy Requirements by Concentrator Area
| Area | Average Load (kW) |
Consumption (MWh per year) |
% of Total |
| Primary Crushing | 750 | 6,600 | 1% |
| Overland Conveying/ Stockpile | 5,800 | 51,000 | 7% |
| Reclaim | |||
| Primary Grinding | 62,000 | 540,000 | 75% |
| Flotation & Regrind | 10,000 | 89,000 | 12% |
| Reagents | 100 | 800 | 0.1% |
| Dewatering | 200 | 2,000 | 0.3% |
| Water Supply System | 2,600 | 23,000 | 3% |
| Other (Lighting, Heat, Ventilation, Compressed Air) |
1,500 | 13,000 | 2% |
| Total | 83,000 | 730,000 | 100% |
| Note: Totals may not add due to rounding |
17.4 Instrumentation & Control System
The concentrator facilities will be monitored and controlled using a distributed control system (DCS). The DCS will provide centralized process monitoring, control, and data acquisition for all major process equipment and circuits.
Operator control rooms for the facility be located in the primary crusher area and the concentrator building.
17.5 Staffing Requirements
The concentrator is designed to operate 24 hours a day, 365 days a year. The workforce will be composed of technical, operational and maintenance personnel. The facility will be operated by four crews of area specific operators reporting to a crew supervisor. Maintenance work will be supervised by electrical and maintenance supervisors and conducted by trades consisting of millwrights, welders, pipe fitters, electricians and instrumentation personnel. The concentrator's technical, operations and maintenance departments will each have a multi-level supervisory structure to ensure safe and efficient operations.
SECTION 18
PROJECT INFRASTRUCTURE
SECTION 18: PROJECT INFRASTRUCTURE
Table of Contents
| Page | ||
| 18.1 | Introduction | 1 |
| 18.2 | Mine Support Infrastructure | 3 |
| 18.3 | Concentrator and Support Infrastructure | 4 |
| 18.4 | Tailings and Water Management Infrastructure | 5 |
| 18.5 | Onsite Ancillary Infrastructure | 8 |
| 18.6 | Offsite Infrastructure and Access | 10 |
| List of Figures | ||
| Figure 18-1: Site Layout | 2 | |
| Section 18 | Project Infrastructure | Page 1 |
18.1 Introduction
The infrastructure and logistics requirements described in this section consist of the following:
• Mine Support Infrastructure
• Concentrator and Support Infrastructure
• Tailings and Water Management Infrastructure
• Onsite Ancillary Infrastructure
• Offsite Infrastructure and Access
The project site layout is shown in Figure 18-1.
| Section 18 | Project Infrastructure | Page 2 |
18.1 Introduction - Cont'd
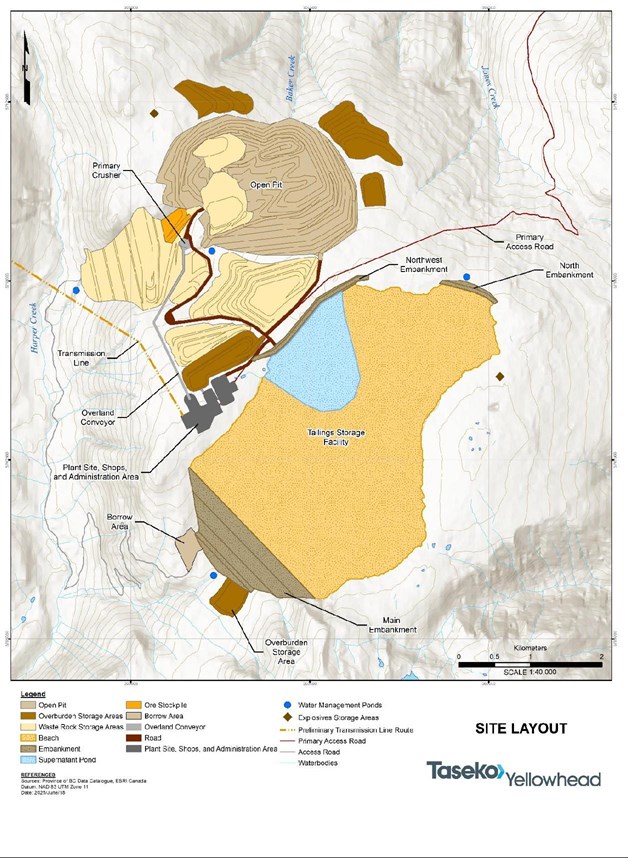
Figure 18-1: Site Layout
| Section 18 | Project Infrastructure | Page 3 |
18.2 Mine Support Infrastructure
(a) Mobile Equipment Maintenance Shop
The mobile equipment maintenance shop will be a pre-engineered building, located at the plant site, that includes a haul truck wash bay, four haul truck service bays, eight medium duty bays, four light duty bays, a light duty wash bay and lunchroom and office spaces. A welding tent sized for truck box repairs and rebuilds will be installed adjacent.
(b) Explosives Facility and Magazines
A bulk explosives facility will be located near the eastern end of the TSF, south of the North Embankment and will be operated by an explosives manufacturer.
Explosives magazines will be located on the northwest side of the open pit to store explosives accessories.
Both the bulk explosives facility and explosives magazine areas will include appropriate buffer zones to provide protection and safety of onsite infrastructure and personnel.
(c) Fuel Storage
A diesel fuelling station for mining and support equipment will be located adjacent to the primary crusher platform. A secondary fueling station for diesel and gasoline will be in the yard surrounding the mobile equipment maintenance shop to service ancillary mobile units and trucks after maintenance work.
(d) Overburden, Waste Rock and Ore Storage
Overburden and NAG waste rock will be stored in designated storage areas surrounding the open pit as shown in Figure 18-1. Ore storage will be located west of the open pit adjacent to the crusher area.
Additional details on overburden, waste rock, and ore storage are provided in Sections 16.4 and 16.5.
| Section 18 | Project Infrastructure | Page 4 |
18.3 Concentrator and Support Infrastructure
(a) Crusher and Conveyor System
The primary crusher will be located near the ultimate pit crest and will be fed by 290 tonne haul trucks from two dump pockets. Crushed ore will be transported via a 2.4 km overland conveyor system to a coarse ore stockpile, with a 45,000 tonne capacity, next to the concentrator.
(b) Concentrator Building
The concentrator building is designed as a pre-engineered building consisting of grinding, flotation and dewatering circuits which will be located in the plant site area shown in Figure 18-1. Apron feeders located underneath the coarse ore stockpile will reclaim the ore onto a conveyor which will feed the grinding circuit. Ore ground to the target particle size will then feed the flotation circuit. The resulting flotation concentrate will be thickened and dewatered using filter presses and then conveyed into the concentrate shed. Tailings will be transported by gravity through a series of pipelines to the TSF.
(c) Concentrator Support Infrastructure
The concentrator will be supported by nearby infrastructure including a process water pond, modular assay and metallurgical lab for onsite sample testing and analysis, a separate modular concentrator office building for technical and operational personnel, and a pre- engineered fixed plant maintenance shop to service the concentrator and associated infrastructure. A reagent building and adjacent lime silo will support flotation reagent preparation and distribution. A concentrate shed will provide covered concentrate storage and a truck loading area to transport final concentrate to the rail load-out facility located near Vavenby.
| Section 18 | Project Infrastructure | Page 5 |
18.4 Tailings and Water Management Infrastructure
(a) Site Water Management
Site water management has been designed to direct contact water to locations onsite for use, storage, or treatment, while non-contact water will be discharged into the receiving environment through ditching and piping. A dewatering system will be in place to manage surface water runoff and groundwater ingress from the open pit. Contact water will be pumped to the process water pond at the plant site for use in the concentrator. Excess contact water pumped to the process water pond will flow through a spillway and diversion channel to the TSF for storage.
(b) Tailings Storage Facility
The TSF will be located in the valley to the south and downstream of the concentrator at the plant site. The TSF will permanently and securely store approximately 710 Mt of tailings and 470 Mt PAG waste rock, requiring a total storage volume of approximately 780 million cubic metres.
Tailings produced at the concentrator will be gravity fed to the TSF through a series of pipelines in a series of large diameter HDPE pipelines in two streams: PAG cleaner tailings and NAG rougher tailings. Process water will be reclaimed from the TSF to the process water pond at the plant site for reuse. The NAG rougher tailings will be cycloned to produce a coarse underflow material to support construction of the TSF main embankment and a finer overflow to create a tailings beach.
The main embankment will initially be constructed as a water retaining starter embankment, using a downstream construction method starting in year -2. The starter embankment will consist of a low permeability core zone, filter zone and a rock fill shell and will begin retaining water in year -1 to capture the required water volume for mill start- up. NAG waste rock from the mine will be used as rockfill starting in year -1 and continue up to year 5. Cycloned sand will be deposited concurrently from years 2 to 5, and after year 5, used to construct centreline raises on top of the starter embankment to a final height of approximately 210 metres at a 3.5H : 1V downstream slope.
Two additional embankments will be constructed during operations. The north and northwest embankments will be built between years 12 and 16, to ensure completion prior to year 18. The north embankment will be a water retaining downstream constructed embankment supporting tailings deposition along its upstream face. The northwest embankment will be a water retaining centreline constructed embankment with a rockfill armoured upstream face to prevent erosion from wave run up. Both embankments will be constructed at a 2H : 1V slope.
| Section 18 | Project Infrastructure | Page 6 |
18.4 Tailings and Water Management Infrastructure - Cont'd
(b) Tailings Storage Facility - Cont'd
The tailings deposition strategy will develop wide tailings beaches to keep supernatant water away from the main and north embankments. A beach will be developed upstream of the main embankment by year 5 ultimately reaching a width of 1.8 km. The supernatant pond will be pushed towards the north end of the TSF until year 16, when concurrent deposition at the main and north embankments will form a second beach approximately 1.3 km wide. The PAG waste rock and cleaner tailings will be co-disposed within the TSF to prevent oxidation. PAG waste rock deposition will cease after year 20 and be fully covered by the end of mine life.
Seepage to groundwater below the TSF will be controlled primarily by the existing glacial till liner within the TSF. Seepage through the main embankment will be minimized with a low permeability core in the starter embankment along with large beaches to keep the supernatant pond far from the main embankment and lower the phreatic surface in proximity to the embankment. Cyclone underflow material used for construction of the main embankment will include water which will also be directed to the seepage pond at the toe of the TSF. Seepage from the main embankment or abutments will be directed to the seepage pond at the toe of the main embankment. Water reporting to the seepage pond downstream of the main embankment will be pumped back to the TSF through the main embankment seepage pump back system.
North embankment seepage losses will be minimized by the low permeability core and establishment of a large beach. Seepage losses from the north embankment will be directed to and collected in the seepage pond at the toe of the north embankment and pumped back to the TSF through a pump back system. Seepage losses from the northwest embankment will be minimized by a low permeability core, then directed to and collected in the site water management system and pumped to the process water pond.
The TSF supernatant pond volume is planned to be maintained at an annual average of 13 million cubic meters roughly equivalent to 2 months storage with a maximum storage volume of 18 million cubic meters during freshet. During closure the supernatant pond water will flow through a spillway to the open pit.
| Section 18 | Project Infrastructure | Page 7 |
18.4 Tailings and Water Management Infrastructure - Cont'd
(c) Process Water Storage and Distribution
Process water stored within the TSF will be pumped from a floating barge within the supernatant pond to a process water pond at the plant site. The reclaim barge will include six pumps and a separate de-icing pump and bubbler system for winter operations. Large diameter, parallel HDPE pipelines will connect the reclaim barge to the process water pond.
(d) Water Treatment Plant
A Water Treatment Plant (WTP) will be constructed and operated to manage the volume of contact water stored on site during operations. The WTP will be located at the plant site, adjacent to the process water pond, and is designed as a modular, scalable, stand-alone plant capable of treating site contact water throughout the mine life.
The initial WTP will be built in year 2 and commissioned in year 3. To meet increasing treatment requirements over the life of mine, the plant will be expanded in phases in years 9 and 20 using modular additions. Treated water will be discharged into Harper Creek through a dedicated HDPE pipeline.
| Section 18 | Project Infrastructure | Page 8 |
18.5 Onsite Ancillary Infrastructure
(a) Gatehouse and Emergency Response Buildings
A gatehouse with first aid services will provide access control for personnel and vehicles entering the site. Near the gatehouse will be an emergency response building that includes a classroom, training area, ambulance, and mine rescue vehicles. A small parking lot area will be located outside the gatehouse for suppliers and visitors.
(b) Administration Building
The administration building will be a 2-storey prefabricated modular building sized to support engineering, operations and administrative staff. The building will initially serve as the construction team office and later be repurposed for operational use after construction concludes.
(c) Mine Dry Building
The mine dry will be a stick-built building equipped with two separate changing and shower areas. It will also include offices for mine operations personnel and will be sized to support the full site operations workforce.
(d) Warehouse Building and Cold Storage
The warehouse building will be located in the plant site area with additional cold storage laydown space. The warehouse and cold storage area will be used for the storage of parts and materials required for both mine and concentrator operations.
(e) Potable and Waste Water Services
Potable water will be sourced from wells near the plant site and treated in a dedicated potable water treatment plant and distributed throughout the plant site. Sewage and wastewater will be processed in a membrane style biological treatment plant housed in a series of connected modular shipping containers. Treated effluent will be discharged into the TSF while the solid wastes will be removed and transported off site by a contractor.
| Section 18 | Project Infrastructure | Page 9 |
18.5 Onsite Ancillary Infrastructure - Cont'd
(f) Fire Protection
Water for fire suppression will be supplied from the process water pond. A prefabricated pump station, including electrical pumps with diesel backup pumps, will provide fire protection to all buildings within the plant site. Dry agent fire suppression systems will be installed in all motor control centers and electrical rooms to maintain the integrity of electrical infrastructure during a fire.
(g) Construction Camp
A single story prefabricated modular construction camp will be installed on site to accommodate the construction workforce. The construction camp will be located on site, adjacent to the other planned infrastructure. The camp will be full service, and will include dormitories, washrooms, kitchen and dining facilities. The camp will be self contained with any domestic wastes being transported offsite for disposal.
(g) Power Distribution
A new substation will be constructed at the plant site where incoming 230 kV power will be transformed down to provide 25 kV and 4.16 kV distribution voltages for site use.
Two 2 MVA stand-by generators will be installed during the pre-production phase to support construction power needs and will be repurposed as standby emergency power generators for operations. These generators will be located by the main substation.
| Section 18 | Project Infrastructure | Page 10 |
18.6 Offsite Infrastructure and Access
(a) Site Access
Primary access to site from Highway #5 is via the Vavenby Bridge Road through Vavenby and across the North Thompson River to the Birch Island Lost Creek Road (BILCR). From there, access is about 20 km along a network of existing Forest Service Roads (FSRs) that climb up to the Project site. The FSRs will be upgraded where required including a 2.5 km road extension to the Project site.
The primary access route will be in frequent use during the operations phase for the transport of concentrate from the mine site to the rail load-out facility and transportation of personnel, goods and services.
Oversized and heavy loads will use a secondary access route across the North Thompson River. This route crosses the North Thompson River at the BILCR bridge then follows the previously described access. The secondary route will be in use primarily during construction and as required during operations.
(b) Power Supply
Electrical power for the project will be supplied by a new 230kV overhead transmission line. The line will tie into BC Hydro's substation near 100 Mile House which will require some upgrades by BC Hydro. The transmission line will terminate at a new substation, located at the plant site.
(c) Rail Load-out Facility
A rail load-out facility will be constructed at an existing rail siding on a property owned by Taseko near Vavenby. The rail load-out facility will be contained within a building with associated truck ramps and equipment access doors. It will include a truck dump area, concentrate storage area and rail car loading area with a railcar scale and crane for handling railcar lids. Concentrate will be trucked from the concentrate storage shed located in the plant site to the rail load-out facility, where it will be loaded onto rail cars and transported to the Port of Vancouver for shipment to overseas markets, and/or directly railed to other North American markets.
SECTION 19
MARKET STUDIES AND CONTRACTS
SECTION 19: MARKET STUDIES AND CONTRACTS
Table of Contents
| Page | ||
| 19.1 | Market Studies and Contracts | 1 |
| Section 19 | Market Studies and Contracts | Page 1 |
19.1 Market Studies and Contracts
Copper is considered a critical metal for various industries and is essential for the development of modern technology and infrastructure. It plays a vital role in electrification and the transition to renewable sources of energy, as it is a key component in wind turbines, solar panels, electric vehicles, and power distribution infrastructure. While the price of copper has experienced some volatility in recent years, most industry experts believe the long-term fundamentals of the copper market will be strong for an extended period. Supply remains constrained due to limited new discoveries, lengthy permitting timelines and rising capital costs, while demand continues to grow above historical levels. With few major copper mines currently under construction and existing resources depleting, a significant copper deficit is projected over the next three to five years.
The project's copper concentrate is estimated to have a 25.5% copper grade with payable amounts of gold and silver and no element approaching typical smelter penalty levels.
A concentrate marketing study completed in 2025 confirmed the marketability of the anticipated final concentrate quality.
While there are currently no contracts in place for the sale of concentrate, it is expected that the clean nature of the concentrate will make it attractive to a large array of smelters globally.
The offsite costs associated with concentrate transport, port storage, stevedoring, shipping, treatment and refining have been incorporated into the project's economic analysis based on inputs developed from the concentrate marketing study and Taseko's current experience at it's Gibraltar Mine.
For evaluating the project, Taseko has relied on long-term street consensus metal pricing as of May 2025.
Standard procurement contracts will be required for construction, materials delivery and some site services.
The QP has reviewed these costs and commodity prices and confirm they support the assumptions in the technical report.
SECTION 20
ENVIRONMENTAL STUDIES, PERMITTING AND SOCIAL OR COMMUNITY
IMPACT
SECTION 20: ENVIRONMENTAL STUDIES, PERMITTING AND SOCIAL OR
COMMUNITY IMPACT
Table of Contents
| Page | ||
| 20.1 | Introduction | 1 |
| 20.2 | Environmental Baseline Studies | 2 |
| 20.3 | Waste Rock and Tailing Storage, Water Management and Site Monitoring | 6 |
| 20.4 | Permitting | 7 |
| 20.5 | Social and Community Relations | 15 |
| 20.6 | Mine Closure and Costs | 17 |
| List of Tables | ||
| Table 20-1: Preliminary List of Provincial Authorizations | 9 | |
| Table 20-2: Preliminary List of Federal Authorizations | 13 | |
| Section 20 | Environmental Studies, Permitting and Social or Community Impact | Page 1 |
20.1 Introduction
The previous owner of the property submitted an Application for an Environmental Assessment Certificate, also known as the Environmental Impact Statement, to the BC Environmental Assessment Office (EAO) and to the Canadian Environmental Assessment Agency (CEA Agency) in January 2015. This document described a previous design of the Project and was required to fulfill the requirements of both the British Columbia Environmental Assessment Act (BC EAA; 2002), and the Canadian Environmental Assessment Act (CEAA; 1992).
The application review timeline was suspended in mid-2015 to allow additional time to address additional requirements relating to tailings alternatives and management to the satisfaction of the EAO, and to further engage with Indigenous groups. After an initial three-year review timeline extension, the provincial Environmental Assessment (EA) process was terminated in 2018 by the EAO due to inactivity on the file. In February 2019, Taseko acquired 100% interest in the Project and, over the course of that year, withdrew the federal EA application and updating the tailings and water management approaches and design for the Project.
These design improvements, informed by comments received during the 2015 Harper Creek Project EA process, are summarized in the 2020 Technical Report.
| Section 20 | Environmental Studies, Permitting and Social or Community Impact | Page 2 |
20.2 Environmental Baseline Studies
Environmental baseline studies were performed between 2007 and 2014 for the Harper Creek Environmental Assessment Certificate Application with additional studies conducted by Taseko from 2019 to present. The results of these are summarized as follows.
(a) Climate and Air Quality
The climate is typical of the central interior of BC, with short warm summers and comparatively mild Canadian winters. The winter season runs from late October to late March. There is significant relief on the project site, and site climatic conditions are dependent on location and elevation.
Temperatures on site can range from highs of +26°C to lows of -35°C. The mean annual precipitation is estimated to be 1,259 mm at an elevation of 1,837 masl, with about 40% falling as rain and 60% falling as snow. At the higher site elevations, precipitation falls almost exclusively as snow from November through March, and as rain from June through August. During the shoulder months of April, May, September and October there are often mixed rain and snow conditions. The mean annual wind speed is approximately 1.6 m/s, with the wind predominantly blowing from the east-southeast year-round, although east- northeast winds are common during the summer. The mean annual relative humidity is approximately 75%.
Industrial activities within the regional area include forestry, CN rail and Trans Mountain pipeline operations in addition to traffic utilizing the Yellowhead Highway route (Highway #5) between Kamloops and Edmonton. The last operating sawmill in Vavenby shutdown in 2019. Overall baseline air quality in the project area is good due to the limited local emissions and the Project's remoteness.
(b) Noise
Potential noise sources in the surrounding area include the town of Vavenby, approximately 10 km northwest of the Project. There is a rail line passing through Vavenby, and active logging in the area surrounding the Project, along with a network of FSRs. Highway #5 runs along the North Thompson River and at its closest point is approximately 7 km to the north of the Project and is a source of traffic noise in the area. Other activities contributing to noise in the area include tourism and recreation activities such as hunting, fishing and skiing.
| Section 20 | Environmental Studies, Permitting and Social or Community Impact | Page 3 |
20.2 Environmental Baseline Studies - Cont'd
(c) Terrain and Soils
Glacial till overlies much of the bedrock in the project area, while a surface veneer of colluvium is generally present in the areas of steeper terrain. Surficial soils locally comprise organic soils and silt-rich glacial lake deposits, which are particularly prone to erosion.
Glaciofluvial outwash deposits and the fluvial terrace of the North Thompson River valley occur in the areas of the proposed power line and rail load-out facility respectively. A probabilistic seismicity assessment for the Project indicates the Project is at low risk of a damaging seismic event.
(d) Hydrology
The site is located within the Columbia Mountains hydrologic zone. The annual peak flow regimes of the watersheds in this hydrologic zone are dominated by spring snowmelt. Autumn rainfall events also can contribute significant amounts of water.
(e) Water Quality
Baseline study streams had near-neutral to slightly alkaline pH and waters were soft to moderately hard with turbidity highest during the freshet period (May to June) due to the greater volumes of discharge within streams. Concentrations of total and dissolved metals exhibited distinct seasonality, with the highest concentrations per site generally occurring during high-flow freshet periods.
(f) Hydrogeology
The Project is located within the Shuswap Highlands physiographic region, with bedrock typically having low permeability and low well yields and valleys containing permeable layers of glacial and post-glacial sediments capable of high-yield wells.
Baseline studies to date have included borehole drilling, monitoring well installation and development, hydraulic testing, geophysical survey, and groundwater level and quality sampling. Groundwater has been analyzed for a suite of variables, including physical variables, major ions, and trace metals.
| Section 20 | Environmental Studies, Permitting and Social or Community Impact | Page 4 |
20.2 Environmental Baseline Studies - Cont'd
(g) Aquatic Resources
Baseline studies conducted for fish, fish habitat, and aquatic ecology found the fish community downstream of the Project is composed of bull trout, mountain whitefish, torrent sculpin, longnose dace, coho salmon and rainbow trout. The distribution of fish is affected by the presence of natural barriers preventing fish from occupying the upstream reaches of creeks. As a result, the creeks within the project footprint are non-fish bearing.
The Harper Creek Watershed supports bull trout (the species that extends furthest up the watershed) and downstream populations of chinook salmon, coho salmon, sockeye salmon, and rainbow trout.
(h) Vegetation
The project area is comprised of low stands of ponderosa and jack pine, hemlock spruce, with alder and birch occupying the creek drainages and North Thompson River valley. A large portion of the project area has been previously logged. The following two biogeoclimate zones are present within the mine site area:
• Engelmann Spruce - Subalpine Fir
• Interior Cedar - Hemlock
Seven BC blue-listed and one red-listed ecosystem were identified as potentially occurring in the project area. Along with six BC blue-listed vascular plant species of which two are Species at Risk Act (SARA) Schedule 1 species, nine BC red-listed and blue-listed lichens and macrofungi of which one is a SARA Schedule 1 species, and two BC red-listed mosses that are also SARA Schedule 1 species. Eight wetlands totalling about 200 ha and approximately 3,000 ha of old-growth forest have been identified in the project area. The project site overlaps with four old-growth management areas.
| Section 20 | Environmental Studies, Permitting and Social or Community Impact | Page 5 |
20.2 Environmental Baseline Studies - Cont'd
(i) Wildlife
Baseline studies indicate that the project area has the potential to support habitat for Western Toad, Olive-sided Flycatcher, Little Brown Myotis, Northern Myotis, Fisher, Wolverine, Moose, Grizzly Bear and Mule Deer. Lower elevation areas within the North Thompson River Valley provide habitat for several species including Bald Eagle, Common Nighthawk, Northern Goshawk and Barn Swallow.
The project site is situated within mapped critical habitat for the Southern Mountain Caribou, which is listed as Endangered by COSEWIC, Threatened on Schedule 1 of Species at Risk Act and red-listed in BC (Data BC 2024). Baseline information submitted as part of the Harper Creek Project EA indicates that use by caribou within the project site area is infrequent.
Portions of the transmission line cross through mapped critical habitat for American badger, which is listed as Endangered by COSEWIC, on Schedule 1 of Species at Risk Act and red-listed in BC.
| Section 20 | Environmental Studies, Permitting and Social or Community Impact | Page 6 |
20.3 Waste Rock and Tailing Storage, Water Management and Site Monitoring
Plans for waste rock storage are provided in Section 16 while tailings storage and water management are described in Section 18.
Taseko will hold and maintain necessary permits for any work that takes place in, on, or about the mine and will comply with all provisions of provincial and federal legislation, regulations, conditions of permits issued, and the BC Mines Act "Health, Safety and Reclamation Code for Mines in British Columbia" (Code). A full list of monitoring and reporting obligations associated with the Project will be developed during the permitting process.
Taseko will be responsible for all environmental monitoring and reclamation programs until such time as all permit conditions have been fulfilled and Taseko has been released from all obligations under the BC Mines Act.
| Section 20 | Environmental Studies, Permitting and Social or Community Impact | Page 7 |
20.4 Permitting
(a) Environmental Assessment
Taseko has engaged with both the EAO and the Impact Assessment Agency of Canada (IAAC) regarding submission of an Initial Project Description (IPD) and Engagement Plan (EP) to start the Early Engagement and Planning phases of the provincial and federal assessment processes, respectively.
The Project's production capacity and transmission line meet criteria for an Environmental Assessment of a proposed metal mine project under the BC Environmental Assessment Act, Reviewable Projects Regulation (BC Government 2019). There is no trigger under the BC Environmental Assessment Act Reviewable Projects Regulation for refurbishment of an existing rail load-out facility or upgrades to the primary and secondary access routes.
The Project's production capacity meets thresholds for an Impact Assessment under the federal Impact Assessment Act (S.C. 2019, C.28, S.1), Physical Activities Regulations (Government of Canada 2019), for Mines and Metal Mills. Although a new transmission line and rail load-out facility will be required for the Project, neither meet thresholds under the Impact Assessment Act (S.C. 2019, C.28, S.1) Physical Activities Regulations.
Taseko has requested the BC Government seek agreement from the federal Minister of Environment and Climate Change Canda (ECCC) to a substituted process under the Impact Assessment Cooperation Agreement between Canada and British Columbia (Government of Canada 2020). While it is expected that the EAO and IAAC will coordinate the initial phases of their respective processes, substitution will support a more streamlined process while retaining independent decision-making by provincial and federal governments with respect to the Project.
| Section 20 | Environmental Studies, Permitting and Social or Community Impact | Page 8 |
20.4 Permitting - Cont'd
(b) Simpcw Assessment Process
̓
The Project is situated primarily in Simpcwúlecw, the territory of Simpcw First Nation (Simpcw). Following the Harper Creek EA, Simpcw concluded that any future proposal to develop the Project will undergo the Simpcw Assessment Process (Simpcw Process). The Simpcw Process is a "six-step review process that establishes protocols for relationship(s), expectations for information collection and sharing, and a structure for decision-making specific to Simpcw" (Simpcw 2023).
Taseko has agreed that it will participate in the Simpcw Process and has completed Step 1 Project Initiation and has made progress under Step 2 Project Introduction. The Simpcw Process will complete in Step 6 with a decision by Simpcw on the Project.
| Section 20 | Environmental Studies, Permitting and Social or Community Impact | Page 9 |
20.4 Permitting - Cont'd
(c) Permits, Licenses, Authorizations and Approvals
A comprehensive permitting process will be undertaken following the assessment process for the Project to enable construction, operation, and eventual closure of the Project. Permitting decisions could only be made following positive decisions under the Simpcw Process and provincial and federal assessment processes.
Table 20-1 and Table 20-2 provide lists of authorizations that may be required from provincial and federal agencies to allow for the Project to proceed. These may be modified based on further evaluation of regulatory requirements and discussion with government agencies to further clarify permitting requirements.
The Project is a Critical Mineral project and compatible with relevant provincial government policies. There are currently no permit applications under review with provincial or federal regulatory bodies.
Table 20-1: Preliminary List of Provincial Authorizations
| Legislation | Responsible Authority | Authorization | Purpose |
| Environmental Assessment Act (2018) |
• Minister of Environment and Parks • Administered by Environmental Assessment Office (EAO) |
Environmental Assessment Certificate (EAC) |
|
| Mineral Tenure Act (1996) |
British Columbia (BC) Ministry of Mining and Critical Minerals (MCM) |
Mineral Claims |
|
| Mining Lease |
|
||
| Mines Act (1996) | MCM | Notice of Work |
|
| Mines Act Permit |
|
| Section 20 | Environmental Studies, Permitting and Social or Community Impact | Page 10 |
20.4 Permitting - Cont'd
(c) Permits, Licenses, Authorizations and Approvals - Cont'd
Table 20-1: Preliminary List of Provincial Authorizations - Cont'd
| Legislation | Responsible Authority | Authorization | Purpose |
| Environmental Management Act (2003) |
Ministry of Environment and Parks (ENV) |
Waste Discharge Permits (effluent, waste, and air) |
|
| Registration of hazardous wastes |
|
||
| Registration of sewage treatment plant |
|
||
| Registration of fuel storage areas |
|
||
| Special Waste Generator Permit |
|
||
| Heritage Conservation Act (1996) |
Ministry of Forests (FOR) | Section 12 Alteration Permit |
|
| Section 14 Inspection Permit |
|
||
| Section 14 Investigative Permit |
|
||
| Forest and Range Practices Act (2002) |
FOR | Occupant License to Cut (OLTC) |
|
| Road Use Permit (RUP) |
|
||
| Special Use Permit (SUP) |
|
| Section 20 | Environmental Studies, Permitting and Social or Community Impact | Page 11 |
20.4 Permitting - Cont'd
(c) Permits, Licenses, Authorizations and Approvals - Cont'd
Table 20-1: Preliminary List of Provincial Authorizations - Cont'd
| Legislation | Responsible Authority | Authorization | Purpose |
| Land Act (1996) | FOR | Investigative Use Permit |
|
| License of Occupation |
|
||
| Statutory Right of Way |
|
||
| Water Sustainability Act (2014) |
Ministry of Water, Land and Resource Stewardship (WLRS) |
Water License |
|
|
|||
|
|||
| Registration of groundwater wells |
|
||
| Drinking Water Protection Act (2001) |
ENV | Waterworks Construction Permit |
|
| Waterworks System Operations Permit |
|
||
| Public Health Act (2008) |
Ministry of Health (Regional Health Authority) |
Filing of Certification Letter |
|
| Onsite Sewage Certification / Permit |
|
||
| Food Premises Permit |
|
||
| Agricultural Land Commission Act (2002) |
Agricultural Land Commission (ALC) |
Decision Letter |
|
| Section 20 | Environmental Studies, Permitting and Social or Community Impact | Page 12 |
20.4 Permitting - Cont'd
(c) Permits, Licenses, Authorizations and Approvals - Cont'd
Table 20-1: Preliminary List of Provincial Authorizations - Cont'd
| Legislation | Responsible Authority | Authorization | Purpose |
| Transportation Act (1985) |
Ministry of Transportation and Transit (TranBC) |
Works on Right-of- Way Permit |
|
| Access Permit |
|
||
| Utility Permit |
|
||
| Railway Safety Act (2004) |
TranBC | Permit |
|
| Wildlife Act (1996) | ENV | Wildlife Act Permit |
|
| Section 20 | Environmental Studies, Permitting and Social or Community Impact | Page 13 |
20.4 Permitting - Cont'd
(c) Permits, Licenses, Authorizations and Approvals - Cont'd
Table 20-2: Preliminary List of Federal Authorizations
| Legislation | Responsible Authority | Authorization or Approval |
Purpose |
| Impact Assessment Act (2019) |
• Minister of Environment and Climate Change Canada (ECCC) or cabinet • Administered by Impact Assessment Agency of Canada (IAAC) |
Decision Statement |
|
| Fisheries Act (2019) Section 34, 35, and/or 36. |
Fisheries and Oceans Canada (DFO) |
Authorization |
|
| Metal and Diamond Mining Effluents Regulation (MDMER) (SOR/2002-222) |
ECCC | Mine Effluent Discharge Authorization |
|
| Migratory Birds Convention Act |
ECCC | Authorization |
|
| Environmental Protection Act |
ECCC | Response requirements under Section 95(1) |
|
| Section 20 | Environmental Studies, Permitting and Social or Community Impact | Page 14 |
20.4 Permitting - Cont'd
(c) Permits, Licenses, Authorizations and Approvals - Cont'd
Table 20-2: Preliminary List of Federal Authorizations - Cont'd
| Legislation | Responsible Authority | Authorization or Approval |
Purpose |
| Species At Risk Act (SC 2002) |
ECCC, DFO, and/or Parks Canada |
Permit and/or agreement under Section 73 |
|
| Explosives Act (RSC 1985) |
Natural Resources Canada | Explosives Magazine License |
|
| Aeronautics Act (RSC 1985) Canadian Aviation Regulation (SOR/96- 433) |
Transport Canada | Letter of Review |
|
| Transportation of Dangerous Goods Act (1992) |
Transport Canada | Permit |
|
| Radiocommunications Act (RSC 1985) |
Innovation, Science and Economic Development Canada (ISED) |
Radio License |
|
| Major Projects Management Office (MPMO) |
Pre-Application project description for review. |
|
| Section 20 | Environmental Studies, Permitting and Social or Community Impact | Page 15 |
20.5 Social and Community Relations
(a) Communities
The Project is located in the area known as the North Thompson Valley within the Thompson Nicola Regional District. The nearest communities to the Project are Vavenby, Birch Island and Clearwater. Some of the mine-related infrastructure, including the rail load-out facility will be located in Vavenby. Overall, these communities are expected to benefit directly and indirectly from the Project. Economic development is needed to offset the economic downturn of the forestry sector and closing of several mills in the North Thompson Valley.
Taseko is committed to hiring local people. When fully operational, the Project will support about 590 direct jobs and approximately 1,120 indirect and induced jobs in the area.
| Section 20 | Environmental Studies, Permitting and Social or Community Impact | Page 16 |
20.5 Social and Community Relations - Cont'd
(b) First Nations
The Project is situated in the unceded territory of the Secwépemc (Shuswap Nation). The Secwépemc is comprised of 17 campfire areas, with approximately 17,000 members. Secwepemcúlecw stretches from the Columbia River valley along the Rocky Mountains, west to the Fraser River, and south to the Arrow Lakes. The territory encompasses approximately 145,000 km2 of the central interior of BC. The Secwépemc campfires are organized into two tribal councils, the SNTC in the south and the NSTC in the north, with some being unaffiliated.
The Project is situated primarily within the territory of the Simpcw First Nation (Simpcwúlecw). Simpcw has the highest potential to be affected by the project site and transmission line. Taseko is focused on working collaboratively with the Simpcw and has agreed to participate in the Simpcw Process, an Indigenous-led assessment process. Through the Simpcw Process, Simpcw will make a Project consent-based decision independent of the provincial and federal assessment process.
Three First Nations were identified as having the potential to be affected by the project site and transmission line. This includes Neskonlith Indian Band, Skwlāx te Secwepemcúlecw (SteS) (formerly Little Shuswap Lake Band), and the Adams Lake Indian Band (ALIB). Neskonlith and ALIB are member of the SNTC and SteS is unaffiliated.
Tsq̓éscen̓First Nation (Formerly Canim Lake Band) Canim Lake is the closest First Nation community to the transmission line and has the highest potential to be affected by the transmission line. Tsq̓éscen̓ is a member of the NSTC.
Additional First Nations have been identified for notification on the Project and may require further engagement. There is the potential for these additional First Nations to be identified or self-identify as being potentially affected by the Project. This will be explored further during Early Engagement with Indigenous groups and through discussion with the provincial and federal governments.
| Section 20 | Environmental Studies, Permitting and Social or Community Impact | Page 17 |
20.6 Mine Closure and Costs
(a) Reclamation and Closure
In British Columbia, mining companies are required to reclaim mine disturbance when mining is complete in accordance with the Code.
The closure phase will begin at the cessation of mineral processing and tailings deposition. The following are key activities related to the closure period:
• Decommissioning and removal of processing and mine support facilities.
• Deactivation of select Project site roads and other supporting infrastructure no longer required for closure and post-closure activities.
• Stabilization and revegetation of TSF embankments and beaches.
• Recontouring and revegetation overburden and waste rock storage areas, select roads, Project site buildings, and supporting infrastructure sites.
• Redirect TSF supernatant pond flow through spillway to open pit.
• Direct site-wide contact water to open pit.
• Water treatment to be discontinued while open pit filling with water.
• Maintenance of WTP and water management structures.
• Environmental monitoring, compliance, and reporting.
The post-closure phase will begin when the open pit has filled with water and discharge of water is restarted. The following are key activities related to the closure period:
• Once open pit has filled with water, if required, restart water treatment until no longer required for discharge to the environment.
• Continue TSF supernatant pond flow through spillway to open pit until TSF water quality allows for direct discharge to the environment.
• Continue contact water flow through open pit until water quality allows direct discharge to the environment.
• Conduct maintenance and repairs on facilities, infrastructure, and equipment remaining onsite as required.
• Decommissioning, recontouring, and revegetation of transmission line and supporting roads once water treatment is no longer required or alternate power source is provided.
• Other activities that are required to release compliance and legal obligations related to final closure of the site.
• Environmental monitoring and reporting for water quality, reclamation success, and other requirements as defined under permits.
| Section 20 | Environmental Studies, Permitting and Social or Community Impact | Page 18 |
20.6 Mine Closure and Costs - Cont'd
(a) Reclamation and Closure - Cont'd
Further discussion of post-closure requirements will occur during the EA and subsequent permitting processes. This period will continue until all conditions of the Code and permits have been fulfilled and Taseko has been released from all regulatory obligations.
(b) Mine Closure Costs
Before any work on a site is conducted, the province requires companies to provide security in accordance with the Code.
The reclamation security amount will be developed as part of the permitting phase.
SECTION 21
CAPITAL AND OPERATING COSTS
SECTION 21: CAPITAL AND OPERATING COSTS
Table of Contents
| Page | ||
| 21.1 | Initial Capital Costs | 1 |
| 21.2 | Sustaining Capital Costs | 11 |
| 21.3 | Operating Costs | 13 |
| List of Tables | ||
| Table 21-1: Initial Capital Costs | 1 | |
| Table 21-2: Foreign Currency Exchange Rates | 1 | |
| Table 21-3: Mine Capital Costs | 2 | |
| Table 21-4: Concentrator Capital Costs | 3 | |
| Table 21-5: Tailings and Water Management Capital Costs | 4 | |
| Table 21-6: Onsite Ancillary Infrastructure Capital Costs | 4 | |
| Table 21-7: Offsite Infrastructure Capital Costs | 5 | |
| Table 21-8: Indirect Costs | 8 | |
| Table 21-9: Sustaining Capital Costs | 11 | |
| Table 21-10: Operating Costs Summary | 13 | |
| Table 21-11: Onsite Operating Costs Summary | 13 | |
| Table 21-12: Unit Mining Costs | 14 | |
| Table 21-13: Process Operating Costs | 16 | |
| Table 21-14: General & Administration Costs | 18 | |
| Table 21-15: Summary of Offsite Costs | 19 | |
| Section 21 | Capital and Operating Costs | Page 1 |
21.1 Initial Capital Costs
(a) Initial Capital Cost Summary
A summary of the initial capital costs estimated for the Project is provided in Table 21-1.
All costs are current as of Q2, 2025 and are stated in Canadian dollars unless otherwise stated. Foreign currency exchange rates utilized for the capital cost estimate are listed in Table 21-2.
Table 21-1: Initial Capital Costs
| Area | Total Capital ($ millions) |
| Mine and Support Infrastructure | 295 |
| Concentrator and Support Infrastructure | 623 |
| Tailings and Water Management Infrastructure | 213 |
| Onsite Ancillary Infrastructure | 143 |
| Offsite Infrastructure | 153 |
| Subtotal Direct Costs | 1,427 |
| Indirect Costs | 207 |
| Owner's Costs | 52 |
| Contingency | 299 |
| Subtotal Indirect Costs | 558 |
| Total Initial Capital | 1,985 |
Note: totals may not add due to rounding
Table 21-2: Foreign Currency Exchange Rates
| Currency | Exchange |
| US Dollar | US$1.00 : C$1.35 |
| Euro | €1.00 : C$1.50 |
No allowances have been made for escalation, interest and financing, taxes or working capital in the capital cost estimate with the exception of the primary mining equipment fleet which assumes a capital leasing arrangement as discussed in Section 21.1(b). The accuracy level for the estimate is ±20%.
Further details on the basis for these costs are included in the following sections.
| Section 21 | Capital and Operating Costs | Page 2 |
21.1 Initial Capital Costs - Cont'd
(b) Direct Costs
Mine and Support Infrastructure
The mining equipment capital cost estimates are based on budgetary quotes supplied by equipment manufacturers. All capital costs include delivery to the project site and include recommended options, assembly and commissioning.
All mining equipment will be purchased new. The primary mining equipment fleet (shovels, trucks, dozers, cleanup loaders and graders) have a total cost of $425 million and will be leased over a period of five years assuming a 10% down payment and interest rate of 6.25%. Initial payments made prior to mill startup are included in the capital costs shown in Table 21-3 and remaining payments are included in the sustaining capital costs discussed in Section 21.2. Supporting equipment fleets will be purchased outright.
Mine support infrastructure capital costs include the mobile equipment maintenance shop, explosives facilities, earthworks and fuel storage areas. Other mine capital costs include allowances for mine technology systems, logging and grubbing the pit and storage areas in preparation for mining, and installation of power distribution to the pit area.
The capitalized pre-production mining costs are estimated using the same methods as operating costs applied to the material mined in the two years prior to mill start-up less the cost of material delivery for TSF embankment construction which is included in the TSF capital cost.
Table 21-3: Mine Capital Costs
| Capital Item | Total Capital ($ millions) |
| Primary Mine Equipment Fleet* | 104 |
| Mine Support Equipment Purchases | 22 |
| Mine Support Infrastructure | 69 |
| Other Mine Capital | 16 |
| Capitalized Pre-Production Mining Costs | 84 |
| Total Mine Capital | 295 |
|
Note: totals may not add due to rounding *Includes down payment and lease costs in pre-production years only. |
|
| Section 21 | Capital and Operating Costs | Page 3 |
21.1 Initial Capital Costs - Cont'd
(b) Direct Costs - Cont'd
Concentrator and Support Infrastructure
Concentrator capital costs include the process equipment, structures and systems required to produce copper concentrate from run-of-mine ore feed. This includes the primary crusher, overland conveyor system, coarse ore stockpile and reclaim system, primary grinding circuits, flotation and concentrate regrind circuits and concentrate dewatering. Concentrator support infrastructure capital costs include the fixed plant maintenance shop, assay laboratory and various outbuildings supporting the concentrator. Capital costs for the concentrator and support infrastructure are detailed in Table 21-4.
Table 21-4: Concentrator Capital Costs
| Area | Total Capital ($ millions) |
| Crushing & Conveying | 127 |
| Stockpile & Reclaim | 45 |
| Primary Grinding | 187 |
| Flotation and Concentrate Regrind | 61 |
| Concentrate Dewatering | 13 |
| Concentrator Building & General | 175 |
| Concentrator Support Infrastructure | 16 |
| Total Concentrator Capital | 623 |
| Note: totals may not add due to rounding | |
Tailings and Water Management Infrastructure
Tailings capital costs include construction of the TSF starter embankment and the mining costs for the required NAG waste rock from the open pit. Additional costs include piping and mechanical systems for transporting and depositing tailings into the TSF and a seepage collection system for the main embankment.
Water Management capital costs include the process water reclaim system for pumping process water from the TSF to the process water pond, construction of the process water pond, the mechanical systems for collecting contact water from around the site and the pit dewatering system. Capital costs for the tailings and water management systems are detailed in Table 21-5.
| Section 21 | Capital and Operating Costs | Page 4 |
21.1 Initial Capital Costs - Cont'd
(b) Direct Costs - Cont'd
Table 21-5: Tailings and Water Management Capital Costs
| Activity | Total Capital ($ millions) |
| TSF Embankments & Earthworks | 79 |
| Rockfill Mining & Hauling Costs | 33 |
| Tailings Piping and Mechanical Systems | 35 |
| Process Water Reclaim and Pond | 29 |
| Water Collection and Pit Dewatering | 37 |
| Total Tailings and Water Capital | 213 |
| Note: totals may not add due to rounding | |
Onsite Ancillary Infrastructure
Onsite infrastructure capital costs include utilities and services such as fire protection systems, potable water system, sewage treatment system, site communications and process control systems, the main electrical substation, site power distribution network and emergency power generators.
Ancillary infrastructure capital costs include plant site general earthworks, gatehouse and emergency response buildings, the administration building, the mine dry building, the warehouse building and cold storage areas, various other outbuildings around the site and mobile equipment for maintaining the plant site area.
Capital costs for the onsite ancillary infrastructure are detailed in Table 21-6.
Table 21-6: Onsite Ancillary Infrastructure Capital Costs
| Area | Total Capital ($ millions) |
| Utilities, Services, Communication & Process Control | 21 |
| Main Electrical Substation and Distribution | 83 |
| Site General Ancillary Infrastructure | 38 |
| Total Onsite Ancillary Infrastructure Capital | 143 |
| Note: totals may not add due to rounding | |
| Section 21 | Capital and Operating Costs | Page 5 |
21.1 Initial Capital Costs - Cont'd
(b) Direct Costs - Cont'd
Offsite Infrastructure
Offsite infrastructure capital costs include the transmission line and BC Hydro interconnection costs to supply power to site, upgrades to the site access road and construction of the rail load-out facility. Capital cost for this area is shown in Table 21-7.
Table 21-7: Offsite Infrastructure Capital Costs
| Activity | Total Capital ($ millions) |
| Power Supply | 135 |
| Access Roads | 8 |
| Rail Load-Out | 10 |
| Total Offsite Infrastructure Capital | 153 |
| Note: totals may not add due to rounding |
| Section 21 | Capital and Operating Costs | Page 6 |
21.1 Initial Capital Costs - Cont'd
(c) Indirect Costs
Indirect costs include services and temporary infrastructure required to support the construction activities.
Temporary Construction Facilities & Services
Costs for temporary facilities and services include infrastructure required to execute the Project as well as construction support services and mobile equipment not supplied by the construction contractors. The cost estimate is based on the anticipated project schedule and recent project experience. This includes:
• Temporary construction service and warehouse facilities;
• Construction and site maintenance equipment not supplied by contractors;
• Materials testing and quality assurance;
• Site survey;
• Site maintenance;
• Waste management;
• Material off-loading and construction warehouse services;
• Construction power supply;
• Scaffolding;
• Site security, safety and fire protection;
• Janitorial services;
• Owner supplied worker transportation to site.
Construction Camp
Construction camp costs are based on a vendor-supplied quote and include mobilization and demobilization, catering, janitorial services, maintenance, waste water treatment and potable water services, and power generation.
Start-up & Commissioning
These costs include contract and vendor support to start-up and commission the site infrastructure excluding owner's team costs. The items included in this area are:
• Contractor and vendor support to assist with the pre-commissioning and commissioning;
• Electrical equipment and protective relay setting and testing;
• Contract process control system support;
Costs are estimated by allowance using recent project data and include service rates and travel expenses.
| Section 21 | Capital and Operating Costs | Page 7 |
21.1 Initial Capital Costs - Cont'd
(c) Indirect Costs - Cont'd
EPCM
The project EPCM costs were estimated as a percentage project direct costs accounting for items which were quoted as design-build and exclude items which will be managed by the owner.
Capital & Maintenance Spares
A capital and maintenance spares allowance includes both capitalized and minor equipment spares.
Owner's Costs
Owner's Costs include the anticipated costs incurred by the owner from the time the Project is authorized to proceed through to production. Costs for work preceding a project authorization are not included in the estimate. The items estimated in this cost include:
• Owner's project management personnel;
• Pre-production mine engineering and planning personnel;
• Ramp up and training of permanent operations, maintenance and administration personnel;
• First fills of consumables necessary to commence operations;
• Field office costs and supplies;
• Environmental testing and monitoring;
• Recruiting and relocation;
• Transportation and accommodation costs for owner's personnel;
• Insurance;
• Taxes, fees and licenses;
• Site access road maintenance.
| Section 21 | Capital and Operating Costs | Page 8 |
21.1 Initial Capital Costs - Cont'd
(c) Indirect Costs - Cont'd
Contingency
The capital cost estimate includes contingencies to cover costs of materials and labour within the scope of the project that are not estimated. Contingencies have based on assessments technical risk and the level of engineering work performed by area within the estimate.
The indirect costs for the Project are detailed in Table 21-8.
Table 21-8: Indirect Costs
| Item | Total Capital ($ millions) |
| Temporary Construction Facilities & Services | 21 |
| Construction Camp & Catering | 42 |
| Start-Up & Commissioning | 7 |
| EPCM | 125 |
| Capital and Maintenance Spares | 11 |
| Owner's Costs | 52 |
| Contingency | 299 |
| Total Indirect Costs | 558 |
| Note: totals may not add due to rounding | |
| Section 21 | Capital and Operating Costs | Page 9 |
21.1 Initial Capital Costs - Cont'd
(d) Basis of Estimate
The capital cost estimate is based on the use of all new equipment and materials for the Project. The direct cost estimate includes supply and installation of the equipment and materials required to construct all of the permanent infrastructure associated with the Project. Primary production mining equipment (shovels, drills, trucks, dozers, cleanup loaders and graders) are purchased on a capital lease basis. The major permanent infrastructure for the project scope are:
• Pre-production mining and pit equipment;
• Infrastructure, roads and site preparation;
• Process buildings;
• Crushing, material handling and process infrastructure;
• Water reclaim and distribution system;
• Assay laboratory;
• Administration building;
• Warehouse;
• Cold storage;
• Mobile equipment maintenance shop;
• Fuel storage;
• Fixed plant maintenance shop;
• Mine dry;
• Offsite power line from 100 Mile House to the project site
• Onsite power distribution;
• Emergency generators;
• Plant site services and utility systems;
• Tailings storage facility and deposition systems;
• Site contact water collection and management systems;
• Plant mobile equipment.
Labour rates for each required construction trade were set based on current rates received from British Columbia contractors. A crew composite labour rate for each trade was calculated which includes:
• Base labour wage rate;
• Benefits and burdens;
• Overtime allowance;
• Small tools and consumables;
• Safety supplies;
• Contractor overhead and profit;
• Appropriate crew compositions;
• Contractor travel allowance.
| Section 21 | Capital and Operating Costs | Page 10 |
21.1 Initial Capital Costs - Cont'd
(d) Basis of Estimate - Cont'd
The rates assume all installation work is completed by external contractors on a schedule of 21 10-hour workdays, followed by 7 days off with overtime premium included in the labour rates.
The capital cost estimate includes a total of approximately 1.8 million hours of direct and indirect labour associated with construction activities, of which 1.5 million are associated with direct construction activities. The average loaded labour rate in the estimate for all construction activities is approximately $169 per hour.
Project direct costs were estimated based on the following information:
• Site topography, layout and preliminary general arrangement drawings as well as process flow diagrams, equipment lists, electrical single line diagrams and some drawings from previously constructed projects where applicable;
• Budgetary quotations for the supply and erection of the major process and ancillary buildings and the supply of major equipment;
• Secondary and ancillary equipment prices based on a combination of budgetary quotations and database prices from recently completed projects;
• Prices for bulk construction materials were based on database prices from recently completed projects;
• Labour rates sourced from contractors in the Province of British Columbia;
• Equipment installation time and labour efficiency based on recent project experience adjusted for site specific conditions and vendor guidelines where appropriate;
• Freight costs to site based on a combination of budgetary quotations and recent project experience.
Capital Cost Exclusions
The following items are excluded from the capital cost estimate:
• Escalation;
• Financing costs and interest during construction except for leased mining equipment;
• Costs due to currency fluctuations;
• Scope changes;
• Schedule delays;
• Reclamation bonding;
• Closure costs;
• Salvage values;
| Section 21 | Capital and Operating Costs | Page 11 |
21.2 Sustaining Capital Costs
(a) Sustaining Capital Cost Summary
Sustaining capital is estimated to be $963 million for the life of the Project. The sustaining capital estimate includes a water treatment plant and discharge system, staged TSF embankment construction, expansion of the site water management systems, additional mining equipment purchased after project construction is complete, mining equipment lease payments, and general sustaining capital through the life of the mine. Sustaining capital costs are shown in Table 21-9.
Table 21-9: Sustaining Capital Costs
| Area | Total Capital ($ millions) |
| Water Treatment Plant and Discharge | 60 |
| Staged TSF Embankment Construction | 107 |
| Water Management Systems | 15 |
| Incremental Mine Capital | 63 |
| Mining Equipment Lease Payments | 395 |
| General Sustaining Capital | 323 |
| Total Sustaining Capital | 963 |
Note: totals may not add due to rounding
| Section 21 | Capital and Operating Costs | Page 12 |
21.2 Sustaining Capital Costs - Cont'd
(b) Sustaining Capital Components
Sustaining Capital for Water Treatment, Tailings and Water Collection
Water treatment will be implemented in stages based on water discharge requirements with the initial treatment plant and discharge system constructed in year 2 followed by expansions in years 9 and 20 to increase treatment and discharge rate.
Sustaining capital costs for the TSF include:
• Raises to the rockfill starter embankment up to year 5;
• Toe drains and foundation preparations for transitioning to cyclone sand construction in years 1 through 6;
• Mechanical systems and mobile equipment for transitioning to cyclone sand dam construction including stationary and mobile equipment in year 2;
• Construction of the north and northwest TSF embankments and seepage collection ponds in years 12 through 16;
• Additional piping and spigot systems for depositing tailings at the north embankment in year 14;
• Seepage collection system upgrades, tailings cyclone feed pumps and miscellaneous mechanical upgrades throughout the project life.
Water collection system upgrades are included in years 2, 3 and 10 for incremental pit dewatering system upgrades as the pit expands and for implementation of additional contact water collection.
Sustaining Capital for Mining Equipment
Mining equipment sustaining capital costs include lease payments for the primary mining equipment fleet as discussed in the Section 21.1(b). Lease payments continue from start of production through year 5.
Additional mining equipment is included as the requirements for the mine plan increase and as new pit phases are developed. This includes an additional production drill in year 4, five additional haul trucks in years 13 through 15 and development costs for new pit areas in years 3 and 10.
General Sustaining Capital
General sustaining capital accounts for maintaining the integrity of the mining, processing and support equipment as well as the site infrastructure through capital replacements and major capital repairs. General sustaining capital is estimated to average $0.17 per tonne mined over the duration of the Project.
| Section 21 | Capital and Operating Costs | Page 13 |
21.3 Operating Costs
(a) Operating Cost Summary
Operating costs for the Project are summarized in Table 21-10 and described in the following sections. All costs are current as of Q2, 2025 and are stated in Canadian dollars unless otherwise stated.
Table 21-10: Operating Costs Summary
| Area | Unit Cost (US$/lb) |
| Onsite Costs | 1.76 |
| Offsite Costs | 0.39 |
| Byproduct Credits from Gold and Silver | (0.25) |
| Total Operating Cost* | 1.90 |
| Note: totals may not add due to rounding * Net of byproduct credits | |
Onsite operating costs include mining, processing and general and administration costs as summarized in Table 21-11. Offsite costs include copper concentrate transportation costs, smelter fees and deductions, and royalty payments. Byproduct credits are calculated using the metal prices and production rates described in Section 22.
Table 21-11: Onsite Operating Costs Summary
| Area | Cost per Tonne Milled ($/t) |
| Mining | 6.06 |
| Processing | 5.75 |
| G&A | 1.07 |
| Total Onsite Cost | 12.89 |
| Note: totals may not add due to rounding | |
| Section 21 | Capital and Operating Costs | Page 14 |
21.3 Operating Costs - Cont'd
(b) Mine Operating Costs
The mine operating cost estimates are built up from first principles and include fuel, lubricants, tires, ground engaging tools, consumables, routine and non-routine component replacements, operating and maintenance labour, and contractor support. Table 21-12 below summarizes the mining operating costs used in this study.
Table 21-12: Unit Mining Costs
| Mine Process | Cost Per Tonne Mined ($/t) |
| Drilling | 0.18 |
| Blasting | 0.41 |
| Loading | 0.34 |
| Hauling | 1.13 |
| Pit Support | 0.35 |
| General Mine Expense | 0.23 |
| Total Mining Cost | 2.63 |
| Note: totals may not add due to rounding | |
Equipment productivities for the primary mining equipment fleet (drills, shovels and trucks) are calculated from the basic operating capacities of the equipment, the travel speed characteristics of the trucks, and the haul road profiles as described in Section 16 of this report. Equipment operating hours determined in the production schedule are multiplied by consumable consumption rates to calculate annual equipment operating costs.
Support equipment operating hours are estimated based on experience and historical performance from the Gibraltar Mine which is a similar sized, mature facility operated by Taseko. As with the primary mining equipment, costs are derived from estimated operating hours in each year and consumable consumption rates.
Blasting costs are based on a vendor quote for operating a down-the-hole delivery service from a bulk depot constructed at the project site. Bulk explosives quantities are calculated based on mining rates and powder factors assumed in the mine plan. Blasting accessories costs are based on the calculated number of blastholes and unit costs of accessories per hole.
General mine expenses include staff and supervision costs and non area-specific operating expenses. These costs are based on factors derived from experience at the Gibraltar Mine and labour calculations described below.
| Section 21 | Capital and Operating Costs | Page 15 |
21.3 Operating Costs - Cont'd
(b) Mine Operating Costs - Cont'd
Operations labour requirements are calculated based on equipment hours estimated in the production schedule for each class of equipment. Additional labour for non-equipment support roles and for maintenance labour have been estimated based on experience from the Gibraltar Mine. Labour costs are calculated based on total manpower counts and fully burdened annual labour costs.
| Section 21 | Capital and Operating Costs | Page 16 |
21.3 Operating Costs - Cont'd
(c) Process Operating Costs
Process operating costs incorporate crushing, conveying, grinding, flotation, concentrate dewatering, general building services, tailings cycloning and deposition, process water reclaim, site contact water collection and water treatment costs. Table 21-13 summarizes typical unit costs by category.
Table 21-13: Process Operating Costs
| Input | Cost Per Tonne Milled ($/t) |
| Crushing, Conveying & Stockpile Reclaim | 0.19 |
| Primary Grinding | 2.86 |
| Flotation & Concentrate Regrind | 0.92 |
| Maintenance | 0.33 |
| Labour | 0.65 |
| General Mill Expense | 0.32 |
| Subtotal of Direct Processing Costs | 5.27 |
| Tailings Deposition & Management | 0.20 |
| Process Water Reclaim | 0.05 |
| Water Collection & Management | 0.12 |
| Water Treatment & Discharge | 0.11 |
| Subtotal Tailings & Water | 0.48 |
| Total Processing Cost | 5.75 |
| Note: totals may not add due to rounding | |
Operating costs for the direct concentrator unit operations include reagents, consumables, grinding mill and crusher liners, grinding media, and electricity consumption. Input costs were obtained from vendor supplied quotes and consumption rates were estimated based on the laboratory scale test work described in Section 13 of this report combined with operating experience derived from the Gibraltar Mine.
Concentrator maintenance costs include all general parts, component rebuilds and replacement equipment for all areas of the concentrator and related systems. Costs have been estimated using a factor applied to the direct equipment costs for the concentrator and related systems.
Concentrator labour costs include staff and hourly manpower for operating and maintenance areas. They are based on the Gibraltar Mine wage structures and are fully burdened. Manpower structures were developed based on process requirements.
General concentrator costs include utilities, assay lab costs, contract services, mill mobile equipment costs and site services. Cost estimates are based on a combination of vendor quotes and experience from the Gibraltar Mine.
| Section 21 | Capital and Operating Costs | Page 17 |
21.3 Operating Costs - Cont'd
(c) Process Operating Costs - Cont'd
Tailings management includes all aspects of tailings deposition and cyclone operations required for raising the main embankment. An allowance for contract engineering services is included for annual safety reviews and routine engineering work by an independent engineer of record.
Water management systems costs are estimated based on the water volumes anticipated at the various collection points and the electrical consumption required to pump the water to the process water pond. The water management costs increase over time as the mine impacted areas expand. An allowance is made for routine maintenance based on factored direct capital costs.
Water treatment costs begin in year 3 of the Project and escalate similarly to the water collection costs. Water treatment costs include all consumables and dedicated labour required to operate the WTP. Water discharge costs are minimal as clean water will be discharged by gravity into Harper Creek through a dedicated HDPE pipeline.
| Section 21 | Capital and Operating Costs | Page 18 |
21.3 Operating Costs - Cont'd
(d) General and Administration Costs
General and administration (G&A) costs for the Project include the labour cost as well as expenses and services associated with the following:
• Mine engineering;
• Materials management;
• Human resources;
• Safety and security;
• Accounting;
• Environmental monitoring;
• Personnel transport to/from site;
• Insurance;
• Maintenance and operating costs for the power line from 100 Mile House to the project site;
• Taxes, fees and licenses;
• General administrative costs.
The G&A labour costs for employees were based on the organizational structure developed for the Project and salaries based on operating experience at the Gibraltar Mine. Other G&A costs, including site consulting requirements and recruiting costs, were estimated based on a combination of operating experience at the Gibraltar Mine, budgetary quotations and estimates as appropriate.
Table 21-14 summarizes the G&A costs by category.
Table 21-14: General & Administration Costs
| Life of Mine G&A Costs | Cost Per Tonne Milled ($/t) |
| Mine Engineering | 0.14 |
| Environmental Monitoring | 0.12 |
| Materials Management | 0.17 |
| Human Resources | 0.14 |
| General Administration | 0.42 |
| Head Office | 0.02 |
| Offsite Power Line | 0.05 |
| Total G&A Cost | 1.07 |
| Note: totals may not add due to rounding. | |
| Section 21 | Capital and Operating Costs | Page 19 |
21.3 Operating Costs - Cont'd
(e) Offsite Costs
Offsite costs include concentrate transportation costs, smelter fees and deductions, and royalty payments. Average offsite costs are summarized in Table 21-15.
Table 21-15: Summary of Offsite Costs
| Area | US$/lb |
| Concentrate Transportation | 0.27 |
| Smelter Fees & Deductions | 0.12 |
| Royalty Payments | 0.00 |
| Total Offsite Cost | 0.39 |
| Note: totals may not add due to rounding | |
Concentrate transportation costs include:
• Trucking and rail load-out operations by a contractor;
• Rail transportation costs to the Port of Vancouver including rail car leasing costs;
• Port storage and handling fees;
• Sampling;
• Ocean freight to overseas smelters.
All concentrate transportation and handling costs are estimated using Gibraltar Mine rates except for trucking and load-out operations which are based on a buildup of vendor supplied rates.
Smelter costs include treatment costs for concentrate and refining costs for all contained metals. Current market rates for smelter terms have been used and are based on a concentrate marketing study completed in 2025.
Two royalties exist for the Project and are included in the offsite costs. The first is a $3.9 million lump-sum royalty payment is expected in the first year of operation. This royalty has been escalated to current dollars as of the effective date of this report. The second is a 2.5% NSR royalty associated with six mineral claims and is not subject to escalation.
SECTION 22
ECONOMIC ANALYSIS
SECTION 22: ECONOMIC ANALYSIS
Table of Contents
| Page | ||
| 22.1 | Introduction | 1 |
| 22.2 | Before-Tax Cashflow | 2 |
| 22.3 | Royalties and Taxes | 3 |
| 22.4 | After-Tax Economic Indicators | 5 |
| 22.5 | Sensitivity Analysis | 5 |
| List of Tables | ||
| Table 22-1: Long-Term Street Consensus Metal Pricing and Foreign Exchange Rate | 1 | |
| Table 22-2: Before-Tax Economic Valuation for the Yellowhead Project | 2 | |
| Table 22-3: Before-Tax Yellowhead Project Cashflow | 2 | |
| Table 22-4: Estimated Project Taxes (LOM) | 3 | |
| Table 22-5: After-Tax Economic Valuation for the Yellowhead Project | 5 | |
| List of Figures | ||
| Figure 22-1: Before-Tax NPV Sensitivities | 6 | |
| Figure 22-2: Before-Tax IRR Sensitivities | 6 | |
| Figure 22-3: After-Tax NPV Sensitivities | 7 | |
| Figure 22-4: After-Tax IRR Sensitivities | 7 | |
| Section 22 | Economic Analysis | Page 1 |
22.1 Introduction
The mineral reserves are supported under the cost and performance data presented in the previous sections of this report. Metal prices are based on long-term street consensus metal pricing as of Q2 2025 and long-term foreign exchange rates based on Taseko's expectations informed by historical exchange rates and are shown in Table 22-1. A discounted cashflow model using a discount rate of 8% is used for the valuation basis with an effective date of June 15, 2025. Results of the valuation are presented on a 100% basis and assume no financing costs except for mining equipment leases as discussed in Section 21 of this report. All values are in Canadian dollars unless otherwise stated.
Table 22-1: Long-Term Street Consensus Metal Pricing and Foreign Exchange Rate
| Long-Term Forecasts | Metal Price |
| Copper Price | US$4.25/lb |
| Gold Price | US$2400/oz |
| Silver Price | US$28.00/oz |
| Foreign Exchange | US$1.00 : C$1.35 |
| Section 22 | Economic Analysis | Page 2 |
22.2 Before-Tax Cashflow
Before-tax economic indicators for the Project are presented in Table 22-2.
Table 22-2: Before-Tax Economic Valuation for the Yellowhead Project
| Economic Indicator | Value |
| Average Annual Before-Tax Cash Flow | $480 million |
| Before-Tax NPV at 8% | $2.8 billion |
| Internal Rate of Return | 22% |
| Payback Period | 3.7 years |
The before-tax cashflow for the Project is presented in Table 22-3.
Table 22-3: Before-Tax Yellowhead Project Cashflow
| Project Period | Year -2 | Year -1 | Year 1 | Year 2 | Year 3 | Year 4 | Year 5 | |
| Copper Production | (M lbs) | -- | -- | 145 | 202 | 232 | 240 | 208 |
| Gold Production | (000 oz) | -- | -- | 8 | 14 | 19 | 22 | 18 |
| Silver Production | (000 oz) | -- | -- | 435 | 636 | 799 | 910 | 982 |
| Operating Profit | (C$ M) | -- | -- | 402 | 663 | 802 | 859 | 689 |
| Capital Costs | (C$ M) | 923 | 1,062 | 112 | 156 | 125 | 109 | 74 |
| Net Cash Flow | (C$ M) | -923 | -1,062 | 289 | 508 | 676 | 750 | 616 |
| Project Period | Year 6 | Year 7 | Year 8 | Year 9 | Year 10 | Year 11 | Year 12 | |
| Copper Production | (M lbs) | 149 | 149 | 149 | 154 | 159 | 160 | 162 |
| Gold Production | (000 oz) | 7 | 8 | 8 | 10 | 10 | 10 | 10 |
| Silver Production | (000 oz) | 615 | 653 | 686 | 782 | 810 | 727 | 801 |
| Operating Profit | (C$ M) | 357 | 349 | 361 | 394 | 404 | 416 | 435 |
| Capital Costs | (C$ M) | 18 | 17 | 19 | 32 | 22 | 23 | 20 |
| Net Cash Flow | (C$ M) | 340 | 332 | 342 | 362 | 382 | 393 | 416 |
| Project Period | Year 13 | Year 14 | Year 15 | Year 16 | Year 17 | Year 18 | Year 19 | |
| Copper Production | (M lbs) | 171 | 173 | 170 | 178 | 178 | 172 | 158 |
| Gold Production | (000 oz) | 10 | 11 | 12 | 12 | 10 | 9 | 8 |
| Silver Production | (000 oz) | 725 | 746 | 846 | 932 | 934 | 988 | 899 |
| Operating Profit | (C$ M) | 457 | 461 | 457 | 501 | 492 | 471 | 390 |
| Capital Costs | (C$ M) | 43 | 53 | 30 | 21 | 17 | 15 | 16 |
| Net Cash Flow | (C$ M) | 414 | 408 | 427 | 479 | 475 | 456 | 374 |
| Project Period | Year 20 | Year 21 | Year 22 | Year 23 | Year 24 | Year 25 | Grand Total |
|
| Copper Production | (M lbs) | 165 | 178 | 196 | 200 | 193 | 198 | 4,441 |
| Gold Production | (000 oz) | 9 | 10 | 11 | 12 | 11 | 12 | 282 |
| Silver Production | (000 oz) | 852 | 730 | 717 | 744 | 729 | 722 | 19,402 |
| Operating Profit | (C$ M) | 438 | 530 | 675 | 709 | 671 | 690 | 13,073 |
| Capital Costs | (C$ M) | 24 | 10 | 5 | 2 | -- | -- | 2,948 |
| Net Cash Flow | (C$ M) | 414 | 520 | 669 | 707 | 671 | 690 | 10,125 |
Note: totals may not add due to rounding
| Section 22 | Economic Analysis | Page 3 |
22.3 Royalties and Taxes
The Yellowhead Project is 100% owned by Taseko. Two royalty obligations exist on the Project and are included within the offsite operating costs discussed in Section 21 of this report.
Profits will be subject to taxation by the provincial and federal governments. Taseko expects the Project to be eligible for the Clean Technology Manufacturing (CTM) Investment Tax Credit (ITC) described below that would result in a tax refund of approximately $540 million in the year following completion of construction. At long-term metal prices, the Project's estimated tax payments are summarized in Table 22-4.
Table 22-4: Estimated Project Taxes (LOM)
| Item | Value |
| BC Mineral Taxes | $1.3 billion |
| Corporate Income Taxes | $2.5 billion |
| Clean Technology Manufacturing Refundable Investment Tax Credit |
$0.5 billion |
| Total Taxes | $3.2 billion |
(a) BC Mineral Tax
Currently the provincial government in British Columbia collects taxes relating to mineral production referred to as BC Mineral Tax. BC Mineral taxes are assessed under a two-part system, made up of Net Current Proceeds Tax and Net Revenue Tax.
Net Current Proceeds Tax applies at a rate of 2% to operating cash flow from production. This tax applies until the producer has recovered applicable capital investments and a prescribed rate of return, at which time the Net Revenue Tax will apply at a rate of 13%. The total tax collected under both Net Revenue Tax and Net Current Proceeds Tax will not exceed 13%.
The development of the Project will be eligible for a new mine allowance (NMA) under the BC Mineral Tax. The NMA is calculated as 1/3 of eligible capital expenditures from the development of the new mine and is applied in determining the Net Revenue Tax. Management has estimated that substantially all initial capital costs associated with the Yellowhead Project will qualify for the NMA.
BC Mineral taxes are deductible against corporate income taxes.
| Section 22 | Economic Analysis | Page 4 |
22.3 Royalties and Taxes - Cont'd
(b) Income Taxes
Currently corporate taxpayers resident in Canada are subject to a federal income tax rate of 15% and taxpayers resident in British Columbia are subject to a further 12%, for a total combined corporate income tax rate of 27%.
Taxable losses generated in a given year may be carried forward for 20 years and applied to taxable income when it arises or carried back 3 years and applied against taxable income if applicable.
Costs associated with exploration and development are allocated to certain resource pools and deductible against taxable income. Canadian Exploration Expenses (CEE) may be carried forward indefinitely and are fully deductible against taxable income. Canadian Development Expenses (CDE) may be carried forward indefinitely and are deductible against taxable income up to a maximum of 30% per year on a declining balance basis.
A depreciation (capital cost allowance) rate of 25% per year on a declining balance basis is generally applied to past capital expenditures on mining and processing production equipment and related facilities.
(c) Clean Technology Manufacturing Investment Tax Credit
The Clean Technology Manufacturing (CTM) Investment Tax Credit (ITC) is a refundable tax credit that applies to new CTM property that becomes available for use on or before December 31, 2034. The CTM ITC rate is generally 30% of the capital cost of eligible property. This ITC provides support to qualifying taxpayers investing capital in the extraction and processing of 6 key critical minerals, one of which is copper. The Yellowhead Project is eligible as substantially all (defined as 90% or more) of its revenue will come from the extraction and processing of copper.
The cash flow assumes that the project completion will be on or before December 31, 2031 and that the refundable ITC will be received during the first year of operations.
| Section 22 | Economic Analysis | Page 5 |
22.4 After-Tax Economic Indicators
After-tax economic indicators for the Project, assuming current federal and provincial tax laws are in force are presented in Table 22-5.
Table 22-5: After-Tax Economic Valuation for the Yellowhead Project
| Economic Indicator | Value |
| After-Tax NPV at 8% | $2.0 billion |
| After-Tax IRR | 21% |
| After-Tax Payback Period | 3.3 years |
(a) Comment on the Clean Technology Manufacturing Investment Tax Credit
The CTM ITC is a significant source of potential cash flow in the first year of operations. In general, enacted tax legislation is subject to change and tax incentives such as the CTM ITC could be significantly modified, reduced or withdrawn in the future. There is also risk that some of the construction and other capital costs incurred in the initial years of the Project are determined not to be eligible by the Canada Revenue Agency as they develop administrative guidance in applying the legislation. There is also risk that construction of the Yellowhead Project is completed after December 31, 2034 and there is no certainty that the ITC program will be extended beyond this deadline date for CTM properties to be put into service. The Canada Revenue Agency will also very likely follow a protocol of auditing ITC claims of this magnitude which could result in delays in the receipt of such funds as well as changes in the final amounts paid.
22.5 Sensitivity Analysis
An analysis was performed to demonstrate the sensitivity of the economic valuation for the Project to fluctuations in metal prices, ore grade, operating costs and capital costs. Results of this analysis are shown on a before-tax basis in Figures 22-1 and 22-2 and on an after- tax basis in Figures 22-3 and 22-4. Project economics are most sensitive to copper price and ore grade followed by operating cost. Economics are less sensitive to capital cost and only marginally sensitive to precious metal prices.
| Section 22 | Economic Analysis | Page 6 |
22.5 Sensitivity Analysis – Cont’d

Figure 22-1: Before-Tax NPV Sensitivities

Figure 22-2: Before-Tax IRR Sensitivities
| Section 22 | Economic Analysis | Page 7 |
22.5 Sensitivity Analysis – Cont’d

Figure 22-3: After-Tax NPV Sensitivities

Figure 22-4: After-Tax IRR Sensitivities
SECTION 23
ADJACENT PROPERTIES
SECTION 23: ADJACENT PROPERTIES
Table of Contents
| Page | ||
| 23.1 | Adjacent Properties | 1 |
| Section 23 | Adjacent Properties | Page 1 |
23.1 Adjacent Properties
There are no adjacent properties as defined by NI 43-101.
SECTION 24
OTHER RELEVANT DATA AND INFORMATION
SECTION 24: OTHER RELEVANT DATA AND INFORMATION
Table of Contents
| Page | |
| 24.1 Other Relevant Data and Information | 1 |
| Section 24 | Other Relevant Data and Information | Page 1 |
24.1 Other Relevant Data and Information
In the opinion of the QP, there is no additional information necessary in order to make the technical report understandable and not misleading beyond that included in this report.
SECTION 25
INTERPRETATION AND CONCLUSIONS
SECTION 25: INTERPRETATION AND CONCLUSIONS
Table of Contents
| Page | ||
| 25.1 | Tenure and Environmental Liabilities | 1 |
| 25.2 | Exploration and Geology | 1 |
| 25.3 | Mining | 2 |
| 25.4 | Metallurgy and Processing | 2 |
| 25.5 | Infrastructure | 3 |
| 25.6 | Environment | 3 |
| 25.7 | Capital and Operating Costs | 3 |
| 25.8 | Economics | 3 |
| 25.9 | Risks | 4 |
| Section 25 | Interpretation and Conclusions | Page 1 |
25.1 Tenure and Environmental Liabilities
Taseko Mines Limited, through its wholly owned subsidiary Yellowhead Mining Inc., is the 100% owner of the Yellowhead mineral tenures. All mineral tenures are in good standing.
Six mineral claims, five of which have been incorporated into the mining lease are subject to a 2.5% NSR royalty to XStrata. Additionally, 31 claims, 27 of which have been incorporated into the mining lease, are subject to a 3% NSR royalty to US Steel Corp., capped at $3.9 million, subject to inflation
The Yellowhead property is subject to environmental liabilities related to the reclamation of surface disturbance associated with permits received for previous exploration and site investigation programs. Funds to cover the expense of these reclamation activities are held in trust and are fully recoverable once the site has been rehabilitated to the satisfaction of the Inspector of Mines.
25.2 Exploration and Geology
Evaluation of the exploration programs and results available to the effective date of this report indicates that:
• The geology is sufficiently well understood to support the mineral resource and mineral reserve estimations presented in this report;
• The drillhole database contains all drilling data collected in the deposit area to date and has been structured for mineral resource estimation;
• QA/QC with respect to the results received to date is acceptable and protocols have been well documented;
• As of June 1, 2025, the Yellowhead deposit is estimated to contain a measured and indicated mineral resource of 1.3 billion tonnes grading 0.25% copper, 0.028 gpt gold, and 1.2 gpt silver using a cut-off grade of 0.15% copper. An additional 111 million tonnes averaging 0.24% copper is classified as inferred;
• As of June 1, 2025, the Yellowhead deposit is estimated to contain a proven and probable mineral reserve of 817 million tonnes grading 0.28% copper, 0.030 gpt gold, and 1.3 gpt silver using a cut-off grade of 0.17% copper. This mineral reserve is contained within the mineral resource stated above;
• Mineral resources and mineral reserves have been estimated in accordance with CIM Definition Standards for Mineral Resources and Mineral Reserves (2014) that are incorporated by reference into NI 43-101.
| Section 25 | Interpretation and Conclusions | Page 2 |
25.3 Mining
The evaluations of the mining options available to effectively recover copper from this deposit indicate that:
• The Yellowhead property contains adequate mineral reserves to develop an open pit mine and supply a process plant with 90,000 tpd of ore for a period of at least 25 years;
• The reserve pit design is consistent with the reserve basis pit shell and meets the recommended geotechnical design parameters. The final pit limit is subdivided into 5 phases with adequate mining width for the selected mine fleet and an efficient ramp system provides access between the mining benches, the waste storage areas, and the primary crusher;
• The mine design provides a reasonable basis for the production schedule meeting the targeted mill feed rate of 90,000 tpd with a consistently sized mining fleet;
• Equipment and fleet sizing is based on appropriate assumptions and is adequate for the operation proposed;
• Mining losses and mining dilution are appropriately considered;
• The design and mine schedule are to a sufficient level of study to support a mineral reserve statement;
• The mine schedule uses only measured and indicated blocks within the mineral resource estimate. Inferred resources are treated as waste.
25.4 Metallurgy and Processing
The evaluation of the metallurgy and processing options available to effectively recover copper from this deposit indicate that:
• A process that utilizes commercially available mineral processing unit operations consisting of crushing, three-stages of comminution, sulphide flotation and concentrate dewatering can be used to produce a clean copper concentrate with no penalty level deleterious elements;
• Recovery of copper can be expected to average 90%;
• Recovery of gold and silver can be expected to average 36% and 59% respectively;
• A processing facility can be constructed at a nominal throughput of 90,000 tpd of feed ore;
• Process tailings from the concentrator can be co-disposed with PAG waste rock in a tailings storage facility located in proximity to the processing facility.
| Section 25 | Interpretation and Conclusions | Page 3 |
25.5 Infrastructure
The infrastructure required has been adequately identified to support the Project at the designed capacity. The design is to a sufficient level of study to support a mineral reserve statement and there are no known conditions that would preclude the establishment of the infrastructure as designed.
25.6 Environment
Environmental baseline studies have been advanced to a level commensurate with initiating an environmental assessment.
25.7 Capital and Operating Costs
The estimation of capital and operating costs is based on a sufficient level of study to support a mineral reserve statement and are current as of Q2 2025.
25.8 Economics
The economics of mining and processing the stated mineral reserves of the Project are appropriate and demonstrate that, as of the effective date of this report, extraction can reasonably be justified.
| Section 25 | Interpretation and Conclusions | Page 4 |
25.9 Risks
The following project risks have been identified:
• The economics of the Project are directly related and sensitive to the price of copper. While copper markets and demand are well established, copper prices are affected by numerous factors beyond the company's control, including demand growth, expectations with respect to the rate of inflation, the exchange rates of the United States dollar to other currencies, interest rates, and global or regional political, economic or financial situations;
• Site operating costs are subject to variation from one year to the next due to factors, such as changing strip ratio, ore grade, minerology, cost of supplies and services (e.g., electricity, fuel, etc.) and the exchange rate of supplies and services denominated in foreign currencies. No assurance can be given that the estimates of production and unit cash costs of production will be achieved. Failure to achieve production or cost estimates or material increases in operating or capital costs could have an adverse impact on the Project's profitability;
• The Project is subject to currency exchange rate risk because the price of copper is denominated in United States dollars and, accordingly, the Project's revenues will be received in United States dollars. The company's expenses will be almost entirely denominated in Canadian dollars. Taseko currently does not engage in foreign exchange hedging. Any strengthening of the Canadian dollar without a corresponding increase in commodity prices would negatively impact the profitability of the Project;
• The Project will require licenses and permits from various governmental authorities. There can be no assurances that Taseko will be able to obtain all necessary licenses and permits that may be required to carry out all proposed development and operations;
• Typical mining risks include adverse geological or ground conditions, adverse weather conditions, potential labour problems, and availability and cost of equipment procurement and repairs;
• The Project's capital cost estimates are based on Q2 2025 quotes received for major equipment, including some from United States-based suppliers. While these quotes reflect pricing after tariff implementation, the full impact may not have been realized and future changes could affect costs. Consideration of alternative non-US-based equipment at the time of procurement would help mitigate this risk;
• Changes in federal or provincial tax legislation as well as the timing and eligibility of capital costs relative to available incentives or credits could impact the Project's after-tax NPV and IRR.
SECTION 26
RECOMMENDATIONS
SECTION 26: RECOMMENDATIONS
Table of Contents
| Page | |
| 26.1 Recommendations | 1 |
| List of Tables | |
| Table 26-1: Cost Estimate for Environmental Assessment Inputs | 1 |
| Table 26-2: Cost Estimate for Proposed Metallurgical Test Work | 2 |
| Section 26 | Recommendations | 1 |
26.1 Recommendations
The following section identifies recommendations for two phases of work to advance the project towards a production decision. The two phases are not contingent on one another.
(a) Environmental Assessment Inputs
As per the provincial and federal regulatory requirements outlined in Section 20 an environmental assessment of the Yellowhead Project will be required before the Project can obtain permits for construction and operation.
Although a significant amount of technical and environmental studies have been completed to date, additional environmental baseline studies, geotechnical site investigation, modelling and effects assessment work are recommended as inputs to support an environmental assessment. A summary of the scope and cost of this work is presented in Table 26-1.
Table 26-1: Cost Estimate for Environmental Assessment Inputs
| Scope of Work | Cost ($ millions) |
| Geotechnical Site Investigation | 5 |
| Environmental Baseline Studies | 15 |
| Modelling and Effects Assessment | 15 |
| Total | 35 |
| Section 26 | Recommendations | 2 |
26.1 Recommendations - Cont'd
(b) Metallurgical Test Work
Metallurgical test work completed to date is consistent with the design, costing, and recovery which supports the mineral reserve that is the subject of this technical report.
It is recommended that additional bench-scale metallurgical test work be undertaken prior to advancing to detailed design.
Gold recovery testing consisting of mineralogical characterization, gravity and flotation testing is recommended to evaluate improvements in gold recovery and final concentrate grade.
Additional variability testing using the updated process flowsheet and reagent scheme is recommended to support improved forecasting of metallurgical performance over the life of mine.
Additional settling and filtration testing will confirm settling and filtration rates and support future dewatering equipment sizing at the updated grind size targets.
A summary of the scope and cost of this work is presented in Table 26-2.
Table 26-2: Cost Estimate for Proposed Metallurgical Test Work
| Metallurgical Bench Test Work | Cost ($ thousands) |
| Gold Recovery Test Program | 60 |
| Additional Variability Test Work | 100 |
| Additional Filtration and Settling Test Work | 15 |
| Total | 175 |
SECTION 27
REFERENCES
SECTION 27: REFERENCES
Table of Contents
| Page | ||
| 27.1 | References | 1 |
| Section 27 | References | 1 |
27.1 References
Aeroquest Ltd., 2006. Report on a Helicopter-Borne AeroTEM II Electromagnetic & Magnetometer Survey.
Aeroquest Ltd., 2009. Interpretation of Helicopter-Borne AeroTEM II Electromagnetic & Magnetometer Survey.
Allnorth Consultants Limited, 2011. Harper Creek Mine Vavenby Rail Siding Report, Lyle Prescott, December 14, 2011.
Allnorth Consultants Limited, 2011. Harper Creek Project Access Investigation, Craig Smith, June 22, 2011.
Allnorth Consultants Ltd., 2025. 2025 Cost Update for Yellowhead Project, unpublished report for Taseko Mines Ltd., by Allnorth Consultants Ltd, June 27, 2025.
Armstrong, R.N., and Hawkins, T.D., 2009. Lithological, Structural and Geochemical Aspects of the Harper Creek Property, British Columbia, unpublished company report for Taseko Mines Ltd.
Ash, C.H., and Riveros, C.P., 2001. Geology of the Gibraltar Copper-Molybdenite Deposit, East-Central British Columbia (93B/9); in Geological Fieldwork 2000, British Columbia Ministry of Energy, Mines and Petroleum Resources, Paper 2001-1, p.1 19- 133.
Bailey, S.L., Paradis, S., and Johnston, S.T., 2001. New Insights Into Metavolcanic Successions and Geochemistry of the Eagle Bay Assemblage, South-Central British Columbia; in Geological Survey of Canada, Current Research 2001- A8, 25 p.
Bailey, S.L., Paradis, S., Johnston, S.T., and Höy, T., 2000. Geologic Setting of the Devonian-Mississippian, Rea and Samatosum VMS Deposits of the Eagle Bay Assemblage, Adams Lake Area, South Central British Columbia; in Geological Fieldwork 1999, British Columbia Ministry of Energy, Mines and Petroleum Resources, Paper 2000-1, p.287-296.
Belik, G.D., 1973. Geology of the Harper Creek Copper Deposit, unpublished thesis, University of British Columbia.
Belik, G.D., 1985. Diamond Drill Report on the Tia Group Kamloops Mining Division, British Columbia for Nu Crown Resources Inc., December 14, 1985.
BQE, 2025. Updated PFS Capital and Operating Cost Estimates - Yellowhead Mine Selen-IX Water Treatment Plant, unpublished company report for Taseko Mines Ltd., May 9, 2025.
| Section 27 | References | 2 |
27.1 References - Cont'd
Bysouth, G.D., Campbell, K.V., Barker, G.E., and Gagnier, G.K., 1995. Tonalite- Trondhjemite Fractionation of Peraluminous Magma and the Formation of the Syntectonic Porphyry Copper Mineralization, Gibraltar Mine, Central British Columbia; in Porphyry Deposits of the Northwestern Cordillera of North America, Schroeter, T.G., Editor, Canadian Institute of Mining, Metallurgy and Petroleum, Special Volume 46, p.201-213.
Calderwood, A.R., van der Heyden, P., and Armstrong, R.L., 1990. Geochronometry of the Thuya, Takomkane, Raft and Baldy Batholiths, South- Central British Columbia; Geological Association of Canada - Mineralogical Association of Canada, Joint Annual Meeting, Vancouver, BC, Program with Abstracts, Volume 15, p.A19.
Campbell, R.B., and Tipper, H.W., 1971. Bonapart Lake Map-Area, British Columbia, Geological Survey of Canada, Memoir 363.
Canadian Institute of Mining, Metallurgy and Petroleum, 2014 CIM Definition Standards for Mineral Resources & Mineral Reserves, Adopted by CIM Council May 19, 2014
Casselman, M.J., McMillan, W.J., and Newman, K.M., 1995. Highland Valley Porphyry Copper Deposits Near Kamloops, British Columbia: A Review and Update with Emphasis on the Valley Deposit: In Porphyry Deposits of the Northwestern Cordillera of North America, Schroeter, T.G., Editor, Canadian Institute of Mining, Metallurgy and Petroleum, Special Volume 46, p.161-191.
Cathro, M.S., and Lefebure, D.V., 2000. Several New Plutonic-Related Gold, Bismuth and Tungsten Occurrences in Southern British Columbia: in Geological Fieldwork 1999, British Columbia Ministry of Energy, Mines and Petroleum Resources, Paper 2000-1, p.207-223.
Conalma Consulting Ltd., 2025. Report on Yellowhead Concentrate as Requested by Yellowhead Mining Inc., unpublished report for Taseko Mines Ltd. by Conalma Consulting Ltd.., June 18th, 2025.
ERM, 2014. Harper Creek Project Meteorological Baseline Report, June 2014.
FLSmidth Dawson Metallurgical Laboratories, 2011. Results of Crushing and Grinding Index Tests on Nine Core Samples from the Harper Creek Project, Philip Thompson, prepared for Laurion Consulting Inc., July 22, 2011.
FLSmidth Inc., 2011. Compressive Strength, Impact Strength, Ball Mill Bond Mill Work Index and Abrasion Analysis performed for Yellowhead Mining Inc. (#2991150261), L.S. Dutt, July 2011.
| Section 27 | References | 3 |
27.1 References - Cont'd
Fraser, T.M., Stanley, C.R., Nikic, Z.T., Pesalj, R., and Gore, D., 1995. The Mount Polley Alkalic Porphyry Copper-Gold Deposit, South-Central British Columbia; in Porphyry Deposits of the Northwestern Cordillera of North America, Schroeter, T.G., Editor, Canadian Institute of Mining, Metallurgy and Petroleum, Special Volume 46, p.609-622.
G&T Metallurgical Services Ltd., 2012. Feasibility Metallurgical Testing Harper Creek Project Yellowhead Mining Inc. (KM2916), February 24, 2012.
G&T Metallurgical Services Ltd., 2012. Concentrate Generation for the Harper Creek Project Yellowhead Mining (KM3221), January 5, 2012.
G&T Metallurgical Services Ltd., 2012. Amenability of Harper Creek Ores to Pre- Concentration by Size Yellowhead Mining (KM3234), February 6, 2012.
G&T Metallurgical Services Ltd., 2011. Supplemental Metallurgical Testing Harper Creek Project Yellowhead Mining Inc. (KM2877), March 3, 2011.
G&T Metallurgical Services Ltd., 2010. Metallurgical Testing Master Composite 1 Harper Creek Project Yellowhead Mining Inc. (KM2756), December 3, 2010.
Holland, S.S., 1976. Landforms of British Columbia, a Physiographic Outline; Ministry of Energy, Mines and Petroleum Resources, Bulletin 48.
Höy, T., 1996. Harper Creek: a Volcanogenic Sulphide Deposit Within the Eagle Bay
Assemblage, Kootenay Terrane, Southern British Columbia: in Geological Fieldwork 1996, British Columbia Ministry of Energy, Mines and Petroleum Resources, Paper 1997-1, p.199-209.
Höy, T., 1999. Massive Sulphide Deposits of the Eagle Bay Assemblage, Adams Plateau, South Central British Columbia: in Geological Fieldwork 1998, British Columbia Ministry of Energy, Mines and Petroleum Resources, Paper 1999-1, p.223-245.
Höy, T., and Goutier, F., 1986. Rea Gold (Hilton) and Homestake Volcanogenic Sulphide-Barite Deposits, Southeastern British Columbia; in Geological Fieldwork 1985, British Columbia Ministry of Energy, Mines and Petroleum Resources, Paper 1986-1, p.59-68.
Hughes, N.D., Paradis, S., Sears, J.W., and Pope, M., 2001. Lithology, Tectonstratigrahy, and Paleogeography of the Vavenby Area, Eagle Bay Assembalge, South-Central British Columbia, a Possible Constraint for the Timing of Rifting of Laurentia. Current Research 2001 -A9 Geological Survey of Canada, 1-8.
| Section 27 | References | 4 |
27.1 References - Cont'd
Insight Geophysics Inc., 2007a. Geophysical Survey Summary Report, Horizontal Loop Electromagnetic and Ground Magnetic Surveys, Jones Grid, Northwest Grid and Harper West Grid, Northwest and Jones Grids, Harper Creek Property, May 2007.
Insight Geophysics Inc., 2007b. Geophysical Survey Summary Report, Horizontal Loop Electromagnetic and Ground Magnetic Surveys, M Anomaly Grid, Harper Creek Property, June 2007.
Insight Geophysics Inc., 2007c. Geophysics Logistical Report, Tuned Gradient and Insight Section Induced Polarization and Resistivity Surveys, Harper Creek Property, November 2007.
Jardine, K., July 13, 2018. Letter to Ronald Mathison, BC Environmental Assessment Office Project Information Center (EPIC), https://projects.eao.gov.bc.ca/p/58851167aaecd9001b81f7a7/documents
JKTech PTY Ltd, 2011. SMC Test Report - Harper Creek - Jktech Job#11017/P10
Knight Piésold Ltd., 2014. Mine Waste and Water Management Design Report (VA101- 458/11-1 Rev. 0), undated.
Knight Piésold Ltd., 2019. Yellowhead Project Pre-Feasibility Waste and Water Management, unpublished report for Taseko Mines Ltd. by Knight Piésold Ltd., December 6th, 2019.
Knight Piésold Ltd., 2019. Yellowhead Project - Water Balance and Water Quality Models, unpublished report for Taseko Mines Ltd. by Knight Piésold Ltd., December 18th, 2019.
Knight Piésold Ltd., 2020a. Yellowhead Project - Preliminary Open Pit Slope Recommendations unpublished report for Taseko Mines Ltd. by Knight Piésold Ltd., January 24th, 2020.
Knight Piésold Ltd., 2020b. Yellowhead Project - Preliminary Waste Dump Slope
Recommendations unpublished report for Taseko Mines Ltd. by Knight Piésold Ltd., January 24th, 2020.
Knight Piésold Ltd., 2024. Yellowhead Project - 2024 Main Dam Site Investigation Factual Data Report, unpublished report for Taseko Mines Ltd. by Knight Piésold Ltd., October 11th, 2024, revised March 18, 2025.
Knight Piésold Ltd., 2025. Yellowhead Project 2025 Cost Estimate Update: Tailings Storage Facility and Water Management Facilities, unpublished report for Taseko Mines Ltd. by Knight Piésold Ltd., June 30th, 2025.
| Section 27 | References | 5 |
27.1 References - Cont'd
Kraft, J.E., 1972., Target Evaluation, Harper Creek Deposits Joint Venture, Private Report, Noranda Exploration Co. Ltd.
Kraft, J.E., 1974. Evaluation Review of Harper Creek Joint Venture, Private Report, Noranda Exploration Co. Ltd.
KWM Consulting Inc., 2011. Grinding Circuit Evaluation for the Harper Creek Project, prepared for Yellowhead Mining Inc., Ken Major, October 7, 2011.
Lakefield Research of Canada Limited, 1968. An Investigation of The Recovery of Copper from samples submitted by Cordilleran Engineering Limited Progress Report No. 1.
Lefebvre, J.J., 2006. Data Compilation of the Harper Creek Property, unpublished report for Yellowhead Mining Inc., by CME Managing Consultants Inc. February 28, 2006.
Logan, J.M., 2000. Plutonic-Related Gold-Quartz Veins in Southern British Columbia; in Geological Fieldwork 1999, British Columbia Ministry of Energy, Mines and Petroleum Resources, Paper 2000-1, p.193-206.
Logan, J.M., 2001. Prospective Areas for Intrusion-Related Gold-Quartz Veins in Southern British Columbia; in Geological Fieldwork 2000, British Columbia Ministry of Energy, Mines and Petroleum Resources, Paper 2001-1, p.231-252.
Logan, J.M., 2002. Intrusion-Related Mineral Occurrences of the Cretaceous Bayonne Magmatic Belt, Southeast British Columbia; British Columbia Ministry of Energy, Mines and Petroleum Resources, Geoscience Map 2002-1.
Logan, J.M. and Mihalynuk, M.G., 2005. Regional Geology and Setting of the Cariboo, Bell, Springer and Northeast Porphyry Cu-Au Zones at Mount Polley, South-Central British Columbia; in Geological Fieldwork 2004, British Columbia Ministry of Energy, Mines and Petroleum Resources, Paper 2005-1, p. 249-270.
Merit Consultants International Inc., 2013. Amended & Restated Technical Report and Feasibility Study for the Harper Creek Copper Project. Prepared by Jay Collins, P.Eng., Mark Dobbs, P.Eng, Ronald Simpson, P. Geo., Kenneth Brouwer, P. Eng., John Fox, P. Eng., John Nilsson, M Sc., P.Eng., January 25, 2013.
Merit Consultants International Inc., 2012. Technical Report and Feasibility Study for the Harper Creek Copper Project. Prepared by Jay Collins, P.Eng., Mark Dobbs, P.Eng, Ronald Simpson, P. Geo., Kenneth Brouwer, P. Eng., John Fox, P. Eng., John Nilsson, M Sc., P.Eng., March 29, 2012.
| Section 27 | References | 6 |
27.1 References - Cont'd
Mortimer, N., 1987. The Nicola Group: Late Triassic and Early Jurassic Subduction- Related Volcanism in British Columbia; Canadian Journal of Earth Sciences, Volume 24, p.2521-2536.
Mortensen, J.K., Ghosh, D.K., and Ferri, F., 1995. U-Pb Geochronology of Intrusive Rocks Associated with Copper- Gold Porphyry Deposits in the Canadian Cordillera, in Schroeter, T.G., ed., Porphyry Deposits in the Northwestern Cordillera of North America: Canadian Institute of Mining, Metallurgy and Petroleum, Special Volume 46, p. 142- 158.
Naas, C.O., 2013. Technical Report on the Phase XI Exploration Program of the Harper Creek Property, unpublished report for Yellowhead Mining Inc. by CME Consultants Inc., May 31, 2013.
Naas, C.O., 2012a. Technical Report on the Phase VIII Exploration Program of the Harper Creek Property, unpublished report for Taseko Mines Ltd. by CME Consultants Inc., January 31, 2012.
Naas, C.O., 2012b. Report on the Condemnation Diamond Drill Program of the Harper Creek Property, unpublished report for Yellowhead Mining Inc. by CME Consultants Inc., March 13, 2012, revised June 22, 2012.
Naas, C.O., 2012c. Report on the Core Logging, Geochemical Sampling and GPS Surveying of the Geomechanical and Geotechnical Drilling Program of the Harper Creek Property, unpublished report for Yellowhead Mining Inc. by CME Consultants Inc., March 14, 2012.
Naas, C.O., 2012d. Report on the Phase X Exploration Program of the Harper Creek Property, unpublished report for Yellowhead Mining Inc. by CME Consultants Inc., March 20, 2012, revised June 22, 2012.
Naas, C.O., 2011a. Technical Report on the Phase VII Exploration Program of the Harper Creek Property, unpublished report for Yellowhead Mining Inc. by CME Consultants Inc., 8 vol., October 15, 2011.
Naas, C.O., 2011b. Metallurgical Drilling and Sample Collection Program on the Harper Creek Property, unpublished report for Yellowhead Mining Inc. by CME Consultants Inc., May 24, 2011.
Naas, C.O., 2010. Technical Report on the Phase VI Exploration Program of the Harper Creek Property, unpublished report for Yellowhead Mining Inc. by CME Consultants Inc., 4 vol., January 15, 2010.
| Section 27 | References | 7 |
27.1 References - Cont'd
Naas, C.O., 2009. Technical Report on the Phase V Exploration Program of the Harper Creek Property, unpublished report for Yellowhead Mining Inc. by CME Consultants Inc., 3 vol., June 11, 2009.
Naas, C.O., 2008. Technical Report on the Phase III Exploration Program of the Harper Creek Property, unpublished report for Yellowhead Mining Inc. by CME Consultants Inc., 2 vol., March 10, 2008.
Naas, C.O., 2007. Technical Report on the Phase II Exploration Program of the Harper Creek Property, unpublished report for Yellowhead Mining Inc. by CME Managing Consultants Inc. 2 vol., July 20, 2007.
Naas, C.O., 2006. Technical Report on the Phase I Exploration Program of the Harper Creek Property, unpublished report for Yellowhead Mining Inc. by CME Consultants Inc., 3 vol., November 30, 2006.
Naas C.O. and Soloviev, S., 2008. Technical Report on the Phase IV Exploration Program of the Harper Creek Property, unpublished report for Yellowhead Mining Inc. by CME Consultants Inc., 9 vol., June 30, 2008.
Nelson, J.A., and Friedman, R., 2004. Superimposed Quesnel (late Paleozoic-Jurassic) and Yukon-Tanana (Devonian- Mississippian) Arc Assemblages, Cassiar Mountains, Northern British Columbia: Field, U-Pb, and Igneous Petrochemical Evidence: Canadian Journal of Earth Sciences, 41(10), p.1201-1235.
Noranda Mines Limited, 1971. Preliminary Flotation Testwork on Harper Creek Copper Property Ore Samples Report No. 1.
Okulitch, A.V., 1979. Lithology, Stratigraphy, Structure and Mineral Occurrences of the ThompsonShuswap- Okanagan Area, British Columbia; Geological Survey of Canada, Open File 637.
Paradis, S., Bailey, S.L., Creaser, R.A., Piercey, S.J. and Schiarizza, P., 2006. Paleozoic Magmatism And Syngenetic Massive Sulphide Deposits Of The Eagle Bay Assemblage, Kootenay Terrane, Southern British Columbia, in Colpron, M. and Nelson, J.L., eds., Paleozoic Evolution and Metallogeny of Pericratonic Terranes at the Ancient Pacific Margin of North America, Canadian and Alaskan Cordillera: Geological Association of Canada, Special Paper 45, p. 383-414.
| Section 27 | References | 8 |
27.1 References - Cont'd
Panteleyev, A., Bailey, D.G., Bloodgood, M.A., and Hancock, K.D., 1996. Geology and Mineral Deposits of the Quesnel River-Horsefly Map Area, Central Quesnel Trough, British Columbia; British Columbia Ministry of Energy, Mines and Petroleum Resources, Bulletin 97, 155 p.
Phillips, Barrat, Kaiser Engineering Ltd., 1988. Geological Evaluation Report, Pre- feasibility Study, Hail - Harper Creek Copper Prospect; B.C. Ministry of Energy, Mines and Petroleum Resources, Assessment Report 17, 650p.
Shi, A. and Tan, G., 2008. Metallurgical Testing on the CME-LG Sample of the Harper Creek Project, Process Research Associates Ltd., July 22, 2008.
Rennie, D.W. and Scott K.C., 2010. Technical Report on the Harper Creek Project, Clearwater, British Columbia, Canada for Yellowhead Mining Inc. prepared by Scott Wilson Roscoe Postle Associates, August 16, 2010.
Rennie, D.W. and Scott K.C., 2007. Technical Report on the Harper Creek Project, British Columbia, Canada prepared for Yellowhead Mining Inc. by Scott Wilson Roscoe Postle Associates Inc., November 1, 2007.
Ross, K.V., Godwin, C.I., Bond, L., and Dawson, K.M., 1995. Geology, Alteration and Mineralization of the Ajax East and Ajax West Copper- Gold Alkalic Porphyry Deposits, Southern Iron Mask Batholith, Kamloops, British Columbia: in Porphyry Deposits of the Northwestern Cordillera of North America, Schroeter, T.G., Editor, Canadian Institute of Mining, Metallurgy and Petroleum, Special Volume 46, p.565-580.
Sanguinetti, M.H. and Lefebvre, J.J., 2006. Technical Report on the Harper Creek Property, unpublished report for Yellowhead Mining Inc., March 16, 2006.
Schiarizza, P., 1986a. Geology of the Eagle Bay Formation Between the Raft and Baldy Batholiths (82M5, 11, 12); in: Geological Fieldwork 1985; Ministry of Energy Mines and Petroleum Resources Paper 1986-1, p. 89-94.
Schiarizza, P., 1986b. Geology of the Vavenby Area (82M5, 11, 12) in Geological Fieldwork 1985, British Columbia Ministry of Energy, Mines and Petroleum Resources, Open File Map 1986-5, scale 1:50,000.
Schiarizza, P. & Boulton, A., 2006. Geology and Mineral Occurrences of the Quesnel Terrane, Canim Lake Area (NTS 092P/15), South-Central British Columbia; in Geological Fieldwork 2005, British Columbia Ministry of Energy, Mines and Petroleum Resources, Paper 2006-1, p.163-184.
| Section 27 | References | 9 |
27.1 References - Cont'd
Schiarizza, P., Hefferman, S., and Zuber, J., 2002. Geology of Quesnel and Slide Mountain Terranes West of Clearwater, South- Central British Columbia (NTS 92P/9, 10, 15, 16) in Geological Fieldwork 2001, British Columbia Ministry of Energy, Mines and Petroleum Resources, Paper 2002-1, p.83-108.
Schiarizza P. and Preto V.A., 1987. Geology of the Adams Plateau-Clearwater-Vavenby Area, British Columbia Ministry of Energy Mines and Petroleum Resources Paper 1987- 2, 88p.
SGS Canada Inc., 2025. An Investigation into Flotation Optimization on Samples from the Yellowhead Deposit, Project 18065-01 - Final Report - Revision 1. June 24th, 2025
SRK Consulting (Canada) Inc., 2012. Harper Creek ML/ARD Memorandum, Stephen Day, report prepared for Yellowhead Mining Inc. February 1, 2012.
Statistics Canada, 2020. Table 18-10-0030-01 industrial product price index, by product, monthly.
Statistics Canada, 2023. Thompson-Nicola [Census division], British Columbia. Census Profile. 2021 Census. Statistics Canada Catalogue no. 98-316-X2016001. Ottawa. Released February 8, 2023. https://www12.statcan.gc.ca/census-recensement/ /2021/dp-pd/prof/index.cfm?Lang=E
Taseko Mines Limited, 2020. Technical Report on the Mineral Reserve Update at the Yellowhead Copper Project, prepared by Richard Weymark, January 16, 2020.
Wardrop, A Tetra Tech Company, 2011. Technical Report and Preliminary Assessment of the Harper Creek Project for Yellowhead Mining Inc., prepared by Narciso, N., Huang, J., Boyle, J.M., Ghaffari, H., Triebel, K., Teymouri, S., Cameron, M., Greenaway, G., and Donaghue, P., March 31, 2011.
Yellowhead Mining Inc., 2014. Technical Report & Feasibility Study of the Harper Creek Copper Project, Collins, A., Dobbs, M., Fontaine, D., Fox, J., Nilsson, J., Simpson, R., July 31, 2014.
Maps in this report were created using ArcGIS® software by Esri. ArcGIS® and ArcMap™ are the intellectual property of Esri and are used herein under license. Copyright © Esri. All rights reserved. For more information about Esri® software, please visit www.esri.com
Richard Weymark, P.Eng., MBA
12th Floor, 1040 West Georgia Street
Vancouver, BC V6E 4H1
I, Richard Weymark, P.Eng., MBA, of Vancouver, British Columbia, hereby certify that:
a) I am an employee of Taseko Mines Limited, with a business office at 12th Floor, 1040 West Georgia Street, Vancouver, British Columbia. In my position as Vice President, Engineering, on behalf of Taseko Mines Limited, I co-authored this technical report on the Yellowhead Copper Project.
b) This certificate applies to the technical report titled “Technical Report Update on the Yellowhead Copper Project, British Columbia, Canada”, dated July 10th, 2025 which has an effective date of June 15th, 2025.
c) I am a graduate of the University of British Columbia in Vancouver, B.C. (B.A.Sc. in Mining Engineering). I have practiced my profession for 17 years since graduation in 2008, in various roles, including supervisory positions, overseeing mine design and planning, resource and reserve estimation, open pit operations, business improvement, tailings dam construction, cost estimation, environmental assessment, permitting and project evaluation. I am a member in good standing of Engineers and Geoscientists British Columbia, license number 46355. As a result of my experience and qualifications, I am a qualified person as defined in National Instrument 43-101 Standards of Disclosure for Mineral Projects ("NI 43-101").
d) My most recent personal inspection of the property was from October 4th to 5th, 2024.
e) I am responsible for the compilation of Sections 1 through 5, 19, 20 and 23 through 27 of this report.
f) I am not independent of Taseko Mines Limited.
g) I have had prior involvement with the property that is the subject of the technical report. I have provided oversight of the technical and environmental work completed since Taseko acquired the Project in 2019 and was the Qualified Person responsible for supervising the preparation of the technical report titled "Technical Report on the Mineral Reserve Update at the Yellowhead Copper Project, British Columbia, Canada", dated January 16, 2020 which has an effective date of January 16, 2020.
h) I have read National Instrument 43-101 and the sections of the technical report for which I am responsible have been prepared in compliance with this Instrument.
i) I, as of the date of this certificate and to the best of my knowledge and information, believe the sections of the technical report for which I am responsible contain all scientific and technical information that is required to be disclosed to make the technical report not misleading.
Signed at Vancouver, British Columbia on the 10th day of July, 2025.
"Signed and Sealed"
Richard Weymark, P.Eng., MBA
Taseko EGBC Permit to Practice: 1000785
Jeremy Guichon, P.Eng.
12th Floor, 1040 West Georgia Street
Vancouver, BC V6E 4H1
I, Jeremy Guichon, P.Eng., of Vancouver, British Columbia, hereby certify that:
a) I am an employee of Taseko Mines Limited, with a business office at 12th Floor, 1040 West Georgia Street, Vancouver, British Columbia. In my position as Director, Mine Engineering, on behalf of Taseko Mines Limited, I co-authored this technical report on the Yellowhead Copper Project.
b) This certificate applies to the technical report titled “Technical Report Update on the Yellowhead Copper Project, British Columbia, Canada”, dated July 10th, 2025 which has an effective date of June 15th, 2025.
c) I am a graduate of the University of British Columbia in Vancouver, British Columbia (B.A.Sc. in Mining Engineering). I have practiced my profession for 17 years since graduation in 2008 in various roles, including supervisory positions, overseeing mine design and planning, resource and reserve estimation, open pit operations and cost estimation. I am a member in good standing of Engineers and Geoscientists British Columbia, license number 37499. As a result of my experience and qualifications, I am a qualified person as defined in National Instrument 43-101 Standards of Disclosure for Mineral Projects ("NI 43- 101").
d) My most recent personal inspection of the property was from October 3rd to 5th, 2024.
e) I am responsible for the compilation of Sections 6 through 11, 14 through 16, 21 and 22 of this report.
f) I am not independent of Taseko Mines Limited.
g) I have had prior involvement with the property that is the subject of the technical report. I have provided oversight of the mine engineering related technical work completed since Taseko acquired the Project in 2019, and supervised the preparation of Sections 15, 16, 21 and 22 of the previous technical report titled "Technical Report on the Mineral Reserve Update at the Yellowhead Copper Project, British Columbia, Canada", dated January 16, 2020 which has an effective date of January 16, 2020.
h) I have read National Instrument 43-101 and the sections of the technical report for which I am responsible have been prepared in compliance with this Instrument.
i) I, as of the date of this certificate and to the best of my knowledge and information, believe the sections of the technical report for which I am responsible contain all scientific and technical information that is required to be disclosed to make the technical report not misleading.
Signed at Vancouver, British Columbia on the 10th day of July, 2025.
"Signed and Sealed"
Jeremy Guichon, P.Eng.
Taseko EGBC Permit to Practice: 1000785
Adil Cheema, P.Eng.
12th Floor, 1040 West Georgia Street
Vancouver, BC V6E 4H1
I, Adil Cheema, P.Eng., of Vancouver, British Columbia, hereby certify that:
a) I am an employee of Taseko Mines Limited, with a business office at 12th Floor, 1040 West Georgia Street, Vancouver, British Columbia. In my position as Director, Process Engineering, on behalf of Taseko Mines Limited, I co-authored this technical report on the Yellowhead Copper Project.
b) This certificate applies to the technical report titled “Technical Report Update on the Yellowhead Copper Project, British Columbia, Canada”, dated July 10th, 2025 which has an effective date of June 15th, 2025.
c) I am a graduate of the University of British Columbia in Vancouver, B.C (B.A.Sc in Chemical Engineering). I have practiced my profession for 15 years since graduation in 2010, in various roles, including supervisory positions, overseeing mineral processing operations, metallurgical test work, flowsheet development, water management, cost estimation, and technical assessments to support project valuations. I am a member in good standing of Engineers and Geoscientists British Columbia, license number 43221. As a result of my experience and qualifications, I am a qualified person as defined in National Instrument 43-101 Standards of Disclosure for Mineral Projects ("NI 43-101").
d) My most recent personal inspection of the property was from October 3rd to 5th, 2024.
e) I am responsible for the compilation of Sections 12, 13, 17 and 18 of this report.
f) I am not independent of Taseko Mines Limited.
g) I have had prior involvement with the property that is the subject of the technical report. I have provided oversight of the process engineering related technical work completed since Taseko acquired the Project in 2019, and supervised the preparation of Sections 13 and 17 of the previous technical report titled "Technical Report on the Mineral Reserve Update at the Yellowhead Copper Project, British Columbia, Canada", dated January 16, 2020 which has an effective date of January 16, 2020.
h) I have read National Instrument 43-101 and the sections of the technical report for which I am responsible have been prepared in compliance with this Instrument.
i) I, as of the date of this certificate and to the best of my knowledge and information, believe the sections of the technical report for which I am responsible contain all scientific and technical information that is required to be disclosed to make the technical report not misleading.
Signed at Vancouver, British Columbia on the 10th day of July, 2025.
"Signed and Sealed"
Adil Cheema, P.Eng.
Taseko EGBC Permit to Practice: 1000785